Statistical Models Supporting the High-Performance Self ...
19
Citation: Kostrzanowska-Siedlarz, A.; Golaszewski, J. Statistical Models Supporting the High-Performance Self-Compacting Concrete (HPSCC) Design Process for High Strength. Materials 2022, 15, 690. https:// doi.org/10.3390/ma15020690 Academic Editor: Jean-Marc Tulliani Received: 14 November 2021 Accepted: 13 January 2022 Published: 17 January 2022 Publisher’s Note: MDPI stays neutral with regard to jurisdictional claims in published maps and institutional affil- iations. Copyright: © 2022 by the authors. Licensee MDPI, Basel, Switzerland. This article is an open access article distributed under the terms and conditions of the Creative Commons Attribution (CC BY) license (https:// creativecommons.org/licenses/by/ 4.0/). materials Article Statistical Models Supporting the High-Performance Self-Compacting Concrete (HPSCC) Design Process for High Strength Aleksandra Kostrzanowska-Siedlarz * and Jacek Golaszewski Faculty of Civil Engineering, Silesian University of Technology, 44-100 Gliwice, Poland; [email protected] * Correspondence: [email protected] Abstract: The type of test ingredients used for obtaining self-compacting high-performance concrete (HPSCC) has been carefully selected to be universal. For this purpose, an extensive statistical analysis of the obtained results of the literature research was carried out. Then, universal and adapted to the typical range, highly fit statistical models are presented that can support the HPSCC design process for achieving high strength. For this purpose, a broad plan of statistical research was used, namely multivariate selection of sidereal points, which allowed the use of as many as five variable factors at three levels of variability. The sidereal points were equal to the respective minimum and maximum input values. Additionally, based on the analysis of variance (ANOVA) for factorial systems with the interaction of the obtained test results, the significance of the impact of the tested material factors on the compressive strength of the HPSCC tested was determined. Keywords: ANOVA; compressive strength; high-performance self-compacting concrete; HPSCC 1. Introduction High-performance self-compacting concrete (HPSCC) combines the features of a mixture of self-compacting concrete (SCC) and hardened high-performance concrete (HPC). HPC technology was initially created at the turn of the 1970s. The initial goal of HPC was to obtain concrete with compressive strength of at least 60 MPa (f ck,cub ≥ 60 MPa, f ck,cyl ≥ 50 MPa) [1–5]. However, SCC was first designed in 1988 in Japan. The immediate reason for undertaking work on the development of SCC was the need to eliminate the vibration process [6–11]. SCC technology has increased the concreting efficiency, reduced labor costs, and increased the quality of concrete after hardening. Less than 10 years later, the first attempts to combine the two SCC and HPC technologies were also made in Japan, which resulted in the creation of HPSCC [12–15]. HPSCC is a cement-aggregate composite that is designed for obtaining compressive strength greater than 60 MPa whose components are also selected for the specific properties of the concrete mix. These properties should ensure the ability of the mix to tightly fill the space between the reinforcement and the space inside the formwork under the influence of its own weight without the need for mechanical compaction [12–20]. The use of HPSCC gives the possibility of concreting elements with dense reinforcement and complex shapes without the need for vibrations, as well as obtaining a very accurate mapping of mold surfaces without surface defects (architectural concrete). At the same time, it eliminates a number of disadvantages associated with vibratory compaction, e.g., noise and vibration, and reduces the work involved in forming elements. Currently, highly developed concrete technology allows the requirements to be specified for both the set of features of hardened concrete and the properties of the concrete mix, depending on the design requirements. The changes taking place in this field set new directions for the modification of properties of concrete mix and hardened concrete properties. This leads to high-quality concrete. Materials 2022, 15, 690. https://doi.org/10.3390/ma15020690 https://www.mdpi.com/journal/materials
-
Upload
khangminh22 -
Category
Documents
-
view
0 -
download
0
Transcript of Statistical Models Supporting the High-Performance Self ...

�����������������
Citation: Kostrzanowska-Siedlarz, A.;
Gołaszewski, J. Statistical Models
Supporting the High-Performance
Self-Compacting Concrete (HPSCC)
Design Process for High Strength.
Materials 2022, 15, 690. https://
doi.org/10.3390/ma15020690
Academic Editor: Jean-Marc Tulliani
Received: 14 November 2021
Accepted: 13 January 2022
Published: 17 January 2022
Publisher’s Note: MDPI stays neutral
with regard to jurisdictional claims in
published maps and institutional affil-
iations.
Copyright: © 2022 by the authors.
Licensee MDPI, Basel, Switzerland.
This article is an open access article
distributed under the terms and
conditions of the Creative Commons
Attribution (CC BY) license (https://
creativecommons.org/licenses/by/
4.0/).
materials
Article
Statistical Models Supporting the High-PerformanceSelf-Compacting Concrete (HPSCC) Design Process forHigh StrengthAleksandra Kostrzanowska-Siedlarz * and Jacek Gołaszewski
Faculty of Civil Engineering, Silesian University of Technology, 44-100 Gliwice, Poland;[email protected]* Correspondence: [email protected]
Abstract: The type of test ingredients used for obtaining self-compacting high-performance concrete(HPSCC) has been carefully selected to be universal. For this purpose, an extensive statistical analysisof the obtained results of the literature research was carried out. Then, universal and adapted to thetypical range, highly fit statistical models are presented that can support the HPSCC design processfor achieving high strength. For this purpose, a broad plan of statistical research was used, namelymultivariate selection of sidereal points, which allowed the use of as many as five variable factors atthree levels of variability. The sidereal points were equal to the respective minimum and maximuminput values. Additionally, based on the analysis of variance (ANOVA) for factorial systems with theinteraction of the obtained test results, the significance of the impact of the tested material factors onthe compressive strength of the HPSCC tested was determined.
Keywords: ANOVA; compressive strength; high-performance self-compacting concrete; HPSCC
1. Introduction
High-performance self-compacting concrete (HPSCC) combines the features of amixture of self-compacting concrete (SCC) and hardened high-performance concrete (HPC).HPC technology was initially created at the turn of the 1970s. The initial goal of HPCwas to obtain concrete with compressive strength of at least 60 MPa (fck,cub ≥ 60 MPa,fck,cyl ≥ 50 MPa) [1–5]. However, SCC was first designed in 1988 in Japan. The immediatereason for undertaking work on the development of SCC was the need to eliminate thevibration process [6–11]. SCC technology has increased the concreting efficiency, reducedlabor costs, and increased the quality of concrete after hardening. Less than 10 years later,the first attempts to combine the two SCC and HPC technologies were also made in Japan,which resulted in the creation of HPSCC [12–15]. HPSCC is a cement-aggregate compositethat is designed for obtaining compressive strength greater than 60 MPa whose componentsare also selected for the specific properties of the concrete mix. These properties shouldensure the ability of the mix to tightly fill the space between the reinforcement and the spaceinside the formwork under the influence of its own weight without the need for mechanicalcompaction [12–20]. The use of HPSCC gives the possibility of concreting elements withdense reinforcement and complex shapes without the need for vibrations, as well asobtaining a very accurate mapping of mold surfaces without surface defects (architecturalconcrete). At the same time, it eliminates a number of disadvantages associated withvibratory compaction, e.g., noise and vibration, and reduces the work involved in formingelements. Currently, highly developed concrete technology allows the requirements to bespecified for both the set of features of hardened concrete and the properties of the concretemix, depending on the design requirements. The changes taking place in this field setnew directions for the modification of properties of concrete mix and hardened concreteproperties. This leads to high-quality concrete.
Materials 2022, 15, 690. https://doi.org/10.3390/ma15020690 https://www.mdpi.com/journal/materials
Materials 2022, 15, 690 2 of 19
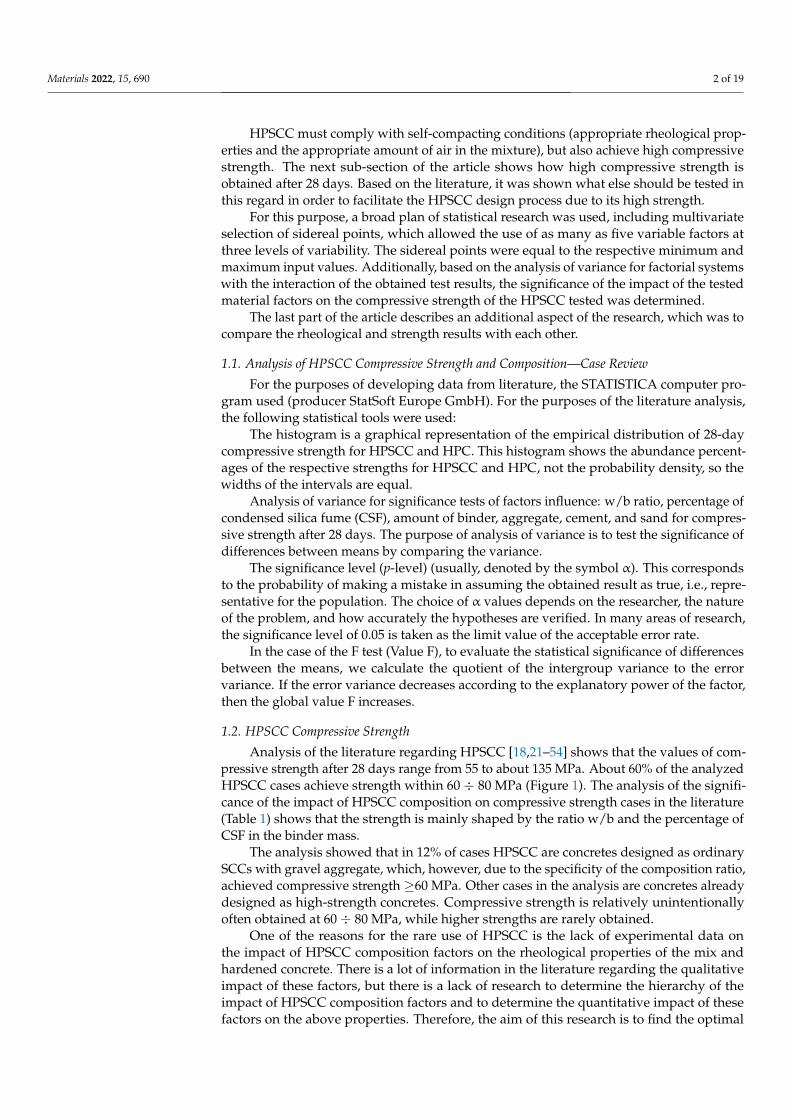
HPSCC must comply with self-compacting conditions (appropriate rheological prop-erties and the appropriate amount of air in the mixture), but also achieve high compressivestrength. The next sub-section of the article shows how high compressive strength isobtained after 28 days. Based on the literature, it was shown what else should be tested inthis regard in order to facilitate the HPSCC design process due to its high strength.
For this purpose, a broad plan of statistical research was used, including multivariateselection of sidereal points, which allowed the use of as many as five variable factors atthree levels of variability. The sidereal points were equal to the respective minimum andmaximum input values. Additionally, based on the analysis of variance for factorial systemswith the interaction of the obtained test results, the significance of the impact of the testedmaterial factors on the compressive strength of the HPSCC tested was determined.
The last part of the article describes an additional aspect of the research, which was tocompare the rheological and strength results with each other.
1.1. Analysis of HPSCC Compressive Strength and Composition—Case Review
For the purposes of developing data from literature, the STATISTICA computer pro-gram used (producer StatSoft Europe GmbH). For the purposes of the literature analysis,the following statistical tools were used:
The histogram is a graphical representation of the empirical distribution of 28-daycompressive strength for HPSCC and HPC. This histogram shows the abundance percent-ages of the respective strengths for HPSCC and HPC, not the probability density, so thewidths of the intervals are equal.
Analysis of variance for significance tests of factors influence: w/b ratio, percentage ofcondensed silica fume (CSF), amount of binder, aggregate, cement, and sand for compres-sive strength after 28 days. The purpose of analysis of variance is to test the significance ofdifferences between means by comparing the variance.
The significance level (p-level) (usually, denoted by the symbol α). This correspondsto the probability of making a mistake in assuming the obtained result as true, i.e., repre-sentative for the population. The choice of α values depends on the researcher, the natureof the problem, and how accurately the hypotheses are verified. In many areas of research,the significance level of 0.05 is taken as the limit value of the acceptable error rate.
In the case of the F test (Value F), to evaluate the statistical significance of differencesbetween the means, we calculate the quotient of the intergroup variance to the errorvariance. If the error variance decreases according to the explanatory power of the factor,then the global value F increases.
1.2. HPSCC Compressive Strength
Analysis of the literature regarding HPSCC [18,21–54] shows that the values of com-pressive strength after 28 days range from 55 to about 135 MPa. About 60% of the analyzedHPSCC cases achieve strength within 60 ÷ 80 MPa (Figure 1). The analysis of the signifi-cance of the impact of HPSCC composition on compressive strength cases in the literature(Table 1) shows that the strength is mainly shaped by the ratio w/b and the percentage ofCSF in the binder mass.
The analysis showed that in 12% of cases HPSCC are concretes designed as ordinarySCCs with gravel aggregate, which, however, due to the specificity of the composition ratio,achieved compressive strength ≥60 MPa. Other cases in the analysis are concretes alreadydesigned as high-strength concretes. Compressive strength is relatively unintentionallyoften obtained at 60 ÷ 80 MPa, while higher strengths are rarely obtained.
One of the reasons for the rare use of HPSCC is the lack of experimental data onthe impact of HPSCC composition factors on the rheological properties of the mix andhardened concrete. There is a lot of information in the literature regarding the qualitativeimpact of these factors, but there is a lack of research to determine the hierarchy of theimpact of HPSCC composition factors and to determine the quantitative impact of thesefactors on the above properties. Therefore, the aim of this research is to find the optimal

Materials 2022, 15, 690 3 of 19
compositions and determine the hierarchy of the influence of the components based onthe analysis of variance and to determine statistical models for compressive strength bymeans of multiple regression. The intention is that the models can aid in the design of theHPSCC. Due to the wide range of variability of the basic parameters of HPSCC composition,adjusted to the typical range, used in the research, both the dependencies and functions aregeneral in nature and can be effectively used in aiding design.
Materials 2022, 15, x FOR PEER REVIEW 3 of 22
Figure 1. Histogram of 28-day compressive strength for HPSCC and HPC [18,21–54].
Table 1. Analysis of variance of factor tests of the impact of HPSCC composition on 28-day com-pressive strength [18,21–54].
Source of Variance Value F The significance Level
α w/b ratio 19.51078 0.006911
Percentage of condensed silica fume,CSF (%) 14.95835 0.046478 Amount of binder, (kg/m3) 4.67745 0.082899
Amount of aggregate, (kg/m3) 3.09583 0.138813 Amount of cement, (kg/m3) 2.36529 0.184673
Amount of sand, (kg/m3) 0.05060 0.830927
The analysis showed that in 12% of cases HPSCC are concretes designed as ordinary SCCs with gravel aggregate, which, however, due to the specificity of the composition ratio, achieved compressive strength ≥ 60MPa. Other cases in the analysis are concretes already designed as high-strength concretes. Compressive strength is relatively uninten-tionally often obtained at 60 ÷ 80 MPa, while higher strengths are rarely obtained.
One of the reasons for the rare use of HPSCC is the lack of experimental data on the impact of HPSCC composition factors on the rheological properties of the mix and hard-ened concrete. There is a lot of information in the literature regarding the qualitative im-pact of these factors, but there is a lack of research to determine the hierarchy of the impact of HPSCC composition factors and to determine the quantitative impact of these factors on the above properties. Therefore, the aim of this research is to find the optimal compo-sitions and determine the hierarchy of the influence of the components based on the anal-ysis of variance and to determine statistical models for compressive strength by means of multiple regression. The intention is that the models can aid in the design of the HPSCC. Due to the wide range of variability of the basic parameters of HPSCC composition, ad-justed to the typical range, used in the research, both the dependencies and functions are general in nature and can be effectively used in aiding design.
1.3. HPSCC Composition The necessity to fulfill the requirements of the SCC rheological behavior and mechan-
ical properties of hardened HPC determines the specificity of the composition of HPSCC. For the purposes of analyzing the composition of concrete, the composition and compo-nents of HPSCC were compared with the compositions of SCC (published by Domone [55]) and the composition of HPC (analysis of 56 selected cases [56–64]). The composition
Figure 1. Histogram of 28-day compressive strength for HPSCC and HPC [18,21–54].
Table 1. Analysis of variance of factor tests of the impact of HPSCC composition on 28-day compres-sive strength [18,21–54].
Source of Variance Value F The Significance Level α
w/b ratio 19.51078 0.006911
Percentage of condensed silica fume, CSF (%) 14.95835 0.046478
Amount of binder, (kg/m3) 4.67745 0.082899
Amount of aggregate, (kg/m3) 3.09583 0.138813
Amount of cement, (kg/m3) 2.36529 0.184673
Amount of sand, (kg/m3) 0.05060 0.830927
1.3. HPSCC Composition
The necessity to fulfill the requirements of the SCC rheological behavior and mechani-cal properties of hardened HPC determines the specificity of the composition of HPSCC.For the purposes of analyzing the composition of concrete, the composition and compo-nents of HPSCC were compared with the compositions of SCC (published by Domone [55])and the composition of HPC (analysis of 56 selected cases [56–64]). The composition ofHPSCC was analyzed on the basis of 76 cases [18,21–54]. Table 2 presents medians andpercentiles of the amount of components in the composition of SCC, HPC, and HPSCC.
The analysis shows that the most common type of cement in the HPSCC compositionis Portland cement CEM I 42.5R. In most of the analyzed cases, HPSCC most often usedbetween 350 and 500 kg/m3 of cement, as in the case of HPC. There are also cases (5%)of the use of 500 to 600 kg/m3 cement in the HPSCC composition [36,65]. The medianamount of cement in the HPSCC composition is 400 kg/m3, and the average value is395 kg/m3. These values are smaller than the median value of the cement quantity in theHPC composition of 432 kg/m3 and the average value of 434 kg/m3. It is widely believedthat the necessary condition for obtaining a HPSCC with a compressive strength of at least80 MPa and high durability of concrete is the addition of condensed silica fume. This isconfirmed by the analysis [18,21–54]. The fine grain size and highly developed surface ofcondensed silica fume grains have a positive effect on the porosity and water permeability
Materials 2022, 15, 690 4 of 19
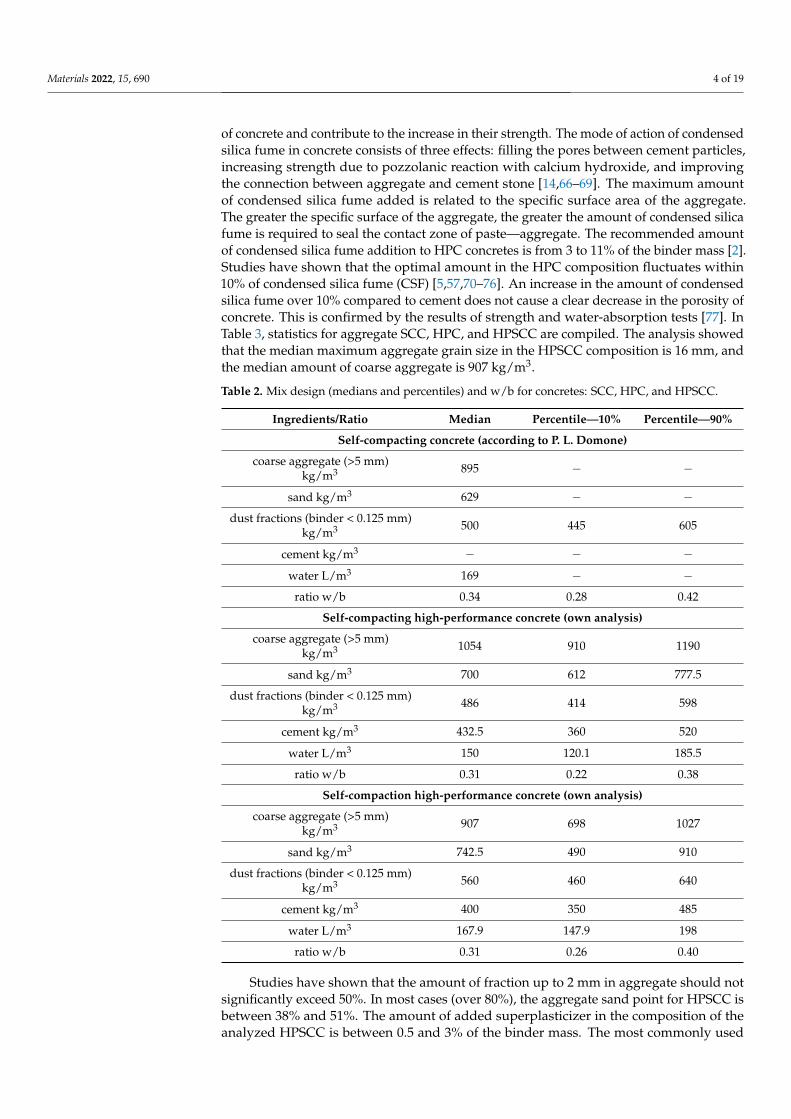
of concrete and contribute to the increase in their strength. The mode of action of condensedsilica fume in concrete consists of three effects: filling the pores between cement particles,increasing strength due to pozzolanic reaction with calcium hydroxide, and improvingthe connection between aggregate and cement stone [14,66–69]. The maximum amountof condensed silica fume added is related to the specific surface area of the aggregate.The greater the specific surface of the aggregate, the greater the amount of condensed silicafume is required to seal the contact zone of paste—aggregate. The recommended amountof condensed silica fume addition to HPC concretes is from 3 to 11% of the binder mass [2].Studies have shown that the optimal amount in the HPC composition fluctuates within10% of condensed silica fume (CSF) [5,57,70–76]. An increase in the amount of condensedsilica fume over 10% compared to cement does not cause a clear decrease in the porosity ofconcrete. This is confirmed by the results of strength and water-absorption tests [77]. InTable 3, statistics for aggregate SCC, HPC, and HPSCC are compiled. The analysis showedthat the median maximum aggregate grain size in the HPSCC composition is 16 mm, andthe median amount of coarse aggregate is 907 kg/m3.
Table 2. Mix design (medians and percentiles) and w/b for concretes: SCC, HPC, and HPSCC.
Ingredients/Ratio Median Percentile—10% Percentile—90%
Self-compacting concrete (according to P. L. Domone)
coarse aggregate (>5 mm)kg/m3 895 − −
sand kg/m3 629 − −
dust fractions (binder < 0.125 mm)kg/m3 500 445 605
cement kg/m3 − − −
water L/m3 169 − −
ratio w/b 0.34 0.28 0.42
Self-compacting high-performance concrete (own analysis)
coarse aggregate (>5 mm)kg/m3 1054 910 1190
sand kg/m3 700 612 777.5
dust fractions (binder < 0.125 mm)kg/m3 486 414 598
cement kg/m3 432.5 360 520
water L/m3 150 120.1 185.5
ratio w/b 0.31 0.22 0.38
Self-compaction high-performance concrete (own analysis)
coarse aggregate (>5 mm)kg/m3 907 698 1027
sand kg/m3 742.5 490 910
dust fractions (binder < 0.125 mm)kg/m3 560 460 640
cement kg/m3 400 350 485
water L/m3 167.9 147.9 198
ratio w/b 0.31 0.26 0.40
Studies have shown that the amount of fraction up to 2 mm in aggregate should notsignificantly exceed 50%. In most cases (over 80%), the aggregate sand point for HPSCC isbetween 38% and 51%. The amount of added superplasticizer in the composition of theanalyzed HPSCC is between 0.5 and 3% of the binder mass. The most commonly used
Materials 2022, 15, 690 5 of 19
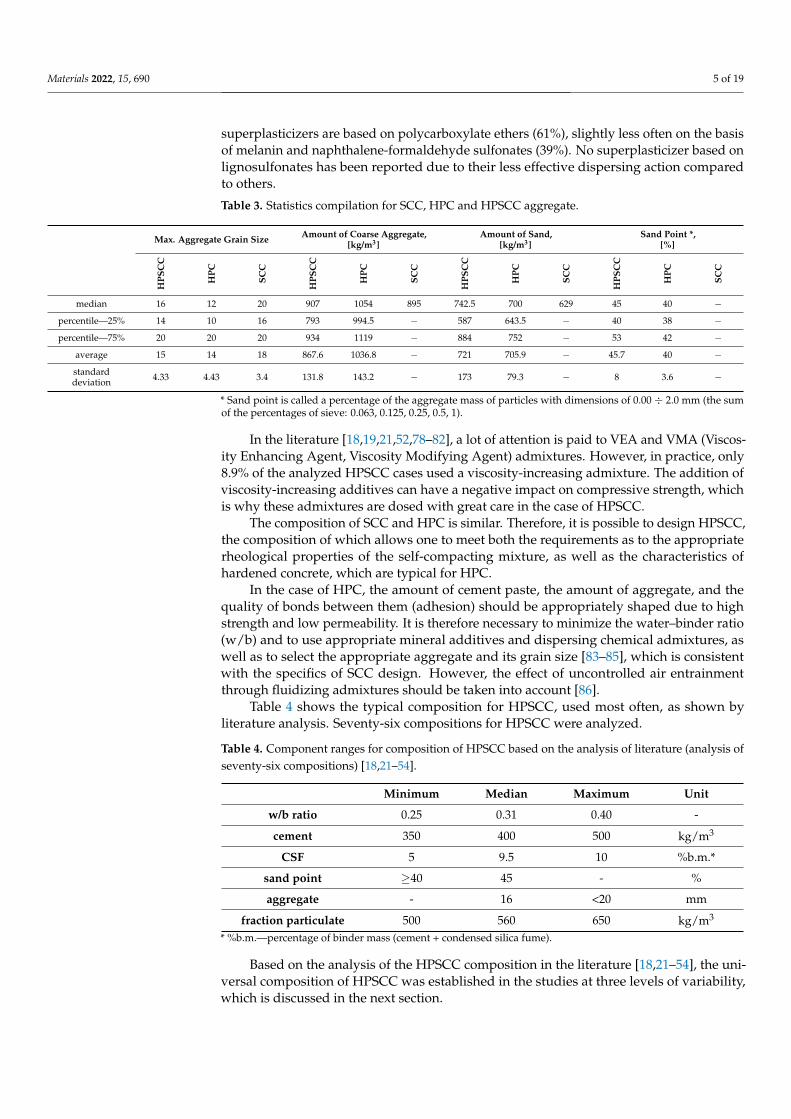
superplasticizers are based on polycarboxylate ethers (61%), slightly less often on the basisof melanin and naphthalene-formaldehyde sulfonates (39%). No superplasticizer based onlignosulfonates has been reported due to their less effective dispersing action comparedto others.
Table 3. Statistics compilation for SCC, HPC and HPSCC aggregate.
Max. Aggregate Grain Size Amount of Coarse Aggregate,[kg/m3]
Amount of Sand,[kg/m3]
Sand Point *,[%]
HPS
CC
HPC
SCC
HPS
CC
HPC
SCC
HPS
CC
HPC
SCC
HPS
CC
HPC
SCC
median 16 12 20 907 1054 895 742.5 700 629 45 40 −
percentile—25% 14 10 16 793 994.5 − 587 643.5 − 40 38 −
percentile—75% 20 20 20 934 1119 − 884 752 − 53 42 −
average 15 14 18 867.6 1036.8 − 721 705.9 − 45.7 40 −
standarddeviation 4.33 4.43 3.4 131.8 143.2 − 173 79.3 − 8 3.6 −
* Sand point is called a percentage of the aggregate mass of particles with dimensions of 0.00 ÷ 2.0 mm (the sumof the percentages of sieve: 0.063, 0.125, 0.25, 0.5, 1).
In the literature [18,19,21,52,78–82], a lot of attention is paid to VEA and VMA (Viscos-ity Enhancing Agent, Viscosity Modifying Agent) admixtures. However, in practice, only8.9% of the analyzed HPSCC cases used a viscosity-increasing admixture. The addition ofviscosity-increasing additives can have a negative impact on compressive strength, whichis why these admixtures are dosed with great care in the case of HPSCC.
The composition of SCC and HPC is similar. Therefore, it is possible to design HPSCC,the composition of which allows one to meet both the requirements as to the appropriaterheological properties of the self-compacting mixture, as well as the characteristics ofhardened concrete, which are typical for HPC.
In the case of HPC, the amount of cement paste, the amount of aggregate, and thequality of bonds between them (adhesion) should be appropriately shaped due to highstrength and low permeability. It is therefore necessary to minimize the water–binder ratio(w/b) and to use appropriate mineral additives and dispersing chemical admixtures, aswell as to select the appropriate aggregate and its grain size [83–85], which is consistentwith the specifics of SCC design. However, the effect of uncontrolled air entrainmentthrough fluidizing admixtures should be taken into account [86].
Table 4 shows the typical composition for HPSCC, used most often, as shown byliterature analysis. Seventy-six compositions for HPSCC were analyzed.
Table 4. Component ranges for composition of HPSCC based on the analysis of literature (analysis ofseventy-six compositions) [18,21–54].
Minimum Median Maximum Unit
w/b ratio 0.25 0.31 0.40 -
cement 350 400 500 kg/m3
CSF 5 9.5 10 %b.m.*
sand point ≥40 45 - %
aggregate - 16 <20 mm
fraction particulate 500 560 650 kg/m3
* %b.m.—percentage of binder mass (cement + condensed silica fume).
Based on the analysis of the HPSCC composition in the literature [18,21–54], the uni-versal composition of HPSCC was established in the studies at three levels of variability,which is discussed in the next section.

Materials 2022, 15, 690 6 of 19
2. Methodology and Materials of Research2.1. Variable Factors and Study Plan
The variable factors proposed in the research are presented in Table 5. The proposedcomposition of high-performance self-compacting concrete pertain to the typical set ofthe aforementioned concrete used in practice on the basis of statistical analysis of theeffects of literature research. In terms of changes, the cement mix had to have adequatefluidity. Therefore, the it was understood that even the minimal addition of SP must berelatively high. The major criterion for selecting variables was obtaining a high variabilityin compressive strength.
Table 5. Table of variable factors in the research in article.
w/b Ratio Indexϕ SP, %b.m. CSF, %b.m. Sand Point, %
Variation in research
The first level 0.30 1.2 2.5 0 40
The second level 0.34 1.3 3.0 5 42.5
The third level 0.38 1.4 3.5 10 45
Index ϕ is called the content of paste in the mixture and is defined as follows [53,87]:
ϕ =V
A · P (1)
where:V—absolute volume of paste in the mixture, (m3);A—weight of aggregates, (kg);P—specific porosity of the poured loosely stack available for water, (m3/kg).
Sand point is called a percentage of the aggregate mass of particles with dimensionsof 0.00 ÷ 2.0 mm (the sum of the percentages of sieve: 0.063, 0.125, 0.25, 0.5, 1) [87].
Multivariate selection of sidereal points was applied due to the purpose and scope ofthe research. The test plan allowed us to lower the large number of measuring points incomparison with the complete research plan and also reduce the volume of material usedfor study.
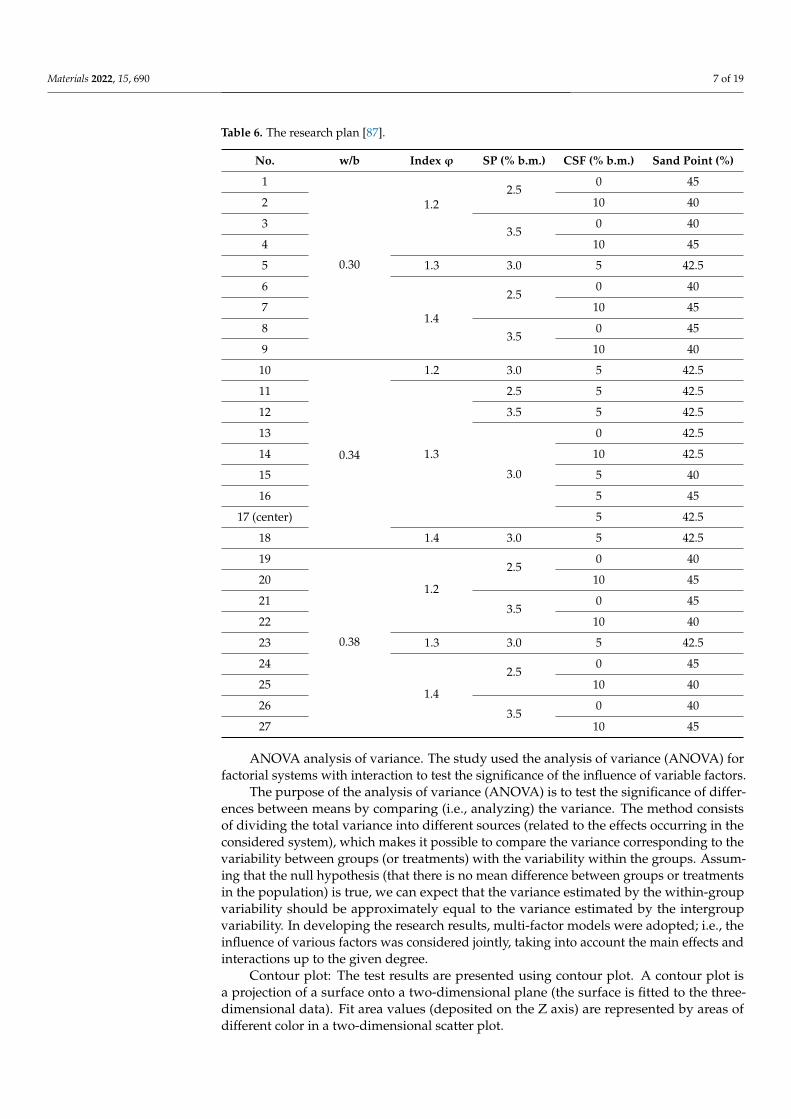
The study was divided for the five input variables (variable factors) with one blockand twenty-seven layouts (Table 6). Sidereal points are equivalent to the correspondingvalues of the minimum and maximum input values. The degree of matching identified instudies of mathematical models was tested based on independent control measurements.
Generally, measurements for compressive strength were performed on several sam-ples. The maximal and average relative standard deviation for compressive strength ofconcretes—6.8% and 5.1%, respectively.
2.2. Methodology of Statistical Analysis
For the purposes of the statistical analysis in the research, the following statisticalmethods and techniques for analyzing measurement results in STATISTICA software(version 13.3) were used:
Lilliefors test and Shapiro—Wolf test: the Lilliefors test and the Shapiro–Wilk test areused to verify the hypothesis that the difference between the examined variable distribution(empirical distribution) and the normal distribution (theoretical distribution) is irrelevant.The Lilliefors test is a correction of the Kolmogorov–Smirnov test in which the mean value(µ) and standard deviation (σ) for the sample population are not known.
Tests are used to verify the hypotheses:
1. H0: the distribution of the examined feature in the population is a normal distribution;2. H1: the distribution of the studied trait in the population is different from the nor-
mal distribution;3. The p-value determined on the basis of the test statistic is compared with the signifi-
cance level α;4. if p ≤ α⇒ reject H0 assuming H1;5. if p > α⇒ there are no grounds to reject H0.
Materials 2022, 15, 690 7 of 19
Table 6. The research plan [87].
No. w/b Index ϕ SP (% b.m.) CSF (% b.m.) Sand Point (%)
1
0.30
1.22.5
0 45
2 10 40
33.5
0 40
4 10 45
5 1.3 3.0 5 42.5
6
1.4
2.50 40
7 10 45
83.5
0 45
9 10 40
10
0.34
1.2 3.0 5 42.5
11
1.3
2.5 5 42.5
12 3.5 5 42.5
13
3.0
0 42.5
14 10 42.5
15 5 40
16 5 45
17 (center) 5 42.5
18 1.4 3.0 5 42.5
19
0.38
1.2
2.50 40
20 10 45
213.5
0 45
22 10 40
23 1.3 3.0 5 42.5
24
1.4
2.50 45
25 10 40
263.5
0 40
27 10 45
ANOVA analysis of variance. The study used the analysis of variance (ANOVA) forfactorial systems with interaction to test the significance of the influence of variable factors.
The purpose of the analysis of variance (ANOVA) is to test the significance of differ-ences between means by comparing (i.e., analyzing) the variance. The method consistsof dividing the total variance into different sources (related to the effects occurring in theconsidered system), which makes it possible to compare the variance corresponding to thevariability between groups (or treatments) with the variability within the groups. Assum-ing that the null hypothesis (that there is no mean difference between groups or treatmentsin the population) is true, we can expect that the variance estimated by the within-groupvariability should be approximately equal to the variance estimated by the intergroupvariability. In developing the research results, multi-factor models were adopted; i.e., theinfluence of various factors was considered jointly, taking into account the main effects andinteractions up to the given degree.
Contour plot: The test results are presented using contour plot. A contour plot isa projection of a surface onto a two-dimensional plane (the surface is fitted to the three-dimensional data). Fit area values (deposited on the Z axis) are represented by areas ofdifferent color in a two-dimensional scatter plot.
Materials 2022, 15, 690 8 of 19
Profiles of approximated values: The approximation profile creates a separate equationfor each output quantity, which is fitted to the measured response values (for a givenoutput quantity). As soon as these equations are obtained, approximate values of theoutput quantities are calculated for any combination of the values of the input quantities.To facilitate the estimation of the credibility of the approximation, the confidence intervalsfor the approximate values are shown.
Confidence interval: The confidence interval shows the values of the expected (average)dependent variable (compressive strength). The confidence interval for the value of thepredicted dependent variable determines the range of values within which (with a givenprobability) we expect the true value of the dependent variable for given values of theindependent variables.
Polynomial (or otherwise called nonlinear linearized) regression calculates the rela-tionship between a dependent variable and one or more independent variables that mayappear at higher powers (square, third power, etc.). Polynomial regression is a commontechnique for studying the curvilinear relationship.
2.3. Testing Procedures
Concrete mixes were prepared in a forced concrete mixer with a volume of V = 50 dm3.The mixing time was 5 min; first, dry ingredients (cement, aggregate, and condensed silicafume) were mixed for 1 min, and then water with the superplasticizer was added. Beforethe second measurement, the mix was mixed for 3 min. The study of the compressivestrength was performed in accordance with standards: PN-EN 12390-2: 2011 and PN-EN12390-3:2011. Concrete mixture after the rheology test was placed into molds of dimensions10 × 10 × 10 cm3. The specimens were covered with a PVC foil for the first 24 hours, andthen the specimens were demolded. The compressive strength was determined on samplesafter 28 days of curing of concrete samples in water at 20 ± 3 ◦C.
Additionally, rheological properties of fresh concretes were tested using the slumpflow test. During the test, the propagation time to a diameter of 50 cm (T (s)) and themaximum diameter (D (cm)) are measured. Slump flow test after 20 and 60 min frommixing ingredients was performed. Temperature of research was 20 ± 1 ◦C. The test alsoprovides some information on the possible segregation, which is assessed visually by visualstability index VSI [85], where 0 means high stability, 1 means stability, 2 means instability,and 3 means high instability.
2.4. Materials and Cement Mixes
Portland cement CEM I 42.5R was used in the tests. The properties of the cementused are determined by the cement supplier (loss on ignition—2.0%; insoluble parts—0.4%;the specific surface area—383 m2/kg; changes in volume, Le Chatelier—0.0mm; beginningof setting time—175 min). The content of cement in the mixtures depends on the w/b ratioand the index ϕ. The content of cement in the mixtures ranged from 438.6 to 638.8 kg/m3.
The aggregates used in this research are composed of natural sand 0–2 mm andsyenite crushed aggregate in three fractions 2–4 mm, 4–8 mm and 8–16 mm, density of2.62 kg/m3, 2.74 kg/m3 and 2.74 kg/m3, respectively. Grains with a size distribution of theaggregate with three sand points—40%, 42.5%, and 45%—were laid on the base accordingto recommendations in [19] (Figure 2).
The significant point influencing the rheological properties of the mix is also the typeand content of superplasticizer (SP). In [86], authors showed that some superplasticizerscan significantly and uncontrollably aerate the cement mix. The selection of superplasticizercompatible with the binder is important.
The choice of superplasticizer (SP) is compatible with condensed silica fume, andcement was made from twenty-four commercial superplasticizers. The chemical admixtureselected as a SP with polyether base (density—1.09 g/cm3, concentration—34%). This is themost usually used type of admixture for Self-Compacting Concrete. The superplasticizerwas dosed by weight and mixed with water.

Materials 2022, 15, 690 9 of 19Materials 2022, 15, x FOR PEER REVIEW 10 of 21
Figure 2. Grain size distribution of the aggregate with three sand points [87].
The significant point influencing the rheological properties of the mix is also the type
and content of superplasticizer (SP). In [86], authors showed that some superplasticizers
can significantly and uncontrollably aerate the cement mix. The selection of superplasti-
cizer compatible with the binder is important.
The choice of superplasticizer (SP) is compatible with condensed silica fume, and
cement was made from twenty-four commercial superplasticizers. The chemical admix-
ture selected as a SP with polyether base (density—1.09g/cm3, concentration—34%). This
is the most usually used type of admixture for Self-Compacting Concrete. The superplas-
ticizer was dosed by weight and mixed with water.
The HPSCC composition does not contain VEA–VMA admixtures due to its possible
negative impact on strength because of the effect of greater aeration of VMA and by im-
peding self-deaeration. This was described in the literature analysis in the Subsection: 1.3.
The aim of choosing a suitable CSF was to search for compatibility with the cement
and SP in research. From among the three CSFs from different suppliers, one was selected
that was compatible with cement and SP used in the tests. The properties of the CSF used
are determined by the supplier (the specific gravity (water = 1)—2.2; densities—350 kg/m3;
the specific surface area—25 m2/g).
The content of condensed silica fume ranged from 0 to 62 kg/m3.
3. Analysis of Test Results
The tested concretes are characterized by compressive strength in the range of 60
MPa to 105.3 MPa (Table 7); therefore, concretes are classified into strength classes from
C50/60 to C90/105, thus belonging to high strength concrete. In most of the tested con-
cretes, the obtained compressive strength was in the range of 80 to 95 MPa (Figure 3). The
self-compacting behavior was checked by the slump flow test, and the obtained results
allowed for the qualification of the concretes to self-compacting concretes. The diameter
of slump flow and the flow time were measured 20 and 60 min after mixing the ingredi-
ents.
Figure 2. Grain size distribution of the aggregate with three sand points [87].
The HPSCC composition does not contain VEA–VMA admixtures due to its possiblenegative impact on strength because of the effect of greater aeration of VMA and byimpeding self-deaeration. This was described in the literature analysis in the Section 1.3.
The aim of choosing a suitable CSF was to search for compatibility with the cementand SP in research. From among the three CSFs from different suppliers, one was selectedthat was compatible with cement and SP used in the tests. The properties of the CSF usedare determined by the supplier (the specific gravity (water = 1)—2.2; densities—350 kg/m3;the specific surface area—25 m2/g).
The content of condensed silica fume ranged from 0 to 62 kg/m3.
3. Analysis of Test Results
The tested concretes are characterized by compressive strength in the range of 60 MPato 105.3 MPa (Table 7); therefore, concretes are classified into strength classes from C50/60to C90/105, thus belonging to high strength concrete. In most of the tested concretes,the obtained compressive strength was in the range of 80 to 95 MPa (Figure 3). The self-compacting behavior was checked by the slump flow test, and the obtained results allowedfor the qualification of the concretes to self-compacting concretes. The diameter of slumpflow and the flow time were measured 20 and 60 min after mixing the ingredients.
Materials 2022, 15, x FOR PEER REVIEW 11 of 21
Table 7. Test results.
No. Visual Stability Index, VSI * Compressive Strength after 28
Days (MPa)
1 − 60.0
2 − 71.0
3 0 87.8
4 − 65.0
5 0 104.5
6 0 101.8
7 − 92.0
8 1 83.2
9 0 105.3
10 0 93.1
11 0 94.4
12 0 87.8
13 2 78.7
14 0 87.7
15 0 95.2
16 1 87.5
17(center) 0 83.4
18 1 85.7
19 2 72.9
20 − 82.6
21 2 67.3
22 1 80.7
23 2 72.6
24 2 70.1
25 1 82.9
26 2 83.0
27 1 90.6
* More information in Subsection 2.3.
Figure 3. HPSCC compression strength histogram. Figure 3. HPSCC compression strength histogram.

Materials 2022, 15, 690 10 of 19
Table 7. Test results.
No. Visual Stability Index, VSI * Compressive Strength after 28 Days (MPa)
1 − 60.0
2 − 71.0
3 0 87.8
4 − 65.0
5 0 104.5
6 0 101.8
7 − 92.0
8 1 83.2
9 0 105.3
10 0 93.1
11 0 94.4
12 0 87.8
13 2 78.7
14 0 87.7
15 0 95.2
16 1 87.5
17 (center) 0 83.4
18 1 85.7
19 2 72.9
20 − 82.6
21 2 67.3
22 1 80.7
23 2 72.6
24 2 70.1
25 1 82.9
26 2 83.0
27 1 90.6* More information in Section 2.3.
The chart in Figure 3 suggests that we are dealing with a normal distribution. To checkthe normal distribution, a diagram of normality for the obtained compressive strength ispresented (Figure 4).
Materials 2022, 15, x FOR PEER REVIEW 12 of 21
The chart in Figure 3 suggests that we are dealing with a normal distribution. To
check the normal distribution, a diagram of normality for the obtained compressive
strength is presented (Figure 4).
Figure 4. Graph of distribution normality for variables compressive strength.
The normal distribution hypothesis was verified using the Lilliefors test and the
Shapiro–Wilk test (Table 8). It was assumed that:
1. H0: Variable distribution—compressive strength is a normal distribution
2. H1: Compressive strength is subject to a distribution other than normal
Table 8. The results of the Lilliefors test and the Shapiro–Wilk test.
Variable N Lillief. p S-W p
Compressive strength [MPa] 27 p > 0.20 0.976101 0.765805
In both the Lilliefors and Shapiro–Wilk tests, the p-value (so-called test probability)
is greater than the level of significance of the test, so there is no reason to reject the null
hypothesis. Thus, we are dealing with the normal distribution for variables—compressive
strength.
3.1. ANOVA—Determination of the Effect of Composition on the Compressive Strength of
HPSCC
Variable factors for determining and prioritizing the impact on HPSCC compressive
strength are w/b ratio, amount of superplasticizer, sand point, and amount of condensed
silica fume as well as the amount of paste expressed by the filling’s ratio of the aggregate’s
crumb pile with paste, index φ.
Based on the analysis of variance (ANOVA), for the factor systems with the interac-
tion of the obtained test results, the significance of the impact of the tested material factors
on the compressive strength of the HPSCC tested was determined.
The results of the statistical analysis of the significance of the impact of individual
factors are presented in Table 9. Variance analysis was performed at a significance level
of 0.05 and a confidence interval of 0.95. The value profiles of the approximated compres-
sive strength are shown in Figure 5.
In ordinary concretes, a higher w/c ratio determines better rheological parameters of
the mixture but deteriorates compressive strength. For HPSCC concretes, high strength
and adequate rheological parameters of the mixture should be ensured at the same time.
The rheological properties of SCC are influenced not only by the w / c ratio, but also by
the increased amount of binders compared to conventional concretes and the greater
amount of fines [87]. These features change not only the rheological properties of the mix,
Figure 4. Graph of distribution normality for variables compressive strength.
Materials 2022, 15, 690 11 of 19
The normal distribution hypothesis was verified using the Lilliefors test and theShapiro–Wilk test (Table 8). It was assumed that:
1. H0: Variable distribution—compressive strength is a normal distribution.2. H1: Compressive strength is subject to a distribution other than normal.
Table 8. The results of the Lilliefors test and the Shapiro–Wilk test.
Variable N Lillief. p S-W p
Compressive strength [MPa] 27 p > 0.20 0.976101 0.765805
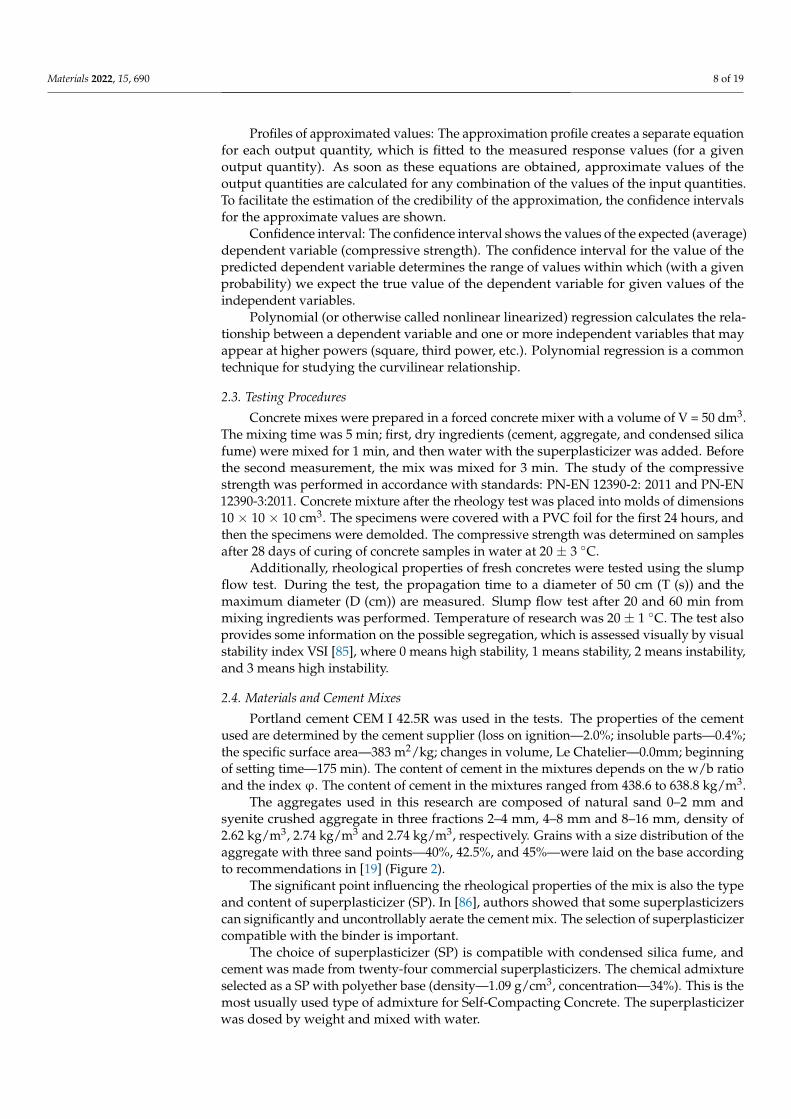
In both the Lilliefors and Shapiro–Wilk tests, the p-value (so-called test probability) isgreater than the level of significance of the test, so there is no reason to reject the null hypoth-esis. Thus, we are dealing with the normal distribution for variables—compressive strength.
3.1. ANOVA—Determination of the Effect of Composition on the Compressive Strength of HPSCC
Variable factors for determining and prioritizing the impact on HPSCC compressivestrength are w/b ratio, amount of superplasticizer, sand point, and amount of condensedsilica fume as well as the amount of paste expressed by the filling’s ratio of the aggregate’scrumb pile with paste, index ϕ.
Based on the analysis of variance (ANOVA), for the factor systems with the interactionof the obtained test results, the significance of the impact of the tested material factors onthe compressive strength of the HPSCC tested was determined.
The results of the statistical analysis of the significance of the impact of individualfactors are presented in Table 9. Variance analysis was performed at a significance level of0.05 and a confidence interval of 0.95. The value profiles of the approximated compressivestrength are shown in Figure 5.
Table 9. Analysis of variance in testing variable factors.
Source of VarianceCompressive Strength
Value F The Significance Levelα
A: w/b ratio 7.581 0.011909
B: Amount of condensed silica fume, CSF (% b.m.) 2.869 0.134113
C: the filling’s ratio of the aggregate’s crumb pile with paste, index ϕ 1.191 0.311163
D: Sand point 0.663 0.442150
E: Amount of superplasticizer, SP (% b.m.) 0.001 0.973548
AB 4.566 0.093526
AC 2.045 0.235689
AD 0.537 0.622562
AE 0.245 0.856625
BC 0.075 0.792645
BD 0.032 0.860248
BE 0.063 0.924577
CD 0.354 0.554875
CE 0.463 0.885454
DE 0.253 0.675645
Bold indicates statistically significant impact for significance level α = 0.05.
In ordinary concretes, a higher w/c ratio determines better rheological parameters ofthe mixture but deteriorates compressive strength. For HPSCC concretes, high strengthand adequate rheological parameters of the mixture should be ensured at the same time.The rheological properties of SCC are influenced not only by the w/c ratio, but also by theincreased amount of binders compared to conventional concretes and the greater amountof fines [87]. These features change not only the rheological properties of the mix, but alsothe porosity and microstructure in ordinary SCCs compared to conventional concretes,

Materials 2022, 15, 690 12 of 19
indirectly improving the compressive strength [88]. However, as it turns out from the tests,it is not enough to be able to affect the high strength of HPSCC.
Materials 2022, 15, x FOR PEER REVIEW 14 of 22
Figure 5. Value profiles of approximated compressive strengths for HPSCC.
3.2. Polynomial Regression (Nonlinear Linearized)—Determination of Statistical Models of HPSCC Concrete Compressive Strength and Other Dependencies
Regression allowed us to describe covariates of the HPSCC composition variables by matching functions to them (Figures 6–9). This statistical method allowed us to estimate the conditional expected value of the variable random compressive strength HPSCC for given values of another variable by constructing a regression model, i.e., a function de-scribing how the expected value of the explained variable depends on the explanatory variables. All equations had a high degree of fit, as shown in Figures 6–9. Statistical mod-els describing the compressive strength are in the form of second-degree polynomials: 1) A-Index φ; E-w/b:
Compressive strength (MPa) = −1333,392 + 31,7232*A + 131,964*E−0,2551*A2−1,1783*A*E−3,2909*E2; R2 = 0,98 (2)
2) B-CSF; E-w/b:
Compressive strength (MPa) = 21,6738 + 5,0247*B−1,133*E−0,0976*B2 +
0,1337*B*E−0,2829* E2; R2 = 0.99 (3)
3) C-Sand point; E-w/b:
Compressive strength (MPa) = −246,832 + 4,6703*C + 1,4632*E−0,3048*C2 +
0,0356*C*E−0,0034* E2; R2 = 0.97 (4)
4) D-SP; E-w/b:
Compressive strength (MPa) = −323,3547 + 19,6374*D + 6,0215*E−0,2982*D2−0,0102*D*E−0,0903* E2; R2 = 0.97
(5)
Figure 5. Value profiles of approximated compressive strengths for HPSCC.
Studies show that the water–binder ratio (w/b) and the amount of condensed silicafume have the greatest impact on compressive strength. The following factors have asmaller impact on the compressive strength, in order: the filling’s ratio of the aggregate’scrumb pile with paste, amount of sand (sand point), and amount of superplasticizer.
The effect of chemical admixture on variability of strength and rheological param-eters is negligible, since it is recommended that the dose of superplasticizer should beclose to saturation [55,87]. Among the interactions of the examined factors, the water-binder ratio w/b with the amount of condensed silica fume has the greatest impact on thecompressive strength.
Increasing the ratio w/b and/or the filling’s ratio of the aggregate’s crumb pile withpaste and/or the amount of sand in the form of a sand point causes a reduction in compres-sive strength. At the same time, increasing the amount of condensed silica fume causes anincrease in compressive strength.
3.2. Polynomial Regression (Nonlinear Linearized)—Determination of Statistical Models ofHPSCC Concrete Compressive Strength and Other Dependencies
Regression allowed us to describe covariates of the HPSCC composition variables bymatching functions to them (Figures 6–9). This statistical method allowed us to estimate theconditional expected value of the variable random compressive strength HPSCC for givenvalues of another variable by constructing a regression model, i.e., a function describinghow the expected value of the explained variable depends on the explanatory variables. Allequations had a high degree of fit, as shown in Figures 6–9. Statistical models describingthe compressive strength are in the form of second-degree polynomials:
Materials 2022, 15, 690 13 of 19
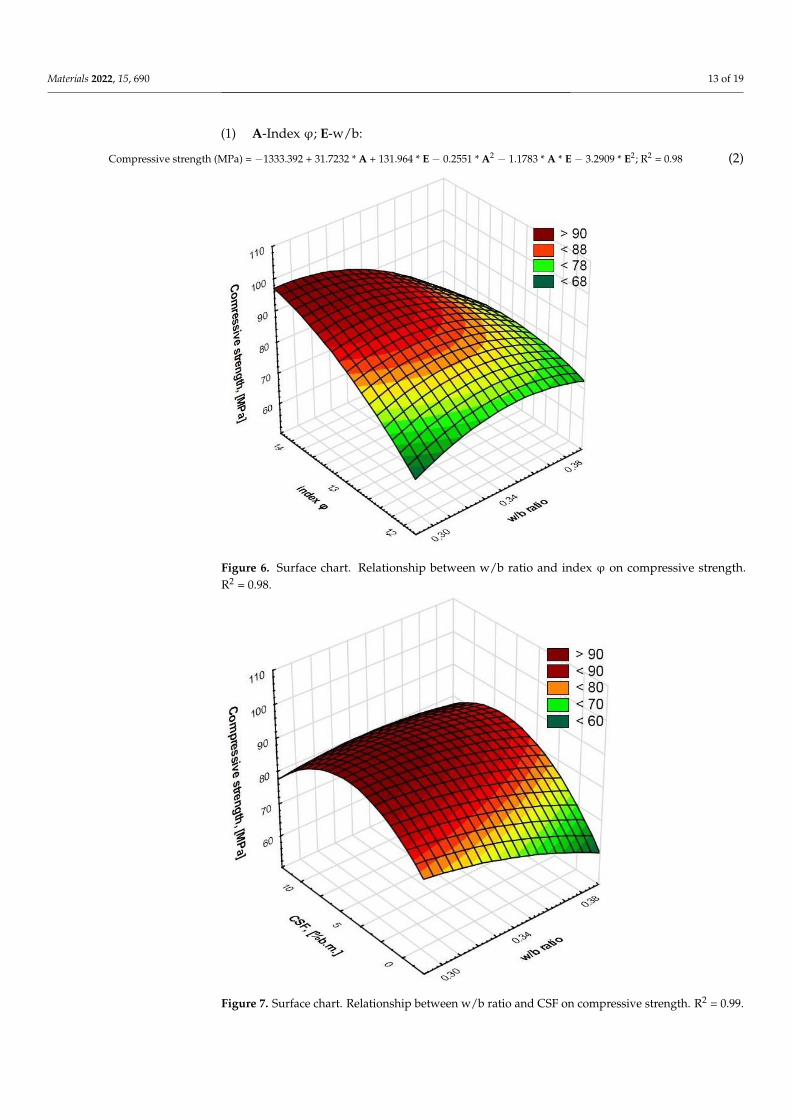
(1) A-Index ϕ; E-w/b:
Compressive strength (MPa) = −1333.392 + 31.7232 * A + 131.964 * E − 0.2551 * A2 − 1.1783 * A * E − 3.2909 * E2; R2 = 0.98 (2)
Materials 2022, 15, x FOR PEER REVIEW 15 of 21
Compressive strength (MPa) = −323,3547 + 19,6374*D +
6,0215*E−0,2982*D2−0,0102*D*E−0,0903* E2; R2 = 0.97 (5)
Figure 6. Surface chart. Relationship between w/b ratio and index φ on compressive strength. R2 =
0.98.
Figure 7. Surface chart. Relationship between w/b ratio and CSF on compressive strength. R2 =
0.99.
Figure 6. Surface chart. Relationship between w/b ratio and index ϕ on compressive strength.R2 = 0.98.
Materials 2022, 15, x FOR PEER REVIEW 15 of 21
Compressive strength (MPa) = −323,3547 + 19,6374*D +
6,0215*E−0,2982*D2−0,0102*D*E−0,0903* E2; R2 = 0.97 (5)
Figure 6. Surface chart. Relationship between w/b ratio and index φ on compressive strength. R2 =
0.98.
Figure 7. Surface chart. Relationship between w/b ratio and CSF on compressive strength. R2 =
0.99.
Figure 7. Surface chart. Relationship between w/b ratio and CSF on compressive strength. R2 = 0.99.
Materials 2022, 15, 690 14 of 19Materials 2022, 15, x FOR PEER REVIEW 16 of 21
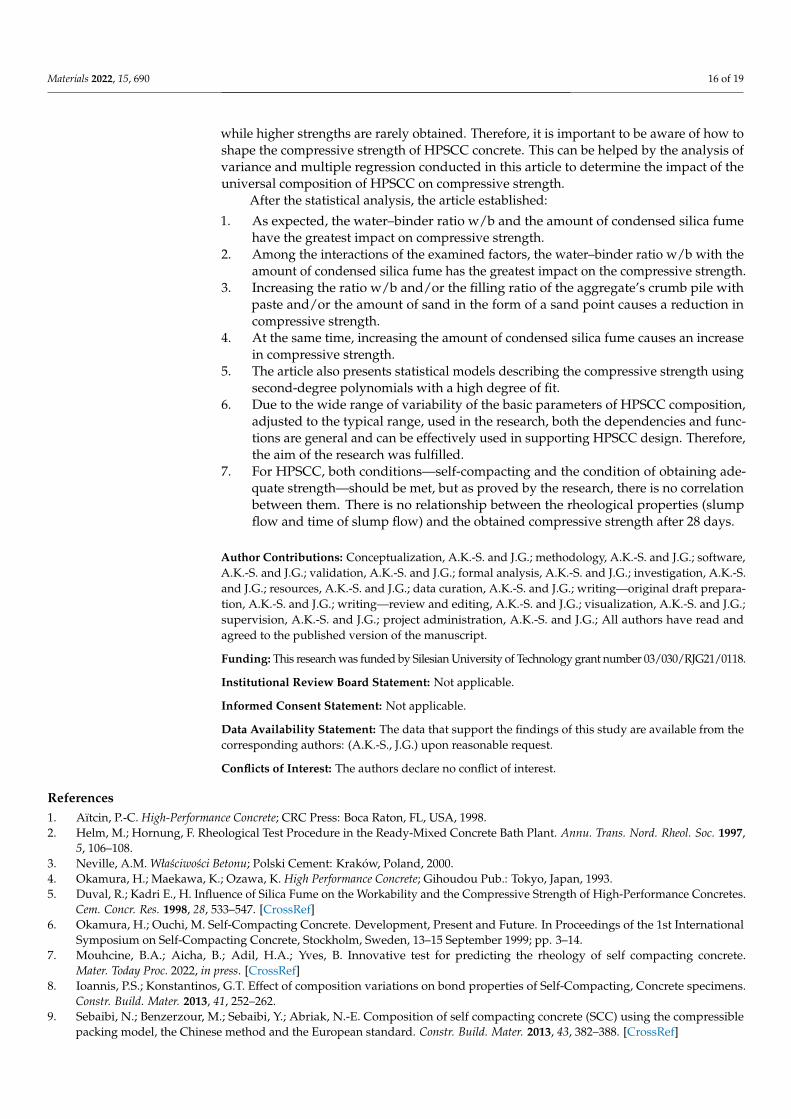
Figure 8. Surface chart. Relationship between w/b ratio and sand point on compressive strength. R2
= 0.97.
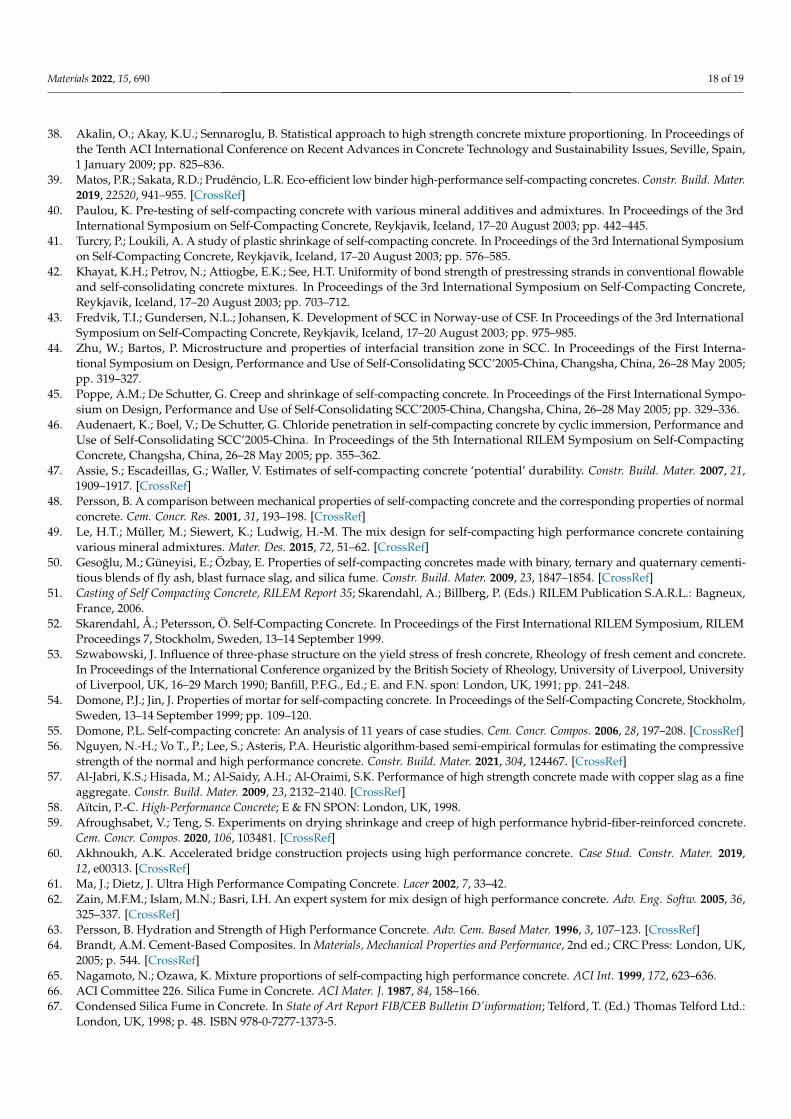
Figure 9. Surface chart. Relationship between w/b ratio and SP on compressive strength. R2 = 0.97.
The self-compacting condition for HPSCC was checked by the standard slump flow
test at 20 and 60 minutes after combining the ingredients. The results allowed the HPSCC
concretes to be classified as self-compacting concretes. However, HPSCC should also be
designed paying special attention to obtaining the appropriate strength, which was pre-
sented in the article. Interestingly, both conditions—self-compacting and the condition of
Figure 8. Surface chart. Relationship between w/b ratio and sand point on compressive strength.R2 = 0.97.
Materials 2022, 15, x FOR PEER REVIEW 16 of 21
Figure 8. Surface chart. Relationship between w/b ratio and sand point on compressive strength. R2
= 0.97.
Figure 9. Surface chart. Relationship between w/b ratio and SP on compressive strength. R2 = 0.97.
The self-compacting condition for HPSCC was checked by the standard slump flow
test at 20 and 60 minutes after combining the ingredients. The results allowed the HPSCC
concretes to be classified as self-compacting concretes. However, HPSCC should also be
designed paying special attention to obtaining the appropriate strength, which was pre-
sented in the article. Interestingly, both conditions—self-compacting and the condition of
Figure 9. Surface chart. Relationship between w/b ratio and SP on compressive strength. R2 = 0.97.
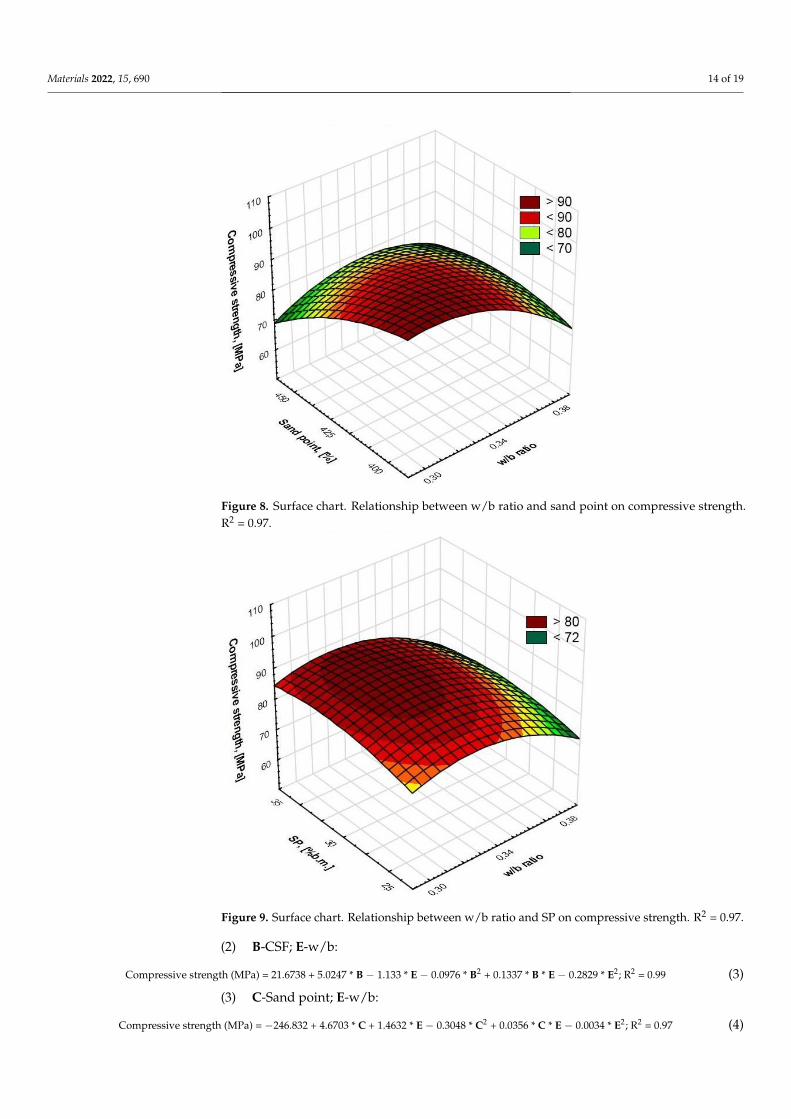
(2) B-CSF; E-w/b:
Compressive strength (MPa) = 21.6738 + 5.0247 * B − 1.133 * E − 0.0976 * B2 + 0.1337 * B * E − 0.2829 * E2; R2 = 0.99 (3)
(3) C-Sand point; E-w/b:
Compressive strength (MPa) = −246.832 + 4.6703 * C + 1.4632 * E − 0.3048 * C2 + 0.0356 * C * E − 0.0034 * E2; R2 = 0.97 (4)

Materials 2022, 15, 690 15 of 19
(4) D-SP; E-w/b:
Compressive strength (MPa) = −323.3547 + 19.6374 * D + 6.0215 * E − 0.2982 * D2 − 0.0102 * D * E − 0.0903 * E2; R2 = 0.97 (5)
The self-compacting condition for HPSCC was checked by the standard slump flowtest at 20 and 60 min after combining the ingredients. The results allowed the HPSCCconcretes to be classified as self-compacting concretes. However, HPSCC should alsobe designed paying special attention to obtaining the appropriate strength, which waspresented in the article. Interestingly, both conditions—self-compacting and the conditionof obtaining adequate strength—should be met, but as proved by the research, there isno correlation between them. In Figure 10, the research shows no correlation from amathematical point of view, because the correlation coefficient is close to zero. There wasa weak correlation, i.e., practically no relationship between slump flow and the obtainedcompressive strength after 28 days and time of slump flow and the obtained compressivestrength after 28 days.
Materials 2022, 15, x FOR PEER REVIEW 17 of 21
obtaining adequate strength—should be met, but as proved by the research, there is no
correlation between them. In Figure 10, the research shows no correlation from a mathe-
matical point of view, because the correlation coefficient is close to zero. There was a weak
correlation, i.e., practically no relationship between slump flow and the obtained com-
pressive strength after 28 days and time of slump flow and the obtained compressive
strength after 28 days.
In addition to the presented statistical methods—ANOVA, polynomial regression for
determination of statistical models of HPSCC concrete compressive strength, and other
dependencies—other alternative methods can also be used, e.g., averaging methods to
predict elastic properties of pre-impregnated composite materials, as in [89].
Figure 10. Poor correlation between compressive strength after 28 days and rheological properties:
slump flow, D (cm) and time of slump flow, T (s).
4. Conclusions and Summary
The tested HPSCC concretes met the characteristics of both self-compacting and
high-performance concrete. Its composition was selected after extensive statistical analy-
sis and with great care. The ingredients and the proportions of ingredients used were typ-
ical for HPC and SCC concretes. In order to obtain high-quality HPSCC, including high
strength, shrinkage, and durability with satisfactory properties of the mixture, the appro-
priate parameter of diameter of slump flow and slump flow time, the composition of raw
materials, chemical and mineral admixtures, aggregate, packing density, and w/b ratio
should be should be chosen carefully and planned, which is also confirmed by research
[90–93].
The above-mentioned statistical analysis showed that in 12% of cases, HPSCCs are
concretes designed as ordinary SCCs with gravel aggregate, which, however, due to the
specificity of the composition ratio, achieved compressive strength ≥ 60MPa. The other
cases in the analysis are concretes already designed as concretes with intentional high
strength. Compressive strength is relatively unintentionally often obtained at 60 ÷ 80 MPa,
while higher strengths are rarely obtained. Therefore, it is important to be aware of how
to shape the compressive strength of HPSCC concrete. This can be helped by the analysis
of variance and multiple regression conducted in this article to determine the impact of
the universal composition of HPSCC on compressive strength.
After the statistical analysis, the article established:
1. As expected, the water–binder ratio w/b and the amount of condensed silica fume
have the greatest impact on compressive strength.
Figure 10. Poor correlation between compressive strength after 28 days and rheological properties:slump flow, D (cm) and time of slump flow, T (s).
In addition to the presented statistical methods—ANOVA, polynomial regression fordetermination of statistical models of HPSCC concrete compressive strength, and otherdependencies—other alternative methods can also be used, e.g., averaging methods topredict elastic properties of pre-impregnated composite materials, as in [89].
4. Conclusions and Summary
The tested HPSCC concretes met the characteristics of both self-compacting and high-performance concrete. Its composition was selected after extensive statistical analysis andwith great care. The ingredients and the proportions of ingredients used were typical forHPC and SCC concretes. In order to obtain high-quality HPSCC, including high strength,shrinkage, and durability with satisfactory properties of the mixture, the appropriateparameter of diameter of slump flow and slump flow time, the composition of raw materials,chemical and mineral admixtures, aggregate, packing density, and w/b ratio should beshould be chosen carefully and planned, which is also confirmed by research [90–93].
The above-mentioned statistical analysis showed that in 12% of cases, HPSCCs areconcretes designed as ordinary SCCs with gravel aggregate, which, however, due to thespecificity of the composition ratio, achieved compressive strength ≥ 60 MPa. The othercases in the analysis are concretes already designed as concretes with intentional highstrength. Compressive strength is relatively unintentionally often obtained at 60 ÷ 80 MPa,
Materials 2022, 15, 690 16 of 19
while higher strengths are rarely obtained. Therefore, it is important to be aware of how toshape the compressive strength of HPSCC concrete. This can be helped by the analysis ofvariance and multiple regression conducted in this article to determine the impact of theuniversal composition of HPSCC on compressive strength.
After the statistical analysis, the article established:
1. As expected, the water–binder ratio w/b and the amount of condensed silica fumehave the greatest impact on compressive strength.
2. Among the interactions of the examined factors, the water–binder ratio w/b with theamount of condensed silica fume has the greatest impact on the compressive strength.
3. Increasing the ratio w/b and/or the filling ratio of the aggregate’s crumb pile withpaste and/or the amount of sand in the form of a sand point causes a reduction incompressive strength.
4. At the same time, increasing the amount of condensed silica fume causes an increasein compressive strength.
5. The article also presents statistical models describing the compressive strength usingsecond-degree polynomials with a high degree of fit.
6. Due to the wide range of variability of the basic parameters of HPSCC composition,adjusted to the typical range, used in the research, both the dependencies and func-tions are general and can be effectively used in supporting HPSCC design. Therefore,the aim of the research was fulfilled.
7. For HPSCC, both conditions—self-compacting and the condition of obtaining ade-quate strength—should be met, but as proved by the research, there is no correlationbetween them. There is no relationship between the rheological properties (slumpflow and time of slump flow) and the obtained compressive strength after 28 days.
Author Contributions: Conceptualization, A.K.-S. and J.G.; methodology, A.K.-S. and J.G.; software,A.K.-S. and J.G.; validation, A.K.-S. and J.G.; formal analysis, A.K.-S. and J.G.; investigation, A.K.-S.and J.G.; resources, A.K.-S. and J.G.; data curation, A.K.-S. and J.G.; writing—original draft prepara-tion, A.K.-S. and J.G.; writing—review and editing, A.K.-S. and J.G.; visualization, A.K.-S. and J.G.;supervision, A.K.-S. and J.G.; project administration, A.K.-S. and J.G.; All authors have read andagreed to the published version of the manuscript.
Funding: This research was funded by Silesian University of Technology grant number 03/030/RJG21/0118.
Institutional Review Board Statement: Not applicable.
Informed Consent Statement: Not applicable.
Data Availability Statement: The data that support the findings of this study are available from thecorresponding authors: (A.K.-S., J.G.) upon reasonable request.
Conflicts of Interest: The authors declare no conflict of interest.
References1. Aïtcin, P.-C. High-Performance Concrete; CRC Press: Boca Raton, FL, USA, 1998.2. Helm, M.; Hornung, F. Rheological Test Procedure in the Ready-Mixed Concrete Bath Plant. Annu. Trans. Nord. Rheol. Soc. 1997,
5, 106–108.3. Neville, A.M. Własciwosci Betonu; Polski Cement: Kraków, Poland, 2000.4. Okamura, H.; Maekawa, K.; Ozawa, K. High Performance Concrete; Gihoudou Pub.: Tokyo, Japan, 1993.5. Duval, R.; Kadri E., H. Influence of Silica Fume on the Workability and the Compressive Strength of High-Performance Concretes.
Cem. Concr. Res. 1998, 28, 533–547. [CrossRef]6. Okamura, H.; Ouchi, M. Self-Compacting Concrete. Development, Present and Future. In Proceedings of the 1st International
Symposium on Self-Compacting Concrete, Stockholm, Sweden, 13–15 September 1999; pp. 3–14.7. Mouhcine, B.A.; Aicha, B.; Adil, H.A.; Yves, B. Innovative test for predicting the rheology of self compacting concrete.
Mater. Today Proc. 2022, in press. [CrossRef]8. Ioannis, P.S.; Konstantinos, G.T. Effect of composition variations on bond properties of Self-Compacting, Concrete specimens.
Constr. Build. Mater. 2013, 41, 252–262.9. Sebaibi, N.; Benzerzour, M.; Sebaibi, Y.; Abriak, N.-E. Composition of self compacting concrete (SCC) using the compressible
packing model, the Chinese method and the European standard. Constr. Build. Mater. 2013, 43, 382–388. [CrossRef]

Materials 2022, 15, 690 17 of 19
10. Meko, B.; Ighalo, J.O.; Ofuyatan, O.M. Enhancement of self-compactability of fresh self-compacting concrete: A review.Clean. Mater. 2021, 1, 100019. [CrossRef]
11. Ashish, D.K.; Verma, S.K. Determination of optimum mixture design method for self-compacting concrete: Validation of methodwith experimental results. Constr. Build. Mater. 2019, 217, 664–678. [CrossRef]
12. Okamura, H.; Ouchi, M. Self-compacting high performance concrete. Prog. Struct. Eng. Mater. 1998, 1, 378–383. [CrossRef]13. Okamura, H. Self-Compacting high performance concrete. Concr. Int. 1997, 19, 50–54.14. Ozawa, K.; Maekawa, K.; Kunishima, M.; Okamura, H. Development of high performance concrete based on the durability
design of concrete structures. In Proceedings of the Second East-Asia and Pacific Conference on Structural Engineering andConstruction (EASEC-2), January 1989; Volume 1, pp. 445–450.
15. Sari, M.; Prat, E.; Labastire, J.-F. High strength self-compacting concrete Original solutions associating organic and inorganicadmixtures. Cem. Concr. Res. 1999, 29, 813–818. [CrossRef]
16. ACI 237R-07. In Self-Consolidating Concrete; ACI Committee 237, Technical Committee Document 237R-07: Farmington Hills, MI,USA, 2007; ISBN 9780870312441.
17. Benaicha, M.; Belcaid, A.; Alaoui, A.H.; Jalbaud, O.; Burtschell, Y. Rheological characterization of self-compacting concrete: Newrecommendation. Struct. Concr. 2019, 20, 1695–1701. [CrossRef]
18. De Schutter, G.; Bartos, P.J.M.; Domone, P.; Gibbs, J. Self Compacting Concrete; Whittles Publishing: Dunbeath, UK, 2008;Volume 296.
19. SCC European Project Group. EFNARC: The European Guidelines For Self-Compacting Concrete. Specif. Prod. Use 2005, 63, 68.20. Kashani, A.; Ngo, T. 3: Production and placement of self-compacting concrete. Self-Compact. Concr. Mater. Prop. Appl. 2020, 3,
65–81.21. Wallevik, O.; Nielsson, I. Self-Compacting Concrete. In Proceedings of the Third International RILEM Symposium, RILEM
Proceedings PRO 33, Reykjavik, Iceland, 17–20 August 2003; p. 1056, ISBN 2-912143-42-X.22. Kostrzanowska-Siedlarz, A.; Gołaszewski, J. Rheological properties and the air content in fresh concrete for self compacting high
performance concrete. Constr. Build. Mater. 2015, 94, 555–564. [CrossRef]23. Jalal, M.; Pouladkhan, A.; Fasihi Harandi, O.; Jafari, D. Comparative study on effects of Class F fly ash, nano silica and silica fume
on properties of high performance self compacting concrete. Constr. Build. Mater. 2015, 94, 90–104. [CrossRef]24. Collepardi, M.; Collepardi, S.; Ogoumah Olagot, J.J.; Troli, R. Laboratory tests and field experiences of high performance SCCs.
In Proceedings of the 3rd International Symposium on Self-Compacting Concrete, Reykjavik, Iceland, 17–20 August 2003;pp. 904–912, ISBN 2-912143-42-X.
25. Dybeł, P.; Kucharska, M. Effect of bottom-up placing on bond properties of high-performance self-compacting concrete.Constr. Build. Mater. 2020, 243, 118182. [CrossRef]
26. Lu, C.; Yang, H.; Mei, G. Relationship between slump flow and rheological properties of self compacting concrete with silicafume and its permeability. Constr. Build. Mater. 2015, 75, 157–162. [CrossRef]
27. Ding, Y.; Zhang, Y.; Thomas, A. The investigation on strength and flexural toughness of fibre cocktail reinforced self-compactinghigh performance concrete. Constr. Build. Mater. 2009, 23, 448–452. [CrossRef]
28. Li, J.; Yin, J.; Zhou, S.; Li, Y. Mix proportion calculation method of self-compacting high performance concrete. In Proceedings ofthe First International Symposium on Design, Performance and Use of Self-Consolidating SCC’2005-China, Changsha, China,26–28 May 2005; pp. 199–205.
29. Ozbay, E.; Oztas, A.; Baykasoglu, A.; Ozbebek, H. Investigating mix proportions of high strength self compacting concrete byusing Taguchi method. Constr. Build. Mater. 2009, 23, 694–702. [CrossRef]
30. Rougeau, P.; Maillard, J.L.; Mary, C.-D. Comparative study on properties of self-compacting and high performance concrete usedin precast construction. In Proceedings of the International RILEM Symposium on Self-Compacting Concrete No1, Stockholm,Sweden, 13–14 September 1999; pp. 251–261.
31. Matos, A.M.; Maia, L.; Nunes, S.; Milheiro-Oliveira, P. Design of self-compacting high-performance concrete: Study of mortarphase. Constr. Build. Mater. 2018, 16710, 617–630. [CrossRef]
32. Ravindrarajah, R.S.; Siladyi, D.; Adamopoulos, B. Development of High-Strengh Self-Compacting Concrete with reducedsegregation potential. In Proceedings of the 3rd International Symposium on Self-Compacting Concrete, Reykjavik, Iceland,17–20 August 2003; pp. 530–532.
33. Tang, C.W.; Yen, T.; Chang, C.S.; Chen, K.H. Optimizing mixture for flowable high-performance concrete via rheology tests. ACIMater. J. 2001, 98, 493–502.
34. Shi, C.; Wu, Z.; Lv, K.; Wu, L. A review on mixture design methods for self-compacting concrete. Constr. Build. Mater. 2015, 84,387–398. [CrossRef]
35. Xie, Y.; Liu, B.; Yin, J.; Zhou, S. Optimum mix parameters of HSSCC with ultrapulverized fly ash. Cem. Concr. Res. V 2002, 32,477–480. [CrossRef]
36. Yin, J.; Xie, Y.; Yu, Z. Optimization of fabrication technology of Self-Compacting High Performance Concrete. In Proceedings ofthe First International Symposium on Design, Performance and Use of Self-Consolidating SCC’2005-China, Changsha, China,26–28 May 2005; pp. 97–107.
37. Eskandari, H.; Raghu Prasad, B.K.; Venkatarama Reddy, B.V. Prediction of compressive strength of SCC and HPC with highvolume fly ash using ANN. Constr. Build. Mater. 2009, 23, 117–128.
Materials 2022, 15, 690 18 of 19
38. Akalin, O.; Akay, K.U.; Sennaroglu, B. Statistical approach to high strength concrete mixture proportioning. In Proceedings ofthe Tenth ACI International Conference on Recent Advances in Concrete Technology and Sustainability Issues, Seville, Spain,1 January 2009; pp. 825–836.
39. Matos, P.R.; Sakata, R.D.; Prudêncio, L.R. Eco-efficient low binder high-performance self-compacting concretes. Constr. Build. Mater.2019, 22520, 941–955. [CrossRef]
40. Paulou, K. Pre-testing of self-compacting concrete with various mineral additives and admixtures. In Proceedings of the 3rdInternational Symposium on Self-Compacting Concrete, Reykjavik, Iceland, 17–20 August 2003; pp. 442–445.
41. Turcry, P.; Loukili, A. A study of plastic shrinkage of self-compacting concrete. In Proceedings of the 3rd International Symposiumon Self-Compacting Concrete, Reykjavik, Iceland, 17–20 August 2003; pp. 576–585.
42. Khayat, K.H.; Petrov, N.; Attiogbe, E.K.; See, H.T. Uniformity of bond strength of prestressing strands in conventional flowableand self-consolidating concrete mixtures. In Proceedings of the 3rd International Symposium on Self-Compacting Concrete,Reykjavik, Iceland, 17–20 August 2003; pp. 703–712.
43. Fredvik, T.I.; Gundersen, N.L.; Johansen, K. Development of SCC in Norway-use of CSF. In Proceedings of the 3rd InternationalSymposium on Self-Compacting Concrete, Reykjavik, Iceland, 17–20 August 2003; pp. 975–985.
44. Zhu, W.; Bartos, P. Microstructure and properties of interfacial transition zone in SCC. In Proceedings of the First Interna-tional Symposium on Design, Performance and Use of Self-Consolidating SCC’2005-China, Changsha, China, 26–28 May 2005;pp. 319–327.
45. Poppe, A.M.; De Schutter, G. Creep and shrinkage of self-compacting concrete. In Proceedings of the First International Sympo-sium on Design, Performance and Use of Self-Consolidating SCC’2005-China, Changsha, China, 26–28 May 2005; pp. 329–336.
46. Audenaert, K.; Boel, V.; De Schutter, G. Chloride penetration in self-compacting concrete by cyclic immersion, Performance andUse of Self-Consolidating SCC’2005-China. In Proceedings of the 5th International RILEM Symposium on Self-CompactingConcrete, Changsha, China, 26–28 May 2005; pp. 355–362.
47. Assie, S.; Escadeillas, G.; Waller, V. Estimates of self-compacting concrete ‘potential’ durability. Constr. Build. Mater. 2007, 21,1909–1917. [CrossRef]
48. Persson, B. A comparison between mechanical properties of self-compacting concrete and the corresponding properties of normalconcrete. Cem. Concr. Res. 2001, 31, 193–198. [CrossRef]
49. Le, H.T.; Müller, M.; Siewert, K.; Ludwig, H.-M. The mix design for self-compacting high performance concrete containingvarious mineral admixtures. Mater. Des. 2015, 72, 51–62. [CrossRef]
50. Gesoglu, M.; Güneyisi, E.; Özbay, E. Properties of self-compacting concretes made with binary, ternary and quaternary cementi-tious blends of fly ash, blast furnace slag, and silica fume. Constr. Build. Mater. 2009, 23, 1847–1854. [CrossRef]
51. Casting of Self Compacting Concrete, RILEM Report 35; Skarendahl, A.; Billberg, P. (Eds.) RILEM Publication S.A.R.L.: Bagneux,France, 2006.
52. Skarendahl, Å.; Petersson, Ö. Self-Compacting Concrete. In Proceedings of the First International RILEM Symposium, RILEMProceedings 7, Stockholm, Sweden, 13–14 September 1999.
53. Szwabowski, J. Influence of three-phase structure on the yield stress of fresh concrete, Rheology of fresh cement and concrete.In Proceedings of the International Conference organized by the British Society of Rheology, University of Liverpool, Universityof Liverpool, UK, 16–29 March 1990; Banfill, P.F.G., Ed.; E. and F.N. spon: London, UK, 1991; pp. 241–248.
54. Domone, P.J.; Jin, J. Properties of mortar for self-compacting concrete. In Proceedings of the Self-Compacting Concrete, Stockholm,Sweden, 13–14 September 1999; pp. 109–120.
55. Domone, P.L. Self-compacting concrete: An analysis of 11 years of case studies. Cem. Concr. Compos. 2006, 28, 197–208. [CrossRef]56. Nguyen, N.-H.; Vo T., P.; Lee, S.; Asteris, P.A. Heuristic algorithm-based semi-empirical formulas for estimating the compressive
strength of the normal and high performance concrete. Constr. Build. Mater. 2021, 304, 124467. [CrossRef]57. Al-Jabri, K.S.; Hisada, M.; Al-Saidy, A.H.; Al-Oraimi, S.K. Performance of high strength concrete made with copper slag as a fine
aggregate. Constr. Build. Mater. 2009, 23, 2132–2140. [CrossRef]58. Aïtcin, P.-C. High-Performance Concrete; E & FN SPON: London, UK, 1998.59. Afroughsabet, V.; Teng, S. Experiments on drying shrinkage and creep of high performance hybrid-fiber-reinforced concrete.
Cem. Concr. Compos. 2020, 106, 103481. [CrossRef]60. Akhnoukh, A.K. Accelerated bridge construction projects using high performance concrete. Case Stud. Constr. Mater. 2019,
12, e00313. [CrossRef]61. Ma, J.; Dietz, J. Ultra High Performance Compating Concrete. Lacer 2002, 7, 33–42.62. Zain, M.F.M.; Islam, M.N.; Basri, I.H. An expert system for mix design of high performance concrete. Adv. Eng. Softw. 2005, 36,
325–337. [CrossRef]63. Persson, B. Hydration and Strength of High Performance Concrete. Adv. Cem. Based Mater. 1996, 3, 107–123. [CrossRef]64. Brandt, A.M. Cement-Based Composites. In Materials, Mechanical Properties and Performance, 2nd ed.; CRC Press: London, UK,
2005; p. 544. [CrossRef]65. Nagamoto, N.; Ozawa, K. Mixture proportions of self-compacting high performance concrete. ACI Int. 1999, 172, 623–636.66. ACI Committee 226. Silica Fume in Concrete. ACI Mater. J. 1987, 84, 158–166.67. Condensed Silica Fume in Concrete. In State of Art Report FIB/CEB Bulletin D’information; Telford, T. (Ed.) Thomas Telford Ltd.:
London, UK, 1998; p. 48. ISBN 978-0-7277-1373-5.

Materials 2022, 15, 690 19 of 19
68. Jasiczak, J.; Mikołajczyk, P. Technologia betonu modyfikowanego domieszkami i dodatkami. Przeglad tendencji krajowych izagranicznych. In Wydawnictwa Politechniki Poznanskiej, Technology of Concrete Modified with Admixtures and Additions; Review ofdomestic and foreign trends; Poznan University of Technology publications: Poznan, Poland, 1997; ISBN 83-7143-083-3.
69. Parichatprecha, R.; Nimityongskul, P. Analysis of durability of high performance concrete using artificial neural networks.Constr. Build. Mater. 2009, 23, 910–917. [CrossRef]
70. Hamid, R.; Yusof, K.M.; Zain, M.F.M. A combined ultrasound method applied to high performance concrete with silica fume.Constr. Build. Mater. 2010, 24, 94–98. [CrossRef]
71. Horszczaruk, E. Mathematical model of abrasive wear of high performance concrete. Wear 2008, 264, 113–118. [CrossRef]72. Hossain, K.M.A. High strength blended cement concrete incorporating volcanic ash: Performance at high temperatures.
Cem. Concr. Compos. 2006, 28, 535–545. [CrossRef]73. Kadri, E.-H.; Aggoun, S.; De Schutter, G. Interaction between C3A, silica fume and naphthalene sulphonate superplasticiser in
high performance concrete. Constr. Build. Mater. 2009, 23, 3124–3128. [CrossRef]74. Picandet, V.; Bastian, G.; Khelidj, A. Compared imbibitions of ordinary and high performance concrete with null or positive water
pressure head. Cem. Concr. Res. 2008, 38, 772–782. [CrossRef]75. Mustapha, F.A.; Sulaiman, A.; Mohamed, R.N.; Umara, S.A. The effect of fly ash and silica fume on self-compacting high-
performance concrete. Mater. Today Proc. 2021, 39, 965–969. [CrossRef]76. Zain, M.F.M.; Safiuddin, M.; Yusof, K.M. A study on the properties of freshly mixed high performance concrete. Cem. Concr. Res.
1999, 29, 1427–1432. [CrossRef]77. Giergiczny, Z.; Małolepszy, J.; Szwabowski, J.; Sliwinski, J. Cementy z dodatkami mineralnymi w technologii betonów nowej
generacji. In Wydawnictwo Instytut Slaski, Cements with Mineral Additives in the New Generation Concrete Technology; Silesian InstitutePublishing House: Opole, Poland, 2002.
78. Khayat, K.H.; Saric-Coric, M.; Tagnit-Hamou, A. Performance characteristics of cement grouts made with various combinationsof high-range water reducer and cellulose-based viscosity modifier. Cem. Concr. Res. 2003, 33, 1999–2008.
79. Khayat, K.H. International RILEM Symposium of Self-Compacting Concrete. In Proceedings of the Design, Production andPlacement of SCC, Montreal, Canada, 26–29 September 2010.
80. Gołaszewski, J. Influence of Viscosity Enhancing Agent on Rheology and Compressive Strength of Superplasticized Mortars.J. Civ. Eng. Manag. 2009, 15, 181–188. [CrossRef]
81. Łazniewska-Piekarczyk, B. Wpływ domieszek stabilizujacych lepkosc (DSL) na własciwosci samozageszczajacych sie zapraw ibetonów. Cem. Wapno Beton 2011, 16, 44–51.
82. Łazniewska-Piekarczyk, B. Effect of viscosity type modifying admixture on porosity, compressive strength and water penetrationof high performance self-compacting concrete. Constr. Build. Mater. 2013, 48, 1035–1044. [CrossRef]
83. Gutierrez, P.A.; Canowas, M.F. High-Performance Concrete: Requirements for Constituent Materials and Mix Proportioning.ACI Mater. J. 1996, 93, 233–241.
84. Kosmatka, S.; Kerkhoff, B.; Panarese, W. High Performance Concrete. In Design and Control of Concrete Mixtures, 14th ed.; PortlandCement Association: New York, NY, USA, 2000; pp. 299–314.
85. Carlsward, J.; Emborg, M.; Utsi, S.; Oberg, P. Effect of constituents on the workability and rheology of self-compacting concrete.In Proceedings of the 3rd International Symposium on Self-Compacting Concrete, Reykjavik, Iceland, 17–20 August 2003;pp. 143–153.
86. Szwabowski, J.; Łazniewska-Piekarczy, B. Zwiekszenie napowietrzenia mieszanki pod wpływem działania superplastyfikatorówkarboksylowych, Increasing the aeration of the mixture under the influence of carboxylic superplasticizers. Cem. Wapno Beton2008, 13/75, 4.
87. Kostrzanowska-Siedlarz, A.; Gołaszewski, J. Rheological properties of High Performance Self-Compacting Concrete:Effects ofcomposition and time. Constr. Build. Mater. 2016, 115, 705–715. [CrossRef]
88. Wallevik, O. Course on Rheology-Rheology of Cement Suspensions; The Icelandic Building Research Institute: Reykjavík, Iceland, 2002.89. Teodorescu-Draghicescu, H.; Vlase, S. Homogenization and averaging methods to predict elastic properties of pre-impregnated
composite materials. Comput. Mater. Sci. 2011, 50, 1310–1314. [CrossRef]90. Han, J.; Fang, H.; Wang, K. Design and control shrinkage behavior of high-strength self-consolidating concrete using shrinkage-
reducing admixture and super-absorbent polymer. J. Sustain. Cem. Based Mater. 2014, 3, 182–190. [CrossRef]91. Esmaeilkhanian, B.; Khayat, K.H.; Yahia, A.; Feys, D. Effects of mix design parameters and rheological properties on dynamic
stability of self-consolidating concrete. Cem. Concr. Compos. 2014, 54, 21–28. [CrossRef]92. Siddique, R.; Aggarwal, P.; Aggarwal, Y. Mechanical and durability properties of self-compacting concrete containing fly ash and
bottom ash. J. Sustain. Cem. Based Mater. 2012, 1, 67–82. [CrossRef]93. Wang, X.H.; Wang, K.J.; Taylor, P.; Morcous, G. Assessing particle packing based self-consolidating concrete mix design method.
Constr. Build Mater. 2014, 70, 439–452. [CrossRef]