
SHAHBAZ ALI SERVICE ORCHESTRATION SUPPORTING ...
68
SHAHBAZ ALI SERVICE ORCHESTRATION SUPPORTING MIXED MODEL AS- SEMBLY LINE BALANCING AND SEQUENCING Master of Science Thesis Examiner: prof. Jose Martinez Lastra Examiner and topic approved on 1 No- vember 2017
-
Upload
khangminh22 -
Category
Documents
-
view
3 -
download
0
Transcript of SHAHBAZ ALI SERVICE ORCHESTRATION SUPPORTING ...
SHAHBAZ ALI SERVICE ORCHESTRATION SUPPORTING MIXED MODEL AS-SEMBLY LINE BALANCING AND SEQUENCING
Master of Science Thesis
Examiner: prof. Jose Martinez Lastra Examiner and topic approved on 1 No-vember 2017
i
ABSTRACT
SHAHBAZ ALI: Service Orchestration Supporting Mixed Model Assembly Line Balancing and Sequencing Tampere University of technology December 2017 Master’s Degree Program in Automation Engineering Major: Factory Automation and Industrial Informatics Examiner: Professor Jose Martinez Lastra Keywords: Manufacturing system, Orchestration, mixed model assembly line, balancing, sequencing, FASTory line. In recent times the market has become extremely competitive because of unpredictable demand of the customers. This uncertain and competitive nature of the market has made manufacturers implement different methodologies to improve their production rate by keeping quality and cost in control. To achieve economies of scale manufacturers have been using a mixed model assembly line. During its operations, manufacturers have faced many problems and one of the problems is balancing and sequencing of the mixed model assembly line. Balancing is defined as the distribution of workload among workstations to reduce cycle time to achieve better cost and production rate. Sequencing is defined as to keep the workflow under control. This thesis presents three different approaches to develop an orchestrator to balance and sequence mixed-model assembly line. The first approach is named as one by one work distribution approach in which orchestrator distributes tasks to all the workstations in se-quence. If one workstation completed the task, it would not get the next task until orches-trator has distributed the tasks to each of other workstations. The second approach which is implemented is named as idle workstation approach. In this approach, orchestrator as-signs a task to the workstation which is near to paper loading workstation. The third ap-proach which is implemented is the fixed colour approach. In this approach, orchestrator allots each workstation with one of the colours (Red, Blue, and Green) and assigns tasks to the workstation based on the allotted colour. After implementing each of the approaches a sample order is run to calculate the time and energy consumed by the system to complete that specific order. After calculating time and energy consumption for each approach at the end a comparison is made to deduce the result. It can be concluded after analysing the results that the approach three would be more effective to balance the Mixed Model Assembly line. As, it provides time efficiency, cost-effectiveness, and can facilitate in achieving equal workload distribution as well.

ii
PREFACE
‘In The Name of Allah, The Most Gracious and The Most Merciful’
I am thankful to my family for their continuous support at every stage of my life. I am also thankful to some of my friends who supported me throughout my studies and stay here at Tampere.
I am thankful to Wael Mohammed from FAST-Lab for his help. I am thankful to Profes-sor Jose Lastra for providing me with the chance to work under his supervision.
I am thankful to everyone who was constant source of support to achieve this milestone.
Shahbaz Ali
12th March 2018
Tampere, Finland
iii
CONTENTS
1. INTRODUCTION .................................................................................................... 1
1.1 Thesis Motivation ........................................................................................... 1
1.2 Scope of Thesis .............................................................................................. 1
1.3 Problem Definition ......................................................................................... 1
1.4 Limits and Assumptions ................................................................................. 2
1.5 Document Outline .......................................................................................... 2
2. LITERATURE REVIEW ......................................................................................... 3
2.1 Manufacturing Systems .................................................................................. 3
2.1.1 Dedicated Manufacturing lines ........................................................ 4
2.1.2 Flexible Manufacturing System ....................................................... 5
2.1.3 Reconfigurable Manufacturing System (RMS) ............................... 7
2.2 ISA-95 Standard ............................................................................................. 8
2.2.1 Aim of ISA-95 standard ................................................................... 9
2.2.2 Levels of Automation pyramid ........................................................ 9
2.3 Service Orchestration and Mixed-model Assembly line.............................. 13
2.4 Balancing and Sequencing ........................................................................... 14
2.5 FASTory Line .............................................................................................. 15
2.6 Programming Tools ...................................................................................... 18
3. METHODOLOGY: ................................................................................................ 20
3.1 Research Phases ........................................................................................... 20
3.1.1. Initiation and Planning ................................................................... 20
3.1.2. Literature Review ........................................................................... 21
3.1.3. Problem Identification.................................................................... 21
3.1.4. Implementation and Obtaining Results .......................................... 21
3.1.5. Documentation ............................................................................... 21
3.2 Architectural View ....................................................................................... 22
3.2.1 Client .............................................................................................. 22
3.2.2 Server ............................................................................................. 23
3.2.3 Assembly line ................................................................................. 23
3.2.4 Orchestrator .................................................................................... 23
3.3 Class Diagram of the System ....................................................................... 24
3.4 System Working ........................................................................................... 25
4. IMPLEMENTATION ............................................................................................. 28
4.1 Orchestrator .................................................................................................. 28
4.1.1 Workstation .................................................................................... 28
4.1.2 Pallet Data ...................................................................................... 30
4.1.3 Run Server...................................................................................... 32
4.2 Different Approaches Implemented ............................................................. 34
4.2.1 One by One Work Distribution Approach ..................................... 34
4.2.2 IDLE Workstation Approach ......................................................... 36
iv
4.2.3 Fixed Colour Approach .................................................................. 37
4.3 User Interface: .............................................................................................. 39
5. RESULTS ............................................................................................................... 41
5.1 Test Conditions ............................................................................................ 41
5.2 Results Obtained by First Approach ............................................................ 42
5.3 Results Obtained by Second Approach ........................................................ 43
5.4 Results Obtained by Third Approach ........................................................... 45
5.5 Result Comparison ....................................................................................... 47
6. CONCLUSIONS ..................................................................................................... 50
6.1 Summary of Discussion ............................................................................... 50
6.2 Future Work ................................................................................................. 51
REFERENCES ................................................................................................................ 52
APPENDIX A: Control Specifications SRX-C61
APPENDIX B: Different Processes Time
v
LIST OF FIGURES
Figure 1: Structure of Flexible Manufacturing System [10] ............................................ 6
Figure 2: Automation Pyramid [18] ................................................................................. 9
Figure 3: SCADA system [24] ........................................................................................ 12
Figure 4: FASTory line [45][46] .................................................................................... 16
Figure 5: FASTory line layout [44][45] ......................................................................... 16
Figure 6: FASTory Line Product [45] ............................................................................ 16
Figure 7: Different Zones of FASTory Line [47] ............................................................ 17
Figure 8: Research Phases ............................................................................................. 20
Figure 9: Architectural View of the System .................................................................... 22
Figure 10: Class Diagram of the System ........................................................................ 24
Figure 11: Sequence Diagram of the Designed System .................................................. 26
Figure 12: Use Case Diagram of Designed System........................................................ 27
Figure 13: Component Diagram of the System .............................................................. 28
Figure 14: Class Diagram of workstation ...................................................................... 29
Figure 15: Creating Workstation Class .......................................................................... 30
Figure 16: Pallet Data Class Diagram ........................................................................... 31
Figure 17: Creating Pallet Data Class ........................................................................... 31
Figure 18: Run Server Class Diagram ........................................................................... 32
Figure 19: Starting each Workstation Server ................................................................. 33
Figure 20: One by One Work Distribution ..................................................................... 35
Figure 21: Approach 1 Sequence Diagram .................................................................... 36
Figure 22: Idle Workstation ............................................................................................ 36
Figure 23: Approach 2 Sequence Diagram .................................................................... 37
Figure 24: Fixed Colour Approach ................................................................................ 38
Figure 25: Approach 3 Sequence Diagram .................................................................... 38
Figure 26: User Interface ............................................................................................... 39
Figure 27: Order JSON Object ....................................................................................... 40
vi
LIST OF TABLES
Table 1: Manufacturing Systems Comparison [12] .......................................................... 8
Table 2: Function of Each Zone [47] ............................................................................. 17
Table 3: Order Specification Approach 1 ....................................................................... 42
Table 4: Results obtained by Approach 1 ....................................................................... 42
Table 5: Order Specification Approach 2 ....................................................................... 44
Table 6: Result obtained by Approach 2 ......................................................................... 44
Table 7: Order Specification Approach 3 ....................................................................... 45
Table 8: Results obtained by Approach 3 ....................................................................... 46
Table 9: Result comparison of all three approaches ...................................................... 47
vii
LIST OF SYMBOLS AND ABBREVIATIONS
CNC Computer Numerical Control
DML Dedicated Manufacturing Lines
DCS Distributed Control Systems
ERP Enterprise Resource Planning
FASTory Factory Automation Systems and Technologies Laboratory
FMS Flexible Manufacturing System
ICS Industrial Control System
MES Manufacturing Execution System
MRP Material Requirement Planning
MMAL Mixed Model Assembly Line
PCS Process Control System
PLCs Programable Logic Controller.
PHP Hypertext Preprocessor
RMS Reconfigurable Manufacturing System
RMT Reconfigurable Machine Tool
SCADA Supervisory Control and Data Acquisition Systems
WS Workstation
1
1. INTRODUCTION
In this chapter, in the beginning the objective and the scope of this thesis is discussed briefly. Furthermore, it describes the problem which is needed to be solved during this thesis work. This chapter also discusses the assumptions which are made in this thesis work. Finally, at the end of this chapter, a thesis outline is explained.
1.1 Thesis Motivation
Manufacturing is an important facet of any country’s economy. Because of its im-portance, it is of extreme priority to solve the problems occurring during the manufactur-ing processes. There are many problems faced by manufacturers, one of the problems is balancing and sequencing of the assembly line which is the research problem of this the-sis. The objective and main motivation to solve this problem to improve manufacturing processes. It is important to understand an unbalanced line causes overburden to the work-stations, increases idle time, causes waste of resources, a low production rate and low overall efficiency of the production system. On the other hand, a balanced line facilitates to minimize the idle time which helps to gain the high production rate which results in the low production cost, better utilization of resources and better distribution of work among the workstations help to achieve high overall efficiency.
1.2 Scope of Thesis
This thesis work is accomplished at the Factory Automation Systems and Technology (FAST) laboratory, which belongs to the Automation and Hydraulics Engineering labor-atory at Tampere University of Technology. This thesis work implements its solution on FASTory line.
1.3 Problem Definition
In recent years, an uncertain situation of the market has led manufacturers to diversify their products by introducing features and offering different models [4]. For product di-versification, a Mixed Model Assembly Line (MMAL) has become the desired option for manufacturers as it helps to assemble different product’s models at the same production line without any changeovers. While using it many problems occur and one of the prob-lems is balancing and sequencing of MMAL.
2
Balancing is defined as the distribution of different jobs to several workstations within a limited time and available resources. Whereas sequencing is defined as detail sequencing and timing of all the completed tasks by workstations to maximize the overall perfor-mance of the MMAL [7]. Balancing and sequencing came up as difficult problems to deal with and requires a lot of effort. This thesis work is about to develop a service orchestrator which facilitates mixed-model assembly line balancing and sequencing.
1.4 Limits and Assumptions
Following are the limitations and assumptions made during this research work
• The orchestrator which is developed is organizing the FASTory line resources and controlling different operations.
• The line which is FASTory line is used as educational purposes so it cannot be considered as efficient as any industrial line.
• The results calculated are for short period of time, but their effect on production line is illustrated for longer time period.
1.5 Document Outline
In chapter 2 the theoretical background is explained which can be helpful to understand the problem. In chapter 3 the methodology is described which is adopted to solve this thesis problem and to obtain the required results. In chapter 4 implementation of this the-sis work is discussed in detail. Chapter 5 illustrates and discusses the results achieved by implementing the adopted approach. Chapter 6 makes a conclusion of work done and discusses the future work which can be done related to this research work.
3
2. LITERATURE REVIEW
This chapter discusses the theoretical background. At the beginning of this chapter man-ufacturing systems and ISA 95 standard are discussed. It also discusses Service orches-tration, mixed model assembly line, and balancing and sequencing. In addition, this chap-ter discusses FASTory line and finally, at the end of this chapter different programming tools are briefly explained.
2.1 Manufacturing Systems
Historically it is evident that the radical change of an economy from traditional to the modern economy can be credited to manufacturing. Manufacturing is a process which was introduced two centuries ago in the mid of the eighteen century, when Great Britain, USA and, other European countries started to use manufacturing processes, because of which rapid growth was witnessed in their economies. In the twentieth century when dif-ferent countries of Asia started to take advantage of manufacturing processes, a quick change in their economies was also recorded. Now, in the twenty-first-century manufac-turing development is still a major point of concern for the poor economies to provide better facilities to their people. [2]
Based on the discussion in [3] it is important to understand why manufacturing is consid-ered as the cornerstone of the economy of the country. It is the strong base of any econ-omy because it pushes and stimulates other ingredients of the economy. It helps to provide a wide variety of jobs as compared to agriculture, construction, and information technol-ogy. Agriculture and construction create jobs which require a lower level of skills, simi-larly art, information, and technology create jobs for only highly skilled personals. On the other hand, manufacturing provides jobs to personals of all skill levels like workers, en-gineers, scientists and to business professionals. Simply, we can say that it facilitates to make society progress.
According to [1] manufacturing system is defined as the mixture of multiple tasks grouped together to create the end products from the inventory. Three key tasks of the manufacturing system are procurement, products production, and their distribution. Aside from these three key tasks, it has supporting tasks as well which are to design, to plan, manage the resources better and market the product perfectly.
An important term which is related to manufacturing is Procurement. It is defined as the management of raw material purchase and storing them in the storage facility. Further-more, Distribution is another term related to manufacturing which is defined as the pro-cess of transferring the finished goods to different warehouses. The procured materials
4
transformed into semi-finished and finished products which then stored into the ware-houses to deal with the customer demand. [1] Another important term related to manu-facturing is production which is defined as the procedure to produce either tangible prod-ucts and intangible service [2].
Based on the discussion [3] the aim of the manufacturing system is to produce a large number of products in a cost-effective way so that products can be sold at a saleable price which helps to achieve economies of scale. As in a globally competitive environment, it is complicated and a key challenge to design a cost-effective manufacturing system and run it efficiently. As discussed earlier, manufacturing system was developed about two centuries before and since then it has gone through a lot of changes and developed con-sistently. Because of the big number of challenges faced by the manufacturers time and time again manufacturing system was consistently developed. The problems occurred mainly during production, manufacturing systems modeling and difficulty in the manage-ment of production schedule because of the customer-driven market. [4]
As time passed on different methods and technologies have been introduced for better implementation of the manufacturing processes. The manufacturing methods evolved slowly over the time and took a lot of efforts. Before going into further detail of different aspects of the manufacturing system. It is beneficial to have some information about dif-ferent manufacturing systems which have been used over the years.
Following are the main types of manufacturing systems which have been used in the in-dustrial systems.
• Dedicated manufacturing lines • Flexible manufacturing system • Reconfigurable manufacturing system
2.1.1 Dedicated Manufacturing lines
Dedicated manufacturing lines (DML) [8] can also be named as transfer lines. This sys-tem consists of a fixed automation system which has a high production rate. Each of the dedicated lines is basically modeled to produce a single part in a very large quantity. The key benefit of the DML system is that it gives a high production rate which in the result minimizes the production cost per product. Because of this, DMLs is regarded as the cost-efficient manufacturing system. The main disadvantage of DML system is that when the demand for the product is high system cannot run at the maximum capacity which causes a big loss. Furthermore, this system doesn’t help to achieve product diversity. Because of these disadvantages, the use of this system is constantly declining.
5
2.1.2 Flexible Manufacturing System
Uncertain change in customer demand has influenced the production processes hugely due to which companies have been dealing with serious problems. The main problems faced are to manage delivery time, how to achieve cost-effectiveness and with all this keep the product quality high. During these difficult circumstances, a flexible manufac-turing system (FMS) is the option which facilitates manufacturers with the possibility to enhance their profit by providing them highly flexible and efficient methods and tech-niques of manufacturing. [9]
The flexible manufacturing system can be defined as the system deals with the uncertain circumstances of the operating environment because of its flexible nature [10]. This sys-tem is made up of different types machines. Three main parts of this system are a control system, transport system, and Computer numerical control (CNC) machine tools [11].
• Basic components of FMS
According to [10], the major parts of flexible manufacturing system are
1. Workstations. 2. Automated Material handling and storage system. 3. Computer control system.
i. Workstations
The workstations can be controlled by the worker and different machines like CNC ma-chine tools which perform different machining operations on different parts of product to be produced. There are different types of workstations which are given as
1. Machine centers. 2. Stations which load and unload the material. 3. Work stations which deal with assembly processes. 4. Stations which inspect the products. 5. Forging stations 6. Processing of metal sheet station etc. [10]
ii. Automated material handling and storage system
It facilitates to transport processing parts and subassemblies to multiple work stations and at times it also helps in storage as well. Following are the different functions which this system performs
1. To transport work parts between processing stations. 2. It handles different configurations of work parts.
6
3. It helps in short term storage. 4. It makes loading and unloading of processing parts convenient. 5. It provides compatibility. [10]
iii. Computer Control System
This system helps in organizing the processes for material handling and control different workstations of the flexible manufacturing system. Following are the different functions performed by this system
1. It helps in controlling each work station. 2. It helps to distribute control instruction to processing stations. 3. It helps to control productions. 4. It helps to control traffic of FMS 5. It helps in monitoring performance and reporting. [10]
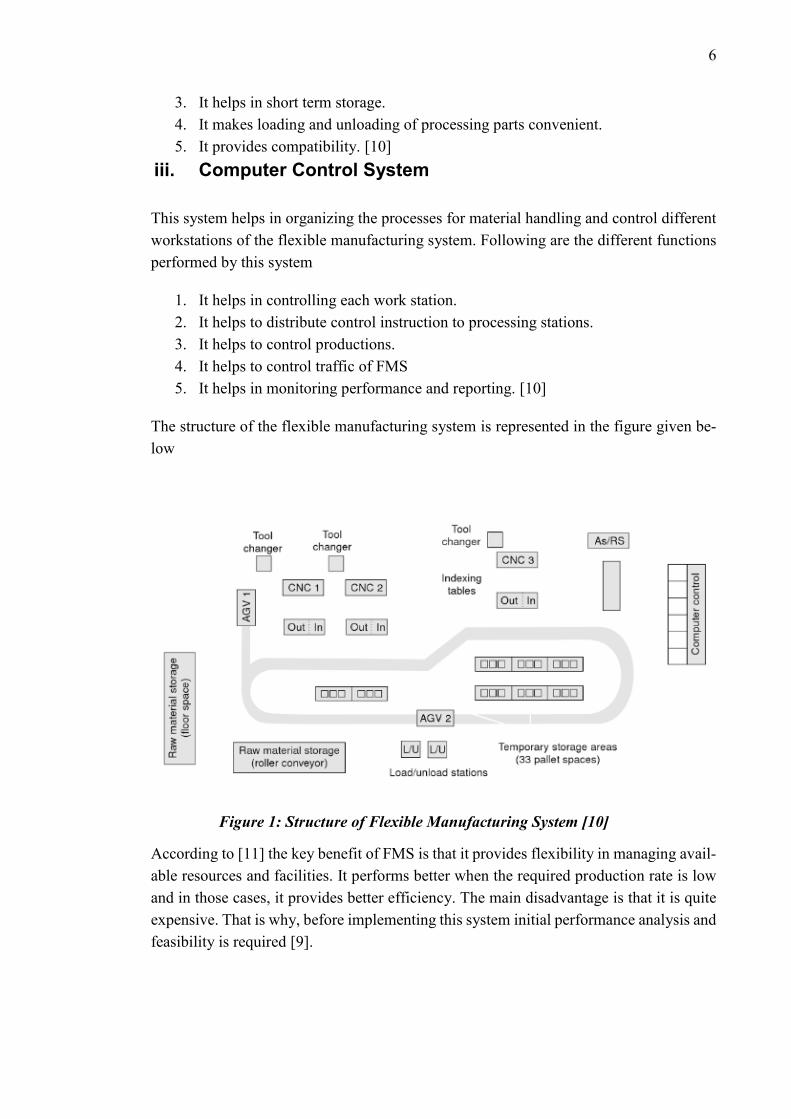
The structure of the flexible manufacturing system is represented in the figure given be-low
Figure 1: Structure of Flexible Manufacturing System [10]
According to [11] the key benefit of FMS is that it provides flexibility in managing avail-able resources and facilities. It performs better when the required production rate is low and in those cases, it provides better efficiency. The main disadvantage is that it is quite expensive. That is why, before implementing this system initial performance analysis and feasibility is required [9].

7
2.1.3 Reconfigurable Manufacturing System (RMS)
According to [12] the need of RMS arose due to unpredictable market conditions which consist of product diversification, a customer-driven market which results in demand for customized products, rapid change in techniques and methods and policies of a govern-ment. Consequently, there was an extreme need for an approach which is cost-effective and contains high production characteristics of DML and flexibility of FMS. RMS [12] is defined as the system which has software and hardware flexible structure to deal with the production capacity and has characteristics to deal with the unpredictability in cus-tomer demand.
• Main elements of RMS
Based on discussion made by [13] following are the main components of reconfigurable manufacturing system;
1. Reconfigurable machine tools 2. Reconfigurable controller.
i. Reconfigurable Machine tool (RMT)
The unique ability of the RMS [13] is that its production capacity can be managed ac-cording to change in market demand. The main element of RMS is RMT which in com-parison to the general-purpose CNC machine is designed for specific operations. The ma-jor objective of RMT is to deal with multiple changes in manufacturing parts or products and to keep those operations cost effective.
ii. Reconfigurable Controller
To control a specific machine functions a reconfigurable controller is used. During run-time, no changes can be made in the reconfigurable controller. [13]
• Main Features of RMS
Following are the main features of RMS;
1. Modularity: All the elements like controller, axes, software and hardware of re-configurable manufacturing system are modular
2. Integrability: machine tools are modelled with the interfaces for component in-tegration. The performance of the integrated system can be anticipated on the ba-sis of its components and interface performance. [12]
8
3. Convertibility: the optimal operating mode is configured in batches that should be completed during the period of one day. Conversion requires changing tools, part-programs, fixtures and may require manual adjustment of passive degrees-of-freedom. [12]
4. Diagnosable: Detecting unacceptable part quality is critical in reducing ramp-up time in RMS. As production system are made more reconfigurable and are modi-fied more frequently, it becomes essential to rapidly tune the newly reconfigured system so that it produces quality parts. [12]
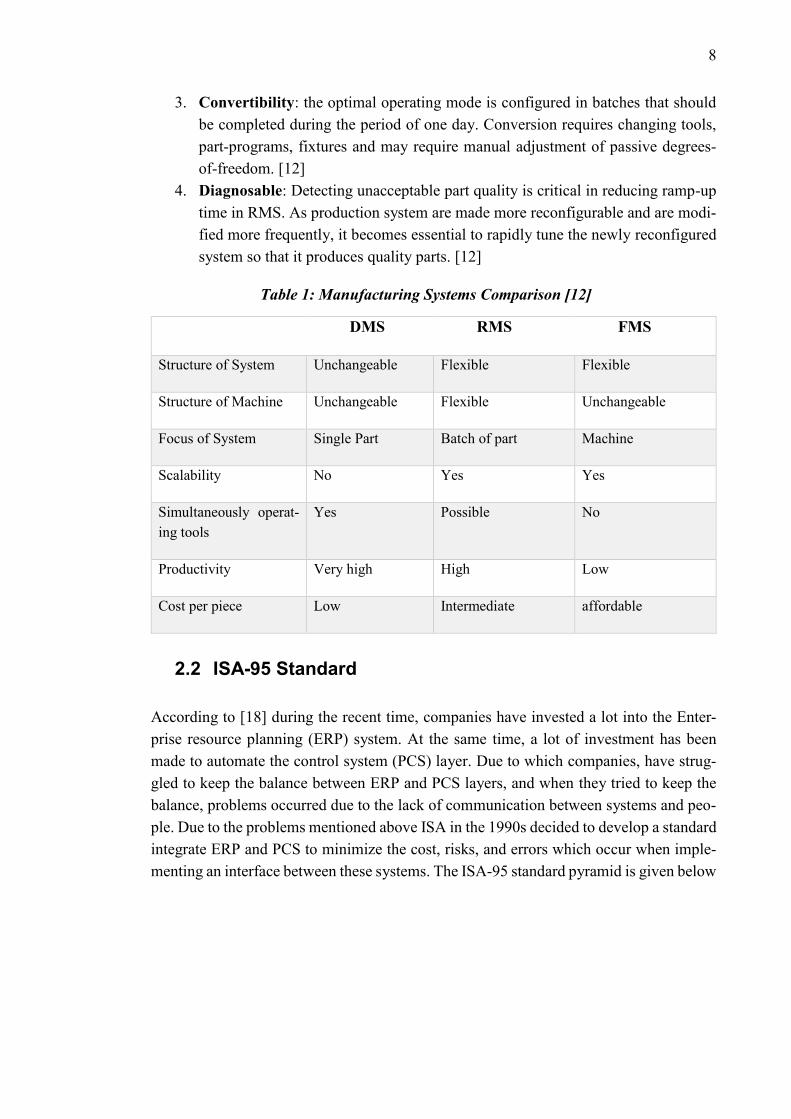
Table 1: Manufacturing Systems Comparison [12]
DMS RMS FMS
Structure of System Unchangeable Flexible Flexible
Structure of Machine Unchangeable Flexible Unchangeable
Focus of System Single Part Batch of part Machine
Scalability No Yes Yes
Simultaneously operat-ing tools
Yes Possible No
Productivity Very high High Low
Cost per piece Low Intermediate affordable
2.2 ISA-95 Standard
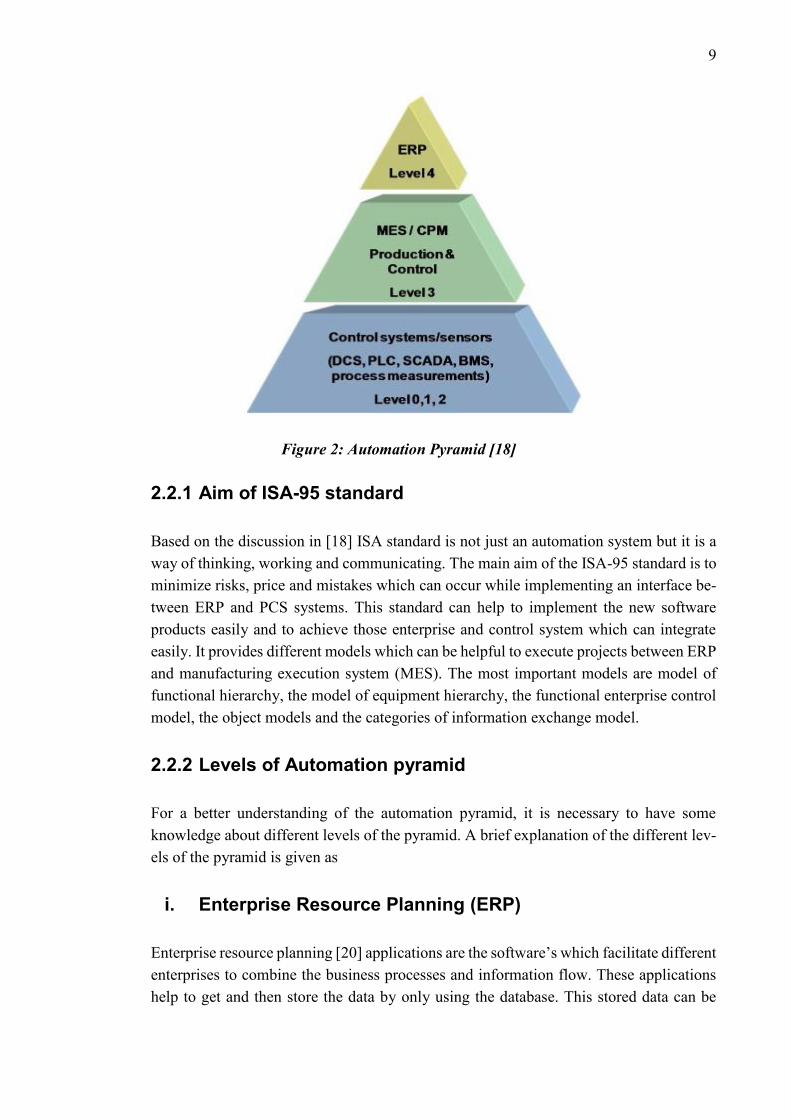
According to [18] during the recent time, companies have invested a lot into the Enter-prise resource planning (ERP) system. At the same time, a lot of investment has been made to automate the control system (PCS) layer. Due to which companies, have strug-gled to keep the balance between ERP and PCS layers, and when they tried to keep the balance, problems occurred due to the lack of communication between systems and peo-ple. Due to the problems mentioned above ISA in the 1990s decided to develop a standard integrate ERP and PCS to minimize the cost, risks, and errors which occur when imple-menting an interface between these systems. The ISA-95 standard pyramid is given below
9
Figure 2: Automation Pyramid [18]
2.2.1 Aim of ISA-95 standard
Based on the discussion in [18] ISA standard is not just an automation system but it is a way of thinking, working and communicating. The main aim of the ISA-95 standard is to minimize risks, price and mistakes which can occur while implementing an interface be-tween ERP and PCS systems. This standard can help to implement the new software products easily and to achieve those enterprise and control system which can integrate easily. It provides different models which can be helpful to execute projects between ERP and manufacturing execution system (MES). The most important models are model of functional hierarchy, the model of equipment hierarchy, the functional enterprise control model, the object models and the categories of information exchange model.
2.2.2 Levels of Automation pyramid
For a better understanding of the automation pyramid, it is necessary to have some knowledge about different levels of the pyramid. A brief explanation of the different lev-els of the pyramid is given as
i. Enterprise Resource Planning (ERP)
Enterprise resource planning [20] applications are the software’s which facilitate different enterprises to combine the business processes and information flow. These applications help to get and then store the data by only using the database. This stored data can be
10
helpful for the enterprise. ERP systems can be extremely advantageous and effective if they are implemented properly in a business organization. These systems help an organi-zation to minimize cycle time, enable a quicker flow of information, help in better finan-cial management and provide better e-commerce base.
According to [20] the main idea of developing ERP is to overcome operational problems which organizations were facing while using previous systems. One of the very first in-formation systems which can control multiple operations of management was material requirement planning (MRP). MRP was designed with the objective to automate the man-ual procedures for controlling and planning schedules for production. Organizations often faced problems while using MRP and most of the problems were not technical but be-cause of people.
Afterward, Manufacturing requirement planning II was developed to solve the most com-mon problems of MRP. MRP II was a closed loop system which considered the capacity when planning schedules were being developed. MRP II applications were considered more refined than MRP and it consisted of a set of modules for individual production processes. However, the challenges to implement persisted with MRP II.ERP can be thought of as the new version of MRP II in some respects because it is a mixture of MRP II functionalities with several other applicational sectors like marketing, accounting, maintenance, and quality. ERP is not only confined to production organizations, but it is also beneficial for the companies where integration of information across several func-tional areas is required. [20]
ii. Manufacturing Execution System
Manufacturing execution system (MES) [21] controls factory operations. It supervises and controls the process control system. It plans the route through which products move through the production system and makes the decision about when production will start. MES [22] is defined as the integrated computerized system that consists of computerized processes and tools to complete production. This system is evolved to reduce the com-munication gap between the manufacturing planning and the control system planning.
MES is a communication mechanism which helps in the flow of information at the factory floor to control managerial, logistical and financial strategies. Its main objective is to improve all aspects which control production processes to attain better flexibility and lower production cost to gain high profit. [23]
The main advantages [22] of using computerized MES are;
• It helps to minimize manufacturing cycle time. • It reduces time to enter data. • It minimizes work in process.
11
• It helps to reduce paperwork between shifts. • It helps to reduce lead time • It empowers the people working at plant. • It improves process planning and customer service.
iii. Level 0,1,2 (Industrial Control System)
According to [23], the industrial control system (ICS) is a system which has been in use to control and monitor industrial infrastructure for example manufacturing, oil, gas, elec-tricity and, transportation. This system consists of most prominent control systems such as “supervisory control and data acquisition systems” (SCADA), distributed control sys-tems (DCS) and programable logic controller. ICS is mainly used in industry to the con-trol overall infrastructure of the production system to attain desired results. For a better understanding of ICS its prominent control systems are briefly explained below
1. SCADA systems
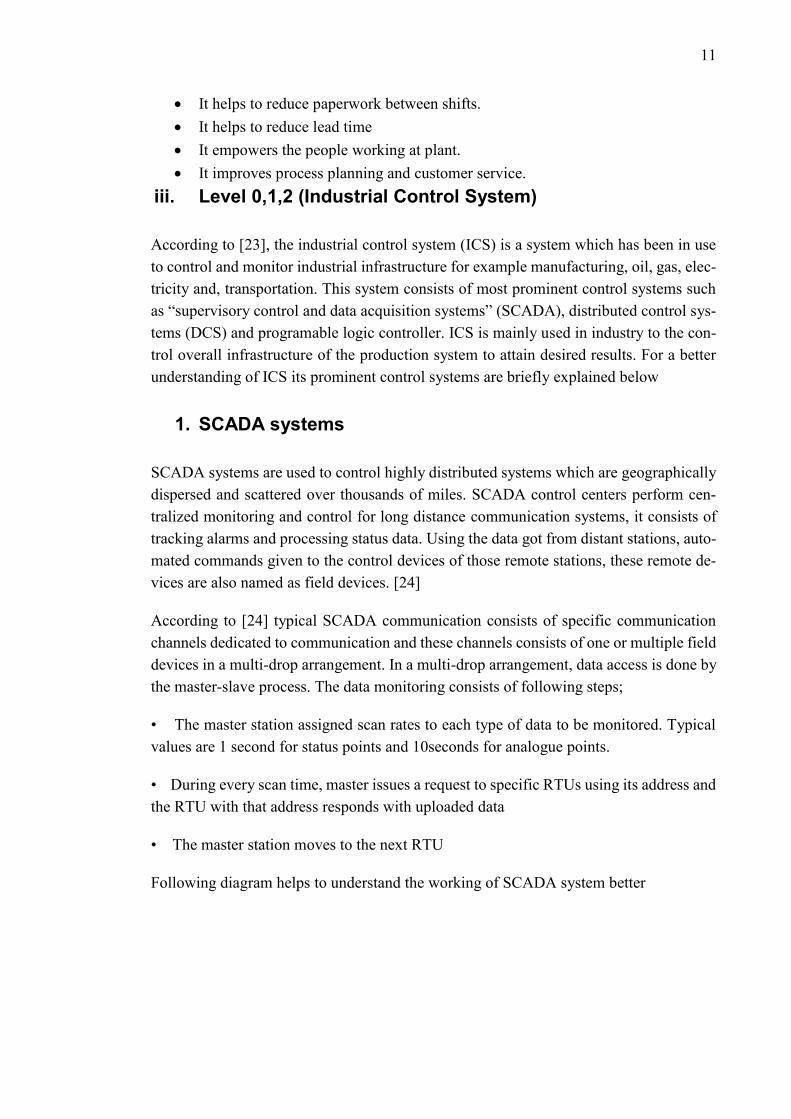
SCADA systems are used to control highly distributed systems which are geographically dispersed and scattered over thousands of miles. SCADA control centers perform cen-tralized monitoring and control for long distance communication systems, it consists of tracking alarms and processing status data. Using the data got from distant stations, auto-mated commands given to the control devices of those remote stations, these remote de-vices are also named as field devices. [24]
According to [24] typical SCADA communication consists of specific communication channels dedicated to communication and these channels consists of one or multiple field devices in a multi-drop arrangement. In a multi-drop arrangement, data access is done by the master-slave process. The data monitoring consists of following steps;
• The master station assigned scan rates to each type of data to be monitored. Typical values are 1 second for status points and 10seconds for analogue points.
• During every scan time, master issues a request to specific RTUs using its address and the RTU with that address responds with uploaded data
• The master station moves to the next RTU
Following diagram helps to understand the working of SCADA system better
12
Figure 3: SCADA system [24]
2. Distributed Control System (DCS)
DCSs [24] are used to deal with factory floor processes such as refineries, chemical man-ufacturing plants, electricity generation facilities, waste and, water treatment plants. DCSs consist of control architecture which contains a supervisory level of control over-seeing multiple and integrated subsystems which control the localized process. DCSs contains an operator console which is similar to SCADA master station. The operator work-station provides the operator interface which consists of alarms, color graphics and, diagnostics etc. The engineering workstation provides the engineer with the platform to configure the system and to implement control algorithms.
3. Programable logic Controllers (PLCs)
According to [24] PLCs are the computer-based devices which deal with the factory floor equipment and processes. PLCs are extensively used in industrial processes. PLCs were initially designed to replace the troublesome relays in the relay logic controllers. The lad-der logic of relay logic controllers remained in PLCs, but technology evolved which pro-vides increased processing power and additional control capabilities.
13
2.3 Service Orchestration and Mixed-model Assembly line
Service orchestration [34] is defined as the approach which provides methods and tech-niques to enable to develop an integrated IT system which can then deal with the demand uncertainty of the enterprises and the market. It gives a person’s or service’s point of view how it interacts and collaborates with other services to gain desired output.
To understand MMAL, it is better to first get an idea about an assembly line. Thomopou-los [7], defines assembly line as a manufacturing system in which sub-assemblies are connected one by one in a sequential manner to produce finished products. Assembly line has been in use since very long. But in the start of twentieth-century innovative ways used by Ford to produce hundreds of cars model per day using assembly line which paved the way for its use all over the world. Assembly lines are of different types which are simple, batch, mixed-model, postponement, one station, disassembly and robotic assembly lines. Next mixed-model assembly line will be discussed.
The current market becomes extremely competitive and customer driven, because of which manufacturers have been trying hard to attract customers by offering them more varieties of products. To get the maximum share of the market, manufacturers are inclined to create a single product with multiple models using a single assembly line. For example, in the automobile industry, there are different models available and customers have some options to make a decision according to their own desire. The same product can have different models with different features size, color, material, and equipment. To produce a variety of product to cope with customer demands MMAL is preferred to use in the industry. MMAL is defined as that type of assembly line where multiple products with similar characteristics can be produced. To balance and sequence MMAL is required to be done to improve the production process and to minimize the cost. A balanced line helps to utilize the available resources efficiently which results to get low production cost. [32]
According to [30] in MMAL each of the workstations performs a certain set of assembly work tasks. The assembly process executes in such a way that each workstation assembles one model at a time. The products like automobiles, large and small home appliances which are in high demand in the market generally produced and assembled at MMAL. These products are characterized by the difference in their model numbers, features and with the name of the brand.
MMAL [30] has a lot of advantages which are given as
1) The mixed model production helps to improve the balance of the assembly line, which can minimize the amount of time of production process.
14
2) The mixed model production helps to distribute the assembly tasks equally and avoids the overload condition.
3) It can be helpful to respond according to the customer demands and make the use of resources efficient.
2.4 Balancing and Sequencing
The main parts of the assembly line are operators, workstations, operational elements and logistics objects. To operate the production system efficiently which consists of MMAL balancing and sequencing of the system need to be done. Thomopoulos [7] defines bal-ancing as the distribution of work load among different work stations. The balancing of an assembly line helps to improve the system efficiency by minimizing the idle time and processing time. Moreover, it facilitates to get better production rate and reduces the over-all production cost.
Sel Kara [27] proposed that the balancing problem of assembly line can be solved by reducing the total cycle time by using cyclic sequencing information. Furthermore, he designed a model using mathematical methods which integrate different models into one model by adding the operational time of each model. Pedro M [28] provided the solution to balance the MMAL with parallel workstations by constructing a mathematical model.
To balance the assembly line, it is required to distribute the work load among the workstations equally. The balancing problem of the MMAL is related to distribute the working unit to each workstation, which helps to reduce the workload and to meet the production require-ment in time. Sequencing is defined as to keep the sequence of different processes in check. [30]
Furthermore, to balance and sequence the MMAL several studies were done in which hierarchical approach was used. According to [31] Hyun, Kim, Erel sequenced the system by using Artificial Intelligence algorithms. The methods in which hierarchical approach was used, balancing and sequencing were treated as different problems. The first system was balanced, once the system got balanced than the results obtained from the balanced system utilized to sequence the system.
More methodologies were proposed including heuristic rules. According to Sparling D there exists some relative relation among tasks. Bukchin described some accurate algo-rithms using the branch and bound method to balance MMAL. Some of the other algo-rithms which were proposed are genetic algorithm proposed by Sabuncuoglu et al., tabu search by Chiang and Sophie, and ant colony algorithm presented by Simaria et al. [31]
Boysen et al. [31] have discussed that as these two problems can be considered as differ-ent. In this case, the simultaneous approach can be extremely useful. Since 2002, many
15
researchers have started to consider integrating these two problems as one problem. Mil-tenburg emphasized a lot on the importance of integrating these two problems as one jointly and presented the solution by computing a weighted average. According to [31] Yeo Keun Kim presented the solution to balance and sequence mixed model U-shaped assembly line by using an endosymbiotic evolutionary algorithm. The algorithm works the same way as the natural evolution process of endosymbionts works. In 2012, Mosa-degh H presented a new approach named as “mixed-inter linear programming model”. This approach considered balancing and sequencing as a single problem.
Based on the discussion in [31] Yakup Kara, Ugur Ozcan proposed the solution to balance and sequence U-shaped MMAL. The solution comprised of the methodology to reduce the number of work stations in use. Furthermore, they implemented a multi-objective ap-proach which concurrently reduces the setup cost, helps to improve the machine life and better work distribution among work stations.
Sarker and Pan utilized MMAL to reduce the processing time cost. Yano and Rachama-dugu reduced the total utility work time by using a sequenced MMAL. Bard, Dar-Elj, and Shtub worked to reduce the length of MMAL and to improve throughput time. They de-signed several models to achieve their set goal. Kim and Jeong sequenced the MMAL by using an approach name” a sequence-dependent set-up” that can be helpful to improve the overall productivity of each workstation by better utilization of resources. [33]
2.5 FASTory Line
This section discusses FASTory assembly line and provides an insight to understand the working of line. As this assembly line is used as the test case and the orchestrator is de-signed to balance and sequence this assembly line. Because of which to have some knowledge about FASTory line is necessary.
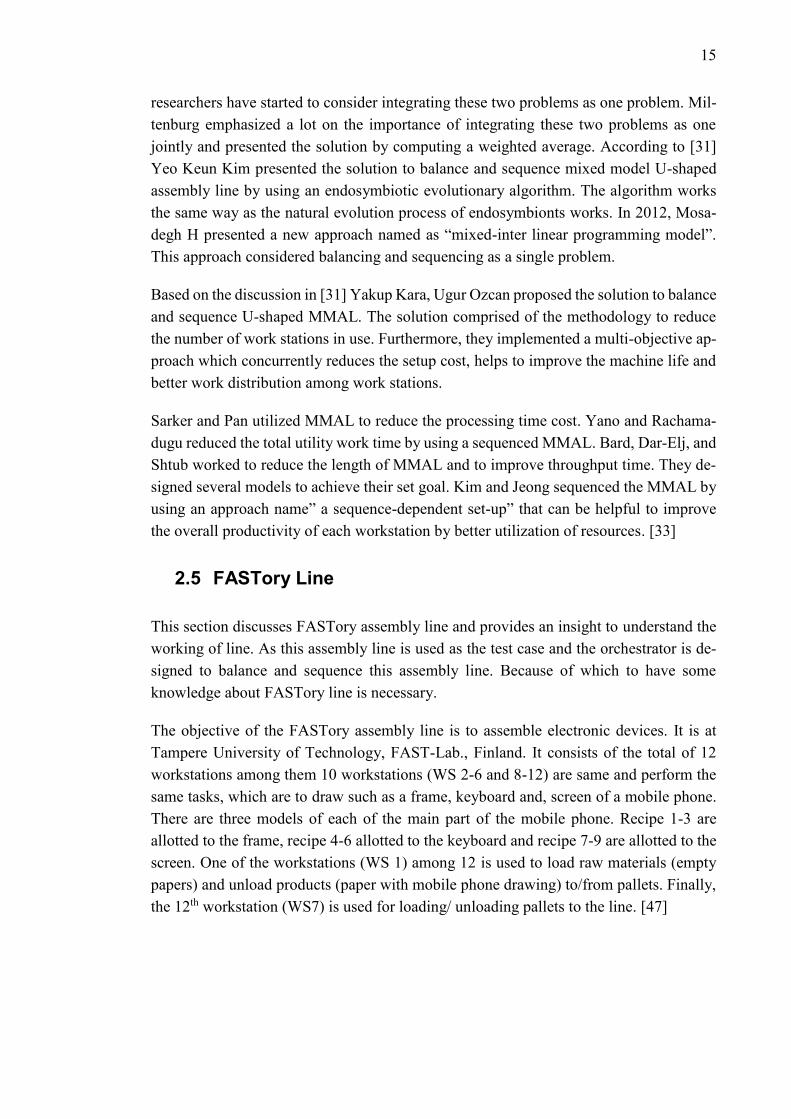
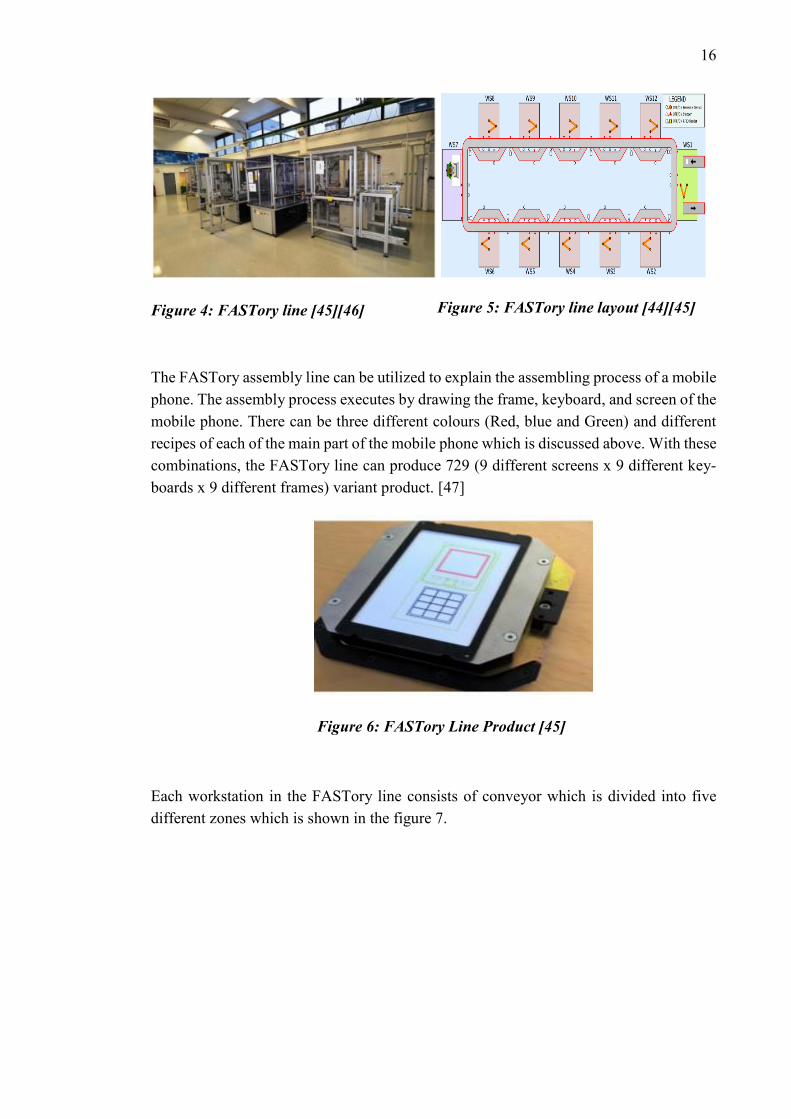
The objective of the FASTory assembly line is to assemble electronic devices. It is at Tampere University of Technology, FAST-Lab., Finland. It consists of the total of 12 workstations among them 10 workstations (WS 2-6 and 8-12) are same and perform the same tasks, which are to draw such as a frame, keyboard and, screen of a mobile phone. There are three models of each of the main part of the mobile phone. Recipe 1-3 are allotted to the frame, recipe 4-6 allotted to the keyboard and recipe 7-9 are allotted to the screen. One of the workstations (WS 1) among 12 is used to load raw materials (empty papers) and unload products (paper with mobile phone drawing) to/from pallets. Finally, the 12th workstation (WS7) is used for loading/ unloading pallets to the line. [47]
16
Figure 5: FASTory line layout [44][45]
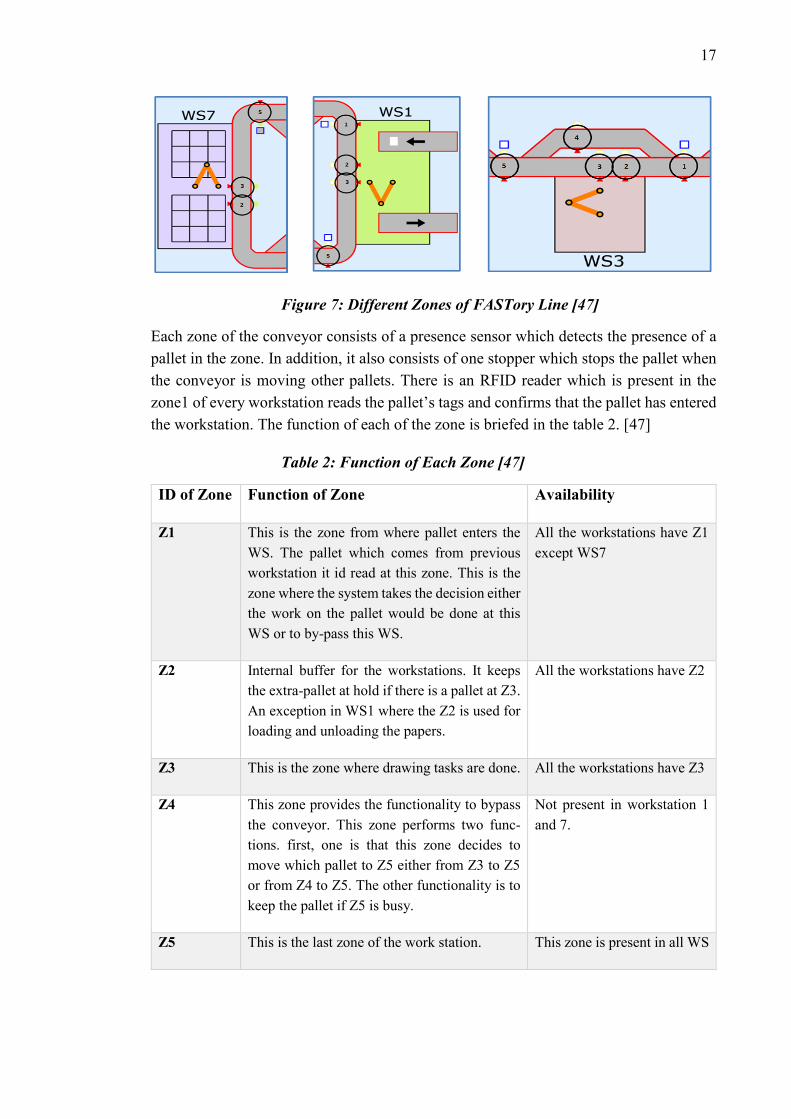
The FASTory assembly line can be utilized to explain the assembling process of a mobile phone. The assembly process executes by drawing the frame, keyboard, and screen of the mobile phone. There can be three different colours (Red, blue and Green) and different recipes of each of the main part of the mobile phone which is discussed above. With these combinations, the FASTory line can produce 729 (9 different screens x 9 different key-boards x 9 different frames) variant product. [47]
Figure 6: FASTory Line Product [45]
Each workstation in the FASTory line consists of conveyor which is divided into five different zones which is shown in the figure 7.
Figure 4: FASTory line [45][46]
17
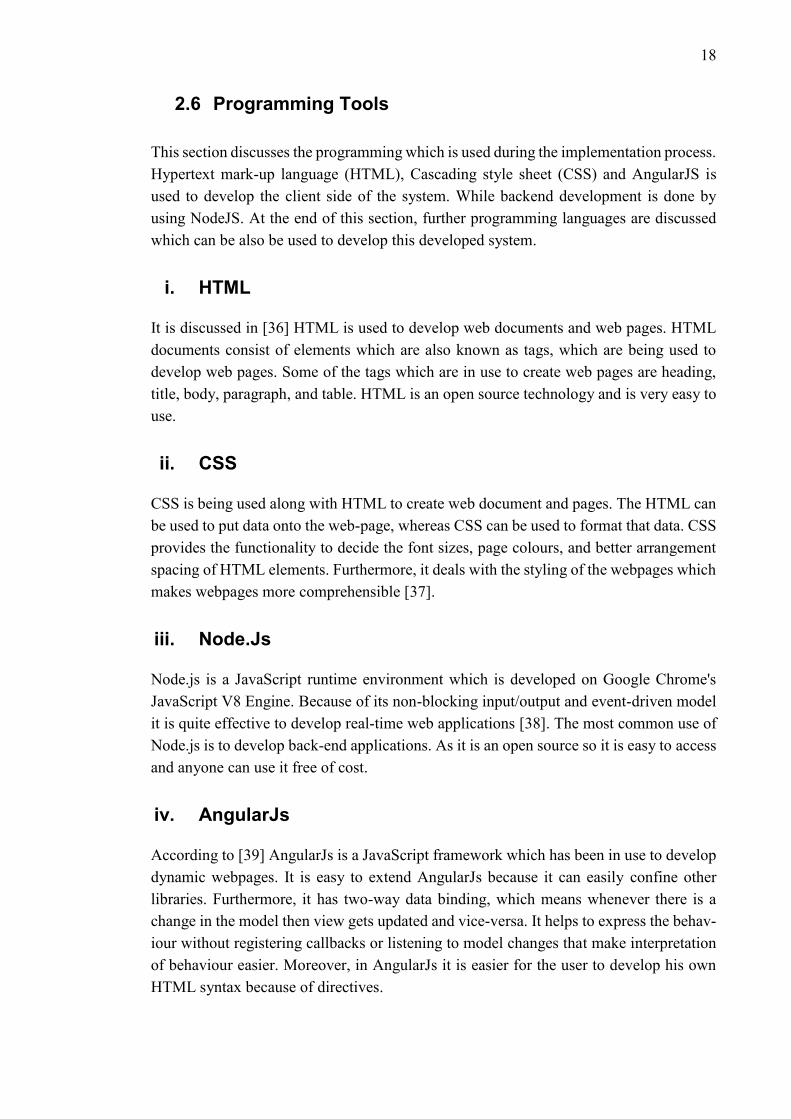
Figure 7: Different Zones of FASTory Line [47]
Each zone of the conveyor consists of a presence sensor which detects the presence of a pallet in the zone. In addition, it also consists of one stopper which stops the pallet when the conveyor is moving other pallets. There is an RFID reader which is present in the zone1 of every workstation reads the pallet’s tags and confirms that the pallet has entered the workstation. The function of each of the zone is briefed in the table 2. [47]
Table 2: Function of Each Zone [47]
ID of Zone Function of Zone Availability
Z1 This is the zone from where pallet enters the WS. The pallet which comes from previous workstation it id read at this zone. This is the zone where the system takes the decision either the work on the pallet would be done at this WS or to by-pass this WS.
All the workstations have Z1 except WS7
Z2 Internal buffer for the workstations. It keeps the extra-pallet at hold if there is a pallet at Z3. An exception in WS1 where the Z2 is used for loading and unloading the papers.
All the workstations have Z2
Z3 This is the zone where drawing tasks are done. All the workstations have Z3
Z4 This zone provides the functionality to bypass the conveyor. This zone performs two func-tions. first, one is that this zone decides to move which pallet to Z5 either from Z3 to Z5 or from Z4 to Z5. The other functionality is to keep the pallet if Z5 is busy.
Not present in workstation 1 and 7.
Z5 This is the last zone of the work station. This zone is present in all WS
18
2.6 Programming Tools
This section discusses the programming which is used during the implementation process. Hypertext mark-up language (HTML), Cascading style sheet (CSS) and AngularJS is used to develop the client side of the system. While backend development is done by using NodeJS. At the end of this section, further programming languages are discussed which can be also be used to develop this developed system.
i. HTML
It is discussed in [36] HTML is used to develop web documents and web pages. HTML documents consist of elements which are also known as tags, which are being used to develop web pages. Some of the tags which are in use to create web pages are heading, title, body, paragraph, and table. HTML is an open source technology and is very easy to use.
ii. CSS
CSS is being used along with HTML to create web document and pages. The HTML can be used to put data onto the web-page, whereas CSS can be used to format that data. CSS provides the functionality to decide the font sizes, page colours, and better arrangement spacing of HTML elements. Furthermore, it deals with the styling of the webpages which makes webpages more comprehensible [37].
iii. Node.Js
Node.js is a JavaScript runtime environment which is developed on Google Chrome's JavaScript V8 Engine. Because of its non-blocking input/output and event-driven model it is quite effective to develop real-time web applications [38]. The most common use of Node.js is to develop back-end applications. As it is an open source so it is easy to access and anyone can use it free of cost.
iv. AngularJs
According to [39] AngularJs is a JavaScript framework which has been in use to develop dynamic webpages. It is easy to extend AngularJs because it can easily confine other libraries. Furthermore, it has two-way data binding, which means whenever there is a change in the model then view gets updated and vice-versa. It helps to express the behav-iour without registering callbacks or listening to model changes that make interpretation of behaviour easier. Moreover, in AngularJs it is easier for the user to develop his own HTML syntax because of directives.
19
v. Java
According to [48] Java is an object-oriented programming language which was developed by Sun Microsystems and released in 1995. It combines the features of both C and C++ with some other essential concepts. Java programs are not dependent on platforms which means that they can be run on any operating system if that operating system contains Java interpreter. Furthermore, if Java code is run on one platform then it can be run on any other platform without recompiling it, this feature of Java code is known as a write once, run anywhere. It is simple to understand as it contains features of both C and C++. More-over, it provides protection from viruses and it helps to find the error made during writing a code quickly. Java has multi-threaded nature which facilitates to write a program that can perform several tasks concurrently. Because of all these features, Java is widely in use in today’s IT industry and web-applications, standalone applications, enterprise ap-plications and mobile applications are being developed using Java.
vi. Python
Python is an object-oriented programming language which was developed in 1980s Guido van Rossum at the National Research Institute for Mathematics and Computer Science in the Netherlands. It contains features of both C and Java programming language as it pro-vides an elegant code writing style like C, contains classes and objects like Java for object -oriented programming. Furthermore, Python language is an open source and it is easy to learn. It has a simple and straightforward syntax which makes to read Python code easy. Python can be used across different platforms if they contain the same interface. Python is being used to develop web and desktop applications and some of the world most famous web application like Instagram, Spotify and Youtube are developed using Python. [49]
vii. PHP (Hypertext Preprocessor)
Based on [50] PHP is a programming language which is developed in 1995 by Rasmus Lerdorf. It is an open-source HTML-embedded server-side programming language. PHP has many syntaxes which are similar to C, Java, and Perl but also contains some specific and unique functions. It is easy to learn for the beginners and for professional program-mers it also contains many advanced features. It works on different operating systems such as Mac, Windows, Linux, and OSX. In addition, it supports many databases such as MySQL, Oracle, MS SQL and many others. It helps to build an application in less time as it is fast and easy to learn. Moreover, it has active community due to which one can easily find help online. It is used to create dynamic and interactive web applications and some most famous web applications like Yahoo, Facebook, Twitter, Wikipedia, and WordPress are being developed using PHP.
20
3. METHODOLOGY:
3.1 Research Phases
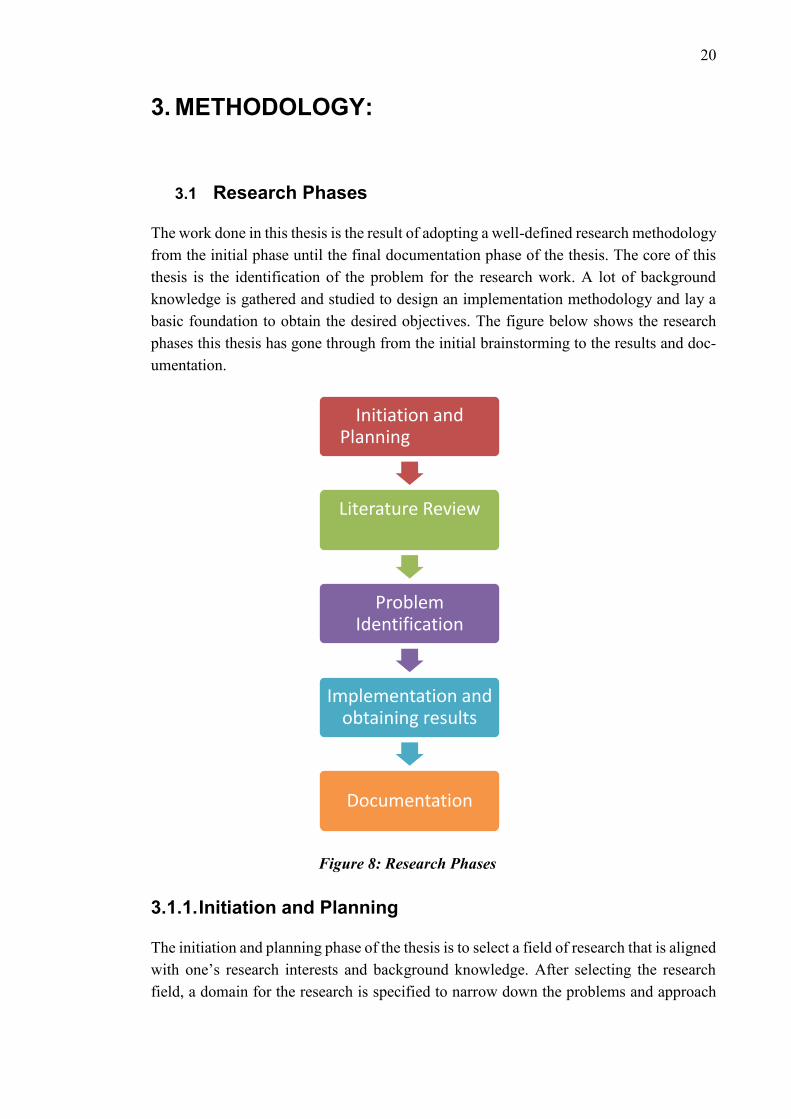
The work done in this thesis is the result of adopting a well-defined research methodology from the initial phase until the final documentation phase of the thesis. The core of this thesis is the identification of the problem for the research work. A lot of background knowledge is gathered and studied to design an implementation methodology and lay a basic foundation to obtain the desired objectives. The figure below shows the research phases this thesis has gone through from the initial brainstorming to the results and doc-umentation.
Figure 8: Research Phases
3.1.1. Initiation and Planning
The initiation and planning phase of the thesis is to select a field of research that is aligned with one’s research interests and background knowledge. After selecting the research field, a domain for the research is specified to narrow down the problems and approach
Initiation and Planning
Literature Review
Problem Identification
Implementation and obtaining results
Documentation
21
used in next phases. A work plan is also designed in this phase that helps in carrying forward the research and monitors the progress at each phase.
3.1.2. Literature Review
During research work analysing the background knowledge of the selected field of re-search is an important step; likewise, it is the most fundamental phase of this thesis as well. Digging through the literature, research journals and articles gave a good overview of the previous work done and ongoing research in the chosen field. It also helps in the next phase of problem identification for the research work.
3.1.3. Problem Identification
After analysing, the background knowledge and getting a perspective of what problems are already solved and what problems still need to be catered is the problem identification phase of the thesis. The problem identified in this thesis is very much aligned to this modern era of data science and are really the need of the hour in the life of every data analyst across the globe.
3.1.4. Implementation and Obtaining Results
The most critical phase in this thesis is implementing the proposed methodology with the help of needed techniques and tools. The most important aspect in the implementation is to keep the solution generic that can adapt to any set of use cases. The implementation developed in this thesis keeps the above-mentioned aspect of generality in view and is generic enough to cater a large set of use cases.
3.1.5. Documentation
No matter how novel and state of the art one’s solution is, until it is not documented and published in a proper scientific manner, it is not valued that much. Therefore, the final phase in this thesis as in almost every research is documenting the results and objective achieved in the form of a dissertation. All the background knowledge collected and ana-lysed along with the implementation and results obtained are documented in this docu-ment for future research and reuse.
22
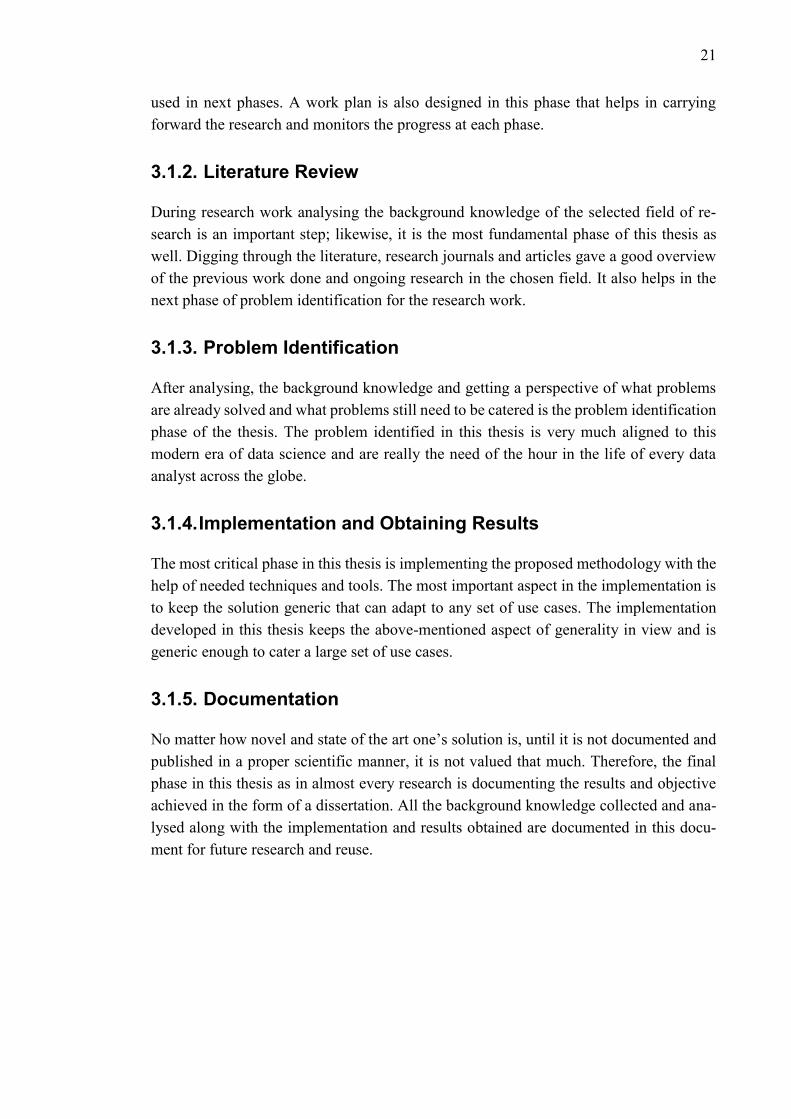
3.2 Architectural View
This subsection gives an overview of the architecture of the system which is modelled to orchestrate and balance the system. As it is shown in the figure below the model of the system consists of four main sections which are:
1. Client. 2. Server 3. Assembly line. 4. Orchestrator
Figure 9: Architectural View of the System
The further detail of the four parts of the architecture of the system is followed
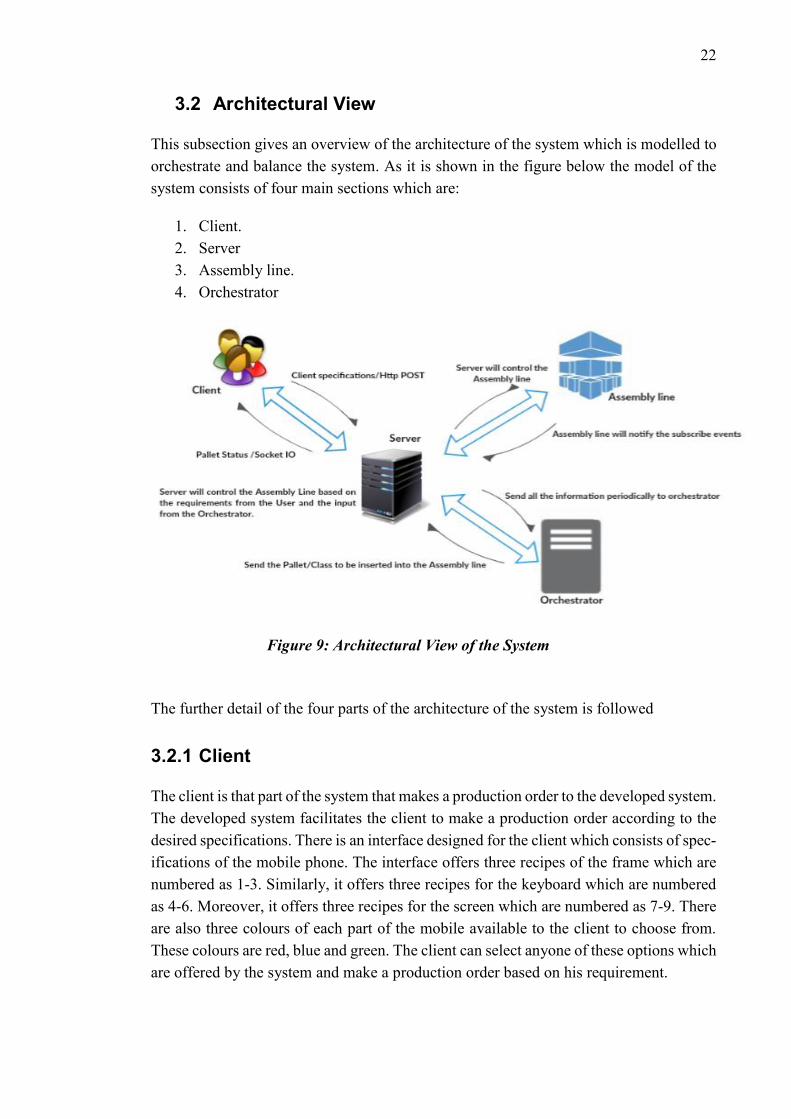
3.2.1 Client
The client is that part of the system that makes a production order to the developed system. The developed system facilitates the client to make a production order according to the desired specifications. There is an interface designed for the client which consists of spec-ifications of the mobile phone. The interface offers three recipes of the frame which are numbered as 1-3. Similarly, it offers three recipes for the keyboard which are numbered as 4-6. Moreover, it offers three recipes for the screen which are numbered as 7-9. There are also three colours of each part of the mobile available to the client to choose from. These colours are red, blue and green. The client can select anyone of these options which are offered by the system and make a production order based on his requirement.
23
3.2.2 Server
The server is the part of the system which facilitates to communicate among the work-stations of the system. As there are 12 workstations in the system so, to avoid the com-plexity of the system there is a separate server designed for each of the workstation. There are different events which can occur at the workstation, which includes a change in zones, drawing process, paper loading, end of ink notification and change of pen. The server of each workstation would be monitoring all of the aforementioned events of the workstation and notifying it to the orchestrator if there is any change happens.
The system starts servers of all the workstation at the same time. When the servers of all the workstations are started, they subscribe all the possible events which can occur at the workstation. Once all the event subscribed, servers then send a notification to the orches-trator for the events that are subscribed. The purpose of subscribing all the events is that whenever there is any change at any workstation, orchestrator gets the notification and make the decision according to that change. There is another server designed which is responsible to start and stop the system.
3.2.3 Assembly line
The assembly line which is used to implement the system is FASTory line located at the Tampere University of Technology. The FASTory assembly line assembles the different parts (frame, screen, and keyboard) of the mobile phone. This line consists of 12 work-stations in total, 10 (WS2-WS6 and WS8-WS12) of the workstations are used for the assembly process. These workstations draw frame, screen, and keyboard. Each of these workstations consists of 5 different zones with different functions which are discussed in FASTory Line. One of the workstations (WS7) loads and unloads the pallet manually. This workstation consists of four zones and doesn’t contain zone5. Moreover, WS1 loads and unloads the paper on the pallet and it also consists of four zones and doesn’t contain zone5.
3.2.4 Orchestrator
It is the most important part of the system as it performs various functions which are:
• When the system starts orchestrator send the message to the server of each work-station to subscribe all the possible events which can occur at the workstation.
• Whenever a client makes an order to the system the orchestrator validates the or-der whether it is correct or not. If the order is not correct orchestrator asks to make an order again and select the specification carefully. If the order is correct then orchestrator starts the assembly process.
24
• Once the assembly process starts, orchestrator starts communicating with the as-sembly line and issues commands based on the response getting back from the assembly line.
3.3 Class Diagram of the System
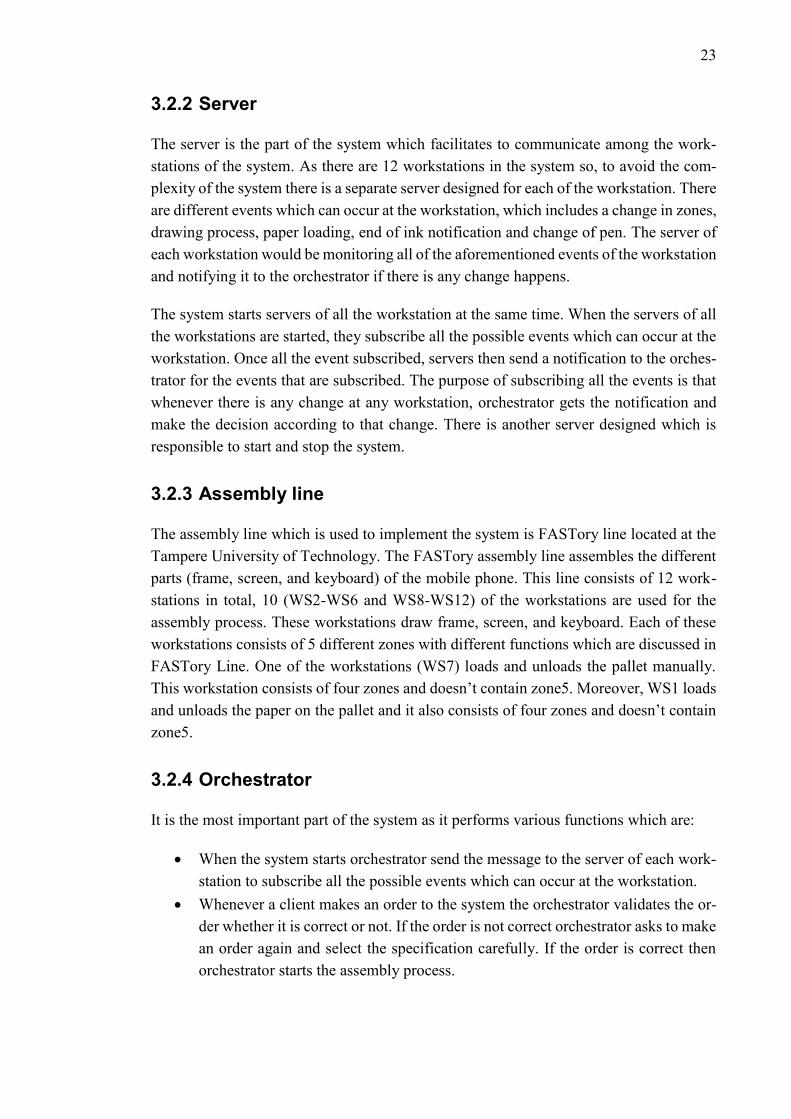
The class diagram is used to give the schematic overview of the system. The class diagram below provides more detail about how the system works:
Figure 10: Class Diagram of the System
It is shown in the class diagram above there are five classes of the system which are: Customer, Order, Orchestrator, Workstation, and PalletID.
i. Customer Class
The customer class discusses attributes of the customer. The system developed allots spe-cific id to each customer. The customer can make multiple orders and select the device specifications according to the requirements. A user can select different recipes for frame, screen, and keyboard and can select different colors for each one of them.
ii. Order Class
This class contains the id of each customer and detail of the order against each customer id. The order detail comprises the number of products to assemble, recipes of each part (frame, screen, keyboard) selected and colour of the different parts.

25
iii. Orchestrator Class
Once customer made an order orchestrator interprets that order. After interpreting the order orchestrator makes a decision-based on that. Orchestrator receives the order after that controls the system and executes the order.
iv. Workstation Class
This class discusses the different attribute of the workstation of the system. The work-station consists of robot and conveyor belts. Workstation executes all the task like to load the pallet, to move the pallet, to load the paper on the pallet and to assemble different parts of the mobile phone.
v. PalletData Class
The palletData class consists of every necessary detail needed for the assembly process. This class contains pallet ID and the information of the different tasks like paper loaded and drawing done against that pallet ID.
3.4 System Working
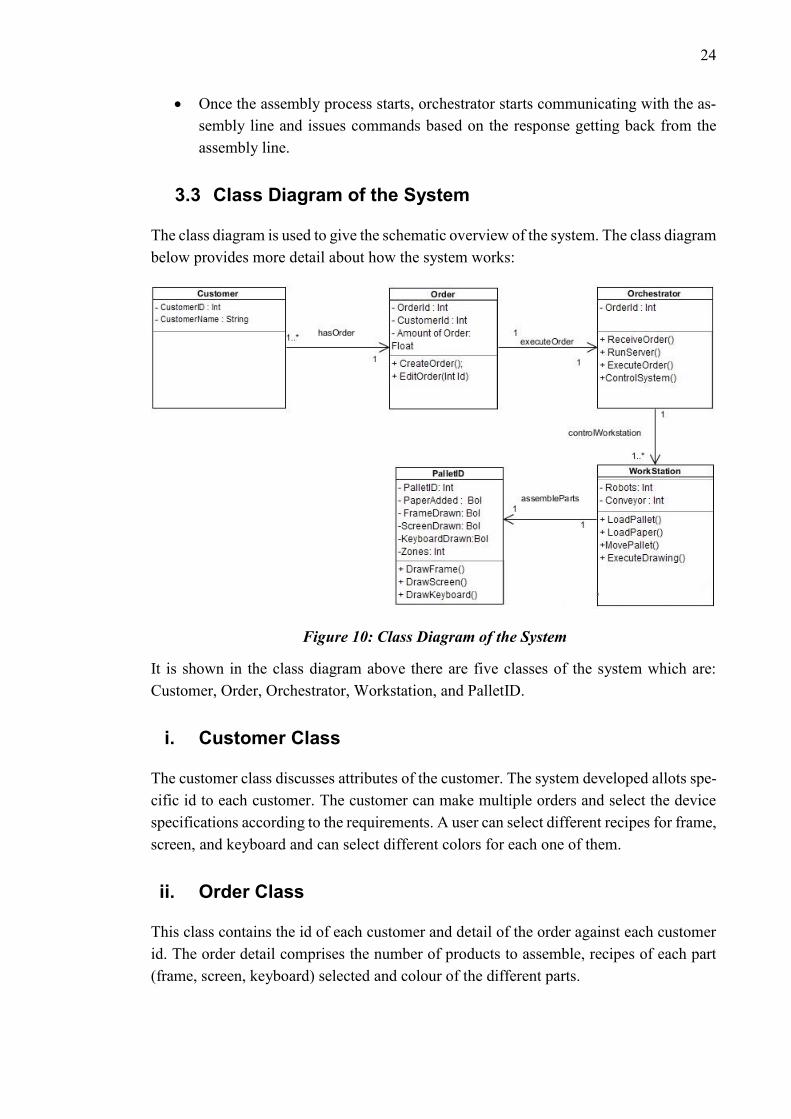
This section discusses how the designed system works. The system designed consists of a client to make an order, server to deal with the responses come from the line, orchestra-tor to make decisions based on the responses obtained from different subscribed events and assembly line which consists of workstations which execute the drawing process. When the system starts client is the part of the system which makes an order by selecting the given specifications (type and colours) of frame, keyboard, and screen. To make a correct order client has to select all possible device specifications. Once the order is made it is being checked by orchestrator and if the order is correct it would be processed and if there is any problem then it would cause an error. Once the correct order is made then its execution will start. The drawing process starts by loading the pallet on WS7 on the as-sembly line and then pallets moves through different workstations to reach WS1 to load the paper on it. Once the paper is loaded then after that drawing process can be done at different workstations. This process continues until the completion of the order. Follow-ing sequence diagram helps to understand the working of system better.
26
Figure 11: Sequence Diagram of the Designed System
As it is shown in figure 11 how the working sequence of the system goes. When the designed system is run, the first process is to make an order, when a client makes an order it is being checked and if there is any problem in the order then the client has to make an order again. If the order is correct then the execution of the order starts and pallets move through different processes and workstations along the assembly line to complete the drawing process. This process continues until the completion of the order.
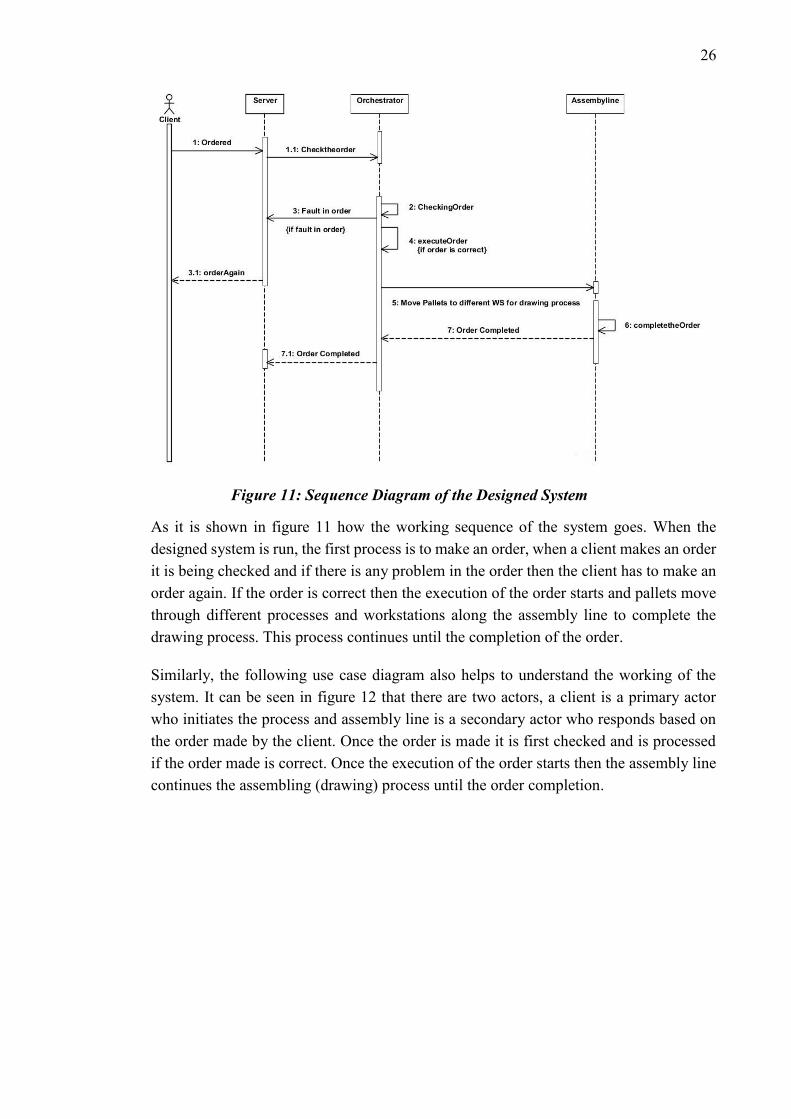
Similarly, the following use case diagram also helps to understand the working of the system. It can be seen in figure 12 that there are two actors, a client is a primary actor who initiates the process and assembly line is a secondary actor who responds based on the order made by the client. Once the order is made it is first checked and is processed if the order made is correct. Once the execution of the order starts then the assembly line continues the assembling (drawing) process until the order completion.
27
Figure 12: Use Case Diagram of Designed System
28
4. IMPLEMENTATION
This section the implementation of the system is discussed. The three different ap-proaches used to develop the orchestrator are discussed, their working and how they differ from each other are explained. Moreover, implementation and working of a user interface how a user can make the production order are briefed.
4.1 Orchestrator
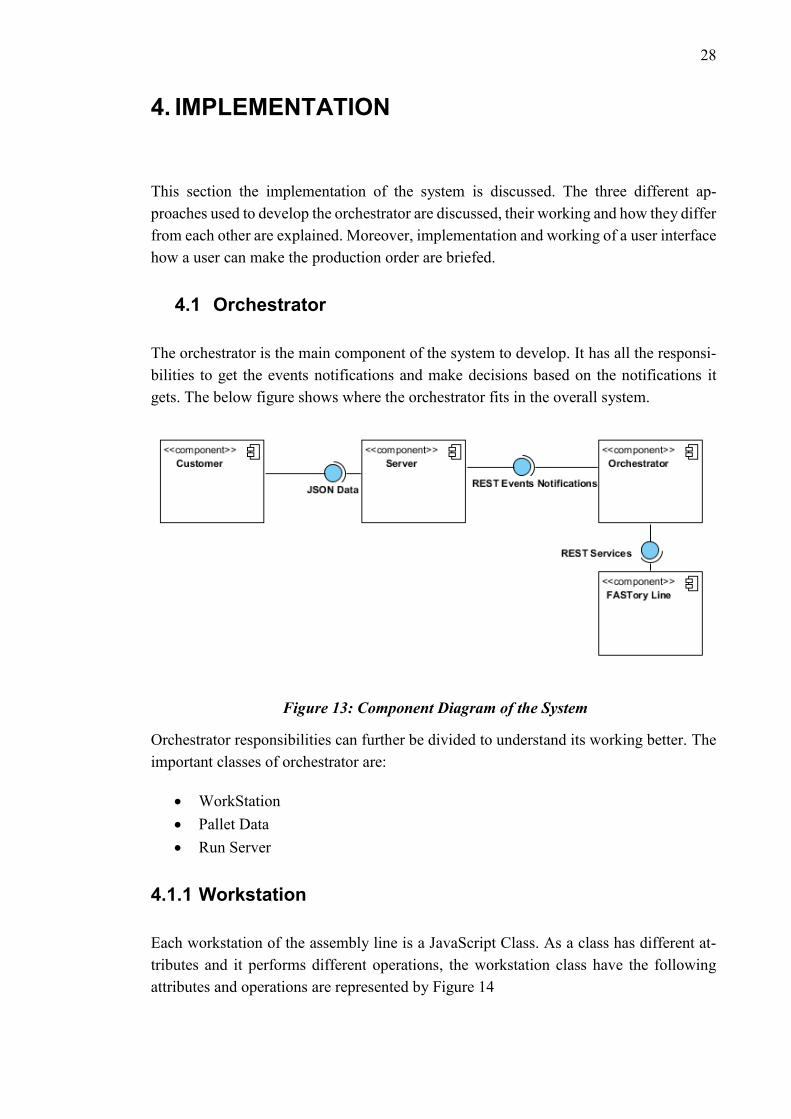
The orchestrator is the main component of the system to develop. It has all the responsi-bilities to get the events notifications and make decisions based on the notifications it gets. The below figure shows where the orchestrator fits in the overall system.
Figure 13: Component Diagram of the System
Orchestrator responsibilities can further be divided to understand its working better. The important classes of orchestrator are:
• WorkStation • Pallet Data • Run Server
4.1.1 Workstation
Each workstation of the assembly line is a JavaScript Class. As a class has different at-tributes and it performs different operations, the workstation class have the following attributes and operations are represented by Figure 14
29
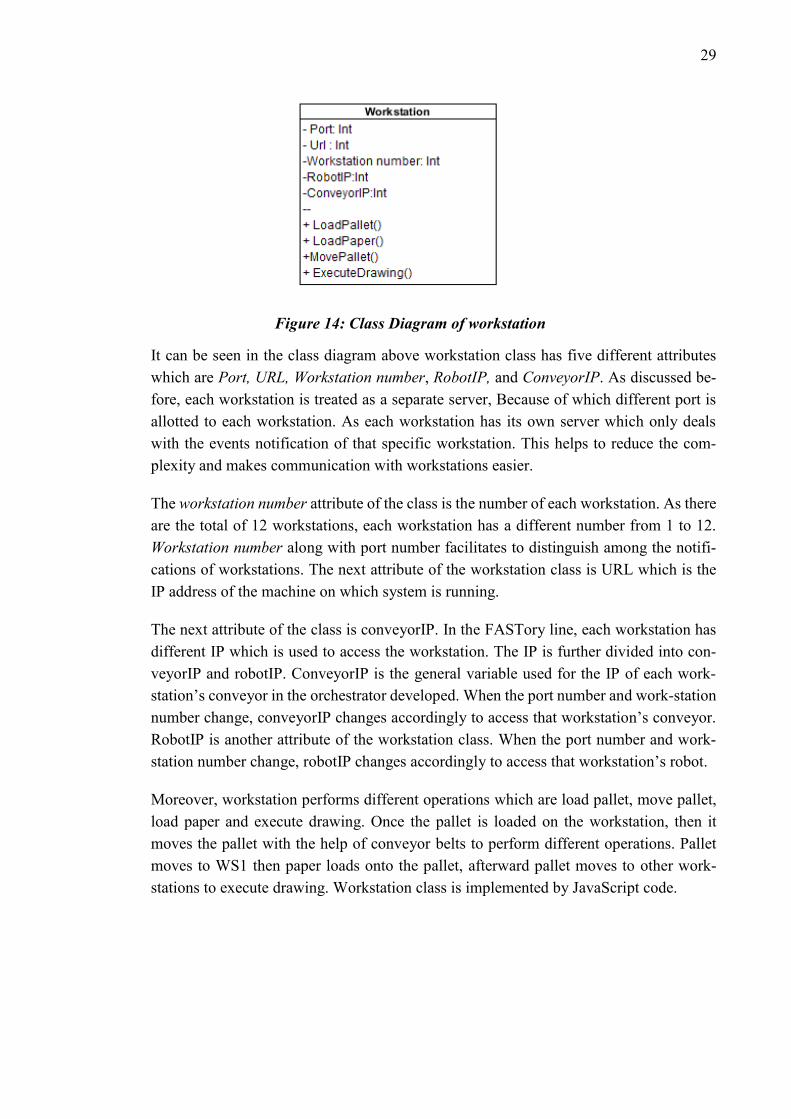
Figure 14: Class Diagram of workstation
It can be seen in the class diagram above workstation class has five different attributes which are Port, URL, Workstation number, RobotIP, and ConveyorIP. As discussed be-fore, each workstation is treated as a separate server, Because of which different port is allotted to each workstation. As each workstation has its own server which only deals with the events notification of that specific workstation. This helps to reduce the com-plexity and makes communication with workstations easier.
The workstation number attribute of the class is the number of each workstation. As there are the total of 12 workstations, each workstation has a different number from 1 to 12. Workstation number along with port number facilitates to distinguish among the notifi-cations of workstations. The next attribute of the workstation class is URL which is the IP address of the machine on which system is running.
The next attribute of the class is conveyorIP. In the FASTory line, each workstation has different IP which is used to access the workstation. The IP is further divided into con-veyorIP and robotIP. ConveyorIP is the general variable used for the IP of each work-station’s conveyor in the orchestrator developed. When the port number and work-station number change, conveyorIP changes accordingly to access that workstation’s conveyor. RobotIP is another attribute of the workstation class. When the port number and work-station number change, robotIP changes accordingly to access that workstation’s robot.
Moreover, workstation performs different operations which are load pallet, move pallet, load paper and execute drawing. Once the pallet is loaded on the workstation, then it moves the pallet with the help of conveyor belts to perform different operations. Pallet moves to WS1 then paper loads onto the pallet, afterward pallet moves to other work-stations to execute drawing. Workstation class is implemented by JavaScript code.
30
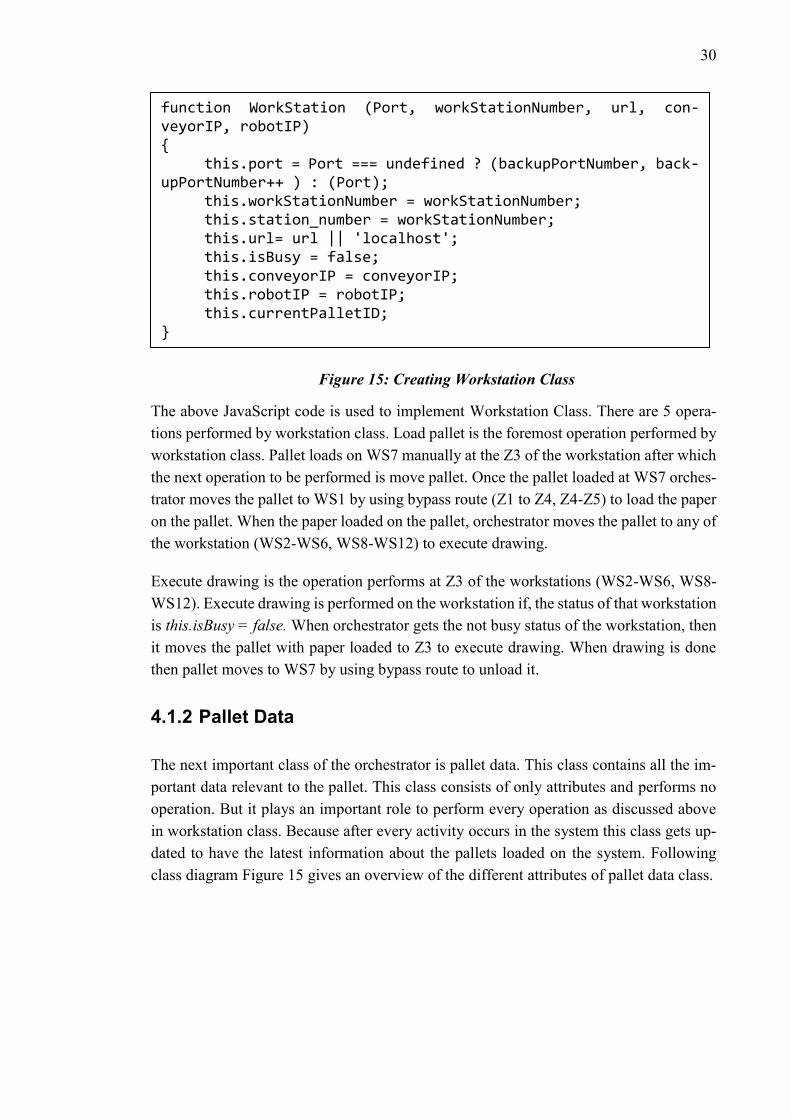
Figure 15: Creating Workstation Class
The above JavaScript code is used to implement Workstation Class. There are 5 opera-tions performed by workstation class. Load pallet is the foremost operation performed by workstation class. Pallet loads on WS7 manually at the Z3 of the workstation after which the next operation to be performed is move pallet. Once the pallet loaded at WS7 orches-trator moves the pallet to WS1 by using bypass route (Z1 to Z4, Z4-Z5) to load the paper on the pallet. When the paper loaded on the pallet, orchestrator moves the pallet to any of the workstation (WS2-WS6, WS8-WS12) to execute drawing.
Execute drawing is the operation performs at Z3 of the workstations (WS2-WS6, WS8-WS12). Execute drawing is performed on the workstation if, the status of that workstation is this.isBusy = false. When orchestrator gets the not busy status of the workstation, then it moves the pallet with paper loaded to Z3 to execute drawing. When drawing is done then pallet moves to WS7 by using bypass route to unload it.
4.1.2 Pallet Data
The next important class of the orchestrator is pallet data. This class contains all the im-portant data relevant to the pallet. This class consists of only attributes and performs no operation. But it plays an important role to perform every operation as discussed above in workstation class. Because after every activity occurs in the system this class gets up-dated to have the latest information about the pallets loaded on the system. Following class diagram Figure 15 gives an overview of the different attributes of pallet data class.
function WorkStation (Port, workStationNumber, url, con-veyorIP, robotIP) { this.port = Port === undefined ? (backupPortNumber, back-upPortNumber++ ) : (Port); this.workStationNumber = workStationNumber; this.station_number = workStationNumber; this.url= url || 'localhost'; this.isBusy = false; this.conveyorIP = conveyorIP; this.robotIP = robotIP; this.currentPalletID; }
31
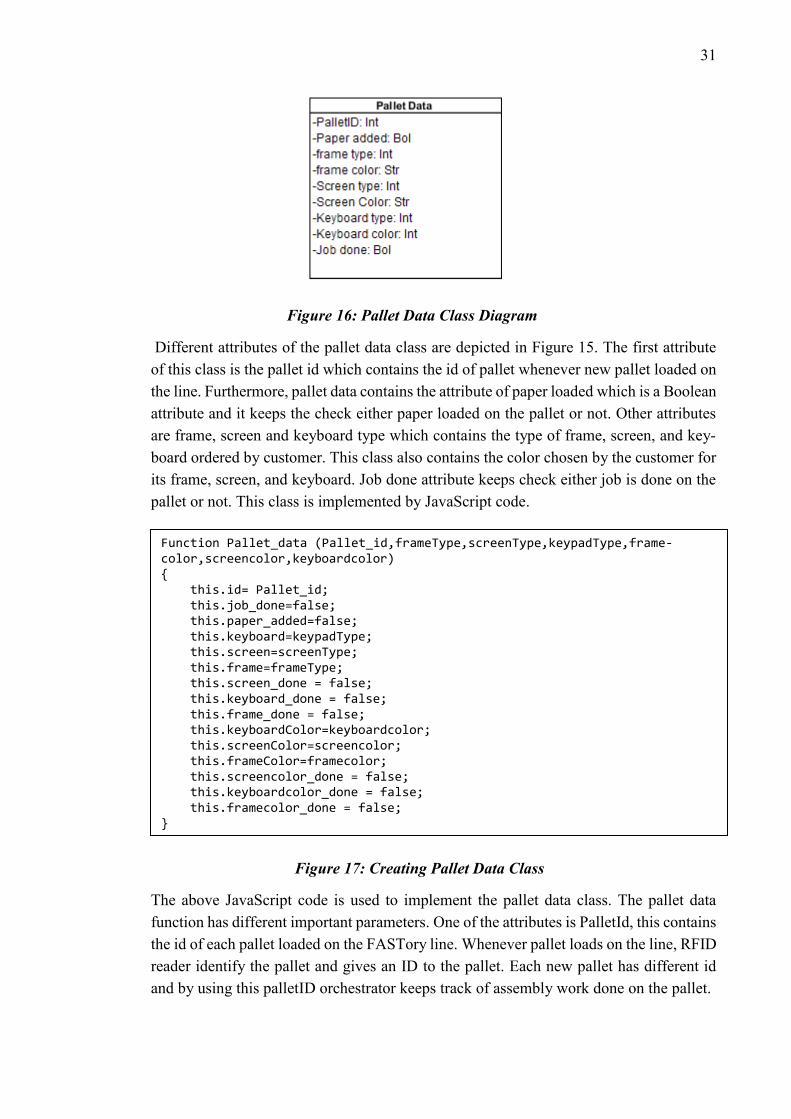
Figure 16: Pallet Data Class Diagram
Different attributes of the pallet data class are depicted in Figure 15. The first attribute of this class is the pallet id which contains the id of pallet whenever new pallet loaded on the line. Furthermore, pallet data contains the attribute of paper loaded which is a Boolean attribute and it keeps the check either paper loaded on the pallet or not. Other attributes are frame, screen and keyboard type which contains the type of frame, screen, and key-board ordered by customer. This class also contains the color chosen by the customer for its frame, screen, and keyboard. Job done attribute keeps check either job is done on the pallet or not. This class is implemented by JavaScript code.
Figure 17: Creating Pallet Data Class
The above JavaScript code is used to implement the pallet data class. The pallet data function has different important parameters. One of the attributes is PalletId, this contains the id of each pallet loaded on the FASTory line. Whenever pallet loads on the line, RFID reader identify the pallet and gives an ID to the pallet. Each new pallet has different id and by using this palletID orchestrator keeps track of assembly work done on the pallet.
Function Pallet_data (Pallet_id,frameType,screenType,keypadType,frame-color,screencolor,keyboardcolor) { this.id= Pallet_id; this.job_done=false; this.paper_added=false; this.keyboard=keypadType; this.screen=screenType; this.frame=frameType; this.screen_done = false; this.keyboard_done = false; this.frame_done = false; this.keyboardColor=keyboardcolor; this.screenColor=screencolor; this.frameColor=framecolor; this.screencolor_done = false; this.keyboardcolor_done = false; this.framecolor_done = false; }
32
Next attribute is the paper loaded, which is a Boolean value. By this orchestrator keeps track of either paper loaded on the pallet or not. When pallet loaded on the line as dis-cussed above it gets an id, then orchestrator keeps track of the pallet by palled id. Orches-trator checks either paper loaded on the pallet or not against pallet id. If the paper is loaded on the pallet orchestrator gets ‘true’ notification and after that drawing process can be done. If the paper is not loaded then orchestrator gets ‘false’ notification and waits for the paper to be loaded.
This class also contains the status of frame, screen, and keyboard either drawn or not by using some flags. The flags which used are this.frame_done, this.framecolor_done, this.keyboard_done, this.keyboardcolor_done this.screen_done and this. screen color_done. When the paper loaded on the pallet, pallet moves to the workstation which executes drawing process. Initially, when the paper loaded on the pallet these flags and this.job_done flag are false. When the drawing process completed all the flags change their value to true which gives an idea that assembly work is done on that specific pallet. All these changes occur against specific pallet id after which orchestrator moves that pal-let to WS7 to unload it manually.
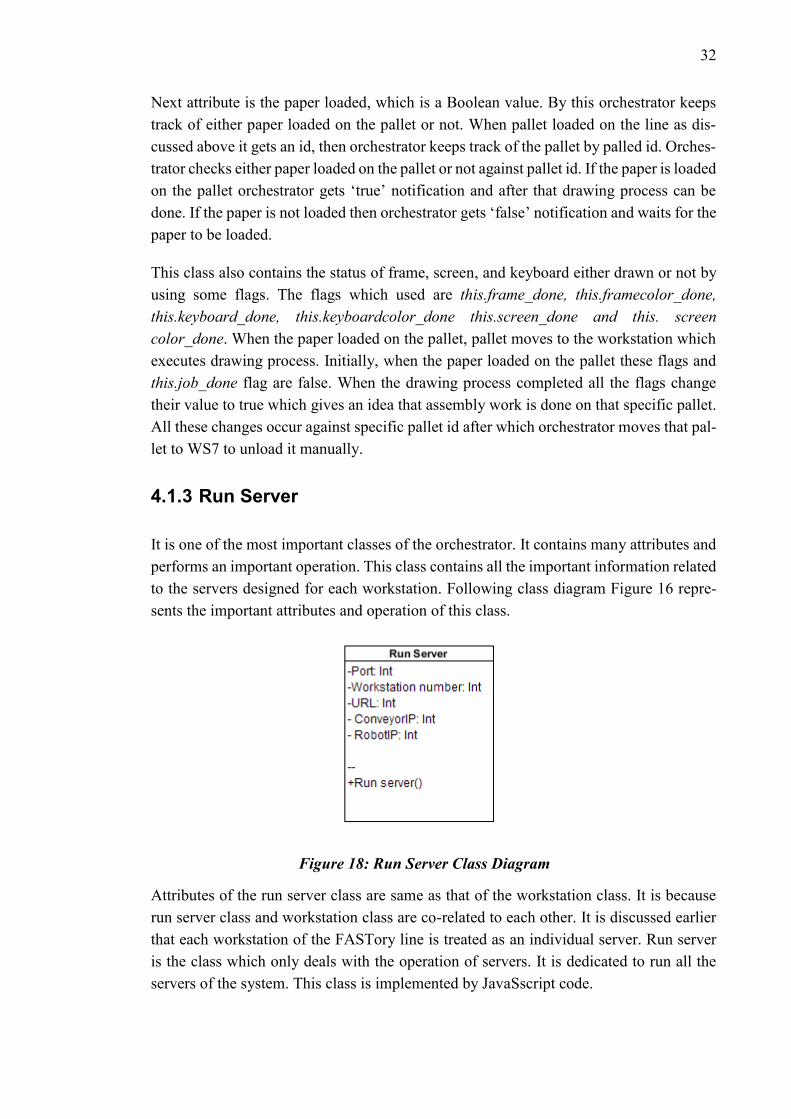
4.1.3 Run Server
It is one of the most important classes of the orchestrator. It contains many attributes and performs an important operation. This class contains all the important information related to the servers designed for each workstation. Following class diagram Figure 16 repre-sents the important attributes and operation of this class.
Figure 18: Run Server Class Diagram
Attributes of the run server class are same as that of the workstation class. It is because run server class and workstation class are co-related to each other. It is discussed earlier that each workstation of the FASTory line is treated as an individual server. Run server is the class which only deals with the operation of servers. It is dedicated to run all the servers of the system. This class is implemented by JavaSscript code.

33
Figure 19: Starting each Workstation Server
function startOrchestrator(computerIP){ var SimCNV1 = new WorkStation(5006,1, AGENTSURL, WORK_STA-TION_IPS['ws1']['cnv'], WORK_STATION_IPS['ws1']['rob']); var SimCNV2 = new WorkStation(5007,2, AGENTSURL, WORK_STA-TION_IPS['ws2']['cnv'], WORK_STATION_IPS['ws2']['rob']); var SimCNV3 = new WorkStation(5008,3, AGENTSURL, WORK_STA-TION_IPS['ws3']['cnv'], WORK_STATION_IPS['ws3']['rob']); var SimCNV4 = new WorkStation(5009,4, AGENTSURL, WORK_STA-TION_IPS['ws4']['cnv'], WORK_STATION_IPS['ws4']['rob']); var SimCNV5 = new WorkStation(5010,5, AGENTSURL, WORK_STA-TION_IPS['ws5']['cnv'], WORK_STATION_IPS['ws5']['rob']); var SimCNV6 = new WorkStation(5011,6, AGENTSURL, WORK_STA-TION_IPS['ws6']['cnv'], WORK_STATION_IPS['ws6']['rob']); var SimCNV7 = new WorkStation(5000,7, AGENTSURL, WORK_STA-TION_IPS['ws7']['cnv'], WORK_STATION_IPS['ws7']['rob']); var SimCNV8 = new WorkStation(5001,8, AGENTSURL, WORK_STA-TION_IPS['ws8']['cnv'], WORK_STATION_IPS['ws8']['rob']); var SimCNV9 = new WorkStation(5002,9, AGENTSURL, WORK_STA-TION_IPS['ws9']['cnv'], WORK_STATION_IPS['ws9']['rob']); var SimCNV10 = new WorkStation(5003,10, AGENTSURL, WORK_STA-TION_IPS['ws10']['cnv'], WORK_STATION_IPS['ws10']['rob']); var SimCNV11 = new WorkStation(5004,11, AGENTSURL, WORK_STA-TION_IPS['ws11']['cnv'], WORK_STATION_IPS['ws11']['rob']); var SimCNV12 = new WorkStation(5005,12, AGENTSURL, WORK_STA-TION_IPS['ws12']['cnv'], WORK_STATION_IPS['ws12']['rob']); SimCNV1.runServer(); SimCNV2.runServer(); SimCNV3.runServer(); SimCNV4.runServer(); SimCNV5.runServer(); SimCNV6.runServer(); SimCNV7.runServer(); SimCNV8.runServer(); SimCNV9.runServer(); SimCNV10.runServer(); SimCNV11.runServer(); SimCNV12.runServer(); }

34
4.2 Different Approaches Implemented
The main goal of this research problem is to create an orchestrator which balances the assembly line. As the assembly line performs different processes (load pallet, move pal-let, load paper and drawing) and each of the processes take some time to be executed. After analysing assembly line working it was concluded that move pallet time cannot be reduced similarly loading paper time cannot be minimized. The time which can be mini-mized is the time which robot takes to complete drawing process. Therefore, to develop an orchestrator the author of this document used three different approaches. The idea of implementing three different approaches to make a comparison of the time system takes to complete the order. This section discusses three approaches which are used to develop orchestrator.
4.2.1 One by One Work Distribution Approach
This is the first and the simplest approach used to develop an orchestrator. In this ap-proach, orchestrator doesn’t balance the system it just runs the assembly line. The idea of developing this approach is to calculate the time which system takes to assemble specific order if the line is not balanced. The time calculated by this approach can be used as a reference to make a comparison with the time calculated with another approach which balances the assembly line. The comparison will help to deduce a result how good the line is balanced.
After discussing the reason for developing this approach it is needed to understand it’s working. As the FASTory line assemble/draw the main parts (frame, keyboard, and screen) of the mobile. The line consists of 12 workstations, 10 (WS2-WS6 and WS8-WS12) among 12 execute drawing process while WS7 loads the pallet and WS1 loads the paper. The workload is distributed to 10 workstations one by one which is implemented by the following JavaScript code.

35
Figure 20: One by One Work Distribution
This approach executes the first job at WS2, second at WS3 and so on up to WS12 and then starts again until the order ends. For instance, the customer gives an order to assem-ble 15 mobile phones. First, 10 products of the order assemble at 10 workstations (WS2- WS6 and WS8-WS12) respectively. The remaining 5 assemble at workstations (WS2- WS6) as work distributed among workstations one by one. In this approach, orchestrator makes sure that no workstation gets the next task of assembling until all the workstation got the task even it is free. This approach works in some specific order and to understand this approach better following sequence diagram can be helpful
function assignWorkStationNumber(inputID) { var rem = inputID % 10; var workStation = 7; switch (rem) { case 0: workStation = 2; break; case 1: workStation = 3; break; case 2: workStation = 4; break; case 3: workStation = 5; break; case 4: workStation = 6; break; case 5: workStation = 8; break; case 6: workStation = 9; case 7: workStation = 10; break; case 8: workStation = 11; break; case 9: workStation = 12; break; } return workStation; }
36
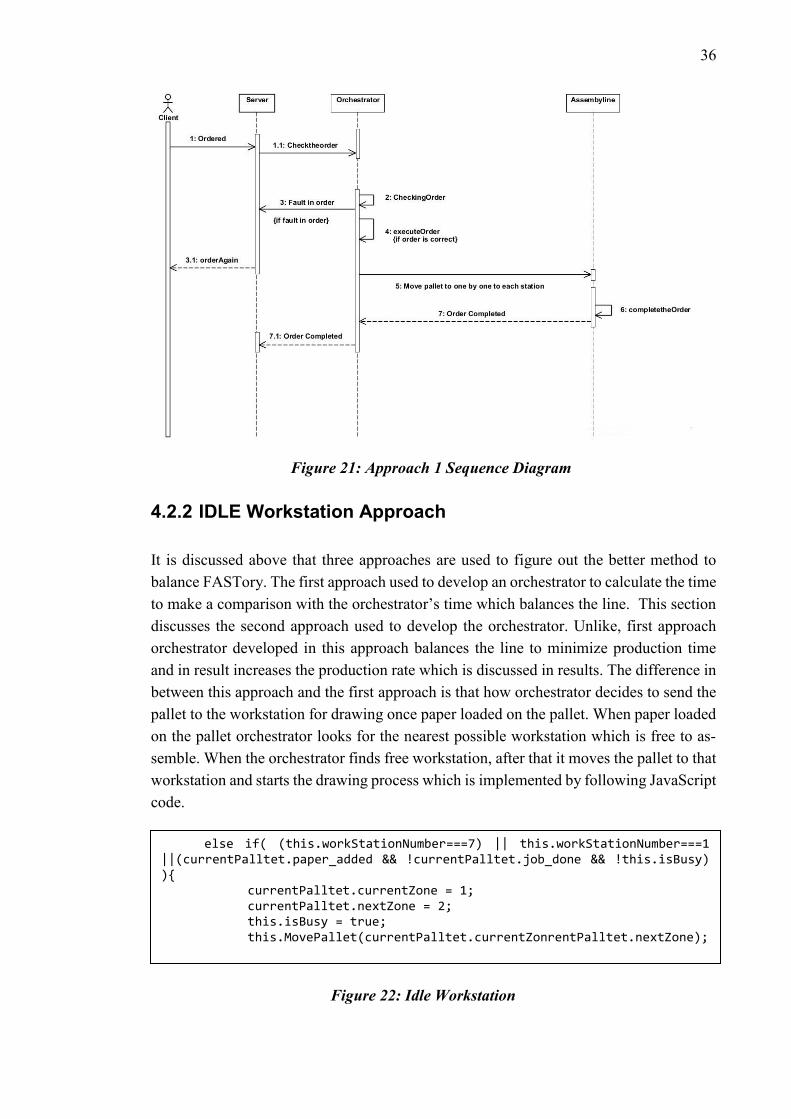
Figure 21: Approach 1 Sequence Diagram
4.2.2 IDLE Workstation Approach
It is discussed above that three approaches are used to figure out the better method to balance FASTory. The first approach used to develop an orchestrator to calculate the time to make a comparison with the orchestrator’s time which balances the line. This section discusses the second approach used to develop the orchestrator. Unlike, first approach orchestrator developed in this approach balances the line to minimize production time and in result increases the production rate which is discussed in results. The difference in between this approach and the first approach is that how orchestrator decides to send the pallet to the workstation for drawing once paper loaded on the pallet. When paper loaded on the pallet orchestrator looks for the nearest possible workstation which is free to as-semble. When the orchestrator finds free workstation, after that it moves the pallet to that workstation and starts the drawing process which is implemented by following JavaScript code.
Figure 22: Idle Workstation
else if( (this.workStationNumber===7) || this.workStationNumber===1 ||(currentPalltet.paper_added && !currentPalltet.job_done && !this.isBusy) ){ currentPalltet.currentZone = 1; currentPalltet.nextZone = 2; this.isBusy = true; this.MovePallet(currentPalltet.currentZonrentPalltet.nextZone); }
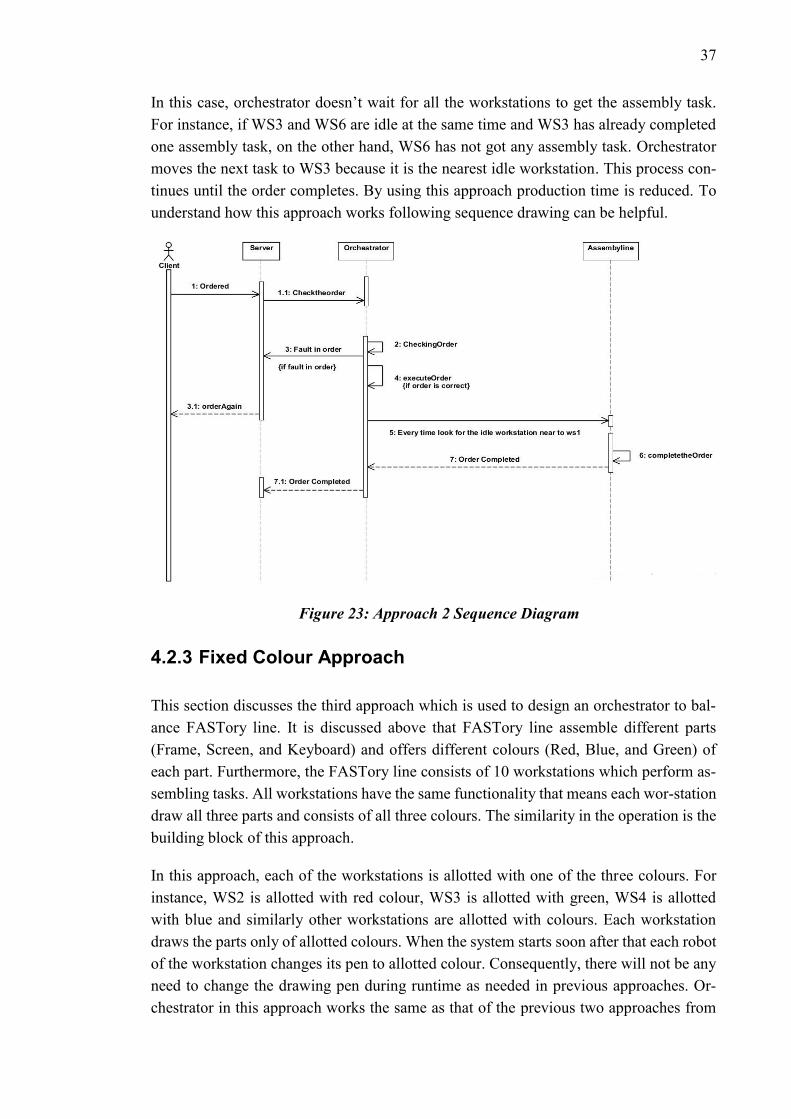
37
In this case, orchestrator doesn’t wait for all the workstations to get the assembly task. For instance, if WS3 and WS6 are idle at the same time and WS3 has already completed one assembly task, on the other hand, WS6 has not got any assembly task. Orchestrator moves the next task to WS3 because it is the nearest idle workstation. This process con-tinues until the order completes. By using this approach production time is reduced. To understand how this approach works following sequence drawing can be helpful.
Figure 23: Approach 2 Sequence Diagram
4.2.3 Fixed Colour Approach
This section discusses the third approach which is used to design an orchestrator to bal-ance FASTory line. It is discussed above that FASTory line assemble different parts (Frame, Screen, and Keyboard) and offers different colours (Red, Blue, and Green) of each part. Furthermore, the FASTory line consists of 10 workstations which perform as-sembling tasks. All workstations have the same functionality that means each wor-station draw all three parts and consists of all three colours. The similarity in the operation is the building block of this approach.
In this approach, each of the workstations is allotted with one of the three colours. For instance, WS2 is allotted with red colour, WS3 is allotted with green, WS4 is allotted with blue and similarly other workstations are allotted with colours. Each workstation draws the parts only of allotted colours. When the system starts soon after that each robot of the workstation changes its pen to allotted colour. Consequently, there will not be any need to change the drawing pen during runtime as needed in previous approaches. Or-chestrator in this approach works the same as that of the previous two approaches from
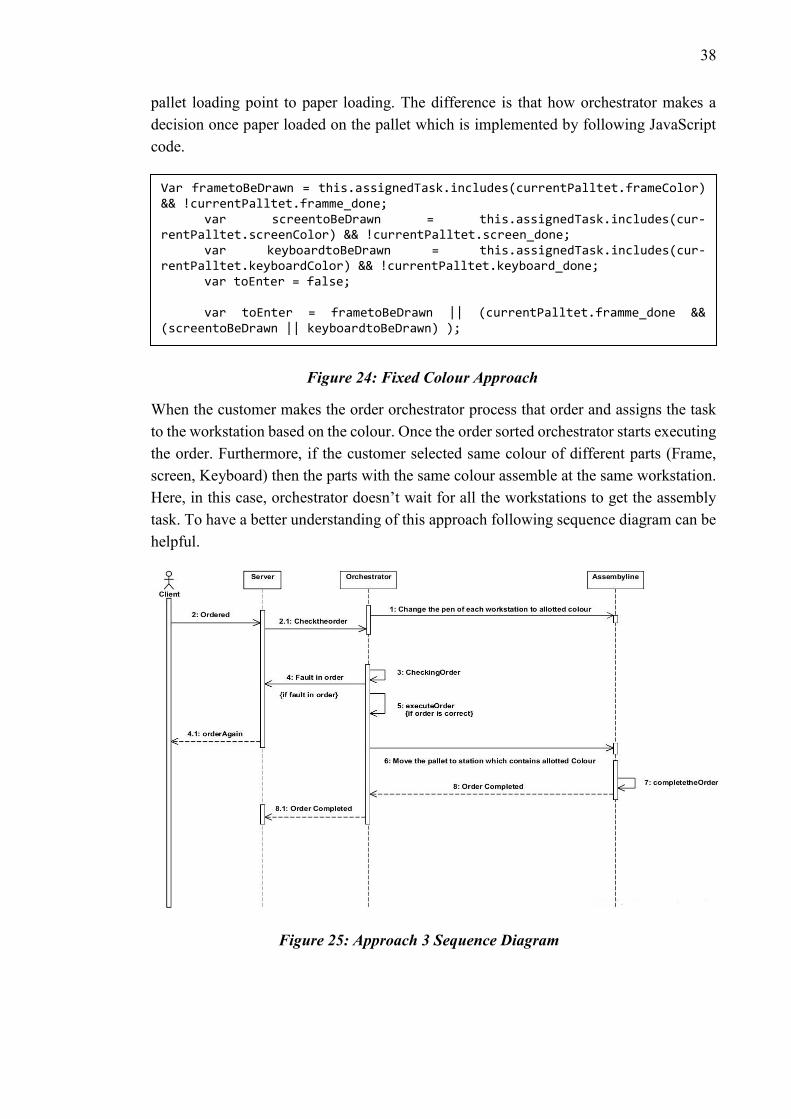
38
pallet loading point to paper loading. The difference is that how orchestrator makes a decision once paper loaded on the pallet which is implemented by following JavaScript code.
Figure 24: Fixed Colour Approach
When the customer makes the order orchestrator process that order and assigns the task to the workstation based on the colour. Once the order sorted orchestrator starts executing the order. Furthermore, if the customer selected same colour of different parts (Frame, screen, Keyboard) then the parts with the same colour assemble at the same workstation. Here, in this case, orchestrator doesn’t wait for all the workstations to get the assembly task. To have a better understanding of this approach following sequence diagram can be helpful.
Figure 25: Approach 3 Sequence Diagram
Var frametoBeDrawn = this.assignedTask.includes(currentPalltet.frameColor) && !currentPalltet.framme_done; var screentoBeDrawn = this.assignedTask.includes(cur-rentPalltet.screenColor) && !currentPalltet.screen_done; var keyboardtoBeDrawn = this.assignedTask.includes(cur-rentPalltet.keyboardColor) && !currentPalltet.keyboard_done; var toEnter = false; var toEnter = frametoBeDrawn || (currentPalltet.framme_done && (screentoBeDrawn || keyboardtoBeDrawn) );
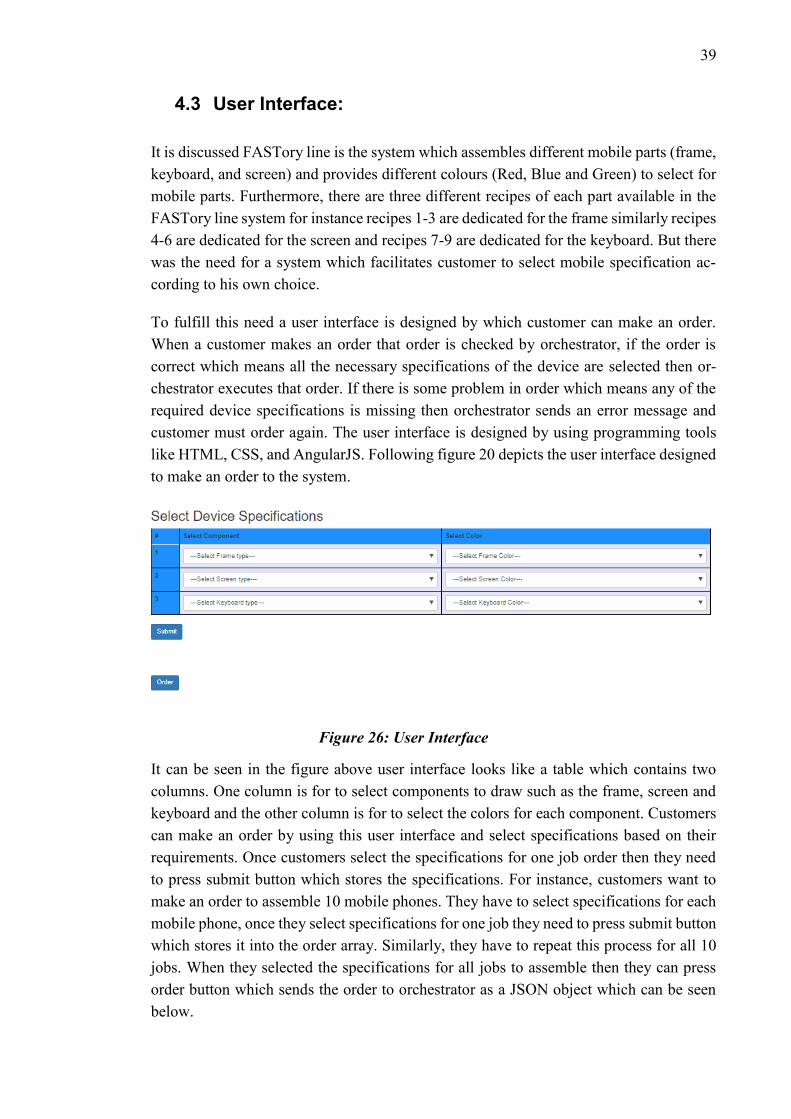
39
4.3 User Interface:
It is discussed FASTory line is the system which assembles different mobile parts (frame, keyboard, and screen) and provides different colours (Red, Blue and Green) to select for mobile parts. Furthermore, there are three different recipes of each part available in the FASTory line system for instance recipes 1-3 are dedicated for the frame similarly recipes 4-6 are dedicated for the screen and recipes 7-9 are dedicated for the keyboard. But there was the need for a system which facilitates customer to select mobile specification ac-cording to his own choice.
To fulfill this need a user interface is designed by which customer can make an order. When a customer makes an order that order is checked by orchestrator, if the order is correct which means all the necessary specifications of the device are selected then or-chestrator executes that order. If there is some problem in order which means any of the required device specifications is missing then orchestrator sends an error message and customer must order again. The user interface is designed by using programming tools like HTML, CSS, and AngularJS. Following figure 20 depicts the user interface designed to make an order to the system.
Figure 26: User Interface
It can be seen in the figure above user interface looks like a table which contains two columns. One column is for to select components to draw such as the frame, screen and keyboard and the other column is for to select the colors for each component. Customers can make an order by using this user interface and select specifications based on their requirements. Once customers select the specifications for one job order then they need to press submit button which stores the specifications. For instance, customers want to make an order to assemble 10 mobile phones. They have to select specifications for each mobile phone, once they select specifications for one job they need to press submit button which stores it into the order array. Similarly, they have to repeat this process for all 10 jobs. When they selected the specifications for all jobs to assemble then they can press order button which sends the order to orchestrator as a JSON object which can be seen below.

40
[ {framerecipe: '1', keyboardrecipe: '8', screenrecipe: '4', framecolor: 'GREEN', screencolor: 'RED', keyboardcolor: 'BLUE' }, {framerecipe: '1', keyboardrecipe: '8', screenrecipe: '4', framecolor: 'GREEN', screencolor: 'RED', keyboardcolor: 'BLUE' } ]
Figure 27: Order JSON Object
41
5. RESULTS
This chapter discusses the results which are obtained by implementing the three different approaches proposed in the previous chapter. Further, as three approaches are imple-mented to achieve the results, initially results obtained by each approach are presented separately and then results of all approaches compared at the end. The goal of this re-search problem is to design an orchestrator which will balance the MMAL. The balanced line has reduced cycle time and minimum idle time due to which it helps to reduce energy consumption and cost. The following equation [42] helps to calculate the energy con-sumption.
(Wattage ∗ Hours Used per Day) /1000 = Daily kilowatt − hour (kWh) (1)
To calculate the cost following equation [42] is used
Energy consumption per month ∗ cost/kWh (2)
Cost/kWh in Finland is 0.067 euro/kWh [43]. This electricity price is last updated in No-vember 2017.
All the robots which are used in the FASTory line are Sony SRX-611. Each robot con-sumes total power of 1.5kW when it is in working condition. Further, the applicable out-put of the robot is 1kW of the total 1.5kW power consumption. In addition to that, it is assumed that the remaining 0.5kW is the power consumed by the robot when it is turned on but is in the idle state. [Appendix A]
5.1 Test Conditions
To get the results by implementing approaches developed, a sample order was run on the FASTory line. The FASTory line consists of 10 workstations which can perform drawing process. But four robots of the workstations (WS3, WS4, WS, WS8) are completely out of the order due to which these four robots cannot be used to obtain the results.
Further, there is a problem with an end effector desired positioning of the robots of the workstations (WS6, WS9, WS10). When the robot turns on, normally it creates pneumatic pressure to put end effector into the desired position to start the drawing process. But in the case of robots of the workstations (WS6, WS9, WS10), when these robots turned on, at times they don’t create enough pneumatic pressure to put end effector into the desired position. This problem could also occur at times during the runtime after any of the above-mentioned robots complete the drawing process. Due to which robot could lose pneumatic pressure which makes end effector goes out of the desired position. When this problem
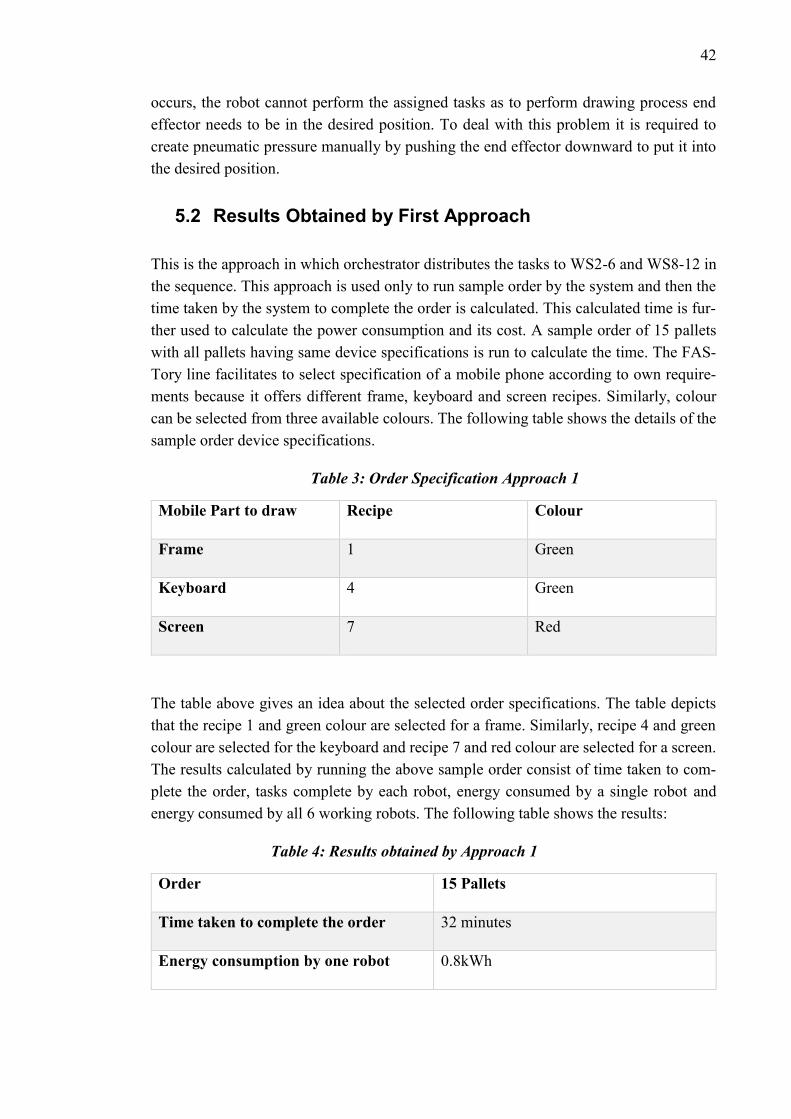
42
occurs, the robot cannot perform the assigned tasks as to perform drawing process end effector needs to be in the desired position. To deal with this problem it is required to create pneumatic pressure manually by pushing the end effector downward to put it into the desired position.
5.2 Results Obtained by First Approach
This is the approach in which orchestrator distributes the tasks to WS2-6 and WS8-12 in the sequence. This approach is used only to run sample order by the system and then the time taken by the system to complete the order is calculated. This calculated time is fur-ther used to calculate the power consumption and its cost. A sample order of 15 pallets with all pallets having same device specifications is run to calculate the time. The FAS-Tory line facilitates to select specification of a mobile phone according to own require-ments because it offers different frame, keyboard and screen recipes. Similarly, colour can be selected from three available colours. The following table shows the details of the sample order device specifications.
Table 3: Order Specification Approach 1
Mobile Part to draw Recipe Colour
Frame 1 Green
Keyboard 4 Green
Screen 7 Red
The table above gives an idea about the selected order specifications. The table depicts that the recipe 1 and green colour are selected for a frame. Similarly, recipe 4 and green colour are selected for the keyboard and recipe 7 and red colour are selected for a screen. The results calculated by running the above sample order consist of time taken to com-plete the order, tasks complete by each robot, energy consumed by a single robot and energy consumed by all 6 working robots. The following table shows the results:
Table 4: Results obtained by Approach 1
Order 15 Pallets
Time taken to complete the order 32 minutes
Energy consumption by one robot 0.8kWh
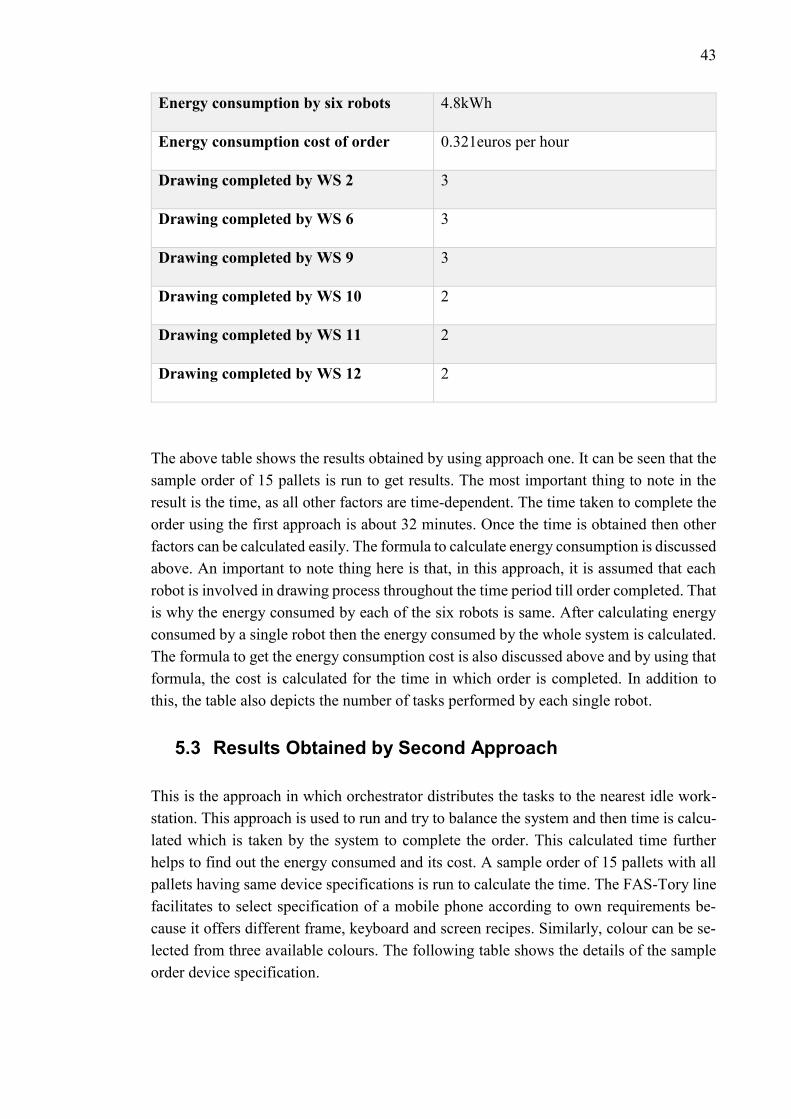
43
Energy consumption by six robots 4.8kWh
Energy consumption cost of order 0.321euros per hour
Drawing completed by WS 2 3
Drawing completed by WS 6 3
Drawing completed by WS 9 3
Drawing completed by WS 10 2
Drawing completed by WS 11 2
Drawing completed by WS 12 2
The above table shows the results obtained by using approach one. It can be seen that the sample order of 15 pallets is run to get results. The most important thing to note in the result is the time, as all other factors are time-dependent. The time taken to complete the order using the first approach is about 32 minutes. Once the time is obtained then other factors can be calculated easily. The formula to calculate energy consumption is discussed above. An important to note thing here is that, in this approach, it is assumed that each robot is involved in drawing process throughout the time period till order completed. That is why the energy consumed by each of the six robots is same. After calculating energy consumed by a single robot then the energy consumed by the whole system is calculated. The formula to get the energy consumption cost is also discussed above and by using that formula, the cost is calculated for the time in which order is completed. In addition to this, the table also depicts the number of tasks performed by each single robot.
5.3 Results Obtained by Second Approach
This is the approach in which orchestrator distributes the tasks to the nearest idle work-station. This approach is used to run and try to balance the system and then time is calcu-lated which is taken by the system to complete the order. This calculated time further helps to find out the energy consumed and its cost. A sample order of 15 pallets with all pallets having same device specifications is run to calculate the time. The FAS-Tory line facilitates to select specification of a mobile phone according to own requirements be-cause it offers different frame, keyboard and screen recipes. Similarly, colour can be se-lected from three available colours. The following table shows the details of the sample order device specification.
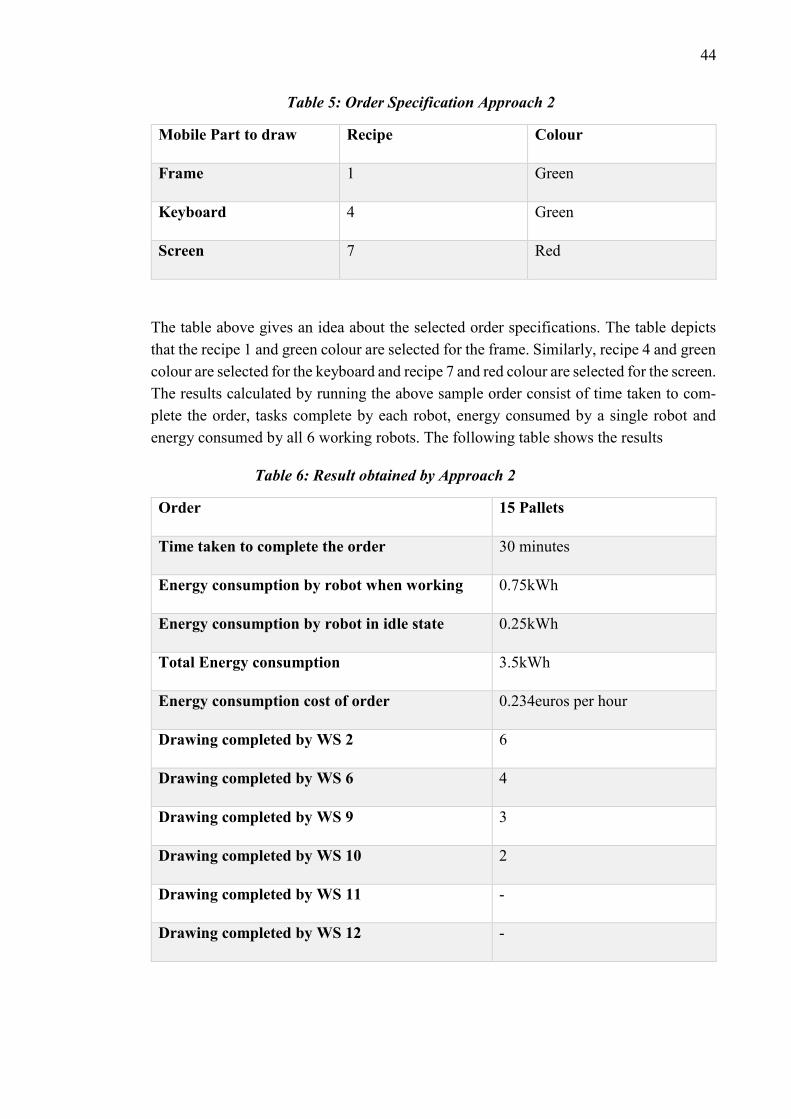
44
Table 5: Order Specification Approach 2
Mobile Part to draw Recipe Colour
Frame 1 Green
Keyboard 4 Green
Screen 7 Red
The table above gives an idea about the selected order specifications. The table depicts that the recipe 1 and green colour are selected for the frame. Similarly, recipe 4 and green colour are selected for the keyboard and recipe 7 and red colour are selected for the screen. The results calculated by running the above sample order consist of time taken to com-plete the order, tasks complete by each robot, energy consumed by a single robot and energy consumed by all 6 working robots. The following table shows the results
Table 6: Result obtained by Approach 2
Order 15 Pallets
Time taken to complete the order 30 minutes
Energy consumption by robot when working 0.75kWh
Energy consumption by robot in idle state 0.25kWh
Total Energy consumption 3.5kWh
Energy consumption cost of order 0.234euros per hour
Drawing completed by WS 2 6
Drawing completed by WS 6 4
Drawing completed by WS 9 3
Drawing completed by WS 10 2
Drawing completed by WS 11 -
Drawing completed by WS 12 -
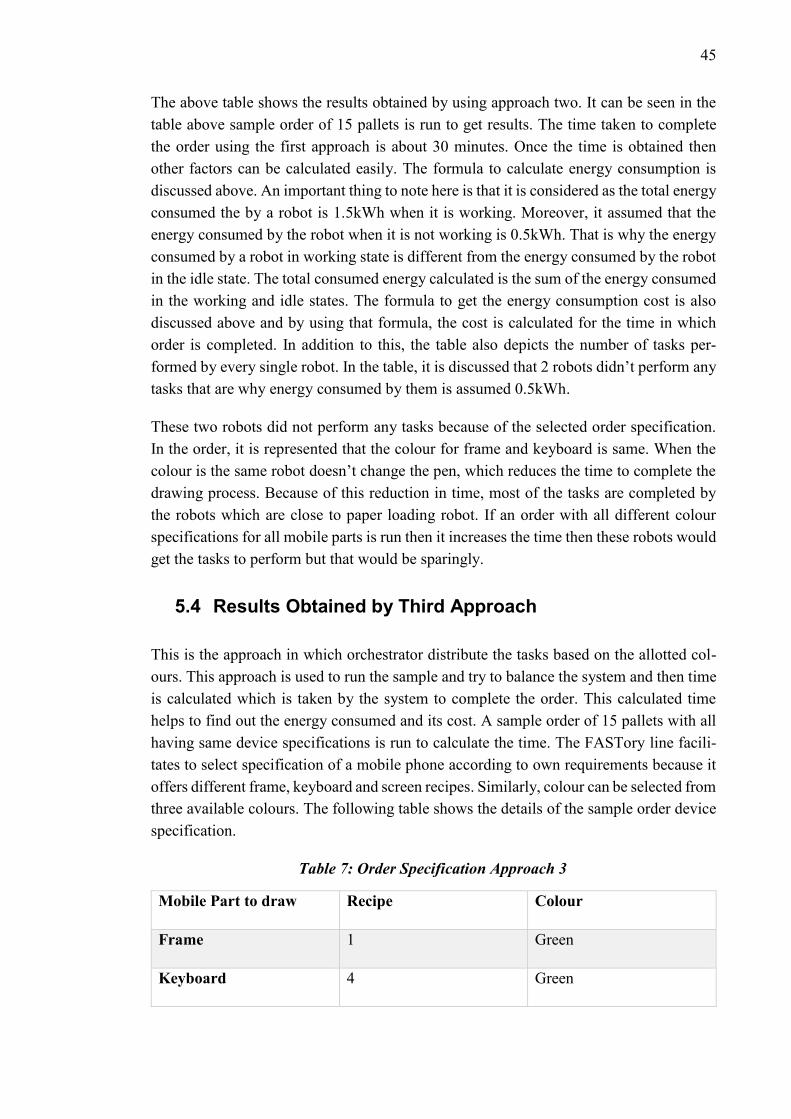
45
The above table shows the results obtained by using approach two. It can be seen in the table above sample order of 15 pallets is run to get results. The time taken to complete the order using the first approach is about 30 minutes. Once the time is obtained then other factors can be calculated easily. The formula to calculate energy consumption is discussed above. An important thing to note here is that it is considered as the total energy consumed the by a robot is 1.5kWh when it is working. Moreover, it assumed that the energy consumed by the robot when it is not working is 0.5kWh. That is why the energy consumed by a robot in working state is different from the energy consumed by the robot in the idle state. The total consumed energy calculated is the sum of the energy consumed in the working and idle states. The formula to get the energy consumption cost is also discussed above and by using that formula, the cost is calculated for the time in which order is completed. In addition to this, the table also depicts the number of tasks per-formed by every single robot. In the table, it is discussed that 2 robots didn’t perform any tasks that are why energy consumed by them is assumed 0.5kWh.
These two robots did not perform any tasks because of the selected order specification. In the order, it is represented that the colour for frame and keyboard is same. When the colour is the same robot doesn’t change the pen, which reduces the time to complete the drawing process. Because of this reduction in time, most of the tasks are completed by the robots which are close to paper loading robot. If an order with all different colour specifications for all mobile parts is run then it increases the time then these robots would get the tasks to perform but that would be sparingly.
5.4 Results Obtained by Third Approach
This is the approach in which orchestrator distribute the tasks based on the allotted col-ours. This approach is used to run the sample and try to balance the system and then time is calculated which is taken by the system to complete the order. This calculated time helps to find out the energy consumed and its cost. A sample order of 15 pallets with all having same device specifications is run to calculate the time. The FASTory line facili-tates to select specification of a mobile phone according to own requirements because it offers different frame, keyboard and screen recipes. Similarly, colour can be selected from three available colours. The following table shows the details of the sample order device specification.
Table 7: Order Specification Approach 3
Mobile Part to draw Recipe Colour
Frame 1 Green
Keyboard 4 Green

46
Screen 7 Red
The table above gives an idea about the selected order specifications. The table depicts that the recipe 1 and green colour are selected for the frame. Similarly, recipe 4 and green colour are selected for the keyboard and recipe 7 and red colour are selected for the screen. The results calculated by running the above sample order consist of time taken to com-plete the order, tasks complete by each robot, energy consumed by a single robot and energy consumed by all 6 working robots. The following table shows the results
Table 8: Results obtained by Approach 3
Order 15 Pallets
Time taken to complete the order 29 minutes
Energy consumption by robot when working 0.725kWh
Energy consumption by robot in idle state 0.2416kWh
Total Energy consumption 3.38kWh
Energy consumption cost of order 0.226 euros per hour
Drawing completed by WS 2 8
Drawing completed by WS 6 8
Drawing completed by WS 9 7
Drawing completed by WS 10 -
Drawing completed by WS 11 7
Drawing completed by WS 12 -
The above table shows the results obtained by using approach three. It can be seen in the table above sample order of 15 pallets is run to get results. The time taken to complete the order using this approach is about 29 minutes. Once the time is obtained then other factors can be calculated easily. The formula to calculate energy consumption is discussed above. An important thing to note here is that it is considered as the total energy consumed the by the robot is 1.5kWh when it is working. Moreover, it is assumed that the energy
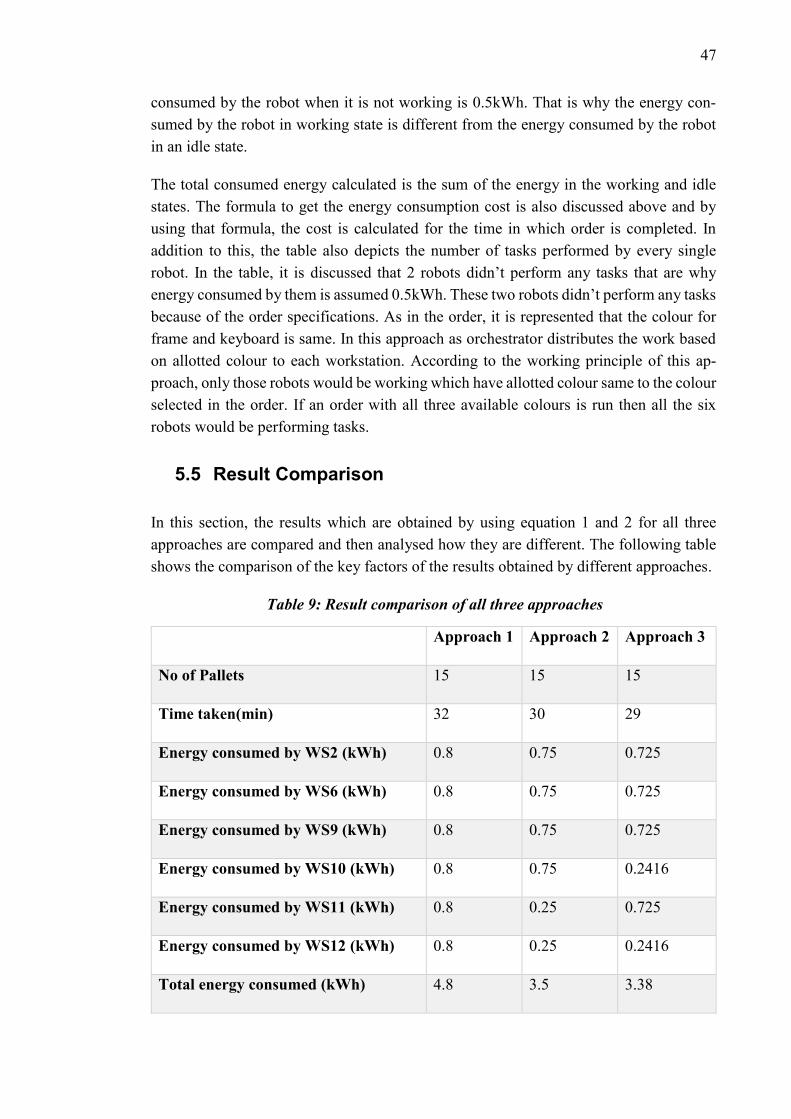
47
consumed by the robot when it is not working is 0.5kWh. That is why the energy con-sumed by the robot in working state is different from the energy consumed by the robot in an idle state.
The total consumed energy calculated is the sum of the energy in the working and idle states. The formula to get the energy consumption cost is also discussed above and by using that formula, the cost is calculated for the time in which order is completed. In addition to this, the table also depicts the number of tasks performed by every single robot. In the table, it is discussed that 2 robots didn’t perform any tasks that are why energy consumed by them is assumed 0.5kWh. These two robots didn’t perform any tasks because of the order specifications. As in the order, it is represented that the colour for frame and keyboard is same. In this approach as orchestrator distributes the work based on allotted colour to each workstation. According to the working principle of this ap-proach, only those robots would be working which have allotted colour same to the colour selected in the order. If an order with all three available colours is run then all the six robots would be performing tasks.
5.5 Result Comparison
In this section, the results which are obtained by using equation 1 and 2 for all three approaches are compared and then analysed how they are different. The following table shows the comparison of the key factors of the results obtained by different approaches.
Table 9: Result comparison of all three approaches
Approach 1 Approach 2 Approach 3
No of Pallets 15 15 15
Time taken(min) 32 30 29
Energy consumed by WS2 (kWh) 0.8 0.75 0.725
Energy consumed by WS6 (kWh) 0.8 0.75 0.725
Energy consumed by WS9 (kWh) 0.8 0.75 0.725
Energy consumed by WS10 (kWh) 0.8 0.75 0.2416
Energy consumed by WS11 (kWh) 0.8 0.25 0.725
Energy consumed by WS12 (kWh) 0.8 0.25 0.2416
Total energy consumed (kWh) 4.8 3.5 3.38

48
Energy consumed cost (euros per hour)
0.321 0.234 0.226
Work distribution Among work-stations
Equal Unequal Can be Equal
The table above compared the results obtained by all three approaches which are imple-mented during this research work. The number of the pallets and device specifications selected in the sample order is same for all the approaches. The idea to keep the number of the pallets and device specifications same because to compare and analyse the different approaches results under same conditions. The results of the first approach show that if sample order run using this approach, it helps to distribute the workload equally among the workstation. The results show that each of the workstation consumes the same amount of energy because of equal work load distribution. When this specific factor (work load distribution) is compared with other approaches, it is represented in the table above that the second approach doesn’t help to achieve equal work load distribution. Further, when time comparison is made, it is evident that it takes more time for the system to complete the order by implementing this approach as compared to other two approaches. Conse-quently, the system would consume more energy to complete the order which results in higher cost. From the discussion above it can be concluded that this approach although facilitates to divide work load equally but it is not time and cost-effective.
Discussing the results of the second approach, the table above shows that when this ap-proach is implemented to run the sample order, work distribution among workstations is not equal. Unequal work distribution occurred because in this approach the orchestrator distributes the tasks to the workstations which are free and nearer to WS1. Due to which it is depicted in the results workstations which are nearer to WS1 have performed more tasks. Moreover, it is represented in the table above that the energy consumption by work-station during this approach is not equal because WS11 and WS12 remain idle during the execution of order due to which they consume 0.5kWh energy respectively. But there is an advantage which is that during the implementation of this approach system takes 30 minutes to complete the order which is better than the first approach. As it takes less time for the system to complete the order which means energy consumption would be lower which would result in lower production cost. It can be concluded from the discussion above, that the second approach is time and cost effective as compared to the first ap-proach but it doesn’t help to achieve equal work distribution which can be achieved by other two approaches.
The results of the third approach depict that work distribution among the workstations is unequal but it takes system 29 minutes to complete the sample order which is better as
49
compared to other approaches. But the workload distribution in this approach is com-pletely dependent on the sample order colour specifications. If all three available colours would be selected in the order specification then this approach would distribute work load equally among the workstations. If the colours for different mobile parts would be same then only those workstations would perform the tasks which have the allotted colour as same as the selected colours which happened in this case. Further, as this approach takes the least time to complete order then energy consumption would also be least which helps to achieve cost-effectiveness. Moreover, it is represented in the table above that the en-ergy consumption by workstation during this approach is not equal because WS10 and WS12 remain idle during the execution of order due to which they consume 0.5kWh en-ergy respectively. It can be concluded from the discussion above that this approach is better than both other approaches as it helps to achieve time and cost-effectiveness and can also facilitate to distribute the workload among workstations equally. Table 9 gives a clear idea how effective are these three approaches. It can be concluded after analysing the results that the approach three would be more effective to balance the MMAL. As, it provides time efficiency, cost-effectiveness, and can facilitate in equal workload distri-bution as well.
It can be concluded from the table above, that the time taken by the system to complete an order when the first approach is implemented is higher as compared to other two ap-proaches due to which energy consumption is the highest. But the workload is equally distributed due to which energy consumption by each workstation is equal. Further, from the table above it can be seen, that the time taken by the system to complete an order when the second approach is implemented is less as compared to the first approach due to which total energy consumption by the system is less. But the workload is not equally distributed because of which WS11 and WS12 consume less energy as they remain idle during the execution of the order. Moreover, when the third approach is implemented time taken to complete the order is least due to which energy consumed by the system is least. Workload distribution in this approach is not equal because during this approach workload distribution is completely dependent on the sample order colours specification. If all three colours would be selected in the order specification then this approach would distribute workload equally among the work-stations. If the colours for different mobile parts would be same then only those work-stations would perform the tasks which have the allotted colour as same as the selected colours which happened in this case. Due to this unequal distribution of load WS10 and WS12 remain idle and consume less energy.
50
6. CONCLUSIONS
This chapter makes a conclusion of the work done during this research problem. Moreo-ver, it discusses the work which can be done related to this research problem and how it can be helpful to solve the balancing and sequencing issue at the industry level.
6.1 Summary of Discussion
This thesis work implements the proposed methodology to develop an orchestrator which helps to balance and sequence Mixed Model Assembly line. To attain the desired results and objectives author of this thesis implemented three different approaches. The proposed approaches are tested on the FASTory line to get the results. The approaches used are one by one work distribution, idle workstation and fixed colour approach.
In one by one work distribution approach orchestrator distributes the work to each work-station in sequence from WS2-WS6 and WS8-WS12. If one workstation completed the task, it would not get the next task until orchestrator distributes the tasks to each of other workstations first. This approach is implemented just to run the assembly line not to bal-ance it and then calculate the time it takes to complete the order. The time calculated during this approach is compared with the time calculated by implementing other ap-proaches to analyse how much cycle time is reduced. Once time is calculated then the energy consumed by the system for the time to complete the order is calculated.
Idle workstation approach is the second approach which is implemented to balance the assembly line. In this approach, orchestrator assigns the task to that workstation which is near and free to execute the assembly process. An order is executed using this approach and time is calculated which an assembly line takes to complete an order and then energy consumption is calculated.
The third approach which is implemented is fixed colour approach. As the FASTory line offers three colours for the production which are RED, BLUE and GREEN. In this ap-proach, each workstation is allotted with different colours. When the orchestrator starts to run the assembly line, exactly during that time orchestrator orders workstations to change their pen colours to the allotted ones. The pen colours remain fixed until the com-pletion of the order due to which there is no need to change the pen colour at runtime which saves time. In this approach, orchestrator distributes tasks based on the allotted colour. An order is executed using this approach and time is calculated which an assembly line takes to complete an order. This calculated time is used to calculate energy consumed by the system.
51
Furthermore, a user interface is also designed which is used to make an order by selecting desired specifications. In the end, the results of all three approaches are compared which helps to draw the conclusion which approach is better. In conclusion, this thesis provides the solution to balance and MMAL. Moreover, during this thesis work not only an ap-proach is proposed but implemented that approach on the FASTory line to get the desired objectives.
6.2 Future Work
This thesis work focuses on to develop an orchestrator which balances and sequence the Mixed Model Assembly Line. To examine how much service orchestration can be effec-tive for balancing and sequencing, this developed orchestrator can be implemented at different Mixed Model Assembly Line by analysing their specifications. By implement-ing and collecting results of different Mixed Model Assembly Lines would help to make it more efficient.
To make the system secure authorization and authentication could be implemented. Au-thentication process would ask for identification. For system analysis, a database can be implemented and integrated with the system to store the log data for each individual work-station. Then RESTful APIs can be implemented which will provide access to frontend to fetch and analyse that log data for analysis.
52
REFERENCES
[1] Altiok, Tayfur. Performance analysis of manufacturing systems. Springer Science & Business Media, 2012.
[2] Hitomi, Katsundo. Manufacturing Systems Engineering: A Unified Approach to Manufacturing Technology, Production Management and Industrial Economics. CRC Press, 1996.
[3] Koren, Yoram. The global manufacturing revolution: product-process-business integration and reconfigurable systems. Vol. 80. John Wiley & Sons, 2010.
[4] Hu, S.J., 2013. Evolving paradigms of manufacturing: from mass production to mass customization and personalization. Procedia CIRP, 7, pp.3-8.
[5] Kamal Uddin, Mohammad, Marian Cavia Soto, and Jose L. Martinez Lastra. "An integrated approach to mixed-model assembly line balancing and sequencing." Assembly Automation 30.2 (2010): 164-172
[6] Mourtzis, Dimitris, and Michael Doukas. "The Evolution of Manufacturing Sys-tems: From Craftsmanship to the." Handbook of Research on Design and Man-agement of Lean Production Systems (2014): 1..
[7] Thomopoulos, Nick T. Assembly line planning and control. Springer International Publishing, 2014.
[8] Dashchenko, A. I. "Reconfigurable manufacturing systems and transformable fac-tories." (2006).
[9] Shang, Jen, and Toshiyuki Sueyoshi. "A unified framework for the selection of a flexible manufacturing system." European Journal of Operational Research 85.2 (1995): 297-315.
[10] Shivanand, H. K. Flexible manufacturing system. New Age International, 2006.
[11] Kostal, Peter, and Karol Velisek. "Flexible manufacturing system." World Acad-emy of Science, Engineering and Technology 53 (2010): 825-829.
[12] Koren, Yoram, et al. "Reconfigurable manufacturing systems." CIRP Annals-Manufacturing Technology 48.2 (1999): 527-540.
[13] Malhotra, V., T. Raj, and A. Arora. "Reconfigurable manufacturing system: An overview." International Journal of Machine Intelligence 1.2 (2009).
53
[14] Pavnaskar, S. J., J. K. Gershenson, and A. B. Jambekar. "Classification scheme for lean manufacturing tools." International Journal of Production Research 41.13 (2003): 3075-3090.
[15] Detty, Richard B., and Jon C. Yingling. "Quantifying benefits of conversion to lean manufacturing with discrete event simulation: a case study." International Journal of Production Research 38.2 (2000): 429-445.
[16] García-Alcaraz, Jorge Luis, Aidé Aracely Maldonado-Macías, and Guillermo Cor-tes-Robles, eds. Lean Manufacturing in the Developing World: Methodology, Case Studies and Trends from Latin America. Springer Science & Business Me-dia, 2014.
[17] Gomes, Duarte F., Manuel Pereira Lopes, and Carlos Vaz de Carvalho. "Serious games for lean manufacturing: the 5S game." IEEE Revista Iberoamericana de Tecnologias del Aprendizaje 8.4 (2013): 191-196.
[18] Scholten, Bianca. The road to integration: A guide to applying the ISA-95 stand-ard in manufacturing. Isa, 2007.
[19] Engell, Sebastian, and Iiro Harjunkoski. "Optimal operation: Scheduling, ad-vanced control and their integration." Computers & Chemical Engineering 47 (2012): 121-133.
[20] Abdinnour-Helm, Sue, Mark L. Lengnick-Hall, and Cynthia A. Lengnick-Hall. "Pre-implementation attitudes and organizational readiness for implementing an enterprise resource planning system." European journal of operational research 146.2 (2003): 258-273.
[21] Valckenaers, Paul, and Hendrik Van Brussel. "Holonic manufacturing execution systems." CIRP Annals-Manufacturing Technology 54.1 (2005): 427-432.
[22] McClellan, Michael. Applying manufacturing execution systems. CRC Press, 1997.
[23] Patel, Zameer. "Manufacturing Execution Systems." Instrument Engineers' Hand-book: Process Software and Digital Networks, Fourth Edition. CRC Press, 2011. 689-697.
[24] Weiss, Joseph. Protecting industrial control systems from electronic threats. Mo-mentum Press, 2010.
[25] Weiner, S., "Perspective on automotive manufacturing, in the manufacturing of productivity and technology in manufacturing", edited by Paul R. Kleindorfer (New York: Plenum Press), (1985), p.57-71.
54
[26] Wild, R., (1972), Mass production management, the design and operation of pro-duction flow line systems, (New York: John Wiley and sons, inc.).
[27] Selcuk Kar, Serpil Say. Assembly line balancing in a mixed model sequencing en-vironment with synchronous transfers. European Journal of Operational Research, 2003, pp. 417-429
[28] Pedro M., Ana Sofia. A two-stage heuristic method for balancing mixed model as-sembly lines with paralled workstations. INT. J. PROD RES., 2002, Vol. 40, No. 6, pp. 1405-1420
[29] Yow yuh leu, Lance A. Matheson. Sequencing mixed model assembly lines with genetic algorithms. Computers Industry Engineering. Vol. 30, No. 4, 1996, pp. 1027-1036
[30] Hu, Luo-ke, Fang-ye Shao, and Gui-xia He. "Balancing analysis and algorithm design for mixed model assembly lines." Industrial Engineering and Engineering Management (IE&EM), 2011 IEEE 18Th International Conference on. IEEE, 2011.
[31] Zhan, Yang, and Rui Zhang. "A genetic algorithm for the balancing and sequenc-ing problem in the mixed-model U-line." Computational Intelligence In Produc-tion And Logistics Systems (CIPLS), 2013 IEEE Workshop on. IEEE, 2013.
[32] Cao, Zhenxin, and Shiping Ma. "Balancing and sequencing optimization of the mixed model assembly lines." Computer Science and Computational Technology, 2008. ISCSCT'08. International Symposium on. Vol. 1. IEEE, 2008.
[33] Faccio, Maurizio, Mauro Gamberi, and Marco Bortolini. "Hierarchical approach for paced mixed-model assembly line balancing and sequencing with jolly opera-tors." International Journal of Production Research 54.3 (2016): 761-777.
[34] Kapuruge, Malinda, Jun Han, and Alan Colman. Service Orchestration as Organi-zation: Building Multi-tenant Service Applications in the Cloud. Elsevier, 2014.
[35] Andrei Lobov and Wael Muhammad. An overview of Introduction to Industrial Informatics course, 2016
[36] "The Basics Of HTML - W3C Wiki". W3.org. N.p., 2014. Web. 15 Feb. 2017.
[37] "CSS Basics - Web Education Community Group". W3.org. N.p., 2012. Web. 15 Feb. 2017.
[38] Foundation, “Node.js,” Node.js. [Online]. Available: https://nodejs.org/en/. [Ac-cessed: 18-Feb-2017].
55
[39] "AngularJS — Superheroic JavaScript MVW Framework", Angularjs.org, 2017. [Online]. Available: https://angularjs.org/. [Accessed: 05- Feb- 2017].
[40] Ahmad, Munir, and William G. Sullivan. Flexible Automation and Integrated Manufacturing 1993. CRC Press, 1993.
[41] Hopp, Wallace J., and Mark L. Spearman. Factory physics. Waveland Press, 2011.
[42] Levy, Sidney M. Construction calculations manual. Elsevier, 2011.
[43] EuroStat, Electricity price statistics [Online]. Available: http://ec.europa.eu/eurostat/statisticsexplained/index.php/Electric-ity_price_statistics . [Accessed: 10- March- 2018].
[44] Ferrer, Borja Ramis, Wael M. Mohammed, Andrei Lobov, Amalia Moreno Ga-lera, and Jose L. Martinez Lastra. "Including human tasks as semantic resources in manufacturing ontology models." In Industrial Electronics Society, IECON 2017-43rd Annual Conference of the IEEE, pp. 3466-3473. IEEE, 2017
[45] Mohammed, Wael M., Andrei Lobov, Borja Ramis Ferrer, Sergii Iarovyi, and Jose L. Martinez Lastra. "A web-based simulator for a discrete manufacturing sys-tem." In Industrial Electronics Society, IECON 2016-42nd Annual Conference of the IEEE, pp. 6583-6589. IEEE, 2016.
[46] Ferrer, Borja Ramis, Sergii Iarovyi, Andrei Lobov, and José L. Martinez Lastra. "Potentials of web standards for automation control in manufacturing systems." In Modelling Symposium (EMS), 2015 IEEE European, pp. 359-366. IEEE, 2015.
[47] Mohammed, Wael M. "Encapsulation of MES Functionalities as RESTful Web Services for Knowledge-Driven Manufacturing Systems." (2017).
[48] Java introducion, Java tutorial [Online]. Available: https://www.w3schools.in/java-tutorial/intro/ .[Accessed: 28- April- 2018].
[49] Python introducion, Python tutorial [Online]. Available: https://www.w3schools.in/python-tutorial/overview/ .[Accessed: 28- April- 2018].
[50] PHP introducion, PHP tutorial [Online]. Available: https://www.w3schools.in/php/intro/ .[Accessed: 28- April- 2018].

56
[51] Operation Manual, SRX-611[Online]. Available: http://www.buildyouridea.com/cnc/scara3d/Sony%20SRX-611%20Manual.pdf .[Accessed: 8- May- 2018].

57
APPENDIX A: CONTROL SPECIFICATIONS SRX-C61
CONTROL SPECIFICATIONS SRX-C61[51]
Drive method AC servo motor drive with an all-axis software servo
Position detection Absolute method (battery back-up)
Movement method PTP, CP, overlap motion, QM, QT
Control axis count Simultaneous and individual control for axis 1 to 4
Applicable output Motor power total consumption 1000 W
Speed control Speed setting: 1-100% in 100 stages
Override function: 1-100%
Interpolation function 3-dimensional direct linear interpolation, 3-dimensional direct circular interpolation
CPU I468DX2 (50MHz inside)
Multi-task LUNA: 16 tasks (robot: 8 tasks, periph-eral: 8 tasks) System task: 1 task
PLC task: 1 task
Data storage capacity 3072 points (for each program) total 176 bytes for all tasks
Memory Card PC CARD STANDARD (PCMCIA2.1 type 1) support
Teaching Teaching with the Teaching Pendant (op-tional)
Direct teaching
Position program creation when off line
Peripheral device control 40 points for each I/O, maximum 184 points for each

58
Serial I/F RS233C : 3 systems 1 special TP, 1 special device for pro-gramming, general purpose: 1
Expansion Expansion slot device: 3 slots
Vision board, I/O board, etc
Built-in PLC function (optional) Program format: Boolean algebra
Operational Status: Independent from ro-bot operations
I/O: Robot user’s I/O used
Power source Single phase AC200V – 240V ±10% 50/60 Hz
Consumed power 1.5kVA
Momentary stop guarantee time Normal operations for momentary power cuts within 20 ms
Insulation resistance 1000 Vp-p 1µs (with a noise simulator. Between the electrical source and chassis)
Ambient temperature 0ºC- 40ºC
Ambient conditions Must not be any corrosive gas. Must be no condensation
Grounding Connect to AWG 14 or more
Humidity 35-90%
External dimensions 430(w)*440(d)*240.5(h) equivalent to 5U of DIN specification
Weight 25kg(55lbs)
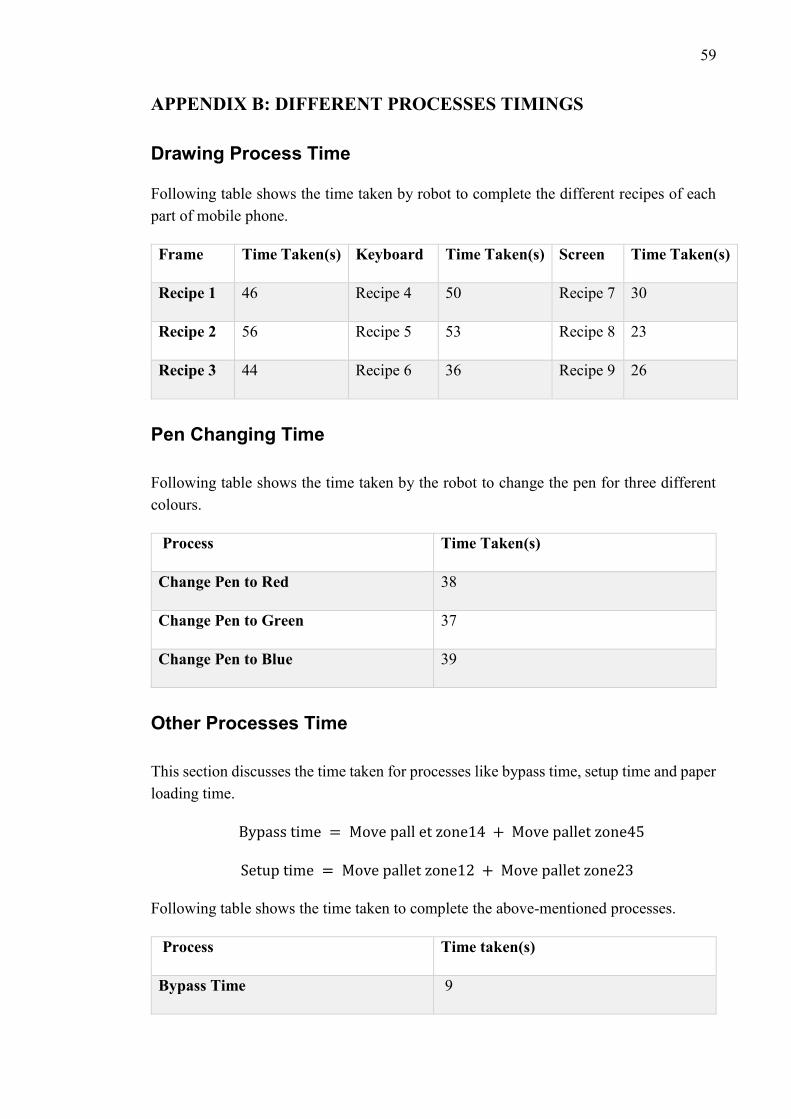
59
APPENDIX B: DIFFERENT PROCESSES TIMINGS
Drawing Process Time
Following table shows the time taken by robot to complete the different recipes of each part of mobile phone.
Frame Time Taken(s) Keyboard Time Taken(s) Screen Time Taken(s)
Recipe 1 46 Recipe 4 50 Recipe 7 30
Recipe 2 56 Recipe 5 53 Recipe 8 23
Recipe 3 44 Recipe 6 36 Recipe 9 26
Pen Changing Time
Following table shows the time taken by the robot to change the pen for three different colours.
Process Time Taken(s)
Change Pen to Red 38
Change Pen to Green 37
Change Pen to Blue 39
Other Processes Time
This section discusses the time taken for processes like bypass time, setup time and paper loading time.
Bypass time = Move pall et zone14 + Move pallet zone45
Setup time = Move pallet zone12 + Move pallet zone23
Following table shows the time taken to complete the above-mentioned processes.
Process Time taken(s)
Bypass Time 9
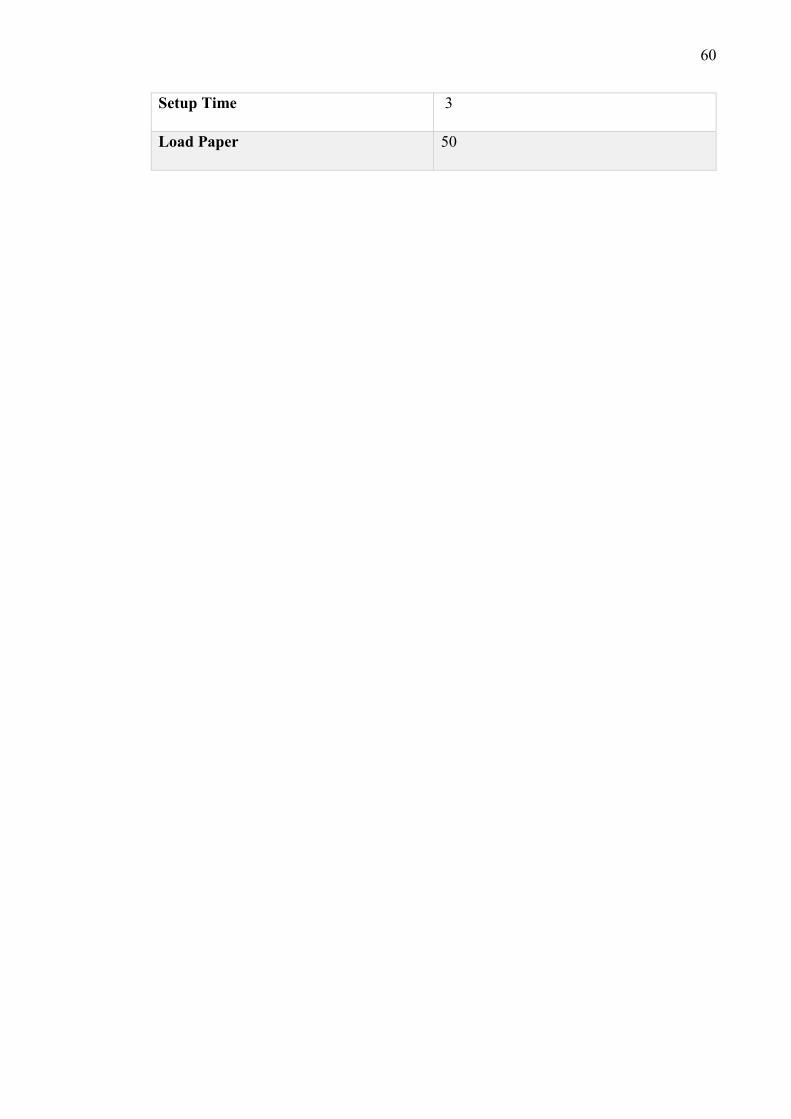
60
Setup Time 3
Load Paper 50