Spatial and temporal distribution of European hake, Merluccius merluccius (L.), eggs and larvae in...
18
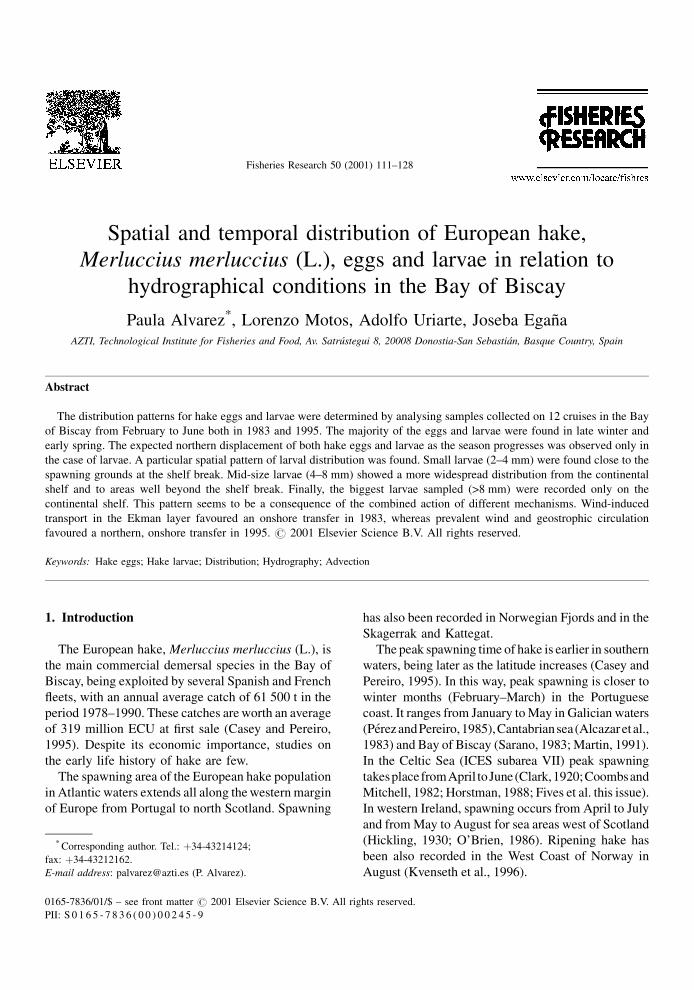
Spatial and temporal distribution of European hake, Merluccius merluccius (L.), eggs and larvae in relation to hydrographical conditions in the Bay of Biscay Paula Alvarez * , Lorenzo Motos, Adolfo Uriarte, Joseba Egan ˜a AZTI, Technological Institute for Fisheries and Food, Av. Satru ´stegui 8, 20008 Donostia-San Sebastia ´n, Basque Country, Spain Abstract The distribution patterns for hake eggs and larvae were determined by analysing samples collected on 12 cruises in the Bay of Biscay from February to June both in 1983 and 1995. The majority of the eggs and larvae were found in late winter and early spring. The expected northern displacement of both hake eggs and larvae as the season progresses was observed only in the case of larvae. A particular spatial pattern of larval distribution was found. Small larvae (2–4 mm) were found close to the spawning grounds at the shelf break. Mid-size larvae (4–8 mm) showed a more widespread distribution from the continental shelf and to areas well beyond the shelf break. Finally, the biggest larvae sampled (>8 mm) were recorded only on the continental shelf. This pattern seems to be a consequence of the combined action of different mechanisms. Wind-induced transport in the Ekman layer favoured an onshore transfer in 1983, whereas prevalent wind and geostrophic circulation favoured a northern, onshore transfer in 1995. # 2001 Elsevier Science B.V. All rights reserved. Keywords: Hake eggs; Hake larvae; Distribution; Hydrography; Advection 1. Introduction The European hake, Merluccius merluccius (L.), is the main commercial demersal species in the Bay of Biscay, being exploited by several Spanish and French fleets, with an annual average catch of 61 500 t in the period 1978–1990. These catches are worth an average of 319 million ECU at first sale (Casey and Pereiro, 1995). Despite its economic importance, studies on the early life history of hake are few. The spawning area of the European hake population in Atlantic waters extends all along the western margin of Europe from Portugal to north Scotland. Spawning has also been recorded in Norwegian Fjords and in the Skagerrak and Kattegat. The peak spawning time of hake is earlier in southern waters, being later as the latitude increases (Casey and Pereiro, 1995). In this way, peak spawning is closer to winter months (February–March) in the Portuguese coast. It ranges from January to May in Galician waters (Pe ´rez and Pereiro, 1985), Cantabrian sea (Alcazar et al., 1983) and Bay of Biscay (Sarano, 1983; Martin, 1991). In the Celtic Sea (ICES subarea VII) peak spawning takes place from April to June (Clark, 1920; Coombs and Mitchell, 1982; Horstman, 1988; Fives et al. this issue). In western Ireland, spawning occurs from April to July and from May to August for sea areas west of Scotland (Hickling, 1930; O’Brien, 1986). Ripening hake has been also recorded in the West Coast of Norway in August (Kvenseth et al., 1996). Fisheries Research 50 (2001) 111–128 * Corresponding author. Tel.: 34-43214124; fax: 34-43212162. E-mail address: [email protected] (P. Alvarez). 0165-7836/01/$ – see front matter # 2001 Elsevier Science B.V. All rights reserved. PII:S0165-7836(00)00245-9
-
Upload
independent -
Category
Documents
-
view
1 -
download
0
Transcript of Spatial and temporal distribution of European hake, Merluccius merluccius (L.), eggs and larvae in...
Spatial and temporal distribution of European hake,Merluccius merluccius (L.), eggs and larvae in relation to
hydrographical conditions in the Bay of Biscay
Paula Alvarez*, Lorenzo Motos, Adolfo Uriarte, Joseba EganÄaAZTI, Technological Institute for Fisheries and Food, Av. SatruÂstegui 8, 20008 Donostia-San SebastiaÂn, Basque Country, Spain
Abstract
The distribution patterns for hake eggs and larvae were determined by analysing samples collected on 12 cruises in the Bay
of Biscay from February to June both in 1983 and 1995. The majority of the eggs and larvae were found in late winter and
early spring. The expected northern displacement of both hake eggs and larvae as the season progresses was observed only in
the case of larvae. A particular spatial pattern of larval distribution was found. Small larvae (2±4 mm) were found close to the
spawning grounds at the shelf break. Mid-size larvae (4±8 mm) showed a more widespread distribution from the continental
shelf and to areas well beyond the shelf break. Finally, the biggest larvae sampled (>8 mm) were recorded only on the
continental shelf. This pattern seems to be a consequence of the combined action of different mechanisms. Wind-induced
transport in the Ekman layer favoured an onshore transfer in 1983, whereas prevalent wind and geostrophic circulation
favoured a northern, onshore transfer in 1995. # 2001 Elsevier Science B.V. All rights reserved.
Keywords: Hake eggs; Hake larvae; Distribution; Hydrography; Advection
1. Introduction
The European hake, Merluccius merluccius (L.), is
the main commercial demersal species in the Bay of
Biscay, being exploited by several Spanish and French
¯eets, with an annual average catch of 61 500 t in the
period 1978±1990. These catches are worth an average
of 319 million ECU at ®rst sale (Casey and Pereiro,
1995). Despite its economic importance, studies on
the early life history of hake are few.
The spawning area of the European hake population
in Atlantic waters extends all along the western margin
of Europe from Portugal to north Scotland. Spawning
has also been recorded in Norwegian Fjords and in the
Skagerrak and Kattegat.
The peak spawning time of hake is earlier in southern
waters, being later as the latitude increases (Casey and
Pereiro, 1995). In this way, peak spawning is closer to
winter months (February±March) in the Portuguese
coast. It ranges from January to May in Galician waters
(PeÂrezandPereiro,1985),Cantabriansea(Alcazaretal.,
1983) and Bay of Biscay (Sarano, 1983; Martin, 1991).
In the Celtic Sea (ICES subarea VII) peak spawning
takesplacefromApril toJune(Clark,1920;Coombsand
Mitchell, 1982; Horstman, 1988; Fives et al. this issue).
In western Ireland, spawning occurs from April to July
and from May to August for sea areas west of Scotland
(Hickling, 1930; O'Brien, 1986). Ripening hake has
been also recorded in the West Coast of Norway in
August (Kvenseth et al., 1996).
Fisheries Research 50 (2001) 111±128
* Corresponding author. Tel.: �34-43214124;
fax: �34-43212162.
E-mail address: [email protected] (P. Alvarez).
0165-7836/01/$ ± see front matter # 2001 Elsevier Science B.V. All rights reserved.
PII: S 0 1 6 5 - 7 8 3 6 ( 0 0 ) 0 0 2 4 5 - 9
ICES (1980) presented the results of the 1977
triennial survey for hake larvae. Larvae were mainly
distributed along the shelf edge from south Biscay to
south Ireland, and displaced to the north as the season
progresses. This latitudinal variation in peak spawning
time is common to other ®sh species. In the case of
hake, it can be explained by a migration of spawners
from south to north, or alternatively, by a spawning
wave going from south to north as local population
components reach maturity and spawn, or it can be a
combination of both. The phenomenon seems to be
related to changes in environmental factors such as
temperature and the consequent changes in biological
features of the spawning habitat. Hake eggs show a
temperature preference in the range of 10.5±128C(Arbault and Lacroix-Boutin, 1969; Coombs and
Mitchell, 1982).
The ®nal spatio-temporal distribution pattern of
eggs and larvae will depend on the initial position
of the spawning, and after the release of eggs by the
parental stock, on the hydrographical features acting
upon this initial distribution. Authors have expressed a
variety of interpretations to explain the cross-shelf
distribution of eggs and larvae. Arbault and Lacroix-
Boutin (1969) concluded that the spawning in the Bay
of Biscay is initiated close to the coast and it spreads
towards deeper waters as the season progress. In more
northern latitudes, Horstman (1988) and Fives et al.
(this issue) suggested the contrary, i.e. spawning starts
along the shelf edge (200 m depth contour) and
spreads onto the shelf afterwards.
The in¯uence of the hydrographical features on the
dispersion of eggs and larvae is of increasing interest.
Several species spawn, as hake does, in areas far away
from the coast but, at the same time, have coastal
nursery areas where the young individuals are
recruited. The European hake occupy different nur-
sery areas, all of them located in coastal, relatively
shallow waters such as the muddy bottoms of the
northern Bay of Biscay known as the `̀ Grand VasieÂreÁ''
(Bez et al., 1995). Consistent mechanisms of retention
over the shelf, and furthermore, transport towards the
coast should occur in the area to ensure the main-
tenance of the population in the long term (Heath,
1992; Koutsikopoulos et al., 1991; Koutsikopoulos
and Lacroix, 1992). Oceanographic events that con-
tribute to the dispersion of ELH stages towards open
ocean waters can cause high larval mortality and
substantially decrease successful recruitment (Lae-
vastu and Hayes, 1981; Hollowed and Bailey, 1989).
Several studies have described the main hydrogra-
phical features in the Bay of Biscay. The general
circulation is weak and the presence of cyclonic
and anticyclonic eddies is frequent (Koutsikopoulos
and Le Cann, 1996). A consistent poleward seeking
slope current is apparent but it shows marked seasonal
changes (Pingree and Le Cann, 1990). The residual
currents over the shelf are principally governed by the
wind, the tide in the northern part and the water
density. The meteorological conditions show marked
spatial and temporal heterogeneity which can have a
notable in¯uence in ®sh populations (Koutsikopoulos
and Le Cann, 1996; Borja et al., 1996; SaÂnchez, 1994).
This paper describes the spatio-temporal pattern of
distribution of hake eggs and larvae in the Bay of
Biscay during the main spawning period for the years
1983 and 1995. Based on the distribution pattern
found, a mechanism to ensure the retention or trans-
portation of eggs and larvae towards the putative
nursery areas where juveniles are recruited is sug-
gested. The spatio-temporal distribution pattern is
analysed in the light of the available data on con-
current oceanographic features. The in¯uence of the
environmental conditions where hake eggs and larvae
develop is assessed by comparing the events described
in the study to the eventual hake recruitment levels
achieved in the year of study (ICES, 1996).
2. Material and methods
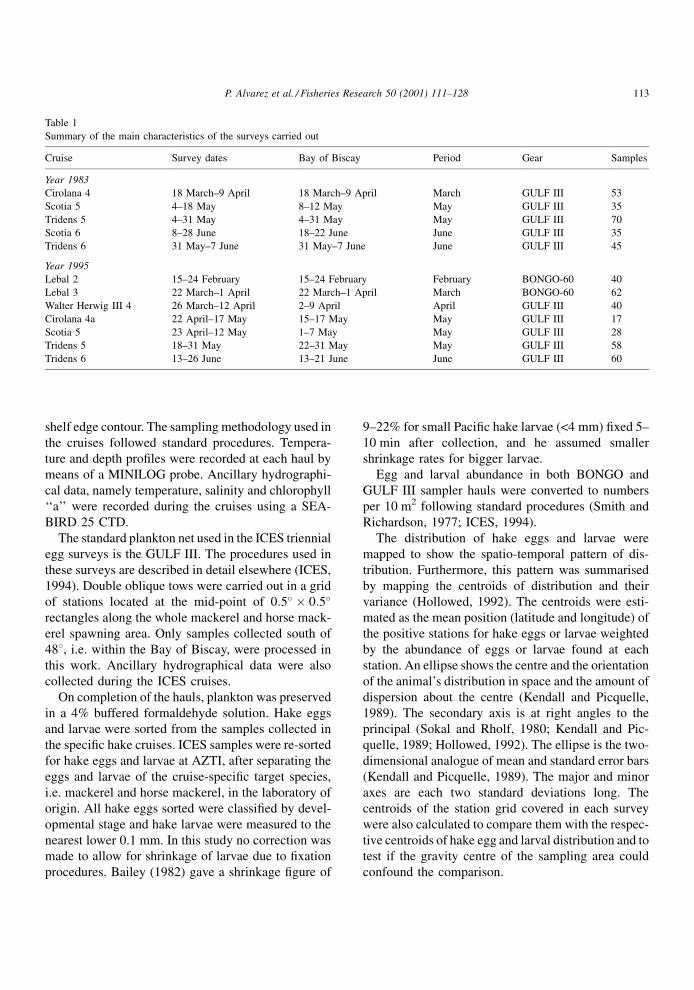
Table 1 summarises the cruises analysed in this
study. Hake eggs and larvae were sorted from the
samples collected in a series of cruises carried out
within the frame of the ICES triennial egg survey, both
in 1983 and in 1995. Additionally, two cruises were
carried out to speci®cally collect hake eggs and larvae
in February and March 1995. For comparison pur-
poses, the cruises were grouped by month. Results
were available for 3 months in 1983, i.e. March, May
and June, and for 5 months in 1995, i.e. February,
March, April, May and June.
During the surveys, a set of single oblique plankton
tows were made using a BONGO net, 60 cm mouth
diameter (Mcgowan and Brown, 1966) in a grid of
stations arranged in transects perpendicular to the
112 P. Alvarez et al. / Fisheries Research 50 (2001) 111±128
shelf edge contour. The sampling methodology used in
the cruises followed standard procedures. Tempera-
ture and depth pro®les were recorded at each haul by
means of a MINILOG probe. Ancillary hydrographi-
cal data, namely temperature, salinity and chlorophyll
`̀ a'' were recorded during the cruises using a SEA-
BIRD 25 CTD.
The standard plankton net used in the ICES triennial
egg surveys is the GULF III. The procedures used in
these surveys are described in detail elsewhere (ICES,
1994). Double oblique tows were carried out in a grid
of stations located at the mid-point of 0:5� � 0:5�
rectangles along the whole mackerel and horse mack-
erel spawning area. Only samples collected south of
488, i.e. within the Bay of Biscay, were processed in
this work. Ancillary hydrographical data were also
collected during the ICES cruises.
On completion of the hauls, plankton was preserved
in a 4% buffered formaldehyde solution. Hake eggs
and larvae were sorted from the samples collected in
the speci®c hake cruises. ICES samples were re-sorted
for hake eggs and larvae at AZTI, after separating the
eggs and larvae of the cruise-speci®c target species,
i.e. mackerel and horse mackerel, in the laboratory of
origin. All hake eggs sorted were classi®ed by devel-
opmental stage and hake larvae were measured to the
nearest lower 0.1 mm. In this study no correction was
made to allow for shrinkage of larvae due to ®xation
procedures. Bailey (1982) gave a shrinkage ®gure of
9±22% for small Paci®c hake larvae (<4 mm) ®xed 5±
10 min after collection, and he assumed smaller
shrinkage rates for bigger larvae.
Egg and larval abundance in both BONGO and
GULF III sampler hauls were converted to numbers
per 10 m2 following standard procedures (Smith and
Richardson, 1977; ICES, 1994).
The distribution of hake eggs and larvae were
mapped to show the spatio-temporal pattern of dis-
tribution. Furthermore, this pattern was summarised
by mapping the centroids of distribution and their
variance (Hollowed, 1992). The centroids were esti-
mated as the mean position (latitude and longitude) of
the positive stations for hake eggs or larvae weighted
by the abundance of eggs or larvae found at each
station. An ellipse shows the centre and the orientation
of the animal's distribution in space and the amount of
dispersion about the centre (Kendall and Picquelle,
1989). The secondary axis is at right angles to the
principal (Sokal and Rholf, 1980; Kendall and Pic-
quelle, 1989; Hollowed, 1992). The ellipse is the two-
dimensional analogue of mean and standard error bars
(Kendall and Picquelle, 1989). The major and minor
axes are each two standard deviations long. The
centroids of the station grid covered in each survey
were also calculated to compare them with the respec-
tive centroids of hake egg and larval distribution and to
test if the gravity centre of the sampling area could
confound the comparison.
Table 1
Summary of the main characteristics of the surveys carried out
Cruise Survey dates Bay of Biscay Period Gear Samples
Year 1983
Cirolana 4 18 March±9 April 18 March±9 April March GULF III 53
Scotia 5 4±18 May 8±12 May May GULF III 35
Tridens 5 4±31 May 4±31 May May GULF III 70
Scotia 6 8±28 June 18±22 June June GULF III 35
Tridens 6 31 May±7 June 31 May±7 June June GULF III 45
Year 1995
Lebal 2 15±24 February 15±24 February February BONGO-60 40
Lebal 3 22 March±1 April 22 March±1 April March BONGO-60 62
Walter Herwig III 4 26 March±12 April 2±9 April April GULF III 40
Cirolana 4a 22 April±17 May 15±17 May May GULF III 17
Scotia 5 23 April±12 May 1±7 May May GULF III 28
Tridens 5 18±31 May 22±31 May May GULF III 58
Tridens 6 13±26 June 13±21 June June GULF III 60
P. Alvarez et al. / Fisheries Research 50 (2001) 111±128 113
Wind data for the area and period of study was
supplied by NOAA as obtained from FNMOC (Fleet
Numerical Oceanographic Center). Geostrophic wind
data is derived from surface pressure ®elds measured
every 6 h. To approximate geostrophic wind to real
wind data, the magnitude has to be reduced by 30%
and the wind vector has to be turned 158 anticlockwise
(Bakun, 1973).
The data used in 1983 were obtained at position
458N, 58W. We assumed that the wind does not change
substantially between two points, if the distance
between them is less than 38 of latitude or longitude.
This is a good approximation to reality (Bakun, 1973).
The data used in 1995 were obtained at 458N, 28Wsince wind data at 458N, 58W were not available. Both
positions were approximately centred in the survey
area. Drift vectors were calculated by using Ekman's
theory (Pond and Pickard, 1983) to depict wind-
induced drift on hake eggs and larvae. Results were
produced for the reproductive periods of 1983 and
1995 at 15 and 100 m water depth. All the six hourly
drift vectors were added to produced one monthly
vector. This vector indicates the potential displace-
ment of eggs and larvae during that period assuming
that the displacement of hake eggs and larvae only
depends on this factor.
The wind-induced current velocity decreases expo-
nentially with water depth as shown by Ekman's
theory:
u � t
Aa���2p
� �ea�ÿz� cos az� p
4
� �(1)
v � t
Aa���2p
� �ea�ÿz� sin az� p
4
� �(2)
a �������rf
2A
r(3)
where z is the water depth, t the wind stress, A the eddy
viscosity, r the water density, f the Coriolis parameter.
The variation of tide-induced current velocity
with water depth has been described by Postma
(1988):
Vz � v0z
h
� �0:2(4)
where v0 is the surface current velocity, h the water
depth, z the depth at which velocity is calculated.
3. Results
3.1. Distribution of eggs
The distribution of hake eggs by month/year is
shown in Fig. 1, together with the distribution cen-
troids. In February 1995, a low abundance of hake
eggs was noted but widely distributed throughout the
study area. A relative abundance maximum (�500
eggs/10 m2) occurred close to the shelf edge at around
478450N latitude. Eggs were also found in the south-
eastern corner of the Bay of Biscay, although in very
low abundance. In March, eggs were more abundant
and widespread than in February. Peak abundance
(�700 eggs/10 m2) was located close to the shelf
break between 458450N and 478450N. No eggs were
found south of 448N in that month. Egg abundance
continued to be relatively high in April. Eggs occurred
very close to the shelf edge in most of the sampling
area covered (45±488N) and were absent in inner shelf
stations (Fig. 1). Abundance peaks were located close
to the shelf break from 468 to 478450N (282 eggs/
10 m2). Egg abundance was lower later, both in May
and June. They occurred over the outer continental
shelf of northern Biscay. Hake eggs in the shelf break
area are almost absent in those months, although an
unusual presence was identi®ed in oceanic waters off
the shelf at 478450N latitude.
The cruises covered only 3 months in 1983, March,
May and June. In general, the seasonal pattern of egg
distribution found that year was similar to that in 1995.
Abundance peaks were located in March. Peak abun-
dance in this month (�1000 eggs/10 m2) were located
around and close to the shelf break, but eggs were
widespread from near the shelf edge to the inner shelf
stations. They were also found in southern waters of
the Bay of Biscay (Cantabrian Sea) although in very
low abundance. Hake eggs appeared in lower quan-
tities both in May and in June 1983. The peak abun-
dance was 10 times lower in May (158 eggs/10 m2)
than it was in March and was located over the external
part of the continental shelf at a latitude of 478250N.
Low abundance egg patches were also observed at
latitudes of 448250N and at 468750N in June 1983.
The distribution centroids of hake eggs summarise
the displacements along the season (Table 2 and
Fig. 2). In 1983, the egg distribution centroids occur
at 46.728N, 4.128W in March and at 47.048N, 5.868W
114 P. Alvarez et al. / Fisheries Research 50 (2001) 111±128
Fig. 1. Proportional representation of egg densities of hake, M. merluccius, in the Bay of Biscay in 1983 and in 1995. Dot size indicates the
abundance (numbers/10 m2) of eggs relative to the maximum observed in that year (1156 eggs/10 m2 in 1983 and 700 eggs/10 m2 in 1995).
Crosses indicate station where hake eggs were not observed. Distribution ellipses are also plotted.
P. Alvarez et al. / Fisheries Research 50 (2001) 111±128 115
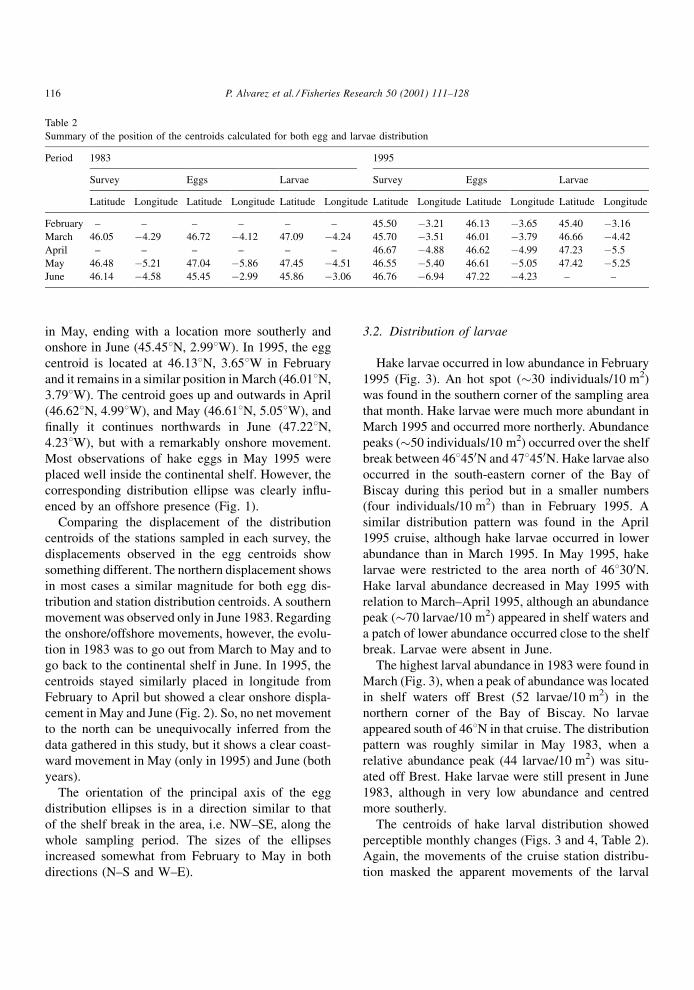
in May, ending with a location more southerly and
onshore in June (45.458N, 2.998W). In 1995, the egg
centroid is located at 46.138N, 3.658W in February
and it remains in a similar position in March (46.018N,
3.798W). The centroid goes up and outwards in April
(46.628N, 4.998W), and May (46.618N, 5.058W), and
®nally it continues northwards in June (47.228N,
4.238W), but with a remarkably onshore movement.
Most observations of hake eggs in May 1995 were
placed well inside the continental shelf. However, the
corresponding distribution ellipse was clearly in¯u-
enced by an offshore presence (Fig. 1).
Comparing the displacement of the distribution
centroids of the stations sampled in each survey, the
displacements observed in the egg centroids show
something different. The northern displacement shows
in most cases a similar magnitude for both egg dis-
tribution and station distribution centroids. A southern
movement was observed only in June 1983. Regarding
the onshore/offshore movements, however, the evolu-
tion in 1983 was to go out from March to May and to
go back to the continental shelf in June. In 1995, the
centroids stayed similarly placed in longitude from
February to April but showed a clear onshore displa-
cement in May and June (Fig. 2). So, no net movement
to the north can be unequivocally inferred from the
data gathered in this study, but it shows a clear coast-
ward movement in May (only in 1995) and June (both
years).
The orientation of the principal axis of the egg
distribution ellipses is in a direction similar to that
of the shelf break in the area, i.e. NW±SE, along the
whole sampling period. The sizes of the ellipses
increased somewhat from February to May in both
directions (N±S and W±E).
3.2. Distribution of larvae
Hake larvae occurred in low abundance in February
1995 (Fig. 3). An hot spot (�30 individuals/10 m2)
was found in the southern corner of the sampling area
that month. Hake larvae were much more abundant in
March 1995 and occurred more northerly. Abundance
peaks (�50 individuals/10 m2) occurred over the shelf
break between 468450N and 478450N. Hake larvae also
occurred in the south-eastern corner of the Bay of
Biscay during this period but in a smaller numbers
(four individuals/10 m2) than in February 1995. A
similar distribution pattern was found in the April
1995 cruise, although hake larvae occurred in lower
abundance than in March 1995. In May 1995, hake
larvae were restricted to the area north of 468300N.
Hake larval abundance decreased in May 1995 with
relation to March±April 1995, although an abundance
peak (�70 larvae/10 m2) appeared in shelf waters and
a patch of lower abundance occurred close to the shelf
break. Larvae were absent in June.
The highest larval abundance in 1983 were found in
March (Fig. 3), when a peak of abundance was located
in shelf waters off Brest (52 larvae/10 m2) in the
northern corner of the Bay of Biscay. No larvae
appeared south of 468N in that cruise. The distribution
pattern was roughly similar in May 1983, when a
relative abundance peak (44 larvae/10 m2) was situ-
ated off Brest. Hake larvae were still present in June
1983, although in very low abundance and centred
more southerly.
The centroids of hake larval distribution showed
perceptible monthly changes (Figs. 3 and 4, Table 2).
Again, the movements of the cruise station distribu-
tion masked the apparent movements of the larval
Table 2
Summary of the position of the centroids calculated for both egg and larvae distribution
Period 1983 1995
Survey Eggs Larvae Survey Eggs Larvae
Latitude Longitude Latitude Longitude Latitude Longitude Latitude Longitude Latitude Longitude Latitude Longitude
February ± ± ± ± ± ± 45.50 ÿ3.21 46.13 ÿ3.65 45.40 ÿ3.16
March 46.05 ÿ4.29 46.72 ÿ4.12 47.09 ÿ4.24 45.70 ÿ3.51 46.01 ÿ3.79 46.66 ÿ4.42
April ± ± ± ± ± ± 46.67 ÿ4.88 46.62 ÿ4.99 47.23 ÿ5.5
May 46.48 ÿ5.21 47.04 ÿ5.86 47.45 ÿ4.51 46.55 ÿ5.40 46.61 ÿ5.05 47.42 ÿ5.25
June 46.14 ÿ4.58 45.45 ÿ2.99 45.86 ÿ3.06 46.76 ÿ6.94 47.22 ÿ4.23 ± ±
116 P. Alvarez et al. / Fisheries Research 50 (2001) 111±128
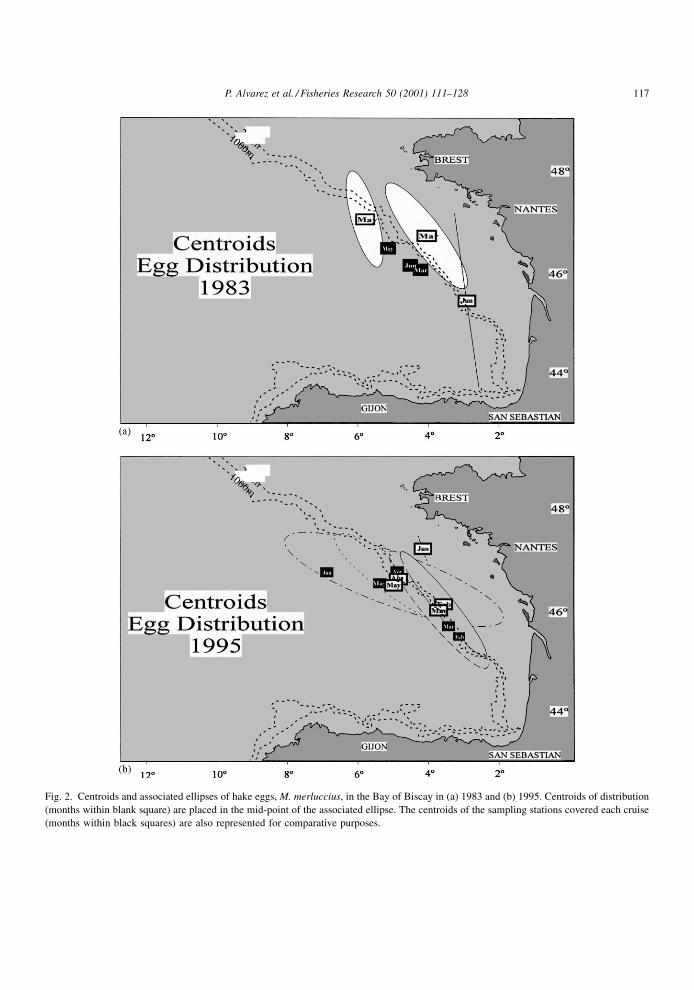
Fig. 2. Centroids and associated ellipses of hake eggs, M. merluccius, in the Bay of Biscay in (a) 1983 and (b) 1995. Centroids of distribution
(months within blank square) are placed in the mid-point of the associated ellipse. The centroids of the sampling stations covered each cruise
(months within black squares) are also represented for comparative purposes.
P. Alvarez et al. / Fisheries Research 50 (2001) 111±128 117
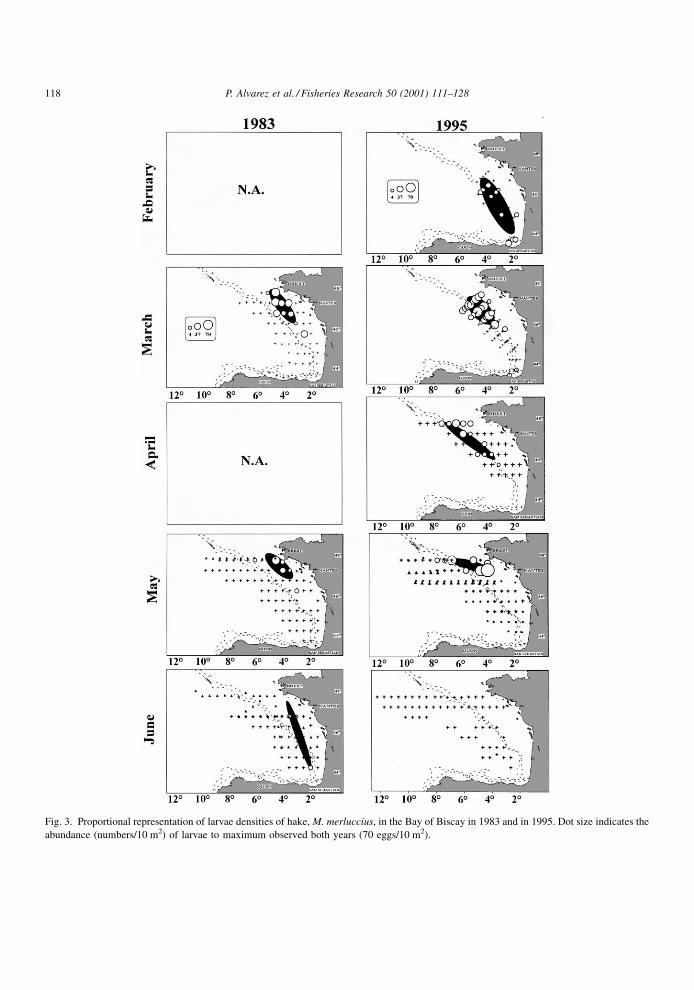
Fig. 3. Proportional representation of larvae densities of hake, M. merluccius, in the Bay of Biscay in 1983 and in 1995. Dot size indicates the
abundance (numbers/10 m2) of larvae to maximum observed both years (70 eggs/10 m2).
118 P. Alvarez et al. / Fisheries Research 50 (2001) 111±128
Fig. 4. Centroids and associated ellipses of hake larvae, M. merluccius, in the Bay of Biscay in (a) 1983 and (b) 1995. Centroids of distribution
(months within blank square) are placed in the mid-point of the associated ellipse. The centroids of the sampling stations covered each cruise
(months within black squares) are also represented for comparative purposes.
P. Alvarez et al. / Fisheries Research 50 (2001) 111±128 119
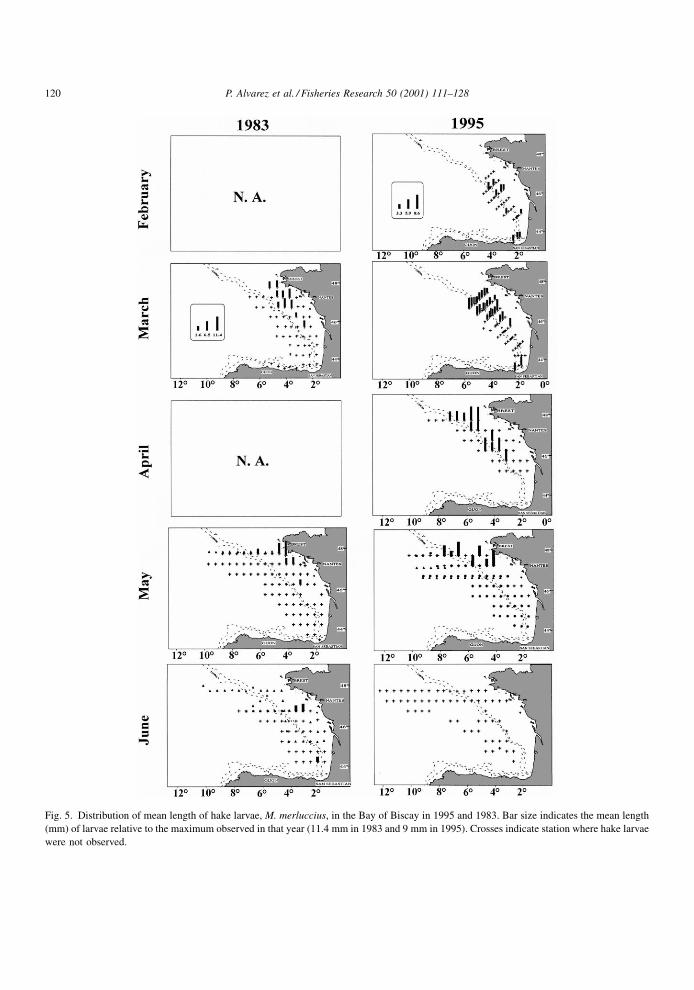
Fig. 5. Distribution of mean length of hake larvae, M. merluccius, in the Bay of Biscay in 1995 and 1983. Bar size indicates the mean length
(mm) of larvae relative to the maximum observed in that year (11.4 mm in 1983 and 9 mm in 1995). Crosses indicate station where hake larvae
were not observed.
120 P. Alvarez et al. / Fisheries Research 50 (2001) 111±128
distribution centroids. However, a close comparison
between both distributions permits a distinction
between the northern movement recorded between
February and March 1995, which was still noticeable
from April to May (Fig. 4b) and the onshore move-
ment which was noticeable from May to June 1983
(Fig. 4a) and from April to May 1995 (Fig. 4b). During
the ®rst survey period (February) of 1995, the centroid
of larval distribution was in front of the Gironde
Estuary, the most southerly location of the centroids
of either eggs or larvae found in this study. Afterwards,
they moved from 458400N in February 1995 to
478420N in May 1995, with a main contribution from
February to March (160 km in the northern direction).
At the same time, the larval distribution centroid
moved onshore from April to May, after having
remained in a similar position with relation to the
shelf break from February to April.
Concerning the relative position of larval distribu-
tion centroid in relation to the egg distribution cen-
troid, the former are generally located more to the
north and to the east (coastward) than the latter
(Figs. 1±4). This feature is clearer in 1983 than in
1995. The only remarkable exception to this rule is the
situation observed in February 1995, when the larval
distribution was much more southerly than in any of
the eggs and larval distribution observed in the
remainder of the cruises.
The distribution of larval mean length per station is
shown in Fig. 5. There was no apparent pattern in the
spatial distribution of this parameter in February.
However, during the remainder of the cruises there
was a consistent pattern, with the largest larvae gen-
erally occurring closer to the coast than the smaller.
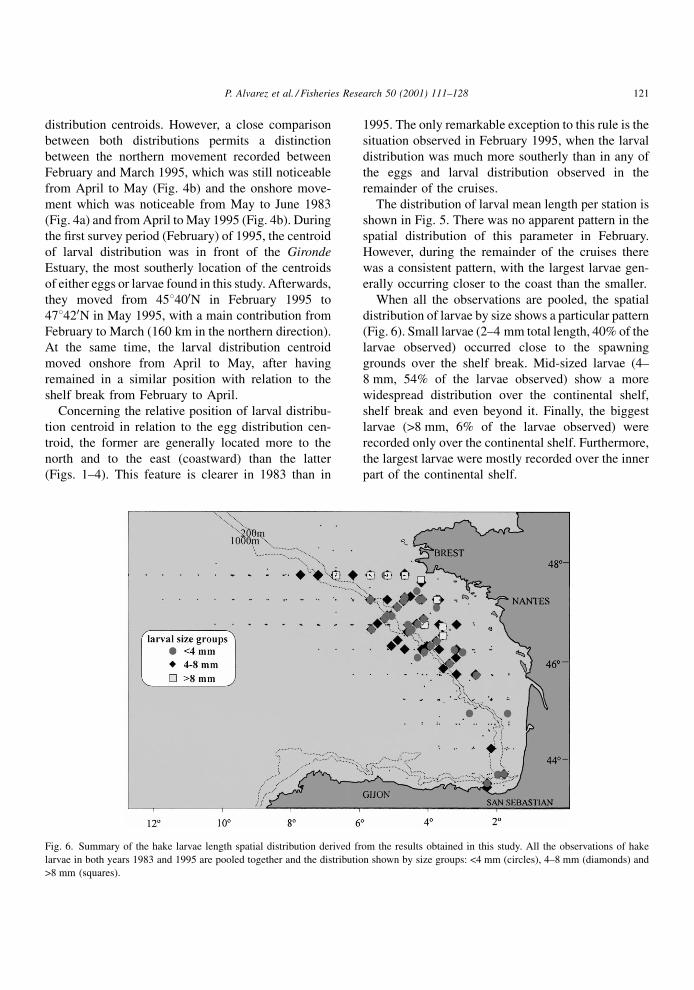
When all the observations are pooled, the spatial
distribution of larvae by size shows a particular pattern
(Fig. 6). Small larvae (2±4 mm total length, 40% of the
larvae observed) occurred close to the spawning
grounds over the shelf break. Mid-sized larvae (4±
8 mm, 54% of the larvae observed) show a more
widespread distribution over the continental shelf,
shelf break and even beyond it. Finally, the biggest
larvae (>8 mm, 6% of the larvae observed) were
recorded only over the continental shelf. Furthermore,
the largest larvae were mostly recorded over the inner
part of the continental shelf.
Fig. 6. Summary of the hake larvae length spatial distribution derived from the results obtained in this study. All the observations of hake
larvae in both years 1983 and 1995 are pooled together and the distribution shown by size groups: <4 mm (circles), 4±8 mm (diamonds) and
>8 mm (squares).
P. Alvarez et al. / Fisheries Research 50 (2001) 111±128 121
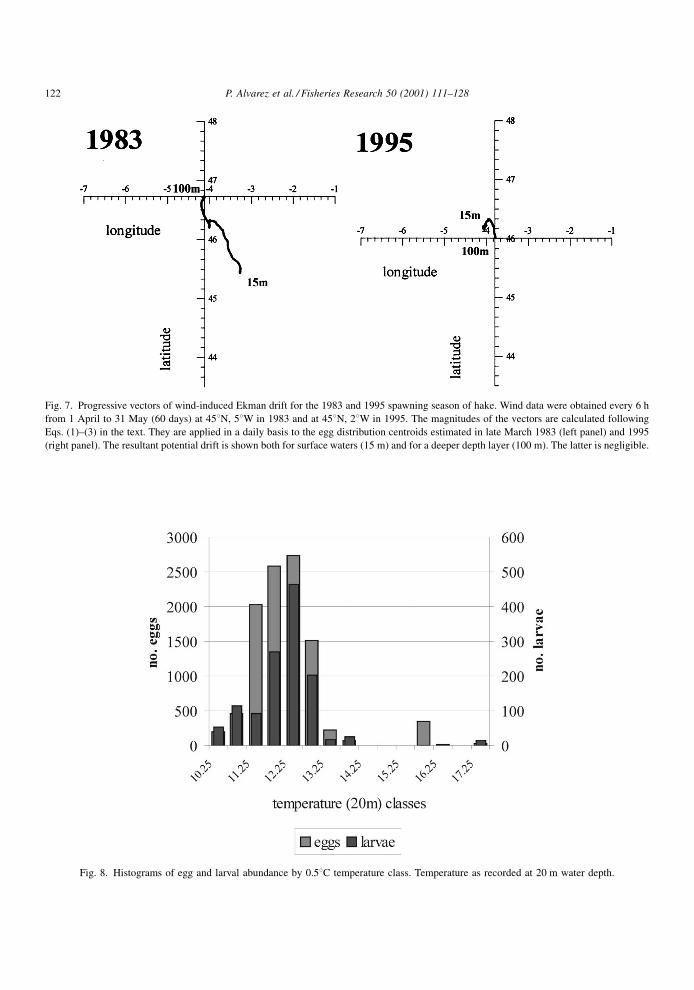
Fig. 7. Progressive vectors of wind-induced Ekman drift for the 1983 and 1995 spawning season of hake. Wind data were obtained every 6 h
from 1 April to 31 May (60 days) at 458N, 58W in 1983 and at 458N, 28W in 1995. The magnitudes of the vectors are calculated following
Eqs. (1)±(3) in the text. They are applied in a daily basis to the egg distribution centroids estimated in late March 1983 (left panel) and 1995
(right panel). The resultant potential drift is shown both for surface waters (15 m) and for a deeper depth layer (100 m). The latter is negligible.
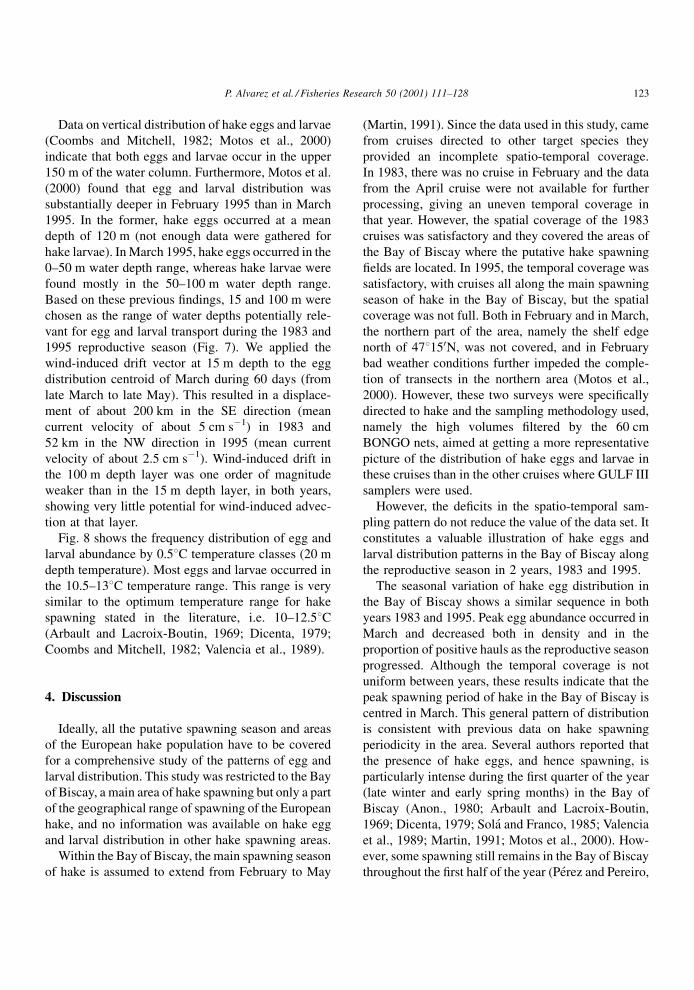
Fig. 8. Histograms of egg and larval abundance by 0.58C temperature class. Temperature as recorded at 20 m water depth.
122 P. Alvarez et al. / Fisheries Research 50 (2001) 111±128
Data on vertical distribution of hake eggs and larvae
(Coombs and Mitchell, 1982; Motos et al., 2000)
indicate that both eggs and larvae occur in the upper
150 m of the water column. Furthermore, Motos et al.
(2000) found that egg and larval distribution was
substantially deeper in February 1995 than in March
1995. In the former, hake eggs occurred at a mean
depth of 120 m (not enough data were gathered for
hake larvae). In March 1995, hake eggs occurred in the
0±50 m water depth range, whereas hake larvae were
found mostly in the 50±100 m water depth range.
Based on these previous ®ndings, 15 and 100 m were
chosen as the range of water depths potentially rele-
vant for egg and larval transport during the 1983 and
1995 reproductive season (Fig. 7). We applied the
wind-induced drift vector at 15 m depth to the egg
distribution centroid of March during 60 days (from
late March to late May). This resulted in a displace-
ment of about 200 km in the SE direction (mean
current velocity of about 5 cm sÿ1) in 1983 and
52 km in the NW direction in 1995 (mean current
velocity of about 2.5 cm sÿ1). Wind-induced drift in
the 100 m depth layer was one order of magnitude
weaker than in the 15 m depth layer, in both years,
showing very little potential for wind-induced advec-
tion at that layer.
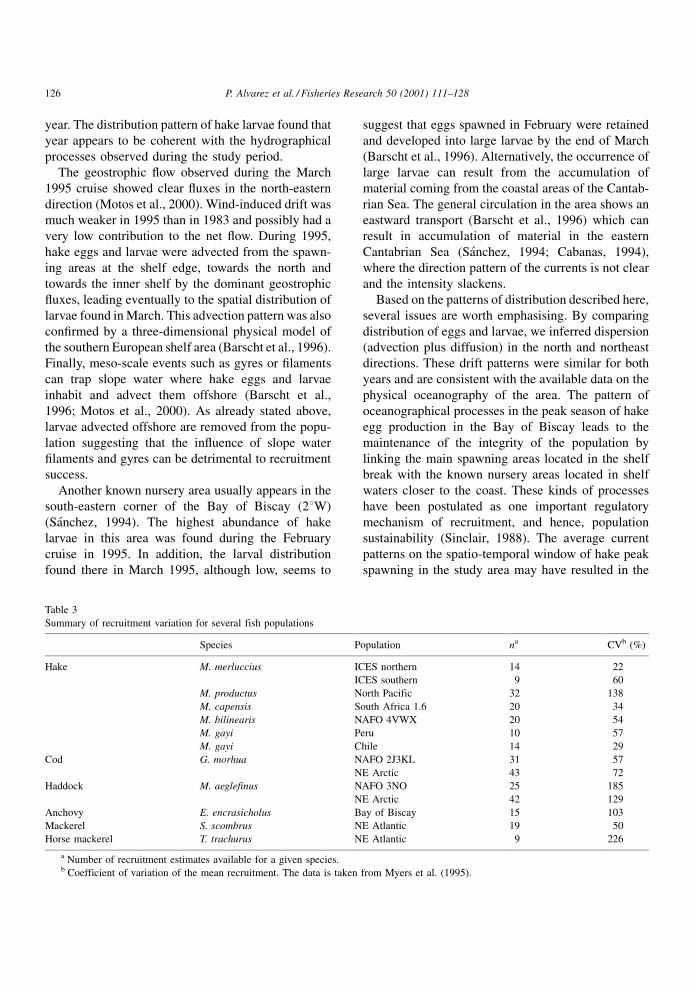
Fig. 8 shows the frequency distribution of egg and
larval abundance by 0.58C temperature classes (20 m
depth temperature). Most eggs and larvae occurred in
the 10.5±138C temperature range. This range is very
similar to the optimum temperature range for hake
spawning stated in the literature, i.e. 10±12.58C(Arbault and Lacroix-Boutin, 1969; Dicenta, 1979;
Coombs and Mitchell, 1982; Valencia et al., 1989).
4. Discussion
Ideally, all the putative spawning season and areas
of the European hake population have to be covered
for a comprehensive study of the patterns of egg and
larval distribution. This study was restricted to the Bay
of Biscay, a main area of hake spawning but only a part
of the geographical range of spawning of the European
hake, and no information was available on hake egg
and larval distribution in other hake spawning areas.
Within the Bay of Biscay, the main spawning season
of hake is assumed to extend from February to May
(Martin, 1991). Since the data used in this study, came
from cruises directed to other target species they
provided an incomplete spatio-temporal coverage.
In 1983, there was no cruise in February and the data
from the April cruise were not available for further
processing, giving an uneven temporal coverage in
that year. However, the spatial coverage of the 1983
cruises was satisfactory and they covered the areas of
the Bay of Biscay where the putative hake spawning
®elds are located. In 1995, the temporal coverage was
satisfactory, with cruises all along the main spawning
season of hake in the Bay of Biscay, but the spatial
coverage was not full. Both in February and in March,
the northern part of the area, namely the shelf edge
north of 478150N, was not covered, and in February
bad weather conditions further impeded the comple-
tion of transects in the northern area (Motos et al.,
2000). However, these two surveys were speci®cally
directed to hake and the sampling methodology used,
namely the high volumes ®ltered by the 60 cm
BONGO nets, aimed at getting a more representative
picture of the distribution of hake eggs and larvae in
these cruises than in the other cruises where GULF III
samplers were used.
However, the de®cits in the spatio-temporal sam-
pling pattern do not reduce the value of the data set. It
constitutes a valuable illustration of hake eggs and
larval distribution patterns in the Bay of Biscay along
the reproductive season in 2 years, 1983 and 1995.
The seasonal variation of hake egg distribution in
the Bay of Biscay shows a similar sequence in both
years 1983 and 1995. Peak egg abundance occurred in
March and decreased both in density and in the
proportion of positive hauls as the reproductive season
progressed. Although the temporal coverage is not
uniform between years, these results indicate that the
peak spawning period of hake in the Bay of Biscay is
centred in March. This general pattern of distribution
is consistent with previous data on hake spawning
periodicity in the area. Several authors reported that
the presence of hake eggs, and hence spawning, is
particularly intense during the ®rst quarter of the year
(late winter and early spring months) in the Bay of
Biscay (Anon., 1980; Arbault and Lacroix-Boutin,
1969; Dicenta, 1979; Sola and Franco, 1985; Valencia
et al., 1989; Martin, 1991; Motos et al., 2000). How-
ever, some spawning still remains in the Bay of Biscay
throughout the ®rst half of the year (PeÂrez and Pereiro,
P. Alvarez et al. / Fisheries Research 50 (2001) 111±128 123
1985; Martin, 1991) as con®rmed by the presence of
hake eggs in June both in 1983 and in 1995, although
in very low abundance.
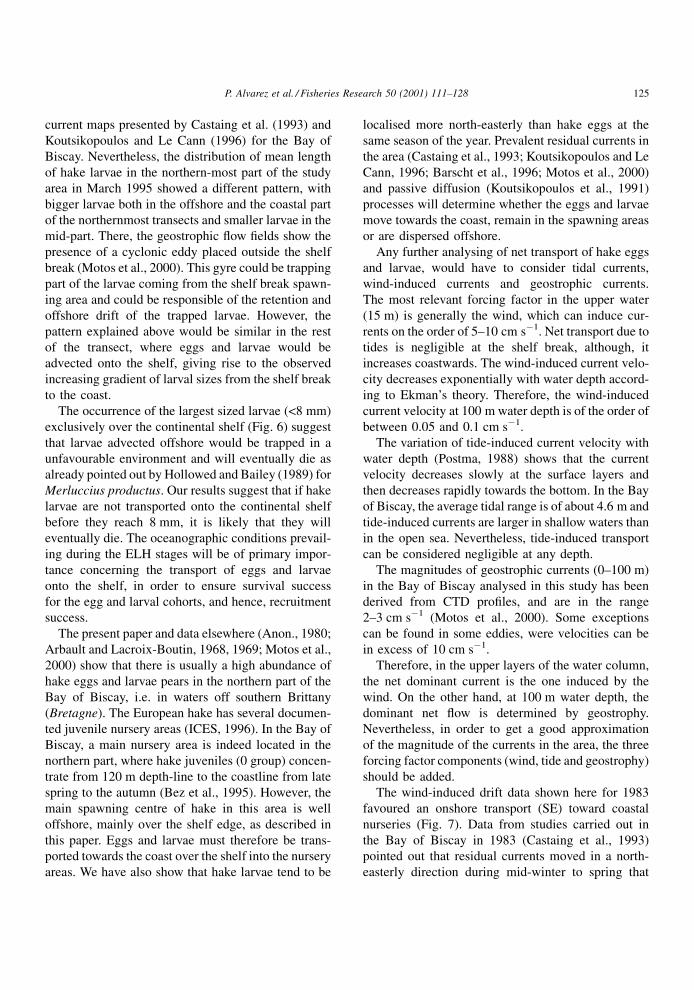
In quantitative terms and regarding the maximum
abundance period (March), our results show that hake
eggs in 1983 were about twice as abundant as in 1995
(Motos et al., 1997). This decrease in egg abundance is
consistent with the general decline in hake population
abundance recorded in the same period (ICES, 1996).
Concerning the spatial distribution of spawning, the
differences in spatial coverage in the different sam-
pling periods should be taken into consideration.
However, two aspects can be highlighted. First, the
platform close to the shelf edge appears as a prefer-
ential region for spawning in the months of peak
spawning, i.e. maximum egg abundance occur in
stations close to the 200 m isobath. Second, the shelf
break seems to represent a natural barrier for the
spawning of this species, since eggs are almost absent
in stations located outside the continental shelf.
The seasonal evolution of the distribution of egg
and larval centroids (Table 2 and Figs. 2 and 4), give
some insights about the spatio-temporal pattern of
hake spawning in the Bay of Biscay. An initial, north-
ward movement is followed by a coastward and
eventually southward movement at the end of the
study period. This pattern can be better demonstrated
in 1995, the year with a better coverage. This pattern is
also consistent with the current knowledge of hake
spawning along the North Atlantic coast concerning
the northern displacement of the spawning as the
season progresses (Coombs and Mitchell, 1982; Casey
and Pereiro, 1995; O'Brien and Fives, 1996; Horstman
and Fives, 1994; Fives et al., this issue). Either a
northward migration of the spawners or a maturation
wave going northwards as the season advances can
explain this fact. On the other hand, the observed
movement of the distribution centroids towards the
coast in May and/or June is consistent with the
description of a spawning starting near the shelf break
and extending later in the season towards the con-
tinental shelf (Horstman, 1988; Fives et al., this issue).
However, as mentioned in Section 1, it contradicts the
observations of Arbault and Lacroix-Boutin (1969)
about hake spawning starting close to the coast and
spreading towards deeper waters later in the season.
Spawning time is the result of an adaptive evolu-
tionary process leading to the population sustaining
itself in the long term (Heath, 1992). The northward
movement of spawning shown in this study should be
related to particular hydrographical conditions favour-
ing maturation and spawning. Temperature appears to
be a determinant factor driving the timing Ð both
beginning and duration Ð of the spawning season
(Hoar and Randall, 1988). In the case of hake, this
paper con®rms that the optimum temperature range
for spawning lies between 10 and 12.58C (Fig. 8). This
temperature range is common in Bay of Biscay waters
in the depth range of the hake habitat along the
reproductive season of this species, i.e. from January
to June (Koutsikopoulos and Le Cann, 1996). There-
fore, the observed displacement of the spawning areas,
although within the temperature range mentioned
above, has to be related to other factors (Valencia
et al., 1989). These authors suggested that vertical
homogeneity and the winter peak of the phytoplankton
cycle were environmental factors related to hake
spawning. In more northern latitudes the spawning
period of hake is located in late spring, early summer
months (O'Brien and Fives, 1996; Horstman and
Fives, 1994), coinciding with water temperature Ð
or related hydrological conditions Ð close to the
optimum range.
For both eggs and larvae the position of the dis-
tribution centroids in the highest abundance month,
i.e. March, indicated that in 1983 the spawning centres
were displaced to the north earlier than in 1995 (78 km
for eggs, and 48 km for larvae) (Fig. 3). Horstman and
Fives (1994), observed an earlier spawning of hake
and other species in the Celtic Sea and West Irish
waters in 1983 and suggested an earlier warming up of
sea water that year as the factor giving rise to early
spawning.
The distribution of larvae was similar in both years.
It was widespread all along the study area during the
two ®rst period intervals (February and March) and
concentrated in the north-eastern corner of the Bay of
Biscay in April and May, giving evidences of a north-
easterly movement of larvae as indicated above.
The spatial distribution of average length of hake
larvae (Fig. 5) shows a size gradient in the east±west
direction. With some exceptions, the largest larvae
appear generally in those stations closer to the coast.
Again, this suggests a coastward displacement of the
larvae from the main spawning areas close to the shelf
break, which is consistent with general residual
124 P. Alvarez et al. / Fisheries Research 50 (2001) 111±128
current maps presented by Castaing et al. (1993) and
Koutsikopoulos and Le Cann (1996) for the Bay of
Biscay. Nevertheless, the distribution of mean length
of hake larvae in the northern-most part of the study
area in March 1995 showed a different pattern, with
bigger larvae both in the offshore and the coastal part
of the northernmost transects and smaller larvae in the
mid-part. There, the geostrophic ¯ow ®elds show the
presence of a cyclonic eddy placed outside the shelf
break (Motos et al., 2000). This gyre could be trapping
part of the larvae coming from the shelf break spawn-
ing area and could be responsible of the retention and
offshore drift of the trapped larvae. However, the
pattern explained above would be similar in the rest
of the transect, where eggs and larvae would be
advected onto the shelf, giving rise to the observed
increasing gradient of larval sizes from the shelf break
to the coast.
The occurrence of the largest sized larvae (<8 mm)
exclusively over the continental shelf (Fig. 6) suggest
that larvae advected offshore would be trapped in a
unfavourable environment and will eventually die as
already pointed out by Hollowed and Bailey (1989) for
Merluccius productus. Our results suggest that if hake
larvae are not transported onto the continental shelf
before they reach 8 mm, it is likely that they will
eventually die. The oceanographic conditions prevail-
ing during the ELH stages will be of primary impor-
tance concerning the transport of eggs and larvae
onto the shelf, in order to ensure survival success
for the egg and larval cohorts, and hence, recruitment
success.
The present paper and data elsewhere (Anon., 1980;
Arbault and Lacroix-Boutin, 1968, 1969; Motos et al.,
2000) show that there is usually a high abundance of
hake eggs and larvae pears in the northern part of the
Bay of Biscay, i.e. in waters off southern Brittany
(Bretagne). The European hake has several documen-
ted juvenile nursery areas (ICES, 1996). In the Bay of
Biscay, a main nursery area is indeed located in the
northern part, where hake juveniles (0 group) concen-
trate from 120 m depth-line to the coastline from late
spring to the autumn (Bez et al., 1995). However, the
main spawning centre of hake in this area is well
offshore, mainly over the shelf edge, as described in
this paper. Eggs and larvae must therefore be trans-
ported towards the coast over the shelf into the nursery
areas. We have also show that hake larvae tend to be
localised more north-easterly than hake eggs at the
same season of the year. Prevalent residual currents in
the area (Castaing et al., 1993; Koutsikopoulos and Le
Cann, 1996; Barscht et al., 1996; Motos et al., 2000)
and passive diffusion (Koutsikopoulos et al., 1991)
processes will determine whether the eggs and larvae
move towards the coast, remain in the spawning areas
or are dispersed offshore.
Any further analysing of net transport of hake eggs
and larvae, would have to consider tidal currents,
wind-induced currents and geostrophic currents.
The most relevant forcing factor in the upper water
(15 m) is generally the wind, which can induce cur-
rents on the order of 5±10 cm sÿ1. Net transport due to
tides is negligible at the shelf break, although, it
increases coastwards. The wind-induced current velo-
city decreases exponentially with water depth accord-
ing to Ekman's theory. Therefore, the wind-induced
current velocity at 100 m water depth is of the order of
between 0.05 and 0.1 cm sÿ1.
The variation of tide-induced current velocity with
water depth (Postma, 1988) shows that the current
velocity decreases slowly at the surface layers and
then decreases rapidly towards the bottom. In the Bay
of Biscay, the average tidal range is of about 4.6 m and
tide-induced currents are larger in shallow waters than
in the open sea. Nevertheless, tide-induced transport
can be considered negligible at any depth.
The magnitudes of geostrophic currents (0±100 m)
in the Bay of Biscay analysed in this study has been
derived from CTD pro®les, and are in the range
2±3 cm sÿ1 (Motos et al., 2000). Some exceptions
can be found in some eddies, were velocities can be
in excess of 10 cm sÿ1.
Therefore, in the upper layers of the water column,
the net dominant current is the one induced by the
wind. On the other hand, at 100 m water depth, the
dominant net ¯ow is determined by geostrophy.
Nevertheless, in order to get a good approximation
of the magnitude of the currents in the area, the three
forcing factor components (wind, tide and geostrophy)
should be added.
The wind-induced drift data shown here for 1983
favoured an onshore transport (SE) toward coastal
nurseries (Fig. 7). Data from studies carried out in
the Bay of Biscay in 1983 (Castaing et al., 1993)
pointed out that residual currents moved in a north-
easterly direction during mid-winter to spring that
P. Alvarez et al. / Fisheries Research 50 (2001) 111±128 125
year. The distribution pattern of hake larvae found that
year appears to be coherent with the hydrographical
processes observed during the study period.
The geostrophic ¯ow observed during the March
1995 cruise showed clear ¯uxes in the north-eastern
direction (Motos et al., 2000). Wind-induced drift was
much weaker in 1995 than in 1983 and possibly had a
very low contribution to the net ¯ow. During 1995,
hake eggs and larvae were advected from the spawn-
ing areas at the shelf edge, towards the north and
towards the inner shelf by the dominant geostrophic
¯uxes, leading eventually to the spatial distribution of
larvae found in March. This advection pattern was also
con®rmed by a three-dimensional physical model of
the southern European shelf area (Barscht et al., 1996).
Finally, meso-scale events such as gyres or ®laments
can trap slope water where hake eggs and larvae
inhabit and advect them offshore (Barscht et al.,
1996; Motos et al., 2000). As already stated above,
larvae advected offshore are removed from the popu-
lation suggesting that the in¯uence of slope water
®laments and gyres can be detrimental to recruitment
success.
Another known nursery area usually appears in the
south-eastern corner of the Bay of Biscay (28W)
(SaÂnchez, 1994). The highest abundance of hake
larvae in this area was found during the February
cruise in 1995. In addition, the larval distribution
found there in March 1995, although low, seems to
suggest that eggs spawned in February were retained
and developed into large larvae by the end of March
(Barscht et al., 1996). Alternatively, the occurrence of
large larvae can result from the accumulation of
material coming from the coastal areas of the Cantab-
rian Sea. The general circulation in the area shows an
eastward transport (Barscht et al., 1996) which can
result in accumulation of material in the eastern
Cantabrian Sea (SaÂnchez, 1994; Cabanas, 1994),
where the direction pattern of the currents is not clear
and the intensity slackens.
Based on the patterns of distribution described here,
several issues are worth emphasising. By comparing
distribution of eggs and larvae, we inferred dispersion
(advection plus diffusion) in the north and northeast
directions. These drift patterns were similar for both
years and are consistent with the available data on the
physical oceanography of the area. The pattern of
oceanographical processes in the peak season of hake
egg production in the Bay of Biscay leads to the
maintenance of the integrity of the population by
linking the main spawning areas located in the shelf
break with the known nursery areas located in shelf
waters closer to the coast. These kinds of processes
have been postulated as one important regulatory
mechanism of recruitment, and hence, population
sustainability (Sinclair, 1988). The average current
patterns on the spatio-temporal window of hake peak
spawning in the study area may have resulted in the
Table 3
Summary of recruitment variation for several fish populations
Species Population na CVb (%)
Hake M. merluccius ICES northern 14 22
ICES southern 9 60
M. productus North Pacific 32 138
M. capensis South Africa 1.6 20 34
M. bilinearis NAFO 4VWX 20 54
M. gayi Peru 10 57
M. gayi Chile 14 29
Cod G. morhua NAFO 2J3KL 31 57
NE Arctic 43 72
Haddock M. aeglefinus NAFO 3NO 25 185
NE Arctic 42 129
Anchovy E. encrasicholus Bay of Biscay 15 103
Mackerel S. scombrus NE Atlantic 19 50
Horse mackerel T. trachurus NE Atlantic 9 226
a Number of recruitment estimates available for a given species.b Coefficient of variation of the mean recruitment. The data is taken from Myers et al. (1995).
126 P. Alvarez et al. / Fisheries Research 50 (2001) 111±128
evolution of reproductive patterns such that hake
spawn in winter and early spring months when
onshore transport prevails in northern Biscay waters.
Hake recruitment shows rather low variability when
compared with other ®sh species. Table 3 shows the
coef®cients of variation (CV) of recruitment for a
series of populations (Myers et al., 1995). The CV
of hake recruitment of the northern population unit in
the ICES area, was 20%, one of the lowest in ®sh
populations. This suggests that the pattern of hake
recruitment described above is consistent year after
year and leads to a relatively low variation in recruit-
ment success in the long term.
Based on the pattern of egg and larval distribution
described here, we inferred advection processes in
particular directions. The drift patterns were compa-
tible with the physical oceanography of the area.
These results re-inforce the need for a good knowledge
of the fundamental physical processes so as to under-
stand better the complex physical/biological interac-
tions in¯uencing recruitment of marine populations
(Sinclair, 1988; Kendall and Picquelle, 1989; Francis
et al., 1989; Heath, 1992; Koutsikopoulos and Le
Cann, 1996; Motos et al., 2000; ValdeÂs et al., 1996).
Acknowledgements
The results presented in this study were obtained
within the European Union SEFOS project (contract
AIR2-CT93-1105). SEFOS is the acronym for Shelf
Edge Fisheries and Oceanography Studies. The
authors very much appreciate the bene®ts of the
contrast of opinions with the various colleagues
involved in the SEFOS project.
Ichthyoplankton samples were provided by MAFF
Fisheries Laboratory (Lowestof, UK) SOAFD Marine
Laboratory (Aberdeen, Scoland) and RIVO-DLO
(Ijmuiden, the Netherlands). Inmaculada MartõÂn and
InÄaki Rico (AZTI) carried out the sample sorting
work.
References
Alcazar, J., Carrasco, J., Llera, E., Menendez, M., Ortega, J.,
Vizcaino, A., 1983. BiologõÂa dinaÂmica y pesca de la merluza en
Asturias. Recursos Pesqueros de Asturias 3.
Anon., 1980. CampanÄa `̀ Plataforma CantaÂbrica''. Informe, pp. 1±54.
Arbault, S., Lacroix-Boutin, N., 1968. Ichthyoplancton oeufs et
larves de poissons teleosteÂens dans le Golfe de Gascogne en
1964. Revue Trav. Inst. Scient.Tech. PeÃch. Marit. 32, 413±476.
Arbault, S., Lacroix-Boutin, N., 1969. Epoques et aires de ponte de
poissons teleosteÂens du le Golfe de Gascongne en 1965±1966
(oeufs et larves). Rev. Trav. Inst. PeÃch. Marit. 33 (2), 181±202.
Bailey, K.M., 1982. The early life history of the Pacific hake,
Merluccius productus. Fish. Bull. 80 (3), 589±598.
Bakun, A., 1973. Coastal upwelling indices west coast of North
America, 1946±71. Technical Report, NMFS SSRF-671. US
Department of Commerce, NOOA, 103 pp.
Barscht, J., Lavin, A., Motos, L., 1996. A numerical model system
of the region around the Iberian peninsula: model validation
and application to hake larvae drift in the Bay of Biscay. ICES
C.M. 1996/S7.
Bez, N., Rivoirard, J., Poulard, J.Ch., 1995. Approche transitive et
densiteÂs de poissons. Cahiers de GeÂostatistique 5, 1995.
Borja, A., Uriarte, A., Valencia, V., Motos, L., Uriarte, A., 1996.
Relationships between anchovy (Engraulis encrasicolus) re-
cruitment and the environment in the Bay of Biscay. Sci. Mar.
60 (Suppl. 2), pp. 179±192.
Cabanas, J.M., 1994. CaracterõÂsticas oceanograÂficas de la plata-
forma continental atlaÂntica de la PenõÂnsula IbeÂrica y su posible
relacioÂn con la distribucioÂn de la merluza. In: GonzaÂlez-GarceÂs
y, A., Pereiro, F.J. (Eds.), Jornadas Sobre el Estado Actual delos
Conocimientos de las Poblaciones de Merluza que Habitan la
Plataforma Continental AtlaÂntica y MediterraÂnea de la UnioÂn
Europea con Especial AtencioÂn a la PenõÂnsula IbeÂrica.
PublicacioÂn Privada, pp. 81±90.
Casey, J., Pereiro, J., 1995. European hake (M. Merluccius) in the
Northeast Atlantic. In: Alheit, J., Pitcher, T.J. (Eds.), Hake,
Fisheries, Ecology and Markets. Chapman & Hall, London, 1995.
Castaing, P., Froidefond, J.-M, Durand, F., 1993. Courantologie de
deÂrive (systeÁme argos) dans le Golfe de Gascogne en relation
avec L'imagerie satellitaire. Actes du IIIe Colloque interna-
tional `̀ Oceanographie du Golfe de Gascogne'', pp. 13±18.
Clark, R.S., 1920. The pelagic young and early bottom stages of
teleosteans. J. Mar. Biol. Assoc. UK 12, 152±240.
Coombs, S.H., Mitchell, C.E., 1982. The development rate of eggs
and larvae of the hake, Merluccius merluccius (L.) and their
distribution to the west of the British Isles. L. Cons. Int. Explor.
Mer. 40, 119±126.
Dicenta, A., 1979. AportacioÂn al conocimiento del ictioplancton de
la costa vasca. Bol. Inst. Esp. Oceanog. 1 (2), 94±195.
Francis, R.C., Adlerstein, A., Hollowed, A., 1989. Importance of
environmental fluctuations in the management of Pacific hake
(Merluccius productus). In: Beamish, R.J., McFarlane, G.A.
(Eds.), Effects of Ocean Variability on Recruitment and an
Evaluation of Parameters Used in Stock Assessment Models.
Can. Spec. Publ. Fish. Aquat. Sci. 108, 51±56.
Heath, M.R., 1992. Field investigations on the early life stages of
marine fish. Adv. Mar. Biol. 28, 1±33.
Hickling, C.F., 1930. The natural history of the hake. Part III.
Seasonal changes in the condition of the hake. Fishery
Investigations of Ministry of Agriculture and Fisheries. Series
II, Vol. XII, No. 1.
P. Alvarez et al. / Fisheries Research 50 (2001) 111±128 127
Hoar, W.S., Randall, D.J. (Eds.) 1988. The Physiology of
Developing Fish. Part A: Eggs and Larvae. Fish Physiology,
Vol. 11. Academic Press, London, 1969, 546 pp.
Hollowed, A.B., 1992. Spatial and temporal distribution of pacific
hake Merluccius productus, larvae and estimates of survival
during early life stages. CalCOFI Rep. 33, 100±123.
Hollowed, A.B., Bailey, K.M., 1989. New perspectives on the
relationships between recruitment of Pacific hake (Merluccius
productus) in the ocean environment. In: Beamish, R.J.,
McFarlane, G.A. (Eds.), Effects of Ocean Variability on
Recruitment and an Evaluation of Parameters Used in Stock
Assessment Models. Can. Spec. Public. Fish. Aquat. Sci. 108,
207±220.
Horstman, R.K., 1988. An investigation of the larval and postlarval
fish community of the Celtic Sea, with special emphasis on the
demographics of Larval Mackerel (Scomber scombrus). Thesis
Doctoral. Department of Zoology, University College Galway,
Galway.
Horstman, R.K., Fives, J.M., 1994. Ichthyoplankton distribution
and abundance in the Celtic Sea. ICES J. Mar. Sci. 51, 447±
460.
ICES, 1980. Report of the working group on assessment of hake
stocks. Mimeo, ICES C.M. 1981/G:11, 59 pp.
ICES, 1994. Report of the Mackerel/Horse Mackerel egg
production workshop. ICES C.M. 1994/H:4.
ICES, 1996. Report of the working group on the assessment of
Southern shelf Demersal stocks. ICES C.M. 1996/Assess:5.
Kendall, A.W., Picquelle, S.J., 1989. Egg and larva distributions of
walleye pollock Theragra chalcogramma in Shelikof Strait,
Gulf of Alaska. Fish. Bull. US 88, 133±154.
Kvenseth, P.G., Skiftesvik, B., Slinde, E., 1996. Hake-next to be
farmed. In: Proceedings of the 1996 CalCOFI Symposium,
Monterrey, CA.
Koutsikopoulos, C., Lacroix, N., 1992. Distribution and abundance
of sole (Solea solea (L.)) eggs and larvae in the Bay of Biscay
between 1986 and 1989. Neth. J. Sea Res. 29 (1±3), 81±91.
Koutsikopoulos, C., Le Cann, B., 1996. Physical processes and
hydrological structures related to the Bay of Biscay Anchovy.
Sci. Mar. 60, 9±19.
Koutsikopoulos, C., Fortier, L., Gagne, J.A., 1991. Cross-shelf
dispersion of Dover sole (Solea solea) eggs and larvae in
Biscay Bay and recruitment to inshore nurseries. J. Plank. Res.
13 (5), 923±945.
Laevastu, T., Hayes, M.L., 1981. Fisheries Oceanography and
Ecology, 3rd Edition. Fishing New Books, Oxford, 1985.
Martin, I., 1991. A preliminary analysis of some biological aspects
of hake (Merluccius merluccius L. 1758) in the Bay of Biscay.
ICES C.M. 1991/G:54.
Mcgowan, J.A., Brown, D.M., 1966. A new opening closing paired
zooplankton net. Scripps Inst. Ocean. Ref. 66-23, 54 pp.
Motos, L., Alvarez, P., Murua, H., Lucio, P., 1997. Egg production
hake biomass in ICES divisions VIIIa,b 1995 in comparison
with 1983. ICES C.M. 1997/U:12.
Motos, L., Alvarez, P., Uriarte, A., 2000. Distribution pattern of
hake (Merluccius merluccius (L.)) eggs and larvae in relation to
environmental conditions in the Bay of Biscay in winter and
early spring. Ozeanografika 3, 273±292.
Myers, R., Bridson, J., Barrowman, N.J., 1995. Summary of
worldwide spawner and recruitment data. Can. Tech. Rep. Fish.
Aquat. Sci. 2024; iv � 327 pp.
O'Brien, B., 1986. The distribution and community structure of
larval and postlarval fish and chaetognaths off the West Coast
of Ireland. Thesis Doctoral. Department of Zoology, University
College Galway, Galway.
O'Brien, B., Fives, J., 1996. Ichthyoplankton distribution and
abundance off the west coast of Ireland, 1994. ICES J. Mar. Sci.
52, 233±245.
PeÂrez, N., Pereiro, F.J., 1985. Aspectos de la reproduccioÂn de la
merluza (Merluccius merluccius L.) de la plataforme gallega y
cantaÂbrica. Biol. Inst. Oceanogr. 2 (3), 39±47.
Pingree, R.D., Le Cann, B., 1990. Structure, strength and
seasonally of the slope currents in the Bay of Biscay region.
J. Mar. Biol. Assoc. UK 70, 857±885.
Pond, S., Pickard, L., 1983. Introductory Dynamical Oceanogra-
phy, 2nd Edtion. Pergamon Press, Oxford.
Postma, H., 1988. Physical and chemical oceanography aspects. In:
Postma, H., Zijlstra, J.J. (Eds.), Continental Shelves. Ecosys-
tems of the World, Vol. 27. Elsevier, New York, pp. 39±99.
SaÂnchez, F., 1994. Patrones de distribucioÂn y abundancia de la
merluza en aguas de la plataforma norte de la PenõÂnsula IbeÂrica.
In: GonzaÂlez-GarceÂs, A., y Pereiro, F.J. (Eds.), Jornadas Sobre
el Estado Actual delos Conocimientos de las Poblaciones de
Merluza que Habitan la Plataforma Continental AtlaÂntica y
MediterraÂnea de la UnioÂn Europea con Especial AtencioÂn a la
PenõÂnsula IbeÂrica. PublicacioÂn Privada, pp. 255±279.
Sarano, F., 1983. La reproduction du merlu (Merluccius merluccius
L.). cycle ovarien et fecondite-cycke sexuel de la population du
Golfe de Gascogne. Tese de Docteur de 3e cycle Ð Universite
de Poitiers Ð Institut et Technique des Peches Maritimes Ð La
Rochelle. In: GonzaÂlez-GarceÂs, A., y Pereiro, F.J., (Eds.),
Jornadas Sobre el Estado Actual delos Conocimientos de las
Poblaciones de Merluza que Habitan la Plataforma Continental
AtlaÂntica y MediterraÂnea de la UnioÂn Europea con Especial
AtencioÂn a la PenõÂnsula IbeÂrica. PublicacioÂn Privada, pp. 81±90.
Sinclair, M., 1988. Marine Populations: An Essay on Population
Regulation and Speciation. University of Washington Press,
Seattle, WA.
Smith, P.E., Richardson, S.L., 1977. Standard techniques for
pelagic fish eggs and larval survey. FAO Fisheries Technical
Paper No. 175, 100 pp.
Sokal, R.R., Rholf, F., 1980. IntroduccioÂn a la BioestadõÂstica.
Barcelona: Editorial ReverteÂ. Serie de BiologõÂa Fundamental,
1980.
SolaÂ, A., Franco, C., 1985. ContribucioÂn al estudio de ictioplancton
de especies de intereÂs comercial de la plataforma cantaÂbrica.
Bol. Esp. Oceanog. 2 (3), 1±14.
ValdeÂs, L., Lago de LanzoÂs, A., SolaÂ, A., Franco, C., Sanchez, P.,
Alvarez, P., 1996. Hake, Mackerel and horse mackerel
distribution of eggs and larvae in relation to geostrophic
circulation in the Bay of Biscay. ICES C.M. 1996/s:16.
Valencia, V., Motos, L., Urrutia, J., 1989. Estudio de la variacioÂn
temporal de la hidrografia y el plancton en la zona neritica
frente a San Sebastian. Informes TeÂcnicos del Dpto. de
Agricultura y Pesca del Gobierno Vasco, 80 pp.
128 P. Alvarez et al. / Fisheries Research 50 (2001) 111±128