sociocultural risk factors of non-insulin dependent diabetes
252
SOCIOCULTURAL RISK FACTORS OF NON-INSULIN DEPENDENT DIABETES MELLITUS AMONG MIDDLE CLASS AFRICAN AMERICANS IN CENTRAL OHIO DISSERTATION Presented in Partial Fulfillment of the Requirements for the Degree of Doctor of Philosophy in the Graduate School of The Ohio State University By Jacquelyn Patricia Price Robinson, M.A. ***** The Ohio State University 2003 Dissertation Committee: Dr. Douglas E. Crews, Advisor Approved by Dr. Patrick Mullen _______________________ Department of Anthropology Dr.William Hicks
-
Upload
khangminh22 -
Category
Documents
-
view
1 -
download
0
Transcript of sociocultural risk factors of non-insulin dependent diabetes

SOCIOCULTURAL RISK FACTORS OF NON-INSULIN DEPENDENT DIABETES MELLITUS AMONG MIDDLE CLASS AFRICAN AMERICANS IN CENTRAL
OHIO
DISSERTATION
Presented in Partial Fulfillment of the Requirements
for the Degree of Doctor of Philosophy in the Graduate
School of The Ohio State University
By
Jacquelyn Patricia Price Robinson, M.A.
*****
The Ohio State University
2003
Dissertation Committee: Dr. Douglas E. Crews, Advisor Approved by Dr. Patrick Mullen _______________________ Department of Anthropology Dr.William Hicks

Copyright© by
Jacquelyn Patricia Price Robinson
2003

ABSTRACT
Slavery, as an innovation in human cultural development, not only caused disequilibria
in culture, ecology and biology, but also produced by-products that affect health and
mortality and stimulated selection for metabolic adjustment to health and environmental
imbalances. That the adjustment may have programmed slaves' descendants to the
present type II diabetes epidemic, forms the basis for this dissertation. Its purpose is to
develop an etiology of diabetes that uses a global structural analysis of folklore,
biohistory, and socio-political hegemony for interpreting anthropometry and sociocultural
variables that may contribute to type II diabetes.
Statistical analyses suggested: obesity and anthropometry predict plasma glucose; the
influence of sociocultural risk factors on the dependent variable is minimal; and the
relationship between total dietary cholesterol and post-load glucose is highly significant.
The cholesterol/post-load glucose relationship has important implications. Global
structural analysis provides confirmatory evidence that "master's" manipulation of slaves'
diets by adding fats to increase energy for maximum labor output, has impacted the
dietary habits and soul food cuisine of slaves' descendants today as social inheritance.
Analysis of data from the Central Ohio Study of Diabetes and Aging (COSDA) and
global structure resulted in development of a diabetes profile, the Anabolic-Catabolic-
Homeostasis Etiology of Diabetes Mellitus (ACHED). It focuses on energy metabolism
under-cum-deficient nutrition, excesses in energy dissipation, morbidity, life stresses, and
and selection of "high-performance genotypes", those adjusted to prolonged catabolism,
ii

fat consumption. Analysis of environmental disequilibria experienced by slaves and their
descendants show two periods of intergenerational food scarcity, one was prolonged and
followed by another shorter and more severe. These periods occurred with excessive
morbidity, life stresses, energy output and fat consumption as precursors to type II
and overweight but can’t maintain metabolic homeostasis following food scarcity
periods.
diabetes when obesity prone “high-performance genotypes” become physically inactive
iii

This Dissertation is dedicated to
My parents,
Mr. Arthur Paul and Mrs. Georgia Mae Price
Who did not live to see me complete the doctorate degree.
iv

ACKNOWLEDGMENTS
This dissertation could not have been completed without a support network of friends,
colleagues, professors, and family. I am deeply grateful to Drs. Esther J. Pressel, Robert
Theodoratus and James Hansen, all professors at Colorado State University whose
encouragement, support, friendship and love enabled me to endure and rise above the
turbulent desegregation there, and whose support continued through my doctoral studies.
I especially thank Esther for organizing the anthropology faculty there to help me locate
articles by Neel, Williams and others.
I am especially thankful to Dr. Ojo Arewa, my first advisor at The Ohio State
University, who delayed his retirement to advise me. He has been my lighthouse as I
sailed the seas of doctoral studies. Words will never express my gratitude for the
opportunity, kindness and support he bestowed upon me.
I am grateful to Dr. Patrick Mullen who taught me that folklore scholarship
exceeds the laughter of some folktales and jokes. Dr. Mullen is never too busy to help,
encourage and quickly respond to his students' needs. I thank him for his compassion,
I thank Dr. Douglas Crews, my second advisor, for his unwavering persistence.
His efforts resulted in me studying African Americans when I wanted to avoid the pain of
advise, guidance, encouragement, character qualities, professionalism, and altruism.
v

past atrocities. Because of him, I can address minority health disparities with confidence
and authority. I benefit tremendously from his editorial skills.
The conscious benefits by Dr. William Hicks resulted in the completion of this
work. His expression that findings of this study are logical and consistent with medical
knowledge and African American experiences were very encouraging. His compassion,
propriety, professionalism and scholarship took me over the top.
I could not have pursued the doctorate without a dependable network of social
support. I am deeply appreciative of Reverend Leroy “Poppy” and Mrs. Virginia Stills,
my dear friends, surrogate parents and my children’s surrogate grandparents, for their
encouragement, assistance, and love. Their Christian fellowship, Bible studies, and meals
provided the foundation for this dissertation. Dr. Alfred and Mrs. Mary Jenkins, my dear
friends, were always there to provide medical assistance and knowledge, to share social
activities, holidays and meals with my family. Dr. Charles and Mrs. Gwyneth Russell
helped me get through difficult times. Chuck took time from the Emergency Room to talk
to me and E-mailed jokes that made me laugh. Gwyneth sent floral arrangements with a
dozen orchids that focused my attention on God’s beauty and her kindness. Mr. Sean
Walton, my personal trainer, kept me “fit” and “laughing” during what would have been
physically inactive and obese doctoral studies. Dr. Evelyn Blanche-Payne, my dear friend
and colleague, gave academic and professional guidance, strength, deep faith and
Christian love. She kept saying, “In God’s time,” brought me to closure with this
assignment. The inspiration, and advice of Mrs. Bessie Johns, my long time and dearest
friend, fostered my hope throughout this work. I am especially indebted to Dr. Howard
and Mrs. Ethel Swonigan, my friends and my children’s surrogate grandparents. I cannot
vi

thank Ethel enough for the support she gave me and for the affection, attention, time, and
gifts she gave my children. Her wings of love lifted my sons above childhood illnesses
and brooded them with protection from the misfortunes of being black, adolescent, and
males in a “color line” society.
There are family members who also made this doctorate possible. Dr. Deborah
Jones, my cousin, took time from her psychiatric patients to share her medical books and
knowledge. Her parents, Lt. Col.(ret.) Meyer and Mrs. Delores Stansberry, shared their
home when I was too tired to drive home from Columbus. Dr. Jacinto and Mrs. Karen
Beard, Deborah's sister, also shared their home with me when I needed to rest before
driving to Dayton. Dr. Ames and Mrs. Burnice Chapman, my cousins, helped arrange the
Diabetes Screening at Zion Baptist Church, the church pastored by their son and my
cousin, Reverend Gary Chapman. I am thankful that, Mrs. Beverlyn Price Jorman, my
sister, and Burnice kept telling me, “Finish the Ph.D. degree!” I thank Mr. Brian and Mrs.
Rhonda Phillips-Guy of Atlanta, Georgia, my cousins, for sharing their home, love and
fellowship with my family when Gene, Louis and I visited Paul when he attended Rabun
Gap-Nacoochee School in Rabun Gap, Georgia. I thank them for floral arrangements
that marked each stage of the doctorate with congratulation cards that encouraged me to,
“Continue working with patience.”
My colleagues also help with this dissertation. The deep compassion of Drs. Sue
Mother, then my Father. Their help were soothing currents that lifted me up over
dissertation statistic. I am especially grateful for Dr. Morgan’s gentle urging that kept me
Kopel and Neville N. Morgan pushed me through overwhelming grief after I lost my
writing through tears of grief to complete this dissertation.
vii

I reserve distinct gratitude for my parents, husband and sons. I honor my parents
post-humously for my formal and informal education, Christian training, and
development of my "gifts" that culminated in this dissertation. Mother and Daddy
encouraged me to never give up, and that I could always seek their wisdom, love and
compassion. They are my model of high ethical conduct and esteem. I am deeply grateful
to Eugene Robinson, Esq., my loving husband, for his financial and domestic support in
every phase of this degree completion. To our sons, Louis A. and Paul D. Robinson, who
came to understand that goal achievement meant their Mother could no longer taxi them
to summer and extra curricular activities. I thank them and Eugene for understanding that
my love for them extends far beyond "book knowledge", anthropology, and computers. I
thank the three of you for patiently waiting on the joys and benefits of “life after the
doctorate degree.”
Again, to all with the utmost gratitude, love and appreciation,
“Thank you from the bottom of my heart.”
viii

VITA
November 9,1951 ………………………..Born, Brunswick, Georgia 1970 ………………………………………B.S. Sociology and Anthropology, The
Colorado State University
1972 ………………………………………M.A. Anthropology, The Colorado State University 1972 – 1973 ………………………………Instructor,
Denver Community College Denver, Colorado 1973 – 1979 ……………………………...Assistant Professor
Central State University, Wilberforce, Ohio
1990 – 1995 ……………………………...Assistant Professor Wilberforce University, Wilberforce, Ohio 2002 – present ……………………………Associate Professor Texas College, Tyler, Texas
FIELDS OF STUDY
Major Field: Anthropology
ix

PageAbstract…………………..………………………………………………………iv
Dedication………………………………………………………………….. vi
Acknowledgements………………………………………………………… vii
Vita…………………………………………………………………………. xi
List of Tables………………………………………………………………. xviiList of Figures……………………………………………………………… xxi
Chapters:
1. Introduction
1.1 Non-insulin Dependent Diabetes Mellitus (NIDDM) In African Americans……………………………………………. 1
1.2 Background of the Problem……………………………………… 81.3 Determnants of Adult Disease…………………………………… 8
1.3.1 Lifestyle and Disease……………………………………… 91.3.2 Racial/ethnic Minorities and Lifestyle…………………….. 101.3.3 Transition or Acculturation and Diabetes Mellitus……….. 13
(Type II)1.4 Objectives and Hypothesis……………………………………… 171.5 Statistics…………………………………………………………. 19
2. Sample and Methods
2.1 ResearchDesign………………………………………………….. 212.1.1 Recruitment……………………………………………….. 222.1.2 Study Population…………………………………………. 232.1.3 History of African Americans in Ohio……………………. 23
2.2 Study Samples2.2.1 Sample Selection…………………………………………… 27
292.2.2.1 Wilberforce (Township), Ohio…………………… 29
3234
TABLE OF CONTENTS
2.2.2 City and Township Description……………………………
2.2.2.2 Columbus, Ohio…………………………………..
x
2.2.2.3 Dayton, Ohio……………………………………..

2.3 Data Collection Techiniques……………………………………. 352.3.1 Difficulties Recruiting Participants………………………. 372.3.2 Recruitment………………………………………………. 402.3.3 The Process………………………………………………. 402.3.4 The Research Team………………………………………. 41
2.4 The Order of COSDA Procedures……………………………… 412.4.1 Procedures………………………………………………… 432.4.2 Anthropometry………………………...…………………. 432.4.3 Anthropometeric Indices…………………………………. 472.4.4 Phlebotomy and Glucose Measurements………………… 47
2.5 Sociocultural Assessment………………………………………. 482.6 Construction and Measurement of Sociocultural Risk Factors… 50
2.6.1 Sociocultural Risk Factors: Sociodemographics Index…… 512.6.2 Sociodemographics: Social Era/Age………………………. 512.6.3 Sociodemographics:Sex…………………………………… 512.6.4 Sociodemographics:Income………………………………. 512.6.5 Sociodemographics:Education……………………………. 522.6.6 Sociodemographics:Occupation………………………….. 522.6.7 Sociodemographics:Marital Status……………………….. 52
2.7 Sociocultural Risk Factors: Lifestyle/Stressor Index…………… 542.7.1 Lifestyle/Stressors:Chronic Stressors
or Assimilation Index…………………………………….. 542.7.2 Chronic Stressors or Assimilation Index:
Social Incongruity………………………………………… 552.7.3 Chronic Stressors or Assimilation Index:
Social Support……………………………………………. 572.7.4 Chronic Stressors or Assimilation Index:
Relaxation………………………………………………… 592.8 Lifestyle/Stressors: Acute Stressors……………………………. 60
2.8.1 Acute Stressors: Desegregation…………………………… 602.8.2 Acute Stressors:Victimization……………………………. 622.8.3 Acute Stressors:Reaction to Anger…….…………………. 632.8.4 Acute Stressors: Discrimination…………………….……. 65
2.9 Lifestyle/Stressors: Health Threatening Behavior………………. 662.9.1 Health Threatening Behavior: Tobacco Use………………. 662.9.2 Health Threatening Behavior: Alcoholic Use……………… 672.9.3 Health Threatening Behavior: Exercise or
Physical Activity………………………………………….. 672.10 Lifestyle/Stressors: Dietary Variables…………………………… 672.11 Statistical Analyses……………………………………………… 692.12 Construction of Biomedical Indices……………………………… 69
xi

3. History and Folklore
3.1 Africans and African Americans………………………….. 733.2 Hebrew Folklore………………………………………….. 763.3 Arab Folklore……………………………………………… 783.4 European Folklore………………………………………… 793.5 A Clash or Ethos, Meanings and Cultures………………… 803.6 Europe…………………………………………………….. 833.7 Africa……………………………………………………… 863.8 Sociocultural Factors……………………………………… 96
3.8.1 Lifestyle/Stressors………………………………….. 963.8.2 Acculturation: Acute Stressors……………………… 98
4. Results: Biological and Sociocultural Variables
4.1 Introduction……………………………………………….. 1004.1.1 Descriptive Statistics Summary……………………. 1004.1.2 Anthropometry Results……………………………. 116
4.2 Sociocultural Risk Factors………………………………… 1244.2.1 Introduction………………………………………… 1244.2.2 Sociodemographics…………………………………. 126
4.2.2.1 Sociodemographics: Age/Social Era……. 1264.2.2.2 Sociodemographics: Occupation………. 1284.2.2.3 Sociodemographics: Sex……………….. 1294.2.2.4 Sociodemographics: Marital Status……. 1304.2.2.5 Sociodemographics: Income…………… 130
4.2.3 Lifestyle/Stressors…………………………………. 1314.2.3.1 Desegregation………………………….. 1314.2.3.2 Discrimination…………………………. 1324.2.3.3 Victimization…………………………… 1334.2.3.4 Relaxation……………………………… 1334.2.3.5 Social Congruity……………………….. 1354.2.3.6 Social Support…………………………. 1364.2.3.7 Reaction to Anger……………………… 137
4.2.3 Health Threatening Behavior………………………. 1394.2.4 Dietary Factors…………………………………….. 139
4.3 Analysis of the Sociocultural Index………………………. 1434.4 Summary of Variables in Regression Analyses…………… 145
5. Model for Diabetes
5.1 Anthropometry & Sociocultural Variables…………….…. 147
xii
5.1.1 Anthropemetry…………………………………….. 1475.1.2 Sociocultural Factors……………………………….. 150
6. Discussion and Conclusion
6.1 Review of Results…………………………………………. 1566.2 Folklore, Literature and History………………………….. 1606.3 Sociocultural Index and Hypothesis………………………. 1616.4 Summary of Major Results and Comparison With Other
Studies…………………………………………………….. 1636.4.1 Major Findings……………………………………… 1756.4.2 Type II Diabetes in African Americans……………. 163
6.5 The Model for the Anabolic-Catabolic Homeostasis Etiology of Diabetes Mellitus (ACHED)…………………. 1686.5.1 Type II Diabetes and Obesity in African Americans………………………………………….. 172
6.5.1.1 Anabolism……………………………… 1726.5.1.2 Catabolism……………………………… 1736.5.1.3 Cutural Ecology and Type II Diabetes… 1756.5.1.4 Enviromental Ecology of Type II Diabetes………………………………… 1766.5.1.5 Homestasis…………………………….. 178
6.5.2 Confounders………………………………………… 1786.6 Significance………………………………………………… 1806.7 Conslusion………………………………………………… 185
Biobliography……………………………………………………………..
Appendix A…………………………………………………………….…… 186
Appendix B…………………………………………………………………. 188
xiii
206

Tables Page
2.1 City and Township Population of COSDA Participants…………. 24
2.2 Demographic factors of COSDA participants by organization…… 25
2.3 Distribution of sample by sociocultural factors and assignedvalues for sociodemographics (SD)…………………………………53
2.4 Diet and Health Risks…………………………………………… 70
2.5 Blood Pressure Value Box………………………………………….71
4.1 Descriptive Data for Age by Gender……………………………… 101
4.2 Descriptive Data for Lifestyle/Stessors by Gender………………. 101
4.3 Descriptive Data for Health Behaviors by Gender……………….. 102
4.4 Descriptive Data for Blood Pressure, GlucoseAnthropometry and Dietary Variables by Gender………………… 105
4.5 Descriptive Data for Age by Social Era…………………………… 105
4.6 Descriptive Data for Lifestyle & Anger by Social Era……………. 105
4.7 Descriptive Data for Lifestyle/Discrimination by Social Era……. 105
4.8 Descriptive Data for Acculturation by Social Era………………… 106
4.9 Descriptive Data for Health Behaviors by Social Era…………….. 106
4.10 Descriptive Data for Dietary Variables by Social Era…………….. 107
4.11 ANOVA Results by Age by Sample Source……………………… 109
LIST OF TABLES
xiv

4.12 ANOVA Results for Lifestyle/Stessors by Sample Source………. 110
4.13 ANOVA Results for Acculturation by Sample Source………… 111
4.14 ANOVA Results for Health Behavior by Sample Source……… 112
4.15 ANOVA Results for Dietary Variables by Sample Source…….. 113
4.16 Pearson Correlations Between Anthropometric MeasurementsGlucose and Blood Pressure……………………………………… 116
4.17 Association of Anthropometrics with Social Era and Participants; n 112COSDA Participants, 58 Apartheid, 54 Post Civil Rights.. 121
4.18 Summary of multiple regression ; Two Skinfold waist-hip ratio, and upper arm area to Post Load Glucose reading……………….. 122
4.19 Distribution of Sample by Sociocultural Factors and Assigned Values for Sociodemographics (SD)………………….. 125
4.20 Age, Social Era, and Sex Distribution of COSDA Participants…. 126
4.21 Fasting and Post-Load Glucose (mg/dl) by Social Eraand Age Categories in the COSDA Sample……………………… 127
4.22 Occupations of COSDA Participants…………………………… 128
4.23 Educational Attainment of COSDA Participants in Years……… 129
4.24 Marital Status of COSDA Participants…………………………. 130
4.25 COSDA Income…………………………………………………. 131
4.26 The Perception of Desegregation by COSDA Participants…….. 132
4.27 COSDA Participant' Evaluation of Equal Pay With Whites……. 133
4.28 COSDA Participants' Perception of Discriminationin Daily Life Beyond the Work Place…………………………… 134
xv

4.29 COSDA Participant's and Their Families Victimizationby Violent Crimes………………………………………………. 135
4.30 The Relationship of Victimization With Type II Diabetes…….. 135
4.31 COSDA Participants' Relaxation Index………………………… 135
4.32 Assessment of Social Incongruity Through MaterialPossessions Owned by COSDA Participants………………….. 136
4.33 Social Support or COSDA Participants byOrganization…………………………………………………….. 138
4.34 Descriptive Statistics for COSDA Participants'Reaction to Anger……………………………………………….. 139
4.35 Prediction of Threatening Behaviors and Post-Load Glucose……………………………………………………. 139
4.36 Prediction of Threatening Behaviors and Lifestyle……………… 140
4.37 Dietary Cholesterol and Total Fat for Post-Load Glucose……… 140
4.38 Regression of Food Nutrients and Post-Load Glucose Reading… 141
4.39 Predicator: (Constant), Health Threatening Behavior, Total Cholesterol, Total Lifestyle/Acculuration Index,Discrimination Index ffor Fasting Glucose……………………… 143
4.40 Health Threatening Behavior, Total Cholestrol,Total Lifestyle/Acculturation Index, and DiscriminationIndex as Predictors of Post-Load Glucose………………………. 144
4.41 Correlation Matrix for Variables in Regression Analyses………. 145
5.1 Sum of Two Skinfolds, Waist-Hip Ratio, and UpperArm Fat Area and Post-Load Glucose………………………….. 147
5.2 Body Mass Index, Arm Fat Index , Waist-Hip Ratio,Sum of Skinfolds for Post-Load Glucose……………………….. 147
xvi

5.3 Effects of the Sum of Two Skinfolds, Waist-Hip Ratio,and Upper Arm Muscle Area and Fasting Glucose…………….. 148
5.4 Sum of Two Skinfolds, Waist-Hip Ratio, Arm FatIndex, and Body Mass Index on Fasting Glucose………………. 149
5.5 Summary of Multiple Regression Analysis:Sociodemographic Predictor Variables for Post-Load Glucose……………………………………………… 150
5.6 Logistic Regression Prediction of the Likehood of > 140 from Sociodemographics…………………………………… 151
5.7 Prediction of Four Sociocultural Variable,Post-Load Glucose………………………………………………. 152
5.8 Summary of Multiple Regression Analysis: Biologicaland Sociocultural Predictor Variables for Post-Load Glucose………153
6.1 Comparisons of Typical Soul Food, European American,and Hypothesized Slave Diet……………………………………… 177
6.2 A Model of Anabolic-Catabolic Homeostasis Etiologyof Diabetes Mellitus in African Americans…………………………183
xvii

Figure Page
2.1 The Dissection Hall………………………………………………………………39
LIST OF FIGURES
xviii

1
CHAPTER 1
INTRODUCTION
1.1 Non-insulin Dependent Diabetes Mellitus (NIDDM) in African Americans
This study is designed to examine the etiology of NIDDM (type II) among middle
class African Americans1 in Central Ohio (Columbus, Dayton, Xenia and Wilberforce
Township). It represents Part II of the 1995 Central Ohio Study of Diabetes and Aging in
African Americans (COSDA): sociocultural risks for NIDDM. Phase I examined
biomedical and genetic risks for NIDDM in this sample (Crews and Moore in press). This
study examines sociocultural risks factors among these participants.
1 African Americans are a self-defined ethnic and sociopolitical population living in the United States. Many define themselves as descendants of Hamitic people who, before Biblical times, populated Africa and during Biblical times, also populated Southern Europe, the Middle East and Western Asia (Watts 1990). Others define themselves as descendants of West and Central African explorers, indentured servants, immigrants, or slaves who were illegally captured, detained, sold, and brought to the New World where they were held hostage in inherited bondage for sixteen generations (Franklin and Moss 1988, Holloway 1990, Bennett 1965, Asante 1996). Whether African Americans adopt the religious definition or the secular definition, they also define themselves as descendants of African people who inhabited the East African caves of Olduvai Gorge, built pyramids in the Nile Valley, used primitive abacuses in the Congo, and started civilization in the fertile crescent in the great river valleys of Africa and Asia (Bennett 1970 p, 4-5) before they left the land they called Whydah (Franklin and Moses 1988, p.1). Many admixed with Europeans, Asians and Native Americans after they came to the United States. There is also a general consensus that African Americans originated in Africa, not in the New World with the inception of American slavery. Regardless of which definition chosen, African Americans are an ethnic population with clear and substantial differences in health characteristics, morbidity, and mortality from other US subpopulations (Crews 1997). Researchers must group humans along some criterion; the criteria appropriate here is self-definition by participants.
`
2
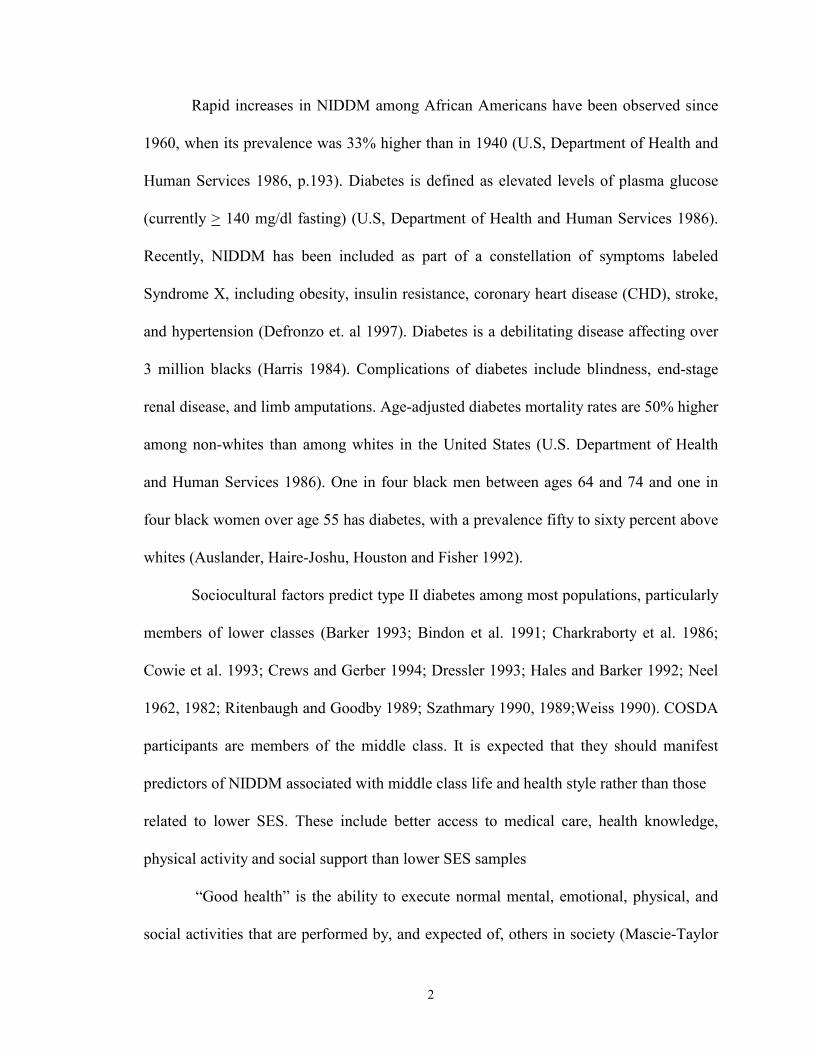
Rapid increases in NIDDM among African Americans have been observed since
1960, when its prevalence was 33% higher than in 1940 (U.S, Department of Health and
Human Services 1986, p.193). Diabetes is defined as elevated levels of plasma glucose
(currently > 140 mg/dl fasting) (U.S, Department of Health and Human Services 1986).
Recently, NIDDM has been included as part of a constellation of symptoms labeled
Syndrome X, including obesity, insulin resistance, coronary heart disease (CHD), stroke,
and hypertension (Defronzo et. al 1997). Diabetes is a debilitating disease affecting over
3 million blacks (Harris 1984). Complications of diabetes include blindness, end-stage
renal disease, and limb amputations. Age-adjusted diabetes mortality rates are 50% higher
among non-whites than among whites in the United States (U.S. Department of Health
and Human Services 1986). One in four black men between ages 64 and 74 and one in
four black women over age 55 has diabetes, with a prevalence fifty to sixty percent above
whites (Auslander, Haire-Joshu, Houston and Fisher 1992).
Sociocultural factors predict type II diabetes among most populations, particularly
members of lower classes (Barker 1993; Bindon et al. 1991; Charkraborty et al. 1986;
Cowie et al. 1993; Crews and Gerber 1994; Dressler 1993; Hales and Barker 1992; Neel
1962, 1982; Ritenbaugh and Goodby 1989; Szathmary 1990, 1989;Weiss 1990). COSDA
participants are members of the middle class. It is expected that they should manifest
predictors of NIDDM associated with middle class life and health style rather than those
related to lower SES. These include better access to medical care, health knowledge,
physical activity and social support than lower SES samples
“Good health” is the ability to execute normal mental, emotional, physical, and
social activities that are performed by, and expected of, others in society (Mascie-Taylor

3
1993). Disease is a pathological condition with a group of clinical signs, symptoms and
laboratory findings that distinguish it as an impairment of health and well-being (Mascie-
Taylor 1993). Health is affected adversely and disease results when imbalances within the
ecosystem occur. Disequilibria in culture, behavior, technology, ecology, and biology
affect health, morbidity, and mortality in a mutual interaction system. Thus, aspects of
culture within variable ecosystems may create sociocultural risks that result in disease as
a by-product. Agriculture, a major innovation in human cultural development, led to
health imbalances and disease as agriculturalists disturbed their ecosystems when they
cleared fields to plant crops (Brown et. al 1966; Massie-Taylor 1993). A consequence of
ecosystem disturbance brought on by swidden agriculture in Africa was creation of
breeding grounds for malaria carrying Plasmodium mosquitoes and, subsequently a high
frequency of sickle cell alleles in many African populations.
Given this model, NIDDM and other diseases may result from systemic
adjustments associated with agriculture and cultural change. Metabolic adjustments to
agriculture by generations of laborers experiencing food scarcity and sociocultural
adversities, while producing a surplus for consumption and wealth accumulation by their
masters, would produce strong selective pressures. All activities from reproduction to
survival require energy. Human cultural development depended on the accumulation and
expenditure of energy. When cultures altered environments, they also triggered ecosystem
imbalances that continue to affect health and disease today.
Agriculture is associated with a variety of endemic, enteric, bacterial and parasitic
infections that modified ecological balances (Mascie-Taylor 1993). Human exposures to
these diseases represented a new phase in human adaptability that still affects human

4
health and illness (Foster and Anderson 1978). Although agriculture increases exposures
and susceptibility to infectious disease, it is the only way to produce sufficient food for
large populations. This need for energy to produce agricultural, handicraft, commercial,
and technological products precipitated in part the colonization and enslavement policies
of pre-industrial societies. Slavery was a major form of human cultural development.
Slaves transformed many simple societies into complex and powerful economic and
political systems (McKay, Hill and Buckler, 1992). Although mortality and morbidity
rates among slaves were always high, pre-industrial people exploited slaves for energy
until methods were developed to use fossil fuels. Excessive energy expenditure of slave
populations led to long-term disequilibria in their health. Slavery was immediately
followed by technological society, a new form of human cultural development. This study
focuses on links between reduced energy output and physical activity, rapid alterations in
food availability, from scarcity to excess, and obesity among one previously enslaved and
colonized population.
Enslavement and colonization result in high morbidity and mortality. Modern
genetic and epidemiological theories rely on multiple models: single-gene, chromosomal,
multifactorial with “high heritability,” multifactorial with “low heritability,” infectious,
and environmental, in the etiology of chronic degenerative disease (Crews and Gerber
1994, Gerber and Crews 1999). Unfortunately, sociocultural factors are seldom examined
in these models. Medical sociology and medical anthropology explicitly include
sociocultural factors in models of disease causation (Brown et al. 1966). No specific
metabolic agent for NIDDM has yet been identified. Morbidity and mortality rates for
NIDDM suggest that enslavement may have placed Africans at increased risk. Both

5
micro- and macrosociological alterations between culture and environment likely led to
the high rates of obesity and NIDDM among today’s African Americans.
Cultural contact alters microsociological and macrosociological patterns giving
rise to new diseases. European slave trading removed Africans from their primary
ecosystems, producing microsociological disequilibria. Slavers restricted slaves’ access to
food subjecting them to malnutrition, deficiency, metabolic and other diseases (Kipple
1984; Corruccini et. al 1982; and Corruccini et. al 1987).
In comparison with US whites, black men and women more often have low
income and education, along with obesity, and a family history of diabetes (Cowie et al.
1993). Both education and income are inversely correlated with NIDDM. NIDDM
exemplifies a biocultural difference in health status in its association with age, sex, body
fat distribution, family history, socioeconomic status, and obesity (Stern 1993, Auslander
et al. 1992).
Historical and cultural factors are of equal importance in understanding the etiology of
NIDDM in African Americans are biological factors. Health and disease in contemporary
populations also reflect historical, political, economic and cultural hegemony. Today,
these power differences are integrated with the global economy and associated social
forces (Brown, Inhorn and Smith 1996). Dressler (1993, Grim and Wilson 1992)
proposed a social structure model for studying ethnic health inequalities such as high
blood pressure in African Americans. Based upon “social closure” (Weber 1954), this
model shows how power preserves a hierarchical place in the social structure by
excluding certain classes from competing for social rewards or restricting their access to
socioeconomic opportunities (Dressler 1993). Skin color is a restriction criterion that

6
produced “color line” societies in the United States. Massey and Denton (1993) suggest
that segregation of blacks in Northern ghettos, along with the bombing and lynching of
blacks by whites following World War I trapped blacks in deteriorating and impoverished
inner cities. These activities created and maintained a “color line” through
institutionalized racism and discrimination.
Dressler’s social structure model is based upon national, rather than global
processes. Conversely, slave trading in the 16th through the 19th century was a global,
event that helped European and New World nations develop (Franklin and Moss 1994,
Clark et al. 2000). As an example, Great Britain fought against Spain in the War of
Spanish Succession or Queen Anne’s War (1701 - 1713) to gain the asiento—exclusive
rights to take slaves to Spanish colonies for thirty years (Franklin and Moss 1994). Such a
global structure model more aptly describes the mobilization of power and accumulation
of wealth that resulted from forced human production by Africans. This created a color
line and restricted non-Europeans from attaining basic needs, including food, security, a
livelihood, inheritance, education, civil rights, and liberty. Thus, a global model is
required to explain the problem of diabetes in African Americans. This model must
include African American history, folklore, global hegemony, sociocultural factors
supporting racial enslavement, economic and industrial growth as well as when and how
African slaves were exposed to disease through prolonged ecosystem disequilibria.
A global structure model incorporates an ecological view of health. That is, health
is seen as an index of adaptation to the environment reflecting adequate energy
acquisition and consumption (McElroy and Townsend 1979:3). Based upon this
perspective, selection pressures engendered by socioculturally constructed long-term food

7
scarcity and excessive dissipation of energy in labor created conditions in which NIDDM-
promoting alleles were advantaged. Etiological models for diabetes have focused on
reproductive efficiency, energy conservation, food intake, thrifty-pleiotropy alleles,
senescence, parity, low birth weight, growth retardation, obesity, physical inactivity and
undernutrition (Crews and Gerber 1994, Barker 1998, Crews 2003 [in press]). Except for
growth retardation (Barker 1998), these all fail to link global politico-economic systems
to Type II diabetes. Here both diabetogenic alleles and pathogenic politico-economic
systems are seen as producing Type II diabetes as a metabolic adjustment to adverse
conditions of low nutrition, hard labor, and high mortality rates in mid-adulthood.
The “environmental disequilibria” model for NIDDM explored here sees world
events and slavery as promoters of NIDDM in African Americans. Slavery—and its
counterpart, colonialization—were major and prolonged sociocultural phenomena that
limited food supplies to slaves on all continents. However, none of the major theories for
high Type II diabetes in African Americans acknowledges slavery as a contributing
factor. These include transition and acculturation theories (Neel 1962, Weiss 1999,
Ritenbaugh and Goodby 1989 and Weidman 1990), culture, perception and obesity
(Kumanyika et al. 1992, Dressler 1993), senescence (Williams 1951, Crews and Gerber
1994), life style (Kumanyika and Golden 1990, Dressler (1994), social support and social
incongruity (Tijhuis et al. 1995, Dressler et al. 1996), physiological theories (Dressler et
al. 1991, Garn 1994), and those incorporating development, social status and life style
(Barker 1992, Davison et al. 1992, Abel 1991, Dressler 1994). A global structure model
recognizes that Type II diabetes affects the descendants of slaves wherever they live,

8
whether in Europe, Africa, Asia, or the Americas. Food scarcity caused by enslavement
lasts longer, is more devastating, and is more widespread than naturally occurring famine.
1.2 Background of the Problem
This study focuses on physiological disequilibria among African Americans. It
examines historical, cultural, folklore, sociocultural, sociopolitical, ecological and
economic data. The premise is that agriculture, enslavement, and technology were major
phases in human development that produced disease profiles as latent by-products. The
focus here is enslavement, a major cultural experience that affected the ancestors of many
of today’s African Americans.
1.3 Determinants of Adult Disease
Structural and functional changes initiated during infancy affect adult disease
(Barker 1998). To some degree physical, biochemical and physiological insults in utero
program late-life diseases (Barker 1998). This occurs when insults acting at critical
periods in development produce permanent or long-term changes in physiological
structure or function (Lucus 1991, Barker 1998). Adult disease susceptibility is
influenced by interuterine, childhood and maternal nutrition (Barker 1998). Fetal
programming may be a major environmental contributor to late-life disease. For example,
among 370 men born in Hertfordshire, England, 40% of those with birth weights of 5.5 lb
or less (2500 g) showed diabetes, while only 14% with birth weights over 9.5 lb (4300 g)
did at age 50 plus; similar associations were observed for men whose weight at age 1 was
18 lb (8.8 kg) or less (43%) compared with those weighing over 27 lb (12.27 kg) (13%)
9
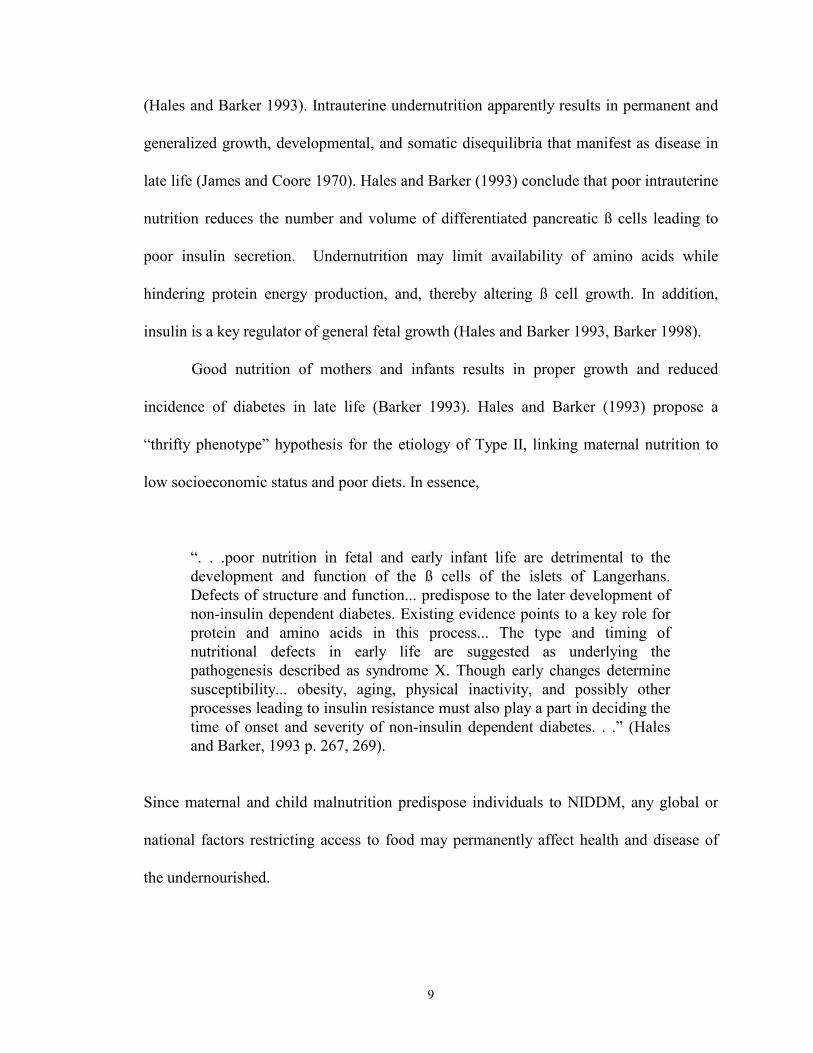
(Hales and Barker 1993). Intrauterine undernutrition apparently results in permanent and
generalized growth, developmental, and somatic disequilibria that manifest as disease in
late life (James and Coore 1970). Hales and Barker (1993) conclude that poor intrauterine
nutrition reduces the number and volume of differentiated pancreatic ß cells leading to
poor insulin secretion. Undernutrition may limit availability of amino acids while
hindering protein energy production, and, thereby altering ß cell growth. In addition,
insulin is a key regulator of general fetal growth (Hales and Barker 1993, Barker 1998).
Good nutrition of mothers and infants results in proper growth and reduced
incidence of diabetes in late life (Barker 1993). Hales and Barker (1993) propose a
“thrifty phenotype” hypothesis for the etiology of Type II, linking maternal nutrition to
low socioeconomic status and poor diets. In essence,
“. . .poor nutrition in fetal and early infant life are detrimental to the development and function of the ß cells of the islets of Langerhans. Defects of structure and function... predispose to the later development of non-insulin dependent diabetes. Existing evidence points to a key role for protein and amino acids in this process... The type and timing of nutritional defects in early life are suggested as underlying the pathogenesis described as syndrome X. Though early changes determine susceptibility... obesity, aging, physical inactivity, and possibly other processes leading to insulin resistance must also play a part in deciding the time of onset and severity of non-insulin dependent diabetes. . .” (Hales and Barker, 1993 p. 267, 269).
Since maternal and child malnutrition predispose individuals to NIDDM, any global or
national factors restricting access to food may permanently affect health and disease of
the undernourished.

10
1.3.1 Life style and Disease
Etiological studies show that health, diabetes, and chronic diseases are associated
with life style (Dressler 1993, McElroy and Townsend 1979). Health and the etiology of
chronic diseases are affected by social incongruity and life style (Dressler 1994, Dressler
1996). Social incongruity assesses the accumulation of consumer goods with respect to
income and education and adoption of leisure activities and behaviors that define social
identity (Dressler 1994, Dressler 1961). Dressler (1994) shows that life style incongruity
is associated with family health and discriminates between households with and without
chronically ill members. The status incongruity model for health differences includes
ethnicity, socioeconomic status, and skin color (Dressler 1993). Skin color is a criterion
of social class, health inequalities, and limited opportunity structures (Dressler 1993).
Dark skin color also may frustrate and block fulfillment of cultural ideals and aspirations
(Dressler 1993; Dressler et al. 1996). Unrealized aspirations, unwanted pregnancies,
criminal behavior, absent/dysfunctional fathers, many children, death of parents, and
addicted parents are all prevalent among darker-skinned blacks in color line societies
(Dressler 1993). Psychosocial frustrations result when social interactions are
incommensurate with social status or when individuals are unable to accumulate material
goods or adopt status-enhancing behaviors. Prolonged frustrations lead to repeated
autonomic arousal and sustained blood-pressure elevation (Dressler 1993). Health is thus
a measure of racism in color line societies and skin color is a key to understanding
differences in life style, social conditions, and disease.

11
1.3.2 Racial/ethnic Minorities and Life style
Racial/ethnic minorities show higher rates of cardiovascular diseases, type II
diabetes, and cancer (chronic degenerative conditions) [CDCs] than does the majority
population (Kumanyika and Golden 1991). Differences in health and life style likely are
related to attributes that increase risks for CSCs. Among disadvantaged members of most
societies, trauma, infectious diseases, asthma, and conditions resulting from osteoarthritis
of weight-bearing joints are higher than among the better off (Kumanyika and Golden
1991). Time trends in disease are related to how sociocultural processes affect health and
disease. Health disparities among racial/ethnic minorities are thought to reflect recent
exposures to western life-styles. In color line societies, health inequalities and life style
incongruity are correlated with the darkness of skin color. In these societies health
disparities between blacks and the white majority most likely reflect racism; lighter skin
color also is associated with higher SES and longer life (Dressler 1993).
Few Irish, Jews, Italians, Chinese, Puerto Ricans, and Mexicans arrived in the US
before the end of the 19th century (Sowell 1981). After the 19th century most immigrants
were poor white peasants (Sowell 1981). They and their descendants, cumulatively, have
less exposure to US life styles than do African Americans who arrived sixteen
generations before their emancipation in 1865. Some slaves already were in industrial and
urban settings before 1865, while runaway slaves began the 1810-20s urbanization
movement of America’s blacks that continued through the 1950s as segregation (Franklin
and Moss 1988). The Fair Housing Act of 1965 halted segregation policies in housing and
Title VII of the Civil Rights Act of 1964 led to 18.8% of US blacks relocating to
suburban areas, and 55% of all living in central cities by 1977 (Clarke 1979). Researchers

12
attributing African Americans’ health disparities to shorter exposure to western life styles
and urbanization failed to incorporate migration, settlement patterns, and social and
political policies into their models. They also may be unaware that market and trade
centers emerged during the 4th and 5th centuries throughout Africa, flourishing and
linking the continent’s cities as early as the 9th to 11th centuries (Davidson 1974).
Africans from these cities were slaves in the New World. Urbanization was not alien to
all slaves. Rather, the slave trade relocated African cities to coastal areas, drastically
depopulating interior cities and leaving many ghost towns, and relocated many Africans
to the rural US (Franklin and Moss 1988). That Africans maintained a pre-slave trade
urban society and had been exposed to unhealthy and unsanitary living conditions for
more than twenty-five generations suggests that the causes for health disparities are not
recent exposures. Kumanyika and Golden (1991) suggest that chronic diseases vary
inversely with infectious diseases while also varying with exposure to and adoption of
sociocultural attributes and expectations. Thus, US minorities have been sufficiently
exposed to modern life to express chronic diseases, but not to risk reduction and
treatment attributes (Kumanyika and Golden 1991).
Exposures to risks include many life style factors, poor eating habits, obesity,
limited access to medical care, and poverty (Veal 1996). Blacks in the US eat, cook and
buy foods that are high in calories, sugar and fats; and they also fry and bake in lard and
heavy oils or boil in “fat back” (Veal 1996). These calorie dense foods had a survival
advantage during periods of food scarcity, slavery, apartheid, and excessive physical
labor. Calorie dense foods no longer have these same advantages. Now that food is more
plentiful and physical labor is less demanding, these foods increase risks for death.

13
CDDs are characteristic of modern, affluent societies (Crews and Gerber 1994).
They are directly correlated with increased life expectancy, high-fat and refined
carbohydrate diets, and physically inactive life-styles (Crews 1992, Kumanyika and
Golden 1991, Crews 2003 [in press], Crews and Gerber 1994, Gerber and Crews 1999).
SES alterations following the civil rights acts likely precipitated an increasing prevalence
of CDDs among African Americans. Increased affluence did not alter biological
propensities selectively programmed during enslavement and apartheid. Desegregation
and equality legislation increased participation in the wider society and its rewards.
Racial/ethnic minorities in the US today show the same order of disease emergence as did
European Americans—surgical disease increased first followed by medical ones
(Kumanyika and Golden 1991).
1.3.3 Transition or Acculturation and Diabetes Mellitus (Type II)
Recent epidemics of NIDDM also occurred in Native, Mexican and Samoan
American. Hypotheses of thrifty genotypes (Neel 1962), antagonistic pleiotropy
(Williams (1957), thrifty-pleiotropic genes (Crews and Gerber 1994), multiparity
(Wiedman 1990), New World Syndrome (Weiss 1990), and centripetal fat and dietary
shift have been offered as explanations (Szathmary 1990). None included historical
enslavement/colonization of these populations, widespread conditions. Slavery was a
long-term risk, but all theories of type II in African Americans ignore the longitudinal
effects of this apartheid institution.
Neel (1962) hypothesized a “thrifty genotype” to explain the evolutionary and
physiological basis of NIDDM. Thrifty genotypes effectively and rapidly store excess

14
energy when it is available (Neel 1967). They likely increased in frequency when humans
were exposed to low caloric consumption and high-energy expenditure interspersed with
periods when calories were plentiful. Neel’s hypothesis was that hypoinsulinism initially
resulted during food shortage, but was later followed by a compensatory increase in beta
cell function during periods of food availability. Neel speculated that “thrifty genotypes”
could overproduce insulin leading to energy conservation in times of food surplus. Later
studies of energy conservation and diabetes did not confirm this theory. Neel (1982)
explained this by suggesting diabetes was advantageous during food shortages, but
became detrimental when food became constant.
Although Williams (1957) does not present a diabetogenic theory, his theory of
senescence due to pleiotropy is used as a model for NIDDM. His theories were used by
biologists and health care researchers to develop etiologies of non-insulin dependent
diabetes mellitus (type II). Williams (1957) suggested that genetics are favored if they
even slightly increase fitness and act during peak years of sexual maturation. If these
traits carry serious decreases in fitness they will be selected against; however, if these
deterrents arise late in life after reproduction they will be retained (Williams 1957). Based
on the concept that genes may have multiple effects, Medawar (1952) proposed the
concept of pleiotropy, that genes may have multiple functions and thus different effects
on fitness at different ages. Williams (1957) used this concept to suggest that tradeoffs
occur between reproduction and survival such that alleles with early life benefits are
retained, even if they lead to early death at ages beyond those of maximum effort (Harper
and Crews 2000, Crews 2003 [in press]). William’s ideas have been used to argue that
since onset of diabetes mellitus (type II) begins during middle age and peaks during the

15
latter decades of life, diabetes is a disease of senescence. Type II commonly occurs after
childbearing is complete. Diabetogenic genotypes may benefit from more vigor during
their reproductive years due to increased glucose and metabolic efficiency.
Crews and Gerber (1994) developed the thrifty-pleiotropic gene model by
combining both evolutionary models in their description of chronic diseases due to gene-
environment interactions. They hypothesized that several major chronic degenerative
diseases (CDDs) of senescence are secondary to risk factors arising from antagonistic
pleiotropy and thrifty genotypes (phenotypes). Many alleles may have selective value
during development and reproductive life, but be associated with debilitation during later
decades (Crews and Gerber 1994). They predict two types of CDDs: those arising due to
pleiotropic effects underlying thrifty genotypes, and those secondary to decreased
availability of once plentiful resources. Today, some CDDs arise secondary to excessive
accumulations of previously scarce but now abundant resources (e.g., calories,
cholesterol, salt) (Crews and Gerber 1994, Gerber and Crews 1999). Efficient use of such
resources still benefits some during early life but leads to deleterious outcomes during
later years. Conversely, resources such as calcium, iron, iodine, and fiber were more
abundant in prior ecological circumstances (Gerber and Crews 1999). Sociocultural
changes result in these resources being less available today although they remain
abundant in the environment (Gerber and Crews 1999). Lack of these over a life-time
may often lead to CDDs.
Dogrib Indians of Canada share multiple historical, sociopolitical, and economic
traits common with African Americans. Many are in the gene-environment etiology of
type II diabetes mellitus with African Americans. Europeans enslaved and/or colonized

16
both. Several generations ago diabetes was rare in both. Both are racial/ethnic minorities
of low socioeconomic status within Western nations. Most importantly, both American
Indian and African American populations suffered declines over several hundred years
following starvation and other atrocities through the mid 19th century. This was followed
by metabolic downshifting associated with continued discrimination and near extinction
of these ethnic groups. About the fourth decade of the twentieth century, a “metabolic
upshifting” occurred. Populations rebounded as food became more plentiful and social
conditions improved. Both experienced these metabolic shifts. In these populations, the
etiology of type II may reflect similar responses to such shifts and alterations in gent-
environment balances. Many indigenous populations with high type II rates, such as
Naruans, Hawaiians, and Pima Indians, may have experienced such metabolic shifts
(Crews 1990).
Szathmary’s (1990) criticism of Neel’s thrifty genotype supports the suggestion
that enslavement and colonization contribute to increased population susceptibility to
type II. The thrifty gene does not fit the Dogrib case. In the Arctic/sub-arctic setting
protein/fat intake is high, while carbohydrates are virtually nonexistent for most of the
year (Szathmary 1990, p.87). Also, hyperinsulinemia is integral to Neel’s thrifty gene
hypothesis. This also has been documented among the Dogrib. Obesity, particularly fat
distribution, was shown to be the most important diabetogenic factor among the Dogrib
(Szathmary 1990, p. 90). Weiss (1990) speculated that environmental change must be
involved in the emergence of hypertriglyceridemia, diabetes, gallstones and obesity
among Native American horticulturalists, constituting a “New World syndrome.”

17
Wiedman (1990) postulated a cultural-historical hypothesis of type II diabetes
attributing it to rapid shifts from subsistence agriculture to industrial technology,
excessive caloric intakes, and low energy expenditure. Obesity, hyperglycemia, and
diabetes are the consequence of techno-industrial developments which have led to a
nutritional shift from indigenous, natural, self-produced foods, to a diet of processed,
refined, high calorie, and high fat ones. Women with thrifty genes are also better at
gaining weight during pregnancy, maintaining sufficient fat for lactation, and have infants
of slightly greater birth weight with slightly higher probability of surviving childhood
(Weidman 1990).
1.4 Objectives and Hypotheses
History and political systems, along with economic and cultural hegemony,
provide a complex background from which to view type II diabetes in today’s African
Americans. Thus, the first step in this study is to review historical literature and African
American folklore to establish the sociocultural context for type II in African Americans.
Multiple social, environmental, and biological factors have contributed to the current
problem. The objective of this study is to explore environmental and social factors that
may program descendants of African slaves for type II diabetes. This study uses
biomedical indices examined in Part I of the Central Ohio Study on Diabetes and Aging
(COSDA) as dependent variables. Dependent variables are cases at risk for or with
fasting and 2-hr post-load plasma glucose scores > 140 mg/dl (the U.S. Department of
Health and Human Services 1986m P. 193). Independent variables are sociocultural and

18
anthropometry risk factors for type II diabetes. Anthropometry and sociocultural variables
will test the following hypotheses:
Hypothesis 1:HD1 - Body Mass Index and skinfold measurements are significantly associated with plasma glucose levels > 140 mg/dl among middle class African Americans in Central Ohio.
HDo – Body Mass Index and skinfold measurements are not significantly associated with plasma glucose levels > 140 mg/dl among middle class African Americans in Central Ohio.
The second step is to determine which of the variety of sociocultural factors may
contribute to the etiology of diabetes in African Americans. Among many populations
social class is directly associated with type II diabetes. Among African Americans it
seems reasonable to examine relationships between a variety of variables associated with
disadvantaged minorities and marginal social classes. However, it is expected that in this
middle-class sample sociocultural risk factors associated with slavery, discrimination and
SES will not be significantly associated with type II diabetes.
Hypothesis 2: H1- Sociodemographics (age/social era, sex, marital status, income, occupation, and education), life style/stressors (acute stressors such as victimization, anger reaction, unemployment/employment, discrimination, desegregation and desegregation, social congruity, social support, relaxation), health behaviors, and dietary variables are significantly associated with plasma glucose > 140 mg/dl among middle class African Americans in Central Ohio.
Ho - Sociodemographics (age/social era, sex, marital status, income, occupation, and education), life style/stressors (acute stressors such as victimization, anger reaction, unemployment/employment, discrimination,

19
desegregation and desegregation, social congruity, social support, relaxation), health behaviors, and dietary variables are not significantly associated with plasma glucose > 140 mg/dl among middle class African Americans in Central Ohio.
The recently emerging black middle class has suffered less discrimination and
desegregation and benefited from upward mobility and broader opportunity structures
Than did earlier generations. Blacks escaped the lower class once educational and
occupational restrictions were removed. Life style and health style changed; however,
many vestiges of social and dietary habits linger yet today. These provide social markers
identifying the black American ethnic group and are used to celebrate holidays and rites
of passages.
Hypothesis 3:
H1 - High consumption of “soul food”, particularly dietary cholesterol willbe significantly associated with plasma glucose above or equal to 140 mg/dl among middle class African Americans in Central Ohio.
Ho - High consumption of “soul food”, particularly dietary cholesterol will not be significantly associated with plasma glucose above or equal to 140 mg/dl among middle class African Americans in Central Ohio.
1.5 Statistics
Although this study examines physiological phenomena, it focuses on
sociocultural phenomena. Both type of variables are outcomes, cases are those with or at
risk for diabetes and control are those without or not currently at risk for diabetes. This
study compares cases with controls among COSDA participants for biological and
sociocultural risk factors identified at baseline and through follow-up to examine how
“life stresses” may serve as risk factors for type II diabetes. Independent variables are
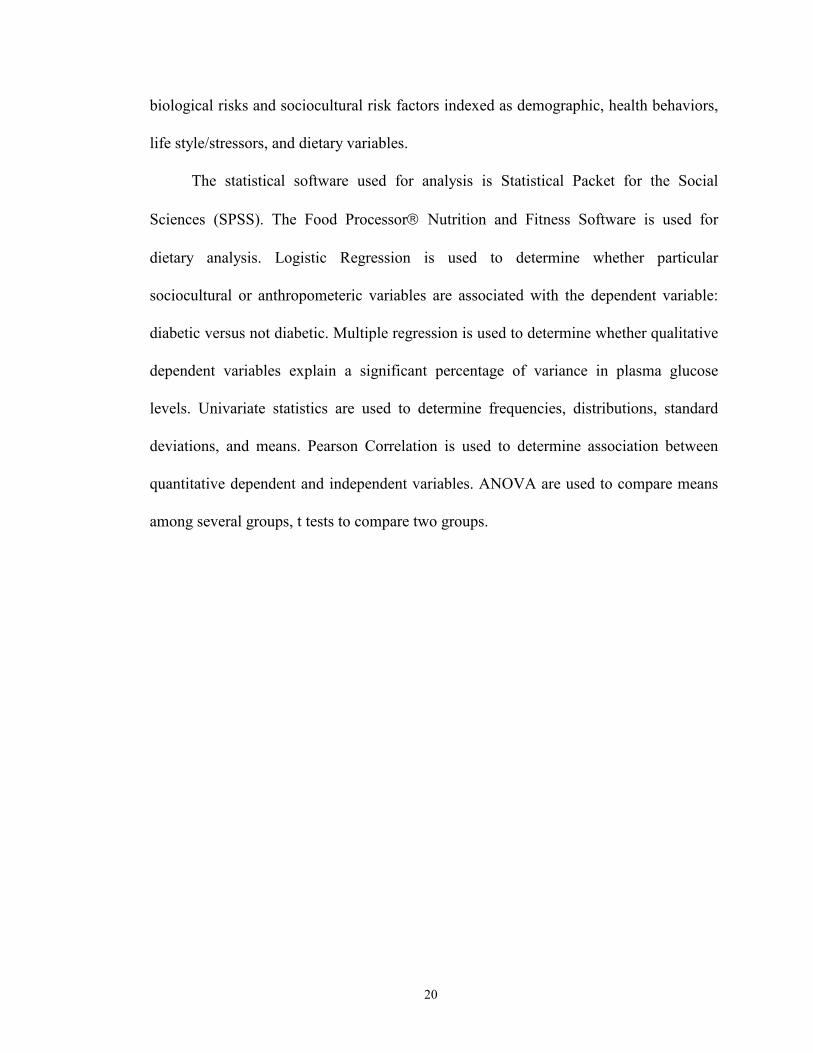
20
biological risks and sociocultural risk factors indexed as demographic, health behaviors,
life style/stressors, and dietary variables.
The statistical software used for analysis is Statistical Packet for the Social
Sciences (SPSS). The Food Processor Nutrition and Fitness Software is used for
dietary analysis. Logistic Regression is used to determine whether particular
sociocultural or anthropometeric variables are associated with the dependent variable:
diabetic versus not diabetic. Multiple regression is used to determine whether qualitative
dependent variables explain a significant percentage of variance in plasma glucose
levels. Univariate statistics are used to determine frequencies, distributions, standard
deviations, and means. Pearson Correlation is used to determine association between
quantitative dependent and independent variables. ANOVA are used to compare means
among several groups, t tests to compare two groups.

21
CHAPTER 2SAMPLE AND METHODS
2.1 Research Design
A century ago, Erwin Ackernecht, physician-ethnologist and father of medical
anthropology, investigated biocultural relationships between past and present human
behavior, health, and disease (Foster and Anderson 1968). Today, medical
anthropologists investigate how health and disease determine human survival and
reproduction. This often requires study of clinical diagnosis, etiological inquiries, and
individual cases. Understanding of disease patterns, risk factors, and time trends provide
data to guide interventive and preventive measures. COSDA was designed to identify
unknown and known cases of NIDDM among African Americans, associated
physiological and sociocultural risk factors, and to construct a model of type II diabetes
among middle class African Americans in Central Ohio.
This research was completed with funding from American Diabetes Association
and The Ohio State University. It was designed to examine diabetes as a multi-system
pathological process affecting all physiological systems and organs (Crews 1992). As part
of COSDA, numerous molecular, physiological, social, cultural, and behavioral risk
factors for type II diabetes were examined in a sample of African Americans (Crews
1992). Blood samples were obtained and used to extract DNA and to determine serum
glucose (glycemia), insulin, lipids, blood chemistry, and glycation of glucose.

22
2.1.1 Recruitment
Because churches are social tools and agents of change in the African American
community, they were selected as primary recruitment sites for COSDA. Dr. Crews
(study PI) originally contacted and made arrangements with black ministers to recruit
COSDA participants from their congregations. However, his success was not satisfactory
and over the first half of the study only fourteen participants had volunteered for COSDA
research. At this point, the author teamed up with the study and was appointed the
Recruiter-in-Charge (RIC). As a recruiter, the author suggested black middle class
participants in Dayton would volunteer for a research project. Additionally, she advised
that she would have greater success soliciting middle class African American volunteers
than the PI because they could identify with her background and class. The author also
recommended recruiting additional participants from black social organizations. With
these measures in place, the author enrolled 133 volunteers within two and a half months,
about half the original projected sample size of 300, but sufficient for this study.
The author followed protocols common to African American culture, adhering to
traditions of the black Baptist Church and “worked the trust” of the black community.
She gained the trust of ministers and organization leaders by first establishing her
credentials and character as an African American health researcher before enlisting the
leader’s compliance. She was able to emotionally appeal to the unspoken and agreed upon
consensus that African Americans seek to overcome vestiges of the African Holocaust
through enhancement of individual, family and community uplift. Previous barriers to
research gradually gave way when the recruiter was able to remind leaders that their
influential positions in the black community made them filial trustees. Black posterity
relies on them to protect the health of the born and yet-to-be-born; thus they were
encouraged to promote research and intervention that might benefit African Americans.
The author also acquired the trust of the COSDA researchers. She not only
explained why African Americans mistrust European American researchers, but also what

23
the researchers should do to remove the mistrust. Black Americans’ distrust mean-
spiritedness in white Americans who disclaim guilt for past atrocities committed against
African slaves. Although they did not commit these atrocities, they benefit from the social
and financial gains these atrocities produced. Even when they refuse to acknowledge or
apologize for the immoralities of the African Holocaust, they still benefit from remnants
of the slavocracy ethos, apartheid and white supremacy. They also benefit from
institutional racism that maintains the secondary citizenship of African Americans.
Conversely, European American researchers build trust in African American research
participants when they consistently display compassion, acknowledge past atrocities,
admit their benefits, advocate justice and deal ethically with blacks. African Americans
are likely to participate in research led by European Americans that extracts body fluids
and genetic materials only when these researchers establish and maintain trust.
2.1.2 Study Population
2.1.3 History of African Americans in Ohio
Participants in this research are residents of Columbus, Dayton, Xenia, and the
rural township of Wilberforce in Central Ohio. The U.S. Department of Commerce
Bureau of Census 2000 released the following population statistics for Ohio cities.

24
_______________________________________________________________________
Total Black White PercentPopulation Population Population Black
_______________________________________________________________________
Columbus 711,470 174,965 483,332 24.46%
Dayton 166,179 71,668 88.676 43.12%
Xenia 24,264 3,265 20,128 13.46%
Wilberforce 1,579 1,329 177 84.17%________________________________________________________________________
Table 2.1City and Township Population of COSDA Participants________________________________________________________________________
In two of these towns, African Americans make up a sizable portion of the populations,
Wilberforce (84%) and Dayton (43%); but in Columbus and Xenia they are a minority.
Having a predominantly Black population likely influences politics, economics, and
sociocultural variability in health and life style. In particular, residents of Wilberforce,
surrounding two traditionally black universities, provide the economic base of
Wilberforce, Ohio. The African American centered economic and political system likely
provides residents an opportunity for structure, health care, and life style similar to those
of majority populations elsewhere in American society.
Ohio today continues to reflect a long series of treaties, ordinances, and
compromises on New World slavery that began with the Treaty of Tordesillas in 1494
(Strayer, Gatzke, and Harbison, 1974).

25
_________________________________________________________________Organizations Number of Percent
participants_________________________________________________________________
1 10 9%
2 25 23%
3 22 20%
4 26 23%
5 11 11%
6 14 13%__________________________________________________________________
2.2 Demographic factors for COSDA Participants by organization__________________________________________________________________
It started conditions that today affect health, diet, mortality, diseases and political affairs
of all Africans and particularly African Americans.
Ohioans continue to struggle against the vestiges of slavery. Slavery became legal
in Ohio in 1719, but never took intrinsic hold (Strayer, Gatzke, and Harbison, 1974).
Many Africans fled enslavement through Ohio because it was the shortest distance to
Canada (Elson 1949; Woodson 1970). The Ordinance of 1785 outlawed slavery east of
Mississippi and North of Ohio while opening the Northwest Territory to peaceful
settlement, although this conflicted with the US Constitution (Woodson, 1970).
Provisions required Ohioans to endorse slavery although most Ohioans generally opposed
slavery (United States Department of the Interior National Park Service, 1995). Some
Ohioans resisted abetting slavery and joined the underground escape movement (circa
1831). This was one of the most dramatic protest actions against slavery in United States

26
history (United States Department of the Interior National Park Service, 1995). Many
refugees from Kentucky and Tennessee escaped to and settled in Wilberforce, Caesar
Creek, New Lebanon, and Oberlin, Ohio between 1810 and 1850. It is estimated that the
South lost 100,000 slaves, 40,000 from Kentucky and Tennessee alone, valued at $30
million during this period (Franklin and Moss, 1988). The conflict culminated in the
Civil War causing Ohio to further restrict the influx of blacks. Legislation also prevented
white slave masters and Quakers from bringing freed slaves to Carthagena, a functioning,
successful, self-governing and self-sufficient black community in Mercer County, Ohio,
established by Augustus Wattles (Knepper 1997). Ohioans responded to federal measures
against slavery by enacting the Black Laws of 1804 and later restricting black emigration.
Black Laws restricted the movement, congregation, and activities of blacks. They
required blacks to register with the state, post a five hundred dollar bond within twenty
days of entering Ohio, and carry a certificate of free and legal status (Burk and Davidson,
1984). They also prevented blacks from receiving public assistance, public education, or
civil protection and security; they could not they serve on juries, testify against whites, or
vote. In 1851, Ohio legislators issued Article I, § 6 of the Constitution of the State of
Ohio stating, “There shall be no slavery in this state, nor involuntary servitude, unless for
the punishment of crime” (Burke and Davidson 1984). Enslavement of Africans remained
an issue until December 18, 1865 when the Thirteenth Amendment ended slavery.
Freedom did not ameliorate conditions. Black Laws still restricted African Americans in
Ohio throughout the Civil War period after which an apartheid system permitted the
vestiges of slavery to continue into the twentieth century. Blacks were segregated into
poor areas and barred from public accommodations, including hospitals. Children could
not live in orphanages nor could adults serve in the state militia, or be served at hotels,
restaurants, theaters, or barber shops. Blacks could not utilize public transportation
(Gerber 1976). Black Ohioans were constant victims of racial discrimination, segregation,
disenfranchisement, and hate crimes. Some cities prohibited black settlement, forbidding

27
residence within city limits. Ohio had multiple race riots during this period. From 1889 to
1922, two racially motivated lynchings a week were reported in the US totaling 3,436
murders in the country.
Northern migration of fugitive slaves started during the 1820s and 1830s,
culminating in the Negro Exodus (1890 to 1900). After World War II, blacks came to
Ohio to find jobs as unskilled, service and menial workers and to seek relief from
poverty, share cropping, and farm work in the South. However, Black Laws passed in the
1800’s continued to make life difficult, preventing blacks from finding jobs, receiving
charity, or living in orphanages. Some opened service businesses, saloons, restaurants,
and beauty and barbershops catering to blacks. With a steady livelihood these
entrepreneurs became the early black middle class. Eventually, white and black
abolitionists, philanthropists, and churches came together to build Central State
University (circa 1887), Payne Theological Seminary (circa 1866), and Wilberforce
University (Circa 1856) offering blacks social, educational, and economic opportunities.
A black middle class of professionals formed around this nexus of institutions in Central
Ohio. Although the Civil Rights Movement of the 1960s led to desegregating schools and
public facilities, many areas of Central Ohio still remain segregated. Most black children
continue to attend segregated and inferior schools and Central Ohio still boasts social
organizations such as the Bicycle Club of Dayton that do not permit black membership.
Eleven o’clock Sunday morning is the most segregated hour in Central Ohio when
religious edifices are attended by either black or white, but not mixed congregations.
2.2 Study Samples
2.2.1 Sample Selection
Columbus, Ohio and surrounding areas of Central Ohio were chosen as a research
area for COSD because the Principal Investigator was located at The Ohio State
University. The recruiter cautioned that common ethnicity would not automatically enable

28
her to access this African American community. This was in part because African
Americans are class conscious. Inner city African Americans have more of a “street
orientation,” and might view an upper middle class black as having a “bourgeois
orientation.” They might also reject her as having “sold out” on black culture. Recruiting
African Americans from Dayton, Xenia and Wilberforce Township, areas where the
recruiter had community support systems and family networks and friends was much
more feasible. There the recruiter could more effectively assuage the prevailing black
attitude that white researchers are unethical, untrustworthy, and they conduct research that
affects black Americans adversely. The study was already aimed at “middle-class,
married, church-going African Americans” and these would be more prevalent and
accessible in these areas. Churches and social groups were the sampling frame for this
study.
Even with the same ethnic identity, the recruiter’s sex required her to use gender-
specific and religious protocols to recruit this sample. The religious domain prevented the
recruiter from approaching the ministers directly concerning the research project.
Therefore, the ministers’ wives or mothers were used to initiate recruitment and become
visible in the church. Often it was difficult to gain ministerial support because of the
community mistrust of what white researchers might do with body fluids and genetic
materials from blacks. They saw their duty as protecting their congregation and people
from foul or demeaning research. One minister made it perfectly clear the only reason
COSDA recruitment was permitted at his church was his personal relationship to the
recruiter and her husband. In this case, the minister’s wife clearly stated her grave
reservations in encouraging her husband to permit COSDA research. Subsequently, both
she and the minister refused to participate in the COSDA research. She admonished the
recruiter to watch the Principal Investigator and researchers carefully because they were
unethical and could not be trusted.

29
Strong resistance was met at the second church sampled also, even though
several members of the recruiter’s family were members of the congregation. Two of her
family members participated because two relatives in that family line had succumbed to
diabetes (Additionally, they wanted the recruiter to obtain the doctorate degree). Another
Baptist Church in Dayton, Ohio, was selected as the third sampling site because it had a
large congregation. A smaller percentage of the congregation volunteered to participate in
COSDA research at this church than at the two smaller churches in Dayton.
Participants also were solicited from the Wilberforce Links, Inc., a national
women’s philanthropic organization that donates money to African Americans and other
charities. Recruiting Links for COSDA provided a means of alerting them to the diabetes
epidemic affecting African Americans. Links are upper middle class black women and
they expressed fewer misgivings concerning participation in COSDA. Approximately
forty percent of the membership participated, some to monitor their plasma glucose
levels, others to support the recruiter. Private physicians screened Links who didn’t
volunteer for COSDA research.
2.2.2 City and Township Description
2.2.2.1 Wilberforce (Township), Ohio
Approximately 201 families and 2,639 people live in predominantly African
American Wilberforce Township (Wilberforce, Ohio Resource Guide 1999). Wilberforce
Township has a distinct history of being one of Ohio’s several terminal stations on the
Underground Railroad, and part of the Southern Ohio area where emancipated slaves,
mainly from Virginia, settled on lands bought for them by former slave masters (Gerber
1976). Quakers and former slave owners assisted fugitive slaves and sponsored black
settlements in Brown and nearby counties (Woodson 1935). Some of those failed to
protect freed bondsmen from swindlers, vigilantes, and land speculators who cheated ex-
slaves out of thousands of acres of land. More astute slave masters and Quakers helped

30
ex-slaves settle into free life by buying farms, building houses, and maintaining freed
bondsmen for one year to establish them as economically independent farmers (Gerber,
1976).
White Ohioans did not want highly skilled and experienced freed bondsmen to
settle in Ohio. Since Africans were specialists in agriculture, crafts, trades, culinary arts,
and manufacturing, they would compete against less skilled and inexperienced
immigrants who left Europe because merchant and craft guilds were reserved for the
middle class (McKay, Buckler and Hill 1992). European immigrants sought opportunities
in America to gain personal privileges, economic security, and tax exemptions while laws
prevented free black laborers from attaining the same.
Black settlers in Ohio often were blood relatives of their masters, natural children
of slave masters and their slave mistresses (Gerber 1976). Before the Civil War, elite
Southern planters often brought their slave mistresses and mulatto children to vacation in
Tawawa Springs Resort, a recreation area in Wilberforce known for its medicinal and
mineral springs (Woodson 1935). Between 1844 and the Civil War, Tawawa Springs
became a center of Negro culture and education in Ohio (Gerber 1976). The education of
Africans began during the 1700s with abolitionists, statesmen, philanthropic
organizations, and black churches establishing “colored” schools for Africans. African
self-help was a means of convincing friendly whites that education is a fundamental right
for all mankind (McGinnis 1941). Three Negro institutions were founded in the Tawawa
Springs area: Union Seminary (1853), Ohio African University (1855), and Wilberforce
University (1856) (King 1979). Wilberforce University was the first African school in the
United States dedicated to collegiate, primary, and secondary education (Goggins 1987).
Tawawa Springs Resort was later renamed Wilberforce, Ohio to honor Samuel
Wilberforce, an English abolitionist who was the major force in securing passage of a bill
that abolished English slavery in 1807. Wilberforce was the driving force in the universal

31
abolition of African enslavement. He and Thomas Clarkson publicized the inhumane and
brutal mistreatment of African slaves in the New World (Everette 1988).
The legacy of anti-slavery, pro-African education and culture, African and
European admixture, African economic development, and intellectual achievement make
Wilberforce, Ohio, a unique community of mostly middle class African American
educators and professionals. Many members of the Wilberforce community are college
graduates with terminal degrees, and belong to professional, social, service, political, and
philanthropic organizations. Wilberforce is a community where club membership
validates social standing and where social inclusion is important. Organizations for
women include
national philanthropic organizations such as Links, Incorporated, sororities such as Alpha
Kappa Alpha, Delta Sigma Theta, Sigma Gamma Rho, and Zeta Phi Beta; service
organizations such as Top Ladies of Distinction, The Twentieth Century Club, and the
Moles, Leisurettes, Epicureans, Couples Clubs, the Partners, and national mother’s
organizations for children including Jack and Jill. Men belong to fraternities such as
Kappa Alpha Psi, Omega Psi Phi, Alpha Phi Alpha, and Phi Beta Sigma; philanthropic
organizations such as the G Men and the Boulé; and art and literary organizations, such as
the Pals (Promoters of the Arts, Literature and Science). Wilberforceians also are active
in political organizations such as the National Council of Negro Women, the Urban
League, National Association for the Advancement of Colored People, and the
Republican and Democratic Parties who control local politics and represent both internal
and external change agents. The active social life of Wilberforceians includes luncheons,
lectures and Brown Bag Series, Bridge Parties and Tournaments, formal dinner dances
and brunches, couples parties and fund raising activities.
Wilberforceians are family and education oriented. Education provides economic
stability for this predominantly black suburban township. Wilberforce has few social
problems such as miseducation, unemployment, institutionalized racism, or ghettoization.

32
Most senior residents of the community attended university operated laboratory schools
for pre-, primary and secondary education. Many are graduates of Central State
University, Wilberforce Universities, or other Historically Black Colleges and
Universities (HBCU). Many have graduate degrees from predominately white
universities. Most of the children who grow up in the Wilberforce community attend
college and earn bachelors, graduate and terminal degrees. Wilberforcians are community
leaders, entrepreneurs, professionals and politicians. Black families in Wilberforce
township are generally stable across generations. Matri-focality is virtually unknown.
When it occurs, it results from the death of a husband/father. Divorce after children and
out-of-wedlock births are virtually unknown among Wilberforcians.
Wilberforceians are also home and business owners who are proprietors of janitor
supplies and services companies, floral shops, law firms, doctor and dentist offices,
barber and beauty shops, Drive Thrus, service stations, day care centers, dry cleaning
outfits, grocery stores, fast food restaurants, and real estate companies. The 2002 fair
market value of the homes range from $90,000 and higher with most properties valued
around $175 to $200,000. Most Wilberforceians are heirs to maternal and paternal
inheritances, including usufruct properties in the South. Wilberforceians are also avid
travelers who expose their children to global excursions. Children travel with parents to
fraternity, sorority, social club, church, and professional conventions. Children attend
family vacations, golf and ski trips, bridge tournaments, ocean cruises, and travel
internationally.
2.2.2.2 Columbus, Ohio
Named for Christopher Columbus, Columbus, located between the Scioto and
Olentangy Rivers in central Ohio, is the capital city of Ohio. Columbus also is the largest
city in Ohio (population 632,000). The African American population in Columbus makes
up 22.6 percent of the city’s total (N= 120,000) (Knepper 1997). Black pioneers in

33
Columbus were victims of the same anti-slave laws and racist sentiments and Black Laws
seen elsewhere. They could not attend public schools with white children and districts
were required to educate black children only if there were more than thirty black children
in the district (Knepper 1997). Laws restricted blacks to living in areas with poor housing
and were designed to keep the city a “white man’s country” (Knepper 1997). Blacks in
Columbus experienced more racial resistance and progressed less than black
Wilberforceians where the HBCU’s stimulated upward mobility, career opportunities and
economic independence. By the early 1900’s, Klan membership grew to 50,000 in
Columbus and nearby counties.
Some blacks in Columbus practiced carpentry, barbering, black smithing, and
occasionally attained high status as captains of boats, and later as train conductors
(Knepper 1997). Others attended universities such as Oberlin College (1855), Ohio
University (1830s), Western Reserve (1820s), and Wilberforce University (1863) to earn
degrees in education, business, and later in medicine, dentistry, and law. A few
professionals and entrepreneurs amassed considerable real property. Whether menial
laborers, tradesmen or professionals, African Americans in Columbus joined other
African Americans throughout Ohio to celebrate enfranchisement and freedom. The
Public Accommodation Law of 1884 banned discrimination in the State of Ohio.
Segregation by race and denial of access to public accommodations, such as hotels,
restaurants, dance halls, roller-skating rinks, swimming pools, bowling alleys, cemeteries,
schools, and private clubs, were made illegal. By 1963, black advancement and social
progress increased in Columbus. Today thousands of black college students, teachers,
doctors, lawyers, businessmen and other professionals form a growing middle class.
Many attend desegregated schools and public facilities, have gained voting rights and
political power, and have suburbanized and Americanized.

34
2.2.2.3 Dayton, Ohio
Tax records for 1798 indicate the first blacks were brought to Dayton to serve
whites (Peters 1995). Tax records identified William Maxwell and his Negro and the
community leader, Daniel Cooper, and a “colored girl” he brought to the city to serve his
family. As in other Ohio cities, Dayton did not want blacks to settle in the city for fear of
job competition with whites. Only blacks with certificates of freedom could settle in
Dayton after they paid a registration fee of twelve and a half cents for adults and children
(Peters 1995). By 1804, there were less than twenty free blacks and indentured servants
living in Dayton. The children of indentured servants were indentured to their parents’
masters. This applied to Harry, age two-and-one-half-years, and Polly, his nine-month-old
sister. Both children were freed, Harry at age twenty-one, and Polly at age eighteen. Both
were given a horse, clothing, and other gender specific items to start their lives as free
people (Peters 1995). Tax records do not contain information about these children’s
parents, only that the “colored girl” was “unjustly detained in slavery contrary to the laws
and Constitution of Ohio” (Peters 1995). Efforts of abolitionists who worked to aid
fugitives from slavery increased the black population to 141 in 1820 and to 548 by 1875.
The “Africa” section of Dayton grew from 1870 to 1920. Hallie Q. Brown became
principal of the first “colored” school in 1870 after the black community petitioned the
Board of Education to locate a school in “Africa” (Peters 1995). Many blacks came to
Dayton from 1915 to 1940, seeking refuge from Southern racism, oppression, violence,
discrimination, and crop destruction. They came to Dayton to find jobs, better education
and opportunities for themselves, children and families. Black professionals in Dayton
increased in 1912 to include ten physicians, an architect, contractors, a police officer,
several entrepreneurs, publishers, editors, morticians, attorneys, army officers, and a
podiatrist (Peters 1995). Dayton celebrities included Paul Laurence Dunbar and his
visiting friend, Frederick Douglass. From 1921 to 1940 many blacks participated in
philanthropic organizations such as the YMCA, YWCA, Linder Center, church

35
organizations, fraternities and sororities, and Garden Clubs (Peters 1995). The six top
career categories during this period were service work, laborers, beauticians, barbers,
craftsmen, clerical/sales, with blacks distributed equally in domestic, professional and
semiprofessional careers (Peters 1995). Many blacks lost their homes and jobs when the
stock market crashed in 1929, but survived the great depression by taking a variety of
jobs to support their families. Others such as C.J. McLin, Sr., C.J. McLin, Jr., and Ethel
Prear, became political leaders who fought for human rights and employment
opportunities. Some whites retaliated by bombing the home of C.J. McLin, Sr. in 1938.
Dayton’s black population increased to 57,288 in 1960 (Peters 1995). During this
period, black Daytonians attended the new Regal Theater, with “all colored employees”;
went to Cincinnati to see Jackie Robinson and the Dodgers; saw the emergence of new
local human rights leaders and groups, including Reverend Cody Bush, W.S. McIntosh,
Reverend David Gilbert, and the Southern Christian Leadership Conference (SCLC).
They witnessed the National Cash Register (NCR) open its apprenticeship program to
black people in 1958 (Peters 1995). According to the West Dayton Profile, ninety-five
percent of Dayton’s black population lived in West Dayton in 1960 (Peters 1995).
2.2.2.4 Xenia, Ohio
Colonel John Paul founded Xenia in 1830 at Trebein Station, an area three miles
west of the present location of the city. Colonel Paul selected Xenia, the Greek word
meaning, “a pledge of friendship” for the name of the town (King 1981). Xenia has not
been a true friend to African Americans. White Xenians dissuaded black fugitives and
free people from settling in the area. Owen Davis, a miller and pioneer, brought the first
free black man to Xenia in 1795 (King 1981). In 1810 the free black population increased
to nearly forty men, women, and children who migrated from the South to escape
competition with abundant slave labor for jobs, and break away from whites who forced
blacks to leave the state. Blacks also left the South to escape illegal capture and

36
enslavement. They also left because blacks were required to pay poll taxes and higher
property taxes than whites (King 1981). Those coming to Xenia came mainly from
Virginia, Kentucky, and North Carolina.
Many blacks who migrated to Xenia were of interracial parentage (Robinson
1966). White slave masters and Quakers brought them to the city, or they came as
passengers on the Underground Railroad. In 1830 twenty percent of the total black
population of Xenia had been freed through self-purchase, purchase by friends, or, more
often, purchase by kinsmen for $400 to $1200 (Peters 1995). Blacks usually paid for their
freedom around thirty years of age. They tended to be males, artisans, cooks, dining room
waiters, and barbers who had been allowed to save a small percentage of their earnings as
hired out slave workers (Robinson 1966).
Black Laws prevented blacks from attending public schools and universities. In
1885, Xenia had a black primary and secondary school and a nearby private university for
young adults. The Xenia-Wilberforce area became a center of education for blacks.
Abolitionists who relocated their movement to Xenia in 1841 were partially responsible
for bringing educational institutions to Xenia by way of private donations and volunteer
services. Thus, fugitives from slave states came to Xenia for work and education. They
settled in the “East End,” an area close to Wilberforce University and open to black
residents. The “East End” segregated blacks in poorer, decaying areas of town that were
without sewage, drainage, ventilation, chimneys, halls, staircases or adequate space (Du
Bois 1979 [1909]). Some lived in crowded conditions as boarders or in extended family
units (Robinson 1966).
Xenia developed into an Oasis for black intellectuals and a site of black social and
political development during the 1870s and 1880s. The “East End” had become a type of
black town (Gerber 1994). Black Baptist and Methodist Churches were centers of black
culture and political and social life. “Color line” segregation restricted poor and affluent
blacks to the “East End”. Over 63% of blacks living in the “East End” were homeowners

37
(Gerber 1994). Some houses were dilapidated, poorly insulated and without sanitary
facilities (Gerber 1994). Many “East End” blacks worked at Wilberforce University, the
local shoe factory, a cordage factory, a gunpowder factory, the Powder Mill, or Greene
County Soldiers and Sailors Orphanage Home (Gerber 1994). As early as 1887, Xenia
was the only place in the state that provided housing for black orphaned children.
The black population increased during the 1880s when the mulatto population
comprised 61.5% of the non-white population (King 1981). Most mulattos were children
of black females and Southern white fathers. Mulattos and full-blooded Africans who
remained in Xenia made steady socio-economic, educational, and political progress
because black men in Xenia were free of restrictions imposed on them by white men,
especially slave masters, who prevented black men from attaining an education and
becoming economically independent (King 1981). The progress of the black community
in Xenia was a direct result of black’s ability to construct black institutions and
communities free of institutional racism.
2.3 Data Collection Techniques
2.3.1 Difficulties Recruiting Participants:
It is difficult to recruit African Americans to participate in medical research
(Harris et al., 1995; Carter-Nolan et al., 1996; Veal, 1996). Their reluctance reflects long
held fears from the time when antebellum medical schools and physicians used blacks for
experimentation to test new operating procedures and for dissection (Savitt 1989). As
late as 1932, the Public Health Institute conducted the Tuskegee Study. Researchers
“withheld available medical cures from syphilitic men during a forty year syphilis
experiment on black men” (Roy 1995). The 1890 Oslo Norwegian study and the
Cooperative Clinic Study that used Bruusgaard data rendered the Tuskegee Study of

38
Syphilis completely unnecessary and racist (Roy 1995), since large numbers of blacks and
whites participated in each of these earlier syphilis studies. The medical community knew
the long term effects of syphilis and had achieved their stated research objectives for the
Tuskegee Study even before they started it.
Blacks’ fear of medical research is also justified by practices of racist southern
physicians and medical students who believed that blacks were inferior to whites.
Southern medical professors taught medical students that blacks and whites differed
anatomically, that blacks were “sub-humans,” whose corpses made good cadavers to
teach medical students human anatomy, and that live blacks were good for medical
experimentation (Blakely 1997). Antebellum blacks had little defense against medical
researchers. They educated one another about unethical medical experimentation by
spreading rumors about immoral practices of physicians that were detrimental to black
health, safety, and existence. Rumors warned both old and young blacks alike of unethical
“nightdoctors” who stole, killed, and dissected blacks (Savitt 1989). One warning
circulated as:

39
The Dissecting Hall
Yuh see dat house? Dat great brick house?Way yonder down de street?Dey used to take dead folks een darWrapped een a long white sheet.
An’ sometimes we’en a nigger’d stop,A-wondering who was dead, Dem stujdent men would take a clubAn’ bat ’em on de head.
An’ drag dat poor dead nigger chileRight een dat ’sectin hallTo vestigate ’is liver—lights—His gizzard an’ ’is gall.
Tek off dat nigger’s han’s an’ feet—His eyes, his head, an’ all,An’ w’en dem stujdent finishDey was nothin’ left at all.(After Savitt 1989:240).
Figure 2.1 The Dissecting Hall
Blacks warned one another through poems, personal narrations, legends, and
especially rumors. The Transylvania Journal of Medicine, Associates Science (1828-
1839) and Transylvania Medical Journal (1849-1851) in Kentucky reported that 80% of
all postmortem experimentations were performed on blacks (Blakely 1997). Southern
medical schools paid men to rob graves for bodies, mostly of black males, for dissection
in Southern and Northern medical schools. In 1987, construction workers renovating the
Medical College of Georgia dug up human bones from the basement floor. The forensic
team called in to excavate the discovery unearthed over 9000 human bones that had been
buried earlier in the century when dissecting human bodies was illegal. Over eighty
percent of the bones were of African American males who were subject to

40
experimentation and dissection. It is speculated that other Southern medical schools also
may have blacks buried in their basements (Blakely 1997).
Much medical experimentation and other practices on blacks were not only
unethical, but also brutal (Harris et al. 1996). African Americans have been
underrepresented in most recent clinical trials (Harris et al. 1996). Most African
Americans, including this writer, had misgivings and questions about participating in
COSDA research organized by white researchers who wanted samples from black bodies.
The perceived ethics and character of white COSDA researchers always posed a problem
for recruitment. No matter what their ethics and character truly were, they could never
overcome the historical evidence of unethical medical practices against blacks by whites.
Instead, the ethics, character, and community standing of the recruiter became the ethic
balance for COSDA participants.
2.3.2 Recruitment:
The principal COSDA recruiter contacted each volunteer by telephone to schedule
appointments for oral glucose and sociocultural testing, and spent up to two hours
preparing each participant for screening. Recruitment sessions included discussion of the
research project, analytical procedures, and, of course researchers’ ethics. Discussions
usually allayed participants’ screening anxieties. Misapprehensions were definitely
present, but were reduced during all procedures, and in reports to organizations and
churches whose members participated in COSDA research.
2.3.3 The Process:
Recruitment of participants was a threefold process. Phase One took place in
Columbus, Ohio at New Salem Baptist Church. Fourteen African Americans volunteered
for COSDA. Phase Two involved door-to-door canvassing of an African American
community to recruit participants. This failed to produce any participants. Recruitment in

41
Wilberforce, Xenia, and Dayton the third phase was productive. Recruitment methods
were based on religious and social protocols of the African American community.
2.3.4 The Research Team:
The research team was headed by D.E. Crews, Ph.D. and inculted his graduate
students. Those who participated in COSDA are: Hilton DaSilva MD, (MPH, Ph.D.) a
Brazilian physician; Lori Fitton (Ph.D.), a medical technologist; Mauren Gallager, DO,
(MPH) an osteopathic physician; Janise Gillespie, RN, (Ph.D.) a registered nurse, Greg
Zehnnera, anthropometrist, Wright Patterson Air Force Base; and Gillian Harper (Ph.D.),
Laura Severson ) Ph.D.), Jacquelyn Robinson (Ph.D.), Melissa Reece-Nelson (M.A.) and
Sharon Williams (ABD). These later individuals were all graduate students in Biological
Anthropology at the time of this research and have since completed higher degrees as
indicated in parentheses.
2.4 The Order of COSDA Procedures
This research followed a twelve-step procedure. It started with the participant
reading (or when required, the recruiter read and explained) the Statement of Participant
Information. Researchers answered participant’s questions about COSDA research, then
explained the screening should take approximately 2 hours and 30 minutes. The recruiter
(JR) then ascertained whether the participant ate, drank or smoked within the past twelve
hours. Those who ate or drank were excluded from participation. Those who had not were
asked to sign the Informed Consent Form. Participants proceeded to the next station
where pulse and blood pressure were measured using protocols of the Systolic
Hypertension in the Elderly Program (SHEP). Pulse and blood pressure measurements
were repeated after the participant relaxed for five minutes. Afterwards, a fasting blood
sample was obtained and participants drank a 75 g oral glucose load (Orangedex®, or

42
Koladex®). Participants then advanced to the anthropometeric technician for
anthropometeric measurements. Measurements were taken three times and then averaged.
An interviewer then completed a Biomedical Questionnaire and then participants
completed the Sociocultural Questionnaire while the interviewer determined whether the
anthropometeric form was complete. If the form was complete, the participant was passed
to the RIC (JR) who then double-checked data for completion, and scheduled
participants’ 2-hour post-load draw. If the form was not complete, the participant returned
to the required station to complete it. Participants attended Sunday School, Church
Service, the club meeting or simply waited 2 hours for their post-load draw. Ushers or
club members helped the recruiter, they collected participants from church or club
meetings ten minutes before the two hour post-load blood draw. After the post-load blood
draw participants were provided their blood pressure readings, glucose scores, a $40
honorarium and a continental breakfast. Participants signed receipts and listed social
security numbers before going to the breakfast station and returning to their own
activities.
Standards of the National Diabetes Data Group and the World Health
Organization were used to identify participants with fasting plasma glucose
concentrations (venous) of more than 7.8 mM (140 mg/dl). These participants were
considered with, or at risk for diabetes (Foster, 1989) and instructed to seek confirmation
with a private physician. Blood pressures ranging from 100 to 140 mmHg systolic and 60
to 90 mmHg diastolic were considered normal. Measurements of 140 mmHg to 160
mmHg systolic and 90 to 115 mmHg diastolic were considered abnormal. When either
the systolic pressure is 160 or more or the diastolic pressure is 115 or above, the elevation
is considered severe (Davis 1989). Participants were informed whether their blood
pressure was normal, abnormal or severe. Abnormal and severe blood pressure
measurements were considered hypertension, and participants were instructed to seek

43
medical attention from private physicians. Participants with excessively high plasma
glucose levels or severe blood pressure levels were advised to seek care immediately.
2.4.1 Procedures
2.4.2 Anthropometry
Anthropometeric measures followed protocols outlined by Lohman et al (1988).
Two anthropometry technicians were enlisted. One measured and the other recorded
measurements. The measurer positioned, measured and announced measurements of the
survey participant, while the recorder repeated and entered the numbers on the
participant’s form. The recorder also assisted in obtaining correct measurements by
verifying correct positioning of both participant and measuring device. The recorder also
was responsible to enter correct data on forms and note “gross” error in measurements.
Equipment included: 1 Health-o-Meter® scale, flat steel tape measure, GPM®
anthropometer, Lange® skinfold caliper, and sliding caliper.
Weight
All participants were weighed on a Health-o-Meter® spring-tension scale after the
scale was zero-adjusted. All heavy outer clothing, such as hats, coats, sweaters, and
shoes, etc., was removed. The weight of participants was recorded in pounds to the
nearest 0.1 pound. Weight was record as more than 300 pounds for participants who
weighed more than the 300 pound upper limit of the scale. The average of two
measurements was recorded.
Stature
Stature was measured to the nearest 0.1 centimeter (cm). Participants stood erect
with back straight, both heels together and toes slightly apart at a 60 degree angle. Arms

44
with palms facing forward hung free at the side of the trunk of the body to distribute the
body weight proportionately on both feet. The head was positioned in the Frankfort Plane
and the anthropometer was aligned with the spine. The measurer placed the sliding arm
on the crown of the head, compressing the hair. The value was announced to the recorder
who repeated it, before recording the value on the participant’s record form. Two
measurements were made and averaged.
Waist Circumference
Participants wore light clothing when waist circumference was measured. They
were standing erect, with arms at sides and feet slightly apart. The researcher stood in
front of participants, looped the tape measure around the participant’s torso and
positioned it at the level of the natural waist. The narrowest part of the torso viewed from
the anterior is the waist (Crews 1994, p. 8). Waist circumference for obese subjects was
the smallest circumference between the bottom of the rib cage and the iliac crest. Waist
circumference was measured to the nearest mm and was taken at minimal respiration after
it was determined that the tape was snug, but not indenting the skin. The measurement
was made, and repeated three times by the recorder, before being entered on the record
form.
Hip (Buttocks) Circumference
Hip circumference was measured with participants standing erect with feet
slightly apart. The anthropometrist looped the tape around the maximum protrusion of the
buttocks while stooping at the right side of the participant. The recorder stood on the left
side of the participant looking to insure the tape was in a horizontal plane. The tape was
pulled snug against any clothing to the zero end to below the measurement value. Values

45
were called out to the recorder who repeated them while entering them to the nearest mm
on the Report Form. Hip circumference was always measured a second time, and a third
time when any discrepancy of > 1 mm existed between the first and second values.
Upper Arm Circumference
Upper arm circumference (UAC) was measured while participants stood erect
with their feet slightly apart. The midpoint of the upper arm was located as participants
flexed their elbow to 90 degrees with the palm superior. The anthropometrist then located
the lateral tip of the right acromion (the outer extremity of the scapula) by palpating
laterally along the superior surface of the spinous process of the scapula and the most
distant point on the olecranion (the point of the ulna that projects beyond the elbow joint).
Then a mark was made midway between these two points for measurements of UAC and
triceps skinfold.
Triceps Skinfold
As described for the UAC, except that while standing behind the participant, the
anthropometrist used the thumb and index finger of his left hand to pick a double-fold of
skin and subcutaneous fat in the midline approximately 1 cm above the previous mark.
The tip of the large skinfold calipers were used to measure the fold to the nearest mm.
The triceps skinfold (TSF) was repeated three times with a 30 second pause between
each.
Subscapular Skinfold
Participants were standing erect. The scapula was palpated along the right
vertebral border to find the inferior angle. A double fold of skin was lifted on a diagonal
approximately 45 degrees to the horizontal plane in the natural cleavage line of the skin, 1

46
cm below the inferior angle of the scapula. For obese participants arms were placed
behind their back while the caliper jaws were applied 1 cm inferior-lateral to the thumb
and index finger. Subscapular skinfold (SS) was measured three times to the nearest mm.
There was a thirty-second pause between each measurement.
Suprailiac Skinfold
The participant was standing erect and relaxed with each arm hanging loose at the
side of his/her body. The measurer identified the iliac crest and a line superior to the mid-
axillary line. The measurer grasped an oblique double-fold of skin and subcutaneous fat
posterior to the mid-axillary line, then placed the caliper jaws 1 cm from the index finger
and thumb. This measurement was repeated three times with a thirty-second pause
between each measurement. It was measured to the nearest mm.
Medial Calf Skinfold
The participant sat with soles of his/her feet flat on the floor while flexing the
right knee at 90 degrees. The maximum calf circumference along the axis of the calf on
the medial aspect was located. About 1 cm above this maximum circumference the
medial calf skinfold (MC) was measured. Caliper jaws were parallel and placed about 1
cm below the left thumb and index. This was repeated 3 times with a thirty-second pause
between each.
Abdominal Depth
Participants were standing erect. Large spreading calipers were used to measure
abdominal depth (AD) at a point 1 cm superior to the umbilicus. One tip of the caliper
was placed at the midline point, and the other was placed on the spinous process of the
vertebra in the same horizontal plane. The anthropometrist stood to the left of participants

47
to maintain the caliper at level. AD was recorded to the nearest 1 mm and repeated three
times with a 30 second pause between each. The anthropmetrics were determined by two
individuals. One is a Certified anthropometrist posted at Wright Patterson Air Force Base,
Cockpit Design Group. The other is a physician and doctoral student in the Department of
Anthropology.
2.4.2 Anthropometeric Indices
Six indices determined from the anthropometric data are used as assessments of
overweight, obesity, and health risks among COSDA participants:
1. Body Mass Index (BMI) = weight (kg)/height (m2);
2. Arm Fat Index (AFI) = (upper arm fat area/total upper arm area) x 100
total upper arm area =upper arm circ2 /(4 x π);
3. Upper arm muscle area (UA Fat) = total upper arm area - upper arm muscle
area;
4. Upper arm fat area (UAF) = total upper arm area - upper arm muscle area;
5. Sum of two skinfolds (Sum SF) = tri SF + subscap sf;
6. Waist hip ratio (WHR) = waist circ / hip circ.
2.4.3 Phlebotomy and Glucose Measurement
Either the PI or a certified phlebotomist drew all blood samples by venipuncture.
These were used to determine fasting blood sugar levels. As discussed above, oral
glucose tolerance tests (OGTT) were performed on all participants who had fasted at least
eight hours and had a fasting glucose measurement below 200 mg/dl. Phlebotomists
cleaned the puncture site with antiseptic, tied a tourniquet around the upper arm to restrict
the blood flow, and inserted a needle into the vein to collect 7 ml EDTA blood in

48
vacutainers®. After blood collection, the tourniquet and needle were removed and the site
covered with cotton and a bandaid.
Blood was used immediately to determine glucose levels using an Ames
Glucometer III®. Results were determined following the manufacturer’s directions.
Following the fasting blood draw, participants to be tolerance-tested ingested a standard
oral solution of 75 g oral glucose load (Orangedex® 75 of Koladex®). After 2 hours
blood was again drawn, and plasma glucose level was determined. Either fasting or 2-hr
post load plasma glucose concentrations (venous) above 7.8 mM (140 mg/dl) are
considered to indicate Type II diabetes following Foster (1989) and the WHO (1998).
Later in Dr. Crews’ laboratory at OSU, Glyc-Affin® columns were used to determine
glycated hemoglobin from preserved whole blood following manufacture’s directions.
Fingerstick blood samples were also performed to check plasma glucose level in
participants who had known diabetes. Participants also had fasted eight hours but were
not given glucose solutions to drink. The fingerstick and phlebotomy protocols were the
same as for other participants, except there was no glucose loading or 2-hour draw. Vials
containing blood were labeled and centrifuged, before being stored on ice for
transportation to The Ohio State University Biological Anthropology Laboratory for
further analysis. Participants were informed that their serum glucose levels were normal,
hyperglycemic (greater-than-normal level), or hypoglycemic (lower-than-normal level).
2.5 Sociocultural Assessment
The sociocultural assessment provides insights into the association of
socioculutral risk factors with “stylization of life,” diabetes, hypertension, and obesity.
Weber (1912) and Veblen (1889) suggested that social differentiation reflects life style
and that it is composed of personal choices and structural conditions of society that may
be termed “stylization of life.” Some social scientists agree that African Americans’ life
style and minority status result from personal choices (Crews 1995) or attribute life and

49
health style to vicissitudes of class rather than to black skin color that historically
determined enslavement and disenfranchisement (Bennett, Jr. 1964). Others explain black
life style as intercultural responses to institutionalized restrictions, economic under
development, social barriers, and racial disenfranchisement. That is “alternative levels of
creations within the confines of the black experience and differential behavioral
adaptation to racism, with its economic, social, and geographical restrictions” (Williams
1981). Rather than concentrating on either aspect of the stylization of life, this study
focuses on global structural conditions generating sociocultural processes that affect
disease incidence. Disease is a barometer of socioeconomic, histopolitical, and biological
processes that produce population-specific disease profiles whether infectious, chronic,
epidemic or pandemic.
Often scientific methodology and researchers have interpreted data from a racist
and dehumanizing perspective, especially on African Americans (Barker 1993). Over
time, data have been denied, rewritten, distorted and/or dismissed. This reflects Sir Karl
Popper’s axiom that “the criterion of the scientific status of a theory is that its falsibility,
refutability or testability has become so deeply embedded in the design of research that it
is often used without conscious awareness of its origins” (Popper, 1994:14). Biased and
racist methodologies and interpretations benefited global culture but also threatened the
cultural autonomy of tribal and state societies. Commercial interests used government and
political power to promote industrial technologies, acquire new energy sources, and
generate social power through economic growth. This displaced indigenous people from
resources and placed them in areas where food supplies were inadequate, undernutrition
common and prolonged, and workloads high. Some researchers view food disruption and
deficiencies among members of tribal societies as the consequences of “progress”
(Bodley 1999). These researchers are so deeply enmeshed in global scale capitalism and
profits that they view health indices and the disequilibria associated with
commercialization as indices of acculturation and lack of exposure to western life style.

50
Instead of indices of minority status and life style, others see poor health as lack of power,
and the sign of malnutrition, starvation and genocide.
Poor health indicators also may reflect pathophysiological or metabolic
maladjustment to socioculturally induced adversity and/or nutritional deprivation,
programmed response to improper growth and development, or abnormal changes in
structure and function of organs and tissues due to previous deleterious conditions.
Global economies determine access to food and goods thereby causing and maintaining
patterns of undernutrition. Undernutrition affects fetuses, infants, children, and adults
adversely and subjects members of small-scale cultures to poor maternal nutrition,
deficient intrauterine environments, poor fetal, infant and childhood nutrition. Studies by
Hales and Barker (1992), James and Coore (1970), Dicke and Henderson (1988), Cohen,
Stern, Rusecki and Zedler (1988), and Dowse, Simmet, Finch and Collins (1991)
demonstrate how poor maternal nutrition leads to impaired glucose tolerance and
diabetes. Maternal malnutrition limits amino acids and reduces protein and energy
production (Hales and Barker 1992). Amino acids are major factors controlling ß cell
growth and development and insulin secretion until later fetal life (Hales and Barker
1992). Reduced ß cell function results in diabetes (Hales and Barker 1992). Multiple
sociocultural factors such as undernutrition and high workloads may lead to poor ß cell
function and diabetes in African Americans and other marginalized peoples. Structural
conditions led by governments such as the United States determined African American
life style and health styles, slavery, segregation, discrimination, access to jobs, and
education. All led to poor nutrition for many generations

51
2.6 Construction and Measurement of Sociocultural Risk Factors All participants
completed the Sociocultural Questionnaire. Sociodemographic, life style/stressors,
threatening health behavior, and dietary variables were measured as separate indices
comprising the Sociocultural Risk Factors.
2.6.1 Sociocultural Risk Factors: Sociodemographics Index
Sociodemographics were obtained by self-report. Sociodemographic variables
included social era/age, sex, income, education, occupation, and marital status.
2.6.2 Sociodemographics: Social Era/Age
Age reflects social era, the social milieu or environmental setting, the overall
living, political and social conditions, and life experience of people living at specific time
periods. World War II demarcated two different social eras for African Americans, the
apartheid social era, and the civil rights social era (Dressler 1996). African Americans
born before World War II lived in an apartheid world where they were forced to adjust to
the restrictions of Black Codes and/or Black Laws and second class citizenship. The
apartheid era ended with the beginning of the civil rights movement in the 1940s and
culminated in the Brown vs. the Board of Education Supreme Court decision in 1954
resulting in desegregation and equal rights. This ruling ushered in wide scale social
changes and a new “stylization of life” for blacks growing up after this court decision
and World War II. Thus, COSDA participants were organized into these two social eras
to reflect their social milieu. Social era was recorded as 0 for those growing up during
apartheid and 1 for those following the civil rights. Age groups were scored 0 for 40 - 49,
1 for 50 - 59, 2 for 60 - 69, 3 for more than 70.

52
2.6.3 Sociodemographics: Sex
There are two sexes of participants, men and women. Men are coded 0, women 1.
2.6.4 Sociodemographics: Income
Scores for income were assigned 0 for incomes under $4,000, 1 for incomes of
$4,000 - $7,999, 2 for $8,000 - $14,999, 3 for $15,000 - $24,000, 4 for $25,000 -
$49,999, and 5 for more than $50,000.
2.6.5 Sociodemographics: Education
A score of 0 was assigned for high school incompletion, 1 for high school/
technical/trade school graduation, 2 for 12 - 16 of college, 3 for graduate school, and 4 for
professional school graduation.
2.6.6 Sociodemographics: Occupation
A score 0 was assigned to unemployed, homemaker, student or retired, 1 for
unskilled or semi-skilled, 2 for lower professional or office worker, and 3 for
professional.
2.6.7 Sociodemographics: Marital Status
A score of 0 was given for never married or living as married, 1 for married, 2 for
divorced or single, and 3 for widowed.

53
________________________________________________________________________Assigned N PercentValue
________________________________________________________________________
Social Era Apartheid 0 58 52%Civil Rights 1 54 48%
Age Group 26 - 40 0 25 22%41 - 50 1 28 25%51 - 60 2 24 21%> 61 3 35 32%
Sex Male 0 34 30%Female 1 78 70%
Education < than 12 years 0 0 8%high school, technical 1 25 22%trade school graduation1 - 4 years of college 2 49 44%complete graduate school 3 25 22%professional school graduate 4 4 4%
Occupation unemployment, homemaker 0 18 16%student or retired,unskilled or semi-skilled 1 34 30%lower professional, office 2 39 35%workerprofessional 3 21 19%
Marital never married 0 16 15%married 1 53 47%divorced/separated 2 9 9%widowed 3 33 29%
Income under $4,000 0 4 4%$4,000 - $7,999 1 6 5%$8,000 - $14,999 2 7 6%$15,000 - $24,000 3 24 22%$25,000 - $49,000 4 36 33%> $50,000 5 32 29%
_______________________________________________________________________Table 2.3 Distribution of the sample by sociocultural factors and assigned values for sociodemographics (SD)_______________________________________________________________________

54
2.7 Sociocultural Risk Factors: Life style/Stressor Index
The life style/stressor index comprises two categories of sociocultural risk factors,
stressors and acculturation. Dressler (1996) described the African American life style as
consisting of two dominant types of stressors, chronic and acute stressors. Chronic
stressors are stressful events in daily life, while acute stressors are sudden, unpredictable
and cataclysmic life events (Dressler 1996). Chronic stressors include social incongruity,
social support, and relaxation, while acute stressors include desegregation adversities,
victimization, anger reaction, employment/unemployment and perceived discrimination.
Chronic stressors are also viewed as indicators of assimilation since they reflect the
degree to which a minority group has assimilated or has been absorbed into the prevailing
American culture.
2.7.1 Life style/Stressors: Chronic Stressors or Assimilation Index
COSDA participants completed a variety of questions that were based upon Likert
scales. Social incongruity measures life style and assimilation. Social incongruity was
determined by the type and number of material items people acquire. Material
possessions included microwaves, stereos, televisions, outfits, shoes, inheritance,
investments, and domestic and international travel. COSDA participants scored 1 point
for each item they owned. There was no maximum number of material possessions
obtainable. Social support was determined by various types of assistance, namely
financial advice and/or money participants received from family members, friends,
neighbors, pastors, and others to alleviate hardships. COSDA participants scored 1 point
for each type of assistance available to them. Thirty-seven points were possible.
Participants scored 1 point for each type of relaxation activity in which they engaged.
Relaxation activities included eating, meditating, praying, bathing, exercising, watching
TV, and having a warm drink.
55
Questions concerning acute stressors assessed participants’ perceptions of
desegregation, victimization by nonviolent and violent crimes, imprisonment, and anger.
Passive responses to anger received a score of 0, aggression and destruction of property
received 1, harm against a person and other acts of violence received 2. Participants’
perceived employment discrimination was scored high to indicate more perceived job
unfairness. Lower points indicated less training, pay, raises, and fewer promotions, and
grievances.
2.7.2 Chronic Stressors or Assimilation Index: Social Incongruity
Health status and the onset of chronic diseases such as diabetes mellitus are often
affected by social incongruity or the degree to which life style (measured by the
accumulation of consumer goods and the adoption of specific leisure activities) exceeds
economic status as assessed by occupational class and educational credentials
(Dressler 1994). In addition to assessing social status, social incongruity also measures
acculturation. Acculturation is often called cultural or social assimilation or integration,
the fusion of institutions and social structure causing people with divergent customs to
come to share common modes of action, norms, language, and dress (Vander Zanden
1983). Social incongruity reflects behaviors that define social identity. These behaviors
develop from patterns of interaction associated with attempts to manage and make
personal choices. Social incongruity also reflects structural conditions of society called
“stylizations of life”. Some social scientists suggest stylizations of African American life
results from the vicissitudes of class rather than phenotypic inheritances. Other social
scientists explain social incongruity and social differentiation as “intercultural responses
to institutionalized restrictions, economic under development, social barriers, and racial
disenfranchisement. These are alternative levels of creations within Black experiences
and differential behavioral adaptation to racism, with its economic, social, and
geographical restrictions” . . . (Williams 1981).

56
Instead of being a genetic trait, skin color is a criterion of social class and health
inequalities. Skin color is a chronic stressor that limits the opportunity structures for
African Americans. It indicates the frustration of darker-skinned people who receive
treatment incommensurate with their social status and education and who are unable to
accumulate material goods and adopt status-enhancing behaviors called life style. Life
style should be consistent with social status, education, economic and political
opportunities and health. Consistent life styles result in social congruity and reflect access
to status-enhancement in societies. Individuals who are barred from status-enhancement
behaviors experience frustration leading to repeated autonomic arousal and sustained
blood-pressure elevation (Dressler 1993). Such health conditions confirm the status
incongruity hypothesis developed by Dressler (1993). He argues discrepancies exist
between life style and occupational status or between life style and education, all of
which are based on skin color. This model not only exemplifies the significance of
ethnicity in a color-conscious society, but also redirects focus from the individual to the
social-relation structure.
William Dressler (1994) concluded social incongruity predicts family health as
locus of incongruity and social identity. It reflects life style yielding personal choices and
structural conditions of society. Life style is highly structured and widely shared across
sub communities indicating strategies members of subcultures use to overcome obstacles
and restrictions common to the black experience in the United States (Dressler 1996),
including adjustments to low status life styles that may be inconsistent with occupational
or educational achievements. Cultural models of life style are shaped by cultural sharing
and patterned behaviors.
Inconsistencies in education/occupation and income prevent the actualization of
shared aspirations, causing those deprived of goal attainment to engage in alternative
behaviors that impede goal attainment. Such behaviors include unwanted pregnancy,
criminal misconduct, victimization, absent/dysfunctional fathers, having too many

57
children, and death or addiction of parents. These behaviors produce a variety of
economic, social, and psychological phenomena that may become stressors in alternative
cultural meaning systems among subgroups. Those who attain shared aspirations of the
cultural meaning system and escape behaviors that prevent shared aspirations gain status,
prestige and social distinction (Dressler et al. 1996). Whether the escape is determined by
internal and external loci of control, personality traits, or skin color, all influence life style
and socioeconomic status. Actualized or blocked aspirations influence material
acquisitions associated with physiological indices such as serum cholesterol, high density
lipoprotein cholesterol, and triglycerides (Dressler et al. 1991), and onset of multifactorial
diseases such as heart disease, hypertension, hyperlipidemia and diabetes (Dressler, Evans
and Gray 1992 a). Material possessions gauge life style, health, and acculturation.
2.7.3 Chronic Stressors or Assimilation Index: Social Support
Social support is the sum of social, (social interaction), emotional (feelings of
social connectedness and encouragement), instrumental (re-education and material
intervention), and companionship (associate, assistant, or mate) exchanges among
individuals. Social support measures perceived, instrumental or tangible assistance. It
assesses financial, illness, guidance, feedback, appraisal, and/or career matters. Social
support causes individuals to see themselves as objects of continuing value in the eyes of
significant others (Glass, et al. 1993; Glass et al. 1992; Berkman, et al. 1992). Social
support is the sum of all relationships making a person matter to the people who matter to
him (Gordy 1996). Social support speeds recovery from illness, helps prevent or delay
disease onset, buttresses financial stability, and solidifies families and relationships
(Martin and Martin 1987). Family, friends and associates give emotional and practical
support in the form of companionship, assistance, affection, information, and security.
Social support bestows protective effects on health and well-being (Communities Count
2000).

58
Social support, however, is somewhat different among African Americans in that,
among slaves, it was a continuation of the African helping tradition, an informal self-help
network of mutually dependent relationships (Jewell 1988). Mutual-aid networks
involved communal cooking, childcare, sewing, and other cooperative activities occurring
in and around slave quarters. It creates on the plantation a type of ‘transresidential
cooperation’ (Jewell 1988). Then, survival was predicated upon assistance, a collective
interdependence of sharing networks among the community and family. Social assistance
was also provided directly or indirectly by the slave master and depended on his resources
and sense of moral obligation (Billingsley and Giovanni 1972). The mutual aids network
dispensed assistance according to need, the principle of the African helping tradition.
Social support changed after the emancipation of slaves. The federal government
through the Freedmen’s Bureau became the major social support agency providing food,
clothing, shelter, information, jobs, and other elements that established and maintained
black nuclear families. By1870, 90% of the black families were nuclear families
(Gutman 1976). The black community also continued its own informal social support
networks that provided basic needs and services for physical survival, child care,
counseling, and guidance (Jewell 1988). Black churches became the vanguard of mutual
aid networks providing goods, credit, job training, services, education, and other types of
mutual support to blacks, especially male household heads. Black churches worked with
Black philanthropic organizations to achieve social control, and establish and reinforce
values, beliefs and behavior.
The mutual-aid system declined after the federal government responded to the
social revolution of the 1960s by “mainstreaming” blacks and other economically
disadvantaged people into the Social Services system (Jewell 1988). Traditional Mutual
Aid Networks in black churches phased out in favor of governmental helping agencies.
Eligibility guidelines for receiving social support differed, though, from the Mutual Aid
Network and African helping tradition criteria. Supreme Court rulings in 1979 stipulated

59
that only mothers with dependent children, not unemployed fathers and their families,
were eligible for aid and services from formal social agencies. Thus, black families in
need responded to the loss of informal social support, but could not seek assistance from
the black community as black helping agencies deteriorated with the mainstreaming of
blacks into Social Service Agencies. Black males who were the last hired and first fired
left their children and wives to make them eligible for governmental social support.
Lower class black families further survived as financially dependent lineal networks of
multi-generational, matri-focal, nuclear and/or malleable family units. This response
stimulated the disruption of black nuclear families that reconstituted themselves by
finding loved ones and marrying after emancipation in 1865. Middle class black families,
however, survived as nuclear families as they escaped dependence on social support due
to job retention. COSDA participants, like other middle class black families, are nuclear,
financially independent and self-sufficient (Martin and Martin 1985).
2.7.4 Chronic Stressors or Assimilation Index: Relaxation
Stress is the physiological and emotional reaction to stressors that cause a change
in homeostatic systems, which if persistent, threatens an individual’s fitness and health
(Harrison 1980; James, Crews, and Pearson 1989; Zastrow and Kirst-Ashman 1995).
Stress triggers a physiological response that prepares individuals for “fight or flight” and
to cope with stressors by increasing outputs of catechoalimines (epinephrine and
norepinephrine) (James, Crews, and Pearson 1989). Catechoalimines are hormones that
alter tissue activity adapting the organism to environmental demands and stressors
(Johansson and Lundberg 1978). Stressors are demands, situations, or circumstances that
disrupt a person’s equilibrium and initiate stress. Stressors include job loss, loud noise,
toxic substances, retirement, arguments, death of a spouse or loved one, moving, heat,
cold, serious illness, and lack of purpose in life (Zastrow and Kirst-Ashman 1995). The

60
body also releases adrenalin and other hormones to cope with demanding stimuli (Shapiro
et al 1979). Hormones increase breathing and heart rates, blood pressure, blood
coagulation, serum cholesterol and blood fat, divert blood from the skin to the brain,
heart, and muscles, decrease mobility of the gastrointestinal tract, and cause pupil dilation
(Zastrow and Kirst-Ashman 1995).
Selye (1956) studied stress and found that individuals undergo a three-stage
reaction to stress: (a) the alarm phase in which the body recognizes and responds to
stress; (b) the resistance phase in which the body returns to homeostasis, repairs damage
caused by stressors, or adapts to stressors; and (c) the exhaustion phase that occurs when
the body remains in high stress states for extended periods, and if the body is unable to
repair damage the person develops stress-related illnesses such as hypertension, heart
attacks, migraine headaches, arrhythmia, diabetes, cancer, colds, flu, insomnia, dermatitis,
infections, and enuresis (Zastrow and Kirst-Ashman 1995). Stress may be dissipated
through stress management or coping skills that change distress or harmful stress,
changing evaluation of distressful events, and thinking about pleasure rather than
participating in compulsive overeating, drug or alcohol abuse, and other destructive
behaviors. A stressed person can also relax by getting a massage, learning muscle
relaxation and biofeedback techniques, meditating, or treating one’s self with pleasurable
and enjoyment. The sociocultural questionnaire recorded number and types of relaxation
activities in which COSDA participants engaged.
2.8 Life style/Stressors:Acute Stressors
2.8.1 Acute Stressors: Desegregation
Segregation started with the capture of Africans for enslavement. Those who
spoke the same language were separated to lessen conspiracies, sabotage, escape, “gold-
bricking” and rebellion. African-born slaves were separated from other slaves because
they were defiantly rebellious often to death, and if they survived, encouraged other

61
tribesmen to escape (Hines et al., 2000). Repressive slave codes were implemented to
regulate and differentiate slaves from other humans, and to demote them to property for
subordination, discipline, and maximum work (Franklin and Moss 1988, 114). Slave
codes prevented bondsmen from leaving plantations without authorization; possessing
firearms; beating drums or blowing horns; hiring themselves out without permission;
conducting themselves as free people; buying or selling goods; visiting or entertaining
whites or Free Negroes; assembling in the absence of a white person; receiving,
possessing, or transmitting incendiary literature; having legal standing or testifying in
court, except against another Negro; being party to a law suit; swearing binding oaths or
making contracts, owning property, or striking a white person; and defending themselves
against sexual and physical transgressions (Franklin and Moss 1988).
No Northern state in the late 1700s disenfranchised blacks. Exclusionary
legislation was coined as Jim Crow Laws in 1841 in Massachusetts and started with
railroad cars. But these restrictions soon spread leading to segregation of free Blacks in
neighborhoods with unheated shacks, dirt-floors, and houses without doors or windows.
Jim Crow laws banned blacks from public lecture halls, art exhibits, religious revivals,
state-supported poorhouses and insane asylums, public transportation, and nearly all
public schools (Franklin and Moss 1988). Segregation policies were further solidified in
1857 by the Dread Scott v. Sanford decision in which the Supreme Court ruled Scott was
a slave although he was taken as a slave from the slave state of Missouri to the free state
of Illinois. This decision established African Negroes of the United States as inferior
beings unfit to associate socially or politically with whites, and denied them rights which
the white men were afforded (Asante, 1995). Robert Purvis, C.L. Redmond, and other
civil and human rights leaders protested against such legislations. However, this decision
enshrined segregation in the South before and after the Civil War. After the Civil War
Southern states unsuccessfully attempted to reinstate former forced servitude by passing
Black Codes to replace Slave Codes. These codes legalized racial separation in public and

62
private life. The 1896 Supreme Court ruling of Plessy v. Ferguson (Selection 16)
mandated that racial segregation in public facilities did not violate the Thirteenth and
Fourteenth Amendments and “separate but equal” public accommodations since they
were evaluated as not denying blacks equal protection of the law (Rothenberg, 2000).
Exclusionary practices in employment made it especially difficult for black men
to find work. Job market restrictions increased antebellum and post-bellum single-parent
families. It also caused black families to take in boarders, move often in search of
employment, and family members to share dwelling places. Extended families increased
(Hines, 2000). Until the 1954 Brown v. Board of Education of Topeka decision by the
Supreme Court, exclusionary conditions nurtured disease, infant mortality, alcoholism,
and crime (Hines, 2000). This decision concluded “separate” could not be “equal”, and
that segregation should be abolished in public facilities, public schools, housing, and
employment (Hines, 2000). Many exclusionary policies and much of de jure segregation
ended with the desegregation that followed the civil rights movement led by Martin
Luther King, Jr. in the 1960s. However, inequalities and segregation still exist today as
de facto segregation in most neighborhoods, work places, private clubs and facilities, and
public schools. Health effects of such social conditions on type II onset for COSDA
participants are examined as sociocultural risk factors.
2.8.2 Acute Stressors: Victimization
This dissertation research documented numerous accounts of Africans, both
enslaved and free, American and African born, being harmed by those who enforced slave
and black codes, disenfranchisement and segregation, and punishments, mistreatments,
tricks, and swindles. African Americans suffered injury, loss and death from acts of
violence making them victims. Conflict theorists explain that oppression and exploitation
underlie violence. As a large force of laborers who do not own the means of production
and capital for investment money, African Americans are without a power base to make

63
business, economic, and social decisions to buy food, clothing, utilities, mortgages, and
transportation (Henslin 1990). When confronted with adversities that affect their
livelihood, some strike out in violence. They became threatened and desperate when
access to culturally approved goals are blocked (Henslin 1990). African Americans are
disproportionately represented among abusers of alcohol, and drugs and among those
committing crimes against property and persons. Owners of production use power and
influence to protect their privileged position in society, causing workers to misdirect
anger and violence against one another. Thus, blacks are more likely to become victims of
crime, violence, racism, drugs, personal theft, rape, robbery, assault, drug and alcohol
abuse, and murder. They are also more likely than other ethnic groups to be statistically
over-represented as criminals (Wilson 1990). In 1988, 5.4% of black households
experienced violent crime, 7.6% were burglarized, 9.1% experienced theft, and Black
males had a 1 in 21 chance of being murdered (Williams (1990). The sociocultural
questionnaire enumerates violence perpetrated against COSDA participants, their
families, mates, and mates’ families.
2.8.3 Acute Stressors: Reaction to Anger
Anger is a physiological, social, or psychological response to emotive situations.
Anger expressions depend on culturally based learning and socialization. The limbic
system and frontal lobes play an important role in creating emotions. Increased heart rate
and fast, shallow breathing are phenotypic signs of arousal. These reflect sympathetic
nervous system responses dependent upon adrenalin, norepinephrine, and cortisol. These
hormones are secreted from the adrenal gland in response to stress perceived by the
hypothalamus (Huffman, Vernoy, and Vernoy 1994). The parasympathetic nervous
system returns the organism to its pre-arousal state following sympathetic arousal from
emotions and stressors.

64
Modern evolutionary theorists contend that basic emotions such as anger, fear,
sexual desire, and aggression have survival and protective functions shaped by natural
selection (Huffman, Vernoy and Vernoy 1994). Anger, fear, joy and sadness are primary
emotions that combine to produce love, submission, awe, and disappointment, the
secondary emotions. Human conduct researchers view anger as the result of frustration, a
condition that exists when a person fails or is prevented from reaching goals (Gelinas
1983). This frustration-aggression hypothesis suggests when needs are not met frustration
and anger follow sometimes leading to violence or hatred. Individuals may either adjust
or control them. When unresolved, angry may be turned against people, objects, or
oneself (Gelinas 1983).
Pierce (1970) developed the micro-aggression concept. It helps explain the
continual assaults and insults African Americans encounter subtly or blatantly in
disadvantaged environments. Assaults and insults remind them of their low status and
mistreatment. Blacks, especially male youths, report being called stupid by teachers,
bypassed by available taxis, ethnically profiled, followed or ignored in stores, or denied
interviews for jobs for which they qualify (Gibbs 1988). African American males,
especially, must either learn to tolerate these micro-assaults against their dignity, react
with uncontrolled aggression that may invite counter violence, suppress their anger and
develop psychosomatic symptoms like hypertension and ulcers, or drown their
frustrations in alcohol and drugs and other health threatening behaviors (Gibbs 1988).
Society reinforces anger catharsis by admonishing black parents to teach their
children to ventilate anger without open expression of enjoyment of an aggressive
response, or to avoid directing damage and aggression on the target (Renfrew 1997). By
adulthood they learn to speak softly and avoid kicking furniture, throwing household
accessories, yelling or rebelling. Those who fail to heed admonishments and vent their
anger in socially unacceptable ways often find themselves victims of the criminal justice
system. In COSDA, relationships between anger management and plasma glucose were

65
assessed (Appendix A). Questions reflecting self-control were scored 1; those vented on
inanimate objects 2, while violent actions toward others were scored 3. The maximum
possible score is 60.
2.8.4 Acute Stressors: Discrimination
Discrimination often accompanies segregation as a prejudging attitude. It is an
unfair action or treatment directed against someone (Henslin, 2001). The unfair treatment
may or may not be deliberate. Discrimination against blacks was legislated as federal and
state policies backed by Supreme Court decisions such as the Dread Scott Decision and
Article 1, Section II—the three fifths clause—of the Constitution of the United States.
Although elements of culture are shared, individual discrimination experiences depend on
personal characteristics, individual accomplishments, family background, shade of skin
color, education, style of dress, language patterns, and other factors upon which
discrimination and privilege are executed.
Discrimination is built into the country’s institutions, specifically the financial and
employment institutions (Henslin, 2001). Examination of 1910 economic opportunities
by Landale and Steward (1991) showed restriction of African Americans from
nonagricultural opportunities created a caste or southern tenancy system and a dual
economic system. These restrictions guaranteed black oppression, restricted upward
mobility, created debt penonage and precluded blacks from saving money, owning
property, inheritance, and other opportunities. Tenant households functioned as
autonomous units in which income for both the tenant family and the landlord depended
on tenant family labor. Tenancy encouraged early marriage and large families. Preventing
black males from pursuing economic opportunities resulted in barring them from
manufacturing and industrial employment in the South but less so in the North.
Employment restrictions to agriculture in the South, and to dangerous or low paying

66
industrial jobs in the North resulted in black family instability and differential marriage
patterns for blacks and whites. Data from the 1910 Public Use Sample of the United
States census indicate 47% percent of black males and 47% of black females, and 37% of
white males and 22% of white females aged 18 were married (Strong et al. 1989). This
system guaranteed whites an opportunity structure where tenancy was a temporary status,
and farm ownership, entrepreneurship and savings were achievable goals for upward
mobility (Landale and Steward, 1991). Discrimination against blacks created
disadvantaged life styles and health styles for blacks and advantages and privileges for
whites (Strong et al. 1989). COSDA participants were asked questions to evaluate life
and health styles resulting from their perceptions of employment discrimination. This
assessment was used to determine the correlation between discrimination and plasma
glucose.
2.9 Life style/Stressors: Health Threatening Behavior
Health threatening behaviors included alcohol and tobacco use and physical
inactivity. Alcohol was scored as the number of drinks consumed per month. Tobacco
was scored as the number of packs participants smoked per day and for how many years.
Pack years or packs per day times years smoked were computed. Physical activity at work
and leisure along with type, frequency, and intensity of exercise were reported. Self-
reports scored physical activity as 0 for very light, 1 for moderate, 2 for heavy, and 3 for
very heavy.
2.9.1 Health Threatening Behavior: Tobacco Use
Questions included when tobacco use began, whether the participant presently
smokes, how many cigarettes per day the participant currently smokes, and how many
years the participant has smoked (Appendix A). The number of cigarettes that were

67
smoked per day was divided by 20, and then 13 to determine the number of packs smoked
per year (pack years).
2.9.2 Health Threatening Behavior: Alcoholic Use
Amount of beer, ale, wine, wine coolers, liquor, cocktails and mixed drinks
containing liquor was determined for the past 12 months (Appendix A). Participants
reported the number of drinks they consumed per day. This figure was used to determine
number of drinks per week and included as a component of threatening health behavior.
2.9.3 Health Threatening Behavior: Exercise or Physical Activity
Level of physical activity was reported as very light, light, moderate, heavy and
very heavy, for work, leisure, and any exercise programs (Appendix A). Strenuous,
biking, running, dancing, basketball, and less strenuous exercises, like cricket, slow
walking, were also determined. A total score of 29 for physical activity was possible.
Tobacco and alcohol use along with physical activity was summed to estimate the
threatening health behaviors index.
2.10 Life style/Stressors: Dietary Variables
All participants completed a dietary recall for foods eaten the past year. The
dietary recall form included a wide variety of foods and asked participants to indicate
portion size and frequency (Appendix A). All items were measured in portions such as
slices, pieces, or cups and then converted into grams consumed per year. To evaluate
dietary deficiencies or excesses, all items were entered into the Food Processor®

68
Nutrition and Fitness Software. The Food Processor® analyzes 114 nutrients and 29 other
factors. This study evaluated nutrition facts based on intake for age, weight, height,
gender, and activity level. They were compared to U.S. 1989 Recommended Daily
Allowances (RDA), Estimated Safe and Adequate Amounts, and Dietary Goals (Esha
Research 1999). Calories, total fats, saturated fats, cholesterol, sodium, total
carbohydrates, dietary fiber, sugars, proteins, vitamins A and C, calcium and iron were
evaluated for COSDA participants with and without diabetes and hyperglycemia.
Food and nutrient intakes influence the onset of NIDDM. In particular, intakes of
fat increase obesity during periods of physical inactivity since fat converts rapidly to
storage forms. Among US type II diabetics, 85-90% are obese (Editorial Diabetes Care
2000). Composition of dietary fat plays a significant role in type II diabetes. An inverse
relationship between vegetable fat and the incidence of NIDDM has been reported
(Meyers et. al 2001). Prolonged environmental, dietary and social assaults may express
themselves as increases in individual risk factor exposures. For example, social
incongruity and life style are associated with dietary, social, and psychosocial correlates
of serum lipids in an urban community sample. Life style incongruity also is a major risk
for high total serum cholesterol and low HDL cholesterol. Lower SES respondents have
lower cholesterol intakes than affluent ones (Dressler et al. 1991). Body mass mediates
relationships between sociocultural factors and serum cholesterol, suggesting that obesity
plays a role in elevating cholesterol and that total cholesterol is affected by SES or by
attempts to maintain general affluence in the context of lower SES.

69
2.11 Statistical Analyses
For all quantitative variables means and standard deviations along with t - tests
comparing means between those with either fasting of 2-hour post load glucose levels
above 7.8 (140 mg/dl) and those below (non Type II, normal glycemia) are reported
(Table 3.2). For all qualitative variables, frequency distributions are presented for these
with and without Type II diabetes (Table 3.3). Multiple linear regression is used to
determine independent predictors of glucose level from the range of available covariates.
Logistic regression models are used to determine independent predictors of Type II from
the available array of sociodemographic life style and biophysiological variables.
2.12 Construction of Biomedical Indices:
All participants completed sociodemographic questionnaires (See Appendix A).
Diabetes/hyperglycemia as a dependent variable is examined with biological and
sociocultural risk factors as two categories of independent variables. The biological risk
factors are obesity, as measured by anthropometry and body mass index (BMI), and blood
pressure. Leibson et al. (2001) categorized BMI in the following ranges: BMI <18.5 =
underweight, 18.5 - 24.9 = normal weight, 25.0 - 29.9 = overweight, 30.0 - 39.9 = obese,
> 40 = extremely obese. Health risks are assessed according to the weight and health risk
chart below. A BMI less than 25 has a minimal health risk for a score of 1, 25 to less than
27 is low risk for a score of 3, 27 to less than 30 is moderate risk for a score of 3, 30 to
less than 35 is high risk for a score of 5, and over 40 is extremely high risk for a

70
________________________________________________________________________
BMI Health Risk If combined with the other risks________________________________________________________________________Less that 25 1 Minimal Low25 – less than 27 2 Low Moderate27 – less than 30 3 Moderate High30 – less than 35 4 High Very High35 – less than 40 5 Very High Extremely HighOver 40 6 Extremely High Extremely High________________________________________________________________________
Treatment Recommendations________________________________________________________________________Minimum Moderate risk High and very Extremely high
Low risk________________________________________________________________________> Heathful eating > All of minimal High and very Extremely highand/or moderate and low risk and low and low moderate and deficit diet recommendations moderate risk high and very high > Increased plus low calorie recommendations recommendationsphysical activity diet plus drug therapy plus surgical > lifestyle change at very low calorie
diet________________________________________________________________________
Table 2.4 Diet and Health Risks________________________________________________________________________
score of 6 (See Table No. 2.3). BMI scores were calculated based on weight and height.
Participants with plasma glucose scores > 140 mg/dl were assessed as diabetic and
hyperglycemic (U.S., Department of Health and Human Services 1986).

71
________________________________________________________________________
Diastolic________________________________________________________________________
Systolic > 85 85 – 89 90 – 104 105 – 114 > 115
Under 140 1 2 3 4 5________________________________________________________________________
140 – 159 3 3 3 4 5________________________________________________________________________
160 – 199 4 4 4 4 5________________________________________________________________________
> 200 4 4 4 4 5________________________________________________________________________
Table 2.5 Blood Pressure Value Box________________________________________________________________________
Participants with diabetes are given 1 point those without diabetes 0. The numerical value
for systolic and diastolic blood pressure risk was determined from the blood pressure
value box as presented in Table No. 2.

72
CHAPTER 3
HISTORY AND FOLKLORE
3.1 Africans and African Americans
Folklore, literature, and historical reports provide a logical first step in unraveling
past and present environmental and ecological settings, laws, attitudes and behaviors that
may today predispose African Americans to type II diabetes. For example, the institution
of slavery was a global and long-term stressor. Still the effects of slavery, slave trading,
social disruption, apartheid, and desegregation on the health of today's African Americans
often are ignored. Previously, much of this ethnic group's population loss and disruption
were omitted from written history and distorted to justify enslavement, deny earlier
atrocities or escape restitution (Marketti 1990). The intent of this chapter is to examine
historical and cultural factors that may contribute to excessive risk for Type II in African
Americans today. My hypothesis is that enslavement led to major environmental
disequilibria that included inadequate nutrition, life-long psychosocial stresses, increase
disease risks, and arduous physical labor.
Using recorded information to examine the bio-history of Africans captured for
enslavement is problematic. Slavery records (e.g.: Bills of lading) were never widely
disseminated, although slavers were known to have kept extensive records. In addition,
narrative and folk knowledge that also recorded history through vernacular expression
and/or other genre of performances were often expressed in one social context and then
transported across categories, textures, texts, and/or other contexts. Most important is the
body of knowledge, thoughts, perceptions, behaviors and treatments redundantly
transmitted through time and space regardless of mode. Those circulated orally as
73
folklore (Ben-Amos 1971), were written in prose or verse as literature, or chronicled in
thoughts, beliefs, and actions as history (McKay et al. 2000) and are equally important.
Folklore as a vehicle to examine the past of African Americans also is problematic
because nineteenth century folklorists reserved "folk" for Europeans who were illiterate,
rural, uncivilized, uneducated, and non-progressive peasants (Dundes 1980). It is
necessary to clarify matters regarding the interpretation, function, diffusion, and
limitations that might otherwise make it difficult to apply folklore to the epidemiology
and study of disease.
To interpret folklore correctly, the folklorist must evaluate the function, texture or
language features; the text or version of a tale, recitation, proverb, or folksong; the
context or specific social situation in which the item was employed; and the researcher's
statement of the use and purpose of the genre of folklore (Dundes 1980). Ben-Amos
explained that folklore is the sum total of knowledge shared by group members in a
society often as communal lore expressed in "collective actions of the multitude,
including public festivities, rituals, and ceremonies restricted to customs and
observances” (Ben-Amos 1971, p. 38). As a form of social interaction, folklore involves
stories, songs, music, painted pictures, and symbolic kinds of action that may be
classified as history and traditions. Symbolic modes of folklore include legends that often
signify chronological truth; myths that symbolize religious truth, and parables that imply
moral truth (Ben-Amos 1971).
Although folklore allows us to look at knowledge, behaviors and truth through
time and space as a communicative process, folklore has its social limitations that bind it
to a group for shared interaction among performer and audiences (Ben-Amos 1971).
Folklorists generally agree folklore that tradition forbearers produced folklore and carry it
through time and space to subsequent generations in "cultural baggage." Richard Bauman
(1971) described this as a "social matrix." This matrix is based in the ethnicity, traditions
and culture of "tradition bearers " who perform it, or tell it. These specifications of

74
folklore caused controversy concerning whether the forbearers of African American
folklore were of European or African origin or both. Then an oppositional framework
developed that defined Europeans as folk, distinguished folk from elite, and separated
Europeans from the non-European "Other," often designated as "primitive." This
framework was based in ethnocentrism and European hegemony. Slavers established
paternity rights over African slaves and also claimed rights to the origins African
American folklore. Proslavery justified slavery as an institution that civilized the
"childlike primitives" by elevating their character, culture and vernacular expression to
European standards and levels of achievement (Roberts 2000, p. 81). This devolution of
African slaves, their history and vernacular expression contained blacks in a social matrix
that was created by whites. It allowed whites to produce, rewrite, and appropriate African
American history and erase African American history to facilitate the development of
African American folklore study within an Eurocentric discourse of folkness (Roberts
2000, p.84-85). Roberts explains this practice lasted until the politics of the late 19th
century made the inclusion of African Americans in a discourse of folkness necessary to
acculturate African Americans to Euroamerican cultural norms. Attaching African
American folklore to the African past during the apartheid era threatened Euroamerican
hegemony.
The vernacular expressivities of African Americans must not be approached as an
oppositional form of creative discourse if we are to discover how ideas, beliefs and
performances of African American vernacular expressions and performances record
knowledge as history and biohistory. As Roberts (2000) suggests, an African American-
centered approach to African American vernacular expressivities would eliminate the
Eurocentric bias that is inherent in culture-specific mode that is linked to the identity
formation peculiar to African people in the New World. He also explains that an African
centered approach would focus on the relationship between processes of vernacular
creativity and identity formation specific to African in America. It would also reveal how
75
folklore incorporates history, biology, disease patterns, social conditions and political
processes as it circulates knowledge through time and space that is chronicled as legends,
myths, proverbs, tales, rumors and other genre of creative expressivity.
3.2 Hebrew Folklore
The legend of Noah-Ham-Canaan originated among ancient Hebrews and appears
in the Midrash, a book of Hebrew legends. It grants them divine authority to claim
ownership of the Promised Land or Canaanland. According to rabbis who circulated and
promoted this legend, Noah planted a vineyard after God judged and destroyed the world
with a cataclysmic flood. The transgressions of “falsehood” and “vexation” survived the
flood by entering the world through Noah. Accordingly, Noah became profaned through
the demon Shamdon or Satan (Bialik and Ravnitzky 1992:29). Supposedly, Noah allowed
Satan to drop the blood from a ewe, lion, and pig on the field before Noah planted
grapevines (Bialik and Ravnitzky 1992:29). The Bible says Noah made wine, got drunk
and
. . . was uncovered within his tent. And Ham, the father of Canaan, saw the nakedness of his father and told his two brethren without.
And Shem and Japheth took a garment, and laid it upon both their shoulders, and went backward, and covered the nakedness of their father; and their faces were backward, and they saw not their father’s nakedness.
And Noah awoke from his wine, and knew what his younger son had done unto him (Genesis 9:21-22).
No one knows exactly what Ham did to Noah, except that he looked at his naked
father. Breaking the privacy taboo was a transgression in tribal societies where people
lived in proximity without walls to separate them from others when they performed
personal and intimate acts. Rabbis amplified Ham’s transgressions with speculations in
the Babylonian Talmud that claimed Ham possibly practiced voyeurism (Drake 1987b),

76
sodomy, bestiality (Drake 1987b), or “castrate[d] his father to prevent him from
increasing the number of progeny with whom they [Ham, Shem, and Japheth] would have
to share the inheritance” (Epstein et al. 1935-50 a). Rabbis explained penalties for these
sexual delinquencies as,
You have prevented me from begetting a young son to serve me, therefore that man [your son] will be a servant to his brethern!...Therefore I curse your fourth son. Your seed will be ugly and dark skinned... Therefore, Ham came forth black-skinned. . . (Ginzberg 1966).
This legend included Rabbis’ personal biases as the black-skin-color-curse appeared in
the legend after the sixth century enslavement of Jews with Africans in Babylon”
(Ginzberg 1966); Drake 1987). According to a Talmudic version of the Flood, Ham
became a black man because he also disregarded the injunction to separate from the
opposite sex in the ark ” (Rappaport 1968). Thus, rabbis also reported of Canaan’s
punishment that his children
“...shall be born ugly and black! Moreover, because you twisted your head around to see my nakedness, your grandchildren’s hair shall be twisted into kinks, and their eyes red; again, because your lips jested at my misfortune, theirs shall swell; and because you neglected my nakedness they shall go naked, and their male members shall be shamefully elongated.” Men of this race are called Negroes; their forefather Canaan commanded them to love theft and fornication, to be banded together in hatred of their masters and never to tell the truth (Ginzberb 1966, p. 45).
This legend loaded with derogatory stereotypes of Canaanites that continued until
the legend of ‘Alexander of Macedon’ became a part of the legend. The legend of
‘Alexander of Macedon’ explains how the curse of Canaan enabled ancient Hebrews to
claim Canaanland, moderns or Israel.

77
“The Africans said, ‘The land claimed by Israel belongs to us, since it is described as ‘the land of Canaan with its various boundaries’ (Num. 34:2), and our forebear was Canaan. The Africans and Jews used the Torah to prove ownership of Canaanland. The Jews said, “ ‘Cursed be Canaan, the lowest of slaves shall he be to his brothers’ (Genesis. 9:25). Now, if a slave acquires property, since he is a slave, to whom does the property belong? Thus, the Jews proved ownership of Canaanland and the Canaanites fled, leaving behind their fields, which had been sown, and their vineyards, which had been planted” (Bailik and Ravnitzky 1992:166:29).
Hebrews mingled with, intermarried, and enslaved the Canaanites. Then they claimed
Canaanland and all its possessions and waged war against the Philistines who occupied
part of Canaanland (Mckay, Hill, Buckler and Ebery 2000), but were not Canaanites. The
Philistines were descendants of Mizriam, the second son of Ham and forbearer of the
Egyptians (Smith 1973). Including the Philistines, extended the original Biblical curse of
enslavement to non-Canaanite Africans on the basis that Ham’s black skin color applied
to all dark-skinned peoples. This, falsehood or myth set in motion a global folklore
pandemic of for all black skinned people were inferior and divinely appointed as slaves.
This led to the transfer of Africans’ physical energy, land, wealth, natural resources, and
lives to non-African peoples.
3.3 Arab Folklore
Long before slavery became a racial institution multicultural slavery was an
established Arab institution. Both customs and Islamic law required Arabs to obtain
slaves from non-Islamic groups including those of the Fertile Crescent, Africa, Central
Asia, India, China, the Byzantine Empire, and Europe (Lewis 1990). After the 5th century
collapse of Rome, the enslavement of Europeans in European countries was no longer
widespread (Everett 1988). Exceptions included German enslavement of Slavs during the
8th to 10th centuries and British enslavement by Anglo-Saxons, during the 10th to 11th

78
centuries and the French 14 to 15th centuries. Reduced availability of European slaves,
the defeat of the Byzantine Christian Empire in 1453, the spread of Islam to Africa by
conquest, conversion, and/or enslavement, and the profitability of sugar and cotton
cultivation in the Iberian Peninsula revived Arabian needs for slaves and led them to seek
slaves elsewhere. In the 15th century, Europeans and Arabs converged on Africa to raid
for slaves, transforming multicultural slavery into racial slavery.
Arab cultures were infected by the Noah-Ham-Canaan folklore legend through
kinship with Ishmael and Abraham. Arabs raided Africa for slaves to use as miners,
domestics, soldiers, policemen, and harem guards (Lewis 1990). The Arab version of the
legend of Noah-Ham-Canaan explained the capture and enslavement of Africans.
“Ham the son of Noah was a white man, with a handsome face and a fine figure, and Almighty God changed his color and the color of his descendants in response to his father’s curse. He went away, followed by his sons, and they settled by the shore, where God increased and multiplied them. They are the blacks. Their food was fish, and they sharpened their teeth like needles, as the fish stuck to them. Some of the children went to West [Maghreb]. Ham begat Kush ibn Ham, Kan ‘am ibn Ham, and Fut ibn Ham. Fut settled in India and Sid and their inhabitants are the descendants. Kush and Kan‘an’s descendants are the various races of blacks: Nubians, Zanj, Qaran, Zaghawa, Ethiopians, Copts, and Berbers (Drake 1991 [1990], p 34).
Although chapters XXX:22 and XLIX:13 of the Qur’an are cited as proof that
Islam does not distinguish people by skin color, this legend reveals a pejorative view of
black skin color. Similarly, literature of the Aghrib al-‘Arag (black Arabs) expresses
resentment of the insults, inferior status, and discrimination they suffered. One tale
describes how Suhaym (“little blackie,” as Arabs called him) was burned to death by his
owner around 600 A.D. because he showed interested in Arabic women (Lewis 1979).
Arab lore also describes aggression and pejorative attitudes toward the Zanj, an East
African people. In Arab legends, the Zanj are “ugly, black, unintelligent, misshapen, and

79
smelly people with kinky hair and sharpened teeth” (Lewis 1979, p.34); Lewis 1990);
Drake 1987b) who Arab men sexually exploited. Zanj slaves had little food, worked long
hours, could not marry, and were forbidden extramarital sex under Islamic law. Poor diet
and living conditions along with endemic and epidemic diseases caused high death rates
among the Zanj (Everett 1988). In 1776, the Zanj revolted, but were defeated by the
Arabs who ridiculed them as rebels, “rabbles,” “mobs of drunken slaves”, “good for
nothing” but to pillage, kill, ravage, loot and rape, and then raided Africa for more black
slaves (Lewis 1979, p. 11).
Additional folk sources of how African slaves circulated through Islamic society
are contained in Arab legends, history, and literature. These all repeat how Arabs
continually raided Africa to replenish their supply of slaves even as late as 1950 (Lewis
1990; Everett 1988). Although the legend of Noah-Ham-Canaan began among Hebrew
peoples it also justified enslavement of Africans in the Middle East, and then shifted
blame for the enslavement of black peoples to Christendom and Judaism (Lewis 1990).
3.4 European Folklore
Classical European folklore includes Osiris, a jet black Egyptian God. Osiris
brought civilization and turned into a man before civilizing Egypt. He then traveled to
India, Greece, and Rome to introduce cultivation, flood control, law and religion. The
Louvre Museum in Paris contains a statue of the god Osiris (Drake 1979). Before the Age
of Exploration many Europeans had heard of, but few had seen any black Africans. In
medieval Europe, folklore portrayed Africans mostly as folk and religious heroes. French
folk songs speak of Roland, an Ethiopian war hero, who led “fifty thousand blacker than
ink soldiers” with big noses, broad ears, and broad white teeth, alongside other Christians
in 8th and 9th-century campaigns against Muslims (Drake 1987). King Senapo of
Ethiopia (aka Prester John) also led troops who fought with other Christians and
Charlemagne. St. Maurice, an African knight, fought with the Holy Roman Empire army

80
and Charles V of Germany to stop the advance of Ottoman Turks into Europe and North
Africa (Drake 1987). Africans helped preserve European and Catholic sovereignty and
pushed Muslims out of western Europe into Turkey (Drake 1987). Europeans honored
African folk heroes with shrines, cathedrals, statues, songs, tales, and legends. The most
honored Egyptian Emperor-Redeemer folk hero was the black Magus, a folk hero who
would save the world from imminent end (Psalms 68:31; Drake 1987) and then establish
a New Age (Kaplan 1984). The Magus was a dark-skinned offspring of the dark-skinned
Virgin Mary, the black Madonna to whom Europeans constructed over 250 shrines and
cathedrals (Drake 1987). “Tradition says that it was St. Luke who knew personally the
Mother of Christ and carved with his own hand the majority of these [statues of the]
black Virgins. If the Mother of Christ was not a Negro woman, how does it happen that
she is a black in France, Switzerland, Italy, and Spain?” (Rogers 1957)
The spread of Christianity introduced Europeans to the curse-on-Canaan legends
of Nimrod, grandson of Ham, and a political leader who built the first cities (Genesis
10:10-12). Church fathers such as Philo Judaeus associated the evil nature of Nimrod
with Ethiopians and equated black skin with sin, darkness and evil (Drake 1987). In the
3rd - 5th centuries, St. Augustine and the Church exposed a doctrine of racial prejudice
that through conversion to Christianity enslavement saved Africans from sin (Drake
1987). Although sin was seen as individual choice without ethnic boundaries, defining
black skin as evil made all Africans sinners, including righteous believers. The Church
used Paul’s New Testament statement supporting multicultural slavery to endorse the
enslavement of blacks. In actuality such racial slavery continued the policies of Rome and
Augustus Caesar who classified all Egyptians and Northern Africans dedicti (legal serfs),
legally segregated from the Greeks and Romans. In effect, early European interpretation
renewed Greek laws prohibiting intermarriage, preventing assimilation and relegating
African slaves to the lowest social strata. Because Africans then received inadequate
food, increased exposure to environmental hazards and stressful life style, they also

81
suffered high suicide, morbidity and mortality rates and lowered life expectancies of 5 to
7 years (Littlefield 1991).
Diffusion of early Hebrew folklore throughout the Old World partly determined
acceptance of African enslavement. Although modern scientists reject the Ham legend,
classical and medieval folklore and literature promote Ham as the forefather of Africans.
Such religious, social, political, and cultural attitudes formed the foundations of 17th and
18th century polygenesis, monogenesis, cultural evolution, racial determinism, racism,
and the American School (Harris 1968). All of these advocated the philosophy that
Africans are inferior to Europeans. Only monogenesis believe that the races were created
separately. Followers of the American School including John Bachman supported the
prevailing Biblical justification of slavery:
“the Holy Scriptures tell how Noah blessed the descendants of Shem by making them ‘the parents of the Caucasian race—the progenitors of the Israelites and Our Savior. The Mongolians were the children of Japheth, and as the Bible predicted, many of them are still living in tents. Ham was the third of Noah’s son’s and the ancestors of the black “servant of servant” race. In slavery, the superior white race leads the inferior black race by the hand, protecting and improving them (Harris 1968, p. 80).
Racists today still quote Bachman’s version of the legend of Noah-Ham-Canaan to
advocate black inferiority and justify crimes against African Americans.
Negative connotations and denigration of Africans in folklore, history, science,
medicine and literature continued into 18th century in Europe. Once supplies of Native
Americans and Europeans became inadequate (Bennett, Jr. 1970) enslavement of
Africans replaced multiracial enslavement. Africans were more plentiful and better
resisted many Old World diseases (Mascie-Taylor 1993). They also produced four times
the labor of one Indian (Bennett 1970). Ultimately, Christian Europeans, Judaic
Hebrews, and Islamic Arabs all condoned enslavement of Africans before the 19th
century.
82
3.5 A Clash of Ethos, Meanings and Cultures
This review has documented how folklore, history and literature illustrate how
past traditions and sociocultural conditions that contributed to physical hardships,
malnutrition, disease and death for Africans held in slavery. The next section surveys
European and African histories along with the ethos of their respective cultures to show
how cultural variables may have meanings and contributed to the recent epidemic of
Type II diabetes among descendants of African slaves. Both African and European
agrarian societies followed their own “little” and “great” traditions” (Bohannan 1968).
Little traditions are aspects of peasant culture. Great traditions include divine kingships,
centralized civilizations, and unilineal descent groups in Africa, and the Church and
anointed kings in Europe. Kings and nobility dominate while peasants perform duties,
produce goods, and support rulers, but benefit little from the great traditions. Both
African and European societies depended on the “manor’ (a city, village, church) as
central to their sociopolitical organization for survival.
3.6 Europe
Europeans had a major part in converting the institution of slavery from a
multicultural to a racial institution. European attitudes also laid the foundations of slavery
transfer to the United States and conditions of enslavement. Furthermore, the vestiges of
American slavery are all that are left on what created the environmental disequilibria that
led to the disease profile for African Americans today. The clash of European and African
ethos also impacted the effects slavery had on African American diet and disease profiles.
Slavery was an established aspect of European culture well before they entered the
New World. In classical Europe most slaves were Europeans. In the mid-5th century BC,
approximately 25% Greeks were slaves (Suzanne 1988). Slaves were essential to the
freedom, privilege, wealth and democracy of Greece. Most Greeks, including Aristotle

83
and Plato, thought it was natural for some people to be slaves while others were masters
(Everett 1988). When slaves refused to accept their preordained fate, it also was
“naturally just” to hunt them down as “wild beasts” and force them into slavery
(Stavrianos 1975). Slaves’ refusal to submit to enslavement culminated in slave revolts
that spread throughout Greek colonies in Sparta, Egypt and the Punjab. These helped end
Greek slavery during the 3rd century B.C.
In the second century B.C., Rome built a military regime that depended on
territorial expansion and enslavement of populations it overthrew (Everette 1988). The
Roman Empire extended from England to the Black Sea and from Damascus into North
Africa. The Romans enslaved conquered people to work in mines, cities, and on
latifundias. In general, Roman slaves could not own property or enter into contracts such
as marriage, although they could enter contubernium (permitted cohabitation designed for
slaves under Roman Law). Slaves were killed if they failed to prevent the violent deaths
of their master and worked in grim conditions, ‘half naked . . . in chains, under lash and
soldiers’ guard (Everett 1988, p.19). Roman slaves frequently revolted to escape
starvation, beatings, brandings, insults and other forms of brutality. Spartacus led a revolt
of 90,000 runaway slaves who were defeated by 17,000 Roman soldiers. Roman soldiers
then crucified 6,000 rebel slaves along the Appian Way to dissuade other slaves from
rebelling or running away. Europe’s classical period of colonization and slavery began to
decline with the fall of the Western Roman Empire in 476 A.D. (Everett 1988).
The period between 476 A.D. and the discovery of the New World by Columbus
in 1492 is generally known as the Middle Ages or Dark Ages. Except for isolated
incidents already mentioned, the 5th century collapse of Rome ended widespread
enslavement of Europeans (Everett 1988). The mold was cast, however, and brutal
European slavery indifferent to humanity, human life, and living conditions had been
established. In addition to being detrimental to slaves, slavery also retarded European
technological development. Believing labor was beneath the dignity of freemen, owners

84
selected manual labor over mechanical devices to keep their slave force active
(Stavrianos 1975). At the same time, European conquests and colonization continued as
a military ethos of rule and conquer led to warfare and disorder (McKay et al. 1992). This
military ethos led to the division of European society into three layers: 1) the privileged
nobility and the military class which were devoted to warfare; 2) peasants or serfs
performing manual labor, producing goods, paying royal taxes, church tithes, dues, and
set aside seeds for their lord; and 3) the monastery that produced the educated elite and
provided vital social services (McKay et al. 1998). Serfs in Eastern Europe were similar
to slaves. Peasants in Western Europe were free, but poor and bound to the land.
Agricultural and technological innovations of the Middle Ages improved life for
the European masses while epidemic diseases reduced population numbers. An open-field
agricultural system, a three-year crop rotation system, and introduction of the potato
increased food production and the population. However, death rates also soared during
famines, droughts or poor harvests (Buckler et al. 1992). The hungry succumbed to
influenza, smallpox, dysentery, and the plague. The Bubonic plague eliminated 30 to 75
percent of the 14th century population, and continued to devastate the population every
few decades until 1600 when brown rats which were poor hosts for the plague bacillus
replaced the black rats, the principal carriers of Yersina pestis (Mascie-Taylor 1993,
McKay et al. 1998). War also devastated the population. Wars were less destructive in the
17th century than between the 4th and 10th centuries when the Germans, Huns, Magyars,
Vikings and Moslems invaded Europe (Stavrianos 1975). From the 10th to the 14th
centuries Europe took the offensive on all fronts (Stavrianos 1975). Agricultural
production increased, but a cycle of poor harvests, bad weather, and wars during the 16th
and 17th centuries increased European death rates periodically. The overall effect of the
plague in Europe was the demise of the feudal system and the rise of the cottage industry
and middle class.

85
By the 18th century, the food supply, social structure and economy were stressed.
Preindustrial Europeans developed a “put-out” system—a kind of capitalism in which
merchant-capitalists loaned raw materials to cottage workers who delivered finished
products such as textiles and other goods to the merchants for income (McKay et al.
1988). Extra income did not relieve economic or family pressures. Laws regulated
marriage and controlled public welfare by stipulating that men had to delay marriage until
they could support a wife usually by inheriting the family farm. Thus, premarital sex,
incest, and illegitimacy were common between 1750 and 1850 (McKay et al. 1988). By
the early 19th century, a third of all babies born in Paris, and 25,000 children a year in
other European cities were abandoned to foundling homes in a system of “legalized
infanticide.” Orphans were often victims of incest, or sired by married men, poor single
men, or poor husbands (McKay et al. 1988). Children of married women died from being
sent to wet or “killing” nurses who fed them (McKay et al. 1988). Other unwanted
children were victims of infanticide or aborticide. Children who were reared by their
parents were often victims of strict physical discipline, indifference, and brutality; they
were often sold to creditors or offered in oblation to monasteries. Eighteenth century
social and Christian activists encouraged parents to protect, love, nurse, and care for their
children. Philanthropists began donating money to monasteries to end “legalized
infanticide.”
3.7 Africa
The massive size of the continent makes it difficult to generalize about peoples
and cultures as diverse as Africa’s. “Africans have been frontiersmen who colonized
especially hostile regions on behalf of the entire human race.” Pioneering is the ethos of
Africans (Illiffe 1995, p. 1). The tradition of migrating to escape population pressures and
colonizing and surviving in harsh and inhospitable environments resulted in Africans
often struggling to establish equilibrium between environments and disease.

86
African developments and innovations distinguish their versions of the little and
great traditions. The great tradition of divine kingship associates with the development of
metallurgy and everything that followed (Bohannan 1968, p. 99). Kings regulated the
distribution of wealth by accumulating gold from mining, collecting revenue from import
and export trading, and distributing gold dust as a medium of exchange. The great
tradition of divine kingship developed by solving three central problems facing all
societies’ infrastructures to support numerous large, self-contained, but distinct groups
(Davidson 1968), geographic and biological barriers to population movement, and
invention of new tools and techniques to improve the economic structure and master a
range of environments.
Africans solved population pressure by developing the extended family and
making the family a source of wealth, and sociopolitical power. The extended family
regulated morality and peace, along with political, social, religious and judicial
institutions (Davidson 1968). The family protected the young and old, free and enslaved.
It regulated motherhood and fatherhood with marriage, and promoted virginity. Elders
were sources of wisdom, respect and knowledge. When the family became too large, it
bifurcated around the extended family and migrated to available territories (Davidson
1968).
The second problem Africans overcame were obstacles restricting habitation of
certain African geographical areas. Africans resisted disease at molecular and
biochemical levels. One type of resistance provided Africans with hemoglobin and
enzymes to effectively exploit ecological niches in areas where malaria existed. Africans
also evolved high levels of resistance to certain parasites, bacteria, and infectious
diseases, including hookworm, anemia, and yaws in equatorial regions, endemic syphilis
in the savanna, and leprosy in equatorial regions and Iboland, and Trypanosomiasis in
West Africa (Illiffe 1995). The high prevalence of blood type O among Africans suggests
to historians that Africans south of the Sahara Desert may have also resisted the Bubonic

87
Plague that devastated Eurasians in the 14 - 16th centuries (Illiffe 1995, McKay et al.
2000,Vol. B.).
Africans also mastered many environments, and improved economic structures
and invented new tools and techniques. They discovered and used metals, to fashion tools
and weapons. The discovery of metals stimulated sociocultural and agricultural
developments, population growth, craft manufacturing, and the production of gold
(McKay et al. 1988). Traders peddled goods to the world via trans-Saharan trade routes,
and along the East coast of Africa. By the 9th or 10th century, trade cities grew along
trade routes and developed into West and East African kingdoms and empires such as
Ghana, Hanem-Bornu, Mali, Songhay, and Axum. These states had effective
governments with civil servants and military forces that were funded with regular sources
of revenue (Davidson 1968).
The trans-Saharan trade affected West Africa in four ways. First, trans-Saharan
trade stimulated the development of Africa’s gold industry. By the twelfth century, gold
was West Africa’s major source of wealth and became the medium of exchange in
Europe and the Muslim world. The slave trade then developed as Africa’s second most
important export. Africans exported black slaves and imported European slaves from
slave markets in Venice and Genose (McKay et al. 1988). Europeans and Africans
perceived slaves were differently. Africans socialized their people to adhere to the
established social order by affiliating them into extended families with full family and
human rights or attached violators of the established order to family corporations as non-
kinsmen who had reduced family rights. Africans believed people were valuable, not
waste or “put out” products for destruction. Destruction signified social disharmony that
required discipline. Violators of the order were ignorant and needed education and
discipline to bring them into harmony with creation, righteousness, justice, and truth
(Asante 1990). Violators were regenerated and reintroduced into society. Prisoners of war
became slaves after their capture and social violators became slaves after their kinsmen

88
“sold” them into slavery as a form of banishment for transgression. Slaves were kinless
members, of new extended families, and, like other family members they were wageless-
laborers who required the status and protection of the family. Although Paul Bohannan
and other Africanists characterize African slavery as a “benign” family-dominated
institution that enhanced family prestige as an institution of restitution, modern people
view slavery in any form as a transgression against inalienable rights. African slavery was
not practiced for subservience, servility or economic value (Bohannan 1964). Slaves
could earn high social status, marry, own property, own slaves, swear an oath, bear
witness, and inherit (Everett 1978).
Third, trans-Saharan trade stimulated the development of cities and empire
building around the beginning of the ninth century” (McKay et al. 1988). Between 1100
AD and 1400 AD African cities played a dynamic role in the commercial life of West
Africa and Europe, and became centers of intellectual creativity (McKay et al. 1988).
Fourth, trans-Saharan trade routes brought the intrusion of Arab culture that modified
African religions and cultural developments and destroyed indigenous African
civilizations and divine kingships (Bohannan 1964).
Intrusion of foreign cultures also brought diseases. Illiffe (1995) is uncertain
whether famines were devastating Africa before Europeans brought acute strains of
diseases. It is certain epidemics, wars, droughts, famine, pestilence, locusts, and cattle-
plagues followed the slave trade and became obstacles to economic development,
population growth and fertility. From 300 to 1000 A.D. West Africa received good
rainfall and was prosperous. Four centuries of dissication with an advancing Sahara
followed until 1630 before rainfall again increased. Most famines that followed were
localized. Although some crop failures and famines were consequences of deforestation
and environmental degradation, nearly all were due to war (Illiffe 1995).
Foreign intrusion also changed African slavery from Bohannan’s "benign"
institution to a cancerous pandemic that degraded African civilizations, social

89
development, and health. Epidemics occurred among those clustering together for food
and water, when people moved into unfamiliar environments, or when wars and
oppression prevented people from exercising traditional survival skills (Illiffe 1995).
Epidemiological data mirror the record of the past and illustrate the effects of
pathogenic stressors in the slave trade and American slavocracy (King and Williams
1998). Todd Savitt said diseases that afflicted African slaves brought to the U.S. were in
most cases directly attributable to
“... lack of proper food, clothing, and shelter and to the occupational hazards and unsanitary conditions that abounded on plantations and in slave quarters. These abject conditions resulted in epidemic contagions of infectious diseases such as respiratory illnesses (tuberculosis, influenza, streptoccal disease, pneumonia, and the like), intestinal diseases (dysentery, typhoid fever) and other maladies, including malaria (1978 p. 49).
Instead of recognizing obvious pathogenic stressors of slaves’ environment,
physicians and proponents of scientific racism such as Samuel Cartwright and Josiah Nott
(1987) viewed slaves’ morbidity and mortality rates as evidence of blacks’ inherent
biological inferiority. These writers overlooked malnutrition, traumatic occlusion,
metabolic insults, and periodic near-starvation (Corruccini et al.1987, p. 179). Caribbean
slaves received 2,500 to 2,900 calories and 55 grams of protein per day. Strenuous
physical activity, with perspiration and stress, however, require between 3,200 and 4,000
calories daily and at least 100 to 125 grams of protein to maintain nitrogen balance (Kiple
1984). Slaves’ diets were low in fat content (20 grams of the 125 grams RDA) and
deficient in vitamins A, B1, B2, B3, C, D, K, iron, calcium, phosphorus, thiamine,
riboflavin, and niacin. Consequently slaves suffered greatly from deficiency diseases
including nytalopia or night blindness, sore eyes, scurvy, crib orbitalis, paraplegic dry and
wet beriberi, pellegra, iron deficiency, hypercementosis and other anemias, and scurvy
(Kiple 1984).

90
Malnutrition, diets and diseases were similar among slaves in the United States.
Dietary deficiencies were reported among slaves in New Orleans (Owsley et al.1987),
Philadelphia (Angel et al. 1987), Virginia and Maryland (Blakley et al. 1994), South
Carolina (Rathbun (1987), and in Texas (Hutchinson 1987). Malnutrition caused “Harris
lines,” traverse lines, severe hypoplasias tooth root Hypercementosis, deaths and other
ailments (Rathbun 1984; Owsley 1987; Rathbun 1987; Corruccini et al. 1987).
Malnutrition in slaves typifies slaves’ led to the development of new foodways. Slaves
were fed “stock animal’ food that corresponded with their stock animal status they were
forces to assume. The stock animal food ultimately became known as “soul food” during
the twentieth century. Soul food, “food made with feeling and care,” is based in African
cookery (Helton 2002). However, slave masters modified the African diet in the United
States by adding “food waste” and “throwaway” foods that were often high-calorie, fat-
dense. Creative African cooks transformed undesirable foods into a “make do” cuisine
that incorporated foods from the Southern United States, West Indian, Caribbean, and
France. Blacks continued to modify their diet after emancipation. Food shortages then
caused African Americans to cook and eat together in large family groups. Soul food
became an occasion for mutual exchange and expression of love and care, assembly and
for renewal and renovation.
African slaves were not allowed to own necessities or personal possessions. Food
selection, quantities, and acquisition were limited and determined by slave masters,
seasons of the year, weather conditions, and crop production. Africans attained freedom
from some of these restrictions through distinct and creative cookery that infused regional
foods with African foods brought with them through the slave trade. African foods
integrated into slave diets included sorghum, yams, eggplants, cucumbers, garlic, onions,
(Soul Food 2002), lima beans and other legumes (Holloway 1990), sesame seeds, cow
peas or black eye peas, okra, watermelon, and peanuts (Helton 2002). Peanuts came from
Guinea via South America to North America (Helton 2002). Slaves boiled and steamed

91
vegetables to make soups and stews. They also smoked foods for flavoring following
techniques used in Africa. They didn’t have African palm oil or vegetable shortening for
frying or groundnuts for thickening sauces and gravies. Instead, they used pork lard to fry
meats, pies, fishes, vegetables, and fruits to add nutrients and for easy transport of these
foods to work places (Soul Food 2002). Meat was sparser in the slave diet than it was in
the African diet (Soul Food 2002; Helton 2002). The average slave diet was similar to the
mostly vegetarian African diet that sometimes included rice, chicken, and milk, while the
poorest Africans ate a type of couscous with leafy vegetables (Soul Food). This same kind
of food, consisting of a small portion of rice and beans with occasional vegetables or a
piece of fruit during the transatlantic voyage, replaced the normally healthy diet (Soul
Food 2002). As a substitution for the more frequent stale bread and water during the
voyage to the New World, a “slabber” sauce, made from old beef and rotten fish and salt,
was poured over the rice and beans (Soul Food 2002).
Slaves' diets were frequently inadequate in quantity, seldom adequate in calories, and
usually lacking in sufficient protein and vitamins (Kiple and Ornelas 2000). A few
fortunate slaves had vegetable gardens. When in season, throwaway vegetables such as
turnips, beet and dandelion tops, collards, kale, cress, mustard, and pokeweed were
seasoned with lard and crackling from hog’s skin (Soul Food 2002). The use of fat rather
than lean pork for slaves was justified by slave masters’ conviction that fat provided
energy needed for hard physical labor (Kible and Ornelas 2000). Fat meats included
infrequent and inadequate portions of throwaway meats, also known as “juba”. These
included pigs’ and chicken’s feet, cow and pig head, pig ears, ham hocks, chitterlings
(also called “gut strut”), hog jowl, tripe, and crackling (Soul Food 2002). Most slaves
relied solely on rations their masters frequently dispensed as salt pork or salted fish, corn
meal, and sometimes molasses or sweet potatoes (Holloway 1990; Kiple and Ornelas
2000). Fluid loss from toiling in the hot sun was replenished with watermelon in the field,
the salt in salted meat and fish, and “pot likker,” seasoned cooking water from boiled

92
vegetables (Helton 2002). Sugar obtained from sugar cane, molasses, and sorghum
provided quick and needed energy. Slaves made hoecakes and ashcakes, the forerunners
of corn bread.
Hoecakes are corn bread batter cooked in the field on spades or hoes held over an
open flame. Ashcakes are corn meal and water that were shaped into loaves and baked on
the ground in an open fire from sun up to the midmorning break. The ashes were brushed
or washed away before eating. Overall, slaves’ diet consisted largely of vegetables and no
alcoholic beverages.
African cookery and slaves’ creativity were combined with the Southern, West
Indian and French cuisines to produce innovative dishes. They combined rice and corn
with beans and peas to make Hoppin’ John (Helton 2002). Poke Salad, a combination of
dandelion and cresses, was a favorite. French-influenced Creole dishes such as Jambalaya
and okra in gumbo were created from a variety of spices, bay leaves, and hot pepper
sauces. The combinations of foods, forced eating habits, cooking techniques, and creative
cookery gave birth to soul food.
Foods that were once cooked in slave quarters, black homes, churches, and
businesses later became known as Soul food. Other foods were also popular among
African Americans and added to the soul food list. Black farmers added pork brains and
eggs, onions and eggs, slab bacon, home made sausage, cornbread and milk, biscuits and
sorghum, fried tomatoes, white beans with rice and hammocks, sugar cane, cornbread
pancakes and sorghum, and buttermilk. Northern city blacks cooked dinners of barbecued
pig’s feet, macaroni and cheese, sweet potato pie, fruit cobblers, pound cake, fried
potatoes, and fried steak. They had fritters, eggs cooked in cream of wheat, grits with
tomato gravy and fried chicken or fish and biscuits for breakfast. Later, poor inner city
blacks living on welfare added Spam, corn pudding, bean pies, and fried pies to this diet.
Nearly all soul foods are high in calories and animal fats since vegetables were boiled in
fat back or hammocks, and seasoned with bacon scraps and drippings, vegetable
93
shortenings or lard. The meats were usually floured or breaded before frying in the same
fats. Desserts were made from large quantities of butter and sugar, and covered with very
sweet and buttery frostings or sauces. Beverages were usually red in color, and syrupy
sweet. Rolls, muffins, biscuits, and cornbread were served piping hot to melt sizable
dollops of butter and hefty portions of jams and jellies.
The emancipation of slaves in 1865 released them from plantations where food
was constant, but inadequate. Freed bondsmen were often without jobs to buy food. Freed
bondsmen had to increase their culinary innovation to prevent starvation. They used every
possible type of food to survive, including wild vegetables, nuts, berries, game, and stale
and rancid meats and breads. They hunted animals and fished. Opossum was the favorite
meat. They made bread pudding from raisins and/or apples and stale bread, and topped it
with a sugary lemon sauce. They mixed leftover fish with eggs, cornmeal and/or flour and
deep fried it to make croquettes (Soul Food 2002). They made biscuits from sour milk,
soup from left over vegetables, potato pancakes from leftover mashed potatoes, hash from
leftover meats and potatoes, and hush puppies from dredgings of catfish. They reused
cooking fats to fry other foods. In the beginning of the twentieth century, they made the
ever popular “wish sandwich” from two slices of bread spread with sugar, syrup,
sorghum, molasses, or mayonnaise, and, “Wished they had a piece of meat!” The 1960s
food stamp program provided Spam, government cheese, and peanut butter to fill and
displace wish sandwiches.
The high fat, salt and sugar content of soul food was retained by habit, social and
economic necessity, eating preference and desired flavoring although the Civil Rights
Movement and the Food Stamp Program gave blacks access to better quality and
abundant food supplies. Removal of education, job and opportunity restrictions and
entrance into low labor desk jobs in air conditioned and heated offices rendered high fat,
salt, and sugar foods no longer a survival necessity.

94
A food developed and modified for survival, soul food of the twenty-first century,
is undergoing a major revolution that started during the enlightenment of the 1970s Afro-
centric Movement. Blacks became aware soul food was a vestige of slave culture that had
been forced on, and inadvertently passed on, to them. They learned how slave owners
increased their profits by depriving slaves of a healthy human diet and fed slaves like
stock animals. These blacks attended seminars and read national newspapers published by
the Nation of Islam and The Black Panthers that told how excessive fat, sugar, and salt
helped African Americans survive labor-intense adversities of enslavement. The slave
diet was no longer advantageous but hazardous to free people who lived and worked in
desegregated communities and engaged in reduced and normal physical activity.
Scientific research of the 1980s and 1990s documented the claims of the Afro-
centric Movements to reinforce the teachings of Dick Gregory and the Honorable Elijah
Muhammad and Louis Farrakan. They encouraged blacks to abandon the slave diet of
waste foods and high fat, sugar, salt. Educated blacks responded to the soul food diet by
substitution or abandonment. Those who altered their cooking and eating habits replaced
lards with Canola and olive oil (Soul Food 2002). Many blacks stopped frying foods and
began baking, boiling, grilling, smoking, and broiling meats. They trimmed fats and skin
from meats and had money to buy more expensive, leaner cuts of meat. They eliminated
oils, fat meats, and greases from cooked vegetables. Other blacks ate raw vegetables.
Many blacks stopped eating pork or substituted chicken for pork, oven frying for deep
frying and simple fresh fruit for sweet cobblers and bread puddings (Soul Food 2002).
Bean pies replaced pound cakes and other high fat and sugar desserts. Many blacks
adopted the vegetarian African diet of their ancestors. Other health cautious blacks
restricted their diets to fishes, organic vegetables, low fat foods, olive and other oils, and
low amounts of sugar and salt. The “Soul Food Revolution of the 21st Century” is
characterized by adoption of healthy eating habits, acquisition of health club
memberships, personal trainers, and dietitians. The goal is to lose weight through

95
increased physical activity. Beauty standards are changing to conform to physical fitness.
The Soul Food Revolution of the 21st Century is the beginning of a new health and life
style for more knowledgeable middle class and educated blacks of all ages.
Nutritional conditions deteriorated after freedom in 1865 (Martin et al. 1987)
because most freed bondsmen could not find work or were paid insufficient
discriminatory wages. Near starvation conditions lasted until the 1940s (Martin,
Magennis and Rose 1987; Farley 1970; Holmes 1937). High mortality and morbidity
rates, gross pathologies and national population decline exceeded antebellum rates to
cause Farley (1970) to declare a “Biological Crisis” for post-Reconstruction blacks. In the
1930s, Holmes (1937) predicted the imminent disappearance of African Americans.
Pathogenic stressors during and after enslavement provide conclusive and indisputable
evidence of environmental disequilibria for Africans.
3.8 Sociocultural Factors
3.8.1 Life Style/Stressors
Human history is characterized by two major cultural transformations. First,
socioeconomic systems changed from simple to complex industrial and technological
production (McGarvey, Bindon, Crews and Schendel 1989:263). Second, labor activities
changed from intensive or extensive labor systems to sedentary labor systems with less
physical activity. These cultural transformations have been paralleled by a disease
transformation from “epidemics of acute and infectious diseases to our current epidemic
of chronic and multi-factorial disorders as the major causes of morbidity and mortality”
(Davidson, Frankel and Smith 1992:675). Approaches to disease eradication now include
treatment, intervention and prevention, and are expanded in spectrum to include
environmental factors in disease etiology relating to modern disease transformations.

96
Likewise, studies of human culture must also expand to include research on the impact of
sociocultural risk factors and “life stresses” on humans.
A study of “life stresses” among African Americans and their associations with
diabetes, obesity and hypertension will improve understanding of social inequality and
cultural and disease transformations (Grim and Wilson 1992). “Life stresses” include “all
the usual external forces affecting any individual—inadequate diet, disease, occupation,
childbirth, accidents, violence, nutritional stresses (Blakely et al., 1994; Rathbun, 1985;
Corruccini, 1987; Owsley et al., 1987), occupational stresses, psychological stresses
(Seligman, 1975; Angel et al. 1987) and pathological stresses, (Kelley and Angel 1987;
1996). Life stresses yield consensus models of cultures or subcultures that represent
cultural constructs of life style producing characteristic differences in status, prestige,
social distinction, and health styles that are caused by differential role performance.
Obviously, “life style is highly structured and widely shared across sub-
communities” (Dressler 1996:350). African Americans are not a monolithic group whose
members have identical life styles, social identities, social values, ideas of success, social
patterns, personal choices, and health consequences. Instead, as members of a subculture,
African Americans use different strategies to overcome similar obstacles and restrictions,
have different abilities to adhere to cultural models, succumb to varying internal or
external loci of individual and social controls that predispose individuals to and influence
behavior, role performance, the realization of goal aspirations, and opportunities to
achieve cultural ideals of consumption. The examination of life style variables
demonstrates how exposure to suspect sociocultural risk factors creates intercultural life
style patterns associated with diabetes, hypertension (Grim and Wilson 1992) and obesity.
Culture specific stressors suspected of contributing to African American life style
examined here include those that cause sudden unpredictable and cataclysmic events in
the life of Blacks in color line societies. These acute stressors are examined first,

97
followed by the examination of chronic stressors, then dietary factors that may contribute
to the onset of diabetes.
3.8.2 Acculturation: Acute Stressors
William Dressler’s (et al. 1996) study of life style in the color line society of
Brazil demonstrates that skin color is associated with life style variables and disease.
Skin color, underpinned by ethnicity, is a cultural key that generates cultural models
reflected by social classes, value systems and manifestation, ideals of success, social
patterns of behavior, and differential opportunity structures, all of which predict life style
and health styles, including the popular culture of prophylactic behaviors concerning diet,
leisure activities, drug use, health threatening and risky behaviors, and personal body
maintenance (Davison et al., 1992). Dressler’s research on family health (1994) also
shows that family health and social status not only predict health relative to social, dietary
and psychosocial stressors that affect physiological indices such as serum lipids, serum
cholesterol, high density lipoprotein cholesterol, and triglycerides, but also reflect
indicators of health and status that probably begin in utero and continue throughout life as
manifestations of chronic and multifactorial diseases.
Chronic diseases, whose prevalence previously was lower for blacks than for
whites, increased among black men and women during the 1960s. The low type II
diabetes prevalence among African Americans’ ancestors and the drastic disease increase
after rapid social and political changes, particularly the civil rights movement, suggest
sociocultural factors as triggers or causative factors in the onset of type II diabetes.
Humans have the biological capacity to adapt to rapid rates of contemporary change
(Thomas, Gage and Little 1989:296).
Researcher’s trepidation concerning elevated type II diabetes prevalence
recognizes the life-threatening nature of heightened type II diabetes prevalence among
African Americans. Epidemic diseases can trigger large-scale mortality or cause

98
extinction (Haldane 1949:68-76). The life-threatening prevalence of type II diabetes
among African Americans prompted this study of diabetes causation and associated
disease risks targeting the identification of sociocultural risk factors that are suggestive of
environmental, social, and life style changes with consideration of ecosystem
disequilibria as a contribution to the current diabetes rate.
Most of today’s African Americans are descendants of slaves who were selected
generally because of their knowledge, skills, health, fitness, ethnicity, and specifically
from West Africans for their cultivation-technological skills and specifically from Central
Africa and Madagascar for their knowledge of rice farming (Holloway 1990:4). The
Central African Civilization of the Granaries and the West Africa Civilization of the
Cities developed intensive agriculture to support urban populations that emerged during
the 5th to 8th centuries. These intensive agriculturalists reformed their ecosystems with
intensive physical activity that created an artificial balance between high productivity
levels and a large population. Disturbance of the artificial balance by a decline in physical
activity would diminish productivity levels, create droughts, and increase silt, insects and
weeds (Plog, Jolly and Bates 1976). Extraction of 40 million Africans from Africa during
the African Holocaust disturbed the artificial balance, causing detrimental effects in these
early non-industrial farming communities where intensification was powered by human
energy.
Human energy produced more food per acre by investing more work per acre.
African agriculturalists were so successful that their agricultural surplus supported large
populations to support urban areas (Plog, Jolly and Bates 1976) such as Audaghost,
Timbuktu, Ife, Kumbi Saleh, Mali, Jeriba, Mani-Kura, Miani, Dura, Kano, Rano, Zaria,
Gober, Katsena, Biram, Ndjimi, El Fasher, Kumasi, Sao, Benin, Abome, Agni, Abomy,
and Nok, to name a few. From the 15th to the 18th centuries, Africans made rapid
adjustments as individuals were extracted for slavery. These systems went from intensive
agricultural with intensive physical activity and adequate food supplies to slavocracies

99
that demanded systematic overloads characterized by excessive physical activity, gross
pathologies and scarce food supplies. In the late 19th and early 20th centuries they were
exposed to a “biological crisis” period that began with widespread starvation, increased
pathologies, overwhelming life stresses, and high rates of morbidity and mortality
(Holmes 1937) that began with emancipation and continued with the development of
American apartheid. The Reverend Martin Luther King, Jr. led a massive desegregation
movement that ushered in for African Americans throughout the US rapid and drastic
social changes that were followed by high prevalence of diabetes, obesity, hypertension,
and other Syndrome X diseases. Therefore, it is probably more bioculturally,
environmentally and historically accurate to examine sociocultural factors associated with
this prolonged period of environmental dissonance as contributing factors to today’s
African American health crisis than to attribute African Americans’ diabetes prevalence
simply to modernization, westernization, urbanization or industrialization.

100
CHAPTER 4
Results:
BIOLOGICAL AND SOCIOCULTURAL VARIABLES
4.1 Introduction
Means and standard deviations for the major variables, indexes, correlations
between dependent and independent variables and univariate analyses are examined for
all biological and sociocultural variables. Also, Hypothesis 1 is examined by statistical
analysis univariate relationships between sociocultural variables are examined to test
Hypothesis 2.
4.1.1 Descriptive Statistics Summary
This section provides a summary of the descriptive statistics for the study sample
detailing the socio-demographic, lifestyle/stressor, acculturation, health behaviors, and
dietary variables across gender, social era, and organization. It is important to note that
only variables measured on an interval or ratio scale are included here since comparisons
are made to test for significant differences between or among groups. It would be
inappropriate to include variables measured on an ordinal or nominal scale since variables
cannot be subjected to t tests or /ANOVA/. It must also be noted that the results of t tests
are given for differences between gender and social era groups (two levels for each

101
variable), and the results of ANOVA’s are given for the organization groups (seven
levels). Tables 4.1 – 4.15 are organized by gender, social era, and organization, and
contain the means, standard deviations, t or F values, and the probability level associated
with each test.
Tables 4.1 – 4.5 present results.
Men Women
Age N X SD N X SD t p
20 50.35 11.74 50 55.50 12.06 -1.63 .11
Table 4.1. Descriptive Data for Age by Gender
Male Female
Variable N M SD N M SD t p
Lifestyle score 14 164.54 49.83 37 272.89 240.86 -1.67 .10
Anger score 13 97.31 2.53 41 96.22 3.31 1.09 .28
Discrimination 13 11.00 5.47 36 7.10 5.13 2.31 .03index
Lifestyle Incong- 14 9.01 2.15 37 7.34 3.76 1.56 .12ruency index
Table 4.2. Descriptive Data for Lifestyle/Stressor by Gender

102
Male Female
Variable N M SD N M SD t p
Drinks per month 19 30.96 54.14 50 4.68 10.28 2.10 .05
Cigarettes per 19 8.89 11.76 50 8.09 11.08 .27 .79month
Health threat 18 54.67 61.13 50 27.93 18.36 2.79 .01index
Table 4. 3. Descriptive Data for Health Behaviors by Gender
Men Women
Variable N M SD N M SD t p
Systolic blood 19 133.18 13.65 50 130.53 19.60 .63 .53pressure
Diastolic blood 19 81.63 9.17 50 78.54 10.52 1.13 .26pressure
Fasting glucose 20 113.20 19.03 50 129.62 65.36 -1.10 .28reading
Post-load glucose 20 136.55 67.78 50 132.12 65.75 .25 .80reading
Average pulse 19 33.70 6.09 50 37.28 9.83 -1.48 .14
Body mass index 19 29.20 3.73 50 30.00 5.81 -.56 .58
Table 4.4. (Continued). Descriptive Data for Blood Pressure, Glucose, Anthropometry and Dietary Variables by Gender

103
Table 4.4. (Continued).
Male Female
Variable N M SD N M SD t p
Body mass 19 3.11 1.15 50 3.24 1.32 -.39 .70index risk
Calories per day 12 4743.16 3196.93 33 2442.70 1070.16 2.44 .03
Fat calories 12 1346.01 728.61 33 1006.59 514.95 1.74 .09per day
Saturated fats 12 68.26 36.00 33 46.43 24.86 2.30 .03per day
Proteins per day 12 160.03 105.52 33 249.93 883.28 -.35 .73in grams
Carbohydrates 12 616.81 535.00 33 273.19 112.36 2.20 .05per day
Sugar total 12 374.24 451.86 33 128.57 65.16 1.88 .09per day
Total fat in 12 178.27 95.51 33 111.37 58.03 2.85 .01in grams
Total cholesterol 12 559.89 355.07 33 328.83 212.30 2.12 .05in grams
Vitamin C in mg 12 345.18 278.14 33 245.60 162.65 1.17 .26
Vitamin A 12 12255.10 7474.99 33 13570.06 8394.98 -.48 .64
Calcium in mg 12 2504.04 3200.74 33 843.58 487.00 1.79 .10
Iron in mg 12 26.84 13.58 33 18.45 11.58 2.06 .05
Sodium in mg 12 5422.94 3114.12 33 3756.43 4486.56 1.18 .24

104
Several variables evidenced significant differences between the mean scores of
men and women. These were: discrimination, alcoholic drinks per month, health threat
index, calories/day, saturated fats/day, carbohydrates/day, total cholesterol/day, and
iron/day. In all cases, men had significantly higher scores than women. No significant
differences were noted for any of the other variables.
Tables 4.6 – 4.9 provide descriptive data and results of the t tests across the two
levels of social era.
Apartheid Civil Rights
Age N M SD N M SD t p
41 62.22 8.13 29 42.45 5.50 11.38 .00
Table 4.5. Descriptive Data for Age by Social Era

105
Apartheid Civil Rights
Variable N M SD N M SD t p
Lifestyle score 28 249.34 238.43 23 235.61 178.72 .23 .82
Anger score 29 97.41 1.59 25 95.40 4.08 2.45 .02
Discrimination 24 7.75 6.28 25 8.50 4.62 -.48 .64
index
Lifestyle incong- 28 6.97 2.15 23 8.80 4.43 -1.81 .08ruency index
Table 4. 6. Descriptive Data for Lifestyle/Stressor by Social Era
______________________________________________________________________Apartheid Civil Rights
Variable N M SD N M SD t p
Social support 41 16.24 8.61 28 15.96 7.61 .14 .29score
Relaxation index 28 9.79 4.58 24 7.63 4.56 1.70 .88
Table 4.7. Descriptive Data for Acculturation by Social Era

106
Apartheid Civil Rights
Variable N M SD N M SD t p
Drinks per month 41 8.10 21.53 28 17.54 41.92 -1.10 .28
Cigarettes per 41 8.72 11.65 28 7.71 10.67 .36 .72month
Health threat 40 31.17 28.40 28 40.49 45.80 -1.04 .31index
Table 4.8. Descriptive Data for Health Behaviors by Social Era
Apartheid Civil Rights
Variable N M SD N M SD t p
Systolic blood 41 138.16 14.30 28 121.17 18.56 4.29 .00pressure
Diastolic blood 41 79.70 9.59 28 78.94 11.18 .30 .77pressure
Fasting glucose 41 123.17 50.01 29 127.41 65.39 -.31 .76reading
Post-load glucose 41 137.46 59.36 29 127.62 78.84 .61 .54reading
Table 4. 9. (Continued). Descriptive Data for Dietary Variables by Social Era

107
Table 4. 9.(Continued).
Apartheid Civil Rights
Variable N M SD N M SD t p
Average pulse 41 35.76 7.92 28 37.08 10.62 -.59 .56
Body mass 41 29.93 4.11 28 29.58 6.76 .24 .81index
Body mass 41 3.37 .94 28 2.96 1.62 1.18 .24index risk
Calories per day 25 2709.50 1193.68 20 3489.47 2853.31 -1.24 .22
Fat calories 25 1109.93 564.62 20 1081.08 635.72 .16 .87per day
Saturated fats 25 45.92 21.95 20 60.16 35.84 -1.56 .13per day
Proteins per day 25 309.02 1012.44 20 122.11 94.78 .82 .42in grams
Carbohydrates 25 299.30 148.75 20 446.73 448.32 -1.55 .13per day
Sugar total 25 146.58 95.11 20 253.46 367.71 -1.27 .22per day
Total fat in 25 122.45 63.99 20 137.66 87.86 -.67 .51grams
Total cholesterol 25 373.09 252.67 20 412.13 303.47 -.47 .64in grams
(Continued).

108
Table 4. 9 (Continued).
Apartheid Civil Rights
Variable N M SD N M SD t p
Vitamin C in mg 25 269.30 229.44 20 275.73 165.58 -.11 .92
Vitamin A 25 12853.40 5985.55 20 13676.91 10305.06 -.34 .74
Calcium in mg 25 1351.73 2109.26 20 1204.66 1405.40 .27 .79
Iron in mg 25 21.37 12.72 20 19.82 12.64 .41 .69
Sodium in mg 25 3347.46 1458.22 20 5267.55 5996.72 -1.40 .18
An examination of the five tables above shows significant differences in only
three of the variables. The first one, age, was expected since the definition of social era
was to categorize participants by social and political conditions they were born into, and
the apartheid era group naturally was older. The apartheid era group, however, also had
significantly higher mean scores on the anger index and systolic blood pressure.
The next five tables (Tables 4.10 – 4. 14) present the descriptive data across
organizations samples for this study.

109
Organization
Age 1 2 3 4 5 6 7
N N N N N N NM M M M M M M F p
(SD) (SD) (SD) (SD) (SD) (SD) (SD)
9 16 15 6 19 1 257.78 49.44 56.73 41.83 58.95 55.00 42.00 2.90 .02
(15.16) (10.95) (12.09) (8.84) (9.61) ─ (2.83)
Note. 1 = Links; 2 = Middle Run Baptist Church; 3 = Zion Baptist Church; 4 = Omega Baptist Church; 5 = New Salem Missionary Baptist Church; 6 = another church; 7 = no church or organization. Table 4.10. ANOVA Results for Age by Sample Source

110
______________________________________________________________________
Organization
Variable 1 2 3 4 5 6 7
N N N N N N NM M M M M M M F p
(SD) (SD) (SD) (SD) (SD) (SD) (SD)
Anger score 9 16 15 5 6 ─ 297.78 96.75 95.60 93.60 98.00 ─ 97.00 1.79 .13(1.86) (2.44) (3.96) (4.72) (1.55) ─ (1.41)
Discrimination 8 15 12 6 6 ─ 2index 7.56 7.90 4.79 13.08 10.25 ─ 11.00 2.56 .04
(4.80) (2.44) (3.96) (4.72) (1.55) ─ (1.41)
Lifestyle Incon- 9 16 12 6 6 ─ 2gruety index 6.11 7.85 7.96 7.29 9.53 ─ .10 .96 .45
(1.86) (2.44) (3.96) (4.72) (1.55) ─ (1.41)
Lifestyle score 9 16 12 6 6 ─ 2323.78 212.56 292.13 247.33 135.00 ─ 143.00 .85 .52
(168.88) (119.09) (361.08) (183.35) (27.05) ─ (24.04)
Note. 1 = Links; 2 = Middle Run Baptist Church; 3 = Zion Baptist Church; 4 = Omega Baptist Church; 5 = New Salem Missionary Baptist Church; 6 = another church; 7 = no church or organization.
Table 4.11. ANOVA Results for Lifestyle/Stressor by Sample Source

111
Organization
Variable 1 2 3 4 5 6 7
N N N N N N NM M M M M M M F p
(SD) (SD) (SD) (SD) (SD) (SD) (SD)
Social support 9 16 15 6 19 1 213.89 15.13 12.60 14.67 20.32 32.00 14.00 2.40 .04
(7.18) (8.70) (8.14) (5.61) (7.33) ─ (5.66)
Relaxation 9 16 13 6 6 0 2index 9.67 11.91 7.08 6.33 7.33 ─ 8.50 1.52 .19
(4.80) (5.15) (3.28) (3.44) (4.97) ─ (4.95)
Note. 1 = Links; 2 = Middle Run Baptist Church; 3 = Zion Baptist Church; 4 = Omega Baptist Church; 5 = New Salem Missionary Baptist Church; 6 = another church; 7 = no church or organization.
Table 4.12. ANOVA Results for Acculturation by Sample Source

112
Organization
Variable 1 2 3 4 5 6 7
N N N N N N NM M M M M M M F p
(SD) (SD) (SD) (SD) (SD) (SD) (SD)
Drinks 9 16 15 6 19 1 2per month 3.83 23.11 12.63 8.83 5.57 7.50 31.00 .67 .67
(3.74) (53.42) (31.92) (11.07) (13.83) ─ (43.84)
Cigarettes 9 16 15 6 19 1 2per month 3.94 7.38 10.32 9.27 8.81 11.00 15.50 .46 .84
(6.41) (10.71) (10.19) (10.60) (14.01) ─ (21.92)
Health threat 9 16 15 6 18 1 2index 21.00 44.53 39.29 35.93 28.88 40.50 53.00 .58 .75
(9.26) (57.09) (36.67) (22.77) (23.11) ─ (62.23)
Note. 1 = Links; 2 = Middle Run Baptist Church; 3 = Zion Baptist Church; 4 = Omega Baptist Church; 5 = New Salem Missionary Baptist Church; 6 = another church; 7 = no church or organization.
Table 4.13. ANOVA Results for Health Behaviors by Sample Source

113
Organization
Variable 1 2 3 4 5 6 7
N N N N N N NM M M M M M M F p
(SD) (SD) (SD) (SD) (SD) (SD) (SD)
Systolic blood 9 16 14 6 19 1 2pressure 132.98 129.81 133.79 108.17 134.81 139.00 151.00 2.48 .03
(17.08) (16.66) (17.52) (13.15) (18.22) ─ (22.63)
Diastolic blood 9 16 14 6 19 1 2pressure 79.00 80.00 78.39 70.17 80.96 82.00 92.00 1.48 .03
(9.36) (12.46) (10.23) (9.35) (8.34) ─ (4.24)
Fasting glucose 9 16 15 6 19 1 2reading 138.00 115.44 136.00 157.83 108.42 126.00 139.00 .85 .54
(50.91) (12.19) (71.21) (140.10) (23.12) ─ (18.38)
Post-load glucose 9 16 15 6 19 1 2reading 126.56 135.88 125.47 92.67 141.53 189.00 227.50 1.31 .27
(75.05) (39.66) (79.49) (54.81) (63.19) ─ (125.16)
Average pulse 9 16 14 6 19 1 235.67 33.94 38.93 38.97 36.21 34.00 36.00 .45 .84(4.41) (10.88) (8.90) (8.96) (10.38) ─ (1.41)
Body mass 9 16 14 6 19 1 2index 30.77 29.51 28.66 27.72 30.88 34.00 29.00 .53 .79
(6.27) (7.23) (4.75) (4.25) (3.75) ─ (8.49)
Body mass 9 16 14 6 19 1 2index risk 3.44 3.00 2.93 2.50 3.63 4.00 3.00 .95 .47
(1.51) (1.55) (1.41) (1.22) (.83) ─ 2.83)
Calories per 7 15 10 6 5 0 2day 3870.20 2628.48 2420.99 3876.38 3085.63 ─ 3556.02 .52 .79
(4223.06) (863.34) (1820.30) (2476.62) (747.50) ─ (831.24)
Note. 1 = Links; 2 = Middle Run Baptist Church; 3 = Zion Baptist Church; 4 = Omega Baptist Church; 5 = New Salem Missionary Baptist Church; 6 = another church; 7 = no church or organization.
Table 4.14. (Continued). ANOVA Results for Dietary Variables by Sample Source

114
Table 4.14. (Continued).
Organization
Variable 1 2 3 4 5 6 7
N N N N N N NM M M M M M M F p(SD) (SD) (SD) (SD) (SD) (SD) (SD)
Fat calories 7 15 10 6 5 0 2per day 1240.40 1026.93 1055.21 970.29 1244.10 ─ 1344.31 .24 .96
(882.78) (334.14) (864.92) (517.87) (308.16) ─ (290.67)
Saturated fats 7 15 10 6 5 0 2per day 49.30 48.76 49.42 69.27 49.20 ─ 59.43 .39 .88
(38.37) (24.29) (37.50) (33.38) (12.78) ─ (6.55)
Proteins in grams 7 15 10 6 5 0 2per day 134.26 434.35 115.11 143.57 94.76 ─ 113.30 .26 .95
(118.77) (1306.30) (121.27) (111.03) (27.69) ─ (51.48)
Carbohydrates 7 15 10 6 5 0 2per day 527.24 314.66 238.38 475.38 384.74 ─ 423.40 .71 .64
(717.54) (142.28) (179.38) (287.54) (110.81) ─ (47.84)
Sugar total 7 15 10 6 5 0 2per day 345.31 160.29 139.63 222.70 144.13 ─ 229.58 .54 .78
(616.01) (111.25) (124.22) (126.33) (65.95) ─ (1.58)
Total fat 7 15 10 6 5 0 2in grams 138.57 114.18 115.98 163.65 138.23 ─ 149.37 .38 .89
(97.62) (37.11) (99.11) (112.08) (34.24) ─ (32.29)
Total cholesterol 7 15 10 6 5 0 2in grams 463.04 374.83 354.57 468.89 294.29 ─ 437.87 .28 .94
(426.36) (213.46) (333.13) (261.21) (135.55) ─ (125.82)
Note. 1 = Links; 2 = Middle Run Baptist Church; 3 = Zion Baptist Church; 4 = Omega Baptist Church; 5 = New Salem Missionary Baptist Church; 6 = another church; 7 = no church or organization.
(Continued).

115
Table 4.14 (Continued).
Organization
Variable 1 2 3 4 5 6 7
N N N N N N NM M M M M M M F p
(SD) (SD) (SD) (SD) (SD) (SD) (SD)
Vitamin C 7 15 10 6 5 0 2in mg 241.02 278.34 237.19 271.51 424.12 ─ 131.59 .69 .66
(113.57) (223.80) (207.36) (153.63) (286.36) ─ (13.32)
Vitamin A 7 15 10 6 5 0 210629.48 13779.30 14032.45 16143.94 11240.11 ─ 10194.33 .34 .91(5107.55)(10125.80) (8624.33) (9113.84) (3546.06) ─ (3257.28)
Calcium 7 15 10 6 5 0 2in mg 1121.63 1002.85 1197.79 1102.21 3068.18 ─ 530.09 .94 .48
(825.61) (565.16) (1855.14) (998.54) 4509.07) ─ (25.45)
Iron in mg 7 15 10 6 5 0 223.46 19.68 15.97 24.44 24.47 ─ 21.35 .44 .85
(11.63) (9.73) (15.57) (18.73) (10.25) ─ (3.54)
Sodium in mg 7 15 10 6 5 0 27795.08 3273.59 2682.89 4438.12 4553.43 ─ 4571.70 1.25 .30
(9286.68) (1422.76) (1879.92) (3560.88) (1262.70) ─ (518.50)
Note. 1 = Links; 2 = Middle Run Baptist Church; 3 = Zion Baptist Church; 4 = Omega Baptist Church; 5 = New Salem Missionary Baptist Church; 6 = another church; 7 = no church or organization.
As the above tables show, four of the analyses of variance performed on the
variables resulted in significant differences. Specifically, participants in organizations 4, 5,
and 7 were significantly younger than those in 1, 2, and 3. Participants in organizations 4, 5,
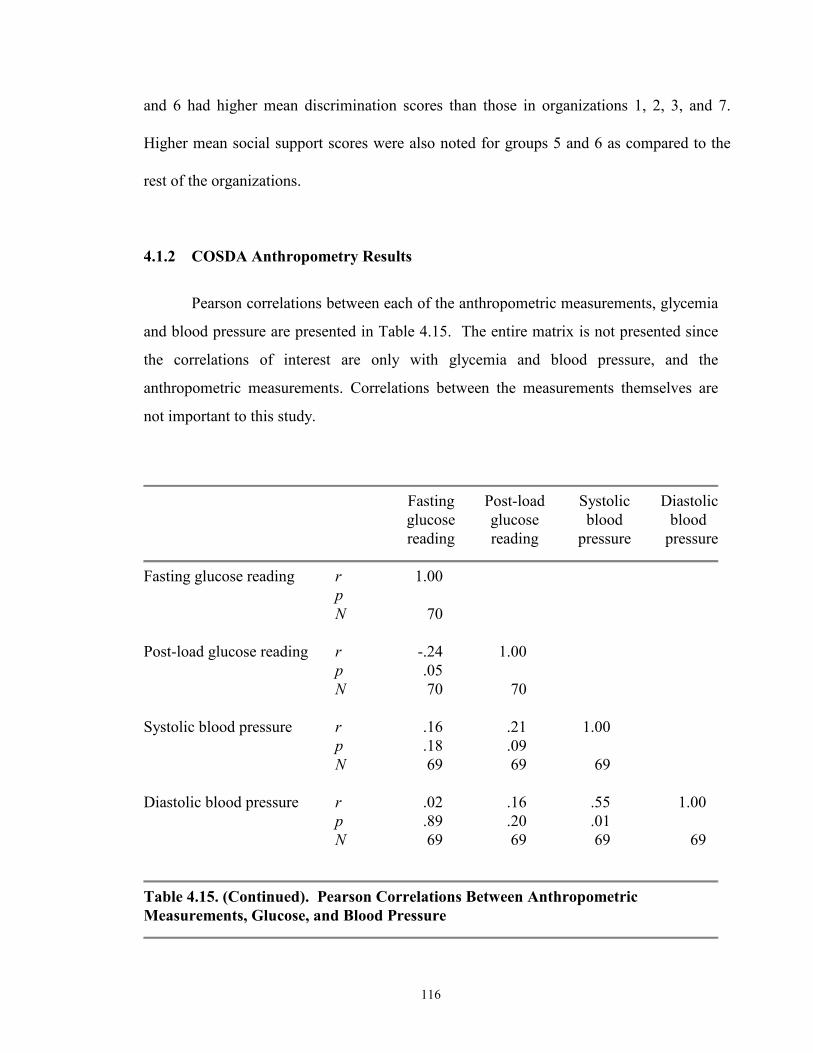
116
and 6 had higher mean discrimination scores than those in organizations 1, 2, 3, and 7.
Higher mean social support scores were also noted for groups 5 and 6 as compared to the
rest of the organizations.
4.1.2 COSDA Anthropometry Results
Pearson correlations between each of the anthropometric measurements, glycemia
and blood pressure are presented in Table 4.15. The entire matrix is not presented since
the correlations of interest are only with glycemia and blood pressure, and the
anthropometric measurements. Correlations between the measurements themselves are
not important to this study.
Fasting Post-load Systolic Diastolicglucose glucose blood bloodreading reading pressure pressure
Fasting glucose reading r 1.00pN 70
Post-load glucose reading r -.24 1.00p .05N 70 70
Systolic blood pressure r .16 .21 1.00p .18 .09N 69 69 69
Diastolic blood pressure r .02 .16 .55 1.00p .89 .20 .01N 69 69 69 69
Table 4.15. (Continued). Pearson Correlations Between Anthropometric Measurements, Glucose, and Blood Pressure

117
Table 4.15. (Continued).
Fasting Post-load Systolic Diastolicglucose glucose blood bloodreading reading pressure pressure
Body mass index r -.03 .20 .06 .02p .84 .10 .60 .88N 69 69 69 69
Weight in pounds r -.03 .24 .13 .20p .84 .05 .27 .10N 69 69 69 69
Stature in cm r -.03 .15 .14 .41p .84 .21 .24 .01N 69 69 69 69
Waist circumference r -.05 -.04 .04 -.23p .68 .75 .75 .06N 69 69 69 69
Hip circumference in cm r -.08 -.002 .10 -.07p .51 .99 .44 .59N 69 69 69 69
Upper arm circumference r -.13 .08 .10 .10in mm p .30 .50 .40 .41
N 69 69 69 69
Abdominal depth r -.09 .13 .07 .07p .46 .11 .57 .59N 69 69 69 69
Triceps skinfold in mm r .09 .06 -.13 -.08p .45 .63 .29 .53N 69 69 69 69
(Continued).

118
Table 4.15. (Continued).
Fasting Post-load Systolic Diastolicglucose glucose blood bloodreading reading pressure pressure
Suprascapular skinfold r .11 .22 -.09 -.01in mm p .36 .07 .47 .96
N 69 69 69 69
Suprailiac skinfold r .03 .17 .08 .15in mm p .86 .17 .50 .22
N 69 69 69 69
Medial calf skinfold r -.02 .09 -.09 -.01in mm p .91 .49 .48 .93
N 69 69 69 69
Total upper arm r -.12 .10 .08 .11p .32 .41 .53 .39N 69 69 69 69
Triceps x pi r .09 .06 -.13 -.08p .47 .63 .29 .53N 69 69 69 69
Upper arm muscle area r -.09 .13 .06 .17p .46 .28 .64 .17N 69 69 69 69
Upper arm fat area r -.13 .05 .09 .02p .29 .70 .49 .86N 69 69 69 69
Sum of 2 skinfolds r .12 .16 -.12 -.05p .35 .20 .32 .70N 69 69 69 69
(Continued).

119
Table 4.15. (Continued).
Fasting Post-load Systolic Diastolicglucose glucose blood bloodreading reading pressure pressure
Waist hip ratio r .06 -.04 -.03 -.17p .64 .77 .80 .17N 69 69 69 69
Arm fat index r .04 -.18 .01 .07p .77 .13 .92 .58
N 69 69 69 69
From Table 4.16 the sole statistically significant relationships are between stature,
diastolic blood pressure and weight and post-load glucose. Borderline relationships exist
between glucose and BMI, weight, stature, waist circumference and Suprascapular
skinfold measurements.
Mean measurements of BMI, weight, stature, circumferences, and skinfolds were
determined for each community organization sampled (See Table 4.16). Comparisons
show that the participants of the woman’s organization (group # 1) have higher average
BMI than other organizations examined, including samples with men (See Table 4.14).
Health risks associated with BMI are highest for participants of the woman’s social
organization (3.5) and lowest 2.92 for organization # 5 (Table 4.14 above). However,
participants from church # 2 were the heaviest (187.93) pounds, while organization # 5

120
had the lowest mean weight (170.57 pounds). Organization # 2 was the tallest (170.41
Cm), while organization # 5 shortest (162.25 cm).
Compared by social era, those of the apartheid era have larger mean BMI, weight,
waist circumference, hip circumferences, upper arm circumference, and abdominal depth.
Apartheid era participants, however, have smaller triceps skinfold scores. Except for
skinfolds, apartheid era participants are larger in circumference but shorter and heavier
than civil rights era participants. Apartheid era participants carry less subcutaneous
adipose tissue than do those of the civil rights area.
Using descriptive statistics, in cross sectional analyses COSDA participants are
larger at older ages (See Table 4.5). The group that is aged 51 - 60 years shows the
highest circumferences and skinfolds along with the highest BMI (30.95), BMI risk
(3.54), weight (186.14 pounds). Among the over sixty years old age group, weight and
skinfold scores are lower. These provide estimates of fat distribution, leanness, and
fatness. To estimate obesity among COSDA participants, anthropometeric indices
described in methods were examined. Relationships of anthropmetrics, social era and
glucose scores were also examined. These are presented in Table 14.16 and 4.17.

121
Anthropometry Social Era M t p
Body mass index Apartheid 30.33 1.77 .08Civil Rights 30.31
BMI risk Apartheid 3.45 2.34 *.02Civil Rights 2.87
Weight Apartheid 179.87 .12 .91Civil Rights 179.04
Stature Apartheid 164.85 -1.30 .20Civil Rights 168.48
Waist Apartheid 93.01 -1.28 .08Civil Rights 86.59
Hip Apartheid 113.90 1.83 .07Civil Rights 102.55
Upper arm circumference Apartheid 109.90 1.83 .70Civil Rights 48.42
Abdominal depth Apartheid 53.19 1.50 .14Civil Rights 34.64
Triceps skinfold Apartheid 29.54 1.92 .06Civil Rights 24.88
Suprascapular skinfold Apartheid 31.44 1.80 .07Civil Rights 27.30
Suprailiac skinfold Apartheid 35.16 2.56 *.04Civil Rights 29.93
Medial calf skinfold Apartheid 24.21 1.60 .11Civil Rights 20.81
Table 4.16. Association of Anthropometrics with Social Era of Participants; n 112 COSDA Participants, 58 Apartheid, 54 Post Civil Rights

122
The indices in Table 4.16 provide estimates of fat distribution, body leanness, and
fatness. To evaluate obesity among COSDA participants, the anthropometeric indices
described in methods were examined.
Model b B t pstandardized standardized coefficient coefficient
Sum of 2 Skinfolds .49 .17 1.39 .70
Waist-Hip-Ratio -19.49 -.04 -.33 .75
Upper Arm Fat Area -.51 .069 .55 .59
Constant 118.41N = 69R Square .03 Adjusted R -.01______________________________________________________________________*P < .05** P < .001
ANOVA
Model Sum of Squares df Mean Square F p
Regression 9291.90 3 3097.30 .71 .55Residual 283299.65 65 4256.93Total 292492.55 68
a. Predictor: (Constant) Upper Arm Fat Area, Sum of 2 Skinfolds, Waist-Hip-Ratiob. Dependent Variable: Post-load Glucose Reading
______________________________________________________________________
Table 4.17. Summary of Multiple Regression Analysis: Two Skinfolds, Waist-Hip-Ratio, and Upper Arm Fat Area to Post-load Glucose Reading______________________________________________________________________
In this sample, the sum of two skinfolds, waist-hip-ratio, and upper arm fat area poorly
predict plasma glucose (R square .03) (Table 4.17).
123
This portion of the study relied on anthropometry to test relationships of obesity
with NIDDM and the hypothesis that body mass index and skinfolds predict plasma
glucose in African Americans of Central Ohio. Four relationships of elevated plasma
glucose scores above 140 mg/dl are significant with obesity among COSDA participants:
1) post load glucose scores and body mass index of apartheid born are significantly
related, r = .048, n = 58, -< .02, two tail; 2) post load glucose scores and body mass index
of civil rights born are significantly related, r = .048, n = 54, p < .02, two tail; 3)
suprailiac skinfolds in mm are significantly related to post load glucose scores for
apartheid participants, r = .048, n = 58, two tail; and 4) suprailiac skinfolds in mm are
significantly related to post load glucose scores for civil rights born COSDA participants,
r= .048, n = 54, p < .04, two tail. Thus, post-load glucose and not fasting glucose is
equally related to elevated body mass index in both apartheid and civil rights COSDA
participants. Again, post load glucose elevated above 140 mg/dl is associated with
suprailiac skinfolds in both civil rights and apartheid-born COSDA participants.
However, several show borderline associations. Other measurements, circumferences,
and indices of adiposity, including degree, distribution and place of deposit, and thickness
of fat layers are not significantly related to plasma glucose in COSDA participants. The
strength of four significant relationships of adiposity and post load plasma glucose are
moderate at best. No skinfold measure associated with Type II diabetes. In combination
with other anthropometeric measures to assess the influence of obesity on plasma glucose
results, results were negligible. Acceptance of the positive relationship of elevated plasma
glucose and the suprailiac skinfold measurement only lends partial support to the
influence of obesity on plasma glucose levels. Since this result is negligible, the
hypothesis is accepted, but minimally. Thus, evaluation of the BMI and skinfolds
hypothesis with respect to anthropometry failed to reject the null hypothesis of no
relationship, but the relationship is not robust.

124
4.2 Sociocultural Risk Factors
4.2.1 Introduction
The Research Objective was also to sociocultural variables as possible
contributors to type II diabetes in African Americans. Descriptive statistics for risk factors
will be presented before regression statistics. Sociocultural risk factors include the
demographic factors, congruity/incongruity, reaction to anger, social support, relaxation,
discrimination, health threatening behaviors, and total dietary cholesterol in grams.
Demographics include occupation, social era (age), sex, education and income.
Acculturation includes acute and chronic stressors African Americans experience in a
color line society.

125
Assigned Value N
Social era Apartheid 0 58Civil Rights 1 54
Age group 26 - 40 0 2541 - 50 1 2851 - 59 2 2460+ 3 35
Sex Male 0 34Female 1 78
Education < 12 years 0 8High school, technical 1 25Trade school graduation – –1 - 4 years college 2 49Complete graduate school 3 25Professional post graduate school 4 4
Occupation Unemployed, homemaker 0 15Student or retired – –Unskilled or semi-skilled 1 34Lower professional, office 2 38Worker – –Professional 3 14
Marital Never married 0 16Married 1 53Divorced/separated 01 9Widowed 001 33
Income Under $4,000 0 4$4,000 - $7, 999 1 6$8,000 - $14,999 2 7$15,000 - $24,000 3 24$25,000 - $49,000 4 36> $50,000 5 32
Table 4.18. Distribution of Sample by Sociocultural Factors and Assigned Values for Sociodemographics (SD)

126
4.2.2 Sociodemographics:
4.2.2.1 Social Demographics: Age/Social Era
COSDA participants were divided into two age groups by social era. Age was
categorized to compare COSDA data with that of other research. Social era reflects
disenfranchisement and the process of discrimination in color line societies. Participants
aged 61 and over are the largest age group (n=37) and those 26 to 40 (n=26) the smallest.
The oldest age group had the highest mean post load glucose (170.6 mg/dl + 165.76) and
the second highest average fasting (146.91 mg/dl +). Those aged 41 - 50 had the lowest
fasting glucose. Average post load glucose of older participants place them well above
the cut point for type II diabetes. They also have a body mass index of 29.7 and a weight
that places them at high to moderate risk of vascular disease and type II diabetes. Those
51 to 60 years old show the highest body weight (186.1 pounds).
Age Social Era Sex
Category n % Era n % ---- n %
26 - 40 25 22 Apartheid 58 52 Male 35 31
41 - 50 28 25 Civil rights 55 49 Female 78 69
51 - 60 24 22
60 + 35 31
Table 4.19. Age, Social Era, and Sex Distribution of COSDA Participants
By social era, the mean fasting glucose score is 136.9 mg/dl and the post load
score 163.6 mg/dl for apartheid-born, but only 115.9 mg/dl and 121.4 mg/dl for civil
rights-born. Both concentrations are above hyperglycemic for the first group (Alberti et

127
al. 1999; Gabir et al. 2000), neither is hyperglycemic for the latter group. The association
with disenfranchisement (social era) is confounded because those born in the civil rights
era may not have expressed their propensities.
Fasting Post Load
Category n M SD M SD
Social eraApartheid 58 136.8 113.5 163.6 164.2
Civil rights 55 115.9 50.3 121.4 65.4
Age
26 - 40 26 118.5 67.8 116.1 57.6
41 - 50 28 111.7 25.0 119.1 62.3
51 - 60 24 146.9 163.2 159.9 165.5
61 + 35 130.8 59.6 170.6 165.7
Table 4.20. Fasting and Post-Load Glucose (mg/dl) by Social Era and Age Categories in the COSDA Sample

128
4.2.2.2 Sociodemographics: Occupation
COSDA participants’ variables were distributed across all occupational
categories. Most frequent were professionals. Over half of retired workers also were
lower and higher level professionals. Professionals included participants with terminal
Occupation f %
No occupation 1 1
Homemaker/retired 18 16
Semi-skilled 34 3
Lower professional 39 34
Professional 22 19
Table 4.21. Occupations of COSDA Participants
degrees or certifications such as Certified Public Accountants, Engineers, Pharmacists,
Ministers, and Professors. Lower level professionals included other college graduates
with bachelor’s and master’s degrees. Ninety-one percent of COSDA participants
graduated high school. Seventy-nine (71%) attended college, 41 (37%) graduated college
and 29% attended graduate school or earned a Masters or Terminal Degree (Table 4.18
and 4.22; Figure 4.1).

129
4.2.2.3 Sociodemographics: Sex
In this sample there were 35 men (30.7%) and 78 women (68.4%). Fasting
(108.82 mg/dl) and post load (124.6 mg/dl) were both lower in men than in women
(134.7 mg/dl).
Years of education completed f %
8th grade 3 2.6
9th grade 1 .9
10th 2 1.8
11th 2 1.8
12th grade or high school grad. 25 21.9
1 year college or technical school grad. 20 17.5
2 years college 16 14.0
3 years college 2 1.8
4 years college 12 10.5
1 year of grad. school or M.S. degree 27 23.7
Professional school grad. 2 1.8
Missing 2 1.8____ _____
Total 113 100.0
Table 4.22. Educational Attainment of COSDA Participants in Years

130
4.2.2.4 Sociodemographics: Marital Status
Among COSDA participants 53 (47%) are currently married and only 14 never
married (14%). Widows made up (28.9%) of the sample (Table 4.23). Marriages of
COSDA participants are stable. Fifty-five percent are married and thirty-three percent are
widowed resulting in eighty-eight percent of the participants being married, some until
the death of a spouse.
4.2.2.5 Sociodemographics: Income
Sixty-eight percent of COSDA participants have incomes over $25,000 with 28%
over $50,000, well above the $16,770 annual income for black women, and the $8500 to
$17,028 for black female heads of households. Table 4.25 provides the frequencies and
percentages of the various income categories.
Status f %
Married 55 47
Living as married 2 2
Widowed 33 30
Divorced 8 8
Separated 1 1
Never married 14 12
Table 4.23. Marital Status of COSDA Participants

131
4.2.3 Life Style/Stressors:4.2.3.1 Life Style/Stressors: Desegregation
On the whole, participants of COSDA evaluated desegregation positively.
Seventy-five percent responded that desegregation had not affected them adversely; only
9% stated it had affected them adversely. Participants who were adversely affected by
desegregation stated their parents were entrepreneurs whose businesses or incomes
decreased once African Americans could patronize other businesses. Unrestricted
patronization was sometimes more convenient, was cheaper, of better quality, or the
services were better or faster (Table 4.25). Sixteen percent of COSDA participants failed
to respond to questions concerning desegregation. In all, about 11% indicated that
desegregation had negative effects on them. For several, their parents did not own
businesses or were not educators and, therefore, did not lose jobs to desegregation.
Others explained they worked with black employers or white employers who hired
African Americans. However, 21% did lose their jobs when desegregation occurred.
Income categories f %
< $4,000 4 4
$4,000 - $7,999 6 5
$8,000 - $14,000 7 7
$15,000 - $24,000 24 21
$25,000 - $49,999 36 32
> $50,000 32 28
Missing 3 3____ ____
Total 114 100
Table 4.24. COSDA Income

132
Desegregation f %
Desegregation affected me adversely 10 9.0
Desegregation did not affect me adversely 76 69
I lost my job due to desegregation 24 21
I lost my business 1 1
My family business became less prosperous 1 1
Table 4.25. The Perception of Desegregation by COSDA Participants
4.2.3.2 Life Style/Stressors: Discrimination
All COSDA participants responded to questions concerning their individual work
experiences. Of the 114 respondents, 50% stated their incomes were commensurate with
their education. In addition, 36.8% stated their incomes are commensurate with those of
whites. A majority (62%), however, indicated that white workers with comparable
education and work experience received more pay (Table 4.26). Over half of the
respondents reported they were unfairly paid, compared to 47% reporting fairly paid.
Another 2% did not know. Additionally, 32% thought they were passed over for a
promotion and 30.7% denied a raise while, 23% filed complaints based on racism.
Finally, 22.8% reported their mates were passed over for a promotion. Twenty-seven
percent felt discriminated against sometimes, and 25.4% felt rarely or almost never
discriminated against in workplaces. Participants also responded to their perception of
discrimination beyond the work place in daily life (Table 4.27). Twenty-five percent felt
they were rarely or almost never discriminated against, while 27% felt they were

133
discriminated against sometimes. Most participants lived in predominantly black
neighborhoods.
4.2.3.3 Life Style/Stressors: Victimization
Participants were asked whether they, their family members including in-laws had
been victims of murder, rape, violent crimes, stalking, robbery, muggings, fraud,
incarceration, or black on black crime. Ninety-nine of 114 participants responded. The
maximum number of incidents per participant was eleven. The average number of
incidents per participant is 2.4 (Table 4.28). Victimization is not significantly correlated
with fasting or post -load glucose (Table 4.29). Both p values are less than <.01.
f %
Whites are not paid more 43 38
$1,000 to $3,000 more 16 14
$3,001 to $7,5000 more 22 19
$7,501 to $25,000 more 9 8
More than $25,000 10 9
Missing 14 12____ ____
Total 114 100
Table 4.26. COSDA Participants' Evaluation of Equal Pay With Whites
4.2.3.4 Life Style/Stressors: Relaxation
COSDA participants reported how they reduced stress. This included engaging in
relaxation activities, such as burning incense, listening to soft music, meditating, reading
for pleasure, chewing gum, watching a wave tape, praying, singing, humming, repeating a

134
Bible verse, bathing, doing muscle relaxing exercises, having sex, getting a massage, and
drinking a warm glass of milk, among others. The average number of relaxation activities
reported was 8.6. The highest number was twenty-three.
Discrimination f %
Rarely or almost never 29 25
Monthly 9 8
Sometimes 31 27
Weekly 9 8
Often 3 3
Daily 4 4
In my neighborhood 3 3
Total 88 77
Missing 26 23____ ____
Total 114 100
Table 4.27. COSDA Participants' Perception of Discrimination in Daily Life Beyond the Work Place
Relaxation was also evaluated by organization. Organization number six engaged
in the greatest number of relaxation activities while participants without church or
organization affiliation engaged in the fewest relaxation activities (Table 4.30).

135
Victimization question n Minimum Maximum X SD
My family and I 99 0 11 2.4 2.7were victimized
Table 4.28. COSDA Participants and Their Families Victimization by Violent Crimes
Glucose Readings
Victimization question Correlation Fasting Post Load
My family and I r -.10 -.09were victimized p (2-tailed) .32 -.40
Table 4.29. The Relationship of Victimization With Type II Diabetes
Organization n Minimum Maximum X SD
1 0 5 19 9 4.8
2 6 2 16 7.3 4.9
3 6 1 11 6.3 3.4
4 0 0 0 0 0
5 13 3 14 7.1 3.3
6 3 3 20 11.2 5.2
Note. 1 = Links; 2 = Middle Run Baptist Church; 3 = Zion Baptist Church; 4 = Omega Baptist Church; 5 = New Salem Missionary Baptist Church; 6 = another or no church or organization.Table 4.30. COSDA Participants' Relaxation Index

136
4.2.3.5 Life Style/Stressors: Social Incongruity
The Sociocultural Questionnaire (Appendix A) accesses the number of material
possessions of COSDA participants to measure acculturation and social incongruity. The
mean number of material possessions COSDA participants owned is 25.06 (Table 4.31).
The maximum number of material possessions owned is 55, and the minimum number is
9 material possessions. The standard deviation is 8.93.
Total number of: n Minimum Maximun M SD
Material possessions 110 9 55 25.0 8.9
Whirlpools, Jacuzzis 94 0 2 .1 .4or swimming pools
Convection ovens 94 0 3 .4 .6
Bathrooms 93 1 4 1.7 .7
Pairs of shoes 94 2 450 25.1 48.9
Outfits 92 20 1600 148.1 212.3
Cars 90 0 8 1.3 1.3
Total lifestyle score 90 69 1791 238.7 248.9
Table 4.31. Assessment of Social Incongruity Through Material Possessions Owned by COSDA Participants

137
4.2.3.6 Life Style/Stressors: Social Support
Social support scored the help available to COSDA participants during
adversities. Some of the individuals COSDA participants depended on belonged to
religious, educational, social, sports, political and professional associations and/or club.
Participants also depended on family, ministers and friends when they need assistance or
counsel. The mean number of points for social supports is 14.8 (Sd = 8.0). The
maximum score is 34. One hundred and eleven participants responded to the
questionnaire. The standard deviation is 8.0. The moderate range of social support
indicates self-reliance and independency among these middle class blacks.
4.2.3.7 Life Style/Stressors: Reaction to Anger
The next component of the lifestyle/stressor portion of the sociocultural index is
reaction to anger. Anger is an emotion. Analysis of reactions to anger reveals a total
adjusted R square of .44 (p <.00). This is indicative of a strong association.
There were significant associations of plasma glucose and the following
lifestyle/stressors: social support (p = .04) (Table 4.12), reaction to anger (p = .03) (Table
4.7), and the discrimination index (p = .03) (Tables 4.2, 4.11). Although these variables
associate significantly with plasma glucose, other lifestyle variables do not show a
significant association with plasma glucose. Therefore, Hypothesis 2 referring to lifestyle
stressors being significantly associated with plasma glucose is minimally supported at
best.
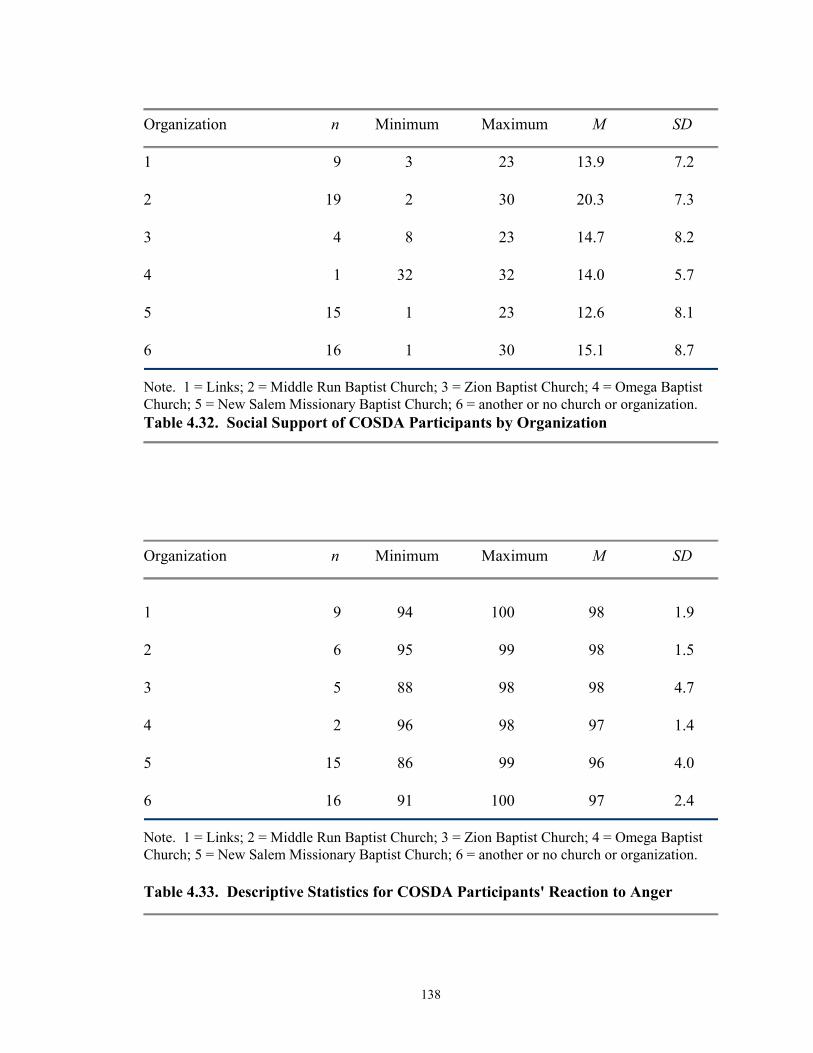
138
Organization n Minimum Maximum M SD
1 9 3 23 13.9 7.2
2 19 2 30 20.3 7.3
3 4 8 23 14.7 8.2
4 1 32 32 14.0 5.7
5 15 1 23 12.6 8.1
6 16 1 30 15.1 8.7
Note. 1 = Links; 2 = Middle Run Baptist Church; 3 = Zion Baptist Church; 4 = Omega Baptist Church; 5 = New Salem Missionary Baptist Church; 6 = another or no church or organization.Table 4.32. Social Support of COSDA Participants by Organization
Organization n Minimum Maximum M SD
1 9 94 100 98 1.9
2 6 95 99 98 1.5
3 5 88 98 98 4.7
4 2 96 98 97 1.4
5 15 86 99 96 4.0
6 16 91 100 97 2.4
Note. 1 = Links; 2 = Middle Run Baptist Church; 3 = Zion Baptist Church; 4 = Omega Baptist Church; 5 = New Salem Missionary Baptist Church; 6 = another or no church or organization.
Table 4.33. Descriptive Statistics for COSDA Participants' Reaction to Anger

139
4.2.4 Health Threatening Behavior
Except drinks per month as analyzed by gender (p = .05) (Table 4.4), none of the
Health Behavior Index or specific items included in the index was significantly associated
with fasting or post-load glucose (Table 4.34, 4.35). Additionally, Logistic Regression
was used to examine associations with either fasting or post load glucose of 140 mg/dl or
more. The model failed to explain any significant variation (Chi square = 4.35, p > .36).
Examination of Wald statistics also failed to support any association between the Health
Threatening Behavior Index and glucose at/over 140 mg/dl (68.5%).
4.2.5 Dietary Factors
The final component of the sociocultural index is the dietary index. Regression
was used to estimate dietary influences on glucose. Only dietary cholesterol was
significantly associated with glycemia (Table 4.36). Other findings were insignificant.
The summary of dietary cholesterol and total fat appears below.
Unstandardized Standardized Coefficients Coefficients
Model B SE B β t p
Threatening health -8.5 .4 -.0 -.2 -.8behaviors
Note: Dependent variable = Post-load glucose.Table 4.34. Prediction of Threatening Behaviors and Post-Load Glucose
Multiple Regression was used to analyze the dietary recalls of COSDA
participants. Food components such as vitamins, minerals, fats, amino acids and other
food nutrients were analyzed. The nutritionists for Esha Research, the producers of the
Food Processor® Nutrition and Fitness Software used for this dietary analysis, suggested

140
restricting the dietary analysis to Nutrient Facts. A Pearson Correlation Matrix of
Nutrients Facts follows in Table 4.38.
UnstandardizedLifestyle Variable Coefficients Wald Odds Ratio
Threatening health behaviors -.01 .6 .9
-2 Log LR 89.5Model χ2 (df = 4) 4.4
PClassification %
Table 4.35. Prediction of Threatening Behaviors and Lifestyle
Unstandardized Standardized Coefficients Coefficients
Model B SE B β t p
Cholesterol 1.8 .00 .65 7.1 .00
Total fat .13 .17 .08 .75 .46
Table 4.36. Dietary Cholesterol and Total Fat for Post-Load Glucose

141
Total Vitamin C Vitamin A Calcium Iron Sodium Fat Saturated Proteins Carbo- Sugar Total Calories Fasting Post-loadcholesterol in mg in mg in mg in mg calories fats per per day hydrate total fats in per day glucose glucosein grams per day day in grams per day per day in grams reading reading
Total cholesterol r 1.000 .201 -.061 -.014 -.009 -.006 .012 .488** .016 -.034 -.021 -.059 -.011 -.033 .660**in grams p (2-tailed) .065 .578 .897 .935 .956 .911 .000 .888 .761 .848 .594 .917 .766 .000
N 85 85 85 85 85 85 85 85 85 85 85 85 85 85 85
Vitamin C in mg r .201 1.000 .295 .090 -.006 .226* .260* .356** -.052 .259* .186 .301** .319** .008 .357p (2-tailed) .065 .006 .410 .954 .037 .016 .001 .633 .017 .088 .000 .003 .942 .357N 85 85 85 85 85 85 85 85 85 85 85 85 85 85 85
Vitamin A r -.061 .295** .1000 .080 .278** .461** .616** .452** .060 .340** .157 .652** .542** -.033 -.092p (2-tailed) .000 .765 .468 .010 .000 .000 .000 .587 .001 .157 .000 .000 .765 .402N 85 85 85 85 85 85 85 85 85 85 85 85 85 85 85
Calcium in mg r -.014 .090 .080 1.000 -.017 .175 .205 .183 .021 .223* .194 .215* .263 -.056 -.088p (2-tailed) .897 .410 .468 -.879 .110 .059 .093 .851 .040 .075 .048 .263 .609 .422N 85 85 85 85 85 85 85 85 85 85 85 85 85 85 85
Iron in mg r -.009 -.006 .278* -.017 1.000 .200 .274* .220 .004 .112 .034 .271 .182 -.030 -.48p (2-tailed) .935 .954 .010 .879 .066 .011 .043 .970 .308 .757 .012 .095 .786 .660N 85 85 85 85 85 85 85 85 85 85 85 85 85 85 85
Sodium in mg r -.006 .226 .461** .175 .200 1.000 .551** .425** .069 .000 .004 .000 .000 -.023 -.041p (2-tailed) .911 .016 .000 .059 .066 .000 .000 .531 .000 .004 .000 .000 .835 .708N 85 85 85 85 85 85 85 85 85 85 85 85 85 85 85
Fat calories r -.012 .260* .616** .205 .616** .205 .274 .551** .000 .123 .493 .764 -.051 -.025per day p (2-tailed) .911 .016 .001 .059 .011 .000 .000 .263 .000 .002 .001 .000 .643 .822
N 85 85 85 85 85 85 85 85 85 85 85 85 85 85 85
Table 4.37. (Continued). Regression of Food Nutrients and Post-Load Glucose Reading

142
Table 4.37. (Continued).
Total Vitamin C Vitamin A Calcium Iron Sodium Fat Saturated Proteins Carbo- Sugar Total Calories Fasting Post-loadcholesterol in mg in mg in mg in mg calories fats per per day hydrate total fats in per day glucose glucosein grams per day day in grams per day per day in grams reading reading
Saturated fat r .481** .356** .452** .183 .220* .425** .724** 1.000 .112 .404** .284** .743** .639** -.023 .266in calories p (2-tailed) .000 .001 .000 .093 .043 .000 .000 .306 .000 .008 .000 .000 .835 .708
N 85 85 85 85 85 85 85 85 85 85 85 85 85 85 85
Proteins per day r .016 -.052 .060 .021 .004 .069 .123 .112 1.000 .035 .025 .129 .090 -.014 .049in grams p (2-tailed) .888 .633 .587 .851 .970 .531 .263 .306 .753 .817 .238 .414 .898 .658
N 85 85 85 85 85 85 85 85 85 85 85 85 85 85 85
Carbohydrates r -.034 .258* .340** .223* .112 .451** .493** .404** .035 1.000 .955** .540** .912** -.031 -.113per day p (2-tailed) .761 .017 .001 .040 .308 .000 .000 .000 .753 .000 .000 .000 .775 .302
N 85 85 85 85 85 85 85 85 85 85 85 85 85 85 85
Sugar total per r -.021 .186 .154 .194 .034 .306** .336** .284** .025 .955** 1.000 .348** .798** -.030 -.107day p (2-tailed) .848 .088 .152 .075 .757 .004 .002 .008 .817 .000 .001 .000 .787 .332
N 85 85 85 85 85 85 85 85 85 85 85 85 85 85 85
Total fat in grams r -.059 .301** .652** .215* .271* .617** .919** .743** .129 .540** .348** 1.000 .825** .050 -.077p (2-tailed) .594 .005 .048 .011 .000 .000 .000 .000 .238 .000 .001 .000 .649 .430N 85 85 85 85 85 85 85 85 85 85 85 85 85 85 85
Calories per day r -.011 .317 .542** .263* .182 .588** .764** .639** .090 .912** .798** .825** 1.000 -.050 -.087p (2-tailed) .917 .003 .000 .015 .095 .000 .000 .000 .414 .000 .000 .000 .651 .430N 85 85 85 85 85 85 85 85 85 85 85 85 85 85 85
Fasting glucose r -.033 0..8 .033 -.056 -.030 -.023 -.051 -.025 -.014 -.031 -.030 -.050 -.050 1.000 .509**p (2-tailed) .766 .942 .765 .609 .786 .835 .643 .835 .898 .775 .787 .649 .651 .000N 85 85 85 85 85 85 85 85 85 85 85 85 85 129 129
Post-load glucose r .660** .101 -.092 -.088 -.048 -.041 -.025 .266* .049 -.113 -.107 -.077 -.087 .509 1.000p (2-tailed) .000 .357 .402 .422 .660 .708 .822 .-14 .658 .302 .332 .483 .430 .000N 85 85 85 85 85 85 85 85 85 85 85 85 85 129 129

143
4.3 Analysis of the Sociocultural Index
The regression analysis of the sociocultural indexes did not significantly predict
fasting glucose (Table 4.38).
Unstandardized Standardized Coefficients Coefficients
Model B SE B β t p
(Constant) 96.48 155.08 .62 .54
Total cholesterol in grams -6.32 .00 -.03 .26 .79
Discrimination index .57 2.21 -.03 .26 .80
Total lifestyle/accultur- .29 1.26 .02 .23 .82ation index
Health threatening index -.30 .41 -.09 -.73 .47
Dependent Variable: Fasting Glucose
Model Summary
Model R R2 Adjusted R2 SE of Estimate p
1 .06 .00 -.02 97.54 .85
Table 4.38. Predictors: (Constant), Health Threatening Behavior, Total Cholesterol, Total Lifestyle/Acculturation Index, Discrimination Index for Fasting Glucose
The regression analysis showed a highly significant association of post-load
glucose and total cholesterol in grams (p= <.00) (Table 4.36), and a significant
association of social support and fasting glucose readings (r = 42, n = 111, p <.02, two
tail). The regression analysis of all sociocultural indexes (Table 4.39) did not significantly
predict post-load glucose. The conclusion is that dietary variables in the sociocultural
index are strongly related to glycemia, specifically post-load glucose. This may indicate

144
that the middle class status of COSDA participants enables them to escape social factors
that correlate with hyperglycemia among lower class African Americans, but not the
social inheritance of food preferences for the high fat soul food diet.
Coefficients
Model B β t p
(Constant) 170.31 1.04 .30
Total cholesterol in grams 1.85 .69 7.64 .00
Discrimination index -.76 -.03 -.32 .75
Total lifestyle/acculturation index -.13 -.01 -.10 .92
Health threatening index -.47 -.10 .01.1 .29
Dependent Variable: Post-Load Glucose
Model Summary
Model R R2 Adjusted R2 SE of Estimate
1 .67 .47 .44 110.1
Table 4.39. Health Threatening Behavior, Total Cholesterol, Total Lifestyle/ Acculturation Index, and Discrimination Index as Predictors of Post-Load Glucose
4.4 Summary of Variables in Regression Analyses
Pearson correlations were calculated to examine relationships between each of the
variables used in multiple regression and logistic regression analyses. A matrix of these
correlations follows (Table 4.40).

145
Fasting Post-load Total Health Accultur-glucose glucose cholesterol threat ationreading reading in grams index score
Fasting glucose r 1.00reading p
N 70
Post-load glucose r -.24 1.00reading p .05
N 70 70
Total cholesterol r -.05 .15 1.00in grams p .74 .33
N 45 45 45
Health threat r -.06 .03 .07 1.00index p .64 .83 .65
N 68 68 45 68
Acculturation r -.20 -.17 .08 -.04 1.00score p .16 .24 .69 .77
N 50 50 42 50 50
Discrimination r -.15 -.05 .08 .21 -.03index p .31 .75 .62 .16 .84
N 49 49 40 49 46
Table 4. 40 Correlations Matrix for Variables in Regression Analyses
Table 4.40 shows that only one relationship was statistically significant. As
expected, the two glucose readings were related. None of the other variables, however,
were correlated.

146
CHAPTER 5
MODEL FOR DIABETES
5.1 Anthropometry and Sociocultural Variables5.1.1 Anthropometry
According to the study hypothesis, anthropometry and sociocultural factors are
predictors of plasma glucose in African Americans. Examination of the effects of
anthropometeric indices on post load glucose reveal that the sum of two skinfolds, waist-
hip-ratio, and upper arm fat area failed to reach significance, (R square =.03) (See Table
5.1). A Multiple Regression analysis was conducted to test effects of anthropometeric
indices in the sample resulting in a R square =.03, adjusted R square = -.01, p=.55. In
essence, the contribution of these variables to the variance is negligible at 3% indicating
little contribution to post-load glucose. There is no significant relationship of
anthropometeric indices with post-load glucose scores (p = .70, .75, .59, p>.05 for sum
of 2 skinfolds, waist-hip-ratio, and upper arm fat area, respectively). Inclusion of body
mass index did not improve this model (Table 5.2). There are no significant relationships
of sum of 2 skinfolds, waist hip ratio, or upper arm fat area to post-load glucose. Sum of
2 skinfolds, waist-hip-ratio, and upper arm muscle area together explain only 2% of the
variance. There are no significant effects of anthropometeric indices on post-load glucose

147
readings (p = .39, .83, and .54, p>.05 for sum of 2 skinfolds, waist-hip-ratio, and upper
arm muscle area, respectively).
Model B β p
Sum of two skinfolds .49 .17 .70
Waist-hip ratio -19.79 -.04 .75
Upper arm fat area 2.51 .069 .59
Constant
R2 .03 Adjusted R2 -.01n = 69
*p < .05. **p < .001.
Table 5.1. Sum of Two Skinfolds, Waist-Hip Ratio, and Upper Arm Fat Area and Post-Load Glucose
Model B β p
Sum of two skinfolds 4.88 .02 .91
Waist-hip ratio -73.12 -.15 .25
Upper arm fat area -1.92 -.19 .13
Body mass index 2.75 .22 .16
Constant 107.00
R2 .09 Adjusted R 2 .03n = 69
*p < .05. **p < .001.Table 5.2. Body Mass Index, Upper Arm Area, Waist-Hip Ratio, Sum of Two Skinfolds for Post-Load Glucose

148
Model B β p
Sum of two skinfolds .26 .01 .39
Waist-hip ratio -11.9 .03 .83
Upper arm muscle area -2.7 .08 .54
Constant 101.9
R2 .02 Adjusted R2 -.02n = 69
*p < .05. **p < .001.Table 5.3. Effects of the Sum of Two Skinfolds, Waist-Hip Ratio, and Upper Arm Muscle Area and Fasting Glucose
Multiple regression analysis was used to determine relationships between the sum
of two skinfolds, waist hip ratio, arm fat index, and body mass index to fasting glucose
readings (See Table 5.3). Results show that these anthropometeric indices have little
predictive values on fasting glucose readings among COSDA participants (p = .39, .83,
.54 for the sum of 2 skinfolds, waist-hip-ratio, and upper arm muscle area, respectively.
These predictor variables explain only 2% of the variance for the dependent variable,
fasting glucose.
Addition of the BMI does little to improve the model, explaining only 3% of total
variation (Table 5.4). Anthropometry measure of body habitus are expected to reflect the
high risk of African Americans and be associated with Type II diabetes. However the
majority of African Americans are of lower SES and tending toward overweight like

149
most members of the lower SES class (Mayer 1968; Mokdad et. al 1993)). This sample of
middle and upper SES African Americans is expected to show better body habitus as
indicated by lower body fat and BMI measures, as found among the middle class in
general (Dressler 1993).
Model B β p
Sum of two skinfolds .53 .22 .15
Waist-hip ratio 46.60 .11 .41
Arm fat index 6.05 .07 .60
BMI -2.01 -.19 .25
Constant 113.01
R2 .09 Adjusted R2 .03n = 69
*p < .05. **p < .001.
Table 5.4. Sum of Two Skinfolds, Waist-Hip Ratio, Arm Fat Index, and Body mass Index on Fasting Glucose
5.1.2 Sociocultural Factors
The only demographic measure significantly associated with post-load plasma
glucose in multivariate analysis is income (Table 5.5). Multivariate analysis was also
used to determine the relationship of other sociodemographic variables to plasma
glucose. No significant relationships of occupation, age or sex and post load glucose were
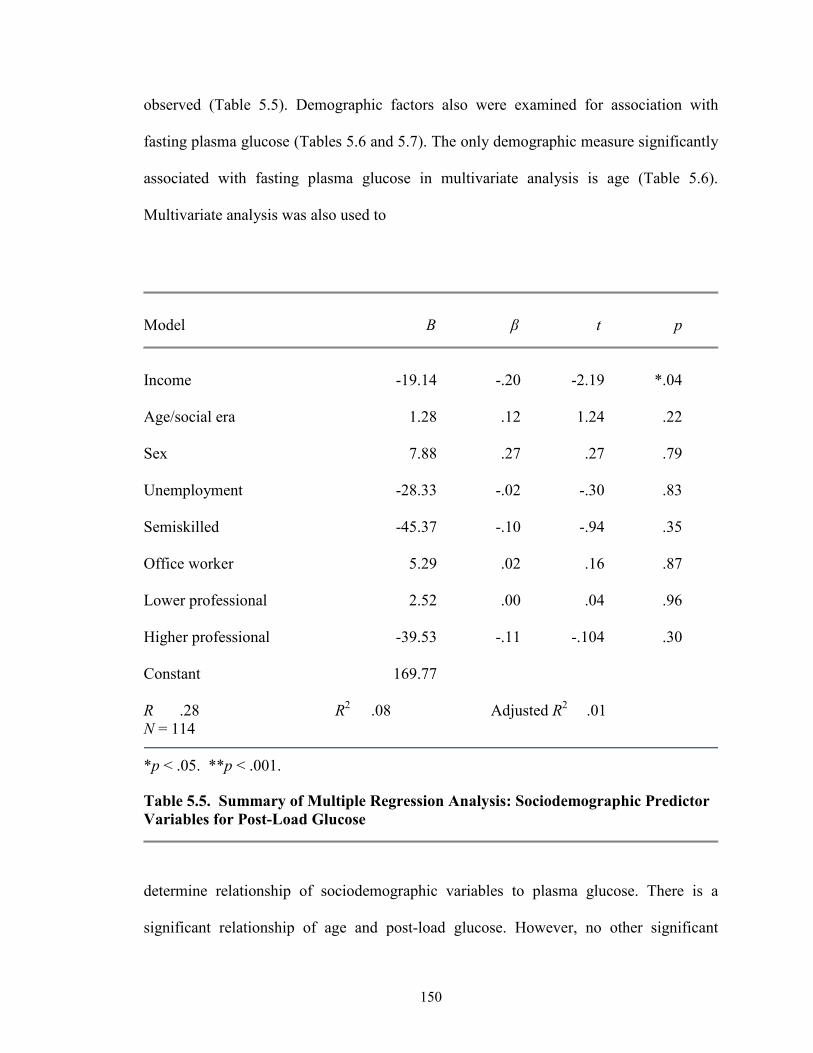
150
observed (Table 5.5). Demographic factors also were examined for association with
fasting plasma glucose (Tables 5.6 and 5.7). The only demographic measure significantly
associated with fasting plasma glucose in multivariate analysis is age (Table 5.6).
Multivariate analysis was also used to
Model B β t p
Income -19.14 -.20 -2.19 *.04
Age/social era 1.28 .12 1.24 .22
Sex 7.88 .27 .27 .79
Unemployment -28.33 -.02 -.30 .83
Semiskilled -45.37 -.10 -.94 .35
Office worker 5.29 .02 .16 .87
Lower professional 2.52 .00 .04 .96
Higher professional -39.53 -.11 -.104 .30
Constant 169.77
R .28 R2 .08 Adjusted R2 .01N = 114
*p < .05. **p < .001.
Table 5.5. Summary of Multiple Regression Analysis: Sociodemographic Predictor Variables for Post-Load Glucose
determine relationship of sociodemographic variables to plasma glucose. There is a
significant relationship of age and post-load glucose. However, no other significant

151
relationships of other demographic variables such as income, occupation, or sex and post-
load glucose were observed (Table 5.6). Overall, sociocultural factors explain only 8%
of the variance in post load glucose (Table 5.5). For this model only age increased the
odds of hyperglycemia, increasing the odds ratio by 3.6 (Table 5.6).
UnstandardizedPredictor Variables Coefficients Wald Odds Ratio
Stepa
Income -.09 .33 .56
Age .03 3.60 .05
Sex -.02 .00 .95
Unemployment 6.06 .07 .78
Semiskilled -.21 .06 .79
Office -.61 1.28 .25
Lower professional -1.95 .84 .35
Higher professional -.94 1.72 .18
Constant -1.72 1.71 .19
-2 Log LR 131.79Model χ2 (df = 1) 10.85P .21Overall rate of correct classification 68.5
Table 5.6. Logistic Regression Prediction of the Likelihood of > 140 mg/dl of Post-Load Plasma Glucose from Sociodemographics

152
Predictor Variables B Odds Ratio 95% Odds CI Ratio
Cholesterol (diet) .00 1.00 0.61 1.61
Discrimination index -.03 .96
Acculturation index -.02 .97
Threatening health index -.01 .99
Constant 2.74 15.48
-2 Log LR 89.47Model χ2 (df = 4) 4.35P .36Overall rate of 65.8% correct classification
Table 5.7. Prediction of Four Sociocultural Variables and Post-load Glucose
Logistic regression was used to estimate the probability of a post-load glucose
reading of 140 or more using a set of four sociocultural variables: discrimination,
acculturation, health threatening behaviors, and diet. The overall prediction model failed
to reach .05 statistical level.

153
ANOVA
Model SS df MS F p
1 Regression 728532.89 4 182133.22 14.64 .00a
Residual 920712.55 74 12442.06Total 1649245.40 78
2 Regression 737614.52 6 122935.75 9.71 .00b
Residual 911631.92 72 12661.54Total 1649245.40 78
a. Predictors: (Constant), total accumulation score-lifestyle, incongruity+anger+support+ relaxation, total cholesterol in grams, What is your health threatening index? What is your income?
b. Predictors: (Constant), total accumulation score-lifestyle, incongruity+anger+ relax, total cholesterol in grams, What is your health threatening index? What is your income?, BMI, total fat in grams.
c. Dependent variable: Post-load glucose reading
Coefficients
Model B β t p
1 (Constant) 203.785 1.301 .20Income -4.37 -.04 -.43 .67Cholesterol in grams 1.79 .65 7.14 .00Health threatening index -.11 -.23 -.29 .78Total acculturation -.38 -.03 -.29 .78
2 (Constant) 148.39 .86 .40Income -3.84 -.04 -.36 .72Cholesterol in grams 1.79 .65 7.09 .00Health threatening index -8.54 -.02 -.22 .83Total acculturation -.32 -.02 -.24 .81Total fat in grams -3.79 -.02 -.25 .80BMI 1.71 .07 .83 .41
a. Dependent variable: Post-load glucose reading
Table 5.8. Summary of Multiple Regression Analysis: Anthropometry and Sociocultural Predictor Variables for Post-Load Glucose

154
Multiple Regression statistics in Table 5.8 show that the relationship of
anthropometery and sociocultural indexes to post load glucose are not significant. It is not
surprising though that total grams of dietary cholesterol is highly significantly related to
post load glucose scores of 140 ml/dl or above (p <.01 Table 5.8, Model 2.

155
CHAPTER 6
Discussion and Conclusion
6.1 Review of Results
Forms of life survive best when they are in equilibrium with their ecosystems.
Humans are thought to be at equilibrium when they are able to perform normal activities
without socially determined or clinically defined symptoms resulting in morbidity,
mortality and impaired health. Conditions that lead to morbidity, impaired health or
mortality render humans unfit in their ecosystem. Humans use culture as the first line of
adjusting to their variable environment. Culture is man’s ecological adjustment. New
opportunities for the spread of parasites and disease emerge when major cultural
innovations result in environmental alterations or rapid population growth or decline.
This is particularly obvious in African agriculture. Agriculture produced surplus food,
and sustained large populations. Control of such surpluses is a prerequisite for the
mobilization of global resources providing wealth and power to those in control of food
supplies and human energy. Slavery helped transform many simple societies to complex
ones with powerful economic and political systems. Human energy allowed for slave and
colonial social systems to accumulate wealth based upon the labor of others. One way to
increase production and decrease expense was to feed fat to slaves. Calorically the
densest and monetarily the cheapest food source was an animal by-product.

156
While building advanced civilizations on the surplus food they produced,
colonized slaves experienced long-term stresses, including food deprivation, exposures to
crowded conditions, associated endemic, enteric, bacterial and parasitic infections and
long-term deficiency diseases resulting from mono crop agriculture. Chronic
degenerative diseases (CDDs) including diabetes are multifactorial. Metabolic
adjustments associated with CDDs often allow humans to survive better in certain
environmental conditions. This study examined type II diabetes as a metabolic
maladjustment. The conclusion is that type II is a consequence of human adaptation to
prolonged food scarcity and undernutrition due to exploitation of human energy causing
environmental disequilibria among its victims.
We explore an environmental model of disequilibria for type II. Historical,
cultural, folklore, sociocultural, socio-political, and ecological data were used to
construct a model of environmental disequilibria for type II. According to Hypothesis 1 a
standard set of biophysical/clinical assessments could be significantly associated with
glycemia. This hypothesis was supported for blood pressure, cholesterol (Table 4.25) and
age (Table 4.20). Although other measures showed borderline associations, none were
strongly correlated with glycemia or glucose above 140 mg/dl (Table 4.3). Hypothesis 1
also addressed biological factors such as obesity and anthropometry. These measures
have predictive ability for plasma glucose levels > 140 mg/dl among middle class African
Americans in Central Ohio.
Hypothesis 2, on the other hand, examined culture specific sociocultural risk
factors that were expected to have minimal ability to predict plasma glucose > 140 mg/dl
among middle class African Americans in Central Ohio. The middle class status,

157
educational attainment, and job stability of COSDA participants are atypical of most
African Americans. African Americans are predominantly lower class, have low levels of
educational attainment, and job instability. The expectation is that exposure to middle
class conditions results in middle class social and health indices.
Hypothesis 3 acknowledges African American food preferences and taste. The
expectation is that food choice is among the last elements of culture to change in an
acculturating population from which disenfranchisement restrictions have been lifted.
Thus, high levels of dietary fats that characterize soul foods are expected to predict
plasma glucose levels above or equal to 140 mg/dl among middle class African
Americans in Central Ohio. This general hypothesis was strongly supported.
Of BMI (r= 0.48, n=58 p < .02) and suprailiac skinfolds (r=.03, n= 58 p.86)
apartheid born ( r=.048, n=58 p < .04 ) and civil rights born (two tail, and r=.048, n=54 p
< .04, two tail ) participants with hyperglycemia were obtained (Table 6.1). Hip
circumferences also were sampled in the 1986 Body Composition Project (BCP). Mean
hip circumference of COSDA participants is 108.4 cm compared to 97.6, 96.1 cm, and
96.8 cm respectively for white, black, and Hispanic in the Body Composition Project (US
Army Research Institute, 1986). Hip circumferences of BCP men and women were 95.5
cm., 12.8 cm below COSDA participants. Waist circumference of COSDA participants
also was larger than that of Chinese men and women measured by Kapanrow et al.
(1996). Waist circumferences of COSDA participants were 89.9 cm compared to 80.7 for
Chinese men and women.
COSDA participants do, however, have smaller waist-to hip ratios than other
ethnic groups. Waist-to-hip ratios are 6.74% smaller than participants in a study by Croft

158
et al (1993). Waist-to-hip ratios are 12.64% smaller than in whites and 13.55% smaller in
Mexican Americans (Roche 1995). These anthropometric differences suggest COSDA
blacks may exhibit adipose placement different from other ethnic groups. Such
differences may be due to their unique environment, opportunity structure, physical
activity, cultural history, biology, or other factors peculiar to their life style.
Affluence and the availability of surplus food make obesity a problem for all
Americans. In both sexes, African Americans between ages 20 and 74 are 69% and 58%
more likely to be overweight and severely more overweight than Europeans
(Kumananyika and Johnson 1991). Excessive weight gain generally results from low
energy expenditure and high food intake. Historical analysis suggests low physical
activity is the most probable explanation of overweight in African Americans.
Environmental disequilibria have led to high intakes of dietary fat. This significant
relationship between total cholesterol and post-load glucose (adjusted R2 = .42) is
presented in Table 4.38 and 4.39. High dietary cholesterol intake was once adaptive and
promoted survival of blacks during slavery and apartheid periods. Today these cultural
and biological contingencies conspire to produce an epidemic of type II diabetes in
African Americans. Other than dietary variables, most sociocultural phenomena assessed
in this study were poorly associated with glycemia.
The sociodemographic profile of COSDA participants reflects their uniqueness.
The apartheid era participants had the highest mean post load glucose score of 17.6
mg/dl, and the second highest fasting glucose score of 146.92 mg/dl while civil rights era
participants had the lowest mean fasting glucose score. Apartheid era participants also
had the highest mean systolic blood pressure of 141.51 mg/dl. COSDA participants are

159
hypertensive, diabetic, and overweight; thus, demonstrating the prevalence of multiple
diseases of syndrome X constellation of diseases.
6.2 Folklore, Literature and History
Folklore, literature and history were surveyed to assess global attitudes and
behaviors towards African Americans in the genesis of the current environmental
disequilibria in the Americas. Sufficient materials were reviewed to indicate the etiology
of NIDDM among descendants of Africans who experienced slavery,
apartheid/segregation, desegregation and modern discrimination. Folklore and legend
justified Africans’ enslavement by Hebrews, Arabs and Europeans. In addition to legend,
the ability of African Americans to survive, produce, reproduce and endure the hardships
of slavery made them highly sought after (Mascie-Taylor 1993; Bennett 1970).
Furthermore, Christianity, Judaism and Islam condoned the enslavement of Africans.
This global attack on Africans resulted in prolonged undernutrition, exposure to endemic
and epidemic diseases, and high mortality rates in both the Old and New Worlds.
Transforming multicultural enslavement to racial enslavement established dark skin color
as a global marker for enslavement. Global denigration of black skin color began with the
legend of Noah and has continued through time, culminating in color line societies. This
furthered black environmental disequilibria and precipitated a biological crisis that almost
led to extinction of African Americans (Holmes 1937). By consuming a high fat diet
blacks were able to survive slavery, the following biological crisis and the apartheid
period.

160
Among this sample high dietary cholesterol and a close association of cholesterol
with type II suggest the detrimental outcome of this diet. Although, COSDA participants
escaped many effects of oppression, their dietary preferences remain in black subculture.
Although no longer participating in physically demanding labor, they still eat the soul
food diet. One professional man explained, “I might as well be dead if I can’t eat the soul
foods I like, especially after I worked hard to acquire a high level education, entered a
high status career, and earned a high-income.” A woman said, “My favorite food is
cholesterol.” Another participant stated, “Cholesterol makes ‘soul food’ taste so good.”
Slaves had to consume a high fat diet to survive. This diet that continues as soul
food culminates today as a close association between dietary cholesterol and type II (r2 =
.42, t= .47, p=.005,) (Table 4.24). This association tends to support the Anabolic-
Catabolic-Homeostasis Model as contributing to the etiology of diabetes among at least
middle class African Americans in Central Ohio.
6.3 Sociocultural Index and Hypotheses
The lifestyle/stressor index indicates COSDA blacks escaped many of the culture
specific life stresses of African American life and culture including menial labor,
violence, discrimination, occupational stresses, and an inadequate diet. This sample
resides in a social milieu contrary to typical US blacks, but the prevalence of NIDDM is
lower. Desegregation was not a major issue in the lives of eighty-five (74.6%)
participants. Desegregation only affected ten (8.8%) adversely. In the Southern US where
school and economic systems were totally segregated, integration accompanied

161
desegregation by closing black school and businesses. However, institutions of higher
learning such as Wilberforce University and Central State University remained
unaffected by desegregation, and their employees maintain control of these institutions
and their economic, social, and political lives. Thus, 50% stated their incomes are
commensurate with their education, but 63.2% felt white workers with comparable work
experience and education were paid more annually. Thirty-one (27.2%) of one hundred
and fourteen felt they were discriminated against sometimes, whereas 29 (25.4%) felt
they were rarely discriminated against. COSDA participants also escaped violence and
crime associated with many black communities in the United Stated. The mean of 2.4
victimizations they experienced was not significantly associated with elevated plasma
glucose levels. There is no significant relation of reaction to anger and post load and
fasting glucose.
The acculturation index composed the second category of the lifestyle stressor
index. This index measured the affect of contact situations between African Americans
with the majority culture by assessing the degree of African American social support,
social incongruity and relaxation. Only social support was significantly related to fasting
glucose readings > 140 mg/dl, r= .42, n = 111, p <. 02, two tail. Neither relaxation nor
social incongruity is significantly related to elevated plasma glucose. COSDA
participants engaged in a mean of 8.6 relaxation activities. COSDA participants
experience little social incongruity. They owned a mean of 25 material possessions with a
total lifestyle score of 238.91. Many material possessions of COSDA participants are
congruent with high educational attainment. Thus, social incongruity was not
significantly associated with plasma glucose levels > 140 mg/dl.

162
The third major part of the sociocultural index is threatening health behaviors that
consisted of total alcohol and tobacco use, and total degree of physical activity/inactivity.
Logical regression was used to estimate the probability of plasma glucose levels > 140
mg/dl. The overall predictive model failed to reach the .05 statistical level to indicate that
disease prophylaxis activities in the prevention of disease does not associate with
individual COSDA participants.
6.4 Summary of Major Results and Comparison With Other Studies
6.4.1 Major Findings
Slaves ate limited meat such as salted fish or bacon, and, more occasionally,
animal products such as organs and fat. Some slaves managed to grow gardens. Gardens
helped to supplement slaves’ diets with African foods including watermelons, lima beans,
and black eye peas (Holloway 1990). This slave diet evolved today’s soul food one. All
animal products were of value in slave diets. Grease, lard and butter were added to
vegetables, cornbread, and greens to produce a more calorically dense and nutritional
adequate diet (Table 6.1).
High fat content foods remained beneficial during the second biological crisis for
African Americans when food supplies were scarce. High fat diets among emancipated
African Americans likely were an adaptive response. The soul food dinner listed below in
Table 6.1 would supply 62.19% more cholesterol and 53.61% more calories than the
American diet. During the Jim Crow era, a similar diet among bondsman performing
strenuous labor likely increased their reproductivity and survival. Adding fat became the

163
basis for the American Soul food diet. This culturally-motivated dietary adaptation over
15 - 20 generations likely reset many aspects of African American metabolism. One way
this culturally-motivated diet manifests today may be by elevating blood glucose scores
and increasing body habitus, and hyperglycemia (> 140 mg/dl) and high BMI (> 27
kg/m2). Among the apartheid era participants, glycemia and BMI are significantly
associated (r= .048, n=58, p=< .02). High lifetime fat intake along with reduced physical
activity may have promoted their high body weight and BMI (Table 4.3). Among civil
rights era participants glycemia and BMI were not significantly correlated. The average
BMI for the apartheid era is 30.3 for age 56. The health risk is 3.5 (high). The BMI was
28.4 for aged 44.4 with a health risk of 2.9.

164
Soul European American Slave
Mg cholesterol calories Mg cholesterol Calories Calories
Barbecued ribs 367.42 1562.71 254.55 815.44 none
Macaroni and cheese 119.36 603.20 18.31 334.00 none
Candied yams 30.38 368.07 0.00 146.52 none
Green beans 9.45 93.31 5.18 18.70 none
Corn bread 6.25 388.26 26.00 172.90 none
Dinner rolls 38.18 220.57 none
Butter (per pat) 10.00 33.33 10.00 33.33 none
Sweet potato pie 71.39 493.81 58.35 295.46 none
Vanilla ice cream 139.31 326.33 120.00 270.00 none791.78 3891.59 492.39 2086.35 none
Percent 62% more 54% more
Table 6.1. Comparisons of Typical Soul Food, European American, and Hypothesized Slave Diet
Multiple explanations could be provided for these results. Age alone may explain
all differences. However, controlling for era has a minor effect. Apartheid era

165
participants’ mothers may have more frequently suffered malnutrition before and during
pregnancy. Thus, the maternal environment model as proposed by Barker (1998, 1992)
may also explain in part the variation across cohorts since the civil rights generation may
have gestated in more economically and nutritionally well-off mothers. Greater access to
health care, information, and life styles also might have altered morbidity/mortality
patterns and allowed those with less extreme body habitus to survive to adulthood to
maintain their weight and fatness at lower levels. Or perhaps, the diet affected members
of the apartheid era. Members of the apartheid era are most likely grandparents of the
civil rights era participants. Parents of civil rights era participants were, obviously, able to
provide food more consistently to their children. These children are the civil rights era
participants. Decreased employment restriction and better economic opportunities
following the gains of the civil rights movement also modified how overweight interacted
with prosperity.
Suprailiac skinfold also significantly associates with hyperglycemia in this sample
(r = .36, p = .04) (Table 4.19) but waist-hip ratio did not ( r=.06, p =.64) (Table 4.2).
Waist-hip ratio commonly is used to assess obesity (National Health and Nutrition
Examination Survey 1997-1999). The suprailiac skinfold measures gait and mobility
(National Health and Nutrition Examination Survey 1997-1999). In this sample of mainly
women (72%), skinfolds more may assess fatness in the lower body (buttocks, gynoid)
with that in the abdominal (android, upper) area and bias the association with BMI
generally found elsewhere (National Health and Nutrition Examination Survey 1997-
1999).

166
COSDA participants weighed more than participants in the National Health
Survey (NHS) that was conducted by the National Center for Health Statistics at the U.S.
Department of Health, Education, and Welfare (1974). Men averaged 203 pounds
compared to a median weight of 169.6 pounds of all NHS men. Women were 169.2
pounds. They exceeded median weights for all (137.8 pounds) black (149.6 pounds) and
white (137.0 pounds) women in the NHS survey. Men also weighed more than median
weight of white (170.6 pounds) and black (166.1 pounds) men. In general COSDA
participants weigh more than the norm for blacks and whites sampled by the NHS.
6.4.2 Type II diabetes in African Americans
The multifactorial nature of chronic diseases makes disease etiology complex.
Involvement of multiple loci and environmental stressors produce a range of continuous
phenotypic variation (Crews and Gerber 1994:173). Such phenomena along with
sociocultural and cultural-historical factors produce ethnic differences in disease etiology
and type II diabetes. African Americans were examined for evidence of evolutionary,
cultural and environmental influences on the etiology of type II diabetes. Data examined
here contradict current explanations for type II diabetes in ethnic groups experiencing
transition, and suggests cultural-history may influence risk at least in African Americans.
The sociocultural level for diabetes type II in COSDA is on all fronts. It was possible to
construct a sociocultural etiology in this middle class sample of African Americans.
Overall adverse sociocultural encounters were not experienced by our sample. Poverty,
disease, adverse sociopolitical situations are encountered more often by lower SES
individuals, particularly minorities (Dressler 1993; Kumanyika and Golden 1991; and

167
Greenberg 1981). The etiology of type II in African Americans likely is related to current
socioeconomic standing.
This research investigated evolutionary, cultural and environmental factors that
might contribute to type II diabetes mellitus causation in African Americans. It used
holistic, cultural-historical and biological models. In this section, an Anabolic-Catabolic-
Homeostasis model of type II diabetes is developed.
6.5 The Model for the Anabolic-Catabolic Homeostasis Etiology of Diabetes
Mellitus (ACHED)
Data examined here suggests SES, body habitus or discrimination factors did not
strongly predict type II among these middle class African Americans. The intake of
dietary fat, however, correlated significantly with type II. Some other genetic, cultural-
historical, or life style aspect shared by all African Americans must also account for their
similarities in rates of type II diabetes and obesity across SES. Neel (1962, 1982) offers
genetic adaptations to starvation as a possible model (McBeth 1993:64). Food scarcity is
but the second part of this tripartite hypothesis model. Individuals with high performance
genotypes also must differ in the genetic moderation of insulin (Knowler, Savage et al.
1982). Those able to maintain constant blood glucose during caloric restriction may more
efficiently utilize food energy. High performance genotypes survive because they are able
to gain more weight, and produce healthier offspring. Energy is the third leg this
hypothesis. Energy provides a key for understanding type II diabetes mellitus. Energy is
an important aspect of diabetes; without sufficient supplies the body will convert other
tissues to provide its needs. The etiology of type II focuses on energy production and

168
expenditure during food scarcity and African enslavement. This major lifestyle change
caused population-wide food scarcity and extreme labor demand for profit. Extraction of
labor was the fundamental purpose for African enslavement. Such extreme labor requires
glucose that diffuses through muscles during exercise without the benefit of insulin
(Ritenbaugh and Goodby 1989:230). Normally the body obtains glucose from exogenous
sources (food, anabolism). During energy scarcity, due to low intakes glucose is obtained
from endogenous sources beginning with catabolism, a limited source stored in liver and
muscle. Next the body’s protein, stored blood and muscle is catabolized (Ritenbaugh and
Goodby 1989:229). Labor or physical activity increases glucose requirements completing
the model.
When food is plentiful, glucose energy is produced normally allowing physical
activity and metabolic equilibrium (anabolism). When food is scarce, production
increases when combined with physical activity or labor, excessive metabolic
disequilibria (catabolism) may occur. Plentiful food with energy efficiency and low
physical activity may itself lead to hyperglycemia. This suggests hyperglycemia is not a
state of homeostasis but physical activity diminishes it. Physical activity burns energy,
maintaining glycemia at a constant level. This facilitates survival. Individuals adapting to
such stress may experience constant hunger due to prolonged food deprivation and
secondary nutritional deficiencies and disease. Complex carbohydrates and meat protein
may be beneficial. Fat is the most calorie dense food, supplying more calories than
carbohydrates or proteins. The common Southern slave diet that consisted of corn, yams,
and salt pork or fish with some occasionally salted beef or fish (Hines et al. 2000). Salt

169
pork is “fat back” or “bacon”. Corn and yam are starchy vegetables (Nelson et al. 1994).
Table 6.2 summarizes the probable disease profile.
Energy and its passage through African Americans’ bodies may be the key to
understanding type II diabetes. Worldwide, peoples have been enslaved and colonized for
their labor (energy). Most researchers associate type II diabetes with Westernization,
cosmopolitanization, diet, urbanization and modernization. These may be superficial
confounders. In addition to the enumerated sociocultural alternations, many populations
with high type II rates have been enslaved and/or colonialized. Slavery, and
disenfranchisement are major life style changes. They altered normal metabolic states
leading to disequilibria (Table 6.2). Hyperglycemia occurred with the eventual return to
anabolism and homeostasis with diminished physical activity. Reduced energy
expenditure in an environment with a sure fit of calories would put high-performance
genotypes at risk for obesity and type II diabetes.

170
Metabolic States
Preenslavement
EnvironmentalEquilibrium
Anabolism
Enslavement
EnvironmentalDisequilibria
Catabolism
Jim Crow
IntensifiedEnvironmentalDisequilibria
HeightenedCatabolism
Desegregation
EnvironmentalEquilibrium
Homeostasis
FoodPlenty Scarce
High dietaryCholesterol and fats
Intermittenthunger
HeightenedScarcity and“Biological Crisis”
High dietaryCholesterol and fats
Heightened hunger
Plenty of food
Normal andhigh dietarycholesterol
EnergyGlucose Normal Exuberant Exuberant Adequate
Conditions
PhysicalActivity Normal Excessive Excessive Normal
Outcomes Normo- glycemia
*"High-performance genotype"
Hyperglycemia
*"High- performance genotype"
Hyperglycemia
Normoglycemiaand *"High-performancegenotype"Hyperglycemia
* "High-performance genotypes" = individuals with exuberant metabolic systems that produce surplus glucose or excessive energy from food that is deficient in nutrients, quality, and quantity. Surplus glucose is required to perform excess and arduous physical labor in states of environmental disequilibria characterized by high life stresses, mortality, and morbidity.
Table 6.2. A Model of Anabolic-Catabolic Homeostasis Etiology of Diabetes Mellitus in African Americans

171
6.5.1 Type II Diabetes and Obesity in African Americans
6.5.1.1 AnabolismAfricans were enslaved for a single reason: labor. African labor generated wealth
for African, Arab, Jewish, and European slave owners. The ACHED model focuses on
fuel needed for labor. It recognizes explicitly the degrading and degenerating of the body
when fuel is undersupplied. This model views type II diabetes as a chronic degenerative
disease (Crews and Gerber 1994), a catabolic processes.
The etiology of type II diabetes in African Americans begins in Africa. There
were large populations with tremendous wealth and complex political organizations
throughout Africa well before Europeans arrived. Well-populated empires and cities are
strong circumstantial evidence that Africans who came to the Americas as slaves
generally were from societies with constant food supplies. One estimate is that
40,000,000 Africans died during the European slave trade (Bennet 1964). Mortuary
studies of Africans slaves’ Osteological remains in Barbados confirm that African-born
were healthy and better able to resist pathologies and nutritional diseases than American-
born (Corruccini et al. 1987, p. 183). Barbados and other Caribbean Islands were
seasoning ground or the first stop in the New World for Africans’ introduction and
adjustment to slavery. Risks for and predispositions to type II diabetes likely were low in
African slaves from such societies. They would probably fall into the anabolic
equilibrium heading of Table 6.2. The probable metabolic cycle for African born
Africans is anabolic.
African prehistory confirms the basic physiological fitness of Africans. Africans’
disease profiles likely paralleled their socio-cultural developments, most important being

172
agricultural and pastoral development. Slavers generally selected slaves from agricultural
and pastoral societies to benefit from skills and knowledge that would be appropriate for
European industries and agriculture (Holloway 1990). Settled agriculture with villages or
cities leave populations susceptible to enteric bacteria, respiratory and other infections,
measles, rubella and venereal diseases (Mascie-Taylor 1963, p. 6).
When energy needs are adequate, the body grows, functions normally, and stores
any excess energy as fat for later use (anabolism). Food producing societies with constant
food supplies are better equipped to meet energy needs. Neel also explains the converse
in societies with plentiful and scarce cycles of food availability. Disease became more
likely when resources are lower and body’s energy requirements are not met (Szathmary
1990, p. 87). When energy needs are not met by the diet, metabolism converts to
catabolism. Anabolism generally is found after food is sure fit. African American slaves
survived periods of food scarcity and catabolism that today contribute to their higher
risks for obesity and type II diabetes.
6.5.1.2 Catabolism
Slave diets and their and Osteological remains contribute to understanding
evolutionary etiology of type II diabetes in African Americans. These records show the
diet was calorie restricted and nutritionally poor. The diet was insufficient to sustain
normal metabolic processes. At the same time, energy expenditure was high. In
Barbados, slaves disembarking from Africa already showed malnutrition and traumatic
occlusion, along with various metabolic insults (Corruccini et al. 1987, p. 179). Some of

173
their skeletal features suggest periodic near-starvation, while infant slaves experienced
considerable weaning trauma, exceeding that of the prenatal or immediate postnatal
periods.
Plantation nutrition records from the Caribbean suggest slaves received 2,500 to
2,900 calories and 55 grams of protein per day (Kiple 1984). Strenuous physical activity
in the tropics causes perspiration and stress, requiring 3,200 to 4,000 calories daily and
100 to 125 grams of protein to maintain nitrogen balance. Slaves were also often fed
rancid foods of poorer nutritional value (Kiple 1984, p. 80). Diets also were deficient in
vitamins A, B1, B2, B3, C and minerals including iron, calcium, phosphorus, thiamine,
riboflavin, and niacin. Salted meats provided some proteins but few vitamins and
minerals. Slaves frequently suffered deficiency diseases such as night blindness, beriberi,
pellegra, iron deficiency and other anemias, dropsy, and scurvy.
Similar diets were provided US slaves. Dietary deficiencies were reported among
slaves in New Orleans (Owsley et al. 1987) in Philadelphia (Angel et al. 1987), Virginia
and Maryland (Blakley et al. 1994), Charleston, South Carolina (Rathbun 1989), Texas
(Hutchinson 1987). Malnutrition caused Harris lines, reflecting acute development arrest
and recovery period (Rathbun 1984, p. 245). Forty-five percent of the males and eighteen
percent of the females in the Charleston sample had Harris lines. Transverse lines were
found on the distal diaphusis, proximal femur and proximal tibia. Childhood growth was
compromised (Owsley 1987, p.193). Dentition showed frequent severe hypoplasias
(Rathbun 1987, p. 245; Corruccini et al. 1982, p. 445) and tooth hypercementosis
(Corruccini 1987, and 1982) caused by endocrine disorders, iron and protein deficiencies,
or malnutrition and vitamin C deficiencies (Corruccini et al. 1987, p. 180).

174
Nutritional conditions deteriorated further when slaves were emancipated in 1865
(Martin, Magennis and Rose 1987, p. 261). Slave masters fed slaves. However, most
freed bondsmen were often unemployed. When employed, employers paid freed
bondsmen insufficient wages to support themselves and families. Emancipated black men
and their families nearly starved. Deteriorating conditions for freed bondsmen continued
until the 1940s (Martin, Magennis and Rose 1987, p. 261; Farley 1970, p. 3; Holmes
1937; Martin, Magennis and Rose 1987, p. 255). High mortality and morbidity rates,
gross pathologies caused national population decline that led to a prediction of the
imminent disappearance of Afro-Americans (Farley 1970, p.3; Holmes 1937). Data on
diets of slaves and freed bondsmen suggest their metabolism was catabolic. Thus, the
model for the Anabolic-Catabolic-Homeostasis Etiology of Diabetes that relies on the
Global Structure Model provides conformity evidence supporting the predictive power of
cholesterol vis’-a’-vis’ Type II.
6.5.1.3 Cultural Ecology and Type II Diabetes
Forced labor and energy expenditure required to complete it provide the
ecological background for today’s African Americans. From 1878 to 1940 skilled blacks
were paid substandard wages and restricted to farm labor and dangerous menial jobs.
Catabolic metabolism continued through 1940 as mortality rates of freed blacks exceeded
each of those among slaves. High mortality and morbidity rates brought African
Americans to near extinction. Nutritional deficiencies increased for calcium, iron, and
proteins. Adults exhibited more frequent spinal osteophytosis and osteoarthritis of the
major joints, hands and feet due to the strenuous labor they performed (Martin, Magennis

175
and Rose 1987, p. 255). Records indicate post-Reconstruction black males worked but
nearly starved by yielding the small quantity of food to wives and children.
During the late nineteenth century, the southern caste system shaped all
institutions of southern society, from voting booths to the market place (Landale and
Talnay 1991, p. 35) as a “dual economy” replaced slavery. Upward mobility was
restricted by crop liens and debt peonage systems. Anti-enticement and vagrancy laws
legalized tenant exploitation. Except for strenuous and dangerous jobs in the turpentine
and timber industries, blacks were excluded from industrial jobs throughout the South”
(Landsdale and Talnay 1991, p. 38). Blacks also were excluded from skilled occupations,
dock labor and professional careers. Strenuous and dangerous jobs and high mortality and
morbidity rates further suggest high catabolism among Post-Reconstruction African
Americans.
6.5.1.4 Environmental Ecology of Type II Diabetes
Environmental conditions of African Americans also support a model of
metabolic disequilibria. This may have particularly affected reproduction and prenatal
environments among blacks. Multiparity hypothesis helps explain possible reproductive
benefits of high performance genotypes. These women are better able to gain weight
during pregnancy. This could lead to higher RS; however, in a setting with a sure fit of
calories high performance genes would be detrimental, resulting in obesity and
hyperglycemia (Weidman 1989, p.242).
Easy weight gain likely reflects efficient metabolism and high performance
genotypes. Among U.S. blacks, 72% of women and 29% of men aged over 25 are

176
overweight (Johnson 1996, p. 227). Infants born to thrifty overweight blacks would be
better able to survive. However, black women in Los Angeles deliver 59% of all
extremely premature infants but represented only 15% of total deliveries (Taeusch and
Supnet 1994), contradicting Weidman’s (1998) hypothesis.
However, very low birth weight black neonates may survive marginally better
than white neonates, particularly girls (Phelps et al. 1989, p. 9). Those with high
performance metabolisms differ from those without. From birth onward, women giving
birth to macro somatic infants often develop clinical diabetes about thirty years later
(Neel 1962, p. 353), although class and ethnicity coined this association. The high
percentage of low birth weight black neonates, overweight black women, and high
diabetes among African Americans suggest that adjustments enabling blacks to survive
enslavement and post-Reconstruction period may place them at a life span disadvantage
with respect to US whites. Adjustments enabling African Americans to reproduce
themselves and avoid extinction may also provide a diabetic phenotype.
Poor maternal nutrition also is linked to low birth weight infants (Hales and
Barker 1992). Malnourished children seem to exhibit permanent alterations in their
responses to glucose. Insulin secretion in protein/calorie malnutrition is severe. Islet
vascularisation appears altered lending to poor secretion due not only to fewer Beta cells
(Hales and Barker 1992, p. 598). Maternal malnutrition predisposes infants to type II
diabetes (Barker 1990). Evolutionary, cultural, and environmental conditions seem to
have predisposed most US blacks to type II diabetes. Circumstances among US blacks
may have been severe enough to predisposition people who were once healthy to type II
diabetes.

177
6.5.1.5 Homeostasis
Following the Civil Rights Movement of the early 1950s blacks gained access to
skilled, management and professional occupations. Such occupations required little
strenuous physical labor. These jobs allowed many to earn more than a survival income
and enter a new phase of homeostasis with adequate and even overadequate nutrition.
Given generation of maternal malnutrition, the hypothesis is that infants born following
these conditions are predisposed to type II diabetes. Barring rapid dietary changes in this
model, reduced energy expenditure and improved nutrition made the onset of type II
diabetes inevitable. A return to metabolic homeostasis accompanied by reduced physical
labor set the stage for the current epidemic of diabetes among African Americans.
6.5.1.6 Confounders
Most models of type II diabetes that fail to consider possible effects of worldwide
slavery and colonialization may bias models of important historic events. Without
consideration of these important historic events, researchers associated the onset of
diabetes mellitus type II with western diets, urbanization and industrialization. Middle
class and free African Americans have consumed a western style, high animal fat, and
high simple carbohydrate “soul food” diet since the 1700s (Helton 2002). Soul food
helped free blacks meet the physically taxing energy demands associated with
disenfranchisement, discrimination and arduous labor of the 19th and 20th centuries.
However, before the 1960s blacks ate soul food, but they did not experience a diabetes
epidemic (Dressler 1993).

178
Urbanization also appears to be a confounder. Before 1865 most free blacks lived
in Northern cities. Skilled slaves also lived in cities, bit in the South. Runaway slaves fled
to Northern cities in search of freedom and jobs. They started a large urban movement
during the late 1820s (Franklin and Moss 1988; Angel et al. 1987). Later, freed
bondsmen fled the South in a mass urban movement called the “Negro Exodus (1889).
The last urban wave was the “Great Folk Movement” that started after World War II
(Franklin and Moss 1988, Bennett 1964). Northern industries hired blacks to break strikes
and fight union demands for wage increases (Abrahamson 1981, p. 54). By 1980, 81% of
southern blacks had migrated to urban areas (Franklin and Moss 1988, p. 420).
Some slaves also lived in urban areas and were industrialized. Industrial slaves
lived in New Orleans from 1720 (Owsley et al. 1987, p. 190) and in Catoctin Furnace,
Maryland, as early as 1790 (Kelley and Angel 1987, p.222). Urban slaves lived in many
other cities. Those in New Orleans lived longer than the white population. Slaves at
Catoctin Furnace were healthier than nonindustrial slaves. Industrialization improved
living conditions, health, opportunity structures and lifestyles for African Americans
whether they were industrial slaves in the South or strikebreakers and industrial workers
in the North. For blacks, industrialization was a major techno-economic change and a
drastic life style improvement. Until recently, the diabetes epidemic was not a significant
factor for urban or industrial experiences of African Americans.
Again, the data suggest one must look elsewhere for the etiology of type II
diabetes in African Americans. Metabolic disequilibria is one common factor for all non-
Western people and Europeans enslaved and colonized by one another. Greeks, Romans,
and Germans enslaved and colonized hundreds of thousands of Europeans (Everett 1978).

179
Europeans stopped enslaving each other during the tenth century (Everett 1978). During
the fifteenth century Europeans gradually shifted their interest from European indentured
servitude to the enslavement of Native Americans, then to “more desirable” African
Negroes (Everett 1988, p. 31; Bennett 1970, p. 35; Franklin and Moss 1988, p. 32).
Europeans probably have a lower prevalence of type II because they have had longer
period of return to metabolic homeostasis compared to more recently enslaved and
colonized non-Westerners.
The Anabolic-Catabolic-Homeostasis model provides an ecological, cultural-
historical, biological and evolutionary explanation of type II diabetes in modern
populations. It focuses attention on human energy expenditures. Accumulation of wealth
requires expenditure of human energy. Those who controlled human energy accumulated
vast quantities of wealth and luxuries for themselves and their posterity. Those who were
captured and forced to expend their energy could only have enhanced their survival by
maintaining constant blood glucose during periods of low caloric restrictions and low
nutrition. In such settings high performance genotypes have a survival advantage
regardless of where they come from.
6.6 Significance
The significance of COSDA research is that its findings are consistent with other
research. Liebson et al. (2001) discussed how obesity is a risk factor for diabetes and
mortality among people with diabetes. Increasing obesity is accompanied by increasing
diabetes (Liebson et al. 2001). Other studies show a positive correlation between diabetes
and total dietary fat (Feskes et al. 1995). This is significant as the percent of energy from
180
fat predicted diabetes, and positively correlates to post load glucose levels after 20 years
of follow-up (Feskes et al. 1995). Post load glucose levels of COSDA participants were
strongly related to dietary fat.
Additionally, the location of adipose tissue may indicate the extent to which
obesity contributes to insulin resistance (Sumner et al 2001). Visceral adipose tissue
(VAT) is measured by abdominal skinfolds. White women have larger VAT
measurements and black women have larger suprailiac skinfold measurements (Sumner
et al (2001). Larger VAT also associates with insulin resistance in white women but not
in black women. COSDA women, like other black women, have larger suprailiac
skinfold measurements. Genetic predisposition for or against obesity does not preclude
overriding environmental influences of energy-dense foods in developing obesity.
Particularly African American women are more likely to be obese because they have
smaller rather than larger visceral fat stores in comparison to white women. Our results
also indicate that obesity is a growing problem in the United States. Twenty percent of
men and twenty-five percent of women aged 20 - 74 have BMI >30 kg/m2 (Looker et al.
2001). Seventy-two percent of the black females and twenty-nine percent of the black
males in a study by Johnson et al. (1996, p. 227) were overweight. African Americans of
both sexes aged 20 to 74 are 69% and 58% more than likely to be overweight and
severely overweight respectively than white Americans (Kumananyika and Johnson
1991). The mean BMI score for COSDA participants is 29.40, the overweight range with
scores from 25 to 29.9 kg.m2.
COSDA findings also reflect diabetes trends in the United States. The prevalence
of diabetes increased from 4.9% in 1990 to 6.5% in 1998, which, in the latter year,

181
equaled 12 million people in the 43 participating states and 13 million people in all 50
states and the District of Columbia (Mokdad et al. 2002). Additionally, the sex-age-race
standardized prevalence of diabetes increased from 4.9% in 1990 to 5.9% in 1998—a
20% increase the was also accompanied by a weight increase in both men and women
during this period, and observed across all age-groups, races, educational levels, levels of
smoking status, weight levels and nearly all states (Mokdad 2002). Data on the
prevalence of diabetes are not available for COSDA participants in 1990. The prevalence
of diabetes also increases among COSDA participants among the other older and better
educated as it did among Americans toward the end of the 1990s (Mokdad 2002).
Findings also show that folklore may contribute to the study of disease causation.
Folklore provided the foundation to develop and examine the global model. Theoretical
perspectives on type II diabetes may need to be revised to include a global structure
perspective and environmental equilibrium model. The impact of the circulation of
folklore indicates researchers should include middle class African Americans in diabetes
etiology.
Folklore has contributor to understanding the etiology of type II diabetes among
African Americans by showing how legends express the “collective actions of the
multitude” and culminate in customs and observances (Ben-Amos 1972 that gave rise to
modern global structure. Following the global circulation of Hebrew, Arab and European
legends, Africans were placed in prolonged states of diminished food supplies, high
morbidity and high mortality. Thus, folklore not only explained disease causation but also
its maintenance.

182
There are many theoretical perspectives of diabetes causation. One of the most
popular and most controversial is Neel’s “thrifty genotype.” This theory explains
diabetes mellitus type II as genetic adaptation to starvation during conditions of plentiful
nutrition (McBeth 1993, p. 64). Neel’s thrifty genotype attributes cycles of food plenty
and scarcity to various environmental, sociocultural, and technological changes.
However, he and other scientists fail to include major global forces of slavery and
colonization in their models. A global structure model goes beyond single-gene,
chromosomal, multifactorial with high heritability, or low heritability, infectious, and
environmental models of disease causation. A global perspective allows us to combine all
models of disease in the examination of actual metabolic adjustment to cyclic food
supplies and other pertinent factors that may have contributed to the etiology of type II.
Neel’s thrifty genotype emerges during fluctuating periods of low caloric consumption.
The Anabolic-Catabolic-Homeostasis Etiology of Diabetes Mellitus presented here is
based on factual historical and sociocultural phenomena. It suggests high performance
genotypes emerged as a result adjustments to prolonged food-scarcity and intensive labor
demands. These high performance genotypes are fueled by high fat consumption as an
adaptation to food scarcity in a setting of high-energy dissipation. The addition of fats
and cholesterol to a diet that is substandard in quality and quantity converts this diet into
one that can more adequately meet the demands for high-energy expenditure.
COSDA research is also significant in that it expands etiological methodology.
The Sociocultural Questionnaire used here provides a new index of culture specific risks
peculiar to African American experiences in the United States. It classifies risks into four
indexes: sociodemographics, lifestyle, health threatening behaviors, and dietary factors.

183
This demonstrates how global factors, folklore global political hegemony, and slavery
and colonization, are major forms of human cultural development that influence modern
sociocultural outcomes.
Previous social science research concerning African Americans generally focuses
on the lower class. These findings often are generalized to all African Americans. This is
a misapplication. Study of middle class African Americans will extend medical and
social science knowledge of health disparities. Research on middle class African
Americans will enable researchers to compare lifestyle, socioeconomic, educational and
other differences of an ethnic minority within a color line society. These differences will
aid social scientists engaged in applied research to develop social policies and implement
social programs to reduce health disparities among minorities regardless of class.
This research should continue to determine how class differences among African
Americans impact health differences and how social class and disenfranchisement affect
disease prevalence and the onset of chronic diseases. An expansion of COSDA research
should also include an assessment of family type and disease among African Americans.
Lastly and most importantly, further research is needed to develop strategies for
successful dietary modifications. African Americans must be informed how the “slave-
food/soul-food” diet is detrimental to health and longevity. African Americans must
developed strategies to alter their preferential food selection. Additionally, standards of
physical attractiveness must be modified so that standards of physical characteristics
promote overall health.

184
6.7 Conclusion
Rapidly increasing type II diabetes is a serious health care threat to African
Americans. Since 1960 its prevalence has increased from almost zero to 33%. Age-
adjusted rates are 50% higher among ethnic minorities, especially those of lower income
and education. Other than dietary cholesterol, sociocultural factors explained only 8% of
the variance in elevated post load glucose levels above 140 ml/dl. Careful examination of
medical, historical, and social phenomena showed the most significant sociocultural
factor in type II onset is prolonged environmental disequilibria culminating in high
dietary fat consumption. Enslavement and colonization led to health imbalances and
ecosystem disturbances on global scale. These major cultural developments forced slave
to alter their diets to their detriment. Analysis of COSDA participants’ diets show they
retain the high saturated fat and cholesterol soul food diet that enabled their ancestors to
survive the “biological crises” associated with slavery, emancipation and apartheid. A
high saturated fat and cholesterol diet is beneficial when excessive, arduous physical
labor accompany food and nutrition scarcity. COSDA participants carved out a middle
class community that enabled them to escape much of the environmental disequilibria
associated with the American color line society. However, the high saturated fat and
cholesterol “slave food/soul food” food way that was forced on their slave ancestor’s
subjects COSDA participants to the same environmental disequilibria of slaves.

185
APPENDIX A

186

187
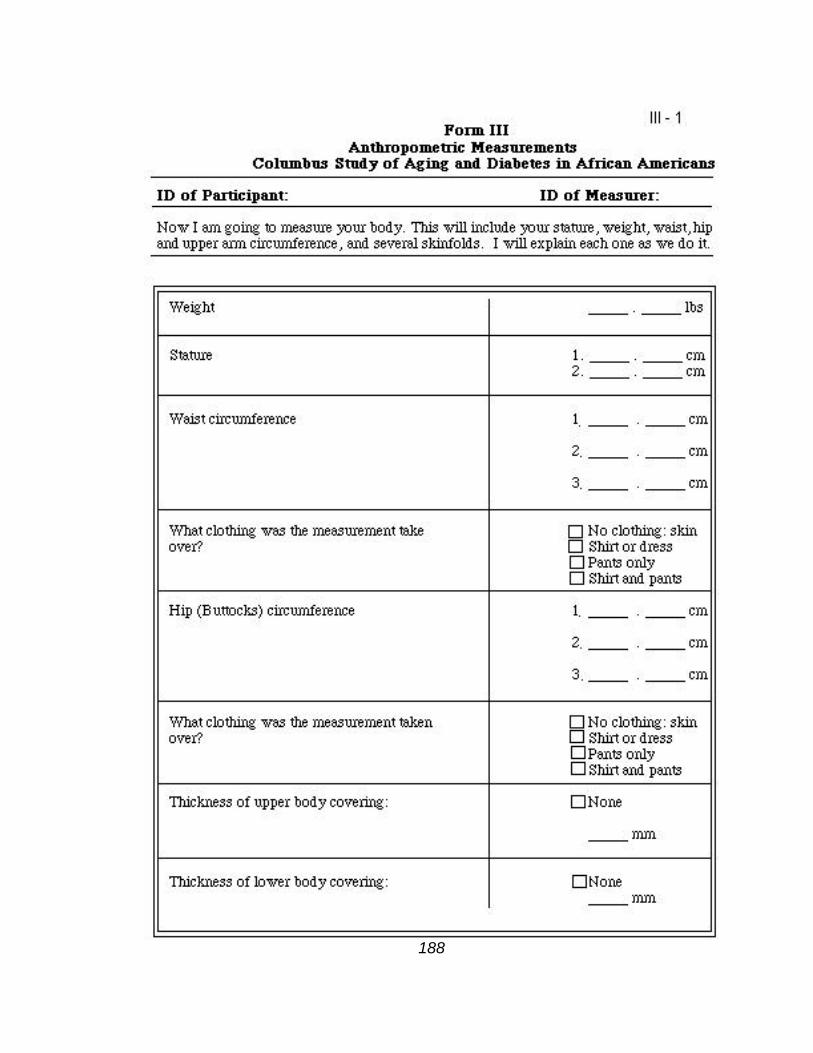
188

189

190

191

192

193

194

195

196

197

198

199

200

201

202

203

204

205

206

207
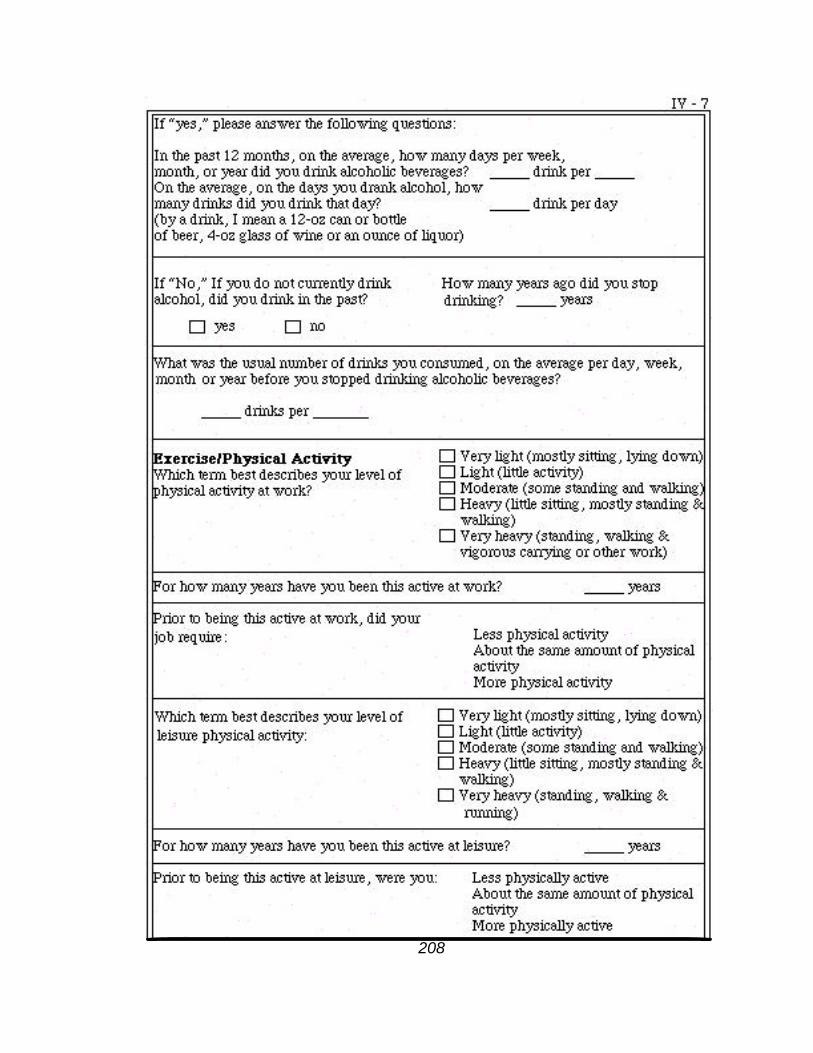
208

209
BIBLIOGRAPHY
Abel TA (1991). Measuring Health Lifestyles in a Comparative Analysis:Theoretical Issues and Empirical Findings. Social Science and Medicine 32 (8):899-908.
Abrahamson M (1981). Sociological Theory: An Introduction to Concepts, Issues and Research. Englewood Cliffs, New Jersey: Prentice-Hall Inc.
Aghani K (1285/1868). Kitab al-Aghani. Cairo, Egypt.
Ajemian , et. al (1995). Race and Ethnic Relations: The Annual Editions Series. Gilford: CT.
Alberti, KGMM , Zimmet P (1998). New Diagnostic Criteria and Classifications of Diabetes—Again? Diab.Med. 15:535-536.
Angel J, Lawrence J, Kelley JO, Parrington M, and Pinter S (1987). Life Stresses of the Free black Community as Represented by the First African Baptist Church, Philadelphia, 1823-1841. American Journal of Physical Anthropology 74:213-229.
Ariosto L (1977). Olando Furioso. Harmondsworth, England: Penguin Books.
Asante MK (1990). Kemet, Afrocentricity and Knowledge. Trenton, New Jersey: African World Press, Inc.
Asante MK (1995). African American History: A Journey of Liberation. Maywood, New Jersey: The Peoples Publishing Group, Inc.
Auslander W, Haire-Joshu D, Houston CA, Fisher EB (1991). Community Organization to reduce the Risk of Non-insulin dependent Diabetes Among Low-Income African-American Women. Ethnicity and Disease 1: 176-184.
Barker DJP, Osmond C, Golding J (1990). Height and Mortality in the Counties of England and Wales. Ann Human Biol 17:1-6.
Barker DJP (1993). Fetal and Infant Origins of Adult Disease. Travistock Square, London: British Medical Journal.

210
Barker DJP (1998). Epidemiology in Medical Practice. New York: Churchill Livingstone.
Baudet H (1965). Paradise on Earth: Some Thoughts on European Images of Non-European Man. New Haven, Connecticut: Yale University Press.
Bauman, R. (1971). Differential Identity and the Social Base of Folklore. Journal ofAmerican Folklore 84.
Ben-Amos, D (1972). Toward a Definition of Folklore in Context. Journal of AmericanFolklore 84.
Bennett, L, Jr. (1964). Before the Mayflower: A History of the Negro in America 1619-1964 (Revised Edition). Baltimore: Penguin Books.
Berkman LF, Leo-Summers L, Horowitz R (1992). Emotional Support and Survival after Myocardial Infarction. Annals of Internal Medicine. 117 (12) 15: 1003 -1009
Bernal M (1987). black Athena: The Afroasiatic Roots of Classical Civilization, Volume I, The Fabrication of Ancient Greece 1785-1985. New Brunswick, New Jersey: Rutgers University Press..
Bernal M (1993). black Athena: The Afroasiatic Roots of Classical Civilization, Volume II, The Archaeological and Documentary Evidence. New Brunswick, New Jersey: Rutgers University Press.
Bialik HN, and Racnitzky YH (1992). The Book of Legends Sefer Ha-Aggadah: Legendsfrom the Talmud and Midrash. Translated by William G. Braude, Introduction by David Stern. New York: Schocken Books.
Biddle FG, Eden SA, Rossler JS, Eales BA (1997). Sex and Death in the Mouse: Genetically Delayed Reproduction and Senescence. Genome. 40(2):229-235.
Billingsley A and Giovanni JM (1972). Children of the Storm: black Children and American Child Welfare. New York: Harcourt, Brace, Joanovich.
Bindon JR, Crews DE, and Dressler WW (1991). Life Style, Modernization and Adaptation Among Samoans. In Collegium Antropologicum 15(1):101-110.
Bjorntorp P (1988). the associations between obesity, adipose tissue distribution and disease. Acla Med. Scand. Suppl. 723:121-134.
Blaine, BE (2000). The Psychology of Diversity: Perceiving and Experiencing Social Difference. Mountain View, California: Mayfield Publishing Company.

211
Blakey M, Leslie TE and Reidy JP (1994). Frequency and Chronological Distribution of Dental Enamel Hypoplasia in Enslaved African Americans: A Test of the Weaning Hypothesis. American Journal of Physical Anthropology. 93: 371-383.
Blakely RL and Harrington, JM (1997). Bones in the Basement: Postmortem Racism inNineteenth-Century Medical Training. Washington: Smithsonian Institution Press.
Blassingame, JW (1972). The Slave Community: Plantation Life in the Antebellum South. New York: Oxford University Press.
Bodley JH (1999). Victims of Progress, Fourth Edition. Mountain View, California: Mayfield Publishing Company.
Bohannan P (1964). Africa and Africans. Garden City, New York: The Natural History Press.
Braxton, B (1973). Women, Sex and Race. Washington D.C. Verta Press.
Bridgwater W and Sherwood EJ (1956). The Columbia Encyclopedia, Second Edition Morningside Heights, New York: Columbia University Press.
Brown DR and Gary LE(1994). Religious Involvement and Health Status Among African Brown P (1994). Medical Anthropology: Cross-Cultural Studies in Health and Illness. Langhorne, Pa.: Gordon and Breach Publishers.
Brown P, Inhorn, MC, Smith D (1996). Disease, Ecology and Human Behavior. In Handbook of Medical Anthropology: Contemporary Theory and Methods, CF Sargent and TM Johnson (eds), Westport, Connecticut: Greenwood Press.
Budge W (1911[1973]). Osiris. New York: Dover Paperback.
Burke L, and Davidson J (1984). Ohio's Heritage. Salt Lake City, Utah: Gibbs M. Smith, Inc. Peregrine Smith Books.
Campbell BG (1979). Humankind Emerging. Boston: Little, Brown and Company.
Charkracorty R, Ferrell RE, Stern MP, Haffner HF, Hazuda HP, and Rosenthal (1986).Relationship of Prevalence of Non-Insulin Dependent Diabetes with Amerindian Admixture of the Mexican-Americans of San Antonio, Texas. Genetic Epidemiology 3(6):435-453.
Charlesworth B and Hughes K (1996). Age-Specific Inbreeding Depression and Components of Genetic Variance in Relation to the Evolution of Senescence. Proc. Nalt.Acad. Sci USA 93:6140-6145.

212
Clarke HH (1975). Exercise and fat Reduction. Physical fitness Research Digest 5: 1-27.
Coogon B, Rose G and Barker DJP (1997). Epidemiology For the Uninitiated, 4th Edition. Plymouth, London: BMJ Publishing Group.
Cole, T.J. (1991). Weight-Stature Indices to Measure Underweight, Overweight, and Obesity. In Anthropological Assessment of Nutritional Status, J Himes (ed), NY: Wiley-Liss, Inc. pp. 83-112.
Communities Count (2000). Basic Needs and Social Determinants of Well-being: SocialSupport. http://www.comunitiescountorg/B_social_support.htm.
Cook NR and Rosner BA (1993). Screening Rules for Determining Blood Pressure Status in Clinical Trials: Applications to the Trials of Hypertension Prevention. In American Journal of Epidemiology. Vol. 137,no. 12, pp. 1341-1352.
Corruccini RJ, Haddler JS, Mutaw RJ, Lange FW (1987). Osteology of a Slave Burial Population From Barbados, West Indies. American Journal of Physical Anthropology 74:185-198.
Corruccini R, Jacobik K, Handler J, Andler JS, and Aufderheide AC. (1987). Implications of Tooth Root Hypercementosis in a Barbados Slave Skeleton Collection. American Journal of Physical Anthropology 74:179-184.
Courlander H (1975). A Treasury of African Folklore: The Oral Literature, Traditions, Myths, Legends, Epics, Tales, Recollections,Wisdom, Sayings, and Humor of Africa. New York: Crown Publishers, Inc.
Cowie CC, Harris MI, Silverman, Johnson EW and Rust KF (1993). Effect of Multiple Risk Factors on Differences Between blacks and whites in the Prevalence of Non-Insulin-Dependent diabetes mellitus type II in the United States. American Journal of Epidemiology 137(7):719-732.
Creel D (2000). Soul food may be good for the soul, bun not for the body. Pick Your Path to Health Medtips. Indiana University School of Medicine. http://medicine.indiana.edu/news_releases/archives_00/pyth_medtips_00.html.
Crews DE (1990). Anthropological Issues in Biological Gerontology. In Anthropologyand Aging: Comprehensive Reviews. Rubinstein RL (ed.), Dordrecht, Netherlands: Kluwer Academic Publishers.
Crews DE and Bindon J (1991). Ethnicity as a Taxonomical Tool in Biomedical and Biosocial Research. Ethnicity and Disease 1(1): 42-49.

213
Crews DE (1994a). Cultural Lags in Social Perceptions of the Aged. Changing Perceptions of Aging and the Aged. New York: Springer Publishing Company.
Crews DE (1994b). Human Population Biology and Human Variation in Health and Disease. Collegium Antropologicum 18(1):1-5.
Crews DE (1994 c). "Columbus Study of Aging and Diabetes in African-Americans: Manual of Operational Procedure."
Crews DE and James GD (1991). Human Evolution and the Genetic Epidemiology of Chronic Degenerative Diseases. In Applications of Biological Anthropology toHuman Affairs, Mascie-Taylor, CGN and Lasker GW (eds). Cambridge [England]: Cambridge University Press, 186-206.
Crews DE and Gerber L (1994). Chronic Degenerative Diseases and Aging. In BiologicalAnthropology and Aging: Perspectives on Human Variation Over the Life Span. New York: Oxford University Press.
Data from the National Health Survey (1974). Skinfold Thickness of Youths 12 - 17 Years: United States. Rockville, Md: U.S. Department of Health, Education, and Welfare, Public Health Service, Health Resources Administration, National Center for Health Statistics.
David S, Bray G, and Bray GA (1991). Anthropometric Assessment in an Adult Obesity Clinic. In Anthropological Assessment of Nutritional Status, J Himes (ed). NY: Wiley-Liss, Inc. pp.399-418.
Davidson B (1968). Africa in History: Themes and Outlines. New York: Cullier Books, MacMillian Publishing Company.
Davison C, Frankel S, Smith GD (1992). The Limits of Lifestyle: Re-Assessing 'Fatalism' in the Popular Culture of Illness Prevention. In Social Science and Medicine. 34 (6):675-685.
Defronzo RA. (1987) Ellemberg and Rifkin's Diabetes Mellitus. Stanford, Conn.: Appleton and Lang.
Department of the Interior National Park Service (1995). Underground Railroad: SpecialResource Study Management Concepts/ Environmental Assessment. Washington, D.C.: Superintendent of Documents, U.S. Government Printing Office.
Despres, J.P., Fong, B.S.. Julien, P., Jimenez J., and Angel, A. (1987). Regional variation in HDL metabolism in human fat cells: Effect of fat cell size. American Journal of Physiology, 252, E654-E659.
214
Diop CA (1974). The African Origin of Civilization: Myth or Reality. Cook M (ed and translator), Chicago: Lawrence Hill Books.
Diop CA (1991). Civilization or Barbarism: An Authentic Anthropology, Translated from Yaa-lengi Meema Ngemi, Salemson HK and de Jager M (eds), Chicago: Lawrence Hill Books.
Dressler WW (1991 [1990]). Social Class, Skin Color and Arterial Blood Pressure in Two Societies: Blood Pressure and Life Style Incongruity. Ethnicity and Disease1:60-77.
Dressler WW (1992). Culture, Stress, and Depressive Symptoms: Building and Testing a Model in a Specific Setting. In Anthropological Research: Process andApplication. J Poggie, Jr., BR DeWalt and W Dressler (eds). Albany, New York: State University of New York Press.
Dressler WW (1993). Health in the African American Community: Accounting for Health Inequalities. Medical Anthropology Quarterly: International Journal for the Analysis of Health. 7(4):325-345.
Dressler WW (1994). Social Status and The Health of Families: A Model. In Social Science and Medicine 39(12):1605-1613.
Dressler W, Philip E and Gray D (1992). A Status Incongruence and Serum Cholesterol in an English General Practice. In Social Science and Medicine, 34(7):757-762.
Dressler WW, Dos Santos JE, and Baliero MC (1996). Studying Diversity and Sharing in Culture: An Example of Lifestyle in Brazil. Journal of Anthropological Research. Albuquerque, New Mexico: University of New Mexico Press. 52(3):331-353.
Dressler WW, Dos Santos JE, Viteri FE and Gallagher PN Jr. (1991). Social and Dietary Predictors of Serum Lipids: A Brazilian Example. Social Science and Medicine. 32 (11):1229-1235.
Dressler W, Dos Santos and Balieiro MC (1996). Studying Diversity and Sharing in Culture: An Example of Lifestyle in Brazil. J Anthropol. Res 52:331-353.
Dressler WW, Philip E and Gray DJP (1992). Status Incongruence and Serum Cholesterol in an English General Practice. Social Science and Medicine, 34(7):757-762.
Dorson, R. M (1975) African and Afro-American Folklore: A Reply to Bascom and Other Misguided Critics. Journal of American Folklore, 88:151-64.
Dundes A (1980). Texture, Text, Context. Interpreting Folklore. Bloomington: University of Indiana Press.

215
Dundes A (1980) Who Are the Folk? In Interpreting Folklore. Bloomington: University of Indiana Press. Du Bois, W.E.B (1979[1909] The Negro Family. Cambridge, Massachusetts: the M.I.T. Press.
Editorial (2000). In Diabetes Care. 23 (4): 1107-1108.
Elliott, E. N (1968). Cotton is king, and pro-slavery arguments: comprising the writings of Hammond, Harper, Christy, Stringfellow, Hodge, Bledsoe, and Cartwright, on this important subject. By E. N. Elliott. With an essay on slavery in the light of international law, by the editor. Augusta, Ga., Pritchard, Abbott & Loomis, 1860. New York: Johnson Reprint Corp.
Elson HW (1949). History of the United States of America: Latest Revised and EnlargedEdition. New York: The Macmillian Company.
Epstein, I (Editor) (1935-53). The Babylonian Talmud in English, with Introductions,Translation and Commentary, Vols. I-XXXVI. London: Soncino Press.
Esha Research (1987 [1999]). The Food Processor for Windows: Nutrition and Fitness Software. Salem, Oregan: Professional Nutrition Analysis Software and Database.
Everett S (1988). The History of Slavery. London: Magna Books.
Farley R (1970). Growth of the Black Population: A Study of Demographic Trends. Chicago: Markham Publishing Company.
Farley E, Jr. (1988). Cultural Diversity in Health Care: The Evaluation of FuturePractitioners. In Ethnicity and Health. Eds. Winston A. Van Horne and Thomas V. Tonnesen. Milwaukee: WI: University of Wisconsin System Institute on Race and Ethnicity.
Fastenfest D (1986). Community Politics and Urban Redevelopment: Poletown, Detroit, and General Motors. Urban Affairs Quarterly 22(1):101-123.
Ferland M, Despres JP, Tremblay A, Pinault S, Nadeau A, Moorjani S, Lupien PJ,Theriault, G, & Bouchard C (1989). Assessment of adipose distribution by computed axial tomography in obese women: Association with body density and anthropometric measurements. British Journal of Nutrition, 61: 139-148.
Foster D (1989). The Metabolic Basis of Inherited Disease, 6th Edition. Charles Scriver, Arthur L. Beaudet, William S. Sly and David Valle (eds). New York: McGraw-Hill Information Services Company.

216
Foster, GM and Anderson (1978). Medical Anthropology. New York: John Wiley & Son.
Franklin JH and Moss A, Jr. (1988). From Slavery to Freedom: A History of AfricanAmericans, sixth edition. New York: McGraw-Hill, Inc.
Franklin JH and Moss A, Jr.(1994). From Slavery to Freedom: A History of AfricanAmericans, seventh edition. New York: McGraw-Hill, Inc.
Gabir Momin et al. (2000). The 1997 American Diabetes Association and 1999 World Health Organization Criteria for Hyperglycemia in the Diagnosis and Prediction of Diabetes. Diabetes Care, 23 ( 8): 1108-1112.
Garn SM (1991). Implications and Applications of Subcutaneous Fat Measurement to Nutritional Assessment and Health Risk Evaluation. In Anthropological Assessment of Nutritional Status, John Himes Editor. NY: Wiley-Liss, Inc. pp. 123-140.
Garn SM (1994). Fat, Lipid, and Blood Pressure Changes in Adult Years. Biological. Anthropology and Aging: Perspectives on Human Variation Over the Life SpanNew York: Oxford University Press.
Gray DS and BGray GA (1991). Anthropometric Assessment in an Adult Obesity Clinic. In Anthropometeric Assessment of Nutritional Status. JH. Himes (ed). New York: A John Wiley & Sons, Inc., Publication.
Gerber DA (1976). Black Ohio and the Color Line 1860-1915. Urbana, Illinois: University of Illinois Press.
Gibbs JL, Jr. (1965). Peoples of Africa: Cultures of Africa South of the Sahara. Prospect Heights, Illinois: Waveland Press, Inc.
Gibbs, Jewelle Taylor (1988). Young, black, and Male in America: An EndangeredSpecies. New York: Auburn House.
Glass TA, Matchar DB, Belyea M, Feussner JR (1993). Impact of Social Spport on Outcome of First Stroke. In Stroke, 24 (1): 64-70.
Glass TA, Maddox GL (1999). The Quality and Quantity of Social Support: Stroke Recovery as Psycho-Social Transition, In Social Science Medicine, 34 (11): 199, pp. 1249-1261.
Gelles RJ (1979). Family Violence. Beverly Hills, California: Sage Publications.

217
Goodison L (1985). Some Aspects of Religious Symbolism in the Aegean Area during the Bronze and Early Iron Ages. Ph.D. dissertation, London:University College.
Goodins L (1988). 'A Female Sun Deity in the Bronze Age Aegean?' Bulletin of theInstitute of Classical Studies of the University of London. London:University College.
Goodins L (1987). Central State University: The First One Hundred Years, 1887-1987. Wilberforce, Ohio: Central State University.
Gordy M (1996). Social Support and Medical Care: Paper prepared and presented by Dr. Michael Gordy At the "Internet for Doctors" conference Genea, May 9, 1996. Sponsored by Health On the Net Foundation.
Gray, DS and Bray GA (1991). Anthropometric Assessment in An Adult Obesity Clinic. In Anthropometric Assessment of Nutritional Status. (Ed.) John H. Himes. New York: A Jonn Wiley & Sons, Inc, Publication.
Greenberg S (1981). Neighborhood Change, Racial Transition, and Work Location: A Case Study of an Industrial City, Philadelphia 1880 - 1930. In Journal of Urban History 7 (3): 267 - 314.
Grim C and Wilson, TW (1992). The Possible Relationship Between the Transatlantic Slave Trade and Hypertension in Blacks Today. In The Atlantic Slave Trade: Effects on Economies, Societies, and Peoples in Africa, The Americas, and Europe. Joseph E. Inikori and Stanley L. Engerman (eds). Durham, Indiana: Duke University Press.
Gutman, H (1976). The Black Family in Slavery and Freedom, 1750 -1925. New York: Vintage.
Hales CN and Barker DJ (1992). Type 2 (non-insulin-dependent) diabetes mellitus type II: the Thrifty Phenotype Hypothesis. Diabetologia 35:595-601.
Heimburger and Weisier (1997). Handbook of Clinical Nutrition. St. Louis: RR Donnelley & Son Co. Henslin JM (1993). In Social Problems, 2nd Ed. Englewood Cliffs: New Jersey.
Henslin, JM (2001). Sociology: A Down-To-Earth Approach. Boston: Allyn and Bavon, A Pearson Education Company.
Heyward V and Stolarczyk L (1996). Applied Body Composition Assessment. Champaign, IL: Human Kinetics.

218
Hine DC, WC Hine, and S Harrold (2000). The African-American Odyssey. Upper Saddle River, New Jersey: Prentice Hall.
Holloway JE (1990). The Origins of African-American Culture. In Africanisms in American Culture. Bloomington, Indiana: University of Indiana Press.
Horodotus (1928). The History of Horodotus, translated by George Rawlinson. New York: Tudor Press.
Huffman K, Vernoy M and Vernoy J (1994). Psychology in Action, 3rd Ed.New York: John Wiley & Sons, Inc.
Haldane JBS (1949). Disease and Evolution. La Ricera Scientifica. 19:68-76.
Haldane CP and Haskins EF (1951). New Paths in Genetics. New York and London: Harper.
Hale CN and Barker DJP (1992) "Type 2 (non-insulin-dependent) Diabetes Mellitus: The Thrifty Phenotype Hypothesis. In Diabetogia 35: 595-601.
Hale CN, Barker DJP, Phipps K, Fall CHD, Osmond C, Clark PMS (1993). Fetal Growth and Impaired Glucose Tolerance in Men and Women. Diabetologia36:225-228.
Harris M, Hamman RF (1984). Diabetes in America: Diabetes in America: Diabetes Data Compiled in 1994 for the National Diabetes Data Group (eds.). Washington DC: US Government Printing Office. (Pub. No. NIH 85-1468.).
Harris M (1968). The Rise of Anthropological Theory. New York: Thomas Y. Crowell Company.
Harris MI (1990). Non-Insulin-Dependent Diabetes Mellitus in Black and White Americans. Diabetes Metab. Rev. 6: 71-90.
Harris MI, Hadden WC and Knowler WC (1987). Prevalence of Diabetes and Impaired Glucose Tolerance and Plasma Glucose Levels in the US Population Aged 20 - 74 Years. Diabetes 36: 523 -534.
Harris Y, Gorelick PB, Samuels P, Bempong I (1996). Why African Americans May Not Be Participating in Clinical Trials. Journal of the National Medical Association. 69: 342 - 355.
Helton M (2002). "Today's Special: Soul Food." With Paula Ford-Martin Your Guide to one of hundreds of sites. diabetes.about.com/library/blfoodforthought/ucTSsoulfooda.htm.

219
Heimburger and Weisier (1997). Handbook of Clinical Nutrition. St. Louis: R. R. Donnelley and Son. Company.
Henslin, James M. (2001). Sociology: A Down-To-Earth Approach. Boston: Allyn and Longman, A Pearson Education Company.
Heyward, Vivian and Lisa Stolarczyk (1996). Applied Body Composition Assessment. Champaign, IL: Human Kinetics.
Holmes SJ (1937). The Negro Struggle for Survival: A Study in Human Ecology. Berkeley, California: University of California Press.
Holloway JE (1990). The Origins of African-American Culture. In Africanisms in American Culture. Bloomington, Indiana: University of Indiana Press.
Horsman, R (1987). Josiah Nott of Mobile: southerner, physician, and racial theorist. Baton Rouge: Louisiana State University Press.
Hutchinson J (1987). The Age-Sex Structure of the Slave Population in Harris County Texas: 1850 and 1860. In American Journal of Physical Anthropology. 74: 321-338.
Huffman V, Venoy M and J Venoy (1994). Psychology in Action. 3rd Ed. New York: John Wiley and Sons, Inc.
Ibn A-H (1922). Futuh Misr, ed. C. C. Torrey. New Haven, Connecticut: cf. Rotter.
Idowo EB (1962). Olodumare: God in Yoruba Belief. Longmans: London.
Idowo EB (1973). African Traditional Religion: A Definition. Mary Knoll, New York: Orbis Books.
Illiffe, J (1995). Africans: The History of a Continent. Melbourne, Australia: Cambridge University Press.
Irwin E (1974). Colour Terms in Greek Poetry. Toronto: Hakkert.
Jackson F and Collier L (1991). Race and Ethnicity as Biological Constructs. In Ethnicityand Disease. 1 (1): 120-125.
Jackson F and Collier L (1992). Race and Ethnicity as Biological Constructs in Anthropological Research Laboratory. College Park, MD University of Maryland Press.

220
James G, Crews D, Pearson J (1989). Catechoalamines and Stress. In Human Population Biology: A Transdisciplinary Science, MA Little and JD Hass (eds). New York: Oxford University Press.
James WPT and Core HG (1970). Persistent impairment of insulin secretion and glucose tolerance after malnutrition. Am J Clin Nutr 23: 386-9.
Johansson G, Frankenhaeuser, M. and Magnusson, D (1973). Catechoalimine excretion and school children as related to performance and adjustment. Scandinavian Journal of Psychology, 14: 20-28.
Johnson T, Sargent C (1990). Medical Anthropology Handbook of Theory and Method. NY: Greenwood Press.
Johnson EH, Brandsond D, Everett J and Lollis CM (1996). Obesity and Hypertension Among African Americans: Do African-American Primary Care Providers Address These Conditions When Secondary to Primary Illness? Journal of theNational Medical Association, 88 (4): 225-229.
Johannes MW, van de Ouwlah L, Lemkes HHPJ, Trembath RCm Ross R, Velho G, Cohen D, Froguel P Maasen JA (1994). Maternally Inherited Diabetes and Deafness is a Distinct Subtype of Diabetes and Associate With a Single Point Mutation on Mitrochondrial tRNA (LEU UUR) Gene. In Diabetes: Journal of the American Diabetes Association 6(43): 146-751.
Johannson G, Lundberg H (1978). Physhophysiological Aspects of Stress and Adaptation in Technological Society. In Human Behavior and Adaptation. V Reynolds and N Blurton and M Jones (eds). London, England: Taylor and Francis, Ltd., pp. 285-303.
Kane RS (1972). Africa A to Z. Garden City, New York: Doubleday & Company, Inc.
Kaplan PHD (1983). The Rise of the Black Magus in Western Art. Ann Arbor: UNI Research Press.
Kelley JO, Angel L (1987). Life Stresses in Slavery. American Journal of PhysicalAnthropology 74:199-211.
Knepper G (1997) Ohio and Its People. Kent, Ohio: Kent State University Press.
King G and Williams D (1995). Race and Health: A Multidimensional Approach to African American Health. In Society and Health. Eds. Benjamin C Amidok Sol Levine, Alvin R. Tarlov and Diana Walsh. New York: Oxford University Press.

221
King R, Rotter J and Motulsky A (1997). The Approach to Genetic Bases of Common Diseases. In The Genetic Basis of Common Disease. Eds. Richard King, Jerome Rotter and Arno Motulsky. NY: Oxford University Press.
King T L (1981). Black Settlement in Xenia, Ohio; 1850-1880: An Historical Geography. Masters Thesis, Department of Geography, University of Colorado.
Kiple KF (1984). The Caribbean Slave: A Biological History. Cambridge: Cambridge University Press.
Kiple KF and Ornelas KC (2000) Diet and Chronic Disease. In The Cambridge WorldHistory of Food, Vol. Two. Cambridge: Cambridge University Press, pp. 1078-1085.
Kiple KF and Ornelas KC (2000) The History and Culture of Food and Drink in Sub-Saharan Africa and Oceania. In The Cambridge World History of Food, Vol. Two. Cambridge: Cambridge University Press, pp. 1330-1338.
Kiple KF and Ornelas KC (2000) Regional Foodways of America. In The Cambridge World History of Food, Vol. Two. Cambridge: Cambridge University Press, pp. 1311-1314.
Kober AE (1932). The Use of Color Terms in Greek Poetry. Geneva, New York: W. F. Humphrey Press.
Kottak, CP Phillip C (1974). Anthropology: The Exploration of Human Diversity. New York: Random House.
Knepper G (1994). Along the Ohio Trail: A Short History of Ohio Lands. Virginia Beach, Va. Donning Co.
Knowler WC, Savage PJ, Nafulesparan , Howard BV, Pettitt DJ, Lisse HR, Aronoff SL, and Bennett PH (1982). Obesity, Insulin Resistance, and diabetes mellitus type II in the Pima Indians. In The Genetics of diabetes mellitus type II. Kobberling J and Tattersall JB (eds), New York: Academic.
Kreiger N (187). Shades of difference: Theoretical underpinnings of the medical controversy on Black/White differences in the Unites States, 1830-1870. In Int. JHealth Serv. 17:259-278.
Kumanyika SK, and Golden PM (1991). Cross-Sectional Differences in Health Status in US Racial/Ethnic Minority Groups: Potential Influence of Temporal Changes, Disease, and Life-Style Transitions. Ethnicity and Disease Vol. 1, Winter:51-59.

222
Kurzmarski and Johnson 1991. Anthropometry in National Surveys. In Anthropological Assessment of Nutritional Status, J Himes (ed). NY: Wiley-Liss, Inc. p.319-337.
Landale, Nancy S. and Stewart E. Tolnay. (1991) "Group Differences in Economic Opportunity and the Timing of Marriage." American Sociological Review. 56:33-45.
Lang A (1968). Custom and Myth. New York: AMS Press.
Lang CC (1989). "Making Sense" About Diabetes: Dakota Narratives of Illness. In Medical Anthropology. 11:305-327.
Lang C (1993). Using Relaxation and Exercise as Part of the Care of People Living with HIV/AIDS. In Physiotherapy. ( 6): 356-384.
Lang GC (1989). Making Sense: About Diabetes: Dakota Narratives on Illness. Medical Anthropology. Vol. 11 p. 305-327.
Larsson B, Svardsudd K, Welin L, Wilhelmsen L, Bjorntorp P, Tibblin (1984).Abdominal adipose tissue distribution, obesity and risk of cardiovascular disease and death: 13 year follow up of participants in the study of men born in 1913. Br. Med J, 288:1401-228.
Leibson CL, Williamson DF, Melton III L K, Palumbo PJ, Smith SA, Ranson JE, Peter PL, Narayan KMV (2001). "Temporal Trends in BMI Among Adults with Diabetes. Diabetes Care 24 (9): 1584-1588.
Legum C (1968). Africa: A Handbook to the Continent. New York: Frederick A. Praeger.
Lewis B (1979). Race and Color in Islam. New York: Octagon Books.
Lewis B (1990). Race and Slavery in the Middle East: A Historical Enquiry. New York: Oxford University Press.
Little MA, Baker P (1988). Migration and Adaptation. In Biological Aspects of HumanMigration. Mascie-Taylor CGN and G. W. Lasker (eds), Cambridge: Cambridge University Press.
Littlefield, DC (1991). Rice and Slaves: Ethnicity and the Slave Trade in Colonial SouthCarolina. Chicago: University of Illinois Press.
Lohman TG, Roche AF, and Martorill R. (eds.) 1988). Anthropometric StandardizationReference Manual. Champaign, IL: Human Kinetics.

223
Lohman TG, Pollock ML, Slaughter MH, Brandon LJ, and Boileau RA (1984). Methodological factors and the prediction of body fat in female athletes. Medicine and Science in Sports and Exercise 16: 92-96.
Looker AC. Langlois A, Mussolino ME, Visser M, Harris T, Madans J (2001). Weight Loss from Maximum Body Weight Among Middle-Aged and Older White Women and The Risk of Hip Fracture: The NHANES I Epidemiologic. In Osteoporosis International 12 (9): 763-768.
Lucus A (1991). Programming By Early Nutrition in Man. In The ChildhoodEnvironment and Adult Disease. Bock GR and Whelan J (eds), CIBA Foundation Symposium No. 156. Chichester: Wiley.
Marketti J (1990). Estimated Present Value of Income Diversity During Slavery. In Wealth Races: Present Value of Benefits from Past Injustices, Richard F. America (ed). pp. 107-123.
Martin E and Martin M (1985). The Helping Tradition in the Black Family andCommunity. Silver Springs, Maryland. National Association of Social Workers.
Martin E and Martin M (1987). The Black Extended Family. Chicago: The University of Chicago Press.
Martin DL, Magennis AI and Rose J (1987). Cortical Bone Maintenance in an Historical Afro-American Cemetery Sample From Cedar Grove, Arkansas. In AmericanJournal of Physical Anthropology 74: 257-267.
Mascie-Taylor CGN (1991). Biological Anthropology of Disease: The Anthropology ofDisease. Oxford: Oxford University Press.
Mascie-Taylor CGN (1991). Nutritional Status: Its Measurement and Relation to Health. In Application of Biological Anthropology to Human Affairs, CGN Mascie-Taylor and GW Lasker (eds), Cambridge: Cambridge University Press.
Mascie-Taylor CGN (1993). Research Designs and Sampling Strategies. In ResearchStrategies in Human Biology: Field and Survey Studies. Cambridge: Cambridge University Press.
Massey D, NA Denton (1993). American Apartheid: Segregation and the Making of theUnderclass. Cambridge, Mass.: Harvard University Press.
Mayer M (1968). Overweight: Causes, Cost, and Control. Englewood Cliffs, N.J.: Prentice-Hall.

224
Maquet J (1972). Civilizations of black Africa. Revised and Translated by Joan Rayfield. New York: Oxford University Press.
Maquet J (1971). Power and Society in Africa. Translated from the French byJeannette Kupfermann. New York: McGraw-Hill Book Company.
McBeth H (1993). Ethnicity and Human Biology. In Social and Biological Aspects ofEthnicity. Ed. Malcolm Chapman. Oxford, England: Oxford University Press.
McElroy A and PK Townsend (1979). Medical Anthropology in Ecological Perspective. North Schituate, Massachusetts: Duxbury Press.
McGarvey ST, Bindon JR, Crews DE, Schendel DE (1989). Modernization andAdiposity: Causes and Consequences. In Human Population Biology: ATransdisciplinary Science. Ed. Michael A. Little and Jere D. Haas. New York:Oxford University Press.
McGee JV (1981). Thru the Bible with J. Vernon McGee, Volume I Genesis-Deuteronomy. Pasadena, California: Thru The Bible Radio.
McGinnis FA (1941). A History and An Interpretation of Wilberforce University. Wilberforce, Ohio: Freeman Publishing Company.
Mckay J, Hill BD, Buckler J (1988 a). A History of World Societies Volume B: From1300 Through the French Revolution. Second Edition. Dallas: Houghton Mifflin Company.
Mckay J, Hill BD, Buckler J (1988 b). A History of World Societies Volume C: Fromthe French Revolution to the Present. Second Edition. Dallas: Houghton Mifflin Company.
Mckay J, Hill BD, Buckler J (1992). A History of World Societies: Volume A FromAntiquity Through The Dark Ages. Third Edition. Boston: Houghton Mufflin Company.
Mckay J, Hill BD, Buckler J (1996). A History of World Societies Volume C: From TheFrench Revolution to the Present. Second Edition. Boston: Houghton Mifflin Company.
Mckay J, Hill BD, Buckler J, Ebrey, PB (2000). A History of World Societies Volume A:From Antiquity to 1500. Fifth Edition. Boston: Houghton Mifflin Company.
Medwar PB (1952). An Unsolved Problem in Biology. London: H.K. Lewis.

225
Medwar PB (1955). The Definition and Measurement of Senescence. CIBA Foundation Colloquium on Aggressing, 1: 4-15.
Meyer K, Lawrence K, Jacob D, and AF (2001). Dietary Fat and Incidence of Type 2 Diabetes in Older Iowa Women. Diabetes Care 24 (8):
Mobbs CV (1993). Genetic Influences on Glucose Neurotoxicity, Aging, and Diabetes: A Possible Role for Glucose Hysteresis. Genetica 91:239-253.
Modan M, Harris MI, Halkin H (1989). Evaluation of WHO and NDDG Criteria for Impaired Glucose Tolerance: Results From Two National Samples. Diabetes 38: 1630-1635.
Mokdad AH, Ford Es, Bowman BA, Nelson DE, Engelgau MM, Vinicor F, Marks JS (1993). Diabetes Trends in the US:1990 - 1998. Diabetes Care 23 (9):1278 -1283.
Mokdad AH, Nelson TL, Hunt KJ, Rosamond WD, Ammernan AS, Keyserling TC (2002). Obesity and Associated Coronary Heart Disease Risk Factors in a Population of Low-Income African-American and White Women in The North Carolina WISEWOMAN Project. Preventive Medicine 35 (1): 1-6.
Morrison T (1988). Beloved. New York: Premium Marketing Division, Penguin Books USA Inc.
Morsy S (1966). Political Economy in Medical Anthropology. In Handbook ofMedical Anthropology: Contemporary Theory and Method (Revised Edition). CF Sargent and TM Johnson (eds), Westport, Connecticut: Greenwood Press, pp.21-40.
Mullen P (1993). The Rabbit, The Lion, The Man: Race Relations in Folklore Fieldwork. In Corners of Texas. Ed. Francis Edward Abernethy. Denton, Texas: University of North Texas Press.
Murdock GP (1959). Africa It's People and Their Culture History. New York: McGraw-Hill.
National Cholesterol Education Program's Laboratory Standardization Panel (1985). Maryland Office of Prevention Education and Control, National Heart, Lung and Blood Institute, National Institute of Health, Conference Planning Washington for Professionals and Patients. pp. 18-19. 151 National Health and Nutrition Examination Survey 1997 –1999.

226
National Cholesterol Education Program's Laboratory Standardization Panel. Maryland Office of Prevention Education and Control, National Heart, Lung and Blood Institute, National Institute of Health, Conference Planning Workshop for Professionals and Patients. March 18-19, 1985.
National Diabetes Data Group: Classification and Diagnosis of Diabetes Mellitus and Other Categories of Glucose Intolerance. (1979). Diabetes. 28: 1039-1057.
National Institute of Diabetes (2002). Diabetes Prevention Program Findings Announced" Type 2 Risk Can Be Cut Dramatically Through Diet & Exercise. Diabetes with Paula Ford-Martin Your Guide to one of hundreds of sites. http://diabetes.about.com/library.blnews.b/nDPP801.htm.
Neel JV (1962). Diabetes Mellitus type II: A "Thrifty" Genotype Rendered Detrimental by "Progress"? American Journal of Human Genetics 14:133-142.
Neel JV (1967). The circumstances of human evolution. Johns Hopkins Medical Journal. 138 (6): 233-44.
Neel JV (1976). The Genetics of Diabetes Mellitus. W. Creutzfeldt, J.Kobberling and J.V. Neel (eds), Heidelberg, Germany: Springer-Verlags.
Neel JV (1982). The Thrifty Genotype Revisited. In The Genetics of diabetes mellitustype II, Serono Symposium # 47. J Kobberling J and R Tattersall (eds), pp. 283-293.
Nelson J, Moxness KE, Jenson MD, and Gastineau CF (1994). Mayo Clinic Die Manual:A Handbook of Nutrition Practices. St. Louis: Mosby-Year Book, Inc.
NDCG (National Diabetes Criteria Group) (1979). Classification and diagnosis of diabetes mellitus and other categories of glucose intolerance. Diabetes 28: 1-57.
Owsley DW, Orser Jr., CE, Mann RW, Moore-Jansen PH, and Montgomery R (1987).Demography and Pathology of an Urban Slave Population From New Orleans.American Journal of Physical Anthropology 74:160-178.
Overfield T (1995). Biological Variation in Health and Illness: Race, Age, and SexDifferences (2nd (ed). Boca Raton, Florida: CRC Press, Inc.
Peters, M. (1995). Dayton's African American Heritage: A Pictorial History. Virginia Beach, Virginia: Donning Company/Publishers.
Phelps D et al. (1991). 28-Day Survival Rates of 6676 Neonates With Birthweights of 1250 Grams or Less. Pediatrics 87 (1):7-14.

227
Phillips DIW and and Barker DJ (1993) The Thrifty Phenotype Hypothesis. InCauses of Diabetes: Genetic and Environmental Factors. R.D. G. Leslie (ed),West Sussex, England: John Wiley & Sons Ltd.
Pierce CM (1970). Offense mechanisms. In The Black 70s. ed F. Barbour. Boston: Porter Sargent Publications.
Pilleam DR and Baker PT (1999) Human Biology: An Introduction to HumanEvolution,Variation, Growth, and Adaptability, Third Edition. Oxford: OxfordScience Publications.
Plog F and Bates DG (1980). Cultural Anthropology. New York: Alfred A. Knopf.
Popper RL (1994). Conjectures and refutations: the growth of scientific knowledge. 5th ed. London: Routledge and Kegan Paul, 1974:66.
"Preliminary Estimates of Weighted Average Poverty Thresholds in 1999," (2000). Department of Commerce: Bureau of Census.
Primer, The Staff of 1991. The Israel Association for Ethiopian Jews (IAEJ). Jerusalem, Israel.
Ransom R L and Sutch R (1997). One Kind of Freedom: The Economic Consequences ofEmancipation. New York: Cambridge University Press.
Rathburn TA (1984). Identification: Case Studies in Forensic Anthropology. TA. Rathbun and JE. Buckstra (eds). Springfield, Ill.: Thomas Publishing Company.
Rathbun TA (1987). Health and Disease in a Caroling plantation: 1840 - 1870. American Journal of Physical Anthropology 74: 239 - 253.
Rathbun TA and Harris EF (1989). Small tooth sizes in a nineteenth century: South Carolina plantation slave series. In American Journal of Physical Anthropology. 78: (3) pp. 411-420.
Rathbun T (1985). Health and Disease at a South Carolina Plantation: 1840-1870. American Journal of Physical Anthropology 74: 239-253.
Regional Planning and Coordinating Commission of Green County 1975 (1975).Wilberforce Area Community Sketch Plan for Development 1974-1975. Dayton,Ohio: Miami Valley Regional Planning Commission.
Renfrew, John W. (1997). Aggression and Its Causes: a Biopsychosocial Approach. New York: Oxford University Press.

228
Ritenbaugh C and Goodby C-S (1989). Beyond the Thrifty Gene: Metabolic Implications of Prehistoric Migration into the New World. In Medical Anthropology 11:227-236.
Rizzitno U (1943). "Abu Mihgan Nusayb b. Rabah" In Rivista degli Studi Orientali, XX.
Roberts JW (2000). African-American Folklore in a Discourse of Folkness. New YorkFolklore 18 (1-4): 73-89.
Robbins J (2002). The Food Revolution: How Your Diet Can Help Save Your Life and The World. "Racism, Food and Health.” http://www.foodrevolution.org/racismfoodhealth.htm.
Robinson B (1990). Africanisms and the Study of Folklore. In Africanisms in AmericanCulture. Bloomington, Indiana: University of Indiana Press.
Robinson R (1993). Introduction. In Fetal and Infant Origins of Adult Disease. DJP Barker (ed), Tavisotck Square, London: the British Medical Journal.
Robinson W (1966). The Negro Village of Yellow Springs, Ohio. Negro HistoryBulletin 29; 103-1-4, 110-112.
Rogers K (1957). 100 Amazing Facts About the Negro With Complete Proof. New York: Helga M. Rogers
Rogers R (1990). Living and Dying in the U.S.A.: Sociodemographic Determinants of Death Among Blacks and Whites. In Demography 29 (2): 287-303.
Roy B (1995). The Tuskegee Syphilis Experiment: Biotechnology and TheAdministrative State. Journal of the National Medical Association. 87: pp. 56-67.
Saint. Drake C (1987). Black Folk Here and There: An Essay in History of Anthropology,Volume II. Los Angeles: Center for Afro-American Studies, University of
California.
Saint. Drake C (1990). Black Folk Here and There: An Essay in History of Anthropology,Volume II. Los Angeles: Center for Afro-American Studies, University of
California.
Savitt TL (1978). Medicine and Slavery: The Diseases and Health Care of blacks inAntebellum Virginia. Urbana, IL: University of Illinois Press.

229
Savitt TL (1989). The Use of Blacks for Medical Experimentation in the Old South. In Articles on American Slavery: Medicine, Nutrition, Demography in Slavery. Paul Finkelman (ed), New York and London: Garland Publishing Inc.
Scheder JC (1988). A Sickly-Sweet Harvest: Farmworker Diabetes and Social Equality. In Medical Anthropology Quarterly: International Journal for the Culture andSocial Analysis of Health. 2 (3):252-277.
Schwartz, GE, Weinberger, DA, and Singer, JA (1981). Cardiovascular differientation of happiness, sadness, anger, and free following imagery and exercise.Psychosomatic Medicine 43:343-364.
Scientific America.com (1999). The Puzzle of Hypertension in African-Americans.http://www/sciam.com//article.cfm?articleID=000874C6-84ED-1CD6- B4A8809EC588EEDF&page Number=4&catlID-2
Seligman MEP (1975). Helplessness: or Depression, Development, and Death. San
Francisco: W. H. Freeman.
Shapiro AP, Benson H, Chobanian AV, Herd JA, Julius S, Kaplan N, Lazarus RS,Ostfeld AM, and Syme SL (1979). The role of stress in hypertension. Journalof Human Stress 5: 7-26.
Smith W (1973). Smith's Bible Dictionary. Old Tappan, New Jersey: Spire Book.
Smith H (1998). Growth and Development and Its Significance for Early HominidBehavior. Helsingorg, 14: 63-96.
Sowell T (1981). Ethnic America: A History. Basic Books: A Division of Harper Collins Publishers.
Spiro E (1958). Children of the Kibbutz. Cambridge, Massachusetts: Harvard University Press.
Stampp KM (1956). The Peculiar Institution: Slavery in the Ante-Bellum South. New York: Random House.
Stern MP (1993) Invited Commentary: Do Risk Factors Explain Ethnic Differences in Type II Diabetes? American Journal of Epidemiology 137(7) April:733-734.
Stephen M. Bailey (1991). Theoretical Considerations in the Measurement and Interpretation of Changes in Adult Dimensions. In Anthropological Assessmentof Nutritional Status, John Himes (ed). NY: Wiley-Liss, Inc.

230
Strayer J, Garzke HW and Harbison EH (1974). The Mainstream of Civilization: Since1500. New York: Harcourt Brace Janovick, Inc.
Stravrianos LS (1975). Man's Past and Present: A Global History. Englewood Cliffs, New Jersey: Prentice-Hall, Inc.
Strong M, Preston SH, Lentzner HR, Seaman JR, and Williams HC (1991). User Guide: Public Use Sample, 1910 United States Census of Population. Philadelphia Population Studies Center: University of Pennsylvania.
Sumner, AE, Farmer NM, Cochran CS, Sebring NG, Vanevski K, Reynolds JC,Premkumar A, Boston RC (2001). Obese Premenopausal African-American Women With Normal and Impaired Glucose Tolerance Have Similar Degree of Insulin Resistance but Differ in ß-Cell Function. Diabetes Care 24 (11): 1978 -1982.
Surveillance Geneva. Definition, Diagnosis and Classification of Diabetes Mellitus and its Complications: Report of a WHO Consultation Part 1:Diagnosis and Classification of Diabetes Mellitus. http://www.//staff.newcastle.ac.uk/philip.home/who_dmc. htm#DefinDiag
Svendsen OL, Hassager C, Bergmann I and Christiansen C (1992). Measurement of abdominal and intra-abdominal fat in postmenopausal women by dual energy x-ray absorptiometry and anthropometry: Comparison with computerized tomography. International Journal of Obesity 17: 45-51.
Szathmary EJE (1990). Diabetes in Amerindian Populations: The Dogrib Studies. In Disease in Populations in Transition: Anthropological and EpidemiologicalPerspectives. AC Swedlund and GJ Armelagos (eds), New York: Bergin and Garvey.
Szathmary EJE (1989). The Impact of Low Carbohydrate Consumption on Glucose Tolerance, Insulin Concentration and Insulin Response to Glucose Challenge in Dogrib Indians. In Medical Anthropology 11 329-350.
Swzed JF and Abrahams RD (1997). After the Myth: Studying Afro-American Cultural Patterns in the Plantation Literature. In African Folklore in the New World.Austin, Texas: University of Texas Press.
Taeusch W and Spunett M (1994). Gestational Age, Birthweight, and Neonatal Mortality For Extremely Premature Inner City African American and Latino Infants. Journal of the National Medical Association 84 (4): 297-302.

231
The Museum of the Confederacy and The University Press of Virginia (1962). BeforeFreedom Came: African-American Life in the Antebellum South. Richmond, Virginia: Carter Printing Company.
Thomas RB, Gage TB, Little MA, (1989). Reflections on Adaptive and Ecological Models. In Human Population Biology: A Transdisciplinary Science. Michael A Little and Jere D. Haas (eds). New York: Oxford University Press, 296-319).
Thompson FC (1982). The Thompson Chain-Reference Bible, Fourth Improved Edition Updates. Indianapolis, Indiana: B.B. Kirkbride Bible Co., Inc.
Thornton J (1998). Africa and Africans in the making of the Atlantic world, 1400-1800. Cambridge: Cambridge University Press.
Tijhuis MAR, Flap HD, Foets M and Groenewegen PP (1995).Social Support andStressful Events in Two Dimensions: Life Events and Illness as an Event. InSocial Science in Medicine 40 (11):1513-1526.
T& M © (2002). Soul Food - A History of Soul Food. http://www.foxhome.com/soulfood/htmls/soulfood.htm.
Trowell HC and DP Burkett (1981). Western Diseases: Their Emergence and Prevention. Cambridge, Mass: Harvard University Press.
Turner PA (1993). I Heard It Through the Grapevine: Rumor in African AmericanCulture. Berkeley: University of California Press.
Urdanta ML and R Krehbeil (1989). Introduction: Anthropological Perspectives on diabetes mellitus type II Type II. In Medical Anthropology 11:221-225.
U.S. Bureau of the Census (1996). Poverty in the United States: 1995. Washington, D.C.: Government Printing Office, pp. 17. 60-194.
U.S. Department of Health and Human Services Public Health Service Centers for Disease Control. (1989). Prevention of Disease, Disability and Death in Blacks and Other Minorities: Annual Program Review, 1986. Center for Disease Control. Washington, D.C.: U.S. Public Health Service.
U.S. Department of the Interior National Park Service (1995). African Americans. Washington, D.C. Government Printing Office.
Vague, J. (1947). La differenciation sexuelle facteur determinant des formes del'obesite. La Presse Medicale 30:339-340.
232
Vander Zanden (1983). American Minority Relations, 4th ed. New York: Alfred A. Knopf.
Veal YS (1996). African Americans and Diabetes: Reasons, Rationale, and Research. In Journal of the National Medical Association. 88(4):203-204.
Veblen T (1889). The Theory of Leisure Class. New edition. New York: Macmillian.
Watts, DM (1990). The Black Presence in the Lands of the Bible. Washington, D.C.: Afro-Vision, Inc.
Watson WH (1984). Black Folk Medicine: The Therapeutic Significance of Faithand Trust. New Brunswick, NJ: Transaction Books.
Weber M (1946). Class, Status, Party. In From Max Weber: Essays in Sociology. HH Gerth and CW Mills (eds). New York: Oxford University Press.
Weber M (1954). Wirtschaft und Gesellschaft. 2nd Edition. Cambridge: HarvardUniversity Press.
Weiss KM, Jan S.Ulbrecht JS, Cananagh PR, and Buchanan AV (1989). diabetes mellitus type II in American Indians: Characteristics, Origins and Preventive Health Care Implications. Medical Anthropology 11:283-304.
Weiss KM (1990). Transitional Diabetes and Gallstones in American Peoples: Genes or Environment? In Disease in Populations in Transition: Anthropological Etiological Perspective. Eds. C. Swedlund and George Armelagos. New York: Bergin and Garvey.
Weiss K (1993 or 1995). Genetic Variation and Human Disease: Principles and Evolutionary Approaches. Cambridge, Great Britain: Cambridge University Press.
Weits T, Van der Beek, EJ, Wedel M & Ter Haar Romeny B M (1988). Computedtomography measurement of abdominal fat deposition in relation to anthropometry. International Journal of Obesity 12: 217-225.
Westerman W (1955). The Slave Systems of Greek and Roman Antiquity. Philadelphia: American Philosophical Society.
Whiston W (1850). The Genuine Work of Flavius Josephus, the Jewish Historian. Translated by William Whiston. Cincinnati: Applegate.
White, Leslie (1949). The Science of Culture. New York:Grove.

233
World Health Organization (1998). Expert Committed on Diabetes Mellitus: Second Report: Geneva, World Health Organization (Tech. Rep. Ser., no. 646).
Wiedman DW (1989). Adiposity or Longevity: Which Factor Accounts for the Increase in Type II Diabetes Mellitus When Populations Acculturate to an Industrial Technology? In Medical Anthropology. 11:237-253.
Wilberforce Ohio Resource Guide (1999). City of Wilberforce, Ohio Facts andInformation. ohcountywilberforce.htm.
Williams C (1974). The Destruction of Black Civilization. Chicago: Third World Press.
Williams GC (1957. Pleiotropy, Natural Selection and the Evolution of Senescence. Evolution. In Evolution, Dec.11:398-411.
Williams M (1981). On The Street Where I Lived. New York: Holt, Rinehart and Winston.
Williams PW (1980). Popular Religion in America: Symbolic Change and theModernization Process in historical Perspective. Englewood Cliffs, New Jersey: Prentice-Hall, Inc.
Wilson A (1990). Black-on-Black Violence: The Psychodynamics of black Self-Annihilation in Service of white Domination. New York: Afrikan World Infosystems.
Woodson CG (1970). A Century of Negro Migration. New York: AMS Press.
Woodson CG (1971). The Story of the Negro Retold, by Carter Godwin Woodson.Washington, D. C.: The Associated Publishers.
Woodson CG (1971). What's in a Name-Negro, African, Black, Afro-American, Colored, Black-American or Negro-American? In Negro History Bulletin 34 (2): 28-29.
Zamboni M, Armellini F, Milani, MP, De Marchi M, Todesco T, Robbi R, Bergamo-Andreis IV, and Bosello O (1992). Body fat distribution in pre- and post-menopausal women: Metabolic and anthropometric variables and the interrelationships. International Journal of Obesity 16: 495-504.
Zastrow, Charles and Karen k. Kirst-Ashman (1995). Understanding Human Behaviorand the Social Environment. Chicago: Nelson-Hall Publishers.
Zimmet P, O'dea K (1993). Thrifty Genotypes. In Causes of Diabetes: Genetic andEnvironmental Factors. RDG Leslie (ed). West Sussex, England: John Wiley & Sons Ltd.