Insulin resistance is a poor predictor of type 2 diabetes in individuals with no family history of...
10
Insulin resistance is a poor predictor of type 2 diabetes in individuals with no family history of disease Allison B. Goldfine* † , Clara Bouche* † , Robert A. Parker †‡ , Caroline Kim*, Amy Kerivan*, J. Stuart Soeldner* † , Blaise C. Martin* † , James H. Warram* † , and C. Ronald Kahn* †§ *Joslin Diabetes Center, One Joslin Place, Boston, MA 02215; † Harvard Medical School, 25 Shattuck Street, Boston, MA 02215; and ‡ Beth Israel Medical Center, Biometrics CenterE-GZ814, 330 Brookline Avenue, Boston, MA 02215 Contributed by C. Ronald Kahn, December 31, 2002 In normoglycemic offspring of two type 2 diabetic parents, low insulin sensitivity (SI ) and low insulin-independent glucose effec- tiveness (SG ) predict the development of diabetes one to two decades later. To determine whether low SI , low S G, or low acute insulin response to glucose are predictive of diabetes in a popu- lation at low genetic risk for disease, 181 normoglycemic individ- uals with no family history of diabetes (FH) and 150 normogly- cemic offspring of two type 2 diabetic parents (FH) underwent i.v. glucose tolerance testing (IVGTT) between the years 1964 – 82. During 25 6 years follow-up, comprising 2,758 person years, the FH cohort (54 9 years) had an age-adjusted incidence rate of type 2 diabetes of 1.8 per 1,000 person years, similar to that in other population-based studies, but significantly lower than 16.7 for the FH cohort. Even when the two study populations were subdivided by initial values of SI and S G derived from IVGTT’s performed at study entry, there was a 10- to 20-fold difference in age-adjusted incidence rates for diabetes in the FH vs. FH individuals with low SI and low S G . The acute insulin response to glucose was not predictive of the development of diabetes when considered independently or when assessed as a function of SI , i.e., the glucose disposition index. These data demonstrate that low glucose disposal rates are robustly associated with the develop- ment of diabetes in the FH individuals, but insulin resistance per se is not sufficient for the development of diabetes in individuals without family history of disease and strongly suggest a familial factor, not detectable in our current measures of the dynamic responses of glucose or insulin to an IVGTT is an important risk factor for type 2 diabetes. Low SI and low S G , both measures of glucose disposal, interact with this putative familial factor to result in a high risk of type 2 diabetes in the FH individuals, but not in the FH individuals. B oth insulin resistance and insulin deficiency are components of the pathogenesis of type 2 diabetes. However their temporal relationships in the disease process remains unclear (1). Hyperglycemia, per se, induces defects in both insulin secretion and in insulin action (2). Thus, it is not possible to distinguish the role of either in the development of diabetes in persons already affected with disease. To elucidate the predictive values of these parameters on the occurrence of type 2 diabetes, studies must be performed in normoglycemic individuals. How- ever there are few prospective studies evaluating normoglycemic subjects to determine their contribution to the pathogenesis of type 2 diabetes. Individuals with a family history of type 2 diabetes are at greater risk of developing the disease than people who have no family history of disease. Insulin sensitivity (S I ) and the acute insulin response to glucose (AIRg) exhibit familial clustering, suggesting these are inherited traits (3, 4). Several studies have shown that insulin resistance (or hyper- insulinemia) predate glucose intolerance and type 2 diabetes in normoglycemic individuals at high risk of developing diabetes, including ethnic Mexican American (5, 6) and Pima Indian groups (7) and Caucasians (8). In a longitudinal study of nondiabetic Caucasian offspring of two type 2 diabetic parents, we found both low S I and low glucose effectiveness (S G ), but not low first-phase insulin secretion, were associated with develop- ment of type 2 diabetes one to two decades later (9). Euglycemic insulin-clamp studies have also shown early defects in glucose metabolism with decreased total-body glucose metabolism and impaired nonoxidative glucose metabolism (primarily glycogen storage) in persons at risk for type 2 diabetes, including nor- moglycemic first-degree relatives of patients with type 2 dia- betes (10). Other studies have focused on the role of insulin secretion in the development of type 2 diabetes and demonstrated reduced cell function. Although fasting insulin levels may appear normal or elevated in patients with type 2 diabetes (11), other studies have shown that islet function testing at matched glucose levels in patients with type 2 diabetes is impaired in both basal and stimulated states (12). In this study we have evaluated whether low S I and low S G , fasting insulin, or the AIRg antedate the development of type 2 diabetes in normoglycemic individuals with no family history of diabetes, and compared this group to the high-risk normogly- cemic offspring of two type 2 diabetic parents. Because many people develop diabetes even in the absence of a family history of disease, if these parameters were to predict the development of diabetes, it would provide a relatively simple screening test for early detection of this important disorder and allow targeting of therapies directed at disease prevention. If these parameters were not predict disease in this group, it would suggest that familial factor(s) other than those measured by these parameters are involved in the occurrence of disease. Patients and Methods Study Subjects. Informed consent was obtained from all individ- uals before participation in the study. Between the years 1963 and 1983, two study cohorts were identified, including 181 individuals with no family (first or second degree relative) history of diabetes (FH), and 155 offspring of two type 2 diabetic parents (FH). The latter were recruited from 330 members of 86 families. A total of 180 were willing to participate; 25 had to be excluded because of abnormal glucose tolerance at study entry as described (8, 13). All study subjects participating in the longitudinal evaluations had 100-gram oral glucose tol- erance tests performed at study entry and determined to be normal based on the National Diabetes Data Group criteria for a 75-g glucose load [blood glucose 5.56 mmolliter (100 mgdl) fasting, 6.67 mmolliter (120 mgdl) at 2 h after glucose, and 10.0 mmolliter (180 mgdl) at all intervening times] (14), and Abbreviations: FH, family history of diabetes; FH, no family history of diabetes; IVGTT, i.v. glucose tolerance test; SI, insulin sensitivity; SG, insulin-independent glucose effective- ness; AIRg, acute insulin response to glucose; BMI, body mass index. § To whom correspondence should be addressed. E-mail: [email protected]. 2724 –2729 PNAS March 4, 2003 vol. 100 no. 5 www.pnas.orgcgidoi10.1073pnas.0438009100
-
Upload
independent -
Category
Documents
-
view
0 -
download
0
Transcript of Insulin resistance is a poor predictor of type 2 diabetes in individuals with no family history of...
Insulin resistance is a poor predictor of type 2diabetes in individuals with no family historyof diseaseAllison B. Goldfine*†, Clara Bouche*†, Robert A. Parker†‡, Caroline Kim*, Amy Kerivan*, J. Stuart Soeldner*†,Blaise C. Martin*†, James H. Warram*†, and C. Ronald Kahn*†§
*Joslin Diabetes Center, One Joslin Place, Boston, MA 02215; †Harvard Medical School, 25 Shattuck Street, Boston, MA 02215; and ‡Beth IsraelMedical Center, Biometrics Center�E-GZ814, 330 Brookline Avenue, Boston, MA 02215
Contributed by C. Ronald Kahn, December 31, 2002
In normoglycemic offspring of two type 2 diabetic parents, lowinsulin sensitivity (SI) and low insulin-independent glucose effec-tiveness (SG) predict the development of diabetes one to twodecades later. To determine whether low SI, low SG, or low acuteinsulin response to glucose are predictive of diabetes in a popu-lation at low genetic risk for disease, 181 normoglycemic individ-uals with no family history of diabetes (FH�) and 150 normogly-cemic offspring of two type 2 diabetic parents (FH�) underwent i.v.glucose tolerance testing (IVGTT) between the years 1964–82.During 25 � 6 years follow-up, comprising 2,758 person years, theFH� cohort (54 � 9 years) had an age-adjusted incidence rate oftype 2 diabetes of 1.8 per 1,000 person years, similar to that inother population-based studies, but significantly lower than 16.7for the FH� cohort. Even when the two study populations weresubdivided by initial values of SI and SG derived from IVGTT’sperformed at study entry, there was a 10- to 20-fold difference inage-adjusted incidence rates for diabetes in the FH� vs. FH�individuals with low SI and low SG. The acute insulin response toglucose was not predictive of the development of diabetes whenconsidered independently or when assessed as a function of SI, i.e.,the glucose disposition index. These data demonstrate that lowglucose disposal rates are robustly associated with the develop-ment of diabetes in the FH� individuals, but insulin resistance perse is not sufficient for the development of diabetes in individualswithout family history of disease and strongly suggest a familialfactor, not detectable in our current measures of the dynamicresponses of glucose or insulin to an IVGTT is an important riskfactor for type 2 diabetes. Low SI and low SG , both measures ofglucose disposal, interact with this putative familial factor to resultin a high risk of type 2 diabetes in the FH� individuals, but not inthe FH� individuals.
Both insulin resistance and insulin deficiency are componentsof the pathogenesis of type 2 diabetes. However their
temporal relationships in the disease process remains unclear(1). Hyperglycemia, per se, induces defects in both insulinsecretion and in insulin action (2). Thus, it is not possible todistinguish the role of either in the development of diabetes inpersons already affected with disease. To elucidate the predictivevalues of these parameters on the occurrence of type 2 diabetes,studies must be performed in normoglycemic individuals. How-ever there are few prospective studies evaluating normoglycemicsubjects to determine their contribution to the pathogenesis oftype 2 diabetes. Individuals with a family history of type 2diabetes are at greater risk of developing the disease than peoplewho have no family history of disease. Insulin sensitivity (SI) andthe acute insulin response to glucose (AIRg) exhibit familialclustering, suggesting these are inherited traits (3, 4).
Several studies have shown that insulin resistance (or hyper-insulinemia) predate glucose intolerance and type 2 diabetes innormoglycemic individuals at high risk of developing diabetes,including ethnic Mexican American (5, 6) and Pima Indiangroups (7) and Caucasians (8). In a longitudinal study of
nondiabetic Caucasian offspring of two type 2 diabetic parents,we found both low SI and low glucose effectiveness (SG), but notlow first-phase insulin secretion, were associated with develop-ment of type 2 diabetes one to two decades later (9). Euglycemicinsulin-clamp studies have also shown early defects in glucosemetabolism with decreased total-body glucose metabolism andimpaired nonoxidative glucose metabolism (primarily glycogenstorage) in persons at risk for type 2 diabetes, including nor-moglycemic first-degree relatives of patients with type 2 dia-betes (10).
Other studies have focused on the role of insulin secretion inthe development of type 2 diabetes and demonstrated reduced� cell function. Although fasting insulin levels may appearnormal or elevated in patients with type 2 diabetes (11), otherstudies have shown that islet function testing at matched glucoselevels in patients with type 2 diabetes is impaired in both basaland stimulated states (12).
In this study we have evaluated whether low SI and low SG,fasting insulin, or the AIRg antedate the development of type 2diabetes in normoglycemic individuals with no family history ofdiabetes, and compared this group to the high-risk normogly-cemic offspring of two type 2 diabetic parents. Because manypeople develop diabetes even in the absence of a family historyof disease, if these parameters were to predict the developmentof diabetes, it would provide a relatively simple screening test forearly detection of this important disorder and allow targeting oftherapies directed at disease prevention. If these parameterswere not predict disease in this group, it would suggest thatfamilial factor(s) other than those measured by these parametersare involved in the occurrence of disease.
Patients and MethodsStudy Subjects. Informed consent was obtained from all individ-uals before participation in the study. Between the years 1963and 1983, two study cohorts were identified, including 181individuals with no family (first or second degree relative)history of diabetes (FH�), and 155 offspring of two type 2diabetic parents (FH�). The latter were recruited from 330members of 86 families. A total of 180 were willing to participate;25 had to be excluded because of abnormal glucose tolerance atstudy entry as described (8, 13). All study subjects participatingin the longitudinal evaluations had 100-gram oral glucose tol-erance tests performed at study entry and determined to benormal based on the National Diabetes Data Group criteria fora 75-g glucose load [blood glucose �5.56 mmol�liter (100 mg�dl)fasting, �6.67 mmol�liter (120 mg�dl) at 2 h after glucose, and�10.0 mmol�liter (180 mg�dl) at all intervening times] (14), and
Abbreviations: FH�, family history of diabetes; FH�, no family history of diabetes; IVGTT,i.v. glucose tolerance test; SI, insulin sensitivity; SG, insulin-independent glucose effective-ness; AIRg, acute insulin response to glucose; BMI, body mass index.
§To whom correspondence should be addressed. E-mail: [email protected].
2724–2729 � PNAS � March 4, 2003 � vol. 100 � no. 5 www.pnas.org�cgi�doi�10.1073�pnas.0438009100
underwent an i.v. glucose tolerance test (IVGTT) within 1 yearof the oral glucose tolerance test. Participants were instructed toconsume a high-carbohydrate diet (250–300 g�day) for the 3 daysbefore both oral and i.v. glucose tolerance tests. For the IVGTT,after fasting blood samples were obtained, glucose (0.5 gm�kgbody weight in 15–20% solution) was administered intrave-nously, and blood was drawn at 1, 3, 5, 10, 15, 20, 30, 40, 50, 60,90, 120, and 180 min. IVGTTs were performed at study entrywith the response subsequently analyzed by using the Bergman’sMinimal Model (15), a computer-based method (MINMOD) toassess plasma insulin and glucose dynamics during an IVGTT.The minimum model for glucose disposal and insulin dynamicsyields assessments of insulin secretion and sensitivity: the AIRgexpressed as the increment above fasting insulin over the first 10min, the SI index; and the SG index (insulin-independent glucoseclearance). High or low SI, SG, and AIRg were determined bymedian values in the FH� group (9), and applied to both theFH� and FH� cohort.
Subjects in the FH� cohort were surveyed to ascertain thediagnosis of diabetes at study exit between 1994 and 1999.Known cases of diabetes were verified by medical history,including documented hyperglycemia and�or supervised medi-cal treatment for diabetes. In the absence of known diabetes,ascertainment of glucose tolerance was based on a 75-g oralglucose tolerance performed after a high-carbohydrate diet(250–300 g�day) for the 3 days preceding the test followed by anovernight fast, or fasting or random glucose. One hundred andnine (61%) subjects participated in follow-up evaluation. Sixsubjects (5.5%) had developed type 2 diabetes: two were con-firmed by oral glucose tolerance tests, two by fasting glucose andtwo were on medical therapy. One hundred and three subjects(94%) remained without diabetes, confirmed by oral glucosetolerance in 73 (72%), fasting glucose in 18 (17%), postprandialglucose in 5 (6%), 7 (7%) deceased with medical record review.Fifteen subjects declined participation in the follow-up study butreported no known diabetes, and 57 subjects who were lost tosubsequent evaluation were not included in analysis.
Follow-up evaluation of the offspring of two diabetic parentsoccurred between the years of 1985 and 1989 (8). Twenty-fiveindividuals (16%) developed type 2 diabetes, confirmed by oralglucose tolerance in 48%, fasting glucose in 32% and postpran-dial glucose in 20%; and 125 offspring of two diabetic parents(84%) remained without diabetes, confirmed by oral glucosetolerance in 78%, fasting glucose in 18%, and postprandialglucose in 5%.
Statistical Analysis. Group differences for quantitative variableswere tested by Student’s t test and for qualitative variables by �2
analysis (SAS 6.12, SAS Institute, Cary, NC). Multiple logisticregressions within a GLM framework was used to test theindependent contribution of each of the variables that seemed tobe important risk factors in univariate analysis. The statisticalsignificance attributed to each variable was based on the im-provement of the fit of the multiple logistic model when thatvariable was added to a model that included all of the othervariables under consideration. Four individuals from the FH�cohort were omitted from longitudinal analysis, as the IVGTTdata could not be fit to the MINMOD model; however, none ofthese individuals developed diabetes. Life table analysis waslimited to the ages of 30–70 years. Trend analysis was assessedin three ways. The Cochran–Armitage test was used to test foran increased risk in development of diabetes across the groups.Two different coding schemes were applied. First, to test for alinear trend in the rate of diabetes across SI and SG groups,standard coding (i.e., 1, 2, 3, and 4) was used, which would testfor a rate four times higher in the highest risk group than thelowest risk group. Next, we coded the four risk groups of theFH� cohort to reflect the pattern of rate increase demonstratedby the FH� group. Because the low rate of diabetes in the twolowest risk groups (i.e., above median SI and SG, and abovemedian SI � below median SG) we treated these two groups asthe same in this model. This would specifically test whether thepattern of rate change in the FH� and FH� cohorts was similarand a significant result (P � 0.05) would suggest an increase inrisk of diabetes with progressive insulin resistance. Finally, weestimated the probability of the results in the FH� group followthe same risk pattern as in the FH� group. This model wouldpresume that SI and SG were similarly predictive of risk ofdiabetes in both FH� and FH� cohorts. To do this we used abeta distribution to randomly generate the distribution of dia-betes in the FH� group over the four SI and SG combinations.Simulations were done one million times. Confidence intervalsfor the simulation results were calculated from a binomialdistribution. This tests whether the pattern of risk in the FH�group is consistent with that in the FH� group, with a significantresult (P � 0.05), suggesting that the pattern is not the same inthe FH� group.
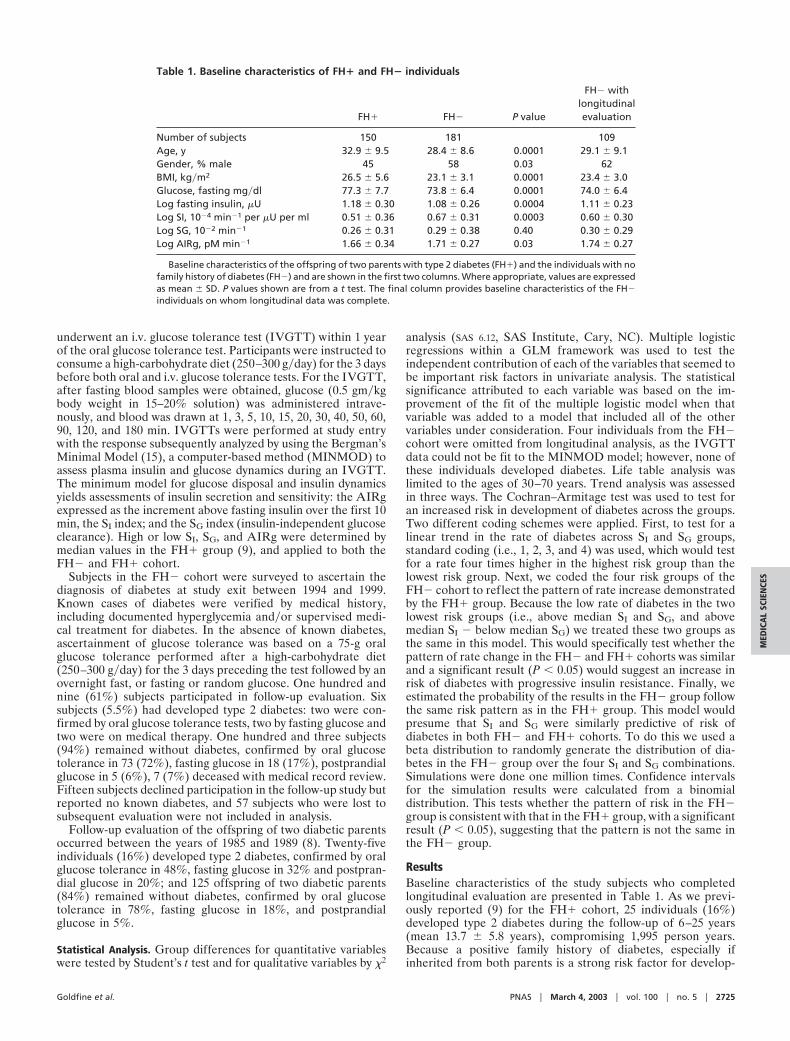
ResultsBaseline characteristics of the study subjects who completedlongitudinal evaluation are presented in Table 1. As we previ-ously reported (9) for the FH� cohort, 25 individuals (16%)developed type 2 diabetes during the follow-up of 6–25 years(mean 13.7 � 5.8 years), compromising 1,995 person years.Because a positive family history of diabetes, especially ifinherited from both parents is a strong risk factor for develop-
Table 1. Baseline characteristics of FH� and FH� individuals
FH� FH� P value
FH� withlongitudinalevaluation
Number of subjects 150 181 109Age, y 32.9 � 9.5 28.4 � 8.6 0.0001 29.1 � 9.1Gender, % male 45 58 0.03 62BMI, kg�m2 26.5 � 5.6 23.1 � 3.1 0.0001 23.4 � 3.0Glucose, fasting mg�dl 77.3 � 7.7 73.8 � 6.4 0.0001 74.0 � 6.4Log fasting insulin, �U 1.18 � 0.30 1.08 � 0.26 0.0004 1.11 � 0.23Log SI, 10�4 min�1 per �U per ml 0.51 � 0.36 0.67 � 0.31 0.0003 0.60 � 0.30Log SG, 10�2 min�1 0.26 � 0.31 0.29 � 0.38 0.40 0.30 � 0.29Log AIRg, pM min�1 1.66 � 0.34 1.71 � 0.27 0.03 1.74 � 0.27
Baseline characteristics of the offspring of two parents with type 2 diabetes (FH�) and the individuals with nofamily history of diabetes (FH�) and are shown in the first two columns. Where appropriate, values are expressedas mean � SD. P values shown are from a t test. The final column provides baseline characteristics of the FH�individuals on whom longitudinal data was complete.
Goldfine et al. PNAS � March 4, 2003 � vol. 100 � no. 5 � 2725
MED
ICA
LSC
IEN
CES
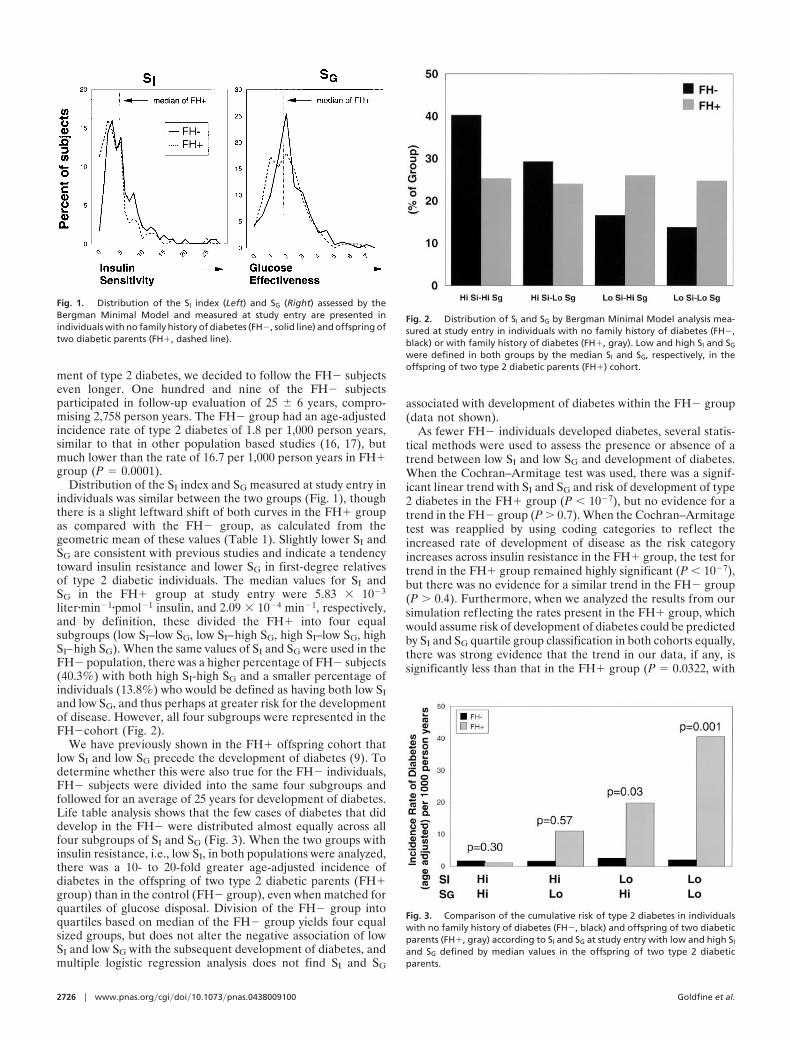
ment of type 2 diabetes, we decided to follow the FH� subjectseven longer. One hundred and nine of the FH� subjectsparticipated in follow-up evaluation of 25 � 6 years, compro-mising 2,758 person years. The FH� group had an age-adjustedincidence rate of type 2 diabetes of 1.8 per 1,000 person years,similar to that in other population based studies (16, 17), butmuch lower than the rate of 16.7 per 1,000 person years in FH�group (P � 0.0001).
Distribution of the SI index and SG measured at study entry inindividuals was similar between the two groups (Fig. 1), thoughthere is a slight leftward shift of both curves in the FH� groupas compared with the FH� group, as calculated from thegeometric mean of these values (Table 1). Slightly lower SI andSG are consistent with previous studies and indicate a tendencytoward insulin resistance and lower SG in first-degree relativesof type 2 diabetic individuals. The median values for SI andSG in the FH� group at study entry were 5.83 � 10�3
liter�min�1�pmol�1 insulin, and 2.09 � 10�4 min�1, respectively,and by definition, these divided the FH� into four equalsubgroups (low SI–low SG, low SI–high SG, high SI–low SG, highSI–high SG). When the same values of SI and SG were used in theFH� population, there was a higher percentage of FH� subjects(40.3%) with both high SI-high SG and a smaller percentage ofindividuals (13.8%) who would be defined as having both low SIand low SG, and thus perhaps at greater risk for the developmentof disease. However, all four subgroups were represented in theFH�cohort (Fig. 2).
We have previously shown in the FH� offspring cohort thatlow SI and low SG precede the development of diabetes (9). Todetermine whether this were also true for the FH� individuals,FH� subjects were divided into the same four subgroups andfollowed for an average of 25 years for development of diabetes.Life table analysis shows that the few cases of diabetes that diddevelop in the FH� were distributed almost equally across allfour subgroups of SI and SG (Fig. 3). When the two groups withinsulin resistance, i.e., low SI, in both populations were analyzed,there was a 10- to 20-fold greater age-adjusted incidence ofdiabetes in the offspring of two type 2 diabetic parents (FH�group) than in the control (FH� group), even when matched forquartiles of glucose disposal. Division of the FH� group intoquartiles based on median of the FH� group yields four equalsized groups, but does not alter the negative association of lowSI and low SG with the subsequent development of diabetes, andmultiple logistic regression analysis does not find SI and SG
associated with development of diabetes within the FH� group(data not shown).
As fewer FH� individuals developed diabetes, several statis-tical methods were used to assess the presence or absence of atrend between low SI and low SG and development of diabetes.When the Cochran–Armitage test was used, there was a signif-icant linear trend with SI and SG and risk of development of type2 diabetes in the FH� group (P � 10�7), but no evidence for atrend in the FH� group (P � 0.7). When the Cochran–Armitagetest was reapplied by using coding categories to reflect theincreased rate of development of disease as the risk categoryincreases across insulin resistance in the FH� group, the test fortrend in the FH� group remained highly significant (P � 10�7),but there was no evidence for a similar trend in the FH� group(P � 0.4). Furthermore, when we analyzed the results from oursimulation reflecting the rates present in the FH� group, whichwould assume risk of development of diabetes could be predictedby SI and SG quartile group classification in both cohorts equally,there was strong evidence that the trend in our data, if any, issignificantly less than that in the FH� group (P � 0.0322, with
Fig. 1. Distribution of the SI index (Left) and SG (Right) assessed by theBergman Minimal Model and measured at study entry are presented inindividuals with no family history of diabetes (FH�, solid line) and offspring oftwo diabetic parents (FH�, dashed line).
Fig. 2. Distribution of SI and SG by Bergman Minimal Model analysis mea-sured at study entry in individuals with no family history of diabetes (FH�,black) or with family history of diabetes (FH�, gray). Low and high SI and SG
were defined in both groups by the median SI and SG, respectively, in theoffspring of two type 2 diabetic parents (FH�) cohort.
Fig. 3. Comparison of the cumulative risk of type 2 diabetes in individualswith no family history of diabetes (FH�, black) and offspring of two diabeticparents (FH�, gray) according to SI and SG at study entry with low and high SI
and SG defined by median values in the offspring of two type 2 diabeticparents.
2726 � www.pnas.org�cgi�doi�10.1073�pnas.0438009100 Goldfine et al.
an approximate 99% confidence interval of 0.0317–0.0329).Thus, these categories of glucose disposal are poor predictors ofdevelopment of diabetes in the FH� group.
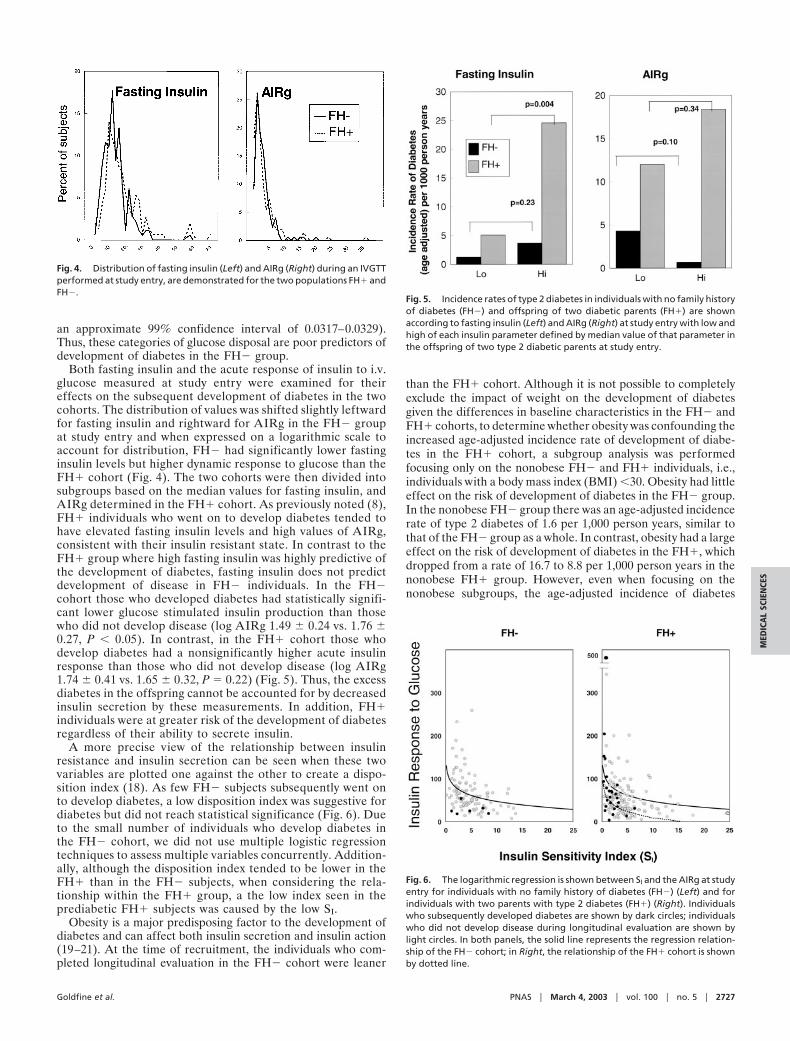
Both fasting insulin and the acute response of insulin to i.v.glucose measured at study entry were examined for theireffects on the subsequent development of diabetes in the twocohorts. The distribution of values was shifted slightly leftwardfor fasting insulin and rightward for AIRg in the FH� groupat study entry and when expressed on a logarithmic scale toaccount for distribution, FH� had significantly lower fastinginsulin levels but higher dynamic response to glucose than theFH� cohort (Fig. 4). The two cohorts were then divided intosubgroups based on the median values for fasting insulin, andAIRg determined in the FH� cohort. As previously noted (8),FH� individuals who went on to develop diabetes tended tohave elevated fasting insulin levels and high values of AIRg,consistent with their insulin resistant state. In contrast to theFH� group where high fasting insulin was highly predictive ofthe development of diabetes, fasting insulin does not predictdevelopment of disease in FH� individuals. In the FH�cohort those who developed diabetes had statistically signifi-cant lower glucose stimulated insulin production than thosewho did not develop disease (log AIRg 1.49 � 0.24 vs. 1.76 �0.27, P � 0.05). In contrast, in the FH� cohort those whodevelop diabetes had a nonsignificantly higher acute insulinresponse than those who did not develop disease (log AIRg1.74 � 0.41 vs. 1.65 � 0.32, P � 0.22) (Fig. 5). Thus, the excessdiabetes in the offspring cannot be accounted for by decreasedinsulin secretion by these measurements. In addition, FH�individuals were at greater risk of the development of diabetesregardless of their ability to secrete insulin.
A more precise view of the relationship between insulinresistance and insulin secretion can be seen when these twovariables are plotted one against the other to create a dispo-sition index (18). As few FH� subjects subsequently went onto develop diabetes, a low disposition index was suggestive fordiabetes but did not reach statistical significance (Fig. 6). Dueto the small number of individuals who develop diabetes inthe FH� cohort, we did not use multiple logistic regressiontechniques to assess multiple variables concurrently. Addition-ally, although the disposition index tended to be lower in theFH� than in the FH� subjects, when considering the rela-tionship within the FH� group, a the low index seen in theprediabetic FH� subjects was caused by the low SI.
Obesity is a major predisposing factor to the development ofdiabetes and can affect both insulin secretion and insulin action(19–21). At the time of recruitment, the individuals who com-pleted longitudinal evaluation in the FH� cohort were leaner
than the FH� cohort. Although it is not possible to completelyexclude the impact of weight on the development of diabetesgiven the differences in baseline characteristics in the FH� andFH� cohorts, to determine whether obesity was confounding theincreased age-adjusted incidence rate of development of diabe-tes in the FH� cohort, a subgroup analysis was performedfocusing only on the nonobese FH� and FH� individuals, i.e.,individuals with a body mass index (BMI) �30. Obesity had littleeffect on the risk of development of diabetes in the FH� group.In the nonobese FH� group there was an age-adjusted incidencerate of type 2 diabetes of 1.6 per 1,000 person years, similar tothat of the FH� group as a whole. In contrast, obesity had a largeeffect on the risk of development of diabetes in the FH�, whichdropped from a rate of 16.7 to 8.8 per 1,000 person years in thenonobese FH� group. However, even when focusing on thenonobese subgroups, the age-adjusted incidence of diabetes
Fig. 4. Distribution of fasting insulin (Left) and AIRg (Right) during an IVGTTperformed at study entry, are demonstrated for the two populations FH� andFH�.
Fig. 5. Incidence rates of type 2 diabetes in individuals with no family historyof diabetes (FH�) and offspring of two diabetic parents (FH�) are shownaccording to fasting insulin (Left) and AIRg (Right) at study entry with low andhigh of each insulin parameter defined by median value of that parameter inthe offspring of two type 2 diabetic parents at study entry.
Fig. 6. The logarithmic regression is shown between SI and the AIRg at studyentry for individuals with no family history of diabetes (FH�) (Left) and forindividuals with two parents with type 2 diabetes (FH�) (Right). Individualswho subsequently developed diabetes are shown by dark circles; individualswho did not develop disease during longitudinal evaluation are shown bylight circles. In both panels, the solid line represents the regression relation-ship of the FH� cohort; in Right, the relationship of the FH� cohort is shownby dotted line.
Goldfine et al. PNAS � March 4, 2003 � vol. 100 � no. 5 � 2727
MED
ICA
LSC
IEN
CES
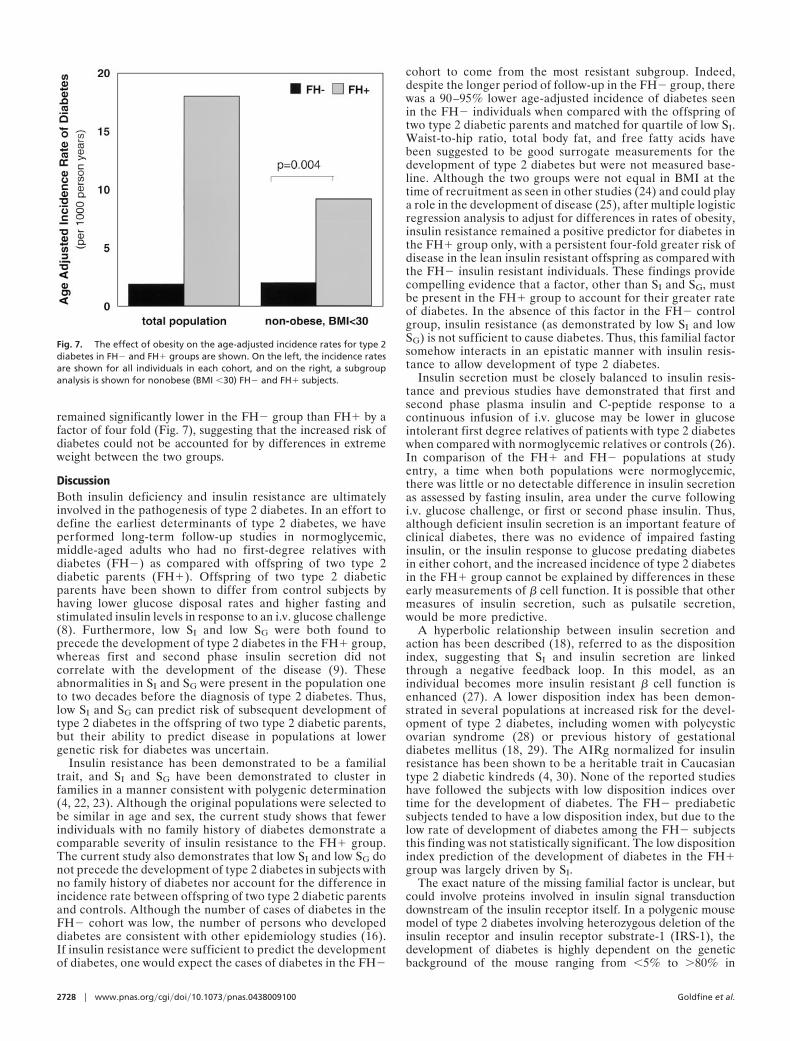
remained significantly lower in the FH� group than FH� by afactor of four fold (Fig. 7), suggesting that the increased risk ofdiabetes could not be accounted for by differences in extremeweight between the two groups.
DiscussionBoth insulin deficiency and insulin resistance are ultimatelyinvolved in the pathogenesis of type 2 diabetes. In an effort todefine the earliest determinants of type 2 diabetes, we haveperformed long-term follow-up studies in normoglycemic,middle-aged adults who had no first-degree relatives withdiabetes (FH�) as compared with offspring of two type 2diabetic parents (FH�). Offspring of two type 2 diabeticparents have been shown to differ from control subjects byhaving lower glucose disposal rates and higher fasting andstimulated insulin levels in response to an i.v. glucose challenge(8). Furthermore, low SI and low SG were both found toprecede the development of type 2 diabetes in the FH� group,whereas first and second phase insulin secretion did notcorrelate with the development of the disease (9). Theseabnormalities in SI and SG were present in the population oneto two decades before the diagnosis of type 2 diabetes. Thus,low SI and SG can predict risk of subsequent development oftype 2 diabetes in the offspring of two type 2 diabetic parents,but their ability to predict disease in populations at lowergenetic risk for diabetes was uncertain.
Insulin resistance has been demonstrated to be a familialtrait, and SI and SG have been demonstrated to cluster infamilies in a manner consistent with polygenic determination(4, 22, 23). Although the original populations were selected tobe similar in age and sex, the current study shows that fewerindividuals with no family history of diabetes demonstrate acomparable severity of insulin resistance to the FH� group.The current study also demonstrates that low SI and low SG donot precede the development of type 2 diabetes in subjects withno family history of diabetes nor account for the difference inincidence rate between offspring of two type 2 diabetic parentsand controls. Although the number of cases of diabetes in theFH� cohort was low, the number of persons who developeddiabetes are consistent with other epidemiology studies (16).If insulin resistance were sufficient to predict the developmentof diabetes, one would expect the cases of diabetes in the FH�
cohort to come from the most resistant subgroup. Indeed,despite the longer period of follow-up in the FH� group, therewas a 90–95% lower age-adjusted incidence of diabetes seenin the FH� individuals when compared with the offspring oftwo type 2 diabetic parents and matched for quartile of low SI.Waist-to-hip ratio, total body fat, and free fatty acids havebeen suggested to be good surrogate measurements for thedevelopment of type 2 diabetes but were not measured base-line. Although the two groups were not equal in BMI at thetime of recruitment as seen in other studies (24) and could playa role in the development of disease (25), after multiple logisticregression analysis to adjust for differences in rates of obesity,insulin resistance remained a positive predictor for diabetes inthe FH� group only, with a persistent four-fold greater risk ofdisease in the lean insulin resistant offspring as compared withthe FH� insulin resistant individuals. These findings providecompelling evidence that a factor, other than SI and SG, mustbe present in the FH� group to account for their greater rateof diabetes. In the absence of this factor in the FH� controlgroup, insulin resistance (as demonstrated by low SI and lowSG) is not sufficient to cause diabetes. Thus, this familial factorsomehow interacts in an epistatic manner with insulin resis-tance to allow development of type 2 diabetes.
Insulin secretion must be closely balanced to insulin resis-tance and previous studies have demonstrated that first andsecond phase plasma insulin and C-peptide response to acontinuous infusion of i.v. glucose may be lower in glucoseintolerant first degree relatives of patients with type 2 diabeteswhen compared with normoglycemic relatives or controls (26).In comparison of the FH� and FH� populations at studyentry, a time when both populations were normoglycemic,there was little or no detectable difference in insulin secretionas assessed by fasting insulin, area under the curve followingi.v. glucose challenge, or first or second phase insulin. Thus,although deficient insulin secretion is an important feature ofclinical diabetes, there was no evidence of impaired fastinginsulin, or the insulin response to glucose predating diabetesin either cohort, and the increased incidence of type 2 diabetesin the FH� group cannot be explained by differences in theseearly measurements of � cell function. It is possible that othermeasures of insulin secretion, such as pulsatile secretion,would be more predictive.
A hyperbolic relationship between insulin secretion andaction has been described (18), referred to as the dispositionindex, suggesting that SI and insulin secretion are linkedthrough a negative feedback loop. In this model, as anindividual becomes more insulin resistant � cell function isenhanced (27). A lower disposition index has been demon-strated in several populations at increased risk for the devel-opment of type 2 diabetes, including women with polycysticovarian syndrome (28) or previous history of gestationaldiabetes mellitus (18, 29). The AIRg normalized for insulinresistance has been shown to be a heritable trait in Caucasiantype 2 diabetic kindreds (4, 30). None of the reported studieshave followed the subjects with low disposition indices overtime for the development of diabetes. The FH� prediabeticsubjects tended to have a low disposition index, but due to thelow rate of development of diabetes among the FH� subjectsthis finding was not statistically significant. The low dispositionindex prediction of the development of diabetes in the FH�group was largely driven by SI.
The exact nature of the missing familial factor is unclear, butcould involve proteins involved in insulin signal transductiondownstream of the insulin receptor itself. In a polygenic mousemodel of type 2 diabetes involving heterozygous deletion of theinsulin receptor and insulin receptor substrate-1 (IRS-1), thedevelopment of diabetes is highly dependent on the geneticbackground of the mouse ranging from �5% to �80% in
Fig. 7. The effect of obesity on the age-adjusted incidence rates for type 2diabetes in FH� and FH� groups are shown. On the left, the incidence ratesare shown for all individuals in each cohort, and on the right, a subgroupanalysis is shown for nonobese (BMI �30) FH� and FH� subjects.
2728 � www.pnas.org�cgi�doi�10.1073�pnas.0438009100 Goldfine et al.
different strains (R. K. Kulkarni, K. Almind, R. L. Quinn, D.Eisenman, and C.R.K., unpublished data). An analogoussituation may be true in humans. As the FH� cohort wasselected as offspring of two type 2 parents, as opposed to asingle affected parent, it is possible that the familial factorimparting increased risk for the development of type 2 diabetescould be a recessive genetic trait. Although these studies donot exclude the possibility that dietary, exercise or otherenvironmental factor(s) in the presence of insulin resistanceaccount for the different rates of development of disease, this
seems much less likely. Further studies are needed to identifythis familial, likely genetic factor, which in the presence ofinsulin resistance leads to the development of type 2 diabetesas a potentially important target in prevention or treatment ofthis disease.
This work was supported in part by National Institutes of Health GrantsK23-DK02795, RO1-DK33201, RO1-DK45935, P30 DK36836, and M01RR01032.
1. DeFronzo, R. A. (1988) Diabetes 37, 667–687.2. Rossetti, L., Giaccari, A. & DeFronzo, R. A. (1990) Diabetes Care 13, 610–630.3. Warram, J. H., Martin, B. C., Soeldner, J. S. & Krolewski, A. S. (1988) Adv.
Exp. Med. Biol. 246, 175–179.4. Watanabe, R. M., Valle, T., Hauser, E. R., Ghosh, S., Eriksson, J., Kohtamaki,
K., Ehnholm, C., Tuomilehto, J., Collins, F. S., Bergman, R. N., et al. (1999)Hum. Hered. 49, 159–168.
5. Haffner, S. M., Stern, M. P., Hazuda, H. P., Pugh, J. A. & Patterson, J. K. (1986)N. Engl. J. Med. 315, 220–224.
6. Haffner, S. M., Stern, M. P., Hazuda, H. P., Mitchell, B. D. & Paterson, J. K.(1988) N. Engl. J. Med. 319, 1297–1301.
7. Lillioja, S., Mott, D. M., Howard, B. V., Bennett, P. H., Yki-Jariven, H.,Freymond, B. L., Nyomba, F., Zurlo, B., Swinburn, B. & Bogardus, C. (1988)N. Engl. J. Med. 318, 1217–1225.
8. Kahn, C. R., Hedo, J. & Kasuga, M. (1983) in Proceedings of the InternationalSymposium on Hormone Receptors and Receptor Diseases, Kyoto, August 29–30,1982, eds. Imura, H. & Kuzuya, H. (Excerpta Medica, Amsterdam), pp. 3–11.
9. Martin, B. C., Warram, J., Krolewski, A. S., Bergman, R. N., Soeldner, J. S. &Kahn, C. R. (1992) Lancet 340, 925–929.
10. Eriksson, J., Franssila-Kallunki, A., Ekstrand, A., Saloranta, C., Widen, E.,Schalin, C. & Groop, L. (1989) N. Engl. J. Med. 321, 337–343.
11. Ward, W., Bearc, J., Halter, J., Pfeifer, M. & Porte, D. J. (1984) Diabetes Care5, 491–502.
12. Kahn, S. E. & Porte, D., Jr. (1988). Am. J. Med. 85 (Suppl. 5A), 4–8.13. Koivisto, V. A., Soman, V., Conrad, P., Hendler, R., Nadel, E. & Felig, P.
(1979) J. Clin. Invest. 64, 1011–1015.14. National Diabetes Data Group (1979) Diabetes 28, 1039–1057.15. Bergman, R. N. (1989) Diabetes 38, 1512–1527.
16. Butler, W. J., Ostrander, L. D., Carman, W. J. & Lamphiear, D. E. (1982) Am. J.Epidemiol. 116, 971–980.
17. Melton, L. J., Palumbo, P. J. & Chu, D. P. (1983) Diabetes Care 6, 75–86.18. Kahn, S. E., Prigeon, R. L., McCulloch, D. K., Boyko, E. J., Bergman, R. N.,
Schwartz, M. W., Neifing, J. L., Ward, W. K., Beard, J. C., Palmer, J. P., et al.(1993) Diabetes 42, 1663–1672.
19. Beard, J., Ward, W., Halter, J., Wallum, B. & Porte, D. J. (1987) J. Clin.Endocrinol. Metab. 1, 59–64.
20. Lillioja, S. & Bogardus, C. (1988) Diabetes Metab. Rev. 5, 517–540.21. Evans, D., Murray, R. & Kissebah, A. (1984) J. Clin. Invest. 4, 1515–1525.22. Lillioja, S., Mott, D. M., Zawadzki, J. K., Young, A. A., Abbott, W. G.,
Knowler, W. C., Bennett, P. H., Moll, P. & Bogardus, C. (1987) Diabetes 36,1329–1335.
23. Martin, B. C., Warram, J. H., Rosner, B., Rich, S. S., Soeldner, J. S. &Krolewski, A. S. (1992) Diabetes 41, 850–854.
24. Ramachandran, A., Snehalatha, C., Satyavani, K., Sivasankari, S. & Vijay, V.(2000) Diabetes Obes. Metab. 2, 149–154.
25. Rodriguez-Moran, M. & Guerrero-Romero, F. (2000) Arch. Med. Res. 31,399–403.
26. O’Rahilly, S., Nugent, Z., Rudenski, A. S., Hosker, J. P., Burnett, M. A.,Darling, P. & Turner, R. C. (1986) Lancet 360–363.
27. Bergman, R. N., Phillips, L. S. & Cobelli, C. (1981) J. Clin. Invest. 68,1465–1467.
28. Dunaif, A. & Finegood, D. T. (1996) J. Clin. Endocrinol. Metab. 81, 942–947.29. Ward, W. K., Johnston, S. L. W., Beard, J. C., Benedette, T. J., Halter, J. B.
& Porte, D. J. (1985) Diabetes 34, 861–869.30. Elbein, S., Hasstedt, S., Wegner, K. & Kahn, C. R. (1999) J. Clin. Endocrinol.
Metab. 4, 1398–1403.
Goldfine et al. PNAS � March 4, 2003 � vol. 100 � no. 5 � 2729
MED
ICA
LSC
IEN
CES
Corrections
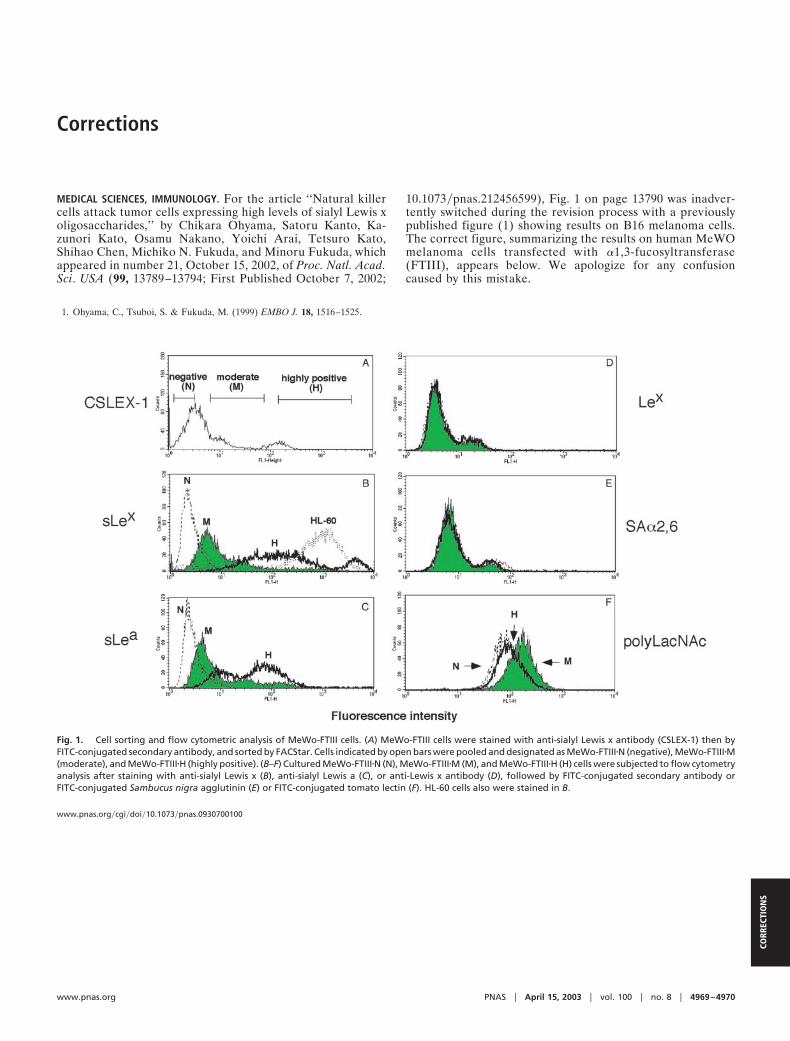
MEDICAL SCIENCES, IMMUNOLOGY. For the article ‘‘Natural killercells attack tumor cells expressing high levels of sialyl Lewis xoligosaccharides,’’ by Chikara Ohyama, Satoru Kanto, Ka-zunori Kato, Osamu Nakano, Yoichi Arai, Tetsuro Kato,Shihao Chen, Michiko N. Fukuda, and Minoru Fukuda, whichappeared in number 21, October 15, 2002, of Proc. Natl. Acad.Sci. USA (99, 13789–13794; First Published October 7, 2002;
10.1073�pnas.212456599), Fig. 1 on page 13790 was inadver-tently switched during the revision process with a previouslypublished figure (1) showing results on B16 melanoma cells.The correct figure, summarizing the results on human MeWOmelanoma cells transfected with �1,3-fucosyltransferase(FTIII), appears below. We apologize for any confusioncaused by this mistake.
1. Ohyama, C., Tsuboi, S. & Fukuda, M. (1999) EMBO J. 18, 1516–1525.
Fig. 1. Cell sorting and flow cytometric analysis of MeWo-FTIII cells. (A) MeWo-FTIII cells were stained with anti-sialyl Lewis x antibody (CSLEX-1) then byFITC-conjugated secondary antibody, and sorted by FACStar. Cells indicated by open bars were pooled and designated as MeWo-FTIII�N (negative), MeWo-FTIII�M(moderate), and MeWo-FTIII�H (highly positive). (B–F) Cultured MeWo-FTIII�N (N), MeWo-FTIII�M (M), and MeWo-FTIII�H (H) cells were subjected to flow cytometryanalysis after staining with anti-sialyl Lewis x (B), anti-sialyl Lewis a (C), or anti-Lewis x antibody (D), followed by FITC-conjugated secondary antibody orFITC-conjugated Sambucus nigra agglutinin (E) or FITC-conjugated tomato lectin (F). HL-60 cells also were stained in B.
www.pnas.org�cgi�doi�10.1073�pnas.0930700100
www.pnas.org PNAS � April 15, 2003 � vol. 100 � no. 8 � 4969–4970
CORR
ECTI
ON
S
CELL BIOLOGY. For the article ‘‘Molecular characterization oflymphatic endothelial cells,’’ by Simona Podgrabinska, PascalBraun, Paula Velasco, Bryan Kloos, Michael S. Pepper, DavidG. Jackson, and Mihaela Skobe, which appeared in number 25,December 10, 2002, of Proc. Natl. Acad. Sci. USA (99, 16069–16074; First Published November 22, 2002; 10.1073�pnas.242401399), the authors note ‘‘In the Results, we have errone-ously stated that the sequence for Prox-1 (GenBank accessionno. U44060) was not present on the Affymetrix GeneChip,although we have listed it in the Table 1, which was published assupporting information on the PNAS web site. As indicated inthe Results, the sequence encoding podoplanin (GenBank ac-cession no. AF390106) was not present on the GeneChip.However, two sequences with 96% homology to podoplaninwere present under the different name, i.e., lung type-I cellmembrane-associated proteins hT1a-1 and hT1a-2 (GenBankaccession nos. AF030427 and AF030428, respectively). Dr.David G. Jackson does not wish to be included as a coauthor butis instead acknowledged for providing the LYVE-1 polyclonalantibody. In addition, the legend of Fig. 1 should have includedthe credit ‘Reprinted with permission from the Journal ofInvestigative Dermatology,’ because the upper panels from Fig. 1were previously published in ref. 7.’’ These corrections do notaffect the conclusions of the article.
MEDICAL SCIENCES. For the article ‘‘Insulin resistance is a poorpredictor of type 2 diabetes in individuals with no family historyof disease,’’ by Allison B. Goldfine, Clara Bouche, RobertA. Parker, Caroline Kim, Amy Kerivan, J. Stuart Soeldner,Blaise C. Martin, James H. Warram, and C. Ronald Kahn, whichappeared in number 5, March 4, 2003, of Proc. Natl. Acad. Sci.USA (100, 2724–2729; First Published February 18, 2003;10.1073�pnas.0438009100), the authors note that the citationgiven for ref. 8 was incorrect. The correct reference appearsbelow. Also, on page 2724, right column, seven lines from thebottom, the citation (8, 13) should have been (8, 9).
8. Warram, J. H., Martin, B. C., Krolewski, A. S., Soeldner, J. S. & Kahn, C. R.(1990) Ann. Intern. Med. 113, 909–915.
www.pnas.org�cgi�doi�10.1073�pnas.0931372100
7. Skobe, M. & Detmar, M. (2000) J. Invest. Dermatol. Symp. Proc. 5, 14–19.
www.pnas.org�cgi�doi�10.1073�pnas.0937466100
4970 � www.pnas.org

Corrections
MEDICAL SCIENCES, IMMUNOLOGY. For the article ‘‘Natural killercells attack tumor cells expressing high levels of sialyl Lewis xoligosaccharides,’’ by Chikara Ohyama, Satoru Kanto, Ka-zunori Kato, Osamu Nakano, Yoichi Arai, Tetsuro Kato,Shihao Chen, Michiko N. Fukuda, and Minoru Fukuda, whichappeared in number 21, October 15, 2002, of Proc. Natl. Acad.Sci. USA (99, 13789–13794; First Published October 7, 2002;
10.1073�pnas.212456599), Fig. 1 on page 13790 was inadver-tently switched during the revision process with a previouslypublished figure (1) showing results on B16 melanoma cells.The correct figure, summarizing the results on human MeWOmelanoma cells transfected with �1,3-fucosyltransferase(FTIII), appears below. We apologize for any confusioncaused by this mistake.
1. Ohyama, C., Tsuboi, S. & Fukuda, M. (1999) EMBO J. 18, 1516–1525.
Fig. 1. Cell sorting and flow cytometric analysis of MeWo-FTIII cells. (A) MeWo-FTIII cells were stained with anti-sialyl Lewis x antibody (CSLEX-1) then byFITC-conjugated secondary antibody, and sorted by FACStar. Cells indicated by open bars were pooled and designated as MeWo-FTIII�N (negative), MeWo-FTIII�M(moderate), and MeWo-FTIII�H (highly positive). (B–F) Cultured MeWo-FTIII�N (N), MeWo-FTIII�M (M), and MeWo-FTIII�H (H) cells were subjected to flow cytometryanalysis after staining with anti-sialyl Lewis x (B), anti-sialyl Lewis a (C), or anti-Lewis x antibody (D), followed by FITC-conjugated secondary antibody orFITC-conjugated Sambucus nigra agglutinin (E) or FITC-conjugated tomato lectin (F). HL-60 cells also were stained in B.
www.pnas.org�cgi�doi�10.1073�pnas.0930700100
www.pnas.org PNAS � April 15, 2003 � vol. 100 � no. 8 � 4969–4970
CORR
ECTI
ON
S

CELL BIOLOGY. For the article ‘‘Molecular characterization oflymphatic endothelial cells,’’ by Simona Podgrabinska, PascalBraun, Paula Velasco, Bryan Kloos, Michael S. Pepper, DavidG. Jackson, and Mihaela Skobe, which appeared in number 25,December 10, 2002, of Proc. Natl. Acad. Sci. USA (99, 16069–16074; First Published November 22, 2002; 10.1073�pnas.242401399), the authors note ‘‘In the Results, we have errone-ously stated that the sequence for Prox-1 (GenBank accessionno. U44060) was not present on the Affymetrix GeneChip,although we have listed it in the Table 1, which was published assupporting information on the PNAS web site. As indicated inthe Results, the sequence encoding podoplanin (GenBank ac-cession no. AF390106) was not present on the GeneChip.However, two sequences with 96% homology to podoplaninwere present under the different name, i.e., lung type-I cellmembrane-associated proteins hT1a-1 and hT1a-2 (GenBankaccession nos. AF030427 and AF030428, respectively). Dr.David G. Jackson does not wish to be included as a coauthor butis instead acknowledged for providing the LYVE-1 polyclonalantibody. In addition, the legend of Fig. 1 should have includedthe credit ‘Reprinted with permission from the Journal ofInvestigative Dermatology,’ because the upper panels from Fig. 1were previously published in ref. 7.’’ These corrections do notaffect the conclusions of the article.
MEDICAL SCIENCES. For the article ‘‘Insulin resistance is a poorpredictor of type 2 diabetes in individuals with no family historyof disease,’’ by Allison B. Goldfine, Clara Bouche, RobertA. Parker, Caroline Kim, Amy Kerivan, J. Stuart Soeldner,Blaise C. Martin, James H. Warram, and C. Ronald Kahn, whichappeared in number 5, March 4, 2003, of Proc. Natl. Acad. Sci.USA (100, 2724–2729; First Published February 18, 2003;10.1073�pnas.0438009100), the authors note that the citationgiven for ref. 8 was incorrect. The correct reference appearsbelow. Also, on page 2724, right column, seven lines from thebottom, the citation (8, 13) should have been (8, 9).
8. Warram, J. H., Martin, B. C., Krolewski, A. S., Soeldner, J. S. & Kahn, C. R.(1990) Ann. Intern. Med. 113, 909–915.
www.pnas.org�cgi�doi�10.1073�pnas.0931372100
7. Skobe, M. & Detmar, M. (2000) J. Invest. Dermatol. Symp. Proc. 5, 14–19.
www.pnas.org�cgi�doi�10.1073�pnas.0937466100
4970 � www.pnas.org