Loss of TFB1M results in mitochondrial dysfunction that leads to impaired insulin secretion and...
23
Loss of TFB1M results in mitochondrial dysfunction that leads to impaired insulin secretion and diabetes Vladimir V. Sharoyko 1 , Mia Abels 2 , Jiangming Sun 1 , Lisa M. Nicholas 1 , Ines Guerra Mollet 3 , Jelena A. Stamenkovic 1 , Isabel Go ¨ hring 1 , Siri Malmgren 1 , Petter Storm 4 , Joa ˜ o Fadista 4 , Peter Spe ´gel 1 , Metodi D. Metodiev 5 , Nils-Go ¨ ran Larsson 5 , Lena Eliasson 3 , Nils Wierup 2 and Hindrik Mulder 1, ∗ 1 Department of Clinical Sciences in Malmo ¨ , Unit of Molecular Metabolism, 2 Unit of Neuroendocrine Cell Biology, 3 Unit of Islet Cell Exocytosis and 4 Unit of Diabetes and Endocrinology, Lund University Diabetes Centre, Clinical Research Centre, Ska ˚ ne University Hospital, 205 02 Malmo ¨ , Sweden and 5 Max Planck Institute for Biology of Ageing, D-50931 Cologne, Germany Received March 18, 2014; Revised March 18, 2014; Accepted June 6, 2014 We have previously identified transcription factor B1 mitochondrial (TFB1M) as a type 2 diabetes (T2D) risk gene, using human and mouse genetics. To further understand the function of TFB1M and how it is associated with T2D, we created a b-cell-specific knockout of Tfb1m, which gradually developed diabetes. Prior to the onset of diabetes, b-Tfb1m 2/ 2 mice exhibited retarded glucose clearance owing to impaired insulin secretion. b-Tfb1m 2/ 2 islets released less insulin in response to fuels, contained less insulin and secretory granules and displayed reduced b-cell mass. Moreover, mitochondria in Tfb1m-deficient b-cells were more abundant with disrupted architecture. TFB1M is known to control mitochondrial protein translation by adenine dimethyla- tion of 12S ribosomal RNA (rRNA). Here, we found that the levels of TFB1M and mitochondrial-encoded proteins, mitochondrial 12S rRNA methylation, ATP production and oxygen consumption were reduced in b-Tfb1m 2/ 2 islets. Furthermore, the levels of reactive oxygen species (ROS) in response to cellular stress were increased whereas induction of defense mechanisms was attenuated. We also show increased apoptosis and necrosis as well as infiltration of macrophages and CD4 1 cells in the islets. Taken together, our findings demonstrate that Tfb1m-deficiency in b-cells caused mitochondrial dysfunction and subsequently diabetes owing to com- bined loss of b-cell function and mass. These observations reflect pathogenetic processes in human islets: using RNA sequencing, we found that the TFB1M risk variant exhibited a negative gene-dosage effect on islet TFB1M mRNA levels, as well as insulin secretion. Our findings highlight the role of mitochondrial dysfunction in impairments of b-cell function and mass, the hallmarks of T2D. INTRODUCTION Failure to secrete sufficient amounts of insulin is ultimately the culprit in the development of type 2 diabetes (T2D), one of the most devastating diseases of our time (1). Fully functional b-cells in a sufficient number is a prerequisite of proper insulin secretion. There is ample evidence for perturbations of both function and mass of b-cells in T2D (2,3). These processes may be influenced by altered mitochondrial function, which has been shown to be compromised in islets from patients with T2D (4). In fact, we recently reported that a variant of TFB1M, which encodes a protein essential for mitochondrial function, is associated with future risk of T2D (5). The b-cell has developed an elaborate mechanism, known as stimulus-secretion coupling, whereby a rise in extracellular glucose, occurring after a meal, is translated into intracellular signals that permit the proper amount of insulin to be released. Circulating insulin then binds to receptors in its main target tissues—skeletal muscle, adipocytes and liver—and promotes glucose uptake and anabolism. The transport of glucose into the b-cell activates a complex metabolic pathway that results in ATP production via electron transport and oxidative phos- phorylation (OXPHOS). The formation of ATP leads to the closing of ATP-dependent K + (K ATP ) channels (6). Thereby the plasma membrane is depolarized, and subsequently intracel- lular Ca 2+ rises, triggering exocytosis of insulin (7,8). ∗ To whom correspondence should be addressed at: Department of Clinical Sciences in Malmo ¨ , Unit of Molecular Metabolism, Lund University Diabetes Centre, CRC 91:11, Ska ˚ne University Hospital, 205 02 Malmo ¨ , Sweden. Tel: +46 40391023; Fax: +46 40391222; Email: [email protected] # The Author 2014. Published by Oxford University Press. All rights reserved. For Permissions, please email: [email protected] Human Molecular Genetics, 2014 1–17 doi:10.1093/hmg/ddu288 HMG Advance Access published July 4, 2014 at INSERM on July 22, 2014 http://hmg.oxfordjournals.org/ Downloaded from
Transcript of Loss of TFB1M results in mitochondrial dysfunction that leads to impaired insulin secretion and...

Loss of TFB1M results in mitochondrial dysfunctionthat leads to impaired insulin secretion and diabetes
Vladimir V. Sharoyko1, Mia Abels2, Jiangming Sun1, Lisa M. Nicholas1, Ines Guerra Mollet3, Jelena
A. Stamenkovic1, Isabel Gohring1, Siri Malmgren1, Petter Storm4, Joao Fadista4, Peter Spegel1,
Metodi D. Metodiev5, Nils-Goran Larsson5, Lena Eliasson3, Nils Wierup2 and Hindrik Mulder1,∗
1Department of Clinical Sciences in Malmo, Unit of Molecular Metabolism, 2Unit of Neuroendocrine Cell Biology, 3Unit of
Islet Cell Exocytosis and 4Unit of Diabetes and Endocrinology, Lund University Diabetes Centre, Clinical Research
Centre, Skane University Hospital, 205 02 Malmo, Sweden and 5Max Planck Institute for Biology of Ageing, D-50931
Cologne, Germany
Received March 18, 2014; Revised March 18, 2014; Accepted June 6, 2014
We have previously identified transcription factor B1 mitochondrial (TFB1M) as a type 2 diabetes (T2D) risk gene,using human and mouse genetics. To further understand the function of TFB1M and how it is associated withT2D, we created a b-cell-specific knockout of Tfb1m, which gradually developed diabetes. Prior to the onsetof diabetes, b-Tfb1m2/2 mice exhibited retarded glucose clearance owing to impaired insulin secretion.b-Tfb1m2/2 islets released less insulin in response to fuels, contained less insulin and secretory granulesand displayed reduced b-cell mass. Moreover, mitochondria in Tfb1m-deficient b-cells were more abundantwith disrupted architecture. TFB1M is known to control mitochondrial protein translation by adenine dimethyla-tion of 12S ribosomal RNA (rRNA). Here, we found that the levels of TFB1M and mitochondrial-encoded proteins,mitochondrial 12S rRNA methylation, ATP production and oxygen consumption were reduced in b-Tfb1m2/2
islets. Furthermore, the levels of reactive oxygen species (ROS) in response to cellular stress were increasedwhereas induction of defense mechanisms was attenuated. We also show increased apoptosis and necrosisas well as infiltration of macrophages and CD41 cells in the islets. Taken together, our findings demonstratethat Tfb1m-deficiency in b-cells caused mitochondrial dysfunction and subsequently diabetes owing to com-bined loss of b-cell function and mass. These observations reflect pathogenetic processes in human islets:using RNA sequencing, we found that the TFB1M risk variant exhibited a negative gene-dosage effect on isletTFB1M mRNA levels, as well as insulin secretion. Our findings highlight the role of mitochondrial dysfunctionin impairments of b-cell function and mass, the hallmarks of T2D.
INTRODUCTION
Failure to secrete sufficient amounts of insulin is ultimately theculprit in the development of type 2 diabetes (T2D), one of themost devastating diseases of our time (1). Fully functionalb-cells in a sufficient number is a prerequisite of proper insulinsecretion. There is ample evidence for perturbations of bothfunction and mass of b-cells in T2D (2,3). These processesmay be influenced by altered mitochondrial function, whichhas been shown to be compromised in islets from patients withT2D (4). In fact, we recently reported that a variant of TFB1M,which encodes a protein essential for mitochondrial function,is associated with future risk of T2D (5).
The b-cell has developed an elaborate mechanism, known asstimulus-secretion coupling, whereby a rise in extracellularglucose, occurring after a meal, is translated into intracellularsignals that permit the proper amount of insulin to be released.Circulating insulin then binds to receptors in its main targettissues—skeletal muscle, adipocytes and liver—and promotesglucose uptake and anabolism. The transport of glucose intothe b-cell activates a complex metabolic pathway that resultsin ATP production via electron transport and oxidative phos-phorylation (OXPHOS). The formation of ATP leads to theclosing of ATP-dependent K+ (KATP) channels (6). Therebythe plasma membrane is depolarized, and subsequently intracel-lular Ca2+ rises, triggering exocytosis of insulin (7,8).
∗To whom correspondence should be addressed at: Department of Clinical Sciences in Malmo, Unit of Molecular Metabolism, Lund University DiabetesCentre, CRC 91:11, Skane University Hospital, 205 02 Malmo, Sweden. Tel: +46 40391023; Fax: +46 40391222; Email: [email protected]
# The Author 2014. Published by Oxford University Press. All rights reserved.For Permissions, please email: [email protected]
Human Molecular Genetics, 2014 1–17doi:10.1093/hmg/ddu288
HMG Advance Access published July 4, 2014 at IN
SER
M on July 22, 2014
http://hmg.oxfordjournals.org/
Dow
nloaded from
Insulin secretion is thus triggered but also maintained via thegeneration of signals from the b-cell mitochondria (9,10). Themolecular machinery in these organelles is controlled by aunique interplay of nuclear- and mitochondrial-encoded genes.Mitochondrial DNA encodes 13 essential proteins that are partof complexes I, III, IV, which carry out cell respiration, andATP synthase. Transcription of mitochondrial genes is con-trolled by nuclear-encoded factors: transcription factor A mito-chondrial (TFAM) and transcription factors B1 and B2mitochondrial (TFB1M and TFB2M). TFAM has a dual func-tion: it is involved in the packaging of mitochondrial DNA intonucleoids and activation of transcription (11). Although TFB1M[also known as S-adenosylmethionine-6-N′,N′-adenosyl(rRNA)-dimethyltransferase 1 mitochondrial (mDMAT1)] was originallythought to serve as a transcription factor along with TFB2M,it is now established that it mainly functions as a dimethyltrans-ferase (12). In mitochondria, TFB1M dimethylates two adjacentadenine residues in the hairpin loop at the 3′ end of 12S rRNA;this modification is a mandatory step in the biogenesis of thesmall subunit of the mitochondrial ribosome (13,14). Deficient12S rRNA methylation results in destabilized ribosomes in themitochondria, leading to severely impaired translation of mito-chondrial proteins (12).
The discovery that a common variant of TFB1M is associatedwith impaired insulin secretion and increased risk of future T2Drecently highlighted the pathogenetic relevance of mitochon-drial protein synthesis for the human disease (5). Carriers of therisk variant had reduced levels of TFB1M and mitochondrial-encoded respiratory proteins in islets as well as impairedinsulin secretion in vivo and in vitro. Furthermore, we havealso shown that TFB1M deficiency causes mitochondrial dys-function and impaired insulin secretion in mice with a generalheterozygous deficiency of Tfb1m (Tfb1m+/2), as well as in ratclonal b-cells (5). These findings show that mitochondrial dys-function is a causal pathogenetic process in the common formof human T2D. The underlying mechanisms and the precise roleof TFB1M in pancreatic b-cells, however, remain unclear.
To elucidate the mechanisms underlying mitochondrial dys-function and the subsequent development of T2D owing toloss of TFB1M, we examined the role of Tfb1m in murineb-cells. We show that conditional targeting of Tfb1m in b-cellsresults in mitochondrial dysfunction, which leads to impairedstimulus-secretion coupling, perturbed insulin secretion, energyfailure, increased production of ROS, progressiveb-cell loss andultimately development of diabetes. Importantly, we also showthat human carriers of the TFB1M risk variant have reducedexpression of TFB1M mRNA in islets as well as lower insulinsecretion. These findings further support the relevance of ourmurine findings for the development of the human disease.
RESULTS
Expression and function of TFB1M are abrogatedin islets from b-Tfb1m2/2 mice
To understand the role of TFB1M in pancreaticb-cells, we inac-tivated the gene specifically in these cells by expressing theCre recombinase under control of the rat insulin 2 promoter(Rip-Cre) in pancreatic b-cells in mice homozygous for a loxP-flanked exon 3 of the Tfb1m locus. We first measured the mRNA
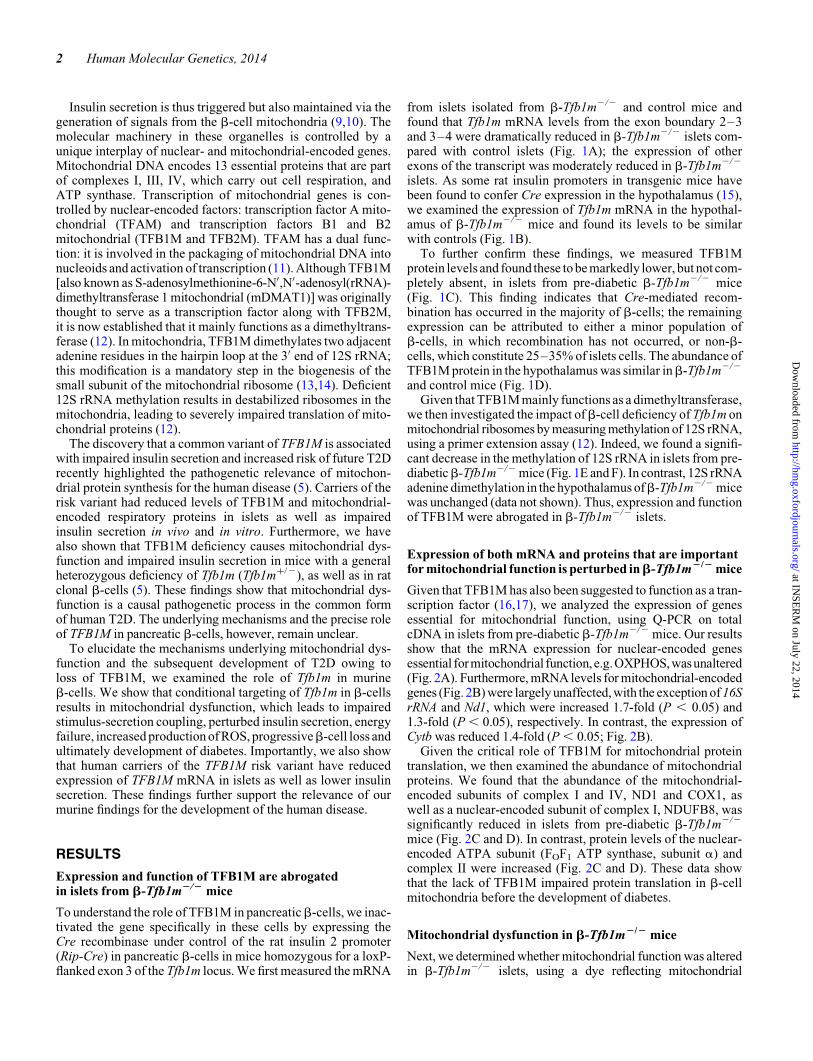
from islets isolated from b-Tfb1m2/2 and control mice andfound that Tfb1m mRNA levels from the exon boundary 2–3and 3–4 were dramatically reduced in b-Tfb1m2/2 islets com-pared with control islets (Fig. 1A); the expression of otherexons of the transcript was moderately reduced in b-Tfb1m2/2
islets. As some rat insulin promoters in transgenic mice havebeen found to confer Cre expression in the hypothalamus (15),we examined the expression of Tfb1m mRNA in the hypothal-amus of b-Tfb1m2/2 mice and found its levels to be similarwith controls (Fig. 1B).
To further confirm these findings, we measured TFB1Mprotein levels and found these to be markedly lower, but not com-pletely absent, in islets from pre-diabetic b-Tfb1m2/2 mice(Fig. 1C). This finding indicates that Cre-mediated recom-bination has occurred in the majority of b-cells; the remainingexpression can be attributed to either a minor population ofb-cells, in which recombination has not occurred, or non-b-cells, which constitute 25–35% of islets cells. The abundance ofTFB1M protein in the hypothalamus was similar inb-Tfb1m2/2
and control mice (Fig. 1D).Given that TFB1M mainly functions as a dimethyltransferase,
we then investigated the impact ofb-cell deficiency of Tfb1m onmitochondrial ribosomes by measuring methylation of 12S rRNA,using a primer extension assay (12). Indeed, we found a signifi-cant decrease in the methylation of 12S rRNA in islets from pre-diabeticb-Tfb1m2/2 mice (Fig. 1E and F). In contrast, 12S rRNAadenine dimethylation in the hypothalamus ofb-Tfb1m2/2 micewas unchanged (data not shown). Thus, expression and functionof TFB1M were abrogated in b-Tfb1m2/2 islets.
Expression of both mRNA and proteins that are importantfor mitochondrial function is perturbed inb-Tfb1m2/2 mice
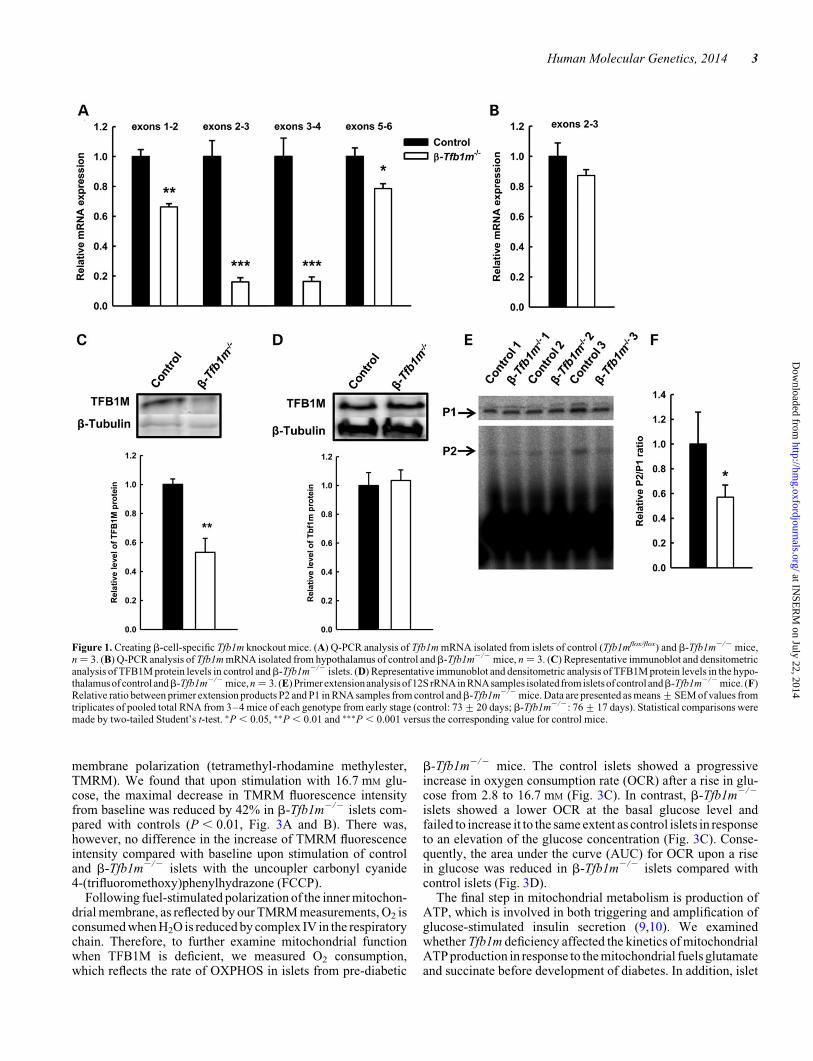
Given that TFB1M has also been suggested to function as a tran-scription factor (16,17), we analyzed the expression of genesessential for mitochondrial function, using Q-PCR on totalcDNA in islets from pre-diabetic b-Tfb1m2/2 mice. Our resultsshow that the mRNA expression for nuclear-encoded genesessential formitochondrial function, e.g.OXPHOS,wasunaltered(Fig. 2A). Furthermore, mRNA levels for mitochondrial-encodedgenes (Fig. 2B) were largely unaffected, with the exception of 16SrRNA and Nd1, which were increased 1.7-fold (P , 0.05) and1.3-fold (P , 0.05), respectively. In contrast, the expression ofCytb was reduced 1.4-fold (P , 0.05; Fig. 2B).
Given the critical role of TFB1M for mitochondrial proteintranslation, we then examined the abundance of mitochondrialproteins. We found that the abundance of the mitochondrial-encoded subunits of complex I and IV, ND1 and COX1, aswell as a nuclear-encoded subunit of complex I, NDUFB8, wassignificantly reduced in islets from pre-diabetic b-Tfb1m2/2
mice (Fig. 2C and D). In contrast, protein levels of the nuclear-encoded ATPA subunit (FOF1 ATP synthase, subunit a) andcomplex II were increased (Fig. 2C and D). These data showthat the lack of TFB1M impaired protein translation in b-cellmitochondria before the development of diabetes.
Mitochondrial dysfunction in b-Tfb1m2/2 mice
Next, we determined whether mitochondrial function was alteredin b-Tfb1m2/2 islets, using a dye reflecting mitochondrial
2 Human Molecular Genetics, 2014
at INSE
RM
on July 22, 2014http://hm
g.oxfordjournals.org/D
ownloaded from
membrane polarization (tetramethyl-rhodamine methylester,TMRM). We found that upon stimulation with 16.7 mM glu-cose, the maximal decrease in TMRM fluorescence intensityfrom baseline was reduced by 42% in b-Tfb1m2/2 islets com-pared with controls (P , 0.01, Fig. 3A and B). There was,however, no difference in the increase of TMRM fluorescenceintensity compared with baseline upon stimulation of controland b-Tfb1m2/2 islets with the uncoupler carbonyl cyanide4-(trifluoromethoxy)phenylhydrazone (FCCP).
Following fuel-stimulated polarization of the inner mitochon-drial membrane, as reflected by our TMRM measurements, O2 isconsumed when H2O is reduced by complex IV in the respiratorychain. Therefore, to further examine mitochondrial functionwhen TFB1M is deficient, we measured O2 consumption,which reflects the rate of OXPHOS in islets from pre-diabetic
b-Tfb1m2/2 mice. The control islets showed a progressiveincrease in oxygen consumption rate (OCR) after a rise in glu-cose from 2.8 to 16.7 mM (Fig. 3C). In contrast, b-Tfb1m2/2
islets showed a lower OCR at the basal glucose level andfailed to increase it to the same extent as control islets in responseto an elevation of the glucose concentration (Fig. 3C). Conse-quently, the area under the curve (AUC) for OCR upon a risein glucose was reduced in b-Tfb1m2/2 islets compared withcontrol islets (Fig. 3D).
The final step in mitochondrial metabolism is production ofATP, which is involved in both triggering and amplification ofglucose-stimulated insulin secretion (9,10). We examinedwhether Tfb1m deficiency affected the kinetics of mitochondrialATP production in response to the mitochondrial fuels glutamateand succinate before development of diabetes. In addition, islet
Figure 1. Creating b-cell-specific Tfb1m knockout mice. (A) Q-PCR analysis of Tfb1m mRNA isolated from islets of control (Tfb1mflox/flox) and b-Tfb1m2/2 mice,n ¼ 3. (B) Q-PCR analysis of Tfb1m mRNA isolated from hypothalamus of control andb-Tfb1m2/2 mice, n ¼ 3. (C) Representative immunoblot and densitometricanalysis of TFB1M protein levels in control andb-Tfb1m2/2 islets. (D) Representative immunoblot and densitometric analysis of TFB1M protein levels in the hypo-thalamus ofcontrol andb-Tfb1m2/2 mice, n ¼ 3. (E) Primerextensionanalysis of12S rRNAin RNAsamples isolatedfrom isletsof controlandb-Tfb1m2/2 mice. (F)Relative ratio between primer extension products P2 and P1 in RNA samples from control andb-Tfb1m2/2 mice. Data are presented as means+SEM of values fromtriplicates of pooled total RNA from 3–4 mice of each genotype from early stage (control: 73+20 days; b-Tfb1m2/2: 76+17 days). Statistical comparisons weremade by two-tailed Student’s t-test. ∗P , 0.05, ∗∗P , 0.01 and ∗∗∗P , 0.001 versus the corresponding value for control mice.
Human Molecular Genetics, 2014 3
at INSE
RM
on July 22, 2014http://hm
g.oxfordjournals.org/D
ownloaded from
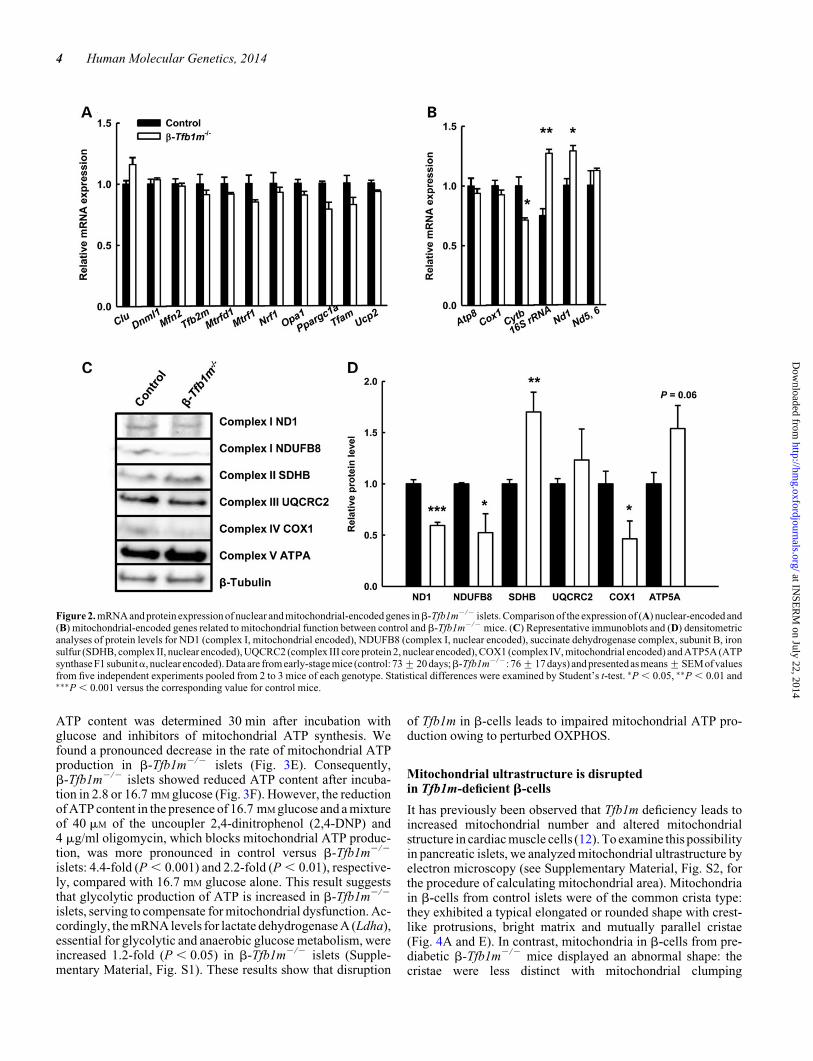
ATP content was determined 30 min after incubation withglucose and inhibitors of mitochondrial ATP synthesis. Wefound a pronounced decrease in the rate of mitochondrial ATPproduction in b-Tfb1m2/2 islets (Fig. 3E). Consequently,b-Tfb1m2/2 islets showed reduced ATP content after incuba-tion in 2.8 or 16.7 mM glucose (Fig. 3F). However, the reductionof ATP content in the presence of 16.7 mM glucose and a mixtureof 40 mM of the uncoupler 2,4-dinitrophenol (2,4-DNP) and4 mg/ml oligomycin, which blocks mitochondrial ATP produc-tion, was more pronounced in control versus b-Tfb1m2/2
islets: 4.4-fold (P , 0.001) and 2.2-fold (P , 0.01), respective-ly, compared with 16.7 mM glucose alone. This result suggeststhat glycolytic production of ATP is increased in b-Tfb1m2/2
islets, serving to compensate for mitochondrial dysfunction. Ac-cordingly, the mRNA levels for lactate dehydrogenase A (Ldha),essential for glycolytic and anaerobic glucose metabolism, wereincreased 1.2-fold (P , 0.05) in b-Tfb1m2/2 islets (Supple-mentary Material, Fig. S1). These results show that disruption
of Tfb1m in b-cells leads to impaired mitochondrial ATP pro-duction owing to perturbed OXPHOS.
Mitochondrial ultrastructure is disruptedin Tfb1m-deficient b-cells
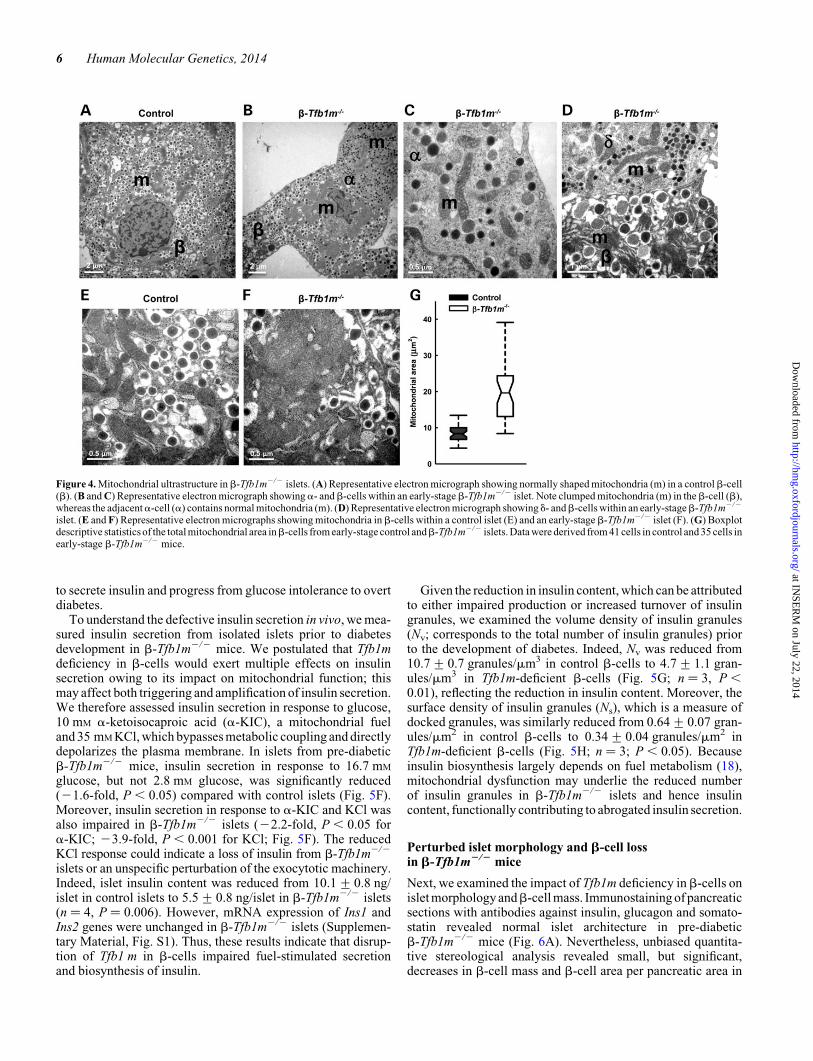
It has previously been observed that Tfb1m deficiency leads toincreased mitochondrial number and altered mitochondrialstructure in cardiac muscle cells (12). To examine this possibilityin pancreatic islets, we analyzed mitochondrial ultrastructure byelectron microscopy (see Supplementary Material, Fig. S2, forthe procedure of calculating mitochondrial area). Mitochondriain b-cells from control islets were of the common crista type:they exhibited a typical elongated or rounded shape with crest-like protrusions, bright matrix and mutually parallel cristae(Fig. 4A and E). In contrast, mitochondria in b-cells from pre-diabetic b-Tfb1m2/2 mice displayed an abnormal shape: thecristae were less distinct with mitochondrial clumping
Figure 2. mRNA and protein expression of nuclear and mitochondrial-encoded genes inb-Tfb1m2/2 islets. Comparison of the expression of (A) nuclear-encoded and(B) mitochondrial-encoded genes related to mitochondrial function between control and b-Tfb1m2/2 mice. (C) Representative immunoblots and (D) densitometricanalyses of protein levels for ND1 (complex I, mitochondrial encoded), NDUFB8 (complex I, nuclear encoded), succinate dehydrogenase complex, subunit B, ironsulfur (SDHB, complex II, nuclear encoded), UQCRC2 (complex III core protein 2, nuclear encoded), COX1 (complex IV, mitochondrial encoded) and ATP5A (ATPsynthase F1 subunita, nuclear encoded). Data are from early-stage mice (control: 73+20 days;b-Tfb1m2/2: 76+17 days) and presentedas means+SEMof valuesfrom five independent experiments pooled from 2 to 3 mice of each genotype. Statistical differences were examined by Student’s t-test. ∗P , 0.05, ∗∗P , 0.01 and∗∗∗P , 0.001 versus the corresponding value for control mice.
4 Human Molecular Genetics, 2014
at INSE
RM
on July 22, 2014http://hm
g.oxfordjournals.org/D
ownloaded from
(Fig. 4B–D, F; Supplementary Material, Fig. S2). The cross-sectional area covered by mitochondria increased significantlyfrom 6.8 mm2 in control b-cells to 19.3 mm2 in b-Tfb1m2/2
b-cells (Fig. 4G). This increase was not accompanied by anychange in totalb-cell cross-sectional area; the ratio of mitochon-drial cross-sectional area and the total cell cross-sectional areain b-cells was 2.7-fold higher in b-Tfb1m2/2 compared withcontrol (P ¼ 4.5E-12). These findings demonstrate that alteredaction of TFB1M in b-cells had a profound effect on mitochon-drial structure, resulting in increased mitochondria-covered areaand perturbed architecture.
Whole-body metabolism and insulin secretion are perturbedin b-Tfb1m2/2 mice
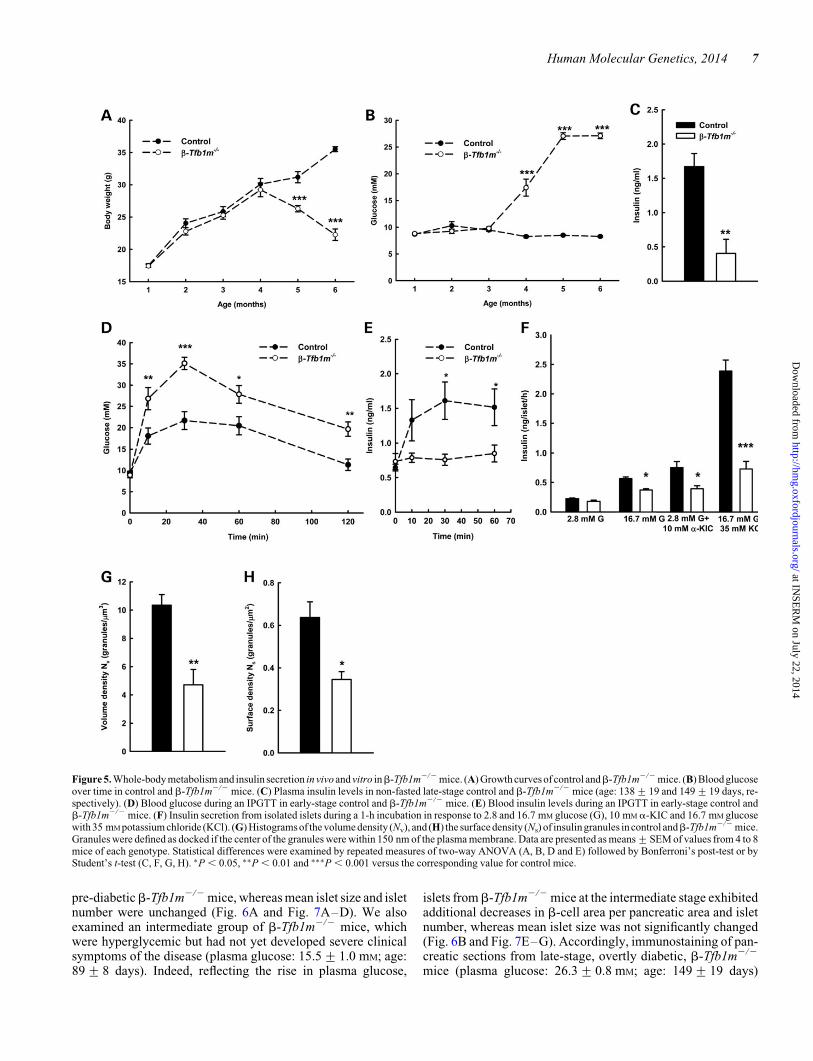
To further investigate our previous findings about a possible roleof TFB1M in diabetes development (5), we then examinedwhole-body metabolism. We found that body weight did notdiffer between early-stage b-Tfb1m2/2 (age: 76+ 17 days)and control mice but late-stage b-Tfb1m2/2 mice (age: 149+
19 days) had reduced body weight compared with controls(Fig. 5A). Plasma glucose levels were measured longitudinallyin non-fasted control and b-Tfb1m2/2 mice: at late stage, virtu-ally all b-Tfb1m2/2 mice had developed diabetes (Fig. 5B).Indeed, at that time point, the plasma insulin concentration inb-Tfb1m2/2 mice was significantly lower than that of controlmice in the non-fasted state (Fig. 5C; in 3 of 8 b-Tfb1m2/2
mice, plasma insulin was below the detection limit of theassay). Accordingly, b-Tfb1m2/2 mice showed clinical symp-toms of diabetes at the late stage (age: 149+ 19 days), i.e.ketosis, cachexia, polyuria and polydipsia.
To further elucidate the mechanism of hyperglycemia, weassessed glucose homeostasis in the b-Tfb1m2/2 mice beforediabetes onset (age: 76+17 days) by an intraperitonealglucose tolerance test (IPGTT): b-Tfb1m2/2 mice showedretarded clearance of glucose (Fig. 5D) and blunted insulin secre-tion (Fig. 5E). Glucose tolerance was similar in Tfb1mloxP/loxP
(b-Tfb1m+/+; control) and Tfb1mRip2Cre/2 (Rip-Cre-transgenic) mice (Supplementary Material, Fig. S3). These find-ings indicate that b-Tfb1m2/2 mice gradually lose the capacity
Figure 3. Mitochondrial function inb-Tfb1m2/2 islets. (A) Representative traces of changes in TMRM fluorescence intensity over time before and after stimulation ofcontrol and b-Tfb1m2/2 islets with 16.7 mM glucose, oligomycin and FCCP. (B) Changes in TMRM fluorescence intensity from baseline following stimulation ofisolated islets from control andb-Tfb1m2/2 mice with 16.7 mM glucose, which leads to membrane hyperpolarization and attenuated fluorescence intensity in quenchmode. Data are mean+SEM. (C) Oxygen consumption rate in control and b-Tfb1m2/2 islets following treatment with glucose, oligomycin, rotenone and2,4-dinitophenol (2.4 DNP). (D) Calculation of the AUC for OCR upon a rise in glucose. (E) Rate of ATP production in permeabilized islets from control andb-Tfb1m2/2 mice. (F) ATP content in response to indicated concentration of glucose, 2,4 DNP and oligomycin in isolated islets from control and b-Tfb1m2/2
mice. Statistical differences were examined by Student’s t-test or repeated measure of two-way ANOVA (E) followed by Bonferroni’s post-test. Data are from early-stage mice (control: 73+20 days;b-Tfb1m2/2: 76+17 days) and presented as means+SEM of values from 3 to 7 mice of each genotype. ∗P , 0.05, ∗∗∗P , 0.001versus the corresponding value for control mice. TMRM, tetramethyl-rhodamine methylester; FCCP, carbonyl cyanide 4-(trifluoromethoxy)phenylhydrazone; DNP,dinitrophenol.
Human Molecular Genetics, 2014 5
at INSE
RM
on July 22, 2014http://hm
g.oxfordjournals.org/D
ownloaded from
to secrete insulin and progress from glucose intolerance to overtdiabetes.
To understand the defective insulin secretion in vivo, we mea-sured insulin secretion from isolated islets prior to diabetesdevelopment in b-Tfb1m2/2 mice. We postulated that Tfb1mdeficiency in b-cells would exert multiple effects on insulinsecretion owing to its impact on mitochondrial function; thismay affect both triggering and amplification of insulin secretion.We therefore assessed insulin secretion in response to glucose,10 mM a-ketoisocaproic acid (a-KIC), a mitochondrial fueland 35 mM KCl, which bypasses metabolic coupling and directlydepolarizes the plasma membrane. In islets from pre-diabeticb-Tfb1m2/2 mice, insulin secretion in response to 16.7 mM
glucose, but not 2.8 mM glucose, was significantly reduced(21.6-fold, P , 0.05) compared with control islets (Fig. 5F).Moreover, insulin secretion in response to a-KIC and KCl wasalso impaired in b-Tfb1m2/2 islets (22.2-fold, P , 0.05 fora-KIC; 23.9-fold, P , 0.001 for KCl; Fig. 5F). The reducedKCl response could indicate a loss of insulin from b-Tfb1m2/2
islets or an unspecific perturbation of the exocytotic machinery.Indeed, islet insulin content was reduced from 10.1+ 0.8 ng/islet in control islets to 5.5+ 0.8 ng/islet in b-Tfb1m2/2 islets(n ¼ 4, P ¼ 0.006). However, mRNA expression of Ins1 andIns2 genes were unchanged in b-Tfb1m2/2 islets (Supplemen-tary Material, Fig. S1). Thus, these results indicate that disrup-tion of Tfb1 m in b-cells impaired fuel-stimulated secretionand biosynthesis of insulin.
Given the reduction in insulin content, which can be attributedto either impaired production or increased turnover of insulingranules, we examined the volume density of insulin granules(Nv; corresponds to the total number of insulin granules) priorto the development of diabetes. Indeed, Nv was reduced from10.7+ 0.7 granules/mm3 in control b-cells to 4.7+ 1.1 gran-ules/mm3 in Tfb1m-deficient b-cells (Fig. 5G; n ¼ 3, P ,0.01), reflecting the reduction in insulin content. Moreover, thesurface density of insulin granules (Ns), which is a measure ofdocked granules, was similarly reduced from 0.64+ 0.07 gran-ules/mm2 in control b-cells to 0.34+ 0.04 granules/mm2 inTfb1m-deficient b-cells (Fig. 5H; n ¼ 3; P , 0.05). Becauseinsulin biosynthesis largely depends on fuel metabolism (18),mitochondrial dysfunction may underlie the reduced numberof insulin granules in b-Tfb1m2/2 islets and hence insulincontent, functionally contributing to abrogated insulin secretion.
Perturbed islet morphology and b-cell lossin b-Tfb1m2/2 mice
Next, we examined the impact of Tfb1m deficiency inb-cells onislet morphology andb-cell mass. Immunostaining of pancreaticsections with antibodies against insulin, glucagon and somato-statin revealed normal islet architecture in pre-diabeticb-Tfb1m2/2 mice (Fig. 6A). Nevertheless, unbiased quantita-tive stereological analysis revealed small, but significant,decreases in b-cell mass and b-cell area per pancreatic area in
Figure 4. Mitochondrial ultrastructure in b-Tfb1m2/2 islets. (A) Representative electron micrograph showing normally shaped mitochondria (m) in a controlb-cell(b). (B and C) Representative electron micrograph showinga- andb-cells within an early-stageb-Tfb1m2/2 islet. Note clumped mitochondria (m) in theb-cell (b),whereas the adjacenta-cell (a) contains normal mitochondria (m). (D) Representative electron micrograph showing d- andb-cells within an early-stageb-Tfb1m2/2
islet. (E and F) Representative electron micrographs showing mitochondria in b-cells within a control islet (E) and an early-stage b-Tfb1m2/2 islet (F). (G) Boxplotdescriptive statistics of the total mitochondrial area inb-cells from early-stage control andb-Tfb1m2/2 islets. Data were derived from 41 cells in control and 35 cells inearly-stage b-Tfb1m2/2 mice.
6 Human Molecular Genetics, 2014
at INSE
RM
on July 22, 2014http://hm
g.oxfordjournals.org/D
ownloaded from
pre-diabeticb-Tfb1m2/2 mice, whereas mean islet size and isletnumber were unchanged (Fig. 6A and Fig. 7A–D). We alsoexamined an intermediate group of b-Tfb1m2/2 mice, whichwere hyperglycemic but had not yet developed severe clinicalsymptoms of the disease (plasma glucose: 15.5+ 1.0 mM; age:89+ 8 days). Indeed, reflecting the rise in plasma glucose,
islets fromb-Tfb1m2/2 mice at the intermediate stage exhibitedadditional decreases in b-cell area per pancreatic area and isletnumber, whereas mean islet size was not significantly changed(Fig. 6B and Fig. 7E–G). Accordingly, immunostaining of pan-creatic sections from late-stage, overtly diabetic, b-Tfb1m2/2
mice (plasma glucose: 26.3+ 0.8 mM; age: 149+ 19 days)
Figure 5. Whole-body metabolism and insulin secretion in vivo and vitro inb-Tfb1m2/2 mice. (A) Growth curves of control andb-Tfb1m2/2 mice. (B) Blood glucoseover time in control and b-Tfb1m2/2 mice. (C) Plasma insulin levels in non-fasted late-stage control and b-Tfb1m2/2 mice (age: 138+19 and 149+19 days, re-spectively). (D) Blood glucose during an IPGTT in early-stage control and b-Tfb1m2/2 mice. (E) Blood insulin levels during an IPGTT in early-stage control andb-Tfb1m2/2 mice. (F) Insulin secretion from isolated islets during a 1-h incubation in response to 2.8 and 16.7 mM glucose (G), 10 mM a-KIC and 16.7 mM glucosewith 35 mM potassium chloride (KCl). (G) Histograms of the volume density (Nv), and (H) the surface density (Ns) of insulin granules in control andb-Tfb1m2/2 mice.Granules were defined as docked if the center of the granules were within 150 nm of the plasma membrane. Data are presented as means+SEM of values from 4 to 8mice of each genotype. Statistical differences were examined by repeated measures of two-way ANOVA (A, B, D and E) followed by Bonferroni’s post-test or byStudent’s t-test (C, F, G, H). ∗P , 0.05, ∗∗P , 0.01 and ∗∗∗P , 0.001 versus the corresponding value for control mice.
Human Molecular Genetics, 2014 7
at INSE
RM
on July 22, 2014http://hm
g.oxfordjournals.org/D
ownloaded from
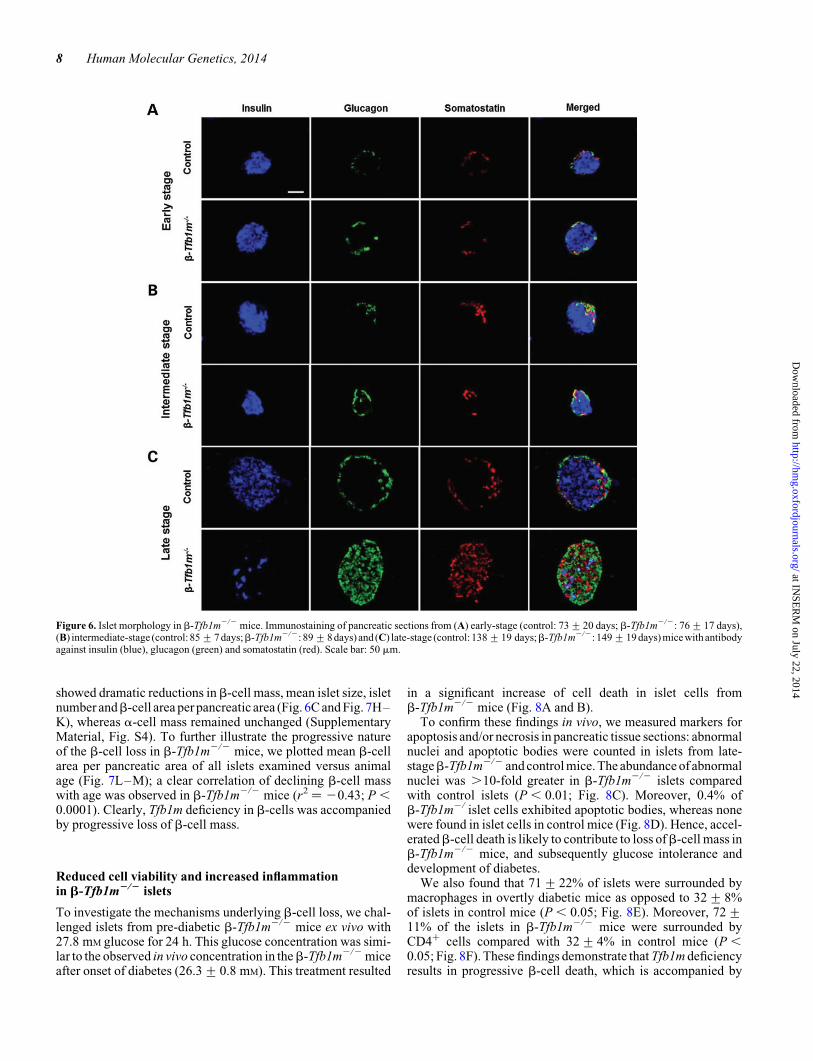
showed dramatic reductions inb-cell mass, mean islet size, isletnumber andb-cell area per pancreatic area (Fig. 6C and Fig. 7H–K), whereas a-cell mass remained unchanged (SupplementaryMaterial, Fig. S4). To further illustrate the progressive natureof the b-cell loss in b-Tfb1m2/2 mice, we plotted mean b-cellarea per pancreatic area of all islets examined versus animalage (Fig. 7L–M); a clear correlation of declining b-cell masswith age was observed in b-Tfb1m2/2 mice (r2 ¼ 20.43; P ,0.0001). Clearly, Tfb1m deficiency in b-cells was accompaniedby progressive loss of b-cell mass.
Reduced cell viability and increased inflammationin b-Tfb1m2/2 islets
To investigate the mechanisms underlying b-cell loss, we chal-lenged islets from pre-diabetic b-Tfb1m2/2 mice ex vivo with27.8 mM glucose for 24 h. This glucose concentration was simi-lar to the observed in vivo concentration in theb-Tfb1m2/2 miceafter onset of diabetes (26.3+ 0.8 mM). This treatment resulted
in a significant increase of cell death in islet cells fromb-Tfb1m2/2 mice (Fig. 8A and B).
To confirm these findings in vivo, we measured markers forapoptosis and/or necrosis in pancreatic tissue sections: abnormalnuclei and apoptotic bodies were counted in islets from late-stageb-Tfb1m2/2 and control mice. The abundance of abnormalnuclei was .10-fold greater in b-Tfb1m2/2 islets comparedwith control islets (P , 0.01; Fig. 8C). Moreover, 0.4% ofb-Tfb1m2/ islet cells exhibited apoptotic bodies, whereas nonewere found in islet cells in control mice (Fig. 8D). Hence, accel-eratedb-cell death is likely to contribute to loss ofb-cell mass inb-Tfb1m2/2 mice, and subsequently glucose intolerance anddevelopment of diabetes.
We also found that 71+ 22% of islets were surrounded bymacrophages in overtly diabetic mice as opposed to 32+ 8%of islets in control mice (P , 0.05; Fig. 8E). Moreover, 72+11% of the islets in b-Tfb1m2/2 mice were surrounded byCD4+ cells compared with 32+ 4% in control mice (P ,0.05; Fig. 8F). These findings demonstrate that Tfb1m deficiencyresults in progressive b-cell death, which is accompanied by
Figure 6. Islet morphology in b-Tfb1m2/2 mice. Immunostaining of pancreatic sections from (A) early-stage (control: 73+20 days; b-Tfb1m2/2: 76+17 days),(B) intermediate-stage (control: 85+7 days;b-Tfb1m2/2: 89+8 days) and (C) late-stage (control: 138+19 days;b-Tfb1m2/2: 149+19 days) mice with antibodyagainst insulin (blue), glucagon (green) and somatostatin (red). Scale bar: 50 mm.
8 Human Molecular Genetics, 2014
at INSE
RM
on July 22, 2014http://hm
g.oxfordjournals.org/D
ownloaded from
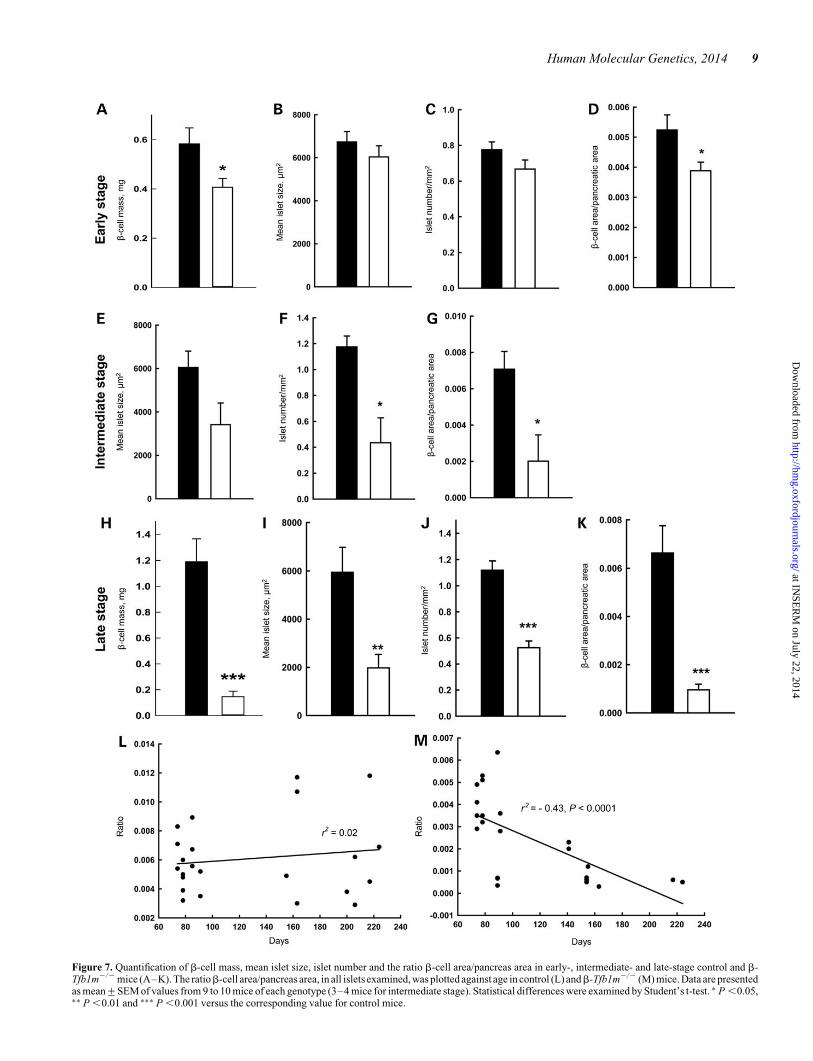
Figure 7. Quantification of b-cell mass, mean islet size, islet number and the ratio b-cell area/pancreas area in early-, intermediate- and late-stage control and b-Tfb1m2/2 mice (A–K). The ratiob-cell area/pancreas area, in all islets examined, was plotted against age in control (L) andb-Tfb1m2/2 (M) mice. Data are presentedas mean+SEM of values from 9 to 10 mice of each genotype (3–4 mice for intermediate stage). Statistical differences were examined by Student’s t-test. ∗ P ,0.05,∗∗ P ,0.01 and ∗∗∗ P ,0.001 versus the corresponding value for control mice.
Human Molecular Genetics, 2014 9
at INSE
RM
on July 22, 2014http://hm
g.oxfordjournals.org/D
ownloaded from
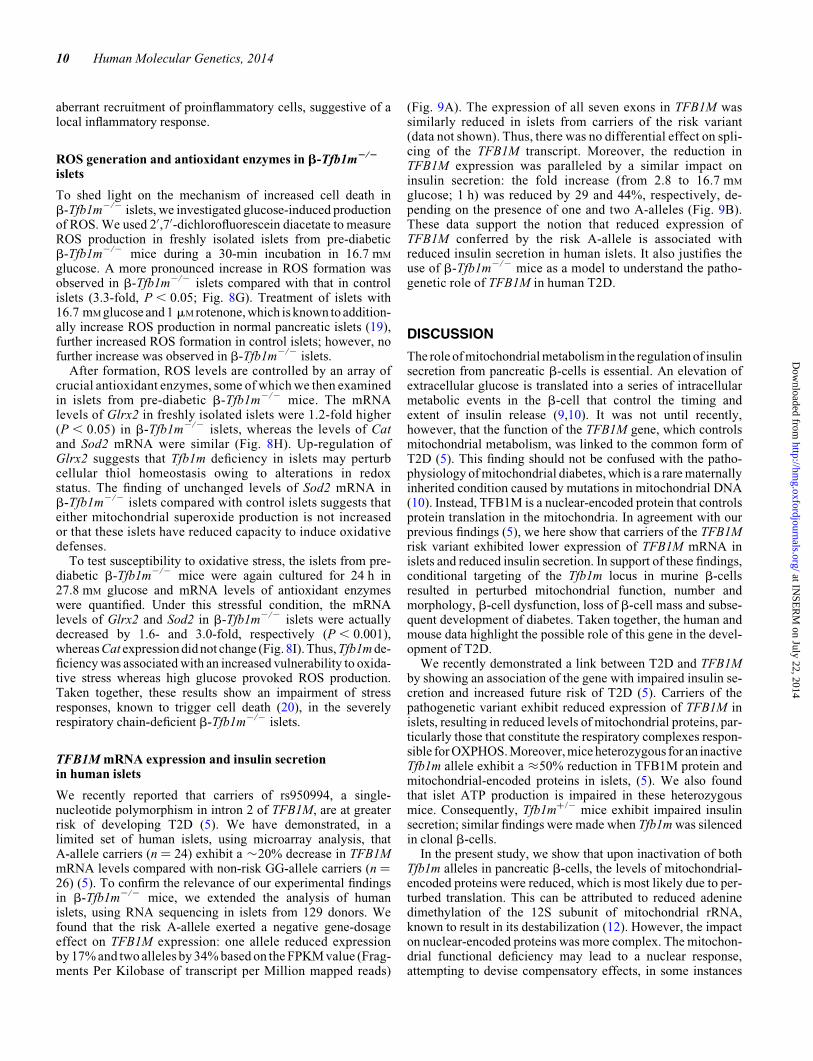
aberrant recruitment of proinflammatory cells, suggestive of alocal inflammatory response.
ROS generation and antioxidant enzymes in b-Tfb1m2/2
islets
To shed light on the mechanism of increased cell death inb-Tfb1m2/2 islets, we investigated glucose-induced productionof ROS. We used 2′,7′-dichlorofluorescein diacetate to measureROS production in freshly isolated islets from pre-diabeticb-Tfb1m2/2 mice during a 30-min incubation in 16.7 mM
glucose. A more pronounced increase in ROS formation wasobserved in b-Tfb1m2/2 islets compared with that in controlislets (3.3-fold, P , 0.05; Fig. 8G). Treatment of islets with16.7 mM glucose and 1 mM rotenone, which is known to addition-ally increase ROS production in normal pancreatic islets (19),further increased ROS formation in control islets; however, nofurther increase was observed in b-Tfb1m2/2 islets.
After formation, ROS levels are controlled by an array ofcrucial antioxidant enzymes, some of which we then examinedin islets from pre-diabetic b-Tfb1m2/2 mice. The mRNAlevels of Glrx2 in freshly isolated islets were 1.2-fold higher(P , 0.05) in b-Tfb1m2/2 islets, whereas the levels of Catand Sod2 mRNA were similar (Fig. 8H). Up-regulation ofGlrx2 suggests that Tfb1m deficiency in islets may perturbcellular thiol homeostasis owing to alterations in redoxstatus. The finding of unchanged levels of Sod2 mRNA inb-Tfb1m2/2 islets compared with control islets suggests thateither mitochondrial superoxide production is not increasedor that these islets have reduced capacity to induce oxidativedefenses.
To test susceptibility to oxidative stress, the islets from pre-diabetic b-Tfb1m2/2 mice were again cultured for 24 h in27.8 mM glucose and mRNA levels of antioxidant enzymeswere quantified. Under this stressful condition, the mRNAlevels of Glrx2 and Sod2 in b-Tfb1m2/2 islets were actuallydecreased by 1.6- and 3.0-fold, respectively (P , 0.001),whereas Cat expression did not change (Fig. 8I). Thus, Tfb1m de-ficiency was associated with an increased vulnerability to oxida-tive stress whereas high glucose provoked ROS production.Taken together, these results show an impairment of stressresponses, known to trigger cell death (20), in the severelyrespiratory chain-deficient b-Tfb1m2/2 islets.
TFB1M mRNA expression and insulin secretionin human islets
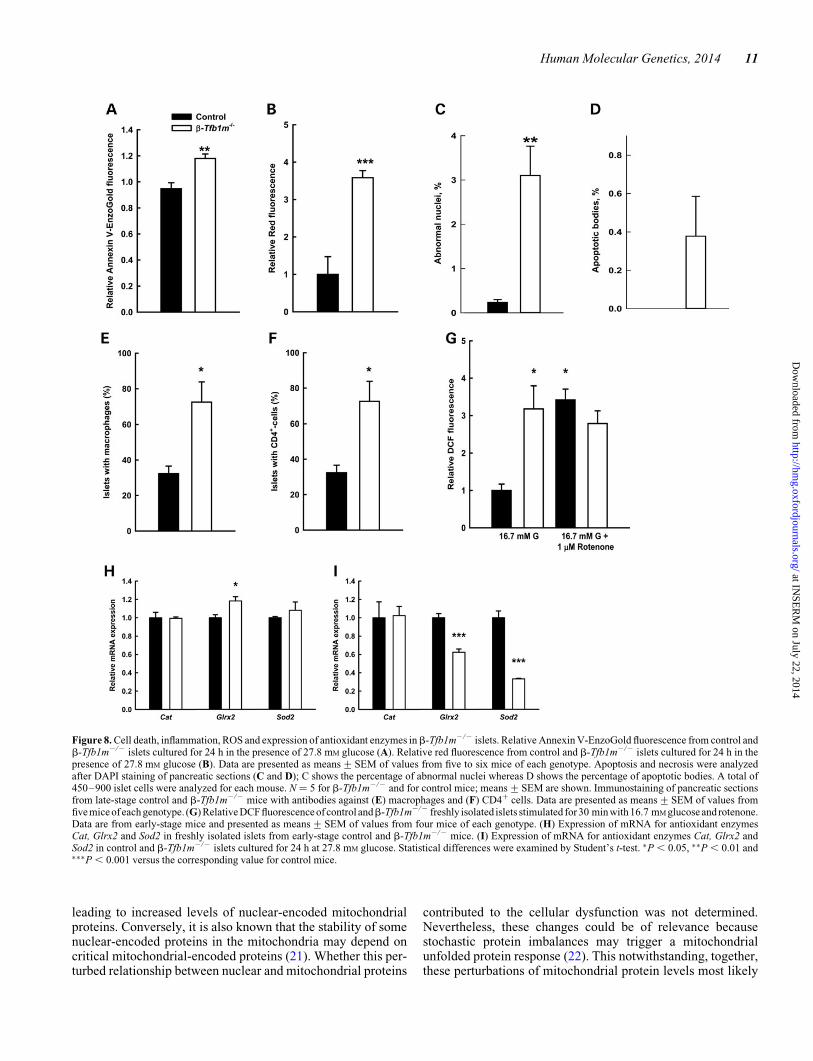
We recently reported that carriers of rs950994, a single-nucleotide polymorphism in intron 2 of TFB1M, are at greaterrisk of developing T2D (5). We have demonstrated, in alimited set of human islets, using microarray analysis, thatA-allele carriers (n ¼ 24) exhibit a �20% decrease in TFB1MmRNA levels compared with non-risk GG-allele carriers (n ¼26) (5). To confirm the relevance of our experimental findingsin b-Tfb1m2/2 mice, we extended the analysis of humanislets, using RNA sequencing in islets from 129 donors. Wefound that the risk A-allele exerted a negative gene-dosageeffect on TFB1M expression: one allele reduced expressionby 17% and two alleles by 34% based on the FPKM value (Frag-ments Per Kilobase of transcript per Million mapped reads)
(Fig. 9A). The expression of all seven exons in TFB1M wassimilarly reduced in islets from carriers of the risk variant(data not shown). Thus, there was no differential effect on spli-cing of the TFB1M transcript. Moreover, the reduction inTFB1M expression was paralleled by a similar impact oninsulin secretion: the fold increase (from 2.8 to 16.7 mM
glucose; 1 h) was reduced by 29 and 44%, respectively, de-pending on the presence of one and two A-alleles (Fig. 9B).These data support the notion that reduced expression ofTFB1M conferred by the risk A-allele is associated withreduced insulin secretion in human islets. It also justifies theuse of b-Tfb1m2/2 mice as a model to understand the patho-genetic role of TFB1M in human T2D.
DISCUSSION
The role of mitochondrial metabolism in the regulation of insulinsecretion from pancreatic b-cells is essential. An elevation ofextracellular glucose is translated into a series of intracellularmetabolic events in the b-cell that control the timing andextent of insulin release (9,10). It was not until recently,however, that the function of the TFB1M gene, which controlsmitochondrial metabolism, was linked to the common form ofT2D (5). This finding should not be confused with the patho-physiology of mitochondrial diabetes, which is a rare maternallyinherited condition caused by mutations in mitochondrial DNA(10). Instead, TFB1M is a nuclear-encoded protein that controlsprotein translation in the mitochondria. In agreement with ourprevious findings (5), we here show that carriers of the TFB1Mrisk variant exhibited lower expression of TFB1M mRNA inislets and reduced insulin secretion. In support of these findings,conditional targeting of the Tfb1m locus in murine b-cellsresulted in perturbed mitochondrial function, number andmorphology, b-cell dysfunction, loss of b-cell mass and subse-quent development of diabetes. Taken together, the human andmouse data highlight the possible role of this gene in the devel-opment of T2D.
We recently demonstrated a link between T2D and TFB1Mby showing an association of the gene with impaired insulin se-cretion and increased future risk of T2D (5). Carriers of thepathogenetic variant exhibit reduced expression of TFB1M inislets, resulting in reduced levels of mitochondrial proteins, par-ticularly those that constitute the respiratory complexes respon-sible for OXPHOS. Moreover, mice heterozygous for an inactiveTfb1m allele exhibit a ≈50% reduction in TFB1M protein andmitochondrial-encoded proteins in islets, (5). We also foundthat islet ATP production is impaired in these heterozygousmice. Consequently, Tfb1m+/2 mice exhibit impaired insulinsecretion; similar findings were made when Tfb1m was silencedin clonal b-cells.
In the present study, we show that upon inactivation of bothTfb1m alleles in pancreatic b-cells, the levels of mitochondrial-encoded proteins were reduced, which is most likely due to per-turbed translation. This can be attributed to reduced adeninedimethylation of the 12S subunit of mitochondrial rRNA,known to result in its destabilization (12). However, the impacton nuclear-encoded proteins was more complex. The mitochon-drial functional deficiency may lead to a nuclear response,attempting to devise compensatory effects, in some instances
10 Human Molecular Genetics, 2014
at INSE
RM
on July 22, 2014http://hm
g.oxfordjournals.org/D
ownloaded from
leading to increased levels of nuclear-encoded mitochondrialproteins. Conversely, it is also known that the stability of somenuclear-encoded proteins in the mitochondria may depend oncritical mitochondrial-encoded proteins (21). Whether this per-turbed relationship between nuclear and mitochondrial proteins
contributed to the cellular dysfunction was not determined.Nevertheless, these changes could be of relevance becausestochastic protein imbalances may trigger a mitochondrialunfolded protein response (22). This notwithstanding, together,these perturbations of mitochondrial protein levels most likely
Figure 8. Cell death, inflammation, ROS and expression of antioxidant enzymes inb-Tfb1m2/2 islets. Relative Annexin V-EnzoGold fluorescence from control andb-Tfb1m2/2 islets cultured for 24 h in the presence of 27.8 mM glucose (A). Relative red fluorescence from control and b-Tfb1m2/2 islets cultured for 24 h in thepresence of 27.8 mM glucose (B). Data are presented as means+SEM of values from five to six mice of each genotype. Apoptosis and necrosis were analyzedafter DAPI staining of pancreatic sections (C and D); C shows the percentage of abnormal nuclei whereas D shows the percentage of apoptotic bodies. A total of450–900 islet cells were analyzed for each mouse. N ¼ 5 for b-Tfb1m2/2 and for control mice; means+SEM are shown. Immunostaining of pancreatic sectionsfrom late-stage control and b-Tfb1m2/2 mice with antibodies against (E) macrophages and (F) CD4+ cells. Data are presented as means+SEM of values fromfive mice of each genotype. (G) Relative DCF fluorescence of control andb-Tfb1m2/2 freshly isolated islets stimulated for 30 min with 16.7 mM glucose and rotenone.Data are from early-stage mice and presented as means+SEM of values from four mice of each genotype. (H) Expression of mRNA for antioxidant enzymesCat, Glrx2 and Sod2 in freshly isolated islets from early-stage control and b-Tfb1m2/2 mice. (I) Expression of mRNA for antioxidant enzymes Cat, Glrx2 andSod2 in control and b-Tfb1m2/2 islets cultured for 24 h at 27.8 mM glucose. Statistical differences were examined by Student’s t-test. ∗P , 0.05, ∗∗P , 0.01 and∗∗∗P , 0.001 versus the corresponding value for control mice.
Human Molecular Genetics, 2014 11
at INSE
RM
on July 22, 2014http://hm
g.oxfordjournals.org/D
ownloaded from
reduced electron transport and subsequently OXPHOS, whichled to mitochondrial dysfunction inb-Tfb1m2/2 islets. As a con-sequence, b-cell stimulus-secretion coupling was perturbed,insulin release and content reduced, and the b-Tfb1m2/2 miceprogressively became glucose intolerant, hyperglycemic and ul-timately developed diabetes. This phenotype seems to have beenbrought about by a combination of b-cell dysfunction and even-tually loss of b-cell mass, driven by the mitochondrial dysfunc-tion. The temporal sequence of events indicates that cellulardysfunction preceded cell loss. This process is very similar tothe development of T2D (2,3), although the velocity of eventshas been accelerated in our model.
Following the initial perturbation of b-cell function, owing tothe mitochondrial impairments, b-cell mass was progressivelyreduced upon loss of Tfb1m. This could be attributed to bothapoptosis and necrosis. Indeed, there are several murine andexperimental models, in which deficiencies in electron
transport and/or OXPHOS result in extensive cell death(23,24), most likely due to energy deficiency. We believe thata similar process promoted cell death in b-Tfb1m2/2 islets.Under physiological conditions, functional b-cells are metabol-ically very active cells; they rely foremost on ATP produced inmitochondria rather than through glycolysis. In a pathologicalsituation, dramatic reduction of ATP production could lead todeath of any cell (25), and depletion of ATP can transform anongoing apoptotic process into necrosis (26). The energy deple-tion inb-Tfb1m2/2 b-cells owing to electron transport dysfunc-tion and impaired OXPHOS could by itself account for celldeath.
It has also become increasingly clear that pancreatic b-cellsare characterized by a weak antioxidant defense (27). Onlylimited amounts of ROS are formed in mitochondria becauseO2 is reduced to H2O. Experimental studies have demonstratedthat a global impairment of mitochondrial DNA expression in
Figure 9. Expression of TFB1M mRNA and insulin secretion in human islets. (A) RNA sequencinganalysis of TFB1M expression (log2(x + 1)-transformed FPKM) inhuman islets; n ¼ 65 (GG), n ¼ 55(AG), n ¼ 9 (AA). (B) Fold-response of insulin secretion in human islets; nGG ¼ 71, nAG ¼ 58 and nAA ¼ 12. Statisticaldifferenceswere examined by Student’s t-test. ∗P , 0.05. (C) A schematic cartoon showing the mechanisms whereby a deficiency of TFB1M may contribute to loss of b-cellfunction and mass in T2D. ATP, adenosintriphosphate; mt, mitochondrial; OCR, oxygen consumption rate; ROS, reactive oxygen species; rRNA, ribosomal RNA.
12 Human Molecular Genetics, 2014
at INSE
RM
on July 22, 2014http://hm
g.oxfordjournals.org/D
ownloaded from
the mouse does not lead to increased ROS production, althoughapoptotic cell death is increased (23,28,29). Here, we challengedb-Tfb1m2/2 islets with glucose and observed a marked increaseof ROS production. Although this process is attractive as a mech-anism for cell death in b-Tfb1m2/2 islets, the result must beinterpreted with caution as the subcellular origin of this ROS pro-duction is unknown. Several other enzymes in metabolism,besides the respiratory chain, are known to produce ROS, e.g.a-ketoglutarate dehydrogenase in the TCA-cycle (30) as wellas intrinsic NADPH oxidase activity inb-cells (31). The macro-phages recruited to the b-Tfb1m2/2 islets, perhaps to clearapoptotic cells, may also be a source for extrinsic productionof ROS. Regardless of the source, the observed increase ofROS production in response to elevated glucose in b-Tfb1m2/2
islets may contribute to the observed cell death. We found thatb-Tfb1m2/2 islets lacked the capacity to induce mRNA expres-sion of scavenging enzymes, e.g. Sod2, in response to oxidativestress. In fact, mRNA levels of Glrx2 and Sod2 in b-Tfb1m2/2
islets were reduced. These findings indicate that the bioenergeticdeficiency in b-Tfb1m2/2 islets led to a decrease of cellularstress responses. This is likely to increase the propensity forcell death. In addition, a perturbed balance between nuclearand mitochondrial proteins may trigger a mitochondrialunfolded protein response. This may further increase the riskof cell death.
Our findings of cell death may also be relevant for humanT2D, whereb-cell loss and apoptosis in islets have been reported(32). The possibility of necrosis with attendant inflammationwas confirmed by an accumulation of macrophages and CD4+
cells in the vicinity of and throughout the b-Tfb1m2/2 islets.This finding is noteworthy, given the recent interest in localislet inflammation in the pathogenesis of T2D (29). Taken to-gether, our data suggest that the disrupted translation of mito-chondrial proteins caused a combined insult of a bioenergeticdeficiency, which depleted ATP, and increased ROS productioninb-Tfb1m2/2 b-cells. It is not unlikely that the bioenergetic de-ficiency and increase in ROS production were mechanisticallylinked because impaired electron transport is known to increaseROS formation (23,28,29). Nevertheless, such an insult maylead to b-cell death via apoptosis and necrosis.
Previous studies of islets from humans with T2D have shownthat mitochondrial membrane polarization and the ATP/ADPratio are unresponsive to glucose (33). Moreover, mitochondrialdensity is increased and mitochondrial morphology altered inislets from T2D patients (4). In mice, a b-cell-specific knockoutof Tfam, the major regulator of expression of mitochondrial-encoded genes, results in a phenotype similar to that of theb-Tfb1m2/2 mice: insulinopenic diabetes evolves owing to acombination of b-cell dysfunction and loss of b-cell mass(34). However, no signs of apoptosis could be detected in Tfamnull mice, but in vitro challenges of islets were not performed.These findings, however, are clearly reminiscent of what wehave observed here and in our previous studies of TFB1M (5).An important difference is that the previous observations ofmitochondrial dysfunction in islets from humans with T2D donot prove a causal relationship (4); they may be secondary tothe pathological metabolic milieu. Furthermore, whereas Tfamis critical for the transcriptional regulation in mitochondria, ithas not been genetically or causally linked to human T2D,whereas this link has been shown for TFB1M (5).
Taken together, our findings point to a pathogenetic and clin-ically important role of TFB1M in T2D. Our data propose amolecular mechanism for TFB1M deficiency in b-cells and itsinvolvement in the pathogenesis of T2D: mitochondrial dys-function paves the way for the development of diabetes owingto combinedb-cell dysfunction and loss ofb-cell mass (Fig. 9C).
MATERIALS AND METHODS
Generation of mice with a b-cell-specific knockout of Tfb1m
To generate a conditional knockout of Tfb1m inb-cells, we usedTfb1mloxP/loxP mice in which exon 3 of the Tfb1m locus wasflanked by two loxP sites (12). Heterozygous Tfb1m+/loxP micewere mated to heterozygous transgenic mice expressing Cre re-combinase under the control of a rat insulin 2 gene promoter(Rip-Cre) (35). Mice with the genotype Tfb1m+/loxP,+/Rip2Cre
were recovered from this cross and bred with Tfb1mloxP/loxP
mice to generate Tfb1mloxP/loxP,+/Rip2Cre (b-Tfb1m2/2; b-cell-specific Tfb1m knockout mice) and Tfb1mloxP/loxP (b-Tfb1m+/+;control) mice. Both male and female animals were used for theexperiments. The floxed Tfb1m+/2 mice used in this studyhave been backcrossed more than nine times onto the C57BL/6J background. For the experiments, mice were defined as earlystage/pre-diabetic (control: glucose 9.6+ 0.4 mM, age: 73+ 20days; b-Tfb1m2/2: glucose 9.4+ 0.3 mM, age: 76+ 17 days),intermediate stage (control: glucose 8.1+ 0.4 mM, age: 85+ 7days; b-Tfb1m2/2: glucose 15.5+ 1.0 mM, age: 89+ 8 days)and late stage/diabetic (control: glucose 8.4+ 0.1 mM, age:138+ 19 days; b-Tfb1m2/2: glucose 26.3+ 0.8 mM; age:149+ 19 days); ages are given as mean+SD. Mouse breedingand handling were carried out according to procedures approvedby the regional animal ethical committee in Lund, Sweden.
Mouse and human islets
Pancreata were removed from mice, chopped and digested at378C in 3 ml of Hanks’ balanced salt solution containing0.8 mg/ml of collagenase for 7–8 min with continuous shaking.Islets were hand-picked under a stereo microscope and incubatedat 378C overnight in a humidified atmosphere of air and 5% CO2
in RPMI-1640 medium (11.1 mM glucose) supplemented with10% fetal calf serum, 100 U/ml penicillin and 100 mg/ml strep-tomycin sulfate.
Human islets were from deceased donors obtained from theNordic Center for Clinical Islet Transplantation by courtesy ofProfessor Olle Korsgren, Uppsala University, Sweden. Isletswere processed at the Human Tissue Laboratory at Lund Univer-sity Diabetes Centre. Purity varied from 23 to 90%, as deter-mined by supravital dithizone staining as described (36). Theislets were cultured in CMRL 1066 (ICN Biomedicals, CostaMesa, CA, USA) supplemented with 10 mmol/l HEPES,2 mmol/l l-glutamine, 50 mg/ml gentamicin, 0.25 mg/ml Fungi-zone (GIBCO, BRL, Gaithersburg, MD, USA), 20 mg/ml cipro-floxacin (Bayer Healthcare, Leverkusen, Germany) and10 mmol/l nicotinamide at 378C in a humidified atmosphere of95% air and 5% CO2 for 1–9 days prior to analysis. All isletdonors had given consent to donate organs for medical research.The procedures were approved by the human ethical committeesin Uppsala and Lund.
Human Molecular Genetics, 2014 13
at INSE
RM
on July 22, 2014http://hm
g.oxfordjournals.org/D
ownloaded from
Genotyping
The genotype of the mice was verified by PCR analysis of DNAisolated from ear clip DNA (DNeasy Blood and Tissue kit;QIAGEN). The presence of the Rip-Cre gene was confirmedby the amplification of an approximately 400-bp product,using forward 5′ GCATTACCGGCTGATGCAACGAGTGATGAG and reverse 5′ GAGTGAACGAACCTGGTCGAAATCAGTGCG primers. PCR conditions were 958C for 1 min, fol-lowed by 35 cycles of 958C for 30 s, 688C for 3 min and 688C for3 min. Genomic PCR for detection of the lox p allele was per-formed using forward 5′ ATGTTTACAGGCTTAGTTGAAand reverse 5′ TAGTAGAGAATACTGCCACAG primers.PCR products were 198 bp for the wild-type allele and 244 bpfor the lox p allele. PCR amplification was performed at 958Cfor 5 min, and 35 cycles of 958C for 30 s, 558C for 30 s, 72 8Cfor 30 s and the final extension at 728C for 5 min.
The genotyping of the human islets was performed on the Illu-mina HumanOmniExpress 12v1 chips (Illumina, Inc., SanDiego, CA, USA) according to manufacturer’s instruction. Gen-otypes for rs950994 were called using Illumina Genome studiosoftware.
RNA extraction, reverse transcription and quantitativereal-time PCR
Total RNA was extracted from islets, using RNAeasy RNA puri-fication kit (Qiagen GmbH, Hilden, Germany) according to themanufacturer’s instructions. RNA concentration was determinedusing a NanoDrop Spectrophotometer (Thermo Scientific) andits quality assessed with the Agilent Bioanalyzer. Equal quan-tities of total RNA were reverse-transcribed using RevertAid
TM
First-Strand cDNA synthesis kit (Fermentas, Vilnius, Lithuania)in reactions containing 500 ng of total RNA, 50 mM Tris–HCl(pH 8.3), 1 mM dNTPs, 200 ng of random hexamer primers,50 mM KCl, 4 mM MgCl2, 10 mM dithiothreitol, 200 U of Rever-tAid
TM
Moloney murine leukemia virus reverse transcriptase and20 U of RiboLock
TM
ribonuclease inhibitor in a final volume of20 ml. The reaction cycle consisted of 10 min of incubation at258C followed by 60 min of incubation at 428C and terminationof the reaction by heating at 708C for 5 min. Samples were storedat 2208C.
Q-PCR was performed on an ABI Prism 7900 HT system(Applied Biosystems), using TaqMan chemistry. All reactionswere performed in triplicate in a final volume of 20 ml containing5 ml of TaqMan Universal PCR Master Mix, 0.25 ml of a corre-sponding TaqMan assay and 12 ng of cDNA template. cDNAwas amplified by 40 cycles of 958C for 15 s and 608C for1 min. mRNA levels of genes were quantified using predesignedTaqMan Gene Expression assays (Applied Biosystems, Supple-mentary Material, Table S2). Gene expression was determinedby the absolute quantification method and normalized tomRNA levels of Hprt or Vdac1.
RNA sequencing
RNA-sequencing libraries were generated from 129 isletdonors (TruSeq RNA sample preparation kit, Illumina) andsequenced on an Illumina HiSeq 2000 using paired-end
chemistry and 100-bp cycles to an average depth of 32 M readpairs/sample. Reads were aligned to hg19, using STAR (37),and read count calculated by HTSeq-count (http://www-huber.embl.de/users/anders/HTSeq/doc/count.html). Data were log2-transformed and normalized, using trimmed mean of M-valuesas implemented in the R-package edgeR. The global genomicand transcriptomic analyses of our human islet depositoryare under review elsewhere (Fadista et al. submitted). The fulldata set will be deposited online for public use once the studyhas been published.
Immunoblot analysis
Islets were solubilized in homogenization buffer (100 mM
HEPES, 9 M urea, 1% Triton X-100, 2 mM EDTA, pH 7.2)mixed with 1:100 (v/v) protease inhibitor cocktail (Sigma,St. Louis, MO, USA). Protein concentration was determinedby the BCA method, protein lysates mixed 1 : 5 with loadingbuffer (100 mM HEPES, 10% SDS, 10% dithiothreitol, 20% gly-cerol, pH 7.2), and 40 mg of total protein were run onto a 12%SDS–PAGE gel and subsequently blotted onto PVDF mem-branes. Proteins for TFB1M, ND1 (complex I), NDUFB8(complex I), SDHB (complex II), COX1 (complex IV) andATP5A (FOF1 ATP synthase, subunit a) were detected asdescribed previously (5). b-Tubulin was detected with primaryrabbit polyclonal antibody (Abcam, Cambridge, UK) in dilutionof 1 : 500. Horseradish peroxidase-coupled goat-anti-rabbit IgG(1:6000) and goat-anti-mouse IgG (1 : 6000) (Santa Cruz Bio-technology, Santa Cruz, CA, USA) were used as a secondaryantibody. Blots were developed with enhanced chemilumines-cence (Amersham Biosciences), and detection was performedusing Molecular Imagerw ChemiDoc
TM
XRS with Image Labsoftware (BioRad). For loading, control blots were strippedwith Restore Western Blot Stripping Buffer (Thermoscientific).
Primer extension analysis
A set of two primers (MM49 and MM13) was used for primer ex-tension. MM49 (12 bases, 5′ GTGTAATTTTAC 3′) is comple-mentary to a region close to the 5′ end of 12S rRNA, and itsextension product (P1; 46 bases) was used as a 12S rRNAloading control. MM13 (12 bases, 5′ ATTATTCCAAGC 3′) iscomplementary to a region positioned downstream of thedimethylated A1006 and A1007. Extension of this primer isinhibited by the presence of methylation and leads to accumula-tion of an extension product P2 (17 bases). Primers were labeledwith g-32P-ATP by using T4 polynucleotide kinase. Labeledprimers were purified using MicroSpin G-25 chromatographycolumns (GE Healthcare) and annealed to RNA from islets ofcontrol and b-Tfb1m2/2 mice. Reactions were incubated at658C for 5 min and placed on ice. M-MuLV Reverse Transcript-ase (Stratagene) was added to 5 U/ml together with dNTPs(0.25 mM/ml each). The reactions were incubated for 1 h at378C. Extension products were precipitated and resuspendedin loading buffer (formamide, 1 mg/ml bromophenol blue,1 mg/ml xylene cyanol, 10 mM EDTA; pH 8.0). Primer exten-sion products were resolved using denaturing urea-PAGE anddetected by autoradiography.
14 Human Molecular Genetics, 2014
at INSE
RM
on July 22, 2014http://hm
g.oxfordjournals.org/D
ownloaded from
Blood glucose
Blood glucose concentrations were repeatedly measured (bi-weekly) in non-fasted control and b-Tfb1m2/2 mice (n ¼ 5–8).The blood glucose concentration was determined using a Free-Style Lite Glucose Analyser (Abbot Diabetes Care, Inc., USA).
Intraperitoneal glucose tolerance test
IPGTTs were performed in fasted mice; food was removed 5 hbefore the glucose challenge. The mice were anesthetized aspreviously described (38). Blood was collected retroorbitallyat 0, 10, 30, 60 and 120 min after intraperitoneal injection ofglucose (2 g/kg body weight). The plasma glucose concentrationwas measured by the FreeStyle Lite Glucose Analyser (Abbott,Abbott Park, Ill, USA). Insulin concentration was assayed by theUltrasensitive Mercodia insulin enzyme-linked immunosorbentassay (Mercodia, Uppsala, Sweden).
Insulin secretion assay
Islets were preincubated in Krebs-Ringer bicarbonate buffer(KRBB) containing (mM) 114 NaCl, 4.7 KCl, 1.2 KH2PO4,1.16 MgSO4, 20 HEPES, 25.5 NaHCO3, 2.5 CaCl2 at pH 7.2with 2 mg/ml BSA and 2.8 mM glucose for 1 h at 378C. Next,groups of three islets were incubated at 378C for 1 h in 300 mlKRBB containing 2.8 mM glucose, 16.7 mM glucose, 2.8 mM
glucose and 10 mM a-KIC, or 16.7 mM glucose and 35 mM
KCl. The buffer was removed, and secreted insulin was deter-mined by the Mercodia insulin enzyme-linked immunosorbentassay.
Islet insulin content
Islets were washed in PBS, mixed with ethanol/HCl at 48C andsonicated. Thereafter, islets were repeatedly frozen andthawed and centrifuged for 5 min at 16 000 g. Supernatantswere stored at 2208C until assayed by the Mercodia insulinenzyme-linked immunosorbent assay (Uppsala, Sweden).
Mitochondrial membrane potential
Islets were loaded with 400 nM TMRM for 2 h in KRBB contain-ing 2.8 mM glucose, thus permitting analysis in “quench mode”(39). The chambered cover glass was inserted into a temperature-controlled (378C) and CO2-controlled (5%) incubation chamberon the stage of a Zeiss LSM510 inverted confocal fluorescencemicroscope. TMRM was excited at 543 nm, and emission wasdetected with a 585-nm long-pass filter. Islets were stimulatedwith 16.7 mM glucose, oligomycin and FCCP at the times indi-cated in Figure 3A to investigate changes in mitochondrial mem-brane potential. Fluorescence intensity was measured in nineislets from control mice (n ¼ 5) and 26 islets fromb-Tfb1m2/2 mice (n ¼ 7; age: 76+ 17 days).
Oxygen consumption
OCR was measured in islets using the XF (extracellular flux)analyzer XF24 (Seahorse Bioscience, Billerica, MA, USA), aspreviously described in detail (40). Following a pre-incubation
at 2.8 mM glucose for 1 h, the OCR was assayed at 2.8 mM
glucose subsequent to a transition to 16.7 mM glucose. AUCwas calculated under the high glucose-stimulated condition.
ATP measurements
Islets were washed in PBS, lysed in Tris–EDTA buffer andATPmeasuredwithaluciferase-basedluminescentassayaccord-ing to the manufacturer’s instructions (BioThema, Handen,Sweden). The rate of mitochondrial ATP production in digitonin(400 mg/ml)-permeabilized islets was measured as previouslydescribed (41) with a mixture of 15 mM glutamate and 15 mM
succinate as stimulating substrate.
Tissue processing
Pancreata were dissected out and weighed before they were fixedovernight at 48C in Stefanini’s solution (2% paraformaldehydeand 0.2% picric acid in 0.1 M PBS; pH 7.2). The tissue waswashed thoroughly 3 × 24 h at 48C, in Tyrode’s solution con-taining 10% sucrose, and thereafter frozen on dry ice. Sections(10 mm) were cut and thaw-mounted on slides.
Immunocytochemistry
Antibodies were diluted in PBS, pH 7.2, containing 0.25% BSAand 0.25% Triton X-100. Sections were incubated with primaryantibodies against insulin (dilution: 1 : 5000, code: 9003, Euro-Diagnostica, Malmo, Sweden), glucagon (dilution: 1 : 5000,code: 7811, EuroDiagnostica), somatostatin (dilution: 1 : 1600,code: sc-7819, Santa Cruz Biotechnology, California, USA),macrophages (dilution: 1 : 1000, T-2007, BMA Biomedicals,Augst, Switzerland), chromogranin A and B (dilution: 1 : 25,code: CAB, EuroDiagnostica) or CD4 (dilution: 1 : 100, code:ab64145, AbCam) overnight at 48C in moisture chambers. Sec-tions were rinsed 2 × 10 min in PBS with 0.25% Triton X-100and incubated 1 h at RT with secondary antibody with specificityfor rabbit-, guinea pig-, rat- or goat-IgG coupled to either Cy2,Texas red or AMCA (all from Jackson, West Grove, PA USA).Sections were rinsed as before and mounted in PBS/glycerol(1 : 1). For double and triple staining, the primary and thesecondary antibodies were applied simultaneously.
Morphometry
Immunofluorescence was examined in an epifluorescencemicroscope (Olympus BX60, Olympus, Tokyo, Japan). Imageswere acquired with a digital camera (Nikon DS- 2Mv, Nikon,Tokyo, Japan). For b-cell mass quantification, all islets in ran-domly selected parts of each pancreas (n ¼ 9 or more) were ana-lyzed using NIS-Elements software (NIS-Elements 3.1, Nikon).First, total insulin-stained area and total section area were ana-lyzed and calculated. The ratio achieved was multiplied withthe pancreas weight to calculate the b-cell mass. An averageof 40 islets per animal was analyzed. a-cell mass was quantifiedin a similar fashion in pancreatic sections immunostained forglucagon. The presence of leukocytes within, or in the vicinityof, the islets was detected by immunofluorescence stainingagainst a subpopulation of leukocytes and chromogranin A andB to visualize the islets. One or more specific leukocyte in an
Human Molecular Genetics, 2014 15
at INSE
RM
on July 22, 2014http://hm
g.oxfordjournals.org/D
ownloaded from
islet or within 150 mm from it was identified as a positive finding.The investigator was unaware of the identity of the specimensduring the analysis.
Electron microscopy
Groups of 40–50 isolated islets were fixed in Millonig buffer(2.26% NaH2PO4 and 2.52% NaON) containing 2.5% glutaral-dehyde. Following washing in Millonig buffer, islets were post-fixed in 1.0% osmium tetroxide, dehydrated and embedded inAGAR 100 (Oxfors Instruments Nordiska AB, Sweden). Theembedded islets were cut into 70- to 90-nm-thick ultrathin sec-tions and put on Cu grids and contrasted with uranyl acetateand lead citrate before being examined in JEM 1230 electronmicroscope (JEOL-USA, Inc., MA, USA). Micrographs wereanalyzed with respect to mitochondrial area, granule distributionand number of docked granules. The mitochondrial area and thegranule diameter were analyzed using ImageJ (NIH, freeware;see Supplementary Material, Fig. S2, for mitochondrial area).The estimated 3D diameter of the granules was calculated asdescribed previously (42). The volume granule density (Nv)and surface density (Ns) were calculated using an in-houseMatlab program.
Detection of apoptosis and necrosis
Batches of 35 islets were incubated overnight in completeRPMI-1640 medium containing 27.8 mM glucose. At the endof the incubation, apoptosis and necrosis were assessed inislets by a GFP-Certified Apoptosis/Necrosis Detection Kit(Enzo Life Sciences, Inc., USA), using a microplate analyzer(TECAN Infinite M200). In the assay, an Annexin V-EnzoGold(enhanced Cyanine-3) conjugate enables detection of apoptosisat 550/570 nm excitation/emission; the necrosis detectionreagent (red) identifies late markers of apoptosis and necrosisat 546/647 nm excitation/emission.
Pancreatic sections from five control mice (age: 138+ 19days) and five b-Tfb1m2/2 mice (age: 149+ 19 days; ages aregiven as mean+SD) were stained with DAPI to visualizenuclei. A total of 450–900 islet cells in each mouse were manu-ally counted to determine the percentage of abnormal nuclei(defined as previously detailed (43) and apoptotic bodies.
Statistical analyses
All calculations were performed in GraphPad Prism 4.03 (Graph-Pad, La Jolla, California, USA) software. P-values were consid-ered significant at ,0.05. All data are presented as mean+SEM of the indicated number of experiments or animals withthe exception of mouse ages and background data on isletdonors, which were given as mean+SD. Data were analyzedusing one-way ANOVA, two-way ANOVA, repeated measureof two-way ANOVA or two-tailed unpaired Student’s t-test. Stat-istical significance of differences in total mitochondrial area wasanalyzed using Student’s unpaired t-test and non-parametricboxplot descriptive statistics using R. In the latter non-overlapping box notches are strong indicators that medians ofthe two sets are different (44).
SUPPLEMENTARY MATERIAL
Supplementary Material is available at HMG online.
AUTHORS’ CONTRIBUTIONS
V.V.S. carried out the majority of in vivo and vitro experimentsand drafted parts of the manuscript. M.A., L.E. and I.G.M. per-formed the morphological and morphometric studies. J.S., J.F.and P.S. performed bioinformatics analyses of RNA sequencing.L.M.N., P.S., S.M. and J.A.S. performed in vivo and vitro experi-ments. M.D.M. and N.-G.L. performed the methylation exp-eriments. L.M.N. N.W., N.-G.L., L.E. and P.S. providedfeedback on data interpretation and assisted in writing the manu-script. H.M. conceived the study, interpreted results and wrotethe manuscript.
ACKNOWLEDGEMENTS
Rita Wallen is acknowledged for preparing the EM samples. L.E.is a senior researcher at the Swedish Research Council. LailaJacobsson is acknowledged for genotyping the mice.
Conflict of Interest statement. None declared.
FUNDING
Support was received from these funding bodies: EuropeanFoundation for the Study of Diabetes (EFSD), Crafoordska,Knut and Alice Wallenberg, Lars Hiertas Minne, Soderberg,O.E. och Edla Johansson, and Albert Pahlsson foundations,and The Swedish Research Council.
REFERENCES
1. Zimmet, P., Alberti, K.G. and Shaw, J. (2001) Global and societalimplications of the diabetes epidemic. Nature, 414, 782–787.
2. Ahren, B. (2005) Type 2 diabetes, insulin secretion and beta-cell mass. CurrMol Med, 5, 275–286.
3. Butler, A.E., Janson, J., Bonner-Weir, S., Ritzel, R., Rizza, R.A. and Butler,P.C. (2003) Beta-cell deficit and increased beta-cell apoptosis in humanswith type 2 diabetes. Diabetes, 52, 102–110.
4. Anello, M., Lupi, R., Spampinato, D., Piro, S., Masini, M., Boggi, U., DelPrato, S., Rabuazzo, A.M., Purrello, F. and Marchetti, P. (2005) Functionaland morphological alterations of mitochondria in pancreatic beta cells fromtype 2 diabetic patients. Diabetologia, 48, 282–289.
5. Koeck, T., Olsson, A.H., Nitert, M.D., Sharoyko, V.V., Ladenvall, C.,Kotova, O., Reiling, E., Ronn, T., Parikh, H., Taneera, J. et al. (2011) Acommon variant in TFB1M is associated with reduced insulin secretion andincreased future risk of type 2 diabetes. Cell Metab, 13, 80–91.
6. Ashcroft, F.M., Harrison, D.E. and Ashcroft, S.J. (1984) Glucose inducesclosure of single potassium channels in isolated rat pancreatic beta-cells.Nature, 312, 446–448.
7. Dekker Nitert, M., Wendt, A., Eliasson, L. and Mulder, H. (2008) CaV1.2rather than CaV1.3 is coupled to glucose-stimulated insulin secretion inINS-I 832/13 cells. Mol Cell Endocrinol, 41, 1–11.
8. Henquin, J.C. (2009) Regulation of insulin secretion: a matter of phasecontrol and amplitude modulation. Diabetologia, 52, 739–751.
9. Maechler, P., Li, N., Casimir, M., Vetterli, L., Frigerio, F. and Brun, T.(2010) Role of mitochondria in beta-cell function and dysfunction. AdvExperim Med Biol, 654, 193–216.
10. Wiederkehr, A. and Wollheim, C.B. (2012) Mitochondrial signals driveinsulin secretion in the pancreatic beta-cell. Mol Cell Endocrinol, 353,128–137.
16 Human Molecular Genetics, 2014
at INSE
RM
on July 22, 2014http://hm
g.oxfordjournals.org/D
ownloaded from
11. Hallberg, B.M. and Larsson, N.G. (2011) TFAM forces mtDNA to make aU-turn. Nat Struct Mol Biol, 18, 1179–1181.
12. Metodiev, M., Lesko, N., Park, C.B., Camara, Y., Shi, Y., Wibom, R.,Hultenby, K., Gustafsson, C.M. and Larsson, N.G. (2009) Methylation of12S rRNA is necessary for in vivo stability of the small subunit of themammalian mitochondrial ribosome. Cell Metab, 9, 1–12.
13. Lafontaine, D., Vandenhaute, J. and Tollervey, D. (1995) The 18S rRNAdimethylase Dim1p is required for pre-ribosomal RNA processing in yeast.Genes Dev, 9, 2470–2481.
14. Lafontaine, D.L., Preiss, T. and Tollervey, D. (1998) Yeast 18S rRNAdimethylase Dim1p: a quality control mechanism in ribosome synthesis?Mol Cell Biol, 18, 2360–2370.
15. Gannon, M., Shiota, C., Postic, C., Wright, C.V. and Magnuson, M.(2000) Analysis of the Cre-mediated recombination driven by ratinsulin promoter in embryonic and adult mouse pancreas. Genesis, 26,139–142.
16. Prieto-Martin, A., Montoya, J. and Martinez-Azorin, F. (2001) A study onthe human mitochondrial RNA polymerase activity points to existence of atranscription factor B-like protein. FEBS Letters, 503, 51–55.
17. Falkenberg, M., Gaspari, M., Rantanen, A., Trifunovic, A., Larsson, N.G.and Gustafsson, C.M. (2002) Mitochondrial transcription factors B1and B2 activate transcription of human mtDNA. Nat Genetics, 31,289–294.
18. Wicksteed, B., Alarcon, C., Briaud, I., Lingohr, M.K. and Rhodes, C.J.(2003) Glucose-induced translational control of proinsulin biosynthesis isproportional to preproinsulin mRNA levels in islet beta-cells but notregulated via a positive feedback of secreted insulin. J Biol Chem, 278,42080–42090.
19. Armann, B., Hanson, M.S., Hatch, E., Steffen, A. and Fernandez, L.A.(2007) Quantification of basal and stimulated ROS levels as predictors ofislet potency and function. Am J Transplant, 7, 38–47.
20. Zhang, Z., Liew, C.W., Handy, D.E., Zhang, Y., Leopold, J.A., Hu, J., Guo,L., Kulkarni, R.N., Loscalzo, J. and Stanton, R.C. (2010) Highglucose inhibits glucose-6-phosphate dehydrogenase, leading toincreased oxidative stress and beta-cell apoptosis. Faseb J, 24,1497–1505.
21. Cardol, P., Matagne, R.F. and Remacle, C. (2002) Impact of mutationsaffectingND mitochondria-encoded subunits on the activity and assemblyofcomplex I in Chlamydomonas. Implication for the structural organization ofthe enzyme. J Mol Biol, 319, 1211–1221.
22. Raimundo, N. (2014) Mitochondrial pathology: stress signals from theenergy factory. Trends Mol Med, 20, 282–292.
23. Wang, J., Silva, J.P., Gustafsson, C.M., Rustin, P. and Larsson, N.G. (2001)Increased in vivo apoptosis in cells lacking mitochondrial DNA geneexpression. Proc Natl Acad Sci USA, 98, 4038–4043.
24. Trifunovic, A., Hansson, A., Wredenberg, A., Rovio, A.T., Dufour, E.,Khvorostov, I., Spelbrink, J.N., Wibom, R., Jacobs, H.T. and Larsson, N.G.(2005)Somatic mtDNAmutations cause agingphenotypeswithoutaffectingreactive oxygen species production. Proc Natl Acad Sci USA, 102,17993–17998.
25. Eguchi, Y., Shimizu, S. and Tsujimoto, Y. (1997) Intracellular ATP levelsdetermine cell death fate by apoptosis or necrosis. Can Res, 57, 1835–1840.
26. Nicotera, P. and Leist, M. (1997) Mitochondrial signals and energyrequirement in cell death. Cell Death Differ, 4, 516.
27. Tiedge, M., Lortz, S., Drinkgern, J. and Lenzen, S. (1997) Relation betweenantioxidant enzyme gene expression and antioxidative defense status ofinsulin-producing cells. Diabetes, 46, 1733–1742.
28. Kujoth, G.C., Hiona, A., Pugh, T.D., Someya, S., Panzer, K., Wohlgemuth,S.E., Hofer, T., Seo, A.Y., Sullivan, R., Jobling, W.A. et al. (2005)Mitochondrial DNA mutations, oxidative stress, and apoptosis inmammalian aging. Science, 309, 481–484.
29. Dinarello, C.A., Donath, M.Y. and Mandrup-Poulsen, T. (2010) Role ofIL-1beta in type 2 diabetes. Curr Opin Endocrinol Diabetes Obes, 17,314–321.
30. Tretter, L. and Adam-Vizi, V. (2004) Generation of reactive oxygen speciesin the reaction catalyzed by alpha-ketoglutarate dehydrogenase. J Neurosci,24, 7771–7778.
31. Newsholme, P., Haber, E.P., Hirabara, S.M., Rebelato, E.L., Procopio, J.,Morgan, D., Oliveira-Emilio, H.C., Carpinelli, A.R. and Curi, R.(2007) Diabetes associated cell stress and dysfunction: role ofmitochondrial and non-mitochondrial ROS production and activity.J Physiol, 583, 9–24.
32. Kjems, L.L., Kirby, B.M., Welsh, E.M., Veldhuis, J.D., Straume, M.,McIntyre, S.S., Yang, D., Lefebvre, P. and Butler, P.C. (2001) Decrease inbeta-cell mass leads to impaired pulsatile insulin secretion, reducedpostprandial hepatic insulin clearance, and relative hyperglucagonemia inthe minipig. Diabetes, 50, 2001–2012.
33. Del Guerra, S., Lupi, R., Marselli, L., Masini, M., Bugliani, M., Sbrana, S.,Torri, S., Pollera, M., Boggi, U., Mosca, F. et al. (2005) Functional andmolecular defects of pancreatic islets in human type 2 diabetes. Diabetes, 54,727–735.
34. Silva, J.P., Kohler, M., Graff, C., Oldfors, A., Magnuson, M.A., Berggren,P.O. and Larsson, N.G. (2000) Impaired insulin secretion and beta-cell lossin tissue-specific knockout mice with mitochondrial diabetes. Nat Genet, 26,336–340.
35. Herrera, P.L. (2000) Adult insulin- and glucagon-producing cellsdifferentiate from two independent cell lineages. Development, 127,2317–2322.
36. Stahle, M., Honkanen-Scott, M., Ingvast, S., Korsgren, O. and Friberg, A.S.(2013) Human islet isolation processing times shortened by one hour:minimized incubation time between tissue harvest and islet purification.Transplantation, 96, e91–e93.
37. Dobin, A., Davis, C.A., Schlesinger, F., Drenkow, J., Zaleski, C., Jha, S.,Batut, P., Chaisson, M. and Gingeras, T.R. (2013) STAR: ultrafast universalRNA-seq aligner. Bioinformatics, 29, 15–21.
38. Fex, M., Wierup, N., Nitert, M.D., Ristow, M. and Mulder, H. (2007) Ratinsulin promoter 2-Cre recombinase mice bred onto a pure C57BL/6Jbackground exhibit unaltered glucose tolerance. J Endocrinol, 194,551–555.
39. Goehring, I., Sharoyko, V.V., Malmgren, S., Andersson, L.E., Spegel, P.,Nicholls, D.G. and Mulder, H. (2014) Chronic high glucose and pyruvatelevels differentially affect mitochondrial bioenergetics and fuel-stimulatedinsulin secretion from clonal INS-1 832/13 cells. J Biol Chem, 289,3786–3798.
40. Wikstrom, J.D., Sereda, S.B., Stiles, L., Elorza, A., Allister, E.M., Neilson,A., Ferrick, D.A., Wheeler, M.B. and Shirihai, O.S. (2012) A novelhigh-throughput assay for islet respiration reveals uncoupling of rodent andhuman islets. PLoS One, 7, e33023.
41. Malmgren, S., Nicholls, D.G., Taneera, J., Bacos, K., Koeck, T., Tamaddon,A., Wibom, R., Groop, L., Ling, C., Mulder, H. et al. (2009) Tightcoupling between glucose and mitochondrial metabolism in clonalbeta-cells is required for robust insulin secretion. J Biol Chem, 284,32395–32404.
42. Barg, S., Olofsson, C.S., Schriever-Abeln, J., Wendt, A., Gebre-Medhin, S.,Renstrom, E. and Rorsman, P. (2002) Delay between fusion pore openingand peptide release from large dense-core vesicles in neuroendocrine cells.Neuron, 33, 287–299.
43. Sathanoori, R., Olde, B., Erlinge, D., Goransson, O. and Wierup, N. (2013)Cocaine- and amphetamine-regulated transcript (CART) protects beta cellsagainst glucotoxicity and increases cell proliferation. J Biol Chem, 288,3208–3218.
44. Chambers, J.M. (1983) Graphical techniques for data analysis. DuxburyPress, Belmont, CA, pp. 395.
Human Molecular Genetics, 2014 17
at INSE
RM
on July 22, 2014http://hm
g.oxfordjournals.org/D
ownloaded from
1
Loss of TFB1M results in mitochondrial dysfunction that
leads to impaired insulin secretion and diabetes
Vladimir V. Sharoyko1, Mia Abels2, Jiangming Sun1, Lisa M.
Nicholas1, Ines Guerra Mollet3, Jelena A. Stamenkovic1, Isabel
Göhring1, Siri Malmgren1, Petter Storm4, João Fadista4, Peter
Spégel1, Nils-Göran Larsson5, Lena Eliasson3, Nils Wierup2, and
Hindrik Mulder1
Department of Clinical Sciences in Malmö, 1Unit of Molecular Metabolism,
2Unit of
Neuroendocrine Cell Biology, 3Unit of Islet Cell Exocytosis,
4Unit of Diabetes and
Endocrinology, Lund University Diabetes Centre, CRC, Skåne University Hospital, 205 02
Malmö, Sweden. 5Max Planck Institute for Biology of Ageing, D-50931, Cologne, Germany.
Running Title: Transcription factor B1 mitochondrial in β-cells
Key words: -cell – metabolism – electron transport – knockout
Corresponding author: Hindrik Mulder, MD, Professor, Department of Clinical Sciences in
Malmö, Unit of Molecular Metabolism, Lund University Diabetes Centre, CRC 91:11, Scania
University Hospital, 205 02 Malmö, Sweden. Phone: 0046 40 39-10-23; Fax: 0046 40 39-12-
22; E-mail: [email protected]
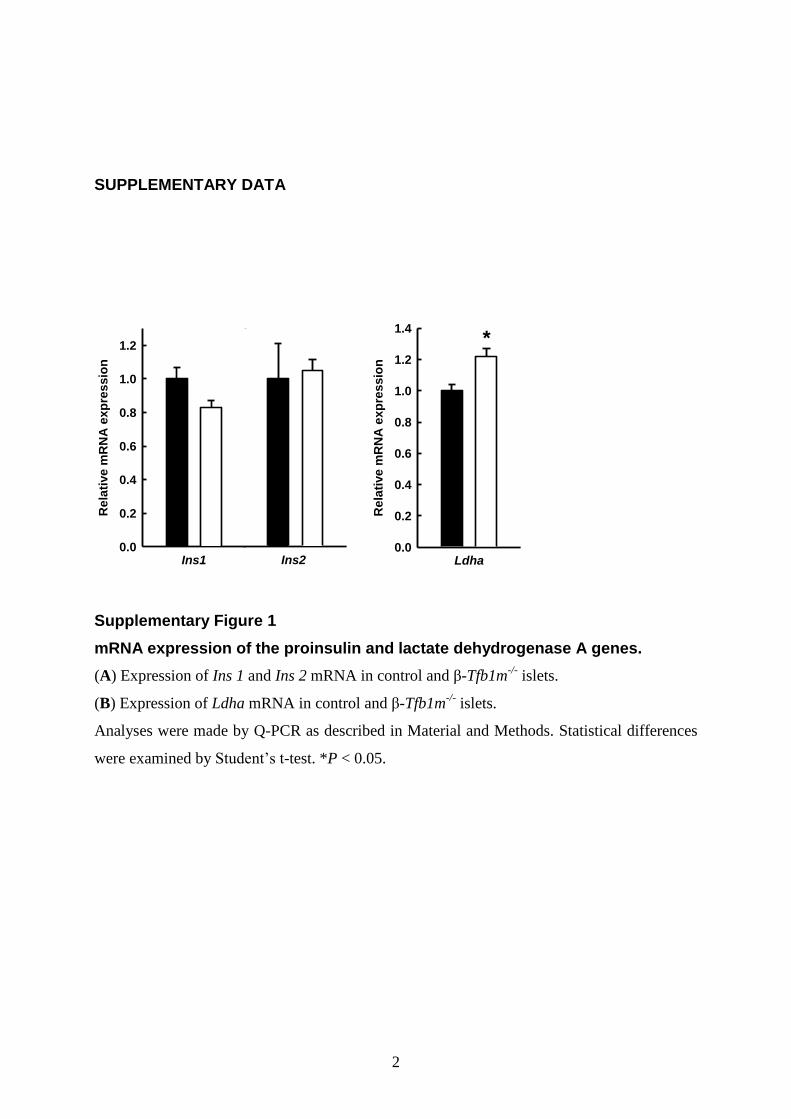
2
SUPPLEMENTARY DATA
Supplementary Figure 1
mRNA expression of the proinsulin and lactate dehydrogenase A genes.
(A) Expression of Ins 1 and Ins 2 mRNA in control and β-Tfb1m-/-
islets.
(B) Expression of Ldha mRNA in control and β-Tfb1m-/-
islets.
Analyses were made by Q-PCR as described in Material and Methods. Statistical differences
were examined by Student’s t-test. *P < 0.05.
Ins1
Re
lati
ve
mR
NA
ex
pre
ss
ion
0.0
0.2
0.4
0.6
0.8
1.0
1.2
Ins2 Ldha
Rela
tive m
RN
A e
xp
ressio
n
0.0
0.2
0.4
0.6
0.8
1.0
1.2
1.4 *
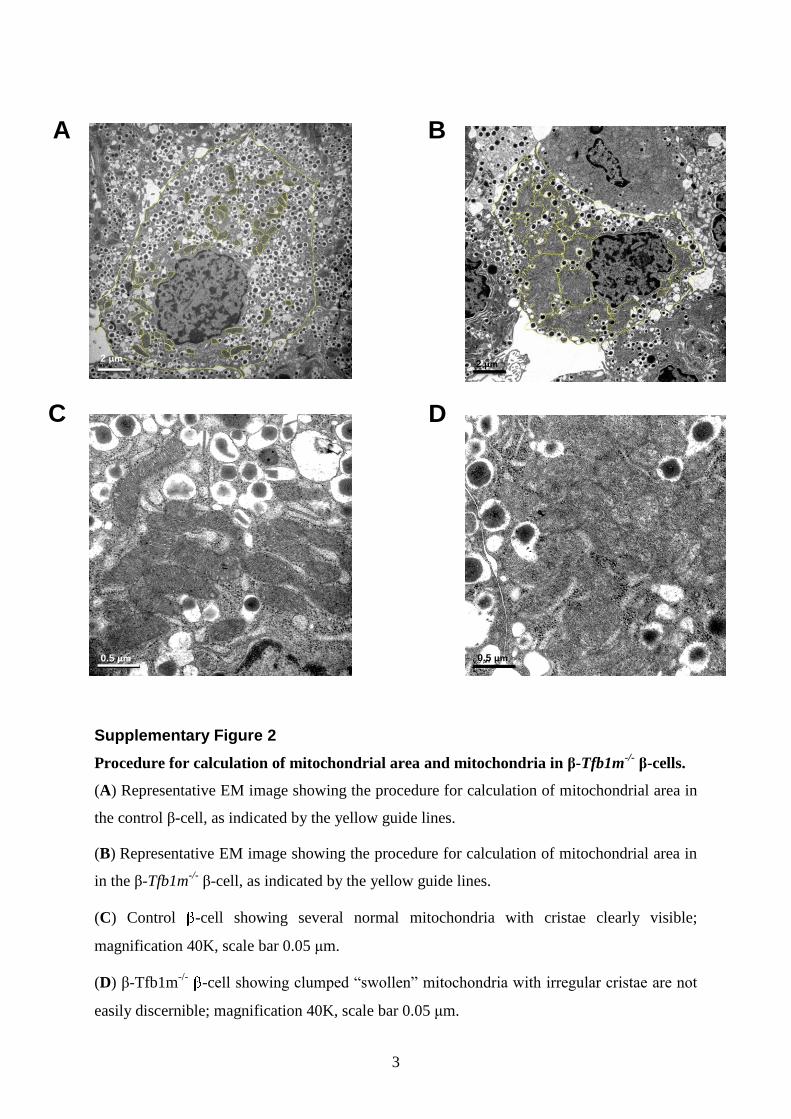
3
Supplementary Figure 2
Procedure for calculation of mitochondrial area and mitochondria in β-Tfb1m-/-
β-cells.
(A) Representative EM image showing the procedure for calculation of mitochondrial area in
the control β-cell, as indicated by the yellow guide lines.
(B) Representative EM image showing the procedure for calculation of mitochondrial area in
in the β-Tfb1m-/-
β-cell, as indicated by the yellow guide lines.
(C) Control -cell showing several normal mitochondria with cristae clearly visible;
magnification 40K, scale bar 0.05 μm.
(D) β-Tfb1m-/-
-cell showing clumped “swollen” mitochondria with irregular cristae are not
easily discernible; magnification 40K, scale bar 0.05 μm.
A
C
B
D
0.5 μm 0.5 μm
2 μm2 μm
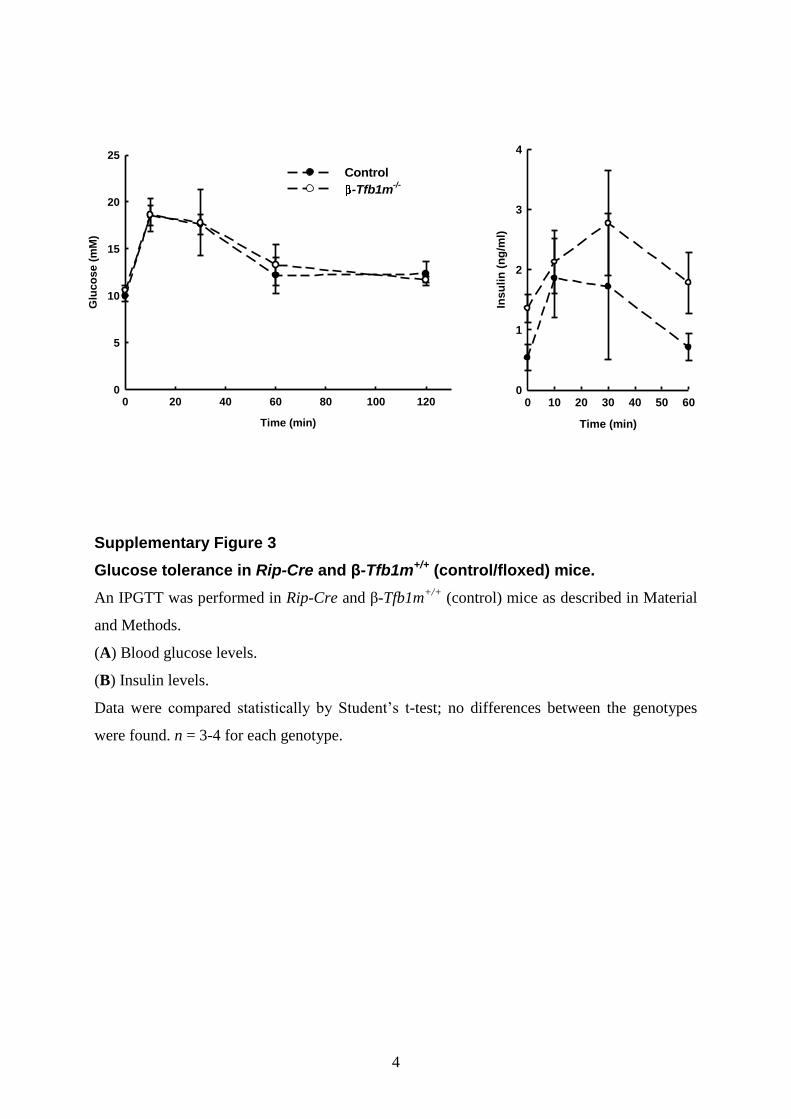
4
Supplementary Figure 3
Glucose tolerance in Rip-Cre and β-Tfb1m+/+ (control/floxed) mice.
An IPGTT was performed in Rip-Cre and β-Tfb1m+/+
(control) mice as described in Material
and Methods.
(A) Blood glucose levels.
(B) Insulin levels.
Data were compared statistically by Student’s t-test; no differences between the genotypes
were found. n = 3-4 for each genotype.
Time (min)
0 20 40 60 80 100 120
Glu
co
se (
mM
)
0
5
10
15
20
25
Time (min)
0 10 20 30 40 50 60
Ins
uli
n (
ng
/ml)
0
1
2
3
4
Control
-Tfb1m-/-
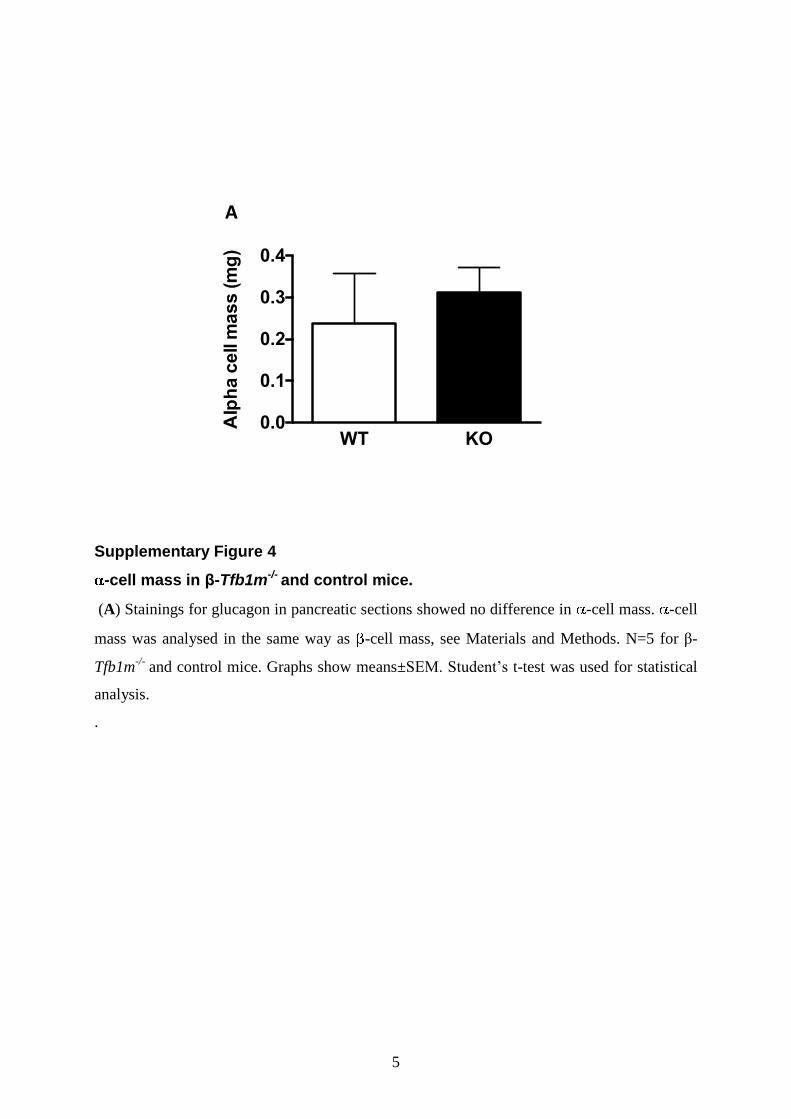
5
Supplementary Figure 4
-cell mass in β-Tfb1m-/- and control mice.
(A) Stainings for glucagon in pancreatic sections showed no difference in -cell mass. -cell
mass was analysed in the same way as -cell mass, see Materials and Methods. N=5 for β-
Tfb1m-/-
and control mice. Graphs show means±SEM. Student’s t-test was used for statistical
analysis.
.
Alp
ha c
ell m
ass (m
g)
WT KO0.0
0.1
0.2
0.3
0.4
A
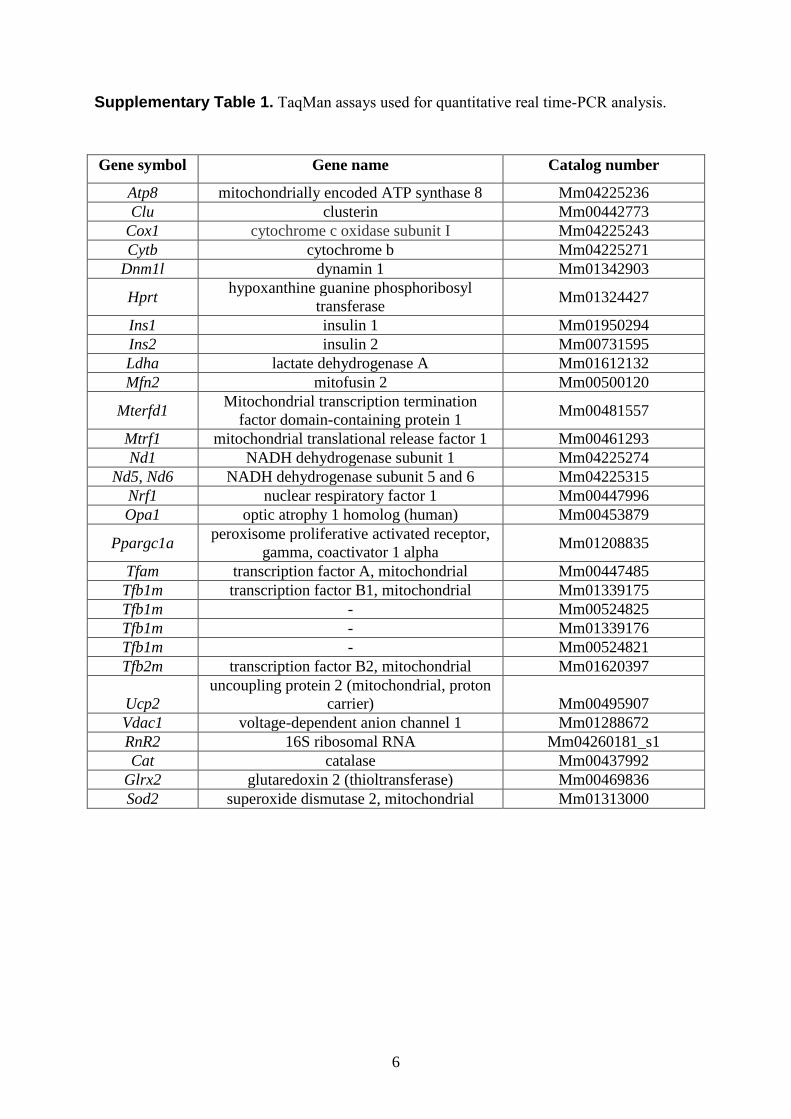
6
Supplementary Table 1. TaqMan assays used for quantitative real time-PCR analysis.
Gene symbol Gene name Catalog number
Atp8 mitochondrially encoded ATP synthase 8 Mm04225236
Clu clusterin Mm00442773
Cox1 cytochrome c oxidase subunit I Mm04225243
Cytb cytochrome b Mm04225271
Dnm1l dynamin 1 Mm01342903
Hprt hypoxanthine guanine phosphoribosyl
transferase Mm01324427
Ins1 insulin 1 Mm01950294
Ins2 insulin 2 Mm00731595
Ldha lactate dehydrogenase A Mm01612132
Mfn2 mitofusin 2 Mm00500120
Mterfd1 Mitochondrial transcription termination
factor domain-containing protein 1 Mm00481557
Mtrf1 mitochondrial translational release factor 1 Mm00461293
Nd1 NADH dehydrogenase subunit 1 Mm04225274
Nd5, Nd6 NADH dehydrogenase subunit 5 and 6 Mm04225315
Nrf1 nuclear respiratory factor 1 Mm00447996
Opa1 optic atrophy 1 homolog (human) Mm00453879
Ppargc1a peroxisome proliferative activated receptor,
gamma, coactivator 1 alpha Mm01208835
Tfam transcription factor A, mitochondrial Mm00447485
Tfb1m transcription factor B1, mitochondrial Mm01339175
Tfb1m - Mm00524825
Tfb1m - Mm01339176
Tfb1m - Mm00524821
Tfb2m transcription factor B2, mitochondrial Mm01620397
Ucp2
uncoupling protein 2 (mitochondrial, proton
carrier) Mm00495907
Vdac1 voltage-dependent anion channel 1 Mm01288672
RnR2 16S ribosomal RNA Mm04260181_s1
Cat catalase Mm00437992
Glrx2 glutaredoxin 2 (thioltransferase) Mm00469836
Sod2 superoxide dismutase 2, mitochondrial Mm01313000