SMYD3 encodes a histone methyltransferase involved in the proliferation of cancer cells
13
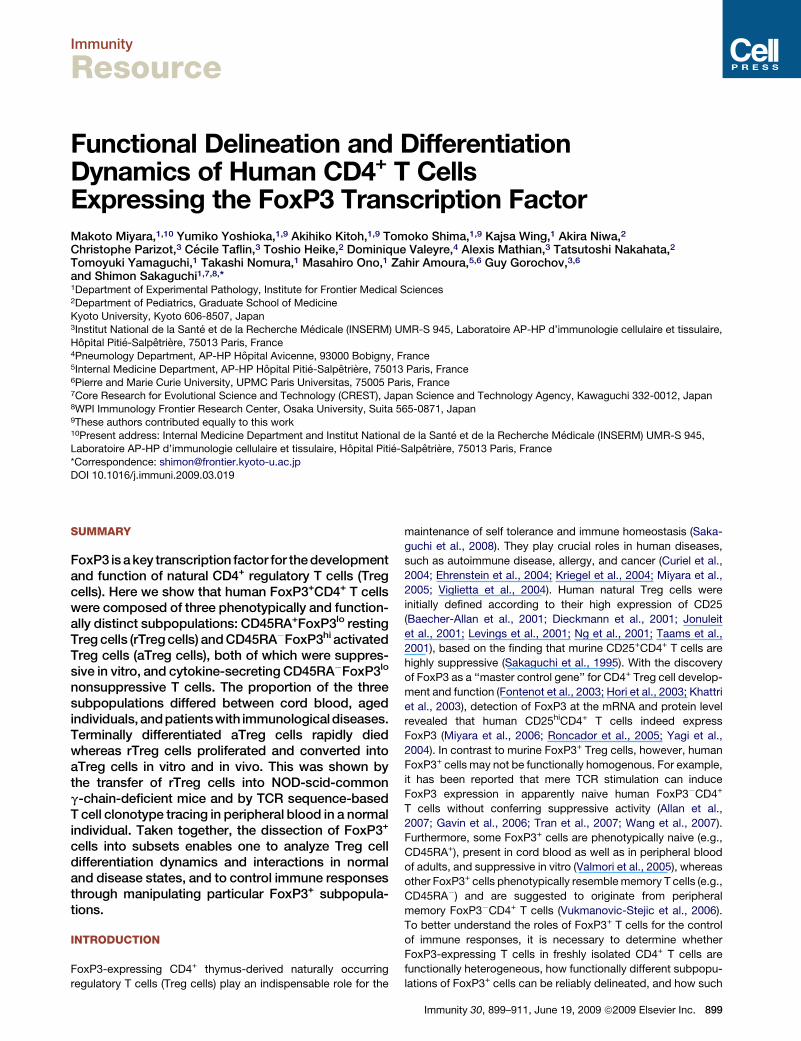
Immunity Resource Functional Delineation and Differentiation Dynamics of Human CD4 + T Cells Expressing the FoxP3 Transcription Factor Makoto Miyara, 1,10 Yumiko Yoshioka, 1,9 Akihiko Kitoh, 1,9 Tomoko Shima, 1,9 Kajsa Wing, 1 Akira Niwa, 2 Christophe Parizot, 3 Ce ´ cile Taflin, 3 Toshio Heike, 2 Dominique Valeyre, 4 Alexis Mathian, 3 Tatsutoshi Nakahata, 2 Tomoyuki Yamaguchi, 1 Takashi Nomura, 1 Masahiro Ono, 1 Zahir Amoura, 5,6 Guy Gorochov, 3,6 and Shimon Sakaguchi 1,7,8, * 1 Department of Experimental Pathology, Institute for Frontier Medical Sciences 2 Department of Pediatrics, Graduate School of Medicine Kyoto University, Kyoto 606-8507, Japan 3 Institut National de la Sante ´ et de la Recherche Me ´ dicale (INSERM) UMR-S 945, Laboratoire AP-HP d’immunologie cellulaire et tissulaire, Ho ˆ pital Pitie ´ -Salpe ˆ trie ` re, 75013 Paris, France 4 Pneumology Department, AP-HP Ho ˆ pital Avicenne, 93000 Bobigny, France 5 Internal Medicine Department, AP-HP Ho ˆ pital Pitie ´ -Salpe ˆ trie ` re, 75013 Paris, France 6 Pierre and Marie Curie University, UPMC Paris Universitas, 75005 Paris, France 7 Core Research for Evolutional Science and Technology (CREST), Japan Science and Technology Agency, Kawaguchi 332-0012, Japan 8 WPI Immunology Frontier Research Center, Osaka University, Suita 565-0871, Japan 9 These authors contributed equally to this work 10 Present address: Internal Medicine Department and Institut National de la Sante ´ et de la Recherche Me ´ dicale (INSERM) UMR-S 945, Laboratoire AP-HP d’immunologie cellulaire et tissulaire, Ho ˆ pital Pitie ´ -Salpe ˆ trie ` re, 75013 Paris, France *Correspondence: [email protected] DOI 10.1016/j.immuni.2009.03.019 SUMMARY FoxP3 is a key transcription factor for the development and function of natural CD4 + regulatory T cells (Treg cells). Here we show that human FoxP3 + CD4 + T cells were composed of three phenotypically and function- ally distinct subpopulations: CD45RA + FoxP3 lo resting Treg cells (rTreg cells) and CD45RA FoxP3 hi activated Treg cells (aTreg cells), both of which were suppres- sive in vitro, and cytokine-secreting CD45RA FoxP3 lo nonsuppressive T cells. The proportion of the three subpopulations differed between cord blood, aged individuals, and patients with immunological diseases. Terminally differentiated aTreg cells rapidly died whereas rTreg cells proliferated and converted into aTreg cells in vitro and in vivo. This was shown by the transfer of rTreg cells into NOD-scid-common g-chain-deficient mice and by TCR sequence-based T cell clonotype tracing in peripheral blood in a normal individual. Taken together, the dissection of FoxP3 + cells into subsets enables one to analyze Treg cell differentiation dynamics and interactions in normal and disease states, and to control immune responses through manipulating particular FoxP3 + subpopula- tions. INTRODUCTION FoxP3-expressing CD4 + thymus-derived naturally occurring regulatory T cells (Treg cells) play an indispensable role for the maintenance of self tolerance and immune homeostasis (Saka- guchi et al., 2008). They play crucial roles in human diseases, such as autoimmune disease, allergy, and cancer (Curiel et al., 2004; Ehrenstein et al., 2004; Kriegel et al., 2004; Miyara et al., 2005; Viglietta et al., 2004). Human natural Treg cells were initially defined according to their high expression of CD25 (Baecher-Allan et al., 2001; Dieckmann et al., 2001; Jonuleit et al., 2001; Levings et al., 2001; Ng et al., 2001; Taams et al., 2001), based on the finding that murine CD25 + CD4 + T cells are highly suppressive (Sakaguchi et al., 1995). With the discovery of FoxP3 as a ‘‘master control gene’’ for CD4 + Treg cell develop- ment and function (Fontenot et al., 2003; Hori et al., 2003; Khattri et al., 2003), detection of FoxP3 at the mRNA and protein level revealed that human CD25 hi CD4 + T cells indeed express FoxP3 (Miyara et al., 2006; Roncador et al., 2005; Yagi et al., 2004). In contrast to murine FoxP3 + Treg cells, however, human FoxP3 + cells may not be functionally homogenous. For example, it has been reported that mere TCR stimulation can induce FoxP3 expression in apparently naive human FoxP3 CD4 + T cells without conferring suppressive activity (Allan et al., 2007; Gavin et al., 2006; Tran et al., 2007; Wang et al., 2007). Furthermore, some FoxP3 + cells are phenotypically naive (e.g., CD45RA + ), present in cord blood as well as in peripheral blood of adults, and suppressive in vitro (Valmori et al., 2005), whereas other FoxP3 + cells phenotypically resemble memory T cells (e.g., CD45RA ) and are suggested to originate from peripheral memory FoxP3 CD4 + T cells (Vukmanovic-Stejic et al., 2006). To better understand the roles of FoxP3 + T cells for the control of immune responses, it is necessary to determine whether FoxP3-expressing T cells in freshly isolated CD4 + T cells are functionally heterogeneous, how functionally different subpopu- lations of FoxP3 + cells can be reliably delineated, and how such Immunity 30, 899–911, June 19, 2009 ª2009 Elsevier Inc. 899
-
Upload
independent -
Category
Documents
-
view
0 -
download
0
Transcript of SMYD3 encodes a histone methyltransferase involved in the proliferation of cancer cells
Immunity
Resource
Functional Delineation and DifferentiationDynamics of Human CD4+ T CellsExpressing the FoxP3 Transcription FactorMakoto Miyara,1,10 Yumiko Yoshioka,1,9 Akihiko Kitoh,1,9 Tomoko Shima,1,9 Kajsa Wing,1 Akira Niwa,2
Christophe Parizot,3 Cecile Taflin,3 Toshio Heike,2 Dominique Valeyre,4 Alexis Mathian,3 Tatsutoshi Nakahata,2
Tomoyuki Yamaguchi,1 Takashi Nomura,1 Masahiro Ono,1 Zahir Amoura,5,6 Guy Gorochov,3,6
and Shimon Sakaguchi1,7,8,*1Department of Experimental Pathology, Institute for Frontier Medical Sciences2Department of Pediatrics, Graduate School of Medicine
Kyoto University, Kyoto 606-8507, Japan3Institut National de la Sante et de la Recherche Medicale (INSERM) UMR-S 945, Laboratoire AP-HP d’immunologie cellulaire et tissulaire,Hopital Pitie-Salpetriere, 75013 Paris, France4Pneumology Department, AP-HP Hopital Avicenne, 93000 Bobigny, France5Internal Medicine Department, AP-HP Hopital Pitie-Salpetriere, 75013 Paris, France6Pierre and Marie Curie University, UPMC Paris Universitas, 75005 Paris, France7Core Research for Evolutional Science and Technology (CREST), Japan Science and Technology Agency, Kawaguchi 332-0012, Japan8WPI Immunology Frontier Research Center, Osaka University, Suita 565-0871, Japan9These authors contributed equally to this work10Present address: Internal Medicine Department and Institut National de la Sante et de la Recherche Medicale (INSERM) UMR-S 945,Laboratoire AP-HP d’immunologie cellulaire et tissulaire, Hopital Pitie-Salpetriere, 75013 Paris, France
*Correspondence: [email protected]
DOI 10.1016/j.immuni.2009.03.019
SUMMARY
FoxP3 is a key transcription factor for the developmentand function of natural CD4+ regulatory T cells (Tregcells). Here we show that human FoxP3+CD4+ T cellswere composed of three phenotypically and function-ally distinct subpopulations: CD45RA+FoxP3lo restingTreg cells (rTreg cells) and CD45RA�FoxP3hi activatedTreg cells (aTreg cells), both of which were suppres-sive in vitro, and cytokine-secreting CD45RA�FoxP3lo
nonsuppressive T cells. The proportion of the threesubpopulations differed between cord blood, agedindividuals, andpatientswith immunological diseases.Terminally differentiated aTreg cells rapidly diedwhereas rTreg cells proliferated and converted intoaTreg cells in vitro and in vivo. This was shown bythe transfer of rTreg cells into NOD-scid-commong-chain-deficient mice and by TCR sequence-basedT cell clonotype tracing in peripheral blood in a normalindividual. Taken together, the dissection of FoxP3+
cells into subsets enables one to analyze Treg celldifferentiation dynamics and interactions in normaland disease states, and to control immune responsesthrough manipulating particular FoxP3+ subpopula-tions.
INTRODUCTION
FoxP3-expressing CD4+ thymus-derived naturally occurring
regulatory T cells (Treg cells) play an indispensable role for the
maintenance of self tolerance and immune homeostasis (Saka-
guchi et al., 2008). They play crucial roles in human diseases,
such as autoimmune disease, allergy, and cancer (Curiel et al.,
2004; Ehrenstein et al., 2004; Kriegel et al., 2004; Miyara et al.,
2005; Viglietta et al., 2004). Human natural Treg cells were
initially defined according to their high expression of CD25
(Baecher-Allan et al., 2001; Dieckmann et al., 2001; Jonuleit
et al., 2001; Levings et al., 2001; Ng et al., 2001; Taams et al.,
2001), based on the finding that murine CD25+CD4+ T cells are
highly suppressive (Sakaguchi et al., 1995). With the discovery
of FoxP3 as a ‘‘master control gene’’ for CD4+ Treg cell develop-
ment and function (Fontenot et al., 2003; Hori et al., 2003; Khattri
et al., 2003), detection of FoxP3 at the mRNA and protein level
revealed that human CD25hiCD4+ T cells indeed express
FoxP3 (Miyara et al., 2006; Roncador et al., 2005; Yagi et al.,
2004). In contrast to murine FoxP3+ Treg cells, however, human
FoxP3+ cells may not be functionally homogenous. For example,
it has been reported that mere TCR stimulation can induce
FoxP3 expression in apparently naive human FoxP3�CD4+
T cells without conferring suppressive activity (Allan et al.,
2007; Gavin et al., 2006; Tran et al., 2007; Wang et al., 2007).
Furthermore, some FoxP3+ cells are phenotypically naive (e.g.,
CD45RA+), present in cord blood as well as in peripheral blood
of adults, and suppressive in vitro (Valmori et al., 2005), whereas
other FoxP3+ cells phenotypically resemble memory T cells (e.g.,
CD45RA�) and are suggested to originate from peripheral
memory FoxP3�CD4+ T cells (Vukmanovic-Stejic et al., 2006).
To better understand the roles of FoxP3+ T cells for the control
of immune responses, it is necessary to determine whether
FoxP3-expressing T cells in freshly isolated CD4+ T cells are
functionally heterogeneous, how functionally different subpopu-
lations of FoxP3+ cells can be reliably delineated, and how such
Immunity 30, 899–911, June 19, 2009 ª2009 Elsevier Inc. 899

Immunity
Definition of Human FoxP3+ CD4+ Treg Cell Subsets
A
C
G
I
K
B
D
H
E
J
F
900 Immunity 30, 899–911, June 19, 2009 ª2009 Elsevier Inc.

Immunity
Definition of Human FoxP3+ CD4+ Treg Cell Subsets
subsets differentiate and interact in physiological and disease
states.
In this report, we show that human FoxP3+CD4+ T cells can be
separated into three functionally and phenotypically different
subpopulations based on the expression of FoxP3, cell surface
phenotype, the degree of DNA methylation of the FoxP3 gene,
DNA microarray profile, proliferation status in the physiological
state, cytokine secreting capacity, TCR repertoire, and in vitro
suppressive activity. These populations are (1) CD45RA+FoxP3lo
resting Treg cells, (2) CD45RA�FoxP3hi activated Treg cells, and
(3) cytokine-secreting CD45RA�FoxP3lo non-Treg cells. With
this dissection of FoxP3+ T cells into subpopulations, we show
the dynamics of Treg cell differentiation in vitro, in vivo, and ex
vivo in normal and disease states. The results indicate that func-
tional and numerical analysis of each FoxP3+ subset is essential
for assessing immunological states, and that manipulation of
a particular subset, rather than whole FoxP3+ cells, helps to
dampen or augment a variety of physiological and pathological
immune responses.
RESULTS
Separation of FoxP3+CD4+ T Cells into ThreeSubpopulations by the Expression of FoxP3, CD25,and CD45RAThe combination of CD25 and CD45RA staining of CD4+ T cells
in peripheral blood lymphocytes (PBL) of normal healthy individ-
uals revealed six subpopulations (Fraction [Fr.] I–VI) that
expressed the FoxP3 protein at different amounts (Figures 1A
and 1B). Among them, Fr. I, II, and III were FoxP3+ (Figure 1B)
and the degree of FoxP3 expression in these fractions were
proportional to CD25 expression (Figure 1C). Notably, these
three FoxP3+ populations could be distinctly separated by the
combination of FoxP3 and CD45RA staining; i.e., FoxP3loC-
D45RA+ cells, which were CD25++ (Fr. I), FoxP3hiCD45RA� cells,
which were CD25+++ (Fr. II), and FoxP3loCD45RA� cells,
which were CD25++ (Fr. III) (Figure 1D). The fractions could be
prepared as live cells by cell sorting as CD25++CD45RA+,
CD25+++CD45RA�, and CD25++CD45RA� cells, respectively
(Figure S1A available online). Purified Fr. I, II, and III populations
expressed FoxP3 transcripts to a similar degree irrespective of
different amounts of FoxP3 protein expressed in each population
(Figure 1B; Figure S1B). Fr. IV formed a distinct population as
CD25+FoxP3� cells (Figure 1C), but it was not well demarcated
from Fr. V by CD45RA or CD25 staining (Figure 1A). Therefore,
we analyzed Fr. IV and V together in the functional examination
of FoxP3+ subsets (see below).
Assessment of the proliferative status of each subpopulation in
the physiological state by detecting the expression of Ki-67,
a nuclear protein expressed in cells ready to proliferate and at
a higher amount in actually proliferating cells (Figure S2), revealed
that about half of the cells in Fr. II were proliferating whereas the
cells in Fr. I and III were not (red dotted line in Figure 1E). Fr. II ex-
pressed intracellular CTLA-4 to the highest degree whereas Fr. I
hardly expressed the molecule (Figure 1F). Furthermore, Fr. II
corresponded to HLA-DR-expressing and also ICOS-expressing
FoxP3+ cells as reported by others (Figures 1G and 1H; Baecher-
Allan et al., 2006; Ito et al., 2008).
Analysis of cytokine production by each fraction showed that
Fr. II scarcely produced IL-2 or IFN-g. Among FoxP3lo cells, Fr. I
was poor producer of IL-2 and IFN-g whereas Fr. III produced
high amounts of these cytokines (Figure 1I; Figure S3).
The 50 flanking region and a STAT5-responsive region in the in-
tron 1 of the FOXP3 gene are critical for induction and enhance-
ment of FoxP3 expression by TCR and IL-2 stimulation (Floess
et al., 2007; Mantel et al., 2006; Zorn et al., 2006). Analysis of
the DNA methylation status of these regions in each fraction
prepared from a male donor showed that the CpG methylation
sites in the regions were completely demethylated in Fr. I and
Fr. II (Figure 1J). The 50 flanking region of Fr. III was also highly
demethylated, although the demethylation pattern was less
uniform compared with Fr. I and II. In contrast, their STAT5-
responsive region was less demethylated than other FoxP3+
subsets. In addition, memory-like CD25+ and CD25�
CD45RA�CD4+ non-Treg cells (Fr. IV, V), which were FoxP3�,
had their 50 flanking region moderately demethylated whereas
the STAT5 responsive region was virtually completely methyl-
ated. Both regions were highly methylated in naive Fr. VI. These
findings were confirmed by analysis of individual clones isolated
from each subpopulation (Figure S4). The results collectively
Figure 1. Delineation of FoxP3+CD4+ T Cells into Subsets by Cell Surface Molecules, Proliferative State, Cytokine Production, MethylationStatus of the FOXP3 Gene, and In Vitro Suppressive Activity
(A–D) Six subsets of CD4+ T cells defined by the expression of CD45RA and CD25: pink line (Fraction [Fr.] I), CD25++CD45RA+ cells; bold red line (Fr. II),
CD25+++CD45RA� cells; broken brown line (Fr. III), CD25++CD45RA� cells; green line (Fr. IV), CD25+CD45RA� cells; blue line (Fr. V), CD25�CD45RA� cells; black
line (Fr. VI), CD25�CD45RA+ cells. Expression of FoxP3 (B), CD25 and intracellular FoxP3 (C), and CD45RA and FoxP3 (D) in each fraction shown in (A). Data are
representative of 19 blood donors.
(E) Flow cytometry of the expression of nuclear Ki-67 and FoxP3 in CD4+ T cells. Red broken line separates Ki-67+FoxP3hi from Ki-67�FoxP3lo cells and
CD45RA+FoxP3lo from CD45RA�FoxP3hi cells. The percentages of Ki-67+ and Ki-67�FoxP3hi cells among CD4+ cells are indicated in the top panel and the
percentage of FoxP3hiCD45RA� cells in the bottom panel.
(F) Flow cytometry of the expression of intracellular CTLA-4 and FoxP3 (top left); CD45RA and CTLA-4 (top right) by CD4+ T cells; and expression of CTLA-4 by
each fraction defined in (A)–(D) (bottom). Numbers indicate percent of cells in each quadrant.
(G and H) Expression of Ki-67 and FoxP3 (top) and of HLA-DR or ICOS and FoxP3 (bottom). Red broken line separates Ki-67+FoxP3hi from Ki-67�FoxP3lo cells
and HLA-DR�FoxP3lo from HLA-DR+FoxP3hi cells (G) or ICOS�FoxP3lo from ICOS+FoxP3hi cells (H).
(I) Production of IFN-g, IL-2 by each fraction after stimulation with PMA + ionomycin, and percent of cytokine-secreting cells in each fraction is shown. Data are
representative of six independent experiments.
(J) Analysis of DNA methylation status at 50 flanking region (left) and STAT5-responsive (right) region of the FOXP3 gene in FoxP3-expressing or -nonexpressing
CD4+ T cell subsets (Figure S1) from PBMCs of one healthy male donor. Percentages of clones displaying demethylation of indicated CpG methylation sites are
indicated and depicted in white in sector graphs. 19 to 20 clones were sequenced from each CD4+ T cell subset.
(K) CFSE dilution by 104 labeled CD25�CD45RA+CD4+ responder T cells assessed after 84–90 hr of TCR-stimulated coculture with indicated CD4+ T cell subset
at a 1 to 1 ratio. Cell number and percentage of dividing cells per well are indicated. Data are representative of 12 separate experiments.
Immunity 30, 899–911, June 19, 2009 ª2009 Elsevier Inc. 901

Immunity
Definition of Human FoxP3+ CD4+ Treg Cell Subsets
A
B
Figure 2. CD45RA�FoxP3loCD4+ T Cells Contain Cells with Th17 Cell Potential
(A) The amounts of transcripts of indicated genes in separated CD4+ T cell subsets were assessed by quantitative PCR.
(B) Flow cytometry of the production of IL-17 by gated CD4+ T cell subsets after stimulation with PMA + ionomycin for 5 hr. Percentages of cytokine-secreting
cells are shown. Data are representative of six independent experiments.
indicate that Fr. I and II are active in FoxP3 gene transcription
and close in their differentiation stage, and that, compared
with these fractions, Fr. III may be less capable of maintaining
FoxP3 expression in the presence of IL-2 and STAT5 signaling.
To assess the in vitro suppressive potency of each fraction, we
measured the extent of CFSE dilution of labeled naive
CD25�CD45RA+CD4+ T cells (hereafter called responder cells)
cocultured with an equal number of each fraction and stimulated
for 4 days (Figure 1K). Fr. I and II (isolated as CD25++CD45RA+
and CD25+++CD45RA�cells, respectively, as shown in Figure S1)
potently suppressed the proliferation of responder cells, where-
as Fr. III, IV, and V did not and even enhanced the responder
proliferation. The inability of Fr. III (CD45RA�Foxp3lo cells) to
suppress was confirmed by using CD127 as an additional
marker for purifying FoxP3-expressing cells from CD4+ T cells
(Figure S5; Liu et al., 2006; Seddiki et al., 2006).
Taken together, three distinct subpopulations of FoxP3+CD4+
T cells can be defined in human PBL by the expression of
CD45RA and FoxP3 as summarized in Table S1; i.e., Fr. I:
CTLA-4loKi-67�CD45RA+FoxP3lo T cells; Fr. II: CTLA-4hiC-
D45RA�FoxP3hi cells, both of which possess a fully functional
FOXP3 gene, hardly secrete cytokines, and potently suppress
proliferation; and Fr. III: CTLA-4intCD45RA�FoxP3lo T cells,
which secrete cytokines, are much less active in the expression
of the FOXP3 gene under the control via STAT5, and do not
suppress proliferation in vitro. Based on their phenotypic and
functional characteristics, Fr. I and Fr. II can be designated as
resting Treg cells (rTreg cells) and activated Treg cells (aTreg
cells), respectively.
FoxP3loCD45RA� Nonregulatory T Cells Contain Cellswith Th17 Cell PotentialDNA microarray analysis of each fraction showed that the gene
expression patterns in the three FoxP3-expressing subpopula-
902 Immunity 30, 899–911, June 19, 2009 ª2009 Elsevier Inc.
tions were distinct (Figure S6A). Quantitative assessment of
mRNA expression of differentially expressed genes revealed
that the expression of RORC, a key transcription factor in Th17
cell lineage (Ivanov et al., 2006), was highly upregulated in Fr. II
and III, indicating that RORC-FoxP3 double-positive population,
which was recently described in mice (Yang et al., 2008a;
Zhou et al., 2008), exists in humans as well in Fr. II and III (Fig-
ure S6B). Transcripts encoding RORa and AHR, both of which
contribute to Th17 cell differentiation in mice (Veldhoen et al.,
2008; Yang et al., 2008b), were highly upregulated in Fr.III, further
indicating that this population contains cells with Th17 cell
potential (Figure 2A). Also of note is that Fr. II specifically ex-
pressed high amounts of AHR repressor transcripts, suggesting
that Treg cell differentiation might accompany an inhibition of
Th17 cell differentiation via expression of AHR repressor.
Assessment of cytokine production revealed that Fr. III was the
highest producer of IL-17 even compared with naive FoxP3�C-
D45RA+ (Fr. VI) or memory-like FoxP3�CD45RA�CD4+ non-
Treg cells (Fr. IV and V) (Figure 2B; Figure S3).
Thus, DNA microarray profiling of FoxP3+ subpopulations
supports the relevance of separating FoxP3+CD4+ T cells into
three subsets. Further, regarding the cell lineage relationship of
FoxP3+ cells and Th17 cells, Fr. III contains FoxP3-RORg
double-positive cells with a Th17 cell potential, in addition to
IL-2- and/or IFN-g-producing cells (Figure 1I).
Resting Treg Cells Proliferate whereas Activated TregCells Die while Suppressing In VitroAs shown in Figure 1E, fresh Fr. I cells (rTreg cells) did not
express Ki-67. However, when they were cocultured with
responder cells and TCR stimulated, all the FoxP3-expressing
cells became Ki-67+ on day 4, indicating that rTreg cells prolif-
erate (Figure S7). Assessment of proliferation by CFSE dilution
during 4 days of culture also revealed that both aTreg cells

Immunity
Definition of Human FoxP3+ CD4+ Treg Cell Subsets
A
B
D
C
Figure 3. In Vitro Properties of FoxP3+ Subpopulations
(A) CFSE dilution by rTreg or aTreg cells and intracellular expression of FoxP3 were analyzed after 4 days TCR stimulation in the absence or presence of non-
labeled responder cells. Percentages of FoxP3� and of FoxP3+ cells among CFSE-labeled cells are indicated.
(B) Viability assessed by 7-AAD staining of CFSE-labeled CD45RA+FoxP3lo (left) or CD45RA�FoxP3hi Treg cells (right) cocultured with nonlabeled responder cells
for 4 days. Only CFSE-labeled cells are shown. Numbers indicate percentage in each quadrant. Data shown are representative of five independent experiments.
(C) CFSE dilution, surface CD45RO, and intracellular FoxP3 expression by CFSE-labeled responder cells cultured alone or cocultured with unlabeled Treg cell
subsets for 4 days. Numbers indicate percentage in each quadrant.
(D) CFSE dilution of labeled rTreg cells cultured alone or with aTreg cells at a 1 to 1 ratio. Numbers and percentage of proliferating cells are indicated. Data shown
in (B) and (D) are representative of five independent experiments.
(Fr. II) and rTreg cells (Fr. I) gave rise to CFSE-diluting FoxP3+ cells
when cultured alone (Figure 3A). In addition, rTreg cells showed
more active proliferation than did aTreg cells in the presence of
responder cells. In contrast with rTreg or aTreg cells, most
(�70%) of CD45RA�FoxP3loCD4+ T cells (Fr. III) did not express
FoxP3 during their proliferation, indicating that FoxP3 expression
in the majority of Fr. III cells may not be stable in concordance
with the methylation status of their FOXP3 gene (Figure 3A).
Based on the finding that very few aTreg cells (Fr. II) were
detectable after 4 days of culture (Figure S7), we assessed the
viability of Treg cells by measuring incorporation of 7-AAD by
CFSE-labeled rTreg or aTreg cells cultured with responder cells
(Figure 3B). The majority (�75%) of aTreg cells were positive for
7-AAD. By contrast, although a fraction (�20%) of rTreg cells
were nonproliferative and 7-AAD+, the majority of proliferating
rTreg cells (�60%) were 7-AAD� (Figure 3B). In addition to
proliferation, rTreg cells showed increased expression of
FoxP3 (Figure 3A), CD45RO (Figure 3C), and intracellular
CTLA-4 (Figure S8). High expression of CD45RO was secondary
to activation because rTreg cells, which were CD45RA+, did
not express CD45RO when freshly isolated from peripheral
blood (Figure S9). Further, when CFSE-labeled rTreg cells
(Fr. I) were cultured with nonlabeled aTreg cells (Fr. II), the latter
substantially suppressed the proliferation of the former
(Figure 3D).
Taken together, rTreg cells are not anergic and are able to prolif-
erate upon TCR stimulation. They acquire a Ki-67+FoxP3hi aTreg
cell phenotype and exert suppression during and after their prolif-
eration and conversion to aTreg cells, which die after proliferation
and exertionofsuppression. Activated Tregcellsalsosuppress the
proliferation of resting Treg cells in a negative feedback fashion.
Thus, in addition to different cell surface phenotypes, rTreg and
aTreg cells possess different cell fates despite their comparable
in vitro suppressive activity when assessed separately.
Immunity 30, 899–911, June 19, 2009 ª2009 Elsevier Inc. 903

Immunity
Definition of Human FoxP3+ CD4+ Treg Cell Subsets
In Vivo Conversion of rTreg Cells to aTreg Cellsand Differentiation of a Small Fraction of FoxP3� Cellsto FoxP3+ CellsNext, to investigate whether the in vitro conversion of rTreg cells
to aTreg cells could also occur in vivo, we transferred human
PBMCs containing CFSE-labeled CD4+ T cells into NOG (Nod-
scid-common g-chain-deficient) mice and analyzed their
splenocytes 5 days after transfer (Hiramatsu et al., 2003). Fox-
P3hiCD4+ T cells recovered in the recipients were largely
CD25hi and CD45RO+ (data not shown) and mostly confined to
Ki-67+CFSE-diluting cells, which had divided more than 6 times
after transfer (Figure 4A). In addition, most CD4+ T cells express-
ing low amounts of FoxP3 had not proliferated. These findings
correspond to the in vitro findings that FoxP3hi aTreg cells found
in PBMCs were highly proliferative and that FoxP3loCD4+ T cells
were Ki-67� in PBMCs (Figure 1E), suggesting that, upon activa-
tion, rTreg cells upregulate FoxP3 expression and then prolif-
erate. We also examined the behavior of Treg cells or whole
FoxP3+ cells when injected without other effector CD4+ T cells.
Neither population proliferated, indicating that the maintenance
and proliferation of FoxP3-expressing cells requires the pres-
ence of other CD4+ T cells in vivo (Figure S10).
Similar analysis of PBMCs containing CFSE-labeled rTreg
cells, prepared as shown in Figure 1A and Figure S1, showed
that they proliferated in vivo and upregulated the expression of
FoxP3 and CD45RO along several cell divisions (Figure 4B and
data not shown). Because most FoxP3hi cells were detected in
CFSE-negative cells after transfer of CFSE-labeled CD4+
T cells or rTreg cells (Figures 4A and 4B), we attempted to deter-
mine whether rTreg cells were the major source of CFSE-nega-
tive FoxP3hi cells. Injection of PBMCs containing CFSE-labeled
CD4+ T cells devoid of rTreg cells revealed a much lower number
of FoxP3hi cells when compared with injection of whole CD4+
T cells, indicating that most FoxP3hi aTreg cells derive from rTreg
cells (Figure 4C).
Further, to investigate whether the conversion of FoxP3� to
FoxP3+ in CD4+ T cells could occur in vivo, we transferred
PBMCs containing CFSE-labeled FoxP3� CD127hiCD4+ T cells
together with nonlabeled FoxP3+ cells (as CD25hiCD127lo cells)
in NOG mice and examined whether FoxP3�CD4+ T cells could
upregulate FoxP3 in vivo (Figure 4D). Although most CFSE-
labeled cells remained FoxP3�, a small number of cells upregu-
lated FoxP3 from low to high amounts. Injection of only CFSE-
labeled CD4+FoxP3� cells confirmed that a small fraction
(<1%) of CD4+FoxP3� cells indeed divided at least 6 times to
give rise to FoxP3hi cells (Figure 4E). Taken together, these
results indicate that rTreg cells convert to aTreg cells and that
only a small fraction of aTreg cells derives from FoxP3�CD4+
non-Treg cells in vivo.
In Vivo Conversion of rTreg Cells to aTreg Cellsin a Normal Human IndividualTo obtain further evidence for the in vivo rTreg to aTreg cell
conversion in normal humans, we attempted to trace clonotypes
of each Treg cell fraction in a single individual at separate time
points. Cells in rTreg cells (Fr. I), aTreg cells (Fr. II), and also
FoxP3� non-Treg CD4+ T cells (Fr. IV, V, VI) that expressed the
same TCRBV5 family were sorted from a single healthy individual
at 18 month intervals. Single-cell RT-PCR and DNA sequencing
904 Immunity 30, 899–911, June 19, 2009 ª2009 Elsevier Inc.
of the amplicons was performed to compare TCRBV5 CDR3
regions in each sorted subset. Given the small size of the sample,
the analysis was able to monitor dominant clones only. First, we
observed that rTreg (Fr. I) and aTreg (Fr. II) cell subsets shared
few dominant clonotypes at a given time point. Second, we
found that a clonotype initially detected in the rTreg cell subset
was found dominant 18 months later in the aTreg but not in the
rTreg cell subset. The TCR repertoire being potentially so hetero-
geneous and the sample size being so limited (45 to 137 cells
analyzed in each subset), it is highly improbable that T cell clones
with identical TCR sequences could be found in the same
subsets only by chance. Indeed, when random samples of
conventional CD4+ T cells were similarly compared, shared clo-
notypes were never found in this individual (Figure 5; Table S2).
The analysis also revealed that none of the clonotypes found in
FoxP3� cells was found in aTreg cells 18 months later, indicating
that if conversion of FoxP3�CD4+ T cells ever occurs in vivo, it
may not be a frequent phenomenon compared with the conver-
sion of rTreg cells to aTreg cells (Figure 5).
Based on these observations in Figures 4 and 5, we conclude
that most FoxP3hi aTreg cells are derived from recently activated
and vigorously proliferating rTreg cells, and that only a minority of
aTreg cells can develop from FoxP3�CD4+ non-Treg cells
in vivo. The result also indicates that the TCR repertoire of Treg
cells, in particular that of aTreg cells, adaptively changes in
normal individuals.
Variations in Human rTreg and aTreg Cell Populationsunder Normal and Disease ConditionsWe then attempted to determine whether the dissection of
FoxP3+ T cells in adult humans into Fr. I–III based on CD45RA
and FoxP3 expression was pertinent to the analysis of the
dynamics of Treg cell generation and differentiation in ontogeny,
aging, and disease states.
Although rTreg cells were highly prevalent in cord blood, we
could easily detect Ki-67+FoxP3hiCD45RA�CD4+ T cells that cor-
responded to aTreg cells in adults. We failed to confirm the previ-
ously reported finding that all CD25+CD4+ T cells were FoxP3+ in
cord blood (Fritzsching et al., 2006). However, CD4+ T cells ex-
pressing the highest amounts of CD25 contained only FoxP3+
cells and CD127 expression efficiently separated FoxP3+CD25+
from FoxP3�CD25+CD4+ T cells (Figure 6A). IFN-g production
was barely detectable in whole CD4+ T cells whereas IL-2
production was observed in FoxP3loCD45RA�CD4+ T cells as
in adults (data not shown).
Analysis of the expression of CD31 (PECAM-1), which is
known to be expressed in recent thymic emigrants but lost
during their post-thymic peripheral expansion (Kimmig et al.,
2002), revealed that almost all CD31+FoxP3+CD4+ T cells in adult
PBL were confined in the CD45RA+FoxP3lo population (Fr. I).
This finding suggests that the majority of rTreg cells may be
recently derived from the thymus (Figure 6B).
The proportion of rTreg cells (Fr. I) among CD4+ T cells was
decreased in aged donors (1.1% ± 0.59%, n = 12 versus
2.40% ± 0.89% in healthy donors, n = 29; p < 0.0001) whereas
that of aTreg cells (Fr. II) was increased (2.48% ± 1.07% versus
1.63% ± 0.53%; p = 0.01; Figures 6C and 6D).
We next applied our new definition of FoxP3+ T cell subsets to
the analysis of two pathological conditions that reportedly show

Immunity
Definition of Human FoxP3+ CD4+ Treg Cell Subsets
different patterns of Treg cell involvement (Miyara et al., 2005,
2006). In sarcoidosis, a granulomatous disease of unknown
origin, patients with active disease showed a considerable
A
B
C
D
E
Figure 4. In Vivo Conversion of Treg Cell
Phenotype in NOG Mice
PBMCs containing human CD4+ T cells were i.v.
injected in NOG mice and collected in the spleen
5 days later. In schematic representations (left) of
flow cytometric profiles of injected cells before
transfer, CFSE-labeled CD4+ T subsets are de-
picted in green and injected with nonlabeled cells
in black. Flow cytometry of human CD4+ T cells
in the spleen after transfer of PBMCs containing
CFSE-labeled human whole CD4+ T cells (A) or
indicated CFSE-labeled CD4+ T cell subpopula-
tions (B–E) into NOG mice. Numbers indicate
percentage in each quadrant (right). Representa-
tive data of four mice transferred with PBMCs con-
taining CFSE-labeled CD4+ T cells isolated from
three different donors (A), and mice (two for each
condition) transferred with PBMCs with indicated
CFSE-labeled T cell populations obtained from
two different donors (B–E).
increase in the proportion of aTreg cells
among CD4+ T cells (4.67% ± 3.35%, n =
41; p < 0.0001) combined with a high prev-
alence of Ki-67+FoxP3hiCD4+ T cells and
a decrease in the proportions of rTreg cells
(1.48% ± 0.89%; p < 0.0001). In active
systemic lupus erythematosus (SLE), a
prototype of systemic autoimmune dis-
ease, there was a decrease in the pro-
portion of aTreg cells (1.24 ± 0.72; n = 15;
p = 0.006) and an increase in the propor-
tions of rTreg cells (4.2 ± 1.86; p =
0.0008). Notably, CD45RA�FoxP3lo non-
Treg cell fraction (Fr. III) increased to
form a distinct population in active SLE
(10.37% ± 9.3% versus 3.04 ± 1.1 in
healthy donors; p < 0.0001; Figures 6C
and 6D).
Thus, distinction of Treg cell subsets
simply based on the combination of
CD45RA and FoxP3 expression is highly
informative in assessing the dynamics of
Treg cell differentiation under physiolog-
ical and disease conditions.
DISCUSSION
We have shown in this report that FoxP3+
cells in human PBL are heterogeneous in
function and include not only suppressive
T cells but also nonsuppressive ones that
abundantly secrete proinflammatory cyto-
kines such as IL-17. Further, Treg cells
functionally and phenotypically differen-
tiate within the FoxP3+ population. This
functional heterogeneity and differentiation dynamics can be
clearly shown by separating FoxP3+ cells into three subsets based
on the expression of FoxP3 and CD45RA (or CD45RO), which
Immunity 30, 899–911, June 19, 2009 ª2009 Elsevier Inc. 905

Immunity
Definition of Human FoxP3+ CD4+ Treg Cell Subsets
controls signaling thresholds in lymphocytes, hence their state of
differentiation and activation (Hermiston et al., 2003). The three
subpopulations are CD45RA�FoxP3hiCD4+ activated Treg cells
and CD45RA+FoxP3loCD4+ resting Treg cells, both of which are
potently suppressive in vitro, and cytokine-secreting nonsuppres-
sive CD45RA�FoxP3loCD4+ non-Treg cells.
The distinction of FoxP3+ subpopulations revealed the differ-
entiation pathways of Treg cell subpopulations. First, most of
FoxP3hi aTreg cells originate from rTreg cells as shown in vitro
and in vivo, although some FoxP3hi Treg cells may arise from
FoxP3�CD4+ non-Treg cells (Vukmanovic-Stejic et al., 2006).
Second, a large proportion of FoxP3hi aTreg cells is highly prolif-
erative in vivo and appears to be recently activated, although
most rTreg cells are in a resting state. Once rTreg cells are stim-
ulated, they upregulate FoxP3 expression, differentiate to aTreg
cells, and proliferate. In addition to these results obtained by
direct ex vivo analysis of the subpopulations and by their transfer
to NOG mice, our longitudinal study of the repertoire of a partic-
ular TCR Vb subfamily in a single individual provides further
evidence that the conversion of rTreg to aTreg cells physiologi-
cally occurs in vivo. In our current analysis, dominant clones
found in the rTreg cell population were found 18 months later
Figure 5. Longitudinal TCR Repertoire
Analysis in FoxP3+ Cell Subpopulations
TCRBV5+CD4+ T cells belonging to indicated Treg
or non-Treg cell fractions were FACS sorted as
a single cell at indicated time points into wells of
PCR plates. By RT-PCR and TCR sequencing,
the frequencies of individual sequences were as-
sessed. Empty slices correspond to sequences
that were found only once in only one subset.
Persistent clones are color highlighted. Slice size
is proportional to the number of occurrences of
the corresponding TCR sequences. The total
number of sequences successfully analyzed in
each subset is indicated.
in the aTreg, but not rTreg, cell popula-
tion. This indicates that the clones have
preferentially expanded after differenti-
ating to aTreg cells, as suggested by the
high rate of Ki-67+ cells in the aTreg cell
population. The presence of such domi-
nant T cell clones over a long period of
time is a key feature of the aTreg cell pop-
ulation (C.P. and G.G., unpublished data).
This also indicates that the TCR repertoire
of Treg cells adaptively changes with
clonal expansion especially in aTreg cells.
Considering that aTreg cells rapidly die
in vitro and that the immune system is
constantly challenged by exogenous
and endogenous antigens, it is highly
likely that the maintenance of the pool of
aTreg cells is the consequence of a tight
balance between the constant develop-
ment of aTreg cells from activated and
proliferating rTreg cells and their death
after exerting suppression. Further, aTreg
cells control rTreg cell expansion in a feedback manner, contrib-
uting to the maintenance of the balance. FoxP3hi aTreg cells thus
appear to be terminally differentiated Treg cells; yet it remains to
be determined whether the aTreg cell population contains
a memory type long-living Treg cells. Given that aTreg cells die
rapidly and that rTreg cells are highly proliferative upon stimula-
tion, attempts to expand Treg cells ex vivo for cell therapy should
be focused on rTreg cells as proposed by others (Hoffmann
et al., 2006). It needs to be determined whether rTreg cells are
constantly produced by the thymus, or whether they have
a high renewal capacity in the periphery, or both.
Our study has clearly shown that human FoxP3+CD4+ T cells
contain cytokine-secreting nonsuppressive effector T cells that
display low expression of FoxP3. These nonsuppressive Fox-
P3loCD45RA�CD4+ T cells (Fr. III) may correspond to recently
described activation-induced FoxP3-expressing cells that tran-
siently express FoxP3 in vitro (Allan et al., 2007; Gavin et al.,
2006; Tran et al., 2007; Wang et al., 2007). Supporting this
notion, although the 50 flanking region of the FOXP3 gene in Fox-
P3loCD45RA�CD4+ T cells is highly demethylated, the STAT5-
responsive region is poorly demethylated, suggesting that they
may be unstable in maintaining FoxP3 expression through
906 Immunity 30, 899–911, June 19, 2009 ª2009 Elsevier Inc.

Immunity
Definition of Human FoxP3+ CD4+ Treg Cell Subsets
Figure 6. Variations in FoxP3+ Cell Subpopulations under Physiological and Disease Conditions
(A) Flow cytometry of PBMCs gated on CD4+ T cells isolated from cord blood. A representative of four samples.
(B) Expression of CD45RA and FoxP3 by gated CD31+ or CD31� CD4+ T cells. Numbers indicate percentage in each quadrant. A representative of four indepen-
dent experiments.
(C) Flow cytometry of PBMCs gated on CD4+ T cells isolated from a 29-year-old healthy adult, an 88-year-old donor, and two patients with active sarcoidosis or
active SLE. Percentage of each quadrant in each staining combination is shown.
(D) Percentages of each FoxP3+ subset among CD4+ T cells in indicated numbers of patients with active sarcoidosis, active SLE, aged donors (between 79 and 90
years old), and healthy donors (between 18 and 40 years old). Red horizontal bars represent mean percentage. Statistical comparisons were performed by
nonparametric Mann-Whitney U test. NS, not significant.
STAT5 signaling. The notion is also supported by recent reports
showing that activation-induced FoxP3+CD4+ T cells have
FOXP3 DNA significantly less demethylated than bona fide
Treg cells (Baron et al., 2007; Janson et al., 2008). In addition,
although CD127 is a convenient marker for isolating FoxP3+ cells
as CD25hiCD127loCD4+ T cells (Liu et al., 2006; Seddiki et al.,
2006), it is of note that they also include FoxP3+ non-Treg cells.
We therefore propose that the combination of CD25 and
CD45RA is so far the best markers for purifying human FoxP3+
Treg cells as rTreg and aTreg cells.
Immunity 30, 899–911, June 19, 2009 ª2009 Elsevier Inc. 907
Immunity
Definition of Human FoxP3+ CD4+ Treg Cell Subsets
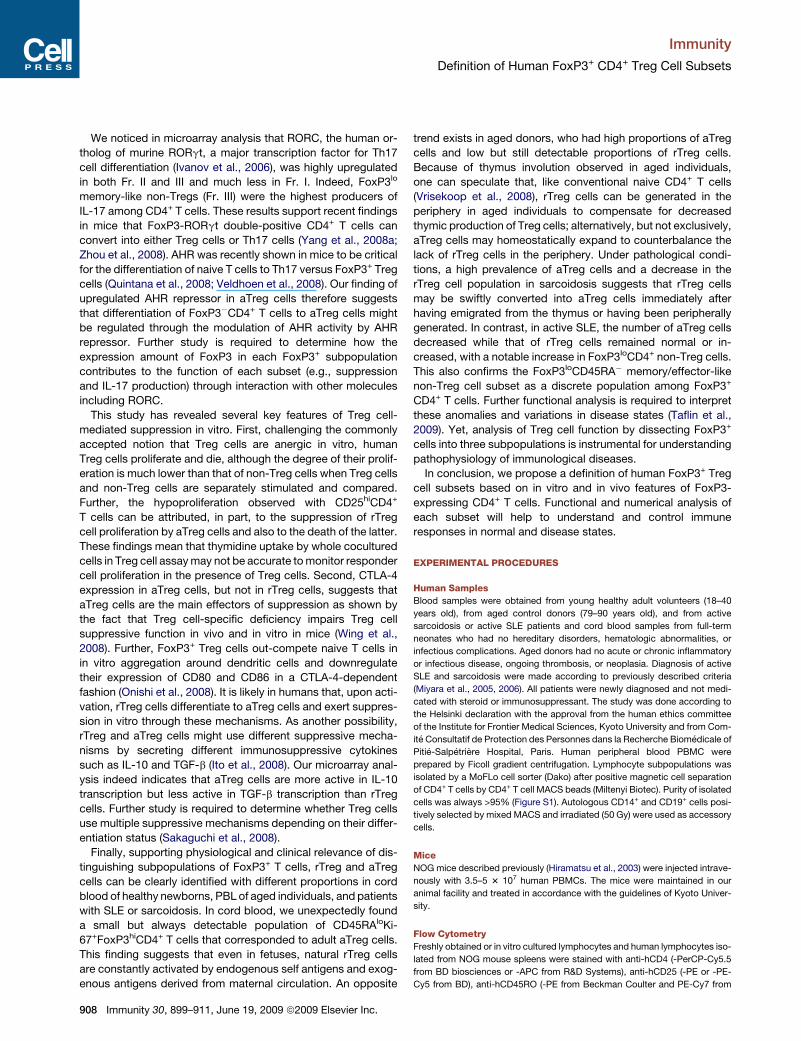
We noticed in microarray analysis that RORC, the human or-
tholog of murine RORgt, a major transcription factor for Th17
cell differentiation (Ivanov et al., 2006), was highly upregulated
in both Fr. II and III and much less in Fr. I. Indeed, FoxP3lo
memory-like non-Tregs (Fr. III) were the highest producers of
IL-17 among CD4+ T cells. These results support recent findings
in mice that FoxP3-RORgt double-positive CD4+ T cells can
convert into either Treg cells or Th17 cells (Yang et al., 2008a;
Zhou et al., 2008). AHR was recently shown in mice to be critical
for the differentiation of naive T cells to Th17 versus FoxP3+ Treg
cells (Quintana et al., 2008; Veldhoen et al., 2008). Our finding of
upregulated AHR repressor in aTreg cells therefore suggests
that differentiation of FoxP3�CD4+ T cells to aTreg cells might
be regulated through the modulation of AHR activity by AHR
repressor. Further study is required to determine how the
expression amount of FoxP3 in each FoxP3+ subpopulation
contributes to the function of each subset (e.g., suppression
and IL-17 production) through interaction with other molecules
including RORC.
This study has revealed several key features of Treg cell-
mediated suppression in vitro. First, challenging the commonly
accepted notion that Treg cells are anergic in vitro, human
Treg cells proliferate and die, although the degree of their prolif-
eration is much lower than that of non-Treg cells when Treg cells
and non-Treg cells are separately stimulated and compared.
Further, the hypoproliferation observed with CD25hiCD4+
T cells can be attributed, in part, to the suppression of rTreg
cell proliferation by aTreg cells and also to the death of the latter.
These findings mean that thymidine uptake by whole cocultured
cells in Treg cell assay may not be accurate to monitor responder
cell proliferation in the presence of Treg cells. Second, CTLA-4
expression in aTreg cells, but not in rTreg cells, suggests that
aTreg cells are the main effectors of suppression as shown by
the fact that Treg cell-specific deficiency impairs Treg cell
suppressive function in vivo and in vitro in mice (Wing et al.,
2008). Further, FoxP3+ Treg cells out-compete naive T cells in
in vitro aggregation around dendritic cells and downregulate
their expression of CD80 and CD86 in a CTLA-4-dependent
fashion (Onishi et al., 2008). It is likely in humans that, upon acti-
vation, rTreg cells differentiate to aTreg cells and exert suppres-
sion in vitro through these mechanisms. As another possibility,
rTreg and aTreg cells might use different suppressive mecha-
nisms by secreting different immunosuppressive cytokines
such as IL-10 and TGF-b (Ito et al., 2008). Our microarray anal-
ysis indeed indicates that aTreg cells are more active in IL-10
transcription but less active in TGF-b transcription than rTreg
cells. Further study is required to determine whether Treg cells
use multiple suppressive mechanisms depending on their differ-
entiation status (Sakaguchi et al., 2008).
Finally, supporting physiological and clinical relevance of dis-
tinguishing subpopulations of FoxP3+ T cells, rTreg and aTreg
cells can be clearly identified with different proportions in cord
blood of healthy newborns, PBL of aged individuals, and patients
with SLE or sarcoidosis. In cord blood, we unexpectedly found
a small but always detectable population of CD45RAloKi-
67+FoxP3hiCD4+ T cells that corresponded to adult aTreg cells.
This finding suggests that even in fetuses, natural rTreg cells
are constantly activated by endogenous self antigens and exog-
enous antigens derived from maternal circulation. An opposite
908 Immunity 30, 899–911, June 19, 2009 ª2009 Elsevier Inc.
trend exists in aged donors, who had high proportions of aTreg
cells and low but still detectable proportions of rTreg cells.
Because of thymus involution observed in aged individuals,
one can speculate that, like conventional naive CD4+ T cells
(Vrisekoop et al., 2008), rTreg cells can be generated in the
periphery in aged individuals to compensate for decreased
thymic production of Treg cells; alternatively, but not exclusively,
aTreg cells may homeostatically expand to counterbalance the
lack of rTreg cells in the periphery. Under pathological condi-
tions, a high prevalence of aTreg cells and a decrease in the
rTreg cell population in sarcoidosis suggests that rTreg cells
may be swiftly converted into aTreg cells immediately after
having emigrated from the thymus or having been peripherally
generated. In contrast, in active SLE, the number of aTreg cells
decreased while that of rTreg cells remained normal or in-
creased, with a notable increase in FoxP3loCD4+ non-Treg cells.
This also confirms the FoxP3loCD45RA� memory/effector-like
non-Treg cell subset as a discrete population among FoxP3+
CD4+ T cells. Further functional analysis is required to interpret
these anomalies and variations in disease states (Taflin et al.,
2009). Yet, analysis of Treg cell function by dissecting FoxP3+
cells into three subpopulations is instrumental for understanding
pathophysiology of immunological diseases.
In conclusion, we propose a definition of human FoxP3+ Treg
cell subsets based on in vitro and in vivo features of FoxP3-
expressing CD4+ T cells. Functional and numerical analysis of
each subset will help to understand and control immune
responses in normal and disease states.
EXPERIMENTAL PROCEDURES
Human Samples
Blood samples were obtained from young healthy adult volunteers (18–40
years old), from aged control donors (79–90 years old), and from active
sarcoidosis or active SLE patients and cord blood samples from full-term
neonates who had no hereditary disorders, hematologic abnormalities, or
infectious complications. Aged donors had no acute or chronic inflammatory
or infectious disease, ongoing thrombosis, or neoplasia. Diagnosis of active
SLE and sarcoidosis were made according to previously described criteria
(Miyara et al., 2005, 2006). All patients were newly diagnosed and not medi-
cated with steroid or immunosuppressant. The study was done according to
the Helsinki declaration with the approval from the human ethics committee
of the Institute for Frontier Medical Sciences, Kyoto University and from Com-
ite Consultatif de Protection des Personnes dans la Recherche Biomedicale of
Pitie-Salpetriere Hospital, Paris. Human peripheral blood PBMC were
prepared by Ficoll gradient centrifugation. Lymphocyte subpopulations was
isolated by a MoFLo cell sorter (Dako) after positive magnetic cell separation
of CD4+ T cells by CD4+ T cell MACS beads (Miltenyi Biotec). Purity of isolated
cells was always >95% (Figure S1). Autologous CD14+ and CD19+ cells posi-
tively selected by mixed MACS and irradiated (50 Gy) were used as accessory
cells.
Mice
NOG mice described previously (Hiramatsu et al., 2003) were injected intrave-
nously with 3.5–5 3 107 human PBMCs. The mice were maintained in our
animal facility and treated in accordance with the guidelines of Kyoto Univer-
sity.
Flow Cytometry
Freshly obtained or in vitro cultured lymphocytes and human lymphocytes iso-
lated from NOG mouse spleens were stained with anti-hCD4 (-PerCP-Cy5.5
from BD biosciences or -APC from R&D Systems), anti-hCD25 (-PE or -PE-
Cy5 from BD), anti-hCD45RO (-PE from Beckman Coulter and PE-Cy7 from

Immunity
Definition of Human FoxP3+ CD4+ Treg Cell Subsets
BD), anti-hCD45RA (-PE-Cy7 from BD or -FITC from Beckman Coulter), anti-
ICOS (-FITC from e-Bioscience), anti-HLA-DR (-PE from BD biosciences),
anti-CD31 (-APC from e-Bioscience), anti-hCD127 (-PE from Beckman Coulter
and -PE-Cy5 from e-bioscience), and 7-AAD (Dako). Intracellular detection of
FoxP3 with anti-hFoxP3 (PE or Alexa Fluor 647, clone 236A/E7 [e-Bioscience]
or clone 259D [BD biosciences]) and of Ki-67 antigen with Ki-67 antibody (FITC
or PE from BD) was performed on fixed and permeabilized cells via Cytofix/
Cytoperm (e-Bioscience). For detection of intracellular cytokine production,
CD4+ T cells were stimulated with 20 ng/ml PMA and 1 mM ionomycin in the
presence of Golgi-Stop (BD Biosciences) for 5 hr and then stained with anti-
hFoxP3-PE, Ki-67-FITC, anti-IL2-APC (BD Biosciences), anti-IFN-g-APC
(BD), or anti-IL-17-Alexa Fluor 647 (e-Bioscience) after fixation and permeabi-
lization. Data acquired by FACSCalibur (Becton Dickinson) were analyzed with
WinMDI 2.9 software (http://facs.scripps.edu/software.html). Statistical com-
parisons were performed with the nonparametric Mann-Whitney U test.
Cell Culture and Suppression Assay
RPMI 1640 medium supplemented with 10% fetal bovine serum, 100 IU/ml
penicillin, and 100 mg/ml streptomycin (Sigma, St. Louis, MO) was used for
T cell culture. Cells were labeled with 1 mM CFSE (Dojindo and Invitrogen). In
suppression assays, unless otherwise indicated, 1 3 104 CFSE-labeled
responder CD25�CD45RA+CD4+ T cells were cocultured with 1 3 104 unla-
beled cells assessed for their suppressive capacity and 1 3 105 irradiated
autologous accessory cells and were stimulated with 0.5 mg/mL plate-bound
anti-CD3 (OKT3 mAb) in 96-well round-bottom plate in supplemented RPMI
medium. Proliferation of CFSE-labeled cells was assessed by flow cytometry
after 84–90 hr of culture. Percent suppression was calculated by dividing the
number of proliferating CFSE-diluting responder cells in the presence of
suppressor cells at a 1 to 1 ratio by the number of proliferating responder cells
when cultured alone, and multiplied by 100.
FOXP3 Gene DNA Methylation
The genomic DNA from purified human CD4+ T cell subsets was extracted by the
Blood & Tissue Genomic DNA Extraction System (Viogene). Genomic DNA from
purified cells was bisulfite converted by the EpiTect Bisulfite Kit (QIAGEN) ac-
cording to the manufacturer’s instructions. DNA was then subjected to PCR
with primers for amplification of specific targets in bisulfite-treated DNA. The
PCR products obtained were cloned into the pGEM-T Easy vector (Promega)
and 20 individual clones from each sample were cycle sequenced by the BigDye
Terminator kit (ver. 3.1; Applied Biosystems) and the ABI automated DNA
sequencer (Applied Biosystems). Primers used: Fxpro-met_F1, 50-TTTTT
GTGGTGAGGGGAAGAAATTATATT-30; Fxpro-met_R2, 50-TACCATCTCCTC
CAATAAAACCCACATC-30; Fxint-met_F8, 50-TTTGGGTTAAGTTTGTTGTAG
GATAGGGTAGTTAG-30; Fxint-met_R7, 50-AAATCTACATCTAAACCCTATTAT
CACAACCCC-30.
Single Cell Sorting, RT-PCR, and Vb5 Sequence Analysis
PBLs were stained with anti-human CD4-FITC, anti-human CD25-PC7 (BD
Biosciences), and anti-human BV5.1, BV5.2, BV5.3-PPE (Beckman Coulter).
Single cells were sorted with the FACS Vantage (Becton Dickinson) into
96-well PCR plates (Abgene, Epsom). Single-cell RT-PCR conditions were
as previously described (Miyara et al., 2006). In the first PCR round, BV5ext
(50-GATCAAAACGAGAGGACAGC-30) and BC (50-CGGGCTGCTCCTTGAG
GGGCTGCG-30) were used. Reactions were subjected after 5 min at 94�C to
8 cycles (94�C for 30 s, 60�C for 40 s, 72�C for 50 s), 32 cycles (94�C for
30 s, 55�C for 40 s, 72�C for 50 s), and a final elongation at 72�C for 5 min.
In a second PCR round, nested primers BV5 (50-AGCTCTGAGCTGAATGT
GAACGCC-30) and BC-int (50-GCGGGTCYGTGCTGACCC-30) were used.
PCR was performed as in the first step.
Products were subjected to automated sequencing (ABI 3100, Applied
Biosystems).
Specific questions regarding this repertoire analysis should be sent to
Microarray and Real-Time PCR
RNA was extracted from FACS-sorted CD4+ T cells according to their amounts
of CD25 and CD45RA and analyzed by Affymetrix Human Genome U133 Plus
2.0 Arrays.
Real-time PCR was performed with a SYBR green assay on the LightCycler
480 system (Roche). Total RNA extracted from FACS-sorted T cells was
reverse transcribed according to the manufacturer’s instructions (RNeasy
Micro kit, QIAGEN). In each reaction, hypoxanthine phosphoribosyltransfer-
ase-1 (HPRT-1) was amplified as a housekeeping gene to calculate a standard
curve and to correct for variations in target sample quantities. Relative copy
numbers were calculated for each sample from the standard curve after
normalization to HPRT-1 by the instrument software. Primers used: FOXP3_F,
50- CAGCACATTCCCAGAGTTCC-30; FOXP3_R,50-TGAGCGTGGCGTAGGT
GAAAG-30; RORA_F,50- TCACCAACGGCGAGACTTC-30; RORA_R,50-GGCA
AACTCCACCACATACTG-30; RORC_F,50-CGCTCCAACATCTTCTCC-30; RO
RC_R,50-CTAACCAGCACCACTTCC-30; AHR_F,50-AACAGATGAGGAAGGAA
CAGAGC-30; AHR_R,50-GAGTGGATGTGGTAGCAGAGTC-30; AHRR_F,50- AA
GGCTGCTGTTGGAGTC-30; AHRR_R,50- TGGATGTAGTCATAAATGTTCTG
G-30; HPRT-1_F,50-GCTGAGGATTTGGAAAGGGTG-30; HPRT-1_R,50-TGAG
CACACAGAGGGCTACAATG-30.
ACCESSION NUMBERS
Microarray data are available from the National Center for Biotechnology Infor-
mation Gene Expression Omnibus (GEO) under accession number GSE15659.
SUPPLEMENTAL DATA
Supplemental Data include ten figures and two tables and can be found with
this article online at http://www.cell.com/immunity/supplemental/S1074-
7613(09)00202-7.
ACKNOWLEDGMENTS
This work was supported by grant in aid from the Ministry of Education, Sports,
and Culture of Japan. M.M. was successively supported by la Fondation pour
la Recherche Medicale and by Japan Society for the Promotion of Science.
The study was also in part supported by a grant from the European Union
(ATTACK project LHS-CT-2005-018914). We thank the blood donors and
the patients who participated in the study, R. Ishii for expertise in cell sorting,
M. Kakino for assistance in molecular biology, M. Yoshida for maintaining
mice, and S. Teradaira, A. Kishi, M. Hashimoto, S. Maeda, H. Uryu, K. Hirota,
C. Badoual, and N. Sakaguchi for technical help and valuable discussion.
Received: December 25, 2008
Revised: February 23, 2009
Accepted: March 26, 2009
Published online: May 21, 2009
REFERENCES
Allan, S.E., Crome, S.Q., Crellin, N.K., Passerini, L., Steiner, T.S., Bacchetta,
R., Roncarolo, M.G., and Levings, M.K. (2007). Activation-induced FOXP3 in
human T effector cells does not suppress proliferation or cytokine production.
Int. Immunol. 19, 345–354.
Baecher-Allan, C., Brown, J.A., Freeman, G.J., and Hafler, D.A. (2001).
CD4+CD25high regulatory cells in human peripheral blood. J. Immunol. 167,
1245–1253.
Baecher-Allan, C., Wolf, E., and Hafler, D.A. (2006). MHC class II expression
identifies functionally distinct human regulatory T cells. J. Immunol. 176,
4622–4631.
Baron, U., Floess, S., Wieczorek, G., Baumann, K., Grutzkau, A., Dong, J.,
Thiel, A., Boeld, T.J., Hoffmann, P., Edinger, M., et al. (2007). DNA demethyla-
tion in the human FOXP3 locus discriminates regulatory T cells from activated
FOXP3(+) conventional T cells. Eur. J. Immunol. 37, 2378–2389.
Curiel, T.J., Coukos, G., Zou, L., Alvarez, X., Cheng, P., Mottram, P., Evdemon-
Hogan, M., Conejo-Garcia, J.R., Zhang, L., Burow, M., et al. (2004). Specific
recruitment of regulatory T cells in ovarian carcinoma fosters immune privilege
and predicts reduced survival. Nat. Med. 10, 942–949.
Immunity 30, 899–911, June 19, 2009 ª2009 Elsevier Inc. 909

Immunity
Definition of Human FoxP3+ CD4+ Treg Cell Subsets
Dieckmann, D., Plottner, H., Berchtold, S., Berger, T., and Schuler, G. (2001).
Ex vivo isolation and characterization of CD4(+)CD25(+) T cells with regulatory
properties from human blood. J. Exp. Med. 193, 1303–1310.
Ehrenstein, M.R., Evans, J.G., Singh, A., Moore, S., Warnes, G., Isenberg,
D.A., and Mauri, C. (2004). Compromised function of regulatory T cells in rheu-
matoid arthritis and reversal by anti-TNFalpha therapy. J. Exp. Med. 200,
277–285.
Floess, S., Freyer, J., Siewert, C., Baron, U., Olek, S., Polansky, J., Schlawe,
K., Chang, H.D., Bopp, T., Schmitt, E., et al. (2007). Epigenetic control of the
foxp3 locus in regulatory T cells. PLoS Biol. 5, e38.
Fontenot, J.D., Gavin, M.A., and Rudensky, A.Y. (2003). Foxp3 programs the
development and function of CD4+CD25+ regulatory T cells. Nat. Immunol.
4, 330–336.
Fritzsching, B., Oberle, N., Pauly, E., Geffers, R., Buer, J., Poschl, J., Krammer,
P., Linderkamp, O., and Suri-Payer, E. (2006). Naive regulatory T cells: A novel
subpopulation defined by resistance toward CD95L-mediated cell death.
Blood 108, 3371–3378.
Gavin, M.A., Torgerson, T.R., Houston, E., DeRoos, P., Ho, W.Y., Stray-Peder-
sen, A., Ocheltree, E.L., Greenberg, P.D., Ochs, H.D., and Rudensky, A.Y.
(2006). Single-cell analysis of normal and FOXP3-mutant human T cells:
FOXP3 expression without regulatory T cell development. Proc. Natl. Acad.
Sci. USA 103, 6659–6664.
Hermiston, M.L., Xu, Z., and Weiss, A. (2003). CD45: A critical regulator of
signaling thresholds in immune cells. Annu. Rev. Immunol. 21, 107–137.
Hiramatsu, H., Nishikomori, R., Heike, T., Ito, M., Kobayashi, K., Katamura, K.,
and Nakahata, T. (2003). Complete reconstitution of human lymphocytes from
cord blood CD34+ cells using the NOD/SCID/gammacnull mice model. Blood
102, 873–880.
Hoffmann, P., Eder, R., Boeld, T.J., Doser, K., Piseshka, B., Andreesen, R., and
Edinger, M. (2006). Only the CD45RA+ subpopulation of CD4+CD25high
T cells gives rise to homogeneous regulatory T-cell lines upon in vitro expan-
sion. Blood 108, 4260–4267.
Hori, S., Nomura, T., and Sakaguchi, S. (2003). Control of regulatory T cell
development by the transcription factor Foxp3. Science 299, 1057–1061.
Ito, T., Hanabuchi, S., Wang, Y.H., Park, W.R., Arima, K., Bover, L., Qin, F.X.,
Gilliet, M., and Liu, Y.J. (2008). Two functional subsets of FOXP3+ regulatory
T cells in human thymus and periphery. Immunity 28, 870–880.
Ivanov, I.I., McKenzie, B.S., Zhou, L., Tadokoro, C.E., Lepelley, A., Lafaille,
J.J., Cua, D.J., and Littman, D.R. (2006). The orphan nuclear receptor ROR-
gammat directs the differentiation program of proinflammatory IL-17+ T helper
cells. Cell 126, 1121–1133.
Janson, P.C., Winerdal, M.E., Marits, P., Thorn, M., Ohlsson, R., and Winqvist,
O. (2008). FOXP3 promoter demethylation reveals the committed Treg popu-
lation in humans. PLoS ONE 3, e1612.
Jonuleit, H., Schmitt, E., Stassen, M., Tuettenberg, A., Knop, J., and Enk, A.H.
(2001). Identification and functional characterization of human CD4(+)CD25(+)
T cells with regulatory properties isolated from peripheral blood. J. Exp. Med.
193, 1285–1294.
Khattri, R., Cox, T., Yasayko, S.A., and Ramsdell, F. (2003). An essential role
for Scurfin in CD4+CD25+ T regulatory cells. Nat. Immunol. 4, 337–342.
Kimmig, S., Przybylski, G.K., Schmidt, C.A., Laurisch, K., Mowes, B., Rad-
bruch, A., and Thiel, A. (2002). Two subsets of naive T helper cells with distinct
T cell receptor excision circle content in human adult peripheral blood. J. Exp.
Med. 195, 789–794.
Kriegel, M.A., Lohmann, T., Gabler, C., Blank, N., Kalden, J.R., and Lorenz,
H.M. (2004). Defective suppressor function of human CD4+ CD25+ regulatory
T cells in autoimmune polyglandular syndrome type II. J. Exp. Med. 199, 1285–
1291.
Levings, M.K., Sangregorio, R., and Roncarolo, M.G. (2001). Human
cd25(+)cd4(+) t regulatory cells suppress naive and memory T cell proliferation
and can be expanded in vitro without loss of function. J. Exp. Med. 193, 1295–
1302.
Liu, W., Putnam, A.L., Xu-Yu, Z., Szot, G.L., Lee, M.R., Zhu, S., Gottlieb, P.A.,
Kapranov, P., Gingeras, T.R., Fazekas de St Groth, B., et al. (2006). CD127
910 Immunity 30, 899–911, June 19, 2009 ª2009 Elsevier Inc.
expression inversely correlates with FoxP3 and suppressive function of human
CD4+ T reg cells. J. Exp. Med. 203, 1701–1711.
Mantel, P.Y., Ouaked, N., Ruckert, B., Karagiannidis, C., Welz, R., Blaser, K.,
and Schmidt-Weber, C.B. (2006). Molecular mechanisms underlying FOXP3
induction in human T cells. J. Immunol. 176, 3593–3602.
Miyara, M., Amoura, Z., Parizot, C., Badoual, C., Dorgham, K., Trad, S., Nochy,
D., Debre, P., Piette, J.C., and Gorochov, G. (2005). Global natural regulatory
T cell depletion in active systemic lupus erythematosus. J. Immunol. 175,
8392–8400.
Miyara, M., Amoura, Z., Parizot, C., Badoual, C., Dorgham, K., Trad, S., Kam-
bouchner, M., Valeyre, D., Chapelon-Abric, C., Debre, P., et al. (2006). The
immune paradox of sarcoidosis and regulatory T cells. J. Exp. Med. 203,
359–370.
Ng, W.F., Duggan, P.J., Ponchel, F., Matarese, G., Lombardi, G., Edwards,
A.D., Isaacs, J.D., and Lechler, R.I. (2001). Human CD4(+)CD25(+) cells: a natu-
rally occurring population of regulatory T cells. Blood 98, 2736–2744.
Onishi, Y., Fehervari, Z., Yamaguchi, T., and Sakaguchi, S. (2008). Foxp3+
natural regulatory T cells preferentially form aggregates on dendritic cells
in vitro and actively inhibit their maturation. Proc. Natl. Acad. Sci. USA 105,
10113–10118.
Quintana, F.J., Basso, A.S., Iglesias, A.H., Korn, T., Farez, M.F., Bettelli, E.,
Caccamo, M., Oukka, M., and Weiner, H.L. (2008). Control of T(reg) and
T(H)17 cell differentiation by the aryl hydrocarbon receptor. Nature 453, 65–71.
Roncador, G., Brown, P.J., Maestre, L., Hue, S., Martinez-Torrecuadrada, J.L.,
Ling, K.L., Pratap, S., Toms, C., Fox, B.C., Cerundolo, V., et al. (2005). Analysis
of FOXP3 protein expression in human CD4+CD25+ regulatory T cells at the
single-cell level. Eur. J. Immunol. 35, 1681–1691.
Sakaguchi, S., Sakaguchi, N., Asano, M., Itoh, M., and Toda, M. (1995). Immu-
nologic self-tolerance maintained by activated T cells expressing IL-2 receptor
alpha-chains (CD25). Breakdown of a single mechanism of self-tolerance
causes various autoimmune diseases. J. Immunol. 155, 1151–1164.
Sakaguchi, S., Yamaguchi, T., Nomura, T., and Ono, M. (2008). Regulatory
T cells and immune tolerance. Cell 133, 775–787.
Seddiki, N., Santner-Nanan, B., Martinson, J., Zaunders, J., Sasson, S.,
Landay, A., Solomon, M., Selby, W., Alexander, S.I., Nanan, R., et al. (2006).
Expression of interleukin (IL)-2 and IL-7 receptors discriminates between
human regulatory and activated T cells. J. Exp. Med. 203, 1693–1700.
Taams, L.S., Smith, J., Rustin, M.H., Salmon, M., Poulter, L.W., and Akbar,
A.N. (2001). Human anergic/suppressive CD4(+)CD25(+) T cells: a highly differ-
entiated and apoptosis-prone population. Eur. J. Immunol. 31, 1122–1131.
Taflin, C., Miyara, M., Nochy, D., Valeyre, D., Naccache, J.M., Altare, F., Salek-
Peyron, P., Badoual, C., Bruneval, P., Haroche, J., et al. (2009). FoxP3+ regu-
latory T cells suppress early stages of granuloma formation but have little
impact on sarcoidosis lesions. Am. J. Pathol. 174, 497–508.
Tran, D.Q., Ramsey, H., and Shevach, E.M. (2007). Induction of FOXP3
expression in naive human CD4+FOXP3 T cells by T-cell receptor stimulation
is transforming growth factor-{beta} dependent but does not confer a regula-
tory phenotype. Blood 110, 2983–2990.
Valmori, D., Merlo, A., Souleimanian, N.E., Hesdorffer, C.S., and Ayyoub, M.
(2005). A peripheral circulating compartment of natural naive CD4 Tregs.
J. Clin. Invest. 115, 1953–1962.
Veldhoen, M., Hirota, K., Westendorf, A.M., Buer, J., Dumoutier, L., Renauld,
J.C., and Stockinger, B. (2008). The aryl hydrocarbon receptor links T(H)17-
cell-mediated autoimmunity to environmental toxins. Nature 453, 106–109.
Viglietta, V., Baecher-Allan, C., Weiner, H.L., and Hafler, D.A. (2004). Loss of
functional suppression by CD4+CD25+ regulatory T cells in patients with
multiple sclerosis. J. Exp. Med. 199, 971–979.
Vrisekoop, N., den Braber, I., de Boer, A.B., Ruiter, A.F., Ackermans, M.T., van
der Crabben, S.N., Schrijver, E.H., Spierenburg, G., Sauerwein, H.P., Hazen-
berg, M.D., et al. (2008). Sparse production but preferential incorporation of
recently produced naive T cells in the human peripheral pool. Proc. Natl.
Acad. Sci. USA 105, 6115–6120.
Vukmanovic-Stejic, M., Zhang, Y., Cook, J.E., Fletcher, J.M., McQuaid, A.,
Masters, J.E., Rustin, M.H., Taams, L.S., Beverley, P.C., Macallan, D.C., and

Immunity
Definition of Human FoxP3+ CD4+ Treg Cell Subsets
Akbar, A.N. (2006). Human CD4+ CD25hi Foxp3+ regulatory T cells are derived
by rapid turnover of memory populations in vivo. J. Clin. Invest. 116, 2423–
2433.
Wang, J., Ioan-Facsinay, A., van der Voort, E.I., Huizinga, T.W., and Toes, R.E.
(2007). Transient expression of FOXP3 in human activated nonregulatory
CD4+ T cells. Eur. J. Immunol. 37, 129–138.
Wing, K., Onishi, Y., Prieto-Martin, P., Yamaguchi, T., Miyara, M., Fehervari, Z.,
Nomura, T., and Sakaguchi, S. (2008). CTLA-4 control over Foxp3+ regulatory
T cell function. Science 322, 271–275.
Yagi, H., Nomura, T., Nakamura, K., Yamazaki, S., Kitawaki, T., Hori, S.,
Maeda, M., Onodera, M., Uchiyama, T., Fujii, S., and Sakaguchi, S. (2004).
Crucial role of FOXP3 in the development and function of human
CD25+CD4+ regulatory T cells. Int. Immunol. 16, 1643–1656.
Yang, X.O., Nurieva, R., Martinez, G.J., Kang, H.S., Chung, Y., Pappu, B.P.,
Shah, B., Chang, S.H., Schluns, K.S., Watowich, S.S., et al. (2008a). Molecular
antagonism and plasticity of regulatory and inflammatory T cell programs.
Immunity 29, 44–56.
Yang, X.O., Pappu, B.P., Nurieva, R., Akimzhanov, A., Kang, H.S., Chung, Y.,
Ma, L., Shah, B., Panopoulos, A.D., Schluns, K.S., et al. (2008b). T helper 17
lineage differentiation is programmed by orphan nuclear receptors ROR alpha
and ROR gamma. Immunity 28, 29–39.
Zhou, L., Lopes, J.E., Chong, M.M., Ivanov, I.I., Min, R., Victora, G.D., Shen, Y.,
Du, J., Rubtsov, Y.P., Rudensky, A.Y., et al. (2008). TGF-beta-induced Foxp3
inhibits T(H)17 cell differentiation by antagonizing RORgammat function.
Nature 453, 236–240.
Zorn, E., Nelson, E.A., Mohseni, M., Porcheray, F., Kim, H., Litsa, D., Bellucci,
R., Raderschall, E., Canning, C., Soiffer, R.J., et al. (2006). IL-2 regulates
FOXP3 expression in human CD4+CD25+ regulatory T cells through
a STAT-dependent mechanism and induces the expansion of these cells
in vivo. Blood 108, 1571–1579.
Immunity 30, 899–911, June 19, 2009 ª2009 Elsevier Inc. 911