Small intestinal CD8+TCRγδ+NKG2A+ intraepithelial lymphocytes have attributes of regulatory cells...
13
Research article The Journal of Clinical Investigation http://www.jci.org Volume 118 Number 1 January 2008 281 Small intestinal CD8 + TCRγδ + NKG2A + intraepithelial lymphocytes have attributes of regulatory cells in patients with celiac disease Govind Bhagat, 1 Afzal J. Naiyer, 2 Jayesh G. Shah, 2 Jason Harper, 2 Bana Jabri, 3 Timothy C. Wang, 2 Peter H.R. Green, 2 and John S. Manavalan 2 1 Department of Pathology and 2 Department of Medicine, Columbia University College of Physicians and Surgeons, New York, New York, USA. 3 Departments of Pathology, Medicine, and Pediatrics, University of Chicago, Chicago, Illinois, USA. Intraepithelial lymphocytes (IELs) bearing the γδ TCR are more abundant in the small intestinal mucosa of patients with celiac disease (CD) compared with healthy individuals. However, their role in disease patho- genesis is not well understood. Here, we investigated the functional attributes of TCRγδ + IELs isolated from intestinal biopsies of patients with either active celiac disease (ACD) or those on a gluten-free diet (GFD). We found that compared with individuals with ACD, individuals on GFD have a higher frequency of CD8 + TCRγδ + IELs that express the inhibitory NK receptor NKG2A and intracellular TGF-β1. TCR triggering as well as cross-linking of NKG2A increased both TGF-β1 intracellular expression and secretion in vitro. Coculture of sorted TCRγδ + NKG2A + IELs, IL-15–stimulated TCRαβ + IELs, and HLA-E + enterocytes resulted in a decreased percentage of cytotoxic CD8 + TCRαβ + IELs expressing intracellular IFN-γ and granzyme-B and surface NKG2D. This inhibition was partially abrogated by blocking either TGF-β alone or both NKG2A and HLA-E. Thus, our data indicate that suppression was at least partially mediated by TGF-β secretion as a result of engagement of NKG2A with its ligand, HLA-E, on enterocytes and/or TCRαβ + IELs. These findings demonstrate that human small intestinal CD8 + TCRγδ + IELs may have regulatory potential in celiac disease. Introduction Celiac disease (CD), or gluten-sensitive enteropathy, is a mal- absorption syndrome that occurs in genetically susceptible individuals who are intolerant to dietary gluten (1). The disease is triggered by exposure to gliadin peptides, which are derived from peptidase-digested gluten and transported across the epi- thelial barrier to the lamina propria (LP). The peptides are then deamidated by the enzyme tissue transglutaminase 2 (tTG2), processed by APCs, and presented to LP CD4 + T cells in the con- text of HLA-DQ2/DQ8 molecules, leading to the activation of antigen-specific Th cells (2). Additionally, LP CD8 + T cells that are activated by deamidated peptides in the context of HLA-A2 have been described in CD patients (3). Gliadin peptides also induce IL-15 secretion by intestinal epithelial cells (ECs) and APCs that results in upregulation of MICA/B on enterocytes and the activation and proliferation of antigen-nonspecific cytotoxic CD8 + TCRαβ + intraepithelial lymphocytes (IELs) (4, 5). Repro- gramming of these effector IELs into lymphokine-activated T cells is thought to contribute to small intestinal mucosal damage in CD (4–6). Interaction of the activating NK cell recep- tors, NKG2D or the heterodimer CD94/NKG2C, expressed by CD8 + TCRαβ + IELs, with their ligands MICA/B and HLA-E (on enterocytes), respectively, results in the release of IFN-γ and the contents of cytotoxic granules (perforin and granzyme B) that cause cytolysis of enterocytes (4–6). Thus, pathogenesis of CD involves generation of an adaptive as well as an innate effector response. The adaptive response involves activation of gliadin-specific LP CD4 + T cells that recog- nize immunogenic gliadin peptides in the context of HLA-DQ2 or HLA-DQ8 molecules, while the innate response, observed in the epithelial compartment, involves CD8 + TCRαβ + cytotoxic IELs directed against stressed ECs (reviewed in ref. 1). Both these effec- tor responses have been well studied in CD and have provided insights into the genesis of mucosal damage. However, little is known about the cellular networks, mechanisms, and mediators responsible for maintaining tolerance to ingested antigens, espe- cially gliadin. Recently, IL-10–secreting, type 1 regulatory (TR1) CD4 + T clones were described in the LP of CD patients on a gluten- free diet (GFD) (7). These T cells were gliadin specific and could suppress the proliferation of pathogenic CD4 + Th0 cells. Increased numbers of TCRγδ + IELs have also been observed in the small intestinal mucosa of CD patients (8–11). An increase of this IEL subset has been observed in all stages of disease including those with latent CD and active CD (ACD) or those on GFD, in some first-degree relatives of CD patients with HLA-DQ2, and in patients with dermatitis herpetiformis (12–16). Although the reason for this increase has not been studied in depth, it has been suggested that TCRγδ + IELs may have immunomodulatory function (17). In humans and mice, TCRγδ + T cells are preferentially located in epi- thelia of various organs, and they constitute a substantial fraction of intestinal IELs (18, 19). It has been proposed that TCRγδ + T cells bridge innate and adaptive immune responses (20). In the intestinal mucosa, these cells play a vital role in the maintenance of epithe- lial integrity and repair through the production of cytokines and growth factors (21–24). TCRδ-deficient mice, which lack TCRγδ + T cells, demonstrate exaggerated intestinal mucosal damage in response to parasitic infections (25). In addition, murine small Nonstandard abbreviations used: ACD, active CD; CD, celiac disease; EC, epithelial cell; ESA, epithelial-specific antigen; GFD, gluten-free diet; IEL, intraepithelial lym- phocyte; iNKR, inhibitory NK receptor; LAP, latency-associated peptide; LP, lamina propria; rhIL-5, recombinant human IL-15; TR1, type 1 regulatory. Conflict of interest: The authors have declared that no conflict of interest exists. Citation for this article: J. Clin. Invest. 118:281–293 (2008). doi:10.1172/JCI30989.
-
Upload
independent -
Category
Documents
-
view
1 -
download
0
Transcript of Small intestinal CD8+TCRγδ+NKG2A+ intraepithelial lymphocytes have attributes of regulatory cells...
Research article
TheJournalofClinicalInvestigation http://www.jci.org Volume 118 Number 1 January 2008 281
Small intestinal CD8+TCRγδ+NKG2A+ intraepithelial lymphocytes have attributes of regulatory cells in patients with celiac diseaseGovind Bhagat,1 Afzal J. Naiyer,2 Jayesh G. Shah,2 Jason Harper,2 Bana Jabri,3 Timothy C. Wang,2
Peter H.R. Green,2 and John S. Manavalan2
1Department of Pathology and 2Department of Medicine, Columbia University College of Physicians and Surgeons, New York, New York, USA. 3Departments of Pathology, Medicine, and Pediatrics, University of Chicago, Chicago, Illinois, USA.
Intraepitheliallymphocytes(IELs)bearingtheγδTCRaremoreabundantinthesmallintestinalmucosaofpatientswithceliacdisease(CD)comparedwithhealthyindividuals.However,theirroleindiseasepatho-genesisisnotwellunderstood.Here,weinvestigatedthefunctionalattributesofTCRγδ+IELsisolatedfromintestinalbiopsiesofpatientswitheitheractiveceliacdisease(ACD)orthoseonagluten-freediet(GFD).WefoundthatcomparedwithindividualswithACD,individualsonGFDhaveahigherfrequencyofCD8+TCRγδ+IELsthatexpresstheinhibitoryNKreceptorNKG2AandintracellularTGF-β1.TCRtriggeringaswellascross-linkingofNKG2AincreasedbothTGF-β1intracellularexpressionandsecretion invitro.CocultureofsortedTCRγδ+NKG2A+IELs,IL-15–stimulatedTCRαβ+IELs,andHLA-E+enterocytesresultedinadecreasedpercentageofcytotoxicCD8+TCRαβ+IELsexpressingintracellularIFN-γandgranzyme-BandsurfaceNKG2D.ThisinhibitionwaspartiallyabrogatedbyblockingeitherTGF-βaloneorbothNKG2AandHLA-E.Thus,ourdataindicatethatsuppressionwasatleastpartiallymediatedbyTGF-βsecretionasaresultofengagementofNKG2Awithitsligand,HLA-E,onenterocytesand/orTCRαβ+IELs.ThesefindingsdemonstratethathumansmallintestinalCD8+TCRγδ+IELsmayhaveregulatorypotentialinceliacdisease.
IntroductionCeliac disease (CD), or gluten-sensitive enteropathy, is a mal-absorption syndrome that occurs in genetically susceptible individuals who are intolerant to dietary gluten (1). The disease is triggered by exposure to gliadin peptides, which are derived from peptidase-digested gluten and transported across the epi-thelial barrier to the lamina propria (LP). The peptides are then deamidated by the enzyme tissue transglutaminase 2 (tTG2), processed by APCs, and presented to LP CD4+ T cells in the con-text of HLA-DQ2/DQ8 molecules, leading to the activation of antigen-specific Th cells (2). Additionally, LP CD8+ T cells that are activated by deamidated peptides in the context of HLA-A2 have been described in CD patients (3). Gliadin peptides also induce IL-15 secretion by intestinal epithelial cells (ECs) and APCs that results in upregulation of MICA/B on enterocytes and the activation and proliferation of antigen-nonspecific cytotoxic CD8+TCRαβ+ intraepithelial lymphocytes (IELs) (4, 5). Repro-gramming of these effector IELs into lymphokine-activated T cells is thought to contribute to small intestinal mucosal damage in CD (4–6). Interaction of the activating NK cell recep-tors, NKG2D or the heterodimer CD94/NKG2C, expressed by CD8+TCRαβ+ IELs, with their ligands MICA/B and HLA-E (on enterocytes), respectively, results in the release of IFN-γ and the contents of cytotoxic granules (perforin and granzyme B) that cause cytolysis of enterocytes (4–6).
Thus, pathogenesis of CD involves generation of an adaptive as well as an innate effector response. The adaptive response involves activation of gliadin-specific LP CD4+ T cells that recog-nize immunogenic gliadin peptides in the context of HLA-DQ2 or HLA-DQ8 molecules, while the innate response, observed in the epithelial compartment, involves CD8+TCRαβ+ cytotoxic IELs directed against stressed ECs (reviewed in ref. 1). Both these effec-tor responses have been well studied in CD and have provided insights into the genesis of mucosal damage. However, little is known about the cellular networks, mechanisms, and mediators responsible for maintaining tolerance to ingested antigens, espe-cially gliadin. Recently, IL-10–secreting, type 1 regulatory (TR1) CD4+ T clones were described in the LP of CD patients on a gluten-free diet (GFD) (7). These T cells were gliadin specific and could suppress the proliferation of pathogenic CD4+ Th0 cells.
Increased numbers of TCRγδ+ IELs have also been observed in the small intestinal mucosa of CD patients (8–11). An increase of this IEL subset has been observed in all stages of disease including those with latent CD and active CD (ACD) or those on GFD, in some first-degree relatives of CD patients with HLA-DQ2, and in patients with dermatitis herpetiformis (12–16). Although the reason for this increase has not been studied in depth, it has been suggested that TCRγδ+ IELs may have immunomodulatory function (17). In humans and mice, TCRγδ+ T cells are preferentially located in epi-thelia of various organs, and they constitute a substantial fraction of intestinal IELs (18, 19). It has been proposed that TCRγδ+ T cells bridge innate and adaptive immune responses (20). In the intestinal mucosa, these cells play a vital role in the maintenance of epithe-lial integrity and repair through the production of cytokines and growth factors (21–24). TCRδ-deficient mice, which lack TCRγδ+ T cells, demonstrate exaggerated intestinal mucosal damage in response to parasitic infections (25). In addition, murine small
Nonstandardabbreviationsused: ACD, active CD; CD, celiac disease; EC, epithelial cell; ESA, epithelial-specific antigen; GFD, gluten-free diet; IEL, intraepithelial lym-phocyte; iNKR, inhibitory NK receptor; LAP, latency-associated peptide; LP, lamina propria; rhIL-5, recombinant human IL-15; TR1, type 1 regulatory.
Conflictofinterest: The authors have declared that no conflict of interest exists.
Citationforthisarticle: J. Clin. Invest. 118:281–293 (2008). doi:10.1172/JCI30989.
research article
282 TheJournalofClinicalInvestigation http://www.jci.org Volume 118 Number 1 January 2008
intestinal TCRγδ+ IELs have been shown to express TGF-β mRNA, secrete IL-10, and inhibit cytotoxic T cell responses in vitro (26).
In this study, we investigated the regulatory potential of small intestinal TCRγδ+ IELs in CD patients and the mechanism of TCRγδ+ IEL–mediated suppression of the cytotoxic effector response. We found that a higher percentage of small intestinal TCRγδ+ IELs expressed the inhibitory NK receptor (iNKR) CD94/NKG2A compared with TCRαβ+ IELs and that the relative fre-quency of NKG2A+TCRγδ+ IELs decreased in patients with ACD. TCRγδ+ IELs from CD patients suppressed the IL-15–induced cyto-toxic phenotype of CD8+TCRαβ+ IELs in vitro by secreting TGF-β. Furthermore, the secretion of TGF-β was enhanced upon ligation of NKG2A and triggering of the TCR. Our findings demonstrate that human small intestinal CD8+TCRγδ+ IELs have regulatory potential and they can utilize the iNKR NKG2A to suppress the cytotoxic programming of CD8+TCRαβ+ IELs in CD.
ResultsFrequencies and phenotypic characteristics of TCRγδ+ IEL subsets. The fre-quency of TCRγδ+ IELs in human intestinal epithelium ranges from 2% to 40%, depending on the segment of bowel sampled (27–30). Several reports have shown that the frequency of TCRγδ+ IELs is increased in the small intestine of patients with CD compared with healthy individuals (8–11). Using flow cytometry, we thus determined the frequency of TCRγδ+ and TCRαβ+ IELs in jejunal biopsies of individuals with CD on GFD; patients with ACD; and healthy individuals, who served as controls (Figure 1A). Screening of IELs from 38 CD patients (23 on GFD, 15 with ACD) and 10 controls revealed a significantly higher frequency of CD3+TCRγδ+ IELs in individuals on GFD (43.8% ± 14.1%) compared with patients with ACD (22.2% ± 14.4%; P < 0.0001) or controls (17.7% ± 7.8%; P < 0.0001) (Figure 1B). The frequency of CD3+TCRαβ+ IELs in
individuals on GFD (56.2% ± 14.2%) was significantly lower com-pared with that in patients with ACD (77.8% ± 14.4%; P < 0.0001) or controls (83.2% ± 4.2%; P < 0.0001) (Figure 1B). We next com-pared the frequencies of CD8+TCRγδ+ IELs and CD8–TCRγδ+ IELs within different patient groups. We found that the frequency of both CD3+CD8+TCRγδ+ and CD3+CD8–TCRγδ+ IELs was signifi-cantly higher in individuals on GFD (15.6% ± 4.7% and 28.2% ± 9.5%, respectively) than patients with ACD (5.0% ± 3.5%, P < 0.0001; and 17.2% ± 11.0%, P = 0.003) or controls (0.7% ± 0.6%, P < 0.0001; and 4.9% ± 2.6%, P < 0.0001) (Figure 1C).
In ACD, CD8+TCRαβ+ cytotoxic IELs undergo a programmed activation that leads to an increase in the number of cells express-ing increased amounts of cytotoxic granule proteins, perforin and granzyme B. In order to determine the cytotoxic potential of TCRγδ+ IELs, we compared the frequency of CD3+CD8+TCRγδ+ IELs and CD3+CD8–TCRγδ+ IELs expressing intracellular cytotoxic granule proteins within different patient groups. The percentage of CD3+CD8+TCRγδ+ IELs expressing perforin and granzyme B was significantly higher in patients with ACD (67.6% ± 6.5% and 50.3% ± 15.5%, respectively) compared with those on GFD (40.5% ± 11.6%, P = 0.002; and 25.3% ± 17.4%, P = 0.01) or controls (7.0% ± 2.4%, P < 0.0001; and 4.7% ± 1.7%, P < 0.0001). However, the percentage of CD3+CD8–TCRγδ+ IELs expressing perforin and gran-zyme B in ACD patients (72.4% ± 13.3% and 51.6% ± 11.7%, respec-tively), though significantly higher than in controls (9.2% ± 2.5% and 5.7% ± 3.8%; P < 0.0001), did not differ significantly from that in individuals on GFD (61.6% ± 19.8%, P = 0.2; and 35.4% ± 20.5%, P = 0.17). These findings indicate that, in addition to CD8+TCRαβ+ IELs, activated CD3+CD8+ TCRγδ+ IELs are also increased during disease exacerbation.
TCRγδ+ IELs suppress the cytotoxic programming of TCRαβ+ IELs. In CD, small intestinal EC damage is thought to be mediated by
Figure 1Frequency of TCRγδ subsets in IELs from CD patients. (A) Flow cytometry dot plots showing gating strategy for CD3+TCRαβ+ IELs and CD3+TCRγδ+ IELs. (B and C) Box-and-whisker plots representing frequencies, as assessed by flow cytometry, of: CD3+TCRαβ+ IELs and CD3+TCRγδ+ IELs in jejunal biopsy samples from ACD patients (n = 15), GFD patients (n = 23), and controls (n = 10) (B); CD3+CD8+TCRγδ+ IELs and CD3+
CD8–TCRγδ IELs in jejunal biopsies from ACD patients, GFD patients, and controls (C) (P values calculated using Mann-Whitney U test).
research article
TheJournalofClinicalInvestigation http://www.jci.org Volume 118 Number 1 January 2008 283
IFN-γ–producing CD8+TCRαβ+ cytotoxic IELs that express the activating NK receptors NKG2D and the heterodimer CD94/NKG2C upon chronic stimulation (4–6). We investigated whether TCRγδ+ IELs could suppress the IL-15–induced NK cell program-ming of TCRαβ+ IELs. TCRαβ+ IELs and epithelial-specific anti-
gen–positive (ESA+) ECs were cocultured in the presence or absence of 25 ng/ml recombinant human IL-15 (rhIL-15). In parallel, TCRγδ+ IELs were added to TCRαβ+ IELs and ESA+ EC cocultures containing 25 ng/ml of rhIL-15, at a 1:1:1 cell ratio. After 36 hours incubation with IL-15 (in 5 independent experiments), the per-
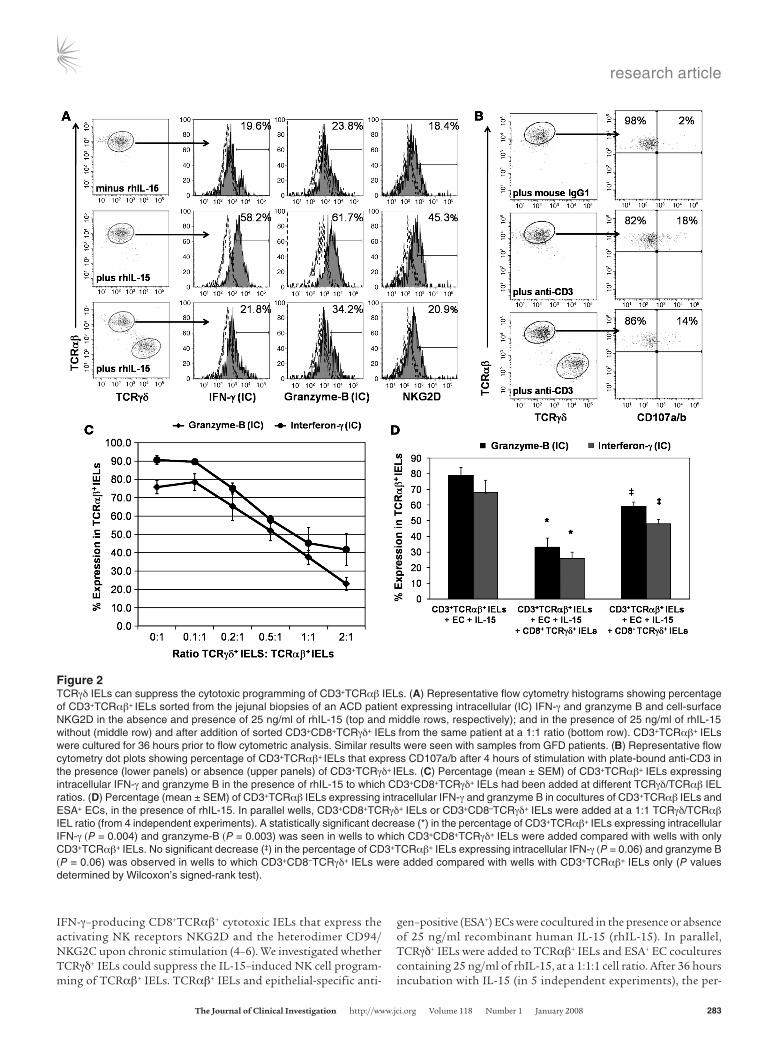
Figure 2TCRγδ IELs can suppress the cytotoxic programming of CD3+TCRαβ IELs. (A) Representative flow cytometry histograms showing percentage of CD3+TCRαβ+ IELs sorted from the jejunal biopsies of an ACD patient expressing intracellular (IC) IFN-γ and granzyme B and cell-surface NKG2D in the absence and presence of 25 ng/ml of rhIL-15 (top and middle rows, respectively); and in the presence of 25 ng/ml of rhIL-15 without (middle row) and after addition of sorted CD3+CD8+TCRγδ+ IELs from the same patient at a 1:1 ratio (bottom row). CD3+TCRαβ+ IELs were cultured for 36 hours prior to flow cytometric analysis. Similar results were seen with samples from GFD patients. (B) Representative flow cytometry dot plots showing percentage of CD3+TCRαβ+ IELs that express CD107a/b after 4 hours of stimulation with plate-bound anti-CD3 in the presence (lower panels) or absence (upper panels) of CD3+TCRγδ+ IELs. (C) Percentage (mean ± SEM) of CD3+TCRαβ+ IELs expressing intracellular IFN-γ and granzyme B in the presence of rhIL-15 to which CD3+CD8+TCRγδ+ IELs had been added at different TCRγδ/TCRαβ IEL ratios. (D) Percentage (mean ± SEM) of CD3+TCRαβ IELs expressing intracellular IFN-γ and granzyme B in cocultures of CD3+TCRαβ IELs and ESA+ ECs, in the presence of rhIL-15. In parallel wells, CD3+CD8+TCRγδ+ IELs or CD3+CD8–TCRγδ+ IELs were added at a 1:1 TCRγδ/TCRαβ IEL ratio (from 4 independent experiments). A statistically significant decrease (*) in the percentage of CD3+TCRαβ+ IELs expressing intracellular IFN-γ (P = 0.004) and granzyme-B (P = 0.003) was seen in wells to which CD3+CD8+TCRγδ+ IELs were added compared with wells with only CD3+TCRαβ+ IELs. No significant decrease (‡) in the percentage of CD3+TCRαβ+ IELs expressing intracellular IFN-γ (P = 0.06) and granzyme B (P = 0.06) was observed in wells to which CD3+CD8–TCRγδ+ IELs were added compared with wells with CD3+TCRαβ+ IELs only (P values determined by Wilcoxon’s signed-rank test).
research article
284 TheJournalofClinicalInvestigation http://www.jci.org Volume 118 Number 1 January 2008
centage of intracytoplasmic IFN-γ– and granzyme B– and cell-sur-face NKG2D–expressing TCRαβ+ IELs increased by 65.8% ± 21.6%, 43.8% ± 18.9%, and 54.9% ± 24.3%, respectively (Figure 2A). Addition of TCRγδ+ IELs to the cocultures suppressed the IL-15–induced upregulation of intracytoplasmic IFN-γ and granzyme B and cell-surface NKG2D in TCRαβ+ IELs by 39.9% ± 12.8%, 63.8% ± 9.7%, and 46.1% ± 17.3%, respectively (Figure 2A).
We next assessed whether TCRγδ+ IELs could prevent activa-tion-induced degranulation of TCRαβ+ IELs, as measured by cell-surface expression of CD107a and CD107b (3, 31). In 4 indepen-dent experiments, 14.6% ± 5.6% of CD3+TCRαβ+ IELs expressed CD107a/b, after 4 hours of stimulation with plate-bound anti-CD3. Addition of TCRγδ+ IELs to stimulated CD3+TCRαβ+ IELs did not decrease the percentage of CD3+TCRαβ+ IELs expressing CD107a/b (12.9% ± 6.1%: Figure 2B). This suggests that TCRγδ+ IELs either decrease synthesis of cytotoxic proteins or formation of cytotoxic granules rather than inhibit exocytosis of cytotoxic granules by TCRαβ+ IELs.
To determine the minimum number of TCRγδ+ IELs required to suppress the IL-15–induced upregulation of intracytoplasmic IFN-γ and granzyme B in TCRαβ+ IELs, TCRγδ+ IELs were added
to TCRαβ+ IEL and ESA+ EC cocultures at various TCRγδ+ IEL/TCRαβ+ IEL ratios (0.1:1, 0.2:1, 0.5:1, 1:1, and 2:1). TCRγδ+ IEL–mediated suppression was dose dependent, and suppression of the TCRαβ+ IEL cytotoxicity markers was seen even at a ratio of 0.2:1 (Figure 2C). These results indicate that human small intestinal TCRγδ+ IELs have the ability to suppress the cytotoxic program-ming of TCRαβ+ IELs. We then compared the suppressive capabili-ties of CD8+TCRγδ+ IELs with those of CD8–TCRγδ+ IELs. At a 1:1 ratio of TCRγδ+ IELs to TCRαβ+ IELs, CD8+TCRγδ+ IELs showed more suppression than CD8–TCRγδ+ IELs. CD8+TCRγδ+ IELs were able to decrease the IL-15–induced increase in the percentage of intracellular IFN-γ– and granzyme B–expressing TCRαβ+ IELs by 58.3% ± 11.9% and 65.8% ± 6.2%, respectively, while CD8–TCRγδ+ IELs were only able to decrease the percentage of intracellular IFN-γ– and granzyme B–expressing TCRαβ+ IELs by 37.6% ± 5.9% and 32.8% ± 4.6%, respectively (Figure 2D). Suppression did not appear to be due to cytolysis of TCRαβ+ IELs by TCRγδ+ IELs, as the per-centage of annexin V+TCRαβ+ IELs was not significantly different in cultures with CD8+TCRγδ+ IELs (22.0% ± 6.5%) compared with cultures without CD8+TCRγδ+ IELs (16.9% ± 4.6%; P = 0.2; Supple-mental Figure 1; supplemental material available online with this
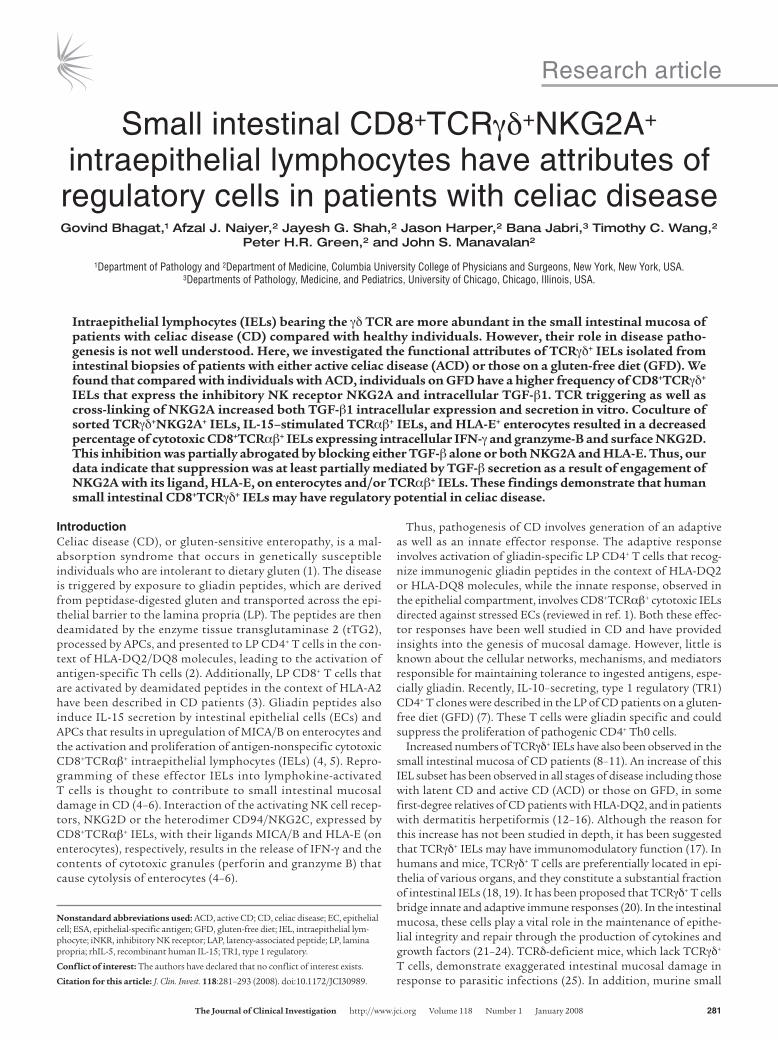
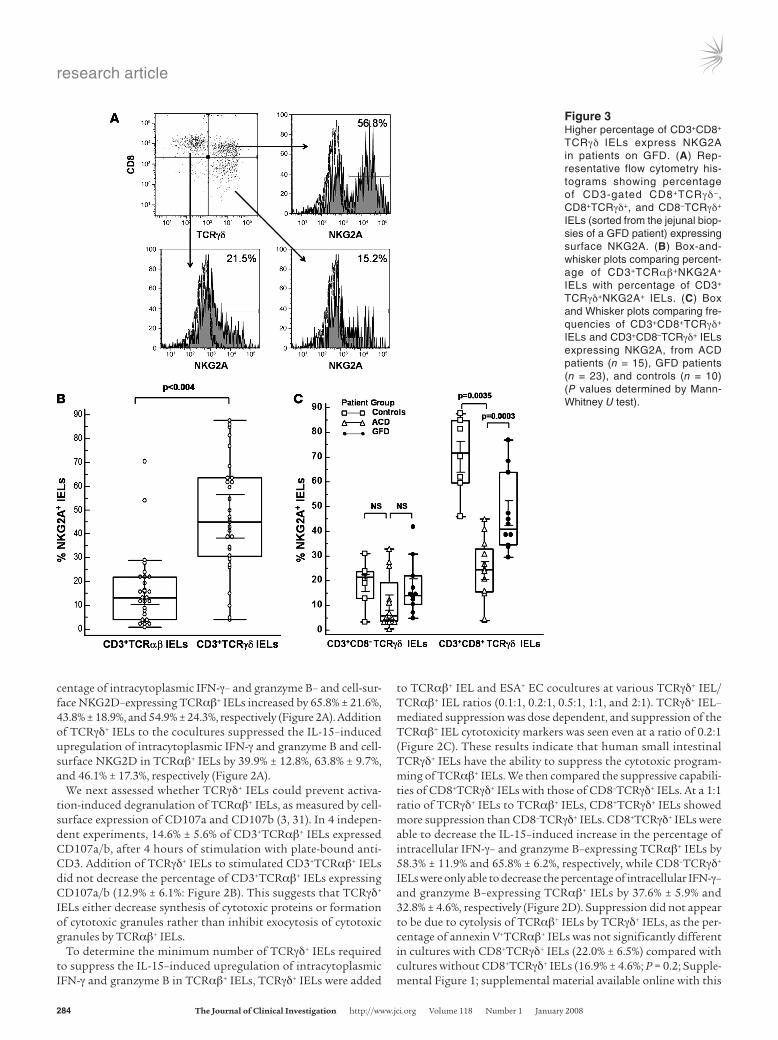
Figure 3Higher percentage of CD3+CD8+
TCRγδ IELs express NKG2A in patients on GFD. (A) Rep-resentative flow cytometry his-tograms showing percentage of CD3-gated CD8+TCRγδ−, CD8+TCRγδ+, and CD8–TCRγδ+ IELs (sorted from the jejunal biop-sies of a GFD patient) expressing surface NKG2A. (B) Box-and-whisker plots comparing percent-age of CD3+TCRαβ+NKG2A+ IELs with percentage of CD3+
TCRγδ+NKG2A+ IELs. (C) Box and Whisker plots comparing fre-quencies of CD3+CD8+TCRγδ+ IELs and CD3+CD8–TCRγδ+ IELs expressing NKG2A, from ACD patients (n = 15), GFD patients (n = 23), and controls (n = 10) (P values determined by Mann-Whitney U test).
research article
TheJournalofClinicalInvestigation http://www.jci.org Volume 118 Number 1 January 2008 285
article; doi:10.1172/JCI30989DS1). In summary, CD8+TCRγδ+ IELs seem to suppress the cytotoxic programming of TCRαβ+ IELs by mechanisms other than direct cytolysis.
TCRγδ+ IELs express NKG2A. Expression of the iNKR NKG2A has been found to be decreased on cytotoxic TCRαβ+ IELs from ACD patients (6). Thus, we determined the frequency of TCRγδ+
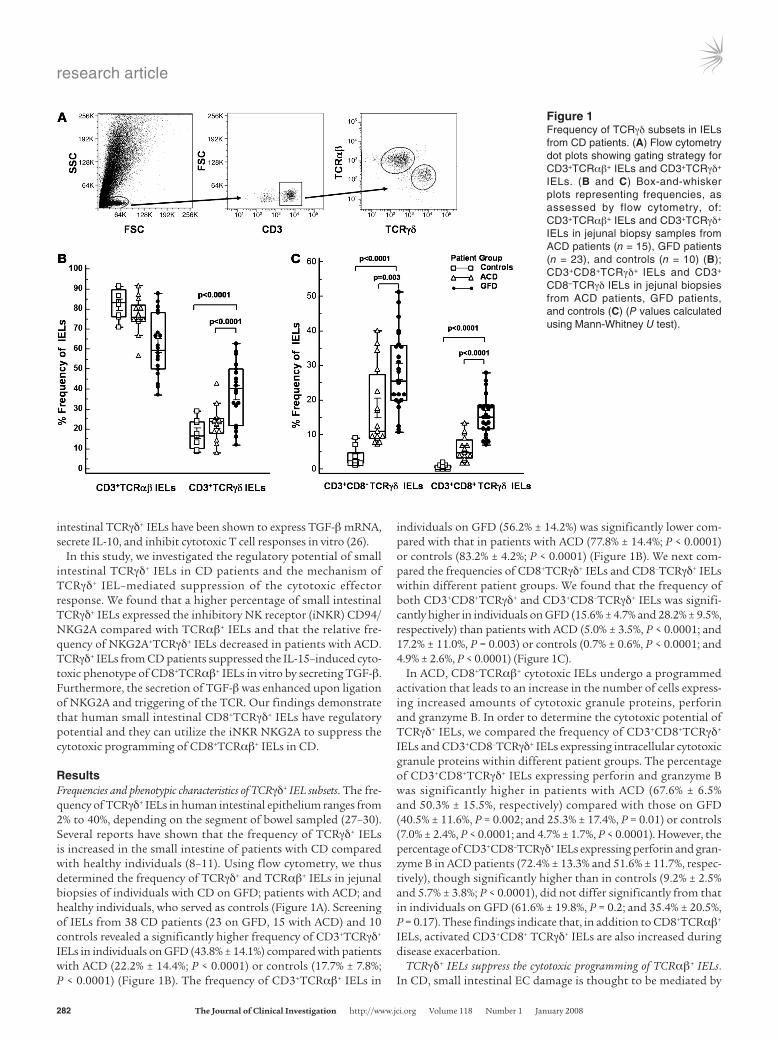
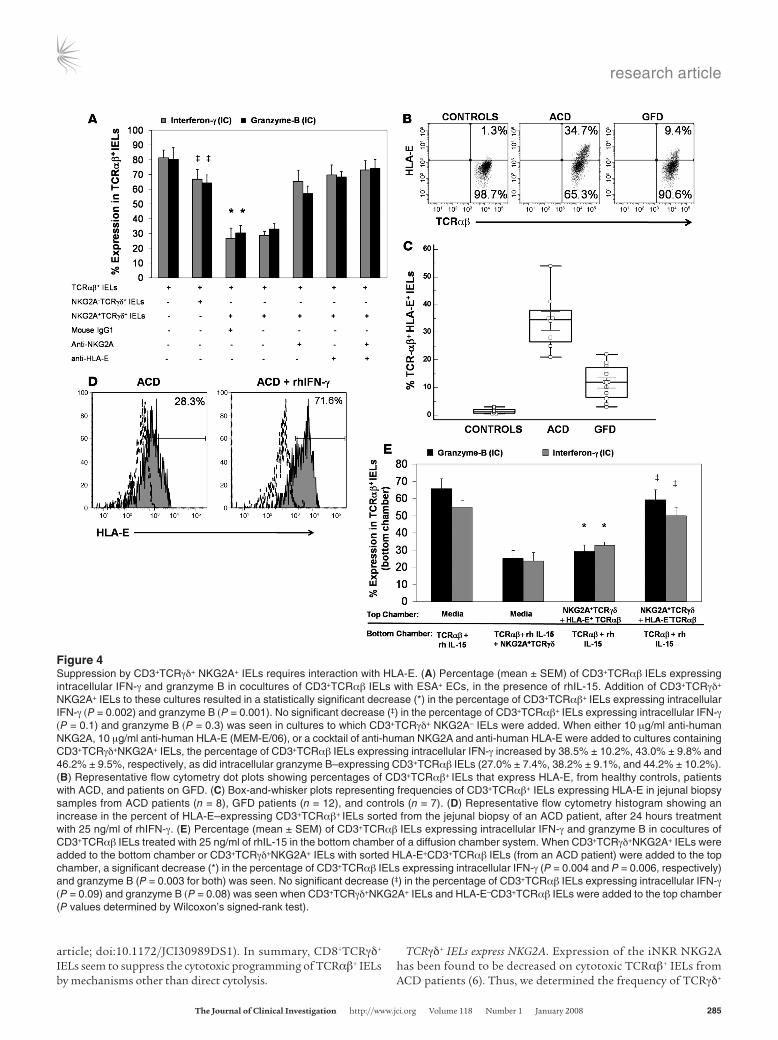
Figure 4Suppression by CD3+TCRγδ+ NKG2A+ IELs requires interaction with HLA-E. (A) Percentage (mean ± SEM) of CD3+TCRαβ IELs expressing intracellular IFN-γ and granzyme B in cocultures of CD3+TCRαβ IELs with ESA+ ECs, in the presence of rhIL-15. Addition of CD3+TCRγδ+ NKG2A+ IELs to these cultures resulted in a statistically significant decrease (*) in the percentage of CD3+TCRαβ+ IELs expressing intracellular IFN-γ (P = 0.002) and granzyme B (P = 0.001). No significant decrease (‡) in the percentage of CD3+TCRαβ+ IELs expressing intracellular IFN-γ (P = 0.1) and granzyme B (P = 0.3) was seen in cultures to which CD3+TCRγδ+ NKG2A– IELs were added. When either 10 μg/ml anti-human NKG2A, 10 μg/ml anti-human HLA-E (MEM-E/06), or a cocktail of anti-human NKG2A and anti-human HLA-E were added to cultures containing CD3+TCRγδ+NKG2A+ IELs, the percentage of CD3+TCRαβ IELs expressing intracellular IFN-γ increased by 38.5% ± 10.2%, 43.0% ± 9.8% and 46.2% ± 9.5%, respectively, as did intracellular granzyme B–expressing CD3+TCRαβ IELs (27.0% ± 7.4%, 38.2% ± 9.1%, and 44.2% ± 10.2%). (B) Representative flow cytometry dot plots showing percentages of CD3+TCRαβ+ IELs that express HLA-E, from healthy controls, patients with ACD, and patients on GFD. (C) Box-and-whisker plots representing frequencies of CD3+TCRαβ+ IELs expressing HLA-E in jejunal biopsy samples from ACD patients (n = 8), GFD patients (n = 12), and controls (n = 7). (D) Representative flow cytometry histogram showing an increase in the percent of HLA-E–expressing CD3+TCRαβ+ IELs sorted from the jejunal biopsy of an ACD patient, after 24 hours treatment with 25 ng/ml of rhIFN-γ. (E) Percentage (mean ± SEM) of CD3+TCRαβ IELs expressing intracellular IFN-γ and granzyme B in cocultures of CD3+TCRαβ IELs treated with 25 ng/ml of rhIL-15 in the bottom chamber of a diffusion chamber system. When CD3+TCRγδ+NKG2A+ IELs were added to the bottom chamber or CD3+TCRγδ+NKG2A+ IELs with sorted HLA-E+CD3+TCRαβ IELs (from an ACD patient) were added to the top chamber, a significant decrease (*) in the percentage of CD3+TCRαβ IELs expressing intracellular IFN-γ (P = 0.004 and P = 0.006, respectively) and granzyme B (P = 0.003 for both) was seen. No significant decrease (‡) in the percentage of CD3+TCRαβ IELs expressing intracellular IFN-γ (P = 0.09) and granzyme B (P = 0.08) was seen when CD3+TCRγδ+NKG2A+ IELs and HLA-E–CD3+TCRαβ IELs were added to the top chamber (P values determined by Wilcoxon’s signed-rank test).
research article
286 TheJournalofClinicalInvestigation http://www.jci.org Volume 118 Number 1 January 2008
and TCRαβ+ IELs expressing NKG2A in jejunal biopsies of CD patients and controls. A significantly higher percentage of TCRγδ+ IELs expressed the iNKR NKG2A (45% ± 12.7%) com-pared with TCRαβ+ IELs (12% ± 6.3%; P < 0.004; Figure 3, A and B). The percentage of TCRγδ+ IELs expressing NKG2A was higher in healthy controls (72.5% ± 13.4%) compared with CD patients (33.1% ± 16.3%; P = 0.0003). Within different patient groups, a significantly higher percentage of TCRγδ+ IELs expressed NKG2A in individuals on GFD (41.1% ± 12.8%) than in ACD patients (25.6% ± 19.8%; P = 0.0035). Among TCRγδ+ IEL subsets, the percentage of CD8+TCRγδ+ IELs expressing NKG2A was sig-nificantly higher (42.3% ± 23.28%) compared with CD8–TCRγδ+ IELs (15.1% ± 12.03%; P < 0.0001: Figure 3C). The frequency of CD8+TCRγδ+ IELs expressing NKG2A was significantly higher in controls (70.2% ± 16.8%) than in GFD patients (47.3% ± 16.4%; P = 0.02), and the frequency of CD8+TCRγδ+ IELs expressing NKG2A was lower in ACD patients (24.1% ± 12.9%) compared with both GFD patients (P = 0.003) and controls (P = 0.0007; Figure 3C). The frequency of NKG2A+CD8–TCRγδ+ IELs was not signifi-cantly different among the 3 groups (Figure 3C). The percentage of CD8+TCRγδ+ IELs expressing NKG2A was higher in patients on GFD for more than 1 year (n = 10; 54.3% ± 15.4%) compared with patients on GFD for less than 1 year (n = 7; 27.9% ± 10.1%) and approximated that of controls (n = 10; 70.2% ± 16.8%); how-ever, this difference was not statistically significant. Taken togeth-er, our results indicate that the iNKR NKG2A is predominantly expressed on CD8+TCRγδ+ IELs, a subset that is increased in indi-viduals with CD who are on GFD.
Suppression by NKG2A+TCRγδ+ IEL requires HLA-E ligation. To evaluate the mechanism of TCRγδ+ IEL–mediated suppression, we first compared the suppressive capacities of NKG2A+TCRγδ+ and NKG2A–TCRγδ+ IELs. For this, we added sorted NKG2A+TCRγδ+ IELs or NKG2A–TCRγδ+ IELs to cocultures of TCRαβ+ IELs and ESA+ ECs, obtained from patients with ACD, in the presence of rhIL-15 (25 ng/ml) at a 1:1:1 ratio. NKG2A+TCRγδ+ IELs were able to suppress the cytotoxic programming of TCRαβ+ IELs, but no suppression was observed on addition of NKG2A–TCRγδ+ IELs (Figure 4A). Suppression by NKG2A+TCRγδ+ IELs was dose depen-dant and was seen even at a 0.1:1 ratio of NKG2A+TCRγδ+ IELs to TCRαβ+ IELs.
HLA-E, the ligand for NKG2A, is expressed on ECs of CD patients but not on ECs of healthy individuals (6). Thus, we tested expression of HLA-E on ECs and IELs from CD patients and controls. As observed previously (6), we found that HLA-E was expressed on ECs from ACD patients (n = 8; 56.4% ± 23.2% of ECs) but not to any appreciable degree on ECs from controls (n = 6, 1.3% ± 0.7%). HLA-E expression was significantly lower in ECs from patients on GFD (n = 11; 4.1% ± 2.1%; P < 0.0001) compared with ACD patients. We also found that a significantly higher percentage of TCRαβ+ IELs from ACD patients expressed HLA-E (n = 8; 34.1% ± 10.2%) compared with TCRαβ+ IELs from individuals on GFD (n = 11; 11.7% ± 6.2%; P < 0.0001) and controls (n = 6; 1.4% ± 0.9%; P < 0.0001; Figure 4B). We could not detect HLA-E expression on any TCRγδ+ IEL subset. In addition, HLA-E expression on TCRαβ+ IELs could be increased 2- to 3-fold upon addition of rhIFN-γ (Figure 4C), similar to what has been shown for small intestinal enterocyte-derived cell lines (6, 32).
Since HLA-E is also expressed on TCRαβ+ IELs from ACD patients, we investigated whether NKG2A+TCRγδ+ IELs were able to suppress the cytotoxic programming of TCRαβ+ IELs in the
absence of ECs. We stimulated TCRαβ+ IELs from ACD patients with rhIL-15, in the absence of ECs, and in parallel wells cocul-tured NKG2A+TCRγδ+ IELs with TCRαβ+ IELs, stimulated with rhIL-15, at a 1:1 ratio (in the absence of ECs). As shown (Figure 2A), addition of rhIL-15 increased the percentage of TCRαβ+ IELs expressing intracellular IFN-γ and granzyme B and surface NKG2D but did not increase the percentage of HLA-E+TCRαβ+ IELs (data not shown). Addition of NKG2A+TCRγδ+ IELs led to a decrease in the percentage of TCRαβ+ IELs expressing intracellular IFN-γ and granzyme B and surface NKG2D by 53.6% ± 12.4%, 66.8% ± 4.4%, and 32.5% ± 11.8%, respectively. Thus, suppression of the cyto-toxic programming of TCRαβ+ IELs by NKG2A+TCRγδ+ IELs, in cultures lacking ECs, was of approximately the same magnitude as in cultures with ECs.
Next, we determined whether cell contact between NKG2A+
TCRγδ+ IELs and TCRαβ+ IELs is necessary for TCRγδ+ IEL–medi-ated suppression. We used diffusion chamber (Transwell) culture plates in which cocultures of NKG2A+TCRγδ+ IELs and sorted HLA-E+TCRαβ+ IELs (from ACD patients) were placed in the top chamber, separated by a 5-μm membrane from TCRαβ+ IELs stim-ulated with 25 ng/ml IL-15 in the bottom chamber. In parallel, cul-tures with NKG2A+TCRγδ+ IELs and HLA-E–TCRαβ+ IELs (from the same patients) were placed in the top chamber, with TCRαβ+ IELs stimulated with 25 ng/ml IL-15 in the bottom chamber. Additional cultures containing TCRαβ+ IELs from ACD patients stimulated with 25 ng/ml IL-15 in the bottom chamber and only media in the top chamber were also set up. Suppression of the cytotoxic programming of TCRαβ+ IELs was seen in cultures in which the HLA-E+TCRαβ+ and NKG2A+TCRγδ+ IELs were added to the top chamber, but not in cultures with NKG2A+TCRγδ+ IELs
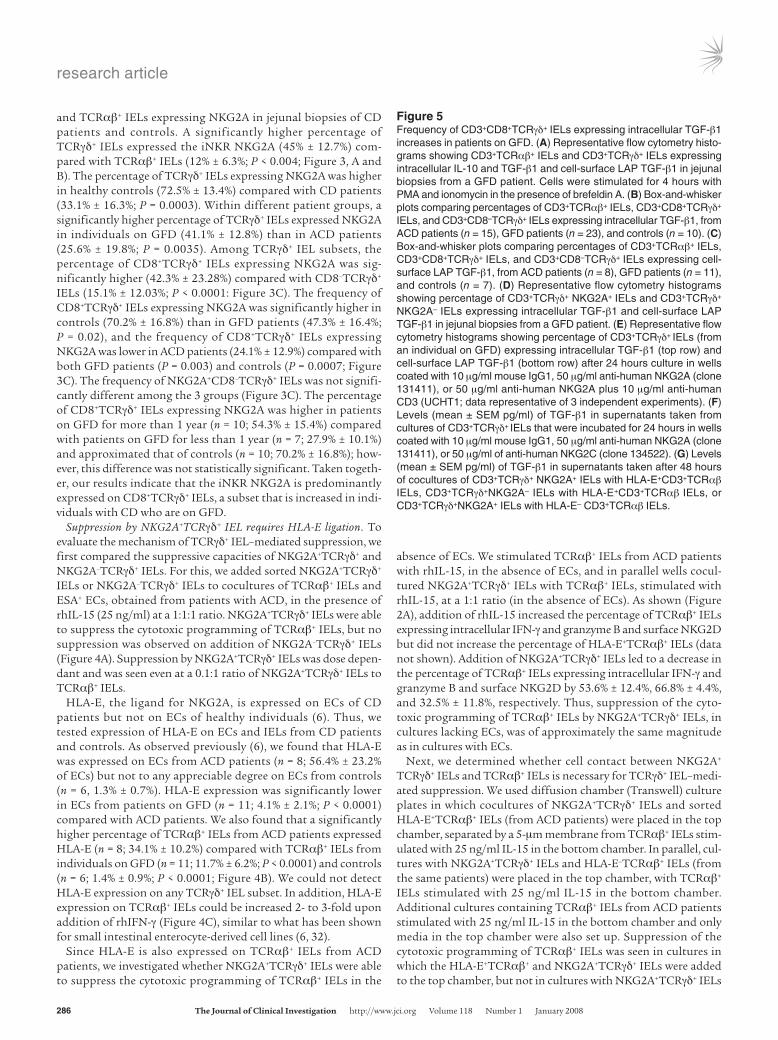
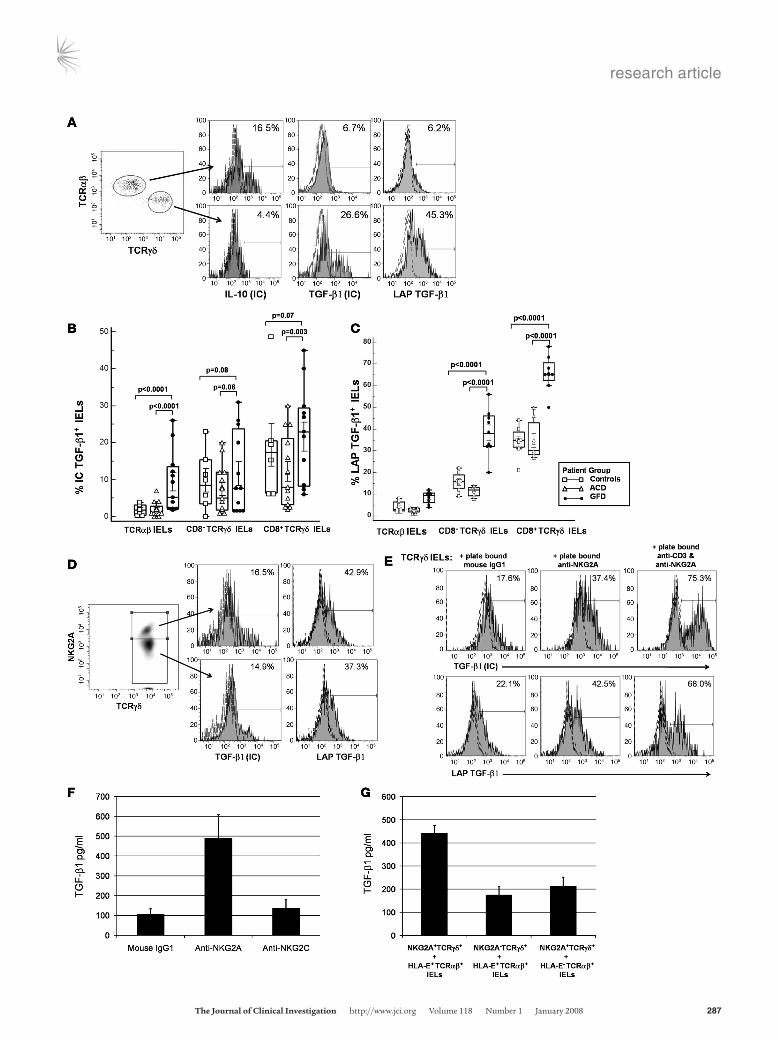
Figure 5Frequency of CD3+CD8+TCRγδ+ IELs expressing intracellular TGF-β1 increases in patients on GFD. (A) Representative flow cytometry histo-grams showing CD3+TCRαβ+ IELs and CD3+TCRγδ+ IELs expressing intracellular IL-10 and TGF-β1 and cell-surface LAP TGF-β1 in jejunal biopsies from a GFD patient. Cells were stimulated for 4 hours with PMA and ionomycin in the presence of brefeldin A. (B) Box-and-whisker plots comparing percentages of CD3+TCRαβ+ IELs, CD3+CD8+TCRγδ+ IELs, and CD3+CD8–TCRγδ+ IELs expressing intracellular TGF-β1, from ACD patients (n = 15), GFD patients (n = 23), and controls (n = 10). (C) Box-and-whisker plots comparing percentages of CD3+TCRαβ+ IELs, CD3+CD8+TCRγδ+ IELs, and CD3+CD8–TCRγδ+ IELs expressing cell-surface LAP TGF-β1, from ACD patients (n = 8), GFD patients (n = 11), and controls (n = 7). (D) Representative flow cytometry histograms showing percentage of CD3+TCRγδ+ NKG2A+ IELs and CD3+TCRγδ+ NKG2A– IELs expressing intracellular TGF-β1 and cell-surface LAP TGF-β1 in jejunal biopsies from a GFD patient. (E) Representative flow cytometry histograms showing percentage of CD3+TCRγδ+ IELs (from an individual on GFD) expressing intracellular TGF-β1 (top row) and cell-surface LAP TGF-β1 (bottom row) after 24 hours culture in wells coated with 10 μg/ml mouse IgG1, 50 μg/ml anti-human NKG2A (clone 131411), or 50 μg/ml anti-human NKG2A plus 10 μg/ml anti-human CD3 (UCHT1; data representative of 3 independent experiments). (F) Levels (mean ± SEM pg/ml) of TGF-β1 in supernatants taken from cultures of CD3+TCRγδ+ IELs that were incubated for 24 hours in wells coated with 10 μg/ml mouse IgG1, 50 μg/ml anti-human NKG2A (clone 131411), or 50 μg/ml of anti-human NKG2C (clone 134522). (G) Levels (mean ± SEM pg/ml) of TGF-β1 in supernatants taken after 48 hours of cocultures of CD3+TCRγδ+ NKG2A+ IELs with HLA-E+CD3+TCRαβ IELs, CD3+TCRγδ+NKG2A– IELs with HLA-E+CD3+TCRαβ IELs, or CD3+TCRγδ+NKG2A+ IELs with HLA-E– CD3+TCRαβ IELs.
research article
TheJournalofClinicalInvestigation http://www.jci.org Volume 118 Number 1 January 2008 287
research article
288 TheJournalofClinicalInvestigation http://www.jci.org Volume 118 Number 1 January 2008
and HLA-E–TCRαβ+ IELs in the top chamber (Figure 4D). These findings indicated that ligation of NKG2A with HLA-E results in the release of a diffusible inhibitory mediator.
To further prove the requirement of NKG2A expression for the suppressive activity of TCRγδ+ IELs, we added either an anti-NKG2A antibody or a mouse IgG1 isotype control antibody to cultures containing NKG2A+TCRγδ+ IELs, TCRαβ+ IELs, and ESA+ ECs. Compared with the isotype control antibody, addition of anti-NKG2A was able to partially abrogate suppression of the cytotoxic programming of TCRαβ+ IELs by NKG2A+TCRγδ+ IELs (Figure 4A). We also found that addition of an anti–HLA-E anti-body to cultures containing NKG2A+TCRγδ+ IELs, TCRαβ+ IELs, and ESA+ ECs was able to partially inhibit the suppression of the cytotoxic programming of TCRαβ+ IELs by NKG2A+TCRγδ+ IELs
(Figure 4A). Thus, blocking the interaction between NKG2A and its ligand, HLA-E, was able to abrogate the suppressive capability of NKG2A+TCRγδ+ IELs.
TCRγδ+NKG2A+ IELs express TGF-β1. IL-10 and TGF-β1 are impor-tant immunoregulatory cytokines, and their role in the function and differentiation of TR1 and Th3 types of Tregs, respectively, has been well documented (33, 34). Using RT-PCR analysis, Lahat et al. have shown that both TCRγδ+ and TCRαβ+ IELs isolated from small bowel biopsies of CD patients express IL-10 and TGF-β1 (35). We investigated intracytoplasmic expression of these cytokines in different IEL subsets isolated from jejunal biopsies of CD patients and compared the frequency of IEL subsets expressing either cytokine across different patient groups. We found a significantly higher percentage of intracellular TGF-β1–expressing cells among
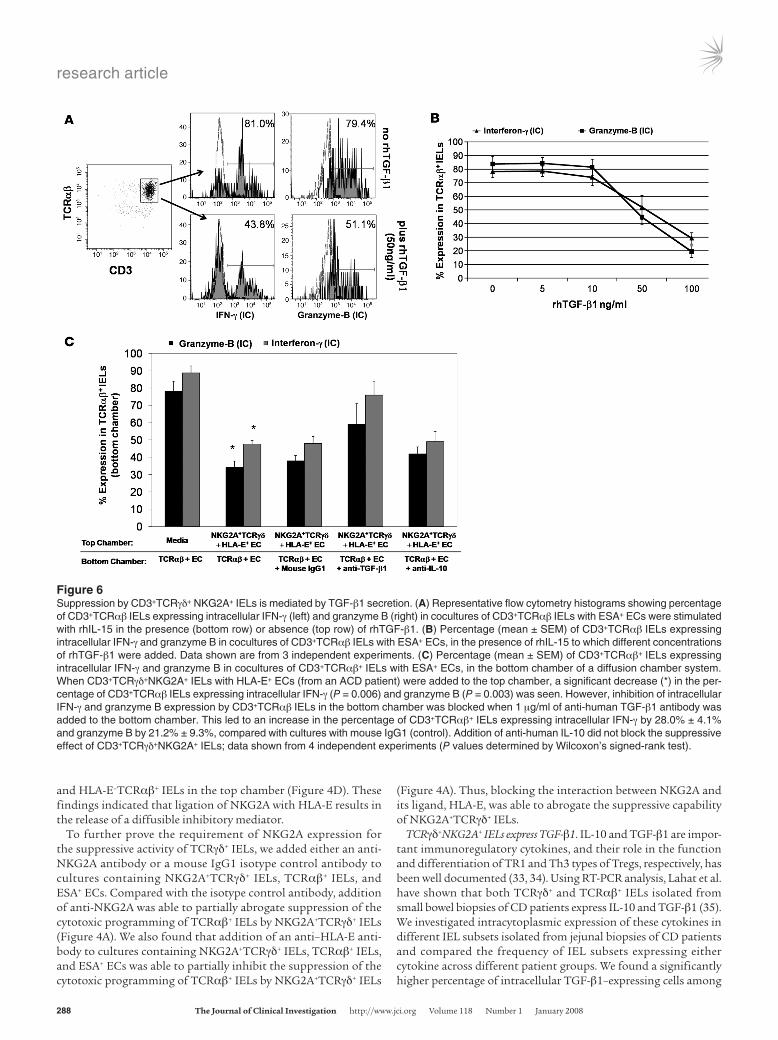
Figure 6Suppression by CD3+TCRγδ+ NKG2A+ IELs is mediated by TGF-β1 secretion. (A) Representative flow cytometry histograms showing percentage of CD3+TCRαβ IELs expressing intracellular IFN-γ (left) and granzyme B (right) in cocultures of CD3+TCRαβ IELs with ESA+ ECs were stimulated with rhIL-15 in the presence (bottom row) or absence (top row) of rhTGF-β1. (B) Percentage (mean ± SEM) of CD3+TCRαβ IELs expressing intracellular IFN-γ and granzyme B in cocultures of CD3+TCRαβ IELs with ESA+ ECs, in the presence of rhIL-15 to which different concentrations of rhTGF-β1 were added. Data shown are from 3 independent experiments. (C) Percentage (mean ± SEM) of CD3+TCRαβ+ IELs expressing intracellular IFN-γ and granzyme B in cocultures of CD3+TCRαβ+ IELs with ESA+ ECs, in the bottom chamber of a diffusion chamber system. When CD3+TCRγδ+NKG2A+ IELs with HLA-E+ ECs (from an ACD patient) were added to the top chamber, a significant decrease (*) in the per-centage of CD3+TCRαβ IELs expressing intracellular IFN-γ (P = 0.006) and granzyme B (P = 0.003) was seen. However, inhibition of intracellular IFN-γ and granzyme B expression by CD3+TCRαβ IELs in the bottom chamber was blocked when 1 μg/ml of anti-human TGF-β1 antibody was added to the bottom chamber. This led to an increase in the percentage of CD3+TCRαβ+ IELs expressing intracellular IFN-γ by 28.0% ± 4.1% and granzyme B by 21.2% ± 9.3%, compared with cultures with mouse IgG1 (control). Addition of anti-human IL-10 did not block the suppressive effect of CD3+TCRγδ+NKG2A+ IELs; data shown from 4 independent experiments (P values determined by Wilcoxon’s signed-rank test).
research article
TheJournalofClinicalInvestigation http://www.jci.org Volume 118 Number 1 January 2008 289
different TCRγδ+ IEL subsets in comparison to TCRαβ+ IEL sub-sets, while the latter had a higher percentage of intracellular IL-10–expressing cells (Figure 5A). Among TCRγδ+ IELs, the fre-quency of CD8+TCRγδ+ T cells expressing TGF-β1 was signifi-cantly higher compared with that of CD8–TCRγδ+ T cells (Figure 5B). Comparing the frequency of TGF-β1–expressing IELs among the different patient groups, we found that patients on GFD had the highest percentage of intracellular TGF-β1–expressing TCRαβ+ IELs, CD8+TCRγδ+ IELs, and CD8–TCRγδ+ IELs (Figure 5B).
TGF-β1 is secreted in its latent form as a homodimer and is noncovalently associated with a homodimer of latency-associated peptide (LAP) (36). We next determined the cell-surface expres-sion of LAP TGF-β1 on IELs from different patient subsets. We found that the percentage expression of LAP TGF-β1 on the cell surface of CD3+ IELs seemed to reflect their intracellular expres-sion of TGF-β1, i.e., there was a significantly higher frequency of CD8+TCRγδ+ IELs expressing LAP TGF-β1 than CD8–TCRγδ+ IELs or TCRαβ+ IELs (Figure 5C). When the frequencies of LAP TGF-β1–expressing IELs were compared among the different patient groups, patients on GFD had a significantly higher fre-quency of CD8+TCRγδ+LAP TGF-β1+ IELs than did ACD patients or controls (Figure 5C).
We compared the intracellular expression of TGF-β1 and cell-surface expression of LAP TGF-β1 in NKG2A+TCRγδ+ IELs and NKG2A–TCRγδ+ IELs. Interestingly, the 2 forms of TGF-β1 were expressed in both IEL subsets in almost equal amounts (Figure 5D). When TCRγδ+ IELs were cultured with plate-bound anti-NKG2A antibody, an increase in the percentage (and intracytoplas-mic levels) of TGF-β1 expressing TCRγδ+ IELs (53.4% ± 8.6%, MFI: 8,345 ± 3,769) as well as the percentage of cell-surface LAP TGF-β1 expressing TCRγδ+ IELs (39.3% ± 12.16%, MFI: 1,289 ± 341) was observed after 24 hours, compared with TCRγδ+ IELs cultured with plate-bound mouse IgG1 isotype control antibody (TGF-β1 23.5% ± 6.1%, MFI: 3,327 ± 929; LAP TGF-β1 16.8% ± 10.0%, MFI: 495 ± 103). The frequency of intracytoplasmic TGF-β1+ and cell-surface LAP TGF-β1+ cells and TGF-β1 expression levels increased further when TCRγδ+ IELs were stimulated with a combination of plate-bound anti-CD3 and anti-NKG2A (TGF-β1 73.4% ± 4.3%, MFI: 18,834 ± 6,377; LAP TGF-β1 60.9% ± 7.7%, MFI: 2,654 ± 723). In addition, triggering of NKG2A on TCRγδ+ IELs resulted in the decreased expression of intracellular IFN-γ and perforin, but intracellular expression of IL-10 was not affected under these con-ditions (data not shown). We also determined the levels of secreted TGF-β1 (measured by ELISA) in the supernatants from cultures in which TCRγδ+ IELs were triggered with plate-bound anti-NKG2A. In 5 independent experiments, significantly higher levels of TGF-β1 were detected in supernatants from cultures with TCRγδ+ IELs and plate-bound anti-NKG2A (490 ± 119 pg/ml), compared with cul-tures of TCRγδ+ IELs and plate-bound mouse IgG1 (107 ± 26 pg/ml; P = 0.0079) or TCRγδ+ IELs and plate-bound anti-NKG2C (136 ± 43 pg/ml; P = 0.0079; Figure 5F). To investigate whether the direct interaction of NKG2A with its ligand, HLA-E, results in secre-tion of TGF-β1, we cocultured NKG2A+TCRγδ+ IELs with sorted HLA-E+TCRαβ+ IELs, NKG2A–TCRγδ+ IELs with sorted HLA-E+
TCRαβ+ IELs, and NKG2A+TCRγδ+ IELs with sorted HLA-E–
TCRαβ+ IELs. After 36 hours, levels of TGF-β1 were measured in supernatants from all 3 cultures by ELISA. In 3 independent experiments, we found significantly higher levels of TGF-β1 in supernatants from cocultures of NKG2A+TCRγδ+ IELs with sorted HLA-E+TCRαβ+ IELs (441 ± 35 pg/ml) compared with cocul-
tures of NKG2A–TCRγδ+ IELs with sorted HLA-E+TCRαβ+ IELs (176 ± 37 pg/ml; P = 0.0009) and NKG2A+TCRγδ+ IELs with sorted HLA-E–TCRαβ+ IELs (213 ± 39 pg/ml; P = 0.0018; Figure 5G).
Taken together, these results suggest that ligation of NKG2A results in increased TGF-β1 expression and secretion that is fur-ther enhanced by TCR triggering.
Suppression by NKG2A+TCRγδ+ IEL is mediated by secreted TGF-β1. TGF-β has been shown to inhibit the expression of granzyme B, IFN-γ (37), and NKG2D (38) by cytotoxic T cells. Having estab-lished that TCRγδ+ IELs express and secrete TGF-β1, we next deter-mined whether TGF-β1 secretion by TCRγδ+ IELs is responsible for their suppressive effect. We first tested whether addition of different concentrations of rhTGF-β1 to IL-15–treated (25 ng/ml) TCRαβ+ IEL cultures affected their cytotoxic phenotype. There was a dose-dependent decrease in the percentage of TCRαβ+ IELs expressing intracellular granzyme B and IFN-γ as well as surface NKG2D in cultures to which rhTGF-β1 was added (Figure 6, A and B). To establish a role of secreted TGF-β1 in NKG2A+TCRγδ+ IEL–mediated suppression, we added either 1 μg/ml anti–TGF-β1 antibody or mouse IgG1 isotype control antibody to cocultures of TCRαβ+ IELs and ESA+ ECs (stimulated with 25 ng/ml rhIL-15) in the bottom wells of a diffusion chamber, with NKG2A+TCRγδ+ IEL and HLA-E+ EC cocultures in the top chamber. The percentage of TCRαβ+ IELs expressing both intracellular granzyme B and IFN-γ and surface NKG2D increased in cultures to which anti–TGF-β1 antibody was added, compared with those with isotype control antibody, indicating that addition of anti–TGF-β1 to the culture partially abrogates the suppressive capability of NKG2A+TCRγδ+ IELs (Figure 6C). Furthermore, we also added 1 μg/ml of an anti–IL-10 antibody in parallel cultures to determine whether IL-10 was involved in NKG2A+TCRγδ+ IEL–mediated suppression. Addition of the anti–IL-10 antibody did not result in an increase in the per-centage of TCRαβ+ IELs expressing intracellular granzyme B and IFN-γ or surface NKG2D (Figure 6C), thus excluding a role for IL-10 in NKG2A+TCRγδ+ IEL–mediated suppression.
Taken together, our findings suggest that ligation of NKG2A expressed on TCRγδ+ IELs with HLA-E on ECs or TCRαβ+ IELs results in the release of TGF-β1, which mediates the suppression of the cytotoxic programming of TCRαβ+ IELs.
DiscussionThe mucosal immune system of the gastrointestinal tract is able to discriminate between harmless ingested antigens such as gliadin, a component of wheat gluten, and pathogenic antigens. This is due to the unique ability of small intestinal mucosa to maintain a tolerogenic state until a pathogenic non-self antigen is encoun-tered, which is cleared by an immediate and effective immune response. This dual ability requires not only crosstalk between the innate and adaptive immune systems, but also a precise balance between the cytotoxic effector arm and regulatory networks in the epithelial compartment and in the LP.
In both mice and humans, several types of Tregs have been shown to play a role in maintaining a tolerant state and prevent-ing intestinal autoimmune reactions (33, 34, 39). Different sub-sets of Tregs, including antigen-specific and naturally occurring CD4+CD25+FOXP3+ Tregs, IL-10–producing TR1 cells, and TGF-β– secreting Th3 cells have been studied extensively in both species (34). Previous reports have also documented that intestinal ECs can activate and expand a subset of CD8+ Tregs within the intesti-nal mucosa of humans (40, 41). However, other T cells with regu-
research article
290 TheJournalofClinicalInvestigation http://www.jci.org Volume 118 Number 1 January 2008
latory activity, such as TCRγδ+ T cells and Qa-1–restricted CD8+ T cells, have only been characterized in rodents (20–22, 42, 43).
Based on previous findings and our current results, it appears that during ACD, TCRγδ+ IELs are recruited to the intestinal epi-thelium, in response to stressed or damaged epithelium, to repair tissue damage by elaborating growth factors (18–24). Several stud-ies have provided evidence for the regulatory capacity of TCRγδ+ T cells in mice (20–22). Kapp et al. (26) showed that murine intes-tinal TCRγδ+ IEL clones, generated by stimulation with concana-valin A and growth factors, expressed TGF-β1 mRNA, but inhi-bition of CTL responses was mediated by secretion of IL-10. We describe the identification and function of a subset of TCRγδ+ IELs, in humans, which appear to have regulatory/suppressor T cell potential by limiting the cytotoxic potential of IL-15–induced TCRαβ+ IELs in CD. Moreover, our findings indicate that, in CD, the suppressive effect of the human intestinal TCRγδ+ IELs is mediated by TGF-β and not IL-10.
Recent studies in mice have shown that the CD94/NKG2A receptor on NK cells interacts with the Qa-1 molecule on activated T cells and inhibits NK cell–mediated elimination of activated auto-reactive CD4+ T cells in EAE (44). Human analogs of murine Qa-1– restricted CD8+ suppressor T cells have not been described as of yet. It has been postulated that certain Treg subsets in humans might have Qa-1–restricted CD8+ suppressor T cell characteristics. However, to date there is no evidence that these cells rely on the interaction of NKG2A with its ligand, HLA-E, for their suppressive capabilities. Our results indicate that the expression and ligation of the iNKR NKG2A by CD8+TCRγδ+ IELs is necessary for their abil-ity to suppress the cytotoxic arming of human CD8+TCRαβ+ IELs. We found that a high percentage of small intestinal CD8+TCRγδ+ IELs express NKG2A in healthy individuals and that these cells are considerably diminished in patients with ACD. We also found that the percentage of small intestinal CD8+TCRγδ+ IELs express-ing NKG2A increases after the patients commence GFD and the frequency approaches that seen in healthy controls after approxi-mately 1 year on the diet. NKG2A recognizes nonamer peptides, which are derived from highly conserved leader sequences of HLA class I molecules or HLA-G and bound to HLA-E (45–47). Although NKG2A competes with NKG2C for its interaction with HLA-E, the former has a higher binding affinity for HLA-E com-pared with NKG2C (48). In humans, the expression of NKG2A has been shown to be higher on circulating TCRγδ+ T cells than on TCRαβ+ T cells (49). In both mice and humans, NKG2A expres-sion on T cells can be increased by TCR triggering (50, 51) and cytokines such as TGF-β1 (51–53). One study has also reported upregulation of NKG2A by IL-15 in humans (54).
Expression of NKG2A on T cells has been hypothesized to fine-tune the immune response and limit the cytotoxic potential of cytotoxic T cells by overriding signals from activating NKRs (50). NKG2A belongs to the C-type lectin family of iNKRs, and its intra-cytoplasmic tail contains 2 ITIMs. Upon interaction with HLA-E, the ITIMs are phosphorylated, leading to the recruitment and acti-vation of SHP-1 or SHP-2 phosphatases (55). This inhibits the for-mation of an activating NK immunologic synapse and suppression of NK cell activation (56). It has been shown that cross-linking of NKG2A results in the suppression of IFN-γ and TNF-α production by NK cells (55). Kim et al. have also shown that NK cells undergo MHC class I–dependent functional maturation or “licensing” that involves ITIM-bearing inhibitory receptors, which blocks activa-tion of NK cells during an effector response (57). Moreover, the
interaction of NKG2A on peripheral blood–derived NK cells with HLA-E on hepatocytes in chronic hepatitis C virus–infected indi-viduals has been shown to induce secretion of TGF-β1 and IL-10 (58). Our results indicate that cross-linking of NKG2A on TCRγδ+ IELs alone or in combination with TCR triggering also leads to increased intracellular expression and secretion of TGF-β1. How-ever, in contrast to NKG2A ligation suppressing activation of the responding cell (as observed in NK cells), we have shown that trig-gering of NKG2A can lead to the secretion of TGF-β1 by TCRγδ+ IELs, which in turn suppresses the cytotoxic programming of TCRαβ+ IELs. Our findings also indicate a novel role for NKG2A in TCRγδ+ IELs, as a coreceptor for induction of TGF-β1, and suggest the possibility that TGF-β1, rather than NKG2A, might orchestrate a differentiation program required for the develop-ment of TCRγδ+ IELs with regulatory potential.
HLA-E (the ligand for NKG2A) is expressed, in association with β2-microglobulin and peptide, on the surface of T cells at low levels (59) but not on normal intestinal epithelium (6). However, it is induced on enterocytes of patients with ACD by IFN-γ (6, 60). We have shown that HLA-E is also expressed on CD8+TCRαβ+ IELs in small intestines of healthy individuals, albeit at low levels. How-ever, HLA-E expression is increased on CD8+TCRαβ+ IELs from ACD patients and diminishes on commencement of GFD. We were also able to demonstrate that NKG2A+TCRγδ+ IELs can sup-press the cytotoxic programming of CD8+TCRαβ+ IELs even in the absence of enterocytes due to the presence of HLA-E+CD8+TCRαβ+ IELs. Our findings might seem paradoxical, since on institution of GFD, epithelial HLA-E levels decrease while the frequency of NKG2A+TCRγδ+ IELs increases. TGF-β1 secretion, however, could still be induced, since increased numbers of NKG2A+TCRγδ+ IELs would have a higher likelihood of encountering HLA-E+ ECs. There is considerable variation, both temporal and qualitative, in the resolution of small bowel mucosal injury after commencement of GFD. Olaussen et al. have shown that chemokine receptor 9 (CCR9) expression is reduced on intraepithelial and LP T cells in patients with ACD. However, CCR9– and hence activated intraepithelial T cells still persist to variable degrees in patients on GFD (61). Fur-ther studies are required to explore whether the relative propor-tion of activated TCRαβ+ IELs to NKG2A+TCRγδ+ IELs can predict mucosal recovery on initiation of GFD. CD8+NKG2A+TCRγδ+ IELs may also play an important role in maintaining a state of quies-cence in latent CD and HLA-DQ2/8+ first-degree relatives of CD patients, since an increase in the number of intestinal TCRγδ+ IELs has been noted in both instances. However, the tolerogenic mecha-nisms in these cases have not been explored.
TGF-β1 is an important regulatory cytokine that affects various biological processes, such as immune responses, wound healing, fibrosis and carcinogenesis (62). It mediates its effect via its recep-tors (TGFBRI, -II, and -III) and a signaling pathway that is both smad dependent and independent (63). TGF-β1 has been shown to limit cytotoxic T cell function by inhibiting the expression of perforin, granzyme A, granzyme B, Fas ligand, and IFN-γ (37, 64) and NK function by decreasing NKG2D expression (38).
Our results indicate that TGF-β1 plays a major role in the TCRγδ+ IEL–mediated suppression of the cytotoxic programming of TCRαβ+ IELs. CD8+NKG2A+TCRγδ+ IELs, which have suppres-sive potential, express intracellular TGF-β1 and cell-surface LAP TGF-β1. The frequency of these cells is increased in patients on GFD compared with those with active disease. In addition, we show that this subset can suppress IL-15–induced cytotoxic pro-
research article
TheJournalofClinicalInvestigation http://www.jci.org Volume 118 Number 1 January 2008 291
gramming of TCRαβ+ IELs, specifically by inhibiting the expres-sion of IFN-γ, granzyme B, and NKG2D.
However, due to the excessive amounts of IL-15 that continu-ally stimulate TCRαβ+ IELs in ACD, the suppressive abilities of TCRγδ+ IELs may be overwhelmed till gluten is withdrawn from the diet and IL-15 levels diminish. It is unclear whether synthe-sis or secretion of TGF-β1 is altered, concomitant with continual activation of CD8+TCRγδ+ IELs in ACD. It is also possible that TCRαβ+ IELs do not respond to TGF-β1 during active disease due to diminished surface expression of TGF-β receptors or ele-vated expression of smad7. The latter, an intracellular inhibitor of TGF-β1 signaling, has been shown to restrict TGF-β1 inhibi-tion of proinflammatory cytokine production in inflammatory bowel disease (65). It has also recently been shown that IL-15 can inhibit smad3-mediated TGF-β1 signaling in T cells and IELs from patients with ACD have impaired smad3-dependent tran-scriptional responses, possibly due to the overwhelming amount of IL-15 produced in active disease (66).
In summary, this report is the first to our knowledge to provide evidence that human small intestinal CD8+TCRγδ+ IELs have attri-butes of Tregs in the context of CD. In addition, we found that CD8–TCRγδ+ IELs, which are also increased in individuals on GFD, have suppressive capabilities, although these are much weaker than those of CD8+TCRγδ+ IELs. It remains possible that a subset of CD8–TCRγδ+ IELs has regulatory potential, warranting further characterization. Our study provides insights into the regulatory mechanism of human small intestinal TCRγδ+ IELs, which might help in the identification of potential therapeutic strategies for patients with CD. Further studies are required to dissect the path-ways used by TCRγδ+ IELs in mediating suppression and identify-ing other regulatory lymphocyte subsets in CD.
MethodsPatients and controls. Jejunal biopsies were obtained from patients with ACD (n = 15) and those on GFD (n = 20). ACD was diagnosed based on clinical symptoms and the presence of serum IgA antibodies and histologic evi-dence of total or partial villous atrophy. GFD patients were on a diet for a range of 1–3 years following diagnosis of CD and were TTG IgA negative, and histology revealed near normalization of villous architecture. Con-trols samples (n = 10) were obtained from healthy individuals who had biopsies taken during screening procedures for abdominal symptoms. All samples were taken in accordance with the regulations and approval of the Institutional Review Board of Columbia University. Informed consent was obtained from all patients.
Isolation of IECs. IECs were isolated from jejunal biopsies as previously described (4, 6). Briefly, biopsies were put in RPMI solution containing 1 mM eEGTA (VWR), 1.5 mM MgCl2 (Sigma-Aldrich), and 1% FBS (Medi-atech). After stirring for 1 hour at 37°C, cell suspensions were pelleted from the supernatant and washed 2 times in culture media containing RPMI (Mediatech) supplemented with 10% FBS, 10,000 IU penicillin, and 10,000 μg/ml streptomycin. Approximately 0.5 × 10⁶ to 2.5 × 10⁶ IECs were isolated from 6 jejunal biopsy pieces per patient.
Flow cytometric analysis and sorting of IELs. Six- or 8-color flow cytometric analysis was performed using an LSR II flow cytometer (BD). For surface staining, IELs were resuspended in flow staining buffer (PBS plus 2% FBS), labeled with fluorochrome-conjugated antibodies for 30 minutes at 4°C, and washed twice before analysis. The following antibodies were used: Pacific blue–conjugated anti-CD3 (anti-CD3–Pacific blue), anti-CD8–Alexa Fluor 700, CD107a- and CD107b-FITC (all from eBioscience), anti-TCRαβ–PerCP, anti-TCRγδ–allophycocyanin, anti-CD103–PE (from BD
Biosciences), anti–LAP TGFβ1–PE, anti-NKG2A–PE, anti-NKG2A–allophy-cocyanin, anti-NKG2D–PE or anti-NKG2C–PE (all from R&D Systems), anti-CD94–FITC (BD) and unconjugated anti-human HLA-E (clones MEM/06 and MEM/07, from Abcam, and 3D12, a generous gift from Joel Le Maoult, Service de Recherches en Hémato-Immunologie, Commissariat a l’Energie Atomique, Hopital Saint Louis, Paris, France). IELs were defined as being CD103 positive. For intracellular staining, cells were fixed and permeabilized using a kit (eBioscience), according to the manufacturer’s protocol, using the following antibodies: anti–CTLA-4–PE (R&D systems), anti–granzyme B–PE, anti-perforin–PE, anti–IL-10–PE, anti–IFN-γ–PE-Cy7 (all from BD Biosciences) and anti–TGF-β1–PE (IQ Products). Mouse IgG1 and IgG2a were used as isotype controls. For intracellular cytokine stain-ing, cells were first activated with 2 μl/105 IELs of lymphocyte activation cocktail (PMA and ionomycin) with brefeldin A (Golgiplug; BD Biosci-ences) for 4 hours at 37°C prior to staining. Intracellular TGF-β1 staining was performed as previously described (67).
An Annexin V:FITC Apoptosis Detection Kit I (BD Biosciences) was used, according to the manufacturer’s instructions, to detect apoptosis of IL-15–treated TCRαβ+ IELs after coculture with TCRγδ+ IELs.
Analysis of flow data was performed using FloJo software (Tree Star Inc.).Flow sorting was performed using FACSAria (BD). Briefly, IELs were
resuspended in flow buffer at 1 × 10⁶/ml and labeled with anti-CD3–Pacif-ic blue, anti-TCRαβ–PerCP, anti-TCRγδ–allophycocyanin, anti-ESA–FITC (Biomeda), and anti-CD8–Alexa Flour 700 or anti-NKG2A–PE. After 30 minutes incubation, cells were washed twice using flow buffer and sorted into the following populations depending on the experiments; CD3+TCRαβ+ IELs, CD3+TCRγδ+ IELs, CD3+CD8+TCRγδ+ IELs CD3+CD8–
TCRγδ+ IELs, CD3+NKG2A–TCRγδ+ IELs, CD3+NKG2A+ TCRγδ+ IELs, and ESA+ ECs. For sorting of HLA-E+ populations, IELs were first stained with the unconjugated anti–HLA-E mAb followed by anti-mouse IgG1–PE.
Cell cultures. Sorted CD3+TCRαβ+ IELs and ESA+ ECs were cultured in RPMI supplemented with 10% FBS at a 1:1 ratio in triplicate wells of 96-well U-bottom plates at 20,000 total cells/well in the presence or absence of 25 ng/ml rhIL-15 (R&D Systems). In some assays, ECs were not added. For suppression assays, sorted CD3+TCRγδ+ IELs, CD3+NKG2A–
TCRγδ+ IELs, or CD3+NKG2A+TCRγδ+ IELs were added to IL-15–treated CD3+TCRαβ+ IELs with or without ESA+ EC cultures in different amounts; TCRαβ+ IEL/TCRγδ+ IEL ratios: 0:1, 0.1:1, 0.2:1,0.5:1, 1:1, and 2:1. Suppres-sion was measured as the mean (± SEM) of the differences of percentage of CD3+TCRαβ+ IELs expressing cytotoxic markers (IFN-γ, granzyme B, and NKG2D) in cultures without and with suppressor IELs.
Diffusion chamber assays were performed using cell culture inserts for 96-well plates with a 0.4 μm polycarbonate membrane (Transwell; Corning Inc.), in which CD3+TCRαβ+ IELs plus ESA+ ECs were added to the bottom chambers and CD3+NKG2A+TCRγδ+ IELs plus either HLA-E+ ECs or HLA-E– ECs were added to the top chamber separated by the membrane.
For antibody blocking experiments, 10 μg/ml anti-human NKG2A (clone Z199; Beckman Coulter), 10 μg/ml anti-human HLA-E (MEM-E/06; Abcam), 1 μg/ml anti–TGF-β1 (R&D Systems), 10 μg/ml anti–IL-10 (BD), or Mouse IgG1 (Sigma-Aldrich) was added to the suppression assays. To evaluate the effect of TGF-β1 on IL-15–induced activation of TCRαβ+ IELs, rhTGF-β1 (R&D Systems) was added at various concentrations (5 ng/ml, 10 ng/ml, 50 ng/ml, and 100 ng/ml) to the IL-15–treated CD3+TCRαβ+ IEL and ESA+ EC cultures. After incubation for 36 hours at 37°C, CD3+TCRαβ+ IELs were phenotyped for expression of intracellular IFN-γ and granzyme B and cell-surface expression of NKG2D as described above.
For antibody-mediated stimulation assays, IELs were cultured in 96-well flat-bottom plates (Costar) coated with 50 μg/ml anti-NKG2A (clone 131411; R&D Systems), 10 μg/ml anti-CD3 (UCHT1; BD Biosciences), or Mouse IgG1 (Sigma-Aldrich) for 24 hours at 37°C.
research article
292 TheJournalofClinicalInvestigation http://www.jci.org Volume 118 Number 1 January 2008
TGF-β1 ELISA. TGF-β1 levels in culture supernatants were detected using a Quantikine Human TGF-β1 Immunoassay (R&D Systems) according to the manufacturer’s protocol. Culture supernatants used were collected and stored at –80°C. Prior to being assayed, the supernatants were thawed, left at room temperature to equilibrate, and treated with 1 N HCl for 10 minutes followed by neutralization with 1.2 N NaOH to activate TGF-β1. TGF-β1 levels in cul-ture media were used to standardize the levels detected in supernatants.
Statistics. The mean values with SEM were used to denote the percent-age expression of a given marker on the IELs and frequencies of IEL sub-sets. Paired samples were compared using Wilcoxon’s signed-rank test, and when the different patient groups were compared, a nonparametric Mann-Whitney U test was used. Statistical analyses were performed using MedCalc software.
AcknowledgmentsThe authors would like to thank Joel Le Maoult and Raphael Hulkow-er for critical review of the manuscript. This work was supported by grants from the Celiac Disease Center of Columbia University.
Received for publication November 16, 2006, and accepted in revised form October 17, 2007.
Address correspondence to: John S. Manavalan, Department of Medicine, Division of Digestive and Liver Diseases, Columbia University College of Physicians and Surgeons, 1130 St. Nicholas Avenue, Room 915, New York, New York 10032, USA. Phone: (212) 851-4599; Fax: (212) 851-4590; E-mail: [email protected].
1. Green, P.H., and Jabri, B. 2006. Celiac disease. Annu. Rev. Med. 57:207–221.
2. Shan, L., et al. 2002. Structural basis for gluten intolerance in celiac sprue. Science. 297:2275–2279.
3. Gianfrani, C., et al. 2003. Celiac disease associa-tion with CD8+ T cell responses: identification of a novel gliadin-derived HLA-A2-restricted epitope. J. Immunol. 170:2719–2726.
4. Meresse, B., et al. 2004. Coordinated induction by IL15 of a TCR-independent NKG2D signaling pathway converts CTL into lymphokine-activated killer cells in celiac disease. Immunity. 21:357–366.
5. Hue, S., et al. 2004. A direct role for NKG2D/MICA interaction in villous atrophy during celiac disease. Immunity. 21:367–377.
6. Meresse, B., et al. 2006. Reprogramming of CTLs into natural killer-like cells in celiac disease. J. Exp. Med. 203:1343–1355.
7. Gianfrani, C., et al. 2006. Gliadin-specific type 1 regulatory T cells from the intestinal mucosa of treated celiac patients inhibit pathogenic T cells. J. Immunol. 177:4178–4186.
8. Halstensen, T.S., Scott, H., and Brandtzaeg, P. 1989. Intraepithelial T cells of the TcR gamma/delta+ CD8- and V delta 1/J delta 1+ phenotypes are increased in coeliac disease. Scand. J. Immunol. 30:665–672.
9. Spencer, J., Isaacson, P.G., MacDonald, T.T., Thom-as, A.J., and Walker-Smith, J.A. 1991. Gamma/delta T cells and the diagnosis of coeliac disease. Clin. Exp. Immunol. 85:109–113.
10. Rust, C., et al. 1992. Phenotypical and functional characterization of small intestinal TcR gamma delta + T cells in coeliac disease. Scand. J. Immunol. 35:459–468.
11. Savilahti, E., Arato, A., and Verkasalo, M. 1990. Intestinal gamma/delta receptor-bearing T lym-phocytes in celiac disease and inflammatory bowel diseases in children. Constant increase in celiac disease. Pediatr. Res. 28:579–581.
12. Maki, M., Holm, K., Collin, P., and Savilahti, E. 1991. Increase in gamma/delta T cell receptor bear-ing lymphocytes in normal small bowel mucosa in latent coeliac disease. Gut. 32:1412–1414.
13. Kutlu, T., et al. 1993. Numbers of T cell receptor (TCR) alpha beta+ but not of TcR gamma delta+ intraepithelial lymphocytes correlate with the grade of villous atrophy in coeliac patients on a long term normal diet. Gut. 34:208–214.
14. Holm, K., et al. 1992. Intraepithelial gamma delta T-cell-receptor lymphocytes and genetic suscepti-bility to coeliac disease. Lancet. 339:1500–1503.
15. Vecchi, M., et al. 1992. Increased jejunal intraepi-thelial lymphocytes bearing gamma/delta T-cell receptor in dermatitis herpetiformis. Gastroenterol-ogy. 102:1499–1505.
16. Savilahti, E., Reunala, T., and Maki, M. 1992. Increase of lymphocytes bearing the gamma/delta T cell receptor in the jejunum of patients with der-matitis herpetiformis. Gut. 33:206–211.
17. Hayday, A. 1997. gd cells in coeliac disease. In Coeliac disease: proceedings of the Seventh International Symposium on Coeliac Disease. September 5–7, 1996. Tampere, Finland. M. Maki, P. Collin, and J.K. Visa-korpi, editors. Coeliac Disease Study Group, Insti-tute of Medical Technology, University of Tampere. Tampere, Finland. 311–320.
18. Goodman, T., and Lefrancois, L. 1988. Expres-sion of the gamma-delta T-cell receptor on intes-tinal CD8+ intraepithelial lymphocytes. Nature. 333:855–858.
19. Itohara, S., et al. 1990. Homing of a gamma delta thymocyte subset with homogeneous T-cell recep-tors to mucosal epithelia. Nature. 343:754–757.
20. Hayday, A., and Tigelaar, R. 2003. Immunoregula-tion in the tissues by gammadelta T cells. Nat. Rev. Immunol. 3:233–242.
21. Boismenu, R. 2000. Function of intestinal gam-madelta T cells. Immunol. Res. 21:123–127.
22. Komano, H., et al. 1995. Homeostatic regulation of intestinal epithelia by intraepithelial gamma delta T cells. Proc. Natl. Acad. Sci. U. S. A. 92:6147–6151.
23. Mak, T.W., and Ferrick, D.A. 1998. The gammad-elta T-cell bridge: linking innate and acquired immunity. Nat. Med. 4:764–765.
24. Chen, Y., Chou, K., Fuchs, E., Havran, W.L., and Boismenu, R. 2002. Protection of the intestinal mucosa by intraepithelial gamma delta T cells. Proc. Natl. Acad. Sci. U. S. A. 99:14338–14343.
25. Roberts, S.J., et al. 1996. T-cell alpha beta + and gamma delta + deficient mice display abnormal but distinct phenotypes toward a natural, widespread infection of the intestinal epithelium. Proc. Natl. Acad. Sci. U. S. A. 93:11774–11779.
26. Kapp, J.A., Kapp, L.M., McKenna, K.C., and Lake, J.P. 2004. gammadelta T-cell clones from intestinal intraepithelial lymphocytes inhibit development of CTL responses ex vivo. Immunology. 111:155–164.
27. Trejdosiewicz, L.K., et al. 1989. Expression of T-cell receptors TcR1 (gamma/delta) and TcR2 (alpha/beta) in the human intestinal mucosa. Immunology. 68:7–12.
28. Jarry, A., Cerf-Bensussan, N., Brousse, N., Selz, F., and Guy-Grand, D. 1990. Subsets of CD3+ (T cell receptor alpha/beta or gamma/delta) and CD3- lymphocytes isolated from normal human gut epithelium display phenotypical features different from their counterparts in peripheral blood. Eur. J. Immunol. 20:1097–1103.
29. Deusch, K., et al. 1991. A major fraction of human intraepithelial lymphocytes simultaneously express-es the gamma/delta T cell receptor, the CD8 acces-sory molecule and preferentially uses the V delta 1 gene segment. Eur. J. Immunol. 21:1053–1059.
30. Farstad, I.N., Halstensen, T.S., Fausa, O., and Brandt-zaeg, P. 1993. Do human Peyer’s patches contribute to the intestinal intraepithelial gamma/delta T-cell population? Scand. J. Immunol. 38:451–458.
31. Betts, M.R., et al. 2003. Sensitive and viable identi-fication of antigen-specific CD8+ T cells by a flow
cytometric assay for degranulation. J. Immunol. Methods. 281:65–78.
32. Perera, L., et al. 2007. Expression of nonclassi-cal class I molecules by intestinal epithelial cells. Inflamm. Bowel Dis. 13:298–307.
33. Levings, M.K., Bacchetta, R., Schulz, U., and Roncarolo, M.G. 2002. The role of IL-10 and TGF-beta in the differentiation and effector function of T regulatory cells. Int. Arch. Allergy Immunol. 129:263–276.
34. Shevach, E.M. 2004. Regulatory/suppressor T cells in health and disease. Arthritis Rheum. 50:2721–2724.
35. Lahat, N., et al. 1999. Cytokine profile in coeliac disease. Scand. J. Immunol. 49:441–446.
36. Faria, A.M., and Weiner, H.L. 2006. Oral tolerance and TGF-beta-producing cells. Inflamm. Allergy Drug Targets. 5:179–190.
37. Thomas, D.A., and Massague, J. 2005. TGF-beta directly targets cytotoxic T cell functions during tumor evasion of immune surveillance. Cancer Cell. 8:369–380.
38. Lee, J.C., Lee, K.M., Kim, D.W., and Heo, D.S. 2004. Elevated TGF-beta1 secretion and down-modula-tion of NKG2D underlies impaired NK cytotoxicity in cancer patients. J. Immunol. 172:7335–7340.
39. Levings, M.K., et al. 2001. IFN-alpha and IL-10 induce the differentiation of human type 1 T regu-latory cells. J. Immunol. 166:5530–5539.
40. Allez, M., Brimnes, J., Dotan, I., and Mayer, L. 2002. Expansion of CD8+ T cells with regulatory func-tion after interaction with intestinal epithelial cells. Gastroenterology. 123:1516–1526.
41. Allez, M., and Mayer, L. 2004. Regulatory T cells: peace keepers in the gut. Inflamm. Bowel Dis. 10:666–676.
42. Jiang, H., and Chess, L. 2000. The specific regula-tion of immune responses by CD8+ T cells restrict-ed by the MHC class Ib molecule, Qa-1. Annu. Rev. Immunol. 18:185–216.
43. Lu, L., Werneck, M.B., and Cantor, H. 2006. The immunoregulatory effects of Qa-1. Immunol. Rev. 212:51–59.
44. Lu, L., et al. 2007. Regulation of activated CD4+ T cells by NK cells via the Qa-1-NKG2A inhibitory pathway. Immunity. 26:593–604.
45. Braud, V.M., et al. 1998. HLA-E binds to natural killer cell receptors CD94/NKG2A, B and C. Nature. 391:795–799.
46. Braud, V.M., Allan, D.S., Wilson, D., and McMi-chael, A.J. 1998. TAP- and tapasin-dependent HLA-E surface expression correlates with the binding of an MHC class I leader peptide. Curr. Biol. 8:1–10.
47. Aramburu, J., et al. 1990. A novel functional cell surface dimer (Kp43) expressed by natural killer cells and T cell receptor-gamma/delta+ T lympho-cytes. I. Inhibition of the IL-2-dependent prolifera-tion by anti-Kp43 monoclonal antibody. J. Immu-nol. 144:3238–3247.
48. Vales-Gomez, M., Reyburn, H.T., Erskine, R.A.,
research article
TheJournalofClinicalInvestigation http://www.jci.org Volume 118 Number 1 January 2008 293
Lopez-Botet, M., and Strominger, J.L. 1999. Kinet-ics and peptide dependency of the binding of the inhibitory NK receptor CD94/NKG2-A and the activating receptor CD94/NKG2-C to HLA-E. EMBO J. 18:4250–4260.
49. Battistini, L., et al. 1997. Phenotypic and cytokine analysis of human peripheral blood gamma delta T cells expressing NK cell receptors. J. Immunol. 159:3723–3730.
50. Jabri, B., et al. 2002. TCR specificity dictates CD94/NKG2A expression by human CTL. Immunity. 17:487–499.
51. Gunturi, A., Berg, R.E., Crossley, E., Murray, S., and Forman, J. 2005. The role of TCR stimulation and TGF-beta in controlling the expression of CD94/NKG2A receptors on CD8 T cells. Eur. J. Immunol. 35:766–775.
52. Sheu, B.C., et al. 2005. Up-regulation of inhibitory natural killer receptors CD94/NKG2A with sup-pressed intracellular perforin expression of tumor-infiltrating CD8+ T lymphocytes in human cervical carcinoma. Cancer Res. 65:2921–2929.
53. Bertone, S., et al. 1999. Transforming growth fac-tor-beta-induced expression of CD94/NKG2A inhibitory receptors in human T lymphocytes. Eur. J. Immunol. 29:23–29.
54. Mingari, M.C., et al. 1998. HLA class I-specific
inhibitory receptors in human T lymphocytes: inter-leukin 15-induced expression of CD94/NKG2A in superantigen- or alloantigen-activated CD8+ T cells. Proc. Natl. Acad. Sci. U. S. A. 95:1172–1177.
55. Le Drean, E., et al. 1998. Inhibition of antigen-induced T cell response and antibody-induced NK cell cytotoxicity by NKG2A: association of NKG2A with SHP-1 and SHP-2 protein-tyrosine phospha-tases. Eur J. Immunol. 28:264–276.
56. Masilamani, M., Nguyen, C., Kabat, J., Borrego, F., and Coligan, J.E. 2006. CD94/NKG2A inhib-its NK cell activation by disrupting the actin net-work at the immunological synapse. J. Immunol. 177:3590–3596.
57. Kim, S., et al. 2005. Licensing of natural killer cells by host major histocompatibility complex class I molecules. Nature. 436:709–713.
58. Jinushi, M., et al. 2004. Negative regulation of NK cell activities by inhibitory receptor CD94/NKG2A leads to altered NK cell-induced modulation of dendritic cell functions in chronic hepatitis C virus infection. J. Immunol. 173:6072–6081.
59. Wei, X.H., and Orr, H.T. 1990. Differential expres-sion of HLA-E, HLA-F, and HLA-G transcripts in human tissue. Hum. Immunol. 29:131–142.
60. Jabri, B., et al. 2000. Selective expansion of intraepi-thelial lymphocytes expressing the HLA-E-specific
natural killer receptor CD94 in celiac disease. Gas-troenterology. 118:867–879.
61. Olaussen, R.W., et al. 2007. Reduced chemokine receptor 9 on intraepithelial lymphocytes in celiac disease suggests persistent epithelial activation. Gastroenterology. 132:2371–2382.
62. Blobe, G.C., Schiemann, W.P., and Lodish, H.F. 2000. Role of transforming growth factor beta in human disease. N. Engl. J. Med. 342:1350–1358.
63. Li, M.O., Wan, Y.Y., Sanjabi, S., Robertson, A.K., and Flavell, R.A. 2006. Transforming growth fac-tor-beta regulation of immune responses. Annu. Rev. Immunol. 24:99–146.
64. Yu, J., et al. 2006. Pro- and antiinflammatory cytokine signaling: reciprocal antagonism regu-lates interferon-gamma production by human natural killer cells. Immunity. 24:575–590.
65. Monteleone, G., et al. 2001. Blocking Smad7 restores TGF-beta1 signaling in chronic inflam-matory bowel disease. J. Clin. Invest. 108:601–609.
66. Benahmed, M., et al. 2007. Inhibition of TGF-beta signaling by IL-15: a new role for IL-15 in the loss of immune homeostasis in celiac disease. Gastroen-terology. 132:994–1008.
67. Garba, M.L., and Frelinger, J.A. 2001. Intracellular cytokine staining for TGF-beta. J. Immunol. Methods. 258:193–198.