Shear-wave anisotropy across the geothermal field of Milos, Aegean volcanic arc
14
Geophys. J. Int. (1991) 107, 673-685 Shear-wave anisotropy across the geothermal field of Milos, Aegean volcanic arc Maria Sachpazi and Alfred Hirn Laboratoire de Sismologie, Institut de Physique de Giobe de Paris, 4 piace Jussieu, F-75252 Paris Cedex 05, France Accepted I991 June 13. Received 1991 May 15; in original form 1990 December 28 SUMMARY The drilled geothermal reservoir of Milos island, Aegean sea (Greece) is densely sampled by seismic waves from local earthquakes occurring at depths of 4-6 km, recorded by numerous three-component seismographs. During the eight months of observation seismic activity on the island occurred in the form of a few swarms located in three different areas. The focal mechanisms of all earthquakes share an area of dilatational quadrants indicating a nearly vertical maximum compressive stress. This implies an extensional field consistent with the regional tectonics of the Aegean sea. Shear-wave splitting is widely observed. Most of the observed leading shear-wave polarizations are aligned around the N-S direction and they are parallel to the structural trends of faults observed at the surface. The other seismograms show a leading shear wave polarized along a N40"E direction. These polarizations are observed particularly at stations located between the geothermal drillholes, indicat- ing probably the orientation of microfractures aligned in the geothermal reservoir by the present-day stress field. Variations of the anisotropy magnitude are deduced from the study of shear-wave delays in the vicinity of geothermal drillholes, and their distribution appears to correlate with the limits of a fractured medium detected by P and S velocity anomalies. Key words: Aegean volcanic arc, crack-induced anisotropy , geothermal area, shear- wave splitting, stress field and faults. 1 INTRODUCTION It has been a recent challenge to geophysical methods to try and prospect for geothermal reservoirs. Seismological methods are particularly proposed in order to detect and locate local seismic activity. The latter, if it is detected by an array of seismological sensors with an adequate geometry and detection capability, may provide, by its spatial distribution, a picture of the fault zones possibly controlling the reservoir geometry or a picture of the zones of preferred fluid flow towards the surface. When sufficient sampling of the interesting area is available, a 3-D analysis of the velocity structure provides further information. It may reveal small-scale velocity variations related to the reservoir characteristics such as fracturation or liquid saturation and the existence of vapour. The observation of shear-wave splitting, for which three-component seismographs are necessary, is especially interesting in geothermal areas where, as in the Milos area, the reservoir is believed to exist in fractured rock. According to Crampin (1978) and Crampin & Booth (1985) the direction of the polarization of the leading shear wave provides information about the orientations of microcracks or zones of fracture which would be aligned by the regional tectonic regime of the area. In this paper we shall concentrate on the analysis of shear-wave splitting. Details on the features of seismic activity and the 3-D heterogeneity are given elsewhere (Hirn, Sachpazi & Nercessian 1989). 2 GEOLOGY AND TECTONICS Figure 1 shows the geographical position of Milos island in the Aegean Sea. The island as described by Fytikas (1977, 1989) belongs, together with the active volcano of Santorini, to the South Aegean volcanic arc. It was formed during the Pliocene as a consequence of the subduction of the African plate beneath Crete. Milos is mainly volcanic. Its volcanism began about 3.5 Myr ago and lasted until 80 000 yr ago. The 673 by guest on July 24, 2016 http://gji.oxfordjournals.org/ Downloaded from
-
Upload
independent -
Category
Documents
-
view
0 -
download
0
Transcript of Shear-wave anisotropy across the geothermal field of Milos, Aegean volcanic arc
Geophys. J . Int. (1991) 107, 673-685
Shear-wave anisotropy across the geothermal field of Milos, Aegean volcanic arc
Maria Sachpazi and Alfred Hirn Laboratoire de Sismologie, Institut de Physique de Giobe de Paris, 4 piace Jussieu, F-75252 Paris Cedex 05, France
Accepted I991 June 13. Received 1991 May 15; in original form 1990 December 28
S U M M A R Y The drilled geothermal reservoir of Milos island, Aegean sea (Greece) is densely sampled by seismic waves from local earthquakes occurring at depths of 4-6 km, recorded by numerous three-component seismographs. During the eight months of observation seismic activity on the island occurred in the form of a few swarms located in three different areas. The focal mechanisms of all earthquakes share an area of dilatational quadrants indicating a nearly vertical maximum compressive stress. This implies an extensional field consistent with the regional tectonics of the Aegean sea.
Shear-wave splitting is widely observed. Most of the observed leading shear-wave polarizations are aligned around the N-S direction and they are parallel to the structural trends of faults observed at the surface. The other seismograms show a leading shear wave polarized along a N40"E direction. These polarizations are observed particularly at stations located between the geothermal drillholes, indicat- ing probably the orientation of microfractures aligned in the geothermal reservoir by the present-day stress field.
Variations of the anisotropy magnitude are deduced from the study of shear-wave delays in the vicinity of geothermal drillholes, and their distribution appears to correlate with the limits of a fractured medium detected by P and S velocity anomalies.
Key words: Aegean volcanic arc, crack-induced anisotropy , geothermal area, shear- wave splitting, stress field and faults.
1 INTRODUCTION
It has been a recent challenge to geophysical methods to try and prospect for geothermal reservoirs. Seismological methods are particularly proposed in order to detect and locate local seismic activity. The latter, if it is detected by an array of seismological sensors with an adequate geometry and detection capability, may provide, by its spatial distribution, a picture of the fault zones possibly controlling the reservoir geometry or a picture of the zones of preferred fluid flow towards the surface. When sufficient sampling of the interesting area is available, a 3-D analysis of the velocity structure provides further information. It may reveal small-scale velocity variations related to the reservoir characteristics such as fracturation or liquid saturation and the existence of vapour.
The observation of shear-wave splitting, for which three-component seismographs are necessary, is especially interesting in geothermal areas where, as in the Milos area,
the reservoir is believed to exist in fractured rock. According to Crampin (1978) and Crampin & Booth (1985) the direction of the polarization of the leading shear wave provides information about the orientations of microcracks or zones of fracture which would be aligned by the regional tectonic regime of the area. In this paper we shall concentrate on the analysis of shear-wave splitting. Details on the features of seismic activity and the 3-D heterogeneity are given elsewhere (Hirn, Sachpazi & Nercessian 1989).
2 GEOLOGY AND TECTONICS
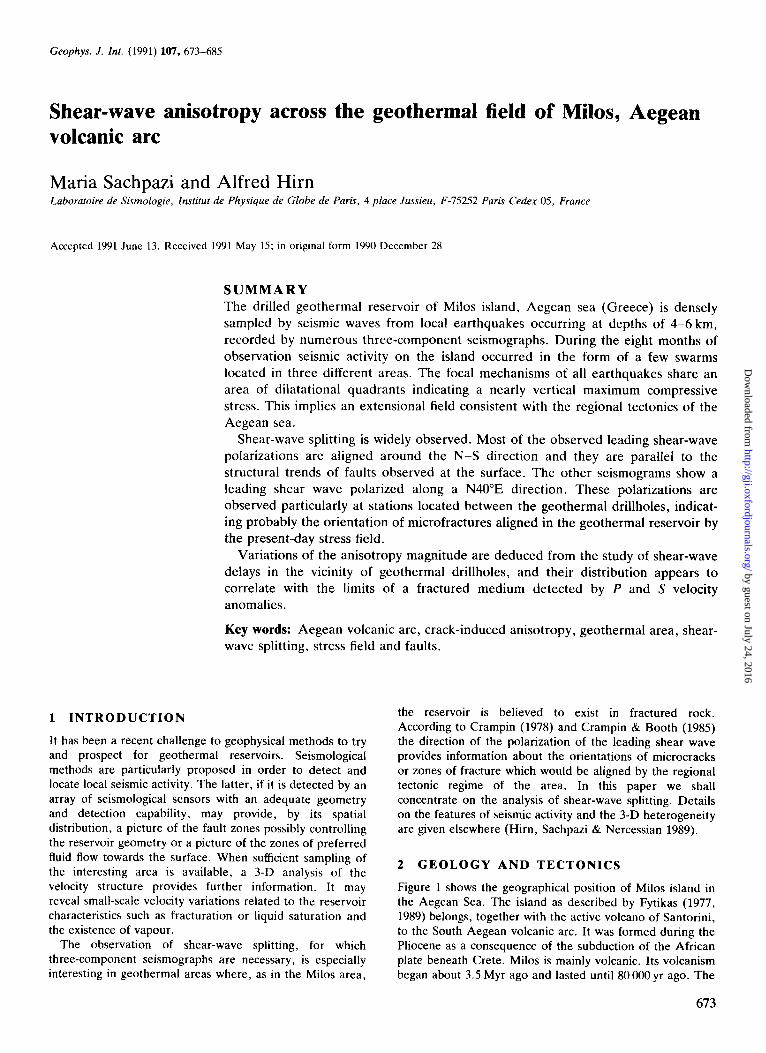
Figure 1 shows the geographical position of Milos island in the Aegean Sea. The island as described by Fytikas (1977, 1989) belongs, together with the active volcano of Santorini, to the South Aegean volcanic arc. It was formed during the Pliocene as a consequence of the subduction of the African plate beneath Crete. Milos is mainly volcanic. Its volcanism began about 3.5 Myr ago and lasted until 80 000 yr ago. The
673
by guest on July 24, 2016http://gji.oxfordjournals.org/
Dow
nloaded from
674 M . Sachpazi and A . H i m
2( 22 23 24 2 5 39- I
PELOPONNESUS
1 1 1 I 21 2 2 23 24 2 5
Figure 1. Geographical position of the island of Milos, in the Aegean Sea.
products of this activity belong t o a calc-alkaline type varying from andesites and dacites to younger rhyolites. The basement of the island is made of rocks of Alpine age metamorphism found at shallow depth by drilling, abundantly as xenoliths, and outcropping on the southern coast.
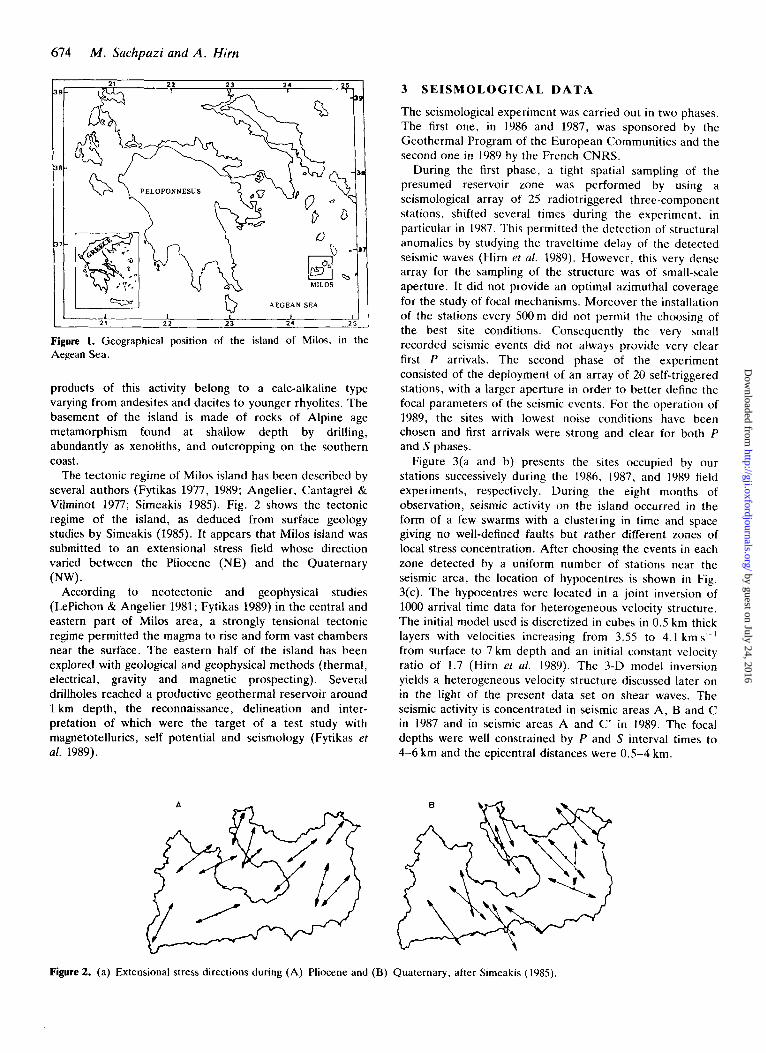
The tectonic regime of Milos island has been described by several authors (Fytikas 1977, 1989; Angelier, Cantagrel & Vilminot 1977; Simeakis 1985). Fig. 2 shows the tectonic regime of the island, as deduced from surface geology studies by Simeakis (1985). It appears that Milos island was submitted to an extensional stress field whose direction varied between the Pliocene (NE) and the Quaternary
According to neotectonic and geophysical studies (LePichon & Angelier 1981; Fytikas 1989) in the central and eastern part of Milos area, a strongly tensional tectonic regime permitted the magma to rise and form vast chambers near the surface. The eastern half of the island has been explored with geological and geophysical methods (thermal, electrical, gravity and magnetic prospecting). Several drillholes reached a productive geothermal reservoir around 1 km depth, the reconnaissance, delineation and inter- pretation of which were the target of a test study with magnetotellurics, self potential and seismology (Fytikas et al. 1989).
( N W
3 SEISMOLOGICAL DATA
The seismological experiment was carried out in two phases. The first one, in 1986 and 1987, was sponsored by the Geothermal Program of the European Communities and the second one in 1989 by the French CNRS.
During the first phase, a tight spatial sampling of the presumed reservoir zone was performed by using a seismological array of 25 radiotriggered three-component stations, shifted several times during the experiment, in particular in 1987. This permitted the detection of structural anomalies by studying the traveltime delay of the detected seismic waves (Hirn et al. 1Y8Y). However, this very dense array for the sampling of the structure was of small-scale aperture. It did not provide an optimal azimuthal coverage for the study of focal mechanisms. Moreover the installation of the stations every 500m did not permit the choosing of the best site conditions. Consequently the very small recorded seismic events did not always provide very clear first P arrivals. The second phase of the experiment consisted of the deployment of an array of 20 self-triggered stations, with a larger aperture in order to better define the focal parameters of the seismic events. For the operation of 1989, the sites with lowest noise conditions have been chosen and first arrivals were strong and clear for both P and S phases.
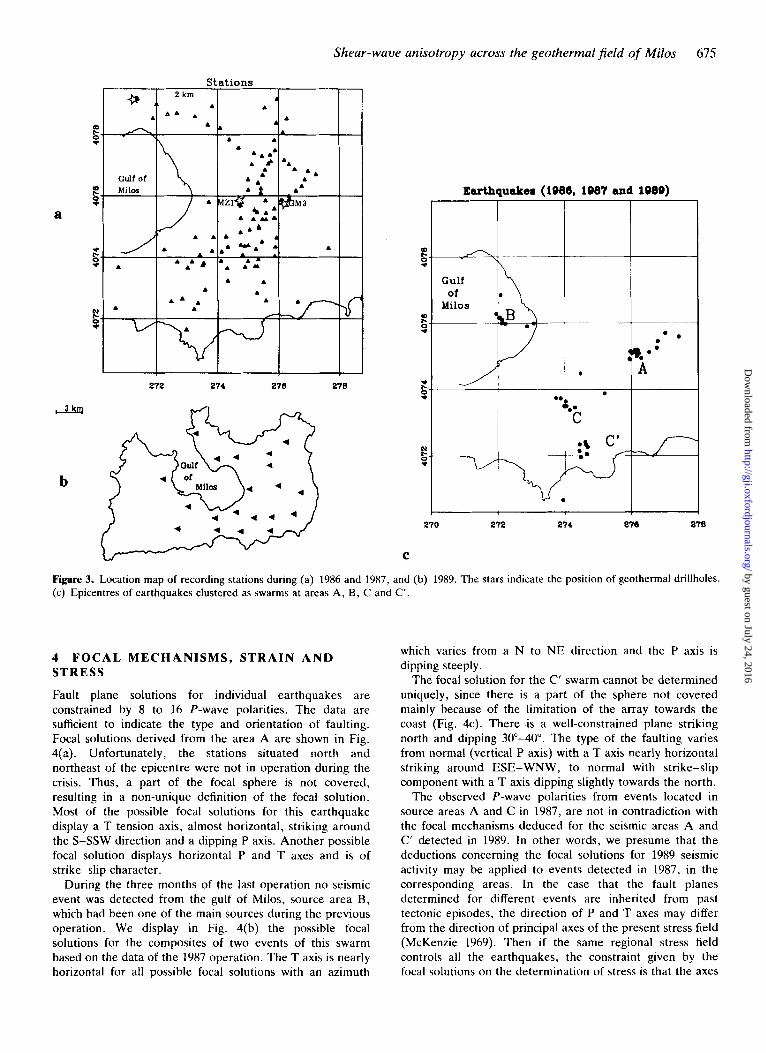
Figure 3(a and b) presents the sites occupied by our stations successively during the 1986, 1987, and 1989 field experiments, respectively. During the eight months of observation, seismic activity on the island occurred in the form of a few swarms with a clustering in time and space giving no well-defined faults but rather different zones of local stress concentration. After choosing the events in each zone detected by a uniform number of stations near the seismic area, the location of hypocentres is shown in Fig. 3(c). The hypocentres were located in a joint inversion of 1000 arrival time data for heterogeneous velocity structure. The initial model used is discretized in cubes in 0.5 km thick layers with velocities increasing from 3.55 to 4.1 km s-I from surface to 7 km depth and an initial constant velocity ratio of 1.7 (Him et al. 1989). The 3-D model inversion yields a heterogeneous velocity structure discussed later on in the light of the present data set on shear waves. The seismic activity is concentrated in seismic areas A , B and C in 1987 and in seismic areas A and C' in 1989. The focal depths were well constrained by P and S interval times to 4-6 km and the epicentral distances were 0.5-4 km.
Figure 2. (a) Extensional stress directions during (A) Pliocene and (B) Quatcrnary, after Simeakis (1985).
by guest on July 24, 2016http://gji.oxfordjournals.org/
Dow
nloaded from
Shear-wave anisotropy across the geothermal field of Milos 675
a
272 274 278 278
d-u
b
Earthquaker (1986, 1987 and 1989)
@ I
Milos ~.
- I c
270 272 274 276 270
C
Figure 3. Location map of recording stations during (a) 1986 and 1987, and (b) 1989. The stars indicate the position of geothermal drillholes. (c) Epicentres of earthquakes clustered as swarms at areas A, B, C and C'.
4 FOCAL MECHANISMS, STRAIN A N D STRESS
Fault plane solutions for individual earthquakes are constrained by 8 to 16 P-wave polarities. The data are sufficient to indicate the type and orientation of faulting. Focal solutions derived from the area A are shown in Fig. 4(a). Unfortunately, the stations situated north and northeast of the epicentre were not in operation during the crisis. Thus, a part of the focal sphere is not covered, resulting in a non-unique definition of the focal solution. Most of the possible focal solutions for this earthquake display a T tension axis, almost horizontal, striking around the S-SSW direction and a dipping P axis. Another possible focal solution displays horizontal P and T axes and is of strike-slip character.
During the three months of the last operation no seismic event was detected from the gulf of Milos, source area B , which had been one of the main sources during the previous operation. We display in Fig. 4(b) the possible focal solutions for the composites of two events of this swarm based on the data of the 1987 operation. The T axis is nearly horizontal for all possible focal solutions with an azimuth
which varies from a N t o N E direction and the P axis is dipping steeply.
The focal solution for the C' swarm cannot be determined uniquely, since there is a part of the sphere not covered mainly because of the limitation of the array towards the coast (Fig. 4c). There is a well-constrained plane striking north and dipping 30"-40". The type of the faulting varies from normal (vertical P axis) with a T axis nearly horizontal striking around ESE-WNW, to normal with strike-slip component with a T axis dipping slightly towards the north.
The observed P-wave polarities from events located in source areas A and C in 1987, are not in contradiction with the focal mechanisms deduced for the seismic areas A and C' detected in 1989. In other words, we presume that the deductions concerning the focal solutions for 1989 seismic activity may be applied to events detected in 1987, in the corresponding areas. In the case that the fault planes determined for different events are inherited from past tectonic episodes, the direction of P and T axes may differ from the direction of principal axes of the present stress field (McKenzie 1969). Then if the same regional stress field controls all the earthquakes, the constraint given by the focal solutions on the determination of stress is that the axes
by guest on July 24, 2016http://gji.oxfordjournals.org/
Dow
nloaded from
676 M . Sachpazi and A. Hirn
+ ? + + +T
@ - - +++ + +
0 oy+ + + Y g +
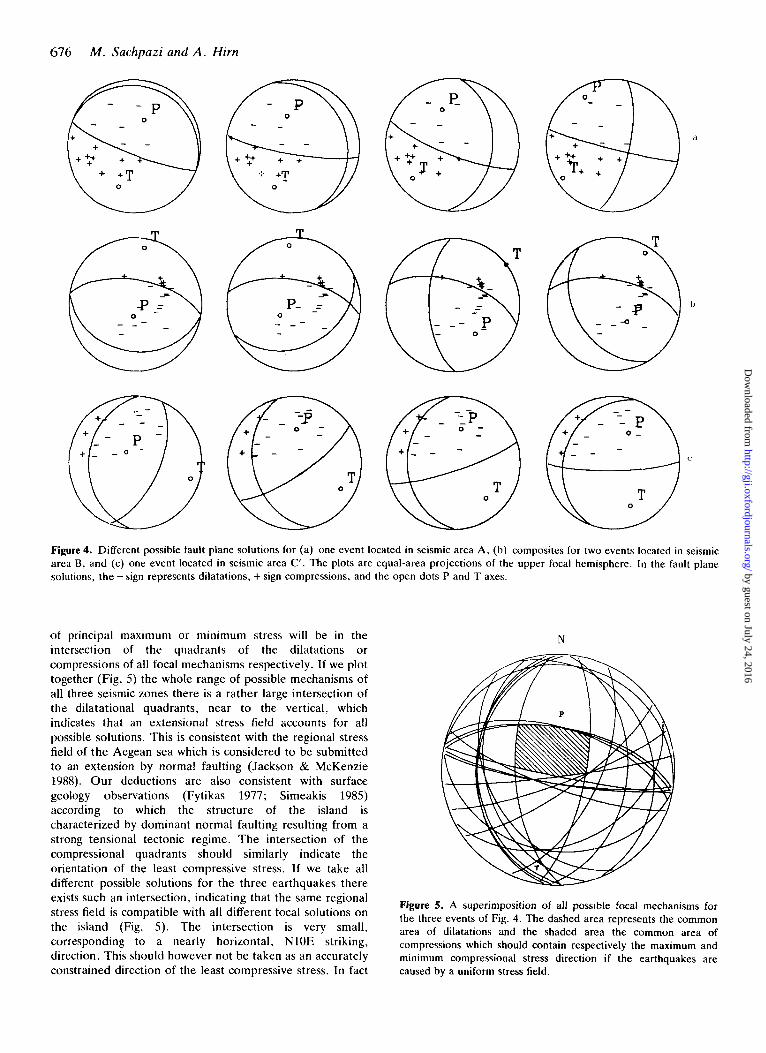
Figure 4. Different possible fault plane solutions for (a) one event located in seismic area A, (b) composites for two events located in seismic area B, and (c) one event located in seismic area C'. The plots are equal-area projections of the upper focal hemisphere. In the fault plane solutions, the - sign represents dilatations, + sign compressions, and the open dots P and T axes.
of principal maximum o r minimum stress will be in the intersection of the quadrants of the dilatations or compressions of all focal mechanisms respectively. If we plot together (Fig. 5) the whole range of possible mechanisms of all three seismic zones there is a rather large intersection of the dilatational quadrants, near to the vertical, which indicates that an extensional stress field accounts for all possible solutions. This is consistent with the regional stress field of the Aegean sea which is considered to be submitted t o an extension by normal faulting (Jackson & McKenzie 1988). O u r deductions are also consistent with surface geology observations (Fytikas 1977; Sirneakis 1985) according to which the structure of the island is characterized by dominant normal faulting resulting from a strong tensional tectonic regime. T h e intersection of the compressional quadrants should similarly indicate the orientation of the least compressive stress. If we take all different possible solutions for the three earthquakes there exists such an intersection, indicating that the same regional stress field is compatible with all different focal solutions on the island (Fig. 5). The intersection is very small, corresponding to a nearly horizontal, NlOE striking, direction. This should however not be taken as an accurately constrained direction of the least compressive stress. In fact
N
Figure 5. A superimposition of all possible focal mechanisms for the three events of Fig. 4. The dashed area represents the common area of dilatations and the shaded area the common area of compressions which should contain respectively the maximum and minimum compressional stress direction if the earthquakes are caused by a uniform stress field.
by guest on July 24, 2016http://gji.oxfordjournals.org/
Dow
nloaded from
Shear-wave anisotropy across the geothermal field of Milos 677
each earthquake considered has a unique focal mechanism, but as this is not completely constrained by our data, we considered together the different possible types of solutions compatible with the data and then, by superimposing them, we consequently constrained the resulting intersection of the quadrants. In the cases where we could choose one of the different possible alternatives as the real focal solution for each earthquake, the real area of the intersection might be significantly larger, hence the direction of the least compressive stress indicated is not as well defined as it would appear.
5 SHEAR W A V E SPLITTING-RESULTS A N D QUESTIONS FROM A FIRST A P P R O A C H
Shear-wave splitting indicating anisotropy above small earthquakes within the continental upper crust has been observed in a number of places with various tectonic and geological settings (Booth et al. 1985; Crampin & Booth 1985; Kaneshima, Ito & Sugihara 1988; Peacock, Crampin & Booth 1988; Savage, Peppin & Vetter 1990). Crampin & Booth (1985), consider the parallel alignment of the faster shear-wave polarizations and the change in particle motion as evidence of shear-wave splitting and consequently of the existence of anisotropy. They interpret it as indicative of distributions of microcracks. The stable orientation of the fast axis for several stations would then be the indication of a homogeneous stress field which they suppose to be the same over a considerable volume. In these terms, the determination of the orientation of the anisotropy is important since we can infer from it the orientation of the stress field. Crampin & Booth (1985) calculated polarization diagrams of synthetic shear-wave seismograms from a point source assuming a homogeneous half-space with liquid-filled vertical cracks. They concluded that for a wide range of azimuths and angles of incidence the leading shear wave will be polarized parallel to the strike of the microcracks.
With the exception of the Takinoue geothermal field in Japan (Kaneshima et al. 1988) the regions studied (e.g. Booth et al. 1985; Peacock et al. 1988) can be considered to be more homogeneous in velocity or stress structure than in the volcanic geothermal field of Milos. For the geothermal example of Takinoue, microearthquakes were shallower than 2 km, hence above or at the top of the reservoir. In contrast, in Milos the detected microearthquakes are deeper than 4 km, well beneath the reservoir, so that the seismic waves have to cross the reservoir level with possibly strong lateral variations in response. Most similar studies are based on an array of permanent stations, so that many earthquakes but only a few recording points can be used, even fewer for S-wave studies, as three-component seismographs are still few, two stations for instance in the case of Takinoue. In the Milos survey, numerous three-component stations operated simultaneously. Even though only a few earthquakes were recorded at every station, a larger number of sites gave data for each of the earthquake source regions (Hirn et al. 1989).
Reliable locations of local earthquakes are important for the analysis of the polarization of shear waves. An accurate determination of focal depths and consequently of angles of incidence provides a further security for the events selected
within the shear-wave window. For the S analysis, pure shear waves have to be selected. For angles greater than the critical angle a strong conversion of SV to P , gives rise t o a local SP phase as a radially polarized precursor to S , which would make the identification of the direct shear-wave polarization difficult (Evans 1984). The direction of the shear wave was measured on the horizontal plane of the particle motion diagrams. There are strong changes in the leading shear-wave polarization between stations closer than 1 km apart and differences of orientation exist also for the same station and events in different source regions (Hirn et al. 1989). Before concluding that anisotropy is responsible for the strong variations observed above, it is necessary to consider the expected effects on the shear-wave motion caused by complications of the source or along the propagation path. Complications may be due to near-surface stratification and more generally to heterogeneity which allows mode conversion. This would result in a precursor to the direct propagation which vibrates in the plane of incidence, has a polarization in the plane of propagation and is thus expected to complicate the shear-wave polarization.
6 EVIDENCE FOR ANISOTROPY FROM S H E A R - W A V E SPLITTING
Sources radiate shear waves with polarizations fixed by the type and orientation of the focal mechanism. Therefore a way to detect anisotropy is to compare the theoretical to the observed polarizations of the shear wave. If there is no anisotropy they should coincide. However the calculated theoretical polarizations assume a homogeneous isotropic structure and they are very sensitive to even small variations in azimuths and angles of incidence due to possible errors in hypocentre location. For instance at the points on the focal sphere where we have data for events of regions A and B the different possible focal solutions give theoretical orientations which vary by more than 90" so that there is no
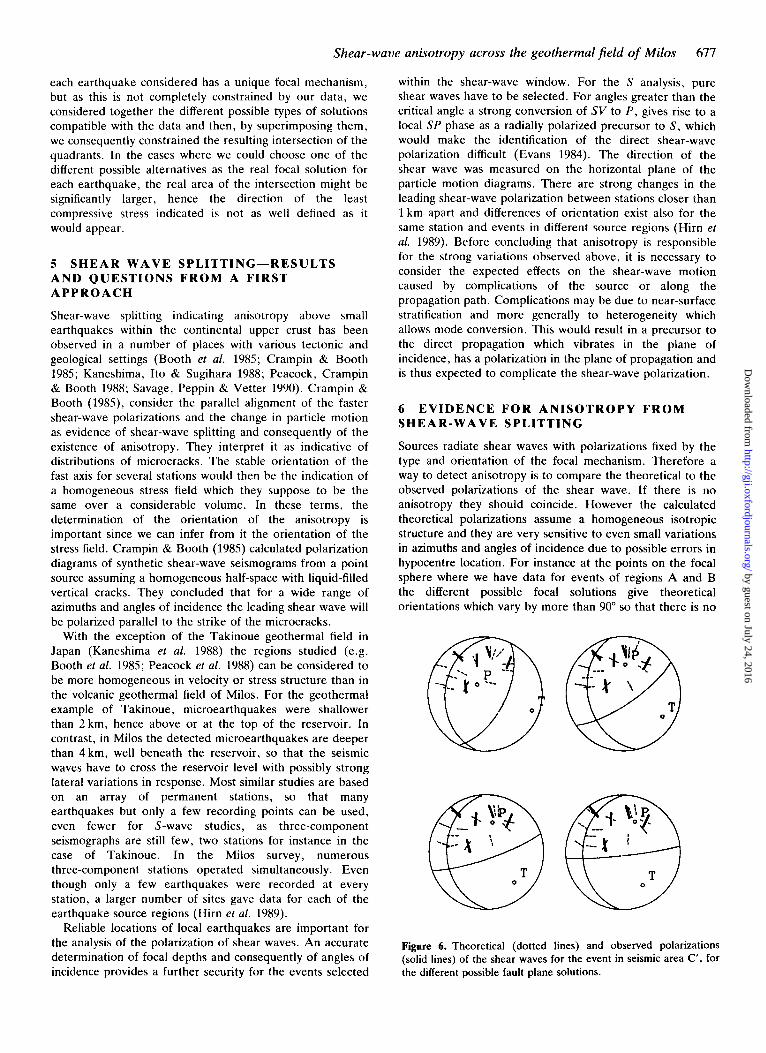
Figure 6. Theoretical (dotted lines) and observed polarizations (solid lines) of the shear waves for the event in seismic area C', for the different possible fault plane solutions.
by guest on July 24, 2016http://gji.oxfordjournals.org/
Dow
nloaded from
2
a s 1
S t . 2 1 8
lsec. -
S t . 218
l " " ' " ' ' I - 1sec. -
7.
b NS
t
S t . 2 1 8
r - - - - " " " " ' " " ' t - - lsec. - 2
E
- 2 -2 -2 272 276
V N N
Isec. - 2
N40E
s1
d S 2
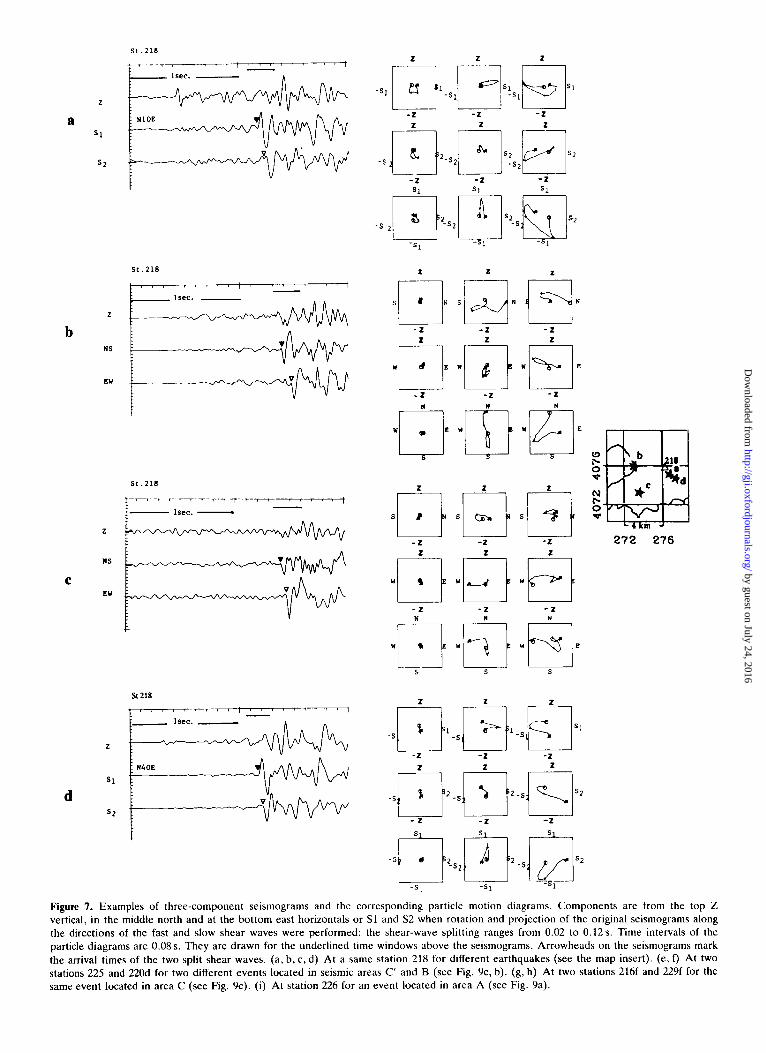
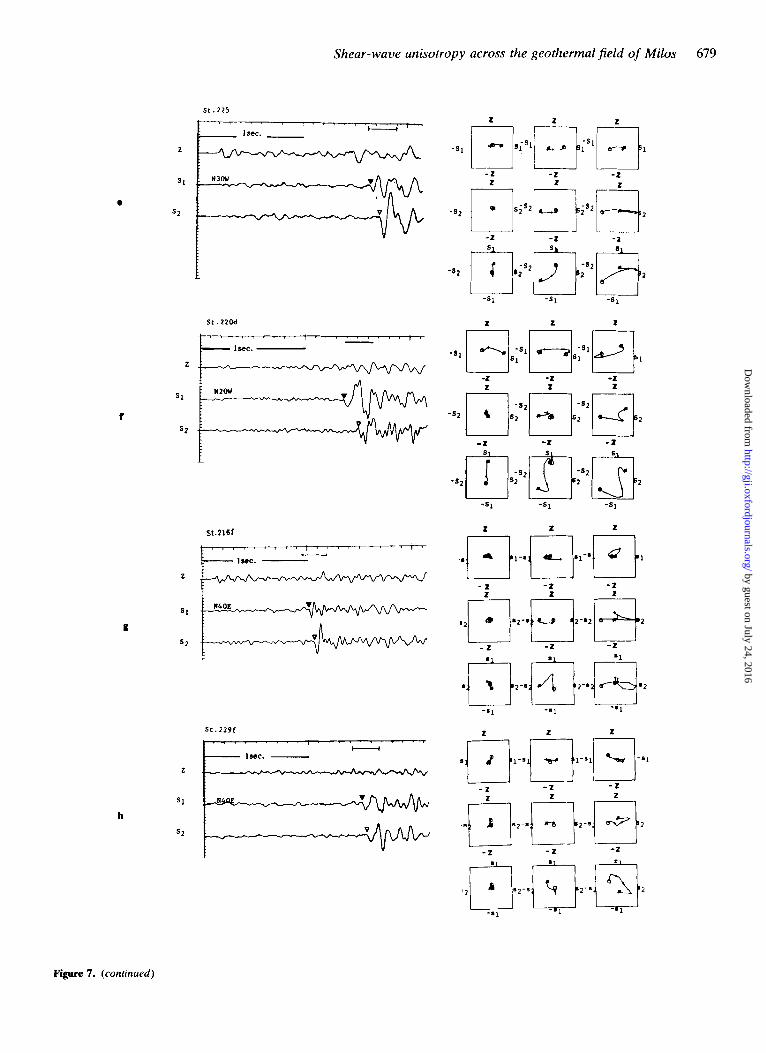
Figure 7. Examples of three-component seismograms and the corresponding particle motion diagrams. Components are from the top Z vertical, in the middle north and at the bottom east horizontals or S1 and S2 when rotation and projection of the original seismograms along the directions of the fast and slow shear waves were performed: the shear-wave splitting ranges from 0.02 to 0.12s. Time intervals of the particle diagrams are 0.08 s. They are drawn for the underlined time windows above the seismograms. Arrowheads on the seismograms mark the arrival times of the two split shear waves. (a, b, c, d) At a same station 218 for different earthquakes (see the map insert). (e, f) At two stations 225 and 220d for two different events located in seismic areas C' and B (see Fig. 9c, b). (g, h) At two stations 216f and 229f for the same event located in area C (see Fig. 9c). (i) At station 226 for an event located in area A (see Fig. 9a).
by guest on July 24, 2016http://gji.oxfordjournals.org/
Dow
nloaded from
Shear-wave anisotropy across the geothermal field of Milos 679
S t . 2 2 5
51.2161
S t . 229f
lsec. -
z 2 z
- 2 - 2
Figure 7. (conzinued)
by guest on July 24, 2016http://gji.oxfordjournals.org/
Dow
nloaded from
680 M . Sachpazi and A . Hirn
7 z z
St . 2 2 6 * ' ' ' " ' ' ' ' I ' - ' " "
:- lsec. - z
i Figure 7. (continued)
point in comparing them with the observed ones. In the case
-2 - 2 -2
More direct evidence for anisotropy is the observation of . _ of the region C' three out of the five clear observed shear-wave splitting on seismograms. We restrict the polarizations do not fit with the theoretical ones for any of shear-wave analysis to data not suspected of complications the possible focal solutions (Fig. 6). This implies in this case and presenting an impulsive and short shear-wave signal that the observed shear-wave polarizations are not due to with shear-wave motion polarized primarily in the horizontal the source radiation but that they are the result of structure plane. This resulted in the removal of numerous between the source and the receivers. seismograms although in general they presented evidence
S t 216c s t 214c
1 " ~ ~ ~ ' - lsec. -
a
N N N
S S S
S t . 18c
7 lsec. -
C
272 276
N N N
S S S
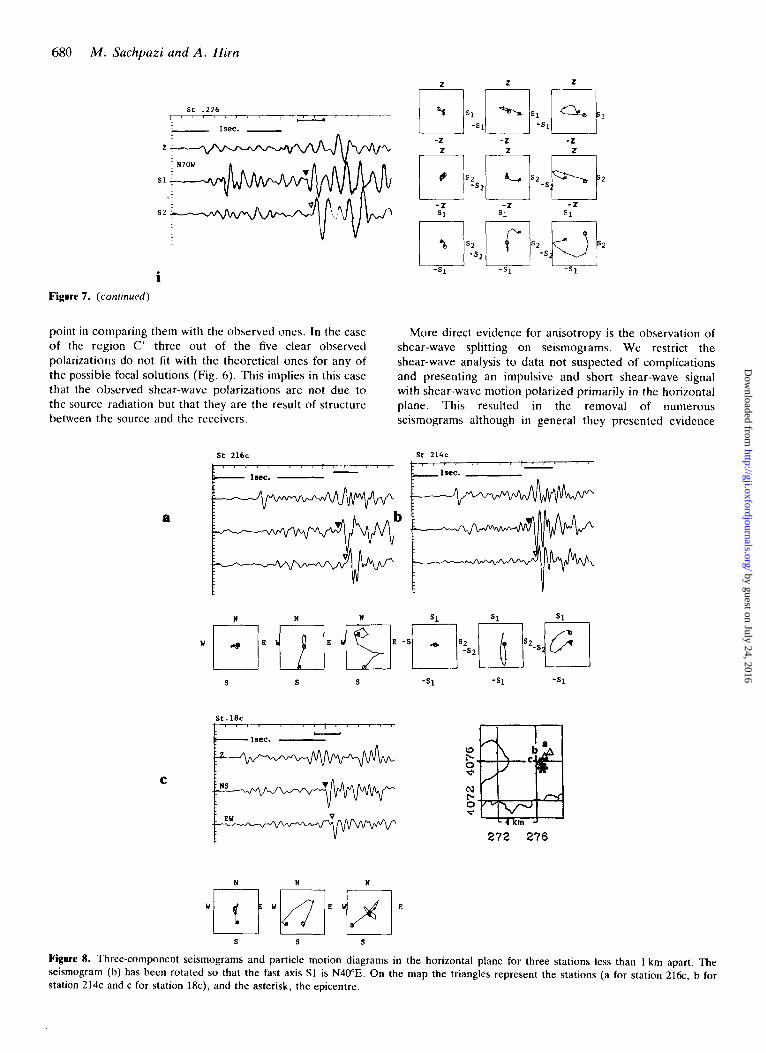
Figure 8. Three-component seismograms and particle motion diagrams in the horizontal plane for three stations less than 1 km apart. The seismogram (b) has been rotated so that the fast axis S1 is N40"E. On the map the triangles represent the stations (a for station 216c, b for station 214c and c for station 18c), and the asterisk, the epicentre.
by guest on July 24, 2016http://gji.oxfordjournals.org/
Dow
nloaded from
Shear-wave anisotropy across the geothermal field of Milos 681
for splitting. Furthermore, in order to keep only the most reliable observations intended to be interpreted in terms of anisotropy , we restricted our analysis and interpretations to seismograms with clear separation between the two shear waves. A rotation and projection of the original seismograms along the directions of the fast and slow shear waves determined from the particle motion diagrams of the
original seismograms was done in order to better define the direction of the faster shear wave, and to observe the maximum separation between the two split shear waves.
Some of the seismograms displaying the observed shear-wave splitting are shown in Figs 7, 8 accompanied by the corresponding particle motion diagrams. Fig. 9(a, b , c) shows the observed polarizations of the leading shear wave
a
1
272 274 276 278
b
2 7 2 273 276 278
, 2 7 2 273 276 278
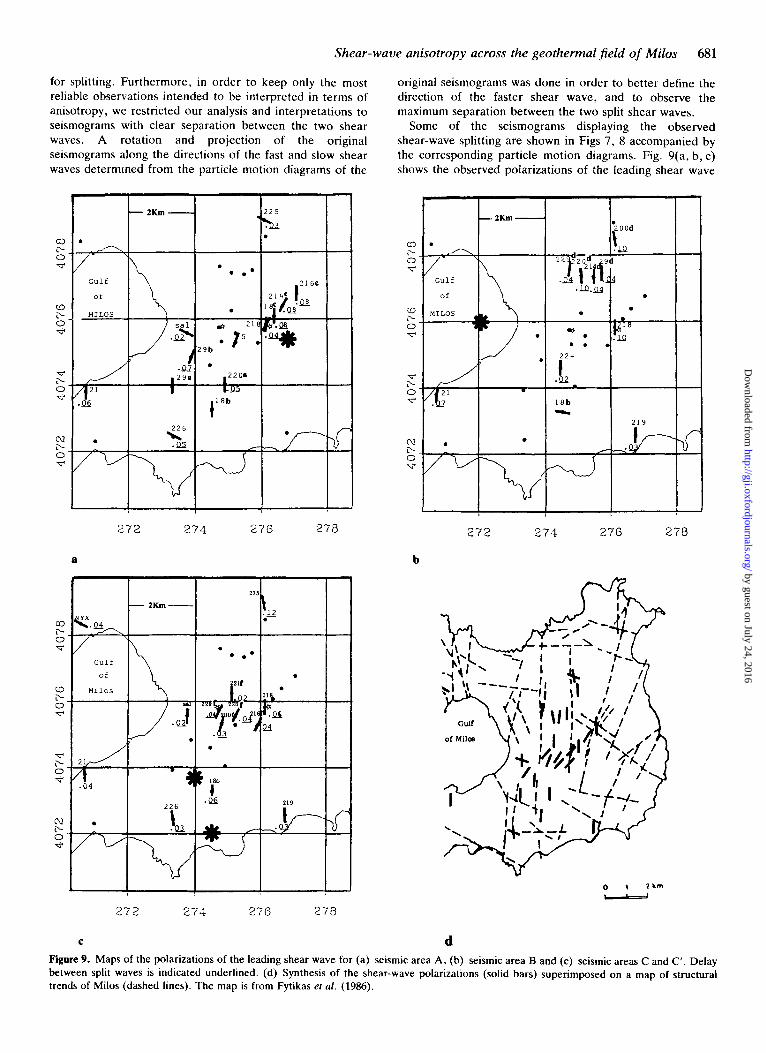
C d Figure 9. Maps of the polarizations of the leading shear wave for (a) seismic area A, (b) seismic area B and (c) seismic areas C and C’. Delay between split waves is indicated underlined. (d) Synthesis of the shear-wave polarizations (solid bars) superimposed on a map of structural trends of Milos (dashed lines). The map is from Fytikas er al. (1986).
by guest on July 24, 2016http://gji.oxfordjournals.org/
Dow
nloaded from
682 M . Sachpazi and A . Hirn
for events detected in A , B and also in C and C ' areas. On these maps the shear-wave delays are also indicated. We observe a variation of the polarizations of the leading shear wave and no uniform alignment may be deduced. However many of the observations are distributed around the north direction and some others around the N E directions.
6.1 Polarizations of split shear waves
Station 21 recorded earthquakes from three different azimuths, A, B and C areas (Fig. 9a, b ,c ) . It displays a stable N-S direction for the polarization of the leading shear wave. Another example of stable polarization for the leading shear wave for different earthquakes is station 218 situated near the geothermal drillhole GM3. The polariza- tions observed at this station are uniformly aligned around the direction north to N2OoE, for shear waves with angles of approach varying by more than 90" (Fig. 9a, b, c). One exception will be discussed below. Stations 220a, 224 and 18b situated in the southeast of the island with a spacing of less than 1 km recorded events from three different azimuths areas A, B and C respectively. The three consistently display a N-S polarization for the leading shear wave. Station 18b displays a shear-wave polarization aligned either N-S or E-W. However when E-W polarization occurs no shear-wave splitting is observed. This may be due to the source mechanism generating an E-W polarization perpen- dicular t o the polarization of the faster shear wave, s o that only the slower shear wave is excited. The uniform leading shear-wave polarizations from earthquakes of different azimuths make it unlikely that the polarizations are source-related, rather they are clear evidence of anisotropic propagation.
Station 218 displays an exceptionally different polarization from the north for one of the events of the area A. The polarization of the first shear wave is N40"E (Fig. 7d). For this event the shear wave did not follow exactly the same path to the surface as for the other event of area A (Fig. 7a). Thus, domains of different orientations might exist revealing different crack patterns. The existence of sharp lateral variation may be supported from other observations also. For station 216f at less than 1 km from 218 a N40"E polarization is also observed (Fig. 7g). Stations 18c, 214c and 216c are situated less than 1 km apart, to the N E of 218 (Fig. 9a). Although they are very close to each other, propagation paths are distinct as the source is just beneath them. The three of them exhibit shear-wave splitting but the one situated in the middle has a leading shear wave polarized at N40"E whereas the others are N-S. To summarize, it appears (Fig. 9a, b, c) that the polarizations corresponding to paths passing beneath the region of the boreholes are approximately N40"E and polarizations corresponding to other paths are generally polarized approximately N-S.
6.2 Relation between the observed polarizations and the orientation of the stress field
We have two directions of shear-wave polarizations, N-S and N40"E. If both are due to crack opening in the present stress field, it implies that stress directions vary locally. This might be attributed to the mode of formation by successive
magmatic intrusions, volcanic conduits or dyke injections which introduce structural heterogeneity on which strain and stress may deviate. Such a possibility is not excluded from the focal plane solutions although they should be accounted for by a uniform regional stress field. We might take another approach and try to attribute anisotropy in places to cracks and faults inherited from previous episodes. These might remain important even if their directions differed from that of the present orientation of horizontal stress since the maximum compressive stress has remained vertical through the different tectonic phases and would not have closed them.
A more likely alternative is in a mixed model. Since the opening and alignment of microcracks by the present stress field is a well-documented cause of shear-wave splitting (Crampin 1978), we consider that one at least of our two directions is due to that. This would be the N40"E direction if we rely on the neotectonic studies of Simeakis (1985) and Mercier, Sore1 & Simeakis (1987), who report a quaternary NW to WNW extension. If on the other hand we seek the most important structural trends, inherited but recently active fault directions, we find that the N-S direction is dominant. This is indicated in Fig. Y(d) where we superimpose all shear-wave polarizations on a map of structural trends on the island (Fytikas et al. 1986). The N-S shear-wave polarization is consistent with a major direction of the faulting observed at the surface since the north and N20"E fracture systems are dominant in the central part of the island. They are considered recent and related to the magmatic processes, and created the plain of Zefiria and the canal of Provatas (Fytikas 1977).
The N40"E direction of anisotropy is observed only around the geothermal area. In this reservoir fluid-filled cracks are likely. This is appropriate for a preferrred orientation of microcracks in the present-day stress field even under a low deviatoric stress. These cracks are expected to be perpendicular to the minimum compressive stress. On the contrary to this observation in the geothermal field, the N-S polarization of the leading shear wave elsewhere would then not be related to this present-day stress field but it is likely related to the direction of local, possibly inherited faulting.
7 S H E A R - W A V E D E L A Y
7.1 Individual examples of variations of shear-wave delays
The time delay between the split shear waves depends on the length of the propagation path in the anisotropic medium, the degree of anisotropy and the direction of the propagation with respect to the anisotropy orientation. The delays between the split shear waves are difficult to identify. Although the onset of the leading shear wave may be easily picked, the corresponding second split shear wave may be preceded by various split shear waves caused at internal interfaces. In the present discussion we use seismograms in which both shear waves have essentially impulsive onsets and arrival of the second shear wave may be reliably picked. They are selected from particle motion diagrams with abrupt changes and read on traces rotated parallel and orthogonal to the fast and slow axis. Estimates of the delay times between the faster and the slower split shear waves are
by guest on July 24, 2016http://gji.oxfordjournals.org/
Dow
nloaded from
Shear-wave anisotropy across the geothermal field of Milos 683
presented for different source locations on the maps of Fig. 9(a, b, c). The mean delay time is about 0.05 s.
Stations 220d, 229d and 29d are only some hundreds of metres apart. The three of them display the same polarization for the leading shear wave. Stations 229d and 29d exhibit the same shear-wave delay, 0.04 s while the third one displays a delay of 0.10 s. The large variation in the time separation of the split shear waves among this group of stations (Fig. 9b) suggests that near-station effects are contributing heavily to these anisotropy effects. A local stronger near-surface anisotropy at 220d may overlie a small deeper crustal anisotropy.
The group of stations 18c, 214c and 216c is situated at the NE of the well (Fig. 9a). The three stations display the same order of splitting, 0.08s (Fig. 8). The station 218 which is at 500m apart and nearer the source displays a smaller shear-wave delay (0.04 s). The time separation of the fast and the slow shear wave does not seem to depend on the distance from the source since we observe the same delay for the stations 18c, 214c and 216c. It would not be acquired at the source depth since in that case we would observe the same delay for the four stations. Therefore it is acquired through the propagation path which seems to be more anisotropic towards the stations lSc, 214c and 216c.
7.2 Distributions of shear-wave delays in relation to the extent of the geothermal reservoir
The vicinity of the well GM3 where station 218 is situated is sampled from different sources at different stations. Strong lateral variations of shear-wave delay can be related to the extent of the geothermal reservoir.
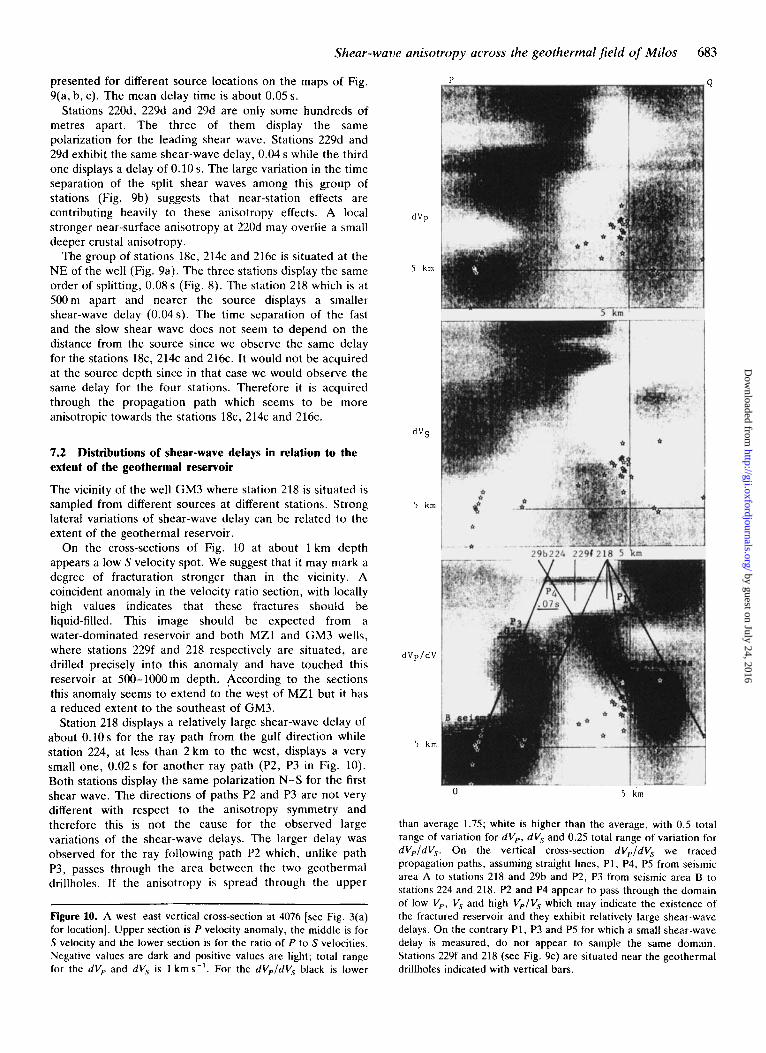
On the cross-sections of Fig. 10 at about 1 km depth appears a low S velocity spot. We suggest that it may mark a degree of fracturation stronger than in the vicinity. A coincident anomaly in the velocity ratio section, with locally high values indicates that these fractures should be liquid-filled. This image should be expected from a water-dominated reservoir and both MZ1 and GM3 wells, where stations 229f and 218 respectively are situated, are drilled precisely into this anomaly and have touched this reservoir at 500-1000 rn depth. According to the sections this anomaly seems to extend to the west of MZ1 but it has a reduced extent to the southeast of GM3.
Station 218 displays a relatively large shear-wave delay of about 0.10s for the ray path from the gulf direction while station 224, at less than 2 km to the west, displays a very small one, 0.02s for another ray path (P2, P3 in Fig. 10). Both stations display the same polarization N-S for the first shear wave. The directions of paths P2 and P3 are not very different with respect to the anisotropy symmetry and therefore this is not the cause for the observed large variations of the shear-wave delays. The larger delay was observed for the ray following path P2 which, unlike path P3, passes through the area between the two geothermal drillholes. If the anisotropy is spread through the upper
Figure 10. A west-east vertical cross-section at 4076 [see Fig. 3(a) for location]. Upper section is P velocity anomaly, the middle is for S velocity and the lower section is for the ratio of P to S velocities. Negative values are dark and positive values are light; total range for the dVp and dV, is 1 k m s - ' . For the dVp/dVs black is lower
d VP
5 km
P
5 km
dVp/dV
5 krn
0 5 i m
Q
than average 1.75; white is higher than the average, with 0.5 total range of variation for dV,, dVy and 0.25 total range of variation for dVJdV,. On the vertical cross-section dV,/dV, we traced propagation paths, assuming straight lines, P1, P4, P5 from seismic area A to stations 218 and 29b and P2, P3 from seismic area B to stations 224 and 218. P2 and P4 appear to pass through the domain of low V,, V, and high V,/V, which may indicate the existence of the fractured reservoir and they exhibit relatively large shear-wave delays. O n the contrary P1, P3 and P5 for which a small shear-wave delay is measured, do not appear to sample the same domain. Stations 229f and 218 (see Fig. 9c) are situated near the geothermal drillholes indicated with vertical bars.
by guest on July 24, 2016http://gji.oxfordjournals.org/
Dow
nloaded from
684 M . Sachpazi and A. H i m
2-3km of propagation then for a shear-wave velocity of 2kms- ' we would have a rapid lateral variation of anisotropy from 2-3 per cent beneath 224 to 6-8 per cent beneath GM3. If the time separation between the fast and the slow shear wave occurs in the vicinity of the drillhole GM3 then a stronger anisotropy of up to 15-20 per cent would occur.
Another observation supports the existence of the anisotropic medium at the west of 218. Stations 218 and 29b for parallel propagation paths coming from the seismic area located a t the east of 218 (P1 and P4 in Fig. 10) display the same polarization but a different shear-wave delay. For P1 it is about 0.04s and for P4 which is the ray path through the reservoir it is about 0.07s. It appears that again the maximum shear-wave delay observed this time at the station 29b instead of 218 is consistent with the passage of the ray path through the region of low V,,, V, and high V,,/V, which probably indicates the existence of a liquid-fractured reservoir.
Finally, the difference of the shear-wave delays observed at station 218, near the drillhole GM3 for two different earthquakes, one beneath the gulf, seismic area B, and the other t o the east of the station, seismic area A, (P1 and P2 in Fig. 10) implies again a highly anisotropic medium to the west of 218. Assuming an anisotropic medium with vertical liquid-filled cracks striking N-S, the propagation path from the source area A has a direction with respect to the strike of the cracks for which a larger shear-wave delay should be observed in comparison to the propagation path P2 (Crampin & Booth 1985). However this is not what is observed since the maximum shear-wave delay is not observed for P1. Therefore again the observed variations of the shear-wave delays are not caused by the difference in the direction of the propagation paths with respect to the anisotropic medium but they are dominated by the localization of a more anisotropic medium to the west of station 218.
CONCLUSIONS
We examined numerous seismograms of local earthquakes recorded over eight months on the island of Milos. The main results may be summarized as follows.
(1) T h e deployment of a tight array of numerous three-component stations allowed the detection and analysis of shear-wave splitting.
(2) T h e fault plane solutions of the local earthquakes are different for different parts of the island. All the focal mechanisms support a dominantly tensional stress regime, but the direction of minimum compression is not well defined, and although local variations of the direction are thought unlikely, they cannot be ruled out.
(3) T h e majority of the polarizations of the first shear-wave strike around the N-S direction which is consistent with the strike of structural trends of faults observed at the surface. Besides this polarization, we observe in the area around the geothermal drillholes a N E polarization for the leading shear wave. This direction suggests a local dominance of cracks induced by the present stress field, determined by neotectonic studies. This shear-wave polarization may be related to the particular
orientations of the cracked reservoir. Large shear-wave differential traveltimes are observed for this area, consistent with the presence of a highly fractured reservoir suggested from the results of the 3-D P - and S-wave velocity.
ACKNOWLEDGMENTS
We thank A. Ferraro, A. Nercessian and J. L. Veinante €or helping with the data analysis, J. and R. Verhille for help with the field work funded by a grant from INSU, and P. Bernard for his continuous interest. We are grateful to reviewers for constructive criticism. MS is supported by a scholarship from the Commission of the European Communities.
REFERENCES
Angelier, J., Cantagrel, J. M. & Vilminot, J. C., 1977. NCotectonique cassante et volcanisme plio-quaternaire dans I'arc CgCen interne. lTle de Milos (Grkce), Bull. SOC. &o/. France, 20, 119-124.
Booth, D. C., Crampin, S. , Evans, R. & Roberts, G., 1985. Shear-wave polarizations near the North Anatolian Fault-I. Evidence for anisotropy-induced shear-wave splitting, Geophys. J . R. astr. S O C . , 83, 61-73.
Crampin, S. . 1978. Seismic wave propagation through a cracked solid: polarization as a possible dilatancy diagnostic, Geophys. J . R. asfr. SOC. , 53, 467-496.
Crampin, S. & Booth, D. C., 1985. Shear-wave polarizations near the North Anatolian Fault-11. Interpretation in terms of crack-induced anisotropy, Geophys. J . R. astr. Soc., 83, 75-92.
Evans, R., 1984. Effects of the free surface on shear wavetrains, Geophys. 1. R. astr. SOC., 76, 165-172.
Fytikas, M., 1977. Geology and Geothermal research in the island of Milos, PhD thesis, University of Thessaloniki.
Fytikas, M., 1989. Updating of the geological and geothermal research on Milos island, Geothermics, 18, 497-505.
Fytikas, M., Garnish, J . D., Hutton, V. R. S. , Staroste, E. & Wohlenberg, J . , 1989. An integrated model for the geothermal field of Milos from geophysical experiments, Geotherrnics, 18,
Fytikas, M., Innocenti, F., Kolios, N., Manetti, P., Mazzuoli, R., Poli, C., Rita, F. & Villari, L., 1986. Volcanology and Petrology of volcanic products from the island of Milos and neighbouring islets, J . Volcanol. Geothermal Res., 28, 297-317.
Him, A,, Sachpazi, M. & Nercessian, A, , 1989. Elements for a model of the geothermal field of Milos from seismological data, Geothermics, 18, 579-595.
Jackson, J. & McKenzie, D., 1988. The relationship between plate motions and seismic moment tensors and the rate of active deformation in the Mediterranean and the Middle East, Geophys. J . R. astr. SOC., 93, 45-73.
Kaneshima, S. , Ito, H. & Sugihara, M., 1988. Shear-wave splitting observed above small earthquakes in a geothermal area of Japan, Geophys. J . R. astr. SOC., 93, 399-411.
Le Pichon, X. & Angelier, J., 1981. The Aegean Sea, Phil. Trans. R. SOC. Lond., A, 300, 357-372.
McKenzie, D. P., 1969. The relation between fault plane solutions for earthquakes and the directions of the principal stresses, Bull. seisrn. SOC. Am., 59, 591.
Mercier, J . L., Sorel, D. & Simeakis, K., 1987. Changes in the state of stress in the overriding plate of a subduction zone: the Aegean Arc from the Pliocene to the Present, Ann. Tectonicae,
Peacock, S. , Crampin, S. & Booth, D. C., 1988. Shear-wave
61 1-623.
1, 20-39.
by guest on July 24, 2016http://gji.oxfordjournals.org/
Dow
nloaded from
Shear-wave anisotropy across the geothermal field of Milos 685
splitting in the Anza seismic gap, Southern California: Caldera, California, 1979- 1988, J . geophys. Res. , 95,
93, 3339-3356. Simeakis, C. , 1985. Neotectonic evolution of the Milos island complex, IGME Report, Institute of Geology and Mineral
anisotropy and stress direction in and near Long Valley Exploration, Athens (in Greek).
Temporal variations as possible precursors, J . geophys. Res., 11 165-11 177.
Savage, M. K., Peppin, A. W. & Vetter, R. U. , 1990. Shear wave
by guest on July 24, 2016http://gji.oxfordjournals.org/
Dow
nloaded from
by guest on July 24, 2016http://gji.oxfordjournals.org/
Dow
nloaded from