
Geothermal Power Generation Project: Environmental Monitoring ...
Upload
khangminh22Category
view
0download
0
GEOTHERMAL ENERGY AS A SOURCE OF ELECTRICITY
A Worldwide Survey of the Design and Operation of Geothermal Power Plants i;
Profeaaolt of Mechanical Engineering Southeastern Massachusetts University North Dartmouth, Massachusetts 02747
and
Brown 'University Providence, Rhode Island 02912
Published January 1980
Prepared under the sponsorship of the
U.S. DEPBRTMENT OF ENERGY Bssistant Secretary for Resource Applications
Division of Geothermal Energy Washington, D.C. 20585
Under Omtract No. A80!+?6E"28820
Adjulnct Professor of Eng&wering (Rese

DISCLAIMER
This report was prepared as an account of work sponsored by an agency of the United States Government. Neither the United States Government nor any agency Thereof, nor any of their employees, makes any warranty, express or implied, or assumes any legal liability or responsibility for the accuracy, completeness, or usefulness of any information, apparatus, product, or process disclosed, or represents that its use would not infringe privately owned rights. Reference herein to any specific commercial product, process, or service by trade name, trademark, manufacturer, or otherwise does not necessarily constitute or imply its endorsement, recommendation, or favoring by the United States Government or any agency thereof. The views and opinions of authors expressed herein do not necessarily state or reflect those of the United States Government or any agency thereof.

DISCLAIMER Portions of this document may be illegible in electronic image products. Images are produced from the best available original document.
j
NOTICE
This report was prepared as an account of work sponsored by the United States Government. Neither the United States nor the United States Department of Energy, nor any of their employees, makes any warranty, express or implied, or assumes any legal liability or re- sponsibility for the accuracy, completeness, or usefulness of any information,. apparatus, product, or process disclosed, or represents that its use would not infringe privately owned rights. Reference herein to any specific commercial product, process, or service by trade name, mark, manufacturer, or otherwise, does not necessarily consti- tute or imply its endorsement, recommendation, or favoring by the United States Government or any agency thereof. The views and opin- ions of authors expressed herein do not necessarily state or reflect those of the United States Government or any agency thereof.

Preface
GE- ENERGY may not be destined to play a major role in solving the contemporary, cataclysmic energy crisis but it is sure to make a con- tribution. Just what percentage of this country’s, or the world’s needs for electricity will be covered from geothermal resources remains to be seen. The potential, however, is very encouraging. For example, the most recent summary by the United States Geological Survey contained in its Circular 790 estimates a potential of 21,000 MW of electrical output for thirty years from the already identified, hot-water, hydrothermal convection systems having temperatures exceeding 15OoC (802OF)’ in the United States alone. The installed capacity in the whole world is now at a level of 1750 MW electrical, and growing.
lear, cannot be ordered: it must be developed, for there is nothing more hazardous than a premature order for conversion equipment. A hydrcithermal field must be discovered. explored, tested and developed. At some point in this process it becomes possible to specify the characteristics of the conversion plant with good assurance of success, and to order the first set of turbines. There follows a long period of continuing development during which more and more electric capacity (up to a maximum limit) can be added. Thus, even though there are financial risks-as with any potentially profitable en terpr i se these can be held to a minimum by cooperation between geologists and mechanical engineers. To this day it is not possible t
or which, aquifers are renew assumed in U.S.G.S. Circular 790, geothermal energy like oil. One way or another, it is, nevertheless, possible to say that geothermal energy is here now, that it is waiting to be more fully exploited, and that it is sure to play a part in the elimination of our plight.
s part of an effortsundertaken on behalf of the Division of Geothermal Energy of the Department of Energy, and under the overall management imaginatively performed by Mr. Clifton B. McFarland, the team at Brown University has undertaken the task of editing a Sourcebook on the Pro- duction of Elect&ty from Beothemal Emrgy which is scheduled to appear at about the same time as this volume. It was thought useful to provide the Sourcebook with a companion compendium which would con-
Geothermal electricity, unlike fossil or
iif
tain in it a snapshot picture of all existing geothermal, electricity-pro- ducing installations in the world. This task was undertaken and imagina- tively completed by my former student and now colleague, Professor Ronald DiPippo. He was able to assemble a vast set of documents de- scribing geothermal installations, and to digest and organize them for the reader’s easy access and use. Much of the information reported in thk volume was ubtained from direct conversations with equipment manufac- turers, plant engineers, and utility managers during site Visits to several installations. Both he and I: believe that the resulting survey is Bssentially complete and accurate as of July 1979.
viable, and that its commercial risks are no different from those associated Work on this survey teaches that electricity from geothermal resources is LJ
with the established and more familiar technologies. Geothermal power has proved beneficial for a number of countries, and will play a particularly important role in such developing countries as El Salvador and the Philip- pina, primarily because of its simplicity of construction, operation, and maintenance. It has demonstrated the ability to achieve capacity factors (ratio of kilowatt-hours produced per annum to the maximum possible) exceeding 80%. The comparable figure for fossil plants is only about 50%. In those applications, geothermal power has proved to be economical, and clearly less expensive than htallatioys using oil, coal or nuclear fuel. As might have been expected, the 1750 M W now in use in the world have
exploited the “easy” reservoirs in that roughly 60% of it is supplied with dry steam. The lowest temperature exploited at the wellhead is 190°C, and there are no commercial binary-fluid installakions as yet (except for the 11 MW plant at East Mesa, California, now under construction). In short, further expansion must reckon with somewhat more challenging condi- tions for exploitation. Them include mastery of low to moderate tempera- tures, avoidance of scaling and corrosion, and an ability to maintain a guaranteed flow of working fluid in an expanding installation. It appears that the development of binary-fluid plants will be essential to achieve these goals and to realize the potential that geothermal energy holds out to us.
Professor DiPippo and I h o p that the present survey will have broad appeal, particularly among energy planners. This book should convince them that geothermal electric power generation is already very important in some parts of the world, that the unrealized potential of geothermal energy should be recognized, and that it must constitute an integral part of my plan to solve the energy problems facing the United States.
J. Ihsm Principal Project Investiga-tor.
duly 1979 PrOSidenOe, R.1.

Acknowledgements THE AUTHOR IS mmi? to many people who have helped in the process of accumulating the vast amount of information in this volume. While I cannot name all of those who helped, special thanks must be extended to the following individuals : K. Aikawa, Mitsubishi Heavy Industries, Ltd. ; D. N. Anderson, Geothermal Resources Council; J. H. Barkman, Republic u. Qeothermal, Inc; R. S. Bolton, Ministry of Works and Development, New Zealand; B. J. Cossette, Pacific Gas and Electric Company; G. CuBllar, Comisi6n E jecutiva Hidroel6ctricia d01 Rio Lempa (CEL) , El Salvador ; E Danno, Mitmbishi Heavy Industries, Ltd.; J. H. Eskesen, General Electric Company ; J. P. Finney, Pacific Gas and Electric Company ; T. C. Hinrichs, Imperial Magma ; T. Kobori, Nissho-Iwai h e n c a n Corpo- ration; J. T. Kuwada, Rogers Engineering Company, Inc.; N. C. Mc- Leod, Ministry of Works and Development, New Zealand; H. Nakamura, Japan Metals & Chemicals Co., Ltd.; R. H. Sheehan, World Bank; B. Tanaka, Mitsubishi International Corporation.
The bulk of the writing was done during a sabbatical leave from South- eastern Massachusetts University, North Dartmouth (July 1977-August 1978). The author wishes to acknowledge the excellent technical support of the Division of Engineering staff at Brown University, especially the secretarial assistance of Mrs. Leslie A. Giacin, and the work of the Draft- ing Department headed by Mrs. Eleanor E. Tartaglia, including Mrs. Muriel S. Anderson, Mrs. Mildred L. Brown, and Michael L. Waldygo.
Clifton B. McFarland, Division of Qeothermal Energy, Department Energy, provided encouragement and support throughout the project,
which was funded under contract No. 8502-76ET28230 to Brown University. I wish to acknowledge, with warmest gratitude, Dr. Joseph Kestin,
Professor bf Engineering at Brown University and Principal Investiga- tar on this project. It was he who first reveaIed to me the mysteries of thermodyliamics and offered guidance and encouragement during my grad-
am grateful to my wife. Lois, and my children, Debora, John , for their patience and understanding during the writing of
s book, and to all those who have provided me with encouragement and inspiration. Ju2y 18,1@7$ Bawhgtun, RJ.
RONALD DIPIPPO
V


I
Contents Pase
Preface
Acknowledgements
Chapter 1 . Overview of Geothermal Power Generation 1.1 General nature of geothermal resources . . . . . . . . . . . . . . . .
1.1.1 Normal-gradient regions ....................... 1.1.2 Radiogenic regions ............................ 1.1.3 High heat flow areas ........................... 1.1.4 Geopressured resources ........................ 1.1.5 Point heat sources .............................
. 1.2 Historical evolution of geothermal power technology. . . . . 1.3 Energy conversion systems ...........................
1.3.1 Dry (or superheated) steam plants . . . . . . . . . . . . . . 1.3.2 Separatedateam (or “single-flash”) plants . . . . . . . . 1.3.3 Separated-steam/hot-water-flash (or “double-
flash”) plants ............................... 1.3.4 Separatedsteam/multiple-flash (or “multiflash”)
plants ..................................... 1.3.6 Single-flash plants with pumped wells., . . . . . . . . . . 1.3.6 Double-flash plants with pumped wells ........... 1.3.7 Binary cycle plants ............................ 1.3.8 Combined flashbinary plants ................... 1.3.9 Hybrid fossil/geothermal plants . . . . . . . . . . . . . . . . . 1.3.10 Total flow systems . ..........................
. 1.4 Power plant performance fact . . . . . . . . . 1.4.1 Operating factors . . . . 1.4.2 Reliability factors .............................
. 1.5 Summary of present and planned geothermal power plants . References ...................................
Chapter 2 . China .
. 2.1 Overview ... .....................
. . . . . . . . . . . . . . . . . . . . . . . . . . . . 2.2.2 Energy convefsion system ...................... Plans for the future . . . . . . . . . . . . . . . . . . . . . . . . . . . . . . . . . .
\
w . . . . . . . . . . . . .......
2.3 References . .. .......................................
v i i
iii V
1 3 3 4 4 5 8 9
10 11
13
13 14 14 14 17 17 18 18 18 19 19 24
27 27
. 27 28 28 30

viii CORTENTB
Chapter 3 . El Salvador
3.1 Overview ........................................... 3.2 Ahuachapin ........................................
3.2.1 Geology ..................................... Well programs and gathering system . . . . . . . . . . . .
Energy conversions systems for Units 1 ahd 2 . . . . Proposed energy conversion system for Unit 3 .....
Effluent and emissions handling system . . . . . . . . . .
3.2.2 3.2.3 Geofluid characteristics ........................ 3.2.4 3.2.5 3.2.6 Auxiliary turbogenerator unit. . . . . . . . . . . . . . . . . . . 3.2.7 Construction materials ........................ 3.2.8 3.2.9 Economic factors .............................. 3.2.10 Operating experience .......................... Geothermal areas under exploration . . . . . . . . . . . . . . . . . . . 3.3.1 Berlfn ....................................... 3.3.2 Chinameca ................................... 3.3.3 San Vicente .................................. 3.3.4 Chipilapa .................................... References . . . . . . . . . . . . . . . . . . . . . . . . . . . . . . . . . . . . . . . . .
3.3
Chapter 4 . Iceland
4.1 Geological features of Icelandic geotheimal regions . . . . . . . 4.2 Nimafjall ..........................................
4.2.1 Well programs and gathering system . . . . . . . . . . . . 4.2.2 Geofluid characteristics ........................ 4.2.3 Energy conversion system ...................... 4.2.4 Economic data and operating experience . . . . . . . . .
4.3 Krafla . . . . . . . . . . . . . . . . . . . . . . . . . . . . . . . . . . . . . . . . . . . . .
4.3.2 Well programs ................................ 4.3.3 Energy conversion system ...................... 4.3.4 Economic data ................................ 4.3.5 Operating experience ..........................
4.4 Svartsengi .......................................... References . . . . . . . . . . . . . . . . . . . . . . . . . . . . . . . . . . . . . . . . .
4.3.1 Planning .....................................
Chapter 6 . Italy
.
5.1 Historical use of geothermal energy in Italy ............ 5.2 Boraciferous region (Larderello) .......................
5.2.1 Geology and exploration techniques . . . . . . . . . . . . . 5.2.2 Well programs and gathering system .............
5.2.2.1 Drilling of wells ....................... 5.2.2.2 Well casings and cementing operations ... 5.2.2.3 Design of wellhead equipment . . . . . . . . . . 5.2.2.4 Steam pipelines .......................
31 31 >
34 34 36 45 48 52
:; &d 56 55 59 60 60 60 60 61
63 65 65 67 67 67 68 68 69 72 73 73 75 75
L; 77 77 77 79 80
' 81 82 84

OOI?l"TB ix'
Chapter 5 . Italy-Continned
6.2 Boraciferous region-continued Pwe
6.2.4 Energy conversion systems ..................... 87 6.2.4.1 Condensing units ...................... 90 5.2.4.2 Noncondensing units . . . . . . . . . . . . . . . . . . 96
6.2.5 Construction materials . . . . . . . . . . . . . . . . . . . . . . . . 106 5.2.6 Effluent and emissions handling systems . . . . . . . . . 106 6.2.7 Economic factors. ............................ 106 6.2.8 Operating experience .......................... 107
6.3, Monte Amiata ...................................... 109 6.3.1 Geology ..................................... 109 6.3.2 Geofluid characteristics ........................ 109 5.3.3 Energy conversion systems .................... 111
5.4 !havale ............................................ 116 6.4.1 Geology . . . . . . . . . . . . . . . . . . . . . . . . . . . . . . . . . . . . . 116 6.4.2 Well programs ................................ 116 5.4.3 Energy conversion systems ..................... 116
References ..................................... 118
5.2.3 Geofluid characteristics . . . . . . . . . . . . . . . . /. . . . . . . . 84
Chapter 6 . Japan 6.1 Overview ........................................... 121 6.2' Matsukawa., ....................................... 121
6.2.1 Geology and exploration ....................... 123 6.2.2 Steam gathering system ........................ 123 6.2.3 Energy conversion system. ..................... 126 6.2.4 Environmental effects and co-utilizati 6.2.6 Economic factors .................. 6.2.6 Operating experience ..............
6.3 Otake ............................................... 133 6.3.1 Geology and exploration ........ . . . . . . . . . . . . 133 6.3.2 Well programs and gathering system . . . . . . . . . . . . 133 6.3.3 Energy conversion system ...................... 136 6.3.4 Construction materials ....... 6.3.5 Environmental effects and co-u 6.3.6 Economic and operating data ..
. 6.4 Onuma ........................... . . . . . . . . 144 6.4.1 Geology and explorati 6.4.2 Well programs ....... ................. 145 6.4.3 Energy conversion system ...................... 146 6.4.4 Operating experience and co-utilization . . . . . . . . . . 147
6.6 Odcobe .... ....................................... 148 6.5.1 Geology and exploration ....................... 148 6.6.2 Wells and productivity ........................ 160 6.5.3 Energy conversion system ...................... 151

!
I X OOXTE1pTS
Chapter 6 . Japan-Continued
6.5 Onikobe-Continued 6.5.4 Environmental effects ......................... 6.5.5 Operating experience ..........................
6.6 Hatchob aru . . . . . . . . . . . . . . . . . . . . . . . . . . . . . . . . . . . . . . . . 6.6.1 Geology and exploration ........................ 6.6.2 Well programs and two-phase fluid transmission
system .................................... 6.6.3 Energy conversion system ...................... 6.6.4 Environmental effects and co-utilization . . . . . . . . . 6.6.5 Economic data ............................... 6.6.6 Operating experience ..........................
6.7 Kdtkonda (Takinoue) ............................... 6.7.1 Geology and exploration ....................... 6.7.2 Well programs and productivity . . . . . . . . . . . . . . . . 6.7.3 Energy conversion system ...................... 6.7.4 Economic data . . . . . . . . . . . . . . . . . . . . . . . . . . . . . . .
6.8 Pilot binary plant a t Otake ........................... 6.8.1 Nature of the geothermal fluid . . . . . . . . . . . . . . . . . . 6.8.2 Energy conversion system ......................
6.9 Pilot binary plant at Mori (Nigorikawa) . . . . . . . . . . . . . . . . 6.10 Other promising areas in Japan .......................
References ..........................................
6.7.5 Operating experience ..........................
Page 163 154 154 154
156 158
165 165 166 166 166 170 170 170 172 173, 173 176 178 178
164 (&;
Chapter 7 . Mexico
7.1 General remarks . . . . . . . . . . . . . . . . . . . . . . . . . . . . . . . . . . . . 7.2 Path6 . . . . . . . . . . . . . . . . . . . . . . . . . . . . . . . . . . . . . . . . . . . . . . 7.3 Cerro Prieto ........................................
7.3.1 Geology ..................................... 7.3.2 Well programs and gathering system . . . . . . . . . . . . 7.3.3 Geofluid characteristics ........................ 7.3.4 Energy conservation system . . . . . . . . . . . . . . . . . . . . 7.3.5 Construction materials ......................... 7.3.6 Effluent and emissions handling systems . . . . . . . . . 7.3.7 Economic factors .............................
7.3.9 Expansion of Cerro Prieto plant . . . . . . . . . . . . . . . . 7.4 Potential geothermal sites in Mexico . . . . . . . . . . . . . . . . . . .
7.4.1 Ixtlttn de 10s Hervores ......................... 7.4.2 Los Negritos ................................. 7.4.3 Los Azufres ..................... . . . . . . . . . . . . 7.4.4 La Primavera ................................ 7.4.6 SanMarcos .................................. References .........................................
7.3.8 Operating experience ..........................
181 181 182 182 185 188 195 200
204 204 205 205 205 206 206 206 206

Chapter 8 . New Zealand . . 8.1 Overview ........................................... 8.2 Wairakei ...........................................
8.2.1 Geology ..................................... 8.2.2 Steam wells and gathering system . . . . . . . . . . . . . . . 8.2.3 Energy conversion system ...................... 8.2.4 Construction materials . . . . . . . . . . . . . . . . . . . . . . . . . 8.2.5 Environmental effects . . . . . . . t . . . . . . . . . . . . . . . . . 8.2.6 Economic factors .............................. 8.2.7 Operating experience ..........................
8.3 Kaprerau ........................................... 8.3.1 Geology . . . . . . . . . . . . . . . . . . . . . . . . . . . . . . . . . . . . . 8.3.2 Steam wells and gathering system . . . . . . . . . . . . . . 8.3.3 Energy conversion system ................... 4 . . 8.3.4 Environmental considerations and future plans . . .
8.4 Ohaki (Broadlands) . . . . . . . . . . . . . . . . . . . . . . . . . . . . . . . . . 8.4.1 GeoIogy ..................................... 8.4.2 Well programs and productivity . . . . . . . . . . . . . . . . 8.4.3 Energy conversion system ...................... 8.4.4 Anticipated environmental effects . . . . . . . . . . . . . . .
8.5 Other geothermal areas in New Zealand ................ References . . . . . . . ................................
Chapter 9 . Philippines
xi
Page
209 209 209 218 221 229 230 239 240 243 243 246 247 248 249 249 252 256 257 262 262
.
9.1 Outlook ............................................ 265 9.2 Tiwi ............................................... 266
9.2.1 Geology and exploration .... ................ 265 9.2.2 Energy conversion system ... . . . . . . . . . . . . . . . . 268
9.3 Makiling Banahaw &os BaA ..................... 268 9.3.1 Steamwells . . . . . . . . . .................... 268
ion systems ..................... 269 9.4 Leyte (Tongon . . . . . . . . . . . . . . 269 9.5 Other khilippine meas with potential . . . . . . 269
..................................... 272
Chapter .
10.1 Introduction .......................... . . . . . . . . . . . 273 10.2 Kmldere ..................... ....). ............... 273 10.3 Exploration activities ........... ................... 276
References .......................................... 276
Chapter 11 . Union of Soviet SociaIist Bepnblics 11.1 Overview . . . . . . . . . . . . . . . . . . . . . . . . . . . . . . . . . . . . . . . . . . 277 11.2 Pauzhetka .......................................... 277
..

xif OOHTEHTS
Chapter 11 . Union of Soviet Socialist Republics-Continued
11.2 Pauzhetka-Continued 11.2.1 Geofluid characteristics ....................... 11.2.2 Energy conversion system .....................
11.3 Paratunka . . . . . . . . . . . . . . . . . . . . . . . : ................. 11.3.1 Objectives .................................. 11 3.2 Geofluid characteristics ....................... 11.3.3 Energy cobversion system .....................
11.4 Bolshoye-Bannoye ................................... Potential Soviet geothermal power plants . . . . . . . . . . . . . . 11.5
11.6 Future use of geothermal energy in the Soviet Union . . . . References .........................................
I I Chapter 12 . United States
12.1 12.2
i
i 1
12.3
12.4
12.5 12.6 12.7 12.8
12.9
Historical background ............................... The Geysers, Sonoma and Lake Counties, Caliornia ..... 12.2.1 Geology and exploration. ..................... 12.2.2 Steam wells and gathering system . . . . . . . . . . . . . . 12.2.3 Energy conversion systems .................... 12.2.4 Construction materials ........................ 12.2.5 Effluent and emissions handling systems . . . . . . . . 12.2.6 Economic data ............................... 12.2.7 Operating experience ......................... Magmamax dual binary plant a t East Mesa, Calif ....... 12.3.1 Geology and exploration ...................... 12.3.2 Well programs ............................... 12.3.3 Energy conversion system ..................... Republic Geothermal a t East Mesa, Calif . . . . . . . . . . . . . . 12.4.1 Setting ..................................... 12.4.2 Well programs and productivity . . . . . . . . . . . . . . . 12.4.3 Energy conversion system ..................... Southern California Edison/Union Oil at Brawley, Calif . . Double-boiling binary plant a t Raft River, Idaho ....... Hawaii geothermal project at Puna, Hawaii . . . . . . . . . . . . Flash-steam demonstration plant at Vdes Caldera, N .
Mexico .......................................... Potential growth of geothermal power in the United
States ........................................... 12.9.1 Imperial Vdey, California . . . . . . . . . . . . . . . . . . . . 12.9.2 Western United States ....................... 12.9.3 Gulf Coast 12.9.4 East Coast .................................. 12.9.5 Summary ...................................
. . . . . . . . . . . . . . . . . . . . . . . . . . . . . . . . . .
References ..........................................
Page 278 278 281 281 282 282 284 288
289 288
291 293 293 295 297 315 317 320 325 326 326 332 332 333 333 334 335 335 335 338
339
340 340 343 347 348 349 349

OOXTERTS xiii
Chapter 13 . Countries Planning Geothermal Power Plants 13.1 Overall survey ....................................... 13.2 Azores (Portugal) ................................... 13.3 Chile ..... 13.4 Costa Rica 13.5 Guatemala 13.6 Honduras . 13.7 Indonesia .
........................................
. . . . . . . . . . . . . . . . . . . . . . . . . . . . . . . . . . . . . . . .
. . . . . . . . . . . . . . . . . . . . . . . . . . . . . . . . . . . . . . . .
. . . . . . . . . . . . . . . . . . . . . . . . . . . . . . . . . . . . . . . .
. . . . . . . . . . . . . . . . . . . . . . . . . . . . . . . . . . . . . . . .
. . . . . . . . . . . . . . . . . . . . . . . . . . . . . . . . . . . . . . . . .... d - . . . . 13.9 Nicaragua ........................................... 13.10 Panama .............................................
References . . . . . . . . . . . . . . . . . . . . . . . . . . . . . . . . . . . . . . . . .
Index
Page
355 355 355 356 356 357 357 360 361 361 361
363

U
CHAPTER 1 OVERVIEW OF GEOTHERMAL POWER
GENERATION
THE QE-L ENERGY stored within the interior of the earth amounts to a vast quantity which, if fully exploited, could supply the energy needs of man for millennia. I f one considers the United States, for example, and hcludes only those geothermal resources with temperatures greater than 15OOC (30O0F), it has been estimated that about 450 million kilowatts (kW) could be generated. Thiais only slightly less than the total installed electric generating capacity of the country from all energy sources [EPRI, 19771.
Tho main difficulty in putting this enormous energy resource to use lies in its diffuse nature. Over the course of a year about 4XlW kilojoules (kJ) or 100 billion megawatt-hours of heat energy is conducted to the sur- face from the interior of the earth [Bowen and Groh, 10771. This is about twenty times the electric energy used by the entire world.
The rest of this chapter will present a short description of the various types of geothermal energy resources, a historical account of geothermal energy usage, a survey of geothermal energy conversion technology along with a clarification of terms used to characterize the operations and relia- bility of central power stations and, finally, a summary of current PO-
theFmal power plants and those planned for the near future.
General nature of geothermal resourc ven though the quantity of’heat rea e surface of the earth
al, it is distributdd more or less evenly over nearly the entire sur- face, resulting in a heat flux of only about 63 milliwatts per square meter, 0.063 W/m2. Were it not for the fact that there are a number of regions where anomalously large geothermal heat fluxes occur, it is unlikely that geothermal energy would be practical means of supplying electrical energy,
These anomalous regions cide with the boundaries of the tectonic plates that comprise the earth’s crust. Figure 1.1. shows the major plates and their associated boundaries. These may be of the ridge, tram- form, or subduction type. It is clear that vulcanism and seismic activity are abundant along these boundaries and in the areas adjacent to them. Not
1

. ._"I I.. ..............."I._ . . . "".I ... " " " ,
F'XCNJRE 1s-Plate tectonics. Lithosphere or crust eomista of many large plates in relative motion. Boundaries are of three typea: ridge mea (platea diverging) ; transforma (platea sliding) ; subduction sonea (platea converging, with one diving beneath the other).

4 1.11 QENEEAL NATURE OF QEOl'HEBMAL BEBOUBaEB 8
surprisingly, the most favorable regions for the exploitation of geothermal energy are characterized by volcanic and earthquake activity.
Geuthermal energy resources may be classified into five categories : (1) normal-gradient, (2) radiogenic, (3) high heat flow areas, (4) geopres- sured, and ( 5 ) point heat sources. The first three are of relatively low practical value at the level of present-day technology, the fourth holds considerable promise, particularly in the Gulf Coast region of the United States, and the last is already being exploited for electric power in a num- ber of countries around the world.
1.l.l N&-gradht regions
In normal regions, i.e., areas outside the anomalous zones near plate boundaries, the temperature gradient in the crust averages about 2.5OC/ 100 m ( 1 . 4 O F / l O O ft). I f one sets a temperature of 15OOC (300OF) as the minimum for feasible electric power generation, one must drill to a depth of about 5000 m (16,400 ft) before encountering temperatures as high as this. Irrespective of the detailed nature of the resource, it is uneconomical at present to attempt to exploit such geothermal systems.
Nevertheless there is a program underway aimed at the development of techniques to fracture hot but dry rock formations, and to introduce water from the surface into the factures in order to extract the thermal energy from the rocks. The Los Alamos Scientific Laboratory has demon- strated that such a scheme is technically feasible [Pettitt, 19783. It is conceivable that continued success in the development of hot dry rock technology will eventually oien up many regions where geothermal energy is not now practical or economical.
land surface of the earth has as its origin the radioactive decay of a number of elements contained within the crust [Bullard, 1973). The principal ones are uranium (U), thorium (Th), and potassium (K). Granite is one of the main constituents of the crust and contains about 3.4% K, 20 parts per million (ppm) Th, and 4.7 ppm U. The energy flow rate caused by radioactivity in granite amounts to about one-billionth of a watt per kilogram of granite (10- W/kg) . fn regions with above-average concentrations of granite, i.e., the White
Mountains of New Hampshire in the United States, there will be a stronger geothermal energy heat flux. However, this energy is quite diffuse and a suitable medium may not be readily available to permit its large-scale extraction. "hat is, there may not be sufficient permeability in the granite to allow for circulation of water, or water may not be present at all.
,

4 OVEBVIEW [Ch. 1
1.13 nigh heat flow areas
Heat transfer through the earth’s crust takes place by means of con- duction when there are no subterranean water reservoirs. In such cases the heat flow rate is proportional to the thermal conductivity of the rock and the temperature gradient. In some areas where abnormally low thermal conductivities are found in combination with high heat flows, very high thermal gradients will exist. As a consequence relatively shallow wells should be able to encounter high-temperature sources. This situation exists, for example, in the Hungarian Basin where thermal gradients range from 40° to 75OC/km ( 2 . 2 O to 4.l0F/1O0 ft), or as much as three times the normal gradient [Boldizdr, 19701. Such high heat flow areas may be associated with regions in which the crust is abnormally thin, thus allow- ing the mantle to come into closer proximity to the surface, or in which a large, deep-seated magma chamber is enclosed within the earth’s crust. From a practical point of view resources of this type have not proved feasible for electric power production because of the diffuse nature of the energy contained in them.
1.14 Geopressured re8ources
There are many basins that have been formed by the steady deposition of sedimentary rocks containing within their pores fluids at pressures in excess of the normal hydrostatic pressure. When the vertical pressure gradient exceeds about 10.5 kPa/m (0.465 lbf/in2 ft), the energy con- tained within such reservoirs is called geopressured-geothermal energy [Wallace et al., 19781. Normal hydrostatic pressure gradient is 9.78 kPa/m (0.433 lbf/in2 - ft). The attractiveness of this form of resource lies in the fact that three types of energy may be extracted: hydraulic energy (by virtue of the high pressure), thermal energy (by virtue of the high tem- perature), and fossil energy (by virtue of dissolved methane gas).
Several questions must be answered satisfactorily, however, before the exploitation of geopressured-geothermal energy will take place on an economically sound basis. These relate to the temperature of the pore fluid (it must be sufsciently high), to the quantity of dissolved methane present (it must be enough to justify its extraction at current gas prices), to the thickness and permeability of the sand zone (it must be sufficiently large and fractured to allow large volumes of fluid to circulate), and to the fault-bounded nature of the zone (it must be bounded by faults but not excessively fractured). Of even greater importance, since these regions are usually associated with coastal areas, is the possibility of signscant land subsidence resulting from the withdrawal of large quantities of high-pres- sure fluid and the consequent flooding of low-lying coastal plains. Rein- jection of waste liquid may alleviate this problem to some extent.
In the United States, the Gulf Coast of Texas and huisiana is cur- rently being explored with deep wells, although eo power plants have
j 1.11 QE- NATUBE OS’ QEOTEEBMAL BEBOUBOES 6
been built to utilize this potentially huge source of energy. Additional details on geopressured resources are given in section 12.9.4.
l.l.6 Point iLeat amrcea
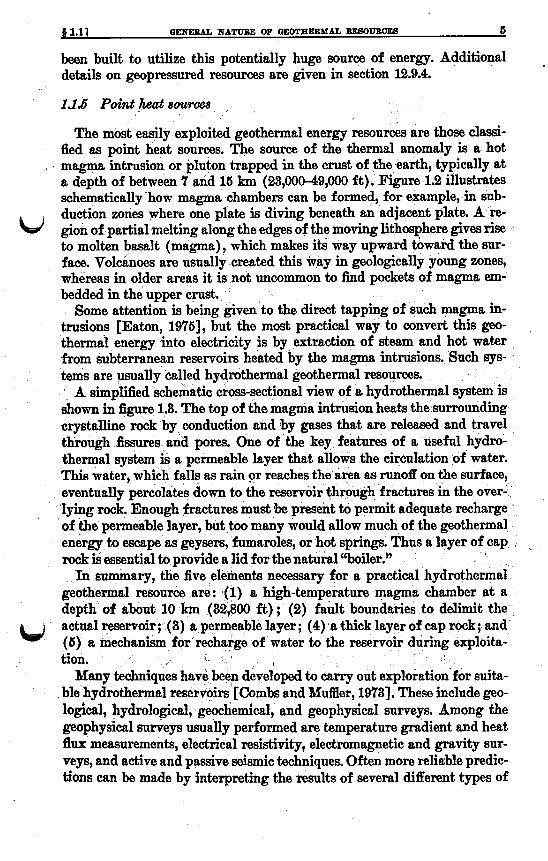
The most easily exploited geothermal energy resources are those classi- fied as point heat sources. The source of the thermal anomaly is a hot
. magma intrusion or pluton trapped in the crust of the earth, typically at a depth of between 7 and 15 km (23,000-49,000 ft). Figure 1.2 illustrates schematically how magma chambers can be formed, for example, in sub- duction zones where one plate is diving beneath an adjacent plate. A re- gion of partial melting along the edges of the moving lithosphere gives rise to molten basalt (magma), which makes its way upward toward the sur- face. Volcitnoes are usually created this way in geologically young zones, whereas in older areas i t is not uncommon to find pockets of magma em- bedded in the upper crust.
Some attention is being given to the direct tapping of such magma in- trusions [Eaton, 19751, but the most practical way to convert this geo- thermal energy into electricity is by extraction of StSam and hot water from subterranean reservoirs heated by the magma intrusions. Such 8ys- tems are usually called hydrothermal geothermal resources.
A simplified schematic cross-sectional view of a hydrothermal system is shown in figure 1.8. The top of the magma intrusion heats the surrounding crystalline rock by conduction and by gases that are released and travel through fissures and pores. One of the key features of a useful hydro- thermal system is a permeable layer that allows the circulation of water. This water, which falls as rain or reaches the area as runoff on the surface, eventually percolates down to the reservoir through fractures in the over- lying rock. Enough fractures must ;be present to permit adequate recharge of the permeable layer, but too many would allow much of the geothermal energy to escape as geysers, fumaroles, or hot springs. rock is essential to provide a lid for the natural “boiler.”
In summary, the five elements necessary for a pr geothermal resource are: (1) a high-temperature magma chamber at a depth of about 10 fnn (82,800 ft); (2) fault boundaries to delimit the actual reservoir; (8) a permeable layer; (4) .a thick layer of cap rock; and (5) a mechanism for tion.
ble hydrothermal reservoirs [Combs and Muffler, 19781. These include geo- logical, hydrological, geochemical, and geophysical surveys. Among the geophysical surveys usually performed are temperature gradient and heat flux measurements, electrical resistivity, electromagnetic and gravity sur- veys, and active and passive seismic techniques. Often more reliable predic- tions can be made by interpreting the results of several different types of
t*,
arge of water to the reservoir duri
Many techniques have been developed to carry out explora

.i ~-.-.---._I ~. . , ...... I ,., . . . , , ... ,. ... .... I. .~.., 1 , ~ ....... . . , .- .. .... ..... ...__.. ".".. ...
- LITHOSPHERE (RIGID M A T T E R )
L ITHOSPHERE
(VISCOUS MATTER)
FIQURE 1.2-Subduction zone. Diving plate forms zone of partial melting, giving rise to molten basalt. Young regions are highly volcanic; other regions may contain magma intrusions.

4 1.11 QEHEBAL NATURE OF QEOTEEBMAL BESOUBOEE I
- W
- -
major dements: magma intrusion, porous layer, impermeable cap rock, fractures, and recharge mechanism.
surveys, since there are times when indications from a particular technique may ,h misleading [Meidav and Tonani, 19751.
the end, it will be necessary to drill exploratory wells to determine the precise nature of the resource. Depending on the relative amount of steam and hot water produced at the surface, hydrothermal systems arc usually classified tis follows : (1) dry steaiii (sattirated or slightly superheated water vapor), (2) vapor-dominated (high percentage of water vapor with relatively small amounts of liquid), or (23) liquid-dominattod (high per- centage of liquid with relatively little steam).
The fluids produced from hydrothermal reservoirs arc complex and cwntain t i lnrgc nii.iiibw of dissol vcd ~riinc~ala tincl gases. ‘I’liest? ‘ 6 ~ a t c ~ ~ ” have been classified as: (1) alkali chloridr, (2) ncid sulfate, (8) ncid srilfntr-cliloridc~. nnd (4) hicnrbonatc. Sonic of the! ~ s c s t.hnt may bo
-
w

8 OVEBVIEW con. 1
released from the fluid when the pressurs is lowered include carbon dioxide (Con), hydrogen sulfide (H2S), methane (C€L), hydrogen ( H2), nitro- gen (Nz), oxygen (Oa), ammonia (”*), argon (Ar), radon (Rn), and other noble gases such as helium (He), neon (Ne), krypton (Hr) , and xenon (Xe) [Ellis and Mahon, 19771.
Exploitation of hydrothermal resources is hampered by the corrosive and/or scaling properties of geothermal “brines.” In particular silica and calcium tend to precipitate in wells and pipes, forming plugs that restrict flow. It is not uncommon for geofluids to contain 10,00&25,000 ppm of dissolved solids, and concentrations as large as 250,009300,000 ppm are found in the brines of the Salton Sea geothermal area in the Imperial Valley of southern California. For comparison, sea water contains about 80,000 ppm. A concerted &oh is being made to solve the problems of proc- essing such hostile geothermal fluids [Austin et al., 19771.
More than sixty countries possess hydrothermal geothermal resources. Those resources being used for electric power generation are some of the hottest and cleanest now known, but current developments are leading to th0 technology to exploit even some of the most hostile resources. These developments wil l be covered in detail in the individual chapters of this book.
(&
1.2 Historical evolution of geothermal power technology
Geothermal energy was known two thousand years ago to the Romans who used the waters of hot springs to heat their baths [Goguel, 19761 and bathed in t;he natural hot springs on the banks of the Danube River [Stone, 19781. Direct heating uses of geothermal .energy have a long his- tory. Towns such as Chaudes Aygues, Dax, and Ax-les-Thermes in France have been distributing geothermal water at 8OoC (176OF) for domestic purposes since the Middle Ages [Goguel, 1976). In the 1700’s, a number of balneological institutes were founded in Hungary to capitalize on the therapeutic virtues of geothermal waters, and some of them are still in operation today [Stone, 19781. The commercial potential of the mineral- laden geothermal waters in the Larderello region of Italy led to wars between the Tuscan republics during the Middle ageS [ENEL, 19701.
It was at hrderello in 1904 that Prince Pier0 Ginori Conti first har- nessed the power of natural geothermal steam to produce electricity [Conti, 19!24]. Conti’s system used a reciprocating engine to receive steam that had been separated from the water. The engine was of the noncondensing type, exhausting to the atmosphere, and produced about 15 k W of electricity from a DC generator to provide lighting for the boric acid factory at Larderello. The original engine was replaced by a turboalternator of 250- k W capacity in 1913, thus marking the beginning of the production of electricity from geothermal energy on a commercial scale. In the United States, a major dry steam geothermal resource was dis-
covered in 1847 in northern California. Known as The Big Geysers, this
b

4 1.31 POlcBOY aOAVEBBIOH BY8TEktB 9
th0rmal anomaly was exploited as a hot-springs resort until the mid-1920’s. The Geysers, as it is known today, was then used to power a 250-kW elec- tric generator [Siegfried, 19251. This tiny plant was not competitive with other sources of power, ana soon fell into disuse. It was not until 1960 that a large-scale commercial geothermal power plant was built and operated at The Geysers (see section 12.1).
The geothermal fields at Larderello and The Geysers a? dry steam re- sources, and as such are relatively easy to exploit as a source of electric power. Most geothermal reservoirs, however, are not as amendable to use. The vast majority of them are liquid dominated, i.e., they yield a mixture of steam and hot water at the wellhead.
A liquid-dominated geothermal resource on the Japanese island of Kyushu was tapped in 1925 to produce 1.12 kW. This very small unit operated off the Tsunumi geothermal well in the famous hot-springs city of Beppu in Oita Prefecture, and was followed in 1951 by a 30-kW test plant, the Hakuryu geothermal power station, also in Beppu. This plant was operated by the Kogyo Gijutsu Institute of the Japanese Ministry of International Trade and Industry (MITI), but was eventually abandoned.
Exploitation of liquid-dominated hydrothermal reservoirs did not take place on a large scale until the Wairakei plant was built in New Zealand in 1958 with an installed capacity of 192,600 kW. Since that time many other countries have begun to use their geothermal fields for electric power generation, including the United States, Mexico, the Soviet Union, Japan, El Salvador, the People’s Republic of China, the Philippines, and h-
;land. Furthermore, several countries are on the verge of developing their geothermal resources. The geothermal power plants of these countries wil l be discussed in the remaining chapters of this book.
’
b,
.3 Energy conversion systems
A variety of energy conversion systems are in use for geothermal power generation throughout the world, and several new systems are in the re- search and development stage. Present-day geothermal power plants may be categorized as follows :
Dry (or superheated) steam plants Separated-steam (or “single-flash”) plants Separated-steam/hot-water-flash (or “double-flash”) plants Separated-steam/multiple-flash (or “multiflash”) plants Single-flash steam plants with pumped wells Double-flash steam plants with pumped wells Binary cycle plants with a secondary working fluid Combined flashbinary plants Hybrid fossil/geothermal plants Total flow systems.

10 OVEBVIEW [Ch. 1
- GENERATOR
Plants of the first four types are in commercial operation. Flash plants with pumped wells and binary plants are either under construction or in the pilot plant stage. Combined cycle, hybrid, and total flow plants are in the conceptual design phase and are being considered seriously for certain applications. In the following subsections we will present simple illustra- tive flow diagrams and describe these systems briefly.
I *
CONTACT CONDENSER
CONDENSATE PUMP
13.2 Dry (or superheated) steam plants
Of all types of geothermal resources, the simplest to exploit for electri- cal power production is dry steam. Power plants at The Geysers in Cali- fornia; Larderello, Monte Amiata, and Travale in Italy; and Matsukawa in Japan operate with direct dry steam. Figure 1.4 is a highly simplified flow diagram for such a system. The sketch shows a condensing turbine with a direct-contact condenser and a mechanically-induced-draf t cooling tower. All Italian geopower plants and the plant at Matsukawa use natu- ral-draft cooling towers, and some of the Italian plants use noncondensing, exhausting-to-atmosphere turbines. When it is necessary to segregate the noncondensable gases in the geothermal steam from the cooling water (e.g., for environmental protection), then shell-and-tube type surface condensers are usually employed. State 1 is either dry saturated vapor or slightly superheated steam; state 2 is wet steam with a dryness fraction of about 0.90 (i.e., 90% vapor and 10% liquid by weight). As can be seen from figure 1.4, the working fluid does not undergo a
cycle in the iisual sense of the word. It is admitted to the turbine at 1, con- densed at 3, and either evaporated from the stack of the cooling tower or rrinjrcterl into the reservoir. Thus the usual definition of power plant
r -I- - I\ 1
CIRCULATING I ' WATER PUMP
ELOWDOWN PUMP
COOLING
ST FI . . M
PRODUCTION WELLS
REINJECTION WELLS
PXQUI~IC 1.4-1~ry-stc:i1n geothermil powcr plant.

f 1.31 E-Y OONVEEBIOR BYSTEYB 11
cycle efficiency is not appropriate for assessing the overall thermodynamic performance of this type of geothermal plant. In that definition, the effi- ciency was givm as
t)= @U,t/&, (1.1)
where Wuet is the net plant output (turbine output minus all pump work), and 0 is the rate at which heat is supplied to the working fluid. Since 4 in this case is produced geothermally and not by the combustion of fuel, the determination of its value becomes ambiguous. Furthermore, equation w 1.1 is valid only for cyclic operations. The appropriate measure of plant performance
sense is the geothermal resource utilization efficiency, tu, which compares the net output of the plant to the maximum theoretically obtainable out- put, i.e.,
?o=W&% (1.2)
where 8 is called the exergy and is defined as the difference between the thermodynamic availability of the entering working fluid at state 1 and that of the working fluid at the ambient, sink condition or the dead state 0 [Kestin, 19781. It can be ahown that the exergj is given by
&=&[&-&- T~(s, -SO)], (1.3)
where h=mass flow rate of geothermal fluid; b, hl=enthalpy of geofluid at states 0, 1 ; 80,8~=entropy of geofluid at states 0, 1;
T,=absolute temperature at the dead state.
Sometimes it is convenient to speak about the specific fluid consumption, SFC, of the plant :
SFC=h/FL,,t. (1.4)
The figures of merit‘, vu and SFC, can be used to assess the thermody- namic performance of any type of geothermal power plant, not only dry steam plants. Well-designed dry steam geothermal power plants with condensing turbines operate with utilization efficiencies of between 60% and SO%, and with steam consumptions of about 18 1bmAcW.h *( 8 kg/kW * h).
13.g 8eparded- s t eam (or “single-@sh”) p h n t 8
It is common in the case of unpumped geothermal wells for the well- head product to consist of a two-phase mixture of liquid and vapor. The
12 OVEBVrEW [Ch. 1
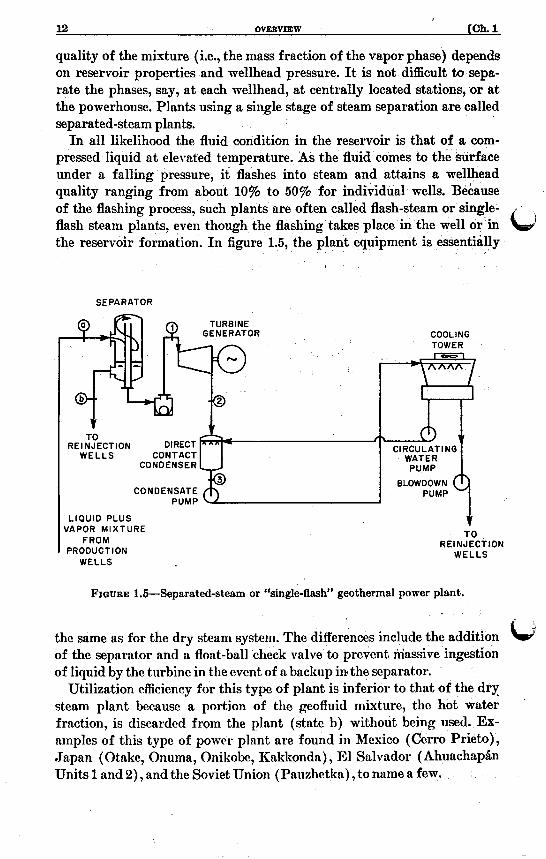
quality of the mixture (i.e., the mass fraction of the vapor phase) depends on reservoir properties and wellhead pressure. It is not difficult tu s p a - rate the phases, say, at each wellhead, at centrally located stations, or at the powerhouse. Plants using a single stage of steam separation are called separated-steam plants.
In all likelihood the fluid condition in the reservoir is that of a com- pressed liquid at elevated temperature. As the fluid comes to the surface under a falling pressure, it flashes into steam and attains a wellhead quality ranging from about 10% to 50% for individual wells. Because of the flashing process, such plants are often called flash-steam or single- flash steam plants, even though the flashing takes place in the well or in the reservoir formation. In figure 1.5, the plant equipment is essentially
SEPARATOR
TURBINE COOLING
CONDENSER
CONDENSATE
LlOUlO PLUS fAPOR MIXTURE
FROM PRODUCT I ON
WELLS
T O REINJECTION
WELLS
FIQURE 1.5-Separated-steam or “single-flash” geothermal power plant.
the same as for the dry steam system. Tho differences include the addition b of the separator and a. float-ball check valve to prevent massive ingestion of liquid by the turbine in the event of n backup in the separator.
Utilization efficiency for this type of plant is inferior to that of the dry steam plant because a portion of the geofluid mixture, the hot water fraction, is discarded from the plant (state b) without being used. Ex- amples of this type of power plant are found in Mexico (Ccrro Prieto), Japan (Otakc, Onuma, Onikobc, Iialrkonda.) , El Salvador (Ahuachaptin Units 1 and 2), and the Soviet Union (Pauzhetlm) , to name a few.

b,
j 3 1.3 13
lS.3 Separated-steam/hot-2oater-jlash (or “doUble-fEash”) phllts
The flow diagram in figure 13 is similar to that in figure 1.5, except that a flash vessel is included to generate additional steam from the hot
SEPARATOR
COOLING
WELLS TO FROM REIN JECTION
WELLS PRODUCT ION WELLS
FIGURE l.&Separated-ateam/hot-water-fla& or “double-flash” geothermal power plant.
water separated from the wellhead mixture. The added steam at state 4 is ’
admitted to the turbine via a plenum, where it mixes yith the primary steam before expanding through the low-pressure stages. The term “double-flash” arises from the fact that two flashes occur, one below the surface and one above the surface in the specially designed flash tank. The main point of interest is that n two-stage process of steam generation and utilization is employed, the second stage captiiring a portion of the energy otherwise wasted lants of this type are operating in Sapan (Hatch rafla), An anihitioils cffort is an- dcrway .to construct n large number of tliese units in the Philippines.
Separated-stearrt/ntzlltip
A multiflash plant employs steam at thrcc or morc levels of pross~~re at turbine entry points. The only known commercial plant of this type is in NPW Zcaland (Wiiiral<ei). Miiltiflash plants a r ~ not, cwnoiiiicdly nttr:tc- tivc at thc prcsent time. The arrangcmcnt, of tlir rncrgy conversion systeni n t Wnirakci (seo section 8.2) resultcd from tlir rcguirwicnts of an anxil-
14 OVEEVIEW [Ch. 1
iary chemical processing plant that was to have used a portion of the geo- tlieniial steam fro111 the power station.
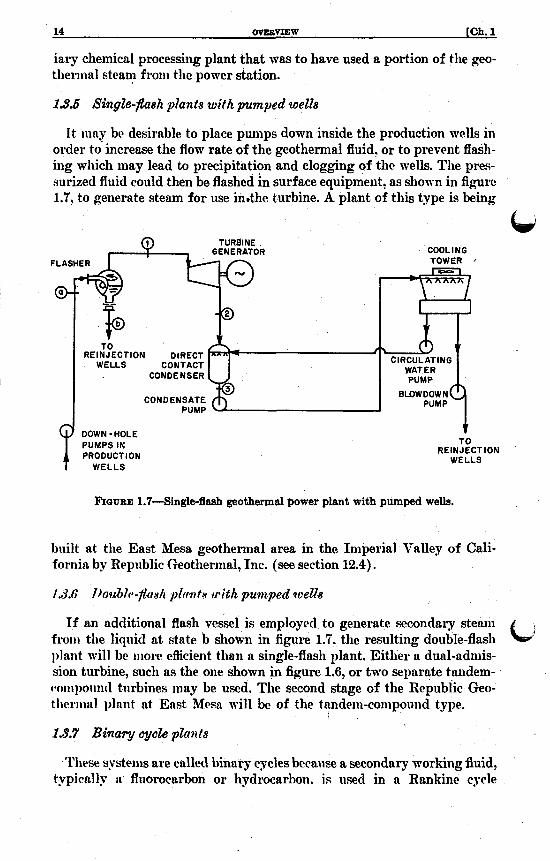
13.6 Single-@sh plants with pumped wells
It tiiay bta desirable to place punips down inside the production wells in order to'increase the flow rate of the geothermal fluid. or to prevent flash- ing which may lead to precipitation and clogging of the wells. The pres- surized fluid could then be flashed in surface equipment, as shown in fiourc 1.7, to generate steam for use in.the turbine. A plant of this type is bemg e.
GENERATOR COOLING TOWER
REINJECTION DIRECT
CONDENSATE
DOWN -HOLE PUMPS IN PRODUCTION
WELLS
t TO
REINJECTION WELLS
FIQURE 1.7-Single-flash geothermal power plant with pumped wells.
h i l t at the East Mesa geothermal area in the Imperial Valley of Cali- fornia by Republic Geothermal, lnc. (see section 12.4).
1.3.6 I)oubZe-flauli plwtrc with punhpped wells
If an additional flash vessel is employed to generate secondary steam froiri the liqiiid at state b shown in figure 1.7. the resulting double-flash plant will be inore efiicient than a single-flash plant. Either a dual-adniis- sion turbine, such as the one shown in figure 1.6, or two separate tandem- c*oliipoiintl turbines may be used. The second stage of the Republic Geo- thermal plant at East Mesa will be of the tandem-con~pomid type.
13.7 Binary cycle plants I
'rhese systems are called binary cycles becaiise a secondary working fluid, typically R fluorocarbon or hydrocarbon. is used in a Rankine cycle

4 1.33 EHERGY COHVERSIOH SYSTEMS 15
u
with the geothermal fluid serving as the source for the required tliermnl energy to vaporize and superheat the secondary working fluid. A flow dia- gram for a simple binary plant is shown in figure 1.8, and the correspond-
TURBINE-OENERATOR COOLING HOT WATER/ TOWER BRINE PUMP
WATER PUMP
OW-PRESSURE
HOT WATER/ BRINE FROM
PRODUCTION WELLS
TO REINJECTION
WELLS
FIQURE l.&Binary geothermal power plant.
ing cycle diagram in pressu halpy coordinates is given in figure 1.9. The latter is drawn for isobutane as the working fluid in the power loop with a supercritical boiler pressure (process 6 to 1).
A number of advantages have been claimed [Anderson, 19731 for a binary cycle compared to a flasli-steam
More suited to low-temperature Smaller turbine size for given output Less expensive turbine for given output High-pressure operation tlirouglioiit, climinnting vacuiim operation No problems of air in-leakage, etc. Non-corrosive working fluid in turbine Higher isentropic tiirbine efficiencies Completelp dry expansion. eliminating erosion problems Condensing temperatures can be lower for better cycle efficiency.
m, including the follolving :
ermal resources
'
W
Some of the diFndvnntnpes include :
Suitable secondary working fliiicls are cspensive No leaks can be permitted

16 OVEBVIEW [Ch. 1
t I I I I 1000
2 600
% 400
0
0 c
- : c
200 =I u) v) W
E 100
50
100 200 3OO0F
0 I O 0 eo0 300
ENTHALPY, B t u / l b m
FIQWRE 1.9-Cycle diag-cam for binary plant with isobutane as the working fluid.
Heat exchangers are major elements and are costly Huge brine flow rates are needed for a reasonable-size plant, leading
li’lammability of hydrocarbon working fluids requires fire protection
A test plant using Refrigerant-12 was built and operated at Paratunka on the I(nmc1iatka Pcninsiila of the Soviet Union. The plant was con- strwtccl in 1967, ran for a number of years, and has since been dis- iii:mtled. The .Japancsc! tested two plants of the binary type, one at Wake itnd 0110 at Mori, and one plant is operating at East Mesa in the Iinperial Valley of Califoimia. Each will be described in detail in later sections of this book.
It is intrresting to notc that the first comrnercial geotliermal power plant in Italy iisctl cndogcnoiis stcam as :t lionting medium to boil puce water in a secondary powrr loop. Tn this way the direct, corrosivr steam did not come in contact with the tiirbinc, hit was iiscd instead in vertical-tube lieat cscliangrrs. In rriotlcrn tmminology, siicli systems might bc called “ennrlogenons-stenm/piire-~vat~r binary cycles.” Eventually, as turbine ma- tcrials technology improved and troiiblrs with heat exchanger performance arose, tlie hinary c:ycle was ;h:uidonrd in ‘Italy in favor of reaction turbines iising direct,, natiiral steam [Hnhn, 19231.
to disposal problems
design.
0 1.33 E”3Y OOIVVERBIOXi SYSTEMB 17
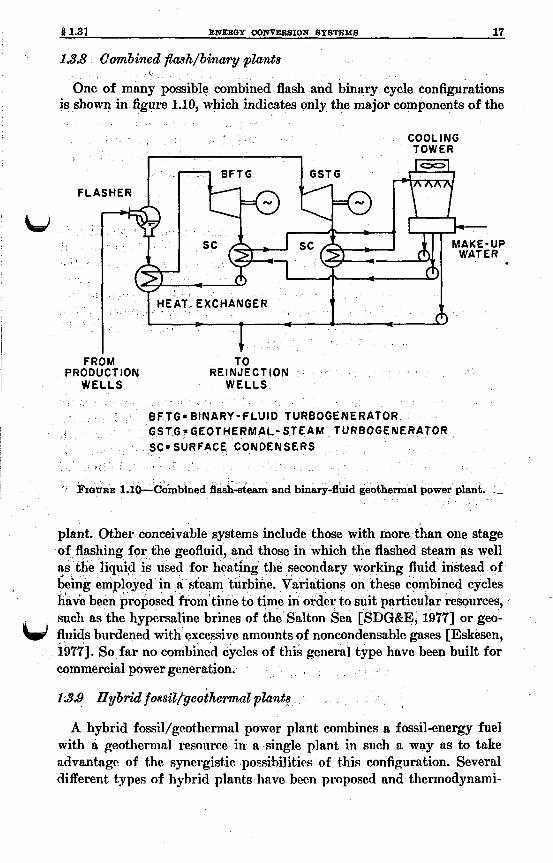
13.8 Combined fEash/binary plants <
One of many possible combined flash and binary cycle configurations is shown in figure 1.10, which indicates only the major components of the
FL A
W
Ff PROD
COOLING TOWER
UP R
+ M TO :TION REINJECTION
WELLS WELLS
~ BFTG. BINARY-FLUID TURBOGENERATOR EOTHERMAL- STEAM TURBOGENERATOR FACE CONDENSERS
IQURE 1.10-Combined flaah-steam and binary-fluid geo a1 power plant. -
plant. Other conceivable systems include those with more than one stage the geofluid, and those in which the flashed steam as well
ing fluid instead of se combined cycles
*time to time in order to suit particular resources, such as the hypersaline brines of the Salton Sea [SDG&E, 19771 or geo- fluids burdened with excessive amounts of noncondensablo gases [Eskesen, 19771. So far no combined cycles of this general type have been built for commercial power generation.
13.3 Hybrid foss i l /geotheml plants
r heating the secondary eam turbine. Variations
A hybrid fossil/gcothermal power plant combines a fossil-energy fuel with a geothermal resource in a single plant in such a way as to take advantage of the synergistic possibilitiw of t>his configuration. Several different types of hybrid plants have been proposed nnd thermodynami-

18 OVEEVIEW [ah. 1
calls analyzed by the group at Brown University [Kestin et d., 1978; Khalifa et al., 1978aI. Generally such plants fall into one of two cate- gories: geothermal-preheat systsms [Khalifa et al., 1978bI or fossil-super- heat systems [DiPippo et al., 19781, Compound hybrid systems combine the features of these two systems, resulting in improved utilization and more flexibility [DiPippo and Avelsr, 1979). These are mentioned in sec- tion 12.9.2 and figures 12.24-12.26 in connection with their possible use at any of a number of resources in the western United States.
13.10 Total flow system
The simplest energy conversion concept for geothermal application is the total flow system. In this cas^ the full two-phase flow from the well
4 s admitted into the expander. The theoretical advantage derives from the elimination of the losses associated with the flashing or separation proc- esses in more conventional geothermal plants. A number of such devices have been developed at the laboratory stage, including expanders of the axial-flow and positivedisplacement types [Austin et al., 10771, and field tests are being conducted for the latter type.
1.4 Pswer plant performance factors
bj
One of the most outstanding features of the geothermal power plants that have been in operation throughout the world is their reliability. As each of the power stations is described in the chapters that follow, such terms as capacity factor, load factor, availability factor, and others wil l be used. Since there are sometimes differences in the basic definitions of these terms among power plant people, we will give our defining equations for these terms at the outset.
1.41 Operating faatom
Several factors are commonly used to describe the operations and re- liability of a power plant. There are three power plant operating factors which, when taken together, indicate the manner in which the plant is used to meet variations in demand. These are :
Load factor, FL: ' FL=z/L*,
Capacity factor, Fa: Fa=E/C, (1.6)
Utilization factor, Fu: Fu= L*/C, (1.7)
where the - terms used have the following meanings: L=average load for a given period,
L*=pe& load for a given period, and O=rated capactity of the plant or unit.

#La] SUMMABY OF PBESENT AND PLANNED OEOTHEBMAL POWEE PLANTS 19
The average load zis found from
z=G'/h, (1.8)
where @=total electrical generation for a p e n period, and
It is clear that
and that whenever the utilization factor equals unity (Le., pure base-load operation), then the load factor becomes identical numerically to the
h=number of hours in the pen0 (usually 8760 h = l year).
Fc=Fr,XFu, (1.9)
b) capacity factor.
2.4.~ ~eiiabi l i ty factma
There are three commonly used power plant reliability factors :
Availability factor, FA : F A = p B / & (1.10)
Forced outage factor, Fm : FFo=pFo/h, (1.11)
Scheduled outage factor, Fa0 : F~o=P~o/h , (1.12) where
Ps=service period, i.e., the number of hours that the unit operated
PFo=forced outage period, i.e., hours of downtime caused by quip-
Pso=scheduled outage period, i.e., hours of downtime for planned
with breakers closed to the station bus,
ment failure or malfunction, and
maintenance.
It is clear th (1.13)
The material presented in the following chapters will show geothermal power plants are characterized generally by high capacity factors, typi-
SO%, and very high availability factors, often exceeding
present and planned geothermal power plants W
The total worldwide installed geothermal electric power capacity is about 1750 MW (as of July l979), of which about 1100 MW is from dry s h m plants. "he number of individual power units is 85, for an average capacity of about 20 MW per unit. Thii is indicative of the generally small size of a typical geothermal plant. "he largest single unit is rated a t 135 M W and is scheduled to be installed at The Qeysers in northern California during 1980.
20 OVEBVIEW [Oh. 1
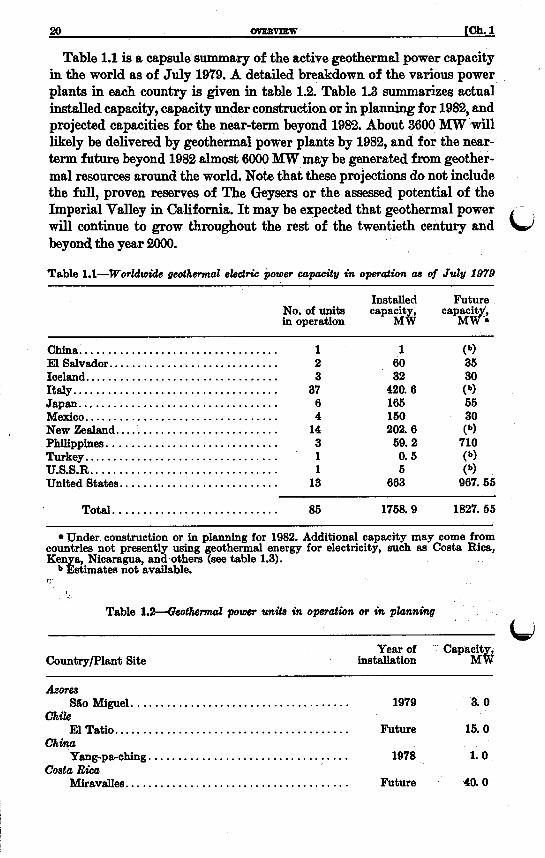
Table 1.1 is a capsule summary of the active geothermal power capacity in the world as of July 1979. A detailed breakdown of the various power plants in each country is given in table 1.2. Table 1.8 summarizes actual installed capacity, capacity under construction or in planning for 1982, and projected capacities for the near-term beyond 1982. About 3600 MW will likely be delivered by geothermal power plants by 1982, and for the near- term future beyond 1982 almost 6000 MW may be generated from geother- mal resourw around the world. Note that these projections do not include the full, proven reserves of The Geysers or the assessed potential of the Imperial Valley in California. It may be expected that geothermal power will continue to grow throughout the rest of the twentieth century and beyond the year 2000.
d,
Table 1.1-Worldwide geothermal electric power capacity in operation as of July 1979
Installed Future No. of units capa$tG cap$$: in operation
~~ ~~ ~~~
China. ................................. 1 El Salvador.. ........................... 2 Iceland. ................................ 3 Italy ................................... 37 Japan .................................. 6 Mexico ................................. 4 New Zealand... ......................... 14 Philippines. ............................ 3 Turkey ................................. - 1 U.S.S.R.. .............................. 1 United States.. ......................... 13
1 60 32
420. 6 165 150 202.6 59. 2 0. 5 5
663
Total.. .......................... 85 1758.9 1827.55
Under construction or in planning for 1982. Additional capacity may come from countries not presently using geothermal energy for electricity, such as Costa Rica, Ken a, Nicaragua, and others (see table 1.3).
b &mates not available. c
Table l.!?iGkothermuZ power units in opmatwn or in phnning
Country/Plant Site Year of Capacity,
installation MW
Azores
Chi28
China
Costa Rica
880 Miguel. .................................... 1979 3. 0
ElTatio ........................................ Future 15. 0
Ymg-pa-ching .................................. 1978 1. 0
Miravalles. ..................................... Future 40.0

f MI SUMMARY OF PRESENT AND PLANNED OEOTHERMAL POWER P U N T S 21
Table 1.2-GeothZ power units in ope~dion or in plunnhg-continued
capa2t% Year of Country/pLant Site installation
El 8ahador Ahuachaph: I
Auxiliary Unit .............................. unit 1 ..................................... unit 2 ..................................... unit 3 .....................................
mlfn .......................................... Chinameca ..................................... Chipilapa ....................................... San Vicente ..................................... Amatitl&n ...................................... Pavana or San Ignacio ........................... Nbafjall (dismantled) ........................... Kratla:
unit 1 ..................................... u n i t 2 .....................................
Qwtemalcr
HOndUraS
IMland
Svartsengi (Grindavik) .......................... lndonesk
Kawah Kamojang ............................... Kawah Kamojang ............................... Larderello 2 (6 units) ............................ Larderello 3 (6 units) ............................ Gabbro ........................................ castelnuovo-V.C. (4 units) ........................
Italy
1976 1976 1976 1980
Future Future Future Future
Future
Future
1969
1978 Future 1978
1979 Future
(9
(9
1969 1969
Serrazzano (6 units) ............................. Lag0 2 (3 units) ................................. sasso Pisan0 (2 units) ............................ Monterotondo ................................... Sant’Ippolito-Vallonsordo ......................... Lagoni Rossi 1 .................................. Lagoni Rossi 2 .................................. sasso 1 ......................................... Molinetto ...................................... “ravde ........................................ Bagnorel ...................................... Bagnore 2 ...................................... Piancastsgnaio .................................. (unspecified sites) ................................
w Capriola ........................................
I
(*I PI P) PI
(9 3 .0 (9 7 .0 (9 3 .0 (9 3 .€4
1973 6 .0 1969 3*q
(‘1 3 .6 1969 16 .0
Future 400.0
1972 1962 . 3 .6
1 . 1 30.0 30 . 0 36 . 0 100.0 100.0 so . 0 100.0
60 . 0
60 . 0 3 . 0 30 . 0 30. 0 2 . 0
0 . 26 100 . 0 69.0 120. 0 16 . 0 60 . 0 47 . 0 33 . 6 16 . 7 12 . 6 0.9
Japan Matsukawa 1966 20 . 0
.......................................... 1967 10 . 0 ........................................... 1973 10 . 0
..................................... Otake Onma
Not available .
.

22 OVEBVIEW [ah . 1
Table 1.2-&othermal power units in operation or in phnning--C ontinued
Country/Plant Site caps%% Year of installation
Japan-Continued onikobe ........................................ Hatchobaru ..................................... Kakkonda (Takinoue) ............................ make (pilot binary; dismantled) .................. Mori (pilot binary; dismantled) ................... Mori ........................................... Kusuneda ...................................... Olkaria ......................................... Cerro Prieto I:
Kenya
Mezico
unit 1 ..................................... Unit2 ..................................... u n i t 3 ..................................... u n i t 4 ..................................... u n i t 5 .....................................
Cerro Prieto I1 ...................................
Kawerau ....................................... Wairakei, Station A:
Machine 1 (IP) ............................. Machine 2 (HP) ............................. Machine 3 (HP) ............................. Machine 4 (IP) ............................. Machine 5 (HP) ............................. Machine 6 (HP) ............................. Machine 7 (LP) ............................. Machine 8 (LP) ............................. Machine 9 (LP) ............................. Machine 10 (LP) ............................ Machine 11 (MP) ........................... Machine 12 (MP) ........................... Machine 13 (MP) ...........................
Unit 1 ..................................... unit 2 ..................................... Unit 3 .....................................
Momotombo .................................... Cerro Pando ....................................
Tongonan (Leyte) :
New Zeaknd
Wairakei, Station B:
Ohaki (Broadlands) :
Nicaragua
Panam
Philippines
Portable Unit ............................... unit 1 ..................................... Unit2 .....................................
Not available .
1975 1977 1978 1978 1978 1979
Future
Future
1973 1973 1979 1979 1982
Future
1961
1959 1958 1959 1959 1962 1962 1959 1959 1960 1960
1962 1963 1963
1983 1984
Future
Future
Future
1977 1980 1981
25 . 0 50 . 0 50 . 0
1.0
5;: Ll 50 . 0
15 . 0
37 . 5 37 . 6 37 . 5 37 . 5 30 . 0
110.0
10 . 0
11 . 2 6.5 6.5
11 . 2 11 . 2 11 . 2 11.2 11 . 2 11 . 2 11 . 2
30 . 0 30 . 0 30 . 0
tt8 cp' 60 . 0
30 . 0
3 . 0 55 . 0 55 . 0

j1.61 BUMMABY OF PBEBENT AND PLANNED QEOTHEBMAL POWEB PLANT8 23
Table 1.2-Ueothend power unite in operation or in planning-continued
Year of Country/Plant Site installation
Philip pinescontinued Makiling Bmahaw (Los Bafios):
Wellhead Unit .............................. 1977 unit 1 ..................................... 1979 unit 2.I ................................... 1979 unit 3 ..................................... 1981 unit 4 ..................................... 1982
unit 1 ..................................... 1979 unit 2 ..................................... 1979 unit 3 ..................................... 1981 u n i t 4 ..................................... 1981
unit 1 ..................................... ' 1981 u n i t 2 ..................................... 1982
unit 1 ..................................... 1981 u n i t 2 ..................................... 1982
Allsites ........................................ Future
Kizildere:
!rid: W
Southern Nepos:
Manat-Masara:
firkey
Wellhead Unit .............................. 1976 Unit 1 ..................................... Future
U.S.S. R . Paratunka (dismantled) .......................... 1907 Pauzhetka ...................................... 1967 Bolshoye-Bannoye ............................... Future Allsites ........................................ Future
The Geysers: ' United8t'tatss
PG&E Unit 1 ........................ 1960 PG&E Unit 2 ........................ 1963 PG&E Unit 3 ................................ 1967 PG&E Unit 4 ................................ 1968 PG&E Unit 6 ....................... 1971 PG&E Unit 6 ...................... 1971 PG&E Unit 7 ............................... 1972
........................ 1972
.... ... .................. 1973 PG&E Unit 10 .............................. 1973 PG&E Unit 11 .............................. 1976 P W E Unit12 .............................. 1979 PG&E Unit 13 .............................. 1980 PG&E Unit 14 .............................. 1980 PG&E Unit 16 .............................. 1979 PG&E Unit 16 .............................. 1983 PG&E Unit17 .............................. 1982 PG&E Unit 18 .............................. 1982
w
1 . 2 66 . 0 66 . 0 66 . 0 66 . 0
66 . 0 65 . 0 66 . 0 66 . 0
66 . 0 66 . 0
66 . 0 66 . 0
656.0
0 . 6 14.0
0 . 7 ' 6 . 0
8 . 0 70 . 0
11.0 13 . 0 27 . 0 27 . 0 6 8 0 63 . 0 63.0 6 8 0
53.0 106.0 106.0 136.0 110.0 [is . 0
110.0 110.0 110.0
63 . 0
\

24, O V E X W W [cn. 11 Table 1.2-Geothennal poroer units in operation or in pZunning-Conthued
~~
Country/Plant Site cap%% Year of
installation
United States-Continued The Qepers-Continued
PG&E Unit 19.. ............................ NCPA Unit 1.. ............................. Magmamax Dual Binary. .................... Republic Geothermal.. ......................
Brawley, So. Cal. Edison., ....................... Puna, HGP Unit.. .............................. Raft River, Binary Unit. ........................ Valles Caldera, Baca No. 1. ...................... Salton Sea, SDG&E. ............................ Heber :
So. Cal. Edieon .............................. SD G&E ....................................
Westmorland ................................... Roosevelt Hot Springs. .......................... Desert Peak.. ..................................
East Mesa:
Future 1981
1979 1980 1980 1980 1980 1982 1982
Future Future Future ’ Future Future
110.0 110.0
11. 2 48. 0 10. 0 6. 0 3.36 60. 0 60. 0
45.0 - 60. 0 60. 0 62. 0 20. 0
- ~~~ ~~ * Table 1.3--Bzcmmaty of &ml, planned and projected geothermal power mp&y in the world QLI of July 1070
MW
(1) Total imtalled capacity.. ................ 1768.9 (2) Planned or under construction.. .......... 1720.8 (3) Future projections, near-term.. ........... 24740
Total (1) + (2). ...................... Total (1) + (2) + (3). ................. 2689.7
6968 7
REFERENCES
~ T E : The United Nations has sponsored three worldwide conferences on new 8 0 u m of energy, including g e o t h e d . Papers from these conferences are cited throughout this book. The full citations for these conferences are listed below; here- after a shorthand notation wil l be used.
Proceedings of the United Nations Conference on New Sources of Energy: Solar Energy, Wind Power and G e o t h e d Energy, Rome, Aug. 21-31, 1961, Vols. 2 h d 3, ‘‘Geothermal Energy: United Nations, New York, 1964. (Referred to as Rome, 1981 hereafter.)
Proceedhzgs of the United N a t h Symposium on the Development and Utilization of Geothermal Resources, Pisa, Sept. 224%. 1, 1970; Geothermies, Spec. Issue 2,
REFEBEIYOEB 25
Vols. 1 and 2, 1970, Pergamon Preas, Inc., New York, 1970. (Referred to aa Pisa. “70 hereafter.)
Proceedings of the Second United Nations Symposium on the Development and Use of Geothermal Resources, San Francisco, May 22-29, 1976, Vols. 1-3, U.S. Gov- ernment Printing OEtce,’Washington, 1976. (Referred to as Sun Francisco, I876 hereafter.)
Anderson, J. H., 197 The Vapor-Turbine Cycle for Geothermal Power Genera- tion,” in Geothermal Energy: Resources, Production, Stimulutwn, P. Kruger and C. Otte, eds., Stanford Univ. Press, Stanford, CA., pp. 163-175.
Austin, A. L., Lundberg, A. W., Owen, L. B., and Tardiff, G. E., 1977. “The LLL Geothermal Energy Program Status Report, January 19764anuary 1977,” U C R L 50046-76, Lawrence Livermore Laboratory, Livermore, CA.
Boldizdr, T., 1970. “Geothermal Energy Production from Porous Sediments in Hungary,” Pisa, lSr0, Vol. 2, pp. 99-109.
Bowen, R. G. and Groh, E. A., 1977. “Geothermal Energy,” in Energy Technology Handbook, D. M. Considhe, ed., McGraw-Hill, New York, pp. 7.4-7.13.
Bullard, Sir E., 1973. “Basic Theories,” in Geothermal Energy: Review of Research and Development, H. C. H. Armatead, ed., UNESCO, Paris, pp. 19-29.
Combs, J. and M d e r , L. J. P., 1973. “Ekploration of Geothermal Resources,” in Geothermal Energy, P. Kruger and C. ate, eds., Stanford Univ. Press, Stanford, CA, pp. 93-128.
Conti, Prince P. G., 1924. “The Larderello Natural Steam Power Plant,” Proc. First World Power Conf., June 30July 12, London.
DiPippo, R. and Avelar, E. M., 1979. “Compound Hybrid Geothermal-Fossil Power Plants”, G e o t h e d Resources Council Trans., Vol. 3, pp. 165-168.
DPippo, R., Khalifa, H. E., Correia, R. J., and Kestin, J., 1978. “Fossil Superheating in Geothermal Steam Power Plants,” Proc. 23th Zntersociety Energy Conv. Engin.
Ehton, W . W., 1975. G e o t h e d Energy, ERDA-TIC, Oak Ridge, TN, p. 2’7. Ellis, A. J. and Mahon, W. A. J., 1977. Chemistry and Geothermal System, Aca-
Press, New York. 1970, Larderello and Monte Amiuta: Electric Power by Endogenous Steam, Naionale per 1’Energia Elettrica, Compartimento di Firenre, Diredone
Studi E Richerche, Roma. (In English.) EPRI, 1977. “Geothermal Energy, The Hot Prospect,” EPRZ Journal, Vol. 2, No. 3,
pp. 6-13. Eskesen, J. H., 1977. “Cost and Performance Comparison of Flash Binary and Steam
Turbine Cycles for the Imperial Valley, California,” Proc. 28th lntersociety Energy Conv. Engin. Conf., Vol. 1, pp. 842-849.
Goguel, J., 1976. Geothemks, 8. P. Clark, Jr., ed., A. Rite, trans., McGraw-Ha, New York.
Hahn, E., 1923. “Some Unusual Steam Plants in Tuscany,” Power, Vol. 57, No. 23, pp. 882-885.
Kestin, J., 1978. “Available Work in Geothermal Energy,” Brown Univ. Rep. No. CATMECnO, DOE No. C00/4051-25, Providence, RI.
K h , J., DiPippo, R., and Khalifa, H. E., 1978. “Hybrid Geothermal-Fossil Power Plants,” Mech. Engineering, Vol. 100, No. 12, pp. W 5 .
-a, H. E., DiPippo, R., and Kestin, J,, 1978a. “Hybrid Fd-Geothermal Power Plants,” Proc. 6th Energy Tech. Conf., pp. 960-970.
m a , H. E., DiPippo, R., and Kestin, J., 197813. ‘‘Geothermal Preheating in Fossil- Fired Steam Power Plants,” Proc. 13th Zntersociety Energy Conv. Conf., Vol. 2, pp. 1068-1073.
Conf., Vol. 2, pp. 1095-1101.
. .

2s ovlmvnm [ah. 11
Meidav, T. and Tonani, F., 1975. “A Critique of Geothermal Exploration Tech- niques,” San Francisco, 1976, Vol. 2, pp. 1143-1164.
Pettitt, R. A., 1978. ‘%ot Dry Rock: A New Potential for Energy,” Geothemzal Energy Magazine, Vol. 6, No. 11, pp. 11-19.
SDG&E, 1977. “Expression of Interest for a Geothermal Demonstration Power Plant,” presented to ERDA on June u) by San Diego Gas and Electric Co., San Diego.
Siegfried, H. N., 1925. “The Geysers,” in Geothemzal Exploration in the First Qwrrter Centuty, D. N. Anderson and B. A. Hall, eds., Geothermal Resources Council Spec. Rep. No. 3, Davis, CA, 1973, pp. 69-88.
Stone, A. M., 1978. “Geothermal in Hungary,” Geothermal Energy Magazine, Vol. 6,
Wallace, R. H., Jr., Kraemer, T. F., Taylor, R. E., and Wesselmsn, J. B., 1978. “Assessment of Geopmred-Geothermal Resources in the Northern Guif of Mexico Basin,” in Assessment of Geothermal Resources of the United States, 1978. L. J. P. Muffler, ed., Geological Survey Circular 790, U.S. Dept. of Interior, pp. 132-165.
NO. 11, pp. !27-28.
6,

CHAPTER 2 CHINA
21 Overview
With the recent emphasis on education, science, and technology in the People’s Republic of China, geothermal energy is expected to be developed for practical purposes. At least one geothermal electric power plant is in operation in China, but there are indications that the geothermal re- sources in the Himalayan mountain area will be developed rapidly for generation of electricity and for other beneficial purposes [Wu, 19781.
2.2 Yang-pa-ching
9.$..l &?OlOg&3 Mth9 The Yang-pa-ching geothermal power plant is located high in the Hima-
layan mountains of Tibet within a vast geothermal field. It is believed that this resource is only one of many such fields in China [Peking, 10783. The Tibetan field is situated on a plateau about 4300 m (14,000 ft) above sea level, in the center of Yang-pa-ching Basin, west of the city of Lhasa. The basin is bounded on the Gouth by the Himalayan Mountains and on the north by the Nyenchin Tangla Range, glacier-covered peaks rising to eleva- tions of i55OO-f3000 m (18,000-19,700 ft). The basin extends for 2000 km (1250 mi) to the east and then turns toward the south at the Transverse Mountains, and extends to western Yunnan Province. Along this Hima- layan geothermal belt are more than 400 sites of geothermal surface
I activity such as hot springs and fumaroles. Even rare phenomena such 11s geothermal water explosions and intermittent springs or geysers have been observed [Peking, 19781.
In November 1975 a colossal geothermal water explosion occurred at the Chupu area in Punan Prefecture in Tibet. A hugh volume of dark gray steam erupted to a height of 800-900 m (26W2950 ft), leaving a crater of several tens of meters (1-13&140 ft) . This crater is still spewing hot water and steam. In the same area another crater caused by a geothermal eruption has a diameter of 80 m (260 ft).
The largest geyser found so far in China is the Da Chis Ger intermittent hot springs $ Mao Nen Prefecture. This geyser shoots a hot water jet of
27

28 OHINA [Ch. 2
2 m (6.6 ft) diameter to a height of 20 m (66 ft) ; an accompanying steam jet shoots to 40-60 m (130-166 ft). Another well-known geothermal field lies east of the Himalayan in Ten-Chung, where more than 50 volcanic cones are in evidence. About 13 km (8 mi) from this city is a large geo- thermal field called Erh Hai, which means “hot sea” [Peking, 19781.
The geothermal resource at Yang-pa-ding is of the liquid-dominated type that produces a mixture of liquid and vapor at the wellhead as a result of flashing in the wellbore as the geothermal liquid rises from the reservoir to the surface. The site is favored by t i ready supply of cooling water for the power plant owing to the presence of the Tsangpo River cutting across the region from southwest to northeast. The water temperature is quite low since the river is fed by melting snow from the surrounding mountain peags. &2W Energy amersirm 8y8tem
The geothermal plant at Yang-pa-ching is of the separated-steam (or “single-flash”) variety and has an installed capacity of 1000 kW. Con- structed within three months by Chinese and Tibetan workers, engineers, md managers, the plant received special recognition for technical achieve- ment by the Tibet Regional Committee of the Communist Party.
Figure 2.1 shows a simplified flow diagram for the plant. Geofluid from a single well is processed in a cyclonic separator which produces a stream of hot water that is led to a disposal area through a silencer, and a stream of vapor that is used to drive the turbogenerator. A barometric, direct-contact condenser is installed on the upper part of a hill and is supplied with cold water from the Tsangpo River. Noncondensable gases, which include carbon dioxide, hydrogen sulfide, oxygen, and nitrogen, are removed from the condenser by means of a high-pressure, water jet ejector [ Wu, 19781. Test runs of the plant indicate that power can be produced continuously
without any adverse effects from the extremely high altitude of the site. The plant is now serving the inhabitants of the Yang-pa-ching Basin with electricity. No other technical specifications for the plant are avail- able at this time.
2.3 Plans for the future
There are plans to construct geothermal power plants of the separated- steam/hot-water-flash (or “double-flash”) variety that take advantage of additional (or secondary) steam released by flashing the hot water sepa- rated at the wellhead [Wu, 19781. A number of small binary plants in the 50-200 k W range have been constructed and tested, but technical infor- mation on these is dacu l t to obtain [Finn, 19791. Multipurpose utiliza- tion of geothermal energy including agricultural, industrial, and residen-

W
FIQURE 2.1-Flow diagram of 1000-kW Chinese geothermal power plant near Yang- peching. Key: P- water-holding pond; 51 =wellhead silencer; W = geothermal well; C=cyclonic separator; R-steam receiver; T-G=turbogenerator; S2=station silencer; B=barometric condenser; E=water jet ejector; RW=river water [after
. Wu, 19781.
tin1 space lienting ns well as electric power geiieration is also being contemplnted.
Attention is being pnid to possible problems associated with geothermal energy utilization such as pollution of streams and rivers by dischargt! of niincwd-lndrn wwte wittws, corrosion cwisacl by tlic disc*liiirg~! of 11,s to the atmosphere, and clogging of wells and pipelines froin deposition of salts from the Lwothcrmal fluid. Reinjection and chemical trcatment are being considered in this regard.
Since the Cultural Revolution, a number of geothermal projects have bwn laiiiicthcil throiiglioiit, the provinces of China. A Inrg(~-scalc gw- thermal power plant, is reportedly tinder constriiction at this time [l’c- king, l978]. 1 t has bcen estimated that the eastern, centrd, i i i id soiithc-m parts of China also hold great, geothermnl potential and may eventually be put to practical use.

30 OHIBA rch. 21
It seems reasonable to assume that more details about China’s geo- thermal energy program will soon become available as a result of China’s new fore& policy announced in early 1979.
REFERENCES
Finn, D. F. X., 1979. “Geothermai Developments in the People’s Republic of China”, ffeothermal Resources Cound Trans., Vol. 3, pp. 209-210.
Peking, 1978. “Geothermal Resources in China,’’ Geothermal Research Group, Geol- ogy and Geography Unit, University of Peking; Reported in the weekly Chinese Zndwtty News, No. 439, May 29, pp. 6-7. (In Chinese.)
Wu, F. T., 1978. Yang-pa-ching Geothermal Experimental Power Plant,” Chinese Zndustry News, No. 439, May 29, pp. 26. (In Chinese.)
NOTE: The author is indebted to Takao Sato (Brown University) and Dr. C. H. Chen (Southeastern Massachusetts University) for their assistance in preparing this chapter.
LJ
CHAPTER 3 EL SALVADOR
3.1 Overview
El Salvador is the first of the Central American countries to construct and operate a geothermal electric generating station. Exploration began in the mid-1960’s at the geothermal field near Ahuachaph in western El Salvador. The first power unit, a separated-steam (or “single-flash”) plant, was started up in June 1976 and was followed a year later by an identical Unit. The 60 Mw of geothermal capacity presently constitutes 14% of the total electric generating capacity of El Salvador, but during 1977 the AhuachaMn plant produced nearly one-third of the electricity generated in the muntry.
o Lempa (CEL) is in the process of installing the third unit at Ahuachaph, a dual-pressure (“double-flash”) unit that wi l l bs rated at 85 MW. In addition, CEL is actively pursuing several other promising Sites for additional geothermal plants. Eventually geothermal energy could contribute as much as 460 M W of electric generating capacity. In any event, it appears that by 1985 El Salvador will be able to meet its domestic needs for electricity by means of its indigenous geothermal and hydroelectric power plants, thus elimi- nating any dependence on imported petroleum for power generation.
‘&e map of El Salvador in figure 8.1 shows the location of thermal sites being explored, together with
The Comisi6n Ejecutiva Hidroeldctrica del
sting power plants, both
mal field is located in the western portion of from the Rio Paz, which forms a portion between El Salvador and Guatemala. The
power plant I s sited on moderately sloping terrain on the northern side of the coasial volcanic mountain chain that extends the length of the country. An aerial view of the power plant and the bore field is shown in figure 8.2.
81

SOY A PAN G 0 1 I
ACAJUTLA SAN SALVADOR I
SAN VICENTE
CHINAMECA a CITIES
THERMAL PLANTS
HYDROELECTRIC PLANTS e 0
L 0 20 40 6 0 k m
0 IO 20 30 mi
Praune 3.1-Map of El Salvador showing geothermal sites and existing power plants [after CEL, 19761.
A GEOTHERMAL PLANT
LI GEOTHERMAL SITES (UNDER EXPLORATION) - c c1

AAVACHAPAN
83

a4 EL BALVADOB [Oh. 8
$.A1 QeoZog y
Information gathered since 1965, when exploration and deep drilling began at Ahuachapin, indicates that the geothermal formation collsists essentially of the following layers :
Brown tuff and pyroclastics (top 50 m) Andesites (next 50 m) Agglomerated tuff and pyroclastics (next 20-150 m) Andesites (next 50-100 m) Young agglomerates (next 100-250 m) Ahuachaph andesites (next 10300 m, absent in parts) Ancient agglomerates (basement rock).
The young agglomerates serve as the reservoir cap, the Ahuachapiin andesites as the aquifer. T h e lithology of the formation is not known precisely, but three faults
cut across the field trending north-northwest. It is believed that the aquifer splits into two layers toward the eastern portion of the field, and that at the western side the aquifer thins out to a contact surface about 500 m (1640 ft) below the surface [G. Cuiillar, personal communict-ition].
388 Wen pvogram and gathering system
At the time of this writing 28 wells have been completed, arranged as shown in figure 3.3. The casing programs for typical production and rein- jection wells are shown in figure 3.4. Since the formation is relatively hard, it is not necessary to install a slotted production liner; for about half of the wells an open hole is sdlicient. For reinjection wells, the inner casing is hung from the surface (not cemented) to allow for msy removal in the event that the well may someday be used as a producer. Table 3.1 sum- marizes information on well completions. “Dual-purpose” wells such as AH-8 and AH-1’7 are producing wells that may also be used for reinjection.
The drilling program for well Al3-26 is given in figure 3.5. Completed in 49 days to a depth of 804 m (2638 ft) , the penetration rate averaged &bout 2 m/h (6.6 ft/h). Drilling mud was used until the aquifer was ,reached at about 400 m (1312 ft) ; drilling proceeded with water to the full depth of the well.
The separation between wells is not less than about 150 m (490 ft) . Over the entire field the average spacing is roughly 23 ha (57 acres) per well, although in the central portion of the field the wells are more densely spaced, 11 ha (28 acres) per well. Figure 3.6 shows the layout of produc- tion and reinjection wells and the location of the powerhouse. The area to the south of the plant is the site of numerous surface thermal manifesta- tions such as steam vents, hot springs, boiling pools, and mud pools (see figure 3.7). Pipelines shown schematically in figure 3.6 do not depict the actual configurations, which include expansion bends (see figure 3.2). The

t 3.21 AHUACHAPAN
* L
FIQUEE 3.3-Arrangement of wells at Ahwhaph. (> e: Wells for Unit 1; 0 =Wells for Unit 2; 0 =Reinjection wells; 0 =Nonproductive web; Q =Collapsed well; 03 = Stand-by wells.
true lengths and diameters of the various steam and liquid reinjection lines are given in table 3.2.
Table 3.3 gives production data for the 10 wells supplying Units 1 and
flow rate are listed for two time periods, October 1976 and April 1978. Average wellhead quality was about 17% in April 1978, whereas it was nearly 19% in October 1976. The highest quality occurs at well AH-26, which delivers 35% steam. This anomalous behavior4s probably caused by a relatively tight formation in the neighborhood of this well that may lead to flashing in the formation. The power potential of well AH-4 is 17 M W , but only 13 MW is being extracted because the size of the wellhead sepa- rator limits flow. Well AH-21 is also an excellent well, with a 9-MW po-
1 2. Wellhead separator pressure, liquid flow rate, steam flow rate, and total
I i

36 EL SALVADOB [Ch. 3
I
slotted liner
Production Zones
Bottom of reservoir v
i i’ i I
L J I . j
I --i 79: dia.
I , casing
I Reinjection
(b)
FIQURE 3A-epical well emsing programs for (a) production and (b) reinjection wells at Ahuachap4n. F
tential and 7-MW actual utilization. Figure 3.8 gives the overall mass balance for the wells serving Units 1 and 2, both with and without rein- jection. Figure 3.9 shows the wellhead equipment at well AH-20.
33.8 Geo@id chrmterietics
Total dissolved solids in the liquid a t the wells average about 18,400 ppm or 1.84%. The principal constituents are chloride (10,430 ppm) , sodium (5690 ppm) , and potassium (950 ppm) . Table 3.4 lists the concentration of all impurities in the liquid from 9 of the 10 wells that supply Units 1
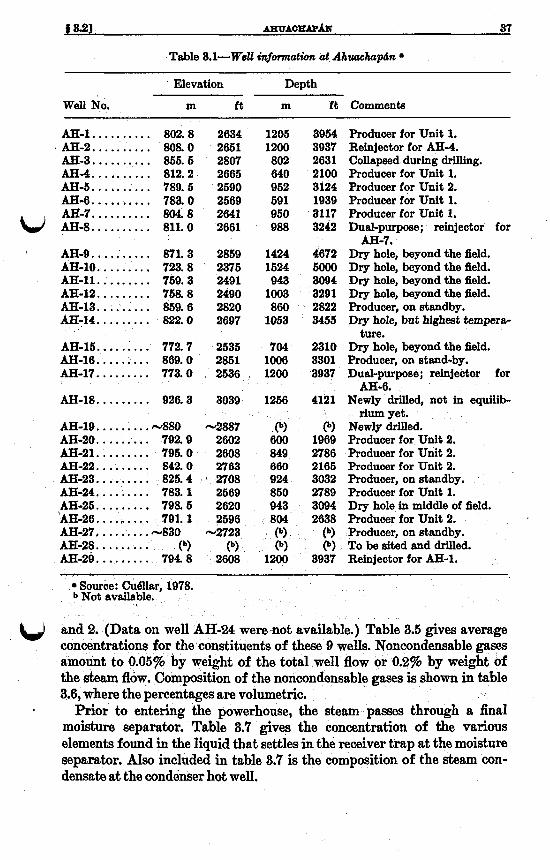
Table 3.1-Well informath at Ahuaehup4n
Elevation Depth
Well No. m f t m f t Commente
W
AH-1. .. .. .. .. . AH-2.. . .. .. .. . AH-3. .. .. .. .. .
802.8 808.0 855.5
AH-4.. . ...... . 812.2 AH-5.. . .. .. ... 789.5 AH-6.. . .. .. .. . 783.0 AH-7. .. .. .. .. . 804.8 AH-8.. . .. .. .. . 811.0
2634 2651 2807 2665 2590 2569 2641 2661
1205 3954 1200 3937 802 2631 640 2100 952 3124 591 1939 950 3117 988 3242
AH-9.. . ...... . 871.3 2859 1424 4672 AH-10.. .... .. . 723.8 2375 1624 5000 AH-11. ........ 759.3 2491 943 3094 AH-12.. .. .... . 758.8 2490 1003 3291 AH-13.. ...... . 859.6 2820 860 2822 AH-14.. .. ..... 822.0 2697 1053 3455
AH-15.. .. ..... 772.7 2535 704 2310 AH-16.. . . .. .. . 869.0 2851 1008 3301 AH-17.. .... ... 773.0 2536 , 1200 3937
AH-18.. .... ... 926.3 a039 1256 4121
AH-19.. .. .... .~880 -2887 AH-20.. , . .... . 792.9 2602 AH-21.. .. .. .. . 795.0 2608 AH-22.. .. .... . 842.0 2763 AH-23.. ...... . 825.4 2708 AH-24. . . . . . . . . 2569 AH-25.. .. .... . 798.6 2620 'AH-26.. .. .. .. . 791.1 2596 AH-27. . . , . . . , . -830 -2723 AH-28.. . . . . . . . (b) (b) AH-29. . . . . . . . 794.8 2608
783.1
(9 600 849 660 924 850 943 804 (9 (9
1200
(b) 1969 2786 2166 3032 2789 3094 2638
(b) (b)
3937
Producer for Unit 1. Reinjector for AH-4. Collapsed during drilling. Producer for Unit 1. Producer for Unit 2. Producer for Unit 1. Producer for Unit 1. Dual-purpose; reinjector for
Dry hole, beyond the field. Dry hole, beyond the field. Dry hole, beyond the field. Dry hole, beyond the field. Producer, on standby. Dry hole, but highest tempera-
Dry hole, beyond the field. Producer, on stand-by. Dual-purpose; reinjector for
Newly drilled, not in equilib- rium yet.
Newly drilled. Producer for Unit 2. Producer for Unit 2. Producer for Unit 2. Producer, on standby. Producer for Unit 1. Dry hole,in middle of 5eld. Producer for Unit 2. Producer, on standby. To be sited and drilled. Reinjector for AH-1.
AH-7.
ture.
AH-6.
Source: Cu6llar, 1978. b Not available.
kJ and 2. (Data on well AH-24 were-not available.) Table 3.5 gives average concentrations for the constituents of these 9 wells. Noncondensable gases amount to 0.05% by weight of the total well flow or 0.2% by weight of the steam flow. Composition of the noncondensable gases is shown in table 3.6, where the percentages are volumetric.
Prior to entering the powerhouse, the sham passes through a final moisture separator. Table 8.7 gives the concentration of the various elements found in the liquid that settles in the receiver trap at the moisture separator. Also included in table 9.7 is the composition of the steam con- densate at the condenser hot well.
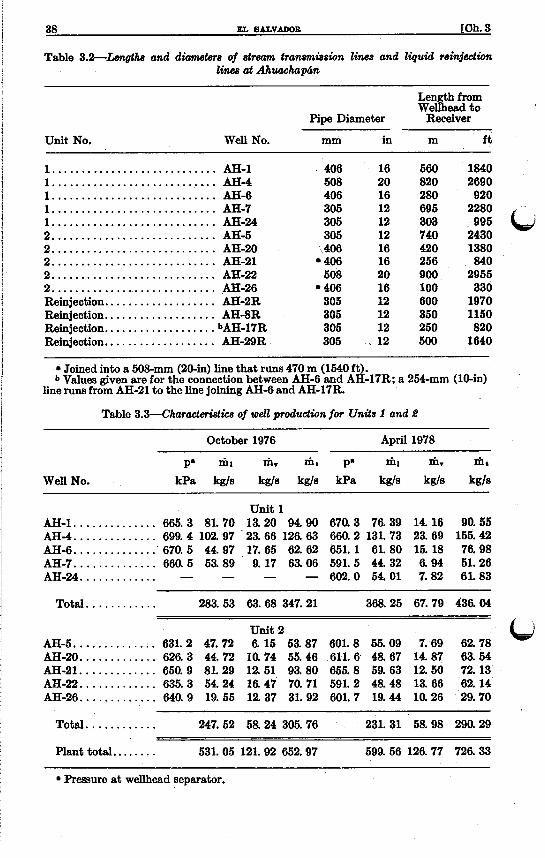
38 EL SALVADOR [Oh. 3
Table 3.2-Lengths and dianUrtsrs of stream transmission lines and liquid reinjection l i m at Ahwrckpdrn
Unit No.
Length from Wellhead to
Pipe Diameter Receiver
Well No. mm in m f t
............................. AH-1 406 16 560 1840
............................. AH-4 508 20 820 2690 1. .. .. .. .. .. .. .. .. .. .. .. .. .. . AH-6 406 16 280 920 1. .. .. .. .. .. .. .. .. .. .. .. .. .. . AH-7 305 12 695 2280 1. .. .. .. .. .. .. .. .. .. .. .. .. .. . AH-24 305 12 303 995 2. .. .. .. . . . . . . .. .. .. . . . . .. .. . AH-5 305 12 740 2430 2. .. .. .. .. .. . . . . .. .. .. . . . . .. . AH-20 ,406 16 420 1380 . . . . . . . . . . . . . . . . . . . . . . . . . . . . . AH-21 406 16 256 840 2. .. . . .. .. . . .. .. . . .. . . .. .. . . . AH-22 608 20 900 2955 . . . . . . . . . . . . . . . . . . . . . . . . . . . . . AH-26 406 16 100 330 Reinjection. , . . . . . . . . . . . . . . . . . AH-2R 305 12 600 1970 Reinjection.. . . . . . . . . . . . . . . . . . AH-8R 305 12 350 1150 Reinjection. . . . . . . . . . . . . . . . . . . bAH-17R 305 12 250 820 Reinjection.. . . . . . . . . . . . . . . . . . AH-29R 305 . 12 500 1640
Joined into a 508-mm (20-in) line that rum 470 m (1540 ft) . b Values given are for the connection between AH-6 and AH-17R; a 254-mm (10-in)
line runs from AH-21 to the line joining AH-6 and AH-17R.
Table 3.3-Charaeteristks of well produdion for Unds 1 and 2
October 1976 April 1978
P. ml m. m, p. 161 m v m, Well No. kPa kg/s kg/s kgls kPa kgls kgls kg/s
unit 1 AH-1.. . . . .. .. .. .. . 665.3 81.70 13.20 94 90 670.3 76.39 14.16 90.55 AH-4.. . . . . . . . . . . . . 699.4 102.97 23.66 126.63 660.2 131.73 23.69 155.42 AH-6.. ... .... .. .. . 670.5 44.97 17.65 62. 62 851. 1 61.80 15.18 76.98 AH-7.. . . ... . . .... . 660.5 53.89 9. 17 63.06 591.5 44.32 6.94 51.26 AH-24. . . . . . . . . . . . . - - - - 602.0 5401 7.82 61.83
Total. . . . . . . . . . . . 283.53 63.68 347.21 368.25 67.79 436.04
Unit 2 AH-5.. .. ... .. . .... 631.2 47.72 6.15 53.87 601.8 55.09 7.69 62.78 AH-20.. . ... . .. .. . . 626.3 44.72 10.74 55.46 611.6 48 67 1487 63.54 AH-21.. . ..... .. ... 650.9 81.29 12 51 93.80 655.8 59.63 12.50 72.13 AH-22.. . ... .. ..... 635.3 5424 16.47 70. 71 591.2 48.48 13.66 62.14 AH-26.. . ... . .. ... . 640.9 19.55 12.37 31.92 601.7 19.44 10.26 29.70
Total. . . . . . . . . . . . 247.52 58.24 305.76 231.31 58.98 290.29
Plant total.. . . . . . . 531.05 121.92 652.97 599.56 126.77 726.33
Pressure at wellhead Sepa&~r.

j 3.21 AEUAOHAPhI 89
Table 3.P-Chentical analyeis of liquid frm wells at Ahuachap4n s
Well Number
Substance AH- AH- AH- AH- AH-1 AH4 AH-5 AH-6 AH-7 20 21 22 26
C l . . . . . . . . . . 10600 . 9050 9110 Na.. ....... 5800 5000 5000 K.. ........ 1000 740 680 SiO,. ....... 577 534 470 Ca .......... 425 400 440 B ........... 147 144 138 Br .......... 46.0 . 35.7 38.1 HCOa.. ..... 34.4 32.5 28. 1 SO,. ........ 30.8 34.2 40.8 Li . , ........ 18.5 15. 7 14.8
I ........... 8.2 6.5 7.0 Rb ......... 7.9 5.6 5.1 Cs .......... 5.8 4.6 4.1 Sr .......... 4.5 4.6 5.7 Sb .......... 2.3 1.9 1.8 F ........... 1.5 1.3 1.2 Mg.. ....... 0.09 0.13 0.24
AS .......... 10.8 10.0 9.9
All values in ppm.
10900 12500 10900 11500 9217 10130 6000 6600 6000 6100 5080 5600 1050 1280 1040 1140 710 900 500 610 556 535 552 500 439 486 450 480 437 430 156 178 155 169 127 142
43.0 50.4 45.9 48.4 39.8 47.7 46.5 26.6 31. 6 40.3 31.5 36.3 29. 7 23.3 30.2 40.5 32.7 44.2
11.6 14.0 12.0 11.8 10.2 11.0 8.5 9.2 8.5 10.1 6.9 8.5
6.3 6.6 6.0 6.3 4.5 5.8 4.5 4.8 4.5 - 4 . 7 4.7 4.5 2. 1 2. 5 - 1. 8 1. 8 1. 6 1. 7 1. 3 1. 4
0.09 0.08 0.07 0.01 0.16 0.30
ia 8 20. o 18. 5 19.1 15. o 17.5
8. 3 8. 5 7. 9 8. 3 5. 2 7. 3
- - -
Table 3.5-Average c h m h l composition of liquid from wells at AhuacLp4n
Substance Concentration bpm)
Chloride, C1 ........ Sodium, Na ........ Potassium, K.. . . . . Silica, S i 4 ......... Calcium, Ca.. ................................ Boron, B. . ...................................
Sulfate, SO, ................................... 34.0
Arsenic, As 1. 3
Rubidium, Rb.. .............................. 7. 1 Ceaium, Cs ................................... 5. 5 Strontium, Sr . , ............................... 4.7 Antimony,Sb ................................. 2. 1 Fluoride, F.. ................................. 1. 5
Bromide, Br.. ..... Bicarbonate, HCOa
Lithium, Li ................................... 17. 5
Iodide, I.. ................................... 8. 1
Magnesium, Mg ............................... 0. 13
Samples taken from wells AH-1,4,5,6,7,20,21,22, and 26.

40 EL
BALV
AD
OB
[Ch. 3

5 3.21 A
EU
A0
-h
41

42 EL EALVAL)OB [Ch. 3
FIGURE 3.7-Surface thermal manifwtations at Ahuachap&n: boiling mud pools and steam vents in foreground, well AH-21 in background [photo by R. DiPippo].

SEPARATORS r TOTAL FLOW I
1
i
i
1
I i
!
1 1
j
1
!
! I I
!
I
r
STEAM I 1 LIQUID TO ' REINJECTION
SILENCERS
I- WASTE WATER
TO CHANNEL
WHEN NO REINJECTION TAKES PLACE TAKES PLACE
@ 7 2 6 . 3 3 kg/s @ 726.33 kg/s
@ 126.77
599.56
Carbon dioxide, COS. .......................... 88.8% Hydrogen sulfide, HSS.. ........................ 12.1% Hydrogen, Ha . . ............................... 0.12670 Nitrogen, N,. ................................. 0.05% Ammonia, NHs Methane, CH ................................
................................ ] 1%


f a21 ARUACEAPAX 45
Table 3.7-compodion of steam eondmute d receiver and hot weU
.Liquid at Receiver Trap Condensate in Hot Well
Concentration Concentration Constituent (ppm) Constituent <pP=d
a ....................... 13.6 C1 ....................... 59. 3 Na ................... 7.15 Na ...................... 130. K . . ....................... 1.25 K ....................... 0. 36 804.. .................... 0.6 SO,.. ................... 181.6 S i a ..................... 1.61 Sios. . ................... 0. 86 ca.. .. :.. ................ 0.80 N E ..................... 0. 36
B. ...................... 0.75 CaCa ................... 6.49 s ........................ 0. 16
pH. ..................... 5.28 pH. ..................... 7. 22
b) H C G . . ................. 2.90 Fe. ..................... 0. 10
834 Emrgy C O n / u e T S h By8tenzg f M Udt8 1 and 8
The layout of the powerhouse, switchyard, and cooling towers is shown in %re 3.10. Cooling towers are oriented so that the prevailing wind carries the plumes away from the powerhouse and transformers. Two steam receivers (one for each unit) are located between the cooling towers for Units 1 and 2 at the end farther from the plant. Collected steam travels by means of elevated pipelines to the final moisture separators and thence to the turbines.' A cross-sectional view of the turbine, a product of Mitsu- bishi Heavy Industries, Ltd., is shown in figure 3.11. It is a five-stage, double-ffow, impulse-reaction machine housed in a single cylinder. The $&-stage blade height is 520 mm (20.6 in). Identical machines are used for each of the first two units.
A schematic flow diagram for each unit is given in figure 3.12. Five wells supply each unit; eteam is separated by means of a simple Webre-type cyclone separator with the steam passing through a ball-check valve prior to entering the steam transmission pipeline. Each turbine exhausts to a low-level, direct-contact condenser fitted with a slanted barometric pipe. This feature allows the condenser hot well to be located adjacent to the turbine building for ease of accessibility to circulating pumps, water treat- ment equipment, etc.
A two-stage steam ejector gas extraction system is connected to the gas cooler section of the condenser. Far each unit there are two sets of extrac- tors arranged in parallel; one serves as a standby system. Cooling towers are of the crossflow, mechancially-induced-draft type. Each has five cells and uses wood packing with fiberglass for the exterior of the stacks.
Technical particulars for Units 1 and 2 are listed in table 3.8. The geothermal energy resource utilization efficiency may be computed using the data from table 3.3 for April 1978 and an output of 60 MW, relative
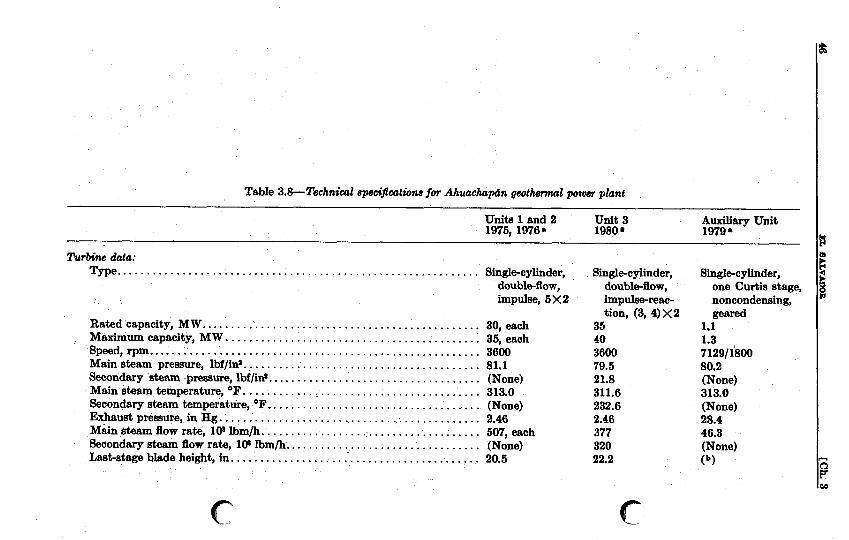
. , . ~ ~ ~ - " .......... .~,-, .. .̂........-..-...............I.. . . . ,, , IY_~IIYI-L, , ..................... ......... , . , . ,., .... .................. , d , l_l-_.i.il_.
Table 3.8-Technical epseijtcatwns for Ahuachup&n gsothmnul power plant
Units 1 and 2 unit 3 Auxiliary Unit 1975, 1976. 1980 1979.
Turbine &a: Type.. ........................................................... Single-cylinder,
double-flow, impulse, 5 x 2
Rated 'capacity, MW.. .............................................. 30, each Maximum capacity, MW .......................................... : 35,each Speed, rpm.. ....................................................... 3600 Main steam pressure, lbf/in*. ....................................... 81.1 Secondary Bteam pressure, lbf/ina.. ... .: ............................. (None) Main steam temperature, OF. ............ ~. .......................... 313.0 Secondary steam temperatuie, OF.. .................................. (None) Exhaust preasure, in Hg. ............................................ 2.46 Main steam flow rate, l(fs Ibm/h. ...................................... 507, each Secondary steam flow rate, 1CP Ibm/h.. ............................... (None) Last-stage blade height, in. .......................................... 20.5
Single-c ylinder, double-flow, impulse-reac- tion, (3, 4) X2
35 40 3600 79.5 21.8 311.6 232.6 2.46 377 320 22.2
Single-cylinder, one Curtis atage, noncondensing, geared
1.1 1.3 7129/1800 80.2 (None) 313.0 (None) 28.4 46.3 (None) (b)

CO7bd6?%3W data: ................................................ Low-level, direct-contact type with (None)
slanted barometric pipe - 80.6
Outlet water temperature, OF.. 104.5 104.5 - 27.0
Cooling water temperature, OF. ..................................... 80.6'
ow rate, 10s lbm/h. .................................. 19.1 - ......................................
................................... Two-stage, steam jet ejector with (None) inter- and after-condenser -
(b) (9 (9
........................................... ............................................ - Suction pressure, in Hg.. 2.32
Gas capacity, ft*/min.. 6,886 S&n consumption, 1P lbm/h. .................................... 9-04, each -
Cooling t o w data: Type. ....................... .................................... cro=flow, mechanically-induced-draft (None)
with vertical axial fans - - -
a Year of startup. b Not available.

48 EL BAI.V&OB [Oh. 3
MOISTURE SEPARATOR
PUMP PIT AREA
GAS EXTRACTOR TURBO-GENERATOR FOR NO.l UNIT
TURBO-GENERATOR
MAIN TRANSFORMER
FIQURE 3.10-Power plant site arrangement: AhuachapBn Units 1 and 2 [MHI, 19771.
to a sink condition at 22.0"C (71.6"F), the design wet-bulb temperature. For these conditions 7,=37%. Overall steam consumption for the plant is about 7.6 Mg/MTV.h (16.8 lbm/kW-h) . 3.8.5 Proposed energy emversion system for Unit d g,
The third unit for Ahuachaph mas originally planned as a 30-MW low-pressure unit operating on steam flashed from separated bore liquid. As the field !became more developed and confidence in the steam supply grew, it was decided to install a dual-pressure unit that would be supplied with medium-pressure (MP) steam from wells together with low-pressure (LP) steam from flashed liquid. The unit mas upgraded to 35 MW as well.
A highly simplified flow diagram for Unit 3 is given in figure 3.13. Hot water at the wellhead separator pressure is drawn from eight wells into


oil coolrr
FIGURE 3.12-F'low diagram for Units 1 and 2 at Ahuachapa [after MHI, 19771.

t 3.21 ~ W ~ O H A P A N 61
t-
HOT WATER FROM COLLECTING TANKS
I I
FROM WELLS LL y1
m m lllh (LP STEAM HEADER) HP STEAM HEADE$
c--J f----D
FROM UNIT 2 STEAM HEADER
GAS EXTRACTOR
I e-----! i
COOLING WATER
FIG&E 8.13-Simplified flow diagram for Unit 3 at Ahwhapth [after Fuji, 19771
els. Steam thus generated leaves each vessel through a pair of ball-check v addition, MP steam produced M P steam fro
and flows to an LP steam header. In paration at three wells is mixed with
header for the existing Unit 2 in a new MP steam ashing a portion of the MP steam from the er, if necessary. The M P steam is admitted
ne entrance after being scrubbed of moisture; the LP steam is admitted to the turbine at a pass-in section. Gas extraction is carried out by a conventional two-stage steam ejecto * gle steam ejector is used to purge the turbine gland seals.
The turbine will be of the dual-pressure, double-flow type in a single cylinder with the medium-pressure section consisting of three stages (es- sentially impulse blading) followed by the low-pressure section of four hpulse-reaction stages. The generator will be air-cooled, rated a t 40,000 kVA, 13.6 kV, a t 60 H z with a 0.875 (lagging) power factor.
Table 3.8 lists the currently projected technical specifications for the third unit, which is under construction and is expected to begin generating electricity early in 1980. According to the data now available, the geo-
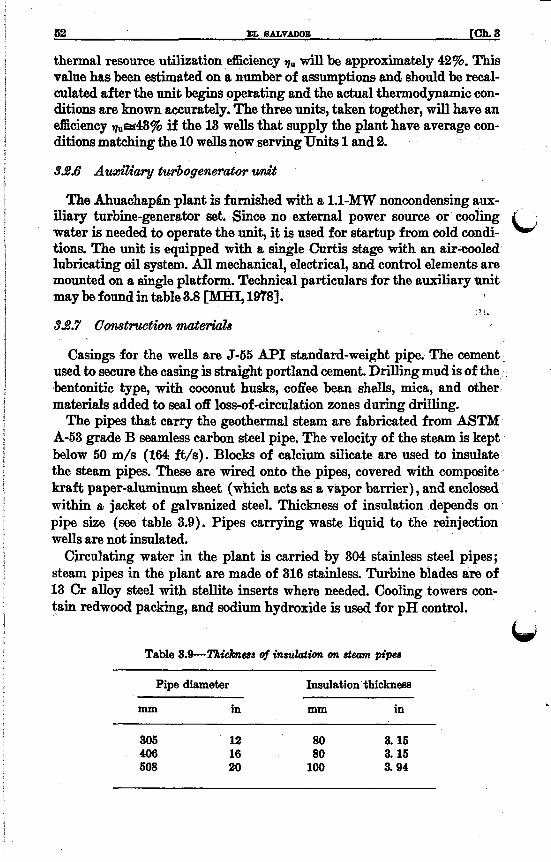
62 Et BALVADOB [ch. a
thermal resource utilization efficiency vu will be approximately 42%. This value has been estimated on a number of assumptions and should be recal- culated after 'the unit begins operating and the actual thermodynamic con- ditions are known accurately. The three units, taken together, will have an
ditions matching the 10 wells now serving Units 1 and 2.
39.6 Aum7kry turbogenerator wit
4 I
efTiciency ~ " ~ 4 3 % if the 13 wells that supply the plant have average con-
Th0 A.huachap&n plant is furnished with a 1.1-MW noncondensing aux- iliary turbinegenerator set. Since no external power source or cooling water is needed to operate the unit, it is used for startup from cold condi- tions. The unit is equipped with a single Curtis stage with an air-cooled lubricating oil system. All mechanical, electrical, and control elements are mounted on a single platform. Technical particulars for the auxiliary Unit may be found in table 3.8 [MHI, 19781.
LJ
' 1. 34.7 ConSfimCCtiW d e & z 8
Casings for the wells are J-55 BPI standard-weight pipe. The cement used to secure the casing is straight portland cement. Drilling mud is of the I sbntonitic type, with coconut husks, cofiee bean shells, mica, and other materials added to seal off loss-of-circulation zones during drilling.
The pipes that carry the geothermal steam are fabricated from ASTM A-53 grade B seamless carbon stcel pipe. The velocity of the steam is kept below 50 m/s (164 ft/s). Blocks of calcium silicate are used to insulate the steam pipes. These are wired onto the pipes, covered with composite kraft paper-aluminum sheet (which acts as a v a p r hr r ie r ) , and enclosed within a jacket of galvanized steel. Thickness of insulation depends on pipe size (see table 3.9). Pipes carrying waste liquid to the reinjection wells are not insulated.
Circulating water in the plant is carried by 304 stainless steel pipes; steam pipes in the plant are made of 316 stainless. Turbine blades are of 13 Cr alloy steel with stellita inserts where needed. Cooling towers con- tain redwood packing, and sodium hydroxide is used for pH control.
L V Table 3.9-~icknurs of insulation on steam pipes
Pipe diameter Insulation thickness
mm in mm in
305 12 80 3. 16 406 16 80 8. 16 508 20 100 3.94

4 3.21 A€IlJAOX€APk 58
33.8 E#'tuent and emheirms handling 8y8tems
Tw70 methods are used for disposal of the waste liquid from the plant. One method is reinjection; the other is discharge to the Pacific Ocean through a covered concreta channel 1 mp (11 fit') in cross-sectional area and 76 km (47 mi) in length.
Four w e b currently kerve as reinjectors (see table 3.2 and figure 3.3). T4e total amount of liquid bein& reinjected (for 60-MW capacity) is 368.8 kg/s (5846 gaVmin), and constitutes about 63% of the waste liquid discharged from the plant. The liquid to be reinjected is taken directly w from the wellhead separators, at the pressure of the separator, and piped tq the reinjection wells without the aid of booster pumps and without chemical treatment or exposure to the atmosphere. Because the temperature of the pquid is not lower than l5OoC (302OF), mineral deposition has been avoided in the reinjection lines and the wells IEinarsson et al., 10751. Morp than 13X106 M g (29X lo* lbm) have been returned to the formation since rejection was started in 1976.
The remainder of the liquid waste, including s t a m condensate from the turbines, is carried through a discharge channel from the plant-around, oveq and through the mountains, eventually to the ocean. The channel passes close to the Rio Paz on the western border of El Salvador, and for a time (until the channel was completed) a short connection between the chanqel qnd the Ria Paz allowed the waste water to be disposed of in that river. Tbi was a temporary and not wholly satisfactory solution. During tbis period it wgs necessary at times to curtail the output of the Ahuacha- p6n plant in order not to exceed the allowable limits on arsenic and boron in the Ria Paz, which is used for irrigation and other purposes, The com- pleted aqyeduct contains 16 siphons (pade from sections of pipe) to carry the fluid over the hills and through valleys across the rugged terrain that lies between the plant and the Pacific Ocean. About 90% of the length of the chaqel is concrete and 10% is pipe. The route was chosen to minimize the average slope of the channel. ' Two labprinth retention tanks in the bore field provide a settling time
of 50 to 60 minutes before the waste water enters the channel. One of these is located between wells AH-1 and AH-25 (see figures 3.3 and 3.6) ; it receives all the liquid from well AH-22 and part of the liquid from AH-4. 4 s can be seen from the photograph in figure 3.14, the open tank is con- siderably easier to clean than the ohannel, which is covered with removable concrete slabs. The other settling tank is located just north of well AH-6 (See figure 8.6). Settling tanks have proved to a very effective means of controlling the deposition of silicR in the effluent lines used for surface disposal of the waste liquid [Cudllar, 19751.
There are no emissions controls on hydrogen sulfide, which reaches con- centrations of 1-4 ppm at the boundary of the plant site. Doynwind of the powerhouse and cooling towers the odor of HzS is noticeable but not objectionable. A minimum of about 100 kg/h (220 lbm/h) of nonconden-


j 3.21 m U A C l W h 56
sables is ejected at full output. This does not include air that enters at the turbine gland seals and in the direct-contact condenser from the cooling water. Of this amount, roughly 95 kg/h) (210 lbm/h) af H,S is emitted, or 1580 g/l\dW.h (3.5 lbm/MW.h), on a specific power basis.
The designers of this'*lant have done an admirable job of minimizing the adverse environmental effects possible from such a plant. Although the plant site is sparsely populated, the city of Ahuachaph is only a few kilometers away and some families actually live on the plant property. These inhsbitants use the hot springs for domestic purposes and graze their cattle among the wellheads and steam pipes of the bore field. The use of a covered waste liquid channel and the careful design and arrangement of the wellhead equipment have prevented despoliation of the countryside and effected a reasonable harmonization of technology and nature.
Actual capital cos ts 1 and 2 and esthatedecapital costs for Unit 8 are given in table 8.10. Average installed capital cost per kilowatt of capacity for the first two units i s about US$825, including the $10 mil- lion cost of the waste disposal channel. Table 3.11 contains a summary of the cost of electricity generation at Ahuachaph over the history of the plant. The Wres in table 3.11 do not include interest payments (which are made) or taxes (which are not paid). Even so, electricity produced from geothermal energy constitutes a very inexpensive source for El Salvador, as the round figures in table 8.12 for alternative sources show. The project has been 6nanced through lo the World Bank [Sheehan, 19773, bonds issued by CEL, and cash.
m a l power plant has been highly successful. The plant is a vital link in the electricity supply system of El Salvador, which relies on three types of power stations: hydroelec- tric, therrnaI (fossil fuel), and geothermal. As can be seen from the figures in table 8.18, the Ahuachap6n plant constitutes about 14% of the country's rated installed electric generating capacity. However, during the dry sea- son when the actual capacity of the hydro plants falls to about 50% of their rated value, the geothermal units constitute nearly 20% of actual capacity. The electrical generation, annual capacity factors, and the per- centage of total generation in El Salvador of Units 1 and 2 at Ahuachaphn are given in tsble 3.14. Unit 1 began in June 1975 and Unit 2 in June 1976.
The geothermal plant has been essentially free of major breakdowns. This is reflected in an availability factor of 95% based on outages caused by breakdowns alone [availability= (total hours -outage hours caused by breakdowns) /total hours]. When scheduled maintenance is included with breakdown outage,the availability factor is 84%. For the sake of compari-

Table 3.10-Capital eo& for geothmnal power un& a1 Ahuachaph
Item Unit 1 unit 2
(US$1975) (US$1976) Unit 3
(US$ est.)
Turbogenerator, condenser, eooHng water system, wellhead equipment, turbine $8, OOS, OOO
Steam piping, including supports, insulation, and drains. 536,526.00 991,679.20 1, 954 OOO controls. ........................................................... $3, 423,740.48 $5,205,803.80
................... E'lecfrical equipment. .................................................. 790, m2. 18 613,576.60 700, OOO A l l x ~ ~ e q u i p m e n t 225, 484.06 68,313.00 110, OOO Well drilling and piping. 3,200, ma 00 3,200, OOO. 00 1, OOO, 000
Total. -. 31,565,990.27 18,031,681; 60 20, m, 000
................................................... ...............................................
Other d d engineering, installation of equipment, studies, engineering, admin- 8,240, 000 istrstion, etc. ....................................................... b 23,389,967.55 b ?, 952,309.00 .......... ..............................................
Estimates shown were made in W75; Istest estimates (1979) for Unit 3 total about $35,000,000. Coat of waste water disposal ehannel ($10,000,000) has been allocated between Units 1 and 2; upon completion of Unit 3 it will be
allocated among the three unitp,

j 8.21 A E U A O E A P ~ 67
Table 3.1 1-Cost of deetricity generation at Ahuuchapdn (exclzlsive of interest)
Fxpensea 1975 1976 1977 0 1978 (est.)
Production. ..................... $82,191 $398,363 $584,340 $613,600 Depreciation.. .................. 235,619 691,222 1,350,731 2,040,000 General. ....................... 24,313 114,680 187,650 192,000
Total.. .................... 342,123 1,104,165 2,122,721 2,845,600
Generation (MWeh) d , ............ 72,330.6 279,800 400,051 418,400 Specific cost (mill/kWeh) a. ....... 4.73 3. 95 5. 31 6. 80 t, Specific cost (d /kW.h) I.. ...... 5. 14 4.29 5. 77 7. 39
a Unit 1 for 7 months of the year. b Unit 1 for full year: Unit 2 for 5 months. a Both units for full year. d Gross generation; net generation is 8% less.
Based on gross generation. f Based on net generation.
Table 3.12-Cost of electricity from various 80urces C El Salvador ~~
Cost of electricit Type of power plant (US d / k W d
Hydroelectric.. ............................. 4 Geothermal.. ............................... 6
25 Thermal (bunker C oil). ..................... Gas turbine (diesel).. ........................ 50
Table 3.13-Installed eledrie power c a p d y in El Satvador (as of mid-1078)
Unit Name Capacity Totkl
Hydroelectric. ...... Cerron Grande Nos. 1 and 2. . .... 135 MW 5thof November.. .............. 82 MW Guajoyo ....................... 15 MW
Thermal. ...... . Acajutla ........................ 63 MW Soyapango (gas turbine). ......... 68.6 MW Gas turbines... ................. 6.6 MW
Geothermal.. ....... Ahuachaph Units 1 and 2. ...... 60 MW
232 MW
128.2 MW
60 MW
1978 Total installed Capacity.. .............................. 420.2 MW

Table 3.14-Electricity generation at Ahuachup6n
Percentage
Year generation factor generation Electrical Capacity of total
1975 72,331 MW-h 47 11. 8% 1976 279,800 MW-h 1977 400,051 MW*h
u son, table 3.15 provides 1977 figures for the hydroelectric plants, which are generically noted for high reliability.
A complete overhaul of each unit is carried out once every 2 years. It takes about 1 month to complete each inspection. Inspections are scheduled to coincide with the wet season so that sufficient hydroelectric capacity is available. Wellhead equipment is given a thorough inspection and clean- ing at least once per year, and each well is visited on a rotating basis. It takes about 1 month to cover all the wells. Maintenance of the bore field is handled by the following teams: general maintenance by 1 engineer and 9 mechanics; measurements hy 1 engineer and 7 persons; operations by 1 engineer and 6 persons. The geothermal plant is maintained by 5 en- gineers and 77 persons.
There have been relatively few problems with operation of the plant. The steam filters for the Unit 1 turbine failed and caused damage to the first- and second-stage buckets. The shell of one of the aftercoolers in the gas extraction system split along a weld that had been exposed to the direct impingement of the flow from the second-stage ejector. The power transformer for Unit 2 failed in June 1978. These have been the only major failures of the energy conversion equipment during the 3 years of operation.
In the wells and gathering system, premature failure of some of the rupture disks has occurred. These 305-mm-diameter (12-in), 3-mm-thick (%-in) aluminum disks have developed pits and have failed, requiring a shutdown of the well. "he failures most likely are caused by a combination of stress cracking and fatigue. Pressure relief valves will be installed on Unit 3 and backfitted on Units 1 and 2 if these prove satisfactory. cpr
Table 3.15-hfonnance factors for hydroelectric plants in El 8alvador (1977 data)
Capacity Availability Plant factor factor
Cerron Grade. 55% 96 % 5th of November. ............... 43% 93% Guajoyo. ....................... 65% 93%
.................

f 3.23 A H U A O H A P ~ 69
In addition, one of the inlet elbows on a wellhead separator gave way. And finally, there was a collapse and eruption of well AH-24 in November 1976 and of well AH-20 in April 1978. The damage has been repaired and both wells are now in production [G, Cudlar, personal communication].
During the 19 months from October 1976 to April 1978, little change in the total geofluid mass flow rate has been observed (see table 3.3). I n fact, the original four wells feeding Unit 1 showed an increase of 7.8%, while the five wells serving Unit 2 dropped by 5%; overall, total flow increased by 1.8%. I n that period a new well was brought on-stream ( AH-24) , but these percentages exclude the flow from this well. There has b n no plugging of production or reinjection wells. Well AH-25 has not produced geofluid even though it is located within 200 m (650 f t ) of four highly productive wells. Most likely a local zone of impermeable material surrounds this particular well. All other dry wells were at the periphery of the field and served to define the limits of the producing reservoir (see table 3.1 and figure 3.3).
Tests have shown that fluid reinjection plays an important role in main- taining reservoir pressure. While it does not seem necessary to reinject all the waste liquid, it is essential to control the amount being reinjected rela- tive to the amount of fluid being withdrawn. At present about 63% of the waste liquid from the plant is reinjected; after Unit 3 comes into service, this percentage will fall to about 30%. Reinjection wells have been sited at the periphery of the field, downstream of the assumed northwestward recharge flow in the aquifer [Romagnoli et al., 19751. In some instances, the reinjected fluid finds its way upward between the reinjection well cas- ing and the bore hole (see figure 3.4), flowing into the reservoir instead of into the basement as intended. Reinjection may also have contributed to the lack of trouble with subsidence, although the formation is relatively hard and should not be subject to significant subsidence in any event.
3.3 Geothermal areas under exploration
rate in electrical demand, El Salvador is exploring four additional geothermal areas. The actual total generation from all types of power plants and the maximum demand are shown in table 3.16 for 1976 and projected to 1080. To meet this expected
ctcd b a n d s for electricity in E=l &ahador
1975 1980 (actual) (projected)
Total electrical generation. . . . 965.9 GW.h Maximum demand.. . . . . . . . . . 183.6 MW 351 MW
1864.7 GW.h

60 EL SALVADOR [Ch. 81
demand, CEL plans to have on-line in 1980 a total capacity of 455.2 MTV with 95 MW being installed a t Ahuachaph Thus 21% of the country’s in- stalled electrical capacity in 1980 will be geothermal. The sites a t which future geothermal power stations may be located are briefly described in the following sections.
33.l Berlin
This field is located in eastern El Salvador, about 90 km (56 mi) from San Salvador, 18 km (11 mi) east o€ the Rio Lempa, and 6 km ( 4 mi) south of the Pan American Highway. Exploration took place at Berlin simultaneously with Ahuachaphn in 1985 when two deep wells were drilled. The terrain is considerably more rugged than that at Ahuachapin, and this fact influenced the decision to proceed with Ahuachapitn for the first geothermal power plant, although the results of the early exploratory studies at Berlin were encouraging. The first deep well was drilled to a depth of abont 1800 m (5900 ft) and encountered a temperature of 271°C (520OF). The geofluid at Berlin contains roughly 10,000 ppm (1%) of total dissolved solids. This area is expected to be the site of the next (the fourth) geothermal unit in El Salvador by 1984/1985. Exploration is con- tinuing at the site; ultimate capacity is estimated to be 100 MW(e).
3.33 Uhimmca
This field is about 20 Ism (12 mi) east of Berlin and 17 lrm (11 mi) west of the city of San Miguel. Exploration is presently underway. A geo- thermal power unit is expected to be operating there by 1985 and may eventually support 100 MW (e).
3.3.3, Sam Vicelzte
The Snn Viccntc gcotheriiial field is located in east-central El Salvador, 50 km (31 mi) east of Snn Salvador and 40 lun (25 mi) west-northwest of Berlin. Extensive exploration activity is taking place. The potentinl of this site is estimated at 100 MW( e).
3.34 Chipihpa
This nrea is aboiit 5 liiii (3 mi) east of the Ahiiachapiin geothermal field and wns the site of the first deep well drilled in El Salvador. Chipilapa may share Ahiiachapiin’s geothermal field nnd is expected to develop nhoiit .io M W ( e ) in the futiire. -

REFEBEXCELI 61
REFERENCES a
CEL, 1976. “Annual Report 1976 : Comisidn Ejecutiva Hidroelectrica del Rio Lempa,”
Cukllar, G., 1975. “Behavior of Silica in Geothermal Waste Waters,” #an Francisco,
Einarsson, S . S., Vides R., A., and Cukllar, G., 1975. “Disposal of Geothermal Waste Water by Reinjection,” San Francisco, 1976, Vol. 2, pp. 1349-1363.
Fuji, 1977. “Ahuachaph Unit No. 3, CEL, El Salvador: Technical Particulars; Steam Flow Diagram, PL 311188; General Arrangement, PL 210640 and PL 210641; Geothermal Turbine Sectional View, ST 418390,” Fuji Electric Company, Ltd., Tokyo.
MHI, 1977. “Geothermal Power Plant: Ahuschapin 30,000 kWx2 units in El Sal- vador, C. A.,” Mitsubishi Heavy Industries, Ltd., Tokyo.
MHI, 1978: “List of Geothermal Power Plant,” Mitsubishi Heavy Industries, Ltd., . Tokyo. Ilomagnoli, P., CuBllar, G., Jimener, M., and Ghezzi, G., 1975. “Hydrogeological
Characteristics of the Geothermal Field of Ahuachaph, El Salvador,” Sun Fran-
Sheehan, R. H., 1977. “Economic Aspects of Geothermal Energy,” in Minutes 6th CATMEC Meeting, Brown Univ. Rep. No. CATMEC/S, DOE No. COO/4051-9, pp. 1-5 and Appendix A, Providence, R.I.
See note on p. 24.
San Salvador.
1976, VOL 2, pp. 1337-1347.
I I
c i s ~ , 1976, ~01.1, pp. 563-574.
,

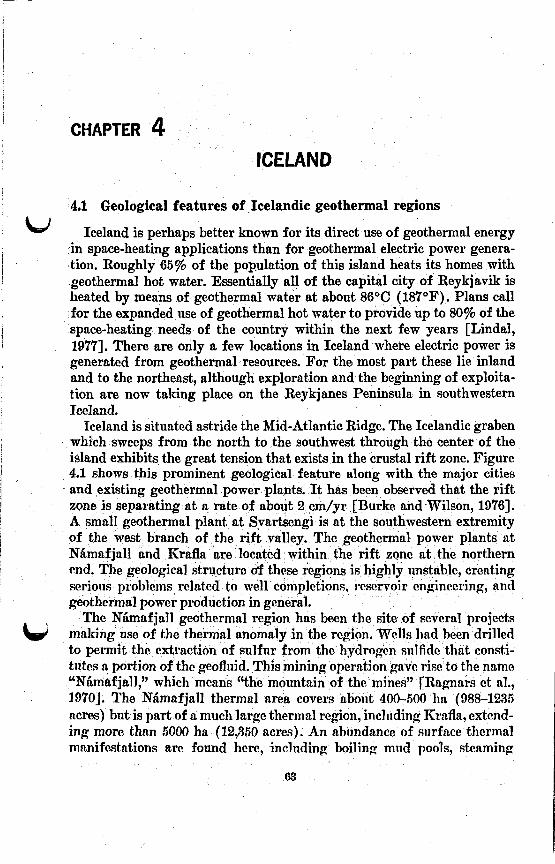
CHAPTER 4 ICELAND
4.1 Geological features of Icelandic geothermal regions
Iceland is perhaps better known for its direct use of geothermal energy in space-heating applications than for geothermal electric power genera- tion. Roughly 65% of the population of this island heats its homes with geothermal hot water. Essentially all of the capital city of Reykjavik is heated by means of geothermal water at about 86OC (187°F). Plans call for the expanded use of geothermal hot mater to provide up to 80% of the space-heating needs of the country within the next few years [Lindal, 19771. There are only a few locations in Iceland where electric power is generated from geothermal resources. For the most part these lie inland and to the northeast, although exploration and the beginning of exploita- tion are now taking place on the Reykjanes Peninsula in southwestern Iceland.
Iceland is situated astride the Mid-Atlantic Ridge. The Icelandic graben which sweeps from the north to the southwest through the center of the island exhibits the great tension that exists in the crustal rift zone. Figure 4.1 shows this prominent geological feature along with the major cities and existing geothermal power plants. It has been observed that the rift zone is separating at n rate of about 2 cm/yr [Burke and Wilson, 19761. A small geothermal plant at Svartsengi is at the southwestern extremity of the west branch of the rift valley. The geothermal power plants at Niimafjall and Krafla are located within the rift zone at the northern end. The geological structure ctf these regions is highly imstable, creating serioiis problems related to well completions, 1c voir engineering, and geothermal powor production in general.
The Niimafjall geothermal region has been the site of several projects making use of the thermal anomaly in the region. Wells had been drilled to permit t,he extraction of sulfur from tho hydrogen sulfide that consti- tutes a portion oflthe geofluid. This mining operation gnvc fisc to the name “Niimaf jall,” which means “the mountain of tha mines” FRapars ct al., 1970J. The Niimafjall thermal area covers about 400-500 ha (988-1285 acres) but is part of a much large thermal region, including Krafla, extend- ing more than 5000 ha (18,350 acres). An abundance of mirface thermal manifestations are found here, including boiling miid pools, steaming
63

84 I O W D [Ch. 4
MAJOR CITIES
0 GEOTHERMAL POWER PLANTS -
0 SO IOOKa
FIGURE 4.1-Map of Iceland showing rift sones, major cities, and sites of geothermal power plants.
ground, and fumaroles. The area is highly fractured with fissures and faults trending north-northeast/south-southwest. Rocks are of the silicic volcanic type and range in composition from basaltic andesites to rhyolites.
As can be seen from figure 4.1, Krafla lies in the same volcanic rift zone as does Nhafjall . The Krafla area was most recently subjected to a series of strong seismic events. In July 1975 earthquake tremors were detected. Gradually these increased in strength, and on December 20, 1975, lava burst out in LeirhnjGkur, only 3 km (2 mi) from the site of the Krafla plant. Although the lava flow lasted only a few hours, steam continued to erupt until the end of the day. During this period 2000-4000 earth tremors were recorded each day.
During the first 3 months of 1976, there occurred seven earthquakes of magnitude greater than 4.0 on the Richter scale, with two of these exceed- ing magnitude 5.0. All of these were centered within a few kilometers of the plant site. By June 1976 most of the activity had ceased, but continuous vigilance is carried out by means of seismic moniturs and field observations [Sblnes, 19’761. This recent activity has resulted in the formation of a large number of new fissures that traverse the geothermal fields in the Krafla area. These trend mostly north-south through the southern border of the caldera in which Krafla is located. A number of new hot springs and boil- ing mud pools were also created [PBlmason et al., 19751.

W
I
W
8 4.21 XAMAFJALL 65
4.2 Ngimafjall
43.l Wdt program a& gatherhg qm%m
The geothermal resource at N h a f j a l l is being employed to process diatomaceous earth, which is used &g a filter aid. The diatomite plant at Mfvatn is supplied with steam from wells at the Nhafjall field [Birsic, 19771. The geothermal power plant, also known as Iusilidjan, is relatively amall and used to supply electricity for the processing plant. The arrange- ment of the wells relative to the power plant and adjacent diatomite plant is &own in Sgure 4.2. A number of shallow wells (not Shawn) were drilled
POWER PLANT
N 7 DIATOMITE PLANT
o N 1 0 5OOm
0 N2
FIGUEE 4.2-Arrangement of wells at NhafjaJl to Bewe diatomite processing plant and 8-MW noncondensing power unit [after Ragnlug et d., 19701.
from 1947 to 1953 for sulfur mining. The present production wells were begun in 1963, with the first of these, N1, being completed in 1966, fol- lowed by N2 and N3 in 1968. The wells are located along two faults and are separated by about 90 m (295 ft) .
Since the uppermost 180 m (690 ft) of the formation are permeable, loss of circulation is often encountered during the shallow drill% phase. Re- peated cementing is required to prevent the wells from collapsing. The
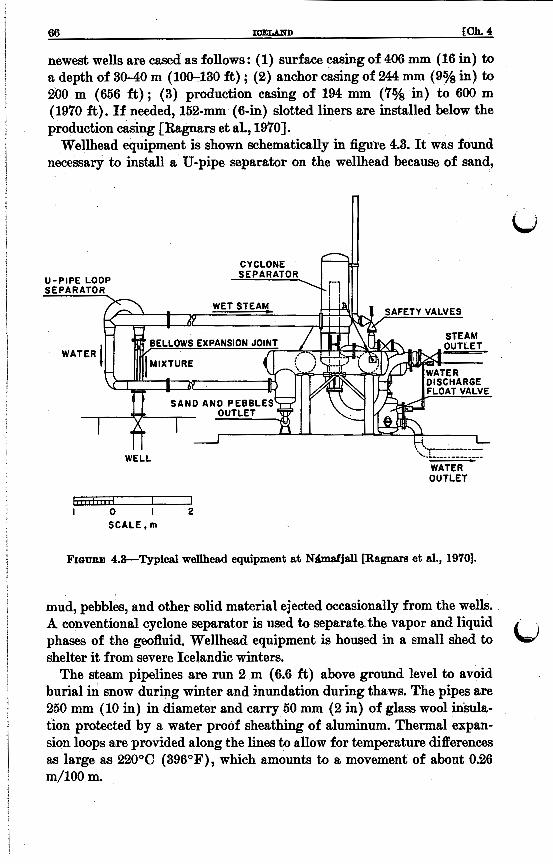
newest wells are cased as follows : (1) surface casing of 406 mm (16 in) to a depth of 30-40 m ( l W 1 3 0 ft) ; (2) anchor casing of 244 mm (9% in) to 200 m (656 ft) ; (3) production casing of 194 mm (7% in) to 600 m (1970 ft) . I f needed, 152-mm (6-in) slotted liners are installed below the production casing [Ragnars et al., 19701.
Wellhead equipment is shown schematically in figure 4.3. It was found necessary to install a U-pipe separator on the wellhead because of sand,
CYCLONE d4 U-PIPE LOOP
I I WELL -
I 0 I 2 SCALE, m
FIGURE 4.3-Typical wellhead equipment at Nhafjall [Ragnars et al., 19701.
mud, pebbles, and other solid material ejected occasionally from the wells. A conventional cyclone separator is used to separate the vapor and liquid phases of the geofluid. Wellhead equipment is housed in a small shed to shelter it from severe Icelandic winters.
The steam pipelines are run 2 m (6.6 ft) above ground level to avoid burial snow during winter and inundation during thaws. The pipes are 250 mm (10 in) in diameter and carry 50 mm (2 in) of glass wool irissila- tion protected by a water proof sheathing of aluminum. Thermal expan- sion loops are provided along the lines to allow for temperature differences as large as 22OOC (396"F), which amounts to a movement of about 0.26 m/100 m.

j 4.23 I4MAFJAI.L 65
.&3.8 GeofEuid characteristics
The wells produce a mixture of liquid and vapor plus an amount of non- condensable gases equal to about 1% (by weight) of the steam flow. The composition (by volume) of the noncondensable gases is roughly as fol- lows : hydrogen sulfide, 52% ; carbon dioxide, 32% ; hydrogen, 12% ; other gases such as nitrogen, methane, argon, etc., 4% [Bjornsson, 1968). Down hole temperatures of nearly 30OoC (572°F) have been observed ; normal steam delivery temperature is about 183OC (361°F). Each well produces about 23 Mg/h (55,000 lbrn/h) of separated steam a t a pressure of 1078 kPa (156 lbf/in2). The total dissolved solids in the liquid (clown-hole) is about 1000 ppm, nearly 60% of which is silica. At 25°C (77°F) the liquid has a pH-7.
4.83 E?WT'g?/ CO?&'Ve?'SW?& 8?/8te??Z
The power plant was of the noncondensing type with a nominal capacity of 3.0 Mw. The original turbine-alternator was manufactured by British Thomson-Houston and had a rating of 2.5 MW. It was purchased second- hand by the Lax6 Power Works to reduce construction time. The plant was, in fact, designed and built in 7 working months [Ragnars et al., 19701. Recently the turbine had been upgraded to 3.0 M W .
The configuration of the power generation equipment is shown in figure 4.4. A final cyclone separator was required at the powerhouse to remove moisture that condenses out of the steam during transmission from the wells to the power plant. The exhaust stack/silencer stands beside the building, rising about 9 m (29 ft) above ground level. The powerhouse is quite compact, being 12.5 m wide, 8 m longer, and 7.5 in high (41 x 26 x 21 ft), Because of the climate, the transformer was located inside the \
building. I
Since the plant was of the noncondensing type, it had a low resource uti- lization efficiency. On the assumption that 20% of the geofluid is vapor at the wellhead and that the appropriate ambient sink temperature for the region is 11°C (51.8"F), then the utilization efficimcy is 14% and the plant consumed 82.5 kg of gcofluid/lcW -11 (182 Ibin/IW -11). Technical specifi- cations for thc! Nliirit~fjall unit are contained in table 4.1 (SCC page 73).
43.4 EcrmomiC data 4 operating experience

68 IOELAND [Ch. 4
I
SECTION A-A
C-B
- SECTION B-B
n 4
m
FIGURE 4.&Layout of 3-MW geothermal power plant at Nllmafjall [Ragnars et al., 19701.
The power plant at Nhafjall is no longer operational. Continuing volcanic activity in the region has damaged the boreholes, and there is only enough steam to supply the diatomite plant a t Mfvatn. There are no plans to set the power plant in opemtion again in the near future, and the tur- bine has been removed for use at another location.
4.3 Krafla
43.1 PZmning
The geothermal power plant at KrafIa is the first major power station of its type in Iceland. An advanced design, it uses a secondary flash pro- cess to generate additional steam for power generation from liquid that would otherwise be wasted. "he project got underway officially in April 1974 when the Icelandic Parliament passed an act calling for construction of a geothermal power plant a t Krda. A number of agencies and organiza- tions have been involved in the planning, design, construction, and opera- tion of the plant. These include :
Rrafla Geothermal Project Executive Committee-Responsibility for planning and construction of power plant, building and turbine.

National Energy Authority of Iceland-Well drilling, steam win- ning, design, and construction of steam gathering system and liquid waste disposal system.
Nature Conservation Councilr‘onsent for plant design, especially waste water disposal as it impacts the environment, specifically Lake Mfvatn and River Lax&.
State Electricity Works--Electncal switchyard and transmission of power away from the site.
A large number of subcontractors have been commissioned for the actual w operations, including the Rogers Engineering Company, Inc., of San Fran- cisco who did the mechanical engineering for the power plant.
.433 wen progrm
A series of exploratory surveys were conducted from 1970 to 19’78 in the Krafla area. These included geological, geochemical, and geophysical (electrical resistivity and magnetic) surveys. As a result of the magnetic low (caused by hydrothermal alteration of magnetite) and the delineation of the field by the resistivity survey, two exploratory wells were sited and drilled to depths of about 1100 m (3600 ft) .
One of these was quite hot, with a bottom-hole temperature of 298°C ( 5W°F), but was a poor producer (low permeability). It was estimated that a temperature of 330OC (626°F) mould be encountered at a depth of 2 km (6560 ft), the depth of the proposed production wells. The other exploratory well was an excellent producer but yielded relatively cool geofluid. The low temperatures were caused by an influx of cool water from a shallow aquifer at a depth of about 840 m (1100 f t ) . Although a hih-temperature reservoir lay a t deeper depths, the cold water from the shallow reservoir resulted in bottom-hole temperatures of only 210°C (410°F). In the case of production wells that intercept the shallow reser- voir, the upper zone will be sealed off to prevent the degradation of fluid temperature arising from mixing of the fluids from the hot and cold pro- ducing zones [J. T. Kuwada, personal communication].
A plan view of the power station site is given in figure 4.5 showing the locations of the powerhouse, cooling tower, cooling pond, and proposed wells. Well locations are tentative and subject to change. Also shown are the sites of recent volcanic activity-hirhnjiikur, mentioned earlier, and Viti (“Hell”), a crater formed at the beginning of the “Fires of Mfvatn” in 1’724. The proximity of these centers of volcanic action to the Krafla bore field is evident. To date 12 wells have been completed and 2 more are planned for the summer of 1979. Pigure 4.6 shows a typical casing pro- gram for a production well. The wells are capped by a 254-mm (10-in) gate valve rated at 6.2-10.3 MPa (9OO-150O lbf/ins).

70 IOJELAKD [Oh. 4
LEIRHNJUKUR 0 VlTl 0
@ . e dr: 0
BORE 0 >WELLS F IELD e 0
FLASH STATION
0
HOUSE COOLING TOWER
0
t N
0.5
SERVICE AREA
1.0 km di APPROX. SCALE
FIGURE 4.6-Arrangement of Krafla geothermal power plant and ateam wells (idealized) [after S6lnes, 19761.
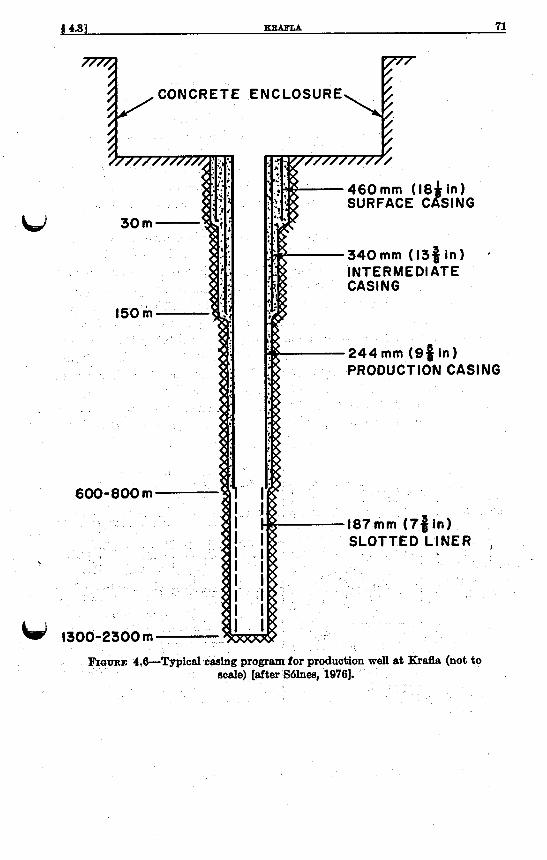
1 71 4 4.3 1 KBAFLA
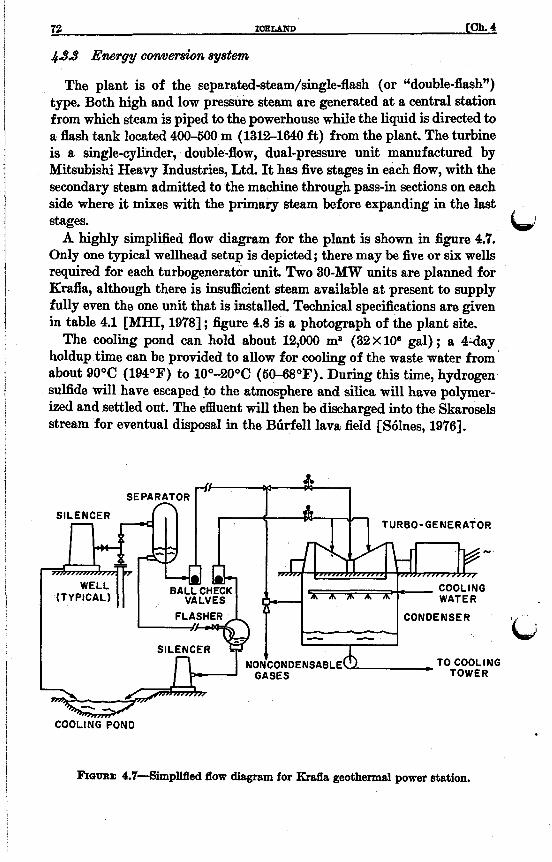
12 IOELAXD [Oh. 4
.$.A9 Energy conversion system
The plant is of the separated-steam/single-flash (or “double-flash”) type. Both high and low pressure steam are generated a t a central station from which steam is piped to the powerhouse while the liquid is directed to a flash tank located 400-500 m (1312-1640 ft) from the plant. Th0 turbine is a single-cylinder, double-flow, dual-pressure unit manufactured by Mitsubishi Heavy Industries, Ltd. It has five stages in each flow, with the secondary steam admitted to the machine through pass-in sections on each side where it mixes with the primary steam before expanding in the last stages.
A highly simplified flow diagram for the plant is shown in figure 4.7. Only one typical wellhead setup is depicted; there may be five or six wells required for each turbogenerator unit. Two 30-MW units are planned for Krafla, although there is insdcient steam available a t present to supply fully even the one unit that is installed. Technical specifications are given in table 4.1 [MHI, 19781; figure 4.8 is a photograph of the plant site.
The cooling pond can hold about 12,000 m8 (32 X lo6 gal) ; a 4-day holdup time can be provided to allow for cooling of the waste water from about 90°C (194°F) to 10”-20°C (50-68°F). During this time, hydrogen sulfide will have escaped to the atmosphere and silica will have polymer- ized and settled out. The d u e n t will then be discharged into the Skarosels stream for eventual disposal in the BGrfell lava field [S6lnes, 19761.
REO-GENERATOR
CONDENSER
TO COOLING
COOLING POND
FIGURE 4.7-SimplSed flow diagram for M a geothermal power dation.

.# 4.31 lcBAFLA 73
Table 4.1-Technical specifications for Icehndic geothermal power stations
Krafla Ngmafjall Unit 1 Svartsengi 196gb 1977b 197flb
~~ ~~ ~~ ~~
Turbine data: Type.. ....................... Single-cyl- Single-cyl- AEFKANIS
inder, one inder, dou- type Curti ble-flow, GT 63, stage, dual-ad- geared noncon- mission, densing impulse-
reaction Rated capacity, M W (per unit). . 3.0 30.0 1.0 Maximum capacity, MW. ...... 3.4 , 35.0 1.0 Speed, rpm.. ................. 3000 3000 4479/1500 Main steam pressure, lbf/inl. ... 142.7 110.0 78.3
Secondary steam pressure, - 27.6 d
Secondary steam temperature, - 2q.4 - Exhaust pressure, in Hg.. ...... 31.4 3.5 60.2
Secondary steam flow rate, 142 (3
Type..;,.. ....... ........ (None) Low-level, (None)
W
Main steam temperature, OF. ... 354.6 334.4 311.0
Ibf/in*
OF
Main steam flow rate, 1V lbm/h. 109 417 ' 70.5
1CP lbm/h Condenser data:
direct- contact, tray type
71.0 ( 9 115.2 (3 12.4 ( 0 )
. Krafla Unit 2 is identical to Unit 1 and is under construction. b Year of startup. 0 Not available.
C i
w The capital investment figures given in table 4.2 are projected values made ~IJ 1976; it is quite likely that the cost of the wells and steam trans- mission system will exceed the figures give in this table. I n fact the latest estimates place the total cost at roughly $55 million. Cost per installed kilowatt is based on the full 60,000-kW station capacity.
&9.6 Operading experience
At present about 7 MW is being produced from five wells that have proved troublesome. Although the geofluid is relatively clean (TDS-
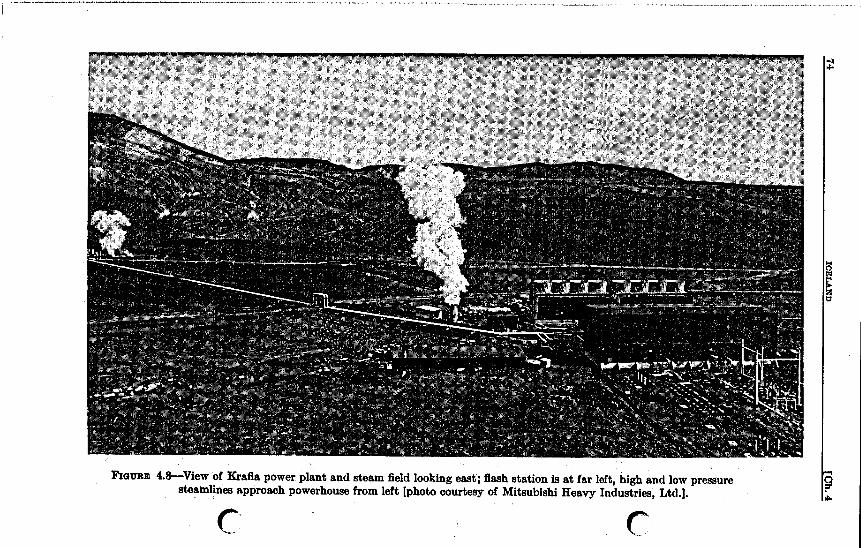
74 IC
EL
AN
D
[Ch. 4

$4.41 6VABT6EIPBI (QBINDAVIK) 75
Table 4.2-Btimated capital co& for Xr&a geothermal power p h n t ~ ~ ~~~ ~
Item Capital Cost unit Cost
Powerhouse, energy co n equipment, substs-
Production wells and complete steam gathering tion, st& housing, .................... $433/kW
system.. ..................................... 10,000,000 167/kW Krafla to Akureyri.. ........ 3,300,000 55/kW
........................... 39,300,000 655/kW
~ g s t s are given in US$.
lo00 ppm with about 650 ppm silica), the wells have been subject to clogging, Two plugs seem to develop: a deep plug at about 1550 m (5085 ft) which consists of irgn sulfide, and a calcium carbonate plug at about 700 m (2300 ft). In a short period of time, the 187-&-diameter (79&in) hole in the slotted liner is reduced to about 38 mm (1% in). One of the two production zones lies between the two plugs, and it is possible that the calcium carbonate plug may be eliminated by blocking off the upper pro- duction zone [J. T. Kuwada, personal communication]. In any event, it now seems evident that the cause of poor production is the presence of these deposits in the bore holes rather than collapsing of the formation from earthquake activity as was earlier believed.
4.4 Svartsengi (Grindavik)
A 2 X 1-MW geothermal power unit is located in Svartsengi near Grinda- vik on the Reykjanes peninsula in southwestern Iceland [Gudmundsson, 19783. It is part of the power plant supplying the Sudurnes District Heat- ing that includes four 12.5 MW thermal units to serve the 12,000 people of the Reykjanes peninsula with 85OC (185OF) hot water. Bottom-hole tem- perature is 235°C (455OF), the temperature of the steam evaporator is 1 5 5 T (3ll.F). The plant is of the noncondensing type and makes use steam from 5 wells. It is expected that the capacity installed at the site will be increased as field development takes place and expansion of the plant can be justified. Table 4.1 contains what little information is known w a b u t the plant.
REFERENCES Birsic, R. J., 1977. “A Krsfis Visit: Iceland’s Major Project,” Geothermal Energy
BjGmsson, S., 1968. “Afhaeling 4 N-3 N4nafj&,” Geothermal Division, National MaguZine, Vol. 5, No. 10, pp. 8-16.
Energy Authority, Reykjavik. (In Icelandic.)
See note on p. 24.

76 1- [Ch. 41
Burke, K. C. and Wilson, J. T., 1976. “Hot Spots on the Earth’s Surface,” .in Con- tinents Adrift and Continents Aground, W. E. Freeman and Co., San Francisco, pp. 68-69.
Dewey, J. F., 1976. “Plate Tectonics,” in Continents Adrift and Continents Aground, W. H. Freeman and Co., San Francisco, pp. 34-45.
Gudmundsson, J. S., 1978. Personal communication to D. J. Ryley, Geothermal Divi- sion, National Energy Authority of Iceland, Reykjavik.
Leardini, T., 1974. “Geothermal Power,” Phil. Tram. R. SOC. Lond. A., Vol. W6,
Liidal, B., 1977. “Geothermal Energy for Space and Process Heating,” in Energy Technology Handbook, D. M. Considhe, ed., McGraw-HiU, New York, pp. 7.43-7.58.
MHI, 1978. “List of Geothermal Power Plant,” Mitmbishi Heavy Industries, Ltd., Tokyo.
P h o n , G., Ragnars, K., and Z a a , J., 1975. ‘‘Geothermal Energy Developments in Iceland, 197G1974,” San Francisco, 1976, Vol. 1, pp. 213-217.
Ragnars, K., Saemundsson, K., Benediktsson, S., and Einarsson, S. S., 1970. “Devel- opment of the Nfimafjall Area, Northern Iceland,” Pisa, 1970, Vol. 2, pp. 923-935.
SBnes, J., 1976. “Krofluvirkjun-Krda Geothermal Power Plant,” KrAa G e o t h e d Project Executive Committee, Akureyri, Iceland.
WiLson, J. T., 1976. “Continental Drift,” in Continents Adrift and Continents Aground, W. H. Freeman and Co., San Francisco, pp. 19-33.
pp. 101-120.
hi

CHAPTER 5 ITALY
'. 5.1 Historical use of geothermal energy in Italy
Documentation shows that the natural steam fields in Tuscany were recognized as early as the third century and that the commercial potential bf these mineral-laden waters led to wars between the Tuscan republics during the Middle Ages PNEL, 19701. It was not until 1904, however, that the power of natural steam was first harnessed to produce electricity, the accomplishment being credited to Prince Piem Ghori Conti.
Conti's original system used a reciprocating engine that received steam separated from the geothermal fluid. The engme was of the noncondensing type, exhausted to the atmosphere, and generated about 16 k W of electric pdwer. The output from the DC generator provided lighting for the boric acid factory at Larderello in the boraciferous region of Italy. This primi- tive engine was replaced by a turboalternator of 250-kW capacity in 1918, thus marking the beginning of the production of electricity from geother- mal sources on a commercial scale [Conti, 19243. Since that time endogen- oc~9 fluid has been tapped at two other sites, Monte Amiata and Travale, and the total installed geothermal electric generating capacity in Italy has grownto420,OOO kW.
some of the geologic features of the main geothermal regions currently under exploitation-Larderello, Monte Amiata, and Travale-as a1 details relatkd to the gathering and distribution of th the energy conversion systems and associated auxiliaries, and the economic and operating ex- periences of the plants.
$2 Boraciferous region (Larderello)
I n the following sections we wil
63.1 cfeology a d exploration technipzles I
The Larderello region in general structural terms corresponds to a tec- tonic high located between the Era Graben to the north and northwest and the positive feature of the crystalline basement evident in outcroppings to the south and southeast [ENEL, 19?0]. The presence of a deep magmatic
-
TI

78 ITALY [Ch. 5
intrusion at about 6-8 km (4-5 mi) is inferred from the huge gravity deficit. The structural outline of the region is caused by the apennine and plutonian tectonics in conjunction with the magmatic intrusion. The up- heaval of Pliocenic coastal deposits to about 600 m (1970 ft) gives evidence of the plutonian tectonic.
The high heat flow in the region is generated by the gross interaction between the African and Eurasian tectonic plates and several smaller plates that am in contact in the area. The Larderello geothermal field is part of an arc of high heat flow extending along the west coast of the Italian peninsula from Tuscany to Sicily [Mongelli and Loddo, 19751.
Figure 5.1 shows a geologic map of the boraciferous region in both plan and cross-sectional views [ENEL, 19703. The major outcrops may be grouped into three main complexes : (1) the upper complex (denoted by regions “2” in the figures), which comprises shales, limestones, and sand- stones (“argille scagliose”) and constitutes, for the most part, the imper- meable cap rock for the underlying reservoir; (2) the main permeable complex (denoted by rc4”), which forms the circulation region for the endogenous fluid and comprises the highly pervious Tuscan formations ranging from radiolarites to evaporites; and (3) the basement complex (denoted by “ 5 9 , consisting of phyllitic-quartzitic formations, which is highly impervious where phyllites predominate but which can be highly pervious where intercalations of quartzites or crystalline limestones occur [ENEL, 19701. The outcroppings of the main permeable complex in the southern region contribute importantly to the recharge of the aquifer through the absorption of rainfall.
During the exploration phase, geologic, geochemical, and geophysical methods have been employed, of which, geochemical techniques have proven highly effective. Normal analytical techniques have been used along with specialized ones to determine the isotopic relationships of certain elements in the geothermal fluid and the rocks including oxygen, hydro-
, gen, and carbon. Of the geophysical methods, the Schlumberger quadri- pole technique has been used extehsively because of its relatively low cost and high efficiency. This method is favored since the reservoir is usually
. located at depths less than 10o0 m (3280 ft) and is characterized by a distinct resistivity high ( > l o 0 0 - m) relative to the overlying cap
Heat flow, thermal gradients, and thermal conductivity measurements have also been employed as prospecting tools. The area is characterized by exceptionally high thermal gradients, on the order of 3O0C/1O0 m
The accepted normal gradient is about 3OC/lOO m (1.6”F/100 ft). The geo- thermal field a t Larderello is believed to cover about 25,000 ha (62,000
L;
1
1 gi I i 1
( C ) w n ’ m ) .
I
I
1 I 4 (16OF/100 ft) and in some places as high as 100°C/lOO m (55OF/100 ft).
acres) [Koenig, 19731, although the drilled area extends over only about 18,500 ha (45,700 acres) [Ceron et al., 1975; Ellis and Mahon, 19771.
j
J
1 1 I
1

BOBACIFEBOUS BEGION (LABDEBELLO) 79 16.21
I
E ~ U U R E 6.1-Geologic map and cross-section of the boraciferous region (Larderello), Tuscany, Italy. Geologic formations: 1, Clays, sandstones, conglomerates, etc.; 2. Shales, marls, limestones, etc. ; 3. “Macigno,” “polychrome shales”; 4. Tuscan for- mations; 6. Phyllites, quartzites [after ENEL, 19701.
6J.a Well progrms and gathel.ing system
There are roughly 190 producing wells in the Larderello region out of a total of 611 drilled [Overton and Hanold, 19771. Average depth of all wells is 656 m (2152 ft) ; wells drilled since 1969 average 1129 m (3704 ft) in depth [Ceron et al., 19751. The techniques used in the drilling, cas-

80 ITALY [Ch. 6
ing, and cementing of the wells in the Italian geothermal fields have been reported in detail elsewhere [Cigni, 1970; Cigni et al., 19751. Furthermore, an extensive discussion dealing with the design and construction of geo- thermal steam pipelines has been published [Pollastri, 19701. We will therefore only summarize the most important operations as described by these authors.
5.2.2.1 Ddling of wells. Geothermal drilling operations are in some ways similar to those employed in oil well drilliing, the notable exceptions being that geothermal wells tend to be larger in diameter, formations are of higher temperature, and flow velocities tend to be larger. These factors lead to the conclusions that drill rigs with larger capacities (for a given depth capability) are needed to support the heavier drilling strings, that special drilling muds are required to withstand the high temperatures, and special materials are needed to resist erosion.
Since the reservoir at Larderello is at about 1000 m (3280 ft), and taking into account safety margins and the inherent differences between geothermal and oil well drilling, the appropriate size rig will be one of 1600-1800 m (5250-5900 ft) capacity. Some of the rigs are capable of reaching 3000 m (9800 ft). The drilling string consists of 127-mm (5-in) and 168-mm (@&in) drill pipe with 203-mm (&in) O.D. drill collars for drilling 406-mm (16-in) and 508-mm (20-in) holes, respec- tively [Cigni, 19701. Large-diameter collars are preferred because of added drill string stability and the improvement in maintaining vertical alignment of the hole.
The power required to conduct drilling operations varies according to the particular phase involved. The figures below are estimates of the maximum power requirements under three sets of conditions for various machine and field services [Cigni, 19701 :
Regular drilling (rotary machine and mud pump at full rate) : Rotary machine.. ................................... 75 kW (100 hp) Mud pump.. ........... L ........................... 520 kW (700 hp) Field services.. ..................................... 35 kW ( 50 hp)
630 kW (850 hp)
Draw-works. ....................................... 330 kW (440 hp) Field services.. ..................................... 35 kW ( 50 hp)
365 kW (490 hp)
Round trip for pipe extraction from maximum depth or owing operations:
Emergency hoisting (during fishing operations) : Draw-works.. .............................. 300-330 kW (400-440 hp) Mud pump (half load). ...................... 185-260 kW (250-350 hp) Field services.. ............................. 35 kW ( 50 hp)
~ ~
520-625 kW (700-840 bp)

B o B A ~ t I 8 EEQIOTJ (--) 81
The accepted procedure for drilling wells in the geothermal fields of Itsly is to use drilling muds while passing through cap rock [Celati et al., 19751. The drilling mud must be carefully selected since the high temperatures encountered stimulate chemical reactions in the mud, altering the fluid viscosity, its free-water content, and other properties [ENEL, 1970]. The presence of clays, anhydrites, and gypsum lenses in the forma- tion makes it diflicult to maintain mud properties during drilling. I n addi- tion, the permeable layers that are encountered lead to frequent loss of circulation. The muds used are dispersed ferro-chrome-lignosulfonate- treated types which exhibit goad dispersion. characteristics owing to their protective effect on clay particles. Furthermore, in high concentrations they inhibit exchange reactions [Cigni et al., 19751. Drilling operations in the permeable reservoir and in the basement rock are usually carried out with fresh, cold water without a return because of the high loss of circulation.
5.2.2.2 Well oaSi?tgs and cenenting operations. A pair of typical well profiles are shown in figure 5.2 ; a standard casing program is shown on the left and a casing program for an exploratory or a relatively deep well is shown on the right. The standard well produces natural steam through a 311-mm (12%-in) open hole and a 400-mm (188/g-in) casing that is ce- mented within a 406-mm (16-in) hole. The deeper well has a 216-mm (8%-in) open hole throughout the permeable zone with a 244-mm (O%-in) production casing. In this case the 400-mm (l3%-in) casing serves as an intermediate casing for safety purposes. The casings are J-55 API heavy- wall pipe to withstahd the corrosive nature of the geothermal fluid and the
Cementation of thd &sings to the formation or to other casings is a critically important operation. A proper cementation job must result in complete and uniform filling of the well casing annulus in order to with- stand the various strains undergone by a casing, to guarantee good bonds between the cement and the cash& and between the cement and the forma- tion to strengthen and protect,the entire casing column, and finally, to allow for well checks during d'r3lling to assure proper production during later stages. The art of casing and cementing geothermal wells requires
& attention to many factors, such as cotrect choice of cement and additions, exact centering and placement of the casing, and proper flushing of the annulus prior to cementation to avoid mud contamination [Cigni et al., 19751.
The cement used for wells in the boraciferous region consists of a mix- ture of portland 425 cement and a fine-grained silica flour in 60/40 pro- portions. In laboratory tests uoder a pressure of 9.8 MPa (1420 Ibf/in*) md temperature of 150°C (820°F) this cement showed a compressive stGngth of 34 MPa (4950 lbf/in*) after a 28-day curing period [Cigni et al,, 19761.
6.23
\ severe temperaturecfcling to which the wells may be subjected.
,

Y 0 0
a 0
a
a
e 0 > w v) w e
- a
I w
1 1500- I800 m
I FIWJFZ 6.2-Typical well profilea in Italian geothermal fields: production well (left)
and exploratory or deep well (right) [after Cigni et al., 19751.
5.2.2.3 Design of weZ2head equdpmm8. The design of wellhead equipment for geothermal applications differs considerably from that used for oil wells. The most important unique characteristics of geothermal wells are [Cigni, 19701 :
High fluid velocities Relatively low well closing and operating pressures High mud and steam temperatures Strong corrosive nature of fluid Connection to large-diameter surface pipelines.
Four wellhead arrangements are shown in figure 5.3 ; each is used during various stages of the drilling operation, as described below.

BOBACIFEBOUB BEQION (LABDEBELLO) a3
Arrangement I: used during drilling through bhe cap rock; wellhead mounted on the surface casing with a guiding bore of 311 mm (12% in). Side valves are 254-mm (10-in) ; mud filling is accomplished through a side connection.

84 lTALY [Oh. 6
Arrangement 11: used during widening of the hole in cap rock,from 311 mm (1234 in) to 406 mm (16 in) ; wellhead mounted on surface w i n g ; central valve eliminated since blowouts are not expected in this phase.
Arrangement 111: used during drilling in the production zone; wellhead mounted on production casing. Since flow of steam is expected in this phase, all equipment is in place to handle the situation, starting with the 356-mm (14-in) central valve.
Arrangement IV: used when production casing is in place but only par- tially cemented; wellhead mounted on surface casing. A device that sup- ports and allows for centering the production casing is provided. Equip- (J ment is installed to handle the expected steam flow in case of a blowout.
In all cases a blowout preventer is installed on the wellhead. Designed to close off the central bore in case of emergencies, even when the drilling string or other pieces of equipment are below the surface, it works by means of a mechanically or hydraulically actuated valve fitted with jaws. to clamp around anything positioned in the well. High-temperature gas- kets are required for steam-well drilling [Cigni, 19701.
5.2.2.4 Steam pipelines. Steam is conveyed from the individual well- heads to the power stations through an interconnected network of pipes. The photograph in figure 5.4 shows a typical wellhead connection; it is characterized by the sweep of a large-radius expansion bend from the wellhead to an anchor. Types of supports used include fixed moorings (anchors), sliding supports, turning type, and supporting trestles of the fixed and fixed slotted type [Pollastri, 19701. The zig-zag layout of the network is designed to accommodate the thermal expansion associated with operation of the plants. Expansion caused by temperature fluctua- tions from ambient values to 260°C (5OOOF) can be absorbed.
The network consists of more than 118 km (73 mi) of steam pipes [Ceron et al., 19753. The pipes are fabricated from weldable steel and have a wall thickness of 6-8 mm (0.244.31 in) and diameters of 250, 350, 450, 650, and 810 mm (10, 14, 18, 2f3, and 32 in). Asbestos fiber is used for insulation, in thicknesses of 30, 60, 90, and 120 mm (1.2, 2.4, 3.5, and 4.7 in) [DiMario, 19611. Pipe and insulation are protected with- in an aluminum-plate jacket or painted with a coating of bituminous material [ENEL, 19701.
63.3 Geojhid c h ~ a c t e r i s t i c s
The geothermal fluid produced at the wells in Larderello consists of steam (dry, saturated or slightly superheated) and a mixture of noncon- densable gases. The amount of noncondensables is relatively high, rang- ing from 1% to 20% by weight of the total fluid flow, on average, with
new wells showing even higher percentages. As a rule, the gas nt of the steam at Larderello has remained roughly constant dur-
LJ

I
BOBACIFEXOUB BWION (LAWE-0) 85 B 6.21
FIQURE 6A-Typical steam pipeline connection at wellhead [Pollastri, 19701.
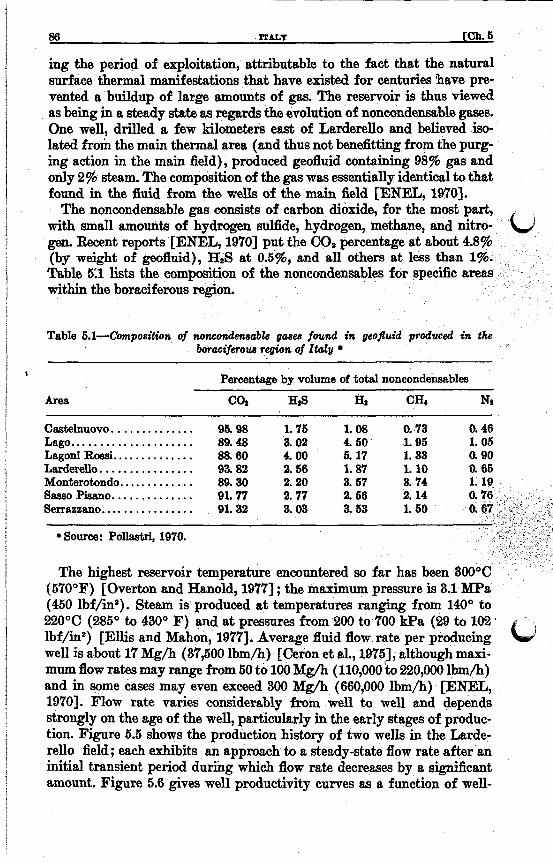
86 ITALY [Ch. 6
ing the period of exploitation, attributable to the fact that the natural surface thermal manifestations th t have existed for centuries have pre- vented a buildup of large amounts of gas. The reservoir is thus Viewed as being in a steady state as regards the evolution of noncondensable gases. One well, drilled a few kilometers east of Larderello and believed is* lated from the main thermal area (and thus not benefitting from the purg- ing action in the main field), produced geofluid containing 98% gas and only 2% steam. The composition of the gas was essentially identical to that found in the fluid from the wells of the main field [ENEL, 1970).
The noncondensable gas consists of carbon dioxide, for the most part, with small amounts of hydrogen sulfide, hydrogen, methane, and nitro- gen. Recent reports [ENEL, 19701 put the C02 percentage at a (by weight of geofluid), H2S at 0.5%, and all others at less Table 5 3 lists the composition of the noncondensables for sp within the boraciferous region.
Table 6.1-cO?npO8itiOn of noncondensabte gae8 found in qeofluid produced in the boraciferow region of Italy
Area
Percentage by volume of total noncondensrtblea
castelnuovo.. ............ 96.98 1.75 1. os 0. 73 0. 46 Lago ..................... 89.48 3. 02 4. 50 1.95 1. 05 Lagoni Rossi.. ............ 88.00 4. 00 5. 17 1. 33 0. 90 Larderello. ............... 93.82 2. 56 1.87 1.10 0. 05 Monterotondo.. ........... 89.30 sasaoPisano. ............. 91.77 Serrarzano ................ 91.32
Source: Pollastri, 1970.
The highest reservoir temperature encountered so far has been 3 (570°F) [Overton and Hanold, 19773 ; the maximum pressure is 3.1 MPa (450 lbf/in2). Steam is produced at temperatures ranging from 144" to 220°C (285O to 430" F ) and at pressures from 200 to 700 kPa (29 to 102 ' Ibf/in*) [Ellis and Mahon, 19771. Average fluid flow rate per producing well is about 17 Mg/h (37,500 lbm/h) [ Ceron et al., 1975 3 , although maxi- mum flow rates may range from 60 to 100 Mg/h (110,000 to 220,000 lbm/h) and in some cases may even exceed 300 Mg/h (660,000 lbm/h) [ENEL, 19703. Flow rate vanes considerably from well to well and depends strongly on the age of the well, particularly in the early stages of produc- tion. Figure 5.5 shows the production history of two wells in the Larde- rello field; each exhibits an approach to a steady-state flow rate after an initial transient period during which flow rate decreases by a significant amount. Figure 5.6 gives well productivity curves as a function of well-
L i b

I I I I I
c 300 - 5 G 200 - l- a e 3 100 - 0 J LL
\ m
-
- ---or;
0 1940 . 1950 1960 1970
F’IQTJRE 6.6-Production history of wells No. 85 (A) and Fabriani (B) at Larderello; wellhead pressurea roughly 0.4 MPa (87 lbf/m*) [after ENEL, 19701.
head pressure for three wells, one each from Sasso Pisano, Lagoni Rossi, and Gabbro. All three curves exhibit the expected behavior for gas flow and may be represented analytically by an equation of the form:
(P/PO)”+ (dmJ-1, (6.1)
where the exponent 12 lies in the range 1.5<12<1.85. The subscript o denotes the maximum value of either the pressure or the flow rate.
6.9.4 Emrg y cmersivn 8 y8tem
Power is produced at the present time in Larderello by means of two types of energy conversion systems 2 direct-intake, noncondensing, impulse or impulse-reaction turbines (“Cycle 1”) , or direct-intake, condensing, impulse-reaction turbines (“Cycle 3”). Prior to 1968 another type was in operation, one using pure steam generated from geothermal steam in heat
changers and expanded in impulse or impulse-reaction, condensing tur- three schemes are shown schematically in figure
s with high noncondensable gas nt in the geothermal steam or at sites insuflticiently developed to
construction of steam lines to join the field to the main network. ants are extremely simple, highly reliable, easily assembled or dis-
remote controlled from
Cycle 2 plants were used when it was desirable and economic to extract chemicals such as boric acid and ammonia from the geothermal fluid, while at the same t h e avoiding materials corrosion problems in the turbine and taking advantage of the improved power output associated with condens-
assembled, and offer low costs because they m a nearby power station. I

WELLHEAD PRESSURE, Ibf/ in2
0 100 200 300
Fromrn 6.6-Flow rate versus wellhead pressure for welts: (A) St. Silvestro (Sass0 pisano); (B) Scamai 3 (Lagoni Rod); and (C) Gabbro 9 [after Pollastri, 19701.
ing operation. Considerable dBculty was encountered in the operation of the heat exchangers, however, because the water tubes that formed the boiler section were subject to deposits of iron sulfide or breakage, depend- ing on whether iron or aluminum was used for the tube material [Hahn, 19241. Since chemicals are no longer extracted from the fluids and the problems of corrosion of turbine blades can be avoided, this energy con- version scheme has been eliminated.
Cycle 3 plants form the mainstay of the Italian geothermal system. The effects of impurities or corrosive substances in the steam can be reduced by
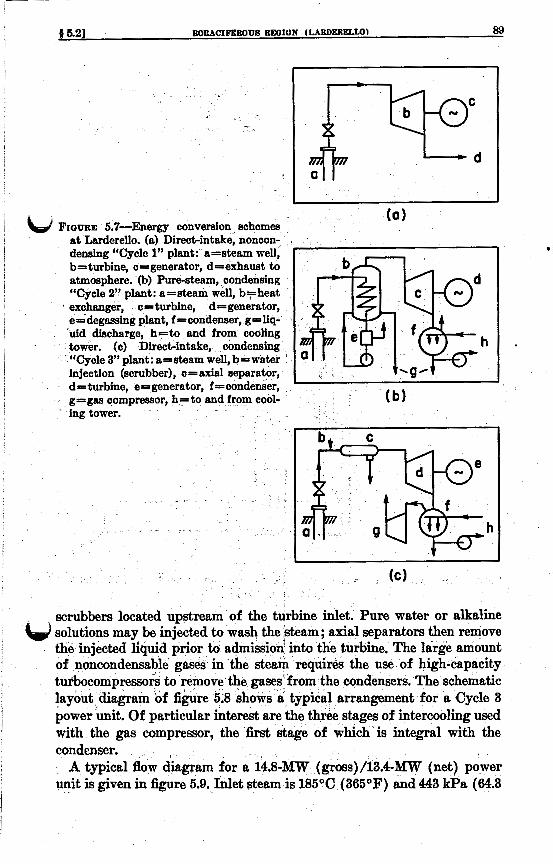
(a) FIGURE 6.7-Energy conversion, schemes
at Larderello. (a) Direct-intake, noncon- densing “Cycle 1” plant: a=steam well, b-turbine, c-generator, d=exhauat to atmosphere. (b) Pureeteam, aondensing “Cycle 2” plant: a-steam well, b=heat
* exchanger, c-turbine, d=generator, e=degassing plant, fscondenser, g=liq-
discharge, h=to and from cooling r. (c) Direct-intake, condensing
Tycle 3” plant: a-steam well,b=water injection (scrubber), c= axial separator, d=turbine, e-generator, f =condenser, g=gas compressor, h=to and from cool-
. - ing tower.
I
scrubbers located upstream of the turbine inlet. Pure water or alkaline w solutions may be injected to wash the @am; axial separators then remove the injected liquid prior to admission into the turbine. The large amount of nmcondensable gases in the st requires the use of high-capacity turbocompressors t gases‘from the condensers. The schematic layout diagram of r rwFment for a Cycle 3 power unit. Of particular intere g- of intercooling used with the gas compressor, the first stage of which is integral with the condenser.
A typical flow diagram for a 14.8-MW (gross)/13.4-Mw (net) power unit is given in figure 5.9. Inlet steam is 185OC (365OF) and 443 kPa (64.8
a

90 ITALY [Ch. 6
FIGURE 6.8-l'37pical arrangement for Cycle 8 power unit at Larderello [Allegrini and Benvenuti, 19701.
Ibf/in2) with about 4% (by weight) of noncondensable gases. The geo- 6d thermal resource utilization efficiency, based on the available work of the geofluid relative to the design wet-bulb temperature of 19.4OC (67OF), is about 52%. However, none of the actual units analyzed and described below have efficiencies as high as this; highest actual efficiency is 47.4% for the two units located at the Sasso 2 geothermal field.
5.2.4.1 Condensing unik. Condensing units in the boraciferous region are in operation at the following sites : Larderello, Gabbro, Castelnuovo, Ser- razzano, Lago, Sass0 Pisano, and Monterotondo. There are 27 such units

8 5.21 BOBACIFEBOUB BEOIOH (LABDEUICLU)) 91
P = PRESSURE, lbf/ inP M = PRESSURE,in Hg
W= WATER FLOW,IO'Ibm/h G = GAS FLOW,IO'lbm/h 365 F ,64.3 P
256 S, 10.7 G
STEAM 14.8 MW (GROSS) WELLS 13.4 M W ( N E 1 )
1 COOLING TOWER
XCESS WATER
T
FIGUBE [i.Q-Typical flow diagram for Cycle 3 power unit with 14.8-MW installed capacity [Dal Secco, 19701.
installed, with a combined capacity of 362.7 MW. These range in size from a 2-MW unit at Castelnuovo to 26-MW units, three of which are located at Larderello 3 and one at Castelnuovo.
All plants use natural-draft cooling towers designed to handle flow rates of 9,12,15, and 18 X 1Oa m8/h (20,26,33, and 40 X lo8 lbm/h) of water de- pending on the unit rating. The water is cooled through a range of 41O- 81°C (105.8°-87.80F), typically, in an environment at 25OC (77°F) and a relative humidity of 6096, i.e., at a wet-bulb temperature of 19.4OC (67°F). The choice of natural-draft over forced-draft towers was dictated by lower operating costs and the need for reliable, continuous operation. Cooling water is circulated by means of 2-speed heEco-centrifugal pumps with vertical axes and adjustable blades, and with a maximum flaw capacity of 9OOO m*/h (20,000 lbm/h) [DiMario, 1961). The following sections offer more details on the condensing power units in the boraciferous region. A
of technical particulars is given in table 5.2..
rello 2. The indirect-steam system (Cycle 2) that generated clean steam by means of heat exchangers has been abandoned in favor of direct- intake, condensing plants. Cycle 2 plants allowed for the recovery of var- ious chemicals from the geothermal fluid (boric acid, ammonia, carbon dioxide, hydrogen sulfide), but were costly both in capital and operating expenses. Furthermore, they required about 14.5-16.0 kg of steam per k W - h of electricity produced at the busbar. With the advent of turbine

t
Table 5.2-Power system speciflcationa for condensing units in the bomciferous region of Italy
Twbins &a: %e. .......................... Installed capacity, MW. ......... Speed, rev/min .................. Steam inlet pressure, Ibf/in*. . . . . . . Steam inlet temperaturePF ....... % (wt.) noncondenaable gases. . . . Exhaust pressure, in Hg.. ........ Steam flow rate 1 6 lbm/h. ....... %e. .......................... Cooling water temperature, OF. ... Outlet water temperature, OF.. .... Cooling water flow rate, 1W Ibm/h..
Condenser data:
(b) -69
3000 59. 7 385 7. 0 3. 0
j 899
87.8 105.8
(a)
(b) f 120 3000 62. 6 387 6. '8 3. 5
i 1480
( 0 )
15 3000
103.8 433 6. 7 3.0 238
(b), 26
3000 61. 1 370
14 3 2. 6 375
(b) 11
3000 27. 0 345 3.8 2. 6 127
(b) ( 0 ) (9 2 '47 6.5
3000 3000 3000 15. 6 69. 7 29. 9 302 385 289 2.4 3.8 1.8 2. 6 2. 9 2. 0
61.7 i633 154
(b) h 27
3000 76. 8 352 2. 2 2. 0
j 558
( "1 i 15.7 3000 71. 1 365 3. 0 3. 0
j 357
All units have low-level, direct-contact, barometric condensers 82.9 87.8 73.4 73.4 73.4 8.42 78.8 78.8 (a)
106.3 105.8 98.6 98.6 98.6 104.0 95.0 95.0 (a)
(*I 17. 8 ('1 (*I (*I (*I (*I (*I
c

c Gas &&or data:
TYPe Gsa capacity, 101 ft*/min. . . . . . . . . . i -31 1 ~ 3 3 0 196 182 (a) (a) i 134 (a) J 134 (a) (a)
Power consumption, kW.. . . . , . - , -5580 1625 2270 ('1 (a ) i 1760 (a) i 1760 (a) (a)
3 4 1 1 1 ('1 (a) (a) (k) (a)
Tspe
All units have multistage centrifugal turbocompresaors with interstage coolers
Haat rejection sy&m data: \I All uNts have natural-draft water cooling towers
No. of towers., . . . . . . . . . . . . . . . . . . Design wet-bulbtemp.,OF ..... .. . 67.0 58.4 67.0 63.3 63.3 63.3 58.4 58.4 58.4 Water pump power, kW.. . ... . ... (a) 855 (a) 750 (a) ' (a) 560 (a) 365
*Year of startu . (A) Larderello 5 13) Larderello 3:
( G-) Serraeeano. (H) Lago 2.
K) Monterotondo.
Not available. Single-cylinder, double-flow. Tandem-comDound. sinale-flow (HP) and doubbflow (L . .
I Single-cylind'er, single-fl%w. Four 14.5-MW units; one 11-MW unit. Three 26-MW units; one 24-MW unit; two 9-MW units. One 15-MW unit; two 12.5MW units; two 3.5-MW units One 14.5-MW unit; one 12.5-MW unit. One 12.5-MW unit: one 3.2-MW unit. Total for all units. For the 14.5-MW unit only.
IP).
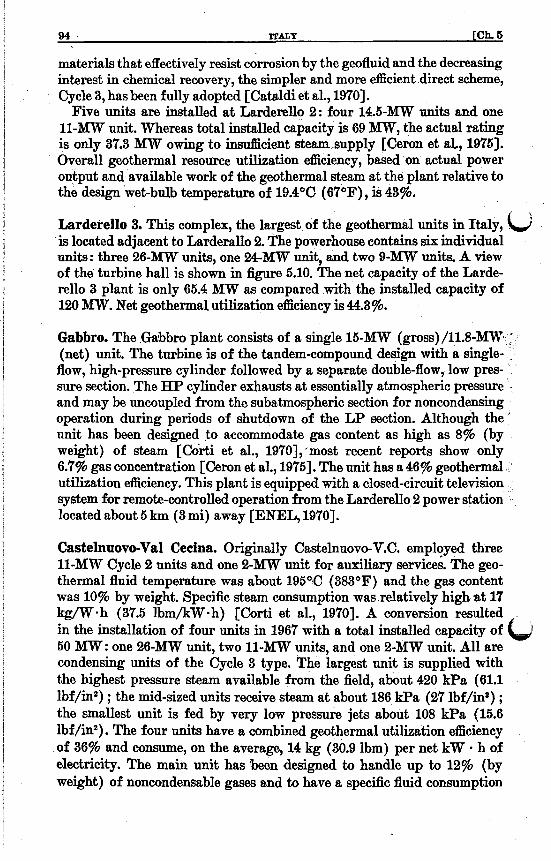
materials that effectively resist corrosion by the geofluid and the decreasing interest in chemical recovery, the simpler and more efficient direct scheme, Cycle 3, has been fully adopted [Cataldi et al., 19701.
Five units are installed at Larderello 2: four 14.5-MW units and one 11-MW unit. Whereas total installed capacity is 69 M W , the actual rating is only 37.3 MW owing to insdicient steamsupply [Ceron et aL, 19751. Overall geothermal resource utilization efficiency, based on actual power output and available work of the geothermal steam at the plant relative to the design wet-bulb temperature of 19.4OC (67”F), is 43%.
Larderello 3. This complex, the largest of the geothermal units in Italy, (cl is located adjacent t.0 Larderallo 2. The powerhouse contains six individual units: three 26-MW units, one 24-MW unit, and two 9-MW Units. A view of the turbine hall is shown in figure 5.10. The net capacity of the Larde- rello 3 plant is only 65.4 Mw as compared with the installed capacity of 120 MW. Net geothermal utilization efficiency is 44.3%.
Gabbro. The Gabbro plant consists of a single 15-MW (gross) /11 .8-W (net) unit. The turbine is of the tandem-compound design with a single- flow, high-pressure cylinder followed by a separate double-flow, low pres- sure section. The HP cylinder exhausts at essentially atmospheric pressure and may be uncoupled from the subatmospheric section for noncondensing operation during periods of shutdown of the LP section. Although the ’ unit has been designed to accommodate gas content as high as 8% (by weight) of steam [Corti et al., 1970],*most recent reports show only 6.7% gas concentration [Ceron et al., 19753. The unit has a 46% geothermal utilization efficiency. This plant is equipped with a closed-circuit television system for remote-controlled operation from the Larderello 2 power station located about 5 km (3 mi) away [ENEL, 19701.
Castelnuovo-Val Cecina. Originally Castelnuovo-V.C. employed three 11-MW Cycle 2 units and one 2-MW unit for auxiliary servic&. The geo- thermal fluid temperature was about 195OCJ (383OF) and the gas content was 10% by weight. Specific steam consumption was relatively high .at 17 kg/W-h (37.5 lbm/kW.h) [Corti et al., 19703. A conversion resulted in the installation of four units in 1967 with a total installed capacity of b 50 M W : one 26-MW unit, two 11-MW units, and one 2-MW unit. All are condensing units of the Cycle 3 type. The largest unit is supplied with the highest pressure steam available from the field, about 420 kPa (61.1 lbf/inz) ; the mid-sized units receive steam at about 186 kPa (27 Ibf/in2) ; the smallest unit is fed by very low pressure jets about 108 kPa (15.6 lbf/inz). The four units have a combined geothermal utilization efficiency of 36% and consume, on the average, 14 kg (30.9 lbm) per net kW - h of electricity. The main unit has ‘been designed to handle up to 12% (by weight) of noncondensable gases and to have a specific fluid consumption


of less than 10 kg/kW. h (22 lbm/kW.h). Figure 5.11 is a photograph of the turbine, generator, and gas compressor arrangement for the 26- w unit.
Serrazzano. There are five condensing units, all of the Cycle 3 variety, in operation at Serrazzano: one 15-MW unit, and two units each of 12.5- M W and 3.5-MW. The turbocompressors for the two 12.5-MW units nre shown in figure 5.12.
Lago 2. Total installed capacity at Lago 2 is 33.5 MW, comprising units of 14.5, 12.5, and 6.5 MW..The three units have a combined geothermal utilization efficiency of 46% and a specific steam consumption of 10.1 di kg/kW. h (22.3 Ibm/kW. h). The arrangement of the turbogenerator and gas compressors for the larger units at Lago 2 is shown in figure 5.13.
Sasso Pisano (Sasso 2). Although total installed capacity at S a m Pisano is 15.7 MW, it was operated at 17.3 MW in 1974 [Ceron et al., 19751. There are two units in operation, one of 12.5 MW and one of 3.2 MW. Combined specific steam consumption is one of the best for the Italian geothermal plants: 9.4 kg/kW h (20.7 lbm/kW h) ; utilization e5ciency is 47.4% This plant is shown in figure 5.14.
Monterotondo. One 12.5-MW unit is in operation at Monterotondo. percentage of noncondensable gases in the steam has fallen steadily from a value of 2.5% (by weight) in 1960 [Cataldi et al., 19701, to 2.2% in 1969, and to 1.7% in 1974 [Ceron et al., 19751. This is the lowest gas con- tent reported for any geothermal plant in Italy. Specific steam con- sumption is 10 kg/kW. h (22 lbm/kW. 11) and geothermal utilization efficiency is 45%. Figure 5.15 shows the turbine hall at Monterotondo with the 12.5-MW unit in the right background.
5.2.4.2 Noneoldensing units. Noncondensing units are installed at six sites in the boraciferous region : Sant’Ippolito-Vallonsordo, Lagoni Rossi 1 and 2, Sasso 1, Capriola, and Molinetto. ,411 operate on Cycle 1 and ex- - haust to the atmosphere at a pressure of 102.9 kPa (30.4 in Hg) , slightly above atmospheric pressure. Noncondensable gas content ranges from 2.7% (by weight) at Sasso to 4.0% at Capriola. The units are relatively small in capacity, with the 900-kW unit at Sant’Ippolito-Vallonsordo being the smallest geothermal unit installed in Italy. The largest unit of this group is at Sasso 1 and has a rated capacity of 7 MW.
All of these small plants are remote controlled from a larger plant. The control equipment used has been standardized and includes the following capabilities [Corti et al., 19701 :
From pilot to satellite plant :
LJ
Six controls: opening and closing of generator breaker, increase and decrease of governor setting, excitation increase and reduction.
One control for emergency plant shutdown.

astelnuovo-V.C. 26-MW turbogenerator unit. Gas compresaora are at left end of the shsft; double- in foreground and the one.to left of the flow turbine and generator are at right end. The two large
compressors are gaa intermolere mlla, 197a.
C

98 lT
AL
Y
[Ch. 6 L


3 3


From satellite to pilot plant :
Five signals : unit shutdown, unit in operation, switch opened, switch closed, alarm.
Eight measurements, six of which are contemporary, including : (with breaker open) generator voltage, generator frequency, excitation current, synchronism, line voltage, and line frequency ; (with breaker closed) generator voltage, generator frequency, excitation current, generator current, output power, and line voltage.
The remote control operation of these plants is characterized by extreme
The following sections describe each of these units in more detail. Tech- nical particulars may be found in table 5.3.
Sant'Ippolito-Vallonsordo. This unit is designed for continuous oper- ation under a wide range of inlet steam conditions: temperatures from I
185O to 25OOC (365' to 482OF), pressures from 441 to 686 kPa (64 to 99.5 lbf/in2), and gas content from 4% to 7% (by weight). The original steam flow contained about 20% noncondensables [Cataldi et al., 19701 but the
The unit consumes 26.7 kg of steam per net kW-h (58.9 lbm/kW*h) and has a geothermal resource utilization efficiency of only 15.3% because a significant fraction of the available work is lost when the steam is ex- hausted at atmospheric pressure. In the photograph of the turbine-gen- erator assembly shown in figure 5.16, the compactness and simplicity of the unit are evident.
Lagoni Rossi 1 and 2. These two units of 3.5 and 3.0 M W , respectively, are characterized by a high degree of flexibility in meeting variable steam conditions. The turbines are capable of performing efficiently with steam conditions ranging in temperature from 230° to 235OC (446' to 455"F), in pressure from 686 to 1079 kPa (99.5 to 156 lbf/in2), and in gas content from 4% to 207% by weight). The flexibility in performance is due to three factors: (1) A wide degree of control is available in the first, impulse stage ; (2) A significant part of the reaction blading is mounted on remov- able inner shells; (3) The control valve is equipped with interchangeable internal elements [Saporiti, 1961bl. I n this way extreme conditions (say, low pressures and temperatures-and corresponding high steam flow rates) can be accommodated by increasing the effective active nozzles in the hn- pulse stage while reducing the reaction blading and increasing the internal steam passages in the control valve. The other extreme can be handled by reversing the effects. Such design flexibility allows good energy con- version efficiency to be maintained over wide variations in steam conditions with only relatively simple modifications to the apparatus. For example, Lagoni Rossi 1 has a specific steam consumption of 18.2 kg/kW - h (40.1
simplicity and high reliability. LJ
1 i 4 .
most recent reports indicate gas content of only 3.3% [Ceron et al., 1975}. ,.
i Q
~
~


104 IT
AL
Y
[Oh. 6

f 6.21 B O U ~ U S BmION (LABmmLm) 106:
lbm/kW * h) and a utilization efficiency of 25.2%, which is quite good for * a noncondensing unit.
Sass0 1, Capriola, and Molinetto. These three units have a combined installed capacity of 13.5 MW, although net capacity is only 4.8 M W . Gas content averages 3.3% (by weight) ; steam inlet temperature averages 189°=k30C (372O A5OF) .'Xleothermal utilization efficiency for the three units taken together is 17.7% and combined specific steam consumption is 25 kg/kW h (55 Ibm/kW 2 h).
Materials used in the fabrication of steam wells and transmission pipe- lines have been described in sections 5.2.2.2 and 5.2.2.4, respectively. This section will focus on materials used for the energy conversion equipment. In order to reduce corrosion by the geothermal fluid, sodium carbonate is added to the water used for scrubbing the steam and to the condensate. This neutralizes the p H and minimizes corrosion of iron and steel parts [DiMario, 19611. Erosion of turbine blades can *be reduced and their life ekended by the use of 13% chrome/O.l% carbon alloy steel. The jet con- denser is made of cast iron covered on the inside by lead-plated sheet. Sbce direct impingement can wear away the lead plating, areas subjected to jets are further protected with sheets of AISI 316 stainless steel (0.1% C!/l6%-18% Cr/lO%-14% Ni/2%-3% M0/2% Mn) [Ciapica, 1970 ; Ricci and Viviani, 1970].
The multistage, centrifugal compressors together with the associated intercoolers are key elements in the Italian geothermal plants because of the high concentration of noncondensable gases in the natural steam. I n general, austenitic and ferritic stainless steels and lead-clad carbon steel are used for these systems. The body casings for both the high- and low- pressure casings are of meehanite cast iron. The LP body rotor is of AISI 431 alloy steel {0.2% C/15%-17% Cr/1.25%-2,50% Ni) ; there are six impellers of the same material. The HP unit has a shaft of carbon steel with AISI 431 sleeves and seven impellers5n two stages. Journal and thrust bearings are of carbon steel with linings of white metal [Dal Secco, 19701.
plates and are lined with lead,.ebonite, or AISI 316 stainless steel on the inside. Cooler di- mensions are large to keep the fluid velocities as low as possible in order to minimize erosion. The pipes conveying the hot compressed gases to the coolers are made of AISI 403 alloy steel (0.15% C/11.5%-13% Cr) ; the pipes tarrying cool gases are of carbon steel with lead lining [Dal Secco, 19703. Layers of sandstone rings are suspended in AISI 316 wire ham- pers downstream of the gas coolers to ,control the humidity and thus re- duce the deposition of solid particles, a process enhanced by the presence of liquid droplets [Ricci and Viviani, 1970].s
Qas coolers me fabricated from carbon steel

106 ITALY [Ch. 6
Pumpes for circulating water are equipped with impellers of 13% chrome/O.l% carbon alloy steel. Pipes carrying water and exposed to the * air are made of either stainless steel or iron with stainlss steel liners. "he hyperbolic-shaped, natural-draft cooling towers are of reinforced concrete.
53.6 E w n t and em6sians handling systems
No controls or abatement systems are used for the liquid and gaseous effluents from the plants. I n the case of the gaseous emissions, hydrogen sulfide (H2S) is potentially the most serious because of its corrosive ef- fects and its toxicity. The data in tables 5.1-5.3 may be used to estimate total H,S emissions in the boraciferous region caused by geothermal power production. The condensink units produce about 3100 kg/h (6800 lbm/h) or roughly 14,000 g / M W - h (31 lbm/MW. h) ; the noncondensing units emit nearly 190 kg/h (419 lbm/h) or 10,000 g/MW. h. The weighted aver- age for both types of plant in the region is 14,300 g/MW. h (32 lbm/ MW-h). This may be compared with the maximum of 200 g/MW.h (0.44 lbm/MW h) suggested by the Environmental Protection Agency for geo- thermal plants in the United States.
Liquid discharge from the power stations equipped with condensing units may be estimated using the flow diagram shown in figure 5.9. About 15% of the entering steam flow (by weight) is produced & excess liquid at the cold well of the cooling tower. Assuming that this percentage holds on the average for all plants, the total liquid effluent from the condensing units would amount to about 360,000 kg/h (794,000 lbm/h or 95,000 gal/ min) . The noncondensing or exhausing-to-atmosphere units discharge all of the steam flow directly to the surroundings; the total amounts to 241,000 kg/h (530,000 lbm/h), as can be seen from the data in table 5.3.
Roughly one-fifth of the waste liquid from the plants in the Larderello region is returned to reservoir by reinjection through wells at the periphery of the field. Generally this practice has been successful, although inter- ference with a production well has been noted recently [Defferding and Walter, 19781. About 80% of the waste liquid is disposed of by surface discharge into streams in spits of the relatively high concentration of boron in the waste. Eventually a greater percentage of the liquid waste may have to be reinjected.
53.7 Economic factors
g,
LiJ The most recent cost figures for Italian geothermal power plants were
reported in 1974 [Leardini]. At that time the actual capital costs for con- structing a plant consisting of two 26-MW condensing steam turbine units in the Larderello region were US$17O/kW. The costs for one 15-MW condensing unit in the same area were US$226/kW. For noncon- densing units, a 15-Mw unit cost US$95/kW and a 4-MW unit cost US$105/kW. The figmes for the condensing units were roughly compara-

B 6.23 BOBACIFElZOUS EEQIOH (LAIWERELX.0) 107
ble to the costs for fossil power plants at that time. The Italian geothermal plants incurred higher capital costs than dry steam geothermal plants in other countries because of the large gas compressors required to ex- pel the large amounts of noncondensable gases. About 20% of capital costs are allocated to gas compressors.
Leardini [1974] also quoted typical operating costs for savera1 types of plant. The largest condensing units (26 MW) had operating costs of 2 US mill/kW - h of net electricity generated. Noncondensing units are simpler to operate and maintain, their operating costs being 1.6 US mill/kW*h. Remote controlled stations are even less expensive to run; condensing units had operating costs of 0.8 mill/kW * h and noncondensing units were reported at 0.6 mill/kW h.
5.9.8 Operating experience
geothermal power plants has been highly successful. One measure of this is plant availability, rhich is con- sistently above 90% and often exceeds 95% [Cataldi et al., 1970; Ricci and Viviani, 19703. Most of the problems are related to the corrosive effects of the natural steam. In plants of the Cycle 1 type (exhausting-to- atmosphere), scale forms on turbine blades, leading to clogging of the passageways. The presence of chlorine ions muses the damage, particu- larly at locations where the superheated steam becomes saturated or wet steam. Cycle 2 (indirect, pure steam) plants were relatively free of prob- lems except for clogging of boiler tubes. Although plants of this type are now obsolete in Italy, when they were in operation turbine blades could be counted on to last 100,000 hours or more. Plants of the Cycle 3 (con- densing) variety experience attaclis by corrosion and clogging in all elements of the plant including the turbine, condenser, water circulating pumps, gas compressors, and interstage gas coolers. These effects can be mitigated to some extent by proper choice of materials and anticipatory design features (see section 5.2.5). For example, it has been found that when the turbine blading is treated with an oil mixture bath during over- haul, scale buildup is reduced and its removal is facilitated. The results shown ,in figure 5.17 reveal that the oil treatment can reduce power loss by about 40% after about 2 year of operation [Ricci and Viviani, 19701.
A program of preGentive maintenance is employed by monitoring of a number of key indicators for signs of or malfunction. These include :
In general the operation of It
+
Pressure drop across the steam i t e r Steam pressure at turbine inlet Vacuum pressure in the condenser Temperature of cooling water into the condenser Suction pressure at gas extraction point Temperature of cold water into gas coolers

108 ITALY [Ch. 6
3.0
2.5
3 2.0 r cn v, 0 1 1.5 a 3
c
W
0 1.0
0.5
0
I I . I I 1
I LARDERELLO 3,26 M W UNITS
0 5 IO 15 20 25
MONTHS AFTER OVERHAUL FIGWE 5.17-Power loss as a function of t i e after overhaul for three 2&MW units
at Larderello 3. Solid lines-without oil washing; broken lines-with oil washing. Steam temperatures: 19OOC (374OF) for Units 1 and 3, 2?1°C (394OF) for Unit 4 [after Ricci and Viviani, 19701. 4wJ
Temperature of hot water out of gas coolers Temperature of noncondensable gases at exhaust Temperature of drain water Temperature of lubricating oil Pressure of lubricating oil Composition of lubricating oil Temperature of bearings Vibration.

8 6.81 YORTE AYIATA 109
.To continue operation as smoothly as possible, a large store of spare parts is maintained at each plant. I n particular, one spare bladed rotor shaft is kept on hand for each two units at a given plant. Some sacrifice in machine efficiency is made when a spare rotor is installed because clear- ances are generally larger than for a custom-matched rotor. However, repairs on the original shaft are made as soon as possible to permit rein- stallation and restoration of design performance [Ricci and Viviani, 19701. The maintenance procedures described above apply to all geother- mal power stations in Italy, those in the Monte Amiata and Trarale regions as well as in the Larderello or boraciferous area.
u 5 . 3 Monte Amiata
6.5.1 Oeology
A schematic geologic map of the Monte Amiata region is shown in figure 5.18 [ENEL, 19703. The area is located about 70 km‘(44 mi) southeast of Larderello. Although the geology of the site is similar to that of Larde- rello, there are somc noteworthy differences. The outcroppings consist of essentially three major complexes: (1) the volcanic complex (denoted by regions cL2” in the figure), which includes the volcanites of Radicofani and Monte Amiata and constitutes a fairly pervious layer; (2) the upper com- plex (denoted by cL4” and (V), consisting of shales, marls, limestones, calcarenites, sandstones, etc. ; and (3) the main pervious complex (denoted by ‘(6’’) of Tuscan formations, from maiolica to evaporites, which con- stitutes the main geothermal reservoir [ENEL, 19701. As can be seen from figure 5.18, the’area is marked by magmatic extru-
sions, a feature absent at Larderello. The products of this volcanic activity are acid in nature and cover about l0,OOO ha (24,700 acres) in the vicinity of Monte Amiata. Unlike the case a t Larderello, there are relatively few outcroppings of the main aquifer complex, The main source of recharge fiuid for the reservoir is the pervious volcanic ion linked to the aqui- fer by fractures, extrusion chimneys, and volcano-tectonic faults. The two areas of the field where power plants are located, B tagnaio, are characterized by extremely high therm 5O0C/lO0 m (27OF/lOO ft) , nearly 17 times the normal gradient. The gra-
p t exceeds 10°C/lOO m (5.6OF/100 ft) over a wide area of 40,000 ha
L
The wells in this region produce dry, slightly superheated steam as at Larderello, but a t generally lower temperatures. Steam temperature in the Bagnore area averages about 138OC (28OoF), at Piancastagnaio 18OOC (36lOF). There has been a considerable decline in the shut-in pressure of the wells since the field was first exploited nearly 20 years ago. At that

M.AMIATA
A
3
I
C
FIGWE 6.18-Geologic map and cross-section of the Monte Amiata region, Tuscany, Italy. Geological formations: 1. "ravertines; 2. Volcanites; 3. Clays, sands, con- glomerates; 4. Shales, mark, limestones, etc.; 6. Calcarenites; 6. Tuscan formations [after ENEL, 19701.
time the closed-in wells showed pressures of 2157 kPa (313 lbf/in*) and 4118 kPa (597 lbf/in2) a t Bagnore and Pianmta.gnaio, respectively. These values have now fallen to 588 kPa (85 lbf/in*) and 1961 kPa (284 lbf/in2), respectively. Wellhead operating pressures at the two sites am about 309 kPa (45 lbf/in*) and 804 kPa (117 lbf/in*).
The amount of noncondensable gas in the geothermal steam is signX- cantly larger than in th0 boraciferous region. At the time the field was being developed, gas content exceeded 90% (by weight) of the natural
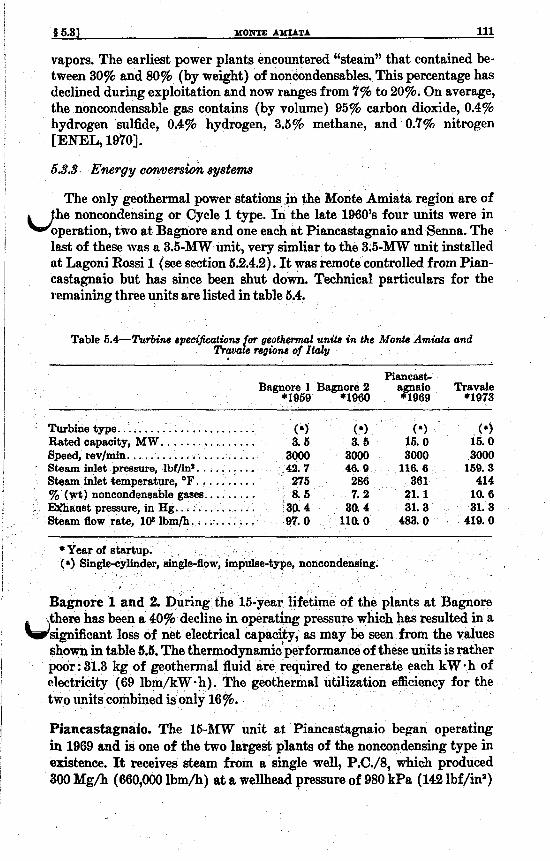
8 5.31 MONTE AXIATA 111
vapors. The earliest power plants encountered “steam” that contained be- tween 30% and 80% (by weight) of noncondensables. This percentage has
the noncondensable gas contains (by volume) 95% carbon dioxide, 0.4% hydrogen sulfide, 0.4% hydrogen, 3.5% methane, and 0.7% nitrogen [ENEL, 19703.
i
, declined during exploitation and now ranges from 7% to 20%. On average,
56.3 Emrgy G o l z z r W 8 h 8YSi?#?l%
The only geothermal power stations in the Monte Amiata region are of u h e noncondensing or Cycle 1 type. In the late 1960’s four units were in
operation, two at Bagnore and one each at Piancastagnaio and Senna. The last of these was a 3.5-MW unit, very simliar to the 3.5-MW unit installed at Lagoni Rossi 1 (see section 6.2.4.2). It was remote controlled from Pian- castagnaio but has since been shut down, Technical particulars for the remaining three units are listed in table 5.4.
Table 5.4-firbine in the Monk Amiata and
Piancast- Bagnore 1 Bagnore 2 agnaio Travale
*1959 *1960 *1969 *1973
. Turbine type.. ...................... ( 8) a) (a) ( 61
Rated capacity, MW. ............... 3. 5 3. 5 16. 0 15. 0 Speed, rev/min. ..................... 3000 am 3000 3000
Steam inlet femperature, OF. ......... 46.9 116.6 169.3
there has been a 44% decline in operating pressure which has resulted in a usignif icant loss of net electrical capacity, as may be seen from the values
shown in table 5.6. The thermodynamic performance of these units is rather poor : 31.3 kg of geothermal fluid are required to generate each kW -h of electricity (69 lbm/kW h) . The thermal utilization efficiency for the two iinits combined is only 16%.
Pianeastagnaio. The 15-BfW unit at Piancastagnaio began operating in 1969 and is one of the two largest plants of the noncundensing type in existence. It receives steam from a single well, P.C./8, which produced 300 Mg/h (660,OOO lbm/h) at a wellhead pressure of 980 kPa (142 lbf/in*)

112 ITALY [Ch. 5
Table 5.5-Production hbto of the noncondenuing units d Bagnore, %ode AmMta
~~~
Bagnore 1 Bagnore 2
Installed capacity, MW. ......... 3. 5 3. 5
Pressure, lbf/ii* ............. 71. 1 7. 11 Temperature, OF. ........... 311 320 Gas content, % (wt). ........ 30 80 Net capacity, MW ........... 3. 70 0. 96
Temperature, OF. ........... 277 286 Gas content, % (wt). ........ 8 8 Net capacity, MW.. ......... 1. 50 2. 00
Temperature, OF.. .......... 275 286 Gas content, % (wt). ........ 8. 5 7. 2 Net capacity, MW.. ......... 1. 20 1. 80
1960
1969 ............ Li Pressure, lbf/iia. 45. 5 50. 0
1974 b Pressure, Ibf/ii*. ............ 42. 7 46. 9
Source: Cataldi et al., 1970. b Source: Ceron et al., 1975.
in 1965. Since that time, the output has fallen 29%; in 1974 the well produced 219 Mg/h (483,000 lbm/h) at 804 kPa (117 lbf/in2) [Corti et al., 1970; Ceron et al., 197751.
The powerhouse, shown in figure 5.19, is designed to allow for easy dis- assembly in the event that the steam flow becomes too low to justify opera- tion. In such a case the entire plant may be readily relocated at another site. Figure 5.20 shows the turbogenerator unit. The turbine is encasedin a single cylinder, employs combined impulse-reaction blading, and has an adjustable intake to allow efficient operation over a wide range of steam pressure from 490 to 1079 kPa (71 to 156 lbf/in2). The turbine is, in fact, identical to the high-pressure turbine installed in the condensing plant at Gabbro described in section 5.2.4.1. A subatmospheric turbine may be attached to the existing machine should steam conditions a t Piancastagnaio warrant conversion to a condensing unit. Gas content would have to dro to about 4% to justify such a change.
The turbine incorporates the same features described in section 5.2.4.2 for the Lagoni Rossi 1 and 2 units. The cutaway view of the turbine in figure 5.21 reveals three sets of blading, each of which has stationary blades mounted on removable inner shells. The first two sets of blades are essen- tially impulse-type, while the last set is impulse-reaction. The adjustable inlet nozzle can also be seen. This plant operates at a geothermal utilization efficiency of 24% and consumes 17.7 kg/kW.h (39 lbm/kW.h) of net electricity generated.
LJ

MO
HTE A
MIA
TA
113
8 6.31

114 IT
AL
Y
[Oh
. ti

8 6.81 M
ON
TE
AM
IAT
A
' 116

116 ITALY [Ch. 6
5.4 Travale
64.1 Geology
The Travale geothermal field is located on the southwest edge of the Era Graben, a northwest-southeast trending feature. The geology of the site is similar to that of the boraciferous region 10-15 km (6-9 mi) to the west- northwest. In fact, the nature of the boundary between the hydrological systems of Larderello and Travale is not well known, even though both regions have been the .subject of many surveys [Petracco and Squarci, 19751.
layer (recent alluvial, coastal deposits, travertines, and magmatic rocks) ; (2) upper complex (Pliocene and Miocene marine, lagoonal, and lacustrine deposits, flysch-facies formations), which forms the impervious cap rock for the reservoir; and (3) lower complex (Mesozoic carbonate forma- tions), which is fractured and constitutes the permeable reservoir. Where the lower complex outcrops, it provides a reasonably absorptive area allowing for recharge and pressure control in the reservoir [Burgassi ’ et al., 19753.
6.4.6 Well programs
.
The hydrogeological complexes may be described as follows : (1) surface b
Locations of the wells in the Travale area are shown in figure 5.22. Eight wells were drilled prior to 1969 (“old” wells) ; as of 1975 six additional wells had been drilled (“new” wells). Information on the new wells is given in table 5.6. In the vicinity of well “22, the main permeable zone is believed to trend northeast-southwest, perpendicular to $he direction of the Era Graben [Cormyand Mus&, 19751. This seems to account for the lack of production from new wells Rl, R2, and R3. Well R4, which lies 0.8 Inn (2600 ft) northeast of well T22, is a good producer. The wide discrepancy in the geofluid characteristics of wells T22 and R4 is related to the fact that these two wells lie on opposite sides of a step-fault that forms one of the boundaries of the Era Graben. As can be seen from table 5.6, the pro- duction zone is down-shifted by about 680 m (2230 ft) from well T22 to well R4 because of the step-fault feature. Well C1 is a replacement for well R3, which was not completed because of technical diEculties. L J 6.43 E’lWTgY CO?LVeT8&”& S?JSi?enC
One power plant is operating at the Travale field, a noncondensing unit (Cycle 1) of 15 Mw nominal capacity. The plant is essentially identical in design to the one at Piancastagnaio, in the Monte Amiata region, described in section 5.3.3. The unit was installed in 1973 and utilizes the geofluid from well T22. Technical particulars are listed in table 6.4. This plant is reported to have the best operating efficiency of any exhausting-to-atmos-

8 6.41 %VALE 117
phere geothermal plant is Italy. Specific steam consumption is 13.5 kg/ kW*h (29.8 lbm/kW*h) [Ceron et al., 19761, and the geothermal energy net utilization efficiency is 29%.
\
1
I I
~
I I
FIGURE 6.22-Well locations at Travale, Italy [after Burgassi et al., 19751.

118 ITALY [Ch. 61
Table 5.6-Information on new wells drilled at Travale
Well
bT22 R1 R2 R3 bR4 c 1
Wellhead elevation, f t 0 . . ........... Total well depth, f t . . .............. Production casing depth, f t . . ....... Casing diameter, in. ............... Reservoir temperature, OF. ......... Delivery pressure, lbf/iis. .......... Delivery temperature, OF.. ......... Total flow rate, lo” Ibm/h. ......... Gas content, % (wt) ..............
1247 2267 2087 13% 507 356 462 388
10. 3
1371 4922 3763
9% 486 - -
* dry -
1214 6040 4856
9% e
516 - -
dry -
1378 3340 2359 13%
d 428 ( 0 ) - - -
1116 4498 4429
9% 387 84
331 201 66
.Source: Burgassi et al., 1976. b Measured during March 1975. 0 Relative to sea level (s.l.=O ft) . Nonequilibrium value; extrapolated value is = 482’F. Not com leted because of technical difficulties. Not avaifable.
#,Originally produced a steam-gas mixture intermittently.
REFERENCES”
Allegrini, G. and Benvenuti, G., 1970. “Corrosion Characteristics and Geothermal Power Plant Protection (Collateral Processes of Abrasion, Erosion and Scaling) ,” Pisa, 19’70, pp. 565-881.
Burgassi, P., Stefani, G. C., Cataldi, R., Rossi, A., Squarci, P., and Taffi, L., 1975. “Recent Developments of Geothermal Exploration in the Trwale-Radicondoli Area,” Sun Francisco, 19‘76, Vol. 3, pp. 1571-1581.
Cataldi, R., Ceron, P., DiMario, P., and Leardini, T., 1970. “Progress Report on Geothermal Development in Italy,” Pisa, 19’70, Vol. 2, pp. 77-87.
Celati, R., Squarci, P., Taffi, L., and Stefani, G. C., 1975. “Analysis of Water Levels and Reservoir Pressure measurements in Geothermal Wells,” Sun Fran- cisco, 1976, Vol. 3, pp. 1583-1590.
Ceron, P., DiMario, P., and Leardini, T., 1975. “Progress Report on Geothermal De- velopment in Italy from 1969 to 1974 and Future Prospects,” Sun Francisco, 1976, Vol. 1, pp. 59-66.
Ciapica, I., 1970. “Present Development of Turbines for Geothermal Application,” Pisa, 19‘70, Vol. 2, pp. 834-838.
Cigni, U., 1970. “Machinery and Equipment for Harnessing of Endogenous Fluid,” Pka, 1970, Vol. 2, pp. 704-713.
Cigni, U., Fabbri, F., and Giovannoni, A., 1975. “Advancement in Cementation Techniques in the Italian Geothermal Wells,” Sun Francisco, 1975, Vol. 2, pp.
Conti, Prince P. G., 1924. “The Larderello Natural Steam Power Plant,” Proc. First
Cormy, G. and Mus6, L., 1975. “Utilization of MT-5-EX in Geothermal Exploration,”
Corti, R., DiMario, P., and Mondolfi, F., 1970. “New Trends in the Planning and
1471-1481.
World Power Conf., London.
Sun Francisco, 1976, Vol. 2, pp. 929-935.
Design of Geothermal Power PlantsJJJ Pisa, 19’70 Vol. 2, pp. 768-779.
a See note on p. 24.

BEFEREICES 119
Dal Secco, A., 1970. “Turbocompressors for Geothermal Plants,” Pka, 1970, Vol. 2, pp. 819-833.
Defferding, L. J. and Walter, R. A., 1978. “Disposal of Liquid Effluents from Geo- thermal Installations,” Geothermal Resources Council Trans., Vol. 2, Sec. 1, pp.
DMario, P., 1961. “Remarks on the Operation of the Geothermal Power Stations at Larderello and on the Transportation of Geothermal Fluid,” Rome, 1961, pp. 334-353.
Ellis, A. J. and Mahon, W. A. J., 1977. Chemistry and Geothermal Systems, Aca- demic Press, New York.
ENEL, 1970, Larderello and Monte Amiata: Electric Power by Endogenous Steam, Ente Nazionale per L’Energia Elettrica, Compartimento di Firenze, Direzione Studi e Richerche, Roma. (In English.) w Hahn, E., 1924. “Some Unusual Steam Plants in Tuscany,” Power, Vol. 57, pp. 882- 885.
Koenig, J. B., 1973. ‘Worldwide Status of Geothermal Resources Development,” in Geothermal Energy, P. Kruger and C. Otte, eds., Stanford Univ. Press, Stanford,
Leardmi, T., 1974. “Geothermal Power,” Phil. Trans. Royal SOC. Lond. A, Vol. 276,
Mongelli, F. and Loddo, M., 1975. “Regional Heat Flow and Geothermal Fields in
Overton, H. L. and Hanold, R. J., 1977. “Geothermal Reservoir Categorization and
Petracco, C. and Squarci, P., 1975. “Hydrological Balance of Larderello Geothermal
.
141-143.
1 CA, pp. 15-58.
pp. 507426.
Italy,” Sun Francisco, 1976, Vol. 1, pp. 495-498.
I Stimulation Study,” Los Alamos Scientific Laboratory, Int. Rep. LA-6889-MS,
Pollastri, G., 1970. “Design and Construction of Steam Pipelines,” Pka, 1970, Vol.
Ricci, G. and Viviani, G., 1970. “Maintenance Operations in Geothermal Power
I Los Alamos, NM.
Region,” Sun Francisco, 1976, Vol. 1, pp. 521-530.
2, pp. 780-811.
Plants,” Pisa, 1970, Vol. 2, pp. 839-847.
. I i
i
I
Saporiti, A., 1961a. “Progress Realized. in Installations with Endogenous Steam
Saporiti, A., 196lb. “Progress Realized in Installations with Endogenous Steam
V i , F. P., 1975. “Geothermal Plants in Italy: Their Evolution and Problems,”
I Condensing Turbine-Genirator Units,” Rome, 1961, pp. 380-394. 1
I I
TurbineGenerator Units without Condenser,” Rome, 1961, pp. 397-409.
Sun Franchco, 1976, Vol. 3, pp. 2055-2064.
,


CHAPTER 6 JAPAN
6.1 Overview
k d ~ Japan is the only country which has operated geothermal plants of the dry steam, single-flash, double-flash, and binary type. Although only 165 Mw are installed at this time, an ambitious and aggressive develop- ment program is underway, aimed at putting 48,000 MW on-line by the year 2000 from all geothermal sources, including tapping volcanic magma and hot dry rocks.
The full range of geothermal activities in Japan is directed by the government's Ministry of International Trade and Industry (MITI) through the Sunshine Project. Problems relating to fundamen tal research and development are handled through the Geothermal Energy Research and Development Company, Ltd. (GERD) , an organization that enjoys the participation of 30 institutions, mainly Zrom industry. The Agency of Industrial Science and Technology (AIST) also oversees certain re- 1
search projects, in particular those of the Geological Survey of Japan (GSJ). Projects related more to development than research are also administered by MITI but are channeled through the Japan Geothermal Energy Development Center (JGEC), where funding is shared between government and industry on a 90/10 ratio. Thus a concerted and effective effort is iinderway in Japan to develop the geothermal resources of that country through a close partnership between government and industry.
Exploitation of geothermal energy for electric power has, nevertheless, been slow in Japan because nbarly all of the outstanding geothermal prospects are located in national parks, which are enthusiastically pro- tected for their natural beauty. The construction and operation of geo- thermal power plants thus are subject to rigid and stringent controls.
A summary of the geothermal plants in Japan is given in table 6.1, where information is provided for plants in operation, in testing, under construction, and in planning. Each will be described in the following sections.
6 2 Matsukawa The Matsukawa geothermal power plant was completed in 1966 by the
Japan Metals and Chemicals Company, Ltd. Located in Iwate Prefecture
121

.............. ......... . ....................... ............. i..--.-_i-_.-_-_.__ - -. ... .............. .. . , , , ..~ --..- i ~ l i~L1 . ~ i ~ i _ ~. "-.?I_._".___ .,.". ,, -, , , ,
Table 6.1-Ueothermal power plant development in Japan
Location Ca acity,
Plant Type M& Island Prefecture Status
Matsukawa. . . . . . . . . . . Dry steam.. . . . . . . . . . . . . 20. ............ Honshu. . . . . . . . Iwate. . . . . . . . . . Operational since 1966 Otake. . . . . . . . . . . . . . . . Singleflash. ............ 10. . . . . . . . . . . . . Kyushu. ....... Oita. . . . . . . . . . . Operational since 1967 Onuma.. ............. Singleflash. . . . . . . . . . . . . 10. . . . . . . . . . . . . Honshu. ....... Akita. ......... Operational since 1973
Hstchobaru. . . . . . . . . . . Double-flash. . . . . . . . . . . . 50. ............ Kyushu ........ Oita . . . . . . . . . . . Operational since 1977 Kakkonda . . . . , . . . . . . . Single-flash . . . . . . . . . . . . . 50. ............ Honshu . . . . . . . . Iwate. ......... Operational since 1978
Mori (Nigorikawa).. ... Binary.. ...............
-- \
Onikobe ............... Singleflash . . . . . . . . . . . . . 25 . . . . . . . . . . . . . Honshu ........ Miyagi. ........ Operational since 1975
Otake ................ Binary.. ................ 1 . . . . . . . . . . . . . Kyushu.. ....... Oita.. ......... Tested 1977-1979
Mori. ................ Singleflash. ............ 55. ............ Hokkaido . . . . . . Hokkaido . . . . . . Under construction (To be named). . . . . . . . Doubleflash.. . . . . . . . . . . 55. . . . . . . . . . . . . Kyushu. ....... Kumamoto.. . . . In planning
1.. ........... Hokkaido.. . . . . Hokkddo.. . . . . Tested 1977-1979
L

in the northern partcof Honshu Island, it is one of the few sites in the world where essentially dry, natural geothermal steam is used to produce electric power. Matsukawa was the first geothermal power plant installed in Japan. The turbine-generator is rated at 20 MW and was supplied by the Tokyo Shibaura Electric Company (Toshiba) . The power produced is supplied to the network of the Tohoku Electric Power Company, Ltd.
ph appears in figure 6.1.
6.8.1 Geology and
w The Matsukawa composite volcano with a uthern margin of the caldera shows thermal outcrops
(fumaroles). The volcano sits on the andesite lava of yet another volcano, which in rests on a Tertiary basement. Surface manifestations result from s in the caldera and a deep-seated magmatic intrusion. The hydrothermal reservoir consists of porous beds in the upper portion of the Tertiary, with the Quaternary andesite lavas forming an overlayer [Saito, 19611.
In 1953 area residents began to drill wells in the hope of discovering a source of hot water to supply a health spa. Instead, many of the wells pro- duced steam at depths of 160-300 m (525-984 ft) [Saito, 196ll. Since that time, numerous methods have been applied to discern the geologic nature of the field, including detailed geologic mappings, geophysical prospecting by means of seismic and electric resistivity methods, and geo- physical well loggings [Saito, 1970; H. Nakamura et al., 19701.
Before the power station was constructed, tests were run for 18 months on a 450-kW back-pressure turbine to as e corrosion effects on vari- ous materials from exposure to geothe team and its condensate. Table 6.2 lists the characteristics of th densate. Fourteen materials were tested; table 6.3 shows the types of ma- terials used for various componen
steady, linear decrease in flow rate. Following a workover of the well, the flow increased somewhat, but not to the full initial value.
Until 1973 all drilling was carried out with mud. With the failure of the No. 3 well at Matsukawa owing to erosion of the casing, air drilling was initiated for the new No. 3 well. Mud was used to a depth of 815 m (2673

124 JA
PAN
[ Ch. 6

g6.21 MATSUKAWA l25
Table 0.2-Charadedties of geothermal 8ham and condensate at Matsukawa
Noncondensable gas content, percent by volume of steam. ......... Composition of noncondensable gases (volume percentage) :
0.2%-0.0%
Carbon dioxide, COS.. ..................................... 79.3%-85.2% Hydrogen sulfide, HsS. .................................... 12.9%-17.7% Methane, CH,. .... ................................... 1.16% Hydrogen, Hs.. .... ................................... 0.28%
Amorphous silicon dioxide, Sia . HsO.. ....................... Sodium, Na ............................................... 280 Potassium, K . . ........................................... 180 Hydrogen sulfide, HtS., .................................... 10-42.4 Chloride, Cl.. ............................................ 9. 2
.
Composition of condensate (ppm) : sulfate, so,. .............................................. 1708. 1
796.6
pH of condensate.. ............................................ 4.36-4.86
Source: Kawasaki, 1977.
Table 0.3-MahriCrls and Corrosion test data: Mataukawa '
Corrosion Material name (ASTM) rate, P W ~ -
casing.. ............ Carbon steel plate (A283-6rDI.. ........ 630 Impingement shield. ......... Stainless steel plate (410). ............... 21.3
'Rotor.. .................... 1% Cr/1.25% Mo/0.25%VY forged steel.. 623 Buckets. .............. ,-. .. Low carbon, 12% Cr steel (410). ........ 21.3 Nozzle diaphragms.. ......... Carbon steel plate (A283-0rD). ......... 030 Nozzle partitions. ........... 12% Cr AI alloy steel.. ................ 49.4 Labyrinth packing strips. ..... 16% Cr/1.76% Mo eteel.. .............. - Valve bodies. ............... Carbon steel plate.. ................... 636 Valve seats.. - ................ Stellite welding.. ...................... Bearing babbits, ............ White metal (D-23-6). ................ - Oil cooler tubes.. ............ Aluminum.. c
Tube sheets., ...... , ........ Naval brass sheets and plates (B-111) . . . Water boxes. - ............... Cast iron (48-35).. .................... Condenser shell and tail pipe. . Epoxy-coated carbon steel. ............. Condenser tray.. ............ Stainless steel (304). .......... Gas ejector.. - . .,. ........... Stainless steel (304). ..........
.......................... b 4.92
b 2.84
.Sources: Akiba, 1970; Mori, 1970. b In condensate.
ft), while air was used from there down to 1170 m (3838 ft). The new well produces 70 Mg/h (0.154X10e lbm/h) [Iga and Baba, 19741. Wells range in depth from 800 to 1200 m (2625 to 3940 ft), At Matsukawa, and typically elsewhere in Japan, geothermal wells are completed as follows : a surface casing of 457-mm diameter (18-in) to a depth of about 30 m (98 ft ) , a UO-mm (18%-in) conductor casing to 250 m (820 ft) , a 244-mm (9s/,-in) production casing to about 500 m (1640 ft), or to the depth of the reservoir, plus an additional 700-800 m (2300-2625 ft) of 219-mm
*
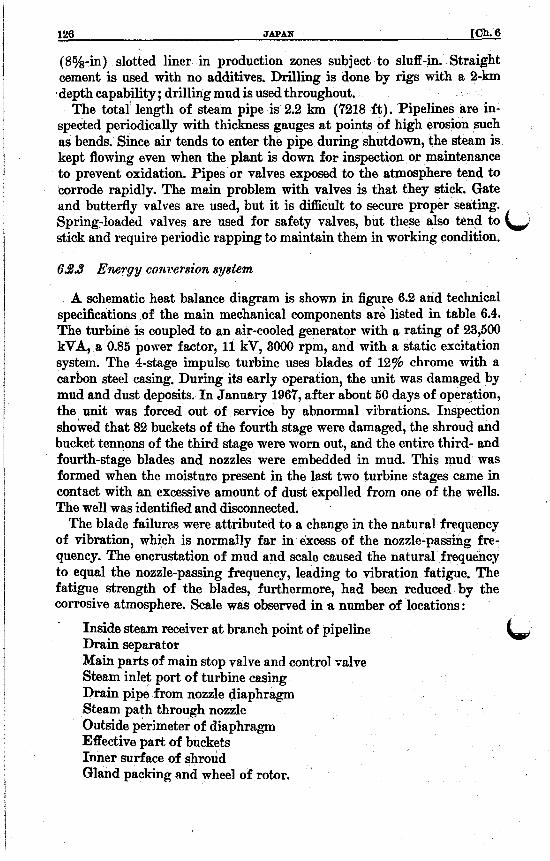
($%-in) slotted liner in production zones subject to sluff-in. Straight cement is used with no additives. Drilliig is done by rigs with a 2-km
.depth capability ; drilling mud is used throughout.
spected periodically with thickness gauges at points of high erosion such as bends. Since air tends to enter the pipe during shutdown, the steam is kept flowing even when the plant is down for inspection or maintenance to prevent oxidation. Pipes or valves exposed to the atmosphere tend to corrode rapidly. The main problem with valves is that they stick. Gate and butterfly valves are used, but it is dacul t to secure proper seating. Spring-loaded valves are used for safety valves, but these aIso tend to stick and require periodic rapping to maintain them in working condition.
6.%3 Energy conrersion system
The total length of steam pipe is 2.2 km (7218 ft). Pipelines
A schematic heat balance diagram is shown in figure 6.2 and technical specifications of the main mechanical components ar; listed in table 6.4. The turbine is coupled to an air-cooled generator with a rating of 23,500 kVA, a 0.85 power factor, 11 kV, 3000 rpm, and with a static excitation system. The 4-stage impulse turbine uses blades of 12% chrome with a carbon steel casing. During its early operation, the unit was damaged by mud and dust deposits. In January 1967, after about 50 days of operation, the unit was forced out of service by abnormal vibrations. Inspection showed that 82 buckets of the fourth stage were damaged, the shroud and bucket tennons of the third stage were worn out, and the entire third- and fourth-stage blades and nozzles were embedded in mud. This mud was formed when the moisture present in the last two turbine stages came in contact with an excessive amount of dust expelled from one of the wells. The well was identified and disconnected.
The blade failures were attributed to a change in the natural frequency of vibration, which is normally far in excess of the nozzle-passing fre- quency. The encrustation of mud and scale caused the natural frequency to equal the nozzle-passing frequency, leading to vibration fatigue, The fatigue strength of the blades, furthermore, had been reduced by the corrosive atmosphere. Scale was observed in a number of locations : . LJ Inside steam receiver a t branch point of pipeline
Drain separator Main parts of main stop valve and control Talve Steam inlet port of turbine casing Drain pipe from nozzle diaphragm Steam path through nozzle Outside perimeter of diaphragm Effective part of buckets Inner surface of shroud Gland packing and wheel of rotor.

. c
484r.4 W
30.0 OC
i - - - - -m - WATER TANU 4T.O OC
FIQIJRE &%Heat balance disgram of Mabukawa geothermal power plant [Akiba, 19701.

Table 6.4-Tsehniwl spscijiccrwna for Japansse gaothannal powm plants
Matsukawa Otake Onuma Onikobe Hatchobaru Kakkonda *1966 *1967 *1973 *1975 *1977 $1977
firbins datcr: - 8 . . . .......................... Rated capacity, MW.. . . . . . . . . . . . . . . . Maximum capacity, MW. . . . . . . . . . . . . Speed, rev/min.. ... .. . . ... . .. .. . . . . . Main steam pressure, lbf/W.. . . . . . . . . Secondary steam pressure, lbf/in'. . . . . . Main steam temperature, OF. . . . . . . . . . Secondary steam temperature, OF.. . . . . Exhaust pressure, in Hg.. . . . . . . . . . . . . Main steam flow, l@ lbm/h.. . . . . . . . . . Secondary steam flow, 10s lbm/h. . . . . . Last-stage blade height, in. . . . . . . . . . . . Typeb ............................. Cooling water temperature, OF.. . . . . . . . Outlet water temperature, OF.. . . . . . . . . Cooling water flow rate, l@ lbm/h . . . . .
Condsnssr data:
C
SCSF4I 20 22
3000 64
297 -
4.0 456
23. 0 -
DCEB 77. 0
116.6 9. 52
SCSF4I 10 13
3600 35. 6
261
3.2 249
16.5
DCEB 78.8
106.5 8. 60
i
-
-
SCSF4I 10
12. 5 3000 35. 6
261
3. 2 236
19. 7
DCEB 73.4
110.1 6. 28
- -
-
SCSF5PI 25 25
3000 64
297
3.1 503
24.7
DCEB
107.8 15.60
- -
-
78.8
C
SCDF5PI 50 55
3600 68. 9 16.6.
327.6 215.6
2. 9 847 256
25. 0
DCLL 78. 8
110.3 27.10
I
SCDF4IR 50 50
3000 64
297
4.0 877
23.0
DCLL (9 (9 ( 0 )
-
-
-

.. . . . ....... ... ........ ...... ...... . . . . . - ~ ~ 1 . . . . . . . - -
I -. ~ - --
c Ga8 axtractor data:
Tsrped ............................. SJE Suction pressure, in Hg.. ............ 3.74 Gaa capacity, ft*/min.. .............. 10,600 Steam consumption, l(P lbm/h.. . . . . . . . (9 Power consumption, kW.. ............. - Type.... .......................... ND Number of cells. ..................... (Tower) Design wet-bulb temperature, O F . . .... (9 Fan motor power, kW.. ..............
Cooling t o m data:
-
MDRVP 2. 66
2,719
53 (steady)
CXMD 3
62. 6 66. 0
-
MDRVP 2. 66 618
30 (steady)
CXMD 3
57. 2 86. 0
c SJE/VP
3. 00 (9 33
CTMD 5
62. 6 ("1
SJEI2RB 2. 75
9,594 11. 5
CTMD 4
62. 6 213 ~
*Year of startu SCSF4I=aIn&-cylinder, single-flow, &age impulse; SCSF5IR
=singlecylinder, single-flow, 5-stage impulse reaction- SCDF5PI =sin e-cylinder, double-flow, 5-stage p d n ; SCRF4iR=single- cylin d p er double-flow, 4-stage impulse-reaction.
b DC&B=diredrcontMt. external. barometric type; DCLL=
0 Not available. d SJE=ateam 'et e'ector; MDRVP=motor driven reciprocating
vacuum pump; )SJE/tP=steam jet ejector with vacuum pump; SJE/2RB=steam jet ejector with 2-stage radial blower.
0 ND=natural draft; CXMD=crossflow, -mechanically-induced draft; CTMD=counterflow, mechanically-induced draft. ._
direct-contact, low-level t$.

Composition of the scale from parts of the turbine is given in table 6.5. These elements formed such compounds as S O , , CaS04, NaS04, Al,O,, MgO, FeS04, and FeS. The decrease in SO4, Na, and K is attributed to their solubility in the moisture of the last stages of the turbine. The in- soluble SiOz is believed to be flushed out mechanically by the condensed steam.
Table 6.5-Chemical composition of seals afte: 60 days of operation at Matsukawa
Element
Control First-stage Second-stage Third-stage valve buckets buckets buckets
(percent) (percent) (percent) (percent)
Si02 . . . . . . . . . . . . . . . 37 so,. ............... 44 Fe ................. 1. 3 A1 ................. 0. 9 Ca ................. 1. 0 Mg ................ 0. 3 s .................. (Trace) Na ................ 11. 5 K ................. 4.3
Source: Akiba, 1970.
24 50 10 0. 6 0. 8 0. 2 0. 4 9. 3 2. 8
11 24 51 0. 2 0. 3 0. 1 2. 3 2. 3 0. 6
4 18 56
0. 2 0. 04
(Trace) 4. 3 0. 6
(Trace)
The condenser is of the direct-contact, barometric type and is designed to condense 194 Mg/h (0.428 X lo6 lbm/h) at a vacuum of 12.? kPa (3.74 in Hg) , absolute pressure. The condenser, located outside the powerhouse, is made of carbon steel plate lined with stainless steel and coated with epoxy paint on the inside surfaces. The shell is 4.7 m (15.4 ft) in diameter and is 10.3 m (33.8 ft) in height. The tail pipes of the inter- and after- condensers for the gas extraction system are now made of stainless steel to protect them against corrosion. The original carbon steel pipes failed from corrosion, leading to loss of vacuum in the condenser.
The water cooling tower is of the natural-draft type, the only one of its kind in use in Japanese geothermal power stations. It has a ground-level diameter of 45 m (147.6 ft) , a height of 44.6 m (146.3 ft) , and is sheathed with 10-cm-thick (3.94411) vacuum concrete panels set to steel pipe shells. The tower is fitted with 1.6 m (5.25 f t ) of plastic packing. Water is dis- tributed by means of steel pipes with plastic spray nozzles. Make-up water is obtained from the Matsukawa River. Some trouble has been experienced at times when the screens are unable to trap d l the dust and sediment. Such contaminants can foul and clog the spray nozzles? thereby lowering the efficiency of the cooling tower. This clogging tends to occur at flood time.
I Since the ambient temperature during the winter can be quite low, ranging from -25' to -5OC (-13O to +23OF), the draft ports have to be covered to control the flow rate of air through the tower to prevent freezing.

$6.21 MATTBUKAWA 181
The main step-up transformer is rated at 23,500 kVA, 11 kV/155 kV, 3-phase, 50 Hz ; the plant auxiliaries are fed from a 2500 kVA transformer, 11 kV/3.5 kV, 3-phase. Electrical power from the plant is fed to the grid of the Tohoku Electric Power Company by means of a 20-km (12.4-mi), 155-kV transmission line. Because of the extremely corrosive atmosphere in the vicinity of the powerhouse, the substation is located about 600 m (0.4 mi) from the plant in an area where the concentration of H,S is ex- tremely low. Main electrical equipment is sealed in oil-filled containers; terminals are coated with conductive grease; bare wires are made of dumi- num; and supporters are coated with antirust paint. It is difficult to pro- tect metars and relays from the corrosive action of the atmosphere with antirust paint because these coatings tend to cause sticking. Since the trip time for a relay is crucial for the safety of the plant, movement tests of all relays are conducted more frequently than in a conventional power sta- tion. The concentration of H,S in the turbine r q m is between 0.06 and 0.40 ppm [Sato, 19’701.
63.4 Emirmmntal effects and co-ect%zat&
Water is taken from the Matsukawa River to provide for cooling water make-up and tower blowdown. The Akagawa River, adjacent to the plant, receives the excess condensate. There are no controls on the emission of hydrogen sulfide. The main steam contains between 0.03% and 0.11% (by volume) H a s . The 2-stage steam jet ejectors remove the HzS and the other noncondensable gases and discharge them to the atmosphere through the cooling tower. The concentration of H,S in the atmosphere is described {Sato, 19’701 as exerting “no remarkable influence” on the power plant. The specific emissions level of HeS from the plant ranges from 5050 to 20,800 g/MW * h, a moderate-to-high Ievel of emissions.
Since 19‘71 the waste heat from the power plant has been used for space- heating at nearby villages [Mori, 19751. Recipients of this thermal energy include Hachimantai Hot Springs in Matsuo Village, Hachimantai Heights (a recreational center for employees of small companies run by the government’s Employment Promotion Corporation), a regional forest- ry office (working sit.), and three inns at Matsukawa Hot Springs. The w supplier of the heated water is the Hachimantai Hot Springs Develop- ment Company, Ltd., which comprises Matsuo Village, Japan Metals and Chemicals Company, Lt Bus Company.
1
E~onolniO f UC~OTS
Construction cost of the Matsukawa geothermal power plant was one and a half to two times the figure for a thermal power station per kW installed. Higher costs resulted from the added expenses of building in a very rug- ged region and the distances between geothermal wells. The figures h

132 JAPAN [ah. 6
table 6.6 show construction costs in 1968 yen [S. Nakamura, 19701. "he cost of electricity for one of the early years of operation turned out to be 2.63 yen/kW h ( 7 mill/kW h), roughly equivalent to the cos& of electricity from fossil-fuel power plants at that time. Since fossil-fuel costs have increased by a factor of three or four since then, the present cost of geothermal electricity from the Matsukawa plant is clearly con- siderably less than that from a fossil-fuel plant.
*
Table 6.6-Comttudion costs of Matsukawa plant (in mawm of yen, 1968)
Geological surveys and exploration. ................. . Steam wells ....................................... Steam-gathering system. ........................... Buildings. ........................................ Cooling tower.. .......................... I . ....... Power generation equipment. ....................... Substation. ....................................... Incidental equipment. ............................. Interest and other related costs. ....................
- 160 439 193 216 357 407 170 49 66
Total. ........................................ 2057 (- US $6 million, 1968)
Note: The total cost is about $285/kW in 1968 US dollars.
63.6 Opemthg e@@me
The Matsukawa plant has been running in a highly reliable fashion since it was commissioned in 1966. A summary of its performance for the period 1967-1974 is given in table 6.7. Recent availability factors have
Table 6.7-Pqformance of Matsukawa dry-steam 8O-MW geothermul power plant
Electricit Generation, Net Capacity Availability
Peak load factor,b factor, Year Gross Net MW (percent) (percent)
dW-h
......... :E L d 1967.. 67,439 62,853 13. 0 49. 0 1968.. ......... 106,673 101,873 20. 5 58. o 1970.. ......... 162,518 155,630 21. 0 88.8 95. 5 1971.. ......... 153,108 146,371 21. 1 83. 5 93. 1 1972.. ......... 176,463 169,228 22. 5 96.3 96. 3 1973.. ......... 183,680 176,884 22. 5 ' 101.0 96. 7 1974.. ......... 185.910 178.660 22. 5 e 102.0 95. 5
1969.. ......... 142,354 136,660 20. 6 713. o 96. 2
Source: JGEDC, 1978. b Based on nominal ca acit of 20 MW.
''When baaed on 22.8M4, these three values become 85.6, 89.8, and 90.7%, respectively.

$8.81 WAKE 183
been greater than 9596, and net capacity factors are consistently above 8676, based on the rated capacity of 20 MW. In recent years the plant has operated at peak loads of 22.5 M W at times, leading to capacity factors in excess of 100%.
6.3 Otake
ower plant was the second to be commissioned ame on-line in August 1967. It was the second central station to us0 a liquid-dominated hydrothernial reservoir, the
aland having been the first. Otake is rated at 10 MW, with a maximum capacity of 13 MW. The Kyushu Electric Power Company, Inc., owns and operates the plant, which is shown in figure 6.3.
volcanic region near Mount Aso on the island of Kyushu, Oita Prefecture, is the site of the Otake power station. Mount As0 is an active volcano of the caldera type. The Otake field is about 20 km (12 mi) southwest of the popular hot-springs resort city of Beppu. Exploration at the Otake geothermal area began as early as 1927, when a 94-m (808-ft) test well was drilled by the Tokyo Electric Power Company. No tempera- ture data were taken because the well blew out. Beginning in 1951 geo- logic, geophysical, and geochemical surveys got underway. These included electrical res;Stivity (1951, 1963-1965), magnetic (1963-1965), gravity (1963-1966), radioactivity (1951), and thermal gradient (1951). From 1953 to 1966, the Kyushu Electric Power Co. drilled six exploratory wells ranging in depth from 300 ot 1030 m (984 to 3380 ft). Although five of these wells blew out, m O to 205OC (298" to Ml°F) were observed.
The early test wells quid dominated, yielding a mixture of sts'am and liquid. Exploitation of such fields, in con- trast to dry steam fields, was unknown in the early 1950's. Thus the Otake field lay unused until the experience at Wairakei, New Zealand, showed
could be tapped to produce electricity. As a result of the ducted in the early 1960's, it was concluded that a geo-
be built at Otake,
.
w thermal power plant of at le given the avail8ble
tion wells, 350-600 m (1150-1970 ft) deep. However, three of these have ceased production, leaving only two wells to supply the plant. Recently a program was undertaken to increase the number of wells, particularly reinjection wells. Table 6.8 gives a summary of the drilling experience at

134 JA
PA
N
CCh. 6
3 d P m ."

LI 6.81 OTAKE 135
Table 6.8-Drilling experience at make
OT-2.. . . Mar. 1953-JW. 1953 142.9
OT-3.. . . Dec. 1953-Mar. 1955 142.9
OT-5.. '. Jul. 195PDec. 1955 193.7
193.7
0-7. . . . . Mar. 196PMay 1964 193.7
0-8 ... .. Oct. 1964-Feb. *1965 142.9
0-9. .. .. Jan. 1965-Mar. 1965 193.7
'b, 0-6... .. Dec. 1963-Feb. 1964
0-10.. os-1 .. OW.. 083 . .
): OR-1. OR-3.
* , OR-4. I OR-5. '. OR-6.
Depth, m Comments
300
300
900
450
600
350
497
550 . Jan. 1966-Apr. 1966 . Oct. 1971-Mar. 1972 . Dec. 1972-Mar. 1974 . Jun. 1978-Dec. 1978 . Nov. 1971-Feb. 1972 . Nov. 1974-Feb. 1975 . Apr. 1976-Sep. 1976 , Nov. 1976-Jun. 1977 . Oct. 1977-Feb. 1978
193.7 193.7 193.7 193.7 193.7 193.7 269.9 269.9 269.9
Successful; stopped prod.
Successful; stopped prod.
Successful; stopped prod.
Successful; stopped prod.
Successful; stopped prod.
Successful; stopped prod.
Successful; stopped prod.
Successful; stii in use
Dec. 1953
Dec. 1953
Mar. 1957
Apr. 1965
Dec. 1967
Oct. 1976
Dec. 1977
600 1550 1300 - 700 329' 600 600 530 501
Successful; stiIl in use Failure; low temperature b
Failure; dry well
Successful; stii in use Successful; still in use
Successful; still in use Successful; stii in use
- Failure
OR-7. . . Mar. 1978-Mar. 1978 269.9 351 Successful; still in use OR-8. . . Apr. 1978-Jun. 1978 269.9 470 Successful; still in use OR-9.. . Rec. 1978- - 269.9 -700 Under construction
Converted to a reinjection well, 0-7R; currently in use. b Converted to a reinjection well, OR-2, plugged at 500 m; currently in use.,
f
Otake. Through the end of 1978 there were two production wells (0-9 and 0-10) and eight reinjection wells (O-m, OR-1, OR-2, OR-3, and OR-5 through OR-8) in operation. Figure 6.4 shows the profiles of the two currently producing wells. A typical wellhead arrangement is shown in figure 6.5 ; a schematic of typical steam separator equipment in figure 6.6. The arrangement of steam pipelines is given in the plan view in figure 6.7 for the original production wells, 0-6 through 0-10. The gathering system covers an area ob about 0.38 ha (0'94 acres), and comprises three main steam lines with a total length of roughly 900 m (2950 f t ) and a maximum diameter of 700 mm (27.5 in)
The characteristics of the geothermal fluid produced by wells 0-9 and 0-10 are listed in table 6.9. The amount of noncondensable gases, particu- larly hydrogen sulfide, is relatively low. The bulk of the noncondensable gases is carbon dioxide [Kawasaki, 19773.

136 JAPAX [Oh. 6
L.O.C. + -
L.O.C. -- -
W E L L 0 - 9 W E L L 0-10 FIQURE 0.4-Well casings for Otake wells 0-9 and 0-10.
63.3 Emrgy c m m ~ 8 y s W
A thorough investigation of site and reservoir characteristics w&s con- ducted for about 18 months prior to the decision to construct a power plant. The well flows were traced for 1 year. The optimum turbine inlet pressure selected was 245.1 kPa (35.6 lbf/in*) in order to yield maximum power output while guarding against future power dropoff in case of scale build- up on the turbine nozzles. Since scaling of nozzles increases working pres- sures, the pressure chosen is somewhat less than the exact value corre- sponding to the power peak. To produce the desired turbine inlet pressure,

8 6.31 OTAKE 187
10")
-
FIGVRE 6.bTypical wellhead apparatus at Otake [MHI, 1976133.
Table R.Q-Charact&tics of the Qeofluid from Otake we& No. 0-9 and 0-10
Well 0-9 Well 0-10
Shut-in pressure, kPa. ........................... Separator pressure, kPa.. ............... 4. ....... Flow rate of steam, M&. ........................ Flow rate of liquid, Mg/h.. ....................... Total flow rate, Ma.. .......................... Wellhead quality, %. ............................ Noncondensable gas content 8 . .................... Composition of NC gases b:
Carbon dioxide.. ............................ Hydrogen sulfide. ........................... Others; Q, Na, etc.. ......................... andy ye is of .hot water: pH ......................... Chloride, ppm.. .............. Total dissolved solids, ppm .... Silica, ppm.. ................ Calcium, ppm.. .............. Magnesium, ppm.. ........... Sodium, ppm.. .............. Potassium. pprn.. ............
..............
..... + ........
..............
..............
..............
..............
..............
.............. . - - Sulfate, ppm... .............................
- 8 As a percentage by volume of steam. b Aa a percentage by volume of total noncondensables.
882 245 29 61 90 82
0.228
96. 0 1. 4 2. 6
6. 7 8810 1630 668 29 17
940 110 145
745 245 80
135 165 18
0. 05
93. 0 1. 0 6. 0
8.0 4030 1720 612 - -
1060 140 -

138 JAPAN [Ch. 6
HO
STEAM SEPARATOR
STEAM - 0 POWER HOUSE)
FIQURE 6.6-Schematic of typical steam separator equipment at Otake [MHI, 1976133.
tiid the pressure at the outlet of the separator must be 303.9 kPa (44.1 Ibf/in2) [Usui and Aikawa, 19701. The schematic for the power plant is given in figure 6.8. Technical specifications of the major mechanical components are listed in table 6.4. Th e turbine, built by Mitsubishi Heavy Industries, Ltd., is a single-
cylinder, single-flow, four-stage impulse machine. It is rated at 10 M W (13 Mw maximum capacity), turns at 3600 rpm, and accepts essentially saturated steam at 127OC (261OF) and 245 kPa (35.6 lbf/in2). To cope with the high moisture content of the steam, the turbine's last stage is fitted
WELL 0-7 WELL 0-6
/ WELLO-IO
N-
0-9
Q '\\ 1 VCOOLING TOWER
L.0'
SUBSTATION
0 50 100 200m E I 1
FIOURE 6.7-Layout of production wells, powerhouse, cooling tower, and substation at Otake [after Kubota and Aosaki, 19751.
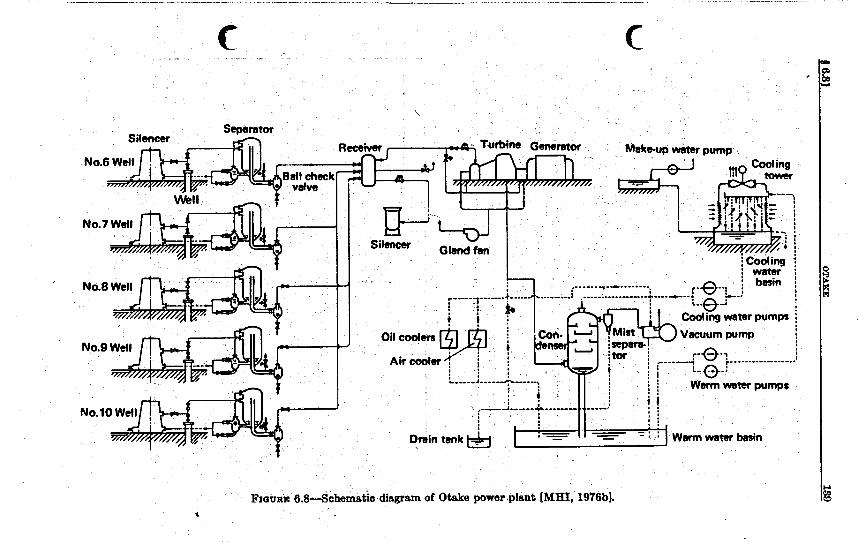
J 6.81 W
AK
E
139 b

140 JAPAB [Ch. 6
with a recessed stsuite strip and each stage has a drain catcher. Liquid droplets are induced to travel to the periphery by centrifugal force en- hmced by a higher-than-normal velocity ratio (wheel velocity to steam velocity), leading to a higher whirl component for the steam. No erosion of turbine blades was dimrned at the first 2-year overhaul after 16,830 hours of operation.
Two main-steam stop valves of the swing-check type are located on each side of the turbine to allow a steam-free test under full-load conditions. In series with the main-steam stop valves are regulating butterfly valves. Since the valves in geothermal plants are subject to sticking because of the deposition of scale and since base-load operation means full, rated flow almost all the time, the regulating valves were designed to move over a large range of angle openings in the vicinity of full steam flow. Thus small departures from full-load operation result in reasonably large angular movement of the regulating valves, and this movement tends to keep the valves moving freely. Figure 6.9 shows the steam flow regulating valve characteristic curve. It is believed that this steam turbine was the first to be controlled with a butterflytype regulating valve from zero speed to full load [ p s u i and Aikawa, 19701.
The generator was built by the Tokyo Shibaura Electric Company, Ltd. (Toshiba) , and was used previously at another Kyushu Electric power
I
w c
5 a 3 0 -I 5 0 LL
5 U w I- tn
0 0 15 30 45 60 75 90
REGULATING VALVE OPENING, degrees
Fxomm G.f+Buttertly regulating valve flow Characteristic at make [Usui and Aikawe, 19701.
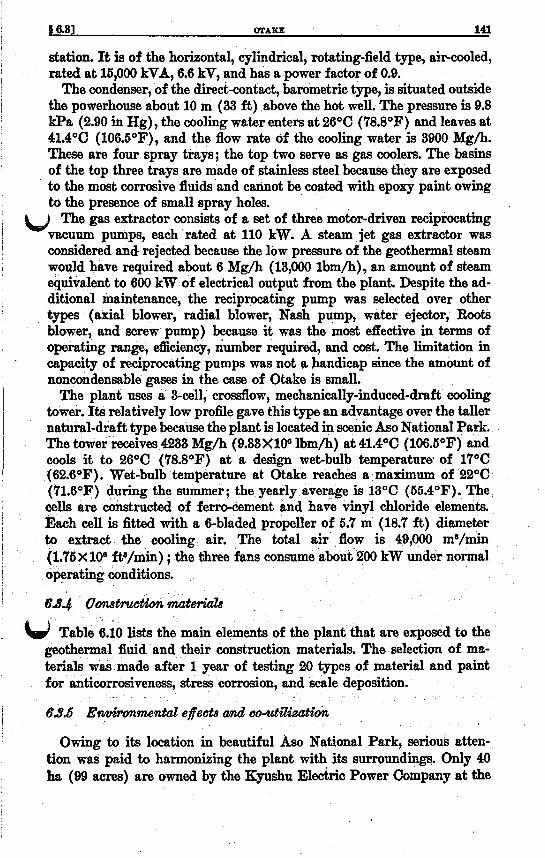
8 6.31 OTAKE 141
station. It is of the horizontal, cylindrical, rotating-field type, ai~cooled, rated at 15,000 kVA, 6.6 kV, and has a power factor of 0.9.
The condenser, of the direct-contact, barometric type, is situated outside the powerhouse about 10 m (33 ft) above the hot well. The pressure is 9.8 kPa (2.90 in Hg), the cooling water enters at 26OC (78.8OF) and leaves at 41.4OC (1O6.ti0F), and the flow rate of the cooling water is 3900 Mg/h. These are four spray trays; the top two serve as gas coolers. The basins of the top three trays are made of stainless steel because they are exposed to the most corrosive fluids and cannot be coated with epoxy paint owing to the presence of small spray holes.
'I$ The gas extractor consists of a set of three motor-driven reciprocating vacuum pumps, each rated at 110 kW. A steam jet gas extractor was considered and- rejected because the low pressure of the geothermal steam would have required about 6 Mg/h (13,000 lbm/h), an amount of stea.m equivalent to 600 k W of electrical output from the plant. Despite the ad- ditional maintenance, the reciprocating pump was selected over other types (axial blower, radial blower, Nash pump, water ejector, Roots blower, and screw pump) because it was the most effective in terms of operating range, efficiency, number required, and cost. The limitation in capacity of reciprocating pumps was not a handicap since the amount of noncondensable gases in the case of Otake is small.
The plant uses a 3 4 1 , crossflow, mechanically-induced-draft cooling tower. Its relatively low profile gave this type an advantage over the taller natural-draft type because the plant is located in scenic As0 National Park. The tower receives 4238 Mg/h (9.38XlP lbm/h) at 41.4OC (106.EioF) and cools it to 26OC (78.8OF) at a design wet-bulb temperaturs of 17OC (62.6OF). Wet-bulb temperature at make reaches a maximum of 22°C (71.6"F) during the summer; the yearly average is l8.C (55.4.F). The cells are constructed of ferro-cement and have vinyl chloride elements. Each cell is fitted with a 6-bladed propeller of 5.7 m (18.7 ft) diameter to extract the cooling air. The total air flow is 49,000 ma/min (1.76 X loe fta/min) ; the khree fans consume about 200 kW under normal operating condikions.
6.84 Qmtructis.h mte&tS
0 lists the main elements of the plant that are exposed to the geothermal fluid and their construction materials. The selection of ma- terials was made after l year of testing 20 types of material and paint for anticorrosiveness, stress corrosion, and scale deposition.
63.6 Eruvironlnental effects and co-uti&zt&
Owing to its location in beautiful As0 National Park, serious atten- tion was paid to harmonizing the plant with its surroundings. Only 40 ha (99 acres) are owned by th0 Kyushu Electric Power Company at the
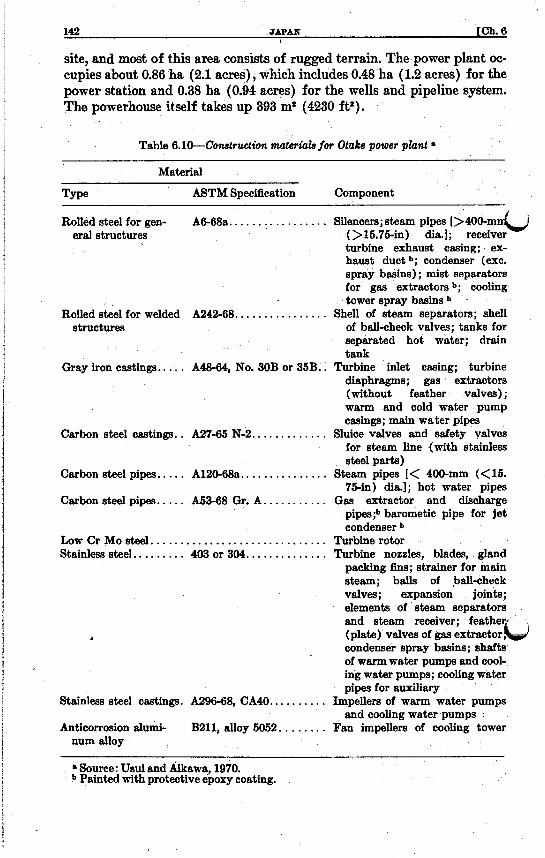
142 JAPAN [Ch. 6
site, and most of this area consists of rugged terrain. The power plant oc- cupies about 0.86 ha (2.1 acres), which includes 0.48 ha (1.2 acres) for the power station and 0.38 ha (0.94 acres) for the wells and pipeline system. The powerhouse itself takes up 393 m2 (4230 ft').
Table 6.lO-~onstructwn mderiab for Otake power plant 8
~~~ ~
Material
TYPe ASTM Specification Component
Rolled steel for gen- A6-68a.. ............... Silencers;steam p i p [>400-mQ eral structures ( > 15.75-in) dia. 1; receiver
turbine exhaust casing; ex- haust duct b; condenser (exc. spray basins) ; mist separators for gas extractorsb; cooling tower spray basins b
Rolled steel for welded A242-68.. .............. Shell of steam separators; shell of bd-check valves; tanks for separated hot water; drain tank
Gray iron castings.. . . . A48-64, No. 30B or 35B.. Turbine inlet casing; turbine diaphragms; gas extractors (without feather valves) ; warm and cold water pump casings; main water pipes
Carbon steel castings.. A27-65 N-2.. ........... Sluice valves and safety valves for steam line (with stainless steel parts)
Carbon steel pipes.. ... A120-68a.. ............. Steam pipes [< 400-mm (<15. 75-in) dia.]; hot water pipes
Carbon steel pipes.. ... A53-68 Gr. A . . ......... Gas extractor and discharge pipes;b barometic pipe for jet condenser b
Low Cr Mo steel. ............................. Turbine rotor Stainless steel.. ....... 403 or 304.. ............ Turbine nozzles, blades, gland
packing fins; strainer for main steam; balls of ball-check valves; expansion joints; elements of steam separators and steam receiver; feather (plate) valves of gas e x t r a c t o r b condenser spray basins; shafts of warm water pumps and cool- ing water pumps; cooling water pipes for auxiliary
Stainless steel castings. A296-68, CA40.. ........ Impellers of warm water pump and cooling water pumps
Anticorrosion alumi- B211, alloy 5052. ....... Fan impellers of cooling tower
structures
num alloy
8 Source : Usui and Aikawa, 1970. b Painted with protective epoxy coating.

Reinjection wells are used for the disposal of the waste liquid from the wellhead separators and the excess steam condensate from the cold well of the mechanically-induced-draft cooling tower. Originally there was no reinjection done at the Otake plant ; the first reinjection well was com- pleted in February 1972. Prior to that time the liquid was held in a settling pond, allowed to cool, and then discharged into the Kusu River. Because the geothermal fluid contains arsenic, this practice was abandoned. The reinjection wells are located along or near the river, but monitoring shows that prsenic is not now entering the waterway.
Reinjection is carried out under atmospheric pressure to guard against Qy chance of inducing earthquake activity. However, loss of reinjectivity
has been severe, with a dropoff in flow rate of about 7% per month. Periodi- cally, the liquid is briefly pumped under pressure into the reservoir. Rein- jectivity is restored for a short time, but the higher flow rate is not main- tained during atmospheric reinjection. An arsenic removal system is now under construction at Otake. This chemical treatment plant will be able to remove arsenic from up to 150 Mg/h of the waste liquid. With the arsenic removed from the spent geofluid, it may be possible to reduce the amount that must be reinjected.
Since the condensate from the geothermal steam is recirculated to pro- vide cooling water for the plant, large quantities of external water are not needed. There is a need, however, for make-up water to prevent the ac- cumulation of acid-laden water in the cooling tower basin; 22 Mg/h (48,500 lbm/h) is drawn from the Kusu River. I There are no controls on the emissions of hydrogen sulfide; the full amount is discharged through the reciprocating vacuum pumps to the atmosphere. The specific amount is not large, however-about 542 g/MW.h, based on a concentration of 48 mg/kg of main steam, 113 Mg/h turbine steam flow, and 10 MW output.
(and nearby Hatchobaru) provides for about 135 private homes and otels in the Sujiyu Hot Springs area. Waste hot water from the plant is used to heat clean river water to about SOOC (194OF) before the gmfluid is reinjected. The hot water is distributed to homes and inns at no charge and arrives at the point
The district water-heating program of Ota
f use at about 75°C (167F). W 6.3.6 E o d am? operating
Capital investment for the Otake plant was $3.27 million (1968 US. dollars) or about US $3OO/kW installed. At a load factor of 90%, the 1968 cost of electricity was 7.1 US mill/kW-h [Hayashida and Ezima, 19701. Table 6.11 summarizes the operating history of the Otake plant for the first 11 years of its existence. The plant has a remarkable and consistent availability factor, averaging 95.5% from 1967 to 1977. The loss of produc-

144 JAFAX fa. 6
Table 6.ll-Petfomzcmce of Otake separated-s~m 10-MW geothermal power plant ~ ~~~~ ~ ~~ ~~
Electricia$ption, Net ca acity Availability
Mean load &or, factor, Year b Gross Net kW percent percent
1967e.. ......... 52,238 48,320 1968.. ......... 75,824 68,317 1969 ........... 71,311 63,895 1970 ........... 84,885 77,160 1971 ........... 73,538 65, 964 1972 ........... 72,128 64,482 1973 ........... 70,318 62,794 1974. .......... 74,758 66,684 1975 ........... 69,216 61,741 1976 ........... 65,761 57,738 1977.. ......... 52,403 44,385
5963 8632 8141 9690 8395 8211 8027 8534 7901 7486 5982
86.2 86. 7 78. 0 95. 3 72. 9 96.1 88. 1 98.9 75. 1 94. 9 73.6 71. 7 75. 9 99. 2 70. 5 94.0 65. 9 98.8 50. 7 93. 9
E (J
Source: Kyushu Electric Power Company. b Year beginning April 1. 0 Plant commissioned August 12, 1967.
tion wells is responsible for,the steady decline in net capacity factor from a vdue of 86.2% in 1967 to 50.7% in 1977.
Maintenance is performed by the Nishi-Nippon Plant Company. In- spection must be carried out at least once every 2 years by Japanese law. Overhauls have taken place during 1968,1969,1971,1973,1975, and 1977.
The cost of the routine maintenance for Otake is 16 million yen (or $9O,OOO). About 1 month is required to carry out routine inspection and maintenance. At Otake the strainer atop the barometric condenser must be cleaned of dirt and other debris once per month ; this operation takes about 4 hours.
The production wells seem to develop a buildup of calcium carbonate, CaCOa, at a point about 20 m (66 ft) below the end of the production casing in the open-hole portion of the well. The deposit thus occurs 270 m (886 ft) below the surface and most likely corresponds to the flash point of the geofluid. An attempt to clean one of the wells (0-6) by treatment with 5000 kg (11,000 lbm) of 35% HC1 acid resulted in a temporary in- crease in total flow from 29 Mg/h (64 klbm/h) to 64 Mg/h ( l 4 b klbm/h) , or a 120% improvement. The treatment caused the steam flow to double from 4 Mg/h (8.8 klbm/h) to 8 Mg/h (17.6 klbm/h). Shut-in pres- sure also increased by about 18%.
6.4 Onnma
The power plant at Onuma mas the third completed in Japan and the second of the liquid-dominated type. The plant was completed and began operations in December 1973. Built and operated by the Mitsubishi Metal

J 6.43 ONUYA 145
Corporation to supply electricity to one of its metal processing mills, %he plant is located i~ the northern part of the main island of Honshu in Akita Prefecture in Towada-Hachimantai National Park The turbine is rated at 10 MW. A site photograph is given in figure 6.10.
6.4.l Qeobgy a& explorathn
Like its neighbor at Matsukawa, the Ongma plant is situated in a Quater- nary volcanic region. The area is dotted with surface manifestations of subterranean magmatic activity such as fumaroles, active volcanoes, and hot springs. Prospecting and dev ment began in 1965, and construction
6.4% We8 program
The geothermal wells are drilled from inclined central platforms so that wellhead equipment can be grouped together to minimize land usage and to avoid unnecessary replication of equipment. The wells are so in- clined that the well bottoms are located 150 m (492 ft) from the drilling platform, measured horizontally at ground level [MHI, 1976~1.
The plant began by using three production and two reinjection wells. - Additional production wells were added in 1975 (well 8Rb) and 1977
(well 8R) ; during this time, two more reinjection wells also were com- pleted. Table 6.12 lists the flow capacities of the nine wells serving the Onuma plant as of June 1977. The reinjection wells receive waste liquid at atmospheric pressure immediately after the pressure is let down in the cyclonh silencers. Depth of the five production wells averages about 1600 m (5250 ft) and for the four ieihjection wells about 960 m (8150 ft). One reinjection well is slant 11 production wells
b.' commenced in 1970.
operates at a speed of 8000 rpm and has a last-stage blade height of 500 mm (19.7 in). The inlet and exhaust conditions are essentially identical to those at Otake. The Onuma t i's located on the ground floor of the
upowerhouse, with the exhaust ikcted upward and leading outdoors to the barometric condenser. Placing the turbine at ground level and the auxiliaries beneath the floor made it possible, to keep the roof elevation of the powerhouse very low, a des ature because the station is situated in a scenic national park.
The generator is rated at 12,500 kVA, 6.6 kV, 0.8 power factor and is air cooled. The step-up transformer is rated a t 12,000 kVA and feeds power to the transmission line at 66 kV. The plant schematic flow diagram is quite similar to that for the Otake plant (see figure 6.8) ; the condenser,

FIQURE 6.lO-Onuma geothermal power plant. Centralized wellhead equipment is in right foreground; powerhouse, barometric condenser, and cooling tower are at left [MHI, 1976~1. c r
u L...

86.43 O W M A 147
Table 6.12-F~ow capacities of wells serving Onuma plant (a8 oj June 1877).
Well number Flow rate, m*/h
Production welle: 3Ra ......................................... 97.8 3Rb.. ....................................... 75.0 5R .......................................... 60.9 6R .......................................... 90.0 8R .......................................... 72.0
Total.. .................................. 395.7
1R .......................................... 65.0 2R. ......................................... 63.7 7R.. ........................................ 126.2 7T ........................................... 140.4
Reinjection wells: td
- Total.. .................................. 395.3
Source: It0 et al., 1977b.
gas extractor, and cooling tower particulars for the major components of the energy conversion system.
6.4.4 Operating experience a d co-wtilization
also similar. Table 6.4 lists technical
The performance of the Onuma plant is summarized in table 6.13. From 1973 through 1977, Onuma operated for 36,073 out of a possible total of 38,424 for an availability factor of 93.9 percent. However, unlike Otake, the Onuma plant began at about one-half capacity and has steadily in- creased its output, achieving a mean output of 7.7 M W in 1977. Reinjec- tion has proved trouble-free even though the fluid is returned to the reservoir at atmospheric pressure. Tbe plant has been overhauled once
ed-steam IO-MW geothsnnal power plant
Availability Mean Ca acity L o r ,
percent Operating factor,
Year . h o w percent
&$
1973 *. ............. 3, 044 90.6 5,055 0.458 1974. ............... 7,873 89. 9 6,183 '0.656 1975. .............. 8,389 95. 8 7,248 0.692 1976.. ............. 8,378 95. 4 6,946 0.664 1977. .............. a, 389 95. 8 7,688 0.737
a Plant commissioned November 12,1973. ,

148 JAPAN [Ch. 6
At the end of 1978 the output at Onuma was,8,200 kW (with a maxi- mum capacity of 8,600 kW). The steam cost was about 2.5 yen/kW h, the cost of generation was about 6.5 yen/kW.h, and the electric power
midnight power demand) and 10 yen/kW.h (for normal power de- mand). Power at one time was sent to a copper refinery owned by Mitsubishi Metals, but that plant closed, and power 'is now sold to the Tohoku Electric Power Company.
Several nearby inns and hotels at Tsunodate city receive about 15 Mg/h (33 klbm/h) of water heated to 6Oo-7O0C (140°-158"F) by the waste
thermal liquid is circulated through heat exchangers before being rein- jccted [Iga and Baba, 19743.
6.5 Onikobe
I i
i /
i I I I
i
I
I I i
I charge by the Tohoku Electric Power Company was 8 yen/kW h (for
I
r water from the Onuma plant. About 266 Mg/h (586 klbm/h) of geo- LJ
j
I The 25-MW power plant at Onikobe was the fourth to be built in Japan. In March 19'75 the plant was turned over to the Electric Power Develop- ment Company, Ltd., by Kawasaki Heavy Industries, Ltd., which con- structed all major plant elements except for wellhead equipment, steam transmission pipelines, and the substation. The plant is located in Kuri- koma National Park in Miyagi Prefecture on the northern part of the island of Honshu, about 120 km (75 mi) south of the Matsukawa-Takinoue region. A site photograph is given in figure 6.11.
' I
I 6.6.1 Geology and exploration
I The Onikobe reservoir may be likened to that of Wairakei, New Zealand. Faults in a Miocene and granite basement allow high-temperature fluids to reach from depth to the overlying Pliocene beds of porous rocks, which form the hydrothermal convective reservoir containing ground water.
The area is an elliptical basin 10 km X 8 km (6 mi X 5 mi) across the axes. A major part of the subsided area was filled by a lake from the Pliocene to the Pleistocene epoch, Exposed pre-Neogene granite and a thick series of Miocene rocks make up most of the subsided area. The rocks are mostly volcanic and partly sedimentary. Total thickness of the formation is about 300 m (984 ft) and consists of a lacustrine formation in loose deposits of conglomerate, andesitic tuff -breccia and tuff, pumiceous tuff of dacitic nature, and mudstone from the base upward [Saito, 19611.
Although the region is a Quaternary volcanic zone, there are no active volcanoes ; the usual surface manifestations (hot springs, fumaroles, sol- fataras, geysers) are scattered throughout the area. Early exploration included a topographic survey and geologic mapping in 1955 and the drilling of three test bores to depths of 255,250, and 192 m (836,820, and 630 ft) [H. Nakamura, 19591.
! i 1
i
i
j I
CI i i i
~

L
k
i 6.61 O
NIK
OB
E
149

The general environment of the site is quite hostile to power station operation. Altitude is 530 in (1738 ft) above sea level, winter snowfall exceeds 2 m (6.6 ft), ambient temperature ranges from -15" to +3OoC (5" to 86"F), the natural concentration of hydrogen sulfide in the air is 0.2 ppm, and the neighboring brooks are extremely acidic with p H of 2-3. Thus the effects of corrosion and erosion place severe design constraints on the Onikobe power plant [Kawasaki, 19771.
6.52 Wells and productivity
(J The geothermal reservoir consists of two producing zones, a shallow zone at about 300 m (980 ft) and a deep zone at about 1000 m (3280 ft). The upper reservoir is vapor dominated and yields a mixture at the well- head with a dqness fraction of about 50%, i.e., equal parts of liquid and vapor by weight. The deep reservoir is liquid dominated but contains highly acidic mater that, so far, has defied utilization because of its cor- rosive nature. Unlike most geothermal hydrothermal reservoirs in Japan, which are characterized by sodium-chloride water, the Onikobe fluid in the deep reservoir contains a large percentage of hydrochloric acid [Ozawa, 19731.
Thus the plant is supplied with steam obtained from relatively shallow wells drilled into the upper hydrothermal reservoir. Originally, nine pro- duction wells were used; three more have since been completed. Char- acteristics of the geothermal fluid are given in table 6.14. Hydrogen sulfide concentration is the highest found in any geothermal power plant now in operation anywhere in the world.
Table 6.14-Characteristics ofgeothermalsteamand condensate at Onikobe 8
Percentage of noncondensable gases (by volume of
Composition of noncondensable gases (volume per- steam). ....................................... 0.5%
centage) : .......................... .........................
Carbon dioxide, COa 58.4% Hydrogen sulfide, HsS 36.0% * Others (hydrogen, methane, ammonia). ......... 5.6%
Chloride, Cl. . ............................... 7590 Calcium, Ca. ................................ 930 Amorphous silicon dioxide, Si02.HaO. .......... 550 Magnesium, Mg .............................. 340 Hydrogen sulfide, HIS ......................... 107 Sulfate, SO,. ................................. 24
pH of condensate.. ............................... 3.0
Composition of condensate (ppm) :
a Source: Kawasaki, 1977.

t 6.61 OXVIKOBE 181
Owing to the vapor-dominated nature of the reservoir, the geofluid arrives at the surface essentially as a saturated vapor with a small amount of liquid entrained. Approximately 400 times more steam is generated than liquid, by volume. Separators are used at the wellheads and at the powerhouse to remove the liquid droplets. Steam is collected a t the station header, where its pressure is controlled by an electrohydraulic regulating valve. Two main steam lines conduct the working fluid to the turbine.
Production from the wells has been only half what was expected. Furthermore, actual well characteristics of pressure versus flow rate differ from the design values. Attempts to correct for these deficiencies are described in the next section.
6.53 E m r g y conversion system
A flow diagram of the plant is given in figure 6.12 ; a listing of technical particulars for the major mechanical elements can be found in table 6.4. Kawasaki Heavy Industries, Ltd., built the steam turbine, a 5-stage, im- pulse-reaction, single-cylinder, single-flow machine rated at 25 MW at 3000 rpm. The generator was furnished by Fuji Electric Company, Ltd., and is rated at 28,000 kVA, 11 kV, power factor of 0.9 (lagging), and is a horizontally-mounted, revolving-field, self-ventilated, enclosed-duct cir- culating type with air cooler [Kawasaki, 1975 3.
The very high levels s f hydrogen sulfide in the working fluid (36% of the total noncondensable gases is H2S) required extensive corrosion fatigue tests on the materials for the turbine rotor and blades in addition to the usual static corrosion tests. Fatigue strength decreases markedly in the presence of a corrosive atmosphere. Thus, absolutely no resonance could be allowed in the turbine, and all blades for each of the five stages were designed to avoid resonance with any excitation force. Further, the static steam-bending stress was set at half the value allowed in conven- tional steam turbines. Stellite plates were silver soldered to the leading edge of the first-stage blades to prevent erosion by dust particles entrained in the steam. Titanium, with its outstanding anticorrosion characteristics, was used in the rotor shaft glands because of their exposure to geothermal steam and air leakage.
The turbine was forced to shut down in May 1975, only 2 months after it began operation. A new well had been connected to the plant, and an excessive amount of scale was carried over and deposited on the nozzles and blades of the first stage. Excessive vibrational stress resulted when the leading edge of the blades came in contact with the deposited scale, break- ing one blade and cracking 11 others.' Following an overhaul, no repetition of this problem has occurred, and no scale buildup has been observed.
The Onikobe plant uses fairly conventional equipment to handle the problem of heat re jection-a barometric condenser, a gas extraction appa- ratus that consists of one set of two steam jet ejectors (in parallel) working to maintain vacuum in the barometric condenser, a motor-driven vacuum

SEPARATOR 8 I DRAIN
26% FROM COOLING WATER TANK
FROM STEAM WELLS
42.1% TO HOT -- -- - - - - - - - -L - WATER TANK
FIQURE 6.12-Schematic and heat bdance diagram for Onikobe power plant [Kawasaki, 19771.
c c

8 6.63 0-OBE 183
pump that removes noncondensable gases from the intercondenser, and a counterflow, mechanically-induced-draft water cooling tower. The plant was originally designed and operated with two sets of steam jet ejectors, but the second set was replaced by the vacuum pump in October 1976.
The inner surface of the condenser is coated with a neoprene k i n g that is more resistant to corrosion and wears better than epoxy paint. The May 1975 overhaul revealed that part of the lining had separated from the con- denser wall near the bottom. This separation was attributed to the direct impingement of hot water and a lack of adhesion. Some minor improve- ments solved this problem.
Some of the spray nozzles of the cooling tower had been attacked by corrosion and erosion and had fallen off. Repairs and improvements such as fixing the nozzles to the headq solved this problem. In October 1975 the sleeve on the circulating water pump was replaced; the new one is fabri- cated from 804 stainless steel whereas the original (which had heavy pit- ting) was made of 403 stainless steel. A summary of the fouling experience of the plant is given in table 6.15.
Table B.16-Fouling e z p A n c s at Onikobs
Problem . Component
Scale accumulation, ..... Nozzles and blades of first and second stages; turbine gland; nozzle of gland ejector; main- steam strainer.
Gland packing ring; cooling pipe of heat exchanger; pressure gauge; spray nozzle of cooling
Erosion.. .............. V ed in condensate line; circulating water pump sleeve.
Separation. .............. Neoprene lining at condenser bot; tom; epoxy coating of exhaust, pipe.
Corrosion ...............
. Source: Kawasaki, 1977. , 6.6.4 EnviTMLnzental effeo
All waste liquid (drains eparators, turbines, and other pieces of equipment plus overflow from the cooling water basin) is collected in a drain pond and reinjected into the formation: "his amounts to a relatively small quantity because of the high dryness fraction of the geofiuid a t the wellhead. Hydrogen sulfide is released to the atmosphere without controls. The concentration of H,S is 0.40 ppm in the turbine room, 0.050 ppm in the control room, and 0.20 ppm outside the plant. Since the main steam con- tains about 8400 mg/lrg, the specific emission level is approximately 31,400 gfMw h, nn extremkly high value.
V

164 JAPAN [Ch. 6
Because Onikobe is located within the Kurikoma National Park, special consideration was given to design features that help the plant blend into its scenic surroundings, including colors, low height of buildings and com- ponents, and restricted sound levels.
6.5.6 Operating expe&w
The Onikobe plant maintained an average availability of 93.7% for the first 17 months of its operation. During this period the plant was shat down twice for improvements, twice for inspection according to the regula- tions of the Ministry of International Trade and Industry, and twice for periodic inspection.
Plant output started at about 9 M W and rose to about 13 M W after 17 months. Production from the steam wells has been disappointing, and as a result the plant is operating at about half its design capacity, albeit very reliably. In October 1975 two improvements were carried out to boost the output. First, the second set of steam jet ejectors was replaced by n motor-driven vacuum pump. Second, the nozzle of the first stage of the turbine was redesigned to correspond more closely with actual steam conditions. These changes increased plant output about 10%. However, steam production remains at about 120 Mg/h (O.264X1O6 lbm/h), far below the design value of 219.5 Mg/h (0.484 X 10⁶ lbm/h) . 6.6 Hatchobaru
b!
The geothermal power plant at Hatchobaru is the most advanced steam plant in Japan, incorporating the following novel features : (1) two-phase transmission of geothermal fluid ; (2) so-called double-flash operation (one separation followed by a flash process) ; (3) low-level jet condenser; and (4) so-called ERR system gas extractor (steam ejector followed by two radial blowers). The fifth commercial geothermal station in Japan, it came on-line in June 1977 with a power rating 0$50 MW. The Kyushu Electric Power Company, Inc. owns the plant.
6.6.1 Geology and exploration
Hatchobaru lies about 1.7 km (1 mi) south of Otake, about 40 km (25 mi) north-northeast of the active volcano Mount As0 in Oita Prefecture on the island of Kyushu. Figure 6.13 is a map of the thermal region showing the locations of the two geothermal sites and the town of Sujiyu, a small hot-springs resort.
The geology of the Hatchubaru region is similar in general to that of Otnke, but different in certain details. In both cases the source of the ther- mal anomaly is the same magma chamber. Both areas are underlain by two hydrothermal reservoirs. However, whereas at Otake the upper zone of the tuff breccia is being tapped for the power phnt, at Hatchobaru the
~
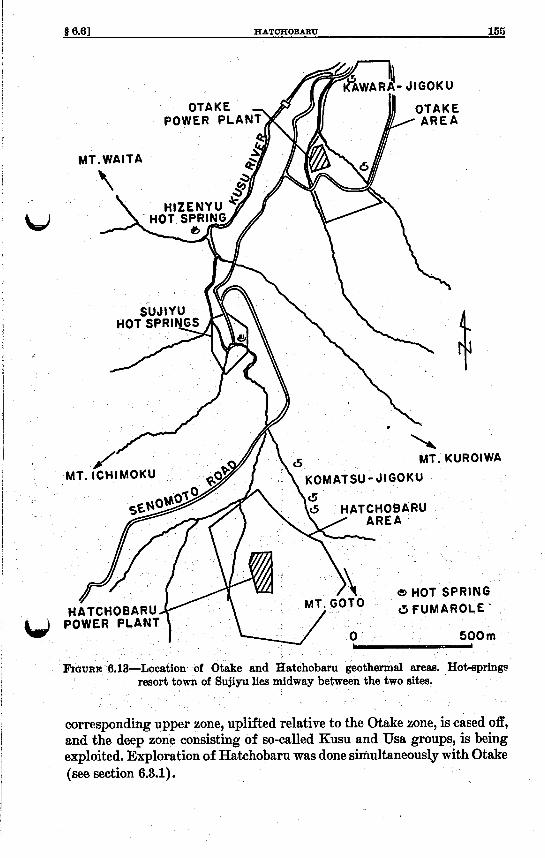
t 6.61 HATCHOBABU 165

166 JAPAN [Ch. 6
6.63 Well program and two-phme @d transmiS8h system
An intensive drilling program was underway during 1978 to bring the station up to its designed capacity of 50 MW. This program includes the drilling of both production and reinjection wells. Table 6.16 gives a sum- mary of the wells drilled at Hatchobaru as of the end of 1978. At that time five successful production wells had been drilled, four of which were de- livering steam to the plant (H-4, H-6, H-7, and H-10) , and one was being tested. Three additional wells were being drilled. Ten w e b wi l l be re- quired to permit the plant to generate 50 MW. Drilling success rate for production wells was 45% through 1978. id
Table 6.16--Dsilling experknee at Hatehobaru
Well No. Drilling period Size, mm Depth, m Comments
HT-1.. . Aug. 1964-Mar. 1965 HT-2. . . Oct. 1965-Nov. 1966 .
H-1. . . . Jul. 1968-Feb. 1969 H-2. . . . Feb. 1969-Jul. 1969
H-4. . . . Jun. 1970-Oct. 1970 H-5.. . . Jan. 1971-Dec. 1971
H-7. . . . Apr. 1976-Nov. 1976 H-8. . . . Apr. 1976-Dec. 1976 H-9. . . . Apr. 19774ct. 1977 H-10. . . Mar. 1977-Sep. 1977 H-11.. . Jan. 1978-Dec. 1978
H-3.. . . Mm. 19704~1. 1970
H-6. . . . Jan. 1971-Aug. 1971
H-12.. . Aug. 1978- H-13. . . Aug. 1978-
HR-1.. . Mm. 1973-Jul. 1973 HR-2.. . Aug. 1973-0ct. 1973 HR-3.. . . . . . . . . . . . . . . . . . . . . . . .
H-14. . . Sep. 1978-
HR-4.. . Jun. 197kSep. 1974 HR-6.. . Jun. 1975-Feb. 1976 HR-7.. . Mar. 1976-Oct. 1976 ER-8.. . Aug. 1975-Apr. 1976 H R 9 . . . Aug. 197bApr. 1976 HR-10.. May 1977-Aug. 1977 HR-11. . Apr. 1977-Nov. 1977 HR-12.. Dec. 1977-Jul. 1978
HR-13.. Mar. 1978-Jul. 1978 HR14.. Oct. 1978- HR-16.. Aug. 1978-
76. 2 1000 Failure 76. 2 900 Successful; stopped prod.
Jan. 1967 193.7 785 Failure 193.7 739 Failure. 142.9 1089 Failure 193.7 1084 Successful; still in use 193.7 1600 Failure 193.7 1238 Successful; still in use 193.7 921 Successful; still in use 193.7 1450 Failureb 193.7 650 Failure0 193.7 759 Successful; still in use 193.7 - Testing 193.7 - Drilling 193.7 - Drilling 193.7 - Drilling 142.9 1500 Failure 219.1 600 Failure
.....,....... ....... Interrupted 193.7 950 Failure 193.7 988 Successful; still in use 193.7 1018 Successful; still in use 193.7 1130 Successful; still in use 193.7 1130 Successful; still in use 269.9 702 Successful; stii in use 269.9 850 Successful; stii in use 269.9 1027 successful; preparing to
269.9 986 Successful; still in use 269.9 - Drilling
use
269.9 - Drilling
Converted to a reinjection well, H-2R; currently in use.
0 Converted to a reinjection well, H-9R; currently in use. Planning to be converted to a reinjection well.

j 6.61 HATCHOBABU 167
Nine wells were being used as reinjection wells; seven of these had been drilled purposely as reinjectors and two had been converted from unsuc- cessful production wells. One well was being prepared for use, another was in the process of being converted, and two were being drilled. The success rate for reinjection wells (drilled for that purpose) was 67%.
Figure 6.14 is a plan view of the power station and bore field. As can be seen, many of the wells are slant drilled for economic and topographic reasons. Production well H-7, for example, which has a total drilled length of 821 m (3022 ft) , actually has a well bottom depth of 897 m (2943 ft) below the surface and offset from the wellhead by 167 m (548 ft). Average w depth of the successful producing wells is 1001 m (3283 f t ) ; for the rein- jection wells in use, it is 899 m (2950 ft) .
One of the most interesting features of the Hatchobaru plant is the method of transporting the geothermal fluid to the powerhouse. For a double-flash plant, there are essentially three ways to carry out this opera-
d- HR-4
FIQURP: 6.14-Location of wells serving the Hatchobaru SO-MW geothermal power plant.
J
\

15s JAPAN [Oh. 6
tion: (1) steam-only transmission; (2) separate steam and hot water trans- mission ; (8) two-phase mixture transmission.
In the first cam, parallel main and secondary steam pipelines must run from each well to the powerhouse. Although this concept is simple, it has some serious disadvantages. Secondary steam pipelines are very large, expensive, and must extend long distances. Waste hot water must be piped from each well to the disposal site and such pipes are subject to scaling. Separators and flash tanks must be located a t each well, and maintenance of scattered wellhead equipment is a problem.
I n the second case the main steam is separated at the wellhead, and both steam and hot liquid are piped separately to the powerhouse, where the liquid is flashed to produce the secondary steam. While the number of flash tanks is reduced and the size of the liquid pipeline is smaller than a secondary steam line, there are still disadvantages to this method. Water- hammer occurs in the liquid pipeline. Static pressure will fall in the liquid, leading to flashing and scale deposition. Hot water pipes cannot be joined on the way to the powerhouse. Furthermore, pumping of the liquid is re- quired unless the wellheads are located at an elevation higher than the powerhouse.
I n the last case the entire steam liquid mixture is transmitted to the sta- tion in a single pipeline. This technique does not automatically eliminate the possibility of waterhammer or scale deposition, and there is a danger of large pressure losses. However, this method does offer a number of dis- -- tinct advantages over the previous two methods. Only one pipeline is needed between each well and the powerhouse, and the pipelines from several wells may be joined on the way to the powerhouse. Various piping arrangements are possible, including upwardly inclined pipes. The separa- tor and flasher are centrally located at the station for ease of maintenance, and a small number of separators and flashers serve many wells. Finally, depending on the method of disposal, only one waste hot water pipeline may be needed.
Extensive field tests were conducted beginning in 1965, including tests at Otake (well No. 5,1966) and Hatchobaru (well No. 1,1970). These tests established the superiority of the two-phase transmission system for the Hatchobaru plant [Takahasi et al., 19701. Each wellhead is equipped with a simple U-bend separator and silencers to allow easy and stable operation during startup of the plant. Table 6.17 gives some of the characteristics of the geoff uid from the four producing wells at Hatchobaru.
6.6.3 Energy conversion system
The turbine is of the mixed-pressure type. Main steam is admitted to the first two stages; second steam enters between the second and third stages, mixing with the main steam, and the full flow continues through the last three stages. The machine is of the single-cylinder, double-flow, impulse- reaction type.
LJ

Table 6.17-Charaeleristies of ths geojluid from producing wells at Hatchobaru
Well H-4 Well H-6 Well H-7 Well H-10
Shubii pressure, kPa. ........... 4207 Separator pressure, kPa .......... 481 Primary steam flow, Mg/h.. ......
Flasher pressure, kPa. ........... 113.7 Secondary steam flow, Mg/h. ..... Secondary hot water flow, Mglh.. . Wellhead quality, %. ............ Noncondensable gas content 8 . . . . . Composition of NC gases: b
68.1 245. 0 313. 1
21. 9 223. 1 21. 8 0. 05
Carbon dioxide.. ............ 75. 5 Hydrogen sulfide. ........... 14.8 Others; Os, N,, etc.. ......... 9. 7
pH ........................ 6. 6 Sodium, ppm.. ............. 2200 Potassium, ppm ............. 243 Calcium, ppm ............... 34 Chloride, ppm ............... 3850 Silica, ppm.. ....... 922 Arsenic, ppm ........ 3. 2
Primary hot water flow, Mg/h.. ... Total flow rate, Mg/h.. ..........
W
Analysis of hot water:
2472 - 481 481
11. 9 54.0 71. 0 166.4 82. 9 220.4
113.7 113.7 6. 3 14.9
64.7 151.6 14. 4 24.5 0. 08 0. os 39. 6 77. 4 3. 2 6. 7
57. 2 15. 9
4.7 6. 1 2860 2390 300 340 10s 68
5160 4125 620 834 3.0 3. 1
1560 48 1
38. 2 71. 8
110.0 113.7
6. 4 65. 4 34. 7 0. 59
84. 1 4.8
11. 1
6. 4 2590 383 80
4475 737 2. 9
As a percentage by weight of primary steam. b As a percentage by volume of total noncondensables.
The main steam is produced from two separators located just outside the turbine room. They are of the vertical cyclone variety with bottom steam outlets and yield steam with a quality in excess of 99.9%. They operate at a pressure of 481.4 kPa (89.9 lbf/inZ), The secondary s h m is flashed from the residual hot water from the separators. The flash tank is a horizontal drum operating at a pressure of 118.7 kPa (16.5 lbf/in2) and producing steam with a quality greater.than 99.9%. A simplified plant schematic is shown in figure 6.15. Table 6.4 lists the specifications of the major me- chanical components of the station. Values shown in the table are the design values when the plant is at a full output of 50 MW.
Both the primary and secondary steam inlets are fitted with two main ciipi stop valves and two control valves. A.ll stop valves are of the swing-check
type; the control valves are of the butterfly type. Turbine speed and flash tank pressure are both controlled by the butterfly valves on the secohdary steam line. The generator is of the horizontal cylindrical rotating-field type; it is rated at 55,000 kVA and is equipped with liydrogen cooling. A view of the power plant as seen from well H-6 is s h m n in figure 6.16 ; the main steam line into the twin cyclone separators is shown in figure 6.17.
This is the first Japanese geothermal power plant to use a low-level jet condenser. Set below the turbine-generator within the concrete foundation,
I

160 .
JAP
AN
[Ch. 6

8 6.81 H
AT
CH
OB
AB
U
161

162 JA
PA
N
[Ch. 6
B 0
a

II 6.61 HATCHOBAXU 163
the compact unit allows the profile of the powerhouse to be kept low. The condenser arrangement is shown in figure 6.18. The right side of the unit is the gas cooler section leading to the gas extraction apparatus. The walls of the concrete condenser me coated with polyester resin to protect the sur- faces from the corrosive action of the condensate. This new, compact design is expected to remove one of the impediments to larger-sized geo- thermal power units [Aikawa and Soda, 19751.
The gas extractor is another innovation of the Hatchobaru station. The system combines steam jet ejectors, which are very efficient for high- vacuum use, with radial blowers, which are better suited for low-vacuum
b) applications. A schematic of the system is shown in figure 6.19. Three steam ejectors in parallel handle the high-vacuum noncondensable gases, while two radial blowers in series handle the low-vacuum load. The blowers are driven by small steam turbines; turbine exhaust is used to supply the steam jet ejectors. Steam consumption is about half that required for the usual two-stage ejector system.
The cooling tower is of the counterflow, mechanically-induced-draft t y b constructed of reinforced concrete with four cells. There is no need
'
FIOURE 6.18-low-level concrete jet condenaer at Hatchobaru [Aikawa and Soda, 19751.

164 JAPAX [Ch. 6
STAND-BY EJECTOR
FIOURE 6.19-Schematic diagram of ERR gas extraction system at Hatchobaru [MHI, 1977bl.
for cooling water pumps because of the pressure differential between the tower basin a t atmospheric pressure, and the condenser at 9.8 kPa (2.9 in Hg).
6.64 Enzr~ronrnental effect8 am? co-utilkatwn
Like the Otake plant, the Hatchobaru station is located in As0 National Park, and attention was paid to minimizing the impact of the plant on its surroundings. The area of the plant site is 36 ha (89 acres). All waste hot liquid is reinjected into the reservoir under gravity feed to reduce the possibility of induced seismic effects. There are no controls on the emission of hydrogen sulfide, and specific levels comparable to that of the Otake plant are likely. The Kyushu Electric Power Company, Inc. is planting trees on the site to help the plant conform to the scenic beauty of the area.
Restrictions placed on noise generation at Hatchobaru are extremely tight : 50 dB (A) under normal operating conditions at the plant boundary, 70 dB(A) under emergency conditions when the safety valves open. By comparison, in the United States the requirements are 65 dB(A) a t the plant boundary or at 0.5 mile from the sound source, whichever is greater. Stringent noise restrictions have led to careful placement of potentially noisy pieces of equipment. Every attempt was made to take advantage of the natural contours of the terrain to provide shielding of noise sources.
The district water-heating system of Otake and Hatchobaru was dis- cussed in section 6.3.5. Pure hot water is generated in a heat exchanger of
b
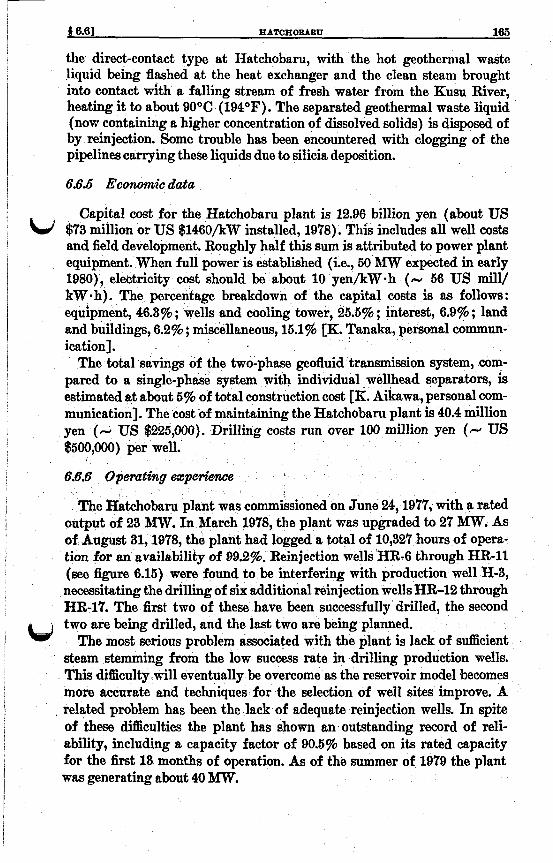
8 6.61 HATCEOBABIJ 185
the directrcontact type at Hatchobaru, with the hot geothermal waste liquid being flashed at the heat exchanger and the clean steam brought into contact with a falling stream of fresh water from the Kusu River, heating it to about 90°C (194OF). The separated geothermal waste liquid (now containing a higher concentration of dissolved solids) is disposed of by reinjection. Some trouble has been encountered with clogging of the pipelines carrying these liquids due to silicia deposition.
6.6.6 Ecmmic data
Capital cost for the Hatchobaru plant is 12.96 billion yen (about US $73 million or US $1460/kW installed, 1978). This includes a11 well costs and field development. Roughly half this sum is attributed to power plant equipment. When full power is established (Le., 50 B l W expected in early 1980), electricity cost should be about 10 yen/kW.h (- 56 US mill/ kW-h). The percentage breakdown of the capital costs is as follows: equipment, 46.8% ; wells and cooling tower, 25.5% ; interest, 6.9% ; land and buildings, 6.2% ; miscellaneous, 15.1% [K. Tanaka, personal commun- ication].
The total savings of the two-phase geofluid transmission system, com- pared to a single-phase system with individual wellhead separators, is estimated at about 5% of total construction cost [K. Aikawa, personal com- munication]. The cost of maintaining the Hatchobaru plant is 40.4 million yen (-. US $225,000). Drilling costs run over 100 million yen (z US $500,000) per well.
6.6.6 Operating expe&me.
The Hatehobaru plant was commissioned on June 24,1977, with a rated output of 23 MW. I n March 1978, the plant was upgraded to 27 Mw. As of August ill, 1978, the plant had logged a total of 10,327 hours of opera- tion for an availability of 99.2%. Reinjection wells HR-6 through HR-11 (see figure 6.15) were found to be interfering with production well H-3, necessitating the drilling of six additional reinjection wells HR-12 through HR-17. The first two of these have been successfully drilled, the second two are being drilled, and the last two are being planned.
The most serious problem associated with the plant is lack of sufficient steam stemming from the low 6uuccess rate in drilling production wells. This difficulty will eventually be overcome as the reservoir model becomes more accurate and techniques for the selection of well sites improve. A related problem has been the lack of adequate reinjection wells. In spite of these difEculties the plant has shown an outstanding record of reli- ability, including a capacity factor of 90.5% based on its rated capacity for the first 13 months of operation. As of the summer of 1979 the plant was generating about 40 MW.

188 JAPAN [Ch. 6
6.7 Kakkonda (Takinoue) -I
The newest Japanese geothermal power plant is a 50-MW, separated- steam (or single-flash) plant at Kakkonda in the Takinoue geothermal region. It is located about 7.5 km (4.7 mi) southwest of the Matsukawa dry-steam field and 50 km (31 mi) west of Morioka, a city with a popula- tion of roughly 200,000, in Iwate Prefecture, northern Honshu.
6.7.l Geology and exploration
Studies by the Geological Survey of Japan (GSJ) in the 1950's estab- lished the fact that a valuable geothermal resource existed at Takinoue. From 1961 to 1964 the GSJ carried out detailed geological surveys, in- vestigated the geochemistry of hot springs, took temperature gradients at depths of 30 m (98 ft) at 50 points, and measured electrical resistivities. The Japan Metals and Chemicals Company, Ltd. (JMC) participated by drilling several shallow wells of 70-mm (2X-h) diameter to depths of 110 m (360 f t ) , cored all the way.
Beginning in 1967 deeper exploratory holes were sunk and temperatures of 2OOOC (392OF) were encountered at 400 m (1312 ft). Temperature pro- files for well No. 203 at Takinoue [GBRD, 19751 showed steep gradien* 6O0C/1O0 m (32OF/100 ft)-to depths of about 100 m (328 ft). This is about 18 times the normal gradient of 33"C/km (1.8°F/100 ft). Average gradient over 400 m (1312 ft) was about 3O0C/1O0 m (16OF/lOO ft) ; there was little gradient between 400 m and 800 m (1312 f t and 2625 ft) , which is typical of a hydrothermal convection system.
From 1969 to 1973 a variety of geothemal exploration techniques were brought to bear on the site. Six deep exploratory wells 700-1000 m (2300-3280 ft) were drilled by JMC beginning in 1973. Geological maps show that the region is comprised of various layers of dacite, silt, sand- stone, andesite, shale, and tuff. Numerous faults cut through the region, many of them nearly vertical. The production zone lies 900-1600 m (2950- 5250 ft) below the surface.
b 6.7.d Well programs and productivity
From August 1974 to December 1977, JMC drilled 11 production wells with diameters of 219 mm (895 in) and an average depth of 1183 m (3881 ft). During the same period 15 reinjection wells were also completed; these have a diameter of 269.9 mm (10% in) and an average depth of 754 m (2474 ft) . Total drilled depth of the 26 wells is 24.3 km (15.1 mi). Air- drilling methods were used for all wells, and all were slant drilled from several central platforms. Table 6.18 summarizes information on all wells serving the Kakkonda plant.

I6.71 KAKKOBDA (TAKIBOUE) 167
Table 6.1&Characterk?ics of wells at Kakkonda ~~
Production Wells Reinjection Wells
Flow rate Flow rate
m &b Li uid Well Depth li uid . Well Depth
Well area NO. m Bi a g p No.
W
A A-1 1600 20 130 AR-1 570 162 A-2 1100 125 725 AR-2 700 312
AR-3 700 289 AR-4 700 287
Totala 145 855 1050
B B-1 1160 35 230 BR-1 690 243 B-2 897 65 340 BR-2 615 212 B-3 1265 70 313 B R 3 700 122
BR-4 700 118
Totals 170 883 695
C C1 1091 38 171 CR-I 724 646 .G2 887 80 354 CR-2 700 308 C 3 1298 85 546 CR-3 700 100
CR-4 954 130
Totals 203 1071 1084
D D-1 954 77 D R 1 600 50 85 22 136 ODR-2 1600 D-2 1666 38
Totals 65 212 I 135
E E-1 1200 53 196 ER-1 650 196
Averages 1183 Tot& 636 3217 3160
754 1
April 1976 and completed the task at the end of 197'7. A total of 2900 m (9515 ft) of pipeline was constructed from the wells to the powerhouse, including 750 m (2460 ft) of hot water pipes. Three types of piping are used : (1) two-phase geofluid pipes, (2) geothermal steam pipes, and (3) geothermal hot water pipes. For the first type there are two sets, a high-temperature set designed for 250°C (482°F) and ranging in diameter from 318.5 to 355.6 mm (12.5 to 14 in), and a medium-temperature set designed for 191°C (3'76'F) with diameters ranging from 165.2 to 863.6 mm (6.5 to 34 in). With regard to

168 JAPAN [Ch. 6
the second type-the geothermal steam pipe-there are also two sets, one designed for 191OC (376OF) with diameters of 216.3 to 762 mm (8.5 to 30 in), and one designed for 179OC (354°F) with diameters of 216.3 to 914.4 mm (8.5 to 36 in). The hot water pipes can handle 191OC (376OF) water and have diameters of 165.2 to 711.2 mm (6.5 to 28 in).
The general layout of the power station and the bore field is given in figure 6.20. A schematic of the steam gathering system is shown in figure 6.21. The wells are located in five groups, designated A, B, C, D, and E.
OR 1
hlyR: A R E A E
HOUSING AREA
REPAIR SHOP A N D S T O R E H O U S E
BASE A R E A A POWERHOUSE
COOLING TOWERS
AR 1 -AR3.AR4 . .. -.. .
FIQDRE 6.20-Arrangement of w e b and powerhouse at Icskkonda (Takinoue). Pro- duction and reinjection wells are clustered in five arw. Two-phase fluid trammkion pipelines connect w e b to area B where main sepiratora are located [JMC, 19781.

FIQURE 6.2l-Steam gathering system for Hakkonda geothermal power plant. The three main separators, silencers, and steam receiver are located at area B (see figure 6.20) [H. Nakamura, personal communication].

170 JAPAN [Ch. 6
Two-phase geofluid from the two wells a t A and the three wells at B is piped to a separator located at the B area. Segarated liquid is either sent to a silencer or returned either to area A or B for reinjection. Three wells at area C produces a mixture of liquid and vapor that is separated initially in a cycline separator in area C, the waste liquid being reinjected in that ama, and the steam being piped to another separator in area B. The two- phase geofluid from the most distant areas, D and E, is first separated by means of U-bend devices, one at each area, the liquid being reinjected at each site. The steam is then passed through a final cyclone separator (at area B) to remove any liquid that may have condensed along the pipeline. All the steam is then sent from area B up to a steam receiver a t the power- house, which is situated on the side of a hill about 60 m (200 ft) above the Kakkonda River. The photograph in figure 6.22 shows base area B in the foreground and the powerhouse and m l i n g towers on the hill in the back- ground. The well silencers are a t the left and three cyclone separators are at the right.
6.7.3 Energy cmverswn rrystem
The turbine and generator were supplied by the Tokyo Shibaura tric Company, LM. (Toshiba). The turbine is of the single-cy1 double-flow type, rated at 50 Mw and turning at 3000 rpm. The machine has four impulse stages in each flow. Each half of the turbine is essentially a duplicate of the single-flow machine used at Matsukawa. The generator is air cooled, rated at 55,600 kVA, 11 kV with 0.9 power factor. The turbine steam inlet conditions are 441 kPa (64 lbf/in2), 147OC (297'F) ; exhaust is 13.5 kPa (4 in Hg). Complete technical specifications for the plant a given in table 6.4.
The power plant converts about 33% of the thermodynamic available work in the geofluid at the wellhead into useful electric work at the busbar. This relatively low utilization factor is a result of wastage of the liquid fraction rather than its utilization by means of a secondary flash process to generate additional steam.
6.7.4 Economic data
fid
"he capital cost for the Kakkonda single-flash 50-MW plant was 18 bi ,billion yen (or US$lOO million or US$2OOO/kW installed). Net cost of electricity is given as 7.39 yen/kW*h, for 80% capacity factor ( ~ 4 2 US mill/kW-h, 1978). These figures include the cost of the wells in the capital cost of the plant [H. Nakamura, personal communication].
6.7.6 Operating e a p m h c e
Unlike all other geothermal power plants in Japan where reinjection is done at atmospheric pressure, the waste liquid at Kakkonda is returned to

i 6.71 K
AK
KO
ND
A
(TA
KIN
OU
E)
171

172 JAPAN [Ch. 6
the formation at the separator pressure, about 550 kPa (80 lbf/in2). Although extensive monitoring is being carried out to check for any signs of induced seismicity, no adverse effects have yet been observed. The reinjection temperature is about l6OoC ; reinjection under pressure seems to promote reinjectivity. Maintaining the fluid temperature above 150°C also aids in preventing silica deposition in the reinjection wells. I f this procedure proves successful, other plants in Japan may be converted, where feasible, to a similar mode of reinjection.
The performance of the plant, from the day it was commissioned (May 26, 1978) to January 20, 1979, is summarized in table 6.19. In the early stages of operation the separators were discovered to be somewhat under- d, sized, leading to excess carryover of mist to the turbine with a design flow rate of 400 Mg/h (882 klbm/h) . To avoid the deposit of silica scale on the turbine blades, it was necessary to restrict the flow below the design value. From November 11 to December 5,1978, another separator was constructed which allowed the plant to reach its full capacity. Otherwise there have been no problems with the operation of the plant [H. Nakamura, personal communication].
Table 6.19-P~ormanecr of Kakkonda single-flash 6&MW geothermal power plant May 36, 1978 to Januaty 30,1979
Ca acity No. Generation, Pactor, Availability,
OU%% days MW*h percent percent Time Period
~ ~
:;} 63,000 84.0 92 0 6-26-78to 6- 7-78 37 6-8-78to 6-14-78 0 6-15-78to 8-17-78 37 64 8-18-78 to 11-10-78 40 85 79,800 99. 0 100.0 11-1 1-78 to 12- 5-78 0 025 12- 6-78to 1-20-79 50 71 53,900 90. 0 loo. 0
Total 265 196,700 d 74.0 88 0
* Source: H. Nakamura, pexyonal communication.
0 Plant down for construction of additional se arator. Inspection period.
Baaed on an effective capacity of 41.7 MW &r the period 5126178-1/20/79.
Finally, a plan is in the works to make use of about 2000 Mg/h of hot QI water from the plant for a variety of heating purposes in the city of Morioka and the town of Shizukuishi. These uses will include district heating, snow melting on roads, agriculture, tourism, and other industrial applications [Mori, 19751.
6.8 Pilot binary plant at Otake
Development of binary geothermal power cycles began in Japan in 1975 in cooperation with the Sunshine Project, promoted by the Agency of
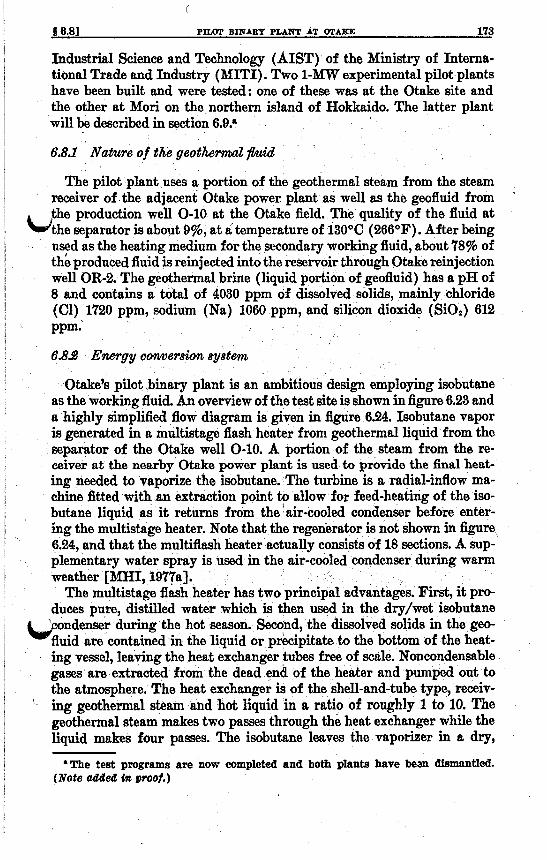
S 6.81 P l U V BIBABY PLAHT AT VFAKE 173
Industrial Science and Technology (AIST) of the Ministry of Interna- tional Trade and Industry (MITI). Two l-MW experimental pilot plants have been built and were tested: one of these was at the Otake site and the other at Mori on the northern island of Hokkaido. The latter plant will be described in section 6.9:
6.8.l Nature of the geothermwcl @id
I I I ! I i 1
1
The pilot plant uses a portion of the geothermal steam from the steam receiver of the adjacent Otake power plant as well as the geofluid from the production well 0-10 at the Otake field. The quality of the fluid at
u t h e separator is about 9%, at a temperature of 13OoC (266OF). After being used as the heating medium for the secondary working fluid, about 78% of thb produced fluid is reinjected into the reservoir through Otake reinjection well OR-2. The geothermal brine (liquid portion of geofluid) has a pH of 8 and contains a total of 4030 ppm of dissolved solids, mainly chloride (Cl) 1720 ppm, sodium (Na) 1060 ppm, and silicon dioxide (SiO,) 612 PPm.
6.83 Energy c m v e r s h system
Otake's pilot ,binary plant is an ambitious design employing isobutane as the working fluid. An overview of the test site is shown in figure 6.23 and a highly simplified flow diagram is in figure 6%. Isobutane vapor is generated in a multistage flash he geothermal liquid from the separator of the Otake well 0-10. A portion of the steam from the re- ceiver at the nearby Otake power plant is used to provide the h a 1 heat- ing needed to vaporize the isobutane. Th0 turbine is a radial-inflow ma- chine fitted with an extraction point to allow for feed-heating of the iso- butane liquid as it returns from the air-cooled condenser before enter- ing the multistage heater. Note that the regenerator is not shown in figure 6.24, and that the multiflash heater actually consists of 18 sections. A sup- plementary water spray ed condenser during warm
The multistage flash advantages. First, it pro- duces pure, distilled water which is then used in the dry/wet isobutane
e n d e n s e r during the hot season. Second, the dissolved solids in the geo- fluid are contained in the liquid or precipitate to the bottom of the heat- ing vessel, leaving the heat exchanger tubes free of scale. Noncondensable gases are extracted from the dead end of the heater and pumped out to the atmosphere. The heat exchanger is of the shell-and-tube type, receiv- ing geothermal steam and hot liquid 'in a ratio of roughly 1 to 10. The geothermal steam makes two passes through the heat exchanger while the liquid makes four passes. The isobutane leaves the vaporizer in a dry,
*The test programs are now completed and both plants have bezn dismantled. (Note added in proor.)
*
I
1
I
!
I weather [ MHI, 197'@].
i
i I 1
1 i i I I

174 JA
PAN
[Ch. 6
!
,- ,

g 6.8 J PILOT BINARY PLANT AT (rrAgE 176
CONDENSER :t
-- U LIQUID
FIQURE 6.24-Schematic diagram pilot binary plant at make (regenerator not shown) [MHI, 19774.
saturated state through a cyclone separator mounted on top of the evapora- tor.
The turbine, generator, reduction gear, and all associated auxiliary rning, sealing, and lubrication are mounted on a com-
transportation and installation. The turbine is a ra- dial expander with a spiral inlet, axial exhaust, and a bleed connectioo for regenerative heating (not currently in use). The turbine is fitted with variable inlet nozzles that serve as a control mechanism. Turbine speed is 17,000 rpm; generator speed is 1800 rpm. A planetary gearbox serves as a speed reducer. Turbine shaft sealing is achieved by means of a double- flow, balance-type oil film seal for normal running, a contact seal for shut- down, and a buffered gas seal for abnormal operation [MHI, 1977al.
. w The plant uses a forced-draft, air-cooled surface condenser augmented by a water spray. The water is obtained from the flash distillation process just described and from a single-cell, counterflow, mechanically-induced- draft cooling tower. The air-cooled condenser uses six bundles of circular finned tube elements with two top-mounted, Gduced-draft fans with var- iable pitch blades.
Table 6.20 lists technical particulars for the plant, which are subject to change owing to its experimental nature. As of October 1978 three test runs had been conducted and another was scheduled for the winter of 1 9 W 79, during which the regenerator was to be tested for the first time.

176 JAPAN [Ch. 6
Table 6.20-8pecifiCations for pilot binary plant at Otake a
Period of operation: 1977-1979
Turbine data: Type. .......................... Rated capacity. ................. Speed, turbinelgenerator .......... Secondary working fluid.. ........ i-CdH10 inlet pressure.. ........... i-C,Hlo inlet temperature. ........ i-CrHlo exhaust pressure. ......... i-CrHlo exhaust temperature. . . . . . i-C,Hlo mass flow rate.. ..........
Inlet pressure. .................. Inlet temperature. ............... Outlet temperature. ............. Mass flow rate, liquid.. .......... Mass flow rate, vapor. ........... Type b. ........................
Cooling water inlet temperature. . . Cooling water flow rate.. ......... Type. .......................... Number. ....................... Suction pressure. ................ Capacity. ...................... Power consumption. ............. Type. ..........................
Geothermal fluid data:
Condenser data:
Gas extractor data:
Heat r6j6dwn s y 6 k data:
Number of cells. ................ Water inlet temperature. ......... Water outlet temperature. ........ Design wet-bulb temperature. .... Water flow rate. ................ Draft fan type. ................. Air flow rate.. ..... : ............ Fan motor power consumption. , . .
Single-cylinder, radial-inflow, geared 1,000 kW 17,000/1800 rev/min Isobutane, i-CdH10 412.4 lbf/inz, 248.0'F 71.1 lbf/inz 125.6'F 154X 101 lbm/h
39.1 lbf/in* 266.0'F 122.0'F 106X 101 lbm/h 10.36X 101 lbm/h
Forced-draft, air-cooled with water spray, surface type
78.8'F 25.4X 1Oa lbm/h
Water-sealed rotary pump 1 3.62 in Hg 353.1 ftVmin 37 kW
Counterflow, mechanically-induced-draft
1 122'F 78.8'F 59.0'F 121 X 101 lbm/h Vertical, axial type 28.2X 1 W ft*/min 30 kW
cooling tower
- Sources: MHI, 1977a; MHI,.1978. Water spray is used only during the hot season.
6.9 Pilot binary plant at Mori (Nigorikawa)
The other binary test facility is located at the Mori geothermal field in the Nigorikawa district of Hokkaido and is being developed under the auspices of the Geothermal Energy Reseamh and Development Company, Ltd. (GERD), in conjunction with the Tokyo Shibaura Electric Com- pany, Ltd. (Toshiba) .

i 6.91 PIWT BINARY PLANT AT YOBI (NIBOBIKAWA) 177
The plant uses Refrigerant-114 (CClF, CClF,) as the working fluid in the power cycle. Shell-and-tube heat exchangers are used for the vapor generators and condensers. The turbine is an axial flow machine rated at 1,000 kW. A summary of .the technical specifications for the plant is given in Table 6.21. I n th0 case of the preheaters for the R-114, of which there are five, and the evaporator, the geothermal fluid is passed through the tubes of the heat exchanger while the R-114 flows through the shell side. This presumably allows for easy cleaning of the tubes in case of fouling. On the other hand, the main condensers operate with the R-114 inside the tubes with the cooling water on the shell side.
Table 6.21-Spe&fications for pilot binurg plant at Moti a
Period of operation: 1977-1979
W
Turbine data: Type ........................... Rated capacity.. ................ 1,000 k W Speed, turbine/generator .......... 3521.7/1500 Secondary working fluid. ......... Refrigerant-114, (CClF,) 2
(CCIFa), inlet pressure. .......... 194.8 lbf/in* (CClFa)a inlet temperature.. ...... 2093°F (CC1Fa)a exhaust pressure ........ 34.1 lbf/in* (CClFa)r exhaust temperature. ... (b)
(CClFa)a mass flow rate . . . . . . . . . 471.8XlW Ibm/h
Inlet pressure. (b) Inlet temperature. ............ Outlet temperature. ............. 197.6OF Mass flow rate, total.. ...... 396.8X 101 lbm/h
Type ...................... Liquid film flowing type Cooling water inlet temperature.. . 63.9OF Cooling water outlet temperature.. 71.6OF cooling water flow rate.. ......... 2.43X10⁸ lbm/h (CClFa), flow rate.. ............. 471.8XlV lbm/h
Type.. ......................... Vertical, ehell-and-tube, surface type Cooling water b e t temperature. .. 69°F
Cooling water flow rate.. ......... 2.43X 1 W lbm/h Bsd (CC1Fa)a flow rate.. ............. 183X lo" lbm/h
Axial-flow, impulse, single-flow, geared
f3sothermu2 $uid data: ..................
Main condenser data:
Auxiliary eondenser data:
' cooling water outlet temperature.. 63.9OF
Source: Sunshine Project, 1977.
The experimental station is equipped with a 1260 kVA generator rated at 3.3 kV at 50 Hz with a power factor of 0.9. The generator is'of the 3-phase synchronous type, drop-proof, air cooled, horizontal, and connected to the turbine through a gearbox with a 2.348 reduction ratio, No informa- tion has been reported on the performance of this pilot plant.
Not available.

178 JAPAN CCh. 61
6.10 Other promising areas in Japan
The ultimate geothermal electric generating capacity in Japan may be as high as 100,000 MW [MITI, 19761. A great many areas are excellent sites for geothermal development, including :
Akinomiya: a liquid-dominated reservoir at which a few wells have been drilled to 800-900 km (2625-2950 ft) .
Fushime : the highest salinity (35,000 ppm) liquid-dominated reser- voir in Japan, located in southernmost Kyushu.
Kirisliima : deep exploratory drilling is underway. Ihmamoto : a 55-MW doublh-flash plant is in the planning stages. Mori: a 5 5 - M W single-flash plant is under construction on this
liquid-dominated reservoir in southwestern Hokkaido ; wells range in depth from 1000 to 1200 m (3280 to 3940 ft) ; geofluid has high gas content.
Oyasu : possible dry steam reservoir; located about 30 km (19 mi) north of Onikobe; wells range from 800 to 1200 m (2625 to 3940 ft) in depth; bottom-hole temperatures of 300°C (572OF), highest in Japan, have been observed.
Sumikawa : located about 4 km (2.5 mi) from Onuma but outside the national parks; 30-MW plant is being contemplated; wells are highly promising with one 50.8-mm-diameter (2-in) well producing 16 Mg/h (35,OOO lbm/h) of steam and 32 Mg/h (70,000 lbm/h) of liquid under wide-open wellhead conditions.
Yakedake : liquid-dominated reservoir with bottom-hole temperatures of about 18OOC (356OF), but low permeability.
Information on these sites has been obtained from a variety of sources [Mom, 1975 ; GERD, 1975 ; Iga and Baba, 1974; MITI, 1976 ; K. Aikawa, personal communication ; K. Baba, personal communication].
REFERENCES a
Aikawa, K. and Soda, M., 1975. “Advanced Design in Hatchobaru Geothermal Power
Akiba, M., 1970. “Mechanical Features of a Geothermal Plant,” Pisa, 1970, Vol. 2,
GERD, 1975. Harnessing the Earth’s Thermal Energy, Geothermal Energy Research and Development Company, Ltd., Tokyo.
Hayashida, T. and Ezima, Y., 1970. “Development of Otake Geothermal Field,” Pisa, 1970, Vol. 2, pp. 208-220.
Iga, H. and Baba, K., 1974. “Annual Information on Development and Utilization for Geothermal Energy in Japan, 1973,” Geothermics, Vol. 3, No. 3, pp. 122-124.
Ito, J., Kubota, Y., and Kurosawa, M., 1977a. “On the Geothermal Water Flow of the Onuma Geothermal Reservoir,” Geothermal Energy, Vol. 14, No. 3, pp. 139- 151. (In Japanese.)
a See note on p. 24.
Station,” Sun Francisco, 1976, Vol. 3, pp. 1881-1888.
LJ pp. 1521-1529.

REFERENCES 179
Ito, J., Kubota, Y., and Kurosaws, M., 1977b. “On the Silica Scale of the Onuma Geo- thermal Power Plant,” Geothermal Energy, Vol. 14, No. 4, pp. 173-179. (In Japanese.)
JGEDG, 1978. Present Status of Geothermal Development and Utilization in Japan, Japan Geothermal Energy Development Center, Tokyo.
JMC, 1978. Kakkonda Geothermal Power Plant, Japan Metals and Chemicals Co., Ltd., Tokyo. (In Japanese.)
Kawasaki, 1975. Geothermal Power Plant, Kawasaki Heavy Industries, Ltd., Tokyo, Cat. No. GE 3847 EC.
Kawasaki, 1977. Outline of Onikobe Geothermal Power Plant, Kawasaki Heavy Industries, Ltd., Kobe, Dwg. No. 83GZl-GT99-02.
Kubota, I(. and Aosaki, H., 1975. “Reinjection of Geothermal Hot Water a t the Otake Geothermal Field,” San Francisco, 1976, Vol. 2, pp. 1379-1383.
W M H I , 1976a. Geothermal Power Development by Mitsubishi, Mitsubishi Heavy In- dustries, Ltd., Tokyo, Brochure JA-237, (1.0) 76-11, M.
. MHI, 1976b. Geothermal Power Generation by Mitsubishi, Mitsubishi Heavy Indus- tries, Ltd., Tokyo, Brochure JA-243, (0.5) 76-11, H.
MHI, 1976c. Mitsubishi Geothermal Power Plant, M i t s u b i Heavy Industries, Ltd. Tokyo, BrocKure JA-212, (2.0) 76-4.
MHI, 1977a. Binary Cycle Geothermal Power Generation Systems with Multistage Flash Heating, Mitsubishi Heavy Industries, Ltd., Tokyo.
MHI, 197713. Mitsubishi 60,000 kW Hatchobaru Geothermal Power Plant, Mitsubishi Heavy Industries, Ltd., Tokyo, Brochure JA-327, (1.0) 78-6 M.
MHI, 1978. Otake B i n a i Cycle Geothermal Generation System, Mitsubishi Heavy Industries, Ltd., Tokyo.
MITI, 1976. Present Status and Future Prospect of Developing Geothermal Re- sources in Japan, Ministry of International Trade and Industry, Agency of Natural Resources and Energy, Tokyo.
Mori, Y., 1970. “Exploitation of the Matsukawa Geothermal Area,” Pisa, 19’70, Vol. 2, pp. 1150-1156.
Mori, Y., 1975. “Geothermal Resources Development Program in Northeastern Japan and Hokkaido,” San Francisco, 1976, Vol. 1, pp. 183-187.
. Nakamura, H., 1959. “Geothermal Conditions in the Onikobe Basin, Miyagi Pre- fecturer, Japan,” J . Japan Assoc. Mineral. Petrol. Econ. Geol., Vol. 43, No. 3.
Nakamura, H., Sumi, K., Katagiri, K., and Iwata, T., 1970. “The Geological Environ- ment of Matsukawa Geothermal Area, Japan,” Pisa, 1970, Vol. 2, pp. 221-231.
Nakamura, S., 1970. “Economics of Geothermal Electric Power Generation at Matsu- kawa,” Pisa, 1970, Vol. 2, pp. 1715-1716.
Ozawa, T., Kamada, M., Yoshida, M., and Senemasa, I., 1973. “Genesis of Hot Spring. Part I: Genesis of Acid Hot Spring,” Geothermal Energy, Vol. 10, No. 2, pp. 31-40. (In Japanese.)
Saito, M., 1961. “Known Geothermal Fields in Japan,” Rome, 1961, Vol. 2, pp. 367-372.
u a k a k u r a , S., 1975. “Sunshine Project of the Japanese Government,” Proc. 2nd Energy Tech. Coni., Government Institute, Washington, pp. 105-121.
Sato, H., 1970. “On Matsukawa Geothermal Power Plant,” Pisa, 1970, Vol. 2, pp. 1546-1551.
Sunshine Project, 1977. Japan’s Sunshine Project: Summary of Geothermal Energy R&D, Ministry of International Trade and Industry, Industrial Science and Tech- nology, Tokyo.
Takahashi, Y., Hayashida, T., Soezima, S., Aramaki, S., and Soda, M., 1970. “An Experiment on Pipeline Transportation of Steam-Water Mdures a t Otake Geo- thermal Field,” Pisa, 1970, Vol. 2, pp. 882-891.
Usui, T. and Aikawa, K., 1970. “Engineering and Design Features of the Otake Geothermal Power Plant,” Pisa, 1070, Vol. 2, pp. 1533-1545.
.


CHAPTER 7 MEXICO
-
7.1 General remarks
The first exploration for sources of geothermal energy in Mexico took place in 1955 west of the city of Pachuca at Path6. This geothermal field is situated along the Neovolcanic axis trending east-west across the country. The region consists of upper Tertiary a i d Quaternary basaltic, andesitic, rhyolitic, and pyroclastic rocks [Alonso, 1971il.
As of 1975 the total installed electric capacity of Mexico was 7500 MW, with 48% supplied by hydroelectric plants, 51% from oil- and gas-fired thermal power plants, and the remaining 1% by coal and geothermal. It is unlikely that expansion in hydroelectric capacity will amount to more than about 12,000 MW. The discovery of extensive petroleum reserves in Mexico has allowed that country to become an exporter of crude oil and rehe'd petroleum products. The proven reserves of crude oil, natural gas, and condensate as of 1977 were 16 billion barrels, with potential reserves of 120 billion barrels [Diaz Serrano, 19781. Thus Mexico's energy situation is extremely favorable for the next several decades, well inla the twenty- firstcentury. ~
important role in meeting the growing demand for electricity in Mexico. More than 130 geothermal regions dot the country, in 24 of the 32 states. The largest concentration of geothermal sites lies in the states of Michoachn (22), Jalisco (16), Baja California (la), and Guanajuato (9). Owing to their wide geographic dis- tribution and their potential as an inexpensive source of local power, these geothermal regions will be taken into account in national plans to meet the expected future demand for electricity in Mexico.
LiJ
f
Geothermal energy will, neve
Mexico's first geothermal power plant was installed a t Path&, a geother- mal field located in the municipality bf Tecozaulta in the state of Hidalgo, about 80 km (60 mi) north-northeast of Mexico City. The plant began operations in 1959 but is now shut down [G. Cuhllar, personal communica- tion]. The Path6 unit had a capacity of 3.5 Mw and employed a noncon- densing turbine supplied with steam separated, most likely, from one well.
i 1 j i I 1 .
I
181
/ I

182 MEXICO [Ch. 7
Very little information exists on this plant in the literature. Figure 7.1 shows a view of the powerhouse at Path&
7.3 Cerro Prieto
The major geothermal development in Mexico is taking place at Cerro Prieto in the state of Baja California, roughly 35 km (22 mi) south of the city of Mexicali and the international boundary between the United States and Mexico. The geothermal field is located between 114O50’ and 115’48’ west longitude and between 31O55‘ and 32O44’ north latitude. The general location of the area is shown in figure 7.2. Since 1973 Cerro Prieto has been generating 75 Mw of power on a highly reliable and economic basis, recently achieving the highest capacity factor of any power plant in Mexico. This experience has been so successful that work has recently been completed on an extension of the plant, duplicating the first two power units and bringing the installed capacity to 150 M W . The full potential of the field is estimated to be at least 400 M W .
L,
7.32 Geology
The Cerro Prieto geothermal field, located on a plain in the Mexicali-, Imperial rift valley, covers an area of about 3000 ha (7400 acres). The most prominent feature of the flat desert area is the volcano of Cerro Pneto (“Black Hill”), which has an elevation of 260 m (853 ft) , covers an area of 400 ha (988 acres), and lies about 6 km (4 mi) west-northwest of the main geothermal steam production area [Reed, 19753. The field bounded on the west by the Sierra de 10s Cucapahs and contains numero faults of the San Jacinto fault zone. These faults strike northwest an have resulted in considerable downthrows on the northeast side. This can be seen in figure 7.3, for example, where the vertical separation between the plutonic rock at the crest of the Sierra de 10s Cucapahs and the same type of rock beneath the geothermal field is about 5.5 km (18,000 ft).
Exploration studies, undertaken in the 1950’s and motivated by the large number of surface manifestations of thermal activity, have revealed a good deal about the nature of the geothermal field. Figure 7.3 is a highly simplified geologic cross-section of it. The reservoir is capped by a layer of plastic, impermeable clays with a thickness of 6OCk700 m (1970-2300 ft) over the main portion of the field. These are sedimentary rocks and deltaic deposits of the quaternary period deposited by the Colorado River [Paredes, 19751.
Underlying the cap clays is the main reservoir, which was formed in the Tertiary period. Shales and sandstones of considerable porosity and permeability were deposited in a large graben as a result of intensive ero- sion of igneous granitic and metamorphic rocks. Basement faulting con- tributed to the permeability of this formation. The pores of these rocks became filled with water during the late Tertiary from the Colorado

CEBBO PBIETO 183
t 7.31

184 XEXICO [ah. 7
0 mi 5 -
hxrm 7.2-Geographical location of Cemo Prieto geothermal field [after CFE, 19711.

GEOTHERMAL SIERRA D E WELL
GRANITIC BASEMENT
.1 km w
APPROX. SCALE
MAGMA SOURCE AT DEPTH
FIQTJRE ?.3--8chematio cross-section of Cerro Prieto geothermal reservoir [stter CFE, 19711.
River. The aquifer is beli to consist of alternating layers of nondeltaic lutites and sandstones, with the sandstones saturated with connate water at a pressure in excess of the hydrostatic saturation pressure. Total thick- ness of the nondeltaic sediments is about 2 km (6500 ft) . The basement rock is granitic and may be seen in large outcroppings in the Sierra de 10s
eriod, probably of the Cretaceous
73.9 Well program and gathriag syetem
Information on the drilling program and reservoir development at Cerro Prieto has been reported at various stages during%he project [Dominguez and Vital, 175 ; Guiza, 1975 ; Mercado, 1974,1975a, 19761. A total of 41 wells had been drilld through 1974 including exploration wells, step-out wells, and deep production wells. Locations of these wells are shown in figure 7.4, which also illustrates the power plant and evapo-

186 MEXICO [ah. 7
I4
TO SAN LUIS R.C.-
t 0
1 km w 0
0 0.5 mi
FIGURE 7.4-Location of wells at Cerro Prieto [after Dominguez and Vital, 19751.
ration pond sites. Eighteen wells are connected to the first two units of the power plant, nine for each unit. Of these, 15-16 are needed to generate 75 MW; the others are held on reserve. Figure 7.5 shows the pip- ing layout for the steam-gathering system. Four main steam-gathering lines run from the wells to the steam receivers at the powerhouse. There are more than 6 km (20,000 f t ) of steam pipelines with diameters greater than 406 mm (16 in).
The wells are drilled with rigs rated for 2200 m (7200 ft) using a draw- works powered by two 250-hp engines. The drill string consists of FH 114-mm (4.5-in) drill pipe and 165-mm (6.5411) drill collars. Drilling mud is of the bentonitic type, emulsified with 40/0-90/0 diesel oil and having a density between 1.09 and 1.24 Mg/m8 (68.05 and 77.41 lbm/fts).Q The mud has a solids content of 845% and a pH of 7.5-10.5 [Guiza, 19753.
The wells were completed during three periods as follows :
1964-1967 : M-5,8,9,10,15 1967-1968 : M-l1,13,15A, 19A, 20,21,21A, 25,26,30,35 197Z1974 : M-29,31,34,38,39.
From the first group, M-10 is not used, and M-15 needed extensive re- pairs and was replaced with a new well, M-15A. From the second group,

57-31 CERBO PBIETO 187
MII
U
M 38
Ml3& M 3 9
EVAPORATION
FIQURE 7.6-Steam pipeline gath system for Units 1 and [after CFE, 1971; Mercado, 19761.
2 at Cerro Prieto
\
five wells suffered casing failures or other problems and needed to be repaired or replaced: M-13, 19A, 20,21, 26. Wells M-13, 20, arid 26 were successfully repaired, BI-lOA vas plugged at the bottom to seal off a zone of cooler water, and M-21 was permanently sealed and replaced with w M-21A. From the last group, only M-29 did not need repairs or rework- ing. The causes of the problems include mechanical accidents during drilling, inadequate materials or materials incapable of withstanding the high temperatures and stresses encountered, and improper well develop- ment and stimulation techniques that subjected the casings to abrupt changes in conditions [Dominguez and Vital, 19751.
A schedule of gradual heating is now followed-to avoid casing failure. The water in the well is allowed to reach its maximum temperature in not less than 15 days, during which period gases and steam produced are vented to the atmosphere. In this way casing and cement expand simul-

i
I
i
!
i i i
I
1 1
i
j
i j
1
i
188 MEXICO [Oh. 7
taneously, without excessive temperature differentials between the casing and the formation [Guiza, 19753. The mean lifetime of a well at Cerro Prieto is considered to be 15 yeam,; some wells that are 14 years old are still in good condition and produce steam [Mercado, 19763. Casing pro- files for the 18 wells that serve the two units are shown in figures 7.6 and 7.7.
The two-phase geofluid is processed conventionally in Webre-type centrifugal separators ; the separated steam passes through a ball-check valve before entering one of the four main-steam transmission lines (see figure 7.8). The main steam is collected outside the powerhouse in a set of receivers (see figure 7.9) and passes through a final stage of moisture separation (see figure 7.10) before entering the turbines.
Observations of pressure, temperature, and flow measurements taken the wells, together with geochemical analyses of the fluid produced, have made it possible to determine the distribution and movement of hot water through relatively shallow layers (100-500 m, 33&1640 ft) from the south- east toward the northwest. Furthermore, hot fluid appears to be rising and flowing horizontally, generally from the eastern and central portions of the field toward the western portion. The temperature gradient is most gradual in the eastern part of the field (in the vicinity of well M-53), where the magma intrusion is believed to lie at depth.
The reservoir is probably being recharged from two sources: (1) the highly pervious and saturated alluvial fans of the Sierra de 10s Cucapahs (see figure 7.3), and (2) meteoric water from the Colorado River. The first of these feeds the reservoir from the west, whereas the second delivers water from the east. The second source is relatively unimportant, however, since the field has only moderate permeability in the eastern region [ Mercado, 1975al.
On the basis of these studies, it has been determined that future wells should be drilled to the following approximate depths, depending on loca- tion in the field: 800-1400 m (2625-4590 f t ) for wells west of the power- house, and 1400-2600 m (4590-8530 f t ) for those east of the powerhouse. The depth required to reach the aquifer increases from west to east across the field [Mercado, 197581.
7.3.3 Geo@&? characteristics
b
The liquid-dominated reservoir produces a mixture of liquid and vapor at the wellhead. The fluid in the reservoir is a compressed liquid that partially flashes to vapor during its ascent through the wells. Under high flow rates there is annular flow in the well bore, i.e., liquid on the walls and vapor in the core [Reed, 19751. Table 7.1 lists average pressure, tem- perature, mass flow rate, and dryness fraction for wells supplying the power plant during January and February 1974. As pointed out in note b of the table, an average wellhead pressure of 729 kPa (106 lbf/inp) is more representative than the average value of 1119 kPa (162 lbf/in2) because of the unusually high pressures in wells M-11 and 31. Tempera-

e
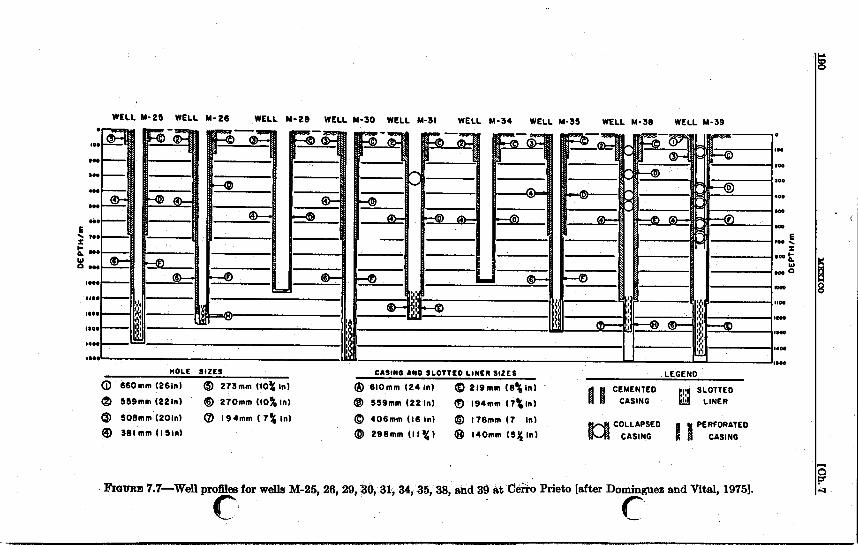
5
OE
PT
nlm
f N
a
4
r
r
m f N
w s m r r F U
u
s r
r
m f u m s r r
m
OE
PT
Hlm

j 7.33 am
R0 PBIETO
191
c
0

192 MEXICO
[Ch. 7

CEBBO PEIEZO 193
FIGURE 7.10-Final moisture separator at Cerro Prieto [photo by R. DiPippo].

104 MEXICO [Ch. 7
Table 7.1-WelWrsad and separator conditions averaged over 16 wells at Cerro Prieto
Tempera- Mass Drbess Pressure $re Flow Rate Fraction
kPa C Mg/h percent
Wellhead.. - - - ......... b 119k982 Separator. .......... 710f72 165f4 47.5f22.7 24k6 Silencer. ........... atmos. - d 130.0f42.8 -
- * 16. OfQ. 2 - Silencer ............ atmos.
Separated steam. d Liquid.
Steam.
ture of the geofluid at the separator was 165°C (32OoF), and quality averaged about 24%.
The geothermal steam contains about 1% by weight of noncondensable gases, mainly carbon dioxide and hydrogen sulfide. Average concentra- tions of these two constituents for eight wells (M-5, 8, 9, 11, 20, 29, 31, 34) were reported to be 7320 and 1564 ppm, respectively [Reed, 19753. The samples were taken for an average steam flow rate of 54.5 Mg/h (120.2 klbm/h) and at an average separator pressure of 790 kPa (114.6 lbf/in2). The impurities in the steam as it enters the turbine were quoted by Mercado as the following: COz, 14,100 ppm; H2S, 1500 ppm; NH,, 110 ppm; C1,0.8 ppm; Na, 0.4 ppm; and SOz, 0.2 ppm [Mercado, 10761.
Table 7.2-Chemical mposition of separated water samples from 16 wells at Cerro Pn'eto *
Standard Concentration Deviation
Constituent meP mgP
Chloride, Cl.. .......................................... 14,370 2,220
Silica, Sios .............................................. 850 185 Calcium, Ca.. .......................................... 545 110 Bicarbonate, HCOs.. .................................... 50 10 Lithium, Li ............................................. 18 3 Boron, B ............................................... 18 4 Sulfate, SO, ............................................. 17 14 Magnesium, Mg ......................................... 1.4 1. 0
............................................. ',4tX g, Sodium, Na 7,760 Potassium, K. . ......................................... 1,660
pH Q 25OC ............................................. 8. 2kO. 1
*Source: Reed 1975; samples taken from wells M-5, 8, 9, 11,20,25,26,29, 30, 31, 34, and 39 during Januaxy and February 1974.

$7.31 CEBRO PRIEI‘O 195
The composition of the separated liquid is given in table 7.2. Total dissolved solids amount to roughly 25,200 ppm or 2.5%. The main im- purities are chloride, sodium, and potassium, which together constitute 94% of the total. Since all this liquid is discharged to the environment, either to the atmosphere through the silencers after flashing or to the ground and atmosphere by means of the settling/evaporation pond, at- tention must be given to the effects of the dissolved solids on the environ- ment. The concentrations of the principal chemical components in the pond (on July 9, 1974) were reported as follows : C1, 47,462 ppm ; Na, 20,412 ppm; K, 4950; Ca, 2169; and Li, 68 ppm [Mercado, 1975bl.
?3..4 Energy conve~sion system W
The power plant is of the separated-steam (or “single-flash”) type with two units, each of 37. d capacity. It is owned and operated by the Comisi6n Federal de ad (CFE) . The units were supplied by the Tokyo Shibaura Electric Company Ltd., (Toshiba) , and are of the single- cylinder, double-flow variety with six stages of impulse-reaction blades in each flow. Unit 2 and a spare rotor are shown in figures 7.11 and 7.12, respectively. A simplified flow diagrambeat balance schematic is shown in figure 7.13 ; technical specifications are given in am essentially identical to the first two units.
The condenser is of the barometric, direct-con next to the powerhouse. It is 25.35 m (83.2 ft) high, with a sh6ll diameter of 6.7 m (22 ft), shell height of 9.6 m (31.5 ft), and tail pipe 2 m (6.6 ft) jn diameter and 12 m (39.4 ft) in length. The exhaust from the turbine is conveyed to the condenser by means: diameter and about 40 m (131 ft) &
.
The gas extraction system consis
sumably for redund three second-stage
requires 24.2 Mg/h (53.4 klbm/h) of motive st
factor of 0.85. S the stator are c utilization efficiency vu of the plant is 40%, based on wellhead flow condi- tions assuming 24% quality and a sink temperature of 26.7OC (80OF). This value is typical-of geothermal plants of this type.

198 Y
EX
ICO
[Ch. 7

I
f
U

MAIN STEAM
310.75 S 4
t60.0°C 618.1 P 157.3 H
T= TURBINE G= GENERATOR C = CONDENSER
I C= INTER-CONDENSER AC =AFTER-COPUENSER EI=Ist-STAGE EJECTOR E2=2nd-STAGE EJECTOR GE =GLAND - SE AL EJECTOR HW=HOT WELL
HW TO
COOLING TOWER L-,,---+
45.9OC; 11.394 W E'IQuR~ 7.13-Simplified BOW diagram for energy conversion system for each unit at Cerro Prieto [after Akiba, 1970; Mercado, 19761.
G C

FIQVRE ?.lbBsrametria condensers for Units 1 and 2 at Cerro Prieto Iphoto by R. DiPippo].
C

200 XEXICO [Oh. 7
Table 7.3-Technical epscijicatwns for Cmo Prieto geother&eteetzic power pknrt, Units 1 and d a
Year of startup: b 1973
firlrine data: Type.. ......................... Single-cylinder, dohble-flow,
Installed capacity.. ............. Steam inlet pressure. ............ % (wt.) noncondensable gases.
6X 2, impulse-reaction 37.5 MW, each
89.6 lbf/id -1.0% of steam
Speed. ......................... 3600 revlmin
Exhaust pressure. ............... 3.5 in Hg Steam flow rate. ................ 629X 1V lbm/h, each I
Type.. ......................... Elevated, direct-contact, barometric con-
Pressure ........................ 3.3inHg Cooling water temperature.. ...... 89.6'F Outlet water temperature.. ....... 113.5'F Cooling water flow rate.. ......... 23.6XlW lbm/h, each
Type ..... & . .................... Steam jet ejectors,
Suction pressure.. ............... 3.1 in H g Steam consumption.. ............ 53X 1V lbm/h, each
Type. .......................... Crossflow, mechanically-induced-drdt cool-
Number of cells. ................ 6, each Water inlet temperature.. ........ ll4.6'F Water flow rate. ................ 25.5 xl(P lbmlh, each Water pump power.. ............ 835 kW
.... LJ
Condsnser data:
denser
Gas extradot data:
Zstage
Heai rejection rryotem dda:
ing tower
Source: Mercado, 1976; Toshiba, 1977. b Units 3 and 4 began operating on April 24, 1979 and are essentially identical to
Units 1 and 2. '
73.6 cmtructim mater&.$
Prior to selection of materials for the various critical parts of the plant, loo0 tats were conducted on a number of candidate materials [Mercado, 1975bl. Samples were exposed to geothermal steam, both aerated and nom aerated, and to condensate for a period of 160 days. The steam was ob- tained from well M-8 and the condensate from steam from wells M-3 and M-5 [Tolivia et al., 19753. I q this section we shall describe the materials used in the construction of the wells, silencers, piping, turbines, condensers, cooling towers, and electrical equipment.
W3ll casings are fabricated from 5-55 API standard-weight pipe with buttress couplings. Extra-heavy wall thickness may be required in future wells. The cement consists of API type G with silica flour, perlite, and
LJ

7.31 CEBBO pBI&To 201
retarders as additives [Guiza, 19753. Silencers are made of concrete with wooden stacks in a twin-silo design [Mercado, 1975bl.
Carbon steel is used for pipes carrying nonaerated steam. The corrosion rate follows a paraboliclaw and is about 0.04 mm/yr (0.0016 in/yr) . When the steam is in contact with air; the corrosion rate is 0.11 mm/yr (0.0Wd in/yr) ; aerated-steam pipelines are, therefore, allowed extra wall thick- ness. The worst case occurs in condensate lines where the corrosion rate for carbon steel is 0.66 mm/yr (0.026 in/yr) . Condensate l i e s are provided with a corrosion allowance and also coated with epoxy resin [Tolivia et al., 1975).
L, The turbine rotor is fabricated from a 1 Cr/l Mo/l/q V alloy steel forg- ing machined to form a solid unit composed of shafts, wheels, bearing jour- nals, and coupling flanges [Akiba, 19701. Alloy steels containing nickel are not use because of their poor corrosion resistance. The turbine blades are machined from 12 Cr alloy steel bar stock and are enclosed with a shroud that is hand riveted in place with tenons on the outer edges of the blades. The blades of the last (sixth) row are fitted with stellite erosion shields and fastened together with lashing wire to minimize vibrations [Akiba, 19701. Nozzle partitions are of 12 Cr/0.2 Al alloy steel, and labyrinth strips are of 15 Cr/1.7 Mo alloy steel. The turbine outer and inner casing are made of carbon steel according to ASTM specification A285 [Mercado, 19761.
The shell of the condenser is carbon steel with a coating of epoxy resin ; the barometric pipe is made of naval brass [Mercado, 19761. The structural members of the cooling tower are constructed from AIS1 4140 steel with redwood md fiberglass packing [Mercado, 19761.
Since electrical equipment is susceptible to corrosive attack by hydrokn sulfide, special precautions are taken for the protection of &is equipment. Most switchboards, including the main one, are installed in rooms that have air-conditioning systems fitted with activated carbon filters. These filters are filled with activated alumina beads impregnated with potassium permanganate [Mercado, 19741. The electrical contacts on the high-voltage side at the substation are gold plated, although platinum
c;pd Liquid separated from the geofluid a t the wellhead separators is either sent to silpcers located at each wellhead kite or piped directly to the evaporation and settling pond (see section 7.8.8). Eventually all waste liquid (liquid from the separatora or the silencers and excess steam con- densate) is discharged into the pond (see figure 7.16). The present pond has an estimated capacity sufficient to support 180 Mw of generation, i.e., through Unit 5. Beyond that, another means must be found for disposal of the waste liquid. Among the options are (1) reinjection, (2) construc- tion of a channel to the Laguna Salada, a dried-up lake, and (3) construc- tion of a channel to the Sea of Cortsz [Guiza, 1975; Mercado, 197Pibl.

302 XEXIo
[Oh. 7
B f

4 7.31 CERRO PBIETO 203
The noncondensable gases removed from the condenser by means of the steam ejector system are discharged to the atmosphere through 475-mm- diameter (18-in) fiberglass pipes (one for each unit) that extend to a height of 40 m (131 ft) above the ground. Since the prevailing winds blow from either the nortkwdst or the southeast, these’ gases should be swept away from the plant. The composition of the stack gases sampled on July 9,1973, when Unit 2 was generating 32 M W , are given in table 7.4. The specific discharge of H2S is more than 11,000 g/lKW-h; for compari- son, note that the U.S. Environmental Protection Agency (EPA) is sug- gesting a maximum specific H,S emission level of 200 g/MW.h for geothermal plants in the United States [Hartley, 19781. W
Table 7,4--Composition of stack gases, sampled July 9, 1973 a
DischGE Percent GllS b wt
Carbon dioxide, COS ............ 62. 5 3440
Air and other gases, ............. 6. 7 365 Hydrogen sulfide, Has.. .......... 6. 5 355
Water (condensate). ............ 24.3 1340
Source: Mercado, 1975b. t
On windless days the concentration of H2S may reach dangerous levels in certain areas. An alarm system is connected to a series of H,S detectors t6 protect personnel in and around the powerhouse. An additional vent fine was constructed from t3ie powerhouse at the base of the gas extraction
ks to the evaporation pond. The resin-lined steel vent duct is 584 mm .in) in diameter and 1250 m (4100 ft) in length. Since H,S is also
acks, it is impossible to vent all the H,S the prevailing winds tend to carry the
the powerhouse. The cooling tower is e direction of the
emitted from the coolin
the plant and is aligned
The effects of other forms of polluti ) are felt to be insign opulation. If it were deemed necessary, steps could be
taken to curtail or further control plant emissions ; however, it is believed that the best course for now is to provide special materials and protective devices and procedures where needed [Mercado, 19751.
73.7 Ecorurmic factors
The only economic data available were reported by CFE in 1971 on the anticipated costs of Units 1 and 2, then under construction. Capital invest- ment was $14.4 million (US l971), of which $7.2 million was for plant

equipment, $2.08 million was for wells, and the remaining $5.12 million was for labor and overhead [CFE, 19711. This report contained an esti- mate of $1.44 million for the annual operating expenses of the plant. The approximate annual savings in fuel (petroleum) costs were estimated at $170,000 million, a figure calculated before the price of oil underwent its dramatic increase in 1973 and thus vastly underestimating the savings in the present market.
1
73.8 Operathg e x p e r h o e
The Cerro Prieto geothermoelectric powerplant has operated very re- liably since it was brought on-line in April 1973. At that time Unit 2 began generating electricity; Unit 1 was started in September of the same year. The figures in table 7.5 give the annual electricity generation and capacity factors for the first 4 years of operation, Highest monthly capacity factor was 94% in September 1975. The capacity factor of 87% in 1976 is the highest of any Mexican powerplant.
u
Table 7.5-Pqfmnee of Cmo Pricto plcmt, 1973-1976
Capacity Generation factor
Year GW-h percent
1973 ........................... 205 63 1974... ........................ 445 68 1975 ............................ 518 79 1976 ........................... 570 87
Source: Domingues, 1977; Mercado, 1976.
Regular maintenance is performed on the units at 2-year intervals; wells are cleaned once every 1 to 4 years. No scaling has been observed in the waste water disposal pipes when the liquid is maintained at the separator pressure (when it is not flashed down to atmospheric pressure at the well- head silencers) and sent directly to the evaporation pond. No signscant subsidence of the geothermal field has occurred, even though no reinjection has taken place. Reinjection is expected to be adopted when the field reaches full exploitation. Approximately 8 X lo6 Bfg/yr (2 X 1O'O lbm/yr) of geofluid must be withdrawn from the field to supply each 37.5-MW unit ; about 80 X lo6 M g , (180 X los lbm) 1 of fluid have been produced dur- ing the operating lifetime of the plant.
I i 73.9 E m p a m h of Orno Prieto plant
i 1 i
The ultimate electric generating capacity of the C e m Prieto field is not known with certainty ; 400 Mw seems a conservative estimate. Units 3 and

f 7.41 PWIWIPTIAL QE0l"EBMAL SITES IN LIEXI00 205
4, each to be rated at 37.5 Mw and essentially duplicates of Units 1 and 2, have been completed and came on-line in 1979. Following these, the next unit will be a double-flash, low-pressure unit rated at 30 Mw, which will dse steam flashed from the waste liquid produced from the first four units. Additional units will probably be standardized 55-34W designs. Although time schedules are difficult to predict accurately, table 7.6 gives the plan for near-term development of Cerro Prieto.
Table 7.6-Ptanncd expasion at &YO PrictO
Site Unit No. Unit Capacity Cum. Capacity
1979 ....... Cerro PrietoI ....... 3 ........... 37.6MW ....... 112.5MW 1979 ....... CerroPrietoI. ...... 4 ........... 87.6MW ....... 160.0MW 1982.. ..... Cerro PrietoI ....... 5. .......... 8O.OMW ....... 180.0 MW 1983 ....... CerroPrietoII ...... 1 ........... 55.0MW ....... 235.0MW 1984.., .... CerroPrietoII.d .... 2 ........... 66.0MW. ...... 2904MW
74 Potential geothermal sites in Mekieo
A large number of hydrothermal areas in Mexico are described by Alonso [1975]. In the 130 sites discovered, only a few wells have been drilled. US- ing conservative estimates, the ultimate geothermal power potential of the country has been placed a t 4ooo MW. Only the most prominent sites are discussed below.
This field is located the state of Michoach within the area known as the Neovolcanic axis, Numerous thermal manifestations exist in the valley, where five small- and three lar&-diameter wells have been drilled. A satisf&ctory evaluatioh of the site has not been accomplished owing to problems with completim of the large-diameter wells [Alonso, 19751.
W ! os Negdtos
The geology of this field has been &died by a cluding seismic refraction, electric resistivity, gravimetric, magnetic, and geochemical. The field is located in the municipality of Villamar in the sthts of Echoadin, also in the Neovolcanic axis. One well, drilled to a depth bf 1000 m (3280 ft) , produces a mixture of liquid and vapor on an intermittent basis. The racks &re believed to be basalts and andesites with ntunerous fractures along the east-west axis [Alonso, 19761.

206 MEXICO CCh. 71
74.3 Lo8 A m f re8
Another promising region in the state of Michoach, Los Azufres has been explored by means of geophysical, geochemical, geologic, and elec- trical resistivity techniques. All indications are favorable for the existence of a hydrothermal reservoir, but no wells had been drilled as of 1975 [Alonso, 19751.
74.4 LaPrimastwa
This volcanic caldera containing a large number of hot springs an steam vents is located west of the city of Guadalajara in the state o Jalisco. The usual exploration techniques have been applied and several mall-diameter wells have been drilled [Alonso, 19753.
Id
Steam vents and hot springs, some with flows as large as 300 kg/s (661 lbm/s) , exist in this field located about 80 km (50 mi) southwest of Guada- lajara in Jalisco. Besides the geologic, resistivity, and geochemical surveys carried out, six small-diameter wells have been sunk to depths of 50-300 m (169-934 ft) [Alonso, 19751.
REFERENCES a
Akiba, M., 1970. “Mechanical Features of a Geothermal Plant,” Pisa, 1970, Vol. 2,
Alonso, H., 1975. “Geothermal Potential of Mexico,” Sun Francisco, 1076, Vol. 1, pp. 21-24.
CFE, 1971. “Cerro Prieto: Underground Power,” Comisi6n Federal de Electricidad, G. V. Caravantes, Dir. Gen., R6dano 14, M h c o 5, D.F.
Disz Serrano, J., 1978. “Pemex Director General Reports on Mexico’s Outlook,” Ocean Industry, Vol. 13, No. 5, pp. 4244.
Dominguez A., B., 1977. “C~RO Prieto, Mexico,” Geothermal Resources: Survey of an Emerging Industry, Geothermal Resources Council Spec. Short Course No. 6, Houston.
Dominguez A., B., and Vital B., F., 1975. “Repair and Control of Geothermal Wells at Cerro Prieto, Baja California, Mexico,” San Francisco, 19’76, Vol. 2, pp. 1483- 1499.
Cuiza L., J., 1975. “Power Generation at Cerro Prieto Geothermal Field,” Satu Francisco, 1076. Vol 3, pp. 1976-1978.
Hartley, R. P., 1978. PoUutwn Control Guidance for Geothermal Energy Develop- ment, EPA Rep. No. 600/7-7&101, Ind. Ehv. Res. Lab., Cicinnati.
Mercado G., S., 1974. “The Geothermal Plant of Cerro Prieto, B.C., Mexico, and Problems Encountered During -Ita Development,” Geothermics, Vol. 3, No. 3, pp. 125-126.
Mercado G., S., 1975a. “Movement of Geothermal Fluids and Temperature Distribu- tion in the Cerro Prieto Geothermal Field, Baja California, Mexico,” San Fran- Cisco, 1076, Vol. 1, pp. 487-494.
see note on p. 24.
pp. 1521-1529.

EEmEENm 207
Mercado G., S., 197513. “Cerro Prieto Geothermwlectric Project: Pollution and Basic Protection,” San Francisco, 1976, Vol. 2, pp. 1385-1398.
Mercado G., S., 1976. “Cerro Prieto Geothermal Field, Mexico: Wells and Plant Operation,” Proc. Int. Cong. on Thermal Wuters, Geothermal Energy and VUG canism of the Mediterranean Area, Geothermal Energy, Vol. 1, pp. 394-408.
Paredes A., E., 1975. “Preliminary Report on the Structural Geology of the Cerro Prieto Geothermal Field,” Sun Francisco, 1976, Vol. 1, pp. 515-519.
Reed, M. J., 1975. “Geology and Hydrothermal Metamorphism in the Cerro Prieto Geothermal Field, Mexico,” Sun Francisco, 1976, Vol. 1, pp. 539-547.
Tolivia M., E., Hoashi, J., and Miyaraki, M., 1975. “Corrosion of Turbine Materials in Geothermal Steam Environment in Cerro Prieto, Mexico,” Sun Francisco, 1976, Vol. 3, pp. 1815-1820. oshiba, 1977. “Toshiba Experience’ List on Geothermal Power Plant,” Tokyo
L n J Shibaura Electric Company, Tokyo.

\
I

. CHAPTER 8 NEW ZEALAND
8 3 Overview bd New Zealand pioneered in the use of liquid-dominated hydrothermal
resources for the generation of electricity. The use of geothermal energy was first considered in the 1930’s. Early investigations led to the con- clusion that geothermal energy could be used to produce electric power. A 5-year program established in 1949 had as its objective the winning of sdc ien t steam to support a 2O-MW plant in an area of the Waiora Valley at Wairakei. Consulting engineers Men and McLellan of England de- signed a 26-MW plant in 1953, based on the proven geothermal steam supply. Construction began in 1956, the first turbine was commissioned on November 15,1958, and Stage One of the program was completed in March 1960. This was followed by the installation of 12 additional ma- chines, the last brought on-line on October 7, 1963. The total installed capacity of the Wairakei geothermal power station was then 192.6 MW [ NZED, 19761.
Multipurpose rise of geothermal energy is made at Kawerau, where process heating, clean steam generation, and electricity production take place. At Ohaki (Broadlands), the New Zealand Electricity Department (NZED) is planning to build a geothermal power plant that will employ a two-stage steam generation process, i.e., a primary separation followed by a secondary flash process. This plant will eventually have a capacity of 160 M W , but is being built in 6O-MW stages.
8.2 Wairakei 83.l GeoZogy
The Wairakei geothermal field lies in an extensive thermal area on New w ealand’s North Island. Wairakei is situated about 8 km (6 mi) north of the northeast corner of Lake Taupo, roughly in the middle of a thermal beh 60 km (31 mi) wide and 250 km (165 mi) long that trends northeast- southwest &cross North Island from a central group of volcanic mountains to the white Island volcano in the Bay of Plenty. Figure 8.1 shows the location of Wairakei (insert) and the general arrangements of the bore field and power station [Armstead, 19611.
a09

ZlO REW ZEALAND [Qh. 8
0 mi 100
WELLiNGTON %/
NORTH ISLAND
mi
km
FIGURE 8.1-Location of Wairakei geothermal field, North Island, New Zealand [Armstead, 19611.
The first bore ak Wairakei delivered steam in 1951 ; the first electricity was generated in 1958. This field has been exploited for a longer time than any other liquid-dominated geothermal reservoir in the world. The reser- voir has passed its peak of production. Whereas the installed capacity is 192.6 MTV, the output in 1974 was only 150 Mw [Bolton, 19771. It is ex- pected, however, that production will stabilize at between 125 and 140 MW for an indefinite period of time.
The Wairakei thermal area is located in a region of Cenozoic subsidence and forms a part of the Taupo volcanic zone. A geologic map of the thermal region is given in figure 8.2 [Grindley, 19611. Large, active ande-(& sitic volcanoes are located at each end of the zone, and the wider central portion is dominated by acid igneous activity. These include rhyolite domes, pyroclastic pumice deposits, and ignimbrites. During the late Mio- cene and Quaternary periods, a huge volume of lava and pyroclastic rocks [lS,OOO kms (3840 mi8)] were erupted from the Taupo volcanic zone and led to the formation of grabens and calderas constituting the zone of subsidence.
A geologic cross-section taken east-west across the thermal belt at Wairakei is shown in figure 8.3 ( a ) [McNitt, 19651, which illustrates the

I,
f 8 2 3 WAIEAEEI nz
Quaternary, rhyolite D Tertiary- Quaternary Quoternary domes and pyroclastics
'. andesite and
Quaternary Ignim- Permian 3 Mesozoic Holocene pumice brites Greywacke pyroclastics
basalt
Active hydrothermal field
l i k O m ~ 8.2-Generalized geologic map of Taupo volcanic zone, New Zealand ~ [Grindley, 19611.
magmatic intrusion at a depth of about 8 Inn (26,000 ft) that is the source of the thermal anomaly. The Wairakei field is situated on a horst block that has been elevated some 1200 m (3940 ft) relative to the surrounding rocks. The horst is flanked by steep .faults that act as feeders for the hot- water aquifer.

212 BIEW !ZEALAND [Uh. 8
i km WEST lAUW PLATEAU WHANGANATA WAIRAKLI ROTOKAWA f t 0 0 i
m.ooo
20.000
30,000
I
i 1 m 1 i
j ! m
400
200
0
-200
-400
-600
-800
ft
1000
500
- 0
-500
-1000
-1500
-2000
-2500
-3000
i
LITHOLOGY LEGEND f3 ASH SHOWERS AND ALLUVIUM I SILTSTONE AND PUMICEOUS SANDSTONE
BPUMICE BRECCIA NON-WELDED LAPILLI CRYSTAL AND VlTRlC TUFF
WAIORA VALLEY ANDESITE WAlRAKEl IGNIMBRITE I D A R K GREY VESICULAR DENSEGREEN-CRAYQUARTZOSE
HYPERSTHENE ANDESITES lGNlM8RlTE (WELDED CRYSTAL TUFF)
FIGWE: 8.3-(a) Geologic cross-section of Taupo thermal eone at Wairakei [McNitt, 19651; (b) Detailed cross-section of Wairakei reservoir [Grindley, 19611.
A detailed cross-section is given in Fig. 8.3(b) [Grindley, 19611, which shows a portion of the field at Wairakei. This view covers a width of about 1.9 km (6100 ft) to a depth of about 900 m (3000 ft) below sea level, or 1300 m (4300 ft) in total depth. T h e major faults (e.g., Waiora, Wairakei, Kaiapo) are shown at the left; the thin vertical lines represent drilled wells. The reservoir coflsists of a pumice breccia aquifer (Waiora forma- tion) varying in thichess from 460 to 900 m (1500 to 3000 ft) . The res-
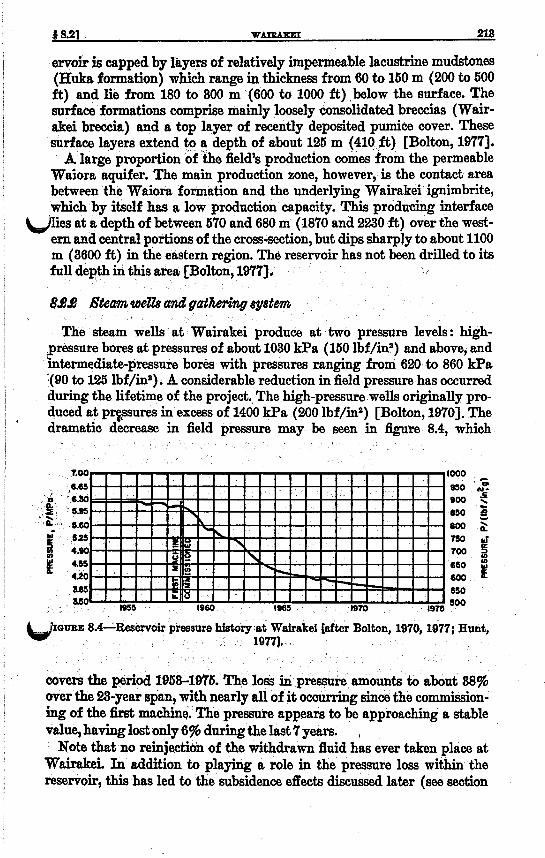
fi 8.21 WAlRAXEI 218
ervoir is capped by layers of relatively impermeable lacustrine mudstones (Huka formation) which range in thickness from 60 to 150 m (200 to 500 ft) and lie from 180 to 800 m (600 tu lo00 ft) ,below the surface. The surface formations comprise mainly loosely consolidated breccias (Wak- akei breccia) and a top layer of recently deposited pumih cover. These surface layers extend to a depth of about 125 m (410$t) [Bolton, 19773. A large proportion of the field’s production comes from the permeable
Waiora aquifer. The main production zone, however, is the contact area between the Waiora formation and the underlying Wairakei ignimbrite, which by itself has a low production capacity. This producing interface
ulies at a depth of between 570 and 680 m (1870 and 2230 ft) over the west- ern and central portions of the cross-section, but dips Sharply to about 1100 m (8600 ft) in the eastern region. The reservoir has not been drilled to its
in this area [Bolton, 19771, f
888 &a%?& We& U n d gdh7’hlg 83f8&?7&
The steam wells at Wairakei produce at two pressure levels: high- pressure bores at pressures of about 1030 kPa (160 lbf/in’) and above, and intermediate-pressure bores with pressures ranging from 620 to 860 kPa ’( 90 to 125 lbf/in2). A considerable reduction in field pressure has occurred during the lifetime of the project. The high-pressure wells originally pro-
~ ’ I G U R E 8.4--Reservoir pressure historg at W&&ei [after Bolton, 1970,1977; Hunt, 19771.
covers the period 1953-1 to about 88% over the 28-year span, with nearly all of it ocourring since the commission- ing of the first rnacbhq. The pressure appears to be approaching a stable value, having lost only 6% during the last ‘7 years.
Note that no reinjection of the withdrawn fluid has ever taken place at Wairakei. In addition to playing a role in the pressure loss within the reservoir, this has led to the subsidence eff eds discussed later (see section
. The loss in pressure am
,

214 HEW !mALAxD [Oh. 8
8.2.5.). Furthermore, the slight recovery in pressure that occurred during a tsst conducted in early 1968 was attributed to a curtailment of fluid drawoff (flow reduced to about one-third the normal value). The implica- tion is that the reservoir is being influenced in some way by an inflow.
It has been reprted recently [Huh, 1977) that the amount of recharge of water into the geothermal field has, in fact, increased markedly over the past several years. Recharge is defined as the ratio of the mass of fluid E- placed to that withdrawn over a specified tim0 interval. On the 'basis of repeat gravity measurements, Hunt indicates the following values of recharge : 1958-1961,30% ; 1961-1967,3596 ; 1967-1974,90%. These values are probably accurate to about *15%. During the last period (1967-1974)d 400 X lo9 kg (822 X lo9 lbm) of fluid were withdrawn and were replaced by 364X109 kg (802X109 lbm). Over the full history of the field, about 695 X loB kg (1532 X loB lbm) have replaced 965 X 1Og kg (2127 X lo9 Ibm) of withdrawn geofluid. If the recharge continues at 90%, it is likely that the field wi l l not be depleted for a long time.
The praotices employed for drilling, casing, operations, and maintenance of the steam wells at Wairakei have been documented extensively [Craig, 1961; Fisher, 1961; Fooks, 1961; Smith, 1961a and 1961b; Stilwell, 1970; Woods, 10611. Figure 8.5 shows a typical drilling rig and drilling fluid circulation layout. The cellar provides a solid base on which to mount the rig and accommodates the wellhead equipment used during production. Early cellars were 3.0 m (10 ft) deep, but in 1966 they were regesigned for 2.1 m (7 ft) , for mediumdepth wells, i.e., wells of 900 m (3000 ft) nominal depth; cellars for deep wells, i.a, wells of 2300 m (7500 ft) nominal depth, are 3.4 m (11 ft) deep [Stilwell, 19701. The drilling program for medium- depth wells is given in table 8.1 ; the various wellhead arrangements used during the drilling operation are shown in figure 8.6. Table 8.2 and figure 8.7 contain comparable information for deep wells. A schematic cross- section of a finished well is shown in figure 8.8; the strata indicated are typical of the region in th0 central portion of the field, Le., in th0 middle of the section shown in figure 8.3b. A typical drill string With blowout preventer equipment (BOPE) is
shown schematically in figure 8.9. "he drill string consists of the following elements: drill bit (usually tri-cone roller type), float valve (to control flow of drilling mud), drill collar (similar to drill pipe except somewh larger and heavier), drill pipe, and the Kelly (square piece of pipe that allows torque to be transmitted from the rotary table through tha square Kelly bushing). Three additional .elements enable the well to be closed off during the drilling operation should this be necessary. A drill-through valve may be used to close the well once the drill string has been removed. Next are the Shaffer gates, two independent horizontal gatm, each of which is split in half. The inner surfaces of the semicircular sections are fitted with rubber rams capable of closing around the drill pipe, drill collar, or well casing. The gates are driven by an air-motor-actuated screw wi6h a
a(BJ

. ... . _. .- ..... -. __"__l_ . I " . . . . . . " ... . . ~.~ ~ . _.__..II._.._ ..I. . .
FIOUREC 8.5-Typioal drilling rig and drilling fluid circulation layout at Wairakei [Craig, 19611. le

216 m w ZlCALAMD [Ch. 8
Table 8.1-Ming program for medium-depth w e h at Wairaiei
For 559-mm (22-in) O.D. Drill 311---diameter (12.25-in) pilot hole. casing. Open out to 060-mm-diameter (20-in).
Use 1%- (7.25411) O.D. drill collars. Run and cement casing; set up Stage 1 wellhead!
Open out to 533-mm-dismeter (21-in) with expanding
Use 184-mm (7.25in) 0.1). drill collars and 108-mm
Run and cement casing; set up Stage 2 wellhead.b For 298-mm (11.76-in) O.D. Drill 381-mm-diameter ( S i n ) hole.
Use 184-mm (7.26-in) O.D. drill collars and 1 0 8 - m m b
Run and cement casing; set up Stage 3 wellhead.b For 219-mm (8.025-in) O.D. Drill 270-mm-diameter (10.825-in) hole.
Use 184-mm (7.25-in) O.D. drill collars and 89-mm
Run and cement casing; set up Stage 4 wellhead.b For 1Wmm (0.025-in) O.D. Drill 194-mm-diameter (7.026-in) hole.
Use 146-mm (5.76-in) O.D. drill collars and 89-mm
Run liner with “J” slot.
For 406-mm (16-ii) O.D. Drill 311-mm-dimeter (12.25-in) pilot hole. casing.
hole opener.
(6.625-in) O.D. drill pipe.
casing. (0.025-in) O.D. drill pipe.
casing. (3.6-in) O.D. drill pipe.
liner. (3.5-in) O.D. drill pipe.
.Source: Stilwell, 1970. b See figure 8.0.
manual backup. Finally, the hydraulically operated blowout preventer (BOP) is able to shut off the well completely by means of a rubber packing element that can fit around any item in the well. The driller has immediate access to the control for the Shaffer gates and the BOP in case of emer- gency [Craig, 19611.
The arrangement of wells in the steam field is shown in figure 8.10 (see page 221) [aftar Haldane and Armstead, 1962; Bolton, 1977; Grind- ley, 19611. Recent operations have extended the drilled area beyond the borders of this plan view. There have been a total of 102 wells drilled, of which 68 have supplied staam to the turbines [Bolton, 1977).
The gathering system is a complicated one involving three pressure levels. The complexity arose bemuse the original plans for development of the area included a plant to produce heavy water for the United King- dom Atomic Energy Authority. This proposal was made in 1953 and the steam pressures were selected to accommodate the requirements of the dis- tillation plant. The proposal for the heavy-water plant was withdrawn in 1956, but only after the design of the steam system had been frozen and turbines were on order. Thus the resulting design is unnecessarily complex, and will not be repeated [Bolton, 19751. The present gathering system is shown schematically in figure 8.11 (see page 222) [Bolton, 19771. Two high-pressure wells are shown. The one on the left supplies fluid to a typical flash plant that produces staam at three pressure levels: high pressure. (HI?), intermediate pressure (IP) and intermediate-low pres-
, ,/’
b
J 821 W- 217
Table 8.2-Drilling program for deep we& at Wairaki
For 659-mm (22-in) O.D. Drill 311-mm-diameter (12.25-ii) pilot hole. casing. Open out to 660-mm-diameter (26-in).
Use 229-mm (9-in) and 203-mm (Sin) O.D. drill
‘Run and cement casing; set up Stage 1 wellhead.b
Open out to 632-mm-diameter (21-in) with expanding
Use 229-mm (9-in) and 203-mm (8-in) O.D. drill
Run and cement casing; set up Stage 2 weUhead.b
collars.
For 467-mm (18-in) O.D. Drill 311-mm-diameter (12.25-in) pilot hole. casing.
hole opener.
c o b and 114-mm (4.6-in) O.D. drill pipe.
iL) For 340-mm (13.376-in) O.D. Drill 311-mm-diameter (12.25-in) pilot hole. casing. Open out to 419-mm-diameter (16.6-in) with hole
opener. Use 229-mm (9-in) md 203-mm (&in) O.D. drill pipes
and 114-mm (4.644 O.D. drill pipe. Run and cement casing; set up Stage 3 wellhead.b
For 244-mm (9.625-in) O.D. Drill 311-mm-diameter (12.25-in) hole. casing. Use 203-mm (&in) O.D. drill collars and l lPmm
(4.544 0.1). driU pipe. Run and cement casing; set up Stage 4 wellhead.b
For 194-mm (7.625-in) dot- Drill 216-mm-diameter (&&in) hole. Use 169-mm (6.25-in) O.D. drill collars and 114-mm
Run liner with ccJ” dot.
ted liner. (4.6-in) O.D. drill pipe.
Source: Stilwell, 1970. b See figure 8.7.
\
sure (ILP). The one at the right produces only high-pressure fluid by means of a simple cyclone separator. The figure does not show the inter- mediate-pressure wells that also produce intermediate-pressure’ (IP) stefLm and additional water for the flash plant.
Wellhead separators are of two types, as shown in figure 8.12(a) and 8.12(b) [Haldane and Armstead, 1962; Bolton, 19771. Early wells were fitted with top-outlet cyclonic (TOC) separators as illustrated in (a) ; re- cent wells use bottom-outlet cyclonic (BOG) separators as shown in (b) [Hunt, 1961 I. The former type incorporated a U-bend upstream of the ad- mission point to the separator, which removed about 80%-00% of the liquid, A baB0 arrangement inside the separator trapped the remaining liquid and allowed the steam to emerge with a dryness fraction of about 99%. The latter type, often called a Webre separator, is much simpler and has been shown to be capable of yielding steam with a dryness fraction in excess of 99.9% [Usui and Aikawa, 1970). The hot water pump shown in (b) was used on th0 originaI pilot plant that pioneered the use of the liquid fraction of the p f l u i d ; it has since been replaced by a simple watar-col- lection tank similar to that shown in (a), but without the U-bend.
The essentially dry, saturated steam is transmitted from the separators to the main steam lines by means of branch pipelines. The main transmis-

218 NEW ZEALAND [Uh. 8
Stage 2 Stage 3. Stage 4.
FIQURE 8.6-Wellheads for various stages of drilling program: medium-depth wells at Wairakei [Stilwell, 19701.
Stage 1. Stage 2 Stage 3. Stage 4. Deck bvel P- Casing Landed 18' Casing Landed 13W8' Casing Landed 9618' Casing Landed l-
FIQWRE 8.7-Wellheads for various stages of drilling program: deep wells at Wairakei [Stilwell, 19701.

4 8.21 WAXEAKEI 219
HOLE 533mm
SOFT 6RECClAS
MUDSTONE 168m (55Oft) OROUT
HOLE 270mm ( 1 0 . 6 2 5 1 n d
203mm (Bin) MASTER VALVE
CASING HEAD
GROUTING HOLES
ASING (ANCHOR) 34ommao. (13.375 h)
CASING (PRODUCTION) 219m a 0. (8.625 h)
FIRM BRECCIAS
LINER, SLOTTED l68mm 0.0. HOLE (OPEN) 194
(7.6 (6.625 In 1
6 5 5 m (215Oft) IGNIMBRITE
FIGURE 8.8--Typical completed well at Wairakei [after Craig, 1961; Stilwell, 19701.
U i o n pipelines are 508,762, 1067, and 1219 mm (20,80,42, and 48 in) in diameter (nom.) ; the branch lines vary from 150 to 300 mm. (6 to 52 in) in diameter. The two largest steam mains are associated with the ILP steam system in which the specific volume is large. Expansion loops are lo- cated every 300 rn (1000 ft) roughly; each loop can absorb about 762 mm (80 in) of pipe movement. Condensate that forms during transmission is removed by means of drain pots located about 150 m (500 ft) apart. Since the drains serve to remove impurities, the steam arrives at the powerhouse in a highly purified condition, the pipeline acting as a very efficient scrubber.
.

220 I E W ZEALAID
/KELLY BUSHING
ROTARY 'TABLE
SQUARE KELLY l - ~ ~ ~ - ~ FLOW TO SCREENS
HYDRAULICJ \, ( I BLOW-OUT PREVENTER
PRESSURE FLOW TO SCREENS ETC.
DRILL PIPE __j
DRILLING MUD RETURN WITH *
IJI VALVE
'AIR 8 MANUAL
DRILLING MUD IN-FLOW
CASING HEAD 4
I
DRILL HOLE
LJ DRILL COLLAR
FLOAT VALVE
ROLLER BIT
FIGURE 8.9-Typical drill string and blowout preventer equipment at Wairakei [Craig, 1961).

8 8.23 WAIBAKEI m
INDICATES H P BORE o INDICATES I P BORE
0 1000 2000 FT - WAIKATO RIVER
FIQURE 8.10--Arrangement of web at Wairakei [after Haldane and Armstead, 1962; Bolton, 1977; Grindley, 19611.
8.923 Energy cmvverh system
The energy conversion system at Wairakei may be described as a multi- pressure, separated-steam, double-flash power plant. On the average, about 80% (by weight) of the high-pressure geothermal fluid at the wellhead is liquid. Steam is separated from high- and intarmediate-pressure wells and sent to the powerhouses. Hot watsr separated from a number of HP wells is flashed to produce IP steam. An additional flash produces ILP steam, which is transmitted to the power plant and subsequently let down for use in the lowest-pressure turbines.
The arrangement of the 13 power turbines is shown in figure 8.13. Two 6.6-MW and two 11.2-MW back-pressure machines are supplied with HP bore steam ; two 11.2-MW back-pressure turbines receive a mixture of IP bore steam, IP flash steam, and exhaust steam from the HP Units; four 11.2-MW condensing units operate on LP steam obtained from the ex- haust of the IP machines and the let-down flashed steam from the second- stage flash tanks ; and three 30-MW dual-admission, condensing units are supplied with the same steam that feeds the IP turbines and receive pass-in, LP steam let down from the second-stage flash vessels.
Tables 8.3 and 8.4 lisf technical particulars of the Eeveral sets of power generating equipment. Since the plant has been undergoing modiiications to compensate for loss of pressure in the geothermal reservoir, some of the values sho the tables are approximate or may not be current. They nevertheless represent the best information available at the time of writing. Figure 8.14 is a simplified plant flow diagram showing the typical wellhead separator/flasher arrangements. It is expected that eventually all high-pressure wells will be adapted to a multiflash setup ; there are now
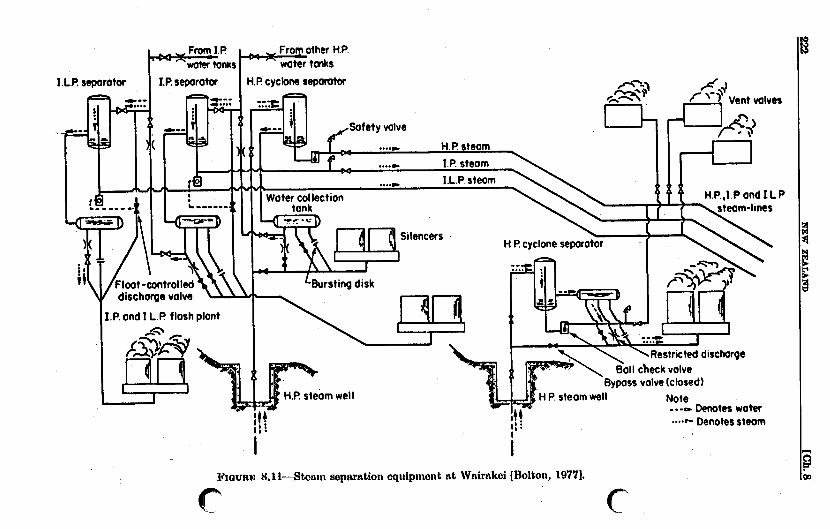
.P. and 1 L P flash plant
H.P. steam well ---- Denotes water -..e- Denotes steam
1a'X'IaURlC 8.1 I-Stcuin separation cquipmont ut Wairakei [klton, 19771.

CYCLONE SEPARATOR
WATER COLLECTION TANK \Ai?
BURST I NG 0 I S C , y c a
U BLOWDOWN VA
STEEL CASING OF BORE 'EXPANSION / COMPENSATOR
( b )
FIGURE 8.12-Wellhead steam separation equipment at Wairakei; (a) top-outlet separator with U-bend; (b) bottom-outlet separator with hot-water pump (pump no longer used) [Haldane and Armatead, 1962; Bolton, 19771.
seven such stations. Figure 8.15 is a Mollier diagram (enthalpy-entropy coordinates) showing the expansion portions of the cycle; it is not drawn to scale and is intended for illustration only. The, photograph in figure 8.16 shows several wellheads and associated separators, flash vessels, and silencers.
The geothermal resource utilization efficiency, vu, has been calculated approximately. This factor is the ratio of the actual power delivered by

[Oh. 8
-KEY- -NOTES - Q BACK PRESSURE SET
L.P. CONDENSING SET
MIXED PRESSURE CONDENSING SET
FIRST STAGE FLASH TANK
1. SET RATINGS SHOWN IN MEGAWATTS
2. PLANT FORMING THE SECOND STAGE SHOWN CROSS-HATCHED. PLANT FORMING THE FIRST STAGE 3 SHOWN PLAIN
SECOND STAGE FLASH TANK
-bb REDUCING VALVE
FIQURE 8.13-Turbme arrangements at Wairakei [after Armstead, 19611.
the plant to the ideal power mailable in the geofluid as it flows from the wellhead. For purposes of the calculation, the actual power was taken equal to the installed capacity of the plant, i.e., 192.6 MW. Actual output at the present time is considerably below this value, and ranges from 140 to 150 JIW. Since flow rates will probably also be less than design values, there may be compensating effects on resource utilization efficiency.

f 8.21 WAIKAKEI 221i
Table 8.3-firbine speeijEcatwns for n o n e o h i n g unite at Wairahi
Unit designation b
HP H P IP
Number of units.. ....................... Year of startup. ........................ Turbine type.. .......................... Installed capacity, MW e. . ............... Speed, rev/min. ......................... Steam inlet pressure, lbf/in*. .............. Steam inlet temperature, O F . ............. %(wt) noncondensable gases d. ........... Exhaust pressure, lbf/ina.. ................ Steam flow rate, 1 0 lbm/h.. ..............
2 2 2 1958,1959 1962 1959
Single-cylinder, single-flow 6. 5 11. 2 11. 2
3000 3000 3000 132 la2 64
34a s 348.5 297 4 . 6 N O . 5 N O . 4 4 4 -04 16. 5 319 0 569 -460
* Source: Bolton, 1977. b HP-high pressure; IP=intermediate pressure. e Per unit. d As a percentage of steam. Original design flow rates when inlet pressure was 194 lbf/in*.
Table 8.4-Technical specijEcatww for condenaing power units at Wairakei
Unit designation
LP MP
Number of units ................................. 4 3 Year of startup. ................................ 1959, 1960 Ihcrbine data:
Typeb. .................................... SCSF SCSFPI Installed capacity, MW. ..................... 11.2, each 30, each Speed, rev/min.. ............................ 3000 3000 Main steam pressure, lbf/in*.. ................. 16 64 Main s t e w temperature, "F.. ................ 213 Secondary steam pressure, Ibf/ina.. ............ - Secondary steam temperature, O F . , ............ - % (6) noncondensable gases 0 . . .............. -0.4 -0.4 Main ateam flow rate, 1 0 lbm/h. .............. -287, each Secondary steam flow rate, lo" lbm/h.. ......... - Type... .................................... Low-level direct-contact, bar-
1962, 1963
297 15 213
-400, emh -100, each
Condenser data:
ometric condenser ; cooling water temperature, O F . . .............. 69 69
Outlet water temperature, O F : ................ d 85.1 d 85.1 d16.4, each Cooling water flow rate, 1W Ibm/h.. ........... 611.1, each
Type.. ...................................... Type.. ..................................... Once-through, Waikato River
G Z h & h 8@@?2: Steam jet ejectors, %stage
He& rejectwn aystem:
LP-low pressure; MP=mixed pressure. b SCSF=single-cylinder, single-flow; SCSFPI= single-cylinder, single-flow, pass-in. 0 As a percentage of steam. d Average values.

226 KEW ZEALAND [Oh. 8
WASTE Liauio TO WAlRAXEl STREAM ll[
1 P. WELLS H. P. WELLS
FIGURE 8.14-Siiplified flow diagram for Wairakei power plant.
I i
SATURATED VAPOR
ENTROPY
FIGURE 8.16-Mollier diagram showing expansion processes for Wairakei power cycle (not to scale).

J 8.21
WA
mA
Xm
m
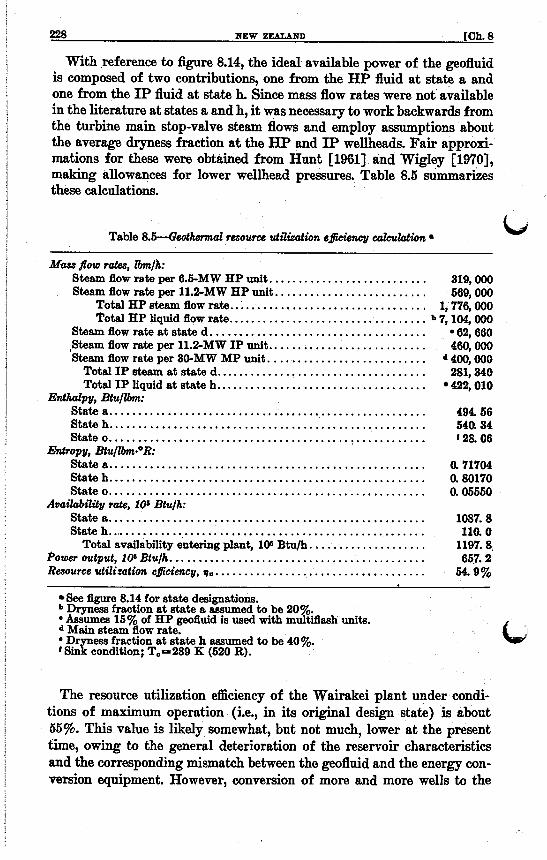
228 lOEW ZEALABD [Oh 8
With reference to figure 8.14, the ideal available power of the geofluid is composed of two contributions, one from the HP fluid at state a and one from the IP fluid at state h. Since mass flow rates were not available in the literature at states a and h, it was necessary to work backwards from the turbine main stop-valve steam flows and employ assumptions about the average dryness fraction at the H p and IP wellheads. Fair approxi- mations for these were obtained from Hunt [1961] and Wigley [1970], making allowances for lower wellhead pressures. Table 8.5 summarizes these calculations.
b Table 8.5-Gedlrtnncrl mource utilization a$iciencg cuIeuMwn
Mass flow rates, h / h : Steam flow rate per 6.5-MW HP unit. .......................... 319, OOO Steam flow rate per 11.ZMW HP unit.. ........................ 569, 000
Total HP steam flow rate.. ................................ 1,776,000 Total HP liquid flow rate.. ................................ b 7, 104,OOO
Steam flow rata a t state d. . ................................... 062,660 ,Steam flow rate per 11.2-MW IP unit.. ......................... 460, OOO Steam flow rate per 30-MW MP unit. .......................... 400,000
Total IP steam at state d.. .................................. 281,340 Total IP liquid at state h.. .................................. 422,010
Statea ...................................................... 494.56 Stateh ...................................................... 540.34 State o . . . . . . . . . . . . . . . . . . . . . . . . . . . . . . . . . . . . . . . . . : . . . . . . . . . . . . ‘28.06
Statea ...................................................... 0.71704 Stateh ...................................................... 0.80170 State0 ...................................................... 0.05550
Statea ...................................................... 1087.8 State h 110.0
1197.8, 657.2
54.9%
Enthalpy, B € u / h :
E ~ T o o ~ ~ , Btu/h*OR:
Avatkbility rate, 1P Btulh:
....................................................... Total availability entering plant, 1W Btu/h. ...................
Power output, 1od Btulh. ........................................... Resource utilization e#iCncy, q,,. ...................................
See figure 8.14 for state designations. b Dryness fraction at state a assumed to be 20 e Assumes 15% of HP geofluid is wed with m&lash units.
‘Sin condition; T.=289 K (520 R). Q Main steam flow rate.
Drgness fraction a t state h assumed to be 40%.
The resource utilization efficiency of the Wairakei plant under condi- tions of maximum operation (i.e., in its original design state) is about 55%. This value is likely somewhat, but not much, lower at the present time, owing to the general deterioration of the reservoir characteristics and the corresponding mismatch between the geofluid and the energy con- version equipment. However, conversion of more and more wells to the

4 8.21 WAIRAKEI 229
multiflash arrangement shown in figure 8.14 will tend to maintain the level of utiliiation in the face of reservoir decline. Interestingly, an earlier re- port [Wigley, 19701 stated that the plant had an “efficiency” of %bout 9% based on the “heat content” of the geofluid. Such an assessment does not take into account the thermodynamic level of the thermal energy contained in the geofield. A more meaningful measure’of system performance is now being applied through the use of the so-called Second Law efficiency, i.e., one based on the thermodynamic available work (or availability, or exergy) [Milora and Tester, 1976 ; Wahl, 1977 ; Kestin, 19781.
83.4 Ubnst&h&&
The choice of materials for construction is largely influenced by the com- position of the geothermal fluid, including impurities both in the form of dissolved solids and noncondensal,de gases in the steam. The fluid produced at Wairakei is reasonably “clean” in both regards, as can be seen from the data in table 8.6 [Armstead, 19611. The total noncondensables reported at that time amounted to about 0.50% and 0.36% cby weight) of the bore steam for the HP and IP wells, respectively. Furthermore, judging from more recent investigations [Glover, 19703, it appears likely that the level
Table 8.6-Impudies in geothermal fluid at Wairakd
3 Concentration, ppm (wt)
Nonoondensable gases in ateam HP we& b IP wells a
Carbon dioxide, COS.. ........................ :. ..... 4867 3467 Hydrogen sulfide, Has.. .............................. 132 . 70 Nitrogen, N:. .......... i.. .......................... 7 17 Methane, CH,. ..................................... a 5 ................................... 1 1
. Total.. ........................................ 5000 3660
Concentration, PPm (wtrt) Constituents in hot liquid
Chloride, Cl.. ....................... .: ............................... 2318 Silica, Sia ........................................................... 300 Metaboric acid, HaB201. .............................................. 116 Bicarbonate, HCOs: ................................................... 39 Sulphate, SO,. ....................................................... 34 Fluoride,F .......................................................... 10
pH of condewate.. ................................................... 8.6
Source: Armstead, 1961. b For pressure of 1.48 MPa (214 lbf/in’). For pressure of 0.68 MPa (84 Ibf/in*).

NEW ZEALAND [ah. 8 230
of noncondensable gases is presently lower than that quoted by Armstead. In fact, during the period from 1960 to 1969 the total noncondensable gas concentration decreased by SO%, although the hydrogen sulfide fraction remained essentially constant [Axtmann, 1975131. The total amount of dissolved solids in the hot liquid from the bores is of the order of 3800 ppm (by weight), but increases to about 4150 ppm and 4550 ppm follo*g the first- and second-stage flash vessels, respectively [Haldane and Arm- stead, 19621. Since the presence of salinity in the fluid entering the turbine will cause stress-corrosion cracking in the blades, scrubbers are used to ensure that the total saline content of the flash steam does not exceed 10
Mild steel is used for wellhead equipment, steam and hot water pipes, and flash vessels. There are no corrosion problems With the geothermal fluid as long as oxygen is avoided. The steam transmission lines are made of seamless steel piping, rolled and butt-welded mild steel pipes, and spiral-melded steel pipe for the largest-sized pipes. The newer, larger pipes are insulated with 38 mm (1.5 in) of fiberglass and covered with alumhum sheathing. "he older, smaller pipes have 38-mm (1.5 in) slabs of 85% magnesia that are wired on, covered by bituminous r o o h g felt and wire netting, and painted with bituminous aluminum [NZED, 19743.
The powerhouses are steel-framed buildings &ished in aluminum and glass. Owing to the relatively low load-bearing capability of the ground, it was necessary to implant a massive raft foundation 4.4 m (14.5 ft) deep, containing about 15,000 Mg (33 X 108 lbm) of concrete. Figures 8.17 and 8.18 show, respectively, an aerial view of the power station and an overall view of the plant, including a portion of the steam field.
The condensing steam turbines are particularly susceptible to erosion in $e last stages owing to condensation of the steam. Since the blades are made of soft stainless steel the problem of erosion will be intensified. Braz- ing on erosion shields (eg., stellite inserts) was ruled out because of the possibility of local hardening and the resulting vulnerability to stress-cor- rosion cracking. Instead, it was decided that blade tip speed would be kept below 274 m/s (900 ft/s) , even though this limits the capacity of the indi- vidual condensing turbine units [Haldane and Armstead, 19621. The pho- tograph in figure 8.19 is a view of "A" station showing the turbine hall that houses Units 1-6 (foreground to background) [NZED, 19743. The reader may refer to Haldane and Armstead [1962] for detailed plan lay- outs and elevation views of both powerhouses.
PPm. Ld
Qj
86.5 Environmental effects
When discussing the effects of the Wairakei geothermal power plant on the environment, it is important to keep in mind that the plant was de- signed and built at a time when environmental issues were regarded as far less important than they are today. The fact that an environmental impact

FIGURE 8.17-Aerial view of Wairakei power station. Steam limes enter from right, switchyard is at left center, cooling water pumphouse is located behind "A" Station on the Waikato River, with outfall seen to left of the plant [NZED, 19741.
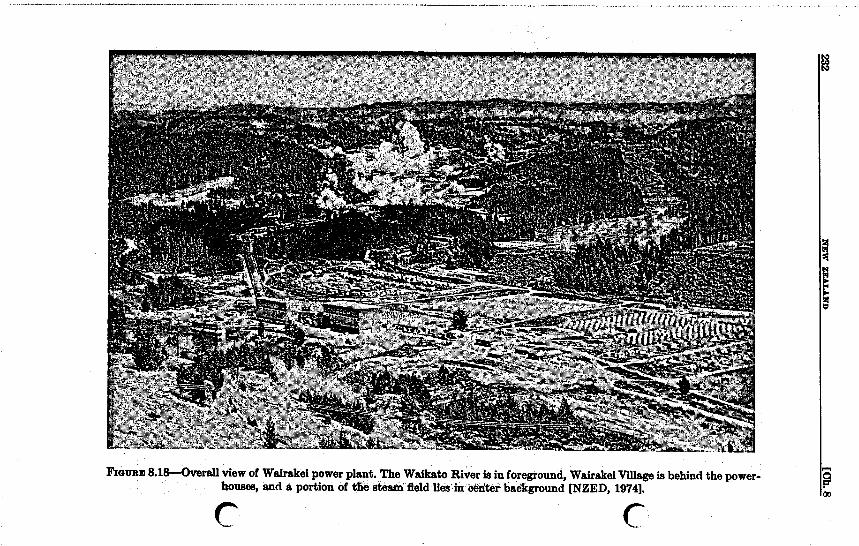
I I
0 a
8
9
L
c
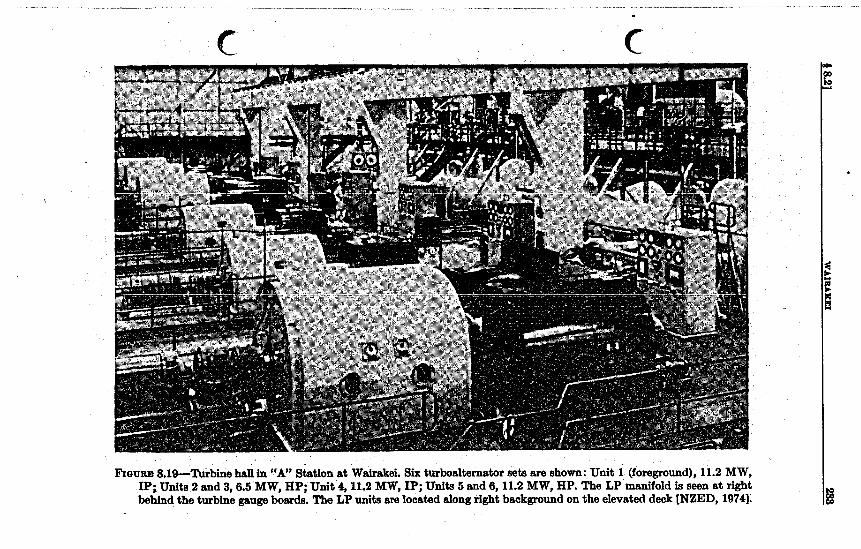
4 8.21 W
AIB
AK
EI
283

234 loEW ZEALAMD [Uh. 8
reference. The following effects wil l be considered here: chemical duen t s in the
liquids and gases flowing from the plant, physical effects including thermal discharge and subsidence, general ecological effects, and “visual pollution” or esthetics. The waste liquid from the bore field is transported in open con- crete trenches to the Wairakei Stream, which flows into the Waikato River at a point roughly 1 km (0.6 mi) upstream of the power plant. The liquid discharge contains a number of constituents, principally sodium and chlo- ride, but also such potentially harmful substances as arsenic, mercury, hydrogen sulfide, and carbon dioxide. Table 8.7 lists the constituents of the discharged fluid and shows the increase they cause in the concentration of each element in the water of the Waikato River, assuming complete mixing without precipitation or absorption, at average flow conditions of the river, i.e., 127 m*/s (2 X lo6 gal/min) .
The arsenic content of the Waikato River has been studied [Reay, 19721, and it was concluded that about 75% of the arsenic in the river comes from the Wairakei plant. According to table 8.7, the concentration of arsenic should be about 0.04 ppm under average conditions, which is just below the allowable concentration for drinking water in the United States (0.050 ppm). However, samples taken at the inlet of the water supply for Wai- rakei Village have shown arsenic concentrations as high as 0.07 ppm. Furthermore, in periods of drought when the flow in the river is much less than normal, the concentration of arsenic could reach values as high as 0.25 ppm [Axtmann, 1975a).
The mercury found in the Waikato River is partly caused by the Wai- rakei plant, although several other geothermal areas in the vicinity are contributors. Mercury o m are known to be asmciated with hot springs, and several areas, including Broadlands, Waiotapu, and Orakeikorako, discharge into the Waikato. Examination of trout taken from the Waikato about 75 km (47 mi) downstream of the power plant revealed about 4.4 times the “normal” concentration of mercury, which is about 0.12 mg/kg of axial muscle tissue (wet weight basis) [Weissberg and zobel, 19731. These fish weigh 1.29 kg (9.4 oz) on average, and since the accepted upper limit for mercury in fish for human consumption is 0.50 mg/kg,
report was not required for the construction of the Wairakei plant stands as evidence. Add to this the facts that Wairakei was the first liquid-domi- nated geothermal resource to be exploited for electrical power, and that the state of the art in geothermal technology was in its infancy at that time (1958). Although the plant has operated successfully for over 20 years with a minimum of unpleasant impact on the human population living near the plant, there are nevertheless many areas of concern relative to the general environment. A detailed report on the impact of the Wairakei plant on its environment has been published [Axtmann, 19741 ; we call the reader’s attention to a summary of this study that appeared in the open literature [Axtmann, 1975aJ This section relies heavily on the latter b *

4 8.21 WAIBAKEI 235
Table 8.7-Effect of liquid discharge from Wairakei power plant on chemical nature of Waikato River 8
'6)
~~ ~~~
Increment in river Constituent concentration, ppm
Chloride, Cl.. ............................... 20.8 Sodium, Na .................................. 12.0 Silica, Si ..................................... 6.3
Boron, B . . .................................. 0.27 Bdfate, 804 .................................. 0.24 Calcium, Ca.. ............................... 0.17 Lithium, Li ....... I.. ........................ 0.13 Fluoride, F . . ................................ 0.077 Bromide, Br.. ............................... 0.055 Arsenic, A s . . ................................ 0.039 Rubidium,Rb, .............................. 0.029 Cesium, Cs. ................................. 0.026
0.0047 Ammonium, "4.. ........................... 0.0014 Magnesium, Mg .............................. 0. 000047 Mercury, Hg ................................. 0.0000016
.Source: Axtmann, 1976a: discharge flow rate=6500 Mg/h (14.3X 1V lbm/h) ; river flow rate=127 m*/s (2x10' gal/min).
Potassium, K . ............................... 1.9
Iodide, I . . ............. .:. ..................
trout weighing more than about 1.25 kg (9.1 oz) might be expected to be unsuitable for human consumption, since mercury concentration' is known to be proportional to the weight of the fish. While reinjection of waste liquid has not been practiced at Wairakei, it is presently being considered because of its potential advantages as a disposal technique and as a means of managing the geothermal reservoir [R. S. Bolton, personal communication].
The hydrogen sulfide (H2S) 'in the geothermal steam becomes divided between the condensate and the noncondensable gas stream, with about 80% of it going into solution. The rate of discharge in the liquid is about 54 kg/h (24 1bm.b). Assuming that no oxidation to sulfur dioxide ( SO2) occurs in the direct-contact condensers, the concentration of H2S in the river would be 0.1 ppm (average flow) or 0.9 ppm (lowest flow). Even at
k w r a g e flow conditions, such a concentration exceeds by a factor of about 15 the safe limit for the eggs and fry of rainbow trout. Even though the solubility of carbon dioxide (COz) in water is quits low at the conditions prevailing at the condenser, nevertheless, about 1 Mg/h (2200 lbm/h) of C02 is discharged to the Waikato River in the condenser effluent [Axt- mann, 1975al.
The condensed geothermal fluid that enters the Waikato contributes to the production of electricity from the system of hydrothermal power sta- tions located along the river. This may be regarded as a positive or com-

236 NEW !AE&UND [cm. 8
pensating environmental effect. The total rate of liquid discharged from the plant is 1.3 ms/s (21,000 gal/&) ; the enhanced evaporation rate (owing to the thermal effect) is about 0.3 ms/s (4800 gal/min), leaving a net increase of 1 m*/s (16,200 gavmin) in the flow of water in the Wai- kato. This is equivalent to about 2.4 MW of electrical power from the hydroelectric plants, or the generation of 20 GW h of electricity per year.
The important gaseous effluents consist of the following: H2S, CO,, and water vapor ; the first of these constitutes the most serious problem, owing to its hazardous nature. Hydrogen sulfide gas is easily detected by the human olfactory sense at extremely low concentrations (i.e., 0.020 ppm threshold). It causes eye irritation at 10 ppm, lung irritation at 20 ppm, and death in 30 minutes at 30 ppm [Miner, 19691. Roughly 14 kg/h (6.4 lbm/h) or 93 g/MW.h (0.2 lbm/MW-h) are discharged into the atmos- phere from the gas ejectors through four stacks on the roof of the plant. The tops of the stacks are 30 m (98 ft) above ground level; concentration of H2S in the stack gas is about 5000 ppm. The odor of H,S is not de- tectable in Wairakei Village, about 2 km (1.2 mi) north of the plant, although there have been some reports of the blackening of silverware and brass [Axtmann, 1975aI. "he gaseous emission of CO, at Wairakei is less by a factor of about 60 than the emission from a conventional fossil-fuel- burning power plant per megawatt of electricity produced.
The amount of water vapor released to the atmosphere during a total plant shutdown (i.e., all wells venting to the atmosphere) would be equiva- lent to the amount discharged from the wet cooling towers of a 750 BXW conventional power plant, i.e., 1.9 Gg/h (4.2X1Oe Ibm/h). Under normal circumstances, however, the amount is 0.84 Mg/h (1.0 X lo8 Ibm/h) , or about 0.04% of the maximum possible discharge. "he presence of large amounts of water vapor can, of course, lead to the formation of fog, which is frequently seen in the area around the power plant.
The physical effects of the Wairakei plant on the environment are related to the drawoff of vast quantities of hot subsurface fluid and to the discharge of these fluids at the surface (i.e., without reinjection into the reservoir). As a result, an area of about 6500 ha (16,000 acres) shows the effects of subsidence and horizontal land movement. The maximum total drop in elevation is in excess of 4.5 m (14.8 ft) over the 10-year period from 1964 to 1974 at a spot removed from the bore field but within about 500 m
to be progressing at the rate of 400 mm/y (16 in/y) ; subsidence volumo is likely related to the volume of fluid withdraw from the field, but a precise correlation is not available. A study of subsidence from 1967 to 1971 by Glover showed that V (subsidence) /V (drawoff) =0.0076, on aver- age [Axtmann, 1975al. Figure 8.20 shows the area of ground subsidence relative to a bench mark, TH7, in the powerhouse (a), and the subsidence that has occurred along the main steam pipelines (b) for the period 1964-1974 [Stilwell et al., 19-76]. Also shown in figure 8.20 (b) is the depth
LJ
(1saO ft) of the steam pipelines [Stilwell et al., 19761. Subsidence appears Li

U
0 100 too a00 Y I
(b)
FIGOSE 8.20-(a))Total subsidence at Wairakei (relative to BM TH7 the power- house) for the period 1964-1974; @) Total subsidence and Waiora breccia thickness measured along the main steam pipelines from 1964-1974 [Stilwell et al., 19761. td
of the bottom of the underlying Waiora breccia illustrated earlier in *re 8.8 (b) . The most drastic subsidence corresponds to the region in which the Waiora breccia fa& off along a buried fault scarp. From about 1957 to 1965 there appeared to be a correlation between pressure lo$ in the reser- voir and field subsidence. Since that time, however, pressure has tended to level off (see figure 8.4) while subsidence has tended to increase.
Horizontal ground movement has been traced since 1966; figure 8.21 shows a vector diagram of the movement of a number of ground stations

Figure 8.21-Vector diagram of horizontal ground movement at Wairakei from 1966 to 1974 [Stilwell et al., 19761.
in the field. AI1 movements tend to be toward the region of maximum vertical displacement, with GS6, for example, showing a displacement of nearly 470 mm (18.5 in) in a westerly direction over the %year from 1966 to 1974. In light of the amount of both vertical and horizontal ground movement in the Wairakei field, it is indeed fortunate that the power- house was sited along the Waikato River instead of near the middle of the bore field.
The so-called wash heat that is rejected from the plant through residual liquid geofluid from the wells and condensate from the powerhouse in- fluence~ the temperature of the Waikato River. Liquid flows from the bore field at about 60°C (140OF) and 1.3 ms/s (21,000 gal/min) , whereas con- densate flows at roughly 33°C (91°F) and 10 mS/s (169,OOO gal/&). The maximum increase in the temperature of the Waikato would be 1.3"C (0.7"F) when the river is flowing at its mean value of 127 m3/s (2XlW gal/min) [Axtmann, 1975al. This temperature change is far less than natural temperature swings during the year. However, during periods of extreme drought when the flow rate in the river is abnormally low, e.g., 28 m8/s (444,OOO gal/min) as was the case during the spring of 1974, it is
g,

j 8.23 WAIBAKEI 239
possible for the power plant to produce significant temperature elevations, in excess of what is permitted under New Zealand’s water standards.
Baseline (i.e., pre-plant) ecological data does not exist at Wairakei since an environmental impact statement was not required when the plant was constructed. Axtmann suggests, however, that the portion of the Waikato River lying between Wairakei Stream and the Aratiatia Dam constitutes a severely stressed ecosystem [Axtmann, 1975al. Several reasons for this conclusion are given, among them the observation that a lack of’diversity exists among the various species of plankton in this part of the riveL
The judgment of the esthetics of a power plant is to some degree sub- jective. In the view of Axtmann, the Wairkei plant lies on a scale some- where between a typical fossil-fuel plant (“visual abomination”) and a typical nuclear plant (somewhat resembling a planetarium when h a g - natively designed). His description of the general scene at Wairakei [&- mann, 1975a] is worthy of full quotation :
w
“. . the w&mkei bOrefhM d 8 high h New ~ea&~ruI?’s mperb h h r c h y of visual delights. If a tramper 012 Eighway 1 were to pause at dusk 8 hm w t h of Tmpo 012 a nzoist day with a stiff
fleecy plumes arc skyward d y to be seized and devoured by green dem*mS that hamt tfie boughs of impe.l.ial cmifers; bzlndle8 of sz%ery bu&hips, crwked by an hvt%bk g h t who h.4rk8 be- hind the western hill, are caught in stop-action a8 they &e and fa&? in Zmisolz. I t ia an odd amalgam of technology and r~lbure, of the Tin Wm&man of 02: ana? the Borcerer’s Appnt ice , gent& tcltderscmed by the wh&peAng, s.?ight& 8ymopated ‘whuf- whuff . . .‘whuff . . . whuff’ of t& wellhead S Z ~ ~ ~ S ? ’
bTeeEk9, he W& 8ek3 U n ee& 8CeTW Of hUzUnhg beauty. 8COTf38 Of
83.6 ~ ? ? c ~ f a c t o r S
Total capital investment at the Wairakei geothermal power plant &s of March 81,1969 was $NZ43,367,000. This included $NZ1,300,000 for explo- ration, $NZ17,176,000 for exploitation, and $NZ24,891,000 for utilization. Based on an installed capacity of 192.6 M W , the capital cost works out to about $NZ221i/kW [Smith and McKenzie, 19701. Table 8.8 lists a detailed breakdown of capital expenditures. Average annual operating costs over the 4-year period from 1965 to 1969 amounted to $NZ5,778,000. This is about 4.8 NZ mill/l:W.h of electricity generation, on the average. Table 8.9 gives average operating coats for the project, including those for the bore field and for the power station. In addition to the working expenses shown in table 8.9, charges for the use of capital and administrative costs contribute to the total 0 & M expenses : total working expenses, $NZ1,210,- 200 ; capital charges, $NZ239,000 ; administrative charges, $NZ328,500. This amounts to total operating and maintenance charges of $NZ5,777,900.

240 NEW U R D [Ch . 8
Table 8.8-Capital m8ts for the Wairakei geothermal powm station 8 ,, Cost
$1000 Item NZ
Land acquisition. .................................................... Site preparation ...................................................... Establishment items (camps. temporary housing. workshops. offices. site
leveling) .......................................................... Permanent Village (Wairakei Village) ................................... Power stations:
Foundations. cooling water culverts . ofjices. workshops. roads and land- scaping ........................................................
Cooling water pumphouse (pumps. mains. valves) .................... Turbines and generators ........................................... Steam piping and valves ........................................... Electrical work (4004 and 11-kV switchgear. panels. control room.
transformere other than generator transformers ..................... Generator transformers ............................................ Outdoor structure and switchgear. high-tension circuit breakem ........ General services (electrical. air. telephones. etc.) ..................... Workshop tools .................................................. Well drilling (including exploration and unproductive wells) ........... Wellhead equipment .............................................. Branch pipelines ................................................. Main pipelines ................................................... Roads ........................................................... Msindrsinage ................................................... W a t e r s u p p ~ ....................................................
Bore field:
nil 278
1. 688 1. 318
4. 674 L/ 1. 881 8. 874
967
840 576 662 115 18
7. 643 1. 638
971 5. 258
462 1. 641
446 Landscaping ..................................................... 405 General services .................................................. 17
Modifications to wellhead equipment ................................ 213 Hot water pipeline ................................................ 732
925 No.10turboalte~ator ............................................ 891
293 241
Total ......................................................... 43, 367
Pilot hot water scheme (later abandoned) :
Flash plant and controls ........................................... Work for plant expansion (not completed) ............................... Miscellaneous charges and adjustments ..................................
8 Source: Smith and McKede, 1970 .
83.7 Operating expeTienm
The Wairakei plant has an outstanding record of reliability. with forced outages essentially negligible . During 1978/1974 the station was in service 85% of the time (availability factor) with an installed capacity factor of 69% and a station load factor of 89% . This performance was unmatched by any other power station. hydro or thermal. and was signXc&tly supe- rior to any thermal power plant in New Zealand . In fact, the Waimkei

$8.21 WAIRAKEI 241
t
Table 8.9-Average annual operating and mahtenance expende~ at Wairakci. 1066-1969 .
Item
cost $1000 NZ
Bore field: Mineral right& .............................. nil Land and roads ............................. 9.4 services .................................... 6.9 Hot water drains ............................ 16.8 Well servicing and modifications.. ............. 84.8 New wells (to maintain production) ............ 295.4 Measurements .............................. 60.3 Main pipeline servicing and modifications ....... 53.7 New pipelines ............................... 30.9 Branch pipelines ............................. 16.0 Steam t r a p ................................. 7.6 Buildings (in e t e d e l d ) ..................... 0 . 5 Hot water equipment ......................... 1.0 Mechanical equipment ....................... 2.1 General workshop ........................... 2.6 Salaries of operating personnel ................ 25.6 8upervision ................................. 8.2 Miscellaaeous ............................... 1.0
Bore field total ............................ 621.7
Power Station: Land and roads ............................. 9.8 Services .................................... 3.8 Buildings (power stations) .................... 19.1 Permanent Village ........................... 22.6 Information Center (3 y e w ) ................. 6.2 Ministry of Works buildings (3 years) ......... 65 . 0 Cooling water system ........................ 12.6 Qasextractoriiystemr ....................... 7.1 Steam lines ................................. 36.6 Turboalternators ............................ 108.0 Electrical equipment ......................... 25.0 Miscellaneous mechanical equipment. .......... 22.0 Operating coab (salaries plus other charges) .... 194.6 Supervision ................................. 12.6 Miscellaneous ............................... 43.6
Power atation total ........................ 588.5
Total working expenses ...................... 1,210.2 -
Source: Smith and McKenzie. 1970 .

J
!&I2 m w !zmLAND [Oh. 8
geothermal power station has maintained this excellent record since it was fully commissioned in 1964 [Ravenholt, 19771. The generating history of t.he Wairakei plant is given in table 8.10. Since it has never been possible to generate s sc i en t geothermal steam to supply fully the installed elec- trical capacity of 192.6 MW, the capacity factors listed in the last column of the table have been adjusted accordingly. The so-called field-limited capacity factor is based on the maximum load during any given year, as shown in the third column.
In 1969 the Wairakei plant delivered 9.9% of the entire electrical gen- eration in New Zealand for that year. The plant produced about 10% of the electricity requirements of North Island in 1974, although this per- centage is expected to fall as the electrical generating capacity of the country as 8 whole increases [Bolton, 19771. For the period 1970-1978, the capacity factor (based on peak load) at Wairakei has averaged 90%.
LI
Table 8.10-EkdrWy generation at WairaM.
Capacity factors, percent Net generation Peak load
Year b MW-h MW Installed 0 Field-limited d
1959 ............... 5,527 1960. .............. 168,589 1961. .............. 384,088 1962 ............... 491,412 1963 ............... 761,355 1964.. ............. 1,004,909 1965 ............... 1,193,583 1966 ............... 1,255,424 1967.. ............. 1,267,553 1968. .............. f 1,057,622 1969.. ............. 1,206,568 1970.. ............. 1,243,057 1971.. ............. 1,185,210 1972 ............... 1,174,364 1973 ............... 1,174,812 1974 ............... 1,161,892 1975. .............. 1,248,603 1976.. ............. 1,272,137 1977.. ............. 1,232,526 1978 ............... 1,157,949
e 5. 1 43. 3 93. 8
107.1 147.0 173.0 173.0 166.0 170.8 166.8 165.7 159.8 153.4 149.3 147.7 148.6 158.0 158.1 152.9 147.5
25. 9 48.7 58. 4 69. 5 70. 1 64.6 70. 7 7 4 4 75. 1 78.5 71. 5 73. 7 70. 2 69. 4 69. 6 68. 9 7 4 0 75. 2 73. 0 68. 6
33. '0 44.3 40. 7 52. 4 59. 1 66. 1 78. 7 86. 3 84.7 72. 2 83. 1
88. 1 89. 5 90. 7 89.3 90. 2
88. 8
.Source: Smith and McKenzie, 1970; Birsic, 1978; R. S. Bolton, personal communication.
b For the year ended March 31. 0 Based on installed ca acity, i.e., 6.5 MW for 137 days in 1959, 39.4 MW for 1960
75.1 MW for 1961, 80.8 %W for 1962, 123.9 MW for 1963, 177.1 MW for 1964, and 192.6 MW thereafter, exce t 153.4 MW for 1968.
d Based on a bore-field-kited effective maximum capacity, i.e., based on peak station load.
Low generation caused by cutback in geofluid flow rate for reservoir pressure re- covery test over four months during which the maximum plant capacity was 75 MW.
0 Test runs.

j 8.31 KAWEEAU !&3
On average 150-160 people are involved in the various phases of station operation, including administration (8), operation of the powerhouse (43), operation of the bore field (8), maintenance of the powerhouse (50), maintenance of the bore field (40), and operations related to the Permanent Village and services (12) [Smith and McKenzie, 19'701.
The most serious accident associated with operation of the plant occurred in January 1960 when Bore 26 exploded, creating a violently steaming crater and several smaller steam jets and boiling mud pools. The blowing well was eventually brought under control through the drilling of another well, Bore 26A, spudded 61 m (200 ft) away from Bore 26. The new well was sunk with a deviated bore and passed within 1.2 m (4 ft) of b, Bore 26 at a depth of 453 m (1486 ft) . Figure 8.22 shows the deviated bore in its programmed and actual form. The operation was supervised by an American drilling team. In order to secure the foundation of the new well, it was necessary to grout an area of 9.186 ha ( (0.46 acres) by means of 250 holes of 30-m (100-ft) depth, into which was poured 1500 Mg (3.3 X lo6 lbm) of cement. After Bore 26 had been intersected in'the open hole below the production casing (November 1960), large amounts of 1'762 kg/ms (110 lbm/fts) cement slurry were pumped down Bore 26A, to no avail. Finally about 7.6 ms (10 yds) of pea gravel were poured in, followed by another large batch of cement, and the violent thermal activity came to an abrupt halt. Restoration of. the landscape was completed, and the tmo highly productive wells, Bore 26A (extended) and Bore 26B, now occupy the area [NZED, 19'74; Craig, 196l].
There are at present no plans to expand the installed capacity at Wair- akei IN. C. McLeod, personal communication], although exploration is continuing at the nearby geothermal field of Te Mihi [Smith and Mc- Kenzie, 19701 and at other promising sites in the thermal belt. Additional geothermal power in New Zealand will likely come from new plants at such sites as Kawerau and Ohaki (Broadlands), which are discussed in the following sections.
*
8.3 Kawerau
83.1 GeoZqy
I ultiple us0 is being ma ermal resource at Kawerau, 9'7
km (60 mi) northeast of Wairakei. The Tasman Pulp and Paper Cam- pany, in fact, relocated their mi e early 1950's specifically to ts,ke advantage of the geothermal en able at Kawerau. Steam and hot water from a number of wells a for production of electricity, for generation of clean steam by means of heat exchangers, and for a number of process applications including timber drying, recovery boiler shatter sprays, liquor heaters, and log handling equipment. The geothermal steam field layout including the pulp and paper mill is shown in figure 8.23. The most active surface manifestations of geothermal energy lie to the west of

244 [Uh. 8
DRILLED
219 m m (8.625in)-< CASING
WNG ..--
'I ' II I 1
I I I I
219 m m (8.625 in) -CAS I NG
477m ( t 5 6 w
3.7m (12 f t ) RADIUS 194 m m ( 7 . 6 2 5 i L j
TARGET AREA I,, I OPEN HOLE
FIQURE 8.22-Drilling of deviated Bore 26A to control blowout well Bore 26 [after NZED, 1974; Craig, 19611.

KAWEXAU 245

1 I 246 lpEW ZE3LAHD [Ch. 8
the Tarawera River (crosshatched areas), although highly productive wells have been drilled on the east bank close to the mill.
The region possesses a top layer of recent alluvium (which probably conceals a number of faults) with the following formations at depth: (1) a shallow layer of breccia to about 75 m (250 f t ) ; (2) a thick layer of rhyolite to about 400 m (1300 ft) ; (3) an aquifer of pumice breccia im- bedded with sandstones to about 730 m (2400 ft) ; (4) another layer of rhyolite; (5) another aquifer of extensively fissured andesite to about 820 m (2700 ft) ; and (6) a basement of dense ignimbrite. Several wells have been drilled to depths in excess of 915 m (3000 ft) and have pene- trated the basement ignimbrite. The deeper layer of rhyolite serves as cap for the lower aquifer and may act as an insulator between the lower, hotter aquifer and the upper one, which. appears to be influenced by an
83.2 Steam wells and gathering system From 1952 to 1955 three small-diameter exploratory wells were drilled :
KA1, KA4, and KA5, the latter a nonproducing well owing to the low temperature encountered, 85°C (185OF) bottom-hole. Table 8.11 lists geo- fluid production from the other two wells during this period. Both of these wells were fitted with 102-mm (4-in) production casings; KAl ran to 449 m (1473 ft) and KA4 to 499 m (1636 ft) . During 1956/1957 seven addi- tional wells were sunk : KA7 at 605 m (1985 ft) , KA8 to 585 m (1918 ft) , KAlO to 634 m (2080 f t ) , RAll to 624 m (2046 ft) , KA12 to 622 in (2042 ft) , KA13 to 603 m (1979 f t ) , and KA14 to 615 m (2018 f t ) . All of these had a 311-mm-diameter (12.25-in) drilled hole and a 219-mm-diameter (8.625-in) production casing. All were good producers, with the exception of KA13.
Table 8.11-Production characteristies of wells KAl and KA4 at Kawerau, 1962?-1966
i 1
!
1 i
i i i !
"LI !
I influx of cooler circulating water [Smith, 19701.
I
1 1 i
1 i i 1
1
1 !
i J
I i i
I
i
Wellhead pressure Steam flow Liquid flow Total flow Quality
lbf/ins l@ lbm/h 101 lbm/h l@ lbm/h percent Well KA1
64.7 ia o 20. 0 3s. o 47. 3 74. 7 17. 0 20. 9 37. 9 44.8 94.7 14.7 22. 2 36. 9
114.7 12. 4 22. 6 35. 0 134.7 10. 2 21. 3 31. 5 32. 4 154.7 ao 18. 7 26. 7 30. 0 174. 7 5. 8 14. 5 20. 3 28. 6
62. 7 ao 17. 0 25. 0 32. 0 74.7 8. 0 18. 0 26. 0 30. 8 84. 7 7. 0 17. 0 24.0 29. 2 94.7 6. 0 16.0 22. 0 27. 3
104.7 5. 0 * 15.0 20. 0 25. 0
2
Well KA.4
*Source: Smith, 1970.

J 8-81 KAWEBAU 247
From 1958 to 1960 these wells deteriorated considerably. Several (KA11, 12 and 14) developed calcite deposits and required reaming, after which the flow rates were still poor. Significant declines in temperature were observed, ranging from 6" to 20°C (11" to 36"F), caused by an invasion of cooler water in the production zones. Another problem was caused by probable clogging of the slots in the production casing from calciting, to- gether with the fact that the slotted liners were installed as a single string cemented to the surface above the slots, thus making it impossible to remove them for cleaning.
During the period 1961-1969 several wells were deepened, increasing their depths by 221-374 m (796-1227 ft), and three new wells were sunk; HA3 to 1092 m (3584 ft) , KA16 to 972 m (3189 ft) , and KA17 to 1033 m (8388 ft). Each of these consists of a 219-mm (8.625411) production cas- ing, a 194-mm-diameter (7.265-in) open hole, and a 168-mm-diameter (6.625-in) slotted liner. Each slotted liner has 52 slots/m (16/ft), with each slot being 19 X 51 mm (0.75 X2 in). A few of the wells have become non- pr~ductive either from calciting or low aquifer permeability. As of late 1969 the following four wells were producing steam at tt pressure of 791 kPa (114.7 lbf/in2) : KA7A-18.6 Mg/h (30 klbm/h) , KA14-10.9 Mg/h (24 klbm/h), KA16-56.7 Mg/h (125 klbm/h), and KA17-18.6 Mg/h (80 klbm/h). Well KA8 delivered 59.0 Mg/h (130 klbm/h) of steam a t a pressure of 1480 kPa (21a.7 lbf/in2) ; an additional 13.6 Mg/h (30 klbm/h) of steam was flashed from the liquid of KA8 at a pressure of 791 kPa (114.7 Ibf/inZ). With the abrupt escalation of world petroleum prices in 1973/ 1974, renewed interest in the development of the Kawerau field led to the drilling of two more wells, KA2l and 22.
Noncondensable gases constitute about 2.5% (by height) of the geo- 1 steam ; about 91% is carbon dioxide, with the rest mainly hydro- fide. The gathering system includes branch pipes from the individ-
1 wellheads to the main steam lines; these branch lines are 203,805, and mm (8, 12, and 16 in) in diameter. The low-pressure wells feed the
ant through a 610-mm-diameter (24-in) steam main capable of handling 145 Mg/h (320 klbm/h) of steam at 791 kPa (114.7 lbf/in*) . The high- pressure well (KA8) delivers through a 305-mm (12-in) supply line, at a maximum ff ow rate of 36 Mg/h (80 klbm/h) and a pressure of 1480 kPa (214.7 lbf/in*). New steam lines are insulated with 51 mm (2 in) of resin-
&bonded fiberglass; older pipes have 51 mm (2 in) of asbestos and 85% magnesia. All are protected with ering of aluminum sheet [Smith, 19701.
83.3 Energy
Details about the nonelectrical use of the geothermal fluid may ;be found elsewhere [Bolton, 1975,1977; Lindal, 1973; Smith, 1970; Stilwell et al., 19751. It is sufficient to note that geothermal energy contributes about 21% of the energy required for process applications, the rest being supplied.by

248 XEW ZEALAXD [On. 8
the burning of waste products and fuel oil. The plant purchases 80% of its electricity from the NZED grid and produces the other 20% in-house. A bank of turboalternators operate in parallel, fed by boiler steam and geu- thermal steam. The latter supplies one 10-MW noncondensing unit; table 8.12 gives its technical specifications. Since the steam that supplies this unit is excess geothermal steam beyond the process needs of the plant, this unit is part-loaded most of the time. Nevertheless, it is capable of operating a t full load in the event of failure of the other turboalternator units. A t full output it has a specific steam consumption of about 14.5 kg/kW - h (32 lbm/kW * 'h) . This corresponds to a geofluid utilization efficiency for elec- trical production of about 24%, assuming a wellhead quality of 30% and taking the available sink temperature as 27OC ( 8 O O F ) .
i l i i I I i 1
i ! \
Table 8.12-!hrbine specificalions for Kawerau geothermal plant a
Turbine data.. ...................... Installed capacity.. ................. 10 MW Speed.. ............................ 3000 rev/& Steam inlet pressure.. ............... 114.7 lbf/ing I
Steam inlet temperature. ............ 337.9OF Noncondensable gas content. ......... <2.5% wt of ateam Exhaust pressure.. .................. -30 in H g Steam flow rate b. ................... 319X 1W lbm/h
Side-cylinder, single-flow, noncondensipg
Year of start-up: 1961 Up to lOOX1W lbm/h of exhaust steam ie condensed in a black liquid pre-
evaporator.
8.34 E m i r m d d c - h and future. plarns I I
i 1
No detailed environmental study exists for this plant. A level network to keep track of subsidence was established in 1970, and checks made in 1972 revealed a subsidence rate of 15 mm/yr (0.6 in/yr) in the area of max- imm fluid drawoff. However, since the mill is located near the center of $he field, the effects of subsidence will unfortunately be largest at the mill. The rate of subsidence there is 28 mm/yr (1.1 in/yr). Differential settling throughout the plant may lead to trouble with the operating equipment b and may necessarily limit the dtjmate exploitation of the field by restrict- ing the rate of fluid withdrawal [Stilwell et al., 19751. Reinjection of wasts fluid has not been reported; excess liquid is presumEbly dumped in the adjacent Tarawera River, which empties into the Bay of Plenty about 20 km (12 mi) northeast of the plant,
Although the main thrust of the plan for geothermal energy utilization at Kawerau 'has been aimed a t process heating and other industrial appli- cations, serious considenition wil l lige1y.b paid to expansion of the facility
i I i I 1 i
i I 1
i I I
i 1
i !
~
l
i
I
I
i
i !

for generation of electricity. Encouragement comes from the fact that one of the newest wells, KA21 (see figure 8.23), by itself appears capable of supporting a 2MO-MW generator. This is four to six times larger than the potential of an average geothermal well. It is expected that a separate gen- erating station, one able to supply all the electrical needs of the mill, will be constructed a t the site as soon as present investigations justify the additional investment [Ravenholt, 19773.
8.4 Ohaki (Broadlands)
The New Zealand Electricity Department is proposing to construct a 150-Mw geothermal power plant near Broadlands, about 28 km (17 mi) northeast of Taupo and Wairakei. The plant will be situated adjacent to the Waikato River and will be supplied with geothermal steam from the liquid-dominated reservoirs at Ohaki and Broadlands. It is expected that the plant wi l l ,be built in three phases, with each phase culminating in the installation of a 55-Mw ( g r o s s ) / 5 0 - ~ (net) turboalternator unit. As of early 19'79 statutory clearances were being obtained and preliminary design work was underway, Authorization to proceed with the first 100 MW was expected to be granted by the end of 1979 or early 1980. The first 50-MW unit may be in operation by late 1983, while the second may be commissioned during 1984. The third unit is expected to come on-line in the mid-1980's. In the following sections we shall discuss the geology of the Ohaki-Broadlands thermal area, the drilling program and productivity of the wells, the proposed energy conversion scheme, and some of the antici-. pated environmental problems and suggested solutions.
8.41 Geology
The Broadlands geothermal field has been studied intensively and sev- eral reports on the geology of the site are available [Browne, 1970; Grind- ley, 1970; Grindley and Browne, 1975; HochStein and Hunt, 1970; Mac- donald, 19751. The drilling of exploration wells began in 1965 with well BR1 and has continued since that time. Figure 8.24 [after Bauer et al., 19'771 shows the general layout of the field including the existing wells, both productive and nonproductive, the proposed steam pipelines, and a
ossible position for the powerhouse and cooling towers. The cross-section G i n , , A-A, is also indicated. The geologic cross-section through the field
along this line is drawn in figure 8.25, in which some of the wells are also shown [Grindley, 19701.
There are three surface areas where the ground temperature is at least 5OC (9OF) above the ambient at a depth of 1 m (3.3 ft). These are : (1) an area of roughly 865-m ( 1200-ft) radius centered on well BR7 (the so-called Broadlands thermal anomaly) ; (2) an area of roughly 550-m (1800-ft) radius centered on well BR9 (the so-called Ohaki thermal anomaly) ; and (3) an elongated area lying between wells BR6 and BR13 and extending

250 [Oh. 8
FIQURE 8.2P-Preliminary layout of the Broadlands geothermal power plant, steam field, and gathering system. Key: .=producing well; O=nonproducing well [Bauer et al., 19771.
about 1220 m (4000 ft) in a north-south direction [Smith, 19701. The first two thermal areas coincide with the Broadlands and Ohaki faults, respec- tively (see figure 8.25). Of the two, the Ohaki area is by far the more productive. The complex geologic forma%ions shown in Figure 8.25 may be de-
scribed as follows, with main emphasis on the hydrological functions of
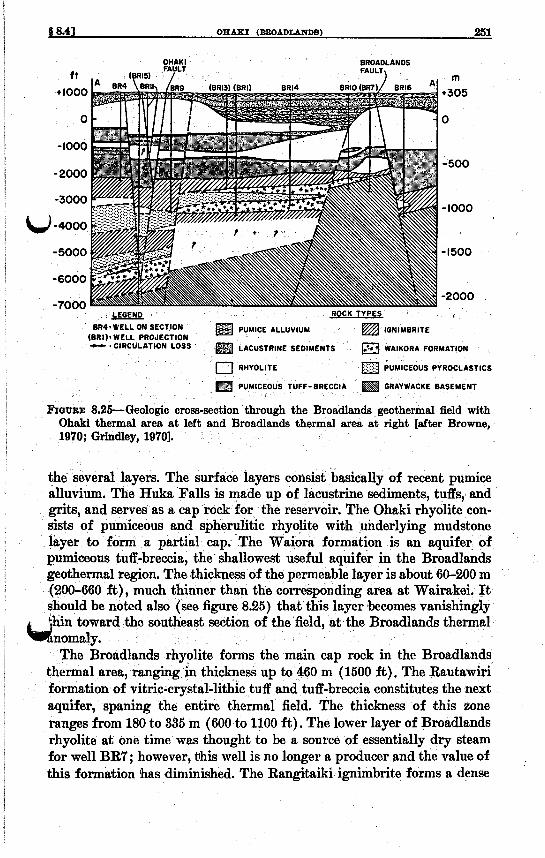
$8.43 OHAKI (WADLANDS)
OHAKI BROADLANDS
f t
+IO00
0
-1000
- 2000
-3000
u-4000
-5000
-6000
-7000 ROCK TYPES &LEGEND
251
m +305
0
-500
- 1000
-1500
-2000 1
BR4'wELL ON a PUMICE ALLUVIUM a IGNIMBRITE (BRII' WELL PROJECTION - *CIRCULATION LOSS ACUSTRINE SEDIMENTS WAIKORA FORMATION
PUMICEOUS PYROCLASTICS
GRAYWACKE BASEMENT
FIG~SE 8.25-Geologic cross-section othermal field with Ohaki thermal area at left and Broadlands thermal area at right [after Browne, 1970; Grindley, 19701.
era1 layers. The surface layers consist basically of recent pumice alluvium. The Huka Falls is made up of lacustrine sediments, tuffs, and grits, and serves as a cap rock for the reservoir. The Ohaki rhyolite con- sists of pumiceous and spherulitic rhyolite wibh underlying mudstone layer to form a partial cap. The Waiora formation is an aquifer of pumiceous tuff-breccia, the' shallowest useful aquifer in the Broadlands geothermal region. The thickness of the permeable layer is about 60-200 m (200-660 ft), much thinner than the corresponding area at Wairakei. It
noted also (see figure 8.25) that this layer .becomes vanishingly rd the southeast secti of the field, at.the Broadlands thermal
s rhyolite forms the main cap rock in the Broadlands m (1500 ft). The Rautawiri
formation of vitric-crystal-lithic tuff a -breccia constitutes the next aquifer, spaning the entire thermal field. The thickness of ;this zone ranges from 180 to 335 m (600 to 1100 ft) . The lower layer of Broadlands rhyolite at one time was thought to be a source of essentially dry steam for well BR7 ; however, his well is no longer a producer and the value of this formation has diminished. The Rangitaiki ignimbrite forms a dense
ea, ranging in thickness up

252 HEW !mALAxm [Oh. 8
cap layer. The Waikora formation appears fairly impermeable, as does the Ohakuri group, a potential aquifer consisting of pumiceous pyro- elastics. The graywacke basement is essentially impermeable, except possibly along the dipping fault line between wells BR14 and BRlO (see figure 8.25). Mainly, however, all joints and fractures in the graywacke are sealed with calcite and quartz.
8.48 Wen p q m m a md produeti&@
As of 1977 32 wells had been drilled; however, only 16 of these were considered sufliciently productive for power production. It will take 20 producing wells to supply the required-steam flow for a 150-MW power plant. The wells currently believed suitab18 for power plant use are BR2, 3, 8, 9, 11, 13, 17-23,25,27, and 28; The geologic logs from the first 16 wells drilled [Smith,1970] are shown in figure 8.26; technical information on these wells is given in table 8.13. Figure S.27 is a log of well operations for the period 1966-1969, while table 8.14 gives the productivity of se- lected wells as a function of wellhead pressure. Note that the average quality is a fairly high 42% at a pressure of 0.79 MPa (114.6 lbf/in2) which will be required at the primary separators for the power station.
The Ohaki area behaves as a connected reservoir, whereas the Broadlands area, with considerably lower permeability, contains essentially isolated
u
Table 8.13-Tachnkt information on wells BRI-16 at Broadlcrnds
Bottom- W e l l h d Depth, m Pres- hole tem-
Date eleva- sure b perature, Well No. drilled tion, m drilled cased MPa. O C O
BR1. .......... 12/66 293 BR2.. ......... 7/66 301 BR3.. ......... 2/67 299 BR4.. ......... 8/67 313 BR6.. ......... 9/67 317 BR6.. ......... 9/67 293 BR7.. ......... 12/67 306 BR8.. ......... 12/67 302 BR9.. ......... 3/68 308 BR10. ......... 4/68 302 BR11.. ........ 6/68 2 1 BR12 .......... 10/68 294 BR13. ......... 7/68 292 BR14 .......... 12/68 297 BR16 .......... 9/69 304 BR16 .......... 6/69 303
Source: Smith, 1970. b Maximum pressure at the wellhead. 0 At the bottom of the well. d Nodowing well.
1936 1034 912
1019 1268 1082 1119 776
1368 1087 760
1369 1080 1282 2418 1404
607 417 469 617 842 663 638 444 600 496 484 663 813 687
1801 626
3. 37 6. 30 5. 21 6. 74 do. 1 1. 66 7. 20 4.94 6. 72 5. 40 4.79 6. 16 0.79 3.99 4.63 6. 84
276 278 276 263 243 143 277
ZQ 278 270 276 264 293 297 273
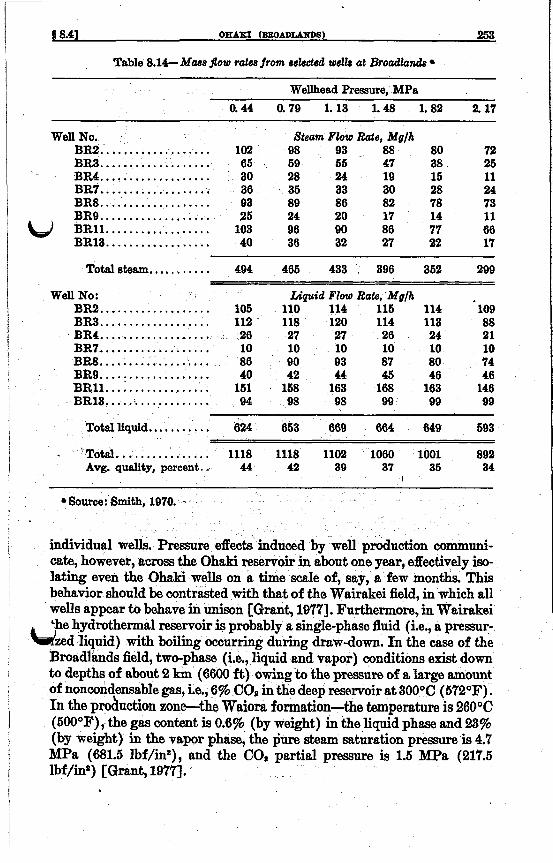
$8.41 OHAKI (-ADLAW) 253
Table 8.14-Mass $ow rates from selsctal wells crd BrocrdlanL
Wellhead Pressure, MPa 0.44 0. 79 1. 13 1.48 1. 82 2. 17
Well No. BR2 ................... 102 BR3. BR4 ................... 30 BR7 ................... 36 BR8 ................... 93 BR9.. ................. 25 B R l l .................. 103 BRl3 .................. 40
.................. e5 '1
&am Flow Rate, Mglh 98 93 88 69 65 47 28 24 19 36 33 30 89 86 82 24 20 17 96 90 86 36 32 27
80 38 16 28 78 14 77 22
72 26 11 24 73 11 66 17
Totalsteam ........... 494 466 433 396 362 299
Well No: Liquid Flow Rote, MgJh ................... BR2 105 110 114 116 114 109
BR3 ................... 112 118 120 114 113 88 BR4 ................... 26 27 27 26 24 21 BR7 ................... 10 10 10 10 10 10 BR8 ................... 86 90 93 87 80 74
BR11 161 168 163 168 163 146 BRl3 .................. 94 98 98 99 99 99
otalliquid ........... 624 653 669 664 649 693
. Total ................ 1118 1118 1102 1060 1001 892 Avg. quality, percent.. 44 42 a9 37 35 34
BR9 ....:. ............. 40 4!2 44 45 46 46 .................. .
Source: Smith, 1970. ~
individual wells. Pressure effects induced by well production communi- cate, however, across the Ohaki reservoir in about one year, effectively iso- lating even the Ohaki wells on a time scale of, say, a few months. This behavior should be contrasted with that of the Wairakei field, in which all wells appear to behave in unison [Grant, 10771. Furthermore, in Wairakei 'he hydrothermal reservoir is probably a single-phase fluid (i.e., a pressur-
U z e d liquid) with boiling occurring during draw-down. In the case of the Broadlands field, two-phase (i.e., liquid and vapor) conditions exist down to depths of about 2 km (6600 f t ) owing to the pressure of a large amount of noncondensable gas, i.e., 6% COS in the deep reservoir at 300°C (572OF). In the production zone-the Waiora formation-the temperature is 260OC (SOOOF), the gas content is 0.6% (by weight) in the liquid phase and 23% (by weight) in the vapor phase, the pure steam saturation pressure is 4.7 MPa (681.5 lbf/in*), and tb.e Con partial pressure is 1.5 MPa (217.5 lbf/in*) [Grant, 1977l.

254 HEW !&EATAND [Oh. 8
m tt
5oo $ 2ooo B R l B R 2 BR3 E R 4 BRS B R 6 BR7 ERE ER9 ERlOBRll ER12 BR13BR14 BR16
0
-500
-1000
hd 1- -4000
ROCK TYPES
SURFACE PUMICE RHYOLITE
SILTSTONE.MUDSTONE IGNIMBRITE
TUFF. SANDSTONE, BRECCIA GREYWACKE
FXQURE 8.26-Geologic logs for wells BR1-16 at Broadlands [after Smith, 19701.
The amounts of carbon dioxide (CO,) , hydrogen sulfide (Has), and am- monia ("*) in the geothermal bore steam are shown in table 8.15 for several wells tested in 1976. These nine wells produced 1490 Mg/h (3.28 X 16'I lbm/h) of total mass flow; the total flow of COz was 12.4 Mg/h
FIQURE 8.27-Log of well operations for wells BR1-16 for the period 1966-1969 [after Smith, 19701.
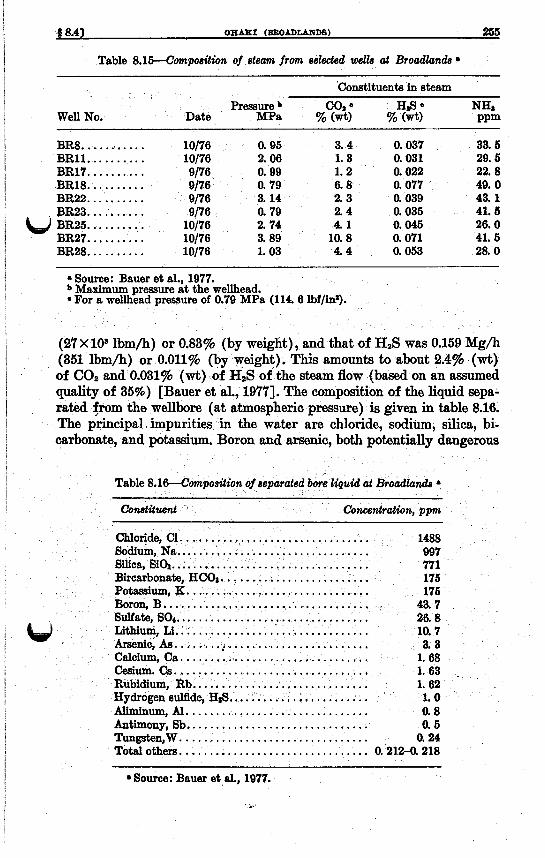
$8.41 OHAKI (BBOrnIAADLS) 255
Table 8.15--Cbmpositwn of steam frmn sekded we& at Broadlande ~
Constituents in steam Ressure b cos 0 HBS 0 ":
Well No. Date MPa %W) % (wt) PPm
BR8. .......... 10/76 0. 95 3. 4 0.037 BR11. ......... 10176 2. 06 1. 3 0.031 BR17. ......... 9/76 0. 99 1. 2 0.022 BR18. ......... 9/76 0. 79 6. 8 0.077 BR22. ......... 9/76 3. 14 2.3 0.039
~ BR23. ......... 9/76 0. 79 2. 4 0.035 BR25. ......... 10176 2. 74 4.1 0.045 BR27. ......... 10/76 3. 89 10. 8 0.071 BR28. ......... 10176 1. 03 4.4 0.053
33. 6 29. 6 22. 8 49. 0 43. 1 41. 6 26.0 41. 5 28. 0
a Source: Bauer et al., 1977. b Maximum pressure at the wellhead.
For a wellhead pressure of 0.79 MPa (114. 6 lbf/ina).
(27X108 Ibm/h) or 0.83% (by weight), and of HzS was 0.159 Mg/h (851 lbm/h) or 0.011% (by weight). This amounts to about 2.4% (wt) of C02 and 0.031% (wt) of H2S of the steam flow (based on an assumed quality of 35%) [Bauer et al., 19771. The composition of the liquid sepa- rated $ram the wellbore (at atmospheric pressure) is given in table 8.16. The principal impurities in the water are chloride, sodium, silica, bi- carbonate, and potassium. Boron and arsenic, both potentially dangerous
...................
...................
...................
Aliminum, Al.. ............................. 0. 8 Antimony, Sb.. ............................. 0. 5 Tungsten,W. ............................... 0. 24 Total others. ............................... 0.212-0.218
Source: Bauer et al., 1977.

256 rn !zEALAxD [Oh. 8
elements, are also present in non-negligible amounts. We shall return to a discussion of these impurities in section 8.4.4.
Pressure recovery and recharge studies were conducted during the 3-year period 1971 to 1974, during which time the wells were essentially closed in. Pressure recovery rate averaged about 170 kPa/yr (25 lbf/in*.yr) in the main producing area ; amounting to a recovery of about 50% of the pres- sure loss sustained during flow tests up to 1971. The mass recharge was estimated to be 360 Mg/h (790 klbm/h) , or the equivalent of one good pro- ducing well [Hitchcock and Bixley, 19751. It is not known whether the recharge will increase or decrease when the field is being exploited. A gravity survey [Hunt and Hicks, 19751, on the other hand, showed no net mass loss from the field though 1974.
G 8.43 Energy conversion system
Present plans call for the construction of a 150-BfW geothermal power station in three phases of 50 MW each. The energy conversion system will be a separated-steam/hot-water-fla~ (or so called double-flash) system. Although certain details about plant design are undecided at this time, basic plant layout wil l follow the generalized schematic shown earlier in figure 1.6. It remains to be determined whether the primary separators will be located at each wellhead or at the powerhouse (with two-phase p f l u i d transmission from wellheads to powerhouse). The condensers may be either direct-contaot (as shown in -re 1.6) or shell-and-tube type, depending on the type of control used for the H,S emissions.
Table 8.17 contains technical specilications for the plant as now pro- posed. On the basis of these figures, the plant would have a geothermal energy resource utilization efficiency of about 43%, relative to the thermo- dynamic available work of the geofluid at the wellhead (with a calculated quality of 25%, assuming an isenthalpic process between the wellhead and the primary separator) and a sink at a temperature of 27°C (80°F). This efficiency is somewhat low for a double-flash plant, corresponding more nearly to that for a single-flash (or separated-steam) plant. Compare the proposed Broadlands plant and a similar plant at Hatchobaru, Japan (see section 6.6). The resource at Hatchobaru is of slightly better quality, (J although the temperatures are essentially the same. The signilkant dif- ference appears to be in the choice of flash temperature (or equivalently, pressure). At Hatchobaru the flash point has been chosen more nearly to agree with the accepted rule for optimum performance (i.e., equal tem- perature differences between geofluid, flash vessel, and condenser), where- as at Broadlands the flash point seems to be on the high side, perhaps to avoid the potential problems associated with a flash pressure near atmos- pheric. As a result, the Broadlands plant will have utilization efficiency of 43% while the value for Hatchobaru is 52%.

3 8.41 OEAKI (BEOADLAIVDB) 257
Table 8.17-Preliminarg cpeeijhtions for Ohaki power plant at Broddlands
Turbine data: Type.. ......................... Single-cylinder, double-flow, pass-in Installed capacity. .............. 60 MW Speed.. ........................ 3000 rev/min Main steam pressure. ............ Main steam temperature. ........ 323.6"F Secondary steam pressure.. ....... Secondary steam temperature. .... 248.0"F Noncondensable gas content. ..... Exhsustpressure. ............... (b) Main team flow rate. ........... Secondarv steam flow rate. .......
94.3 Ibf/in*
29.0 lbf/in*
-2.4% (by wt) of main steam
913X lo" lbm/h 206X lo" lbmh
Comienaer data: Type. ......................... Cooling water temperature. ....... Outlet water temperature.. ....... Cooling water flow rate.. ......... Type. .......................... Type. .......................... Number of cells. ................ Water flow rate. ................
Auzilia7y power requirements. .........
Gad eztrcrdion cystem data:
Heat rejection q s t e m data:
(b) 86'F 109.4"F 130.6 X 1V lbm/h
Steam jet ejector or radial blower
Mechanically induced-draft cooling tower -6 133.7X 10⁸ lbm/h 6000 kW
~~
Year of start-u : 1983. Unit 2 is expected to be 'n o erating in 1984 and wil l be
b Not available. essentially identioaf to Unit 1; Unit 3, Slao identioaf wdfollow.
84.4 Allti0ipate.d envir-d effects
The potential damage to the environment from the Broadlands geo- thermal power development project has been documented in detail in the NZED Environmental Impact Report [Bauer et al., 19771, source for most of the material in this section. 'Our attention will be focused on the following topics: land usage, liquid and gaseous effluents, thermal discharge, and subsidence.
The total area encompassed by the Ohak and Broadlands thermal region amounts to about 1380 ha (3410 acres), with roughly 566 ha (1396 p) lying west of the River where the main geothermal field is located and where the ant will be built. Most of this land is owned by the Maori. Land on which wells are drilled has been leased from the Maori owners, and it has been made clear that geothermal development will not encroach upon sacred lands or artifacts of special tribal im- portance. The powerhouse is expected to be 80 m long, 35 m wide, and 30 m high (263X 116x98 ft). About 4 ha (10 acres) will be reserved for the switchyard, allowing for future growth.
Although four options were given consideration for the disposal of waste bore liquid, reinjection has been recommended. Nevertheless, a

258 HEW !ZEALAND [Oh. 8
standby cooling pond is being included in the plant design because long- term operational characteristics of reinjection remain uncertain. Should it become necessary to dump 100% of the waste water into the 40-ha (100-acre) pond at full output, it would take 31 days to reach maximum pond level. Even so, the fluid discharge would be at a temperature only 5OC (9OF) above ambient river temperature, causing a mere 0.loC (0.18"F) rise in river temperature upon complete mixing. Figure 8.28 shows the proposed location of the cooling pond, two powerhouse site options, and the steam/hot water mains.
The most serious chemical elements carried by the geothermal liquid (in terms of their effects on the ecology of the Waikato River) are a m u monia (NH,), arsenic (As), boron (B), lithium (Li), and mercury (Hg) , in order of decreasing effect. Should it become necessary to discharge the full amount of geothermal liquid into the Waikato (say, in the event of a total failure of the reinjection system), then the increment of the composition of these elements in the river water would be in the following ranges: NH,, 0.066-0.360 ppm; As, 0.016-0.080 ppm; B, 0.210-1.000 ppm; Li, 0.052-0.260 ppm ; and Hg, (22.3-101.0) X 1o-B ppm. The range of values corresponds to average and low river flows, respectively. The NH, values include the amount that would enter the cooling water from the vapor phase of the geofluid. This would enter the cooling water either in the con- denser (if it is of the direct-contact type) or in the wet cooling tower. About 2% of the amount shown is carried in the separated liquid stream. The same general situation exists in the case of Hg, where about 99% of this impurity is carried in the stream and only about 1% in the separated bore liquid.
Three gaseous effluents are of primary concern regarding impact on the environment : carbon dioxide (CO,) , hydrogen sulfide ( H2S), and radon (Rn-222). Under conditions of full power output at 150 MW, with no emissions controls on the plant, the following amounts of these would be released to the atmosphere : CO,, 35 Mg/h (55,000 Ibm/h) ; H,S, 0.45 Mg/ h (992 lbm/h) ; Rn-222,ll nCi/h (7.5 X 1O-l' kg/h or 1.7X le1* lbm/h). This quantity of CO, is believed to be insignificant, certainly much less than is emitted by a typical thermal power station. For H2S, this level of emission would mean a specific emission rate of 3000 g/MW h (6& Ibm/MW h), and may be compared with the proposed standard of 2 g/MW h (0.44 lbm/MW * h) for geothermal power plants in the United States [Hartley, 19781. Furthermore, Broadlands would vent about 13 times as much H2S into the atmosphere as does the plant a t Wairakei. The concentration of Rn-222 in the exhaust stack gas would be about 0.3 pCi/l, even without dilution in the atmosphere.
Table 8.18 gives the concentrations of the main gaseous elements in the gas exhauster stack, assuming no emissions controls upstream of the power plant and a shell-and-tube condenser that concentrates all noncondensables

c

B O NEW ZEALAxD [oh. 8
Table 8.18-CompositiOn and quuntitv of exhaust stuck gas diecharge at Ohaki a
Concentration Flow rate
Gas PPm (Wt) PPm (vel) Ibm/h
cot. ............................. 92. 6 84.6 77, OOO His .............................. 1. 2 1.4 992 C& ............................. 0. 8 2. 1 661 NI ............................... 0. 7 1. 1 661 Ht ............................... 0. 0 0. 2 0 Ha0 (vapor). ..................... 4.8 10. 6 3,970
.Source: Bauer et d. 1977. estimates assume no emissions controls upstream of plant and condenser of t6e aheh-and-tube type.
into the exhauster stack. Hydrogen sulfide appears to be the-only gaseous dlluent that wi l l require abatement equipment. Several techniques can be used to handle this problem :
Iron catalyst added to cooling water Incineration of H,S to form SO, which is then scrubbed Stretford sulfur recovery p m s s Modified Clause process Takahax process (similar to Stretford process) Giammarco-Vetmke p r o m s
In any case, it appears feasible to reduce the H2S emissions from 0.45 Mg/h to about 0.07 Mg/h or less by means of treatment of the exhaust stack gas alone. By adding shell-and-tube condensers and preventing the H2S from dissolving in the cooling water, this could be reduced a full order of mag- nitude to 0.007 Mg/h (15 lbm/h) or 47 g/MW * h (0.10 lbm/MW * h) .
Land subsidence at Broadlands could result in serious inundation by the waters of the Waikato River if subsidence trends during exploration continue. Figure 8.29 shows subsidence contours during the p e n d May 1968-March 1974. Maximum subsidence was about 190 mm (7.5 in) for 8
total mass drawoff of about 35X10Q kg (77X108 lbm), very nearly the required mnud drawoff to supply the lCiO-MW(e) plant. Because the center of the subsidence area i s within about 500 m (1640 f t ) of the west bank of the Waikato River, it is likely that some type of retaining wall may be necessary to prevent inundation of the field after, say, 20 years of operation. Furthermore, as the wells on the east side of the river begin producing in larger quantities, the center of the subsidence may shift even closer to the river, thereby causing a more immediate problem. The power- house will be located west of the area affected by subsidence and presuma- bly wil l not be subjected to problems of differential ground movement (cf. figures 8.24 and 8.29).

8 8.41 OHAKI (BXOADLANDB) 261
FIQIJRE 8.294ubsidence contours at Broadlands for the period May 1968-March 1974 [after Bauer et al., 19771.

8.5 Other geothermal areas in New Zealand
The thermal belt across North Island from Lake Taupo to White Island in the Bay of Plenty abounds with thermal areas, some of which may prom useful for the generation of electricity, district or process heating, or other commercial or industrial applications. Some of the areas that have been investigated include :
Ngawha : bottom-hole temperat~re=236~C (45T0F), but low reservoir
Orakeikorako : few producing wells, low-quality steam, idltration of
Reporoa : unimpressive ltemperature and low reservoir permegbility. htokawa: bottom-hole temperatures -306OC (583’F) ; high steam
quality, but high noncondensables and only moderate reservoir permeability.
Tauhara: adjacent to Wairakei; very similar temperatures with high- er pressures, some weak linkage between Wairakei and Tauhara but not enough to influence production at either site.
Te Kopia : field aligned with fault scarp ; steam output is moderate but of low quality, highest temperatures occur in upper formation, become indifferent at depth.
Te Mihi : extension of Wairakei field ; at least one well has been con- i nected to Wairakei system. i Waiotapu : area of considerable thermal potential ; shallow wells
Other areas hold promise, and the interested reader may consult several references for further details [Dench, 1961; Smith, 1970; Smith and McKenzie, 1970; Bolton, 19771. At present, however, there are no plans to install electric generating stations at ony of these geothermal areas.
i
1 1 i
i
1
i permeability.
cold water.
i
I
ci I
rapidly develop calcite deposits, deep wells are more promising. 1
REFERENCES *
Armstead, H. C. H., 1961. “Geothermal Power Development at Wairakei, New Zealand,” Rome, 1961, Vol. 3, pp. 27443.
Axtmann, R. C., 1974. “An Environmental Study of the Wairakei Power Plant,” N. Z. Dept. Sci. Ind. Res., Phys. Eng. Lab. Rep. No. 445.
Axtmann, R. C., 1975a. ‘%nvironment,al Impact of a Geothermal Power Plant,” Science, Vol. 187, pp. 795-803.
Axtmann, R. C., 1975b. ‘%mimion Control of Gas Effluents from Geothermal Power Plants,” Environ. Letters, Vol. 8, No. 2, p. 135.
Bauer, H. E., Jones, E. M. E., Stirling, J. J., Willis, D.J., and Wu, P., 1977. “Environ- mental Impact Report for the Broadlands Geothermal Power Development,” New Zealand Electricity Department, Power Development Section, Wellington.
Birsic, R. J., 1978. “Geothermal Steam Paths of New Zealand,” Geothermal Energy Magazine, Vol. 6, No. 11, pp. 29-32.
LJ
a See note on p. 24.

BEXEJiENCES 263
Bolton, R. S., 1970. “The Behaviour of the Wairakei Geothermal Field During Ex- ploitation,” Pisa, 1970, Vol. 2, pp. 1426-1439.
Bolton, R. S., 1975. “Recent Developments and Future Prospects for Geothermal Energy in New Zealand,” Sun Francisco, 1976, Vol. 1, pp. 37-42.
Bolton, R. S., 1977. “Geothermal Energy in New Zealand,” in Energy Technology Handbook, D. M. Considine, ed.-in-chief, McGraw-Hill, New York, pp. 7.14-7.33.
Browne, P. R. L., 1970. “Hydrothermal Alteration as an Aid in Investigating Geo- thermal Fields,” Pisa, 1970, Vol. 2, pp. 564-570.
Craig, S. B., 1961. “Geothermal Drilling Practices a t Wairakei, New Zealand,” Rome,
Dench, N. D., 1961. “Investigations for Geothermal Power at Waiotapu, New Zea-
Fisher, W. M., 1961. YDrilliig Equipment Used at Wairakei Geothermal Power
Fooks, A. C. L., 1961. “The Development of Casings for Geothermal Boreholes at
Glover, R. B., 1970. “Interpretation of Gas Compositions from the Wariakei Field
Grant, M. A., 1977. “Broadlands-A Gas-Dominated Geothermal Field,” Geo-
Grindley, G. W., 1961. “Geology of New Zeala eothermal Steam Fields,” Rome,
Grindley, G. W., 1970. “Subsurface Structures and Relations to Steam Production in the Broadlands Geothermal Field, New Zealand,” Pisa, 1970, Vol. 2, pp. 248-261.
Grindley, G. W. and Browne, P. R. L., 1975. “Structural and Hydrological Factors Controlling the Permeabilities of Some Ho Francisco, 19’76, Vol. 1, pp. 377486.
Haldane, T. G. N. and Armstead, H. C. H., 1962. “The Geothe ment a t Wairakei, New Zealand, Proc. Zmt. Mech. Engrs., Vol. 176, No. 23, pp. 603-649.
Hartley, R. P., 1978. “Pollution Control Guidance for Geothermal Energy Develop- ment,” EPA Rep. No. 600/7-7&101, Ind. Env. Res. Lab., Cincinnati.
Hitchcock, G. W.‘and Bixley, P. F., 1975. “Observations of the Effect of a Three-Year Shutdown at Broadlands Geothermal Field, New Zealand,” Sun Francisco, 1976,
Hochstein, M. P. and Hunt, T. M., 1970. “Seismic, Gravity and Magnetic Studies, Broadlands Geothermal Field, New Zealand,” Pisa, 1970, Vol. 2, pp. 333-346.
Hunt, A. M., 1961. “The Measurement of Borehole Discharges, Downhole Tempera- tures and Pressures, and Surface Heat Flows at Wairakei,” Rome, 1961, Vol. 3, pp. 196-207.
Hunt, T. M., 1977. “Recharge of Water in Wairakei Geothermal Field Determined ravity Measurements,” N Z J . Geol. Geophys., Vol. 20, No. 2, pp.
Hicks, S. R., 1975. “Repeat Gravity Measurements a t Broadlands Geothermal Field, 1967-1974,” Geophys. Div. Rep. No. 113, Geophysics Division, DSIR, Wellington.
Kestin, J., 1978. “Available Work in Geothermal Energy,” Brown Univ. Rep. No. CATMEC/20, DOE No. COO/4051-25, Providence, RI.
Lindal, B., 1973. “Industrial and Other Applications of Geothermal Energy,” Geo- thermal Energy: Review of Research and Development, H. C. H. Armstead, ed., UNESCO, Paris, pp. 135-148.
Macdonald, W. J. P., 1975. ‘‘The Useful Heat Contained in the Broadlands Geo- thermal Field,” Sun Francisco, 1976, Vol. 2, pp. 1113-1119.
1961, Vol. 3, pp. 121-133.
land,” Rome, 196‘1, Vol. 2, pp. 179-191.
Project, New Zealand,” Rome, 1961, Vol. 3, pp. 151-168.
Wairakei, New Zealand,” Rome, 1931, Vol. 3, pp. 170-183.
over 10 Years,” Pisa, 1970, Vol. 2, pp. 1355-1366.
thermics, Vol. 6, pp. 9-29.
1961, Vol. 2, pp. 237-245.
Vol. 3, pp. 1657-1661.

264 MEW ZEAIAND [ch. 82
McNitt, J. R., 1965. “Review of Geothermal Resources,” Terrestrial Heat Flow, W . H. K. Lee, ed., Geophysical Monograph Series No. 8, h e r . Geophy. Union of NAS-NRC, Pub. No. 1288.
Mora, S. L. and Tester, J. W., 1976. Geothermal Energy a8 a Source of Electric Power, MIT Press, Cambridge.
Miner, S., 1969. “Preliminary Air Pollution Survey of Hydrogen SuWde: A Literature Review,” Nat. Air Poll. Cont. A h . , Raleigh, NC.
NZED, 1974. ‘Wairakei-Power from the Earth,” New Zealand Electricity Depart- ment, Pamphlet No. 50392H, A. R. Shearer, Gov. Printer, Wellington.
NZED, 1975. ‘Wairakei Power Station,” New Zealand Electricity Department, Pamphlet No. 60657H, A. R. Shearer, Gov. Printer, Wellington.
Ravenholt, A., 1977. ‘Wairakei and New Zedand’s Geothermal Power,” Fieldstaff Reports, Southeast Asia eries, Vol. 25, No. 6.
b a y , P. F., 1972. ‘The Accumulation of Arsenic from Arsenic-Rich Natural Waters by Aquatic Plants,” J. Appl. Ecol., Vol. 9, pp. 557-565.
Smith. J. H.. 1961a. “ C h Failures in G e o t h e d Bores at Wairakei,” Rome,
L.l i ~ i , voi. i, pp. 254-261.
Smith, J. H., 1961b. “The Organization for and Cost of Drilling Geothermal Steam Bo&,” Rome, 1961, Vol. pp. 264-268.
Smith, J. H., 1970. ‘ % e o t h e d Development in New Zealand,” Pha, 197’0, Vol. 2,
Smith, J. H. and McKenzie, G. R., 1970. ‘Wairakei Power Station New Zea,land- Economic Factors of Development and Operation,” Pisa, 197’0, Vol. 2, pp. 1717- 1723.
Sawell, W. B., 1970 “Drilling Practices and Equipment in Use at Wairakei,” PiSa, 1970, Vol. 2, pp. 714724.
Sawell, W. B., Hall, W. K., and Tawhai, J., 1975. “Ground Movement in New Zea- land Geothermal Fields,” San FraneiSco, 1976, Vol. 2, pp. 1427-1434.
Usui, T. and Aikawa, K., 1970. “Engineering and Design Features of the Otake Geo- thermal Power Plant,” Piaa, 1970, Vol. 2, pp. 1533-1545.
Wahl, E. F., 1977. G e o t h e d Energy Utilization, John Wiley & Sons, New York. Webberg, G. B. and Zobel, M. G. R., 1973. B d . Environ. Contam. Toxicology, Vol.
9, p. 145. Wigley, D. M., 1970. “Recovery of Flash Steam from Hot Bore Water,” %a, 1970,
Vol. 2, pp. 1588-1591. Woods, D. I., 1961. ‘ ? ) f i g Mud in Geothermal Drilling,” Rome, 1961, Vol. 3, pp. 270-273.
pp. 232-247.

265
CHAPTER 9 PHILIPPINES
\
9.1 Outlook
Geothermal energy presently accounts for 58 MTV of electricity in the Philippines. According to optimistic projections this will rise to 1320 MW by 1985, when geothermal energy would be supplying nearly one-quarter of the total electric generating capacity of the country. This chapter will cover the main geothermal areas in some detail and briefly discuss the ambitious geothermal development program of the Philippines.
9.2 Tiwi 9a.I Geology and et~p2oration
"iwi is the site of one of the principal geothermal fields in the Philip- pines. One of the most popular hot springs on the island of Luzon in Albay Province, it is located at the far southeastern tip of Luzon, about 300 km (185 mi) from M d h [Mufller, 19751, The Tiwi field has been investi- gated with a number of techniques, including Wenner and dipole-dipole resistivity surveys, geologic, heat flow, and geochemical methods. Explora- tory work began in 1964'through the Philippine Commission on Vol- canology, supported with financial assistance from the National Science Development Board. As a result of the surveys an area of 2300 ha (5680 acres) was outlined
as a potential reservoir at drillable depths. Fourteen wells sunk inside the resistivity low confirmed the indications of the surveys. The wells produced a mixture of liquid and vapor at high flow rates, revealing the nature of the reservoir. The Tiwi system is a liquid-dominated field in a reservoir of Quaternary andesites and subsidiary decites. A system of microfrac- tures is believed to lend permeability to the reservoir. These findings were reported by A. P. Alcaraz in 1976 and quoted by Ravenholt [1977].
A total of u) wells have now been drilled; 19 of these are producers extending to depths of between 760 and 2180 m f2500 and 7000 ft). The weUs were drilled by Philippine Geothermal, Inc., a wholly owned sub- sidiary of Union Oil Company, which subcontracted the actual drilling operations to Richter Drilling International Pty., Ltd., of Australia. Two rigs are kept active with three work shifts.

Table 9.1-Technical spec$cathr for Philippine geothermal power statwns _.
n w i Los Bafios b Los Bafios b Leyte units 1-4 Wellhead Unit Units 1-4 Wellhead Unit 1979* 1977* 1979* 1977*
Turbine data: Type.. ......................................... Single-cylinder,
doubleflow, dual-admission, 6 x 2
Rated capacity, MW.. ........................... 55 Speed, rpm.. ................................... 3600 Main steam pressure, Ibf/ins.. ..................... 101. 4 Main steam temperature, OF. ..................... 329.0 Secondary steam pressure, lbf/in*. ................. 26.8 Secondary steam temperature, OF.. ................ 244.4 Exhaust pressure, in Hg.. ........................ 4.0
................. Main steam flow rate, 1 W lbm/h.. Secondary steam flow rate, 10 lbm/h..
( 0 )
( 0 ) ............. condsnsst data:
Type ........................................... Barometric, spray jet
Cooling water temperature, OF. ................... 87.1 Outlet water temperature, OF. .................... 120. 0 Cooling water flow rate, 1Q Ibm/h. ................ 27.8
Single-cylinder, one Curtis stage, noncon- densing, geared
1. 2 7129/1800 95. 5 324.1 - - 30. 4 49. 2 -
Single-c ylinder, double-flow, dual-admission, 5 x 2
55 3600 94.8 324. 1 24.8 240. 1 4.0 776.0 276.0
Single-c ylinder, one Curtis stage, noncon- densing, geared
3. 0 7554/1800 114.2 338.0 - - 37. 6 117.0 -
Barometric, - 87. 1 120.0 - 29. 1
spray jet -
-
C

QI c &a extractor data:
Wage blower - ........................................... - Type (9 and steam jet ejector ............................. - 1 set of each - Number.
Suction pressure, in Hg.. .............. - ...................... h
- 3. 75 - 16,275
430 k W (blower), - .............................. - Capacity, each set, ftl/min.. (9 ( 0 )
19.33 Mg/h (ejector)
Heat r&ction 8yatam data: ........................................... - Type Crossflow, - Crossflow,
Number of cells. ......... /. ..................... (a) - - induced-draft induced-draft cooling tower cooling tower
6 - 80 - - 30. 6 -
; Aikawa et aL, 1978.

i
268 PElLmPms [ah. 9
9.93 Energy cowversion qptk3rn
i - The preliminary design, equipment procurement, specifications, and contract documents for the first two units at Tiwi were carried out by Rogers Intarnational. The Tokyo Shibaura Electric Company of Japan (Toshiba) holds orders for the turbogenerators for t.he first four-units to
be installed at Tiwi. Each of these are identical 55-MW, single-cylinder, double-flow, 6 X 2 stage machines of the dual-admission type. Technical specifications for these units are given in table 9.1 [Toshiba, 19773. The generators for the units will be rated at 69,000 kVA a t 13.8 kV and 60 Hz with 0.8 power factor. The stator will be conventionally hydrogen cooled ; the rotor, direct hydrogen cooled.
The energy conversion scheme wil l be a separated-steam/hot-water-flash (“double-flash”) system (see figure 1.6). Since the flow rata of steam re- quired for plant operation is not known at present, we cannot compute pre- cisely the geothermal mwurca utilization, efficiency for the plant. How- ever, it is anticipated that 10 producing wells will be needed for each 55-MW unit, and using as a guide Units 9 and 10 at The Geysers, Cali- fornia [DiPippo, 19781, which are both 55-MW condensing units manu- factured by Toshiba, each unit will require roughly 454 Mg/h (1.0 x 10⁸ l b m b of geothermal steam. For an average wellhead quality 5=25%, the resource utilization efficiency, I,,, would be approximately 41%; for Z=30%, 1,,-49%; fora?=35%; 1,-57%. These estimates are all based on the available work of the pf luid at the wellhead.
Each unit of the power plant will produca about 1247 Mg/h (2.75 x lo6 lbm/h) of waste liquid which wil l be disposed of through reinjection wells. It was originally planned to have Units 1 and 2 on-line during 1978, but
second is now expected on-line during the fall of 1979, and the other two
1 1
1
j
i
1 1 i i 4 I I 1 1 I i 1 I
1
I this date was not met. The first unit began operating in January 1979, the
units should be operating by 1981.
9.3 lMakiling Banahaw (Los Bafios)
L d 93.1 stem we&
Los Baiios lies about 70 km (43 mi) southeast of Manila on the island of Luzon. Part of a huge area with a geothermal potential of around 720 MW, the area extends over 153,000 ha (378,000 acres) in the Makiling-Banahaw volcanic region. At least 14 wells have been drilled at the Los Bafios ther- mal area. Bottom-hole temperatures are in the range 28Oo-31O0C (540’- 590°F), and geofluid qualities as high as 36% at the wellhead have been reported [Ravenholt, 19771. Most of the wells are located about 450 m (1475 ft) above sea level near Mount Bulalo.

$9.61 OTHEB PELIL*PINE ABEA8 WITH OEOTHEEMAL PUTENTIhL 289
g.83 hf3Tgy C o T U V e T 8 h SYStents
A small wellhead auxiliary geothermal power unit has been operating at Los Bafios (now called Makiling Banahaw) since early 1977. It was sup- plied by Mitsubishi Heavy Industries, Ltd. (MHI) ; technical particulars for this machine may be found in table 9.1. The main power units for Maki- ling Banahaw will consist of four identical units, each of 55-MW capacity, of the single-cylinder, double-ff ow, mixed pressure, impulse-reaction de- sign. The process flow diagram will be similar to that shown earlier in . figure 1.6, irer, a separated-steam/hot-water-ff ash (“double-flash”) system. Table 9.1 contains the technical specifications for each of the first four
u u n i t s . According to these particulars, the geothermal resource utilization efficiency, vu, will be as follows, depending on the actual quality, E, of the geofluid a t the wellhead: vU==54% for E=25%; ~,=57% for 5=30%‘0; 7,=6O% for 5=36%.
9.4 Leyte (Tongonan)
A 3-MW portable geothermal unit is operating at Tongonan on the is- land of Le@. The unit consists of a noncondensing turbine (single Curtis stage) connected to a generator through a helical reduction gear. The en- tire unit is mounted on a platform to facilitate transfer from one site to apother. It was manufactured by Mitsubishi Heavy Industries, Ltd. ; tech- nical specifications are given in table 9.1. Figure 9.1 shows the powerhouse; figure 9.2 shows the assembled power unit being tested in the MHI shop ‘ [Ravenholt, 1977; MHI, 19771.
9.5 Other Philippine areas with geothermal potential
The potential for geothermal development in the Philippines is signifi- cant, estimated at 1320 MW by 1985. Table 9.2 gives a breakdown of the
i Table 9.2-Potential geotheml power generdion in the Philippines
Geothermal Est. Max. Field 1978 1979 1980 1981 1982 1988 1984 1985 Capacity
Qwi. ............ a110 - 55 65 - 66 65 I - 660
Tongonan ........ - - 65 66 - 65 65 - (d) ...... 65. 65 - 65 65 425 S. Ne groa... ManatcMasaxa.. .. - - - 65 65 - 65 55 600
TotalAnnual.. 165 55 110 276 165 110 275 165 .......... Cumulative ....... 165 220 330 605 770 880 1165 1320 ..........
W B ~ O S ~ ....... ‘65 65 - 55 66 - 65 65 720 ,
- - -
Source: Ravenholt, 1977. All values in megawatts; wellhead units not included. b Now called Mskilin Banahaw.
Now expected in 19f9. 4 Not available.
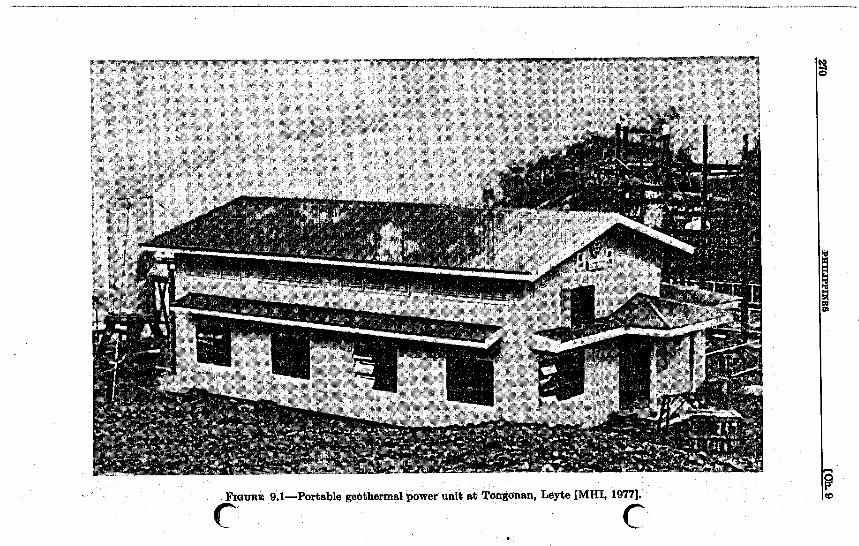
Ui
X
E 1 B "g


272 PHILIPPINES CCh- 91
distribution of this expected generating capacity. In addition to the sites listed, initial investigations are underway at Mambucal in northern Negros. Resistivity surveys indicate that the potential of the fields in- cluded in the table exceeds 2200 MW.
Some idea of the scope of the effort that will be needed to achieve an installed capacity of 1320 MW in 1985 can be derived from the fact that about 10 producing wells are needed for each 55-MW unit. This means that 240 producing wells must be drilled; allowing 3 out of every 4 wells drilled to be producers, a total of 320 wells must be sunk. Assuming that each well costs $1,000,000 (current costs are $750,000), this will necessitate a capital investment, for wells alone, of $320,000,000. Taking into a c c o u n t b both the time required to prove a field and the construction lead time for a power plant, it is d;fficult to imagine how such an enormous project can be accomplished within 7 years. Simply to drill the required wells within that time would mean that roughly 4 wells would have to be drilled each month.
Small wellhead units in the 1-10 M W range are expected to find applics- tion in cases where large units are either unnecessary or impractical, par- ticularly on the smaller islands of the Philippines such as the Visayan group of Leyte, Cebu, Bohol, Negros, and Panay. The electricity produced- from them is cheaper than that generated by diesel engines. I n any case, the use of wellhead units provides a source of revenue and local power during the early stages of development of a geothermal field. The revenue obtained helps alleviate the cash flow problem faced by field developers.
The opportunity exists for the Philippines to supply a significant per- centage of its electrical needs from indigenous geothermal energy. The high cost of imported petroleum products provides a great deal of motiva- tion for development of the geothermal resources of the country.
REFERENCES *
Aikawa, K., Fukuda, S., and Tahara, M., 1978. ‘1MHI’s Recent Achievements in Field of Geothermal Power Generation,” MHZ Technical Review, Vol. 15, No. 3, Ser. 43, pp. 195-207, Mitsubishi Heavy Industries, Ltd., Tokyo.
DiPippo, R., 1978. “Geothermal Power Plants of the United States-A Technical Survey of Existing and Planned Installations,” Brown Univ. Rep. No. C A T n C / 14, DOE No. C00/4051-20, Providence, RI.
MHI, 1977. “Portable Geothermal Power Plant3,OOO kW byte Geothermal P o w e r b Plant in Philippines,” Mitmbmhi Heavy Industries, Ltd., Nagasaki Shipyard & Engine Works, Nagasaki.
Mufiler, L. J. P., 1975. “Summary of section I-Present Status of Resources Develop- ment,” San Francisco, 1976, Vol. 1, pp. d - x l i v .
Ravenholt, A., 1977. “Energy from Heat in the Earth-Philippines Taps Immense Resources of Pacific Fire Belt,” Fieldstaff Reports, Southeast Asia Series, Vol. 25, No. 5.
Toshiba, 1977. “Toshiba Experience List on Geothermal Power Plant,” Tokyo Shi- baura Electric Company, Ltd., Heavy Apparatus Division, Tokyo.
’ See note on p. 24.

CHAPTER 10 TURKEY
10.1 Introduction
'3 The focus of geothermal energy development in Turkey is at the Klzll- dere field in the Menderes River valley, western Anatolia. A small wellhead power-generating unit is in operation at this site, and there are plans to expand the installed capacity to about 12 MW in the near future. Turkey is situated on an active tectonic zone and possesses great potential for geo- thermal energy, as evidenced by more than 600 hot springs, some with temperatures as high as 102OC (216OF), and numerous areas exhibiting hydrothermal alteration. Since 1962 the Mineral Research and Explora- tion Institute of Turkey (MTA) has been conducting surveys of the &eo- thermal resources of the country by means. of geologic, geophysical, geochemical, and drilling studies. Fourteen promisingxareas have been identified, the best of which is located at Kmldere, near Saraykoy in the Denizli Province [Alpan, 19761.
10.2 G l d e r e
The geothermal field at Kmldere consists of two producing reservoirs, one lying between 300 and 800 m (984 and 2625 ft), and one between 4-00 and 1100 m (1312 and 3609 ft) . The deeper reservoir is considered the main producer and has a temperature of 2OOOC (@B°F)I,whereas the upper zone is at 170°C (338OF). The chemical comp6sition of the fluids from the two sones are similar [Tezcan, 1976al. Portions of the field may &mist of isolated dry steam caps [Tezcan, 1976bl.
From 1966 to 1976,14 wells were drilled in tihe area, with 12 of these ing produ&rs. The wells range in depth from 370 to 1241 m (1214 to
ma& the deep reservoir. In general, the produced fluid may be charac- tanzed as follows [Alpan, 19761: maximum erature, 207.4"C (405.8OF) ; maximum wellhead pressure, 2.16 MPa (314 lbf/in*) ; maxi- mum total flow rate (single well), 1003.5 t/h (2.2X10⁶ lbm/h; maxi- mum vapor flow rate (single well), 67.6 t/h (149 X 108 lbm/h) ; fluid dry- ness h t i o n (at wellhead), 2%-12%, 10% average.
,w 072 ft) . Half the produking wells terminate in the upper reservoir ; half
273

n 4 TmxFx [ah. 10
Table 1O.l-GeojEuid charadetistics at Kzzalrkre jisld, Turkeg
Concentration, ppm
Substance Well KD-XI11 Avg., 12 Wells
Bicarbonate, HCO;. ............................. Sulfate, SO,.. ................................... Sodium, Na.. ................................... Silica, Si0 ..................................... Potassium, K . . ................................. Chloride, (3.. .................................. Boron, B. ......................................
Calcium, Ca. ................................... Magnesium, Mg ................................. Arsenic, As.. ...................................
Fluoride, F. . . .................................. Ammonium, NH, ................................
2116 1174 641 327 131 115
24.5 la 2 5. 8 4. 1 1. 5
0. 51
2247 1240 811 288 128 107
18. 1 3. 95 3. 2
0. 95 0.17
pH ............................................ 8. 9 8. 8
Source: Alpan, 1975.
A 0.5-MW power unit has been installed on well KD-XIII by MTA. The composition of the geofluid produced by this well is shown in table 10.1, along with the average composition for all 12 producing wells [Alpan, 19751. Well KD-I11 is 760 m (2494 ft) deep and produces from the lower reservoir, which it enters at a depth of 590 m (1936 ft) . The maximum tem- perature is 197°C (386.6"F), the production pressure is 1.08 MPa (157 lbf/in*), and the flow rates of liquid and vapor are 552 and 20 t/h (1.15 X lo6 and 44 X los lbm/h) , respectively [Alpan, 19751. Characteristics '
of the wellhead turbine are given in table 10.2. The plant has a specific geo- fluid consumption rate of 79.8 kg/kW h (176 lbm/kW - h) . Table 10.2-Char&tk of wellhead power generator at KD-XIII, KaZzZdere, Turkey
Turbine type.. ...................... Single-cylinder, one Curtie stage, noncon-
0.5 MW
-70.5 Ibf/ina
17% (by wt of steam) -34.0 in Hg -114 lbf/ina -3255 Ibm/h 3 in
densing
Speed 4500rpm Inlet steam pressure. ................ Inlet steam temperature.. ............ -302'F Noncondensable gaa content. ......... Exhaust steam pressure. ............. Maximum allowable pressure.. ........ Turbine steam flow rate b.. ........... Last-stage blade height.. .............
Rsted capacity.. .................... ..............................
.Year of startup: 1975. Total geofluid flow rate is -88X lo" lbm/h; dryness fraction is 3.7%.
4 10.83 XXPLoBhTIOX AUl’IVITIES 27s
A realistic appraisal of the ultimate potential of the Kmldere field is diflicult owing to serious problems of well plugging. Out of a total of 12 producing wells only 6 have been judged suitable for production. How- ever, only 3 of these can be relied on at any given time because of the necessity for periodic reaming of clogged wells. With 3 wells in operation and 1086 t /h (2.4X10⁶ Ibm/h) of geofluid being produced, it has been estimated that 11,430 k W (gross) or 10,550 kW (net) could be generated. Under the best conditions, if 6 wells could be used simultaneously to pro- duce 1640 t /h (3.6 X lo8 Ibm/h) , then the system could support 32 MW (gross) or 28 MW (net). To achieve this level of output, a reliable and effective system of reinjection of waste water would need to be imple-
10.3 Exploration activities
hd mented [Alpan, 19751.
Exploration has reached the drilling phase in a number of areas, includ- ing Ankara (Ayag, Cubuk, Kizilcahamam, and Murtet), Afyon, Izmir ( Agamemnum and Seferihisar-Doganbey ) , Ganakkale (Tuzla-Kestanbol) , and Soke (Germencik) . Preliminary investigations are being carried out at several other sites, including Bergama-Dikili, Qan-Gonen, EsGehir, Gediz, Nevgehir-Kozakli, Salihli-Turgutlu, SmdirB-Hisaralin, and Tatvan-Nemrut. The geothermal resources at these sites may be applied for generation of electricity, heating of buildings and greenhouses, and general improvement of hot springs for the tourist trade [Alpan, 19-75],
REFERENCES a
Alpan, S.,. lp75. “Geothermal Energy Ekploration in Turkey,” Sun Francisco,
Teaan, A. K., 1975a.. “Geophysical Studies in Saraykoy-Kmldere Geothermal Field,
Texan, A. K., 1975b. “Dry Steam Possibilities in Saraykoy-Kisldere Geothermal
lN6, Vol. 1, pp. 25-28.
Turkey,” Sun Francisco, 197’6, Vol. 2, pp. 1231-1240.
Field, Turkey,” Sun Francisco, 197’8, Vol. 3, pp. 1805-1813.
See note on p. 24.
4


CHAPTER 11
UNION OF SOVIET SOCIALIST REPUBLICS
hdfl.1 Overview
The Soviet Union has a huge potential in moderate-temperature geo- thermal waters that may someday be exploited for space or process heating. The only known sites, however, that are being used or contemplated for electric power production are located on the Kamchatka Peninsula, well removed from main population centers. Whereas the potential for direct heating from geothermal resources is estimated at 48,000 MW (thermal) [Tikhonov and Dvorov, 19701, a realistic estimate for the geothermal elec- tric power capacity may be several hundreds of megawatts. An extensive survey of potential geothermal applications in the Soviet
Union concentrated on nonelectrical uses, but several areas in the Kurile Islands and on the Kamchatka Peninsula where electric power plants could be installed were identified [Makarenko et al., 1970; Tikhonov and Dvorov, 19701 : Pauzhetka, UzonoSemyachik, Mutnovo-Zhirovo, Bol- shoye-Bannoye, and Goryachy Plyazh (Yuzhno-Kurilsk) . All of these sites are in regions of recent vulcanism characterized by dramatic surface thermal manifestations.
The locations of seve&l major hydrothermal areas on the Kamchatka Peninsula are shown in figure 11.1. The major populatrion center of the area, Petropavlovsk-Kamchatskiy, is within 75 km (47 mi) of several of these geothermal prospects. By and large the resources are of low-to- moderate temperature and are situated in relatively shallow reservoirs (<1 km). Some typical temperature profiles are shown in figure 11.2. The highest 'bttom-hole tem&ratures have been found at $he Pauzhetka
At least two geothermal powerplants have been in operation in Russia and several others have been mentioned as either under construction or in planning. These include the flash steam plant at Pauzhetka, the binary plant at Paratunka, the multiple-flash steam plant under construction at Bolshoye-Bannoye, and the steam plants proposed for Makhachkala and Yuzhno-Kurilsk. Each will be discussed in the following sections.
bit&, about 200°C (892OF) at 400 m (1312 ft).
n7

FIGURE 1l.l-Location of hydrothermal areas on Kamchatka Peninsula, USSR Key: 1. Kireundsy; 2. Uzon-Geyserny, 3. Semyachimky; 4. Nalychevaky; 6. Bolshoye-Bannoye; 6. Paratunka; 7. zhirovshy; 8. Severo, Mutnovsky; 9. Khodutkinsky; 10. Pauzhetka; 11. Koshelewky; 12. Petropavlovsk- Kamchatakiy [after Vakin et al., 19701.
L,
ll.2 Pauzhetka
Approximately 20-25 wells have been drilled at the Pauzhetka geo- thermal area, each producing 36 t /h (79,000 lbm/h) of steam and liquid. The geofluid is a mixture of liquid and vapor with a dryness fraction of about 9%. Wellhead pressure lies between 196 and 392 kPa (28 and 57 lbf/in2). The fluid carries 1000-3400 ppm of total dissolved solids, of which about 250 ppm is silica. Noncondensable gases amount to s l i g h t l b more than 0.05% (by weight) of the geofluid mixture (or 0.6% of the steam), with the bulk of the gases being C02 (92%), and the rest mainly H,S (4%) and NHs (3%) [Tikhonov and Dvorov, 19703. Composition of the geothermal liquid from a typical well a t Pauzhetka (well No. 4) is given in table 11.1 [Vakin et al, 19701.
112.9 Energy OMvUereiolt system
At present, a separated-steam plant of 5-MW capacity is in operation at Pauzhetka. The plant, owned and operated by the Kamchatka Electricity
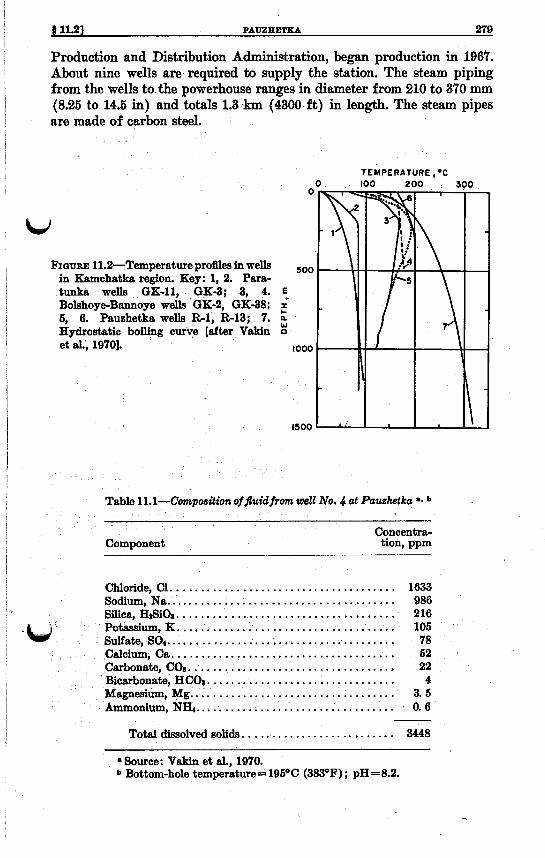
PAUZHETKA 279 4 11.21 Production and Distribution Administration, began production in 1967. About nine wells are required to supply the station. The steam piping from the wells to the powerhouse ranges in diameter from 210 to 370 mm (8.25 to 14.6 in) and totals 1.3 km (4300 ft) in length. The steam pipes are made of carbon steel.
0
W FIGURE 11.2-Temperature proflea in wells
in Kamchatka region. Key: 1, 2. Para- tunka wells GK-11, GK-3; 3, 4. E Bolshoye-Bannoye wells GK-2, GK-38; f 6, 6. Pauzhetka wells R-1, R-13; 7. a Hydrostatic boiling curve [after Vakin
5oo
et al., 19701. too0
1500
TEMPERATURE .'C
Table 1l.l-Compos~ion offluidfrom well No. 4 d Pauzhetka b
Concentra- Component tion, ppm
Chloride, Cl.. .................................... 1633 Sodium, Na ....................................... 986 Silica, H&@. .................................... 216
Sulfate, SO, ....................................... 78 Calcium, Ca. ..................................... 52 Carbonate, COS.. ................................. 22
Magnesium, Mg ................................... 3.6 Ammonium, NHI. ................................. 0.6
Total dissolved solids. ......................... 3448
Potassium, K.. .............. ................... 105
Bicarbonate, HCO,. ............................... 4
8 Source: Vakin et al., 1970. b Bottom-hole temperature= 195OC (3830F) ; pH~8 .2 .

280 WMIOX OF SOVIET BOCIALIST BEPUBLIOE [Oh. 11
The design of the plant is straightforward; a flow diagram is given in figure 11.3. Cyclone separators with mist eliminators in the upper part yield steam of approximately 0.995 dryness fraction. The 5-1Mw output is obtained by means of two 2.5-MW turbines arranged in tandem. The ma- chines were manufactured by the Thermal Turbine Machine Construction Plant at Kaluga, and are situated in a turbine room that has a flood area of 33 X 9=297 m2 (108X30=3200 ft*). Condensers are of the direct-contact type, made of stainless steel, with 11 m3 (389 f t3) of steam volume, and are fitted with 118 nozzles through which the cooling water is sprayed.
-i- -+
FIGURE 11.3-Flow diagram for Pauzhetka flash-steam geothermal power plant. Key: S = separator; T-G = turbogenerator; C = condenser; E-water jet ejector [after ARPA, 19701.
k A summary of the technical particulars for the unit may be found table 11.2 [Naymanov, 19701. On the basis of the data in table 11.2 an assuming a geofluid wellhead dryness fraction of 9%, the plant would have a resource utilization efficiency of 54% and would consume 56 kg/ kW h (123 lbm/kW * h). However, values as low as 5% for the geofluid dryness fraction have been reported [Tikhonov and Dvorov, 19701, and this would reduce utilization efficiency to 28%. The actual value probably lies somewhere between these limits.
Power from the plant is transmi&ted to the town of Pakhetka, the Ozernovsk fishing combine, and the collective farm at Krasnyy Truzhenik.

Table ll.&Technical 6pecijications for Pauzhetka geothermal power p k n t
Turbine datu: Type. .......................... Rated capacity.. ................ Steam inlet pressure. ............ Bteam inlet temperature., ........ Noncondensable gas content. ..... Exhaust pressure.. .............. Steam flow rate. ................ Type. .......................... Condenser data:
b G c a extractor data: Type. ..........................
Tandem-compound, single-flow 2X2.5 MW 28.4 Ibf/W 260.6'F 0.6% by weight of steam 0.87-2.32 in Hg 59.5 X l(r lbm/h
Direcbcontact, barometric
Water jet ejector _ _ Water impeller power.. .......... Type.. ......................... Once-through, Psushetka River
170 kW Heat rejedion system:
Year of startup: 1967.
The power line carries electricity at 35 kV and is 30 lun (19 mi) long [ARPA, 19721. The geothermal liquid that is separated a t the wellheads is discharged into the Pauzhetka River at a temperature of llO°C (2300F) and at a rate of 100 kg/s (220 lbm/s) . There were plans to make use of this hot fluid for the heating of greenhouses, although it is not lmown whether this scheme has been implemented [Tikhonov and Dvorov, 19701. The same authors also reported that the cost of electricity from the Pauzhetka geothermoelectric station is less by a factor of 10 to 15 than electricity gen- erated by diesel power plants on the Kamchatka Peninsula.
Although there were plans to expand the capacity of the plant to 12.5 MW, and eventually to 20 MW, these intentions remain unfulfilled at present [ARPA, 19721. The ultimate potential of the Pauahetka reservoir has been estimated at between 50 and 70 M W of electrical power {Tikhonov and Dvorov, 19701.
11.3 Paratanka
213.l Ob jeothes
The Paratunka geothermal power plant was an ambitious attempt at providing a form of total-energy system, albeit on a rather limited scale. The power plant was a binary fluid cycle employing Refrigerant-12 as the working fluid in conjunction with geothermal waters at temperatures as low as 81°C ( lW°F). The power from the plant served a small village and several Soviet state farms. In addition, the geothermal water, after leaving &e powerhouse a d having been cooled to 45OC (113OF) in the plant's heat exchangers, was used to heat the soil in a series of greenhouses. Finally, the cooling water leaving the condensers of the power plant was used to water
-
1

282 ~ I O B OF SOVIET BOCIALXST BEsmmas [oh. 11
the plants in the greenhouses. Direct use of water from the Paratunka River is not feasible because of its low temperature of 5 O - 7 O C (4l0-45OF).
It is generally acknowledged that the Paratunka plant was the first binary geothermal pilot plant to generate electricity, having begun opera- tions in 1967. Although the plant apparently operated successfully for several years, recent reports indicate that the power station has been closed and dismantled because of difiiculties with leaks in the Refrigerant- 12 piping [Smith, 19781. Although the properties of Refrigerant-12 are not ideally suited for geothermal applications [Naymanov, 19701, it is instructive to examine the details of the Paratunka plant.
113.9 @eo@id charadeTistk8
The geothermal hot water is obtained from a number of shallow wells located about 1.5 km (0.9 mi) from the plant site. The wells range in depth from 302 to 604 m (991 to 1982 ft), and in diameter from 127 to 200 mm (5 to 7.875 in) [ARPA, 19723. Eight wells were completed in 1964 before construction got underway on the plant ; six wells were used to supply the plant with about 280 t/h (617 X los lbm/h) of hot water [Moskvicheva and Popov, 19701 with one well kept on reserve. Composition of the geothermal water from a typical well (Stredne-Paratunka well No. 2) is given in table 11.3 [Vakin et al., 19701.
c,
Table 11.3-Composition of fluid from well No. d at StredneParatunka b
Component Concentra- tion, ppm
~~~ ~~ ~~~ ~~~~~ ~~~~
Sulfate, SO,. ..................................... 556 Sodium, Na ....................................... 206 Calcium, Ca.. .................................... 71 Chloride, (3.. .................................... 39 Sica, H2SiOl.. ................................... 32 Carbonate, C q . . ................................. 19 Potassium, K . . ................................... 10 Fluoride;F.. ...................................... 2
Total dissolved solids. ......................... 935
Source: Vakin et al., 1970. b Bottom-hole temperature=90°C (194'F) ; pHx9.O.
11.3.9 ElteTgY COWM7'8W9l 8&e7?%
A simplified flow diagram of the power plant is given in figure 11.4; tech- nical specifications are listed in table 11.4. Values given in the table are the actual values achieved during the tests reported by Moskvicheva and

f 11.81 PABATUNKA 283
T- G
t t w FIGURE 11.4-Flow diagram for Paratunka binary geothermal power plant. Key:
1-2 = hot water inlet-outlet; H1, H2, H3 = heaters; E E= evaporator; SH = superheater; T-G = tubogenerator; C1, C2 = condensers; R = receiver; P = pump.
Popov [1970]. I n certain respects, these differ from the design values. For example, the hot water inlet temperature should have been 90" C (194"F), the cooling water from the Paratunka River should have been 5°C (41°F), and the condensation temperature of the Ref rigerant-12 should have been 15°C (5OoF), instead of 81.5"C (178:7OF), 6O-8OC (42.8O-46.4"F), and 32°C (89.6"F), respectively. Note also that the performance data quoted in the above reference leads to a negative pinch-point temperature differ- ence in the geofluid/Refrigeranbl2 heat exchanger. This result is pro- hibited by the laws of thermodynamics and casts doubt on the validity of the data as reported.
Nevertheless, the efficiency of the energy conversion system can be deter- mined in terms of the amount of hot water required for a given output. Figure 11.5 shows hot water flow rate as a function of gross powel: oukput. The actual fluid consumption was roughly 65% higher than the design value a t 680 kW because of the 8.6°-9"C shortfall in geofluid temperature. In fact, the actual fluid requirement exceeded the calculated value by
u a b o u t 9% at the actual temperature. The specific hot water consumption at maximum load (680 kW) was about 412 kg/kW.h (908 Ibm/kW.h). This converts to a geathermal resource utilization efficiency of 23% (gross), or 15% (net) when 110 kW for the cooling water pump and 130 kW for the two Refrigerant-12 circulating pumps is subtracted from the gross output. The *turboexpander reached an isentropic efficiency of 82% at full load, two percentage points below the design value.
The turbine-generator, three preheaters, the boiler/superheater, two condensers, and associated auxiliary equipment, were located in a machine

2&1. U X I O X OF BO= BOUIALIST BICPUBUOS [oh. 11
Table 11.4-Technical speci$cutwns for Paratunka geouISrmcrl power plant
Turbine data: Type ....................................... Radialoutflow Rated capacity.. ............................ 680 KW Maximumcapacity .......................... 760 KW Secondary working fluid. ..................... Dichlorocljfluoromethane,
Ref-12 inlet pressure.. ....................... Ref-12 inlet temperature. .................... 149'F Ref-12 exhaust pressure. ..................... Ref-12 exhaust temperature.. ................. ~ 1 0 6 ' F Ref-12 mass flow rate..
Inlet pressure. .............................. 42.6 lbf/in* Inlet temperature.. ................. .. . . . . . . . . 1 178.7'F Outlet temperature. ......................... -113'F Hot water flow rate.. ........................
CQFa (Ref-12) 202.7 lbf/ina
113.8 lbf/ina
4 0 X 101 lbm/h ...................... (JI cleothcrm.al fluid data:
617 X 101 lbm/h condenserdata:
Type.. ..................................... Surface type, ahell-and-tube Cooling water inlet temperature. .............. Cooling water outlet temperature. ............. Cooling water flow rate. .....................
43'46'F 66'-68'F 3.307 X 1 W lbm/h
Heat rqectwn system: Type ....................................... Once-through, Paratunks
River 110 kW Water pump power. .........................
Year of startup: 1967 (now dismantled).
hall 12 m wide, 24 m long, and 8 m high (39 X 79 X 26 a). A photapaph of the turbine-generator is shown in figure 11.6. The specific installed cost of the plant has been reported to be four times that of the other Soviet geo- thermal power plant located at Pauzhetka. Paratunka's high cost was attributed to the small size of the unit, the costs associated with develop- ment of the unique halocarbon turboexpander, and with installation of the piping system to supply the adjacent greenhouse facilities [ARPA, 19721.
114 Bolshoye-Bannoye
power plant was under construction at Bolshoyc-Bannoye. [ARPA, 19721. Only 20 wells, however, had hen completed and the rate of construction was slow. Composition of the geothermal liquid from a typical well in the Bolshoye-Bannoye region ba ell No. 35) is @yen in t d e 11.5 [Vakin et al., 19701.
Whether the plant was completed or has ever been operated is unknown. It was to have a rated output of 8 MW, with two 2.5-MW low-pressure tur- bines and four 750-kW very low pressure turbines. A flow dirtgram for the plant is shown in figure 11.7. A mixturp of geothermal steam and hot
A 1965 report stated that a sophisticated, multiple-flash geothermalb

I MAXIMUM OUTPUT=680 k
I I I I I f 0 - 0 100 200 300 400 500 600 7
GROSS POWER OUTPUT, k W F~G-E 11.5-Performance characteristics of Paratunka binary plant
[after Moskvicheva and Popov, 1910).
Table ll.&CompositiOn of $uid from well No. 36 at Bobhoys-
Sulfate, SO4 ....................................... 532 Sodium, Na ....................................... 324 Sica,&Si@ ..................................... 290 Chloride, CL. . .................................... 127 Bicarbonate, HCOa.. .............................. 42.7 . Carbonate, ................................. 37.2 Potassium, .................................. 25 Calcium, Ca ...................................... 23 Arsenic, As. ...................................... 0.12 Ammonium, "4.. ................................ 0.1 -
Totaldholvedsolids.. ........................ 1400
Source: Vakin et al., 1970. bpRs8.7.

FIQURE 11.6-Paratunka turbogenerator unit [Moskvicheva and Popov, 19701.
c c i

J 11.41 BOLBIIOYE-BANNOYE 287
TO PUMP
FIQURE 11.7-Flow diagram for proposed multiple-flash plant at Bolshoye-Bannoye [after ARPA, 19721.
I
r from a number of wells is fed to a series of separators at a pressure 2 kPa (22 lbf/in2). By the time the separated steam reaches the low-
presslire turbines, the pressure has fallen to 101 kPa (14.7 lbf/in*). ,4n intermediate flash tank generates additional steam at one atmosphere for the low-pressure turbines from the hot water separated at the wellheads.
aining hot water is first collected in a receiver and then flashed ree streams of subatmospheric steam for use in
& ) a set of four multiple-admission turbines. The liquid effluent from the final flasher must be pumped back to atmospheric pressure for disposal.
Based upon the exergy of the geofluid at the wellhead and the indicated geofluid flow rats and power output, the plant would have a gross geo- thermal resource utilization efficiency of 35%, or R specific geofluid con- sumption of 90 kg/kW * h (198 1 b d W - h) . Quality of the geofluid mix- ture at the wellhead would be about 7%. The cost of electricity from the plant was estimated to be %bout one-sixth the cost of electrictiy from con- ventional sources serving the city of Petropavlovsk-Kamchatskiy [ARPA, 19721.
,
i

288 UHIOX OF S O m T SQOIALIST EEPWLIOS [Oh. 11
11.5 Potential Soviet geothermal power plants
A limited amount of information is available on Soviet geothermal power plant developments. The sites described below seem to be the best prospects for new plants in the Soviet Union.
Makhachkda. A 12-MW flash-steam geothermal plant has been pro- posed to satisfy the electrical and heating requirements of the tom of Makhachkala in the Dagestan ASSR. Estimates are that a total geofluid discharge of about 100 t/h (220 X los lbm/h) will be required to supply the plant. Very deep wells of the order of 44 .5 km (2.5-2.8 mi) are needed to tap waters at 160°C (320°F). Water at 12OOC (248OF) may be o b t a i n e d u from wells 2.5-3 km (1.6-1.9 mi) in depth. No other technical details on this plant have been made available.
Ywhno-KuriZsk A geothermal power plant of about 5 to 6 M W capacity has been proposed for the Goryachy Playazh geothermal area on Kuma- shir Island of the Kurile Island group, about 8 km ( 5 mi) from the town of Yuzhno-Kurilsk. The plant will be designed to use geofluid at 13OOC (266'F). Numerous surface thermal manifestations exist in the Guryachy Playazh region, with several steam vents having temperatures of looo-
I 13OOC (212O-266'F).
Nizhne-K0&?8he98&aya. A recent report indicated that a plant of 50 to 70 MW capacity wi l l soon be constructed at Nizhne-Koleshevskapa [ECPE, 19771, but no additional data were included.
AumhimM Vokano. The same source also reported that plans are under- way to tap the Avachinski Volcano on the Kamchatka Peninsula a t a depth of 3.5 km (11,500 ft) in the hope of establishing a resource that might slip- ply a 5000-MW geothermal plant for 500 years.
11.6 Future use of geothermal energy in the Soviet Union
Beneath the surface of Siberia lies the largest known reservoir of geo- thermal hot water. This area is sparsely populated, and the temperature of the water is not high enough at currently drillable depths to permit effi- cient production of electricity. This resource will likely be developed f domestic heating and agricultural purposes where it is feasible to do so.
With regard to geothermal power plants in the Soviet Union, informa- tion generally is diflicult $0 obtain, and once obtained is difficult to confirm. The bulk of the information on which this report is based appeared in papers included in the 1970 United Nations Symposium on the Develop- ment and Utilization of Geothermal Resources in Pisa, Italy. It is known. however, that the Soviet research and development effort in geothermal energy has included the design, construction, and testing of a so-called

i I 9 ll.61 FVlWBEI UBE OIP QEOTHEBYdL ENEBQY IN TEE 80- UNION 289 1 j j
i
i j
j !
I
I
!
I 1
total-flow turbine to make use of the total geofluid mixture as it emerges from the wellhead [Naymanov, 19701. It seems that the Soviet Union in- tends to exploit its geothermal resources by providing an efficient match between the characteristics of its relatively low-temperature hydrothermal fluids and the requirements of selected applications such as domestic space heating, agricultural soil heating, or electric power production.
REFERENCES a
ARPA, 1972. “Soviet Geothermal Electric Power Engineering,” Report 2, ARPA Order No. 1622-3, Informatics, Inc., Rockville, MD.
W E C P E , 1977. “5OOO MW Geothermal Power Plant?”, Energy in Countries with Planned Economies, Vol. 1, No. 4, Dec. 14.
I Kutateladze, 8. S., Moskvicheva, V. N., and Petin, Yu. M., 1975. “Applications of Low-Temperature Heat Carriers in Geothermal Energetics for Use as a Sec- ondary Energy Source in Industry,” San Francisco, 1976, Vol. 3, pp. 2031-2035.
Wakarenko, F. A., Manit.&, B. F., Lokshin, B. A,, and Konov, V. I., 1970. “Geo- thermal Resources of the USSR and Prospects for Their Practical Use,” Pisa,
Moskvicheva, V. N. and Popov, A. E., 1970. “Geothermal Power Plant on the Paratunka River,” Pisa, 1970, Vol. 2, pp. 1567-1571.
Naymanov, 0. S., 1970. “A Pilot Geothermoelectric Power Station in Pauzhetka, Kamchatka,” Pisa, 1n0, Vol2, pp. 1560-1566.
Smith, R. A., 1978. “Soviet Failure,” Geothermal Report, Vol. 7, No. 24, Dec. 15, p. 3. Tikhonov, A. N. and Dvorov, I. M., 1970. “Development of Research and Utilization
of Geothermal Resources in the USSR,” Pisa, 1970, Vol. 2, pp. 1072-1078. Vakin, E. A., Polak, B. G., Sugrobov, V. M., Erlikh, E. N., Belousov, V. I., and
pilipenko, GI.. F., 1970. “Recent Hydrothermal Systems of Kamchatka,” Pbu, l97Oi Vol. 2, pp. 1116-1133.
a see note onxp 24.
1970, VOl. 2, pp. 1086-1091.
r


CHAPTER 12 r UNITED STATES
12.1 Historical background
“Tb W 8 t hportant faOtW8 having been W ~ k e d O Z L h 8UC-
cessfd mathod of drilling into high pressure mztu~d s t e m bear- ing areas and a suc0essful method established for the control of s t ~ m thw pr0dwed-an.d with a solutiort of the mhor faotors n m asmred, it w& appear that the succesafu~ comrmRrcial we of this natural resource is on the eve of accomplishment at The c;r,pe~s.”
These words were written by H. N. Siegfried, an engineer for the South- ern Sierras Power Company, in a 1925 report to A. B. West, president and general manager of the same company [Siegfried, 19251. Thirty-five years later the first commercial geothermal power plant came on-line at The Geysers. At the time of Siegfried’s comment, six steam wells had been drilled (all of them producers), flow tests had been carried out, and esti- mates of power output had been made. His report contained a layout of a simple power plant with three 10,OOO-kW turbines. The Geysers Unit 1 produced 11,000 kW from a single turbine starting on September 25,1960.
The history of geothermal energy in the United States dates back more than 180 years. Explorer-surveyor William Bell Elliott is credited with discovering The Geysers natural steam field while hunting bears in April 1847 between Cloverdale and Calistoga [Lengquist and Hirschfeld, 19WJ. The awesome sight of clouds of water vapor shooting high into the air accompanied by the roar of escaping steam and the odor of sulfur fumes led Elliott to believe he had discovered the very gates to t;he Inferno.
The region was exploited at first &s a tourist attraction boasting alleged therapeutic qualities for the hot fluids and advertised as “The Eighth Wonder of the World,” “Nature’s Gift to California,” and &‘The Tourists’ Paradise.” The register of the resort hotel contained the names of Theo- dore Roosevelt, William McKinley, Ulysses Grant, and Mark Twain. Fol- lowing th0 passing of the resort as a popular attract@, an attempt was made in the early 1920’s to develop its potential for eledric power produc- tion. John I). Grant, a rock, gravel, and cement contractor from Healds- burg, not far from The Geysers, deserves the credit for initiating the
291
\

292 UIITJCD STATES [Oh. 12
development of The Geysers [Siegfried, 19251. Grant secured the services of J. D. Galloway, a San Francisco consulting engineer, who supervised the technical aspects of the work. The drilling was done by Fred Stone, part owner of the Doheny-Stone Drilling Company, who used his invention called the “Hydrill,” a hydraulically operated drilling head that could con- trol the flow of well fluid through the casing annulus from the wellhead [Anderson and Hall, 19731. Large quantities of underground steam were tapped with relatively shal-
low wells. Eight wells were drilled to depths of between 47 and 194 m (154 to 363 ft.) The steam was used to power a 250-kW generator driven by a reciprocating, noncondensing engine. Further power development at that time, however, was not carried out. Although the major technical obstacles to the use of geothermal energy seemed to have been overcome, geopower plants would have ’to compete with the hydroelectric plants that were appearing in the same areas where geothermal energy was present. Fur- thermore, the 1920’s, 1930’s, and 1940’s were years of very rapid growth of the fossil-fuel industry, and oil and gas were both plentiful and relatively inexpensive.
And so the potential of The Geysers lay unexploited until B. C. McCabe, a Los Angeles lumber merchant with no engineering education and no ex- perience in the power industry, decided to invest in the site in the early 1950’s. He leased 14.6 km2 (3620 acres) from The Geysers Development Company and established the Magma Power Company. In 1955 he drilled his first well, Magma No. 1; it was 249 m (817 ft) deep and produced 68 Mg/h (150,000 lbm/h) of dry steam at a wellhead pressure of 790 kPa (114 lbf/in2).
McCabe joined forces with Dan A. McMillan, Jr., of Thermal Power Company and by 1957 they had completed six wells ranging in dept~h from 161 to 431 m (527 to 1414 ft). They signed a contract on October 30,1958, with Pacific Gasand Electric Company (PG&E) that obligated Magma- Thermal to supply steam at a flow rate of 107 Mg/h (235,000 lbm/h) and at a pressure of 790 kPa (114 lbf/in2) to the strainer inlet of a 12,500-kW turbine-generator Dngquist and Hirschfeld, 19761. In 1967 Union Oil Company of California joined Magma-Thermal in development of the geothermal field. A total of about 61 km8 (15,000 acres) is under lease. The U.S. Department of the Interior has classified an additional 668 km2 (165,000 acres) surrounding The Geysers as a Known Geothermal Re- source Area (KGRA) .
In the early days of geothermal energy discovery in the United States? several areas besides The Geysers were explored. Most of these appeared promising because of surface manifestations such as steam vents, hot springs, and boiling mud pots. Potential sites in the Imperial Valley of California such at Niland and Mullet Island (Salton Sea) were studied and drilled as early as 1927. Fred Stone, who carried out the drilling, reported that the wells a t the Salton Sea encountered gas (probably carbon

512.21 THE QEYBEBS AT BONOMA AND LhKE OOUNTIEB, OALmBNIA 293
dioxide) , considerable steam, water, and a large quantity of “slush” [Anderson and Hall, 19733. The wells were good steam producers, but the slush caused a number of problems. Although Stone believed these diflicul- ties would clear up in time, they persist to the present. The geothermal brines of the Salton Sea contain 2 . 5 O , ~ O O , O O O ppm of total dissolved solids [Austin et al., 19771, and utilization of these fluids remains one of the major unsolved problems in geothermal energy in the United States.
A problem with nearly all geothermal regions in the early days was their remoteness. Expensive transmission lines would have to be con- structed to transmit the power from geothermal sites to populated areas. Although the population of the western United States has grown con- siderably during the past 50 years, this economic factor still plays a role in development of the geothermal resources of the country.
l22 The Geysers at Sonoma and Lake Counties, California
?he largest geothermal electric power complex in the world is located at The Geysers in Sonoma County of northern California. Pacific Gas and Electric Company produces more than 660 MW at the site; 245 M W of additional capacity are under construction, and PG&E intends to install an additional 220 MW by 1982. The present proved capacity of The Geysers exceeds 2000 MW.
1M.l UeoZogy and e ~ p t o r a t h
The Geysers is one of several areas of hot springs and fumaroles that occur along a section of a long fault zone in the Mayacmas Mountains in northern California. The geothermal reservoir is of the vapor-dominated type and errtends over an area 21.5 X 8.6 km-( 13.3 X 6.3 mi), bounded by the MercuryviUe fault zone on the southwest and the Collayomi fault zone on the northeast [Donnelly et al., 19761. The drilled area covers more than 50 km* (12,350 acres) in an 11.2X4.5 km (7x23 mi) strip lying roughly between Big Sulphur Creek in Sonoma County and the border between Sonoma and Lake counties. An adjacent, and as yet untapped, liquid- dominated reservoir is believed to lie to the northeast.
The Geysers-Clear Lake geothermal region lies in a zone of transform faulting between the Pacific and North American plates. The region is characterized by very young faults, and the geology is quite complex. The Mayacmas Mountains, a post-Pliocene uplift, are formed of an internal structure of differentially uplifted fault blocks tilted 3O0-4O0 to the north- east. The majority of the faults dip steeply to the southwest, with vertical displacements along individual blocks ranging from 1.5 to 3 km (0.9 to 1.9 mi). Surface rocks are from the Jurassic to Cretaceous periods and are of marine sediments from both shallow and deep depositional environ- ments [Reed and Campbell, 19751.

294 UNITED STATJCS [Oh. l2
The precise nature of the hydrothermal reservoir and the exact mecha- nism for production of steam in The Geysers field remain controversial. A large negative Bouguer gravity anomaly ( ~ 2 5 mgal) exists in the center of the field, accompanied #by an electrical resistivity low. Large P-wave delays ( ~ 1 sec) have been observed, as well. Although no clear and con- sistent interpretation of these observations has been formulated, we can conclude that the source of the thermal anomaly is n deep-seated magmatic intrusion that lies embedded in the crust at a depth of about 10 km (6 mi).
The steam-producing areas are highly fractured regions with nearly vertical orientation. The fractures occur in hard, dense graywacke (a sandstone), and steam is found in two depth ranges: a shallow zone at 300-600 m (984-1968 ft) and a deep zone at 15003000 in (4920-9840 ft) [Reed and Campbell, 19751. The vapor-dominated reservoir is charac- terized by a pressure far less than the hydrostatic pressure and extends to depths of at least 3 km (9840 ft) . The pressure anomaly is so drastic that at a depth of about 3 km (9840 ft) the reservoir pressure is only 3.5 MFa (500 lbf/in2), whereas at a horizontal distance of merely 0.8 km (2600 ft) away from the reservoir it is 30 MPa (4300 lbf/in2). A very efficient self- sealing mechanism is clearly present here to provide a tight cap rock, other- wise the reservoir would quickly be inundated by near-surface ground water. In addition, there is a linear temperature profile through the cap rock signifying that heat transfer in that layer is purely by conduction. The solidarity of the cap rock is all the more remarkable in light of the high tectonic activity in the region.
In regard to the origin and nature of the vapor-dominated reservoir, there appear to be a t least two schools of thought. It has been proposed that the presence of the vapor-dominated zone is the result of the boiling of a deep water table and that the pressure anomaly is preserved by a seal of minerals at the boundary caused by deposition of solids from the geo- thermal fluid, in particular calcite (CaC03) and anhydrite (CaSO,) [White et al., 1971; Truesdell and White, 19731. Opponents of this view argue that the water table would need to fall by at least 2 km (6560 ft) to account for the size of the vapor-dominated region [Weres et al., 19773; Furthermore, it has been shown that there is insufficient volume in the res- ervoir to contain only steam in the quantities required to explain the ob- served production from the field [Witherspoon, 19'771. An alternate model, is one in which the pores or fractures in the reservoir contain liquid as well as vapor. I n this model the liquid may even be at relatively shallow depths, sealed in pores that have been closed by movements of elements of the fault zone. Witherspoon [1977] speculates that the liquid water is of meteoric origin (rain water) at least 50 years old.
In summary, the existence and exploitability of The Geysers dry-steam field may be attributed to three causes. First, a network of passageways allows meteoric water to percolate into the reservoir, serving to recharge
u
L
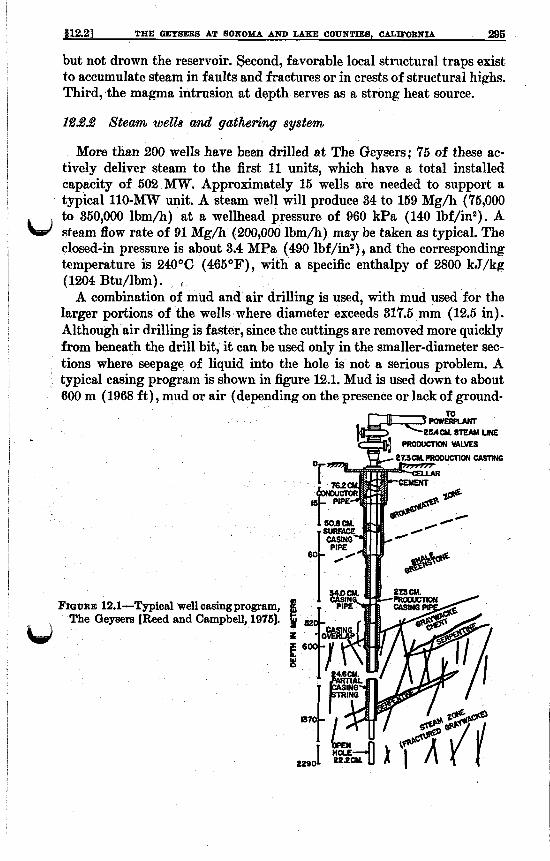
312.21 TEE QEYSEES AT SOHOYA AND LAKE COUNTIES, CALmBNI.4 296
but not drown the reservoir. gecond, favorable local structural traps exist to accumulate steam in faults and fractures or in crests of structural highs. Third, the magma intrusion at depth serves as a strong heat source.
1lJ.B ateam wells and gathering system
More than 200 wells have been drilled at The Geysers; 75 of these ac- tively deliver steam to the first 11 units, which have a total installed capacity of 502 MW. Approximately 15 wells are needed to support a typical 110-MW unit. A steam well will produce 34 to 159 Mg/h (75,000 to 350,000 lbm/h) at a wellhead pressure of 960 kPa (140 lbf/in2). A w steam flow rate of 91 Mg/h (200,000 lbm/h) may be taken as typical. The closed-in pressure is about 3.4 MPa (490 lbf/in2), and the corresponding temperature is 240OC (465OF), with a specific enthalpy of 2800 kJ/kp (1204 Btu/lbm). ,
A combination of mud and air drilling is used, with mud used for the larger portions of the wells where diameter exceeds 31’7.5 mm (12.5 in). Although air drilling is faster, since the cuttings are removed more quickly from beneath the drill bit, it can be used only in the smaller-diameter sec- tions where seepage of liquid into the hole is not a serious problem. A typical casing program is shown in figure 12.1. Mud is used down to about 600 m (1968 ft) , mud or air (depending on the presence or lack of ground-
W FIGURE 12.1-Typical well casing program,
m e Geysers [Reed and Campbell, 19761.

water) from there to 1370 m (4494 ft), and air from the top of the frac- tured graywacke to the bottom of the well. Table 12.1 lists characteristics of the two methods of drilling wells ; table 12.2 gives the composition of the drilling mud used by Union-Magma-Thermal.
Table 12.1-Chicractsristiesrm*t& of mud and air drilling mathods
Characteristic Mud Air
Hole diameter.. ..................... >444.5 mm (17.5 <317.5 mm (12.5 in) in).
Drillingrate.. ....................... 1 (reference) ........ 4 Drill bit life.. ....................... 1 (reference). ....... 2.3-4.6 Time in drilling typical wellb.. ........ 7 days. ............ 14-21 days Wearitem.. ........................ Drillbit ............ Drillpipe Recovery of lost drill string.. ......... Possible. . . . . . . . . . . . Impossible
Directional control.. ................. Fair. .............. Poor Directional devices. ................. Bent; kick sub. ..... Whipstock Ground-water seepage.. .............. >several Mg/h.. .... <a few Mg/h Pipecooling.. ...................... Good.. . . . . . . . . . . . . Fair Noise (unabated) ................... Moderate.. ......... Extreme Dust blown from well.. . . . . . . . . . . . . . . None. . . . . . . . . . . . . . Great Wateruse.. ........................ Some.. . . . . . . . . . . . . For control of dust
Water pollution. .................... Possible. . . . . . . . . . . . Unlikely Air pollution.. ...................... Diesel exhaust. . . . . . Diesel exhaust; some
steam and rock dust
Steam pressure countered by.. . . . . . . . . Mud weight. . . . . . . ! 0 Wellhead BOPE
and noise
Source: Weres et al., 1977.
0 BOPE= blowout prevention equipment. Total drilling time is the sum of the figures shown.
Table 12.2-Composition of drilling mud as used by Union-Magma-Thermal at The ffeysers *
Component Formula Percentage
(volume)
Water ........................ H20 93.09 Bentonite. .................... Nao.aA4.07S4.8 5. 39
Quebracho.. .................. Organic, wood extract 0. 45 Caustic soda. ................. NaOH 0. 32 Lignin (Tannathin). ........... G I ~ H ~ ~ ~ O , I N & ~ 0. 12 Sodium bicarbonate.. .......... NaNCOs 0. 09
Walnut ahells b.. ....... .'. ..... Organic Micab ....................... K A ~ S N I O ( O H ) S
Oao(0H) a
Cottonseed hulls b . ............ O r g m i c
a Source: Reed and Campbell, 1975. Materials added to control loss of circulation by plugging the fissures causing
the loss.

4 12.21 TEE QEYBEBB AT BONOMA AND LAKE COUNTIES, CALIFOBIPIA 287
The spacing between wells is determined by economics and the physical setting in the field. Many drill pads are built on filled land owing to the rugged terrain. The density of wells differs from company to company; Union-Magma-Thermal drills one well per 8 ha (20 acres) and Aminoil drills one well per 16 ha (40 acres) [ Weres et al., 19771. Directional drill- ing is used to drill under areas that would otherwise be inaccessible, to in- tersect nearly vertical fissures, to intmcept a blown-out well in order to control the blowout, to reduce the number of pads required to drill a number of wells, and to simplify the steam-gathering system necessary to transmit the steam to the powerhouse. Directional drilling with air is ac- complished by means of a wedge placed down-hole to deflect the bit off to the side. The wedge is called a whipstock and is capable of producing a deflection of 6.6°-8.20/100 m (2"-2.5"/100 ft). It is relatively easy to achieve a lateral displacement of 400 m (1310 ft) in a well of 1500 m (4920 ft) nominal depth. Since drilling a directional well may take about one-third longer than drilling a vertical well of the same depth, directioml drilling is more costly than vertical drilling. These added drilling costs are partially offset by savings resulting from consolidation of wellhead equipment at a single site ; only a small additional area is needed to accom- modate up to six wellheads, whereas a single wellhead requires between 0.4 and 1.2 ha (1 to 8 acres).
A typical gathering system for a 55-MW unit consists of a network of carbon steel pipes, starting with 254-mm (10-in) O.D. pipes at the well- heads and ending with 914-mm (36-in) O.D. pipes of 9.5-mm (0.375-in) wall thickness at the powerhouse. Usually seven wells must be connected to the system to supply the required 0 t /h (106 lbm/h) of steam. A cen- trifugal axial separator is situated the steam line at each well to remove particulate matter that can cause erosion of the steam pipes and turbine blades [Matthew, 19751. A map of The Geysers area in figure 12.2 shows the locations of the first 15 units. The steam pipelines are no longer than about 2 km (6560 ft) to control loss of availability of the steam from the wellhead to the turbine.
1$.M Elnergy coruuersh ty8temS
The power units at The Geysers have evolved from relatively small units with barometric, external condensers and no emissions controls to units of
wllO-MW capacity with low-level, surface-type condensers and Stretford- type H2S removal systems. Table 12.3 lists the geothermal units at The Geysers and provides technical information on each of them. Table 12.4 summarizes technical specifications for power units in operation at The Geysers as of early 1979, In the sections that follow, each unit will be described in some detail. I
Unit 1. The first two units of The Geysers project are housed in a single powerhouse located adjacent to Big Sulphur Creek, not far from the site

298 UNITED STATES [Oh. 12
FIGURE 12.2-Map of The Geysers areashowinglocation of Units 1-15 [Dan et al., 19761.
of the original Geysers Resort. An aerial photograph of the plant site is shown in figure 12.3 ; an elevation drawing of the unit including the cooling tower is given in figure 12.4; a heat balance diagram for Unit 1 is shown in figure 12.5. Table 12.4 contains technical specifications for the major mechanical elements of the unit. Although the maximum capacity of the unit is 12.5 MW, it is usually operated a t 11 Mw to allow for flexibility in load factor. The steaiii turbine for Unit 1 is a reconditioned General Electric machine of 1924 vintage originally in service at a PG&E plant in Sacramento. The original version had nine stages and was designed for steam at 1.31 MPa (190 lbf/inz) and 248°C (478OF) with exhaust at 5.1 kPa (1.5 in Hg). The first three stages were removed, the control valves were replaced by two butterfly valves of 152 mni (6 in) and 254 mm (10 in), and the last two stages of buckets were rebuilt of 11-13% chrome steel. Other modifications were inade to allow the turbine to accommodate the geothermal steam conditions and the higher back-pressure [Bruce, 1961’).
g?
Unit 2. Unit 2 came on-line in 1963,s years after the first unit, and shares the same powerhoiise with Unit 1. The arrangement of the unit is similar to the first, although the turbine is a newly designed unit by the Elliott Company, rated at 13 M W [Barton, 1970; Bruce, 19703. Turbine inlet

t 3.221 TEE QEY- AT SOXOMA AND LAKE COUNTIES, CALIFOBNU
Table 12.3-Gmthml power plant development at The Geysers natural steam f i la,
299
California
Year of pacit denser Steam
c_ .. - ._ L Ca- Turbine Con-
Utility/Unit startup M 6 Manufacturer Type type b supplier a
PG&E, No. 1 . . . 1960 11 G.E. PG&E, No. 2 . . . 1963 13 Elliott PG&E, No. 3 . . . 1967 . 27 Elliott PG&E, No. 4 . . . 1968 27 Elliott PG&E, No. 5 . . . 1971 53 Toshiba
1971 53 Toshiba b., ::: ;: : : 1972 53 Toshiba PG&E, No. 8. . . 1972 53 Toshiba PG&E, No. 9 . . . 1973 53 Toshiba PWE, No. 10. . 1973 53 Toshiba PG&E, No. 11. . 1976 106 Toshiba PG&E, No. 12. . 1979 106 Toshiba PG&E, No. 13.. 1980 135 G.E. PG&E, No. 14. . 1980 110 Toshiba PGtE, No. 15. . 1979 55 Toshiba PG&E, No. 16. . 1983 110 Toshiba PG&E, No. 17 . . 1982 110 Toshiba PG&E, No. 18. . 1982 110 ( d ) PG&E, No. 1 9 . . 1982 110 (d) PG&E, No. 20. . PG&E, No. 21. . 1983 110 (d)
NCPA, No. 1 . . . 1981 110 Fuji
6 x 1 5 x 1 7X 1 7X 1 6 x 2 6 x 2 6 x 2 6 x 2 6 x 2 6 x 2 6 x 4 6 x 4 6 x 4 6 x 4 5 x 2 6 x 4 6 x 4
(dl (9 (-9 ( d )
(dl
DCEB U-M-T DCEB U-M-T DCEB U-M-T DCEB U-M-T DCLL U-M-T DCLL U-M-T DCLL U-M-T DCLL U-M-T DCLL U-M-T DCLL U-M-T DCLL U-M-T DCLL U-M-T
STST U-M-T STST Aminoil
STST Thermogenic8 STST Aminoil STST U-M-T STST U-M-T
STST U-M-T STST U-M-T
STST Aminoil
STST ShellOil
PG&E=Pscific Gas & Electric Company; NCPAINorthern California Power b DCEB= Direct-contact, external, barometric type; DCLL= Direct-contact, low-
e. STST=Shell-and-tube, surface type. e U-%-'k= Union Oil-Magma Power-Thermal Power.
Agency.
level t
Not available. \
pressure is about 550 kPa (80 lbf/ina), somewhat lower than that of the first unit. Table 12.4 gives the unit's technical specifications.
Units 3 and 4. Units 3 and 4 are essentially identical. Each has about twice the capacity of either Unit 1 or 2 [Barton, 1970; Bruce, 19701. Steam
ts)flow to the turbine of Unit 4 is about 1.2% greater than that for Unit 3 because Unit 4's generator is air cooled rather than hydrogen cooled. The photograph in figure 12.6 shows the site of these units, including a portion of the steam-gathering system. The rugged nature of the terrain is evident from the photograph. Figure 12.7 is a flow diagram for Unit 3, and table 12.4 lists technical data for the major components.
Units 5-10. Units $10, each 55 MW, are about double the capacity of Units 3 and 4. The increase in unit size was made possible by confidence in the wbility of the geothermal reservoir to produce the required steam flow

800 UlPlTED BTATES [oh. 12
Table 12.4-Technical sp&jiCrrti0ns for geothermal u n h in operatwn at Ths *8er8
Unit No.
1 2 3-4 5-10 11-12 15
Turbine data: Type.. ................ Rated capacity, MW. . . . Steam pressure, lbf/ii*. .. Steam temperature, O F . .. Noncondensable gas,
% w t ................ Exhaust pressure, in Hg.. Steam flow rate,
1 0 lbm/h.. ...........
Speed, rpm.. ...........
Condenser data: Coaling water tempera-
Outlet water tempera-
Water flow rate,
ture, OF.. ............ ture, O F . . ............ l@ ibm/h. ............
Type. .................. Gas capacity, fts min. ... Steam consumption,
He& rejedwn 8@6m dda:
cfap extractor dda:
101 lbm/h.. ........... Type. .............. ,. ... Number of cells. ........ Design wet-bulb temper-
ature, O F . . ........... Water pump power, kW. . Fan motor power, kW. ..
SCSF SCSF SCSF SCDF TCFF SCDF 11 13 27 53 106 55
1800 3600 3600 3600 3600 3600 93.9 79.7 78.9 b113.O 113.3 113.7 348 348 341.8 355 355 338
<0.3 <0.3 <0.5 <0.5 <1.0 - 1 . Q U 4 0 4 0 4.0 4 .0 4 0 5. 5
240 255 a510 907.5 1808 -1100
80. 6 80. 6 80. 6 80. 0 80. 0 80. 0
120.8 120.0 119.8 118.4 118.4 120.4
5.5 -6.0 6.41 21.3 4 2 . 8 -35
~ ~ * u . n i t s have steam jet ejectors. -350 -350 -1000 -1830 -3660 w
-10 -10 -23 58.4 120 -50
All Units have crwflow, mechanically-induced-draft
3 3 6 5 10 5
66.5 65 66 65 65 65 (d) (d) (d) 930 1860 ~ 9 0 0 ( d ) ( d ) 355 605 1210 4 2 0
water cooling towers.
SCSF=Single-cylinder, single-flow; SCDF=Single-cylinder, double-flow; TCFF=
a 516 for Unit 4. d Not available.
Tandem-com ound, four-flow. 113.7 for b i t s 5 and 6.
over the anticipated plant lifetime [Finney, 1972; Matthew, 19751. Such b confidence was established through 9 to 10 years of operating experience at the site. For these units a change was made from the barometric jet condensers used on Units 1-4 to low-level, tray-type jet condensers. T h e turbines, supplied by the Tokyo Shibaura Electric Company, Ltd. (Toshiba) , are all still of the single-cylinder type, but of the double-flow variety. On the ground floor of the powerhouse are the condensers and various auxiliaries; the turbine and operating floor are on an elevated deck. As illustrated in the heat balance diagram of figure 12.8, no cooling

f 12.21 THE QEYBEB8 AT BONONA AND LAKE COUNTIEB, UALIByIlUiIA 801
FIQURE 12.3-Unita 1 and 2, The Geysers [photo by PG&E News Bureau].

802 U
NIT
ED
STATES [Ch. 12

c PERFORMANCE
1 3 F
= 1.0 CONENER BACK f"E 4.0" ORY BuB~RTEWERAllJRE 9 6 q WET EIVLB AR TEWEMW€=BI.C)S GAS SHOmp ENTERING COWW TWER IS AIR ABSORBED By WATER. WEST[) ANO FROM C W G 7 M R W N O T ~ c o o u N B AIR BVTOMYMAT WHml IS ABSORBEDAND DEGASSED. ANY AIR ABSORBED IN COOLINQ WATER IN HOT WELL IS NOT INCLUDED.
&LEOEND 0--- MAIN STEAM LINE -WATER LINES . ---- STEAM LINES --- GAS LINES
S POUNIWPEAHOURSTEAM W WUNDSPERHOURWATER
H STEAM ENTHALPY A PRESSUREPSIABSOLUTr 0 FtXSSUREPSI (3AGE
P E?%%TK*s=
FIGURE 12.5-Heat balance diagram for Unit 1, The Geysers [Bruce, 19611.

UN
ITE
D E
TA
TE
B
[Oh. 12

I 512.23
THE Q
EY
SEB
S AT
EO
HO
YA
AN
D LA
ICE
OO
UR
TIE
E, O
AL
IFOB
NIA
305
I
I ,
-_
I I I

i I
306 U
NIT
ED
STATES [Oh.

i I I
, i
I I I I !
I
i
I !
I
i I
8 12.21 807
water pump is needed between the cooling tower water basin and the low- level jet condenser owing to the condenser vacuum. Auxiliary cooling water pumps are needed, however, to handle the requirements of the inter- and after-condensers, the cooler for the hydrogen used to cool the generator, and the turbine lubricating oil coolers. About 4% of the gross electrical output is required for plant auxiliaries such as circulating water pumps and cooling tower fans. Figures 12.9 and 12.10 show the site of Units 5 and 6 and the site of Units 7 and 8, respectively. Table 12.4 contains technical data on the major components. Units 11 and 12. Alkhough; Units 11 and 12 do not share a common power- w house (see figure 12.2), they are essentially twin units and represent another step upward in unit capacity. Each is rated at 106 MW and uses a tandem-compound, four-flow turbine manufactured by Toshiba. Tech- 'nical data for these units are given in table 12.4. These units represent about the maximum feasible capacity (per unit) in The Geysers; with the exception of Units 13 and 15, all future units ark planned to have 110-MW capacities. Unit 13. Of the two units now under construction, Unit 13, which is ex- pected on-line in February of 1980, is unique in several respects. It is the first unit to be built in Lake County rather than Sonoma County, and the first to be supplied with steam from a producer other than Union-Magma- Thermal; in this case, the supplier is Aminoil (formerly Signal Oil and Gas Company). It will be the largest single geothermal unit in the world, with a rated capacity of 135 MW. Furthermore, the unit will be fitted with a turbine manufactured in the United States, the first American turbine installed at The Geysers in more than a decade. This unit will be located in the lower southwest section of Lake County, just over the boundary from Sonoma County (see figure 12.2). It will be sited on the eastern side of the Mayacmas Mountains in a sheltered valley known as Hidden Valley. Lying about 4 km (2.5 mi) southeast of Units 9 and 10, closest of the other units at The Geysers, it will feed power to PG&E's Fulton substation by means of a new 230-kV transmission line which will run 3.4 km (2.1 mi) to join the one from Units 9 and 10 [GEM, 1977b-j.
Although the unit was initially designed with a direct-contact condenser of the low-level jet type, it will be built with a surface condenser of the shell-and-tube type in erder to assist the hydrogen sulfide abatement sys-
W t a m 4x1 be installed on the unit. This will be the first unit to have a surface condenser at The Geysers, and the first unit of any dry steaiii geothermal plant in the world so equipped." Furthermore, this and all future units will be fitted with a means of controlling hydrogen sulfide emissions from the plant. A Stretford system will be employed for units expected on-line in the near future. Because of these'late design changes, technical specifica- tions for this unit, are not yet known reliably; table 12.5 lists the specifica-
from Unit 13. (Note added in prml.)
THE GEYSEBB AT SOXOMA AND LAKE COUNTIES, OILCIFOBNIA
Unit 16, p. 314, which came on-line in June 1979, has taken this particular honor

[Uh. 12
i

912.23 T
HE
QE
YSE
BB
AT SO
NO
MA
AN
D L
AK
E C
OU
NT
IES,
CA
LIFO
BN
IA
809

310 UNITED BTATES [Ch. 12
Table 12.5-Pre2iminuty specijiecxtions for units under construction ut The Geysers
Unit No.
13 14
Turbine data: Type. ..................................... TCFF TCFF
Speed, rev/&. ............................. 3600 3600 Steam pressure, lbf/in' ....................... 114 113.7
Rated capacity, MW. ....................... 135 110
Steam temperature, O F . ...................... 338 355 Noncondensable gas, % wt. Exhaust pressure, in Hg.. ....................
.................. "t g, -1. 0 5. 5
Steam flow rate, 105 lbm/h.. .................. -2640 1940
Cooling water temperature, O F . ............... 80. 0 80. 0 Outlet water temperature, OF. ................ 118.4 118.4 Water flow rate, 10' lbm/h.. .................. (b) 70. 6
condenser data:
Gas extractor &a: Type.. ..................................... Both units will have steam jet
Steam consumption, 105 lbm/h.. P) ejectors.
............... 60
Type ....................................... Both units wiU have cross- flow, mechanicdy-induced- draft water cooling towers.
Number of cells. ............................ 10 10 Design wet-bulb temperature, O F . ............. 65 65
.................... -1860 Water pump power, kW.. (b) ...................... -1210 Fan motor power, kW.. P)
Heat rejection system dda:
TCFF= Tandem-compound, four-flow. b Not available.
tions as they are currently understood, and figure 12.11 is a simplified schematic of the preliminary heat balance diagram.
Unit 14. The design of Unit 14 is similar to that of Units 11 and 12, having a capacity of 110 M W , with Toshiba turbines and steam furnished from Union-Magma-Thermal. The plant will be situated near Big Sulphur Creek, about 2 km (1.2 mi) southeast of Units 1 and 2 (see figure 12.2), and should start up in June of 1980. However, unlike Units 11 and 12, U
shell-and-tube surface condenser. Compare the plant specifications for'the two cases! (1) no H,S abatement (figure 12.12) and (2) with Stretford abatement system (figum 12.13). In the latter case it may be possible to produce about 8% more output from the same input by lowering the tur- bine exhaust pressure from 13.5 E a (4 in Hg) to 10.2 kPa (8 in Hg) . In addition, the steam flow to the turbine will increase by about 1% owing to the reduced steam requirements of the gas ejection system when the Stret- ford plant is used. In this configuration, the flow of cooling water through
14 will be equipped with a Stretford hydrogen sulfide removal plant, and 3-J

I35
193 w TO REINJECTION
WELLS
LEGEND S=STEAM, Mg/h W= WATER,Mg/h H=E"ALPYf kJ/kq C= TEMPERATURE, O C
P= PRESSURE, kPa FIGURE 12.11-Heat balance diagram for Unit 13, The Geysers [PG&E, 19751.

NONCONDENSABLE GASES*
HYDROTHERMAL STEAM FROM WELLS
2,000,000pph 3 w F 114 G o 80,000 pph COOLING WATER 900,000 kg/h BO% 7.8 atm I 36,000 kg/h
AIR AND EVAPORCVED WATER*
3,000 GPM 0.19 m3/sec
f ZOOOGPM
L I CONDENSER
CONDENSATE COOLING WATER AND CONDENSATE c
L CONDENSATE PUMPS 97,000 GPM
6.12m3hrc EXCESS STEAM CONDENSATE TO REINJ&TION WELLS
800 QPM 0.01 m3/ssc DATA ESTIMATED FROM GEYSERS UNIT 14 DESIGN SPECIFICATIONS BEFORE STRETFORD SYSTEM MOOlFlCATlON. * SOURCE OF H2S EMISSION.
FWJRE 12.12-Schematia flow diagram for Unit 14 befork HB abatement modification, The Gepera [Ramachandran, 19771.
C
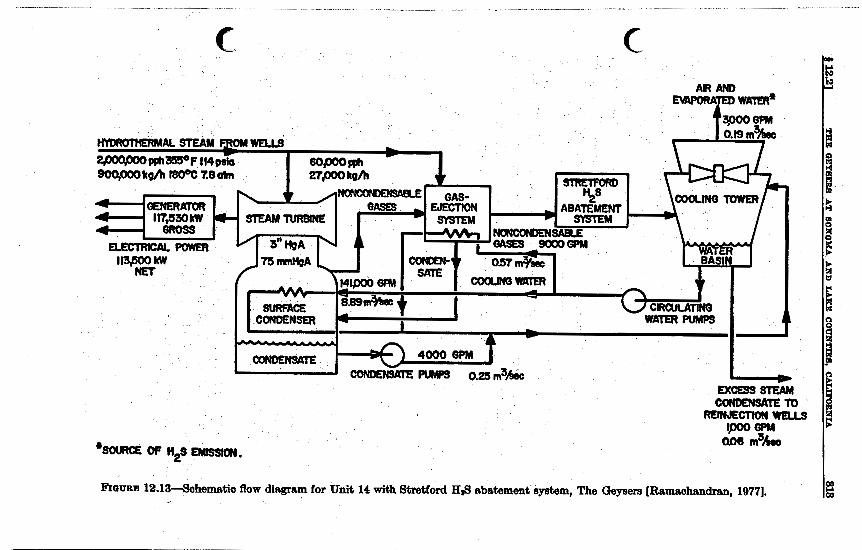
THE Q
EY
SEB
S AT SO
XO
MA
AN
D L
AK
E U
OU
WlT
ES, C
AL
IFO
BX
U
818 $12.23
*) P
f P I
I
i cn a

the cooling tower is increased significantly (59%) because the shell-and- tube heat exchanger is used instead of the direct-contact condenser. Table 12.5 contains technical specifications for Unit 14 with the Stretford plant and the shell-and-tube condenser.
Unit 15. Unit 15 is rated at 55 MW, has a double-flow, impulse-reaction turbine manufactured by the General Electric Company, is supplied wkh steam from Thermogenics, and is fitted with H2S abatement equipment. It is located in the western portion of the geothermal field (see figure 12.2). Table 12.5 lists technical specifications for the modified unit ; many of the values shown have been estimated and are subject to refinement as the plant goes through its initial operations. The unit was started up ingune of 1979.
Table 12.6 summarizes geothermal resource utilization efficiency for the first 15 power units at "he Geysers. Values range from 500/0-560/0 based on the thermodynamic availability of the steam at the wellhead. Units 13 and 15 are expected to operate with steam at the lowest temperature of any unit, 1'70°C (338OF), and may have the lowest efficiency of all units at The Geysers. Although they are not included in the table, Units 16 and 17 will be similar to Unit 14 in design and performance; i.e., they may be expected to operate a t a 56% resource utilization efficiency.
Lt
Table 12.6-Resouree utilWwn eficiencg of The Geysers units 8
Unit No. TiPF h/(Btu/lbm) w.l(Btu/lbm) w/(BWbm) vu/%
1 2 3 4
5-6 7-10
11-12 13 14 15
348 348
341.8 341.8
355 355 355 338 355 338
1200.5 1203.2 1200.2 1200.2 1200.4 1200.6 1200.5 1190.3 1200.4 1190.6
324.9 316.2 314.8 314.8 335.6 335.3 335.5 332.8 335.8 332.4
164.6 166.9 169.7 167.7 187.0 187.0 187.6 165.3 187.7 164.8
51 53 54 53 56 56 56 50 56 50
Based on a ai& temperature of 80'F.
Future units. Units 16 and 17, both to be rated at 110 MW, are expected L to be commissioned by PG&E in 1981. Unit 16 will be located in Lake County and will be supplied with steam from Aminoil; Unit 17 wil l be located in Sonoma County and be supplied with steam from Union- Magma-Thermal, Toshiba wil l manmfacture the turbines for both units, which will operate with steam a t a pressure of 784 Wa (113.7 lbf/in2) and a temperature of 169OC (336.2OF), with less than 1% of noncundensable gas by weight. Units 18-21 should come_on-line two at a time, each with an installed capacity of 110 MW. Units 18,20, and 21 wil l use steam from

$12.21 TEE BICYBEW AT BOROMA AND LAKE COUXTIES, OALIFORNIA 316
Union-Magma-!@hemal; Unit 19 will be supplied by Aminoil. Unit 18 is expected to be sited in Sonoma County, and Units 19-21 in Lake County [B. J. Cassette, personal communication].
The Northern California Power Agency (NCPA) plans to construct a 110-MW plant to serve the communities of Lodi, Roseville, Santa Clara, Alameda, Ukiah, Healdsburg, and Lompoc in conjuction with the Plu- mas-Sierra Rural Electric Cooperative [GEM, 1977al. The plant will be furnished with steam from Shell Oil Company wells and will be built on one of Shell’s leases in The Geysers steam field. Expected to come on-line in 1981, the unit will require about 907 Mg/h (2X10⁶ lbm/h) of steam, similar to PG&E’s 110-MW units at The Geysers.
The Sacramento Municipal Utility District (SMUD) has recently an- nounced its intention to become active in the construction of geothermal power plants at The Geysers.
19.9.4 Comtlrcction materiala
A primary factor in determining the materials used in manufacturing components for a geothermal pomerplant is the composition of the go- thermal fluid. Table 12.7 lists the concentration of the constituents of the steam found at The Geysers, using data taken from measurements on 61 wells during the period 1972-1974 by PG&E. Carbon dioxide, hydrogen
ne, and ammonia are the main constituents carried by the f the total impurities. Steam from The sive since it comes from the wells in a
slightly superheated state. Carbon steel ( ASTM-A106 Gr.B or equiva- Frit) can therefore be used in the gathering system, including main-steam pipelines, valves, and strainers. For the most part, the tu from manufacturer’s standard materials with items of fabricated steel. The casing is carbon steel, but the blading is of 13%
Table 12.7-C‘omtituents of steam at The U~ysers
Cbncentration, mglkg Average Flow into 110-MW Unit
Constituents Low Average High . kg/hb
Carbon dioxide, Con.. ....... 290 3260 30600 2700 Hydrogen M d e , HsS.. ..... 6 222 1600 180
Ammonia, NH, .............. 9.4 194 1060 160 Boric acid, HSBO,. .......... 12 91 233 76 Hydrogen, HI.. ............. 11 666 218 46 Nitrogen, N, ................ 6 62 638 43 Ethane, GH6.. ............. 3 8 19 6. 6 Arsenic, A s . . ............... 0.002 0.019 0.060 0.016 Mercury, Hg ................ 0.00031 0.005 0.018 0.004
L, Methane, CH,. ............ 13 194 1447 160
Source: Reed and Campbell, 1975. b Based on a steam flow of 821 Mg/h (1.81Xl@lbm/h) to the turbine.

316 UNITED STATES [Oh. 12
chrome steel. Moisture removal provisions exist in the lower-pressure stages where expansion leads to higher moisture content. Such moisture traps are of standard design and are used in conventional steam turbines as well [Finney, 19721. The quality of the steam a t the turbine exhaust hood is typically about 90%.
The corrosive nature of the geofluid becomes manifest when the steam condenses, especially in the presence of air. As with all turbines that operate under vacuum conditions, some infiltration of air into the turbine through the seals is unavoidable. Under condensation the noncondensable gases become more concentrated, the hydrogen sulfide in the presence of air oxidizes to weak sulfuric acid, and the fluid becomes highly corrosive to such materials as carbon steel, cast iron, copper-based alloys, zinc, cadmium, silver, wood, and concrete. The condenser consists of a shell of carbon steel plate overlaid with 1.6 mm ( l/ls in) of Tspe 304 (19% Cr/ 9% Ni) stainless steel and internals made of solid stainless steel. Con- densate lines are fabricated from Type 304 stainless steel pipe; conden- sate pumps are of conventional canned, vertical design but all wetted parts, including impellers and bowls or volutes, are made of austenitic Q p e 304 stainless steel. The circulating water lines above ground are made of aluminum pipe of Type 3003, 3053, or 6061. Aluminum alloys with no copper content are used. Reinforced concrete was used for under- ground water pipes in earlier units, but this material has not been totally satisfactory. Newer units use glass-reinforced plastic for all buried piping between the powerhouse and cooling tower. In addition, good results have been obtained with cement-asbestos, epoxy-lined pipe.
The Cooling towers are of the conventional mechanically-induced-draft design, but 'Qpe 304 stainless steel or aluminum is used for wetted metal parts. Redwood is used for structural support members of the water dis- tribution headers and basins; transite forms the tower siding. Where cast iron must be used, it is covered with a thick coating of coal-tar epoxy resin or other plastic material. Wood is unsuitable as tower fill material; poly- styrene, polypropylene, or polyvinyl chloride (PVC) are acceptable alter- natives. The preferred material is PVC because of its strength and fire-retardant properties.
Stainless steel, aluminum, or plastic-lined material is used for all pipes carrying condensate or cooling water. Concrete surfaces exposed to these waters are coated with coal-tar epoxy compounds or synthetic rubber coat- Lid ings. Heat exchangers am made from aluminum or austenitic stainless steel. Since copper alloys and silver are SuScBptible to corrosive attack by hydrogen sulfide, electrical equipment should not be made of thew mate- rials. Experience shows that tin alloy coatings are effective in resisting cor- rosion but are unsatisfactory on current-carrying contact surfaces. Aluminum, stainless steel, and some precious metals are particularly eff ec- tive. Platinum inserts or plating has been used on these contacts. Outdoor equipment must be protected since the air contains corrosive elements. The
c1

Jl2.21 THE OEYSEB8 AT SONOMA AND LAKE COUNTIES, CALIFOBNU 817
fog and mist produced by evaporation from the cooling towers are quite corrosive. Epoxy paints and heavy galvanizing resist these corrosive gases.
183.6 E#&?& and & ? T b & 8 h h&t?&~~ SystenZS
All units currently operating at The Geysers employ evaporative water cooling towers in conjunction with direct-contact jet condensers.* Since the amount of condensate produced from the geothermal StSam exceeds the amount of water evaporated in the towers, proper disposal of the excess liquid is a problem. In addition, emission of gaseous impurities in the geothermal steam into the atmosphere must be considered because of the
Liquid efiluent. Approximately 20% of the mass of geothermal steam produced from the wells must be disposed of as excess liquid from the cool- ing tower basin. From 1960 to 1970 the problem was solved simply by allowing the liquid to run into nearby Big Sulphur Creek. Beginning with Units 6 and 6, however, excess water has been reinjected into the producing reservoir. For each 65-MW unit 1700 m8/day (450,000 gal/day) must be reinjected. In 1974 four wells were employed for the reinjection of approx- imately 14,000 m8/day (8.7X10⁶ gal/day) of excess water [Reed and Campbell, 19751. Since the steam-producing reservoir is of anomalously low pressure relative to hydrostatic conditions, it is not necessary to pump .the liquid down the wells; pumping is required only to move the liquid from the cooling tower sites to tKe reinjection wells.
Gaseous emissions. The noncondensarble gases in the geothermal steam
u t e n t i a 1 hazard to health, wildlife, and vegetation. -
are vented It0 the atmosphere at two places 1% the plant, the gas ejector and the cooling tower, as shown in figure 12.12. The composition of the gas stream leaving the gas ejector is shown in table 12.8 for nine of the early
*Unit 15 has a &ell-and-tube, surface condenser.
Table 12.8-Cm,po&h of gas 8treum.8 from gas ejectors d The &yset8
Average Concen- Average Flow from 110-M W Unit tration, % by
Constituents weight kgm
on dioxide, CO,.. ................... 69. 9 2500 Nitrogen, NI. . .......................... 0 25.8 8 1100 Oxygen, Os.. ........................... 08.4 0 350 Methane, CH4.. ........................ 3.8 160 Hydrogen sulfide, HsS.. .................. 1.2 50 Hydrogen, HI.. ......................... 0.9 38
Source: Reed and Campbell, 1976; based on measurements by PG&E of nine units
b Base$ on a steam flow of 821 Mg/h (1.81 X1W lbm/h) to the turbine. 8 Nitrogen and oxygen are from air entering at the turbine.
over the eriod 1967-1974.

. 3l8 UNITED STATES [Ch. 12
units at The Geysers. Measurements were taken by PG&E from 1967 to 1974; the values shown are averages. The output from the stacks of the cooling tower has been estimated by PG&E, and table 12.9 lists the results for plants without emissions controls.
Table 12.9-Estimated emissions f r m cooling towers on uncontrolled unils d The Geysers
Constituents
Average Flow Average from 110-MW
Concentration Unit
kgb bb meJkg
Ammonia, NH:. ........................ 240 160 Carbon dioxide, COa.. ................... 210 140 Hydrogen sulfide, Has.. .................. 200 130 Hydrogen, &.. ......................... 12 8
'a Source: Reed and Campbell 1975. b Based on a flow rate of 658 &g/h (1.45 X 1od lbm/h) of water vapor from the tower
The most objectionable of the gases discharged is hydrogen sulfide, H,S. It has an unpleasant smell that can be detected by the human olfactory sense at extremely low levels of concentration. The California ambient air quality standard for HzS is 30 parts per billion (ppb) , based on an assumed odor detection threshold [Semrau, 19761. Although no Federal standards exist for H,S, the U.S. Environmental Protection Agency (EPA) has suggested a maximum of 200 g/MW.h of electrical production or its equivalent [Hartley, 19783. The first 10 units at The Geysers were orig- inally provided with no means of control of HzS emissions. Daily operation of these 10 uncontrolled units produced 22 Mg/d or 2300 g/MW.h of H2S [Weres, 19761. All new units will be fitted with some type of H,S abate- ment system. An iron hydroxide system of about 70% efficiency was tested on Unit 11. It discharges on the average 2 Mg/d or 800 g/MW.h into the atmosphere, including preplant emissions and vent emissions that occur during plant shutdown and are uncontrolled a t this time [Weres, 19761. Units 13, 14, 15, and future units will have surface condensers instead of jet condensers. Separate chemical processing plants operating on the Stret- ford process will remove the hydrogen sulfide on Units 13-15 [ S e m r a u , b 19763 ; a simplified flow diagram of the Stretford process is shown in &re 12.14. Since this forms an independent facility, it will have no direct influence on power plant performance. The product of the Stretford process is pure, marketable sulfur.
The bulk of the H2S (90%) will be confined to the noncondensable gas stream where it can be effectively controlled. The concentration at the exit of the gas extractor is guaranteed by the vendor not to exceed 10 ppm, which is equivalent to an efficiency greater than 99.9% [Semrau, 19761.

flz.21 THE GEYSEBS AT 80NOMA AND LAXE COUNTIES, CALIFOBNIA 819
CLEANED GAS TO
COOLINQ TOWER
ABSORBER
VENT 6AS FROM P W E F k) PLAN --B
L
CENTRIFUGATION
I
FIGURE 12.14-’I3pical flow diagram of Stretford H,S removal process [Laszlo, 19761.
t However, the overall plant abatement of HzS with such a system is only . expected to be between 78% and 92%, since about 10% of the H2S will still
reach the cooling tower through the condensate from the surface condenser. As illustrated in figure 12.13, about 0.25 ms/s (4000 gal/min) of con- densate, containing about 10% of the H2S originally present in the steam, is fed into the cooling water and eventually reaches the tower.
Tough, new regulations on HzS emissions in The Geysers area will most form of emissions controls on all existing power units xception of Units 1 and 2). Stretford or iron catalyst
systems will need to be back-fitted at considerable cost to the utility. Another potentially harmful emission from The Geysers plant is radon,
a radioactive decay product of uranium found in the gaseous state in sedimentary rocks. Carried by the natural steam from the reservoir to the surface and emitted along with the other noncondensables, it is detectable in extremely minute concentrations owing to its radioactivity. The Cali- fornia Department of Health requires radon concentrations be less than 8 picocuriefliter (pCi/l) in uncontrolled areas (1 pCi of radon= 6.8~10-~’ kg). Table 12.10 gives data on the emission of radon from The Geysers plants. As the table shows, the natural steam from the wells con-

820 UlUl’ED STATES [Oh. 12
Table l2.lO-Maa$mum me~ncrcm6n. t~ of radon a & s w n s at The Geysers 8
Location Concentration b
Steam from wells. ............... Ejector gas from plant. .......... Cooling tower water. ............ Ambient air outside plant. .......
8.3 picocuriefiter 6.3 microcuriefiter 0.21 picocuriefiter 0.026 picocuriefiter
8 Source: Reed and Campbell 1976; measurements by PG&E. b California Department of dealth requirea radon concentra-
LJ tions be less than 3 pC/l in uncontrolled areas.
tains about 2.8 times the allowable amount, and the ejector gas carries nearly two million times the allowable limit. Measurements nevertheless show that the standards are not exceeded in areas of normal access by humans.
The problem of emissions to the atmosphere is not totally solved by abatement equipment at the powerhouse. No emission control devices have yet been installed in the pre-plant elements. Thus during plant shutdown steam is vented directly to the atmosphere and constitutes a total failure, in effect, of the abatement systems. Venting is employed to avoid damage to either the producing reservoir or the steam wells, which might occur under totally closed-in conditions. A possible technique to control vent emissions of HzS is to use a bed of iron oxide to absorb the gas. This tech- nique would eliminate the problems of other systems requiring condensa- tion of the sham. The projecten emission levels of HzS are shown in figure 12.15. With an overall abatement of 90%, H,S in the year 2000 will be comparable to those at present, even though overall capacity will have grown by an order of magnitude to 5100 Mw.
1M.6 Ecoluvmdcdata
The cost to an electric power company of producing and transmitting a unit of electricity to the customer is the most important factor infiuenchg the choice of energy conversion system in a free marketplace. Three basic which includes the outlay for the power plant, interest incurred during expenses contribute to the total cost of electricity : (1) capital investment, construction, working capital, organization, startup expenses, and the costs of constructing transmission lines, if necessary; (2) operating and mainte- nance expenses; and (3) fuel cost, which in the case of geothermal power plants means the price the utility must pay to the field developer for the geofluid, be it steam or hot brine.
At The Geysers, the utility purchases dry steam “over the fence” from the supplier, according to a pricing formula that includes a surcharge levied on the utility by the supplier to cover the cost of disposing (by
L

c \
le F I Q ~ E 12.15--Estimated Ha emissions from The Geysers power plants [Ramachandran, 19771.

822 UlPITED STATES [Ch. 12
reinjection) of excess condensate. The formula that PG&E uses to buy steam for its Geysers units is as follows [Dnkher and Moir, 19761 :
where
Cs EF EN G c7, &" MER =minimum heat rate for fossil plants during year +1 MER"=minimum heat rate for fossil plants during 1968 2.11 =negotiable constant.
-cost of steam (mill/kW * h) for year IZ
=electricity produced from fossil fuel during year n-1 =electricity produced from nuclear fuel during year n-1 =average cost of fossil fuel for year n-1 =average cost of nuclear fuel for year n-1 paverage cost of fossil fuel in 1968
cj
Thus the cost of geothermal steam for any year is determined by the amount and cost of electrical production by fossil and nuclear means dur- ing the previous year. Base figures are taken for the cost of fossil fuel and fossil plant heat rate during 1968. In addition there is a surcharge of 0.5 mill/kW.h for reinjection of the spent geofluid. The historical price of The Geysers steam since 1969 is given in table 12.11. These prices include the surcharge for liquid effluent disposal.
Year Price
1969 ............................................. 2.65 1970 ............................................. 2.64 1971.. ........................................... 2.74 1972 ............................................. 2.90 1973. ............................................ 3.15 1974 ............................................. 3.73 1975 ............................................. 7.39 1976 ............................................. 11.35 1977 ............................................. 14.10 1978 ............................................. 16.05
Source: Ramachandran, 1977.
The only other geothermal steam contract at The Geysers is the one be- tween Shell Oil Company and the Northern California Power Agency (NCPA) , signed June 27,1977. The contract calls for NCPA to pay Shell

U
412.2 J 323
according to the amount of steam delivered. The initial price, at the time of the contract, was $0.6917/1000 lbm of steam. Beginning July 1,1977, the price will be adjusted semiannually by the Gross National Product (GJW) Implicit Price Deflator Index (IPD) published by the U.S. Department of Commerce for the preceding calendar quarter [Lindsay, 19771. The IPD is the ratio of the GNP in current dollars to the GNP in constant 1972 dollars for the current period. The geothermal steam supplied by Shell must be dry and at a pressure no lower than 799.8 kPa (116.0 lbf/in2) ; when the amount of noncondensable gases exceeds 0.5% (weight), the flow rate of steam will be corrected accordingly. Uncontaminated waste liquid will be returned to Shell for disposal at a temperature not greater than 79.4OC (175°F) and at a pressure not less than 262 kPa (38 lbf/in2). . The history of capital investment by PG&E at The Geysers is given in
table 12.12, where all figures are in current US dollars. A comparison be- tween the cost of electricity generated by Units ll and 14 is shown in table 12.13, in which cost figures are given in constant 1976 dollars. The effect of inflation is nullified in this comparison, leaving the added expense of the equipment additions and modifications needed to meet the H2S emissions constraints as the main contributing factor causing the 1.6 mill/kW - h (9%) increase in the cost of electricity. Of course, since Unit 14 is under construction, the cost of electricity fmm that unit, 19.2 mill/kW - h, is
Table 12.12-Cizpital imesl&nt 6y €'#&E d The Geysers geothermul power project 8
THE GEYBICBB AT SOKOMA AND LAKE COUNTIES, CALIFOBNU
; w i
Date of P W E Com- . PG&E Cumulative
Cumulative mercial Capital Capital Unit Megawatts Megawatts Operstion Investment Investment
1 2 3 4 5 6 7
$ 8 9
LO 11 12
b 13 b 14
15 16
d 17
11 13 27 27 53 63 53 53 53 53
106 106 135 110 55
110 110
11 24 61 78
131 184 237 290 343 396 802 'SO8 743 853 908
1018 1128
9/25/60 } !la, 010,000 3/19/63
3/02/68
12/15/71
11/23/72 8/18'72 ] 10, 982, 000
10/25/73 } 13,520, OOO 11/30/73 11/20/76 14,404,000 3/01/79 0 21,473,000 2/01/80 0 28,934,000 6/01/80 0 27,966,000 6/17/79 0 17,339, 000
o 1983 0 42,449,000 o 1982 0 41,592,000
%p, 010, 000
11,620, 000
24,376,000
35,358,000
48,878,000 63,282,000
O 84,755,000 0 113,689,000 0 141, 655,000 0 158,994,000 O 201,443,000
243,035, OOO
Source: Dan et al., 1975; all figures in US $.
0 Estimated. Under COIIEtNCtiO?t.
Permits pending.
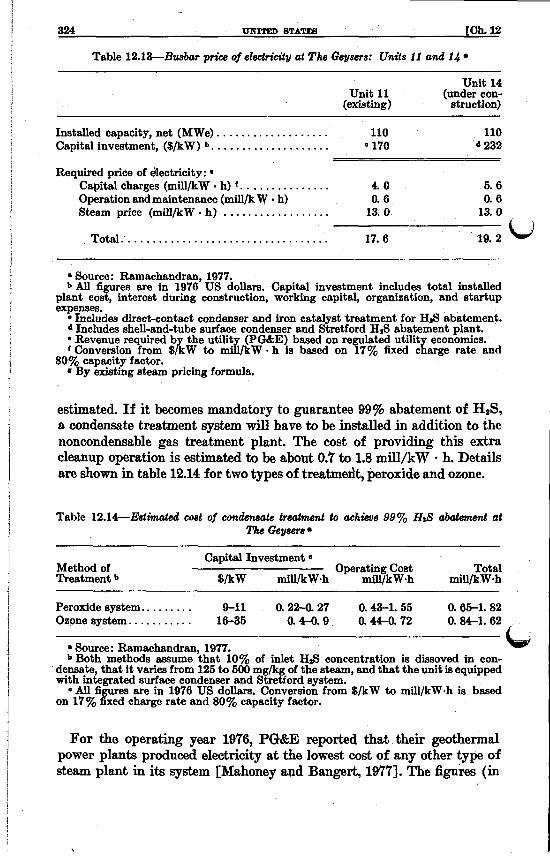
324 UNITED STATFS [Oh. 12 I
Table 12.13-Busbar price of slectrieity at The Geysers: Units 11 and 14
Unit 14 Unit 11 (under con-
(existing) struction)
Installed capacity, net (MWe) ................... 110 110 Capital investment, ($/kW) b. ................... e 170 * 232
Required price of dlectricity: * Capital charges (mill/kW . h) f . .............. 4.0 5. 6 Operation and maintenance (mill/lc W - h) 0. 6 0. 6 Steam price (mUl/kW . h) .................. 13. 0 13. 0
Total. .................................. 17. 6 19. 2 U Source: Ramachandran, 1977.
bAll figures are in 1976 US dollars. Capital investment includes total installed plant cost. interest during construction. working capital. organization, and startup - expenses.
e Includes direct-contact condenser and iron catalyst treatment for HsS abatement. d Includes shell-and-tube surface condenser and Stretford Has abatement plant. * Revenue required b the utiiit (PG&E) based on regulated utilit economics. f Conversion from $&W to m&kW - h is based on 17% fixed cgarge rate and
* 'by existing steam pricing formula. 807 capacity factor.
estimated. If it becomes mandatory to guarantee 99% abatement of H2S, a condensate treatment system wi l l have to be installed in addition to the noncondensable gas treatment plant. The cost of providing this extra cleanup operation is estimated to be about 0.7 to 1.8 mill/kW - h. Details are shown in table 12.14 for two types of treatmedt, peroxide and ozone.
Table 12.14--Estimated coat of condensate tredment to achieve 99% HIS abatement at The &yWT8
Capital Investment e Method of Operating Cost Total Treatment b $/kW mill/kW.h mill/kW.h mill/kW.h
Peroxide system.. ....... 9-11 0.22-0.27 0.43-1.55 0. 65-1. 82 Ozone system.. . . . . . . . . . 16-35 0 . 4 4 . 9 0.44-0.72 0. 84-1. 62
Source: Ramachandran, 1977. b Both methods assume that 10% of inlet HsS concentration is dissoved in con-
densate, that i t varies from 125 to 500 mg/kg of the steam, and that the unit is equipped with integrated surface condenser and Stretiord system.
e All figures are in 1976 US dollars. Conversion from $/kW to mill/kW.h is based on 17% fixed charge rate and 80% capacity factor.
For the operating year 1976, PG&E reported that their geothermal power plants produced electricity a t the lowest cost of any other type of steam plant in its system [Mahoney and Bangert, 19773. The figures (in
\

# 12.21 825
1977 dollars) are as follows: geothermal, 18 d / k W * h; nuclear, 24 mill/kW h; coal-fired, 26 mill/kW h ; oil-fired, 36 mill/kW h. e o - thermal plants were the least expensive to construct; they were 26% cheaper than oil-fired plants, about half as expensive as coal-fired plants, and cost only 38% of a typical nuclear plant. All comparisons are on a dollars-per-kilowatt basis.
193.7' O p e r a h g experience ~
Operation of The Geysers power plants is challenging because of several factors, including the isolated location, rugged mountain terrain, and end- ronmental and operating requirements unique to geothermal plants [Matthew, 19751. All units are designed for automatic operation. A com- puter-based information and control center located at Units 5 and 6 is manned full-time. Information and alarms from each unit in the system are sent to this center for action by the operator. The units function as base- load units, since abrupt changes in well flow rates damage both the wells and the turbines owing to gross carryover of water, dust, and debris. When a unit trips off4he line, the wells connected to it are allowed to vent to the atmosphere through silencers. These wells are not closed-in unless the unit must remain off-line for an extended period for maintenance or repairs.
Ambient temperature fluctuates during the year from about -3" to 46°C (20" to 115"F), necessitating forced ventilation of the electrical equipment during summer and special precautions to prevent freezing of outside
1 equipment, particularly the cooling towers, in winter. Automobile access to the plant during winter is difTicult becaye the narrow mountain roads are often ice covered.
Table 12.15 contains information on plant reliability. Capacity and availability factors are shown for The Geysers system over the operating history of the plant up to 1935. For comparison, figures are quoted for
Table 12.15-PQ &E power plant reliability, geothermal versw) fossil
THY QEYSEBS AT BONOMA AND LAKE COUNTIES, CALXTOBNXA
I
~-
The Geysers System Fossil Plants
Avg: Performance Factor 1960-1975 1961-1974 Nonreheat b Reheat 0
U c a p a c i t y factor (%)d. . . . . . . . 70-96 75. 6 24.8 54. 0 Availability factor (%)a .. . . . . 70-96 86. 8 91. 5 87. 6
6. 2 1. 3 2. 5 ' 7.2 7.0 9. 8
Forced outage rate (%) . . . . ... Scheduled outage rate (%) . . .
- - Source: Matthew, 1975.
to 51OOC (9WF to 950OF)
psi): T=538OC to 585OC (100WF to 1050OF)
b 100 MW, turbine Met conditions: P=8.7 to 9.1 MPa (1265 to 1315 psi); T=482OC
e 165 to 330 MW turbine inlet conditions: P112.5 to 16.6 MPa (1815 to 2415
capacity factor= gen&ation/(unit rating X eriod) Availability factor= (period-outage perioa)/period

326 UNITED STATE8 [Oh. 12
fossil-fired plants in the PG&E system. The Geysers has the highest capac- ity factor, an indication of preferential base-load usage. The availability factor is comparable to but slightly lower than that for fossil plants. The higher forced outage rate for the geothermal plants is a result of
unexpected failure of auxiliaries and components that usually function without trouble in conventional plants. These components include turbine blades and shrouds, rotating electrical apparatus (exciters and motors), small pumps, and cooling tower fan blades. A spare parts maintenance pro- gram is designed to minimize downtime. Geothermal units at The Geysers are dismantled, cleaned, and repaired every 2 to 3 years compared with 5 to 8 years for conventional units. Downtime is less, 3 to 4 weeks instead of 8 to 12 weeks, because of the smaller size and relative simplicity of the geo- thermal units. As experience is gained, the scheduled outage rate should continue to improve.
12.3 Magmamax dual binary plant at East Mesa, California
t,
There are currently two practical methods for converting the energy in n liquid-dominated hydrothermal resource into electricity. The first in- volves either separating the vapor fraction for use in a steam turbine or combining a separation with a subsequent flashing process of the residual liquid to generate more vapor. The second involves the use of the hot geo- fluid as a heating medium for a secondary working fluid of a suitably low boiling point which is then used in a more or less conventional, basic Rankine cycle. The geothermal power plant being constructed at East Mesa, California by the Magma companies is of the latter type and is called the Magmamax" dual binary cycle. When completed in 1979, it wil l be the first commercial geothermal power plant of this type in the United States. The plant mill have a rated capacity of 11.2 MW(e).
H3.l Geology and t m p h a t h
The plant is being built on the East Mesa KGRA in the Imperial Valley, about 2.4 km (1.5 mi) east of the junction of routes 1-8 and 115, or about 8 km (5 mi) southeast of Holtville. The plant site is in Section 7 Township 16 South and Range 17 East (T16S-Rl7E) of the KGRA, a well-known thermal anomaly. The plant is located between heat flow con- tours of 6.0 and 7.0 heat flow units (HFU)." Figure 12.16 shows a heath flow contour map of the area [BuRec, 19771. The plant is adjacent to the U.S. Bureau of Reclamation's East Mesa Test Site; Magma Power Com- pany holds 756 ha (1868 acres) of Federal leases for which they paid $2.25 per acre [Williams et al., 19771.
The East Mesa KGRA is part of the larger Mexicali-Imperial Rift Valley, an extension of the system of mid-oceanic ridges and rifts that
Magmamax Process, U.S. Pat. No. 3757616, Magma Energy, Inc., Los Angeles. 1 HFU=l @/c+s.
J

8 12.33 MAOMAMAX DUAL BINARY PLANT AT EABT MEBA, CALIROBRIA 327
FIGURE 12.16-Heat flow contours, East Mess KGRA [BuRec, 19771.
circle the earth. The valley is oriented northwest-southeast and is bounded by the San Andreas fault zone on the northeast and by the San Jacinto fault zone on the southwest. The most prominent feature of the valley is the Salton Sea, 48 X 16 km (30 X 10 mi) in size and lying at about 72 m (235 f t ) below sea level. During the last 2000 years and until about, 300 years ago, the area now occupied by the Salton Sea was the site of the larger Lake Cahuilla. The irrigated agricultural land found today in the Im- perial Valley is confined roughly within the ancient shoreline of Lake ’
Cahuilla; the East Mesa KGRA lies at the eastern boundary of this ancient shoreline [Saint, 19761. The Salton Sea was formed when the Colorado River flooded the area during 1905,4906 ; its level is maintained by the runoff from irrigation in the valley.
The structure of the valley is characterized by predominantly trans- form faults with lateral movement, crustal spreading, high heat flow, w faulting, and volcanic activity. The crystalline basement of the valley in the East Mesa area is at a depth of about 3.7 km (12,100 ft) and is over- lain with water-saturated sediments of the later Cenozoic era (Quaternary and late Tertiary periods), having been deposited by the Colorado River and other streams khat flowed through the Colorado River drainage basin during the last 4 million years. The depth to the top of the hydrothermal (convective) reservoir is estimated to be 1 Inn (3281 ft) [Williams et al., 19771. Although there are no surface thermal manifestations in the East Mesa area, the subsurface hydrothermal reservoir is quite extensive, con-
-
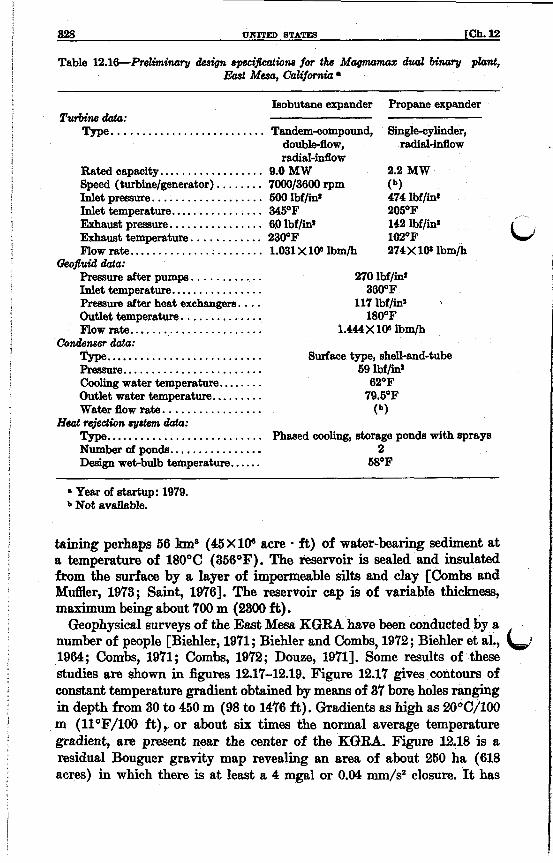
828 UNITED STATES [Ch. 12
Table 12.16-Preliminu~ design specijiediona for the Mc~pwnux dual bincrry p h t , Eiut Mesa, California
Isobutane expander Propane expander Turbine datu:
Type. ......................... Tandem-compound, Single-cylinder, double-flow, radial-idow radial-mow
Rated capacity.. ................ 9.0 MW 2.2 MW P)
Inlet pressure. .................. 600 lbf/in* 474 lbf/ing Inlet temperature.. .............. 345°F 205°F Exhaust pressure. 60 lbf/ing 142 lbf/ii* Exhaust temperature. ........... 230'F 102°F Flow rate.. ..................... 1.031 X 1CP lbm/h 274X 101 lbm/h
Pressure after pumps. ........... Fhmure after heat exchangers. ... Outlet temperature. ............. 180°F Flow rate.. ..................... 1.444XlW lbm/h
Speed (turbime/generator) ........ 7000/3600 rpm
............... L, Geofluid &a:
270 lbf/ins
117 lbf/in' Inlet temperature. ............... 3600F
Condsnser data: Type. .......................... Surface type, ah&-and-tube Pressure. ....................... 59 lbf/iig cooling water temperature.. ...... 62°F Outlet water temperature.. ....... 79.6'F Water flow rate. ................ (b)
Tgpe.. Number of ponds.. .............. 2 Design wet-bulb temperature. ..... 68°F
H a t rejectwn q s t m dcrkr: ......................... Phased cooling, storage ponds with sprays
a Year of startup: 1979. b Not available.
taining perhaps 56 b8 (45 X loa acre ft) of waterharing sediment at a temperature of 180°C (356OF). The reservoir is sealed and insulated from the surface by a layer of impermeable silts and clay [combs and M d e r , 1973; Saint, 19'761. The reservoir cap is of variable thickness, maximum being about 700 m (2800 fi) .
Geophysical surveys of the East Mesa KGRA have been conducted by a number of people [Biehler, 1971 ; Biehler and Combs, 1972 ; Biehler et al., b 1964; Combs, 1971; Combs, 1972; Douze, 19711. Some results of these studies are shown in figures 12.17-12.19. Figure 12.17 gives contours of constant temperature gradient obtained by means of 37 bore holes rangbg in depth from 30 to 450 m (98 to 1476 ft). G-radients as high as 20°C/100 m (ll°F/lOO ft), or about six times the normal average temperature gradient, are present near the center of the KGRA. Figure 12.18 is a residual Bouguer gravity map revealing an area of about 250 ha (618 acres) in which there is at least a 4 mgal or 0.04 mm/s2 closure. It has

t 12.31 MAQMAMAX DUAL BIXABY PLANT AT EAST MESA, a A u m x N u 329
HOLTVLLE C
z D r15s r
r16S
iLYlNG FIELD
CONSTANT THERMAL GRADIENT , OC/ lOOm
\ *
ALL AMERICAN CANAL 1
FIGURE 12.17-Thermal gradient map, East Mesa KGRA [Combs, 19711.

UNITED STATES [Ch. 12 330
d
d
FIGURE 12.18-Residual Bouguer gravity anomaly map, East Mesa KGRA. Contour values in mgal (1 mgal=lO rm/s5) (Biehler, 19711.

5 12.81 MAQMAMAX DUAL BINABY PLANT AT EAST MESA, OALIFOBNIA . 331
beep suggested that this gravity high is an indication of either an increase in density of the sediments caused by cementation and thermal alteration by circulating hot brines, or the emplacement of higher-density ignesous rocks [Biehler and Combs, 10721.
Seismic ground noise may be an,indicator of a geothermal reservoir when reinforcing evidence from other geophysical measurements exists. Figure 12.19 shows a ground-noise map of the East Mesa KGRA, where
\ HOLTVILLE OJTLYHG FIELD
1/20 I 2 3 k m - ALL AMERICAN CANAL
W W
Framr~, 12.19-Seismic ground-noise map, East Mesa KGRA. Contour values in dB relative to 1 (nm/s)s/Hs in passband 3-5 Hz [Dowe, 19711.

!
1 332 UNITED BTATEB [Oh. 12
contours are given in decibels relative to 1 (mm/s)2 per hertz in the pass-
that is, there are no surface manifestation-its discovery marked a major triumph for the science of geothermal exploration, even though the o*- nal indication of a possible thermal anomaly came about accidentally through oil and gas drilling in the area [Koenig, 19771.
1 1 1 band 33 Hz. Since the East Mesa region constitutes a “hidden reservoir’’- ! i
! i
1 1i?J$ Well program 1 1
1 I
The Magmamax dual binary plant will be supplied with pressuriZed p- fluid from three wells. Down-hole pumps will be used to prevent flashing and. help inhibit the’ deposition of scale. Each well is expected to produce about 218 Mg/h (481,000 lbm/h) of brine at wellhead condition of 182°C
will raise the pressure to 1.86 MPa (270 lbf/in2). The geothermal fluid wi l l circulate through a number of heat exchangers before being reinjected into the reservoir through two reinjection wells. The spent fluid will enter the reinjection pump at 82°C (180OF) and 0.81 MPa (117 lbf/in2) ; the pump will raise the pressure to 1.3 MPa.
i 1$.&8 Ertergy C W n V f P 8 h Sy8tf”n
Li i , (360OF) and 1.35 MPa (196 lbf/in*). A booster pump at the power plant
I I
A highly simplified flow diagram for the plant is shown in @re 12.20; the planned layout design as of December 20,1976, is shown in figure 12.21. Preliminary design specifications for the plant are given in table 12.16. There are two parallel power loops, one using isobutane ( i-CJL ) and one using propane ( C,H, ) as the working fluid. The two loops are con- nected by means of the recuperator, which uses the superheated isobutane
~
r
I
I
I
I
leaving the turbine to preheat and vaporize the propane. On the basis of the preliminary specifications quoted for the plant, the system will be capable of a resource utilization efficiency of about 52%, assuming a sink I
temperature of 27°C (80OF). Specific brine consumption will be about 58.5 kg/kW h (129 lbm/kW h). The objective of the plant’s developers is to reduce consumption to less than 45.4 kg/kW * h (100 lbm/kW - h) [Hinrichs and Falk, 19781.
The isobutane turbine was built by the Pork Division of Borg-Warner Corporation to the specifkations of J. Hilbert Anderson [Anderson, 19731. d i The machine is of the double-flow type with each side being a three-stage radial inflow turbine. The unit is essentially a compressor that has been redesigned for turbine duty. The turbine is expected to operate a t an isen- tropic efficiency of about 77%. The propane turbine was built by Mafi- Trench and is typical of machines of this type used for low-temperature
tions indicate an expected isentropic efficiency of about 86% [Ma&, 19783. About 10.5 ha (26 acres) will be dedicated to the storage ponds required
for the phased cooling system. The two ponds will hold roughly 1.7 X lo5
i
I 1
i I
i i
i
I
1 i
I
I applications; of the radial inflow type, its preliminary design specifica-
1
~

3 12.4 BEPUBLIO GEOTHEBMAL AT EALBT MELBA, C-ORNIA 833
INJECTION WEJ,'-~ TO HEATERS- ISOBUTANE BOILERS- 1-1 ~ L & C T I O H SUPERHEATERS
ISOBUTANE RECUPERATOR- PROPANE HEATERIBOILER
BOILERISUPERH TURBOGENERATOR
- GEOFLUID - ISOBUTANE PRO PAN E
I C T CONDENSER
FIGURE 12.20-SiiplSed flow diag-ram for the Magma- Process (U.S. Pat. No. 3767616) of the dual binary plantat East Mesa [Anderson, 197Sa].
m8 '(138 acre ft) and 9.0 X l(r m8 (73 acre * ft) of water, respectively, for a storage time of about 16 hours [Hinrichs, 19781. The combined use of phased storage and spray cooling is expected to produce cooling water at a temperature only 2.2"C ( 4 O F ) above the design wet-bulb temperature of 14.4OC (68OF).
12.4 Republic Geothermal at East Mesa, California I
Republic Geothermal is currently developing a portion of the East Mesa w eothermal field with the intention of building a 48-M3V(e) double-flash power plant to be operating in 1980. Republic's plant will be located about 5 km (3 mi) north of the Magmamax dual binary plant (=e figure 12.16). Republic holds leases to 2713 ha (6705 acres) ; as can be seen from figure 12.16, Republic's holdings lie in a region of the Known Geothermal Resource Area (KGRA) in which the thermal anomaly ranges from a high of about 6 HFU to less than 4 HFU. Otherwise the geology of the area is practically identical to the portion of the KGRA described in section 12.3.1.

1 I 1 I I I
L J
FIGURE 12.21-Plant layout diagram for Magmamax binary plant, East Meaa. Key: A=brine inlet; B=brine outlet; C=isbbutane heaters, boners, superheaters (typ.) ; D-isobutane turbine, gearbox, generator; E=recuperator ; F=isobutane con- densers; G=propane superheater; €€=propane turbine, gearbox, generator; I= propane condenser [Anderson, 1976b; T. C. Hinrichs, personal communication].
lg.4.9 Well programs and productivity
A recent analysis of flow tests was carried out for well EM 16-29, which extends to a depth of 2420 m (7940 ft) with the following casing program [Elliott, 1978; J. H. Barkman, personal communication] :
384 mm (15.124 in) I.D. from wellhead to 329 m (1079 ft) 276 mm (10.880 in) I.D. from 283 to 1408 m (929 to 4619 ft) 201 mm (7.921 in) T.D. from 1355 to 2420 in (4446 to 7044 ft). LJ The analysis indicated that the reservoir pressure was 14.80 MPa (2146
lbf/in2) at 1524 m (5000 ft), and the draw-down coefficient was 21 P a / ( kg/s) , or 1.38 lbf/in2/ (Ibm/s). True reservoir temperature (ob- tained by a weighted average over the production interval) was about 168°C (334°F). The maximum observed flow rate was limited by the Size of certain elements of the surface equipment to about 45 kg/s (357,000 lbm/h) . The wells will be operated not in the self-flowing mode (as in these tests), but in a pumped mode using down-hole pumps of either line- shaft or electric, submersible design. Each well is expected to deliver

8 12.61 DOUBLE-BOILINQ BINABY PLANT AT BART BIVEB, mAHO 835
about 113 kg/s (900,000 lbm/h) of fluid under pumped conditions with bhe pump set at approxbuately 305 m (1000 ft) .
Republic received the first loan guaranty made by the government under the Geothermal Loan Guaranty Program (GLGP). Issued in May 1977, the guaranty provides $9 million to drill a number of additional produc- tion and reinjection wells at the East Mesa site. Each well is expected to be capable of producing more than 2 M W of electrical power [Silverman, 1977 ; ERDA News, 1977).
I$..&8 EWTgY CO!WVeT8h 8YStem
w A single-flash plant of 10 MW output is planned, the first of its type in the United States. This commercial plant should be completed in 1979 [Holt, 1977b) and will be the first element of a larger, 48-MW(e) double-flash plant presently being designed. This plant will include the above-mentioned 10-MW turbine-generator and is expected to begin operating in 1980. An artist’s conception of the proposed plant is shown in figure 12.22.
lZ.5 Southern California Edison/Union Oil at Brawley, California
A 10-MW separated-steam (or “single-flash”) geothermal power plant is being designed for the Brawley field in the Imperial Valley. The plant will be operated by Southern CJifornia Edison using steam supplied by Union Oil Company. The Brawley field lies about 38 km (24 mi) north- west of East Mesa with a reservoir characterized by higher fluid tempera- tures and salinities than at East Mesa. Six geothermal wells have been sunk; the deepest extends to a depth of about 4 km (13,000 ft). At a depth of 2.4 km (7870 ft) , a maximum temperature of 262°C (504OF) has been reported. Mean reservoir temperature is believed to be 253OC (478OF) [Muffler, 1979) ; dissolved solids amount to roughly 10,000 ppm.
The energy conversion system will be supplied by Mitsubishi Heavy Industries, Ltd., and consist of that company’s portable Modular-10 turbine-generator package [Aikawa et al., 19781, a unit designed for simplicity of installation and maintenance. It is patterned after the plant at Onuma, Japan (see section 6.4.3). The turbine, generator, and all aux- ilaries are located at ground level; the exhaust is led from the upper part
u o f the turbine casing to a shell-and-tube condenser. Table 12.17 lists specifications for the turbine.
12.6 Double-boiling binary plant at Raft River, Idaho
A 5-MW (gross) binary plant is being designed by the Idaho National Engineering Laboratory for operation at the Rast River KGRA in Idaho [Ingvarsson and Madsen, 19761. This plant will use geothermal fluid at the relatively low temperature of 143OC (290OF) and will employ iso- butane as the cycle working fluid. A simplified process flow diagram is

\
536 U
HlT
ED
STATES [Oh. 12
c
0
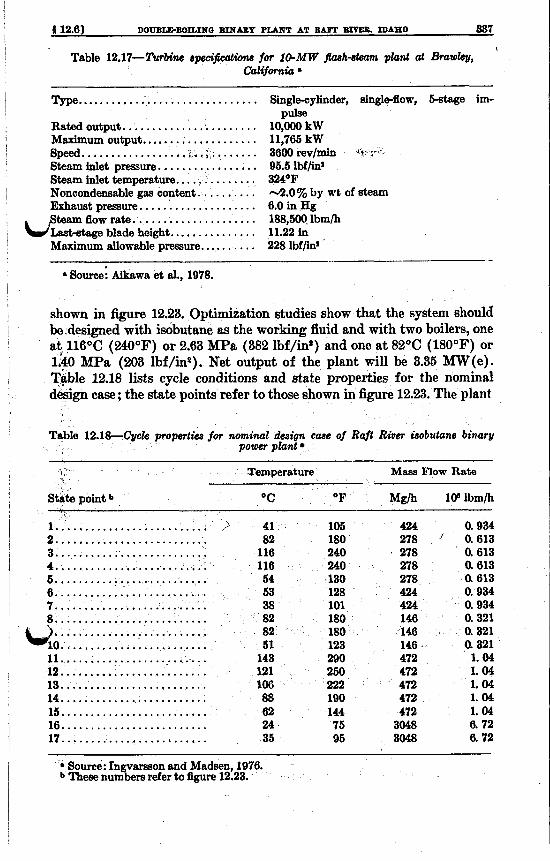
4 12.61 DOUBLE-EOXLIHO BINABY PLANT AT EA6T m. IDAHO 837
Table 12.17-firbine spw'3cattWns for IO-MW jkrsh-steam plant at Brawlsy, '
California 8
1 Type ............................... Single-cylinder, single-flow, &stage im- I Pulse
Rated output.. ..................... 10,OOO kW Maximum output.. .................. 11,765 kW Speed.. ................... ., ........ 3600rev/min 1
Steam inlet pressure. ................ 95.5 lbf/im* i Steam inlet temperature.. ............ 324'F
Noncondensable gas content. ......... 4.0% by wt of steam Exhaust presaure. ................... 6.0 in Hg Steam flow rate. .................... 188,500. lbm/h
~ L a s t d t a g e blade height.. ............. 11.22 in Maximum allowable pressure. ......... 228 Ibf/in*
, -
l 8 Source: Aikawa et al., 1978.
shown in figure 12.23. Optimization studies show that the system should be designed with isobutane as the working fluid and with two boilers, one
6°C (240°F) or 2.63 MPa (382 Ibf/in2) and one at 82°C (180°F) or MPa (203 lbf/in2). Net output of the plant will be 3.35 MW(e).
Tkble 12.18 lists cycle conditions and state properties for the nominal case; the state points refer to those shown in figure 12.23. The plant
iver isobulans binary
1
I
l e 12.18-Cyek properties for nominal design m e of R
power plant
Temperature Mass Flow Rate
I 1. ........................ 105 424 0.934 2 . . . . . . . . . . . . . . . . . . . . . . . . . . 180 278 0.613
I 3. ........................ 240 278 0.613 4 . ....................... 240 278 0.613 ~
0.613 I 5 .......................... 130 278 6..............,.......,... 53 128 424 0. 934
~ ?........,................. 38 101 424 0.934 8. ......................... 82 180 146 0.321
82 180 146 0.321 51 123 146 a 321
11 ..................... i . . . . 143 290 472 1. 04 12 ......................... 121 250 472 1. 04 13. ........................ 106 222 472 1. 04
1 1. 04 14.. ....................... 88 190 472 15. ........................ 62 144 472 1. 04 16 ......................... 24 75 3048 6.72 17. ........................ 35 95 3048 6.72
I I
+do: : : : : : : : : : : : : : : : : : : : : : : : :
1
Source: Ingvarsson and Madsen, 1976. - 1 I
b These numbers refer to figure 12.23.
i I

PREHEATER 2
-* ------- c WATER
- - - - - - - - d m
LOW- PRESSURE’ TURBINES
CONDENSER
FIGURE 12.23-Process flow diagrm for Raft River double-boiling isobutane binary cycle power plant [Ingvamon and Madsen, 19761.
will require about 141 kg/kW - h (310 lbm/kW h) and have a resource utilization efficiency 7,=320/0, based on a wellhead availability of 14.88 kJ/kg (34.62 Btu/lbm) and a plant output of 4.72 kJ/kg (10.99 Btu/lbm). Although the plant will serve primarily as a test bed for low-temperature geothermal power plants, the electricity produced will be fed into the gn of the Raft River Electrical Cooperative. The cost of electricity is esti- mated to be 31.15 mill/kW - h [Ingvarsson and Madsen, 19763. The plant is expected to begin operating in January 1980.
12.7 Hawaii geothermal project at Puna, Hawaii
L d
=-
A separated-steam (or %ingle-flash”) plant of 5 M W capacity will be installed at khe Kapoho reservoir near Cape Kumukahi in the Puna (Puulena) region of the Big Island of Hawaii in 1980. The plant will con-
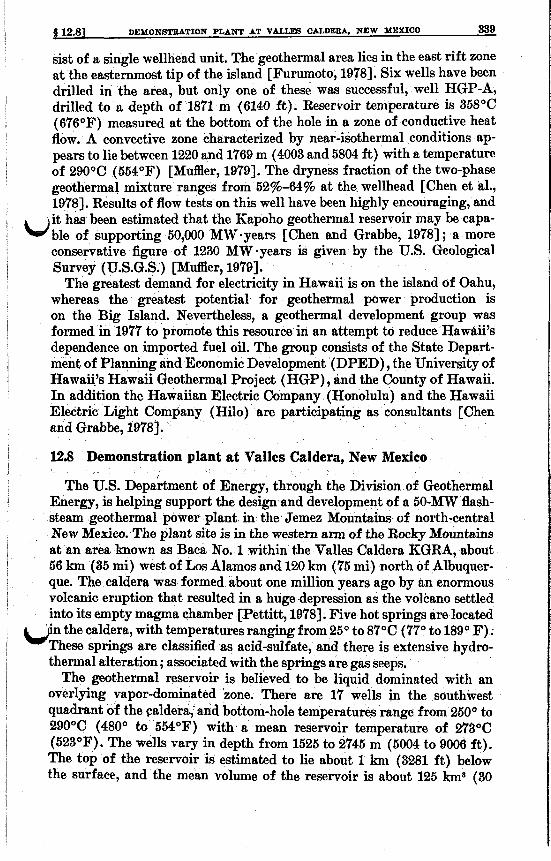
$12.83 DEMONSTEATION PLANT AT VALLES CALDERA, NEW MEXIOO 339
sist of a single wellhead unit. The geothermal area lies in the east rift zone at the easternmost tip of the island [Furumoto, 19781. Six wells have been drilled in the area, but only one of these was successful, well HGP-A, drilled to u depth of 1871 m (6140 ft). Reservoir temperature is 358°C (676°F) measured at the bottom of the hole in a zone of conductive heat flow. A convective zone characterized by near-isothermal conditions ap- pears to lie between 1220 and 1769 m (4003 and 5804 f t ) with a temperature of 290QC (554°F) [Muffler, 19791. The dryness fraction of the two-phase geothermal mixture ranges from 52oJo-64oJo at the. wellhead [Chen et al., 19781. Results of flow tests on this well have been highly encouraging, and it has been estimated that the Kapoho geothermal reservoir may be capa-
u b l e of supporting 50,000 MW-years [Chen and Grabbe, 19781 ; a more conservative figure of 1230 MW-years is given by the U.S. Geological Survey (U.S.G.S.) [Mder , 19791.
The greatest demand for electricity in Hawaii is on the island of Oahu, whereas the greatest potential for geothermal power production is on the Big Island. Nevertheless, a geothermal development group was formed in 1977 to promote this resource in an attempt to reduce Hawaii's dependence on imported fuel oil. The group consists of the State Depart- ment of Planning and Economic Development (DPED) , the University of Hawaigs Hawaii Geothermal Project (HGP) , and the County of Hawaii. In addition the Hawaiian Elcctric Company (Honolulu) and the Hawaii Electric Light Company (Hilo) are participating as consultants [Chen and Grabbe, 19783.
12.8 Demonstration plant at Valles Caldera, New Mexico
The U.S. Department of Energy, through the Division of Geothermal Energy, is helping support the design and development of a 50-Mw flash- steam geothermal power plant in the Jemez Mountains of north-central New Mexico. The plant site is in the western arm of the Rocky Mountains at an area known as Baca No. 1 within the Valles Caldera KGRA, about 56 km (35 mi) west of Los Alamos and 120 km (75 mi) north of Albuquer- que. The caldera was formed about one million years ago by an enormous volcanic eruption that resulted in a huge depression as the volcano settled into its empty magma chamber [Pettitt, 19781. Five hot springs are located
w n the caldera, with temperatures ranging from 25" to 87°C (77" to 189' F) . These springs are classified as acid-sulfate, and there is extensive hydro- thermal alteration; associated with the springs are gas seeps.
The geothermal reservoir is believed to be liquid dominated with an overlying vapor-dominated zone. There are 17 wells in the southwest quadrant of the Caldera, and bottom-hole temperatures range from 250" to 290°C (480" to 554°F) with a mean reservoir temperature of 273°C (528°F). The wells vary in depth from 1525 to 2745 m (5004 to 9006 f t ) . The top of the reservoir is estimated to lie about 1 km (3281 ft) below the surface, and the mean volume of the reservoir is about 125 lun* (30

840 UET- STATEX [Ch. 12
mi*) [Mder , 19791. The overlying rocks, for drilling purposes, are clas- sified as hard. The U.S.G.S. reported that the Valles Caldera KGRA has the potential to support 2700 Mw of electrical power production for 30 years [Mufler, 19791. At this stage it is known that the plant will utilize the two-phase geofiuid in a separated-steam (or so-called “single-flash”) power system. The plant flow diagram will likely follow the general lay- out shown earlier in figure 1.5.
The geothermal field has been developed by Union Oil Company, which wi l l supply steam to Public Service Company of New Mexico. Each pro- duction well is believed capable of providing 91 Mglh (200,000 lbm/h) of geothermal fluid with a quality of 35% at a wellhead pressure of 965 kPa (140 lbf/in8). Roughly 15 wells .will be needed to supply the 50-MW plant. The intent of the demonstration project is to show that geothermal power plants using liquid-dominated resources can be built and operated in the United States on an economically competitive, commercial basis. If all goes as planned, electricity will begin flowing in 1982 [GEM, 19783.
Li
12.9 Potential growth of geothermal power in the United States
The most recent assessment by the U.S.G.S. w b e r , 19791 estimates that the identified hydrothermal convection systems with temperatures in excess of 90°C (194OF) in the United States (excluding National Parks) are capable of generating about 23,000 MW of electricity for a period of 30 years, i.e., the equivalent of 23 large nuclear power plants. When undiscovered systems are included, the estimate jumps to 95,000- 150,000 Mw for 30 years. A comprehensive list of known geothermal sites together with their characteristics may be found in U.S.G.S. Circular 790 [ M d e r , 19791.
The thermal energy contained in geopressured-geothermal reservoirs may ultimately deliver between 23,000 and W,000 MW of electricity for 30 years. This estimate does not include any electricity generated from the separate combustion of dissolved methane gas. The technology for convehing the energy in hot, dry rocks into electricity is not yet estab- lished; the U.S.G.S. could not assess the potential of hot, dry-rock sys- tems, although it is estimated that the energy associated with such systems is several thousand times that associated with either hydrothermal or geo- pressured reservoirs [ M a e r , 19793.
1dS.l Imperial Valley, Oalifolynia
The Imperial Valley of southern California holds a huge reserve of geo- thermal energy. A recent conservative estimate of the potential of this area suggests that 8700 MW of geothermal electricity capacity may .be possible assuming 2030-year plant lifetimes [Younker and Kasameyer, 19783. A number of power plants of various designs are either under construction or in the advanced stages of planning. Table 12.19 lists particulars for these
di

.. .. ~lllllllllll.. _.____.__I.I__. ~ .. . . . . . . . . . . . . . . . . . . .......... . . . . . . . . . . . . . . .
c c
Table 12.19-GsotM power plants undcr mstrtution or planned for the Imperial V a l b , California
Year of Capacit Site ’ Utility or Plant Owner Field Developer Startup MI$ Plant-
East Mesa ............ ImperialMagrna .......... MagmaPower.. .......... E& Mesa. ........... San Diego G & E.. ........ &public Geothermal.. .... Brawley.. ............ So. CaL Edison. .......... Union Oil.. .............. Niland. .............. So. CaL Edison. .......... Union Oil.. .............. Ndand. .............. San Diego G & E.. ........ Magma Electric.. ......... Heber.. .............. So. CaL Edieon.. ......... Chevron .................. Heber.. .............. San Diego G & E.. ........ Chevron.. ................ Weatmorland.. ........ (b). ..................... Republic Geothermal.. ....
’ 1979 1980, 1982
1980 1982 1982 i982
(.I (a) -- ---
6 In planning. b Not available.
11.2 Magrnamax dual binary 4 8 0 Single- and double-flash la0 Single-flaah 10. 0 Single-flash 50 Single- or double-flash 45 Doubleflash 50 Binary 50 Double-flsah

342 UNlTED STATES [Ch. 12
plants. The first three have been described in sections 12.3-12.5; of the plants now in planning, two are slated for the Heber geothermal field. One of these will be a 50-MW “double-flash” plant to be operated by Southern California Edison, and the other will be a 45-MW binary plant for San Diego Gas & Electric.
The Heber KGRA is located about 32 km (20 mi) west-southwest of East Mesa. Reservoir temperature is about 180°C (356°F) ; 11 wells, rang- ing in depth from 0.9 to 3.3 km (2950 to 10,800 ft) , have been drilled to date [Muffler, 19791. The total amount of dissolved solids in the Heber geo- fluid is between 14,000 and 25,000 ppm, or about one order of magnitude greater than the fluid at East Mesa. Also, Heber is located in the midst o valuable, irrigated agricultural land and will necessitate careful handling of the geofluid-from the production wells through the power plants and nltimately to reinjection wells for disposal. The depth to the crystalline basement in the Heber area, estimated at 7 km (4.3 mi), is greater than at any other known site in the Imperial Valley [Geonomics, 19761. The con- vecting reservoir consists of deltaic sediments considered relatively soft for drilling purposes. The U.S.G.S. estimates that Heber is capable of sup- porting 650 MW of electrical generating capacity for 30 years [Muffler, 19791.
Preliminary specifications for the SDG&E 45-MW binary plant are given in table 12.20. (See also figure 1.8.) Although the working fluid has not yet been determined, it is expected to be a mixture of isobutane and iso- pentane. It has been suggested that the composition of the mixture be changed over the lifetime of the plant in order to maintain as near an optimum operating condition as possible in the event the reservoir temper- ature should decline in the course of exploitation. Resource utilization efficiency would be about 41% based on present design specifications and allowing for 15,000 pprn of total dissolved solids in the brine. The plant would require a specific brine flow of about 68 kg/kW.h (149 lbm/ IcW - h) [ SDG&E, 19’771.
Republic Geothermal is planning to build a 50-MW true “double-flash” plant at Westmorland, about 35 km (22 mi) north of Heber. Reservoir temperatures have been quoted ranging from 217OC (423°F) [Mder , 19791 to 260°C (500°F) [Anderson, 19771. Six geothermal test wells have been drilled with a maximum depth of about 2.6 km (8530 ft) . The geo fluid carries between 20,000 and ‘70,OOO ppm of dissolved solids, and fiow rates of up to 263 Mg/h (580,000 lbm/h) of two-phase fluid have been reported [Anderson, 197’71.
A 50-MW flash-steam plant is being contemplated by San Diego Gas & Electric for the Salton Sea KGRA. This geothermal site, sometimes referred to as Niland, is situated at the southeastern shore of the Salton Sea, about 18 km (11 mi) north of Westmorland. The geofluid is quite hot, but hypersaline ; temperature is 323OC (613°F) and salinity ranges from 250,000 to 300,000 ppm. Chlorides of sodium, calcium, and potassium may
t;
li

f 12.01 POTENTIAL DBOWTH OF GEOTHEEMAL POWEE IN THE UNITED STATES a43
Table 12.20-Preliminary technical crpe&$cations for proposed 46-M W binary plant at Heber
Turbine data: Rated capacity.. ................ 45 MW Maximum capacity. ............. 65 MW
Inlet pressure.. ................. 500 Ibf/in% Inlet temperature.. .............. 295" F Eghaust pressure. ............... 72.3 lbf/in* Exhaust temperature.. ........... 165.6' F Mass flow rate. .................
Secondary working fluid. ......... Isobutane-isopentano mixture
7,687,000 lbm/h Uoethermal juid data: bd Inlet pressure.. ................. 153 lbf/inS
Inlet temperature.. .............. 3GO' F Outlet pressure.. ................ 133 lbf/ii* Outlet temperature. ............. 1530 F Mass flow rate. ................. 6,722,000 lbm/h
Type. ................ :, ........ Single-pass, counterflow, shell-and-tube Cooling water inlet temperature.. . 900 F Cooling water outlet temperature.. 108.2" F Cooling water flow rate.. ......... 67,783,000 lbm/h
Condenser data:
Heat rejectwn system data: m e . . ......................... Crossflow, mechanically-induced-drdt wa-
ter cooling tower Number of cells. ................ 10 Design wet-bulb temperature. . . . . Water pump power. .............
80" F 5000 kW
' be economically recovered fiom the brines, in addition to production of electricity by means of appropriate energy conversion schemes. Before a
' large-scale commercial power station can be installed, methods must be -perfected for the proper handling of the extremely corrosive brine. The field has been developed by Magma Power which has contracted with the engineering firm of Morrison-Knudsen of Boise, Idaho, to carry out engi- neering and construction management for the plant at a cost of $50 mil- lion. Electricity may begin to flow in 1982 if construction proceeds according to plan [Smith, 19791.
u9.9.9 Western United States
Table 12.21 lists the geothermal plants outside California that are now under construction or being planned. The first three have been discussed in sections 12.6-12.8. The plants shown for Roosevelt Hot Springs, Utah, Desert Peak, Nevada, and the hybrid coal/geothermal plant proposed by the City of Burbank, California, are not definite but are in advanced planning stages.
The Roosevelt Hot Springs area is located in Beaver County near Mil- ford, Utah, at the junction of the Escalante Valley (a north-south trending

_. . ~ . _
Table 12.21-Proposed U.S. geothermal power plunts outside California
Site Utility or Plant Owner Field Developer Year of Capacity startup MW Plant type
Raft River, ID. ....... EGdcG.. ................. EG&G.. ................ 1980 5 Doubleboiling binary Puna, HI.. ........... aHELCO.. .............. Univ. of Hawaii.. ......... 1980 5 Single-flash VaUes Caldera, NM.. .. Public Service Co. of New Union Oil. ............... 1982 50 Single-flash
Roosevelt Hot Springs, Rogers Engineering Co.. ... Phillips. ................. (b) 55 Double-flash
Desert, Peak, NV.. .... Sierra Pacific. ............ Phillip .................. (b) 20-50 Single- or double-flash (e). .................. d City of Burbank.. ....... (e) . ..................... ( b, 250-750 Hybrid coal-geothermal
Mexico
UT
a Hawaii Electric Light Company. b In plannin 0 Not availabe.
In conjunction with a consortium of neighboring citiea in the Loa Angeles area.
6 c

I 412.91 WIENTIAL BBOWTH OF QEOTHEBMAL POWEB IN THE UNITED BTATEB 845
graben) and the Mineral Range (a horst block running parallel to the east side of the valley). The Mineral Range is characterized by rugged topog- raphy and is about 48 km (30 mi) long and from 96 to 16 km (6 to 10 mi) wide. The Escalante Valley is filled with sediments to a thickness of roughly 1.5 km (0.9 mi) in the center [Lenzer et al., 1977a, 197'7bl.
Many iaults are present Shroughout the area, several of which have an important influence on the hydrology. The hydrothermal reservoir itself is fracture dominated. The top of the reservoir. lies at a depth of about 900 m (2970 ft) over most of the area. A thermal gradient profile was obtained from 39 test holes; 5 of these at the center of the anomaly registered gradients in excess of 4O0C/1O0 m (22"F/100 ft), or about 12 times the w normal gradient. Test holes ranged in depth from 60 to 610 m (197 to 2000 ft). The region within which the thermal gradient exceeds 10°C/lOO m (5,5"F/100 ft) covers an area roughly 8 X 13 km (5 X 8 mi). The predomi- nant rock types are Precambian granite and Pliocene or Pleistocene volcanics. The overlaying rock is judged medium-to-hard for drilling p u r p m [Williams et al., 19771. The U.S.G.S. reports that the reservoir should be able to support 970 MW for 80 years [Mder , 19791. So far, a total of seven wells are each capable of producing, on the average, about 450 Mg/h (992 X lo* lbm/h) of liquid and steam mixture at 260°C (500°F). The geofluid contains less than 8000 ppm of dissolved solids, and the reser- voir pressure is nearly hydrostatic.
Negotiations are underway among the Utah Power and Light Company (UP&L) , Phillips Petroleum Company, and Rogers International, a sub- sidiary of Rogers Engineering Company, concerning the financing, design, construction, and operation of a 52-MW geothermal power plant at Roosevelt Hot Springs. It is expected that Phillips Petroleum, developer of the geothermal field, will supply steam to Rogers, which will be responsi- ble for financing the design and construction of the plant and for operat- ing it. UP&L will buy the power and have an option to acquire the plant after it has evaluated the long-term reliability of the plant and the re- source. No details are currently available concerning the energy conversion system, although the plant is expected to be of the separated-steam/flash- steam type.
The City of Burbank and a number of neighboring cities in the Los Angeles metropolitan area are seriously considering a hybrid power plant utilizing both fossil and geothermal energy resources. Although plant
, location has not yet been decided, four possible areas have been studied: East Mesa, Cos0 Hot Springs, and Long Valley, California ; and Roosevelt Hot Springs, Utah [Burbank, 19771. The best site from an overall em- nomic standpoint appears to be Roosevelt. Design is at present in the hands of an architect/enginwring firm, which is considering a plant of 750 MW capacity. . Thermodynamic analysis of several possible hybrid fossil/geothermal energy conversion systems has .been carried out at Brown University
I I
I I

346 UNITED BTATEB [Ch. 3.2
[Khalifa et al., 1978a). Candidate systems include the so-called geo- thermal-preheat system (figure 12.24) ; the fossil-superheat system (figure 12.25) ; and the compound-hybrid system (figure 12.26).
The Pacific Sierra Research Corporation has conducted economic studies that compare the cost of constructing and operating a hybrid plant of the geothermal-preheat type at each of the four sites mentioned above [Thomas, 19771. The calculated capital costs and the cost of electricity for a 750-MmT hybrid plant at these respective sites are as follows : $289/kW
FIQURE 12.24-Simplified flow diagram for geothermal-preheat fossil/geothermal power plant [ M a et al., 1978b].
G FIQURE 12.25-Simplified flow diagram for
fossilauperhest hybrid geothermal/fossil 'power plant [DiPippo et al., 19781.

I
12.91 POTENT= QBOWTE OF QEOTHEBYAL POWEB IN TEE UNlTED STATES 347
I W PW IW
FIQURE 12.26-Compound hybrid fossil/geothermnl power plant, which combines featurea of the geothermal-preheat and fossilsuperheat system8 [DiPippo and Avelar, 1979; malus et a]., 1978al.
and 20.4 rnill/kW h for Roosevelt Hot Springs; $493/kW and 25.3 mill/ kW * h for Cos0 Hot Springs; $533/kW and 28.3 mill/kW h for East Slesa; and $521/kW and 30.5 mill/kW h for Long Valley. All figures are in 1977 dollars. Owing to the thermodynamic advantage of the hybrid plant over individual fossil and geothermal plants [DiPippo et al., 19771, a geothermal-preheat hybrid plant of 750 M W net output at Roosevelt mould save 50 B5gh (110X108 lbm/h) of coal compared to an all-coal w plant of the same capacity [Thomas, 19771.
l B . 9 3 (hilf Ooast
Beneath the Gulf Coast of the United States, principally along the Louisiana and northeastern Texas shorelines, lies a vast reservoir of brine at moderate temperatures and enormous pressure that contains various concentrations of dissolved methane [Bebout, 1976; Britton, 1979 ; Holt, 1977al. The potential exists for three different modes of energy extraction : (1) direct use of methane gas after separation at high pressure, (2) hy-

8 4 8 7 UlrlITED STATE8 [Ch. 12
draulic turbogenerator driven by high-pressure liquid, and (3) binary- cycle power generation by means of a low boiling point fluid receiving heat from the hot brine. A plant that could perform these energy conversions is shown schematically in figure 12.27.
I TO PIPELINE
4(% - i
PRODUCTION WELL
C
Or hl 0
rt
r
-c
COOLING WATER
+ L,
REINJECTION WELL
FIGVRE 12.27-Proposed system for three-way utilization of geopressured geothermal energy resources. Key: A=high-pressure methane separator; B=hydraulic turbine; C=intermediate-pressure methane separator; D=heat exchanger; E=hydrooarbon or halocarbon turbine; F=condenser [after Britton, 1978; Holt, 1977~1.
The U.S. Department of Energy is actively supporting the drilling of deep exploratory wells in the geopressured reservoirs of Brazoria County, south of EIouston. While it is possible to estimate the total energy con- tained in the Gulf Coast geopressured zones (and this amount is compa- rable to the total hydrothermal resources of the rest of the United States) , it is more difficult to assess what fraction of this energy can eventually be brought to the surface for exploitation. The U.S.G.S. says that the elec- tricity that could be generated for 8% recovery amounts to between 23,000 and 240,000 MW for a period of 30 years [Muffler, 19791.
I$$.,$ East Coast
The geothermal exploration program along the East Coast of the United States from New Jersey to Georgia is aimed at delineating a hot water reservoir that might be exploited for space heating or other industrial, com- mercial, or residential purposes. The Department of Energy is conducting an extensive drilliing program involving about 60 shallow wells 300 m

8 12.01 849
(1000 ft) deep to gauge the thermal gradient and allow selection of sites for deep exploratory wells. The first of these will be drilled near Crisfield, Maryland, and extend to a depth of about 1525 m (5000 ft) .
Since the highest temperatures expected to be encountered are about 90°C (194OF), it is unlikely that East Const geothermal energy will be used for generation of electricity. It should be recalled, however, that binary-cycle power plants can operate with geofluids as cool as these. The Soviet pilot plant at Paratunka, for example, functioned with brine at 81.5OC ( 178.7OF) (see section 11.3). The pioneering work in the discovery of the East Coast geothermal potential was done by J. K. Costain at the Virginia Polytechnic Institute and State TJniversity [Costain et al., 19781.
188.6 Summary
I”ENTIAL OBOWTH OF QEOTHEBMAL WWEE IN THE UNITED STATES
W I I
The installed electrical generating capacity of the geothermal resources in the United States has grown dramatically since the first 11-MW unit began operating at The Geysers in 1960. This pattern of growth is traced in f i g u ~ 12.28, which includes projections of expected new generating capacity up to the year 1984. It seems certain that by 1985 there will be 2000 MmT of geothermal-based electrical generating capacity in this coun- try, representing a savings of about 25 million barrels of oil equivalent per year. Furthermore, considering only those states in which geothermal power plants are expected to be operating at that time (California, Ha- waii, Nevada, New Mexico, and Utah), geothermal energy may account for as much as 3% of the total electricity generated.
REFERENCES a
Aikawa, K., Fukuda, S., and Tahara, M., 1978. “MHI’s Recent Achievements in Field of Geothenyl Power Generation,” MHI Technical Review, Vol. 15, No. 3, Ser. 43, pp. 195-207, Mitsubishi Heavy Industries, Ltd., Tokyo.
Anderson, D. N., 1977. ‘’Recent Developments of Geothermal Resources in the United States A Survey of the Ten Most Promising New Areas,” Geothermal Re- sources Council Spec. Short Course No. 6, Dec. 1213, Houston. derson, D. N, and Hall, B. A., eds., 1973. “Geothermal Exploration in the First
arter Century,”,Geothermal Resources Council Spec. Rep. No. 3, Davis, CA,
nderson, J. H., 1973. “The Vapor-Turbine Cycle for Geothermal Power Genera-
and C. a t e , e&., Stanford Ulliv. Press, Stanford, CA, pp. 163-176. Anderson, J. H., 1976a, “Process Flow for Magmamax PlantMagma Electric Co.,
East Mesa, CA,” J. Hilbert Anderson, Inc., Dwg. No. 134-540, York, PA. Anderson, J. H., 1976b. “Plant Layout, Magma Electric Co., Esst Mesa, CA, Plant,” J. Hilbert Anderson, Inc., Dwg. No. 13-E-383, York, PA.
Austin, A. L., Lundberg, A. W., Owen, L. B., and Tardiff, G. E., 1977. “The LLL Geothermal Energy Program Status Report: January 1976January 1977,” Lawrence Livermore Laboratory UCRMoOQ6-76, Livermore, CA, pp. 51-126.
See note on p. 24.
up- tion,” 172. in Geothermal Energy : Resources, Production, Stimulation, P. Kruger

350 UNITED STATES [Ch. 121
c.
2 1,500 z - > I- 0 - 2 4 d 1,000 I W I I- O W t3
Q W J J
a
500 a
z G
2,000
0 1 I I 1 - I960 1970 I980
tb
1990
bi YEAR
FIQURE 12.28-Growth of installed geothermal electric generating capacity in the United States, projected to 1986.
Barton, D. B., 1970. “Current Status of Geothermal Power Plants a t The Geysers, Sonoma County, California, U.S.A.,” Pisa, 1970, Vol. 2, pp. 1552-1559.
Bebout, D. G., 1976. “Subsurface Technique for Locating and Evaluating Geo- pressured Geothermal Reservoirs Along the Texas Gulf Coast,” Proc. 9nd Geo- pressured Geothermal Energy Conf., Vol. 2, Univ. of Texas, Austin.
Biehler, S., 1971. “Gravity Studies in the Imperial Valley,” in Cooperative Geo- bgiccrEGeophysical-Geochemical Znvestigatwns of Geothermal Resources in the Zmpetial VaUey Area of Cdifornia, Educ. Res. Serv., Univ. of California a t River- side, pp. 29-41.

Biehler, S. and Combs, J., 1972, “Correlation of Gravity and Geothermal Anomalies in the Imperial Valley, Southern California,” Geol. SOC. Amer. Abstracts with Programs, Vol. 4, No. 3, p. 128.
Biehler, S., Kovach, R. L., and Men, C. R., 1964. “Geophysical Framework of North- ern End of Gulf of California Structural Province,” in Matine Geology of the Gulf of California, A Symposium, T. H. Van Andel and G. G. Shor, Jr., eds., Amer. h o c . Petrol. Geol. Mem. 3, pp. 126-143.
Britton, P., 1979. “Geothermal Goes East,” Popular Science, Vol. 214, No. 2, pp. 66-69.
Bruce, A. W., 1961. “Experience Generating Geothermal Power at The Geysers Power Plant, Sonoma County, California,” Rome, 1961, Vol. 3, pp. 2M-296.
Bruce, A. W., 1970. “Engineering Aspects of a Geothermal Power Plant,” Pka, 197‘0, Vol. 2, pp. 1516-1520. u Burbank, City of, 1977. “Site-Specific Analysis of Hybrid Geothermal/Fossil Power Plants,” Rep. prep. for ERDA under Contract No. E (0-4-1311).
BuRec, 1977. “Geothermal Resource Investigations, East Mesa Test Site, Imperial Valley, California: Status Report,” US. Dept. of Interior, Bureau of Reclamation.
Chen, B. H. and Grabbe, E. M., 1978. “Planning for Geothermal Development in Hawaii,” Geothermal Resources Council Trans., Vol. 2, Sect. 1, pp. 95-98.
Chen, B. H., Kihara, D. H, Yuen, P. C., and Takahashi, P. K., 1978. “Well Test Results from HGP-A,” Geothermal Resources Council Trans., Vol. 2, Sec. 1, pp. 99-102.
Combs, J., 1971. “Heat Flow and Geothermal Resource Estimates for the Imperial Valley,” in Cooperative Geological-Geophysical-Geochemical Investigations of Geo; thermal Resources in the Imperial Valley Area of California, Educ. Res. Serv, Univ. of California a t Riverside, pp. 6-27.
Combs, J., 1972. “Preliminary Heat Flow Values and Temperature Distributions Associated with the Mesa and Dunes Geothermal Anomalies, Imperial Valley, Southern California,” EO& Vol. 53, No. 4, pp. 515-516.
Combs, J. and M d e r , L. J. P., 1973. “Exploration for Geothermal Resources,” in Geothermal Energy: Resources, Production, Stimulation, P. Kruger and C. Otte, e&., Stanford Univ. Press, Stanford, CA, pp. 95-128.
Costain, J. K., Glover, J., 111, and Siha , A. K., 1978. “Geothermal Resource Poten- tial of the Eastern United States,” Geothermal Resources Council Spec. Short Course No. 7, Geothermal Energy: A National Opportunity, Washington.
Dan, F. J., Hersam, D. E., Kho, S K., and Krumland, L. R., 1975. “Development of a Typical Generating Unit a t The Geysers Geothermal Project, A Case Study,” San Francisco, 197’6, Vol. 3, pp. 1949-1958.
DiPippo, R. and Avelar, E.M., 1979. “Compound Hybrid Geothermal-Fossil Power I Plants,” Geothermal Resources Council Tram., Vol. 3, pp. 165-168. DiPippo, R., Khalifa, H. E., Correia, R. J., and Kestin, J., 1978. “Fossil Superheat-
ing in Geothermal Steam Power Plants,” Proc. 13th Intersociety Energy Conv. Engin. Conf., Vol. 2, pp. 1095-1101.
&? DiPippo, R., Khalifa, H. E., and Kestin, J., 1977. “Hybrid Fossil-Geothermal Power Plants,” ASME Pap No. 77-WA/Ener-2, ASME Winter Annual Meeting, Atlanta, Ga.
Donnelly, J. M., Goff, F. E., Thompson, J. M., and Hearn, B. C., Jr,, 1976. “Implica- tions of Thermal Water Chemistry in The Geysers, Clear Lake Area,” Proc. Geo- thermal Environ. Sem. ‘76, Lake County, CA, pp. 99-103.
Douze, E. J., 1971. “Seismic Ground-Noise Survey of the Mesa Anomaly,” Teledyne- Geotech, Dallas.
Dutcher, J. L. and Moir, L. J., 1976. ‘%eothermal Steam Pricing at The Geysers, Lake and Sonoma Counties, California,” Proc. 12th Intersociety Energy Conv. Engin. Conf., Vol. 1, pp. 786-789.
352 UNITED STATES cm. 121
Elliott, D. G., 1978. “Analysis of EM 16-29 Well Flow Data,” Letter Rep. No. 2, ERDA Interagency Agree. No. EG-77-A-36-1016, Jet Propulsion Laboratory, Pasadena.
ERJDA News, 1977. “ERDA Okays First Geothermal Loan for Republic Geothermal,” Geothermal Energy Magazine, Vol. 5, No. 6, p. 21.
h e y , J. P., 1972. “The Geysers Geothermal Power Plant,” Chem. Eng. Prog., Vol. 68, pp. 83-86.
Furumoto, A. S., 1978. “The Relationship of a Geothermal Reservoir to the Geo- logical Structure of the East Rift of Kilauea Volcano, Hawaii,” Geothermal Re-
\ sources Council Trans., Vol. 2, Sec. 1, pp. 199-201. GEM, 1977a. “Shell and NCPA Sign Geothermal Pact,” Geothermal Energy Maga-
zine, Vol. 5, No. 9, p. 42. GEM, 197713. “PG&E Unit 13 Currently under Construction,” Geothermal Energy
Magazine, Vol. 6, No. 2, p. 49. GEM, 1978. “Geothermal Plant Proposed in N.M.,” Geothermal Energy Magazine,
Vol. 6, No. 2, p 49. Geonomics, 1976, “Geotechnical Environmental Aspects of Geothermal Power Gen-
eration at Heber, Imperial Valley, California,” submitted to EPRI for HolV Procon; October.
Hartley, R. P., 1978. PoUution Control Guidance for Geothermal Energy Develop- ment, EPA Rep. No. 600/7-78-101, Ind. Env. Res. Lab., Cincinnati.
Hinrichs, T. C., 1973. “Magmamax B u r y Pilot Plant,” in Minutes 8th CATMEC Meeting, Brown Univ. Rep. No. CATMEC/lO, DOE No. C00/4051-17, Provi- dence, RI, pp. 18-19.
Hinrichs, T. C. and Falk, H. W., Jr., 1978. “The East Mesa ‘Magmamax Process’ Power Generation Plant,” Geothermal Energy Magazine, Vol. 6, No. 1, pp. 4446.
Holt, B., 1977a. ‘Geopressured Resource: A Sleeping Giant,” Geothermal Energy Magazine, Vol. 5, No. 11, pp. 30-32. (Reprinted from Hydrorcarbon Processing, July 1977.)
Holt, B., 1977b. “Geothermal Utilization Projecta in the Western United States,” Geothermal Resources Council Spec. Short Course No. 6, Dec. 12-13, Houston.
Inparason, I. J. and Madsen, W. W., 1976. ‘Wetermination of the 5 MW Gross Nominal Design Case Binary Cycle for Power Generation at Raft River, Idaho,” INEL, EG&G Idaho, Rep. No. TREE-1039.
Khalifa, H. E., DiPippo, R., and Kestin, J., 1978a. “Hybrid Fossil-Geothermal Power Plants,” Proc. 6th Energy Tech. Con#,, pp. 960-970.
Khalifa, H. E., DiPippo, R., and Kestin, J., 1978b. “Geothermal Preheating in Foasil-Fired Steam Power Plants,” Proc. 13th Intersociety Energy Conv. Engin. Conf., Vol. 2, pp. 1068-1073.
Koenig, J. B., 1977. “Exploration for Geothermal Resources,” Geothermal Resource Council Spec. Short Course No. 6, Dec. 12-13, Houston.
Laszlo, J., 1976. “Application of the Stretford Process for H,S Abatement a t The Geysers Geothermal Power Plant,” Proc. 11th Intersociety Energy Conv. Engin.
LengquiSt, R. and Hirschfeld, F., 1976. “Geothermal Power: The Sleeper in the Energy Race,” Mech. Engineering, Vol. 98, No. 12, pp. 25-31.
Lenzer, R. C., Crosby, G. W., and Berge, C. W., 1977s. “Geothermal Exploration of Roosevelt KGRA, Utah,” Geothermal Resources Council Spec. Short Course No. 6, Dec. 12-13, Houston.
Lenzer, R. C., Crosby, G. W., and Berge, C. W., 1977b. “Recent Developments at the Roosevelt Hot Springs KGRA,” Geothermal Resources Council Spec. Short Course No. 6, Dec. 12-13, Houston.
Lindsay, D. R., 1977. “A New Steam Sales Contract at The Geysers,” Geothermal Resources Council Spec. Short Course No. 6, Dec. 12-13, Houston.
L,
, Conf., Vol. 1, pp. 724-730. 6,
I
BEFKBEHCEB 353
Mafi, S., 1978. “Turboexpanders in a Geothermal Power Recovery Cycle, Turbo- machinery Znt., Vol. 19, No. 3, pp. 41-42.
Mahoney, D. J. and Bangert, A. C., 1977. “Economic Impact of Geothermal Devel- opment, Sonoma and Lake Counties, California,” Pacific Gas and Electric Co., San Francisco.
Matthew, P., 1975. “Geothermal Operating Experience, Geysers Power Plant,” Sun Franckco, 1976, VoL 3, pp. 2049-2054.
Muffler, L. J. P., ed., 1979. Assessment of Geothermal Resources of the United States-1978, Geological Survey Circular 790, US. Dept. of the Interior.
Pettitt, R. A., 1978 “Hot Dry Rock: A New Potential fur Energy,” Geothermal Energy Magazine, Vol. 6, No. 11, pp. 11-19.
PG&E, 1975. “Amended Environmental Data Statement, Geysers Unit 13,” Pacific Gas and Electric Co., San Francisco.
&sJ Ramachandran, G., 1977. “Economic Analyses of Geothermal Energy Development in California, Vol. 1,” Stanford Res. Inst., SAN-115 P 108-1 (Vol. l), Menlo Park, CA.
Reed, M. J. and Campbell, G. E., 1975. “Environmental Impact of Development in The Geysers Geothermal Field, U.SA.” Sun Francisco, 1976, Vol. 2, pp. 1399- 1410.
Saint, P. K., 1976. “Geothermal Guide to Mexicali-Imperial Rift Valley,” Geothermal Energy Assoc., W. Covina, CA.
SDG&E, 1977. “Expression of lnterest for a Geothermal Demonstration Power Plant,’’ presented to US. ERDA by San Diego Gas and Electric Co., San Diego, June 20.
S e m u , K. T., 1976. “Control of Hydkgen S a d e from Geothermal Power Pro- duction,” Proc. Geothermal Environm. Sem. ‘76, Oct. 27-29, Lake County, CA,
. pp. 185-189. Siegfried, H. N ,1925. “The Geysers,” in Geothermal Exploration in the First Quarter
Century, D. N. Anderson and B. A. Hall, eds., Geothermal Resources Council Spec. Rep. No. 3, Davis, CA, 1973, pp. 58-88.
Silverman, M., 1977. “Geothermal Loan Guarantee Program,” paper presented at ” Geothermal: State of the Art, 1977 Annual Meeting Geothermal Resources Coun- ‘ cil, May 9-11, San Diego. Smith, R. A., ed., 1979. Geothermal Report, Vol. 8, No. 4, Feb. 15, p. 3. Thomas, F. J., 1977. “Cost Factors Related to Fossil-Geothermal Power Plants,”
in Minutes 6th CATMEC Meeting, Brown Univ. Rep. No. CATMEC/5, DOE No. COO/4051-9, Providence, RI, pp. 16-17 and Appendix M.
Truesdell, A. H. and White, D. E., 1973. “Production ‘of Superheated Steam from Vapor-Dominated Reservoirs,” Geothermics, Vol. 2, p. 154.
Weres, O., 1976. “Environmental Implications of the Exploitation of Geothermal Brines,” Proc. Geothermal Environm. Sem. ‘76, Oct. 27-29, Lake County, CA, pp. 115-123.
Weres, O., Tsao, K., and Wood, B., 1977. “Resource, Technology, and Environment a t The Geysers,” Rep. No. LBL-5231, Lawrence Berkeley Laboratory, Berkeley.
White, D. E., MufBer, L. J. P., and Truesdell, A. H., 1971. “Vapor-Dominated Hydro- thermal Systems Compared with Hot-Water Systems,” Econ. Geol., Vol. 66, p. 75.
Williams, F., Cohen, A., Pfundstein, R., and Pond, S., 1977. “Site-Specific Analysis of Geothennal Development-Data Files of Prospective Sites,” Mitre/Metrek pep. NO. MTR-7586, Vol. 3.
Witherspoon, P. A., 1977. “Geothermal Reservoir Engineering,” in Minutes 4th CATMEC Meeting, Brown Univ. Rep. No. CATMEC/3, DOE No. C00/4051-4, Providence, RI, pp. 1-10.
Younker, L. and Kasameyer, P., 1978. “A Revised Estimate of Recoverable Thermal Energy in the Salton Sea Geothermal Resource Area,” Lawrence Livermore Labora- tory Rep. NO. UCRL-52450, Livermore, CA.
’
w


CHAPTER 13 COUNTRIES PLANNING GEOTHERMAL POWER
PLANTS
13.1 Overall survey
The number of countries engaged in geothermal exploration, develop- ment, or exploitation for all purposes or those interested in putting their geothermal resources to use is estimated to be at least 65. These include Australia, Austria, Bahamas, Barbados, Belgium, Bhutan, Bolivia, Brazil, Canada, Chile, China, Colombia, Congo, Costa Rica, Dominican Republic, Ecuador, Egypt, El Salvador, Ethiopia, Fiji, France, Germany, Ghana, Greece, Guatemala, Guinea, Guyana, Haiti, Honduras, Hungary, Iceland, India, Indonesia, Iran, Israel, Italy, Jamaica, Japan, Kenya, Kuwait, Malaysia, Mexico, New Zealand, Nicaragua, Panama, Philippines, Portu- gal (Azores), Saudi Arabia, Spain (Canary Islands), Sri Lanka, Switzer- land, Taiwan, Tanzania, Trinidad and Tobago, Turkey, Uganda, Union of Soviet Socialist Republics, United Arab Emirates, United Kingdom, United States, Venezuela, Yugoslavia, Zaire, and Zambia. This chapter discusses those countries on the threshold of exploiting their geothermal resources for electricity generation.
13.2 Azores (Portugal)
The islands of the Azores lie on the Mid-Atlantic Ridge, a spreading tectonic plate boundary. Of the nine islands that comprise the group, the largest and most heavily populated is SLo Miguel. In 1970 a well drilled on the northern flank of the Agua de Pau Volcano encountered fluids in excess of 2OOOC (392'F) at depths greater than 550 m (1805 ft). The full depth of the well was 981 m (3219 f t ) [Meucke et al., 19743. A 3-Mwwell- head power unit is being designed for SLo Miguel, and could be in opera-
W
6d tion as soon as 1979 [K. Aikawa, personal communication].
13.3 Chile
The El Tatio geothermal field has been the subject of considerable ex- ploration and drilling. The site is located in northern Chile, in Antofagasta Province, in a region consisting of a volcanic desert plateau at an elevation of over 4000 m (13,100 ft) with Quaternary volcanic mountains rising to
355

356 FUTUUE QEOTEIEBYAL SURVEY [Ch. 13
nearly 6000 m (19,700 ft). Owing to the extreme remoteness and near- inaccessibility of the field, exploration is proceeding slowly. Furthermore, because the region is essentially and, any geothermal development is likely to include the production of fresh water [Koenig, 19731. It has been esti- mated that about 18 MW of electricity could be generated from the existing 13 wells [Lahsen and Truiillo, 19751. These range in depth from 600 to 1820 m (1970 to 5970 f t ) and have encountered geofluids at temperatures from 180" to 265OC (356O to 509°F). A small pilot plant is in operation and plans are underway to construct a 15-Mw plant in the near future [Ellis and Mahon, 19771.
13.4 Costa Rica L.l The geothermal development program in Costa Rica is directed by the
Instituto Costarrince de Electricidad (ICE) and has concentrated on Guanacaste Province in the northwestern part of the country. The geo- thermal area extends for 30 km (19 mi) along the flank of a chain of active volcanoes [Furgerson and Afonso, 19773. An integrated program in- volving heat flow, temperature gradient, geochemical, electrical, and hy- drological investigations is being carried out in the southwestern portion of the Cordillera de Quanacaste.
Particular attention is being given to the areas of Las Hornillastde Miravalles, Las Pailas, and Borinquen, where some drilling has been con- ducted [Blackwell et al., 19773. A total of 35 exploratory wells have been sunk in the area; 24 have been to depths of 50 m (164 ft) or less, and 9 have exceeded 90 m (295 ft). Active development is underway and a 40-MW geothermal power plant is scheduled by ICE to be installed by 1984/1985. At Las Hornillas de Miravalles geochemical studies have re- vealed the possibility of a deep, chlorinated aquifer with reservoir base temperatures as high as 240°C (464°F) [Gardner and Corrales, 19771. Deep drilling is underway with the objective of achieving a total depth of 4000 m (13,000 ft), which should allow for the completion of 4 wells since the aquifer is estimated to lie at a depth of between 800 and 1200 m (2625 and 3937 ft) [J. T. Ihwada, personal communication].
13.5 Guatemala
The national electric company of Guatemala, INDE, is aiming for 100 di MW of installed geothermal capacity by the early 1980's [Meidav et al., 19773. Three areas-Moyuta, Amatitlln, and Zunil-have been under ex- ploration with technical assistance from Japan. There were high hopes for the field at Moyuta, about 25 km (16 mi) northwest of the successful project at Ahuachapln across the border in El Salvador. Shallow wells revealed gradients of about O.2Ci0C/m (0.14OF/ft), but two wells pro- duced low temperatures, and the site has been abandoned [Dominco, 1977; J. T. Kuwada, personal communication]. Attention is still being given to
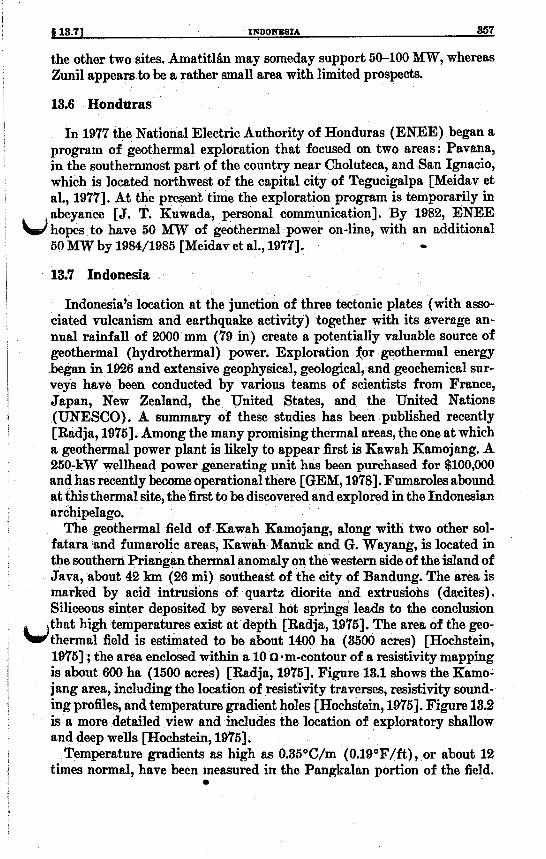
j) 13.71 IIQDONEBIA 357
the other two sites. Amatitlh may someday support 50-100 M W , whereas Zuni1 appears to be a rather small area with limited prospects.
13.6 Honduras
In 1977 the National Electric Authority of Honduras (ENEE) began a program of geothermal exploration that focused on two areas : Pavana, in the southernmost part of the country near Choluteca, and San Ignacio, which is located northwest of the capital city of Tegucigalpa [Meidav et al., 19771. At the present time the exploration program is temporarily in abeyance [J. T. Kuwada, personal communication]. By 1982, ENEE
u l i o p e s to have 50 MW of geothermal power on-line, with an additional
I I I
50 M W by 1984/1985 [Meidav et al., 19771. - 13.7 Indonesia
Indonesia's location at the junction of three tectonic plates (with asso- ciated vulcanism and earthquake activity) together with its average an- nual rainfall of 2000 mm (79 in) create a potentially valuable source of geothermal (hydrothermal) power. Exploration for geothermal energy began in 1926 and extensive geophysical, geological, and geochemical sur- veys have been conducted by various teams of scientists from France, Japan, New Zealand, the United States, and the United Nations (UNESCO). A summary of these studies has been published recently [Radja, 19751. Among the many promising thermal areas, the one at which a geothermal power plant is likely to appear first is Kawah Kamojang. A 250-kW wellhead power generating unit has been purchased for $100,000 and has recently become operational there [GEM, 19781. Fumaroles abound at this thermal site, the first to be discovered and explored in the Indonesian archipelago.
"he geothermal field of Rawah Kamojang, along with two other sol- fatara and fumarolic areas, Rawah Manuk and (3. Wayang, is located in the southern Priangan thermal anomaly on the western side of the island of .Java, about 42 km (26 mi) southeast of the city of Bandung. The area is marked by acid intrusions of quartz diorite and extrusiohs (dacites). Siliceous sinter deposited by several hot springs leads to the conclusion that high temperatures exist at depth [Radja, l.9761. The area of the geo-
, u t h e r m a l field is estimated to be about 1400 ha (3500 acres) [Hochstein, 19761 ; the area enclosed within a 10 a-m-contour of a resistivity mapping
1 is about 600 ha (1500 acres) [Radja, 19751. Figure 13.1 shows the Kamo- ! i jang area, including the location of resistivity traverses, resistivity sound-
i is a more detailed view and includes the location of exploratory shallow i and deep wells [Hochstein, 19'761. 1 1 Temperature gradients as high as 0.35OC/m (0.19OF/ft), or about 12
times normal, have been measured in the Pangkalan portion of the field.
I I ing profiles, and temperature gradient holes [Hochstein, 19751. Figure 13.2

368 FUTUBE QEOTHEBMAL BUBVEY [Ch. 13
9 h b
d
LEGEND 1 0 LOW RESISTIV ITY AREA
( c l O a m , A B / 2 = 1 k m ) H APPARENT RESISTIVITY
*lo O m ( A B / 2 = 5 0 0 m ) .oeoO RESISTIVITY TRAVERSE
TEMP. GRADIENT HOLE (20-50111 D E P T H )
& HOT SPRING
AREA
SCALE
P
d"
L,
FIGURE 13.1-Exploration of the Kawah Kamojang geothermal field, Indonesia [Hochstein, 19751.
One of the earliest wells drilled is still producing; steam flows at 130°C (266°F) and 12.4 Mg/h (27.3 klbm/h). This particular well (No. 3) was drilled in 1926 [Stehn, 1929; Kartokusumo et al., 19751. The steam con- tains 2%-4% by weight of noncondensable gases: CO, makes up about 96.5% by volume, H,S about 1.85%, with CH,, HZ, and N, making up the bulk of the residuals [Kartokusumo et al., 19751. The findings indicate t-hat Kawah Kamojang is a vapor-dominated field, perhaps a dry steam field, to shallow depths of at least 130 m (425 ft) . Maximum temperature at these depths is about 238°C (460°F). Hochstein states that the reservoir is quite extensive and is 200-500 m (656-1640 ft) thick, with a power po- tential of between 100 and 250 M W for 50 years [Hochstein, 19751. Furthermore, he concludes that vapor-dominated hydrothermal systems in young volcanic rocks may be much more common than previously believed.
t ad
0

i $13.71 IIPDOXESU 359
&d FIQURE 18.2-Location of explora ivity survey at Kawah
Power production at Ramojang is expected to begin during 1979. Geo- thermal Power Company of New York has supplied a 250-kW, noncon- densing, wellhead turbogenerator to PERTAMINA, the state oil and natural gas mining company [GR, 1978; GEM, 1978]. The self-contained unit consists of a turbine, generator, controls, gearbox, and exhaust
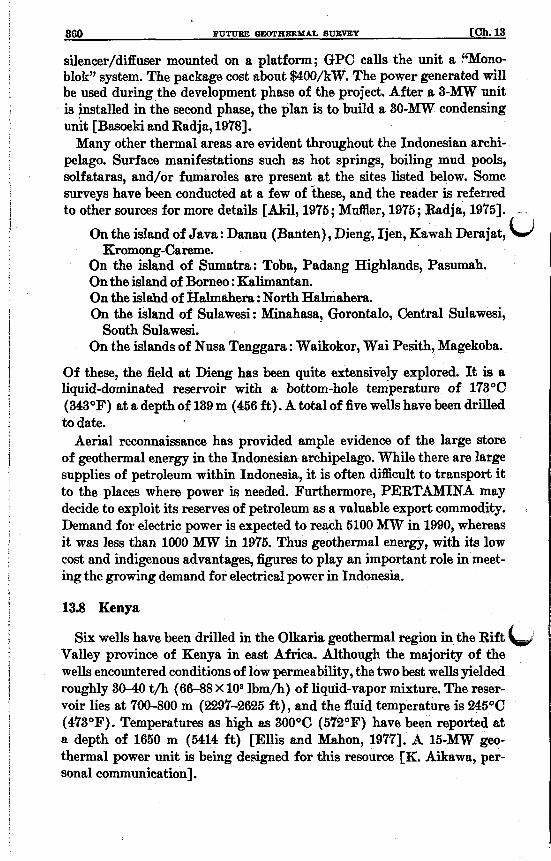
860 FUTURE QEOTHEBMAL BUBVEY [Ch. 13
silencer/diffuser mounted on a platform; GPC calls the unit a “Mono- blok” system. The package cost about $a00/kW. The power generated will be used during the development phase of the project. After a 3-MW unit is installed in the second phase, the plan is to build a 30-MW condensing unit [Basoeki and Radja, 19781.
Many other thermal areas are evident throughout the Indonesian archi- pelago. Surface manifestations such as hot springs, boiling mud pools, solfataras, and/or fumaroles are present at the sites listed below. Some surveys have been conducted at a few of these, and the reader is referred to other sources for more details [Akil, 1975; MuHer, 1975; Radja, 19’751.
On the island of Java : Danau (Banten), Dieng, Ijen, Kawah Derajat,
On the island of Sumatra: Toba, Padang Highlands, Pasumah. On the island of Borneo : Kalimantan. On the islafid of Halmahera : North Halmahera. On the island of Sulawesi: Minahasa, Gorontalo, Central Sulawesi,
On the islands of Nusa Tenggara : Waikokor, Wai Pesith, Magekoba.
Of these, the field at Dieng has been quite extensively explored. It is a liquid-dominated reservoir with a bottom-hole temperature of 173OC (343OF) at a depth of 139 m (456 ft) . A total of five wells have been drilled to date.
Aerial reconnaissance has provided ample evidence of the large store of geothermal energy in the Indonesian archipelago. While there are large supplies of petroleum within Indonesia, it is often diflicult to transport it to the places where power is needed. Furthermore, PERTAMINA may decide to exploit its reserves of petroleum as a valuable export commodity. Demand for electric power is expected to reach 5100 MW in 1990, whereas it was less than 1000 MW in 1975. Thus geothermal energy, with its low cost and indigenous advantages, figures to play an important role in meet- ing the growing demand for electrical power in Indonesia.
13.8 Kenya
Kromong-Careme.
South Sulawesi.
Six wells have been drilled in the Olkaria geothermal region in the Rift Valley province of Kenya in east Africa. Although the majority of the wells encountered conditions of low permeability, the two best wells yielded roughly 30-40 t/h (66-88 X lo3 lbm/h) of liquid-vapor mixture. The reser- voir lies at 700-800 m (2297-2625 ft), and the fluid temperature is 245°C (473OF). Temperatures as high as 300°C (572OF) have been reported at a depth of 1650 m (5414 ft) [Ellis and Mahon, 19771. A 15-MW geo- thermal power unit is being designed for this resource [K. Aikawa, per- sonal communication ].

J 13.101 PA??- 361
13.9 Nicaragua
The national electric authority of Nicaragua (ENALUF) has predicted that 100 Mw of geothermal power will be installed in Nicaragua by the early 1980’s, with about 150-220 MW installed by 1985,300-400 M W by 2000, and as much as 800 Mw by the year 2020 [Meidav et al., 19771. The most likely candidate site for the first geothermal power plant is the Momotombo field, which was investigated from 1969 to 1971, along with the San Jacinto-Tisate area, both explored under a program sponsored by the U.S. Agency for International Development. Work at the sites was delayed several years by the Managua earthquake of Decem-
U b e r 23,1972 [Mder , 19761, and has suffered another setback because of political problems which erupted in 1978.
The geothermal field at Momotombo is located on the lower slopes of the Momotombo Volcano, on the edge of Lake Managua. A total of 25 wells have been drilled in the field. Some of these wells show drastic tempera- ture inversions, as much as -1.5OC/m ( -0.8OF/ft), indicating the pres- ence of colder fluid at depth. Some flow rates from a few of the wells have been reported [Girelli, 19771 : Momotombo well No. 3, 85 Mg/h (187. klbm/h) ; well No. 9, 56 Mg/h (123 klbm/h) ; well No. 12,40 Mg/h (88 klbm/h). Construction was scheduled to begin in 1979 on a geothermal power plant at Momotombo, but the size of the unit has not been decided. The site is believed capable of supporting 100 Mm, but a smaller 30-MW unit may be installed initially until confidence in the field is thoroughly established [Girelli, 19771.
13.lO Panama
Panama presently has a total installed electric capacity of 237 M W with projections of 534 MW by 1984. Although hydroelectric plants consti- tute a significant fraction of Panama’s generating capacity, it is believed that a 76-MW powerplant, either conventional thermal or geothermal, will be needed by 1985. The most pro&ising geothermal site in Panama is at Cerro Pando. It is too early, however, to assess the quality and the potential of this area in light of the minimal amount of exploratory work completed at this time [Ho, 1977; Meidav et al, 19771.
REFERENCES 8
Akil, I., 1975. “Development of Geothermal Resources in Indonesia,”San Francisco,
Basoeki, M. and Radja, V. T., 1978. “Recent Development of 30 MW Kamojang Geothermal Power Project, West Java, Indonesia,” Geothermal Resources Council Trans., Vol. 2, Sec. 1, pp. 35-38.
See note on p. 9.4.
W
1976, Vol. 1, pp. 11-15. ,

362 BxlmlmNcEB [Ch. 131
Blackaell, D. D., Granados, G. E., and Koenig, J. B., 1977. “Heat Flow and Geo- thermal Gradient Exploration of Geothermal Areas in the Cordillera de Guana- caste Costa Rica of,” Geothermal Resources Council Trans., Vol. 1, pp. 17-18.
Dominco, E., 1977. “Guatemala,” Geothermal Resources: Survey of an Emerging Industry, Geothermal Resources Council Spec. Short Course No. 6, Houston.
Ellis, A. J. and h!lahon, W. A. J., 1977. Chemistry and Geothermal System, Aca- demic Press, New York.
Furgerson, R. B. and Afonso L., P. S., 1977. “Electrical Investigations in the Guam- caste Geothermal Area (Costa Rica),” Geothermal Resources Council Trans., Vol. 1, pp. 94-100.
Gardner, M. C. and Corrales, R., 1977. “Geochemical and Hydrological Investiga- tions of the Guanacaste Geothermal Project, Costa Rica,” Geothermal Resources Council Trans., Vol. 1, pp. 101-102.
GEM, 1978. “Indonesia Uses U.S. Technology to Obtain Electricity from the Earth,” Geothermal Energy Magazine, Vol. 6, No. 11, pp. 20-21.
Girelli, M., 1977. “Nicaragua,” Geothermal Resources: Survey of an Emerging I&- try, Geothermal Resources Council Spec. Short Course No. 6, Houston.
GR, 1978. Geothermal Report, R. A. Smith, ed., Vol. 7, No. 11, June 1, p. 4. Ho, A., 1977. “Panama,” Geothermal Resources: Survey of an Emerging Industry,
Geothermal Resources Council Spec. Short Course No. 6, Houston. Hochstein, M. P., 1975. “Geophysical Exploration of the Kawah Kamojang Geo-
thermal Field, West Java,” Sun Francisco, 1976, Vol. 2, pp. 1049-1058. .Kartokusumo, W., Mahon, W. A. J., and Seal, K. E., 1975. “Geochemistry of the
Kawah Kamojang Geothermal System, Indonesia,” Sun Francisco, 1976, Vol. 1, pp. 757-759.
Koenig, J. B., 1973. ‘Worldwide Status of Geothermal Resources Development,” in Geothermal Energy : Resources, Production, Stimulation, P. Kruger and C. Otte, eds., Stanford Univ. Press, Stanford, CA, pp. 15-58.
Lahsen, A. and Trujillo, P., 1975. “The Geothermal Field of El Tatio, Chile,” Sun Francisco, 1976, Vol. 1, pp. 157-177.
Meidav, T., Sanyal, S., and Facca, G., 1977. “An Update of World Geothermal En- ergy Development,” Geothermal Energy Magazine, Vol. 5, No. 5, pp. 30-34.
Meucke, G. K., Ade-Hall, J. M., Aumento, F., MacDonald, A., Reynolds, P. H., Hyndman, R. D., Quintino, J., Opdyke, N., and Lowrie, W., 1974. “Deep Drilling in an Active Geothermal Area. in the Azores,” Nature, Vol. 252, pp. 281-285.
M d e r , L. J. P., 1975. “Summary of Section I: Present Status of Resources Devel- opment,” Sun Francisco, 1976, Vol. 1, pp. d - x l i v .
Radja, V. T., 1975. “Overview of Geothermal Energy Studies in Indonesia,” San Francisco, 1976, Vol. 1, pp. 233-240.
Stehn, C. E., 1929. “Kawah Kamojang,” Fourth Pacific Science Congress, Java, Indonesia.
ti

Index
Ahuachap$n, 8lff. auxiliary unit, 62 capital costs, 56fl. construction materials, 52
drilling program, 84,40 t-f' discharge channel, 53
energy conversion systems, 45ff.. 48 fluid gathering system, 84,88 fluid production data, 35 geofluid characteristics, 86,39 geology, 34 hydrogen sulflde, 63 inspections, 68 maintenance, 58 operating experience, 65 plant layout, 45,48 reinjection, 53,59 retention tanks, 53 site photographs, 83, 42, 44, 54 subsidence, 69 utilization aciency, 45, 52 waste liquid, 53 $well programs, 34,37,40
Availability factor, definition, 19
Ax-lesThermes, 8 Azores (Portugal), 355
Balneological institute, 8 Binary cycle power plant, 14 Bolshoye-Bannoye power plant, 2Wf.
cost of electricity, 287 %ow diagram, 287 geofluid characteristics, 285
. utilization efficiency, 287 w r a w l e y power plant, 835
energy conversion system, 835, 837 production wells, 835
California, Big Geysers, The, 8 East Mesa, 14, 16, 326fl., 333ff., 345 Geysers, The, 9ff., 293ff. Salton Sea, 8,17
Capacity factor, \ definition, 18 ,i
Cerro Prieto power plant, 182ff. capacity factor, 204 capital investment, 203 condenser, 195,201 construction materials, 200 dissolved solids, 195 drilling program, 185 electrical equipment, 201 electrical generation, 204 energy conversion system, 196 exploration, 182 flow diagram, 198 gas extractor, 195 generator, 195 geofluid characteristics, 188,194 geology, 182 hydrogen sulfide, 203 maintenance, 204 map, 184 noncondensable gases, 194, 203 operating expenses, 204 piping layout, 186ff. plant expansion, 204ff. production wells, 185,200 site photographs, 101-193, 196, 197,
steam pipes, 201 subsidence, 204 turbine, 395,201 utilization efficiency, 195 waste liquid, 201 well proflles, 18911.
199,202
Chaudes Aygues, 8 Chile, 355 China, 277ff. Combined flash/binary power plant, 17 Conti, Prince P.G., 8,77 Costa Rica, 356
drilling program, 356 exploration, 856
863

364 =Ex
Cycle efkiency, i definition, 11
Danube River, 8 Dax, 8 Doubleflash power plant, 13 Dry steam power plant, 9 Dry steam resource, 7
East Mesa, 14, 16, 326ff.. 333ff., 345 El Salvador, 31ft.
AhuachapBn, 3lff. Berlfn, 60 Chinameca, 60 Chipilapa, 60 map, 32
I San Vicente, 80 El Tatio pilot plant, 356 Energy conversion systems, 9ff. Exergy,
I
definition, 11
Forced outage factor, definition, 19
France, 8
Geophysical surveys, 5 Geopressured/geothermal power plants,
Geopressured resource, 4 Geothermal countries, 355 Geothermal heat flux, 1 Geysers (See The Geysers) Guatemala, 366
347fl.
Hakuryu power plant, 9 Hatchobaru power plant, 154ff.
availability factor, 165 capacity factor, 165 capital cost, 185 condenser, 169 cost of drilling, 165 cost of electridty, 166 . cost of maintenance, 166 district water heating, 164 drilling program, 166 energy conversion system, 168 environmental effects, 164 exploration, 165 gas extractor, 163 geofluid characteristics, 169 geology, 154 noise generation, 164 operating experience, 165
Hatchobaru power plant, 164ff.4on. plant layout, 167 site photographs, 161,162 mater cooling tower, 183
Hawaii geothermal project, 838fl. reservoir properties, 339
Heber binary power plant, 342 energy conversion system, 342, 343 reservoir properties, 342 utilization eaciency, 342
High heat flow areas, 4 Himalayan Mountains, !27 Eonduras, 357 Hot, dry rocks, 3 Hungarian Basin, 4
Hybrid fossil/geothermd power systems,
c H u n m ~ , 8
11,345fr. capital costs, 346 cost of electricity, 846
Hydrothermal resource, 5.7
Iceland, 63tf. Grindavik (See Svartsengi) Kisilidjan, 65 Krafla, 63, Ssff. Leirhnjukur, 64
MQvatn, 65 Nhmafjall, 63, ,SSff. Reykjavik, 63 Reykjanes Peninsula, 63 Svartsengi, 76
map, 64
Imperial Valley, 8, 14, 16, 292, 326fY..
Indonesia, 867ff. 34off.
Dieng, 860 exploration, 367tf. Kawah Kamojang, 357ff.
Installed geothermal capadty, 19fi. Italy, 8, riff.
Boraciferous region (See Larderello) Larderello, 8, 10, riff. Monte Amiata, lwff. Travale. 116fl.
Japan, Agency of Industrial Sdence and
Akinomiya, 178 BepPu, 9 Fuaime, 178 Geological Survey of Japan (BSJ) ,
Technology (AIS11 , 121
121

W
Japan-continued Geothermal Energy Research an
Development Company, Ltc (UEBD, 121
Hakurgn, 9 Hatchobaru, 164ff. Japan Geothermal Energy Develoi
Kakkonda, l66ff. Kidshima, 178 Kumamoto, 178 Matsukawa, l21ff. Ministry of International Trade an Industry (MITI), 121
Mori, 178 Nigorikawa (See Mori) Onikobe, 148ff. Onuma, 144ff. Otake, 133 If. Oyam, 178 Sumikawa, 178 Sunshine Project, 172 Takinoue (See Kakkonda ) Tsunnmi, 9 Yakedake, 178
ment Center (JUEIU), 12l
Kakkohda power plant, l66fl. capital cost, 170 cost of electricity, 170 district heating, 172 energy conversion system, 170 exploration, 166 geologg, 166 operating experience, 172 pipeline system, 167tf. plant layout, 188 production web, 166ff. reinjection wells, 166ff., 170 ff. site photograph, 17l
power potential, 858 wellhead power unit, 857, S9ff.
awerau power plant, 243ff. energy conversion system, 247 exploratory wells, 246 geology, 243ff. noncondensable gases, 247 plant layout, 245 production wells, 246ff. steam lines, 247 subsidence, 248 utilfmtion efficiency, 248
Kenya, 860 J
Kawah Kamojang power plant, S57ff.
Kmldere power plant, 273ff. geofluid characteristics, 274 production wells, 278 reservoir, 278 wellbead generator, 274
Kogyo Uijutsu Institute, 9 Krafla power plant, Ssff.
economic data, Is energy conversion system, 72 exploratory surveys, 89 operating experience, 78 Plannfng, 68 plant layout, 70 region, 64 site photograph, 74 well programs, 69, n
Larderello (Boradferous region), 77fl. capital costs, 106 Capriola power plant, 103 Castelnuovo power plant, g4,w cementing operations, 81 condensing units, 90 construction materials, 105 cooling towers, 91 drilling mud, 81 drilling operations, 80 energy couversion systems, 87ff. exploration, 78 Gabbro power plant, 94 gas content, 84 gaseous emissions, 108 geofluid characteristics, 84 geologic map, 79 geologY, 77 Lago 2 power plant, M,99 Lagoui Rossi power plants, 102 Larderello 2 power plant, 91 Larderello 3 power plant, 94,95 liquid diwharge, 106 Molinetto power plant, 105 Monterotondo power plant, 96,101 noncondensing units, 96 operating costs, 107 operating experience, 107 plant availability, 107 preventive mafntenance. 107 reinjection, 106 Sant'Ippolito-Vallonsordo power
Sasso Pisauo power plant, 06,100 Sasso power plant, 106 Berrazzano power plant, 96,98 site photographs, 86,96,97-101
plant, 102,104

Larderello (Boraciferous region), 7577.- Continued
steam pipelines, 84 thermal gradients, 78 utiltzati on efficiency, 90 well casings, 81 well equipment, 82 wen productivity, 86 wen programs, 79
Leyte (Tongonan) power plant, 289 site photographs, NO, 211
Liquid-dominated resource, 7 Louisiana, 4,847 h a d factor,
definition, 18
Magma intrusion, 5 Magmamax power plant, 326ff.
brine consumption, 332 cycle flow diagram, 333 energy conversion system, 332 geology, 326 geophysical surveys, 328 isobutane turbine, 332 phased cooling system, 332 plant layout diagram, 334 propane turbine, 332 utilization e%iciencp, 332 well programs, 332
Makiling Banaham (Los BaRos) power
energy conversion systems, 269 steam wells, 268 utilization efficiency, 269
availability factors, 132 condenser, 130 construction cost, 131 cost of electricity, 132 drilling, 123 energy conversion system, 123 environmental effects, 131 geology exploration, 123 heat balance diagram, 123. 127 operating experience, 132 site photograph, 124 water cooling tower, 130
Cerro Prieto. 1Sff. hydrothermal areas, 205 Ixtlan de 10s Hervores, 205 La Primavera, 206 Los Amfres, 206 Los Negritos. 205 Path&. 1Slff.
plant, 268fl.
Matsukawa power plant, 10, 1237.
Mexico, 18lff.
Mexico, lSlfl.-Continued petroleum reserves, 181 San Marcos, 206
Methane, 4,348 Hid-Atlantic Ridge, 63 Momotombo power plant, 361 Monte Amiata, 10,loSff.
Bagnore power plants, 111 energy conversion systems, 111 geofluid characteristics, 109 geologic map, 110 geology, 109 Piancastagnaio power plant, l l l f l . site photographs, 113,114
Mori binary plant, 176ff. heat exchangers, 177 turbine, 177 working fluid, 177
Multiflash power plant, 18
NBmafjall power plant, @Iff capital costs, 67 enexgy conversion system, 67 geofluid characteristics, 67 operating experience, 68 power plant, 66 region, 63 steam pipelines, 66 utilization efficiency, 67 wellhead equipment, 66 well programs, 65
New Hampshire. 3 New Zealand, 9,2091y.
Broadlands (See Ohaki) Kawerau, 243ff. Ngawha, 262 Ohaki (Broadlands), 249fl. Orakeikorako, 234, 262 Reporoa, 262 Rotokawa, 262 !huhara, 262 Te Kopia, 262 Te Mihi, 262 Waiotapu, 234, 262 Wairakei, mff. Momotombo fleld, 861
Nicaragua, 861
Normal-gradient regions, 8
Ohaki (Broadlands) power plant, 249ff. energy conversion system, 256 environmental effects, 257 exploration wells, 249 gaseous emuents, 268 geofluid characteristicR, 268ff.

!
Ohaki power plant, 249ff.4ontinued geology, 249ff. hydrogen sulfide, 260 land usage, 257
pressure recovery, 256
recharge, 256 reinjection, 257
I Plant layout, 250,259
1 production wells, 252ff. 1 I I subsidence, 260ff. 1 ntflization &ciency, 256 !
waste liquid, 258 well operatihns, 251
Olkaria power plant, 860 Onikobe power plant, 148
availability factor, 164 condenser, 153 .
1 energy conversion system, 161 I exploration, 148
I
,
I geology, 148 ' heat balance diagram, 152
I hydrogen W d e , 153 operating experience, 154 production wells, 150 site photograph, 149 waste liqafd, l!B water cooling tower, 158
availability factor, 147 capacity factor, 147 cost of generation, 148 energy conversion system, 146 exploration, 145 geology, 145 1 production wells, 145 reinjection weUs, 145 site photograph, 146 well programs, 145
definitions, 18 Otake binary power plant, 172tf.
condenser, 175 energy conversion system, 178
geofl uid characteristics, 178 site photograph, 174 turbine, 175
1
I i I Onuma power plant, l4ff.
i
1
( Operating factors,
1 w flash heater, 178
I working fluid, 1'13
I Otake power plant, 16,183ff. availability factor, 143
I capital fnvestment, 143 condenser, 141 construction materials, 141 cost of electricity, 143
I district water heating, 143
,
I
MDEX 867
Otake power plant, 16,18312.4ontinued energy conversion system, 186 environmental effects, 141 exploration, 138 gas extractor, 141 geologg., 133 hydrogen sulfide emissions, 143 maintenance, 144 operating data, 148 plant layout, 188jt. production wells, 183ft. reinjection, 143 reinjection wells, 188ff. site photograph, 134 waste liquids, 143 water cooling tower, 141
Panama, 861 C e m Pando field, 861
Paratunka, 16 Paratunka power plant, 28lfl.
binary fluid cycle, 281 capital cost, 284 energy conversion system, 282 flow diagram, 283 geofluid characteristics, 282 greenhouse heating, 281 heat exchanger, 288 site photograph, 288 turbine efficiency, 288 utilization efficiency, 283
Path15 power plant, Iglff. site photograph, 183
Pauzhetka power,plant, 277fl. cost of electridty, 281 energy conversion system, 277 flow diagram, 280 -geofl uid characteristics, 277fl. greenhouse heating, 281 steam pipes, 270,280 steam wells, 279, 280 utilization efEciency, 280
Performance factors, definitions, 18
PhilSppines, 265ff. Leyte (Tongonan), 269 Los Bafios (See Makiling Banahaw) Lnzon, 266,268 Magiling Banahaw (Los Bafios),
Mambucal, 272 Manat-Masara, 289 Manila, 265,268 S. Negros, 269
mff.
\

368 mDFX
Philippines, 265#.-Continued nwi, 265fl.
Plate tectonics, Iff. Pluton, 5 Point heat 8ources,6 Portugal (See Azores) Primped wells, 14
Tongonan, 270,271
Radiogenic regions, 8 Raft River power plant, 335ff.
cost of electricity, a38 flow diagram, 338 utilization e%idency, 838
Reliability iactors, definitions, 19
Republic Geothermal power plant, SS3ff. energy conversion system, 335 Geothermal Loan Guaranty Program,
plant sketch, s36 production wells, SS4 setting, 533
833
Romans, 8
Salton Sea, 8, 17 Salton Sea power plants, 842ff. Slio Miguel power plant, 835
Scheduled outage factor,
Secondary working fluid, 16 Separated-steamoot-water-flash power
Separated-steam/multiple-flash power
Separated-steam power plant, 11 Singleflash power plant, 11.12 Soviet Union, 277jt.
Avachinski Volcano, 288 BolshoyeBannoye, 284ff. Kamchatka Peninsula, 277jt. Makhachkala, 288 map, 278 Nizhne-Koleshevskays, 288 Paratunka, 28lff. Pauzhetka, 277ff. Siberia, 288 total flow turbine, 289 Yuzhno-Kurilsk, 288
Specific fluid consumption, definition, 11
Subduction zone, 5jf. Siibeidence, 4
wellhead power unit, S55
definition, 19
plant, 18
plant, 13 .
Tectonic plates, Iff. Texas, 4,847 The Geysers power plant, 29355.
availability factor, 825 capacity factor, S25 capital investment, 823 construction materials, 315 corrosion, 316 cost of electricity, 32311. directional drilling, 297 drilling, 294 drilling mud, 296 economic data, 320 energy conversion systems, 2975f. fleld layout, 29715. forced outage rate, 325 future units, 314ff. gathering system, 297 gaseous eliiuents, 317ff. geology, 293ff. heat balance diagrams, 803,305, W,
hydrogen sulfide, 318ff. liquid ef€luent, 817 operating experience, 325 preplant emissions, 820 radon, 310ff. rehjection, 817 reliability, 325 scheduled outage rate, 325 site photographs, 301, 804, 308, SO9 steam composition, 315 steam pricing formula, 82Off. steam reservoir, 294 steam wells, 294 Unit 1,297ff. Unit 2,298n. Units 3 and 4,299 Units 510,299ff. Units 11 and 12,807. Units 18, SO7ff. Unit 14, SlOff. Unit 16,814 utilization efficiency, 814 well spacing, 297
I’ibet, 27 riwi power plant, 265ff.
energy conversion system, 268 exploration, 265
production wells, 265 utilization e5ciency, 268 waste liquid, 268
rota1 flow power plant, 18
311413
geology, 265

I i I IRDEX 869
Travale, 10, l l 6 f f . energy conversion system, 116 geology, 116 well programs, 116ff.
geothermal areas, 276 geothermal exploration, 273, !&76 IClaldere, 27Sf l .
Turkey, 273ff.
Union of Soviet Socialist Republica (See Soviet Union)
United States, 1,29111.
'W
, j I
i
w
Brawley, 886 California, 29lfl. Cos0 Hot brings, 345 Costain, J. K., 849 Desert Peak, 343 East Coast, 848 East Mesa, 826rf., ~ f l . , 845 Elliott, W. B., 291 Galloway, J. D., 292 geopressured reservoirs, 840 Georgia, 848 geothermal power potential, 8 4 O f l . Geysers Resort, 291 Grant, J. D., 291 growth predictions, 849 Gulf Coast, 347 Hawaii, 838ff. Heber, 842 history of geothermal energy, 291rf. hot, dry rock systems, 840 Idaho, Wfl. Imperial Valley, 8, 14, 16, 292, 84ojt. Long Valley, 845 Louisiana, 347 McCabe, B. C., 292 Mcnfillan, D. A, Jr., 292 Mexicali-Imperial Rift Valley, 326j2. Mullet Island, 292 Nevada, 843 New Jersey, 848 New Mexico, SSfi . Niland, 292 Puna, 838jj. Raft River, 335fl. Roosevelt Hot Springs, 843ff. Salton Sea, 292,327,342 Siegfried, H. N., 291 Stone, F., 292 Texas, 847 The Geysers, 293fl. Utah, Wff.
United States, 1,291fl.4ntinned Valles Caldera, S S S f f . Westmorland, 342
Utilization eWiency, deflnition, 11
Utilization factor, definition. 18
Valles Caldera demonstration plant, m9rr.
Baca No. 1 location, 839 energy conversion system, 840 reservoir properties, 339ff.
Vnpor-dominated resource, 7 Vulcanism, 1
Wairakei power plant, 9,209ff. arsenic, 234 availability factor, 240 blowout prevention equipment, 220 capacity factor, 240,242 capital investment, 2SQff. carbon dioxide, 235 construction materials, 22Qfl. dissolved solids, 230 drilling, 214 drilling program, 216ff. drilling rig, 216 drill string, 214,220 electricity generation, 242 energy conversion system, 221 environmental effects. 230ff. esthetics, 239 gaseous emuents, 236 generating history, 242 geofluid characteristics, 229 geology, 209ff. hydrogen sulfide, 23sff. land movements, 236ff. load factor, 240 map, 210 mercury, 234 noncondensable gases, 229 operating costs, 23Bff. operating experience, Mff. pressure bistow, 213 recharge, 214 reservoir, 21211. site photographs, 227. 231-233 steam pipelines, 'A9 steam wells, 213,221 subsidence, 236ff.

370 INDEX
Wairakei power plant, 9,209fl.4on. turbinm, 221, 224ff. utilization efficiency, 223,228 waste liquid, 234 well blowout, 243 wellhead equipment, 218
Westmorland power plant, 342 White Mountains, 3
Pang-pa-ching power plant, 27ff. energy conversion system, 28 geothermal resource, 28
Copyright © 2022 FDOKUMEN