Sequencing, de novo annotation and analysis of the first Anguilla anguilla transcriptome: EeelBase...
13
RESEARCH ARTICLE Open Access Sequencing, de novo annotation and analysis of the first Anguilla anguilla transcriptome: EeelBase opens new perspectives for the study of the critically endangered european eel Alessandro Coppe 1† , Jose Martin Pujolar 1† , Gregory E Maes 2 , Peter F Larsen 3 , Michael M Hansen 3 , Louis Bernatchez 4 , Lorenzo Zane 1* , Stefania Bortoluzzi 1 Abstract Background: Once highly abundant, the European eel (Anguilla anguilla L.; Anguillidae; Teleostei) is considered to be critically endangered and on the verge of extinction, as the stock has declined by 90-99% since the 1980s. Yet, the species is poorly characterized at molecular level with little sequence information available in public databases. Results: The first European eel transcriptome was obtained by 454 FLX Titanium sequencing of a normalized cDNA library, produced from a pool of 18 glass eels (juveniles) from the French Atlantic coast and two sites in the Mediterranean coast. Over 310,000 reads were assembled in a total of 19,631 transcribed contigs, with an average length of 531 nucleotides. Overall 36% of the contigs were annotated to known protein/nucleotide sequences and 35 putative miRNA identified. Conclusions: This study represents the first transcriptome analysis for a critically endangered species. EeelBase, a dedicated database of annotated transcriptome sequences of the European eel is freely available at http:// compgen.bio.unipd.it/eeelbase. Considering the multiple factors potentially involved in the decline of the European eel, including anthropogenic factors such as pollution and human-introduced diseases, our results will provide a rich source of data to discover and identify new genes, characterize gene expression, as well as for identification of genetic markers scattered across the genome to be used in various applications. Background The European eel ( Anguilla anguilla L.; Anguillidae; Teleostei) is a catadromous fish species with a complex life cycle conditioned by marine (spawning, larval phase and maturation) and continental (feeding, growth) envir- onments. Current available information indicates that the overall stock is at an historical minimum in most of the distribution area and continues to decline, while fishing mortality is still high both on juveniles (glass eels) and adults (yellow and silver eels) [1]. At present, recruitment is dramatically low, with a sharp and wide- spread reduction by 90-99% as compared to recruitment prior to 1980 [2]. Several hypotheses have been put for- ward concerning the causes of the eel stock decline, including anthropogenic factors affecting eels during their continental phase of the life-cycle (overfishing, migration barriers, pollution and human-introduced dis- eases; [3]) and climatic events affecting eels during the oceanic phase [4,5]. The European eel was included in 2007 in Appendix II of the Convention on International Trade of Endangered Species (CITES; http://www.cites. org) and was listed in 2008 as critically endangered in the IUCN Red List of Threatened Species http://www. iucnredlist.org. A management framework for the recov- ery of the European eel stock was established in 2007 by the Council of the European Union through a dedicated regulation (EU 1100/2007) for eel recovery and sustain- able use of the stock requiring the preparation of national eel management plans from any Member * Correspondence: [email protected] † Contributed equally 1 Biology Department, University of Padova, Via G. Colombo 3, I-35131 Padova, Italy Full list of author information is available at the end of the article Coppe et al. BMC Genomics 2010, 11:635 http://www.biomedcentral.com/1471-2164/11/635 © 2010 Coppe et al; licensee BioMed Central Ltd. This is an Open Access article distributed under the terms of the Creative Commons Attribution License (http://creativecommons.org/licenses/by/2.0), which permits unrestricted use, distribution, and reproduction in any medium, provided the original work is properly cited.
-
Upload
independent -
Category
Documents
-
view
0 -
download
0
Transcript of Sequencing, de novo annotation and analysis of the first Anguilla anguilla transcriptome: EeelBase...
RESEARCH ARTICLE Open Access
Sequencing, de novo annotation and analysis ofthe first Anguilla anguilla transcriptome: EeelBaseopens new perspectives for the study of thecritically endangered european eelAlessandro Coppe1†, Jose Martin Pujolar1†, Gregory E Maes2, Peter F Larsen3, Michael M Hansen3,Louis Bernatchez4, Lorenzo Zane1*, Stefania Bortoluzzi1
Abstract
Background: Once highly abundant, the European eel (Anguilla anguilla L.; Anguillidae; Teleostei) is considered tobe critically endangered and on the verge of extinction, as the stock has declined by 90-99% since the 1980s. Yet,the species is poorly characterized at molecular level with little sequence information available in public databases.
Results: The first European eel transcriptome was obtained by 454 FLX Titanium sequencing of a normalized cDNAlibrary, produced from a pool of 18 glass eels (juveniles) from the French Atlantic coast and two sites in theMediterranean coast. Over 310,000 reads were assembled in a total of 19,631 transcribed contigs, with an averagelength of 531 nucleotides. Overall 36% of the contigs were annotated to known protein/nucleotide sequences and35 putative miRNA identified.
Conclusions: This study represents the first transcriptome analysis for a critically endangered species. EeelBase, adedicated database of annotated transcriptome sequences of the European eel is freely available at http://compgen.bio.unipd.it/eeelbase. Considering the multiple factors potentially involved in the decline of the Europeaneel, including anthropogenic factors such as pollution and human-introduced diseases, our results will provide arich source of data to discover and identify new genes, characterize gene expression, as well as for identification ofgenetic markers scattered across the genome to be used in various applications.
BackgroundThe European eel (Anguilla anguilla L.; Anguillidae;Teleostei) is a catadromous fish species with a complexlife cycle conditioned by marine (spawning, larval phaseand maturation) and continental (feeding, growth) envir-onments. Current available information indicates thatthe overall stock is at an historical minimum in most ofthe distribution area and continues to decline, whilefishing mortality is still high both on juveniles (glasseels) and adults (yellow and silver eels) [1]. At present,recruitment is dramatically low, with a sharp and wide-spread reduction by 90-99% as compared to recruitment
prior to 1980 [2]. Several hypotheses have been put for-ward concerning the causes of the eel stock decline,including anthropogenic factors affecting eels duringtheir continental phase of the life-cycle (overfishing,migration barriers, pollution and human-introduced dis-eases; [3]) and climatic events affecting eels during theoceanic phase [4,5]. The European eel was included in2007 in Appendix II of the Convention on InternationalTrade of Endangered Species (CITES; http://www.cites.org) and was listed in 2008 as critically endangered inthe IUCN Red List of Threatened Species http://www.iucnredlist.org. A management framework for the recov-ery of the European eel stock was established in 2007 bythe Council of the European Union through a dedicatedregulation (EU 1100/2007) for eel recovery and sustain-able use of the stock requiring the preparation ofnational eel management plans from any Member
* Correspondence: [email protected]† Contributed equally1Biology Department, University of Padova, Via G. Colombo 3, I-35131Padova, ItalyFull list of author information is available at the end of the article
Coppe et al. BMC Genomics 2010, 11:635http://www.biomedcentral.com/1471-2164/11/635
© 2010 Coppe et al; licensee BioMed Central Ltd. This is an Open Access article distributed under the terms of the Creative CommonsAttribution License (http://creativecommons.org/licenses/by/2.0), which permits unrestricted use, distribution, and reproduction inany medium, provided the original work is properly cited.

States. Current demand for eels cannot be met byfisheries and relies on aquaculture instead, based onwild-caught juvenile eels as artificial reproduction of thespecies is not yet feasible [1].From this perspective, an evaluation of European eel
population genetic structure, genetic diversity, effective(spawning) population size, and possible evolutionaryresponses to anthropogenic environmental stress is cru-cial. Traditionally, these issues have been addressed bystudying a limited number of markers due to the short-age of genomic sequence resources available for eels. Nogenome sequencing have been conducted for any anguil-lid species so far and all the species within the genusAnguilla are still poorly characterized at the molecularlevel. For the species A. anguilla only 232 proteins areavailable. Similarly, only 121 ESTs and 404 nucleotidesequences are known, the latter including the completemitochondrial genome (NCBI databases 9/25/2010),encoding 13 peptides.Next-generation sequencing techniques such as 454
pyrosequencing methodology allow for a massive charac-terization of expressed genes [6-10]. A complete character-ization of Expressed Sequence Tags (ESTs) provides anoverview of the transcriptome, i.e. those genes expressedin a given tissue at a given time [11]. Initially, pyrosequen-cing was restricted to model organisms [12-15] because ofthe short reads (100-200 bp) produced that make de novogenome assembly difficult without a reference genome.However, the more accurate base calling and deepersequencing coverage of the 454 approach means that tran-scribed genes of non-model organisms can be character-ized without a pre-existing sequence reference. Recently,454 pyrosequencing has been successfully applied to large-scale EST sequencing in non-model organisms [16],including insects [17,18], plants [19-21] and corals [22]. Infish, characterized transcriptomes include the whitefishCorenogus clupeaformis [23], the eelpout Zoarces viviparus[24], the lake sturgeon Acipenser fulvescens [25] and thecichlid Amphilophus sp. [26]. Pyrosequencing of ESTs canbe used to characterize gene expression, discover andidentify new genes, providing a rich data resource for iden-tification of novel Type I genetic markers (microsatellitesand SNPs) for quantitative trait locus (QTL) and popula-tion genomic analyses. Up till now, only 196 ESTs areavailable for the Japanese eel [27] and 121 ESTs for theEuropean eel [28]. More recently, EST sequencing of anormalized A. anguilla cDNA library produced by theEuropean Marine Genomics Network of Excellenceallowed to obtain 4,893 ESTs (795 contigs and 4,008 sin-gletons), used for the identification of putatively selectedmicrosatellites markers [29,30].The non-coding portion of the transcriptome has been
largely neglected in studies focusing on non-modelorganisms despite its emerging biological importance
and the continuous discovery of novel classes offunctional non-coding RNAs [31,32]. As an example,microRNAs (miRNAs) are small non-coding RNAs play-ing an important role in the regulation of gene expres-sion in a wide range of biological processes, includingcell differentiation, organogenesis and development,which have been found in a wide range of organisms,from plants to viruses and vertebrates (reviewed in[33]). The majority of fish miRNAs have been charac-terised in model species (360 for Danio rerio, 131 forFugu rubripes and 132 for Tetraodon nigroviridis), withthe exception of rainbow trout [34].Here we present the European eel transcriptome,
obtained by 454 FLX Titanium sequencing of over300,000 ESTs from a normalized cDNA library, andassembly of reads in about 19,000 contigs, representingbona fide individual transcripts. An innovative aspect ofour study is the identification of putative European eelmiRNA sequences, by comparing reconstructed contigsequences with known Metazoan miRNAs hairpin pre-cursor sequences. In summary, 36% of contigs wereannotated by similarity to known protein or nucleotidesequences, plus 35 contigs matching miRNAs sequencesknown in different species were identified. A database(EeelBase) has been established that provides the firstpicture of the genomic transcriptional activity of thiseconomically important but endangered species. Thedatabase will be updated in the future, if additional databecomes available.
Results and discussionContigs assembly and validationA normalised cDNA library obtained from pooling equi-molar amounts of total RNA from 18 glass eels wassequenced using the 454 Titanium platform. A singlesequencing run from a single region produced 310,079reads, with an average sequence length of 266 nucleotides(available at NCBI Short Read Archive SRA020995).Using MIRA 3, sequence reads were assembled into
contigs, representing European eel transcripts. A firstrun of assembly using 264,866 reads (85.4% of the total)produced a total of 28,459 sequences, consisting of28,229 contigs and 230 singlets. The large majority ofcontigs (25,614 contigs or 91%) were assembled withhigh confidence, while the remaining 2,615 contigs wereassembled despite the absence of a starting region cov-ered by an “anchor” read with long overlap with manyother reads. Plots in Additional Files 1 and 2 describethe distributions of length and average quality over allassembled sequences, and illustrate pair-wise relationsbetween main sequence properties (see also Table 1A).Due to the heuristic nature of the assembly process andprevious reports of redundancy (different contigsequences belonging to the same transcript region) in
Coppe et al. BMC Genomics 2010, 11:635http://www.biomedcentral.com/1471-2164/11/635
Page 2 of 13
sets of transcriptome contigs assembled with differentmethods [17], a second run of assembly was conductedusing the previously obtained contigs and singlets asinput. In this way, one quarter of contigs (7,510) werefurther assembled in 3,048 meta-contigs, with anincrease of the average length from 455 (all contigs) to783 nucleotides (meta-contigs). On average, meta-contigs included 2.47 contigs (from 2 to 11) and werecovered by 43.2 reads.A total of 23,997 sequences were obtained by merging
all meta-contigs with the contigs and singlets from thefirst assembly not included in any meta-contig. Thenumber of contigs remained stable over further reas-sembly (data not shown), which suggests that mostredundancy had been eliminated. A further qualitycheck was conducted for the final set of putative tran-scripts by selecting only those sequences at least 200nucleotide long and with a minimum average sequencequality of 30 (corresponding to an average error rate of1/1,000). A total of 19,631 transcripts were obtained(Table 1B), with an average length of 531 nucleotidesand an average sequence quality of 45 (about 1 in32,000 bp error rate). Transcripts included informationderived from 248,011 original reads, with an average of12.6 reads per transcript. The GC content in the tran-scripts ranged from 21.86% to 67.94%, with a meanvalue of 41.44% (median 41.06).Figure in Additional File 3 shows the distribution of
sequence length and average quality in the final set ofcontigs. All contigs were aligned with the set of originalreads from which they were assembled, generating mul-tiple alignments in ACE format. These were included inthe database and might be useful for future identifica-tion of intra- and inter-specific sites of genetic variation(SNPs, microsatellites).To our knowledge, no general criteria have been
proposed as standard for quality evaluation of de novotranscriptome assembly. In this sense, three aspects canbe regarded as substantial for assessing how well thesample of assembled contig sequences represents theactual transcriptome population: (1) gene coverage, (2)transcript sequence quality and (3) completeness.
(1) First, we compared the ratio between number ofgenes and transcripts in zebrafish Danio rerio and stick-leback Gasterosteus aculeatus. A recent paper by Lu etal. [35] showed that rates of alternative splicing varyamong teleost species, in terms of fraction of genes withalternative transcripts (17% in zebrafish; 32.4% in stick-leback) and average number of splicing events per gene(1.74 in zebrafish and 1.65 in stickleback), resulting in adifferent ratio between transcripts and genes (1.13 inzebrafish, 46,571 transcripts/41,365 genes; 1.21 in stick-leback, 28,071 transcripts/23,188 genes). Under thehypothesis that the number of genes and the tran-scripts/genes ratio in A. anguilla is similar to that esti-mated for stickleback, which is reasonable consideringthe highly duplicated nature of zebrafish genome [35],the total of 19,631 European eel transcripts would repre-sent about 16,200 genes, with at best about 70% genecoverage.The transcriptome gene coverage was estimated by
comparison with the available sequence information forA. anguilla. All 13 mitochondrial protein-coding genespreviously described in European eel were present in theassembled contigs. Moreover, regarding the 232 knownA. anguilla protein sequences, 113 (75%) out of the 150different proteins (after eliminating redundancy) werefound in the transcriptome. These two estimationsmight be inaccurate because of the limited numbers ofsequences used for comparison, mostly belonging tohighly and/or constitutively expressed genes. By con-trast, only 5 out of the 8 glutathione peroxidase genesknown in zebrafish are found in the eel transcriptome.While 12 genes of two small families of Iroquoishomeobox proteins are found in zebrafish, only 5 con-tigs/2 putative genes are represented in the eel tran-scripts. For ATPase genes, a large family in vertebrateswith over 125 genes in zebrafish, only 15 contigs/9 puta-tive genes were present in the eel transcriptome.However, coverage values in the European eel tran-
scriptome might not be comparable to zebrafish, thegenome of which is characterized by high rates of geneduplications [35], which might correspond to a consid-erable increase in gene family size in comparison with
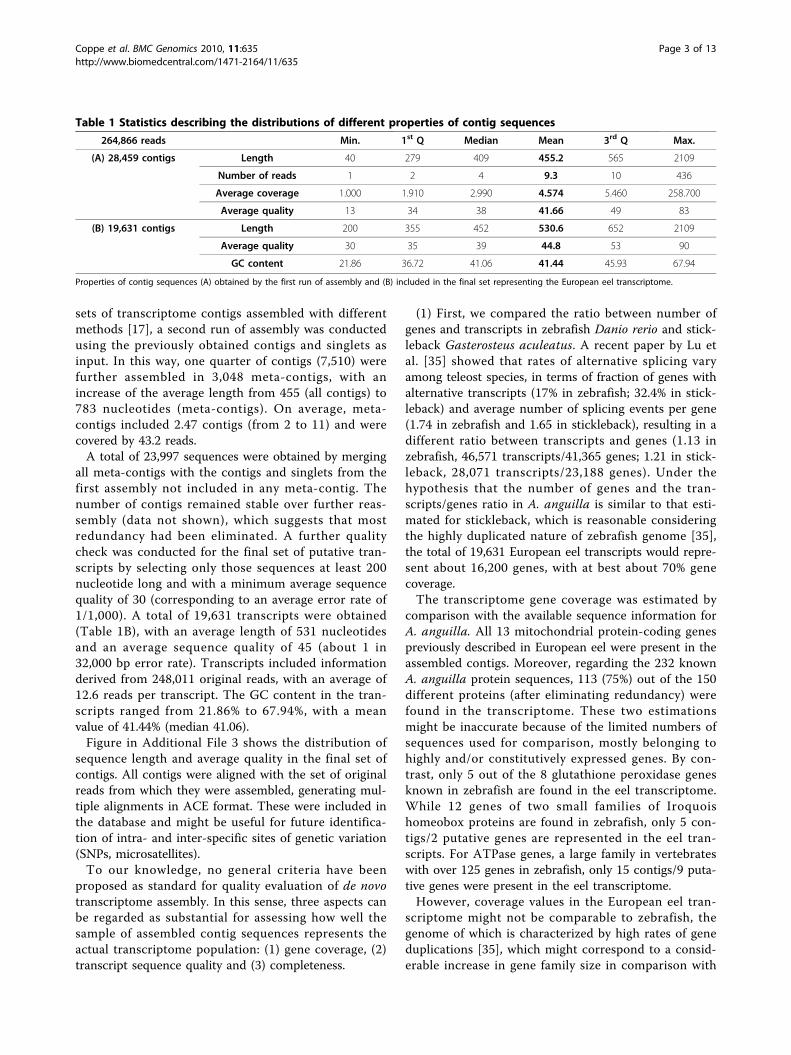
Table 1 Statistics describing the distributions of different properties of contig sequences
264,866 reads Min. 1st Q Median Mean 3rd Q Max.
(A) 28,459 contigs Length 40 279 409 455.2 565 2109
Number of reads 1 2 4 9.3 10 436
Average coverage 1.000 1.910 2.990 4.574 5.460 258.700
Average quality 13 34 38 41.66 49 83
(B) 19,631 contigs Length 200 355 452 530.6 652 2109
Average quality 30 35 39 44.8 53 90
GC content 21.86 36.72 41.06 41.44 45.93 67.94
Properties of contig sequences (A) obtained by the first run of assembly and (B) included in the final set representing the European eel transcriptome.
Coppe et al. BMC Genomics 2010, 11:635http://www.biomedcentral.com/1471-2164/11/635
Page 3 of 13

other species. A moderate to low gene coverage can alsobe attributable to tissue/life stage-specific and/or weaklyexpressed gene transcripts, which might be applicable toour study in which the cDNA library was producedusing a single life-stage (glass eels).(2) Transcriptome sequence quality was evaluated by
comparing the mitochondrial protein-coding genesfound in the assembled contigs with the mitochondrionsequence in Genbank (NC_006531). A total of 18,554nucleotide identities were observed out of 18,791 totalnucleotide length of contig to genome BLAST matches,suggestive of good transcriptome sequence quality. Theobserved 1% sequence difference might be due to eitherintraspecific genetic variability and/or sequencing errorsaffecting assembled mtDNA sequences.(3) Finally, in terms of sequence completeness, the esti-
mation of the fraction of full-length sequences in thetranscriptome was obtained. A sequence is consideredfull-length when it comprises the complete 5’ and 3’sequences of the mRNA. In this study, we used a lessstringent but broadly adopted definition, considering asequence as full length when it contains at least the com-plete coding sequence (CDS). Using the software Full-Lengther, 54% of predicted transcripts were validated asfull-length (10,169) or putative full-length (474).Approximately 25% (2,575) presented at least a signifi-cant BLAST match (min. E-value = 1E-3) with nucleotide
(nr) or protein (UniProt) sequences. The remaining 75%(8,068) were not similar to any known sequence but theirlongest ORF fitted the Full-lengther criteria (exceeds 66nucleotides and contains both ATG and stop codons, orthe ATG is located at no more than 150 nucleotidesfrom the 5’ end of the transcript, without an in-frameend codon). Among the 8,988 transcripts considered asnon full-length by the software, 2,348 (12% of the total)showed BLAST matches. Thus, at least 66% of all contigs(54% full-length plus 12% non-full-length but withBLAST hits) could be successfully annotated by similarityand/or contained a complete CDS.
Functional annotation by similarityDe novo annotation of the European eel transcriptome,both for the coding and for the non-coding fraction oftranscripts, was obtained by a multistep procedure,starting with similarity search against main protein andnucleotide sequence databases, as detailed below.BLASTX against protein sequence databasesTranscript sequences were compared by BLASTXagainst nr database of peptide sequences, the most com-prehensive and well annotated collection of proteins,thus identifying significant similarity with known pro-teins for 5,530 transcripts (28.2%). In total, 98,799 nrhits were identified, with an average of 18 hits per tran-script. Figure 1 shows the European eel contigs vs nr
Figure 1 BLAST E-values (Eel contigs vs nr protein database) distribution analysis. Lines show the fraction of E-values lower than thethreshold indicated in the x-axis. Four groups of HSP- associated E-values are considered, corresponding to the best hits only and to all the hits,both for the complete set of 5,530 contigs with protein BLAST hits and for the subset of 3,556 contigs with protein hits, which weresubsequently annotated, by association to GO terms.
Coppe et al. BMC Genomics 2010, 11:635http://www.biomedcentral.com/1471-2164/11/635
Page 4 of 13

protein database BLAST E-values analysis, in relation tothe annotated status of contigs. Eukaryotes accountedfor 98.5% of all BLAST hits, while teleost fish accountedfor 34.4% of hits (Table 2; Figure 2). Among fish, zebra-fish Danio rerio and salmon Salmo salar representedabout 50% of all the hits, with 10,540 and 6,991 hits,respectively.Considering alignment coverage between query and
subject sequences, aligned regions covered on average45.1% of contigs length: 75% of contigs were alignedwith subject sequences for more than 24.6% of theirlength, and 25% for more than 63.5% of their length.Aligned regions covered on average 35.1% of subjectsequence (known proteins) length, whereas three quar-ters of aligned regions covered over 55.1% of subjectsequence length. The majority of contig/transcriptsequences (14,316) were not associated to nr BLASThits. Comparison of sequence length, quality and GCcontent of the set of sequences with and without nrBLAST hits showed highly significant differences (Table3): annotated sequences were longer and of higher qual-ity than non-annotated sequences, and GC content ofthe two sets was on average about 8 percent pointshigher in annotated sequences.In parallel, BLASTX search with the SwissProt set of
UniProt protein sequences identified significant similar-ity with known proteins for 4,023 transcripts (20.5%)with a total of 62,630 hits, with 16 hits per transcript onaverage. Only 29 contigs, not previously annotated bysimilarity using nr database, were included in the set of4,023 contigs with SwissProt BLAST hits. Merging theresults of the two BLAST searches, 5,559 transcripts(28.3%) resulted to be similar to at least one known pro-tein sequence in UniProt or nr database, with adoptedsettings.BLAST against nucleotide sequence databasesTranscript sequences were also compared by BLASTNagainst nt database of nucleotide sequences, identifyingsignificant similarity for 5,495 transcripts (28%). In total,70,530 nt hits were identified, with an average numberof 13 hits per transcript. A group of 1,433 contigs with-out hits after BLASTX searches resulted to be similar tont sequences.
In summary, a total of 6,963 contigs with at least onehit after all the BLAST searches were identified, whichrepresent 36% of the transcriptome.Functional annotationBLASTX with nr database was chosen as most informa-tive and used as starting point for the functional annota-tion analysis conducted with the Blast2GO suite. Amongcontigs with nr BLASTX hits, 3,556 (64%) were asso-ciated to one or more 3,276 unique GO terms, for atotal of 122,193 term occurrences. After merging GOannotations to eliminate redundancy, 18.1% of contigsresulted to be associated to GO terms. The number ofGO terms per annotated contig is reported in Figure3A. In order to give a broad overview of the ontologycontent, GO classes were grouped into GO-slim terms,which are cut-down versions of the GO ontologies con-taining a subset of the terms in the whole GO. Usingthe web tool CateGOrizer, GO classes were groupedinto a total of 124 GO-Slim terms (Figure 3B, Addi-tional File 4), which included biological process (53%),molecular function (25%) and cellular component (22%)ontologies. Among biological processes, cellular, regula-tory and development processes represented 95% of thetotal, while other key processes like growth or reproduc-tion were also present. Binding represented about 70%of the molecular function terms.Sequence and annotation information included in
EeelBase might be valuable for the study of Europeaneel biology under changing environmental conditions.Different groups of European eel transcripts that puta-tively encode proteins critical for environmental stressresponse are found in the database. Several transcriptsencoding proteins putatively involved in environmentaladaptation were found in the database. A total of 11 dif-ferent heat shock proteins were identified (AdditionalFile 5), a class of functionally related proteins whoseexpression is increased when exposed to stress, manyfunctioning as molecular chaperones with a critical rolein protein binding and folding. Regarding oxidativestress response, 12 contigs encoding at least 5 differentforms of glutathione peroxidase were identified, keyenzymes involved in detoxification of hydrogen peroxidebut also associated with SH3-domain binding, endopep-tidase inhibition and anti-apoptotic activity through cas-pase regulation. Three contigs were annotated asencoding at least two superoxide dismutase proteins, aclass of enzymes with a role in superoxide catalysis.Finally, 22 contigs represented MHC (Major Histocom-patibility Complex) genes, which play an important rolein the immune system. Direct keyword search by GOterms, implemented in the database, allows to efficientlyretrieve the relevant information.As a last step, the KEGG (Kyoto Encyclopedia of Genes
and Genomes) pathway approach for higher order
Table 2 E-values and Scores distribution of all the155,749 alignments identified by BLAST betweenEuropean eel transcripts and nr protein hits
BLASTalignments
Min. 1st Q Median Mean 3rd Q Max.
E-value 0 1.430E-47
8.743E-24
1.928E-05
9.604E-11
9.982E-04
Score 41 131 209 289 380 2155
Coppe et al. BMC Genomics 2010, 11:635http://www.biomedcentral.com/1471-2164/11/635
Page 5 of 13

functional annotation was implemented using the toolDAVID. Using zebrafish as reference genome, a total of2,076 zebrafish genes homologous to European eel tran-scripts were mapped to KEGG pathways. Three of themare significantly enriched: ribosome (37 genes, FDR 2.7E-9), oxidative phosphorylation (34 genes, FDR 2.4E-4) andproteasome (15 genes, FDR 2.1E-1) (Additional File 6).
Comparison with zebrafish and three-spine sticklebackgenomesEuropean eel transcripts were aligned with the completezebrafish genome using BLAT, in order to reconstructthe exon-intron structure of European eel genes, whichmight be useful for primer and probes design in futureexperimental studies. For each transcript, the pairwisealignment with the best-matching zebrafish genome
region was retrieved and analysed. In total, BLATdetected similarities with a genomic region for 18,990contigs, although a fraction of alignments includedsmall regions and/or low percentages of sequence iden-tity. Using alignments between transcript and genomicof at least 100 nucleotides and 70% sequence identity ascriteria, 3,245 transcripts (17.1%) were related bona fideto the corresponding orthologous region in the zebrafishgenome. Considering the ratio between matching regionand transcript length, 77.8% of transcripts with signifi-cant genome match aligned with zebrafish for at least50% of the sequence length, while 35.7% aligned with atleast 75% of the sequence length. Similarly, eel tran-scripts were aligned with the available genome of thethree-spine stickleback Gasterosteus aculeatus. Applyingthe same criteria used for zebrafish genome matches,
Figure 2 Species distribution of European eel BLAST hits from nr sequence database. A total of 5,530 contigs found significant similaritywith 98,799 hit sequences. The relative abundance of hits in main taxonomic groups is represented as percentage of the total number of hits, ina simplified “tree of life” diagram (lines between nodes mean “belong to”).
Table 3 Comparison among contig sequences annotated by similarity search against nr database and contigsequences without any significant hit
Average Contigs with nr BLAST hits Contigs without nr BLAST hits t-test p-value
Length 666.8 479.2 <2.2E-16
Average quality 50.17 42.77
GC content 46.97 39.34
Coppe et al. BMC Genomics 2010, 11:635http://www.biomedcentral.com/1471-2164/11/635
Page 6 of 13

only 1,062 European eel contigs, corresponding to 5.4%of the total, aligned with the stickleback genome. Ofthese, 4% aligned for at least 50% of the sequence lengthand 0.2% for at least 75% of the sequence length,whereas 671 (63%) aligned also with zebrafish genome.According to phylogenetic data, Anguilliformes are a
basal branch in the teleost evolution that diverged
before the separation of other teleost lineages, includingCyproniformes (zebrafish) and Gasterosteiformes (stick-leback). Thus, discrepancies in genome matches acrossspecies could be explained by differences in genomestructure rather than by differential sequence diver-gence. The higher number of matches in zebrafish maybe consequence of the highly duplicated nature of the
Figure 3 Functional annotation. Panel A reports the number of transcripts annotated with numbers of GO terms per transcripts. Panel B showsEuropean eel contigs GO terms representation for biological process (BP), molecular function (MF) and cellular component (CC) ontologies,calculated after mapping by single count 122,193 GO terms to a total of 124 GO-Slim ancestor terms.
Coppe et al. BMC Genomics 2010, 11:635http://www.biomedcentral.com/1471-2164/11/635
Page 7 of 13
zebrafish genome [35]. Indeed, genome size is threetimes larger in zebrafish (1.7 Gb) than in stickleback(0.6 Gb), according to [35]. Moreover, while the zebra-fish genome is fully sequenced, the stickleback genomeis under completion with only 0.45 Gb available so far(Ensembl assembly BROAD S1).
Transcriptome redundancyTranscriptome redundancy is expected in assembledcontigs due to the heuristic nature of the assembly pro-cess and the settings used to avoid assembly of slightlydifferent sequences. Different kinds of redundancy canbe considered. Transcript-level redundancy is observedif different contigs belong to the same transcript. Thismay result from lack of conditions for merging readsequences for a same transcript in a unique contig, dueto no sequence overlap or to sequencing errors. Gene-level redundancy is observed when different contigsequences belong to the same gene or transcriptionalregion. This may partially be explained by the pervasiveexistence of alternative transcripts. Recently, Lu et al.[35] suggested an inverse relation between genome sizeand alternative splicing frequency in teleost fish. Whilethe lowest value of alternatively splicing was found inthe highly duplicated zebrafish genome, the highestvalue was found in the compact genome of pufferfish.Assuming 30% alternative splicing that is intermediateamong the values found in [35] and an approximatevalue of 1.7 events per gene, about 42% of transcriptsare expected to belong to alternatively spliced genes inthe European eel. Considering the fraction of annotatedcontigs, 5,314 contigs are associated to 3,202 uniquedescriptions, 2,281 of which are represented by a singlecontig. Thus 43% (2281/5314) of contigs might be tran-scripts of different genes, whereas the remaining fractionof contigs may be redundant at gene level (3.3 contigsper description, on average). Considering that differentdescriptions may correspond to different genes, the frac-tion of descriptions represented by at least two contigs(29%, 921/3202) is very close to the assumed 30% ofalternatively spliced genes. On the other hand, the num-ber of contigs per description exceeds the expectednumber of transcripts per alternatively spliced gene (3.3and 1.7, respectively) with an excess only partiallyexplained by the fact that some of the largest groups ofcontigs are associated to quite general descriptions (e.g.“novel protein”, “histone” or “member ras oncogenefamily”). Thus, the description redundancy in Europeaneel contig annotation may be largely, but not comple-tely, explained by alternative splicing rates in fishes.As an example, contig eu_c381 (2109 nucleotides long,
average quality 66) is annotated as PSA2 (proteasomesubunit alpha type-2), as it matches different proteinsof the InterPro family IPR000426 (Proteasome,
alpha-subunit, conserved site). The contig sequencecorresponds to a putative full-length transcript with bestmatch in translated nr to a putative ortholog of zebra-fish (NP_001122146), a 234 aa proteasome subunit,whose CDS is completely included in the European eeltranscriptome. The alignment of the same contig withthe zebrafish genome highlights the existence of detect-able sequence similarity also outside the CDS, since thecontig aligns with a 4,930 nucleotides genomic region ofchromosome 19, with a total of 1,448 nucleotidesaligned with 87% sequence identity. Looking at the con-tig annotation, there are two additional (shorter) contigsin the transcriptome, which are annotated as PSA2:eu_c1147 and eu_c27369. These sequences match par-tially overlapping protein hits groups with eu_c381, andmatch the same zebrafish genome region. However, theyinclude different combinations of sequence fragmentsand likely correspond to alternative transcripts. Thus,these three transcripts belonging to a putative PSA2European eel gene are correctly included in separatedcontigs.
Identification of putative microRNAsMicroRNAs are small non-coding RNAs playingimportant roles in the regulation of gene expression inbiological processes including cell differentiation, orga-nogenesis and development [33]. In order to identifyputative novel microRNAs belonging to evolutionaryconserved families, the European eel transcriptome wascompared with known metazoan microRNA hairpinsequences. A total of 54 significant local alignmentsbetween contigs and hairpin sequences were identified,involving 54 different hairpins. For each hairpinsequence, we also considered the absolute positions ofthe known major and/or minor mature sequences in thehairpin, given by the miRBase database, in order to dis-criminate between contig/hairpin matches involving amore or less extended region of a hairpin from thoseoverlapping a mature miRNA sequence. Table 4 reportsa total of 35 contigs matching both hairpins and maturemiRNAs sequences known in different species.
EeelBase: the European eel transcriptome databaseA database, freely available online at http://compgen.bio.unipd.it/eeelbase/, has been implemented using MySQLand Django web framework. The database is filled withdifferent layers of information regarding the Europeaneel transcriptome sequences and analysis results. Foreach contig, a gene-like entry (Figure 4) reports differentdata and bioinformatic analyses results, according to theschema detailed below:• Contig information. For each contig (identified by
EeelBase ID and preliminary description), the FASTAsequence is provided along with an informative contig
Coppe et al. BMC Genomics 2010, 11:635http://www.biomedcentral.com/1471-2164/11/635
Page 8 of 13

description using Blast2GO or the best hit when theBlast2GO description was unavailable.• Assembly. The list of reads belonging to the contig
is given, together with two FASTA files including allread sequences, contig with read sequences, and multi-ple alignment of the contig with reads.• Gene Ontology. GO terms associated to transcripts
using the Blast2GO analysis on BLASTX vs nr databaseresults are given for the three ontologies, linked to theGO database. BLAST results, both for nucleotide andprotein database searches, are shown in a dedicated
section in the classic BLAST output format, hyperlinkedto external databases, and including the list of alignmentdescriptions and details about the pairwise alignments ofthe transcript with BLAST hits.• Reference fish genomes alignment. Zebrafish and
three-spine stickleback genome matches in the UCSCGenome Browser are provided to the user, by means oflinks allowing on the fly BLAT search against the lastrelease of zebrafish and three-spine stickleback genomes,thus facilitating the identification and visualisation ofone or more genomic regions putatively homologous tothe considered transcript.• BLAST results. Both for nucleotide and protein data-
base, results of similarity searches are shown in a dedi-cated section in the classic BLAST output format,including the list of alignments descriptions and detailsabout the pairwise alignments with hits, each hyper-linked to external databases entries.• Putative miRNAs. For those eel transcripts including
a putative miRNA sequence, a dedicated field isincluded in the entry, detailing its identity, linked to thecorresponding miRBase database entry.Summary of EeelBase information content (Table 5) is
reported in the home page, which will be regularlyupdated with the subsequent database releases.The database is searchable by keywords and by
BLAST, using nucleotide or protein sequences. Indeed,it implements a query system for massive data retrieval.For a given group of contigs, selected by GO terms IDor by keywords search on contigs and BLAST hitsdescriptions, a customizable .tsv file can be retrievedwith data regarding contig ID, description and sequenceas well as associated GO IDs and terms. FASTA filesand ACE files with reads/contigs alignments can bedownloaded from the main page.
ConclusionsNext generation sequencing has opened the door togenomic analysis of non-model organisms. The growingnumber of species for which significant geneticresources are available is sparking a new era of study inwhich fundamental genetic questions underlying pheno-typic evolution, adaptation and speciation can beaddressed with rigor. The European eel transcriptome,the first obtained by high throughput 454 sequencingfor a critically endangered species, has been produced,annotated and made freely available through a dedicatedand searchable database. With over 19,000 contigs, 36%of which annotated by similarity to known protein ornucleotide sequences and about 18.5% aligned to thezebrafish or three-spine stickleback genomes, and 35contigs matching miRNAs sequences known in differentmetazoan species, this new resource represents a signifi-cant advance in anguillid genomics. Considering the
Table 4 List of European eel contigs putatively includinga microRNA
European eel contig miRNA Species
eu2_c1597 sme-mir-2175 Major Schmidtea mediterranea
eu2_c1626 ptr-mir-1282-2 Major Pan troglodytes
eu2_c1815 mmu-mir-203 Major Mus musculus
eu2_c1886 mmu-mir-2142 Major Mus musculus
eu2_c1924 mmu-mir-682 Major Mus musculus
eu_c793 mml-mir-297 Major Macaca mulatta
eu_c2050 gga-mir-1814 Major Gallus gallus
eu_c2515 sko-mir-252b Major Saccoglossus kowalevskii
eu_c3632 mmu-mir-466d Minor Mus musculus
eu_c4382 mmu-mir-1192 Major Mus musculus
eu_c5018 sko-mir-252b Major Saccoglossus kowalevskii
eu_c5414 sme-mir-756 Minor Schmidtea mediterranea
eu_c6355 mdo-let-7d Major Monodelphis domestica
eu_c6415 sme-mir-87d Major Schmidtea mediterranea
eu_c7274 mmu-mir-466i Major Mus musculus
eu_c7409 bta-mir-220e Major Bos taurus
eu_c7978 mmu-mir-1937a Major Mus musculus
eu_c8918 ptr-mir-297 Major Pan troglodytes
eu_c9238 mml-mir-298 Major Macaca mulatta
eu_c9980 mmu-mir-1192 Major Mus musculus
eu_c10632 mmu-mir-2142 Major Mus musculus
eu_c11528 dgr-mir-308 Major Drosophila grimshawi
eu_c11553 rno-mir-297 Major Rattus norvegicus
eu_c12746 hsa-mir-522 Major Homo sapiens
eu_c14091 hsa-mir-224 Minor Homo sapiens
eu_c14597 mmu-mir-1903 Major Mus musculus
eu_c14993 mmu-mir-2142 Major Mus musculus
eu_c16240 bta-mir-2444 Major Bos taurus
eu_c17072 mmu-mir-669i Major Mus musculus
eu_c17332 rno-mir-124-2 Major Rattus norvegicus
eu_c17397 hsa-mir-297 Major Homo sapiens
eu_c17444 dan-mir-92a Major Drosophila ananassae
eu_c18441 dre-mir-107b Major Danio rerio
eu_c19859 mmu-mir-674 Major Mus musculus
eu_c20136 dan-mir-289 Major Drosophila ananassae
Contigs were selected when part of their sequence is highly similar to aknown Metazoan hairpin microRNA precursor. For each hairpin sequence, wealso considered if the regions aligned with the hairpin sequence overlap themajor or the minor mature sequence position.
Coppe et al. BMC Genomics 2010, 11:635http://www.biomedcentral.com/1471-2164/11/635
Page 9 of 13

critically endangered status of the European eel and themultiple factors potentially involved in eel decline,including anthropogenic factors such as pollution andhuman-introduced diseases, our results provide a richsource of data to discover and identify new genes,
characterize gene expression and for the identification ofmicrosatellites and single nucleotide polymorphisms(SNPs). Transcriptome sequencing is frequently used toprovide greater insight into many basic biological ques-tions. Applications include the understanding of
Figure 4 EeelBase screenshots. Example of the “gene-like” entry in the European eel transcriptome database (EeelBase). For each contig,different categories of information are given together with links to additional web pages (e.g. UCSC graphic display of contig alignments withzebrafish genome).
Coppe et al. BMC Genomics 2010, 11:635http://www.biomedcentral.com/1471-2164/11/635
Page 10 of 13

adaptation, effects of and possible adaptive evolutionaryresponses to pollutants and other types of environmentalstress, improvement of aquaculture, and the discovery ofnovel genes coding for important life-history traits.Current demand for eels cannot be met by fisheries
and relies on aquaculture instead [1]. The most promis-ing application of genomics in the European eel is aqua-culture, which currently satisfies the big market demandfor eels that fisheries are no longer meeting. Using aproteomic approach, key genes for growth and survivalin aquaculture stocks can be identified. In this sense,our annotation revealed several genes with a potentialrole in growth including growth hormone (GH), insulin-like growth factor (IGF) and transforming growth factor(TGF), primary candidates for genetic factors affectinggrowth. Our annotation also showed proteins related tostress, which could also be important in aquaculture asthe reduction of stress might lead to a higher growthand reproductive output.
MethodsBiological samplesRecruiting glass eel (juvenile) samples were collected inearly 2007 at three separate geographic locations acrossEurope, one in the Atlantic Ocean: (1) the estuary of theriver Vilaine (47°29’N; 2°28’W) in Brittany/North-WestFrance; and two in the Tyrrhenian Sea/MediterraneanSea: (2) the estuary of the river Tiber (41°46’N; 12°14’E);and (3) the estuary of the river Sele (40°48’N; 14°93’E).Individuals were sacrificed immediately after collectionfrom the field following internationally recognizedguidelines. Samples were stored in RNALater (Ambion)at -20°C prior extraction. No analyses or experimentswere conducted with live animals.
RNA extraction and cDNA library constructionTotal RNA was extracted from a total of 18 individuals(6 per sampling location) using the RNeasy mini-columnkit (QIAGEN). To avoid overrepresentation of musclespecific genes only the cephalic region (approximately
30 mg) was used. After checking the integrity and sizedistribution of total RNA, RNA samples were pooledand stored in pure ethanol for shipment to the MaxPlanck Institute (Berlin, Germany). One single cDNAlibrary was constructed using equal amounts of RNAand normalized for later sequencing. The SMART(Switching Mechanism At 5’ end of RNA Template) kitfrom BD Biosciences Clontech was used to constructthe cDNA libraries, which were later normalised usingthe duplex-specific nuclease (DSN) method [36].
SequencingApproximately 15 μg of normalized cDNA were usedfor sequencing library construction at the Max PlanckInstitute, following described procedures [6]. Sequencingwas performed using GS FLX Titanium series reagentsand utilizing one single region on a Genome SequencerFLX instrument. Bases were called with 454 software byprocessing the pyroluminescence intensity for eachbead-containing well in each nucleotide incorporationand reads were trimmed to remove adapter sequences.
AssemblySequence reads were assembled into contigs by using theMIRA 3 assembler [37], which uses iterative multipassstrategies centered on high-confidence regions withinsequences and uses low-confidence regions when needed,with special functions to assemble high numbers of highlysimilar sequences without prior masking. Two runs ofassembly were conducted by MIRA 3 in “EST” and “accu-rate” usage mode, respectively. Settings adopted for thefirst run (de novo assembly) of ESTs were those defined bythe 454 sequencing technology. [mira -project = eu1 -job= denovo,est,accurate,454 -notraceinfo]. The second runwas conducted on previously obtained contigs, which wereused as input for MIRA 3 as Sanger sequences. [mira -pro-ject = eu2 -job = denovo,est,accurate]. The complete set ofavailable reads was realigned to contigs using the mappingassembly method provided by the Roche GS ReferenceMapper, specifically designed for consensus alignment ofreads against a given reference sequence.
Putative full-length transcripts identificationThe software Full-Lengther [38] was used to obtain afirst validation of the assembly, integrating the results ofBLAST against UniProt and nr with those of ORF pre-diction, in order to calculate the fraction of transcripts,i.e. assembled contigs, which can be considered bonafide full-length.
BLAST against sequences databases and functionalannotationDe novo functional annotation of the European eel tran-scriptome was obtained by similarity using BLAST,
Table 5 Summary of the annotation data included in thefirst release of EeelBase
Contigs Number Percentage
Total 19631 100
Putative Full-length 10643 54.2
With BLAST hits 6963 35.5
nr hits 5530 28.2
SwissProt hits 4023 20.5
nt hits 5495 28.0
With GO terms 3556 18.1
Predicted microRNAs 35 0.2
Novel/hypothetical 12640 64.4
Coppe et al. BMC Genomics 2010, 11:635http://www.biomedcentral.com/1471-2164/11/635
Page 11 of 13

Blast2GO and custom made scripts. Batch BLAST simi-larity searches for the entire transcriptome were locallyconducted against (1) nr peptide database (release ofOctober 4 2009, including all non-redundant GenBankCDS translations + PDB + SwissProt + PIR+PRF); (2)the SwissProt part of the UniProt database; (3) nt data-base. BLASTX and BLASTN searches were carried outusing default parameters. Alignments with an E-value <1E-3 were considered significant.The Blast2GO suite [39] was used for functional anno-
tation of transcripts applying the function for the map-ping of GO terms to transcripts with BLAST hitsobtained from BLAST searches against nr. Only ontolo-gies obtained from hits with E-value < 1E-6, annotationcut-off > 55, and a GO weight > 5 were used for anno-tation. The web tool CateGOrizer [40] was used forgrouping and counting GO classes using the GO-Slimmethod [41]. Additionally, the KEGG (Kyoto Encyclope-dia of Genes and Genomes, [42]) database, a knowledgebase for systematic analysis of gene functions linkinggenomic and higher order functional information, wasimplemented for further functional annotation using thetool DAVID [43].
BLAT against zebrafish and three-spine sticklebackgenomesEuropean eel transcripts were aligned with the completegenomes of zebrafish Danio renio and three-spine stick-leback Gasterosteus aculeatus using the BLAT searchtool in the UCSC (University of California Santa Cruz)Genome Browser. For all transcripts, the pairwise align-ment with the best matching genome region wasretrieved and recorded for statistical analysis.
MicroRNA discoveryAfter transcription, primary miRNAs (pri-miRNAs) arecleaved by the microprocessor complex to generateprecursors sequences with hairpin structure. These pre-miRNAs are exported from the nucleus and subse-quently cleaved by Dicer to generate a miRNA-miRNA*duplex with an average length of 21 nucleotides. Finally,one of the two mature miRNAs is integrated into themiRISC (microRNA induce silencing) complex. Byimperfect base pairing with the 3’ untranslated region(3’-UTR) of their target mRNAs, mature miRNAs cancause target silencing mainly by translation inhibition ormRNA cleavage.The complete set of microRNA hairpin sequences was
downloaded from miRBase database release 14 [44], asearchable database of published miRNA sequences. The10,867 sequences belonging to Metazoan species werecompared to European eel contigs by BLAST similaritysearch, using the same thresholds and settings adoptedbefore.
Additional material
Additional file 1: Additional Figure. Distribution of average quality (A),length (B) and number of reads (C) in the set of 28,229 contigs obtainedby the first run of reads assembly.
Additional file 2: Additional Figure. Pair-wise relationships betweenmain properties (sequence length, number of reads per contig, averagesequence quality, and average sequence coverage) characterizing the setof 28,229 contigs obtained by the first run of reads assembly.
Additional file 3: Additional Figure. Distribution of sequence length(A) and relationship between length and average quality (B) in the set of19,631 contigs of the European eel transcriptome.
Additional file 4: Additional Table. Mapping of the 122,193 GO termsassociated to the European eel contigs to a total of 124 GO-Slimancestor terms by single count.
Additional file 5: Additional Table. Genes encoding heat shockproteins represented in EeelBase. The table summarizes a total of 92 GOterms associated to 26 contigs belonging to 11 different heat shockprotein genes. The 55 non-redundant terms are also reported in a wordcloud form, with character size proportional to the number ofoccurrences of the functional term.
Additional file 6: Additional Figures. Mapping of zebrafish geneshomologous to European eel transcripts to three KEGG pathways:ribosome (37 genes), oxidative phosphorylation (34 genes) andproteasome (15 genes). Green boxes represent KEGG nodes specific tothe considered organism; Red stars indicate enriched nodes, which mayrepresent one or more genes.
AcknowledgementsThe study was supported by a Marine Genomics Europe network ofexcellence grant (Bid 45) to MMH and by two University of Padova grants(CPDA085158/08 to LZ and CPDR074285/07 to SB). MMH and PFLacknowledge support from the Danish Council for Independent Research,Natural Sciences (grant 09-072120). GEM is a post-doctoral researcher fundedby the Fund for Scientific Research (FWO Vlaanderen). We thank FabrizioDestro and Cedric Briand for providing us glass eel samples and IlariaMarino, Serena Ferraresso and Raffaella Franch for RNA extraction.
Author details1Biology Department, University of Padova, Via G. Colombo 3, I-35131Padova, Italy. 2Katholieke Universiteit Leuven, Laboratory of Animal Diversity& Systematics, B-3000 Leuven, Belgium. 3Aarhus University, Department ofBiological Sciences, Ny Munkegade 114, DK-8000 Aarhus C, Denmark.4University of Laval, IBIS, Quebec City, PQ G1V 0A6 Canada.
Authors’ contributionsAC carried out all the bioinformatic analyses, designed and implementedthe database. JMP tested the database, contributed to the statistical analysisand interpretation of data and wrote the paper with SB. GEM, PFL, MMHand LB made substantial contributions to the conception of the study,acquisition of data, and were involved in revising the manuscript critically;LZ conceived the study, performed initial molecular work, acquired data, hasbeen involved in all the phases of the project and reviewed the manuscript.SB participated to the bioinformatic analyses, performed the statisticalanalyses, interpreted results and wrote the paper with JMP. All the authorsread and approved the final manuscript.
Received: 20 July 2010 Accepted: 16 November 2010Published: 16 November 2010
References1. ICES: Report of the Working Group on Eels (WGEEL), 3-9 September
2008, Leuven, Belgium. ICES CM 2008/ACFM:15. Copenhagen: InternationalCouncil for the Exploration of the Seas; 2008.
2. Dekker W: Did lack of spawners cause the collapse of the European eelAnguilla anguilla? Fish Manage Ecol 2003, 10:365-376.
Coppe et al. BMC Genomics 2010, 11:635http://www.biomedcentral.com/1471-2164/11/635
Page 12 of 13

3. Van den Thillart G, Rankin JC, Dufour S: Spawning migration of theEuropean eel: reproduction index, a useful tool for conservationmanagement. Dordercht, The Netherlands: Springer; 2009.
4. Knights B: A review of the possible impacts of long-term oceanic andclimate changes and fishing mortality on recruitment of anguillid eels ofthe Northern hemisphere. Sci Total Environ 2003, 310:237-244.
5. Munk P, Hansen MM, Maes GE, Nielsen TG, Castonguay M, Riemann L,Sparholt H, Als TD, Aarestrup K, Andersen NG, Bachler M: Oceanic fronts inthe Sargasso Sea control the early life and drift of Atlantic eels. Proc RSoc Lond B Biol Sci 2010, 277:3593-3599.
6. Margulies M, Egholm M, Altman WE, Attiya S, Bader JS, Bemben LA, et al:Genome sequencing in microfabricated high-density picolitre reactors.Nature 2005, 437:376-380.
7. Moore MJ, Dhingra A, Soltis PS, Shaw R, Farmerie WG, Folta KM, Soltis DE:Rapid and accurate pyrosequencing of angiosperm plastid genomes.BMC Plant Biol 2006, 6:17.
8. Wicker T, Schlagenhauf E, Graner A, Close TJ, Keller B, Stein N: 454sequencing put to the test using the complex genome of barley. BMCGenomics 2006, 7:275.
9. Huse SM, Huber JA, Morrison HG, Sogin ML, Welch DM: Accuracy andquality of massively-parallel DNA pyrosequencing. Genome Biol 2007, 8:R143.
10. Weber APM, Weber KL, Carr K, Wilkerson C, Ohlrogge JB: Sampling theArabidopsis transcriptome with massively parallel pyrosequencing. PlantPhysiol 2007, 144:32-42.
11. Wang S, Peatman E, Abernathy J, Waldbieser G, Lindquist E, Richardson P,Lucas S, Wang M, Li P, Thimmapuram J, Liu L, Vullaganti D, Kucuktas H,Murdock C, Small BC, Wilson M, Liu H, Jiang Y, Lee Y, Chen F, Lu J,Wang W, Somridhivej B, Baoprasertkul P, Quilang J, Sha Z, Bao B, Wang Y,Wang Q: Assembly of 500,000 inter-specific catfish expressed sequencetags and large scale gene-associated marker development for wholegenome association studies. Genome Biol 2010, 11:R8.
12. Bainbridge MN, Warren RL, Hirst M, Romanuik T, Zeng T, Go A, Delaney A,Griffith M, Hickenbotham M, Magrini V, Mardis ER, Sadar MD, Siddiqui AS,Marra MA, Jones SJ: Analysis of the prostate cancer cell line LNCaPtranscriptome using a sequencing-by-synthesis approach. BMC Genomics2006, 7:330.
13. Cheung F, Haas BJ, Goldberg SMD, May GD, Xiao YL, Town CD: SequencingMedicago truncatula expressed sequenced tags using 454 life sciencestechnology. BMC Genomics 2006, 7:272.
14. Emrich SJ, Barbazuk WB, Li L, Schnable PS: Gene discovery and annotationusing LCM-454 transcriptome sequencing. Genome Res 2007, 17:69-73.
15. Torres TT, Metta M, Ottenwalder B, Schlotterer C: Gene expression profilingby massively parallel sequencing. Genome Res 2008, 18:172-177.
16. Morozova O, Hirst M, Marra MA: Applications of New SequencingTechnologies for Transcriptome Analysis. Annu Rev Genomics Hum Genet2009, 10:135-151.
17. Vera JC, Wheat CW, Fescemyer HW, Frilander MJ, Crawford DL, Hanski I,Marden JH: Rapid transcriptome characterization for a nonmodelorganism using 454 pyrosequencing. Mol Ecol 2008, 17:1636-1647.
18. Guerrero FD, Dowd SE, Djikeng A, Wiley G, Macmil S, Saldivar L, Najar F,Roe BA: A database of expressed genes from Cochliomyia hominivorax(Diptera: Calliphoridae). J Med Entomol 2009, 46:1109-1116.
19. Novaes ED, Drost R, Farmerie WG, Pappas GJ, Grattapaglia D, Sederoff RR,Kirst M: High-throughput gene and SNP discovery in Eucalyptus grandis,an uncharacterized genome. BMC Genomics 2008, 9:312.
20. Alagna F, D’Agostino N, Torchia L, Servili M, Rao R, Pietrella M, Giuliano G,Chiusano ML, Baldoni L, Perrotta G: Comparative 454 pyrosequencing oftranscripts from two olive genotypes during fruit development. BMCGenomics 2009, 10:399.
21. Parchman TL, Geist KS, Grahnen JA, Benkman CW, Buerkle CA:Transcriptome sequencing in an ecologically important tree species:assembly, annotation, and marker discovery. BMC Genomics 2010, 11:180.
22. Meyer E, Aglyamova GV, Wang S, Buchanan-Carter J, Abrego D,Colbourne JK, Willis BL, Matz MV: Sequencing and de novo analysis of acoral larval transcriptome using 454 GS-FLX. BMC Genomics 2009, 10:219.
23. Renault S, Nolte AW, Bernatchez L: Mining transcriptome sequencestowards identifying adaptive Single Nucleotide Polymorphisms in lakewhitefish species pairs (Coregonus sp.). Mol Ecol 2009, 19:115-131.
24. Kristiansson E, Asker N, Forlin L, Larsson DG: Characterization of theZoarces viviparus liver transcriptome using massively parallelpyrosequencing. BMC Genomics 2009, 10:345.
25. Hale CM, McCormick CR, Jackson JR, DeWoody JA: Next-generationpyrosequencing of gonad transcriptomes in the polyploid lake sturgeon(Acipenser fulvescens): the relative merits of normalization andrarefaction in gene discovery. BMC Genomics 2009, 10:203.
26. Elmer KR, Fan S, Gunter HM, Jones JC, Boekhoff S, Kuraku S, Meyer A:Molecular Rapid evolution and selection inferred from thetranscriptomes of sympatric crater lake cichlid fishes. Ecology 2010,19:197-211.
27. Miyahara T, Hirono I, Aoki T: Analysis of expressed sequence tags from aJapanese eel Anguilla japonica spleen cDNA library. Fish Sci 2000,66:257-260.
28. Nogueira P, Lourenço J, Rodriguez E, Pacheco M, Santos C, Rotchell JM,Mendo S: Transcript profiling and DNA damage in the European eel(Anguilla anguilla) exposed to 7,12-dimethylbenz[a]anthracene. AquatToxicol 2009, 94:123-130.
29. Pujolar JM, De Leo GA, Ciccotti E, Zane L: Genetic composition of Atlanticand Mediterranean recruits of the European eel (Anguilla anguilla) basedon EST-linked microsatellite loci. J Fish Biol 2009, 74:2034-2046.
30. Pujolar JM, Bevacqua D, Capoccioni F, Ciccotti E, De Leo GA, Zane L:Genetic variability is unrelated to growth and parasite infestation innatural populations of the European eel (Anguilla anguilla). Mol Ecol2009, 18:4604-4616.
31. Calin GA, Liu CG, Ferracin M, Hyslop T, Spizzo R, Sevignani C, Fabbri M,Cimmino A, Lee EJ, Wojcik SE, Shimizu M, Tili E, Rossi S, Taccioli C,Pichiorri F, Liu X, Zupo S, Herlea V, Gramantieri L, Lanza G, Alder H,Rassenti L, Volinia S, Schmittgen TD, Kipps TJ, Negrini M, Croce CM:Ultraconserved regions encoding ncRNAs are altered in humanleukemias and carcinomas. Cancer Cell 2007, 12:215-29.
32. Yasuda J, Hayashizaki Y: The RNA continent. Adv Cancer Res 2008,99:77-112.
33. He L, Hannon GJ: MicroRNAs: small RNAs with a big role in generegulation. Nature Reviews 2004, 5:631.
34. Salem M, Xiao C, Womack J, Rexroad CE, Yao J: A microRNA repertoire forfunctional genome research in rainbow trout (Oncorhynchus mykiss). MarBiotechnol 2009, 26:2452-2458.
35. Lu J, Peatman E, Wang W, Yang Q, Abernathy J, Wang S, Kucuktas H, Liu Z:Alternative splicing in teleost fish genomes: same-species and cross-species analysis and comparisons. Mol Genet Genomics 2010, 283:531-539.
36. Zhulidov PA, Bogdanova EA, Shcheglov AS, Vagner LL, Khaspekov GL,Kozhemyako VB, Matz MV, Meleshkevitch E, Moroz LL, Lukyanov SA,Shagin DA: Simple cDNA normalization using kamchatka crab duplex-specific nuclease. Nucleic Acids Res 2004, 32:e37.
37. Chevreux B, Pfisterer T, Drescher B, et al: Using the miraEST assembler forreliable and automated mRNA transcript assembly and SNP detection insequenced ESTs. Genome Res 2004, 14:1147-59.
38. Full-Lengther. [http://www.scbi.uma.es/cgi-bin/full-lengther/full-lengther_login.cgi].
39. Götz S, Garcia-Gomez JM, Terol J, Williams TD, Nagaraj SH, Nueda MJ,Robles M, Talon M, Dopazo J, Conesa A: High-throughput functionalannotation and data mining with the Blast2GO suite. Nucleic Acids Res2008, 36:3420-3435.
40. CateGOrizer. [http://www.animalgenome.org/bioinfo/tools/countgo/].41. Hu ZL, Bao J, Reecy JM, Hu ZL, Bao J, Reecy JM: CateGOrizer: A Web-Based
Program to Batch Analyze Gene Ontology Classification Categories.Online J Bioinformatics 2008, 9:108-112.
42. Kanehisa M, Goto S: KEGG Kyoto Encyclopedia of Genes and Genomes.Nucleic Acids Res 2000, 28:27-30.
43. DAVID. [http://david.abcc.ncifcrf.gov/].44. Griffiths-Jones S: The microRNA registry. Nucleic Acids Res 2004, , 32
Database: D109-111.
doi:10.1186/1471-2164-11-635Cite this article as: Coppe et al.: Sequencing, de novo annotation andanalysis of the first Anguilla anguilla transcriptome: EeelBase opens newperspectives for the study of the critically endangered european eel.BMC Genomics 2010 11:635.
Coppe et al. BMC Genomics 2010, 11:635http://www.biomedcentral.com/1471-2164/11/635
Page 13 of 13


![Anguilla anguilla L. Biochemical and Genotoxic Responses to Benzo[ a]pyrene](https://static.fdokumen.com/doc/165x107/631d4597f26ecf94330a787a/anguilla-anguilla-l-biochemical-and-genotoxic-responses-to-benzo-apyrene.jpg)