
2014 The Giant Mottled Eel, Anguilla marmorata, Uses Blue-Shifted Rod Photoreceptors During Upstream...
11
The Giant Mottled Eel, Anguilla marmorata, Uses Blue- Shifted Rod Photoreceptors during Upstream Migration Feng-Yu Wang 1 , Wen-Chun Fu 2 , I-Li Wang 3,4 , Hong Young Yan 2,5 * . , Tzi-Yuan Wang 6 * . 1 Taiwan Ocean Research Institute, National Applied Research Laboratories, Kaohsiung, Taiwan, 2 Sensory Physiology Laboratory, Marine Research Station, Academia Sinica, I-Lan County, Taiwan, 3 Chemical Biology and Molecular Biophysics, Taiwan International Graduate Program, Institute of Biological Chemistry, Academia Sinica, Taipei, Taiwan, 4 Institute of Biochemical Sciences, National Taiwan University, Taipei, Taiwan, 5 Hanse-Wissenschaftskolleg Institute for Advanced Study, Delmenhorst, Germany, 6 Biodiversity Research Center, Academia Sinica, Taipei, Taiwan Abstract Catadromous fishes migrate between ocean and freshwater during particular phases of their life cycle. The dramatic environmental changes shape their physiological features, e.g. visual sensitivity, olfactory ability, and salinity tolerance. Anguilla marmorata, a catadromous eel, migrates upstream on dark nights, following the lunar cycle. Such behavior may be correlated with ontogenetic changes in sensory systems. Therefore, this study was designed to identify changes in spectral sensitivity and opsin gene expression of A. marmorata during upstream migration. Microspectrophotometry analysis revealed that the tropical eel possesses a duplex retina with rod and cone photoreceptors. The l max of rod cells are 493, 489, and 489 nm in glass, yellow, and wild eels, while those of cone cells are 508, and 517 nm in yellow, and wild eels, respectively. Unlike European and American eels, Asian eels exhibited a blue-shifted pattern of rod photoreceptors during upstream migration. Quantitative gene expression analyses of four cloned opsin genes (Rh1f, Rh1d, Rh2, and SWS2) revealed that Rh1f expression is dominant at all three stages, while Rh1d is expressed only in older yellow eel. Furthermore, sequence comparison and protein modeling studies implied that a blue shift in Rh1d opsin may be induced by two known (N83, S292) and four putative (S124, V189, V286, I290) tuning sites adjacent to the retinal binding sites. Finally, expression of blue-shifted Rh1d opsin resulted in a spectral shift in rod photoreceptors. Our observations indicate that the giant mottled eel is color-blind, and its blue-shifted scotopic vision may influence its upstream migration behavior and habitat choice. Citation: Wang F-Y, Fu W-C, Wang I-L, Yan HY, Wang T-Y (2014) The Giant Mottled Eel, Anguilla marmorata, Uses Blue-Shifted Rod Photoreceptors during Upstream Migration. PLoS ONE 9(8): e103953. doi:10.1371/journal.pone.0103953 Editor: Alfred S. Lewin, University of Florida, United States of America Received March 7, 2014; Accepted July 3, 2014; Published August 7, 2014 Copyright: ß 2014 Wang et al. This is an open-access article distributed under the terms of the Creative Commons Attribution License, which permits unrestricted use, distribution, and reproduction in any medium, provided the original author and source are credited. Funding: This study was supported by intramural grants from Academia Sinca, Taiwan, and by the National Science Council grants (NSC 100-2311-B-001-001- MY2, NSC 102-2311-B-001-019 and NSC 102-2311-B-001-010). The funders had no role in study design, data collection and analysis, decision to publish, or preparation of the manuscript. Competing Interests: The authors have declared that no competing interests exist. * Email: [email protected] (HYY); [email protected] (TZW) . These authors contributed equally to this work. Introduction Fish habitats are highly diverse, ranging from the deep sea to the upper reaches of freshwater rivers in the mountains, and from the tropics to the Arctic; the photic conditions in these environments vary greatly in terms of turbidity, color, and brightness. Certain fishes can alter their visual abilities in different photic environments [1,2]. For example, the spectral sensitivities of rod and cone photoreceptors of deep-water fishes adapt to match the blue-shifted spectral bandwidth of ambient light [3,4]. In contrast, shallow-sea fishes, such as black bream, possess cone photoreceptors with higher maximal light absorbance wavelength (l max ) values to match their green light-dominated habitats [5]. Plasticity of sensory sensitivity is also crucial in speciation [6–9]. Aside from the variations between species or higher taxa, intraspecific differences in fish spectral sensitivity may arise from spatial adaptation or ontogenetic changes [4]. For example, in the sand goby, Pomatoschistus minutus, rod sensitivity is altered to fit the local light environment [10]. Furthermore, diadromous fishes, which migrate between freshwater and seawater, also exhibit adaptation to changes in their photic environment during development. As an example, Pacific salmon are born in freshwater rivers, mature in the ocean, and then return to their birthplace to spawn. In order to adapt to photo-environment changes from freshwater to seawater, the salmon express blue opsin insteand of UV gene(s) in the single cone [11]. Similarly, the spectral sensitivities of rod photoreceptors in two catadromous freshwater eels, European and American eels, are modified by alterations in chromophore and opsin gene usage during ontogenesis and spawning migration; it should be noted that spectral tuning via opsin shift (rather than A1/A2 shifts) was first observed in eels [12–16]. The visual system plays important roles in foraging, prey capture, predator avoidance, and mating behavior. Two types of photoreceptors are found in fish retinas - rod and cone cells. Rod cells mediate scotopic vision, while cone cells mediate photopic, high acuity vision [17]. Several molecular mechanisms have been demonstrated to alter the spectral sensitivity of photoreceptors in fish. First, the spectral sensitivity of visual pigments can be modulated by differential expression of five classes of opsin genes, including rhodopsin (Rh1) in rod cells and four other genes in cone cells [18–20]. Second, the l max of the visual pigment changes depending on whether it uses 11-cis-retinal (vitamin A1-derived) or 3-dehydroretinal (vitamin A2-derived) chromophores [1,21–23]. PLOS ONE | www.plosone.org 1 August 2014 | Volume 9 | Issue 8 | e103953
Transcript of 2014 The Giant Mottled Eel, Anguilla marmorata, Uses Blue-Shifted Rod Photoreceptors During Upstream...

The Giant Mottled Eel, Anguilla marmorata, Uses Blue-Shifted Rod Photoreceptors during Upstream MigrationFeng-Yu Wang1, Wen-Chun Fu2, I-Li Wang3,4, Hong Young Yan2,5*., Tzi-Yuan Wang6*.
1 Taiwan Ocean Research Institute, National Applied Research Laboratories, Kaohsiung, Taiwan, 2 Sensory Physiology Laboratory, Marine Research Station, Academia
Sinica, I-Lan County, Taiwan, 3 Chemical Biology and Molecular Biophysics, Taiwan International Graduate Program, Institute of Biological Chemistry, Academia Sinica,
Taipei, Taiwan, 4 Institute of Biochemical Sciences, National Taiwan University, Taipei, Taiwan, 5 Hanse-Wissenschaftskolleg Institute for Advanced Study, Delmenhorst,
Germany, 6 Biodiversity Research Center, Academia Sinica, Taipei, Taiwan
Abstract
Catadromous fishes migrate between ocean and freshwater during particular phases of their life cycle. The dramaticenvironmental changes shape their physiological features, e.g. visual sensitivity, olfactory ability, and salinity tolerance.Anguilla marmorata, a catadromous eel, migrates upstream on dark nights, following the lunar cycle. Such behavior may becorrelated with ontogenetic changes in sensory systems. Therefore, this study was designed to identify changes in spectralsensitivity and opsin gene expression of A. marmorata during upstream migration. Microspectrophotometry analysisrevealed that the tropical eel possesses a duplex retina with rod and cone photoreceptors. The lmax of rod cells are 493, 489,and 489 nm in glass, yellow, and wild eels, while those of cone cells are 508, and 517 nm in yellow, and wild eels,respectively. Unlike European and American eels, Asian eels exhibited a blue-shifted pattern of rod photoreceptors duringupstream migration. Quantitative gene expression analyses of four cloned opsin genes (Rh1f, Rh1d, Rh2, and SWS2)revealed that Rh1f expression is dominant at all three stages, while Rh1d is expressed only in older yellow eel. Furthermore,sequence comparison and protein modeling studies implied that a blue shift in Rh1d opsin may be induced by two known(N83, S292) and four putative (S124, V189, V286, I290) tuning sites adjacent to the retinal binding sites. Finally, expression ofblue-shifted Rh1d opsin resulted in a spectral shift in rod photoreceptors. Our observations indicate that the giant mottledeel is color-blind, and its blue-shifted scotopic vision may influence its upstream migration behavior and habitat choice.
Citation: Wang F-Y, Fu W-C, Wang I-L, Yan HY, Wang T-Y (2014) The Giant Mottled Eel, Anguilla marmorata, Uses Blue-Shifted Rod Photoreceptors duringUpstream Migration. PLoS ONE 9(8): e103953. doi:10.1371/journal.pone.0103953
Editor: Alfred S. Lewin, University of Florida, United States of America
Received March 7, 2014; Accepted July 3, 2014; Published August 7, 2014
Copyright: � 2014 Wang et al. This is an open-access article distributed under the terms of the Creative Commons Attribution License, which permitsunrestricted use, distribution, and reproduction in any medium, provided the original author and source are credited.
Funding: This study was supported by intramural grants from Academia Sinca, Taiwan, and by the National Science Council grants (NSC 100-2311-B-001-001-MY2, NSC 102-2311-B-001-019 and NSC 102-2311-B-001-010). The funders had no role in study design, data collection and analysis, decision to publish, orpreparation of the manuscript.
Competing Interests: The authors have declared that no competing interests exist.
* Email: [email protected] (HYY); [email protected] (TZW)
. These authors contributed equally to this work.
Introduction
Fish habitats are highly diverse, ranging from the deep sea to
the upper reaches of freshwater rivers in the mountains, and from
the tropics to the Arctic; the photic conditions in these
environments vary greatly in terms of turbidity, color, and
brightness. Certain fishes can alter their visual abilities in different
photic environments [1,2]. For example, the spectral sensitivities of
rod and cone photoreceptors of deep-water fishes adapt to match
the blue-shifted spectral bandwidth of ambient light [3,4]. In
contrast, shallow-sea fishes, such as black bream, possess cone
photoreceptors with higher maximal light absorbance wavelength
(lmax) values to match their green light-dominated habitats [5].
Plasticity of sensory sensitivity is also crucial in speciation [6–9].
Aside from the variations between species or higher taxa,
intraspecific differences in fish spectral sensitivity may arise from
spatial adaptation or ontogenetic changes [4]. For example, in the
sand goby, Pomatoschistus minutus, rod sensitivity is altered to fit
the local light environment [10]. Furthermore, diadromous fishes,
which migrate between freshwater and seawater, also exhibit
adaptation to changes in their photic environment during
development. As an example, Pacific salmon are born in
freshwater rivers, mature in the ocean, and then return to their
birthplace to spawn. In order to adapt to photo-environment
changes from freshwater to seawater, the salmon express blue
opsin insteand of UV gene(s) in the single cone [11]. Similarly, the
spectral sensitivities of rod photoreceptors in two catadromous
freshwater eels, European and American eels, are modified by
alterations in chromophore and opsin gene usage during
ontogenesis and spawning migration; it should be noted that
spectral tuning via opsin shift (rather than A1/A2 shifts) was first
observed in eels [12–16].
The visual system plays important roles in foraging, prey
capture, predator avoidance, and mating behavior. Two types of
photoreceptors are found in fish retinas - rod and cone cells. Rod
cells mediate scotopic vision, while cone cells mediate photopic,
high acuity vision [17]. Several molecular mechanisms have been
demonstrated to alter the spectral sensitivity of photoreceptors in
fish. First, the spectral sensitivity of visual pigments can be
modulated by differential expression of five classes of opsin genes,
including rhodopsin (Rh1) in rod cells and four other genes in cone
cells [18–20]. Second, the lmax of the visual pigment changes
depending on whether it uses 11-cis-retinal (vitamin A1-derived) or
3-dehydroretinal (vitamin A2-derived) chromophores [1,21–23].
PLOS ONE | www.plosone.org 1 August 2014 | Volume 9 | Issue 8 | e103953

Third, amino acid substitutions within opsins can result in the
spectral shift of visual pigments [24–26]. Based on crystal structure
analysis and mutagenesis studies, it is known that amino acid
changes at 26 sites are involved in the spectral tuning of visual
pigments in vertebrates [2,27]. Finally, several studies have shown
that accumulation of interactions between distally-located amino
acid substitutions and the retinal binding pocket may also induce
spectral shifts [28,29]. Therefore, a modeling study based on
available opsin gene sequences may yield useful information with
regard to the interplay of tuning sites and spectral shifts.
Freshwater eels are born in the deep-sea, mature in freshwater,
and then return to the deep-sea to spawn. However, many studies
have shown that some populations of temperate eels never enter
freshwater, but stay in estuarine and coastal waters until
maturation [30–36]. Similar plasticity in migratory behavior was
also observed in tropic freshwater eels, i.e. giant mottled eel
(Anguilla marmorata) and bicolor eel (A. bicolor) [37]. This
plasticity may be influenced by intra- or inter-specific competition
[34]. For example, the giant mottled eel and Japanese eel are
considered sympatric in Taiwan. However, otolith microchemistry
studies have shown that the giant mottled eel is more abundant in
the upper reaches of the rivers, while the Japanese eel
preferentially inhabits lower reaches or estuaries within the same
river [34,38]. This disparity in migratory behaviors and habitat
choice between species may reflect inter-specific competition or
selection for certain environmental parameters.
To date, our understanding of the ontogenetic changes of
spectral sensitivities of freshwater eels are based on studies of
temperature eels, including European and American eels. These
species exhibit a spectral shift towards red during upstream
ontogenetic migration, but a shift towards blue during downstream
spawning migration [12,15]. In contrast, such studies using tropic
eels are limited. The current study was devised to test the
hypothesis that migration behavior or habitat choices affect the
spectral sensitivity and opsin gene expression of giant mottled eels
during their upstream ontogenetic migration. In addition, the
interactive forces of amino acids within cloned opsins were
predicted and analyzed, to investigate the mechanisms of spectral
tuning. Finally, opsin gene expression patterns and photoreceptor
spectral sensitivities at different developmental stages of the eel
were determined. Our findings thus reveal the mechanisms of the
ontogenetic changes in the visual system of giant mottled eel.
Materials and Methods
Sampling localities and collectionsTo study spectral sensitivity, clone opsin genes, and quantify
gene expression, giant mottled eels of different developmental
stages were collected. The glass-stage eels (denoted as ‘Glass’) were
collected from the mouth of the Hsiukuluan River (23u27941.999N
121u30905.299E) in eastern Taiwan. Yellow eels were collected in
two different ways: four specimens were bought from an eel farm
(22u44950.199N 120u32943.099E) and consent/permission was
obtained from an eel farm owner in Pingtung County (the eels
were 3-years-old, and are denoted as ‘Cultured yellow’), while two
specimens were caught upstream of the Laomei Stream
(25u15925.999N 121u32911.499E) in northern Taiwan (these eels
are denoted as ‘Wild yellow’). During the two field collections
(Hsiukuluan River and Laomei Stream), an Ocean Optics UBS-
2000 spectrophotometer with a waterproof probe was used to
measure the in situ light spectra 30-cm underwater in order to
provide photic parameters of the environments where the samples
resided (Figure S4). The sample sizes for each stage were as
follows: 9 for Glass, 4 for Cultured yellow, and 2 for Wild yellow
(Table S1). Specific permission was not required to obtain the
indicated animals from these field locations for the activities
described. The field studies did not involve endangered or
protected species. For studies of spectral sensitivity, specimens
were kept alive in a tank with running freshwater (temperature of
25,28uC) under a natural light cycle. Animal use protocols No.
RFiZOOYH2007012 & IACUC_11-02-133, approved by the
Academia Sinica Institutional Animal Care and Use Committee
(IACUC), were followed for all surgical procedures to minimize
suffering.
Microspectrophotometry (MSP)After overnight dark adaptation inside a darkroom, eels were
first anesthetized with an overdose of MS-222 (50 ppm), and then
enucleated under a dim red light. Retinae were removed under a
stereomicroscope by technicians wearing night vision goggles, and
were immediately immersed in chilled phosphate buffered saline
with 6% sucrose, (Sigma, USA; pH 6.5). Retinae were cut into
pieces, placed between two cover slides (20 mm630 mm), sealed
with silicone grease, and placed onto the single-beam, computer-
controlled, microspectrophotometer stage to measure the absor-
bance spectra of photoreceptors [39,40]. The absorbance curve
and the wavelength of maximal absorbance (lmax) of photorecep-
tors were obtained by a programmed statistical method [40].
Examples of absorbance curves are presented in Figure S1. The
lmax and A1/A2 template of the normalized absorbance spectra
were determined followed a previously described method [41–43].
For each measurement, the best template of fit was obtained using
a visual examining procedure. The best visual fit was the template
with the lowest standard deviation (SD). If the SD of the lmax was
smaller than 7.5 nm, then the spectrum was considered valid and
collected for analysis [44,45]. Approximately 40 measurements
were obtained from each specimen. The lmax values of each
photoreceptor were averaged, and then a final estimate of mean
lmax 6 SD of each category of retinal cell was obtained.
Extraction of genomic DNA and total RNA, and cDNAsynthesis
Genomic DNA was extracted from 100 mg of muscle tissue
using a Roche DNA Isolation Kit (Indianapolis, USA), following
the manufacturer’s instructions. The heads of glass-stage eels and
the eyecups (without the lens) of yellow eels were collected and
immersed in RNAlater (Ambion, Inc., Austin, TX) and stored at
280uC. Total RNA was extracted using the Qiagen RNeasy mini
kit (Valencia, USA). To prevent contamination by genomic DNA,
RNA was treated with TURBO DNase (Ambion, Inc., Austin,
TX). Total RNA was reverse-transcribed to cDNA using the
SuperScript III First-Strand Synthesis System (Invitrogen, Carls-
bad, California, USA) with oligo-d(T) primers. The cDNA was
used as template for PCR.
Opsin gene cloning and sequencingTarget genes were amplified with the indicated primers (see
below) and genomic DNA as template using a Fast-Run Taq
Master Mix (Protech Technology Enterprise Co., Taiwan), in
accordance with the manufacturer’s recommendations. The PCR
products were cloned individually into the pGEM-T vector
(Promega, Madison, USA), and five to ten clones were sequenced
to ensure fidelity. All primers and the accession number of cloned
genes are listed in Table S2 and Table S3, respectively. The
cloning protocols for each type of gene are described in detail
below:
Blue-Shift in A. marmorata Vision during Migration
PLOS ONE | www.plosone.org 2 August 2014 | Volume 9 | Issue 8 | e103953

House-keeping genes: mitochondrial cytochrome b (intron-free)
and acidic ribosomal phosphoprotein P0 (ARP) were selected as
house-keeping genes to serve as endogenous controls for normal-
ization of quantitative PCR data (Weltzien et al. 2005). The
primers used to amplify these house-keeping genes in A.marmorata were designed based on those of A. anguilla [46].
Rod opsin genes: retinal cDNA and genomic DNA were used as
templates to amplify Rh1f (freshwater type) and Rh1d (deep-sea
type) opsin genes, respectively. The P1-P2/P1-P3 primer sets
originally designed to amplify the fwo and dso opsin genes of A.japonica [47], were used to amplify rod opsin genes.
Cone opsin genes: complete cone opsin mRNA sequences were
obtained as described by Carleton & Kocher (2001). A degenerate
primer set, OPF and OPR, was used to clone an exon region of the
cone opsin genes; the A. marmorata opsin gene sequences were
used as a basis for designing the gene-specific primers to amplify
the 59- and 39-RACE fragments. Opsin genes were cloned from
retinal RNA using 39 and 59 rapid amplification of cDNA ends
(RACE) with the SMARTTM
RACE Amplification Kit (Clontech
Laboratories, Inc., USA), following the manufacturer’s instruc-
tions. The resulting products were gel-purified, cloned, sequenced,
and assembled.
Phylogenetic analysis of ospin genesThe sequences of cytochrome b and opsin genes were
downloaded from Genbank for comparison and analysis (Table
S3). The Clustal W function merged in MEGA 5 software [48] was
used to align the sequences according to the predicted amino acid
sequences. The best-fit model of nucleotide substitution was
determined by hierarchical likelihood ratio tests (LRT) imple-
mented in Model Test v3.7 [49]. Neighbor-joining [50] trees of
each gene were constructed using PAUP 4.0* [51] and MEGA 5
software with the best-fit model of nucleotide substitution and
1000 bootstrap replicates. Ancestral sequences of the opsin genes
of freshwater eels were predicted using PAML 1.4 [52].
Rhodopsin structure predictionTo investigate possible tuning sites, we applied SwissModel and
Ligplot to predict the protein structure of Rh1 and the amino acid
interactions/interactive forces. Protein models of eel rhodopsins
(Rh1) were constructed with SwissModel (http://swissmodel.
expasy.org/) with the X-ray structure of bovine rhodopsin (PDB
code: 1U19) as template. The 3D structure simulation could reveal
the functional amino acids for putative tuning sites. In addition,
the hydrogen bonds and hydrophobic interactions between amino
acid residues and the retinal were analyzed with Ligplot software
(http://www.ebi.ac.uk/thornton-srv/software/LIGPLOT/). The
Ligplot diagrams portray the hydrogen-bond interaction patterns
and hydrophobic contacts between the ligand(s) and the main-
chain or side-chain elements of the protein. The Ligplot system is
able to analyze a single ligand binding to homologous proteins, or
general cases in which both the protein and ligand change. These
analyses revealed putative tuning sites of Rh1 opsins.
Quantitative PCRRelative gene expression ratios were analyzed by quantitative
PCR. Gene specific primer pairs were designed using the Primer
Express software from Applied Biosystems (Carlsbad, California,
USA). The amplification efficiency of the opsin genes and the
house keeping genes were approximately equal. Quantitative PCR
analyses were carried out in a final volume of 20 ml, which
contained 3 ml diluted cDNA (10 ng/ml), 0.5 ml each of gene-
specific forward and reverse primers (5 mM), and 10 ml Fast SYBR
Green Master Mix from Applied Biosystems (Carlsbad, California,
USA); thermal cycling was performed as follows: 40 cycles of
denaturation at 95uC for 3 sec and annealing/extension at 60uCfor 30 sec. The relative expression of each opsin gene was
calculated with the following equation:
Ti
Th
~
1
(1zEi)Cti
1
(1zEh)Cth
where Ti is the expression level for a given gene I; Th is the
expression level for the relevant house-keeping gene; Ei is the PCR
efficiency for each opsin gene primer set; Eh is the PCR efficiency
for the house-keeping gene primer set; and Cti and Cth are the
critical cycle number for each opsin gene and house-keeping gene,
respectively.
Proportional opsin expression was calculated as a fraction of
total opsin gene expression for an individual, according to the
following equation:
Ti
Tall
~
1
(1zEti)Cti
X 1
(1zEti)Cti
where Ti is the proportional expression for a given gene i; Tall is
the total expression for a given gene i; Eti is the PCR efficiency for
each primer set; and Cti is the critical cycle number for each gene.
The QPCR primer sequences are shown in Table S2.
Results
Spectral sensitivities of photoreceptor cellsThe mean lmax values of rod cells were 49364.7 nm for glass
eels and 48966.1 nm for cultured yellow eels (Table 1). No
significant difference in lmax was observed between cultured and
wild yellow eels (48965.1nm). The lmax of glass eel was
significantly different from those of other stages (Table 2). A
spectral shift of 4 nm was observed between glass eels and eels at
other stages.
Only a single cone cell was observed in cultured and wild yellow
eels. The mean lmax values of single cone cells are all in the range
of green light spectra (Table 1). Student’s t-test showed that the
lmax values between cultured yellow eel and other stages are
significantly different (Table 2). The lmax frequency distributions
for rod and cone cells at each stage are presented in Figure 1.
Classification of freshwater eel opsins and phylogeneticanalysis
Four opsin genes were cloned from retinal cDNA and/or
genomic DNA. Two types of rod opsin genes, Rh1f (freshwater
type) and Rh1d (deep-sea type), were obtained, both of which were
1025 base pairs (bps) in length. The Rh1f gene is usually expressed
in eels during the juvenile stage in freshwater, while the Rh1d gene
is expressed during spawning migration to the deep-sea [47,53].
We also identified two types of cone opsin genes, SWS2 (short-
wavelength sensitive 2, blue-sensitive) and Rh2 (rhodopsin-like,
green-sensitive), which encode mRNAs of 2459 and 2306 bps in
length, respectively; the coding regions were 1080 and 1044 bps,
respectively.
Few opsin gene sequences have been characterized in Anguilli-
form fishes; as such, we used opsin genes from cichlids, cyprinids,
salmons, lamprey, and coelacanth as substitutive out-groups for
Blue-Shift in A. marmorata Vision during Migration
PLOS ONE | www.plosone.org 3 August 2014 | Volume 9 | Issue 8 | e103953
phylogenetic analysis (Figure 2). The Rh1 genes of freshwater eels
were separated into Rh1f and Rh1d clades (Figure 2A). A.marmorata is clustered with A. anguilla in the Rh1d clade, but is
clustered with A. japonica in the Rh1f clade. The results suggest
two possible different evolutionary origins for the Rh1 genes of
freshwater eels. For Rh2, the freshwater eel genes are the sister
group of moray eel genes, and these form a distinct monophyletic
group from other fishes (Figure 2B). For SWS2, freshwater eel
genes are clustered together, and located at the basal position of
the phylogenetic tree (Figure 2C). For cytochrome b, the freshwater
eel genes form a monophyletic group (Figure 2D).
Comparison of putative spectral tuning sitesWe subsequently compared the cloned opsin gene sequences
with those of two freshwater eels (A. anguilla and A. japonica), as
shown in Table 3 and 4. In the Rh1 gene, there are seven amino
acid sites important for spectral tuning: positions 83, 122, 207,
211, 265, 292, and 295 [54]. Tuning sites in the Rh1d and Rh1f
genes of freshwater eels are identical, with the exceptions of
positions 83 and 292. Earlier studies utilizing site-directed
mutagenesis suggested that the S292A and A292S substitutions
in vertebrates may induce a 7–16 nm red-shift and a 7–15 nm
blue-shift of lmax, respectively [27,53,55–57]. Moreover, the
D83N substitution may cause a blue-shift in the lmax of Rh1 in
fishes [27,58]. In Rh2, four specific amino acid sites have been
reported to be involved in spectral tuning: positions 97, 122, 207,
and 292 [25,27]; these sites are fully conserved among the
freshwater eels. In SWS2, substitutions at amino acid sites 94, 116,
118, 265, and 292 can result in spectral shifts. Here, we only
observed one substitution (M116T) between the SWS2 genes of A.marmorata and A. anguilla; however, it should be noted that only
one SWS2 gene from A. anguilla was available for comparison.
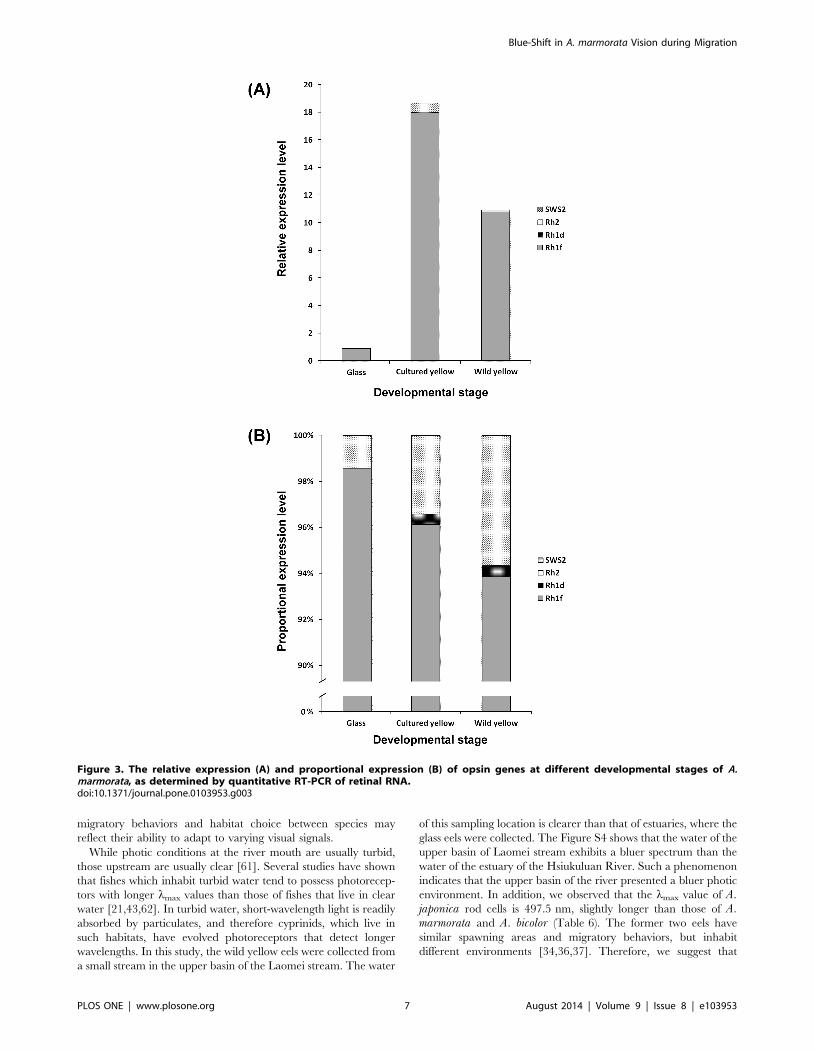
Opsin gene expression at different life stagesThe relative expression levels of total opsin genes in more
mature stages (cultured and wild yellow eels) are significantly
higher than those in glass-eel stage. Rh1f was found to be the
dominant opsin gene expressed at all stages (Figure 3A). Rh1f
expression accounted for 93.6 to 98.5% of total opsin gene
expression, while Rh2 gene expression accounted for 1.5,6.3%
(Figure 3B). Rh1d was only expressed in older eels (cultured and
wild yellow eels), while SWS2 was not detected at any stage. These
findings suggest that A. marmorata may require Rh1f and Rh2
opsin during upstream migration, and this observation is consistent
with the MSP data.
Rh1 protein structure analysis reveals putative tuningsites
We proceeded to predict and compare the amino acid
interactions/interactive forces within the Rh1f pigments of
freshwater eels (Table 5). The results of prediction and modeling
confirmed that two known tuning sites, D83N and A292S, interact
with different residues depending on the protein, and may thus
influence Rh1 protein structure (Figure S2). The same criteria
predicted that four amino acid residues (A124S, I189V, I286V,
and L290I) near the retinal binding pocket may be putative tuning
sites, and that the interactions of these sites also differ between
Rh1f and Rh1d (Figure S3). In addition, we observed that eight
amino acid residues (sites 112, 137, 189, 191, 193, 219, 255, and
313) interacted with different amino acid residues depending on
the protein, and interacted indirectly with residues near the retinal
molecules.
Discussion
Color-blindness and blue-shifted visual spectra duringupstream migration
To distinguish between colors, an organism must possess at least
two cone photoreceptors with distinct spectra. Species with only
one type of color receptor in their retina are regarded as having
‘‘monochromatic vision’’ or being color-blind [1,59]. Here, we
report that A. marmorata possesses only one type of cone cell,
which senses a limited range of the light spectrum, i.e., from
500 nm to 535 nm (Figure 1). Furthermore, our quantitative PCR
data demonstrate that Rh2 is the only green cone opsin gene
expressed at all stages (Figure 3B). These findings clearly indicate
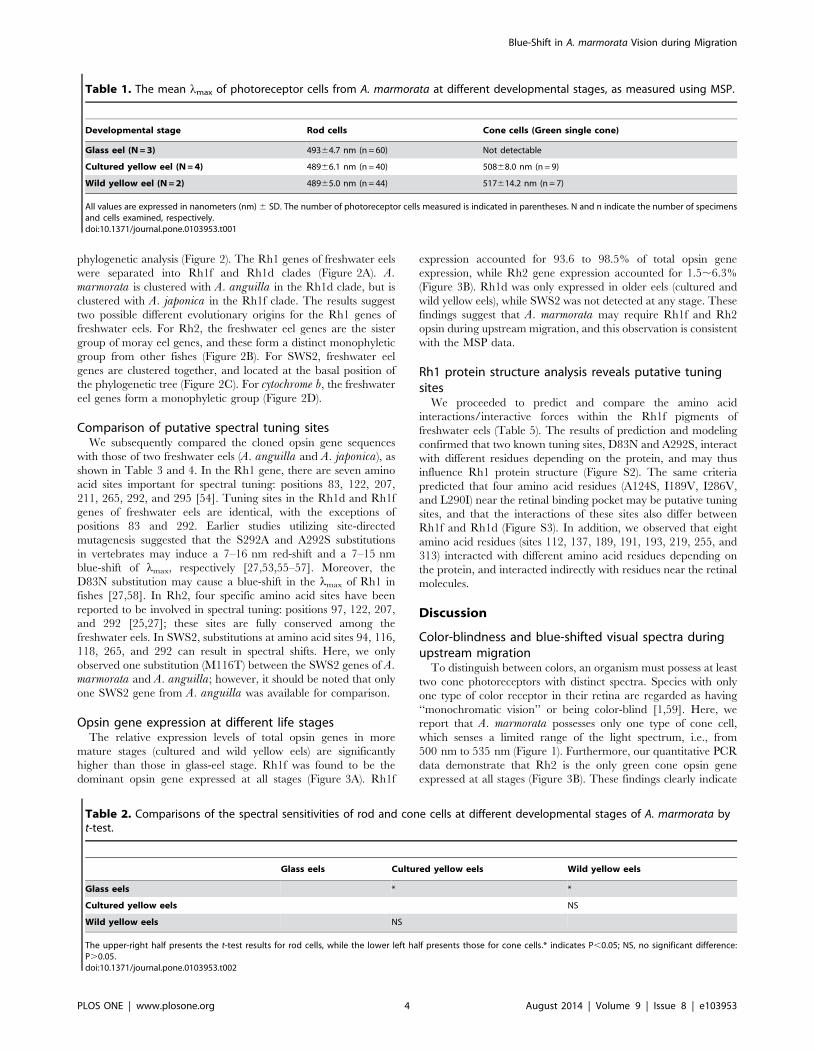
Table 1. The mean lmax of photoreceptor cells from A. marmorata at different developmental stages, as measured using MSP.
Developmental stage Rod cells Cone cells (Green single cone)
Glass eel (N = 3) 49364.7 nm (n = 60) Not detectable
Cultured yellow eel (N = 4) 48966.1 nm (n = 40) 50868.0 nm (n = 9)
Wild yellow eel (N = 2) 48965.0 nm (n = 44) 517614.2 nm (n = 7)
All values are expressed in nanometers (nm) 6 SD. The number of photoreceptor cells measured is indicated in parentheses. N and n indicate the number of specimensand cells examined, respectively.doi:10.1371/journal.pone.0103953.t001
Table 2. Comparisons of the spectral sensitivities of rod and cone cells at different developmental stages of A. marmorata byt-test.
Glass eels Cultured yellow eels Wild yellow eels
Glass eels * *
Cultured yellow eels NS
Wild yellow eels NS
The upper-right half presents the t-test results for rod cells, while the lower left half presents those for cone cells.* indicates P,0.05; NS, no significant difference:P.0.05.doi:10.1371/journal.pone.0103953.t002
Blue-Shift in A. marmorata Vision during Migration
PLOS ONE | www.plosone.org 4 August 2014 | Volume 9 | Issue 8 | e103953

that the giant mottled eel is color-blind during upstream
migration. However, European eel (A. anguilla) possesses green
and blue cones at the large yellow eel stage (older than 4 years old),
suggesting it may be able to discriminate colors [60]. Cottrill et al.(2009) further showed that blue cone opsin genes are expressed at
low levels during the silver eel stage of European eel. The varying
abilities of freshwater eels to discriminate color may result from the
plasticity of ontogenetic expression and/or migratory behavior.
The MSP results demonstrate that the rod cells of A. marmorataexhibit a blue-shifted pattern during upstream migration (Fig-
ure 1). The lmax value of rod cells decreased from 493 nm in glass
eels to 489 nm in yellow eels (Table 1). This decrease may result
from adaptation to different photic environments. Water at the
river mouth area is usually turbid and dominated by longer
wavelength light, i.e., red light [61]; however, water upstream is
usually clear and dominated by light with shorter wavelengths,
such as blue light. To optimize vision, rod cell spectral sensitivity
may be shifted during upstream migration of A. marmorata. The
observed 4 nm rod cell spectral shift may be a consequence of the
expression of alternative opsin genes. We found that Rh1f gene
expression dominated at all sampled stages, but Rh1d gene
expression was detectable only in yellow eels; these findings may
account for the 4 nm spectral shift of rod cells during develop-
ment.
Plastic migratory behaviors and spectral sensitivity infreshwater eels
The spectral sensitivity of A. marmorata alters as it matures. At
the glass eel stage, the average lmax of A. marmorata rod cells was
493 nm, whereas that of European eel rod cells was 505 nm [15].
By the yellow eel stage, the average lmax of A. marmorata rod cells
shifted to 489 nm, while American and European eels of the same
stage possessed rod cells with lmax values of around 516 nm
[12,13]. Therefore, significant red shifts occur in the rod cells of
European and American eels during upstream migration, as
opposed to the blue shift of A. marmorata rod cells.
Several studies have shown that freshwater eels have a flexible
migratory life cycle (see the Introduction). Temperate freshwater
eels, (i.e., European, American, and Japanese eels) have been
described as exhibiting one of the following migratory strategies:
(1) restricted to freshwater; (2) restricted to brackish water; (3)
frequent migration between estuaries and the ocean. Tropic
freshwater eels (i.e., giant mottled eel and bicolor eel) exhibit
plastic strategies of upstream migration. Furthermore, A. marmor-ata may preferentially inhabit environments containing either
multiple or single species of Anguilla sp. [30]. In Taiwan, A.marmorata and A. japonica are sympatric. Based on Sr/Ca ratio
analysis of otoliths, A. marmorata prefers to live in the upper
reaches of rivers, while A. japonica favors the lower reaches or
estuaries within the same river [34,38]. Such differences in
Figure 1. Distribution histograms of the lmax of photoreceptorcells at four stages of A. marmorata. (A) Glass eel; (B) Culturedyellow eel; (C) Wild yellow eel. Rod cells: black bars. Cone cells: whitebars.doi:10.1371/journal.pone.0103953.g001
Figure 2. Neighbor joining trees of the freshwater eel Rh1 (A),Rh2 (B), and SWS2 (C) opsin and (D) cytochrome b genes basedon Maxima-likelihood distances. The scale bar represents 0.05nucleotide substitutions. The nucleotide sequences of fish opsin geneswere obtained from GenBank. The genes and their accession numbersare listed in Table S3. a lmax of rod cells from Table 1 & Table 6. b lmax
of rod cells from [15]. c lmax of rod cells from [12]. d lmax of rod cellsfrom [71]. e lmax of rod cells from [65].doi:10.1371/journal.pone.0103953.g002
Blue-Shift in A. marmorata Vision during Migration
PLOS ONE | www.plosone.org 5 August 2014 | Volume 9 | Issue 8 | e103953

Ta
ble
3.
Co
mp
aris
on
so
fth
eR
h1
seq
ue
nce
so
ffr
esh
wat
er
ee
ls.
Ge
ne
Rh
1
Am
ino
aci
dS
ite
s
83
12
22
07
21
12
65
29
22
95
Co
nse
nsu
sD
EM
HW
SA
A.
an
gu
illa
Rh
1f.
..
..
A.
A.
jap
on
ica
Rh
1f.
..
..
A.
A.
ma
rmo
rata
Rh
1f*
..
..
.A
.
A.
an
gu
illa
Rh
1dN
..
..
..
A.
jap
on
ica
Rh
1dN
..
..
..
A.
ma
rmo
rata
Rh
1d*
N.
..
..
.
*in
dic
ate
sth
eo
psi
ng
en
eo
bta
ine
din
this
stu
dy.
Seq
ue
nce
sar
eco
mp
are
dto
the
con
sen
sus
seq
ue
nce
,w
ith
ide
nti
cal
amin
oac
ids
ind
icat
ed
by
ad
ot.
Site
sar
en
um
be
red
acco
rdin
gto
bo
vin
erh
od
op
sin
.d
oi:1
0.1
37
1/j
ou
rnal
.po
ne
.01
03
95
3.t
00
3
Ta
ble
4.
Co
mp
aris
on
so
fth
eR
h2
and
SWS2
seq
ue
nce
so
ffr
esh
wat
er
ee
ls.
Ge
ne
Rh
2G
en
eS
WS
2
Am
ino
aci
dsi
tes
Am
ino
aci
dsi
tes
97
12
22
07
29
29
41
16
11
82
65
29
2
Co
nse
nsu
sT
EM
SC
on
sen
sus
AM
TW
S
A.
an
gu
illa
..
..
A.
an
gu
illa
..
..
.
A.
ma
rmo
rata
*.
..
.A
.m
arm
ora
ta*
.T
..
.
*in
dic
ate
sth
eo
psi
ng
en
eo
bta
ine
din
this
stu
dy.
Seq
ue
nce
sar
eco
mp
are
dto
the
con
sen
sus
seq
ue
nce
,w
ith
ide
nti
cal
amin
oac
ids
ind
icat
ed
by
ad
ot.
Site
sar
en
um
be
red
acco
rdin
gto
bo
vin
erh
od
op
sin
.d
oi:1
0.1
37
1/j
ou
rnal
.po
ne
.01
03
95
3.t
00
4
Blue-Shift in A. marmorata Vision during Migration
PLOS ONE | www.plosone.org 6 August 2014 | Volume 9 | Issue 8 | e103953
migratory behaviors and habitat choice between species may
reflect their ability to adapt to varying visual signals.
While photic conditions at the river mouth are usually turbid,
those upstream are usually clear [61]. Several studies have shown
that fishes which inhabit turbid water tend to possess photorecep-
tors with longer lmax values than those of fishes that live in clear
water [21,43,62]. In turbid water, short-wavelength light is readily
absorbed by particulates, and therefore cyprinids, which live in
such habitats, have evolved photoreceptors that detect longer
wavelengths. In this study, the wild yellow eels were collected from
a small stream in the upper basin of the Laomei stream. The water
of this sampling location is clearer than that of estuaries, where the
glass eels were collected. The Figure S4 shows that the water of the
upper basin of Laomei stream exhibits a bluer spectrum than the
water of the estuary of the Hsiukuluan River. Such a phenomenon
indicates that the upper basin of the river presented a bluer photic
environment. In addition, we observed that the lmax value of A.japonica rod cells is 497.5 nm, slightly longer than those of A.marmorata and A. bicolor (Table 6). The former two eels have
similar spawning areas and migratory behaviors, but inhabit
different environments [34,36,37]. Therefore, we suggest that
Figure 3. The relative expression (A) and proportional expression (B) of opsin genes at different developmental stages of A.marmorata, as determined by quantitative RT-PCR of retinal RNA.doi:10.1371/journal.pone.0103953.g003
Blue-Shift in A. marmorata Vision during Migration
PLOS ONE | www.plosone.org 7 August 2014 | Volume 9 | Issue 8 | e103953

blue-shifted visual spectra may facilitate adaptation of giant
mottled eel to clear water during upstream migration.
Spectral shift of rod cells between European and giantmottled eel
Comparing the MSP results of this study to those of a previous
study of European eel revealed a 10 nm spectral shift between the
rod cells of A. marmorata and A. anguilla at the glass eel stage.
The possible mechanisms were introduced previously. We will
address four possibilities in turn. First, examination of opsin gene
expression in A. marmorata (this study) and A. anguilla [46]
revealed that Rh1f is the most highly expressed opsin gene, while
Rh1d is undetectable at the glass eel stages. Second, we describe
here that freshwater eels share the same substitutions at known
spectral tuning sites of Rh1f opsin (Table 3). Third, both template
fitting in this study (Table S4) and the HPLC analysis of a previous
Table 5. Eight putative tuning sites of Rh1f, as predicted using protein modeling and Ligplot.
Central site Species Amino acid Hydrogen bond Hydrophobic interaction
112 A. marmorata b L Thr 108, Phe 116 -
A. japonica I Thr 108, Phe 116 Gly 89, Gly 90
A. Anguilla I Thr 108, Phe 116 Gly 89, Gly 90
137 A. marmorata V Ile 133 Lys 141, Pro 142, Phe 146, Phe 148
A. japonica V Ile 133 Lys 141, Pro 142, Phe 146, Phe 148
A. Anguilla M Val 133 Lys 141, Pro 142, Phe 146, Phe 148
189 c A. marmorata I - Pro 171, Try 178, Tyr 191, Phe 203, Ret 1296
A. japonica I - Pro 171, Try 178, Tyr 191, Phe 203, Ret 1296
A. anguilla b M - Thr 118, Cys 167, Phe 203, Met 207, Ret 1296
191 A. marmorata Y Tyr 268 Ile 189, Ala 272
A. japonica Y Tyr 268 Ile 189, Ala 272
A. anguillab H - Val 204, Met 297, Phe 208
193 A. marmorata T Arg 177, Asp 190 -
A. japonica T Arg 177, Asp 190 -
A. anguillab A Asp 190 -
219 A. marmorata V Pro 215, Tyr 223 Val 129
A. japonica V Pro 215, Tyr 223 Val 129
A. anguillab I Pro 215, Tyr 223 Leu 128, Val 129
255 A. marmorata V Thr 251, Val 258, Ile 259 -
A. japonica V Thr 251, Val 258, Ile 259 -
A. anguillab I Thr 251, Val 258, Ile 259 Tyr 223
313 A. marmorata F Asn 310, Met 317 Val 61, Tyr 306, Ile 307
A. japonica F Asn 310, Met 317 Val 61, Tyr 306, Ile 307
A. anguillab S Asn 310, Met 317 -
retinala A. marmorata Retinal - Ala 117, Gly 121, Gly 188, Ile 189, Met 207, Phe 212, Phe 261,Trp 265, Tyr 268, Ala 269
A. japonica Retinal - Ala 117, Gly 121, Gly 188, Ile 189, Met 207, Phe 212, Phe 261,Trp 265, Tyr 268, Ala 269
A. Anguilla Retinal - Ala 117, Gly 121, Gly 188, Met 189, Met 207, Phe 212, Phe 261,Trp 265, Tyr 268, Ala 269
athe retinal molecule is covalently bound to Lys 296.bthe number of binding amino acids, as predicted by Ligplot.csite 189 may directly bind to the retinal molecule, as predicted by Ligplot.doi:10.1371/journal.pone.0103953.t005
Table 6. The mean lmax of rod cells from A. japonica and A. bicolor pacific glass eels, as determined using MSP.
Species Rod cells Cone cells (Green single cone)
A. japonica (N = 2) 49765.3 nm (n = 32) 51067.4 nm (n = 3)
A. bicolor pacific (N = 4) 49465.2 nm (n = 37) 51469.8 nm (n = 18)
All values are expressed in nanometers (nm) 6 SD. The number of photoreceptor cells measured is indicated in parentheses.N and n indicate the number of specimens and cells examined, respectively.doi:10.1371/journal.pone.0103953.t006
Blue-Shift in A. marmorata Vision during Migration
PLOS ONE | www.plosone.org 8 August 2014 | Volume 9 | Issue 8 | e103953

study [15] revealed that A1-retinal predominates at the glass eel
stages of A. marmorata and A. anguilla. However, the A1/A2
ratio in A. marmorata is 3:1, while that in A. anguilla is 6:4. The
giant mottled eel contained more A1-retinal than European eel at
all stages. Therefore, alternative chromophore usage may induce
the spectral shift of rod cells. Finally, fourteen amino acid
substitutions were observed between the Rh1f opsins of A.marmorata and A. anguilla, but none of these are located at
known tuning sites. Earlier studies have shown that the accumu-
lation of distal effects can induce spectral shifts of opsin pigments
in vertebrates [28,29]. Our structural model predicts that the
amino acid interaction/interactive forces of eight sites differ
between the Rh1f opsins of A. anguilla and A. marmorata(Table 5). Four of them, M137V, M189I, H191Y and I255V, are
involved in adjusting the spectral sensitivity of opsin pigments
[63,64]. As mentioned above, alternative chromophore usage and
amino acid substitutions located distally to the retinal binding
pocket may cause spectral shifts of Rh1f opsin between A.marmorata and A. anguilla.
Evolution of opsin genes in freshwater eelsThe phylogenetic tree of the Rh1 gene (Figure 2A) reveals that a
duplication event occurred before the speciation of freshwater,
moray, and conger eels. The predicted ancestral sequence of the
Anguilliformes Rh1 gene (Figure S5) contains serine at site 292;
furthermore, the lmax of Rh1 in these species is usually around
485 nm [3]. The S292A substitution, which induced a red-shift in
Rh1 opsin, occurred in the freshwater eel Rh1f lineage. On the
other hand, the D83N substitution, which induced a blue-shift in
Rh1 opsin, occurred in the freshwater eel Rh1d lineage. In
addition, our analyses have demonstrated that eight putative
tuning sites can affect Rh1f opsin function. These results imply
that the ancestors of freshwater eels possessed rod cells capable of
adapting to different photic environments during catadromous
migration.
Rh2 gene duplication has been regarded as a common
occurrence in teleosts, including cichlids, puffer fish, medaka,
ayu, cyprinids, seabreams, and eels [19,43,58,65–70]. As shown in
Figure 2B, non-duplicated Rh2 genes of freshwater eels clustered
with those of moray eels, and together formed a monophyletic
group. It is unclear whether freshwater eels failed to undergo Rh2
duplication or subsequently lost one of the duplicated genes;
further study in both freshwater and marine eels will be needed to
clarify this issue.
The phylogenetic tree of eels and the lmax values of rod cells
suggest that different visual abilities may influence the migratory
behaviors and habitat choices of eels. As shown in Figure 2D, the
rod cells of marine and Asian freshwater eels possess shorter lmax
spectra than those of European and American freshwater eels.
Asian freshwater eels have similar spawning areas and migratory
behaviors to their European and American brethren, but differ in
their habitat preferences. The blue-shift in visual spectra may help
ensure that the giant mottled eel is better adapted to clear water
during upstream migration. In conclusion, different migratory
behaviors and habitat preferences may reflect divergent visual
signal optimization between eels.
Conclusion
In this study, we measured and identified the spectral
sensitivities and opsin expression patterns of A. marmorata at
different ontogenetic stages. We report that the giant mottled eel is
color-blind and possesses blue-shifted scotopic vision during
ontogenetic upstream migration, which may be achieved by
alternative chromophore usage and amino acid substitutions
located distally to the retinal binding pocket. This unique visual
system characteristic, a novel finding among eel species, may
influence its upstream migration behaviors and habitat choices.
The samples used in this study were collected in Taiwan, yet A.marmorata is distributed widely in the Indo-Pacific, from East
Africa to French Polynesia, and from southeastern Asia to
southern Japan. Is this unique visual system characteristic common
to all giant mottled eels, or specific to the population in Taiwan?
Future sampling from the Indian Ocean or southeastern Asia will
be required to answer this question.
Supporting Information
Figure S1 Representative absorbance spectra of rodand cone cells.
(PDF)
Figure S2 Protein modeling of known tuning sites inRh1f and Rh1d.
(PDF)
Figure S3 Protein modeling of putative tuning sites inRh1f and Rh1d.
(PDF)
Figure S4 Light spectra (in the air and underwater) ofthe indicated sampling locations.
(PDF)
Figure S5 Rh1 ancestral protein sequences.
(PDF)
Table S1 Sample sizes of eels at different stages usedfor MSP and QPCR measurements.
(PDF)
Table S2 Primers used in this study.
(PDF)
Table S3 The accession numbers of genes used for thephylogenetic analysis.
(PDF)
Table S4 The A1/A2 chromophore ratios of rod cells ineels of different stages.
(PDF)
Acknowledgments
The article was improved by comments from two anonymous reviewers.
We thank the Sequencing Core Facility, SIC, Academia Sinica, for DNA
sequencing, and Dr. Duncan Wright for English editing. During the course
of preparation of this manuscript, HYY was supported by a fellowship from
the Hanse-Wissenschaftskolleg Institute for Advanced Study, Delmenhorst,
Germany.
Author Contributions
Conceived and designed the experiments: TYW FYW HYY. Performed
the experiments: FYW WCF. Analyzed the data: FYW TYW ILW.
Contributed reagents/materials/analysis tools: TYW HYY FYW. Wrote
the paper: FYW TYW HYY.
Blue-Shift in A. marmorata Vision during Migration
PLOS ONE | www.plosone.org 9 August 2014 | Volume 9 | Issue 8 | e103953
References
1. Bowmaker JK (1995) The visual pigments of fish. Progress in Retinal and Eye
Research 15: 1–31.
2. Bowmaker JK (2008) Evolution of vertebrate visual pigments. Vision Research
48: 2022–2041.
3. Hunt DM, Dulai KS, Partridge JC, Cottrill P, Bowmaker JK (2001) The
molecular basis for spectral tuning of rod visual pigments in deep-sea fish. TheJournal of Experimental Biology 204: 3333–3344.
4. Partridge JC, Arche SN, Lythgoe JN (1988) Visual pigments in the individualrods of deep-sea fishes. Journal of Comparative Physiology A, Sensory, Neural
and Behavioral Physiology 162: 543–550.
5. Shand J, Hart NS, Thomas N, Partridge JC (2002) Developmental changes in
the cone visual pigments of black bream Acanthopagrus butcheri. The Journal ofExperimental Biology 205: 3661–3667.
6. Price TD, Qvarnstrom A, Irwin DE (2003) The role of phenotypic plasticity indriving genetic evolution. Proceedings of the Royal Society B 270: 1433–1440.
7. Endler JA, Basolo A, Glowacki S, Zerr J (2001) Variation in response to artificialselection for light sensitivity in guppies (Poecilia reticulata). The American
Naturalist 158: 36–48.
8. Aubin-Horth N, Renn SC (2009) Genomic reaction norms: using integrative
biology to understand molecular mechanisms of phenotypic plasticity. MolecularEcology 18: 3763–3780.
9. Seehausen O, Terai Y, Magalhaes IS, Carleton KL, Mrosso HDJ, et al. (2008)Speciation through sensory drive in cichlid fish. Nature 455: 620–626.
10. Jokela M, Vartio A, Paulin L, Fyhrquist-Vanni N, Donner K (2003)
Polymorphism of the rod visual pigment between allopatric populations of the
sand goby (Pomatoschistus minutus): a microspectrophotometric study. TheJournal of Experimental Biology 206.
11. Cheng CL, Flamarique IN (2004) Opsin expression: new mechanism formodulating colour vision. Nature 428: 279.
12. Beatty DD (1975) Visual pigments of the american eel Anguilla rostrata. Vision
Research 15: 771–776.
13. Hope AJ, Partridge JC, Hayes PK (1998) Switch in rod opsin gene expression in
the European eel, Anguilla anguilla (L.). Proceedings of the Royal Society B
265: 869–874.
14. Wood P, Partridge JC (1993) Opsin substitution induced in retinal rods of the eel(Anguilla anguilla (L.)): a model for G-protein-linked receptors. Proceedings of
the Royal Society of London Series B Biological Science 254: 227–232.
15. Wood P, Partridge JC, Grip WJD (1992) Rod visual pigment changes in the
elver of the eel Anguilla anguilla L. measured by microspectrophotometry.Journal of Fish Biology 41: 601–611.
16. Bridges CDB (1972) The Rhodopsin-Porphyropsin Visual System. In: DartnallHA, editor. Photochemistry of Vision: Springer Berlin Heidelberg. pp. 417–480.
17. Sandstrom A (1999) Visual ecology of fish–a review with special reference topercids. Fiskeriverket Rapport 2: 45–80.
18. Carleton KL, Kocher TD (2001) Cone opsin genes of african cichlid fishes:tuning spectral sensitivity by differential gene expression. Molecular Biology and
Evolution 18: 1540–1550.
19. Parry JW, Carleton KL, Spady T, Carboo A, Hunt DM, et al. (2005) Mix and
match color vision: tuning spectral sensitivity by differential opsin geneexpression in Lake Malawi cichlids. Current Biology 15: 1734–1739.
20. Bowmaker JK, Semo M, Hunt DM, Jeffery G (2008) Eel visual pigmentsrevisited: the fate of retinal cones during metamorphosis. Visual Neuroscience
25: 249–255.
21. Kusmic C, Gualtieri P (2000) Morphology and spectral sensitivities of retinal and
extraretinal photoreceptors in freshwater teleosts. Micron 31: 183–200.
22. Nawrocki L, BreMiller R, Streisinger G, Kaplan M (1985) Larval and adult
visual pigments of the zebrafish, Brachydanio rerio. Vision Research 25: 1569–1576.
23. Palacios AG, Varela FJ, Srivastava R, Goldsmith TH (1998) Spectral sensitivity
of cones in the goldfish, Carassius auratus. Vision Research 38: 2135–2146.
24. Takahashi Y, Ebrey TG (2003) Molecular basis of spectral tuning in the newt
short wavelength sensitive visual pigment. Biochemistry 42: 6025–6034.
25. Yokoyama S (2002) Molecular evolution of color vision in vertebrates. Gene 300:
69–78.
26. Yokoyama S, Tada T (2003) The spectral tuning in the short wavelength-
sensitive type 2 pigments. Gene 306: 91–98.
27. Yokoyama S (2008) Evolution of Dim-Light and Color Vision Pigments. Annual
Review of Genomics and Human Genetics 9: 259–282.
28. Chinen A, Matsumoto Y, Kawamura S (2005) Reconstitution of ancestral green
visual pigments of zebrafish and molecular mechanism of their spectraldifferentiation. Molecular Biology and Evolution 22: 1001–1010.
29. Takenaka N, Yokoyama S (2007) Mechanisms of spectral tuning in the RH2
pigments of Tokay gecko and American chameleon. Gene 399: 26–32.
30. Arai T, Chino N (2012) Diverse migration strategy between freshwater and
seawater habitats in the freshwater eel genus Anguilla. Journal of Fish Biology81: 442–455.
31. Chino N, Arai T (2010) Migratory history of the giant mottled eel (Anguillamarmorata) in the Bonin Islands of Japan. Ecology of Freshwater Fish 19: 19–25.
32. Chino N, Arai T (2010) Habitat use and habitat transitions in the tropical eel,Anguilla bicolor bicolor. Envrionmental Biology of Fish 89: 571–578.
33. Jessop BM, Shiao JC, Iizuka Y, Tzeng WN (2002) Migratory behaviour andhabitat use by American eels Anguilla rostrata as revealed by otolith
microchemistry. Marine Ecology Progress Series 233: 217–229.
34. Shiao JC, Iizuka Y, Chang CW, Tzeng WN (2003) Disparities in habitat use and
migratory behavior between tropical eel Anguilla marmorata and temperate eelA. japonica in four Taiwanese rivers. Marine Ecology Progress Series 261: 233–
242.
35. Tsukamoto K, Arai T (2001) Facultative catadromy of the eel Anguilla japonicabetween freshwater and seawater habitats. Marine Ecology Progress Series 220:
265–276.
36. Tzeng WN, Severin KP, Wickstrom H (1997) Use of otolith microchemistry toinvestigate the environmental history of European eel Anguilla anguilla. Marine
Ecology Progress Series 149: 73–81.
37. Tsukamoto K, Aoyama J, Miller MJ (2001) Migration, speciation, and the
evolution of diadromy in anguillid eels. Canadian Journal of Fisheries andAquatic Sciences 59: 1989–1998.
38. Briones AA, Yambot AV, Shiao J-C, Iizuka Y, Tzeng W-N (2007) Migratory
pattern and habitat use of tropical eels Anguilla spp. (Teleostei: Anguilliformes:Anguillidae) in the Philippines, as revealed by otolith microchemistry. The
Raffles Bulletin of Zoology Supplement 14: 141–149.
39. Levine JS, MacNichol EF (1979) Visual pigments in teleost fishes: Effects of
habitat, microhabitat, and behavior on visual system evolution. SensoryProcesses 3: 95–131.
40. Loew E (1994) A third, ultraviolet-sensitive, visual pigment in the Tokay gecko
(Gekko gekko). Vision Research 34: 1427–1431.
41. Govardovskii VI, Fyhrquist N, Reuter T, Kuzmin DG, Donner aK (2000) Insearch of the visual pigment template. Visual Neuroscience 17: 509–528.
42. Lipetz LE, Cronin TW (1988) Application of an invariant spectral form to the
visual pigments of crustaceans: Implications regarding the binding of the
chromophore. Vision Research 28: 1083–1093.
43. Wang FY, Chung WS, Yan HY, Tzeng CS (2008) Adaptive evolution of coneopsin genes in two colorful cyprinids, Opsariichthys pachycephalus and Candidiabarbatus. Vision Research 48: 1695–1704.
44. Sillman AJ, Carver JK, Loew ER (1999) The photoreceptors and visualpigments in the retina of a boid snake, the ball python (Python regius). The
Journal of Experimental Biology Pt 14: 1931–1938.
45. Sillman AJ, Johnson JL, Loew ER (2001) Retinal photoreceptors and visualpigments in Boa constrictor imperator. The Journal of Experimental Zoology
290: 259–365.
46. Cottrill PB, Davies WL, Semo Ma, Bowmaker JK, Hunt DM, et al. (2009)
Developmental dynamics of cone photoreceptors in the eel. BMC Develop-mental Biology 9: 71–79.
47. Zhang H, Futami K, Horie N, Okamura A, Utoh T, et al. (2000) Molecular
cloning of fresh water and deep-sea rod opsin genes from Japanese eel Anguillajaponica and expressional analyses during sexual maturation. FEBS Letter 469:
39–43.
48. Tamura K, Peterson D, Peterson N, Stecher G, Nei M, et al. (2011) MEGA5:
Molecular Evolutionary Genetics Analysis using Maximum Likelihood,Evolutionary Distance, and Maximum Parsimony Methods. Molecular Biology
and Evolution 28: 2731–2739.
49. Posada D, Crandall KA (1998) Modeltest: testing the model of DNAsubstitution. Bioinformatics 14: 817–818.
50. Saitou L, Nei M (1987) The neighbor-joining method: a new method for
reconstructing phylogenetic trees. Molecular Biology and Evolution 4: 406–425.
51. Swofford DL (2000) PAUP*. Phylogenetic analysis using parsimony (*and other
methods). Version 4. ed: Sinauer Associates, Sunderland, Massachusetts.
52. Yang Z (1997) PAML: a program package for phylogenetic analysis bymaximum likelihood. CABIOS 13: 555–556.
53. Archer S, Hope A, Partridge JC (1995) The molecular basis for the green-blue
sensitivity shift in the rod visual pigments of the European eel. Proceedings of theRoyal Society B: Biological Sciences 262: 289–295.
54. Yokoyama S (2000) Molecular evolution of vertebrate visual pigments. Progress
in Retinal and Eye Research 9: 385–419.
55. Fasick JI, Robinson PR (1998) Mechanism of spectral tuning in the dolphinvisual pigments. Biochemistry 37: 433–438.
56. Hunt DM, Fitzgibbon J, Slobodyanyuk SJ, Bowmaker JK (1996) Spectral tuning
and molecular evolution of rod visual pigments in the species flock of cottoid fish
in Lake Baikal. Vision Research 36: 1217–1224.
57. Yokoyama S, Tada T, Zhang H, Britt L (2008) Elucidation of phenotypicadaptations: Molecular analyses of dim-light vision proteins in vertebrates.
Proceedings of the National Academy of Sciences of the United States ofAmerica 105: 13480–13485.
58. Wang FY, Yan HY, Chen JS-C, Wang TY, Wang D (2009) Adaptation of visual
spectra and opsin genes in seabreams. Vision Research 49: 1860–1868.
59. Marshall J, Vorobyev M, Siebeck UE (2006) What does a reef fish see when it
sees a reef fish? Eating ‘Nemo’. In: Ladich F, Collin SP, Moller P, Kapoor BG,editors. Communication in Fishes. Enfield: Science Publishers. pp. 393–422.
60. Damjanovic I, Byzov AL, Bowmaker JK, Gacic Z, Utina IA, et al. (2005)
Photopic vision in eels: evidences of color discrimination. Annals of the NewYork Academy of Sciences 1048: 69–84.
Blue-Shift in A. marmorata Vision during Migration
PLOS ONE | www.plosone.org 10 August 2014 | Volume 9 | Issue 8 | e103953

61. Roesler CS (1998) Theoretical and experimental approaches to improve the
accuracy of particulate absorption coefficients derived from the quantitative filtertechnique. Limnology and Oceanography 43: 1649–1660.
62. Chinen A, Matsumoto Y, Kawamura S (2005) Spectral differentiation of blue
opsins between phylogenetically close but ecologically distant goldfish andzebrafish. The Journal of Biological Chemistry 280: 9460–9466.
63. Kuwayama S, Imai H, Hirano T, Terakita A, Shichida Y (2002) Conservedproline residue at position 189 in cone visual pigments as a determinant of
molecular properties different from rhodopsins. Biochemistry 41: 15245–
152452.64. Palczewski K, Kumasaka T, Hori T, Behnke CA, Motoshima H, et al. (2000)
Crystal structure of rhodopsin: A G protein-coupled receptor. Science 289: 739–745.
65. Wang FY, Tang MY, Yan HY (2011) A comparative study on the visualadaptations of four species of moray eel. Vision Research 51: 1099–1108.
66. Chinen A, Hamaoka T, Yamada Y, Kawamura S (2003) Gene duplication and
spectral diversification of cone visual pigments of zebrafish. Genetics 163: 663–675.
67. Johnson RL, Grant KB, Zankel TC, Boehm MF, Merbs SL, et al. (1993)
Cloning and expression of goldfish opsin sequences. Biochemistry 32: 208–214.
68. Matsumoto Y, Fukamachi S, Mitani H, Kawamura S (2006) Functional
characterization of visual opsin repertoire in Medaka (Oryzias latipes). Gene 371:
268–278.
69. Minamoto T, Shimizu I (2005) Molecular cloning of cone opsin genes and their
expression in the retina of a smelt, Ayu (Plecoglossus altivelis, Teleostei).
Comparative Biochemistry and Physiology Part B: Biochemistry and Molecular
Biology 140: 197–205.
70. Neafsey DE, Hartl DL (2005) Convergent loss of an anciently duplicated,
functionally divergent RH2 opsin gene in the fugu and Tetraodon pufferfish
lineages. Gene 350: 161–171.
71. Shapley R, Gordon J (1980) The visual sensitivity of the retina of the conger eel.
Proceedings of the Royal Society of London Series B Biological Science 209:
317–330.
Blue-Shift in A. marmorata Vision during Migration
PLOS ONE | www.plosone.org 11 August 2014 | Volume 9 | Issue 8 | e103953