The catadromous European eel Anguilla anguilla (L.) as a model for freshwater evolutionary...
16
Aquatic Toxicology 73 (2005) 99–114 The catadromous European eel Anguilla anguilla (L.) as a model for freshwater evolutionary ecotoxicology: Relationship between heavy metal bioaccumulation, condition and genetic variability G.E. Maes a,∗ , J.A.M. Raeymaekers a , C. Pampoulie a,1 , A. Seynaeve a , G. Goemans b , C. Belpaire b , F.A.M. Volckaert a a Katholieke Universiteit Leuven, Laboratory of Aquatic Ecology, Ch. de B´ eriotstraat, 32, B-3000 Leuven, Belgium b Ministry of the Flemish Community, Institute for Forestry and Game Management, A. Duboislaan 14, B-1560 Hoeilaart, Belgium Received 11 April 2004; received in revised form 20 December 2004; accepted 17 January 2005 Abstract Understanding the effects of pollutants on the genome is of crucial importance to preserve the evolutionary potential of endangered natural populations. The highly vagile European eel (Anguilla anguilla L.) has suffered a dramatic decline in recruitment since two decades, urging for a better understanding of the genetic impact of pollution. Its catadromous life history constitutes a model to assess local selection of pollutants on condition and genetic variability, as juveniles recruit in European rivers without appreciable pollution load or interfering genetic background. Because of its high fat content and local benthic feeding behaviour, the feeding stage is considered extremely prone to the bioaccumulation of pollutants. We studied the relationship between heavy metal bioaccumulation, fitness (condition) and genetic variability in the European eel. The muscle tissues of 78 sub-adult eels, originating from three Belgian river basins (Scheldt, Meuse and Yser), were examined for nine heavy metal pollutants (Hg, Cd, Pb, Cu, Zn, Ni, Cr, As and Se), while in total 123 individuals were genotyped at 12 allozyme and 8 microsatellite loci. A significant negative correlation between heavy metal pollution load and condition was observed, suggesting an impact of pollution on the health of sub-adult eels. In general, we observed a reduced genetic variability in strongly polluted eels, as well as a negative correlation between level of bioaccumulation and allozymatic multi-locus heterozygosity (MLH). Microsatellite genetic variability did not show any pollution related differences, suggesting a differential response at metabolic enzymes and possibly direct overdominance of heterozygous individuals. © 2005 Elsevier B.V. All rights reserved. Keywords: Evolutionary toxicology; Multi-locus heterozygosity; Nuclear markers; River pollution; Selection ∗ Corresponding author. Tel.: +32 16 32 45 72; fax: +32 16 32 45 75. E-mail address: [email protected] (G.E. Maes). 1 Present address: Division of Population Genetics, Marine Research Institute, C/O Biotechnology House, Keldnaholt, IS-112 Reykjavik, Iceland. 0166-445X/$ – see front matter © 2005 Elsevier B.V. All rights reserved. doi:10.1016/j.aquatox.2005.01.010
Transcript of The catadromous European eel Anguilla anguilla (L.) as a model for freshwater evolutionary...

Aquatic Toxicology 73 (2005) 99–114
The catadromous European eelAnguilla anguilla(L.) as a modelfor freshwater evolutionary ecotoxicology: Relationship betweenheavy metal bioaccumulation, condition and genetic variability
G.E. Maesa,∗, J.A.M. Raeymaekersa, C. Pampouliea,1, A. Seynaevea,G. Goemansb, C. Belpaireb, F.A.M. Volckaerta
a Katholieke Universiteit Leuven, Laboratory of Aquatic Ecology, Ch. de B´eriotstraat, 32, B-3000 Leuven, Belgiumb Ministry of the Flemish Community, Institute for Forestry and Game Management, A. Duboislaan 14, B-1560 Hoeilaart, Belgium
Received 11 April 2004; received in revised form 20 December 2004; accepted 17 January 2005
Abstract
Understanding the effects of pollutants on the genome is of crucial importance to preserve the evolutionary potential ofendangered natural populations. The highly vagile European eel (Anguilla anguilla L.) has suffered a dramatic decline inrecruitment since two decades, urging for a better understanding of the genetic impact of pollution. Its catadromous life historyconstitutes a model to assess local selection of pollutants on condition and genetic variability, as juveniles recruit in European riverswithout appreciable pollution load or interfering genetic background. Because of its high fat content and local benthic feeding
lationshiptissues ofavy metalsatelliteimpact ofs, as wellsatellitemes and
behaviour, the feeding stage is considered extremely prone to the bioaccumulation of pollutants. We studied the rebetween heavy metal bioaccumulation, fitness (condition) and genetic variability in the European eel. The muscle78 sub-adult eels, originating from three Belgian river basins (Scheldt, Meuse and Yser), were examined for nine hepollutants (Hg, Cd, Pb, Cu, Zn, Ni, Cr, As and Se), while in total 123 individuals were genotyped at 12 allozyme and 8 microloci. A significant negative correlation between heavy metal pollution load and condition was observed, suggesting anpollution on the health of sub-adult eels. In general, we observed a reduced genetic variability in strongly polluted eelas a negative correlation between level of bioaccumulation and allozymatic multi-locus heterozygosity (MLH). Microgenetic variability did not show any pollution related differences, suggesting a differential response at metabolic enzypossibly direct overdominance of heterozygous individuals.© 2005 Elsevier B.V. All rights reserved.
Keywords:Evolutionary toxicology; Multi-locus heterozygosity; Nuclear markers; River pollution; Selection
∗ Corresponding author. Tel.: +32 16 32 45 72; fax: +32 16 32 45 75.E-mail address:[email protected] (G.E. Maes).
1 Present address: Division of Population Genetics, Marine Research Institute, C/O Biotechnology House, Keldnaholt, IS-112Reykjavik, Iceland.
0166-445X/$ – see front matter © 2005 Elsevier B.V. All rights reserved.doi:10.1016/j.aquatox.2005.01.010
100 G.E. Maes et al. / Aquatic Toxicology 73 (2005) 99–114
1. Introduction
Evidence from animal and plant populations indi-cates that allozymatic polymorphism and heterozygos-ity might be linked to environmental heterogeneity andstress (Nevo et al., 1986; Benshlomo and Nevo, 1988;Chagnon and Guttman, 1989; Gillespie and Guttman,1989; Stanton et al., 2000; Nevo, 2001). Understand-ing the effects of pollutants on the genome is of crucialimportance to preserve the evolutionary potential ofendangered natural populations, as a high genetic di-versity provides a population the potential to adapt toselective forces (Gillespie and Guttman, 1989). Undernatural conditions (e.g. absence of anthropogenic influ-ences), allelic frequencies within a population fluctu-ate with time according to stochastic processes (drift),migration and/or environmental selection pressures(such as climate or habitat changes), while maintain-ing polymorphism. However, severe perturbations ona short temporal scale, such as man-induced pollutionand harvesting, may lower the condition and geneticvariability, reducing the viability (fitness) of naturalpopulations. Hence the susceptibility to additional en-vironmental stress increases, weakening the survivalof the species (Thorpe et al., 1981; Leary et al., 1987;Stanton et al., 2000). The importance of genetic varia-tion to survive anthropogenic environmental changesrelates to factors such as resistance to heat stress(mummichog,Fundulus heteroclitus; Powers et al.,1991), oil pollution (mussels,Mytilus edulis; Fevoldena er,C ,1
ectt ,1t uta-t ionr eym andc to-w auseb ha-n lat-t eticv rreda s,2
The impact of pollutants or toxicants, such as heavymetals, pesticides or industrial waste, on the geneticdiversity and structure of natural populations relates toa reduced genetic variability in polluted populations,genotype-specific survivorship and subsequent shift inthe distribution of tolerant genotypes without net lossof diversity, or significant correlations between pollu-tants and allele frequencies (Hvilsom, 1983; Fevoldenand Garner, 1986; Klerks and Weiss, 1987; Patarnelloand Battaglia, 1992; Posthuma and Vanstraalen, 1993).Heavy metal pollutants seem to strongly affect allelicselection or allele frequency shifts at polymorphic loci(Hvilsom, 1983; Benshlomo and Nevo, 1988; Chagnonand Guttman, 1989; Frati et al., 1992). Most of thesestudies focused on well-defined populations, with lowdispersal capability and reproducing locally. Organ-isms with a catadromous life history (i.e. spawning atsea, feeding in rivers and lakes) are expected to reflectlocal pollutants impact faithfully, as somatic and popu-lation genetic comparisons can be made after dispersalwithout worrying about different genetic background,parental influence or larval pollution load. Species witha high effective population size (mostly marine) gen-erally exhibit high levels of heterozygosity and are ex-pected to be more resistant to pollution; multi-locusheterozygotes often show an increased fitness over ho-mozygotes (Nevo et al., 1986; David, 1998). The ques-tion remains whether the effect of pollutants can also bemeasured on condition and genetic variability in highlyvagile species.
eent iver-sp surei ac-t thelC t al-w thei useh abi-tA n-t passb s ofe
ro-p ,
nd Garner, 1986) and radiation (central stonerollampostoma anomalum; Gillespie and Guttman989).
There are four ways in which toxicants may affhe genetic variability in a population (Van Straalen999; Van Straalen and Timmermans, 2002): (1) some
oxicants are mutagenic, increasing directly the mion rate; (2) they may indirectly affect the mutatate by affecting DNA repair mechanisms; (3) thay favour more tolerant genotypes than others
hange the genetic composition of the populationards a higher mean tolerance; and (4) they may cottlenecks or alter migration. The first two mecisms will increase genetic diversity, while the two
er ones will decrease it, possibly exhausting genariation in natural populations. This process is refes “genetic erosion” (Van Straalen and Timmerman002).
There are few analyses of the relationship betwhe bioaccumulation of contaminants and genetic dity in natural populations (Van Straalen, 1999). An im-ortant aspect when quantifying contaminant pres
s not only the exposure concentration but also theual uptake of the contaminant in the body, namelyevel of bioaccumulation (Van Der Oost et al., 2003).oncentrations of environmental pollutants do noays reflect the actual level of contamination of
ndividuals; lab based experimental studies oftenigher concentrations than present in the natural h
at (Newman and Jagoe, 1998, but seeBelfiore andnderson, 2001). Hence, a combination of experime
al and field-based studies remains ideal to encomoth molecular and population-genetic influencenvironmental contaminants (Bickham et al., 2000).
The organism of interest in this study is the Euean eel (Anguilla anguillaL., Anguillidae, Teleostei)

G.E. Maes et al. / Aquatic Toxicology 73 (2005) 99–114 101
a marine fish spending most of its lifetime in Euro-pean freshwater rivers, lagoons or lakes, but spawn-ing in the Sargasso Sea in the South-Western Atlantic(Tesch, 1977). Leptocephali larvae migrate along theGulf Stream and North Atlantic Drift to reach the Eu-ropean continent, enter the rivers as glass eels, feedat least for 6 (males) to 8 years (females) until theirspawning migration as silver eels (Tesch, 1977). Itscatadromous life history constitutes a model to assesslocal selection of pollutants on condition and geneticvariability, as juveniles recruit without appreciable pol-lution load or interfering genetic background. Despiteextensive spawning migrations, the feeding stage (yel-low eel) seems relatively sedentary (Tesch, 1977). Infact, because of its high fat content and local benthicfeeding behaviour, the sub-adult stage is consideredextremely prone to the bioaccumulation of pollutants(Linde et al., 1996; Roche et al., 2003).
The European eel stock is declining rapidly andis now at its minimum since 1970, probably dueto climate/current changes, but compounded by an-thropogenic changes like habitat destruction, migra-tion barriers, overfishing and pollution (Dekker, 2000,Feunteun, 2002). The impact of pollutants in eel isknown (seeRobinet and Feunteun, 2002for a review),but it is unclear to what extent the reproductive poten-tial is affected and whether strong differential selectionmay alter the genetic composition of resident freshwa-ter populations before the spawning migration.
Although there is firm proof that higher pollutionl vari-a ande s oft re-l andfi ianr loadi esiso tel-l posth avym is ac H)a ac-c se-l es,t r be-t etic
variability) and those from not or less impacted sites(Gillespie and Guttman, 1989). A positive correlationbetween MLH and condition indices or negative corre-lation with level of bioaccumulation, would suggest ahigher fitness (less contamination) for more heterozy-gous individuals (heterosis) (Nevo et al., 1986).
2. Material and methods
2.1. Samples
A total of sixteen sites were sampled in three riverbasins (Fig. 1). Approximately ten sub-adult freshwatereels (yellow eel stage) were collected either by electro-fishing or with fyke nets at each site during the year2000 (N= 123). The sampling was part of an extensiveeel pollution-monitoring network for Flanders in 2000(Goemans et al., 2003). To detect inter-basin differ-ences and to improve the statistical power of the analy-ses (especially by avoiding low sampling bias in geneticvariability estimates), we initially grouped samples byriver basin. The first set of samples originated from theLower Scheldt (S1, S2, S3, S4, S5, S6 and S7), the sec-ond set was sampled in the river Meuse (M1, M2, M3and M4), while the third set was sampled in the riverYser (Y1, Y2, Y3, Y4 and Y5) (Fig. 1). Eels were keptalive in oxygenated tanks for maximally 3 days andprocessed in the laboratory. Standard length (L), bodyweight (WB) and liver weight (WL) were determined fore uesw on-c ites)a
2 is
re-m .A ea-si me-t ifi-c acea ingt .,2C tw
evels decrease fitness traits, the impact of geneticbility in a catadromous organism like eel to withstnvironmental stress is not known. The objective
his study were threefold: (1) We quantified theationship between heavy metal bioaccumulationtness (condition) of yellow eels from three Belgiver basins, assuming that a high environmentals reflected in the biota. (2) We tested the hypothf equal post-settlement allozymatic and microsa
ite genetic constitution among basins and amongoc defined groups exhibiting various levels of heetal bioaccumulation. (3) We tested whether there
orrelation between multi-locus heterozygosity (MLt both genetic markers, the individual level of bioumulation and condition. If contaminants causeective mortality of individuals with specific genomhen allele and genotype frequencies should diffeween populations from impacted sites (lower gen
ach individual. Samples from muscle and liver tissere collected for ecotoxicological (heavy metal centration) and genetic (allozymes and microsatellnalyses.
.2. Heavy metal load measurements and analys
A sample of about 3–5 g of muscle tissue wasoved, labelled and frozen at−20◦C before analysistotal of nine heavy metal concentrations were m
ured for three to six eels per sampling site (N= 78) bynductive coupled plasma-optical emission spectrory (ICP-OES) for Cr, Ni, Cu, Zn, Cd and Pb. Quantation of As and Se was performed by graphite furntomic absorption spectrometry (GF-AAS) accord
o standard procedures (Skoog, 1997, Goemans et al003). Concentrations were expressed in�g kg−1 (Hg,d, Pb, Ni, Cr, As and Se) or mg kg−1 (Cu and Zn) weeight.

102 G.E. Maes et al. / Aquatic Toxicology 73 (2005) 99–114
Fig. 1. Anguilla anguilla: flanders with sampling sites along three Belgian river basins; Yser: Y1, Y2, Y3, Y4, Y5; Scheldt: S1, S2, S3, S4, S5,S6, S7; Meuse: M1, M2, M3, M4.
2.3. Allozyme electrophoresis
A total of 123 individuals (including the 78 individ-uals characterised for pollutants) were genotyped us-ing cellulose acetate gel electrophoresis (CAGE,Harrisand Hopkinson, 1976; Richardson et al., 1986). Elec-trophoresis and staining procedures followedMaesand Volckaert (2002). The most common allele wascalled ‘100’ and other alleles were classified accord-ing to their relative mobility to allele ‘100’ for the lo-cus under study. The nomenclature used for enzymesfollowed Shaklee et al. (1990). Buffers used in theelectrophoretic analyses were Tris–glycine (TG) and
Tris–maleate (TM); both liver (L) and muscle (M) tis-sue were used. The following nine enzyme systems(coding for 16 loci) were scored: alcohol dehydroge-nase (ADH-1* , ADH-2* , EC 1.1.1.1, TG, L), aspartateaminotransferase (AAT-1* , AAT-2* , EC 2.6.1.1, TM,L), glucose-6-phosphate isomerase (GPI-1* , GPI-2* ,EC 5.3.1.9, TG, M), isocitrate dehydrogenase (IDH-1* , IDH-2* , EC 1.1.1.42, TM, L),l-lactate dehydroge-nase (LDH-A* , LDH-B* , EC 1.1.1.27, TM, M), malatedehydrogenase (MDH-1* ,MDH-2* , EC 1.1.1.37, TM,L), malic enzyme (MEP-1* , MEP-2* , EC 1.1.1.40,TM, L), mannose-6-phosphate isomerase (MPI-1* , EC5.3.1.8, TG, L) and phospho-glucomutase (PGM-1* ,
G.E. Maes et al. / Aquatic Toxicology 73 (2005) 99–114 103
EC 5.4.2.2, TG, M). Twelve presumed polymorphicloci were scored to examine genetic diversity and geno-type distribution.
2.4. DNA extraction and microsatelliteamplification
Minute sections of tissue from ethanol preservedyellow eel fins (same individuals as allozymes,N= 123) were digested in a lysis buffer containing200�l 5% Chelex 100 solution (BioRad), 7�l of 1 Mdithiothreitol (DTT) solution pH 5.2 (diluted in 0.08 MNaAc) and 10�l protein K solution (10 mg ml−1) forat least 4 h at 56◦C. After incubation at 100◦C for10 min, the samples were centrifuged at 13,000 rpm(10,000×g) for another 10 min; the supernatant wasstored at−20◦C for later analysis. Genotypes wereexamined at 8 dinucleotide repeat microsatellite loci:AAN 01, AAN 02, AAN 05(Daemen et al., 2001); ARO095,ARO054,ANG151,ANG114andARO121(Wirthand Bernatchez, 2001). PCR reaction conditions wereas follows: denaturation at 95◦C for 3 min followed bya cycle of denaturation at 95◦C for 35 s, annealing at61◦C (AAN 01, AAN 02) or 57◦C (AAN 05) for 30 sand finally elongation at 72◦C for 40 s. This cycle wasrepeated 30 (AAN 01, AAN 02) or 25 (AAN 05) times,after which an additional elongation of 10 min at 72◦Cwas performed. Single PCR reactions consisted of 1×PCR buffer (supplied with polymerase), MgCl2 at aconcentration of 1 mM (AAN 02, AAN 05) or 1.5 mM(w old-s m)a asaA htff a-t es,aw d of1a -a 0,W lledr d1 o
25�l. PCR products were run on a 5.5% acrylamide7 M urea sequencing gel using an automated sequencer(LICOR 4200). Along with the PCR products, a molec-ular ladder (Westburg) was run in order to quantify theallele sizes.
2.5. Analyses of condition and heavy metal data
To assess the relative condition of individuals un-der pollutant stress, two condition factors were used:(1)Ricker’s (1975)condition index (CI) was calculatedas 1000(WB/Lb), where respectivelyL andW relate tostandard length in millimetres and body weight in mil-ligrams (King, 1995). (2) The hepato-somatic index(HSI) was calculated as HSI = (WL/WB) × 100, whereWL andWB represent wet liver weight and wet bodyweight, respectively. The coefficientb in (1) was cal-culated as the slope from the logWB − logL regressionanalysis for all three basins, as allometric growth wasdetected. We then assessed the relative condition ofeach individual from each basin using the formula (1).ANOVA tests were performed to compare the meanrelative condition between basins. Since the liver is themajor detoxification and lipid storage reserve organ,changes in weight of this organ will relate to detox-ification and energy storage. Weight effects on HSIwere removed from (2), followed by an ANOVA onthe residuals of the weight-HSI regression for groupcomparison.
enh fol-l n onh mu-l alco llm ndi-t an( e-fi
I
wui0 la-t ed
AAN 01), 200�M of dNTP, 0.4�M of labelled for-ard and non-labelled reverse primer, 0.5 U of GtarTaq polymerase (Eurogentec, Seraing, Belgiund 10–100 ng of gDNA. Double distilled water wdded up to 10�l. Loci ARO 095,ARO 054,ANG 151,NG 114andARO121 were run in a multiplex wit
he following PCR conditions: denaturation at 95◦Cor 5 min followed by a cycle of denaturation at 95◦Cor 30 s, annealing at 57◦C for 30 s and a final elongion at 72◦C for 30 s. This cycle was repeated 25 timfter which an additional elongation of 8 min at 72◦Cas performed. Multiplex PCR reactions consiste× PCR buffer (supplied with polymerase), MgCl2 atconcentration of 1.5 mM, 80�M of dNTP, on aver
ge 0.4�M of fluorochrome labelled (IRD700 or 80estburg, The Netherlands) forward and non-labe
everse primer, 0.5 U of GoldstarTaqpolymerase an0–100 ng of gDNA. Double dH2O was added up t
We used a Multivariate ANOVA on a set of seveavy metals and univariate ANOVA’s per metal
owed by Tukey tests to detect the influence of basieavy metal load. We calculated a relative bioaccu
ation index by dividing (standardizing) the individuoncentration of heavy metali (Ci) by the maximumbserved concentration (Cimax) and averaging over aetals, to relate heavy metal bioaccumulation to co
ion and genetic variability. Thus, the individual memulti-metal) bioaccumulation index (IMBI) was dned as:
MBI =∑n
i=1Ci/Cimax
n
ith N the total number of metals,Ci the individ-al concentration of heavy metali, Cimax the max-
mal observed concentration of heavy metali and< IMBI < 1. To compare heavy metal bioaccumu
ion among basins, an ANOVA analysis was perform

104 G.E. Maes et al. / Aquatic Toxicology 73 (2005) 99–114
on the IMBI values, followed by post hoc analyses(Tukey tests). We calculated Pearson’s correlation co-efficients between individual IMBI values and condi-tion indices (CI and HSI) to assess pollutant impacton condition. All analyses were performed in STATIS-TICA version 6.0 (StatSoft, 2001).
2.6. Genetic data analyses
Allozymatic and microsatellite genetic diversitywas evaluated based on genotype and allele frequen-cies, the level of polymorphism (P), observed and ex-pected heterozygosity (HO andHE), total number ofalleles and mean number of alleles per locus (MNA).Multi-locus heterozygosity (MLH) was calculated asthe percentage heterozygous loci per individual (cor-rected for non-scored loci). Homogeneity of allelefrequencies among samples was tested with the pro-gram GENEPOP version 3.1d (Raymond and Rous-set, 1995). Departures from Hardy–Weinberg (H&W)equilibrium were calculated asD= (HO −HE)/HE withGENEPOP version 3.1d (Raymond and Rousset, 1995)using the Markov chain method. The standard devi-ation of each value was estimated by the jack-knifemethod over loci as implemented in GENETIX version4.02 (Belkhir et al., 1999) and the linkage disequilib-rium between loci was calculated using the LINKDISprocedure implemented in GENETIX (Belkhir et al.,1999). Population structure was characterised using hi-erarchicalF-statistics (theta) andGST-values as im-p age( na esti-ma -ha . Ge-
netic diversity indices (HE, HO, MNA, MLH andP) were compared between individuals, river basinsand post hoc defined LOW-HIGH pollution groups(LOW = IMBI < 0.22 and HIGH = IMBI > 0.25, valuesof 0.22 < IMBI < 0.25 were removed to avoid overlapbetween both groups). Because of the absence of repro-ductively isolated populations within each river basin(Tesch, 1977; Maes and Volckaert, 2002), the proposeddivision by pollution load is justified. In all cases signif-icance levels were corrected for multiple comparisonsusing a sequential Bonferroni correction (Rice, 1989).Locus-by-locus heterozygosities (HO), allelic richness(AR) were compared using a pairwiset-test for depen-dant samples, while individual MLH values of bothpollution groups were compared using an ANOVA. Bi-variate regression analyses helped us to assess the re-lationship between condition and genetic estimators.Subsequent multiple regression analysis (Sokal andRohlf, 1997) was performed to test the overall con-tribution of MLH (allozymes and microsatellites) andcondition (CI and HSI) on the level of bioaccumu-lation (IMBI). Analyses were performed in STATIS-TICA version 6.0 (StatSoft, 2001).
3. Results
3.1. Heavy metal bioaccumulation
Comparisons of heavy metal pollution between riverb llu-t ,pm ticalt per-f useb out
TA illaL.
B Zn
Y 3.88M 6.31S 5.14
p 0.5152
M ccumu ldt basin.V alues f edi
lemented in the GENETIX 4.02 software packBelkhir et al., 1999). Due to the subtle differentiationd the high number of rare alleles, we chose toate the fixation index (FST(RB)) following Robertsonnd Hill (1984)after correction byRaufaste and Bonomme (2000). Significance of multi-locusFST wasssessed with permutation tests (1000 replicates)
able 1verage heavy metal concentration per river basin ofAnguilla angu
asin N Hg Cd Pb Cu
ser 25 150.32 2.448 41.68 0.518 2euse 20 173.6 19.485 37.6 0.493 2cheldt 33 93.6 2.993 52.78 0.643 2
-value 0.0006 0.0000 0.4600 0.5222
ultivariate and univariate ANOVA’s for equal heavy metal bioaalues for Hg, Cd, Pb, Ni, Cr, As and Se are expressed in�g kg−1. V
n bold.
asins pointed to a strong heterogeneity in poion load between sites (MANOVA,F14,138= 5.044< 0.0001,N= 78 (seeAppendix AandTable 1). Theetals As and Se were not included in the statis
reatment because of the low number of analysesormed (1–5 individuals per river basin). The Measin exhibited the highest concentrations for six
Ni Cr As Se All metals
46.52 295.68 135 329 W-value = 0.43865.7 361.5 371.25 663.5 F= 5.04446.54 174.36 308.67 1022.8 d.f. = 14
0.1482 0.3818 – – 0.0000
lation in eel tissue originating from the Yser, Meuse and Scheor Cu and Zn are expressed in mg kg−1. The highest values are list

G.E. Maes et al. / Aquatic Toxicology 73 (2005) 99–114 105
Fig. 2. Level of heavy metal pollution (IMBI) inAnguilla anguilla:(a) per sampling site within river basin; (b) histogram: the “HIGH”and “LOW” group are defined from the bimodal distribution of IMBIvalues.
of nine heavy metal measurements (when includingAs and Se), but only two out of seven heavy metal(Hg, Cd) concentrations differed significantly betweenriver basins (ANOVA,Table 1). The Scheldt showedthe lowest Hg concentration, while the Meuse had thehighest level of Cd. The distribution of heavy metalconcentrations was heterogeneous between sites withinriver basin (Appendix A), as shown inFig. 2a. The dis-tribution of the IMBI values (based on seven metals)ranged from 0.113 to 0.479 and showed a roughly bi-modal pattern of lowly and highly polluted individuals(Fig. 2b). Later on this separation was used in the ge-netic analyses to define the “HIGH” and “LOW” pollu-tion groups. An ANOVA of the IMBI values followedby a Tukey test indicated the Meuse basin as being sig-nificantly stronger polluted than the other two rivers
Fig. 3. Boxplots representing relative condition index (CI± S.D.),hepatosomatic index (HSI± S.D.) and level of heavy metal pollution(IMBI ± S.D.) ofAnguilla anguillafor each river basin.** p< 0.01.
(F2,75= 6.834,p< 0.01,N= 78, Fig. 3). Consideringthe possible relationship between size and pollutionload (length is only weakly correlated with age in yel-low eels), we found no significant correlation betweenlength and pollutant concentration for any heavy metal(data not shown).
3.2. Condition (CI) and hepatosomatic (HSI)indices
The regression equation between length andweight was log(W) = 3.155 log(L) − 3.032 (R= 0.9746,N= 123,p< 0.001). The relative condition index (CI)was calculated as 1000(W/L3.155) and varied sig-nificantly among basins (ANOVA,F2,120= 10.565,p< 0.001), with the Meuse showing the lowest con-dition (Fig. 3). HSI values varied from 0.917 to 2.639among basins. The correlation between weight and HSIwasR=−0.27;p< 0.01. The relative hepato-somaticindex, measured as the residuals of the former regres-sion, differed significantly among basins (ANOVA,F2,120= 5.897,p< 0.01), pointing to the Meuse riveras exhibiting the lowest values (Tukey test). Finally,there was a significant negative correlation betweenheavy metal bioaccumulation (IMBI) and condition(R=−0.24; p< 0.05, Fig. 4a) and a negative rela-tionship between IMBI and HSI (R=−0.20;p= 0.09)(Fig. 4b). No correlation was observed between CI andHSI (data not shown).

106 G.E. Maes et al. / Aquatic Toxicology 73 (2005) 99–114
Fig. 4. Correlation between heavy metal bioaccumulation (IMBI) ofA. anguillaand (a) condition index (CI) withR=−0.24;p= 0.039;(b) hepatosomatic index (HSI) withR=−0.20;p= 0.09 for all indi-viduals (N= 73).
3.3. Intra- and inter-basin genetic variability
A total of 12 enzymatic loci were scored. The to-tal number of alleles per locus ranged from 1 to 6and from 2.3 to 2.6 per sample over all loci. Ob-served (HO) and expected (HE) heterozygosities persample ranged from 0.103 to 0.119 and from 0.122to 0.129, respectively (Table 2). An overall proba-bility test of H&W equilibrium based on 1000 iter-ations was highly significant (p< 0.001), pointing tothe non-random distribution of alleles within somesamples. A global test based on 1000 iterations withH1 = heterozygote deficiency was only highly signifi-
cant for the Meuse river (FIS: 0.21;p< 0.001,Table 2),mainly due to lociGPI-1* , GPI-2* , MDH-2* andADH-1* . A more detailed analysis of heterozygosi-ties within river basin showed that the Meuse exhib-ited the highest expected heterozygosity (HE = 0.129),the highest mean number of alleles (MNA = 2.58)and the highest level of polymorphism (P(0.95)= 0.50).In contrast, this population exhibited the lowest ob-served heterozygosity (HO = 0.107) (Table 2). Nolinkage disequilibrium was observed in the threepopulations.
The microsatellite loci revealed higher levels of vari-ability than the allozymes as the total number of alle-les per locus ranged from 12 (AAN 05) to 40 (ANG114) and heterozygosity values (HE) per locus rangedfrom 0.735 to 0.939. The mean number of alleles perlocus by population varied between 14.4 (Scheldt)and 16.3 (Meuse). Observed and expected heterozy-gosity (HO andHE) per population were highly vari-able, ranging from 0.792 to 0.822 and from 0.850to 0.869, respectively (Table 2). Exact tests assum-ing H1 = heterozygote deficiency, revealed significantdepartures from the null hypothesis of H&W equi-librium in all samples (Table 2). The deficits couldbe attributed to a particular locus, namelyAAN 02which exhibited the strongest inbreeding coefficients(FIS = 0.22, p< 0.001), most likely due to null alle-les. Detailed analysis of population specific geneticvariability defines the Meuse population as the mostvariable, with the highest mean number of alleles(aN reep
3
nt( n-t es( s( if-f ark-e asina ,p en-t ,p
MNA = 16.3), expected heterozygosity (HE = 0.869)nd observed heterozygosity (HO = 0.822) (Table 2).o linkage disequilibrium was observed in the thopulations.
.4. Micro-scale genetic structure
Overall genetic differentiation was significap< 0.05), but the multi-locus unbiased differeiation estimators were very low for allozymFST(RB)= 0.007,GST = 0.001) and for microsatelliteFST(RB)= 0.018,GST = 0.003). Pairwise genetic derentiation shows discrepancies between both mrs. The microsatellite genotypes of the Meuse bre most distinct from the Yser (FST(RB)= 0.025< 0.01), while the allozyme genotypes differ
iate Yser and Scheldt the most (FST(RB)= 0.017< 0.05).
G.E. Maes et al. / Aquatic Toxicology 73 (2005) 99–114 107
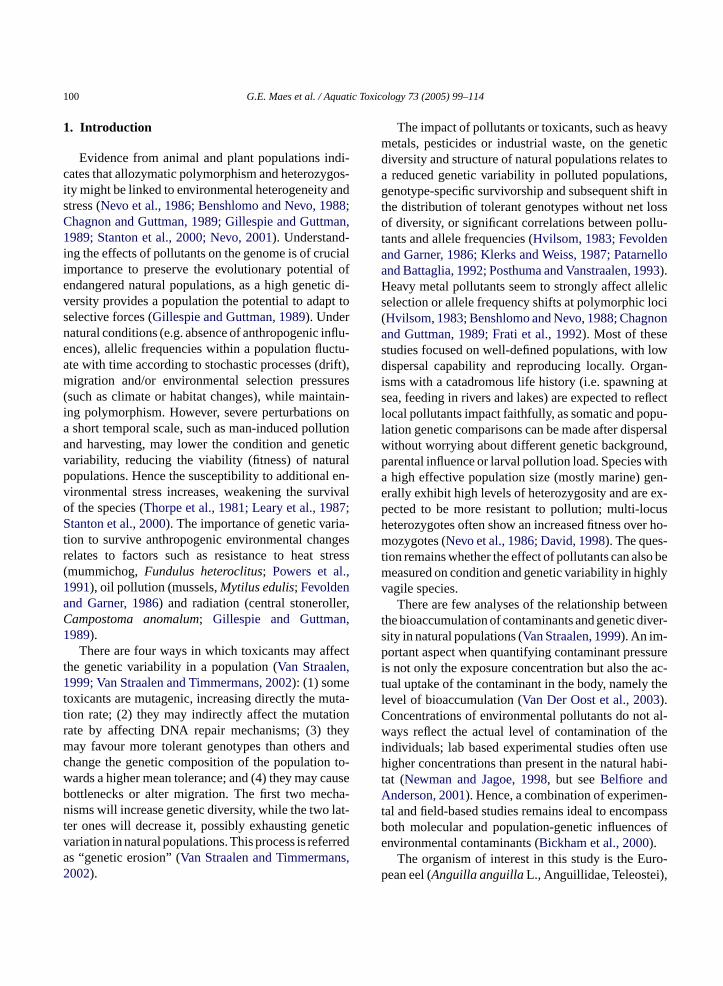
Table 2Allozymatic and microsatellite genetic variability ofAnguilla anguillaL. in the three river basins and in the LOW and HIGH pollution group
Sample N HE ±S.E. HO ±S.E. P(0.95) P(0.99) MNA FIS
AllozymesYser 41 0.122± 0.154 0.111± 0.119 0.417 0.750 2.333 0.104Meuse 41 0.129± 0.147 0.103± 0.107 0.500 0.750 2.583 0.212**
Scheldt 41 0.125± 0.165 0.119± 0.171 0.417 0.583 2.417 0.063
LOW 35 0.140± 0.159 0.131± 0.151 0.500 0.750 2.833 0.075HIGH 32 0.109± 0.140 0.088± 0.094 0.417 0.667 2.333 0.212**
MicrosatellitesYser 41 0.850± 0.073 0.792± 0.089 1.0 1.0 14.875 0.082**
Meuse 41 0.869± 0.068 0.822± 0.087 1.0 1.0 16.250 0.069**
Scheldt 41 0.851± 0.078 0.802± 0.054 1.0 1.0 14.375 0.072**
LOW 35 0.863± 0.073 0.803± 0.077 1.0 1.0 15.875 0.087**
HIGH 32 0.856± 0.080 0.817± 0.049 1.0 1.0 15.250 0.062**
Expected (HE) and observed (HO) heterozygosity per sample/post hoc group over all loci, level of polymorphism (P) and mean number of alleles(MNA) per sample/post hoc group over all loci.N: number of individuals; S.E.: standard error;P(0.95) or P(0.99): 95% or 99% polymorphismcriterion, respectively.∗∗ p< 0.01.
3.5. Genetic composition of the “HIGH” and“LOW” pollution group
The bimodal distribution of the IMBI values al-lowed us to define two groups ranked by their mag-nitude of relative metal load (Fig. 2b). A total of 67individuals were ultimately selected, with 35 and 32individuals in “HIGH” and “LOW” polluted condition,respectively. To exclude redundancy, we tested for theindependence between basin and HIGH–LOW pollu-tion groups (Chi-square = 7.33; d.f. = 5;p> 0.05). The“HIGH” pollution group clearly exhibited a lower al-lozymatic genetic variability (HE, HO, level of poly-morphism and MNA) than the “LOW” pollution group(Table 2). The proportional difference between bothgroups (HLOW −HHIGH/HLOW) amounted to 21.5%HE and 34.6%HO between both pollution groups.Locus-by-locus heterozygosity (HO) and allelic rich-ness (AR) analysis points to a significantly lower AR(t-test,p= 0.01,Fig. 5a) and lowerHO (t-test,p= 0.03,Fig. 5b) for polluted individuals. Finally, the numberof multi-locus genotypes (28 versus 22) was higher inthe “LOW” pollution group. In contrast, microsatel-lite variability (multi- and locus-by-locus analyses)showed no appreciable difference in expected or ob-served heterozygosity, allelic richness or number ofalleles between both groups (data not shown). Whenindividual MLH were compared for allozymes and mi-
crosatellites, we observed marginally significant lowerallozyme MLH values for HIGH polluted individu-als (ANOVA, F1,65= 3.898,p= 0.05), while for mi-crosatellites no differences could be detected (p> 0.05)(Fig. 5c)
3.6. MLH, condition and heavy metal loadregression
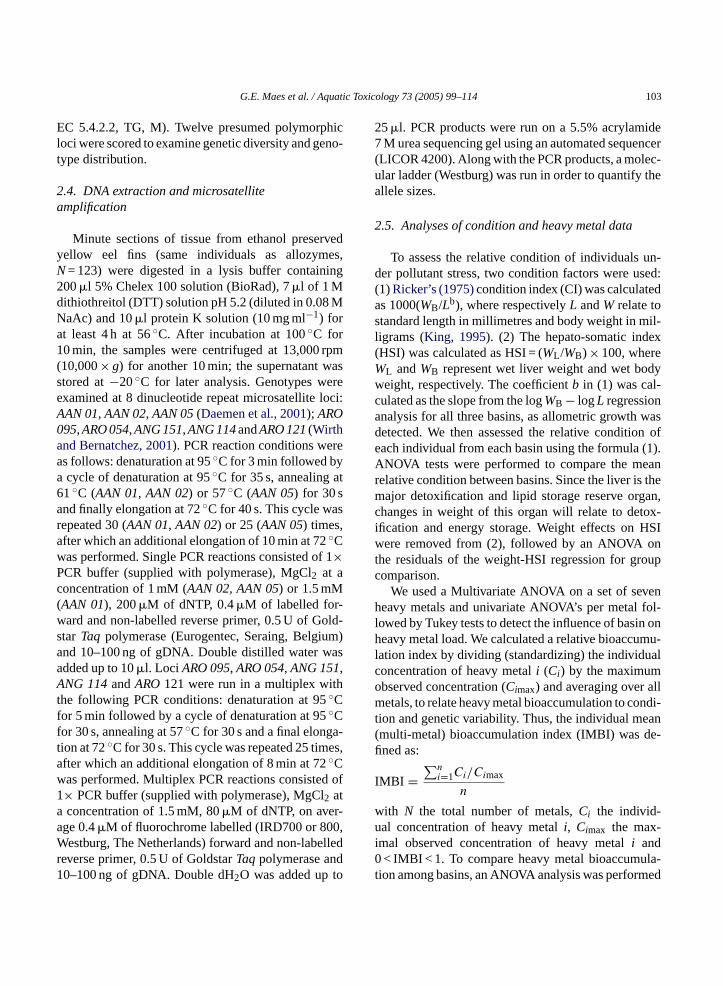
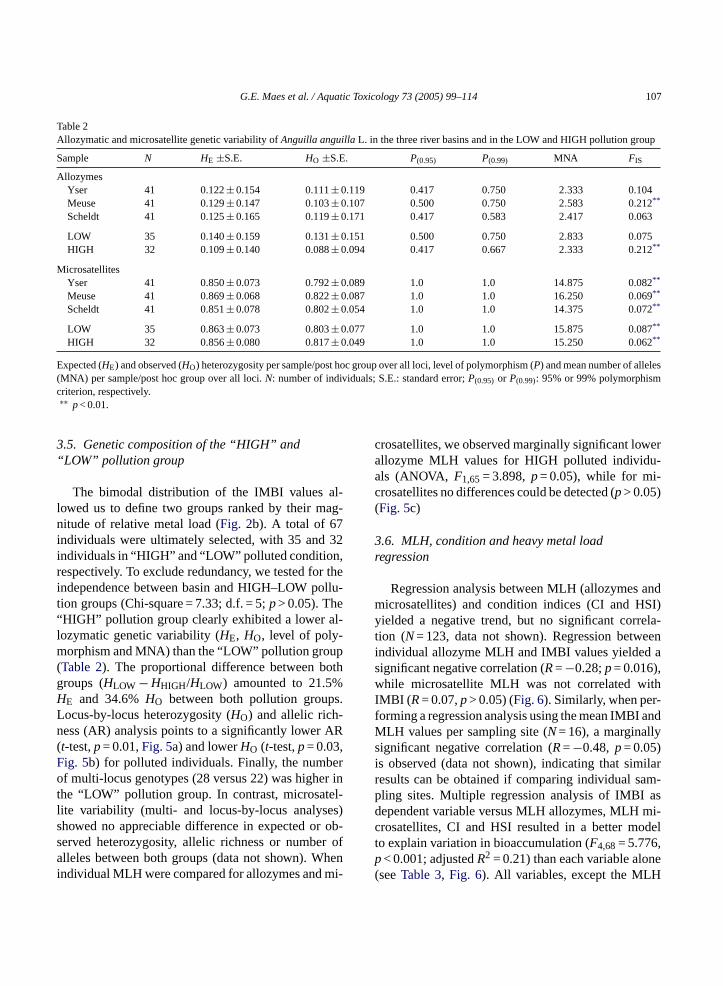
Regression analysis between MLH (allozymes andmicrosatellites) and condition indices (CI and HSI)yielded a negative trend, but no significant correla-tion (N= 123, data not shown). Regression betweenindividual allozyme MLH and IMBI values yielded asignificant negative correlation (R=−0.28;p= 0.016),while microsatellite MLH was not correlated withIMBI (R= 0.07,p> 0.05) (Fig. 6). Similarly, when per-forming a regression analysis using the mean IMBI andMLH values per sampling site (N= 16), a marginallysignificant negative correlation (R=−0.48, p= 0.05)is observed (data not shown), indicating that similarresults can be obtained if comparing individual sam-pling sites. Multiple regression analysis of IMBI asdependent variable versus MLH allozymes, MLH mi-crosatellites, CI and HSI resulted in a better modelto explain variation in bioaccumulation (F4,68= 5.776,p< 0.001; adjustedR2 = 0.21) than each variable alone(seeTable 3, Fig. 6). All variables, except the MLH
108 G.E. Maes et al. / Aquatic Toxicology 73 (2005) 99–114
Fig. 5. Allozymatic genetic variability ofA. anguilla. Boxplots rep-resenting mean (±S.E.): (a) allelic richness (AR,t-test;p= 0.01),(b) observed heterozygosity (HO; t-test;p= 0.03) locus-by-locus and(c) multi-locus heterozygosity (MLH, ANOVA,p= 0.05) compar-isons between “HIGH” and “LOW” heavy metal pollution groups.*p= 0.05,** p< 0.05.
of microsatellites, were correlated with IMBI values.MLH of allozymes contributed the most (β-weights) tothe variation in IMBI, followed by CI, HSI and MLHof microsatellites (Table 3).
Fig. 6. Correlation between relative heavy metal bioaccumulation(IMBI) and multi-locus heterozygosity (MLH) inA. anguilla forallozymes (MLH A) withR=−0.28;p= 0.016 and microsatellites(MLH M) with R= 0.07;p= 0.56.
4. Discussion
Although the impact of pollution on genetic vari-ability has been assessed previously (Bickham et al.,2000; Belfiore and Anderson, 2001for a review), thisstudy is novel in several aspects. First, our study fo-cused on the level of bioaccumulation in a species ex-tremely prone to pollution due to its high fat content,reflecting the actual pollution stress in the organism(Collings et al., 1996). Its catadromous life historyenables the detection of local pollutant influences onsomatic and genetic characteristics, as juveniles en-ter rivers with much less pollution load or differen-tial genetic background than locally reproducing andgenetically distinct freshwater species. Their level ofbioaccumulation after a few years spent in the riverscan be considered as indicative of their fitness, becausestrongly polluted eels detoxify less efficiently, have alower condition and might be less successful spawners(Feunteun, 2002). Secondly, it has been suggested thatseveral genetic markers should be used to discriminatebetween the influence of selection and other factorsthat might be marker specific (Belfiore and Anderson,2001). In this study we compared patterns from strictlyneutral genetic markers (microsatellite DNA) with en-zymatic markers (allozymes), for which the assump-tion of selective neutrality has often been challenged(Eanes, 1999). The significance of assessing biometric

G.E. Maes et al. / Aquatic Toxicology 73 (2005) 99–114 109
Table 3Multiple regression analysis relating individual heavy metal bioaccumulation (IMBI) to condition (CI and HSI) and multi-locus heterozygosity(allozymes; MLH-A and microsatellites; MLH-M)
Parameter (S.E.) d.f. t p-value β-weights (S.E.)
Intercept 0.535 (0.100) 1 5.352 0.000 –CI −0.210 (0.066) 1 −3.185 0.002 −0.343 (0.108)HIS −0.070 (0.026) 1 −2.653 0.010 −0.285 (0.107)MLH-A −0.350 (0.100) 1 −3.486 0.001 −0.376 (0.108)MLH-M 0 .086 (0.071) 1 1.209 0.231 0.129 (0.107)Error – 68 – – –
The relative contribution of each variable is reported asβ-weight (standardised regression coefficient). Standard errors are given in parentheses.
(weight, condition, growth) responses has also beenunderlined as a measure of pollutant impact on the or-ganism (Van Straalen and Timmermans, 2002). Finally,the study of highly vagile organisms with a catadro-mous life-history like eel remains underrepresented,due to the difficulty of defining biologically relevantpopulations. Earlier studies used reproductively iso-lated populations, enabling straightforward populationcomparisons in the light of the “genetic erosion” hy-pothesis (Van Straalen and Timmermans, 2002). Here,we explain this issue in two ways, namely (1) by as-sessing the impact of pollutants on genetic variability(“Genetic Erosion” hypothesis) and (2) by consider-ing individual genetic variability as an advantage tocope with pollution (“Heterosis” or “overdominance”hypothesis). Nevertheless, due to the catadromous life-history of eel and its failure to breed in captivity, nostrong conclusions about evolutionary consequencescan be drawn from our observations.
4.1. Spatial heterogeneity in pollution andcondition
Although the European eel is a highly vagile fishspecies (Tesch, 1977), the feeding stage inhabiting thefreshwater environment is remarkably sedentary andpollutants are expected to have a local influence. Ourresults confirm this knowledge; the accumulation ofheavy metals is strongly heterogeneous between andw td herr ol-l usebl 3;
Cellule Etat de l’Environnement Wallon, 2003). Thebioaccumulation of heavy metals, defined as a rela-tive index (IMBI), confirmed single metal predictions,namely pointing to the Meuse eels as significantlystronger polluted than the eels of other basins. Earlierstudies on European eel have confirmed the hetero-geneous distribution of pollutants in rivers and lakes(Linde et al., 1996; Belpaire et al., 2002; Goemanset al., 2003). The individual level of bioaccumulationmight provide both an estimate of the environmentalquality of the sediment (eels are benthic feeders) anda measure of health condition (fitness) of the organ-ism (Bervoets and Blust, 2003). As no correlation wasfound between eel length and pollutants, the capacity ofdetoxification of individuals seemed unrelated to theirsize.
Life-history traits, such as condition, growth andfecundity, reflect the environmental quality and theorganism’s historic experience (Meffe, 1991; Ridley,1996). We expected an impact of the level of bioac-cumulation on the condition of European eel, dueto the excess energy required for detoxification. Weclearly showed a relationship between an increasedheavy metal content and a lower condition in eel.The Meuse population exhibited a significantly lowercondition than the other two river basins. Regres-sion analysis revealed a strong negative correlationbetween individual bioaccumulation and conditionindices (Fig. 4a and b), which confirms the litera-ture. For example, in the Sydney rock oyster (Sac-c r-r ,w tiono inE tly
ithin basins (Table 1, Fig. 2). We found significanifferences between individuals originating from otiver basins, pointing to locally highly and less puted sites. Despite intra-riverine variability, the Measin was the strongest polluted river (Table 1), in
ine with current perception (Maeckelberghe, 200
ostrea commercialis), bioaccumulation strongly coelated with condition (Avery et al., 1996). Hencee have strong indications that the bioaccumulaf heavy metals is a predictor of the conditionuropean eel and that pollution might significan

110 G.E. Maes et al. / Aquatic Toxicology 73 (2005) 99–114
affect individual fitness. Due to the mobilisation offat reserves during the spawning migration, it is ex-pected that highly polluted individuals will have a lowerreproductive success during spawning (Van Ginnekenand Van den Thillart, 2000; Robinet and Feunteun,2002)
4.2. Bioaccumulation versus intra river and posthoc genetic variability
Because of the absence of reproductively isolatedgroups in Belgium and Europe (Wirth and Bernatchez,2001; Maes and Volckaert, 2002), it remains diffi-cult to sustain the concept of “populations” in a riverbasin. Analyses performed at the population level aremostly testing for Hardy–Weinberg equilibrium, whichcan also be interpreted as randomness in genotypicdistribution within rivers instead of random matingamongst individuals. Our proposal to analyse on theone hand natural populations (river basin) and onthe other hand phenotypic traits (pollution charge),aims first at analysing the influence of a geographi-cally divergent pollution level (local pattern of geneticvariability) and subsequently mainly at comparingthe genetic variability based on pollutant concentra-tion in “general”, where an individual’s heterozygos-ity determines its response to pollutants. The level ofbioaccumulation does not necessarily reflect the en-vironmental pollution but also the individual capacityfor detoxification. Hence, we argue that individualb eticm
in,w theh Wd iono uchr sub-sa uc-t ultso ions typics thel t-i usi otec
Due to the heterogeneous distribution of metals andthe absence of “biological” populations in rivers, weranked individuals in post hoc groups according totheir level of bioaccumulation. The pattern exhibitedhere was much more unambiguous, namely a loweroverall genetic allozymatic variability in strongly pol-luted individuals and again a strong H&W disequilib-rium. A similar decrease in genetic variability has beendemonstrated in various other freshwater, marine andterrestrial organisms under natural and laboratory con-ditions (Hvilsom, 1983; Fevolden and Garner, 1986;Klerks and Weiss, 1987; Posthuma and Vanstraalen,1993). Changes in diversity were mostly attributed tothe selective advantage of certain genotypes or a re-duction in population size (Ne). Remarkably, in moststudies either only a few enzymatic loci were screenedor an impact was observed at few loci (Chagnon andGuttman, 1989; Gillespie and Guttman, 1989; Patar-nello and Battaglia, 1992; Newman and Jagoe, 1998).In the present study, we observed a multi-locus re-sponse on pollution, namely at seven out of nine enzy-matic loci. Only locusGPI-1* remained constant, whileMPI-1* even exhibited a higher variability in stronglypolluted individuals, possibly pointing to a heavy metaltolerant allele. We observed a lower number of geno-types in the highly polluted group, which fits the ex-pectations (Benshlomo and Nevo, 1988; Chagnon andGuttman, 1989; Diamond et al., 1991), and suggestsdifferential mortality or genotype shifts. Interestingly,74% of Meuse individuals belong to the HIGH pol-l sera ob-s -m yh het-e ari-a nyp um-b romt d-i rre-l ationaa at-s .,2 d ast pat-t ant
ioaccumulation is also determined by the genake-up.Considering genetic variability within a river bas
e showed that the Meuse, despite exhibitingighest expected variability, was in strong H&isequilibrium, pointing to a non-random distributf genotypes and possibly differential selection. Sesults may have several causes, like populationtructure, null alleles, inbreeding and selection (Hartlnd Clark, 1997). Because of the absence of reprod
ively active populations and the lack of similar resn microsatellites (excluding locus AAN 02), selecteems the most plausible explanation for the genohift. The most strongly polluted population waseast heterozygous (HO) at allozymes, possibly attribung weaker detoxification ability to more homozygondividuals and/or shifts towards certain homozyglasses.
ution group compared to 40 and 35% for the Ynd Scheldt, respectively. This confirms the lowererved variability (HO) in the Meuse, while the reaining low polluted individuals from this river maave raised the MNA and hence the expectedrozygosity by carrying rare alleles. The genetic vbility at strictly neutral markers did not show aollution related differences, despite the high ner of alleles and the higher resolution expected f
his marker (Hedrick, 1999). Nevertheless, other stues using similar markers have found a strong coation between a decrease in neutral genetic varind the level of pollution in natural aquatic (Nadig etl., 1998; Krane et al., 1999; Ma et al., 2000; Mon et al., 2000) and terrestrial (Theodorakis et al001) habitats. This result was somewhat expecte
he only selection possibly influencing the geneticern of eel is direct selection on metabolically import
G.E. Maes et al. / Aquatic Toxicology 73 (2005) 99–114 111
enzymes, as microsatellites evolve strictly neutrally,mainly enabling the detection of post-reproductive se-lection (Bickham et al., 2000; Belfiore and Anderson,2001).
4.3. Bioaccumulation versus individual geneticvariability
A comparison between individual-based pollutioncharacteristics and population summary statistics (HE,P, MNA, H&W equilibrium) holds several difficultiesfor the interpretation, due to the assumption of “pop-ulation” in genetic estimators. Therefore, we choseto analyse the relationships between all variables us-ing individual based regression analyses. A negativecorrelation was observed between IMBI and condi-tion indices, as well as between IMBI and allozymaticMLH. This suggests that strongly polluted individu-als need more energy for detoxification and are onaverage in a worse condition, while more heterozy-gous individuals may accumulate less (Van Straalenand Kammenga, 1998). Increased fitness with het-erozygosity has been empirically demonstrated in alarge number of plants and animal species (seeDavid,1998for a review), as heterozygotes are better bufferedagainst environmental fluctuations, are superior dueto their multimeric enzymes (Nevo et al., 1986) andhave a lower energetic demand, favouring such indi-viduals in strongly polluted conditions (heterosis). Duet ela-t bepm cit-r tion( dantw atew tel-l -t aind ssedb aticM c-t id-u ly itsg por-t ac-c
5. Conclusion
We clearly showed a strong correlation betweenthe level of bioaccumulation and a reduced condi-tion within resident eel populations. We also foundan obvious link between pollution and a lower al-lozymatic genetic variability at the individual leveland in two post hoc defined groups of different pol-lution levels. Microsatellite variability did not reflectany pollution or condition related trend, and no indi-vidual HFC pattern. We hypothesize that enzymaticgenetic variability (MLH) is a key issue to explaindifferences in the bioaccumulation of toxicants (ordetoxification success), in other words to retain fit-ness. Hence, direct overdominance seems the mostlikely explanation for the observed pattern in eel andthus not associative overdominance or genetic ero-sion (only detectable after reproduction). Complemen-tary sampling and experimental studies should increaseour confidence about the strength of ecological conse-quences in catadromous organisms, as well as aboutthe heterosis effect (HFC) detected in this study. Con-ditional is the optimisation of artificial breeding beforeevolutionary inferences can be made experimentally.Our results also underline the complexity of evolution-ary toxicology research in diadromous species, whichswitch between habitats. The knowledge of the geneticmake-up is crucial to infer evolutionary consequencesof pollutants in such species, which is only possiblewhen assessing the interaction between ecology andg
A
theF toK singo oudta theq h.D.s iono rs).J oft en).C romF
o the multi-locus response or cause of the corrion, an overall metabolic gain in efficiency mayroposed as cause for the correlation (Eanes, 1999);ost allozymes studied belong to the glycolysis or
ic acid cycle. No heterozygosity fitness correlaHFC) was found at microsatellites, results concorith recent findings in farmed eel where growth ras correlated to allozymatic but not to microsa
ite MLH (Pujolar et al., 2005). The relative imporance of condition and genetic variability to explifferences in heavy metal bioaccumulation as assey multiple regression analysis, pointed to allozymLH, followed by the condition index as the main fa
ors influencing bioaccumulation. Hence, an indival’s enzymatic heterozygosity (and not necessarienome-wide heterozygosity) seems to play an im
ant role in the potential to counteract pollutant bioumulation.
enetics.
cknowledgments
This research was funded by The Ministry oflemish Community (AMINAL). Many thanks go. Peirsman for organizing the fishing and procesf the samples. We thank J.P. Nash, J.K.J. Van Hnd two anonymous referees who helped improveuality of this manuscript. G.E. Maes received a Pcholarship from the IWT (Institute for the Promotf Innovation by Science and Technology in Flande.A.M. Raeymaekers received a Ph.D. fellowshiphe Fund for Scientific Research (F.W.O.-Vlaander. Pampoulie received a post-doctoral fellowship fWO-Vlaanderen and the KULeuven.
112 G.E. Maes et al. / Aquatic Toxicology 73 (2005) 99–114
Appendix A. Average heavy metal concentration per kg of wetAnguilla anguilla tissue per sampling site:N: number of individuals analysed for heavy metals. Values for As and Se correspond to one individual atthe respective sampling site. Values for Hg, Cd, Pb, Ni, Cr, As and Se are expressed in�g kg−1. Values forCu and Zn are expressed in mg kg−1
River Sampling site N Hg Cd Pb Cu Zn Ni Cr As Se
YSER Y1 5 245.20 2.60 49.80 0.37 25.76 46.00 171.00 – –YSER Y2 5 59.60 1.78 75.40 1.20 19.20 77.20 632.40 135.00 329.00YSER Y3 5 139.40 2.18 24.80 0.39 23.78 37.80 285.60 – –YSER Y4 5 194.60 2.58 20.00 0.37 27.36 17.20 146.60 – –YSER Y5 5 112.80 3.10 38.40 0.33 23.30 54.40 242.80 – –MEUSE M1 6 152.50 23.15 10.33 0.68 27.22 55.67 823.67 263.00 1081.00MEUSE M2 5 215.40 22.72 39.20 0.53 30.24 94.00 138.40 168.00 743.00MEUSE M3 4 175.20 22.58 28.00 0.33 23.92 82.20 157.60 733.00 488.00MEUSE M4 5 144.20 5.16 83.60 0.36 23.84 27.00 197.20 321.00 342.00SCHELDT S1 3 70.33 1.67 85.67 0.83 32.50 92.00 183.67 243.00 667.00SCHELDT S2 3 142.00 1.50 95.33 0.70 23.83 37.33 135.33 257.00 913.00SCHELDT S3 5 91.20 3.86 5.00 0.58 19.74 27.00 139.00 229.00 1064.00SCHELDT S4 5 66.00 1.50 55.60 0.83 24.46 5.00 200.20 – –SCHELDT S5 3 99.67 1.50 15.67 0.50 17.00 25.00 187.33 254.00 1166.00SCHELDT S6 5 66.20 6.98 85.60 0.57 28.90 90.00 174.60 – –SCHELDT S7 4 127.75 1.50 73.75 0.67 24.75 61.25 181.25 704.00 1556.00
References
Avery, E.L., Dunstan, R.H., Nell, J.A., 1996. The detection of pollu-tant impact in marine environments: condition index, oxidativeDNA damage, and their associations with metal bioaccumula-tion in the Sydney rock oysterSaccostrea commercialis. Arch.Environ. Contam. Toxicol. 31, 192–198.
Belfiore, N.M., Anderson, S.L., 2001. Effects of contaminants ongenetic patterns in aquatic organisms: a review. Mut. Res. -Rev.Mut. Res. 489, 97–122.
Belkhir, K., Borsa, P., Goudet, J., Bonhomme, F., 1999. Genetix:logiciel sous Windows pour la genetique des populations, ver-sion 3.0. Laboratoire GENOME & POPULATION, CNRS-UPR,Universite de Montpellier II, Montpellier (France).
Belpaire, C., Derwich, A., Goemans, G., Van Thuyne, G., Coore-man, K., Guns, M., Ollevier, F., 2002. Intra-lake spatial varia-tions in pollution patterns of eelA. anguilla. In: Aida, K., et al.(Eds.), Proceedings of the International Symposium ‘Advancesin eel Biology’. University of Tokyo, 28–30 September 2003, pp.170–174.
Benshlomo, R., Nevo, E., 1988. Isozyme polymorphism as monitor-ing of marine environments — the interactive effect of cadmiumand mercury pollution on the shrimp,Palaemon elegans. Mar.Poll. Bull. 19, 314–317.
Bervoets, L., Blust, R., 2003. Metal concentrations in water, sedimentand gudgeon (Gobio gobio) from a pollution gradient: relation-ship with fish condition factor. Environ. Poll. 126 (1), 9–19.
Bickham, J.W., Sandhu, S., Hebert, P.D.N., Chikhi, L., Athwal, R.,2000. Effects of chemical contaminants an genetic diversity in
natural populations: implications for biomonitoring and ecotox-icology. Mut. Res. -Rev. Mut. Res. 463, 33–51.
Cellule Etat de l’Environnement Wallon, 2003. Tableau de bordde l’environnement wallon 2003. Ed. MRW Ð DGRNE,144 pp.
Chagnon, N.L., Guttman, S.I., 1989. Differential survivorshipof allozyme genotypes in mosquitofish populations exposedto copper or cadmium. Environ. Toxicol. Chem. 8, 319–326.
Collings, S.E., Johnson, M.S., Leah, R.T., 1996. Metal contaminationof angler-caught fish from the Mersey estuary. Mar. Environ. Res.41, 281–297.
Daemen, E., Cross, T., Ollevier, F., Volckaert, F.A.M., 2001. Anal-ysis of the genetic structure of European eel (Anguilla anguilla)using microsatellite DNA and mtDNA markers. Mar. Biol. 139,755–764.
David, P., 1998. Heterozygosity-fitness correlations: new perspec-tives on old problems. Heredity 80, 531–537.
Dekker, W., 2000. A procrustean assessment of the European eelstock. ICES J. Mar. Sci. 57, 938–947.
Diamond, S.A., Newman, M.C., Mulvey, M., Guttman, S.I., 1991.Allozyme genotype and time-to-death of mosquitofish,Gambu-siaholbrooki, during acute inorganic mercury exposure — a com-parison of populations. Aquat. Toxicol. 21, 119–134.
Eanes, W.F., 1999. Analysis of selection on enzyme polymorphisms.Ann. Rev. Ecol. Syst. 30, 301–326.
Feunteun, E., 2002. Management and restoration of European eelpopulation (Anguilla anguilla): an impossible bargain. Ecol. Eng.18, 575–591.
G.E. Maes et al. / Aquatic Toxicology 73 (2005) 99–114 113
Fevolden, S.E., Garner, S.P., 1986. Population-genetics ofMytilusedulis from Oslofjorden, Norway, in oil-polluted and nonoil-polluted water. Sarsia 71, 247–257.
Frati, F., Fanciulli, P.P., Posthuma, L., 1992. Allozyme variation inreference and metal-exposed natural populations ofOrchesellacincta(insecta, collembola). Biochem. Syst. Ecol. 20, 297–310.
Gillespie, R.B., Guttman, S.I., 1989. Effects of contaminants on thefrequencies of allozymes in populations of the central stoneroller.Environ. Toxicol. Chem. 8, 309–317.
Goemans, G., Belpaire, C., Raemaekers, M., Guns M., 2003. HetVlaamse palingpolluentenmeetnet, 1994–2001: gehalten aanpolychloorbifenylen, organochloorpesticiden en zware metalenin paling (report nr: IBW.Wb.V.R.2003.99). 169 pp.
Harris, H., Hopkinson, D.A., 1976. Handbook of Enzyme Elec-trophoresis in Human Genetics. North Holland Publishing Co.,Oxford.
Hartl, D.L., Clark, A.G., 1997. Principles of Population Genetics,third ed. Sinauer Associates, Inc., USA.
Hedrick, P.W., 1999. Perspective: highly variable loci and their inter-pretation in evolution and conservation. Evolution 53, 313–318.
Hvilsom, M.M., 1983. Copper-induced differential mortality in themusselMytilus edulis. Mar. Biol. 76, 291–295.
King, M., 1995. Fisheries Biology, Assessment and Management.Fishing News Books. Blackwell Science Ltd., Oxford, England.
Klerks, P.L., Weiss, J.S., 1987. Genetic adaptation to heavy metalsin aquatic organisms — a review. Environ. Poll. 45, 173–205.
Krane, D.E., Sternberg, D.C., Burton, G.A., 1999. Randomly ampli-fied polymorphic DNA profile-based measures of genetic diver-sity in crayfish correlated with environmental impacts. Environ.Toxicol. Chem. 18, 504–508.
Leary, R.F., Allendorf, F.W., Knudsen, K.L., 1987. Differences ininbreeding coefficients do not explain the association betweenheterozygosity at allozyme loci and developmental stability inrainbow-trout. Evolution 41, 1413–1415.
Linde, A.R., Arribas, P., Sanchez Galan, S., Garcia Vazquez, E.,
pollu-icol.
M on
,
M vlak-
M tion
M 000.
En-
M fishish.
N lter-d to
contaminants using RAPD assay. Aquat. Toxicol. 43, 163–178.
Nevo, E., 2001. Evolution of genome–phenome diversity under en-vironmental stress. PNAS 98, 6233–6240.
Nevo, E., Noy, R., Lavie, B., Beiles, A., Muchtar, S., 1986. Geneticdiversity and resistance to marine pollution. Biol. J. Linn. Soc.29, 139–144.
Newman, M.C., Jagoe, R.H., 1998. Allozymes reflect the population-level effect of mercury: simulations of the mosquitofish (Gambu-sia holbrookigirard) GPI-2 response. Ecotoxicology 7, 141–150.
Patarnello, T., Battaglia, B., 1992. Glucosephosphate isomerase andfitness — effects of temperature on genotype dependent mor-tality and enzyme-activity in 2 species of the genusGammarus(Crustacea, Amphipoda). Evolution 46, 1568–1573.
Posthuma, L., Vanstraalen, N.M., 1993. Heavy-metal adaptation interrestrial invertebrates — a review ofoccurrence, genetics, phys-iology and ecological consequences. Comp. Biochem. Physiol.C-Pharmacol. Toxicol. Endocrinol. 106, 11–38.
Powers, D.A., Lauerman, T., Crawford, D., Dimichele, L., 1991.Genetic mechanisms for adapting to a changing environment.Annu. Rev. Genet. 25, 629–659.
Pujolar, J.M., Maes, G.E., Vancoillie, C., Volckaert, F.A.M., 2005.Growth rate correlates to individual heterozygosity in Europeaneel,Anguilla anguillaL. Evolution 59 (1), 189–199.
Raufaste, N., Bonhomme, F., 2000. Properties of bias and variance oftwo multiallelic estimators ofFST. Theor. Pop. Biol. 57, 285–296.
Raymond, M., Rousset, F., 1995. Genepop (version 1.2): a populationgenetics software for exact tests and ecumenicism. J. Hered. 86,248–249.
Rice, W.R., 1989. Analyzing tables of statistical tests. Evolution 43,223–225.
Richardson, B.J., Baverstock, P.R., Adams, M., 1986. AllozymeElectrophoresis: A Handbook for Animal Systematics and Pop-ulation Studies. Academic Press, Inc., California, San Diego.
Ricker, W.E., 1975. Computation and interpretation of the biologi-191,
R e.R erg
f in-
R osureeels?
R alida-sedh na-. 58,
S 90.ish.
S ntal
S cticeom-
1996. Eel (Anguilla anguilla) and brown trout (Salmo trutta) tar-get species to assess the biological impact of trace metaltion in freshwater ecosystems. Arch. Environ. Contam. Tox31 (3), 297–302.
a, X.L., Cowles, D.L., Carter, R.L., 2000. Effect of pollutiongenetic diversity in the bay musselMytilus galloprovincialisandthe acorn barnacleBalanus glandula. Mar. Environ. Res. 50559–563.
aeckelberghe, H., 2003. De kwaliteit van het Vlaamse oppertewater en de afvalwaterlozingen in 2002. Water 3, 1–6.
aes, G.E., Volckaert, F.A.M., 2002. Clinal variation and isolaby distance within the European eel (Anguilla anguillaL.). Biol.J. Linn. Soc. 77, 509–521.
atson, C.W., Rodgers, B.E., Chesser, R.K., Baker, R.J., 2Genetic diversity ofClethrionomys glareoluspopulations fromhighly contaminated sites in the Chornobyl region, Ukraine.viron. Toxicol. Chem. 19, 2130–2135.
effe, G.K., 1991. Life-history changes in Eastern mosquito(Gambusia holbrooki) induced by thermal elevation. Can. J. FAquat. Sci. 48, 60–66.
adig, S.G., Lee, K.L., Adams, S.M., 1998. Evaluating aations of genetic diversity in sunfish populations expose
cal statistics of fish populations. Bull. Fish. Res. Bd. Can.1–382.
idley, M., 1996. Evolution. Blackwell Science, Inc., Cambridgobertson, A., Hill, W.G., 1984. Deviations from Hardy–Weinb
proportions — sampling variances and use in estimation obreeding coefficients. Genetics 107, 703–718.
obinet, T.T., Feunteun, E.E., 2002. Sublethal effects of expto chemical compounds: a cause for the decline in AtlanticEcotoxicology 11, 265–277.
oche, N., Buet, A., Ramade, F., 2003. Characterization and vtion of ecotoxicological biomarkers in an eel population expoto persistent organic pollutants in the Vaccares lake, Frenctional reserve of Camargue. Rev. D Ecol. -La Terre et La Vie127–141.
haklee, J.B., Allendorf, F.W., Morizot, D.C., Whitt, G.S., 19Gene nomenclature for protein-coding loci in fish. T. Am. FSoc. 119, 2–15.
koog, D.A., 1997. In: Cole, B. (Ed.), Principles of InstrumeAnalysis, fifth ed. Florence, USA.
okal, R.R., Rohlf, F.J., 1997. Biometry, the Principles and Praof Statistics in Biological Research. W.H. Freeman and Cpany, New York.

114 G.E. Maes et al. / Aquatic Toxicology 73 (2005) 99–114
Stanton, M.L., Roy, B.A., Thiede, D.A., 2000. Evolution in stress-ful environments. I. Phenotypic variability, phenotypic selection,and response to selection in five distinct environmental stresses.Evolution 54, 93–111.
StatSoft, Inc., 2001. STATISTICA (data analysis software system),version 6.www.statsoft.com.
Tesch, F.W., 1977. The Eel, Biology and Management of Anguillideels. Chapman & Hall, London.
Theodorakis, C.W., Bickham, J.W., Lamb, T., Medica, P.A., Lyne,T.B., 2001. Integration of genotoxicity and population geneticanalyses in kangaroo rats (Dipodomys merriami) exposed to ra-dionuclide contamination at the Nevada test site, USA. Environ.Toxicol. Chem. 20, 317–326.
Thorpe, J.E., Koonce, J.F., Borgeson, D., Henderson, B., Lamsa,A., Maitland, P.S., Ross, M.A., Simon, R.C., Walters, C., 1981.Assessing and managing mans impact on fish genetic resources.Can. J. Fish. Aquat. Sci. 38, 1899–1907.
Van Der Oost, R., Beyer, J., Vermeulen, N.P.E., 2003. Fish bioac-cumulation and biomarkers in environmental risk assessment: areview. Environ. Toxicol. Pharmacol. 13, 57–149.
Van Ginneken, V.J.T., Van den Thillart, G.E.E.J.M., 2000. Eelfat stores are enough to reach the Sargasso. Nature 403 (67),156–157.
Van Straalen, N.M., 1999. Genetic biodiversity in toxicant-stressedpopulations. Prog. Environ. Sci. 1, 195–201.
Van Straalen, N.M., Kammenga, J.E., 1998. Assessment of ecotox-icity at the population level using demographic parameters. In:Schuurmann, G., Markert, B. (Eds.), Ecotoxicology. John Wiley& Sons, Inc. and Spektrum Akademischer Verlag, pp. 621–644.
Van Straalen, N.M., Timmermans, M.J.T.N., 2002. Genetic variationin toxicant-stressed populations: an evaluation of the “geneticerosion” hypothesis. Hum. Ecol. Risk Assess. 8, 983–1002.
Wirth, T., Bernatchez, L., 2001. Genetic evidence against panmixiain the European eel. Nature 409, 1037–1040.


![Anguilla anguilla L. Biochemical and Genotoxic Responses to Benzo[ a]pyrene](https://static.fdokumen.com/doc/165x107/631d4597f26ecf94330a787a/anguilla-anguilla-l-biochemical-and-genotoxic-responses-to-benzo-apyrene.jpg)