2D waveform tomography applied to long-streamer MCS data from the Scotian Slope
Upload
khangminh22Category
view
1download
0
Knowl. Manag. Aquat. Ecosyst. 2020, 421, 42© G. Pottier et al., Published by EDP Sciences 2020https://doi.org/10.1051/kmae/2020034
Knowledge &Management ofAquaticEcosystems
www.kmae-journal.orgJournal fully supported by Officefrançais de la biodiversité
RESEARCH PAPER
Electrofishing eel, salmon and trout: impact of waveformand frequency on capture-per-unit-effort and spinal damage
Gaétan Pottier1,2,3,*, Marie Nevoux2,4 and Frédéric Marchand1,2
1 Ecologie et Ecotoxicologie Aquatique, INRAE, Rennes, France2 Management of Diadromous Fish in their Environment, OFB, INRAE, Agrocampus Ouest, Univ Pau Pays Adour, Rennes, France3 Hydréco Guyane, Laboratoire Environnement de Petit Saut, Kourou, France4 Ecology and Ecosystem Health, INRAE, Agrocampus Ouest, Rennes, France
Received: 29 July 2020 / Accepted: 31 October 2020
*Correspon
This is an Opendistribution,
Abstract – Performing fish survey protocols with different electrofishing equipment and settings canlead to difficulties in comparing the data obtained. In this study, we captured two fish taxa (i.e. theEuropean eel and salmonids: Atlantic salmon and brown trout) in the field using four models ofelectrofishers that provided different waveforms: direct current (DC), pulsed direct current (PDC) andpulsed exponential current (PEC). This study aimed to assess effects of using different waveforms andfrequencies, while considering environmental variables, on i) attraction, represented by occurrence andcatch-per-unit-effort (CPUE) of fishes, and ii) spinal damage, based on ultrasound of the spinal column.For all species, DC and PDC yielded equivalent occurrences and CPUEs, regardless of the frequency. Incontrast, PEC induced a significant decrease in occurrences and CPUEs of both eels and salmonids. Thepercentage of injured fishes increased as the frequency or length of the salmonids increased whilewaveform had no effect. Ultrasound was determined to be a good non-invasive method to detectinjuries in fishes.
Keywords: Electrofishing / waveform / current frequency / catch-per-unit-effort / spinal damage
Résumé – Pêche électrique d’anguilles, de saumons et de truites : impact de la forme du courant etde la fréquence sur la capture-par-unité-d’effort et les dommages vertébraux. La réalisation deprotocoles de suivi de poissons avec différents équipements de pêche électrique et différents réglages peutentrainer des difficultés pour comparer les données obtenues. Dans cette étude, nous avons capturé deuxtaxons de poissons (c.-à-d. l’anguille européenne et les salmonidés : le saumon Atlantique et la truite fario)sur le terrain à l’aide de quatre modèles d’engins de pêche électrique qui fournissaient différentes formes decourant : le courant continu (DC), le courant continu pulsé (PDC) et le courant pulsé exponentiel (PEC).Cette étude visait à évaluer les effets de l’utilisation de différentes formes de courant et fréquences, tout entenant compte des variables environnementales, sur i) l’attraction, représentée par l’occurrence et la capture-par-unité-d’effort (CPUE) des poissons, et ii) les dommages vertébraux, sur la base de l’échographie de lacolonne vertébrale. Pour toutes les espèces, le DC et le PDC ont donné des occurrences et des CPUEséquivalentes, quelle que soit la fréquence. En revanche, le PEC a induit une diminution significative desoccurrences et des CPUEs des anguilles et des salmonidés. Le pourcentage de poissons blessés augmentait àmesure que la fréquence ou la longueur des salmonidés augmentait, tandis que la forme du courant n’avaitaucun effet. L’échographie s’est avérée être une bonne méthode non invasive pour détecter les blessureschez les poissons.
Mots clés : Pêche électrique / forme de courant / fréquence du courant / capture-par-unité-d’effort /dommage vertébral
ding author: [email protected]
Access article distributed under the terms of the Creative Commons Attribution License CC-BY-ND (https://creativecommons.org/licenses/by-nd/4.0/), which permits unrestricted use,and reproduction in any medium, provided the original work is properly cited. If you remix, transform, or build upon the material, you may not distribute the modified material.
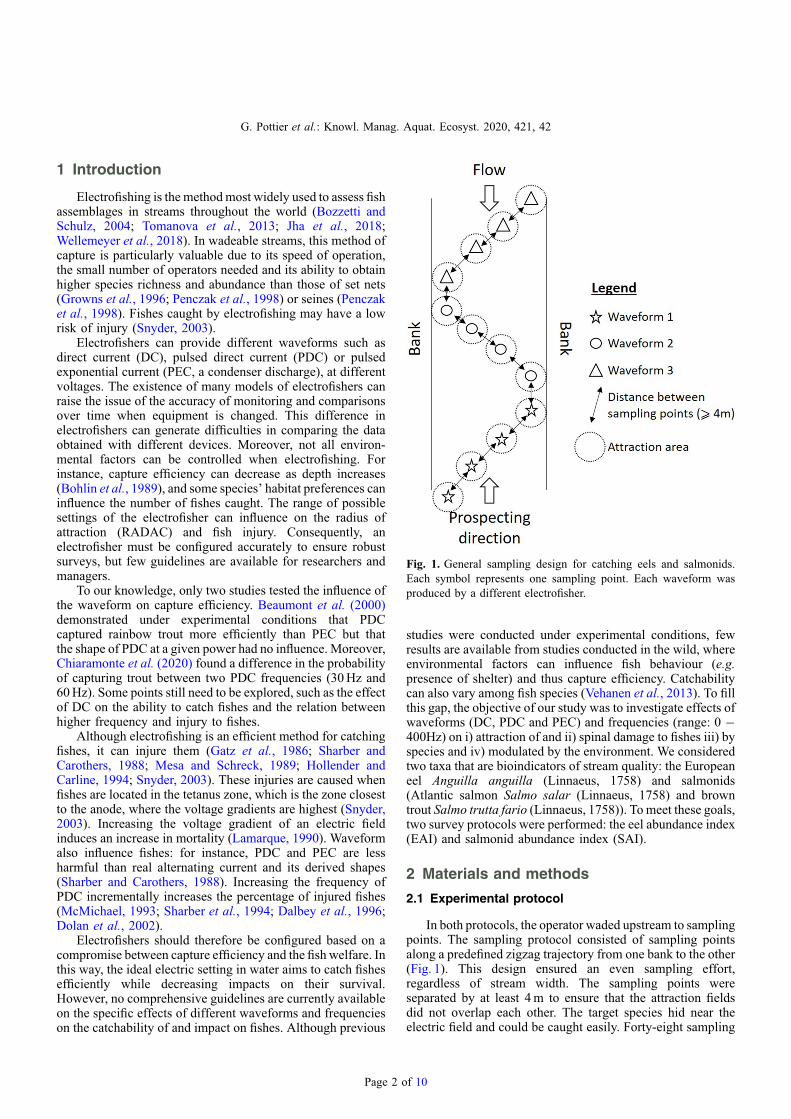
Fig. 1. General sampling design for catching eels and salmonids.Each symbol represents one sampling point. Each waveform wasproduced by a different electrofisher.
G. Pottier et al.: Knowl. Manag. Aquat. Ecosyst. 2020, 421, 42
1 Introduction
Electrofishing is the methodmost widely used to assess fishassemblages in streams throughout the world (Bozzetti andSchulz, 2004; Tomanova et al., 2013; Jha et al., 2018;Wellemeyer et al., 2018). In wadeable streams, this method ofcapture is particularly valuable due to its speed of operation,the small number of operators needed and its ability to obtainhigher species richness and abundance than those of set nets(Growns et al., 1996; Penczak et al., 1998) or seines (Penczaket al., 1998). Fishes caught by electrofishing may have a lowrisk of injury (Snyder, 2003).
Electrofishers can provide different waveforms such asdirect current (DC), pulsed direct current (PDC) or pulsedexponential current (PEC, a condenser discharge), at differentvoltages. The existence of many models of electrofishers canraise the issue of the accuracy of monitoring and comparisonsover time when equipment is changed. This difference inelectrofishers can generate difficulties in comparing the dataobtained with different devices. Moreover, not all environ-mental factors can be controlled when electrofishing. Forinstance, capture efficiency can decrease as depth increases(Bohlin et al., 1989), and some species’ habitat preferences caninfluence the number of fishes caught. The range of possiblesettings of the electrofisher can influence on the radius ofattraction (RADAC) and fish injury. Consequently, anelectrofisher must be configured accurately to ensure robustsurveys, but few guidelines are available for researchers andmanagers.
To our knowledge, only two studies tested the influence ofthe waveform on capture efficiency. Beaumont et al. (2000)demonstrated under experimental conditions that PDCcaptured rainbow trout more efficiently than PEC but thatthe shape of PDC at a given power had no influence. Moreover,Chiaramonte et al. (2020) found a difference in the probabilityof capturing trout between two PDC frequencies (30Hz and60Hz). Some points still need to be explored, such as the effectof DC on the ability to catch fishes and the relation betweenhigher frequency and injury to fishes.
Although electrofishing is an efficient method for catchingfishes, it can injure them (Gatz et al., 1986; Sharber andCarothers, 1988; Mesa and Schreck, 1989; Hollender andCarline, 1994; Snyder, 2003). These injuries are caused whenfishes are located in the tetanus zone, which is the zone closestto the anode, where the voltage gradients are highest (Snyder,2003). Increasing the voltage gradient of an electric fieldinduces an increase in mortality (Lamarque, 1990). Waveformalso influence fishes: for instance, PDC and PEC are lessharmful than real alternating current and its derived shapes(Sharber and Carothers, 1988). Increasing the frequency ofPDC incrementally increases the percentage of injured fishes(McMichael, 1993; Sharber et al., 1994; Dalbey et al., 1996;Dolan et al., 2002).
Electrofishers should therefore be configured based on acompromise between capture efficiency and the fish welfare. Inthis way, the ideal electric setting in water aims to catch fishesefficiently while decreasing impacts on their survival.However, no comprehensive guidelines are currently availableon the specific effects of different waveforms and frequencieson the catchability of and impact on fishes. Although previous
Page 2 o
studies were conducted under experimental conditions, fewresults are available from studies conducted in the wild, whereenvironmental factors can influence fish behaviour (e.g.presence of shelter) and thus capture efficiency. Catchabilitycan also vary among fish species (Vehanen et al., 2013). To fillthis gap, the objective of our study was to investigate effects ofwaveforms (DC, PDC and PEC) and frequencies (range: 0 �400Hz) on i) attraction of and ii) spinal damage to fishes iii) byspecies and iv) modulated by the environment. We consideredtwo taxa that are bioindicators of stream quality: the Europeaneel Anguilla anguilla (Linnaeus, 1758) and salmonids(Atlantic salmon Salmo salar (Linnaeus, 1758) and browntrout Salmo trutta fario (Linnaeus, 1758)). To meet these goals,two survey protocols were performed: the eel abundance index(EAI) and salmonid abundance index (SAI).
2 Materials and methods
2.1 Experimental protocol
In both protocols, the operator waded upstream to samplingpoints. The sampling protocol consisted of sampling pointsalong a predefined zigzag trajectory from one bank to the other(Fig. 1). This design ensured an even sampling effort,regardless of stream width. The sampling points wereseparated by at least 4m to ensure that the attraction fieldsdid not overlap each other. The target species hid near theelectric field and could be caught easily. Forty-eight sampling
f 10

Tab
le1.
Description
ofthehabitatsforthe
48samplingpo
intsof
each
combination
ofprotocolandwaveform.F
ormacroph
ytes,the
percentage
indicatesthepercentage
ofcover-abun
dance.
(0/1):absence/presence.Valuesin
brackets:standard
error.
Protocol
Waveforms
Facies
Macroph
ytes
(0:0%
;1:
<50
%;2:
>50
%)
Helop
hytes(0/1)
Woo
dydebris(0/1)
Roo
ts(0/1)
Blocks(0/1)
Riparianvegetation
(0/1)
Meandepth(cm)
Riffles
Flats
01
20
10
10
10
10
1
EAI
DC
1929
2121
646
248
047
145
337
1141
.3(1.5)
PEC-20H
z20
2820
217
480
480
462
462
426
42.2
(1.3)
PDC-20H
z23
2523
187
462
480
462
453
399
41.7
(1.7)
PDC-400
Hz
1929
2516
748
048
047
145
340
845
.5(1.8)
SAI-20
15
DC
1236
396
348
044
440
848
04
4422
.4(1.1)
PEC-40H
z12
3632
115
480
462
408
480
642
23.6
(1.3)
PDC-40H
z24
2430
108
480
462
435
480
1038
22.5
(1.8)
PDC-100
Hz
2325
3011
748
047
141
748
04
4420
.1(1.4)
SAI-20
17
DC
2919
3113
448
048
032
1643
516
3216
.5(1.2)
PDC-50H
z29
1928
182
480
480
2820
462
1335
14.3
(1.3)
PDC-100
Hz
2820
3511
248
048
027
2145
314
3416
.1(1.1)
PDC-400
Hz
2622
397
248
047
125
2345
316
3216
.0(1.2)
G. Pottier et al.: Knowl. Manag. Aquat. Ecosyst. 2020, 421, 42
points were used per waveform. The waveforms were emittedin the stream, each at four consecutive sampling points, in arandom order by a given electrofishers: waveform 1 wasemitted at four points by operator A, then waveform 2 wasemitted at four points by operator B, etc. (Fig.1). Because eachoperator had his/her own fishing behaviour, which could havebiased the results, the four operators exchanged electrofishersevery 12 sampling points per waveform. In the first rotation,waveform 1 was emitted at four points by operator B, thenwaveform 2 was emitted at four points by operator C, etc. Ineach EAI and SAI, the two net carriers remained unchanged forall sampling points to maintain a constant fishing effort.
At each sampling point, all fishes seen were caught. For theEAI, the survey was performed out by emitting electricity intothe water at each sampling point for 30 seconds (measuredwith a stopwatch). For the SAI, the sampling points consistedof transects 2m long with electricity emitted into the water for8 seconds. This design yielded in comparable sampling points(i.e. a similar effort for each protocol). Each fish was identifiedto the species level and measured (fork length for salmonidsand total length for eels).
2.2 Study sites
Each protocol was performed on a different day in onewadeable section of a river (depth <60 cm). Habitat wasdescribed (visual estimation and depth measurement) at eachsampling point after passage of the anode to include it as apotential factor that influenced the results. Environmentalvariables of the habitats varied among combinations ofprotocol and waveform (Tab. 1). The EAI protocol wasperformed in the Odet River in north-western France(47° 59044.700N 4°05020.100W) in June 2016. The ambientconductivity of the water was 145mS cm−1. Mean stream widthwas 15.3m. Two SAIs were performed in 2015 (SAI-2015) and2017 (SAI-2017), respectively.BothSAIswere performed in theOir River in north-western France (48°38017.000N 1°11006.600W)inSeptember.Theambientconductivityof thewaterwas184and207mS cm−1 for SAI-2015 and SAI-2017, respectively. Meanstream width was 3.4m.
2.3 Selection and adjustment of waveforms
Four backpack electrofishers were used to produce thewaveforms (Fig. 2) and frequencies. The DC was produced bya Hans Grassl ELT60II, PEC (induced by discharging acapacitor with a capacity of 4mF, with the pulse widthdepending on the conductivity) was produced by an IMEOVolta and PDC was produced by a Smith-Root LR-24 and aDream Electronique Martin-Pêcheur (Tab. 2). The pulse width(i.e. how long the signal exceeds 0V) was measured with anoscilloscope (Industrial Scopemeter Fluke®).
For the EAI, pulsed currents were set at the optimalfrequency (20Hz) to catch eels, based on the protocoldeveloped by Halsband (1968). However, 400Hz is also anoptimal frequency according to Gosset et al. (1971). As theMartin-Pêcheur can be adjusted only through battery power, itwas set to 50% of the battery power and a frequency of 400Hz,which are usual typical settings for the EAI protocol (Germis,2016).
Page 3 of 10

Fig. 2. Waveforms (diagram and field picture) used in this study(dotted lines). DC: direct current. PDC: pulsed direct current. PEC:pulsed exponential current. U: voltage. t: time.
G. Pottier et al.: Knowl. Manag. Aquat. Ecosyst. 2020, 421, 42
During the SAIs, multiple frequencies were used to assesseffects of a complete range of frequencies on the attraction ofand the impact on fish. For SAI-2015, the pulsed currents wereset at a recommended frequency (40Hz) to catch salmonids(10−60Hz; Beaumont, 2011). Again the Martin-Pêcheur wasadjusted to 50% of the battery power, which is the usual settingfor the abundance salmons index protocol (Prévost andBaglinière, 1995). Its frequency was set at 100Hz (whichattracted trout the most, according to Lamarque, 1968). ForSAI-2017, the frequency of LR-24 was set at 50Hz, which isan intermediate frequency for catching salmonids. Thefrequencies of two Martin-Pêcheurs were set at 100Hz and400Hz to assess whether results differed at high frequencies.
When electrofishing, the easiest way to determine theattraction of the electric field is to assess the theoreticalRADAC around the anode with the following voltage gradient:0.1V cm−1. This value is the theoretical detection threshold ofattraction for DC and PDC for conductivity in the range of100−10,000mS cm−1 (Cuinat, 1968; Kolz and Reynolds, 1989;Lamarque, 1968; Snyder, 2003). For all of the protocols, thevoltage was adjusted to create an equal RADAC (i.e. the samevoltage gradient of 0.1V cm�1 from the edge of the anode)(Tab. 2). The RADAC was adjusted as a function of the usualsettings of the Martin-Pêcheur. The voltage gradient wasmeasured using a “penny” probe (term defined by Beaumont(2011)) connected to an oscilloscope (Industrial ScopemeterFluke®). Because of the uncontrollable environment and thedifficulty in maintaining a constant voltage gradient in anatural environment, and because propagation of the voltagegradient depends on the duty cycle (Pottier et al., 2020),RADAC was measured four times for each waveform (Tab. 2).
Page 4 o
Voltage was adjusted to match the RADAC of the Martin-Pêcheur (Tab. 2) throughout the survey. The power densityassociated with the RADAC was then calculated according toKolz (1989). All electrofishers had the same anode diameter(35 cm) to remove bias caused by operation.
2.4 Catch-per-unit-effort
The catch-per-unit-effort (CPUE) indicated attraction tothe anode, fish abundance and capture efficiency and whetherthey were influenced by environmental variables, the wave-forms or frequency. For the EAI and SAI protocols, CPUE wasexpressed as the number of individuals per 30 or 8 seconds,respectively, of emitting of electricity into the water.
2.5 Damage quantification
To analyse internal damage, sub-samples of fishes fromeach waveform tested were haphazardly selected (to attempt toavoid bias) for examination. Fifty-five (18.5%) of the 297 eelscaught and 585 (89.6%) of the 653 salmonids caught wereexamined. Spinal injuries were visualized using an ultrasoundsystem (Sonosite M-Turbo) with a 10-5Mhz transducer. Thisequipment was portable, which allowed fishes to be scannedwithin minutes of capture. Spinal injuries consisted ofcompressed, misaligned or fractured vertebrae (Fig. 3). Injuredfishes were noted. Only spinal injuries were recorded becausethe ultrasound system is non-invasive, which allowed theoperators to release fishes alive.
2.6 Statistical analysis
Generalised linear models (GLMs) were built to test effectsof the waveform, frequency, environmental variables andlength of fishes on the CPUE and the occurrence of injuredfishes. For data analysis, DC was considered as PDC with afrequency of 0Hz.
For the CPUE data, the delta method (Maunder and Punt,2004) was applied to address the large number of zero catches.First, we modelled the probability of obtaining a non-zerocatch. The occurrence of fishes (presence/absence) wasmodelled using a GLM with a binomial distribution of error(link: logit). The predictors were the environmental variables,waveform, frequency and operator. For the SAIs, because thedata consisted of two species and two years of sampling, theproportion of salmon and the year (nested effect with powerdensity) were added as predictors.
Second, we modelled the catch rate within non-null CPUEsampling points. The variation in CPUE was analysed as afunction of a set of predictors using a GLM that included aPoisson distribution error (link: log). The predictors were theenvironmental variables, waveform, frequency, mean fishlength per sampling point and operator. For the SAIs only, theproportion of salmon and the year were also added aspredictors.
For the SAIs, the occurrence of injured fishes was analysedusing a GLM with a binomial distribution of error (link: logit).Because of the small number of injured fishes, degrees ofspinal damage were not differentiated. The predictors were theenvironmental variables, frequency, power density, fish length,
f 10

Tab
le2.
Setting
sof
theelectrofi
shers(associatedwithwaveform
codes)du
ring
applicationof
theEelAbu
ndance
Index(EAI)andSalmon
idAbu
ndance
Index(SAI-20
15andSAI-20
17)
protocols,withtheradius
ofattraction
(RADAC)itsassociated
power
density.
For
theRADAC,four
measurements
weretaken.
Valuesin
brackets:standard
error.
Protocol
Waveformscode
Eng
ine
Catho
dedimension
sAno
dedimension
sWaveforms
Frequ
ency
(Hz)
Pulse
width
(ms)
Peak
voltage
atthe
anod
e(V
)
RADAC
(cm)
Pow
erdensity
(mW.cm
�3)
EAI
PDC-0Hz
HansGrassl®
ELT
60II
GI
Hon
daGXV50
(130
0W)
Length:
150cm
,width:
2.5cm
,thickn
ess:
0.3cm
diam
eter:35
cm;gaug
e:
0.6cm
DC
n/a
n/a
228
174(1)
1.45
PEC-20H
zIm
eo®Volta
(80W)
Length:
120cm
,diam
eter:0.5cm
diam
eter:35
cm;gaug
e:
1.6cm
PEC
202.25
139
187(1)
1.45
PDC-20H
zSmithRoo
t®LR-24
(400
W)
Length:
110cm
,diam
eter:0.5cm
diam
eter:35
cm;gaug
e:
0.6cm
PDC
2012
.515
317
2(2)
1.45
PDC-400
Hz
Dream
Electroniqu
e®
Martin-Pêcheur
(240
W)
Length:
110cm
,diam
eter:0.5cm
diam
eter:35
cm;gaug
e:
1.6cm
PDC
400
0.48
194
184(8)
1.45
SAI-20
15
PDC-0Hz
HansGrassl®
ELT
60II
GI
Hon
daGXV50
(130
0W)
Length:
150cm
,width:2.5cm
,thickn
ess:
0.3cm
diam
eter:35
cm;gaug
e:
0.6cm
DC
n/a
n/a
215
150(0)
1.84
PEC-40H
zIm
eo®Volta
(80W)
Length:
120cm
,diam
eter:0.5cm
diam
eter:35
cm;gaug
e:
1.6cm
PEC
402.25
139
154(5)
1.84
PDC-40H
zSmithRoo
t®LR-24
(400
W)
Length:
110cm
,diam
eter:0.5cm
diam
eter:35
cm;gaug
e:
0.6cm
PDC
406.25
153
148(2)
1.84
PDC-100
Hz
Dream
Electroniqu
e®
Martin-Pêcheur
(240
W)
4braids
(length:
85cm
,width:1cm
,tickness:0,3cm
)
diam
eter:35
cm;gaug
e:
1.6cm
PDC
100
0.40
160
160(5)
1.84
SAI-20
17
PDC-0Hz
HansGrassl®
ELT
60II
GI
Hon
daGXV50
(130
0W)
Length:
150cm
,width:2.5cm
,thickn
ess:
0.3cm
diam
eter:35
cm;gaug
e:
0.6cm
DC
n/a
n/a
190
174(5)
2.07
PDC-50H
zSmithRoo
t®LR-24
(400
W)
Length:
110cm
,diam
eter:0.5cm
diam
eter:35
cm;gaug
e:
0.6cm
PDC
5025
178
188(7)
2.07
PDC-100
Hz
Dream
Electroniqu
e®
Martin-Pêcheur
(240
W)
4braids
(length:
85cm
,width:1cm
,tickness:
0,3cm
)
diam
eter:35
cm;gaug
e:
1.6cm
PDC
100
10.70
213
204(6)
2.07
PDC-400
Hz
Dream
Electroniqu
e®
Martin-Pêcheur
(240
W)
4braids
(length:
85cm
,width:1cm
,tickness:
0,3cm
)
diam
eter:35
cm;gaug
e:
1.6cm
PDC
400
12.70
213
192(6)
2.07
Page 5 of 10
G. Pottier et al.: Knowl. Manag. Aquat. Ecosyst. 2020, 421, 42

Fig. 3. Ultrasound image of a spinal column of a brown trout. Thearrow indicates misalignment of the spinal column. The fish is placedon its left flank, with the head on its left side of the image.
Table 3. Modelling the (A) occurrence and (B) non-null CPUE ofEuropean eels using the Eel Abundance Index protocol, as a functionof environmental variables and waveforms. N: 192. With Cohen’seffect: 0.2; statistical power: 1.
(A) Estimate StandardError
Z value P value
Intercept 4.29 0.909 4.71 <0.001
Depth −0.068 0.019 −3.60 <0.001PEC waveform −3.92 0.59 −6.70 <0.001
(B) Estimate StandardError
Z value P value
Intercept 1.84 0.21 8.67 <0.001Riparian vegetation −0.34 0.16 −2.08 0.04Depth −0.020 0.0053 −3.88 <0.001PEC waveform −1.07 0.50 −2.13 0.03
Fig. 4. Estimates of the (A) occurrence and (B) non-null catch-per-unit-effort of eels by waveform and frequency. Results are means ± 1SD. N: 192. With Cohen’s effect: 0.2; statistical power: 1.
Table 4. Modelling the (A) occurrence of salmonids and (B) the non-null CPUE of salmonids, using the Salmonids Abundance Indexprotocol, as a function of environmental variables and waveforms.N: 384. With Cohen’s effect: 0.2; statistical power: 1.
(A) Estimate StandardError
Z value P value
Intercept 0.011 0.25 0.05 0.96
Roots 0.96 0.29 3.36 <0.001Depth 0.035 0.013 2.72 <0.01PEC waveform −1.73 0.35 −4.91 <0.001
(B) Estimate StandardError
Z value P value
Intercept 0.42 0.13 3.38 <0.001Roots 0.20 0.085 2.35 0.02Depth 0.015 0.0042 3.47 <0.001PEC waveform −0.51 0.23 −2.20 0.03Year 2017 0.29 0.097 2.99 <0.01
G. Pottier et al.: Knowl. Manag. Aquat. Ecosyst. 2020, 421, 42
species, operator and year. We did not perform this analysis forthe EAI survey because of the low percentage of eels examinedwith ultrasound and the low occurrence of injuries detectedwithin this subsample. The EAI data are presented only forinformation.
For each model, we used stepwise backward elimination toidentify the significant predictors: analysis of variance of thesemodels was performed, starting with the most complex model,and predictors were removed until only significant (p value<0.05) ones were left. Residuals were verified using Q–Q plotsand binned residual plots (Gelman and Yu-Sung, 2018). Datawere analysed using R software v.3.3.2 (R Development CoreTeam, 2011).
3 Results
3.1 Catch-per-unit-effort
During the EAI, 297 eels were caught. Eel occurrencedecreased significantly as water depth increased (Tab. 3A).Waveform influence CPUE significantly (Tab. 3). PECdetected significantly fewer fishes (by a factor of 8–10) thanother waveforms (Fig. 4A). Moreover, non-null CPUEdecreased as depth increased, when the vegetation was presentand when using PEC (Tab. 3B). The CPUE was higher inshallow habitats, but PEC was less efficient at capturing fishesregardless of the habitat (Fig. 4B).
Page 6 o
During SAI-2015, 192 brown trout and 172 Atlanticsalmon were caught using the two waveforms and fourfrequencies. During SAI-2017, 130 brown trout and 298Atlantic salmon were caught using one waveform and fourfrequencies. Waveform influenced CPUE significantly(Tab. 4). The occurrence of salmonids decreased when usingPEC, when roots were absent and as depth decreased (Tab. 4A,Fig. 5A). With PEC, 50% fewer fish occurrences were detectedthan with the other waveforms. Moreover, non-null CPUEdecreased in 2015 when using PEC, when roots were absent,and as depth decreased (Tab. 4B, Fig. 5B). With PEC, CPUEwas 50% lower than those with the other waveforms. Theeffect of year was nested with that of power density. There wasa year and/or density effect on the non-null CPUE but not on
f 10

Fig. 5. Estimates of the (A) occurrence and (B) non-null catch-per-unit-effort of salmonids by waveform and frequency. Results aremeans ± 1 SD. N: 384. With Cohen’s effect: 0.2; statistical power: 1.
Table 5. Modelling the occurrence of spinal damage in salmonids asa function of biological and environmental variables and frequency.N: 585. With Cohen’s effect: 0.2; statistical power: 1.
Estimate Standard Error Z value P value
Intercept –4.13 0.41 –10.15 <0.001
Roots 0.84 0.30 2.80 <0.01Frequency 0.0030 0.00091 3.31 <0.001Fork length 0.011 0.0028 3.98 <0.001
Fig. 6. Estimated percentage of spinal damage in salmonids byfrequency. Fork length was fixed at 89mm (the mean) and theoccurrence of roots was fixed at 0.44 (the mean). Grey bands: ± 95%confidence interval of the frequency effect. A frequency of 0Hzcorresponded to DC. N: 585. With Cohen’s effect: 0.2; statisticalpower: 1.
G. Pottier et al.: Knowl. Manag. Aquat. Ecosyst. 2020, 421, 42
the occurrence of salmonids (Tab. 4B). Indeed, more fisheswere caught in 2017, when the power density was higher thanin 2015.
3.2 Physical damages
No direct mortality was observed in any of the protocols.Concerning the EAI, 1 eel of 23 (4.3%), 1 eel of 9 (11.1%),2 eels of 22 (9.1%) and 0 of 1 (0%) eels showed evidence ofspinal damage when caught with DC, PDC-20Hz, PDC-400Hzand PEC-20Hz, respectively.
For both SAI-2015 and SAI-2017, 57 of 585 (9.7%)salmonids showed evidence of spinal damage. The percentageof spinal injuries increased significantly when roots werepresent and as frequency and fork length increased (Tab. 5;Fig. 6).
4 Discussion
This study compared in the field the attraction and impactof different waveforms and frequencies on fishes whenelectrofishing. To compare effects of different waveforms onthe attraction or impact of an electric field on fishes, Lamarque(1990) recommended using DC as a standard. Becauseproducing DC with a battery in the field is challenging
Page 7 o
because it requires a large amount of power, several studies didnot consider DC. In the present study, the backpack electro-fishers that produce pulsed currents were powered by a battery,while the one that produced DC was powered by a petrol-powered generator. We were thus able to compare a wide rangeof frequencies (0−400Hz) using DC as a standard.
In the present study, although the output voltage at theanode remained constant while fishing, the RADAC may havevaried slightly (Tab. 2). The type of substrate can influencepropagation of the electric field from the anode (Scholten,2003; Pottier, 2017). Side effects (e.g. surface tension,variability in the topography of the riverbed and bank) canalso alter the pattern of equipotential lines (Novotny andPriegel, 1974; Beaumont et al., 2005). The power transferredinto fishes (Kolz, 1989) was not estimated because the debatebetween using DC or a pulsed current still contains contra-dictions (Henry and Grizzle, 2006). Likewise, the conductivityof most freshwater fish species is not known well enough toresolve this debate completely. Furthermore, in situ, dispersionof the electric field in the water depends on the duty cycle(Pottier et al., 2020), which makes the power-transfer theorycomplicated to calculate when using PDC. However, in theambient conductivity range of 145–207mS cm−1, the presentstudy had the advantage of providing an equal RADACregardless of the frequency of PDC (considering that 0Hz isDC) or the anode and cathode on the electrofisher (Pottieret al., 2020). Because equal RADACs yielded the samesampling effort, they allowed for replicability and comparisonof different waveforms and frequencies among samplingpoints.
The type of waveform significantly influenced fishoccurrence and non-null CPUE at the sampling points forthe European eel and salmonids (Atlantic salmon and browntrout). When performing the EAI and the SAI protocols,
f 10

G. Pottier et al.: Knowl. Manag. Aquat. Ecosyst. 2020, 421, 42
DC and the different frequencies of PDC obtained the sameoccurrences of fishes and non-null CPUEs, which were higherthan those obtained by PEC. These results agree with thoseobtained under experimental conditions by Beaumont et al.(2000), who found that PEC captured rainbow trout lessefficiently than other forms of pulsed currents. Using DC as areference, the present study confirmed this trend in the fieldand for species with different morphologies. Lamarque et al.(1975) theorized that there is a “useful time” for applyingcurrent to induce a reaction in fishes. Using a low duty cycle(i.e. the percentage of a period during which the signal exceeds0V) means that the power emitted into the water and thentransferred into fishes may be too low to trigger an anodiccurve, which forces fishes to swim towards the anode. Themathematical integral of the PEC pattern may be insufficient toexcite spinal nerves, which may explain why the PEC, with arapid discharge, did not attract fishes. For instance, for SAI-2015, the discharge time of the PEC-40Hz was 2ms, whichwould correspond to a duty cycle of 8% for a PDC pattern.In comparison, that of PDC-100Hz was estimated at 6.2% andthat of PDC-40Hz at 25%. Voltage decreases during a PECdischarge, however, so the voltage gradient in the water isprobably not sufficient (less than 0.1V cm�1) to induce aneuromuscular reaction in fishes. During depletion captures,Chiaramonte et al. (2020) found greater capture efficiencywhen they electrofished salmonids with a PDC-60Hz than aPDC-30Hz. This suggests that frequency can influence results(estimation of abundance and capture efficiency with thecontinual application of electricity) when using depletionsampling, but not, according the present study, when usingsampling points (CPUE with a discrete application ofelectricity).
For both the EAI and SAIs, environmental variablesinfluenced the CPUE. For the EAI, the occurrence and non-nullCPUE decreased as depth increased. Depth is usuallymentioned as a limiting factor when electrofishing (Bohlinet al., 1989; Beaumont, 2011). When depth increases, fishescan escape from the sight of operators or the attraction fieldmore easily, which decreases capture efficiency. For the EAI,the presence of riparian vegetation decreased CPUE, which isconsistent with results of Laffaille et al. (2003), who found thatsmall eels (<450mm long) generally avoided riparian cover.For the SAIs, greater depth and the presence of roots increasedCPUE. Both can shelter salmonids (Armstrong et al., 2003),which explain the greater number of fishes observed in thismicrohabitat.
In this study, fishes were released into their naturalenvironment instead of being necropsied. If a haemorrhageoccurred, the visual contrast between blood and coelomicliquid could not have been perceived by ultrasound, especiallybecause many fishes have small coeloms (due to their smallsize). As a result, although ultrasound could properly identifyonly spinal injuries, it was determined to be an effective toolfor doing so. It should not be forgotten, however, that captureand manipulation can also cause spinal damage. Beaumontet al. (2000) demonstrated that brown trout exposed to PEC orPDC showed no difference in their plasma concentration ofcortisol (a stress hormone). In contrast to their study,ultrasound in the present study revealed an effect of the typeof waveform on spinal injuries in fishes. The present studysuggests that ultrasound is a less invasive method to detect
Page 8 o
injuries in fishes than necropsy or assessing plasma cortisolconcentrations.
Sharber and Carothers (1988) found 44%, 44% and 67% ofrainbow trout with spinal injuries (detected with X-rays) whencaught with PEC, PDC or quarter sinusoidal current,respectively (all of which peaked at 260V). In comparison,the percentage of injured individuals in the present study wasapproximately half that observed by Sharber and Carothers(1988). The risk of injury increases if fishes remain in theelectric field too long (Snyder, 2003). The unknown time ofexposure and longer total fish length (mean of 320mm) in thestudy of Sharber and Carothers (1988) may explain that study’slarger percentage of spinal injuries. In the present study, allsampling points had the same duration for each protocol (30and 8 seconds for EAI and SAIs respectively).
Several studies agree that increasing the frequencyincreases the percentage of injured fishes (McMichael,1993; Sharber et al., 1994; Dalbey et al., 1996; Dolanet al., 2002). The present study demonstrated that thepercentage of spinal injuries to salmonids was not influencedby the waveform, but did increase as frequency increased.A similar trend was observed for the eels, although it was notstatistically significant. This study highlights the influence offrequency while considering biological and environmentalvariables. Larger salmonids had a higher probability of beinginjured, which agrees with results of Dalbey et al. (1996), whofound that the incidence and severity of injury were positivelycorrelated with the length of rainbow trout. Indeed, when a fishis pointed towards the anode, the longer its fork length, themore it is subject to a strong voltage gradient. Furthermore, thepower densities used in this study did not influence thepercentage of injured fishes, which suggests that the voltagegradient through fishes is the main variable that influencesinjury. Thus, when electrofishing, it is imperative to quicklycatch large fishes with nets. Our results revealed that thepresence of roots also increased the percentage of injuredsalmonids. Indeed, fishes were larger in microhabitats withroots and thus, likely to have a higher probability of sufferingspinal damage. Consequently, special care must be taken whencatching fishes around roots. Because different environments(e.g.macrophytes, helophytes, woody debris and boulders) canshelter some fishes, we hypothesized that they might influenceCPUE and the percentage of injured fishes, but they did not.They were less present than roots or riparian vegetation, whichmay explain why their potential effects were not significant.
Although attraction remained the same for eels andsalmonids regardless of the frequency, increasing thefrequency increased the percentage of injured fishes. Byassessing the attraction and fish injury of survey protocols, thisstudy provides compelling evidence that setting an electro-fishing device requires a trade-off should between DC andPDC. This trade-off concerns the weight of a backpackelectrofisher: those that produce DC are usually heavier(ca.15 kg) but less harmful than those that produce PDC(ca. 10 kg).
Halsband (1968) suggested 20Hz and 80Hz as optimalfrequencies at which to fish for eel and trout, respectively,when using pulsed current (i.e. using the smallest amount ofenergy to tetanize fish). The present study showed thatfrequency did not influence CPUE. We thus recommend usingDC (0Hz) to obtain good capture efficiency while minimizing
f 10

G. Pottier et al.: Knowl. Manag. Aquat. Ecosyst. 2020, 421, 42
the impact on fish.When using DC is not possible, PDC shouldbe used, but at a low frequency. As increasing the frequencywas more harmful to fishes (significantly so for salmonids),frequencies should not reach or exceed 100Hz. Regardless ofintercalibration among electrofishers, PEC is not recom-mended because of its low attraction for fish. For longitudinalsurveys, the results show that electrofishers that produce DC orPDC (with of 0–400Hz) can be used interchangeably becausetheir influence on the CPUE of eels and salmonids should notdiffer.
Finally, this study involved separate sampling efforts foreels and salmonids, each optimized for the target species, afterwhich injuries were assessed. This sampling method impactsnot only the target species, but also fish communities. Becausespecies react differently when electrified (e.g. immobilizingsmaller species requires higher power densities to beimmobilized; Lutnesky et al., 2019), additional taxa need tobe evaluated to assess the overall impact of electrofishing onfish communities.
By comparing the efficiency and impact of differentwaveforms using sampling points in the field, this studyprovides recommendations for fine tuning electrofishingprotocols while considering biological and environmentalvariables. With the emergence of new waveforms such as theburst PDC (with two adjustable frequencies) and the long-termuse of electrofishing, it is important to continue to examine theuse of electricity by combining aspects of attraction and ofimpacts on fishes.
Acknowledgments. This study benefited from support from thePEARL platform of INRAE (1036, U3E), the ANR via the“Investments for the future” program, the National Infrastruc-ture in Health Biology “ANAEE-Services” (ANR-11-INBS-0001) and financial support from the OFB INRAE Gest’Aquapole. The experiments also resulted from collaboration in thefield between the INRAE (U3E, ESE), OFB, DepartmentalFisheries (departments 22, 29, 35, 44 and 56), environmentalassociations (BGM, LOGRAMI) and Agrocampus OuestRennes.
References
Armstrong JD, Kemp PS, Kennedy GJA, Ladle M, Milner NJ. 2003.Habitat requirements of Atlantic salmon and brown trout in riversand streams. Fish Res 62: 143–170.
Beaumont WRC. 2011. Electric fishing: a complete guide to theoryand practice, Game &Wildlife Conservation Trust, Wareham, 98 p.
Beaumont WRC, Lee MJ, Rouen MA. 2000. An evaluation of someelectrical waveforms and voltages used for electric fishing; withspecial reference to their use in backpack electric fishing gear.J Fish Biol 57: 433–444.
Beaumont WRC, Lee MJ, Peirson G. 2005. The equivalent resistanceand power requirements of electric fishing electrodes. Fish ManagEcol 12: 37–43.
Bohlin T, Hamrin S, Heggberget TG, Rasmussen G, Saltveit SJ. 1989.Electrofishing � Theory and practice with special emphasis onsalmonids. Hydrobiologia 173: 9–43.
Bozzetti M, Schulz UH. 2004. An index of biotic integrity based onfish assemblages for subtropical streams in southern Brazil.Hydrobiologia 529: 133–144.
Page 9 o
Chiaramonte LV, Meyer KA, Branigan PR, Reynolds JB. 2020.Effect of pulsed DC frequency on capture efficiency and spinalinjury of trout in small streams. North Am J Fish Manag 40:691–699.
Cuinat R. 1968. Contribution à l’étude de quelques paramètresphysiques dans la pêche électrique en courant continu, en rivière.Applications de l’électricité à la biologie et à l’aménagement despêches continentales. Symposium de Belgrade, mai 1966,Organisation des Nations Unies pour l’Alimentation etl’Agriculture. INRA, Paris, 145–180.
Dalbey SR, McMahon TE, Fredenberg W. 1996. Effect ofelectrofishing pulse shape and electrofishing-induced spinal injuryon long-term growth and survival of wild rainbow trout. North AmJ Fish Manag 16: 560–569.
Dolan CR, Miranda LE, Henry TB. 2002. Electrofishing for Crappies:Electrical Settings Influence Immobilization Efficiency, Injury, andMortality. North Am J Fish Manag 22: 1442–1451.
Gatz AJJ, Loar JM, Cada CF. 1986. Effects of repeated electro-shocking on instantaneous growth of trout. North Am J Fish Manag6: 176–182.
Gelman A, Yu-Sung S. 2018. Data Analysis Using Regression andMultilevel/Hierarchical Models. https://cran.r-project.org/web/packages/arm/arm.pdf (accessed July 25, 2018).
Germis G. 2016. Méthode de pêche électrique par échantillonnagepar point au Martin-Pêcheur “Indice d’Abondance Anguille”.Protocole 2009 actualisé avril 2016. Bretagne Grands Migrateurs.
Gosset C, Lamarque P, Charlon N, Garaïcoechea C. 1971. Un nouvelappareil de péche électrique portable: le “Martin-Pêcheur.” Bull FrPiscic 242: 34–46.
Growns IO, Pollard DA, Harris JH. 1996. A comparison of electricfishing and gillnetting to examine the effects of anthropogenicdisturbance on riverine fish communities. Fish Manag Ecol 3:13–24.
Halsband E. 1968. Principes fondamentaux de la pêche à l’électricité.Applications de l’électricité à la biologie et à l’aménagement despêches continentales. Symposium de Belgrade, mai 1966,Organisation des Nations Unies pour l’Alimentation etl’Agriculture. INRA, Paris, 79–85.
Henry TB, Grizzle JM. 2006. Electric-induced mortality of newlytransformed juvenile fishes in waters of different conductivity.J Fish Biol 68: 747–758.
Hollender BA, Carline RF. 1994. Injury to wild brook trout bybackpack electrofishing. North Am J Fish Manag 14: 643–649.
Jha BR, Gurung S, Khatri K, Gurung A, Thapa AKCM, Gurung B,Acharya S. 2018. Patterns of diversity and conservation status offreshwater fishes in the glacial fed and rain fed rivers of EasternNepal. Environ Biol Fishes 101: 1295–1305.
Kolz AL. 1989. A power transfer theory for electrofishing.Electrofishing, a power related phenomenon. Fish and WildlifeTechnical ReportUnited States Department of the Interior Fish andWildlife Service, Washington, D.C., U.S.A.
Kolz AL, Reynolds JB. 1989. Determination of power thresholdresponse curves. Fish Wildl Serv Tech Rep U S Dep Inter Fish WildlServ Wash DC USA 22: 15–24.
Laffaille P, Feunteun E, Baisez A, Robinet T, Acou A, Legault A, LekS. 2003. Spatial organisation of European eel (Anguilla anguilla L.)in a small catchment. Ecol Freshw Fish 12: 254–264.
Lamarque P. 1968. Electrophysiologie du poisson soumis à l’actiond’un champ électrique. Applications de l’électricité à la biologie età l’aménagement des pêches continentales. Symposium deBelgrade, mai 1966. Organisation des Nations Unies pourl’Alimentation et l’Agriculture. INRA, Paris. 87–110.
f 10

G. Pottier et al.: Knowl. Manag. Aquat. Ecosyst. 2020, 421, 42
Lamarque P. 1990. Electrophysiology of fish in electric field. Fishingwith electricity, applications in freshwater fisheries management,Oxford, England. 4–33.
Lamarque P, Therezien Y, Charlon N. 1975. Etude des conditions de lapêche à l’électricité dans les eaux tropicales. Bull Cent DétudesRech Sci Biarritz 10: 405–665.
Lutnesky MMF, Cradock KR, Reynolds JB. 2019. ImmobilizationThreshold and Fish Conductivity of Two Small Fishes. North AmJ Fish Manag 39: 788–792.
Maunder MN, Punt AE. 2004. Standardizing catch and effort data: areview of recent approaches. Fish Res 70: 141–159.
McMichael GA. 1993. Examination of Electrofishing Injury andShort-TermMortality in Hatchery Rainbow Trout. North Am J FishManag 13: 229–233.
Mesa MG, Schreck CB. 1989. Electrofishing mark-recapture anddepletion methodologies evoke behavioral and physiologicalchanges in cutthroat trout. Trans Am Fish Soc 118: 644–658.
Novotny DW, Priegel GR. 1974. Electrofishing boats: Improveddesigns and operational guidelines to increase the effectivenessofboom shockers. Technical Bulletin No. 73wisconsin Department ofNatural Resources.
Penczak T, Gomes LC, Bini LM, Agostinho AA. 1998. Theimportance of qualitative inventory sampling using electric fishingand nets in a large, tropical river (Brazil). Hydrobiologia 389:89–100.
Pottier G. 2017. Influence du substrat sur la propagation dans l’eaud’un champ électrique produit par un engin de pêche électrique.Cah Tech INRA 91: 7 pages.
Pottier G, Marchand F, Beaulaton L. 2020. A comprehensive guideto set up correctly an electrofishing gear. Environ Monit Assess192: 22.
Page 10
Prévost E, Baglinière J-L. 1995. Présentation et premiers éléments demise au point d’une méthode simple d’évaluation du recrutementen juvéniles de saumon atlantique (Salmo salar) de l’année en eaucourante. Les recherches françaises en évaluation quantitative etmodélisation des ressources et des systèmes halieutiques: actes ducolloque, ORSTOM, Paris. 39–48.
R Development Core Team. 2011. R: A Language and Environmentfor Statistical Computing. Vienna: R Foundation for StatisticalComputing. http://www.r-project.org/ (accessed August 25, 2015).
ScholtenM. 2003. Efficiency of point abundance sampling by electro-fishing modified for short fishes. J Appl Ichthyol 19: 265–277.
Sharber NG, Carothers SW. 1988. Influence of electrofishing pulseshape on spinal injuries in adult rainbow trout. North Am J FishManag 8: 117–122.
Sharber NG, Carothers SW, Sharber JP, De Vos JC, House DA. 1994.Reducing Electrofishing-induced injury of Rainbow trout. NorthAm J Fish Manag 14: 340–346.
Snyder DE. 2003. Electrofishing and its harmful effects onfish. Information and Technology Report USGS/BRD/ITR-2003-0002U.S. Geological Survey Biological Resources Division.U.S. Government Printing Office, Denver, CO.
Tomanova S, Tedesco PA, Roset N, Berrebi dit Thomas R, Belliard J.2013. Systematic point sampling of fish communities in medium-and large-sized rivers: sampling procedure and effort. Fish ManagEcol 20: 533–543.
Vehanen T, Sutela T, Jounela P, Huusko A, Mäki-Petäys A. 2013.Assessing electric fishing sampling effort to estimate stream fishassemblage attributes. Fish Manag Ecol 20: 10–20.
Wellemeyer JC, Perkin JS, Fore JD, Boyd C. 2018. Comparingassembly processes for multimetric indices of biotic integrity. EcolIndic 89: 590–609.
Cite this article as: Pottier G, Nevoux M, Marchand F. 2020. Electrofishing eel, salmon and trout: impact of waveform and frequency oncapture-per-unit-effort and spinal damage. Knowl. Manag. Aquat. Ecosyst., 421, 42.
of 10
Copyright © 2022 FDOKUMEN