Using web security scanners to detect vulnerabilities in web services
Upload
independentCategory
view
3download
0
Slope Stability 2013 – P.M. Dight (ed) © 2013 Australian Centre for Geomechanics, Perth, ISBN 978-0-9870937-5-2
Slope Stability 2013, Brisbane, Australia 1
A. Afana 3D Laser Mapping and University of Durham, UK
G. Hunter 3D Laser Mapping, UK
J. Davis 3D Laser Mapping, UK
N. Rosser Department of Geography, Durham University, UK
R. Hardy Department of Geography, Durham University, UK
J. Williams Department of Geography, Durham University, UK
Forecasting of the timing of slope failure has been widely modelled using strain-rate based approaches. Such techniques are reliant upon high-precision data on slope deformation, yet conventionally a trade-off between monitoring precision and spatial resolution has to be made in mine slope safety systems. Newly available full waveform terrestrial laser scanners (FW-TLS) have been shown capable of capturing detailed additional metrics of rock slope surfaces, which from sequential scans allow significantly reduced uncertainties in change detection. Innovatively, this approach obtains both geometric and radiometric target surface information which is suited to the measurement of very small scale deformation, whilst retaining the spatially rich detail of TLS point-clouds.
We present data captured using this new technology integrated into the slope safety monitoring system ‘SiteMonitor’, to explore the opportunities offered by this new technology in characterising actively failing rock slopes in new ways. Results presented highlight the ability to resolve surface features at a scale appropriate to precursory mass wasting and creep in unstable rock slopes. These findings open the possibility for a step-change in the integration of recent strain-rate based predictive models with the unprecedented level of combined precision and detail offered by newly available FW-TLS data.
Recently, advances in slope monitoring have evolved in line with the emergence of new technologies, notably allowing high-quality data with millimetre precision and accuracy to be captured across extensive areas. Amongst other techniques, terrestrial laser scanning (TLS) allows the rapid acquisition of 3D data to describe rock slopes, and through time to capture and quantify change detection (Slob et al., 2005). Delimitation of topography by TLS at high resolutions has several applications that extend from classical mapping, the construction of Digital Surface Models (DSMs), landslides forensics, monitoring deformation and rock slope displacement, and precursory to slope failure (Oppikofer et al., 2009; Abellán et al., 2010; Jaboyedoff et al., 2012). However, in mining, TLS is being widely and increasingly introduced as range, speed and resolution of system align with the scale and geometry of open pit slopes, allowing new generations of slope failure warning systems to be developed. We report on one such advance here.
Understanding slope failure mechanisms is essential for the timing of slope failure to be forecast (Rosser et al., 2007). Identifying precursory patterns (i.e. small rockfall events) prior to failure remains challenging, principally as such approaches are controlled by a variety of factors, many of which are detached from monitoring data accuracy and precision. Terrestrial laser scanners have the potential to provide great insight into pre-failure deformation at scales ranging from a few centimetres to metres (Rose and Hungr, 2007), and offer considerable advantages in precision, capture frequency and repeatability. However, Abellán et al. (2009) analysed precursory displacement with TLS and concluded that reliable detection of
Integration of full waveform terrestrial laser scanners into slope monitoring system A. Ashraf et al.
2 Slope Stability 2013, Brisbane, Australia
small precursory displacement could be hampered by a scanner's own level of error, and hence, higher precisions and accuracies are required to overcome these problems.
TLS systems rely upon range measurement to provide geometric data (e.g. range, slope and topography) and to date record only limited radiometric (reflectance) properties. Depending on the range, beam divergence, and backscattering properties of the target surface, such radiometric attributes of each point measurement remain single measured values representative of average backscattered energy as received by the scanner. In recent years, a new generation of TLS systems has emerged, widely known as full waveform (FW) technology, with the ability to digitise and record increased detail on the backscattered signal of each emitted laser pulse (Mallet and Bretar, 2009). Basically, the FW-TLS digitises the complete structure of the waveform of the received laser eco pulse (i.e. measured by the amount of energy received or amplitude) at a constant interval of 2.01005 ns. This advance builds upon considerable work in the field of airborne LiDAR analysis. Advantages of FW data over classic multi/single-eco LiDAR have been suggested to hold great potential for surface analysis and monitoring (Chauve et al., 2007). In addition to basic geometry and radiometry of object morphology, these may include considerable improvement in precision and accuracy (Ullrich and Pfennigbauer, 2011) and detailed information about the physical properties of the objects (Mallet and Bretar, 2009). This advantage is crucial in fragmented materials or on complex rock slope surfaces as FW data can be decomposed to retrieve individual metrics (e.g. amplitude), or areas with similar characteristics. Recently, several researches have identified the potential of FW-TLS in forestry (Reitberger et al., 2009), in the classification of objects in urban areas (Mallet et al., 2008), and in enhancing DSMs to separate vegetated areas from bare soil (Doneus and Briese, 2006).
On a pixel by pixel basis, Digital Elevation Models (DEMs) and first derivative topographic attributes (e.g. slope and aspect), may form prerequisite elements for a spatially distributed characterisation of slope geometry (Meentemeyer and Moody, 2000). Several researches (Günther and Thiel, 2009; Ghosh et al., 2010) have used such capacity to evaluate the feasibility of rock slope failure along geological discontinuities. Hence, slope stability assessment on the basis of topographic attributes can be achieved if locations of kinematically critical (unstable) areas of the slope surface are determined (Günther et al., 2012). Detailed characterisation of rockfall scar surfaces is possible if high resolution DEMs are captured (Oppikofer et al., 2011), providing direct remote measurement of dip angle, and spacing and roughness of foliation surfaces and step fractures.
FW data presents an advance in TLS technology, predominantly in terms of increased spatial resolution and measurement precision. However the ability to use FW-TLS data to detect and quantify the nature of spatial deformations in rockslopes is still to be demonstrated. Hence, we base the study reported here on the following motivations to capture and characterise rock surface properties: (i) the limitations of conventional slope monitoring systems on the detection of irregular, small or complex surfaces independently of the laser footprint size and beam divergence with range; and, (ii) an enhanced reliability to provide information not only on displacement change, but also to capture more complex 3D deformation for incorporation into predictive failure models.
In this paper we report on the capacity of FW data as a new source of information to enhance measurements of precursory indicators of slope failure. We also try to explain FW variations in relation to common topographic attributes that may directly affect the reflected laser signal, as widely experienced when monitoring rock slopes. Hence, this paper addresses the following objectives: (i) Testing the capabilities of FW-TLS to identify rock structure properties; (ii) Understanding variations in laser footprint based on the comparison between conventional and FW laser scanning technologies; (iii) Determining topographic attributes and their effect as complementary sources to understand variations in reflected laser signal; and (iv) Classification of the rock structure morphology based on FW metrics and their relation to topographic features.
Slope performance
Slope Stability 2013, Brisbane, Australia 3
The methodology of the present work was restricted to the processing of the FW data generated directly from a TLS system with an echo digitiser. In contrast to FW from airborne LiDAR, this ground-based data is characterised by an online processing (deconvolution and decomposition) unit that allows for characterisation of individual discrete targets along the path of the laser beam (Mallet et al., 2008). A Gaussian fit was assumed to represent the pulse distribution through time (Ullrich and Pfennigbauer, 2011), and hence the collected pulse is a convolution between the Gaussian fit and a surface function (Chauve et al., 2007). A general Gaussian fit is described by:
(1)
Where:
a = pulse amplitude.
σ = pulse width.
µ = function mode.
α = shape parameter that allows simulation of the Gaussian model.
The FW processing reported here consists of two basic approaches. The first includes the construction of a link to the original point cloud. This was achieved by defining the range and position (x,y,z) of each record in the FW data. Each record in the FW data comprises information on the object structure from all reflectors along the line of sight of the emitted beam. The second approach is the construction of the major topographic attributes that we explore as direct influences on the reflected signal as recorded by the laser scanner. The definition of these attributes is intended to highlight some of the reflectance properties where the object dimensions are less than the laser beam-footprint (e.g. edges, and transitions between distinct surfaces or structures).
To provide the 3D coordinates of the FW data in relation to the scanner position, first the range (ρ) is to be defined:
(2)
Where:
v = speed of light (m/s).
tref = timestamp of the laser pulse emitted from the scanner.
ti = timestamp of a particular sample of reflected laser energy.
The position of the target (l) is determined by the location of the emitted pulse and its range derived using the following equation:
(3)
Where:
o and d are the origin and direction of the vector of the laser pulse, respectively.
The potential of FW data to describe rock surface properties was handled using two approaches. First, a probability distribution function (PDF) of each attribute captured by the scanner was analysed. Second, in order to verify the potential of the FW to identify changes in the morphology across the rock surface, such as faults, joints or fractures, a local unsupervised classification was applied. This is based upon a combination of ISO cluster and maximum likelihood classification methods (during this work both are referred to as ISODATA) that provide unlimited numbers of clusters without having a priori information on the target surface. Both are iterative data analysis techniques, which numerically identify clusters by
Integration of full waveform terrestrial laser scanners into slope monitoring system A. Ashraf et al.
4 Slope Stability 2013, Brisbane, Australia
assigning a centroid based on minimising variability within clusters. The basic function is the sum of square distances (errors) between each pixel and its assigned cluster centre:
(4)
Where:
x = pixel value and c(x) is its assigned cluster centre.
Since the capacity and the potential of FW-TLS to depict rock surface properties remains to be resolved, the classification process has been undertaken in three group sets. The first was applied exclusively to FW metrics, the second to the topographic attributes, and the third to a combination of the two. Using this new technology as a source of information on actively failing rock slopes is dependent upon the capacity to delineate both small features, as well as wider scale characteristics of the rock surfaces.
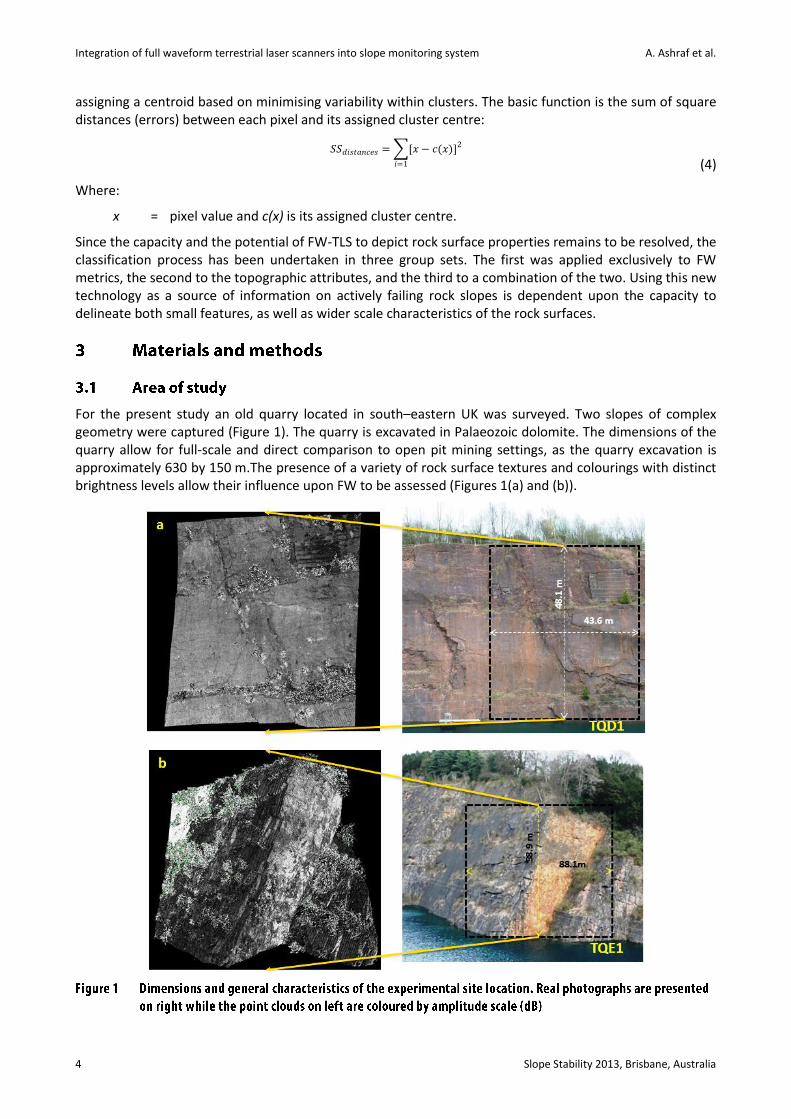
For the present study an old quarry located in south–eastern UK was surveyed. Two slopes of complex geometry were captured (Figure 1). The quarry is excavated in Palaeozoic dolomite. The dimensions of the quarry allow for full-scale and direct comparison to open pit mining settings, as the quarry excavation is approximately 630 by 150 m.The presence of a variety of rock surface textures and colourings with distinct brightness levels allow their influence upon FW to be assessed (Figures 1(a) and (b)).
Slope performance
Slope Stability 2013, Brisbane, Australia 5
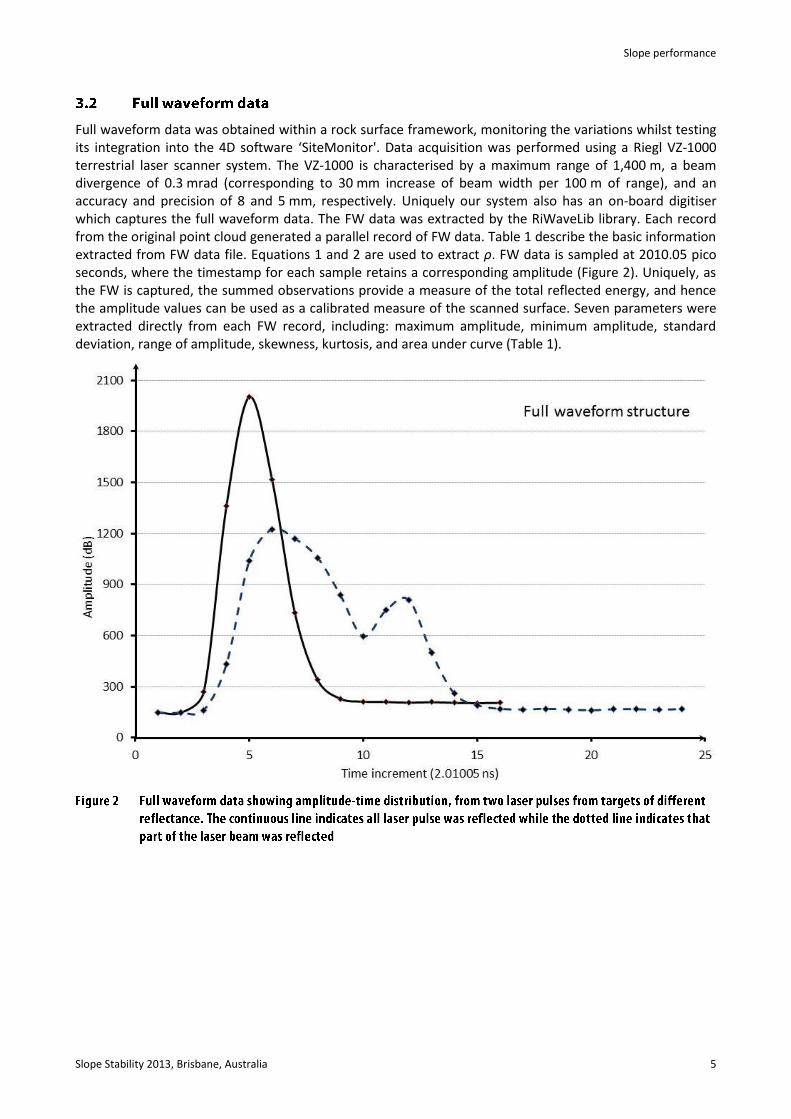
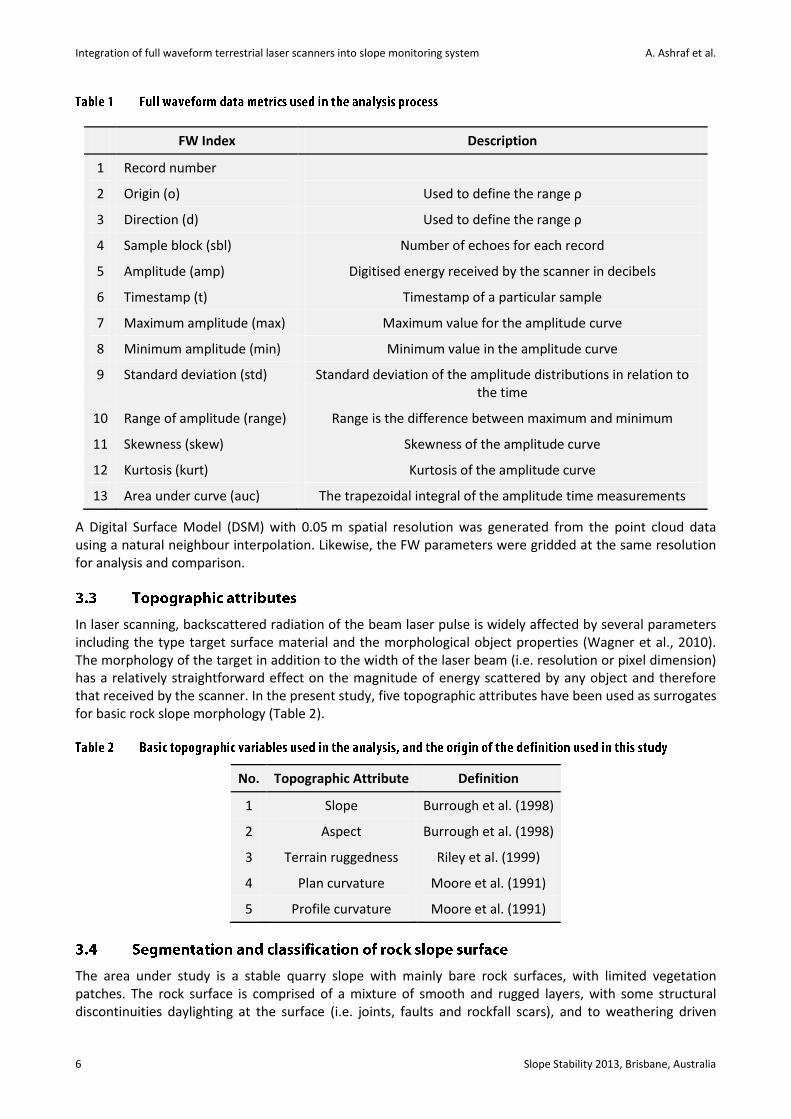
Full waveform data was obtained within a rock surface framework, monitoring the variations whilst testing its integration into the 4D software ‘SiteMonitor'. Data acquisition was performed using a Riegl VZ-1000 terrestrial laser scanner system. The VZ-1000 is characterised by a maximum range of 1,400 m, a beam divergence of 0.3 mrad (corresponding to 30 mm increase of beam width per 100 m of range), and an accuracy and precision of 8 and 5 mm, respectively. Uniquely our system also has an on-board digitiser which captures the full waveform data. The FW data was extracted by the RiWaveLib library. Each record from the original point cloud generated a parallel record of FW data. Table 1 describe the basic information extracted from FW data file. Equations 1 and 2 are used to extract ρ. FW data is sampled at 2010.05 pico seconds, where the timestamp for each sample retains a corresponding amplitude (Figure 2). Uniquely, as the FW is captured, the summed observations provide a measure of the total reflected energy, and hence the amplitude values can be used as a calibrated measure of the scanned surface. Seven parameters were extracted directly from each FW record, including: maximum amplitude, minimum amplitude, standard deviation, range of amplitude, skewness, kurtosis, and area under curve (Table 1).
Integration of full waveform terrestrial laser scanners into slope monitoring system A. Ashraf et al.
6 Slope Stability 2013, Brisbane, Australia
FW Index Description
1 Record number
2 Origin (o) Used to define the range ρ
3 Direction (d) Used to define the range ρ
4 Sample block (sbl) Number of echoes for each record
5 Amplitude (amp) Digitised energy received by the scanner in decibels
6 Timestamp (t) Timestamp of a particular sample
7 Maximum amplitude (max) Maximum value for the amplitude curve
8 Minimum amplitude (min) Minimum value in the amplitude curve
9 Standard deviation (std) Standard deviation of the amplitude distributions in relation to the time
10 Range of amplitude (range) Range is the difference between maximum and minimum
11 Skewness (skew) Skewness of the amplitude curve
12 Kurtosis (kurt) Kurtosis of the amplitude curve
13 Area under curve (auc) The trapezoidal integral of the amplitude time measurements
A Digital Surface Model (DSM) with 0.05 m spatial resolution was generated from the point cloud data using a natural neighbour interpolation. Likewise, the FW parameters were gridded at the same resolution for analysis and comparison.
In laser scanning, backscattered radiation of the beam laser pulse is widely affected by several parameters including the type target surface material and the morphological object properties (Wagner et al., 2010). The morphology of the target in addition to the width of the laser beam (i.e. resolution or pixel dimension) has a relatively straightforward effect on the magnitude of energy scattered by any object and therefore that received by the scanner. In the present study, five topographic attributes have been used as surrogates for basic rock slope morphology (Table 2).
No. Topographic Attribute Definition
1 Slope Burrough et al. (1998)
2 Aspect Burrough et al. (1998)
3 Terrain ruggedness Riley et al. (1999)
4 Plan curvature Moore et al. (1991)
5 Profile curvature Moore et al. (1991)
The area under study is a stable quarry slope with mainly bare rock surfaces, with limited vegetation patches. The rock surface is comprised of a mixture of smooth and rugged layers, with some structural discontinuities daylighting at the surface (i.e. joints, faults and rockfall scars), and to weathering driven
Slope performance
Slope Stability 2013, Brisbane, Australia 7
surface deterioration. The aim of the rock segmentation process is to cluster or categorise the outcrop face into isolated morphological units, to provide a quantitative descriptor of the surface properties. Analysis of the scanning data using the method outlined above should allow significant elements to be identified (i.e. simple versus compound, tiny versus large, fragments versus intact) without previous knowledge of the dominant surface features. The classes produced by each data set (the FW metrics, the topographic attributes, and a combination of both) should be comparable quantitatively, and differences will be used to test the descriptive potential of each set in isolation. As a result the additional benefit of FW-TLS over and above conventional TLS systems is tested without this capability.
Full waveform (FW) data was generated for the two studied slope faces, referred to here as TQD1 and TQE1. The original point cloud data was processed and filtered to remove spurious data from the point cloud positioned into a Cartesian grid system. A correlation matrix between the extracted parameters revealed that some are highly correlated, mainly maximum amplitude (max) and range of amplitude (range) (0.99 at p<0.05), which may lead to redundancy in the analysed data. Hence, range was eliminated from the analysis process.
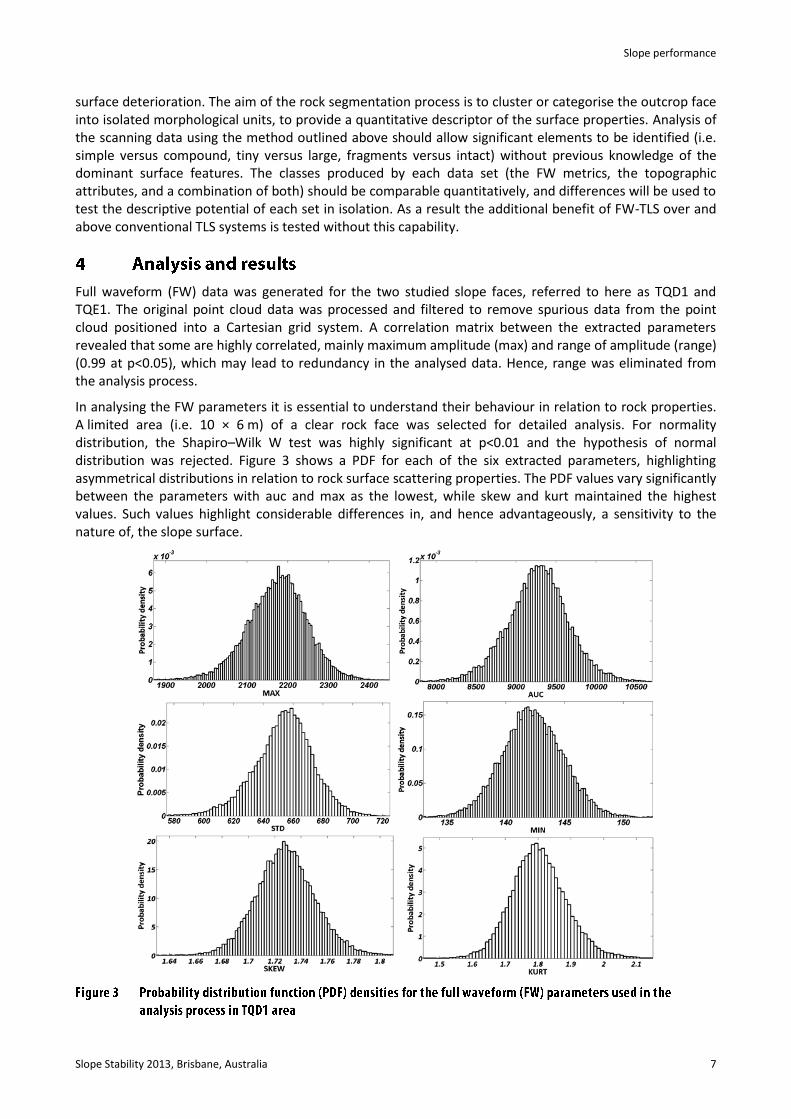
In analysing the FW parameters it is essential to understand their behaviour in relation to rock properties. A limited area (i.e. 10 × 6 m) of a clear rock face was selected for detailed analysis. For normality distribution, the Shapiro–Wilk W test was highly significant at p<0.01 and the hypothesis of normal distribution was rejected. Figure 3 shows a PDF for each of the six extracted parameters, highlighting asymmetrical distributions in relation to rock surface scattering properties. The PDF values vary significantly between the parameters with auc and max as the lowest, while skew and kurt maintained the highest values. Such values highlight considerable differences in, and hence advantageously, a sensitivity to the nature of, the slope surface.
Integration of full waveform terrestrial laser scanners into slope monitoring system A. Ashraf et al.
8 Slope Stability 2013, Brisbane, Australia
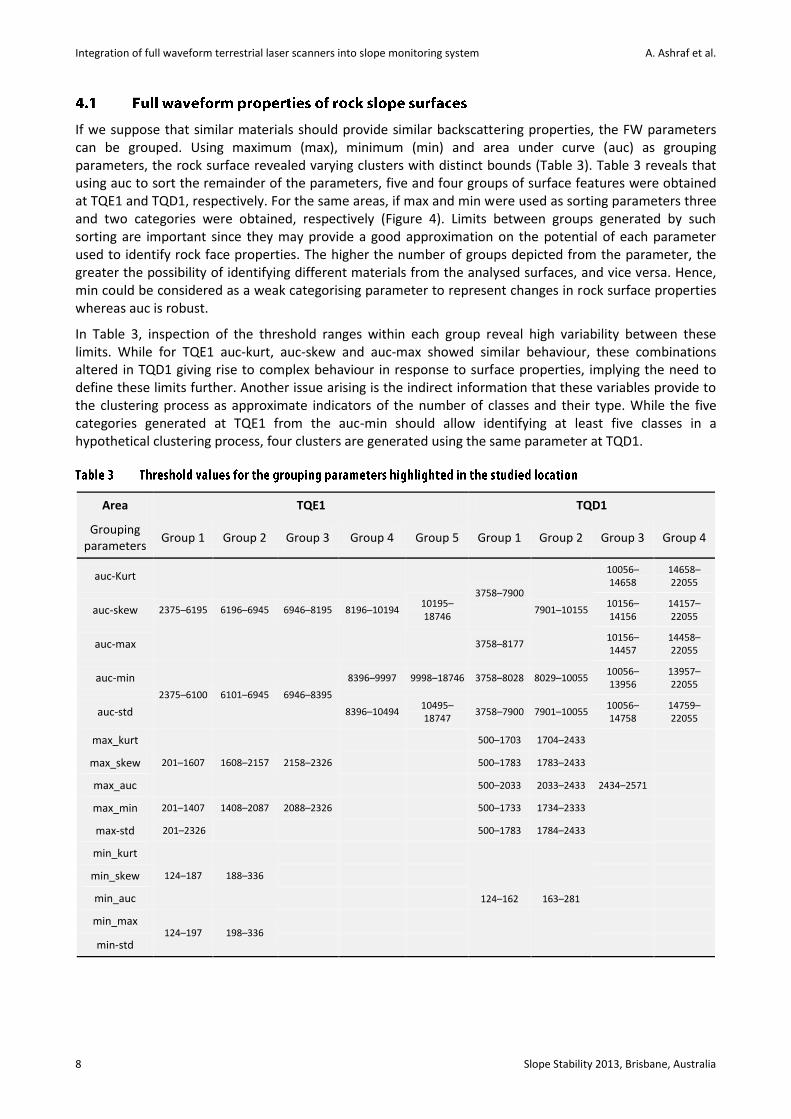
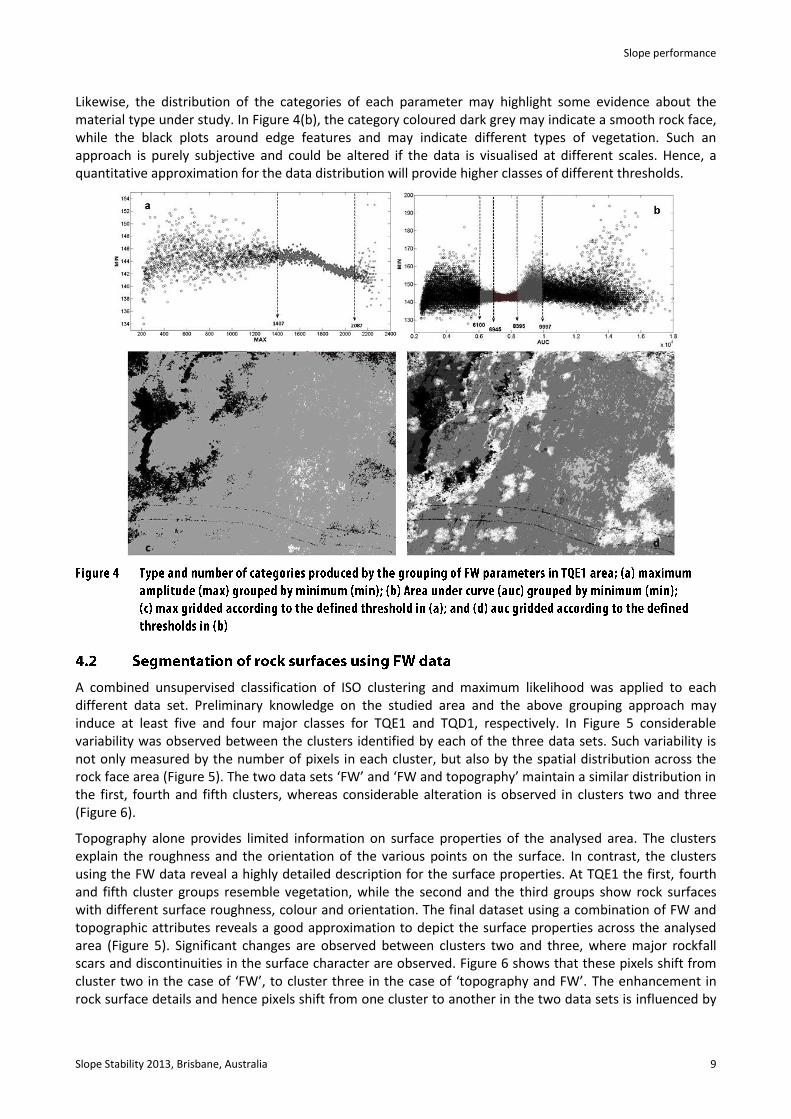
If we suppose that similar materials should provide similar backscattering properties, the FW parameters can be grouped. Using maximum (max), minimum (min) and area under curve (auc) as grouping parameters, the rock surface revealed varying clusters with distinct bounds (Table 3). Table 3 reveals that using auc to sort the remainder of the parameters, five and four groups of surface features were obtained at TQE1 and TQD1, respectively. For the same areas, if max and min were used as sorting parameters three and two categories were obtained, respectively (Figure 4). Limits between groups generated by such sorting are important since they may provide a good approximation on the potential of each parameter used to identify rock face properties. The higher the number of groups depicted from the parameter, the greater the possibility of identifying different materials from the analysed surfaces, and vice versa. Hence, min could be considered as a weak categorising parameter to represent changes in rock surface properties whereas auc is robust.
In Table 3, inspection of the threshold ranges within each group reveal high variability between these limits. While for TQE1 auc-kurt, auc-skew and auc-max showed similar behaviour, these combinations altered in TQD1 giving rise to complex behaviour in response to surface properties, implying the need to define these limits further. Another issue arising is the indirect information that these variables provide to the clustering process as approximate indicators of the number of classes and their type. While the five categories generated at TQE1 from the auc-min should allow identifying at least five classes in a hypothetical clustering process, four clusters are generated using the same parameter at TQD1.
Area TQE1 TQD1
Grouping parameters
Group 1 Group 2 Group 3 Group 4 Group 5 Group 1 Group 2 Group 3 Group 4
auc-Kurt
2375–6195 6196–6945 6946–8195 8196–10194 10195–18746
3758–7900
7901–10155
10056–14658
14658–22055
auc-skew 10156–14156
14157–22055
auc-max 3758–8177 10156–14457
14458–22055
auc-min
2375–6100 6101–6945 6946–8395
8396–9997 9998–18746 3758–8028 8029–10055 10056–13956
13957–22055
auc-std 8396–10494 10495–18747
3758–7900 7901–10055 10056–14758
14759–22055
max_kurt
201–1607 1608–2157 2158–2326
500–1703 1704–2433
2434–2571
max_skew 500–1783 1783–2433
max_auc 500–2033 2033–2433
max_min 201–1407 1408–2087 2088–2326 500–1733 1734–2333
max-std 201–2326 500–1783 1784–2433
min_kurt
124–187 188–336
124–162 163–281
min_skew
min_auc
min_max 124–197 198–336
min-std
Slope performance
Slope Stability 2013, Brisbane, Australia 9
Likewise, the distribution of the categories of each parameter may highlight some evidence about the material type under study. In Figure 4(b), the category coloured dark grey may indicate a smooth rock face, while the black plots around edge features and may indicate different types of vegetation. Such an approach is purely subjective and could be altered if the data is visualised at different scales. Hence, a quantitative approximation for the data distribution will provide higher classes of different thresholds.
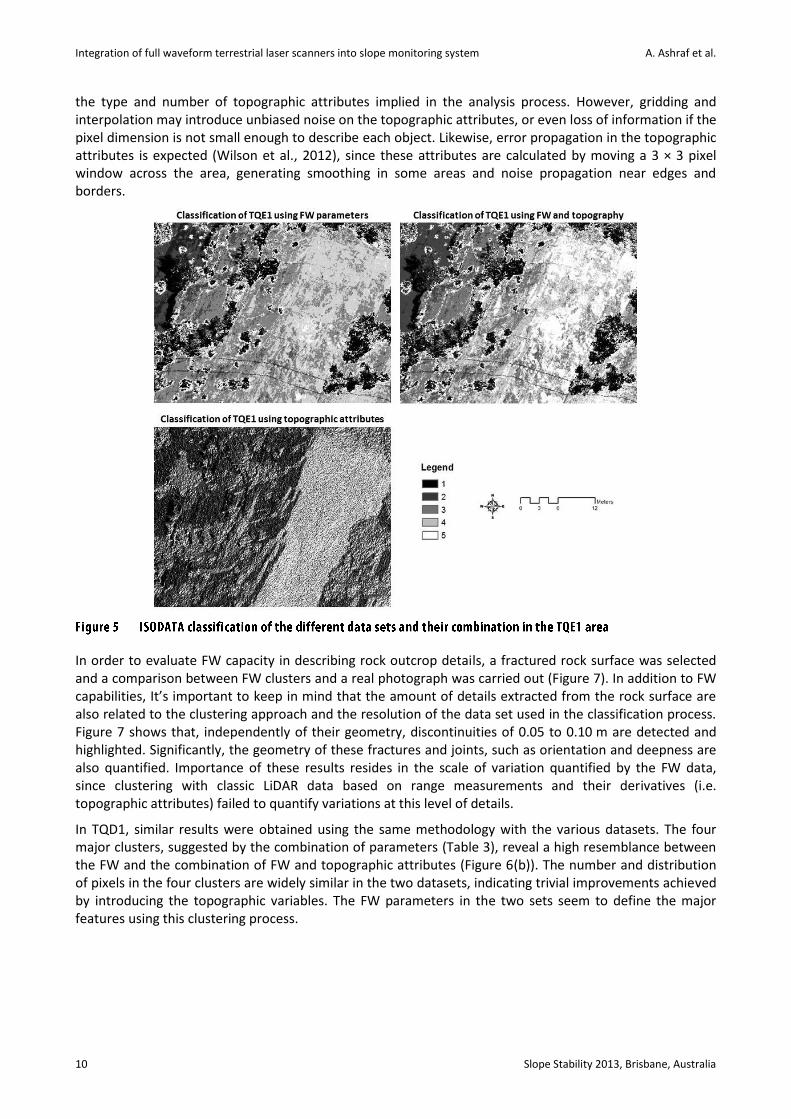
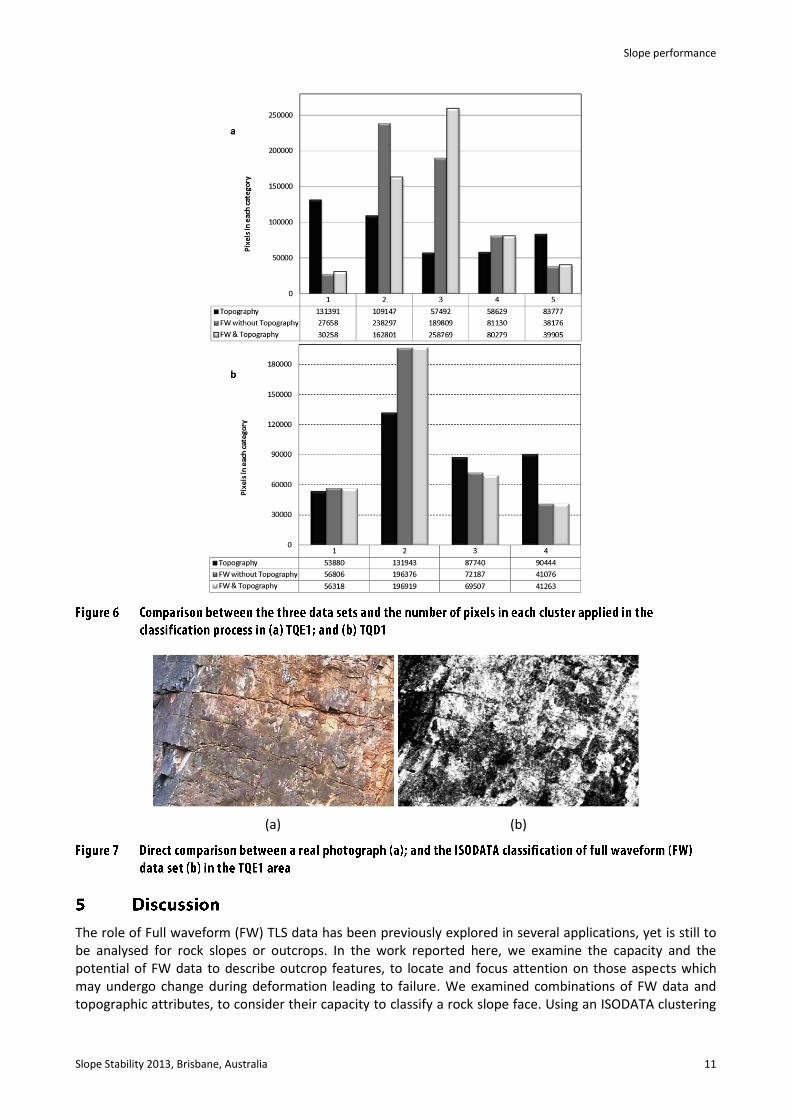
A combined unsupervised classification of ISO clustering and maximum likelihood was applied to each different data set. Preliminary knowledge on the studied area and the above grouping approach may induce at least five and four major classes for TQE1 and TQD1, respectively. In Figure 5 considerable variability was observed between the clusters identified by each of the three data sets. Such variability is not only measured by the number of pixels in each cluster, but also by the spatial distribution across the rock face area (Figure 5). The two data sets ‘FW’ and ‘FW and topography’ maintain a similar distribution in the first, fourth and fifth clusters, whereas considerable alteration is observed in clusters two and three (Figure 6).
Topography alone provides limited information on surface properties of the analysed area. The clusters explain the roughness and the orientation of the various points on the surface. In contrast, the clusters using the FW data reveal a highly detailed description for the surface properties. At TQE1 the first, fourth and fifth cluster groups resemble vegetation, while the second and the third groups show rock surfaces with different surface roughness, colour and orientation. The final dataset using a combination of FW and topographic attributes reveals a good approximation to depict the surface properties across the analysed area (Figure 5). Significant changes are observed between clusters two and three, where major rockfall scars and discontinuities in the surface character are observed. Figure 6 shows that these pixels shift from cluster two in the case of ‘FW’, to cluster three in the case of ‘topography and FW’. The enhancement in rock surface details and hence pixels shift from one cluster to another in the two data sets is influenced by
Integration of full waveform terrestrial laser scanners into slope monitoring system A. Ashraf et al.
10 Slope Stability 2013, Brisbane, Australia
the type and number of topographic attributes implied in the analysis process. However, gridding and interpolation may introduce unbiased noise on the topographic attributes, or even loss of information if the pixel dimension is not small enough to describe each object. Likewise, error propagation in the topographic attributes is expected (Wilson et al., 2012), since these attributes are calculated by moving a 3 × 3 pixel window across the area, generating smoothing in some areas and noise propagation near edges and borders.
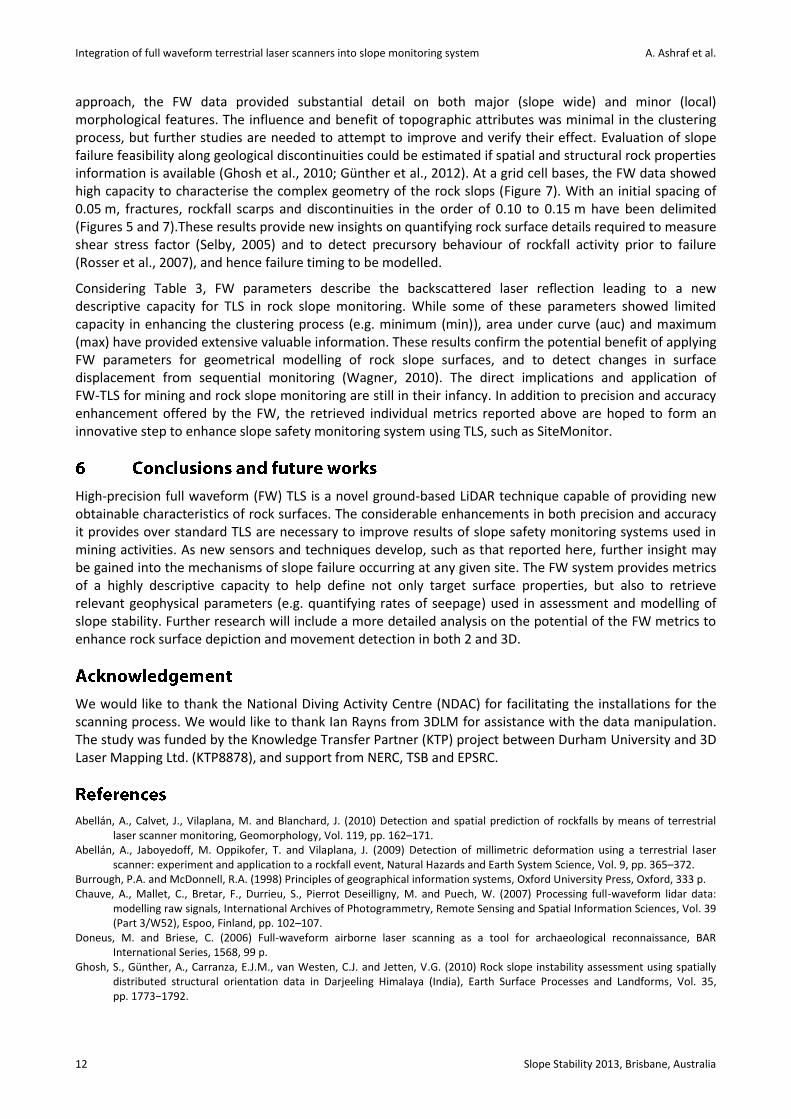
In order to evaluate FW capacity in describing rock outcrop details, a fractured rock surface was selected and a comparison between FW clusters and a real photograph was carried out (Figure 7). In addition to FW capabilities, It’s important to keep in mind that the amount of details extracted from the rock surface are also related to the clustering approach and the resolution of the data set used in the classification process. Figure 7 shows that, independently of their geometry, discontinuities of 0.05 to 0.10 m are detected and highlighted. Significantly, the geometry of these fractures and joints, such as orientation and deepness are also quantified. Importance of these results resides in the scale of variation quantified by the FW data, since clustering with classic LiDAR data based on range measurements and their derivatives (i.e. topographic attributes) failed to quantify variations at this level of details.
In TQD1, similar results were obtained using the same methodology with the various datasets. The four major clusters, suggested by the combination of parameters (Table 3), reveal a high resemblance between the FW and the combination of FW and topographic attributes (Figure 6(b)). The number and distribution of pixels in the four clusters are widely similar in the two datasets, indicating trivial improvements achieved by introducing the topographic variables. The FW parameters in the two sets seem to define the major features using this clustering process.
Slope performance
Slope Stability 2013, Brisbane, Australia 11
(a) (b)
The role of Full waveform (FW) TLS data has been previously explored in several applications, yet is still to be analysed for rock slopes or outcrops. In the work reported here, we examine the capacity and the potential of FW data to describe outcrop features, to locate and focus attention on those aspects which may undergo change during deformation leading to failure. We examined combinations of FW data and topographic attributes, to consider their capacity to classify a rock slope face. Using an ISODATA clustering
Integration of full waveform terrestrial laser scanners into slope monitoring system A. Ashraf et al.
12 Slope Stability 2013, Brisbane, Australia
approach, the FW data provided substantial detail on both major (slope wide) and minor (local) morphological features. The influence and benefit of topographic attributes was minimal in the clustering process, but further studies are needed to attempt to improve and verify their effect. Evaluation of slope failure feasibility along geological discontinuities could be estimated if spatial and structural rock properties information is available (Ghosh et al., 2010; Günther et al., 2012). At a grid cell bases, the FW data showed high capacity to characterise the complex geometry of the rock slops (Figure 7). With an initial spacing of 0.05 m, fractures, rockfall scarps and discontinuities in the order of 0.10 to 0.15 m have been delimited (Figures 5 and 7).These results provide new insights on quantifying rock surface details required to measure shear stress factor (Selby, 2005) and to detect precursory behaviour of rockfall activity prior to failure (Rosser et al., 2007), and hence failure timing to be modelled.
Considering Table 3, FW parameters describe the backscattered laser reflection leading to a new descriptive capacity for TLS in rock slope monitoring. While some of these parameters showed limited capacity in enhancing the clustering process (e.g. minimum (min)), area under curve (auc) and maximum (max) have provided extensive valuable information. These results confirm the potential benefit of applying FW parameters for geometrical modelling of rock slope surfaces, and to detect changes in surface displacement from sequential monitoring (Wagner, 2010). The direct implications and application of FW-TLS for mining and rock slope monitoring are still in their infancy. In addition to precision and accuracy enhancement offered by the FW, the retrieved individual metrics reported above are hoped to form an innovative step to enhance slope safety monitoring system using TLS, such as SiteMonitor.
High-precision full waveform (FW) TLS is a novel ground-based LiDAR technique capable of providing new obtainable characteristics of rock surfaces. The considerable enhancements in both precision and accuracy it provides over standard TLS are necessary to improve results of slope safety monitoring systems used in mining activities. As new sensors and techniques develop, such as that reported here, further insight may be gained into the mechanisms of slope failure occurring at any given site. The FW system provides metrics of a highly descriptive capacity to help define not only target surface properties, but also to retrieve relevant geophysical parameters (e.g. quantifying rates of seepage) used in assessment and modelling of slope stability. Further research will include a more detailed analysis on the potential of the FW metrics to enhance rock surface depiction and movement detection in both 2 and 3D.
We would like to thank the National Diving Activity Centre (NDAC) for facilitating the installations for the scanning process. We would like to thank Ian Rayns from 3DLM for assistance with the data manipulation. The study was funded by the Knowledge Transfer Partner (KTP) project between Durham University and 3D Laser Mapping Ltd. (KTP8878), and support from NERC, TSB and EPSRC.
Abellán, A., Calvet, J., Vilaplana, M. and Blanchard, J. (2010) Detection and spatial prediction of rockfalls by means of terrestrial laser scanner monitoring, Geomorphology, Vol. 119, pp. 162–171.
Abellán, A., Jaboyedoff, M. Oppikofer, T. and Vilaplana, J. (2009) Detection of millimetric deformation using a terrestrial laser scanner: experiment and application to a rockfall event, Natural Hazards and Earth System Science, Vol. 9, pp. 365–372.
Burrough, P.A. and McDonnell, R.A. (1998) Principles of geographical information systems, Oxford University Press, Oxford, 333 p. Chauve, A., Mallet, C., Bretar, F., Durrieu, S., Pierrot Deseilligny, M. and Puech, W. (2007) Processing full-waveform lidar data:
modelling raw signals, International Archives of Photogrammetry, Remote Sensing and Spatial Information Sciences, Vol. 39 (Part 3/W52), Espoo, Finland, pp. 102–107.
Doneus, M. and Briese, C. (2006) Full-waveform airborne laser scanning as a tool for archaeological reconnaissance, BAR International Series, 1568, 99 p.
Ghosh, S., Günther, A., Carranza, E.J.M., van Westen, C.J. and Jetten, V.G. (2010) Rock slope instability assessment using spatially distributed structural orientation data in Darjeeling Himalaya (India), Earth Surface Processes and Landforms, Vol. 35, pp. 1773−1792.
Slope performance
Slope Stability 2013, Brisbane, Australia 13
Günther, A. and Thiel, C. (2009) Combined rock slope stability and shallow landslide susceptibility assessment of the Jasmund cliff area (Rügen Island, Germany), Natural Hazards and Earth System Sciences, Vol. 9, pp. 687–698.
Günther, A., Wienhöfer, J. and Konietzky, H. (2012) Automated mapping of rock slope geometry, kinematics and stability with RSS-GIS, Natural hazards, Vol. 61, pp. 29–49.
Jaboyedoff, M., Oppikofer, T., Abellán, A., Derron, M.-H., Loye, A., Metzger, R. and Pedrazzini, A. (2012) Use of LiDAR in landslide investigations: a review, Natural hazards, Vol. 61, pp. 5–28.
Mallet, C. and Bretar, F. (2009) Full-waveform topographic lidar: State-of-the-art, ISPRS Journal of Photogrammetry and Remote Sensing, Vol. 64, pp. 1–16.
Mallet, C., Bretar, F. and Soergel, U. (2008) Analysis of full-waveform lidar data for classification of urban areas, Photogrammetrie Fernerkundung Geoinformation, Vol. 5, pp. 337–349.
Meentemeyer, R.K. and Moody, A. (2000) Automated mapping of conformity between topographic and geological surfaces, Computers and Geosciences, Vol. 26, pp. 815–829.
Moore, I.D.G., Ladson, A.R. and Grayson, R.B. (1991) Digital Terrain Modelling: a review of Hydrological, Geomorphological, and Biological applications, Hydrological Processes, Vol. 5, pp. 3–30.
Oppikofer, T., Jaboyedoff, M., Blikra, L., Derron, M.H. and Metzger, R. (2009) Characterization and monitoring of the Aknes rockslide using terrestrial laser scanning, Natural Hazards and Earth System Science, Vol. 9, pp. 1003–1019.
Oppikofer, T., Jaboyedoff, M., Pedrazzini, A., Derron, M.H. and Blikra, L.H. (2011) Detailed DEM analysis of a rockslide scar to characterize the basal sliding surface of active rockslides, Journal of Geophysical Research: Earth Surface (2003–2012), Vol. 116, F2.
Reitberger, J., Schnörr, C., Krzystek, P. and Stilla, U. (2009) 3D segmentation of single trees exploiting full waveform LiDAR data, ISPRS Journal of Photogrammetry and Remote Sensing, Vol. 64, pp. 561–574.
Riley, S.J., DeGloria, S.D. and Elliot, R. (1999) A terrain ruggedness index that quantifies topographic heterogeneity, Intermountain Journal of Sciences, Vol. 5, pp. 23–27.
Rose, N.D. and Hungr, O. (2007) Forecasting potential slope failure in open pit mines–contingency planning and remediation, International Journal of Rock Mechanics and Mining Sciences, Vol. 44, pp. 308–320.
Rosser, N., Lim, M., Petley, D., Dunning, S. and Allison, R. (2007) Patterns of precursory rockfall prior to slope failure, Journal of Geophysical Research: Earth Surface, Vol. 112, F04014.
Selby, M.J. (2005) Hillslope Material and Processes, Oxford Press, Oxford, 451 p. Slob, S., van Knapen, B., Hack, R., Turner, K. and Kemeny, J. (2005) Method for automated discontinuity analysis of rock slopes with
three-dimensional laser scanning, Journal of the Transportation Research Board 1913, pp. 187–194. Ullrich, A. and Pfennigbauer, M. (2011) Categorisation of full waveform data provided by laser scanning devices, in Proceedings SPIE
8186, G. Kamerman, O. Steinvall, G. Bishop, J. Gonglewski, K. Lewis, R. Hollins, and T. Merlet, (eds), 5–8 October 2011, Prague, Czech Republic, Electro-Optical Remote Sensing, Photonic Technologies, and Applications V, 818609, doi: 10.1117/12.898490.
Wagner, W. (2010) Radiometric calibration of small-footprint full-waveform airborne laser scanner measurements: Basic physical concepts, ISPRS Journal of Photogrammetry and Remote Sensing, Vol. 65, pp. 505–513.
Wilson, J.P. (2012) Digital terrain modeling, Geomorphology, Vol. 137, pp. 107–121.

Integration of full waveform terrestrial laser scanners into slope monitoring system A. Ashraf et al.
14 Slope Stability 2013, Brisbane, Australia
Copyright © 2022 FDOKUMEN