Application of the imaginary planes method to three-dimensional systems
Upload
independentCategory
view
1download
0
Joint International Symposium on Deformation Monitoring
Jacky C.K. Chow, William F. Teskey, and J.W. (Bill) Lovse
In-situ Self-calibration of Terrestrial Laser Scanners and Deformation Analysis Using Both Signalized Targets
and Intersection of Planes for Indoor Applications
14th FIG Symposium on Deformation Measurements and Analysis, 5th IAG Symposium on Geodesy for
Geotechnical and Structural Engineering, and 2nd International Workshop on Spatial Information Technologies
for Monitoring the Deformation of Large-Scale Man-Made Linear Features
Hong Kong, China, November 2-4, 2011
1/15
In-situ Self-calibration of Terrestrial Laser Scanners and Deformation
Analysis Using Both Signalized Targets and Intersection of Planes for
Indoor Applications
Jacky C.K. CHOW, William F. TESKEY, and J.W. (Bill) LOVSE, Canada
Key words: Terrestrial laser scanning, calibration, deformation monitoring, geometric
modeling, point cloud
SUMMARY
Terrestrial laser scanners are high-accuracy 3D imaging instruments that are capable of
measuring deformations with sub-millimetre level accuracy in most close-range applications.
Traditionally, deformation monitoring is performed using distinct signalized targets. In this
case, the centroids of these targets must be determined with great accuracy. A least-squares
based target centroid extraction algorithm for planar checkerboard/chessboard targets is
proposed for laser scanner data. These targets are used in a free-station network for
performing deformation analysis with no assumptions about the deformation pattern. To
ensure the optimum measurement accuracy of the instrument, all systematic errors inherent to
the instrument at the time of data acquisition need to be removed. One method for reducing
these systematic errors is self-calibration of terrestrial laser scanners. In this paper, this was
performed on-site to model the systematic errors in the raw observations of the scanner. Post
self-calibration, the accuracy of the measured translation movements were improved from the
millimetre level to the sub-millimetre level.
Despite the outstanding performance of using laser scanners with signalized targets in
deformation analysis, the main benefit of active sensors like terrestrial laser scanning systems
is its ability to capture 3D information of the entire scene without markers. A new markerless
deformation analysis technique that utilizes intersection points derived from planar-features is
proposed and tested in this paper. The extraction and intersection of planes in each point
cloud can be performed automatically or semi-automatically. This new method is based on
free-stationing and does not require a priori knowledge about stable control points. It can
detect and measure translational and rotational movements of the planes with minimal human
interaction. This paper will present both simulated and real results, demonstrating the
performance of the newly proposed methodology.
Joint International Symposium on Deformation Monitoring
Jacky C.K. Chow, William F. Teskey, and J.W. (Bill) Lovse
In-situ Self-calibration of Terrestrial Laser Scanners and Deformation Analysis Using Both Signalized Targets
and Intersection of Planes for Indoor Applications
14th FIG Symposium on Deformation Measurements and Analysis, 5th IAG Symposium on Geodesy for
Geotechnical and Structural Engineering, and 2nd International Workshop on Spatial Information Technologies
for Monitoring the Deformation of Large-Scale Man-Made Linear Features
Hong Kong, China, November 2-4, 2011
2/15
In-situ Self-calibration of Terrestrial Laser Scanners and Deformation
Analysis Using Both Signalized Targets and Intersection of Planes for
Indoor Applications
Jacky C.K. CHOW, William F. TESKEY, and J.W. (Bill) LOVSE, Canada
1. INTRODUCTION
Deformation analysis is a common task in surveying and structural engineering. Typically
this can be done noninvasively using total stations, photogrammetry, or laser scanners. For
outdoor applications, terrestrial laser scanning (TLS) has been used in land/rock deformation
monitoring (Monserrat & Crosetto, 2007; Alba & Scaioni, 2010). For indoor TLS
applications, the deflection of structural beams has been measured with sub-millimetre level
accuracy (Gordon & Lichti, 2007; Rönnholm et al., 2009). The performance of modern static
terrestrial laser scanners for detecting and measuring deformations in an indoor environment
is explored in this paper. The well-established point-based deformation analysis method
forms the basis of this paper. Although the accuracy of a single point in a laser scanner point
cloud is inferior when compared to high-precision total stations, by exploiting the large
redundancy, unique targets can be extracted from the point cloud with great accuracy. These
targets can either be signalized targets with a radiometric pattern, or they can be derived from
geometric features such as the intersection of three planes. From simulation and real data, it
is evident that translational movements can be reliably identified and measured automatically
with accuracy in the sub-millimetre level. To ensure this level of accuracy, it is crucial that
all blunders and systematic errors are removed from the data. Systematic errors can usually
be reduced if not eliminated when in both epochs the same sensor is used to capture data with
similar network geometry, and over a short period of time. Alternatively, this paper shows
that the laser scanner self-calibration is an effective tool for modelling the sensor errors. The
accuracy of the recovered deformations improved from a few millimetres to the sub-
millimetre level after self-calibration. By adopting the intersection of planar surfaces as
targets, after the point-based deformation analysis the rotational movements of the planes can
be measured as well. This can give a better description of the deformation pattern in the
scene than the conventional method.
2. METHODOLOGY
2.1 Point-based Deformation Analysis Method
The conventional 3D deformation monitoring technique explained in Gründig et al. (1985)
forms the core structure of the newly proposed methodology. This widely adopted method
allows the 3D translations of common targets observed in two epochs to be detected and

Joint International Symposium on Deformation Monitoring
Jacky C.K. Chow, William F. Teskey, and J.W. (Bill) Lovse
In-situ Self-calibration of Terrestrial Laser Scanners and Deformation Analysis Using Both Signalized Targets
and Intersection of Planes for Indoor Applications
14th FIG Symposium on Deformation Measurements and Analysis, 5th IAG Symposium on Geodesy for
Geotechnical and Structural Engineering, and 2nd International Workshop on Spatial Information Technologies
for Monitoring the Deformation of Large-Scale Man-Made Linear Features
Hong Kong, China, November 2-4, 2011
3/15
measured. The fundamental procedure is summarized here for completeness. First, a network
adjustment is performed separately for both epochs. The datum is defined using inner-
constraints with all the targets in the object space included. Systematic errors should be
reduced if not eliminated. All outliers are identifed and removed from the network, for
example through Baarda’s data snooping. Since the raw observations of a TLS instrument are
range (ρ), horizontal direction (θ), and vertical angle (α), the network adjustment should be
performed in the spherical coordinate system instead of the Cartesian coordinate system.
Variance component esitmation should be performed to ensure proper weighting of the
observations. After each individual epoch has been properly adjusted, a series of statistical
tests such as Bartlett’s Test and the Global Congruency Test can be carried out. Every target
point should be tested for movement after the contribution of each point to the network has
been isolated. The target point with the most significant movement is eliminated from the
datum using the S-transformation. This point localization/isolation and elimination repeats
until no statistically significant movements among the target points are detected. The
effectiveness of this deformation analysis method depends greatly on the target measurement
accuracy. In the next section, a least-squares approach for deriving the centroid of a
checkerboard type target in a laser scanner point cloud is explained.
2.1.1 Checkerboard/chessboard Target Centroid Extraction Algorithm
The centroid of a checkerboard target (Figure 1a) can be measured semi-automatically in a
similar fashion as measuring the centroid of circular planar targets (Chow et al., 2010a). A
seed point is manually selected near the centroid of the target. The target can then be
segmented from the point cloud based on a fixed radial distance (Figure 1b). Since the target
is planar, the parameters of the best-fit plane can be computed using either least-squares
adjustment or orthogonal regression (Shakarji, 1998) and the point cloud can be rotated into
the plane’s coordinate system. The irregular structure of a laser scanner point cloud makes it
difficult to identify sharp transitions in radiometric properties, so the point cloud is resampled
using bilinear interpolation. The edges of the checkerboard in the gridded intensity image can
then be extracted with ease using a high-pass filter, such as the Canny edge detector (Figure
1c). The two edges (crosshairs) of the target can be separated using RANSAC line fitting and
the planimetric centroid of the signalized target is defined as the intersection of the two lines
with a least-squares constraint maintaining the orthogonality of the lines. The orthogonal
distance to the best-fit plane gives the third dimension of the centroid. Finally, after reversing
the rotations, the 3D coordinates of the checkerboard target in the scanner space are obtained
(Figure 1d). This method works well regardless of the checkerboard target orientation and
with low density point clouds as well. The accuracy of the extracted centroids using this
method is similar to measurements made with the Leica Cyclone software. Major benefits of
this method compared to Cyclone are efficiency, reduced human interaction, and full
variance-covariance information for every target.

Joint International Symposium on Deformation Monitoring
Jacky C.K. Chow, William F. Teskey, and J.W. (Bill) Lovse
In-situ Self-calibration of Terrestrial Laser Scanners and Deformation Analysis Using Both Signalized Targets
and Intersection of Planes for Indoor Applications
14th FIG Symposium on Deformation Measurements and Analysis, 5th IAG Symposium on Geodesy for
Geotechnical and Structural Engineering, and 2nd International Workshop on Spatial Information Technologies
for Monitoring the Deformation of Large-Scale Man-Made Linear Features
Hong Kong, China, November 2-4, 2011
4/15
(a) (b) (c) (d)
Figure 1: a) Digital image of the checkerboard target design. b) Point cloud of the signalized
target after segmentation with the colour difference indicating the difference in intensity. c)
Binary image of the target after performing Canny edge detector to the gridded intensity
image. d) The centroid of the target measured as the intersection of two orthogonal lines.
2.2 Plane-based Deformation Analysis Method
One of the benefits of active 3D imaging sensors like TLS instruments is their ability to make
dense measurements on smooth surfaces without the need of any textures. In urban
environments, planar features are encountered frequently. In addition, among the various
geometric features, planes are one of the easiest to model mathematically. Deformation
analysis using planar features had been proposed previously by Lindenbergh et al. (2005) and
Gielsdorf et al. (2008). In this paper, a simpler deformation analysis technique using planes is
presented. It is based on a network of intersection points; therefore at each epoch more than
one scan needs to be captured with no less than four non-parallel planes. This new method
begins by extracting planes with various orientations and distances from the point cloud (e.g.
the ceiling, walls, and floor). This can be achieved either through manual segmentation or
automatic classification and segmentation of features in the point cloud (Vosselman et al.,
2004; and Belton & Lichti, 2006). The best-fit plane parameters for every flat surface are
estimated using least-squares adjustment with the observations expressed in the spherical
coordinate system. To accommodate for the varying incidence angle of the laser, the standard
deviation for the range observations is set to be proportional to the secant of the incidence
angle (Soudarissanane et al., 2011). After computing the plane parameters, intersection points
can be uniquely determined from the intersection of three planes and used as targets. Given m
number of planes, the maximum number of intersection points is mC3. However, if any two of
the three planes are nearly parallel, an accurate intersection point is unlikely to be achievable.
An intersection point is best determined geometrically when the three planes are mutually
orthogonal. Hence, only planes with an intersection angle greater than a threshold value
should be utilized for determining the intersection points. These intersection points will serve
as targets in each scan, and since there is point-to-point correspondence, the conventional
point-based deformation analysis technique explained in Section 2.1 can be directly applied.
This approach is more effective than merely using the points of maximum curvature in the
point cloud because even virtual corners can be used as targets in the network adjustment,
which increases the redundancy.

Joint International Symposium on Deformation Monitoring
Jacky C.K. Chow, William F. Teskey, and J.W. (Bill) Lovse
In-situ Self-calibration of Terrestrial Laser Scanners and Deformation Analysis Using Both Signalized Targets
and Intersection of Planes for Indoor Applications
14th FIG Symposium on Deformation Measurements and Analysis, 5th IAG Symposium on Geodesy for
Geotechnical and Structural Engineering, and 2nd International Workshop on Spatial Information Technologies
for Monitoring the Deformation of Large-Scale Man-Made Linear Features
Hong Kong, China, November 2-4, 2011
5/15
Although the point-based deformation analysis approach is widely adopted, it has its
limitations. One of the drawbacks of the point-based deformation analysis technique is that
only 3D translational movements can be estimated for the targets. Compared to total stations,
one of the advantages of TLS instruments is that the entire scene is mapped, rather than just
individual target points. By using geometric primitives such as planes instead of points,
rotational movements can be recovered in addition to the translational movements. After the
intersection points with significant deformations are identified, the planes which might have
moved can be easily recognized if the composition of each intersection point is known. The
plane that composes the majority of deformed intersection points, especially the points with
the most statistically significant deformations, is identified and the movement of that plane is
calculated. By assuming that all planes behave as rigid bodies, the three rotations and three
translations of a particular plane between two epochs can be estimated using the rigid body
transformation. The intersection points belonging to the moving plane in both epochs will be
the observations. This can be accomplished efficiently without any initial approximations
using Horn’s Method (Horn, 1987). Although six degrees of freedom can be calculated, not
all of them are physically realized because translations orthogonal to the normal axis and
rotations about the normal axis of the plane cannot be measured. Alternatively, the rotational
and translational movements of a plane can be estimated as the spatial angle between the
normal axes of the moving plane and the change in orthogonal distance, respectively. This
method of deformation analysis eliminates the need for signalized targets and is a simple
modification to the well-established point-based deformation analysis technique. It is based
on free-stationing and it can detect and measure deformations in the scene automatically.
3. RESULTS FROM SIMULATION
3.1 Point-based Deformation Simulation
To determine the achievable level of accuracy and precision when using TLS instruments
with the conventional point-based deformation analysis technique, a simulation is performed.
A 14 m by 11m by 3m rectangular room is designed with 62 targets randomly distributed on
the walls, floor, and ceiling (Figure 2). Six scans were captured from two locations, where at
each location the scanner has an initial heading that is rotated 120o clockwise from the
previous one. The scanner is assumed to have an unrestricted field of view with a range
precision of 1mm and an angular measurement precision of 15”. These values were chosen
based on a recent self-calibration of the Leica HDS6100 scanner. Data from two epochs were
simulated with the same scanner design and similar network geometry. In the second epoch,
two targets at different distances away from the first scan station (3.5m and 11m) were
shifted. For the closer target, a 5cm translation in the x-direction was introduced and for the
farther target, 5cm translations in both the y-direction and negative x-direction were
introduced. The recovered translations (Tx, Ty, and Tz) along with their standard deviations
(σTx, σTy, and σTz) are presented in Table 1. In this simulation, it appears the deformation can
be recovered with accuracy and precision better than the millimeter-level.

Joint International Symposium on Deformation Monitoring
Jacky C.K. Chow, William F. Teskey, and J.W. (Bill) Lovse
In-situ Self-calibration of Terrestrial Laser Scanners and Deformation Analysis Using Both Signalized Targets
and Intersection of Planes for Indoor Applications
14th FIG Symposium on Deformation Measurements and Analysis, 5th IAG Symposium on Geodesy for
Geotechnical and Structural Engineering, and 2nd International Workshop on Spatial Information Technologies
for Monitoring the Deformation of Large-Scale Man-Made Linear Features
Hong Kong, China, November 2-4, 2011
6/15
Figure 2: Geometry of simulated room used in the point-based deformation test. The
magenta, green, and blue lines indicate the x, y, and z axis of the scan stations, respectively.
The black and red dot represent the targets that will be shifted.
Table 1: Recovered translational movement of targets using the point-based deformation
analysis method in simulation
Target Dist
(m) Tx (cm) Ty (cm) Tz (cm) σTx (cm) σTy (cm) σTz (cm)
3.5 5.01 0.02 -0.01 0.06 0.02 0.02
11.0 -4.93 4.95 -0.05 0.05 0.05 0.04
3.2 Plane-based Deformation Simulation
In the plane-based deformation scenario, a room with similar dimensions as before is
simulated. There are 8 walls, a ceiling, and a floor arranged to simulate the actual room used
in the real experiment (Figure 3). A scanner with the same specifications as before is
simulated. Six scans from two locations at the opposite corners of the room were captured,
with the assumption that the scanner’s field of view was not being obstructed. A 15cm by
15cm plane located either 3.5m north of the first scan station or 8m east of the first scan
station was moved in the second epoch. A total of 21 planes were segmented in each epoch,
and 200 randomly distributed points are observed on each segmented plane. This point
density is low for modern terrestrial laser scanners, and is chosen to demonstrate the
achievable performance of the proposed method even with low-density point clouds. Table 2
shows the recoverability of the proposed plane-based deformation method for both
translational and rotational movements. The recovered translations are precise and accurate to
a level better than sub-millimetre. Rotational movements are measured within precision and
accuracy of a few arc minutes.

Joint International Symposium on Deformation Monitoring
Jacky C.K. Chow, William F. Teskey, and J.W. (Bill) Lovse
In-situ Self-calibration of Terrestrial Laser Scanners and Deformation Analysis Using Both Signalized Targets
and Intersection of Planes for Indoor Applications
14th FIG Symposium on Deformation Measurements and Analysis, 5th IAG Symposium on Geodesy for
Geotechnical and Structural Engineering, and 2nd International Workshop on Spatial Information Technologies
for Monitoring the Deformation of Large-Scale Man-Made Linear Features
Hong Kong, China, November 2-4, 2011
7/15
Figure 3: Top view of the simulated room used for testing the plane-based deformation
analysis method. The magenta and green lines indicate the x and y axes of a scan station,
respectively.
Table 2: Recovered translational and rotational movement of the planes using the newly
proposed markerless method in simulation
Target Dist
(m)
True Deformation Recovered Deformation
Shift (cm) Rotation Shift (cm) σshift (cm) Rotation σrotation
3.5 5.000 10o00’00” 5.000 0.004 10
o02’04” 0
o02’46”
8.0 5.000 10o00’00” 5.000 0.003 9
o59’21” 0
o02’34”
4. RESULTS FROM REAL DATA
4.1 Point-based Deformation Results
Three separate datasets were captured in a 14m by 11m by 3m room at the University of
Calgary (Figure 4a). Each dataset consisted of signalized targets acquired by the TLS
instrument at different positions and orientations. Translational movements were introduced
between the two epochs using a bi-directional translation stage (Figure 4b). In the first
dataset, six levelled scans were captured using the Leica HDS6100 laser scanner in both
epochs. The scanner occupied two locations with varying heading orientations. A total of 62
checkerboard-style signalized targets were fixed to the walls, ceiling, and floor. In the second
epoch, the scanner was set up at locations similar to the first epoch. Since the deformation
analysis technique being tested is based on free-stationing, the scanner location does not need
to be reestablished accurately between the two epochs. In the second dataset, 99
checkerboard targets were scanned using the HDS6100. The two epochs were captured a day
apart and on each day four scans were acquired from two different locations. The last dataset
consisted of 84 checkerboard targets. Comparable to the second dataset, four levelled scans
were captured from two locations in both epochs. However, in this case the first epoch was

Joint International Symposium on Deformation Monitoring
Jacky C.K. Chow, William F. Teskey, and J.W. (Bill) Lovse
In-situ Self-calibration of Terrestrial Laser Scanners and Deformation Analysis Using Both Signalized Targets
and Intersection of Planes for Indoor Applications
14th FIG Symposium on Deformation Measurements and Analysis, 5th IAG Symposium on Geodesy for
Geotechnical and Structural Engineering, and 2nd International Workshop on Spatial Information Technologies
for Monitoring the Deformation of Large-Scale Man-Made Linear Features
Hong Kong, China, November 2-4, 2011
8/15
captured using the Trimble GS200 laser scanner and after a few hours the second epoch was
captured using the HDS6100.
(a) (b)
Figure 4: a) Room used for the deformation analysis experiments. b) Signalized target
mounted on a translation stage
In the first dataset, two checkerboard targets that were 3.5m and 11m away from the first scan
station were translated between the two epochs. The closer target was moved 5cm north and
the farther target was moved 5cm north and 5cm west. The normal axes of both planar
checkerboard targets were pointing towards the scanner. Table 3 shows the recovered
deformations for both targets using the conventional point-based deformation technique.
Over a short duration of time and using the same scanner, performing self-calibration of the
scanner was deemed unnecessary, even though significant systematic errors were identified.
With or without the sensor error modeling the translational movements can be measured with
sub-millimetre level accuracy and precision.
Table 3: Recovered translational movement of targets from applying the point-based
deformation analysis method to the first dataset
Target Dist
(m) Tx (cm) Ty (cm) Tz (cm) σTx (cm) σTy (cm) σTz (cm)
3.5 5.01 0.01 0.05 0.04 0.04 0.03
11 -4.98 5.01 0.05 0.08 0.09 0.09
The second dataset had two targets that were approximately 4m and 8m away from the first
scan station. The farther target faced the scanner, while the closer target was rotated 45o away
from the scanner. The introduced and recovered deformations for this dataset are given in
Table 4. Similar to the first dataset, the deformations are measured with sub-millimetre level
accuracy even without self-calibration.

Joint International Symposium on Deformation Monitoring
Jacky C.K. Chow, William F. Teskey, and J.W. (Bill) Lovse
In-situ Self-calibration of Terrestrial Laser Scanners and Deformation Analysis Using Both Signalized Targets
and Intersection of Planes for Indoor Applications
14th FIG Symposium on Deformation Measurements and Analysis, 5th IAG Symposium on Geodesy for
Geotechnical and Structural Engineering, and 2nd International Workshop on Spatial Information Technologies
for Monitoring the Deformation of Large-Scale Man-Made Linear Features
Hong Kong, China, November 2-4, 2011
9/15
Table 4: Recovered translational movement of targets from applying the point-based
deformation analysis method to the second dataset
Target Dist (m) True Translation (cm) Recovered Translation (cm)
4 5.00 5.00
8 5.00 5.01
The final dataset had two targets set up in similar fashion as the second dataset. Table 5
shows the quality of the point-based deformation analysis method before and after on-site
TLS self-calibration. The self-calibration is performed based on the approach explained in
Lichti (2007) and following the same notations, the error models for the GS200 and HDS6100
are given in Equations 1 and 2, respectively. The statistically significant systematic errors for
the GS200 are the rangefinder offset (a0) and horizontal encoder circle eccentricity (b8). The
significant systematic errors for the HDS6100 were different from the GS200; they were the
laser axis vertical offset (a2) and the non-orthogonality of encoder circle and vertical axis (b3
and b4). The value of each systematic error along with its standard deviation is shown in
Table 6.
Table 5: Recovered translational movement of targets from applying the point-based
deformation analysis method to the third dataset before and after TLS self-calibration
Target Dist (m) True Translation
(cm)
Recovered Translation (cm)
Before Calibration After Calibration
4 5.00 4.75 4.99
8 5.00 4.55 4.94
cos80 ba 1
2cos2sinsin 432 bba 2
Table 6: Statistically significant systematic errors for the HDS6100 and GS200
Coefficient Value Standard Deviation
a0 [mm] 2.9 0.7
a2 [mm] 1.4 0.6
b3 [”] -8.0 4.0
b4 [”] -13.4 3.7
b8 [”] 39.2 10.5
When the two epochs are captured over a short period of time, the intrinsic parameters of the
HDS6100 are relatively stable, and since deformation analysis can be thought of as a simple
subtraction process, majority of the unmodelled systematic errors are reduced if not
eliminated through subtraction. In Lichti (2007) and Chow et al. (2010b), it has been shown
that for some laser scanners, the short-term stability of the systematic errors could be in
Joint International Symposium on Deformation Monitoring
Jacky C.K. Chow, William F. Teskey, and J.W. (Bill) Lovse
In-situ Self-calibration of Terrestrial Laser Scanners and Deformation Analysis Using Both Signalized Targets
and Intersection of Planes for Indoor Applications
14th FIG Symposium on Deformation Measurements and Analysis, 5th IAG Symposium on Geodesy for
Geotechnical and Structural Engineering, and 2nd International Workshop on Spatial Information Technologies
for Monitoring the Deformation of Large-Scale Man-Made Linear Features
Hong Kong, China, November 2-4, 2011
10/15
question. From the second dataset, it appears that even though there is a slight difference in
calibration parameters for the HDS6100 over a 24 hour period, the effect on the point cloud is
negligible. However, if different scanners were used to acquire the data, sensor calibration is
critical in high accuracy applications even if the data is captured on the same day. From
Table 5 it can be seen that the accuracy of deformation measurements can be improved by an
order of magnitude after self-calibration. If the same scanner is used for both epochs, but the
two epochs are far apart and/or there are reasons to suspect the instability of the sensor’s
interior orientation parameters, TLS self-calibration should still be performed.
4.2 Plane-based Deformation Results
The same point clouds from datasets 1 and 2 in the point-based deformation experiment above
were used for testing the plane-based deformation method. Instead of using signalized
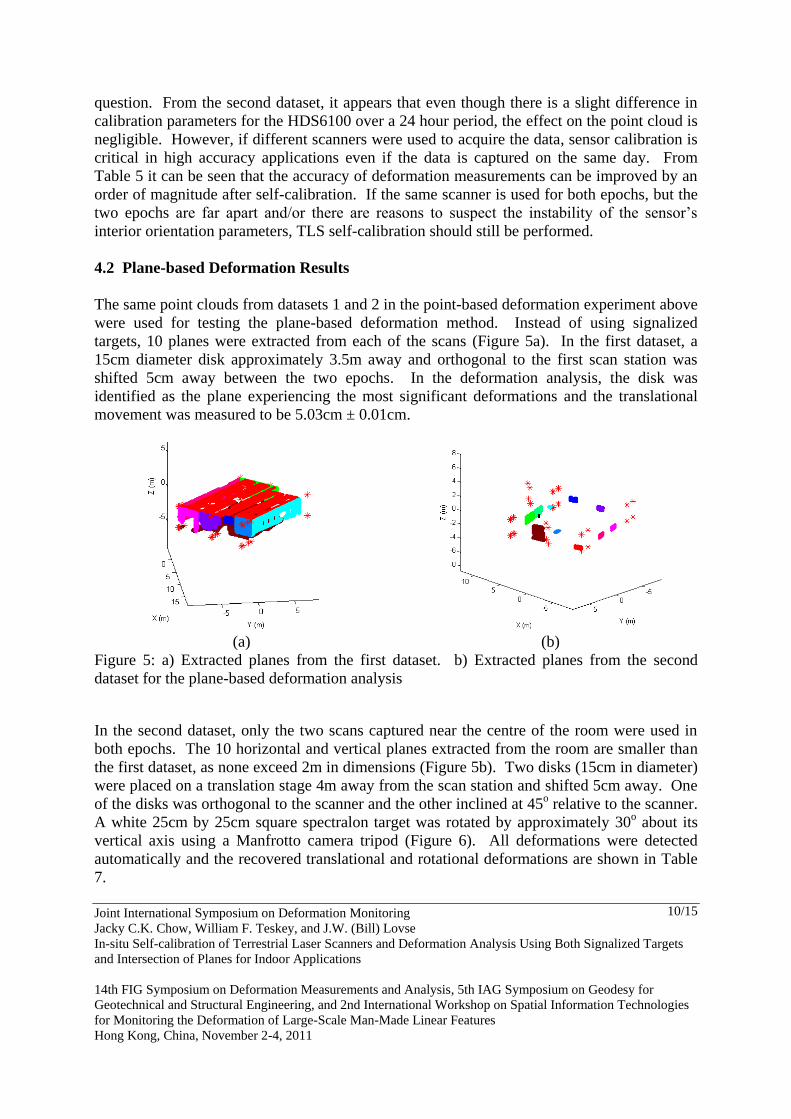
targets, 10 planes were extracted from each of the scans (Figure 5a). In the first dataset, a
15cm diameter disk approximately 3.5m away and orthogonal to the first scan station was
shifted 5cm away between the two epochs. In the deformation analysis, the disk was
identified as the plane experiencing the most significant deformations and the translational
movement was measured to be 5.03cm ± 0.01cm.
(a) (b)
Figure 5: a) Extracted planes from the first dataset. b) Extracted planes from the second
dataset for the plane-based deformation analysis
In the second dataset, only the two scans captured near the centre of the room were used in
both epochs. The 10 horizontal and vertical planes extracted from the room are smaller than
the first dataset, as none exceed 2m in dimensions (Figure 5b). Two disks (15cm in diameter)
were placed on a translation stage 4m away from the scan station and shifted 5cm away. One
of the disks was orthogonal to the scanner and the other inclined at 45o relative to the scanner.
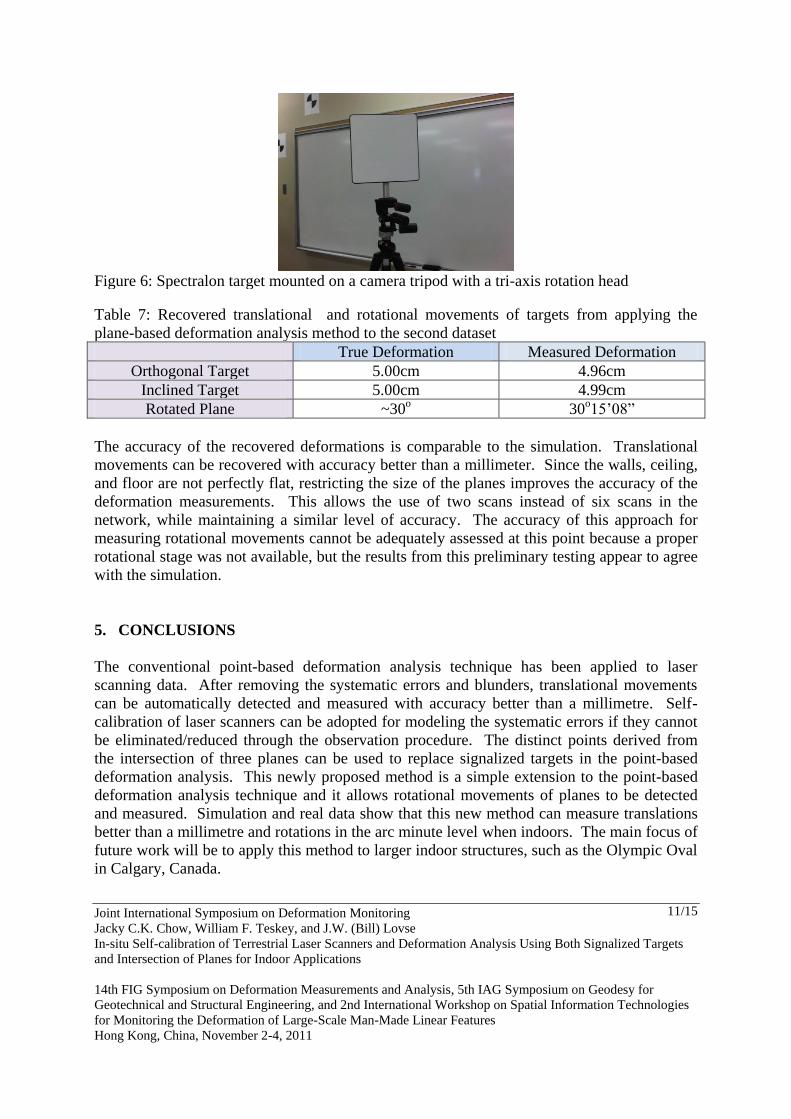
A white 25cm by 25cm square spectralon target was rotated by approximately 30o about its
vertical axis using a Manfrotto camera tripod (Figure 6). All deformations were detected
automatically and the recovered translational and rotational deformations are shown in Table
7.
Joint International Symposium on Deformation Monitoring
Jacky C.K. Chow, William F. Teskey, and J.W. (Bill) Lovse
In-situ Self-calibration of Terrestrial Laser Scanners and Deformation Analysis Using Both Signalized Targets
and Intersection of Planes for Indoor Applications
14th FIG Symposium on Deformation Measurements and Analysis, 5th IAG Symposium on Geodesy for
Geotechnical and Structural Engineering, and 2nd International Workshop on Spatial Information Technologies
for Monitoring the Deformation of Large-Scale Man-Made Linear Features
Hong Kong, China, November 2-4, 2011
11/15
Figure 6: Spectralon target mounted on a camera tripod with a tri-axis rotation head
Table 7: Recovered translational and rotational movements of targets from applying the
plane-based deformation analysis method to the second dataset
True Deformation Measured Deformation
Orthogonal Target 5.00cm 4.96cm
Inclined Target 5.00cm 4.99cm
Rotated Plane ~30o 30
o15’08”
The accuracy of the recovered deformations is comparable to the simulation. Translational
movements can be recovered with accuracy better than a millimeter. Since the walls, ceiling,
and floor are not perfectly flat, restricting the size of the planes improves the accuracy of the
deformation measurements. This allows the use of two scans instead of six scans in the
network, while maintaining a similar level of accuracy. The accuracy of this approach for
measuring rotational movements cannot be adequately assessed at this point because a proper
rotational stage was not available, but the results from this preliminary testing appear to agree
with the simulation.
5. CONCLUSIONS
The conventional point-based deformation analysis technique has been applied to laser
scanning data. After removing the systematic errors and blunders, translational movements
can be automatically detected and measured with accuracy better than a millimetre. Self-
calibration of laser scanners can be adopted for modeling the systematic errors if they cannot
be eliminated/reduced through the observation procedure. The distinct points derived from
the intersection of three planes can be used to replace signalized targets in the point-based
deformation analysis. This newly proposed method is a simple extension to the point-based
deformation analysis technique and it allows rotational movements of planes to be detected
and measured. Simulation and real data show that this new method can measure translations
better than a millimetre and rotations in the arc minute level when indoors. The main focus of
future work will be to apply this method to larger indoor structures, such as the Olympic Oval
in Calgary, Canada.

Joint International Symposium on Deformation Monitoring
Jacky C.K. Chow, William F. Teskey, and J.W. (Bill) Lovse
In-situ Self-calibration of Terrestrial Laser Scanners and Deformation Analysis Using Both Signalized Targets
and Intersection of Planes for Indoor Applications
14th FIG Symposium on Deformation Measurements and Analysis, 5th IAG Symposium on Geodesy for
Geotechnical and Structural Engineering, and 2nd International Workshop on Spatial Information Technologies
for Monitoring the Deformation of Large-Scale Man-Made Linear Features
Hong Kong, China, November 2-4, 2011
12/15
ACKNOWLEDGEMENTS
Research funding provided by the Natural Sciences and Engineering Research
Council of Canada, Alberta Innovates, and Informatics Circle of Research Excellence,
Terramatics Technologies Inc., and SarPoint Engineering Ltd. is gratefully acknowledged.
The authors would also like to thank Kathleen Ang for proof-reading and editing this paper.
REFERENCES
Alba, M., & Scaioni, M. (2010). Automatic detection of changes and deformation in rock
faces by terrestrial laser scanning. Proceedings of the ISPRS Commission V Mid-Term
Symposium on Close Range Image Measurement Techniques, vol. XXXVIII.
Belton, D., & Lichti, D. (2006). Classification and segmentation of terrestrial laser scanner
point clouds using local variance information. The Internation Archives of the
photogrammetry, Remote Sensing, and Spatial Information Sciences, Vol. XXXVI, Part 5 , 44-
49.
Chow, J., Ebeling, A., & Teskey, W. (2010a). Low Cost Artificial Planar Target Measurement
Techniques for Terrestrial Laser Scanning. FIG Congress 2010: Facing the Challenges -
Building the Capacity. Sydney, Australia, April 11-16.
Chow, J., Teskey, W., & Lichti, D. (2010b). Self-calibration and evaluation of the Trimble
GX terrestrial laser scanner. The International Archives of the Photogrammery, Remote
Sensing and Spatial Information Sciences 38 (Part 1).
Gielsdorf, F., Gruendig, L., & Milev, I. (2008). Deformation analysis with 3D laser scanning.
Measuring the Changes - 13th FIG Symposium on Deformation Measurement and Analysis &
4th IAG Symposium on Geodesy for Geotechnical and Structural Engineering (In CD-ROM).
Lisbon, Portugal. May 12-15.
Gordon, S., & Lichti, D. (2007). Modeling terrestrial laser scanner data for precise structural
deformation measurement. Journal of Surveying Engineering 133(2), 72-80.
Gründig, L., Neureither, M., & Bahndorf, J. (1985). Detection and localization of geometrical
movements. Journal of Surveying Engineering 111 , 118–132.
Horn, B. (1987). Closed-form solution of absolute orientation using unit quaternions. J. Opt.
Soc. Amer. A, 4(4) , 629-642.
Lichti, D. (2007). Modelling, calibration and analysis of an AM-CW terrestrial laser scanner.
ISPRS Journal of Photogrammetry and Remote Sensing 61 (5) , 307-324.

Joint International Symposium on Deformation Monitoring
Jacky C.K. Chow, William F. Teskey, and J.W. (Bill) Lovse
In-situ Self-calibration of Terrestrial Laser Scanners and Deformation Analysis Using Both Signalized Targets
and Intersection of Planes for Indoor Applications
14th FIG Symposium on Deformation Measurements and Analysis, 5th IAG Symposium on Geodesy for
Geotechnical and Structural Engineering, and 2nd International Workshop on Spatial Information Technologies
for Monitoring the Deformation of Large-Scale Man-Made Linear Features
Hong Kong, China, November 2-4, 2011
13/15
Lindenbergh, R., & Pfeifer, N. (2005). A statistical deformation analysis of two epochs of
terrestrial laser data of a lock. In Proceedings of Optical 3D Measurement Techniques, Vol II,
(s. 61-70). Vienna, Austria.
Monserrat, O., & Crosetto, M. (2008). Deformation measurement using terrestrial laser
scanning data and least squares 3D surface matching. ISPRS Journal of Photogrammetry and
Remote Sensing 63(1), 142-154.
Rönnholm, P., Nuikka, M., Suomine, A., Salo, P., Hyyppa, H., Pontinen, P., et al. (2009).
Comparison of measurement techniques and static theory applied to concrete beam
deformation. Photogrammetric Record 24(128), 351–371.
Shakarji, C. (1998). Least-squares fitting algorithms of the NIST algorithm testing system.
Journal of Research of the National Institute of Standards and Technology 103 (6) , 633-641.
Soudarissanane, S., Lindenbergh, R., Menenti, M., & Teunissen, P. (2011). Scanning
geometry: Influencing factor on the quality of terrestrial laser scanning points. ISPRS Journal
of Photogrammetry and Remote Sensing, 66(4) , 389-399.
Vosselman, G., Gorte, B., Sithole, G., & Rabbani, T. (2004). Recognising structure in laser
scanner point clouds. International Archives of Photogrammetry, Remote Sensing and Spatial
Information Sciences 46(8/W2) , 33-38.

Joint International Symposium on Deformation Monitoring
Jacky C.K. Chow, William F. Teskey, and J.W. (Bill) Lovse
In-situ Self-calibration of Terrestrial Laser Scanners and Deformation Analysis Using Both Signalized Targets
and Intersection of Planes for Indoor Applications
14th FIG Symposium on Deformation Measurements and Analysis, 5th IAG Symposium on Geodesy for
Geotechnical and Structural Engineering, and 2nd International Workshop on Spatial Information Technologies
for Monitoring the Deformation of Large-Scale Man-Made Linear Features
Hong Kong, China, November 2-4, 2011
14/15
BIOGRAPHICAL NOTES
Jacky is currently a PhD student studying in the Geomatics Engineering department at the
University of Calgary. He specializes in close-range digital imaging techniques for accurate
3D object space reconstruction and deformation monitoring. His research interests include:
imaging sensor error modelling (e.g. self-calibration of terrestrial laser scanners, digital
medium format cameras, and 3D range cameras), point cloud manipulation and processing
(e.g. geometric form fitting, feature extraction, and classification), markerless point cloud
registration techniques (e.g. ICP), multi-sensor integration, and deformation analysis.
Dr. William (Bill) Teskey is a Professor in the Department of Geomatics Engineering at the
University of Calgary. He is a registered Professional Engineer in Alberta and a registered
Land Surveyor in Alberta and Canada. Bill served for a number of years on the Western
Canadian Board of Examiners for Land Surveyors and on the Board of Examiners of the
Association of Professional Engineers, Geologists and Geophysicists of Alberta. His areas of
interest are precise engineering and deformation surveys.
Bill Lovse is the Principal of Terramatic Technologies, Inc., Calgary, Alberta. Terramatic
Technologies is an Industrial Partner in the "Low-Cost High-Precision Indoor/Outdoor 3D
Laser Scanning" NSERC Collaborative Research and Development Project in which Jacky
Chow is the Senior PhD Student and Bill Teskey is the Principal Investigator.

Joint International Symposium on Deformation Monitoring
Jacky C.K. Chow, William F. Teskey, and J.W. (Bill) Lovse
In-situ Self-calibration of Terrestrial Laser Scanners and Deformation Analysis Using Both Signalized Targets
and Intersection of Planes for Indoor Applications
14th FIG Symposium on Deformation Measurements and Analysis, 5th IAG Symposium on Geodesy for
Geotechnical and Structural Engineering, and 2nd International Workshop on Spatial Information Technologies
for Monitoring the Deformation of Large-Scale Man-Made Linear Features
Hong Kong, China, November 2-4, 2011
15/15
CONTACTS
Jacky C.K. Chow
Department of Geomatics Engineering
Schulich School of Engineering, University of Calgary
2500 University Drive N.W.
Calgary, Alberta, T2N 1N4
Canada
Tel. +1 (403) 220-3582
Fax + 1 (403) 284-1980
Email: [email protected]
Prof. Dr. William F. Teskey
Department of Geomatics Engineering
Schulich School of Engineering, University of Calgary
2500 University Drive N.W.
Calgary, Alberta, T2N 1N4
Canada
Tel. +1 (403) 220-7397
Fax + 1 (403) 284-1980
Email: [email protected]
J.W. (Bill) LOVSE
Terramatic Technologies Inc
Suite 12, 5080 12a St SE
Calgary, Alberta, T2G 5K9
Tel. +1 (403) 214-3655
Fax +1 (403) 214-1428
Email: [email protected]
Copyright © 2022 FDOKUMEN