Modeling Signalized-Intersection Safety with Corner Clearance

International Journal of Transportation
Vol. 2, No. 2 (2014), pp.1-14
http://dx.doi.org/10.14257/ijt.2014.2.2.01
ISSN: 2287-7940 IJT
Copyright © 2014 SERSC
Simulation Based Analysis of Scramble Crossings at Signalized Intersections
Tran Vu Tu1 and Kazushi Sano
2
1, 2Department of Civil and Environmental Engineering, Nagaoka University of
Technology, Niigata, 940-2188, Japan
Abstract
This paper conducts an analysis of the effect of scramble crossings in comparison with that
of normal ones on the intersection performance by using simulation models. Based on real
data collected at a signalized intersection with normal crossings, the research firstly designs
and simulates the scenario of scramble crossings at the studied intersection. The paper
secondly analyses the effects of the scramble crossings and that of the normal ones under
various situations of traffic flow and pedestrian demand. The paper results show that the
scramble crossings keep the intersection level of service more stable than the normal ones
once the situations of traffic and pedestrian change. In terms of vehicle delay reduction, the
pedestrian demand plays an important role in the decisions of choosing the crossing type. The
higher the pedestrian demand is, the more advantageous the scramble crossings are. The
scramble crossings can reduce the vehicle delay significantly, by up to 35.74% compared
with the normal pedestrian crossings.
Keywords: Simulation, Scramble crossing, Diagonal crossing, Pedestrian
1. Introduction
1.1. Research Studies Related to Pedestrian
Pedestrians play a more and more important role in modern societies where public
transportation operates as a key role to ease traffic congestion. The attractiveness of the
public transportation encourages walking in any traffic system. At signalized intersections,
the interactions between crossing pedestrians and turning traffic streams affect the
performance of the intersections. Intuitively, these interactions become significant when the
number of crossing pedestrians is high. To improve the situation, scramble crossings or
diagonal crossings are promising deployments which have been applied in many countries
such as America, Canada, Japan, etc. However, research studies on scramble crossings are
still few. Most of the previous studies utilized real applications of scramble crossings to
conclude the bi-directional effects between pedestrians and vehicles or to find related
pedestrian behaviour. Some others developed simulation models to investigate the effects of
scramble crossings. However, the scopes of these research studies have limitations. A
criterion for city planners to decide the deployment of scramble crossings at a signalized
intersection is still a question mark.
Although there have been many research studies about the effects of pedestrians,
pedestrian behaviour, pedestrian safety, etc., in urban streets [26]. Very few research studies
about integration of pedestrians into simulation models to investigate the scramble crossings
are available. Indeed, most of the previous studies about pedestrians concentrated on
pedestrian behavior or pedestrian safety [5, 8, 9, 29, 30, 32, 33]. Some research studies focus
International Journal of Transportation
Vol. 2, No. 2, (2014)
2 Copyright ⓒ 2014 SERSC
on capacity analysis under the effects of pedestrian flow [3, 27]. These analyses were
conducted for Capacity of Right-Turn Movements at Signalized Intersections [28], or for
capacity of entire the signalized intersection with the presence of pedestrians or bicycles [4],
[14, 28]. Some others analyzed the conflicts between Right-Turning Vehicles and Pedestrians
at urban Signalized Intersections [24], or took pedestrian flow analyses [20], or studied on
Pedestrian Impedance of Turning-Movement Saturation Flow Rates [16]. Several papers
concluded the benefit based on real applications [7] or developed simulation models for the
interaction of vehicles and pedestrians to investigate trade-offs between vehicular and
pedestrian traffic [2, 15, 25, 31]. However, these studies stopped at investigating into impacts
on pedestrians as well as how the intersections perform under the confliction between
pedestrians and vehicles. Investigations or analyses concerning scramble crossings that are
very useful for the current tendency of developing a pedestrian-friendly environment were not
mentioned in these above research studies. Therefore, studies on the benefit of scramble
crossings are necessary and urgent.
Concerning scramble crossings, some research studies summarized the consequence of
conducting real study cases of scramble deployment [1, 7, 23]. However, these research
studies only ends at evaluation of the scramble crossing pedestrian in terms of determinations
of the number of pedestrian violations, the safe areas as well as conclusions on the rate of
pedestrian-vehicle conflicts, traffic delay or pedestrian delay, etc. Also relating to scramble
crossings, Muhammad [15] conducted micro-simulated comparisons of alternative signalized
pedestrian crossings including diagonal crossings by using VISSIM. However, the research
stops at studying the effects of four different signalized pedestrian crossing technologies on
various measures of effectiveness. A single set of vehicle and pedestrian demand could not
represent the dynamic traffic and pedestrian situations. In addition, the criteria of choosing
pedestrian crossing type have not been mentioned much in previous research studies.
Therefore, a study on the effects of scramble crossings in comparison with the normal
pedestrian crossings as well as the criteria for determination of the scramble crossings is
necessary for the development of a pedestrian-friendly environment.
1.2. Research Objective
The objective of this paper aims at two targets. The first target is the simulation of
scramble crossings in comparison with the current normal pedestrian crossings at a signalized
intersection in Nagaoka city of Japan. The second target is the analysis of the operation of
scramble crossings under various situations of traffic flow and pedestrian demand. Based on
the analysis, the research then suggests criteria for choosing scramble crossings in terms of
vehicle delay reduction.
2. Methodology
2.1. Evaluation Method
The vehicle delay at the studied intersection is output based on simulation models in
PARAMICS. To investigate the signalized intersection performance, the research adopts the
Level of Service (LOS) for intersections introduced in HCM 2010 [26]. The table is
expressed as follows:
International Journal of Transportation
Vol. 2, No. 2, (2014)
Copyright ⓒ 2014 SERSC 3
Table 1. Level of Service
Level of service Vehicle delay (s/veh)
A d≤10
B 10<d≤20
C 20<d≤35
D 35<d≤55
E 55<d≤80
F d>80
2.2. Integration of Pedestrians into Simulation Models in PARAMICS
Quadstone PARAMICS [18] allows simulating traffic and pedestrians for operational
assessment of current and future scenarios of traffic conditions including car, bus, tram,
cyclist, pedestrian, etc. By using the PARAMICS Pedestrian Module (PPM), the research
simulates the actions as well as interactions of autonomous individuals on the traffic system.
According to Quadstone PARAMICS [18], signalized pedestrian crossings can be modeled
using the concepts of agent type, agent space, region, connector, etc. The interaction between
pedestrians and vehicles is analysed through the concepts of shared spaces and vehicle aware
space. First of all, the research defines a study area of pedestrians at the studied intersection.
The Space types are then defined in the study area, including pedestrian space, shared
aggressive space, vehicle aware space, etc. The demand regions are defined to input the
demand of pedestrians at each approach of each intersection. These demand regions may
specify a source point for agents to be released onto a network or a destination point for
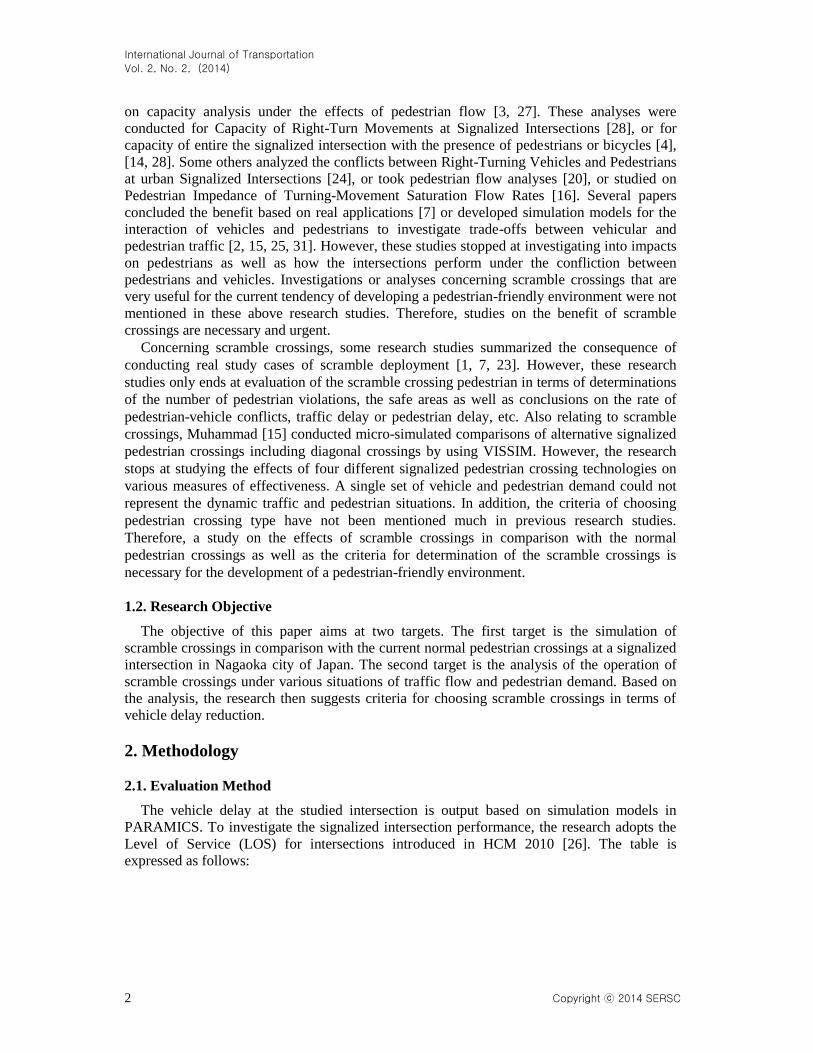
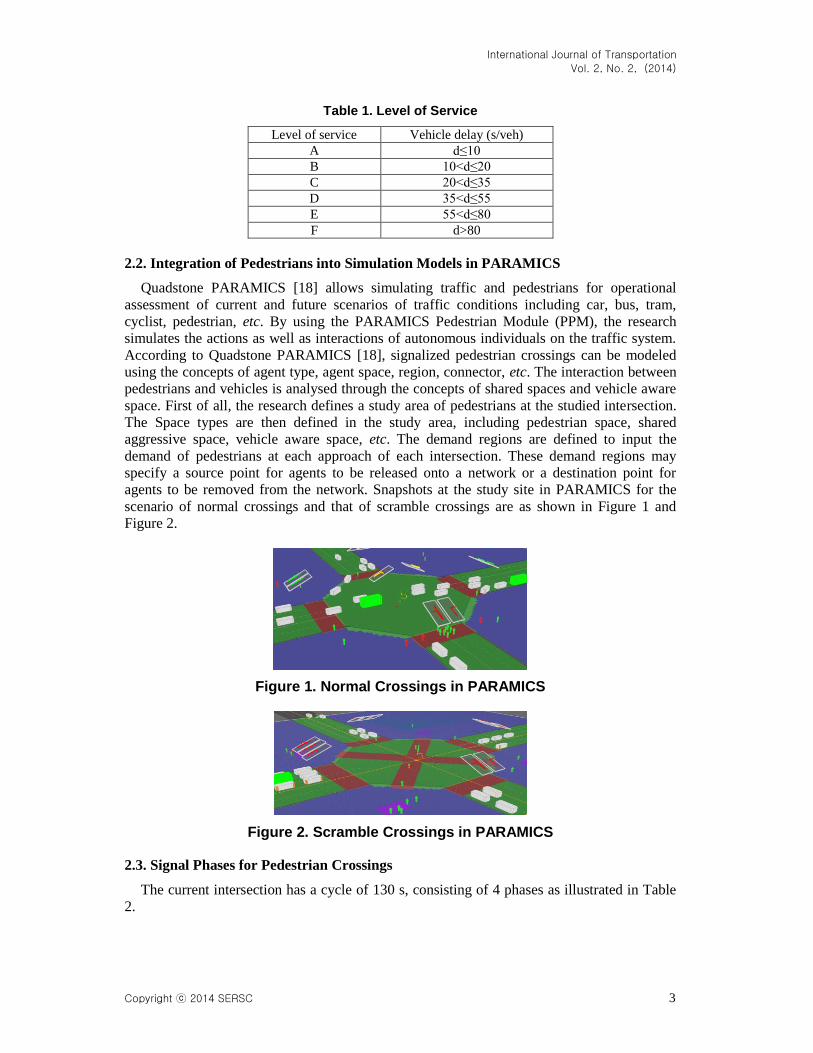
agents to be removed from the network. Snapshots at the study site in PARAMICS for the
scenario of normal crossings and that of scramble crossings are as shown in Figure 1 and
Figure 2.
Figure 1. Normal Crossings in PARAMICS
Figure 2. Scramble Crossings in PARAMICS
2.3. Signal Phases for Pedestrian Crossings
The current intersection has a cycle of 130 s, consisting of 4 phases as illustrated in Table
2.
International Journal of Transportation
Vol. 2, No. 2, (2014)
4 Copyright ⓒ 2014 SERSC
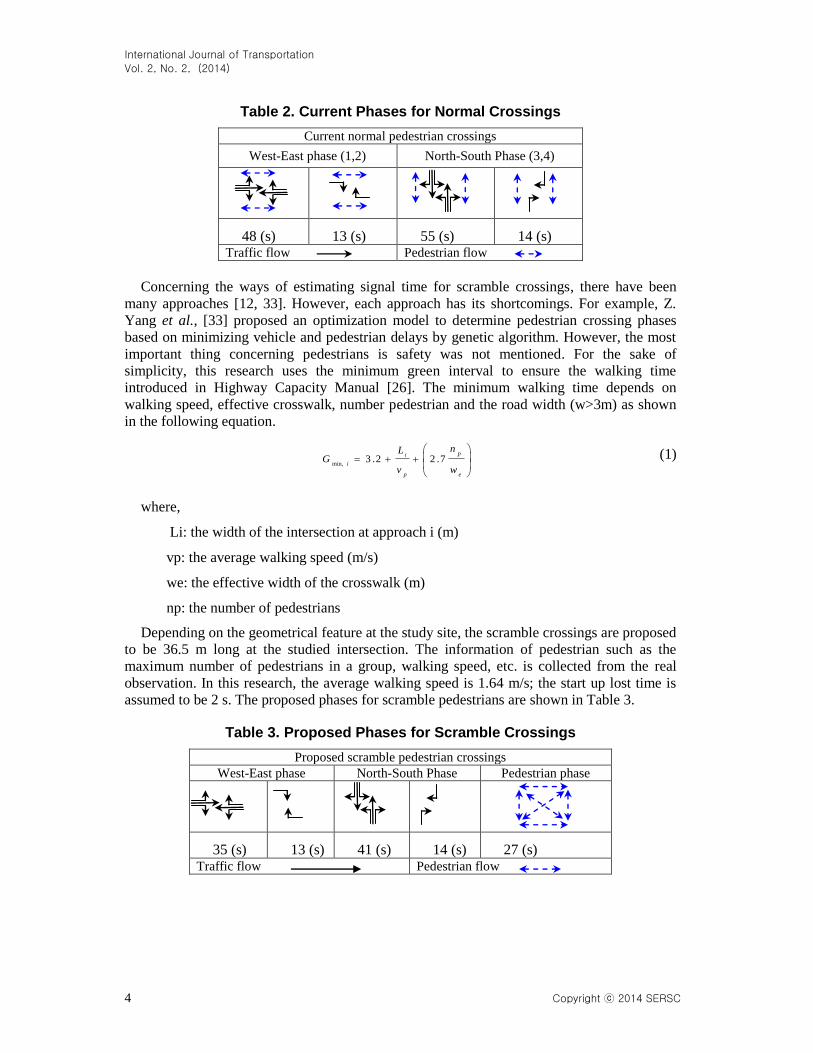
Table 2. Current Phases for Normal Crossings
Current normal pedestrian crossings
West-East phase (1,2) North-South Phase (3,4)
48 (s) 13 (s) 55 (s) 14 (s) Traffic flow Pedestrian flow
Concerning the ways of estimating signal time for scramble crossings, there have been
many approaches [12, 33]. However, each approach has its shortcomings. For example, Z.
Yang et al., [33] proposed an optimization model to determine pedestrian crossing phases
based on minimizing vehicle and pedestrian delays by genetic algorithm. However, the most
important thing concerning pedestrians is safety was not mentioned. For the sake of
simplicity, this research uses the minimum green interval to ensure the walking time
introduced in Highway Capacity Manual [26]. The minimum walking time depends on
walking speed, effective crosswalk, number pedestrian and the road width (w>3m) as shown
in the following equation.
e
p
p
i
i
w
n
v
LG 7.22.3
min,
(1)
where,
Li: the width of the intersection at approach i (m)
vp: the average walking speed (m/s)
we: the effective width of the crosswalk (m)
np: the number of pedestrians
Depending on the geometrical feature at the study site, the scramble crossings are proposed
to be 36.5 m long at the studied intersection. The information of pedestrian such as the
maximum number of pedestrians in a group, walking speed, etc. is collected from the real
observation. In this research, the average walking speed is 1.64 m/s; the start up lost time is
assumed to be 2 s. The proposed phases for scramble pedestrians are shown in Table 3.
Table 3. Proposed Phases for Scramble Crossings
Proposed scramble pedestrian crossings
West-East phase North-South Phase Pedestrian phase
35 (s) 13 (s) 41 (s) 14 (s) 27 (s) Traffic flow Pedestrian flow

International Journal of Transportation
Vol. 2, No. 2, (2014)
Copyright ⓒ 2014 SERSC 5
3. Study Location
The studied intersection is Otetsuri intersection, lying on Route No. 36 leading to Nagaoka
Station. This intersection is near Nagaoka station where there are lots of pedestrians moving.
According to a survey [22], Nagaoka city has a large network of bus routes with Nagaoka
Station as a hub. The station serves approximately 1500 buses operating, 11,600 railway
passengers and 25,000 bus users everyday. In addition, from April 1st 2012, Nagaoka city
Hall Plaza was setup near the intersection. This City Hall Plaza consists of the City Office,
Arena, the Roofed Open Plaza (Nakadoma), and many other facilities providing various
spaces for citizens to come together. Therefore, a huge number of pedestrians is predicted to
walk around here. Moreover, there are many restaurants, shopping centres, bus stops around
the intersection and along the road No. 351. The studied intersection as well as the four entry
approaches is as illustrated in Figure 3.
Figure 3. The Studied Intersection
The research used cameras to record the traffic and pedestrian flow as shown in Figure 3
during the peak hour from 8AM-9AM. The recorded videos are analyzed in Transportation
Lab by using a video based software (SEV) [13]. Based on the result of data analysis, the
traffic proportion at the studied site includes bus, car, small truck and big truck. Besides bus
routes, the traffic proportion with the figures is shown as in Figure 4.
96.2%
0.7%3.1%
Car Small truck Big truck
Figure 4. Traffic Proportion at the Studied Site
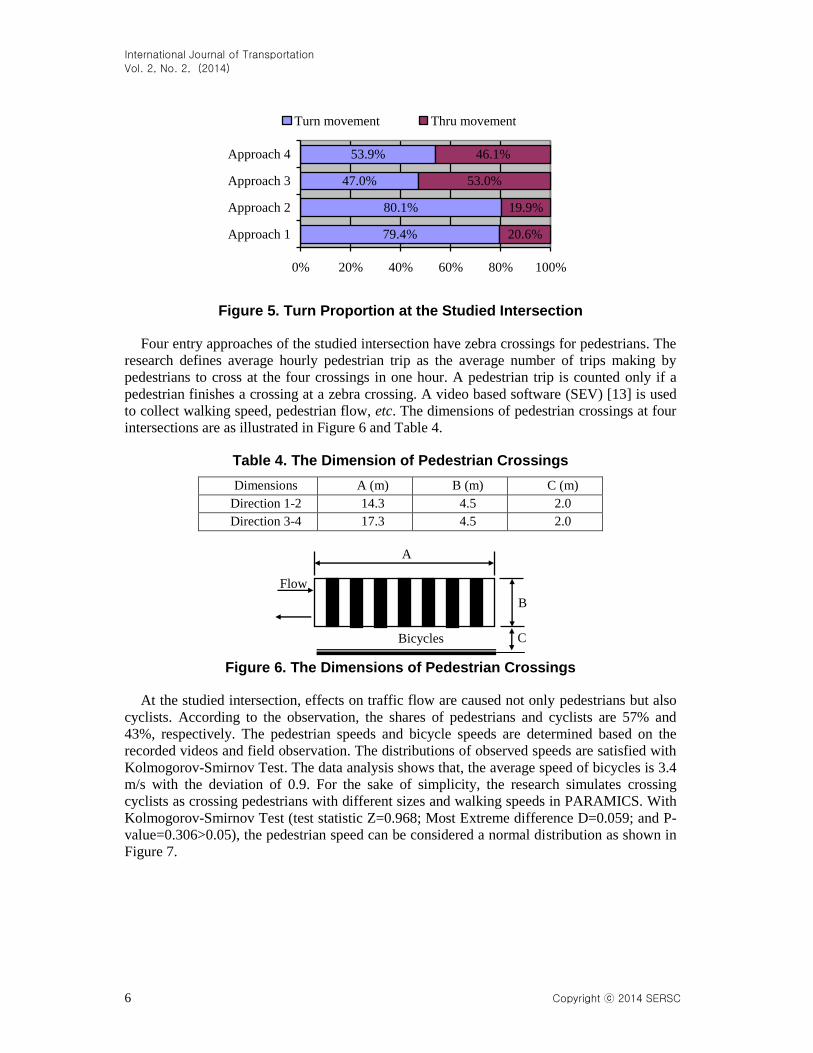
Because crossing pedestrians affect directly the turning left or right flows at signalized
intersections, the turn flow is an important factor. At the studied intersection, the proportion
of the turn flows (turning right and turning left) is high, up to 79.4% and 80.1% for approach
1 (traffic from Oteo bridge) and approach 2 (traffic from Nagaoka station), respectively. The
proportion of turn movement in comparison with that of through movement at the studied
intersection is as illustrated in Figure 5.
City Hall Plaza
Otetsuri intersection
1 2
3
4
Na
gao
ka
Sta
tion
Camera locations
International Journal of Transportation
Vol. 2, No. 2, (2014)
6 Copyright ⓒ 2014 SERSC
79.4%
80.1%
47.0%
53.9%
20.6%
19.9%
53.0%
46.1%
0% 20% 40% 60% 80% 100%
Approach 1
Approach 2
Approach 3
Approach 4
Turn movement Thru movement
Figure 5. Turn Proportion at the Studied Intersection
Four entry approaches of the studied intersection have zebra crossings for pedestrians. The
research defines average hourly pedestrian trip as the average number of trips making by
pedestrians to cross at the four crossings in one hour. A pedestrian trip is counted only if a
pedestrian finishes a crossing at a zebra crossing. A video based software (SEV) [13] is used
to collect walking speed, pedestrian flow, etc. The dimensions of pedestrian crossings at four
intersections are as illustrated in Figure 6 and Table 4.
Table 4. The Dimension of Pedestrian Crossings
Dimensions A (m) B (m) C (m)
Direction 1-2 14.3 4.5 2.0
Direction 3-4 17.3 4.5 2.0
Figure 6. The Dimensions of Pedestrian Crossings
At the studied intersection, effects on traffic flow are caused not only pedestrians but also
cyclists. According to the observation, the shares of pedestrians and cyclists are 57% and
43%, respectively. The pedestrian speeds and bicycle speeds are determined based on the
recorded videos and field observation. The distributions of observed speeds are satisfied with
Kolmogorov-Smirnov Test. The data analysis shows that, the average speed of bicycles is 3.4
m/s with the deviation of 0.9. For the sake of simplicity, the research simulates crossing
cyclists as crossing pedestrians with different sizes and walking speeds in PARAMICS. With
Kolmogorov-Smirnov Test (test statistic Z=0.968; Most Extreme difference D=0.059; and P-
value=0.306>0.05), the pedestrian speed can be considered a normal distribution as shown in
Figure 7.
Flow
A
B
Bicycles C

International Journal of Transportation
Vol. 2, No. 2, (2014)
Copyright ⓒ 2014 SERSC 7
Figure 7. Observed Distributed Walking Speed
4. Result and Analysis
4.1. Simulation of the Base Scenario
To evaluate the model performance, the paper uses relative error (RE) as a criterion. The
definition is expressed as follows:
Obs
ObsSim
V
VVRE
(2)
where,
VSim : Simulation values
VObs : Observation values
The flow rates were compared between the simulation values and observation ones for
every 5 min interval. The simulation values and corresponding observation ones are generally
approximate. The relative error is rather small as shown in Figure 8.
0
200
400
600
800
0 200 400 600 800
Observed flow rate (vph)
Sim
ula
ted
flo
w r
ate
(v
ph
)
Figure 8. Traffic Flow Validation
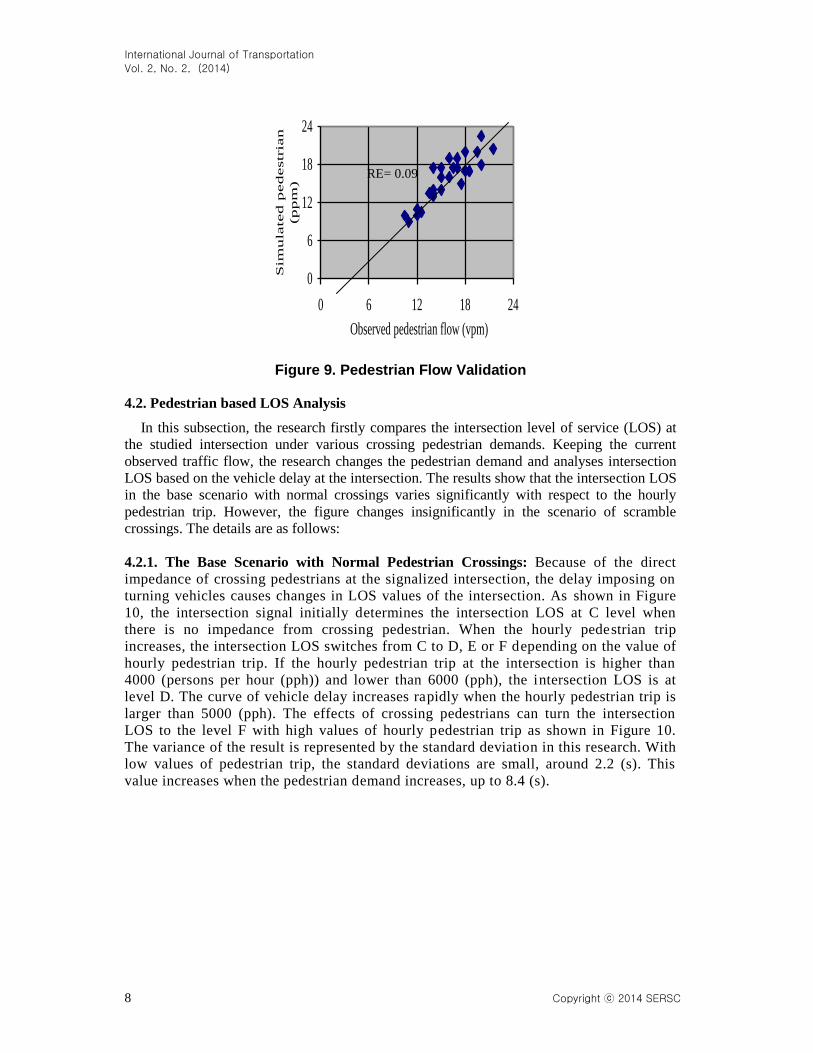
As for pedestrian flow, the research compared the pedestrian flows at each signal cycle of
the studied intersection. The data of simulated pedestrian flow is directly counted from the
simulation animation with different random seeds. The values of simulated pedestrian flows
and observed pedestrian flows (person per minute (ppm)) distributes closely along the 45-
degree line with low relative errors as in Figure 9.
Pedestrian speed (m/s) Fre
qu
ency
(%
)
Mean=1.64
Std.Dev. =0.33
N=267
RE= 0.07
International Journal of Transportation
Vol. 2, No. 2, (2014)
8 Copyright ⓒ 2014 SERSC
0
6
12
18
24
0 6 12 18 24
Observed pedestrian flow (vpm)
Sim
ulated
ped
estrian
(p
pm
)
Figure 9. Pedestrian Flow Validation
4.2. Pedestrian based LOS Analysis
In this subsection, the research firstly compares the intersection level of service (LOS) at
the studied intersection under various crossing pedestrian demands. Keeping the current
observed traffic flow, the research changes the pedestrian demand and analyses intersection
LOS based on the vehicle delay at the intersection. The results show that the intersection LOS
in the base scenario with normal crossings varies significantly with respect to the hourly
pedestrian trip. However, the figure changes insignificantly in the scenario of scramble
crossings. The details are as follows:
4.2.1. The Base Scenario with Normal Pedestrian Crossings: Because of the direct
impedance of crossing pedestrians at the signalized intersection, the delay imposing on
turning vehicles causes changes in LOS values of the intersection. As shown in Figure
10, the intersection signal initially determines the intersection LOS at C level when
there is no impedance from crossing pedestrian. When the hourly pedestrian trip
increases, the intersection LOS switches from C to D, E or F depending on the value of
hourly pedestrian trip. If the hourly pedestrian trip at the intersection is higher than
4000 (persons per hour (pph)) and lower than 6000 (pph), the intersection LOS is at
level D. The curve of vehicle delay increases rapidly when the hourly pedestrian trip is
larger than 5000 (pph). The effects of crossing pedestrians can turn the intersection
LOS to the level F with high values of hourly pedestrian trip as shown in Figure 10.
The variance of the result is represented by the standard deviation in this research. With
low values of pedestrian trip, the standard deviations are small, around 2.2 (s). This
value increases when the pedestrian demand increases, up to 8.4 (s).
RE= 0.09

International Journal of Transportation
Vol. 2, No. 2, (2014)
Copyright ⓒ 2014 SERSC 9
Figure 10. Pedestrian based LOS for the Normal Crossings
4.2.2. The Scramble Scenario: The scramble crossings with private signal phases for
pedestrian helps pedestrians traverse the intersection safely. Even when the hourly
pedestrian trip increases, the vehicle delay increases slowly. The standard deviation
changes slightly. This deviation is directly proportional to the pedestrian demand. The
maximum value of deviation is 1.96 (s) in this study. As shown in Figure 11, the LOS
of the intersection almost does not change. The intersection LOS is at D level
regardless of the magnitude of the hourly pedestrian trip at the intersection. The details
are as shown following.
Figure 11. Pedestrian based LOS for Scramble Crossings
4.3. Suitable Areas for Scramble Crossings
Although the normal pedestrian crossings can initially hold the intersection LOS at C level,
much better than that in the scenario of scramble crossings with D level when hourly the
pedestrian trip is low, the scramble crossings give pedestrian a safe facility of walking. In
addition, the scramble crossings have a stable LOS even when the number of hourly
pedestrian trip increases. Except the aspect of safety, the vehicle delay is an important factor
to decide which crossing is suitable for a signalized intersection. With the current traffic
situation, the decision on choosing normal pedestrian crossings or scramble crossings in terms
of vehicle delay at the intersection is investigated in this part. As shown in Figure 12, the
critical point at which the vehicle delays in the scenarios of normal pedestrian crossings and
scramble crossings are the same divides the graph into two parts. The left part (P<4800 (pph))
where the vehicle delay in the normal crossing scenario is less than that in the scenario of
scramble crossing is suitable for normal pedestrian crossing deployment. On the contrary, the
Hourly pedestrian trip (pph)
LOS F
LOS E
LOS D
LOS C
LOS B
LOS A
Hourly Pedestrian trip (pph)
LOS D
International Journal of Transportation
Vol. 2, No. 2, (2014)
10 Copyright ⓒ 2014 SERSC
right part in which the hourly pedestrian trip is higher than 4800 is proper for the deployment
of scramble crossings. In this area, the scramble crossings reduce the vehicle delay at the
intersection significantly compared with the normal pedestrian crossings. The detail is as
shown in Figure 12.
020406080
0 2000 4000 6000 8000
Hourly pedestrian trip (pph)
Veh
icle
del
ay
(s)
Normal crossings Scramble crossings
Figure 12. Proper Areas for Scramble Crossings
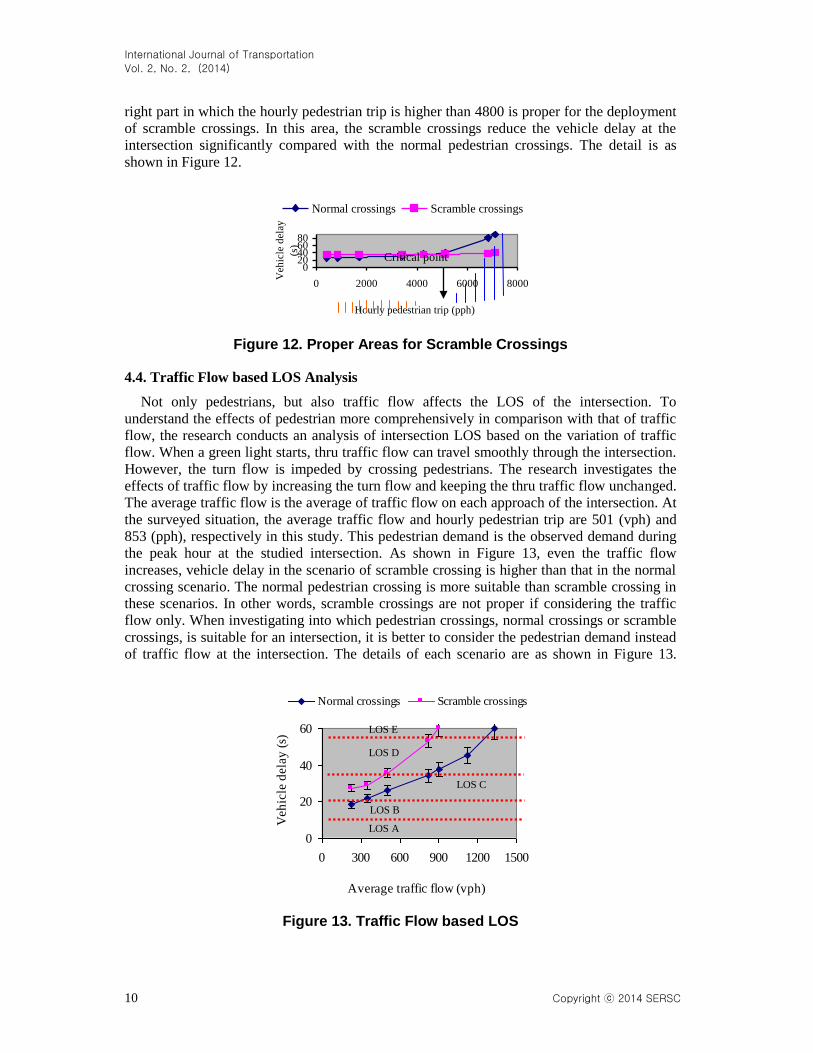
4.4. Traffic Flow based LOS Analysis
Not only pedestrians, but also traffic flow affects the LOS of the intersection. To
understand the effects of pedestrian more comprehensively in comparison with that of traffic
flow, the research conducts an analysis of intersection LOS based on the variation of traffic
flow. When a green light starts, thru traffic flow can travel smoothly through the intersection.
However, the turn flow is impeded by crossing pedestrians. The research investigates the
effects of traffic flow by increasing the turn flow and keeping the thru traffic flow unchanged.
The average traffic flow is the average of traffic flow on each approach of the intersection. At
the surveyed situation, the average traffic flow and hourly pedestrian trip are 501 (vph) and
853 (pph), respectively in this study. This pedestrian demand is the observed demand during
the peak hour at the studied intersection. As shown in Figure 13, even the traffic flow
increases, vehicle delay in the scenario of scramble crossing is higher than that in the normal
crossing scenario. The normal pedestrian crossing is more suitable than scramble crossing in
these scenarios. In other words, scramble crossings are not proper if considering the traffic
flow only. When investigating into which pedestrian crossings, normal crossings or scramble
crossings, is suitable for an intersection, it is better to consider the pedestrian demand instead
of traffic flow at the intersection. The details of each scenario are as shown in Figure 13.
0
20
40
60
0 300 600 900 1200 1500
Average traffic flow (vph)
Veh
icle
dela
y (
s)
Normal crossings Scramble crossings
Figure 13. Traffic Flow based LOS
Critical point
LOS A
LOS B
LOS C
LOS D
LOS E

International Journal of Transportation
Vol. 2, No. 2, (2014)
Copyright ⓒ 2014 SERSC 11
4.5. Sensitivity Analysis
At the studied intersection, pedestrian demands as well as traffic flow varies hour to hour
or day by day. An investigation into the effects of pedestrian and traffic flow on the decision
of choosing the scramble crossings is necessary. Called the improvement of scramble
crossings compared with the normal crossings in terms of vehicle delay as I, the definition is
expressed as follows:
%100
0
0
D
DDP
S (3)
0
(%)P
I (4)
where,
P: Percentage of delay difference (%)
D0: The vehicle delay in the normal scenario (s)
DS: The vehicle delay in the scramble scenario (s)
I: The improvement of the scramble crossing in comparison with the normal pedestrian
crossings (%)
As shown in Figure 14, the scramble crossing can improve the intersection delay by up to
35.74% (with the standard deviation of 6.4%) in scenarios of high pedestrian demand. The
figure confirms the stronger effect of pedestrians on the performance of the intersection in
comparison with that of the traffic flow. Indeed, with high values of hourly pedestrian trip
(around 6000pph), the scramble crossing is proper for nearly all of the traffic flow conditions.
Moreover, Figure 14 shows that, in scenarios of high traffic flow (greater than 1200vph), the
scramble crossing is suitable for the minimum hourly pedestrian trip of 2000 pedestrians per
hour. The lower the average traffic flow is, the higher the pedestrian demand is required for
choosing the scramble crossing in comparison with the normal crossings. This is proper to
previous studies on pedestrian that as a prerequisite for installing a scramble at an
intersection, Transportation Services looks for a volume of at least two thousand pedestrians
per hour, sustained over an eight-hour period [19]. The details of the analysis are as shown in
Figure 14.
Figure 14. Sensitivity Analysis for Choosing Scramble Crossings
, If P ≥ 0 (Scramble is BENEFICIAL)
, Otherwise (Scramble should NOT be used)

International Journal of Transportation
Vol. 2, No. 2, (2014)
12 Copyright ⓒ 2014 SERSC
However, the blue area in which the pedestrian demand is low (less than 2000 (pph) for
example) as shown in Figure 14 is not suitable for scramble crossings in terms of delay
reduction. Unlike the cases in which the scramble is beneficial (green, yellow and red areas in
Figure 14), an increase in traffic flow makes the scramble worse than the normal crossing
(Figure 13). It is suggested to introduce normal crossings instead of scramble in this area.
5. Conclusion
The research aims at two targets. The first target is to design and simulate the scenario of
scramble crossings based on current normal pedestrian crossings at a signalized intersection
in Nagaoka city of Japan. The second target is the analysis of effects of the scramble
crossings and that of the normal one under various situations of traffic flow as well as
pedestrian demand. The intersection LOS shows that the scramble crossings are more stable
than the normal pedestrian crossing in terms of intersection performance when the pedestrian
demand changes. The analysis confirms the important role of the pedestrian demand in the
decisions of choosing the scramble crossings. The higher the pedestrian demand is, the more
advantageous the scramble crossings are. The scramble crossings can reduce the vehicle delay
significantly, by up to 35.74% compared with the normal pedestrian crossings.
The research has several shortcomings needed to be improved. The research evaluates the
scramble crossings in terms of vehicle delay reduction only. The aspect of pedestrian delay
and safety is an important factor that should be concerned in next research studies. Intuitively,
the number of conflictions between vehicles and pedestrians in the scenarios of normal
crossings and scramble crossings are quite different. Because of the exclusive signal for
pedestrian in the scenario of scramble crossings, the number of conflictions in this scenario is
lower than that in the normal crossing scenario if considering under the same situations of
traffic and pedestrian demand. Therefore, the safety level or the reduction of pedestrian delay
in the scenario of scramble crossings is better than in the normal crossings. This kind of
safety should be studied in future research. In addition, the results of simulation-based
analysis require real data of scramble crossing deployments to have a more realistic
evaluation. Moreover, the fixed signal in this study should be complicated to become actuated
or adaptive ([10, 11, 17]) to clarify the benefit of scramble crossing. The points should be
investigated more in further studies to understand comprehensively about the benefit of
scramble crossings in developing a pedestrian-friendly environment as well as encouraging
walking in urban areas.
Acknowledgements
The authors highly appreciated all members of Transportation Lab for data collection as
well as valuable suggestions from anonymous authors in improving the quality of the paper.
References
[1] A. K. Bechtel, K. E. MacLeod and D. R. Ragland, “Oakwood Chinatown Pedestrian Scramble: An
Evaluation”, UC Berkeley Traffic Safety Centre, (2003).
[2] C. Pretto, H. Cybis and A. Jacobsen, “A multi-layer simulation model for vehicle and pedestrian
interaction”, Compendium of Papers CD-ROM, the 89th Annual Meeting of the Transportation
Research Board, Washington D.C., (2011) January 22-26.
[3] X. Chen, C. Shao and H. Yue, “Influence of Bicycle Traffic on Capacity of Typical Signalized
Intersection”, Tsinghua Science and Technology, ISSN 1007-0214 10/14, vol. 12, no. 2, (2007), pp.
198-203.

International Journal of Transportation
Vol. 2, No. 2, (2014)
Copyright ⓒ 2014 SERSC 13
[4] D. Cheng, Z. Tian and H. Liu, “Implementing actuated signal controlled intersection capacity
analysis with pedestrians”, Compendium of Papers CD-ROM, the 87th Annual Meeting of the
Transportation Research Board, Washington D.C., (2008) January 13-17.
[5] P. Eleonora, Y. George and G. John, “A critical assessment of pedestrian behaviour models”,
Transportation Research Part F 12, (2009), pp. 242–255.
[6] M. M. Ishaque and R. Bm Noland, “Micro-simulation Comparisons of Alternative Signalized
Pedestrian Crossings”, Paper submitted for presentation at the Transportation Research Board
Annual Meeting, Washington D.C., (2006) January 22-26.
[7] J. P. Pitaksringkarn, “Implementation of the first pedestrian scramble in downtown San Diego”,
California, Proceedings of the Eastern Asia Society for Transportation Studies, vol. 5, (2005), pp.
2504-2515.
[8] K. Hagita, T. Hagiwara and H. Hamaoka, “Analysis of Driver’s Visual Conditions in Right-Turning
Accidents involving Pedestrians at Signalized Intersection in Japan”, Compendium of Papers CD-
ROM, the 89th Annual Meeting of the Transportation Research Board, Washington D.C., (2011),
January 22-26.
[9] K. L. Kotkar, R. Rajat and C. Satish, “Pedestrian Flow Characteristics in Mixed Traffic Conditions”,
Journal of urban planning and development (ASCE), vol. 136, no. 1, (2010), pp. 23-33.
[10] W. Lin, H. K. Lo and L. Xiao, “A Quasi-Dynamic Robust Control Scheme for Signalized
Intersections”, Journal of Intelligent Transportation Systems, vol. 15, no. 4, (2011), pp. 223-233.
[11] H. K. Lo and A. H. F. Chow, “Control Strategies for Oversaturated Traffic”, Journal of
Transportation Engineering, vol. 130, no. 4, (2004), pp. 466-478.
[12] R. V. Mark, “Scramble and Crosswalk Signal Timing, Transportation Research Record 1636”,
accessed on Mar. 18th 2013, available at http://www.enhancements.org/download/trb/1636-013.PDF.
[13] C. C. Minh, “Analysis of motorcycle behaviour at Midblocks and Signalized intersections”, Ph.D
thesis, Nagaoka University of Technology, (2007).
[14] S. C. Mohsin and R. Prakash, “Capacity Analysis of Signalised Intersection using Micro-
simulation”, 32nd Australian Transport Research Forum, (2009).
[15] M. I. Muhammad and B. N. Robert, “Trade-offs between vehicular and pedestrian traffic using
micro-simulation methods”, Transport Policy, vol. 14, (2007), pp. 124–138.
[16] M. R. Nagui and S. E. Brian, “Pedestrian Impedance of Turning-Movement Saturation Flow Rates
Comparison of Simulation”, Analytical, and Field Observations, Transportation research Record
1578, Paper No. 971239, (1997), pp. 56-63.
[17] G. F. Newell, “Theory of Highway Traffic Signals”, University of California, Berkeley, CA.:
Institute of Transportation Studies, Course Notes, (1989).
[18] Quadstone PARAMICS, PARAMICS User Guide – Version 6.9.1, Quadstone Limited, Edinburgh,
UK, (2013).
[19] B. Rajnath and T. Craig, “Pedestrian Scramble Crossings – A Tale of Two Cities”, accessed on Mar.
18th 2013, available at http://www.toronto.ca/transportation/walking/pdf/pedestrian_scramble
_crossings.pdf
[20] T. R. Richard and K. S. Shashi, “Integrated Systems Methodology for Pedestrian Traffic Flow
Analysis”, Transportation research Record 1578, Paper No. 971195, pp. 30-37.
[21] S. Clark., “Scramble Pedestrian Crossings”, Department for Transport, Energy and infrastructure,
Government of South Australia, (1998).
[22] K. Sano, Y. Suga, R. Pairoj and W. Wisinee, “A study on the benefit caused by the improvement of
the punctuality of the local bus service”, Journal of the Eastern Asia Society for Transportation
Studies, vol.7, (2007), pp. 1575-1583.
[23] S. Acharjee, L. Kattan and R. Tay, “A Pilot Study on Pedestrian Scramble Operations in Calgary”,
Paper submitted for presentation at the Transportation Research Board Annual Meeting, Washington
D.C., (2009) January 10-15.
[24] T. Hagiwara, H. Hamaoka, K. Hagita, Y. Tabata, D. Uchibori and H. Takagi, “Analysis of Traffic
Conflicts between Right-Turning Vehicles and Pedestrians/Cyclists at an Urban Signalized
Intersection”, Compendium of Papers CD-ROM, the 89th Annual Meeting of the Transportation
Research Board, Washington D.C., (2010) January 10-14.
[25] N. Takashi, “Four species CA model for facing pedestrian traffic at rush hour”, Applied
Mathematical Modelling, vol. 36, (2012), pp. 702–711.
[26] TRB, Highway Capacity Manual, National Research Council, Washington, D.C.,USA, (2010).
[27] W. Brilon and T. Miltner, “Capacity and Delays at Intersections Without Traffic Signals”,
Compendium of Papers CD-ROM, the 84h Annual Meeting of the Transportation Research Board,
Washington D.C., (2005) January 09-13.
International Journal of Transportation
Vol. 2, No. 2, (2014)
14 Copyright ⓒ 2014 SERSC
[28] X. Chen, C. Shao and H. Yue, “Influence of Pedestrian traffic on capacity of right-turn movements
at signalized intersections”, Compendium of Papers CD-ROM, the 87th Annual Meeting of the
Transportation Research Board, Washington D.C., (2008) January 13-17.
[29] Z. Zhou, G. Ren, W. Wang, Y. Zhang and W. Wang, “Pedestrian Crossing Behaviors at Signalized
Intersections: Observational Study and Survey in China”, Compendium of Papers CD-ROM, the 89th
Annual Meeting of the Transportation Research Board, Washington D.C., (2011) January 22-26.
[30] J. Yang, W. Deng, J. Wang, Q. Li and Z. Wang, “Modeling pedestrians_ road crossing behavior in
traffic system micro-simulation in China”, Transportation Research Part A 40, (2006), pp. 280–290.
[31] T. Kardi, “Application of microscopic pedestrian simulation model”, Transportation Research Part F,
vol. 9, (2006), pp. 15–27.
[32] V. P. Sisiopiku and D. Akin, “Pedestrian behaviors at and perceptions towards various pedestrian
facilities: an examination based on observation and survey data, Transportation Research Part F, vol.
6, (2003), pp. 249–274.
[33] Z. Yang and R. F. Benekohal, “Pedestrian crossing phase optimization based on minimizing vehicle
and pedestrian delays by genetic algorithm”, Compendium of Papers CD-ROM, the 90th Annual
Meeting of the Transportation Research Board, Washington D.C., (2011) January 22-26.
Authors
Dr. Tran Vu TU, he is a postdoctoral researcher at Niigata
University. He achieved a doctoral degree in Transportation
Engineering at Nagaoka University of Technology in Japan. Before
coming to Japan, he worked as a lecturer in the department of civil
engineering, Saigon Technology University (STU), Vietnam. His
research interests are traffic engineering, traffic simulation, Transit
Priority System, network analysis, discrete choice model,
mathematical optimization. He has published numerous journals and
proceedings as well as co-authored many research papers in the
related fields.
Dr. Kazushi SANO, he is an Associate Professor in the Department
of Civil and Environmental Engineering at Nagaoka University of
Technology (NUT) in Japan. Dr. Sano received a doctoral degree in
Doctor of Engineering in Traffic Engineering and Land Planning. He has
published numerous papers and reports in such journals and proceedings
as Academic Journal, Advanced Transgraft Telematics/Intelligent
Vehicle-Highway Systems, or Application of Artificial Intelligence in
Engineering. His research interests are in the area of traffic engineering,
traffic simulation, public transport system, and land planning.
Copyright © 2022 FDOKUMEN