Modeling Signalized-Intersection Safety with Corner Clearance
11
Modeling Signalized-Intersection Safety with Corner Clearance Xuecai Xu, Ph.D. 1 ; Hualiang (Harry) Teng, Ph.D. 2 ; Valerian Kwigizile, Ph.D. 3 ; and Eneliko Mulokozi 4 Abstract: Signalized intersections next to each other on the same arterial share some unobservable information, such as traffic flow and roadway characteristics. This study investigated the impact of access management techniques on crash counts at signalized intersections. The analysis was performed using crash data from 275 signalized intersections in southern Nevada. The panel data random-effect model was used to account for the unobserved factors for each unique arterial. It was found that the negative binomial (NB) regression models were the best in reflecting the dispersion in the crash data. Therefore, the random-effects negative binomial model (RENB) was applied to investigate the relationship between crash occurrence and access-management techniques. The results of the panel data RENB models were compared with those from the pooled NB models, which did not account for the panel data structure. Evaluation of the goodness-of-fit of the models developed indicated that the random-effect negative binomial model was the best-fit for the data at hand. The results from the panel data RENB showed that nine variables significantly affecting the safety at signalized intersections were the average length of corner clearance, traffic flow, land-use types, number of left-turn lanes for main streets, number of through lanes for main and minor streets, posted speed limit on main and minor streets, and grades of legs. DOI: 10.1061/(ASCE)TE.1943-5436.0000636. © 2014 American Society of Civil Engineers. Author keywords: Access management; Signalized intersection; Count data model; Panel data model. Introduction Signalized intersections are areas where traffic goes through or changes route by responding to a traffic control (if any), such as traffic signals. Too much access around intersections can cause traffic conflicts and lead to crashes. In efforts to enhance safety around signalized intersections, access management techniques have been implemented to control access and improve safety (Xu 2010). Corner clearance is one important measure to control proximity of the access from intersections. It is defined as the minimum length between a signalized intersection and the first driveway along connecting streets. It is important to keep the corner clearance long enough to separate conflict points effectively. By providing sufficient corner clearance, it gives drivers enough time to make safe maneuvers. When corners are not adequately cleared, the conflicts between turning and through traffic are imminent, which may lead to crashes and longer delays. A literature review revealed that only a few studies have explored the impact of corner clearance on intersection safety and operation. McCoy and Heimann (1994) evaluated the impact of corner clearance on saturation flow rates at signalized intersections in Lincoln, Nebraska. Long and Cheng-Tin (1993) and Kaub (1994) estimated the required corner clearance distances by developing a formula, while Gluck et al. (1999) focused on how to specify the corner clearance criterion for practical implementa- tion. A study by Oh et al. (2004) was the only one in which the corner clearance impact on safety at intersections was studied. Although driveways at intersections were considered in their study, only the number of driveways at intersections was included, not the corner clearance. In concept, an intersection approach may have more than one driveway. However, the corner clearance could vary significantly given a fixed number of driveways on approach. Thus, it is necessary to consider corner clearance directly in the evaluation of intersection safety in addition to other factors, such as traffic flow and roadway function classifications that have been included in the study by Oh et al. (2004). It was also found that the study by Oh et al. (2004) was for intersections in rural areas. The corner clearance requirements in urban areas would be different from the rural areas. The objective of this study is to identify the influence of corner clearance and other factors on safety at intersections. In the inves- tigation, this study considers the spatial correlation of intersection along the same arterial. Such intersections are most likely sharing some unobservable factors that are unique to an arterial. For exam- ple, through traffic flow along one arterial has similar patterns, and adjacent intersections probably share similar land-use types and roadway design features. This is especially common in urban areas. Such unobserved similarities may lead to a statistical problem known as heterogeneity, which may lead to invalid statistical infer- ence if ignored. To address this issue, a panel data model is adopted in this study where the intersections on an arterial are vie.wed as a group. A unique intersection is imagined existing for an arterial, and the observations for the intersections on the same arterial are viewed as repeated ones for the virtual unique intersection. To evaluate the safety impact of corner clearance at intersections, 1 Lecturer, School of Civil Engineering and Mechanics, Huazhong Univ. of Science and Technology, Wuhan 430074, China. E-mail: xuecai [email protected] 2 Associate Professor, Dept. of Civil and Environmental Engineering, Univ. of Nevada, Las Vegas, NV 89154. 3 Assistant Professor, College of Engineering and Applied Sciences, Western Michigan Univ., Kalamazoo, MI 49008 (corresponding author). E-mail: [email protected] 4 Graduate Student, Dept. of Civil and Environmental Engineering, Univ. of Nevada, Las Vegas, NV 89154. Note. This manuscript was submitted on January 10, 2012; approved on October 14, 2013; published online on March 12, 2014. Discussion period open until August 12, 2014; separate discussions must be submitted for individual papers. This paper is part of the Journal of Transportation En- gineering, © ASCE, ISSN 0733-947X/04014016(11)/$25.00. © ASCE 04014016-1 J. Transp. Eng. J. Transp. Eng. 2014.140. Downloaded from ascelibrary.org by Huazhong University of Science & Technology on 05/21/14. Copyright ASCE. For personal use only; all rights reserved.
Transcript of Modeling Signalized-Intersection Safety with Corner Clearance

Modeling Signalized-Intersection Safetywith Corner Clearance
Xuecai Xu, Ph.D.1; Hualiang (Harry) Teng, Ph.D.2; Valerian Kwigizile, Ph.D.3;and Eneliko Mulokozi4
Abstract: Signalized intersections next to each other on the same arterial share some unobservable information, such as traffic flow androadway characteristics. This study investigated the impact of access management techniques on crash counts at signalized intersections.The analysis was performed using crash data from 275 signalized intersections in southern Nevada. The panel data random-effect model wasused to account for the unobserved factors for each unique arterial. It was found that the negative binomial (NB) regression models were thebest in reflecting the dispersion in the crash data. Therefore, the random-effects negative binomial model (RENB) was applied to investigatethe relationship between crash occurrence and access-management techniques. The results of the panel data RENB models were comparedwith those from the pooled NB models, which did not account for the panel data structure. Evaluation of the goodness-of-fit of the modelsdeveloped indicated that the random-effect negative binomial model was the best-fit for the data at hand. The results from the panel dataRENB showed that nine variables significantly affecting the safety at signalized intersections were the average length of corner clearance,traffic flow, land-use types, number of left-turn lanes for main streets, number of through lanes for main and minor streets, posted speed limiton main and minor streets, and grades of legs. DOI: 10.1061/(ASCE)TE.1943-5436.0000636. © 2014 American Society of Civil Engineers.
Author keywords: Access management; Signalized intersection; Count data model; Panel data model.
Introduction
Signalized intersections are areas where traffic goes through orchanges route by responding to a traffic control (if any), such astraffic signals. Too much access around intersections can causetraffic conflicts and lead to crashes. In efforts to enhance safetyaround signalized intersections, access management techniqueshave been implemented to control access and improve safety(Xu 2010). Corner clearance is one important measure to controlproximity of the access from intersections. It is defined as theminimum length between a signalized intersection and the firstdriveway along connecting streets. It is important to keep the cornerclearance long enough to separate conflict points effectively. Byproviding sufficient corner clearance, it gives drivers enough timeto make safe maneuvers. When corners are not adequately cleared,the conflicts between turning and through traffic are imminent,which may lead to crashes and longer delays.
A literature review revealed that only a few studies haveexplored the impact of corner clearance on intersectionsafety and operation. McCoy and Heimann (1994) evaluated theimpact of corner clearance on saturation flow rates at signalized
intersections in Lincoln, Nebraska. Long and Cheng-Tin (1993)and Kaub (1994) estimated the required corner clearance distancesby developing a formula, while Gluck et al. (1999) focused on howto specify the corner clearance criterion for practical implementa-tion. A study by Oh et al. (2004) was the only one in which thecorner clearance impact on safety at intersections was studied.Although driveways at intersections were considered in their study,only the number of driveways at intersections was included, not thecorner clearance. In concept, an intersection approach may havemore than one driveway. However, the corner clearance could varysignificantly given a fixed number of driveways on approach. Thus,it is necessary to consider corner clearance directly in the evaluationof intersection safety in addition to other factors, such as trafficflow and roadway function classifications that have been includedin the study by Oh et al. (2004). It was also found that the study byOh et al. (2004) was for intersections in rural areas. The cornerclearance requirements in urban areas would be different from therural areas.
The objective of this study is to identify the influence of cornerclearance and other factors on safety at intersections. In the inves-tigation, this study considers the spatial correlation of intersectionalong the same arterial. Such intersections are most likely sharingsome unobservable factors that are unique to an arterial. For exam-ple, through traffic flow along one arterial has similar patterns, andadjacent intersections probably share similar land-use types androadway design features. This is especially common in urban areas.Such unobserved similarities may lead to a statistical problemknown as heterogeneity, which may lead to invalid statistical infer-ence if ignored. To address this issue, a panel data model is adoptedin this study where the intersections on an arterial are vie.wed asa group. A unique intersection is imagined existing for an arterial,and the observations for the intersections on the same arterial areviewed as repeated ones for the virtual unique intersection. Toevaluate the safety impact of corner clearance at intersections,
1Lecturer, School of Civil Engineering and Mechanics, HuazhongUniv. of Science and Technology, Wuhan 430074, China. E-mail: [email protected]
2Associate Professor, Dept. of Civil and Environmental Engineering,Univ. of Nevada, Las Vegas, NV 89154.
3Assistant Professor, College of Engineering and Applied Sciences,Western Michigan Univ., Kalamazoo, MI 49008 (corresponding author).E-mail: [email protected]
4Graduate Student, Dept. of Civil and Environmental Engineering,Univ. of Nevada, Las Vegas, NV 89154.
Note. This manuscript was submitted on January 10, 2012; approved onOctober 14, 2013; published online on March 12, 2014. Discussion periodopen until August 12, 2014; separate discussions must be submitted forindividual papers. This paper is part of the Journal of Transportation En-gineering, © ASCE, ISSN 0733-947X/04014016(11)/$25.00.
© ASCE 04014016-1 J. Transp. Eng.
J. Transp. Eng. 2014.140.
Dow
nloa
ded
from
asc
elib
rary
.org
by
Hua
zhon
g U
nive
rsity
of
Scie
nce
& T
echn
olog
y on
05/
21/1
4. C
opyr
ight
ASC
E. F
or p
erso
nal u
se o
nly;
all
righ
ts r
eser
ved.

count data regression models are developed, by which the unob-served factors for each unique arterial can be better interpreted.
Literature Review
The study on crash frequency has had different perspectives anddifferent approaches since years ago. From the methodology per-spective, there have been many studies on the accident-frequencymodels including [see Lord and Mannering (2010) for detaileddescription] Poisson models, negative binomial models, Poisson-lognormal models, zero-inflated count models, Conway–Maxwell–Poisson models, gamma models, generalized estimating equationmodels, generalized additive models, random effects models, neg-ative multinomial models, random parameters count models, finitemixture and Markov switching models, and other intelligent algo-rithms. Most of these studies focused on identifying the influencingfactors such as intersection geometric features (i.e., number ofthrough lanes, right-turn lanes, left-turn lanes), traffic control andoperational features (i.e., signal phase, speed limit) and traffic flowcharacteristics (saturated and unsaturated), and these factors werefound to have significant impact on the crash occurrence.
From the practice perspective, many researchers (Poch andMannering 1996; Ivan et al. 2000; Carson and Mannering 2001)attempted to assess the influencing factors of crash frequency byidentifying impact factors, such as roadway geometric design (hori-zontal and vertical location, median type, or shoulder width), trafficfeatures (hourly volume, average daily volume, vehicle proportion)and environmental conditions (land use, roadway condition, lightcondition, or weather condition). Shankar (1997) developed theNB regression model to analyze the impact of roadway geometricdesign and environmental condition on rural accident frequency.The results showed that the number of curves and weather-relatedfactors (rainy and snowfall days) influenced crash frequency sig-nificantly. Shankar et al. (1998) developed the random effect neg-ative binomial (RENB) and cross-sectional NB models, whichverify that the RENB model offers advantages in terms of modeltransferability and updating. Ivan et al. (2000) described the esti-mation of Poisson regression models for both single and multive-hicle crash rates on rural, two-lane highway segments. The resultsshowed that the traffic intensity explains the differences in crashrates. Continuing their research in crash modeling, Ulfarsson andShankar (2003) compared negative multinomial models with amultiyear panel of cross-sectional roadway data. Their results in-dicated that the negative multinomial model outperforms the NBand RENB significantly. Along this line of modeling approach,Caliendo et al. (2007) adopted Poisson, NB, and negative multino-mial regression models to investigate crash prediction for four-lanemedian divided motorways in Italy, focusing on stopping sight dis-tance and pavement surface characteristics. Caliendo et al. (2013)compared RENB and negative multinomial regression models forthe effect of year on severe crashes of road tunnels. In the study byHauer (2004), various safety models were listed, including the NBmodel, and it was concluded that appropriate functional formsshould be chosen, which is universal for all roadway safety mod-eling. As for crash frequency at intersections, Wong et al. (2007)adopted Poisson and NB regression models, quantifying the influ-ence of possible contributory factors on slight injury crashes andkilled and severe injury (KSI) crashes in Hong Kong, separately.Ye et al. (2009) focused on the collision types at rural intersectionsin Georgia and presented multivariate Poisson models within a si-multaneous equations structure of crash frequency. This study pro-vides new insights of analyzing the crash frequency, although theimpact of the risk factors was found to be modest. Xie et al. (2013)
evaluated the signalized intersection safety in Shanghai usingBayesian hierarchical NB models at both the intersection and thecorridor levels. To sum up, various studies investigate the influenc-ing factors of crash frequency from methodological and practicalperspectives and conclude that different factors contribute to thecrash occurrence under different conditions, and each study has itsown applicable requirements.
There have been several studies that considered the hetero-geneity among signalized intersections. Karlaftis and Tarko (1998)considered the heterogeneity problem by using negative binomialmodels with cluster analysis to investigate the relationship betweencrash frequency and influencing factors, such as vehicle miles trav-eled (VMT), population, and income, but it focused on the generalaccidents without taking into account signalized intersections spe-cifically. Chin and Quddus (2003) used the random effects negativebinomial (RENB) model to identify the affecting elements for in-tersection safety in Singapore, which began to mention the hetero-geneity problem, but the results were limited by the relatively smallsample size used. Wang and Abdel-Aty (2006) and Wang et al.(2007) investigated the rear-end crash frequencies at signalized in-tersections using the generalized estimating equations (GEE) to ac-count for the temporal or spatial correlation among the data, but themain problem is that the GEE model assumes the same correlationmatrix for different corridors, which is impossible to be identical.Guo et al. (2010) integrated the Poisson and negative binomialmodels with the Bayesian models to evaluate the intersection safetywith corridor-level spatial correlations from 170 signalized inter-sections in Florida. The results indicated that the Poisson spatialmodel provided the best model fitting, and the performance wasrelated to the proximity function. It was pointed out in their studythat it will be worthwhile in investigating the performance of alter-native functions, e.g., exponential function. Moreover, the endoge-neity problem caused by a Bayesian work needs to be furtherdiscussed. Castro et al. (2012) reformulated the count models as aspecial case of generalized ordered-response models for intersec-tions, and presented the flexible count model, flexible count withtemporal effects model, and flexible count with temporal and spa-tial effects model, respectively. Temporal and spatial correlationswere addressed, and the method is quite general for further specificcrash analysis. A summary of the results from studies that consid-ered the heterogeneity among signalized intersections is presentedin Table 1.
Data Description
In this study, about 300 signalized intersections along 27 majorand minor arterials are selected in 2003 from the Las VegasMetropolitan area, including Clark County, City of Las Vegas, Cityof North Las Vegas. and City of Henderson, for evaluating thesafety performance with regard to corner clearance at intersections.Data are collected from the midblock with signalized intersectionsat both ends.
The geographic information system (GIS) and Google Earth areutilized to visualize and locate the selected signalized intersections.The GIS map of the Las Vegas area is considered as the base. Thegeographic coordinates of each intersection are obtained fromGoogle map and are used to geocode the intersections within thebase map. Although there are a total of 400 intersections selected inTable 2, some of them are counted twice. By deleting the duplicatesand freeway sections, the remaining number of signalized intersec-tions included in this study is 275. The number of intersections oneach arterial is listed in Table 2. Fig. 1 displays the locations ofthese intersections.
© ASCE 04014016-2 J. Transp. Eng.
J. Transp. Eng. 2014.140.
Dow
nloa
ded
from
asc
elib
rary
.org
by
Hua
zhon
g U
nive
rsity
of
Scie
nce
& T
echn
olog
y on
05/
21/1
4. C
opyr
ight
ASC
E. F
or p
erso
nal u
se o
nly;
all
righ
ts r
eser
ved.
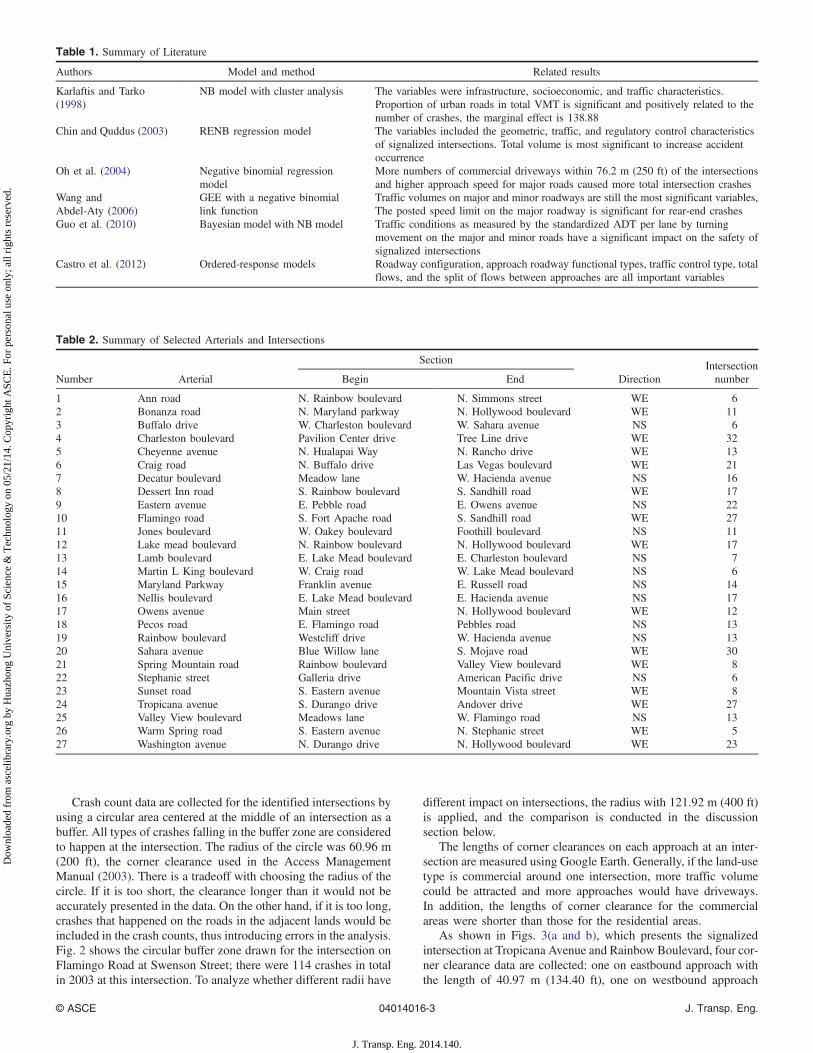
Crash count data are collected for the identified intersections byusing a circular area centered at the middle of an intersection as abuffer. All types of crashes falling in the buffer zone are consideredto happen at the intersection. The radius of the circle was 60.96 m(200 ft), the corner clearance used in the Access ManagementManual (2003). There is a tradeoff with choosing the radius of thecircle. If it is too short, the clearance longer than it would not beaccurately presented in the data. On the other hand, if it is too long,crashes that happened on the roads in the adjacent lands would beincluded in the crash counts, thus introducing errors in the analysis.Fig. 2 shows the circular buffer zone drawn for the intersection onFlamingo Road at Swenson Street; there were 114 crashes in totalin 2003 at this intersection. To analyze whether different radii have
different impact on intersections, the radius with 121.92 m (400 ft)is applied, and the comparison is conducted in the discussionsection below.
The lengths of corner clearances on each approach at an inter-section are measured using Google Earth. Generally, if the land-usetype is commercial around one intersection, more traffic volumecould be attracted and more approaches would have driveways.In addition, the lengths of corner clearance for the commercialareas were shorter than those for the residential areas.
As shown in Figs. 3(a and b), which presents the signalizedintersection at Tropicana Avenue and Rainbow Boulevard, four cor-ner clearance data are collected: one on eastbound approach withthe length of 40.97 m (134.40 ft), one on westbound approach
Table 1. Summary of Literature
Authors Model and method Related results
Karlaftis and Tarko(1998)
NB model with cluster analysis The variables were infrastructure, socioeconomic, and traffic characteristics.Proportion of urban roads in total VMT is significant and positively related to thenumber of crashes, the marginal effect is 138.88
Chin and Quddus (2003) RENB regression model The variables included the geometric, traffic, and regulatory control characteristicsof signalized intersections. Total volume is most significant to increase accidentoccurrence
Oh et al. (2004) Negative binomial regressionmodel
More numbers of commercial driveways within 76.2 m (250 ft) of the intersectionsand higher approach speed for major roads caused more total intersection crashes
Wang andAbdel-Aty (2006)
GEE with a negative binomiallink function
Traffic volumes on major and minor roadways are still the most significant variables,The posted speed limit on the major roadway is significant for rear-end crashes
Guo et al. (2010) Bayesian model with NB model Traffic conditions as measured by the standardized ADT per lane by turningmovement on the major and minor roads have a significant impact on the safety ofsignalized intersections
Castro et al. (2012) Ordered-response models Roadway configuration, approach roadway functional types, traffic control type, totalflows, and the split of flows between approaches are all important variables
Table 2. Summary of Selected Arterials and Intersections
Number Arterial
Section
DirectionIntersectionnumberBegin End
1 Ann road N. Rainbow boulevard N. Simmons street WE 62 Bonanza road N. Maryland parkway N. Hollywood boulevard WE 113 Buffalo drive W. Charleston boulevard W. Sahara avenue NS 64 Charleston boulevard Pavilion Center drive Tree Line drive WE 325 Cheyenne avenue N. Hualapai Way N. Rancho drive WE 136 Craig road N. Buffalo drive Las Vegas boulevard WE 217 Decatur boulevard Meadow lane W. Hacienda avenue NS 168 Dessert Inn road S. Rainbow boulevard S. Sandhill road WE 179 Eastern avenue E. Pebble road E. Owens avenue NS 2210 Flamingo road S. Fort Apache road S. Sandhill road WE 2711 Jones boulevard W. Oakey boulevard Foothill boulevard NS 1112 Lake mead boulevard N. Rainbow boulevard N. Hollywood boulevard WE 1713 Lamb boulevard E. Lake Mead boulevard E. Charleston boulevard NS 714 Martin L King boulevard W. Craig road W. Lake Mead boulevard NS 615 Maryland Parkway Franklin avenue E. Russell road NS 1416 Nellis boulevard E. Lake Mead boulevard E. Hacienda avenue NS 1717 Owens avenue Main street N. Hollywood boulevard WE 1218 Pecos road E. Flamingo road Pebbles road NS 1319 Rainbow boulevard Westcliff drive W. Hacienda avenue NS 1320 Sahara avenue Blue Willow lane S. Mojave road WE 3021 Spring Mountain road Rainbow boulevard Valley View boulevard WE 822 Stephanie street Galleria drive American Pacific drive NS 623 Sunset road S. Eastern avenue Mountain Vista street WE 824 Tropicana avenue S. Durango drive Andover drive WE 2725 Valley View boulevard Meadows lane W. Flamingo road NS 1326 Warm Spring road S. Eastern avenue N. Stephanie street WE 527 Washington avenue N. Durango drive N. Hollywood boulevard WE 23
© ASCE 04014016-3 J. Transp. Eng.
J. Transp. Eng. 2014.140.
Dow
nloa
ded
from
asc
elib
rary
.org
by
Hua
zhon
g U
nive
rsity
of
Scie
nce
& T
echn
olog
y on
05/
21/1
4. C
opyr
ight
ASC
E. F
or p
erso
nal u
se o
nly;
all
righ
ts r
eser
ved.

Fig. 1. Selected intersections in Las Vegas area (data from Nevada Department of Transportation)
© ASCE 04014016-4 J. Transp. Eng.
J. Transp. Eng. 2014.140.
Dow
nloa
ded
from
asc
elib
rary
.org
by
Hua
zhon
g U
nive
rsity
of
Scie
nce
& T
echn
olog
y on
05/
21/1
4. C
opyr
ight
ASC
E. F
or p
erso
nal u
se o
nly;
all
righ
ts r
eser
ved.

Fig. 2. Intersection sample Flamingo Rd. and Swenson St. (data from Nevada Department of Transportation)
© ASCE 04014016-5 J. Transp. Eng.
J. Transp. Eng. 2014.140.
Dow
nloa
ded
from
asc
elib
rary
.org
by
Hua
zhon
g U
nive
rsity
of
Scie
nce
& T
echn
olog
y on
05/
21/1
4. C
opyr
ight
ASC
E. F
or p
erso
nal u
se o
nly;
all
righ
ts r
eser
ved.

with the length of 26.37 m (86.50 ft) long, one on southboundapproach with the length of 27.54 m (90.35 ft), and the last oneon northbound approach with the length of 32.26 m (105.84 ft).By comparing the traffic volume, Rainbow Boulevard is consideredas the main street, so the average corner clearance on the main streetis 27.46 m (90.10 ft), and on the minor street is 33.67 m (110.45 ft).It can be seen from the map that there are eight lanes on eastbound-westbound and southbound-northbound approaches, including theleft-turn and right-turn lanes.
Land-use type data are also collected for the lands adjacent tothe corners at intersections. For a four-legged intersection, the ad-jacent land is divided into four pieces. Land-use type is assigned avalue of 1 if all the four pieces are commercial and assigned a valueof 0 if all the four pieces are residential. All the other conditions forthe land-use value will be considered as mixed, being equal to anumber between 0 and 1. In Figs. 3(a and b), two corners are ad-jacent with residential land use, and the other two are commercial.
The value for land use is 0.5. It can also be seen that the clearancesof corners with commercial land are shorter, while those with res-idential land are longer.
The AADT data collected for the approaches at the intersectionare specified by their directions: west and east flows for eastbound-westbound, north and south flows for northbound-southbound.
For each approach of the intersection, functional classificationdata are obtained from the GIS database provided by the RegionalTransportation Commission (RTC) of Southern Nevada. From thesame database, the number of lanes on four directions (includingleft-turn, through, and right-turn lane) and the posted speed limitsare also extracted and confirmed with the Google map. Between thetwo intersecting roads, which road is the primary and which is thesecondary are determined based on the AADT on the roads.
The intersection angle of two roadways can influence both thesafety and operational characteristics of an intersection (Rodegerdtset al. 2004). If the intersections are heavily skewed, not only are the
Commercial
Land Use
Residential
(a)
(b)
Land Use
Residential
Land Use
Commercial
Land Use
W. Tropicana Ave
Fig. 3. Corner clearances for commercial and residential land (© 2013 Google): (a) aerial view of the intersection between Tropicana Ave.and Rainbow Blvd., Las Vegas, Nevada; (b) diagram of corner clearances at the intersection between Tropicana Ave. and Rainbow Blvd.,Las Vegas, Nevada
© ASCE 04014016-6 J. Transp. Eng.
J. Transp. Eng. 2014.140.
Dow
nloa
ded
from
asc
elib
rary
.org
by
Hua
zhon
g U
nive
rsity
of
Scie
nce
& T
echn
olog
y on
05/
21/1
4. C
opyr
ight
ASC
E. F
or p
erso
nal u
se o
nly;
all
righ
ts r
eser
ved.

conflicts produced, but the drivers and pedestrians are difficult tocross, so intersection angle is considered as one variable.
The approach to a signalized intersection should make the driv-ers or bicyclists aware of an intersection by providing the requiredstopping sight distance before the intersection, so the approachgrades of an intersection should get more attention when designed.To find out the impact of approach grades on intersection safety,the grades of each approach at an intersection are collected and areconsidered as the average grades on eastbound-westbound andsouthbound-northbound respectively to meet the requirements ofaggregated crash data at the intersection.
In Table 3, a statistics summary of selected variables is pre-sented. These include the number of observations, mean, standarddeviation, minimum values, and maximum values. The variablesare the crash count, average length of corner clearance on mainand minor streets, number of corner sides with driveways, numberof main street lanes and minor street lanes (left-turn, through, andright-turn lanes), posted speed limit on main and minor streets,land-use types, traffic flow sum on main and minor streets, inter-section angle, and approach grades on main and minor streets. Theaverage number of crashes that occurred within the intersectionsis about 58. The average length of corner clearance on main streetsis around 56.54 m (185.5 ft), and on minor streets is 52.33 m(171.7 ft). The minimum number of corner sides with drivewaysis 1, the maximum is 8, and the average value is around 6. Theaverage number of left-turn lanes on main streets is about 1.4, andthe maximum is 4; the average number of right-turn lanes is about0.4, and the maximum is 2. The average number of through lanes isabout 5.5 with the maximal value 8; the average number of left-turnlanes on minor streets is about 1.2, and the maximum is 2. Theright-turn lane number is about 0.4, and the maximum is 2 whilethe through lane number is around 3.9 with the maximal number 6.The average value of posted speed limit on the main street is18.77 m=s (42 mph), and the minor street speed limit average is14.30 m=s (32 mph). The average value of land-use type is around0.8, which means there is more commercial land around intersec-tions than residential land. The average intersection angle is around85.6 degree, and the maximum is 90.0 degree. The average grade
on main streets is around 0.1 percent and on minor streets is 0.08percent, with the maximum values 4.69 percent and 2.36 percent,respectively, in which the approach grades to an intersection isavoided greater than 6 percent (Rodegerdts et al. 2004). Althoughthere are a number of independent variables collected, only thesignificant ones are included in the final models. Selection of thevariables to include in the final model depends on whether the var-iable has a reasonable engineering interpretation, whether the cor-relation among the selected variables is weak, and whether thevariable can provide the different aspects of properties of the inter-section (Guo et al. 2010).
Model Development
Model Structure
Cross-Sectional Count Data ModelsThe process of crash occurrence at an intersection can be viewed asa Bernoulli trial, each with unequal probabilities of independentevents. A Bernoulli trial has two potential outcomes: one is con-sidered as a success (i.e., a crash) and the other is failure (i.e., nocrash). The number of trials with success in a certain time periodfollows binomial distribution. With the large number of trials, thebinomial distribution can be approximated with a Poisson distri-bution. According to Poisson distribution, the probability PðyiÞ ofintersection i having yi crashes in a time period can be written as
PðyiÞ ¼e−λi · λyii
yi!ð1Þ
where λi denotes the Poisson parameter for intersection i. By def-inition, λi is equal to the expected number of crashes in a timeperiod for intersection i.
Poisson regression models applied to this study to relate theexpected number of crashes λ, to explanatory variables, accordingto Washington et al. (2003), can be expressed as
λi ¼ expðβ · XiÞ ð2Þ
Table 3. Summary of Selected Variables
Abbreviation Variable description MeanStandarddeviation Minimum Maximum
Crash count Number of crashes at intersections 58.215 50.948 2 261MAINAVGCC Average corner clearance on main streets, m (ft) 56.53 (185.452) 117.208 0 211.89 (695.17)MINORAVGCC Average corner clearance on minor streets, m (ft) 52.34 (171.731) 97.245 0 228.98 (751.25)NOCC Number of corner sides with driveways 5.950 1.912 1 8LTTNMAIN Number of left-turn lanes on main streets 1.360 0.517 0 4RTTNMAIN Number of right-turn lanes on main streets 0.389 0.517 0 2TRMAIN Number of through lanes on main streets 5.491 0.983 0 8LTTNMINOR Number of left-turn lanes on minor streets 1.178 0.548 0 2RTTNMINOR Number of right-turn lanes on minor streets 0.411 0.529 0 2TRMINOR Number of through lanes on minor streets 3.865 1.523 0 6MAINSP Posted speed limit on main streets, m=s (mph) 18.65 (41.712) 5.364 11.175 (25) 20.115 (45)MINORSP Posted speed limit on minor streets, m=s (mph) 14.257 (31.895) 7.729 6.705 (15) 20.115 (45)LANDUSE Land use types, 1 is for commercial, 0 is for
residential, the mixed is in between0.763 0.334 0 1
MAINFL Total traffic flow on main streets by 1,000 67.854 42.317 0.76 177.14MINORFL Total traffic flow on minor streets by 1,000 61.577 37.788 0.41 172.60ANGLE Intersection angle, degree 85.628 8.375 27.91 90.00MAINGRADE Grade on main streets, positive for upgrade, negative
for downgrade, percent0.101 0.717 −2.62 4.69
MINORGRADE Grade on minor streets, positive for upgrade, negativefor downgrade, percent
0.080 0.585 −2.36 2.36
© ASCE 04014016-7 J. Transp. Eng.
J. Transp. Eng. 2014.140.
Dow
nloa
ded
from
asc
elib
rary
.org
by
Hua
zhon
g U
nive
rsity
of
Scie
nce
& T
echn
olog
y on
05/
21/1
4. C
opyr
ight
ASC
E. F
or p
erso
nal u
se o
nly;
all
righ
ts r
eser
ved.

where Xi = a vector of explanatory variables and β represents avector of estimable parameters.
By the virtue of Poisson distribution, the mean and variance ofcrashes occurring at an intersection in a year are equal (i.e., E½yi� ¼Var½yi�). To handle the cases where the mean and variance ofcrashes are not equal, Eq. (2) is modified as follows:
lnðλiÞ ¼ β · Xi þ εi ð3Þ
where Xi = a vector of explanatory variables; β = a vector of esti-mable parameters, and expðεiÞ is a gamma-distributed error termwith mean one and variance α2. With such a modification, the meanλi becomes a variable that follows binomial distribution. The mean-variance relationship becomes
Var½yi� ¼ EðyiÞ · ½1þ αEðyiÞ� ¼ E½yi� þ αEðyiÞ2 ð4Þ
If α is significantly different from zero, the crash data are over-dispersed or underdispersed. If α is equal to zero, the negativebinomial distribution reduces to Poisson distribution. The resultingnegative binomial probability distribution is
PðyiÞ ¼Γ½ð1=αÞ þ yi�Γð1=αÞyi!
�1=α
ð1=αÞ þ λi
�1=α
�λi
ð1=αÞ þ λi
�yi ð5Þ
where ΓðxÞ = a value of the gamma function; yi = the number ofcrashes for intersection i; and α = an overdispersion parameter.
Panel Data Negative Binomial ModelsConsidering that intersections on the same arterials share themissing information that is unique to the arterials, Eq. (3) can bewritten as
lnðλikÞ ¼ β · Xik þ εik ð6Þ
where Xik represents a vector of explanatory variables for the k-thintersection on arterial I; β = a corresponding vector of estimableparameters; and expðεikÞ denote a gamma-distributed error termwith mean one and variance α2.
Assuming that there is missing information that is distrib-uted over arterials with a probability distribution, Eq. (3) can bewritten as
lnðλikÞ ¼ βxik þ vi þ εik ð7Þ
where vi follows a probability distribution over arterials; and εik =the error term for the intersection k on arterial i. For the randomeffects, the beta distribution is selected, which is the conjugate priorof the negative binomial. With inverse dispersion following a betadistribution like vi=ð1þ viÞ ∼ Betaða; bÞ (a and b are distribu-tional parameters for vi), which integrates the random panel effectinto the negative binomial model, the probability of occurring yicrashes can be written as
Prðyik;xik;β;a;bÞ ¼ΓðaþbÞΓðaþP
k λikÞΓðbþP
k yikÞΓðaÞΓðbÞΓðaþbþP
k λikþP
k yikÞð8Þ
The details of the fixed-effects and random-effects negative bi-nomial models can be found in Greene (2006) and Hilbe (2007).
In this study whether the random-effects negative binomial re-gression model is suitable to estimate the impact of corner clear-ance on safety is determined based on the dispersion factor α.To evaluate if the resulting model is the best fit, log-likelihood ratio,given by ρ2 ¼ 1 − ½lðβÞ=lð0Þ� was used. lðβÞ is the log-likelihoodvalue of the fitted model and lð0Þ is the log-likelihood value of themodel with no variables included.
Model Estimation
Beginning with the independent variables in Table 3, each variablewas tested for statistical significance, and the random-effects NBregression model and the pooled NB regression model were esti-mated using STATA 9.0 software. The pooled NB regression modeldid not account for panel data structure while the random-effectsNB regression model accounted for the panel data structure. Afterremoving the variables one by one that are not significant, the finalmodels were estimated. The final set of variables, their coefficients,standard error, and z-statistics are shown in Tables 4–7.
For both the random-effects NB regression models and thepooled NB regression models, the following variables are sta-tistically significant: average corner clearance on main streets(MAINAVGCC), land-use type (LANDUSE), number of left-turnlanes on main streets (LFTNMAIN), number of through lanes onmain and minor streets (TRMAIN and TRMINOR), total traffic(entering) flow on main streets (MAINFL), and posted speed limiton minor streets (MINORSP). However, there exists a little dif-ference between the estimation results with the 60.96-m (200-ft)and 121.92-m (400-ft) buffer zone around intersections by pooledNB regression models and random-effects NB regression models.The random-effects NB regression model with a 60.96-m (200-ft)buffer zone is found to be the best fitted as evidenced by Akaike
Table 4. Pooled NB Regression Model for Intersection Safety with60.96-m (200-ft) Buffer Zone
Variables CoefficientStandarderror z-Statistic
MAINAVGCC −0.001 0.000 −2.38LANDUSE 0.411 0.115 3.55LFTNMAIN 0.323 0.070 4.67TRMAIN 0.115 0.037 3.14TRMINOR 0.102 0.030 3.36MAINFL 0.006 0.001 6.61MINORSP 0.016 0.006 2.68CONST 0.726 0.248 2.92Model statisticsNumber of observations = 275Overdispersion parameter α ¼ 0.248Chi square (7) = 217.45Log likelihood at convergence ¼ −1103.900
Table 5. Random-Effects NB Regression Model for Intersection Safetywith 60.96-m (200-ft) Buffer Zone
Variables CoefficientStandarderror z-Statistic
MAINAVGCC −0.001 0.000 −2.77LANDUSE 0.361 0.119 3.02LFTNMAIN 0.293 0.072 4.10TRMAIN 0.151 0.040 3.75TRMINOR 0.106 0.026 4.09MAINFL 0.006 0.001 7.33MAINSP 0.015 0.006 2.26MINORSP 0.017 0.005 3.34MAINGRADE −0.093 0.039 −2.43CONST −0.517 0.304 −1.70Model statisticsNumber of observations = 275Log likelihood at convergence, lðβÞ ¼ −1,090.413Log likelihood at zero, lð0Þ ¼ −1,648.880Chi square (9) = 356.70Ratio of log-likelihood index, ρ2 ¼ 0.340
© ASCE 04014016-8 J. Transp. Eng.
J. Transp. Eng. 2014.140.
Dow
nloa
ded
from
asc
elib
rary
.org
by
Hua
zhon
g U
nive
rsity
of
Scie
nce
& T
echn
olog
y on
05/
21/1
4. C
opyr
ight
ASC
E. F
or p
erso
nal u
se o
nly;
all
righ
ts r
eser
ved.
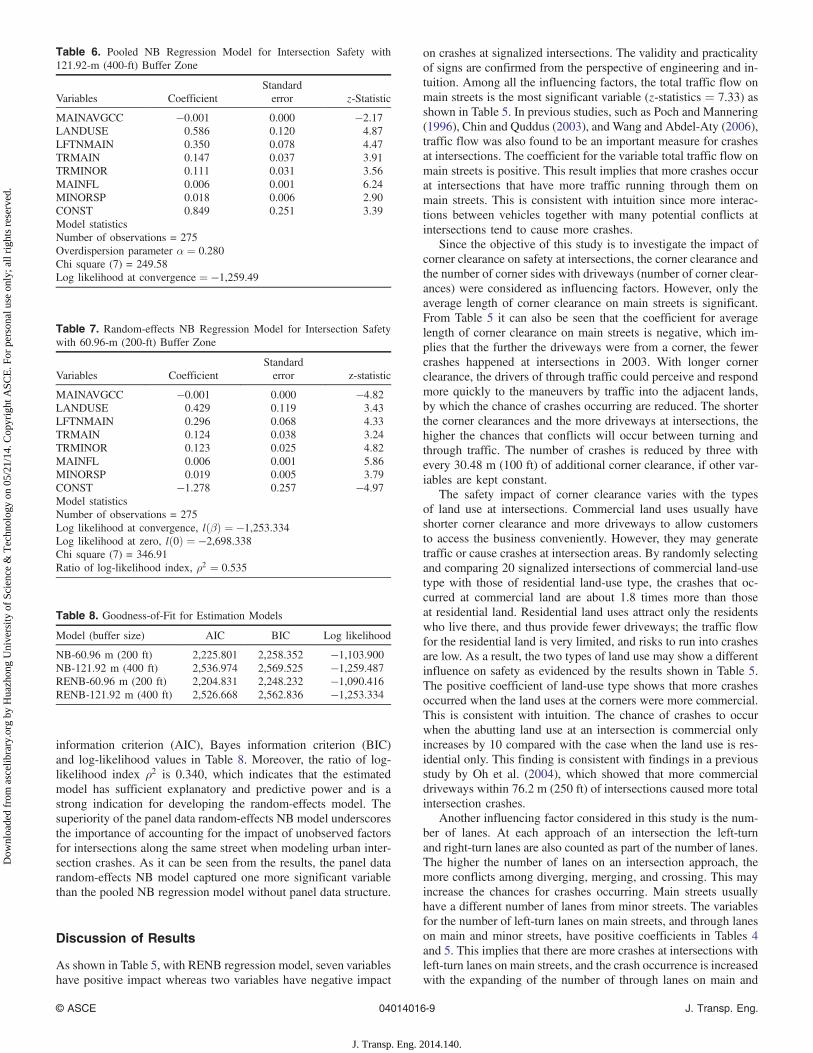
information criterion (AIC), Bayes information criterion (BIC)and log-likelihood values in Table 8. Moreover, the ratio of log-likelihood index ρ2 is 0.340, which indicates that the estimatedmodel has sufficient explanatory and predictive power and is astrong indication for developing the random-effects model. Thesuperiority of the panel data random-effects NB model underscoresthe importance of accounting for the impact of unobserved factorsfor intersections along the same street when modeling urban inter-section crashes. As it can be seen from the results, the panel datarandom-effects NB model captured one more significant variablethan the pooled NB regression model without panel data structure.
Discussion of Results
As shown in Table 5, with RENB regression model, seven variableshave positive impact whereas two variables have negative impact
on crashes at signalized intersections. The validity and practicalityof signs are confirmed from the perspective of engineering and in-tuition. Among all the influencing factors, the total traffic flow onmain streets is the most significant variable (z-statistics ¼ 7.33) asshown in Table 5. In previous studies, such as Poch and Mannering(1996), Chin and Quddus (2003), and Wang and Abdel-Aty (2006),traffic flow was also found to be an important measure for crashesat intersections. The coefficient for the variable total traffic flow onmain streets is positive. This result implies that more crashes occurat intersections that have more traffic running through them onmain streets. This is consistent with intuition since more interac-tions between vehicles together with many potential conflicts atintersections tend to cause more crashes.
Since the objective of this study is to investigate the impact ofcorner clearance on safety at intersections, the corner clearance andthe number of corner sides with driveways (number of corner clear-ances) were considered as influencing factors. However, only theaverage length of corner clearance on main streets is significant.From Table 5 it can also be seen that the coefficient for averagelength of corner clearance on main streets is negative, which im-plies that the further the driveways were from a corner, the fewercrashes happened at intersections in 2003. With longer cornerclearance, the drivers of through traffic could perceive and respondmore quickly to the maneuvers by traffic into the adjacent lands,by which the chance of crashes occurring are reduced. The shorterthe corner clearances and the more driveways at intersections, thehigher the chances that conflicts will occur between turning andthrough traffic. The number of crashes is reduced by three withevery 30.48 m (100 ft) of additional corner clearance, if other var-iables are kept constant.
The safety impact of corner clearance varies with the typesof land use at intersections. Commercial land uses usually haveshorter corner clearance and more driveways to allow customersto access the business conveniently. However, they may generatetraffic or cause crashes at intersection areas. By randomly selectingand comparing 20 signalized intersections of commercial land-usetype with those of residential land-use type, the crashes that oc-curred at commercial land are about 1.8 times more than thoseat residential land. Residential land uses attract only the residentswho live there, and thus provide fewer driveways; the traffic flowfor the residential land is very limited, and risks to run into crashesare low. As a result, the two types of land use may show a differentinfluence on safety as evidenced by the results shown in Table 5.The positive coefficient of land-use type shows that more crashesoccurred when the land uses at the corners were more commercial.This is consistent with intuition. The chance of crashes to occurwhen the abutting land use at an intersection is commercial onlyincreases by 10 compared with the case when the land use is res-idential only. This finding is consistent with findings in a previousstudy by Oh et al. (2004), which showed that more commercialdriveways within 76.2 m (250 ft) of intersections caused more totalintersection crashes.
Another influencing factor considered in this study is the num-ber of lanes. At each approach of an intersection the left-turnand right-turn lanes are also counted as part of the number of lanes.The higher the number of lanes on an intersection approach, themore conflicts among diverging, merging, and crossing. This mayincrease the chances for crashes occurring. Main streets usuallyhave a different number of lanes from minor streets. The variablesfor the number of left-turn lanes on main streets, and through laneson main and minor streets, have positive coefficients in Tables 4and 5. This implies that there are more crashes at intersections withleft-turn lanes on main streets, and the crash occurrence is increasedwith the expanding of the number of through lanes on main and
Table 6. Pooled NB Regression Model for Intersection Safety with121.92-m (400-ft) Buffer Zone
Variables CoefficientStandarderror z-Statistic
MAINAVGCC −0.001 0.000 −2.17LANDUSE 0.586 0.120 4.87LFTNMAIN 0.350 0.078 4.47TRMAIN 0.147 0.037 3.91TRMINOR 0.111 0.031 3.56MAINFL 0.006 0.001 6.24MINORSP 0.018 0.006 2.90CONST 0.849 0.251 3.39Model statisticsNumber of observations = 275Overdispersion parameter α ¼ 0.280Chi square (7) = 249.58Log likelihood at convergence ¼ −1,259.49
Table 7. Random-effects NB Regression Model for Intersection Safetywith 60.96-m (200-ft) Buffer Zone
Variables CoefficientStandarderror z-statistic
MAINAVGCC −0.001 0.000 −4.82LANDUSE 0.429 0.119 3.43LFTNMAIN 0.296 0.068 4.33TRMAIN 0.124 0.038 3.24TRMINOR 0.123 0.025 4.82MAINFL 0.006 0.001 5.86MINORSP 0.019 0.005 3.79CONST −1.278 0.257 −4.97Model statisticsNumber of observations = 275Log likelihood at convergence, lðβÞ ¼ −1,253.334Log likelihood at zero, lð0Þ ¼ −2,698.338Chi square (7) = 346.91Ratio of log-likelihood index, ρ2 ¼ 0.535
Table 8. Goodness-of-Fit for Estimation Models
Model (buffer size) AIC BIC Log likelihood
NB-60.96 m (200 ft) 2,225.801 2,258.352 −1,103.900NB-121.92 m (400 ft) 2,536.974 2,569.525 −1,259.487RENB-60.96 m (200 ft) 2,204.831 2,248.232 −1,090.416RENB-121.92 m (400 ft) 2,526.668 2,562.836 −1,253.334
© ASCE 04014016-9 J. Transp. Eng.
J. Transp. Eng. 2014.140.
Dow
nloa
ded
from
asc
elib
rary
.org
by
Hua
zhon
g U
nive
rsity
of
Scie
nce
& T
echn
olog
y on
05/
21/1
4. C
opyr
ight
ASC
E. F
or p
erso
nal u
se o
nly;
all
righ
ts r
eser
ved.

minor streets. This is understandable because left-turn lanes areusually related to potential rear-end conflicts among vehicles,which tend to cause more crashes at intersections. More throughlanes mean more traffic volume attracted, thus increasing thechance of crash occurrence. Wang and Abdel-Aty (2006) found thatthe number and types of right-turn lanes on a minor roadway andthe number of left-turn lanes on major roadway contributed to therear-end crash occurrence, which proved this point. The results inTable 5 suggest that with one additional left-turn lane on the mainstreet, one more crash would occur around the intersections, and ifone through lane is added on main and minor streets in each direc-tion, the probabilities of the crash occurrence are increased by 10%and 4% respectively.
Posted speed limits influence the speeds of vehicles arriving atintersections. Generally, higher speed limits are associated withhigher speeds of vehicles approaching intersections, which maylead to a higher probablity for crashes.The variables for the postedspeed limit on main and minor streets have positive coefficients.It is reasonable because a higher speed limit on streets is associatedwith higher running speeds, which usually contributes significantlyto the occurrence of crashes. With other variables kept constant,if the posted speed limit on main and minor streets is increasedby 5 mph, the probabilities of causing crashes are raised by 0.2%and 0.3% respectively. In comparison, Oh et al. (2004) found thathigher approach speed for major roads led to more intersectioncrashes in rural areas, which is uniform with the results of theRENB regression model in Table 5.
Approach grades at intersections play an important role in safetyas shown from the results in Table 5. Only the grade on main streetsis significant in the RENB regression model, and the coefficient isnegative. Since there is more traffic flow on main streets, it makessense that the grades on main streets have significant influence oncrashes. If the grades are higher, the drivers would pay more atten-tion and decelearate, the potential conflict might be avoided, thusreducing the crash occurrence.
Most of the estimation results in Tables 6 and 7 are similar tothose in Tables 4 and 5 except for a few variables. By comparing theresults of pooled NB regression models, it can be seen that all thevariables are the same as those in Table 4. Furthermore, sincesmaller AIC and BIC values are better, in Table 8, the results witha 60.96-m (200-ft) buffer zone are less than those with a 121.92-m
(400-ft) one by using pooled NB regression models, which impliesthat the pooled NB regression model with a 60.96-m (200-ft) bufferzone is better.
By comparing results of the RENB regression models, all thevariables are the same except that the posted speed limit and gradeon main streets are eliminated in Table 7. According to the estima-tion criteria in Table 8, AIC and BIC values are smaller and the log-likelihood value is larger with a 60.96-m (200-ft) buffer zone thanthose with a 121.92-m (400-ft) one, which proves the former RENBis better.
To prove whether the NB regression model is better than thePoisson regression one, Tables 9 and 10 give the results of crashesat intersections. Almost all the variables are significant withPoisson regression models. Seen from the ratios of log likelihoodto freedom, NB regression models with 200 ft (−137.61) and 400 ft(−179.93) are obviously larger than Poisson regression models(−143.53) and (−184.03) respectively; moreover, the Chi squaresof NB regression models (223.45) and (249.58) are much less thanthose of Poisson models (3,089.31) and (6,907.69), which indicatesthat the fitness effect of NB regession models is better than that ofPoisson regression models.
To sum up, RENB regression models prove to be betterthan pooled NB ones, and the RENB regression model with a60.96-m (200-ft) buffer zone is better than that with a 121.92-m(400-ft) one. Also, the results indicate that the 60.96-m (200-ft)buffer zone around an intersection is the best fit, which conformsto the criteria in the Access Management Manual (2003), so withthe RENB regression model the transferability in other cities can beapplicable and considered.
Conclusions and Recommendations
In this paper, the safety impact of corner clearance at intersectionswas evaluated by developing panel data-based count data models,with which the unobserved missing information at intersectionson the same arterials was taken into account. A unique intersectionwas imagined for an arterial, and the observations for the inter-sections on the same arterials were viewed as repeated observa-tions for the virtual unique intersection. With this approach, the
Table 9. Estimation Results of Poisson Regression Model with 60.96-m(200-ft) Buffer Zone
Variables CoefficientStandarderror z-Statistic
MAINAVGCC −0.001 0.000 −6.27NOCC 0.034 0.007 4.67LANDUSE 0.310 0.051 6.10LFTNMAIN 0.341 0.027 12.71TRMAIN 0.138 0.015 9.21RTMINOR 0.085 0.024 3.48TRMINOR 0.111 0.015 9.60MAINFL 0.007 0.000 21.70MAINSP −0.016 0.002 −6.40MINORSP 0.014 0.002 6.96MAINGRADE −0.076 0.014 −5.35MINORGRADE −0.114 0.018 −6.24CONST 1.229 0.121 10.13Model statisticsNumber of observations = 275Chi square (12) = 3,089.31Log likelihood at convergence ¼ −1,722.409
Table 10. Estimation Results of Poisson Regression Model with 121.92-m(400-ft) Buffer Zone
Variables CoefficientStandarderror z-Statistic
MAINAVGCC −0.001 0.000 −7.94NOCC 0.042 0.005 7.59LANDUSE 0.438 0.039 11.06LFTNMAIN 0.315 0.022 14.05RTTNMAIN 0.068 0.017 3.83TRMAIN 0.170 0.012 14.09LFTNMINOR 0.042 0.020 2.04RTMINOR 0.073 0.019 3.84TRMINOR 0.111 0.008 12.65MAINFL 0.006 0.000 27.55MAINSP −0.012 0.002 −6.79MINORSP 0.018 0.001 11.95MAINGRADE −0.068 0.010 −6.44MINORGRADE −0.018 0.013 −6.34CONST 1.132 0.097 11.72Model statisticsNumber of observations = 275Chi square (14) = 6907.69Log likelihood at convergence ¼ −2576.364
© ASCE 04014016-10 J. Transp. Eng.
J. Transp. Eng. 2014.140.
Dow
nloa
ded
from
asc
elib
rary
.org
by
Hua
zhon
g U
nive
rsity
of
Scie
nce
& T
echn
olog
y on
05/
21/1
4. C
opyr
ight
ASC
E. F
or p
erso
nal u
se o
nly;
all
righ
ts r
eser
ved.

heterogeneity issue can be better taken into account using paneldata model structure. Both the random-effects NB regression modeland the pooled NB regression model were estimated. Evaluationof the goodness-of-fit of the models developed indicated that therandom-effects negative binomial model was the best fit for the dataat hand. Moreover, compared with NB, spatial correlation betweenintersections along one arterial can be estimated by RENB whilethe basic NB leads to weaker statistical inference due to test sta-tistics and standard errors.
Analysis of the data from 275 signalized intersections pro-vides the opportunity for identifying the safety impact of access-management technique in the Las Vegas area. The results revealedthe contribution of the corner clearance on intersection crashes. Itwas found that the average length of corner clearance and the gradeon main streets play major and negative roles in crash occurrence atintersections. In addition, the total traffic flow on main streets, land-use types, the number of left-turn lanes on main streets, the numberof through lanes on main and minor streets, and the posted speedlimit on main and minor streets tend to increase the total crashoccurrence as well. Intersection angle is not significant for bothpooled NB regression models and RENB models, and grade onmain streets is only significant in the RENB regression model witha 60.96-m (200-ft) buffer zone.
In future studies, it is recommended that more influencing fac-tors and access management techniques, such as signal control(e.g., signal coordination, signal phasing), median types, signalspacing, and more be considered to evaluate the safety impact.Moreover, if the average approach speeds from all directions ofintersections can be obtained, the endogeneity problem betweensafety and mobility is worth further investigating.
Acknowledgments
This study was initially funded by the University TransportationCenter at the University of Nevada Las Vegas (UNLV), and sub-sequently supported by the Fundamental Research Fund forthe Central Universities (2013QN031), National Natural ScienceFoundation of China (NSFC) (No: 51208222 & 51078165) andScientific Research Foundation for the Returned Overseas ChineseScholars, State Education Ministry of China.
References
Access Management Manual. (2003). Transportation Research Board,National Research Council, Washington, DC.
Caliendo, C., De Guglielmo, M. L., and Guida, M. (2013). “A crash-prediction model for road tunnels.” Accident Anal. Prev., 55, 107–115.
Caliendo, C., Guida, M., and Parisi, A. (2007). “A crash-prediction modelfor multilane roads.” Accident Anal. Prev., 39(4), 657–670.
Carson, J., and Mannering, F. L. (2001). “The effect of ice warning signson accident frequencies and severities.” Accident Anal. Prev., 33(1),99–109.
Castro, M., Paleti, R., and Bhat, C. R. (2012). “A latent variable represen-tation of count data models to accommodate spatial and temporaldependence: Application to prediction crash frequency at intersections.”Transp. Res. Part B Method., 46(1), 253–272.
Chin, H. C., and Quddus, M. A. (2003). “Applying the random effectnegative binomial model to examine traffic accident occurrence atsignalized intersections.” Accident Anal. Prev., 35(2), 253–259.
Gluck, J., Levinson, H. S., and Stover, V. (1999). “Impact of access man-agement techniques.” NCHRP Rep. 420, Transportation ResearchBoard, National Research Council, Washington, DC.
Greene, W. H. (2006). Econometric analysis, 3rd Ed., Prentice-Hall,New York.
Guo, F., Wang, X., and Abdel-Aty, M. (2010). “Modeling signalized inter-section safety with corridor-level spatial correlations.” Accident Anal.Prev., 42(1), 84–92.
Hauer, E. (2004). “Statistical road safety modeling.” Transp. Res. Rec.1897, Transportation Research Board, Washington, DC, 1897, 81–87.
Hilbe, J. M. (2007). Negative binomial regression, 1st Ed., CambridgeUniversity Press, U.K.
Ivan, J. N., Wang, C., and Bernardo, N. R. (2000). “Explaining two-lanehighway crash rates using land use and hourly exposure.” AccidentAnal. Prev., 32(6), 787–795.
Karlaftis, M., and Tarko, A. P. (1998). “Heterogeneity considerations inaccident modeling.” Accident Anal. Prev., 30(4), 425–433.
Kaub, A. R. (1994). Safety management with the access management ac-cident and safe access spacing models.
Long, G., and Cheng-Tin, G. (1993). Driveway impact on saturated trafficflow, Transportation Research Center, Univ. of Florida, Gainesville.
Lord, D., and Mannering, F. L. (2010). “The statistical analysis of crash-frequency data: A review and assessment of methodological alterna-tives.” Transp. Res. Part A, 44(5), 291–305.
McCoy, P. T., and Heimann, J. E. (1994). “Effect of driveway traffic onsaturation flow rates at signalized intersections.” ITE J. Inst. Transp.Eng., 60(2), 12–15.
Oh, J., Washington, S., and Choi, K. (2004). “Development of accidentprediction models for rural highway intersections.” Proc. 83th AnnualMeeting, Transportation Research Board, Washington, DC.
Poch, M., and Mannering, F. (1996). “Negative binomial analysis ofintersection-crash frequencies.” J. Transp. Eng., 10.1061/(ASCE)0733-947X(1996)122:2(105), 105–113.
Rodegerdts, L. A., Nevers, B., Robinson, B., and Ringert, J. (2004). Sig-nalized Intersections: Informational Guide, No. FHWA-HRT-04-091,U.S. Dept. of Transportation, Federal Highway Administration,McLean, VA.
Shankar, V. N. (1997). “Limited dependent variable and structural equa-tions models: Empirical applications to traffic operations and safety.”Ph.D. dissertation, Univ. of Washington, Seattle, WA.
Shankar, V. N., Albin, R. B., Milton, J. C., and Mannering, F. L. (1998).“Evaluating median crossover likelihoods with clustered accidentcounts: An empirical inquiry using the random effects negative bino-mial model.” Transportation Research Record 1635, TransportationResearch Board, Washington, DC, 44–48.
Ulfarsson, G. F., and Shankar, V. N. (2003). “Accident count model basedon multiyear cross-sectional roadway data with serial correlation.”Transportation Research Record 1840, Transportation Research Board,Washington, DC, 193–197.
Wang, X., and Abdel-Aty, M. (2006). “Temporal and spatial analysesof rear-end crashes at signalized intersections.” Accid. Anal. Prev.,38(6), 1137–1150.
Wang, X., Abdel-Aty, M., and Chen, X. (2007). “Safety analysis at signal-ized intersections: research strategies, modeling techniques, and signifi-cant factors.” Plan, Build, and Manage Transportation Infrastructure inChina Congress 2007(ISSTP), Shanghai, China, 389–400.
Washington, S. P., Karlaftis, M. G., and Mannering, F. L. (2003). Statisticaland econometric methods for transportation data analysis, Chapman &Hall/CRC, New York.
Wong, S., Sze, N., and Li, Y. (2007). “Contributory factors to traffic crashesat signalized intersections in Hong Kong.” Accident Anal. Prev., 39(6),1107–1113.
Xie, K., Wang, X., Huang, H., and Chen, X. (2013). “Corridor-level sig-nalized intersection safety analysis in Shanghai, China using Bayesianhierarchical models.” Accident Anal. Prev., 50(1), 25–33.
Xu, X. (2010). “Evaluation of safety impact of access management in urbanareas.” Ph.D. dissertation, Univ. of Nevada, Las Vegas, NV.
Ye, X., Pendyala, R. M., Washington, S. P., Konduri, K., and Oh, J. (2009).“A simultaneous equations model of crash frequency by collision typefor rural intersections.” Safety Sci., 47(3), 443–452.
© ASCE 04014016-11 J. Transp. Eng.
J. Transp. Eng. 2014.140.
Dow
nloa
ded
from
asc
elib
rary
.org
by
Hua
zhon
g U
nive
rsity
of
Scie
nce
& T
echn
olog
y on
05/
21/1
4. C
opyr
ight
ASC
E. F
or p
erso
nal u
se o
nly;
all
righ
ts r
eser
ved.