2012 Manhattan River Crossings - NYC.gov
142
2012 Manhattan River Crossings A member of the New York Metropolitan Transportation Council Bill de Blasio Mayor NEW YORK CITY TM Polly Trottenberg Commissioner
-
Upload
khangminh22 -
Category
Documents
-
view
4 -
download
0
Transcript of 2012 Manhattan River Crossings - NYC.gov
2012 Manhattan River Crossings
A member of the New York Metropolitan Transportation Council
Bill de Blasio Mayor
NEW YORK CITY TM
Polly Trottenberg Commissioner

2012 Manhattan River Crossings
Contract D000642
2012-2013: PTDT12D00.E01
2013-2014: PTDT13D00.E01
The preparation of this report was financed in part with funds from the U.S. Department of Transportation, Federal Highway Administration, under the Federal Highway Act of 1956, as amended, and the Urban Mass Transportation Act of 1964, as amended. This document is disseminated by the New York City Department of Transportation in the interest of information exchange. It reflects the views of the New York City Department of Transportation (NYCDOT), which is responsible for the facts and the accuracy of the data presented herein. The report does not necessarily reflect any official views or policies of the Federal Transit Administration, the Federal Highway Administration, or the State of New York. The report does not constitute a standard, specification, or regulation. NYCDOT is grateful to the Port Authority of New York and New Jersey (PANYNJ), the Metropolitan Transportation Authority Bridges and Tunnels (MTABT), the New York City Department of City Planning (NYC DCP), and the New York Metropolitan Transportation Council (NYMTC) for providing data used to develop this report.
Prepared by: New York City Department of Transportation Polly Trottenberg Commissioner Lori A. Ardito First Deputy Commissioner Ryan Russo Assistant Commissioner Naim Rasheed Director, Traffic Planning Ann Marie Doherty Chief, Research, Implementation, & Safety Richard P. Roan Research, Implementation, & Safety Published July 2014

ManhattanRiver Crossings
24 Hour VolumesInbound:
Outbound:
24,420Washington Bridge
University Heights Bridge
Broadway Bridge
Henry Hudson Bridge
Alexander Hamilton Bridge
Macombs Dam Bridge
Madison Avenue Bridge
Third Avenue Bridge
Willis Avenue Bridge
145th Street Bridge
George WashingtonBridge
Robert F. Kennedy Bridge(Formerly Triborough Bridge)
Lincoln Tunnel
Ed Koch Queensboro Bridge
Queens-Midtown Tunnel
Williamsburg Bridge
Manhattan Bridge
Brooklyn Bridge
Hugh L. Carey Tunnel(Formerly Brooklyn-Battery Tunnel)
Holland Tunnel
32,591
90,431
94,878
20,762
18,258
13,683
14,235
18,58216,829
22,242
17,399
137,949
138,699
18,912
22,870
59,053
62,062
50,818
40,138
48,499
88,123
53,731
59,435
90,065
39,438
57,468
55,228
46,524
46,219
43,788
45,29950,452
49,836
27,216
27,083
29,03534,399
2012
908,994897,655

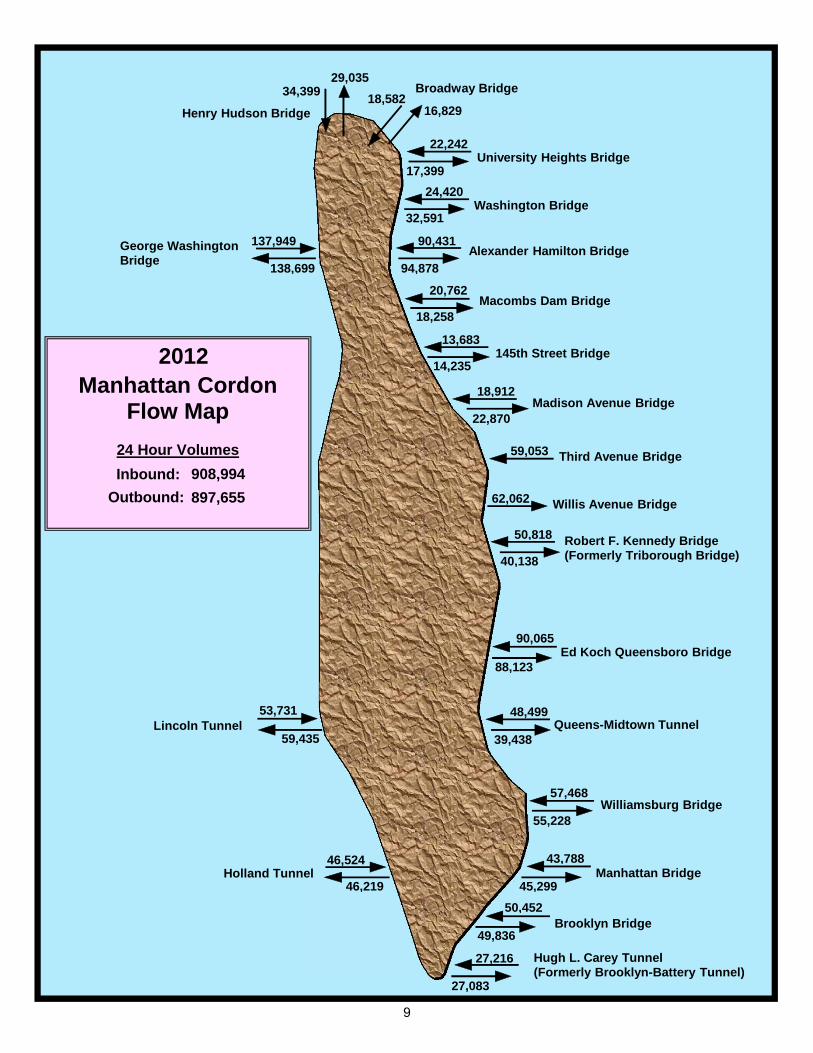
1,806,600daily vehicles used the 20 Manhattan River Crossings in 2012 (total of both directions).
0.1% Decreasefrom the 1,808,200 daily vehicles recorded in 2011.
8.9% IncreaseWashington Bridge (Harlem River) Largest percentage increase for crossings carrying more than 50,000 daily vehicles, to 57,000 in 2012 from 52,400 in 2011.
5.2% DecreaseBrooklyn Bridge (East River)Largest percentage decrease for crossings carrying more than 50,000 daily vehicles, to 100,300 in 2012 from 105,800 in 2011.
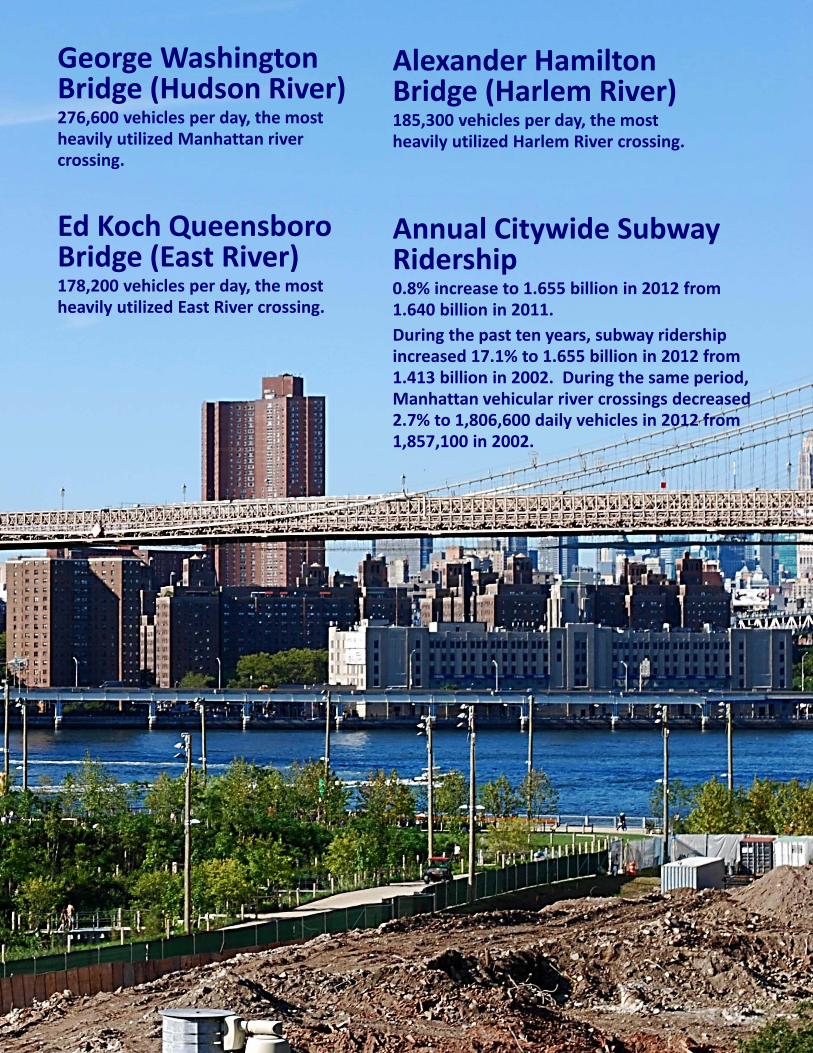
Ed Koch QueensboroBridge (East River)178,200 vehicles per day, the most heavily utilized East River crossing.
Alexander HamiltonBridge (Harlem River)185,300 vehicles per day, the most heavily utilized Harlem River crossing.
Annual Citywide SubwayRidership0.8% increase to 1.655 billion in 2012 from 1.640 billion in 2011. During the past ten years, subway ridership increased 17.1% to 1.655 billion in 2012 from 1.413 billion in 2002. During the same period, Manhattan vehicular river crossings decreased 2.7% to 1,806,600 daily vehicles in 2012 from 1,857,100 in 2002.
George WashingtonBridge (Hudson River)276,600 vehicles per day, the most heavily utilized Manhattan river crossing.

TABLE OF CONTENTS
PAGE
INTRODUCTION . . . . . . . . . . . . . . . . . . . . . . . . . . . . . . . . . . . . . . . . . . 1
SUMMARY ~ 2012 Daily Traffic . . . . . . . . . . . . . . . . . . . . . . . . . . . . . . . . . 5
Manhattan Cordon Flow Maps . . . . . . . . . . . . . . . . . . . . . . . . . . . . . 9
Average Daily Traffic Volumes . . . . . . . . . . . . . . . . . . . . . . . . . . . . . 12
Average Hourly Traffic Volumes . . . . . . . . . . . . . . . . . . . . . . . . . . . . 14
Manhattan Vehicular Accumulation . . . . . . . . . . . . . . . . . . . . . . . . . . 16
TRIP CHARACTERISTICS . . . . . . . . . . . . . . . . . . . . . . . . . . . . . . . . . . . . . 17
Origins & Travel Modes of Manhattan Auto Commuters . . . . . . . . . . . . . . . 18
Thru vs. Local Trips via Hudson River Crossings . . . . . . . . . . . . . . . . . . . . 19
Vehicle Occupancy . . . . . . . . . . . . . . . . . . . . . . . . . . . . . . . . . . . . 24
2011‐2012 TRENDS . . . . . . . . . . . . . . . . . . . . . . . . . . . . . . . . . . . . . . . . 25
Hourly Vehicular Volumes 2012 vs. 2011 . . . . . . . . . . . . . . . . . . . . . . . 28
Manhattan Crossings Daily Traffic Volume Trends 2012 vs. 2011 . . . . . . . . . . 30
Volume Comparisons 2012 vs. 2011 . . . . . . . . . . . . . . . . . . . . . . . . . . 31
East River Bridges . . . . . . . . . . . . . . . . . . . . . . . . . . . . . . . . 32
Harlem River Bridges . . . . . . . . . . . . . . . . . . . . . . . . . . . . . . 33
MTABT Manhattan Crossings . . . . . . . . . . . . . . . . . . . . . . . . . . 34
PANYNJ Manhattan Crossings . . . . . . . . . . . . . . . . . . . . . . . . . 35
TEN‐YEAR TRENDS ~ 2002 ‐ 2012 . . . . . . . . . . . . . . . . . . . . . . . . . . . . . . . . 37
Manhattan Crossings Daily Traffic Volume Trends 2012 vs. 2002 . . . . . . . . . . 41
Hourly Vehicular Volumes 2012 vs. 2002 . . . . . . . . . . . . . . . . . . . . . . . 43
Volume Comparisons 2012 vs. 2002 . . . . . . . . . . . . . . . . . . . . . . . . . . 45
East River Bridges . . . . . . . . . . . . . . . . . . . . . . . . . . . . . . . . 46
Harlem River Bridges . . . . . . . . . . . . . . . . . . . . . . . . . . . . . . 47
PAGE
MTABT Manhattan Crossings . . . . . . . . . . . . . . . . . . . . . . . . . . 48
PANYNJ Manhattan Crossings . . . . . . . . . . . . . . . . . . . . . . . . . 49
Motor Vehicle Registrations 2002 ‐ 2012 . . . . . . . . . . . . . . . . . . . . . . . 49
HISTORIC TRENDS . . . . . . . . . . . . . . . . . . . . . . . . . . . . . . . . . . . . . . . . 51
Manhattan Crossings Daily Volumes 1948 ‐ 2012 . . . . . . . . . . . . . . . . . . . 57
Historical Comparisons 1948 ‐ 2012 . . . . . . . . . . . . . . . . . . . . . . . . . . 58
East River Bridges . . . . . . . . . . . . . . . . . . . . . . . . . . . . . . . . 59
Harlem River Bridges . . . . . . . . . . . . . . . . . . . . . . . . . . . . . . 59
MTABT Manhattan Crossings . . . . . . . . . . . . . . . . . . . . . . . . . . 60
PANYNJ Manhattan Crossings . . . . . . . . . . . . . . . . . . . . . . . . . 60
Manhattan River Crossings vs. Annual Subway Ridership 1948‐2012 . . . . . . . . 61
Motor Vehicle Registrations 1915 ‐ 2012 . . . . . . . . . . . . . . . . . . . . . . . 63
Past and Present Passenger Car Toll Structures . . . . . . . . . . . . . . . . . . . . 64
River Crossings vs. Toll Rates . . . . . . . . . . . . . . . . . . . . . . . . . . . . . . 65
EAST RIVER BRIDGES . . . . . . . . . . . . . . . . . . . . . . . . . . . . . . . . . . . . . . . 67
Brooklyn Bridge . . . . . . . . . . . . . . . . . . . . . . . . . . . . . . . . . . . . . 70
Ed Koch Queensboro Bridge . . . . . . . . . . . . . . . . . . . . . . . . . . . . . . 72
Manhattan Bridge . . . . . . . . . . . . . . . . . . . . . . . . . . . . . . . . . . . . 74
Williamsburg Bridge . . . . . . . . . . . . . . . . . . . . . . . . . . . . . . . . . . . 76
HARLEM RIVER BRIDGES . . . . . . . . . . . . . . . . . . . . . . . . . . . . . . . . . . . . 79
Alexander Hamilton Bridge . . . . . . . . . . . . . . . . . . . . . . . . . . . . . . . 82
Broadway Bridge . . . . . . . . . . . . . . . . . . . . . . . . . . . . . . . . . . . . . 84
Macombs Dam Bridge . . . . . . . . . . . . . . . . . . . . . . . . . . . . . . . . . . 86
Madison Avenue Bridge . . . . . . . . . . . . . . . . . . . . . . . . . . . . . . . . . 88
Third Avenue Bridge . . . . . . . . . . . . . . . . . . . . . . . . . . . . . . . . . . . 90

PAGE
University Heights Bridge . . . . . . . . . . . . . . . . . . . . . . . . . . . . . . . . 92
Washington Bridge . . . . . . . . . . . . . . . . . . . . . . . . . . . . . . . . . . . . 94
Willis Avenue Bridge . . . . . . . . . . . . . . . . . . . . . . . . . . . . . . . . . . . 96
145th Street Bridge . . . . . . . . . . . . . . . . . . . . . . . . . . . . . . . . . . . 98
MTA BRIDGES AND TUNNELS FACILITIES . . . . . . . . . . . . . . . . . . . . . . . . . . . 101
Brooklyn‐Battery Tunnel . . . . . . . . . . . . . . . . . . . . . . . . . . . . . . . . 104
Queens‐Midtown Tunnel . . . . . . . . . . . . . . . . . . . . . . . . . . . . . . . . 106
Henry Hudson Bridge . . . . . . . . . . . . . . . . . . . . . . . . . . . . . . . . . . 108
R.F.K. Memorial Bridge Manhattan Plaza . . . . . . . . . . . . . . . . . . . . . . . 109
PORT AUTHORITY OF NEW YORK AND NEW JERSEY FACILITIES . . . . . . . . . . . . . . . 111
George Washington Bridge . . . . . . . . . . . . . . . . . . . . . . . . . . . . . . . 114
Holland Tunnel . . . . . . . . . . . . . . . . . . . . . . . . . . . . . . . . . . . . . . 116
Lincoln Tunnel . . . . . . . . . . . . . . . . . . . . . . . . . . . . . . . . . . . . . . 118
APPENDIX ‐‐ 2012 Bridge and Tunnel Reconstruction
Brooklyn Bridge . . . . . . . . . . . . . . . . . . . . . . . . . . . . . . . . . . . A ‐ 1
Ed Koch Queensboro Bridge . . . . . . . . . . . . . . . . . . . . . . . . . . . . A ‐ 2
Manhattan Bridge . . . . . . . . . . . . . . . . . . . . . . . . . . . . . . . . . . A ‐ 3
Williamsburg Bridge . . . . . . . . . . . . . . . . . . . . . . . . . . . . . . . . . A ‐ 5
Alexander Hamilton Bridge . . . . . . . . . . . . . . . . . . . . . . . . . . . . . A ‐ 6
Broadway Bridge . . . . . . . . . . . . . . . . . . . . . . . . . . . . . . . . . . . A ‐ 7
Willis Avenue Bridge . . . . . . . . . . . . . . . . . . . . . . . . . . . . . . . . . A ‐ 7
145th Street Bridge . . . . . . . . . . . . . . . . . . . . . . . . . . . . . . . . . A ‐ 7
Henry Hudson Bridge . . . . . . . . . . . . . . . . . . . . . . . . . . . . . . . . A ‐ 8
Hugh L. Carey Tunnel (Formerly Brooklyn‐Battery Tunnel) . . . . . . . . . . . A ‐ 8
PAGE
Queens‐Midtown Tunnel . . . . . . . . . . . . . . . . . . . . . . . . . . . . . . A ‐ 8
R.F.K. Memorial Bridge . . . . . . . . . . . . . . . . . . . . . . . . . . . . . . . A ‐ 9
George Washington Bridge . . . . . . . . . . . . . . . . . . . . . . . . . . . . . A ‐ 9
Holland Tunnel . . . . . . . . . . . . . . . . . . . . . . . . . . . . . . . . . . . . A ‐ 9
Lincoln Tunnel . . . . . . . . . . . . . . . . . . . . . . . . . . . . . . . . . . . . A ‐ 10
Introduction
Madison Avenue Bridge
1

2

INTRODUCTION
The 2012 Manhattan River Crossings report is an annual publication prepared by the New York City Department of Transportation (NYCDOT), and funded by the Unified Planning Work Program (UPWP) under the Planning Program of the Moving Ahead for Progress (MAP‐21) Act.
Since 1948, the City of New York has been monitoring traffic flow over the 20 bridges and tunnels serving Manhattan. The Manhattan River Crossings report, published annually by the New York City Department of Transportation (NYCDOT) since 1972, presents vehicular volumes, classification, and trends for all bridges and tunnels serving Manhattan. All toll‐free bridges are monitored with automatic traffic recording (ATR) machines during the fall season.
The average hourly volumes by direction for 2012 are presented in histograms for each facility. The total vehicular flow to and from Manhattan has been summarized similarly with hourly histograms, and a graph of vehicle accumulation in Manhattan. The analysis presented in the report was performed by Subregional Transportation Planning Program staff of NYCDOT during the 2012‐2013 and 2013‐2014 program years.
NYCDOT extends its appreciation to the Port Authority of New York and New Jersey (PANYNJ), the Metropolitan Transportation Authority Bridges and Tunnels (MTABT), the New York City Department of City Planning (NYCDCP), and the New York Metropolitan Transportation Council (NYMTC) for their assistance in the data collection process.
Note: NYCDOT uses the averages of vehicular volumes from selected representative weekdays. Publications from other sources may be based on alternative computation methodologies for some facilities, most notably the tolled bridges and tunnels, possibly yielding different results for those facilities.
The Harlem River and East River Bridges, as well as the MTABT and PANYNJ facilities, have been classified under a highway functional classification system. Functional classification is the process by which streets and highways are grouped into classes, or systems, according to the character of service each roadway provides.
The five functional classifications are defined as follows:
1. Interstate ‐ connects population centers across state lines.
2. Principal Arterial ‐ serves major centers of activity of an urban area and carries a high proportion of the total urban area travel on a minimum of mileage.
3. Minor Arterial ‐ interconnects with and augments urban principal arterials; provides service for trips of moderate length at a somewhat lower level of travel mobility than principal arterials; distributes travel to geographic areas smaller than those identified with the higher system.
4. Collector Street ‐ provides both land access service and traffic circulation within residential neighborhoods, and commercial and industrial areas. Differs from the arterial systems in that facilities on the collector system may penetrate residential neighborhoods, distributing trips from arterials to the ultimate destination.
3
Conversely, collector streets also collect traffic from local streets in residential neighborhoods and channel it into the arterial system.
5. Local Street ‐ comprises all facilities not on one of the higher systems. Serves primarily to provide direct access to abutting land and access to the higher order systems. Offers the lowest level of mobility and usually contains no bus or truck routes.
4
Summary ~ 2012 Daily Traffic
Brooklyn Bridge
5

6
SUMMARY
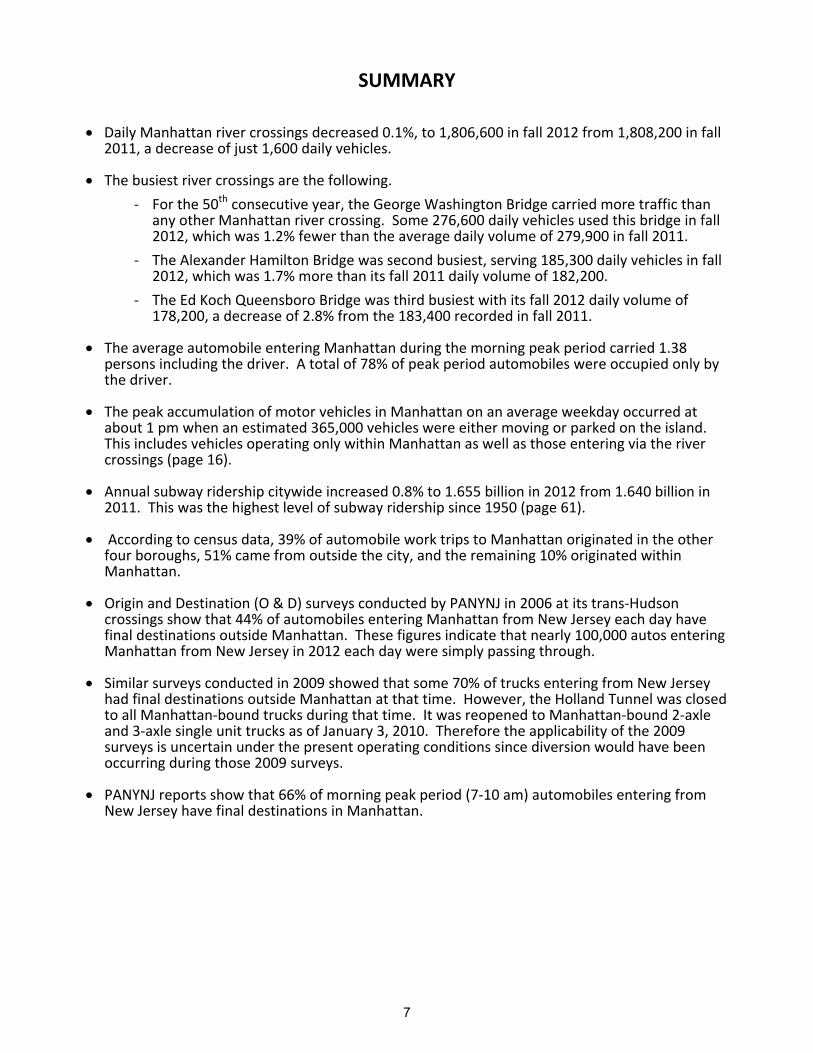
Daily Manhattan river crossings decreased 0.1%, to 1,806,600 in fall 2012 from 1,808,200 in fall 2011, a decrease of just 1,600 daily vehicles.
The busiest river crossings are the following. ‐ For the 50th consecutive year, the George Washington Bridge carried more traffic than
any other Manhattan river crossing. Some 276,600 daily vehicles used this bridge in fall 2012, which was 1.2% fewer than the average daily volume of 279,900 in fall 2011.
‐ The Alexander Hamilton Bridge was second busiest, serving 185,300 daily vehicles in fall 2012, which was 1.7% more than its fall 2011 daily volume of 182,200.
‐ The Ed Koch Queensboro Bridge was third busiest with its fall 2012 daily volume of 178,200, a decrease of 2.8% from the 183,400 recorded in fall 2011.
The average automobile entering Manhattan during the morning peak period carried 1.38 persons including the driver. A total of 78% of peak period automobiles were occupied only by the driver.
The peak accumulation of motor vehicles in Manhattan on an average weekday occurred at about 1 pm when an estimated 365,000 vehicles were either moving or parked on the island. This includes vehicles operating only within Manhattan as well as those entering via the river crossings (page 16).
Annual subway ridership citywide increased 0.8% to 1.655 billion in 2012 from 1.640 billion in 2011. This was the highest level of subway ridership since 1950 (page 61).
According to census data, 39% of automobile work trips to Manhattan originated in the other four boroughs, 51% came from outside the city, and the remaining 10% originated within Manhattan.
Origin and Destination (O & D) surveys conducted by PANYNJ in 2006 at its trans‐Hudson crossings show that 44% of automobiles entering Manhattan from New Jersey each day have final destinations outside Manhattan. These figures indicate that nearly 100,000 autos entering Manhattan from New Jersey in 2012 each day were simply passing through.
Similar surveys conducted in 2009 showed that some 70% of trucks entering from New Jersey had final destinations outside Manhattan at that time. However, the Holland Tunnel was closed to all Manhattan‐bound trucks during that time. It was reopened to Manhattan‐bound 2‐axle and 3‐axle single unit trucks as of January 3, 2010. Therefore the applicability of the 2009 surveys is uncertain under the present operating conditions since diversion would have been occurring during those 2009 surveys.
PANYNJ reports show that 66% of morning peak period (7‐10 am) automobiles entering from New Jersey have final destinations in Manhattan.
7

8
Manhattan CordonFlow Map
24 Hour VolumesInbound:
Outbound:
24,420Washington Bridge
University Heights Bridge
Broadway Bridge
Henry Hudson Bridge
Alexander Hamilton Bridge
Macombs Dam Bridge
Madison Avenue Bridge
Third Avenue Bridge
Willis Avenue Bridge
145th Street Bridge
George WashingtonBridge
Robert F. Kennedy Bridge(Formerly Triborough Bridge)
Lincoln Tunnel
Ed Koch Queensboro Bridge
Queens-Midtown Tunnel
Williamsburg Bridge
Manhattan Bridge
Brooklyn Bridge
Holland Tunnel
32,591
90,431
94,878
20,762
18,258
13,683
14,235
18,58216,829
22,242
17,399
137,949
138,699
18,912
22,870
59,053
62,062
50,818
40,138
48,499
88,123
53,731
59,435
90,065
39,438
57,468
55,228
46,524
46,219
43,788
45,29950,452
49,836
27,216
27,083
29,03534,399
2012
908,994897,655
Hugh L. Carey Tunnel(Formerly Brooklyn-Battery Tunnel)
9
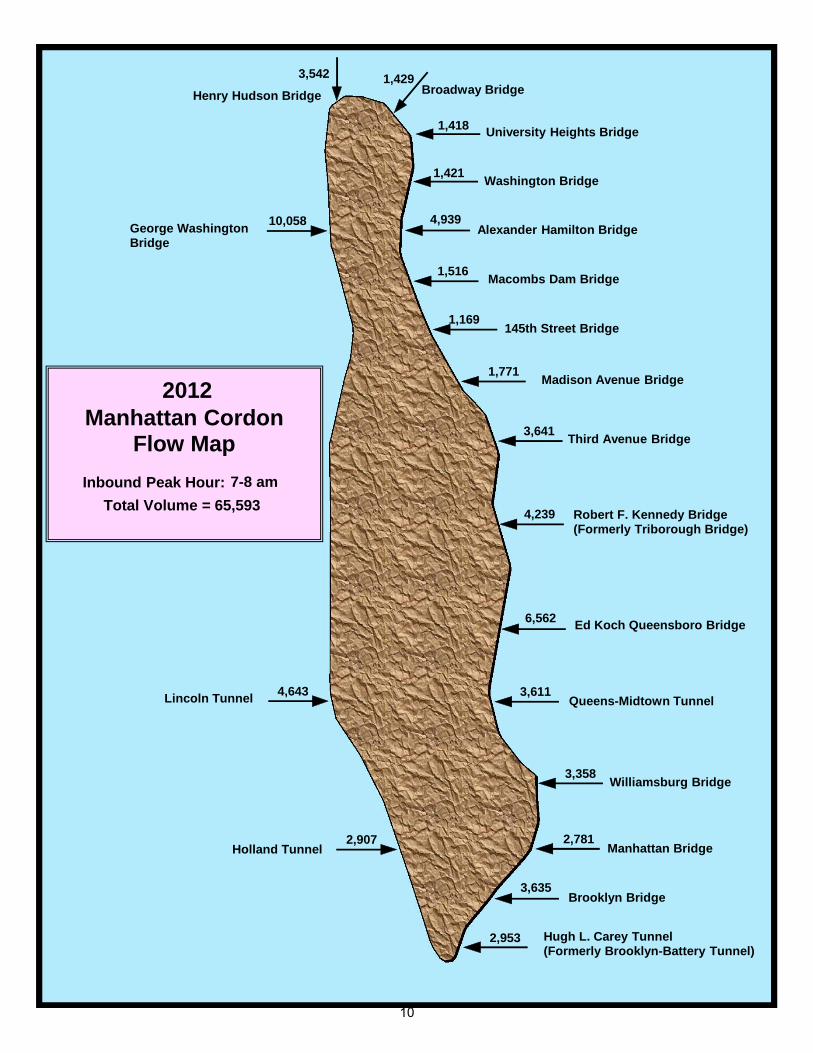
Manhattan CordonFlow Map
Inbound Peak Hour:Total Volume =
1,421 Washington Bridge
University Heights Bridge
Broadway BridgeHenry Hudson Bridge
Alexander Hamilton Bridge
Macombs Dam Bridge
Madison Avenue Bridge
Third Avenue Bridge
145th Street Bridge
George Washington Bridge
Robert F. Kennedy Bridge(Formerly Triborough Bridge)
Lincoln Tunnel
Ed Koch Queensboro Bridge
Queens-Midtown Tunnel
Williamsburg Bridge
Manhattan Bridge
Brooklyn Bridge
Holland Tunnel
4,939
1,516
1,169
1,429
1,418
10,058
1,771
3,641
4,239
3,6114,643
6,562
3,358
2,907 2,781
3,635
2,953
3,542
2012
7-8 am65,593
Hugh L. Carey Tunnel(Formerly Brooklyn-Battery Tunnel)
10

Manhattan CordonFlow Map
Outbound Peak Hour:Total Volume =
2,380 Washington Bridge
University Heights Bridge
Broadway BridgeHenry Hudson Bridge
Alexander Hamilton Bridge
Macombs Dam Bridge
Madison Avenue Bridge
Willis Avenue Bridge
145th Street Bridge
George Washington Bridge
Robert F. Kennedy Bridge(Formerly Triborough Bridge)
Lincoln Tunnel
Ed Koch Queensboro Bridge
Queens-Midtown Tunnel
Williamsburg Bridge
Manhattan Bridge
Brooklyn Bridge
Holland Tunnel
4,688
1,065
1,176
1,269
1,083
10,215
1,608
3,984
3,194
2,9874,617
5,939
3,374
2,569 2,778
3,295
2,532
2,472
2012
4-5 pm61,225
Hugh L. Carey Tunnel(Formerly Brooklyn-Battery Tunnel)
11

To From 2-wayEAST RIVER BRIDGES Manhattan Manhattan Total
Brooklyn Bridge 50,452 49,836 100,288 Ed Koch Queensboro Bridge * 90,065 88,123 178,188 Manhattan Bridge 43,788 45,299 89,087 Williamsburg Bridge 57,468 55,228 112,696
Total East River 241,773 238,486 480,259
HARLEM RIVER BRIDGES
Alexander Hamilton Bridge 90,431 94,878 185,309 Broadway Bridge 18,582 16,829 35,411 Macombs Dam Bridge 20,762 18,258 39,020 Madison Avenue Bridge 18,912 22,870 41,782 Third Avenue Bridge 59,053 ----- 59,053 University Heights Bridge 22,242 17,399 39,641 Washington Bridge 24,420 32,591 57,011 Willis Avenue Bridge ----- 62,062 62,062 145th Street Bridge 13,683 14,235 27,918
Total Harlem River 268,085 279,122 547,207
MTABT FACILITIES
Henry Hudson Bridge 34,399 29,035 63,434 Hugh L. Carey Tunnel ** 27,216 27,083 54,299 Queens-Midtown Tunnel 48,499 39,438 87,937 Robert F. Kennedy Bridge *** 50,818 40,138 90,956
Total MTABT 160,932 135,694 296,626
PANYNJ FACILITIES
George Washington Bridge 137,949 138,699 276,648 Holland Tunnel 46,524 46,219 92,743 Lincoln Tunnel 53,731 59,435 113,166
Total PANYNJ 238,204 244,353 482,557
GRAND TOTAL 908,994 897,655 1,806,649
* Queensboro Bridge renamed April 11, 2011.** Formerly Brooklyn-Battery Tunnel, renamed October 22, 2012.
*** Formerly Triborough Bridge, renamed November 19, 2008.
Manhattan Crossings2012 Average Daily Traffic Volumes
To and From Manhattan
12

2012 Manhattan Crossings Vehicle Volumes
East River 480,259 - 26.6 %
Harlem River 547,207 - 30.3 %
24-Hour Volumes – Both Directions
MTABT 296,626 - 16.4 %
PANYNJ 482,557 - 26.7 %
P.M. Peak Hour Volumes – Outbound4-5 pm
East River 15,386 - 25.1 %
Harlem River 17,253 - 28.2 %MTABT
11,185 - 18.3 %
PANYNJ 17,401 - 28.4 %
A.M. Peak Hour Volumes – Inbound7-8 am
East River 16,336 - 24.9 %
Harlem River 17,304 - 26.4 %
PANYNJ 17,608 - 26.8 %
MTABT 14,345 - 21.9 %
13

Entering Leaving 2-Way Manhattan Manhattan Total
12-1am 15,214 23,271 38,4851-2am 9,965 14,547 24,5122-3am 8,091 11,083 19,1743-4am 8,591 10,803 19,3944-5am 14,323 14,879 29,2025-6am 32,308 22,179 54,4876-7am 58,832 32,708 91,5407-8am 65,593 ** 40,628 106,2218-9am 61,391 41,106 102,4979-10am 54,727 36,921 91,64810-11am 47,235 37,504 84,73911-12am 43,350 38,827 82,17712-1pm 41,717 40,779 82,4961-2pm 42,518 44,309 86,8272-3pm 45,952 49,825 95,7773-4pm 49,018 57,619 106,6374-5pm 50,133 61,225 ** 111,3585-6pm 51,283 59,977 111,2606-7pm 48,074 56,021 104,0957-8pm 41,840 51,564 93,4048-9pm 35,318 45,750 81,0689-10pm 31,848 41,234 73,08210-11pm 28,805 34,241 63,04611-12pm 22,868 30,655 53,523
24 hrs 908,994 897,655 1,806,649
7-10am 181,711 118,655 300,36610am-1pm 132,302 117,110 249,4121-4pm 137,488 151,753 289,2414-7pm 149,490 177,223 326,713
7am-7pm 600,991 564,741 1,165,732
** Peak Volumes
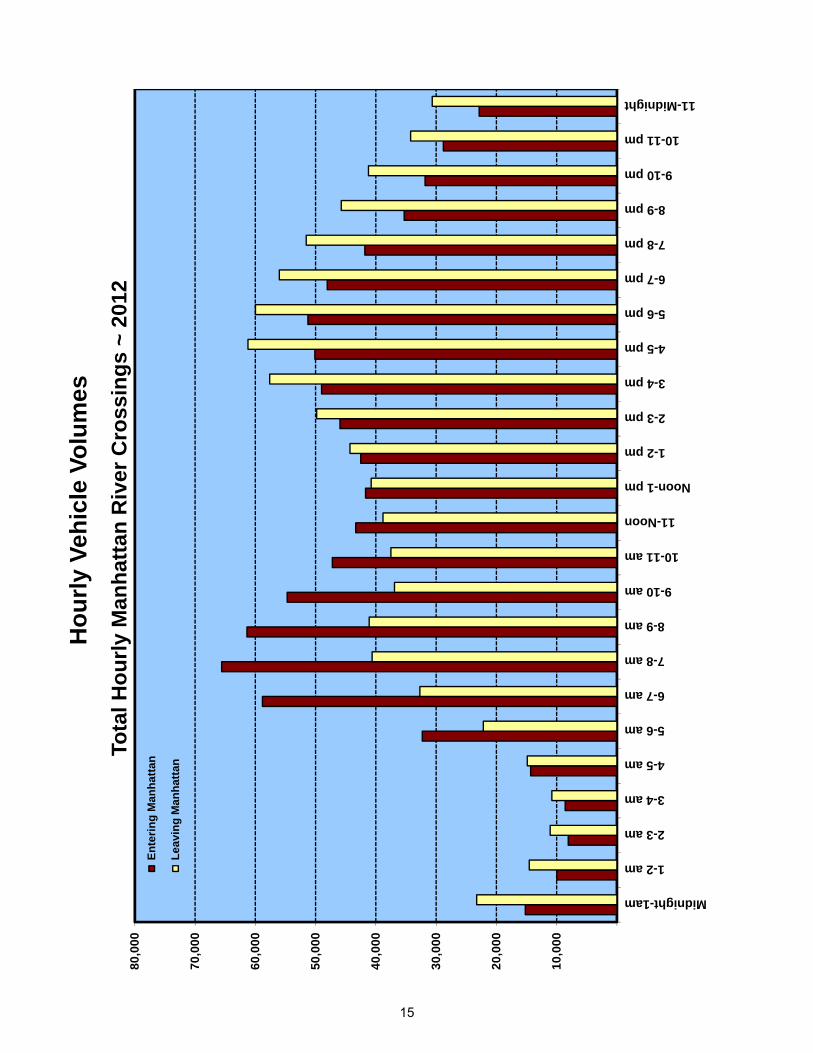
Total Manhattan Crossings2012 Average Hourly Traffic Volumes
To and From Manhattan(All Facilities)
14
10,0
00
20,0
00
30,0
00
40,0
00
50,0
00
60,0
00
70,0
00
80,0
00Midnight-1am
1-2 am
2-3 am
3-4 am
4-5 am
5-6 am
6-7 am
7-8 am
8-9 am
9-10 am
10-11 am
11-Noon
Noon-1 pm
1-2 pm
2-3 pm
3-4 pm
4-5 pm
5-6 pm
6-7 pm
7-8 pm
8-9 pm
9-10 pm
10-11 pm
11-Midnight
Ent
erin
g M
anha
ttan
Lea
ving
Man
hatta
n
Tota
l Hou
rly M
anha
ttan
Riv
er C
ross
ings
~ 2
012
Hou
rly V
ehic
le V
olum
es
15

50100
150
200
250
300
350
400 1 am
2 am
3 am
4 am
5 am
6 am
7 am
8 am
9 am
10 am
11 am
Noon
1 pm
2 pm
3 pm
4 pm
5 pm
6 pm
7 pm
8 pm
9 pm
10 pm
11 pm
Midnight
Man
hatta
n Ve
hicu
lar A
ccum
ulat
ion
2012
Thou
sand
s
250,
510
(5 a
m)
Man
hatta
n Ve
hicl
e R
egis
trat
ions
365,
011
(1 p
m)
16
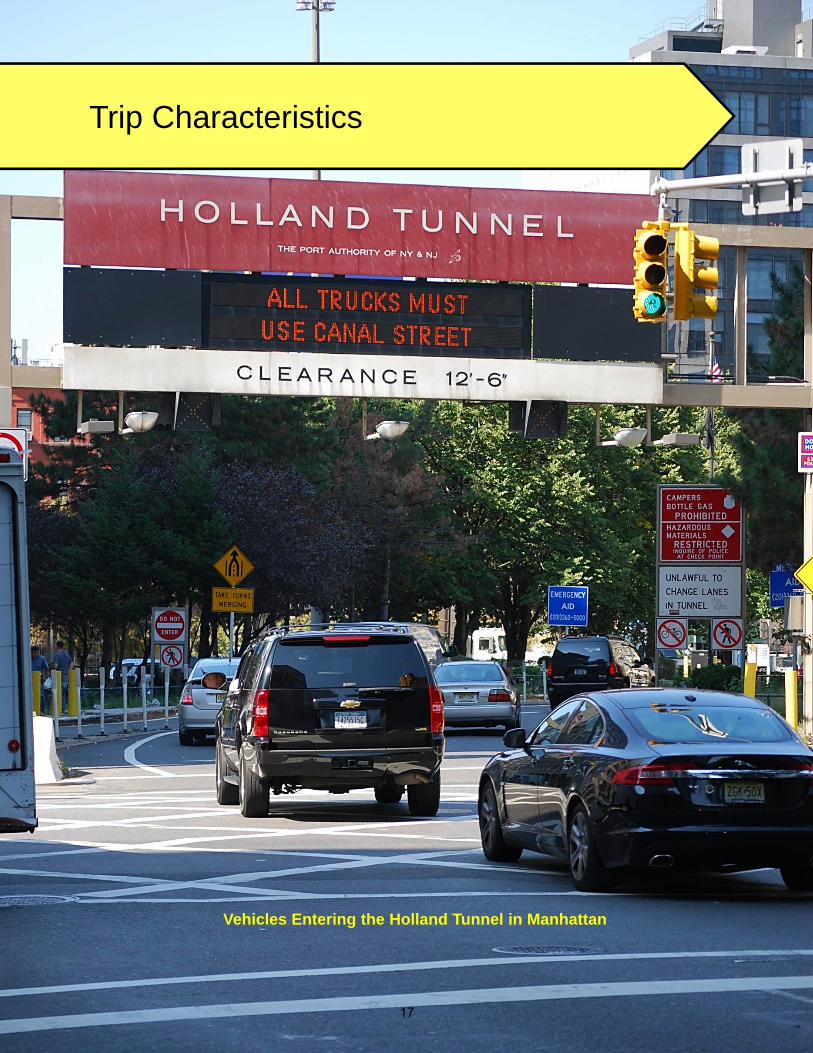
Trip Characteristics
Vehicles Entering the Holland Tunnel in Manhattan
17
Total
23
4+ R
ail
Man
hattan
Drove
Person
Person
Person
Rap
id W
orkers
Alon
eCa
rpoo
lCa
rpoo
lCa
rpoo
lBu
s Transit
Railroa
d Ferry
Bicycle
Walk
Taxi
Other
NY ~ Bron
x19
1,71
522
,815
4,24
597
053
021
,335
133,37
55,42
565
270
1,37
51,08
023
0 NY ~ Broo
klyn
387,96
025
,155
5,29
51,83
593
019
,635
322,27
56,50
015
52,40
52,04
580
093
0 NY ~ Manhattan
656,59
523
,435
5,36
51,15
51,25
567
,875
333,27
57,99
030
8,07
017
3,83
031
,035
3,28
0 NY ~ Que
ens
378,36
039
,800
8,98
01,73
51,28
529
,305
274,56
518
,710
105
360
1,38
596
51,16
5 NY ~ Staten
Is.
56,695
10,280
1,55
042
539
531
,580
4,84
583
06,36
010
518
520
120
Sub
total NYC
Orig
ins
1,67
1,32
512
1,48
525
,435
6,12
04,39
516
9,73
01,06
8,33
539
,455
6,71
511
,210
178,82
033
,900
5,72
5
NY ~ Nassau
95,554
18,550
3,63
555
025
52,75
59,86
059
,205
604
305
120
255
NY ~ Westche
ster
83,745
17,620
3,51
051
520
03,32
57,81
049
,645
140
030
028
539
5 NY ~ Suffo
lk41
,135
9,99
01,97
552
560
1,07
02,42
024
,100
115
3536
531
017
0 NY ~ Ro
ckland
15,815
7,43
01,45
522
511
54,36
526
01,79
010
045
00
30 NY ~ Orange
11,595
4,95
580
019
018
02,18
044
52,78
00
040
250
NY ~ 52
Rem
aining
Cou
nties
16,298
5,02
21,18
389
4975
31,80
16,36
715
9867
860
183
New
York State To
tals
1,93
5,46
718
5,05
237
,993
8,21
45,25
418
4,17
81,09
0,93
118
3,34
27,14
511
,392
180,50
834
,700
6,75
8
NJ ~
Hud
son
70,020
5,93
01,29
539
023
522
,155
32,840
2,54
04,00
070
310
4521
0 NJ ~
Bergen
65,495
18,855
5,05
51,07
560
030
,310
1,98
06,44
588
00
130
2514
0 NJ ~
Essex
33,030
5,16
51,01
538
015
58,43
53,27
014
,090
500
8520
365
NJ ~
Middlesex
28,130
3,80
065
580
509,29
51,07
512
,990
500
5015
70 NJ ~
Mon
mou
th24
,809
4,08
01,24
530
536
09,07
094
06,30
52,28
035
130
455
NJ ~
Union
17,380
3,65
071
517
016
03,29
51,73
06,84
015
060
074
5 NJ ~
Morris
13,064
4,20
033
095
292,93
052
54,76
030
030
013
5 NJ ~
14 Re
maining
Cou
nties
36,397
8,73
41,93
016
527
011
,550
1,46
911
,470
135
4027
579
280
New
Jersey
Totals
288,32
554
,414
12,240
2,66
01,85
997
,040
43,829
65,440
7,44
014
51,07
018
82,00
0
CT ~ Fairfield
27,965
4,09
572
515
2074
01,72
520
,365
00
8020
180
CT ~ 7 Re
maining
Cou
nties
5,81
31,95
531
480
3032
058
52,24
020
012
475
70
Con
necticut Totals
33,778
6,05
01,03
995
501,06
02,31
022
,605
200
204
9525
0
Pen
nsylvania To
tals
14,886
3,73
974
424
039
54,99
31,33
32,96
50
026
90
208
GRA
ND TOTA
LS2,27
2,45
624
9,25
552
,016
11,209
7,55
828
7,27
11,13
8,40
327
4,35
214
,605
11,537
182,05
134
,983
9,21
6
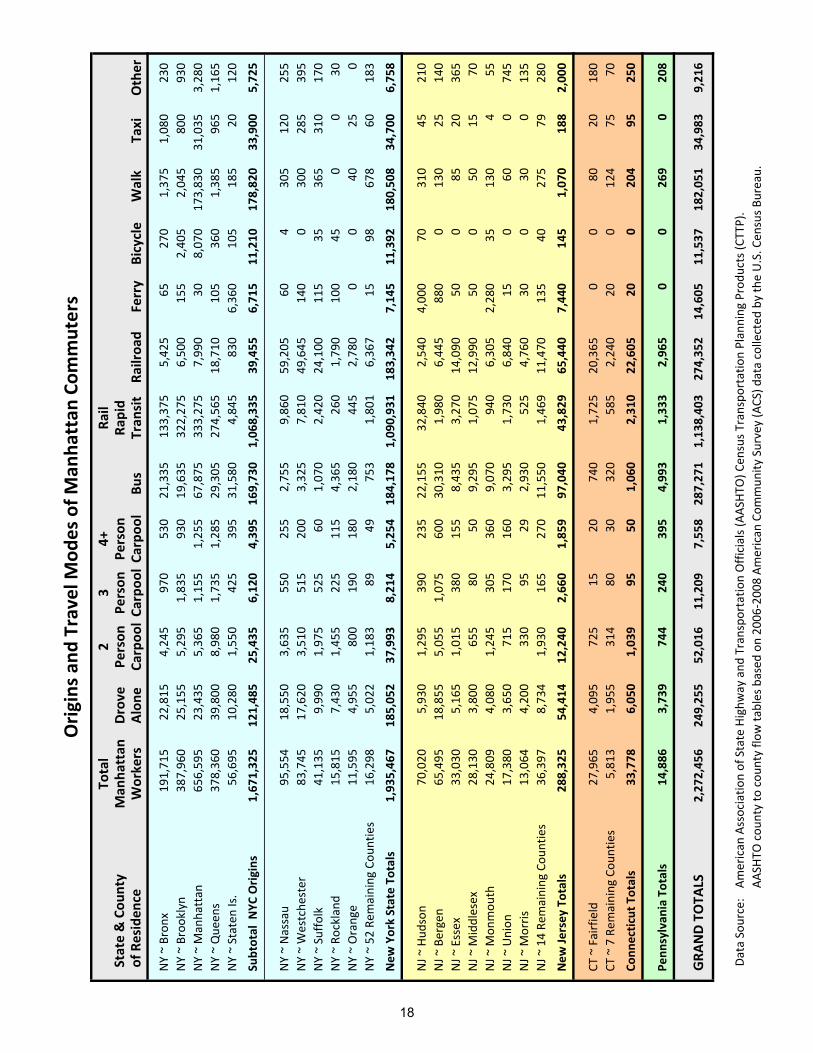
Data Source: American
Associatio
n of State Highw
ay and
Transpo
rtation Officials (AA
SHTO
) Cen
sus T
ranspo
rtation Planning
Produ
cts (CT
TP).
AAS
HTO cou
nty to cou
nty flo
w ta
bles based
on 20
06‐200
8 Am
erican
Com
mun
ity Survey (ACS) d
ata collected
by the U.S. Cen
sus B
ureau.
State & Cou
nty
of R
esiden
ce
Orig
ins a
nd Travel M
odes of M
anha
ttan
Com
muters
18
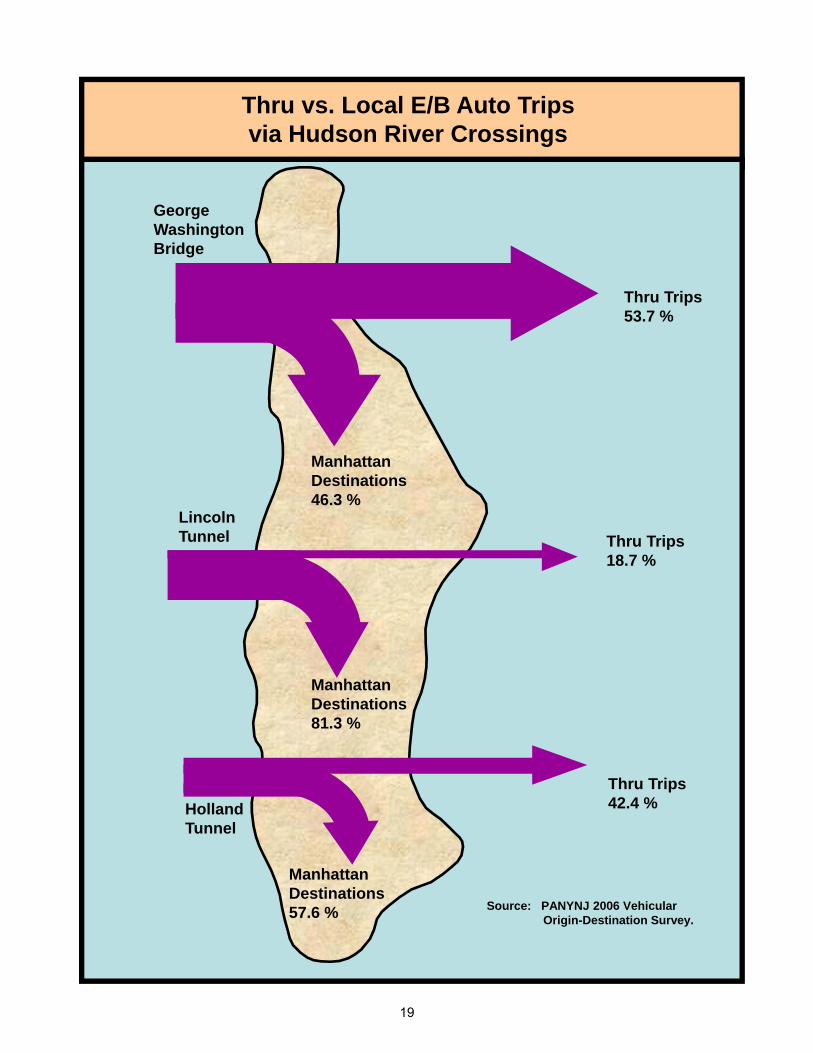
Thru vs. Local E/B Auto Tripsvia Hudson River Crossings
Source: PANYNJ 2006 VehicularOrigin-Destination Survey.
George Washington Bridge
Thru Trips53.7 %
Manhattan Destinations46.3 %
Lincoln Tunnel Thru Trips
18.7 %
Manhattan Destinations81.3 %
Thru Trips42.4 %
Manhattan Destinations57.6 %
Holland Tunnel
19

Eastbound AutoDestinations 6-7 am 7-10 am 4-7 pm 5 am - 11 pm
ManhattanManhattan CBD 42.4 % 46.2 % 24.4 % 34.5 %Upper Manhattan 23.8 % 20.1 % 21.3 % 21.7 %
Manhattan Total 66.2 % 66.3 % 45.7 % 56.2 %
Bronx 12.2 % 9.6 % 10.1 % 10.8 %Brooklyn 7.8 % 7.1 % 10.6 % 9.0 %Queens 4.6 % 7.3 % 17.3 % 10.9 %Westchester 4.3 % 3.2 % 7.7 % 4.7 %Long Island 3.5 % 3.7 % 7.4 % 5.5 %Other 1.4 % 2.8 % 1.2 % 2.9 %
Thru Trip Total 33.8 % 33.7 % 54.3 % 43.8 %
GRAND TOTAL 100.0 % 100.0 % 100.0 % 100.0 %
Source: Weekday data from the PANYNJ 2006 Vehicular Origin-Destination Survey.
TOTAL OF HOLLAND TUNNEL, LINCOLN TUNNELAND GEORGE WASHINGTON BRIDGE
DESTINATIONS OF HUDSON RIVER CROSSINGS EASTBOUND AUTO TRAFFIC
20
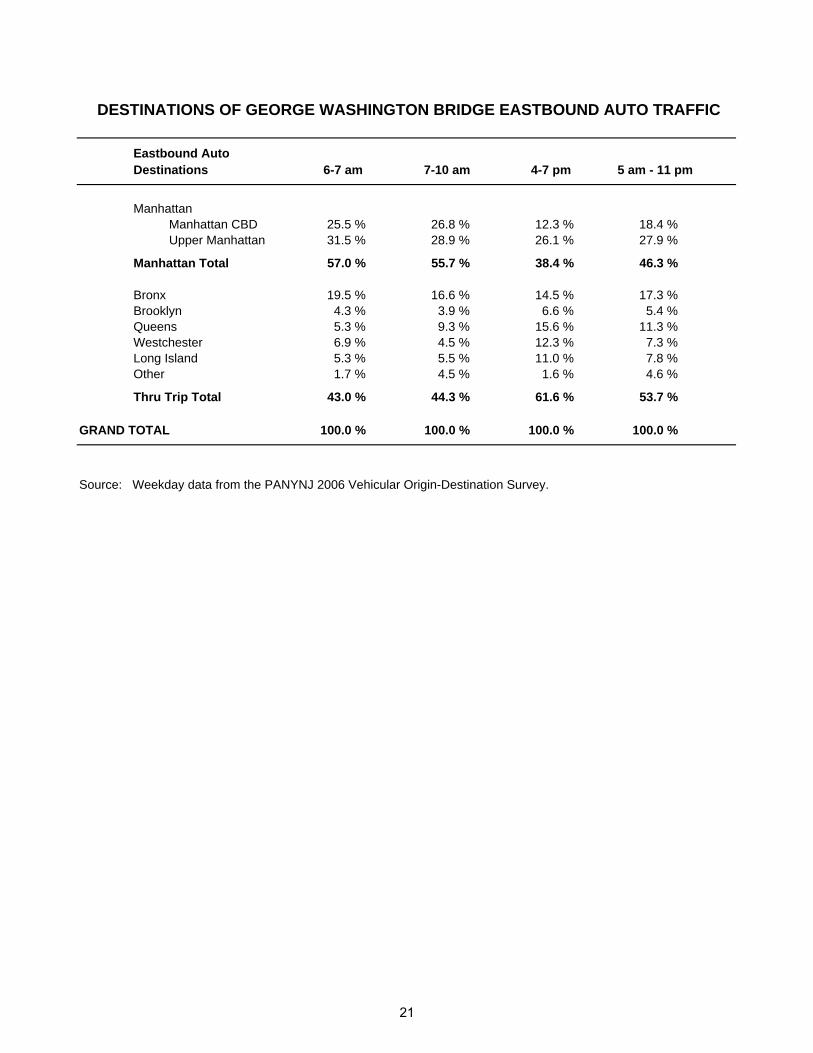
Eastbound AutoDestinations 6-7 am 7-10 am 4-7 pm 5 am - 11 pm
ManhattanManhattan CBD 25.5 % 26.8 % 12.3 % 18.4 %Upper Manhattan 31.5 % 28.9 % 26.1 % 27.9 %
Manhattan Total 57.0 % 55.7 % 38.4 % 46.3 %
Bronx 19.5 % 16.6 % 14.5 % 17.3 %Brooklyn 4.3 % 3.9 % 6.6 % 5.4 %Queens 5.3 % 9.3 % 15.6 % 11.3 %Westchester 6.9 % 4.5 % 12.3 % 7.3 %Long Island 5.3 % 5.5 % 11.0 % 7.8 %Other 1.7 % 4.5 % 1.6 % 4.6 %
Thru Trip Total 43.0 % 44.3 % 61.6 % 53.7 %
GRAND TOTAL 100.0 % 100.0 % 100.0 % 100.0 %
Source: Weekday data from the PANYNJ 2006 Vehicular Origin-Destination Survey.
DESTINATIONS OF GEORGE WASHINGTON BRIDGE EASTBOUND AUTO TRAFFIC
21

Eastbound AutoDestinations 6-7 am 7-10 am 4-7 pm 5 am - 11 pm
ManhattanManhattan CBD 60.6 % 62.7 % 40.3 % 49.0 %Upper Manhattan 11.4 % 5.8 % 12.2 % 8.6 %
Manhattan Total 72.0 % 68.5 % 52.5 % 57.6 %
Bronx 2.1 % 0.6 % 3.2 % 2.2 %Brooklyn 19.3 % 20.4 % 24.9 % 23.0 %Queens 3.9 % 4.9 % 16.9 % 12.4 %Westchester 0.6 % 3.3 % 0.0 % 2.0 %Long Island 0.5 % 2.3 % 1.8 % 2.4 %Other 1.6 % 0.0 % 0.7 % 0.4 %
Thru Trip Total 28.0 % 31.5 % 47.5 % 42.4 %
GRAND TOTAL 100.0 % 100.0 % 100.0 % 100.0 %
Source: Weekday data from the PANYNJ 2006 Vehicular Origin-Destination Survey.
DESTINATIONS OF HOLLAND TUNNEL EASTBOUND AUTO TRAFFIC
22

Eastbound AutoDestinations 6-7 am 7-10 am 4-7 pm 5 am - 11 pm
ManhattanManhattan CBD 76.7 % 78.6 % 51.6 % 64.0 %Upper Manhattan 12.1 % 10.3 % 15.0 % 17.3 %
Manhattan Total 88.8 % 88.9 % 66.6 % 81.3 %
Bronx 0.0 % 0.2 % 2.7 % 1.2 %Brooklyn 7.8 % 5.1 % 3.9 % 6.0 %Queens 2.9 % 4.5 % 25.8 % 8.6 %Westchester 0.0 % 0.1 % 0.0 % 0.3 %Long Island 0.5 % 0.5 % 1.0 % 2.0 %Other 0.0 % 0.7 % 0.0 % 0.6 %
Thru Trip Total 11.2 % 11.1 % 33.4 % 18.7 %
GRAND TOTAL 100.0 % 100.0 % 100.0 % 100.0 %
Source: Weekday data from the PANYNJ 2006 Vehicular Origin-Destination Survey.
DESTINATIONS OF LINCOLN TUNNEL EASTBOUND AUTO TRAFFIC
23
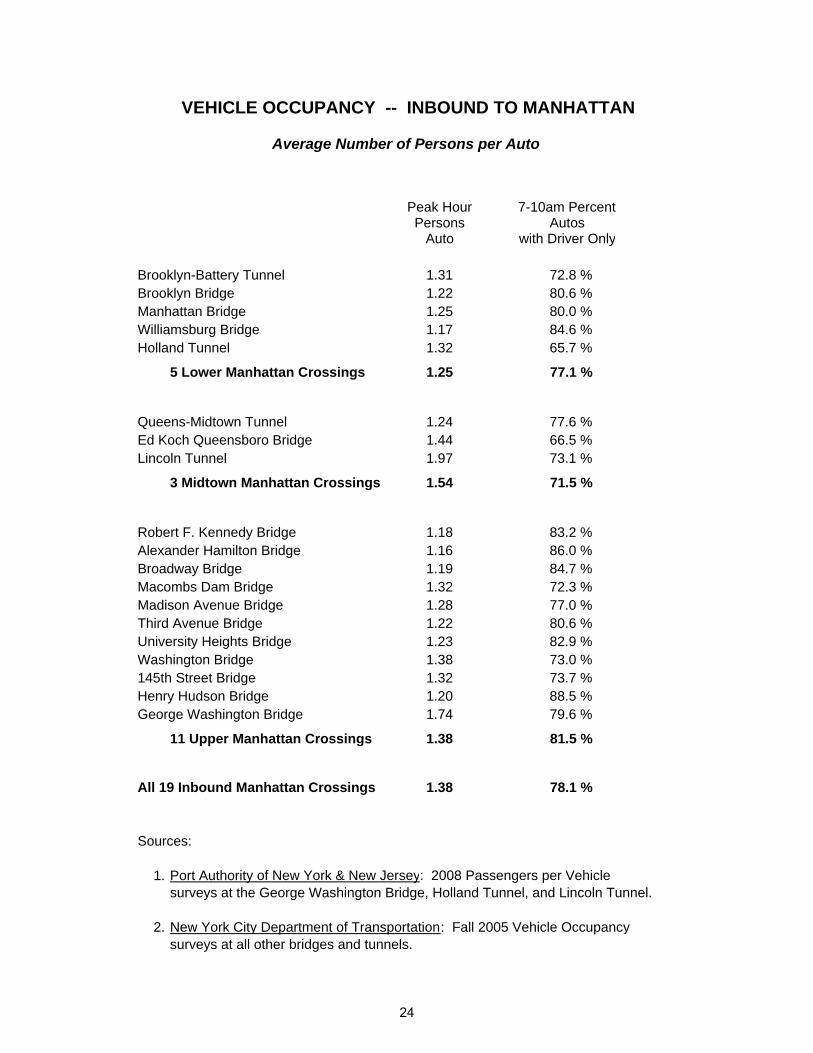
Peak Hour 7-10am PercentPersons Autos
Auto with Driver Only
Brooklyn-Battery Tunnel 1.31 72.8 %Brooklyn Bridge 1.22 80.6 %Manhattan Bridge 1.25 80.0 %Williamsburg Bridge 1.17 84.6 %Holland Tunnel 1.32 65.7 %
5 Lower Manhattan Crossings 1.25 77.1 %
Queens-Midtown Tunnel 1.24 77.6 %Ed Koch Queensboro Bridge 1.44 66.5 %Lincoln Tunnel 1.97 73.1 %
3 Midtown Manhattan Crossings 1.54 71.5 %
Robert F. Kennedy Bridge 1.18 83.2 %Alexander Hamilton Bridge 1.16 86.0 %Broadway Bridge 1.19 84.7 %Macombs Dam Bridge 1.32 72.3 %Madison Avenue Bridge 1.28 77.0 %Third Avenue Bridge 1.22 80.6 %University Heights Bridge 1.23 82.9 %Washington Bridge 1.38 73.0 %145th Street Bridge 1.32 73.7 %Henry Hudson Bridge 1.20 88.5 %George Washington Bridge 1.74 79.6 %
11 Upper Manhattan Crossings 1.38 81.5 %
All 19 Inbound Manhattan Crossings 1.38 78.1 %
Sources:
1. Port Authority of New York & New Jersey: 2008 Passengers per Vehiclesurveys at the George Washington Bridge, Holland Tunnel, and Lincoln Tunnel.
2. New York City Department of Transportation: Fall 2005 Vehicle Occupancy surveys at all other bridges and tunnels.
VEHICLE OCCUPANCY -- INBOUND TO MANHATTAN
Average Number of Persons per Auto
24
2011-2012 Trends
Willis Avenue Bridge
25

26
2011-2012 Trends
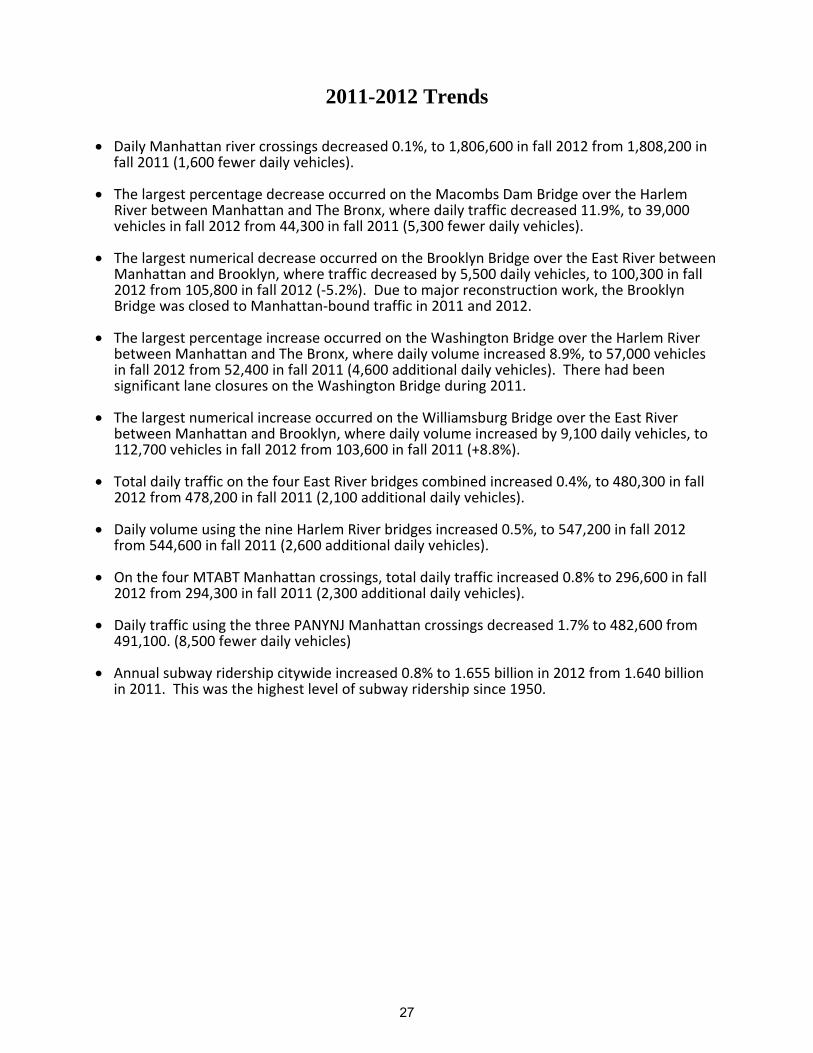
• Daily Manhattan river crossings decreased 0.1%, to 1,806,600 in fall 2012 from 1,808,200 in fall 2011 (1,600 fewer daily vehicles).
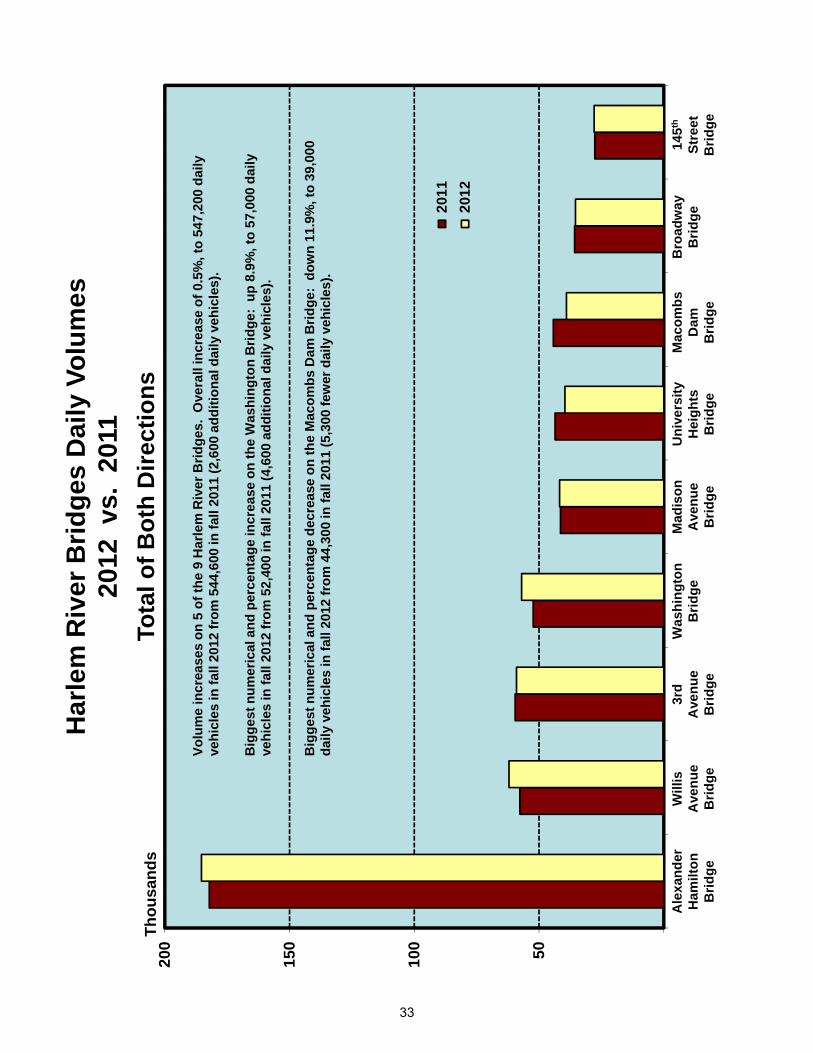
• The largest percentage decrease occurred on the Macombs Dam Bridge over the Harlem River between Manhattan and The Bronx, where daily traffic decreased 11.9%, to 39,000 vehicles in fall 2012 from 44,300 in fall 2011 (5,300 fewer daily vehicles).
• The largest numerical decrease occurred on the Brooklyn Bridge over the East River between Manhattan and Brooklyn, where traffic decreased by 5,500 daily vehicles, to 100,300 in fall 2012 from 105,800 in fall 2012 (‐5.2%). Due to major reconstruction work, the Brooklyn Bridge was closed to Manhattan‐bound traffic in 2011 and 2012.
• The largest percentage increase occurred on the Washington Bridge over the Harlem River between Manhattan and The Bronx, where daily volume increased 8.9%, to 57,000 vehicles in fall 2012 from 52,400 in fall 2011 (4,600 additional daily vehicles). There had been significant lane closures on the Washington Bridge during 2011.
• The largest numerical increase occurred on the Williamsburg Bridge over the East River between Manhattan and Brooklyn, where daily volume increased by 9,100 daily vehicles, to 112,700 vehicles in fall 2012 from 103,600 in fall 2011 (+8.8%).
• Total daily traffic on the four East River bridges combined increased 0.4%, to 480,300 in fall 2012 from 478,200 in fall 2011 (2,100 additional daily vehicles).
• Daily volume using the nine Harlem River bridges increased 0.5%, to 547,200 in fall 2012 from 544,600 in fall 2011 (2,600 additional daily vehicles).
• On the four MTABT Manhattan crossings, total daily traffic increased 0.8% to 296,600 in fall 2012 from 294,300 in fall 2011 (2,300 additional daily vehicles).
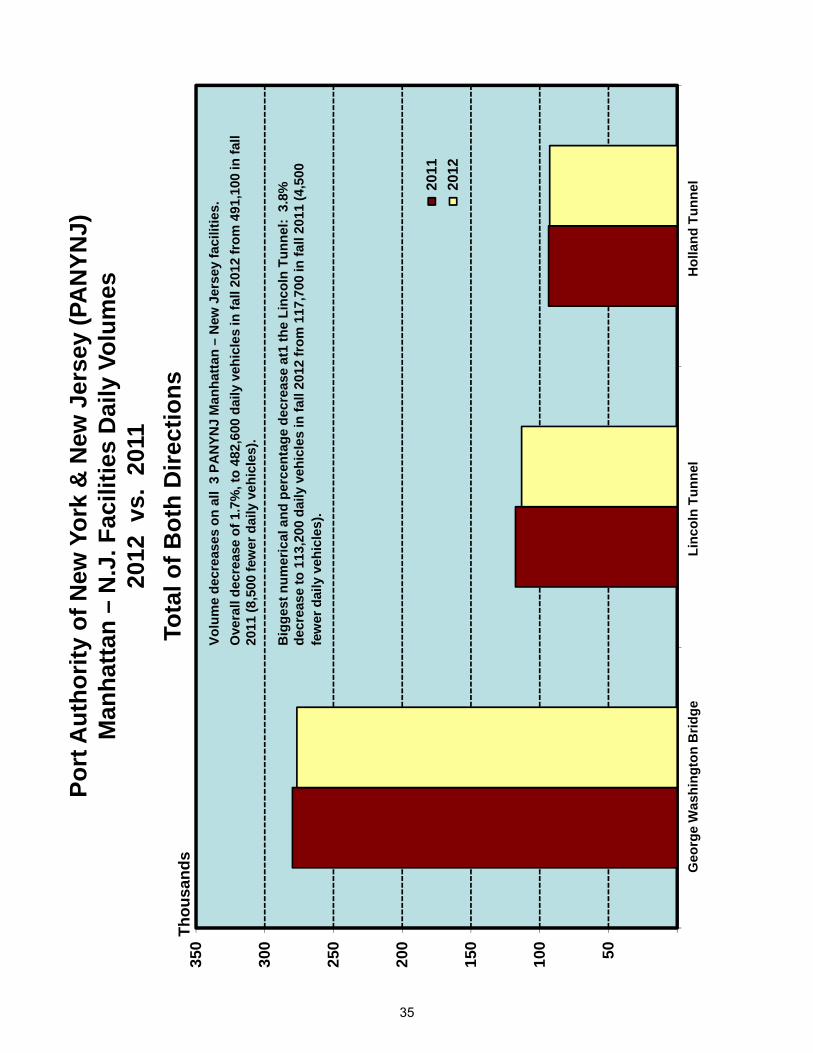
• Daily traffic using the three PANYNJ Manhattan crossings decreased 1.7% to 482,600 from 491,100. (8,500 fewer daily vehicles)
• Annual subway ridership citywide increased 0.8% to 1.655 billion in 2012 from 1.640 billion in 2011. This was the highest level of subway ridership since 1950.
27

Percent Percent 2011 2012 Change 2011 2012 Change
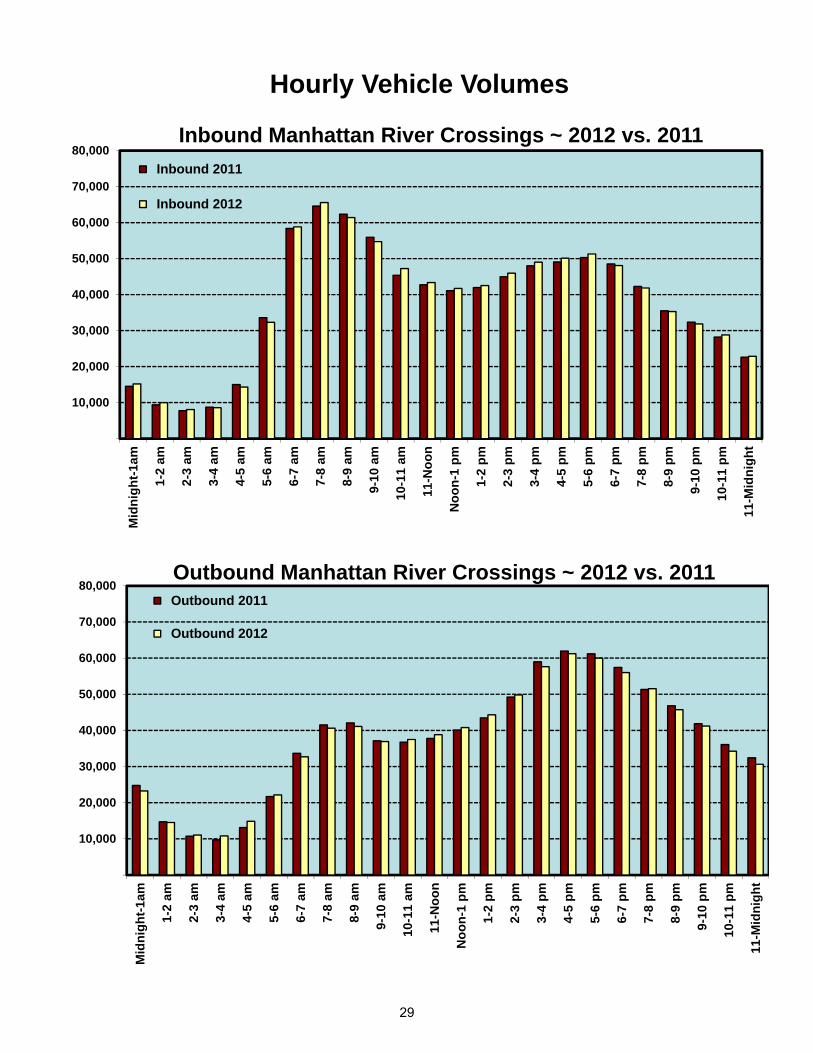
Mid-1 14,532 15,214 4.7 % 24,790 23,271 - 6.1 % 1-2 am 9,401 9,965 6.0 % 14,731 14,547 - 1.2 % 2-3 am 7,770 8,091 4.1 % 10,749 11,083 3.1 % 3-4 am 8,758 8,591 - 1.9 % 9,740 10,803 10.9 % 4-5 am 15,022 14,323 - 4.7 % 13,126 14,879 13.4 % 5-6 am 33,604 32,308 - 3.9 % 21,716 22,179 2.1 % 6-7 am 58,402 58,832 0.7 % 33,682 32,708 - 2.9 % 7-8 am 64,613 65,593 1.5 % 41,541 40,628 - 2.2 % 8-9 am 62,361 61,391 - 1.6 % 42,074 41,106 - 2.3 % 9-10 am 55,937 54,727 - 2.2 % 37,149 36,921 - 0.6 % 10-11 a 45,384 47,235 4.1 % 36,755 37,504 2.0 % 11-Noon 42,730 43,350 1.5 % 37,787 38,827 2.8 % Noon-1 41,100 41,717 1.5 % 40,103 40,779 1.7 % 1-2 pm 41,950 42,518 1.4 % 43,485 44,309 1.9 % 2-3 pm 44,968 45,952 2.2 % 49,230 49,825 1.2 % 3-4 pm 48,006 49,018 2.1 % 59,003 57,619 - 2.3 % 4-5 pm 49,071 50,133 2.2 % 61,969 61,225 - 1.2 % 5-6 pm 50,328 51,283 1.9 % 61,206 59,977 - 2.0 % 6-7 pm 48,517 48,074 - 0.9 % 57,434 56,021 - 2.5 % 7-8 pm 42,269 41,840 - 1.0 % 51,333 51,564 0.5 % 8-9 pm 35,506 35,318 - 0.5 % 46,824 45,750 - 2.3 % 9-10 pm 32,353 31,848 - 1.6 % 41,871 41,234 - 1.5 % 10-11 p 28,215 28,805 2.1 % 36,093 34,241 - 5.1 % 11-Mid 22,623 22,868 1.1 % 32,436 30,655 - 5.5 %
Totals 903,420 908,994 0.6 % 904,827 897,655 - 0.8 %
1-4am 25,929 26,647 2.8 % 35,220 36,433 3.4 % 4-7am 107,028 105,463 - 1.5 % 68,524 69,766 1.8 % 7-10am 182,911 181,711 - 0.7 % 120,764 118,655 - 1.7 % 10am-1pm 129,214 132,302 2.4 % 114,645 117,110 2.2 % 1-4pm 134,924 137,488 1.9 % 151,718 151,753 0.0 % 4-7pm 147,916 149,490 1.1 % 180,609 177,223 - 1.9 % 7-10pm 110,128 109,006 - 1.0 % 140,028 138,548 - 1.1 % 10pm-1am 65,370 66,887 2.3 % 93,319 88,167 - 5.5 %
7am-7pm 594,965 600,991 1.0 % 567,736 564,741 - 0.5 %
6-10am 241,313 240,543 - 0.3 % 154,446 151,363 - 2.0 % 3-7pm 195,922 198,508 1.3 % 239,612 234,842 - 2.0 % 6am-7pm 653,367 659,823 1.0 % 601,418 597,449 - 0.7 %
Hourly Vehicular Volumes2012 vs 2011
Manhattan Crossings
Inbound Outbound
28
10,000
20,000
30,000
40,000
50,000
60,000
70,000
80,000
Mid
nigh
t-1am
1-2
am
2-3
am
3-4
am
4-5
am
5-6
am
6-7
am
7-8
am
8-9
am
9-10
am
10-1
1 am
11-N
oon
Noo
n-1
pm
1-2
pm
2-3
pm
3-4
pm
4-5
pm
5-6
pm
6-7
pm
7-8
pm
8-9
pm
9-10
pm
10-1
1 pm
11-M
idni
ght
Outbound 2011
Outbound 2012
Inbound Manhattan River Crossings ~ 2012 vs. 2011
Hourly Vehicle Volumes
10,000
20,000
30,000
40,000
50,000
60,000
70,000
80,000M
idni
ght-1
am
1-2
am
2-3
am
3-4
am
4-5
am
5-6
am
6-7
am
7-8
am
8-9
am
9-10
am
10-1
1 am
11-N
oon
Noo
n-1
pm
1-2
pm
2-3
pm
3-4
pm
4-5
pm
5-6
pm
6-7
pm
7-8
pm
8-9
pm
9-10
pm
10-1
1 pm
11-M
idni
ght
Inbound 2011
Inbound 2012
Outbound Manhattan River Crossings ~ 2012 vs. 2011
29
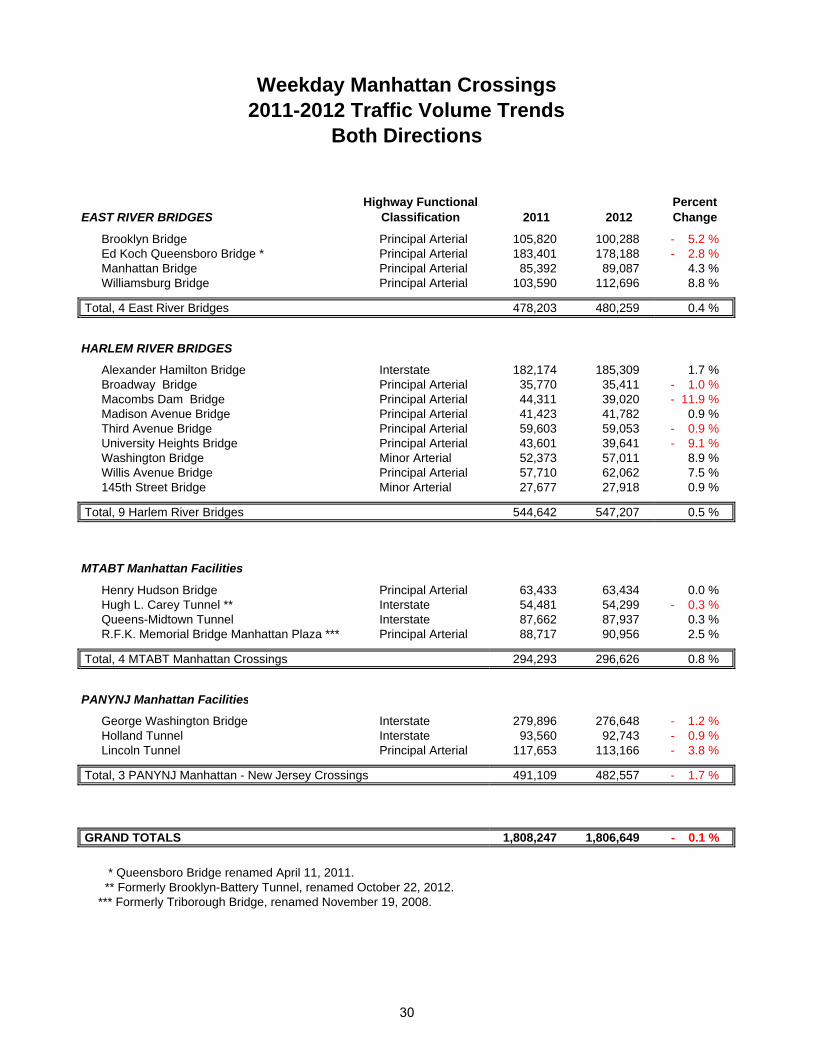
Highway Functional PercentEAST RIVER BRIDGES Classification 2011 2012 Change
Brooklyn Bridge Principal Arterial 105,820 100,288 - 5.2 % Ed Koch Queensboro Bridge * Principal Arterial 183,401 178,188 - 2.8 % Manhattan Bridge Principal Arterial 85,392 89,087 4.3 % Williamsburg Bridge Principal Arterial 103,590 112,696 8.8 %
Total, 4 East River Bridges 478,203 480,259 0.4 %
HARLEM RIVER BRIDGES
Alexander Hamilton Bridge Interstate 182,174 185,309 1.7 % Broadway Bridge Principal Arterial 35,770 35,411 - 1.0 % Macombs Dam Bridge Principal Arterial 44,311 39,020 - 11.9 % Madison Avenue Bridge Principal Arterial 41,423 41,782 0.9 % Third Avenue Bridge Principal Arterial 59,603 59,053 - 0.9 % University Heights Bridge Principal Arterial 43,601 39,641 - 9.1 % Washington Bridge Minor Arterial 52,373 57,011 8.9 % Willis Avenue Bridge Principal Arterial 57,710 62,062 7.5 % 145th Street Bridge Minor Arterial 27,677 27,918 0.9 %
Total, 9 Harlem River Bridges 544,642 547,207 0.5 %
MTABT Manhattan Facilities
Henry Hudson Bridge Principal Arterial 63,433 63,434 0.0 % Hugh L. Carey Tunnel ** Interstate 54,481 54,299 - 0.3 % Queens-Midtown Tunnel Interstate 87,662 87,937 0.3 % R.F.K. Memorial Bridge Manhattan Plaza *** Principal Arterial 88,717 90,956 2.5 %
Total, 4 MTABT Manhattan Crossings 294,293 296,626 0.8 %
PANYNJ Manhattan Facilities
George Washington Bridge Interstate 279,896 276,648 - 1.2 % Holland Tunnel Interstate 93,560 92,743 - 0.9 % Lincoln Tunnel Principal Arterial 117,653 113,166 - 3.8 %
Total, 3 PANYNJ Manhattan - New Jersey Crossings 491,109 482,557 - 1.7 %
GRAND TOTALS 1,808,247 1,806,649 - 0.1 %
* Queensboro Bridge renamed April 11, 2011. ** Formerly Brooklyn-Battery Tunnel, renamed October 22, 2012. *** Formerly Triborough Bridge, renamed November 19, 2008.
Weekday Manhattan Crossings2011-2012 Traffic Volume Trends
Both Directions
30

500,
000
1,00
0,00
0
1,50
0,00
0
2,00
0,00
0
20 C
ross
ings
4 Ea
st R
iv B
rgs
9 H
arle
m R
iv B
rgs
4 M
TAB
T Xg
s3
PAN
YNJ
Xgs
201
1 2
012
Man
hatta
n R
iver
Cro
ssin
gs D
aily
Vol
umes
2012
vs.
201
1To
tal o
f Bot
h D
irect
ions
Gra
nd T
otal
s20
Veh
icul
arR
iver
Cro
ssin
gs
Tota
ls4
East
Riv
erB
ridge
s
Tota
ls9
Har
lem
Riv
erB
ridge
s
Tota
ls4
MTA
BT
Cro
ssin
gs
Tota
ls3
PAN
YNJ
Cro
ssin
gs
Tota
l dai
ly tr
affic
on
the
20 R
iver
Cro
ssin
gs d
ecre
ased
0.1
%, t
o 1,
806,
600
in fa
ll 20
12 fr
om
1,80
8,20
0 in
in fa
ll 20
11.
0.4%
incr
ease
on
the
4 Ea
st R
iver
Brid
ges,
to 4
80,3
00 d
aily
veh
icle
s in
fall
2012
from
478
,200
in fa
ll 20
11.
0.5%
incr
ease
on
the
9 H
arle
m R
iver
Brid
ges,
to 5
47,2
00 d
aily
veh
icle
s in
fall
2012
from
544
,600
in fa
ll 20
11.
0.8
incr
ease
on
the
4 M
TAB
T R
iver
Cro
ssin
gs, t
o 29
6,60
0 da
ily v
ehic
les
in fa
ll 20
12fr
om 2
94,3
00 in
fall
2011
.
1.7%
dec
reas
e on
the
3 PA
NYN
J R
iver
Cro
ssin
gs, t
o 48
2,60
0 da
ily v
ehic
les
in fa
ll 20
12fr
om 4
91,1
00 in
fall
2011
.
31
50100
150
200
Ed K
och
Que
ensb
oro
Brg
Bro
okly
n B
rgW
illia
msb
urg
Brg
Man
hatta
n B
rg
201
1 2
012
East
Riv
er B
ridge
s D
aily
Vol
umes
2012
vs.
201
1To
tal o
f Bot
h D
irect
ions
Thou
sand
s Ed K
och
Que
ensb
oro
Brid
ge
Bro
okly
nB
ridge
Will
iam
sbur
gB
ridge
Man
hatta
nB
ridge
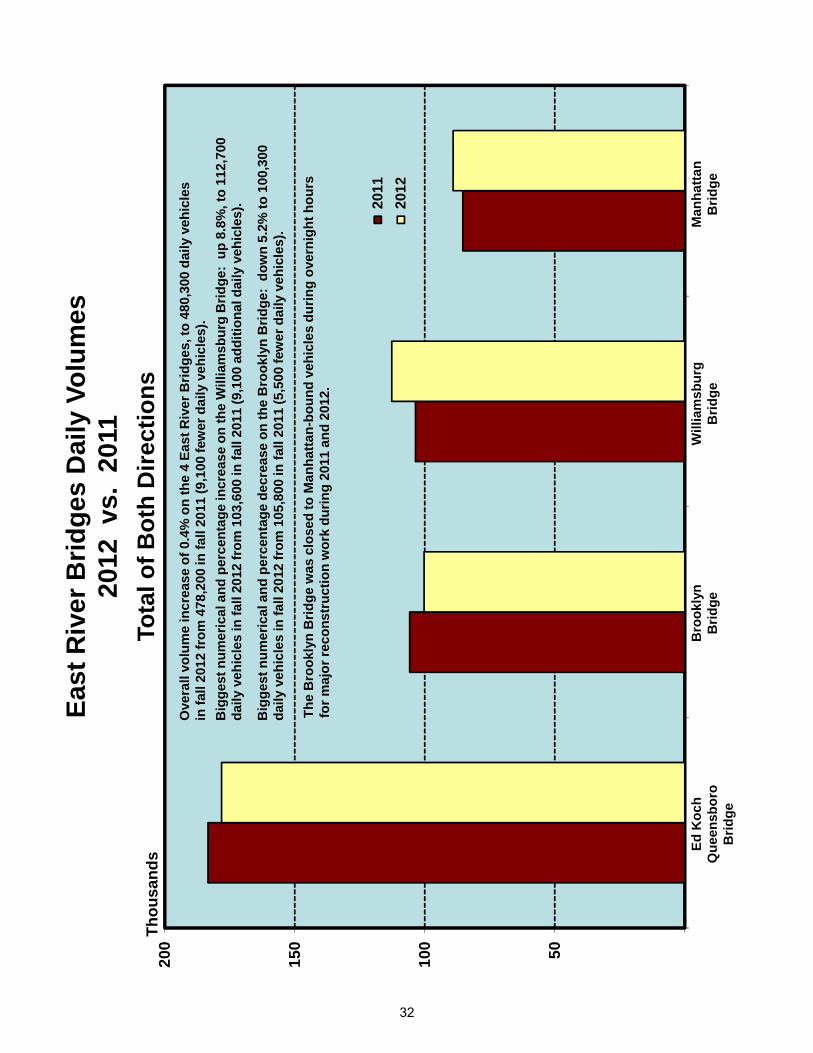
Ove
rall
volu
me
incr
ease
of 0
.4%
on
the
4 Ea
st R
iver
Brid
ges,
to 4
80,3
00 d
aily
veh
icle
sin
fall
2012
from
478
,200
in fa
ll 20
11 (9
,100
few
er d
aily
veh
icle
s).
Big
gest
num
eric
al a
nd p
erce
ntag
e in
crea
se o
n th
e W
illia
msb
urg
Brid
ge:
up 8
.8%
, to
112,
700
daily
veh
icle
s in
fall
2012
from
103
,600
in fa
ll 20
11 (9
,100
add
ition
al d
aily
veh
icle
s).
Big
gest
num
eric
al a
nd p
erce
ntag
e de
crea
se o
n th
e B
rook
lyn
Brid
ge:
dow
n 5.
2% to
100
,300
daily
veh
icle
s in
fall
2012
from
105
,800
in fa
ll 20
11 (5
,500
few
er d
aily
veh
icle
s).
The
Bro
okly
n B
ridge
was
clo
sed
to M
anha
ttan-
boun
d ve
hicl
es d
urin
g ov
erni
ght h
ours
for m
ajor
reco
nstr
uctio
n w
ork
durin
g 20
11 a
nd 2
012.
32
050100
150
200
A H
amilt
onB
rgW
illis
Ave
Brg
3rd
Ave
Brg
Was
hing
ton
Brg
Mad
ison
Av
Brg
Uni
v H
ts B
rgM
acom
bsD
am B
rgB
road
way
Brg
145t
h St
Brg
201
1 2
012
Har
lem
Riv
er B
ridge
s D
aily
Vol
umes
2012
vs.
201
1To
tal o
f Bot
h D
irect
ions
Thou
sand
s
Ale
xand
erH
amilt
onB
ridge
Was
hing
ton
Brid
geM
adis
onA
venu
eB
ridge
Mac
ombs
Dam
Brid
ge
Volu
me
incr
ease
s on
5 o
f the
9 H
arle
m R
iver
Brid
ges.
Ove
rall
incr
ease
of 0
.5%
, to
547,
200
daily
vehi
cles
in fa
ll 20
12 fr
om 5
44,6
00 in
fall
2011
(2,6
00 a
dditi
onal
dai
ly v
ehic
les)
.
Big
gest
num
eric
al a
nd p
erce
ntag
e de
crea
se o
n th
e M
acom
bs D
am B
ridge
: do
wn
11.9
%, t
o 39
,000
da
ily v
ehic
les
in fa
ll 20
12 fr
om 4
4,30
0 in
fall
2011
(5,3
00 fe
wer
dai
ly v
ehic
les)
.
Will
isA
venu
eB
ridge
3rd
Ave
nue
Brid
ge
Uni
vers
ityH
eigh
tsB
ridge
Bro
adw
ayB
ridge
145th
Stre
etB
ridge
Big
gest
num
eric
al a
nd p
erce
ntag
e in
crea
se o
n th
e W
ashi
ngto
n B
ridge
: up
8.9
%, t
o 57
,000
dai
ly
vehi
cles
in fa
ll 20
12 fr
om 5
2,40
0 in
fall
2011
(4,6
00 a
dditi
onal
dai
ly v
ehic
les)
.
33

50100
150
RFK
Brg
Man
h Pl
zQ
ns-M
idto
wn
Tun
H H
udso
n B
rgB
kln-
Bat
tery
Tun
201
1 2
012
Met
ropo
litan
Tra
nspo
rtat
ion
Aut
horit
y B
ridge
s &
Tun
nels
(MTA
BT)
Man
hatta
n Fa
cilit
ies
Dai
ly V
olum
es20
12 v
s. 2
011
Tota
l of B
oth
Dire
ctio
nsTh
ousa
nds
Rob
ert F
. Ken
nedy
Mem
oria
l Brid
geM
anha
ttan
Plaz
a(F
orm
erly
Trib
orou
gh B
ridge
)
Que
ens-
Mid
tow
nTu
nnel
Hen
ry H
udso
nB
ridge
Volu
me
incr
ease
s on
3 o
f 4 M
TAB
T M
anha
ttan
faci
litie
s.
Big
gest
num
eric
al a
nd p
erce
ntag
e in
crea
se o
n th
e R
ober
t F. K
enne
dy M
emor
ial B
ridge
: up
2.5
%
to 9
0,90
0 da
ily v
ehic
les
in fa
ll 20
12 fr
om 8
8,70
0 in
fall
2011
(2,2
00 a
dditi
onal
dai
ly v
ehic
les)
.
Hug
h L.
Car
ey T
unne
l(F
orm
erly
Bro
okly
n-B
atte
ry T
unne
l)
Ove
rall
incr
ease
of 0
.8%
, to
296,
600
daily
veh
icle
s in
fall
2012
from
294
,300
in fa
ll 20
11
(2,3
00 a
dditi
onal
dai
ly v
ehic
les)
.
Smal
l dec
reas
e at
the
Hug
h L.
Car
ey T
unne
l (B
rook
lyn-
Bat
tery
Tun
nel):
dow
n 0.
3% to
54,
300
daily
ve
hicl
es in
fall
2012
from
54,
500
in fa
ll 20
11 (2
00 fe
wer
dai
ly v
ehic
les)
.
34
050100
150
200
250
300
350
Geo
Was
h B
rgLi
ncol
n Tu
nH
olla
nd T
un 201
1 2
012
Port
Aut
horit
y of
New
Yor
k &
New
Jer
sey
(PA
NYN
J)M
anha
ttan
–N
.J. F
acili
ties
Dai
ly V
olum
es20
12 v
s. 2
011
Tota
l of B
oth
Dire
ctio
nsTh
ousa
nds
Geo
rge
Was
hing
ton
Brid
geLi
ncol
n Tu
nnel
Volu
me
decr
ease
s on
all
3 P
AN
YNJ
Man
hatta
n –
New
Jer
sey
faci
litie
s.
Hol
land
Tun
nel
Big
gest
num
eric
al a
nd p
erce
ntag
e de
crea
se a
t1 th
e Li
ncol
n Tu
nnel
: 3.
8%
decr
ease
to 1
13,2
00 d
aily
veh
icle
s in
fall
2012
from
117
,700
in fa
ll 20
11 (4
,500
few
er d
aily
veh
icle
s).
Ove
rall
decr
ease
of 1
.7%
, to
482,
600
daily
veh
icle
s in
fall
2012
from
491
,100
in fa
ll 20
11 (8
,500
few
er d
aily
veh
icle
s).
35

36
Ten-Year Trends 2002 - 2012
145th Street Bridge
37

38
Ten‐Year Trends: 2002 ‐ 2012
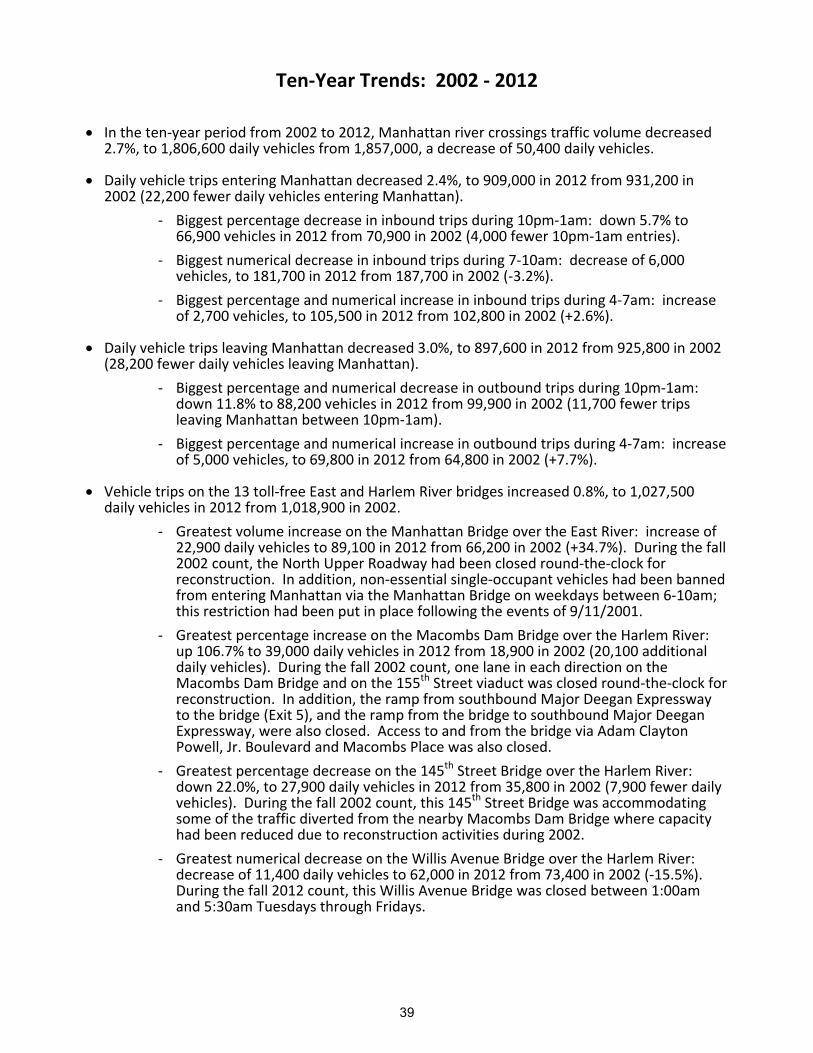
• In the ten‐year period from 2002 to 2012, Manhattan river crossings traffic volume decreased 2.7%, to 1,806,600 daily vehicles from 1,857,000, a decrease of 50,400 daily vehicles.
• Daily vehicle trips entering Manhattan decreased 2.4%, to 909,000 in 2012 from 931,200 in 2002 (22,200 fewer daily vehicles entering Manhattan).
‐ Biggest percentage decrease in inbound trips during 10pm‐1am: down 5.7% to 66,900 vehicles in 2012 from 70,900 in 2002 (4,000 fewer 10pm‐1am entries).
‐ Biggest numerical decrease in inbound trips during 7‐10am: decrease of 6,000 vehicles, to 181,700 in 2012 from 187,700 in 2002 (‐3.2%).
‐ Biggest percentage and numerical increase in inbound trips during 4‐7am: increase of 2,700 vehicles, to 105,500 in 2012 from 102,800 in 2002 (+2.6%).
• Daily vehicle trips leaving Manhattan decreased 3.0%, to 897,600 in 2012 from 925,800 in 2002 (28,200 fewer daily vehicles leaving Manhattan).
‐ Biggest percentage and numerical decrease in outbound trips during 10pm‐1am: down 11.8% to 88,200 vehicles in 2012 from 99,900 in 2002 (11,700 fewer trips leaving Manhattan between 10pm‐1am).
‐ Biggest percentage and numerical increase in outbound trips during 4‐7am: increase of 5,000 vehicles, to 69,800 in 2012 from 64,800 in 2002 (+7.7%).
• Vehicle trips on the 13 toll‐free East and Harlem River bridges increased 0.8%, to 1,027,500 daily vehicles in 2012 from 1,018,900 in 2002.
‐ Greatest volume increase on the Manhattan Bridge over the East River: increase of 22,900 daily vehicles to 89,100 in 2012 from 66,200 in 2002 (+34.7%). During the fall 2002 count, the North Upper Roadway had been closed round‐the‐clock for reconstruction. In addition, non‐essential single‐occupant vehicles had been banned from entering Manhattan via the Manhattan Bridge on weekdays between 6‐10am; this restriction had been put in place following the events of 9/11/2001.
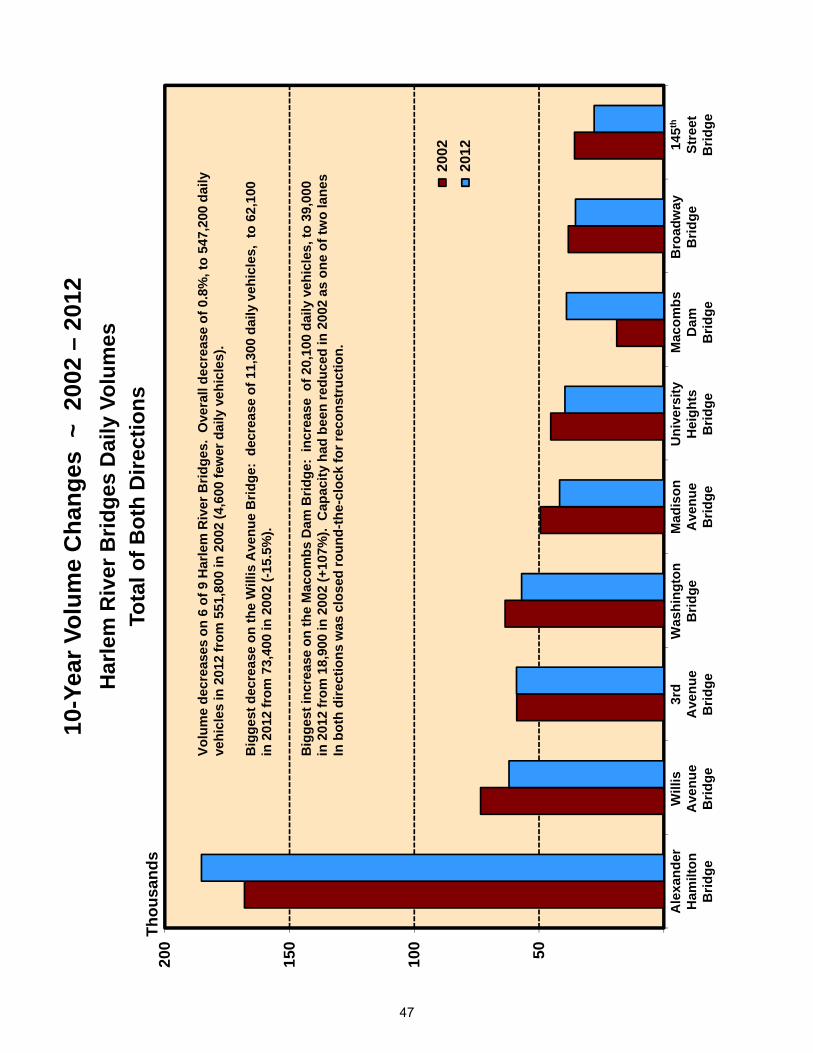
‐ Greatest percentage increase on the Macombs Dam Bridge over the Harlem River: up 106.7% to 39,000 daily vehicles in 2012 from 18,900 in 2002 (20,100 additional daily vehicles). During the fall 2002 count, one lane in each direction on the Macombs Dam Bridge and on the 155th Street viaduct was closed round‐the‐clock for reconstruction. In addition, the ramp from southbound Major Deegan Expressway to the bridge (Exit 5), and the ramp from the bridge to southbound Major Deegan Expressway, were also closed. Access to and from the bridge via Adam Clayton Powell, Jr. Boulevard and Macombs Place was also closed.
‐ Greatest percentage decrease on the 145th Street Bridge over the Harlem River: down 22.0%, to 27,900 daily vehicles in 2012 from 35,800 in 2002 (7,900 fewer daily vehicles). During the fall 2002 count, this 145th Street Bridge was accommodating some of the traffic diverted from the nearby Macombs Dam Bridge where capacity had been reduced due to reconstruction activities during 2002.
‐ Greatest numerical decrease on the Willis Avenue Bridge over the Harlem River: decrease of 11,400 daily vehicles to 62,000 in 2012 from 73,400 in 2002 (‐15.5%). During the fall 2012 count, this Willis Avenue Bridge was closed between 1:00am and 5:30am Tuesdays through Fridays.
39
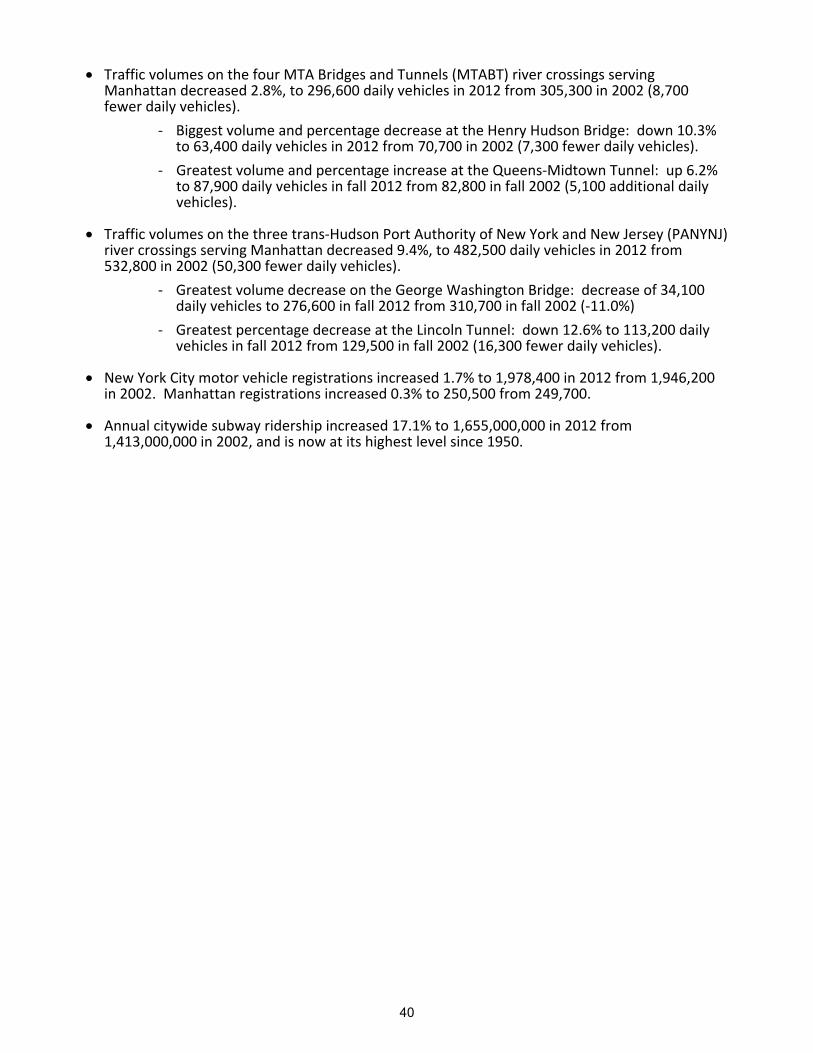
• Traffic volumes on the four MTA Bridges and Tunnels (MTABT) river crossings serving Manhattan decreased 2.8%, to 296,600 daily vehicles in 2012 from 305,300 in 2002 (8,700 fewer daily vehicles).
‐ Biggest volume and percentage decrease at the Henry Hudson Bridge: down 10.3% to 63,400 daily vehicles in 2012 from 70,700 in 2002 (7,300 fewer daily vehicles).
‐ Greatest volume and percentage increase at the Queens‐Midtown Tunnel: up 6.2% to 87,900 daily vehicles in fall 2012 from 82,800 in fall 2002 (5,100 additional daily vehicles).
• Traffic volumes on the three trans‐Hudson Port Authority of New York and New Jersey (PANYNJ) river crossings serving Manhattan decreased 9.4%, to 482,500 daily vehicles in 2012 from 532,800 in 2002 (50,300 fewer daily vehicles).
‐ Greatest volume decrease on the George Washington Bridge: decrease of 34,100 daily vehicles to 276,600 in fall 2012 from 310,700 in fall 2002 (‐11.0%)
‐ Greatest percentage decrease at the Lincoln Tunnel: down 12.6% to 113,200 daily vehicles in fall 2012 from 129,500 in fall 2002 (16,300 fewer daily vehicles).
• New York City motor vehicle registrations increased 1.7% to 1,978,400 in 2012 from 1,946,200 in 2002. Manhattan registrations increased 0.3% to 250,500 from 249,700.
• Annual citywide subway ridership increased 17.1% to 1,655,000,000 in 2012 from 1,413,000,000 in 2002, and is now at its highest level since 1950.
40

Highway Functional PercentEAST RIVER BRIDGES Classification 2002 2012 Change
Brooklyn Bridge Principal Arterial 121,145 100,288 - 17.2 % Ed Koch Queensboro Bridge * Principal Arterial 176,419 178,188 1.0 % Manhattan Bridge Principal Arterial 66,152 89,087 34.7 % Williamsburg Bridge Principal Arterial 103,364 112,696 9.0 %
Total, 4 East River Bridges 467,080 480,259 2.8 %
HARLEM RIVER BRIDGES
Alexander Hamilton Bridge Interstate 168,079 185,309 10.3 % Broadway Bridge Principal Arterial 38,287 35,411 - 7.5 % Macombs Dam Bridge Principal Arterial 18,878 39,020 106.7 % Madison Avenue Bridge Principal Arterial 49,487 41,782 - 15.6 % Third Avenue Bridge Principal Arterial 58,949 59,053 0.2 % University Heights Bridge Principal Arterial 45,311 39,641 - 12.5 % Washington Bridge Minor Arterial 63,609 57,011 - 10.4 % Willis Avenue Bridge Principal Arterial 73,435 62,062 - 15.5 % 145th Street Bridge Minor Arterial 35,796 27,918 - 22.0 %
Total, 9 Harlem River Bridges 551,831 547,207 - 0.8 %
MTABT Manhattan Facilities
Henry Hudson Bridge Principal Arterial 70,731 63,434 - 10.3 % Hugh L. Carey Tunnel ** Interstate 56,976 54,299 - 4.7 % Queens-Midtown Tunnel Interstate 82,834 87,937 6.2 % R.F.K. Memorial Bridge Manhattan Plaza *** Principal Arterial 94,759 90,956 - 4.0 %
Total, 4 MTABT Manhattan Crossings 305,300 296,626 - 2.8 %
PANYNJ Manhattan Facilities
George Washington Bridge Interstate 310,771 276,648 - 11.0 % Holland Tunnel Interstate 92,557 92,743 0.2 % Lincoln Tunnel Principal Arterial 129,511 113,166 - 12.6 %
Total, 3 PANYNJ Manhattan - New Jersey Crossings 532,839 482,557 - 9.4 %
GRAND TOTALS 1,857,050 1,806,649 - 2.7 %
* Queensboro Bridge renamed April 11, 2011. ** Formerly Brooklyn-Battery Tunnel, renamed October 22, 2012. *** Formerly Triborough Bridge, renamed November 19, 2008.
Weekday Manhattan Crossings10-Year Traffic Volume Trends ~ 2002-2012
Both Directions
41

500
1
,000
1
,500
2
,000
2002
2003
2004
2005
2006
2007
2008
2009
2010
2011
2012
Dai
ly M
anha
ttan
Riv
er C
ross
ings
2002
-20
12To
tal o
f Bot
h D
irect
ions
Thou
sand
s
Year
42
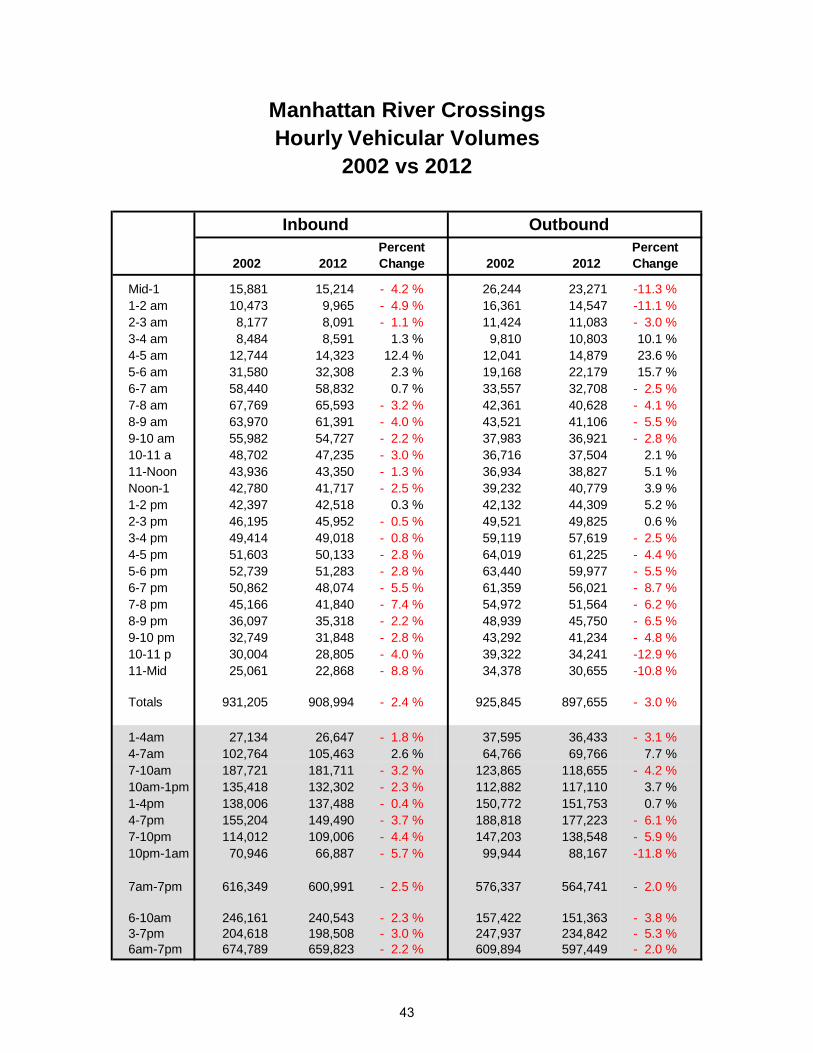
Percent Percent 2002 2012 Change 2002 2012 Change
Mid-1 15,881 15,214 - 4.2 % 26,244 23,271 -11.3 % 1-2 am 10,473 9,965 - 4.9 % 16,361 14,547 -11.1 % 2-3 am 8,177 8,091 - 1.1 % 11,424 11,083 - 3.0 % 3-4 am 8,484 8,591 1.3 % 9,810 10,803 10.1 % 4-5 am 12,744 14,323 12.4 % 12,041 14,879 23.6 % 5-6 am 31,580 32,308 2.3 % 19,168 22,179 15.7 % 6-7 am 58,440 58,832 0.7 % 33,557 32,708 - 2.5 % 7-8 am 67,769 65,593 - 3.2 % 42,361 40,628 - 4.1 % 8-9 am 63,970 61,391 - 4.0 % 43,521 41,106 - 5.5 % 9-10 am 55,982 54,727 - 2.2 % 37,983 36,921 - 2.8 % 10-11 a 48,702 47,235 - 3.0 % 36,716 37,504 2.1 % 11-Noon 43,936 43,350 - 1.3 % 36,934 38,827 5.1 % Noon-1 42,780 41,717 - 2.5 % 39,232 40,779 3.9 % 1-2 pm 42,397 42,518 0.3 % 42,132 44,309 5.2 % 2-3 pm 46,195 45,952 - 0.5 % 49,521 49,825 0.6 % 3-4 pm 49,414 49,018 - 0.8 % 59,119 57,619 - 2.5 % 4-5 pm 51,603 50,133 - 2.8 % 64,019 61,225 - 4.4 % 5-6 pm 52,739 51,283 - 2.8 % 63,440 59,977 - 5.5 % 6-7 pm 50,862 48,074 - 5.5 % 61,359 56,021 - 8.7 % 7-8 pm 45,166 41,840 - 7.4 % 54,972 51,564 - 6.2 % 8-9 pm 36,097 35,318 - 2.2 % 48,939 45,750 - 6.5 % 9-10 pm 32,749 31,848 - 2.8 % 43,292 41,234 - 4.8 % 10-11 p 30,004 28,805 - 4.0 % 39,322 34,241 -12.9 % 11-Mid 25,061 22,868 - 8.8 % 34,378 30,655 -10.8 %
Totals 931,205 908,994 - 2.4 % 925,845 897,655 - 3.0 %
1-4am 27,134 26,647 - 1.8 % 37,595 36,433 - 3.1 % 4-7am 102,764 105,463 2.6 % 64,766 69,766 7.7 % 7-10am 187,721 181,711 - 3.2 % 123,865 118,655 - 4.2 % 10am-1pm 135,418 132,302 - 2.3 % 112,882 117,110 3.7 % 1-4pm 138,006 137,488 - 0.4 % 150,772 151,753 0.7 % 4-7pm 155,204 149,490 - 3.7 % 188,818 177,223 - 6.1 % 7-10pm 114,012 109,006 - 4.4 % 147,203 138,548 - 5.9 % 10pm-1am 70,946 66,887 - 5.7 % 99,944 88,167 -11.8 %
7am-7pm 616,349 600,991 - 2.5 % 576,337 564,741 - 2.0 %
6-10am 246,161 240,543 - 2.3 % 157,422 151,363 - 3.8 % 3-7pm 204,618 198,508 - 3.0 % 247,937 234,842 - 5.3 % 6am-7pm 674,789 659,823 - 2.2 % 609,894 597,449 - 2.0 %
Inbound Outbound
Manhattan River CrossingsHourly Vehicular Volumes
2002 vs 2012
43

10,000
20,000
30,000
40,000
50,000
60,000
70,000
80,000
Mid
nigh
t-1am
1-2
am
2-3
am
3-4
am
4-5
am
5-6
am
6-7
am
7-8
am
8-9
am
9-10
am
10-1
1 am
11-N
oon
Noo
n-1
pm
1-2
pm
2-3
pm
3-4
pm
4-5
pm
5-6
pm
6-7
pm
7-8
pm
8-9
pm
9-10
pm
10-1
1 pm
11-M
idni
ght
Outbound 2002
Outbound 2012
Inbound Manhattan River Crossings ~ 2012 vs. 2002
Hourly Vehicle Volumes
10,000
20,000
30,000
40,000
50,000
60,000
70,000
80,000M
idni
ght-1
am
1-2
am
2-3
am
3-4
am
4-5
am
5-6
am
6-7
am
7-8
am
8-9
am
9-10
am
10-1
1 am
11-N
oon
Noo
n-1
pm
1-2
pm
2-3
pm
3-4
pm
4-5
pm
5-6
pm
6-7
pm
7-8
pm
8-9
pm
9-10
pm
10-1
1 pm
11-M
idni
ght
Inbound 2002
Inbound 2012
Outbound Manhattan River Crossings ~ 2012 vs. 2002
44
500,
000
1,00
0,00
0
1,50
0,00
0
2,00
0,00
0
20 C
ross
ings
4 Ea
st R
iv B
rgs
9 H
arle
m R
iv B
rgs
4 M
TAB
T Xg
s3
PAN
YNJ
Xgs
200
2 2
012
10-Y
ear V
olum
e C
hang
es ~
200
2 vs
. 201
2M
anha
ttan
Riv
er C
ross
ings
Dai
ly V
olum
es ~
Tot
al o
f Bot
h D
irect
ions
Gra
nd T
otal
s20
Veh
icul
arR
iver
Cro
ssin
gs
Tota
ls4
East
Riv
erB
ridge
s
Tota
ls9
Har
lem
Riv
erB
ridge
s
Tota
ls4
MTA
BT
Cro
ssin
gs
Tota
ls3
PAN
YNJ
Cro
ssin
gs
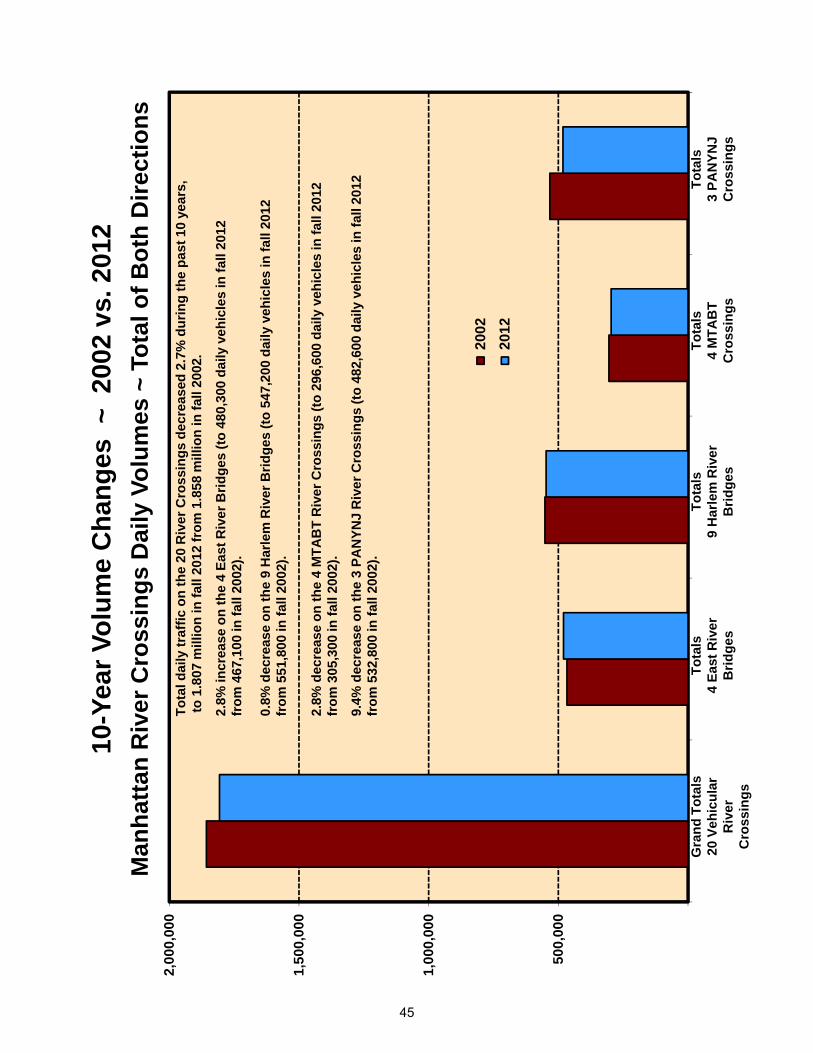
Tota
l dai
ly tr
affic
on
the
20 R
iver
Cro
ssin
gs d
ecre
ased
2.7
% d
urin
g th
e pa
st 1
0 ye
ars,
to 1
.807
mill
ion
in fa
ll 20
12 fr
om 1
.858
mill
ion
in fa
ll 20
02.
2.8%
incr
ease
on
the
4 Ea
st R
iver
Brid
ges
(to 4
80,3
00 d
aily
veh
icle
s in
fall
2012
from
467
,100
in fa
ll 20
02).
0.8%
dec
reas
e on
the
9 H
arle
m R
iver
Brid
ges
(to 5
47,2
00 d
aily
veh
icle
s in
fall
2012
from
551
,800
in fa
ll 20
02).
2.8%
dec
reas
e on
the
4 M
TAB
T R
iver
Cro
ssin
gs (t
o 29
6,60
0 da
ily v
ehic
les
in fa
ll 20
12fr
om 3
05,3
00 in
fall
2002
).
9.4%
dec
reas
e on
the
3 PA
NYN
J R
iver
Cro
ssin
gs (t
o 48
2,60
0 da
ily v
ehic
les
in fa
ll 20
12fr
om 5
32,8
00 in
fall
2002
).
45
50100
150
200
Ed K
och
Que
ensb
oro
Brg
Bro
okly
n B
rgW
illia
msb
urg
Brg
Man
hatta
n B
rg
200
2 2
012
10-Y
ear V
olum
e C
hang
es ~
200
2 –
2012
East
Riv
er B
ridge
s D
aily
Vol
umes
Tota
l of B
oth
Dire
ctio
nsTh
ousa
nds Ed
Koc
hQ
ueen
sbor
oB
ridge
Bro
okly
nB
ridge
Will
iam
sbur
gB
ridge
Man
hatta
nB
ridge
Volu
me
incr
ease
s on
3 o
f the
4 E
ast R
iver
Brid
ges.
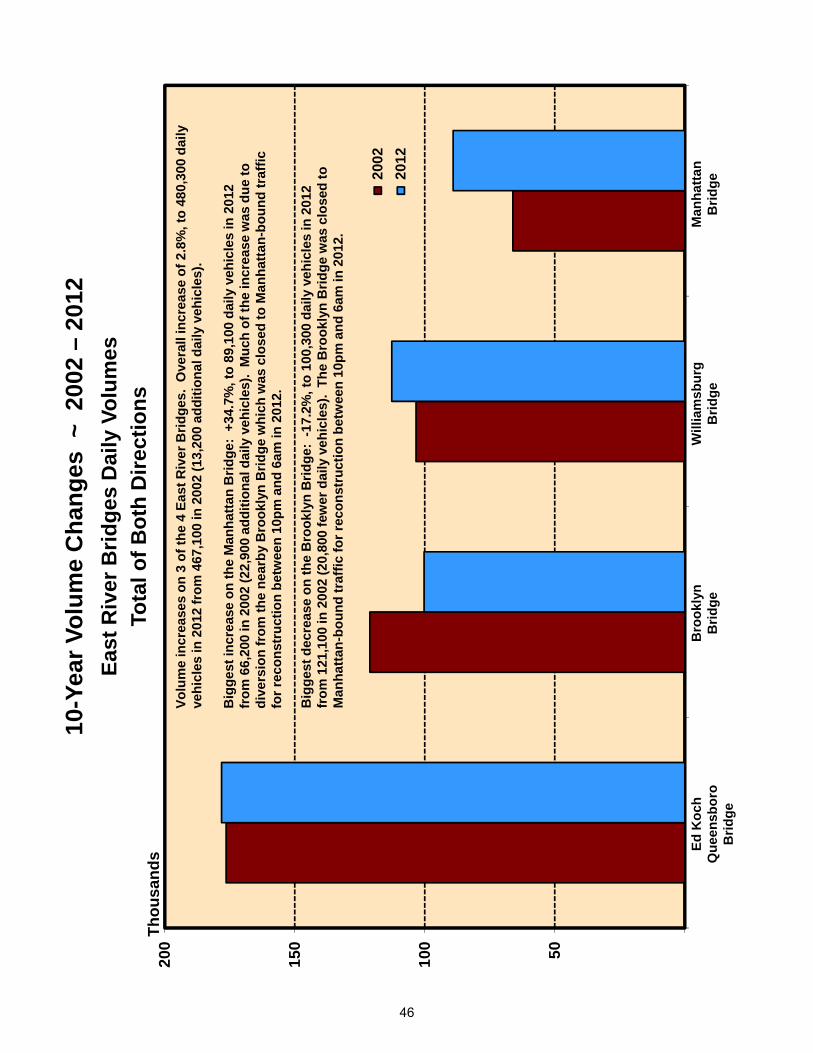
Ove
rall
incr
ease
of 2
.8%
, to
480,
300
daily
vehi
cles
in 2
012
from
467
,100
in 2
002
(13,
200
addi
tiona
l dai
ly v
ehic
les)
.
Big
gest
incr
ease
on
the
Man
hatta
n B
ridge
: +3
4.7%
, to
89,1
00 d
aily
veh
icle
s in
201
2 fr
om 6
6,20
0 in
200
2 (2
2,90
0 ad
ditio
nal d
aily
veh
icle
s).
Muc
h of
the
incr
ease
was
due
to
dive
rsio
n fr
om th
e ne
arby
Bro
okly
n B
ridge
whi
ch w
as c
lose
d to
Man
hatta
n-bo
und
traf
fic
for r
econ
stru
ctio
n be
twee
n 10
pm a
nd 6
am in
201
2.
Big
gest
dec
reas
e on
the
Bro
okly
n B
ridge
: -1
7.2%
, to
100,
300
daily
veh
icle
s in
201
2 fr
om 1
21,1
00 in
200
2 (2
0,80
0 fe
wer
dai
ly v
ehic
les)
. Th
e B
rook
lyn
Brid
ge w
as c
lose
d to
M
anha
ttan-
boun
d tr
affic
for r
econ
stru
ctio
n be
twee
n 10
pm a
nd 6
am in
201
2.
46
050100
150
200
A H
amilt
onB
rgW
illis
Ave
Brg
3rd
Ave
Brg
Was
hing
ton
Brg
Mad
ison
Av
Brg
Uni
v H
ts B
rgM
acom
bsD
am B
rgB
road
way
Brg
145t
h St
Brg
200
2 2
012
10-Y
ear V
olum
e C
hang
es ~
200
2 –
2012
Har
lem
Riv
er B
ridge
s D
aily
Vol
umes
Tota
l of B
oth
Dire
ctio
nsTh
ousa
nds
Ale
xand
erH
amilt
onB
ridge
Was
hing
ton
Brid
geM
adis
onA
venu
eB
ridge
Mac
ombs
Dam
Brid
ge
Volu
me
decr
ease
s on
6 o
f 9 H
arle
m R
iver
Brid
ges.
Ove
rall
decr
ease
of 0
.8%
, to
547,
200
daily
vehi
cles
in 2
012
from
551
,800
in 2
002
(4,6
00 fe
wer
dai
ly v
ehic
les)
.
Big
gest
dec
reas
e on
the
Will
is A
venu
e B
ridge
: de
crea
se o
f 11,
300
daily
veh
icle
s, t
o 62
,100
in 2
012
from
73,
400
in 2
002
(-15.
5%).
Will
isA
venu
eB
ridge
3rd
Ave
nue
Brid
ge
Uni
vers
ityH
eigh
tsB
ridge
Bro
adw
ayB
ridge
145th
Stre
etB
ridge
Big
gest
incr
ease
on
the
Mac
ombs
Dam
Brid
ge:
incr
ease
of 2
0,10
0 da
ily v
ehic
les,
to 3
9,00
0in
201
2 fr
om 1
8,90
0 in
200
2 (+
107%
). C
apac
ity h
ad b
een
redu
ced
in 2
002
as o
ne o
f tw
o la
nes
In b
oth
dire
ctio
ns w
as c
lose
d ro
und-
the-
cloc
k fo
r rec
onst
ruct
ion.
47

050100
150
RFK
Brg
Man
h Pl
zQ
ns-M
idto
wn
Tun
H H
udso
n B
rgB
kln-
Bat
tery
Tun
200
2 2
012
10-Y
ear V
olum
e C
hang
es ~
200
2 –
2012
Met
ropo
litan
Tra
nspo
rtat
ion
Aut
horit
y B
ridge
s &
Tun
nels
(MTA
BT)
Man
hatta
n Fa
cilit
ies
Dai
ly V
olum
esTo
tal o
f Bot
h D
irect
ions
Thou
sand
s
Rob
ert F
. Ken
nedy
Mem
oria
l Brid
geM
anha
ttan
Plaz
a(F
orm
erly
Trib
orou
gh B
ridge
)
Que
ens-
Mid
tow
nTu
nnel
Hen
ry H
udso
nB
ridge
Volu
me
decr
ease
s on
3 o
f 4 M
TAB
T M
anha
ttan
faci
litie
s.
Big
gest
num
eric
al a
nd p
erce
ntag
e de
crea
se o
n th
e H
enry
Hud
son
Brid
ge:
10.3
% d
ecre
ase
to 6
3,40
0 da
ily v
ehic
les
in fa
ll 20
12 fr
om 7
0,70
0 in
fall
2002
(7,3
00 fe
wer
dai
ly v
ehic
les)
.
Hug
h L.
Car
ey T
unne
l(F
orm
erly
Bro
okly
n-B
atte
ryTu
nnel
)
Onl
y in
crea
se a
t the
Que
ens-
Mid
tow
n Tu
nnel
: in
crea
se o
f 6.2
%, t
o 87
,900
dai
ly v
ehic
les
in 2
012
from
82,
800
in 2
002
(5,1
00 a
dditi
onal
dai
ly v
ehic
les)
.
Ove
rall
decr
ease
of 2
.8%
, to
296,
600
daily
veh
icle
s in
201
2 fr
om 3
05,3
00 in
200
2 (8
,700
few
er d
aily
veh
icle
s).
48

050100
150
200
250
300
350
Geo
Was
h B
rgLi
ncol
n Tu
nH
olla
nd T
un 200
2 2
012
Big
gest
per
cent
age
decr
ease
at t
he L
inco
ln T
unne
l: d
ecre
ase
of 1
2.6%
to 1
13,2
00
daily
veh
icle
s in
fall
2012
from
129
,500
in fa
ll 20
02 (1
6,30
0 fe
wer
dai
ly v
ehic
les)
.
10-Y
ear V
olum
e C
hang
es ~
200
2 –
2012
Port
Aut
horit
y of
New
Yor
k &
New
Jer
sey
(PA
NYN
J)M
anha
ttan
–N
.J. F
acili
ties
Dai
ly V
olum
esTo
tal o
f Bot
h D
irect
ions
Thou
sand
s
Geo
rge
Was
hing
ton
Brid
geLi
ncol
n Tu
nnel
Volu
me
decr
ease
s on
2 o
f 3 P
AN
YNJ
Man
hatta
n –
New
Jer
sey
faci
litie
s.
Hol
land
Tun
nel
Smal
l inc
reas
e at
the
Hol
land
Tun
nel:
incr
ease
to 9
2,70
0 da
ily v
ehic
les
in 2
012
from
92,
500
in 2
002
(200
add
ition
al d
aily
veh
icle
s).
Big
gest
num
eric
al d
ecre
ase
at th
e G
eorg
e W
ashi
ngto
n B
ridge
: de
crea
se o
f34
,100
dai
ly v
ehic
les,
to 2
76,6
00 in
fall
2012
from
310
,700
in fa
ll 20
02 (-
11.0
%).
Ove
rall
decr
ease
of 9
.4%
, to
482,
500
daily
veh
icle
s in
fall
2012
from
532
,800
in
fall
2002
(dec
reas
e of
50,
300
daily
veh
icle
s).
49
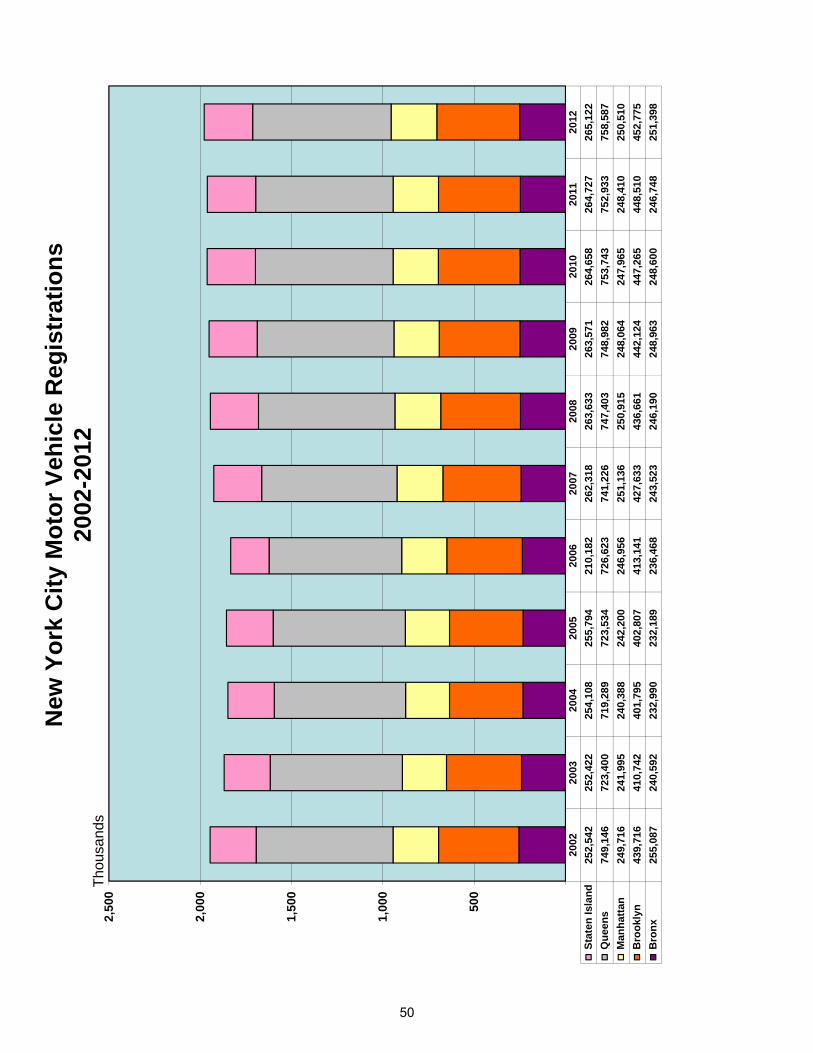
New
Yor
k C
ity M
otor
Veh
icle
Reg
istr
atio
ns20
02-2
012
2002
2003
2004
2005
2006
2007
2008
2009
2010
2011
2012
Sta
ten
Isla
nd25
2,54
225
2,42
225
4,10
825
5,79
421
0,18
226
2,31
826
3,63
326
3,57
126
4,65
826
4,72
726
5,12
2 Q
ueen
s74
9,14
672
3,40
071
9,28
972
3,53
472
6,62
374
1,22
674
7,40
374
8,98
275
3,74
375
2,93
375
8,58
7 M
anha
ttan
249,
716
241,
995
240,
388
242,
200
246,
956
251,
136
250,
915
248,
064
247,
965
248,
410
250,
510
Bro
okly
n43
9,71
641
0,74
240
1,79
540
2,80
741
3,14
142
7,63
343
6,66
144
2,12
444
7,26
544
8,51
045
2,77
5 B
ronx
255,
087
240,
592
232,
990
232,
189
236,
468
243,
523
246,
190
248,
963
248,
600
246,
748
251,
398
500
1,00
0
1,50
0
2,00
0
2,50
0Th
ousa
nds
50
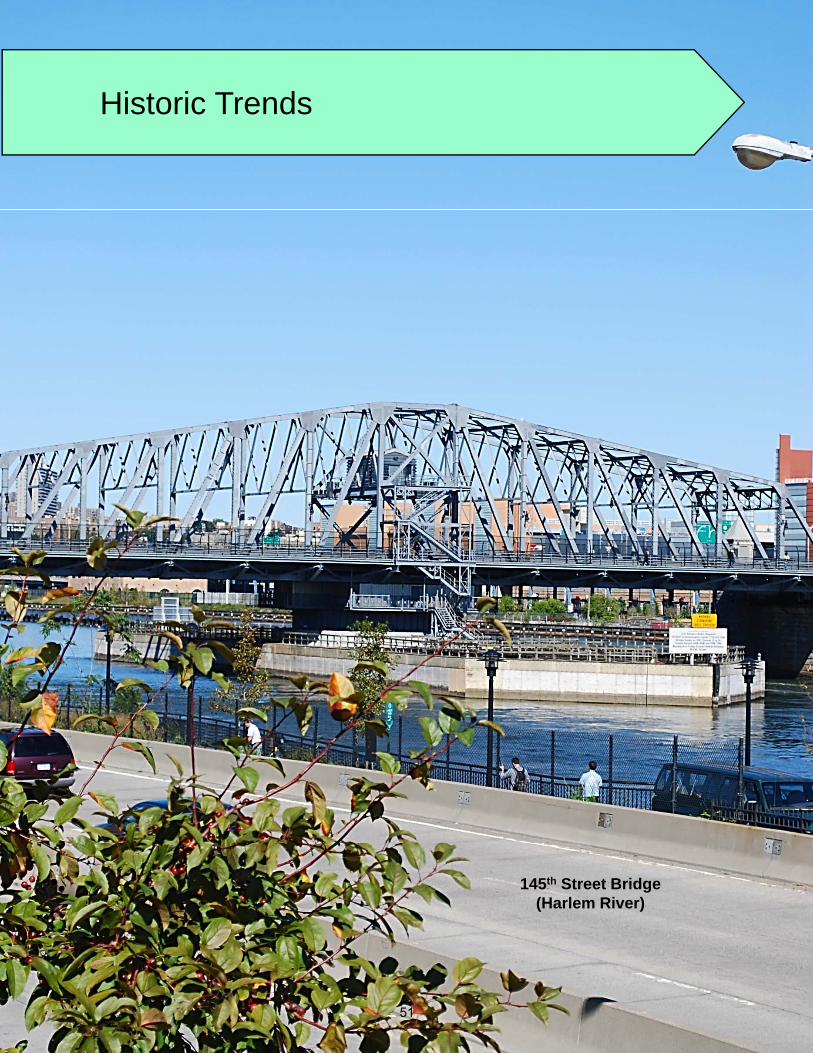
Historic Trends
145th Street Bridge(Harlem River)
51

52

HISTORIC TRENDS
In 1948, average daily traffic to and from Manhattan was 670,000 trips per day. By 1969 that figure had more than doubled, to 1,376,400 daily trips. In 2012, it stood at 1,806,600 daily trips, nearly three times the 1948 volume.
1948 – 1962
Between 1948 and 1962, daily traffic to and from Manhattan increased 66.4%, to 1,115,100 daily river crossings in 1962 from 670,000 in 1948, an increase of 445,100 daily vehicles.
Large increases in daily traffic occurred at the following facilities. ‐ George Washington Bridge (Hudson River between Manhattan and New Jersey): up 163% to 111,100 daily vehicles in 1962 from 42,300 in 1948 (68,800 additional daily vehicles).
‐ Lincoln Tunnel between Manhattan and New Jersey: up 163% to 81,000 daily vehicles in 1962 from 30,800 in 1948 (50,200 additional daily vehicles).
‐ Queens‐Midtown Tunnel (East River between Manhattan and Queens): up 146% to 65,000 daily vehicles from 26,400 (38,600 additional daily vehicles).
‐ Robert F. Kennedy Memorial Bridge Manhattan Plaza (Harlem River between Manhattan and Bronx/Queens): up 128% to 60,300 daily vehicles from 26,500 (33,800 additional daily vehicles).
‐ Brooklyn Bridge (East River between Manhattan and Brooklyn): up 113% to 78,800 daily vehicles from 37,000 (41,800 additional daily vehicles).
‐ Washington Bridge (Harlem River between Manhattan and Bronx): up 91% to 56,100 daily vehicles from 29,400 (26,700 additional daily vehicles).
‐ Williamsburg Bridge (East River between Manhattan and Brooklyn): up 74% to 81,900 daily vehicles from 47,100 (34,800 additional daily vehicles).
‐ Willis Avenue Bridge (Harlem River between Manhattan and Bronx): up 89% to 55,900 daily vehicles from 29,600 (26,300 additional daily vehicles).
‐ Third Avenue Bridge (Harlem River between Manhattan and Bronx): up 71% to 53,600daily vehicles from 31,400 (22,200 additional daily vehicles).
The only decreases from 1948 to 1962 occurred at the following two facilities.
‐ Manhattan Bridge (East River between Manhattan and Brooklyn): down 40.7% to 51,400 daily vehicles in 1962 from 86,700 in 1948 (35,300 fewer daily vehicles).
‐ Madison Avenue Bridge (Harlem River between Manhattan and Bronx): down 6.7% to 25,400 daily vehicles in 1962 from 27,200 in 1948 (1,800 fewer daily vehicles).
1962 – 1972
From 1962 to 1972, daily river crossings to and from Manhattan increased 29.5%, to 1,444,100 daily vehicles in 1972 from 1,115,100 in 1962, an increase of 329,000 daily vehicles.
53
Large increases in daily traffic occurred at the following facilities. ‐ George Washington Bridge between Manhattan and New Jersey: up 99% to 221,200 daily vehicles in 1972 from 111,100 in 1962 (110,100 additional daily vehicles). The lower level was opened in 1962.
‐ Robert F. Kennedy Memorial Bridge Manhattan Plaza between Manhattan and Bronx/Queens: up 32.9% to 80,100 daily vehicles from 60,300 (19,800 additional daily vehicles).
‐ Brooklyn Bridge between Manhattan and Brooklyn: up 31.7% to 103,800 daily vehicles from 78,800 (25,000 additional daily vehicles).
‐ Ed Koch Queensboro Bridge between Manhattan and Queens: up 28.8% to 136,400 daily vehicles from 105,900 (30,500 additional daily vehicles).
‐ Manhattan Bridge between Manhattan and Brooklyn: up 43.4% to 73,800 daily vehicles from 51,400 (22,400 additional daily vehicles).
Large decreases in daily traffic occurred at the following facilities. ‐ Washington Bridge between Manhattan and Bronx: down 34.4% to 36,800 daily vehicles in 1972 from 56,100 in 1962 (19,300 fewer daily vehicles).
‐ Henry Hudson Bridge between Manhattan and Bronx: down 23.1% to 45,800 daily vehicles from 59,500 (13,700 fewer daily vehicles).
1972 – 1982
From 1972 to 1982, daily river crossings to and from Manhattan increased 8.9%, to 1,573,000 daily vehicles in 1982 from 1,444,100 in 1972, an increase of 128,900 daily vehicles.
The largest increases in daily traffic occurred at the following facilities. ‐ George Washington Bridge between Manhattan and New Jersey: up 12.7% to 249,300 daily vehicles in 1982 from 221,200 in 1972 (28,100 additional daily vehicles).
‐ Lincoln Tunnel between Manhattan and New Jersey: up 15.1% to 110,500 daily vehicles from 96,000 (14,500 additional daily vehicles).
‐ Alexander Hamilton Bridge (Harlem River between Manhattan and Bronx): up 9.8% to 156,000 daily vehicles from 142,100 (13,900 additional daily vehicles).
‐ Manhattan Bridge between Manhattan and Brooklyn: up 18.9% to 87,800 daily vehicles from 73,800 (14,000 additional daily vehicles).
The most significant decrease occurred at the Henry Hudson Bridge (Harlem River between Manhattan and Bronx): down 32.5% to 30,900 daily vehicles in 1982 from 45,800 in 1972 (14,900 fewer daily vehicles).
1982 – 1992
From 1982 to 1992, daily river crossings to and from Manhattan increased 11.7%, to 1,757,600 daily vehicles in 1992 from 1,573,000 in 1982, an increase of 184,600 daily vehicles.
Large increases in daily traffic occurred at the following facilities. ‐ Holland Tunnel between Manhattan and New Jersey: up 21.9% to 90,200 daily vehicles from 74,000 (16,200 additional daily vehicles).
54

‐ Henry Hudson Bridge between Manhattan and Bronx: up 90% to 58,700 daily vehicles from 30,900 (27,800 additional daily vehicles).
‐ Alexander Hamilton Bridge between Manhattan and Bronx: up 13.0% to 176,300 daily vehicles from 156,000 (20,300 additional daily vehicles).
‐ Williamsburg Bridge between Manhattan and Brooklyn: up 23.9% to 98,300 daily vehicles from 79,400 (18,900 additional daily vehicles).
‐ Brooklyn Bridge between Manhattan and Brooklyn: up 13.2% to 125,600 daily vehicles from 111,000 (14,600 additional daily vehicles).
‐ University Heights Bridge between Manhattan and Bronx: up 54.4% to 39,200 daily vehicles from 25,400 (13,800 additional daily vehicles).
The most significant decrease occurred at the Manhattan Bridge between Manhattan and Brooklyn: down 11.0% to 78,100 daily vehicles in 1992 from 87,800 in 1982 (9,700 fewer daily vehicles).
1992 – 2002
From 1992 to 2002, daily river crossings to and from Manhattan increased 5.7%, to 1,857,100 daily vehicles in fall 2002 from 1,757,600 in fall 1992, an increase of 99,500 daily vehicles.
Large increases in daily traffic occurred at the following facilities. ‐ George Washington Bridge between Manhattan and New Jersey: up 16.0% to 310,800 daily vehicles in 2002 from 268,000 in 1992 (42,800 additional daily vehicles).
‐ Ed Koch Queensboro Bridge between Manhattan and Queens: up 25.1% to 176,400 daily vehicles from 141,100 (35,300 additional daily vehicles). Throughout 1992, two lower inner roadway lanes were closed round‐the‐clock.
‐ Madison Avenue Bridge between Manhattan and Bronx: up 50.4% to 49,500 daily vehicles in 2002 from 32,900 in 1992 (16,600 additional daily vehicles). In 2002, this bridge was accommodating traffic diverted from the nearby Macombs Dam Bridge which was subject to ongoing lane closures due to major reconstruction.
‐ Washington Bridge between Manhattan and Bronx: up 22.5% to 63,600 daily vehicles from 51,900 (11,700 additional daily vehicles).
‐ Henry Hudson Bridge between Manhattan and Bronx: up 20.6% to 70,700 daily vehicles from 58,700 (12,000 additional daily vehicles).
Large decreases in daily traffic occurred at the following facilities. ‐ Macombs Dam Bridge between Manhattan and Bronx: down 55.1% to 18,900 daily vehicles in 2002 from 42,000 in 1992 (23,100 fewer daily vehicles). This bridge had a reduced capacity during 2002 as it was undergoing reconstruction.
‐ Manhattan Bridge between Manhattan and Brooklyn: down 15.3% to 66,100 daily vehicles from 78,100 (12,000 fewer daily vehicles).
1948 – 2012
From 1948 to 2012, Manhattan vehicular river crossings increased 170%, to 1,806,600 vehicles per day in 2012 from 670,000 in 1948 (1,136,600 additional daily motor vehicle trips).
‐ Increases occurred on all twenty Manhattan river crossings.
55
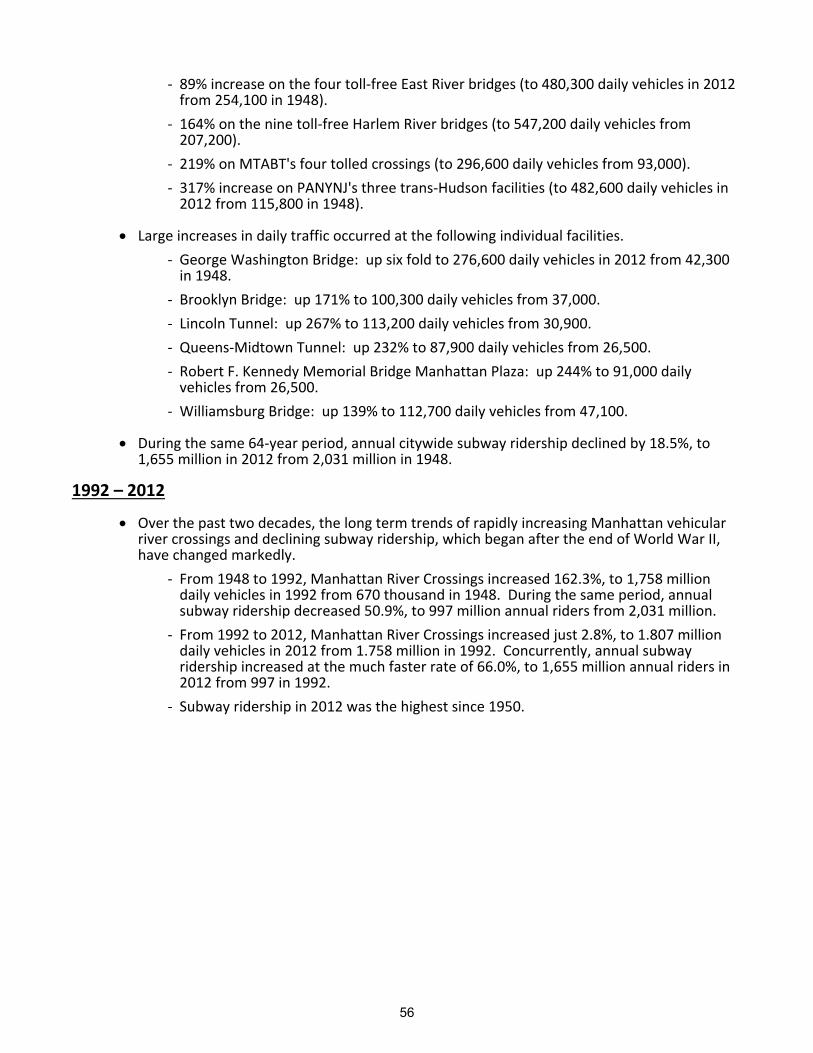
‐ 89% increase on the four toll‐free East River bridges (to 480,300 daily vehicles in 2012 from 254,100 in 1948).
‐ 164% on the nine toll‐free Harlem River bridges (to 547,200 daily vehicles from 207,200).
‐ 219% on MTABT's four tolled crossings (to 296,600 daily vehicles from 93,000).
‐ 317% increase on PANYNJ's three trans‐Hudson facilities (to 482,600 daily vehicles in 2012 from 115,800 in 1948).
Large increases in daily traffic occurred at the following individual facilities. ‐ George Washington Bridge: up six fold to 276,600 daily vehicles in 2012 from 42,300 in 1948.
‐ Brooklyn Bridge: up 171% to 100,300 daily vehicles from 37,000.
‐ Lincoln Tunnel: up 267% to 113,200 daily vehicles from 30,900.
‐ Queens‐Midtown Tunnel: up 232% to 87,900 daily vehicles from 26,500.
‐ Robert F. Kennedy Memorial Bridge Manhattan Plaza: up 244% to 91,000 daily vehicles from 26,500.
‐ Williamsburg Bridge: up 139% to 112,700 daily vehicles from 47,100.
During the same 64‐year period, annual citywide subway ridership declined by 18.5%, to 1,655 million in 2012 from 2,031 million in 1948.
1992 – 2012
Over the past two decades, the long term trends of rapidly increasing Manhattan vehicular river crossings and declining subway ridership, which began after the end of World War II, have changed markedly.
‐ From 1948 to 1992, Manhattan River Crossings increased 162.3%, to 1,758 million daily vehicles in 1992 from 670 thousand in 1948. During the same period, annual subway ridership decreased 50.9%, to 997 million annual riders from 2,031 million.
‐ From 1992 to 2012, Manhattan River Crossings increased just 2.8%, to 1.807 million daily vehicles in 2012 from 1.758 million in 1992. Concurrently, annual subway ridership increased at the much faster rate of 66.0%, to 1,655 million annual riders in 2012 from 997 in 1992.
‐ Subway ridership in 2012 was the highest since 1950.
56
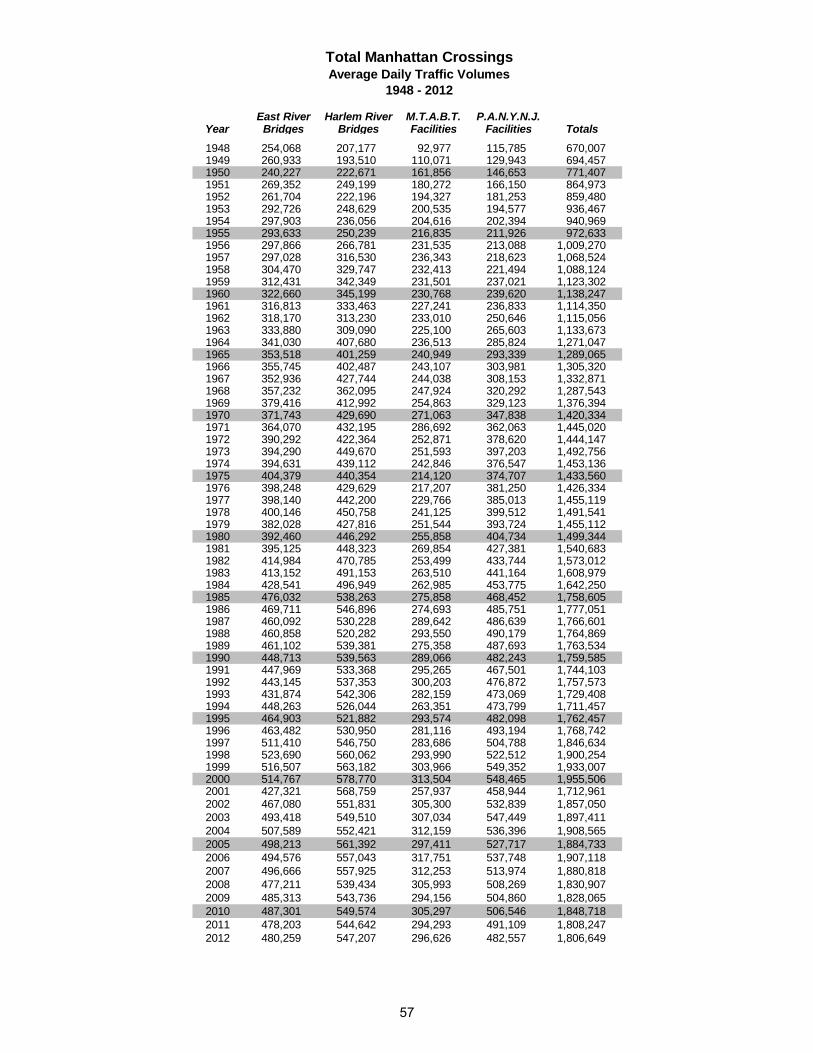
East River Harlem River M.T.A.B.T. P.A.N.Y.N.J.Year Bridges Bridges Facilities Facilities Totals 1948 254,068 207,177 92,977 115,785 670,007 1949 260,933 193,510 110,071 129,943 694,457 1950 240,227 222,671 161,856 146,653 771,407 1951 269,352 249,199 180,272 166,150 864,973 1952 261,704 222,196 194,327 181,253 859,480 1953 292,726 248,629 200,535 194,577 936,467 1954 297,903 236,056 204,616 202,394 940,969 1955 293,633 250,239 216,835 211,926 972,633 1956 297,866 266,781 231,535 213,088 1,009,270 1957 297,028 316,530 236,343 218,623 1,068,524 1958 304,470 329,747 232,413 221,494 1,088,124 1959 312,431 342,349 231,501 237,021 1,123,302 1960 322,660 345,199 230,768 239,620 1,138,247 1961 316,813 333,463 227,241 236,833 1,114,350 1962 318,170 313,230 233,010 250,646 1,115,056 1963 333,880 309,090 225,100 265,603 1,133,673 1964 341,030 407,680 236,513 285,824 1,271,047 1965 353,518 401,259 240,949 293,339 1,289,065 1966 355,745 402,487 243,107 303,981 1,305,320 1967 352,936 427,744 244,038 308,153 1,332,871 1968 357,232 362,095 247,924 320,292 1,287,543 1969 379,416 412,992 254,863 329,123 1,376,394 1970 371,743 429,690 271,063 347,838 1,420,334 1971 364,070 432,195 286,692 362,063 1,445,020 1972 390,292 422,364 252,871 378,620 1,444,147 1973 394,290 449,670 251,593 397,203 1,492,756 1974 394,631 439,112 242,846 376,547 1,453,136 1975 404,379 440,354 214,120 374,707 1,433,560 1976 398,248 429,629 217,207 381,250 1,426,334 1977 398,140 442,200 229,766 385,013 1,455,119 1978 400,146 450,758 241,125 399,512 1,491,541 1979 382,028 427,816 251,544 393,724 1,455,112 1980 392,460 446,292 255,858 404,734 1,499,344 1981 395,125 448,323 269,854 427,381 1,540,683 1982 414,984 470,785 253,499 433,744 1,573,012 1983 413,152 491,153 263,510 441,164 1,608,979 1984 428,541 496,949 262,985 453,775 1,642,250 1985 476,032 538,263 275,858 468,452 1,758,605 1986 469,711 546,896 274,693 485,751 1,777,051 1987 460,092 530,228 289,642 486,639 1,766,601 1988 460,858 520,282 293,550 490,179 1,764,869 1989 461,102 539,381 275,358 487,693 1,763,534 1990 448,713 539,563 289,066 482,243 1,759,585 1991 447,969 533,368 295,265 467,501 1,744,103 1992 443,145 537,353 300,203 476,872 1,757,573 1993 431,874 542,306 282,159 473,069 1,729,408 1994 448,263 526,044 263,351 473,799 1,711,457 1995 464,903 521,882 293,574 482,098 1,762,457 1996 463,482 530,950 281,116 493,194 1,768,742 1997 511,410 546,750 283,686 504,788 1,846,634 1998 523,690 560,062 293,990 522,512 1,900,254 1999 516,507 563,182 303,966 549,352 1,933,007 2000 514,767 578,770 313,504 548,465 1,955,506 2001 427,321 568,759 257,937 458,944 1,712,961 2002 467,080 551,831 305,300 532,839 1,857,050 2003 493,418 549,510 307,034 547,449 1,897,411 2004 507,589 552,421 312,159 536,396 1,908,565 2005 498,213 561,392 297,411 527,717 1,884,733 2006 494,576 557,043 317,751 537,748 1,907,118 2007 496,666 557,925 312,253 513,974 1,880,818 2008 477,211 539,434 305,993 508,269 1,830,907 2009 485,313 543,736 294,156 504,860 1,828,065 2010 487,301 549,574 305,297 506,546 1,848,718 2011 478,203 544,642 294,293 491,109 1,808,247 2012 480,259 547,207 296,626 482,557 1,806,649
Total Manhattan CrossingsAverage Daily Traffic Volumes
1948 - 2012
57
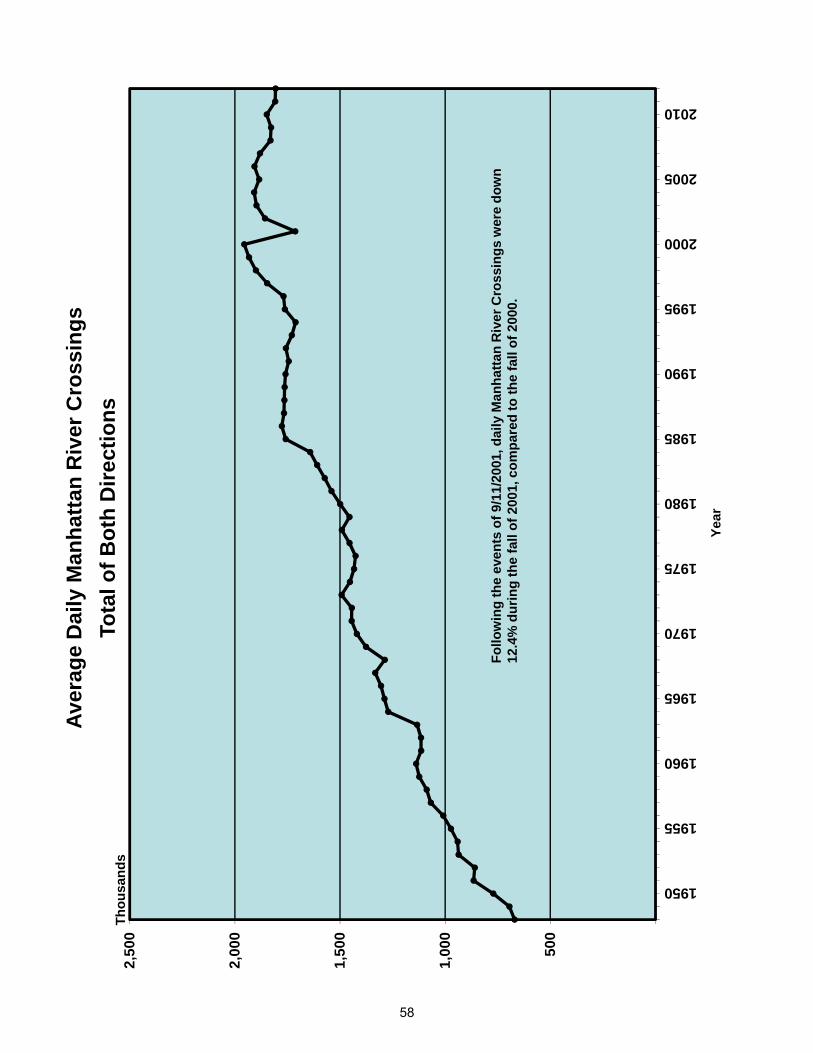
500
1,00
0
1,50
0
2,00
0
2,50
0
1950
1955
1960
1965
1970
1975
1980
1985
1990
1995
2000
2005
2010
Aver
age
Dai
ly M
anha
ttan
Riv
er C
ross
ings
Tota
l of B
oth
Dire
ctio
nsTh
ousa
nds
Year
Follo
win
g th
e ev
ents
of 9
/11/
2001
, dai
ly M
anha
ttan
Riv
er C
ross
ings
wer
e do
wn
12.4
% d
urin
g th
e fa
ll of
200
1, c
ompa
red
to th
e fa
ll of
200
0.
58
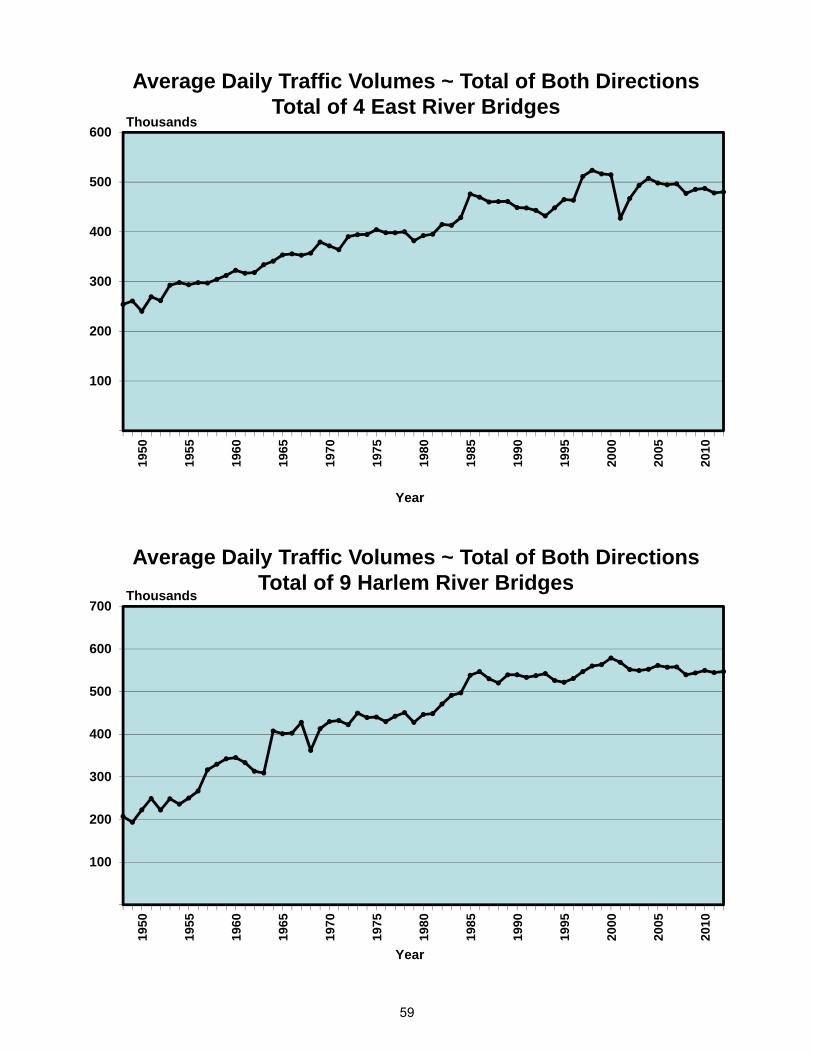
100
200
300
400
500
60019
50
1955
1960
1965
1970
1975
1980
1985
1990
1995
2000
2005
2010
Average Daily Traffic Volumes ~ Total of Both DirectionsTotal of 4 East River Bridges
Thousands
100
200
300
400
500
600
700
1950
1955
1960
1965
1970
1975
1980
1985
1990
1995
2000
2005
2010
Thousands
Year
Year
Average Daily Traffic Volumes ~ Total of Both DirectionsTotal of 9 Harlem River Bridges
59
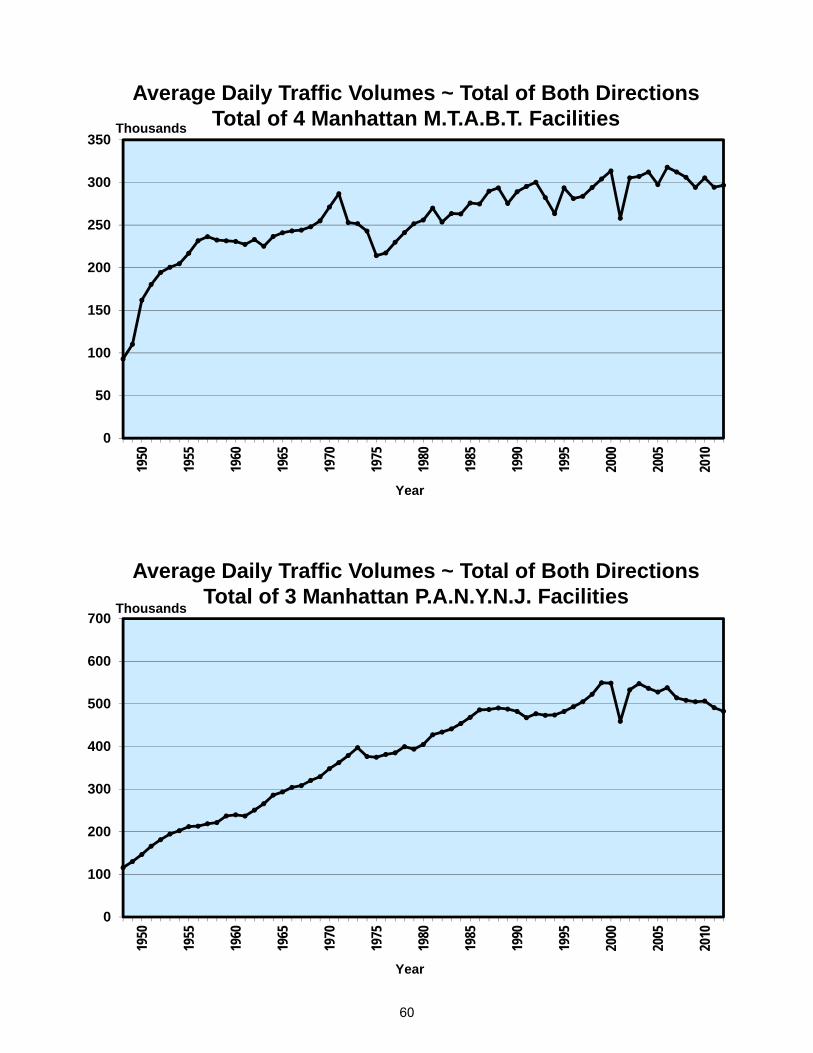
0
50
100
150
200
250
300
35019
50
1955
1960
1965
1970
1975
1980
1985
1990
1995
2000
2005
2010
Average Daily Traffic Volumes ~ Total of Both DirectionsTotal of 4 Manhattan M.T.A.B.T. FacilitiesThousands
0
100
200
300
400
500
600
700
1950
1955
1960
1965
1970
1975
1980
1985
1990
1995
2000
2005
2010
Thousands
Year
Year
Average Daily Traffic Volumes ~ Total of Both DirectionsTotal of 3 Manhattan P.A.N.Y.N.J. Facilities
60
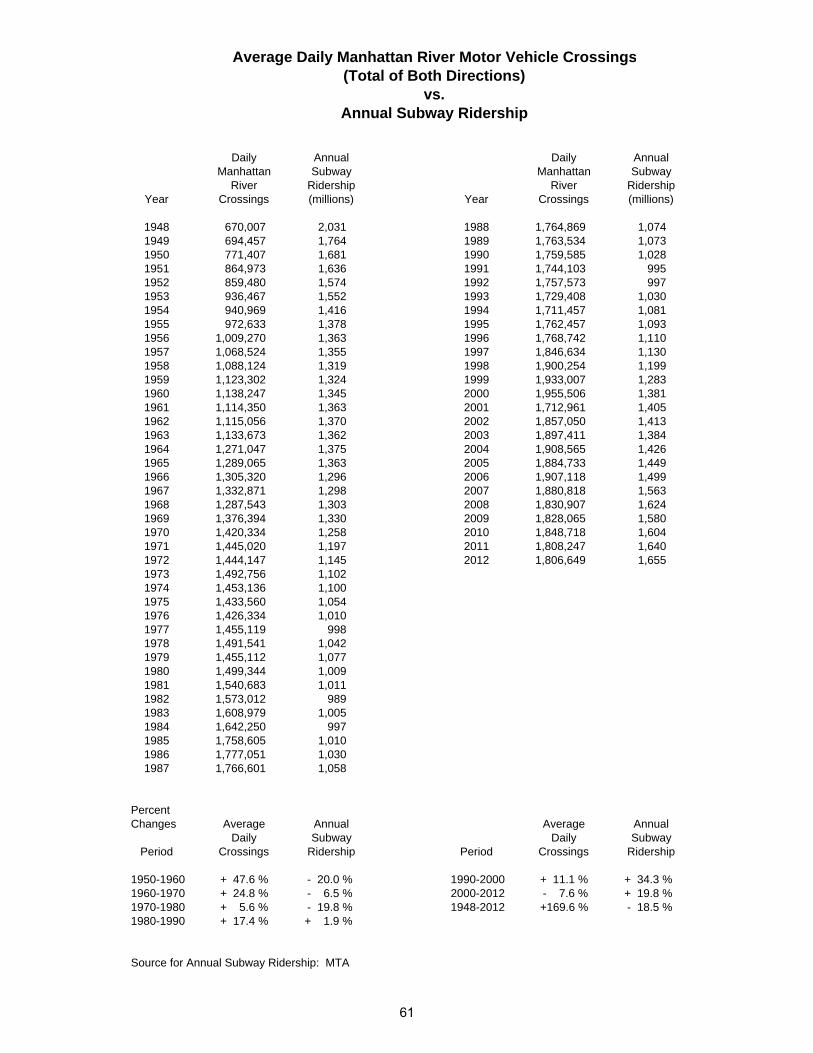
Daily Annual Daily AnnualManhattan Subway Manhattan Subway
River Ridership River RidershipYear Crossings (millions) Year Crossings (millions)
1948 670,007 2,031 1988 1,764,869 1,0741949 694,457 1,764 1989 1,763,534 1,0731950 771,407 1,681 1990 1,759,585 1,0281951 864,973 1,636 1991 1,744,103 9951952 859,480 1,574 1992 1,757,573 9971953 936,467 1,552 1993 1,729,408 1,0301954 940,969 1,416 1994 1,711,457 1,0811955 972,633 1,378 1995 1,762,457 1,0931956 1,009,270 1,363 1996 1,768,742 1,1101957 1,068,524 1,355 1997 1,846,634 1,1301958 1,088,124 1,319 1998 1,900,254 1,1991959 1,123,302 1,324 1999 1,933,007 1,2831960 1,138,247 1,345 2000 1,955,506 1,3811961 1,114,350 1,363 2001 1,712,961 1,4051962 1,115,056 1,370 2002 1,857,050 1,4131963 1,133,673 1,362 2003 1,897,411 1,3841964 1,271,047 1,375 2004 1,908,565 1,4261965 1,289,065 1,363 2005 1,884,733 1,4491966 1,305,320 1,296 2006 1,907,118 1,4991967 1,332,871 1,298 2007 1,880,818 1,5631968 1,287,543 1,303 2008 1,830,907 1,6241969 1,376,394 1,330 2009 1,828,065 1,5801970 1,420,334 1,258 2010 1,848,718 1,6041971 1,445,020 1,197 2011 1,808,247 1,6401972 1,444,147 1,145 2012 1,806,649 1,6551973 1,492,756 1,1021974 1,453,136 1,1001975 1,433,560 1,0541976 1,426,334 1,0101977 1,455,119 9981978 1,491,541 1,0421979 1,455,112 1,0771980 1,499,344 1,0091981 1,540,683 1,0111982 1,573,012 9891983 1,608,979 1,0051984 1,642,250 9971985 1,758,605 1,0101986 1,777,051 1,0301987 1,766,601 1,058
PercentChanges Average Annual Average Annual
Daily Subway Daily SubwayPeriod Crossings Ridership Period Crossings Ridership
1950-1960 + 47.6 % - 20.0 % 1990-2000 + 11.1 % + 34.3 %1960-1970 + 24.8 % - 6.5 % 2000-2012 - 7.6 % + 19.8 %1970-1980 + 5.6 % - 19.8 % 1948-2012 +169.6 % - 18.5 %1980-1990 + 17.4 % + 1.9 %
Source for Annual Subway Ridership: MTA
Average Daily Manhattan River Motor Vehicle Crossings
vs.Annual Subway Ridership
(Total of Both Directions)
61
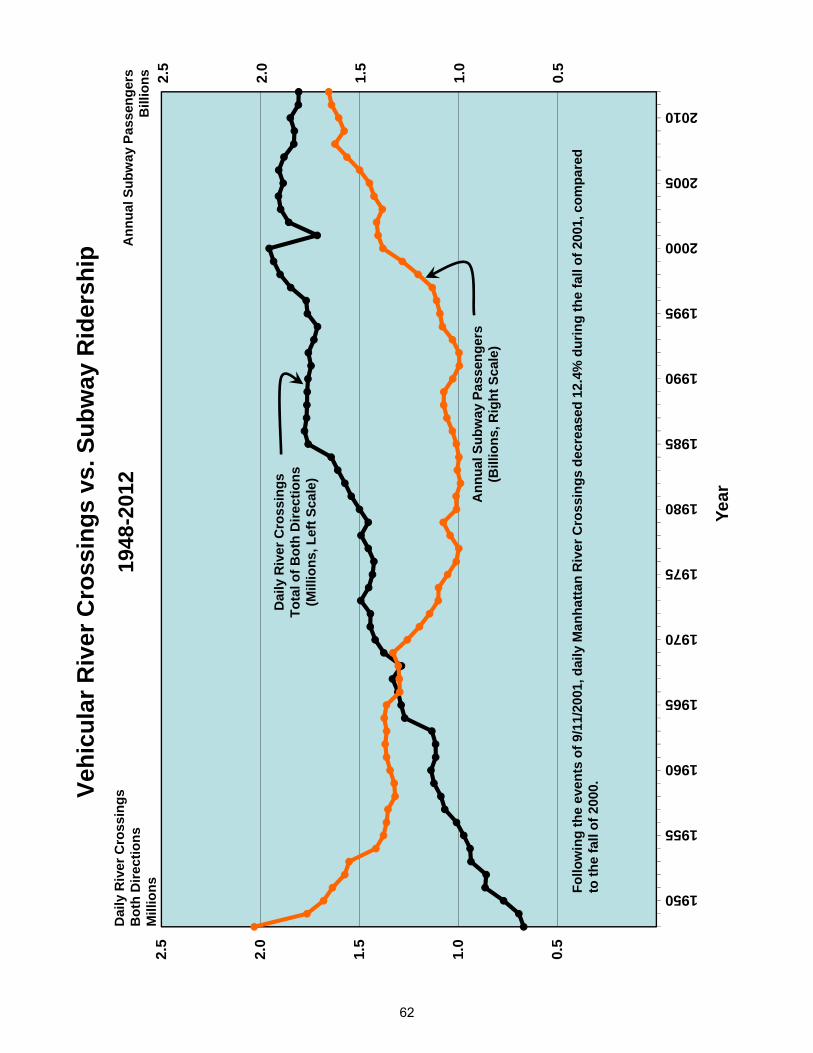
Vehi
cula
r Riv
er C
ross
ings
vs.
Sub
way
Rid
ersh
ip19
48-2
012
0.0
0.5
1.0
1.5
2.0
2.5
1950
1955
1960
1965
1970
1975
1980
1985
1990
1995
2000
2005
2010
Follo
win
g th
e ev
ents
of 9
/11/
2001
, dai
ly M
anha
ttan
Riv
er C
ross
ings
dec
reas
ed 1
2.4%
dur
ing
the
fall
of 2
001,
com
pare
d to
the
fall
of 2
000.
Year
Dai
ly R
iver
Cro
ssin
gsTo
tal o
f Bot
h D
irect
ions
(Mill
ions
, Lef
t Sca
le)
Ann
ual S
ubw
ay P
asse
nger
s(B
illio
ns, R
ight
Sca
le)
2.5
2.0
1.5
1.0
0.5
Dai
ly R
iver
Cro
ssin
gsB
oth
Dire
ctio
nsM
illio
nsA
nnua
l Sub
way
Pas
seng
ers
Bill
ions
62
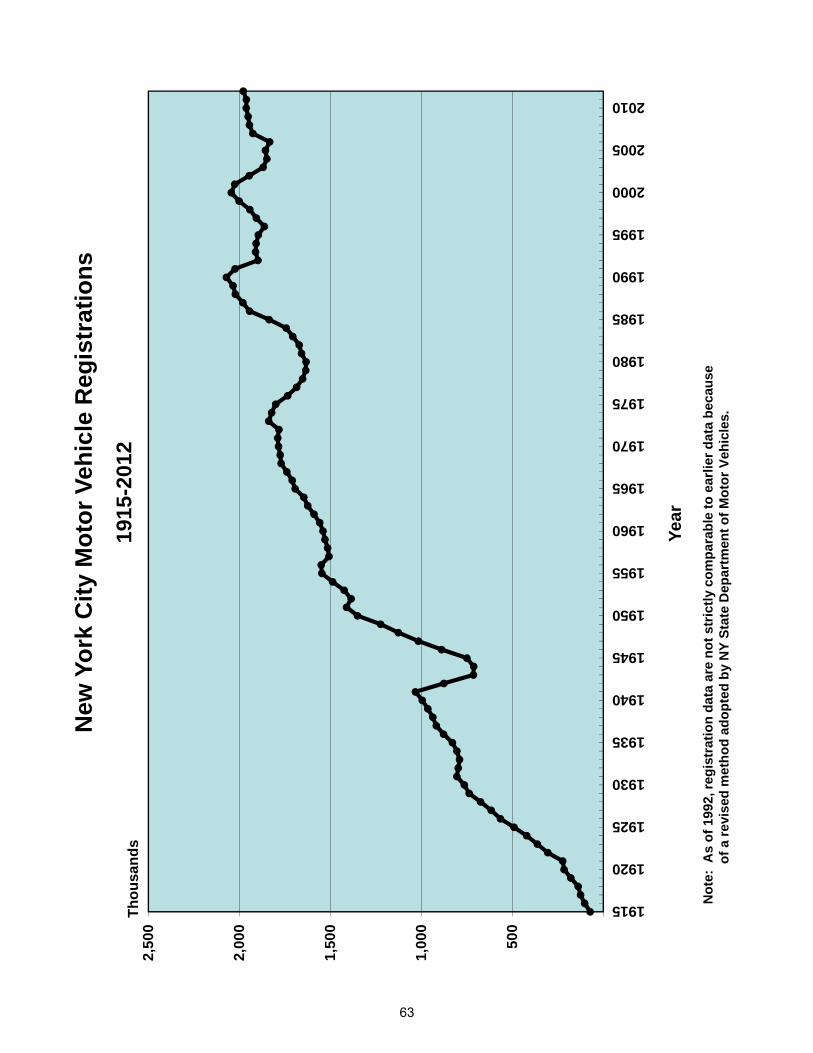
500
1,00
0
1,50
0
2,00
0
2,50
01915
1920
1925
1930
1935
1940
1945
1950
1955
1960
1965
1970
1975
1980
1985
1990
1995
2000
2005
2010
New
Yor
k C
ity M
otor
Veh
icle
Reg
istr
atio
ns19
15-2
012
Thou
sand
s
Not
e: A
s of
199
2, re
gist
ratio
n da
ta a
re n
ot s
tric
tly c
ompa
rabl
e to
ear
lier d
ata
beca
use
of a
revi
sed
met
hod
adop
ted
by N
Y St
ate
Dep
artm
ent o
f Mot
or V
ehic
les.
Year
63
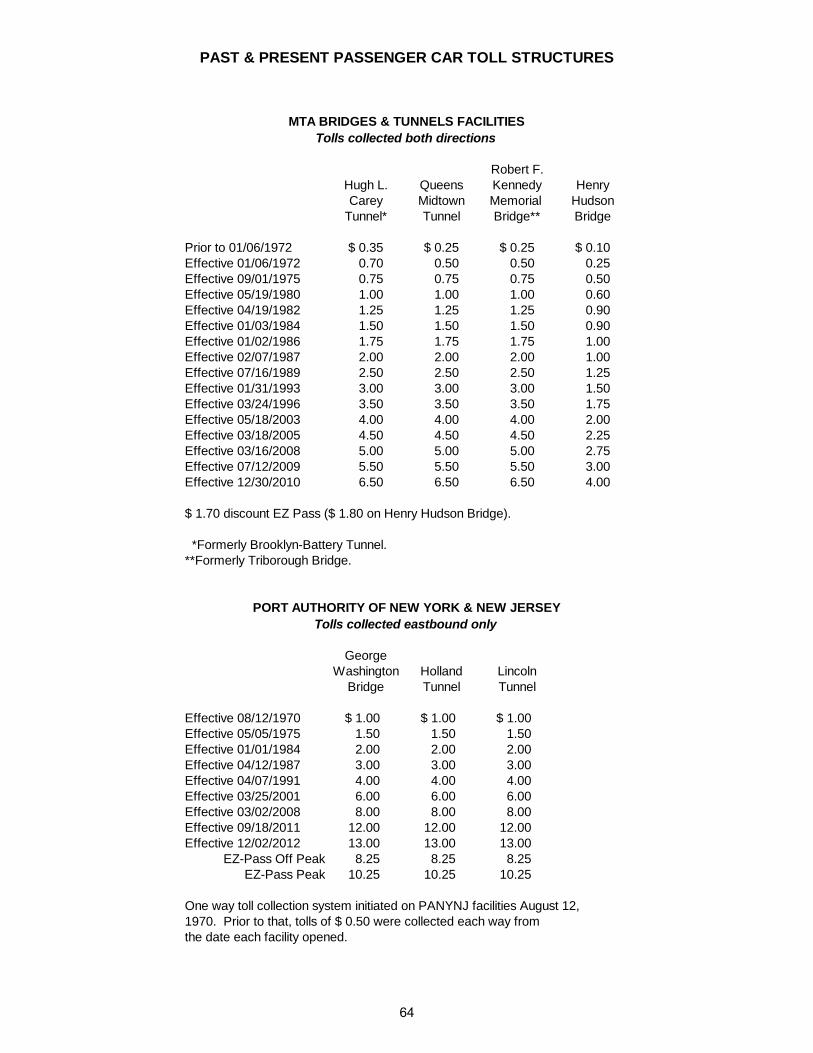
Robert F.Hugh L. Queens Kennedy HenryCarey Midtown Memorial Hudson
Tunnel* Tunnel Bridge** Bridge
Prior to 01/06/1972 $ 0.35 $ 0.25 $ 0.25 $ 0.10Effective 01/06/1972 0.70 0.50 0.50 0.25Effective 09/01/1975 0.75 0.75 0.75 0.50Effective 05/19/1980 1.00 1.00 1.00 0.60Effective 04/19/1982 1.25 1.25 1.25 0.90Effective 01/03/1984 1.50 1.50 1.50 0.90Effective 01/02/1986 1.75 1.75 1.75 1.00Effective 02/07/1987 2.00 2.00 2.00 1.00Effective 07/16/1989 2.50 2.50 2.50 1.25Effective 01/31/1993 3.00 3.00 3.00 1.50Effective 03/24/1996 3.50 3.50 3.50 1.75Effective 05/18/2003 4.00 4.00 4.00 2.00Effective 03/18/2005 4.50 4.50 4.50 2.25Effective 03/16/2008 5.00 5.00 5.00 2.75Effective 07/12/2009 5.50 5.50 5.50 3.00Effective 12/30/2010 6.50 6.50 6.50 4.00
$ 1.70 discount EZ Pass ($ 1.80 on Henry Hudson Bridge).
*Formerly Brooklyn-Battery Tunnel.**Formerly Triborough Bridge.
GeorgeWashington Holland Lincoln
Bridge Tunnel Tunnel
Effective 08/12/1970 $ 1.00 $ 1.00 $ 1.00 Effective 05/05/1975 1.50 1.50 1.50 Effective 01/01/1984 2.00 2.00 2.00 Effective 04/12/1987 3.00 3.00 3.00 Effective 04/07/1991 4.00 4.00 4.00 Effective 03/25/2001 6.00 6.00 6.00 Effective 03/02/2008 8.00 8.00 8.00 Effective 09/18/2011 12.00 12.00 12.00 Effective 12/02/2012 13.00 13.00 13.00
EZ-Pass Off Peak 8.25 8.25 8.25 EZ-Pass Peak 10.25 10.25 10.25
One way toll collection system initiated on PANYNJ facilities August 12,1970. Prior to that, tolls of $ 0.50 were collected each way fromthe date each facility opened.
MTA BRIDGES & TUNNELS FACILITIES
PAST & PRESENT PASSENGER CAR TOLL STRUCTURES
Tolls collected both directions
PORT AUTHORITY OF NEW YORK & NEW JERSEYTolls collected eastbound only
64

Dai
ly V
ehic
ular
Riv
er C
ross
ings
vs.
Tol
lsM
TAB
T M
anha
ttan
Faci
litie
s19
48-2
012
050100
150
200
250
300
350
400
450
500
550
600
650
1950
1955
1960
1965
1970
1975
1980
1985
1990
1995
2000
2005
2010
Year
Dai
ly R
iver
Cro
ssin
gs ~
Bot
h D
irect
ions
Tota
l of 4
MTA
BT
Cro
ssin
gs(T
hous
ands
, Lef
t Sca
le)
1-w
ay T
oll o
n M
TAB
T M
anha
ttan
Cro
ssin
gsTo
lls C
olle
cted
in B
oth
Dire
ctio
ns(D
olla
rs, R
ight
Sca
le)
Dai
ly R
iver
Cro
ssin
gsTo
tal o
f 4 M
TAB
T Fa
cilit
ies
Bot
h D
irect
ions
(Tho
usan
ds)
MTA
BT
1-W
ay T
oll $
5.00
$ 4.
00
$ 3.
00
$ 2.
00
$ 4.
50
$ 3.
50
$ 2.
50
$ 1.
50
$ 1.
00
$ 0.
50
$ 6.
50
$ 5.
50
$ 6.
00
65
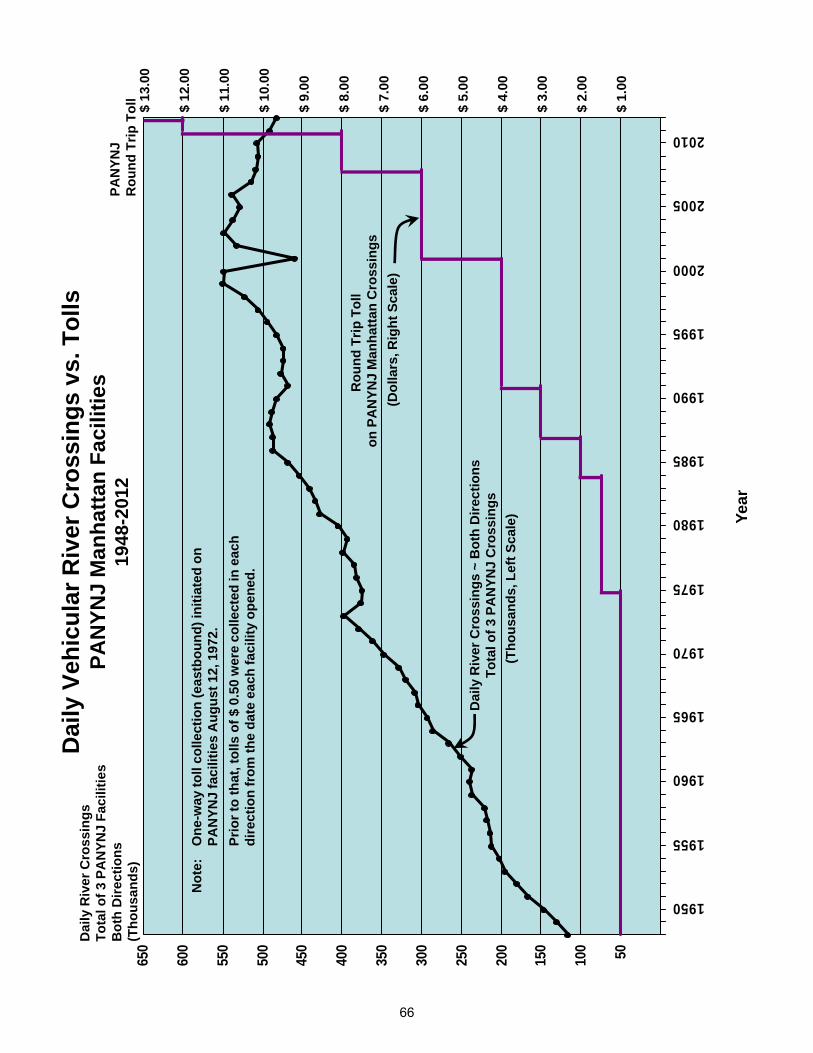
Dai
ly V
ehic
ular
Riv
er C
ross
ings
vs.
Tol
lsPA
NYN
J M
anha
ttan
Faci
litie
s19
48-2
012
50100
150
200
250
300
350
400
450
500
550
600
650
1950
1955
1960
1965
1970
1975
1980
1985
1990
1995
2000
2005
2010
Year
Dai
ly R
iver
Cro
ssin
gs ~
Bot
h D
irect
ions
Tota
l of 3
PA
NYN
J C
ross
ings
Rou
nd T
rip T
oll
on P
AN
YNJ
Man
hatta
n C
ross
ings
Dai
ly R
iver
Cro
ssin
gsTo
tal o
f 3 P
AN
YNJ
Faci
litie
sB
oth
Dire
ctio
ns(T
hous
ands
)PA
NYN
JR
ound
Trip
Tol
l
$ 6.
00
$ 4.
00
$ 2.
00
$ 8.
00
$ 5.
00
$ 1.
00
$ 3.
00
Not
e:
Prio
r to
that
, tol
ls o
f $ 0
.50
wer
e co
llect
ed in
eac
hdi
rect
ion
from
the
date
eac
h fa
cilit
y op
ened
.
$ 12
.00
$ 11
.00
(Tho
usan
ds, L
eft S
cale
)
(Dol
lars
, Rig
ht S
cale
)
One
-way
toll
colle
ctio
n (e
astb
ound
) ini
tiate
d on
PAN
YNJ
faci
litie
s A
ugus
t 12,
197
2.
$ 13
.00
$ 7.
00
$ 10
.00
$ 9.
00
66
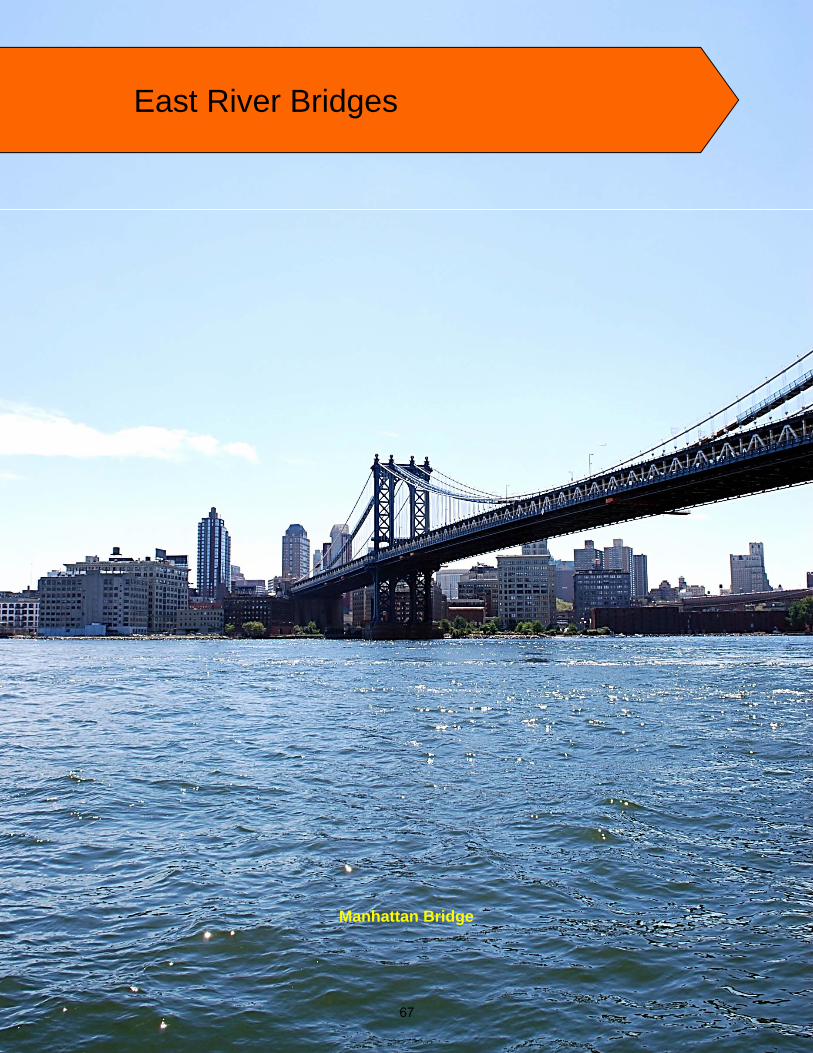
East River Bridges
Manhattan Bridge
67

68
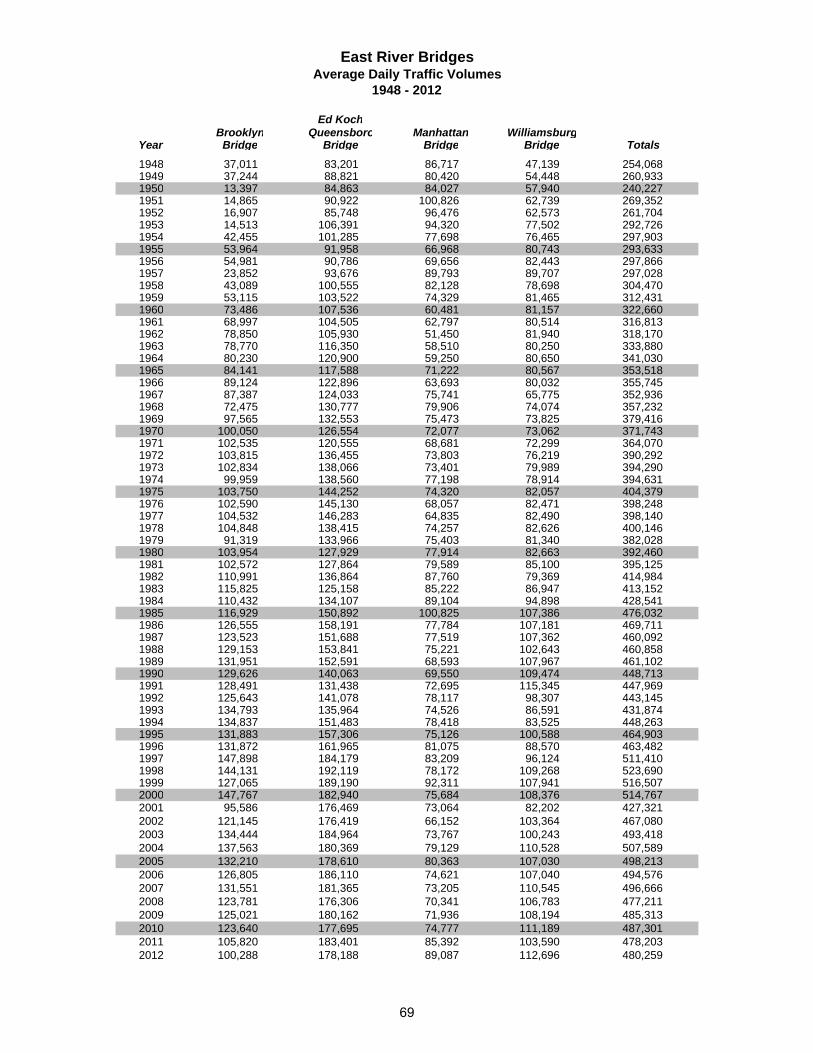
Ed KochBrooklyn Queensboro Manhattan Williamsburg
Year Bridge Bridge Bridge Bridge Totals 1948 37,011 83,201 86,717 47,139 254,068 1949 37,244 88,821 80,420 54,448 260,933 1950 13,397 84,863 84,027 57,940 240,227 1951 14,865 90,922 100,826 62,739 269,352 1952 16,907 85,748 96,476 62,573 261,704 1953 14,513 106,391 94,320 77,502 292,726 1954 42,455 101,285 77,698 76,465 297,903 1955 53,964 91,958 66,968 80,743 293,633 1956 54,981 90,786 69,656 82,443 297,866 1957 23,852 93,676 89,793 89,707 297,028 1958 43,089 100,555 82,128 78,698 304,470 1959 53,115 103,522 74,329 81,465 312,431 1960 73,486 107,536 60,481 81,157 322,660 1961 68,997 104,505 62,797 80,514 316,813 1962 78,850 105,930 51,450 81,940 318,170 1963 78,770 116,350 58,510 80,250 333,880 1964 80,230 120,900 59,250 80,650 341,030 1965 84,141 117,588 71,222 80,567 353,518 1966 89,124 122,896 63,693 80,032 355,745 1967 87,387 124,033 75,741 65,775 352,936 1968 72,475 130,777 79,906 74,074 357,232 1969 97,565 132,553 75,473 73,825 379,416 1970 100,050 126,554 72,077 73,062 371,743 1971 102,535 120,555 68,681 72,299 364,070 1972 103,815 136,455 73,803 76,219 390,292 1973 102,834 138,066 73,401 79,989 394,290 1974 99,959 138,560 77,198 78,914 394,631 1975 103,750 144,252 74,320 82,057 404,379 1976 102,590 145,130 68,057 82,471 398,248 1977 104,532 146,283 64,835 82,490 398,140 1978 104,848 138,415 74,257 82,626 400,146 1979 91,319 133,966 75,403 81,340 382,028 1980 103,954 127,929 77,914 82,663 392,460 1981 102,572 127,864 79,589 85,100 395,125 1982 110,991 136,864 87,760 79,369 414,984 1983 115,825 125,158 85,222 86,947 413,152 1984 110,432 134,107 89,104 94,898 428,541 1985 116,929 150,892 100,825 107,386 476,032 1986 126,555 158,191 77,784 107,181 469,711 1987 123,523 151,688 77,519 107,362 460,092 1988 129,153 153,841 75,221 102,643 460,858 1989 131,951 152,591 68,593 107,967 461,102 1990 129,626 140,063 69,550 109,474 448,713 1991 128,491 131,438 72,695 115,345 447,969 1992 125,643 141,078 78,117 98,307 443,145 1993 134,793 135,964 74,526 86,591 431,874 1994 134,837 151,483 78,418 83,525 448,263 1995 131,883 157,306 75,126 100,588 464,903 1996 131,872 161,965 81,075 88,570 463,482 1997 147,898 184,179 83,209 96,124 511,410 1998 144,131 192,119 78,172 109,268 523,690 1999 127,065 189,190 92,311 107,941 516,507 2000 147,767 182,940 75,684 108,376 514,767 2001 95,586 176,469 73,064 82,202 427,321 2002 121,145 176,419 66,152 103,364 467,080 2003 134,444 184,964 73,767 100,243 493,418 2004 137,563 180,369 79,129 110,528 507,589 2005 132,210 178,610 80,363 107,030 498,213 2006 126,805 186,110 74,621 107,040 494,576 2007 131,551 181,365 73,205 110,545 496,666 2008 123,781 176,306 70,341 106,783 477,211 2009 125,021 180,162 71,936 108,194 485,313 2010 123,640 177,695 74,777 111,189 487,301 2011 105,820 183,401 85,392 103,590 478,203 2012 100,288 178,188 89,087 112,696 480,259
East River BridgesAverage Daily Traffic Volumes
1948 - 2012
69
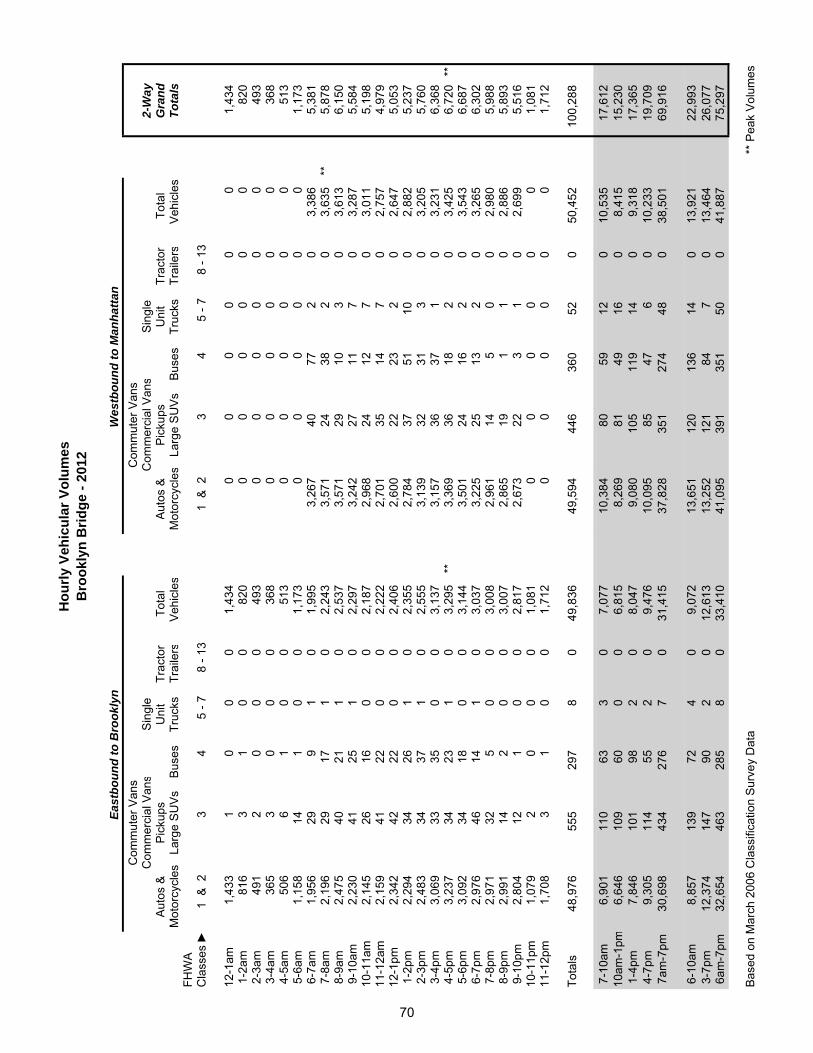
Com
mut
er V
ans
Com
mut
er V
ans
Com
mer
cial
Van
sS
ingl
e C
omm
erci
al V
ans
Sin
gle
2-W
ayA
utos
& P
icku
psU
nit
Trac
tor
Tota
l
Aut
os &
Pic
kups
Uni
tTr
acto
rTo
tal
G
rand
Mot
orcy
cle s
Lar
ge S
UV
sB
uses
Tr
ucks
Trai
lers
Veh
icle
sM
otor
cycl
es L
arge
SU
Vs
Bus
es
Truc
ksTr
aile
rsV
ehic
les
Tota
lsFH
WA
Cla
sses
►
1 &
23
4
5 -
7
8 - 1
3 1
& 2
34
5
- 7
8 - 1
3
12-1
am1,
433
10
00
1,43
4
00
00
00
1,
434
1-2
am81
63
10
082
0
00
00
00
82
0 2
-3am
491
20
00
493
0
00
00
0
493
3-4
am36
53
00
036
8
00
00
00
36
8 4
-5am
506
61
00
513
0
00
00
0
513
5-6
am1,
158
141
00
1,17
3
00
00
00
1,
173
6-7
am1,
956
299
10
1,99
5
3,26
740
772
03,
386
5,
381
7-8
am2,
196
2917
10
2,24
3
3,57
124
382
03,
635
**
5,87
8 8
-9am
2,47
540
211
02,
537
3,
571
2910
30
3,61
3
6,15
0 9
-10a
m2,
230
4125
10
2,29
7
3,24
227
117
03,
287
5,
584
10-1
1am
2,14
526
160
02,
187
2,
968
2412
70
3,01
1
5,19
8 11
-12a
m2,
159
4122
00
2,22
2
2,70
135
147
02,
757
4,
979
12-1
pm2,
342
4222
00
2,40
6
2,60
022
232
02,
647
5,
053
1-2
pm2,
294
3426
10
2,35
5
2,78
437
5110
02,
882
5,
237
2-3
pm2,
483
3437
10
2,55
5
3,13
932
313
03,
205
5,
760
3-4
pm3,
069
3335
00
3,13
7
3,15
736
371
03,
231
6,
368
4-5
pm3,
237
3423
10
3,29
5
**3,
369
3618
20
3,42
5
6,72
0 **
5-6
pm3,
092
3418
00
3,14
4
3,50
124
162
03,
543
6,
687
6-7
pm2,
976
4614
10
3,03
7
3,22
525
132
03,
265
6,
302
7-8
pm2,
971
325
00
3,00
8
2,96
114
50
02,
980
5,
988
8-9
pm2,
991
142
00
3,00
7
2,86
519
11
02,
886
5,
893
9-1
0pm
2,80
412
10
02,
817
2,
673
223
10
2,69
9
5,51
6 10
-11p
m1,
079
20
00
1,08
1
00
00
00
1,
081
11-1
2pm
1,70
83
10
01,
712
0
00
00
0
1,71
2
Tota
l s48
,976
555
297
80
49,8
36
49,5
9444
636
052
050
,452
10
0,28
8
7-1
0am
6,90
111
063
30
7,07
7
10,3
8480
5912
010
,535
17
,612
10
am-1
pm6,
646
109
600
06,
815
8,
269
8149
160
8,41
5
15,2
30
1-4
pm7,
846
101
982
08,
047
9,
080
105
119
140
9,31
8
17,3
65
4-7
pm9,
305
114
552
09,
476
10
,095
8547
60
10,2
33
19,7
09
7am
-7pm
30,6
9843
427
67
031
,415
37
,828
351
274
480
38,5
01
69,9
16
6-1
0am
8,85
713
972
40
9,07
2
13,6
5112
013
614
013
,921
22
,993
3
-7pm
12,3
7414
790
20
12,6
13
13,2
5212
184
70
13,4
64
26,0
77
6am
-7pm
32,6
5446
328
58
033
,410
41
,095
391
351
500
41,8
87
75,2
97
Bas
ed o
n M
arch
200
6 C
lass
ifica
tion
Sur
vey
Dat
a**
Pea
k V
olum
e s
Hou
rly V
ehic
ular
Vol
umes
Bro
okly
n B
ridge
- 20
12
East
boun
d to
Bro
okly
nW
estb
ound
to M
anha
ttan
70
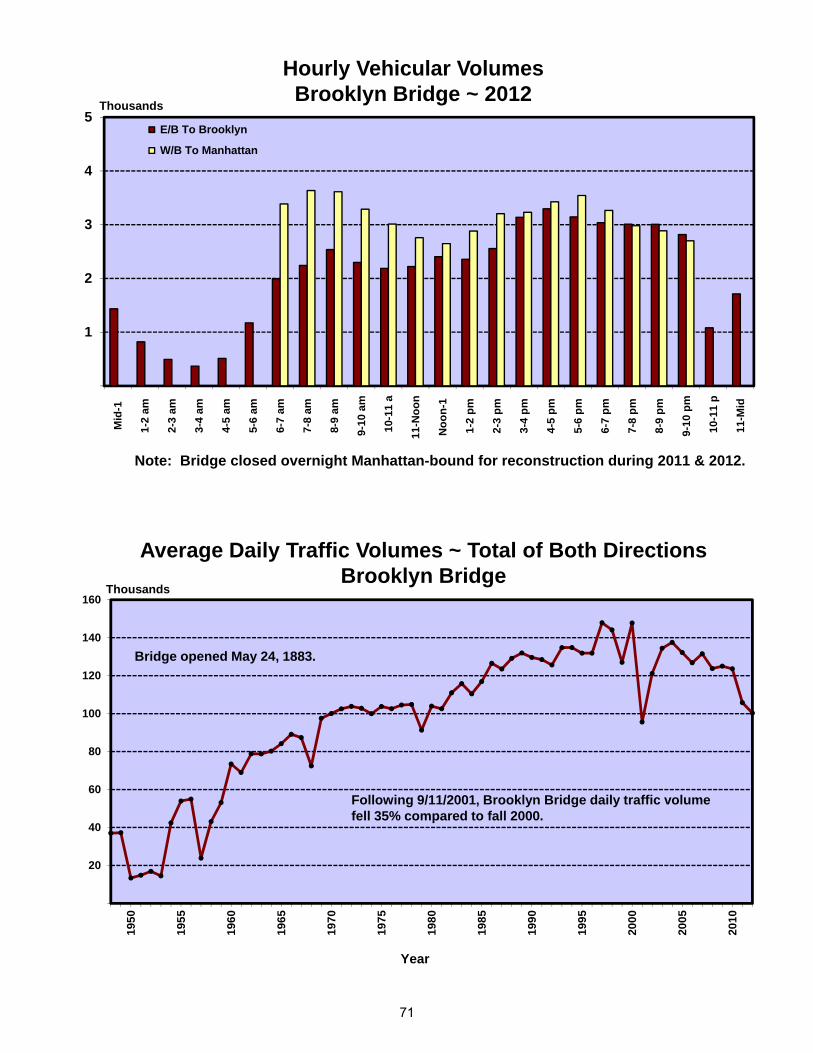
1
2
3
4
5 M
id-1
1-2
am
2-3
am
3-4
am
4-5
am
5-6
am
6-7
am
7-8
am
8-9
am
9-1
0 am
10-
11 a
11-
Noo
n
Noo
n-1
1-2
pm
2-3
pm
3-4
pm
4-5
pm
5-6
pm
6-7
pm
7-8
pm
8-9
pm
9-1
0 pm
10-
11 p
11-
Mid
E/B To Brooklyn
W/B To Manhattan
Hourly Vehicular VolumesBrooklyn Bridge ~ 2012
20
40
60
80
100
120
140
160
1950
1955
1960
1965
1970
1975
1980
1985
1990
1995
2000
2005
2010
Average Daily Traffic Volumes ~ Total of Both DirectionsBrooklyn Bridge
Bridge opened May 24, 1883.
Thousands
Thousands
Year
Following 9/11/2001, Brooklyn Bridge daily traffic volume fell 35% compared to fall 2000.
Note: Bridge closed overnight Manhattan-bound for reconstruction during 2011 & 2012.
71

Com
mut
er V
ans
Com
mut
er V
ans
Com
mer
cial
Van
sS
ingl
e C
omm
erci
al V
ans
Sin
gle
2-W
ayA
utos
& P
icku
psU
nit
Trac
tor
Tota
l
Aut
os &
Pic
kups
Uni
tTr
acto
rTo
tal
G
rand
Mot
orcy
cle s
Lar
ge S
UV
sB
uses
Tr
ucks
Trai
lers
Veh
icle
sM
otor
cycl
es L
arge
SU
Vs
Bus
es
Truc
ksTr
aile
rsV
ehic
les
Tota
lsFH
WA
Cla
sses
►
1 &
2
3
4
5 -
7
8 - 1
3 1
& 2
3
4 5
- 7
8
- 13
12-1
am4,
051
50
16
45
0
4,
162
1,
845
17
13
11
1
1,
887
6,
049
1-2
am2,
600
21
10
24
1
2,
656
1,
226
14
6
14
2
1,
262
3,
918
2-3
am1,
681
9
4
27
1
1,
722
1,
023
11
5
37
0
1,
076
2,
798
3-4
am1,
360
7
2
42
0
1,
411
1,
312
8
13
70
1
1,
404
2,
815
4-5
am1,
709
15
12
55
0
1,
791
2,
306
30
22
15
1
1
2,51
0
4,30
1 5
-6am
2,22
935
14
80
1
2,35
9
4,16
954
28
222
23
4,
496
6,
855
6-7
am2,
877
31
23
16
8
0
3,09
9
6,09
184
41
263
17
6,
496
9,
595
7-8
am2,
760
50
27
20
6
4
3,04
7
6,11
971
52
287
33
6,
562
**
9,60
9 8
-9am
2,41
748
37
204
6
2,
712
5,
342
74
58
26
9
27
5,77
0
8,48
2 9
-10a
m2,
176
38
34
20
1
5
2,45
4
4,58
575
48
215
35
4,
958
7,
412
10-1
1am
2,75
558
52
252
10
3,
127
3,
802
70
36
23
1
35
4,17
4
7,30
1 11
-12a
m3,
151
51
41
24
2
4
3,48
9
3,42
958
27
194
38
3,
746
7,
235
12-1
pm3,
395
67
41
26
5
6
3,77
4
3,42
140
39
194
37
3,
731
7,
505
1-2
pm3,
571
80
45
28
0
5
3,98
1
3,73
253
35
141
40
4,
001
7,
982
2-3
pm4,
006
79
52
25
2
7
4,39
6
4,17
571
44
141
38
4,
469
8,
865
3-4
pm5,
018
82
56
27
1
7
5,43
4
4,19
952
43
150
23
4,
467
9,
901
4-5
pm5,
543
89
43
25
7
7
5,93
9
**4,
197
51
34
11
7
15
4,41
4
10,3
53
** 5
-6pm
5,17
873
44
231
10
5,
536
4,
336
39
36
74
23
4,
508
10
,044
6
-7pm
4,35
557
45
167
6
4,
630
4,
069
32
25
48
14
4,
188
8,
818
7-8
pm4,
410
74
55
15
1
9
4,69
9
3,45
025
27
34
11
3,54
7
8,24
6 8
-9pm
4,34
582
65
133
4
4,
629
3,
133
29
21
30
8
3,
221
7,
850
9-1
0pm
4,07
864
49
116
3
4,
310
3,
005
26
16
34
4
3,
085
7,
395
10-1
1pm
4,08
759
47
121
1
4,
315
3,
186
24
21
30
1
3,
262
7,
577
11-1
2pm
4,30
953
27
60
2
4,45
1
2,77
315
18
24
1
2,83
1
7,28
2
Tota
l s82
,061
1,27
2
841
3,85
0
99
88,1
23
84,9
251,
023
70
8
2,
981
42
8
90,0
65
178,
188
7-1
0am
7,35
313
6
98
61
1
15
8,21
3
16,0
4622
0
158
771
95
17
,290
25
,503
10
am-1
pm9,
301
176
13
4
75
9
20
10,3
90
10,6
5216
8
102
619
11
0
11,6
51
22,0
41
1-4
pm12
,595
241
15
3
80
3
19
13,8
11
12,1
0617
6
122
432
10
1
12,9
37
26,7
48
4-7
pm15
,076
219
13
2
65
5
23
16,1
05
12,6
0212
2
95
23
9
52
13,1
10
29,2
15
7am
-7pm
44,3
2577
2
517
2,82
8
77
48,5
19
51,4
0668
6
477
2,06
1
358
54
,988
10
3,50
7
6-1
0am
10,2
3016
712
177
915
11,3
12
22,1
3730
419
91,
034
112
23,7
86
35,0
98
3-7
pm20
,094
301
188
926
3021
,539
16
,801
174
138
389
7517
,577
39
,116
6
am-7
pm47
,202
803
540
2,99
677
51,6
18
57,4
9777
051
82,
324
375
61,4
84
113,
102
Bas
ed o
n A
pril
2006
Cla
ssifi
catio
n S
urve
y D
ata.
** P
eak
Vol
umes
East
boun
d to
Que
ens
Wes
tbou
nd to
Man
hatta
n
Ed K
och
Que
ensb
oro
Brid
ge -
2012
Hou
rly V
ehic
ular
Vol
umes
72
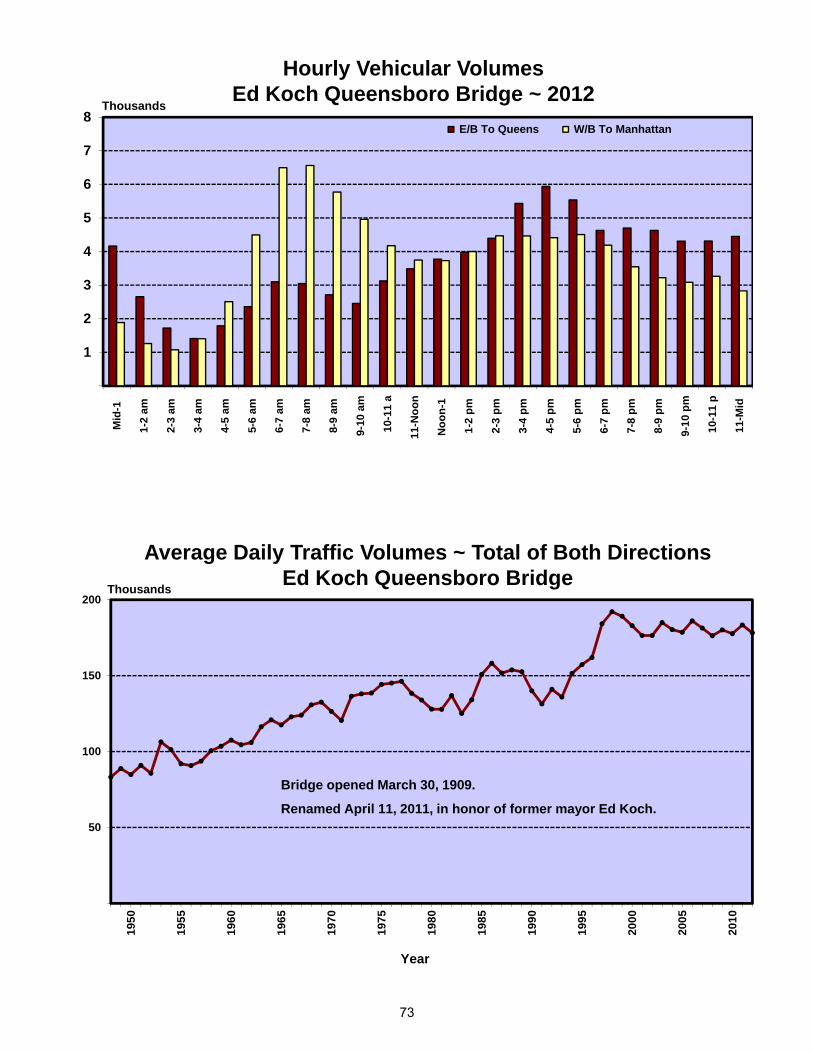
1
2
3
4
5
6
7
8 M
id-1
1-2
am
2-3
am
3-4
am
4-5
am
5-6
am
6-7
am
7-8
am
8-9
am
9-1
0 am
10-
11 a
11-
Noo
n
Noo
n-1
1-2
pm
2-3
pm
3-4
pm
4-5
pm
5-6
pm
6-7
pm
7-8
pm
8-9
pm
9-1
0 pm
10-
11 p
11-
Mid
E/B To Queens W/B To Manhattan
Hourly Vehicular VolumesEd Koch Queensboro Bridge ~ 2012
50
100
150
200
1950
1955
1960
1965
1970
1975
1980
1985
1990
1995
2000
2005
2010
Average Daily Traffic Volumes ~ Total of Both DirectionsEd Koch Queensboro Bridge
Bridge opened March 30, 1909.
Renamed April 11, 2011, in honor of former mayor Ed Koch.
Thousands
Thousands
Year
73
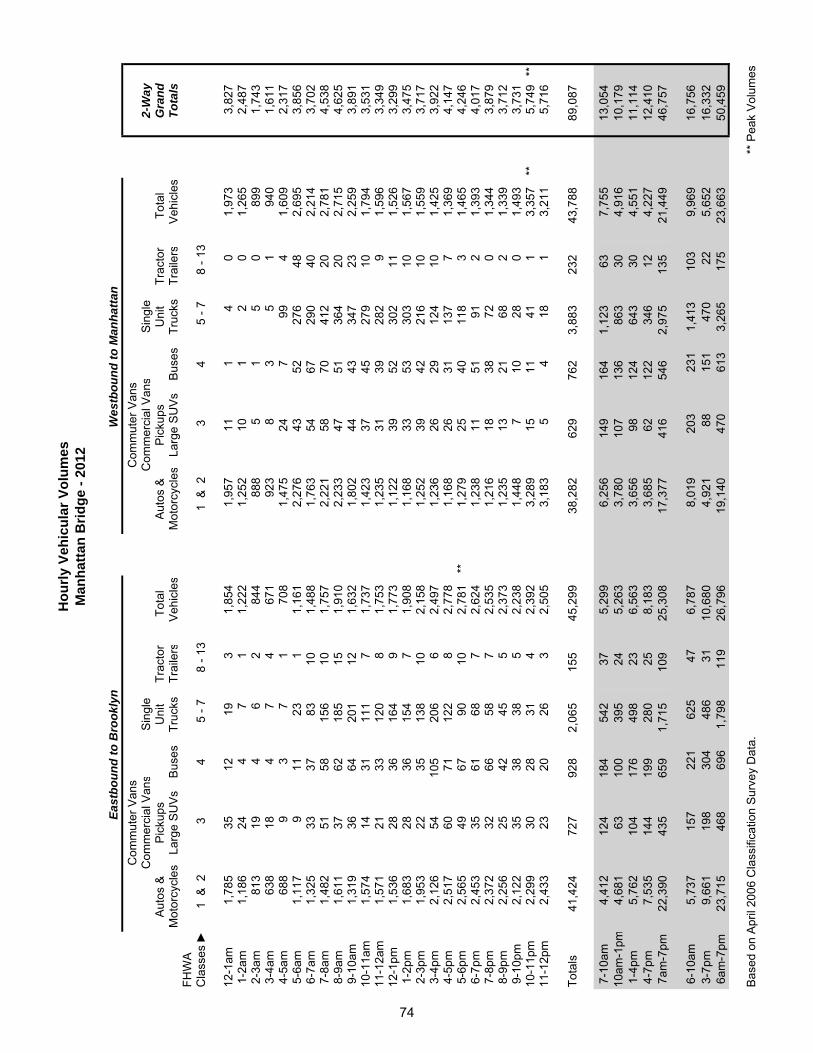
Com
mut
er V
ans
Com
mut
er V
ans
Com
mer
cial
Van
sS
ingl
e C
omm
erci
al V
ans
Sin
gle
2-W
ayA
utos
& P
icku
psU
nit
Trac
tor
Tota
l
Aut
os &
Pic
kups
Uni
tTr
acto
rTo
tal
G
rand
Mot
orcy
cle s
Lar
ge S
UV
sB
uses
Tr
ucks
Trai
lers
Veh
icle
sM
otor
cycl
es L
arge
SU
Vs
Bus
es
Truc
ksTr
aile
rsV
ehic
les
Tota
lsFH
WA
Cla
sses
►
1 &
2
3
4
5 -
7
8 - 1
3 1
& 2
3
4 5
- 7
8
- 13
12-1
am1,
785
35
12
19
3
1,
854
1,
957
11
1
4
0
1,
973
3,
827
1-2
am1,
186
24
4
7
1
1,
222
1,
252
10
1
2
0
1,
265
2,
487
2-3
am81
319
4
6
2
844
88
85
1
5
0
899
1,
743
3-4
am63
818
4
7
4
671
92
38
3
5
1
940
1,
611
4-5
am68
89
3
7
1
708
1,
475
24
7
99
4
1,
609
2,
317
5-6
am1,
117
9
11
23
1
1,
161
2,
276
43
52
27
6
48
2,69
5
3,85
6 6
-7am
1,32
533
37
83
10
1,48
8
1,76
354
67
290
40
2,
214
3,
702
7-8
am1,
482
51
58
15
6
10
1,75
7
2,22
158
70
412
20
2,
781
4,
538
8-9
am1,
611
37
62
18
5
15
1,91
0
2,23
347
51
364
20
2,
715
4,
625
9-1
0am
1,31
936
64
201
12
1,
632
1,
802
44
43
34
7
23
2,25
9
3,89
1 10
-11a
m1,
574
14
31
11
1
7
1,73
7
1,42
337
45
279
10
1,
794
3,
531
11-1
2am
1,57
121
33
120
8
1,
753
1,
235
31
39
28
2
9
1,59
6
3,34
9 12
-1pm
1,53
628
36
164
9
1,
773
1,
122
39
52
30
2
11
1,52
6
3,29
9 1
-2pm
1,68
328
36
154
7
1,
908
1,
168
33
53
30
3
10
1,56
7
3,47
5 2
-3pm
1,95
322
35
138
10
2,
158
1,
252
39
42
21
6
10
1,55
9
3,71
7 3
-4pm
2,12
654
10
5
20
6
6
2,49
7
1,23
626
29
124
10
1,
425
3,
922
4-5
pm2,
517
60
71
12
2
8
2,77
8
1,16
826
31
137
7
1,
369
4,
147
5-6
pm2,
565
49
67
90
10
2,
781
**
1,27
925
40
118
3
1,
465
4,
246
6-7
pm2,
453
35
61
68
7
2,
624
1,
238
11
51
91
2
1,
393
4,
017
7-8
pm2,
372
32
66
58
7
2,
535
1,
216
18
38
72
0
1,
344
3,
879
8-9
pm2,
256
25
42
45
5
2,
373
1,
235
13
21
68
2
1,
339
3,
712
9-1
0pm
2,12
235
38
38
5
2,23
8
1,44
87
10
28
0
1,49
3
3,73
1 10
-11p
m2,
299
30
28
31
4
2,
392
3,
289
15
11
41
1
3,
357
**
5,74
9 **
11-1
2pm
2,43
323
20
26
3
2,50
5
3,18
35
4
18
1
3,21
1
5,71
6
Tota
l s41
,424
727
92
8
2,
065
15
5
45,2
99
38,2
8262
9
762
3,88
3
232
43
,788
89
,087
7-1
0am
4,41
212
4
184
542
37
5,
299
6,
256
149
16
4
1,
123
63
7,
755
13
,054
10
am-1
pm4,
681
63
100
395
24
5,
263
3,
780
107
13
6
86
3
30
4,91
6
10,1
79
1-4
pm5,
762
104
17
6
49
8
23
6,56
3
3,65
698
12
4
64
3
30
4,55
1
11,1
14
4-7
pm7,
535
144
19
9
28
0
25
8,18
3
3,68
562
12
2
34
6
12
4,22
7
12,4
10
7am
-7pm
22,3
9043
5
659
1,71
5
109
25
,308
17
,377
416
54
6
2,
975
13
5
21,4
49
46,7
57
6-1
0am
5,73
715
722
162
547
6,78
7
8,01
920
323
11,
413
103
9,96
9
16,7
56
3-7
pm9,
661
198
304
486
3110
,680
4,
921
8815
147
022
5,65
2
16,3
32
6am
-7pm
23,7
1546
869
61,
798
119
26,7
96
19,1
4047
061
33,
265
175
23,6
63
50,4
59
Bas
ed o
n A
pril
2006
Cla
ssifi
catio
n S
urve
y D
ata.
** P
eak
Vol
umes
Man
hatta
n B
ridge
- 20
12H
ourly
Veh
icul
ar V
olum
es
East
boun
d to
Bro
okly
nW
estb
ound
to M
anha
ttan
74

500
1,000
1,500
2,000
2,500
3,000
3,500 M
id-1
1-2
am
2-3
am
3-4
am
4-5
am
5-6
am
6-7
am
7-8
am
8-9
am
9-1
0 am
10-
11 a
11-
Noo
n
Noo
n-1
1-2
pm
2-3
pm
3-4
pm
4-5
pm
5-6
pm
6-7
pm
7-8
pm
8-9
pm
9-1
0 pm
10-
11 p
11-
Mid
E/B To Brooklyn W/B To Manhattan
Hourly Vehicular VolumesManhattan Bridge ~ 2012
20
40
60
80
100
120
1950
1955
1960
1965
1970
1975
1980
1985
1990
1995
2000
2005
2010
Average Daily Traffic Volumes ~ Total of Both DirectionsManhattan Bridge
Bridge opened December 31, 1909.
Thousands
Year
75
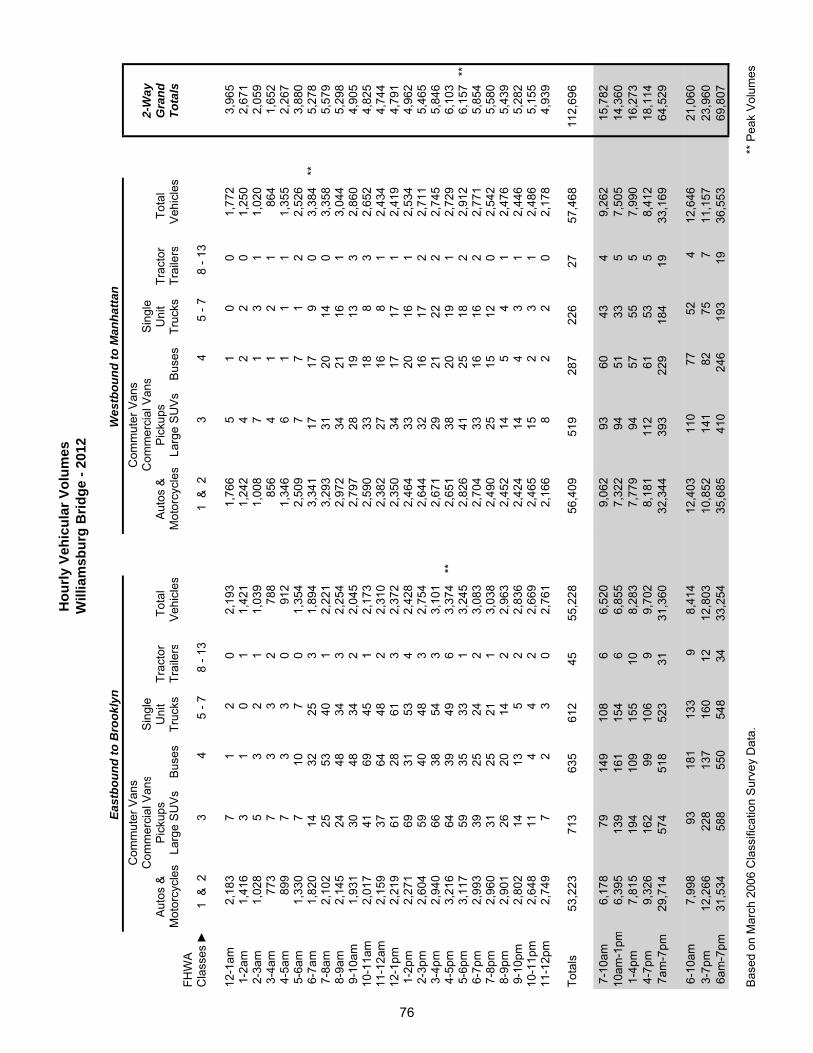
Com
mut
er V
ans
Com
mut
er V
ans
Com
mer
cial
Van
sS
ingl
e C
omm
erci
al V
ans
Sin
gle
2-W
ayA
utos
& P
icku
psU
nit
Trac
tor
Tota
l
Aut
os &
Pic
kups
Uni
tTr
acto
rTo
tal
G
rand
Mot
orcy
cle s
Lar
ge S
UV
sB
uses
Tr
ucks
Trai
lers
Veh
icle
sM
otor
cycl
es L
arge
SU
Vs
Bus
es
Truc
ksTr
aile
rsV
ehic
les
Tota
lsFH
WA
Cla
sses
►
1 &
2
3
4
5
- 7
8
- 13
1 &
2
3
4
5
- 7
8 - 1
3
12-1
am2,
183
7
1
2
0
2,19
3
1,76
65
1
0
0
1,
772
3,
965
1-2
am1,
416
3
1
0
1
1,42
1
1,24
24
2
2
0
1,
250
2,
671
2-3
am1,
028
5
3
2
1
1,03
9
1,00
87
1
3
1
1,
020
2,
059
3-4
am77
37
3
3
2
78
8
856
4
1
2
1
864
1,
652
4-5
am89
97
3
3
0
91
2
1,34
66
1
1
1
1,
355
2,
267
5-6
am1,
330
7
10
7
0
1,35
4
2,50
97
7
1
2
2,
526
3,
880
6-7
am1,
820
14
32
25
3
1,89
4
3,34
117
17
9
0
3,
384
**
5,27
8 7
-8am
2,10
225
53
40
1
2,
221
3,
293
31
20
14
0
3,35
8
5,57
9 8
-9am
2,14
524
48
34
3
2,
254
2,
972
34
21
16
1
3,04
4
5,29
8 9
-10a
m1,
931
30
48
34
2
2,04
5
2,79
728
19
13
3
2,
860
4,
905
10-1
1am
2,01
741
69
45
1
2,
173
2,
590
33
18
8
3
2,65
2
4,82
5 11
-12a
m2,
159
37
64
48
2
2,31
0
2,38
227
16
8
1
2,
434
4,
744
12-1
pm2,
219
61
28
61
3
2,37
2
2,35
034
17
17
1
2,
419
4,
791
1-2
pm2,
271
69
31
53
4
2,42
8
2,46
433
20
16
1
2,
534
4,
962
2-3
pm2,
604
59
40
48
3
2,75
4
2,64
432
16
17
2
2,
711
5,
465
3-4
pm2,
940
66
38
54
3
3,10
1
2,67
129
21
22
2
2,
745
5,
846
4-5
pm3,
216
64
39
49
6
3,37
4
**2,
651
38
20
19
1
2,72
9
6,10
3 5
-6pm
3,11
759
35
33
1
3,
245
2,
826
41
25
18
2
2,91
2
6,15
7 **
6-7
pm2,
993
39
25
24
2
3,08
3
2,70
433
16
16
2
2,
771
5,
854
7-8
pm2,
960
31
25
21
1
3,03
8
2,49
025
15
12
0
2,
542
5,
580
8-9
pm2,
901
26
20
14
2
2,96
3
2,45
214
5
4
1
2,
476
5,
439
9-1
0pm
2,80
214
13
5
2
2,
836
2,
424
14
4
3
1
2,44
6
5,28
2 10
-11p
m2,
648
11
4
4
2
2,66
9
2,46
515
2
3
1
2,
486
5,
155
11-1
2pm
2,74
97
2
3
0
2,
761
2,
166
8
2
2
0
2,17
8
4,93
9
Tota
l s53
,223
713
63
5
612
45
55
,228
56
,409
519
28
7
226
27
57
,468
11
2,69
6
7-1
0am
6,17
879
14
9
108
6
6,
520
9,
062
93
60
43
4
9,26
2
15,7
82
10am
-1pm
6,39
513
9
161
15
4
6
6,85
5
7,32
294
51
33
5
7,
505
14
,360
1
-4pm
7,81
519
4
109
15
5
10
8,28
3
7,77
994
57
55
5
7,
990
16
,273
4
-7pm
9,32
616
2
99
106
9
9,
702
8,
181
112
61
53
5
8,
412
18
,114
7
am-7
pm29
,714
574
51
8
523
31
31
,360
32
,344
393
22
9
184
19
33
,169
64
,529
6-1
0am
7,99
893
181
133
98,
414
12
,403
110
7752
412
,646
21
,060
3
-7pm
12,2
6622
813
716
012
12,8
03
10,8
5214
182
757
11,1
57
23,9
60
6am
-7pm
31,5
3458
855
054
834
33,2
54
35,6
8541
024
619
319
36,5
53
69,8
07
Bas
ed o
n M
arch
200
6 C
lass
ifica
tion
Sur
vey
Dat
a.**
Pea
k V
olum
es
Will
iam
sbur
g B
ridge
- 20
12H
ourly
Veh
icul
ar V
olum
es
East
boun
d to
Bro
okly
nW
estb
ound
to M
anha
ttan
76
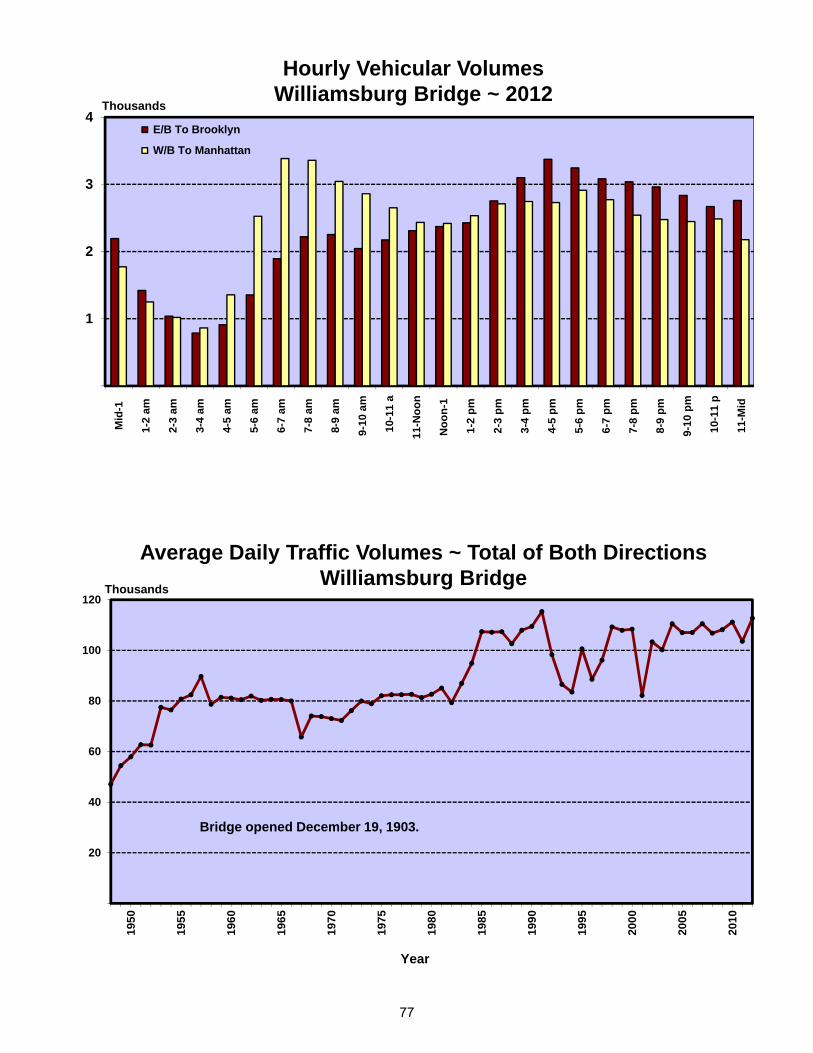
1
2
3
4 M
id-1
1-2
am
2-3
am
3-4
am
4-5
am
5-6
am
6-7
am
7-8
am
8-9
am
9-1
0 am
10-
11 a
11-
Noo
n
Noo
n-1
1-2
pm
2-3
pm
3-4
pm
4-5
pm
5-6
pm
6-7
pm
7-8
pm
8-9
pm
9-1
0 pm
10-
11 p
11-
Mid
E/B To Brooklyn
W/B To Manhattan
Hourly Vehicular VolumesWilliamsburg Bridge ~ 2012
20
40
60
80
100
120
1950
1955
1960
1965
1970
1975
1980
1985
1990
1995
2000
2005
2010
Average Daily Traffic Volumes ~ Total of Both DirectionsWilliamsburg Bridge
Bridge opened December 19, 1903.
Thousands
Thousands
Year
77

78
Harlem River Bridges
Broadway Bridge
79

Alexander Macombs Madison ThirdYear Hamilton Broadway Dam Avenue Avenue
1948 16,020 33,608 27,222 31,403 1949 17,369 23,854 17,363 20,024 1950 15,462 28,641 27,933 34,984 1951 Bridge 16,374 31,072 33,576 51,478 1952 Opened 17,412 36,100 27,468 34,023 1953 Jan. 1963 16,821 35,331 24,382 37,593 1954 15,958 27,911 23,408 33,667 1955 17,046 27,914 34,681 38,201 1956 17,960 32,761 46,591 42,735 1957 20,345 55,609 40,860 47,269 1958 22,132 50,227 33,393 61,367 1959 25,491 48,720 27,967 56,525 1960 23,025 50,865 22,541 68,079 1961 21,097 32,447 28,375 61,584 1962 19,170 39,580 25,400 53,580 1963 23,110 43,450 27,090 63,840 1964 87,840 25,020 31,050 31,170 63,250 1965 125,133 17,555 37,451 26,315 55,644 1966 104,559 22,438 39,922 28,865 70,938 1967 135,803 22,844 35,595 27,683 52,931 1968 92,771 23,621 33,875 27,658 41,243 1969 132,487 22,224 38,845 28,219 57,748 1970 141,609 23,115 46,523 24,941 48,110 1971 137,881 28,232 40,489 28,891 50,548 1972 142,139 25,178 39,702 26,923 47,454 1973 137,133 24,408 38,349 34,815 60,415 1974 144,909 21,825 40,934 30,425 54,770 1975 134,013 30,638 38,995 29,823 62,079 1976 137,141 26,453 36,065 27,838 54,957 1977 158,710 26,465 33,539 29,832 52,969 1978 151,342 25,145 35,764 34,938 54,177 1979 143,973 27,673 37,145 29,036 54,428 1980 152,852 29,838 37,464 27,476 54,152 1981 148,609 30,485 42,064 29,456 51,483 1982 156,038 30,846 45,178 30,485 60,236 1983 161,772 29,875 42,747 30,715 67,813 1984 164,734 28,338 46,870 33,101 56,706 1985 171,602 33,086 52,497 37,956 59,907 1986 175,635 32,314 50,602 39,809 64,404 1987 180,908 31,934 48,021 31,506 62,089 1988 172,970 33,047 43,318 31,321 62,379 1989 183,661 35,066 43,450 31,688 64,849 1990 192,848 41,705 41,113 32,458 63,516 1991 187,309 40,444 42,393 34,826 65,787 1992 176,279 35,184 42,022 32,907 66,967 1993 180,507 33,752 39,251 32,432 68,812 1994 178,522 32,833 39,876 22,923 66,104 1995 175,279 42,555 41,571 22,739 68,663 1996 176,856 40,040 40,031 17,948 67,206 1997 176,102 34,645 44,033 28,646 71,365 1998 176,632 35,770 42,027 32,922 70,757 1999 180,201 35,412 41,813 38,102 68,544 2000 177,899 37,990 21,008 47,583 73,121 2001 168,605 41,175 39,615 43,331 72,756 2002 168,079 38,287 18,878 49,487 58,949 2003 182,704 36,888 42,254 41,575 43,065 2004 175,323 35,190 40,558 48,723 47,053 2005 181,566 35,698 40,112 48,397 60,152 2006 190,183 33,551 39,878 43,805 61,874 2007 192,651 35,523 40,749 44,663 59,712 2008 189,598 33,266 38,897 41,740 58,510 2009 191,646 35,566 39,508 43,480 59,039 2010 192,213 37,292 39,627 42,966 60,549 2011 182,174 35,770 44,311 41,423 59,603 2012 185,309 35,411 39,020 41,782 59,053
Harlem River BridgesAverage Daily Traffic Volumes
1948 - 2012
80
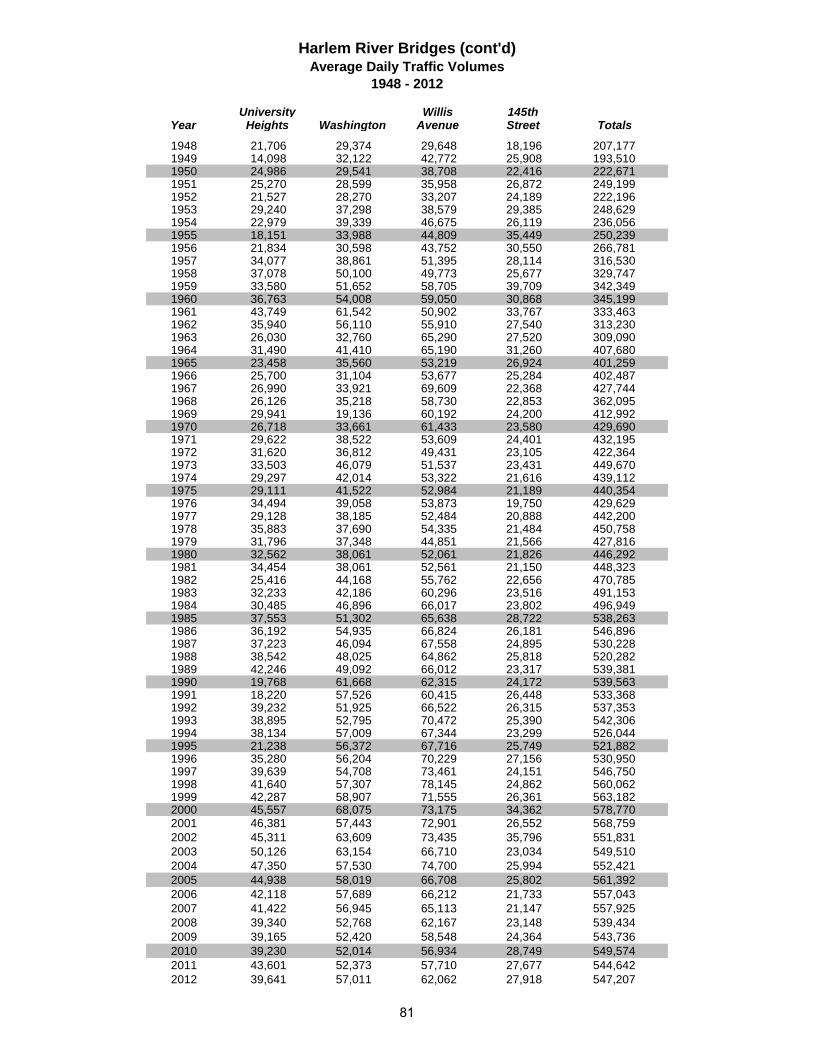
University Willis 145thYear Heights Washington Avenue Street Totals
1948 21,706 29,374 29,648 18,196 207,177 1949 14,098 32,122 42,772 25,908 193,510 1950 24,986 29,541 38,708 22,416 222,671 1951 25,270 28,599 35,958 26,872 249,199 1952 21,527 28,270 33,207 24,189 222,196 1953 29,240 37,298 38,579 29,385 248,629 1954 22,979 39,339 46,675 26,119 236,056 1955 18,151 33,988 44,809 35,449 250,239 1956 21,834 30,598 43,752 30,550 266,781 1957 34,077 38,861 51,395 28,114 316,530 1958 37,078 50,100 49,773 25,677 329,747 1959 33,580 51,652 58,705 39,709 342,349 1960 36,763 54,008 59,050 30,868 345,199 1961 43,749 61,542 50,902 33,767 333,463 1962 35,940 56,110 55,910 27,540 313,230 1963 26,030 32,760 65,290 27,520 309,090 1964 31,490 41,410 65,190 31,260 407,680 1965 23,458 35,560 53,219 26,924 401,259 1966 25,700 31,104 53,677 25,284 402,487 1967 26,990 33,921 69,609 22,368 427,744 1968 26,126 35,218 58,730 22,853 362,095 1969 29,941 19,136 60,192 24,200 412,992 1970 26,718 33,661 61,433 23,580 429,690 1971 29,622 38,522 53,609 24,401 432,195 1972 31,620 36,812 49,431 23,105 422,364 1973 33,503 46,079 51,537 23,431 449,670 1974 29,297 42,014 53,322 21,616 439,112 1975 29,111 41,522 52,984 21,189 440,354 1976 34,494 39,058 53,873 19,750 429,629 1977 29,128 38,185 52,484 20,888 442,200 1978 35,883 37,690 54,335 21,484 450,758 1979 31,796 37,348 44,851 21,566 427,816 1980 32,562 38,061 52,061 21,826 446,292 1981 34,454 38,061 52,561 21,150 448,323 1982 25,416 44,168 55,762 22,656 470,785 1983 32,233 42,186 60,296 23,516 491,153 1984 30,485 46,896 66,017 23,802 496,949 1985 37,553 51,302 65,638 28,722 538,263 1986 36,192 54,935 66,824 26,181 546,896 1987 37,223 46,094 67,558 24,895 530,228 1988 38,542 48,025 64,862 25,818 520,282 1989 42,246 49,092 66,012 23,317 539,381 1990 19,768 61,668 62,315 24,172 539,563 1991 18,220 57,526 60,415 26,448 533,368 1992 39,232 51,925 66,522 26,315 537,353 1993 38,895 52,795 70,472 25,390 542,306 1994 38,134 57,009 67,344 23,299 526,044 1995 21,238 56,372 67,716 25,749 521,882 1996 35,280 56,204 70,229 27,156 530,950 1997 39,639 54,708 73,461 24,151 546,750 1998 41,640 57,307 78,145 24,862 560,062 1999 42,287 58,907 71,555 26,361 563,182 2000 45,557 68,075 73,175 34,362 578,770 2001 46,381 57,443 72,901 26,552 568,759 2002 45,311 63,609 73,435 35,796 551,831 2003 50,126 63,154 66,710 23,034 549,510 2004 47,350 57,530 74,700 25,994 552,421 2005 44,938 58,019 66,708 25,802 561,392 2006 42,118 57,689 66,212 21,733 557,043 2007 41,422 56,945 65,113 21,147 557,925 2008 39,340 52,768 62,167 23,148 539,434 2009 39,165 52,420 58,548 24,364 543,736 2010 39,230 52,014 56,934 28,749 549,574 2011 43,601 52,373 57,710 27,677 544,642 2012 39,641 57,011 62,062 27,918 547,207
Harlem River Bridges (cont'd)Average Daily Traffic Volumes
1948 - 2012
81

East
boun
d to
Bro
nxW
estb
ound
to M
anha
ttan
Com
mut
er C
omm
erci
alC
omm
uter
Com
mer
cial
2-W
ayA
utos
Buse
sV
ans
Truc
ksVa
nsTo
tals
Aut
osBu
ses
Van
sTr
ucks
Vans
Tota
lsTo
tals
12-1
am--
- --
- --
- --
- --
- 2,
150
---
---
---
---
---
1,92
24,
072
1-2
am--
- --
- --
- --
- --
- 1,
622
---
---
---
---
---
1,41
53,
037
2-3
am--
- --
- --
- --
- --
- 1,
513
---
---
---
---
---
1,44
32,
956
3-4
am--
- --
- --
- --
- --
- 1,
770
---
---
---
---
---
1,40
33,
173
4-5
am--
- --
- --
- --
- --
- 2,
614
---
---
---
---
---
1,85
34,
467
5-6
am--
- --
- --
- --
- --
- 4,
442
---
---
---
---
---
3,52
67,
968
6-7
am--
- --
- --
- --
- --
- 5,
767
**--
- --
- --
- --
- --
- 5,
218
**10
,985
** 7
-8am
4,13
714
239
790
120
5,30
04,
177
989
444
220
4,93
910
,239
8-9
am3,
723
524
393
621
75,
124
4,14
134
3448
115
34,
843
9,96
7 9
-10a
m3,
744
524
01,
226
135
5,35
03,
404
4928
747
199
4,42
79,
777
10-1
1am
4,54
63
108
355
515,
063
4,00
528
1843
214
54,
628
9,69
111
-12a
m3,
395
1024
475
512
54,
529
3,28
214
211,
024
291
4,63
29,
161
12-1
pm3,
959
011
244
649
4,56
63,
830
1110
535
136
4,52
29,
088
1-2
pm3,
669
817
587
587
4,81
43,
308
1224
860
225
4,42
99,
243
2-3
pm3,
762
620
078
011
04,
858
3,35
719
4190
018
04,
497
9,35
5 3
-4pm
4,45
38
9034
898
4,99
74,
261
2317
501
914,
893
9,89
0 4
-5pm
3,93
16
148
491
112
4,68
83,
904
445
985
238
5,17
69,
864
5-6
pm3,
851
510
836
290
4,41
63,
883
232
866
170
4,95
39,
369
6-7
pm3,
694
819
442
475
4,39
53,
910
323
474
136
4,54
68,
941
7-8
pm--
- --
- --
- --
- --
- 4,
067
---
---
---
---
---
4,63
68,
703
8-9
pm--
- --
- --
- --
- --
- 3,
812
---
---
---
---
---
4,04
37,
855
9-1
0 pm
---
---
---
---
---
3,46
5--
- --
- --
- --
- --
- 3,
732
7,19
710
-11 p
m--
- --
- --
- --
- --
- 3,
029
---
---
---
---
---
2,97
96,
008
11-1
2 pm
---
---
---
---
---
2,52
7--
- --
- --
- --
- --
- 1,
776
4,30
3
Tota
ls---
---
---
---
---
94
,878
---
---
---
---
---
90,4
3118
5,30
9
7-1
0am
11,6
0424
722
2,95
247
215
,774
11,7
2292
151
1,67
257
214
,209
29,9
8310
am-1
pm11
,900
1346
41,
556
225
14,1
5811
,117
5349
1,99
157
213
,782
27,9
40 1
-4pm
11,8
8422
465
2,00
329
514
,669
10,9
2654
822,
261
496
13,8
1928
,488
4-7
pm11
,476
1945
01,
277
277
13,4
9911
,697
910
02,
325
544
14,6
7528
,174
7am
-7pm
46,8
6478
2,10
17,
788
1,26
958
,100
45,4
6220
838
28,
249
2,18
456
,485
114,
585
6-1
0am
---
---
---
---
---
21,5
41---
---
---
---
---
19
,427
40,9
68 3
-7pm
15,9
2927
540
1,62
537
518
,496
15,9
5832
117
2,82
663
519
,568
38,0
64 6
am-7
pm---
---
---
---
---
63
,867
---
---
---
---
---
61,7
0312
5,57
0
Base
d on
198
9 C
lass
ifica
tion
Surv
ey D
ata
** P
eak
Volu
mes
Hou
rly V
ehic
ular
Vol
umes
Alex
ande
r Ham
ilton
Brid
ge -
2012
82
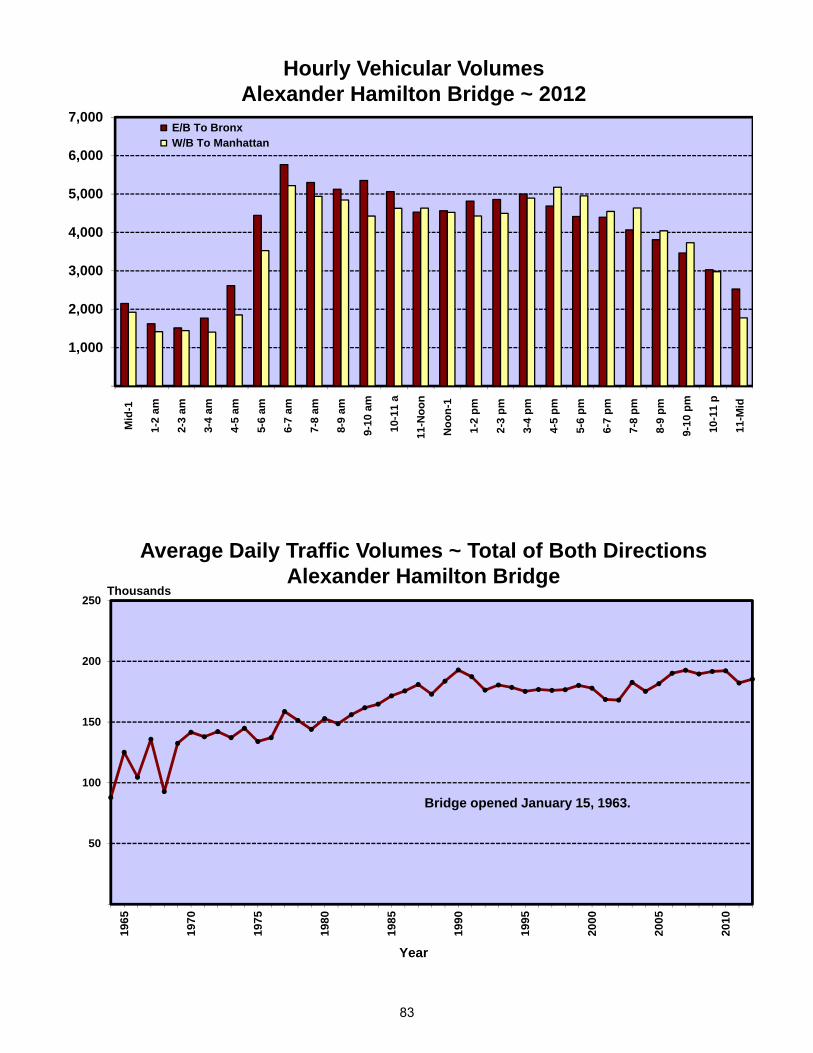
1,000
2,000
3,000
4,000
5,000
6,000
7,000 M
id-1
1-2
am
2-3
am
3-4
am
4-5
am
5-6
am
6-7
am
7-8
am
8-9
am
9-1
0 am
10-
11 a
11-
Noo
n
Noo
n-1
1-2
pm
2-3
pm
3-4
pm
4-5
pm
5-6
pm
6-7
pm
7-8
pm
8-9
pm
9-1
0 pm
10-
11 p
11-
Mid
E/B To Bronx W/B To Manhattan
Hourly Vehicular VolumesAlexander Hamilton Bridge ~ 2012
50
100
150
200
250
1965
1970
1975
1980
1985
1990
1995
2000
2005
2010
Average Daily Traffic Volumes ~ Total of Both DirectionsAlexander Hamilton Bridge
Thousands
Bridge opened January 15, 1963.
Year
83
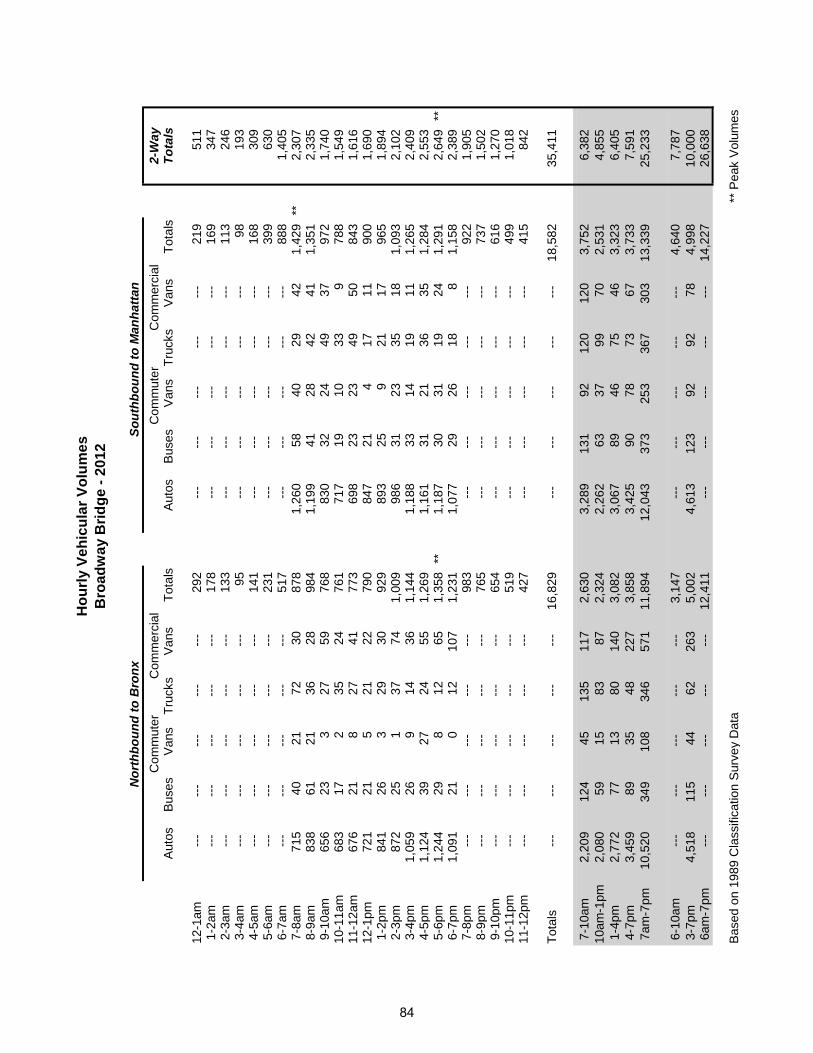
Nor
thbo
und
to B
ronx
Sout
hbou
nd to
Man
hatta
nC
omm
uter
Com
mer
cial
Com
mut
er C
omm
erci
al2-
Way
Aut
osBu
ses
Van
sTr
ucks
Vans
Tota
lsA
utos
Buse
sV
ans
Truc
ksVa
nsTo
tals
Tota
ls
12-1
am--
- --
- --
- --
- --
- 29
2--
- --
- --
- --
- --
- 21
951
1 1
-2am
---
---
---
---
---
178
---
---
---
---
---
169
347
2-3
am--
- --
- --
- --
- --
- 13
3--
- --
- --
- --
- --
- 11
324
6 3
-4am
---
---
---
---
---
95--
- --
- --
- --
- --
- 98
193
4-5
am--
- --
- --
- --
- --
- 14
1--
- --
- --
- --
- --
- 16
830
9 5
-6am
---
---
---
---
---
231
---
---
---
---
---
399
630
6-7
am--
- --
- --
- --
- --
- 51
7--
- --
- --
- --
- --
- 88
81,
405
7-8
am71
540
2172
3087
81,
260
5840
2942
1,42
9**
2,30
7 8
-9am
838
6121
3628
984
1,19
941
2842
411,
351
2,33
5 9
-10a
m65
623
327
5976
883
032
2449
3797
21,
740
10-1
1am
683
172
3524
761
717
1910
339
788
1,54
911
-12a
m67
621
827
4177
369
823
2349
5084
31,
616
12-1
pm72
121
521
2279
084
721
417
1190
01,
690
1-2
pm84
126
329
3092
989
325
921
1796
51,
894
2-3
pm87
225
137
741,
009
986
3123
3518
1,09
32,
102
3-4
pm1,
059
269
1436
1,14
41,
188
3314
1911
1,26
52,
409
4-5
pm1,
124
3927
2455
1,26
91,
161
3121
3635
1,28
42,
553
5-6
pm1,
244
298
1265
1,35
8**
1,18
730
3119
241,
291
2,64
9**
6-7
pm1,
091
210
1210
71,
231
1,07
729
2618
81,
158
2,38
9 7
-8pm
---
---
---
---
---
983
---
---
---
---
---
922
1,90
5 8
-9pm
---
---
---
---
---
765
---
---
---
---
---
737
1,50
2 9
-10 p
m--
- --
- --
- --
- --
- 65
4--
- --
- --
- --
- --
- 61
61,
270
10-1
1 pm
---
---
---
---
---
519
---
---
---
---
---
499
1,01
811
-12 p
m--
- --
- --
- --
- --
- 42
7--
- --
- --
- --
- --
- 41
584
2
Tota
ls--
- --
- --
- --
- --
- 16
,829
---
---
---
---
---
18,5
8235
,411
7-1
0am
2,20
912
445
135
117
2,63
03,
289
131
9212
012
03,
752
6,38
210
am-1
pm2,
080
5915
8387
2,32
42,
262
6337
9970
2,53
14,
855
1-4
pm2,
772
7713
8014
03,
082
3,06
789
4675
463,
323
6,40
5 4
-7pm
3,45
989
3548
227
3,85
83,
425
9078
7367
3,73
37,
591
7am
-7pm
10,5
2034
910
834
657
111
,894
12,0
4337
325
336
730
313
,339
25,2
33
6-1
0am
---
---
---
---
---
3,14
7---
---
---
---
---
4,
640
7,78
7 3
-7pm
4,51
811
544
6226
35,
002
4,61
312
392
9278
4,99
810
,000
6am
-7pm
---
---
---
---
---
12,4
11--
- --
- --
- --
- --
- 14
,227
26,6
38
Base
d on
198
9 C
lass
ifica
tion
Surv
ey D
ata
** P
eak
Volu
mes
Hou
rly V
ehic
ular
Vol
umes
Bro
adw
ay B
ridge
- 20
12
84
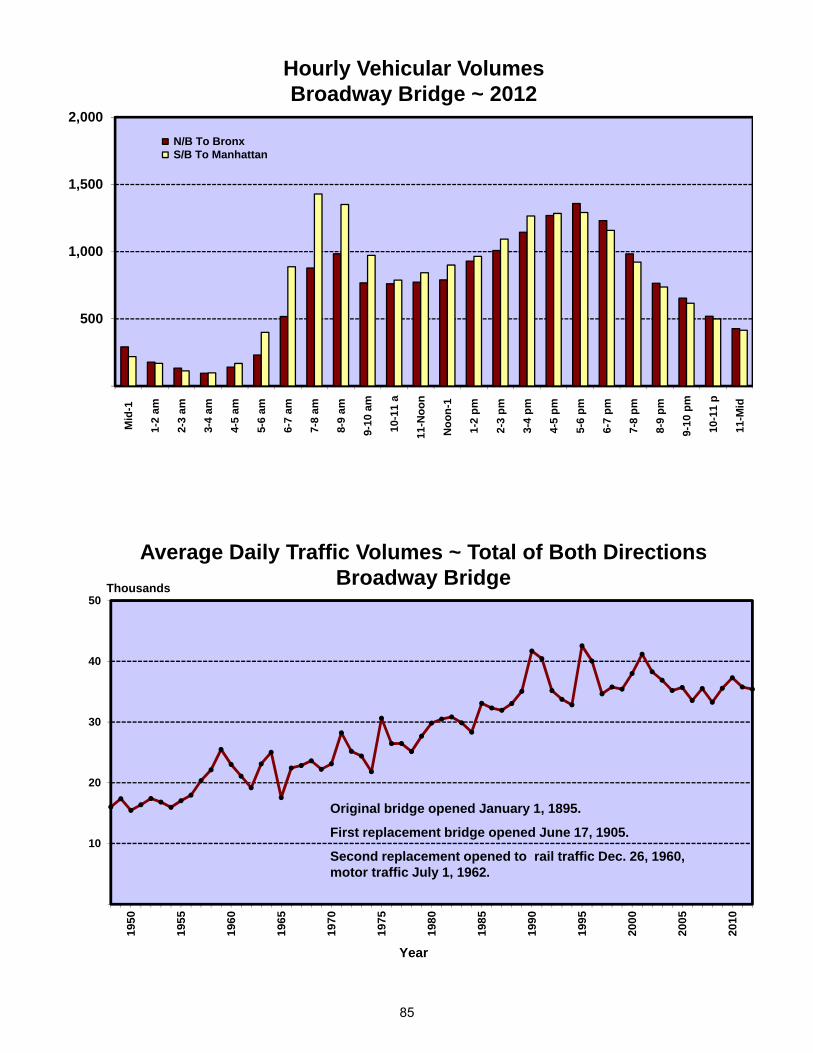
500
1,000
1,500
2,000 M
id-1
1-2
am
2-3
am
3-4
am
4-5
am
5-6
am
6-7
am
7-8
am
8-9
am
9-1
0 am
10-
11 a
11-
Noo
n
Noo
n-1
1-2
pm
2-3
pm
3-4
pm
4-5
pm
5-6
pm
6-7
pm
7-8
pm
8-9
pm
9-1
0 pm
10-
11 p
11-
Mid
N/B To Bronx S/B To Manhattan
Hourly Vehicular VolumesBroadway Bridge ~ 2012
10
20
30
40
50
1950
1955
1960
1965
1970
1975
1980
1985
1990
1995
2000
2005
2010
Average Daily Traffic Volumes ~ Total of Both DirectionsBroadway BridgeThousands
Original bridge opened January 1, 1895.
First replacement bridge opened June 17, 1905.
Second replacement opened to rail traffic Dec. 26, 1960, motor traffic July 1, 1962.
Year
85

East
boun
d to
Bro
nxW
estb
ound
to M
anha
ttan
Com
mut
er C
omm
erci
alC
omm
uter
Com
mer
cial
2-W
ayA
utos
Buse
sV
ans
Truc
ksVa
nsTo
tals
Aut
osBu
ses
Van
sTr
ucks
Vans
Tota
lsTo
tals
12-1
am--
- --
- --
- --
- --
- 44
6--
- --
- --
- --
- --
- 39
283
8 1
-2am
---
---
---
---
---
305
---
---
---
---
---
243
548
2-3
am--
- --
- --
- --
- --
- 22
2--
- --
- --
- --
- --
- 18
140
3 3
-4am
---
---
---
---
---
180
---
---
---
---
---
162
342
4-5
am--
- --
- --
- --
- --
- 21
6--
- --
- --
- --
- --
- 24
345
9 5
-6am
---
---
---
---
---
309
---
---
---
---
---
428
737
6-7
am--
- --
- --
- --
- --
- 57
9--
- --
- --
- --
- --
- 98
21,
561
7-8
am79
932
2149
7397
41,
168
376
8322
21,
516
**2,
490
8-9
am90
713
1655
931,
084
1,18
110
293
167
1,45
32,
537
** 9
-10a
m80
518
1351
5494
191
319
1310
617
31,
224
2,16
510
-11a
m74
17
331
3982
190
58
739
551,
014
1,83
511
-12a
m70
09
1158
6884
681
06
1371
8098
01,
826
12-1
pm79
69
626
3687
391
417
318
4099
21,
865
1-2
pm88
32
627
2594
395
019
721
761,
073
2,01
6 2
-3pm
808
1220
6469
973
993
2215
4985
1,16
42,
137
3-4
pm93
920
851
601,
078
1,07
733
920
401,
179
2,25
7 4
-5pm
826
727
7113
41,
065
1,02
19
2837
691,
164
2,22
9 5
-6pm
924
813
3312
21,
100
**1,
056
129
1758
1,15
22,
252
6-7
pm1,
002
36
2440
1,07
595
76
1121
731,
068
2,14
3 7
-8pm
---
---
---
---
---
1,03
9--
- --
- --
- --
- --
- 1,
031
2,07
0 8
-9pm
---
---
---
---
---
976
---
---
---
---
---
907
1,88
3 9
-10 p
m--
- --
- --
- --
- --
- 87
4--
- --
- --
- --
- --
- 79
51,
669
10-1
1 pm
---
---
---
---
---
715
---
---
---
---
---
758
1,47
311
-12 p
m--
- --
- --
- --
- --
- 62
4--
- --
- --
- --
- --
- 66
11,
285
Tota
ls--
- --
- --
- --
- --
- 18
,258
---
---
---
---
---
20,7
6239
,020
7-1
0am
2,51
163
5015
522
02,
999
3,26
266
2128
256
24,
193
7,19
210
am-1
pm2,
237
2520
115
143
2,54
02,
629
3123
128
175
2,98
65,
526
1-4
pm2,
630
3434
142
154
2,99
43,
020
7431
9020
13,
416
6,41
0 4
-7pm
2,75
218
4612
829
63,
240
3,03
427
4875
200
3,38
46,
624
7am
-7pm
10,1
3014
015
054
081
311
,773
11,9
4519
812
357
51,
138
13,9
7925
,752
6-1
0am
---
---
---
---
---
3,57
8---
---
---
---
---
5,
175
8,75
3 3
-7pm
3,69
138
5417
935
64,
318
4,11
160
5795
240
4,56
38,
881
6am
-7pm
---
---
---
---
---
12,3
52--
- --
- --
- --
- --
- 14
,961
27,3
13
Base
d on
198
9 C
lass
ifica
tion
Surv
ey D
ata
** P
eak
Volu
mes
Hou
rly V
ehic
ular
Vol
umes
Mac
ombs
Dam
Brid
ge -
2012
86

500
1,000
1,500
2,000 M
id-1
1-2
am
2-3
am
3-4
am
4-5
am
5-6
am
6-7
am
7-8
am
8-9
am
9-1
0 am
10-
11 a
11-
Noo
n
Noo
n-1
1-2
pm
2-3
pm
3-4
pm
4-5
pm
5-6
pm
6-7
pm
7-8
pm
8-9
pm
9-1
0 pm
10-
11 p
11-
Mid
E/B To Bronx W/B To Manhattan
Hourly Vehicular VolumesMacombs Dam Bridge ~ 2012
10
20
30
40
50
60
1950
1955
1960
1965
1970
1975
1980
1985
1990
1995
2000
2005
2010
Average Daily Traffic Volumes ~ Total of Both DirectionsMacombs Dam BridgeThousands
Original (tolled) bridge opened 1814.
First replacement bridge opened 1861, second replacement opened May 1, 1895.
Year
In 2000 and 2002, capacity was reduced by lane closures associated with reconstruction activities.
87
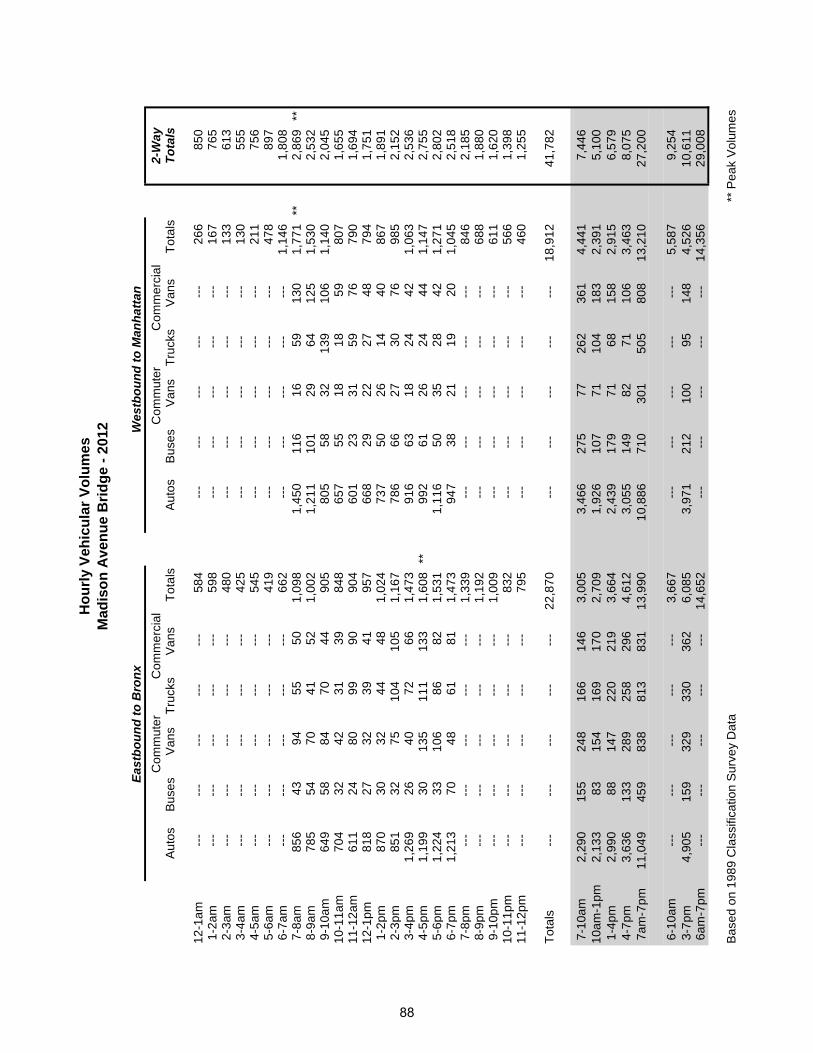
East
boun
d to
Bro
nxW
estb
ound
to M
anha
ttan
Com
mut
er C
omm
erci
alC
omm
uter
Com
mer
cial
2-W
ayAu
tos
Buse
sVa
nsTr
ucks
Vans
Tota
lsAu
tos
Buse
sVa
nsTr
ucks
Vans
Tota
lsTo
tals
12-1
am--
- --
- --
- --
- --
- 58
4--
- --
- --
- --
- --
- 26
685
0 1
-2am
---
---
---
---
---
598
---
---
---
---
---
167
765
2-3
am--
- --
- --
- --
- --
- 48
0--
- --
- --
- --
- --
- 13
361
3 3
-4am
---
---
---
---
---
425
---
---
---
---
---
130
555
4-5
am--
- --
- --
- --
- --
- 54
5--
- --
- --
- --
- --
- 21
175
6 5
-6am
---
---
---
---
---
419
---
---
---
---
---
478
897
6-7
am--
- --
- --
- --
- --
- 66
2--
- --
- --
- --
- --
- 1,
146
1,80
8 7
-8am
856
4394
5550
1,09
81,
450
116
1659
130
1,77
1**
2,86
9**
8-9
am78
554
7041
521,
002
1,21
110
129
6412
51,
530
2,53
2 9
-10a
m64
958
8470
4490
580
558
3213
910
61,
140
2,04
510
-11a
m70
432
4231
3984
865
755
1818
5980
71,
655
11-1
2am
611
2480
9990
904
601
2331
5976
790
1,69
412
-1pm
818
2732
3941
957
668
2922
2748
794
1,75
1 1
-2pm
870
3032
4448
1,02
473
750
2614
4086
71,
891
2-3
pm85
132
7510
410
51,
167
786
6627
3076
985
2,15
2 3
-4pm
1,26
926
4072
661,
473
916
6318
2442
1,06
32,
536
4-5
pm1,
199
3013
511
113
31,
608
**99
261
2624
441,
147
2,75
5 5
-6pm
1,22
433
106
8682
1,53
11,
116
5035
2842
1,27
12,
802
6-7
pm1,
213
7048
6181
1,47
394
738
2119
201,
045
2,51
8 7
-8pm
---
---
---
---
---
1,33
9--
- --
- --
- --
- --
- 84
62,
185
8-9
pm--
- --
- --
- --
- --
- 1,
192
---
---
---
---
---
688
1,88
0 9
-10p
m--
- --
- --
- --
- --
- 1,
009
---
---
---
---
---
611
1,62
010
-11p
m--
- --
- --
- --
- --
- 83
2--
- --
- --
- --
- --
- 56
61,
398
11-1
2pm
---
---
---
---
---
795
---
---
---
---
---
460
1,25
5
Tota
ls--
- --
- --
- --
- --
- 22
,870
---
---
---
---
---
18,9
1241
,782
7-1
0am
2,29
015
524
816
614
63,
005
3,46
627
577
262
361
4,44
17,
446
10am
-1pm
2,13
383
154
169
170
2,70
91,
926
107
7110
418
32,
391
5,10
0 1
-4pm
2,99
088
147
220
219
3,66
42,
439
179
7168
158
2,91
56,
579
4-7
pm3,
636
133
289
258
296
4,61
23,
055
149
8271
106
3,46
38,
075
7am
-7pm
11,0
4945
983
881
383
113
,990
10,8
8671
030
150
580
813
,210
27,2
00
6-1
0am
---
---
---
---
---
3,66
7--
- --
- --
- --
- --
- 5,
587
9,25
4 3
-7pm
4,90
515
932
933
036
26,
085
3,97
121
210
095
148
4,52
610
,611
6am
-7pm
---
---
---
---
---
14,6
52--
- --
- --
- --
- --
- 14
,356
29,0
08
Base
d on
198
9 C
lass
ifica
tion
Surv
ey D
ata
** P
eak
Vol
umes
Mad
ison
Ave
nue
Brid
ge -
2012
Hou
rly V
ehic
ular
Vol
umes
88
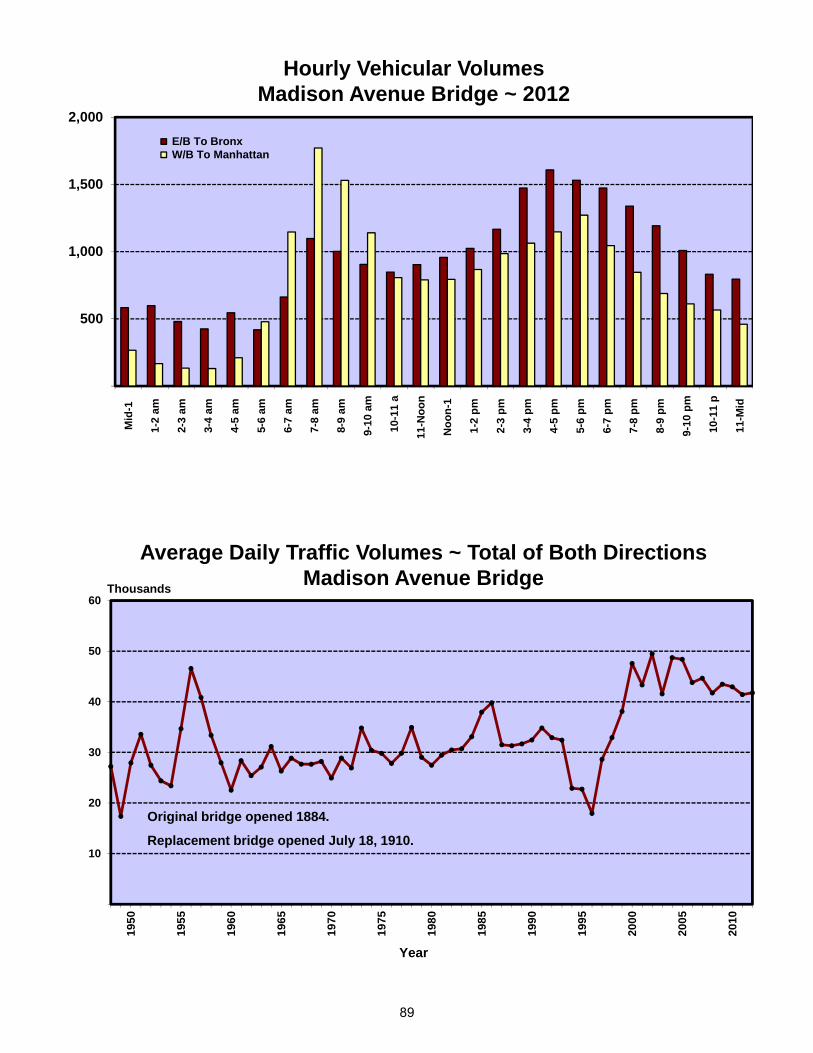
500
1,000
1,500
2,000 M
id-1
1-2
am
2-3
am
3-4
am
4-5
am
5-6
am
6-7
am
7-8
am
8-9
am
9-1
0 am
10-
11 a
11-
Noo
n
Noo
n-1
1-2
pm
2-3
pm
3-4
pm
4-5
pm
5-6
pm
6-7
pm
7-8
pm
8-9
pm
9-1
0 pm
10-
11 p
11-
Mid
E/B To Bronx W/B To Manhattan
Hourly Vehicular VolumesMadison Avenue Bridge ~ 2012
10
20
30
40
50
60
1950
1955
1960
1965
1970
1975
1980
1985
1990
1995
2000
2005
2010
Average Daily Traffic Volumes ~ Total of Both DirectionsMadison Avenue BridgeThousands
Original bridge opened 1884.
Replacement bridge opened July 18, 1910.
Year
89

Nor
thbo
und
to B
ronx
Sout
hbou
nd to
Man
hatta
nC
omm
uter
Com
mer
cial
Com
mut
er C
omm
erci
al2-
Way
Auto
sBu
ses
Vans
Truc
ksVa
nsTo
tals
Auto
sBu
ses
Vans
Truc
ksVa
nsTo
tals
Tota
ls
12-1
am--
- --
- --
- --
- --
- 1,
052
1,05
2 1
-2am
---
---
---
---
---
632
632
2-3
am--
- --
- --
- --
- --
- 56
256
2 3
-4am
---
---
---
---
---
675
675
4-5
amB
ridge
is 1
-way
sou
thbo
und
---
---
---
---
---
1,15
11,
151
5-6
amto
Man
hatta
n--
- --
- --
- --
- --
- 2,
322
2,32
2 6
-7am
---
---
---
---
---
4,08
5**
4,08
5**
7-8
am2,
340
4836
248
840
33,
641
3,64
1 8
-9am
2,02
129
200
409
426
3,08
53,
085
9-1
0am
1,92
231
253
375
296
2,87
72,
877
10-1
1am
2,26
528
150
145
120
2,70
82,
708
11-1
2am
1,73
548
281
333
206
2,60
32,
603
12-1
pm2,
216
6611
412
898
2,62
22,
622
1-2
pm2,
105
9618
316
027
42,
818
2,81
8 2
-3pm
2,18
810
927
326
931
53,
154
3,15
4 3
-4pm
2,97
288
102
8374
3,31
93,
319
4-5
pm2,
824
6415
214
616
83,
354
3,35
4 5
-6pm
3,19
463
132
112
943,
595
3,59
5 6
-7pm
2,96
260
120
8088
3,31
03,
310
7-8
pm--
- --
- --
- --
- --
- 2,
878
2,87
8 8
-9pm
---
---
---
---
---
2,40
02,
400
9-1
0pm
---
---
---
---
---
2,22
92,
229
10-1
1pm
---
---
---
---
---
2,16
02,
160
11-1
2pm
---
---
---
---
---
1,82
11,
821
Tota
ls--
- --
- --
- --
- --
- 59
,053
59,0
53
7-1
0am
6,28
310
881
51,
272
1,12
59,
603
9,60
310
am-1
pm6,
216
142
545
606
424
7,93
37,
933
1-4
pm7,
265
293
558
512
663
9,29
19,
291
4-7
pm8,
980
187
404
338
350
10,2
5910
,259
7am
-7pm
28,7
4473
02,
322
2,72
82,
562
37,0
8637
,086
6-1
0am
---
---
---
---
---
13,6
8813
,688
3-7
pm11
,952
275
506
421
424
13,5
7813
,578
6am
-7pm
---
---
---
---
---
41,1
7141
,171
Base
d on
198
9 C
lass
ifica
tion
Surv
ey D
ata
** P
eak
Volu
mes
Third
Ave
nue
Brid
ge -
2012
Hou
rly V
ehic
ular
Vol
umes
90
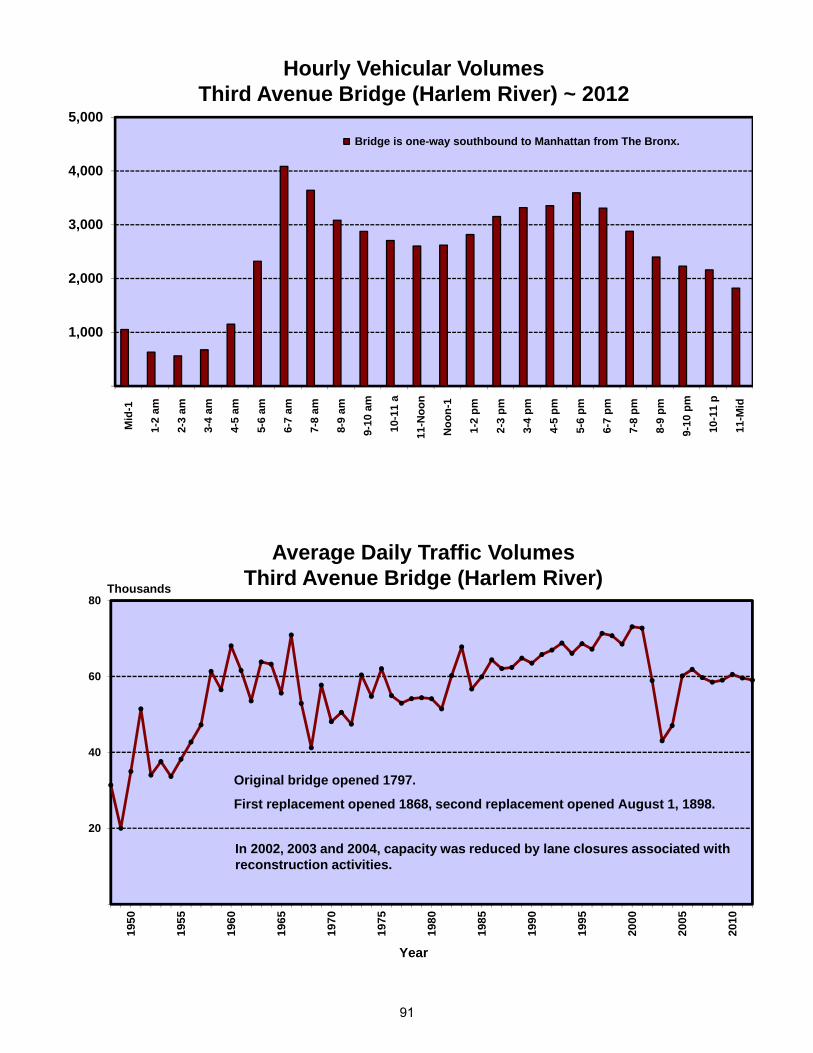
1,000
2,000
3,000
4,000
5,000 M
id-1
1-2
am
2-3
am
3-4
am
4-5
am
5-6
am
6-7
am
7-8
am
8-9
am
9-1
0 am
10-
11 a
11-
Noo
n
Noo
n-1
1-2
pm
2-3
pm
3-4
pm
4-5
pm
5-6
pm
6-7
pm
7-8
pm
8-9
pm
9-1
0 pm
10-
11 p
11-
Mid
Bridge is one-way southbound to Manhattan from The Bronx.
Hourly Vehicular VolumesThird Avenue Bridge (Harlem River) ~ 2012
20
40
60
80
1950
1955
1960
1965
1970
1975
1980
1985
1990
1995
2000
2005
2010
Average Daily Traffic VolumesThird Avenue Bridge (Harlem River)Thousands
Original bridge opened 1797.
First replacement opened 1868, second replacement opened August 1, 1898.
Year
In 2002, 2003 and 2004, capacity was reduced by lane closures associated with reconstruction activities.
91

East
boun
d to
Bro
nxW
estb
ound
to M
anha
ttan
Com
mut
er C
omm
erci
alC
omm
uter
Com
mer
cial
2-W
ayAu
tos
Buse
sVa
nsTr
ucks
Vans
Tota
lsAu
tos
Buse
sVa
nsTr
ucks
Vans
Tota
lsTo
tals
12-1
am--
- --
- --
- --
- --
- 40
9--
- --
- --
- --
- --
- 40
080
9 1
-2am
---
---
---
---
---
331
---
---
---
---
---
282
613
2-3
am--
- --
- --
- --
- --
- 22
2--
- --
- --
- --
- --
- 20
542
7 3
-4am
---
---
---
---
---
204
---
---
---
---
---
188
392
4-5
am--
- --
- --
- --
- --
- 25
6--
- --
- --
- --
- --
- 31
056
6 5
-6am
---
---
---
---
---
349
---
---
---
---
---
683
1,03
2 6
-7am
---
---
---
---
---
564
---
---
---
---
---
1,15
51,
719
7-8
am67
147
8641
4388
81,
230
2032
3510
11,
418
**2,
306
8-9
am73
08
7755
7194
11,
112
1124
4591
1,28
32,
224
9-1
0am
587
858
6768
788
1,01
113
1652
102
1,19
41,
982
10-1
1am
673
435
3327
772
967
44
2758
1,06
01,
832
11-1
2am
604
763
7337
784
944
713
6085
1,10
91,
893
12-1
pm75
412
2326
2183
61,
037
25
2850
1,12
21,
958
1-2
pm75
038
3729
2287
61,
112
45
2037
1,17
82,
054
2-3
pm80
713
6950
4898
71,
085
1021
4810
31,
267
2,25
4 3
-4pm
967
1722
2828
1,06
21,
191
426
2653
1,31
82,
380
** 4
-5pm
943
558
4433
1,08
3**
1,15
118
1624
851,
294
2,37
7 5
-6pm
944
059
2944
1,07
61,
176
114
1352
1,25
62,
332
6-7
pm89
80
5519
561,
028
1,17
37
109
551,
254
2,28
2 7
-8pm
---
---
---
---
---
970
---
---
---
---
---
1,11
22,
082
8-9
pm--
- --
- --
- --
- --
- 93
2--
- --
- --
- --
- --
- 96
61,
898
9-1
0pm
---
---
---
---
---
803
---
---
---
---
---
829
1,63
210
-11p
m--
- --
- --
- --
- --
- 66
0--
- --
- --
- --
- --
- 75
91,
419
11-1
2pm
---
---
---
---
---
578
---
---
---
---
---
600
1,17
8
Tota
ls--
- --
- --
- --
- --
- 17
,399
---
---
---
---
---
22,2
4239
,641
7-1
0am
1,98
863
221
163
182
2,61
73,
353
4472
132
294
3,89
56,
512
10am
-1pm
2,03
123
121
132
852,
392
2,94
813
2211
519
33,
291
5,68
3 1
-4pm
2,52
468
128
107
982,
925
3,38
856
3294
193
3,76
36,
688
4-7
pm2,
785
517
292
133
3,18
73,
500
2640
4619
23,
804
6,99
1 7
am-7
pm9,
328
159
642
494
498
11,1
2113
,189
139
166
387
872
14,7
5325
,874
6-1
0am
---
---
---
---
---
3,18
1--
- --
- --
- --
- --
- 5,
050
8,23
1 3
-7pm
3,75
222
194
120
161
4,24
94,
691
6846
7224
55,
122
9,37
1 6
am-7
pm--
- --
- --
- --
- --
- 11
,685
---
---
---
---
---
15,9
0827
,593
Base
d on
198
9 C
lass
ifica
tion
Surv
ey D
ata
** P
eak
Volu
mes
Uni
vers
ity H
eigh
ts B
ridge
- 20
12H
ourly
Veh
icul
ar V
olum
es
92
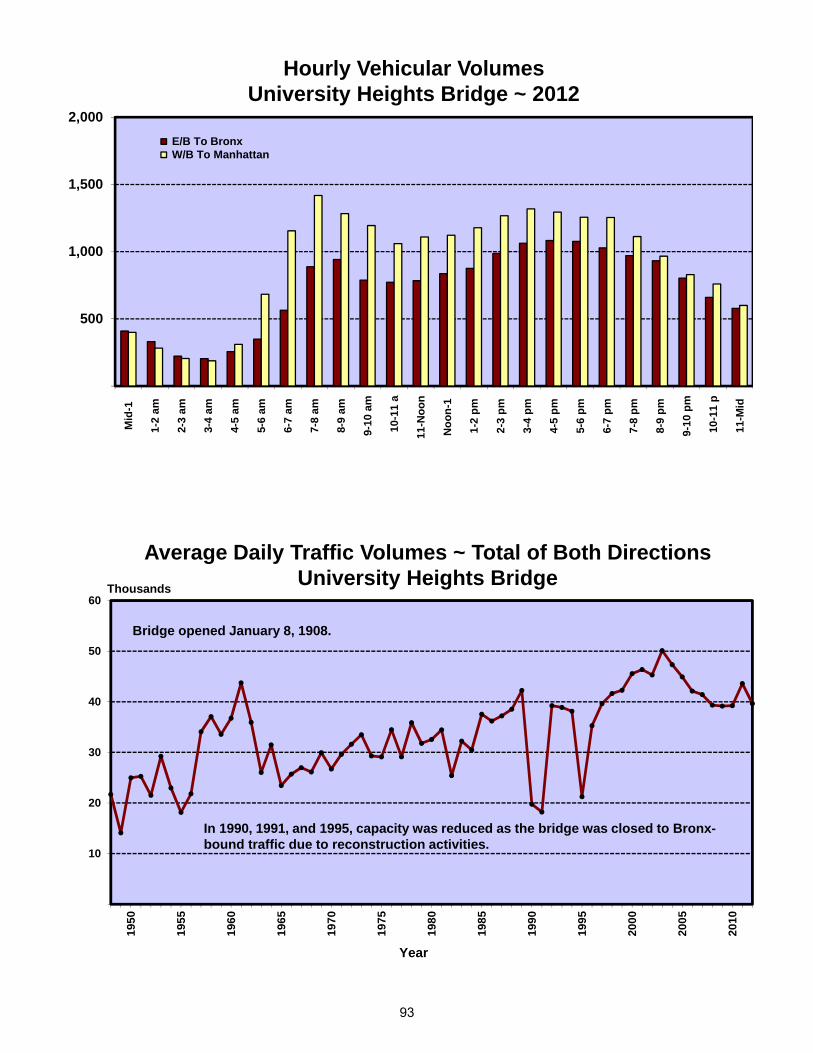
500
1,000
1,500
2,000 M
id-1
1-2
am
2-3
am
3-4
am
4-5
am
5-6
am
6-7
am
7-8
am
8-9
am
9-1
0 am
10-
11 a
11-
Noo
n
Noo
n-1
1-2
pm
2-3
pm
3-4
pm
4-5
pm
5-6
pm
6-7
pm
7-8
pm
8-9
pm
9-1
0 pm
10-
11 p
11-
Mid
E/B To Bronx W/B To Manhattan
Hourly Vehicular VolumesUniversity Heights Bridge ~ 2012
10
20
30
40
50
60
1950
1955
1960
1965
1970
1975
1980
1985
1990
1995
2000
2005
2010
Average Daily Traffic Volumes ~ Total of Both DirectionsUniversity Heights BridgeThousands
Bridge opened January 8, 1908.
Year
In 1990, 1991, and 1995, capacity was reduced as the bridge was closed to Bronx-bound traffic due to reconstruction activities.
93

East
boun
d to
Bro
nxW
estb
ound
to M
anha
ttan
Com
mut
er C
omm
erci
alC
omm
uter
Com
mer
cial
2-W
ayAu
tos
Buse
sVa
nsTr
ucks
Vans
Tota
lsAu
tos
Buse
sVa
nsTr
ucks
Vans
Tota
lsTo
tals
12-1
am--
- --
- --
- --
- --
- 58
6--
- --
- --
- --
- --
- 53
31,
119
1-2
am--
- --
- --
- --
- --
- 40
5--
- --
- --
- --
- --
- 33
574
0 2
-3am
---
---
---
---
---
291
---
---
---
---
---
227
518
3-4
am--
- --
- --
- --
- --
- 23
6--
- --
- --
- --
- --
- 23
046
6 4
-5am
---
---
---
---
---
306
---
---
---
---
---
409
715
5-6
am--
- --
- --
- --
- --
- 50
3--
- --
- --
- --
- --
- 59
51,
098
6-7
am--
- --
- --
- --
- --
- 1,
268
---
---
---
---
---
978
2,24
6 7
-8am
1,83
070
3963
134
2,13
61,
199
5610
735
241,
421
3,55
7 8
-9am
1,72
153
3192
158
2,05
51,
160
6471
5328
1,37
63,
431
9-1
0am
1,42
647
3011
310
71,
723
1,06
236
5341
281,
220
2,94
310
-11a
m1,
390
419
3851
1,52
91,
012
3611
2723
1,10
92,
638
11-1
2am
1,23
930
1868
781,
433
978
4629
3137
1,12
12,
554
12-1
pm1,
235
4119
2560
1,38
01,
119
2910
2116
1,19
52,
575
1-2
pm1,
395
346
3553
1,52
31,
168
3017
1914
1,24
82,
771
2-3
pm1,
544
3828
7589
1,77
41,
219
5743
5241
1,41
23,
186
3-4
pm1,
999
4713
3910
02,
198
1,47
446
4646
221,
634
**3,
832
4-5
pm1,
980
4760
7322
02,
380
**1,
325
3867
8245
1,55
73,
937
** 5
-6pm
2,05
738
5740
108
2,30
01,
402
2843
3240
1,54
53,
845
6-7
pm1,
875
2433
2583
2,04
01,
230
3449
1727
1,35
73,
397
7-8
pm--
- --
- --
- --
- --
- 1,
768
---
---
---
---
---
1,21
92,
987
8-9
pm--
- --
- --
- --
- --
- 1,
605
---
---
---
---
---
1,02
62,
631
9-1
0pm
---
---
---
---
---
1,29
3--
- --
- --
- --
- --
- 91
02,
203
10-1
1pm
---
---
---
---
---
1,02
0--
- --
- --
- --
- --
- 92
31,
943
11-1
2pm
---
---
---
---
---
839
---
---
---
---
---
840
1,67
9
Tota
ls--
- --
- --
- --
- --
- 32
,591
---
---
---
---
---
24,4
2057
,011
7-1
0am
4,97
717
010
026
839
95,
914
3,42
115
623
112
980
4,01
79,
931
10am
-1pm
3,86
411
246
131
189
4,34
23,
109
111
5079
763,
425
7,76
7 1
-4pm
4,93
811
947
149
242
5,49
53,
861
133
106
117
774,
294
9,78
9 4
-7pm
5,91
210
915
013
841
16,
720
3,95
710
015
913
111
24,
459
11,1
79 7
am-7
pm19
,691
510
343
686
1,24
122
,471
14,3
4850
054
645
634
516
,195
38,6
66
6-1
0am
---
---
---
---
---
7,18
2--
- --
- --
- --
- --
- 4,
995
12,1
77 3
-7pm
7,91
115
616
317
751
18,
918
5,43
114
620
517
713
46,
093
15,0
11 6
am-7
pm--
- --
- --
- --
- --
- 23
,739
---
---
---
---
---
17,1
7340
,912
Base
d on
198
9 C
lass
ifica
tion
Surv
ey D
ata
** P
eak
Volu
mes
Was
hing
ton
Brid
ge -
2012
Hou
rly V
ehic
ular
Vol
umes
94
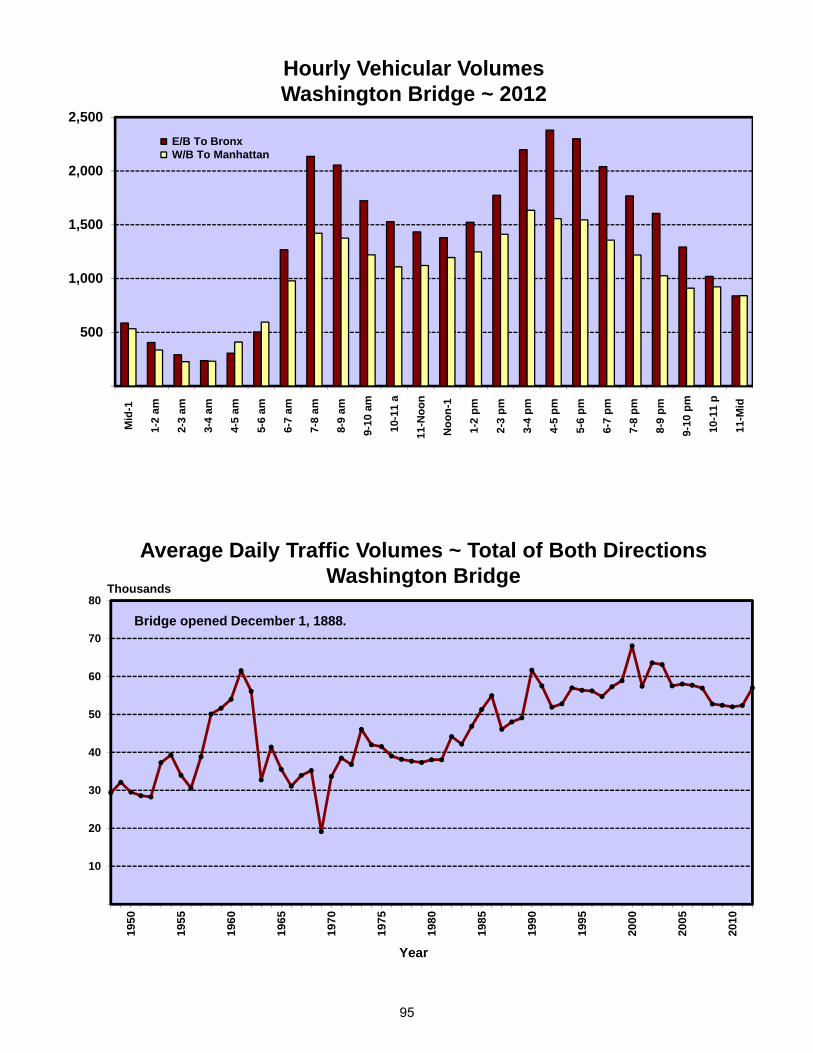
500
1,000
1,500
2,000
2,500 M
id-1
1-2
am
2-3
am
3-4
am
4-5
am
5-6
am
6-7
am
7-8
am
8-9
am
9-1
0 am
10-
11 a
11-
Noo
n
Noo
n-1
1-2
pm
2-3
pm
3-4
pm
4-5
pm
5-6
pm
6-7
pm
7-8
pm
8-9
pm
9-1
0 pm
10-
11 p
11-
Mid
E/B To Bronx W/B To Manhattan
Hourly Vehicular VolumesWashington Bridge ~ 2012
10
20
30
40
50
60
70
80
1950
1955
1960
1965
1970
1975
1980
1985
1990
1995
2000
2005
2010
Average Daily Traffic Volumes ~ Total of Both DirectionsWashington Bridge
Thousands
Bridge opened December 1, 1888.
Year
95

Nor
thbo
und
to B
ronx
Sout
hbou
nd to
Man
hatta
nC
omm
uter
Com
mer
cial
Com
mut
er C
omm
erci
al2-
Way
Auto
sBu
ses
Vans
Truc
ksVa
nsTo
tals
Auto
sBu
ses
Vans
Truc
ksVa
nsTo
tals
Tota
ls
12-1
am--
- --
- --
- --
- --
- 90
490
4 1
-2am
---
---
---
---
---
774
774
2-3
am--
- --
- --
- --
- --
- 1,
052
1,05
2 3
-4am
---
---
---
---
---
1,75
91,
759
4-5
am--
- --
- --
- --
- --
- 2,
701
Brid
ge is
1-w
ay n
orth
boun
d2,
701
5-6
am--
- --
- --
- --
- --
- 2,
633
to T
he B
ronx
2,63
3 6
-7am
---
---
---
---
---
2,34
52,
345
7-8
am2,
211
6610
312
889
2,59
72,
597
8-9
am2,
097
8978
151
184
2,59
92,
599
9-1
0am
1,76
010
386
211
195
2,35
52,
355
10-1
1am
2,04
447
6515
314
42,
453
2,45
311
-12a
m2,
074
3612
229
827
52,
805
2,80
512
-1pm
2,77
047
5917
011
63,
162
3,16
2 1
-2pm
3,17
929
4813
416
83,
558
3,55
8 2
-3pm
2,79
934
137
403
407
3,78
03,
780
3-4
pm3,
570
6561
171
167
4,03
4**
4,03
4**
4-5
pm3,
137
3612
126
842
23,
984
3,98
4 5
-6pm
3,13
256
104
174
385
3,85
13,
851
6-7
pm2,
984
2991
105
202
3,41
13,
411
7-8
pm--
- --
- --
- --
- --
- 3,
226
3,22
6 8
-9pm
---
---
---
---
---
2,75
22,
752
9-1
0pm
---
---
---
---
---
2,35
12,
351
10-1
1pm
---
---
---
---
---
1,74
31,
743
11-1
2pm
---
---
---
---
---
1,23
31,
233
Tota
ls--
- --
- --
- --
- --
- 62
,062
62,0
62
7-1
0am
6,06
825
826
749
046
87,
551
7,55
110
am-1
pm6,
888
130
246
621
535
8,42
08,
420
1-4
pm9,
548
128
246
708
742
11,3
7211
,372
4-7
pm9,
253
121
316
547
1,00
911
,246
11,2
46 7
am-7
pm31
,757
637
1,07
52,
366
2,75
438
,589
38,5
89
6-1
0am
---
---
---
---
---
9,89
69,
896
3-7
pm12
,823
186
377
718
1,17
615
,280
15,2
80 6
am-7
pm--
- --
- --
- --
- --
- 40
,934
40,9
34
Base
d on
198
9 C
lass
ifica
tion
Surv
ey D
ata
** P
eak
Volu
mes
Hou
rly V
ehic
ular
Vol
umes
Will
is A
venu
e B
ridge
- 20
12
96
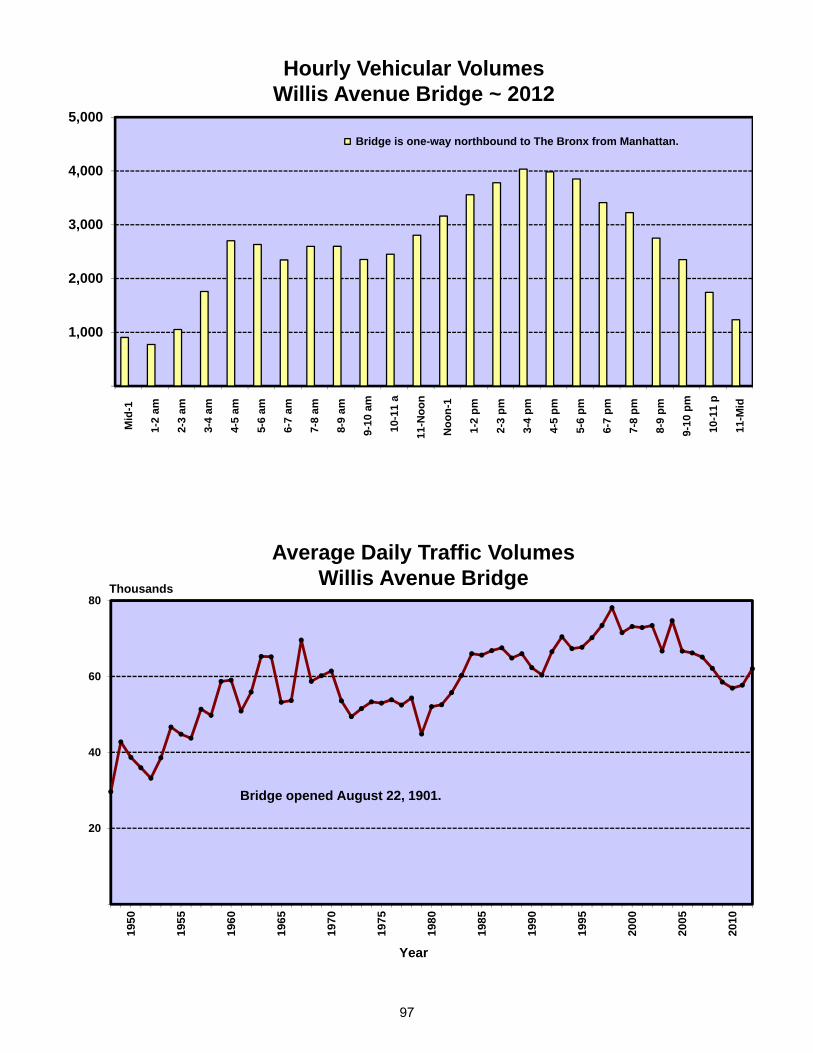
1,000
2,000
3,000
4,000
5,000 M
id-1
1-2
am
2-3
am
3-4
am
4-5
am
5-6
am
6-7
am
7-8
am
8-9
am
9-1
0 am
10-
11 a
11-
Noo
n
Noo
n-1
1-2
pm
2-3
pm
3-4
pm
4-5
pm
5-6
pm
6-7
pm
7-8
pm
8-9
pm
9-1
0 pm
10-
11 p
11-
Mid
Bridge is one-way northbound to The Bronx from Manhattan.
Hourly Vehicular VolumesWillis Avenue Bridge ~ 2012
20
40
60
80
1950
1955
1960
1965
1970
1975
1980
1985
1990
1995
2000
2005
2010
Average Daily Traffic VolumesWillis Avenue BridgeThousands
Bridge opened August 22, 1901.
Year
97

East
boun
d to
Bro
nxW
estb
ound
to M
anha
ttan
Com
mut
er C
omm
erci
alC
omm
uter
Com
mer
cial
2-W
ayAu
tos
Buse
sVa
nsTr
ucks
Vans
Tota
lsAu
tos
Buse
sVa
nsTr
ucks
Vans
Tota
lsTo
tals
12-1
am--
- --
- --
- --
- --
- 24
8--
- --
- --
- --
- --
- 19
644
4 1
-2am
---
---
---
---
---
178
---
---
---
---
---
129
307
2-3
am--
- --
- --
- --
- --
- 12
2--
- --
- --
- --
- --
- 91
213
3-4
am--
- --
- --
- --
- --
- 89
---
---
---
---
---
7816
7 4
-5am
---
---
---
---
---
100
---
---
---
---
---
101
201
5-6
am--
- --
- --
- --
- --
- 14
0--
- --
- --
- --
- --
- 20
134
1 6
-7am
---
---
---
---
---
288
---
---
---
---
---
574
862
7-8
am63
230
4141
1075
41,
017
4721
4440
1,16
9**
1,92
3 8
-9am
789
2848
5130
946
939
3237
3157
1,09
62,
042
9-1
0am
588
1340
6325
729
630
2138
2967
785
1,51
410
-11a
m55
09
1525
2762
650
117
3426
5062
81,
254
11-1
2am
496
1629
6843
652
460
1247
4856
623
1,27
512
-1pm
564
1217
4017
650
606
1111
915
652
1,30
2 1
-2pm
596
1234
3118
691
603
3011
159
668
1,35
9 2
-3pm
555
1630
9540
736
602
2328
2740
720
1,45
6 3
-4pm
828
2122
4028
939
779
309
711
836
1,77
5 4
-5pm
937
1561
105
581,
176
846
1816
923
912
2,08
8 5
-6pm
977
1156
8173
1,19
8**
849
1815
1014
906
2,10
4**
6-7
pm91
429
3225
511,
051
753
246
411
798
1,84
9 7
-8pm
---
---
---
---
---
810
---
---
---
---
---
699
1,50
9 8
-9pm
---
---
---
---
---
702
---
---
---
---
---
564
1,26
6 9
-10p
m--
- --
- --
- --
- --
- 59
3--
- --
- --
- --
- --
- 49
51,
088
10-1
1pm
---
---
---
---
---
447
---
---
---
---
---
427
874
11-1
2pm
---
---
---
---
---
370
---
---
---
---
---
335
705
Tota
ls--
- --
- --
- --
- --
- 14
,235
---
---
---
---
---
13,6
8327
,918
7-1
0am
2,00
971
129
155
652,
429
2,58
610
096
104
164
3,05
05,
479
10am
-1pm
1,61
037
6113
387
1,92
81,
567
4092
8312
11,
903
3,83
1 1
-4pm
1,97
949
8616
686
2,36
61,
984
8348
4960
2,22
44,
590
4-7
pm2,
828
5514
921
118
23,
425
2,44
860
3723
482,
616
6,04
1 7
am-7
pm8,
426
212
425
665
420
10,1
488,
585
283
273
259
393
9,79
319
,941
6-1
0am
---
---
---
---
---
2,71
7--
- --
- --
- --
- --
- 3,
624
6,34
1 3
-7pm
3,65
676
171
251
210
4,36
43,
227
9046
3059
3,45
27,
816
6am
-7pm
---
---
---
---
---
10,4
36--
- --
- --
- --
- --
- 10
,367
20,8
03
Base
d on
198
9 C
lass
ifica
tion
Surv
ey D
ata
** P
eak
Volu
mes
Hou
rly V
ehic
ular
Vol
umes
145t
h St
reet
Brid
ge -
2012
98

200
400
600
800
1,000
1,200
1,400 M
id-1
1-2
am
2-3
am
3-4
am
4-5
am
5-6
am
6-7
am
7-8
am
8-9
am
9-1
0 am
10-
11 a
11-
Noo
n
Noo
n-1
1-2
pm
2-3
pm
3-4
pm
4-5
pm
5-6
pm
6-7
pm
7-8
pm
8-9
pm
9-1
0 pm
10-
11 p
11-
Mid
E/B To Bronx W/B To Manhattan
Hourly Vehicular Volumes145th Street Bridge ~ 2012
10
20
30
40
50
1950
1955
1960
1965
1970
1975
1980
1985
1990
1995
2000
2005
2010
Average Daily Traffic Volumes ~ Total of Both Directions145th Street Bridge
Thousands
Bridge opened August 24, 1905.
Year
99

100
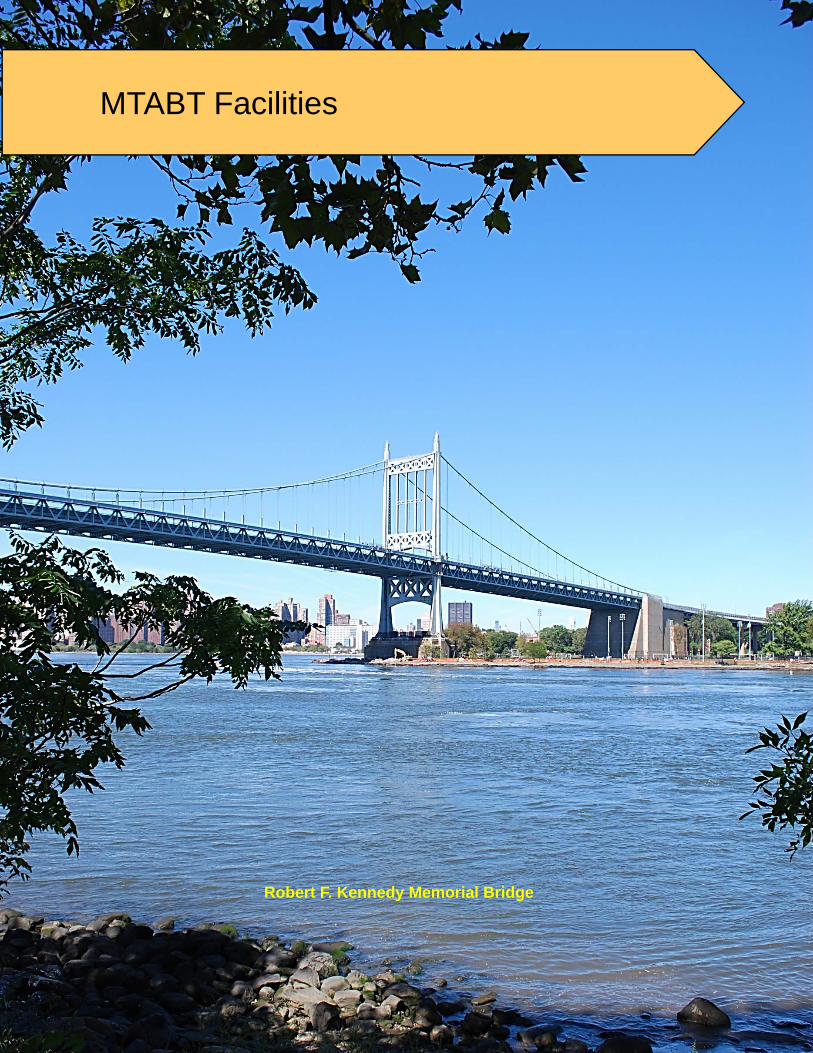
MTABT Facilities
Robert F. Kennedy Memorial Bridge
101
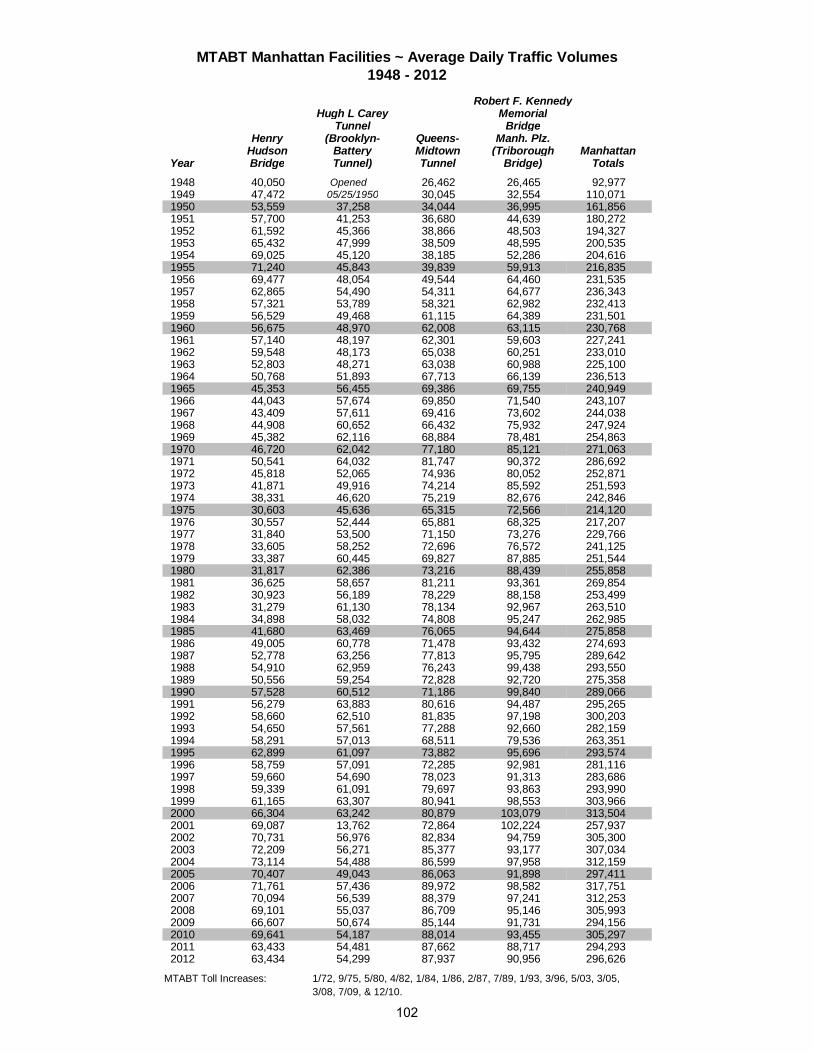
Robert F. KennedyHugh L Carey Memorial
Tunnel BridgeHenry (Brooklyn- Queens- Manh. Plz.
Hudson Battery Midtown (Triborough ManhattanYear Bridge Tunnel) Tunnel Bridge) Totals1948 40,050 Opened 26,462 26,465 92,977 1949 47,472 05/25/1950 30,045 32,554 110,071 1950 53,559 37,258 34,044 36,995 161,856 1951 57,700 41,253 36,680 44,639 180,272 1952 61,592 45,366 38,866 48,503 194,327 1953 65,432 47,999 38,509 48,595 200,535 1954 69,025 45,120 38,185 52,286 204,616 1955 71,240 45,843 39,839 59,913 216,835 1956 69,477 48,054 49,544 64,460 231,535 1957 62,865 54,490 54,311 64,677 236,343 1958 57,321 53,789 58,321 62,982 232,413 1959 56,529 49,468 61,115 64,389 231,501 1960 56,675 48,970 62,008 63,115 230,768 1961 57,140 48,197 62,301 59,603 227,241 1962 59,548 48,173 65,038 60,251 233,010 1963 52,803 48,271 63,038 60,988 225,100 1964 50,768 51,893 67,713 66,139 236,513 1965 45,353 56,455 69,386 69,755 240,949 1966 44,043 57,674 69,850 71,540 243,107 1967 43,409 57,611 69,416 73,602 244,038 1968 44,908 60,652 66,432 75,932 247,924 1969 45,382 62,116 68,884 78,481 254,863 1970 46,720 62,042 77,180 85,121 271,063 1971 50,541 64,032 81,747 90,372 286,692 1972 45,818 52,065 74,936 80,052 252,871 1973 41,871 49,916 74,214 85,592 251,593 1974 38,331 46,620 75,219 82,676 242,846 1975 30,603 45,636 65,315 72,566 214,120 1976 30,557 52,444 65,881 68,325 217,207 1977 31,840 53,500 71,150 73,276 229,766 1978 33,605 58,252 72,696 76,572 241,125 1979 33,387 60,445 69,827 87,885 251,544 1980 31,817 62,386 73,216 88,439 255,858 1981 36,625 58,657 81,211 93,361 269,854 1982 30,923 56,189 78,229 88,158 253,499 1983 31,279 61,130 78,134 92,967 263,510 1984 34,898 58,032 74,808 95,247 262,985 1985 41,680 63,469 76,065 94,644 275,858 1986 49,005 60,778 71,478 93,432 274,693 1987 52,778 63,256 77,813 95,795 289,642 1988 54,910 62,959 76,243 99,438 293,550 1989 50,556 59,254 72,828 92,720 275,358 1990 57,528 60,512 71,186 99,840 289,066 1991 56,279 63,883 80,616 94,487 295,265 1992 58,660 62,510 81,835 97,198 300,203 1993 54,650 57,561 77,288 92,660 282,159 1994 58,291 57,013 68,511 79,536 263,351 1995 62,899 61,097 73,882 95,696 293,574 1996 58,759 57,091 72,285 92,981 281,116 1997 59,660 54,690 78,023 91,313 283,686 1998 59,339 61,091 79,697 93,863 293,990 1999 61,165 63,307 80,941 98,553 303,966 2000 66,304 63,242 80,879 103,079 313,504 2001 69,087 13,762 72,864 102,224 257,937 2002 70,731 56,976 82,834 94,759 305,300 2003 72,209 56,271 85,377 93,177 307,034 2004 73,114 54,488 86,599 97,958 312,159 2005 70,407 49,043 86,063 91,898 297,411 2006 71,761 57,436 89,972 98,582 317,751 2007 70,094 56,539 88,379 97,241 312,253 2008 69,101 55,037 86,709 95,146 305,993 2009 66,607 50,674 85,144 91,731 294,156 2010 69,641 54,187 88,014 93,455 305,297 2011 63,433 54,481 87,662 88,717 294,293 2012 63,434 54,299 87,937 90,956 296,626
MTABT Toll Increases: 1/72, 9/75, 5/80, 4/82, 1/84, 1/86, 2/87, 7/89, 1/93, 3/96, 5/03, 3/05,3/08, 7/09, & 12/10.
MTABT Manhattan Facilities ~ Average Daily Traffic Volumes1948 - 2012
102
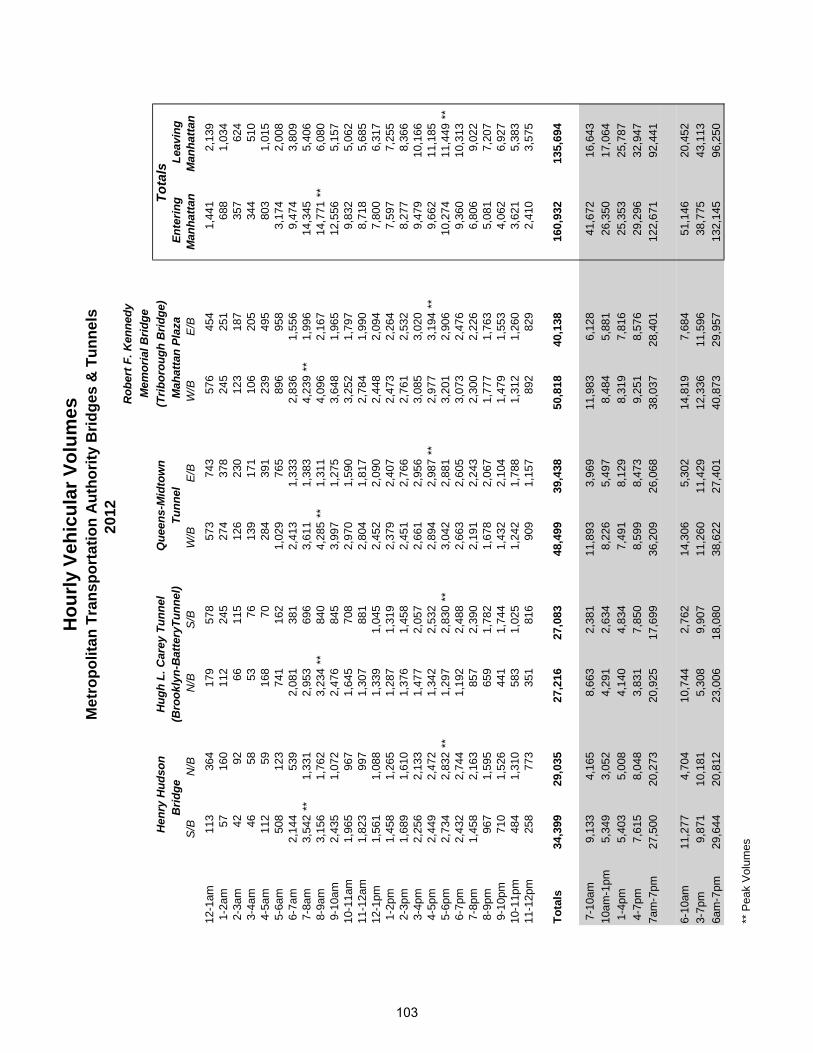
Tota
ls E
nter
ing
Le
avin
g
S/B
N
/B
N/B
S
/B
W/B
E
/B
W/B
E
/B
Man
hatta
n M
anha
ttan
12-1
am11
336
417
957
857
374
357
645
41,
441
2,13
9 1
-2am
5716
011
224
527
437
824
525
168
81,
034
2-3
am42
9266
115
126
230
123
187
357
624
3-4
am46
5853
7613
917
110
620
534
451
0 4
-5am
112
5916
870
284
391
239
495
803
1,01
5 5
-6am
508
123
741
162
1,02
976
589
695
83,
174
2,00
8 6
-7am
2,14
453
92,
081
381
2,41
31,
333
2,83
61,
556
9,47
43,
809
7-8
am3,
542
**1,
331
2,95
369
63,
611
1,38
34,
239
**1,
996
14,3
455,
406
8-9
am3,
156
1,76
23,
234
**84
04,
285
**1,
311
4,09
62,
167
14,7
71**
6,08
0 9
-10a
m2,
435
1,07
22,
476
845
3,99
71,
275
3,64
81,
965
12,5
565,
157
10-1
1am
1,96
596
71,
645
708
2,97
01,
590
3,25
21,
797
9,83
25,
062
11-1
2am
1,82
399
71,
307
881
2,80
41,
817
2,78
41,
990
8,71
85,
685
12-1
pm1,
561
1,08
81,
339
1,04
52,
452
2,09
02,
448
2,09
47,
800
6,31
7 1
-2pm
1,45
81,
265
1,28
71,
319
2,37
92,
407
2,47
32,
264
7,59
77,
255
2-3
pm1,
689
1,61
01,
376
1,45
82,
451
2,76
62,
761
2,53
28,
277
8,36
6 3
-4pm
2,25
62,
133
1,47
72,
057
2,66
12,
956
3,08
53,
020
9,47
910
,166
4-5
pm2,
449
2,47
21,
342
2,53
22,
894
2,98
7**
2,97
73,
194
**9,
662
11,1
85 5
-6pm
2,73
42,
832
**1,
297
2,83
0**
3,04
22,
881
3,20
12,
906
10,2
7411
,449
** 6
-7pm
2,43
22,
744
1,19
22,
488
2,66
32,
605
3,07
32,
476
9,36
010
,313
7-8
pm1,
458
2,16
385
72,
390
2,19
12,
243
2,30
02,
226
6,80
69,
022
8-9
pm96
71,
595
659
1,78
21,
678
2,06
71,
777
1,76
35,
081
7,20
7 9
-10p
m71
01,
526
441
1,74
41,
432
2,10
41,
479
1,55
34,
062
6,92
710
-11p
m48
41,
310
583
1,02
51,
242
1,78
81,
312
1,26
03,
621
5,38
311
-12p
m25
877
335
181
690
91,
157
892
829
2,41
03,
575
Tota
ls34
,399
29,0
3527
,216
27,0
8348
,499
39,4
3850
,818
40,1
3816
0,93
213
5,69
4
7-1
0am
9,13
34,
165
8,66
32,
381
11,8
933,
969
11,9
836,
128
41,6
7216
,643
10am
-1pm
5,34
93,
052
4,29
12,
634
8,22
65,
497
8,48
45,
881
26,3
5017
,064
1-4
pm5,
403
5,00
84,
140
4,83
47,
491
8,12
98,
319
7,81
625
,353
25,7
87 4
-7pm
7,61
58,
048
3,83
17,
850
8,59
98,
473
9,25
18,
576
29,2
9632
,947
7am
-7pm
27,5
0020
,273
20,9
2517
,699
36,2
0926
,068
38,0
3728
,401
122,
671
92,4
41
6-10
am11
,277
4,70
410
,744
2,76
214
,306
5,30
214
,819
7,68
451
,146
20,4
523-
7pm
9,87
110
,181
5,30
89,
907
11,2
6011
,429
12,3
3611
,596
38,7
7543
,113
6am
-7pm
29,6
4420
,812
23,0
0618
,080
38,6
2227
,401
40,8
7329
,957
132,
145
96,2
50
** P
eak
Volu
mes
Hug
h L.
Car
ey T
unne
l(B
rook
lyn-
Bat
tery
Tunn
el)
Hou
rly V
ehic
ular
Vol
umes
Met
ropo
litan
Tra
nspo
rtat
ion
Aut
horit
y B
ridge
s &
Tun
nels
2012
Mem
oria
l Brid
ge
R
ober
t F. K
enne
dy
B
ridge
H
enry
Hud
son
Q
ueen
s-M
idto
wn
Tu
nnel
Mah
atta
n Pl
aza
(Tr
ibor
ough
Brid
ge)
103
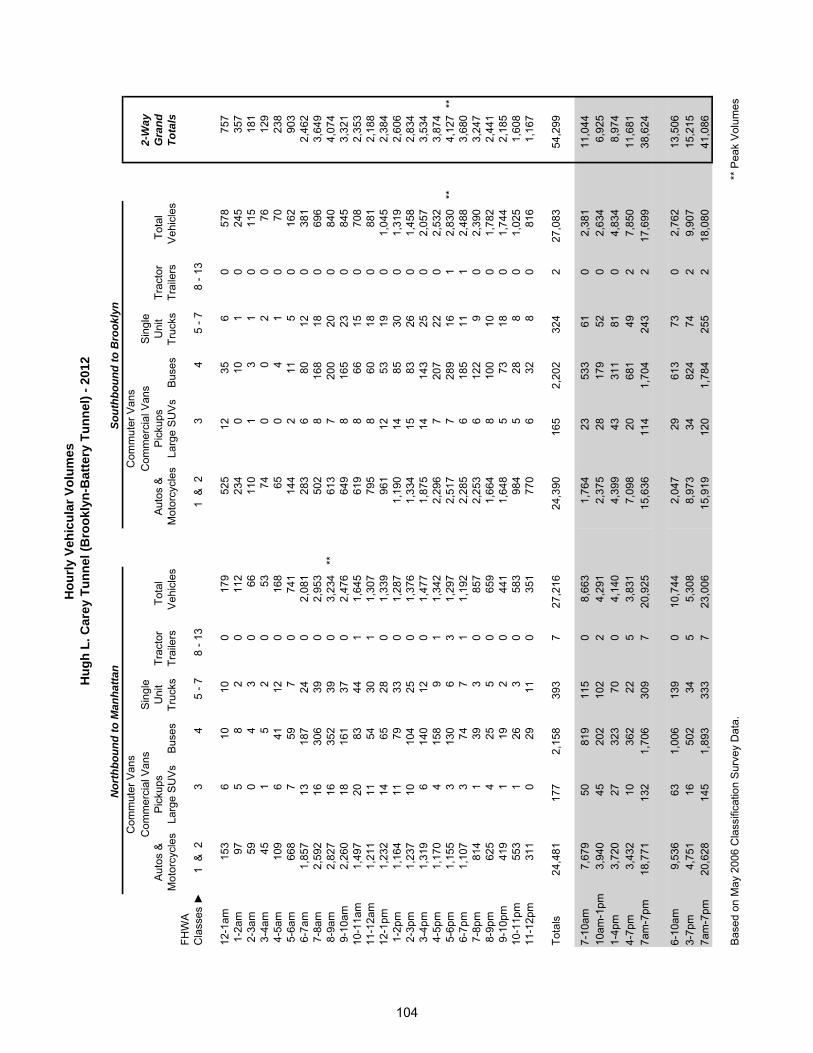
Com
mut
er V
ans
Com
mut
er V
ans
Com
mer
cial
Van
sS
ingl
e C
omm
erci
al V
ans
Sin
gle
2-W
ayA
utos
& P
icku
psU
nit
Trac
tor
Tota
l
Aut
os &
Pic
kups
Uni
tTr
acto
rTo
tal
G
rand
Mot
orcy
cles
Lar
ge S
UV
sB
uses
Tr
ucks
Trai
lers
Veh
icle
sM
otor
cycl
es L
arge
SU
Vs
Bus
es
Truc
ksTr
aile
rsV
ehic
les
Tota
lsFH
WA
Cla
sses
►
1 &
23
4
5 -
7
8 -
13
1 &
23
4
5 -
7
8 -
13
12-1
am15
36
1010
017
9
525
1235
60
578
75
7 1
-2am
975
82
011
2
234
010
10
245
35
7 2
-3am
590
43
066
11
01
31
011
5
181
3-4
am45
15
20
53
740
02
076
12
9 4
-5am
109
641
120
168
65
04
10
70
238
5-6
am66
87
597
074
1
144
211
50
162
90
3 6
-7am
1,85
713
187
240
2,08
1
283
680
120
381
2,
462
7-8
am2,
592
1630
639
02,
953
50
28
168
180
696
3,
649
8-9
am2,
827
1635
239
03,
234
**
613
720
020
084
0
4,07
4 9
-10a
m2,
260
1816
137
02,
476
64
98
165
230
845
3,
321
10-1
1am
1,49
720
8344
11,
645
61
98
6615
070
8
2,35
3 11
-12a
m1,
211
1154
301
1,30
7
795
860
180
881
2,
188
12-1
pm1,
232
1465
280
1,33
9
961
1253
190
1,04
5
2,38
4 1
-2pm
1,16
411
7933
01,
287
1,
190
1485
300
1,31
9
2,60
6 2
-3pm
1,23
710
104
250
1,37
6
1,33
415
8326
01,
458
2,
834
3-4
pm1,
319
614
012
01,
477
1,
875
1414
325
02,
057
3,
534
4-5
pm1,
170
415
89
11,
342
2,
296
720
722
02,
532
3,
874
5-6
pm1,
155
313
06
31,
297
2,
517
728
916
12,
830
**
4,12
7 **
6-7
pm1,
107
374
71
1,19
2
2,28
56
185
111
2,48
8
3,68
0 7
-8pm
814
139
30
857
2,
253
612
29
02,
390
3,
247
8-9
pm62
54
255
065
9
1,66
48
100
100
1,78
2
2,44
1 9
-10p
m41
91
192
044
1
1,64
85
7318
01,
744
2,
185
10-1
1pm
553
126
30
583
98
45
288
01,
025
1,
608
11-1
2pm
311
029
110
351
77
06
328
081
6
1,16
7
Tota
ls24
,481
177
2,15
839
37
27,2
16
24,3
9016
52,
202
324
227
,083
54
,299
7-10
am7,
679
5081
911
50
8,66
3
1,76
423
533
610
2,38
1
11,0
44
10am
-1pm
3,94
045
202
102
24,
291
2,
375
2817
952
02,
634
6,
925
1-4p
m3,
720
2732
370
04,
140
4,
399
4331
181
04,
834
8,
974
4-7p
m3,
432
1036
222
53,
831
7,
098
2068
149
27,
850
11
,681
7a
m-7
pm18
,771
132
1,70
630
97
20,9
25
15,6
3611
41,
704
243
217
,699
38
,624
6-10
am9,
536
631,
006
139
010
,744
2,
047
2961
373
02,
762
13
,506
3-
7pm
4,75
116
502
345
5,30
8
8,97
334
824
742
9,90
7
15,2
15
7am
-7pm
20,6
2814
51,
893
333
723
,006
15
,919
120
1,78
425
52
18,0
80
41,0
86
Bas
ed o
n M
ay 2
006
Cla
ssifi
catio
n S
urve
y D
ata.
** P
eak
Vol
umes
Hou
rly V
ehic
ular
Vol
umes
Hug
h L.
Car
ey T
unne
l (B
rook
lyn-
Bat
tery
Tun
nel)
- 201
2
Nor
thbo
und
to M
anha
ttan
Sout
hbou
nd to
Bro
okly
n
104

1,000
2,000
3,000
4,000M
idni
ght-1
am
1-2
am
2-3
am
3-4
am
4-5
am
5-6
am
6-7
am
7-8
am
8-9
am
9-10
am
10-1
1 am
11-N
oon
Noo
n-1
pm
1-2
pm
2-3
pm
3-4
pm
4-5
pm
5-6
pm
6-7
pm
7-8
pm
8-9
pm
9-10
pm
10-1
1 pm
11-M
idni
ght
N/B To Manhattan
S/B To Brooklyn
Hourly Vehicular VolumesHugh L. Carey Tunnel ~ 2012
10
20
30
40
50
60
70
1950
1955
1960
1965
1970
1975
1980
1985
1990
1995
2000
2005
2010
Average Daily Traffic Volumes ~ Total of Both DirectionsHugh L. Carey Tunnel
Tunnel opened May 25, 1950.
Thousands
Following 9/11/2001, Brooklyn-Battery Tunnel daily 2-way volume fell 78% compared to fall 2000. Inbound volume was down 89%, outbound down 65%.
Year
Originally Brooklyn-Battery Tunnel; officially renamed Hugh L. Carey Tunnel October 22, 2012.
105
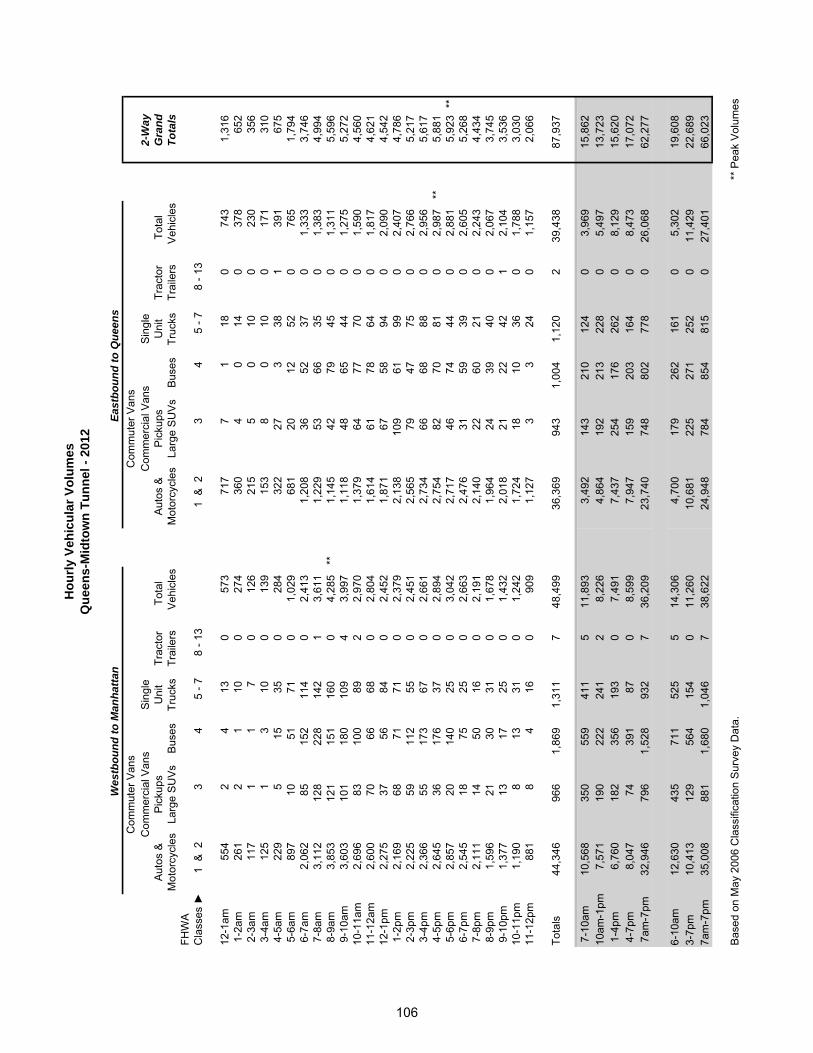
Com
mut
er V
ans
Com
mut
er V
ans
Com
mer
cial
Van
sS
ingl
e C
omm
erci
al V
ans
Sin
gle
2-W
ayA
utos
& P
icku
psU
nit
Trac
tor
Tota
l
Aut
os &
Pic
kups
Uni
tTr
acto
rTo
tal
G
rand
Mot
orcy
cles
Lar
ge S
UV
sB
uses
Tr
ucks
Trai
lers
Veh
icle
sM
otor
cycl
es L
arge
SU
Vs
Bus
es
Truc
ksTr
aile
rsV
ehic
les
Tota
lsFH
WA
Cla
sses
►
1 &
23
4
5 -
7
8 -
13
1 &
23
4
5 -
7
8 -
13
12-1
am55
42
413
057
3
717
71
180
743
1,
316
1-2
am26
12
110
027
4
360
40
140
378
65
2 2
-3am
117
11
70
126
21
55
010
023
0
356
3-4
am12
51
310
013
9
153
80
100
171
31
0 4
-5am
229
515
350
284
32
227
338
139
1
675
5-6
am89
710
5171
01,
029
68
120
1252
076
5
1,79
4 6
-7am
2,06
285
152
114
02,
413
1,
208
3652
370
1,33
3
3,74
6 7
-8am
3,11
212
822
814
21
3,61
1
1,22
953
6635
01,
383
4,
994
8-9
am3,
853
121
151
160
04,
285
**
1,14
542
7945
01,
311
5,
596
9-1
0am
3,60
310
118
010
94
3,99
7
1,11
848
6544
01,
275
5,
272
10-1
1am
2,69
683
100
892
2,97
0
1,37
964
7770
01,
590
4,
560
11-1
2am
2,60
070
6668
02,
804
1,
614
6178
640
1,81
7
4,62
1 12
-1pm
2,27
537
5684
02,
452
1,
871
6758
940
2,09
0
4,54
2 1
-2pm
2,16
968
7171
02,
379
2,
138
109
6199
02,
407
4,
786
2-3
pm2,
225
5911
255
02,
451
2,
565
7947
750
2,76
6
5,21
7 3
-4pm
2,36
655
173
670
2,66
1
2,73
466
6888
02,
956
5,
617
4-5
pm2,
645
3617
637
02,
894
2,
754
8270
810
2,98
7 *
*5,
881
5-6
pm2,
857
2014
025
03,
042
2,
717
4674
440
2,88
1
5,92
3 **
6-7
pm2,
545
1875
250
2,66
3
2,47
631
5939
02,
605
5,
268
7-8
pm2,
111
1450
160
2,19
1
2,14
022
6021
02,
243
4,
434
8-9
pm1,
596
2130
310
1,67
8
1,96
424
3940
02,
067
3,
745
9-1
0pm
1,37
713
1725
01,
432
2,
018
2122
421
2,10
4
3,53
6 10
-11p
m1,
190
813
310
1,24
2
1,72
418
1036
01,
788
3,
030
11-1
2pm
881
84
160
909
1,
127
33
240
1,15
7
2,06
6
Tota
ls44
,346
966
1,86
91,
311
748
,499
36
,369
943
1,00
41,
120
239
,438
87
,937
7-1
0am
10,5
6835
055
941
15
11,8
93
3,49
214
321
012
40
3,96
9
15,8
62
10am
-1pm
7,57
119
022
224
12
8,22
6
4,86
419
221
322
80
5,49
7
13,7
23
1-4
pm6,
760
182
356
193
07,
491
7,
437
254
176
262
08,
129
15
,620
4
-7pm
8,04
774
391
870
8,59
9
7,94
715
920
316
40
8,47
3
17,0
72
7am
-7pm
32,9
4679
61,
528
932
736
,209
23
,740
748
802
778
026
,068
62
,277
6-10
am12
,630
435
711
525
514
,306
4,
700
179
262
161
05,
302
19
,608
3-
7pm
10,4
1312
956
415
40
11,2
60
10,6
8122
527
125
20
11,4
29
22,6
89
7am
-7pm
35,0
0888
11,
680
1,04
67
38,6
22
24,9
4878
485
481
50
27,4
01
66,0
23
Bas
ed o
n M
ay 2
006
Cla
ssifi
catio
n S
urve
y D
ata.
** P
eak
Vol
umes
Wes
tbou
nd to
Man
hatta
n
Que
ens-
Mid
tow
n Tu
nnel
- 20
12H
ourly
Veh
icul
ar V
olum
es
East
boun
d to
Que
ens
106
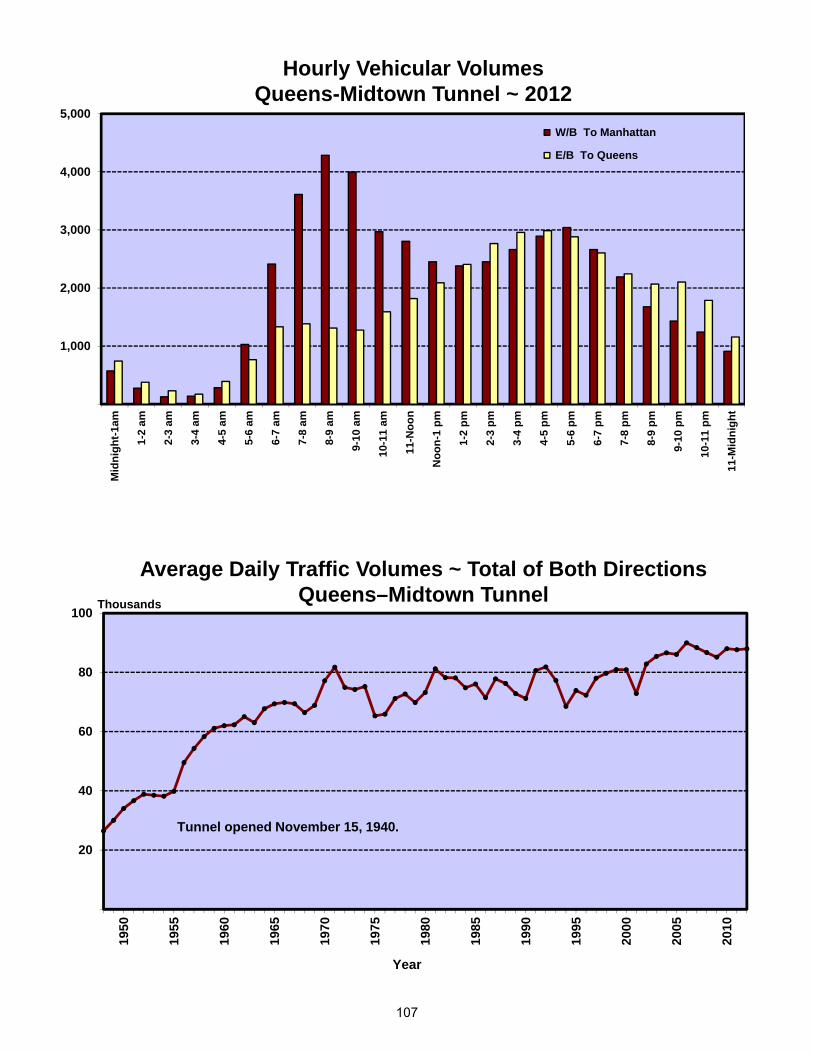
1,000
2,000
3,000
4,000
5,000M
idni
ght-1
am
1-2
am
2-3
am
3-4
am
4-5
am
5-6
am
6-7
am
7-8
am
8-9
am
9-10
am
10-1
1 am
11-N
oon
Noo
n-1
pm
1-2
pm
2-3
pm
3-4
pm
4-5
pm
5-6
pm
6-7
pm
7-8
pm
8-9
pm
9-10
pm
10-1
1 pm
11-M
idni
ght
W/B To Manhattan
E/B To Queens
Hourly Vehicular VolumesQueens-Midtown Tunnel ~ 2012
20
40
60
80
100
1950
1955
1960
1965
1970
1975
1980
1985
1990
1995
2000
2005
2010
Average Daily Traffic Volumes ~ Total of Both DirectionsQueens–Midtown Tunnel
Tunnel opened November 15, 1940.
Thousands
Year
107

1,000
2,000
3,000
4,000M
idni
ght-1
am
1-2
am
2-3
am
3-4
am
4-5
am
5-6
am
6-7
am
7-8
am
8-9
am
9-10
am
10-1
1 am
11-N
oon
Noo
n-1
pm
1-2
pm
2-3
pm
3-4
pm
4-5
pm
5-6
pm
6-7
pm
7-8
pm
8-9
pm
9-10
pm
10-1
1 pm
11-M
idni
ght
S/B To Manhattan
N/B To Bronx
Hourly Vehicular VolumesHenry Hudson Bridge ~ 2012
20
40
60
80
1950
1955
1960
1965
1970
1975
1980
1985
1990
1995
2000
2005
2010
Average Daily Traffic Volumes ~ Total of Both DirectionsHenry Hudson BridgeThousands
Bridge opened December 12, 1936.
Year
108

1,000
2,000
3,000
4,000
5,000M
idni
ght-1
am
1-2
am
2-3
am
3-4
am
4-5
am
5-6
am
6-7
am
7-8
am
8-9
am
9-10
am
10-1
1 am
11-N
oon
Noo
n-1
pm
1-2
pm
2-3
pm
3-4
pm
4-5
pm
5-6
pm
6-7
pm
7-8
pm
8-9
pm
9-10
pm
10-1
1 pm
11-M
idni
ght
W/B To Manhattan E/B To Queens & Bronx
Hourly Vehicular VolumesRobert F. Kennedy Memorial Bridge, Manhattan Plaza ~ 2012
(Triborough Bridge)
20
40
60
80
100
120
1950
1955
1960
1965
1970
1975
1980
1985
1990
1995
2000
2005
2010
Average Daily Traffic Volumes ~ Total of Both DirectionsRobert F. Kennedy Memorial Bridge, Manhattan Plaza
(Triborough Bridge)
Bridge opened July 11, 1936. Renamed November 19, 2008.
Thousands
Year
109

110

PANYNJ Facilities
George Washington Bridge
111

GeorgeWashington Holland Lincoln
Year Bridge Tunnel Tunnel Totals
1948 42,306 42,623 30,856 115,785 1949 49,261 45,167 35,515 129,943 1950 54,437 49,660 42,556 146,653 1951 64,516 53,792 47,842 166,150 1952 76,446 51,317 53,490 181,253 1953 84,398 53,270 56,909 194,577 1954 90,306 54,560 57,528 202,394 1955 98,013 55,445 58,468 211,926 1956 97,059 56,961 59,068 213,088 1957 98,110 56,801 63,712 218,623 1958 97,435 55,881 68,178 221,494 1959 105,334 57,926 73,761 237,021 1960 106,245 57,678 75,697 239,620 1961 104,107 56,277 76,449 236,833 1962 111,090 58,518 81,038 250,646 1963 127,452 58,814 79,337 265,603 1964 143,193 59,702 82,929 285,824 1965 155,967 55,060 82,312 293,339 1966 167,304 55,559 81,118 303,981 1967 173,093 54,181 80,879 308,153 1968 182,934 53,962 83,396 320,292 1969 189,817 54,438 84,868 329,123 1970 194,910 58,574 94,354 347,838 1971 210,749 57,968 93,346 362,063 1972 221,172 61,485 95,963 378,620 1973 232,686 64,731 99,786 397,203 1974 211,955 64,765 99,827 376,547 1975 215,927 62,381 96,399 374,707 1976 215,136 64,663 101,451 381,250 1977 222,897 63,015 99,101 385,013 1978 229,666 66,405 103,441 399,512 1979 232,739 61,403 99,582 393,724 1980 235,615 64,417 104,702 404,734 1981 250,804 68,750 107,827 427,381 1982 249,294 73,997 110,453 433,744 1983 254,728 76,226 110,210 441,164 1984 258,723 71,819 123,233 453,775 1985 275,934 76,121 116,397 468,452 1986 286,398 77,300 122,053 485,751 1987 288,642 73,655 124,342 486,639 1988 284,984 84,626 120,569 490,179 1989 281,812 84,429 121,452 487,693 1990 272,556 87,976 121,711 482,243 1991 262,491 87,502 117,508 467,501 1992 268,007 90,206 118,659 476,872 1993 260,732 92,685 119,652 473,069 1994 259,863 94,637 119,299 473,799 1995 266,029 96,310 119,759 482,098 1996 275,469 96,798 120,927 493,194 1997 282,293 100,986 121,509 504,788 1998 297,188 100,872 124,452 522,512 1999 317,640 103,020 128,692 549,352 2000 317,618 101,137 129,710 548,465 2001 309,310 43,377 106,257 458,944 2002 310,771 92,557 129,511 532,839 2003 319,029 101,097 127,323 547,449 2004 315,066 96,171 125,159 536,396 2005 304,302 96,960 126,455 527,717 2006 312,078 98,425 127,245 537,748 2007 291,391 100,491 122,092 513,974 2008 293,059 97,057 118,153 508,269 2009 289,694 96,184 118,982 504,860 2010 292,047 94,667 119,832 506,546 2011 279,896 93,560 117,653 491,109 2012 276,648 92,743 113,166 482,557
PANYNJ one-way tolls initiated 8/12/1970. PANYNJ toll increases May 1975, January 1984, April, 1987, April 1991, March 2001, March 2008, September 2011, & December 2012.
PANYNJ Manhattan - New Jersey FacilitiesAverage Daily Traffic Volumes
1948 - 2012
112
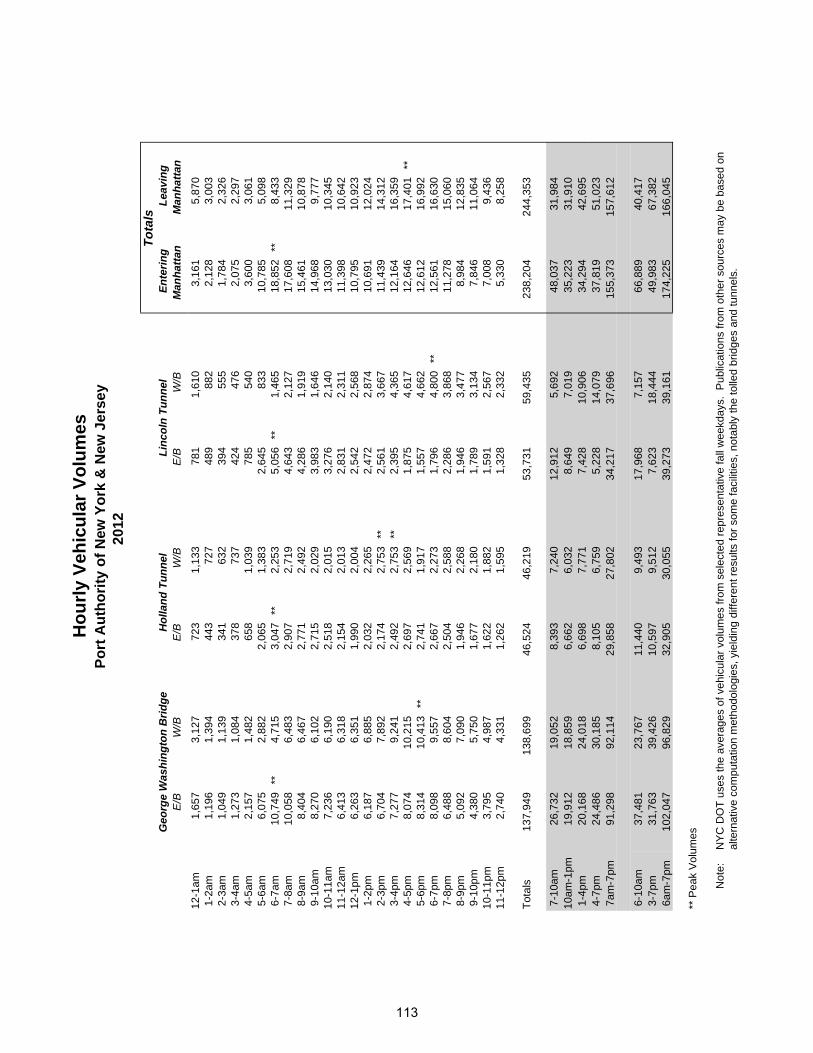
Tota
lsG
eorg
e W
ashi
ngto
n B
ridge
Hol
land
Tun
nel
L
inco
ln T
unne
l
Ent
erin
g L
eavi
ng
E/B
W
/B
E/B
W
/B
E/B
W
/B
Man
hatta
n M
anha
ttan
12-1
am1,
657
3,12
772
31,
133
781
1,61
03,
161
5,87
0 1
-2am
1,19
61,
394
443
727
489
882
2,12
83,
003
2-3
am1,
049
1,13
934
163
239
455
51,
784
2,32
6 3
-4am
1,27
31,
084
378
737
424
476
2,07
52,
297
4-5
am2,
157
1,48
265
81,
039
785
540
3,60
03,
061
5-6
am6,
075
2,88
22,
065
1,38
32,
645
833
10,7
855,
098
6-7
am10
,749
**4,
715
3,04
7**
2,25
35,
056
**1,
465
18,8
52**
8,43
3 7
-8am
10,0
586,
483
2,90
72,
719
4,64
32,
127
17,6
0811
,329
8-9
am8,
404
6,46
72,
771
2,49
24,
286
1,91
915
,461
10,8
78 9
-10a
m8,
270
6,10
22,
715
2,02
93,
983
1,64
614
,968
9,77
710
-11a
m7,
236
6,19
02,
518
2,01
53,
276
2,14
013
,030
10,3
4511
-12a
m6,
413
6,31
82,
154
2,01
32,
831
2,31
111
,398
10,6
4212
-1pm
6,26
36,
351
1,99
02,
004
2,54
22,
568
10,7
9510
,923
1-2
pm6,
187
6,88
52,
032
2,26
52,
472
2,87
410
,691
12,0
24 2
-3pm
6,70
47,
892
2,17
42,
753
**2,
561
3,66
711
,439
14,3
12 3
-4pm
7,27
79,
241
2,49
22,
753
**2,
395
4,36
512
,164
16,3
59 4
-5pm
8,07
410
,215
2,69
72,
569
1,87
54,
617
12,6
4617
,401
** 5
-6pm
8,31
410
,413
**2,
741
1,91
71,
557
4,66
212
,612
16,9
92 6
-7pm
8,09
89,
557
2,66
72,
273
1,79
64,
800
**12
,561
16,6
30 7
-8pm
6,48
88,
604
2,50
42,
588
2,28
63,
868
11,2
7815
,060
8-9
pm5,
092
7,09
01,
946
2,26
81,
946
3,47
78,
984
12,8
35 9
-10p
m4,
380
5,75
01,
677
2,18
01,
789
3,13
47,
846
11,0
6410
-11p
m3,
795
4,98
71,
622
1,88
21,
591
2,56
77,
008
9,43
611
-12p
m2,
740
4,33
11,
262
1,59
51,
328
2,33
25,
330
8,25
8
Tota
ls13
7,94
913
8,69
946
,524
46,2
1953
,731
59,4
3523
8,20
424
4,35
3
7-1
0am
26,7
3219
,052
8,39
37,
240
12,9
125,
692
48,0
3731
,984
10am
-1pm
19,9
1218
,859
6,66
26,
032
8,64
97,
019
35,2
2331
,910
1-4
pm20
,168
24,0
186,
698
7,77
17,
428
10,9
0634
,294
42,6
95 4
-7pm
24,4
8630
,185
8,10
56,
759
5,22
814
,079
37,8
1951
,023
7am
-7pm
91,2
9892
,114
29,8
5827
,802
34,2
1737
,696
155,
373
157,
612
6-1
0am
37,4
8123
,767
11,4
409,
493
17,9
687,
157
66,8
8940
,417
3-7
pm31
,763
39,4
2610
,597
9,51
27,
623
18,4
4449
,983
67,3
82 6
am-7
pm10
2,04
796
,829
32,9
0530
,055
39,2
7339
,161
174,
225
166,
045
** P
eak
Vol
umes
Not
e:
NY
C D
OT
uses
the
aver
ages
of v
ehic
ular
vol
umes
from
sel
ecte
d re
pres
enta
tive
fall
wee
kday
s. P
ublic
atio
ns fr
om o
ther
sou
rces
may
be
base
d on
al
tern
ativ
e co
mpu
tatio
n m
etho
dolo
gies
, yie
ldin
g di
ffere
nt re
sults
for s
ome
faci
litie
s, n
otab
ly th
e to
lled
brid
ges
and
tunn
els.
Hou
rly V
ehic
ular
Vol
umes
Port
Aut
horit
y of
New
Yor
k &
New
Jer
sey
2012
113

2-W
ayS
mal
lLa
rge
Tota
l
Sm
all
Larg
eTo
tal
G
rand
Aut
osB
uses
Truc
ksTr
ucks
Veh
icle
sA
utos
Bus
esTr
ucks
Truc
ksV
ehic
les
Tota
ls
12-1
am1,
318
1045
284
1,65
7
2,75
617
5829
63,
127
4,
784
1-2
am81
15
6631
41,
196
1,
394
2,
590
2-3
am61
24
7435
91,
049
1,
139
2,
188
3-4
am69
64
103
470
1,27
3
1,08
4
2,35
7 4
-5am
1,37
112
154
620
2,15
7
1,48
2
3,63
9 5
-6am
4,95
837
344
736
6,07
5
2,06
817
230
567
2,88
2
8,95
7 6
-7am
9,63
873
451
587
10,7
49
**3,
808
5829
955
04,
715
15
,464
7
-8am
9,20
810
035
939
110
,058
5,
609
8534
644
36,
483
16
,541
8
-9am
7,61
282
362
348
8,40
4
5,68
579
304
399
6,46
7
14,8
71
9-1
0am
7,40
881
370
411
8,27
0
5,15
280
354
516
6,10
2
14,3
72
10-1
1am
6,44
956
321
410
7,23
6
5,02
068
373
729
6,19
0
13,4
26
11-1
2am
5,69
957
278
379
6,41
3
5,03
053
423
812
6,31
8
12,7
31
12-1
pm5,
566
6727
835
26,
263
5,
134
6343
971
56,
351
12
,614
1
-2pm
5,56
164
257
305
6,18
7
5,78
450
457
594
6,88
5
13,0
72
2-3
pm6,
067
8525
929
36,
704
6,
891
6241
952
07,
892
14
,596
3
-4pm
6,70
897
227
245
7,27
7
8,20
168
420
552
9,24
1
16,5
18
4-5
pm7,
554
102
200
218
8,07
4
9,32
882
343
462
10,2
15
18,2
89
5-6
pm7,
864
102
150
198
8,31
4
9,60
179
310
423
10,4
13
**18
,727
**
6-7
pm7,
694
7912
020
58,
098
8,
935
8220
733
39,
557
17
,655
7
-8pm
6,12
067
8821
36,
488
8,
046
6714
734
48,
604
15
,092
8
-9pm
4,73
750
7323
25,
092
6,
584
4911
734
07,
090
12
,182
9
-10p
m4,
042
3964
235
4,38
0
5,26
137
9535
75,
750
10
,130
10
-11p
m3,
469
2350
253
3,79
5
4,57
341
5831
54,
987
8,
782
11-1
2pm
2,43
419
3725
02,
740
3,
951
3259
289
4,33
1
7,07
1
Tota
l s12
3,59
61,
315
4,73
08,
308
137,
949
13
8,69
9
276,
648
7-1
0am
24,2
2826
31,
091
1,15
026
,732
16
,446
244
1,00
41,
358
19,0
52
45,7
84
10am
-1pm
17,7
1418
087
71,
141
19,9
12
15,1
8418
41,
235
2,25
618
,859
38
,771
1
-4pm
18,3
3624
674
384
320
,168
20
,876
180
1,29
61,
666
24,0
18
44,1
86
4-7
pm23
,112
283
470
621
24,4
86
27,8
6424
386
01,
218
30,1
85
54,6
71
7am
-7pm
83,3
9097
23,
181
3,75
591
,298
80
,370
851
4,39
56,
498
92,1
14
183,
412
6-1
0am
33,8
6633
61,
542
1,73
737
,481
20
,254
302
1,30
31,
908
23,7
67
61,2
48
3-7
pm29
,820
380
697
866
31,7
63
36,0
6531
11,
280
1,77
039
,426
71
,189
6
am-7
pm93
,028
1,04
53,
632
4,34
210
2,04
7
84,1
7890
94,
694
7,04
896
,829
19
8,87
6
Cla
ssifi
catio
n ba
sed
on O
ctob
er 2
012
Dat
a.**
Pea
k V
olum
es
Hou
rly V
ehic
ular
Vol
umes
Geo
rge
Was
hing
ton
Brid
ge -
2012
East
boun
d to
Man
hatta
nW
estb
ound
to N
ew J
erse
y
114

2
4
6
8
10
12
14M
idni
ght-1
am
1-2
am
2-3
am
3-4
am
4-5
am
5-6
am
6-7
am
7-8
am
8-9
am
9-10
am
10-1
1 am
11-N
oon
Noo
n-1
pm
1-2
pm
2-3
pm
3-4
pm
4-5
pm
5-6
pm
6-7
pm
7-8
pm
8-9
pm
9-10
pm
10-1
1 pm
11-M
idni
ght
E/B To Manhattan
W/B To New Jersey
Hourly Vehicular VolumesGeorge Washington Bridge ~ 2012
50
100
150
200
250
300
350
1950
1955
1960
1965
1970
1975
1980
1985
1990
1995
2000
2005
2010
Average Daily Traffic Volumes ~ Total of Both DirectionsGeorge Washington Bridge
Upper Level opened October 25, 1931.
Lower Level opened August 29, 1962.
Thousands
Year
Thousands
115

2-W
ayS
mal
lLa
rge
Tota
l
Sm
all
Larg
eTo
tal
G
rand
Aut
osB
uses
Truc
ksTr
ucks
Veh
icle
sA
utos
Bus
esTr
ucks
Truc
ksV
ehic
les
Tota
ls
12-1
am66
79
470
723
1,
096
235
01,
133
1,
856
1-2
am41
14
280
443
72
7
1,17
0 2
-3am
301
634
034
1
632
97
3 3
-4am
315
261
037
8
737
1,
115
4-5
am57
48
742
658
1,
039
1,
697
5-6
am1,
926
2111
53
2,06
5
1,30
07
760
1,38
3
3,44
8 6
-7am
2,86
864
113
23,
047
**
2,12
623
104
02,
253
5,
300
7-8
am2,
721
6811
62
2,90
7
2,57
432
113
02,
719
5,
626
** 8
-9am
2,58
756
126
22,
771
2,
339
4710
42
2,49
2
5,26
3 9
-10a
m2,
550
5510
82
2,71
5
1,82
948
152
02,
029
4,
744
10-1
1am
2,39
028
991
2,51
8
1,82
126
167
12,
015
4,
533
11-1
2am
2,06
019
750
2,15
4
1,80
013
199
12,
013
4,
167
12-1
pm1,
906
1964
11,
990
1,
805
619
12
2,00
4
3,99
4 1
-2pm
1,94
820
631
2,03
2
2,09
49
161
12,
265
4,
297
2-3
pm2,
089
2857
02,
174
2,
567
1317
21
2,75
3
**4,
927
3-4
pm2,
378
5756
12,
492
2,
597
2213
40
2,75
3
**5,
245
4-5
pm2,
538
105
531
2,69
7
2,40
049
120
02,
569
5,
266
5-6
pm2,
639
7131
02,
741
1,
773
5391
01,
917
4,
658
6-7
pm2,
580
5828
12,
667
2,
185
4444
02,
273
4,
940
7-8
pm2,
445
3227
02,
504
2,
503
1965
12,
588
5,
092
8-9
pm1,
884
1546
11,
946
2,
191
2749
12,
268
4,
214
9-1
0pm
1,62
912
360
1,67
7
2,13
617
270
2,18
0
3,85
7 10
-11p
m1,
588
1222
01,
622
1,
844
1621
11,
882
3,
504
11-1
2pm
1,23
68
171
1,26
2
1,53
36
560
1,59
5
2,85
7
Tota
ls44
,230
777
1,49
621
46,5
24
46,2
19
92,7
43
7-1
0am
7,85
817
935
06
8,39
3
6,74
212
736
92
7,24
0
15,6
33
10am
-1p m
6,35
666
238
26,
662
5,
426
4555
74
6,03
2
12,6
94
1-4
pm6,
415
105
176
26,
698
7,
258
4446
72
7,77
1
14,4
69
4-7
pm7,
757
234
112
28,
105
6,
358
146
255
06,
759
14
,864
7
am-7
pm28
,386
584
876
1229
,858
25
,784
362
1,64
88
27,8
02
57,6
60
6-1
0am
10,7
2624
346
38
11,4
40
8,86
815
047
32
9,49
3
20,9
33
3-7
pm10
,135
291
168
310
,597
8,
955
168
389
09,
512
20
,109
6
am-7
pm31
,254
648
989
1432
,905
27
,910
385
1,75
28
30,0
55
62,9
60
Cla
ssific
atio
n ba
sed
on O
ctob
er 2
012
Dat
a.**
Pea
k V
olum
es
East
boun
d to
Man
hatta
nW
estb
ound
to N
ew J
erse
y
Hol
land
Tun
nel -
201
2H
ourly
Veh
icul
ar V
olum
es
116
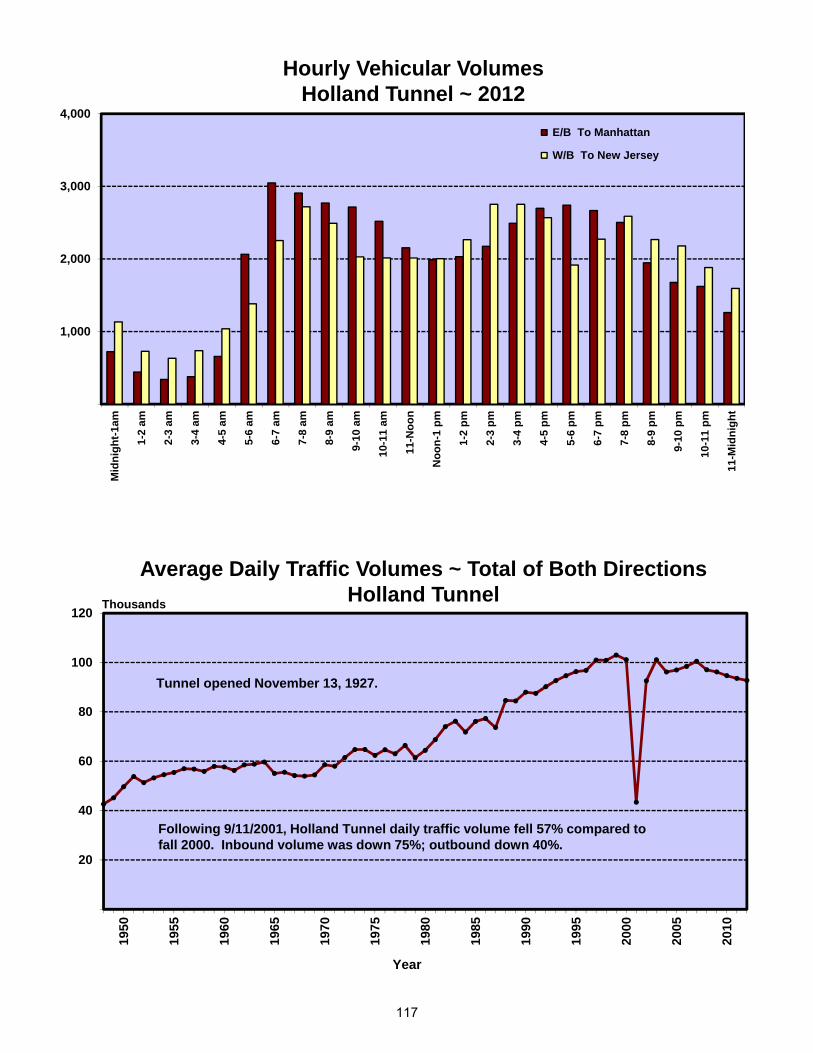
1,000
2,000
3,000
4,000M
idni
ght-1
am
1-2
am
2-3
am
3-4
am
4-5
am
5-6
am
6-7
am
7-8
am
8-9
am
9-10
am
10-1
1 am
11-N
oon
Noo
n-1
pm
1-2
pm
2-3
pm
3-4
pm
4-5
pm
5-6
pm
6-7
pm
7-8
pm
8-9
pm
9-10
pm
10-1
1 pm
11-M
idni
ght
E/B To Manhattan
W/B To New Jersey
Hourly Vehicular VolumesHolland Tunnel ~ 2012
20
40
60
80
100
120
1950
1955
1960
1965
1970
1975
1980
1985
1990
1995
2000
2005
2010
Average Daily Traffic Volumes ~ Total of Both DirectionsHolland Tunnel
Tunnel opened November 13, 1927.
Thousands
Year
Following 9/11/2001, Holland Tunnel daily traffic volume fell 57% compared tofall 2000. Inbound volume was down 75%; outbound down 40%.
117
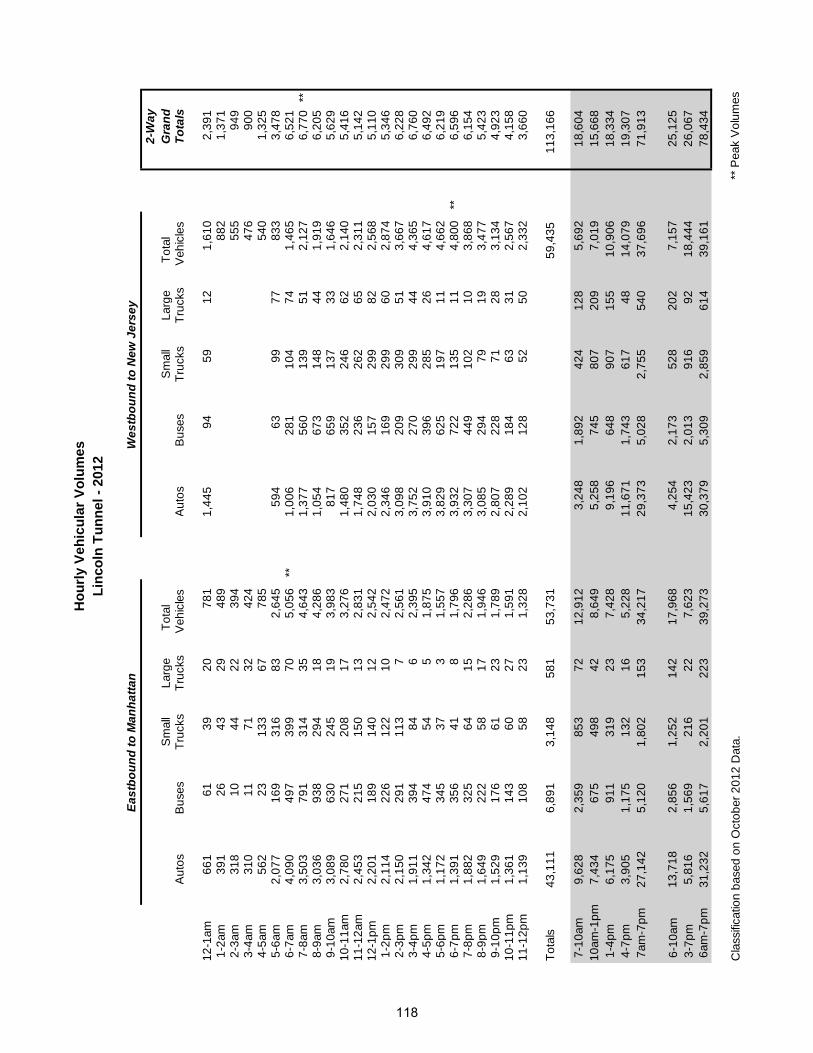
2-W
ayS
mal
lLa
r ge
Tota
l
Sm
all
Larg
eTo
tal
G
rand
Aut
osB
uses
Truc
ksTr
ucks
Veh
icle
sA
utos
Bus
esTr
ucks
Truc
ksV
ehic
les
Tota
ls
12-1
am66
161
3920
781
1,
445
9459
121,
610
2,
391
1-2
am39
126
4329
489
88
2
1,37
1 2
-3am
318
1044
2239
4
555
94
9 3
-4am
310
1171
3242
4
476
90
0 4
-5am
562
2313
367
785
54
0
1,32
5 5
-6am
2,07
716
931
683
2,64
5
594
6399
7783
3
3,47
8 6
-7am
4,09
049
739
970
5,05
6
**1,
006
281
104
741,
465
6,
521
7-8
am3,
503
791
314
354,
643
1,
377
560
139
512,
127
6,
770
** 8
-9am
3,03
693
829
418
4,28
6
1,05
467
314
844
1,91
9
6,20
5 9
-10a
m3,
089
630
245
193,
983
81
765
913
733
1,64
6
5,62
9 10
-11a
m2,
780
271
208
173,
276
1,
480
352
246
622,
140
5,
416
11-1
2am
2,45
321
515
013
2,83
1
1,74
823
626
265
2,31
1
5,14
2 12
-1pm
2,20
118
914
012
2,54
2
2,03
015
729
982
2,56
8
5,11
0 1
-2pm
2,11
422
612
210
2,47
2
2,34
616
929
960
2,87
4
5,34
6 2
-3pm
2,15
029
111
37
2,56
1
3,09
820
930
951
3,66
7
6,22
8 3
-4pm
1,91
139
484
62,
395
3,
752
270
299
444,
365
6,
760
4-5
pm1,
342
474
545
1,87
5
3,91
039
628
526
4,61
7
6,49
2 5
-6pm
1,17
234
537
31,
557
3,
829
625
197
114,
662
6,
219
6-7
pm1,
391
356
418
1,79
6
3,93
272
213
511
4,80
0
**6,
596
7-8
pm1,
882
325
6415
2,28
6
3,30
744
910
210
3,86
8
6,15
4 8
-9pm
1,64
922
258
171,
946
3,
085
294
7919
3,47
7
5,42
3 9
-10 p
m1,
529
176
6123
1,78
9
2,80
722
871
283,
134
4,
923
10-1
1 pm
1,36
114
360
271,
591
2,
289
184
6331
2,56
7
4,15
8 11
-12 p
m1,
139
108
5823
1,32
8
2,10
212
852
502,
332
3,
660
Tota
ls43
,111
6,89
13,
148
581
53,7
31
59,4
3511
3,16
6
7-1
0am
9,62
82,
359
853
7212
,912
3,
248
1,89
242
412
85,
692
18
,604
10
am-1
p m7,
434
675
498
428,
649
5,
258
745
807
209
7,01
9
15,6
68
1-4
pm6,
175
911
319
237,
428
9,
196
648
907
155
10,9
06
18,3
34
4-7
pm3,
905
1,17
513
216
5,22
8
11,6
711,
743
617
4814
,079
19
,307
7
am-7
pm27
,142
5,12
01,
802
153
34,2
17
29,3
735,
028
2,75
554
037
,696
71
,913
6-1
0am
13,7
182,
856
1,25
214
217
,968
4,
254
2,17
352
820
27,
157
25
,125
3
-7pm
5,81
61,
569
216
227,
623
15
,423
2,01
391
692
18,4
44
26,0
67
6am
-7pm
31,2
325,
617
2,20
122
339
,273
30
,379
5,30
92,
859
614
39,1
61
78,4
34
Cla
ssific
atio
n ba
sed
on O
ctob
er 2
012
Dat
a.**
Pea
k V
olum
es
East
boun
d to
Man
hatta
nW
estb
ound
to N
ew J
erse
y
Linc
oln
Tunn
el -
2012
Hou
rly V
ehic
ular
Vol
umes
118

1,000
2,000
3,000
4,000
5,000
6,000M
idni
ght-1
am
1-2
am
2-3
am
3-4
am
4-5
am
5-6
am
6-7
am
7-8
am
8-9
am
9-10
am
10-1
1 am
11-N
oon
Noo
n-1
pm
1-2
pm
2-3
pm
3-4
pm
4-5
pm
5-6
pm
6-7
pm
7-8
pm
8-9
pm
9-10
pm
10-1
1 pm
11-M
idni
ght
E/B To Manhattan
W/B To New Jersey
Hourly Vehicular VolumesLincoln Tunnel ~ 2012
20
40
60
80
100
120
140
160
1950
1955
1960
1965
1970
1975
1980
1985
1990
1995
2000
2005
2010
Average Daily Traffic Volumes ~ Total of Both DirectionsLincoln Tunnel
Center tube opened December 22, 1937.North tube opened February 1, 1945.South tube opened May 25, 1957.
Thousands
Year
Following 9/11/2001, Lincoln Tunnel daily traffic volume fell 18% compared tofall 2000. Inbound volume was down 13%; outbound down 23%.
119

120

APPENDIX
2012 Bridge and Tunnel Reconstruction


A - 1
APPENDIX
Major Bridge Reconstruction In 2012
Brooklyn Bridge (East River between Brooklyn & Manhattan)
As of Monday night, April 4, 2011, the Brooklyn Bridge was closed to Manhattan-bound traffic during overnight hours for reconstruction.
The closure times in 2012 were as follows.
01/01 – 06/30: 11:00pm –6:00am Sun–Fri, 12:01am–7:00am Sat, 12:01am–9:00am Sun.
07/01 – 07/13: 11:00pm –6:00am Sun–Fri, 12:01am–7:00am Sat.
07/14 – 08/17: 10:30pm –6:00am Sun–Fri, 12:01am–7:00am Sat, 12:01am–9:00am Sun.
08/18 – 10/05: 10:30pm –6:00am Sun–Fri, 12:01am–7:00am Sat.
10/06 – 10/19: 10:30pm –6:00am Sun–Fri, 12:01am Sat. – 6:00am Mon.
10/20 – 11/02: 10:30pm –6:00am Sun–Fri, 12:01am–7:00am Sat, 12:01am–9:00am Sun.
12/10 –12/21: 10:30pm –6:00am Sun–Fri, 12:01am–7:00am Sat, 12:01am–9:00am Sun.
On Gridlock Alert Days, closures did not begin until midnight.
Bicycle and pedestrian access was maintained during these times.
The northbound FDR Drive exit to the bridge was closed during these times.
The Brooklyn – Queens Expressway eastbound exit to the Manhattan-bound bridge was closed during these times.
The Manhattan Bridge Lower Roadway was operated Manhattan-bound weekdays from 9:00pm to 3:00pm.
There were no closures Memorial Day weekend or Labor Day weekend.
There were no closures from December 22, 2012 to January 2, 2013.

A - 2
Throughout 2012, there were additional closures of single lanes in each direction on the Brooklyn Bridge during off–peak hours.
Ed Koch Queensboro Bridge (East River between Queens & Manhattan)
This bridge was officially renamed on April 11, 2011, when Mayor Michael R. Bloomberg signed the legislation which had been passed by the City Council on March 23, 2011.
Throughout 2012, trucks were permitted only on the two Lower Inner Roadways.
Throughout 2012, a High Occupancy Vehicle (HOV) facility was in effect on the Ed Koch Queensboro Bridge. The normally Queens–bound South Upper Roadway was reversed between 6:00am and 10:00am on weekdays to accommodate Manhattan–bound HOVs (no trucks) carrying two or more occupants.
Throughout 2012, the North Outer Roadway was reserved for bicyclists and pedestrians.
Ed Koch Queensboro Bridge Operation: All 2012 except as noted. North Inner Roadway: W/B all times; W/B trucks required to use this roadway. South Inner Roadway: E/B all times; E/B trucks required to use this roadway. North Upper Roadway: W/B all times. South Upper Roadway: Closed for reversal 5:30–6:00am weekdays, W/B HOVs 6:00–10:00am weekdays, Closed for reversal 10:00–11:00am weekdays, E/B all other times. North Outer Roadway: Bicyclists and pedestrians all times. South Outer Roadway: E/B all times (passenger cars only).
South Outer Roadway was closed as follows in 2012. 02/18 – 02/26: 2:00am – 2:00pm Sat-Sun-Mon. Roadway closed. 03/02 – 03/17: 2:00am – 2:00pm Sat-Sun. Roadway closed. 10/27 – 11/16: 1:00am – 5:30am Mon-Fri. Rdwy closed intermittently. 2:00am – 7:00am Sat. Rdwy closed intermittently. 2”00am – 8:00am Sun. Rdwy closed intermittently.
One of two lanes on the South Upper Roadway was closed as follows in 2012. 06/16 - 06/17: 10:00am – 2:00pm Mon-Fri, 6:00am – 1:00pm Sat-Sun. 06/23 - 12/31: 10:00am – 2:00pm Mon-Fri.
North Upper Roadway lane closures were in effect as follows in 2012. 08/18 – 08/31: 10:00pm – 11:00pm Fri-Sat. 1 of 2 lanes closed. 6:00am – 2:00pm Sat-Sun. 1 of 2 lanes closed. 11:00pm – 6:00am Fri-Sat. Both lanes closed.
Throughout 2012, there were additional intermittent closings of single lanes on individual roadways of the Ed Koch Queensboro Bridge during off-peak hours.
A - 3
Manhattan Bridge (East River between Brooklyn & Manhattan)
The Manhattan Bridge was open to pedestrians and bicyclists during all hours throughout 2012. As of July 18, 2011, pedestrians and bicyclists had traded paths so that the north path was used by pedestrians and the south path was used by cyclists. This reversal of pedestrian and bicycle paths was necessary during reconstruction along the north side. The reversal of paths remained in effect until March 5, 2012, at which time cyclists returned to the north path and pedestrians returned to the south path.
Manhattan Bridge Operation: All 2012
Note: During 2012, the nearby Brooklyn Bridge was closed to Manhattan-bound traffic during overnight hours.
• 6:00am – 10:00am weekdays. One of three lanes closed on the Lower Roadway.
- Manhattan-bound: 4 lanes. - 2 lanes on the North Upper Roadway (no trucks, left lane reserved
for buses and HOV 2+). - 2 lanes on the Lower Roadway for all vehicle types.
- Brooklyn-bound: 2 lanes on the South Upper Roadway.
• 10:00am – 2:00pm weekdays. Two of three lanes closed on the Lower Roadway.
- Manhattan-bound: 3 lanes. 2 lanes on the North Upper Roadway (no trucks January 1 to March 16). Truck ban during these hours discontinued as of March 17, 2012. 1 lane on the Lower Roadway for all vehicle types.
- Brooklyn-bound: 2 lanes on the South Upper Roadway.
• 2:00pm – 3:00pm weekdays. Lower Roadway closed for reversal.
- Manhattan-bound: 2 lanes on the North Upper Roadway. - Brooklyn-bound: 2 lanes on the South Upper Roadway.
• 3:00pm – 9:00pm weekdays. One of three lanes closed on the Lower Roadway.
- Manhattan-bound: 2 lanes on the North Upper Roadway. - Brooklyn-bound: 4 lanes.
- 2 lanes on the South Upper Roadway. - 2 lanes on the Lower Roadway.
• 9:00pm – 9:30pm weekdays. Lower Roadway closed for reversal.
- Manhattan-bound: 2 lanes on the North Upper Roadway. - Brooklyn-bound: 2 lanes on the South Upper Roadway.
A - 4
• 9:30pm – 6:00am weekdays. One of three lanes closed on the Lower Roadway.
- Manhattan-bound: 4 lanes. - 2 lanes on the North Upper Roadway. - 2 lanes on the Lower Roadway.
- Brooklyn-bound: 2 lanes on the South Upper Roadway.
• 9:00pm Friday – 10:00am Monday. One of three lanes closed on the Lower Roadway.
- Manhattan-bound: 4 lanes. - 2 lanes on the North Upper Roadway. - 2 lanes on the Lower Roadway.
- Brooklyn-bound: 2 lanes on the South Upper Roadway.
Manhattan Bridge Lower Roadway - Available to all vehicle types at all times. - Manhattan–bound trucks required to use the Lower Roadway during the following
times. - Weekdays 6:00am – 2:00pm from Jan. 1 to March 16, 2012. - Weekdays 6:00am – 10:00am as of March 17, 2012.
- Access to westbound Canal Street in Manhattan. - Off-peak lane closures as needed on the Lower Roadway.
Manhattan Bridge North Upper Roadway - Manhattan–bound all hours. - No trucks during the following times.
- Weekdays 6:00am – 2:00pm from Jan. 1 to March 16, 2012. - Weekdays 6:00am – 10:00am as of March 17, 2012.
- Left lane reserved for buses and HOVs weekdays 6:00am – 10:00am. Access to the HOV lane from Brooklyn–Queens Expressway eastbound exit 29A, from Nassau Street, and from Flatbush Avenue–Tillary Street.
- Single–occupant cars permitted only in the right lane weekdays 6:00am – 10:00am, with access from Brooklyn–Queens Expressway eastbound exit 29A and from Nassau Street. Single–occupant cars are not permitted to access the North Upper Roadway from Flatbush Avenue–Tillary Street during these hours.
- When the Lower Roadway is Manhattan–bound, access in Manhattan from the North Upper Roadway is to northbound Chrystie Street and eastbound Canal Street only, with no access to westbound Canal Street from the North Upper Roadway during these hours. Drivers seeking access to westbound Canal Street during these hours must use the Lower Roadway.
- Off-peak lane closures as needed on the Manhattan-bound North Upper Roadway.
Manhattan Bridge South Upper Roadway - Brooklyn–bound all hours for all vehicle types. - Off-peak lane closures as needed on the Brooklyn-bound South Upper Roadway.

A - 5
Throughout 2012, there were additional closures of single lanes in each direction on the Manhattan Bridge during off–peak hours.
Williamsburg Bridge (East River between Brooklyn & Manhattan)
Throughout 2012 trucks were permitted only on the outer roadways.
Pedestrian and bicycle access was maintained on the bridge at all times throughout 2012.
Williamsburg Bridge Operation: January 1 – March 18, 2012, Except as noted below.
• 6:00am – 10:00am weekdays. Two lanes closed in the off-peak direction.
- Manhattan-bound: 4 lanes. - Brooklyn-bound: 2 lanes.
• 10:00am – 3:00pm weekdays. Three lanes closed.
- Manhattan-bound: 3 lanes. - Brooklyn-bound: 2 lanes.
• All other times. - Manhattan-bound: 4 lanes. - Brooklyn-bound: 4 lanes.
Williamsburg Bridge Operation: March 19 – April 2, 2012, Except as noted below.
• 6:00am – 10:00am weekdays. Two lanes closed in the off-peak direction.
- Manhattan-bound: 4 lanes. - Brooklyn-bound: 2 lanes.
• 10:00am – 3:00pm weekdays. Three lanes closed.
- Manhattan-bound: 3 lanes. - Brooklyn-bound: 2 lanes.
• 10:00pm – 5:00am Mon-Thu. Three lanes closed.
- Manhattan-bound: 3 lanes. - Brooklyn-bound: 2 lanes.
• All other times. - Manhattan-bound: 4 lanes. - Brooklyn-bound: 4 lanes.
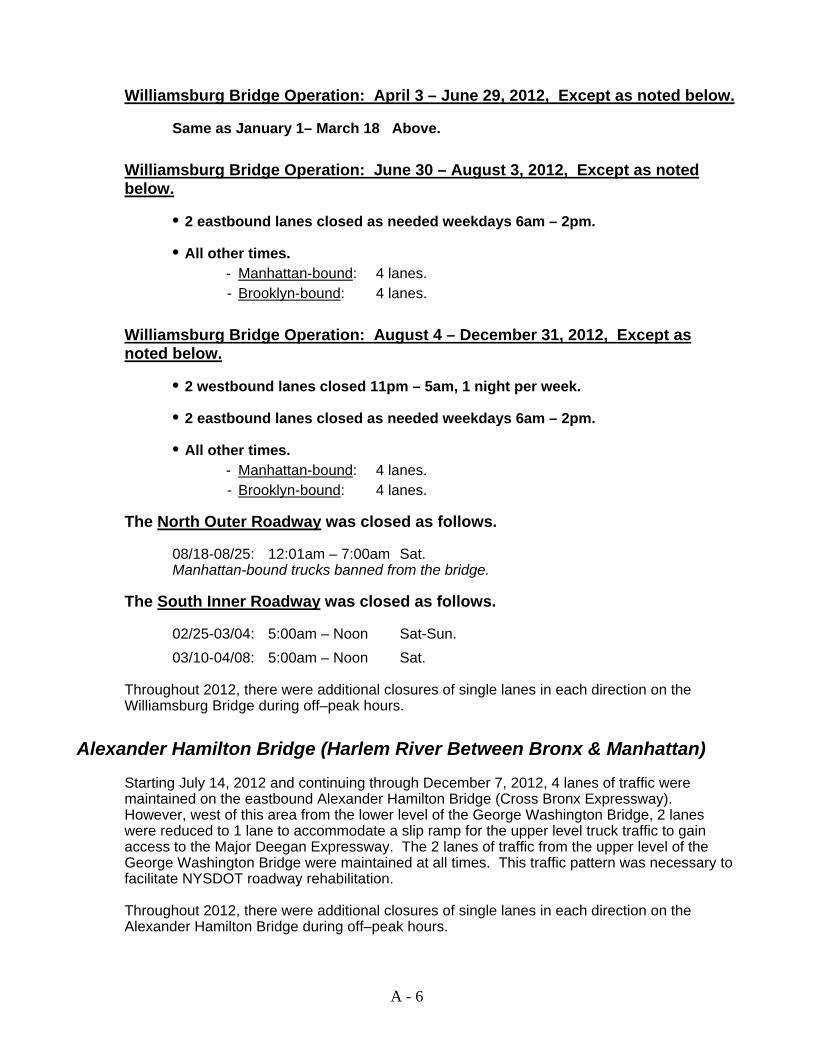
A - 6
Williamsburg Bridge Operation: April 3 – June 29, 2012, Except as noted below.
Same as January 1– March 18 Above.
Williamsburg Bridge Operation: June 30 – August 3, 2012, Except as noted below.
• 2 eastbound lanes closed as needed weekdays 6am – 2pm.
• All other times. - Manhattan-bound: 4 lanes. - Brooklyn-bound: 4 lanes.
Williamsburg Bridge Operation: August 4 – December 31, 2012, Except as noted below.
• 2 westbound lanes closed 11pm – 5am, 1 night per week.
• 2 eastbound lanes closed as needed weekdays 6am – 2pm.
• All other times. - Manhattan-bound: 4 lanes. - Brooklyn-bound: 4 lanes.
The North Outer Roadway was closed as follows.
08/18-08/25: 12:01am – 7:00am Sat. Manhattan-bound trucks banned from the bridge.
The South Inner Roadway was closed as follows.
02/25-03/04: 5:00am – Noon Sat-Sun. 03/10-04/08: 5:00am – Noon Sat.
Throughout 2012, there were additional closures of single lanes in each direction on the Williamsburg Bridge during off–peak hours.
Alexander Hamilton Bridge (Harlem River Between Bronx & Manhattan)
Starting July 14, 2012 and continuing through December 7, 2012, 4 lanes of traffic were maintained on the eastbound Alexander Hamilton Bridge (Cross Bronx Expressway). However, west of this area from the lower level of the George Washington Bridge, 2 lanes were reduced to 1 lane to accommodate a slip ramp for the upper level truck traffic to gain access to the Major Deegan Expressway. The 2 lanes of traffic from the upper level of the George Washington Bridge were maintained at all times. This traffic pattern was necessary to facilitate NYSDOT roadway rehabilitation.
Throughout 2012, there were additional closures of single lanes in each direction on the Alexander Hamilton Bridge during off–peak hours.
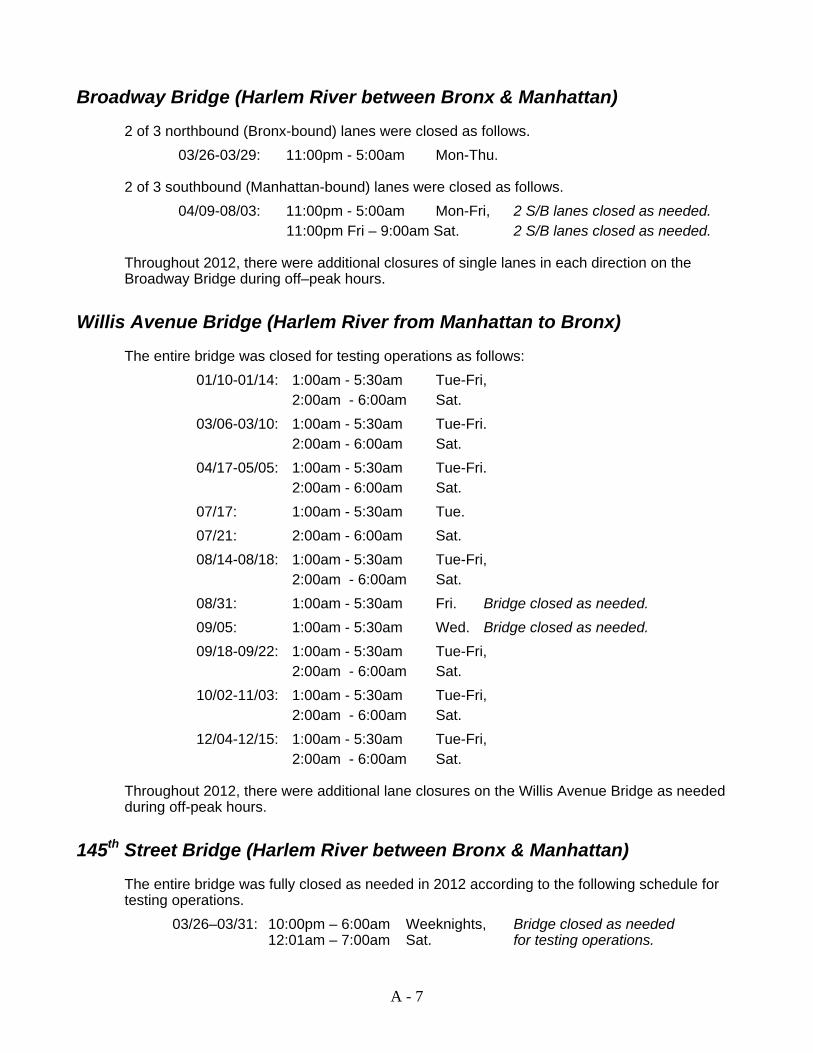
A - 7
Broadway Bridge (Harlem River between Bronx & Manhattan)
2 of 3 northbound (Bronx-bound) lanes were closed as follows. 03/26-03/29: 11:00pm - 5:00am Mon-Thu.
2 of 3 southbound (Manhattan-bound) lanes were closed as follows. 04/09-08/03: 11:00pm - 5:00am Mon-Fri, 2 S/B lanes closed as needed. 11:00pm Fri – 9:00am Sat. 2 S/B lanes closed as needed.
Throughout 2012, there were additional closures of single lanes in each direction on the Broadway Bridge during off–peak hours.
Willis Avenue Bridge (Harlem River from Manhattan to Bronx)
The entire bridge was closed for testing operations as follows: 01/10-01/14: 1:00am - 5:30am Tue-Fri, 2:00am - 6:00am Sat. 03/06-03/10: 1:00am - 5:30am Tue-Fri. 2:00am - 6:00am Sat. 04/17-05/05: 1:00am - 5:30am Tue-Fri. 2:00am - 6:00am Sat. 07/17: 1:00am - 5:30am Tue. 07/21: 2:00am - 6:00am Sat. 08/14-08/18: 1:00am - 5:30am Tue-Fri, 2:00am - 6:00am Sat. 08/31: 1:00am - 5:30am Fri. Bridge closed as needed. 09/05: 1:00am - 5:30am Wed. Bridge closed as needed. 09/18-09/22: 1:00am - 5:30am Tue-Fri, 2:00am - 6:00am Sat. 10/02-11/03: 1:00am - 5:30am Tue-Fri, 2:00am - 6:00am Sat. 12/04-12/15: 1:00am - 5:30am Tue-Fri, 2:00am - 6:00am Sat.
Throughout 2012, there were additional lane closures on the Willis Avenue Bridge as needed during off-peak hours.
145th Street Bridge (Harlem River between Bronx & Manhattan)
The entire bridge was fully closed as needed in 2012 according to the following schedule for testing operations.
03/26–03/31: 10:00pm – 6:00am Weeknights, Bridge closed as needed 12:01am – 7:00am Sat. for testing operations.
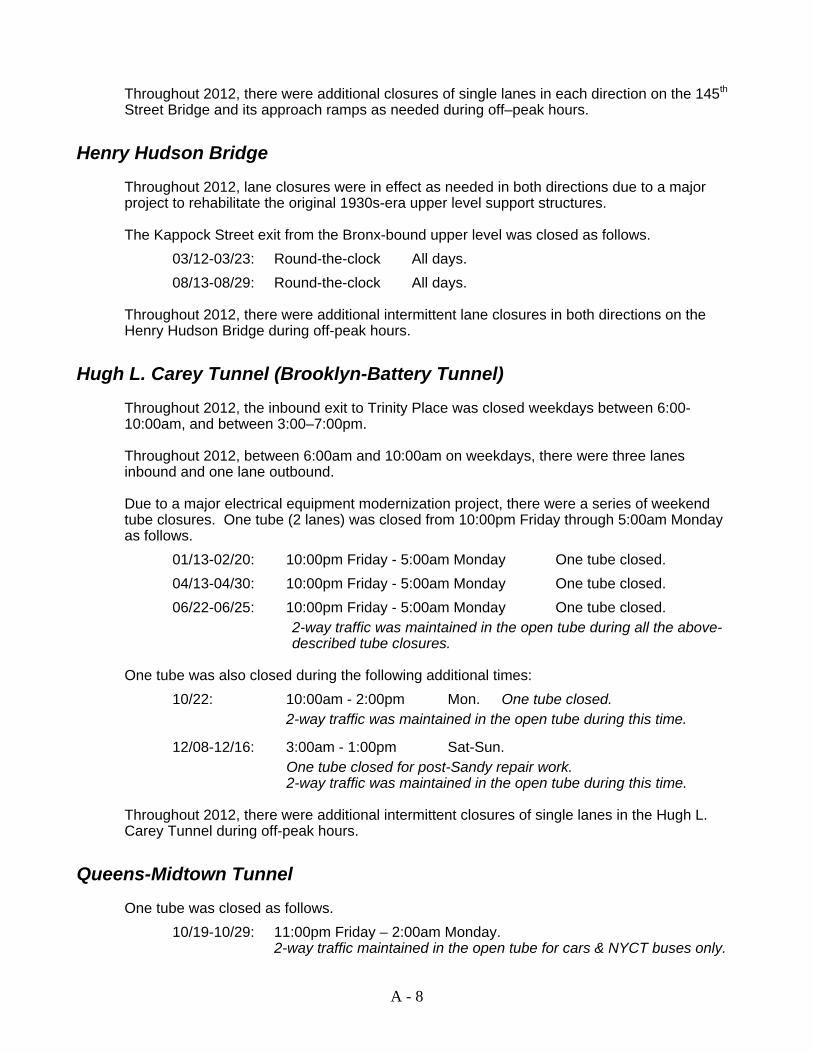
A - 8
Throughout 2012, there were additional closures of single lanes in each direction on the 145th Street Bridge and its approach ramps as needed during off–peak hours.
Henry Hudson Bridge
Throughout 2012, lane closures were in effect as needed in both directions due to a major project to rehabilitate the original 1930s-era upper level support structures.
The Kappock Street exit from the Bronx-bound upper level was closed as follows. 03/12-03/23: Round-the-clock All days. 08/13-08/29: Round-the-clock All days.
Throughout 2012, there were additional intermittent lane closures in both directions on the Henry Hudson Bridge during off-peak hours.
Hugh L. Carey Tunnel (Brooklyn-Battery Tunnel)
Throughout 2012, the inbound exit to Trinity Place was closed weekdays between 6:00-10:00am, and between 3:00–7:00pm.
Throughout 2012, between 6:00am and 10:00am on weekdays, there were three lanes inbound and one lane outbound.
Due to a major electrical equipment modernization project, there were a series of weekend tube closures. One tube (2 lanes) was closed from 10:00pm Friday through 5:00am Monday as follows.
01/13-02/20: 10:00pm Friday - 5:00am Monday One tube closed. 04/13-04/30: 10:00pm Friday - 5:00am Monday One tube closed. 06/22-06/25: 10:00pm Friday - 5:00am Monday One tube closed.
2-way traffic was maintained in the open tube during all the above-described tube closures.
One tube was also closed during the following additional times: 10/22: 10:00am - 2:00pm Mon. One tube closed.
2-way traffic was maintained in the open tube during this time.
12/08-12/16: 3:00am - 1:00pm Sat-Sun. One tube closed for post-Sandy repair work. 2-way traffic was maintained in the open tube during this time.
Throughout 2012, there were additional intermittent closures of single lanes in the Hugh L. Carey Tunnel during off-peak hours.
Queens-Midtown Tunnel
One tube was closed as follows. 10/19-10/29: 11:00pm Friday – 2:00am Monday. 2-way traffic maintained in the open tube for cars & NYCT buses only.
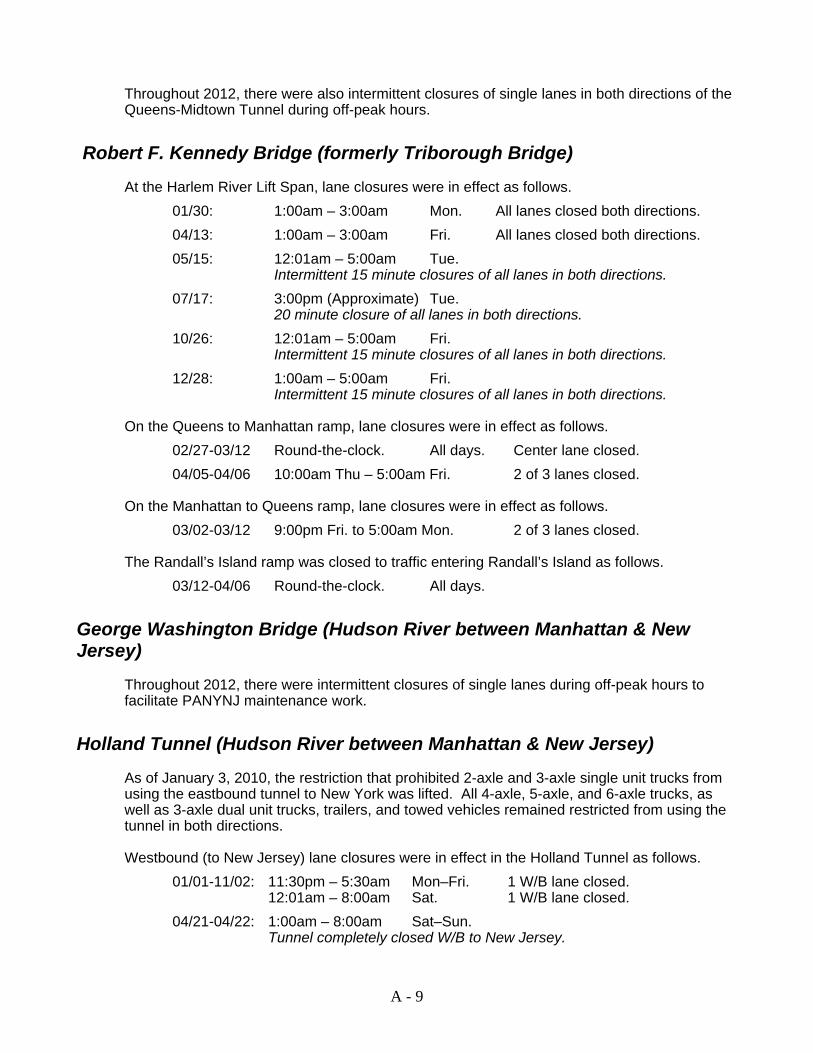
A - 9
Throughout 2012, there were also intermittent closures of single lanes in both directions of the Queens-Midtown Tunnel during off-peak hours.
Robert F. Kennedy Bridge (formerly Triborough Bridge)
At the Harlem River Lift Span, lane closures were in effect as follows. 01/30: 1:00am – 3:00am Mon. All lanes closed both directions. 04/13: 1:00am – 3:00am Fri. All lanes closed both directions. 05/15: 12:01am – 5:00am Tue. Intermittent 15 minute closures of all lanes in both directions. 07/17: 3:00pm (Approximate) Tue. 20 minute closure of all lanes in both directions. 10/26: 12:01am – 5:00am Fri. Intermittent 15 minute closures of all lanes in both directions. 12/28: 1:00am – 5:00am Fri. Intermittent 15 minute closures of all lanes in both directions.
On the Queens to Manhattan ramp, lane closures were in effect as follows. 02/27-03/12 Round-the-clock. All days. Center lane closed. 04/05-04/06 10:00am Thu – 5:00am Fri. 2 of 3 lanes closed.
On the Manhattan to Queens ramp, lane closures were in effect as follows. 03/02-03/12 9:00pm Fri. to 5:00am Mon. 2 of 3 lanes closed.
The Randall’s Island ramp was closed to traffic entering Randall’s Island as follows. 03/12-04/06 Round-the-clock. All days.
George Washington Bridge (Hudson River between Manhattan & New Jersey)
Throughout 2012, there were intermittent closures of single lanes during off-peak hours to facilitate PANYNJ maintenance work.
Holland Tunnel (Hudson River between Manhattan & New Jersey)
As of January 3, 2010, the restriction that prohibited 2-axle and 3-axle single unit trucks from using the eastbound tunnel to New York was lifted. All 4-axle, 5-axle, and 6-axle trucks, as well as 3-axle dual unit trucks, trailers, and towed vehicles remained restricted from using the tunnel in both directions.
Westbound (to New Jersey) lane closures were in effect in the Holland Tunnel as follows. 01/01-11/02: 11:30pm – 5:30am Mon–Fri. 1 W/B lane closed. 12:01am – 8:00am Sat. 1 W/B lane closed. 04/21-04/22: 1:00am – 8:00am Sat–Sun. Tunnel completely closed W/B to New Jersey.
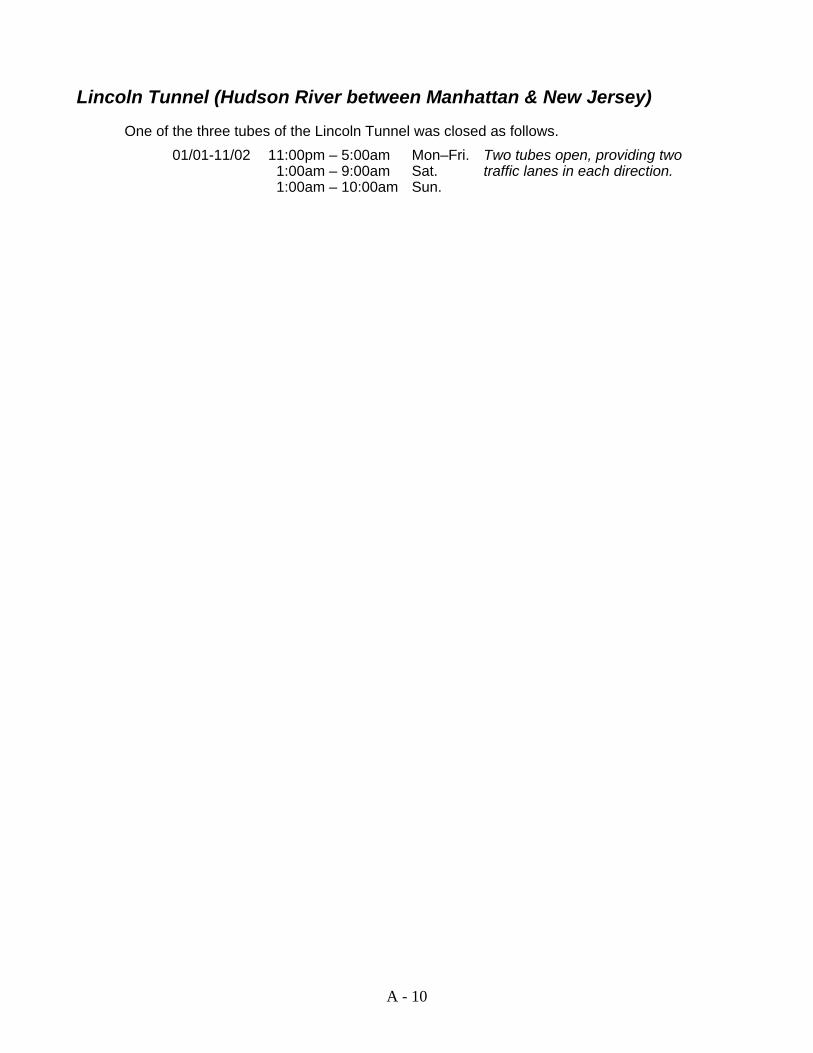
A - 10
Lincoln Tunnel (Hudson River between Manhattan & New Jersey)
One of the three tubes of the Lincoln Tunnel was closed as follows. 01/01-11/02 11:00pm – 5:00am Mon–Fri. Two tubes open, providing two 1:00am – 9:00am Sat. traffic lanes in each direction. 1:00am – 10:00am Sun.