
Image quality and accuracy in 3D scanners
25
25 Goodwin, L., Evison, M.P. and Schofield, D. (2010). Image quality and accuracy in 3D scanners. In, Evison, M.P. and Vorder Bruegge, R.W. (Eds.) Computer-aided forensic facial comparison. New York: Taylor and Francis, pp 11-33. ISBN 9781439811337 This text is the Accepted Manuscript only. The final volume can be found here. Goodwin, L., Evison, M.P. and Schofield, D. (2010). Image quality and accuracy in 3D scanners. In, Evison, M.P. and Vorder Bruegge, R.W. (Eds.) Computer-aided forensic facial comparison. New York: Taylor and Francis, pp 11-33. ISBN 9781439811337
-
Upload
independent -
Category
Documents
-
view
3 -
download
0
Transcript of Image quality and accuracy in 3D scanners

25
Goodwin, L., Evison, M.P. and Schofield, D. (2010). Image quality and accuracy in 3D
scanners. In, Evison, M.P. and Vorder Bruegge, R.W. (Eds.) Computer-aided forensic
facial comparison. New York: Taylor and Francis, pp 11-33. ISBN 9781439811337
This text is the Accepted Manuscript only. The final volume can be found here.
Goodwin, L., Evison, M.P. and Schofield, D. (2010). Image quality and accuracy in 3D scanners. In, Evison, M.P. and Vorder Bruegge, R.W. (Eds.) Computer-aided forensic facial comparison. New York: Taylor and Francis, pp 11-33. ISBN 9781439811337
26
CHAPTER 2
IMAGE QUALITY AND ACCURACY IN THREE 3D SCANNERS
Lorna Goodwin, Martin Evison and Damian Schofield
A. INTRODUCTION
There are a number of 3D stereophotographic and laser based scanners available commercially.
Of these, three scanners were assessed for 3D image quality and accuracy. These were a
Cyberware® 3030PS Head and Neck Scanner (Cyberware Inc., Monterey, CA), a Geometrix
FaceVision® FV802 Series Biometric Camera (ALIVE Tech, Cumming, GA) and a
3dMDface™ System (3dMD, Atlanta, GA) scanner.
These provisional assessments were intended to provide guidance as to the relative benefits of
the equipment for the purposes of computer-assisted forensic facial comparison and identify
factors affecting their optimal use.
All three scanners were investigated via a visual assessment of 3D image quality and an analysis
of accuracy of anthropometric landmarking from these images. Assessment of the 3dMDface™
System scanner, however, was restricted to the three subject images that were available. These
subjects were also scanned with the Cyberware® 3030PS Head and Neck Scanner and the
Geometrix FaceVision® FV802 Series Biometric Camera, permitting a limited direct
comparison between all three scanners. As the assessment of the 3dMDface™ System scanner is
based on a very small sample, it should be treated with circumspection.
Goodwin, L., Evison, M.P. and Schofield, D. (2010). Image quality and accuracy in 3D scanners. In, Evison, M.P. and Vorder Bruegge, R.W. (Eds.) Computer-aided forensic facial comparison. New York: Taylor and Francis, pp 11-33. ISBN 9781439811337
27
Data was collected from the three scanners and directly from live subjects using calipers for the
purposes of comparative controls.
It is important to note that neither the Cyberware® 3030PS Head and Neck Scanner or the
3dMDface™ System is built for forensic facial comparison. The Geometrix FaceVision® FV802
System, however, offers a further separate and purpose designed means of 3D landmarking via
triangulation from as series of 2D images. This facility is not evaluated in this Chapter, which is
concerned with 3D image quality and accuracy—it is considered in detail in Chapter 3, however.
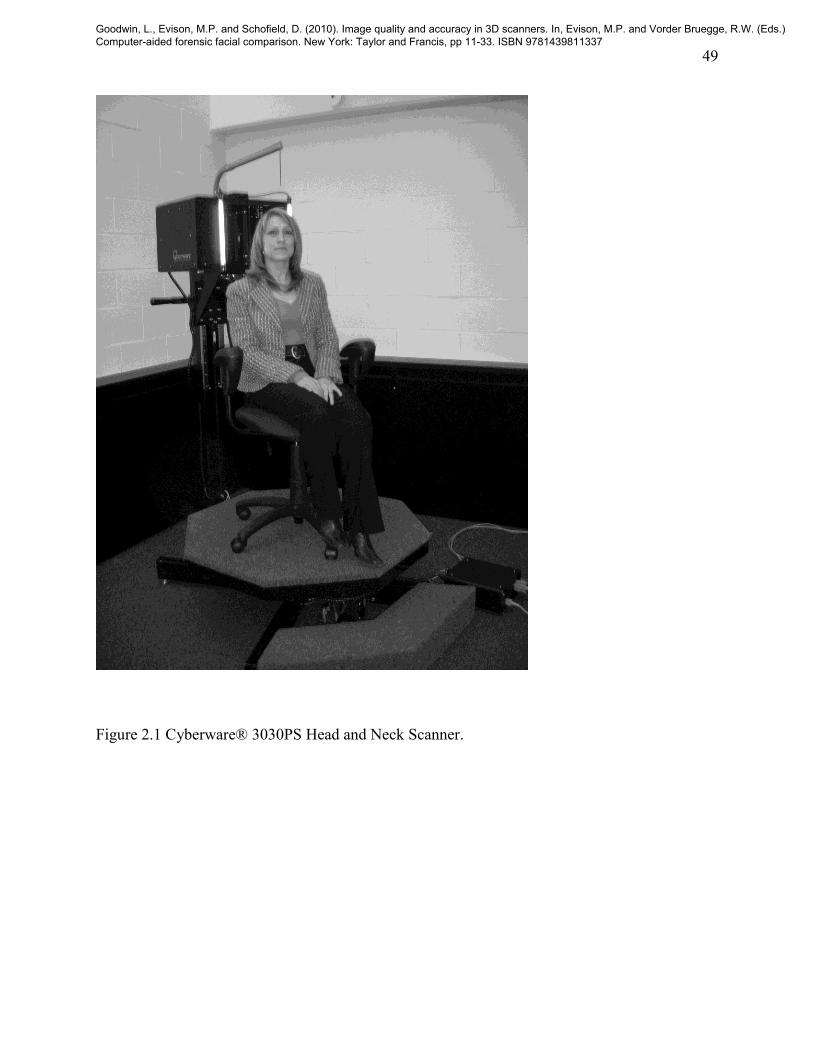
B. CYBERWARE® 3030PS HEAD AND NECK SCANNER
The Cyberware® 3030PS Head and Neck Scanner is shown in Figure 2.1.
FIGURE 2.1 HERE
The scanner uses a low intensity laser light source, which is projected at the subject’s head on a
rotating platform. As the platform rotates, the range and color of the lighted points of the head
are captured by sensors, and are streamed into two data files: one containing the 3D coordinates
of the head and the second a color or texture map.
1. Method of assessment
Goodwin, L., Evison, M.P. and Schofield, D. (2010). Image quality and accuracy in 3D scanners. In, Evison, M.P. and Vorder Bruegge, R.W. (Eds.) Computer-aided forensic facial comparison. New York: Taylor and Francis, pp 11-33. ISBN 9781439811337

28
Performance of the Cyberware® 3030PS Head and Neck Scanner was evaluated in two ways.
Firstly, via a subjective assessment of 3D image quality and, secondly, via an empirical
comparison of measurements collected from 3D scanned images with those collected directly
from a live subject and two artificial head-shaped objects—mannequins—using calipers.
Thirty-two 3D image datasets of the same subject were captured at the high resolution—512 ×
512 coordinate matrix—setting of the scanner following the manufacturer’s instructions. Two
mannequin heads—one polyvinylchloride (PVC) and one polystyrene—were scanned fifteen
times each in the same way in order to provide comparative controls.
Each dataset was then exported to the 3D modeling package 3ds Max® v. 7.0 (Autodesk, San
Rafael, CA) in 3ds (Autodesk, San Rafael, CA) format and seven anthropometric landmarks
were placed on each wireframe model: the pronasale (prn), sellion (se), pogonion (pg), subnasale
(sn), sublabiale (sl), and exocanthion left (ex l) and right (ex r) landmarks (Figure 2.2).
FIGURE 2.2 HERE
Figure 2.2 The seven landmarks used in the assessment. NB. Bilateral landmarks are indicated
by an asterisk suffix.
The Euclidean distances for every combination of two landmarks—21 pairs in total—were
measured for each of the 32 datasets representing the live subject, and each of the fifteen datasets
representing each of the two mannequin heads.
Goodwin, L., Evison, M.P. and Schofield, D. (2010). Image quality and accuracy in 3D scanners. In, Evison, M.P. and Vorder Bruegge, R.W. (Eds.) Computer-aided forensic facial comparison. New York: Taylor and Francis, pp 11-33. ISBN 9781439811337

29
Three repetition measurements of these 21 pair wise distances were collected directly from the
two mannequin heads using digital calipers (Mitutoyo USA, Aurora, IL) by the same observer
and from the 32 live subjects and by a separate observer.
Image quality was assessed by careful visual scrutiny of each texture map and 3D wireframe
surface. In order to assess accuracy of the 3D geometry, pair wise distance measurements
collected from the scanned datasets were analyzed and compared with the measurements
collected with calipers.
2. Assessment of image quality
A subjective assessment of 3D image quality revealed a series of imperfections in some of the
3D images. Stretching (Figure 2.3) is a consequence of the obtuse angle of incidence of the laser
during scanning. Spikes (also Figure 2.3) appear to be the result of specular highlighting of the
skin or reflection of the laser by the moist sclera of the eye. Scan overlap results from slight
movement of the subject as they are being scanned (see Figure 2.4).
FIGURE 2.3 HERE
FIGURE 2.4 HERE
Goodwin, L., Evison, M.P. and Schofield, D. (2010). Image quality and accuracy in 3D scanners. In, Evison, M.P. and Vorder Bruegge, R.W. (Eds.) Computer-aided forensic facial comparison. New York: Taylor and Francis, pp 11-33. ISBN 9781439811337

30
Stretching was also observed on 3D images collected form the PVC and polystyrene mannequin
heads (Figures 2.5 and 2.6, and 2.9, respectively). Other anomalies detected on the scanned PVC
image included spikes (Figure 2.7). Ridges, which were not bilateral, were detected on both the
scanned PVC (Figure 2.8) and polystyrene (Figure 2.10) images. These are assumed to be due to
a lighting bias or the particular sensitivity of a light weight object to subtle unevenness in the
platform surface. The manufacturer’s instructions emphasize the need for the platform to be
level.
FIGURE 2.5 HERE
FIGURE 2.6 HERE
FIGURE 2.7 HERE
FIGURE 2.8 HERE
FIGURE 2.9 HERE
FIGURE 2.10 HERE
Spikes were not observed on the scanned polystyrene image, probably as a consequence of its
relatively lusterless surface. In contrast, nose stretching was more striking—an observation
attributed to the stepped topology of the polystyrene mannequin head.
Goodwin, L., Evison, M.P. and Schofield, D. (2010). Image quality and accuracy in 3D scanners. In, Evison, M.P. and Vorder Bruegge, R.W. (Eds.) Computer-aided forensic facial comparison. New York: Taylor and Francis, pp 11-33. ISBN 9781439811337
31
3. Comparison of pair wise measurements
A chart illustrating variation in pair wise distance between landmark measurements collected
from scanned images compared with average distances collected with calipers from live subjects
is shown in Figure 2.11.
FIGURE 2.11 HERE
A chart illustrating variation in pair wise distance measurements collected from scanned images
compared with average distances collected with calipers from the PVC mannequin is shown in
Figure 2.12.
FIGURE 2.12 HERE
A chart illustrating variation in pair wise distance measurements collected from scanned images
compared with average distances collected with calipers from the polystyrene mannequin is
shown in Figure 2.13.
FIGURE 2.13 HERE
4. Discussion of Cyberware® scanner performance
Goodwin, L., Evison, M.P. and Schofield, D. (2010). Image quality and accuracy in 3D scanners. In, Evison, M.P. and Vorder Bruegge, R.W. (Eds.) Computer-aided forensic facial comparison. New York: Taylor and Francis, pp 11-33. ISBN 9781439811337

32
Anomalies in the scanned surface will affect the position of any anthropometric landmarks
derived from it. Bush and Antonyshyn (1996) showed that variation in head position and
inclination had a significant effect on the 3D image due to alteration in the orientation of the
curved surfaces of the face with respect to the plane of light projected by the laser scanner. The
anticipated effect of head inclination on the reliability of landmark positioning was specific for
each landmark. Spikes and stretching or ridges are each likely to affect landmark position and
that certain landmarks will be affected more than others. Any movement of the subject may
affect the quality of the scanned surface.
The largest variation detected in measurements from scans of live subjects was about 7 mm for
the pogonion to subnasale (pg-sn) distance. In a study on the repeatability of landmarking from
laser-scanned faces, Coward et al. (1997) reported comparable coefficients of repeatability
ranging between 1.6 and 7.0 mm. Comparison between measurements derived from scans and
those collected from live subjects indicates a small amount of error, which barely exceeds the
range of variation in measurements of scanned images (Figure 2.11). The differences—in the
region of a few millimeters—are small, and may be attributed to random error, inter-observer
error in landmark positioning or systematic error resulting from the two strikingly different
modes of data collection.
Variation in measurement pair wise measurement from scanned PVC mannequin appears to be
less than that observed for live subjects, and differences from the averages collected from the
real object tends to be less (Figure 2.12). Measurements collected from the polystyrene
mannequin (Figure 2.13) shows more variation and differences, however. Since all of the
Goodwin, L., Evison, M.P. and Schofield, D. (2010). Image quality and accuracy in 3D scanners. In, Evison, M.P. and Vorder Bruegge, R.W. (Eds.) Computer-aided forensic facial comparison. New York: Taylor and Francis, pp 11-33. ISBN 9781439811337
33
measurements collected from the mannequins were collected by the same observer, little inter-
observer error in landmark positioning is anticipated—although one landmark, the sublabiale
(sl), appears to be implicated as observer error in the most divergent pair wise measurements. In
any event, the findings appear to reveal systematic differences due to the surface properties of
the materials from which the mannequins are constructed.
B. GEOMETRIX FACEVISION® FV802 SCANNER
The Geometrix FaceVision® FV802 Scanner is shown in Figure 2.14.
FIGURE 2.14 HERE
The scanner uses eight one-megapixel 2D digital cameras held in fixed orientation on a gantry in
order to capture eight 2D image files that cover the facial surface of the subject. The Geometrix
FaceVision® software uses areas of resemblance between groups of pixels in each of these
images to synthesize a wireframe dataset representing the 3D facial surface. A setting in the
software can be selected, which allows the resolution to be determined in relation to the size of
the wireframe mesh in polygons.
1. Method of assessment
Performance of the Geometrix FaceVision® FV802 Series Biometric Camera was evaluated in
two ways. Firstly, via a subjective assessment of 3D image quality and, secondly, via an internal
Goodwin, L., Evison, M.P. and Schofield, D. (2010). Image quality and accuracy in 3D scanners. In, Evison, M.P. and Vorder Bruegge, R.W. (Eds.) Computer-aided forensic facial comparison. New York: Taylor and Francis, pp 11-33. ISBN 9781439811337

34
comparison of measurements collected from 3D scanned images captured using different sized
polygon meshes.
Eight 3D image files of the same subject were captured at the four different resolution settings of
the scanner in 3ds format following the manufacturer’s instructions. The resolutions were
selected using the polygon number settings of the scanner, and 20,000, 40,000, 60,000 and
80,000 polygon settings were chosen.
Each of the resulting 32 3ds files was then imported into 3ds Max® and seven anthropometric
landmarks were placed on each wireframe model, namely the pronasale (prn), sellion (se),
pogonion (pg), subnasale (sn), sublabiale (sl), and exocanthion left (ex l) and right (ex r)
landmarks (see Figure 2.2).
The Euclidean distances for every combination of two landmarks—21 pair wise distances in
total—were measured for each of the 32 files.
In order to assess accuracy of 3D geometry, pair wise distance measurements collected from the
scanned files were analyzed and the findings at different polygon number settings was compared.
2. Assessment of image quality
A subjective assessment of 3D image quality revealed a series of anomalies. Texture map
misalignment with the 3D wireframe (Figures 2.15 and 2.16) appears to be a re-occurring finding
Goodwin, L., Evison, M.P. and Schofield, D. (2010). Image quality and accuracy in 3D scanners. In, Evison, M.P. and Vorder Bruegge, R.W. (Eds.) Computer-aided forensic facial comparison. New York: Taylor and Francis, pp 11-33. ISBN 9781439811337

35
affecting the orbital region at every scan resolution used, but varying in extent with each scan.
Other—apparently systematic—distortion affects the nose (Figure 2.17) and random distortion
affects other parts of the facial surface (Figure 2.18).
FIGURE 2.15 HERE
FIGURE 2.16 HERE
FIGURE 2.17 HERE
FIGURE 2.18 HERE
3. Comparison of pair wise measurements
Charts illustrating variation in pair wise distance measurements collected from scanned images at
20,000, 40,000, 60,000 and 80,000 polygons are shown in Figures 2.19 to 2.22.
FIGURE 2.19 HERE
FIGURE 2.20 HERE
FIGURE 2.21 HERE
Goodwin, L., Evison, M.P. and Schofield, D. (2010). Image quality and accuracy in 3D scanners. In, Evison, M.P. and Vorder Bruegge, R.W. (Eds.) Computer-aided forensic facial comparison. New York: Taylor and Francis, pp 11-33. ISBN 9781439811337
36
FIGURE 2.22 HERE
Maximum variation appears to differ between scanning resolutions. At 20,000 polygons (Figure
2.19), maximum variation is 13 mm (sl-ex r). At 40,000 polygons, an anomaly in the third scan
has resulted in outliers in the chart (Figure 2.20). Maximum variation is about 14 mm (sl-ex r).
At 60,000 polygon resolution (Figure 2.21), maximum variation is about 20 mm (sl-ex r) and
many exceed 15 mm. Maximum variation in the 80,000 polygon resolution scans (Figure 2.22) is
about 12 mm (se-pg and pg-ex l).
4. Discussion of Geometrix ® scanner performance
Differences in pair wise distance variation found at different polygon resolutions and in different
scans are attributed to errors in scaling of the 3D surface and to anomalies in surfaces described
in the assessment of image quality. Figure 2.23 shows an example of scaling difference in two
images both captured at the 60,000 polygon resolution. The observed number of polygons
recorded does not agree precisely with the resolution setting.
FIGURE 2.23 HERE
A number of anomalies were identified that have the potential to introduce random and
systematic error in anthropometric measurements when they occur at landmark sites. These
include scaling errors, localized anomalies and texture map misalignment. Movement of the
subject is again revealed as a source of anomalies in the 3D image.
Goodwin, L., Evison, M.P. and Schofield, D. (2010). Image quality and accuracy in 3D scanners. In, Evison, M.P. and Vorder Bruegge, R.W. (Eds.) Computer-aided forensic facial comparison. New York: Taylor and Francis, pp 11-33. ISBN 9781439811337
37
D. 3DMDFACE™ SYSTEM AND COMPARISON BETWEEN SCANNERS
The 3dMDFace™ System scanner is shown in Figure 2.24.
FIGURE 2.24 HERE
The 3dMDFace™ System scanner also utilizes stereophotography to capture 3D surface
geometry and a texture map.
1. Method of assessment
Performance of the 3dMDFace™ System scanner was evaluated in two ways. Firstly, via a
subjective assessment of 3D image quality and, secondly, via an empirical comparison of
measurements collected from 3D scanned images with those collected directly from live
subjects.
Single 3D image files of three subjects were captured with the 3dMDFace™ System scanner in
3ds format following the manufacturer’s instructions. Each 3ds file was then imported into 3ds
MAX® and seven anthropometric landmarks were placed on each wireframe model in 3ds
MAX®, namely the pronasale (prn), sellion (se), pogonion (pg), subnasale (sn), sublabiale (sl),
and exocanthion left (ex l) and right (ex r) landmarks (see Figure 2.2).
Goodwin, L., Evison, M.P. and Schofield, D. (2010). Image quality and accuracy in 3D scanners. In, Evison, M.P. and Vorder Bruegge, R.W. (Eds.) Computer-aided forensic facial comparison. New York: Taylor and Francis, pp 11-33. ISBN 9781439811337
38
The Euclidean distances for every combination of two landmarks—21 pair wise distances in
total—were measured for each of the three files representing the three live subjects.
In order to assess accuracy of 3D geometry, pair wise distance measurements collected from the
scanned files was compared with measurements collected with calipers.
The three subjects scanned using the 3dMDFace™ System Scanner had also been scanned—at
different data collection locations—with the Cyberware® 3030PS Head and Neck Scanner and
the Geometrix FaceVision® FV802 Series Biometric Camera, and had also been measured
directly with digital calipers. These additional datasets permitted a limited direct comparison to
be undertaken between all three scanners and the live subjects.
2. Assessment of image quality
Texture map misalignment with the 3D wireframe appears to be a minor or non-existent anomaly
with the 3dMDFace™ System scanner (Figure 2.25) and random localized anomalies were not
observed in this small sample.
FIGURE 2.25 HERE
Figures 2.26 and 2.27 show the geometry of the nose, comparing the 3dMDFace™ System
scanner and the Geometrix FaceVision® FV802 Series Biometric Camera.
Goodwin, L., Evison, M.P. and Schofield, D. (2010). Image quality and accuracy in 3D scanners. In, Evison, M.P. and Vorder Bruegge, R.W. (Eds.) Computer-aided forensic facial comparison. New York: Taylor and Francis, pp 11-33. ISBN 9781439811337

39
FIGURE 2.26 HERE
FIGURE 2.27 HERE
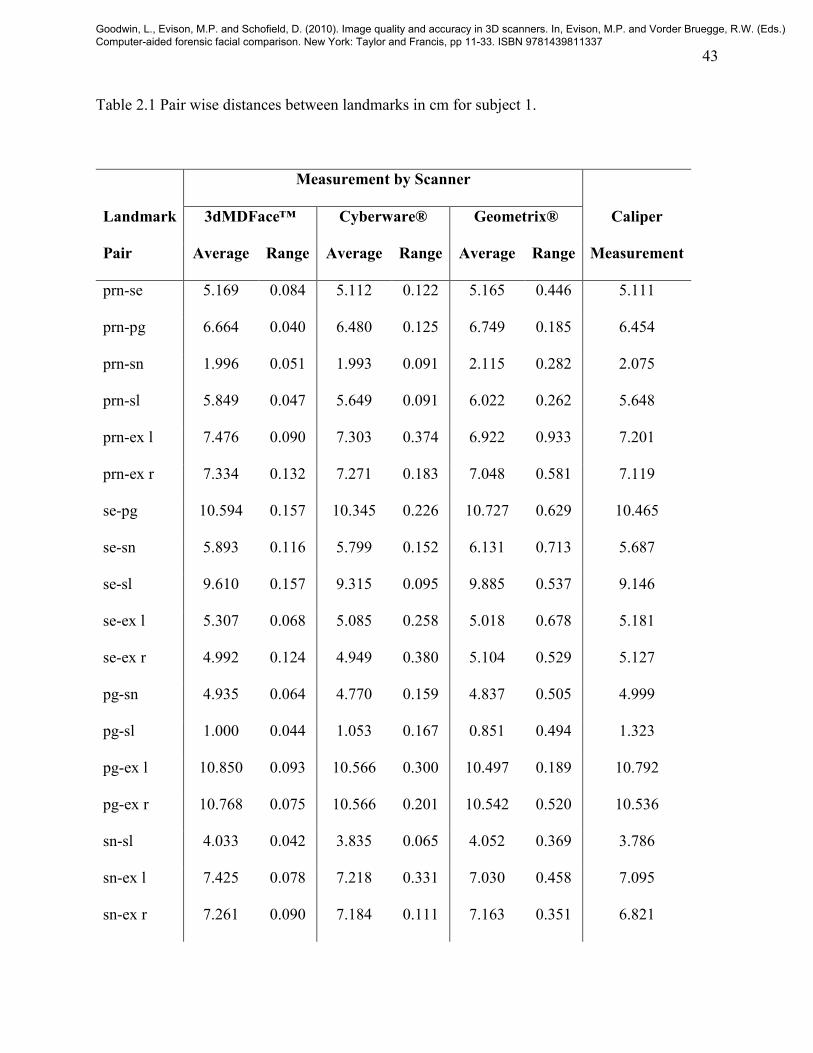
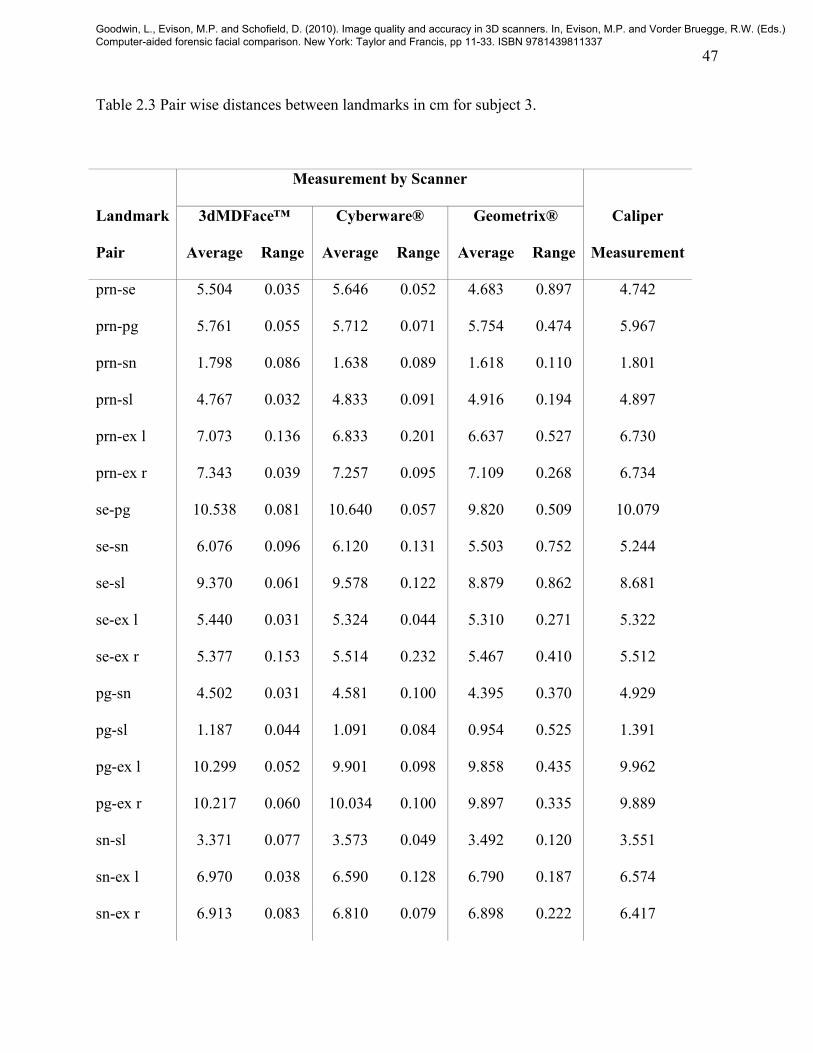
3. Comparison of pair wise measurements
Results of pair wise measurements collected from 3D images with each scanner and from live
subjects with calipers are shown in Tables 2.1 to 2.3. Results are plotted in charts shown in
Figures 2.28 to 2.30.
FIGURE 2.28 HERE
FIGURE 2.29 HERE
FIGURE 2.30 HERE
Tables 2.1 to 2.3 and Figures 2.29 to 2.3 consistently show that greatest variation in pair wise
distance measurements arise from the Geometrix FaceVision® FV802 Series Biometric Camera.
The 3dMDFace™ System scanner is consistently the most precise. Precision does not necessarily
translate into accuracy in comparison with caliper measurements, however, where scanner
performance appears to vary from subject to subject and no clear leader emerges. This
comparison is complicated by the error inherent in caliper measurement (see Discussion and
Summary).
Goodwin, L., Evison, M.P. and Schofield, D. (2010). Image quality and accuracy in 3D scanners. In, Evison, M.P. and Vorder Bruegge, R.W. (Eds.) Computer-aided forensic facial comparison. New York: Taylor and Francis, pp 11-33. ISBN 9781439811337
40
D. DISCUSSION AND SUMMARY
Common sources of error in anthropometry—accruing form both manual and digital sources—
are widely known (Farkas 1994, Bush and Antonyshyn 1996, Coward et al. 1997, El-Hussuna
2003). Key sources include improper identification of landmarks, improper positioning or
measuring technique and inadequate measuring equipment. As confirmed in this investigation,
motion artifacts and head position or inclination may also influence surface geometry and, hence,
landmark position. Comparison between measurements collected using calipers from living
individuals and those collected from digital analogues encounter particular problems. Identifying
landmarks on the face and on an image on the screen are different processes. Careful
identification of certain landmarks may require palpation of the facial surface—a process clearly
impossible on the screen. Although facial expression and other biological variation is recognized
as a potential source of error in anthropometry, this investigation shows that surface properties
like luster are a further potential source. Caliper measurement may involve other particular
sources of error. The potential for motion error may be exacerbated when a sharp metal
instrument is placed near to the eyes and other sensitive tissues, and operators may themselves
contribute to motion error. Differences between live and digital measurements involving the left
(ex l) and right (ex r) exocanthions (see Tables 2.1 to 2.3) are possibly attributable to this cause.
There also appear to be some systematic errors—possibly observer error—involving different
positioning of the sublabiale (sl) when collected digitally and from live subjects.
In summary, the following findings were encountered affecting image quality:
Goodwin, L., Evison, M.P. and Schofield, D. (2010). Image quality and accuracy in 3D scanners. In, Evison, M.P. and Vorder Bruegge, R.W. (Eds.) Computer-aided forensic facial comparison. New York: Taylor and Francis, pp 11-33. ISBN 9781439811337
41
motion artifacts
spikes due to tissue surface luster, particularly affecting the Cyberware® 3030PS Head
and Neck Scanner
localized anomalies in tissue surface affecting the Geometrix FaceVision® FV802 Series
Biometric Camera
surface geometry and texture map misalignment affects the Geometrix FaceVision®
FV802 Series Biometric Camera, but is not evident in the other two
localized distortion, including possibly systematic distortion of the position of the nasal
tip, affecting the Geometrix FaceVision® FV802 Series Biometric Camera
Each of these anomalies is a potential source of error in anthropometric landmark placement.
Ridges in images collected from mannequins were also evident, affecting the Geometrix
FaceVision® FV802 Series Biometric Camera, but do not appear to arise from scans of living
individuals. This observation is somewhat academic in that Geometrix FaceVision® FV802
Series Biometric Camera was developed to work on live faces, not mannequins.
Repeatability and accuracy of measurements derived from 3D images captured using the
Cyberware® 3030PS Head and Neck and 3dMDFace™ System scanners, assessed against
caliper measurements collected from living individuals, were comparable to that reported in
another study (Coward et al. 1997). The 3dMDFace™ System scanner shows an impressive
degree of precision in the small sample investigated—not necessarily manifested in greater
accuracy than the other systems, however.
Goodwin, L., Evison, M.P. and Schofield, D. (2010). Image quality and accuracy in 3D scanners. In, Evison, M.P. and Vorder Bruegge, R.W. (Eds.) Computer-aided forensic facial comparison. New York: Taylor and Francis, pp 11-33. ISBN 9781439811337
42
Whilst the Geometrix FaceVision® FV802 Series Biometric Camera appears to generate
relatively poor quality 3D images of varying accuracy, it is important to note that the system of
anthropometric measurement intended for use with this system is entirely separate—and is
considered in detail in the next Chapter.
E. REFERENCES
Bush, K. and Antonyshyn, O.M. 1996. Three-dimensional facial anthropometry using a laser
surface scanner: validation of the technique. Plastic and Reconstructive Surgery 98(2):226-35.
Coward, T.J., Watson, R.M. and Scott, B.J. 1997. Laser scanning for the identification of
repeatable landmarks of the ears and face. British Journal of Plastic Surgery 50(5):308-14.
El-Hussuna, A. 2003. Statistical variation of three dimensional face models. Masters diss., IT-
University of Copenhagen.http://www.sumer.dk/Researches/thesis-02.pdf (accessed January 31,
2008)
Farkas, L.G. 1994. Anthropometry of the head and face, 2nd
ed. New York: Raven Press.
Goodwin, L., Evison, M.P. and Schofield, D. (2010). Image quality and accuracy in 3D scanners. In, Evison, M.P. and Vorder Bruegge, R.W. (Eds.) Computer-aided forensic facial comparison. New York: Taylor and Francis, pp 11-33. ISBN 9781439811337
43
Table 2.1 Pair wise distances between landmarks in cm for subject 1.
Measurement by Scanner
Landmark 3dMDFace™ Cyberware® Geometrix® Caliper
Pair Average Range Average Range Average Range Measurement
prn-se 5.169 0.084 5.112 0.122 5.165 0.446 5.111
prn-pg 6.664 0.040 6.480 0.125 6.749 0.185 6.454
prn-sn 1.996 0.051 1.993 0.091 2.115 0.282 2.075
prn-sl 5.849 0.047 5.649 0.091 6.022 0.262 5.648
prn-ex l 7.476 0.090 7.303 0.374 6.922 0.933 7.201
prn-ex r 7.334 0.132 7.271 0.183 7.048 0.581 7.119
se-pg 10.594 0.157 10.345 0.226 10.727 0.629 10.465
se-sn 5.893 0.116 5.799 0.152 6.131 0.713 5.687
se-sl 9.610 0.157 9.315 0.095 9.885 0.537 9.146
se-ex l 5.307 0.068 5.085 0.258 5.018 0.678 5.181
se-ex r 4.992 0.124 4.949 0.380 5.104 0.529 5.127
pg-sn 4.935 0.064 4.770 0.159 4.837 0.505 4.999
pg-sl 1.000 0.044 1.053 0.167 0.851 0.494 1.323
pg-ex l 10.850 0.093 10.566 0.300 10.497 0.189 10.792
pg-ex r 10.768 0.075 10.566 0.201 10.542 0.520 10.536
sn-sl 4.033 0.042 3.835 0.065 4.052 0.369 3.786
sn-ex l 7.425 0.078 7.218 0.331 7.030 0.458 7.095
sn-ex r 7.261 0.090 7.184 0.111 7.163 0.351 6.821
Goodwin, L., Evison, M.P. and Schofield, D. (2010). Image quality and accuracy in 3D scanners. In, Evison, M.P. and Vorder Bruegge, R.W. (Eds.) Computer-aided forensic facial comparison. New York: Taylor and Francis, pp 11-33. ISBN 9781439811337

44
sl-ex l 9.962 0.107 9.626 0.238 9.738 0.339 9.477
sl-ex r 9.866 0.115 9.618 0.115 9.783 0.588 9.282
ex-ex 9.191 0.081 8.951 0.439 9.024 0.809 9.400
Goodwin, L., Evison, M.P. and Schofield, D. (2010). Image quality and accuracy in 3D scanners. In, Evison, M.P. and Vorder Bruegge, R.W. (Eds.) Computer-aided forensic facial comparison. New York: Taylor and Francis, pp 11-33. ISBN 9781439811337

45
Table 2.2 Pair wise distances between landmarks in cm for subject 2.
Measurement by Scanner
Landmark 3dMDFace™ Cyberware® Geometrix® Caliper
Pair Average Range Average Range Average Range Measurement
prn-se 4.762 0.038 4.663 0.102 4.167 0.360 4.671
prn-pg 7.056 0.004 6.931 0.177 7.102 0.286 7.260
prn-sn 1.872 0.008 1.956 0.048 2.040 0.343 2.089
prn-sl 5.797 0.004 5.730 0.182 5.870 0.452 5.740
prn-ex l 7.140 0.158 6.971 0.185 6.629 0.900 7.253
prn-ex r 7.203 0.206 7.131 0.344 6.624 0.384 7.202
se-pg 10.902 0.044 10.667 0.208 10.462 0.688 10.917
se-sn 5.449 0.047 5.361 0.092 5.226 0.299 5.424
se-sl 9.383 0.045 9.188 0.232 9.068 0.431 9.229
se-ex l 5.203 0.197 4.993 0.250 5.013 0.186 5.683
se-ex r 5.195 0.226 5.139 0.197 5.236 0.385 5.695
pg-sn 5.564 0.007 5.395 0.246 5.323 0.512 5.710
pg-sl 1.579 0.002 1.554 0.077 1.424 0.391 1.877
pg-ex l 11.177 0.035 10.891 0.275 10.572 0.526 11.025
pg-ex r 11.262 0.081 10.949 0.349 10.684 0.554 11.137
sn-sl 4.152 0.008 4.022 0.219 3.993 0.174 3.979
sn-ex l 7.051 0.095 6.829 0.200 6.618 0.487 7.101
sn-ex r 7.109 0.174 6.949 0.266 6.812 0.300 7.171
Goodwin, L., Evison, M.P. and Schofield, D. (2010). Image quality and accuracy in 3D scanners. In, Evison, M.P. and Vorder Bruegge, R.W. (Eds.) Computer-aided forensic facial comparison. New York: Taylor and Francis, pp 11-33. ISBN 9781439811337

46
sl-ex l 9.764 0.036 9.500 0.224 9.300 0.370 9.402
sl-ex r 9.849 0.086 9.548 0.283 9.422 0.300 9.686
ex-ex 9.317 0.249 8.858 0.087 9.066 0.271 10.069
Goodwin, L., Evison, M.P. and Schofield, D. (2010). Image quality and accuracy in 3D scanners. In, Evison, M.P. and Vorder Bruegge, R.W. (Eds.) Computer-aided forensic facial comparison. New York: Taylor and Francis, pp 11-33. ISBN 9781439811337
47
Table 2.3 Pair wise distances between landmarks in cm for subject 3.
Measurement by Scanner
Landmark 3dMDFace™ Cyberware® Geometrix® Caliper
Pair Average Range Average Range Average Range Measurement
prn-se 5.504 0.035 5.646 0.052 4.683 0.897 4.742
prn-pg 5.761 0.055 5.712 0.071 5.754 0.474 5.967
prn-sn 1.798 0.086 1.638 0.089 1.618 0.110 1.801
prn-sl 4.767 0.032 4.833 0.091 4.916 0.194 4.897
prn-ex l 7.073 0.136 6.833 0.201 6.637 0.527 6.730
prn-ex r 7.343 0.039 7.257 0.095 7.109 0.268 6.734
se-pg 10.538 0.081 10.640 0.057 9.820 0.509 10.079
se-sn 6.076 0.096 6.120 0.131 5.503 0.752 5.244
se-sl 9.370 0.061 9.578 0.122 8.879 0.862 8.681
se-ex l 5.440 0.031 5.324 0.044 5.310 0.271 5.322
se-ex r 5.377 0.153 5.514 0.232 5.467 0.410 5.512
pg-sn 4.502 0.031 4.581 0.100 4.395 0.370 4.929
pg-sl 1.187 0.044 1.091 0.084 0.954 0.525 1.391
pg-ex l 10.299 0.052 9.901 0.098 9.858 0.435 9.962
pg-ex r 10.217 0.060 10.034 0.100 9.897 0.335 9.889
sn-sl 3.371 0.077 3.573 0.049 3.492 0.120 3.551
sn-ex l 6.970 0.038 6.590 0.128 6.790 0.187 6.574
sn-ex r 6.913 0.083 6.810 0.079 6.898 0.222 6.417
Goodwin, L., Evison, M.P. and Schofield, D. (2010). Image quality and accuracy in 3D scanners. In, Evison, M.P. and Vorder Bruegge, R.W. (Eds.) Computer-aided forensic facial comparison. New York: Taylor and Francis, pp 11-33. ISBN 9781439811337

48
sl-ex l 9.263 0.088 8.936 0.165 9.029 0.143 8.683
sl-ex r 9.165 0.074 9.067 0.089 9.071 0.283 8.668
ex-ex 9.082 0.130 8.726 0.201 9.052 0.159 9.239
Goodwin, L., Evison, M.P. and Schofield, D. (2010). Image quality and accuracy in 3D scanners. In, Evison, M.P. and Vorder Bruegge, R.W. (Eds.) Computer-aided forensic facial comparison. New York: Taylor and Francis, pp 11-33. ISBN 9781439811337
49
Figure 2.1 Cyberware® 3030PS Head and Neck Scanner.
Goodwin, L., Evison, M.P. and Schofield, D. (2010). Image quality and accuracy in 3D scanners. In, Evison, M.P. and Vorder Bruegge, R.W. (Eds.) Computer-aided forensic facial comparison. New York: Taylor and Francis, pp 11-33. ISBN 9781439811337