Report of the Study Group on Biological Characteristics ... - ICES
Upload
khangminh22Category
view
1download
0
Joint EIFAC/ICES WGEEL Report 2007 | 139
Norway: Report on the eel stock and f ishery in Norway 2007
NO.A Authors
Caroline Durif, Institute of Marine Research, 5392 Storebø / University of Oslo, Department of Biology PO box 1066 Blindern, 0316 Oslo, NORWAY. Tel: +47 56 18 22 50. FAX: +47 56 18 22 22 e-mail: [email protected]
Jan Atle Knutsen, Institute of Marine Research, Flødevigen 4817 HIS, NORWAY. Tel: +47 37 05 90 18. FAX: +47 37 05 90 01 e-mail: [email protected]
Reporting Period: This report was completed in August 2007, and contains data up to 2006.
Contributors to the report:
L. A. Vøllestad, University of Oslo
J. Gjøsæter, Institute of Marine Research-Flødevigen
NO.B Introduction
Norway has abundant rivers and lakes (12% of the country is covered by lakes, rivers, swamp/marsh areas; 144 river systems with a catchment area ≥ 200 square km). 1104 river systems, in varied degrees, are regulated to produce hydroelectric power but 341 river systems are permanently protected against being exploited for the production of electric energy.
The larger rivers of Norway are found in the east, where the country’s longest river, the Glåma, has a course of 610 km (380 mi). With its tributaries, the Glåma drains about one-eighth of Norway’s area. In northern Norway, the longest river is the Tana. Flowing north into the Barents Sea, it forms part of the frontier with Finland, and it is renowned as the country’s most important salmon-fishing river.
The length of the continental coastline is 25 148 km (including fjords and bays). In total the Norwegian shoreline adds up to 83 281 km (including fjords, bays and islands).
Despite the abundance of rivers and lakes inland, eel fishing only takes place along the coast in estuarine, brackish and saltwater areas. The data reported here consists of the only known eel dataset from brackish or saltwater.
Eel fishing is performed with fyke nets, during spring and summer.
The European eel has been added to the Norwegian Red List of Species since May 2006.
NO.C Fishing capacity
Fishing for glasseel is prohibited in Norway.
There is a minimum legal size of between 37 (silver eels)–40 cm (yellow eels). The official catch data consists of annual totals by district.
The eel fisheries are located mainly along the southern coast of Norway. No distinction is made between yellow and silver eels and they are both caught with eel pots. Fishermen operate in the estuarine area around coastal islands. Eel pots are set on soft and muddy bottom, and mostly on seagrass beds (Zostera).

140 | Joint EIFAC/ICES WGEEL Report 2007
Reported by year
The table lists the number of eel fishing licenses delivered each year. These figures correspond approximately to the number of fishermen although one boat (fisherman) can change licences within a year.
Table 1. Number of eel fishing licenses in Norway between 1977–2006.
YEAR NUMBER OF LICENSES
1977 326 1978 313 1979 374 1980 541 1981 501 1982 505 1983 478 1984 434 1985 399 1986 412 1987 425 1988 525 1989 479 1990 468 1991 449 1992 434 1993 404 1994 452 1995 423 1996 417 1997 445 1998 389 1999 429 2000 347 2001 336 2002 327 2003 284 2004 258 2005 241 2006 247
Reported by district
The total number of licenses delivered in Norway since 1977 is 12 062. Trends are similar in all the districts (Figure 1). Highest numbers were in 1980 and 1988. The number of registrations is significantly decreasing since the year 2000.

Joint EIFAC/ICES WGEEL Report 2007 | 141
Table NO.2. Number of eel fishing licenses in Norway between 1977–2006.
Figure NO.1. Number of eel fishing licenses per year and per district in Norway between 1977 and 2006.
NO.D Fishing effort
There is no registration of fishing effort (in terms of number of eel pots or boat per license).
NO.E Catches and landings
Eel landings were highest in the 30’s and 60’s amounting to an annual total of 500 tons. Two important decreases in the landings were observed during both World Wars (1914–18 and 1939–45). Since 1969, landings have decreased with a few years of exception (for example in 1988). It is difficult say whether this trend reflects the number of eels since this number is correlated with the number of licenses (available between 1977 and 2006, R=0.60).
DISTRICT NUMBER OF LICENSES
A 89 BD 38 F 3 H 2930 M 463 N 20
NT 47 O 27 R 1733 SF 384 ST 42 T 10
TK 677 V 736
VA 1680 Ø 1980
AA 1203

142 | Joint EIFAC/ICES WGEEL Report 2007
Figure NO.2. Landings (tons) of yellow and silver eels reported for Norway between 1908 and 2006.
Figure NO.3. Relationship between reported eel landings in Norway and number of licenses between 1977 and 2006.
NO.F Catch per unit of effort
Cpues were calculated as: cpue=landings/number of registration. Between 1977 and 2006 cpues do not show any significant trend. However the last four years show an increase.

Joint EIFAC/ICES WGEEL Report 2007 | 143
Figure NO.4. Cpues of eels calculated between 1977 and 2006.
NO.G Scientific surveys of the stock
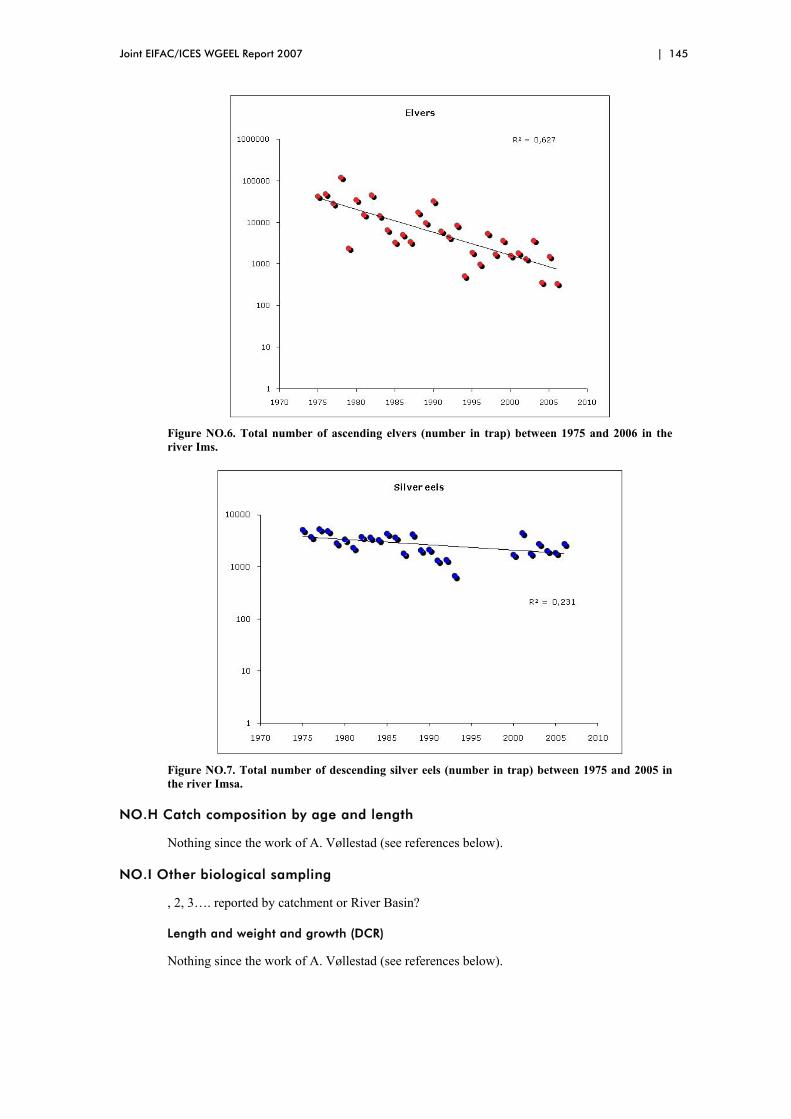
This corresponds to data from the river Imsa (since 1975). Silver eels are caught in a Wolf Trap at the river’s mouth. Eels are counted every day. Data is missing 1994 and 1999.It is carried out at the NINA biological station on the River Imsa (south-west Norway).
Both data series (numbers of elvers and silver eels) show a significant decrease in since the start of the survey in 1975.
Figure NO.5. Map of Norway and location of Imsa river. Most of the eel fishing activity takes place along the Skaggerak coast.

144 | Joint EIFAC/ICES WGEEL Report 2007
Table NO.3. Trap data from the river Imsa.
YEAR NUMBER OF ELVERS NUMBER OF SILVER EELS
1975 42945 5201 1976 48615 3824 1977 28518 5435 1978 121818 4986 1979 2457 2914 1980 34776 3382 1981 15477 2354 1982 45750 3818 1983 14500 3712 1984 6640 3377 1985 3412 4427 1986 5145 3733 1987 3434 1833 1988 17500 4274 1989 10000 2107 1990 32500 2196 1991 6250 1347 1992 4450 1394 1993 8625 681 1994 525 1995 1950 1996 1000 1997 5500 1998 1750 1999 3750 2000 1625 1749 2001 1875 4580 2002 1375 1850 2003 3575 2824 2004 375 2076 2005 1550 1894 2006 350 2827
Joint EIFAC/ICES WGEEL Report 2007 | 145
Figure NO.6. Total number of ascending elvers (number in trap) between 1975 and 2006 in the river Ims.
Figure NO.7. Total number of descending silver eels (number in trap) between 1975 and 2005 in the river Imsa.
NO.H Catch composition by age and length
Nothing since the work of A. Vøllestad (see references below).
NO.I Other biological sampling
, 2, 3…. reported by catchment or River Basin?
Length and weight and growth (DCR)
Nothing since the work of A. Vøllestad (see references below).

146 | Joint EIFAC/ICES WGEEL Report 2007
Contaminants
Included in the international Eel Quality Database.
NO.J Other sampling
None
NO.K Stock assessment
None
Sampling intensity and precision
None
NO.L Standardisation and harmonisation of methodology
None
NO.N Literature references
Vøllestad, L. A. 1992. Geographic variation in age and length at metamorphosis of maturing European eel: environmental effects and phenotypic plasticity. Journal of Animal Ecology 61: 41–48.
Vøllestad, L. A., Jonsson, B. 1986. Life-history characteristics of the European eel Anguilla anguilla in the Imsa River, Norway. Transactions of the American Fisheries Society 115: 864–871.
Vøllestad, L. A., Jonsson, B. 1988. A 13-year study of the population dynamics and growth of the European eel Anguilla anguilla in a Norwegian river: evidence for density-dependent mortality, and development of a model for predicting yield. Journal of Animal Ecology 57: 983–997.

Joint EIFAC/ICES WGEEL Report 2007 | 147
Sweden: Report on the eel stock and f ishery in Sweden 2007
SE.A Authors
Håkan Wickström, Swedish Board of Fisheries, Institute of Freshwater Research, SE-178 93 DROTTNINGHOLM, Sweden. Tel. +46 8 6990607. Fax: +46 8 6990650. e-mail [email protected]
Jan Andersson, Swedish Board of Fisheries, Institute of Coastal Research
Mårten Åström, Swedish Board of Fisheries, Institute of Freshwater Research
This report was completed in August 2007; most data are from 2006 and some from 2004 and 2005.
The following persons provided useful input to the report; Joakim Hjelm, Institute of Marine Research, Håkan Westerberg, HQ, Berit Sers and Stefan Sjögren, Institute of Freshwater Research, Sven Gunnar Lunneryd and Johan Modin, Institute of Coastal Research, all within the Swedish Board of Fisheries.
SE.B Introduction
Eel fisheries in Sweden occur in most coastal waters from the Norwegian border in Skagerrak to about 61°N in the Baltic Sea. In the beginning of the 20th century eel fishery was practised also along the northern most parts of the Baltic Sea. There is also a considerable eel fishery in a number of freshwater lakes. Both yellow and silver eels are fished, but there is no tradition (it is also against the law) to catch glass eels or elvers. The Government manages and controls the fishery in most marine areas and in the five largest lakes using a few management instruments like minimum legal size, gear restrictions, etc. There is also a substantial fishery for eels in privately owned waters both in coastal areas as in freshwater. In most lakes, except the five largest ones, the Government has almost no jurisdiction to regulate the fishery for any species. However, since 1st May 2007 fishing for eels is prohibited in Sweden. There are some exceptions to this general ban as professional fishermen that could prove they have fished more than 400 kg of eel on average during 2003–2005 or had a corresponding income from processed eel products could apply for a special permit (during 2007). At the same time this rule was imposed the minimum legal size was raised from 600 to 650 mm in freshwater and along the Baltic Coast. On the Swedish West Coast this size was raised from 370 to 400 mm. These minimum legal sizes now include also silver eels that were earlier exempted. The total number of fyke nets allowed is now limited to 500 single or double fykes. To avoid an unwanted bycatch of eels, fyke nets used by non-eel fishermen should be equipped with two escape openings in each cod end. As the mortality in eels passing several hydropower turbines probably is very high, eel fishing at sites (rivers and lakes) above three turbines without safe passages for descending silver eels is still allowed. In most fisheries the eels are fished in combination with other species. Depending on the type of water (fresh or brackish, west or east coast etc.) species as pike-perch, perch, pike, cod, turbot, whitefish and flounders are important bycatch in the eel fisheries, though not worth enough alone for a viable fishery without eel as the main target species. The distribution of the commercial Swedish eel fishery could be simplified as follows:
148 | Joint EIFAC/ICES WGEEL Report 2007
The present division in eel fishing areas
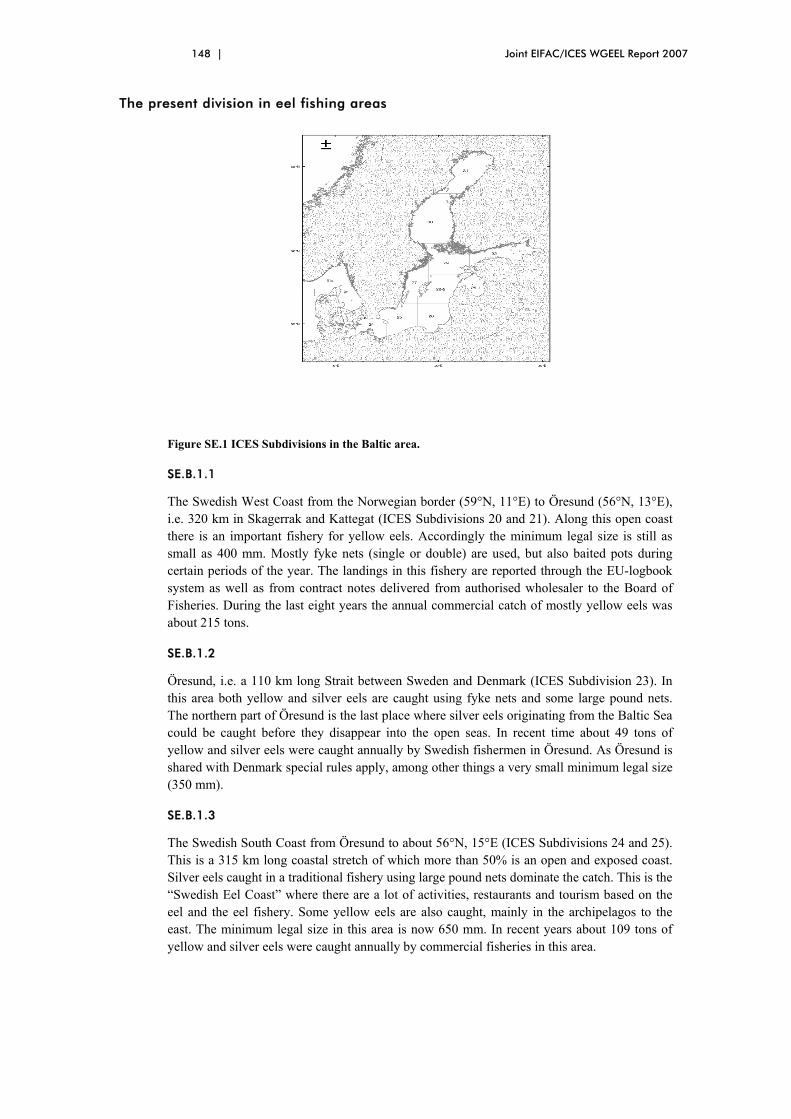
Figure SE.1 ICES Subdivisions in the Baltic area.
SE.B.1.1
The Swedish West Coast from the Norwegian border (59°N, 11°E) to Öresund (56°N, 13°E), i.e. 320 km in Skagerrak and Kattegat (ICES Subdivisions 20 and 21). Along this open coast there is an important fishery for yellow eels. Accordingly the minimum legal size is still as small as 400 mm. Mostly fyke nets (single or double) are used, but also baited pots during certain periods of the year. The landings in this fishery are reported through the EU-logbook system as well as from contract notes delivered from authorised wholesaler to the Board of Fisheries. During the last eight years the annual commercial catch of mostly yellow eels was about 215 tons.
SE.B.1.2
Öresund, i.e. a 110 km long Strait between Sweden and Denmark (ICES Subdivision 23). In this area both yellow and silver eels are caught using fyke nets and some large pound nets. The northern part of Öresund is the last place where silver eels originating from the Baltic Sea could be caught before they disappear into the open seas. In recent time about 49 tons of yellow and silver eels were caught annually by Swedish fishermen in Öresund. As Öresund is shared with Denmark special rules apply, among other things a very small minimum legal size (350 mm).
SE.B.1.3
The Swedish South Coast from Öresund to about 56°N, 15°E (ICES Subdivisions 24 and 25). This is a 315 km long coastal stretch of which more than 50% is an open and exposed coast. Silver eels caught in a traditional fishery using large pound nets dominate the catch. This is the “Swedish Eel Coast” where there are a lot of activities, restaurants and tourism based on the eel and the eel fishery. Some yellow eels are also caught, mainly in the archipelagos to the east. The minimum legal size in this area is now 650 mm. In recent years about 109 tons of yellow and silver eels were caught annually by commercial fisheries in this area.

Joint EIFAC/ICES WGEEL Report 2007 | 149
SE.B.1.4
The Swedish East Coast from about 56°N, 15°E to 59°30’N, 18°50’°E. Along this 450 km long stretch both silver and yellow eels are fished using both fyke nets and large pound nets. Also in this area 650 mm is the new minimum legal size for eels. About 139 tons of yellow and silver eels are caught annually in this area.
SE.B.1.5
Freshwater lakes. There are sparse stocks of eels in most drainage basins all over Sweden except in the high mountain areas. However, nowadays most eels are fished with pound nets in Lakes Mälaren, Vänern and Hjälmaren. A number (at least 17) of smaller lakes, mainly situated in the southern part of the country, add another 25% to the catch in the large lakes. In total about 110 tons of eels are caught annually by the commercial eel fishery in lakes. In the five largest lakes where the Government has jurisdiction 650 mm is the new minimum legal size for both yellow and silver eels.
The fishery in freshwater is probably to a large extent based on stocked eels (about 90% in Lakes Hjälmaren and Mälaren) since the natural immigration to these lakes should be small today. Stocking material is either yellow eels in the size of 0.1 kg that has been caught on the Swedish West Coast or imported newly pigmented eels. In the three large lakes Vänern, Mälaren and Hjälmaren the fishermen must have a permit from their respective County Board to fish with fyke nets as soon they are deeper than 1,5 m. With that they are also obliged to leave catch statistics to the Board of Fisheries on a monthly basis. In the smaller lakes the professional fishermen fish in privately owned waters but as they have a fishing license they have to deliver catch statistics but only on a yearly basis. The fishing is usually carried out from small boats with a length of 5–6 m.
Eel fishing may also occur in additional lakes and some streams where traps have been built. The extent of this fishery is unknown, but it is probably of very little importance today. The recreational fishing of eel in small freshwaters is probably of even smaller importance, even if long line fishing exists in some lakes (cf. the 20 tons mentioned below). Probably most of such eel fisheries have now stopped due to the new restrictions imposed.
Besides what is described above there is a more or less unknown and uncontrolled fishery by non-commercial fishermen, by recreational fishers using professional fishing gears and by true anglers (rod and line). This fishery has been estimated four times since 1990 by using questionnaires and amounts according to the most recent poll in 2005 to 491 tons of which 388 came from the sea and 103 from freshwater (Fiskeriverket, 2005). As the estimates for eel are based on very few replies the uncertainties are large.
The commercial catch of eels in Sweden in 2004 was then about 473 tons from the sea and 100 tons from freshwater, i.e. about 573 tons in total. The recreational catch adds another 491 tons making a grand total of about 1000 tons. A very recent correction of the estimate of the recreational catch is discussed in SE.E.5. In short the new estimate of the recreational catch is 249 tons only. Thus the grand total might be about 800 tons.
Most preliminary results from a similar questionnaire for 2006 give ca 280 tons of eel as total recreational catch of which ca 20 tons were taken by anglers. Most of this fishery is now (since 1st May, 2007) prohibited due to the new legislation.

150 | Joint EIFAC/ICES WGEEL Report 2007
Figure SE.2. The commercial catch in year 2004 expressed per unit area (squares of 1 minute latitude * 1 minute longitude). The catch from the major Swedish lakes is given as their respective percentages of the total Swedish catch. The River Basin Districts are schematically indicated (as 1–5).
SE.B.2
River Basin Districts (RBD)
The Water Framework Directive subdivides Sweden into 5 separate River Basin Districts, of which two extend to some importance beyond our borders (Figure SE.2). These are the RBD nos.:
1 ) Bottenvikens vattendistrikt (or BBAY) shared with Finland (small part to the north). This RBD includes all drains to the northern part of the Gulf of Bothnia. Eels do occur in this RBD, but are nowadays quite rare. A few

Joint EIFAC/ICES WGEEL Report 2007 | 151
successful stocking experiments were performed in this RBD during the 1970s and 1980s. Drainage area: 154 702 km2.
2 ) Bottenhavets vattendistrikt (or BSEA) that drains into the southern part of the Gulf of Bothnia. Eels occur also in this area. During the early 20th century there was a substantial eel fishery in the southern parts of this RBD. At the present time the commercial catches are small. Drainage area: 146 667 km2.
3 ) Norra Östersjöns vattendistrikt (or NBAL) drains the central parts of Sweden, including two of the five largest lakes in Sweden. Eels and eel fisheries are quite abundant in this RBD and in addition to a reduced natural recruitment both lakes and coastal areas are frequently stocked with imported elvers. Drainage area: 44 212 km2.
4 ) Södra Östersjöns vattendistrikt (“the Southern Baltic Sea”) (or SBAL) drains a large part of southern Sweden and includes a vast number of lakes with eel and also the coastal waters where there was and still is an important and traditional fishery for silver eels. Several lakes are stocked annually also in this RBD. Drainage area: 59 939 km2.
5 ) Västerhavets vattendistrikt (“the North Sea”) (or WEST) shared with Norway (to a minor part). This RBD includes the large Lake Vänern and numerous lakes and streams were eels still are quite abundant. Several lakes are stocked annually in this RBD. Drainage area: 73 330 km2.
The main parts of the eel fisheries in Sweden are concentrated to RBD 3, 4 and 5. However, the catch of silver eels along the coast of RBD 4 is known to come from eels that have lived and grown in almost any part of the Baltic Basin. However, a majority have grown up in brackish water. This knowledge is based on tagging studies and otolith chemistry.
SE.C Fishing capacity
SE.C.1 Coastal waters
Table SE.a. Number fisherme®n by RBD with eel landings (all gears).
Reliable information on fishing capacity can only be presented as the number of individual fishermen reporting catches in the official statistics. The numbers in Table SE.a do not consider the size of the reported catch of the individual fisherman or which life stage is the primary target. The Southern Baltic and the West Coast (North Sea) RBD´s were the dominating districts with equal shares in 1999–2005.
SE.C.2 Freshwater
From the inland eel fishery, statistics exists from all fishermen that have fishing licenses or a permit to use deeper fyke nets and pound nets in Lakes Vänern, Mälaren and Hjälmaren. There are no companies operating in the lakes but the fishing is carried out by single
BBAY BSEA NBAL SBAL WEST ALL1999 0 27 37 162 176 402 2000 3 28 35 135 139 340 2001 0 27 27 134 142 330 2002 1 23 28 118 149 319 2003 1 29 28 134 139 331 2004 1 31 29 127 134 322 2005 0 30 33 143 137 343 mean 1 28 31 136 145 341

152 | Joint EIFAC/ICES WGEEL Report 2007
fishermen or in very few cases by two fishermen together. The number of fishermen in the lakes that reported catch of eels is shown below, per lake or group of lakes and per RBD. The total number of eel fishermen has decreased from 104 to 93 in a few years.
Table SE.b.
LAKE VÄNERN MÄLAREN HJÄLMAREN OTHER LAKES TOTAL
Number of fishermen in 2006
22 26 25 20 93
RBD 3 4 5 TOTAL
Number of fishermen in 2006
53 12 28 93
SE.D Fishing Effort
SE.D.1 Coastal waters
The official catch statistics at the present do not give reliable information on the effort in the fishery for eel.
SE.D.2 Freshwater
In the eel fisheries in the three lakes mentioned above, the type of net used varies both between and within lakes. There is no other information than that the nets are deeper than 1, 5 m. The nets have a leader, which may be 50–300 m long, and the depth of the nets varies between 3 and 20 m.
The temporal resolution of the statistics is on a daily basis in the larger lakes and on a yearly basis in the smaller lakes. The maximum number of all kinds of fyke nets used in 2006 is shown in the table below.
Table SE.c.
LAKE VÄNERN MÄLAREN HJÄLMAREN OTHER LAKES TOTAL
Number of net permits
101 165 167 133 566
During 2006 the following number of pound nets (“bottengarn”) was used on a daily average in four of our lakes.
Table SE.d.
LAKE NUMBER OF POUND NETS USED (DAILY AVERAGE OVER THE YEAR)
Vänern 43 Vättern 4 Mälaren 69 Hjälmaren 77 Total 192
The abundance of fyke nets is largest in the shallow Lake Hjälmaren, which area is about 20% of the area of Lake Vänern and 40% of the area of Lake Mälaren.

Joint EIFAC/ICES WGEEL Report 2007 | 153
SE.E Catches and Landings
SE.E.1
Not valid as there are no glass eel fisheries in Sweden (neither viable nor legally allowed).
SE.E.2 Restocking
Restocking inland and coastal waters with glass eels, elvers, bootlace or medium-sized yellow eels, is practised since many years in Sweden, in order to improve the local eel fishery. Already in the beginning of the 20th century elvers were imported from England (via Hamburg, Germany). Since the beginning of the 1970s a more regular restocking programme has been in operation. From the beginning mostly medium-sized yellow eels from the Swedish West Coast were used but the proportion of imported and quarantined elvers has slowly increased. Most of the costs are covered by the Government using different funds destined for fish stock management (e.g. funds imposed by the water-rights courts), but also the commercial fishermen’s asociation and local societies make a substantial contribution. In 1998 ca. 1,1 million € was spent on restocking while only about 0,5 million € was spent in 2005. A database over the amounts of stocked eels in separate water bodies is under construction. During 2000-2005 the following quantities (preliminary data) of eels were restocked:
Table SE.e. Restocked quantities per RBD in 2000–2005.
RBD 2000 2001 2002 2003 2004 2005 TOTAL
G (pcs)
M (kg)
G (pcs)
M (kg)
G (pcs)
M (kg)
G (pcs)
M (kg)
G (pcs)
M (kg)
G (pcs)
M (kg)
G (pcs)
M (kg)
1 0 0 0 0 0 0 0 0 0 0 0 0 0 0
2 0 0 0 0 32 000 0 111 460 0 138 850 0 71 819 0 354 129
0
3 249 955 24 183 183 820
13 550 374 390 5 388 377 210
6 724 114 292 4 200 185 496 3 662 1 485 163
57 707
4 156 560 33 298 136 560 21 031 259 633 15 330 148 860 16 118 231 480 12 493 286 778 1 924 1 219 871
100 194
5 723 839
3 238 317 330
4 344 407 336 2 570 0 1 960 497 608 1 679 189 780 292 2 135 893
14 083
Not defined
205 455
0 209 176
0 311 969
0 3 736
0 69 626
0 0 0 799 962
0
Total 1 335 809
60 719
846 886
38 925
1 385 328
23 288
641 266
24 802
1 051 856
18 372
733 873
5 878
5 995 018
171 984
Today “glass eels” (G) implies quarantined and pre-grown elvers of about one gram each and the medium-sized yellow eels (M) are about 90 gram each.
In 2006 and 2007 about 1 215 000 and 944 000 “glass eels”, respectively were stocked in total. For the first time in many years no medium-sized yellow eels were stocked in 2006 and 2007.
154 | Joint EIFAC/ICES WGEEL Report 2007
SE.E.3 Catch of yellow and silver eel
SE.E.3.1 Landings (data from contract notes)
Commercial landings of eels in Sweden
0
500
1000
1500
2000
2500
3000
1925 1930 1935 1940 1945 1950 1955 1960 1965 1970 1975 1980 1985 1990 1995 2000 2005
Year
Cat
ch (t
on)
FreshwaterKattegat-SkagerrakEast C. (Baltic Sea) South C. (Baltic Sea)
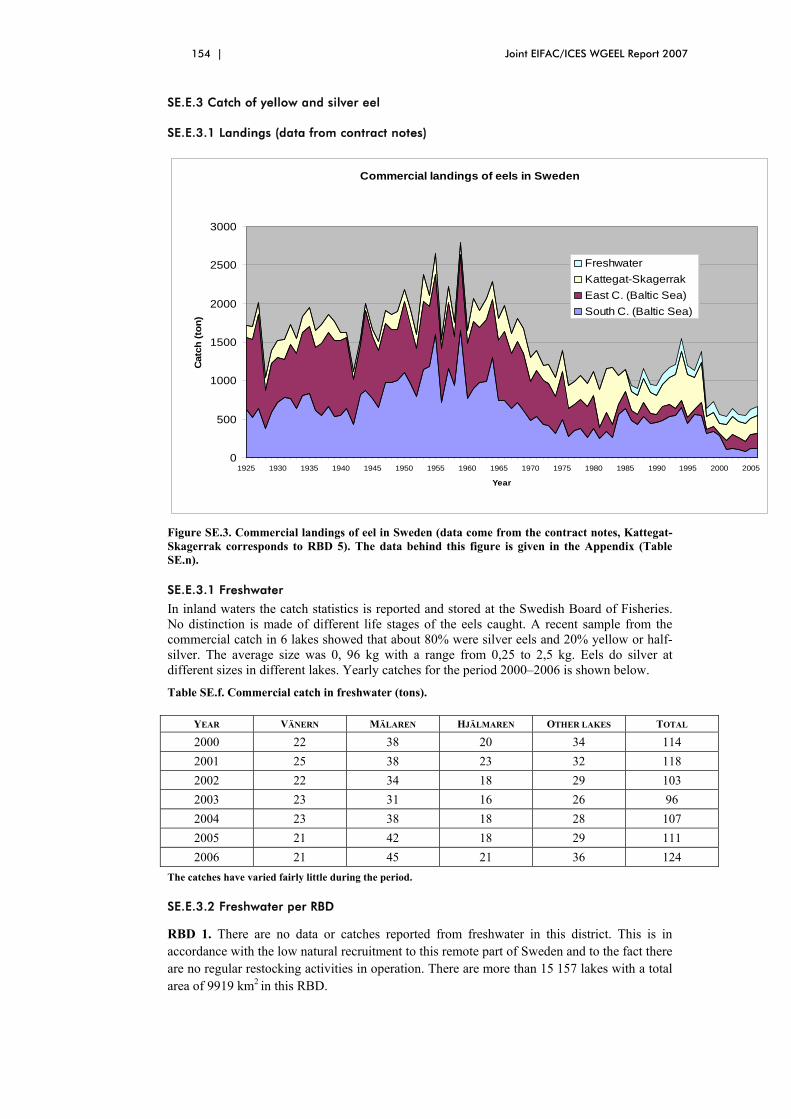
Figure SE.3. Commercial landings of eel in Sweden (data come from the contract notes, Kattegat-Skagerrak corresponds to RBD 5). The data behind this figure is given in the Appendix (Table SE.n).
SE.E.3.1 Freshwater
In inland waters the catch statistics is reported and stored at the Swedish Board of Fisheries. No distinction is made of different life stages of the eels caught. A recent sample from the commercial catch in 6 lakes showed that about 80% were silver eels and 20% yellow or half-silver. The average size was 0, 96 kg with a range from 0,25 to 2,5 kg. Eels do silver at different sizes in different lakes. Yearly catches for the period 2000–2006 is shown below.
Table SE.f. Commercial catch in freshwater (tons).
YEAR VÄNERN MÄLAREN HJÄLMAREN OTHER LAKES TOTAL
2000 22 38 20 34 114 2001 25 38 23 32 118 2002 22 34 18 29 103 2003 23 31 16 26 96 2004 23 38 18 28 107 2005 21 42 18 29 111 2006 21 45 21 36 124
The catches have varied fairly little during the period.
SE.E.3.2 Freshwater per RBD
RBD 1. There are no data or catches reported from freshwater in this district. This is in accordance with the low natural recruitment to this remote part of Sweden and to the fact there are no regular restocking activities in operation. There are more than 15 157 lakes with a total area of 9919 km2 in this RBD.
Joint EIFAC/ICES WGEEL Report 2007 | 155
RBD 2. Eels do occur in this area, but there is only a small fishery for them. There are no data from freshwater available. There are more than 12 132 lakes with a total area of 10 212 km2 in this RBD.
RBD 3. From this district there are catch data from four lakes, Mälaren, Hjälmaren, Sottern and Öljaren. The total reported catch was 68,2 tons in 2006. There are more than 2474 lakes with a total area of 3375 km2 in this RBD.
RBD 4. In this district there are catch data from 16 lakes. In total 12,1 tons were caught in 2004. There are more than 3970 lakes with a total area of 4899 km2 in this RBD.
RBD 5. There are commercial eel fisheries in six lakes in this district. The main part comes from the huge Lake Vänern (5650 km2) with 21,3 tons and the total reported catch was 44,3 tons in 2004. There are more than 4900 lakes with a total area of 9734 km2 in this RBD.
SE.E.3.3 Coastal waters
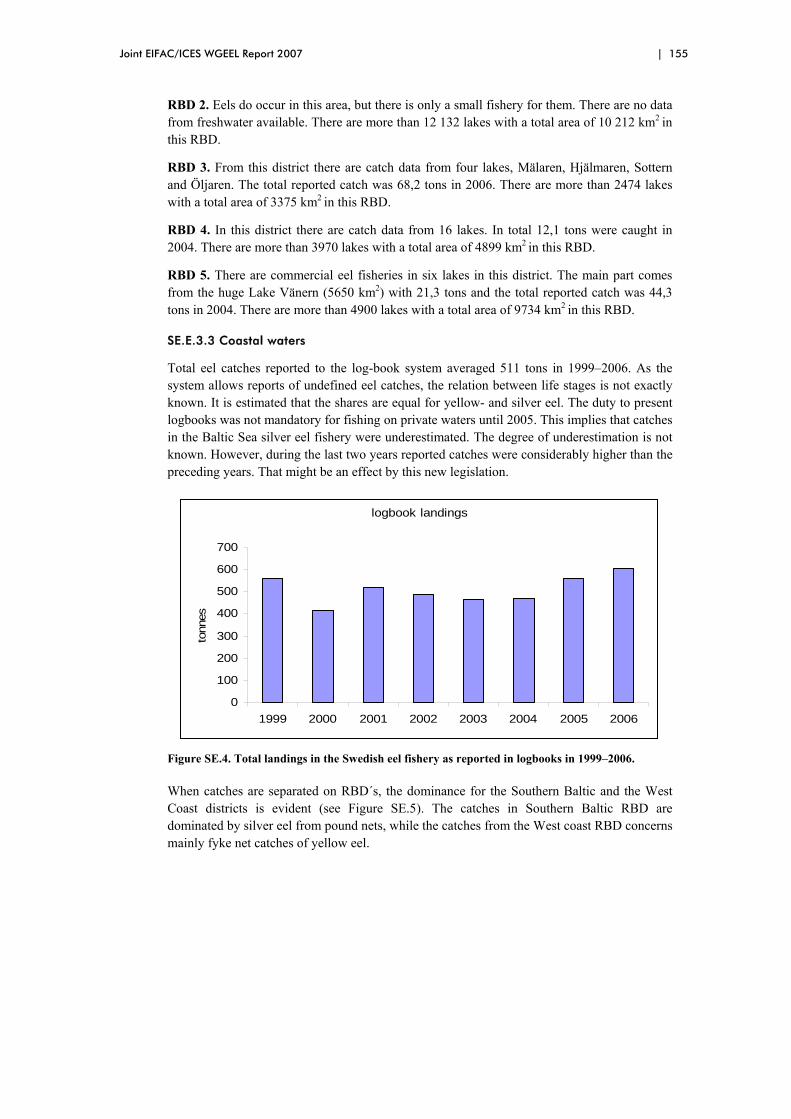
Total eel catches reported to the log-book system averaged 511 tons in 1999–2006. As the system allows reports of undefined eel catches, the relation between life stages is not exactly known. It is estimated that the shares are equal for yellow- and silver eel. The duty to present logbooks was not mandatory for fishing on private waters until 2005. This implies that catches in the Baltic Sea silver eel fishery were underestimated. The degree of underestimation is not known. However, during the last two years reported catches were considerably higher than the preceding years. That might be an effect by this new legislation.
logbook landings
0
100
200
300
400
500
600
700
1999 2000 2001 2002 2003 2004 2005 2006
tonn
es
Figure SE.4. Total landings in the Swedish eel fishery as reported in logbooks in 1999–2006.
When catches are separated on RBD´s, the dominance for the Southern Baltic and the West Coast districts is evident (see Figure SE.5). The catches in Southern Baltic RBD are dominated by silver eel from pound nets, while the catches from the West coast RBD concerns mainly fyke net catches of yellow eel.

156 | Joint EIFAC/ICES WGEEL Report 2007
logbook landings
050
100150200250300350
1999 2000 2001 2002 2003 2004 2005 2006
tonn
es
sd 20,21,23 (WEST) sd 24,25,27,28 (SBAL) sd 29 (NBAL)
sd 30 (BSEA) sd 31 (BBAY)
Figure SE.5. Total logbook landings in 1999–2006 approximately separated on RBD´s.
SE.E.4 Aquaculture
Different sources reported slightly diverging results for the Swedish aquaculture industry:
Table SE.g. Production of eels in aquaculture from 1983 in Sweden. (SCB 1 and SCB 2 denote one official (SCB 1) and one “unofficial” (SCB 2) version (SCB 2007).
DATA SOURCE AQUACULTURE PRODUCTION (TONS/YEAR) *SCB 1 *SCB 2 FAO FISHSTAT
1983 2 2 2 1984 12 15 12 1985 41 47 41 1986 51 59 51 1987 90 104 90 1988 203 233 203 1989 166 190 166 1990 157 179 157 1991 141 160 141 1992 171 195 171 1993 169 192 169 1994 160 182 160 1995 139 158 139 1996 161 184 161 1997 189 215 189 1998 204 232 204 1999 222 253 222 2000 273 311 273 2001 200 228 200 2002 167 190 167 2003 170 194 170 2004 158 158 2005 222 2006 191
*SCB ( Statistics Sweden) is the official source of statistics in Sweden.

Joint EIFAC/ICES WGEEL Report 2007 | 157
SE.E.5 Recreational Fisheries
In addition to commercial fisheries, the sports/recreational/household fisheries contribute significantly to the total landings of eel. The recreational fisheries have been studied in four surveys, most recently in 2005, by means of questionnaires (Fiske 2005-Report by the Swedish Board of Fisheries and Statistics Sweden). Although biased when it comes to the representativeness in the collected data (those who do fish tend to answer questionnaires whereas those who do not fish do not bother) the amount of eel caught by sport/recreational/household fishery in the whole country is estimated to 491±218 tonnes per year- about the same amount as the commercial fisheries.
The results and conclusions from this study have recently been subject for a provisional recalculation. It seems that due to the problems mentioned above the recreational catch of eels was overestimated with 97%. The new and corrected results are shown below.
A fifth survey has just been carried out and the preliminary results concerning eel and 2006 give ca 280 tons of which 20 tons were taken by anglers.
Table SE.h
FISHING DISTRICT SKAGERRAK & KATTEGAT
THE SOUND
S. BALTIC SEA
MIDDLE BALTIC SEA
THE GULF OF BOTHNIA
OTHERS TOTAL
Corresponding RBD 5 4 4 ~3 ~1-2 na Corrected estimated catch (kg)
18 283 19 765 60 549 81 597 3 364 65 840 249 398
Adding up these 249 tons of eel from recreational fisheries (Table SE.h) to the commercial catch ends in a total Swedish catch of about 800 tons.
Using the most recent but preliminary data above for the recreational fishery in 2006, the corresponding total Swedish catch was about 950 tons.
SE.F Catch per unit of effort
SE.F.1 Freshwater
In inland eel fisheries cpue data can be calculated on a yearly basis in respective lake, but the dataset is not accessible at the moment. As the type of nets may shift over time it may, however not seem to be very meaningful to do that. In Lake Mälaren and Hjälmaren for example the fishermen tend to replace fine mesh fyke nets, which catches pike, pikeperch and perch in addition to eel, with nets with a coarser mesh size to be able to fish for pikeperch more effectively. The data has never been used for stock assessment as the fishery is based mainly on stocked individuals.
SE.F.2 Marine areas
Selected companies have provided detailed catch statistics from the pound net fishery for silver eel in the Baltic Sea since the late 1950s. The trend in cpue is negative in the longest time series, corresponding to a 50% decrease from the highest levels in the early 1960s to recent years. The series starting in the early 1970s are diverging, although the changes in time were small. Due to different reasons two of the longer time series were broken in the early 2000s. In the longest one from northern Småland (Figure SE.6) a negative trend in the early 2000s.
Fishing for eel with fyke nets is of minor importance compared to pound nets on the Swedish coast of the Baltic Proper. Nevertheless it operates in a rather conservative way since several decades and long time series exist from a few companies. Since determination of life stage by the fishermen may be influenced by market demands rather than being based on biology, catch

158 | Joint EIFAC/ICES WGEEL Report 2007
per unit effort is presented for yellow- and silver eel together (Figure SE.7). The cpue was stable in both areas over the years In southern county of Östergötland area yellow eel became less abundant in the mid 1990s, but this decrease was compensated by a larger proportion of silver eels. The cpue in 2006 of both life stages together was the highest since 1974. In the northern county of Kalmar, silver eel became more abundant in fyke net catches in the early 1990s. In this area the silver eel catches in 2005 and 2006 were the biggest ever recorded in fyke nets, and fishers all over the area reported good catches.
From 1990 the minimum legal size for landing of yellow eel was raised in two steps from 53 to 60 cm. This may had an influence on the cpue in fyke nets. From 1 May, 2007 the minimum legal size was raised to 650 mm for both yellow and silver eels. The mean weight for yellow eel landings was close to 600 g in recent years.
0
2
4
6
8
10
1959 1964 1969 1974 1979 1984 1989 1994 1999 2004
S Öst ergöt land N Småland N Öst ergöt land
0
200
400
600
800
1000
1959 1964 1969 1974 1979 1984 1989 1994 1999 2004
N Kalmarsund
Figure SE.6. Time trends in pound net catches of silver eel in four subareas in Swedish RBD 4 (Southern Baltic). The subareas are all located in ICES subdivision 27 on the Swedish coast of the Baltic Proper.

Joint EIFAC/ICES WGEEL Report 2007 | 159
Figure SE.7. Time trends in cpue and effort for fyke net catches of silver and yellow eel in two subareas in Swedish RBD 4 (Southern Baltic). The subareas are all located in ICES subdivision 27 on the Swedish coast of the Baltic Proper. Southern part of the county of Östergötland (upper) and northern part of the county of Kalmar (lower).
SE.G Scientific surveys of the stock
SE.G.1.1 Recruitment surveys/ascending young eels
Recruitment of young eels (from glass eels and elvers to quite large bootlace eels) in Swedish waters is monitored in eel passes (equipped with collecting boxes) at the most downstream hydropower dam in a number of rivers along the Swedish coasts. Eels caught are weighed (or counted) before being released in upstream areas. Data from the most reliable eel passes, four in the Baltic Sea and four in Skagerrak-Kattegat, are given in the table below (see Wickström, 2002 for a more complete description).
During the last years the recruitment has generally been low or very low compared to historical levels until the 1960s. So far unexplained, there are sudden peaks in the amount of ascending eels during certain years and in different rivers. In e.g. River Kävlingeån there was an unusually high catch in 2004 when all the remaining rivers were still very low. Since 2006 the catch in the River Göta Älv eel pass is negligible and the reason behind is still unclear. Reconstruction work at the most downstream dam might have affected the upstream run of eels in the river.
Additional recruitment series on glass eels come from an experimental trawl fishery (with an IKMWT) in the intake channel for cooling water at the Ringhals Nuclear Power Plant (in Kattegat) and from the ICES-IBTS (formerly YFS) using an MIK-trawl in Skagerrak-Kattegat (c.f. SE.G.1.2).
ICES SD 27 south
00,10,20,30,4
1979 1984 1989 1994 1999 2004
kg /
gear
*day
s
0
5000
10000
n ge
asr*
days
yellow eel silver eel effort
ICES SD 27 north
0
0,05
0,1
0,15
1974 1979 1984 1989 1995 2000 2005
kg /
gear
*day
s05000100001500020000
n ge
ars*
days
yellow eel silver eel effort

160 | Joint EIFAC/ICES WGEEL Report 2007
Table SE.i. Amounts (kg) of ascending young eels caught in eight rivers along the Swedish coasts.
RIVER DALÄLVEN MOTALA STRÖM MÖRRUMSÅN KÄVLINGEÅN RÖNNE Å LAGAN VISKAN GÖTA ÄLV
YEAR/RBD RBD 2 RBD 4 RBD 4 RBD 4 RBD 5 RBD 5 RBD 5 RBD 5 1900 530,0 1901 5100,0 1902 340,0 1903 858,0 1904 552,0 1905 8700,0 1906 2000,0 1907 275,0 1908 -9,0 1909 -9,0 1910 -9,0 1911 5728,0 1912 6529,0 1913 20,0 1914 2828,0 1915 -9,0 1916 -9,0 1917 45,0 -9,0 1918 4,5 -9,0 1919 -9,0 1465,0 1920 -9,0 800,0 1921 -9,0 1555,0 1922 -9,0 455,0 1923 -9,0 1732,0 1924 -9,0 4551,0 1925 -9,0 331,3 5463,0 1926 49,0 357,8 3893,0 1927 445,0 581,1 4796,0 1928 0,0 211,9 47,0 1929 0,0 4,5 756,0 1930 147,0 268,0 5753,0 1931 -9,0 316,0 2103,0 1932 -9,0 408,0 7238,0 1933 -9,0 303,5 6333,0 1934 -9,0 236,0 6338,0 1935 -9,0 53,5 1336,0 1936 -9,0 24,5 2537,0 1937 -9,0 0,5 8711,0 1938 -9,0 106,5 3879,0 1939 -9,0 36,0 4775,0 1940 -9,0 684,0 1894,0 1941 -9,0 321,0 2846,0 1942 14,0 -9,0 454,0 427,0 1943 283,0 -9,0 1248,0 1848,0

Joint EIFAC/ICES WGEEL Report 2007 | 161
RIVER DALÄLVEN MOTALA STRÖM MÖRRUMSÅN KÄVLINGEÅN RÖNNE Å LAGAN VISKAN GÖTA ÄLV
1944 773,0 -9,0 1090,0 2342,0 1945 406,0 -9,0 1143,0 2636,0 1946 280,0 29,7 766,5 2452,0 1947 272,5 5,8 440,8 675,0 1948 120,0 6,0 494,7 1702,0 1949 43,0 39,4 603,6 1711,0 1950 304,5 93,5 419,9 2947,0 1951 210,0 2713,0 1,0 281,8 1744,0 1952 324,0 1543,5 9,1 379,1 3662,0 1953 241,5 2698,0 70,0 802,4 5071,0 1954 508,5 1030,0 2,7 511,3 1031,0 1955 550,0 1871,0 42,6 506,9 2732,0 1956 215,0 429,0 14,1 501,6 1622,0 1957 161,5 826,0 46,8 336,1 1915,0 1958 336,7 172,0 73,2 497,2 1675,0 1959 612,6 1837,0 80,0 910,5 1745,0 1960 289,0 799,0 29,0 93,0 552,4 1605,0 1961 303,0 706,0 665,5 143,7 314,8 269,0 1962 289,0 870,0 534,8 113,0 261,9 873,0 1963 445,4 581,0 241,2 32,5 298,1 1469,0 1964 158,0 181,6 177,8 34,7 27,5 622,0 1965 276,4 500,0 292,3 87,1 28,0 746,0 1966 157,5 1423,0 196,3 48,5 216,5 1232,0 1967 331,8 283,0 353,6 6,6 24,4 493,0 1968 265,5 184,0 334,8 398,0 74,4 849,0 1969 333,7 135,0 276,8 85,7 117,1 1595,0 1970 149,8 2,0 80,4 29,8 24,7 1046,0 1971 242,0 1,0 141,1 53,3 45,3 12,0 842,0 1972 87,6 51,0 139,9 249,0 106,2 88,0 810,0 1973 159,7 46,0 375,0 282,3 107,1 177,0 1179,0 1974 49,5 58,5 65,4 120,7 33,6 13,0 631,0 1975 148,7 224,0 93,3 206,7 78,4 99,0 1230,0 1976 44,0 24,0 147,2 17,1 20,2 501,0 798,0 1977 176,4 353,0 89,6 32,1 26,4 850,0 256,0 1978 35,1 266,0 168,4 10,8 75,8 532,6 873,0 1979 34,3 112,0 61,4 56,1 165,9 505,2 190,0 1980 71,2 7,0 36,5 165,7 226,0 72,5 906,0 1981 6,8 31,0 72,8 49,2 78,0 513,1 40,0 1982 0,5 22,0 129,0 40,0 90,8 472,0 882,0 1983 112,1 12,0 204,6 37,6 87,8 308,4 113,0 1984 33,9 48,0 189,9 0,5 68,0 20,7 325,0 1985 69,7 15,2 138,1 0,0 234,1 211,5 77,0 1986 28,4 26,0 220,3 8,6 2,5 150,9 143,0 1987 73,5 201,0 54,5 84,8 69,8 140,9 168,0 1988 69,0 169,5 241,0 4,9 191,7 91,9 475,0 1989 -9,0 35,2 30,0 0,0 44,0 32,7 598,0 1990 -9,0 21,0 72,5 32,0 21,6 42,1 149,0

162 | Joint EIFAC/ICES WGEEL Report 2007
RIVER DALÄLVEN MOTALA STRÖM MÖRRUMSÅN KÄVLINGEÅN RÖNNE Å LAGAN VISKAN GÖTA ÄLV
1991 -9,0 2,0 151,0 -9,0 -9,0 161,3 0,4 264,0 1992 9,6 108,0 14,0 12,5 -9,0 42,2 70,3 404,0 1993 6,6 89,0 45,7 25,8 -9,0 8,7 43,4 64,0 1994 71,9 650,0 283,0 4,0 -9,0 30,7 76,1 377,0 1995 7,6 32,0 72,4 2,9 -9,0 11,6 5,5 0,0 1996 17,5 14,0 51,9 13,5 -9,0 2,8 10,0 277,0 1997 7,5 8,1 148,0 19,4 10,4 31,7 7,6 180,0 1998 14,7 5,5 12,9 15,3 24,0 62,6 5,0 0,0 1999 15,5 85,0 84,2 22,2 4,2 49,5 1,8 0,0 2000 12,4 270,1 1,0 5,0 -9,0 13,0 14,1 0,0 2001 8,2 177,5 19,3 34,5 1,8 26,8 1,8 0,0 2002 58,6 338,8 37,4 19,3 27,0 102,0 26,2 693,0 2003 126,1 19,0 11,0 9,7 9,1 31,7 45,1 266,0 2004 26,4 42,0 1,5 248,3 2,0 29,0 5,0 125,0 2005 30,9 24,8 2,5 3,4 0,1 20,5 25,8 105,0 2006 35,1 25,9 2,5 94,4 0,1 38,1 2,7 0,04 2007 >18,4 >30 na yet >74,5 na yet >70 >2,1 na yet
The ascent in River Viskan is totally dominated by elvers arrived as glass eels the same year. Also in River Lagan there is a considerable proportion of “glass eels” but in the remaining rivers there is a mix of year-classes, with eels up to more than 300 mm in TL. The value -9,0 implies no data available. Not available = na. 0 for River Göta Älv in recent years is due to the fact the eel pass was closed in those years. Data for 2007 are only indicated as the season is not over yet.

Joint EIFAC/ICES WGEEL Report 2007 | 163
Ascending young eels in eight Swedish rivers
0
1000
2000
3000
4000
5000
6000
7000
8000
9000
1900 1910 1920 1930 1940 1950 1960 1970 1980 1990 2000
Year
Cat
ch (k
g)Göta ÄlvDalälvenMotala StrömViskanLaganMörrumsånRönneåKävlingeån
Ascending young eels in eight Swedish rivers, from 1950 onwards
0
100
200
300
400
500
600
700
800
900
1000
1950 1960 1970 1980 1990 2000
Year
Cat
ch (k
g)
0
500
1000
1500
2000
2500
3000
3500
4000
4500
5000
Riv
ers
Göt
a Ä
lv a
nd M
otal
a St
röm
DalälvenViskanLaganMörrumsånRönneåKävlingeånGöta ÄlvMotala Ström
Figure SE.8 a and b. Long-term trends in the catches of young eels at various places along the Swedish coast. The lower panel is a magnified version of the upper one from 1950 onwards.

164 | Joint EIFAC/ICES WGEEL Report 2007
Recruitment index for young eels
0
200
400
600
800
1000
1200
1400
1600
1900 1910 1920 1930 1940 1950 1960 1970 1980 1990 2000
Year
% o
f ave
rage
for 1
971-
80
0
500
1000
1500
2000
2500
% o
f ave
rage
for 1
971-
80 (M
otal
a St
röm
)
Göta ÄlvDalälvenViskanLaganMörrumsånRönneåArithmetic mean for all seven riversMotala StrömGeometric mean of all seven rivers
j
Figure SE.9. Recruitment indices from seven Swedish rivers. Data are presented as percentages of the averages for 1971 to 1980 in the same rivers, respectively.
SE.G.1.2 Recruitment surveys/marine data
The abundance of glass eels in the open sea (Kattegat and Skagerrak) are surveyed by trawling with either an Isaacs-Kidd Midwater trawl (IKMT) or with a modified Methot-Isaacs-Kidd Midwater trawl (MIKT). The former trawl is used in a fixed position in the intake canal for cooling water to the condensers at the Ringhals Nuclear Power Station (e.g. Westerberg, 1998 a and b). The latter method is used from R/V Argos during the ICES-International Young Fish Survey (since 1993 called the International Bottom trawl Survey (IBTS Quarter 1) (Hagström and Wickström, 1990).
When the glass eels have settled they and larger eels can be monitored on soft and shallow bottoms using a “Drop Trap” technique (Westerberg et al., 1993). This was successfully done during a number of years but is now a resting series. This approach made it possible to roughly estimate the total recruitment of young eels to the Swedish coast.
From all three methods recruitment series could be compiled:
Recruitment of glass eel to the Swedish west coast is monitored at the intake of cooling water to the nuclear power plant at Ringhals in the Kattegat (Figure SE.10 and Table j). The time of arrival of the glass eels to the sampling site varies between years, probably due to hydrographical conditions, but the peak in abundance normally occurred in late March to early April. Abundance has decreased by 90% if recent years are compared to the peak in the early 1980s.

Joint EIFAC/ICES WGEEL Report 2007 | 165
Glass eel abundance, Ringhals 1981-2007
y = -15,074x + 447,38R2 = 0,2962
0
100
200
300
400
500
600
700
800
900
1981 1983 1985 1987 1989 1991 1993 1995 1997 1999 2001 2003 2005 2007
n/ni
ght
Figure SE.10. Time trend in glass eel recruitment at the Ringhals nuclear power plant on the Kattegat coast in Swedish RBD 5 (Västerhavet).

166 | Joint EIFAC/ICES WGEEL Report 2007
Table SE.j. Annual indices of glass eel recruitment at the intake canal for cooling water to reactors 1 and 2 at the Ringhals nuclear power plant. Mean of weekly means of numbers of glass eels collected with a modified Isaacs-Kidd midwater trawl during March and April (weeks 9–18). Data were corrected for variations in water flow.
WEEK 1981
1982
1983
1984
1985
1986
1987
1988
1989
1990
1991
1992
1993
1994
1995
1996
1997
1998
1999
2000
2001
2002
2003
2004
2005
2006
2007
3 3 1 4 0 17 1 4 0 5 4 8 15 14 18 30 5 4 0 0 1 0 74 2 27 6 20 10 6 28 27 13 56 45 7 11 0 1 1 0 142 0 86 5 1 12 2 42 7 6 22 9 85 331 7 41 0 22 9 8 267 3 154 2 2 62 3 4 8 1 34 57 3 44 57 8 48 11 3 50 12 115 5 327 5 0 22 2 12 9 187 51 3 36 342 185 3 160 55 3 172 0 68 125 62 344 5 117 5 1 15 6 11 10 199 24 2 80 372 150 15 471 118 7 224 4 200 100 121 377 3 200 10 3 10 2 29 11 250 130 528 176 4 19 129 150 88 290 130 610 333 13 198 8 72 533 22 366 44 3 39 1 81 12 374 806 835 289 14 6 2 16 107 145 42 469 535 400 569 25 60 177 158 214 24 530 53 18 162 13 38213 1886 1258 265 122 109 1 0 72 291 251 110 562 495 1430 331 60 42 220 2 479 16 59 185 35 153 17 18614 2093 1335 469 181 0 3 31 149 121 351 138 151 403 1236 625 33 77 448 314 942 22 185 192 65 162 55 10115 1849 878 112 878 141 603 67 284 414 298 540 1145 91 128 201 237 377 154 45 184 151 55 202 97 19116 925 476 69 416 42 120 254 142 527 619 64 73 49 96 79 299 25 53 74 90 286 132 20 17 804 477 171 350 6 127 37 193 231 564 278 80 56 44 202 141 257 128 8 84 32 66 62 18 18 0 297 114 124 55 230 31 9 46 8 10 36 7 mean 9–18 849 711 553 175 305 45 52 169 184 186 138 283 374 636 277 44 117 164 147 400 32 171 84 31 110 42 102
The numbers of glass eels caught during the Swedish parts of the International Bottom trawl Survey (IBTS Quarter 1) are given in Figure SE.11.

Joint EIFAC/ICES WGEEL Report 2007 | 167
Number of glass eels per haul and m2
0
0,002
0,004
0,006
0,008
0,01
0,012
0,014
1991 1993 1995 1997 1999 2001 2003 2005
Year
Num
bers
Figure SE.11. Catch of glass eels by a modified Methot-Isaacs-Kidd Midwater trawl (MIKT) in the Skagerrak-Kattegat 1991–2006. Numbers have been corrected for the flow through the net.
SE.G.1.3
Another way of estimating the occurrence of young eels ascending in smaller streams is by electro-fishing (Degerman, 1985; Fiskeriverket and Laxforskningsinstitutet, 1999; CEN, 2002). Normally this is done with salmonids in focus with eels as secondary product or spin-off.
20062005200420032002200120001999199819971996199519941993199219911990
YEAR
100
80
60
40
20
0
Eel o
ccur
renc
e (%
)
Figure SE.12. Proportion of electro-fished stations (%) with eel occurrence (+/- 95% CI) along the West Coast. The stations in Halland County (Swedish West Coast) that were fished in 1990–2006 are situated from 0 to 100 m asl. Note that local abundance is not given here, only presence/absence. Data from SERS (Swedish Electrofishing Register). The positive trend is significant (Pearson correlation, n=17, r=0,48, p=0,046).

168 | Joint EIFAC/ICES WGEEL Report 2007
20062005200420032002200120001999199819971996199519941993199219911990
YEAR
100
80
60
40
20
0
Eel o
ccur
renc
e (%
)
Figure SE.13. Proportion of electro-fished stations (%) with eel occurrence (+/- 95% CI) along the East Coast. Stations that were fished in 1990–2000 in this figure are situated from 0 to 100 m asl in six counties along the Baltic Sea Coast. Note that local abundance is not given here, only presence/absence. Data from SERS (Swedish Electrofishing Register). The negative trend is significant (Pearson correlation, n=17, r=-0,64, p=0,006).
SE.G.2 Yellow eel surveys
SE.G.2.1 Yellow eel surveys in coastal waters
The coastal fish communities on the Swedish west coast are monitored by standardized fishing with fyke nets in shallow water (2–5 m). Yellow eel was among the dominating fish species in August most years. Barsebäck in the SW part of the area belongs to RBD SE Baltic, other areas to RBD Västerhavet. The trend for the longest time series from Vendelsö in N Kattegatt is significantly positive. A negative tendency for the Barsebäck area was broken by increasing catches in 2006 and 2007. In the other areas the period of sampling was too short to be examined for biologically significant trends. The magnitude of cpue though, was similar to that of the longer series. The inter annual variations in cpue were influenced by water temperature at the time of sampling, but no time trends in temperature were observed for the period with available data (1988–2006).

Joint EIFAC/ICES WGEEL Report 2007 | 169
0
0,5
1
1,5
2
2,5
3
1976 1981 1986 1991 1996 2001 2006
n/fy
kene
t * d
ay
0
5
10
15
20
25
oC
Barsebäck Kullen Vendelsö Hakefjorden
Lysekil Fjällbacka Water temperature Linjär (Vendelsö)
Figure SE.14. Time trend in the yellow eel catches in coastal fish monitoring with fyke nets in August on the Swedish west coast. RBD SE Baltic (Barsebäck) and RBD Västerhavet (others). Annual mean water temperature at the fishing gears is presented for the Vendelsö area in central Kattegat.
SE.G.2.2 Yellow eel surveys in freshwater
There are no routine stock surveys for yellow eels in freshwater. The nearest equivalents are the surveys dedicated to stocked populations of eels. These are mostly performed in smaller lakes but also at one site in the large Lake Mälaren where glass eels were stocked in both 1980 and 1997. The aim is to follow the development of the introduced stock and individual growth of young eels stocked in nature. The eels that were stocked in 1997 were marked with Alizarin Complexone. Such marked eels are now dominating the local eel population. Their proportion of the catch has increased from 4% in 2000 to 69% in 2007. In 2007 the stocked eels were 494 mm (+/- 75 SD) which corresponds to a growth rate of 39,8 mm/year (+/- 7,5 SD) after stocking.
SE.G.3 Silver eel surveys
There are no regular silver eel surveys in Sweden. However, in 2003 the Institute of Freshwater Research collected large samples from the commercial fisheries in eight lakes and at two sites where most silver eels try to leave the Baltic Sea, i.e. in the Sound (Öresund). In 2005 and 2006 silver eels from additional sites along the Baltic Coast were collected for a tagging study. All these eels (except tagged but not recaptured individuals) have now been analysed with respect to e.g. their fat content and to their chemical background (by otolith microchemistry). This extensive study might together with a now realized tag-recapture study be the baseline for recurrent sampling of silver eels. The Coastal Institute is sampling the commercial catch with the purpose to collect length and age data. This is done within the DCR (Data Collection Regulation Programme). See also SE.H below.
SE.H Catch composition by age and length
SE.H.1 Catch composition by age and length in coastal areas
In 2002–2006 over 7000 yellow eel vere sampled for individual length, total and somatic weight, sex and prevalence of Anguillicola crassus. All but fifty were female and the males were mainly recorded on the Skagerrak coast in SD 20. Age readings exist for 2700 individuals in August 2007 (Table SE.k(b)).The sampling programme started as an initiative from the Swedish Board of Fisheries and is now part of the Swedish contribution to the DCR. Sampling of silver eel in pound net catches started in 2005. So far length and weight

170 | Joint EIFAC/ICES WGEEL Report 2007
recordings and otoliths were collected from 1700 silver eels and 1200 age readings were performed.
Table SE.k. Swedish sampling of yellow eel in commercial catches with fyke nets.
a. total number sampled for size and ageYear of catch
ICES SD 2002 2003 2004 2005 2006 Total20 202 201 200 729 670 200221 205 198 200 202 100 90523 202 201 200 200 197 100025 409 405 414 1 122927 392 426 469 465 478 2230
Total 1410 1431 1483 1596 1446 7366
b. total number of age recordsYear of catch
ICES SD 2002 2003 2004 2005 200620 97 96 98 433 72421 98 99 98 201 100 59623 96 96 198 199 58925 97 99 1 19727 390 188 578
Total 291 388 883 1021 101 2684
Sampling for length in commercial fyke net catches show a similar size composition of yellow eel in four out of five areas. Sizes in the interval 40–50 cm were most abundant. Sampling in subdivision 27 in the central Baltic Proper demonstrates a population with considerably higher mean length and with single individuals reaching almost 90 cm in length (Figure SE.x).

Joint EIFAC/ICES WGEEL Report 2007 | 171
0
20
40
60
80
100
120
140
26 29 32 35 38 41 44 47 50 53 56 59 62 65 68 71 74 77 80+
cm-group
nSD 20 SD 21
0
20
40
60
80
100
120
26 29 32 35 38 41 44 47 50 53 56 59 62 65 68 71 74 77 80+
cm-group
nSD 23 SD 25 SD 27
Figure SE.15. Length composition of yellow eel from commercial fyke net catches in samples collected in 2002–2006 in RBD SE Västerhavet (ICES SD 20–21) and RBD SE Baltic (ICES SD 23,25 and 27). Samples from subdivisions 25 and 27 are based on an unsorted mixture of landings and discard.
There is a gradient in mean length of silver eel from 77 cm SD 27 in central Baltic to 65 cm in SD 23, Öresund. Since May 2007 the minimum legal landing size is 65 cm in the Baltic. The length distribution in SD 24 in southern Baltic indicates a potential for a considerable reduction of the fishing mortality in the pound net fishery in this area with the new regulations.

172 | Joint EIFAC/ICES WGEEL Report 2007
05
101520253035404550
38 40 42 46 50 52 54 56 58 60 62 64 66 68 70 72 74 76 78 80 82 84 86 88 90 92 94 96cm-group
n
SD 23 SD 24SD 25 SD 27
Figure SE.16. Length composition of silver eel from commercial pound net catches for samples collected in 2005–2006 in RBD SE Baltic (ICES SD 23, 24, 25 and 27).
In the three western subdivisions, Öresund, Kattegat and Skagerrak, the average age of the yellow eel landings varied between 8 and 10 years. The samples from SD 25 represent the first proper habitat for yellow eel recruits on their path of migration from the west coast into the Baltic Sea. The relatively low mean age in unsorted fyke net landings in SD 25 indicate that migrants on transit might make up a considerable proportion of the catches. Although the yellow eels from SD 27 in the Central Baltic were considerably larger, they were only 1–2 years older compared to the western sampling sites. Silver eel ages varied from 14 years on average in SD 27 to 10–12 years in SD 23–25.
Table SE.l. Mean age of yellow eel in the Swedish coastal fyke net fishery
ICES SD Year of catch2002 2003 2004 2005 2006 Total
20 9,0 8,9 9,6 8,7 8,921 8,7 8,2 8,7 7,9 9,2 8,423 8,6 9,6 9,4 8,9 9,125 7,2 6,8 7,027 9,8 10,9 10,1
In SD 20, 21 and 23 (West Coast) eels were recruited to the fishery at the age of 4 to 5 years and the oldest individuals recorded had reached the age of 18. On the southern Baltic coast the age span in unsorted landings was 3–12 years. The age distribution in SD 27 was similar to those from the west coast, although shifted one year to the right in Figure SE.X.

Joint EIFAC/ICES WGEEL Report 2007 | 173
020406080
100120140160180200
3 4 5 6 7 8 9 10 11 12 13 14 15 16 18 20age
n
SD25 SD20SD21 SD23SD27
Figure SE.17. Age distribution of yellow eel from commercial fyke net catches for samples collected in 2005–2006 in RBD SE Västerhavet (ICES SD 20–21) and RBD SE Baltic (ICES SD 25 and 27).
The growth pattern is close to linear for both length and weight in all areas (Figure SE.x). Bias is probably introduced for younger ages du to gear selectivity and in higher ages due to silvering. Yellow eel from SD 27 in central Baltic were considerably longer and heavier than in other areas, a 10 year old female beeing 57 cm and 314 g in the former area compared to 49,5 cm and 192 g on the Skagerrak coast (SD 20). Comparing the most abundant ages, somatic condition is higher in the Baltic samples and increases with increasing age. The possibly transiting eels in SD 25 thus were fatter than eels from the west coast, but had otherwise grown at approximately the same speed. Condition increasing with increasing age is seen in all areas but SD 20.

174 | Joint EIFAC/ICES WGEEL Report 2007
300
400
500
600
700
800
900
3 4 5 6 7 8 9 10 11 12 13 14 15 16 18 20age
mm
SD20 SD21SD23 SD25SD27
0
100
200
300
400
500
600
700
800
900
3 4 5 6 7 8 9 10 11 12 13 14 15 16 18 20age
g
SD20 SD21SD23 SD25SD27
1
1,2
1,4
1,6
1,8
2
2,2
3 4 5 6 7 8 9 10 11 12 13 14 15 16 18 20age
condition factor
SD20 SD21SD23 SD25SD27
Figure SE.18. Length, weight and condition factor at age of yellow eel from commercial fyke net catches for samples collected in 2005–2006 in RBD SE Västerhavet (ICES SD 20–21) and RBD SE Baltic (ICES SD 25 and 27).
SE.H.2 Freshwater
In addition to the programme mentioned under SE.G.3 no data on catch composition is collected in freshwaters.
Joint EIFAC/ICES WGEEL Report 2007 | 175
SE.I Other biological sampling
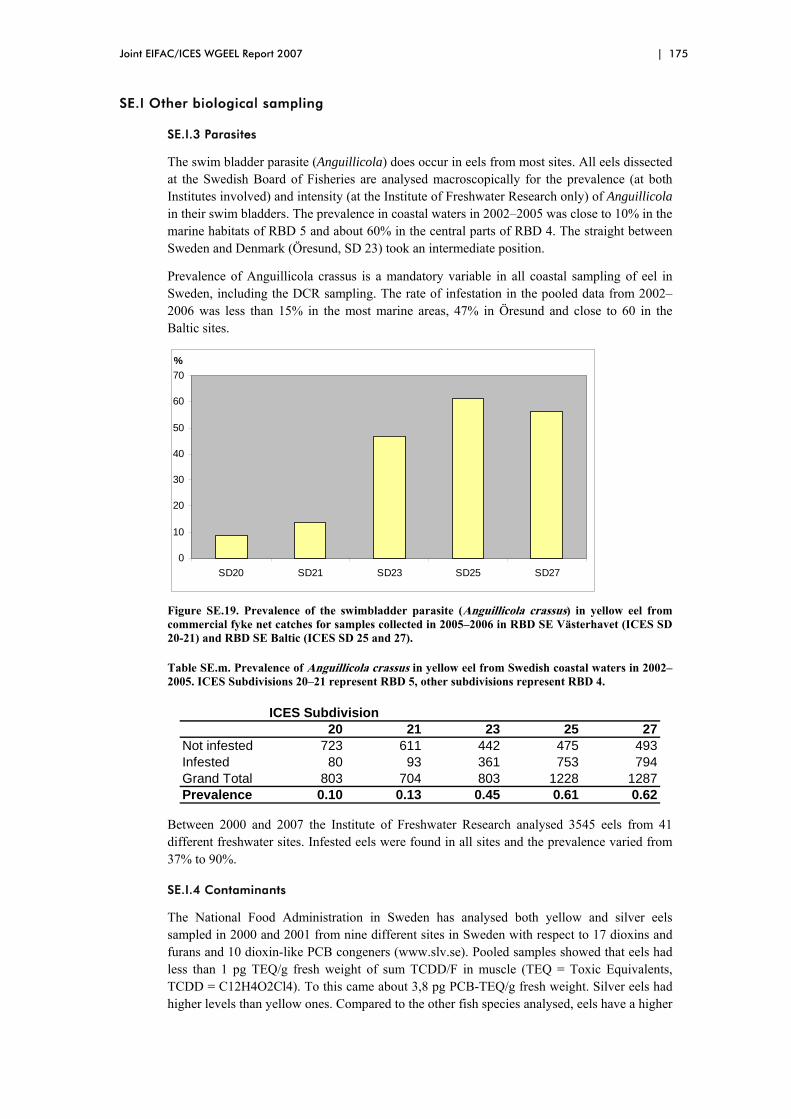
SE.I.3 Parasites
The swim bladder parasite (Anguillicola) does occur in eels from most sites. All eels dissected at the Swedish Board of Fisheries are analysed macroscopically for the prevalence (at both Institutes involved) and intensity (at the Institute of Freshwater Research only) of Anguillicola in their swim bladders. The prevalence in coastal waters in 2002–2005 was close to 10% in the marine habitats of RBD 5 and about 60% in the central parts of RBD 4. The straight between Sweden and Denmark (Öresund, SD 23) took an intermediate position.
Prevalence of Anguillicola crassus is a mandatory variable in all coastal sampling of eel in Sweden, including the DCR sampling. The rate of infestation in the pooled data from 2002–2006 was less than 15% in the most marine areas, 47% in Öresund and close to 60 in the Baltic sites.
0
10
20
30
40
50
60
70
SD20 SD21 SD23 SD25 SD27
%
Figure SE.19. Prevalence of the swimbladder parasite (Anguillicola crassus) in yellow eel from commercial fyke net catches for samples collected in 2005–2006 in RBD SE Västerhavet (ICES SD 20-21) and RBD SE Baltic (ICES SD 25 and 27).
Table SE.m. Prevalence of Anguillicola crassus in yellow eel from Swedish coastal waters in 2002–2005. ICES Subdivisions 20–21 represent RBD 5, other subdivisions represent RBD 4.
ICES Subdivision20 21 23 25 27
Not infested 723 611 442 475 493Infested 80 93 361 753 794Grand Total 803 704 803 1228 1287Prevalence 0.10 0.13 0.45 0.61 0.62
Between 2000 and 2007 the Institute of Freshwater Research analysed 3545 eels from 41 different freshwater sites. Infested eels were found in all sites and the prevalence varied from 37% to 90%.
SE.I.4 Contaminants
The National Food Administration in Sweden has analysed both yellow and silver eels sampled in 2000 and 2001 from nine different sites in Sweden with respect to 17 dioxins and furans and 10 dioxin-like PCB congeners (www.slv.se). Pooled samples showed that eels had less than 1 pg TEQ/g fresh weight of sum TCDD/F in muscle (TEQ = Toxic Equivalents, TCDD = C12H4O2Cl4). To this came about 3,8 pg PCB-TEQ/g fresh weight. Silver eels had higher levels than yellow ones. Compared to the other fish species analysed, eels have a higher

176 | Joint EIFAC/ICES WGEEL Report 2007
ratio of PCB to dioxins. Due to the high costs for this type of analyses only few eels will be sampled regularly in future.
Recently yellow eels from the Sound (between Sweden and Denmark) outside a heavily loaded industrial area in Helsingborg were analysed for dioxins and dioxin-like PCB:s. Pooled samples from 2005 contained 5,7 WHO-PCDD/F-TEQ pg/g and 11 WHO-PCB-TEQ pg/g, both based on fresh weights. In 2006 another five pooled samples from the same area were analysed. The dioxins varied between 0,9 and 4,7 with an average of 2,2 WHO-PCDD/F-TEQ pg/g. The PCB:s varied between 3,9 and 12,7 with an average of 6,6 WHO-PCDD/F-PCB-TEQ (Source: SLV (The National Food Administration)). At some sites the level of dioxins in eel muscle exceeded by that the 4 p/g level of dioxins or the 12 pg/g level of summed up dioxins and dioxin-like PCBs, set as maximum allowed levels in eel by the Commission of the European Communities.
Recent analyses of mercury (Hg) in eels from a number of lakes did show very low levels.
SE.I.5 Predators
Cormorants
Cormorants are believed to predate substantially on eels. As about 2900 young eels stocked in Lake Ymsen 1998–2000 were equipped with PIT-tags in the spring 2004 we took the opportunity to scan the ground below the only cormorant colony in that lake for tags. In total 30 PIT-tags were found corresponding to a minimum loss by cormorant predation of 1%.
An extensive study of the stomach content of cormorants at three sites along the Kattegat-Skagerrak coast revealed that eels were taken by about 5% of the cormorants. That was equivalent to about 1% of their diet. Although the low percentage, it corresponds to a total annual predation of 310 000 yellow eels, i.e. one fourth of the commercial catch on this coast (Lunneryd and Alexandersson, 2005).
Seals
Along the Swedish West Coast there is substantial damage on eel fyke-nets done by harbour seal (Phoca vitulina) (Königson et al., 2006). The cost of the damage estimates to several percent (up to 18%) of the catch (Königson et al., 2003). There are circumstances that indicate that the raiding seals are a minor part of the population. It is shown that those seals have strong preference for eel compared with cod or flatfish in the fyke nets (Königson et al., 2006). Old diet studies indicate that a “normal” seal seldom eat eel (Härkönen and Heide-Jørgensen, 1991) but obvious is that the specialised seals that damage the fyke nets cause an additional mortality on the eel population of several percent of the catches.
There is only one minor diet study of grey seals (Halichoerus grypus) in the Baltic proper. The material consists of fish remains from 54 stomachs and intestines which reflect maximum one day’s food. Remains were found from two eels (Lundström et al., in press). It is from those figures impossible to calculate an accurate figure of how important eels are fore the grey seals.
SE.J Other sampling
SE.J.2 Obstacles to eel migration
During 2005 and 2006 an inventory of obstacles for eels migrating both up- and downstream was performed. Not only are the obstacles as such studied but also the occurrence of fish passes, by-passes, deflecting screens, etc. and their suitability for eels. The purpose is to achieve a database to be used as background when installing new or improving existing eel passes and deflecting devices. Water Courts decisions might be reconsidered with this database as argument.
Joint EIFAC/ICES WGEEL Report 2007 | 177
SE.K Stock assessment
So far the collected data has not by routine been used for stock assessment. Published mortality estimates from subdivision 20 and 21 (Svedäng, 1999) (approximating RBD 5, Västerhavets vattendistrikt (“the North Sea”)) have been used in a simple length based mortality rate model to assess the effect of present yellow eel exploitation on spawner escapement in relation to present and estimated past unexploited levels of spawner escapement (Åström and Wickström, 2004). The relation between the present and past population levels has been estimated using the longer data series on ascending elvers and young eels, indicating that the present population probably is less than 10% of the one in the mid-1900s.
An attempt has also been made to use the length sampling from the yellow eel fishery in fives areas in ICES Subdivision 25 and 27 (part of RBD 4, Södra Östersjöns vattendistrikt (“the Southern Baltic Sea” or SBAL)) in a catch-at-length analysis to estimate natural and yellow eel fishery induced instantaneous mortality rates, in terms of mortality rate per unit length increment. The result from analyses of a large number of mark recapture studies on silver eels has been used as a rough estimate of the silver eel fishery mortality rate. Data on average length of female silver eels in the subdivisions were also needed for the analyses. Males have been disregarded because of their very low prevalence in Swedish waters. The simple length based mortality rate model has then been used to assess the effect of present yellow and silver eel exploitation on spawner escapement in subdivision 25 and 27 in relation to present and estimated past unexploited levels of spawner escapement (Åström, 2004).
The above analyses indicate that the yellow eel exploitation allows at most 15% of the present possible escapement to the silver eel stage. This applies both to subsections 20 and 21 (~ RBD 5) as well as to subsections 25 and 27 (part of RBD 4), and indicates a severe overexploitation. The silver eel fishery in the latter two subsections then further reduces the spawner escapement by about half, so that only about 7% of the present possible spawner escapement remains from these subsections. In perspective of past possible spawner escapement this would only amount to less than 0.7% of the spawner escapement possible in the mid-1900s.
Using additional data on the amounts of yellow and silver eels caught in the different subdivisions have allowed for analyses of the possible effects of fishing restrictions and re-stocking of elvers on spawner escapement using the same conceptual model (Åström, 2005).
SE.O. Overview
To some extent Sweden has a good data situation, particularly regarding coastal yellow eels. At the same time much remains to be filled in order to be able to establish a sustainable management in accordance with the EU regulation regarding eel management. The Department of Research and Development of the Swedish Board of Fisheries is currently changing it system for planning and prioritizing hopefully allowing for coherent planning, collection of data and analyses.
SE.P Literature references
CEN. 2002. Water analysis-Sampling fish with electricity. CEN/TC 230/WG 2/TG 4 N. Final draft for formal vote.
Degerman, E., Fogelgren, J. E., Tengelin, B., and Thörnelöf, E. 1985. Förekomst och täthet av havsöring, lax och ål i försurade mindre vattendrag på svenska västkusten [Occurrence of brown trout, Atlantic salmon and eel in small acidified watercourses on the West Coast of Sweden]. Information från Sötvattenslaboratoriet, Drottningholm. 65 p.
Fiskeriverket. 2005. Fiske 2005, en undersökning om svenskarnas fritidsfiske, Fiskeriverket i samarbete med SCB. 89 p. [Fishing 2005, a survey of the Swede’s recreational fishing].

178 | Joint EIFAC/ICES WGEEL Report 2007
Fiskeriverket & Laxforskningsinstitutet. 1999. RASKA - Resursövervakning av sötvattensfisk. [English summary: The status of fish populations in inland waters and coastal rivers in Sweden]. Inform.Inst.Freshw.Res., Drottningholm (8). 37 p.
Hagström, O., and Wickström, H. 1990 Immigration of Young Eels to the Skagerrak-Kattegat Area 1900 to 1989. Int. Revue. Ges. Hydrobiol. 75 86): 707–716.
Härkönen, T., and Heide-Jørgensen, M. P. 1991. The harbour seal Phoca vitulina as a predator in the Skagerrak. Ophelia, 34: 191–207.
Königson, S., Lunneryd, S.G., and Lundström, K. 2003. Sälskador i ålfisket på svenska västkusten. En studie av konflikten och dess eventuella lösningar. (The seal-fisheries conflict on the west coast of Sweden. An investigation of the problem and its possible solutions. (In Swedish with an English summary)). Finfo. Fiskeriverket informerar,. 9: 1–24. http://www.fiskeriverket.se/service/publikationer/fiskeriverketinformerar/finfo2003/finfo20039.4.63071b7e10f4d1e2bd380006462.html
Königson, S., Lundström, K., Hemmingsson, M., Lunneryd, S. G., and Westerberg, H. 2006. Feeding Preferences of Harbour Seals (Phoca vitulina) Specialised in Raiding Fishing Gear. Aquatic Mammals, 32(2): 152–156.
Lunneryd, S.-G., and Alexandersson, K. 2005. Födoanalyser av storskarv, Phalacrocorax carbo i Kattegatt–Skagerrak. Finfo, 2005:11. 22p.
SCB (Statistics Sweden). 2005. Vattenbruk 2004 [Aquaculture in Sweden 2004]. Sveriges Officiella Statistik, Statistiska Meddelanden JO60SM0501, 17p.
Svedäng, H. 1999 Vital population statistics of the exploited eel stock on the Swedish west coast. Fisheries Research, 40: 251–265.
Westerberg, H. 1998a. Oceanographic aspects of the recruitment of eels to the Baltic Sea. Bull. Fr. Pêche Piscic. 349: 177–185.
Westerberg, H. 1998b. The migration of glass-eel and elvers in the Skagerrak and theKattegatt. ICES CM 1998/N:11, 14 p.
Westerberg H., J. Haamer and I. Lagenfelt 1993 A new method for sampling elvers in the coastal zone. ICES C.M. 1993/M:5, 10p.
Wickström, H. 2002. Monitoring of eel recruitment in Sweden. Volume 2A: Country reports, Northern part: 69-86. In: Monitoring of glass eel recruitment. Dekker, W. (Ed). Netherlands Institute of Fisheries Research, Ijmuiden, The Netherlands, Report C007/02-WD, 256 pp.
www.slv.se 2004 Delrapport 3 - dioxinanalyser av fet fisk från Sverige 2001 – 2002 [Report 3 – analyses of dioxins in fat fish from Sweden 2001–2002] http://www.slv.se/templates/SLV_Page.aspx?id=9624
Åström, M. 2004. "Analyser rörande ålen och ålfisket i svenska kustvatten". Intern rapport inom Fiskeriverket. [Analyses concerning the eel and the eel fishery in coastal waters of Sweden. Internal report of the Swedish Board of Fisheries]
Åström, M. 2005. Spawner escapement from yellow and silver eel fishery. Appendix 3.3. in ICES CM 2005/I:01, Report on the ICES/EIFAC Working Group on Eels, Galway (WGEEL), 22–26 November 2004, Galway, Ireland.
Åström, M. & Wickström, H. 2004. Some management options for the yellow eel fishery on the Swedish west coast. Internal report of the Swedish Board of Fisheries.

Joint EIFAC/ICES WGEEL Report 2007 | 179
Appendix
Table SE.n. Commercial landings of eel in Sweden (Kattegat-Skagerrak corresponds to RBD 5 and the data come from the contract notes).
Year South C. (Baltic Sea)
East C. (Baltic Sea)
Kattegat-Skagerrak
Freshwater Total Sweden
1925 624 936 155 1715 1926 520 1011 176 1707 1927 642 1216 152 2010 1928 373 509 157 1039 1929 582 644 167 1393 1930 716 596 216 1528 1931 782 497 252 1531 1932 769 701 253 1723 1933 645 704 196 1545 1934 798 830 215 1843 1935 829 880 240 1949 1936 608 818 226 1652 1937 548 931 244 1723 1938 666 969 235 1870 1939 535 988 248 1771 1940 553 974 98 1625 1941 633 926 69 1628 1942 426 592 110 1128 1943 820 648 77 1545 1944 879 1042 79 2000 1945 778 790 96 1664 1946 658 738 116 1512 1947 980 761 169 1910 1948 979 689 194 1862 1949 999 671 229 1899 1950 1109 911 168 2188 1951 962 755 212 1929 1952 791 627 180 1598 1953 1146 879 353 2378 1954 1186 780 140 2106 1955 1599 780 272 2651 1956 714 707 112 1533 1957 1158 856 211 2225 1958 938 642 171 1751 1959 1658 977 154 2789 1960 778 703 165 1646 1961 896 870 300 2066 1962 980 713 215 1908 1963 997 802 272 2071 1964 1303 749 236 2288 1965 749 768 285 1802 1966 748 893 328 1969

180 | Joint EIFAC/ICES WGEEL Report 2007
Year South C. (Baltic Sea)
East C. (Baltic Sea)
Kattegat-Skagerrak
Freshwater Total Sweden
1967 646 703 268 1617 1968 713 794 301 1808 1969 622 733 320 1675 1970 476 515 318 1309 1971 545 587 259 1391 1972 425 582 197 1204 1973 419 553 240 1212 1974 322 470 242 1034 1975 494 629 276 1399 1976 283 363 289 935 1977 346 340 303 989 1978 376 385 315 1076 1979 267 404 285 956 1980 371 438 303 1112 1981 243 153 491 887 1982 342 250 569 1161 1983 267 171 735 1173 1984 559 136 378 1073 1985 647 213 280 1140 1986 479 138 234 92 943 1987 439 119 250 89 897 1988 532 190 304 136 1162 1989 447 132 264 109 952 1990 452 119 242 129 942 1991 486 181 285 132 1084 1992 534 162 352 132 1180 1993 550 93 438 129 1210 1994 654 98 630 171 1553 1995 444 79 555 127 1205 1996 564 67 406 97 1134 1997 546 181 513 142 1382 1998 318 50 165 112 645 1999 339 69 186 140 734 2000 286 39 123 113 561 2001 107 123 195 118 543 2002 126 183 222 102 633 2003 115 145 209 96 565 2004 84 134 227 106 551 2005 119 187 211 111 628 2006 125 195 227 123 670
Joint EIFAC/ICES WGEEL Report 2007 | 181
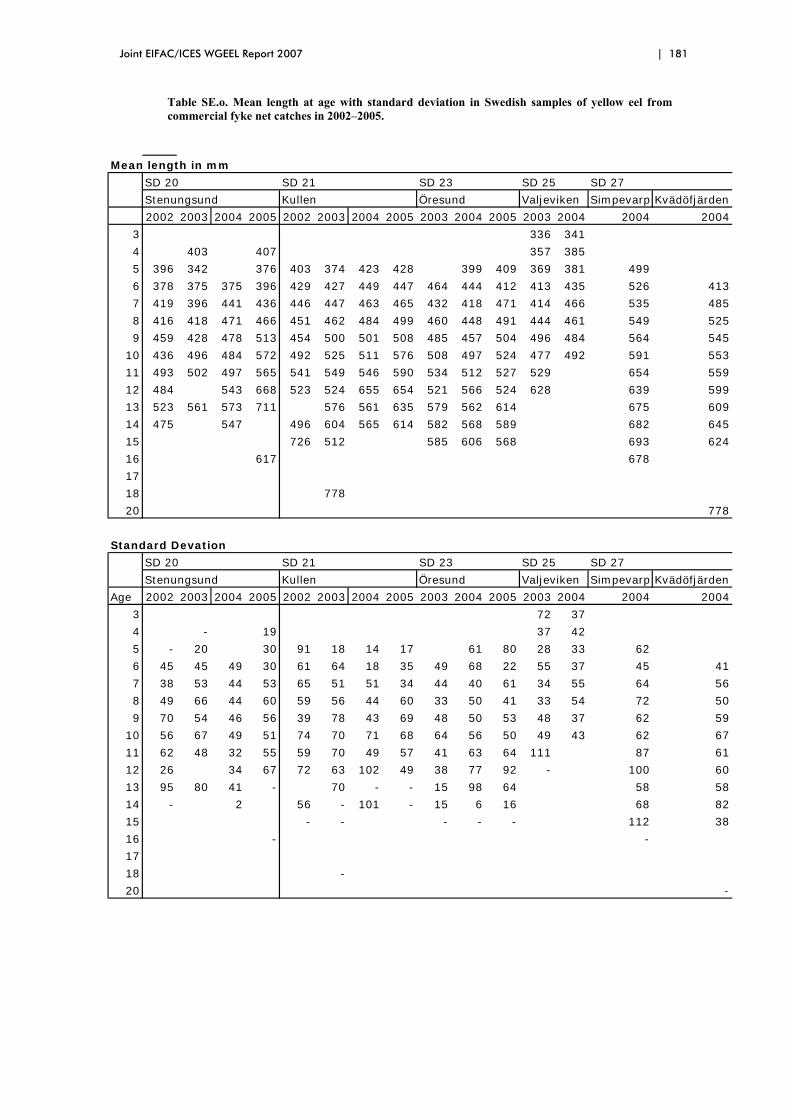
Table SE.o. Mean length at age with standard deviation in Swedish samples of yellow eel from commercial fyke net catches in 2002–2005.
Mean length in mmSD 20 SD 21 SD 23 SD 25 SD 27Stenungsund Kullen Öresund Valjeviken Simpevarp Kvädöfjärden2002 2003 2004 2005 2002 2003 2004 2005 2003 2004 2005 2003 2004 2004 2004
3 336 3414 403 407 357 3855 396 342 376 403 374 423 428 399 409 369 381 4996 378 375 375 396 429 427 449 447 464 444 412 413 435 526 4137 419 396 441 436 446 447 463 465 432 418 471 414 466 535 4858 416 418 471 466 451 462 484 499 460 448 491 444 461 549 5259 459 428 478 513 454 500 501 508 485 457 504 496 484 564 545
10 436 496 484 572 492 525 511 576 508 497 524 477 492 591 55311 493 502 497 565 541 549 546 590 534 512 527 529 654 55912 484 543 668 523 524 655 654 521 566 524 628 639 59913 523 561 573 711 576 561 635 579 562 614 675 60914 475 547 496 604 565 614 582 568 589 682 64515 726 512 585 606 568 693 62416 617 6781718 77820 778
Standard Devation SD 20 SD 21 SD 23 SD 25 SD 27Stenungsund Kullen Öresund Valjeviken Simpevarp Kvädöfjärden
Age 2002 2003 2004 2005 2002 2003 2004 2005 2003 2004 2005 2003 2004 2004 20043 72 374 - 19 37 425 - 20 30 91 18 14 17 61 80 28 33 626 45 45 49 30 61 64 18 35 49 68 22 55 37 45 417 38 53 44 53 65 51 51 34 44 40 61 34 55 64 568 49 66 44 60 59 56 44 60 33 50 41 33 54 72 509 70 54 46 56 39 78 43 69 48 50 53 48 37 62 59
10 56 67 49 51 74 70 71 68 64 56 50 49 43 62 6711 62 48 32 55 59 70 49 57 41 63 64 111 87 6112 26 34 67 72 63 102 49 38 77 92 - 100 6013 95 80 41 - 70 - - 15 98 64 58 5814 - 2 56 - 101 - 15 6 16 68 8215 - - - - - 112 3816 - -1718 -20 -

182 | Joint EIFAC/ICES WGEEL Report 2007
SE.F
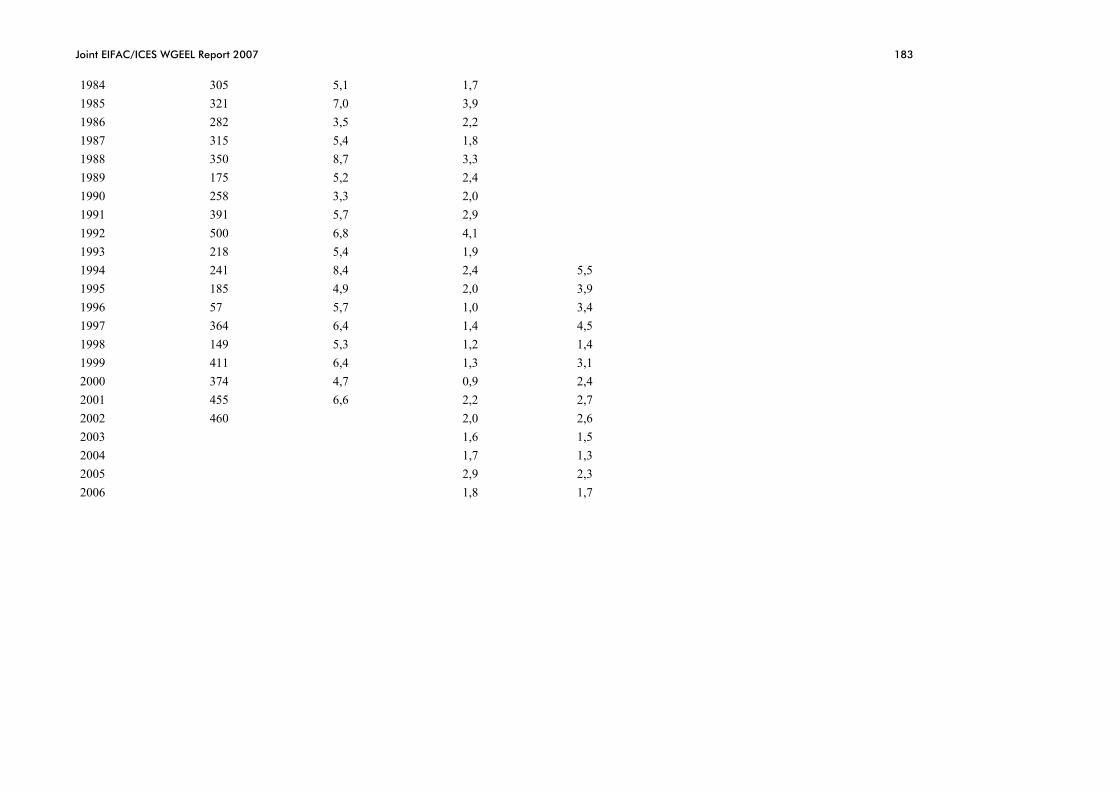
Table SE.p. Time trends in pound net catches of silver eel in four subareas in Swedish RBD Southern Baltic.
The Subareas are all located in ICES subdivision 27 on the Swedish coast of the Baltic Proper.
(antal per redskap och dygn).
N Kalmarsund S Östergötland N Småland N Östergötland 1959 553 1960 797 1961 871 1962 812 1963 886 1964 646 1965 712 1966 774 1967 509 1968 526 1969 392 1970 335 1971 401 1972 444 3,4 2,8 1973 301 4,8 2,3 1974 416 4,6 3,2 1975 313 5,1 3,4 1976 278 3,9 2,4 1977 257 4,9 2,1 1978 392 5,5 2,0 1979 434 4,3 2,6 1980 279 5,4 2,8 1981 199 3,6 2,4 1982 263 6,0 3,9 1983 268 5,6 2,2
Joint EIFAC/ICES WGEEL Report 2007 183
1984 305 5,1 1,7 1985 321 7,0 3,9 1986 282 3,5 2,2 1987 315 5,4 1,8 1988 350 8,7 3,3 1989 175 5,2 2,4 1990 258 3,3 2,0 1991 391 5,7 2,9 1992 500 6,8 4,1 1993 218 5,4 1,9 1994 241 8,4 2,4 5,5 1995 185 4,9 2,0 3,9 1996 57 5,7 1,0 3,4 1997 364 6,4 1,4 4,5 1998 149 5,3 1,2 1,4 1999 411 6,4 1,3 3,1 2000 374 4,7 0,9 2,4 2001 455 6,6 2,2 2,7 2002 460 2,0 2,6 2003 1,6 1,5 2004 1,7 1,3 2005 2,9 2,3 2006 1,8 1,7
184 | Joint EIFAC/ICES WGEEL Report 2007
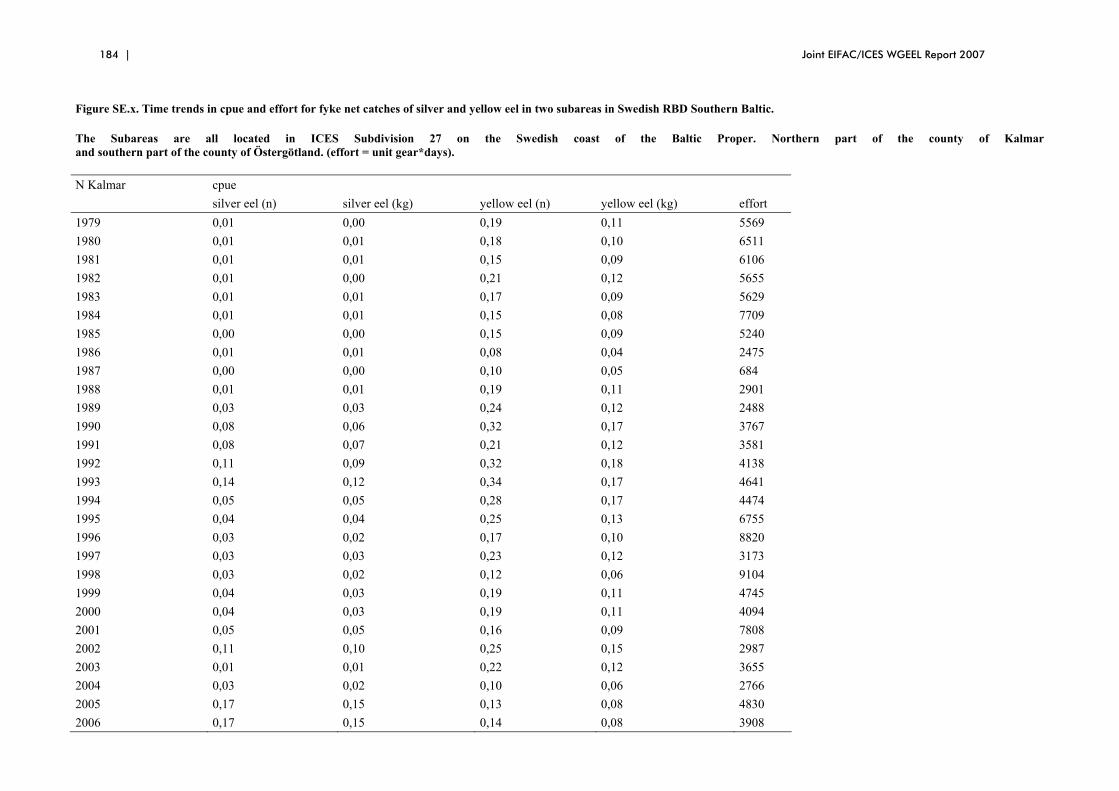
Figure SE.x. Time trends in cpue and effort for fyke net catches of silver and yellow eel in two subareas in Swedish RBD Southern Baltic.
The Subareas are all located in ICES Subdivision 27 on the Swedish coast of the Baltic Proper. Northern part of the county of Kalmar and southern part of the county of Östergötland. (effort = unit gear*days).
N Kalmar cpue silver eel (n) silver eel (kg) yellow eel (n) yellow eel (kg) effort 1979 0,01 0,00 0,19 0,11 5569 1980 0,01 0,01 0,18 0,10 6511 1981 0,01 0,01 0,15 0,09 6106 1982 0,01 0,00 0,21 0,12 5655 1983 0,01 0,01 0,17 0,09 5629 1984 0,01 0,01 0,15 0,08 7709 1985 0,00 0,00 0,15 0,09 5240 1986 0,01 0,01 0,08 0,04 2475 1987 0,00 0,00 0,10 0,05 684 1988 0,01 0,01 0,19 0,11 2901 1989 0,03 0,03 0,24 0,12 2488 1990 0,08 0,06 0,32 0,17 3767 1991 0,08 0,07 0,21 0,12 3581 1992 0,11 0,09 0,32 0,18 4138 1993 0,14 0,12 0,34 0,17 4641 1994 0,05 0,05 0,28 0,17 4474 1995 0,04 0,04 0,25 0,13 6755 1996 0,03 0,02 0,17 0,10 8820 1997 0,03 0,03 0,23 0,12 3173 1998 0,03 0,02 0,12 0,06 9104 1999 0,04 0,03 0,19 0,11 4745 2000 0,04 0,03 0,19 0,11 4094 2001 0,05 0,05 0,16 0,09 7808 2002 0,11 0,10 0,25 0,15 2987 2003 0,01 0,01 0,22 0,12 3655 2004 0,03 0,02 0,10 0,06 2766 2005 0,17 0,15 0,13 0,08 4830 2006 0,17 0,15 0,14 0,08 3908

Joint EIFAC/ICES WGEEL Report 2007 185
S ÖSTERGÖTLAND CPUE SILVER EEL (N) SILVER EEL (KG) YELLOW EEL (N) YELLOW EEL (KG) EFFORT
1974 0,17 0,12 0,04 0,01 8419 1975 0,06 0,05 0,10 0,04 10088 1976 0,05 0,04 0,06 0,03 6774 1977 0,05 0,04 0,07 0,03 7667 1978 0,03 0,02 0,07 0,03 9355 1979 0,03 0,02 0,08 0,04 10360 1980 0,05 0,04 0,05 0,02 11967 1981 0,03 0,02 0,06 0,03 10713 1982 0,03 0,02 0,08 0,04 7826 1983 0,02 0,02 0,09 0,04 10404 1984 0,03 0,02 0,06 0,03 10860 1985 0,02 0,01 0,08 0,04 11396 1986 0,01 0,01 0,09 0,04 10831 1987 0,01 0,01 0,06 0,03 12131 1988 0,04 0,03 0,10 0,05 10396 1989 0,03 0,02 0,10 0,05 11116 1990 0,05 0,04 0,06 0,03 14508 1991 0,03 0,02 0,10 0,05 6565 1993 0,03 0,02 0,06 0,03 4867 1994 0,03 0,02 0,09 0,05 8667 1995 0,03 0,03 0,06 0,04 5045 1996 0,02 0,02 0,09 0,05 7607 1997 0,04 0,04 0,03 0,02 6961 1998 0,04 0,03 0,02 0,01 6334 1999 0,05 0,05 0,03 0,02 4830 2000 0,04 0,03 0,03 0,02 4858 2001 0,02 0,02 0,04 0,03 3815 2002 0,06 0,05 0,02 0,01 4641 2003 0,05 0,04 0,02 0,02 4123 2004 2005 2006 0,09 0,08 0,06 0,03 3157

186 | Joint EIFAC/ICES WGEEL Report 2007
SE.G
Figure SE.x. Time trend in the yellow eel catches in coastal fish monitoring with fyke nets in August on the Swedish west coast. RBD SE Baltic (Barsebäck) and RBD Västerhavet (others). Annual mean water temperature at the fishing gears is presented for the Vendelsö area in central Kattegat. NUMBERS/FYKE NET*DAY BARSEBÄCK KULLEN VENDELSÖ HAKEFJORDEN LYSEKIL FJÄLLBACKA TEMPERATURE 1976 0,29 1977 0,05 1978 0,08 1981 0,13 1982 0,18 1983 0,19 1984 0,38 1985 0,44 1986 0,57 1987 0,49 1988 0,80 0,64 20,6 1989 0,69 0,63 17,1 1990 1,10 0,26 20,1 1991 1,24 0,77 19,2 1992 0,80 0,33 18,4 1993 0,43 0,47 16,4 1994 1,08 1,69 22,1 1995 1,56 0,77 19,7 1996 1,02 0,23 18,4 1997 1,02 0,23 20,3 1998 0,35 0,19 1,02 16,8 1999 1,46 0,32 20,2 2000 0,55 0,29 0,48 17,3 2001 0,47 0,61 0,77 18,7 2002 0,92 0,63 1,44 0,73 2,76 1,77 20,9 2003 0,59 1,17 1,22 1,23 1,36 1,24 19,3 2004 0,47 0,41 2,09 0,39 1,13 0,88 20,7 2005 0,34 0,37 1,03 0,37 0,38 1,01 18,1 2006 0,77 1,01 1,37 0,84 0,86 21,4 2007 1,24 0,14 0,78

Joint EIFAC/ICES WGEEL Report 2007 187
Table X. Annual indices of glass eel recruitment at the intake canal for cooling water to reactors 1 and 2 at the Ringhals nuclear power plant. Mean of weekly means
of numbers of glass eels collected with a modified Isaaks-Kidd midwater trawl during March and April (weeks 9–18). Data were corrected for variations in water flow.
week 1981 1982 1983 1984 1985 1986 1987 1988 1989 1990 1991 1992 1993 1994 1995 1996 1997 1998 1999 2000 2001 2002 2003 2004 2005 2006 2007 3 3 1 4 0 17 1 4 0 5 4 8 15 14 18 30 5 4 0 0 1 0 74 2 27 6 20 10 6 28 27 13 56 45 7 11 0 1 1 0 142 0 86 5 1 12 2 42 7 6 22 9 85 331 7 41 0 22 9 8 267 3 154 2 2 62 3 4 8 1 34 57 3 44 57 8 48 11 3 50 12 115 5 327 5 0 22 2 12 9 187 51 3 36 342 185 3 160 55 3 172 0 68 125 62 344 5 117 5 1 15 6 11 10 199 24 2 80 372 150 15 471 118 7 224 4 200 100 121 377 3 200 10 3 10 2 29 11 250 130 528 176 4 19 129 150 88 290 130 610 333 13 198 8 72 533 22 366 44 3 39 1 81 12 374 806 835 289 14 6 2 16 107 145 42 469 535 400 569 25 60 177 158 214 24 530 53 18 162 13 382 13 1886 1258 265 122 109 1 0 72 291 251 110 562 495 1430 331 60 42 220 2 479 16 59 185 35 153 17 186 14 2093 1335 469 181 0 3 31 149 121 351 138 151 403 1236 625 33 77 448 314 942 22 185 192 65 162 55 101 15 1849 878 112 878 141 603 67 284 414 298 540 1145 91 128 201 237 377 154 45 184 151 55 202 97 191 16 925 476 69 416 42 120 254 142 527 619 64 73 49 96 79 299 25 53 74 90 286 132 20 17 804 477 171 350 6 127 37 193 231 564 278 80 56 44 202 141 257 128 8 84 32 66 62 18 18 0 297 114 124 55 230 31 9 46 8 10 36 7 mean 9–18 849 711 553 175 305 45 52 169 184 186 138 283 374 636 277 44 117 164 147 400 32 171 84 31 110 42 102

188 | Joint EIFAC/ICES WGEEL Report 2007
SE.H.silver
Table SE.x. Length composition of silver eel from commercial pound net catches in samples collected in 2005–2006 in RBD.
RBD SE Baltic (ICES SD 23, 24, 25 and 27).
ICES SUBDIVISION CM-CLASS SD 23 SD 24 SD 25 SD 27
38 3 39 40 1 41 42 4 43 3 46 2 48 2 50 2 1 51 3 52 7 2 2 53 5 54 15 1 55 12 4 7 1 56 18 3 5 57 17 5 3 58 18 1 4 59 13 4 7 5 60 13 3 9 3 61 16 5 12 1 62 24 10 16 4 63 22 10 10 4 64 16 8 19 1 65 17 11 31 6 66 15 10 24 6 67 19 6 28 8 68 18 8 39 9 69 14 8 40 14 70 10 12 32 18 71 13 3 44 17 72 12 3 29 24 73 15 7 43 17 74 6 35 27 75 3 6 27 22 76 13 4 20 30 77 4 4 29 38 78 6 5 22 24 79 1 7 22 29 80 8 14 19 81 3 4 16 22

Joint EIFAC/ICES WGEEL Report 2007 189
82 3 1 12 25 83 4 2 15 24 84 4 1 12 12 85 2 1 8 16 86 3 3 5 9 87 2 4 7 88 1 4 9 89 2 1 2 1 90 2 2 3 91 1 2 92 1 2 93 3 2 94 1 95 1 96 1 1 1 1 102 1 Total 412 171 658 465
Table SE.x. Swedish sampling of silver eel in commercial catches with pound nets.
Number of samles Year of catch 2005 2006 SD 23 206 206 SD 24 72 99 SD 25 299 353 SD 27 312 149 Totalt 894 810 Year of catch Number of ages 2005 2006 SD 23 200 200 SD 24 71 SD 25 292 198 SD 27 236 Total 799 398

190 | Joint EIFAC/ICES WGEEL Report 2007
Table SE.x. Average age of silver eel from commercial pound net catches in samples collected in 2005–2006 in RBD.
Baltic (ICES SD 23, 24, 25 and 27). Year of catch 2005 2006 Totalt SD 23 11,6 10,4 11,0 SD 24 12,3 12,3 SD 25 12,0 12,1 12,0 SD 27 13,8 13,8 Total 12,4 11,3 12,0
Table SE.x Length at age of silver eel from commercial pound net catches in samples collected in 2005–2006 in RBD.
SE Baltic (ICES SD 23, 24, 25 and 27). s = standard deviation. 5 6 7 8 9 10 11 12 SD 23 536 640 614 612 616 636 648 681 s 104 118 107 88 88 92 83 98 SD 24 629 632 646 721 703 s 47 36 64 109 76 SD 25 654 593 645 702 677 683 688 708 s 37 33 63 61 59 61 65 SD 27 839 704 740 759 740 s 87 88 62 66 Total 587 636 622 634 640 665 686 706 s 100 113 92 94 81 83 79 79

Joint EIFAC/ICES WGEEL Report 2007 191
Table SE.x. Weight at age of silver eel from commercial pound net catches in samples collected in 2005–2006 in RBD.
SE Baltic (ICES SD 23, 24, 25 and 27). s = standard deviation. 5 6 7 8 9 10 11 12 SD 23 333 567 520 470 479 527 542 659 s 194 267 309 225 214 282 225 340 SD 24 481 542 577 878 721 s 163 84 256 509 246 SD 25 407 522 694 658 660 676 724 s 104 103 142 182 201 201 214 SD 27 1143 685 865 886 836 s 318 280 272 247 Total 447 554 521 527 548 612 671 726 s 207 258 263 244 214 263 270 268 SE Baltic (ICES SD 23, 24, 25 and 27). s = standard deviation. 5 6 7 8 9 10 11 12 SD 23 1,87 1,89 1,94 1,84 1,85 1,82 1,83 1,86 s 0,21 0,26 0,38 0,18 0,20 0,20 0,18 0,21 SD 24 1,80 2,03 1,90 2,01 1,88 s 0,24 0,17 0,35 0,28 0,20 SD 25 2,04 1,88 1,86 1,89 1,98 1,93 1,93 1,90 s 0,15 0,12 0,10 0,19 0,21 0,18 0,19 SD 27 1,84 1,77 1,97 1,88 1,91 s 0,21 0,13 0,20 0,17 Total 1,95 1,89 1,92 1,85 1,90 1,88 1,90 1,89 s 0,20 0,24 0,32 0,17 0,20 0,21 0,20 0,19
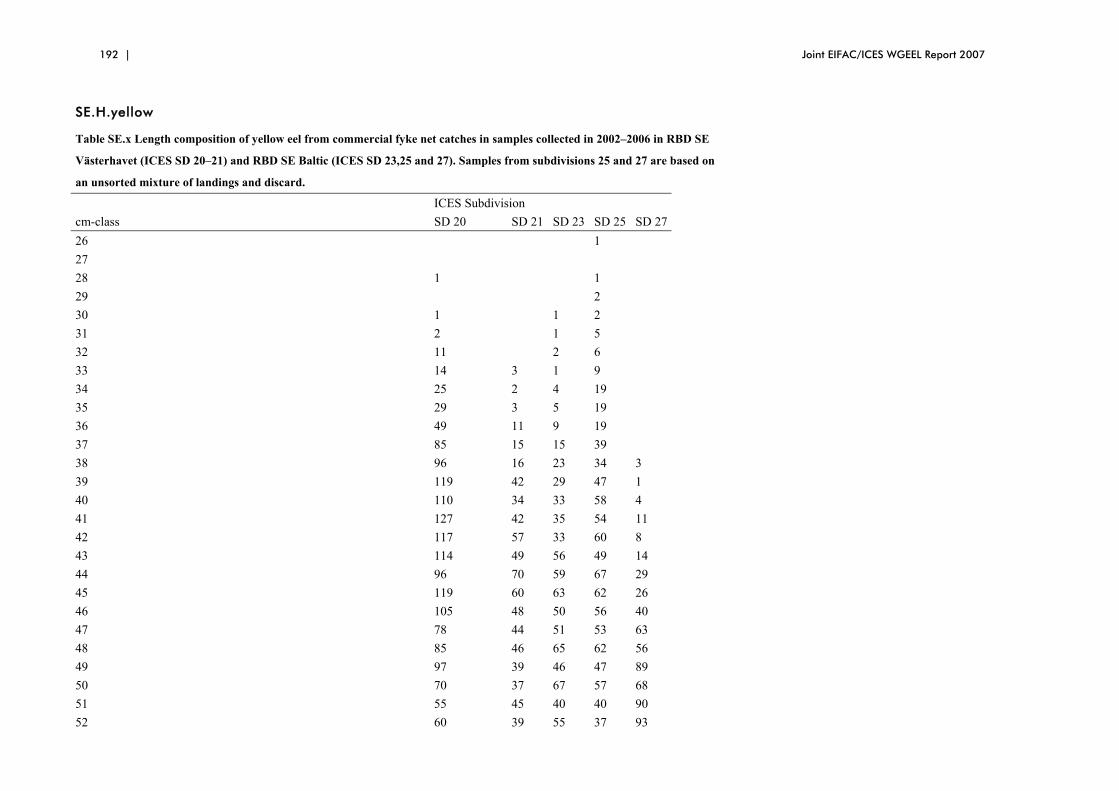
192 | Joint EIFAC/ICES WGEEL Report 2007
SE.H.yellow
Table SE.x Length composition of yellow eel from commercial fyke net catches in samples collected in 2002–2006 in RBD SE Västerhavet (ICES SD 20–21) and RBD SE Baltic (ICES SD 23,25 and 27). Samples from subdivisions 25 and 27 are based on an unsorted mixture of landings and discard. ICES Subdivision cm-class SD 20 SD 21 SD 23 SD 25 SD 27 26 1 27 28 1 1 29 2 30 1 1 2 31 2 1 5 32 11 2 6 33 14 3 1 9 34 25 2 4 19 35 29 3 5 19 36 49 11 9 19 37 85 15 15 39 38 96 16 23 34 3 39 119 42 29 47 1 40 110 34 33 58 4 41 127 42 35 54 11 42 117 57 33 60 8 43 114 49 56 49 14 44 96 70 59 67 29 45 119 60 63 62 26 46 105 48 50 56 40 47 78 44 51 53 63 48 85 46 65 62 56 49 97 39 46 47 89 50 70 37 67 57 68 51 55 45 40 40 90 52 60 39 55 37 93

Joint EIFAC/ICES WGEEL Report 2007 193
53 56 27 41 32 104 54 44 19 35 42 106 55 32 20 31 23 104 56 29 21 37 29 98 57 29 15 25 29 88 58 27 12 17 18 110 59 17 8 24 28 98 60 25 9 10 19 98 61 15 14 7 12 108 62 17 14 10 15 80 63 12 10 6 6 89 64 11 10 1 10 74 65 8 4 5 12 67 66 1 4 9 51 67 6 3 2 6 54 68 2 5 1 5 58 69 1 1 3 45 70 5 37 71 1 1 1 3 30 72 1 2 1 5 27 73 2 1 1 2 25 74 5 12 75 1 15 76 1 10 77 1 2 1 17 78 1 1 4 79 1 7 80+ 0 1 0 2 19 Total 2002 905 1000 1229 2230

194 | Joint EIFAC/ICES WGEEL Report 2007
Table SE.x. Annual mean age of yellow eel from commercial fyke net catches in samples collected in 2002–2006 in RBD SE Västerhavet (ICES SD 20–21) and RBD SE Baltic (ICES SD 23,25 and 27). Samples from subdivisions 25 and 27 are based on an unsorted mixture of landings and discard. s = standard deviation. Year of catch Year of catch 2002 2003 2004 2005 2006 Total SD20 9,0 8,9 9,6 8,7 8,9 s 1,69 1,65 1,80 1,91 1,86 SD21 8,7 8,2 8,7 7,9 9,2 8,4 s 2,03 2,28 1,99 2,04 1,96 2,11 SD23 8,6 9,6 9,4 8,9 9,1 s 2,15 1,95 1,73 1,85 1,91 SD25 7,2 6,8 7,0 s 1,99 1,60 1,83 SD27 9,8 10,9 10,1 s 2,17 2,08 2,20 Table SE.x. Age distribution of yellow eel from commercial fyke net catches for samples collected in 2005–2006 in RBD Västerhavet (ICES SD 20–21) and RBD SE Baltic (ICES SD 23,25 and 27). Samples from subdivisions 25 and 27 are based on an unsorted mixture of landings and discard. Year of catch guål Age 3 4 5 6 7 8 9 10 11 12 13 14 15 16 18 20 SD20 4 18 42 90 151 172 119 62 40 20 5 1 SD21 32 85 94 127 89 81 42 21 12 8 3 1 1 SD23 11 25 71 123 131 104 60 38 13 7 4 1 1 SD25 7 13 18 36 44 37 28 9 4 1 SD27 4 14 39 90 96 91 98 65 41 19 16 4 1 Total 7 17 83 202 338 528 516 404 266 165 86 39 23 7 2 1

Joint EIFAC/ICES WGEEL Report 2007 195
Table SE.x. Length at age of yellow eel from commercial fyke net catches for samples collected in 2005–2006 in
RBD Västerhavet (ICES SD 20–21) and RBD SE Baltic (ICES SD 23,25 and 27). Samples from subdivisions 25 and 27
are based on an unsorted mixture of landings and discard. s = standard deviation.
Age 3 4 5 6 7 8 9 10 11 12 13 14 15 16 18 20 SD20 407 369 412 426 444 476 495 513 543 563 570 617 s 11,63 37,26 40,96 42 56,91 65,16 65,64 56,64 68,08 73,86 71,34 SD21 405,4 439,4 455,1 475,1 490,1 522,4 548,5 572 590,7 550 616,7 777 778 s 32,57 50,41 50,08 59,01 61,33 78,75 57,18 107,9 62,89 78,69 107,1 SD23 397,3 427,3 445,7 464,3 480,2 505,9 522,5 538,7 577,9 580,7 582,5 487 506 s 68,25 43,64 54,31 47,38 53,3 56,26 60,76 66,71 77,16 14,67 17,33 SD25 339,1 366 376 425 445 453 491 482 547 628 s 49,07 39,34 30,78 46,7 53,97 45,91 43,5 45,28 97,7 SD27 499,3 509,6 516 533,6 552,6 567,2 601,8 608,6 641,6 657,5 649,9 695,5 778 s 50,63 59,27 65,59 59,77 63,21 61,97 80,28 66,28 61,81 69,21 60,65 78,8 Total 339,1 375,4 394,6 434,5 451,1 472,1 494,5 519,3 554 572,1 606,7 610,5 633,8 666,1 642 778 s 49,07 38,9 48,48 52,64 57,44 62,74 66,41 70,5 77,47 79,06 74,78 78,95 65,55 107,1 192,3

196 | Joint EIFAC/ICES WGEEL Report 2007
Table SE.x. Weight at age of yellow eel from commercial fyke net catches for samples collected in 2005–2006 in RBD Västerhavet (ICES SD 20–21) and RBD SE Baltic (ICES SD 23,25 and 27). Samples from subdivisions 25 and 27 are based on an unsorted mixture of landings and discard. s = standard deviation. Age 3 4 5 6 7 8 9 10 11 12 13 14 15 16 18 20 SD20 94,58 81,51 112,1 119,3 135,6 169,9 191,8 213,2 263,9 295,9 310,6 392 s 17,87 34 41 41 58 83 89 85 120 126 135 SD21 99,75 121,1 129,8 154,7 167,8 220,9 248,9 341 348,1 270,2 501 839 833,7 s 32 71 50 84 80 134 99 263 137 128 386 SD23 96 105 130 148 169 206 229 257 358 338 350 149 169,3 s 74 47 65 66 66 82 93 134 165 52 75 SD25 57,86 73,46 79 121 145 150 193 189 310 537 s 23,41 26,16 19 44 64 51 61 63 163 SD27 186 208 223 254 286 314 390 392 473 509 493 649 665 s 62,47 67,99 95,35 106,9 114,5 113,3 188,2 140 166 183,8 192,4 252,9 Total 57,86 78,43 95 123,2 139,8 164,3 192,1 228,8 288,9 324,1 397 407,5 469,4 567,9 501,5 665 s 23,41 25,65 44,98 62,54 67,2 86,42 95,67 113,1 156,8 166,2 168,9 180,4 206,6 288,1 469,8

Joint EIFAC/ICES WGEEL Report 2007 197
Table SE.x. Condition factor at age of yellow eel from commercial fyke net catches for samples collected in 2005–2006 in
RBD Västerhavet (ICES SD 20–21) and RBD SE Baltic (ICES SD 23,25 and 27). Samples from subdivisions 25 and 27
are based on an unsorted mixture of landings and discard. s = standard deviation.
Age 3 4 5 6 7 8 9 10 11 12 13 14 15 16 18 20 SD20 1,31 1,44 1,44 1,42 1,38 1,39 1,40 1,42 1,47 1,47 1,47 1,59 s 0,19 0,25 0,20 0,21 0,18 0,20 0,19 0,18 0,22 0,18 0,29 SD21 1,38 1,27 1,25 1,27 1,27 1,34 1,36 1,47 1,33 1,78 1,69 1,61 s 0,25 0,23 0,18 0,22 0,19 0,22 0,21 0,32 0,32 0,14 0,51 SD23 1,26 1,20 1,30 1,33 1,37 1,41 1,44 1,43 1,63 1,63 1,66 1,22 1,25 s 0,15 0,19 0,18 0,20 0,19 0,19 0,18 0,23 0,22 0,21 0,22 SD25 1,33 1,35 1,38 1,43 1,47 1,47 1,49 1,55 1,67 2,08 s 0,05 0,11 0,13 0,13 0,20 0,16 0,14 0,19 0,06 SD27 1,37 1,44 1,44 1,51 1,54 1,57 1,58 1,59 1,64 1,63 1,63 1,75 1,34 s 0,11 0,16 0,16 0,16 0,16 0,20 0,17 0,18 0,19 0,19 0,21 0,23 Totalt 1,327 1,339 1,379 1,338 1,357 1,371 1,395 1,433 1,481 1,513 1,582 1,55 1,654 1,641 1,433 1,338 s 0,05 0,12 0,21 0,22 0,21 0,21 0,20 0,21 0,20 0,24 0,22 0,23 0,25 0,25 0,25

198 | Joint EIFAC/ICES WGEEL Report 2007
SE.I
Table SE.x. Prevalence of Anguillicola crassus in yellow eel from commercial fyke net catches for samples collected in 2005–2006 in RBD Västerhavet (ICES SD 20–21) and RBD SE Baltic (ICES SD 23,25 and 27). Samples from subdivisions 25 and 27 are based on an unsorted mixture of landings and discard. Not infested Infested Total Prevalence n n n % SD20 1829 173 2002 9 SD21 782 124 906 14 SD23 530 470 1000 47 SD25 476 753 1229 61 SD27 975 1255 2230 56 Total 4592 2775 7367 38

199 Joint EIFAC/ICES WGEEL Report 2007
SE.11
NUMBER OF GLASS EELS
PER M2 1991 0,000887 1992 0,003287 1993 0,007485 1994 0,012144 1995 0,008874 1996 0,000702 1997 0,000653 1998 0,0019 1999 0,00297 2000 0,010742 2001 0,000516 2002 0,002831 2003 0,001771 2004 9,94E-05 2005 0,002121 2006 0,000815 2007 0,000173 provisional value
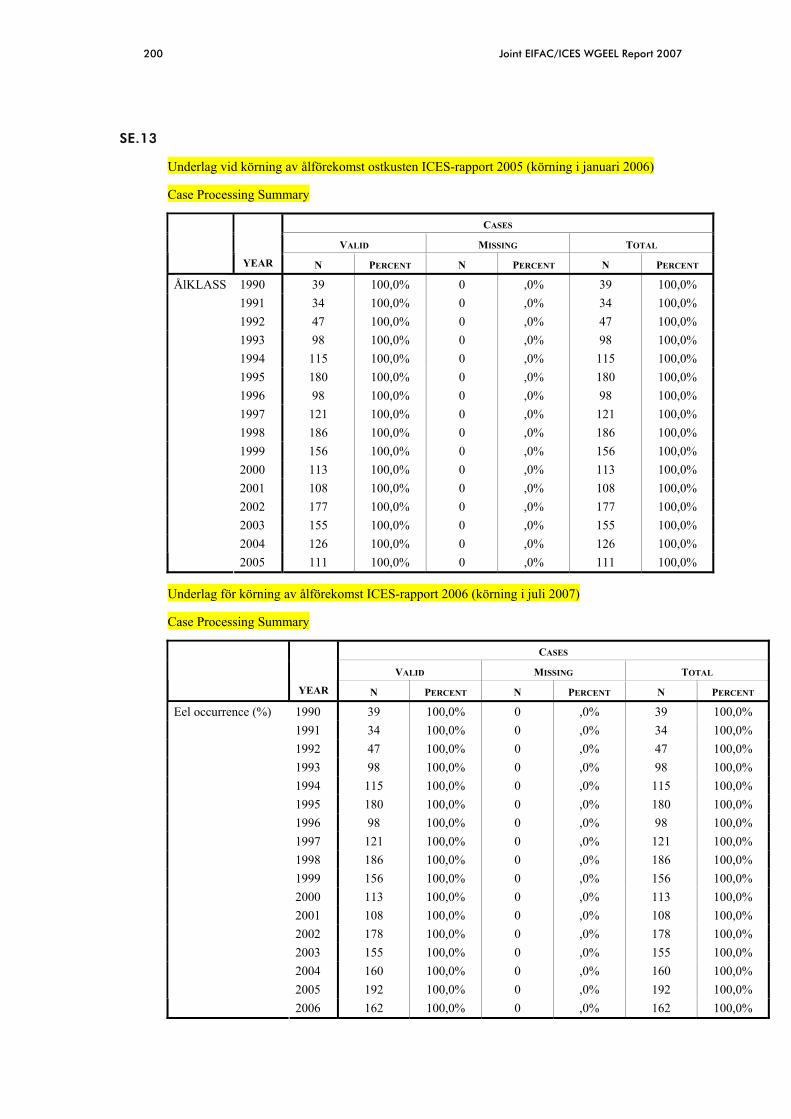
200 Joint EIFAC/ICES WGEEL Report 2007
SE.13
Underlag vid körning av ålförekomst ostkusten ICES-rapport 2005 (körning i januari 2006)
Case Processing Summary
CASES
VALID MISSING TOTAL
YEAR N PERCENT N PERCENT N PERCENT
1990 39 100,0% 0 ,0% 39 100,0% 1991 34 100,0% 0 ,0% 34 100,0% 1992 47 100,0% 0 ,0% 47 100,0% 1993 98 100,0% 0 ,0% 98 100,0% 1994 115 100,0% 0 ,0% 115 100,0% 1995 180 100,0% 0 ,0% 180 100,0% 1996 98 100,0% 0 ,0% 98 100,0% 1997 121 100,0% 0 ,0% 121 100,0% 1998 186 100,0% 0 ,0% 186 100,0% 1999 156 100,0% 0 ,0% 156 100,0% 2000 113 100,0% 0 ,0% 113 100,0% 2001 108 100,0% 0 ,0% 108 100,0% 2002 177 100,0% 0 ,0% 177 100,0% 2003 155 100,0% 0 ,0% 155 100,0% 2004 126 100,0% 0 ,0% 126 100,0%
ÅlKLASS
2005 111 100,0% 0 ,0% 111 100,0%
Underlag för körning av ålförekomst ICES-rapport 2006 (körning i juli 2007)
Case Processing Summary
CASES
VALID MISSING TOTAL
YEAR N PERCENT N PERCENT N PERCENT
1990 39 100,0% 0 ,0% 39 100,0% 1991 34 100,0% 0 ,0% 34 100,0% 1992 47 100,0% 0 ,0% 47 100,0% 1993 98 100,0% 0 ,0% 98 100,0% 1994 115 100,0% 0 ,0% 115 100,0% 1995 180 100,0% 0 ,0% 180 100,0% 1996 98 100,0% 0 ,0% 98 100,0% 1997 121 100,0% 0 ,0% 121 100,0% 1998 186 100,0% 0 ,0% 186 100,0% 1999 156 100,0% 0 ,0% 156 100,0% 2000 113 100,0% 0 ,0% 113 100,0% 2001 108 100,0% 0 ,0% 108 100,0% 2002 178 100,0% 0 ,0% 178 100,0% 2003 155 100,0% 0 ,0% 155 100,0% 2004 160 100,0% 0 ,0% 160 100,0% 2005 192 100,0% 0 ,0% 192 100,0%
Eel occurrence (%)
2006 162 100,0% 0 ,0% 162 100,0%

201 Joint EIFAC/ICES WGEEL Report 2007
F inland: Report on the eel stock and f ishery in Finland 2007
FI.A. Author
Jouni Tulonen Finnish Game and Fisheries Research Institute (FGFRI) 16970 Evo, Finland Tel. +358 205 751 432. Fax +358 205 751 429 [email protected]
This report was completed in June 2007, and contains data up to 2006 and some provisional data for 2007.
FI.B. Introduction
In Finland eels are on their North-Eastern limits of natural geographical distribution. Natural eel stocks have probably always been very sparse, and the overall importance of the species has been low. Only in few areas in Southern parts of the country eel has been a target in the recreational fisheries. Almost all rivers running to the Baltic are closed by hydroelectric power plants. Natural eel immigration is possible only in few freshwater systems near the coast and in the coastal areas of the Baltic. Eel populations and eel fisheries in Finnish inland waters depend almost completely on introductions and re-stockings (Table FI.1). Until now the most numerous introductions were made in the sixties and 1970’s. Some 8 000 000 glass eels (originating France) and 700 000 elvers (Denmark, Germany) were introduced in 250 inland lakes and coastal waters (Pursiainen and Toivonen, 1984). During the years 1979–1988 it was not allowed to import eels because eel was detected to be a possible carrier of some viral fish diseases. For this reason it was decided in 1989 to carry on re-stockings only with glass eels reared in a careful quarantine. Since then 1 452 000 glass eels originating from River Severn in the UK have been imported through a Swedish quarantine and re-stocked in almost one hundred lakes in Southern Finland and in the Baltic along the Southern coast of Finland.
FI.C. Fishing capacity
There is no exact data available but for the professional fisheries eel is of no importance. Some semi-professional fishermen may have minor income from eels mainly as a by-catch. Therefore the recreational fisheries mainly catch the eels. The number of recreational fishermen in Finland is high (1,9 mill. Out of 5 mill.) but only a very small portion of those catch eels as a main target (with fyke nets, longlines, angling, spears etc.). For most of the people eel is a surprising bycatch.
FI.D. Fishing effort
There is no exact data available.

202 Joint EIFAC/ICES WGEEL Report 2007
Table FI.1. Eel stockings in Finland in 1961–2007 (number of individuals).
FI.E. Catches and landings
The re-stockings in the late sixties and in 1970’s gave a catch of 60–80 tonnes a year in the end of 1970’s and the beginning of 1980’s (Pursiainen and Toivonen, 1984). Introductions and re-stockings ceased in 1979, which caused a radical reduction in the annual eel catch (Table FI.2). After the year 1986 the catch decreased under 20 tonnes a year. Therefore the eel was
GLASS EELS QUARANTINED GLASS EELS
ELVERS
1961 53 000 1962 143 000 1963 1964 83 000 1965 114 000 1966 1 077 000 53 000 1967 3 935 000 1968 2 803 000 4 000 1969 35 000 1970 30 000 1971 no introductions allowed 1972 no introductions allowed 1973 no introductions allowed 1974 no introductions allowed 1975 38 000 1976 19 000 1977 30 000 1978 368 000 12 000 1979 75 000
1980-88 no introductions allowed 1989 9 700 1990 58 840 1991 108 515 1992 102 450 1993 105 000 1994 103 500 1995 216 600 1996 74 580 1997 82 200 1998 77 550 1999 62 500 2000 61 015 2001 45 500 2002 55 000 2003 0 2004 63 500 2005 64 000 2006 55 000 2007 107 000

203 Joint EIFAC/ICES WGEEL Report 2007
not detected as a species in the official statistics, but included into the group “other species”. There is no data available on the present catch. Pursiainen and Toivonen (1984) find out that 1000 stocked individuals/year in freshwaters in Southern Finland gave a catch of 90 kg/year about ten years later. Using the same figures the re-stockings in 1990’s probably give nowadays a catch between 5–10 tonnes/year.
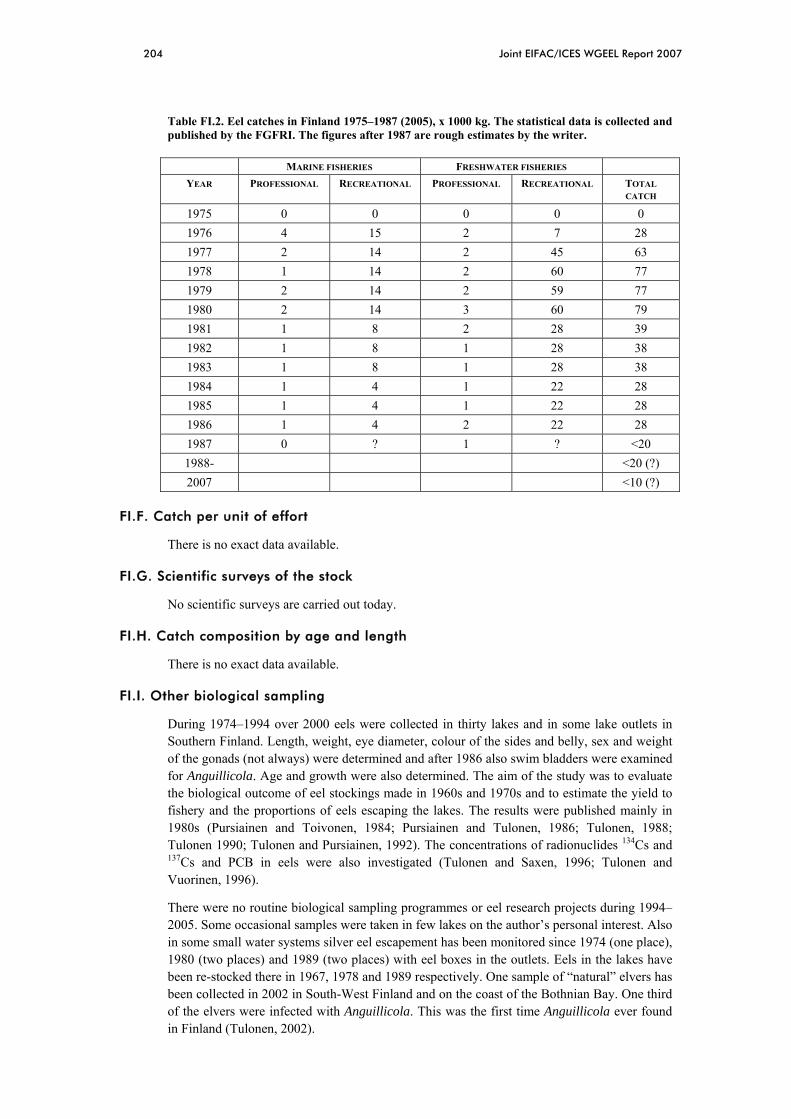
204 Joint EIFAC/ICES WGEEL Report 2007
Table FI.2. Eel catches in Finland 1975–1987 (2005), x 1000 kg. The statistical data is collected and published by the FGFRI. The figures after 1987 are rough estimates by the writer.
MARINE FISHERIES FRESHWATER FISHERIES YEAR PROFESSIONAL RECREATIONAL PROFESSIONAL RECREATIONAL TOTAL
CATCH
1975 0 0 0 0 0 1976 4 15 2 7 28 1977 2 14 2 45 63 1978 1 14 2 60 77 1979 2 14 2 59 77 1980 2 14 3 60 79 1981 1 8 2 28 39 1982 1 8 1 28 38 1983 1 8 1 28 38 1984 1 4 1 22 28 1985 1 4 1 22 28 1986 1 4 2 22 28 1987 0 ? 1 ? <20 1988- <20 (?) 2007 <10 (?)
FI.F. Catch per unit of effort
There is no exact data available.
FI.G. Scientific surveys of the stock
No scientific surveys are carried out today.
FI.H. Catch composition by age and length
There is no exact data available.
FI.I. Other biological sampling
During 1974–1994 over 2000 eels were collected in thirty lakes and in some lake outlets in Southern Finland. Length, weight, eye diameter, colour of the sides and belly, sex and weight of the gonads (not always) were determined and after 1986 also swim bladders were examined for Anguillicola. Age and growth were also determined. The aim of the study was to evaluate the biological outcome of eel stockings made in 1960s and 1970s and to estimate the yield to fishery and the proportions of eels escaping the lakes. The results were published mainly in 1980s (Pursiainen and Toivonen, 1984; Pursiainen and Tulonen, 1986; Tulonen, 1988; Tulonen 1990; Tulonen and Pursiainen, 1992). The concentrations of radionuclides 134Cs and 137Cs and PCB in eels were also investigated (Tulonen and Saxen, 1996; Tulonen and Vuorinen, 1996).
There were no routine biological sampling programmes or eel research projects during 1994–2005. Some occasional samples were taken in few lakes on the author’s personal interest. Also in some small water systems silver eel escapement has been monitored since 1974 (one place), 1980 (two places) and 1989 (two places) with eel boxes in the outlets. Eels in the lakes have been re-stocked there in 1967, 1978 and 1989 respectively. One sample of “natural” elvers has been collected in 2002 in South-West Finland and on the coast of the Bothnian Bay. One third of the elvers were infected with Anguillicola. This was the first time Anguillicola ever found in Finland (Tulonen, 2002).

205 Joint EIFAC/ICES WGEEL Report 2007
In 2006 a four year study on the biological and economical outcome of eel stockings made since 1989 and on the state of natural eelstocks was established in FGFRI. In that study sampling is done in seven lakes in southern Finland and in several places in the Baltic along the coasts of Gulf of Finland and Bothnian Bay and in the rivers running into them. Due to sparse populations the sample sizes are still only in few cases big enough to make any scientific evaluations. Considering eel’s low status for fisheries and low economic value in Finland, it is obvious that collecting data more effective is not possible.
FI.J. Other sampling
No other sampling is carried out at the moment.
FI.K. Stock assessment
There is no routine assessment of the stock.
FI.L. Sampling intensity and precision
There is no exact data available.
FI.M. Standardisation and harmonisation of methodology
Nothing to report.
FI.N. Overview, conclusions and recommendations
1 ) In the ongoing study the present natural distribution of eel in Finland is going to be examined, and suitable “unused” growing areas are to be determined. These areas could be used as a some kind of refuges for the European eel (slow growth, high survival, long period before silvering phase).
2 ) Anguillicola infection level should be investigated in the natural and introduced eel populations. Eel populations in Finnish fresh waters over the hydroelectric dams are probably mostly still uninfected. If Anguillicola is one factor in decreasing the number of spawners in the Sargasso Sea, these uninfected eels might have extra value in the future.
3 ) Stock surveys are carried out to find out the biological outcome of the stockings conducted since 1989. Especially recruitment of yellow eels to silver eels and the possibility of silver eels to reach the sea undamaged must be studied.

206 Joint EIFAC/ICES WGEEL Report 2007
FI.O. Literature references
Pursiainen, M., and Toivonen, J. 1984 The enhancement of eel stocks in Finland; a review of introduction and stockings. EIFAC Technical Paper No. 42, Suppl., 1: 59–67.
Pursiainen, M., and Tulonen, J. 1986 Eel escapement from small forest lakes. Vie Milieu, 36 (4): 287–290.
Tulonen, J. 1988 Ankeriaan ikä, sukupuolijakaumat ja kasvu eräissä eteläuomalaisissa järvissä. (Age, sex ratio and growth of eels in some lakes in southern Finland). Rktl, Monistettuja julkaisuja, 81: 1–106.
Tulonen, J. 1990 Growth and sex ratio of eels (Anguilla anguilla) of known age in four small lakes in southern Finland. Abstract in: Int. Revue ges. Hydrobiol., 75: 792.
Tulonen, J., and Pursiainen, M. 1992 Ankeriasistutukset Evon kalastuskoeaseman ja kalanviljelylaitoksen vesissä. (Eel stockings in the waters of the Evo State Fisheries and Aquaculture Research Station) Suomen Kalatalous, 60: 246–261.
Tulonen, J., and Saxen, R. 1996 Radionuclides 134Cs and 137Cs in eel (Anguilla anguilla L.) in finnish freshwaters after the accident at Chernobyl nuclear power station in 1986 Arch. Ryb. Pol., 4: 267–275.
Tulonen, J., and Vuorinen, P. 1996 Concentrations of PCBs and other organochlorine compounds in eels (Anguilla anguilla, L.) of the Vanajavesi watercourse in southern Finland, 1990-1993 The Science of the Total Environment, 187: 11–18.
Tulonen, J. 2002 Anguillicola crassus tavattu ensikerran Suomessa (Anguillicola crassus found in Finland). Suomen Kalastuslehti, 4: 36–37.

207 Joint EIFAC/ICES WGEEL Report 2007
Latvia: Report on the eel stock and f ishery in Latvia 2007
LV.A. Author
Janis Birzaks Latvian Fish Resources Agency Daugavgrivas 8, Riga, LV-1048, Latvia Tel. +371 7612536. Fax: +371 7616946 [email protected]
This report was completed in August 2007 and contains data including 2006.
LV.B. Introduction
Historically the eel fishery in Latvia is carried out in coastal waters, river estuaries and lagoon-type lakes close by the sea. After the initiation of artificial restocking of eel in 1930s, fisheries were organized in the inland lakes and lake outlets, too. At present eel commercial fisheries are carried out in 17 lakes and along 500 km of the coastline in ICES subdivision 28.
Only stationary gears are used in eel fisheries by Latvian fishermen. Since 1930 to 1950s anchored bottom long- lines have been the main gear in eel fisheries in the coastal waters. Fyke- and trapnets as well as eel weirs are mainly used gear in the inland waters fisheries. Currently different construction fykenets and trapnets are more common gear in the eel fisheries.
Only in some lakes fisheries targeting eel still exist. In the coastal waters eel mostly is bycatch in mixed fisheries used small mesh size gear and targeting other fish species, especially herring and eelpout.
Current management measures of eel stock exploitation limits:
• the number of gear in coastal and inland waters; • local closures regarding season and placement of gear; • the construction of gear (size, mesh size); • size limit (40 cm) and bag limit (for angling only).
In accordance with WFD territory of Latvia is separated in 4 River Basin Districts (Figure LV.6).
LV.C Fishing capacity
In the coastal waters of Latvia there are no fisheries companies targeting only eel. In 2206 66 fishing rights owners reported eel catch/bycatch.
In the inland waters eel catches are reported in 17 lakes belonging to 3 river basin districts. In 2006 38 fishing rights owners where engaged in eel fishery in lakes.
Only 2 of these lakes are accessible for diadromous fish, other watercourses are blocked by HPS dams, fisheries in these waterbodies based on restocked eel.

208 Joint EIFAC/ICES WGEEL Report 2007
Table LV.A Eel fisheries in the RBD’s (2004), Latvia
RBD NUMBER OF LAKES WITH
EEL FISHERIES
SURFACE OF RBD
(KM2)
NUMBER OF FISHERMEN’S
REPORTING THE EEL LANDING
CATCH OF EELS (T)
DATA SOURCE
Daugava 14 27041.5 17 3.5 Logbooks Venta 2 15632.7 21 2.1 Logbooks Lielupe 1 8841.7 1 <0.1 Logbooks Coastal waters
66 2.1 Logbooks
LV.D Fisheries effort
Fisheries effort is fixed by the limited number of gear used in the both inland and coastal fisheries.
In total fisheries tend to decrease due to different reasons. In coastal waters number of fishermen’s decreased due to:
• decreasing of profits; • EU politics of decreasing the number of active boats; • predation of catch by grey seals.
In inland waters the effort of fisheries decreased due to new restrictions initiated by anglers NGO’s:
• closing of lakes and reservoirs for commercial fisheries; • prohibition of gear earlier used in commercial fisheries (seines, lines).
In last 5 years the area of lakes and number of lakes with commercial fisheries are decreased significantly.
LV.E Catches and landings
LV.E1 Catches of glass eel
There is no catch of glass eel in Latvia.
LV.E2 Restocking
The first official glass eel and young yellow ell stocking are carried out in 1927. Interruptedly eel re- stocking has been performed till nowadays, the maximum was fixed in 1960–70s. From the dawn of eel restocking till 1990s this measure was organized by the state (for example to increase an income and welfare of fishermen in 1930s).
In the last decade eel restocking are carried out by the fishing rights owners or lakes leaseholders. There are no eel restocking financed by state programs.

209 Joint EIFAC/ICES WGEEL Report 2007
0200400600800
100012001400160018002000
1927 1933 1935 1939 1960 1965 1968 1970 1972 1983 1999
Year
num
ber o
f gla
ss e
el*1
000
Number of restocked eel (*1000)
Figure LV.1 The young eel re-stocking in Latvia inland waters.
LV.E3 Catches of yellow and silver eel
Latvian fisheries legislation does not contribute the separation of eel catch in two different strains. Only small scale data based on biological sampling still exist. This data were collected in the summer of 2005–2006 from three reference areas/fishermen who voluntarily checked the own catch and marked the yellow or silver eel presence.
0
20
40
60
80
100
120
140
160
1924 1934 1944 1954 1964 1974 1984 1994 2004
Year
Land
ing
(t)
Inland watersCoastal waters
Figure LV.2. Historical eel catches in coastal and inland waters of Latvia.
In the course of time the fisheries statistics principles, organization and collection changed significantly. At present eel fisheries statistics in the inland waters by RBD’s would be accessible from 1946, but in the coastal waters from the period of 1927–1938 and 1946 till now.
From 1992 fisheries statistics in coastal and inland waters of Latvia are based on monthly logbooks with declared daily catch if fishing carried out. Each logbook embodies data

210 Joint EIFAC/ICES WGEEL Report 2007
regarding fishermen, fishing area, gear used and catch. Monthly logbooks collected by the Marine and Inland waters Administration regional officers. The logbook data are processed and stored in LFRA.
LV.E4 Aquaculture
There is no eel aquaculture in Latvia.
LV.E5 Recreational fisheries
Share of recreational fisheries in inland and coastal waters was estimated by questionnaires organized in 2000 and 2001. The number of anglers in Latvia assessed to be 80 000–120 000, the total catch is 1600 t of fish.The eel was reported as occasional not regular catch.
Nevertheless, eel catch was limited by bag limit and size in recreational fisheries. In the some lakes restocked by eel leaseholders restrict the angling in the night time to decrease the pressure on eel stock.
In 2007 the new angler’s inquiry is organized. To obtain the data for National fisheries data collection programme, questions regarding eel angling included in questionnaire. In total 3000 individual anglers will survey in this study.
LV.F Catch per unit effort
Catch per unit effort data is achievable for the some lakes where eel fisheries are carried out by “eel weir”. These lakes were restocked by eel in different periods therefore this data series characterize only effectiveness of restocking.
30–40 years data series for eel fisheries exist for 2 lake areas (>5000 ha) with free entrance of eel form the Baltic sea.
0
1000
2000
3000
4000
5000
6000
7000
8000
1946 1956 1966 1976 1986 1996
Year
Cat
ch in
lake
s (kg
)
0
10000
20000
30000
40000
50000
60000
Cat
ch in
coa
stal
wat
ers (
kg)
Accessible lakesCoastal waters
Figure LV.3. The eel landings in coastal waters and lakes with free access (without migration barriers).
LV.G Scientific surveys of the stock
No eel stock surveys in Latvia.

211 Joint EIFAC/ICES WGEEL Report 2007
LV.H Catch composition by age and length
Eel has been included in National Fisheries Data Collection program since 2006. Eel sampling is organized in 2 areas- near the river Daugava outlet in the Gulf of Riga and the lake Kisezers connected with the river Daugava without migration barriers for migratory species (Figure LV.5). Sampling is carried out by commercial fishermen’s operated with standard gear.
Table LV.C. The number of sampled eel in Fisheries data collection program-LV.
YEAR LOCATION OF SAMPLING
L/W DATA AGE OTHER (EYE, STAGE, SEX)
2006 Lake Kisezers 215 - Only stage 2007 Gulf of Riga 83 80* 83 2007 Lake Kisezers 101 98* 101 *-number of otholits collected.
0
20
40
60
80
100
55 70 85 100
Lenght (cm)
Num
ber o
f eel
Figure LV.4. Length distribution of eel sampled in 2006–2007 LV.
LV.I Other biological sampling
In 2006 small scale sampling was realised to collect the biological data and tissue samples for research project “Application of Genetical and Microchemical Markers as Implements for Diadromous and Endangered Commercial Fish Species Populations” leaded by Taiwan University, Institute of Fisheries Science. Results and project report will report in 2007.

212 Joint EIFAC/ICES WGEEL Report 2007
Table LV.B. The results of eel sampling in Latvia, 2006.
ORIGIN STAGE N L (CM) W (G) AGE
Lake available for migration Wild yellow 12 81.1 ± 7.3
(69.4 - 91.7) 980.8 ± 250.9 (521 – 1330)
12.8 ± 1.4 (11 – 15)
stocked yellow 4 81.8 ± 6.7 (73.8 - 89.2)
976.8 ± 281.5 (712 – 1230)
14.3 ± 3.3 (11 – 18)
Gulf of the Riga Wild yellow
28 78.8 ± 6.2 (66.2 – 90.7)
1038.7 ± 258.3 (543 – 1560)
12.2 ± 1.8 (9 – 16)
Stocked yellow 2 No.210 60,3 No.224 65,7
No.210 416 No.224 650
15 -
No other biological sampling of eel in LV.
LV.J Other sampling
The river fish monitoring covers all country territory by 110 electrofishing stations. Only few specimens of eel were caught in monitoring 2006–2007.
LV.K Stock assessment
Eel landing statistics and effort data were collected every year by LFRA and reported to Ministry of Agriculture.
LV.L Sampling intensity and precision
Sampling intensity exceeds DCR requirements.
LV.M Standardization and harmonization of methodology
Biological samples of eel were collected from landings by 2 fishermen’s families enterprises through all fishing season from April to October.
LV.N Overview, conclusions and recommendations
Several conclusions
1 ) The eel landings in LV coastal and inland waters continue decreasing, in fact it reaches historically lowest level.
2 ) The share of unreported catches of eel seems to be high, therefore catch and landing statistics should be verified.
3 ) General results of river fish monitoring demonstrated the very low abundance of eel in the rivers.
LV.O Literature references (the full bibliography of references regarding eel in Latvia)
Andrušaitis, G. 1960. Zivju savairošana un aklimatizācija Latvijā.–In: LPSR Iekšējo ūdeņu zivsaimniecība, IV, Rīga [The fish re-stocing and acclimatization in Latvia].
Cimermanis, S. 1998. In.: Zveja un zvejnieki Latvijā 19.gs.Latvijas Zinātņu Akadēmijas Vēstis, Rīga. [Fisheries and fishemrn’s in Latvia].
Eglītis, P. 1937. Zušu audzēšana Latvijas ezeros. Zvejniecības Mēnešraksts, II, Nr.2, Rīga. [Eel re-stocking in the lakes of Latvia].

213 Joint EIFAC/ICES WGEEL Report 2007
Kairov, E.A., Rimsh, E.Y. Biocommervial characteristic of the Gulf of Riga eel. (in Russian)- In: Rybokhozaistvenniye issledovanya (BaltNIIRKH), Riga, Zvaigzne, 1979, p.83–90.
Ludvigs, P. 1940. Zvejniecība un zivkopība. In.: Latvijas zeme, zemnieki un viņu darbs, XIX - Lauksaimniecības pārvalde, Rīga [Latvia, Latvia’s farmers and their labour].
Mansfelds, V.1936. Latvijas zivis. In.: Latvijas zeme, daba un tauta, II., Rīga, 1936.
[The fishes of Latvia]
Mansfelds, V. 1937. Zušu sarkansērga Liepājas ezerā. Zvejniecības Mēnešraksts, II, Nr.7, Rīga, 1937.
Miezis, V.1925–1939. In.: Latvijas jūras zvejniecība 1924–1938. – Rīga, Lauksaimniecības pārvalde, 1925-1939.
[Sea fisheries in Latvia]
Miezis, V. 1938. Zušu zveja. Zvejniecības Mēnešraksts, II, Nr.7, Rīga, 1938.
[Eel fisheries]
Sapunovs, A.1893. Reka Zapadnaja Dvina ( in Russian). Tipografija G. A. Malkina, Vitebsk, 1893.
[The river Daugava]
Volkova L.V., Tarkach G.M., Growth of eel in lakes of Latvia. (in Russian) In: Rybokhozaistvenniye issledovanya (BaltNIIRKH), Riga, Zvaigzne, 1971, p.83–89.
Figure LV.5. Location of eel sampling 2006–2007.

214 Joint EIFAC/ICES WGEEL Report 2007
Figure LV.6 Latvia RBD’s and their accessibility.
215 Joint EIFAC/ICES WGEEL Report 2007
Poland: Report on the eel stock and f ishery in Poland 2007
PL.A Authors
Tomasz Nermer, Sea Fisheries Institute , Gdynia, Poland
TEL: 48 0587356211 FAX: +48 (0) 58 73 56 110
Wojciech Pelczarski, Sea Fisheries Institute, Gdynia, Poland
Reporting Period: This report was completed in August 2007, and contains data up to 2005 and data for 2006.
Contributors to the report:
Iwona Psuty, Sea Fisheries Institute, Poland
Szymon Bzoma, Sea Fisheries Institute, Poland
PL.B Introduction
PL.B.1 General overview of fisheries
Eel fisheries in Poland occur in lakes, rivers, coastal open waters and two brackish water basins namely Szczecin Lagoon and Vistula Lagoon, however, part of Szczecin Lagoon belongs to Germany and part of Vistula Lagoon belongs to Russia (Figure PL.1). Inland and coastal fisheries are targeted on silver eel and on yellow eel but no data on share of those forms in the catches are available. The total area of inland lakes, reservoirs (over 50 ha) is 2293 km2.In the main stream of Vistula and Odra Rivers and in supporting rivers many dams were constructed, which successfully stopped the upward migrations of eel, as well as other fish species.
Eel fisheries have a long tradition in Poland. Before WW II it was concentrated mainly in inland waters, because Poland had a very small piece of coast available for sea fishery at that time. After WW II, with gaining a broader access to the Baltic (over 500 km of coastal line), the Polish coastal eel fisheries has developed much more and achieved up to 388 tons per year while inland eel fisheries, which also increased substantially its number of lakes, reached up to 1500 tons per year. In the period of 1974–1994 inland catches constituted up to 75% of total yearly Polish catch of eel. Since then dropped very much, almost to the level of coastal catch and recently both fisheries achieve the level of 200–300 tons.
Until late 1950s Polish eel fisheries based almost exclusively on natural recruitment, later on, extensive restocking mainly with glass eel was carried out in many lakes and both lagoons. This stocking decreased almost to zero in late 1990s due to changes in the fishery management and high prices for glass eel. The lack of stockings resulted in very serious decrease of catch, mainly in inland fisheries.
The eel is a non-licensed species in Poland, both in coastal and inland fisheries. All eel fisheries is in private hands and, at the present, there are no organized fishing companies in the coastal fishing, however, in some river districts so called “cooperatives” operate and they are also fishing for eel. There are private fishery farms having also several lakes with eel but most

216 Joint EIFAC/ICES WGEEL Report 2007
of lakes have a separate owner. There is no solely eel stock and fisheries management in Poland, however, all eel management issues are within hands of the Ministry of Agriculture and Rural Development. Governmental control is limited only to a set of general rules: size limits, gear restrictions, closed seasons and areas. Special protection rules applies to eel fyke net fishing, in Szczecin Lagoon, Pomeranian Bay and Vistula Lagoon, where all fyke nets have to be equipped with protection metal “sieves” in the end of bag to allow release of undersized eel. The three Regional Inspectorates of Fisheries, located in Szczecin, Slupsk and Gdynia, are responsible for management, monitoring and surveillance of fisheries at territorial level. In the coastal fisheries landings and effort are registered and reported on obligatory basis as monthly reports (boats up to 8 m) and in the EU-standard logbooks (boats 8-10 meters, if they are fishing cod, otherwise only as a monthly reports) Boats over 10m all have EU-logbooks. There is no obligatory reporting from fishery in lakes and rivers. Polish Anglers Association has some data available but it comes from voluntary reporting by PAA members only. The Inland Fisheries Institute in Olsztyn collects selected inland catch data based on its own sources (mainly questionnaires distributed among lake owners).
Figure PL.1. The Polish coastal area.
There are five main fishing areas along the Polish Baltic coast (also see Figure PL.1), from all of them landing statistics according to DCR are available since 1994:
1 ) Szczecin Lagoon; which is influenced firstly by waters of the Pomeranian Bay, where some fish migrate to feeding grounds and then return with the back flow, and secondly by the waters of Odra River and Swina, Dziwna and Piana Rivers which connect it with the bay (Figure PL.2). Total area of lagoon is 911,8 km2, of which 457 km2 is under control of the Polish fishing administration, the rest is under Germany control. The lagoon comprises of several bays, islands, rivers and internal channels. Total exchange of water between the lagoon and bay occurs seven times a year. The lagoon is eutrophic and relatively shallow (mean depth 3,8 m) but along shipping lanes it reaches 11–12 m. In the Polish part of the lagoon approximately 200 fishermen with 74 boats operating from 10 bases reported eel catches in 2006, however, total number of motor boats operating there is higher. The main gear used for eel are different types of fyke nets and hooks. The Polish highest catch was 447 t in 1967. In 1975–1990 the lagoon was restocked by Poland with an average of 2,5 tons of glass eel per year. The volume of catch is shown in Table PL.d

217 Joint EIFAC/ICES WGEEL Report 2007
2 ) Pomeranian Bay; is a broad open area of ca. 6000 km2, which in part is situated within Polish EEZ (Figure PL.2). Its depth is up to 20 m and mean depth is 13 m. The south-west part is under influence of fresh water of rivers: Odra, Piana and Swina. The boat fishing effort in the whole area was “frozen” to the level of 1996. Main gears for eel: hooks, fyke nets. In 2006 there were 5 boats from three fishing bases reporting eel catches from the area. The volume of catch is shown in Table PL.d.
Figure PL.2. Fishing bases in the Szczecin Lagoon and Pomeranian Bay.
3 ) Open coast (ICES Subarea 25): an open broad belt of coast from 150E to 180E, with fisheries operating up to 6 mile from the shore and up to depth of 20 m. There are several rivers discharging to the sea; some of them are connected with near-coastal lakes. The eel fishing there has minor importance and its catches dropped from 5 tons in 1954 (Trella, 2000) to 2,5 tons recently (Table PL.E). There were 8 fishing bases with 9 boats reporting eel catches in 2006.
4 ) ICES Subarea 26: the Polish waters of Gulf of Gdansk and some part of waters north of Hel Peninsula, from 180E to the Polish-Russian border (without Vistula Lagoon). Salinity ranges from 4–7‰ in the inner part of Puck Bay to 13–14‰ in open coasts. Coastal eel fishing is carried out mainly in shallow waters of Puck Bay and also in coasts on both sides of Vistula River mouth. This area has big tradition in fisheries and has 17 fishing bases with over 100 fishermen and 64 boats reporting eel catch in 2006. Yearly eel catch was 118 tons in 1955 (Borowski, 2000) but in the last decade decreased to 9–16 tons (Table PL. E).
5 ) Vistula Lagoon-the largest estuarial coastal eutrophic reservoir in the southern Baltic and very important in coastal eel fishing. Total area is 915,5 km2 out of this 328 km2 is within Polish borders (Figure PL.3). Total length of the lagoon is 91 km, average width is 9,5 km and mean depth is 2,8 m. The salinity is 0,10‰–1,60‰ during summer and 2,90‰–4,70‰ during autumn. The water has very low transparency (30–90 cm). The only one and narrow connection with Baltic Sea is in the Russian part. The highest eel catches of 350–500 tons yearly were recorded in 1926–1940 (Borowski, 2000) but in last decade it decreased from 108 tons in 1996 to 14 tons in 2006 (Table PL.E). There are ca. 100 fishermen and 66 boats, reporting eel catches (2006), operating from 8 bases. Fishing gears: fyke nets, hooks.

218 Joint EIFAC/ICES WGEEL Report 2007
Figure PL.3. Fishing bases in the Vistula Lagoon.
PL.B.2 River Basin Districts in Poland
Water Framework Directive separates two RBD’s in Poland.
a ) Odra RBD (ORBD) of total area within Polish borders 118 462 km2, which includes: • Odra drainage -118 861 km2, out of this 106 057 km2 is within Polish
borders, 7217 km2 within Czech and 5587 km2 within Germany borders; • Szczecin Lagoon of 12 100 km2, out of this 2459,2 km2 is within Polish
borders and 9471,2 km2 is within Germany borders; • drainages of three Pomeranian rivers ( Rega, Parseta,Wieprza) of total area
9029 km2 , which are discharging to Baltic Sea; • drainages of other international rivers, present in the Polish territory, of total
area of 249,6 km2, out of this 239,8 km2 is Elbe drainage, 1,3 km2 is Danube drainage and 8,5 km2 is Ucker River drainage (flowing to Szczecin Lagoon).
b ) Vistula RBD (VRBD) of total area within Polish borders 194 223 km2, which includes: • Vistula drainage of total area 199 813,0 km2 , out of this 174 087,2 km2 is
within Polish borders and 25 725,8 km2 is outside Polish borders; • Drainages of Pomeranian rivers discharging to Baltic Sea, with total area of
5 965,8 km2; • Vistula Lagoon of 915,5 km2 with drainage of Pasleka River-2294 km2; • drainages of other international rivers present in the Polish territory of total
area 11 020 km2 , out of this drainage of Pregola-7519,8 km2, Niemen (Nemunas)-2511,6 km2, Dniestr-233,2 km2, Danube-381 km2, and Swieza River -374,1 km2.
PL.C. Fishing capacity
No data is available neither for inland fisheries nor for recreational fisheries.
There are no companies organized for coastal fishing eel and every boat owner catch fish on its own. Total number of bases and boats involved in eel fishery from 2004 to 2006 in particular areas is given in Tables PL.b.1–b.3. Those figures are derived from fisheries

219 Joint EIFAC/ICES WGEEL Report 2007
database of the Ministry of Agriculture and Rural Development. Details on size of individual boats are readily available but there are no data on numbers of fishermen involved.
Total number of boats in register is presently changing due to implementation of EU program of reducing fishing capacity. The length of fishing boats ranges from 4 m to 11 m and their age is 6–16 years.
Mean engine power of boat differs between the areas (Polanski, 2000):
• ORBD VRBD • Szczecin Lagoon - 37 KM, ICES sub-area 26 -
26 KM, • Pomeranian Bay - 63 KM, Vistula Lagoon -
76 KM • Open coast (ICES sub-area 25) - 65 KM,
Table PL.A. Fish bases and relevant number of boats involved in coastal eel fishery in the period.
VRBD 2004 2005 2006 ORBD 2004 2005 2006
East Coast (ICES 26) Pomeranian Bay Chałupy 6 6 6 Międzywodzie 1 Hel 4 6 4 Międzyzdroje 4 3 2Jastarnia 17 17 16 Świnoujście 3 8 3Jelitkowo 1 TOTAL 8 11 5Kuźnica 9 11 9 Mikoszewo 2 1 2 Szczecin Lagoon Obłuże 3 4 5 Kamień Pom. 8 8 7Oksywie 1 Karsibór 3 4 2Orłowo 3 4 2 Lubin 9 6 6Puck 4 5 3 Przytór 1 2 1Rewa 3 2 2 Szczecin Dąbie 11 11 11Swarzewo 6 6 4 Szczecin Stołczyn 10 10 8Świbno 12 3 5 Stepnica 8 3 2Władysławowo 3 4 5 Trzebież 44 43 37Górki Wsch. 1 1 N.Warpno 1 Górki Zach. 1 2 1 Wolin 5 1 TOTAL 76 72 64 TOTAL 100 88 74 Vistula Lagoon Open Coast 25 VRBD 2004 2005 2006 ORBD 2004 2005 2006Frombork 14 8 6 Chłopy 4 3 3Kąty Rybackie 17 12 9 Darłowo 12 9 2Kamienica Elbląska 4 3 Dąbki 4 5 Krynica Morska 12 8 7 Rewal 1 2 1N. Pasłęka 20 16 14 Jarosławiec 2 1 1Piaski 17 15 12 Kołobrzeg 7 7 2Suchacz 8 7 6 Mrzeżyno 1 Sztutowo 1 Unieście 2 Tolkmicko 22 20 12 TOTAL 33 27 9TOTAL 115 89 66 GRAND TOTAL 191 161 130 GRAND TOTAL 141 126 88VISTULA RIVER BASIN DISTRICT ODRA RIVER BASIN DISTRICT

220 Joint EIFAC/ICES WGEEL Report 2007
PL.D Fishing effort
Before 1994 data on effort (no of gears and days) were recorded in old database. Since 1994 the number and type of gear used are recorded obligatory in the monthly reports and in the EU-standard logbooks, from where there are retrieved into database of the Ministry. However, the number of days the gears are used, is not recorded (Table PL.b-c). The database is operating from 2004 and there is still lot of errors; especially data on gears are not fully reliable. Nowadays only fyke nets and hooks are used.
Table PL.b. Total effort (no. of gear set) in 2005 in Szczecin and Vistula Lagoons.
MONTH ORBD- SZCZECIN LAGOON VRBD- VISTULA LAGOON
FYKE NETS HOOKS FYKE NETS HOOKS
I II III IV 2782 3762 V 6401 11613 45850 VI 5565 7669 49830 VII 4440 2821 38350 VIII 8081 4324 20900 IX 6802 8776 13700 X 4709 8093 XI 1419 688 XII 78 17
TOTAL 40277 47763 168630
Table PL.C. Total effort (no. of gear set) in 2006 in Szczecin and Vistula Lagoons.
MONTH ORBD- SZCZECIN LAGOON VRBD- VISTULA LAGOON
FYKE NETS HOOKS FYKE NETS HOOKS
I II III IV 5226 992 V 11770 7898 9250 VI 14947 4053 10400 VII 11868 1680 3200 VIII 15384 2144 7000 IX 9172 4553 4250 X 13877 3792 XI 2906 376 XII 258 47
TOTAL 85408 25535 34100
PL.E Catches and landings
PL.E.1 Restocking
Restocking with glass eel was conducted in Vistula Lagoon (VRBD) during 1970–1988 (mean 1400 kg/year) and in 1988–1994 (mean 167 kg/year) (Borowski, 2000). Restocking in

221 Joint EIFAC/ICES WGEEL Report 2007
Szczecin Lagoon was conducted in 1975–1991 with mean 1240 kg/year (Borowski et al.,1999).
The Polish natural inland waters are divided into small fishery areas (about 2356 sections).Every fishery users (big professional fisher company, amateur fishers, and private people) have to restock in quantity declared in their contracts with Regional waters authorities. Table PL.D presents yearly value (aprox. 8 tons) of restocking in inland waters.
Table PL .D Yearly value of restocking in Polish inland waters.
QUANTITY (KG) INDIVIDUAL MASS (G) SOURCE
5000 2–10 Aquaculture (Denmark,Holland,Germany)
2000 60–100 Swedish natural waters 1000 2–20 Polish farm
There is a constant government restocking programme in both lagoons (from 2005) with mean 0,5 ton eels released yearly ( ind. mass 2–20 grams) into the each lagoon.
0
500
1000
1500
2000
2500
3000
3500
1970
1972
1974
1976
1978
1980
1982
1984
1986
1988
1990
1992
1994
1996
1998
2000
2002
2004
2006
Years
Res
tock
ing
valu
e (k
g)
glass eel
reared eel
Figure PL.4. Restocking value (kg) in the Vistula Lagoon in the period 1970–2006.
PL.E.2 Catches of yellow and silver eel
Eel fishery in Poland applies mostly to the silver eel and occasionally to the yellow eel. Inland and Baltic coastal eel catches (tons) in 1950–2001 are presented in Figure PL.5. Time series for the coastal eel in 1997–2006 are presented in Table PL.E. In the fishery documents the volume of catch equals to volume of landing. It means that total catch is practically the total landing. The magnitude of unreported catches is probably high, but is difficult to assess. No fishing auction system, except the first one in Ustka, takes place in Poland. Monthly catches in two main coastal fishing areas are shown on PL.6, Fig.PL.7.The present database in the Ministry has still some errors, also due to misclassification of species. For inland waters, no obligatory registration of landings exists. The estimates of inland landings are based on other data sources, PAA questionnaires and lake owners’ inquiries.

222 Joint EIFAC/ICES WGEEL Report 2007
0
200
400
600
800
1000
1200
1400
1600
1950
1954
1958
1962
1966
1970
1974
1978
1982
1986
1990
1994
1998
tons
Inland waters Baltic
Figure PL.5. Polish inland and Baltic coastal eel catches (tons) in 1950–2001(source: FAO).
Table PL.E. Polish Baltic coastal eel catch (kg) by area in 1997–2006.
VRBD 1998 1999 2000 2001 2002 2003 2004 2005 2006
East Coast (ICES 26) 7 249 16 751 16 290 12 729 14 656 15 213 14 367 14 500 10 900
Vistula Lagoon 74 373 100 300 70 155 60 585 34 182 51 472 21 233 21 600 14 200
TOTAL 81 622 117 051 86 445 73 314 48 838 66 685 35 600 36 100 25 100 ORBD Middle Coast (ICES 25) 2 127 2 855 1 712 787 1 916 1 550 2 562 2 600 800
Pomeranian Bay 14 100 9 600 10 800 12 600 12 400 8 752 2 380 11 100 8 900
Szczecin Lagoon 132 900 92 800 66 200 67 200 58 726 39 162 34 620 26 600 18 300
TOTAL 149 127 105 255 78 712 80 587 73 042 49 464 39 562 40 300 28 000
GRAND TOTAL 230 749 222 306 165 157 153 901 121 880 116 149 75 162 76 400 53 100

223 Joint EIFAC/ICES WGEEL Report 2007
0
10000
20000
30000
40000
50000
60000
70000
I II III IV V VI VII VIII IX X XI XIImonths
kg
1995 1996 1997 1998 1999 2000 2001 20022003 2004 2005 2006
Figure PL.6. Polish monthly landings of eel in Szczecin Lagoon in 1995–2006.
05000
100001500020000250003000035000
I II III IV V VI VII VIII IX X XI XIImonth
kg
1995 1996 1997 1998 1999 2000 20012002 2003 2004 2005 2006
Figure PL.7. Polish monthly landings of eel in Vistula Lagoon in 1995–2006.
PL.F Catch per unit of effort
No evaluation (by requested method) on catch per unit effort was done in coastal and inland waters.
PL.G Scientific surveys of the stock
No surveys conducted.
PL.H Catch composition by age and length
For the Vistula Lagoon samples from commercial fyke nets landings have been collected in the years 1969–1976 (Filuk and Olsza, 1978) and 1992–2001 (fig.PL.8). For the Szczecin Lagoon sampling from fyke nets was conducted in 1969–1970 and in some years during 1993–2000. After then no measurements were conducted . Samples from hook catches were collected in the period 1999–2001 (Figure PL.9) During 1996–1998 also length and weight measurements from fyke nets in the Puck Bay (part of ICES area 26) were done.

224 Joint EIFAC/ICES WGEEL Report 2007
For all eels in the samples length (up to 1 cm) and weight (up to 1–2 g) were determined. In 1969–1970 otoliths from Szczecin Lagoon eels were collected and age readings were carried out in the laboratory. Fish for sampling were acquired directly from fishermen in fishing bases located in different parts of the coast.
All length-weight-age sampling was executed by the Sea Fisheries Institute in Gdynia. Having in mind that DCR specifies one sample of 100 eel per 20 tons of landings, the previous level of sampling was sufficient, even in some years much exceeding, for landings obtained. Results of catch composition findings were used in general management advice presented to the Ministry as a part of all-species sampling and fishery expertise.
There is no regular sampling for eel in inland waters; however, scientist of Inland Fishery Institute (IFI) in Olsztyn were collecting length and weight data from some lakes in the Pojezierze Mazurskie between 1986 and 1990. Data were collected from 60 lakes of overall area reaching 43 846 ha. The lakes were communicated with each other by permanent connections and varied in terms of depth, area and trophic status.
0
2
4
6
8
10
27 31 35 39 43 47 51 55 59 63 67 71 75 79 83 87 91 95 99 103
107
length (cm)
catc
h co
mpo
sitio
n (%
)
Figure PL.8. Average length composition of fyke net catches, with confidence intervals (± 4,9 std), for Vistula Lagoon, based on data sets from 1992–2001.

225 Joint EIFAC/ICES WGEEL Report 2007
0
12
3
45
6
78
9
34 37 40 43 46 49 52 55 58 61 64 67 70 73 76 79
lenght (cm)
catc
h co
mpo
sitio
n (%
)
Figure PL.9. Average length composition of hooks catches based on data sets 1999–2001.
Eel has been included in the Polish data collection programme since 2006. Samples are collected mainly at the fishing harbours in the Vistula and Szczecin lagoons (Figures PL.10–PL.11). In 2006 ,190 eels were measured (Figure PL.12 ),weighted and aged.
Figure PL.10. Fishing base in Szczecin Lagoon from samples were taken.

226 Joint EIFAC/ICES WGEEL Report 2007
Figure PL.11. Fishing bases in Vistula Lagoon, from samples were taken.
0,0
1,0
2,0
3,0
4,0
5,0
6,0
7,0
8,0
45 48 51 53 56 58 60 62 64 66 68 70 72 74 76 78 80 82 84 86 88 91 94
lenght (cm)
catc
h co
mpo
sitio
n (%
)
Figure PL.12. Length distribution of eels sampled in 2006.
PL.I Other biological sampling
PL.I.1 Length, weight & growth (DCR)
Beside length, weight and age measurements requested by DCR regulation, stage determination was done (silvering index).
PL.I.2 Parasites
A part of fish in some years in the Vistula Lagoon was analyzed by SFI for stomach fullness, and presence of Anguillicola crassus in the swimbladder. In 2006 all 190 eels were inspected and infection rate indicated almost 90%.
PL.I.3 Contaminants
In 2007SFI has started investigations of lipid content ,concentration of heavy metals and dioxins.
227 Joint EIFAC/ICES WGEEL Report 2007
PL.I.4 Predators
There are studies being carried out on the black cormorant pressure on the coastal and inland waters ichthyofauna. Eel contributed from 1,9% to 2,4% in weight of cormorants food from Gulf of Gdansk in 1998 and 1999 respectively (Bzoma, 2004). In most cases one or two eels on average weight 300g and length 56 cm were found in eel food. Total amount of eel eaten from Vistula Lagoon is estimated for 52 tons/year on average, during 1998–2000.
PL.I.4.1 What is monitored? What information is available
Nothing is monitored. Data about 2006 breeding colony count exist. Also data about some larger colonies or some “hot” areas were collected.
PL.I.4.2 Information on predator impact on eel, diet, etc
Few local studies including coastal lagoons and inland lakes.
PL.I.4.3 National legislation protecting predators
Cormorants are partially protected (can be killed on fish-ponds without permission, all year). It is forced to be changed by European Commission-Bird Directive obligated to stronger protection. Polish Ministry of Environment let to kill cormorants everywhere after application.
PL.I.4.4 National control measures being implemented/proposed
Nothing, few local actions like egg-oiling in one colony, few small colonies per year are removed on pond areas.About 1.000 cormorants per year are culled legally in Poland.
PL.J Other sampling
There is a constant (except year 2004) “self-sampling” monitoring programme conducted by SFI in the Vistula Lagoon. The fishing gear used in the monitoring was comprised of a fence 120 meters length (24 mm mesh size) and four fyke nets deployed in the so-called free water of the border zone. This region, known colloquially as the "corridor", is 1580 m wide, and fishing is forbidden here to allow the fish free passage between the Polish and Russian sides of the Vistula Lagoon. The gear was deployed parallel to the border, which, at the water surface, is 10 800 m. The fyke nets deployed were constructed in the same way as those used in Vistula Lagoon fishery (Grzywacz et al., 1982), with a mesh bar length of 16 mm in the last chamber and in the bunt. The frequency of checking the fyke nets depended on the season of the year and fish abundance. During the spring herring spawning stock migration, the gear is cleared even as often as twice daily. In the summer season, the uninterrupted deployment of the gear is extended to 5–6 days, while in the fall this period decreased to 3–5 days. The fish removed from the gear is sorted by species and size category and then counted. Fishers sort eels into 4 baskets ,each size category separately. Categories are: undersized (<45 cm), small (<200 grams), medium (200–300 grams) and large (>500 grams). Figures PL.13–PL.16 presents daily medium number of eels caught in the autumn in each category size during the period 1995–2006.

228 Joint EIFAC/ICES WGEEL Report 2007
0 2 4 6 8 10 12
19951996199719981999200020012002200320052006
Year
Mean no. of fish
XI
X
IX
Figure PL.13. Mean number of eels caught per day in the individual months during the period 1995–2006 .Category size “Large”.
0 1 2 3
19951996199719981999200020012002200320052006
Year
Mean no. of fish
XI
X
IX
Figure PL.14. Mean number of eels caught per day in the individual months during the period 1995–2006. Category size “Medium”.
0 1 2
19951996199719981999200020012002200320052006
Year
Mean no. of fish
XI
X
IX
Figure PL.15.1. Mean number of eels caught per day in the individual months during the period 1995–2006. Category size “Small.

229 Joint EIFAC/ICES WGEEL Report 2007
0 1 2
19951996199719981999200020012002200320052006
Year
Mean no. of fish
XI
X
IX
Figure PL.16. Mean number of eels caught per day in the individual months during the period 1995–2006. Category size “Undersized”.
PL.K Stock assessment
Landing statistics and effort data are reported to the Ministry of Agriculture through Inspectorates of Fisheries. Data on length-and-age sampling are presented every year to the Ministry and fisheries authorities in the form of research reports of the Sea Fisheries Institute.
The other data collected while doing the research is being used for cognitive aims as well as for planning and prognosis actions connected with running a rational fisheries management.
Recommendations on minimum size, effort reduction, closed periods and areas for eel in the Vistula Lagoon were presented by Borowski (2000). In the 1997 calculations of the von Bertalanffy growth equation parameters were based on a complete set of tag recoveries, as well as on recoveries from particular tagging experiments and the biomass of the eel population of the Vistula Lagoon was estimated based on the catch curve (Borowski et al., 1997).
PL.I Sampling intensity and precision
The spatial variation in mean length of fyke net catches and change in size composition of eel coastal landings was analysed by Borowski (2000), Wysokiński (1998), however the statistical properties of the sampling protocol were not given.
Number of sampled fish from Vistula Lagoon varied from 400 to 6500 per year (Tab.PL.F) and each sample included 5–>100 fish. An example of effort distribution in fishery squares and sampling distribution in 1996 is presented in the Figure PL.17.

230 Joint EIFAC/ICES WGEEL Report 2007
Table PL.F. Intensity of the eel sampling in the Vistula Lagoon (VRBD) in 1993–2000.
YEAR
MONTH 1993 1994 1995 1996 1997 1998 1999 2000
Number of fish sampled IV 4 10 22 V 193 648 63 397 25 53 223 33 VI 169 3503 66 180 68 103 142 46 VII 347 54 558 92 238 31 28 VIII 189 120 86 182 45 128 IX 1651 150 103 725 146 43 177 X 716 152 131 378 84
Total 709 6518 678 1358 1127 1110 590 412
Figure PL.17. Fyke nets and sampling distribution in Vistula Lagoon in 1996.
PL.M Standardisation and harmonisation of methodology
PL.M.1 Sampling commercial catches
In the coastal waters in 2006 samples were collected mainly from landings in 3 fishery harbours. Total length was measured with accuracy of 1 cm and weight of 1 g. All samples were taken to SFI laboratory.
PL.M.2 Age analysis
Age analysis is conducted in SFI laboratory. Age is calculated based on number of growth interval rings, which are visible as dark rings, clearly differing from light protein matrix, on the surface of otolith. (Moriarty, 1983; Campana, 1992; Campana and Jones, 1992; Lecomte-Finiger, 1992; Tzeng et al., 1994). Two methods of preparation are used. More common broken & burnt, and less common sectioned & stained . Thin sections are cut using a high-speed “Acutom-50” saw with a diamond blade.

231 Joint EIFAC/ICES WGEEL Report 2007
PL.M.3 Life stages
Life stage is determined using a method described in “EELREP” final report. The silver index is based on the following external body measurements: total body length (L), bodyweight (W), pectoral fin length (FL), and mean eye diameter (MD) which is calculated according to: MD= (vertical eye diameter + horizontal eye diameter)/2.
PL.M.4. Sex determinations
The sex of eel is defined macroscopic according to established schema of ovary and core building.

232 Joint EIFAC/ICES WGEEL Report 2007
PL.N Overview, conclusions and recommendations
Table PL.G 1 Overview of the eel fisheries in Poland for 2006.
GEOGRAPHICAL AREA
C D E. CATCH (T)
COUNTRY RBD WATER BODY
LA
TIT
UD
E (º
N)
LO
NG
ITU
DE
(º E
)
DR
AIN
AG
E A
RE
A K
M2
WA
TE
R S
UR
FAC
E K
M2
NU
MB
ER
OF
CO
MPA
NIE
S
GE
AR
S U
SIN
G H
OO
KS
DR
IFT
& F
IXE
D N
ET
S
POT
S &
TR
APS
OT
HE
RS
GL
ASS
EE
L
BO
OT
LA
CE
YE
LL
OW
EE
L
SIL
VE
R E
EL
AQ
UA
CU
LT
UR
E (T
)
PL Odra Inland 106182 ++ ++ +
Lakes over 50 ha
791,49 ++ ++ +
Pomeranian Bay
+ 8900
Szczecin Lagoon
2001,9 457,3 + + 85408 + 18300
Open coast ICES 25
9029,1 800
Vistula Inland 183546 + ++ +
Lakes over 50 ha
1501,1 ++ ++ +
Vistula Lagoon
2294,5 915,5 34100 ++ 47763 14200
Open coast ICES26
5965,8 ++ ++ ++ + 10900
PL sum 309019 3665,39 53100

Joint EIFAC/ICES WGEEL Report 2007 233
PL.O Literature references
Boëtius I., Boëtius J., 1967. Studies in the European Eel, Anguilla anguilla (L.). Experimental induction of the male sexual cycle, its relation to temperature and other factors. Medd. Danmark Fisk. Havundersogelser. N.S. 4, 11:339–405.
Borowski W., H.Dąbrowski, R. Grzebielec.,1997. Results of the tagging of eel of the Vistula Lagoon. Bull. Sea.Fish.Inst. 2(141):33–54.
Borowski W., A.Wesołowska, J. Wiktor., 1999. Zarybianie węgorzem Zalewów Wiślanego i Szczecińskiego [Restocking Vistula and Szczecin Lagoons with eel]. Wiad. Ryb.nr 11–12:12–13.
Borowski W., 2000. Stan zasobów ryb Zalewu Wiślanego i warunki ich eksploatacji [State of the fish stocks in the Vistula Lagoon and conditions of their exploitation].Studia i Mat. MIR Seria B, No.72:9–34.
Bzoma S., 2004. Kormoran Phalacrocorax carbo (L.) w strukturze troficznej ekosystemu. Zatoki Gdańskiej [Cormorant Phalacrocorax carbo (L.) in trophic structure of the Gulf of Gdansk ecosystem]. Ph.D thesis. Univ. of Gdansk.
Campana S.E., 1992. Measurement and interpretation of the microstructurre of fish otoliths. Can. Spec. Publ. Fish. Aquat. Sc. 117 : 59–71.
Campana S.E., Jones C.M., 1992. Analysis of otolith microstructure data. Can. Spec. Publ.Fish. Aquat. Sc. 117: 73–100.
Filuk J, E.Olsza.,1978. Badania ryb Zalewu Wislanego i Szczecińskiego. [Research on fish of the Vistula and Szczecin lagoons]. Studia i Mat. MIR. Seria B,No.41.
Filuk J., J.Wiktor.,1988. Gospodarka zasobami węgorza w Zalewie Wiślanym i w Zalewie Szczecińskim w świetle procesu zarybiania.[Management of eel stocks in the Vistula Lagoon and in the Szczecin Lagoon in the light of restocking processs]. MIR.11 pp.
Garbacik-Wesolowska A. and Borowski W.,1995. Znakowanie ryb w morskich wodach przybrzeżnych [Tagging fish in marine coastal waters].Bull. Sea. Fish. Inst. 2 (135):66–67.
Garbacik-Wesolowska A. and Boberski E., 2000. Stan zasobów ryb Zalewu Szczecińskiego oraz strefy przybrzeżnej wybrzeża Zachodniego i warunki ich eksploatacji [State of the fish stocks of the Szczecin Lagoon and coastal zone of West Coast and conditions of their exploitation]. Studia i Materialy MIR Seria B, No.72:77–104.
Jackowski E, 2000. Stan zasobów ryb strefy przybrzeznej Wybrzeża Srodkowego I warunki ich eksploatacji [State of the fish stocks of the East Coast and conditions of their exploitation]. Studia i Materialy MIR Seria B, No.72:35–64.
Lecomte-Finiger R,. 1992. The crystalline ultrastructure of otoliths of the eel (A. anguilla L.1758). J.Fish Biol. 40:181–190.
Moriarty C, 1983. Age determination and growth rate of eels, Anguilla anguilla (L.). J. Fish Biol. 23: 257–264.
Pankhurst N.W., 1982a. Relation of visual changes to the onset of sexual maturation in the European eel Anguilla anguilla (L.). J.Fish Biol. 21: 127–140.
Pankhurst N.W., 1982b. Changes in body musculature with sexual maturation in the European eel Anguilla anguilla (L.). J. Fish Biol. 21:417–428.
Pankhurst N.W., 1982c. Changes in the skin-scale complex with sexual maturation in the European eel Anguilla anguilla (L.). J. Fish Biol. 21: 549–561.
Pankhurst N.W., 1983d. Changes in vision and olfaction during sexual maturation in the European eel Anguilla anguilla (L.). J. Fish Biol. 23: 229–240.
234 Joint EIFAC/ICES WGEEL Report 2007
Pankhurst N.W., Lythgoe J.N. 1982. Strukture and colour of the integument of the European eel Anguilla anguilla (L.). J.Fish Biol. 21:279–296.
Polanski Z. 2000., Polskie rybołówstwo przybrzeżne [Polish coastal fisheries]. Studia i Materialy, Seria E, No.60; MIR Gdynia. 50 pp.
Stramke D., 1972. Veränderungen am Auge des europäischen Aales (Anguilla anguilla, L.) während der Gelb- und Blankaalphase. Arch. FischWiss. 23: 101–117.
Szczerbowski J.,1993. (Ed.) Rybactwo śródlądowe [Inland fishery]. IRS Olsztyn. 569 pp.
Thurow F., 1958. Untersuchungen über die spitz und breitköpfigen Varianten des Flussaales Arch. Fisch. Wiss., 9: 79–97.
Trella K., 2000. Stan zasobów ryb strefy przybrzeżnej Wybrzeża Środkowego i warunki ich eksploatacji [ State of the fish stocks of the Middle Coast and conditions of their exploitation] Studia i Materialy MIR Seria B, No.72:65–76.
Tzeng W. N.,. Wu H. F., Wickstrom H., 1994. Scaning electron microscopic analysis of annulus microstructure in otolith of European eel, Anguilla anguilla. J. Fish Biol. 45: 479–492.
Wysokinski A., 1998. Fishery management in the Szczecin Lagoon. Bulletin Sea. Fish. Inst. 3(145):65–81.

Joint EIFAC/ICES WGEEL Report 2007 235
Germany: Report on the eel stock and f ishery in Germany 2007
DE.A Authors
Klaus Wysujack, Federal Research Centre for Fisheries, Institute for Fisheries Ecology, Wulfsdorfer Weg 2004, 22926 Ahrensburg, Germany.
Tel: 0049–4102–51128. FAX: 0049–4102–898207
Detlev Ingendahl, Migratory Fish Programme Northrhine-Westfalia, Bezirksregierung Arnsberg, Heinsbergerstr. 53, 57399 Kirchhundem, Germany
Tel: 0049–2723–77940. FAX: 0049–2723–77977
Reporting Period: This report was completed in September 2007, and contains data up to 2006.
Contributors to the report:
DE.B Introduction
In German, the European eel Anguilla anguilla is an important species for both commercial and recreational fisheries, which occur in all types of water bodies, including coastal waters, estuaries and lakes and rivers of different size.
Germany is a federation consisting of 16 states (Figure 1), all of them having their own fisheries related legislation. The fisheries legislations include regulations, which are relevant for eel, such as minimum size limits or restrictions for fishing gears. In some states, the fisheries managers (fishermen or angling clubs) have to prepare a management plan, which is examined by the responsible authorities. However, there is no general obligation to provide statistics on fishing efforts or landings.
Coastal eel fisheries occur in Niedersachsen, Bremen, Hamburg, Schleswig-Holstein and Mecklenburg-Pomerania.
State borders of the 5 above-mentioned states extending 12 sm into the sea are for Niedersachsen from the Dutch border to the River Elbe, for Schleswig-Holstein from the River Elbe to the Danish border on the North Sea coast and from the Danish border near to the city of Lübeck on the Baltic Sea side, and for Mecklenburg-Pomerania from Lübeck to the Polish border. Bremen is located on the lower courses of the River Weser and Hamburg on both sides of the River Elbe some 100–140 km inland between the states of Niedersachsen on the left and Schleswig-Holstein on the right bank. Rather important water masses are drained into the Wadden Sea from the catchment areas (Figure 2) of the respective rivers, especially Weser and Elbe.
Coastal marine fishing areas for eel fisheries in the North Sea can be divided into the lower courses and estuaries of rivers and the Wadden Sea. In the Baltic Sea there are lower courses of rivers, the inner part of the coast especially in Mecklenburg-Pomerania, called Bodden or Haff, and the outer coast.
The North Sea coastline of Schleswig-Holstein is in total 553 km long, 256 km of which belong to the islands and 297 to the continent. The Baltic Sea coast is 637 km incl. the island of Fehrmarn. The Schleswig-Holstein Wadden Sea has a surface area of about 1700 km2 (Ministerium für ländliche Räume, 2001).

236 Joint EIFAC/ICES WGEEL Report 2007
The coastline of Mecklenburg-Pomerania is 1712 km long; 1358 km of it belong to the inner coast and 354 km to the outer coast. There are several isles of different sizes between 17 km2 (Hiddensee) and 930 km2 (Rügen). The total surface area of the fishing districts of the inner part is 171 400 ha and 568 000 ha of the outer part; resulting in a total area of 739 400 ha.
Generally the borderline between inland fisheries and marine fisheries is regulated in the respective state fishery legislations. It can be rather narrow to the coast as for smaller rivers like Eider and Stör or rather inland as with the River Elbe, near to the city of Hamburg, or the River Ems close to the city of Papenburg.
The European Water Framework Directive subdivides Germany into 10 separate River Basin Districts (RBD; Figure 2). Six of them are real international RBDs (Rhine, Danube, Elbe, Meuse, Oder, Ems). The two smaller RBDs Schlei/Trave and Eider mainly belong to Germany with only small parts of the catchment area being located in Denmark. Only two RBDs exclusively belong to Germany.
The Rhine is 1320 km long and has a drainage area of about 185 000 km² from which 106 000 km² belong to Germany. The drainage area is shared with Switzerland (28 000 km²), France (23 300 km²), The Netherlands (22 700 km²), Luxemburg (2520 km²), Austria (2400 km²), Belgium (767 km²), Liechstenstein (160 km²) and Italy (70 km²). The Rhine is draining into the North Sea.
The Elbe has a length of 1094 km and a catchment area of 148 268 km². The German part of the catchment area is 97 175 km² and 49 933 km² belong to the Czech Republic. Austria (921 km²) and Poland (239 km²) contribute less than 1% to the drainage area. Important tributaries in the German part of the catchment area are the rivers Havel, Saale, Mulde and Schwarze Elster. The Elbe is also draining into the North Sea.

Joint EIFAC/ICES WGEEL Report 2007 237
Figure 1: Map of the Federal Republic of Germany and its 16 states (Länder). A coastal fishery exists in Niedersachsen (Lower Saxony), Bremen and Hamburg in the North Sea, in Schleswig-Holstein in both North Sea and Baltic Sea and in Mecklenburg-Pomerania in the Baltic Sea.
The Weser is one of the two RBDs which completely belong to Germany. The total drainage area is 48 800 km² (including coastal waters). The Weser itself results from the confluence of the rivers Werra and Fulda. The main tributaries are Werra, Fulda, Diemel, Aller and Leine. The Weser is draining into the North Sea.
The river Ems is also draining into the North Sea. The total drainage area amounts to 18 000 km² which are shared with The Netherlands. About 15 000 km² belong to Germany and 2400 km² to The Netherlands. The rest results from the Ems-Dollart estuary.

238 Joint EIFAC/ICES WGEEL Report 2007
Figure 2: River Basin Districts (RBD) in the Federal Republic of Germany: Eider, Schlei/Trave, Elbe, Warnow/Peene, Oder, Weser, Ems, Rhine, Meuse and Danube.
The catchment area of the river Meuse (35 000 km²) is shared with The Netherlands, Belgium, France and Luxemburg. The main tributaries in Germany are the rivers Rur (2338 km²), Niers (1382 km²) and Schwalm (273 km²). The Meuse is draining into the North Sea.
With a total catchment of 4701 km², the Eider is a very small RBD. Only a small proportion of it belongs to Denmark. The Eider is draining into the North Sea.
With a catchment area of 122 512 km² (including the Szczecin Lagoon and its tributaries), which is shared by Poland, the Czech Republic and Germany, and a length of 855 km, the Oder is one of the bigger rivers draining into the Baltic Sea. The main part of the drainage area belongs to Poland (87.6%), whereas the German part is 7987 km² (6.5%).
The Warnow/Peene RBD includes a total drainage area of 13 600 km². The main rivers in this RBD are Warnow and Peene with catchment areas of 3300 km² and 5100 km², respectively. About 2900 km² coastal waters are also included. Both rivers are draining directly into the Baltic Sea. This RBD belongs exclusively to Germany.
The Schlei/Trave RBD has a drainage area of 6174 km². Besides Schlei and Trave, it consists of some small rivers and streams, which also drain into the Baltic Sea. The Schlei is no

Joint EIFAC/ICES WGEEL Report 2007 239
running water (river) but a firth of glacial origin. The RBD is also characterized by 51 lakes with areas of more than 50 hectares.
With 807 827 km² (including coastal waters), the drainage area of the Danube is the second largest European river catchment. The river has a length of 2870 km, and 18 countries contribute to the drainage area. The Danube is draining into the Black Sea and does not belong to the natural distribution area of the European eel.
DE.C Fishing capacity
DE.C.1 Coastal and marine fishery (if relevant for eel)
The statistics of the German fleet (2005) lists 1624 fishing vessels with lengths of less than 12 m in the North Sea and the Baltic Sea. These vessels mainly fish for ground fish and herring and are probably the most relevant part of the fishing fleet with regard to eel. Additionally, there are 109 trawlers of different size fishing in both the North Sea and the Baltic Sea. 26 vessels with lengths of more than 12 m fish with passive gears, e. g. longlines. They may be partly relevant for eel.
The Mecklenburg-Pomerania fishermen are using hooped fyke nets, eel fyke net chains and longlines for eel in the inner coastal waters and fyke net chains, longlines for eel and pound nets in the outer part.
Fishery on eel in the North Sea part of Schleswig-Holstein is with fyke nets only. There is no more trawl fishery. In the lower course of the River Elbe, a stow net fishery exists. In the Baltic Sea Schleswig-Holstein fishermen are often part-time fishers. They are using fyke nets of different construction, even big sized ones fixed to piles nearly having the size of pound nets. In recent years more and more pipe eel traps are used, since they provide better catches, are cheaper and easier to protect against theft. There is also a sporadic longline fishery using sandeel and crustaceans as bait.
Lower Saxony has a small fishery on eel in the lower courses of the rivers Ems, Weser and Elbe. Trawl fishery has been finished some 10 years ago for economic reasons. On the river Ems there is a traditional fixed stow nets fishery (poles), which has been reduced for economic reasons as well. On the rivers Weser and Elbe an anchored stow net fishery exists. Fishery on yellow and silver eel starts in spring with increasing water temperatures and ends in October. Strong winds can result in good catches even till the end of the year. During summer time eel baskets are being used additionally.
DE.C.2 Inland fishery
Fishing capacity of inland fisheries is not reported in detail.
The total surface area of German inland waters is 845 305 ha, from which at present 536 777 ha are used for fisheries purposes.
In 2006, about 219 000 ha of lakes and reservoirs and 26 000 ha of rivers were managed by nearly 900 companies (including 478 full commercial fisheries and about 400 semi-professional and hobby fisheries; Brämick, in prep.). The total economic yield was about 9.4 million €.
DE.D Fishing effort
Landings from vessels less than 10 m which are landing eel need not to report on logbooks. Instead they are using landings declarations in which there is no record for effort or gear. Therefore, a pilot study was initiated in the frame of the Data Collection Regulation

240 Joint EIFAC/ICES WGEEL Report 2007
1639/2001 to estimate effort for this part of the German fleet. Results will be available after the end of the pilot study.
Fishing effort is not reported for inland fisheries.
DE.E Catches and Landings
DE.E.1 Coastal fishery
Data on landings of eel from the North Sea and the Baltic Sea have been provided by the relevant bodies of the respective states.
Schleswig-Holstein reported on trawl fishery in the North Sea around the island of Helgoland during the 60–70s. But this fishery ceased in the meantime. Stocking size eel (in Table 1) were exclusively caught in lower parts of the rivers Elbe and Eider. These small sized eels are sold via the Aalversandstelle of the German Fisheries Association or directly to lake fishermen for restocking of inland waters of this state. For this reason the data on stocking size eels are probably more representative than data on market size eels.
In the Baltic Sea there is no trawl fishery from Schleswig-Holstein vessels since long. All landings are from small enterprises at Schlei and Trave. Around the island of Fehmarn and in the Lübeck Bight, catches decreased dramatically during recent years. According to fishermen concerned this decrease is at least partly due to cormorants often sitting on the piles of pound nets and drying their plumage after a successful visit of the catch chambers of the passive gear. During the past 5 years 2/3 of all pound nets places have been given up due to a strong decrease of catches.
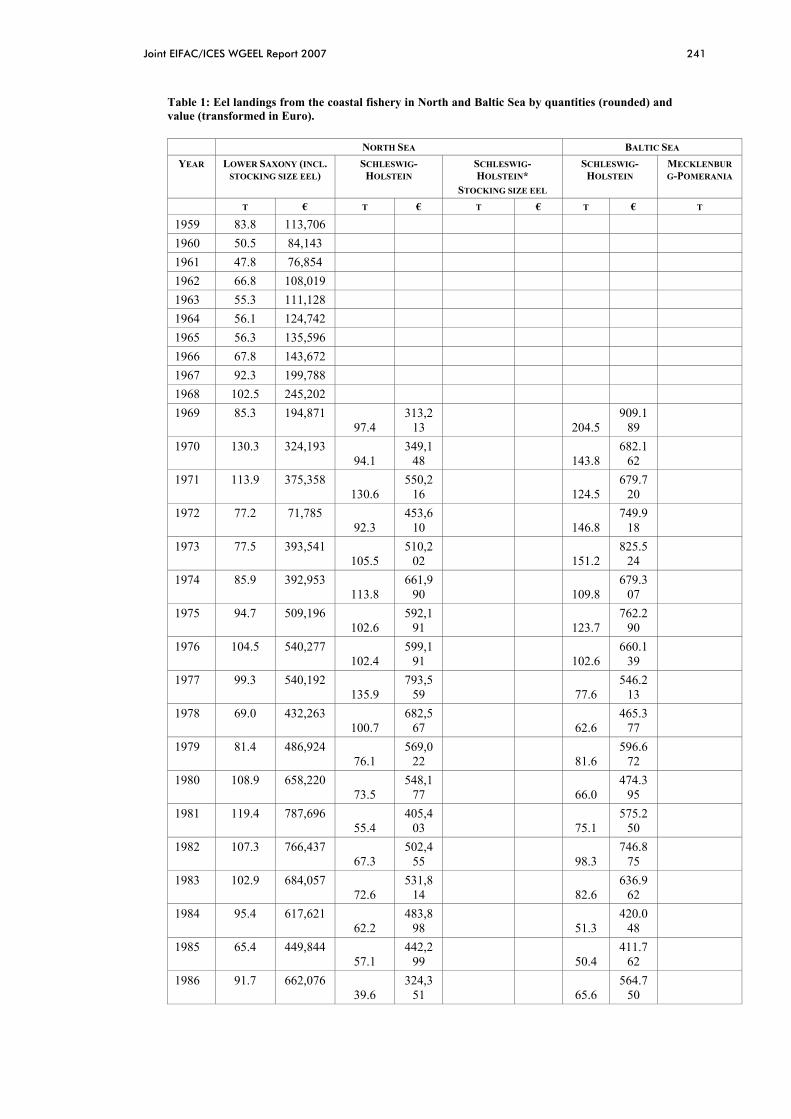
Joint EIFAC/ICES WGEEL Report 2007 241
Table 1: Eel landings from the coastal fishery in North and Baltic Sea by quantities (rounded) and value (transformed in Euro).
NORTH SEA BALTIC SEA YEAR LOWER SAXONY (INCL.
STOCKING SIZE EEL) SCHLESWIG-
HOLSTEIN SCHLESWIG-HOLSTEIN*
STOCKING SIZE EEL
SCHLESWIG-HOLSTEIN
MECKLENBURG-POMERANIA
T € T € T € T € T
1959 83.8 113,706 1960 50.5 84,143 1961 47.8 76,854 1962 66.8 108,019 1963 55.3 111,128 1964 56.1 124,742 1965 56.3 135,596 1966 67.8 143,672 1967 92.3 199,788 1968 102.5 245,202 1969 85.3 194,871
97.4 313,2
13
204.5 909.1
89
1970 130.3 324,193 94.1
349,148
143.8
682.162
1971 113.9 375,358 130.6
550,216
124.5
679.720
1972 77.2 71,785 92.3
453,610
146.8
749.918
1973 77.5 393,541 105.5
510,202
151.2
825.524
1974 85.9 392,953 113.8
661,990
109.8
679.307
1975 94.7 509,196 102.6
592,191
123.7
762.290
1976 104.5 540,277 102.4
599,191
102.6
660.139
1977 99.3 540,192 135.9
793,559
77.6
546.213
1978 69.0 432,263 100.7
682,567
62.6
465.377
1979 81.4 486,924 76.1
569,022
81.6
596.672
1980 108.9 658,220 73.5
548,177
66.0
474.395
1981 119.4 787,696 55.4
405,403
75.1
575.250
1982 107.3 766,437 67.3
502,455
98.3
746.875
1983 102.9 684,057 72.6
531,814
82.6
636.962
1984 95.4 617,621 62.2
483,898
51.3
420.048
1985 65.4 449,844 57.1
442,299
50.4
411.762
1986 91.7 662,076 39.6
324,351
65.6
564.750

242 Joint EIFAC/ICES WGEEL Report 2007
NORTH SEA BALTIC SEA YEAR LOWER SAXONY (INCL.
STOCKING SIZE EEL) SCHLESWIG-
HOLSTEIN SCHLESWIG-HOLSTEIN*
STOCKING SIZE EEL
SCHLESWIG-HOLSTEIN
MECKLENBURG-POMERANIA
T € T € T € T € T
1987 69.0 485,298 21.0
171,292
57.1
478.490
1988 45.6 349,384 42.2
363,694
70.1
590.345
1989 29.3 220,463 31.4
265,244
86.9
751.143
1990 35.9 283,640 14.7
125,732
82.4
741.405
1991 24.5 202,558 11.8
94,525
83.5
773.621
1992 25.7 223,031 6.1
57,957
78.7
701.902
1993 30.1 227,157 12.8
115,980 1.9 9,690 66.5
624.781
1994 64.5 492,489 13.3
68,891 10.4
44,146 63.7
567.412
1995 42.5 322,316 7.7
60,244 3.6
18,496 60.2
542.434
1996 15.7 135,320 6.3
43,984 3.5
17,850 27.7
267.152
1997 30.0 238,911 12.0
84,278 3.7
22,452 44.5
417.479
1998 13.8 114,715 8.5
62,714 3.7
22,289 19.1
186.149
1999 19.9 161,782 10.5
75,144 6.1
33,233 27.0
254.386
2000 16.3 141,990 5.7
39,266 5.0
27,756 30.1
284.963
2001 21.1 186,200 4.7
37,764 4.7
26,266 28.6
278.228
108
2002 35.3 292,198 4.4
38,850 4.0
21,547 28.0
218.217
98
2003 29.8 233,986 4.8
36,067 3.4
19,548 27.4
251.862
93
2004 31.7 246,038 5.4
39,745 4.1 17.3
136.337
94
2005 22.2 198,872 5.0
38,400 17.0
130,560
86
2006 19.1 165,340 4.1
29,247 21.1
141.178
* Catches of stocking size eel result exclusively from the rivers Elbe and Eider (North Sea).
DE.E.2 Inland fishery
Due to the federal structure of Germany, catches are not reported separately for RBDs but for states (Bundesländer).
A clear decrease in the yellow and silver eel catches (not distinguished) was observed during the last 10 years (Table 2). However, there has been no further decline since 2003. In 2006, the most important states with regard to eel fisheries were Brandenburg (963.0 t) and Mecklenburg-Pomerania (51.0 t).

Joint EIFAC/ICES WGEEL Report 2007 243
In the Schleswig-Holstein part of the river Elbe RBD, commercial fishermen reported eel catches of about 2.9 kg/ha for lakes (former catches about 3.2 kg/ha) and 3.7 kg/ha for the channels (S. Spratte, pers. comm.).
Table 2: Development of eel catches from the inland fishery in the last 10 years. Data represent the sum of catches from Bavaria, Berlin, Brandenburg, Mecklenburg-Pomerania, Saxony-Anhalt and Thuringia.
YEAR EEL CATCHES (T)
1995 369.3 1996 300.2 1997 280.7 1998 251.9 1999 261.0 2000 276.4 2001 239.3 2002 236.9 2003 170.9 2004 168.6 2005 174,4 2006 185,6
DE.E.3 Aquaculture
In Germany, the eel is the most important species for aquaculture in recirculation systems. With a total production of 567 t in 2006, an increase of 72% was achieved compared to 2005 (Table 3). There are no other aquaculture techniques used for production of eel.
Table 3: Production of eel in recirculation systems.
YEAR PRODUCTION (T)
1995 186 1996 204 1997 221 1998 appr. 260 1999 appr. 400 2000 422 2001 347 2002 381 2003 372 2004 328 2005 329 2006 567

244 Joint EIFAC/ICES WGEEL Report 2007
DE.E.4 Recreational fisheries
In 2006, about 9100 angling clubs with 954 000 members existed in Germany (Brämick 2005). The total number of valid fishing licenses1 was 1 502 183. Consequently, the number of anglers is assumed to be approximately 1.5 million.
A study revealed that 6.4% of anglers most frequently took eel home (Arlinghaus, 2004).
Even though some associations and clubs ask their members for catch reports, there exists no general catch statistics from recreational fisheries. Consequently, the order of magnitude of angler catches is not well known. However, by considering the high number of anglers, it is likely that angler catches of eel contribute considerably to total eel mortality in the fresh waters. E. g., an estimate from Lower-Saxony suggests that angler catches (appr. 68 t/year) were nearly twice as high as the catches of the commercial fishery (approximately 36 t/year).
During the process of data collection for the eel management plans, the data basis has improved for some regions and it can be expected that this process will continue. E.g. in Schleswig-Holstein, fisheries managers already have to prepare management plans for their waters including data on catches and stocking. In the course of preparing the draft eel management for the river Elbe, the following data were obtained for waters of the Elbe catchment in Schleswig-Holstein:
• Mean annual catch of eel per member of angling club: 0.53 kg • Mean annual catch of eel per “active” angler: 1.09 kg
At a number of about 30 000 anglers in this area, the total eel catch was estimated to 15 t (S. Spratte, pers. comm.).
DE.E.5 Restocking
Restocking of eel is very common in German waters, but as there is no central database for eel stocking, no representative data are available. Earlier data on restocking, in particular from the area of the former GDR and later from the state Brandenburg, have been presented in former reports of the wgeel (e.g. 2003-R. Knösche).
Some data exist for certain regions or waters and may describe the situation at least roughly (Data from S. Spratte, pers. comm.). In the Schleswig-Holstein part of the Elbe River basin district, running waters managed by anglers have been stocked with about 75 glass eel equivalents per ha (mean value for this type of waters) during the last years. In lakes in the same area managed by anglers, the stocking density was between 0.08 kg farmed eels per ha and 1.2 kg “Satzaal” (wild caught eels of ca. 30g per individual) per hectare.
Lakes managed by commercial fishermen received about 1.2 kg satzaal per ha (about 210 glass eel equivalents). From the same area, stocking densities in the middles of the 1990s were about 75–150 glass eel equivalents. There was usually no re-stocking at the bigger channels (Elbe-Lübeck-Kanal, Kiel channel).
In 2005, approximately 400 000 bootlace eel equivalents were stocked by commercial fishermen in the river Havel (Brämick et al., 2006). This results in a mean stocking density of about 13 bootlace eels per hectare for this important tributary of the river Elbe.
1 The fishing license itself does not allow to fish. It is possible to get the license after passing an examination (basic knowledge on fish biology, angling techniques as well as conservation or animal welfare issues). The fishing license is needed to get the fishing permit at the respective waters.

Joint EIFAC/ICES WGEEL Report 2007 245
At present, there is a big project running at the Elbe system (Spawner stock enhancement in the river Elbe, financial support by FIAF) which includes a huge re-stocking programme. Data and results of the scientific investigations included in this programme will become available during the next years.
DE.F Catch per unit of effort
Data on catch per unit effort are not reported. There is only one long-term series on (silver) eel catches available from a stow net fishery at Gorleben at the river Elbe. During the last years, the cpue data were rather constant and the mean value of the years 2002–2005 were only slightly lower than the mean value of the period 1966–1980 (Figure 3).
Figure 3: Long-term cpue data on eel catches of a stow net fishery at the river Elbe at Gorleben (data provided by the fisherman, Mr. Köthke).
DE.G Scientific surveys of the stock
DE.G.1 Recruitment
Monitoring of glass eel recruitment in Germany has been reported by Kuhlmann and Hahlbeck (2002). Glas eel fishing had been performed at the Herbrum station (53°02’N 7°20’E) and is published elsewhere (e.g. Moriarty & Dekker, 1997). Due to heavy water works on the River Ems with the consequence of strong currents which did not exist before this station is no longer in operation. In the meantime research on immigration and upstream migration of young eels on some locations in Mecklenburg-Pomerania and in Brandenburg was initiated.
For a quantitative monitoring of immigrating elvers, eel ladders were installed at four locations, two of them in tributaries to the rivers Elbe and Oder, respectively. The distance of the two locations in the river Elbe from the North Sea coast was 255 km (Löcknitz eel ladder) and 311 km (Havel eel ladder and and fyke net), respectively, while the locations in the river Oder were somewhat closer to the Baltic coast (Welse eel ladder 77 km, Finow fyke net 109 km). At all of these spots, upstream migration of elvers is interrupted by dams.
With 45 156 eels, the vast majority of eels were recorded in tributaries of the river Elbe, while only 82 upstream migrating eels were caught in tributaries of the river Oder (Table 4). Monitoring by fyke net had to be stopped at the Havel for 52 days within two periods at the end of May and the first half of July due to high water levels and malfunction of the fyke net. The same applies for the eel ladder at the same station, which was out of function in the first half of June and from the beginning of August onwards. When using the percentage catch per day at the Löcknitz eel ladder as a scale for these periods, the amount of elver migrating into the river Havel as the main tributary to the river Elbe can be estimated with about 70 000 in

246 Joint EIFAC/ICES WGEEL Report 2007
2005. In relation to the upstream area of the river Havel system, this amounts theoretically to an average of 2 elvers per hectare (Brämick et al., 2006).
Table 4: Number of elvers registered at four monitoring locations in tributaries of the rivers Elbe and Oder between April and November 2005 (Brämick et al., 2006).
RIVER TRIBUTARY MONITORING LOCATION
GEAR NUMBER OF ELVERS REGISTERED
Elbe Havel Fyke net 44169 Elbe Havel Eel ladder 95 Elbe Löcknitz Eel ladder 987 Oder Finow Eel ladder 0 Oder Finow Fyke net 79 Oder Welse Eel ladder 3 Total 45334
Results are also available from some rivers in Mecklenburg-Pomerania. The data indicate that the numbers of glass eels arriving are very low if compared to former data and that the numbers did not significantly differ during recent years (Lemcke, 2003, Schaarschmidt, 2005, Schaarschmidt et al., 2007; Table 5).
Compared to data from former periods, the recruitment into the Mecklenburg-Pomeranian waters is on a very low level. At the Müritz-Elde-Wasserstraße, the recent catches are about 1.5% compared to the 1950s. Similarly, at the Warnow system, the catches are 2% of the catches in the 1950s and only about 0.08% of the 1930s. At the Wallensteingraben, the recent data represent 1.9% of the catches in the 1950s.

Joint EIFAC/ICES WGEEL Report 2007 247
Table 5. Comparison of standardised catches of upstream migrating eels 2001–2006 in several rivers in Mecklenburg-Pomerania (number of eels per fishing gear between May and October; Schaarschmidt et al., unpubl. report).
CATCHMENT RIVER STATION DISTANCE TO COAST GEAR/RELATION 2001 2002 2003 2004 2005 2006
Baltic Sea Warnow Bützow 53 km per eel ladder 37 230 73 56 76 40 Hellbach Mühle 7 km per eel ladder not
sampled 25 33 not
sampled not
sampled not
sampled Wallensteingraben Wismar
(Mühlenteich) 2 km per eel ladder not
sampled not
sampled not
sampled 173 153 123
Mühlengrube Wismar (Ziegenmarkt)
0.1 km per eel ladder not sampled
not sampled
not sampled
not sampled
not sampled
---
Uecker Torgelow (Wehr) 52 km (Oder estuary) or
83 km (Peene estuary)
per eel ladder not sampled
70 33 --- --- 53
Peezer Bach Straßenbrücke 1.8 km per eel collector
not sampled
not sampled
not sampled
not sampled
not sampled
---
Plastbach (or Farpener Bach)
Alt Farpen (Stausee/Speicher)
per eel collector
not sampled
not sampled
not sampled
not sampled
not sampled
2.9
Recknitz Bad Sülze (Fischpass)
28 km per eel collector
not sampled
not sampled
not sampled
not sampled
not sampled
---
North Sea Müritz-Elde-Wasserstraße
Dömitz (Fischpass) 224 km per fyke net not sampled
5934 2365 3145 2861 3124
per eel collector
not sampled
not sampled
not sampled
not sampled
not sampled
9
Dove Elbe Dömitz (Wehr) 224 km per eel ladder not sampled
not sampled
1981 676 721 1035
per eel collector
not sampled
not sampled
not sampled
not sampled
not sampled
11

248 Joint EIFAC/ICES WGEEL Report 2007
DE.G.2 Yellow eel
There are no yellow eel surveys in German marine coastal waters.
In the course of a project at the river Elbe, data on the yellow eel stock in Elbe and some tributaries will become available in the next years. In waters in the Bundesland Brandenburg, there are also studies running on growth and mortality rates of stocked eels which had been marked before stocking. These studies are expected to improve the knowledge basis for management decisions in the next years.
DE.G.3 Silver eel
Generally, there are no long-term data on silver eel stocks and escapement available.
Studies on silver eel escapement have also been started at the rivers Elbe (and the tributary Havel) and Warnow. Data will become available in the next years.
Rhine Silver Eel project-progress briefing
The German states North Rhine-Westphalia and Rhineland-Palatinate, and the Netherlands started a Rhine Silver Eel project in 2004 in order to:
• quantify the female part of the whole downstream migrating Rhine silver eel population independently from fisheries,
• determine the relevance of the different migration routes of these female migrants in the Lower Rhine, the mortalities during downstream migration and the escapement to the sea.
Over 3000 female silver eels > 50 cm were marked and released in Cologne (300–350 km from the sea, depending on the migration route) in both 2004 and 2005. And more than 4000 and 6000 silver eels respectively were checked for marks in the different Rhine branches close to the sea. Only 6 and 5 marked eels were recaptured in these two years. Estimates of the population size of the downstream migrating female (> 50 cm) Rhine silver eel population were made in 2004 and 2005. The numbers of marked eels and the corresponding estimates of the population size were corrected for non-migrants (see below). The corrected population sizes were at most 1.2 million and 1.9 million in number respectively, with corresponding biomasses of 600 and 1000 tons.
The routes of downstream migration of 150 silver eels in 2004 and 157 in 2005 were tracked by telemetry (active transponders) from the point of release in Cologne through the three main branches of the Rhine (Waal, Nederrijn + Lek, IJssel + Lake IJsselmeer) and up to the sea.
Downstream migration up to the sea took from less than 2 days to more than one year and generally occurred in October and November of the year of release. A substantial number of the tracked eels in 2004 (38%) and in 2005 (47%) did not appear to migrate up to or further than Xanten, close to the German/Dutch border.
Most of the escapees released in Cologne seemed to find their way to the sea via the Nieuwe Waterweg (57 in the years combined) and not via Lake IJsselmeer (1 in total) or via the Haringvliet (0 in total). The 2004 cohort released in Cologne showed an escapement to the sea of 23% by January 2006 (37% of those eels that passed Xanten). Corresponding data for the 2005 cohort were 15% and 28% respectively.
The fisheries independent telemetry data from this study seem to indicate much higher mortalities in the Rhine silver eel run in The Netherlands than can be calculated from the catch statistics and the mark-recapture estimate of the population size. The telemetry data suggest that the Nederrijn + Lek watercourse, the only location where hydropower stations have been built in the lower Rhine system, might be important for downstream migration of eels only in

Joint EIFAC/ICES WGEEL Report 2007 249
the years with higher discharges. This suggests that management measures should concentrate on the Waal and downstream sections in order to improve the spawning escapement of the German part of the silver eel population of the Rhine system.
The project was continued in 2006, but data for publication from this year are not available yet. The continuation in 2007 is questionable because of lacking funds in The Netherlands. A scientific paper on the project has been accepted for publication in the ICES Journal of Marine Science.
Klein Breteler, J., Vriese, T., Borcherding, J., Breukelaar, A., Jörgensen, L., Staas, J., de Laak, G., and Ingendahl, D. 2007. Assessment of population size and migration routes of silver eel in the River Rhine based on a two-year combined mark-recapture and telemetry study. -ICES Journal of Marine Science, 64: 000–000.
DE.H Catch composition by age and length
There is no information available on composition of commercial catches by age and length.
Germany has not sampled the landings/catches of eel. Due to the Data Collection Regulation which relates only to marine landings/stocks a country need not to sample a stock when the average of landings of the last 3 years is less than 100 t for a stock not under TAC regulation as it is for eel. For each division 4b, 3c and 3d, from where landings have been recorded the averages over the last 3 years were below 100.
DE.I Other biological sampling
DE.I.1 Length, weight & growth (DCR)
Recently, some data on age and growth have been published from waters in Mecklenburg-Pomerania (Simon, 2007). The ageing of the fish was done by otoliths.
Table 6: Results of determination of age and growth of eels from waters in Mecklenburg-Pomerania (Simon, 2007).
CATCHMENT WATER BODY N AGE GROUPS ANNUAL INDIVIDUAL GROWTH PER YEAR ACCORDING LENGTH BACK CALCULATION
(CM)
Min Mean Max North Sea Müritz-Nationalpark 17 4 to 13 2.3 4.8 8.2
Bodstedter Bodden 8 5 to 10 2.6 5.9 10.6 Grabower Bodden 10 5 to 12 2.8 6.0 10.5 Greifswalder Bodden 21 4+ to 6+ 1.4 5.6 8.7 Salzhaff 18 5 to 8 2.8 5.8 10.4
Baltic Sea/Inner coastal waters
Wieker Bodden 10 5 to 9 3.8 6.2 11.0 Adlergrund 8 4+ to 9+ 1.3 6.0 9.5 Arkonasee / Arkonabecken
11 3+ to 12+ 1.4 6.0 11.6
Außenstrand Thiessow
9 4+ to 8+ 1.4 5.5 8.6
Außenstrand Usedom
10 6 to 10 2.9 5.2 9.5
Künstliches Riff 18 4+ to 9+ 1.0 5.4 9.5
Baltic Sea/Outer coastal waters
Ostmole Warnemünde
8 6+ to 8+ 2.7 5.4 8.0

250 Joint EIFAC/ICES WGEEL Report 2007
DE.I.2 Parasites
A monitoring for Anguillicola crassus has been established at the rivers Elbe and Weser and Ems, which are all important rivers for eel. For this monitoring, commercial fisherman collect eel swim bladders from commercial catches on a weekly basis. As a consequence, no data on length or weight of the fish are available.
Table 7: Monitoring of infection of eels from the Rivers Weser, Elbe and Ems with Anguillicola crassus.
RIVER YEAR N PREVALENCE (%) ABUNDANCE INFECTION INTENSITY
Weser 2000 982 88.1 7.6 8.7 2001 969 85.4 5.7 6.6 2002 916 87.9 5.3 6.0 2003 957 81.5 4.1 5.1 2006 980 90.7 5.5 6.1 Elbe 2000 373 83.4 5.3 6.3 2001 135 88.9 4.7 5.3 2002 259 87.7 5.7 6.5 2003 275 86.2 4.3 4.9 2006 358 89.1 4.4 4.9 Ems 2000 384 73.7 4.5 6.1 2002 240 69.2 3.0 4.3
At Lake Starnberger See, 1022 eels were examined between 1994 and 2005 (Leuner, 2006). The mean prevalence was 80%, and the prevalence appears to decrease slightly (from 88% in 1994 to 71% in 2005).
Lehmann et al. (2005a) reported infection with A. crassus from several rivers in North Rhine-Westfalia: Lippe 52.1%, Ruhr 58.6%, Ems 51.0%, Rhine 62.0%, Sieg 58.1%, Issel 72.7%, Vechte 46.7%, Große Aue 75.0% and Weser 74.8%.
An investigation on 469 eels from several lakes and rivers in the Bundesland Brandenburg revealed a prevalence of 66.7% (Knösche et al., 2004).
DE.I.3 Contaminants
Concentrations of pollutants/contaminants in the musculature of eels from the river Elbe have been measured by the Elbe River Water Quality Board (ARGE ELBE) in 1999 and 2000 (e. g. ARGE ELBE 2000). Along the entire German length of the Elbe, contaminant levels were measured in excess of the maximum allowable levels. This was particularly evident for HCB (hexachlorobenzene) content. Occasionally, maximum levels were also exceeded for other contaminants, e.g. DDT. It is not possible to present the data here, but a selection of data on heavy metals, pesticides and PCB’s have been provided to C. Belpaire and C. Geeraerts in preparation of the working group meeting. The reports from the Elbe River Water Quality Board are available at www.arge-elbe.de.
DE.I.4 Predators
Mortality of eel due to predation by cormorants was estimated by Brämick & Fladung (2006) for lakes and rivers in Brandenburg. According to the study, 109 t eel (1.4 kg/ha) were annually preyed upon by cormorants.
DE.I.5 Diseases
Investigations on the health status of eels have been conducted at the river Rhine in Northrine-Westfalia (see special part RBD Rhine). In several samples from the Rivers Rhine and

Joint EIFAC/ICES WGEEL Report 2007 251
Moselle and from a lake in North Rhine-Westfalia, the occurrence of Herpesvirus anguillae (HVA) was reported by Lehmann et al. (2005a, b). A massive eel kill in one lake in summer 2004 was mainly attributed to an HVA infection. Infections with HVA have also been reported from 38 waters out of 80 waters investigated in Bavaria (Scheinert & Baath, 2004).
Health status of stocked juvenile eels in Northrhine-Westfalia, Germany: preliminary results
Due to a regression of natural immigration from the downstream part of the Rhine (delta) stocking of juvenile eel started more than 20 years ago. In the beginning the stocking was performed mainly with glass eel. But due to the increase of prices stocking with juveniles from aquaculture (farmed eels with mean weight about 10 g and mean length of 20 cm) became more and more common. Stocking in this area is predominantly performed by angling associations or the holders of the fishing rights. An inventory about life stage, numbers and origine of stocked material is lacking.
Since 2005 tagging of farmed eels was started with coded wire tags before stocking them into the River Rhine and one of its tributary. This was an opportunity to control eels with regard to parasites and viruses (especially HVA). From a study on silver eels in a tributary of the River Rhine, HVA was detected in an adult eel and its presence was confirmed in another eel collected in a lake with an unexplained eel mortality (Lehmann et al. 2005). Therefore the presence of HVA was confirmed in eels from Northrhine-Westfalian waters.
In the year 2005 four groups of juvenile eels were sampled for analysing the health status. Eels from all four groups revealed to be HVA positive (pooled samples). The presence of the EVEX/EVE viruses was confirmed only for one sample. The infection of the stocking material with Anguillicola crassus ranged from 23% to 40% for three of the four batches. Only one batch was not contaminated with regard to Anguillicola crassus.
In 2006 we extended the sampling of juveniles to four batches received for tagging and subsequent stocking. The analysis of 25 individuals of each batch showed a positive PCR reaction in 12 to 33% of the tested individuals. Anguillicola crassus was found in 0 up to 40 % (mean value 12%). Other parasites identified in two of the four batches were Trichodina, Flagellates and Pseudodactylogyrus. Another two samples screened in 2006 from other eel batches arriving for stocking activities in northrhine-westfalian waters showed even higher presence of HVA 30 to 45% (but in pooled samples). But no Anguillicola crassus infection was found in eels from these two batches.
In 2007 the analysis of juvenile, farmed eels from two batches used for stocking showed a positive reaction of HVA in 50 and 70% of the individuals, respectively (15 and 10 eels screened). The presence of Angullicola crassus was not detected. But the presence of Pseudodactylogyrus, Trichodina and Trypanosoma granulosum was confirmed for some individuals.
In order to compare the quality of farmed eel to glass eel as an alternative life stage for stocking, we received glass eel from France (sampled by Cemagref and a commercial glass eel trader) and the Netherlands (sampled by Imares). The French glass eel were sampled or held in fresh water for a short time whereas the sample from the Netherlands was collected in salt water (Den Oever). Until now more than 150 individuals have been analysed by the PCR-method. All glass eel were negative except one individual from the freshwater sampling in France where the presence of HVA cannot completely ruled out. No glass eel showed an infection with Anguillicola crassus.
Discussion of the preliminary results
The quality and health status of farmed eels was analysed with regard to the presence of parasites (especially Anguillicola crassus) and viruses (especially Herpesvirus anguilla). In the

252 Joint EIFAC/ICES WGEEL Report 2007
first two years (2005 and 2006) Anguillicola crassus was regularly detected in farmed eels (up to 40% of the individuals). In 2007 the parasite was no longer detected possibly because the commercial eel traders were asked to deliver eel free of parasites by the angling societies. Nevertheless other parasites as Pseudodactylogyrus, Trichodina and Flagellates (Trypanosoma granulsosum) can still be detected in eels destinated for stocking in rivers. No presence of Angullicola crassus was detected in glass eels sampled in France (fresh water) or the Netherlands (salt water origine).
The presence of the Herpesvirus anguillae was regularly detected in batches of farmed eels. The prevalence was HVA was between 12 to 50%. The farmed eels are already used for a long time period for stocking freshwater habitats probably all over Germany. Up until now the commercial eel traders asked about an alternative for providing HVA free farmed eels stated that this is not possible as the HVA is present to a certain level in nearly all eel farms they get eel from for stocking purposes.
A survey about the presence of HVA in 80 rivers or lakes of Bavaria showed HVA positive eels in nearly 50% of the sampled waters (Scheinert and Baath, 2006). These authors stated that eel mortalities observed during the hot summer 2003 could be related to the interaction of high water temperatures (above 20oC) and the presence of HVA in eel populations. They stated that HVA positive juveniles should not be released into natural waters (where HVA is not detected) and concluded that the control of the health status of juvenile eels used for stocking should be a prerequisite of an effective eel management.
By this investigation it seems to be confirmed that glass eel arriving at the European coast or just entering freshwater should be free of HVA and parasites such as Anguillicola crassus. In the beginning of eel stocking glass eels were most predominantly used for that purpose. The cultivation of glass eel in eel farms before using them for stocking seems to significantly increase the risk of contamination with viruses and parasites. Unless there is no effective health control taking place for individuals used for stocking it was recommended for northrhine-westfalian waters to use glass eel for stocking.
Acknowledgements
We thank P. Lambert (Cemagref) and W. Dekker (Imares) for providing samples of glass eel for this investigation.
DE.J Other sampling
DE.K Stock assessment
There is no regular stock assessment. Some studies have started on parameters of certain life stages (e.g. recruitment/immigration, silver eel escapement, mortality rates). Some of these results have been presented in other sections, and some results will become available in the course of the studies.
DE.L Sampling intensity and precision
There is no consistent sampling design applied in Germany.

Joint EIFAC/ICES WGEEL Report 2007 253
DE.M Standardisation and harmonisation of methodology
DE.M1 Survey techniques
DE.M.2 Sampling commercial catches
DE.M.3 Sampling
DE.M.4 Age analysis
DE.M.5 Life stages
DE.M.6 Sex determinations
DE.N Overview, conclusions and recommendations
The eel is an important species for the German fisheries sector, especially inland and coastal fishery. However, the importance of this sector itself is rather small.
After a clear decrease during the last decades, due to enormous efforts spent on re-stocking, the catches of eel by the German fisheries now appear to be on a rather stable (but lower) level.
The data basis is still relatively small but in the last years, several projects and studies have been started, which will improve the availability of data on important population parameters in the future.
In Germany, the relevant authorities and institutions started to prepare the eel management plans according to the EU Council Regulation on eel management. This will also lead to an improved data basis.
DE.O Literature references
ARGE ELBE (2000): Schadstoffe in Elbefischen. Belastung und Vermarktungsfähigkeit. 103 pp.
Arlinghaus, R. (2004): Angelfischerei in Deutschland – eine soziale und ökonomische Analyse. Berichte des IGB 18: 160 pp.
Brämick, U. (2005): Binnenfischerei 2004. In: Bundesministerium für Ernährung, Landwirtschaft und Verbraucherschutz (ed.): Jahresbericht über die deutsche Fischwirtschaft. DCM Verlag, Meckenheim: 49–80.
Brämick, U. (in prep.): Binnenfischerei 2006. In: Bundesministerium für Ernährung, Landwirtschaft und Verbraucherschutz (ed.): Jahresbericht über die deutsche Fischwirtschaft.
Brämick, U. & Fladung, E. (2006): Quantifizierung der Auswirkungen des Kormorans auf die Seen- und Flussfischerei Brandenburgs am Beispiel des Aals. Fischer & Teichwirt 57(1): 8–11.
Brämick, U., Simon, J. & Fladung, E. (2006): Monitoring of eel stocks in North-East Germany. (CD-ROM, CM 2006/J:08). ICES Annual Science Conference, Maastricht, The Netherlands.
Knösche, R., Schreckenbach, K., Simon, J., Eichhorn, T., Pietrock, M. & Thürmer, C. (2004): Aalwirtschaft in Brandenburg. Entwicklung der Aalbestände, Schadfaktoren und nachhaltige Aalwirtschaft. Schriften des Instituts für Binnenfischerei e. V. Potsdam-Sacrow 15: 75 pp.
Kuhlmann, H., Hahlbeck, E. and Dekker, W. (2002): Monitoring of glass eel recruitment in Germany. In: Dekker, W. (ed.): Monitoring of glass eel recruitment. Netherlands Institute

254 Joint EIFAC/ICES WGEEL Report 2007
of Fisheries Research, Ijmuiden, The Netherlands, Report C007/02-WD, Vol. 2A: 135–150.
Lehmann, J. Stürenberg, F.-J., Kullmann, Y. & Kilwinski, J. (2005a): Umwelt- und Krankheitsbelastungen der Aale in Nordrhein-Westfalen. LÖBF-Mitteilungen 2: 35–40.
Lehmann, J., Stürenberg, F.-J., Mock, D. & Feldhaus, A. (2005b): Untersuchungen auf virale Infektionen bei Aalen in Nordrhein-Westfalen. Fischer & Teichwirt 6: 205–206.
Lemcke, R. (2003): Etablierung eines langfristigen Glas- und Jungaalmonitorings in Mecklenburg-Vorpommern und erste Egebnisse. Fischerei & Fischmarkt in Mecklenburg-Vorpommern 1/2003: 14–23.
Leuner, E. (2006): Untersuchungen zum Befall von Aalen mit dem Schwimmblasenwurm (Anguillicola crassus) im Starnberger See. Fischer & Teichwirt 12: 450–452.
Ministerium für ländliche Räume, Landesplanung, Landwirtschaft und Tourismus des Landes Schleswig-Holstein (Hrsg.) (2001): Generalplan Küstenschutz - integriertes Küstenschutzmanagement in Schleswig-Holstein. Kiel: 76 pp.
Moriarty, C. & Dekker, W. (1997): Management of the European eel. Fisheries Bulletin No. 15, (Dublin).
Schaarschmidt, T. (2005): Erfassung des Aufkommens von Glas- und Jungaalen in ausgewählten Fließgewässern im Einzugsgebiet von Nord- und Ostsee in Mecklenburg-Vorpommern – Ergebnisbericht 2005. Landesforschungsanstalt für Landwirtschaft und Fischerei Mecklenburg-Vorpommern, Institut für Fischerei, Rostock: 8 pp.
Schaarschmidt, T., Lemcke, R., Krenkel, L. & Schulz, S. (2007): Erfassung des Aufkommens von Glas- und Jungaalen in ausgewählten Fließgewässern im Einzugsgebiet von Nord- und Ostsee in Mecklenburg-Vorpommern. Unpublished report. Landesforschungsanstalt für Landwirtschaft und Fischerei Mecklenburg Vorpommern, Institut für Fischerei: 33 p.
Scheinert, P. & Baath, C. (2006): Untersuchungen zum Vorkommen des Herpesvirus anguillae (HVA) in den Aalpopulationen bayerischer Gewässer. Fischer & Teichwirt 8: 289–293.
Simon, J. (2007): Erste Ergebnisse der Altersbestimmung von Aalen (Anguilla anguilla) aus Mecklenburg-Vorpommern. Fischmarkt and Fischerei in Mecklenburg-Vorpommern 2:29–35.

Joint EIFAC/ICES WGEEL Report 2007 255
Denmark: Report on the eel stock and f ishery in Denmark 2007
DK.A. Author
Michael Ingemann Pedersen,
Danish Institute for Fisheries Research, DTU
Department of Inland Fisheries
Vejlsoevej 39DK-8600 Silkeborg,
Tlf. +45 89 213128; Fax. +45 89 213150
This report was completed in January 2007, and contains data up to 2007.
DK.B. Eel and eel fisheries
The eel is present all along the 7500 km Danish coast line, except on the open North Sea coast in Jutland. In inland waters eels may be found naturally or stocked in ponds, lakes and streams. The fishery is concentrated in the southern and eastern parts of Denmark here the silver eel is exploited during the spawning migration from the Baltic towards the North Sea. These fisheries catch the migrating eel by pound nets out to the 10+ meter depth line. Throughout the country, in shallow Fjords, Bays, Lagoons and Inland waters, a combined yellow and silver eel fishery takes place. Most of the catch ca. 97% is reported from saline areas suggesting that catches in freshwater are smaller and more fragmented recreational fisheries.
Current management of the eel stock aims to secure local yield and by a set of general and local rules regarding minimum legal size, mesh size etc. The freshwater legislation ensures free movement of local stock by enforcing eel passes at migration barriers. No licences are given explicit to eel fishing but professional fisherman has a licence to fish. Catch data are reported to the directorate of fisheries by the trade and processing companies. Three different groups exploit the eel. These are: 1) Professional fisherman with a licence; either fulltime or part time fishermen. 2) Recreational fishermen with a licence and 3) land owners without a licence. Only catches from the professional fishermen are known. In this report, where possible, data are separated in River Basin Districts.

256 Joint EIFAC/ICES WGEEL Report 2007
Figure DK. B. River Basin Districts in Denmark defined by the Water Framework Directive.
DK.C. Fishing capacity
The available figure of capacity is the number of boats that have landed eel. At present about 500 boats (Table DK. C) are operating in marine areas. The number of professional fishermen in inland waters is very limited less than 5 boats are registered.
Table DK C. No of fishing boats that have landed eel in fresh and salt water. (Source: Directorate of fisheries).
YEAR NO OF EEL FISHING BOATS
MARINE FRESH
2001 604 - 2002 590 - 2003 578 5 2004 562 3 2005 503 3 2006 507 4
DK.D. Fishing effort
The Pound net fishery is concentrated in the southern and eastern parts of Denmark (BRD 2). The number and position of pound nets are in some areas known but again in others no exact figure is available. The number of pound nets registered in year 2004 was 2124, however this figure is probably not all active gear (Lasse Aufeldt, pers. comm.) a more realistic figure is <1000 pound net. The number of larger fyke net (Pole fyke net) used by recreational fishermen is shown in Table DK.E. Eels are also caught by long lines and bottom trawl but no record is available.
In freshwater landowners/stakeholders have an ancient privilege to operate eel traps fixed at the outlet of a lake or mill pond. Currently there are 87 of these eel traps.
DK.E. Catches and landings
DK. E.1 Catch of glass eel
Catch of glass eel in Denmark took place between 1971 and 1990 at Vidaa and Ballum sluices in the Wadden Sea. There has been no glass eel fishery since 1990.

Joint EIFAC/ICES WGEEL Report 2007 257
DK.E. 2 Restocking
Restocking has taken place for many decades, by landowners in inland waters where recruitment of young eel, was limited or absent, because of distance to the ocean or migration barriers. From mid 1960s to the end of the 1980s a number of licenses were given to sell young eels for restocking. These eels were captured at pass traps and glass eels at the sluices in the Wadden Sea. This is now forbidden due to the low recruitment. Since 1988 a restocking program has been financed by the Danish government and the eel fishermen. From 1994 the restocking program has been financed solely by the recreational license fee. The eels stocked today are imported, as glass eels mostly from France. They are grown to a weight of 2–5 gram in heated culture before they are stocked. The amount stocked has been decreasing during the last years because the price for stocked eel increased dramatically in the same period. Figure DK.E.2.
Eelstocking 1987 - 2007
0123456789
87 89 91 93 95 97 99 01 03 05 07
Stoc
ked
eel (
x m
illio
n)
StreamsLakesBrackish
0
0,5
1
1,5
2
2,5
3
3,5
Cost
of 2
-5 g
elv
er, D
kr
1993 1995 1997 1999 2001 2003 2005 2007
Restocking cost
Figure and Table DK.E.2. Restocking of elvers (2-5g) in marine and fresh waters from 1987–2007. Numbers stocked in (millions) and cost per stocked eel.
YEAR MARINE LAKE RIVER TOTAL YEAR MARINE LAKE RIVER TOTAL
1987 0.07 0.26 1.26 1.58 1998 2.35 0.53 0.1 2.98 1988 0.11 0.24 0.4 0.75 1999 3.38 0.56 0.18 4.12 1989 0 0.24 0.17 0.42 2000 3.02 0.55 0.25 3.83 1990 2.46 0.49 0.51 3.47 2001 1.2 0.38 0.12 1.7 1991 2.3 0.44 0.32 3.06 2002 1.66 0.47 0.3 2.43 1992 2.94 0.81 0.11 3.86 2003 1.54 0.49 0.22 2.24 1993 2.97 0.76 0.23 3.96 2004 0.52 0.18 0.06 0.75 1994 6.12 0.61 0.67 7.4 2005 0.24 0.06 0 0.3 1995 6.83 0.72 0.9 8.44 2006 1.15 0.35 0.1 1.6 1996 3.58 0.58 0.44 4.6 2007 0.59 0.21 0.02 0.83 1997 2.02 0.29 0.22 2.53
DK.E.3. Catch of yellow and silver eel in marine and salt water
Marine catches
The annual catch of yellow and silver eels during the last decade have been fairly constant (table DK. E). There is a trend that relatively more silver than yellow are being captured, suggesting yellow eels are less exploited now a days.
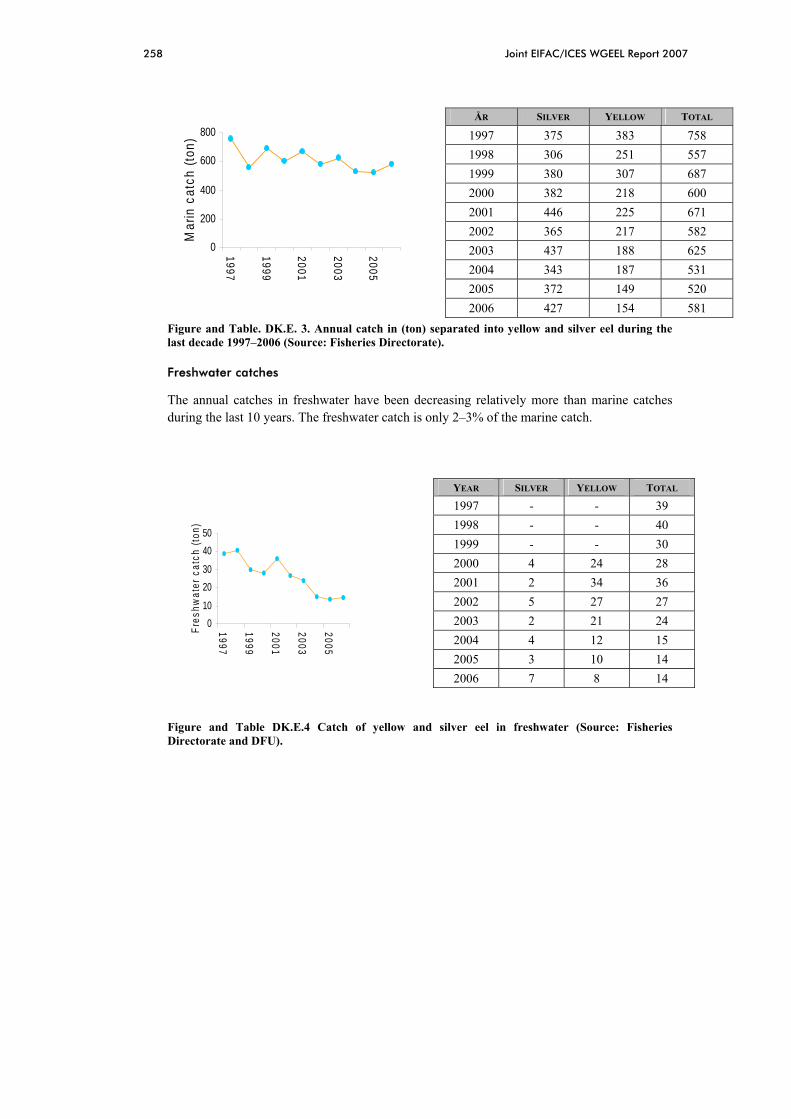
258 Joint EIFAC/ICES WGEEL Report 2007
0
200
400
600
800
1997
1999
2001
2003
2005
Mar
in c
atch
(ton
)
Figure and Table. DK.E. 3. Annual catch in (ton) separated into yellow and silver eel during the last decade 1997–2006 (Source: Fisheries Directorate).
Freshwater catches
The annual catches in freshwater have been decreasing relatively more than marine catches during the last 10 years. The freshwater catch is only 2–3% of the marine catch.
010
2030
4050
1997
1999
2001
2003
2005
Fres
hwat
er c
atch
(ton
)
Figure and Table DK.E.4 Catch of yellow and silver eel in freshwater (Source: Fisheries Directorate and DFU).
ÅR SILVER YELLOW TOTAL
1997 375 383 758 1998 306 251 557 1999 380 307 687 2000 382 218 600 2001 446 225 671 2002 365 217 582 2003 437 188 625 2004 343 187 531 2005 372 149 520 2006 427 154 581
YEAR SILVER YELLOW TOTAL
1997 - - 39 1998 - - 40 1999 - - 30 2000 4 24 28 2001 2 34 36 2002 5 27 27 2003 2 21 24 2004 4 12 15 2005 3 10 14 2006 7 8 14

Joint EIFAC/ICES WGEEL Report 2007 259
DK.E.4. Aquaculture
Aquaculture production in Denmark started in 1984. The production takes place at indoor, heated aquaculture systems. Annual production is ca. 2000 ton.
Table. DK.E.4. Aquaculture production (1984–2007) (source: C. Graver).
YEAR PRODUCTION UNITS
PRODUCTION [TON]
YEAR PRODUCTION UNITS
PRODUCTION [TON]
1984 ?? 18 1996 28 1568 1985 30 40 1997 30 1913 1986 30 200 1998 28 2483 1987 30 240 1999 27 2718 1988 32 195 2000 25 2674 1989 40 430 2001 17 2000 1990 47 586 2002 16 1880 1991 43 866 2003 13 2050 1992 41 748 2004 9 1500 1993 35 782 2005 9 1700 1994 30 1034 2006 9 1900 1995 29 1324 2007 9 ~2100
DK.E.5. Recreational fishermen
The number of licences sold to recreational fishermen was 33 615 in 2005 and has been quite stable for the last seven years (www.fd.dk). The recreational fishermen are not allowed to sell their catch and the catch is not recorded. The number of gear allowed to fish with, is one large fyke (Pole fyke) and five small summer fykes! A questionnaire among the recreational fishermen in 1997 showed that 56% of all recreational fishermen catch eels. Based on the information given in the questionnaire it was estimated that in 1997 they caught 200 tonnes, equivalent to 26% of the official catch. Assuming this relation to total landing hold, each licence landed 7 kg (50–70 eel) in 2004 equivalent to a recreational catch of 138 tonnes.
Table DK.E.5. Estimated no. of recreational eel fishermen, estimated catch, and number of gear registered in the directorate of fisheries in the year 2004.
RIVER BASIN DISTRICT
RECREATIONAL EEL FISHERMEN, ESTIMATED, NO
CATCH, KG
POLE-FYKE (PÆLERUSE)
1 11,181 82,249 448 2 7,260 53,406 264 3 327 2,406 0 4 - - -
Total 18,768 138,060 712
DK.F. Catch per unit of effort in commercial landings
There are no official cpue-data available. The only records available are from the fishermen. These records are available because the fishermen count the number of eels caught by each pound net. There has been no attempt to collect cpue data from the fishermen. Below is data from one fisherman (N.E. Jensen) who has been fishing on the same spot and same depth for many years in Fakse Bugt (Øresund, RDB no. 2). These data show that cpue has been increasing during the last two decades. We speculate if this may be interpreted as a result of

260 Joint EIFAC/ICES WGEEL Report 2007
decreasing nr of poundnets on the migration route and thus fewer eels caught (decrease in fishing mortality) on the way out of the Baltic and in the Danish Sound.
CPUE
0500
10001500200025003000350040004500
1970 1975 1980 1985 1990 1995 2000 2005
No
of e
els
per p
ound
net
A
B
C
D
Figure. DK.F. Annual catches (in number) of silver eels per pound net (A.D) in Faxe Bugt, RDB 2 (550,10’;120 8’). All the eels are females with an average weight per eel of ca. 800 gram (N.E. Jensen, pers.comm.) Fishing depth of pound net A and C = 5,3 meter; B and D = 8 meter.
DK.G. Scientific surveys of the stock
DK.G.1 Recruitment surveys of glass eel and ascending yellow eel
The recruitment of young eels to Danish freshwater is currently monitored in pass traps at Harte hydropower stations in river Kolding Å and at Tange hydropower station in river Guden Å. Both rivers empty into Kattegat on the east coast of Jutland. On the west coast of Jutland no passive trapping facilities are available. Here the recruitment is monitored by annual population surveys (electro fishing four sections 2–4 times a year) in a brook by the Wadden Sea. The method used is sampling by during the year VesterVedsted brook). Further details in Pedersen (2002).

Joint EIFAC/ICES WGEEL Report 2007 261
Table DK.G: Rercruitment monitoring of young eel at pass traps and electrofishing.
YEAR TANGE
HARTE
VESTER VEDSTED BROOK DENSITY EEL/M2
YEAR TANGE HARTE VESTER VEDSTED BROOK DENSITY EEL/M2
KG KG MEAN MAX (SEASON) KG KG MEAN MAX (SEASON)
1967 500 1988 252 253 - - 1968 200 1989 354 145 - - 1969 175 1990 367 101 - - 1970 235 1991 434 44 - - 1971 59 1992 53 40 - - 1973 117 1993 93 26 - - 1974 212 1994 312 35 - - 1975 325 1995 83 23 2,6 2,6 1976 91 1996 56 6 4,6 6,8 1977 386 1997 390 9 0,7 1 1978 334 1998 29 18 0,3 0,4 1979 291 2,8 6,5 1999 346 15 0,4 0,5 1980 93 522 7 13 2000 88 18 0,6 0,7 1981 187 279 7,8 13 2001 239 11 0,6 0,8 1982 257 239 - - 2002 278 17 0,5 0,6 1983 146 164 - - 2003 260 9 0,6 0,7 1984 84 172 - - 2004 246 9 0,3 0,4 1985 315 446 - - 2005 88 7 0,5 0,5 1986 676 260 - - 2006 123 7 0,3 0,7 1987 145 105 - - 2007 62 ~7 - -
DK.G.2 Stock surveys, yellow eel
All Danish streams are electrofished every 7th year in BRD (1, 2, 3, 4) to determine trout stocks and the need for restocking trout. During this evaluation all fish species are recorded and the number of eels observed during the survey is included in the final report. The information on eel is semi quantitative or just qualitative. These data are probably of little value!
DK.G.3 Silver eel
In the small Roskilde Fjord (BRD 2) a catch and recapture survey with tagged silver eel has taken place during autumn 1998, 2001–2004. The silver eels are tagged with Carlin tags and released in the inner parts of the fjord. On reported recapture, a fee per tag is given to the fisherman. The F-values are minimum values but reflecting a high level of fishery mortality on silver eels in this area.
Table DK.G.3 Catch- recapture experiment with Carlin tagged silver eel during 1998, 2001–2004.
DATE OF RELEASE STAGE TAGGED NO
RECAPTURED NO
F %
30.09.1998 Silver 500 189 37,8 09.08.2001 Half silver 300 25 8,3 07.10.2002 Silver 400 68 17,0 19.09.2003 Silver 500 159 31,8 20.09.2004 Silver 500 135 27,0

262 Joint EIFAC/ICES WGEEL Report 2007
DK.H. Catch composition by age and length
Only a few sporadic datasets of old age are available. A countrywide survey of catch composition by age and length will take place in fall 2007.
DK.I Parasites
Anguillicola
The swim bladder worm Anguillicola crassus introduced to Europe from the far east in the beginning of the 1980s was discovered in Danish wild eels in 1986. Since 1988 a monitoring program on the abundance of the anguillicola, in the eel population in different fresh and brackish water bodies has been continued annually. Data from 2006 in the Table DK.I.1.

Joint EIFAC/ICES WGEEL Report 2007 263
Table DK.I.1 Analyses of anguillicola 2006.
LOCATION PPT COORDINATES YEAR TOTAL INFECTED PREVALENCE INTENSITY ABUNDANCE
N n % Mean Stdv Max Arresø 0 55,59N;11,57E 2006 107 61 57,0 3,4 3,1 14 2,3 Isefjord 18 55,50N:11,50E 2006 101 30 29,7 3,1 3,1 11 0,9
Ringk. Fj 5–10 55,55N:08,20E 2006 60 38 63,3 6,3 5,2 24 4,0
DK.J Contaminants
There are few surveys and mostly of older date. Recent data for PFAS and organotin-compounds in the aquatic environment extracted from report by Strand et al. (2007) and unpublished data from Århus Amt (2003) see Apendix. A.
DK.K Predators
Cormorants
The number of Cormorants is estimated throughout the country every year by the Ministry of Environment. Cormorant’s predation on flatfish, trout, salmon (smolt) and eels have been studied using various tagging methods e.g. floy tags, coded wire tags and radio tags in Ringkøbing Fjord (BRD 1; 55,55’N:08,20’E). In a study og cormorant predation eel 10 163 eels (10 gram) were coded wire tagged and released in Ringkøbing Fjord in 2003. In the same year 5734 regurgitate were analysed and 21 coded wire tags were found. It was estimated that 43% of the tagged eels were eaten by the cormorants. Hoewever the frequency of occurrence in 2005 was only 0,12 (Sonnesen, 2007) suggesting that eels are not important as feed in Rinkøbing Fjord. Recent work from Hirsholmene (57,29’N;10.37’E) a cormorant colony in Kattegat suggested that of 350 regurgitate eel otoholiths occurred with a frequency of 0,3% (Poul Hald, 2007).
DK.L Summery of the report
The fishing capacity in terms of boats landing eel have been reduced from ca 600 boats to approximately 500 boats during the last five years. No exact data for the current effort are available but the effort in terms of pound nets in use has without been markedly reduced. The marine fishermen claim that cpue have not changed negatively over several years and an example of increase in cpue is provided. During the last 10 years the total catches in the marine areas have been fairly constant ca. 500–600 ton. In freshwater reported catch has decreased from ca. 40 ton to ca. 15 ton during the last 10 years. Restocking costs have increased by 100% over the last four years and therefore enhancement by restocking has been reduced equally. Eel production in aquaculture is ca. 2000 tons of eel per year. Recruitment surveys of glass eel and ascending yellow eel indicate a continuously low recruitment.

264 Joint EIFAC/ICES WGEEL Report 2007
DK.M Literature references
Hald P. (2007). Skarvernes Fødevalg ved Hirsholmene i årene 2001–2003. (In press).
Pedersen MI (2002). Monitoring of glass eel recruitment in Denmark. In: Dekker W. (ed).
Monitoring of glass eel recruitment. Netherlands Institute of Fisheries Research IJmuiden, the Netherlands, report C007/02-WD,Volume 2A, pp, 97–106.
Sonnesen P. (2007). Skarvens prædation omkring Ringkøbing Fjord-en undersøgelse af sammenhænge mellem fødevalg og fiskebestandenes sammensætning. Pp 76 and appendices.
Strand, J., Bossi, R., Sortkjær, O., Landkildehus, F. & Larsen, M.M. (2007). PFAS og organotinforbindelser i punktkilder og det akvatiske miljø NOVANA screeningsundersøgelse. DMU rapport nr. 608 (http://www2.dmu.dk/Pub/FR608.pdf).
Erichsen et al., 2000. Miljøfremmede stoffer i sediment, vandløbsvand, fisk og jord. Miljø og Teknologi/Vand og Landskab 14: 7–16.
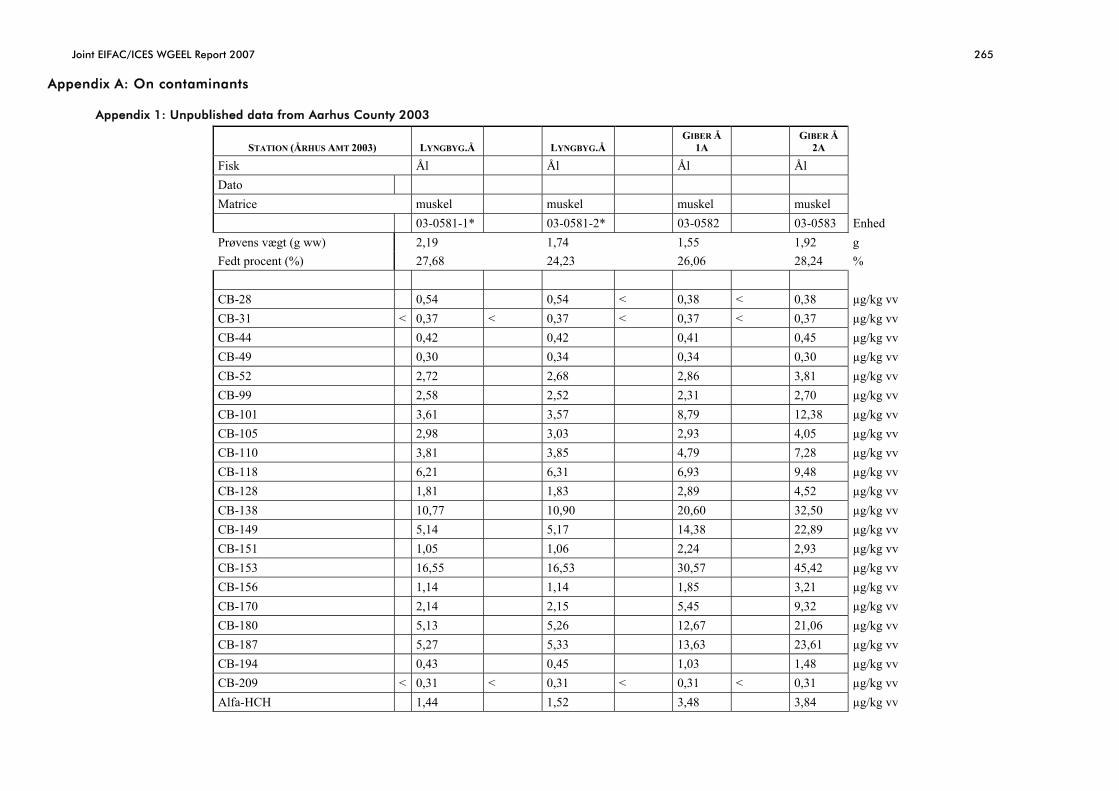
Joint EIFAC/ICES WGEEL Report 2007 265
Appendix A: On contaminants
Appendix 1: Unpublished data from Aarhus County 2003
STATION (ÅRHUS AMT 2003) LYNGBYG.Å LYNGBYG.Å GIBER Å
1A GIBER Å
2A
Fisk Ål Ål Ål Ål Dato Matrice muskel muskel muskel muskel 03-0581-1* 03-0581-2* 03-0582 03-0583 Enhed Prøvens vægt (g ww) 2,19 1,74 1,55 1,92 g Fedt procent (%) 27,68 24,23 26,06 28,24 % CB-28 0,54 0,54 < 0,38 < 0,38 µg/kg vv CB-31 < 0,37 < 0,37 < 0,37 < 0,37 µg/kg vv CB-44 0,42 0,42 0,41 0,45 µg/kg vv CB-49 0,30 0,34 0,34 0,30 µg/kg vv CB-52 2,72 2,68 2,86 3,81 µg/kg vv CB-99 2,58 2,52 2,31 2,70 µg/kg vv CB-101 3,61 3,57 8,79 12,38 µg/kg vv CB-105 2,98 3,03 2,93 4,05 µg/kg vv CB-110 3,81 3,85 4,79 7,28 µg/kg vv CB-118 6,21 6,31 6,93 9,48 µg/kg vv CB-128 1,81 1,83 2,89 4,52 µg/kg vv CB-138 10,77 10,90 20,60 32,50 µg/kg vv CB-149 5,14 5,17 14,38 22,89 µg/kg vv CB-151 1,05 1,06 2,24 2,93 µg/kg vv CB-153 16,55 16,53 30,57 45,42 µg/kg vv CB-156 1,14 1,14 1,85 3,21 µg/kg vv CB-170 2,14 2,15 5,45 9,32 µg/kg vv CB-180 5,13 5,26 12,67 21,06 µg/kg vv CB-187 5,27 5,33 13,63 23,61 µg/kg vv CB-194 0,43 0,45 1,03 1,48 µg/kg vv CB-209 < 0,31 < 0,31 < 0,31 < 0,31 µg/kg vv Alfa-HCH 1,44 1,52 3,48 3,84 µg/kg vv

266 Joint EIFAC/ICES WGEEL Report 2007
STATION (ÅRHUS AMT 2003) LYNGBYG.Å LYNGBYG.Å GIBER Å
1A GIBER Å
2A
beta-HCH 0,41 0,73 0,89 0,70 µg/kg vv gamma-HCH 1,63 1,60 2,64 2,52 µg/kg vv HCB 13,38 13,70 33,22 69,30 µg/kg vv o'p-DDE 0,86 0,87 0,77 0,91 µg/kg vv o'p-DDT 0,73 0,67 4,38 3,38 µg/kg vv p'p'-DDD 7,04 6,82 11,64 10,25 µg/kg vv p'p-DDE 33,40 34,69 49,76 42,84 µg/kg vv p'p-DDT 9,09 9,11 16,95 21,62 µg/kg vv TNC 2,83 2,83 2,00 1,96 µg/kg vv Recovery CB-40 (%) 96,0 95,8 97,3 96,2 % Brommerede flammehæmmere PBDE-17 0,09 0,16 < 0,08 0,08 µg/kg vv PBDE-28 0,14 0,38 0,19 0,20 µg/kg vv PBDE-49 0,28 0,29 0,19 0,23 µg/kg vv PBDE-47 6,48 6,83 3,57 4,04 µg/kg vv PBDE-66 0,10 0,11 < 0,08 0,11 µg/kg vv PBDE-100 2,13 1,86 1,53 2,27 µg/kg vv PBDE-99 0,71 0,59 0,37 0,40 µg/kg vv PBDE-85 < 0,06 < 0,07 < 0,08 < 0,06 µg/kg vv PBDE-154 0,26 0,17 0,14 0,23 µg/kg vv PBDE-153 0,38 0,28 0,22 0,36 µg/kg vv PBDE-183 < 0,29 < 0,36 < 0,40 < 0,32 µg/kg vv Recovery PBDE (%) 106 97 107 97 µg/kg vv

Joint EIFAC/ICES WGEEL Report 2007 267
Appendix 2.
Analyses from Brabrand sø in 1998 mussel tissue on eel pool of 6 individuals. Erichsen et al. (2000).
sum PCB 0.33 mg/kg tørstof sum DDT/DDE/DDD 0.1 mg/kg tørstof sum PAH 0.59 mg/kg tørstof
Figure 0.1 PFAS concentration in eel (ål) and flatfish (fladfisk) in freshwater (ferskvand) and marine (marint) waters. Samlet oversigt over antal af b) median- og maksimumkoncentrationer af PFAS i lever fra fisk fra marine og ferskvandsrecipienter. For flere detaljer se også Bilag 6.
Figure 0.2 PFAS concentration wet veight (vådvægt) in eel (ål) and flatfish (fladfisk) in freshwater (ferskvand) and marine (marint) waters from fish liver. Koncentrationsniveauer af tributyltin (TBT), dibutyltin (DBT), monbutyltin (MBT) og triphenyltin (TPhT) i lever fra fisk indsamlet i ferskvand og marine områder i Danmark. Se også Bilag 9.

268 Joint EIFAC/ICES WGEEL Report 2007
Appendix 3 Data for PFAS in freshwater
LAB-ID Fisk, lever (µg/kg vådvægt) PFHxS PFOS PFOSA PFOA PFNA PFDA PFUnA 04-0700 Odense Å v. Åsum, ål <0,8 54,5 <0,5 8,9 2,4 6,9 3,9 04-0679 Skjern Å, ål <0,8 51,6 <0,5 3,6 2,7 7,9 9,4 04-0680 Silkeborg Havn, ål <0,8 51,1 <0,5 2,1 <1,4 1,9 <0,7 04-0683 Silkeborg Langsø, ål <0,8 70,1 <0,5 <1,2 <1,4 <0,8 <0,7 04-0682 Ørnsø, ål <0,8 31,7 <0,5 2,9 <1,4 <0,8 <0,7 04-0681 Almind Sø, ål <0,8 42,3 <0,5 2,1 <1,4 3,3 5,1 04-0684 Guden Sø, ål <0,8 13,7 <0,5 <1,2 <1,4 <0,8 <0,7 04-0314 Randers Fjord, ål 1,4 39,5 <0,5 6,5 <1,4 2,5 1,8 04-0315 Køge Bugt, ål 1,2 13,1 <0,5 4,5 <1,4 2,4 1,7 04-0316 Ringkøbing Fjord, ål 1,6 26,5 <0,5 24,5 3,6 2,8 3,1 04-0467 Odense Fjord, Seden Strand, ål <0,8 54,3 <0,5 9,8 2,3 3,1 2,1 04-0816 Agersø, ål <0,8 26,8 <0,5 4,0 1,7 2,0 2,5 04-0632 Øresund, Nivå Bugt, skrubbe <0,8 9,5 <0,5 1,9 <1,4 <0,8 1,2 04-0633 Storebælt, Agersø, skrubbe <0,8 25,4 <0,5 3,3 2,0 <0,8 <0,7 04-0634 Skagerrak, Hirtshals, rødspætte <0,8 156,0 2,3 <1,2 <1,4 <0,8 <0,7 LAB-ID Sediment, ferskvand (µg/kg tørstof) PFHxS PFOS PFOSA PFOA PFNA PFDA PFUnA 04-0623 Guden Sø (TS: 33.6% , GT:25.0%) <0,7 <1,0 <0,9 <0,4 <0,7 <1,0 <1,7 04-0624 Ørn Sø (TS: 24,7% , GT: 18,3%) <0,7 <1,0 <0,9 <0,4 <0,7 <1,0 <1,7 04-0625 Silkeborg Langsø (TS:27,7%, GT:28,7%) <0,7 <1,0 <0,9 <0,4 <0,7 <1,0 <1,7 04-0626 Almind Sø (TS: 28,2% , GT: 25,5%) <0,7 <1,0 <0,9 <0,4 <0,7 <1,0 <1,7 04-0678 Silkeborg Havn (TS: 63,8% , GT: 3,0%) <0,7 <1,0 <0,9 <0,4 <0,7 <1,0 <1,7 04-0698 Odense Å (TS: 14.7% , GT: 24,4%) <0,7 <1,0 <0,9 <0,4 <0,7 <1,0 <1,7 04-0699 Skjern Å (TS: 61,1% , GT: 3,4%) <0,7 <1,0 <0,9 <0,4 <0,7 <1,0 <1,7 04-0284 Tryggevælde Å (TS: 20,1% , GT: 15,0%) <0,7 <1,0 <0,9 <0,4 <0,7 <1,0 <1,7 LAB-ID Muslinger, marint (µg/kg vådvægt) PFHxS PFOS PFOSA PFOA PFNA PFDA PFUnA 04-0317 Odense Fjord <0,8 <0,2 <0,5 <1,2 <1,4 <0,8 <0,7 04-0320 Nivå Bugt, Øresund <0,8 <0,2 <0,5 <1,2 <1,4 <0,8 <0,7 04-0323 Agersø, Storebælt <0,8 <0,2 <0,5 <1,2 <1,4 <0,8 <0,7 04-0332 Køge Bugt, <0,8 <0,2 <0,5 <1,2 <1,4 <0,8 <0,7 04-0335 Randers Fjord <0,8 <0,2 <0,5 <1,2 <1,4 <0,8 <0,7 04-0346 Ringkøbing Fjord <0,8 <0,2 <0,5 <1,2 <1,4 <0,8 <0,7 04-0407 Anholt, Kattegat <0,8 <0,2 <0,5 <1,2 <1,4 <0,8 <0,7 04-0658 Bornholm, Østersø <0,8 <0,2 <0,5 <1,2 <1,4 <0,8 <0,7 04-0671 Lønstrup, Skagerrak <0,8 <0,2 <0,5 <1,2 <1,4 <0,8 <0,7 LAB-ID Sediment, marint (µg/kg tørstof) PFHxS PFOS PFOSA PFOA PFNA PFDA PFUnA 00-1992 Randers Fjord <0,7 <1,0 <0,9 <0,4 <0,7 <1,0 <1,7 00-2006 Ringkøbing Fjord <0,7 <1,0 <0,9 <0,4 <0,7 <1,0 <1,7 00-2063 Odense Fjord <0,7 <1,0 <0,9 <0,4 <0,7 <1,0 <1,7 04-0179 Anholt, Kattegat <0,7 <1,0 <0,9 <0,4 <0,7 <1,0 <1,7 04-0183 Bornholm, Østersø <0,7 <1,0 <0,9 <0,4 <0,7 <1,0 <1,7 04-0190 Agersø, Storebælt <0,7 <1,0 <0,9 <0,4 <0,7 <1,0 <1,7 04-0203 Nivå Bugt, Øresund <0,7 <1,0 <0,9 <0,4 <0,7 <1,0 <1,7 04-0206 Lønstrup, Skagerrak <0,7 <1,0 <0,9 <0,4 <0,7 <1,0 <1,7 PFHxS: perfluorohexane sulfonate; PFOS: perfluorooctane sulfonate; PFOSA: perfluorooctane sulfonamide; PFOA: perfluorooctanoic acid; PFNA: perfluorononanoic acid; PFDA: perfluorodecanoic acid; PFUnA: perfluoroundecanoic acid, TS: tørstof; GT:glødetab.

Joint EIFAC/ICES WGEEL Report 2007 269
Data for organotin in fish og freshwatersediment
LAB-ID Fisk, lever (µg Sn/kg vådvægt) TBT DBT MBT TPhT DPhT MPhT TOcT DOcT MOcT 04-0700 Odense Å v. Åsum, ål 0,5 0,3 0,4 <0,5 <0,3 <0,2 <0,5 <0,5 <0,3 04-0701 Odense Å v. Borreby, ål 0,3 0,4 0,2 <1 <0,5 <0,2 <1 <0,5 <0,3 04-0679 Skjern Å, ål <0,2 <0,2 <0,2 <0,5 <0,3 <0,2 <0,5 <0,5 <0,3 04-0680 Silkeborg Havn, ål 8,3 8,7 5,1 24 3,2 1,9 <0,5 <0,5 <0,3 04-0683 Silkeborg Langsø, ål 4,7 3,6 1,7 11 2,0 0,6 <0,5 <0,5 <0,3 04-0682 Ørnsø, ål 0,3 0,2 <0,2 1,2 <0,3 <0,2 <0,5 <0,5 <0,3 04-0681 Almind Sø, ål 0,3 0,4 0,3 1,5 0,5 0,3 <0,5 <0,5 <0,3 04-0684 Guden Sø, ål <0,2 <0,2 <0,2 1,4 <0,3 <0,2 <0,5 <0,5 <0,3 04-0284 Tryggevælde Å, ål <0,2 <0,2 <0,2 <0,5 <0,3 <0,2 <0,5 <0,5 <0,3 04-0314 Randers Fjord, ål 5,5 5,6 1,0 <0,5 <0,3 <0,2 <0,5 <0,5 <0,3 04-0315 Køge Bugt, ål 2,8 6,1 1,7 3,4 <0,3 <0,2 <0,5 <0,5 <0,3 04-0316 Ringkøbing Fjord, ål 1,6 1,5 0,4 2,4 <0,3 <0,2 <0,5 <0,5 <0,3 04-0467 Odense Fjord, Seden Strand, ål 8,8 22,1 2,5 2,6 <0,3 <0,2 <0,5 <0,5 <0,3 04-0816 Agersø, ål 5,2 5,2 1,7 3,7 <0,3 <0,2 <0,5 <0,5 <0,3 04-0632 Øresund, Nivå Bugt, skrubbe 1,7 10,1 10,8 8,0 0,9 1,0 <0,5 <0,5 <0,3 04-0633 Storebælt, Agersø, skrubbe 0,9 3,3 0,8 <1 <0,5 <0,2 <1 <0,5 <0,3 04-0634 Skagerrak, Hirtshals, rødspætte 0,8 0,6 <0,5 <1 <0,5 <0,2 <1 <0,5 <0,3 LAB-ID Sediment, ferskvand (µg Sn/kg tørstof) TBT DBT MBT TPhT DPhT MPhT TOcT DOcT MOcT 04-0623 Guden Sø (TS: 33,6% , GT:25,0%) <2 <2 <4 <10 <5 <5 <5 <4 <4 04-0624 Ørnsø (TS: 24,7% , GT: 18,3%) <1 <1 <1 <5 <4 <4 <5 <4 <4 04-0625 Silkeborg Langsø (TS:27,7%, GT:28,7%) 21 13 <3 <5 <4 <4 <5 <4 <4 04-0626 Almind Sø (TS: 28,2% , GT: 25,5%) <2 <5 <4 <10 <5 <5 <5 <5 <4 04-0678 Silkeborg Havn (TS: 63,8% , GT: 3,0%) 6,1 3,4 <2 <1 <1 <1 <1 <1 <1 04-0698 Odense Å(TS: 14,7% , GT: 24,4%) 6,6 10 7,3 <1 <1 <1 <1 <1 <1 04-0699 Skjern Å (TS: 61,1% , GT: 3,4%) <0,5 <0,5 <0,5 <2 <2 <2 <2 <2 <2 04-0284 Tryggevælde Å (TS: 20,1% , GT: 15,0%) <1 <1 <2 <3 <1 <1 <3 <1 <1 TBT: Tributyltin; DBT: Dibutyltin; MBT: Monobutyltin; TPhT: Triphenyltin; DPhT: Diphenyltin; MPhT: monophenyltin; TocT: Trioctyltin; DocT: Dioctyltin; MocT: Monooctyltin; TS: tørstof; GT: glødetab.

270 Joint EIFAC/ICES WGEEL Report 2007
Netherlands: Report on the eel s tock and f ishery in the Netherlands 2007
NL.A Authors
Willem Dekker
IMARES, Institute for Marine Resources & Ecosystem Studies
PO Box 68, 1970 AB IJmuiden, Netherlands
Tel. +31 255 564 646. Fax: +31 255 564 644
Reporting Period: This report was completed in August 2007, and contains data up to 2006 and recruitment data for 2007.
Contributors to the report: Jan Klein Breteler, Vivion, Händelstraat 18, 3533 GK Utrecht, Netherlands. [email protected]
NL. B Introduction
NL.B.1 Status of this report
In 2002 (ICES 2003), the EIFAC/ICES working group on eels recommended that member countries should report annually on trends in their local populations and fisheries to the Working Group. In 2003 (ICES 2004), detailed data reports per country were annexed to the working group report, which have subsequently been updated, refined and restructured to match the set-up of the EU Data Collection Regulation. ICES (2006) is the most recent version. This report on the status of and trend in the eel stock in the Netherlands updates the information presented before. Since the previous report (2006) was compiled early in the year 2006, while this report is compiled in August 2007, this report effectively presents two new data years.
NL.B.2 General overview of fisheries
Eel fisheries in the Netherlands occur in coastal waters, estuaries, larger and smaller lakes, rivers, polders, etc. The total fishery involves just over 200 companies, with an estimated total catch of nearly 1000 tonnes. Management of eel stock and fisheries has been an integral part of the long tradition in manipulating water courses (polder construction, river straightening, ditches and canals, etc.). Governmental control of the fishery is restricted to on the one hand a set of general rules (gear restrictions, size restrictions, for course fish: closed seasons), and on the other hand site-specific licensing. Within the licensed fishing area, and obeying the general rules, fishermen are currently free to execute the fishery in whatever way they want. There is no existing general registration of fishing efforts or landings required. In recent years, licensees in state-owned waters are obliged to participate in so-called Fish Stock Management Committees [‘Visstand Beheer Commissies’ VBC,], in which commercial fisheries, sports fisheries and water managers are represented. The VBC is responsible for the development of a regional Fish Stock Management Plans. The Management Plans are currently not subject to general objectives or quality criteria.
NL.B.3 Spatial subdivision of the territory
The fishing areas can be categorised into five groups (see also Figure NL.1):
1 ) The Waddensea; 53ºN 5ºE; 2591 km2. This is an estuarine-like area, shielded from the North Sea by a series of islands. The inflow of sea water at the western

Joint EIFAC/ICES WGEEL Report 2007 271
side mainly consists of the outflow of the river Rhine, which explains the estuarine character of the Waddensea. The fishery in the Waddensea is permitted to license holders and assigns specific fishing sites to individual licensees. Fishing gears include fyke nets and pound nets; the traditional use of eel pots is in rapid decline. The fishery in the Waddensea is obliged to apply standard EU fishing logbooks. Landings statistics are therefore available from 1995 onwards; 40 tons per year.
2 ) Lake IJsselmeer; 52º40'N 5º25'E; now 1820 km2. Lake IJsselmeer is a shallow, eutrophic freshwater lake, which was reclaimed from the Waddensea in 1932 by a dike (Afsluitdijk), substituting the estuarine area known as the Zuiderzee. The surface of the lake was stepwise reduced by land reclamation, from an original 3470 km2 in 1932, to just 1820 km2 since 1967. In preparation for further land reclamation, a dam was built in 1976, dividing the lake into two compartments of 1200 and 620 km2, respectively, but no further reclamation has actually taken place. In managing the fisheries, the two lake compartments have been treated as a single management unit. The discharge of the river IJssel into the larger compartment (at 52º35'N 5º50'E, average 7 km3 per annum, coming from the River Rhine) is sluiced through the Afsluitdijk into the Waddensea at low tide, by passive fall. Fishing gears include standard and summer fyke nets, eel boxes and long lines; trawling was banned in 1970. Licensed fishermen are not spatially restricted within the lake, but the number of gears is controlled by a gear-tagging system. The registered landings at the auctions are assumed to cover some 80% of the actual total.
3 ) Main rivers; 180 km2 of water surface. The Rivers Rhine and Meuse flow from Germany and Belgium respectively, and constitute a network of dividing and joining river branches in the Netherlands. Traditional eel fisheries in the rivers have declined tremendously during the 20th century, but following water rehabilitation measures in the last decades, is now slowly increasing. The traditional fishery used stow nets for silver eel, but fyke net fisheries for yellow and silver eel now dominates. Individual fishermen are licensed for specific river stretches, where they execute the sole fishing right. No registration of efforts or landings is required.
4 ) Zeeland; 965 km2. In the Southwest, the Rivers Rhine, Meuse and Scheldt (Belgium) discharge into the North Sea in a complicated network of river branches, lagoon-like waters and estuaries. Following a major storm catastrophe in 1953, most of these waters have been (partially) closed off from the North Sea, sometimes turning them into fresh water. Fishing is licensed to individual fishermen, mostly spatially restricted. Fishing gears are dominated by fyke nets. Management is partially based on marine, partly on fresh water legislation.
5 ) Remaining waters; inland 1340 km2. This comprises 636 km2 of lakes (average surface: 12.5 km2); 386 km2 of canals (> 6 m wide, 27 590 km total length); 289 km2 of ditches (< 6 m wide, 144 605 km total length); and 28 km2 of smaller rivers (all estimates based on areas less than 1 m above sea level, 55% of the total surface; see Tien and Dekker 2004 for details). Traditional fisheries are based on fyke netting and hook and line. Individual licenses permit fisheries in spatially restricted areas, usually comprising a few lakes or canal sections, and the joining ditches. Only the spatial limitation is registered. 8 small companies operating scattered along the North Sea coast have been added to this category.
The Water Framework Directive subdivides the Netherlands into 4 separate River Basin District, all of which extend beyond our borders. These are:
a ) the River Ems (Eems), 53º20'N 7º10'E (=river mouth), shared with Germany. This RBD includes the north-eastern Province Groningen, and the eastern part of Province Drente. Drainage area: 18 000 km2, of which 2400 km2 in the Netherlands.
b ) the River Rhine (Rijn), 52º00'N 4º10'E,shared with Germany, Luxemburg, France, Switzerland, Austria, Liechtenstein. Drainage area: 185 000 km2, of which 25 000 km2 in the Netherlands, which is the major part of the country.

272 Joint EIFAC/ICES WGEEL Report 2007
c ) the River Meuse (Maas), 51º55'N 4º00'E,shared with Belgium, Luxemburg, France and Germany. Drainage area: 35 000 km2 , of which 8000 km2 in the Netherlands.
d ) the River Scheldt (Schelde), 51º30'N 3º25'E,shared with Belgium and France. Most of the south-western Province Zeeland use to belong to this RBD, but water reclamation has changed the situation dramatically. Drainage area: 22 000 km2, of which 1860 km2 in the Netherlands.
Within the Netherlands, all rivers tend to intertwine and confluent. Rivers Rhine and Meuse have a complete anastomosis at several places, while a large part of the outflow of the River Meuse is now redirected through former outlets of the River Scheldt. Additionally, the coastal areas in front of the different RBDs constitute a confluent zone. Consequently, sharp boundaries between the RBDs cannot be made - neither on a practical nor on a juridical basis. In the following, we will subdivide the national data on eel stock and fisheries by drainage area on a preliminary basis.
Figure NL.1 Distribution of eel fishery companies in the Netherlands (2005). Home addresses of companies have been grouped in a 10*10 km grid. Within each grid cell, individuals are listed in artificially created rows. Symbols indicate the fishing areas: Waddensea; IJsselmeer; Rivers; Zeeland; Others.

Joint EIFAC/ICES WGEEL Report 2007 273
Table NL.a Overview of water surface, number of commercial companies and their annual landings (2004), by fishing area. Estimates in Italics have been broken down by RBD, assuming that catches are proportional to the number of fishing companies.
SURFACE NUMBER OF ESTIMATED LANDINGS (T) DATA SOURCE
Area RBD (km2) companies yellow eel silver eel Waddensea Rhine 2591 25 37 - EU logbooks Ems 38 2 3 - EU logbooks IJsselmeer Rhine 1820 85† 240 40 Auction statistics Rivers Rhine 120 21 46 91 Informed guess Meuse 60 2 4 9 Informed guess Zeeland Meuse 535 43 75 ? (EU logbooks) Scheldt 428 0 0 Others Rhine 900 56 222 133 Informed guess Ems 86 2? 9 5 Informed guess Meuse 288 1? 4 2 Informed guess Scheldt 67 0 Sum 6528 237 640 280 † 85 licenses, owned by 68 companies.
NL.C Fishing capacity
Table NL.a lists the number of fishing companies having a specific eel fishing license, by fishing area. Most licenses are linked to a specific ship. For marine waters and Lake IJsselmeer, a register of ships is kept, but for the other waters, no central registration takes place. Registration of the number of gears owned or employed is lacking. For Lake IJsselmeer, a maximum number of gears per company is enforced (authenticated tags are attached to individual gears), but the actual usage is often much lower, amongst others since restrictions apply on the combinations of types of fishing gears (e.g. no fyke nets and gill nets should be operated concurrently, since perch and pikeperch are the target species of the gill netting, while landing perch and pikeperch from fyke nets is prohibited).
NL.D Fishing effort
For most of the country, fishing capacity is unknown. In areas where fishing capacity is known, no record is kept of the actual usage of fishing gears. Consequently, no information is available on fishing effort. For Lake IJsselmeer, an estimate of the number of gears actually used is available for the years 1970–1988 (Dekker 1991). In the mid 1980s, the number of fyke nets was capped, and reduced by 40% in 1989. In 1992, the number of eel boxes was counted, and capped. Subsequently, the caps have been lowered further in several steps, the latest being a nuy-out in 2006. Since the number of companies has reduced at the same time, the nominal fishing effort per company has not reduced at the same rate, and underutilisation of the nominal effort probably still exists. The effort in the longline fishery is not restricted, other than by the number of licenses.

274 Joint EIFAC/ICES WGEEL Report 2007
2006: buy-out
1985: cap on fykenets
1989
: red
uctio
n fy
kene
ts
1992: cap eel boxes
-
10,000
20,000
30,000
40,000
50,000
60,000
1970 1980 1990 2000 2010
year
Num
ber o
f gea
rs
Large fykenetsTrain fykenetssum fykenetseelboxes
Figure NL.2 Trends in the nominal number of fishing gear employed in the eel fishery on Lake IJsselmeer. Information before 1989 is based on a voluntary inquiry in 1989 (Dekker, 1991); after 1992, the licensed number of gear is shown. The reduction in-between is realistic.
NL.E Catches and landings; restocking; aquaculture
NL.E.1 Catches and landings, commercial fisheries
Catches and landings in marine waters are registered in EU logbooks, but these do not allow for a break down by RBD. The estimates listed in Table NL.a are calculated on the assumption that landings must be approximately proportional to the number of companies per RBD. Other fishing companies, fishing for shrimps or flatfish, will have a by-catch of eel. Their landings will have been included in the marine total.
For Lake IJsselmeer, statistics from the auctions around Lake IJsselmeer are kept by the Fish Board (Table NL.b). These statistics are broken down by species, month, harbour and main fishing gear; the quality of this information has deteriorated considerably over the past decade, due to misclassification of catches, and the trading of eel from other areas at the IJsselmeer auctions.
Table NL.b Landings in tons per year, from the auctions around Lake IJsselmeer, Rhine RBD. Only landings recorded at the auctions are included; other landings are assumed to represent a minor and constant fraction.
YEAR 1900 1910 1920 1930 1940 1950 1960 1970 1980 1990 2000
0 324 620 1157 838 3205 4152 2999 1112 641 472 368
1 387 988 989 941 4563 3661 2460 853 701 573 381
2 514 720 900 1048 3464 3979 1443 857 820 548 353
3 564 679 742 2125 1021 3107 1618 823 914 293 279
4 586 921 846 2688 1845 2085 2068 841 681 330 245
5 415 1285 965 1907 2668 1651 2309 1000 666 354 234
6 406 973 879 2405 3492 1817 2339 1172 729 301 230
7 526 1280 763 3595 4502 2510 2484 783 512 285
8 453 1111 877 2588 4750 2677 2222 719 437 323 9 516 1026 1033 2108 3873 3412 2241 510 525 332

Joint EIFAC/ICES WGEEL Report 2007 275
NL.E.2 Catches and landings, recreational fisheries
Recreational catches of eel are not systematically recorded, and the order of magnitude is not well known. Inquiries related to angler licensing (NIPO 2004) indicate that 350 000 out of 913 000 male anglers fish for eels (in 2003); 57 500 of them take eels back home, in an average annual quantity of 18 specimens, approx. 1 kg per capita per annum. The number of female anglers is much lower, but not exactly reported. The total quantity taken home by anglers thus equals 57 tons at minimum. The 1 kg per capita per annum applied to the catch-and-return anglers results in an estimate of 350 tons, while the same quantity applied to all male anglers yields 913 tons. Recent information from an ongoing research project using more up-to-date inquiries and inside-information, indicates an intermediate order of magnitude of approximately 670 tons. Results of this project will be reported by the end of 2007.
No information is currently available on the location of angling, that is: on the break down by RBD. However, it seems reasonable to assume that angling activity is more or less proportional to the drainage area of the RBD; RBD Ems has the lowest human population density, and is therefore probably overestimated. Table NL.e provides this rough estimate of the recreational catches per RBD, for the three assumptions on their overall impact.
Table NL.e Rough estimate of the catch of recreational fisheries per RBD, based on three distinct assumptions on the overall impact of recreational fisheries.
Country RBD drai
nage
are
a km
2
Estim
ate
base
d on
913,
000
mal
e an
gler
sea
ch ta
king
1 k
g pe
r ann
um
Estim
ate
base
d on
350,
000
men
fish
ing
for e
elea
ch ta
king
1 k
g pe
r ann
um
Estim
ate
base
d on
57,5
00 m
en ta
king
eel
hom
eea
ch ta
king
1 k
g pe
r ann
um
NL Ems 2,400 59 23 4Rhine 25,000 613 235 39Meuse 8,000 196 75 12Scheldt 1,860 46 17 3
NL sum 37,260 913 350 57.5
NL.E.3 Restocking
Glass eel and young yellow eel are used for re-stocking inland waters since time immemorial, mostly by local action of stakeholders. Although a minimum legal size for capture, holding and transport of eels is set in a byelaw, the existing practice of short-range transports has never been prosecuted. Since World War II, the Organisation for the Improvement of Inland Fisheries OVB has organized a re-stocking programme, importing glass eels from France and England, and buying yellow eel from commercial fishermen fishing in the Waddensea. Data on re-stocking quantities are listed in table NL.c. Average weight of the young yellow eel amounts to approx. 33 grammes.
In recent years, the OVB has merged with the major anglers organisation, and subsequently handed over the glass eel importing to the Organisation of Professional Fishermen CvB. Information on recent glass eel imports was made available by the CvB. Restocking of young eel is no longer organised centrally, although trade of small eels (undersized?) still occurs. No information on the quantities of young eels being restocked could be obtained.
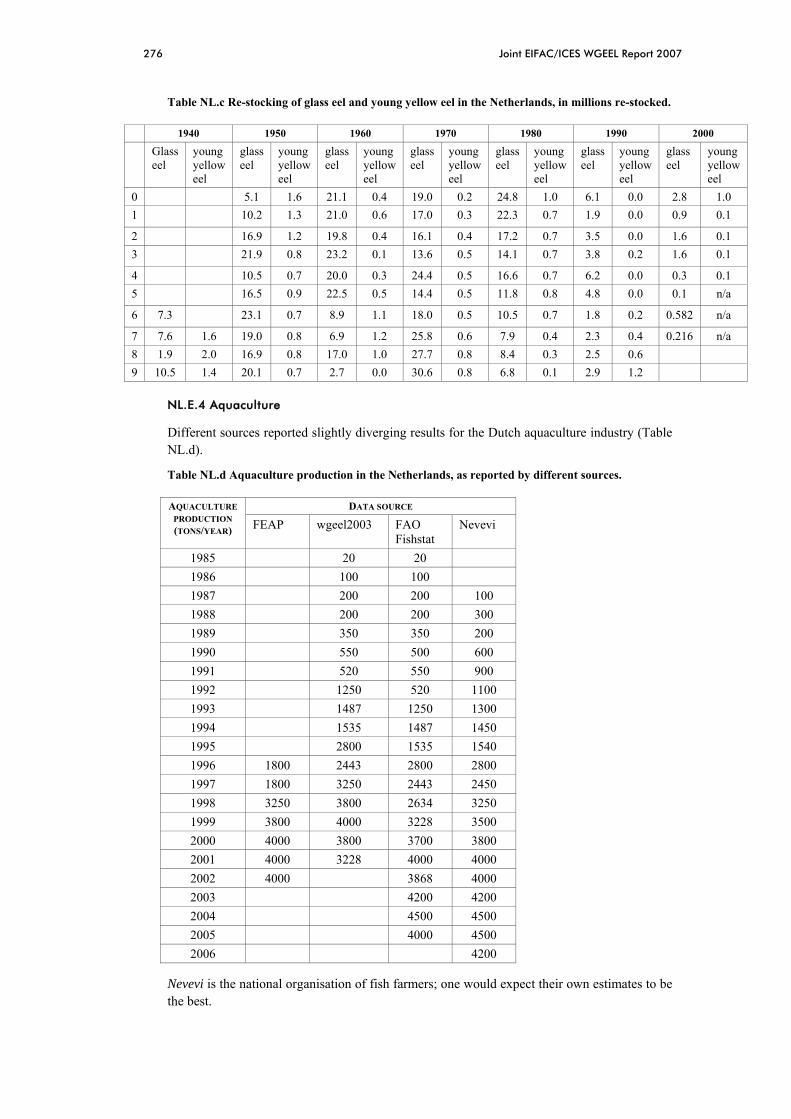
276 Joint EIFAC/ICES WGEEL Report 2007
Table NL.c Re-stocking of glass eel and young yellow eel in the Netherlands, in millions re-stocked.
1940 1950 1960 1970 1980 1990 2000
Glass eel
young yellow eel
glass eel
young yellow eel
glass eel
young yellow eel
glass eel
young yellow eel
glass eel
young yellow eel
glass eel
young yellow eel
glass eel
young yellow eel
0 5.1 1.6 21.1 0.4 19.0 0.2 24.8 1.0 6.1 0.0 2.8 1.0 1 10.2 1.3 21.0 0.6 17.0 0.3 22.3 0.7 1.9 0.0 0.9 0.1
2 16.9 1.2 19.8 0.4 16.1 0.4 17.2 0.7 3.5 0.0 1.6 0.1 3 21.9 0.8 23.2 0.1 13.6 0.5 14.1 0.7 3.8 0.2 1.6 0.1
4 10.5 0.7 20.0 0.3 24.4 0.5 16.6 0.7 6.2 0.0 0.3 0.1 5 16.5 0.9 22.5 0.5 14.4 0.5 11.8 0.8 4.8 0.0 0.1 n/a
6 7.3 23.1 0.7 8.9 1.1 18.0 0.5 10.5 0.7 1.8 0.2 0.582 n/a
7 7.6 1.6 19.0 0.8 6.9 1.2 25.8 0.6 7.9 0.4 2.3 0.4 0.216 n/a 8 1.9 2.0 16.9 0.8 17.0 1.0 27.7 0.8 8.4 0.3 2.5 0.6 9 10.5 1.4 20.1 0.7 2.7 0.0 30.6 0.8 6.8 0.1 2.9 1.2
NL.E.4 Aquaculture
Different sources reported slightly diverging results for the Dutch aquaculture industry (Table NL.d).
Table NL.d Aquaculture production in the Netherlands, as reported by different sources.
DATA SOURCE AQUACULTURE PRODUCTION (TONS/YEAR) FEAP wgeel2003 FAO
Fishstat Nevevi
1985 20 20 1986 100 100 1987 200 200 100 1988 200 200 300 1989 350 350 200 1990 550 500 600 1991 520 550 900 1992 1250 520 1100 1993 1487 1250 1300 1994 1535 1487 1450 1995 2800 1535 1540 1996 1800 2443 2800 2800 1997 1800 3250 2443 2450 1998 3250 3800 2634 3250 1999 3800 4000 3228 3500 2000 4000 3800 3700 3800 2001 4000 3228 4000 4000 2002 4000 3868 4000 2003 4200 4200 2004 4500 4500 2005 4000 4500 2006 4200
Nevevi is the national organisation of fish farmers; one would expect their own estimates to be the best.

Joint EIFAC/ICES WGEEL Report 2007 277
NL.F Catch per unit of effort
Starting in 1993, the fish assemblage in the main rivers and linked waters (see Figure NL.2) has been monitored, by means of logbook registration of commercial catch and bycatch, in a restricted number of fyke nets (4 large fyke nets or 2 pairs of summer fyke nets per location), mostly on a weekly basis. For eel, the number of yellow eels and silver eels caught is recorded. The annual report on the status of fish stocks in the rivers (Tien et al., 2004) contains a section on eel, reporting the trend in these data. Results show no particular trend over the years, but the year-to-year variation is considerable. There is no formal application of these data in eel fisheries management, but the results have frequently been quoted in the debate on the status of the eel stock.
This monitoring programme is operated under the governmental responsibility for monitoring state-managed waters, and is executed by the Netherlands Institute for Fisheries Research RIVO.
1
23
45
6
789
10
14
15
1617
1819
202122
23
24
2526
2728
29
30
31
32
33
Noordzee
Rijn
Maas
Schelde
Vecht
1
23
45
6
789
10
14
15
1617
1819
202122
23
24
2526
2728
29
30
31
32
33
Noordzee
Rijn
Maas
Schelde
Vecht
Figure NL.2 Sampling sites for the 4-fyke monitoring of commercial catches and bycatch.

278 Joint EIFAC/ICES WGEEL Report 2007
Figure NL.3 Time trends in the 4-fyke monitoring of commercial eel catches, for respectively Benedenrivierengebied (lower stretches of rivers, mostly Rhine), Gelderse Poort (Rhine near German border), IJsselmeergebied (Lake IJsselmeer and linked waters, RBD=Rhine) and Maas (Meuse). Note the influence of the first data points (1993 and 1994) on the overall trends.
NL.G Scientific surveys of the stock
NL.G.1 Recruitment surveys
Recruitment of glass eel in Dutch waters is monitored at Den Oever and 11 other sites along the coast (see Dekker, 2002 for a full description).
2005 was the lowest season on record. Catches were low throughout the season.
2006 was an extremely early season. Catches in March and early April were considerably higher than in previous years, but from mid-April onwards, hardly any glass eel was caught anymore; the normal season extends through late May. Winter and spring were extraordinary warm.

Joint EIFAC/ICES WGEEL Report 2007 279
Table NL.f Number of glass eel caught per lift net haul. All observations in a year have been corrected for time of day and month of sampling, and averaged.
DECADE YEAR
1930 1940 1950 1960 1970 1980 1990 2000
0 16.57 7.84 28.19 51.57 35.83 4.47 1.96 1 14.15 15.79 48.68 22.86 30.42 1.37 0.65 2 22.38 101.64 114.13 40.94 19.18 3.60 1.29 3 15.01 17.21 162.78 29.49 12.86 3.61 1.74 4 43.68 25.65 50.68 34.15 17.14 5.68 1.77 5 35.45 104.88 44.19 17.33 7.94 0.97 6 7.19 9.27 25.24 36.18 18.24 9.00 0.41 7 7.00 20.75 38.71 76.27 7.08 14.46 1.28 8 19.71 6.10 68.02 26.47 51.41 5.43 2.59 9 44.35 6.04 37.30 22.67 71.45 3.74 4.01
↑105
↑163
↑114
↑102
0
50
100
1940 1950 1960 1970 1980 1990 2000
num
ber o
f gla
ss e
el p
er h
aul,
Apr
il 22
h00.
moving averageannual index
0
5
10
15
1995 2000 2005
Figure NL.4 Time trend in the glass eel survey at Den Oever.

280 Joint EIFAC/ICES WGEEL Report 2007
Table NL.g Annual indices of glass eel recruitment at places in the Netherlands, other than Den Oever. Annual indices are expressed as the mean catch per lift net haul, at whatever time in the night. Most hauls are made in the evening, just in the dark.
YEAR
OT
HE
EN
SE K
RE
EK
BA
TH
KR
AM
ME
R
S TE
LL
EN
DA
M
KA
TW
IJK
IJM
UID
EN
DE
N O
EV
ER
SH
IP L
OC
K
HA
RL
ING
EN
LA
UW
ER
SOO
G
NIE
UW
STA
TE
NZ
IJL
TE
RM
UN
TE
N-Z
IJL
RBD Scheldt Scheldt Meuse Mesue Rhine Rhine Rhine Rhine Rhine Ems Ems1969 47.3 1970 31.5 1971 15.4 1972 4.1 1973 13.1 32.8 1974 22.8 119.3 1975 13.9 66.8 1976 11.3 73.1 14.4 1977 42.1 130.25 159.2 28.4 1978 42.1 30.23 131.7 83.9 1979 27.3 3.23 176 66.2 1980 45.1 171.60 101.5 80.3 1981 47.3 31.65 113.9 55.1 1982 11.3 4.13 20.8 17.4 1983 14.3 2.10 15.6 15.1 1984 3.8 23.62 11.4 7.1 1985 8.7 6.67 1 25.2 1986 6.4 4.7 1.3 1987 9.8 14.00 7.7 52 1988 7.6 3.5 0.5 1989 4.4 3.67 1.6 12.1 1990 0.3 11.3 4.7 5 1991 5.9 0.1 1.7 5.10 2 6.3 0.31992 12.3 0.3 9.9 8.20 2.5 14.8 7.3 0.41993 17.5 0.3 5.2 13.50 1.6 20.8 1.41994 14.6 0.5 2.7 15.10 3.6 16 22.5 2.21995 0.5 15.7 0.3 3.2 27.10 13.1 27.8 6.8 11.6 31996 1 26.8 0.7 0.4 25.40 4 10.2 29.7 34.4 24 61997 0 40.4 0.4 2.5 10.90 1.3 10.2 12.4 20.9 21 10.61998 0.7 18.3 0.6 0.9 38.80 1.2 6.5 15.4 9.9 19.9 1.11999 1.2 23.1 0.6 1 101.30 1.6 5.6 12.7 15.1 11.8 7.52000 0.7 20.1 0.8 5.6 8.80 1.5 4 2.8 6.6 23.3 5.72001 0.5 (1.2†) 0.1 0.9 8.10 0.4 1.5 1.8 1.7 16.1 0.82002 0 13.6 0.4 3.7 9.80 0.05 1 2.2 3.4 35.3 0.92003 0 7 0.1 0.4 11.80 0 4.7 3.8 1.2 25.5 0.42004 0 (24.9†) 0.03 0.3 4.50 0.105 4.1 (4.9†) 1.7 21.7 1.22005 0 13.4 0.5 0.2 4.40 0 4.6 3.3 0.9 18.2 1.32006 0.00 9.70 0.21 0.02 1.33 0.07 0.28 0.48 1.39 8.33 1.132007‡ 0.00 55.86 0.22 0.29 24.77 0.09 0.38 0.59 1.13 18.11 3.26†Sampling only took place in part of the season. ‡ Very early season (warm spring), sampling stopped early (start of May) --> low number of empty samples lateron, increases the calculated mean catch.

Joint EIFAC/ICES WGEEL Report 2007 281
0.01
0.1
1
10
100
1970 1980 1990 2000 2010
inde
x
OtheenseKreek Bath Krammer
Stellendam Katwijk IJmuiden
Harlingen Lauwersoog Nieuwstatenzijl
Termuntenzijl Den Oever
Figure NL.5 Long-term trends in the glass eel catches in the experimental fisheries at various places along the Dutch coast.
NL.G.2 Yellow eel surveys
IJsselmeer surveys: Figure NL.5a presents the trends in cpue for the yellow eel surveys in Lake IJsselmeer, using the electrified trawl.
Northern compartment
Southern compartment
1
10
100
1000
1990 2000 2010
year
CPU
E (#
/ha)
.
Figure NL.5a Cpue trends in Lake IJsselmeer stock surveys, in number per hectare swept area, using the electrified trawl. Note: The northern and southern compartments are separated by a dyke.
Main Rivers survey: Figure NL.6 presents the trends in biomass (left) and numbers (right), per hour fishing.

282 Joint EIFAC/ICES WGEEL Report 2007
Biomassa
0
0.2
0.4
0.6
0.8
1
1.2
1.4
1.6
1.8
2
1998 1999 2000 2001 2002 2003 2004 2005
cpue
electrokor
Aal
Aantallen
0
2
4
6
8
10
12
14
16
18
1998 1999 2000 2001 2002 2003 2004 2005
cpue
electrokor
Aal
Figure NL.6 Trends in biomass (left) and numbers (right), for electro dipnet and trawl (kor), in the Main River surveys.
Coastal Surveys: the number of eels caught in coastal surveys (Dutch Young Fish Survey) is presented in Figure NL.7.
0
2
4
6
8
10
1970 1975 1980 1985 1990 1995 2000 2005
Surv
ey C
PUE
(Nr/h
a)
WaddenseaWestern CoastOosterschelde
Figure NL.7 Trends in coastal survey cpue. Most of the Waddensea belongs to RBD Rhine; Oosterschelde is mixed Scheldt and Meuse; Western Coast belongs to RBD Rhine.
Overall, these surveys are not representative for the whole River Basin Districts. Lake IJsselmeer is extremely overexploited, while fisheries in the remainder of the country is less severe. The Main Rivers Surveys are probably reasonably representative for the rivers. However, Lake IJsselmeer and the Main Rivers differ substantially, and it is not quite clear how the two should be weighted.
NL.G.3 Silver eel surveys
There are no routine surveys for silver eel in the Netherlands.
The German states North Rhine-Westphalia and Rhineland-Palatinate, and the Netherlands started a Rhine Silver Eel project in 2004 in order to:
• quantify the female part of the whole downstream migrating Rhine silver eel population independently from fisheries,
• determine the relevance of the different migration routes of these female migrants in the Lower Rhine, the mortalities during downstream migration and the escapement to the sea.

Joint EIFAC/ICES WGEEL Report 2007 283
Over 3000 female silver eels > 50 cm were marked and released in Cologne (300–350 km from the sea, depending on the migration route) in both 2004 and 2005. And more than 4000 and 6000 silver eels respectively were checked for marks in the different Rhine branches close to the sea. Only 6 and 5 marked eels were recaptured in these two years. Estimates of the population size of the downstream migrating female (> 50 cm) Rhine silver eel population were made in 2004 and 2005. The numbers of marked eels and the corresponding estimates of the population size were corrected for non-migrants (see below). The corrected population sizes were at most 1.2 million and 1.9 million in number respectively, with corresponding biomasses of 600 and 1000 tons.
The routes of downstream migration of 150 silver eels in 2004 and 157 in 2005 were tracked by telemetry (active transponders) from the point of release in Cologne through the three main branches of the Rhine (Waal, Nederrijn + Lek, IJssel + Lake IJsselmeer) and up to the sea.
Downstream migration up to the sea took from less than 2 days to more than one year and generally occurred in October and November of the year of release. A substantial number of the tracked eels in 2004 (38%) and in 2005 (47%) did not appear to migrate up to or further than Xanten, close to the German/Dutch border.
Most of the escapees released in Cologne seemed to find their way to the sea via the Nieuwe Waterweg (57 in the years combined) and not via Lake IJsselmeer (1 in total) or via the Haringvliet (0 in total). The 2004 cohort released in Cologne showed an escapement to the sea of 23% by January 2006 (37% of those eels that passed Xanten). Corresponding data for the 2005 cohort were 15% and 28% respectively.
The fisheries independent telemetry data from this study seem to indicate much higher mortalities in the Rhine silver eel run in The Netherlands than can be calculated from the catch statistics and the mark-recapture estimate of the population size. The telemetry data suggest that the Nederrijn and Lek watercourse, the only location where hydropower stations have been built in the lower Rhine system, might be important for downstream migration of eels only in the years with higher discharges. This suggests that management measures should concentrate on the Waal and downstream sections in order to improve the spawning escapement of the German part of the silver eel population of the Rhine system.
The project was continued in 2006, but data for publication from this year are not available yet. The continuation in 2007 is questionable because of lacking funds in The Netherlands. A scientific paper on the project has been accepted for publication in the ICES Journal of Marine Science.
NL.H Catch composition by age and length
NL.H.1 Long term trends in length compositions
For Lake IJsselmeer, the landings are regularly sampled at the auctions. Results have indicated extreme overfishing (see Figure NL.8 ). Since the catch composition did not change much over the years (see Figure NL.9), results have not been reported in detail for the past years. The length composition in 2006 (Figure NL.10) shows considerable higher abundance of the larger (> 40 cm) eels; circumstantial evidence indicates that this developed gradually over the past years.

284 Joint EIFAC/ICES WGEEL Report 2007
IJsselmeer
Elsewhere
0%
5%
10%
15%
20%
25 30 35 40 45 50length (cm)
catc
h co
mpo
sitio
n
Figure NL.8 Average length composition of fyke net catches, with confidence intervals (±1 std), for Lake IJsselmeer and Elsewhere, based on the entire historical data sets. The presented length distributions conform to the situation in 1990.
Elsewhere
IJsselmeer
-1
-0.5
0
0.5
1
1.5
2
1975 1980 1985 1990 1995 2000
Rel
ativ
e in
dex
for a
vera
ge si
ze
Figure NL.9 Relative change in size composition of eel landings. Positive values indicate a shift towards larger size classes. In Lake IJsselmeer, effort reductions and the recruitment failure in the 1980s initially shifted the length composition gradually to higher values. When the low recruitment had progressed into even the largest size classes, the mean size restored to normal values. Elsewhere, the data showed less variability. Presumably, sampling ceased before the 1980s recruitment failure had progressed into the exploited length classes.

Joint EIFAC/ICES WGEEL Report 2007 285
050
100150200250300350400450500
20 23 26 29 32 35 38 41 44 47 50 53 56 59
Length (cm)
Num
ber o
f eel
s m
easu
red
Figure NL.10 Length frequency of fyke net catches in Lake IJsselmeer, in 2006.
NL.H.2 Length composition in 2006
In the most recent years, length frequency distributions of commercial catches from Lake IJsselmeer have shown a remarkable shift upwards (Figure NL.10). This shift is observed consistently in all gears, and in several years in a row. This upward shift might be the result of the effort reductions in 2005, of the further decline in recruitment since 2000 now progressing into the commercial sizes, or of increased dependence on eels from outside Lake IJsselmeer, which are less overexploited.
NL.I Other biological sampling
NL.I.1 Length, weight and growth (DCR)
For Lake IJsselmeer, the market sampling described under NL.H comprises measurements of length, weight, sex, maturity, liver weight, stomach content weight, parasitism (Anguillicola crassus), and otolith collection; see under NL.H. In addition to the market sampling, an annual sample of 100 specimens is collected during the autumn stock survey on Lake IJsselmeer; see NL.G.2. This survey sampling conforms to the protocol for market samples (NL.H). For market and survey samples, otoliths are collected and stored dry, but no age reading is performed.
For all other areas, no biological sampling of catches is performed.
NL.I.2 Parasites
The market sampling for Lake IJsselmeer collects information on the percentage of eels showing Anguillicola infection (Figure NL.11, based on inspection of the swimbladder by the naked eye). Following the initial break-out in the late 1980s, infection rates have stabilised between 40% and 60%, while the number of parasites per infected eel fluctuates between 4 and 6.

286 Joint EIFAC/ICES WGEEL Report 2007
2
4
6
8
10
0
20
40
60
80
100
1980 1985 1990 1995 2000 2005 2010
year
Perc
enta
ge in
fect
ed ■
.
0
400
800
1200
1600
2000
Num
ber of eels sampled • .
Num
ber of parasites per eel ― / − − .
Figure NL.11 Trend in Anguillicola infections in Lake IJsselmeer eel.
NL.I.3 Contaminants
For a recent overview of contamination in eel in the Netherlands, see Hoek-Nieuwenhuizen and Kotterman (2007) and Hoogenboom et al. (2007).

Joint EIFAC/ICES WGEEL Report 2007 287
NL.I.3.1 Spatial pattern
Schatting van TEQ gehalte
0
5
10
15
20
25
30
35
40
45
50
IJssel
meer
Markerm
eer
Maas Borg
haren
Maas Keiz
ersveer
Ketelm
eer
Wolderw
ijd
Eemmeer
IJ Amste
rdam
Haring
vliet
Hollands
Diep
Volkera
k
Rijn Lobit
h
Lek Culem
borg
Twentek
anaal
ng/kg productbasis
2001
2002
2003
2004
2005
2006
NL.I.3.2 Temporal trend
The temporal trend differs substantially between sampling locations, but overall a decline is observed. Figure NL.12 shows the trend in eels derived from Lake IJsselmeer.

288 Joint EIFAC/ICES WGEEL Report 2007
NL.I.4 Predators
Predation of eel by cormorants (Phalacrocorax carbo) is much disputed amongst eel fishermen and bird protectionists. The number of cormorant breeding pairs increased rapidly until the early 1990s, and then stabilised (Figure NL.12). For Lake IJsselmeer, food consumption has been well quantified (van Rijn and van Eerden, 2001; van Rijn, 2004); eel constitutes a minor fraction here. In other waters, neither the abundance, nor the food consumption is accurately known, but predation on eel appears to be a bigger issue here.
Naardermeer
OostvaardersplassenLepelaarplassen
Enkh. K
0
5000
10000
15000
20000
1975 1980 1985 1990 1995 2000 2005
year
Num
ber o
f bre
edin
g pa
irs
Figure NL.12 Trend in the number of breeding cormorants around Lake IJsselmeer, by breeding place. The breeding places are ordered from south (bottom) to north (top). Enkh=Enkhuizer Zand (de Ven), K=Kreupel.
NL.J Other sampling
NL.K Stock assessment
The basic results of the monitoring programmes in Lake IJsselmeer and the main rivers, the landings statistics and age-and-length sampling of the catch in Lake IJsselmeer are reported to
0
500
1000
1500
2000
2500
1992
1993
1994
1995
1996
1997 1998 1999 2000
2001 2002 2003 2004
2005
2006
Som 7CBs
IJsselmeer
95% Int- 95% Int+
Jaar

Joint EIFAC/ICES WGEEL Report 2007 289
the Ministry of Fisheries in annual status reports; salient details are published in the fishing press.
Dekker (1996, 2000c) developed a VPA-type assessment model for the eel fisheries on Lake IJsselmeer. This model has been applied to data from Lough Derg (Ireland) in the context of FP6-project 022488 SLIME (Dekker et al., 2006).
Growth in eel shows considerable inter-individual variation; individual year classes overlap almost completely in length. Additionally, fisheries, predation mortality (cormorants) and silvering are length-, rather than age-specific. The traditional age-structure of the VPA was therefore replaced by a length-structuring; a length-length transition matrix then replaces the conventional ageing process. Unfortunately, the retrospective application of this deterministic model yielded numerically unstable results (small glitches in the data causing huge shifts in outcome). Dekker (2004a) replaced the deterministic model by a statistical analysis, and included landings and catch-composition data as well as stock survey data. Although this cleared the numerical instability problem, results no longer match the status of the stock in individual years precisely, but reflect the overall trend over the years.
Initial assessment of the status of Lake IJsselmeer eel fishery indicated extremely severe overexploitation (F ≈ 1.0; Dekker 1996, 2004a). A 50% reduction in the nominal fishing effort in 1989 resulted in an effective drop in fishing mortality of only 25%. Although assessments were still available, further effort reductions in the 1990s have only loosely been related to monitoring and catch sampling results. In the mid-1990s, the quality of the landing statistics deteriorated, following the transfer of the registration from the Ministry of Fisheries to the Fish Board. Subsequently, the annual assessments have been discontinued. The latest formal management advice dates back to 2000 (an 80% reduction in fishing effort is required to obtain a sustainable eel fishery). Since that date, length frequencies have changed considerably, necessitating a major review of the scientific advice.

290 Joint EIFAC/ICES WGEEL Report 2007
Belgium: Report on the eel s tock and f ishery in Belgium 2007
BE.A Authors
Claude Belpaire
Research Institute for Nature and Forest (INBO)
Duboislaan 14, 1560 Groenendaal-Hoeilaart, Belgium
Tel. +32 +32 2 658 04 11. Fax : +32 2 657 96 82
Serge Gomes da Silva, Groupe d’Intérêt pour les Poissons, la Pêche et l’Aquaculture (GIPPA), Av. Maréchal Juin 23, B-5030 Gembloux
Thierry Demol, Groupe d’Intérêt pour les Poissons, la Pêche et l’Aquaculture (GIPPA), Av. Maréchal Juin 23, B-5030 Gembloux
Kristof Vlietinck, Agency for Nature and Forest, Brussels
Gerlinde Van Thuyne, Research Institute for Nature and Forest (INBO), Duboislaan 14, 1560 Groenendaal-Hoeilaart, Belgium
Geert Goemans, Research Institute for Nature and Forest (INBO), Duboislaan 14, 1560 Groenendaal-Hoeilaart, Belgium
Caroline Geeraerts, Research Institute for Nature and Forest (INBO), Duboislaan 14, 1560 Groenendaal-Hoeilaart, Belgium
Els Cuveliers, Katholieke Universiteit Leuven, Laboratory of Aquatic Ecology, Ch. De Beriotstraat 32, 3000 Leuven
Jean-Claude Philippart, Laboratoire de Démographie des Poissons et Hydroécologie, Unité de Biologie du Comportement, Institut de Zoologie, Département des Sciences et Gestion de l'Environnement, Université de Liège, Quai van Beneden 22, 4020 Liège, Belgique
Reporting Period: This report was completed in August 2007, and contains data up to 2007.
BE.B Introduction
This report is written in preparation of the EIFAC/ICES Working Group on Eel meeting at Bordeaux (3–7 september 2007).
BE.C Fishing capacity
BE.C.1 Professional coastal and sea fisheries
Following a global European downward tendency, the Belgian fishing fleet consisted in 2005 of a total of 121 motorized vessels, with a total power of 65 643 kW and a gross registered tonnage of 22 694. The national fishing fleet represents 0.1% of the European fleet, 1.1% of the European tonnage and 0.9% of total engine power (2005 data)(EC, 2006). The fleet consists mostly of beam trawlers, the remainder being otter trawlers. There are data available on fishing effort.
BE.C.2 Estuarine fisheries on the Scheldt.
Fishing capacity has decreased last 5 five years. The estuarine Scheldt fisheries around 2000 was performed by 2 boat trawlers (one beam trawler and one otter trawler) and by ca. 30 semi

Joint EIFAC/ICES WGEEL Report 2007 291
professional fishermen fishing with fykes (estimated at 150 fykes). The trawl fisheries was focused on eel, but recently boat fishing has been prohibited, and only fyke fishing is permitted. The number of licensed fyke fishermen has decreased to seven (in 2005 and 2006)(Fig. BE.1). Including possible poaching we may estimate the number of eel fishermen with fykes on the Scheldt on ten, which means that maximum ca 50 fykes are used along the estuarine river.
0
2
4
6
8
10
12
14
16
18
1992
1993
1994
1995
1996
1997
1998
1999
2000
2001
2002
2003
2004
2005
2006
2007
Year
Num
ber o
f lic
ense
s
Figure BE.1 Time series of the number of licensed semi professional fishermen on the Scheldt from 1992 to 2004 (Data Section Forest and Green, AMINAL).
BE.C.3 Recreational fisheries in the Flemish Region
The number of licensed anglers was 60 520 in 2004, 58 347 in 2005 and 56 789 in 2006. The time series shows a general decreasing trend from 1983 (Fig BE.2). From an inquiry among anglers it was estimated that ca. 8% were eel fishermen (Vandecruys, 2004).

292 Joint EIFAC/ICES WGEEL Report 2007
0
20.000
40.000
60.000
80.000
100.000
120.000
140.000
1981
1982
1983
1984
1985
1986
1987
1988
1989
1990
1991
1992
1993
1994
1995
1996
1997
1998
1999
2000
2001
2002
2003
2004
2005
2006
2007
Year
Num
ber o
f lic
ense
s
Figure BE.2 Time series of the number of licensed anglers in Flanders from 1980 to 2006 (Data Data Agency for Nature and Forests).
BE.C.4 Recreational fisheries in the Walloon Region
Although in constant decline since the nineties, fishermen are still a well represented community in the Walloon region. The number of licensed anglers was 65 687 in 2004. For the year 2006, 59 489 fishing licenses were attributed for fishing activity in rivers, ponds and lakes. In addition, according to estimations given by the Nature and Forestry Division (DNF) of the Walloon Environment and Natural Resources DG (DGRNE), approximately 50 000 persons exercise fishing activity in private waters and closed ponds dedicated to recreational angling (FigureBE.3).

Joint EIFAC/ICES WGEEL Report 2007 293
0
10000
20000
30000
40000
50000
60000
70000
80000
90000
1995
1996
1997
1998
1999
2000
2001
2002
2003
2004
2005
2006
2007
Year
Num
ber o
f lic
ense
s in
Wal
loon
regi
on
Figure BE.3 Number of fishing licences issued in the Walloon region since 1995 (Source MRW-DGRNE-DNF)
BE.C.5 Recreational fisheries in the Brussels capital
The number of licensed anglers is approximately 1400 (Data Brussels Institute for Management of the Environment).
In total, there are approximately 118 000 licensed recreational fishermen in Belgium for 2006. It was not possible to split out this information per RBD, however this is feasable as databases exist concerning the localities where licenses were emitted.
BE.D Fishing effort
No specific data. See also under BE.E
BE.E Catches and Landings
BE.E.1 Professional coastal and sea fisheries
Professional coastal and sea fisheries are of minor relevance as this fisheries is targeted on sole, plaice, turbot and cod, and by-catch of eels is of minor importance. Eel catches are small and unpredictable. Usually these eels are sold directly on the quay. Only exceptionally, eels are presented for selling in the fish market and reported in these statistics.
BE.E.2 Estuarine fisheries on river Scheldt
No official landing statistics for the fyke fisheries are available. On the basis of some fishermen’s logbooks and on the basis of cpue data on scientific monitoring (see BE.F) the total landings of eels by fyke fishermen were roughly estimated at 5 tonnes per year around 2000. Considering the decrease in fishing capacity it may be roughly estimated that the catch now is between 1 and 2 tonnes per annum.
BE.E.3 Recreational fisheries
Recreational catches of eels are not recorded, data exist on number of licenses per region, and results of inquiries.

294 Joint EIFAC/ICES WGEEL Report 2007
As will be clear from the information below there is a big gap in knowledge concerning the recording of eel landings from recreational fisheries in Belgium. Data available are only rough estimates.
BE.E.4 Recreational fisheries in the Flemish Region
There are no official data about the catches of eels. A recent estimate of the total amount of fish (all species) taken from Flemish waters by recreational anglers was 431 tonnes. 28% or 121 tonnes of the total number of extracted fish are eels (De Vocht and De Pauw, 2005). However, the catches and the number of extracted eels have been considerably influenced by a catch and release obligation for eels. This law was brought out as a result of the high PCB levels measured in most Flemish eels.
Another estimate can be deduced from data from Bilau et al., (2007). In 2003, 61 245 individuals in Flanders had a fishing license for public waters. A survey on specific aspects of recreational fisheries, including the issue of taking home a catch, was carried out (Vandecruys, 2004). The survey included questions on the fish species caught and taken home as well as the number and the weight of the fish caught and taken home. A total number of 3001 of the licensed anglers (out of 9492 contacted) completed a questionnaire about recreational fishing. Respectively 1.9% and 5.3% of these anglers indicated that they “always” (group A) or “sometimes” (on average: 1 out of 5 eels caught)(group B) take home the eel they have caught. Based on extrapolation to all licensed fishermen, the number of people taking home the eel, caught in Flemish public waters is estimated to be 4429 (7.2% of licensed anglers). Considering the catch and release obligation for eels in all public waters in Flanders, this is a high proportion, and an underestimate of the situation where all eels may legally taken home.
Based on the number of fishing occasions (average of 41.67 and 42.03 trips/y, respectively for group A and B), the number of eels caught per occasion (average of 4.14 and 3.12, respectively for group A and B) and a mean weight of edible portion per eel (150 g), it has been calculated that individuals in group A take home on average 25.9 kg of edible eel per year or a mean of 498 g/week. For group B it was calculated to be 3.9 kg per year or 76 g/week (Bilau et al., 2007). The total estimate for Flanders is thus 43 tonnes of eels per annum, which is approximately one third of the estimate by De Vocht and De Bruyn (2005)(Tab. BE.1).

Joint EIFAC/ICES WGEEL Report 2007 295
Table BE.1 Rough estimate of the catch of recreational fisheries in Belgium.
Country drai
nage
are
a km
2
Estim
ate
for t
he 1
.9%
or 1
164
angl
ers
each
taki
ng 2
5.9
kg e
el p
er
annu
m
Estim
ate
for t
he 5
.3 %
or 3
246
angl
ers
each
taki
ng 3
.9 k
g pe
r ann
um
Tota
l est
imat
e
BE Flanders 13.521 30148 12659 42807Wallonia 16.845 no data no data no dataBrussels 162 no data no data no data
BE sum 30.528
BE.E.5 Recreational fisheries in the Walloon Region
There are no official estimates about the catches of eels in the Walloon region. Precise quantitative figures of fishing catches in the Walloon region are thus lacking, however, species submitted to heavier fishing are identified. These are: the brook trout (Salvelinus fontinalis), the roach (Rutilus rutilus), the pike (Esox lucius), the perch (Perca fluviatilis) and the common carp (Cyprinus carpio). A 2002 survey estimated that 8% of the anglers never catch any eels and 33% sometimes catch them. More then half the anglers catch them and the others rarely. In 61% of the fishing occasions one eel is caught, in 26% of the cases two are caught, in 11% of the cases 3 eels are caught. In 1% of the fishing occasions more then 3 eels are caught. 63% of the eels are eaten. (Data from an inquiry from the Federation of Anglers in Wallonia).
In the Walloon region, fishing of eels is prohibited since 2006 (Walloon Governement, 2006). By modification of the 1954 law on fishing activities, there is now an obligation to release captured eels whatever their length. So from 2006 recreational catches of eel in Wallonia should be nihil.
BE.E.6 Recreational fisheries in Brussels capital
No information on eel catches.
BE.F Catch per unit of effort
There are some data about the catch per unit of effort for the estuarine fyke fisheries on the Scheldt. These cpue data were collected from scientific monitoring. The cpue is strongly influenced by temporal and regional variation. Fig. BE.4 gives the trend in cpue of estuarine fyke fishing from 1995 to 2003 in the Scheldt estuary. Additional data of other sampling stations along the estuary are available.
See also some data under BE.E.

296 Joint EIFAC/ICES WGEEL Report 2007
Figure BE.4 Mean number of eel per day per fyke from 1995 to 2003 in the Scheldt estuary at Zandvliet (Maes et al., 2003).
BE.G Restocking
BE.G.1 Restocking in Flanders
Glass eel and young yellow eels were used for restocking inland waters by governmental fish stock managers. The origin of the glass eel used for restocking from 1964 onwards was the glass eel catching station at Nieuwpoort on river Yser. However, due to the low catches after 1980 and the shortage of glass eel from local origin, foreign glass eel was imported mostly from UK or France.
Also young yellow eels were restocked, the origin was mainly the Netherlands. Restocking with yellow eels was stopped after 2000 when it became evident that also yellow eels used for restocking contained high levels of contaminants (Belpaire and Coussement, 2000).
In recent years the glass eel restocking could not be done each year due to the high market prices. Only in 2003 and 2006 respectively 108 and 110 kg of glass eel was stocked in Flanders (Figure BE.5 and Table BE.2).

Joint EIFAC/ICES WGEEL Report 2007 297
0
50
100
150
200
250
300
1994
1995
1996
1997
1998
1999
2000
2001
2002
2003
2004
2005
2006
2007
Year
Kg
glas
s ee
l res
tock
ed
Figure BE.5 and Table BE.2 Re-stocking of glass eel in Belgium (Flanders) over the period 1994 to 2007, in kg of glasseel.
BE.G.2 Restocking in Wallonia
Restockings of fish species in a given location are usually performed in order to enhance the biomass of the naturally occurring species, mainly for the purpose of recreational fishing. Those above-densitary restockings represent, in weight, the main part of restocking measures in the Walloon region, the concerned species for these restocking procedures are the brook trout, the roach, the rudd (Scardinius erythrophthalmus) and the common carp.
In 2006, 503 restocking authorisations were issued by the DNF. They concerned approximately 200000 fishes for a total weight of 150 tons. Since 2001, both authorisations and quantity of introduced fishes are in decline (Figure BE.6) (Philippart, 2006).
No eel restocking was performed in 2006 in the Walloon region.
YEAR QUANTITY
(KG GLASS EEL)
1994 175 1995 157,5 1996 169 1997 144 1998 0 1999 251,5 2000 0 2001 54 2002 0 2003 108 2004 0 2005 0 2006 110 2007 0

298 Joint EIFAC/ICES WGEEL Report 2007
Figure BE.6. Number of authorisations and quantity of fishes introduced in waterways for restocking.
BE.H Aquaculture
BE.H.1 Flanders
Allthough in recent years, two farm for intensive production of eels in recirculation systems were operating for a total production of 125 tonnes per annum (Belpaire and Gerard, 1994), nowadays eel culture has stopped completely.
BE.H.2 Wallonia
The only eel farming society (Pi.B.A. S.A.) in the Walloon region started its activities in 2000 and ceased in 2005. No feedback was obtained from the owner or controlling authorities as to the activities and results of this society.
BE.I Scientific surveys of the stock
BE.I.1 Glass eel recruitment at Nieuwpoort at the mouth of River Yser (Yser basin)
Fisheries on glass eel is carried out by the Flemish government. The glass eels are used exclusively for restocking in inland waters. In Belgium, commercial glass eel fisheries is forbidden by law.
Long term time series on glass eel recruitment are available for the Nieuwpoort station at the mouth of the river Yser. Recently new initiatives have been started to monitor glass eel recruitment in the Scheldt basin.
For extensive description of the glass eel fisheries on the river Yser see Belpaire (2002, 2006).
Figure BE.7 and Table BE.3 give the time series of the total annual catches of the dipnet fisheries in the Nieuwpoort ship lock and give the maximum day catch per season. Since the last report (Belpaire, 2006) the figure has been updated with data for 2006 and 2007.
Fishing effort in 2006 was half of normal, with 130 dipnet hauls during only 13 fishing night between March 3rd, and June 6th. Catches of the year 2006 were extremely low and close to
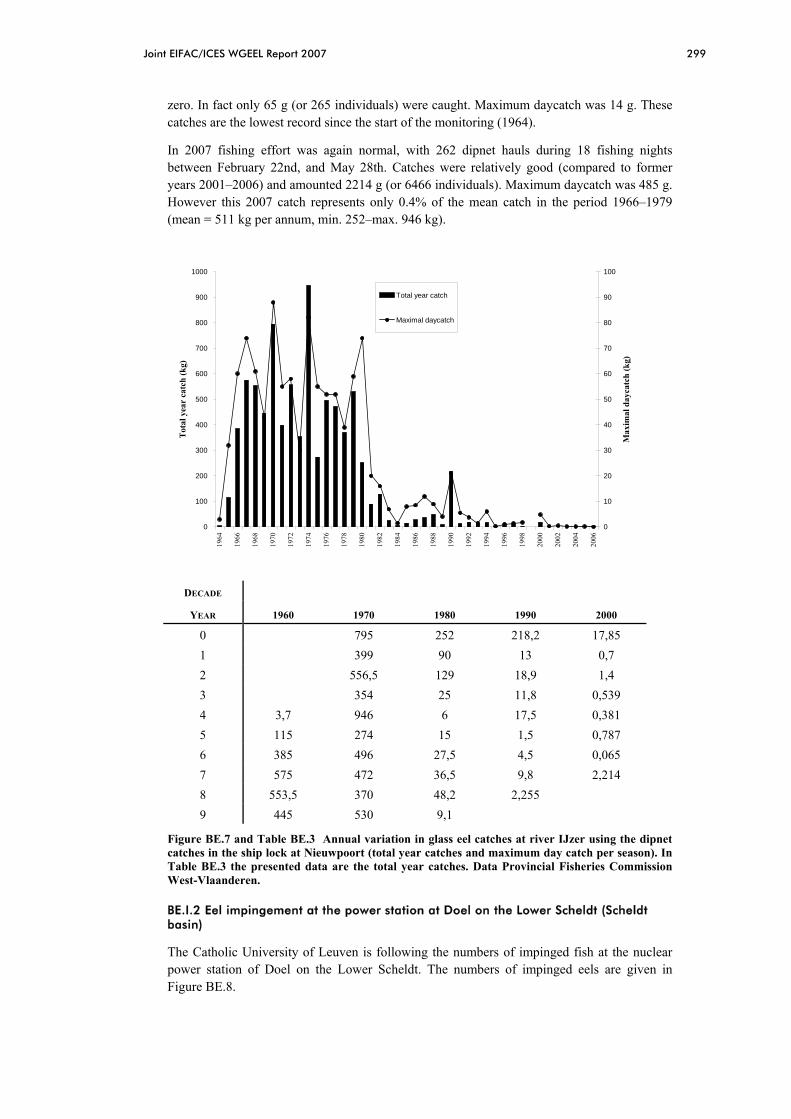
Joint EIFAC/ICES WGEEL Report 2007 299
zero. In fact only 65 g (or 265 individuals) were caught. Maximum daycatch was 14 g. These catches are the lowest record since the start of the monitoring (1964).
In 2007 fishing effort was again normal, with 262 dipnet hauls during 18 fishing nights between February 22nd, and May 28th. Catches were relatively good (compared to former years 2001–2006) and amounted 2214 g (or 6466 individuals). Maximum daycatch was 485 g. However this 2007 catch represents only 0.4% of the mean catch in the period 1966–1979 (mean = 511 kg per annum, min. 252–max. 946 kg).
0
100
200
300
400
500
600
700
800
900
1000
1964
1966
1968
1970
1972
1974
1976
1978
1980
1982
1984
1986
1988
1990
1992
1994
1996
1998
2000
2002
2004
2006
Tot
al y
ear
catc
h (k
g)
0
10
20
30
40
50
60
70
80
90
100
Max
imal
day
catc
h (k
g)
Total year catch
Maximal daycatch
DECADE
YEAR 1960 1970 1980 1990 2000
0 795 252 218,2 17,85 1 399 90 13 0,7 2 556,5 129 18,9 1,4 3 354 25 11,8 0,539 4 3,7 946 6 17,5 0,381 5 115 274 15 1,5 0,787 6 385 496 27,5 4,5 0,065 7 575 472 36,5 9,8 2,214 8 553,5 370 48,2 2,255 9 445 530 9,1
Figure BE.7 and Table BE.3 Annual variation in glass eel catches at river IJzer using the dipnet catches in the ship lock at Nieuwpoort (total year catches and maximum day catch per season). In Table BE.3 the presented data are the total year catches. Data Provincial Fisheries Commission West-Vlaanderen.
BE.I.2 Eel impingement at the power station at Doel on the Lower Scheldt (Scheldt basin)
The Catholic University of Leuven is following the numbers of impinged fish at the nuclear power station of Doel on the Lower Scheldt. The numbers of impinged eels are given in Figure BE.8.
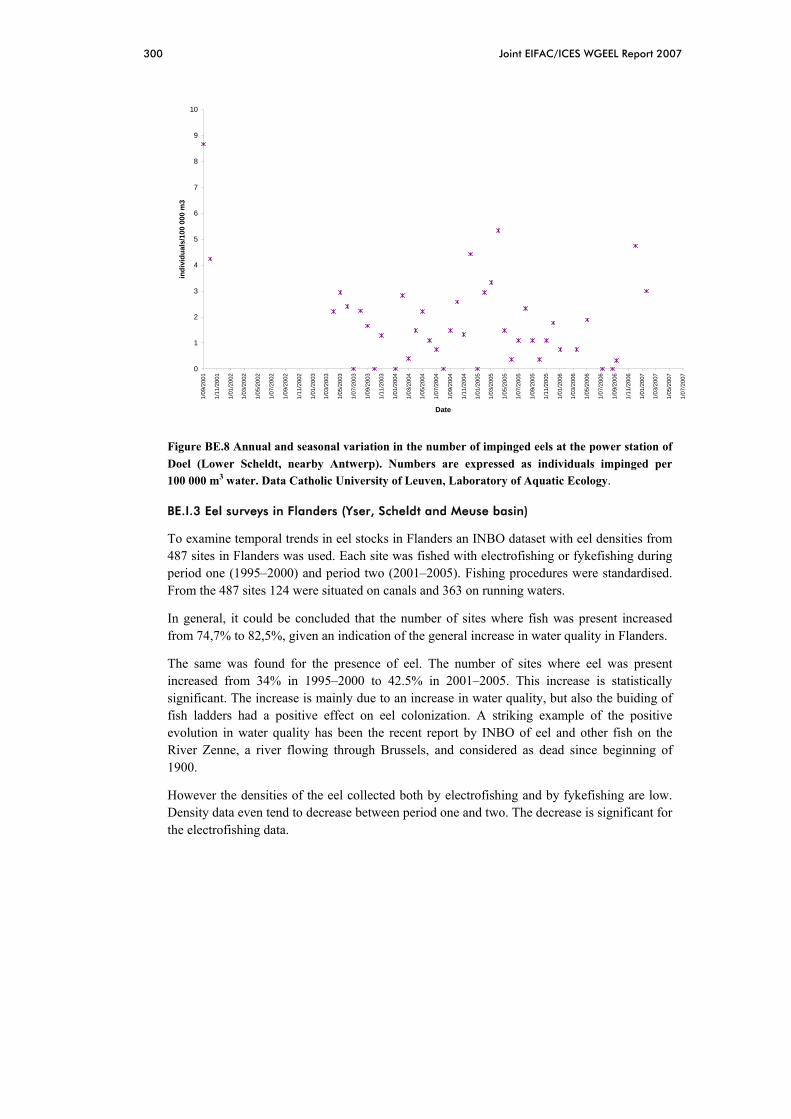
300 Joint EIFAC/ICES WGEEL Report 2007
0
1
2
3
4
5
6
7
8
9
10
1/09
/200
1
1/11
/200
1
1/01
/200
2
1/03
/200
2
1/05
/200
2
1/07
/200
2
1/09
/200
2
1/11
/200
2
1/01
/200
3
1/03
/200
3
1/05
/200
3
1/07
/200
3
1/09
/200
3
1/11
/200
3
1/01
/200
4
1/03
/200
4
1/05
/200
4
1/07
/200
4
1/09
/200
4
1/11
/200
4
1/01
/200
5
1/03
/200
5
1/05
/200
5
1/07
/200
5
1/09
/200
5
1/11
/200
5
1/01
/200
6
1/03
/200
6
1/05
/200
6
1/07
/200
6
1/09
/200
6
1/11
/200
6
1/01
/200
7
1/03
/200
7
1/05
/200
7
1/07
/200
7
Date
indi
vidu
als/
100
000
m3
Figure BE.8 Annual and seasonal variation in the number of impinged eels at the power station of Doel (Lower Scheldt, nearby Antwerp). Numbers are expressed as individuals impinged per 100 000 m3 water. Data Catholic University of Leuven, Laboratory of Aquatic Ecology.
BE.I.3 Eel surveys in Flanders (Yser, Scheldt and Meuse basin)
To examine temporal trends in eel stocks in Flanders an INBO dataset with eel densities from 487 sites in Flanders was used. Each site was fished with electrofishing or fykefishing during period one (1995–2000) and period two (2001–2005). Fishing procedures were standardised. From the 487 sites 124 were situated on canals and 363 on running waters.
In general, it could be concluded that the number of sites where fish was present increased from 74,7% to 82,5%, given an indication of the general increase in water quality in Flanders.
The same was found for the presence of eel. The number of sites where eel was present increased from 34% in 1995–2000 to 42.5% in 2001–2005. This increase is statistically significant. The increase is mainly due to an increase in water quality, but also the buiding of fish ladders had a positive effect on eel colonization. A striking example of the positive evolution in water quality has been the recent report by INBO of eel and other fish on the River Zenne, a river flowing through Brussels, and considered as dead since beginning of 1900.
However the densities of the eel collected both by electrofishing and by fykefishing are low. Density data even tend to decrease between period one and two. The decrease is significant for the electrofishing data.

Joint EIFAC/ICES WGEEL Report 2007 301
0
10
20
30
40
50
60
70
80
90
canals running waters canals and running waters
% s
ites
1995-20002001-2005
Figure BE.9 Presence of eels from 487 surveys in canals and running water in period one: 1995–2000 and two: 2001–2005 (the same locations were fished in period 1versus period two).
0,0
10,0
20,0
30,0
40,0
50,0
60,0
70,0
80,0
90,0
1-5 5-15 >15
number of eels in canals
% s
ites
1995-20002001-2005
Figure BE.10 Abundance of eels (number of eels/100m EF and number of eels/fyke/24 u) on sites where eels are present in canals in period one: 1995–2000 and two: 2001–2005 (the same locations were fished in period one versus period two).

302 Joint EIFAC/ICES WGEEL Report 2007
0,0
10,0
20,0
30,0
40,0
50,0
60,0
70,0
80,0
90,0
1-5 5-15 >15
number of eels in running waters
%si
tes
1995-20002001-2005
Figure BE.11 Abundance of eels (number of eels/100m EF and number of eels/fyke/24 u) on sites where eels are present in running water in period one: 1995–2000 and two: 2001–2005 (the same locations were fished in period one versus period two).
BE.I.4 Eel surveys in the Walloon region (Meuse basin)
Decline of the European eel in Belgium-Walloon region (adapted from Philippart, pers. comm.).
At the Walloon region scale, the European eel shows recent demographic degradation in the last river basin (Meuse) where the species could still be encountered with fair abundance (Figure BE.13 and Table BE.4). Other basins have faced eel stock depletion for a long time because of multiple factors including (1) pollution (Scheldt, Sambre), (2) obstacles caused by dams (basins of the Chiers, the Semois and the Viroin, upstream Nisramont dam oriental and occidental Ourthe, and the Amblève upstream Coo) and (3) the suspension since 1980 of restocking with wild glass eels (from the Yser), yellow, or silver eels obtained from the wild and farmed before release (Figure BE.12).
Figure BE. 12 Distribution of the European eel in Wallonia between 1970 and 1982 showing catches i) in the lower Meuse and its tributaries (typically colonised by young eels originating from the sea, and ii) in the Semois and the Warche, (typically fed by young eels from the Yser estuary, captured and farmed for restocking).
Meuse and
Semois, Warche
and tributaries

Joint EIFAC/ICES WGEEL Report 2007 303
On the Meuse, the University of Liège is monitoring the amount of ascending young eels in a fish-pass. From 1992 to 2004 upstream migrating eels were collected in a trap (0,5 cm mesh size) installed at the top of a small pool-type fish-pass at the Visé-Lixhe dam (built in 1980 for navigation purposes and hydropower generation; height: 8,2 m; not equipped with a ship-lock) on the international River Meuse near the Dutch-Belgium border (290 km from the North Sea; width: 200 m; mean annual discharge: 238 m3/s; summer water temperature 21–26°C).The trap in the fish-pass is checked continuously (three times a week) over the migration period from March to September each year, except in 1994. A total number of 32 157 eels was caught (biomass 1955 kg) with a size from 14 cm to 85 cm and a mean value of 31,6 cm corresponding to yellow eels (data up to 2004). The study based on a constant year-to-year sampling effort revealed a regular decrease of the annual catch from a maximum of 5613 fish in 1992 to a minimum of 423 in 2004 (Baras et al., 1994, Philippart et al., 2004, Philippart and Rimbaud, 2005) (Figure BE.13).
The data for 2005 and 2006 stay low : respectively 758 and 559 (Philippart, 2006).
0
1000
2000
3000
4000
5000
6000
1992
1993
1994
1995
1996
1997
1998
1999
2000
2001
2002
2003
2004
2005
2006
Year
Num
ber
of e
els
Figure BE.13 Variation in the number of ascending young yellow eels trapped at the fish trap of the Visé-Lixhe dam Data from University of Liège (J.C. Philippart) in Philippart and Rimbaud, 2005 and Philippart (2006).
Scientific samplings of resident eels (counts from the Méhaigne, in Hosdent, from 1985 to 2005) and migrating eels (upstream migrating in the Meuse at the Lixhe dam, from 1992 to 2006) show a clear and critical demographic collapse (Figure BE.14). This could lead before 2010 to the disruption of recruitment of young individuals at the gates of the mosan basin in Wallonia, straightly leading for decades to a drastic reduction in continental populations, and eventually, to their extinction within twenty years.

304 Joint EIFAC/ICES WGEEL Report 2007
0
24
6
810
12
1416
18
1985
1987
1989
1991
1993
1995
1997
1999
2001
2003
2005
Year
Num
ber o
f eel
s
Figure BE.14 Number (x 100) of resident eels sampled by electric fishing in the Méhaigne in Hosdent-Latinne between 1985 and 2005 (Phillipart 2006).
Table BE.4 Number of yellow eels captured swimming upstream in the fish ladder unit of the Lixhe dam between 1992 and 2006, and number (x 100) of resident eels sampled by electric fishing in the Méhaigne in Hosdent-Latinne between 1985 and 2005 (Phillipart, 2006).
Meuse Mehaigne (x 100) 1985 1986 1570 1987 1988 1989 1000 1990 1991 1992 5613 450 1993 1994 1995 4240 770 1996 1997 2706 1998 3061 660 1999 4664 2000 3365 2001 2915 350 2002 1790 2003 1842 2004 423 300 2005 758 2006 559

Joint EIFAC/ICES WGEEL Report 2007 305
BE.J Restoring fish migration
For an overview of the actions of restoration of fish migration in Flanders, see www.vismigratie.be.
Fish ladders (adapted from the 2006–2007 report on Walloon environment).
In the perspective of the program “Saumon Meuse” (Malbrouck et al., 2007), modern fish ladders have been, or are in the process of being, built on five major dams and smaller obstacles distributed along the Meuse river and its tributaries (Figure BE.15). Efficiency of these ladders is under scientific monitoring. This monitoring shows positive and encouraging results, it has appeared that all mosan species, including the European eel, have been seen “using” the ladder devices. Between 1999 and 2005, 71 000 individuals belonging to 35 fish species were intercepted, then freed, in the mosan fish ladder of the Visé-Lixhe dam. Such migratory passes are useful tools for fish biodiversity monitoring. The process of fish ladder installation follows a systematic obstacle listing for the navigable and un-navigable waterways of the Walloon region. This inventory should be finalized by the end of 2007 for the southern basins of Wallonia, which are the most important regarding migrating amphihaline species (Figure BE.16). Those measures fit perfectly in the perspective of the Water Framework Directive which aims to restore good ecological state or potential for 2015, notably trough restoring a longitudinal ecological continuity along European rivers.
Figure BE.15 Fish ladders in the Walloon region 1Direction Générale des Ressources Naturelles et de l’Environnement, 2 Ministère de l’Equipement et des Transports, 3 Service Technique Provincial.

306 Joint EIFAC/ICES WGEEL Report 2007
Figure BE.16 Hydrographical domain where planning is needed in order to restore open circulation of the European eel.
Priorities in obstacle planning in the Walloon region-The case for European eel (adapted from Philippart and Ovidio-Laboratoire de Démographie des Poissons et Hydroécologie de l'Unité de Biologie du comportement, Université de Liège) (adapted from Philippart and Ovidio, 2007).
The geographical distribution area of the European eel encompasses the whole hydrographical network (figure), even if several sub-basins experience a critical decline in eel numbers due to the presence of major dams. In the future, all waterways from the mosan basin in the Walloon region should be accessible and provide settlement for yellow eels originating from the Atlantic Ocean. This is also the case for the Scheldt basin.
Effective management of migrating eel populations faces two main threats:
1 ) Wild stocks of young eels migrating upstream in the Meuse river experience a critical decline (clearly shown by the continuous samplings since 1990 in the small fish ladder of the Visé-Lixhe dam), ultimately leading to a definitive halt in natural recruitment trough that migration course around 2008 (Philippart et al., 2005).
2 ) Restockings with young eels from the wild (notably with glass eels from the Yser estuary) in waterways (Meuse, Sambre, Semois, Shelt and tributaries), channels and dam lakes (Bütgenbach, Robertville, Nisramont) situated upstream from physical barriers thus impassable for migrating eels.
For a migrating catadromous species such as the European eel, experiencing critical demographic decline in Europe and Belgium (Belpaire, 2005), it is necessary (a) to provide an adequate migration route along the Meuse migrating axis, especially in the segment between Lixhe and Monsin/Liège where dams are not equipped with navigation locks, (b) to list and provide solutions to provide eels with means to bypass obstacles blocking or slowing down upstream migration. Management actions should primarily focus on obstacles located in basins closer to the sea (Berwinne, the great-basin of Ourthe-Vesdre-Amblève) then spread to the basins located upstream from Liège (Méhaigne, Samson, Lesse).
In the sub-basin of the Sambre, and in all waterways of the Schelt basin, the European eel is the only amphihaline migrating species justifying recovery actions in order to restore their upstream migration pattern. However, given the present status of the stocks actually reaching

Joint EIFAC/ICES WGEEL Report 2007 307
those waterways, some of those still showing significant levels of pollution, those actions taken isolatedly, will not curb down the pressures experienced by eel populations, and must be integrated to broader actions promoted by international initiatives such as the International Schelt Commission (Scaldit Project (http://www.scaldit.org/)) and cooperation programs, i.a. with France regarding the Sambre and trans-boundary waterways.
BE.K Catch composition by age and length
BE.K.1 Flanders
An extensive database on length and weight is available at INBO, based on surveys with electrofishing and fykenetting. Many data are also available on the internet at http://vis.milieuinfo.be/.
BE.K.2 Wallonia
An extensive database on length and weight is available at GIPPA, based on fish stock surveys in Wallonia.
BE.L Other biological sampling
BE.L.1 Length, weight and growth (DCR)
An extensive database on length and weight is available at INBO, based on surveys with electrofishing and fykenetting. Many data are also available on the internet at http://vis.milieuinfo.be/. Growrth is studied in a population of eels at lake Weerde, a man made lake, but is not reported yet. In Wallonia length and weight data from scientific surveys is available at GIPPA.
BE.L.2 Parasites
Since last report (Belpaire, 2006) no new information is available on Anguillicola in Belgium. Anguillicola infection rates were monitored in 1987, 1997 and 2000. The presence of A. crassus in Flanders was first discovered in 1985; 2 year later a survey revealed a prevalence of 34.1% and a mean infection intensity of 5.5, based on adult nematodes only, and 10 year later the parasite was present at all 11 sites sampled. Prevalence had increased to 62.5% but the mean infection intensity had decreased to 3.9 adults per infected eel. In the year 2000, a third study revealed that A. crassus was present in 139 of 140 investigated sites; a further increase in prevalence to 68.7% and a decrease in mean infection intensity to 3.4 adults per infected eel was observed. When all larval stages were taken into account, mean prevalence amounted to 88.1% and mean intensity to 5.5 adults. The high infection level in Flanders is thought to be the result of restocking with glass eel and yellow eel, both of which are susceptible to A. crassus. For distribution maps of the parasite, see Belpaire (2006) or Audenaert et al. (2003).
In an older study (Schabuss et al., 1997) endoparasitic helminth communities of eel were investigated in for cut off meanders of Rivers Leie and Scheldt. Two cestodes (Proteocephalus macrocephalus and Bothriocephalus claviceps), two nematodes (Anguillicola crassus and Camallanus lacustris) and two acanthocephales (Acanthocephalus lucii and Acanthocephalus anguillae) were studied. Parasite communities were quite different between sites, but it was the nematode Anguillicola which was dominant at all sites.
BE.L.3 Contaminants
BE.L.3.1 Flanders
Extensive information has already been provided in the WG Eel 2006 report (Belpaire, 2006).

308 Joint EIFAC/ICES WGEEL Report 2007
Maes et al. (2007) described the results of a spatial and temporal analysis of the data from the Flemish eel pollution network. This network is running since 1994 and aims to use to yellow eel muscle tissue as an indicator of environmental and potential human dietary exposure by hazardous chemicals of surface waters and sediments. It also gives direct indications of the health of the eel, with respect to the presence of these chemicals. Between 1994 and 2005, over 2800 eel captured at 365 stations were analysed for PCBs, pesticides and heavy metals. A spatial analysis of the data demonstrated that the variation in pollutant concentration tended towards higher values (Figures BE.17, 18 and 19). This was especially evident for PCBs, lindane, endrin, dieldrin and DDE. The concentration of almost all banned substances decreased significantly during the study period, however some heavy metals like mercury and cadmium did not decrease.
ΣDDT
μg k
g-1 w
et w
eigh
t
10
100
1000
HCB
0.01
0.1
1
10
100
PCB 153
1994
1995
1996
1997
1998
1999
2000
2001
2002
2003
2004
2005
1
10
100
1000
10000
ΣPCB
1994
1995
1996
1997
1998
1999
2000
2001
2002
2003
2004
2005
μg k
g-1 w
et w
eigh
t
1
10
100
1000
10000
Figure BE.17. Temporal trends in average eel muscle tissue concentration of ∑DDT, ∑PCB, HCB and PCB 153 at sampling stations that were sampled more than once between 1994 and 2005. The bold line represents the average time trend which was modelled using a linear mixed model. Data from Maes et al., 2007.

Joint EIFAC/ICES WGEEL Report 2007 309
α-HCH
1994
1995
1996
1997
1998
1999
2000
2001
2002
2003
2004
2005
0.01
0.1
1
10
lindane
μg k
g-1 w
et w
eigh
t
0.1
1
10
100
1000
endrin
0.001
0.01
0.1
1
10
100
1000
dieldrin
1994
1995
1996
1997
1998
1999
2000
2001
2002
2003
2004
2005
μg k
g-1 w
et w
eigh
t
0.01
0.1
1
10
100
1000
Figure BE. 18 Temporal trends in average eel muscle tissue concentration of lindane, dieldrin, endrin and alpha-HCH at sampling stations that were sampled more than once between 1994 and 2005. The bold line represents the average time trend which was modelled using a linear mixed model. Data from Maes et al., 2007.

310 Joint EIFAC/ICES WGEEL Report 2007
mercury
μg k
g-1 w
et w
eigh
t
10
100
1000
cadmium
1994
1995
1996
1997
1998
1999
2000
2001
2002
2003
2004
2005
1
10
100
1000
lead
1994
1995
1996
1997
1998
1999
2000
2001
2002
2003
2004
2005
μg k
g-1 w
et w
eigh
t
1
10
100
1000
Figure BE.19 Temporal trends in average eel muscle tissue concentration of three heavy metals at sampling stations that were sampled more than once between 1994 and 2005. The bold line represents the average time trend which was modelled using a linear mixed model. Data from Maes et al., 2007.
Recent results of analyses of dioxins, furanes and dioxin like PCBs on eels from 8 sites in Flanders indicate that on 50% of the sites the levels were higher than the maximum allowed levels (Goemans, pers. comm.). Maximum allowed levels of the sum of dioxins, furans and dioxin-like PCBs (WHO-PCDD/ F-PCB-TEQ) is for eel 12,0 pg/g fresh weight (EC, 2006). Comparing with the Palstra et al. (2006) benchmark of 4 pg TEQ (PCDDs/PCDFs + PCBs) /g ww where malformation of larvae appear, 5 on 8 sites (62%) are above this level.
There is an increasing awareness that spawner quality might be an essential element in the decline of the European eel. Recent studies have shown that pollution with dioxin like substances, including PCBs may have a large impact on the reproduction success of the eel. We did a study (Geeraerts et al., 2007) around the ecotoxicological effects of pollutants in European eel which contains a literature overview about the (harmful) consequences of these contaminants on eel. For various compounds the relation between the concentration in the water and the contamination and subsequent health of eels is described. A general survey is

Joint EIFAC/ICES WGEEL Report 2007 311
given about the analysed pollutants in Flanders (Belgium) and their properties. The relevance of eel as a bio-indicator species is explained and the results of the Flemish eel pollution network presented.
During their transoceanic migration to the spawning grounds eels consume about 60% of their fat supplies (van Ginneken and van den Thillart, 2000) meaning that a part of the accumulated pollutants becomes available. A continuously fat burning means a continuous availability of pollutants and a large extent of toxicity in the eel, despite the fact that a part of those contaminants again is stored in the fat tissue. Such a poisoning leads to disruptions in the immune, reproduction, nervous and endocrine system. The toxification that way causes physiological disruptions, reduced endocrine stress response and reduced resistance against infections of viruses and parasites, which for his part leads to a disturbed reproduction and even dead of the eel. So pollutants can play an important role in the decline of the species. A study done by De Boer et al. (1993) brought to light that 85-90% of the toxic effects of PCBs is caused by PCBs 126, 156 and 118 which have many industrial purposes. De Boer et al. (1994) also showed that once PCBs are accumulated in eel tissue, the biological half-life in eels can be years (1–4 years). It is reasonable to assume that persistent contaminant levels reported in eel tissues remain very close to the initial values after the migration, when spawning takes place. Other results show that hosts (eels) exposed to pollution easily are infected by parasites opposite to non-contaminated eels. The sensitivity to contaminants and the consequences are species- and dose dependent. Much is known about the influence of pollutants on eels and its predators but there still are many uncertainties. Less information is available on the exact concentration at which a compound becomes toxic. Further research is necessary.
A review of latest data and reports on contaminants in eel has been given, and Flemish eel data are compared to toxic benchmarks from literature. An extensive dataset of contaminants has been analysed by statistical modelling, to show relationships between fitness (lipid content and eel condition) and various environmental variables. We saw that mean fat percentage of Flemish eel (1994–2005) is 15.1% of the body weight meaning that eels will not be able to finish their transoceanic migration with sufficient reserves. The analysis shows that the fat percentage is influenced by typology and year. Eels from standing waters and polder waters have lowest fat percentage while eels from rivers and canals have striking higher fat percentages. It was also concluded that PCBs (especially the higher chlorinated ones) and DDTs have a negative impact on the lipid content of the eel. (Geeraerts et al., 2007).
Belpaire et al. (2003) reported on the extreme high levels of Brominated Flame Retardants (BFRs) in eels (collected in 2000) from one particular site on the Scheldt river (near Oudenaarde) (which were the highest concentrations worldwide in eel measured). New samples were taken in 2006 and analysed. Even though the BFR concentrations dropped significantly compared to the concentrations found in 2000, they remain among the highest in the world. Atmospheric deposition can be considered as a minor pollution pathway since the two closed water bodies in the close vicinity of these highly contaminated sites on the River Scheldt, used as reference waters, showed no abnormally high BFR contamination (Goemans et al., 2007).
Starting from the same dataset of the eel pollution network and additional analyses of brominated flame retardants, volatile organic pollutants (VOCs), endocrine disruptors, dioxins, perfluorooctane sulphonic acids (PFOSs), metallothioneins, and polycyclic aromatic compounds, Belpaire and Goemans (2007a) have illustrated how eel can pinpoint environmental contamination of the environment. The biomonitoring value of eels as a tool for monitoring environmental contamination has been discussed. It was concluded that (1) eel is a highly suitable biomonitor for environmental contaminants, for both local and international purposes, e.g. to evaluate the chemical status for the Water Framework Directive, and (2)

312 Joint EIFAC/ICES WGEEL Report 2007
dependent on the degree of pollution in their habitat, the levels of certain contaminants reported in yellow eels can be high, and might affect their potential for reproduction.
The usefulness of monitoring contaminants in eel for the WFD was further discussed in Belpaire and Goemans (2007b). The Water Framework Directive recently (2006) proposed to monitor a selection of priority substances and to report on the chemical status of our water bodies. The final objective is the protection of aquatic life and human health. The majority of these substances are lipophilic, nevertheless it is proposed to monitor them in the water-phase. As there is serious concern about whether measurements of these lipophilic compounds in water will give satisfying results to guarantee the protection of aquatic life, monitoring in biota seems to be more appropriate.
The advantages of using the European eel (Anguilla anguilla) as a model for evaluating the chemical status within the WFD is discussed. A wide range of studies over Europe exist and have pinpointed various types of environmental contamination. Eel contaminant profiles seem to be a fingerprint of the contamination pressure of a specific site. From the Flemish eel pollution database, reference values and quality classes for PCBs, OCPs and heavy metals in eel were deduced and are presented.
The set up of a harmonised, Europe-wide chemical monitoring programme of eels could stand for a triple application: (1) the evaluation of environmental health and chemical status, (2) the sanitary control of fisheries products within human food safety regulations, and (3) the monitoring of eel quality within the requirements of the international eel restoration plan (Fig. BE.20). Taking into account the actual high concentration of some contaminants in certain eel subpopulations and the ecotoxicological effects of these substances, achieving good chemical status of EU waters will directly be beneficial for the eel restoration. By measuring in eel itself we could better direct protect the eel.
Framework
EEL POLLUTION BIOINDICATORSampling & Analysing
NATIONAL EEL MANAGEMENT PLAN(Data Collection Regulation)
WATER FRAMEWORK DIRECTIVE(and other environmental issues)
HUMAN HEALTH PROTECTIONSANITARY CONTROL OF FISHERIES PRODUCTS
Focus on lipid content, PCBs, Anguillicola, EVEX virusesor other factors affecting spawner quality
Achieving good chemical statusfor 33 substances (CEC 2006a)
EU Regulations : Dioxins and PCBs, Cd, Pb, HgNational legislation, e.g. Belgium Sum PCB,
WATER QUALITY MEASURES
FISHERIES AND TRADE RESTRICTIONS
EUROPEAN PROTECTIVE MEASURES FOR EEL
Focused substances Measures
Figure BE.20 Possibilities of combined use of monitoring contaminants in the eel (Belpaire and Goemans, 2007b).
Another recent study (Bilau et al., 2007) assessed the intake PCBs through consumption of eel by recreational fishermen and compared it with the intake of a background population. Concentrations of the sum of the seven indicator PCBs (Sum PCBs) measured in non

Joint EIFAC/ICES WGEEL Report 2007 313
commercial European eel (Anguilla anguilla L.) in Flanders are high: in 80% of all sampled localities, the Belgian PCB standard for fish was exceeded. The median estimated intake for recreational fishermen varies between 18.4 and 237.6 ng Sum PCBs/kg bw/day, depending on the consumption scenario, while the estimated intake of the background population (consumers only) is 4.3 ng Sum PCBs/kg bw/day. Since the levels of intake via eel for two intake scenarios were respectively 50 and 25 times higher than the intake of the background population, the body burden might be proportionately higher and reach levels of toxicological relevance. The intake of PCBs via consumption of self-caught eel in Flanders seems to be at a level of high concern. It was advised to maintain the Flemish catch-and-release obligation for eel, established in 2002, but withdrawn in 2006.
Considering (1) that the effects of contaminants on biota in general and on eel specifically are better known and seem to be of utmost importance for the reproduction success of the species, (2) that the pollution in eels is impressively varying between sites within and between member countries, (3) that the level of pollution in eel in many cases surpasses binding human consumption maximum allowed levels or advisory consumption limits and thus has an effect on fisheries management and regulation, we strongly recommend that at community level initiatives are taken to collate information, to set up comparative monitoring actions, to set up a pan-european database, to set up studies on effects , etc.
BE.L.3.2 Wallonia (adapted from the 2006–2007 report on Walloon environment)
In order to assess the health risk associated to the consumption of fishes originating from Walloon rivers (fishes sampled in 61 stations situated on 30 different waterways between 2001 and 2004), the amounts of PCB dioxins and furans encountered in eel tissues were compared with the standard values applied to human health (Thomé et al., 2004)(Figure BE.21). These are set to 75 ng/g of fresh weight for PCBs (Royal Order from 6th March 2002 modifying the previous Royal Order (19th may 2000) establishing maximal dioxin and PCB levels in several food stuffs. Levels concern PCB congeners 28, 52, 101, 118, 138, 153 and 180) and 12 pg TEQ-WHO/g (TEQ-WHO or Toxic Equivalents-World Health Organization) of fresh weight for dioxins and furans (European Council regulation of the 29th November 2001).
Eel contamination by dioxins and furans stays in safe levels, encountered values never exceed the 12 pg TEQ-WHO/g of fresh weight.
However, the situation of PCB contamination is far more alarming. Eels reveal PCB concentrations between 40 and 1761 ng/g of freshweight (Figure BE.22 and Table BE.5). Such results are particularly disturbing because they nearly systematically exceed the defined value for human consumption. The highest contamination levels are encountered in the lower Meuse, the Albert channel and the Vesdre. It is to be feared that a regular consumption of eel meat should reveal a threat to human health. Facing this situation, a Walloon jurisdiction aiming to prohibit consumption of eels fished from Walloon rivers was published in june 2006 (Walloon Governement, 2006).

314 Joint EIFAC/ICES WGEEL Report 2007
Figure BE.21 Eel contamination by PCB, dioxins and furans in Wallonia (Chalon et al., 2006, Thomé et al., 2004).
Figure BE.22 Comparison between the accepted PCB level of 75 ng/g FW (red line) and leves in eels reported by waterway and basin-acronyms explained in annexed table (adapted from Chalon et al., 2006).

Joint EIFAC/ICES WGEEL Report 2007 315
Table BE.5 Acronyms for the sites in Figure BE.22 (PCB contamination samples).
BASIN SUB-BASIN WATERWAY CODE LOCATION
Amblève AMB 1 Comblain-la-tour/Halleux Amblève AMB 2 Deidenberg Amblève AMB 3 Lorcé-Mabompré
Amblève
Warche WAR 1 Robertville Lesse LES 1 Redu Lesse LES 2 Eprave Lesse L'homme LHO 1 Poix-st-Hubert Eau- Blanche EAB 1 Aublain Meuse MEU 5 Waulsort Meuse MEU 3 Tailfer Samson SAM 1 Goyet
Meuse-amont
Viroin VIR 1 Vierves/Dourbes Olloy Berwinne BER 1 Mortroux Berwinne BER 2 Berneau Canal Albert C/ALB 1 Lanaye Gueule GUE 1 Sippenaeken Gueule GUE 2 Plombières Hoyoux HOY 1 Huy Mehaigne MEH 1 Goyet Mehaigne MEH 2 Latinnes-Hosdent Mehaigne MEH 3 Wanze Meuse MEU 1 Tihange Meuse MEU 2 Lixhe/Visé
Meuse-aval
Meuse MEU 4 Ben Hahin/Ampsin Aisne AIS 1 Bomal Aisne AIS 2 Haut-Roche Ourthe OTH 1 Comblain-la-tour Ourthe OTH 2 Tilff-Colonster Ourthe OTH 3 Hotton Ourthe OTH 4 Houffalize Ourthe OTH 5 Ortho Ourthe OTH 6 Maboge Ourthe OTH 7 Angleur Ourthe OTH 8 Nisramont Ourthe OTH 9 Barvaux
Ourthe
Ourthe OTH 10 Bardonwez Eau d'Heure EDH 1 Jamioulx Hantes HAN 1 Wiheries Sambre SAB 1 Landelies
Sambre
Sambre SAB 2 Marchienne-au-pont Rulles RUL 1 Marbehan Rulles RUL 2 Habay-la-vieille
Meuse
Semois-Chiers
Semois SEM 1 Bohan

316 Joint EIFAC/ICES WGEEL Report 2007
BASIN SUB-BASIN WATERWAY CODE LOCATION
Semois SEM 2 Chiny Ton TON 1 Lamorteau Ton TON 2 Harnoncourt Hoegne HOE 1 Theux Vesdre VES 1 Vaux -s/Chevremont Vesdre VES 2 Chênée Vesdre VES 3 et 4 Chaudfontaine Vesdre VES 5 Nessonvaux
Vesdre
Vesdre H VES Aval Dohain Dendre DEN 0 Lessines
Dendre Oriental Dendre DEN 1 Ath
Dyle-Gette Dyle Bassin / / Escaut-Lys Escaut ESC 1 Kain
Grande-Honnelle GHO 1 Baisieux
Escaut
Haine Trouille TRO 1 Givry Our OUR 1 Ouren Our OUR 2 Andler Rhine Moselle Sûre SUR 1 Martelange
BE.L.4 Predators
We hereby give some information about the great cormorant in Flanders and Wallonia.
BE.L.4.1 Flanders (after Devos et al., 2005)
The great cormorant disappeared as a nesting bird in Flanders in 1965 and only returned in 1993. Since then the breeding population has increased from 8 pairs in 1993 to 443 in 1999 with a wintering group of between 2000 and 2500 birds. The total (ecological and economical) impact of this large number of fish-eating birds on a small area like Flanders (with only 257 km2 water surface) needs urgent investigation. The diet of the great cormorant mainly consists of roach and other cyprinids, perch and ruffe with only a few eel. However, the impact of great cormorant predation on fish stocks is difficult to assess because of lack of data on fish populations. Moreover, economic losses can only be deduced roughly from numbers of birds and their daily food requirement.
In Flanders there are very few commercial fisheries and no specific studies on great cormorants. Nevertheless the population has increased considerably during the last decade and damage to fish farms and ponds was considered to be a major problem. For the extensive aquaculture facilities in Flanders, losses in yields are estimated to be almost 50% and economical losses are even higher as investments have to be made to prevent further damage. Thus, the impact of the great cormorant on fish stocks and fisheries in Flanders can be highlighted as follows:
i ) Ecological problems: preference for roach rather than bream which resulted in depleted roach stocks; habitat alteration and predation on rare species.
ii ) Pathologic problems: wounding of fish and causing stress as well as the spread of diseases.
iii ) Social problems: decrease in the number of fishermen/anglers. iv ) Economic problems: loss of income because of lower fish yields; fewer
fishing/angling permits sold.

Joint EIFAC/ICES WGEEL Report 2007 317
Consideration of cormorant management in Flanders laid emphasis on financial support and/or compensation for fish culturists rather than the reduction of the cormorant population.
In conclusion: (i) Further investigation is necessary to assess possible ecological damage.(ii) Damage to fish farms and ponds is a major local problem highlighting the necessity for government intervention in the form of financial compensation and/or subsiding of scaring technology. Passive deterrents are not possible for very large ponds and are not allowed in nature reserves.
BE.L.4.2 Wallonia (after Paquet, 2005)
Almost no scientific studies on Cormorant impacts are available in Wallonia as conflicts have only surfaced as recently as 1994. Data presented here were mostly collected in 2001–02. Since then, an interdisciplinary research team has conducted an in-depth study of the conflicts involving cormorants in Wallonia. A technical report (web site: http://environnement.wallonie.be/crnfb/), which updates the data presented here, has been published by the Centre de Recherche Nature, Forêt, Bois.
The great cormorant first appeared as a regular wintering bird in Wallonia during 1991–1992. The wintering population subsequently developed rapidly, first along the main valley of the Meuse River and then along the tributaries and other water systems. The total mid-winter count in January 2002 was 3900 individuals, with 2600 birds in the Meuse valley. The wintering population is still increasing slowly in the smaller river systems, primarily due to colonization of new fishing grounds. Since 1992 a still growing small breeding population of 250 pairs has been established in two colonies within Wallonia but they have not shown any sign of expanding yet.
The cormorant is still strictly protected (regional law on wild indigenous birds from 14/07/1994). The regional law from 8/10/1998 allows financial compensation for damage caused by protected birds to professional fisheries but these compensations are considered too low or too difficult to obtain by fish farmers, for whom the fish farming activity is mostly a supplementary job.
String devices have been used at some fish farms as well as across some stretches of river important for fly-fishing. Illegal culling of great cormorants is probably limited, although difficult to assess. The use of a fishing hook fixed into small live or dead fish and used as bait for the birds has been known to occur. Disturbance of night roosts rarely happens although it has along some small rivers. Breeding colonies are located in protected/private sites.
i ) More studies are needed of the impact of wintering Great Cormorants, particularly on smaller rivers (e.g. Semois, Lesse, Amblève).
ii ) Wallonia is a good area to assess conflicts with cormorant in the context of a ‘no killing’ policy.
iii ) Good communication with fish farmers and anglers about the problems they face and possible solutions is urgently needed.

318 Joint EIFAC/ICES WGEEL Report 2007
BE.M Other sampling
BE.N Stock assessment
BE.O Sampling intensity and precision
BE.P Standardisation and harmonisation of methodology
BE.P.1 Survey techniques
BE.P.1.1 Flanders
The survey techniques are following the standardised procedures used for the INBO Fish Assessment Network and described in Belpaire et al. (2000). For particular projects more appropriate methods can be used (see under Wallonia).
Table BE.6. Description of the techniques used for fish stock analysis in Flandrian waterbodies by INBO.
WATERTYPE TECHNIQUES USED
Running waters < 1.5 m 100 m electrofishing with 1 anode Running waters 1.5–4 m 100 m electrofishing with 2 anodes Running waters 4–6 m 100 m electrofishing with 3 anodes Running waters 6–8 m 100 m electrofishing with 4 anodes Running waters > 8 m Combination of:
500 m boat electrofishing (2 x 250 mon both river banks) fykes and/or gill nets
Closed river arms and ponds Polder drainage systems
Combination of : seine netting boat electrofishing (both river banks) fykes and/or gill nets
BE.P.1.2 Wallonia
Two main techniques are employed in order to assess eel numbers in standard sampling points: electrical fishing and direct counts of eels passing fish ladders. Other techniques in use are the metallic grid keepnet, net, seine, direct obstacle counts, bait fishing (using crayfish), observations from tanks emptying, and from biotic index.
BE.P.2 Sampling commercial catches
No data.
BE.P.3 Sampling
BE.P.4 Age analysis
There is currently no general monitoring program for growth rates of eel. In the past studies haven been undertaken to follow growth of elvers stocked in ponds (Belpaire et al., 1992). In 2001, a study has been set up to study and monitor growth of tagged eel in a Flandrian lake (Lake Weerde) over 6 years. Results are in process.
BE.P.5 Life stages
BE.P.6 Sex determinations
No data.

Joint EIFAC/ICES WGEEL Report 2007 319
BE.Q Overview, conclusions and recommendations
The development of eel management plans are still to be worked out in Belgium. There are major critical points where considerable efforts still have to be made, essentially on water quality and pollution, and on habitat restoration and restoration of the migration possibilities.
Considering (1) that the effects of contaminants on biota in general and on eel specifically are better known and seem to be of utmost importance for the reproduction success of the species, (2) that the pollution in eels is impressively varying between sites within and between member countries, (3) that the level of pollution in eel in many cases surpasses binding human consumption maximum allowed levels or advisory consumption limits and thus has an effect on fisheries management and regulation, we strongly recommend that at community level initiatives are taken to collate information, to set up comparative monitoring actions, to set up a pan-european database, to set up studies on effects , etc.
BE.R Literature references
Audenaert V., Huyse T., Goemans G, Belpaire C. and Volckaert F. 2003 Spatio-temporal dynamics of the parasitic nematode Anguillicola crassus in Flanders, Belgium. Diseases of Aquatic Organisms 56: 223–233.
Baras E., Salmon B. and Philippart J.C. 1994 Evaluation of a eel-trap sampling method for the assessment of migrant yellow eels Anguilla anguilla (L.) in the river Meuse. Bull. Fr. Pêche Piscic. 335: 7–16 (in French).
Belpaire C., Goemans G., de Boer J. and Van Hooste H. 2003 Verspreiding van gebromeerde vlamvertragers. [Distribution of Brominated Flame Retardants.] In: MIRA-T 2003: Report of the Environment and Nature in Flanders, Flemish Environmental Agency and Lannoo publishing, Heverlee, Belgium, pp 387–395. (in Dutch).
Belpaire C., Goemans G., Van Thuyne G., Verreycken H. and Maes, J., 2003 Eel Fisheries and Management in Flanders, Belgium: Status and Trends. International Eel symposium, Quebec 10–15 august, 2003.
Belpaire C., Van Driessche H., Gao F.Y. and Ollevier, F. 1992 Food and feeding activity of glasseel Anguilla anguilla (L.) stocked in earthen ponds. Irish Fisheries Investigations, series A (Freshwater) 36: 43–54.
Belpaire, C. (2002) Monitoring of glass eel recruitment in Belgium. In: Dekker W. (Ed.) Monitoring of glass eel recruitment. Netherlands Institute of Fisheries research, report C007/02-WD, Volume 2B, pp. 169–180.
Belpaire, C. (2006) Report on the eel stock and fishery in Belgium 2005. In FAO European Inland Fisheries Advisory Commission; International Council for the Exploration of the Sea. Report of the 2006 session of the Joint EIFAC/ICES Working Group on Eels. Rome, 23–27 January 2006. EIFAC Occasional Paper. No. 38, ICES CM 2006/ACFM:16. Rome, FAO/Copenhagen, ICES. 2006. 352p., 217–241.
Belpaire, C. and Coussement, M. 2000 Nota omtrent het uitzetten van paling in de Vlaamse openbare waters. [Note on the restocking of glasseel in Flandrian public waters]. Advice for the High Fisheries Council (March 20, 2000). Institute for Forestry and Game Management, Vlaamse Vereniging van Hengelsport Verbonden, IBW.Wb.V.ADV.2000.070 (in Dutch).
Belpaire, C. and Gerard, P., 1994 Rapport sur la situation de l'aquaculture en Belgique. EIFAC, Consultation sur les stratégies d'aménagement des pêches et de l'aquaculture, Rome (Italie), May 1994, p. 7.
Belpaire, C., Goemans, G. (2007a). Eels: contaminant cocktails pinpointing environmental pollution. Journal of Marine Science, in press.
320 Joint EIFAC/ICES WGEEL Report 2007
Belpaire, C., Goemans, G. (2007b) submitted. The European eel Anguilla anguilla, a rapporteur of the chemical status for the Water Framework Directive? 12 years of monitoring in Flanders. Life and Environment, subm.
Belpaire, C.; Smolders, R.; Vanden Auweele, I.; Ercken, D.; Breine, J.; Van Thuyne, G.; Ollevier, F. (2000). An index of biotic integrity characterizing fish populations and the ecological quality of Flandrian water bodies. Hydrobiologia 434: 17–33.
Bilau, M., I. Sioen, C. Matthys, A. De Vocht, G. Goemans, C. Belpaire, J.L. Willems, S. De Henauw, 2007 in press. Polychlorinated biphenyl (PCB) exposure through eel consumption in recreational fishermen as compared to the general population, using a probabilistic approach. Food Additives and Contaminants.
Cellule Etat de l’Environnement Wallon (2007). Rapport Analytique sur l’état de l’environnement Wallon 2006-2007 (2006-2007 report on Walloon environment)-MRW-DGRNE, Namur ; 736 p. Direct link : http://environnement.wallonie.be/eew/tablematiere.aspx
Chalon, C., Leroy, D., Thome, J.P., Goffart, A. (2006) Les micropolluants dans les eaux de surface en Région wallonne. Dossier scientifique réalisé dans le cadre de l’élaboration du Rapport Analytique 2006–2007 sur l’état de l’environnement wallon.
de Boer, J., C.J.N. Traag, W.A. Stronck & J. van der Meer, 1993. Non-ortho and mono-ortho substituted chlorobiphenyls and chlorinated dibenzo-p-dioxins and dibenzofurans in marine and freshwater fish and shellfish from the Netherlands. Chemosphere 26(10): 1823–1842.
de Boer, J., F. van de Valk, M.A.T. Kerkhoff, P. Hagel & U.A.Th. Brinkman, 1994. 8-Year study on the elimination of PCBs and other organochlorine compounds from eel (Anguilla anguilla) under natural conditions. Environmental Science and Technology 28(13): 2242–2248.
Devos, K., H. Verreycken, D. de Charleroy, C. Belpaire, 2005. Flanders. In : Reducing the conflict between cormorants and fisheries on a pan-European scale. Summary & National Overviews. Edited by: D N Carss & M Marzano (2005).
EC (2006a). Facts and figures on the CFP-publication of the European Commission Basic data on the Common Fisheries Policy Luxembourg: Office for Official Publications of the European Communities ISBN 92–79–00898–6.
EC (2006b) COMMISSION REGULATION (EC) No 199/2006 of 3 February 2006 amending Regulation (EC) No 466/2001 setting maximum levels for certain contaminants in foodstuffs as regards dioxins and dioxin-like PCBs L 32/34 EN Official Journal of the European Union 4.2.2006.
Geeraerts, C., G. Goemans, P. Quataert & C. Belpaire (2007) Ecologische en ecotoxicologische betekenis van verontreinigende stoffen in paling. Studie uitgevoerd in opdracht van de Vlaamse Milieumaatschappij, MIRA, MIRA/2006X/XX, INBO/R/2007/40. Instituut voor Natuur-en Bosonderzoek. p. 207, in press.
Goemans, G., Roosens, L., Dirtu A.C., Belpaire, C., Neels, H., Covaci, A. (2007). Brominated flame retardants in fish from the Scheldt river (Belgium). Proceedings Dioxin2007, Tokyo, Japan.
Groupe d’intérêt pour les poissons, la pêche et l’aquaculture (GIPPA asbl) 2006. Vers une nouvelle politique des rempoissonnements. Ebauche de document de synthèse, fruit des travaux du Groupe de Travail “Rempoissonnements”. 179p.
Maes J., Geysen B., Ercken D. and Ollevier F. 2003 Opvolging van het visbestand van de Zeeschelde. Resultaten voor 2002. KU Leuven, Laboratorium voor Aquatische Ecologie, Report for Institute for Forestry and Game Management, 29p. (in Dutch).
Maes, J., Goemans, G. and Belpaire, C., 2007. Spatial variations and temporal trends between 1994 and 2005 in polychlorinated biphenyls, organochlorine pesticides and heavy metals

Joint EIFAC/ICES WGEEL Report 2007 321
in European eel (Anguilla anguilla L.) in Flanders, Belgium. Environmental Pollution doi:10.1016/j.envpol.2007.07.021.
Malbrouck, C, Micha., J.-C., Philippart J.-C.(2007) Projet «Meuse Saumon 2000» Project associating the Walloon Cabinet for Agriculture, Rural affairs, Environment and Tourism, the Facultés Universitaires Notre-Dame de la Paix de Namur (FUNDP) and the Université de Liège (ULg). Direct link: http://environnement.wallonie.be/publi/education/saumon2000.pdf
Palstra AP, van Ginneken VJT, Murk AJ, van den Thillart GEEJM 2006. Are dioxin-like contaminants responsible for the eel (Anguilla anguilla) drama? Naturwissenschaften 93: 145–148.
Paquet, J.Y., 2005. Wallonia. In : Reducing the conflict between cormorants and fisheries on a pan-European scale. Summary & National Overviews. Edited by: D N Carss & M Marzano (2005).
Philippart J.C and Rimbaud G. 2005 L’efficacité de la nouvelle grande échelle à poissons du barrage de Visé-Lixhe sur la Meuse. Eléments du suivi scientifique 1999–2004. [Efficiency of the new large fish pass at the Visé-Lixhe dam on the river Meuse. Follow-up 1999–2004]. Draft report-50 years of Fonds Piscicole.
Philippart J.C, Sonny D. and Ovidio M. 2005 A 12-year study of the upstream migration of Anguilla anguilla in a fish-pass in the River Meuse reveals a dramatic decrease of the stock in Belgium. Bordeaux, Fish and diadromy in Europe; Ecology, Management, Conservation Bordeaux Conference 2005, poster.
Philippart, J.C and Ovidio, M. (2007) Définition des bases biologiques et éco-hydrauliques pour la libre circulation des poissons dans les cours d’eau non naviguables de Wallonie. Identification des priorités d’action d’après les critères biologiques et piscicoles. Vol.3. LDPH. Rapport final de synthèse pour la période 2005–2007, convention Ulg n°05/43388.
Philippart,J-C. (2006) L’érosion de la biodiversité : les poissons. Dossier Scientifique réalisé dans le cadre de l’élaboration du rapport analytique 2006-2007 sur l’état de l’environnement Wallon. Université de Liège. 306 pp.
Schabuss, M., Konecny, R., Belpaire, C., Schiemer, F., 1997. Endoparasitic helminths of the European eel, Anguilla anguilla, from our disconnected meanders from the rivers Leie and Scheldt in western Flanders, Belgium. Folia Parasitologica 44 : 12–18.
Thomé JP, Bertrand A, Brose F, Carabin O, De Pauw E, Dukmans C, Eppe G, Gaspar P, Leroy A, Louvet M, Maghuin-Rogister G, Marneffe Y, Massart AC, Philippart, JC, Rimbaut G, Scippo ML 2004. Evaluation du niveau de contamination des rivières par les PCBs et les dioxines. Report Université de Liège. Convention avec la Région Wallonne, Ministère de l’Aménagement du Territoire, de l’Urbanisme et de l’Environnement, Engagement n° 01/4143, 167 p.
van Ginneken, V.J.T. & G.E.E.J.M. Van den Thillart, 2000. Eel fat stores enough to reach the Sargasso. Nature 403: 156–157.
Vandecruys, W., 2004. Economische en sociale aspecten van de hengelsport op openbaar water in Vlaanderen. Limburgs Universitair Centrum.
Vocht, de A. and Bruyn, de L., 2005 Binnenvisserij. In Natuurrapport 2005, Institute of Nature Conservation, Brussels.
Walloon Government (2006) Walloon Government Order of 15th june 2006 modifying the Walloon Regional Executive Order of 11th March 1993 concerning angling, in order to impose no-kill practices for the European eel.
322 Joint EIFAC/ICES WGEEL Report 2007
I reland: Report on the eel stock and f ishery in Ireland 2007
IR.A. Authors
Dr. Russell Poole, Marine Institute, Furnace, Newport, Co. Mayo, Ireland.
Tel: 00–353–98–42300. FAX: 00–353–98–42340
Reporting Period: This report was completed in August 2007, and contains data up to Dec 2006 and some provisional data for 2007.
Contributors to the report:
Eastern Regional Fisheries Board Southern Regional Fisheries Board South Western Regional Fisheries Board Shannon Regional Fisheries Board Western Regional Fisheries Board North Western Regional Fisheries Board Northern Regional Fisheries Board Marine Institute Central Fisheries Board Electricity Supply Board, Ardnacrusha & Ballyshannon Galway Fishery Dept. of Zoology, National University, Galway Dept. of Zoology, Trinity College Dublin NSSHARE Project - INTERREG IIIA Programme for Ireland/Northern Ireland
IR.B. Introduction
This report continues the sequence of reporting annual national eel data to the ICES/EIFAC Eel Working Group. In line with the requirements of the EU Eel Recovery Plan (Action Plan; COM 2003, 573: Regulation; COM (2005) 472) and the EU Data Collection Regulation for fisheries (Council Regulation 1543/2000 and Commission Regulations 1639/2001, 1581/2004) the National Eel Reports have now been restructured under the standard headings of the DCR. The EU has also recommended in the proposed regulation (COM (2005) 472) that Eel Management Plans be established and implemented on a Waterframework Directive River Basin District level and this report includes reporting catch data by Fisheries Region and by River Basin District.
IR.B.1 The Irish National programme
The Irish National Programme will be conducted in close co-operation between the following organisations, although the details in relation eel and inland fisheries have yet to be established.
Department of Communications Marine and Natural Resources (DCMNR)
DCMNR is the main governmental department with responsibility for fisheries policy, management, control and enforcement.

Joint EIFAC/ICES WGEEL Report 2007 323
The Marine Institute (MI)
The MI is a semi-state marine research organisation with national responsibility for the provision of scientific advice on eel and the collection of scientific data on the fisheries sector and the implementation of the module on evaluation of inputs, fishing capacities and fishing effort and the module of evaluation of catches and landings as defined in the Application regulation of EU Council Regulation 1543/2000.
An Bord Iascaigh Mhara (BIM-The Irish Sea Fisheries Board)
BIM is a semi state sea fisheries development agency charged by DCMNR with the collection of economic data on the marine fisheries sector.
The Central (CFB) and Regional Fisheries Boards (RFBs)
The CFB is a statutory body, established under the Fisheries Act 1980, operating under the aegis of the DCMNR. The principal functions of the CFB are to advise the DCMNR on policy relating to the conservation, protection, management, development and improvement of inland fisheries and sea angling, and to support, coordinate and provide specialist support services to the RFBs. The seven statutory RFBs are responsible for maintaining and improving environmental quality and developing and protecting the fisheries resource in their regions (Figure IR.1). Eel fishing licences and authorizations are issued on a Regional basis.
Electricity Supply Board (ESB)
ESB has a statutory role in preserving and developing the Shannon fishery, since the establishment of a hydroelectric scheme on the river when the government handed over all fishing rights to the company in 1935.
IR.B.2 The Irish eel fishery
Glass eel and elver fishing in Ireland is prohibited by law (1959 Fisheries Act, Sec. 173) and its current government policy that fishing for juvenile eel may only be carried out under Section 18 authorisation from the Regional Fisheries Boards for the purposes of stock enhancement. Capture of juvenile eel for supply to eel farms or export requires a Section 14 Authorisation from the Dept. of Communications, Marine and Natural Resources. Capture of glass eel did not take place in Ireland until the 1990s. This is a tidal activity using a variety of techniques such as anchored nets (tela), fyke net, trawl and dip-net. Upstream migrating elver have been captured since 1959 under statute, for transfer upstream around barriers; first on the Shannon and more latterly on other rivers under the control of the Electricity Supply Board (ESB). This is usually carried out using fixed elver traps incorporating elevated ladders and collecting boxes. All juvenile eel captured are released upstream for enhancement. There is no National sampling programme for the glass eel/elver fishery.
The commercial eel fishery involves harvesting both brown and silver eel in freshwater and in estuarine or tidal waters. Brown eel are fished using a variety of techniques, the most common of which are baited long-line, fyke nets and baited pots. When silver eel are migrating downstream in the autumn they are caught in fyke nets and stocking-shaped nets called "coghill nets" which are attached to fixed structures in the river flow, often at "eel weirs".
The declared commercial eel catch in the Irish Republic, 2001–2002, was about 100 t involving about 150–200 part-time fishermen (data from RFBs/MI), but inadequate reporting and illegal fishing makes this difficult to quantify accurately and maybe a substantial under estimate. The value of the reported catch in 2002 was therefore some €0.5 million. The declared commercial catch in 2004 was about 120 t, in 2005 it was 87 t (~ €475 k) and 122 t (~ €684 k) in 2006.

324 Joint EIFAC/ICES WGEEL Report 2007
Recreational eel fishing is only carried out by a minority of anglers and there is no legal, or voluntary, declaration of catch. Some "recreational" fishing using fyke nets and baited pots takes place and this is authorized under the commercial legislation.
Currently, there are no statutory instruments for the co-ordinated management of the European eel stock, its exploitation or other impacts. Management of the Irish eel fishery is currently hampered by a number of factors, such as no national closed season, size limit, policy on estuarine and coastal fishing and a lack of accurate information on stock, catch returns or sales. There is no register of fishing effort, landings or sales and illegal fishing and unreported catches are believed to be considerable.
IR.B.3 The catchment approach
In the Republic of Ireland, six main catchments, or groups of catchments, and one cross border catchment have been estimated to potentially produce at least 87% of the national eel production (Marine Institute, unpublished data). It is in these catchments, with the exception of the Laune, that the main fisheries are focussed. These catchments are:
i ) the Shannon system (Shannon RFB) ii ) the Erne system (Cavan-Monaghan lakes -Northern RFB; Upr. & Lwr. L. Erne
Dept. of Culture, Arts & Leisure, NI) iii ) the greater Corrib system (Western RFB) iv ) the Moy system (including L. Gill and Arrow) (North Western RFB) v ) the Laune system, based on surface area (South Western RFB)-currently closed
as a conservation area vi ) the tidal areas of the Barrow/Nore/Suir (Southern RFB) vii ) Wexford harbour, together with Loughs Ramor & Muckno in north of the region
(Eastern RFB)
These top seven catchments fall within the relevant Regional Fisheries Board jurisdictions. This would allow for the Data Collection Regulation for Eel to be implemented at a regional and catchment level by the Fisheries Boards although, in the case of the Erne system, it will require continued close co-operation between agencies in the North and Republic of Ireland as instigated under the Erne Eel Enhancement Programme (1997–2001).
The coast of Ireland is covered by ICES Areas VI & VII (Fig. IR.2) which is in the single NE Atlantic category.
As mentioned previously, the EU has proposed (COM (2005) 472) that Eel Management Plans be established and implemented on a Waterframework Directive River Basin District level. The WFD subdivides the Republic of Ireland into four River Basin Districts and three International River Basin Districts (Fig. IR.3) (Data reported here is taken from the RBD Article 5 Characterisation Reports).
These are:
a ) the Neagh Bann IRBD. The Republic of Ireland (RoI) portion of the NBIRBD drains significant portions of Counties Louth and County Monaghan whilst counties Cavan and Meath have smaller drainage areas. The river basins located within the NBIRBD include the Lough Neagh/River Bann System with smaller river basins draining into Carlingford Lough and Dundalk Bay. There are 71 river water bodies in the RoI portion of the NBIRBD with a channel length of 414km. In addition, 74 cross-border river water bodies exist within the NBIRBD but these have not been characterized yet. There are 16 lake water bodies in the Republic of Ireland portion of the NBIRBD.
b ) the Eastern RBD. The Eastern RBD drains to the Irish Sea and adjacent transitional and coastal waters. There are 16 distinct river catchments (with over

Joint EIFAC/ICES WGEEL Report 2007 325
5600 km of river of which some 51% is first order stream), seven coastal and twelve transitional, of which three are typed as "lagoons". There are also seven reservoirs of area greater than 10 ha and two man-made canals with restricted access to the sea in the east and the R. Shannon in the west. There are only 20 natural lakes with an area greater than 10 ha and only six of these are greater than 50 ha.
c ) the South Eastern RBD. The South Eastern River Basin District has a land area of over 12 700 km2. The principal rivers are the Slaney River and three sister rivers which drain to Waterford Harbour i.e. the Barrow, Nore and the Suir Rivers. The Suir, Barrow, Nore river system is the second largest in the country (after the Shannon) with a combined catchment area of over 9000 km2. There are relatively few lakes in the RBD with none over 50 ha. The South Eastern River Basin District also includes over 1200 km2 of transitional and coastal waters.
d ) the South Western RBD. The South Western RBD covers a total area of approximately 15 000 km2 and with a coastline of over 1800 km along the Atlantic Ocean and Celtic Sea. All river catchments have been subdivided into river water bodies based primarily on the geology and slope of the land over which they flow. The total length of river water channels within the SWRBD is approximately 3428 km. There are 20 lakes over 50 hectares, the largest of which are Lough Leane (1952 hectares) in County Kerry and Carrigadrohid (586 hectares) in County Cork. 43 estuarine bodies and 27 coastal water bodies were identified in the SWRBD.
e ) the Shannon IRBD. The ShIRBD is the largest river basin district in Ireland, comprising a land area of approximately 18 000 km2 and includes an extensive area of central Ireland, from its source in County Cavan to the mouth of the Shannon Estuary. The Shannon River extends 250 km and discharges through an 83 km estuary. It drains an area of 11 700 km2 and includes some 41 000 ha of surface waters. Lakes greater than 100 ha in size make up some 90% of the total water surface area of the catchment and Loughs Derg, Ree and Allen are the principle lakes along the Shannon River. The Rivers Suck, Inny and Brosna are among the principle tributaries of the upper Shannon and the Rivers Fergus, Maigue, Deel and Mulkear are among the principle tributaries of the lower Shannon region.
f ) the Western RBD. The Western RBD drains to the Atlantic Ocean, and adjacent transitional and coastal waters. It stretches from Co Clare in the south to Co Leitrim to the north. It comprises 89 river catchments with over 14 200 km of river. Of the 14 200 km of river some 52% are first order streams, the small streams draining land areas which feed into the larger river system. The major catchments include the Corrib, Moy, Ballysadare, Dunkellin and Bonet rivers. Smaller catchments drain directly in the coastal areas to the sea. The basin area is rich in lakes, the highest number of lakes in the country, with a total of 5638 lakes of which sixty nine are greater than 50 hectares. Only one percent of lakes are greater than 50 hectares in size, these include the Great Western lakes the Corrib, Mask, Conn and Cullen. Four percent are between 50 and 10 hectares, a further four percent between 10 and 5 hectares, fifteen percent between 5 and 1 hectare and seventy six percent are less than 1 hectare in size.
g ) the North Western IRBD. The RoI portion of the NWIRBD drains all of County Donegal, significant portions of counties Cavan, Monaghan, and Leitrim, and smaller portions of Longford and Sligo. The main catchments within the NWIRBD include the cross-border Foyle and the Erne systems and the main lakes include Upper and Lower Lough Erne, Lough MacNean and Lough Melvin. There are 665 river water bodies in the RoI portion of the NWIRBD with an approximate channel length of 2350 km. In addition, approximately 150 cross-border river water bodies exist within the NWIRBD. There are 227 lake water bodies greater than 50 ha in the RoI portion of the NWIRBD. There is one cross-border lake in the NWIRBD, which spans the Northern Ireland/Republic of Ireland border; Lough Melvin in County Leitrim (RoI) and County Fermanagh (NI).

326 Joint EIFAC/ICES WGEEL Report 2007
NOTE: To date, the collection of inland fisheries data has not been managed, organised or presented under the WFD structure. In the following report, the national data will be sub-divided by RBD on a preliminary basis, but the catch will also be reported by Fisheries Region to allow comparisons. IRBD reports only include Republic of Ireland data.
Figure IR.1. Map of Ireland showing the seven Regional Fisheries Boards and the 17 Fishery Districts (Source: CFB).
Figure IR.2. Map indicating ICES areas around Irish shorelines (Source: ICES).
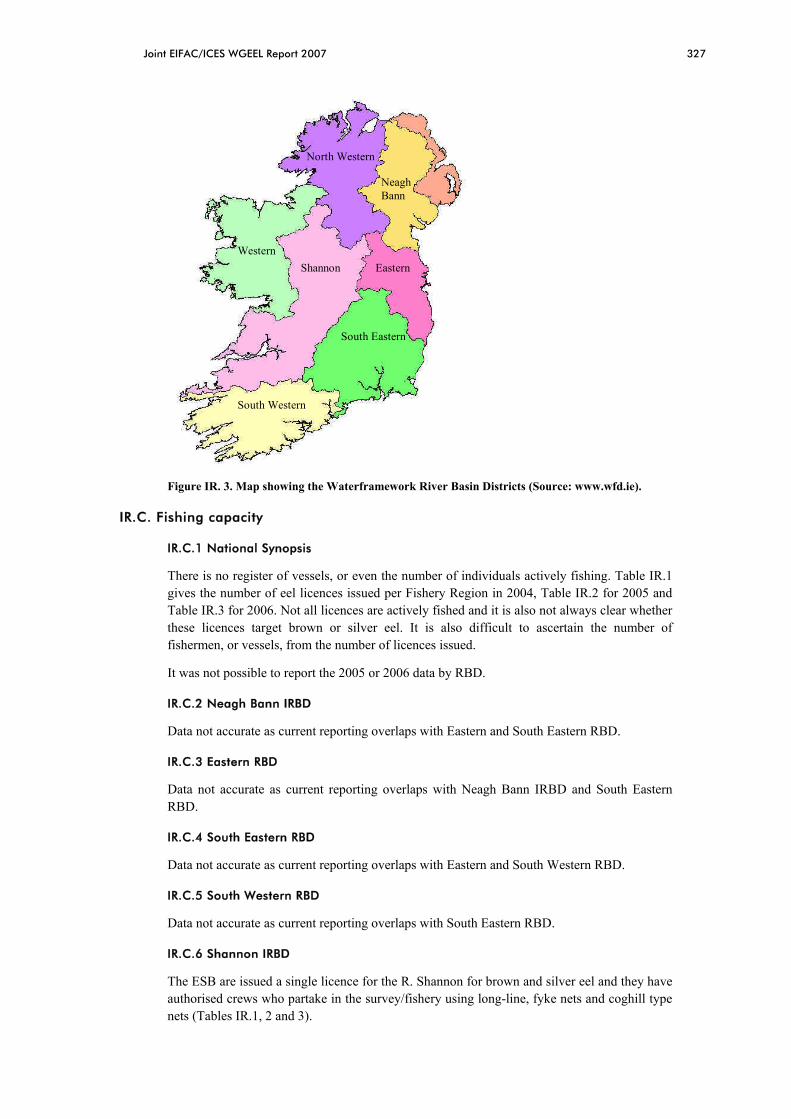
Joint EIFAC/ICES WGEEL Report 2007 327
North Western
Western Shannon
South Western
South Eastern
Eastern
Neagh Bann
Figure IR. 3. Map showing the Waterframework River Basin Districts (Source: www.wfd.ie).
IR.C. Fishing capacity
IR.C.1 National Synopsis
There is no register of vessels, or even the number of individuals actively fishing. Table IR.1 gives the number of eel licences issued per Fishery Region in 2004, Table IR.2 for 2005 and Table IR.3 for 2006. Not all licences are actively fished and it is also not always clear whether these licences target brown or silver eel. It is also difficult to ascertain the number of fishermen, or vessels, from the number of licences issued.
It was not possible to report the 2005 or 2006 data by RBD.
IR.C.2 Neagh Bann IRBD
Data not accurate as current reporting overlaps with Eastern and South Eastern RBD.
IR.C.3 Eastern RBD
Data not accurate as current reporting overlaps with Neagh Bann IRBD and South Eastern RBD.
IR.C.4 South Eastern RBD
Data not accurate as current reporting overlaps with Eastern and South Western RBD.
IR.C.5 South Western RBD
Data not accurate as current reporting overlaps with South Eastern RBD.
IR.C.6 Shannon IRBD
The ESB are issued a single licence for the R. Shannon for brown and silver eel and they have authorised crews who partake in the survey/fishery using long-line, fyke nets and coghill type nets (Tables IR.1, 2 and 3).

328 Joint EIFAC/ICES WGEEL Report 2007
The collection of glass eel, elver and other juvenile eels for lake-stocking is supervised by staff from the Shannon Regional Fishery Board and researchers from the National University of Ireland, Galway, and daily records are available.
Brown eel fishing involves authorized fishing crews, 2 persons per boat, entitled to use one or other of two methods (decided by fishery management, on biological advice); i.e. up to 50 fyke-nets or earthworm baited longlines, not exceeding 1000 hooks. Authorizations are issued by the ESB subject to weekly provision by crews of data on: Fishing locations, fishing effort, eel catch, bycatch and some environmental data (daily log-book records, analysed at end of season, and checked by fishery independent monitoring). At present no records of fuel consumption, other than by research crews, are maintained.
Silver eel fishing, at ESB eel weirs (coghill nets) and sites fished by authorized crews (coghill and fyke-nets) is also monitored by means of daily log-book records and fishery independent surveys. An annual, end of season report is compiled.
IR.C.7 Western RBD
Licences issued include those from the Western and North Western Regional Fisheries Boards in Tables IR. 1, 2 and 3). Seventy eight licences were issued in 2006.
IR.C.8 North Western IRBD
Forty nine licences were issued by the NRFB in the North Western IRBD in 2006.

Joint EIFAC/ICES WGEEL Report 2007 329
Table IR.1. Number of licences/authorisations issued in each Fishery Region in 2004.
___________________________________________________________________________
Fishery Region Type Number Comment
___________________________________________________________________________
Eastern Longline 4
Fyke 16
Coghill 7
Traps 3
Southern Fyke 4 100 nets
Pots 21 354 pots
Coghill 2
South Western Fyke/Pot 3 total of 80 nets
Shannon Longline 8* capped @ 10
Longline 15 by ESB
Fyke 8*
Fyke 15 by ESB
Coghill 6*
Coghill 20 max by ESB @ Killaloe
Coghill 21 by ESB, 1 net to each fisherman
Western Longline 1
Fyke 20 2 are for tot 60 nets x 1m high
Trap 1
Gap, Eye, Net 27 inc. 14 nets in Galway
North Western Longline 16 or fyke option
Fyke 5
Coghill 2 on trial basis
Northern Longline 24 Republic capped @ 32
Fyke 13 20 nets/licence
Total 262
___________________________________________________________________________
* not verified for 2004
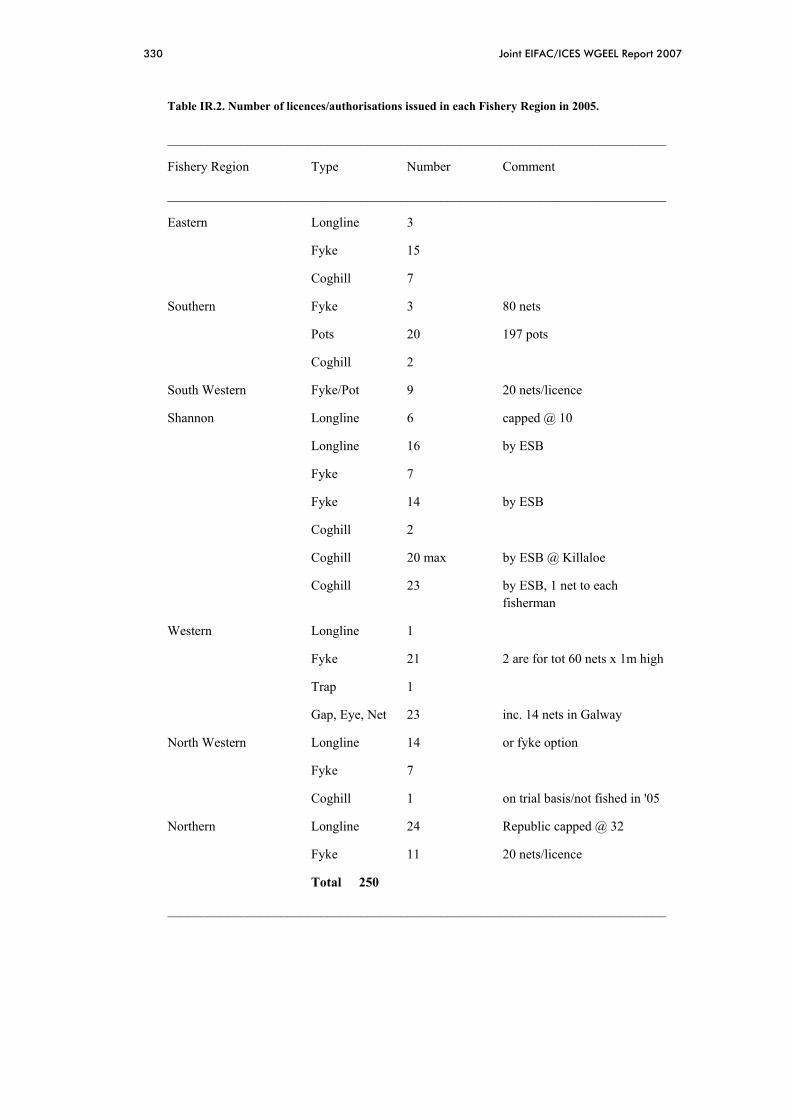
330 Joint EIFAC/ICES WGEEL Report 2007
Table IR.2. Number of licences/authorisations issued in each Fishery Region in 2005.
___________________________________________________________________________
Fishery Region Type Number Comment
___________________________________________________________________________
Eastern Longline 3
Fyke 15
Coghill 7
Southern Fyke 3 80 nets
Pots 20 197 pots
Coghill 2
South Western Fyke/Pot 9 20 nets/licence
Shannon Longline 6 capped @ 10
Longline 16 by ESB
Fyke 7
Fyke 14 by ESB
Coghill 2
Coghill 20 max by ESB @ Killaloe
Coghill 23 by ESB, 1 net to each fisherman
Western Longline 1
Fyke 21 2 are for tot 60 nets x 1m high
Trap 1
Gap, Eye, Net 23 inc. 14 nets in Galway
North Western Longline 14 or fyke option
Fyke 7
Coghill 1 on trial basis/not fished in '05
Northern Longline 24 Republic capped @ 32
Fyke 11 20 nets/licence
Total 250
___________________________________________________________________________

Joint EIFAC/ICES WGEEL Report 2007 331
Table IR.3. Number of licences/authorisations issued in each Fishery Region in 2006.
___________________________________________________________________________
Fishery Region Type Number Comment
___________________________________________________________________________
Eastern Longline 4
Fyke 12
Coghill 7
Southern Fyke 4 100 nets
Pots 20 349 pots
Coghill 2
South Western Fyke/Pot 4 20 nets/licence
Shannon Longline 6* capped @ 10
Longline 16* by ESB
Fyke 7*
Fyke 14* by ESB
Coghill 2*
Coghill 20* max by ESB @ Killaloe
Coghill 23* by ESB, 1 net to each fisherman
Western Longline 8
Fyke 25 2 are for tot 60 nets x 1m high
Trap 1
Gap, Eye, Net 22 inc. 14 nets in Galway
North Western Longline 14 or fyke option
Fyke 8
Northern Longline 24 Republic capped @ 32
Fyke 21 20 nets/licence
Trap 1
Coghill 3
Total 268
___________________________________________________________________________
* not verified for 2006
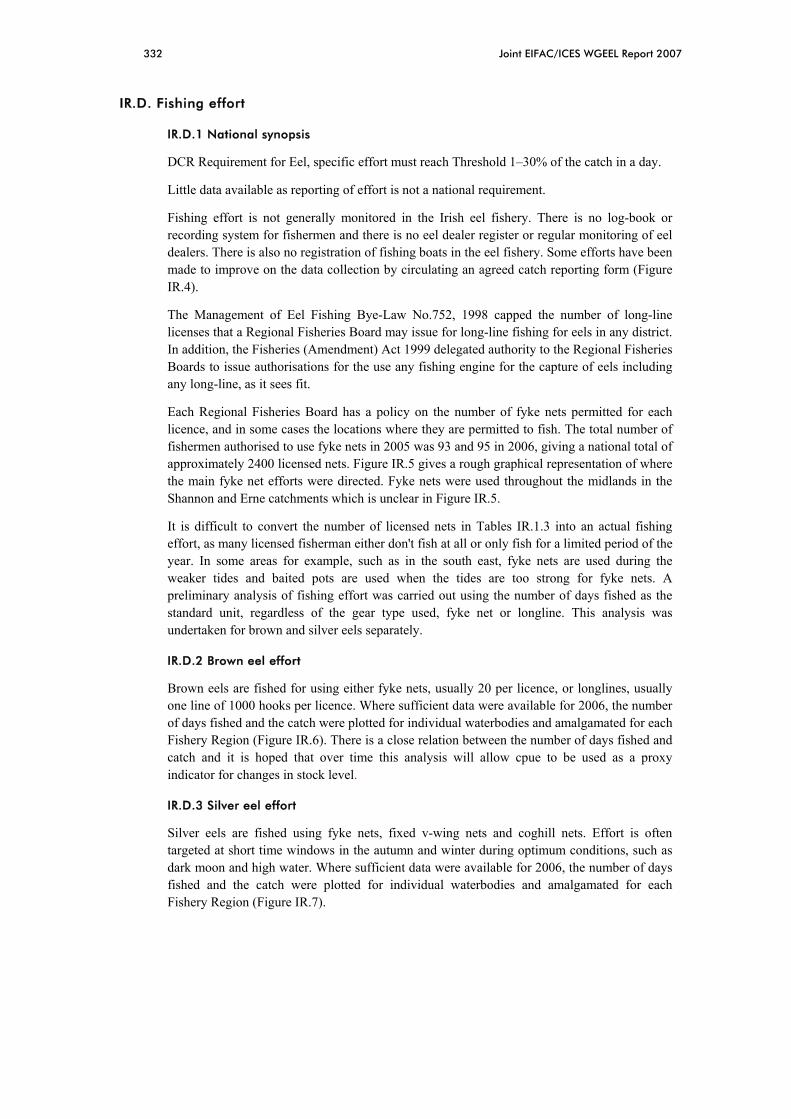
332 Joint EIFAC/ICES WGEEL Report 2007
IR.D. Fishing effort
IR.D.1 National synopsis
DCR Requirement for Eel, specific effort must reach Threshold 1–30% of the catch in a day.
Little data available as reporting of effort is not a national requirement.
Fishing effort is not generally monitored in the Irish eel fishery. There is no log-book or recording system for fishermen and there is no eel dealer register or regular monitoring of eel dealers. There is also no registration of fishing boats in the eel fishery. Some efforts have been made to improve on the data collection by circulating an agreed catch reporting form (Figure IR.4).
The Management of Eel Fishing Bye-Law No.752, 1998 capped the number of long-line licenses that a Regional Fisheries Board may issue for long-line fishing for eels in any district. In addition, the Fisheries (Amendment) Act 1999 delegated authority to the Regional Fisheries Boards to issue authorisations for the use any fishing engine for the capture of eels including any long-line, as it sees fit.
Each Regional Fisheries Board has a policy on the number of fyke nets permitted for each licence, and in some cases the locations where they are permitted to fish. The total number of fishermen authorised to use fyke nets in 2005 was 93 and 95 in 2006, giving a national total of approximately 2400 licensed nets. Figure IR.5 gives a rough graphical representation of where the main fyke net efforts were directed. Fyke nets were used throughout the midlands in the Shannon and Erne catchments which is unclear in Figure IR.5.
It is difficult to convert the number of licensed nets in Tables IR.1.3 into an actual fishing effort, as many licensed fisherman either don't fish at all or only fish for a limited period of the year. In some areas for example, such as in the south east, fyke nets are used during the weaker tides and baited pots are used when the tides are too strong for fyke nets. A preliminary analysis of fishing effort was carried out using the number of days fished as the standard unit, regardless of the gear type used, fyke net or longline. This analysis was undertaken for brown and silver eels separately.
IR.D.2 Brown eel effort
Brown eels are fished for using either fyke nets, usually 20 per licence, or longlines, usually one line of 1000 hooks per licence. Where sufficient data were available for 2006, the number of days fished and the catch were plotted for individual waterbodies and amalgamated for each Fishery Region (Figure IR.6). There is a close relation between the number of days fished and catch and it is hoped that over time this analysis will allow cpue to be used as a proxy indicator for changes in stock level.
IR.D.3 Silver eel effort
Silver eels are fished using fyke nets, fixed v-wing nets and coghill nets. Effort is often targeted at short time windows in the autumn and winter during optimum conditions, such as dark moon and high water. Where sufficient data were available for 2006, the number of days fished and the catch were plotted for individual waterbodies and amalgamated for each Fishery Region (Figure IR.7).

Joint EIFAC/ICES WGEEL Report 2007 333
Figure IR.4. Example of eel catch reporting form issued to fishermen with licences.

334 Joint EIFAC/ICES WGEEL Report 2007
-10.5 -10 -9.5 -9 -8.5 -8 -7.5 -7 -6.5 -6 -5.5
51.5
52
52.5
53
53.5
54
54.5
55<100 nets
101 - 200 nets
>200 nets
Maximum Licenced Effort per Fishery District
*
*
Figure IR.5. Graphical representation of the maximum fyke net effort (number of individual nets) licensed per Fishery District. The location of the circles, with the exception of the two marked *, indicate the general location of the use of the fyke nets. In the case of the two marked *, fykes are used throughout the Shannon and Erne catchments.

Joint EIFAC/ICES WGEEL Report 2007 335
02000400060008000
100001200014000160001800020000
Eastern
Southern
SouthW
estern
Shannon
Western
North
Western
Northern
Fishery Region
Cat
ch (k
gs)
0200400600800100012001400160018002000
Effo
rt (d
ays)
CatchEffort
02000400060008000
100001200014000160001800020000
L. Ram
or
Ladys Island
Wexford H
b
River S
laney
Waterford
R. Lee
L. Corrib
L. Mask
Mask/C
orrib
L. Carra
L.Arrow
L.Gill
L.Conn
BallyshannonWaterbody
Cat
ch (k
gs)
0200400600800100012001400160018002000
Effo
rt (d
ays)
CatchEffort
Figure IR.6. Brown eel catch in kgs and fishing effort in days (fyke net and long line combined) for individual waterbodies/catchments in the top graph and combined into Fishery Region in the bottom graph.
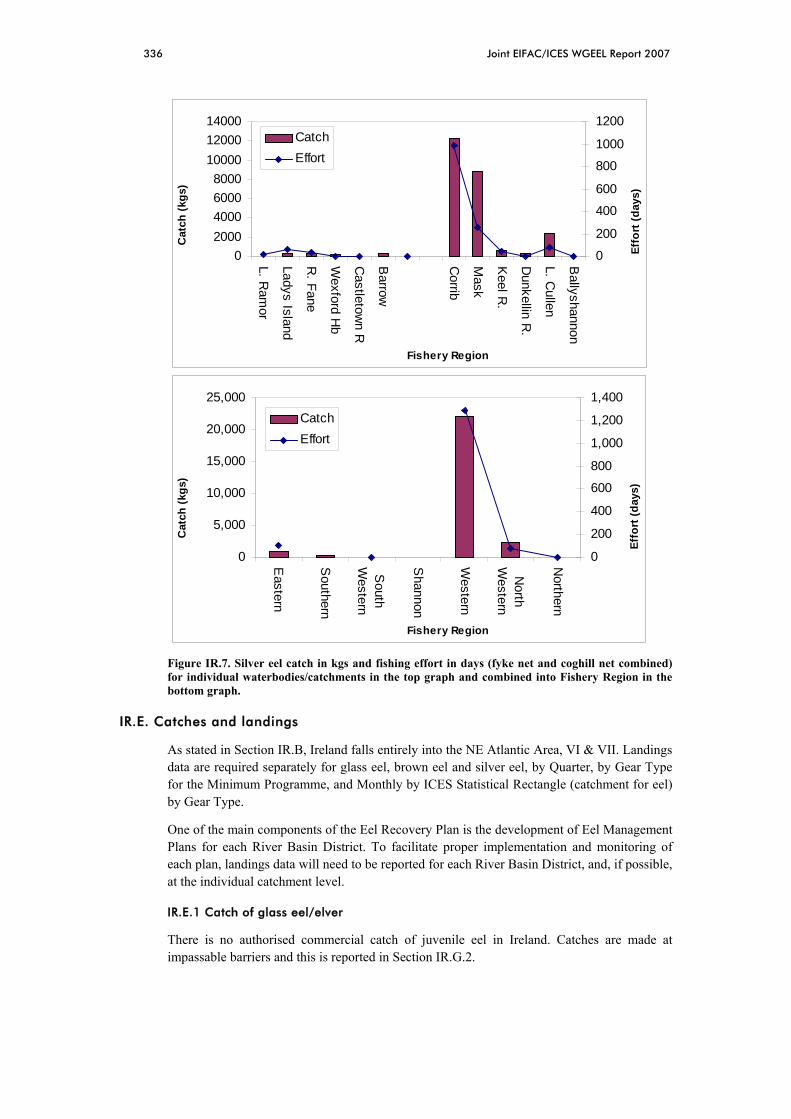
336 Joint EIFAC/ICES WGEEL Report 2007
0
5,000
10,000
15,000
20,000
25,000
Eastern
Southern
South
Western
Shannon
Western
North
Western
Northern
Fishery Region
Cat
ch (k
gs)
0
200
400
600
800
1,000
1,200
1,400
Effo
rt (d
ays)
CatchEffort
02000400060008000
100001200014000
L. Ram
or
Ladys Island
R. Fane
Wexford H
b
Castletow
n R
Barrow
Corrib
Mask
Keel R
.
Dunkellin R
.
L. Cullen
Ballyshannon
Fishery Region
Cat
ch (k
gs)
0
200
400
600
800
1000
1200
Effo
rt (d
ays)
CatchEffort
Figure IR.7. Silver eel catch in kgs and fishing effort in days (fyke net and coghill net combined) for individual waterbodies/catchments in the top graph and combined into Fishery Region in the bottom graph.
IR.E. Catches and landings
As stated in Section IR.B, Ireland falls entirely into the NE Atlantic Area, VI & VII. Landings data are required separately for glass eel, brown eel and silver eel, by Quarter, by Gear Type for the Minimum Programme, and Monthly by ICES Statistical Rectangle (catchment for eel) by Gear Type.
One of the main components of the Eel Recovery Plan is the development of Eel Management Plans for each River Basin District. To facilitate proper implementation and monitoring of each plan, landings data will need to be reported for each River Basin District, and, if possible, at the individual catchment level.
IR.E.1 Catch of glass eel/elver
There is no authorised commercial catch of juvenile eel in Ireland. Catches are made at impassable barriers and this is reported in Section IR.G.2.

Joint EIFAC/ICES WGEEL Report 2007 337
IR.E.2 Restocking
All of the catches reported in Section IR.G.2 are used for restocking, primarily in the Erne and Shannon catchments.
IR.E.3 Catch of brown and silver eel-National Synopsis
There is no compulsory declaration of eel catch in Ireland and in many Regions, declarations of catches are not complete and under-reporting is probably widespread. Currently, reported catches are only available on an annual basis at the Fisheries Regional Level, with some RFBs reporting on a District basis. The introduction of the new catch reporting form has led to considerable improvement in the system.
Catches of brown and silver eel are presented in Tables IR.4 and 5 for 2005 and 2006 and the estimated reported catches for are also shown for each River Basin District in Table IR.6.
Since 2001 the ESB has embarked on a programme of transporting a proportion of the silver eels captured in the Shannon silver eel fishery around the dams and releasing them for onward migration to the sea (Tables IR.5 and 6). The eels released below the hydropower facilities are broadly representative of the overall catch in terms of sizes.
Catch data are not generally available on a quarterly basis, or by gear type.
Table IR.4. Declared Regional catches (t) of brown eel for 2001–2006.
___________________________________________________________________________
Fishery Region 2001 2002 2003 2004 2005 2006
___________________________________________________________________________
Eastern 14.0 16.0 10.7 9.0 1.3 1.0
Southern 8.5 4.8 4.7 3.6 5.3 2.7
South Western 0.6 1.0 0.1 0.1 0.1 0.5
Shannon 16.1 15.8 21.9 21.5 18.7 19.5
Western 8.9 3.9 12.4 9.8 7.9 13.3
North Western 13.9 11.0 12.5 12.1 10.5 6.7
Northern 4.7 8.9 - 4.5 6.6 18.1
Total 66.7 61.4 62.3 60.6 50.4 61.8
___________________________________________________________________________

338 Joint EIFAC/ICES WGEEL Report 2007
Table IR.5. Declared Regional catches (t) of silver eel for 2001–2006. * total catch including a proportion released below hydroelectric dam, ** amount released & (% of catch).
___________________________________________________________________________
Fishery Region 2001 2002 2003 2004 2005 2006
___________________________________________________________________________
Eastern 2.5 4.3 3.2 2.7 0.6 0.9
Southern - 0.1 - 0.2 0.0 0.3
South Western 0.0 0.0 0.0 0.0 0.0 0.0
Shannon Region 21.5
Shannon System *24.1 25.3 17.1 37.1 20.8 34.5
Shannon Released **1.3 3.9 1.6 2.9 1.5 7.7
(5%) (15%) (9%) (8%) (7.3%) (22.3%)
Western 9.4 13.0 10.6 13.9 13.4 22.4
North Western 1.4 1.2 2.0 4.0 1.5 2.4
Northern 0.1 0.1 - - 0.0 0.0
Total 37.5 44.0 32.9 57.9 37.1 60.5
___________________________________________________________________________
Table IR.6. Estimated catches (t) for River Basin Districts of brown and silver eel for 2004, 2005 & 2006. * total catch including a proportion released below hydroelectric dam, ** amount released & (% of catch).
____________________________________________________________________________________
River Basin District Brown Silver
2004 2005 2006 2004 2005 2006
___________________________________________________________________________
Neagh Bann 0.5 0.0 0.0 0.7 0.2 0.3
Eastern 4.9 0.9 0.7 1.0 0.1 0.1
South Eastern 7.2 5.6 2.9 1.2 0.0 0.8
South Western 0.1 0.1 0.5 0.0 0.0 0.0
Shannon IRBD - 18.7 19.5 - 21.5 -
Shannon System * 21.5 16.6 17.6 37.1 20.8 34.5
Shannon Released** 2.9 1.5 7.7
(8%) (7.3%) (22.3%)
Western 21.9 18.4 20.0 17.9 15.0 24.8
North Western 4.5 6.6 18.1 0.0 0.0 0.0
Total 60.6 50.3 61.8 57.9 36.8 60.5
___________________________________________________________________________

Joint EIFAC/ICES WGEEL Report 2007 339
IR.E.4 Neagh Bann IRBD
Reported catch for Neagh Bann: '04 was 0.5 t of brown and 0.7 t of silver.
'05 was 0 t of brown and 0.2 t of silver.
'06 was 0 t of brown and 0.3 t of silver.
IR.E.5 Eastern RBD
Reported catch for Eastern: '04 was 4.9 t of brown and 1.0 t of silver.
'05 was 0.9 t of brown and 0.1 t of silver.
'06 was 0.7 t of brown and 0.1 t of silver.
IR.E.6 South Eastern RBD
Reported catch for South Eastern : '04 was 7.2 t of brown and 1.2 t of silver.
'05 was 5.6 t of brown and 0 t of silver.
'06 was 2.9 t of brown and 0.8 t of silver.
The brown eel catch was predominantly taken in tidal estuarine waters. This RBD represents the largest tidal eel fishery in Ireland. The silver eel catch come from one station on the R. Barrow.
IR.E.7 South Western RBD
Reported catch for South West: '04 was 0.1 t of brown.
'05 was 0.1 t of brown.
'06 was 0.5 t of brown.
The catch was confined to the lower reaches of the R. Lee. There is no silver eel fishery.
IR.E.8 Shannon IRBD
Reported catch for Shannon: '04 was 21.5 t of brown and 37.1 t of silver (inc. 2.9 t rel. bel. bar.).
'05 was 18.5 t of brown and 21.5 t of silver (inc. 1.5t rel. bel. bar.).
'06 was 17.6 t of brown and 34.5 t of silver (inc. 7.7t rel. bel. bar.).
The Shannon RBD reported catch came from the R. Shannon catchment and no catches were reported from other rivers in the RBD in 2004 and 2006.
Shannon Catchment. The annual downriver migrations of silver eels have traditionally been exploited in the River Shannon and the three commercial eel weirs, owned by ESB since 1937, have continued this practice with varying success (Figure IR.8). In many respects the overall pattern of change, with steadily declining silver eel catches at Killaloe/Clonlara, but relatively steady catches at Athlone, mirrors the results obtained by monitoring the Lough Derg fyke net CPUE brown eel catches versus those in upper catchment lakes.
The silver eel catch in 2004/05 in Killaloe was 5.02 t and upstream of Killaloe it was 32.09 t, giving a total silver eel catch for the river of 37.12 t. This was more than double the catch recorded in 2003/04.
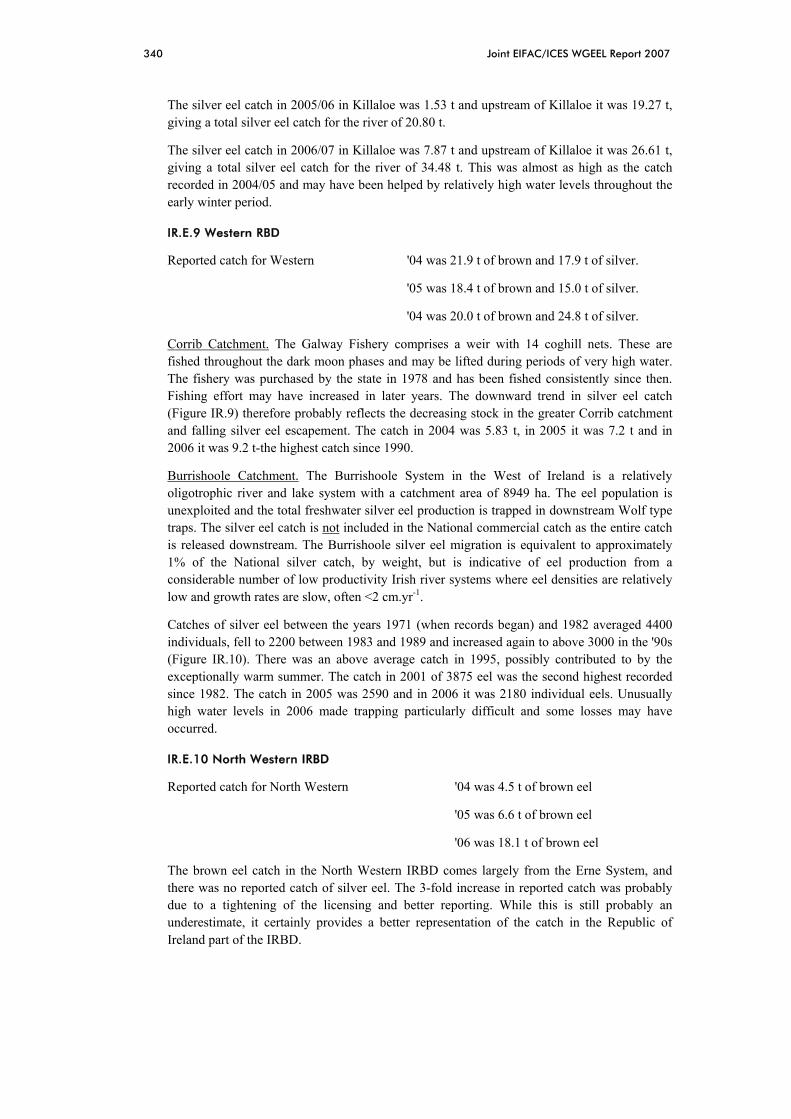
340 Joint EIFAC/ICES WGEEL Report 2007
The silver eel catch in 2005/06 in Killaloe was 1.53 t and upstream of Killaloe it was 19.27 t, giving a total silver eel catch for the river of 20.80 t.
The silver eel catch in 2006/07 in Killaloe was 7.87 t and upstream of Killaloe it was 26.61 t, giving a total silver eel catch for the river of 34.48 t. This was almost as high as the catch recorded in 2004/05 and may have been helped by relatively high water levels throughout the early winter period.
IR.E.9 Western RBD
Reported catch for Western '04 was 21.9 t of brown and 17.9 t of silver.
'05 was 18.4 t of brown and 15.0 t of silver.
'04 was 20.0 t of brown and 24.8 t of silver.
Corrib Catchment. The Galway Fishery comprises a weir with 14 coghill nets. These are fished throughout the dark moon phases and may be lifted during periods of very high water. The fishery was purchased by the state in 1978 and has been fished consistently since then. Fishing effort may have increased in later years. The downward trend in silver eel catch (Figure IR.9) therefore probably reflects the decreasing stock in the greater Corrib catchment and falling silver eel escapement. The catch in 2004 was 5.83 t, in 2005 it was 7.2 t and in 2006 it was 9.2 t-the highest catch since 1990.
Burrishoole Catchment. The Burrishoole System in the West of Ireland is a relatively oligotrophic river and lake system with a catchment area of 8949 ha. The eel population is unexploited and the total freshwater silver eel production is trapped in downstream Wolf type traps. The silver eel catch is not included in the National commercial catch as the entire catch is released downstream. The Burrishoole silver eel migration is equivalent to approximately 1% of the National silver catch, by weight, but is indicative of eel production from a considerable number of low productivity Irish river systems where eel densities are relatively low and growth rates are slow, often <2 cm.yr-1.
Catches of silver eel between the years 1971 (when records began) and 1982 averaged 4400 individuals, fell to 2200 between 1983 and 1989 and increased again to above 3000 in the '90s (Figure IR.10). There was an above average catch in 1995, possibly contributed to by the exceptionally warm summer. The catch in 2001 of 3875 eel was the second highest recorded since 1982. The catch in 2005 was 2590 and in 2006 it was 2180 individual eels. Unusually high water levels in 2006 made trapping particularly difficult and some losses may have occurred.
IR.E.10 North Western IRBD
Reported catch for North Western '04 was 4.5 t of brown eel
'05 was 6.6 t of brown eel
'06 was 18.1 t of brown eel
The brown eel catch in the North Western IRBD comes largely from the Erne System, and there was no reported catch of silver eel. The 3-fold increase in reported catch was probably due to a tightening of the licensing and better reporting. While this is still probably an underestimate, it certainly provides a better representation of the catch in the Republic of Ireland part of the IRBD.

Joint EIFAC/ICES WGEEL Report 2007 341
IR.E.11 Recreational Fisheries
Recreational eel rod catches were not recorded in '04, '05 or '06, but these were thought to be relatively low. Recreational net and trap eel catches were also low and were included in the commercial catch returns.
Shannon Silver Eel
0
10,000
20,000
30,000
40,000
50,000
60,000
1964
1967
1970
1973
1976
1979
1982
1985
1988
1991
1994
1997
2000
2003
2006
Year
Cat
ch (k
s)
Killaloe Total
Figure IR.8. Silver eel catches from the Killaloe eel weir and the Shannon system (1964 to 2006).
Commercial Silver Eel Catch Galway Fishery 1976-2006
0
5
10
15
20
25
30
35
1976
1978
1980
1982
1984
1986
1988
1990
1992
1994
1996
1998
2000
2002
2004
2006
Year
Tonn
age
Figure IR.9. Annual silver eel catch (t) in the commercial Galway Fishery, Corrib System, for 1976 to 2006.

342 Joint EIFAC/ICES WGEEL Report 2007
Burrishoole Silver Eel
010002000300040005000600070008000
1971
1974
1977
1980
1983
1986
1989
1992
1995
1998
2001
2004
Year
Num
ber
0
50
100
150
200
250
300
Wei
ght (
gm)
NumberWeight
Figure IR.10. Annual silver eel catch, and mean weight (gm) in the Burrishoole System for 1971 to 2006.
IR.F. Catch per unit of effort
IR.F.1 National Synopsis
Given the lack of log books or fishery register there is little cpue information available for Irish eel fisheries. Some data is available from selected individuals, fisheries or research teams and these are summarised here. Cpue is dependent on the amount of gear, such as the number of fyke nets or the number of hooks per length of longline, and the number of nights that these are fished. Assumptions made here are that the same number of nets or hooks remain constant. Future analysis should separate catch by gear type effort and catch reporting will have to be refined to achieve this.
Where sufficient data were available for 2006, the catch per unit effort (cpue), number of days fished and the catch, were plotted for individual waterbodies and amalgamated for each Fishery Region for brown eel (Figure IR.11) and silver eel (Figure IR.12).

Joint EIFAC/ICES WGEEL Report 2007 343
0.02.04.06.08.0
10.012.014.016.0
Eastern
Southern
South
Western
Shannon
Western
North
Western
Northern
Fishery Region
CPU
E (k
g/da
y)
0.05.0
10.015.020.025.030.035.040.0
L. Ram
or
Ladys Island
Wexford H
b
River S
laney
Waterford
R. Lee
L. Corrib
L. Mask
Mask/C
orrib
L. Carra
L.Arrow
L.Gill
L.Conn
BallyshannonWaterbody
CPU
E (k
g/da
y)
Figure IR.11. Brown eel catch per unit effort (cpue) in kgs per day (fyke net and long line combined) for individual waterbodies/catchments in the top graph and combined into Fishery Region in the bottom graph.

344 Joint EIFAC/ICES WGEEL Report 2007
0.0
5.0
10.0
15.0
20.0
25.0
30.0
35.0
Eastern
Southern
South
Western
Shannon
Western
North
Western
Northern
Fishery Region
CPU
E (k
g/da
y)
Catch
0.0
20.0
40.0
60.0
80.0
100.0
120.0
L. Ram
or
Ladys Island
R. Fane
Wexford H
b
Castletow
n R
Barrow
Corrib
Mask
Keel R
.
Dunkellin R
.
L. Cullen
Ballyshannon
Fishery Region
CPU
E (k
g/da
y) Catch
Figure IR.12. Silver eel catch per unit effort (cpue) in kgs per day (fyke net and coghill net combined) for individual waterbodies/catchments in the top graph and combined into Fishery Region in the bottom graph.
IR.F.6 Shannon IRBD
Shannon-brown eel
Since 1992 fishery and fishery-independent records of brown eel catches are used, as total catch and cpue, to monitor stocks at fishing zone (single crew), lake and river catchment levels. These data represent both fyke-net and long-line survey results. The overall trend, as reflected by analyses of monitored long-line surveys through out the fishery, is illustrated in Figure IR.13. Comparative studies, same night/same zone, and research crew/authorized crew, were undertaken in recent years as part of a Ph.D study and in 1992–1994.
Shannon-Silver eel
As the fishing effort at Killaloe, Shannon, is similar between years, this means that the catch presented in Figure IR.8 is relatively independent of effort and reflects a cpue time series of silver eels catches.

Joint EIFAC/ICES WGEEL Report 2007 345
IR.F.7 Western RBD
Burrishoole-Brown eel
There is no commercial fishing for brown eel in Burrishoole. A series of research fishings using standard summer fyke nets has been carried out (Table IR.7). There would appear to be little overall change in the cpue over time. The cpue of 0.2 in L. Furnace in June 2005 should be noted. A severe toxic algal bloom, Prorocentrum balticum/minimum-an estuarine and coastal species, was recorded in August/September 2003 and this may have caused mortalities of eel in the lake. Dead eels were observed in fyke net catches in late 2003. However, good catches were again recorded in August 2005 and 2006.
Burrishoole-Silver eel
As the trapping effort in the Burrishoole is total (+10% estimated) and continual, this means that the catch presented in Figure IR.10 is independent of effort and reflects the total migration of silver eels from the freshwater catchment. As the catchment stock is not exploited, the silver eel migration is the total spawning escapement from Burrishoole.
IR.F.8 North Western IRBD
Erne-Brown eel
Cpue data are not generally available from the Erne and there were none for 2004.
Extracted from: Matthews et al. (2001). An extensive fyke net survey of the brown eel stocks of the Erne lakes was carried out from May to September 1998–2000 employing up to six two-man crews stationed throughout the system. Catch data from over 56 700 net-nights was compiled.
Highest catches were obtained from Upper and Lower L. Erne in the lower reaches of the catchment where the greater part of commercial fishing takes place. Catch Per Unit Effort (cpue) ranged from 30–45 eels weighing 4.5–8.5 kg per 10 nets per night.
In contrast, numbers from the upper reaches of the catchment were lower (4–15 eels or 1.3–4.2 kg per 10 nets per night).
Evidence for local depletion of eel stocks through commercial fishing was apparent, particularly in the Narrows, Lower L. Erne, where cpue fell progressively from 4.9 to 2.4kg per 10 nets per night over the three years of the study.

346 Joint EIFAC/ICES WGEEL Report 2007
Pe arson coe ffic ie nt r = 0,89; p<0,05
0
2
4
6
8
10
12
14
0102030405060
no o f e e ls pe r 100 hooks
wei
ght p
er 1
00 h
ooks
low biomas
low density
high biomas
high density
1992 20031997 2002year 2004
Pe arson coe ffic ie nt r = 0,89; p<0,05
0
2
4
6
8
10
12
14
0102030405060
no o f e e ls pe r 100 hooks
wei
ght p
er 1
00 h
ooks
low biomas
low density
high biomas
high density
1992 20031997 2002year 20041992 20031997 2002year 2004
Figure IR.13. Changes in River Shannon cpue (numbers, biomass) for eel populations, as indicated by results of monitored long-line fishing surveys (1992–2004).

Joint EIFAC/ICES WGEEL Report 2007 347
Table IR. 7. Summary 'summer' fyke net catch (number of eels), effort (per net-pair of trap ends) and cpue (number of eels per net per night) for the Burrishoole system.
LAKE DATE EFFORT CATCH CPUE
NETS X NIGHTS CATCH/NET/NIGHT
Bunaveela April-Sept 1987 80 113 1.4 May-Sept 1988 250 171 0.7 May-Aug 2001 120 126 1.1 Jun 05 30 43 1.4 May 07 30 18 0.6 Jul 07 40 13 0.3 Feeagh Jun 73 100 23 0.2 May-Sept 1987 240 399 1.7 May-Sept 1988 380 501 1.3 Jun-Aug 2001 120 249 2.1 Jun 05 60 103 1.7 May 07 20 54 2.7 Jul 07 20 60 3.0 Furnace May-Sept 1987 320 1558 4.9 April-Sept 1988 330 1056 3.2 Jun-Aug 2001 120 614 5.1 Jul 03 40 107 2.7 Jun 05 58 12 0.2 Aug 05 20 90 4.5 Aug 06 40 152 3.8 Furnace Lwr July-Sept 1987 60 803 13.4 May-Sept 1988 60 532 8.9 Jun-Aug 2001 40 329 8.2
IR.G. Scientific surveys of the stock
IR.G.1 National synopsis
There are no national surveys of eel currently taking place-these are not specifically required for eel by the DCR. A small number of research programmes are ongoing and data have been incorporated into the relevant sections of this report. Probably the most important datasets are the recruitment index data for the Shannon and Erne and the long-term silver eel datasets for the Shannon, Corrib and Burrishoole (presented elsewhere in this report).
Since 1992 there has been a comprehensive series of stock assessment surveys and sampling of the River Shannon eel fishery. This Shannon Eel Management Programme has included an extension of the brown and silver eel fishing, the experimental development of glass eel fishing and the improvement of the elver trapping. The focus of the River Shannon study undertaken by NUIG was changed in 2005 and much effort has been devoted to evaluation of alternative sampling protocols. This was done with a view to getting more accurate estimations of brown eel densities in lakes and to establishing the quantity, and quality, of silver eels migrating from selected lakes and through the lower section of the river system.
348 Joint EIFAC/ICES WGEEL Report 2007
IR.G.2 Recruitment surveys-glass eel
Monitoring of elver migrating at Ardnacrusha (Shannon), Cathleens Falls (Erne) and for the Feale, Inagh and Maigue Rivers and monitoring of bootlace eel migrating at Parteen Dam (Shannon). Monitoring is carried out at six fixed stations by the ESB and fishing is also undertaken by the ESB/Shannon Regional Fisheries Board in the Shannon Estuary for glass eels (Table IR.7). Indications are that recruitment remains low. Catches in 2004 for both Erne and Shannon were the second lowest recorded and while there is no effort data available, the total catch for all stations in 2004 was the lowest yet recorded (Table IR.8). Elver and bootlace catches in 2005 were much more unpredictable, with good catches of elvers recorded in the Erne (45% of the 1979–84 mean) and a poor catch in Ardnacrusha (1.4% of the 1979–1984 mean). The bootlace catch in Parteen was relatively good, almost equally the mean (641 kg) for the last 20 years. Figure IR.14 presents the historical elver monitoring for the Erne and the Shannon (Ardnacrusha).
All catches reported in Table IR.8 are transported upstream and used in restocking.
IR.G.3 Adult eel surveys
There were no co-ordinated national surveys carried out in 2004, 2005 or 2006. A number of surveys were undertaken by the National University of Ireland Galway and the Electricity Supply Board, the Marine Institute and Trinity College Dublin and the Central Fisheries Board in the NSSHARE project-INTERREG IIIA Programme for Ireland/Northern Ireland. The majority of these are projects in progress, but will yield data compatible with Eel Management Plans and the DCR. Table IR.9 details the locations sampled.

Joint EIFAC/ICES WGEEL Report 2007 349
Table IR.8. Glass eel, elver and bootlace (Parteen) catches (kg), 1985 to 2006 (nf = not fished).
ERNE MOY SHANNON SHANNON SH. ESTUARY
YEAR ERNE ESTUARY ESTUARY ARDNACRUSHA PARTEEN R FEALE R MAIGUE INAGH R GLASS EELS
1985 400 1093 984 503 1986 700 948 1555 1987 2300 1610 984 1988 3000 145 1265 1989 1800 27 581 1990 2400 467 970 1991 500 90 372 1992 1400 32 464 1993 1700 24 602 1994 4400 287 125 70 14 1995 2100 398 799 0 194 1996 647 332 95 0 34 140 1997 1087 2120 906 407 467 188 616 1998 723 46 275 255 81 8 11 484 1999 1246 441 18 701 135 0 0 416 2000 1074 188 39 389 174 0 120 43 2001 699 13 27 3 58 2 18 1 2002 113 21 178 677 116 5 37 2003 580 36 378 873 36 72 111 147 2004 269 0 58 320 0 0 24 1 2005 836 13.5 41.4 612 0 1 0 41 2006 118 0 41.5 467 1 0 4 3.1 *2007 182 0 45.4 789 0 0 38.5 11.5
* data provisional
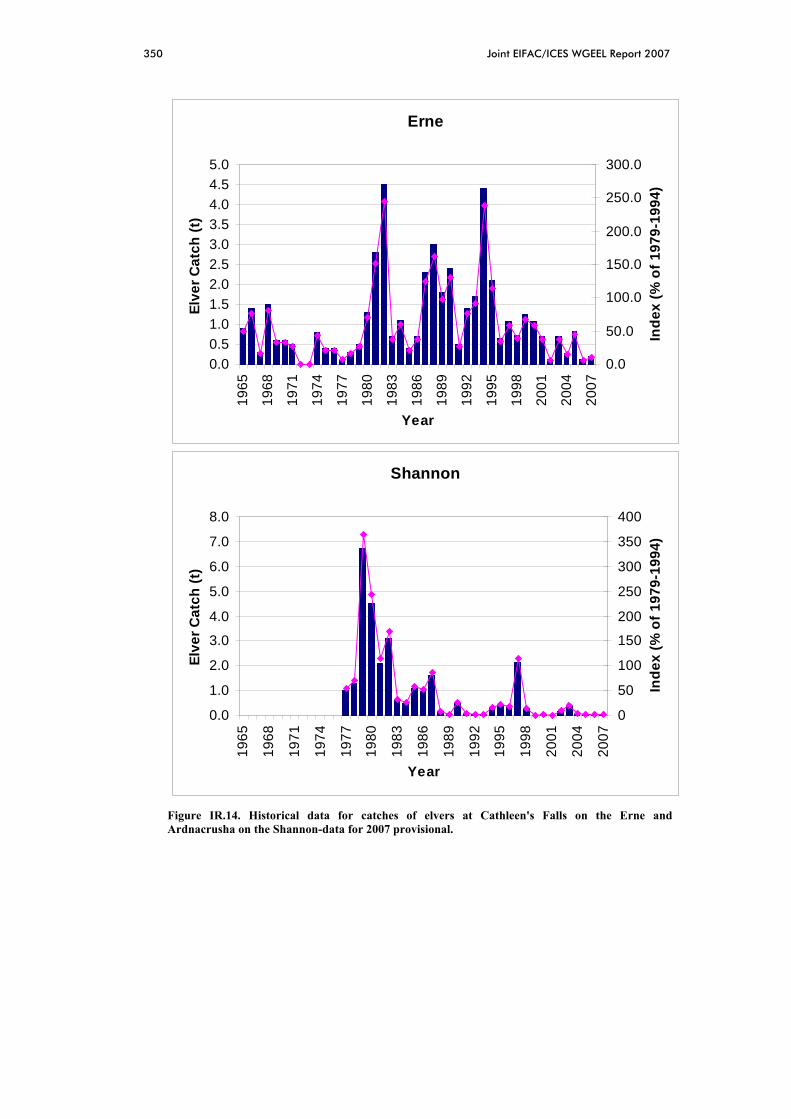
350 Joint EIFAC/ICES WGEEL Report 2007
Erne
0.00.51.01.52.02.53.03.54.04.55.0
1965
1968
1971
1974
1977
1980
1983
1986
1989
1992
1995
1998
2001
2004
2007
Year
Elve
r Cat
ch (t
)
0.0
50.0
100.0
150.0
200.0
250.0
300.0
Inde
x (%
of 1
979-
1994
)
Shannon
0.0
1.0
2.0
3.0
4.0
5.0
6.0
7.0
8.0
1965
1968
1971
1974
1977
1980
1983
1986
1989
1992
1995
1998
2001
2004
2007
Year
Elve
r Cat
ch (t
)
0
50
100
150
200
250
300
350
400
Inde
x (%
of 1
979-
1994
)
Figure IR.14. Historical data for catches of elvers at Cathleen's Falls on the Erne and Ardnacrusha on the Shannon-data for 2007 provisional.

Joint EIFAC/ICES WGEEL Report 2007 351
Table IR.9. Summary details of the numbers of locations sampled in 2004, 2005 and 2006, and the numbers of eels sampled for length, weight, age and other elements, such as contamination and parasites.
CATCHMENT NO. OF RBD LIFE STAGE CAPTURE NO. OF NO. OF LENGTH WEIGHT AGE OTHER SOURCE
SITES METHOD SAMPLES FISH (N) (N) (N) (N)
2004
Burrishoole 1 WRBD Silver Perm Trap 3 2905 382 144 0 0 MI
Owenduff 8 WRBD Yellow Electro 8 99 99 0 0 0 MI/RFB
Durnish L. 1 NWIRBD Yellow Fyke 1 150 150 150 150 Parasitology NUIG
L Ahalia 4 WRBD Yellow Fyke 4 200 200 200 200 Various NUIG
Shannon 19 ShIRBD Yellow Longline 19 2403 2136 870 127* 0 NUIG
Shannon 16 ShIRBD Yellow Fyke 16 799 799 289 0 0 NUIG
Shannon 9 ShIRBD Silver Coghill net 23 2158 2158 872 280* 0 NUIG
2005
Burrishoole 1 WRBD Silver Perm Trap 5 2590 586 580 122 Contam (10) MI
Burrishoole 3 lks (15) WRBD Yellow Fyke 20 249 249 179 0 Contam (10) MI
Fane 1 NBIRBD Silver Catch 1 200 200 100 100 Contam (10) MI/TCD
Moy/Conn 1 WRBD Silver Catch 1 200 200 100 100 Contam (10) MI/TCD
Corrib/Galway 1 WRBD Silver Catch 1 314 314 100 100 Contam (10) MI/TCD
Waterford 1 SERBD Yellow Catch 1 200 200 100 100 Contam (10) MI/TCD
Lady's Island Lake 1 SERBD Yellow Fyke 1 200+ 200+ 200+ 200+ Par/Contam NUIG
Maigue River 1 ShIRBD elver Traps/electro 10 350 350 90 0 0 NUIG
Shannon Parteen 1 ShIRBD elver-yellow Traps 4 312 312 198 86* 0 NUIG
Mulcair River 11 ShIRBD elver-yellow Electro 11 239 239 239 0 0 NUIG
Shannon R (lwr) 13 ShIRBD elver-yellow Electro 13 528 528 148 0 0 NUIG
Castelconnel 1 ShIRBD elver-yellow Electro 3 217 217 217 0 0 NUIG
Shannon R (lwr) 3 ShIRBD elver-yellow Electro 7 551 551 65 0 0 NUIG
Shannon 12 ShIRBD yellow Fyke 15 978 978 268 0 Contam NUIG
Shannon 12 ShIRBD yellow Longline 24 3447 3447 1120 210* Contam NUIG
Shannon 8 ShIRBD silver Coghill net 11 1980 1980 821 112* Contam NUIG
Akibbon 1 NWIRBD Yellow Fyke 7 7 7 7 5 CFB NSSHARE
Altan 1 NWIRBD Yellow Fyke 4 4 4 2 1 CFB NSSHARE
Auva 1 NWIRBD Yellow Fyke 9 9 9 9 0 CFB NSSHARE
Avehy 1 NWIRBD Yellow Fyke 2 2 2 2 1 CFB NSSHARE
Lough Barra 1 NWIRBD Yellow Fyke 15 15 15 15 5 CFB NSSHARE

352 Joint EIFAC/ICES WGEEL Report 2007
Table IR.9 cont.. Summary details of the numbers of locations sampled in 2004, 2005 and 2006, and the numbers of eels sampled for length, weight, age and other elements, such as contamination and parasites.
CATCHMENT NO. OF RBD LIFE STAGE CAPTURE NO. OF NO. OF LENGTH WEIGHT AGE OTHER SOURCE
SITES METHOD SAMPLES FISH (N) (N) (N) (N)
Bawn Lough 1 NWIRBD Yellow Fyke 1 1 1 1 0 CFB NSSHARE
Bunerky 1 NWIRBD Yellow Fyke ? 1 0 0 0 CFB NSSHARE
Corglass 1 NWIRBD Yellow Fyke 8 8 8 8 0 CFB NSSHARE
Deralk 1 NWIRBD Yellow Fyke 1 1 1 0 0 CFB NSSHARE
Derg 1 NWIRBD Yellow Fyke 33 33 33 33 14 CFB NSSHARE
Derrybrick 1 NWIRBD Yellow Fyke 1 1 1 1 0 CFB NSSHARE
Dunlewy 1 NWIRBD Yellow Fyke 5 5 5 5 5 CFB NSSHARE
Fad (west) 1 NWIRBD Yellow Fyke 10 10 10 10 10 CFB NSSHARE
Fern 1 NWIRBD Yellow Fyke 15 15 15 15 15 CFB NSSHARE
Gartan 1 NWIRBD Yellow Fyke 29 29 29 29 5 CFB NSSHARE
Golagh 1 NWIRBD Yellow Fyke 3 3 3 3 3 CFB NSSHARE
Kiltooris 1 NWIRBD Yellow Fyke 10 10 10 10 0 CFB NSSHARE
Kiltyfanad 1 NWIRBD Yellow Fyke 15 15 15 15 4 CFB NSSHARE
Lee 1 NWIRBD Yellow Fyke 8 8 8 8 8 CFB NSSHARE
Meela 1 NWIRBD Yellow Fyke 192 192 192 93 0 CFB NSSHARE
Melvin 1 NWIRBD Yellow Fyke 123 123 123 106 0 CFB NSSHARE
Nalughraman 1 NWIRBD Yellow Fyke 1 1 1 1 0 CFB NSSHARE
New lake 1 NWIRBD Yellow Fyke 25 140 140 140 0 CFB NSSHARE
Lough Ross 1 NBIRBD Yellow Fyke 11 12 12 12 11 CFB NSSHARE
Town lake 1 NWIRBD Yellow Fyke 1 1 1 1 0 CFB NSSHARE
Veagh 1 NWIRBD Yellow Fyke 7 7 7 7 5 CFB NSSHARE
Vearty 1 NWIRBD Yellow Fyke 4 4 4 4 4 CFB NSSHARE
Waskel 1 NWIRBD Yellow Fyke 9 9 9 9 CFB NSSHARE
2006
Burrishoole 1 WRBD Silver Perm Trap 6 2180 493 158 0 MI
Corrib/Galway 1 WRBD Silver Catch 1 202 202 51 51 MI
Gowla 1 WRBD Silver Catch 1 88 88 88 88 MI/WRFB
Shannon ShIRBD yellow Fyke NUIG
Shannon ShIRBD yellow Longline NUIG
Shannon ShIRBD silver Coghill net NUIG
Lee Carigadrohid 1 SWRBD yellow fyke 3 85 85 85 30 NUIG
Lee Carigadrohid 1 SWRBD yellow longline 1 51 51 51 30 NUIG

Joint EIFAC/ICES WGEEL Report 2007 353
Table IR.9 cont.. Summary details of the numbers of locations sampled in 2004, 2005 and 2006, and the numbers of eels sampled for length, weight, age and other elements, such as contamination and parasites.
CATCHMENT NO. OF RBD LIFE STAGE CAPTURE NO. OF NO. OF LENGTH WEIGHT AGE OTHER SOURCE
SITES METHOD SAMPLES FISH (N) (N) (N) (N)
Lee Iniscara 1 SWRBD yellow fyke 3 277 277 277 30 30 NUIG Lee Iniscara 1 SWRBD yellow longline 3 70 70 70 30 30 NUIG Allen 1 NWIRBD Yellow Fyke 1 4 4 4 1 CFB NSSHARE Anure 1 NWIRBD Yellow Fyke 1 22 22 22 12 CFB NSSHARE Dungloe 1 NWIRBD Yellow Fyke 1 18 18 18 12 CFB NSSHARE Dunragh 1 NWIRBD Yellow Fyke 1 1 1 0 0 CFB NSSHARE Egish 1 NWIRBD Yellow Fyke 1 6 6 6 3 CFB NSSHARE Eske 1 NWIRBD Yellow Fyke 1 22 22 21 12 CFB NSSHARE Glen 1 NWIRBD Yellow Fyke 1 34 34 33 11 CFB NSSHARE Gortnawinny 1 NWIRBD Yellow Fyke 1 5 5 5 3 CFB NSSHARE Keel 1 NWIRBD Yellow Fyke 1 16 16 16 9 CFB NSSHARE Kindrum 1 NWIRBD Yellow Fyke 1 16 16 15 9 CFB NSSHARE Muckno 1 NWIRBD Yellow Fyke 1 53 53 53 0 CFB NSSHARE NaBack 1 NWIRBD Yellow Fyke 1 1 1 1 0 CFB NSSHARE Sessiagh 1 NWIRBD Yellow Fyke 1 13 13 13 11 CFB NSSHARE Toome 1 NWIRBD Yellow Fyke 1 4 4 4 2 CFB NSSHARE White L. (Ballybay) 1 NWIRBD Yellow Fyke 1 2 2 2 2 CFB NSSHARE (NSShare fish in lakes project, funding under Interreg IIIA programme. Data provided by T. Champ, F. Kelly & L. Connor (CFB); Age analysis by L. Connor (CFB), C. O'Toole, J. Cooney & R. Poole (MI)).

354 Joint EIFAC/ICES WGEEL Report 2007
IR.H. Catch composition by age and length
IR.H.1 National Synopsis
There is no national sampling programme for age and length of commercial eel catch in Ireland.
IR.H.2 ERFB-Fane-Silver
Figure IR.15 gives the length frequency of silver eels from the fishery on the River Fane, sampled on the 4th November 2005. This shows the typical bimodal distribution, with a higher proportion of the smaller male eels.
0
5
10
15
20
25
30
28 34 40 46 52 58 64 70 76 82 88
Length (cm)
Num
ber
Figure IR.15. Length frequency distribution for silver eels from the fishery on the River Fane in November 2005 (n=200).
IR.H.2 SRFB-Waterford-Brown
Figure IR.16 gives the length frequency of the catch of eels from the fishery on the tidal portion of the River Suir, sampled in November 2005. This shows the typical distribution for a brown eel catch which includes both male and female eels.

Joint EIFAC/ICES WGEEL Report 2007 355
0
5
10
15
20
25 31 37 43 49 55 61 67 73 79
Length (cm)
Num
ber
Figure IR.16. Length frequency distribution for eels from the brown eel fishery on the River Suir in November 2005 (n=200).
IR.H.2 ShRFB Shannon Catchment Programme (Shannon IRBD)
Length measurements are taken annually (see Table IR.9).
IR.H.2.1 Shannon-Brown Eel
Annual surveys undertaken by National University of Ireland, Galway, (1992 to date) involve measurement of sub-sampled catches of authorized fishing crews, representative of all major lakes in the catchment, and the length frequency distributions are statistically analysed at lake and total fishery levels. Total length data typically involve over 2000 eels per year, and further data are available from fishery independent and research sampling. Weight and age data, which vary in numbers from year to year, are available for selected zones. Changes in population demography have been recorded. These are mostly due to poor recruitment but the overall size frequencies are mostly determined by fishing gear selectivity (i.e. fyke-net mesh size, long-line bait/hook size).
IR.H.2.2 Shannon-Silver Eel
Annual surveys, by NUIG (1992 to date), at ESB fishing weirs and of authorized fishing crew catches provide length data for a series of sites located through out the river system. Annual length measurements involve 1500–2000 eels. Sub-samples are used for calculation of length/weight relationships and 200–250 are used for age determinations. Sex ratio changes, reflected in length, weight and age data have been detected. A recent increase in the percentage of males at Killaloe represents a reversal of a trend noted since around 1985, seems to be due to changes in fishing intensities in upper versus lower catchment and selective stocking of the lower part of the catchment.
IR.H.2.3 WRFB Galway-Galway Fishery Corrib.Silver
Figure IR.17 gives the length frequency of silver eels from the fishery on the River Corrib, Galway, sampled on the 27th October 2005 and 20th November 2006. This shows the typical bimodal distribution, with a higher proportion of the smaller male eels in 2005 and females in 2006. The change in sex ratio may be an artefact of fishing conditions or the timing of sampling.

356 Joint EIFAC/ICES WGEEL Report 2007
05
10
15202530
3540
28 34 40 46 52 58 64 70 76 82 88Length (cm)
Num
ber
05
10
15202530
3540
28 34 40 46 52 58 64 70 76 82 88
Length (cm)
Num
ber
2005
2006
Figure IR.17. Length frequency distribution for eels from the silver eel fishery on the River Corrib, Galway, in October 2005 (n=382) and November 2006 (n=202).
IR.H.2.4 WRFB Galway-Gowla-Silver
Figure IR.18 gives the length frequency of silver eels from the trap on the River Gowla, sampled in October 2006. This shows the typical bimodal distribution, with a higher proportion of the larger female eels.

Joint EIFAC/ICES WGEEL Report 2007 357
0
5
10
15
20
25
30
28 34 40 46 52 58 64 70 76 82 88
Length (cm)
Num
ber
Figure IR.18. Length frequency distribution for eels from the silver eel trap on the River Gowla in October 2006 (n=88).
IR.H.3 NWRFB Burrishoole Catchment (Western RBD)-Silver
Monitoring of length of silver eel in the Burrishoole has taken place since 1958, with total trapping since 1970 (Poole et al. 1990). Table IR.9 gives the length and weight data since 1987 for both the total annual run, and where available for the separate sexes. Age data is presented in Table IR.10. The silver eel lengths clearly fit into a bimodal distribution consistent with males and females (Figures IR.19 and 20). There is a normal distribution of females between 40 and 60 cm with a small proportion of longer females up to 100 cm. Burrishoole eels are generally considered relatively old and slow growing, typical of oligotrophic Irish waters. Growth rates in the more productive waters in Ireland are generally faster than in Burrishoole.

358 Joint EIFAC/ICES WGEEL Report 2007
Table IR.10. Length and weight for migrating silver eel, Burrishoole. St Er given in brackets.
___________________________________________________________________________
Year Sample Sample Mean Min/Max Sample Mean Min/Max
Type Size Length Length Size Weight Weight
(Lt) (cm) (Wt) (g) (g)
___________________________________________________________________________
1987 Total 849 44.5 29.7–98.8 849 190.5 48–2523
(0.26) (4.6)
1988 Total 3003 45.6 28.9–92.9 2996 205.9 37–2240
(0.14) (2.3)
Male 1120 37.3 28.9–46.0 1116 97.7 37–210
(0.10) (0.93)
Female 1883 50.5 40.5–92.9 1880 270.2 90–2240
(0.11) (2.7)
1995 Total 1547 46.4 29.1–100.0 263 225.3 45–2700
(0.22) (18.1)
1997 Total 1022 48.9 25.3–95.0 - - -
(0.27)
2001 Total 850 48.9 24.4–95.6 72 208.6 60–1295
(0.31) (20.8)
2002 Total 732 46.2 24.2–86.1 60 191.1 57–671
(0.35) (16.3)
2003 Total 649 45.1 29.2–93.9 60 190.4 46–393
(0.37) (15.1)
2004 Total 382 48.2 31.1–81.7 144 248.0 57–1399
(0.45) (11.2)
2005 Total 587 48.8 27.3–99.6 581 237.0 35–2545
(0.40) (9.1)
2006 Total 493 48.0 29.5–87.6 158 242.8 45–1770
(0.39) (13.6)
___________________________________________________________________________
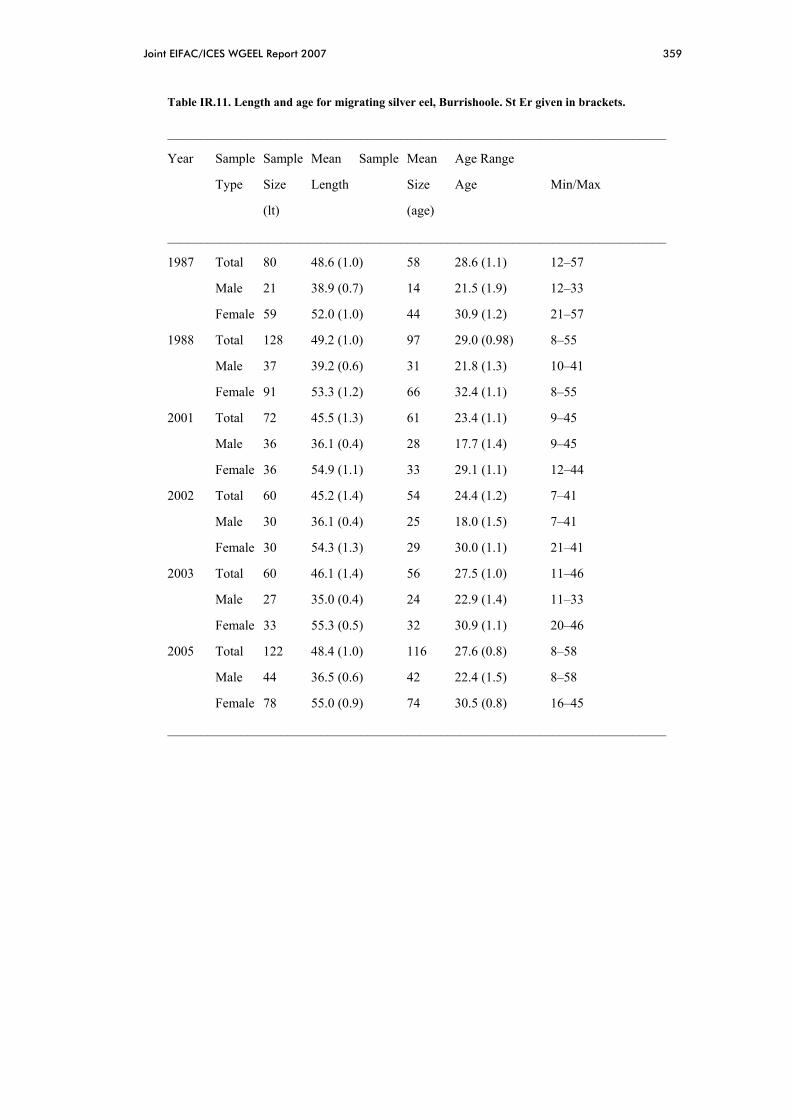
Joint EIFAC/ICES WGEEL Report 2007 359
Table IR.11. Length and age for migrating silver eel, Burrishoole. St Er given in brackets.
___________________________________________________________________________
Year Sample Sample Mean Sample Mean Age Range
Type Size Length Size Age Min/Max
(lt) (age)
___________________________________________________________________________
1987 Total 80 48.6 (1.0) 58 28.6 (1.1) 12–57
Male 21 38.9 (0.7) 14 21.5 (1.9) 12–33
Female 59 52.0 (1.0) 44 30.9 (1.2) 21–57
1988 Total 128 49.2 (1.0) 97 29.0 (0.98) 8–55
Male 37 39.2 (0.6) 31 21.8 (1.3) 10–41
Female 91 53.3 (1.2) 66 32.4 (1.1) 8–55
2001 Total 72 45.5 (1.3) 61 23.4 (1.1) 9–45
Male 36 36.1 (0.4) 28 17.7 (1.4) 9–45
Female 36 54.9 (1.1) 33 29.1 (1.1) 12–44
2002 Total 60 45.2 (1.4) 54 24.4 (1.2) 7–41
Male 30 36.1 (0.4) 25 18.0 (1.5) 7–41
Female 30 54.3 (1.3) 29 30.0 (1.1) 21–41
2003 Total 60 46.1 (1.4) 56 27.5 (1.0) 11–46
Male 27 35.0 (0.4) 24 22.9 (1.4) 11–33
Female 33 55.3 (0.5) 32 30.9 (1.1) 20–46
2005 Total 122 48.4 (1.0) 116 27.6 (0.8) 8–58
Male 44 36.5 (0.6) 42 22.4 (1.5) 8–58 Female 78 55.0 (0.9) 74 30.5 (0.8) 16–45
___________________________________________________________________________

360 Joint EIFAC/ICES WGEEL Report 2007
0
50
100
150
200
250
300
350
400
450
28 32 36 40 44 48 52 56 60 64 68 72 76 80 84 88 92
Length (cm)
Num
ber
FemaleMale
Figure IR.19. Length frequency distribution for male and female silver eels in the Burrishoole system, 1988 (n = 3003).

Joint EIFAC/ICES WGEEL Report 2007 361
0
10
20
30
40
50
60
70
80
90
100
26 32 38 44 50 56 62 68 74 80 86 92 98
Length (cm)
Num
ber
0
10
20
30
40
50
60
70
80
90
100
26 32 38 44 50 56 62 68 74 80 86 92 98
Length (cm)
Num
ber
2005
2006
Figure IR.20. Length frequency distribution for male and female silver eels in the Burrishoole system, 2005 (n = 587) and 2006 (n = 493).
IR.H.3.1 NWRFB Conn-Silver
Figure IR.21 gives the length frequency of silver eels from the fishery at the outflow from Lough Conn, sampled on 11th November 2005. This shows the typical bimodal distribution of male and female silver eels.

362 Joint EIFAC/ICES WGEEL Report 2007
0
2
4
6
8
10
12
28 34 40 46 52 58 64 70 76 82 88
Length (cm)
Num
ber
Figure IR.21. Length frequency distribution for eels from the silver eel fishery on Lough Conn on 11th November 2005 (n=157).
IR.H.3.2 NSSHARE
The NS Share River Basin District Project is the vehicle for delivering the objectives of the Water Framework Directive within the North South Share River Basin District between August 2004 and March 2008. This project is supported by the EU INTERREG IIIA Programme for Ireland/Northern Ireland.
The North South Share Project comprises of three river basin districts.
1 ) North Western International River Basin District 2 ) Neagh Bann International River Basin District 3 ) North Eastern River Basin District
The North Western and Neagh Bann River Basin Districts are shared between the Republic of Ireland and Northern Ireland whilst the North Eastern RBD is completely within Northern Ireland.
Table IR.12 gives the summary data, length, weight and age, for the eels captured during the two year fyke net survey of the lakes in the NSSHARE project.
IR.I. Other biological sampling
IR.I.1 National Synopsis
DCR requirement: Samples of length and weight are to be taken every three years for compliance with the DCR.
There is no national programme for sampling other biological aspects of eel in Ireland. A number of catchment based research programmes collect data which may be informative (see Table IR.9).
IR.I.2 Parasites
Anguillicola crassus was first recorded in Irish eels in the Waterford area in 1997. They were subsequently recorded in the Erne (see below) and this invasion probably occurred between 1997 and 1998, as they were apparently absent in 1996 (Copely and McCarthy, 2005).

Joint EIFAC/ICES WGEEL Report 2007 363
Anguillicola has now also spread to the R. Shannon (McCarthy and Cullen, 2000). A summary of the known distribution of Anguillicola in Ireland was compiled in 2003 (McCarthy et al, in press) and the data-base is currently being up-dated, following discovery of the species in small and reputedly unexploited western Irish catchments. Investigations of parasites assemblages of eels in marine, mixohaline and freshwater habitats in the Shannon and other Irish rivers are being undertaken by the National University of Ireland, Galway, as part of a research project funded by the Higher Education Authority ( HEA PRTLI-3).
IR.I.3 Shannon Catchment (Shannon IRBD)-Parasites
Annual surveys of brown and silver eels in the Shannon fisheries, undertaken since 1992, show that Anguillicola was first detected in 1998 at Killaloe and that since then it has become well established in the lower catchment and that it has more recently spread to lakes further up in the river system.
IR.I.4 Erne Catchment (North Western IRBD)-length & growth
Extracted from: Matthews et al. (2001). An extensive fyke net survey of the brown eel stocks of the Erne lakes was carried out from May to September 1998–2000 (see also Section IR.F). Weekly samples of 5–10 eel were taken to determine age, growth, feeding patterns and parasitic burden from different sections of the catchment.
Highest catches were obtained from Upper and Lower L. Erne in the lower reaches of the catchment where the greater part of commercial fishing takes place. Mean length ranged from 42–44 cm. Mean growth rates ranged from 2.7 cm per year in Lower L. Erne to 3.4 cm per year in Upper L. Erne.
In contrast, numbers from the upper reaches of the catchment were lower and were characterised by the preponderance of large (mean length 46–64 cm), female eel. Growth rates (3.6–4.6 cm per year) confirmed brown eel from Upper Erne to have some of the fastest growth rates in Ireland.
The proportion of undersize eel (less than 42 cm) in fyke net catches declined progressively from Lower L. Erne (mean 40%) to less than 10% in the upper reaches of the Erne system. The size composition of catches from some of the Cavan-Monaghan lakes (e.g. Annalee-Dromore and Ballinamore lakes) suggests natural recruitment of juvenile eel to these lakes is negligible.

364 Joint EIFAC/ICES WGEEL Report 2007
Table IR.12. Summary sample details (Length, weight and age) for the lakes surveyed by fyke net in the NSSHARE programme.
LAKE DATE CATCH EFFORT CPUE MEAN LT RANGE MEAN WT RANGE MEAN AGE RANGE NO. AGED
Akkibon 08/09/2005 7 6 1.2 42.9 32-53 163.7 83-291 11.6 8-17 5 Allen 08/06/2006 4 15 0.3 52.8 41-75 390.8 149-984 13.0 13 1 Altan 27/07/2005 4 18 0.2 48.5 45-51 206.8 153-254 24.2 23-25 4 Anure 02/08/2006 22 9 2.4 45.0 36-59 196.6 110-410 18.6 13-25 12 Auva 10/08/2005 9 6 1.5 38.5 30-43 148.9 76-240 - - 0 Avehy 01/09/2005 2 6 0.3 41.0 38-44 126.5 110-143 - - 0 Barra 04/08/2005 15 9 1.7 42.5 32-67 196.0 60-700 18.7 14-19 4 Bawn 23/09/2005 1 6 0.2 53.0 53-53 200.0 200-200 - - 0 Corglass 05/07/2005 8 12 0.7 55.9 39-71 421.3 100-810 - - 0 Deralk 05/10/2005 1 6 0.2 52.0 52-52 - - - - 0 Derg 13/09/2005 33 15 2.2 50.2 34-66 268.0 89-550 21.6 12-31 11 Derrybrick 04/10/2005 1 6 0.2 49.0 49-49 290.0 290-290 0 Dungloe 11/08/2006 18 9 2.0 36.0 28-54 115.8 60-250 20.5 12-29 12 Dunlewy 03/08/2005 5 12 0.4 55.6 38-80 466.0 110-1150 16.7 11-29 4 Dunragh 11/07/2006 1 9 0.1 48.0 48-48 - - - - 0 Egish 29/08/2006 6 9 0.7 67.0 57-85 661.7 360-1350 11.0 9-13 3 Eske 16/08/2006 22 12 1.8 37.8 31-46 106.7 44-186 18.9 12-27 10 Fad 21/07/2005 10 9 1.1 38.5 33-45 113.4 78-182 23.2 17-38 10 Fern 20/09/2005 15 9 1.7 37.9 31-54 108.4 55-277 11.8 7-26 14 Gartan 06/09/2005 29 12 2.4 46.8 34-60 225.3 82-560 16.0 14-19 5 Glen 25/07/2006 34 9 3.8 42.8 26-85 138.2 36-338 19.0 14-24 10 Golagh 31/08/2005 3 6 0.5 63.2 54-68 573.3 360-710 19.3 17-23 3 Gortnawinny 01/09/2006 5 9 0.6 64.1 46.74 748.0 260-1350 16.7 14-19 3 Keel 27/07/2006 16 9 1.8 47.1 34-62 215.5 70-438 19.9 13-31 7 Kiltooris 09/08/2005 10 9 1.1 39.3 29-42 119.3 26-298 - - 0 Kiltyfanned 10/08/2005 15 6 2.5 34.5 29-42 122.0 70-180 14.5 12-17 2 Kindrum 18/07/2006 16 9 1.8 35.8 25-79 166.1 60-1130 22.4 11-47 7 Latone 19/08/2005 6 9 0.7 46.8 37-54 184.1 90-271 14.3 8-18 6 Lee 30/08/2005 8 6 1.3 53.9 47-67 376.0 210-800 18.4 13-24 8 Meela 28/06/2005 192 18 10.7 37.2 19-73 413.3 60-790 - - 0 Melvin 13/07/2005 123 24 5.1 37.7 7-75 157.2 17-980 - - 0 Muckno Sep/2006 53 9 5.9 43.7 29-74 442.8 120-1360 - - 0 NaBack 05/09/2006 1 6 0.2 67.0 67-67 500.0 500-500 - - 0 Nalughraman 23/09/2005 1 6 0.2 68.8 69-69 752.2 752-752 - - 0

Joint EIFAC/ICES WGEEL Report 2007 365
Table IR.12 cont. Summary sample details (Length, weight and age) for the lakes surveyed by fyke net in the NSSHARE programme.
LAKE DATE CATCH EFFORT CPUE MEAN LT RANGE MEAN WT RANGE MEAN AGE RANGE NO. AGED
New L. Jun/2005 140 33 4.2 40.5 25-82 157.2 30-1100 - - 0 Ross 23/08/2005 12 6 2.0 39.6 28-54 130.7 64-329 15.7 12-23 11 Sessiagh 13/07/2006 13 9 1.4 43.5 36-50 147.1 62-212 17.7 12-26 10 Toome 22/08/2006 4 6 0.7 39.6 33-51 142.5 60-240 16.5 21-32 2 Town 27/09/2005 1 6 0.2 53.0 53-53 200.0 200-200 - - 0 Veagh 16/08/2005 7 9 0.8 43.4 33-74 228.4 90-868 27.4 18-40 5 Vearty 02/09/2005 4 6 0.7 49.2 39-55 220.0 100-310 22.2 19-24 4 Waskel 05/08/2005 9 9 1.0 43.7 35-51 135.8 69-218 14.4 9-20 8 White (Ballybay) 31/08/2006 2 9 0.2 48.5 42-55 350.0 250-450 8.0 6-10 2 Total 888 423 2.1 183 (NSShare fish in lakes project, funding under Interreg IIIA programme. Data provided by T. Champ, F. Kelly & L. Connor (CFB); Age analysis by L. Connor (CFB), C. O'Toole, J. Cooney & R. Poole (MI)).

366 Joint EIFAC/ICES WGEEL Report 2007
IR.I.5 Erne Catchment (North Western IRBD)-Parasites (Matthews et al., 2001)
Eight parasitic endohelminth worm species (2 Cestoda, 3 Nematoda and 3 Acanthocephala) were found in the intestines of 1089 brown eel examined from throughout the Erne system, 1998–2001. Of greatest concern was the discovery of the pathogenic blood-sucking nematode Anguillicola crassus in the swim-bladder of brown and silver eel from the Erne.
Initially detected in the R. Barrow in 1997, the parasite has since spread to the lower reaches of the R. Shannon and was first recorded from brown eel in southern Lower Lough Erne in 1998 (Evans and Matthews, 1999). By 1999 the parasite was detected as far upstream as L. Garadice with 90% of brown eel from the Narrows, Lower L. Erne found to be infected.
IR.I.6 Burrishoole Catchment (Western RBD)-Silver
Length and weight are measured for Burrishoole silver eel on an annual basis (Table IR.10). The average weight of the silver eels in the catches has been steadily increasing from 95 g in the early 1970s to 215 g in the 1990s (Figure IR10). The increase in average weight has been caused, at least in part, by a change from a predominantly male sex ratio to more than 60% females in the more recent years (Poole et al., 1990).
Anguillicola has not been recorded to date in Burrishoole.
IR.I.7 Predation
Studies of the cormorant’s diet have been carried out both in the breeding and non-breeding season. During the non-breeding season such studies showed a high incidence of coarse fish, particularly roach and perch, with roach providing over 80% of the diet in late winter (Mcdonald, 1987). Mcdonald (1987) also showed that systems with high populations of roach coincided with the highest concentrations of wintering cormorants. However, work carried out on the Bush River (Kennedy and Greer, 1988) have suggested high predation levels ( 51 to 66%) on wild smolts over the short space of the smolt run. Brown trout were also found to be important in the diet. Doherty and McCarthy (1997) found that cormorants in the lower reaches of the Shannon fed predominantly on perch in winter and eels in summer and concluded that the ‘greatest potential for impact on economically important fish stocks seems to involve eels’.
A study carried out at two breeding colonies on the west coast identified wrasse and eel as the dominant prey species (Mcdonald, 1987). This was similar to the findings of West et al. (1975) who suggested that cormorants exploited locally available fish species within the local range of their breeding colony. Piggins (1959) found that in a study of 22 stomachs collected between May and October in Mayo, the main freshwater prey were brown trout and eel. A study carried out on the Erne to assess the impact of cormorants on salmonid stocks suggests that cormorants did not pose a serious threat to salmon smolts (Crowley, Mathers and O’Teangana, 2001). This was similar to the findings of Doherty and McCarthy (1997) who suggested that it was unlikely that salmon smolts were extensively preyed upon by cormorants in the lower river Shannon system.
Other predators known to impact on eel in Ireland include otter, mink, seals, herons, merganser and smaller birds eating elvers. The impact of any of these predators on individual populations of eel has not been quantified.
IR.J. Other sampling
No other sampling for such issues pertinent to eel has taken place in Ireland up to 2004. Some samples have been taken in 2005 and are currently undergoing analysis for contaminants (PCBs, dioxins, BFRs) and presence of Anguillicola (Table IR.9).

Joint EIFAC/ICES WGEEL Report 2007 367
Many issues relating to water quality, river continuity, and physical habitat have been included in the Risk Classifications under the Waterframework Directive.
A study funded under the NDP Programme to determine the extent of usable wetted area for salmon was recently been completed, (McGinnity et al., 2003). The initial study determined the extent of wetted area for all rivers and lakes in Ireland. This has been refined to establish a river inventory of 261 salmonid rivers. This habitat information is derived from remotely sensed data analysed in a GIS platform. A series of complex datasets (including topography, rivers, riverine gradient, lakes, catchments and Fishery Districts) with national coverage were required for the development of an integrated, GIS based, data model for the quantification of the freshwater habitat asset and for the determination of the quantity of habitat available to migratory salmonids. This information will be important in helping determine the potential productivity of eel in catchments throughout the country.
The EPA (Irish Environmental Protection Agency) Biological River Monitoring Programme carries out a triennial survey of the biological elements of water quality at in excess of 3300 monitoring stations on the main river channels. These surveys derive a biological quality rating or 'Q value' of waters at each monitoring station. Within their GIS the EPA has developed a facility to map the river stretches which correspond to the different Q value classes by a form of interpolation between the monitoring stations along the river network. These data on Q value extents, recorded in the EPA River Q Value Class, were utilised to provide a classification of wetted area amounts within each Q value class.
It is proposed to update this GIS database in 2007 to include natural and man-made barriers and to ground truth it for eel but this has not been undertaken as yet.
IR.K. Stock assessment
There is no nationally co-ordinated eel stock assessment programme in Ireland and there is also no co-ordinated use of stock assessment data for the estimation of exploitation or % SPR.
Individual stock assessments are used to inform local fisheries management decisions, such as the R. Shannon Eel Fishery Programme run by the ESB and NUIG.
IR.L. Sampling intensity and precision
Data on sampling intensity, precision, catch composition, etc have not been analysed or compared. Any analysis would have been restricted to the research programme under which the data was collected.
IR.M. Standardisation and harmonisation of methodology
IR.M.1 Survey techniques
Fyke Nets-Standard summer fyke nets (Matthews et al., 2001; McCarthy et al., 1994; Moriarty, 1975; Poole, 1990, 1994; Poole and Reynolds, 1996b) have been widely used in eel surveys around Ireland since the early 1970s. The nets used have been generally similar in all the surveys, normally fished in chains of five or ten nets. A "typical" summer fyke net consists of two traps (each 3.3 m in length), facing each other, joined by a leader net (8 m in length), mesh size 16–18 mm. Each trap consists of two chambers and a cod end with knot to knot mesh sizes of 16, 12, and 10 mm respectively. The diameter of the trap entrance was 58 cm and the outer ring of each trap was 'D' shaped.
Catch per unit effort (cpue) data are normally reported in number of eels, or weight, per net (pair of traps) per night fished.

368 Joint EIFAC/ICES WGEEL Report 2007
Long-lines-Long-lines have not been extensively used as a survey tool in Ireland. On the Shannon (McCarthy & Cullen, 2000) long-lines have been standarised and the bait is restricted to earthworm allowing some comparisons to be made between fishing areas and years.
River Surveys-In deeper rivers and estuaries, fyke nets have been the standard survey tool. In smaller rivers electrofishing is generally employed, in spite of being fraught with difficulties when applied to eel, with a variety of back-pack portable and bankside generator gear being used. Single pass and three fishing depletion methods are used, but often eel assessments are carried out as a "by-product" of other surveys, in particular salmonid surveys.
IR.M.2 Sampling commercial catches
There is no national programme for sampling commercial catches.
Erne-The survey of the Erne catchment 1998–2001 was carried out using a semi-commercial research team of crews (Matthews et al., 2001). An observer was placed with each crew at least once a week to ensure standardisation. Eels were stored in keep nets or boxes similar to those used by commercial fishermen. Eels were graded and sold to eel dealers at the lake shore. The entire catch was sampled prior to grading and the fishermen were paid full price for undersized eel, before their release.
Shannon-Commercial crews authorised by the ESB sell to eel dealers at lakeside locations on designated dates. ESB staff and NUIG researchers attend at sales points, to monitor catches and to obtain samples for length, weight, age and parasitology analyses. Dealers are required to provide advance notice of their collection schedules. Comparisons are made annually between sales statistics and cumulative catches, reported in log-books, by the fishing crews. Dealers are required to disinfect truck tanks, monitored by ESB staff, before collections begin and to ensure that no water/potential pathogens are introduced to the river system.
IR.M.3 Sampling
Catch sampling is normally carried out on anaesthetised eel, although some samples may be taken from either freshly sacrificed or frozen samples.
IR.M.4 Age analysis
Age analysis of eel in Ireland has generally followed the methodology of burning and cracking (Christensen, 1964; Cullen and McCarthy, 2003; Hu and Todd, 1981; Moriarty, 1983; Poole and Reynolds, 1996a; Vollestad et al., 1988). Otoliths are extracted as described by Moriarty (1973), stored dry and prepared by burning in either gas or spirit flame. There is no formal validation or quality control in Ireland. Some cross validation and double reading has been carried out between projects and this has ensured some degree of continuity between samples and surveys, (i.e. Moriarty, 1983; Poole et al., 1992; Matthews et al., 2001; Matthews et al., 2003; Maes, unpubl.). Comparisons have also been made between age derived growth (back-calculations) and tag/mark recapture determined growth, thereby validating the use of burning and cracking otoliths for age and growth determinations in slow growing Irish eel (Poole and Reynolds, 1996b; Moriarty, 1983).
IR.M.4.1 Life stages
Glass Eel/Elver life stages are determined the pigmentation classification using that published by Elie et al. (1982).
Brown eel and silver eel are categorised by a combination of capture method and season, colouration and eye size. Silver eels are generally captured during their downstream

Joint EIFAC/ICES WGEEL Report 2007 369
migration, or can be recognised in the brown eel catch by the enlarged eyes and onset of coloration change.
IR.M.4.2 Sex determinations
Brown eel <25 cm are problematical to sex and >25 cm up to 45 cm are sexed by dissection.
Silver eel are sexed by length and some studies have carried out dissections on eels between ~38 cm and 48 cm in order to determine the length overlap between the sexes.
Histological verification has not been used to any extent in Ireland.
IR.N. Overview, conclusions and recommendations
This report presents an overview of the eel in Ireland. Glass eel and elver fishing in Ireland is prohibited by law (1959 Fisheries Act, Sec. 173) and this may only be carried out under Section 18 Authorisations from the relevant Regional Fisheries Boards, for the purposes of enhancement and development of the fishery.
The commercial eel fishery involves highly seasonal, small scale, scattered fisheries, harvesting both brown and silver eel in freshwater, estuarine or tidal waters. Brown eel are fished using a variety of techniques, the most common of which are baited long-line, fyke nets and baited pots. When silver eel are migrating downstream in the autumn they are caught in licensed fyke or coghill nets which are often attached to fixed structures in the river flow.
The declared commercial eel catch in the Irish Republic, 2001–2002, was about 100 t involving about 150–200 part-time fishermen (data from RFBs/MI), but inadequate reporting and illegal fishing makes this difficult to quantify accurately and maybe a substantial under estimate. The value of the reported catch in 2002 was therefore some €0.5 million. The declared commercial catch in 2004 was about 120 t, in 2005 it was 87 t (~ €475 k) and 120 t (~ €670 k) in 2006.
National reporting of eel catch to ICES was initiated by the WGEEL in 2001 but catch reporting by fishermen has not been made a statutory regulation. Ireland has proposed to include eel in the DCR for 2006 and will produce a sampling schedule and costs before the year end, following consultation between the relevant State Agencies and advice from the EU Eel Sampling Workshop planned for Sweden in September '05.
The eel data collection programme must be structured in order to take account of the differing characteristics of individual catchments, such as productivity, channel continuity, fishery type, and also the nuances of eel biology, such as timing of migrations, sex ratios and differences in growth rates.
The EU Data Collection Regulation sets minimum standards for national data collection programmes. The obligation to register and monitor is specifically placed on the national government. Organising and implementing a centralised Data Collection Programme for eel will be a costly and laborious task. Integration with the DCR programme for marine species and focusing on the catchments with the main fisheries (6–12 catchments) would be more cost effective. Implementation of the DCR for eel will require support for the inland fisheries sector in both legislative and financial terms. It is still unclear, however, how the EU intends to implement the DCR for eel in inland waters.
IR.O. Literature references
Christensen J. M. 1964 Burning of otoliths, a technique for age determination of soles and other fish. J. Cons. perm. int. Explor. Mer, 29, 73–81.

370 Joint EIFAC/ICES WGEEL Report 2007
Cullen P. & McCarthy T.K. 2003 A comparison of two age determination techniques commonly used for eels Anguilla anguilla (L.). Ir. Nat. J. 27 (8), 301–305.
Copely L. & McCarthy T.K. 2005 Some observations on endoparasites of eels, Anguilla anguilla (L.) from two lakes in the River Erne catchment. Irish Naturalist Journal 28 (1), 31–35.
Crowley, K. Mathers R. and O’ Teangana, D. O., 2000. An assessment of the impact of predation on migrating salmon smolts in the Erne Catchment 1999/2000. In Erne Salmon management Programme, Edited by R.G. Mathers and K. Crowley.
Doherty, D. and Mc Carthy K., (1997). The population dynamics, foraging activities and diet of great cormorants (Phalacrocorax carbo carbo L.) in the vicinity of an Irish hydroelectricity generating station.
Elie P., Lecomte-Finiger R., Cantrelle I. & Charlon N. 1982 Définition des limites des différents stades pigmentaires durant la phase civelle d’Anguilla anguilla L. Vie et milieu 32 (3), 149–157.
Evans D. & Matthews M. (1999) Anguillicola crassus (Nematoda, Dracunculoidea); first documented record of this swimbladder parasite of eels in Ireland. Journal of Fish Biology 55, 665–668.
Hu L.C. & Todd P.R. 1981 An improved technique for preparing eel otoliths for aging. N. Z. J. Mar. and Freshw. Res., 15, 445–446.
Kennedy, G.J.A. & Greer, J.E. (1988). Predation by cormorants, Phalacrocorax carbo (L.), on the salmonid populations of an Irish river. Aquacult. & Fish. Manage. 19, ( 2); 159–170.
Matthews M., Evans D., Rosell R., Moriarty C. & Marsh, I. 2001 Erne Eel Enhancement Programme. EU Programme for Peace & Reconciliation Project No. EU 15. Northern Regional Fisheries Board, Donegal; 348pp.
Matthews M., Evans D.W., McClintock C.A. & Moriarty C. 2003 Age, growth and catch-related data of yellow eel Anguilla anguilla (L.) from the lakes of the Erne catchment, Ireland. American Fisheries Society Symposium 33, 207–215.
McCarthy T.K. & Cullen P. 2000 Eel Fishing in the River Shannon: Eel population changes, fishery management options and fishery conservation issues. A synthesis report on the River Shannon Eel Management Programme 1992–2000. Report to the ESB, NUIG; 21pp.
McCarthy T.K., O'Farrell M., McGovern P. & Duke A. 1994 Elver Management Programme; Feasibility Study Report, Forbairt, Dublin, 90pp.
Mcdonald, R.A., (1987). The breeding population and distribution of the cormorant in Ireland. Irish Birds, 3: 405–416.
McGinnity P., Gargan P., Roche W., Mills P., & McGarrigle M. 2003 Quantification of the freshwater salmon habitat asset in Ireland using data interpreted in a GIS platform. Irish Freshwater Fisheries Ecology and Management Series: No. 3, Central Fisheries Board, Dublin, Ireland, 132pp.
Moriarty C. 1973 A technique for examining eel otoliths. J. Fish Biol. 5, 183–184.
Moriarty, C. 1975 The small fyke net as a sampling instrument in eel research. EIFAC/T23 (Suppl. 1), 507–518.
Moriarty, C. 1983 Age determination and growth rate of eels, Anguilla anguilla (L). J. Fish Biol. 23, 257–264.
Piggins, D.J. (1959). Investigations on the predators of salmon smolts and parr. Annual Report. Salmon Research Trust Ireland Incorporated 1958.
Poole W.R. 1990 Summer fyke nets as a method of eel capture in a salmonid fishery. Aquaculture and Fisheries Management 21, 259–262.
Joint EIFAC/ICES WGEEL Report 2007 371
Poole W.R. 1994 A population study of the European Eel (Anguilla anguilla (L.)) in the Burrishoole System, Ireland, with special reference to growth and movement. PhD Thesis, Dublin University, 416pp.
Poole W.R. & Reynolds J.D. 1996a Growth rate and age at migration of Anguilla anguilla. J. Fish Biology, 48, 633–642.
Poole W.R. & Reynolds J.D. 1996b Age and growth of yellow eel, Anguilla anguilla (L), determined by two different methods. Ecology of Freshwater Fish 5 (2), 86–95.
Poole W.R., Reynolds J.D.R. & Moriarty C. 1990 Observations on the silver eel migrations of the Burrishoole river system, Ireland 1959–1988. Int. Revue Ges Hydrobiol. 75 (6), 807–815.
Poole W.R., Reynolds J.D. & Moriarty C. 1992 Age and growth of eel (Anguilla anguilla L.) in oligotrophic streams. Irish Fisheries Investigations, Series A (Freshwater). 36, 74–79.
Vøllestad L. A., Lecomte-Finiger R. & Steinmetz B. 1988 Age determination of Anguilla anguilla (L.) and related species. EIFAC Occas. Pap., 21, 1–28.
West, B., Cabot, D. & Greer-Walker, M., (1975). The food of the Cormorant (Phalacrocorax carbo) at some breeding colonies in Ireland. Proceedings of the Royal Irish Academy. 75: 285–304.

372 Joint EIFAC/ICES WGEEL Report 2007
UK: Report on the eel stock and f ishery in United Kingdom 2007
UK.A Authors
Dr. Alan Walker, Cefas, Pakefield Road, Lowestoft, Suffolk, England, NR33 0HT.
Tel: 00–44–1502–524351, Fax: 00–44–1502–526351.
Dr Miran Aprahamian, Environment Agency NW Region, Richard Fairclough House, Knutsford Road, Warrington, WA4 1HG.
Tel: 00–44–1925–653999, Fax: 00–44–1925–415961.
Dr Brian Knights, West Lodge, Old Perry Street, Chislehurst, Kent BR7 6PL, UK
Tel: 00–44–208–467–1917
Dr Jason Godfrey, FRS Freshwater Fisheries Laboratory, Faskally, Pitlochry, Perthshire, Scotland, PH16 5LB.
Tel: 00–44–1796–472060, Fax: 00–44–1796–473523
Dr Robert Rosell and Dr Derek Evans, Agri-Food & Biosciences Institute Northern Ireland, Newforge Lane, Belfast BT9 5PX.
Tel: 00–44–28–90255506, Fax: 00–44–028–90255004
[email protected]; [email protected]
Reporting Period: This report was completed in August 2007, and contains data up to 2006 and some provisional data for 2007.
Contributors to the report: Tony Bark and Beth Williams, Division of Life Sciences, King’s College London, Norfolk Building, Surrey Street, London WC2 2LS, UK. email: [email protected], [email protected]; and Peter Wood, UK Glass Eels, Gloucester, England.
UK.B Introduction
UK.B.1 Distribution of eel within England and Wales 2001–2007
Routine electric fishing surveys for coarse fish and salmonids conducted by the Environment Agency (EA) from 2001 to 2007 show eels are present in nearly all river systems in England and Wales (Figure 1). There are some areas where eels are scarce or absent, particularly the upper reaches of rivers, though some lower reaches of rivers appear devoid of eel whilst the species is present further upstream. This may result from different survey techniques being utilized across a catchment. Eel were present in 43–51% of the survey samples during this period.

Joint EIFAC/ICES WGEEL Report 2007 373
LegendEel Present 2001-2007
Eel Absent 2001-2007
River Basin Districts
¯0 70 14035 Kilometers
Figure 1. Environment Agency data on eel presence and absence in England and Wales, 2001–2007.
The EA is responsible for the management of commercial eel fisheries in England and Wales. Fisheries are licensed at the regional scale, with licences issued for a single region and not transferable other than where estuaries are shared by more than one region (Thames and Humber, for example), where licences for wingless and winged traps may be issued for the water body that lies in more than one region. Fisheries are managed by national and local byelaws.
National Eel Fishing Byelaws introduced in 2004 authorise the use of six instruments for eel fishing as follows:
• Permanently fixed traps, e.g. weir or rack traps and putts; • Moveable or temporary nets or traps without leaders or wings and with an
opening with a maximum diameter of less than 75 cm, e.g. putcheons, some fyke nets, pipe traps, crigg, pots, baskets and hives;
• Moveable or temporary nets or traps with leaders or wings with an opening with a maximum diameter of less than 1 m, eg. wing nets, and most fyke nets;

374 Joint EIFAC/ICES WGEEL Report 2007
• Gloucester wing nets-large fyke nets used on the River Severn, not exceeding 25 m in length and with leaders of up to 7 m;
• Eel trawl nets; • Elver dip nets.
Appendix 1 provides a summary description of netting and trapping methods used to catch eels in the UK.
Apart from rod and line, there are no other legal methods for catching eels.
The Eel Byelaws also stipulate that:
• All salmon, migratory trout, trout or freshwater fish caught in any instrument licensed to take eels must be returned as soon as possible;
• All eels less than 30 cm in length must be returned to the water (apart from elvers caught in a dip net);
• No part of any net, wing or leader shall be made of a mesh greater than 36 mm stretched mesh;
• Except for an elver dip net, monofilament material is prohibited; • Nets should be set so that they do not dry out unless they are checked just before
they do so; • Nets should not cover more than half the width of the watercourse, or apart from
in stillwaters and tidal waters, should not be set closer than 30 m apart; • No fishing is allowed within 10 m above and below any obstruction; • Elver dip nets must be used singly, by hand and without the use of ropes, nets, • chains, floats or boats; • Every licensed instrument must carry an identity tag issued by the EA; • Otter guards must be fitted to all fyke nets; • Catch returns are required from all eel and elver fishermen.
In terms of fishing locations:
• Fixed traps can be used across the whole of England and Wales, except North East Region, non-tidal rivers in Devon and Cornwall, and the Border Esk;
• Small wingless traps and winged traps can be used across the whole of England and Wales except non-tidal rivers in Devon and Cornwall and parts of North East Region;
• Gloucester Wing nets can only be used in the River Severn within Midlands Region;
• Eel trawls are restricted to a box in the outer Thames Estuary (but no longer operate);
• Elver dip nets are restricted to two zones in parts of Wales and the North West and South West of England.
UK.B.2 Distribution of eel within Northern Ireland
Lough Neagh in N. Ireland is the largest freshwater lake in the UK. Prior to 1983, estimates of annual recruitment of glass eel to the Lough consistently exceeded 6 million and averaged in excess of 11 million (based on a mean weight of 3000 kg-1). Productivity is such that the Lough sustains a large population of yellow eel and produces many silver eels that migrate via the out-flowing Lower River Bann.
The system sustains the largest remaining commercial wild eel fishery in Europe, producing 25% of the total recorded EU wild catch and supplying 3% of the entire EU market. Fishing rights to all eel life stages are owned by the Lough Neagh Fishermen’s Co-operative Society

Joint EIFAC/ICES WGEEL Report 2007 375
(LNFCS). The fishery is managed to allow the capture of approximately 400–500 t of yellow eel and 100–150 t of silver eels annually, with an escapement of silver eels at least equivalent to the catch of silvers. Whilst it is illegal to fish for glass eels in N. Ireland, provision is made whereby staff from the LNFCS are allowed to catch glass eels using drag nets below a river-spanning sluice gate, which creates a barrier to upstream juvenile eel migration, for onward stocking into L. Neagh. Elvers are also trapped at the same location and stocked into the Lough.
The yellow eel fishery (May-September, 5 days a week) supports 80–90 boats each with a crew of 2 men using draft nets and baited longlines. Eels are collected and marketed centrally by the Co-operative. Around 300 families derive and depend on income from the fishery. Through the Co-operative, yellow eel fishermen are paid the market price for their catch. Silver eels are caught in weirs in the Lower River Bann. Profit from the less labour-intensive silver eel fishery sustains the management of the whole co-operative venture, providing working capital for policing, marketing and stocking activity and an out-of-season bonus payment for yellow eel fishermen at Christmas.
Natural recruitment has been supplemented since 1984 by the purchase of glass eel. Approximately 73 million additional glass eel have been stocked by the LNFCS. Reviews on the fishery, its history and operation can be found in Kennedy (1999) and Rosell et al (2005).
The cross-border Erne system is comparable in size to L. Neagh and produces in the region of 50 t of eels per year. Within N. Ireland, Upper and Lower Lough Erne sustain small-scale and declining yellow and silver eel fisheries. Elvers are trapped at the mouth of the River Erne using ladders placed at the base of the hydroelectric facility that spans the Erne, and trucked into the Erne lake system for stocking. A comprehensive study into the structure, composition and biology of the eel fisheries on the Erne was conducted by Matthews et al (2001).
Overall policy responsibility for the supervision and protection of eel fisheries in Northern Ireland, and for the establishment and development of those fisheries rests with the Department of Culture, Arts and Leisure (DCAL).
Summary of management measures for eel fisheries in Northern Ireland
• Ban on glass eel fishing (other than for stocking); • Trapping and transport of juveniles on the Erne system; • Restricted access to the fisheries through a system of licence, permits and
seasonal closures; • Minimum landing sizes (30 cm, though fisheries impose voluntary 40 cm); • Technical measures associated with fishing gears; • Closure of the Department-owned silver eel fishery on the Erne as a conservation
measure; • Free gaps (10%) in silver eel fishing weirs.
In addition to the above, the LNFCS has in place
• Trapping and transport of juveniles on the Bann; • A quota system on yellow eel catch; • Restocking with purchase of supplemental glass eel; • Ban on the use of fyke nets.
UK.B.3 Distribution of eel within Scotland (1996–2006)
Electrofishing surveys by the Fisheries Trusts in Scotland (from 1996–2006) indicate that the eel is widespread in Scotland (Figure 2). These surveys were primarily targeted at salmonids. Eels appear absent from many of the upper reaches of rivers, likely due to difficulties of

376 Joint EIFAC/ICES WGEEL Report 2007
access. Data are currently available only for the Scotland River Basin District (excluding areas of Galloway and the Tweed in the South). A total of 6651 electrofishing visits were made to 3645 sites. Eels were present at 39.7% of visits, and recorded as present on one or more visits at 44.3% of sites.
!( !(!(!(!(
!(
!(!(!(!(
!(
!(
!(!(
!(!(
!(
!(!(!(
!(
!(
!(
!(
!(
!( !(
!(!( !(
!(!( !(
!(!(
!( !(
!(!(!(
!(!(
!(!(!(
!(!(
!(!(
!(
!(
!(!(
!(!(
!(
!( !(
!(
!( !(!( !(
!(!(
!(
!(!(
!(
!(
!(
!(
!(
!(
!(
!(!(
!(
!(
!(!(!( !(
!(!(!(!(
!(!(
!(!(!(
!(!(!(!(!(
!(!(!(!(
!( !(!( !(
!(
!(
!(!(!( !(
!(!(!(!(!( !(!( !(
!(!(
!(!(!(
!(
!(
!(!(!(
!(!(!(!(!(
!(!( !(!( !(!(
!(!(!(!(!(!(!(
!(!(!(!(!(!(!(
!( !(!(
!(!(
!( !(!(
!(!( !(!(
!(!(
!(!(!(
!(!(
!( !(
!(!(
!(
!(!(!(
!(!(!(
!(
!(
!(
!(!(!(!(
!(!(
!(
!(!(
!(!(!(!(
!(
!(!(
!(
!(!(!(
!(!(!(
!(
!(
!(!(!(
!(
!(!(
!(!(!(
!(!(!(
!(
!(!(
!(!(!(
!(!(!(!(
!(
!(
!(
!(!(
!(
!(
!(
!(
!(
!(
!(
!(!(!(
!(
!(
!(
!(
!(
!(
!(
!(!(!(
!(
!(
!(
!(
!(!(
!(
!(
!(
!(
!(
!(
!(
!(
!(!(
!(
!(
!(
!(
!(
!(!(
!(
!(
!(
!(
!(
!(
!(
!(
!(
!(!(
!(!(
!(
!(
!(
!(
!( !(
!(
!(!(
!(
!(
!(
!(
!(
!(
!(
!(
!(
!(
!(
!(
!(
!(
!(
!(!(
!(!(
!(
!(
!(
!(!(
!(!(
!(
!(!(
!(
!(
!( !(
!(
!(
!(
!(
!(
!(
!(!(
!( !(!(
!(
!(
!(
!(
!(
!(!(!( !(
!(
!(
!(
!(
!(
!(
!(!(
!(!(
!(!(
!(!(
!( !(!(
!(
!(
!(
!( !(
!(!( !(
!(
!(
!(!(!(
!(
!(
!(
!(
!(
!(
!(
!( !(
!(
!(
!(!(
!(
!(
!(
!(
!(
!(!(!(
!(
!(
!(
!(
!(
!(
!(
!(
!(
!(!(
!(
!(!(!(
!(
!(!(!(
!(!(
!(
!(
!(!(
!(
!(!(
!( !(!(
!(!(!(
!(
!(!(!(
!(
!(
!( !(!(!(
!(!(
!(!(
!(!(
!(
!(!(!(!(
!(!( !(
!(!(!(!(!(!(!(!(
!(!(
!(!(
!(!(
!(!( !(!(!(!(!(!(!(!(!(!(
!(!(!(
!(!(!(!(!(!(!(!(
!(!(!(!(!(
!(!(!(
!(
!( !(
!( !( !(!(
!( !(!(
!(!(!(
!(!(!(
!(!(
!(!(!(!(!(!(!(!(!(!( !(!(!(!(
!(!(!(
!(
!(
!(!(!(!(!(!(
!(!(!(!(!(!(!(!(
!(!(!(
!(
!(
!(
!(
!(!(!(!(
!(!(!(!(
!(!(
!(
!(!(!(
!(!(!(
!(
!(!(!(
!(!(
!(
!(!(!( !(!(
!(!(!(
!(!(!(
!(
!(!(
!(!(
!( !(!(!(
!(
!(!(
!(!(!(!(
!(
!(
!(
!( !(!(!(!(
!(!(
!(!(
!(!(
!(!(!(
!(!(!(!(!( !(!(!( !( !(!(
!(!(!(
!(
!(
!(
!(
!(!(!(
!(!(
!(
!(
!(
!(!(!(!(!(
!(!(
!(
!(!(!(
!(
!(!(
!(
!(
!(
!(
!( !(!(
!(!( !(
!(!( !(!( !(
!(!(!(!(
!( !(
!(!(!(!( !(!(!(
!(!(!(
!( !(!(!(
!(!(!( !(!(!(
!(!(!(
!(
!(
!(!(
!(!(
!( !(!(!(
!(!(
!(!(
!(
!(
!(!(
!( !(
!(!(!(!(
!(!(
!(!(
!(!(!( !(!(!(
!( !(!(!(
!(
!(!(!(
!(!(
!(!(!(
!(
!(!(
!(
!( !(
!(
!(!(
!(
!(
!(
!(
!(!(!( !(
!(
!(
!(!(!(
!(
!(
!(!(!(
!(!(!(
!(
!(!(
!(
!(
!(!( !(
!(
!(!(!(!(!(
!(
!(!(
!(!(
!(
!(!(!(
!(!( !(!(
!(
!(!(
!(
!(!(!(!(
!(
!(!(
!(
!(
!(!(
!(
!( !(!(
!(!(
!(
!(!(!(
!(
!(!( !(
!(
!(!(
!( !(!(!(
!(!(!(
!(
!(!(
!(!(!(
!( !( !(!(!(!(!(
!(
!(!(
!(!(!(!(
!(!(!(!(
!(!(
!(
!(!(
!(
!(!(
!(!(!(!(!( !(
!(!(!(
!(!(
!(!(!(!(!(!(!(
!( !(!(!(
!(!( !(
!(
!(!(
!(
!(
!( !(!(!(!(
!(!(
!(
!(
!(!(
!(
!(!(!(!(!(!(!(
!(!(!(!(!( !(!(!(!(!(
!(
!(!(!( !(!(!(!(
!(!(!(!(
!(!(!(!(!(!(!(
!( !(!(!(!(!(!(!(
!(!(!(!(!(
!(!(!(!(
!(!(!( !(
!(!(
!(!(
!(
!(
!(!( !(!(
!(
!(
!(!( !(!(!( !(
!(
!(
!(
!(
!( !(
!(
!(
!(!(
!(!(!(
!(!(!(
!( !(!(
!(!(
!(!(
!(
!(
!(!(!(!(
!(
!(
!(
!(!(
!(
!(!(!(
!(!(
!(!(!(
!(!(
!(
!(
!(
!(!(!( !(!(!(!(
!(!(!(!(!(
!(
!(!(!(
!( !(
!(!( !(!(
!(!(
!(
!(
!(
!(
!(!(
!( !(
!(
!(
!(!(
!(
!( !(!(
!(!(!(
!(
!(!(
!(!(!(
!(
!(
!(
!(
!(!(!(
!(!(!(
!(
!(
!(!(
!(
!(
!( !(
!(
!(!(!(!(!(
!(
!( !(!(!(
!(
!(
!(
!(!(
!(
!(
!(!(!(!(!(!(
!(!(!(!(!(!(!(!(!(!(!(
!(
!(
!(!(!(!(!(
!(
!(!(!(!(!(!(
!(
!(!(!(
!(!(
!(!(
!(!(
!(!(!(!( !(!(!(!(!(
!(!(!(!(!(!(!(
!(!(
!(
!(
!(
!( !(
!(!(
!( !(!(!( !(
!(!(
!(
!(!(
!(
!(!(
!(
!( !(
!(
!(
!(!(!(!(!(
!(
!(
!(
!(
!(
!(!(
!(!(
!(
!(
!(
!(!(
!( !(!(
!(
!(
!(
!(
!(
!( !(!(
!(
!(
!(!(
!( !(
!(!( !(
!(
!(!(!(
!(!(
!(
!(
!(!(
!(
!(
!(!(
!(!(
!( !(
!(
!(!(
!(
!(!(!(!(
!(!( !(!(
!(!(
!(!(!(
!(
!(!(
!(
!(
!(
!(
!(
!(
!( !(!(!(
!(
!(!(!(
!( !(!(
!(
!(
!(
!( !(
!(
!( !(!(!(!( !(
!(
!(
!(!(
!(
!(
!(
!(
!(!( !(
!(
!(!(
!(
!(!(
!(
!(
!(
!(!(!(!(
!(
!( !( !(
!(!(
!(!(!(
!(!(
!(
!(!(!( !(
!(!(
!(
!(!(
!(
!(
!(
!(!(!(!(
!(!( !(!(
!(!( !(!(!(!(
!(!(
!(
!(!(
!(
!(!(
!(!(
!(!(!(
!(!(!(
!(
!(
!(
!(
!(
!(!(
!(
!(
!(
!(
!(
!(
!(
!( !(
!(
!(!(!(!(
!(!(
!(!(
!(!(
!(
!(!(
!(!(
!(
!(!(!(!(
!(!(!(!(
!(!(
!(
!(
!(
!(
!(
!(!( !(
!(!(!(!(
!(!(!(
!(!(
!(
!(
!(
!(!(
!(
!(!(!(
!(
!(
!(!(
!(
!(!(
!(!(!(
!(
!(!(
!(
!( !(
!(
!(!(!(
!(!(
!(
!(
!(
!(!(!(!(
!(!(!( !(!(!(
!(!(
!(!(
!(!(!(
!(
!(!( !(!(!(!(
!(!(!(
!(
!(!(!(!(!( !(!(!(!(!(!(!(!(
!(!(
!(!(!(
!(
!(
!(
!(!(!(
!( !(!(!(!(!(!(!(!(!( !(
!(!(!(!(
!(
!(!(
!(!(!(!(
!(!( !( !(
!(!(
!(!(
!(!( !(
!(!(
!(!(!(!(!(!(!(!(
!(
!(!(!(!(
!(
!(!( !(!(!(!(!(!(!(!(!(!(
!(!(!(!(!(
!(!(!(!(!(!(
!(
!(
!(!(!(
!(!(!(!(
!(!(
!(
!(!(
!(!(
!(
!( !(!(!(!(!(!(
!(
!(
!(!(!(
!(!(!(!(!(!(!(!(!(!(!(
!(!(!(
!(
!(!(!(!(
!( !(!(!(!(
!(!(!(
!(
!(
!(
!(!(!(!(
!(!(!(!(!(!(!(!(!(!(!(
!(!(!(
!(!(
!(!( !(!(
!(!(!(!(!(
!(!(!(!(!(!(!(!(
!(
!(!(
!(!(!(
!( !(!(!(!(!( !(!(
!(!(
!(
!(!(
!(!(!( !(!( !(!(!(
!(!(!(!(
!(!(
!(!(!(!(!(!(!(!( !(!(!(
!( !(
!(!(
!(
!(!( !(
!(!( !(!(!(!(!(!(!(
!(
!(!( !(!(
!( !(!(!(!(!(!(!(!(!(!(
!(!(
!(!(
!(
!(!(!(!(!(!(!(!(!(!(
!(!(!( !(!(!(!(
!(
!( !(
!(!(!(!(!(!(!(
!(!(
!(
!( !(!(
!(
!( !(
!(!(!(
!(
!(!(!(!(!( !(!(!(!(!(!(!(!(!(!(!(!(
!(!(!(!(!(
!(!(!(
!(
!(!(
!(!(!(
!(!(
!( !(!( !(!(!(!( !(
!(!(
!(!(!( !(
!(!(
!(
!(!(!(!(!(!(
!( !( !(!(!(!( !( !(!(
!(!(
!(
!( !(!(!(!(!(
!( !(!(!(
!( !(!(!(!(
!(
!(
!(!( !(
!(!(!(!( !(
!(!(
!(
!(
!( !(!(!(!( !(
!(
!(!(
!(
!(!(
!(!(!( !(
!( !(!(!(
!(!(
!(
!(!(
!(!(
!(
!(!(!(!(
!(
!(!(!(!(!( !(
!(!(
!(!(!(
!(
!(
!(!(!(
!(!(!(!(!(
!(!( !(!(
!( !(
!(!(!(!(
!(
!(!( !(!(
!(!(
!( !( !(!( !( !( !(!(!(!(
!(!(!(
!(
!(
!(
!( !(
!(!(!(
!(!(
!(!( !(!(!(!(
!(
!(!(
!(!( !(!(!( !(
!(
!(!(
!(!(!( !( !(!(!(!(!(
!(!(!(!(
!(!(!(!(
!(
!(
!(
!(!(!(
!(!(!(
!(
!(!(!(!( !(
!(!(!(!(!(!(!(!( !(!(!(!(!(!(!(!(!(!(!(!(!(!(
!(
!(!(!(!(!(!(!( !(
!(!(!(!(!(
!(!(!(!(!( !( !(!(
!(!(!(
!( !(!(!(
!(!(
!(!(
!(!(!(
!(!(
!(!(
!(
!(!(!(
!(!(!(!(!(!(
!(!(!(!(!(!(!(!(!(!(
!(
!( !(!(!( !(!(
!( !(
!(!(
!(!(!(!(!( !(
!(!(
!(
!(
!(!(!(!(
!(!( !(!(
!(!(
!(!(
!(
!(!(!(!(!(
!( !(!(!(!(!(!(
!(!(!(
!(!(!(!(!(!(!(!(!(!(
!(!(!(!(!(!(
!(!(!( !(
!(!(
!(!(
!(!(!(
!(
!(!(
!(
!(!(!(!(!(!(!(!(!(!(!(!(!(
!(!(!(!(
!(!(
!(!(!(!(!(!(
!(!(!( !(!(
!(!(
!(
!(!(!(!(
!(!(!(!(
!(!(
!(!( !(!(!(
!(
!(!( !(!( !(
!(
!(!(!(!(!(!(!(!(!(!(!(!(!(
!(
!(!(!( !(
!(
!(
!(!(!(
!(!(!(
!(
!(!( !(
!(!(!(
!(!(
!(!(
!(
!(!(
!(!(!(
!(
!(!( !(!(!(
!(
!( !(
!(
!(!(
!(!(
!(!(
!(!(!(!(!(!(
!(
!(!(!(!(!(
!(
!(
!(!(!(!(
!(
!(
!( !(!(!(!(
!(!(
!(
!(
!(!(
!(
!(
!(!( !(!(!(
!(!(
!(
!(!(!( !(
!(!(!(!(
!(!(!(
!(
!(!(!(!(!(!( !(!(
!(
!(
!(
!( !(!(!( !(!(!(
!(!(!(
!(
!(
!(!(
!(!(!(!(
!(!(
!(
!(
!(!(!(!(!(!(!(!(!(!(
!(!(
!(!(!(!(!(!( !( !( !(
!(!(!(!(!(!(!(
!(!(
!( !(
!(!(!(!(!(!(!(!(!(!(!( !(!(!(
!(!(
!(
!(!(
!( !(
!(!(!( !(!(
!( !(!( !(!( !(!(!(!(!(
!(!(!(!(
!(!(
!( !(!(
!(!( !(
!( !(!(
!(
!(!(!(!(!(!( !(!(
!( !( !(!(!(!(!(!(!(!(!(!(
!(!(
!(!(
!(!(!(!(
!(!(
!(!(
!(!(!(
!(!(!(!(
!(
!(!(!( !(
!(!(!(!(
!(
!(!(
!(!( !(!(!(!(!(
!(!(!(
!(!(
!(!(!(!(!(!(!( !(!(!(
!(!( !(
!(!(!(!(!(!(!(!(
!(
!(!(!(!(
!(
!(!(!(!(
!(
!(!(!( !(!(!(!(
!(
!(!(!(!(
!( !(!(!(!( !(
!(
!( !(!(
!(!(!(!(!(!( !(!( !(!(!(!(!(!(!(!(!(!(!(!(!(!(
!(
!(!(!(!(!(!(!(!(!(!(!(
!(
!(!(!(!(!(!(!(!(!(!( !(!(!(!(!(!(!(!(!(!(!(!(
!(
!(!( !(
!( !(
!(
!(!(
!( !(!( !(!(
!(
!(!(!(
!(
!(!(
!(
!(!(!(
!(!(!( !(!(
!(
!(!( !(!(!(
!(!(!(!(
!(!(!( !( !(
!(
!(!(
!(!( !(!(!(!(!(
!(
!(!( !(
!(!( !(!(!(!(
!(
!(!(!(
!(!(!(
!(
!(!(!(!( !(!(!( !(!(!(
!(!(
!(!(
!(
!( !(!(!(!(
!(
!(!(!(!(!( !(!(!(
!(!(!(
!(!(!(
!(!(
!(!(
!(
!(!(!(!(!(!(!(!(!(!(!(!(!(!(!(!(
!(
!(!(!(!(
!(!( !(!(!(
!(!( !(!(!(!(
!(
!( !(!(
!(!( !(
!(!(!( !( !(!(!(!(
!(!(!(!(!(!(
!(
!(!(!(!(!(
!(!(
!(!(
!(!(!( !(!( !(
!(!(!(
!(
!( !(!(
!(!(!(!( !(!(!(!(!(!(!(!(!(!(
!(!(!(
!(!(!(
!(!(!(
!(!(
!(!(
!(
!(!(!(!(!(!(!(!(!(!(!(!(!(!(
!(!(!(!( !(
!(
!(!(!( !(
!(!( !(!(
!(!(!(!(!( !(!(!( !(!( !(!( !(!(!(
!(!(
!(
!(!(
!(!(
!(
!(!(
!(
!(!(
!(
!(
!(
!(
!(
!(!(
!(
!(!(!(!(!(!( !(!(!(
!(!(!(!(!(!(
!(
!(!(
!(!( !(
!( !(
!(!(!(!(!(
!(!(
!(
!(!(!(
!(!(
!(
!(!(!(
!(
!(!(
!(
!(
!(
!(!( !(
!(
!(!(!(
!(
!(
!(
!(
!(
!(
!(!(
!(!(!(!(!(
!( !(!(!(
!(!(!(!(
!(
!(
!(!(!(
!(
!(
!(!(
!(!(!(
!(
!(
!( !( !(!(!(
!(
!(
!(!(!(!(
!(!(
!(!(!(
!(!(!(!(!(!(!(!(!( !(!( !( !(!( !(
!(!(!(!(
!(!(
!(!(
!(!(
!(
!(!(
!(
!( !(
!(!( !(!(!(
!(!(
!(
!(!(!( !(
!(
!(!(!(
!(!(
!(!(!(
!(!( !(!(!(!(
!(!(!(!(!(
!( !(!( !(
!(
!(
!(
!(
!(
!(!(
!(!(!(!(!(!(
!(!(!(!(
!(!(
!(!(
!(!(!(
!(!(!(
!(!(!(!(!(!(
!(
!(!(
!(!(
!(
!(!(
!(!(!(
!( !(!(!(!(!(!( !(!(!(!(!(!(
!(
!(
!(!(
!(!(
!(!(!(!(!(
!(!(
!(!(
!(
!(!(
!(
!(!(!(
!(
!(!(
!(
!(
!(!(!(
!(
!(
!(
!(
!(
!(!(!(
!(!(
!(
!(
!(
!(
!(!(
!(
!(
!(
!(
!(!(!(!(
!(
!(
!(
!(!( !(!(
!(
!(!(!(
!(
!(!(
!(!(!(!(
!(
!(!(
!(!(
!(
!(!( !( !(!(
!(!(!(!(
!(!(
!(
!(
!(!(!(
Figure 2. Eel presence (●) or absence (◦) for sites electrofished by the Fisheries Trusts in Scotland RBD (1996 and 2006). Where sites were visited more than once, eels appear as present if they were reported at the site on any occasion.

Joint EIFAC/ICES WGEEL Report 2007 377
UK.C Fishing capacity
UK.C.1 England and Wales
All life stages of eel are exploited in England and Wales by approximately 1000 eel fishermen. At present, there is no legislative mechanism to limit the number of licences. The main fisheries are for glass eel by dip-nets (719 licences in 2006), in estuaries draining into the Bristol Channel, in particular from the Rivers Severn, Wye and Parrett, with smaller fisheries, such as that in Morecambe Bay, Cumbria (Figure 3) (Knights et al., 2001). The main fisheries for eel >300 mm (2679 licences in 2006) are based in southern and eastern lowland England, with fyke nets being the preferred instrument used for capturing yellow and silver eel (Figure 3). Note, however, that no data are collected on the number of nights fished (for glass eel/elver, yellow or silver eel fisheries). Therefore, the use of licence numbers in this report provides a very rudimentary index of fishing effort.
Eel Fishery LocationEel Fishery Location
WFD River Basin Districts
Main Rivers
80 Instruments
Elver Dip Nets
Fixed Elver Traps
Small Wingless Fykes
Winged Traps/Fykes
Gloucester Winged Nets
Eel Trawls
Other Fixed Traps
Eel Fishery LocationEel Fishery Location
WFD River Basin Districts
Main Rivers
80 Instruments
Elver Dip Nets
Fixed Elver Traps
Small Wingless Fykes
Winged Traps/Fykes
Gloucester Winged Nets
Eel Trawls
Other Fixed Traps
Figure 3. Eel and Elver Fisheries in England and Wales. Proportional size pie charts representing number of each instrument type in each WFD River Basin District.
UK.C.2 Northern Ireland
UK.C.2.1 L. Erne
Fishing capacity is measured in terms of the number of licensed instruments (by type of gear) and is an individual activity with no regulating company. Currently there are 24 commercial fishermen operating on this catchment, with 28 eel permits (23 long line and 5 fyke nets) issued. Boat size on the Erne is restricted to 6.1 m long by 2.2 m at the widest point. Licence applications are approved by the fishery owner (DCAL) and are issued on the condition that a catch declaration is returned at the end of each year. All of these catch data are held within DCAL Inland Fisheries Division. The elver run to the River Erne is monitored by capture at a box at the tidal head and transported to upper and lower Lough Erne. Silver eel fisheries let by

378 Joint EIFAC/ICES WGEEL Report 2007
the State on Lower Lough Erne have been suspended since 2005. Two minor fisheries on the Irish Republic/NI border on the Erne river are fished, but no catch data are available.
UK.C.2.2 L. Neagh
Lough Neagh/River Bann comprises a 400 km2 lake-based system, which produces around 95% of the total Northern Ireland eel catch. Eel fishing on L. Neagh is controlled by a Registered Company, the LNFCS who licence the fishery to 180 fishermen. Around 1990, there were 200 boats fishing the Lough, but this number has steadily declined to the present day number of 80 to 90 boats as a result of an aging fisher population, availability of alternative employment and falling market prices for eel. Boat size on L. Neagh is restricted to 8.6 m long and 2.7 m wide. Information on licence applications, number of boats, fishing activity, recruitment to the fishery and the catch of yellow and silver eels from L. Neagh is collected and maintained by the LNFCS with several aspects of these data spanning 40 years. This information is made available to DCAL and the Agri-food and Biosciences Institute (AFBI) for scientific analysis.
UK.C.3 Scotland
Historically there has been no regulation of commercial eel fisheries in Scotland, no licenses were issued and there was therefore no means of collecting catch return data. There is no export of any eel product and therefore no proxy values for recruitment or home or international market trends.
However, early in 2007, provision was made by the Scottish Parliament to allow for the regulation of eel fisheries if Scottish Ministers considered it necessary or expedient for eel conservation (see: http://www.scottish.parliament.uk/business/bills/67aquaFish/b67s2-introd.pdf)
UK.D Fishing effort
UK.D.1 England and Wales
Fishing effort is not directly quantified, but annual licence sale data from the EA and predecessor agencies provide an index from which we can examine changes in apparent effort over time.
UK.D.1.1 Glass eel and elvers
Sales of glass eel/elver licences (dip nets, fixed traps) were around 1100 per year from 1980 to 1994, increased rapidly thereafter to peak at nearly 2500 in 1998, declined to 2100 in 2000, and then fell to about 800 in 2001 and have since remained around this level (Figure 4). The rapid increase in numbers of licenses in 1995–2000 was due to substantial increases in the market value of glass eel from about £100/kg to over £250/kg, due to extra demands from eel farms in the Far East. Fishing activities were depressed during the 2001 Foot and Mouth Disease outbreak because of restrictions imposed on access to fishing sites and have not recovered.

Joint EIFAC/ICES WGEEL Report 2007 379
0500
10001500200025003000
1980
1982
1984
1986
1988
1990
1992
1994
1996
1998
2000
2002
2004
2006
Num
ber o
f lic
ense
s
Year
Figure 4. Number of licenses sold across England and Wales for dip-net fishing per year, 1980 to 2007 (Agency data).
UK.D.1.2 Yellow and silver eels
EA sales of yellow and silver eel licences (combined) have varied from around 1100 to 2900 over the period 1983–2006, with highest sales in the mid-1980s, mid-1990s and again in 2005 and 2006 (Figure 5).
0
500
1000
1500
2000
2500
3000
1980
1982
1984
1986
1988
1990
1992
1994
1996
1998
2000
2002
2004
2006
Lice
nce
sale
s
Year
Figure 5. Number of licenses sold across England and Wales for yellow and silver eel fishing per year, 1983 to 2006 (Agency data)
UK.D.2 Northern Ireland
The capture of glass eel and elvers is prohibited in N. Ireland, except under licence from DCAL to help with upstream migration passed in-river obstacles on the River Bann.
In N. Ireland, fyke nets, long lines and draft nets are authorised fishing instruments for yellow eels. Silver eels are trapped at fixed weirs using large coghill nets.
UK.D.2.1 L. Erne
Twenty three long line licences were issued in 2006 and each fisherman is allowed to fish a long line not exceeding 1200 hooks of a standard hook size 23 mm long, 7.75 m gape. Five

380 Joint EIFAC/ICES WGEEL Report 2007
fyke net licences were issued in 2006 and a fisherman is not eligible to fish fyke nets and long lines simultaneously. Each fyke net licence permits the holder to use 25 fyke nets (not exceeding 7.3 m in length a trap at each end on which no hoop shall exceed 50 cm in diameter and no mesh size of less than 12 mm knot to knot). There is no obligation for a fisherman to use a log book to record his catch, but it is a condition of the licence to report the total catch at the end of each year. Catches are sold to travelling eel dealers who are also required to make annual returns. The small silver eel fishery in the Erne river has been suspended since 2005.
UK.D.2.2 L. Neagh
Glass eel fishing on the River Bann for stocking into L. Neagh is carried out using a drag net with an area of 0.94 m2. A record of total catch per night is recorded, but not catch per individual net. Thirty percent of the L. Neagh yellow eel catch is derived from draft nets, the other 70% from long line fishing using a maximum of 1200 standard sized hooks baited with either earthworms, fish fry or the larvae of the flour beetle (meal worm). The fishery is run on a quota based system (normally 60 kg per boat per day) and a log is kept of each individual boat’s daily (Monday-Friday) catch. However, as most fishermen catch their quota every day, the catch is not always limited by the size of the eel population, and it is not appropriate to calculate cpue. New technologies such as hydraulic draft net haulers have been introduced over the last 10 years, thereby reducing the labour needed in the fishery. Daily catch statistics and division by method are recorded by the LNFCS.
Silver eel catch is taken by three weirs at two locations using coghill nets. The number of coghill nets fished depends on weather and flow conditions in the river at the time of fishing and normally ranges from 2–4 nets per fishing night. The record of nightly catch is only obtained if the catch is processed and sold the following day, otherwise catches are retained in tanks, processed and sold as and when market conditions are more favourable, and therefore a ‘single’ catch record may be a total for several nights fishing.
UK.D.3 Scotland
UK.D. 3.1 Glass eel fisheries and recruitment in 2004 and 2005
In survey in the early 1970s no elver fisheries were recorded in the Scottish Highlands and Islands (Williamson, 1976). During the mid-late 1990s there was a short period of exploitation, in response to the rise in demand and thus prices. Catches were estimated at 1–2 t per annum, mainly from the North West and Outer Hebrides. Present levels of exploitation are unknown.
There have been no studies of glass eel recruitment in Scotland, although there is some interest in establishing traps on some systems as a means of monitoring recruitment.
UK.D.3.2 Yellow eel and silver eel fisheries
Commercial fisheries for yellow eels are largely based in low-lying productive lochs, the eels being sold mainly to local smoke houses. There is no tradition of eel consumption in Scotland. During the 1960s–1970s, eel catches in Scotland were estimated at around 10–40 t per annum. In 1989, 17 eel fisheries were operating, with catches ranging from 0.25 to 10.76 t (total: 23 t) (I. McLaren, FRS, unpubl. data). Correspondence with proprietors of eel fisheries in 2003 indicated a catch of less than 2–3 t per annum, chiefly yellow eels, with silver eels contributing less than 100 kg, mostly from traps in mill-races. Although there are few comprehensive records, data for one silver eel fishery show a 90% decline in catches between the early 1990s and 2002, although a yellow eel fishery was established in the upstream loch during the same period. The last known commercial yellow and silver eel fishery in Scotland ceased operation in late 2006, and today, catches of silver eels are largely destined for research purposes.
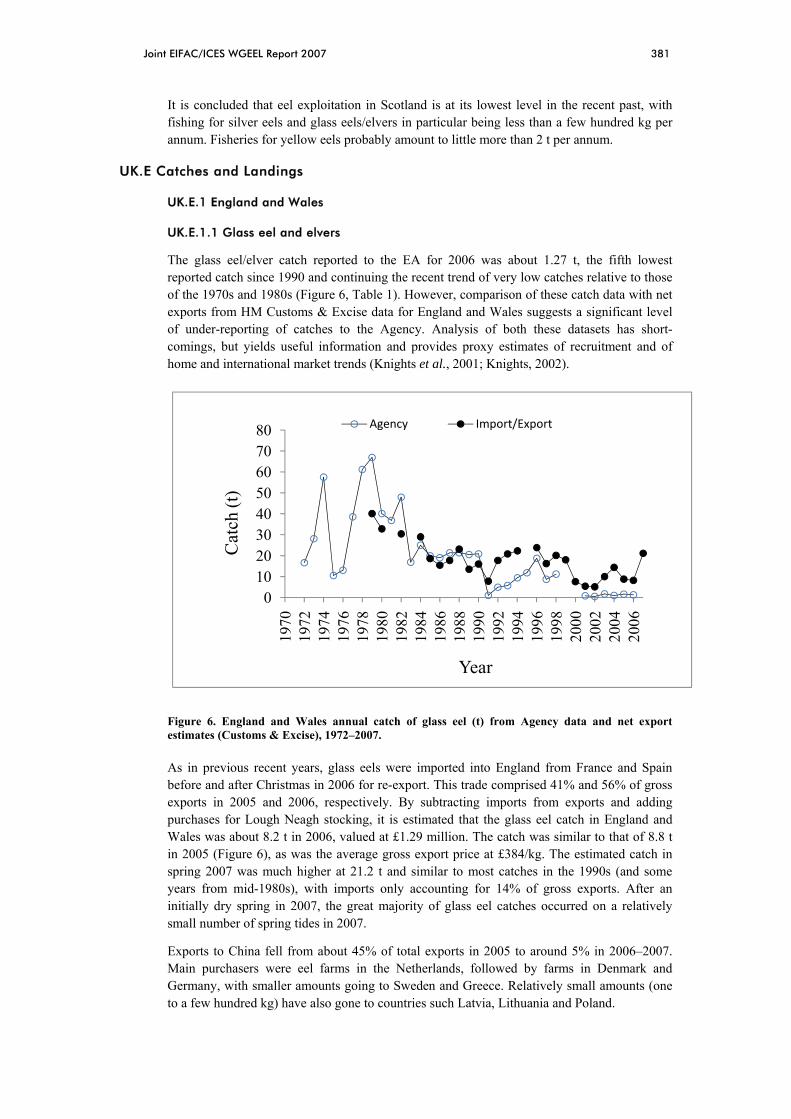
Joint EIFAC/ICES WGEEL Report 2007 381
It is concluded that eel exploitation in Scotland is at its lowest level in the recent past, with fishing for silver eels and glass eels/elvers in particular being less than a few hundred kg per annum. Fisheries for yellow eels probably amount to little more than 2 t per annum.
UK.E Catches and Landings
UK.E.1 England and Wales
UK.E.1.1 Glass eel and elvers
The glass eel/elver catch reported to the EA for 2006 was about 1.27 t, the fifth lowest reported catch since 1990 and continuing the recent trend of very low catches relative to those of the 1970s and 1980s (Figure 6, Table 1). However, comparison of these catch data with net exports from HM Customs & Excise data for England and Wales suggests a significant level of under-reporting of catches to the Agency. Analysis of both these datasets has short-comings, but yields useful information and provides proxy estimates of recruitment and of home and international market trends (Knights et al., 2001; Knights, 2002).
01020304050607080
1970
1972
1974
1976
1978
1980
1982
1984
1986
1988
1990
1992
1994
1996
1998
2000
2002
2004
2006
Cat
ch (t
)
Year
Agency Import/Export
Figure 6. England and Wales annual catch of glass eel (t) from Agency data and net export estimates (Customs & Excise), 1972–2007.
As in previous recent years, glass eels were imported into England from France and Spain before and after Christmas in 2006 for re-export. This trade comprised 41% and 56% of gross exports in 2005 and 2006, respectively. By subtracting imports from exports and adding purchases for Lough Neagh stocking, it is estimated that the glass eel catch in England and Wales was about 8.2 t in 2006, valued at £1.29 million. The catch was similar to that of 8.8 t in 2005 (Figure 6), as was the average gross export price at £384/kg. The estimated catch in spring 2007 was much higher at 21.2 t and similar to most catches in the 1990s (and some years from mid-1980s), with imports only accounting for 14% of gross exports. After an initially dry spring in 2007, the great majority of glass eel catches occurred on a relatively small number of spring tides in 2007.
Exports to China fell from about 45% of total exports in 2005 to around 5% in 2006–2007. Main purchasers were eel farms in the Netherlands, followed by farms in Denmark and Germany, with smaller amounts going to Sweden and Greece. Relatively small amounts (one to a few hundred kg) have also gone to countries such Latvia, Lithuania and Poland.
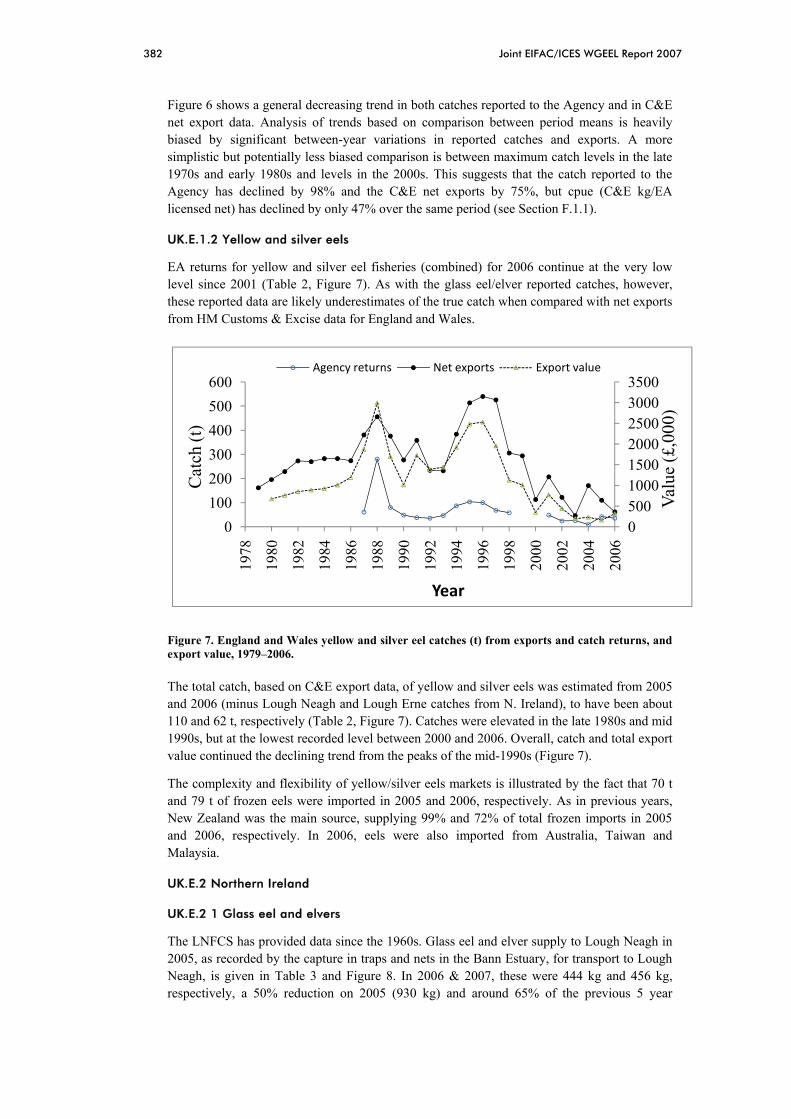
382 Joint EIFAC/ICES WGEEL Report 2007
Figure 6 shows a general decreasing trend in both catches reported to the Agency and in C&E net export data. Analysis of trends based on comparison between period means is heavily biased by significant between-year variations in reported catches and exports. A more simplistic but potentially less biased comparison is between maximum catch levels in the late 1970s and early 1980s and levels in the 2000s. This suggests that the catch reported to the Agency has declined by 98% and the C&E net exports by 75%, but cpue (C&E kg/EA licensed net) has declined by only 47% over the same period (see Section F.1.1).
UK.E.1.2 Yellow and silver eels
EA returns for yellow and silver eel fisheries (combined) for 2006 continue at the very low level since 2001 (Table 2, Figure 7). As with the glass eel/elver reported catches, however, these reported data are likely underestimates of the true catch when compared with net exports from HM Customs & Excise data for England and Wales.
0500100015002000250030003500
0100200300400500600
1978
1980
1982
1984
1986
1988
1990
1992
1994
1996
1998
2000
2002
2004
2006
Valu
e (£
,000
)
Cat
ch (t
)
Year
Agency returns Net exports Export value
Figure 7. England and Wales yellow and silver eel catches (t) from exports and catch returns, and export value, 1979–2006.
The total catch, based on C&E export data, of yellow and silver eels was estimated from 2005 and 2006 (minus Lough Neagh and Lough Erne catches from N. Ireland), to have been about 110 and 62 t, respectively (Table 2, Figure 7). Catches were elevated in the late 1980s and mid 1990s, but at the lowest recorded level between 2000 and 2006. Overall, catch and total export value continued the declining trend from the peaks of the mid-1990s (Figure 7).
The complexity and flexibility of yellow/silver eels markets is illustrated by the fact that 70 t and 79 t of frozen eels were imported in 2005 and 2006, respectively. As in previous years, New Zealand was the main source, supplying 99% and 72% of total frozen imports in 2005 and 2006, respectively. In 2006, eels were also imported from Australia, Taiwan and Malaysia.
UK.E.2 Northern Ireland
UK.E.2 1 Glass eel and elvers
The LNFCS has provided data since the 1960s. Glass eel and elver supply to Lough Neagh in 2005, as recorded by the capture in traps and nets in the Bann Estuary, for transport to Lough Neagh, is given in Table 3 and Figure 8. In 2006 & 2007, these were 444 kg and 456 kg, respectively, a 50% reduction on 2005 (930 kg) and around 65% of the previous 5 year

Joint EIFAC/ICES WGEEL Report 2007 383
average (691 kg). As in some years since 1984, 1 million and 3 million (2006 and 2007, respectively) glass eels were bought from the Severn Estuary to stock L. Neagh (Figure 8).
0100020003000400050006000700080009000
10000
1960
1965
1970
1975
1980
1985
1990
1995
2000
2005
Inpu
t (kg)
Year
Supplemental Natural supply
Figure 8. Elver supply to Lough Neagh, 1960 to 2007.
The elver runs to the Erne in 2006 were 118 kg, monitored by capture at a box at the tidal head and transported to upper and lower Lough Erne.
UK.E.2.2 Yellow and silver eels
Annual commercial production figures (LNFCS) are divided into outputs of yellow eels (line or draft net catch) and silver eels (caught in traps in the River Bann when migrating downstream from L. Neagh) (Table 3, Figure 9).
0
200000
400000
600000
800000
1000000
1200000
1965
1969
1973
1977
1981
1985
1989
1993
1997
2001
2005
Catch (kg)
Year
Yellow eels Silver eels
Figure 9. Yellow and silver eel catches-Lough Neagh, 1965 to 2006.

384 Joint EIFAC/ICES WGEEL Report 2007
Yellow and silver eel catches in L. Neagh in 2006 amounted to 242 and 104 t, respectively, continuing the downward trend since the late 1990s (Figure 9) associated with reducing effort in the yellow eel fishery. Catches per boat per day in the long line and draft net fisheries continue to meet or exceed daily quotas imposed by the co-operative, implying that stocks in the Lough are being maintained. Licences have fallen from 200 active boats in 1990 to around 80–90 boats in 2006, a significant cause of the long-term decline in catches and a response to alternative work/low prices available for yellow eels rather than declining stocks.
Sex ratio in the silver eels in 2004 to 2005 were numerically close to 1:1 male:female, but changed in 2006 to 0.37:0.63 (Table 4). Taking account of differing sizes and weights of males and females, 80% of the recorded silver eel biomass is now female.
An annual mark-recapture programme was initiated in October 2003, with the objective of estimating escapement of silver eels past the fishery (weir traps), which is subject to a trap-free gap in the river channel, a three-month fishing season (some silver eel movement occurs outside this season), and inefficient fishing when river flows are very high. Recaptures occur both during the year of upstream release and at least one or even two years afterwards. Maximum estimates of escapement, based on the proportion of recaptured FloyTM tagged silver eels, range from 62% to 84% during 2003 to 2005: the provisional estimate for 2006 fish is 62% (Table 5).
Silver eel fisheries let by the State on Lower Lough Erne remain suspended. Two minor fisheries on the Irish Republic/NI border on the River Erne were fished, but there are no catch data. Yellow eel catch data for the River Erne are not available.
UK.E.3 Scotland
No commercial fisheries.
UK.F Catch per unit of effort
UK.F.1 England and Wales
UK.F.1.1 Glass eel and elvers
The apparent under-reporting of glass eel/elver catches to the Agency precludes a meaningful analysis of cpue from Agency data alone. Therefore, trends in cpue (kg/licensed net) are examined based on net export over Agency licence sales. The data for 2005 presented in the previous WGEEL report (2006) were provisional, and are updated here.
Cpue trends probably provide a better indicator of recruitment than total catches. Cpues have declined since 1979, but the increase starting after 2002 has appeared to continue into 2006 to a level some 50% of the maximum in the early 1980s, and the provisional 2007 cpue is the highest in the time series (Table 1, Figure 10).

Joint EIFAC/ICES WGEEL Report 2007 385
05101520253035
0
500
1000
1500
2000
2500
3000
1980
1982
1984
1986
1988
1990
1992
1994
1996
1998
2000
2002
2004
2006
CPU
E (k
g/ne
t)
Effo
rt (n
o. d
ip-n
ets )
Year
no. dip‐nets kg/net
Figure 10. England and Wales glass eel fishery effort as number of licensed dip-nets per year and cpue (from export estimates) in kg/net, 1980–2007.
UK.F.1.2 Yellow and silver eels
As with glass eel/elver data, estimations of cpue for E&W yellow and silver eel fisheries continue to be a problem. Notwithstanding the above concerns, cpue, as C&E exports over Agency licence sales, were relatively consistent in the late 1980s and mid 1990s, but declined by some 80% since 2002 (Figure 11). This correlates with a longer term decline in value of the fishery, represented as £/licence (Figure 11).
012345678910
0
50
100
150
200
250
1980
1982
1984
1986
1988
1990
1992
1994
1996
1998
2000
2002
2004
2006
Cat
ch v
alue
(£/n
et)
CPU
E (k
g/ne
t)
Year
Export kg/Agency sales Catch value
Figure 11. England and Wales yellow/silver eel fisheries cpue from export estimates in kg/Agency licence, and average catch value as export value/Agency licence, 1983–2006.

386 Joint EIFAC/ICES WGEEL Report 2007
UK.F.2 Northern Ireland
UK.F.2.1 Glass eel and elvers
No standardised cpue data are available for glass eel fishing (for stocking) on the River Bann.
UK.F.2.2 Yellow and silver eels
A quota-based catch management system on L. Neagh means it is not possible to calculate cpue. Daily catch statistics and division by method are recorded by the LNFCS.
UK.G Scientific surveys of the stock
UK.G.1 England and Wales
UK.G.1.1 Project to develop biological reference points for the management of the European eel
An extensive four year programme of catchment surveys, data collection and model development of eels has been carried out as part of a Defra-funded contract. Nine catchments have been studied, representing different geographical areas and catchment types in relation to assumed glass eel recruitment pathways, covering fourteen rivers, two estuaries and a freshwater lagoon (Figure 12). Data on eel populations were collected via electric fishing, fyke netting, fixed eel racks and elver traps. A total of 13500 eels have been caught, their length and weight recorded, with a sub-sample of 1400 eels sexed and aged. These data are reviewed in relation to geographical patterns across England and Wales (Bark et al., in press a,b).
Figure 12. SF0236. Geographical location of the nine England and Wales test catchments surveyed for eels between 2003–2005. Main migration routes/currents are shown in blue.
River Blyth
River Hull
River Clone, Blackwater
River Darent
Slapton Ley and Rivers Gara and Start
Lower River Severn
Afon Wnion
River Ellen
River Piddle
River Blyth
River Hull
River Clone, Blackwater
River Darent
Slapton Ley and Rivers Gara and Start
Lower River Severn
Afon Wnion
River Ellen
River Piddle

Joint EIFAC/ICES WGEEL Report 2007 387
UK.G.1.2 Agency eel-specific and multi-species surveys
The EA conducts annual multi-species surveys of fish populations in rivers, lakes and estuaries throughout England and Wales. Prior to 2001, eels were not a target species for these surveys, but some records of presence/absence or more quantitative data are available. From 2001 to 2006, at least the presence/absence of eels was recorded on all surveys (see Figure 1). From 2007 onwards, all Environment Agency surveys will collect length, and possibly weight, measurements for all eel caught.
More intensive, eel-specific electrofishing surveys, and silver eel or elver trapping exercises have been conducted in a number of basins (Figure 13), yielding more accurate estimates of survey site population biomass, density and length frequency distributions over a number of years. In addition, fyke net surveys have been conducted in still waters and estuaries, yielding length and weight data for eels along with catch per unit effort indices.
Figure 13. Regional distribution of eel-specific monitoring by the Environment Agency in England and Wales.
UK.G.2 Northern Ireland
The North South Shared Aquatic Resource (NSSHARE) Project covers three river basin districts; North Western International River Basin District, Neagh Bann International River Basin District and North Eastern River Basin District. One of the main outcomes of the project is to develop ecological classification tools for assessing water quality under the Water

388 Joint EIFAC/ICES WGEEL Report 2007
Framework Directive using three biological quality elements; aquatic flora, benthic invertebrate fauna and fish fauna. The fish fauna biological quality element must include species composition, abundance and age structure. Eels are recorded as part of the species composition element (see Table 6).
The NSSHARE Fish in Lakes team was set up to develop an ecological classification tool using fish fauna, suitable for monitoring and classification of lakes under the requirements of the Water Framework Directive. This involved developing a standard methodology for sampling fish populations in lakes, with which a total of 83 lakes have been surveyed to date. The ecological classification tool is currently under development.
UK.G.2.1 L Erne
There are no surveys of the L. Erne eel population at present.
UK.G.2.2 L Neagh
Eels are sampled regularly as part of an ongoing 5 years research programme, which investigates all life stages throughout the year.
Glass eel/elvers are sampled twice a month from their arrival in February/March through to August. A sample of 50 juveniles is removed for morphometric analysis, calculation of number per kg and length frequency analysis.
Yellow eel catches are sampled weekly over 20 weeks (from May to September). A sample of 20 eels is chosen to reflect all size ranges caught, and analysed for age and length. In addition, the entire, ungraded landing of two fishing crew on one day each month is sampled, usually comprising 400–600 eels captured by long line and a similar number by draft net, to enable comparison between methods. Every eel is measured for length and the total number of fish captured recorded.
Preliminary analysis indicates that a larger proportion of small eels (<40 cm) are captured by draft nets (34%, compared to 21.4% on long lines), and that more of the larger eels (>60 cm) are taken on long lines (Figure 14). The results also indicated there was significant variation in the numbers of small eels captured by long lining dependent upon bait type (earthworm caught more) and hook size (larger hook caught fewer small eels). Undersized eels are returned to the Lough.
Silver eel catches are sampled over a 12 week period (from October to December). At weekly intervals, the previous night’s haul averaging at least 400 fish is measured for length, and 10 eels are chosen to reflect all size ranges caught, and analysed for age.

Joint EIFAC/ICES WGEEL Report 2007 389
Figure 14. Length frequency distributions for L. Neagh yellow eels caught via long lines and draft nets, 2006.
UK.G.3 Scotland
UK.G.3.1 Fisheries research services datasets
The FRS Freshwater Laboratory has two long-term, but intermittent, datasets on yellow eels, both from small, upland tributaries. FRS has operated a fish trap on the Girnock Burn, a tributary of the River Dee in Northeast Scotland, since the mid-1960s. The Girnock Burn rises at an altitude of 500 m and flows northwards, joining the River Dee some 70 km above the tidal limit. The stream channel has a largely open aspect, and is typically <5 m wide, depths ranging from a few cm to 0.5 m. Annual trap catch and electrofishing data were collected between 1967 and 1982 and again in 2004 and 2005. Since 2004, eels >200 mm have been PIT-tagged in order to determine movements and growth.
Analysis of these data (Chadwick et al., 2007) shows that, in the late 1960s, the Girnock Burn eel population was comprised of relatively high densities of small (140–180 mm) males and with few females (320–360 mm). Growth rates are currently estimated to be between 8.7 and 17.4 mm y-1, with growth occurring chiefly in the summer months. Small eels leave the system in late spring/early summer, larger eels in late summer/early autumn. Due to construction of a major barrier to immigration (plus the effects of recruitment declines since the 1980s), the estimated standing stock and escapement declined from 1968 to 2005 by about 80%. This shows that eel populations in rivers like the Girnock Burn may take decades to show major changes due to a decline in recruitment. The mean population density declined
Draft nets
Long lines

390 Joint EIFAC/ICES WGEEL Report 2007
between 1968 and 2005 from 16 to 3 eels 100 m-2, and biomass from 256 g to 71 g m-2. Thus, current densities are about 19% of the 1968 level, biomass about 28%. Biomass has probably fallen more slowly than density because the average body length has increased 11% over the 37 year time series, possibly due to lower in-river densities reducing competition and density-dependent mortality.
The other site monitored by FRS is the Allt Coire nan Con Burn, which is situated in the Strontian region of western Scotland and drains into the River Polloch, an inflow to Loch Shiel. The catchment covers 790 ha and its altitude falls from 756 m to 10 m at the sampling point, where the river is 5–6 m wide and features riffle interspersed with glides which can be deep. Riparian vegetation at the sampling sites is predominantly mature deciduous woodland. In Table 7, data from the annual electrofishing survey show no clear evidence of declines in yellow eel densities since 1992 (source: P. Collen, unpubl. data).
UK.G.3.2 Fisheries trust data
The establishment of Fisheries Trusts and the Scottish Fisheries Co-ordination Centre has allowed the co-ordination of a number of electrofishing surveys, which now represent the principal source of information. The earliest of these data are from 1996, but spatial coverage is adequate only from 1997 onwards. It should be noted that there is considerable variation amongst the reports from individual Trusts in the level of detail that are recorded. Some of the data were collected with funding from Scottish Natural Heritage (SNH) and are their property. Otherwise all data are the property of the relevant Fisheries Trusts which have kindly allowed their use here. There are substantial areas of Scotland RBD for which data are not available, including the catchments of the Rivers Clyde, Don, Ythan, Nairn, Ugie, as well as the entire islands of Skye, Orkney and Shetland, (these latter two island groups are omitted from subsequent maps for reasons of space and clarity).
There are a number of problems with the interpretation of these data:
1 ) The surveys were not specifically targeted at eels; instead the eel data were a by-catch of a sampling programme aimed at assessing salmonid densities.
2 ) Even directly targeted at the species, electrofishing for eels is an inexact science, and density estimates should be regarded with caution. Observed densities are likely to be size and habitat (in particular substrate) dependent, and no attempt has been made to account for this.
3 ) The data set is comprised of different types of electrofishing: multi-pass (22.9%), single-pass (69.5%), and timed fishings without delineated areas (7.6%).
4 ) In most cases the numbers of eels caught were in any case not recorded directly, but allotted to abundance classes (Absent, 1–10, 11–100, 101–1000). For some Trust areas the exact number of eels was routinely reported. In others the exact number was only occasionally reported, with potential for bias (of unknown size or direction).
5 ) In most cases the size of eels was not reported. For some Trust areas length of eels was routinely reported, in others the lengths of eels were only occasionally reported, with potential for bias (of unknown size or direction). The distribution of sites where eel lengths were recorded is shown in Appendix A.
6 ) Where eel lengths were recorded individual eels were sometimes described as ‘silver’, but it is not known how often (if ever) the lengths of eels was recorded and their maturity status overlooked.
In an attempt to standardise these disparate fishing methods, the following assumptions were made:
• Based on the average decline in capture rates of eels in three run fishings (where they were recorded), the likely result of a single-pass fishing was calculated for the remaining three-pass and two-pass fishings;
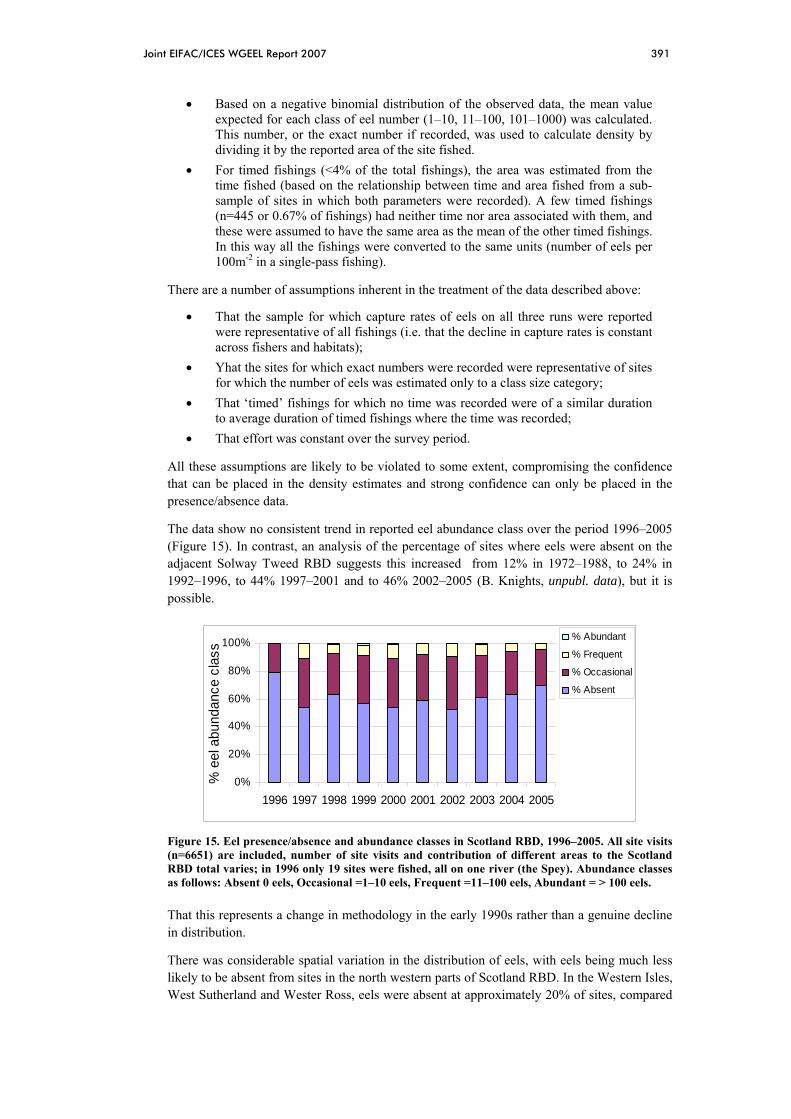
Joint EIFAC/ICES WGEEL Report 2007 391
• Based on a negative binomial distribution of the observed data, the mean value expected for each class of eel number (1–10, 11–100, 101–1000) was calculated. This number, or the exact number if recorded, was used to calculate density by dividing it by the reported area of the site fished.
• For timed fishings (<4% of the total fishings), the area was estimated from the time fished (based on the relationship between time and area fished from a sub-sample of sites in which both parameters were recorded). A few timed fishings (n=445 or 0.67% of fishings) had neither time nor area associated with them, and these were assumed to have the same area as the mean of the other timed fishings. In this way all the fishings were converted to the same units (number of eels per 100m-2 in a single-pass fishing).
There are a number of assumptions inherent in the treatment of the data described above:
• That the sample for which capture rates of eels on all three runs were reported were representative of all fishings (i.e. that the decline in capture rates is constant across fishers and habitats);
• Yhat the sites for which exact numbers were recorded were representative of sites for which the number of eels was estimated only to a class size category;
• That ‘timed’ fishings for which no time was recorded were of a similar duration to average duration of timed fishings where the time was recorded;
• That effort was constant over the survey period.
All these assumptions are likely to be violated to some extent, compromising the confidence that can be placed in the density estimates and strong confidence can only be placed in the presence/absence data.
The data show no consistent trend in reported eel abundance class over the period 1996–2005 (Figure 15). In contrast, an analysis of the percentage of sites where eels were absent on the adjacent Solway Tweed RBD suggests this increased from 12% in 1972–1988, to 24% in 1992–1996, to 44% 1997–2001 and to 46% 2002–2005 (B. Knights, unpubl. data), but it is possible.
0%
20%
40%
60%
80%
100%
1996 1997 1998 1999 2000 2001 2002 2003 2004 2005
% e
el a
bund
ance
cla
ss
% Abundant
% Frequent
% Occasional
% Absent
Figure 15. Eel presence/absence and abundance classes in Scotland RBD, 1996–2005. All site visits (n=6651) are included, number of site visits and contribution of different areas to the Scotland RBD total varies; in 1996 only 19 sites were fished, all on one river (the Spey). Abundance classes as follows: Absent 0 eels, Occasional =1–10 eels, Frequent =11–100 eels, Abundant = > 100 eels.
That this represents a change in methodology in the early 1990s rather than a genuine decline in distribution.
There was considerable spatial variation in the distribution of eels, with eels being much less likely to be absent from sites in the north western parts of Scotland RBD. In the Western Isles, West Sutherland and Wester Ross, eels were absent at approximately 20% of sites, compared

392 Joint EIFAC/ICES WGEEL Report 2007
with 55% in Scotland RBD as a whole (Figure 16). This probably reflects the proximity of the north west of Scotland RBD to the continental shelf (Knights et al., 2001).
0%
20%
40%
60%
80%
100%
Ayrs
hire
Lom
ond
Argy
llLo
chab
erW
este
r Ros
sW
est S
uthe
rland
Wes
tern
Isle
sN
aver
Thur
soBe
rrie
dale
Kyle
of S
uthe
rland
Con
onBe
auly
Nes
sFi
ndho
rnSp
eyD
ever
on Dee
Sout
h Es
kTa
yFo
rth
Eel a
bund
ance
cla
ss fr
eque
ncy
(%)
Abundant
Frequent
Occasional
Absent
Figure 16. Percentage frequency of eel abundance class at electrofishing sites in various rivers or districts of Scotland RBD. Areas are arranged clockwise around the coast, from Ayrshire in the south-west, to Naver and Thurso on the north coast then down the east coast to the Forth region. Where more than one visit to a site was made the highest recorded abundance class was used. In general eels were more widely distributed and more common in the north-west and north.

Joint EIFAC/ICES WGEEL Report 2007 393
Figure 17. Eel density (log scale) from all electrofishing sites between 1997 and 2005. Smoothing spline fitted with 3 degrees of freedom suggests a slight decline in density post-2002, however, different regions of Scotland RBD are not equally represented in each year.
There is weak evidence that eel densities in Scotland may have declined since 2002 (Figure 17). It is possible that this is a spatial rather than a temporal effect, however, because the distribution of sites differed between years, both locally and regionally. A similar pattern of decline in recent years was evident for several individual regions of Scotland RDB for which data was available, but was not universal; in particular West Sutherland in the North West showed a trend for an increase in population density (Figure 18).
Date
0
1
10
100
2
34567
2
34567
2
345679
2
34
Eel d
ensi
ty (n
100
m-2
)
1997 1998 1999 2000 2001 2002 2003 2004 2005

394 Joint EIFAC/ICES WGEEL Report 2007
1000 3000 1000 3000Day since 1 Jan 1997
01
10100
3
3
32
01
10100
3
3
32
Eel d
ensi
ty (n
100
m-2
)
Argyll Ayrshire Beauly
Conon Findhorn Forth
Lochaber Spey West Sutherland
Wester Ross Western Isles
Figure 18. Temporal variation in eel population density at regional level within Scotland RBD, 1997–2005. Sites where eels are absent do not appear in the graphs, but the lines (smoothing splines with 3 degrees of freedom) are fitted with them.
UK.H Catch composition by age and length
UK.H.1 England and Wales
Catch are only reported by stage (glass/elver, yellow, eel), so there are no data on catch composition by age and length.
UK.H.2 Northern Ireland
See Section G.2.2 above.
UK.H.3 Scotland
No commercial fisheries.
UK.I Other biological sampling
UK.I.1 Length & Weight & Growth (DCR)
UK.I.1.1 England and Wales
As of 2007, measurements of length are now collected from all eel captured by the Environment Agency during eel-specific and multi-species surveys.
A total of 13 500 eels have been caught, their length and weight recorded, with a sub-sample of 1400 eels sexed and aged, from surveys of none basins across England and Wales during 2002 to 2006 (Bark et al., in press a,b).

Joint EIFAC/ICES WGEEL Report 2007 395
UK.I.1.2 Northern Ireland
In addition to the glass eel sampling at the River Bann, other sampling is undertaken at several other coastal sites in N. Ireland: the Foyle Estuary, the River Lagan (Belfast), River Quoile (Strangford Lough) and Carlingford Lough Estuary.
UK.I.1.2.1 L Erne
There are no surveys on going on L. Erne.
UK.I.1.2.2 L Neagh
The monitoring programmes listed in Section G.2 also measure many other biological parameters within the fishery stock and samples removed from it.
The glass eel/elvers are monitored for the presence of Anguillicola crassus.
The weekly samples of yellow eels are also examined for weight, sex, age, stomach contents, the prevalence and intensity of A. crassus, and gastrointestinal endohelminths.
The undersized yellow eels (<40 cms long) captured via long line are returned to the Lough at the point of capture with hooks in place. Every month 100 undersized eels are sampled at the fishery, their hook location recorded and in conjunction with catch composition analysis, attempts are made to quantify possible losses to the fishery through hook mortality.
The weekly silver eel samples are also analysed for weight, sex, age, stomach contents, the prevalence and intensity of A. crassus, and gastrointestinal endohelminths. Sex ratio of the silver eel population is also estimated by counting the numbers of individuals contained in the graded 15 kg boxes which the fishery then sell. Eels are graded as small (males) and large (females), based on a length-sex key derived from previous sampling.
UK.I.1.3 Scotland
An un-coordinated effort is being made to determine the presence/absence of Anguillicola crassus is currently being undertaken in Scotland.
Some Fisheries Trusts collect data on the length of eels captured during routine electrofishing surveys targeted at salmonids (1136 eels have been measured since 1996).
UK.I.2 Parasites
UK.I.2.1 England and Wales
Anguillicola crassus is now considered ubiquitous throughout the United Kingdom (Nigel Hewlett, Environment Agency National Fisheries Laboratory, pers. comm.). Foster & Block (2006) reported infestation levels in eels (~300 mm total length) sampled across the Sussex area in 2005–2006 ranging from 60% to 88% (regional mean 72%). Similar levels of infestation were reported for eels in Kent rivers in 1996–1998 (Cave, 2000).
UK.I.2.2 Northern Ireland
UK.I.2.2.1 Lough Erne
Anguillicola crassus was first recorded in the swimbladders of eels in Ireland during an extensive fyke net survey of the Erne system in July 1998. Of 328 yellow eels examined in 1998, 24 (7.3%) were infected, with a mean intensity of 4.3 worms per eel. Infected eels were only recorded in southern Lower Lough Erne and northern Upper Lough Erne. Examination of 432 yellow eels in 1999, showed an increase in both mean intensity (6.7 worms per eel) and prevalence (9.9%) of A. crassus. The range of the parasite had also increased, with infected
396 Joint EIFAC/ICES WGEEL Report 2007
eels recorded from the lower reaches of the Erne, 30 km downstream of the original area of infection. Monthly samples of silver eels taken by commercial nets near the outlet of the Erne during October-December 1998 and 1999 confirmed active migrants contained the parasite. Prevalence and mean intensity amongst silver eels rose from 4.5% and 2.5 worms per silver eel in 1998 to 15% and 8.6 worms per eel in 1999 (Evans et al., 2001).
UK.I.2.2.2 Lough Neagh
A. crassus was found in Lough Neagh yellow and silver eels for the first time in 2003, and its spread has been monitored via the analysis of a total of 1100 yellow and 400 silver eels from 2003 to 2006. Samples were stored in 70% alcohol and in the lab, swimbladders were examined macroscopically for the presence of pre-adult and adult A. crassus, but not for larval A. crassus. Recorded prevalence and mean intensity in yellow eels rose from 24.4% and 2.2% in 2003 to 69% and 3.6%, and to 100% and 7.7% in 2004 and 2005, respectively. However, the same infection parameters recorded for silver eel were significantly different, with almost 60% infected in 2003 rising to almost 90% in 2004. By 2006, 100% of yellow and silver eels were found to be infected with A. crassus (Evans & Rosell, 2006).
UK.I.2.3 Scotland
There is to date only a single reported instance of Anguillicola crassus in Scottish RBD (Lyndon and Pieters 2005), for a fish farm near Bridge of Earn, on the Tay system. However, the absence of targeted effort on the identification of A. crassus in the Scottish RBD may have led to under-recording. The parasite is currently being sought in eel samples collected in the catchments of central Scotland, and there is an unconfirmed report of an infected eel from the Forth (Willie Yeomans, pers. comm.). However, the likelihood is that A. crassus is not sufficiently widespread as yet in Scotland, due to low levels of stock transfer, to have had possible impacts on eel populations.
UK.I.3 Contaminants
UK.I.3.1 England and Wales
Concentrations of most metals including mercury, arsenic, cadmium, chromium, copper, lead, nickel and zinc, Poly-chlorinated biphenyls (PCBs), Dichloro-diphenyl-trichloroethanes (DDTs), Hexa-chlorocyclo-hexanes (HCHs) and Aldrin and Endrin (‘Drins) decreased substantially in eels from Sussex rivers between 1994–1995 and 2005–2006 (Foster and Block, 2006). In 2005–2006 more eels were in the low to moderate risk bands (to people) and fewer eels were in the high risk band for PCBs proposed by the Oslo & Paris Commissions. The EU regulation limit of 8 pg/g of dioxin-like PCBs in eels was significantly exceeded for the dioxin-like PCB-118 at 100% of sampled sites in 1994–1995 and 2005–2006. Current levels of dioxin-like contaminants in eels in Sussex rivers are higher than those necessary to impair survival of fertilised eel eggs (Palstra et al., 2006).
UK.I.3.2 Northern Ireland
None undertaken.
UK.I.3.3 Scotland
No assessments of contaminants in eels have been undertaken in Scotland.

Joint EIFAC/ICES WGEEL Report 2007 397
UK.I.4 Predators
UK.I.4.1 England and Wales
Limited studies of the diet of piscivorous birds shot during winter suggest that eels are rare in the diet at this time of the year, but other published information for England and Wales indicates a fairly high proportion of eel at other times.
UK.I.4.2 Northern Ireland
None undertaken though an MSc into cormorant diets has just been completed and eel otoliths were found to comprise a significant element of stomach contents.
UK.I.4.3 Scotland
No information.
UK.J Other sampling
UK.J.1 England and Wales
The Environment Agency’s eel population model development programme, running from 2006 to 2010, includes the collation and analysis of existing and new data describing eel production processes from river basins in England and Wales.
A Defra-funded research programme (SF0249), running from 2007 to 2012, will (1) determine and compare the population structure and relative production of eels from different habitats within river basins, and (2) investigate relationships between habitat and eel production in order to inform the transport of models from data-rich to data-poor locations within and between river basins. This programme includes substantial field sampling of eel populations from the variety of habitats utilised within river basins in England and Wales.
UK.J.2 N. Ireland
Attempts are being made to assess natural upstream elver migration in the River Bann, which flows from L. Neagh, based on predicted survival rate models which indicate that additional elvers (natural recruitment) must somehow contribute to the overall stock in L. Neagh. Upstream traps are being developed for placement inside elver passes.
Samples of yellow and silver eel from L. Neagh are now analysed for fat content. Condition factors have been calculated for several thousand eels and are being compared against A. crassus infection status.
UK.J.3 Scotland
No information.
UK.K Stock assessment
UK.K.1 England and Wales
No formal assessments of eel populations have been conducted to date for England and Wales, although assessment methodologies are being developed to provide the tools required for Eel Management Plans (EMPs). EMPs require the assessment of silver eel escapement biomass against a historic target level, but as silver eel escapement biomass is not, nor has been, measured from any river in England and Wales, a modelling approach is required to estimate potential and actual escapement, and to assess the likely effects of management measures. Two modelling approaches have been developed in the UK: the Reference Condition Model (RCM: EIFAC/ICES, 2004; Aprahamian et al., 2007) and the Scenario-based Model for Eel
398 Joint EIFAC/ICES WGEEL Report 2007
Populations (SMEP: developed for the Department for Environment, Food and Rural Affairs (Defra) by El-Hosaini, Bark, Knights, Williams (Kings College, London) and Kirkwood (Imperial College, London): El-Hosaini et al., in prep; Aprahamian et al., 2007). The EA is supporting the further development of SMEP and the RCM.
Draft EMPs have been prepared for 12 River Basin Districts (11 in England and Wales and one in N. Ireland). The plans aim to describe the catchment, status of the eel stock, assess compliance with the 40% escapement target and, for those RBDs which are failing the target, set out management options to increase silver eel output. The plans conclude with a plan of actions that are to be achieved and associated delivery schedules.
In addition, various biological indicators of stock status have been considered during recent Environment Agency-, and Defra-funded research programmes (Knights et al., 2001; Knights, 2005; Knights, 2007, Bark et al., in press a,b), though these indicators do not address the specific requirements of the EMPs.
UK.K.2 Northern Ireland
Apart from the biological sampling efforts listed above, there are currently no eel stock assessment exercises within Northern Ireland. However, attempts have been made to predict future catches the L. Neagh fishery using biological data and catch statistics (Allen et al., 2006).
Stock assessment was carried out on the Erne as part of the 3 year Erne Eel Enhancement Programme which ended in 2001 (Matthews et al., 2001).
UK.K.3 Scotland
No information.
UK.L Sampling intensity and precision
UK.L.1 England and Wales
Knights et al. (2001) examined variation in Severn eel population data from the early 1980s and late 1990s, and suggested that at least 25 sites should be surveyed throughout the first 50 km of river length (measured from the tidal influence) in order to determine the number of sites required to detect a temporal change in eel population density or biomass. Their analysis suggested that this intensity of sampling would be required if one wished to detect a ±50% change in density or biomass between two consecutive surveys, with 95% statistical confidence and 80% power.
UK.L.2 Northern Ireland
No information.
UK.L.3 Scotland
No information.
UK.M Standardisation and harmonisation of methodology
UK.M.1 Survey techniques
UK.M.1.1 England and Wales
Knights et al. (2001) provided recommendations for design of monitoring programmes to detect spatial and temporal changes in population status, including those on electrofishing method.
Joint EIFAC/ICES WGEEL Report 2007 399
The Environment Agency has two standard work instructions in relation to eel, for survey in rivers and specifically for fyke netting. These instructions are provided in Appendix 2, though note that the river sampling instruction will be updated later in 2007.
UK.M.2 Sampling commercial catches
UK.M.21 England and Wales
There is no routine sampling of commercial catches, although some sampling has occurred to characterise migrating silver eel populations sampled by commercial eel-rack fisheries (Knights et al., 2001; Bark et al., in press a,b).
UK.M.2.2 Northern Ireland
Methods described in Section G.2. No Quality Assurance is undertaken within the sampling of the commercial catches.
UK.M.2.3 Scotland
No commercial catches are reported.
UK.M.3 Sampling
UK.M.3.1 England and Wales
See Section M.1.1.
UK.M.3.2 Northern Ireland
Methods described in previous sections.
UK.M.3.3 Scotland
No information.
UK.M.4 Age analysis
UK.M.4.1 England and Wales
Ages reported in Knights et al. (2001) were quality assured by the Environment Agency’s National Fisheries Laboratory at Brampton. A similar QA method was employed by Bark et al. (2007).
UK.M.4.2 Northern Ireland
Age analysis is performed on yellow and silver eels sampled from the Lough Neagh fisheries using the grinding and polishing technique. The results have been quality assured against burning and cracking of sister otoliths performed at the Marine Institute labs in Newport. Results to date indicate mean yellow eel age of 14 years, male silvers 11 years and female silvers 18 years.
UK.M.4.3 Scotland
No information.

400 Joint EIFAC/ICES WGEEL Report 2007
UK.M.5 Life stages
UK.M.5.1 England and Wales
No information.
UK.M.5.2 Northern Ireland
All life stages on Lough Neagh are studied. Glass eels and yellow eels are periodically examined from those systems listed previously and as part of NS Share work.
For Northern Ireland in general, no analysis of glass eel developmental stage is undertaken. The difference between yellow eel and silver eel is determined by gross morphology, aided by length and time of year and was originally under the guidance of senior fisheries scientists and in the company of experienced fishermen.
UK.M.5.3 Scotland
No information.
UK.M.6 Sex determinations
UK.M.6.1 England and Wales
No information.
UK.M.6.2 Northern Ireland
The correct gender assignment was originally under the guidance of senior fisheries scientists and is based on in situ macroscopic examination.
UK.M.6.3 Scotland
No information.
UK.N Overview, conclusions and recommendations
Acknowledging the concerns regarding the quality of catch data from England and Wales, all UK indicators continue to suggest that natural recruitment of glass eels and elvers is much lower than the peaks of the late 1970s and early 1980s. Indicators of natural yellow and silver eel production suggest similar trends.
There have been few attempts to assess the stock status of eel populations throughout the UK to date, but research and monitoring is underway to address this in light of the requirements set out in the Eel Recovery Plan and associated Eel Management Plans.
UK.O Literature references
Allen, M., Rosell, R. & Evans, D. (2006). Predicting catches for the Lough Neagh (Northern Ireland) eel fishery based on stock inputs, effort and environmental variables. Fisheries Management and Ecology 13, 251–260.
Bark, A., Williams, B. & Knights, B. in press a. The current status and temporal trends in stocks of the European eel in England and Wales. ICES Journal of Marine Science, 64. In Press
Bark, A., Williams, B. & Knights, B. in press b. Long term changes in recruitment, population dynamics and the status of the European eel in two English river systems. In J. Casselman (ed.) Eels at the edge. American Fisheries Society, Symposium 58, Bethesda, Maryland USA.

Joint EIFAC/ICES WGEEL Report 2007 401
Cave, J. (2000). The presence of the parasite, Anguillicola crassus, in the swimbladders of the eel, Anguilla anguilla, in river catchments in Kent. Environment Agency Regional Report, Kent, 11 pp.
Chadwick, S., Knights, B., Thorley, J.L. & Bark, A. (2007). A long-term study of population characteristics and downstream migrations of the European eel Anguilla Anguilla (L.) and the effects of a migration barrier in the Girnock Burn, north-east Scotland. Journal of Fish Biology 70, 1535–1553.
Evans, D.W., Matthews, M.A. & C.A. McClintock (2001). The spread of the swimbladder nematode Anguillicola crassus through the Erne System, Ireland. Journal of Fish Biology 59, pp 1416–1420.
Evans, D.W. & Rosell R. (2006) The Spread of Anguillicola crassus through the European Eel population of Lough Neagh, Northern Ireland. Proceedings of the International Conference of Parasitology XI, Glasgow pp 1211–1212.
Foster, J and Block, D. (2006). The Sussex Eel Project. Environment Agency Ecological Appraisal, Report No. F001EEL05-6, Environment Agency, Bristol, 16 pp.
Kennedy Rev. O.P. (1999) The Commercial eel fishery on Lough Neagh. In: L. Watson, C. Moriarty & P. Gargan (eds) Development of the Irish Eel fishery. Fisheries Bulletin, Marine Institute, Dublin, Ireland 17, pp. 27–32.Knights, B. 2001 Economic evaluation of eel and elver fisheries in England and Wales. R&D Technical Report W2–039, Environment Agency, Bristol, UK, 44 pp.
Knights, B. (2002) Economic Evaluation of Eel and Elver Fisheries in England and Wales (Module C). Environment Agency R&D Technical report W2–039/TR/2, 42 pp.
Knights, B. (2003) A review of the possible impacts of long-term oceanic and climate changes and fishing mortality on recruitment of anguillid eels of the Northern Hemisphere The Science of the Total Environment 310, 237–244.
Knights, B. (2005). A review of the status of eel populations in the River Thames and its tributaries. Contract Report to Environment Agency Thames Fisheries. Environment Agency, Hatfield, England. 53 pp.
Knights, B. (2007). The status and management of eel populations in the North Wessex area. Contract Report to Environment Agency Ecological Appraisal and Fisheries, Environment Agency, 77 pp.
Knights, B., A. Bark, M. Ball, F. Williams, E. Winter, and S. Dunn (2001). Eel and elver stocks in England and Wales-status and management options. Environmental Agency, Research and Development Technical Report W248. 294 pp.
Lyndon, A.R. & Pieters, N. (2005) The first record of the eel swimbladder parasite Anguillicola crassus (Nematoda) from Scotland. Bulletin of the European Association of Fish Pathologists, 25, 82–85.
Maitland, P.S. (2004). Keys to the freshwater fish of Britain and Ireland, with notes on their distribution and ecology. Freshwater Biological Association, Scientific Publication No. 62, 248 pp.
Matthews, M., Evans, D., Rosell, R., Moriarty, C. & Marsh, I. (2001). The Erne Eel Enhancement Programme. EU Programme for Peace and Reconcilliation Project Number EU15, Bord Iascaigh Regiunach An Tuaisceart, Ballyshannon, Co. Donegal, Ireland. 348 pp.
Naismith I.A. & Knights B. (1990). Modelling of unexploited and exploited populations of eels, Anguilla anguilla (L.), in the Thames Estuary. Journal of Fish Biology 37, 975–986.
Naismith I.A. and Knights B. (1993). The distribution, density and growth of European eels, Anguilla anguilla L., in the River Thames catchment. Journal of Fish Biology, 42, 217–226.

402 Joint EIFAC/ICES WGEEL Report 2007
Palstra, A.P., van Ginneken, V.J.T., Murk, A.J. and van der Thillart, G.E.E.J.M. (2006). Are dioxin-like contaminants responsible for the eel (Anguilla anguilla) drama? Naturwissenschaffen 93, 145–148.
Ringuet, S., Muto, F. & Raymakers, C. (2002) Eels: their harvest and trade in Europe and Asia. Traffic Bulletin 19, 80–106.
Rosell, R.S., Evans, D., and Allen, M. (2005). The Eel fishery in Lough Neagh, Northern Ireland-An example of sustainable management? Fisheries Management and Ecology, 12, 377–385.
Williamson, G.R. (1976) Eels in the Scottish Highlands, Highlands and Islands Development Board, Commissioned Report 1976/15.
Appendix A. Summary descriptions of commercial fishing methods for exploiting eel in UK waters
UK.O.1 England and Wales
A weir trap or rack is a fixed trap incorporated into a weir or outflow structure, in which water flows through a grating set to intercept eels. The gap between the parallel bars shall be no less than 12 mm, and the use of netting in the construction and operation of a weir trap is prohibited.
A trap (putcheon, pipe trap, crigg, pot, basket, hive) or like instrument does not have leaders or wings, can be fished baited or unbaited, is fitted with a single inscale (or two inscales if double ended). The dimensions of such a trap shall not exceed 2 metres in length, 75 cm in height, or 75 cm in width.
A Fyke Net (leaderless/wingless) is a conical net with inscales and a circular or D-shaped opening. The net shall not exceed 5 metres in length or 75 cm at its widest point.
A Fyke Net (with leaders or wings) is a conical net with inscales and a circular or D-shaped opening, with not more than two leaders (or wings acting as leaders); each wing or leader shall not exceed 10 metres in length. The net, excluding wings or leaders, shall not exceed 5 metres in length or 1 metre at its widest point. The height of any wing or leader shall not exceed the width of the net opening at its widest point.
A Gloucester Wing Net is a conical net with inscales and with two wings acting as leaders. The overall length of the net exclusive of the wings, but inclusive of the cod end, does not exceed 25 metres, with each of the two wings not exceeding 7 metres in length. This net may only be used on the River Severn.
Elver Dip Nets are single, hand-operated devices solely for taking elvers (glass eel), which are constructed in part or in whole of netting; the net frame is no greater than 1 metre at its widest point and 1.25 metres in overall length excluding the handle and the depth of the net or bag shall not exceed 1 metre.
Eels can be landed using a Trawl containing meshes between 16 and 31 mm, but only if they comprise at least 60% of the legal landed catch.

Joint EIFAC/ICES WGEEL Report 2007 403
UK.P Tables
Table 1. Glass eel/elver catch and cpue estimates for England and Wales, based on reports, import and export data, 1972–2007.
Catch estimates based on Licence sales CPUE
Defra/EA Customs & Excise
Import/Export
Year t/yr t/yr No. dip-nets kg/net £/net 1972 16.70 1973 28.20 1974 57.50 1975 10.50 1976 13.10 1977 38.60 1978 61.20 1979 67.00 40.10 1980 40.10 32.80 1367 23.99 121 1981 36.90 1303 0 1982 48.00 30.40 1288 23.60 187 1983 16.90 6.20 1537 4.03 49 1984 25.00 29.00 1192 24.33 162 1985 20.00 18.60 1026 18.13 245 1986 19.00 15.50 917 16.90 330 1987 21.30 17.70 1162 15.23 384 1988 21.40 23.10 918 25.16 861 1989 20.60 13.50 1087 12.42 804 1990 20.90 16.00 1169 13.69 986 1991 1.10 7.80 960 8.13 625 1992 5.00 17.70 969 18.27 1335 1993 5.73 20.90 1000 20.90 1959 1994 9.50 22.30 1058 21.08 1304 1995 11.90 1530 1996 18.80 23.90 1682 14.21 1480 1997 8.70 16.20 2450 6.61 821 1998 11.20 20.10 2480 8.10 1113 1999 18.00 2207 8.16 1012 2000 7.60 2100 3.62 2001 0.81 5.40 838 6.44 1021 2002 0.52 5.10 899 5.67 2003 1.72 10.00 922 10.85 1213 2004 0.97 14.40 957 15.05 709 2005 1.70 8.80 812 10.84 1836 2006 1.27 8.20 719 11.40 1789 2007 21.20 695 30.50 2332

404 Joint EIFAC/ICES WGEEL Report 2007
Table 2. Yellow and silver eel catch and effort data for England and Wales, 1979–2006.
Total exports
Catch returns
Export value No. of licensed instruments
CPUE/instrument
Year (t) (t) £000 £/kg kg/instr £/instr 1979 162 1980 196 670 3.42 1981 229 759 3.31 1982 273 850 3.11 1983 270 888 3.29 1523 177 583 1984 283 922 3.26 2085 136 442 1985 283 1012 3.58 2624 108 386 1986 274 1190 4.34 1994 137 597 1987 381 60.41 1869 4.91 2168 176 862 1988 456 280.58 2992 6.56 2443 187 1225 1989 376 80.63 1699 4.52 2041 184 832 1990 277 48.74 1016 3.67 1589 174 639 1991 358 38.26 1724 4.82 1704 210 1012 1992 234 35.63 1383 5.91 1724 136 802 1993 232 46.62 1442 6.22 1859 125 776 1994 384 86.79 1920 5.00 2647 145 725 1995 514 103.76 2484 4.83 2648 194 938 1996 540 100.51 2532 4.69 2752 196 920 1997 526 68.04 1956 3.72 2602 202 752 1998 306 58.31 1126 3.68 1825 168 617 1999 294 1012 3.44 1670 176 606 2000 113 345 3.05 2001 207 48.62 771 3.72 1991 104 387 2002 122 24.06 445 3.65 1992 61 223 2003 46 25.44 195 4.24 1831 25 106 2004 171 9.58 232 1.36 1600 107 145 2005 110 42.26 160 1.45 2369 46 68 2006 62 35.91 314 5.06 2679 23 117

Joint EIFAC/ICES WGEEL Report 2007 405
Table 3. Lough Neagh eel fishery data, 1960–2007.
NATURAL ADDITIONAL ELVERS EMIGRATING YELLOW EEL CATCH TOTAL YIELD
ELVER RUN
BOUGHT FROM SILVER EEL CATCH (KG) YELLOW +SILVER EELS
YEAR
(KG) R SEVERN (KG) (KG) (KG)
1960 7408.55 1961 4938.69 1962 6740.46 1963 9076.7 1964 3136.92 1965 3801 0 329563.6 236759.1 566322.7 1966 6183 0 332800 284772.7 617572.7 1967 1898.77 0 242727.3 327281.8 570009.1 1968 2524.9 0 204618.2 382327.3 586945.5 1969 422.03 0 238327.3 368677.3 607004.5 1970 3991.63 0 237345.5 516504.5 753850 1971 4157.07 0 233309.1 610909.1 844218.2 1972 2905.27 0 124945.5 509090.9 634036.4 1973 2524.2 0 162400 562481.8 724881.8 1974 5859.47 0 178872.7 587904.5 766777.3 1975 4637.27 0 187527.3 576354.5 763881.8 1976 2919.93 0 144872.7 481886.4 626759.1 1977 6442.8 0 236690.9 455350 692040.9 1978 5034.4 0 280727.3 544695.5 825422.7 1979 2088.8 0 341163.6 702609.1 1043773 1980 2485.93 0 245272.7 668945.5 914218.2 1981 3022.6 0 228690.9 681545.5 910236.4 1982 3853.73 0 209890.9 705759.1 915650 1983 242 0 203636.4 662709.1 866345.5 1984 1533.93 1334.67 165890.9 807672.7 973563.6 1985 556.73 3638.51 135054.5 616668.2 751722.7 1986 1848.47 5935.16 129854.5 522359.1 652213.6 1987 1682.8 4584.07 121345.5 503777.3 625122.7 1988 2647.4 2107 150981.8 503236.4 654218.2 1989 1567.53 0 152436.4 643395.5 795831.8 1990 2293.2 0 123600 613231.8 736831.8 1991 676.67 0 121381.8 578868.2 700250 1992 977.67 785.87 148036.4 533240.9 681277.3 1993 1524.6 0 90327.27 535150 625477.3 1994 1249.27 771.87 95200 597418.2 692618.2 1995 1402.8 686 138581.8 659050 797631.8 1996 2667.93 33.19 112290.9 594045.5 706336.4 1997 2532.6 70.47 109418.2 554750 664168.2 1998 1283.33 17.27 104545.5 531968.2 636513.6 1999 1344.93 1200 113054.5 556213.6 669268.2 2000 562.8 150.33 101963.6 486595.5 588559.1 2001 315 0 84000 451309.1 535309.1 2002 1091.53 1007 95963.64 432313.6 528277.3

406 Joint EIFAC/ICES WGEEL Report 2007
NATURAL ADDITIONAL ELVERS EMIGRATING YELLOW EEL CATCH TOTAL YIELD
ELVER RUN
BOUGHT FROM SILVER EEL CATCH (KG) YELLOW +SILVER EELS
YEAR
(KG) R SEVERN (KG) (KG) (KG)
2003 1155.93 1368.03 114327.3 413763.6 528090.9 2004 334.6 427.09 99636.36 363522.7 463159.1 2005 930 718.67 116727.3 317800 434527.3 2006 456 330 104000 242000 346000 2007 444 1000 na na na

Joint EIFAC/ICES WGEEL Report 2007 407
Table 4. Current and historical sex ratios in silver eels emigrating from Lough Neagh.
Table 5. Results of mark-recapture estimation of silver eel escapement from the Lough Neagh fishery.
Recaptures Year No.
tagged Toome Kilrea Carry over
to catch T+1, T+2y
Total Rate (%)
Total annual silver catch
(t)
Max. possible escapement estimate (t)
2003 189 26 7 7 42 22.2 114 399.0 2004 838 302 15 4 321 38.3 99 159.4 2005 750 109 0 N/A 109 14.9 117 688.0 2006 700 197 1 2 199 28.4 104 262
Males Females year % mean L
(cm) mean Wt
(g) Age % mean L
(cm) mean Wt
(g) Age
1927 0 100 567 1943 27 73 1946 40 60 1956 61 39 1957 62 38 1965 10 180 90 330 2004 51 40.6 122 11 49 58.6 386 18 2005 52 41.4 126 48 58.1 393 2006 37 40.1 117 12.3 63 59.5 368 na

408 Joint EIFAC/ICES WGEEL Report 2007
Table 6. Eel population data for Northern Ireland lakes from surveys conducted during the development of ecological classification tools for the WFD, 2005–2006. No eels were caught in loughs Big Dog, Carrick, Carrickavoy, Corry, Drumacrittin, Formal, Lea (Knox Lake), Legane, Nadarra, Natroey, Portmore, Rossole, Roughan and Skale.
Length (cm) Weight (g) Age (y)
Lake Catch CPUE Mean Range Mean Range Mean Range (no.)
Ballydoolagh 1 0.125 62.5 62.5 654.9 654.9 18 18 (1) Beg 11 1.375 48.9 20.0-70.0 297 35.0-740.0 14 14 (1) Brantry 1 0.125 80 80.0 1362 1362 Castlehume 2 0.25 31.5 30.0-33.0 71 64.5-77.5
Castlewellan 13 1.625 73 62.5-80.0 857.3 616.5-1362.0 23.1 18-25 (11)
Clea Lakes A 16 2 49.4 41.2-56.2 219.7 106.8-347.8 16.6 14-23 (14)
Corranny 1 0.25 56 56.0 867.9 867.9 18 18 (1)
Creeve 4 0.5 54 49.0-57.0 253.7 169.8-303.5 15.3 13-18
(4)
Erne Upper 5 1.25 45.3 42.5-48.2 170.6 125.0-230.2 14 13-15
(5) Glencreawan Lough 1 0.25 60 60.0 402.1 402.1 Knockballymore Lough A 1 0.25 68.5 68.5 748 748 14 14 (1) Lisleitrim 4 1 43.4 37.0-52.5 176.2 93.0-341.6
Macnean Lower 8 0.889 50.5 36.0-60.2 261.6 82.1-423.1 12.4 8-17 (8)
Macnean Upper 5 0.556 49.4 42.0-55.2 229 126.4-338.5 13.5 12-16
(4) Meenameen 2 0.5 37 34.0-39.0 90 65.0-115.0 Nalughoge 2 0.5 58.5 56.0-61.0 423.4 397.2-449.6 Sand 2 0.5 16 16 (2) Tullybrick 1 0.25 60 60.0 407.8 407.8
Table 7. Relative population density of eels in electrofishing surveys in a small stream in north Argyll, 1990–2004.
Year Population density (no.s/100m2)
1990 41 1991 30 1992 16 1993 14 1994 11 1995 15 1996 18 1997 12 1998 14 1999 8 2000 10 2001 14 2002 15 2003 3 2004 14

Joint EIFAC/ICES WGEEL Report 2007 409
Table 8. Number of electrofishing sites for various catchments or districts of Scotland RBD, 1997–2006, together with the abundance class of eels recorded. Where sites had multiple visits the visit with the highest reported abundance class appears. Occasional = 1–10 eels, Frequent=11–100 eels, abundant=>100 eels.
AREA NUMBER OF SITES WITH EELS TOTAL
ABSENT OCCASIONAL FREQUENT ABUNDANT
Argyll 336 168 33 4 541
Ayrshire 164 146 42 6 358
Beauly 16 10 5 0 31
Berriedale 5 4 0 0 9
Conon 150 25 7 1 183
Dee 101 56 5 0 162
Deveron 91 19 1 0 111
Findhorn 46 27 1 0 74
Forth 91 41 5 3 140
Kyle of Sutherland 182 17 4 0 203
Lochaber 238 150 51 2 441
Lomond 33 24 0 0 57
Naver 3 4 1 0 8
Ness 15 0 0 0 15
South Esk 6 4 1 0 11
Spey 111 96 9 0 216
Tay 35 7 0 0 42
Thurso 4 6 1 0 11
West Sutherland 72 109 57 5 243
Wester Ross 32 111 35 0 178
Western Isles 47 150 83 0 280
410 Joint EIFAC/ICES WGEEL Report 2007
France: Report on the eel stock and f ishery in France 2007
FR.A. Authors
Gérard Castelnaud, Cemagref, 50, avenue de Verdun, 33616 Cestas Cedex-France
Cédric Briand, Institution d'Aménagement de la Vilaine, 56 130 La Roche Bernard-France
Thomas Changeux, Institut de Recherche pour le Développement, Département des Ressources Vivantes, 213, rue La Fayette, F-75480 Paris Cédex 10
Laurent Beaulaton, ONEMA, Direction Scientifique et Technique, 16, avenue Louison Bobet, 94132 Fontenay sous bois Cedex
Marie-Noelle de Casamajor, CERECA/ADERA, Technopôle Izarbel, Maison du Parc, 64210 Bidart
Katia Charles, Tableau de bord anguille du bassin de la Loire, Université de Rennes 1, Bat 25, Equipe de Recherche et Technologie : Biodiversité Fonctionnelle et Gestion des Territoires, 35000 Rennes Cedex France
Reporting Period: This report was revised and completed in August 2007. Last updates on data depends on rivers and range from 2004 to 2007.
FR.B. Introduction
FR. B. 1 Presentation of the eel fisheries in France
The French eel fisheries occur mainly in inland waters (rivers, estuaries, ponds and lagoons) and also in coastal waters (see Figure FR.1 and Table FR.a). The glass eel fisheries are more important in the Bay of Biscay region but they are also found in the Manche region. The yellow eel fisheries occur in the same areas and concerns also the upper parts of the rivers of the Atlantic coast, the Rhine and tributaries. The Mediterranean lagoons produce the most part of yellow eels and bootlace eels are targeted for exportation towards Italy. Silver eel fisheries are limited to some rivers, mostly in the Loire basin.
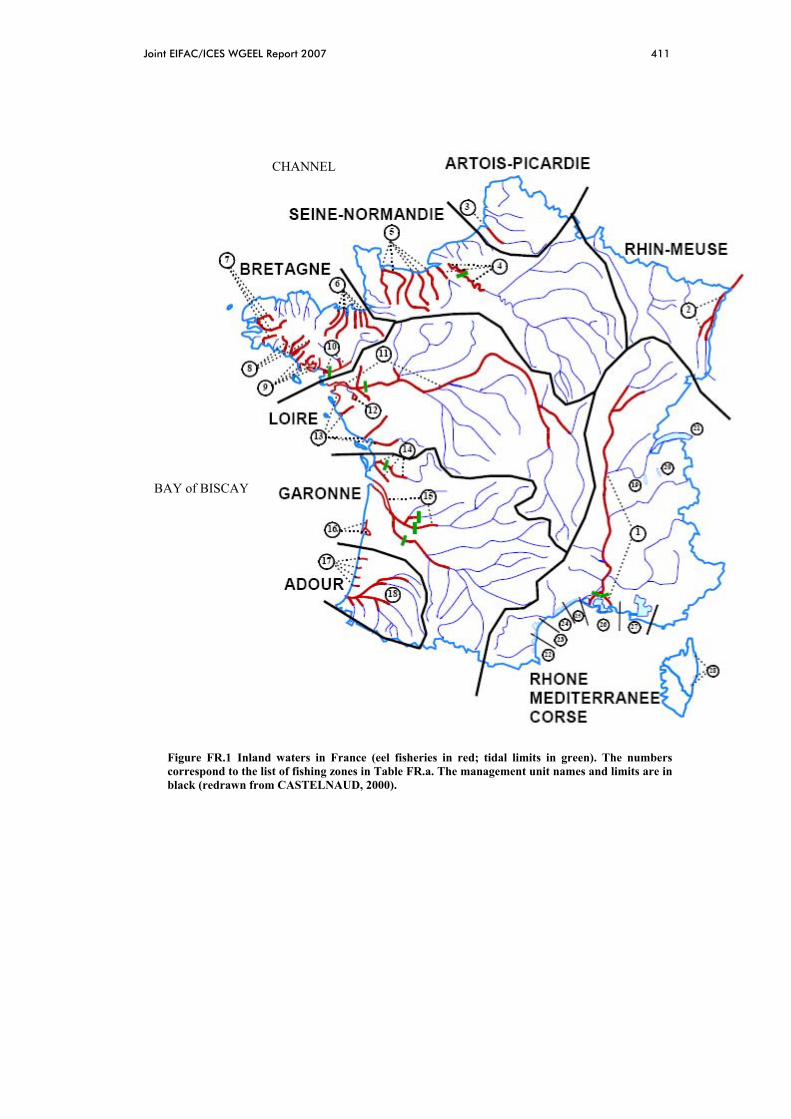
Joint EIFAC/ICES WGEEL Report 2007 411
Figure FR.1 Inland waters in France (eel fisheries in red; tidal limits in green). The numbers correspond to the list of fishing zones in Table FR.a. The management unit names and limits are in black (redrawn from CASTELNAUD, 2000).
CHANNEL
BAY of BISCAY

412 Joint EIFAC/ICES WGEEL Report 2007
Table FR.a Fishing zones in French inland waters related to the 8 management units (COGEPOMI) (modified from CASTELNAUD et al., 2000, unpublished data).
(NUMBER FROM FIGURE FR.1) FISHING ZONE – SURFACE FOR LAGOONS COGEPOMI
(1) Delta du Rhône Rhône-Méditerranée Corse (1) Fleuve Rhône aval et amont, Saône, Doubs Rhône-Méditerranée Corse (2) Fleuve Rhin, Ill Rhin Meuse (3) Estuaire Somme Artois-Picardie (4) Estuaire Seine, Fleuve Seine aval Seine Normandie (4) Fleuve Seine amont, Risle Seine Normandie (5) Estuaires Touques, Dives, Orne, Aure, Vire Seine Normandie (6) Estuaires Couesnon, Rance, Fremur, Arguenon, Gouessan, Gouet Bretagne (7) Estuaires Elorn, Aulne, Odet Bretagne (8) Estuaires Laïta, Scorf, Blavet Bretagne (9) Rivières d'Etel, d'Auray, de Penerf, Golfe du Morbihan Bretagne (10) Estuaire Vilaine aval Bretagne (10) Estuaire Vilaine amont, Fleuve Vilaine aval, Oust, Chere, Don Bretagne (11) Estuaire Loire, Loire aval, Erdre, Sèvre Nantaise Loire (11) Fleuve Loire amont, Maine, Mayenne, Allier Loire (12) Lac de Grand-Lieu Loire (13) Baie de Bourgneuf, Estuaires Vie, Lay, Sèvre Niortaise Loire (14) Estuaire Charente, Fleuve Charente aval, Estuaire Seudre Garonne (14) Fleuve Charente amont Garonne (15) Estuaire Garonne, Garonne aval, Dordogne aval, Isle Garonne (15) Fleuve Garonne amont, Dordogne amont Garonne (16) Canal de Lège Garonne (16) Delta d'Arcachon Garonne (17) Courants de Mimizan, Contis, Huchet, Vieux-Boucau Adour (18) Estuaire Adour, Fleuve Adour, Nive, Bidouze, Gaves de Pau et d'Oloron, Luy Adour (19) Lac du Bourget Rhône-Méditerranée Corse (20) Lac d'Annecy Rhône-Méditerranée Corse (21) Lac Léman Rhône-Méditerranée Corse (22) Etang de Canet - 480 ha Rhône-Méditerranée Corse (22) Etang de Salses Leucate - 5800 ha Rhône-Méditerranée Corse (23) Etang de Lapalme - 600 ha Rhône-Méditerranée Corse (23) Etang de Bages-Sigean - 3700 ha Rhône-Méditerranée Corse (23) Etang de Campignol – 115 ha Rhône-Méditerranée Corse (23) Etang de l'Ayrolle – 1320 ha Rhône-Méditerranée Corse (23) Etang de Gruissan – 145 ha Rhône-Méditerranée Corse (24) Etang de Thau – 7500 ha Rhône-Méditerranée Corse (25) Etang d'Ingril – 685 Rhône-Méditerranée Corse (25) Etang de Vic – 1255 ha Rhône-Méditerranée Corse (25) Etang de Pierre- Blanche – 371 ha Rhône-Méditerranée Corse (25) Etang du Prévost – 294 ha Rhône-Méditerranée Corse (25) Etang de l'Arnel – 580 ha Rhône-Méditerranée Corse (25) Etang du Grec – 270 ha Rhône-Méditerranée Corse (25) Etang Latte-Méjean – 747 ha Rhône-Méditerranée Corse (25) Etang de l'Or – 3200 ha Rhône-Méditerranée Corse (26) Etang du Ponant – 200 ha Rhône-Méditerranée Corse (26) Petite Camargue gardoise – 1200 ha Rhône-Méditerranée Corse (26) Etang du Vacares et des Impériaux – 12000 ha Rhône-Méditerranée Corse (27) Etang de Berre – 15500 ha Rhône-Méditerranée Corse (28) Etang de Palo – 210 ha Rhône-Méditerranée Corse (28) Etang d'Urbino – 790 ha Rhône-Méditerranée Corse (28) Etang de Diana – 570 ha Rhône-Méditerranée Corse
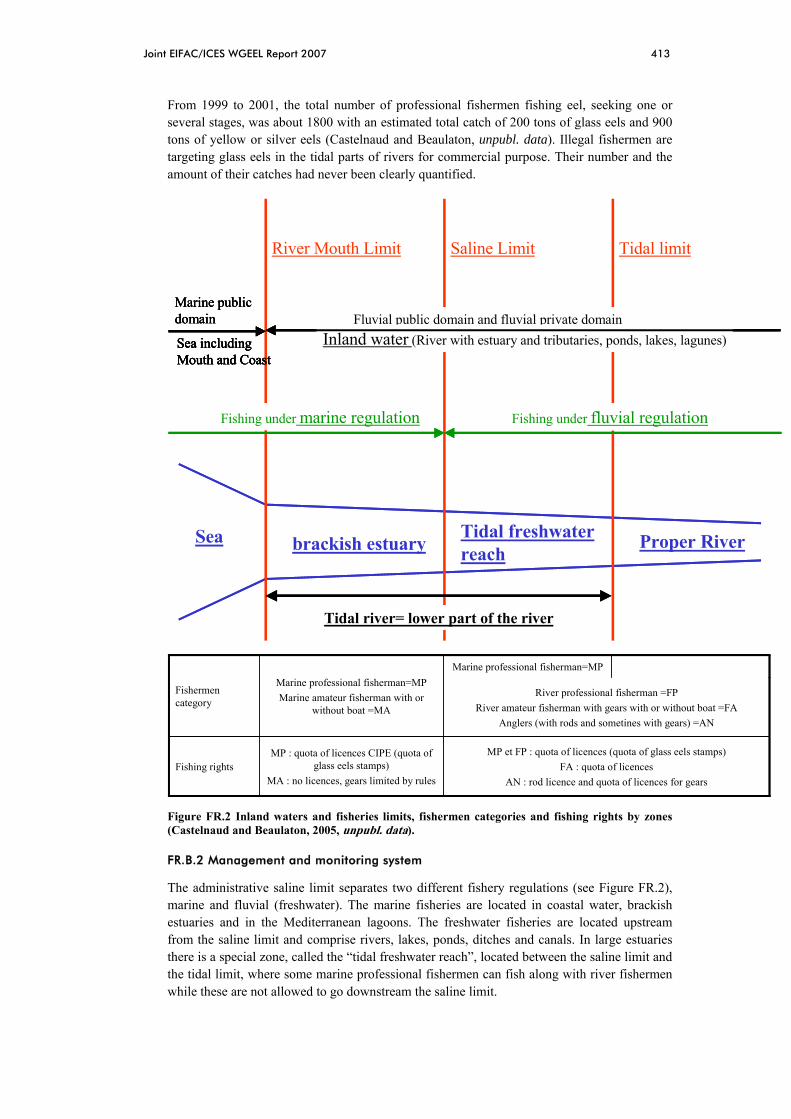
Joint EIFAC/ICES WGEEL Report 2007 413
From 1999 to 2001, the total number of professional fishermen fishing eel, seeking one or several stages, was about 1800 with an estimated total catch of 200 tons of glass eels and 900 tons of yellow or silver eels (Castelnaud and Beaulaton, unpubl. data). Illegal fishermen are targeting glass eels in the tidal parts of rivers for commercial purpose. Their number and the amount of their catches had never been clearly quantified.
Sea brackish estuary Tidal freshwater reach Proper River
Sea includingMouth and Coast
Marine public domain Fluvial public domain and fluvial private domain
Inland water (River with estuary and tributaries, ponds, lakes, lagunes)Sea includingMouth and Coast
Marine public domain
Sea includingMouth and CoastSea includingMouth and Coast
Marine public domain Fluvial public domain and fluvial private domain
Inland water (River with estuary and tributaries, ponds, lakes, lagunes)Fluvial public domain and fluvial private domain
Inland water (River with estuary and tributaries, ponds, lakes, lagunes)Inland water (River with estuary and tributaries, ponds, lakes, lagunes)
Fishing under marine regulation Fishing under fluvial regulationFishing under marine regulationFishing under marine regulation Fishing under fluvial regulationFishing under fluvial regulation
Tidal river= lower part of the riverTidal river= lower part of the river
River Mouth Limit Saline Limit Tidal limit
Marine professional fisherman=MP
MP et FP : quota of licences (quota of glass eels stamps) FA : quota of licences
AN : rod licence and quota of licences for gears
River professional fisherman =FPRiver amateur fisherman with gears with or without boat =FA
Anglers (with rods and sometines with gears) =AN
MP : quota of licences CIPE (quota of glass eels stamps)
MA : no licences, gears limited by rulesFishing rights
Marine professional fisherman=MPMarine amateur fisherman with or
without boat =MA
Fishermen category
Figure FR.2 Inland waters and fisheries limits, fishermen categories and fishing rights by zones (Castelnaud and Beaulaton, 2005, unpubl. data).
FR.B.2 Management and monitoring system
The administrative saline limit separates two different fishery regulations (see Figure FR.2), marine and fluvial (freshwater). The marine fisheries are located in coastal water, brackish estuaries and in the Mediterranean lagoons. The freshwater fisheries are located upstream from the saline limit and comprise rivers, lakes, ponds, ditches and canals. In large estuaries there is a special zone, called the “tidal freshwater reach”, located between the saline limit and the tidal limit, where some marine professional fishermen can fish along with river fishermen while these are not allowed to go downstream the saline limit.

414 Joint EIFAC/ICES WGEEL Report 2007
In brackish and coastal waters, amateur fishermen do not need licenses to fish with authorized fishing gears. A system of licenses is set up for marine professional fishermen, for river professional and amateur fishermen in inland waters. The glass eel fishery is limited with a quotas of glass eel stamps and the silver eel fishery is limited by personal authorizations. In the Mediterranean lagoons, where glass eel fishing is forbidden, there are also limitations in the number of marine professional fishermen and fishing capacities but no system of licences exists.
In the rivers under fluvial regulation, the fishing rights are delivered to fishermen by the local Fluvial Fisheries Administrations. The regulation systems in brackish estuaries and Mediterranean lagoons are the result of a negotiation between fishermen organizations (respectively “Commission des poissons migrateurs et des estuaires” and “Prud’homies”) and Marine Fisheries Administrations.
The marine professional fisheries in Atlantic coastal areas, estuaries and tidal part of rivers in France have been monitored since 1993 by the Centre National de Traitement Statistiques (CNTS, ex-CRTS) depending from the Direction des Pêches Maritimes et de l’Aquaculture (DPMA) of the Ministry of Agriculture and fisheries. No similar system exists for the marine professional fishermen fishing eel in the Mediterranean lagoons.
The river professional and amateur fishermen in rivers above marine estuaries (and in lakes) have been monitored since 1999 by the ONEMA (Office National de l'Eau et des Milieux Aquatiques, ex-CSP) in the frame of the « Suivi National de la Pêche aux Engins et aux filets » (SNPE).
These two monitoring systems are based on compulsory declarations of captures and effort (logbooks) using similar fishing forms collected monthly (Table FR.b) with the help of some local data collectors.
Beside these obligatory systems, for which reliability, accuracy and availability of data are variable, local scientific monitoring are developed in the Gironde, the Adour and the Vilaine basin for instance. Also data on annual captures are provided for some sectors by the local fishery administrations: Directions Départementales des Affaires Maritimes (DDAM), Directions Départementales de l’Agriculture et de la Forêt (DDAF).

Joint EIFAC/ICES WGEEL Report 2007 415
Table FR.a. Official administrative monitoring systems in France.
To manage the migratory species and their fisheries all along the watershed (under marine and fluvial regulation), special organizations, called “Comités de Gestion des Poissons Migrateurs” (COGEPOMI), have been created in 1994. There are 8 COGEPOMI (management units, grouping basins), one for each important group of basin: Rhine-Meuse, Artois-Picardie, Seine-Normandie, Bretagne, Loire, Garonne, Adour and Rhone-Méditerranée-Corse (see Figure FR.1 and Table FR.a). They gather representatives of fishermen organizations, administrations and research centers. Each COGEPOMI propose a management plan and funding every five years and has to monitor them. The plan determines conservation and management actions, restocking operations, proposes fishing regulations for both recreational and professional fisheries.
Until now, these management plans did not aim at achieving a particular escapement rate for eel, and the results of management actions have not really been evaluated. While this system allows for a global approach, and tries to solve environmental problems such as migration barriers or turbine mortality, it does not give for the moment, a consistent management basis for eel at the national level by lack of central regulation and designing of practical management rules. In 2006 and 2007, the ministers in charge of eel management have asked the scientific community to propose the basis of a national plan on eel management, suitable at the River Basin District level.
FR.C. Fishing capacity
FR.C.1 Glass eel
The professional glass eel fishing gear is variable from a river to another (Table FR.c).
SEASalt water Brackish water FreshwaterMarine Public domain: Sea Coast Marine Public domain: Estuaries Fluvial Public domain: parts of rivers above estuaries, lakesProfessionnal fishermen Professionnal fishermen Professionnal fishermen
no specific license Quota of licenses by estuary (specific for glass eel since 1993 and for eel since 2005)
Quota of licenses by river section and by lake (specific for glass eel since 1988)
Logbook for sea fishingCompulsory logbook (by day, by gear) since 1993 treated by CNTS (ex-CRTS ) and Ifremer until 2001, no more data available
Compulsory logbook (by day, by gear) since 1999 treated by ONEMA (ex-CSP) until 2002
Few oriented fishery on eel, few data availableLocal scientific monitoring of landings and effort since 1978, Cemagref, evalution of productions by some DDAF Services
Non professionnal fishermen, amateurs and anglers
Local scientific monitoring of landings and effort since 1978, Cemagref, Ifremer, IAV, evalution of productions by some Affaires Maritimes Services
No licence, no logbook Non professionnal fishermen, amateurs and anglersNon professionnal fishermen, amateurs and anglers since 1988)
No licence, no logbookCompulsory logbook (by day, by gear) 1999-2002 treated by ONEMA (ex-CSP)
Marine Public domain: Mediterranean lagoonsProfessionnal fishermen Anglers
No license but limitation of the number of fishermen by lagoon Licenses per departementNo logbook, some technical and scientific surveys No logbook, ponctual estimates (ONEMA, ex- CSP)
Non professionnal fishermen, amateurs and anglersPrivate domain: others parts of rivers above estuaries, others parts of lakes
No licence, no logbook Professionnal fishermenNo licence, no logbook, ponctual estimate of effort (ONEMA, ex- Non professionnal fishermen, amateurs and anglersLicenses per departementNo logbook, ponctual estimate of effort (ONEMA, ex- CSP)
INLAND WATERS

416 Joint EIFAC/ICES WGEEL Report 2007
Table FR.c Size and dimensions of the nets allowed in the French inland waters to professional fishermen. The numbers in bracket correspond to the COGEPOMI in Figure FR. 1 (source CASTELNAUD, 2002).
TYPE SHAPE TOTAL FISHING
SURFACE (2 NETS)
BASINS AND REGULATIONS, M=MARINE , F=FRESHWATER; COGEPOMI
Push net Circular 2.262 m² Nord pas de Calais (m), ARTOIS-PICARDIE Picardie (m), ARTOIS-PICARDIE Normadie (m), SEINE-NORMANDIE Bretagne (m), BRETAGNE Loire (m + f), LOIRE Baie de Bourneuf (m), LOIRE Garonne, Dordogne, Isle (f), GARONNE Adour (f), ADOUR
Large push net (Pibalour)
Rectangular 8 to 14 m² Gironde (m), GARONNE Charente (m), GARONNE Seudre (m), GARONNE
Handed scoop net
Oval Close to 2.262 m
Arcachon (m), GARONNE Garonne, Dordogne, Isle (f), GARONNE Courants Landais, Adour (m), ADOUR
Push net Square 2.88 m² Lay (m), LOIRE Push net Rectangular 4.32 m² Sèvre Niortaise (m), LOIRE Push net Rectangular 3.60 m² Vie(m), LOIRE
The classical and basic gear used to fish glass eel is the scoop net of different sizes and shapes. Scoop nets are handled from the river bank for amateur fishermen (1 scoop net of small size) or handled from a boat for professional fishermen (1 scoop net of large size and oval) or pushed by a boat (2 scoop net of large size and circular). They are called “pibalour” when they are rectangular, wider and pushed by a boat.
For amateur fishermen, the scoop net dimension is 0.19 m² in all basins.
The poachers with or without boat can use the different gears and techniques described but also special poaching devices like very large nets called “chaussette” or passive traps called “caisse à civelles” (see LUNEAU et al., 2003 for more details).
The glass eel fisheries involve pure estuarine or river professional fishermen, coastal professional fishermen and some shellfish farmers (Champion and Perraudeau, 2000).
A socio-economic study of the coastal fishery in the Bay of Biscay was carried out in 2000 in the frame of the Pecosude project (Leaute and Caill-Milly N, 2003). The survey concerned 248 commercial fishermen representing 20% of the whole population. Seven classes of fishing boats were built. Nineteen surveys concerned the class of « pure glass eel boat » and 36 the class of “estuarine boat.”
The river and estuarine professional fishermen have small boats, 18 years old, 6.5m long, 2.5 TJB de jauge, 41 kW. They are handled by a mean number of 1.1 fishermen. Others types of boat are used by coastal marine professional fishermen for glass eel like “trawlers”, “dredgers”. Those are larger (8m) and more powerful boats (72 kW) (Caill-Milly, 2001).
FR.C.2 Yellow and silver eel
In inland waters, the eel pot (10 mm mesh size minimum, last entrance larger than 40 mm) is the common fishing gear used by all categories of fishermen to fish yellow eel. The shapes are

Joint EIFAC/ICES WGEEL Report 2007 417
very diversified according to the basin and also the fishing zone; the eel pots are not always baited. The fyke-net is also used by the professionals only, with a 10 mm mesh size minimum. A barrier can be associated. Others gears exist: deep-lines, lift nets, “vermée” for anglers.
The main fishing gear used in Mediterranean lagoons is a fyke-net (mesh size 10 mm) transformed with wings (“ganguis”) and with three chambers (“capéchade”). In some places, fixed fisheries are made of batteries of fyke nets. These fixed fisheries have to let a passage for the migration from the lagoons to the sea of euryhalines species which are mostly captured (sea-breams in particular).
The special gear called “dideau” used to fish silver eel in the Loire basin was introduced in large rivers from the Netherlands in the early 20th century. It is a sort of trawl used from a fixed boat. The net measures 25 m of length with a mouth of 10 m width and 5 m height. The mesh size starts at 16 cm at the mouth and ends at 10 mm.
FR.D. Fishing effort
FR.D.1 Glass eel
For marine professional fishermen the quota of seasonal license for glass eel has been limited to 1137. Between 1999 and 2005, the total number of licenses delivered was comprised between 900 to 1000. There were 936 marine professional fishermen fishing for glass eel in 1997 (Castelnaud, 2000) and around 1050 in 2001 (Table FR.d). The total number of marine professional fishermen is higher than 1000 licences, probably because one licence permit with stamps to fish in several estuaries or because some fishermen fish without licence).
For river professional fishermen, from 1999 to 2005, the number of seasonal licenses has decreased from 430 to 360 (from Briand et al., 2005). In 2000, 432 licences were distributed as following: 186 Adour, 147 Loire, 26 Charente, 77 Gironde). In fact there were 300 river professional fishermen fishing for glass eel in 1997 (Castelnaud et al., 2000) and 241 in the last evaluation (Table FR.d); the difference between number of licences and number of river fishermen is the number of licences delivered to marine professional fishermen who can fish in the tidal freshwater reach under fluvial regulation; see Figure FR.2).
For legal river amateur fishermen, the number of licenses was stable from 1993 to 1999 with an average of 617. Since 1999, the number of legal river amateur fishermen has decreased to 285 in 2005 and 193 in 2006. The amateur glass eel fishery has been banned in 2006 in the Loire river.
Finally a total mean number of about 1300 professional fishermen has been evaluated during the period 1999–2001 and this figure has not changed much these last years (Table FR.d).

418 Joint EIFAC/ICES WGEEL Report 2007
Table FR.d Mean number of glass eel professional fishermen per basin from 1999 to 2001; except a
year 1989 Castelnaud et al., 1994; b year 1997 Castelnaud et al., 2000; c year 2000 Cuende et al., 2002. Source CSP, CRTS, Cemagref.
COGEPOMI FISHING ZONE
MARINE PROFESSIONAL
FLUVIAL PROFESSIONAL
TOTAL
Artois-Picardie/Seine-Normadie Manche - Seine-Normandy 10a 10 Bretagne Bretagne (Vilaine excluded) 86a 86 Bretagne Vilaine 131 131 Loire Loire 278 50b 328 Loire Vendée 209 209 Garonne Charente-Seudre 163 24 187 Garonne Gironde 75 75 150 Garonne Arcachon 42 42 Adour Adour + courants landais 57 92c 149 Total France 1051 241 1292
Fishing effort is determined by the number of boats/ fishermen and the size of nets which varies with the fishermen categories and the fishing zone (Table FR.c) (Castelnaud, 2002). It depends also on the speed and power of the boat and the fishing duration.
FR.D.2 Yellow eel
Yellow eel fisheries are not under specific quotas of stamps like glass eel fisheries. Fishermen often target yellow and silver eels indistinctly.
FR.D.2.1 Inland fisheries
The inland fisheries are scattered and involve professional fishermen, amateur fishermen with gears and anglers with rods.
Whatever the category, the number of fishermen has been decreasing since 1987 (Briand, et al., 2005).Only a part of the 450 professionals fishermen fishing diadromous species in inland waters target eel at yellow and silver stages (Castelnaud, 2000), their number is evaluated at 128 marine and 107 river professional fishermen (Table FR.e). The most part of these marine professional fishermen and two third of these fluvial fishermen also target glass eel.

Joint EIFAC/ICES WGEEL Report 2007 419
Table FR.e Mean number of yellow eel professional fishermen per fishing zone from 1999–2001(Source CSP, CRTS, Cemagref; except a 1997, Castelnaud, 2000;b 2000, Sauvaget, 2001).
COGEPOMI
FISHING ZONE
MARINE PROFESSIONAL
FLUVIAL PROFESSIONAL
TOTAL
Artois-Picardie/Seine-Normadie
Manche - Seine-Normandy 5(a) 1 6
Bretagne Bretagne (Vilaine excluded) 13(b) 13 Bretagne Vilaine 2 1 3 Loire Loire 16 28 44 Loire Grand Lieu 8 8 Loire Vendée 5 5 Garonne Charente-Seudre 1 1 Garonne Gironde 30 42 72 Garonne Arcachon 42 42 Adour Adour + courants landais 14 10 24 Rhône-Méditerranée-Corse Rhone 4 4 Rhin-Meuse Rhin 8 8 Rhône-Méditerranée-Corse Méditerranée 513 5 518 Total 641 107 748
FR.D.2 2 Atlantic coastal fisheries
On the Atlantic coast, (Désaunay and Aubrun, 1988) described in the past an important fishery of yellow eel by trawling. This activity nowadays is unreported or has collapsed (Table FR.f). Recently, there might have been changes in eel exploitation in connection with the new use of fyke nets.
Table FR. b. Number of boats fishing eels on the Atlantic and Channel coasts. Source 1 DÉSAUNAY and AUBRUN, 1988; 2 CHAMPION and PERRAUDEAU, 2000; 3 SAUVAGET et al., 2001.
COGEPOMI FISHING ZONE 1986 NB BOAT (1) 1997 NB BOAT (2) 2000 NB BOAT (3)
Artois-Picardie Manche 9 ? Seine-Normandie Seine-Normadie 7 2 to 3 Bretagne Bretagne-Sud 5 9 Bretagne Vilaine 3 Loire Loire 115 Loire-Garonne Vendée-Charente 80 to 90 Garonne Arcachon 2
FR.D.2.3 Mediterranean fisheries
Since 1988, the number of 400 to 500 marine professional fishermen targeting eel in the Mediterranean lagoons has been regularly announced. Nevertheless, a strong decrease of the population has been noticed (see details in (Table FR.m): 63% between 1969 and 1994 on the Palavasiens lagoons (fishing zone 25, see Table FR.a) (Ruiz, 1994) and 33 % between 1986 and 1996 on the Gruissan and Bages-Sigean lagoons (Loste and Dusserrre, 1996, Dusserre and Loste, 1997). The most reliable data are collected by the Cépralmar in the Languedoc-Roussillon region which yield the main part of French Mediterranean eels and totalise 430 marine professional fishermen targeting eel in 2002 (Loste and Dusserre, 1996, Dusserre and Loste, 1997, Cepralmar, 2003).

420 Joint EIFAC/ICES WGEEL Report 2007
The most recent evaluation (Castelnaud et al., 2000) estimates that 513 marine professional fishermen were fishing yellow eel in 1997 in all the French Mediterranean lagoons (Table FR.e).
FR.D.3 Silver eel
If we do not consider the Mediterranean fisheries, where an unknown part of silver eel can be captured, the only significant fishery of silver eel is in the Loire basin, with 11 fishermen using the special gear called “dideau”.
In 2002 the special five years authorizations for fishing silver eel in private waters were stopped by the local fishery administration (extinction in 2006; more than 200 authorizations existed yet in 2000 from Changeux, 2001).
FR.E. Catches and landings
FR.E.1 Historical series of catches and landings for glass eels and yellow eel
In 1999 the production of glass eels was estimated at 255 tons, with a turnover of 35.2 millions euros in the whole French basins (Table FR.g).The historical analysis of the series of captures concerning the main landing areas of the Atlantic coast highlights a fall of the glass eel productions starting in the eighties.
Table FR.g Estimation of the total glass eel production and of the number of fishermen in France from 1970 to 2000. (MP: Marine professional fishermen, PF: professional river fishermen, River and Marine non-pro: river and marine amateur fishermen and poachers); (1) unknown number of marine amateur fishermen to be added; (2) marine non-professional fishermen included; (3) comprising 110 t from marine amateur fishermen; (4) number of licenses delivered.
YEAR 1970 1979 1986 1989 1999 2000
Production MP (t) 450 1175 300 225 180 Production PF and river non-pro f(t) 895 675 110 30 16,6
Total Production (t) 1345 1850 500 520 (3) 255 196,6 Mean price /kg (€) 2,75 5,65 61 138 120 Total value (M€) 2,74 10,44 12,5 30,5 35.2 Number MP(1) 648 964 850 886 936 970 (4) Number PF and River non-professionals 2424 2588 4000(2) 1512 761 671
Number Marine non-pro (1) (1) 2055 109 (1) Origin of the data
Popelin (1971) CIPE (1982) Desaunay and Aubrun (1988)
Castelnaud et al. (1989)
Castelnaud (2002) Castelnaud et al. (2003) (5)
Castelnaud et al. (2003) (5)
The estimation of inland waters captures for years 1999 and 2000 in Table FR.g, made by Cemagref, ONEMA (ex-CSP) and CNTS (ex-CRTS) for the FAO-FIDI, has been revised with the estimation for year 2001 and the new figures are reported in Table FR.i. This table contains the result of an extrapolation from the scientific estimations obtained in the main basins monitored (Adour, Gironde, Loire and Vilaine) with a relation obtained from the comparison with the punctual evaluation of total production for France available: years 1979 and 1989 in Table FR.g and years 1999, 2000 indicated just above, for professional fishermen and the same years for non-professional fishermen, apart 1979.

Joint EIFAC/ICES WGEEL Report 2007 421
On the basis of this attempt, considering the FAO database, where gaps and under-evaluated figures were found, a more realistic temporal series has been built by biological stages (glass eel, yellow and silver eel) and fishermen categories.
Table FR.h Glass eel professional catches in the large French basins and total production in France for professional and non-professional fishermen. MP: marine professional fishermen, PF: river professional fishermen, Non professional: amateur fishermen including poachers for Gironde; numbers in black= estimations by extrapolation; 0t = less than 1t.
PROFESSIONAL FISHERMEN CATCH (TONS) NON PROFESSIONAL FISHERMEN CATCH (TONS) SEASON ADOU
R GIRONDE LOIRE VILAINE TOTAL (1) ADOUR GIRONDE LOIRE TOTAL (2)
MP FP MP FP MP FP MP 1978 27 83 514 12 106 1484 108 647 1979 28 90 620 22 209 1850 116 697 1980 46 167 508 18 95 1667 217 1303 1981 45 78 288 15 57 967 151 904 1982 50 37 261 13 98 917 36 219 1983 49 26 241 19 69 808 27 161 1984 31 26 168 15 36 550 26 156 1985 16 12 145 9 41 446 12 71 1986 8 26 14 113 10 53 432 14 87 1987 10 32 25 131 14 41 486 29 172 1988 12 25 7 165 12 47 511 7 40 1989 9 38 16 78 9 37 410 17 110 1990 3 4 29 9 81 16 36 338 9 54 1991 2 4 36 10 31 5 15 193 14 87 1992 8 12 17 8 32 7 30 188 13 77 1993 6 7 30 12 80 11 31 325 22 130 1994 3 7 35 7 95 24 340 18 12 0 74 1995 8 4 47 10 127 6 30 439 10 19 0 113 1996 4 3 21 4 73 8 22 257 12 4 25 1997 5 33 11 67 4 23 276 6 6 39 1998 2 7 14 2 61 18 189 7 1 6 1999 4 2 41 8 80 7 15 242 2 3 1 6 2000 10 21 4 74 6 14 206 0 1 2 2001 9 0 33 3 8 101 0 0 1 2002 28 9 42 8 16 206 6 37 2003 10 1 53 4 9 151 0 2004 13 1 20 8 76 2005 11 6 17 3 7 88 2
This work leads to the following data (total for professional and non-professional fishermen, anglers excluded) in Table FR.i:
• glass eel landings in inland waters from 1978 to 2001, • yellow and silver eel landings in inland waters from 1986 to 2001 and in the
Mediterranean lagoons from 1983 to 2001; • eel production in France compared to uncorrected data registered by FAO-FIDI.

422 Joint EIFAC/ICES WGEEL Report 2007
Table FR.i Estimate of capture of glass eels and yellow eels (few silver eel fisheries) in France and comparison with FAO database (Fishstat).
stage glass eel yellow eel (+silver)
yellow eel (+silver)
yellow eel (+silver) all stages all stages
area inland water inland water mediterranean lagoons France France France - FAO
1978 2 1311979 2 5471980 2 9701981 1 8711982 1 1351983 969 1 7001984 706 1 8101985 516 1 5011986 518 720 1 224 1 944 2 462 2 6871987 658 700 1 362 2 062 2 720 1 9781988 551 700 1 565 2 265 2 816 2 1091989 520 440 1 306 1 746 2 266 1 6721990 392 380 1 398 1 778 2 170 1 6741991 280 380 1 265 1 645 1 925 1 4501992 264 380 941 1 321 1 585 1 1641993 456 380 900 1 280 1 736 8641994 414 380 900 1 280 1 694 6071995 552 380 900 1 280 1 832 3201996 282 380 900 1 280 1 562 4031997 314 323 900 1 223 1 537 1 7821998 195 250 900 1 150 1 345 4491999 248 105 900 1 005 1 253 2892000 214 86 900 986 1 200 3992001 101 102 900 1 002 1 103 415
FR.E.2 Catches and landings by fishing sector for glass eels and yellow eel
The mean production of glass eel is given for the recent period 1999–2001 by fishing sectors in Table FR.j.
Table FR.j Mean landings in tons of Glass eel per sectors of the period 1999–2001 (Sources: CSP-SNPE, CRTS, Cemagref, Affaires maritimes except for *, period 1994–1998). Number of fishermen corresponding in Table Section C.
COGEPOMI FISHING SECTORS MARINE AND RIVER PROFESSIONALS RIVER AMATEURS
Artois-Picardie/Seine-Normandie Manchel - Seine-Normandie 2.7* Bretagne Bretagne (Vilaine excluded) ? Bretagne Vilaine 12.5 Loire Loire 70.3 0.6 Loire Vendée 26.4 Garonne Charente-Seudre 18.9 Garonne Gironde 27.6 1.0 Garonne Arcachon ? Adour Adour + courants landais 15.5 0.4 Total 173.9 2
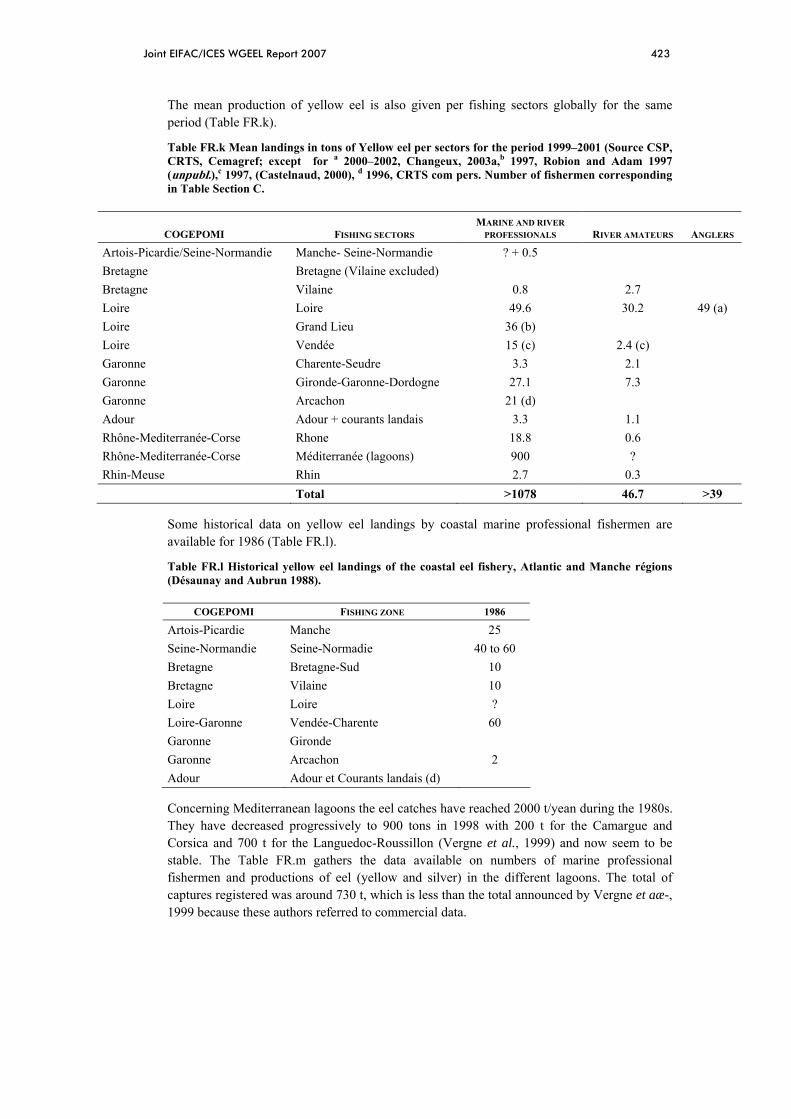
Joint EIFAC/ICES WGEEL Report 2007 423
The mean production of yellow eel is also given per fishing sectors globally for the same period (Table FR.k).
Table FR.k Mean landings in tons of Yellow eel per sectors for the period 1999–2001 (Source CSP, CRTS, Cemagref; except for a 2000–2002, Changeux, 2003a,b 1997, Robion and Adam 1997 (unpubl.),c 1997, (Castelnaud, 2000), d 1996, CRTS com pers. Number of fishermen corresponding in Table Section C.
COGEPOMI FISHING SECTORS
MARINE AND RIVER PROFESSIONALS RIVER AMATEURS ANGLERS
Artois-Picardie/Seine-Normandie Manche- Seine-Normandie ? + 0.5 Bretagne Bretagne (Vilaine excluded) Bretagne Vilaine 0.8 2.7 Loire Loire 49.6 30.2 49 (a) Loire Grand Lieu 36 (b) Loire Vendée 15 (c) 2.4 (c) Garonne Charente-Seudre 3.3 2.1 Garonne Gironde-Garonne-Dordogne 27.1 7.3 Garonne Arcachon 21 (d) Adour Adour + courants landais 3.3 1.1 Rhône-Mediterranée-Corse Rhone 18.8 0.6 Rhône-Mediterranée-Corse Méditerranée (lagoons) 900 ? Rhin-Meuse Rhin 2.7 0.3 Total >1078 46.7 >39
Some historical data on yellow eel landings by coastal marine professional fishermen are available for 1986 (Table FR.l).
Table FR.l Historical yellow eel landings of the coastal eel fishery, Atlantic and Manche régions (Désaunay and Aubrun 1988).
COGEPOMI FISHING ZONE 1986
Artois-Picardie Manche 25 Seine-Normandie Seine-Normadie 40 to 60 Bretagne Bretagne-Sud 10 Bretagne Vilaine 10 Loire Loire ? Loire-Garonne Vendée-Charente 60 Garonne Gironde Garonne Arcachon 2 Adour Adour et Courants landais (d)
Concerning Mediterranean lagoons the eel catches have reached 2000 t/yean during the 1980s. They have decreased progressively to 900 tons in 1998 with 200 t for the Camargue and Corsica and 700 t for the Languedoc-Roussillon (Vergne et al., 1999) and now seem to be stable. The Table FR.m gathers the data available on numbers of marine professional fishermen and productions of eel (yellow and silver) in the different lagoons. The total of captures registered was around 730 t, which is less than the total announced by Vergne et aæ-, 1999 because these authors referred to commercial data.

424 Joint EIFAC/ICES WGEEL Report 2007
Table FR.m Total production from Mediterranean lagoon fisheries from various authors. (Ximenes et al., 1990; Ruiz, 1994; Loste and Dusserre, 1996; Dusserre and Loste, 1997).
Table FR. c
FR.E.3 Restocking
No restocking recorded at the central level.
FR.E.4 Aquaculture
No data.
FR.E.5 Catch of recreational fisheries
Several local attempts to evaluate the fishing pressure of anglers on eel have been set up in France: on the river Loire (Chancerel, 1991; Ricou, 2003; Changeux et al., 2003; Baisez, 2006), in the Cotentin marshes (Changeux and Michelot, 2006), in the northern part of France near Calais (Fasquelle and Ledouble, 2006), in the Adour basin (Samuel Marty, Migradour, pers comm.) and in the Rhine river (Vauclin and Storck, 2002). On this basis and different hypothesis, we have tried to make an estimate of catches or fishing effort on eel for French anglers.
One can consider that there are now about 2 million freshwater anglers in France (Changeux, in press). In 2005 only 1.25 million of them were paying their fishing tax (Source ONEMA). The others 0.75 million are occasional anglers or don’t practice in large public rivers or marshes where eel is still abundant. Finally, the number of tax payers is widely used as a low hypothesis to assess the population of anglers. This information is known per department and has been updated every year by the CSP-ONEMA since 1942. We can hope this situation will stand with the recent changing’s in the organization of fishing administration. Considering this population, the annual activity of an angler is approximately for eel of 17 fishing session per year (Changeux, in press).
We have retained four types of department following the distribution map of Chancerel (1994): 1-department with high to mean density of eels, 2-department with mean to low density, 3-department were eel presence is marginal, and 4-department not accessible to eel. The proportion of anglers fishing for eels at least once a year varies between 30%, in the department where the species is abundant, to 1% in the department were it is absent (Table FR.d). This last figure is not nill because they are some anglers searching for eel who pay their
Secteurs Zones de pêche Effectif de pêcheurs
captures anguilles Captures poissons Sources
(22) Etang de Canet 10 ? ? Prud’homie(22) Etang de Salses Leucate 40 ? 150 t total Prud’homie
(23) Etang de Lapalme 2 ? ?(23) Etang de Bages-Sigean 28 120 +100 t other fishes
(23) Etang de Campignol(23) Etang de l'Ayrolle
(23) Etang de Gruissan
Etang de Thau (24) Etang de Thau 290 120 ? Vergnes et al. (1999), Mazouni et al (1999)
(25) Etang d'Ingril(25) Etang de Vic
(25) Etang de Pierre- Blanche(25) Etang du Prévost(25) Etang de l'Arnel(25) Etang du Grec
(25) Etang Latte-Méjean(25) Etang de l'Or
(26) Etang du Ponant 8 ? ? Prud'homie(26) Petite Camargue gardoise 15 ? ? Prud'homie
(26) Etang du Vacares et des Impériaux 20 40 ? Vergnes et al. (1999)Etang de Berre (27) Etang de Berre 30 150 ? Vergnes et al. (1999)
(28) Etang de Palo(28) Etang d'Urbino(28) Etang de Diana
50
47
87
22
38
10 ?
+30 t other fishes
+ 13 t other fishes
Loste et Dusserre (1996), Prud’homie
Dusserre et Loste (1997)
Ruiz (1994)
Ximenes et al. (1990), Ximenes (com. pers.)Etangs de Corse
Etangs du Roussillon
Etangs du Narbonnais
Etangs Palavasiens
Etangs Camarguais

Joint EIFAC/ICES WGEEL Report 2007 425
tax in these departments and travel to fish in other department were eel is more abundant. The estimation of the number of eel anglers give around 147 300 in France (Table FR.e). The capture per unit of effort varies (cpue) in the same way from 3 to 0,003 eels per fishing session. This last value take into account the lower number of days the anglers from distant department, may spend on eel.
Table FR.n Hypothetic percent of anglers seeking for eel and associate capture per unit of effort (cpue in nb eels per fishing session) for the four types of departments.
Departement type Percent of eel anglers CPUE (eel per session)High to medium density 30% 3Medium to low density 15% 0,3Marginal presence 5% 0,03Not accessible to eel 1% 0,003
The application to entire France (Table FR.e), using a mean annual activity estimate of 17 fishing session per angler, and a mean weight of 127.61 g per eel, gives a total amount of 508.6 t/year. This seems to be a high value if we consider that we count 17 fishing session for anglers who have fished for eel at least once a year. But it’s a way to offset the low number of anglers given by the tax.
Looking to this simulation in detail, we find for the Loire basin a weight of captures which is very close to the previous figure of Chancerel (1991): 136 t/year related to 100 to 150 t/year. For Loire-Atlantique our estimate is 14% lower than the result of the 2000 study (42 t of eels against 49 given by Changeux et al., 2003, see Table FR.k). However this first assessment will be useful to draw up a protocol for a regular national survey (Changeux, 2007).

426 Joint EIFAC/ICES WGEEL Report 2007
Table FR.o: Assessment of the number of anglers seeking for eels at least once a year, the associate number of fishing session, number and weight of eels based on the number of tax sold in 2005.
Bassin Eel density class Departement Nb of tax
Nb of anglers for
eelsNb of
sessions Nb of eelsWeight of eels (kg)
Adour Densité forte à moyenne Pyrénées-Atlantiques 16 327 4 898 83 268 249 803 31 877Adour Densité moyenne à faible Landes 16 049 2 407 40 925 12 277 1 567Adour Présence marginale Hautes-Pyrénées 12 159 608 10 335 310 40Total Adour 44 535 7 913 134 528 262 390 33 484Artois-Picardie Densité forte à moyenne Pas-de-Calais 26 246 7 874 133 855 401 564 51 244Artois-Picardie Densité forte à moyenne Somme 16 654 4 996 84 935 254 806 32 516Artois-Picardie Densité moyenne à faible Nord 38 334 5 750 97 752 29 326 3 742Total Artois-Picardie 81 234 18 620 316 542 685 696 87 502Bretagne Densité forte à moyenne Finistère 6 436 1 931 32 824 98 471 12 566Bretagne Densité forte à moyenne Morbihan 10 999 3 300 56 095 168 285 21 475Bretagne Densité moyenne à faible Côtes-d'Armor 9 819 1 473 25 038 7 512 959Bretagne Densité moyenne à faible Ille-et-Vilaine 18 548 2 782 47 297 14 189 1 811Total Bretagne 45 802 9 486 161 254 288 457 36 811Corse Densité moyenne à faible Corse 5 266 790 13 428 4 028 514Total Corse 5 266 790 13 428 4 028 514Garonne Densité forte à moyenne Charente-Maritime 18 407 5 522 93 876 281 627 35 938Garonne Densité forte à moyenne Gironde 26 682 8 005 136 078 408 235 52 095Garonne Densité moyenne à faible Charente 14 653 2 198 37 365 11 210 1 430Garonne Densité moyenne à faible Dordogne 18 563 2 784 47 336 14 201 1 812Garonne Densité moyenne à faible Lot-et-Garonne 12 223 1 833 31 169 9 351 1 193Garonne Présence marginale Corrèze 11 612 581 9 870 296 38Garonne Présence marginale Haute-Garonne 25 644 1 282 21 797 654 83Garonne Présence marginale Gers 8 026 401 6 822 205 26Garonne Présence marginale Lot 9 264 463 7 874 236 30Garonne Présence marginale Tarn-et-Garonne 10 499 525 8 924 268 34Garonne Inaccessible Ariège 9 647 96 1 640 5 1Garonne Inaccessible Aveyron 17 281 173 2 938 9 1Garonne Inaccessible Cantal 10 116 101 1 720 5 1Garonne Inaccessible Lozère 6 866 69 1 167 4 0Garonne Inaccessible Tarn 14 517 145 2 468 7 1Total Garonne 214 000 24 178 411 044 726 313 92 683Loire Densité forte à moyenne Loire-Atlantique 21 459 6 438 109 441 328 323 41 897Loire Densité forte à moyenne Maine-et-Loire 28 084 8 425 143 228 429 685 54 832Loire Densité forte à moyenne Vendée 17 771 5 331 90 632 271 896 34 697Loire Densité moyenne à faible Indre-et-Loire 19 109 2 866 48 728 14 618 1 865Loire Densité moyenne à faible Loir-et-Cher 11 764 1 765 29 998 8 999 1 148Loire Densité moyenne à faible Deux-Sevres 15 172 2 276 38 689 11 607 1 481Loire Présence marginale Allier 12 326 616 10 477 314 40Loire Présence marginale Cher 12 787 639 10 869 326 42Loire Présence marginale Indre 10 063 503 8 554 257 33Loire Présence marginale Loiret 14 326 716 12 177 365 47Loire Présence marginale Mayenne 12 056 603 10 248 307 39Loire Présence marginale Nièvre 13 768 688 11 703 351 45Loire Présence marginale Puy-de-Dôme 17 722 886 15 064 452 58Loire Présence marginale Sarthe 19 970 999 16 975 509 65Loire Présence marginale Vienne 13 802 690 11 732 352 45Loire Présence marginale Yonne 12 655 633 10 757 323 41Loire Inaccessible Creuse 8 066 81 1 371 4 1Loire Inaccessible Loire 15 778 158 2 682 8 1Loire Inaccessible Haute-Loire 12 223 122 2 078 6 1Loire Inaccessible Haute-Vienne 15 204 152 2 585 8 1Total Loire 304 105 34 587 587 988 1 068 710 136 379Meuse Présence marginale Ardennes 12 469 623 10 599 318 41Meuse Présence marginale Meuse 10 795 540 9 176 275 35Total Meuse 23 264 1 163 19 775 593 76Rhin Densité moyenne à faible Bas-Rhin 26 611 3 992 67 858 20 357 2 598Rhin Densité moyenne à faible Haut-Rhin 14 820 2 223 37 791 11 337 1 447Rhin Présence marginale Meurthe-et-Moselle 16 826 841 14 302 429 55Rhin Présence marginale Moselle 16 772 839 14 256 428 55Rhin Présence marginale Vosges 13 051 653 11 093 333 42Total Rhin 88 080 8 548 145 300 32 884 4 197Rhône-Méditerranée Densité forte à moyenne Bouches-du-Rhône 8 075 2 423 41 183 123 548 15 766Rhône-Méditerranée Densité forte à moyenne Hérault 12 831 3 849 65 438 196 314 25 052Rhône-Méditerranée Densité moyenne à faible Alpes-Maritimes 6 428 964 16 391 4 917 628Rhône-Méditerranée Densité moyenne à faible Gard 12 373 1 856 31 551 9 465 1 208Rhône-Méditerranée Densité moyenne à faible Pyrénées-Orientales 9 514 1 427 24 261 7 278 929Rhône-Méditerranée Densité moyenne à faible Var 8 839 1 326 22 539 6 762 863Rhône-Méditerranée Densité moyenne à faible Vaucluse 11 599 1 740 29 577 8 873 1 132Rhône-Méditerranée Présence marginale Ain 19 540 977 16 609 498 64Rhône-Méditerranée Présence marginale Alpes-de-Haute-Provence 7 635 382 6 490 195 25Rhône-Méditerranée Présence marginale Ardèche 13 662 683 11 613 348 44Rhône-Méditerranée Présence marginale Aude 10 237 512 8 701 261 33Rhône-Méditerranée Présence marginale Côte-d’Or 16 599 830 14 109 423 54Rhône-Méditerranée Présence marginale Doubs 15 592 780 13 253 398 51Rhône-Méditerranée Présence marginale Drôme 11 538 577 9 807 294 38Rhône-Méditerranée Présence marginale Isère 22 531 1 127 19 151 575 73Rhône-Méditerranée Présence marginale Rhône 14 938 747 12 697 381 49Rhône-Méditerranée Présence marginale Haute-Saône 11 974 599 10 178 305 39Rhône-Méditerranée Présence marginale Saône-et-Loire 30 764 1 538 26 149 784 100Rhône-Méditerranée Présence marginale Territoire-de-Belfort 2 193 110 1 864 56 7Rhône-Méditerranée Inaccessible Hautes-Alpes 7 819 78 1 329 4 1Rhône-Méditerranée Inaccessible Jura 12 725 127 2 163 6 1Rhône-Méditerranée Inaccessible Savoie 12 749 127 2 167 7 1Rhône-Méditerranée Inaccessible Haute-Savoie 13 569 136 2 307 7 1Total Rhône-Méditerranée 293 724 22 915 389 527 361 699 46 159Seine-Normandie Densité forte à moyenne Calvados 7 865 2 360 40 112 120 335 15 356Seine-Normandie Densité forte à moyenne Eure 8 994 2 698 45 869 137 608 17 560Seine-Normandie Densité forte à moyenne Manche 10 659 3 198 54 361 163 083 20 811Seine-Normandie Densité forte à moyenne Seine-Maritime 7 168 2 150 36 557 109 670 13 995Seine-Normandie Densité moyenne à faible Oise 10 221 1 533 26 064 7 819 998Seine-Normandie Densité moyenne à faible Orne 8 526 1 279 21 741 6 522 832Seine-Normandie Densité moyenne à faible Paris et couronne 6 460 969 16 473 4 942 631Seine-Normandie Densité moyenne à faible Val-d’Oise 3 937 591 10 039 3 012 384Seine-Normandie Présence marginale Aisne 15 768 788 13 403 402 51Seine-Normandie Présence marginale Aube 9 686 484 8 233 247 32Seine-Normandie Présence marginale Eure-et-Loir 8 650 433 7 353 221 28Seine-Normandie Présence marginale Marne 12 913 646 10 976 329 42Seine-Normandie Présence marginale Haute-Marne 9 572 479 8 136 244 31Seine-Normandie Présence marginale Seine-et-Marne 17 024 851 14 470 434 55Seine-Normandie Présence marginale Yvelines 4 585 229 3 897 117 15Seine-Normandie Présence marginale Essonne 8 875 444 7 544 226 29Total Seine-Normandie 150 903 19 132 325 228 555 211 70 850Total 1 250 913 147 332 2 504 614 3 985 981 508 655

Joint EIFAC/ICES WGEEL Report 2007 427
FR.F Catch per unit of effort
FR.F.1 Glass eel cpue in the Gironde basin
The Gironde basin is the tidal part (Figure FR.1 and Figure FR.2) of the Garonne basin, comprising the brackish estuary and the tidal freshwater reach of the Garonne river, Dordogne river and of its tributary, the Isle river. The results are providing by the Cemagref statistical monitoring system.
One of the notable features of the glass eel fishery in the Gironde during the 1978–2003 period is the major shift from scoop net catches in favor of large push net catches (Figure FR.3 and Table FR.p). The fishery is presently very largely a large push net fishery in the estuary, whereas formerly it was a mixed-gear fishery in both the brackish and fresh estuary. After a strong decrease of the glass eel abundance in the Gironde basin between 1981 and 1985, the situation at present seems stationary, at a very low level (Figure FR.3 and Table FR.p). The 2003 season is close to the worst historical level (2001).
Table FR. p Catches of glass eel for professional large push net (LPN), small push net (SPN) and scoop net (SN) and non professional scoop net fishermen, cpue on the Gironde basin for 1978–2004 (Source: Cemagref).
TOTAL CATCH (T) CPUE (KG/DAY) YEAR
PRO. LPN PRO. SN PRO. SPN NONPRO. SN PRO. LPN
1977–1978 26.7 83.3 107.8 12.8 1978–1979 28.0 89.7 116.2 14.0 1979–1980 45.8 167.3 217.1 25.4 1980–1981 45.5 78.3 150.6 14.9 1981–1982 49.6 36.6 36.5 10.9 1982–1983 49.5 25.8 26.9 12.7 1983–1984 30.5 26.0 26.0 17.6 1984–1985 16.3 11.7 11.8 8.1 1985–1986 26.3 13.6 14.4 8.8 1986–1987 31.9 25.0 28.6 13.5 1987–1988 25.4 6.7 6.7 9.3 1988–1989 37.5 15.6 17.3 7.1 1989–1990 28.6 8.6 9.0 5.6 1990–1991 36.0 9.6 14.5 8.5 1991–1992 17.0 8.0 12.8 4.5 1992–1993 29.6 11.6 21.7 8.9 1993–1994 34.6 6.5 12.4 9.2 1994–1995 47.5 9.6 18.9 7.9 1995–1996 21.4 1.5 2.2 4.2 4.7 1996–1997 33.0 3.6 7.9 6.4 6.3 1997–1998 14.1 0.4 1.7 1.0 3.8 1998–1999 40.6 0.8 7.5 2.7 8.9 1999–2000 21.2 0.1 3.4 0.3 6.6 2000–2001 8.8 0.0 0.2 0.1 1.9 2001–2002 28.3 3.8 4.7 6.2 4.9 2002–2003 9.5 0.1 0.8 0.1 2.7 2003–2004 13.0 0.0 1.0 0.0 2.5

428 Joint EIFAC/ICES WGEEL Report 2007
0
50
100
150
200
250
300
350
400
450
500
1977
-197
8
1978
-197
9
1979
-198
0
1980
-198
1
1981
-198
2
1982
-198
3
1983
-198
4
1984
-198
5
1985
-198
6
1986
-198
7
1987
-198
8
1988
-198
9
1989
-199
0
1990
-199
1
1991
-199
2
1992
-199
3
1993
-199
4
1994
-199
5
1995
-199
6
1996
-199
7
1997
-199
8
1998
-199
9
1999
-200
0
2000
-200
1
2001
-200
2
2002
-200
3
2003
-200
4
0
5
10
15
20
25
30scoop net NON PRO (1)
small push net PRO (1)
scoop net PRO (1)
large push net PRO (1)
CPUE large push net (2)
(1) catch (t) (2) CPUE (kg/day)
Figure FR.3 Cumulated capture of glass eel for professional and non professional fishermen, cpue on the Gironde basin for 1978–2004 (Source: Cemagref).
The use of GLM model with these fishery data has permitted to correct the variation of catches and effort between fishermen. The glass eel cpue in the Gironde is a valid abundance index, the same trend is obtained for two metiers (large push net and scoopnet) and two zones (brackish and fresh estuary) (Beaulaton and Castelnaud, in press). This result confirms the decreasing trend of glass eel in the Gironde basin (Figure FR.4).
-1.5
-1.0
-0.5
0.0
0.5
1.0
1.5
2.0
2.5
3.0
3.5
1977
1978
1979
1980
1981
1982
1983
1984
1985
1986
1987
1988
1989
1990
1991
1992
1993
1994
1995
1996
1997
1998
1999
2000
large push net (brackish estuary)
scoop net (fresh estuary)
Figure FR.4 Standardized cpue (from GLM) for the large push net (Pibalour) and the scoop net (Tamis) metiers for the period 1978–1999 (Beaulaton and Castelnaud, in press).
FR.F.2 Yellow eel cpue in the Gironde basin
The eel pot cpue for yellow eel has fallen down between 1988 and 1989, slightly increased until 1998 before decreasing again until 2004 (Figure FR.5 and Table FR.q). The total catches have decreased while the number of fishermen has also decreased. But changes in the fishing power and in the tactics have increased the real effort and our effort unit does not reflect these changes. Consequently, this cpue is not fully representative of the real current tendency of the abundance which presents certainly a more marked decrease.

Joint EIFAC/ICES WGEEL Report 2007 429
To analyse this situation, a biological sampling through the professional fishery has been made in 2004 and 2005. This sampling will permit to precise the effort parameters, the stock structure and the fishing impact on the stock. If this study is maintained during several years, it will be possible to evaluate the magnitude of the yellow eel stock with VPA methods (Sparre, 1979; Ardizzone and Corsi, 1985; Gascuel and Fontenelle,1994; Dekker, 2000).
We will also apply GLM methods on eel pot cpue, to precise and verify the tendency of yellow eel abundance.
Table FR.q Catches of yellow eel for professional and non professional eel pot fishermen, cpue on the Gironde basin for 1978–2004 (Source: Cemagref).
TOTAL CATCH (T) CPUE (KG/EELPOT/MONTH) YEAR
PRO. NON PRO. PRO.
1978 195.5 204.1 1979 241.3 229.5 1980 181.4 155.7 1981 187.8 148.8 1982 157.9 133.1 1983 71.8 76.2 1984 103.8 164.1 1985 106.0 170.3 1986 124.5 160.5 1987 94.8 134.3 1.9 1988 102.3 97.7 1.9 1989 67.1 40.2 0.9 1990 47.1 28.3 0.8 1991 26.3 15.8 1.2 1992 46.1 27.7 1.1 1993 35.7 21.4 0.9 1994 35.2 21.1 1.0 1995 36.9 18.4 1.3 1996 25.7 7.7 1.1 1997 32.2 9.7 1.5 1998 24.4 7.3 1.5 1999 21.8 1.5 1.1 2000 20.0 1.4 1.1 2001 18.0 0.6 1.2 2002 13.1 1.1 1.0 2003 10.4 0.5 0.9 2004 14.4 1.0 1.4

430 Joint EIFAC/ICES WGEEL Report 2007
0
50
100
150
200
250
300
350
400
450
500
1978
1979
1980
1981
1982
1983
1984
1985
1986
1987
1988
1989
1990
1991
1992
1993
1994
1995
1996
1997
1998
1999
2000
2001
2002
2003
2004
0 ,0
0 ,2
0 ,4
0 ,6
0 ,8
1 ,0
1 ,2
1 ,4
1 ,6
1 ,8
2 ,0ee l po t N O N P R O (1 )ee l po t P R O (1 )C P U E ee l po t (2 )
(1 ) ca tch (t) (2 ) C P U E (kg / ee l po t / m on th )
Figure FR.5 Cumulated catch of yellow eel for professional and non professional fishermen, cpue on the Gironde basin for 1978–2004 (Source: Cemagref).
FR.F.3 Glass eel cpue in the Adour basin
The results are providing by Ifremer in connection with CNTS (Table FR.r)
Table FR.r Mean, maximum minimum annual cpue (Kg/trip) for the glass eel fishery (hand nets) in the Adour estuary (source : Ifremer/CNTS).
YEAR CPUE MEAN CPUE MIN CPUE MAX
YEAR CPUE MEAN CPUE MIN
CPUE MAX
1927/1928 5 4.7 5.3 1984/1985 2.4 1.5 3.3 1928/1929 5.5 4.4 7 1985/1986 1.5 0.6 2.1 1929/1930 6.7 4.3 9.9 1986/1987 3.3 0.3 5.3 1930/1931 18.7 10.1 35.2 1987/1988 3.7 1.4 5.6
1988/1989 4.1 0.9 6.2 1965/1966 5.1 1.3 8.8 1989/1990 1.2 0.2 2.1 1966/1967 6.4 4.1 9.7 1990/1991 0.7 0.15 1.1 1967/1968 10.1 3 23.3 1991/1992 2.9 0.4 4.4 1968/1969 5 0.9 7.8 1992/1993 2.4 1.3 2.3 1969/1970 7.5 3.6 11.2 1993/1994 1.4 0.8 1.9 1970/1971 4.6 2.9 5.6 1994/1995 2.6 0.85 3.9 1971/1972 4.4 1.5 7.8 1995/1996 1.53 0.75 1.8 1972/1973 4.5 3.5 6.8 1996/1997 1.6 1.13 1.97 1973/1974 7.4 4.3 12.3 1997/1998 1.07 0.49 1.31 1974/1975 5 2.2 7.9 1998/1999 1.82 1.05 2.21 1975/1976 11 3.3 16 1999/2000 4.43 2.77 4.34
2000/2001 0.49 0.53 1.05 1978/1979 10 2001/2002 0.89 0.48 1.23 1979/1980 5 2002/2003 0.31 0.09 0.45
2003/2004 0.6 0.2 0.9 2004/2005 1.13 0.42 2.17

Joint EIFAC/ICES WGEEL Report 2007 431
FR.F.4 Comparison of yellow eel cpue between the Adour and the Gironde basins
The exploitation of the yellow eel in the Adour and the Gironde basins can be compared with two long historical series (Figure FR.6 and Figure FR.7). The Adour data concern marine professional fishermen (source: Ifremer) and the Gironde data correspond to marine and river professional fishermen (source: Cemagref). Catches have significantly decreased from 1978 to 1986 (Gironde data) mainly because of a strong decrease in nominal effort, the cpue (ratio between catch and nominal effort) has shown a great variability during this period. From 1987 onward (Adour and Gironde data), the nominal effort decreased slightly whereas catches fell. In the Adour basin, cpue decreased sharply in a first period (1987–1990) and then decreased but more slightly (from 1990 onward). In the Gironde basin, the decrease is more continuous since 1986. The overall decrease of cpue (1987–2003) in both basins seems to be of the same order of magnitude.
1980 1985 1990 1995 2000 2005
0
5
10
15
20Adour
season
catc
h (t)
nom
inal
effo
rt (fi
sher
man
)no
min
al e
ffort
(fish
erm
an)
1980 1985 1990 1995 2000 200
0
50
100
150
200
250
300
350Gironde
season
catc
h (t)
nom
inal
effo
rt (fi
sher
man
)
Figure FR.6 Catch (solid line) and nominal effort (dashed line) in the Adour (left panel) and Gironde (right panel) basins over the period 1978–2004. Source: Adour = Ifremer; Gironde = Cemagref.

432 Joint EIFAC/ICES WGEEL Report 2007
G
G
GGG
G
GG
GGG
G
G
GG
GGG
G
GGGGG
GG
1980 1985 1990 1995 2000 2005
020
040
060
080
010
00
season
CP
UE
(kg
/ fis
herm
an)
A
AA
AAAA
AA
AAAAAAA
AA
AG
CPUE - AdourCPUE - Gironde
Figure FR.7 Cpue in the Adour (dashed line) and Gironde (solid line) basins over the period 1978–2004. Source: Adour = Ifremer; Gironde = Cemagref.
FR.G Scientific surveys of the stock
FR.G.1 Recruitment surveys, glass eel
A recruitment surveys have been set up in the Gironde since 1979. In the Adour it has been set since 1998 and in the Loire and Isle (tributary from the Gironde) since 2004 as part of the Indicang project. The methods are described in (Feunteun et al., 2002). A fishery and trap based survey is also conducted in the Vilaine from 1996. The Loire time series is based on catches.
FR.G.1.1 Recruitment survey, the Gironde
The Gironde survey consists in a monthly sampling of 24 stations (surface and deep) distributed along 4 transects. This monitoring uses a research vessel (Figure FR.8) and aims at evaluating the abundance variations of the juveniles of fish and crustacean and the adults of small species.

Joint EIFAC/ICES WGEEL Report 2007 433
Figure FR.8 The “Estuarial” boat used for scientific survey in the Gironde (Source: Cemagref).
0.0
0.1
0.2
0.3
0.4
0.5
0.6
0.7
0.8
0.9
1.0
1991-1992
1992-1993
1993-1994
1994-1995
1995-1996
1996-1997
1997-1998
1998-1999
1999-2000
2000-2001
2001-2002
season
p
0.0
0.5
1.0
1.5
2.0
2.5
3.0
3.5
4.0
µ o
r d
ensi
ty (
# /
1000
3 )
pµdensity
Figure FR.9 Results for glass eel of a delta-gamma analysis for season effect (p=probability of positive capture, µ=mean capture for only positive capture, density=p*µ) (extracted from Lambert, 2005).
These data were recently analysed by (Lambert, 2005) using a delta-gamma approach (Stefánsson, 1996). This method allows separate analyses of the presence probability (p) and positive capture (µ) and joint analyse through overall density. The delta and gamma approaches were both performed thanks to generalized linear models (GLM; (McCullagh and

434 Joint EIFAC/ICES WGEEL Report 2007
Nelder, 1989) with spatial and temporal effects. Only results on season effect for glass eel are presented in Figure FR.9 (for more details see Lambert, 2005). All combinations of p and µ are encountered. However, we can notice some peculiar seasons like 2000–2001 for which glass eels were rarely caught (low p) and when caught, in low number (low µ), resulting in a very low density. In the main, this analysis confirms results coming from fishery data (see FR.F.1) even if some little differences remain to analyse.
FR.G.1.2 Recruitment survey, the Adour
The Adour survey aims at estimating the glass eel flux transported during flood tide in the estuary. The protocol is based on the simultaneous catch of glass eels located at the surface (Figure FR.10) and in full water along three longitudinal transects. These catches are done downsteam from the dynamic tide reversal area, at a fixed station and during the entire flood.
Figure FR.10 Descriptive diagram of the materials of catch and positioning used in the Adour protocol (Source: Cereca).
The variability of the glass eel captures over the recent period 1985–2002 (Table Fr.s) seems especially related to the fluctuations of hydro-climatic conditions (Figure FR.11).

Joint EIFAC/ICES WGEEL Report 2007 435
0
0,5
1
1,5
2
2,5
3
3,5
4
4,5
5
1987
/1988
1988
/1989
1989
/1990
1990
/1991
1991
/1992
1992
/1993
1993
/1994
1994
/1995
1995
/1996
1996
/1997
1997
/1998
1998
/1999
1999
/2000
2000
/2001
2001
/2002
2002
/2003
2003
/2004
2004
/2005
CPU
E (K
g/so
rtie)
Moyenne Tamis poussé Tamis à main Tamis ancré
Figure FR.11 Variations of glass eels captures per type of fishing gears in the Adour estuary. Moyenne = mean, tamis poussé = small push net, tamis à main = scoop net, tamis ancré = fixed scoop net (Lissardy et al., 2007).
Table FR.s Total catches for the glass eel fishery (from 2000 only marine fishermen combining small push nets and scoop nets) in the Adour estuary.
DECADE
SEASON (N–1,N) 1970 1980 1990 2000
0 3.2 9 1 1.5 2 2 8 2,4 3 5.5 0.6 4 3 1.7 5 7.5 3,2 6 8 4.1
7 9.5 4.6
8 12 1.5
9 9 4.3
FR.G.2 Time series of catches of glass eel and yellow eel, the Vilaine
The Vilaine time series is collected from total catches of the fishery. As the fishing closure has been modified from 1996, those catches are corrected from the evaluation of the standing stock after the closure of the fishery. These evaluations are based on marking recaptures surveys performed in April and May and modeling (Table FR.t). The results of the monitoring of the trapping ladder are summarized in Figure FR.12Figure FR.12.
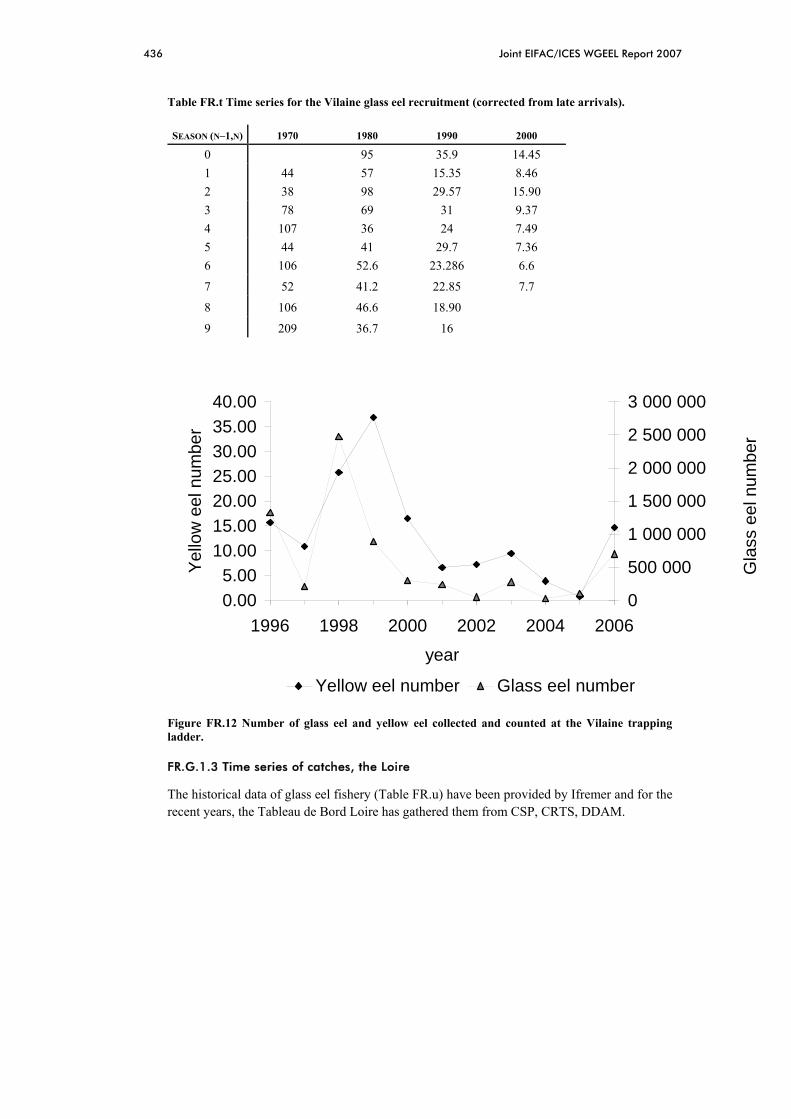
436 Joint EIFAC/ICES WGEEL Report 2007
Table FR.t Time series for the Vilaine glass eel recruitment (corrected from late arrivals).
SEASON (N–1,N) 1970 1980 1990 2000
0 95 35.9 14.45 1 44 57 15.35 8.46 2 38 98 29.57 15.90 3 78 69 31 9.37 4 107 36 24 7.49 5 44 41 29.7 7.36 6 106 52.6 23.286 6.6
7 52 41.2 22.85 7.7
8 106 46.6 18.90
9 209 36.7 16
0.005.00
10.0015.0020.0025.0030.0035.0040.00
1996 1998 2000 2002 2004 2006
year
Yel
low
eel
num
ber
0
500 000
1 000 000
1 500 000
2 000 000
2 500 000
3 000 000
Gla
ss e
el n
umbe
r
Yellow eel number Glass eel number
Figure FR.12 Number of glass eel and yellow eel collected and counted at the Vilaine trapping ladder.
FR.G.1.3 Time series of catches, the Loire
The historical data of glass eel fishery (Table FR.u) have been provided by Ifremer and for the recent years, the Tableau de Bord Loire has gathered them from CSP, CRTS, DDAM.

Joint EIFAC/ICES WGEEL Report 2007 437
Table FR.u Time series for the Loire glass eel fishery, marine and fluvial professionals until 2001, only marine professionals from 2002 to 2007 (* an assumption was made for catches of fluvial fishermen, not available for this year).
DECADE
SEASON (N–1,N) 1950 1960 1970 1980 1990 2000
86 411 453 526 96 80 1 166 334 330 303 36 33 2 121 185 311 274 39 42 3 91 116 292 260 91 53 4 86 142 557 183 103* 27 5 181 134 497 154 133 17 6 187 253 770 123 81 15 7 168 258 677 145 71 21 8 230 712 526 177 66 9 174 225 642 87 87
FR.G.2 Stock surveys, yellow eel
Specific stock surveys were performed in small basin (Frémur, Oir). The result are in previous ICES reports.
The “Reseau hydrobiologique et piscicole” (RHP), is a survey of 761 stations yearly sampled with electrofishing. These samples are used to determine the ecological status request by the Water framework directive. The abundance of eel distribution shows a classical downstream increase in density (Figure FR.13). No peculiar trend can by given by the first analysis of the 1995–2003 time series (see p. 21 of Anonymous, 2004.). A detailed observation of the stations of higher density in 1995 shows significant erosion during the first year of the monitoring. A program starting in 2006 will analyses the data more deeply.

438 Joint EIFAC/ICES WGEEL Report 2007
Figure FR.13 RHP electrofishing stations, mean value from 1995 to 2003 (Source: CSP).
FR.G.3 Silver eel
These silver eel fluxes to the sea were assessed using the sequential fishery in the Loire basin following a mark-recapture protocol (Boury and Feunteun, unpubl.).
No other information is available on silver eel stock.
FR.H Catch composition by age and length
There is no routine program measuring the catch composition by age and length in France.
FR.I. Other biological sampling (age and growth, weight, sex, maturity, fecundity)
There is no routine program measuring parameters of the eel population dynamics at the national level in France.

Joint EIFAC/ICES WGEEL Report 2007 439
FR.J References
ARDIZZONE G. D. and CORSI F., 1985. Eel population structure, dynamics and fishing yield in a mediterranean coastal lagoon. Oebalia, 11, 547–560.
BAISEZ A. 2005. Indicateur anguille Loire. Captures aux lignes. Population sédentaire. Tableau de bord anguille Bassin Loire (LOGRAMI), 26 p.
BEAULATON, L., and G. CASTELNAUD. In Press. Abundance trends of glass eel between 1978 and 1999 from fisheries data in the Gironde Basin, France. In J. Casselman and D. Cairns, editors. Eels at the edge. American Fisheries Society, Symposium 58, Bethesda, Maryland.
BRIAND C., CASTELNAUD G., BEAULATON L., CHANGEUX T., BAISEZ A., DE CASAMAJOR M. N. and PROUZET P.,2005. FR – Report on eel stock and fishery in France, 2004, ICES/EIFAC Working Group on Eels.Galway. 160–171.
CAILL-MILLY N., 2001. Résultats de l'enquête socio-économique France. La flottille des civeliers purs; la flottille des pêcheurs estuariens et fluviaux. Plaquettes d'information PECOSUDE. Contrat européen PECOSUDE n°99/024 ED/DG FISH (DGXIV). Ifremer. 8 p.
CASTELNAUD G., 2000. Localisation de la pêche, effectifs de pêcheurs et production par pêche des espèces amphihalines dans les fleuve français. Bull Fr Pêche Piscic, 357/358, 439–460.
CASTELNAUD G., 2002. Caractéristiques de la pêcherie civellière du golfe de Gascogne. Contrat Européen N° 99/023EC/DG FISH (DG XIV). Historique des captures de civelles, intensité actuelle de leur exploitation, variation de leur capturabilité par la pêche professionnelle maritime et indices de colonisation sur la bassin versant de l'Adour. CEMAGREF, Groupement de Bordeaux, Cestas (France). 16 p.
CASTELNAUD G., LOSTE C. and CHAMPION L.,2000. La pêche commerciale dans les eaux intérieures françaises à l'aube du XXIème siècle : bilan et perspectives., Symposium CECPI on fisheries and society.Budapest. 1–24.
CASTELNAUD G., GUÉRAULT D., DÉSAUNAY Y. and ELIE P., 1994. Production et abondance de la civelle en France au début des années 90. Bulletin Français de la Pêche et de la Pisciculture, 335, 263–288.
CASTELNAUD, G., C. BRIAND, L. BEAULATON, T. CHANGEUX, P. PROUZET, and M. N. De CASAMAJOR, 2006. Report on the eel stock and fishery in France, 2005. Appendix 3, pp 296–319 in FAO European Inland Fisheries Advisory Commission; International Council for the Exploration of the Sea. Report of the 2006 session of the Joint EIFAC/ICES Working Group on Eels. Rome, 23–27 January 2006. EIFAC Occasional Paper. No. 38, ICES CM 2006/ACFM:16. Rome, FAO/Copenhagen, ICES. 2006. 352p.
CEPRALMAR, 2003. Prud'homies du Languedoc - Roussillon - Suivi de la pêche aux petits métiers - Année 2002. Rapport Cépralmar. 65 p.
CHAMPION L. and PERRAUDEAU Y., 2000. Etude socioeconomique des pêches maritimes estuariennes Françaises. LEN-CORRAIL, Nantes. 107 p.
CHANCEREL F. 1991. L’anguille en centre ouest. Répartition de l’espèce et mode d’exploitation en zone continentale. Conseil supérieur de la pêche, Délégation régionale de Poitiers, 13 p and annexes.
CHANCEREL F. 1994. La répartition de l’anguille en France. BFPP, 335, 289–296.
CHANGEUX T., 2001. La pêche fluviale en France. In Atlas des poisons d'eau douce de France., (ed P. Keith and J. Allardi). Patrimoines naturels, n°47, Muséum national d'histoire naturelle.

440 Joint EIFAC/ICES WGEEL Report 2007
CHANGEUX T., RANCON J., LELIEVRE M. 2003. Evaluation des captures d’anguilles par les membres d’AAPPMA dans le bassin de la Loire. Cas du département de Loire-Atlantique. Conseil supérieur de la pêche. Deuxième phase : enquête ciblée et synthèse. 22 p.
CHANGEUX T., 2003. Evaluation des captures d'anguilles par les membres d'AAPPMA dans le bassin de la Loire. LOGRAMI/CSP, Orléans. 4 p.
CHANGEUX T. MICHELOT E. 2006. Prélèvements d’anguilles par la pêche à la vermée sur le bassin versant de la Douve. Saison 2005. IRD/ Conseil supérieur de la pêche, Brigade de la Manche. 17 p. and annexes.
CHANGEUX T. 2007 - Protocole pour une évaluation des captures annuelles d'anguilles par la pêche de loisir des eaux douces de France métropolitaine. Institut de recherche pour le développement – Conseil supérieur de la pêche, janvier 2007, 16 p.
CHANGEUX T. in press. La pêche fluviale en France. Atlas des poissons d'eau douce de France (Keith P. & Allardi J. coord.) Patrimoines Naturels, 47. Edition 2007.
CUENDE F. X., CAILL-MILLY N. and PROUZET P., 2002. Site atelier de l'Adour. Caractéristiques des petites pêches côtières et estuariennes de la côte Atlantique du sud de l'Europe. Ifremer Aquitaine. 43 p.
DEKKER W., 2000. Impact of yellow eel exploitation on spawner production in Lake IJselmeer, the Netherland. Dana, 12, 17–32.
DÉSAUNAY Y. and AUBRUN L.,1988. Description des pêcheries d'anguille (Anguilla anguilla) sur le littoral français de la Manche et de l'Atlantique, Comité des Poissons Anadromes et Catadromes. 15.
DUSSERRE K. and LOSTE C., 1997. La pêche sur les étangs de Gruissan. Evolution de 1986 à 1996. CEPRALMAR. 30 p.
FASQUELLE J.-S., LEDOUBLE O. 2006. La pêche de loisir à l’anguille dans les « Wateringues du Calaisis ». Quelques données sur l’activité halieutique et les prélèvements. Conseil supérieur de la pêche, Brigade du Pas-de-Calais. 37 p.
FEUNTEUN E., CASTELNAUD G., BRIAND C., PROUZET P., MENELLA J. Y. and DE ROTON G., 2002. Monitoring of glass eel recruitment in France. In Monitoring of glass eel recruitment, report C007/02-WD, (ed W. Dekker). IJmuiden, the Netherlands. Vol. 2A, 256.
GASCUEL D. and FONTENELLE G., 1994. Approche conceptuelle de la modélisation de la dynamique du stock d'anguille dans un bassin versant : intérêt et adaptation du modèle de rendement par recrue. Bull Fr Pêche Piscic, 332, 43–56.
LAMBERT P., 2005. Exploration multiscalaire des paradigmes de la dynamique de la population d'anguilles européennes à l'aide d'outils de simulation., Université Bordeaux 1, Bordeaux, 219 p.
LEAUTE J.-P. et CAILL-MILLY N., 2003. Caractéristiques des petites pêches côtières et estuariennes de la côte Atlantique du sud de l'Europe. Synthèse du contrat européen PECOSUDE n°99/024 ED/DG FISH (DGXIV). Ifremer. 66p.
LOSTE C. and DUSSERRE K., 1996. La pêche sur l'étang de Bages- Sigean. Evolutions de 1985 à 1995. CEPRALMAR. 98 p.
LUNEAU S., MERTENS D. and CHANGEUX T., 2003. Guide des engins de pêche fluviale et lacustre en France métropolotaine. In Collection mise au point (ed J. Allardi), pp. 198. Conseil Supérieur de la Pêche, Paris.
MAZOUNI N. , REY H , VALARIE P., 1999. Gestion d’une ressource naturelle exploitée – le cas de la palourde (Ruditapes decussatus) dans la lagune de Thau. Rapp. CRPEMLR, 107 p. and annexes.

Joint EIFAC/ICES WGEEL Report 2007 441
MCCULLAGH P. and NELDER J. A., 1989. Generalized linear models. 2nd ed. In Monographs on statistics and applied probability (ed. C. Hall), pp. 551, London.
MICHELOT E., 2005. Prélèvements d'anguilles par pêche à la vermée sur le bassin versant de la Douve, saison 2004, pp. 13 p., Rennes.
RICOU G. 2003. Quelques caractéristiques de la pêche aux lignes sur le Cher et la Vienne (Mai 2002-Janvier 2003), Fédération de pêche d’Indre-et-Loire. 33 p.
RUIZ J. F., 1994. Les étangs palavasiens : un complexe lagunaire dégradé. Approche de l’évolution de la pêcherie et réflexion pour une restauration du milieu. DESS. Univ. Montpellier I, II, III. Rap. CEPRALMAR. 54 p. and annexes p.
SAUVAGET B., FATIN D. and BRIAND, 2001. Etude de l'exploitation de l'anguille dans le Golfe du Morbihan. Institution d'Aménagement de la Vilaine, La Roche Bernard. 25 p.
SPARRE P.,1979. Some necessary ajustements for using the common methods in eel assessment, Rapports et procés-verbaux des réunions. Conseil International pour l'Exploration de la Mer. 41–44.
STEFÁNSSON G., 1996. Analysis of groundfish survey abundance data: combining the GLM and delta approaches. ICES Journal of Marine Science, 53, 577–588.
VAUCLIN V., STORCK F. 2002. La pêche de l’anguille à la ligne sur le Rhin et le grand canal d’Alsace en 2000. Conseil supérieur de la pêche, Délégation régionale n°3, Montigny-les-Metz, 18 p. and annexes.
VERGNE L., BRON L., DECORPS M. and ROMEYER D., 1999. Projet de réhabilitation de l'anguille dans le bassin Rhône - Méditerranée - Corse. Etude socio-économique. DIREN Rhône-Alpes/ISARA,. 315 p. and annexes. p.
XIMENES M. C., LIEUTAUD A., PIERRE D., DE ROBERT A., DO CHI T., DERIJARD R. and GRAZIANI M. P., 1990. La production d'anguilles en lagunes de Méditerranée. Analyse et comparaison des sources statistiques. Rapport Cemagref Montpellier, Secrétariat d'Etat à la Mer, Région PACA et Corse, 138 p. Rapport Cemagref Montpellier, Secrétariat d'Etat à la Mer, Région PACA et Corse. 13 p.

442 Joint EIFAC/ICES WGEEL Report 2007
Spain: Report on the eel stock and f ishery in Spain 2007
ES.A Authors
Estibaliz Díaz, Jaime Castellanos, AZTI-Tecnalia/Itsas Ikerketa Saila, Txatxarramendi Ugartea z/g, 48395 Sukarrieta (Bizkaia), Tel: 94 6029400-Fax: 94 6870006 e-mail: ediaz@suk. azti. es
This report was completed in August 2007; and contains data up to March 2007.
Contributors to the report:
Lucía García Flórez and Fernando Jiménez Herrero
Environment and Rural and Fishery Development Department of the Principality of Asturias
Consuelo Esteve Departamento de Microbiología y Ecología Facultad de Ciencias Biológicas (Universidad de Valencia)
Arantza Maceira AZTI - Tecnalia / Itsas Ikerketa Saila
ES.B Introduction
In Spain, almost all the eels are fished in estuaries, lagoons, deltas, beaches and rivers, and the autonomous regions are charged of the management of these water units (Figure ES.1). Each autonomous region has its own regulation concerning eel fisheries, and in some cases it even does not exist. That fact creates great differences among the autonomies (Table ES.a.).
• The amplitude of the historical data series is variable depending of the date the regulation was issued.
• In some Autonomies the same regulation is applied to all the river basins while in others each basin has its own regulation, or in some river basins fishery is regulated and not in others.
• In some Autonomies fishermen are professional and have to sell the catches to the fish market, while in others they are non-professional. That way the precision of the information of catches and landing differs greatly among those autonomies.
• Each Autonomy has its own way of managing the stock: different fishing techniques are allowed and so some of them use quotas, while others control the effort.
• Besides, in many cases, the organizations that are involved in the management of each stage in the same autonomy could differ.

Joint EIFAC/ICES WGEEL Report 2007 443
TableES.a. Eel fishery regulation of Spanish coastal autonomies.
GLASS EEL YELLOW AND SILVER EEL
CO
NT
RO
L
SYST
EM
FISH
ING
SE
ASO
N
AL
LO
WE
D
FISH
ING
GE
AR
S
EFF
OR
T O
R
CA
TC
HE
S C
ON
TR
OL
PRO
FESS
ION
AL
/ R
EC
RE
AT
ION
AL
C
ON
TR
OL
SY
STE
M
F ISH
ING
SE
ASO
N
AL
LO
WE
D
FISH
ING
GE
AR
S
EFF
OR
T O
R
CA
TC
HE
S C
ON
TR
OL
PRO
FESS
ION
AL
/ R
EC
RE
AT
ION
AL
OBSERVATIONS
Bas
que
Cou
ntry
L. Only to be used in one river basin.
New moon October- New moon March.
Sieve and Hoe. Boat trawling allowed.
No. R L March 18–January 31
Rods. From sunrise until sunset. Fishing forbiddden on Tues-days. 2 rods per fishermen. Eels > 20 cm
R Regulation for glass eel issued in 2003. It is obligatory to fill in the Daily Catches report with effort and catches.
Can
tabr
ía
L. October 10–March 31
Squared sieve (Max.:1.2 m2)
Fishing forbi-dden between Saturday 14:00 and Sunday 18:00. At least 10 ms between fishermen. Catches <250 gr in recrea-tional.
R and P (Catches <250 gr).
March 17–July 21
Rods. Max: 20 eels/ fisherman/day
R
Ast
uria
s
L. Fishermen from the Nalón River can fish just in the Nalón River, and the rest of fisher-men can fish in all the rivers except from in the Nalón river.
Fishing season: November 2–March 31 During last seasons it has been shortened.
Squared sieve (Max.: 200 x 60 cms). Boat traw-ling allowed only in Nalón river basin.
No fishing during week-end. In Nalón river number of licences:70 from land and 50 from boat.
P L End of summer and autunm.
Eel traps. From sunrise until 1 hour after sunset. Not allowed during the weekend.
P Glass eel and eel recreational fishery forbidden since 2000 and 2006 respectively.
Gal
icia
L Five days before and after the new moon from No-vember until March.
Boat fishing is forbidden and the only allowed gear is a Max. 70 cm opening sieve.
No. R and P L March 19–August 21
Creels. Fixed gears are forbidden.
During all the day. Max. Of 10 creels.
R and P
The glass eel fishing normative can change during the fishing season depending on the evolution of the fishing season.

444 Joint EIFAC/ICES WGEEL Report 2007
GLASS EEL YELLOW AND SILVER EEL
CO
NT
RO
L
SYST
EM
FISH
ING
SE
ASO
N
AL
LO
WE
D
FISH
ING
GE
AR
S
EFF
OR
T O
R
CA
TC
HE
S C
ON
TR
OL
PRO
FESS
ION
AL
/ R
EC
RE
AT
ION
AL
C
ON
TR
OL
SY
STE
M
F ISH
ING
SE
ASO
N
AL
LO
WE
D
FISH
ING
GE
AR
S
EFF
OR
T O
R
CA
TC
HE
S C
ON
TR
OL
PRO
FESS
ION
AL
/ R
EC
RE
AT
ION
AL
OBSERVATIONS
And
aluc
ía
L All the year. Squared sieve (Max. : 0.80 x 0.80m2)
No. Catches sale allowed.
L All the year.
Rods and 5 ring creel. First, second and third mesh size of creel 12, 8, and 6 mm respectively.
From 1 hour before sunrise until 1 hour after sunset. 2 rods/fishermen. Eels >35 cm.
Catches sale allowed.
Mur
cia
No specific legislation
L All the year
2 rods per fishermen.
From 1 hour before sunrise until 1 hour after sunset. Eels >20 cm.
R
Val
enci
a
L November 18–March 31
Fyke nets (Mouth max 1. 5m2 and mesh size 1 mm).
From sunset to sunrise of Sunday, Mon-day, Wednes-day and Thursdays. Tuesdays are reserved to take glass eels for restocking and experi-mentation. The Fyke net can not take up more than a third of the river width.
P* In wa-ters with trouts from March 21 to August 31. In waters without trouts all the year.
Rod, with and without hook in recreational and fyke net in professional.
Rod with hook: from 1 hour before sunrise until 1 hour after sunset. Rod without hook: all the day. 1 rod /fishermen. Eels >25 cm in recreational.
R and P* Very dynamic, fishing season changes every year.
Cat
alon
ia
L October 20–March 10th.
Fyke nets. Max. 340 Fyke nets and at least 50 ms between them.
P L Changes every year.
Rods. During all the day. No light sources allo-wed. 2 rods per fishermen. Eels > 35 cm.
R
L: Licence L*: Fishermen must be member of a fishermen guilt to obtain the professional fishing licence P: Professional R: Recreational

Joint EIFAC/ICES WGEEL Report 2007 445
Figure ES.1. Autonomies from Spain.
The RBD of Spain had not been definitively defined. However a proposition has been made by the Environmental Ministry (Figure ES.2) that will be used in the present report.
Figure ES.2. Spanish RBDs.
In Spain the glass eel fishery exists in all the RBDs. In the Atlantic, the most important glass eel fishery basins are the Miño (North I RBD), the Asturian basins (North II) the Basque river basins (Basque inner rivers), and the Guadalquivir. In the Mediterranean, the most important glass eel fishing points are the Delta of the River Ebro and the Valencian Albufera (Jucar RBD). Besides, in Galicia, Valencia and Cataluña, there is an important yellow and silver eel fishery.
For the reasons explained above, the available information from each Autonomy is variable, and as a national fish stock management plan for eel does not exist, a compilation of all the data from different autonomies, in order to give a national overview of the eel fisheries in
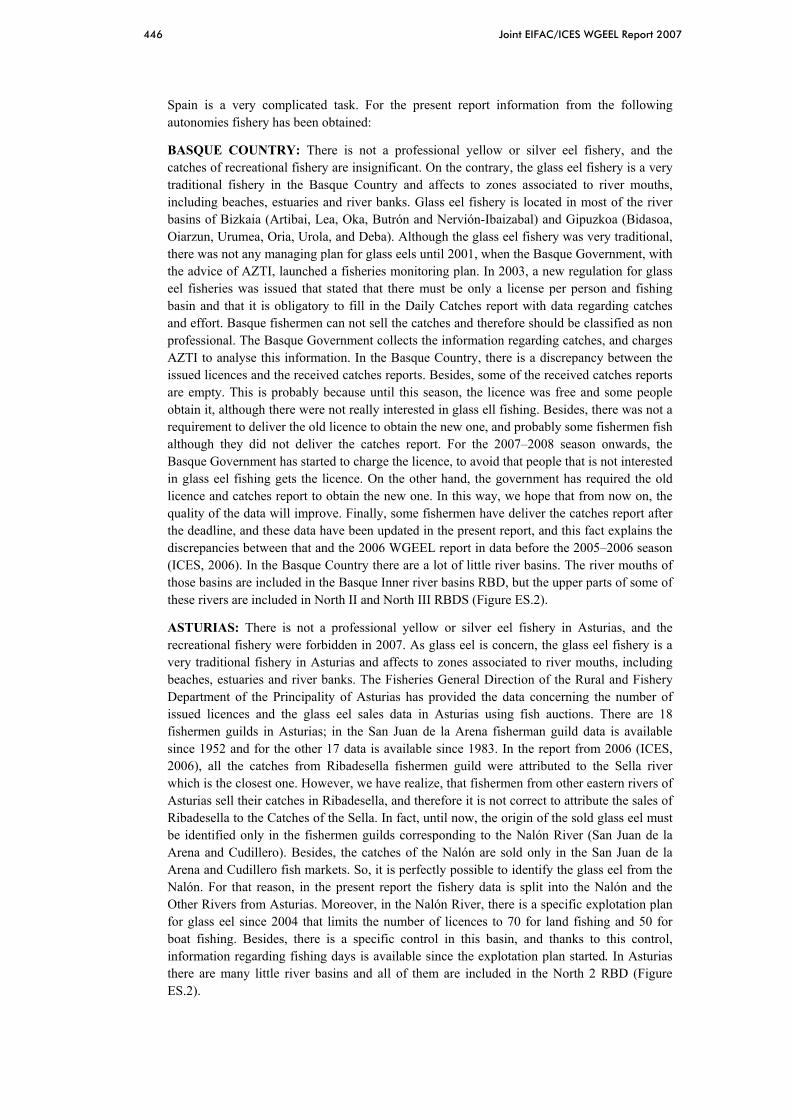
446 Joint EIFAC/ICES WGEEL Report 2007
Spain is a very complicated task. For the present report information from the following autonomies fishery has been obtained:
BASQUE COUNTRY: There is not a professional yellow or silver eel fishery, and the catches of recreational fishery are insignificant. On the contrary, the glass eel fishery is a very traditional fishery in the Basque Country and affects to zones associated to river mouths, including beaches, estuaries and river banks. Glass eel fishery is located in most of the river basins of Bizkaia (Artibai, Lea, Oka, Butrón and Nervión-Ibaizabal) and Gipuzkoa (Bidasoa, Oiarzun, Urumea, Oria, Urola, and Deba). Although the glass eel fishery was very traditional, there was not any managing plan for glass eels until 2001, when the Basque Government, with the advice of AZTI, launched a fisheries monitoring plan. In 2003, a new regulation for glass eel fisheries was issued that stated that there must be only a license per person and fishing basin and that it is obligatory to fill in the Daily Catches report with data regarding catches and effort. Basque fishermen can not sell the catches and therefore should be classified as non professional. The Basque Government collects the information regarding catches, and charges AZTI to analyse this information. In the Basque Country, there is a discrepancy between the issued licences and the received catches reports. Besides, some of the received catches reports are empty. This is probably because until this season, the licence was free and some people obtain it, although there were not really interested in glass ell fishing. Besides, there was not a requirement to deliver the old licence to obtain the new one, and probably some fishermen fish although they did not deliver the catches report. For the 2007–2008 season onwards, the Basque Government has started to charge the licence, to avoid that people that is not interested in glass eel fishing gets the licence. On the other hand, the government has required the old licence and catches report to obtain the new one. In this way, we hope that from now on, the quality of the data will improve. Finally, some fishermen have deliver the catches report after the deadline, and these data have been updated in the present report, and this fact explains the discrepancies between that and the 2006 WGEEL report in data before the 2005–2006 season (ICES, 2006). In the Basque Country there are a lot of little river basins. The river mouths of those basins are included in the Basque Inner river basins RBD, but the upper parts of some of these rivers are included in North II and North III RBDS (Figure ES.2).
ASTURIAS: There is not a professional yellow or silver eel fishery in Asturias, and the recreational fishery were forbidden in 2007. As glass eel is concern, the glass eel fishery is a very traditional fishery in Asturias and affects to zones associated to river mouths, including beaches, estuaries and river banks. The Fisheries General Direction of the Rural and Fishery Department of the Principality of Asturias has provided the data concerning the number of issued licences and the glass eel sales data in Asturias using fish auctions. There are 18 fishermen guilds in Asturias; in the San Juan de la Arena fisherman guild data is available since 1952 and for the other 17 data is available since 1983. In the report from 2006 (ICES, 2006), all the catches from Ribadesella fishermen guild were attributed to the Sella river which is the closest one. However, we have realize, that fishermen from other eastern rivers of Asturias sell their catches in Ribadesella, and therefore it is not correct to attribute the sales of Ribadesella to the Catches of the Sella. In fact, until now, the origin of the sold glass eel must be identified only in the fishermen guilds corresponding to the Nalón River (San Juan de la Arena and Cudillero). Besides, the catches of the Nalón are sold only in the San Juan de la Arena and Cudillero fish markets. So, it is perfectly possible to identify the glass eel from the Nalón. For that reason, in the present report the fishery data is split into the Nalón and the Other Rivers from Asturias. Moreover, in the Nalón River, there is a specific explotation plan for glass eel since 2004 that limits the number of licences to 70 for land fishing and 50 for boat fishing. Besides, there is a specific control in this basin, and thanks to this control, information regarding fishing days is available since the explotation plan started. In Asturias there are many little river basins and all of them are included in the North 2 RBD (Figure ES.2).

Joint EIFAC/ICES WGEEL Report 2007 447
GALICIA: In Galicia, both glass eel and yellow and silver fishery exists and the Miño River is the most important fishing point. The lower part of the Miño River delimits the borders of Spain and Portugal and for that reason the permanent International Commission of the Miño is charged of the management of this part of the river. In the present report, only the information collected by the Galician autonomy is included and therefore the data from the Miño River is not included. Catches are determined using auctions form different fishermen guilds, and we have assigned a river basin to each fishermen guild. In this way the following rivers contain catches data from the following fishermen guilds:
• Arousa River: Cambados, Carril, O grove and Rianxo fishermen guilds. • Eo River: Coruña and Ribadeo fishermen guilds. • Landro River: Barallobre, Celeiro, and Ferrol fishermen guilds. • Lérez River: Pontevedra and Marín fishermen guilds. • Verduxo River: Arcade and Vigo fishermen guilds.
In the Galician fishermen guilds, yellow and silver eel catches are not split. All the Galician river basins mentioned in this report belong to the Galician coast RBD (Figure ES.2).
VALENCIA: The principal eel fishing point is the Albufera, which is a 738 km2 costal lacuna between Turia and Jucar rivers. In the Albufera there are two fishermen guilds which have a limited right to exploit the glass eel (Perellonet fishermen house) and yellow and silver eel (El Palmar fishermen guild) fisheries. Glass eel is fished in two different channels of the Albufera: El Pujol and El Perelló. These fishermen guild have given their data to Consuelo Esteve from the University of Valencia who has provided this information.
The total catches in Spain are not given in this report since data from much Autonomy is missing and the addition of available data will greatly underestimate the result of Spain.

448 Joint EIFAC/ICES WGEEL Report 2007
Table ES.b. Coordinates of the river basins included in the present report.
AUTONOMY RBD RIVER BASIN LATITUDE (N°)*
LNGITUDE (E°)*
DRAINAGE AREA (KM2)
RIVER LENGTH (KM)
Basque B. Inner basins Bidasoa 43º19' 1º58'
700 69
B. Inner basins Oria 43º16' 2º06'
882 77
B. Inner basins Urola 43º17' 2º14'
342 65
B. Inner basins Deba 43º19' 2º26'
530 60
B. Inner basins Artibai 43º21' 2º29'
104 26
B. Inner basins Lea 43º22' 2º35'
99 26
B. Inner basins Oka 43º21' 2º40'
183 27
B. Inner basins Butrón 43º23' 2º56'
172 44
B. Inner basins
Nervion-Ibaizabal 43º19' 3º00'
1798 72
B. Inner basins Barbadun 43º17' 3º07'
128 27
Asturias North II Nalón 48º17' 5º23' 2692 142 Galicia G. Coast Landro 43º4' 7º04' 268 42 G. Coast Eo 43º4' 7º05' 819 78 G. Coast Verduxo 43º2' 8º04' 176 40 G. Coast Lérez 43º2' 8º04' 594 57 G. Coast Arousa 43º4' 8º05' 2964 132 Valencia Jucar Albufera 39º22' 0º18' 738
*The coordinates correspond to the river mouth
ES.C Fishing capacity
See Table ES.a. for information regarding fishing gears.
As aforementioned, in the Basque Country, there is a discrepancy between the issued licences and the received catches reports. For that reason, we have decided to include only those licences that have been received by the Basque Government with the full catches report. This is because we think that most of the fishermen that have not deliver the catches report have not go fishing. Probably, this will underestimate the number of real fishermen, but the overestimation of including all the issued licences will be bigger than the underestimation if they are not included Most of the licences in the Basque Country are for land fishing, and boat fishing is concentrated in a few rivers. Since the glass eel regulation was established, the number of fishermen has varied between the 310 in the 2003–2004 season to the 446 in the 2006–2007 season with some variability between these seasons.
On the other hand, there is no any fishermen list until 2003, but the oldest fishermen assert that since the 1970s the decline is important in the number of fishermen during the last three decades following the decline of the recruitment. It seems that this decline has conditioned fishermen activity, giving up their activity in some cases, or reducing the fishing nights in those who still keep fishing since the catches are lower.

Joint EIFAC/ICES WGEEL Report 2007 449
In the Basque Country, in Aginaga (Oria river basin) there are 6 companies dedicated to the commercialization, and one among them to growth, of glass eels. These companies have hatcheries in Asturias, Valencia, Catalonia, and the Atlantic coast of France to maintain the glass eels they buy to local fishermen until they are transported to the hatcheries in Aginaga.
The number of licences in Asturias is lower than in the Basque County, but it must be kept in mind that the fishery in Asturias is professional while in the Basque Country it is recreational. In Asturias boat fishing is only allowed in the Nalón River, and a maximum of 50 licences can be issued. In this way, the boat licences are around 50 during last three fishing season but the land licences have shown an increase during the 2004–2005 season.
Table ES.c. Number of glass eel fishing licences per basin and fishing gear in the last three fishing seasons.
2004–2005 2005–2006 2006–2007
AREA RBD RB B
OA
T
LA
ND
TO
TA
L
BO
AT
LA
ND
TO
TA
L
BO
AT
LA
ND
TO
TA
L
Basque C. B. inner Bidasoa 1 1 1 1 1 1 Oria 33 66 99 21 41 62 35 78 113 Urola 22 6 28 7 2 9 14 7 21 Deba 95 95 74 74 113 113 Artibai 5 5 6 6 7 7 Lea 10 10 14 14 Oka 10 10 7 7 10 10 Butron 4 112 116 7 88 95 2 83 85 Nervion 70 71 1 78 79 74 74 Barbadun 5 5 7 7 6 6 Total 60 380 440 36 318 354 51 395 446 Asturias North II Nalón 44 67 111 50 67 117 47 70 117 Others 125 125 0 204 204 0 164 164 Total 44 192 236 50 271 321 47 234 281
In Valencia, there are approximately 100 fishermen fishing yellow and silver eel two days a week from October to March (C. Esteve, pers.comm.).
ES.D Fishing effort
In the Basque Country, the number of fishing hours per fishing season has decrease during the last three decades; nevertheless, the hours that each fisherman dedicate to fish glass eel increased in 2005–2006 when comparing it to the 2004–2006 season, and in the 2006–2007 season it showed intermediate values. Boat fishermen dedicate more hours to fish that land fishermen. During last fishing season both the total number of hours and the number of hours per licence has decrease since the data base exists.
In Asturias both, the total days dedicated to fish, and the days each fisherman dedicated to fish have decreased. As in the Basque Country, boat fishermen dedicate more hours to fish that land fishermen.

450 Joint EIFAC/ICES WGEEL Report 2007
Table ES.d. Number of fishing hours (glass eels), in the case of The Basque Country, and days, in the case of Asturias and Valencia, during the last three fishing season.
2004–2005 2005–2006 2006–2007
AREA RBD RIVER BASIN BOAT LAND BOAT LAND BOAT LAND
Basque C*
B. inner Bidasoa 15. 6 24. 0 18. 0
Oria 62. 0 22. 5 71. 9 48. 5 47. 6 16. 0 Urola 43. 8 21. 0 158. 6 121. 8 65. 4 35. 4 Deba 24. 7 36. 6 23. 6 Artibai 19. 2 10. 1 0. 7 Lea 12. 4 20. 9 Oka 15. 7 22. 4 9. 7 Butron 6. 0 17. 9 31. 3 11. 7 10. 5 12. 6 Nervion 41. 1 10. 5 21. 9 17. 1 Barbadun 12. 3 11. 1 8. 8
Total 3034.
4 9282. 6 2850. 6 8290. 6 2640. 0 6891. 3
Asturias** North II Nalón 1257.0 711 1968 1316 458 1774
*: Fishing hours **: Fishing days
Table ES.e. Number of fishing hours, in the case of The Basque County, and days, in the case of Asturias, per fishermen.
2004 2005 2005 2006 2006 2007
AREA RBD RIVER BASIN
BO
AT
LA
ND
BO
AT
LA
ND
BO
AT
LA
ND
Basque C* B. inner Bidasoa 1 1 1 1 Oria 33 66 99 21 41 62 Urola 22 6 28 7 2 9 Deba 95 95 74 74 Artibai 5 5 6 6 Lea 10 10 14 14 Oka 10 10 7 7 Butron 4 112 116 7 88 95 Nervion 70 71 1 78 79 Barbadun 5 5 7 7 Average 37 20 68 33 41 16 Asturias** North II Nalón 29 11 26 7 20 5 *: Fishing hours/kg **: Fishing days/kg
In Valencia data of glass eel fishing days from the Albufera between 1981 and 2003 is available. There is not any clear temporal trend in the number of days that fishermen have dedicated to glass eel fishing during this period.

Joint EIFAC/ICES WGEEL Report 2007 451
0
50
100
150
200
250
1981
1984
1987
1989
1993
1995
1998
2000
2002
2004
Gla
ss e
el fi
shin
g da
ys
Figure ES.3. Glass eel fishing days in The Albufera.
ES.E Catches and landings
During the short time series in the Basque Country, glass eel catches have been the lowest during the 2006–2007 season. This is because the three, the number of licences, the hours per licence, and the cpues have dropped (Tables ES.c., ES.d., and ES.h.).
In Asturias the glass eel catches from 2005–2006 and 2006–2007 were similar and lower than those of the 2004–2005 season.

452 Joint EIFAC/ICES WGEEL Report 2007
Table ES.f. Glass eel catches during the last three fishing seasons.
2004–2005 2005–2006 2006–2007
AREA RBD RB
BO
AT
LA
ND
TO
TA
L
BO
AT
LA
ND
TO
TA
L
BO
AT
LA
ND
TO
TA
L
Basque C.
B. inner Bidasoa 0. 8 0. 8 0. 9 0. 9 0. 1 0. 1
Oria 392. 8
87. 3
480. 1
316. 4
191. 8
508. 2
190. 0
55. 5
245. 5
Urola 113. 5 8. 1
121. 5
114. 4
10. 8
125. 2
66. 9 6. 1 73. 0
Deba 194.
5 194.
5 300.
0 300.
0 0. 0 169.
8 169.
8 Artibai 5. 1 5. 1 1. 9 1. 9 0. 0 0. 0
Lea 7. 4 7. 4 26. 7 26. 7 0. 0
Oka 10. 7 10. 7
11. 9 11. 9 7. 4 7. 4
Butron 1. 4 112.
7 114.
1 13. 1
39. 3 52. 4 0. 9
55. 8 56. 7
Nervion 163.
2 163.
2 1. 0 114.
9 115.
9 0. 0 88. 6 88. 6
Barbadun 3. 0 3. 0 1. 6 1. 6 4. 3 4. 3
Total 507. 6
592. 7
1100. 3
444. 9
699. 8
1144. 8
257. 9
387. 5
645. 4
Asturias North II Nalón
1834. 8
1354. 5
1004. 6
1040? 820? 1261? 2875? 2175? 2266? Valencia Jucar Albufera 233 233 209 209 ND
Although 6 different gears are used, most of the catches in the Basque Country are obtained by boat trawling and sieve (Figure ES.4).
Wave4.0%
Unfilled8.2%
Boat38.3%
Sieve37.2%
Hoe0.3%
Land trawling12.0%
Figure ES.4. Percentage of de obtained catches with each fishing gear during the 2004–2005, 2005–2006 and 2006–2007.
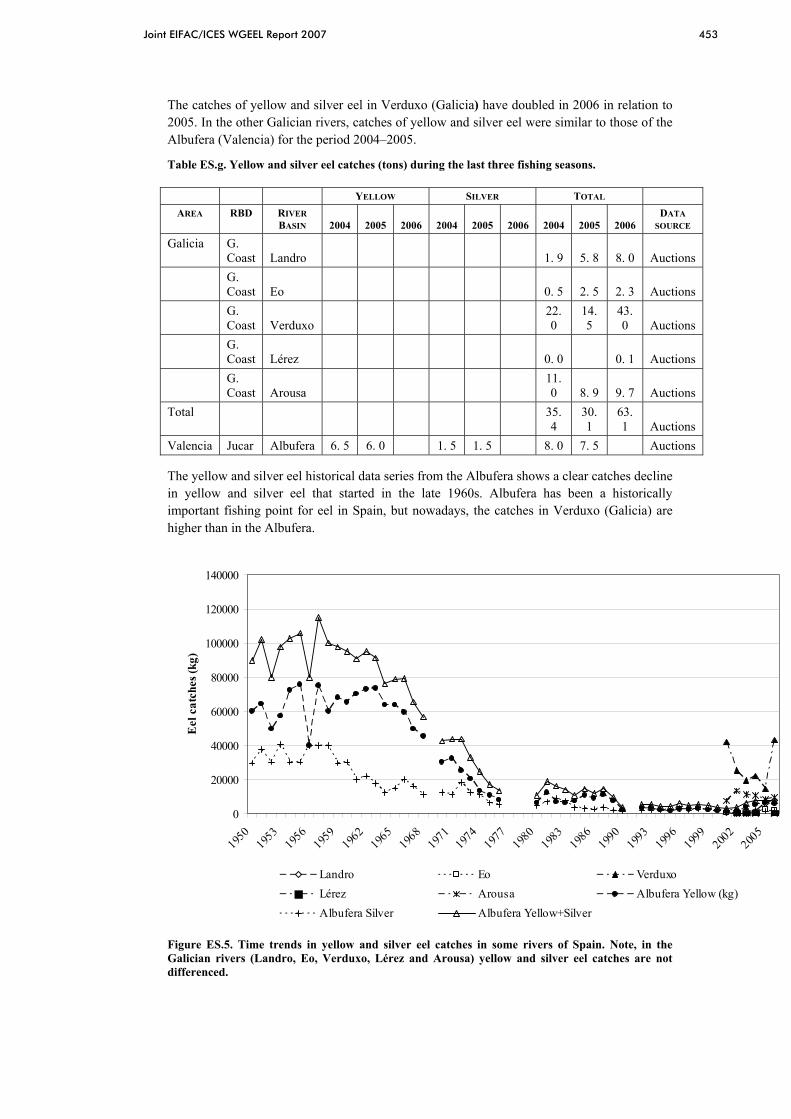
Joint EIFAC/ICES WGEEL Report 2007 453
The catches of yellow and silver eel in Verduxo (Galicia) have doubled in 2006 in relation to 2005. In the other Galician rivers, catches of yellow and silver eel were similar to those of the Albufera (Valencia) for the period 2004–2005.
Table ES.g. Yellow and silver eel catches (tons) during the last three fishing seasons.
YELLOW SILVER TOTAL AREA RBD RIVER
BASIN 2004 2005 2006 2004 2005 2006 2004 2005 2006 DATA
SOURCE
Galicia G. Coast Landro 1. 9 5. 8 8. 0 Auctions
G. Coast Eo 0. 5 2. 5 2. 3 Auctions
G. Coast Verduxo
22. 0
14. 5
43. 0 Auctions
G. Coast Lérez 0. 0 0. 1 Auctions
G. Coast Arousa
11. 0 8. 9 9. 7 Auctions
Total
35. 4
30. 1
63. 1 Auctions
Valencia Jucar Albufera 6. 5 6. 0 1. 5 1. 5 8. 0 7. 5 Auctions
The yellow and silver eel historical data series from the Albufera shows a clear catches decline in yellow and silver eel that started in the late 1960s. Albufera has been a historically important fishing point for eel in Spain, but nowadays, the catches in Verduxo (Galicia) are higher than in the Albufera.
0
20000
40000
60000
80000
100000
120000
140000
1950
1953
1956
1959
1962
1965
1968
1971
1974
1977
1980
1983
1986
1990
1993
1996
1999
2002
2005
Eel
cat
ches
(kg)
Landro Eo VerduxoLérez Arousa Albufera Yellow (kg)Albufera Silver Albufera Yellow+Silver
Figure ES.5. Time trends in yellow and silver eel catches in some rivers of Spain. Note, in the Galician rivers (Landro, Eo, Verduxo, Lérez and Arousa) yellow and silver eel catches are not differenced.

454 Joint EIFAC/ICES WGEEL Report 2007
ES.F Catch per unit of effort
The available data series of cpues in the Basque Country and Asturias is not wide enough to detect any trend.
Table ES.h. Glass eel cpues during the last three fishing seasons.
2004–2005 2005–2006 2006–2007
AREA RBD RB
BO
AT
LA
ND
TO
TA
L
BO
AT
LA
ND
TO
TA
L
BO
AT
LA
ND
TO
TA
L
Basque C. *
B. inner Bidasoa
0. 05
0. 05
0. 04
0. 04
0. 00
0. 00
Oria 0. 19
0. 06
0. 13
0. 13
0. 08
0. 10
0. 11
0. 04
0. 07
Urola 0. 08
0. 06
0. 08
0. 08
0. 03
0. 07
0. 06
0. 02
0. 05
Deba 0. 08
0. 08
0. 10
0. 10
0. 00
0. 05
0. 05
Artibai 0. 05
0. 05
0. 03
0. 03
0. 00
0. 00
Lea 0. 05
0. 05
0. 10
0. 10
Oka 0. 07
0. 07
0. 08
0. 08
0. 08
0. 08
Butron 0. 05
0. 05
0. 05
0. 06
0. 03
0. 04
0. 04
0. 05
0. 05
Nervion 0. 06
0. 06
0. 06
0. 06
0. 06
0. 00
0. 07
0. 07
Barbadun 0. 07
0. 07
0. 02
0. 02
0. 01
0. 01
Total 0. 15
0. 06
0. 08
0. 10
0. 07
0. 08
0. 09
0. 05
0. 06
Asturias** North II Nalón
0. 93
0. 76
0. 79
Valencia** Jucar Albufera 0.56 ND ND *: Fishing hour/glass eel (Kg) **: Fishing days/glass eel (Kg)
In the Albufera (Valencia) the historical records of the glass eel cpues, measured as glass eel catches per fishing day, demonstrate that the number of glass eel arriving to the Albufera has decreased during the1981–2003 period.

Joint EIFAC/ICES WGEEL Report 2007 455
02468
10121416182022
1982
1984
1985
1987
1988
1989
1990
1991
1992
1993
1994
1995
1996
1997
1998
1999
2000
2002
2003
2004
2005
2006
CPU
Es (K
g/fis
hing
day
)
Figure ES.6. Time trends in cpues of glass eels in the Albufera.
ES.G Scientific surveys of the stock
In Spain there is not any national eel specific surveys program. However, there are some researches that have made some work in the subject, and there are some Autonomies that have promote different studies regarding eel.
ES.G.1 Recruitment surveys
Figure ES.7. Time trends in glass eel sales or catches in different Spanish basins. Note that the scale is logarithmic.
In the INDICANG framework Javier Lobón Cervia together with the Consejería de Medio Ambiente, Ordenación del Territorio e Infraestructuras and the Consejería del Medio Rural y
100
1000
10000
100000
1954
1957
1960
1963
1966
1969
1972
1975
1978
1981
1984
1987
1990
1993
1996
1999
2002
2005
Gla
ss e
el c
atch
es (k
g)
San Juan de la Arena sales Asturias sales Albufera sales Basque Country catches

456 Joint EIFAC/ICES WGEEL Report 2007
Pesca (Dr. Lucia Garcia Florez) will estimate the abundance and recruitment index of glass eels of Nalón and Esva in Asturias. In the Basque Country, when the INDICANG project finishes data regarding glass eel recruitment per river basin and their migratory patterns in the Oria river basin (a PhD is being carried out at this moment) will be available.
In this way, in order to analyse recruitment historic trends in Spain it is necessary to use the glass eel catches. The oldest data series, the one form San Juan de la Arena (Atlantic Sea) and the other form the Albufera (Mediterranean sea) confirms the decline in glass eel recruitment observe in the rest of Europe.
Glass eel fishing activities in the Guadalquivir (Sobrino et al., 2005) made some samplings to analyze glass eel fishery during 1997–1998 and 1998–1999 seasons and they determined glass eel catches and cpues during this period. Sobrino et al made an study (Sobir Estuary have not as yet been regulated and there are no official statistics on commercial glass eel catches.
Table ES.i. Glass eel catches and cpues (Catches per fishing day) in the Guadalquivir estuary.
1997–1998 1998–1999
NO. OF
BOAT FISHING
DAY FISHING
HOUR CATCH CPUE
NO. OF
BOAT FISHING
DAY FISHING
HOUR CATCH CPUE
Zone I 1.2 218 29.3 5333 42661 1900 0.5 Zone II 7.8 1420 1747 29.3 5333 42661 1800 0.3 Zone III 15.5 2821 11357 15.7 2857 22859 900 0.3 Total 24.5 4459 22568 5000 1.1 74.3 13532 108181 4600 0.3 Source: Sobrino et al., 2005
There is not restocking In the Basque Country and Asturias. In Catalonia, a percentage of the glass eels catches should be conserved for restocking. In Valencia, the glass eel fishermen give the 10% of the catches from one of the two channels where they fish, to the city council of Valencia: The city council of Valencia releases a half of these glass eels in the Albufera between January and March. The other is grown in a farm owned by the Valencian Government, until they reach a weight of 8 gr. This farm must giveback to the city council 3000 eels of 8 gr for each Kg of glass eel they have received. The Valencian city council releases these glass eels in the Albufera.
ES.G.2 Yellow and silver eel surveys
In the Basque Country, Thanks to the INDICANG project, an ascendant young eel sampling station was installed in September 2004 which will give an abundance and a fluvial recruitment index independent of fisheries. The trap was installed in a salmonids monitoring station, located 11 km from the Oria river mouth in the tidal limit. Although the time series is not wide enough to extract conclusions, some general conclusions can be extracted. The young eels start upstream migration in May and finish it in November. During this period, migration is constant but irregular and there is a decrease in eel migrant size from May on. This size gradient was more evident during the year the trap was installed, probably because there was an accumulation of eel below the trap, caused by the impediment of migration by the dam until the trap was installed.
In Asturias, Javier Lobón has been monitoring the yellow and silver eel in the Esva basin since 1986 (Lobon-Cervia, et al., 1990; Lobon-Cervia and Carrascal, 1992; Lobon-Cervia et al., 1995; Lobon-Cervia, 1999). Besides, in the INDICANG framework the monitoring of silver and yellow eel in the Esva and Nalón river basins and relation with environmental parameters will be performed.

Joint EIFAC/ICES WGEEL Report 2007 457
Figure ES.8. Amount (kg) and number of ascending young eels caught in the Oria River (Basque Country).
In Catalunia, the CERM (Center for the Study of Mediterranean Rivers) will sample in five sections of three different rivers (Ebro, Ter, Riera del Port de la Selva) with eel populations between 2006 and 2008 with the principal aim of studying the connectivity. Besides they have applied for a research project that aims to improve the situation of migratory fishes, specially the eel, in the Mediterranean area. This project would include 12 research teams, Universities and administrations from the EU and 4 more from Magreb and Near East.
In Castilla la Mancha, the Historic Evolution of the eel has been studied (Marin et al., 1994).
ES.H Catch composition by age and length
No information available.
ES.I Other biological sampling
ES.I.1 Length, weight and growth (DCR)
As mentioned above, in Spain there is not any national eel specific surveys program. In the Spanish National Program proposal for 2007 (http://datacollection. jrc. cec. eu. int/nationalprog. php?y=2007) Spain has ask for an exemption to sample eel based on the low discards. However, the bulk of the eel catches are monitored by the autonomous governements of the different Spanish regions as mentioned above, and unfortunately these data is not submitted to the Spanish Fishery Secretary. Therefore, in Spain total eel catches are unknown.
ES.I.2 Parasites
Some studies have been carried out regarding the presence of Anguillicola crassus in rivers form Spain (Table. ES.j). These studies demonstrate that the parasite is widespread in Spain. However, there are still some rivers in Asturias and Galicia that have not been colonized yet (the Urola is not considered because only one eel was analyzed); therefore special measures should be taken to avoid the infection of this basins. It is difficult to follow the sequence of A. crassus introduction in Spain since the first data we have is from 2000 and probably the nematode arrived before that data. However, it looks like in the Mediterranean the presence of the parasite is lower than in the Atlantic (lower prevalence, intensity and abundance). On the
0.1
1
10
100
1000
10000
07/1
1/20
04
07/1
2/20
04
07/0
1/20
05
07/0
2/20
05
07/0
3/20
05
07/0
4/20
05
07/0
5/20
05
07/0
6/20
05
07/0
7/20
05
07/0
8/20
05
07/0
9/20
05
07/1
0/20
05
07/1
1/20
05
07/1
2/20
05
07/0
1/20
06
07/0
2/20
06
07/0
3/20
06
07/0
4/20
06
07/0
5/20
06
07/0
6/20
06
07/0
7/20
06
07/0
8/20
06
07/0
9/20
06
07/1
0/20
06
07/1
1/20
06
07/1
2/20
06
07/0
1/20
07
07/0
2/20
07
07/0
3/20
07
07/0
4/20
07
07/0
5/20
07
07/0
6/20
07
07/0
7/20
07
Wei
ght
(g)
0.1
1
10
100
1000
Eel
s (n)
Biomasa Nº anguilas
458 Joint EIFAC/ICES WGEEL Report 2007
other hand, if we compare the results of Gallastegi et al. (2002) in the Butron in year 2000, with those of Díaz et al. (2007) in the Basque rivers in 2006, we can see that there is an increase in the prevalence of the parasite, but that the infection intensity has decrease.
ES.I.3 Contaminants
Although there is not any specific survey to analyze the presence of contaminants on eel, eel is sometimes among the species included in the biomonitoring of water masses made by the public administrations. Besides, in some studies regarding contamination eel is among the studied fishes. In this way, information regarding PCBs, pesticides and heavy metals bioaccumulation in eels from rivers of the Basque Country (Sanchez et al.,. 1997), from the river Ebro (Santillo et al.,. 2006), river Miño (Santillo et al.., 2006), river Jucar (Bordajandi et al.,. 2003) and river Guadalquivir (Usero et al.. 2003) is available. Few studies represent a specific survey to analyze the presence of contaminants in eel, as heavy metals determination in eels from the Albufera lacuna (Alcaide and Esteve, 2007). These authors concluded that among the HM tested, bioaccumulation of Cd, Hg, Zn, and Cu in liver tissue is related to the age/lengh of individuals [W and B values; p< 0,01] and so remarked recommendations on standardization on length and/on age of the eels used in such studies (Alcaide and Esteve, 2007).
ES.I.4 Predators
In 1996 there were 35 000 great cormorants (Phalacrocorax carbo sinensis) ovewintering in Spain, by 2003 the population increased a 96% (DelMoral and DeSouza, 2004).
Regarding the impact of this specie in eels, the Cantabrian Goverment carried out a study in which they analyzed the gut content of cormorants (Serdio, 2005). In that study, it was concluded that salmonids were the most consumed prey by cormorants, and that they have a high impact in trout population. However, the presence of eel in the cormorant diet was not very important (Table ES.k.). The same thing happened in the Mediterranean Santa Pola Lagoon, where eel constituted the 1% of the diet of the cormorants in terms of numbers and the 0.4% in terms of biomass. In fact, the diet of cormorants was mainly composes of mugilids (Olmos et al., 2000).
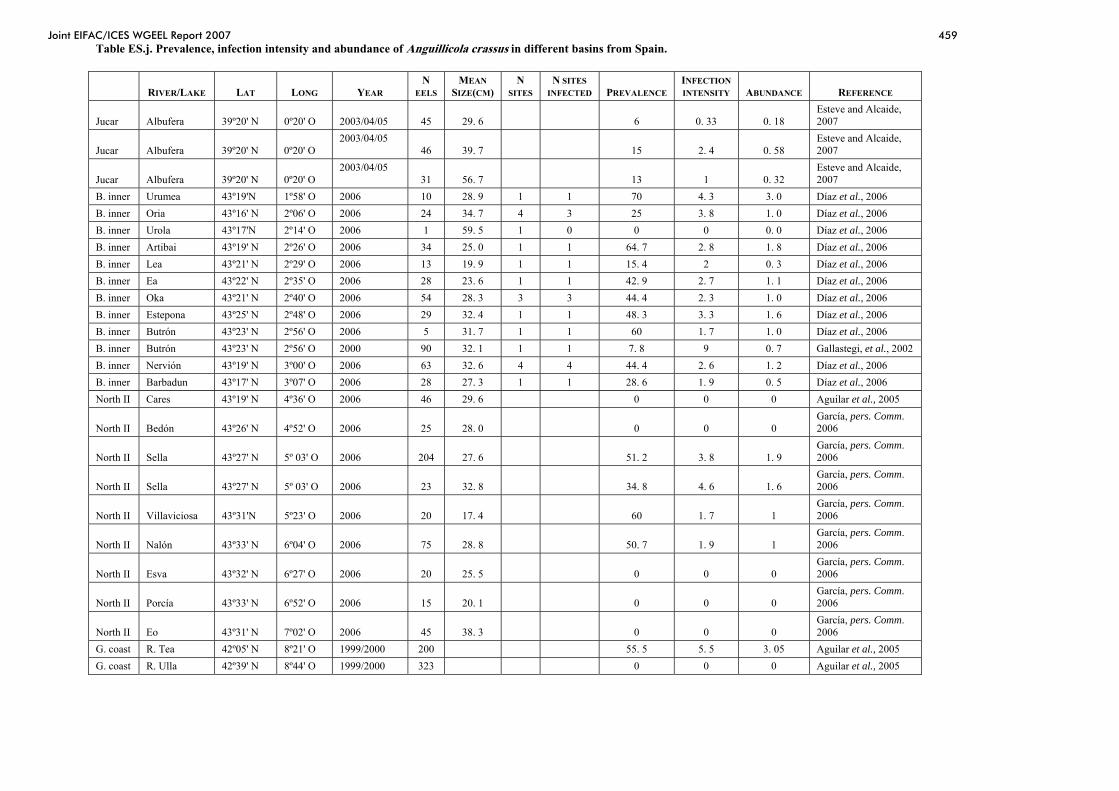
Joint EIFAC/ICES WGEEL Report 2007 459
Table ES.j. Prevalence, infection intensity and abundance of Anguillicola crassus in different basins from Spain.
RIVER/LAKE LAT LONG YEAR N
EELS MEAN
SIZE(CM) N
SITES N SITES
INFECTED PREVALENCE INFECTION INTENSITY ABUNDANCE REFERENCE
Jucar Albufera 39º20' N 0º20' O 2003/04/05 45 29. 6 6 0. 33 0. 18 Esteve and Alcaide, 2007
Jucar Albufera 39º20' N 0º20' O 2003/04/05
46 39. 7 15 2. 4 0. 58 Esteve and Alcaide, 2007
Jucar Albufera 39º20' N 0º20' O 2003/04/05
31 56. 7 13 1 0. 32 Esteve and Alcaide, 2007
B. inner Urumea 43º19'N 1º58' O 2006 10 28. 9 1 1 70 4. 3 3. 0 Díaz et al., 2006 B. inner Oria 43º16' N 2º06' O 2006 24 34. 7 4 3 25 3. 8 1. 0 Díaz et al., 2006 B. inner Urola 43º17'N 2º14' O 2006 1 59. 5 1 0 0 0 0. 0 Díaz et al., 2006 B. inner Artibai 43º19' N 2º26' O 2006 34 25. 0 1 1 64. 7 2. 8 1. 8 Díaz et al., 2006 B. inner Lea 43º21' N 2º29' O 2006 13 19. 9 1 1 15. 4 2 0. 3 Díaz et al., 2006 B. inner Ea 43º22' N 2º35' O 2006 28 23. 6 1 1 42. 9 2. 7 1. 1 Díaz et al., 2006 B. inner Oka 43º21' N 2º40' O 2006 54 28. 3 3 3 44. 4 2. 3 1. 0 Díaz et al., 2006 B. inner Estepona 43º25' N 2º48' O 2006 29 32. 4 1 1 48. 3 3. 3 1. 6 Díaz et al., 2006 B. inner Butrón 43º23' N 2º56' O 2006 5 31. 7 1 1 60 1. 7 1. 0 Díaz et al., 2006 B. inner Butrón 43º23' N 2º56' O 2000 90 32. 1 1 1 7. 8 9 0. 7 Gallastegi, et al., 2002 B. inner Nervión 43º19' N 3º00' O 2006 63 32. 6 4 4 44. 4 2. 6 1. 2 Díaz et al., 2006 B. inner Barbadun 43º17' N 3º07' O 2006 28 27. 3 1 1 28. 6 1. 9 0. 5 Díaz et al., 2006 North II Cares 43º19' N 4º36' O 2006 46 29. 6 0 0 0 Aguilar et al., 2005
North II Bedón 43º26' N 4º52' O 2006 25 28. 0 0 0 0 García, pers. Comm. 2006
North II Sella 43º27' N 5º 03' O 2006 204 27. 6 51. 2 3. 8 1. 9 García, pers. Comm. 2006
North II Sella 43º27' N 5º 03' O 2006 23 32. 8 34. 8 4. 6 1. 6 García, pers. Comm. 2006
North II Villaviciosa 43º31'N 5º23' O 2006 20 17. 4 60 1. 7 1 García, pers. Comm. 2006
North II Nalón 43º33' N 6º04' O 2006 75 28. 8 50. 7 1. 9 1 García, pers. Comm. 2006
North II Esva 43º32' N 6º27' O 2006 20 25. 5 0 0 0 García, pers. Comm. 2006
North II Porcía 43º33' N 6º52' O 2006 15 20. 1 0 0 0 García, pers. Comm. 2006
North II Eo 43º31' N 7º02' O 2006 45 38. 3 0 0 0 García, pers. Comm. 2006
G. coast R. Tea 42º05' N 8º21' O 1999/2000 200 55. 5 5. 5 3. 05 Aguilar et al., 2005 G. coast R. Ulla 42º39' N 8º44' O 1999/2000 323 0 0 0 Aguilar et al., 2005
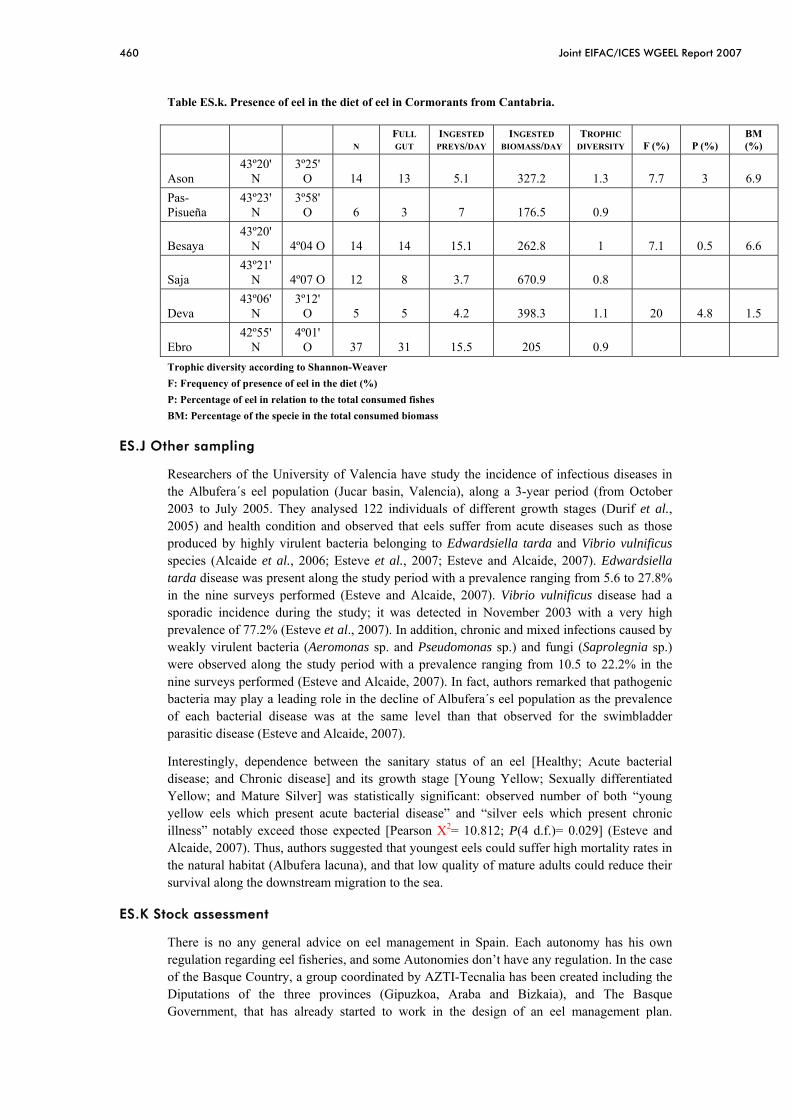
460 Joint EIFAC/ICES WGEEL Report 2007
Table ES.k. Presence of eel in the diet of eel in Cormorants from Cantabria.
N FULL GUT
INGESTED PREYS/DAY
INGESTED BIOMASS/DAY
TROPHIC DIVERSITY F (%) P (%)
BM (%)
Ason 43º20'
N 3º25'
O 14 13 5.1 327.2 1.3 7.7 3 6.9 Pas-Pisueña
43º23' N
3º58' O 6 3 7 176.5 0.9
Besaya 43º20'
N 4º04 O 14 14 15.1 262.8 1 7.1 0.5 6.6
Saja 43º21'
N 4º07 O 12 8 3.7 670.9 0.8
Deva 43º06'
N 3º12'
O 5 5 4.2 398.3 1.1 20 4.8 1.5
Ebro 42º55'
N 4º01'
O 37 31 15.5 205 0.9 Trophic diversity according to Shannon-Weaver F: Frequency of presence of eel in the diet (%) P: Percentage of eel in relation to the total consumed fishes BM: Percentage of the specie in the total consumed biomass
ES.J Other sampling
Researchers of the University of Valencia have study the incidence of infectious diseases in the Albufera´s eel population (Jucar basin, Valencia), along a 3-year period (from October 2003 to July 2005. They analysed 122 individuals of different growth stages (Durif et al., 2005) and health condition and observed that eels suffer from acute diseases such as those produced by highly virulent bacteria belonging to Edwardsiella tarda and Vibrio vulnificus species (Alcaide et al., 2006; Esteve et al., 2007; Esteve and Alcaide, 2007). Edwardsiella tarda disease was present along the study period with a prevalence ranging from 5.6 to 27.8% in the nine surveys performed (Esteve and Alcaide, 2007). Vibrio vulnificus disease had a sporadic incidence during the study; it was detected in November 2003 with a very high prevalence of 77.2% (Esteve et al., 2007). In addition, chronic and mixed infections caused by weakly virulent bacteria (Aeromonas sp. and Pseudomonas sp.) and fungi (Saprolegnia sp.) were observed along the study period with a prevalence ranging from 10.5 to 22.2% in the nine surveys performed (Esteve and Alcaide, 2007). In fact, authors remarked that pathogenic bacteria may play a leading role in the decline of Albufera´s eel population as the prevalence of each bacterial disease was at the same level than that observed for the swimbladder parasitic disease (Esteve and Alcaide, 2007).
Interestingly, dependence between the sanitary status of an eel [Healthy; Acute bacterial disease; and Chronic disease] and its growth stage [Young Yellow; Sexually differentiated Yellow; and Mature Silver] was statistically significant: observed number of both “young yellow eels which present acute bacterial disease” and “silver eels which present chronic illness” notably exceed those expected [Pearson Χ2= 10.812; P(4 d.f.)= 0.029] (Esteve and Alcaide, 2007). Thus, authors suggested that youngest eels could suffer high mortality rates in the natural habitat (Albufera lacuna), and that low quality of mature adults could reduce their survival along the downstream migration to the sea.
ES.K Stock assessment
There is no any general advice on eel management in Spain. Each autonomy has his own regulation regarding eel fisheries, and some Autonomies don’t have any regulation. In the case of the Basque Country, a group coordinated by AZTI-Tecnalia has been created including the Diputations of the three provinces (Gipuzkoa, Araba and Bizkaia), and The Basque Government, that has already started to work in the design of an eel management plan.

Joint EIFAC/ICES WGEEL Report 2007 461
Besides, some meetings have been held with technicians from the Northern Coastal autonomies of Spain (Basque Country, Cantabria, Asturias, and Galicia) regarding eel management plans. Sampling intensity and precision:
• Valencia and Catalonia have an eel restocking program.
ES.L Standardisation and harmonisation of methodology
No work has been done in this subject until now.
ES.M Overview, conclusions and recommendations
As mentioned above, in Spain, each autonomous government is in charge of the control, regulation and management of the eel fishery and population, and apart from the present report, there is not any global study or sampling program directed towards compiling information from all the Spanish regions, neither in the case of fishery nor in the biological aspects, in order to give a Spanish national overview of the eel situation. For that reason, and considering the new EC regulation proposal for eel, we propose the inclusion of eel in the Spanish National Data Collection Program and we consider that a special effort should be carried out in order to compile information regarding eel population in the whole of Spain.
ES.N Literature
Aguilar, A., Álvarez, M. F., Leiro, J. M., and Sanmartín, M. L. 2005. Parasite populations of the European eel (Anguilla anguilla L. ) in the Rivers Ulla and Tea (Galicia, northwest Spain). Aquaculture 249: 85–94.
Alcaide, E., Herraiz, S,. and Esteve C. 2006. Occurrence of Edwardsiella tarda in wild European eels Anguilla anguilla from Mediterranean Spain. Diseases of Aquatic Organisms 71: 77–81.
Alcaide, E., and Esteve, C. 2007. Relationship among heavy metals accumulation, growth stage, and infectious diseases in wild eels from lake Albufera (Valencia, Spain) 13th International EAFP conference on fish and shellfish diseases. Grado, Italy.
Del Moral, J. C. and De Souza, J. A. 2004. Cormorán grande invernante en España. II Censo nacional. SEO/BirdLife. Madrid.
Díaz, E., Castellanos, J., Díez, G., Gómez de Segura, A., Martinez, J., and Maceira, A. (2006). Caracterización de la pesquería de angula y estudio de parasitación en anguila por Anguillicola crassus en las cuencas del País Vasco. Informe elaborado por AZTI-Tecnalia para la Dirección de Pesca y Acuicultura, Viceconsejería de Desarrollo Agrario y Pesquero, Dpto. Agricultura, Pesca y Alimentación, Eusko Jaurlaritza - Gobierno Vasco.
Durif, C., Dufour, E. and Elie P. 2005. The silvering process of Anguilla anguilla: a new classification from the yellow resident to the silver migrating stage. Journal of Fish Biology 66: 1025–1043.
Bordajandi, L. R., Gómez, G., Fernández M. A., Abad, E., Rivera, J., and González, M. J. 2003. Study on PCBs, PCDD/Fs, organochlorine pesticides, heavy metals and arsenic content in freshwater fish species from the River Turia (Spain). Chemosphere 53: 163–171.
Esteve, C., and Alcaide, E. 2007. Influence of diseases on the wild eel stock: the case of lake Albufera (Valencia, Spain) 13th International EAFP conference on fish and shellfish diseases. Grado, Italy.
Esteve C., Alcaide, E., Herraiz S., Canals, R., Merino, S., and Tomás, J.M. 2007. First description of nonmotile Vibrio vulnificus strains virulent for eels. FEMS Microbiology Letters 266: 90–97.

462 Joint EIFAC/ICES WGEEL Report 2007
Gallastegui, I., Rallo, A., Mulcahy, M. F. 2002. A report of Anguillicola crassus from Spain. Bull. Eur. Ass. Fish Pathol., 22(4) 2002, 283.
EIFAC/ICES, 2006. Report of the 2006 session of the Joint EIFAC/ICES Working Group on Eels. Rome, 23–27 January 2006. EIFAC Occasional Paper. No. 38, ICES CM 2006/ACFM:16. Rome, FAO/Copenhagen, ICES. 2006. 352p.
Lobon-Cervia, J., Utrilla, C. G., and Ricon, P. A. 1995. Variations in the population dynamics of the european eel Anguilla anguilla (L. ) along the course of a Cantabrian river. Ecology of Freshwater Fish 4, 17–27.
Lobon-Cervia, J. 1999. The decline of Anguilla anguilla (L. ) in a river catchment of northern Spain 1987-1997. Further evidence for a critical status of eel in Iberian Waters. Arch. Hidrobiol. 144 2 245–253.
Lobon-Cervia, J., Carrascal, M. 1992. Seasonal timing of silver eels (Anguilla anguilla L. ) in a cantabrian stream (North Spain). Arch. Hidrobiol. 125 1 121–126.
Lobon-Cervia, J., Bernat, Y., Rincon, P. A. 1990. Effects of eel (Anguilla anguilla L. ) removals from selected sites of a stream on its subsequent densities. Arch. Hidrobiol. 206 207–216.
Marin, T., Bueno, M., and Alonso, F. 1994. Evolución histórica de la distribución de la anguila (Anguilla anguilla (L. )) en la Comunidad Autónoma de Castilla-La Mancha. Symposium sobre "Los ecosistemas acuáticos en Castilla-La Mancha".
Olmos, V., Aragoneses, J., Echevarrias, J. L., Oltra, Y. R., 2000. Composición de la dieta e impacto del cormorán grande (Phalacrocorax carbo sinensis) durante la invernada en las salinas de Santa Pola, Alicante, este de España. Ardeola 47(2): 227–236.
Santillo, D., Johnston, P., Labunska, I., and Brigden, K. 2005. Widespread presence of brominated flame retardants and PCBs in eels (Anguilla anguilla) from rivers and lakes in 10 European countries. Greenpeace Research Laboratories Technical Note 12/2005, publ. Greenpeace International, October 2005. 56 pp. http://www. greenpeace. org/raw/content/international/press/reports/pollutionPCBBFReels. pdf
Sánchez, J., Marino, N., Vaquero, M. C., Ansorena, J., and Legorburu, I. 1998. Metal pollution by old leadzinc mines in Urumea river valley (Basque Country, Spain). soil, biota and sediment. Water, Air, and Soil Pollution 107: 303–319.
Serdio, A., 2005. Programa de control experimental de la depredación por cormorán grande en los ríos de Cantabria. resultados invierno 2004-2005. Gobierno de Cantabria Consejería De Ganadería, Agricultura Y Pesca Dirección General De Montes y Conservación De La Naturaleza.
Sobrino, I., , Baldó, F., ,García-González, D., Cuesta, J. A., Silva-García, A., Fernández-Delgado, C., Arias A. M., Rodríguez A., and Drake, P. 2005. The effect of estuarine fisheries on juvenile fish observed within the Guadalquivir Estuary (SW Spain). Fis. Res. 76: 229–242.
Usero, J., Izquierdo D., Morillo, J., and Gracia, I. 2003. Heavy metals in fish (Solea vulgaris, Anguilla anguilla and Liza aurata) from salt marshes on the southern Atlantic coast of Spain. Environment International 29: 949–956.

Joint EIFAC/ICES WGEEL Report 2007 463
Table ES.l. Glass eel catches (kg) in Spain from 1952 onwards.
B. COUNTRY*
SAN JUAN DE
LA ARENA**
NALÓN**● REST OF ASTURIAS**
ASTURIAS** GUADALQUIVIR† ALBUFERA **
1952 14529 1953 8318 1954 13576 1955 16649 1956 14351 1957 12911 1958 13071 1959 17975 10000 1960 13060 17000 1961 17177 11000 1962 11507 16000 1963 16139 11000 1964 20364 4000 1965 11974 6000 1966 12977 5000 1967 20556 4000 1968 15628 4000 1969 18753 5000 1970 17032 1000 1971 11219 1000 1972 11056 1000 1973 24481 2000 1974 32611 1000 1975 55514 6000 1976 37661 5000 1977 59918 1978 37468 1979 42110 1980 34645 1981 26295 1309 1982 21837 1983 22541 30804 2387 1984 12839 15911 2980 1985 13544 14229 1986 23536 22219 2845 1987 15211 27417 4255 1988 13574 13500 2513 1989 9216 14309 1322 1990 7117 7515 1079 1991 10259 7660 831 1992 9673 12990 300 1993 9900 10109 303 1994 12500 14307 199

464 Joint EIFAC/ICES WGEEL Report 2007
B. COUNTRY*
SAN JUAN DE
LA ARENA**
NALÓN**● REST OF ASTURIAS**
ASTURIAS** GUADALQUIVIR† ALBUFERA **
1995 5900 6117 1633 7751 271 1996 3656 5302 2027 7329 5000 366 1997 3273 4723 1792 6514 4600 1998 3815 5572 1541 7113 616 1999 1330 2039 1020 3058 323 2000 1285 1839 893 2732 678 2001 1569 2305 800 3105 466 2002 1231 1793 977 2770 357 2003 858 506 764 588 1351 233 2004 1181 914 1835 1040 2875 209 2005 1282 836 1355 820 2175 2006 687 615 1005 1261 2266 *Data from catches report ** Data from auctions † Sobrino et al., 2005 ● In the Nalón River, data from San Juan de la Arena and Cudillero guilds is included.

Joint EIFAC/ICES WGEEL Report 2007 465
Table ES.2. Yeloow and silver eel catches (kg) in Spain from 1950 onwards.
LANDRO EO VERDUXO LÉREZ AROUSA ALBUFERA YELLOW
+ SILVER YELLOW + SILVER
YELLOW + SILVER
YELLOW + SILVER
YELLOW + SILVER
YELLOW SILVER YELLOW + SILVER
1950 60000 30000 90000 1951 64200 38000 102200 1952 50000 30200 80200 1953 57300 40400 97700 1954 72500 30400 102900 1955 75860 30260 106120 1956 40000 40000 80000 1957 75000 40000 115000 1958 60000 40000 100000 1959 68000 30000 98000 1960 65300 30040 95340 1961 70500 20200 90700 1962 73000 22400 95400 1963 73500 18000 91500 1964 64000 12300 76300 1965 64000 15000 79000 1966 59500 20000 79500 1967 49600 16000 65600 1968 45300 11200 56500 1969 1970 30250 12600 42850 1971 32400 11612 44012 1972 25500 18300 43800 1973 20600 12428 33028 1974 13612 11210 24822 1975 10620 6570 17190 1976 8260 5300 13560 1977 1978 1979 1980 6352 4668 11020 1981 12269 6848 19117 1982 6845 9126 15971 1983 6397 7697 14094 1984 7395 3577 10972 1985 11013 3464 14477 1986 9243 2871 12114 1987 11228 3611 14839 1988 7698 2098 9796 1990 2000 1843 3843 1991 1992 3000 2330 5330 1993 3000 2349 5349 1994 2000 2155 4155

466 Joint EIFAC/ICES WGEEL Report 2007
1995 1600 2897 4497 1996 2960 3105 6065 1997 2784 2123 4907 1998 3100 2563 5663 1999 2400 2503 4903 2000 1537 2047 3584 2001 479 467 42159 0 7439 1284 1995 3279 2002 213 643 25252 30 13563 1432 2126 3558 2003 266 180 19708 16 11171 4042 2598 6640 2004 1887 460 22014 14 10997 5591 2138 7729 2005 5849 2480 14512 0 8861 6493 1472 7965 2006 7993 2344 42994 73 9707 5974 1479 7453

Joint EIFAC/ICES WGEEL Report 2007 467
Portugal: Report on the eel stock and f ishery in Portugal 2007
PT.A. Author
Carlos Antunes
Centre for Marine and Environmental Research (CIIMAR)-University of Porto
Rua dos Bragas, 289, 4050–123 Porto Portugal
Telf. 00351226060421
PT.B. Introduction
In Portugal, the European eel, Anguilla anguilla, is an important species for both commercial and recreational fisheries, which occur in different types of water bodies specially in lagoon coastal waters, estuaries and rivers.
The main river basins are international shared between Portugal and Spain, namely:
Minho river, with a total surface area of 17 080 Km2 (800 Km2 in Portugal, 16 280 Km2 in Spain) and 330 Km long; Lima river, with a total surface area of 2480 Km2 (1177 Km2 in Portugal, 1303 Km2 in Spain) and 108 Km long; Douro river, with a total surface area of 97 290 Km2 ( 18 338 Km2 in Portugal, 78 952 Km2 in Spain) and 897 Km long; Tejo river, with a total surface area of 80 600 Km2 (24 850 Km2 in Portugal, 55 750 Km2 in Spain) and 1007 Km long; Guadiana river, with a total surface area of 66 800 Km2 (11 580 Km2 in Portugal, 55 220 Km2 in Spain) and 810 Km long.
The main national river basins are:
Cávado river, with a total surface area of 1600 Km2 and 135 Km long; Ave river, with a total surface area of 1390 Km2 and 94 Km long; Vouga river, with a total surface area of 3635 Km2and 148 Km long; Mondego river, with a total surface area of 6644 Km2 and 234 Km long; Lis river, with a total surface area of 945 Km2 and 39,5 Km long; Sado river, with a total surface area of 7640 Km2 and 180 km long; Mira river, with a total surface area of 1600 Km2 and 145 Km long; Arade river with a total surface area of 229 Km2 and 75 Km long. In Portugal, the eel commercial exploitation comprises glass eel (Minho River) and yellow eel (all rivers) phases of its life cycle.

468 Joint EIFAC/ICES WGEEL Report 2007
Figure PT.B.1 Map of Portugal
PT.B.1. Minho River
The Minho River has a total length of 330 Km and catchment area of 17 080 Km2. Over a length of 80 Km, it forms the northern border between Portugal and Spain. It is about 10 m wide entering Portuguese territory, and 2 Km wide in the estuarine area. The salinity front extends about 10–17 Km upstream, depending on tide and river discharge. The average discharge is 300 m3s-1. The first dam, at 80 Km from the mouth of the river, was built in 1969. Glass eel fishing takes place in the estuary up to the tidal limit, 20 Km upstream.
Special legislation (Dec. Law 316, Art. 55 of 26.11.81), for this international river allows Portuguese and Spanish fishermen to use the stow net “tela”, forbidden in the rest of the country. Until the 2000/2001 season only the use of a dip net from the river bank was permitted in the remainder of the country. Starting in 2001, the glass eel fishery was restricted to the Minho River. On other rivers, only fisheries for aquaculture or restocking purposes is allowed (Dec. regulamentar nº 7/2000 of May 30).

Joint EIFAC/ICES WGEEL Report 2007 469
Figure PT.B.2. Hidrographic basin of the Minho River.
PT.C. Fishing capacity
PT.C.1. Glass eel
The glass eel fishing is prohibited in all rivers of Portugal with exception of the Minho River. Because glass eel has a high economical value a strong illegal activity is going on in these rivers.
PT.C.1.1. Minho River
The Minho river which constitutes over 80 Km the northern boundary between Portugal and Spain has become one of the most important glass eel fisheries on the Iberian Peninsula over the last three decades. Management of the eel stock is under the responsibility of the “Ministério da Agricultura, do Desenvolvimento Rural e das Pescas”. Two kind of laws are implemented in the country concerning glass eels fishery. In the Minho River an agreement between Portuguese and Spanish authorities allow to fish glass eels between November and April (in the past), November and last New Moon of March (last season) using a stow net. In 2000/2001, the fishery was prohibited in all other Portuguese rivers, except for aquaculture and restocking programmes. The monitoring of glass eel recruitment has been carried out since the mid 1970s based in professional fishermen catch values and declared annually to the authorities. The Portuguese catches are mainly sold to Spain for human consumption and aquaculture, and higher prices are attained before Christmas (in average-350 €/Kg, could attain 500 €/Kg). Because glass eel has a high economical value a strong illegal activity is going on in all other national rivers.
In the Minho River the glass eel fishery is permitted with a stow net. The stow net has the following maximum dimensions: 10 m of floatline, kept at the surface with 10–20 buoys, 8 m height, 15 m leadline, width of netend 2.5 m and mesh size of 1–2mm. Opening area is around

470 Joint EIFAC/ICES WGEEL Report 2007
50 m2. The net is anchored when the tide is rising, the end fastened to a boat, and glass eels are scooped out with a small dipnet frequently. This gear is exclusively used for glass eel fishing but the bycatch can be very important, including up to 49 species. From the river bank, glass eels can also be fished with a dipnet of 1.5 m maximum diameter and mesh size of 1–2 mm. In 1983 there were 450 licensed fishermen in Spain and 750 in Portugal, corresponding to 300–400 nets in total. In 1988 approximately 600 boats in Portugal have permission to fish glass eels with one net each and in 1995, 455 Portuguese boat inscriptions were recorded. In 1999, 251 Spanish fishermen were registered for the glass eel fishery. Actually, approximately 500 fishermen from both countries have a professional licence to fish glass eel.
The fact that a fishermen has a licence to fish glass eels in a certain year does not necessarily mean that he will actually fish. The seasonal occurrence of other, relatively abundant species, like lamprey, influences the effort in the glass eel fisheries in an unpredictable manner.
The official glass eel fishing seasons was from November to April, until 2005/06 season. In the last one the period was from November until March. The fishery is always performed at night around new moon as it depends completely on the rising tidal current. Depending on weather conditions peaks may occur in winter or spring. Catches in summer months are very low (Antunes, 1994a).
Fishermen are obliged to inform the local authorities of their total annual catches. The official fishery statistics are kept by the responsible local authorities- Capitania do Porto de Caminha. Total annual statistics have been recorded since 1974. Between 1974 and 2005, 13.4.tons of glass eels were caught annually (however we estimated that values are 80 % underestimated). A maximum of 50 tons was declared in 1980/81 followed by a second peak of 30.3 tons in 1984. In the period of 1985 to 1988 the official yield dropped to 9,5 tons with a peak of 15.2 tons in 1995. In 2000/2001 low catches were obtained, probably due to bad weather conditions that prohibited the fishery during 3 months. After 2001/2002 season until 2005 the values decreased to 2.6 tons. The 2005/2006 season values are not yet available.
Figure PT.C.1. Stow net-“tela”.

Joint EIFAC/ICES WGEEL Report 2007 471
Figure PT.C.2. Stow net-“tela” showing the bycatch.
0
10
20
30
40
50
60
1974 1976 1978 1980 1982 1984 19861988 1990 19921994 1996 19982000 2002 20042006
year
Ton
Portugal Spain Total
Figure PT.C.3. Official data of glass eel fishery between 1974 and 2006.

472 Joint EIFAC/ICES WGEEL Report 2007
Table PT.C.1. Official data of glass eel fishery between 1974 and 2006.
YEAR PORTUGAL SPAIN TOTAL (TONS)
1974 0,05 1,6 1,65 1975 5 5,6 10,6 1976 7,5 12,5 20 1977 15 21,6 36,6 1978 7 17,3 24,3 1979 13 15,4 28,4 1980 2,9 13 15,9 1981 32 18 50 1982 6,7 9,7 16,4 1983 16 14 30 1984 14,8 15,3 30,1 1985 7 6 13 1986 9,5 5,5 15 1987 2,6 5,6 8,2 1988 3 5 8 1989 4,5 4 8,5 1990 2,5 3,6 6,1 1991 4,5 2,4 6,9 1992 3,6 9,8 13,4 1993 2,9 2,1 5 1994 5,3 4,7 10 1995 8,7 6,5 15,2 1996 4,4 4,3 8,7 1997 4,5 2,9 7,4 1998 3,6 3,8 7,4 1999 3 3,8 6,8 2000 1,2 6,5 7,7 2001 1,1 1,1 2002 1,443 7,8 9,243 2003 0,814 1,6 2,414 2004 1,17 1,3 2,47 2005 2,7 0,32 3,02 2006 * 1,14 1,14
* data not available
PT.C.1.2. Illegal fishing
In the country, in all main rivers basin, with exception of the Minho River basin, an important illegal commercial glass eel fishing exists. In general there is no information concerning data of these fisheries. The information available is obtained directly through fishermen and dealers. It is used an “invisible net”-stow net with bag that could be permanently in the water causing an important ecological impact.

Joint EIFAC/ICES WGEEL Report 2007 473
PT.C.4. Stow net with bag (17 meters long).
PT.C.2.Yellow eel
The yellow eel fishery management is from responsibility of “Ministério da Agricultura, do Desenvolvimento Rural e das Pescas” and there are different regulations among the national catchment areas. Generally are permitted long lines and fyke-nets to fish yellow eel, during all year with a minimum size that varies between 20 and 22 cm.
Figure PT.C.5. Fyke net “galricho”, Ria de Avero, Tejo river (Franca et al., 1998).
In the 1980s and concerning small scale (“artesanal”) fishery there was about 10 000 boats (15 000 fishermen) which 80% were dedicated to the local fishery and 20% were to the coastal fishery. However, after one decade the number of fishermen dropped to 12 000 (Franca et al., 1988). We don’t know the total number of professional fishermen fishing yellow eel. Only a partial data are declared, because a low percentage of yellow eel pass in the auction market for fish products.

474 Joint EIFAC/ICES WGEEL Report 2007
Figure PT.C.6. Fyke net.
0
0,5
1
1,5
2
2,5
3
3,5
month
Ton
Series1 3,3 3,1 3,1 2,9 2,9 2,9 3,2 3,1 3,3 3,2 3 1,9
J F M A M J J A S O N D0
0,5
1
1,5
2
2,5
3
3,5
month
Ton
Series1 3,3 3,1 3,1 2,9 2,9 2,9 3,2 3,1 3,3 3,2 3 1,9
J F M A M J J A S O N D
6% 3%
89%
2%0%
North* Center Tejo Valley Alente jo Algarve
The number of recreative fishermen is estimated in 600 000 which 50 % corresponds to inland fishing involving 100 M€/year.
PT.C.2.1. Minho River
In 1984 there were 1744 Portuguese fishermen with licence to fish in the Minho River. The number decreased to around 800 at the beginning of the 1990s and stabilized until our days. Actually the number of Portuguese and Spanish fishermen is approximately 1200 which only 50% declared fish captures each year.
The yellow eel is captured using baited hooks and fyke-nets with the following legal fishing period: all year to the baited hooks and between September and November to fyke-nets.

Joint EIFAC/ICES WGEEL Report 2007 475
Figure PT.C.9. Fyke-nets “nassa”, Minho River.
0
1
2
3
4
5
6
1983 1985 1987 1989 1991 1993 1995 1997 1999 2001 2003 2005 2007
year
Ton
Portugal Spain Total
Figure PT.C.10. Yellow eel catches in the Minho River between 1983 and 2006.

476 Joint EIFAC/ICES WGEEL Report 2007
Table PT.C.2. Yellow eel catches in the Minho River between 1983 and 2006 (source:Capitania do porto de Caminha) * data not available.
YEAR PORTUGAL SPAIN TOTAL
1984 2 * 2 1985 0,2 * 0,2 1986 3 * 3 1987 3,4 * 3,4 1988 3,1 * 3,1 1989 3 * 3 1990 3,8 * 3,8 1991 2,5 * 2,5 1992 2,984 * 2,984 1993 3,5 * 3,5 1994 5,6 * 5,6 1995 1,3 * 1,3 1996 1,5 * 1,5 1997 1,2 * 1,2 1998 0,75 * 0,75 1999 1,6 * 1,6 2000 0,65 0,37 1,02 2001 0,86 * 0,86 2002 0,316 * 0,316 2003 0,671 0,671 2004 1,014 0,265 1,279 2005 0,807 0,277 1,084 2006 0,95 0,32 1,27 2007 * 0,1 0,1
PT.D. Fishing effort
Landings declarations don’t include record for effort or gear. This kind of information is possible asking directly the fishermen or dealers.
PT.E. Catches and landings
Catch of glass eel-In the Minho River the monitoring of glass eels recruitment has been carried out since de mid 1970s based in professional fishermen catch values and declared annually to the authorities.
Catch of yellow eel-There is no real data on landings of yellow eel in the country because usually the fish caught in estuaries and inland waters didn’t pass in the auction market.
Aquaculture production-In Portugal the eel culture has no expression. Actually the available data means respect to extensive aquaculture practised in coastal lagoons and the values declared are below to 10 tons/year.
Re-stocking-There is no national programme for eel re-stocking.
Catch of recreational fisheries-There exists no catch statistics from recreational fisheries.

Joint EIFAC/ICES WGEEL Report 2007 477
The eel fishing activity in Portugal is not enough to the internal market. The main areas of eels consumption are in the Centre and South of the country, specially in the Tejo Valley region. No data exists about the amounts of eels alive that arriving Portugal from different origin markets like America, Marrocos, Tunisia, Spain, France, Belgium, Netherlands.
PT.F. Catch per unit of effort
Data on catch per unit effort do not exist.
PT.G. Scientific surveys of the stock
PT.G.1. Glass eel
Experimental glass eel fishery in the Minho River was initiated in 1981, supported by grants and projects, and conducted for several purposes, with no fixed stations in general (Weber, 1986; Antunes and Weber, 1990, 1993; Antunes, 1994ab). Occasional studies in Lis River, Mondego River, Guadiana River and Lima River were conducted for short periods (Jorge and Sobral, 1989; Jorge et al.,1990; Domingos, 1992; Bessa,1992; Bessa and Castro, 1994, 1995; Domingos et al., 2006). Generally the information available from scientific studies includes fishing time, yield, by-catch, biometric parameters, pigmentation, relation with moon’s phase and time of the year.
SITES OF EXPERIMENTAL GLASS EEL FISHERY PERIOD
Mondego River 1979–83/1988–90 Lis River 1991–94 Guadiana River 1998–99 Lima River 2001–02 Minho River 1981–
PT.G.1.1. Minho River
The statistics on the commercial fishery have been used as indicator of the recruitment strength. Underreporting is rather likely. Nevertheless, they will be indicative for the trend in glass eel recruitment to the Minho River for the last 30 years. Experimental fishing in Minho River has been operated since 1981 in several time periods. Although monitoring was not the primary objective, this research has contributed to our knowledge of the fish stock and fisheries. The experimental fishing trend is in agreement with official data.

478 Joint EIFAC/ICES WGEEL Report 2007
0
1000
2000
3000
4000
5000
Nov81
J82
M M Jl S N J83
M Mar00
M Jl A O D F A J A O D Fmonth
glass eels (g/h)
0
1000
2000
3000
4000
5000
Nov81
J82
M M Jl S N J83
M Mar00
M Jl A O D F A J A O D Fmonth
glass eels (g/h)
The work that is going on concerning glass eel entrance comprises:
1 ) monthly experimental glass eel fishery (biometric and pigmentation stage, environmental data and in some periods the bycatch analyses).
2 ) accurate fishing data from fishermen to apply in glass eel estimation entrance.
PT.G.2. Silver eel
There is no data series about silver eels in the country.

Joint EIFAC/ICES WGEEL Report 2007 479
0
100
200
300
400
500
600
2000 2001 2002 2003 2004 2005
yearm
m
y ellow s ilver
Figure PT.G.2. Yellow and silver eels length from Tea River (Minho tributary) between 2000 and 2005. Source: Conselleria Medio Ambiente, Xunta da Galicia (unpubl. data).
In one Spanish tributary of the Minho River, a recent registration of eels made in salmon ladders, controlled by Xunta da Galicia, have available some biometric data concerning silver eels.
PT.H. Catch composition by age and length
Portugal has not sampled the landings/catches of eel.
PT.I. Other biological sampling
PT.I.1. Yellow eel
At national level several eco-toxicological studies using eels from different catchment areas, were published, eg.: Aveiro lagoon (Pacheco and Santos, 2001), Pateira de Fermentelos (Maria et al., 2006; Teles et al., 2007); Iqbal et al.(2004, 2006).
Information about trace metals in several fish species of the Ria de Aveiro, included eels is given by Cid et al. (2001) and PCB’s in Minho River by Santillo et al. (2005).
Different works dedicated to eel parasites are available:
Nematoda – Ria de Aveiro (Cruz et al., 1992), Douro River catchment (Saraiva et al., 2002; Saraiva et al., 2002).
Intestinal Helminth communities-Lima, Cávado, Ave and Douro catchment areas (Saraiva et al., 2005).
Protozoa-Âncora, Lima,.Cávado, Douro and Tejo catchment areas (Carvalho-Varela, 1984; Cruz and Davies, 1998); Cruz and Eiras (1997).
Parasite fauna in general including Anguillicola-Minho River catchment (Aguilar et al., 2005), several rivers (Saraiva and Molnar, 1990; Saraiva, 1994, 1995, 1996; Saraiva and Chubb, 1996; Saraiva and Eiras,1996; Rodrigues and Saraiva, 1996; Cardoso and Saraiva, 1998,).
Age and growth:
Aveiro lagoon (Gordo and Jorge, 1991).
Interaction with other species:
Halobatrachus didactylus – Mira River estuary (Costa et al., 2006).
Ecology:

480 Joint EIFAC/ICES WGEEL Report 2007
Population structure, feeding and condition-Tejo River basin (Costa et al., 2007).
Size structure, spatiotemporal variations-Mondego River (Domingos et al., 2006).
PT.I.1.1. Minho River
At present, the scientific work in the Minho River estuary comprises:
1 ) Mark-recapture studies in yellow eels (complete biometric data is registered, eels marked with PIT tag, injected with OTC and all are tattoed).
2 ) Parasites (comparing actual prevalence of Anguillicola with old data (Antunes, 1999)); other parasites (Hermida et al., 2006).
3 ) Potencial predators (eg. Cormorant-Phalacrocorax carbo). 4 ) Abundance of eel population in tributaries (electric fishery) and compare with old
data (Antunes, 1990).
Figure PT.I.2. Tattooing after PIT tag mark.
Figure PT.I.3. Anguillicola present in yellow eel.

Joint EIFAC/ICES WGEEL Report 2007 481
Variação sazonal das prevalências (%) de parasitose
0,0020,0040,0060,0080,00
100,00
Primav
eraVerã
o
Outono
invern
o
Myxidium giardi
PseudodactylogyrusanguillaeGnathiidae gen. sp.
Ergasilus gibbus
PT.J. Other sampling
PT.K. Stock assessment
No regular stock assessment.
PT.L. Sampling intensity and precision
PT.M. Standardisation and harmonisation of methodology
At national level nothing is done about standardisation and harmonisation of methodology concerning eel scientific surveys, however the Minho river basin was in the Indicang project. Indicang was a network with participants spreading from UK to Northern Portugal and the main objective was to establish like a “net abundance indicators of European eel in its repartition central area.” One the most important phase of the project was to publish different methodological guides with the objective to produce scientific and technical basis to estimate, from the descriptors chosen by the project, the relevant indicators to follow and evaluate the status of the eel resources and its environment.
Concerning available data to the Minho River the work inside the project consisted in:
1 ) database organization in a Geographical Information System (GIS) (Hidrology, land uses, geology, dams and its characteristics). New data will loaded in the future.
2 ) Knowledge of the water quality analysis points-29 automatic stations (temp., pH, conduct., oxíg., turb., NH4+), 385 periodic sampling stations, international area-8 sampling stations analysing 68 parameters (physical, chemical, bacteriological, heavy metals).
3 ) Identification of the water uses in the basin (consumption, agriculture, aquaculture....).
In the field some work started in different areas:
• characterization of the obstacles in the basin. • sediment quality analysis concerning heavy metals and pesticides in Minho river
estuary, including saltmarsh areas.

482 Joint EIFAC/ICES WGEEL Report 2007
• parasite characterisation of the eel population including comparison of Anguillicola prevalence with old data.
• mark recapture of yellow eel in the estuary. • Abundance analysis of yellow eel population (electric fishing in tributaries) and
compare with old data.
PT.N. Overview, conclusions and recommendations
Specific regulations exist in Portugal for the glass eel and yellow eel fisheries but they are not supported by any kind of management programme.
In the Minho River the fisheries Law was made in agreement between Portuguese and Spanish authorities and the fishermen have to declare the catch values annually. These data is the common source concerning management programme.
Because glass eel has a high economical value, the fishery management is difficult in all rivers, being the Minho River the exception, and that is why a strong illegal activity is going on. The Minho is the only river where the “tela”-net is authorised by the two governments. Instead of “tela”-net prohibition as solution in the future, perhaps it would be better to reduce the time fishing (between November and January because in this month starts the lamprey fishery). In addition, would be better to forbid the glass eel fishery during the weekend, to implement fishing forbidden areas (specially in the mouth of the river) and to control the fishing licences. These rules associated with efficient surveillance by local authorities will help for a proliferation of illegal nets, as it happen in the other national rivers, and as we know causes eel damages and have a stronger ecological impact compared with “tela”-net. By other side, the distribution areas concerning eel migration in inland waters, was reduced by building dams and no re-stocking and fish pass programs were implemented.
PT.O. Literature references cited
Antunes C (1990). Abundance and distribution of eels (Anguilla anguilla) in the Rio Minho. Int. Revue ges. Hydrobiol., 75(6):795.
Antunes C (1994a). The seasonal occurrence of glass eels (Anguilla anguilla) in the Rio Minho between 1991 and 1993 (North of Portugal). Int. Revue ges. Hydrobiol., 79(2):287–294.
Antunes C (1994b). Estudo da migração e metamorphose de Anguilla anguilla L. Por analise dos incrementos dos sagittae, em leptocéfalos e enguias de vidro. [Study of the migration and metamorphosis of Anguilla anguilla L. by the analysis of sagittae increments in leptocephali and glass eels. Tese de Doutoramento, Instituto de Ciências Biomédicas Abel Salazar, Universidade do Porto, 294 pp.
Antunes C (1999). Anguillicola infestation of eel population from the Rio Minho (North of Portugal). ICES-EIFAC, 20–24 September, Silkeborg, Denmark.
Antunes C & Weber M (1990). Influência da pesca do meixão, Anguilla anguilla L. No stock de enguias , no rio Minho internacional. [Glass eel fishing influence on the eel stock of international Minho River]. Comissão de Coordenação da Região Norte, 69 pp.
Antunes C & Weber M (1993). The glass eel fishery and the by-catch in the Rio Minho alter one decade (1981-182 and 1991-1992). Archiwum Rybactwa Polskiego, 4(2):131–139.
Aguilar A, Álvarez MF, Leiro JM, Sanmartín ML (2005). Parasite populations of the European eel (Anguilla anguilla L.) in the rivers Ulla and Tea (Galicia, nothwest Spain). Aquaculture, 249:85–94.
Bessa, R (1992). Apanha de meixão com “sarrico” na safra de 1989/90 no rio Lis. [Glass eel catch with “sarrico” during the season of 1989/90 in Lis River]. Relatório Técnico Científico INIP, 57, 13pp.

Joint EIFAC/ICES WGEEL Report 2007 483
Bessa, R; Castro M (1994). Evolução das capturas de meixão ao longo do ano no rio Lis e sua relação com as condições ambientais. Relatório Técnico Científico INIP, 2, 19pp.
Bessa, R; Castro M (1995). Variação sazonal dos parâmetros biométricos de meixão capturado no rio. Relatório Técnico Científico INIP, 4, 11pp.
Cardoso EM, Saraiva AM (1998). Distribution and seasonal occurrence of Anguillicola (Anguillicola crassus)(Nematoda:Dracunculoidea) in the European eel Anguilla anguilla from rivers of North Portugal. Bulletin of the European Association of Fish Pathologists, 18(4):136–139.
Carvalho-Varela M, Cunha-Ferreira V, Cruz e Silva MP, Grazina-Freitas MS (1984). Sobre a parasitofauna da enguia europeia (Anguilla anguilla (L.)) em Portugal. Repositório de trabalhos do L.N.I.V., XVI:143–150.
Cid BP, Boia C, Pombo L, Rebelo E (2001). Determination of trace metals in fish species of the Ria de Aveiro (Portugal) by electrothermal atomic absortion spectrometry. Food Chemistry 75:93–100.
Costa JL, Domingos I, Almeida AJ, Feunteun E, Costa MJ (2006). The interaction between Anguilla anguilla (Linnaeus, 1758) and Halobatrachus diadactylus (Bloch & Schneider, 1801) and potencial consequences of climatic changes. ICES CM 2006/J:29.
Costa JL, Domingos I, Assis C, Almeida PR, Moreira F, Feunteun E, Costa MJ (2007). Comparative ecology of the European eel, Anguilla anguilla (L.,1758), in a large Iberian river. Environ. Biol. Fish DOI10.1007/s10641–007–9229–2.
Cruz C, Davies AJ (1998). Some observations on Babesiosoma bettencourti (Franca,1908) n. comb.(syns. Haemogregarina bettencourti Franca, 1908; Desseria bettencourti Siddall, 1995) from eels, Anguilla anguilla L., in Portugal. Joournal of Fish Diseases, 21(6):443–448.
Cruz C, Eiras JC (1997). Prevalence of Trypanosoma granulosum in Anguilla anguilla in Portugal. Bulletin of the European Association of Fish Pathologists, 17 (3–4):126–128.
Cruz P, Silva E, Freitas MS, Carvalho-Varela M (1992). First report of Anguillicola crassus in the European eel in Portugal. Bull. Eur. Ass. Fish Pathol. 12(5): 155.
Domingos IM (1992). Flutuation of glass eel migration in the Mondego estuary (Portugal) in 1988 and 1989. Irish Fisheries Investigations Series A (Freshwater), 36:1–4.
Domingos IM, Costa JL, Costa MJ (2006). Factores determining length distribution and abundance of the European eel, Anguilla anguilla, in the River Mondego (Portugal). Freshwater Biology 51:2265–2281.
Franca MLP, Martins R, Carneiro M (1998). A pesca artesanal local na costa continental portuguesa. IPIMAR (eds.), 234 pp.
Gordo LS, Jorge IM (1991). Age and growth of the European eel, Anguilla anguilla (Linnaeus, 1758) in the Aveiro lagoon, Portugal. Scientia Marina, 55:389–395.
Hermida M (2006). Estudo de parasitas metazoários de uma população de enguia europeia (Anguilla anguilla) em meio salobro. Tese de Mestrado, ICBAS-Univ. Porto, 85pp.
Hermida M, Saraiva A, Santos J, Guilhermino L (2006). Parasitas branquiais da enguia europeia, Anguilla anguilla (L.) do estuário do rio Minho. III Simpósio Ibérico Sobre a Bacia Hidrográfica do Rio Minho, Actas: 110–117, V.N. Cerveira, Portugal.
Iqbal A, Pacheco M, Santos MA (2004). Enzymatic and nonenzimatic antioxidants as an adaptation to phagocyte-induced damage in Anguilla anguilla L. following in situ harbour water exposure. Ecotoxicology and Environmental Safety 57: 290–302.
Iqbal A, Pacheco M, Santos MA (2006). Anguilla anguilla L. Oxidative stress biomarkers: An in situ study of freshwater wetland ecosystem (Pateira de Fermentelos, Portugal). Chemosphere 65:952–962.

484 Joint EIFAC/ICES WGEEL Report 2007
Jorge I, Sobral, M (1989). Contribuição para o conhecimento da pescaria do meixão (Anguilla anguilla L.)-dados preliminares sobre a influência das prinicipais artes de pesca e importância das capturas acessórias no estuário do Mondego. [Contribution for the knowledge of glass eel fishery (Anguilla anguilla L.).-Preliminary data about the efficiency of the main fishing gears and importance of the by-catch in Mondego estuary. Relatório Técnico Científico INIP, 82 pp.
Jorge I, Sobral M, Bela J (1990). On the efficiency and bycatch of the main glass eel (Anguilla anguilla L.) fishing gears used in Portugal. Int. Revue ges. Hydrobiol., 75(6):841.
Maria VL, Pacheco M, Santos MA (2006). Anguilla anguilla L. Genotoxic responses after in situ exposure to freshwater wetland (Pateira de Fermentelos, Portugal). Environmental International 32: 510–515.
Pacheco M, Santos MA (2001). Biotransformation, endocrine, and genetic responses of Anguilla anguilla L. to petroleum distillate products and environmentally contaminated waters. Ecotoxicology and Environmental Safety 49:64–75.
Rodrigues AA, Saraiva A (1996). Spatial distribution & seasonality of Pseudodactylogyrus anguillae & P. Bini on the gills of the European eel Anguilla anguilla from Portugal. Bulletin of the European Association of Fish Pathologists, 16(3):85–88.
Santillo D, Johnston P, Labunska I, Brigden K (2005). Widespread presence of brominated flame retardants and PCBs in eels (Anguilla anguilla) from rivers and lakes in 10 European countries. Greenpeace, Technical Note 12/2005.
Saraiva A, Molnar K (1990). Myxobolus portucalensis n.sp. in the fins of European eel Anguilla anguilla (L.) in Portugal. Revista Iberica de Parasitologia, 50 (1–2):31–35.
Saraiva A. (1994). Contribuição para o conhecimento da parasitofauna da enguia europeia, Anguilla anguilla L. Tese Doutoramento, Fac. Ciências-Univ. Porto, 284pp.
Saraiva A (1995). Pseudodactylogyrus anguillae (Yin & Sproston, 1984) Gussev,1965 and P. bini (Kikuchi, 1929) Gussev,1965 (Monogenea, Monopisthocotylea) in Portugal.Bulletin of the European Association of Fish Pathologists, 15(3):81–83.
Saraiva A (1996). Ergasilus gibbus Nordmann, 1832 (Copepoda:Ergasilidae) on the gills of the european eel Anguilla anguilla L. from Portugal. Research and Reviwes in Parasitology 56(1):21–24.
Saraiva A, Chubb JC (1996). Preliminary observations on the parasites of Anguilla anguilla (L.) from Portugal. Bulletin of the European Association of Fish Pathologists, 9(4):88–89.
Saraiva A, Eiras JC (1996). Prasite community of European eel, Anguilla anguilla (L.) in the River Este, northern Portugal. Research and Reviews in Parasitology, 56(4):179–183.
Saraiva A, Pereira A, Cruz C (2002). Observations on the occurrence and maturation of Spinitectus inermis (Nematoda:Cystidicolidae) in the Sousa River, Portugal. Folia Parasitologica 49:167–168.
Saraiva A, Moravec F, Pereira A, Cruz C (2002). Development of Spinitectus inermis (Nematoda:Cystidicolidae),a parasite of eel,Anguilla anguiila, in Europe. Folia Parasitologica 49:118–126.
Saraiva A, Antao A, Cruz C (2005). Comparative study of parasite communities in European eel Anguilla anguilla from rivers of northern Portugal. Helminthologia, 42(2):99–106.
Teles M, Pacheco M, Santos MA (2007). Endocrine and metabolic responses of Anguilla anguilla L. caged in a freshwater-wetland (Pateira de Fermentelos-Portugal). Science of the Total Environmental 372: 562–570.
Weber M (1986). Fishing method and seasonal occurrence of glass eels (Anguilla anguilla L.) in the Rio Minho, west coast of the Iberian Peninsula. Vie et Milieu, 36(4):243–250.

Joint EIFAC/ICES WGEEL Report 2007 485
I taly: Report on the eel stock and f isheries in I taly 2007
IT.A. Author
Eleonora Ciccotti
Dipartimento di Biologia, Università degli Studi “Tor Vergata”
Via della Ricerca Scientifica s.n.c.
00133 Rome, Italy
Tel. +39 (0)6 72595969 Fax +39 (0)6 72595965
Email [email protected]
This report was completed in August 2007, and contains data up to 2006.
IT.B. Introduction
Eel (Anguilla anguilla L.) exploitation in Italy has a long standing tradition, and still concerns all continental stages, i.e. glass eel, yellow and migratory silver eel.
A most distinctive exploitation pattern for eel in Italy has been in the past coastal lagoon fishery, that yielded most of yellow and silver eel extensive culture and fishery production (Ciccotti, 1997; Ciccotti et al., 2000; Ciccotti, 2005). Quite important was also eel intensive aquaculture, that played a major role within the national and European context up to a few years ago, but has strongly reduced today (Ciccotti et al., 2000; Ciccotti & Fontenelle, 2001).
Lagoons cover around 1500 km2 , 610 of which are exploited at the present moment. Of the exploited area, about 300 km2 are located in the upper Adriatic and 120 in the Po delta, the rest being scattered in Apulia, Campania, Latium, Tuscany, Sicily and Sardinia (Ardizzone et al., 1988).
In the upper Adriatic lagoons the typical form of management was the vallicoltura that slightly differed from other lagoon management and fisheries because relying on artificial fry stocking and active hydraulic management.
Inland eel fisheries are found in main rivers and lakes. Most of the eel catches are from the great Alpine lakes in the northern regions, but the eel is also an important target species for professional fisheries in some volcanic lakes of Central Italy. Professional eel fisheries in rivers are confined today to residual activities, while professional glass eel fisheries still take place in some estuaries, and in many channel mouths as well. At the moment, most of the glass eel yield comes from the Central and Southern Thyrrenhian area. The main sites of glass eel catches are the estuaries of rivers such as the Arno and Ombrone in Tuscany, the Tiber and the Garigliano in Latium, and the Volturno and Sele in the Campania region. Those sites are frequented not only by local fishermen but occasionally also by fry fishermen from other regions, who reach those sites with trucks equipped with oxygenated tanks to collect mullet, sea bass, sea bream and eel fry. Local fishermen are usually single or Co-operative fishermen that are equipped with boats and structures to store the product alive. Fishing instruments vary depending on the characteristics of the site.

486 Joint EIFAC/ICES WGEEL Report 2007
Figure IT.1 Distribution of main eel fisheries in Italy (O Lakes, Δ Coastal lagoons, + Rivers).
Governmental management framework for eel results disjointed, because in Italy the Ministry of Agriculture and Forestry Politics controls salt and brackish waters, while inland waters are under the control of local Administrations, i.e. Regions or Provinces. Therefore the only eel fisheries under a central Administration are the glass eel fisheries practiced in estuaries, as no marine adult eel fishery exists in Italy. In most cases, anyway, central and regional regulations are in agreement, glass eel fishery regulation being joined always to the regulation of fishery of finfish and bivalve fry for aquaculture. In both departments, a licence is necessary, which has to be renewed annually, in which quantities to be fished have to be declared. Fishermen must notify their catches and sales. Destination of glass eels ought to be restricted to aquaculture and restocking purposes. However, poaching and black market in some regions remain a problem. In absence of counterchecks, collection of data can prove to be partial, and their reliability doubtful.
With regards to inland fisheries, each Region has its own regulations, none specific for eel. At the present moment, an agreement between National Administration and Regions is being discussed regarding fisheries, but not yet in force. Up to now, as a rule individual professional fishing licences are issued, which are valid for 6 years, by each Region, and are enlisted in registers kept by the Provinces. The permitted gears vary from region to region, also in relation to local traditions, and are specified by each Administration, together with authorised times and places. For the nets, mesh sizes and minimum and maximum dimensions of gears are listed.
In the present report an overview on the eel stock and fisheries in Italy is presented, based on information gathered for previous meetings (Workshop on National Data Collection for the European eel held in Sweden in 2005, Eel WG 2006), and updated to 2007. At the present moment, Italy has not established yet its Data Collection Framework for eel, nor has developed a proposal for a National Management Plan. Nevertheless some actions are being undertaken, based on the debate on those important actions currently going on at the administrative levels as well as within the scientific community, in the light of the contents of the Communication on the Development of a Community Action Plan for the management of European Eel (COM(2003) 573 final) and of the Proposal for a Council Regulation establishing measures for the recovery of the stock of European eel (COM(2005)472 final), newly adopted in June 2007 after thorough discussions. In detail, a pilot project for eel Data Collection was tentatively presented in the 2007 Italy National Programme for the collection of fishery data foreseen by Council Regulation 1543/2000 and Commission Regulations 1639/2001, 1581/2004. In addition, in the course of 2007 the Ministry of Agriculture and

Joint EIFAC/ICES WGEEL Report 2007 487
Forestry Politics has accepted a proposal, that followed a specific call, for a Programme that is going to start in the autumn 2007, targeted to the setting up of the knowledge base for the preparation of a National Management Plan, by developing a data collection framework specific for eel, and by identifying the key elements for eel management and restoration at the national level.
With regards to the WFD and its transposition into national legislation, Italy has partly acknowledged it with the law 152/2006, while participating to the actions within the Commission Implementation Strategy, while the River Basin Districts have been identified. This has not yet reflected in the practice, fish monitoring campaigns are going to start by the end of the year, and therefore in this report data are referred to the national level or environmental typology (such as inland or coastal waters) and not even tentatively evaluated at the river basin or district level.
IT.C, D, E and F. Fishing capacity and fishing effort, catches and landings, catch per unit of effort
Notwithstanding the Programmes that are going to start at the national level, at the present moment no estimates of fishing capacity can be given because there a central registration is not available of fishing companies per fishing typology nor per region, apart the Province Registers of fishing licences mentioned above, that are not specific. For glass eel fisheries in marine waters, the number of licenses issued annually by the Ministry for coastal waters shows a sharp drop in the course of the 1990s, also due to the fact that from 1998 a pecuniary charge is due by the fry fishing companies, but it must be borne in mind that the license is not restricted to glass eel. A rough estimate of fishing companies dedicated to glass eel amounts to less than ten.
For adult eel, there is no possibility to evaluate the number of companies dedicated to eel fishing at the present moment.
Fishing equipment for eel catching in lagoons, lakes and rivers includes a variety of instruments ranging from single fyke nets to groups of fyke nets, traps, baskets and fish hooks. Systems consisting of arrangements of nets and fykenets, constituting barriers that close the lagoon from one shore to the other, are used in some lagoons, such as the “paranze” from the lagoon of Lesina in the Southern Adriatic, Italy. Most of silver eel captures take place at fish barriers (lavoriero), devices based on the principle of V-shaped traps that intercept the fish when moving to reach the sea: in the case of silver eel, most captures take place in winter in coincidence with seaward migration. Fishing efficiency by these devices can be considered to attain 100 %.
For glass eel fishing, dip nets are used often in Tuscany, but usually glass eel fishing is carried out with fyke nets of varying dimensions, which are often provided with wings.
There are no log-book systems to record type and number of nets, neither obligatory nor voluntary, at any level, neither central nor local. Considering the large heterogeneity of the fishing devices, no other measure of fishing effort, fuel consumption or other, seems applicable at the present moment.
No obligatory registration of landings exists, at any level, at the present moment, for eel, apart the catch declarations required by the Ministry or by the local Administrations for issuing annual glass eel fishing licences, that seem purely indicative.
Official statistics to which it is possible to make reference for eel are, at the present moment, only those gathered by the Istituto Nazionale di Statistica, Servizio Statistiche sull'Agricoltura. Statistics are grouped on a annual basis, by region and by species or species group. Data are given separately for marine and brackish waters (lagoon and sea fisheries) and for inland

488 Joint EIFAC/ICES WGEEL Report 2007
(lakes and artificial basin fisheries). Riverine catches are not considered, being probably worthless. It must be borne in mind that statistics referring to eel consider only adult eel, yellow and silver cumulated, deriving only by professional fisheries. However, catches from anglers are possibly quite significant.
Eel total landings from lagoon fisheries in Italy from 1969 to 2004 are reported in figure IT.2. Data refer to coastal lagoons only, no marine fisheries existing, while extensive culture productions such as the vallicoltura yields ought not to be considered, falling within the aquaculture productions. It is possible, however, that a certain overlap has occurred in the past.
0
500
1.000
1.500
2.000
2.500
1969
1970
1971
1972
1973
1974
1975
1976
1977
1978
1979
1980
1981
1982
1983
1984
1985
1986
1987
1988
1989
1990
1991
1992
1993
1994
1995
1996
1997
1998
1999
2000
2001
2002
2003
2004
yiel
d, to
nne
Figure IT.2 Eel landings (yellow and silver eel) in Italy, period 1969–2004, from lagoon fisheries (Istituto Nazionale di Statistica).
Inland waters eel landings from 1969 to 2005 are reported in figure IT.3; statistics refer only to lakes and artificial basins.
0
100200
300
400500
600
700800
900
1969
1970
1971
1972
1973
1974
1975
197 6
1977
197 8
1979
198 0
1981
198 2
1983
198 4
1 985
198 6
198 7
1988
198 9
1990
199 1
1 992
199 3
1 994
199 5
1 996
199 7
1 998
199 9
2 000
200 1
2 002
200 3
2 004
2005
yiel
d, to
nne
Figure IT.3 Eel landings (yellow and silver eel) in Italy, period 1969–2005, from lakes and artificial basins (Istituto Nazionale di Statistica).
The above statistics refer to yields cumulated for all Italy, but landing data splitted at the Regional level are also available, not given in the present report.

Joint EIFAC/ICES WGEEL Report 2007 489
With regards to catch per unit of effort, considering that no estimate of fishing effort can be given, it is not possible to estimate CPUE for eel, for any of the fishing tipologies.
IT.G. Scientific surveys of the stock
IT.G.1 Recruitment surveys, glass eel
The monitoring of glass eel recruitment in Italy has been carried out since the mid 1980s within research programmes supported by the Ministry of Agriculture and Forestry Politics, aimed at the assessment of euryhaline finfish fry used for aquaculture and restocking (Ciccotti, 2002; Ciccotti, 2004; Ciccotti 2006). Methodology has been extensively described in Ciccotti, 2002.
The monitoring method set up in the Tiber has allowed to describe glass eel recruitment trend at the river Tiber estuary during the 16 years monitoring (Figure 4), as well has having allowed to draw a picture of the trend of glass eel fishery dating back as far as the mid 1970s (Figure 5), and appeared completely reliable in recording catches of the local fishery. Catch data from the Tiber, and the fishing indicators obtained within the monitoring, also allowed to figure out an overview of recruitment at a national scale, because of a general coherence of recruitment trends among sites, and evidenced a declining trend up to the season 2005–2006. Nevertheless, an assessment of total glass eel yield at the national level has never been possible because of gaps regarding regions where the glass eel fishery seems to continue with good results (such as in Campania and Toscana), and because of a general lack of information in relation to poaching and black markets.
0
100
200
300
400
500
600
1990
-91
1991
-92
1992
-93
1993
-94
1994
-95
1995
-96
1996
-97
1997
-98
1998
-99
1999
-00
2000
-01
2001
-02
2002
-03
2003
-04
2004
-05
2005
-06
yield, kg
0
100
200
300
400
500
600
days x nets
Figure IT.4 Glass eel recruitment trend (landings, left axis; fishing effort, right axis) at the river Tiber estuary during the 16 years monitoring (from Ciccotti, 2006).

490 Joint EIFAC/ICES WGEEL Report 2007
0
2
4
6
8
10
12
74/
75
75/
76
76/
77
77/
78
78/
79
79/
80
80/
81
81/
82
82/
83
83/
84
84/
85
85/
86
86/
87
87/
88
88/
89
89/
90
90/
91
91/
92
92/
93
93/
94
94/
95
95/
96
96/9
7
97/9
8
98/9
9
99/0
0
00/0
1
01/
02
02/
03
03/0
4
04/0
5
05/
06
yield, tonnes
0
2
4
6
8
10
12
74/
75
75/
76
76/
77
77/
78
78/
79
79/
80
80/
81
81/
82
82/
83
83/
84
84/
85
85/
86
86/
87
87/
88
88/
89
89/
90
90/
91
91/
92
92/
93
93/
94
94/
95
95/
96
96/9
7
97/9
8
98/9
9
99/0
0
00/0
1
01/
02
02/
03
03/0
4
04/0
5
05/
06
yield, tonnes
Figure IT.5 Time series of glass eel fishery production at the river Tiber (from Ciccotti, 2006).
The monitoring at the Tiber mouth has allowed to witness the ending of the glass eel professional fishery, as a consequence of the unquestionable drop in recruitment, but also of a local environmental situation (unpredictable floods, water quality), while the yellow eel fishery, practised by the same fishers, is still going on, even if it has progressively reduced. This has strongly hampered the carrying out of the monitoring, and some doubts have arisen that the Tiber might not be so representative of recruitment on the Thyrrhenian coast any more. Therefore, an implementation of the monitoring was actuated by adding a second monitoring site, located on the river Marta estuary, also in Latium, on the Thyrrenian coast Despite its small dimensions, in this estuary glass eel recruitment has always been present and in fact a small fishery is still present. From 1999, a monitoring station was set up here, with a methodology similar to the one set up in the Tiber, with data recorded on a daily basis during the ascent period, and stored in a book set up jointly with fishermen. Time series for a seven years period (1999–2006) are reported in Figure IT.6.

Joint EIFAC/ICES WGEEL Report 2007 491
0
100
200
300
400
500
1999
-20
00
2000
-20
01
2001
-20
02
2002
-20
03
2003
-20
04
2004
-20
05
2005
-20
06
yield, kg
020406080100120140160180200
days x nets
Figure IT.6 Glass eel recruitment trend (landings, left axis; fishing effort, right axis) at the river Marta estuary during the 7 years monitoring (from Ciccotti, 2004, updated to 2006).
The comparison between the respective performances of the two monitoring sites, besides allowing to draw a more complete picture of recruitment situation, highlighted the fact that a higher level of organization in the fishery can turn out in a major obstacle for the monitoring.
At the present moment, anyway, the major problem seems to be linked to the fact that the time series has been discontinued, because the no prosecution of the monitoring nor of the resource assessment has been foreseen nor financed since 2006. A breakdown of the monitoring work, that involves also a weakening of the monitoring framework set up in the course of the years, is not recommended; it is to be hoped that the recruitment monitoring can be resumed within the Programmes mentioned above.
IT.G.2 Stock surveys, yellow and silver eels
Scientific surveys of eel stock in Italy have been carried out on a continuative basis only for recruitment. For yellow and silver eels, a number of researches on population dynamics were carried out between 1973 and 1985, for some northern Adriatic valli populations as well as for some other coastal lakes in the southern Adriatic (Lesina, Varano, Acquatina) and Thyrrhenian (Monaci, Orbetello, Sardinian ponds) as well as for the Tiber river. Most of those were published in scientific journals, while some remained as grey literature (see Ciccotti, 1997 for a review). Subsequently, as interest, also in research, shifted towards intensive aquaculture, investigations on wild stock were abandoned, apart for some modelling applications investigated more recently, that focus on eel population structure and body growth, and its applications for the resource management (De Leo and Gatto, 1995; De Leo and Gatto, 1996; De Leo and Gatto, 2001).
Anyway, all these investigations rely on scattered, in space and time, samplings, and therefore cannot be defined scientific surveys. Nothing is actually being executed on a continuative basis. Recently (2007) a national research project regarding eel has started, financed by the Ministry of Research that involves 5 Universities, aimed at the widening of the knowledge base for the management of the European eel.

492 Joint EIFAC/ICES WGEEL Report 2007
IT.H. Catch composition by age and length
In Italy there is no sampling programme foreseen in any national or regional framework for adult eel, and therefore no samplings are taken from commercial catches, within any fishery tipology. It must be borne in mind that landing data are collected for statistical purposes, linked therefore to the characterization of social, economic and environmental conditions of the country, and only secondarily related to fishery management. A number of researches were carried out in the past (see above section), but no information is available at present for recent years.
IT.I. Other biological sampling (age and growth, weight, sex, maturity, fecundity)
As specified above, only incidental samplings within specific researches have been performed, and not recently, and this represents a major gap, because for many local stocks it may be that strong changes have occurred, regarding productivity, age structure, length composition, sex ratio. Unfortunately, no routine programme for any population parameter is executed.
Among the samplings and examinations performed within specific research projects, other features have been occasionally examined, such as parasitic infestations, in particular regarding Anguillicola sp. infection rates, contaminants loads and eel condition, fat levels, etc. Some recent data based on available information (published, grey) have been gathered, presented in the relative section of the present report. Probably, occasionally some analyses for these features related to human health or to veterinary aspects have been monitored by official sanitary or veterinary services, but no information is ever made available, and most probably also in this case only scattered sporadic samplings have been actuated.
IT.J. Other sampling
For inland waters, most Regional laws in Italy contemplate the accomplishment of Fish Maps by the Provinces, instruments aimed at the planning and management of fish populations and of fishing activities. The reference unit for the Fish Maps is the catchment basin, investigation levels are actuated at different levels (environmental characteristics of water habitats, anthropogenic effects, structure and dynamics of fish populations, fisheries). Methodologies should follow in most cases standardized guidelines, and differ depending on the habitat. Therefore, Fish Maps could contribute with an useful amount of information. Up to now, only a certain number of Provinces, mostly in the northern regions, have compiled Fish Maps, and in most cases have been published by the Provinces and available. The main constraint at the present moment for the utilization of this source if information is the fact that no centralized work of co-ordination and synthesis is done for any fish species. Eel presence has been ascertained in most of the catchments were investigations have been carried out, but no data on density or biomass are available.
Other samplings in Italy concern environmental monitoring, that involves a network of Agencies at different levels. The APAT (Agenzia per la Protezione dell'Ambiente e per i Servizi Tecnici) is the technical organ of the Ministry of the Environment, whose function is to co-ordinate actions as well as to maintain the connection with the European network EIOnet, while the ARPA are Regional Agencies involved in environmental protection. An important section of the work of these Agencies involves water environments. Data from environmental monitoring are collected, elaborated and divulgated on a framework basis through the SINAnet, the National Environmental Informative System. In this way a great amount of information regarding different environmental aspects is made available.

Joint EIFAC/ICES WGEEL Report 2007 493
IT.K. Stock assessment
In Italy no routine assessment of eel stock is under any scheme nor at the central nor regional level. There is no formal advice on eel fishery management.
IT.L. Sampling intensity and precision
Having stated beforehand that no samplings nor investigations on catch composition and/or age and growth are carried out within official recordings, it is not possible to analyse variation in samplings, within and among sites, seasons, gears. Anyway, a discussion on this topic seems important for eel in Italian waters (and probably in other Mediterranean countries) in relation to the heterogeneity in eel habitats and fisheries organization, to the seasonal variation of eel catch and catch composition most pronounced in lagoons, etc.
IT.M. Standardisation and harmonisation of methodology
Having stated beforehand that only incidental samplings within specific researches have been performed, it is impossible to give an overview of methods with regards to the different items. In most research studies, sampling collection and sampling treatment (size measurements, age reading, sex determination, stage identification) as well as any other biological observation (parasites) or determination (contaminants) has been done by following the latest protocols as inferred from literature available at the moment the research was carried out.
The setting up of a standardised sampling methodology and of protocols for biological investigations on eel is therefore a priority.
IT.N. Overview, conclusions and recommendations
In the present report an overview of the European eel stock and fisheries is presented for Italy. From the presented information, it is possible to summarise the following points:
• Eel landings in Italy, in coastal waters as well as in inland water bodies, show a continued decrease, while glass eel monitoring confirms the current low trend in recruitment.
• Scientific surveys on a continuative basis have been carried out only for recruitment, along 16 years (1999–2006) within the Three-years Plans of Ministry of Agriculture and Forestry Politics, law 41/82, and contributed up to now to the understanding of the eel stock situation in Italy with respect to the rest of Europe. At the present moment, anyway, the monitoring has been discontinued.
• At the present moment, Italy has not established yet its Data Collection Framework for eel, nor has developed a proposal for a National Management Plan. Nevertheless, in the course of 2007 the Ministry of Agriculture and Forestry Politics has accepted a Proposal, that followed a specific call, for a programme that is going to start in the autumn 2007, targeted to the setting up of the knowledge base for the preparation of a National Management Plan, by developing a data collection framework specific for eel, and by identifying the key elements for eel management and restoration at the national level.
• Debate on the course of actions to be undertaken to comply with the European Commission dispositions is currently being held at different levels, administrative as well as scientific, in relation to the awareness of the necessity of urgent actions for the eel stock recovery. The establishing of a data collection framework specific for eel shall represent a major opportunity to evaluate its present state in the setting of a coordinated framework.

494 Joint EIFAC/ICES WGEEL Report 2007
IT.O Literature references
Ardizzone G.D., Cataudella S. and Rossi R. 1988 Management of coastal lagoon fisheries and aquaculture in Italy. FAO Fisheries Technical Paper 293, 103 pp.
Ciccotti E. 1997. Italy. In: Moriarty C. & W. Dekker (eds.), Management of European eel fisheries. Fisheries Bulletin (Dublin), 15: 91–100.
Ciccotti E., Busilacchi S. and Cataudella S. 2000 Eel, Anguilla anguilla (L.), in Italy: recruitment, fisheries and aquaculture. Dana, 12: 7–15.
Ciccotti E. and Fontenelle G. 2001 A review of eel, Anguilla anguilla, aquaculture in Europe: Perspectives for its sustainability. J. Taiwan Fish. Res., 9 (1&2): 27–43.
Ciccotti E. 2002 Monitoring of glass eel recruitment in Italy. In: Monitoring of glass eel recruitment, W. Dekker ed., Netherlands Institute of Fisheries research, Ijmuiden, The Netherlands, report C007/02 WD: 227–236.
Ciccotti E. 2004. Monitoraggio del reclutamento di ceche di anguilla (Anguilla anguilla L.) e studio dell’influenza di fattori ambientali sulle dinamiche migratorie [Monitoring of glass eel (Anguilla anguilla L.) recruitment and evaluation of local estuarine conditions on the migration dynamics.] Relazione finale, Ministero per le Politiche Agricole e Forestali, IV Piano Triennale, 82 pp.
Ciccotti E. 2005 Interactions between capture fisheries and aquaculture: the case of the eel (Anguilla anguilla L., 1758). In: "Interactions between Capture Fisheries and Aquaculture: a methodological perspective”, Cataudella S., Massa F. & D. Crosetti Eds, Studies and Reviews, General Fisheries Commission for the Mediterranean. N. 78, Rome, FAO, 2005: 190–203.
Ciccotti E. 2006. Nuovi metodi ecologici per la valutazione del reclutamento di ceche di anguilla europea (Anguilla anguilla L.) per la gestione sostenibile di questa risorsa [ “New ecological methods for the assessment of glass eel (Anguilla anguilla) recruitment, for the sustainable management of this resource” Research number 6A21] Relazione finale, Ministero per le Politiche Agricole e Forestali, VI Piano Triennale, 104 pp.
De Leo G.A. and Gatto M. 1995 A size and age structured model of the European eel (Anguilla anguilla L.). Canadian Journal of Fisheries and Aquatic Sciences, 52: 1351–1367.
De Leo G.A. and Gatto M. 1996 Trends in vital rates of the European eel: evidence for density dependence ? Ecological applications, 6(4): 1281–1294.
De Leo G.A. and Gatto M. 2001 A stochastic bioeconomic analysis of silver eel fisheries. Ecological applications, 11(1): 281–294.

Joint EIFAC/ICES WGEEL Report 2007 495
Canada: Report on the eel stock and f isheries in Canada 2007
CA.A. Authors
Guy Verreault, Ministère des Ressources naturelles et de la Faune
506, rue Lafontaine, Rivière-du-Loup, Qc. G5R 3C4 Canada
Tel: +418 862 8649 ext. 226. FAX: +418 862 8176
Reporting Period: This report was completed in August 2007, and contains data up to 2005 and some provisional data for 2006 and 2007.
Contributors to the report:
D. K. Cairns, Fisheries and Oceans Canada
P. Dumont and Y. Mailhot, Ministère des Ressources naturelles et de la Faune du Québec
A. Mathers, Ontario Ministry of Natural Resources
R. Verdon, Hydro-Québec
G.-H. Lizotte, Association des pêcheurs d’anguilles du Québec
CA.B. Introduction
The American eel (Anguilla rostrata) is widely distributed in the eastern part of Canada, from the Atlantic Ocean as far inland as Niagara Falls in the Great Lakes. Historically, the American eel had one of the largest distribution of any fish species in Canada but abundance has declined precipitously since the mid-1980s, in the upper reaches of the St. Lawrence River and Lake Ontario. This sharp decline prompted government agencies involved in stock and fisheries management (Québec, Ontario and Canada) to collate information in order to determine the status of the species throughout the distribution range. Information was revised and summarized in a Status Report prepared for the Committee on the Status of Endangered Wildlife in Canada (COSEWIC). In spite of the presumed panmictic nature of American eel, geographic trends are evident in population parameters, types and magnitude of threats and contribution to the spawning stock (Table 1). Therefore, the use of five designatable units (DU) was adopted. These DUs are: 1) Great Lakes-Western St. Lawrence (Ontario and western Québec); 2) Eastern St. Lawrence (eastern Québec); 3) Maritimes (New Brunswick, Nova Scotia, Prince Edward Island); 4) Atlantic Islands (Newfoundland); and 5) Eastern Arctic (Labrador), and are shown in Figure. 1. Most of data presented in this Country Report come from this COSEWIC Status Report and datasets were updated when feasible.
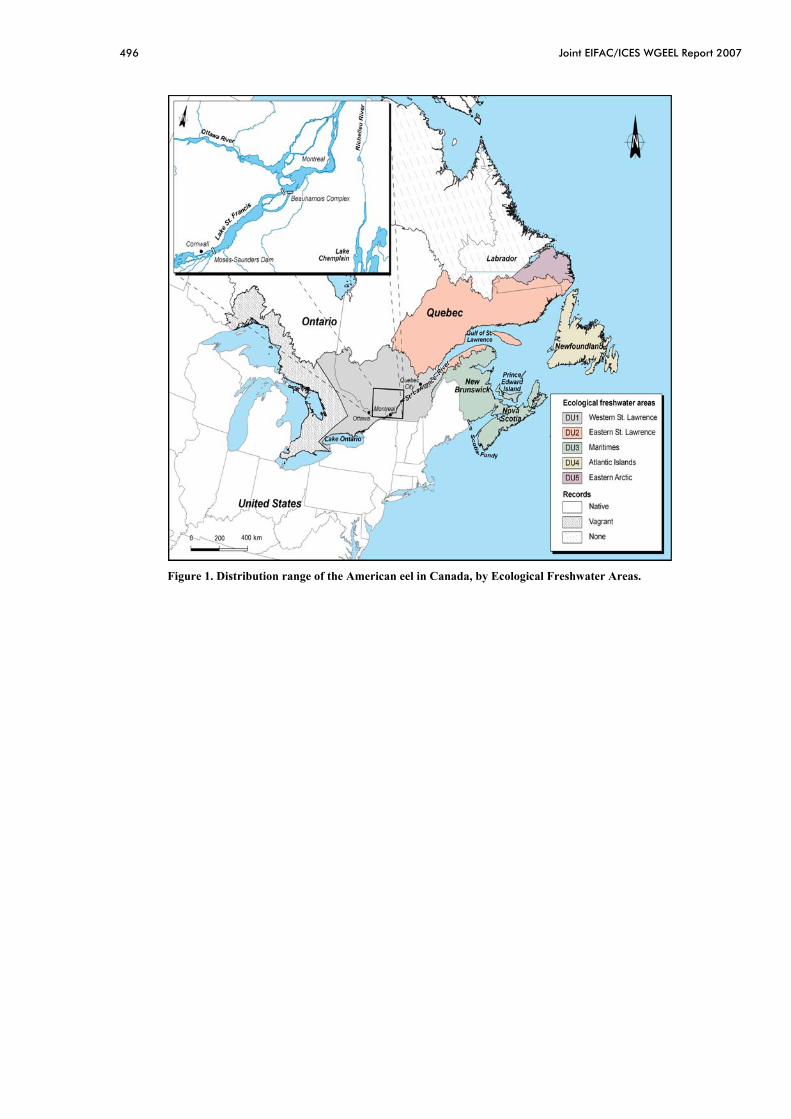
496 Joint EIFAC/ICES WGEEL Report 2007
Figure 1. Distribution range of the American eel in Canada, by Ecological Freshwater Areas.

Joint EIFAC/ICES WGEEL Report 2007 497
Table 1. Migration periods, mean length and age of female silver eels in Canadian fresh water systems (COSEWIC 2006).
SITE DUA MIGRATION PERIOD N LENGTH (MM)
AGE REFERENCE
Upper St. Lawrence River St. Francis and St. Lawrence lakes, Moses-Saunders Vicinity of Iroquois dam
1
June-October
200 53 30
915 976
1001
20
21
Casselman, 2003 McGrath et al., 2003 Tremblay, 2004
Richelieu River 1 June-October 494 1019 Dumont et al., 1998
St. Lawrence estuary 1 September-October
474 4529 30
840 853 837
20
Couillard et al., 1997 Verreault et al., 2003 Tremblay, 2004
Sud-Ouest River (South shore of the St. Lawrence)
2 August-November
107 30
1026 1043
21 23
Verreault, 2002 Tremblay, 2004
Petite Trinité River (North shore of the St. Lawrence)
2 August-October 424 30
650 679
16,7 20
Fournier and Caron, 2005 Tremblay, 2004
Long Pond (Prince Edward Island)
3 August-October 30 693 20 Tremblay, 2004
Topsail and Indian ponds, Salmon River, Burnt Berry Brook, Topsail Barachois (Newfoundland)
4 August-October 92 694 12 Gray and Andrews, 1971
LaHave River (Nova Scotia)
3 August-November 346 611 19 Jessop, 1987
ADesignatable units (DU): 1= Great Lakes-Western St. Lawrence River; 2= Eastern St. Lawrence; 3= Maritimes; 4= Atlantic Islands.
CA.B.1. Species status and management plan
In May 2006, COSEWIC assessed the American eel in Canada as Special Concern (a species that may become a threatened or an endangered species because a combination of biological characteristics and identified threats). A decision by the Government of Canada on whether or not to officially list the species is pending. A draft Management Plan has been developed to coordinate actions among Canadian jurisdictions. Public hearings on the Management Plan took place in early 2007 and a final version will be completed based on input from the public and stakeholders. The next step will be the implementation of a more detailed plan to strengthen management, reverse abundance declines and foster conditions for rebuilding the population.
CA.C. Fishing capacity
Eels are subject to ongoing fisheries in part of eastern Canada (Figure 2), although substantial areas have never been commercially fished (Figure 2). There have been changes in fisheries since the mid eighties in many sectors. Traditional fisheries were for yellow and silver eels but a recent (1989) fishery for elvers and glass eels began in Nova-Scotia and southern New Brunswick (DU 3). Restrictions in the number of licences and on seasons for large eels, and on harvest for elvers, have been in places in all areas since the mid-nineties (Anon. 2007).
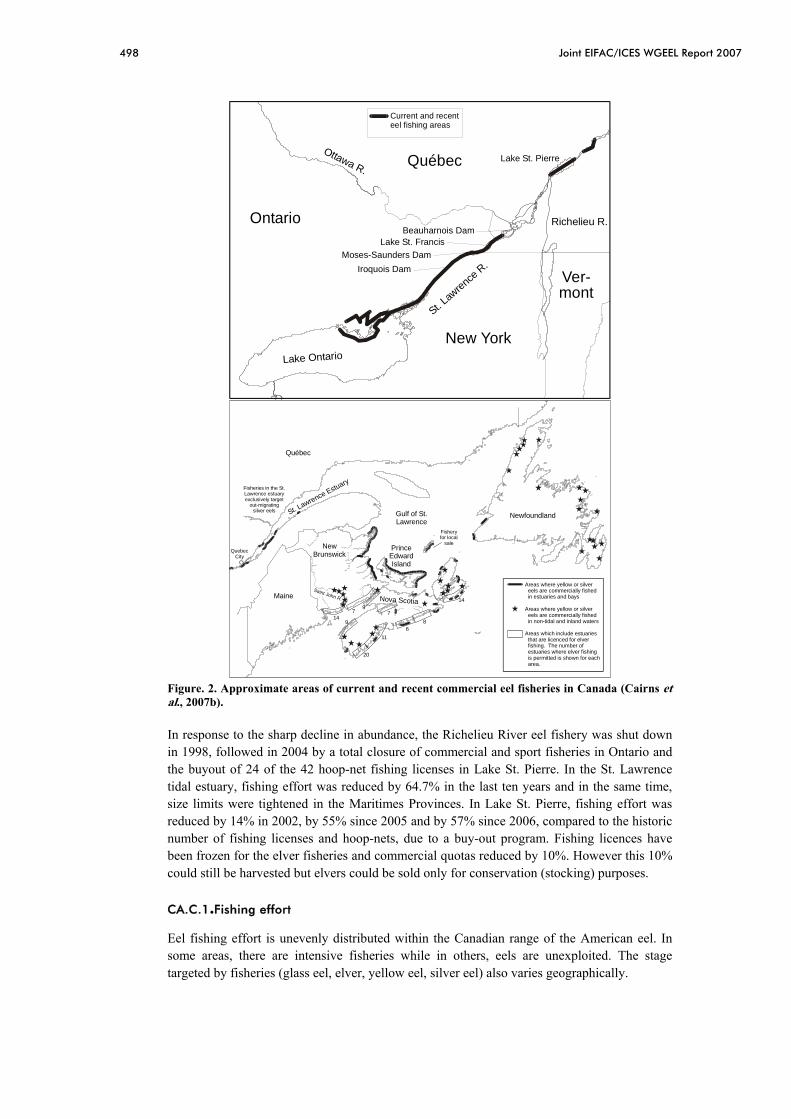
498 Joint EIFAC/ICES WGEEL Report 2007
Figure. 2. Approximate areas of current and recent commercial eel fisheries in Canada (Cairns et al., 2007b).
In response to the sharp decline in abundance, the Richelieu River eel fishery was shut down in 1998, followed in 2004 by a total closure of commercial and sport fisheries in Ontario and the buyout of 24 of the 42 hoop-net fishing licenses in Lake St. Pierre. In the St. Lawrence tidal estuary, fishing effort was reduced by 64.7% in the last ten years and in the same time, size limits were tightened in the Maritimes Provinces. In Lake St. Pierre, fishing effort was reduced by 14% in 2002, by 55% since 2005 and by 57% since 2006, compared to the historic number of fishing licenses and hoop-nets, due to a buy-out program. Fishing licences have been frozen for the elver fisheries and commercial quotas reduced by 10%. However this 10% could still be harvested but elvers could be sold only for conservation (stocking) purposes.
CA.C.1.Fishing effort
Eel fishing effort is unevenly distributed within the Canadian range of the American eel. In some areas, there are intensive fisheries while in others, eels are unexploited. The stage targeted by fisheries (glass eel, elver, yellow eel, silver eel) also varies geographically.
Lake Ontario
St. Law
rence R.
Ottawa R.Québec
Ontario
New York
Ver-mont
Beauharnois Dam
Moses-Saunders DamLake St. Francis
Iroquois Dam
Lake St. Pierre
Richelieu R.
Current and recent eel fishing areas
PrinceEdwardIsland
Gulf of St.Lawrence
Québec
Fisheries in the St. Lawrence estuary exclusively target
out-migratingsilver eels
Fisheryfor local
saleQuebec
City
St. Lawrence Estuary
NewBrunswick
Maine
Newfoundland
Saint John R. Nova Scotia
Areas where yellow or silver eels are commercially fished in estuaries and bays
Areas where yellow or silver eels are commercially fished in non-tidal and inland waters
Areas which include estuaries that are licenced for elver fishing. The number of estuaries where elver fishing is permitted is shown for each area.
20
9
11
97
68
14
714

Joint EIFAC/ICES WGEEL Report 2007 499
In Québec, there are major fisheries in the upper St. Lawrence River and estuary (DU1) which target mainly silver eels. Except for the Magdalen Islands, eels originating in DU2 are not exploited. In the southern Gulf of St. Lawrence (DU3), commercial fisheries target yellow eels in tidal waters. Yellow eels are fished extensively in coastal waters and estuaries of New Brunswick and Prince Edward Island. There is little eel fishing effort in Nova Scotia, and none in most fresh waters of the southern Gulf of St. Lawrence. Winter recreational spear fisheries also contribute to anthropogenic mortality of yellow eels in the Southern Gulf of St. Lawrence. In the Scotia-Fundy area, eel fishing occurs in both fresh and marine waters, but many rivers and coastal areas are not fished. The only elver fishery in Canada occurs in Scotia-Fundy. In Newfoundland (DU4) and Labrador (DU5), yellow and silver eels are fished principally in rivers, but many rivers are not exploited. Landings for Labrador were reported only in 1985 (4.3 tonnes) and in 1993 (0.1 tonne), and it is unknown whether this irregular pattern is related to abundance; however, landings are not large (COSEWIC 2006).
The silver eel fishery in the St. Lawrence estuary has a very long history and is well documented. Fishing effort decreased steadily since the early nineties from 34 000 m of tidal weirs in 1997 to only 12 000 m in 2006. Harvest composed of large migrating female decreased drastically and average weight gradually rose from 1,16 to 1,64 kg between 1996 and 2006 (Figure 3).This observation suggests an ageing population not sufficiently supplemented by recruits.
1,1
1,3
1,5
1,7
1996 1997 1998 1999 2000 2001 2002 2003 2004 2005 2006
Year
Mea
n w
eigh
t (kg
)
Figure 3. Silver eel mean weight harvested in the St. Lawrence estuary fishery from 1996 to 2006.
(Verreault, G., Ministère des Ressources naturelles et de la Faune du Québec, unpubl. data).
CA.D. Catches and landings
Total harvest for Canada between 1961 and 2003 fluctuated between 500 and 1200 tons per year and catches declined from approximately 1100 tons in late eighties to less than 500 tons today. Unreported catches are not thought to be significant (Anon., 2007).

500 Joint EIFAC/ICES WGEEL Report 2007
A-Ontario (DU1)
050
100150200250
1917 1927 1937 1947 1957 1967 1977 1987 1997
B- Quebec (DU1)
0
500
1 000
1 500
1917 1927 1937 1947 1957 1967 1977 1987 1997
SilverYellow
C- Southern Gulf of St. Law rence (DU3)
0
200
400
600
800
1917 1927 1937 1947 1957 1967 1977 1987 1997
PEIGulf NSGulf NB
D- Scotia-Fundy (DU3)
050
100150200250
1917 1927 1937 1947 1957 1967 1977 1987 1997
Scotia-Fundy NBScotia-Fundy NS
E- New foundland (DU4)
0
50
100
150
1917 1927 1937 1947 1957 1967 1977 1987 1997
West coastNorth & northeast coastSouth coast
F- Canada
0
500
1 000
1917 1927 1937 1947 1957 1967 1977 1987 1997
Figure 4.: Reported landings in tonnes of American eels in (A) Ontario; (B) Québec (1920–1940; 1942–1984; 1986–2003; (C) Southern Gulf of St. Lawrence (D) Maritimes (1950–2003; (E) Newfoundland (1961–2003, and, (F) Canada (1961–1984; 1986–2003). Many factors affect landings; for specific explanations, see original sources (From Cairns et al., 2007b).
CA.E. Catch per unit of effort
Total landings have limited value as indicators for population abundance since effort varies greatly and rapidly and catches is influenced by market prices, regulations, etc. For this reason, cpue is a better indicator of abundance. For two fishermen involved in the St. Lawrence estuary silver eel fishery, cpue showed a negative trend over time when fishing

Joint EIFAC/ICES WGEEL Report 2007 501
effort by the entire fishery was relatively constant (1985–1997) but no significant trend when annual effort decreased (Table 2).
Table 2. Catch and catch per unit effort of two eel fishers at Rivière-Ouelle on the St. Lawrence estuary.Each fisher fished from 1 to 3 traps.
Year Mean Mean MeanCatch Effort CPUE Catch Effort CPUE CPUE CPUE CPUE(kg) (m of net) (kg eels/ (kg) (m of net) (kg eels/ constant decreasing
m of net) m of net) effort effort
1985 4841 601 8.06 1547 230 6.73 7.39 7.391986 10560 601 17.57 2171 230 9.44 13.51 13.511987 7139 601 11.88 1873 230 8.14 10.01 10.011988 7467 601 12.42 2240 230 9.74 11.08 11.081989 6852 601 11.4 1543 230 6.71 9.05 9.051990 8691 601 14.46 2095 230 9.11 11.78 11.781991 6860 601 11.41 1781 230 7.74 9.58 9.581992 4156 601 6.92 877 230 3.81 5.36 5.361993 5892 601 9.8 1474 230 6.41 8.11 8.111994 5347 601 8.9 1584 230 6.89 7.89 7.891995 4405 601 7.33 948 230 4.12 5.73 5.731996 3325 601 5.53 794 230 3.45 4.49 4.491997 2886 601 4.8 918 230 3.99 4.4 4.41998 3854 601 6.41 1374 171 8.04 7.22 7.221999 1887 510 3.7 993 171 5.81 4.75 4.752000 2750 367 7.49 705 171 4.12 5.81 5.812001 2728 454 6.01 445 171 2.6 4.31 4.312002 2935 402 7.3 502 122 4.11 5.71 5.712003 1859 448 4.15 292 168 1.74 2.94 2.942004 4029 402 10.02 666 122 5.46 7.74 7.74
FISHER 1 FISHER 2
CA.F Scientific surveys of the stock
CA.F.1 Recruitment surveys/ascending young eels
Long-term datasets on recruitment of young eels in Ontario and Québec include the Chambly ladder (since 1997), the Beauharnois trap and ladder (starting in 1994), the Saunders eel ladder (initiated in 1974), and the Sud-Ouest River ladder (since 1994). Two other series targeting yellow eel exist: the Bay of Quinte trawling survey, starting in 1972, and, a standardized electrofishing series in Lake Ontario which was first collected data in 1974. In the most downstream location (DU 2), on the Sud-Ouest River, a continuing juvenile year-class strength index (YCSI) was developed and has been maintained since 1994. This index allows the evaluation of the relative contribution of each cohort ascending this river. The YCSI shows a general and drastic decline in cohort relative abundance (fig. 5) which might possibly be related to a general decline of the overall recruitment of the species.
0,0
0,4
0,8
1,2
1,6
1993 1995 1997 1999 2001 2003Cohort
YCSI
Figure 5. Year-Class Strength Index for American eel, Sud-Ouest River, Québec, Canada.

502 Joint EIFAC/ICES WGEEL Report 2007
On the Richelieu River (DU 1), the Chambly ladder is operated at a dam during the upstream migration. Total annual count was 9875 during the first year and decreased rapidly the following years (Table 3), while to support annual historical landings of silver eel (circa 35 t), many hundred thousands would be required each year. Mean total length of young eels ascending the ladder fluctuated between 386.3 and 283.3 mm during those years. No age estimation is available on this location.
Table 3. Young eels ascending the Chambly ladder from 1998 to 2006 (data from Bernard and Desrochers 2006).
YEAR TOTAL COUNT (N) MEAN LENGTH (MM) STANDARD ERROR (MM)
2006 434 283.3 93.4 2005 2177 324.8 73.4 2004 727 2003 3336 2002 240 2001 357 2000 239 1999 3685 331.3 52.7 1998 9875 386.3 79.3
At the Beauharnois Power Dam, the first anthropogenic obstacle for eels migrating upstream in the St. Lawrence, two ladders are operated and total count along with mean length are routinely monitored by Hydro-Québec. Recent numbers showed an increase in migrants ascending along with a decreasing trend in mean length since the beginning of the operations (Table 4). However, compared to what was need to support historical fisheries in the watershed, these counts are still very low.
Table 4. Total count and mean length of ascending juvenile eels in the Beauharnois ladder from 1994 to 2006 (data from Bernard and Desrochers, 2006).
WEST SIDE LADDER
EAST SIDE LADDER YEAR
TOTAL COUNT (N)
MEAN LENGTH (MM)
TOTAL COUNT (N)
MEAN LENGTH (MM)
TOTAL
2006 50 389 349.0 28 127 339.5 78 516 2005 51 694 344.3 2932 347.1 54 626 2004 42 635 350.8 15 951 58 586 2003 32 684 365.9 26 885 382.8 59 569 2002 10 503 426.2 32 608 388.5 43 211 2001 13 099 420.6 13 099 2000 6881 448.3 6881 1999 10 692 468.7 10 692 1998 5441 471.7 5441 1995 17 072 449.6 17 072 1994 24 721 430.0 448.9 24 721
Although increasing numbers and decreasing mean length could be seen as a good news for the species, our interpretation is limited without age structure evaluation of those migrants. To add more comprehensive interpretation on those data, a specific age-length key was developed for 2004 and given length measurements taken that year, we observed that the age ranged from age-2 to age-22 and 83.9 % were comprised within age-4 and age-7. Overall, mean age for upstream migrating eels was 6.3 (s= 2.2).

Joint EIFAC/ICES WGEEL Report 2007 503
The next man-made obstacle for upstream migrants is the Moses-Saunders Power Dam, located 85 km upstream from Beauharnois. An eel ladder built and operated by Ontario Power Generation since 1974 is located on the Canadian side of the Moses-Saunders Power Dam and represents the longest-term dataset on yellow eel recruitment in the St. Lawrence system. At this site, numbers of eels have declined by three orders of magnitude over the past 22 years, from over 1-million in 1982 and 1983 to 8184 in 2006. An index was developed for better estimation during the peak migration (31 days) and data are presented in Table 5 In 2006, a second ladder was put in operation, on the US side of the power dam. From this year on, the recruitment index will have to be recalibrated integrating the original Canadian and the new U.S. ladder.
Table 5. Eel indices from Lake Ontario and the upper St. Lawrence River.Year Bay of Quinte, Estern
geometric L. Ontario basin,mean eels eels electrofished Summer Fallper trawl per hour
1972 1,8731973 1,6201974 0,997 79341975 1,543 144031976 1,286 103631977 1,064 200131978 0,417 164481979 0,767 189771980 0,252 90461981 1,530 134731982 1,884 274891983 0,557 261031984 0,330 85,60 150511985 0,778 63,10 185101986 0,865 82,90 53801987 1,552 89,00 92771988 0,299 68,80 54421989 0,952 93,00 57951990 0,356 64,10 30961991 0,454 38,50 12261992 0,585 44,40 2771993 0,434 22,70 2321994 1,157 30,00 49981995 0,091 10,50 6711996 0,356 14,90 4051997 0,085 7,30 144 491998 0,123 12,90 57 361999 0,074 21,60 27 192000 0,053 9,37 52 122001 0,006 6,82 18 72002 0,013 3,36 55 172003 0,000 0,65 40 202004 0,000 0,52 53 2742005 0,000 1,23 227 1602006 0,000 0,49 xxxx xxxx
Mean eels per day during 31 daypeak period at Saunders eel ladder
Two other indices for yellow eels are in place in Lake Ontario and their results can be related to the decline of the eel passage at Moses-Saunders. The Bay of Quinte trawling index and an electrofishing index in the eastern part of Lake Ontario have declined by 1 and 2 orders of magnitude to near 0 between the 1980s and today.
Although available information and indices cannot be combined into a quantitative assessment to the overall abundance population, they clearly show a general decline due to reduced recruitment and reduction of distribution area.

504 Joint EIFAC/ICES WGEEL Report 2007
The longest fisheries-independent time-series of American eel abundance come from the electrofishing surveys in the southern Gulf of St. Lawrence. These include series from Restigouche River (from 1970), the Miramichi River (from 1952), and the Margaree River (from 1957) (Figure 6). The series with the greatest sampling intensity is that of the Miramichi, which shows stable numbers in the 1950s and 1960s, a peak in the 1970s, a trough in the late 1980s and early 1990s, and subsequent recovering numbers.
Figure 6. Densities of American eels in Southern Gulf of St. Lawrence Rivers, based on electrofishing surveys. Data from Cairns et al., 2007a.
CA.G. Catch composition by age and length
Catch composition by length is not routinely done for fisheries. Age composition is restricted to specific research projects in Québec (DU 1 and DU2) and the Maritimes (DU 3). In the latter, short-term series (2–4 years) are available for unexploited and exploited sites (see
RestigoucheMean + SE
0.0
0.5
1.0
1.5
2.0
2.5
3.0
3.5
1970 1975 1980 1985 1990 1995 2000 2005
Eel
s 10
0 m
-2
MiramichiMean + SE
0.0
0.5
1.0
1.5
2.0
2.5
3.0
3.5
1950 1960 1970 1980 1990 2000
Eel
s 10
0 m
-2
MargareeMean + SE
0
2
4
6
8
1956 1966 1976 1986 1996 2006
Eel
s 10
0 m
-2
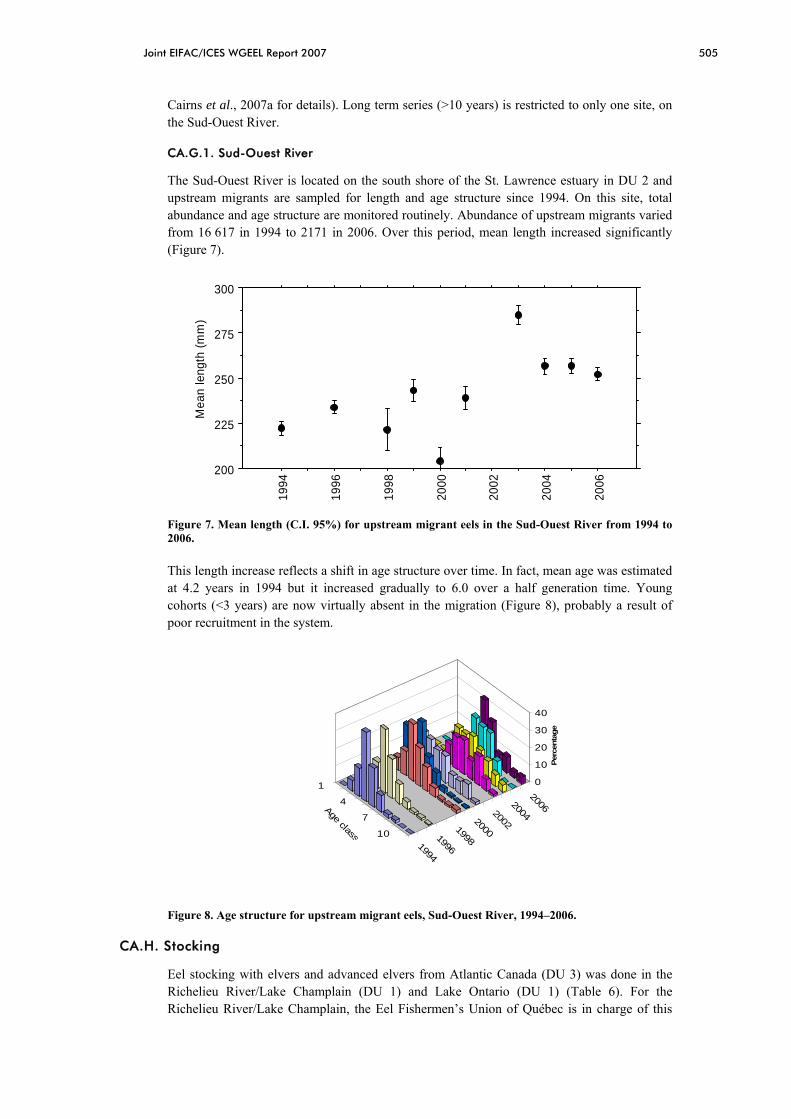
Joint EIFAC/ICES WGEEL Report 2007 505
Cairns et al., 2007a for details). Long term series (>10 years) is restricted to only one site, on the Sud-Ouest River.
CA.G.1. Sud-Ouest River
The Sud-Ouest River is located on the south shore of the St. Lawrence estuary in DU 2 and upstream migrants are sampled for length and age structure since 1994. On this site, total abundance and age structure are monitored routinely. Abundance of upstream migrants varied from 16 617 in 1994 to 2171 in 2006. Over this period, mean length increased significantly (Figure 7).
200
225
250
275
300
Mea
n le
ngth
(mm
)
1994
1996
1998
2000
2002
2004
2006
Figure 7. Mean length (C.I. 95%) for upstream migrant eels in the Sud-Ouest River from 1994 to 2006.
This length increase reflects a shift in age structure over time. In fact, mean age was estimated at 4.2 years in 1994 but it increased gradually to 6.0 over a half generation time. Young cohorts (<3 years) are now virtually absent in the migration (Figure 8), probably a result of poor recruitment in the system.
1
4
7
101994
1996
1998
2000
2002
2004
2006
0
10
20
30
40
Age class
Per
cent
age
Figure 8. Age structure for upstream migrant eels, Sud-Ouest River, 1994–2006.
CA.H. Stocking
Eel stocking with elvers and advanced elvers from Atlantic Canada (DU 3) was done in the Richelieu River/Lake Champlain (DU 1) and Lake Ontario (DU 1) (Table 6). For the Richelieu River/Lake Champlain, the Eel Fishermen’s Union of Québec is in charge of this

506 Joint EIFAC/ICES WGEEL Report 2007
activity and financial and scientific support is provided by Hydro-Québec and provincial agencies. For Lake Ontario, the Ontario Power Generation company was in charge of the stocking. A monitoring program was initiated by provincial agencies in recent years.
Table 6. American eel stocking in Canadian waters.
YEAR RICHELIEU RIVER/ LAKE CHAMPLAIN
LAKE ONTARIO
2005 600 000 105 kg - - 2006 1 000 000 200 kg 144 300 100 kg 2007 421 500 74.2 kg 450 000 90 kg
CA.I Other biological sampling
CA.I.1 Parasites
To avoid parasite transfers, screenings are routinely done before elvers stocking from marine water in DU 3 to freshwater locations in DU 1. Searching for virus (IHNV, ISAV, IPNV and EVH) in individuals prior to stocking were negative during last years. During summer 2006, 266 yellow eels were collected from ten rivers in Nova Scotia, Québec and Ontario and no Anguillicola crassus was found in those stocks. This swimbladder parasite is thought to be absent from Canadian waters (Ken Oliveira, University of Massachusetts, pers. comm.).
CA.I.2 Contaminants
Concentrations of many contaminants in the North American environment were high in the 1960s and 1970s, and then decreased as bans and restrictions took effect. The St. Lawrence River-Great Lakes system receives a wide variety of pollutants, some of which have lethal (Dutil et al., 1987, Castonguay et al., 1994a) or sublethal (Couillard et al., 1997) effects on eels. Concentrations of most contaminants, including PCBs and mirex, in eels migrating through the St. Lawrence Estuary fell in the 1980s (Hodson et al., 1994). This trend presumably reflects decreased contaminant exposure, but does not takes into account the presence of new contaminant (for example the brominated compounds) and the increasing number of non native species in the Great Lakes watershed that alter fish community composition and food web energy flow, leading to subsequent change to pathways and fate of contaminants. No recent studies involving American eel are available on these concerns.
CA.I.3 Predators
No study available.
CA.J. Other sampling
CA.K. Stock assessment
Stock assessment was done for all DU’s during the COSEWIC process. A bi-national recovery framework focussing on American eel in the St. Lawrence River and Lake Ontario below Niagara Falls extending to the St. Lawrence estuary (DU 1 and a portion of DU 2) is underway.
CA.L. Overview, conclusions and recommendations
The following overview comes from the COSEWIC assessment of the American eel status in Canada. Indicators of this status of the total Canadian component of this species are not available. Indices of abundance in the Upper St. Lawrence River and Lake Ontario have declined by approximately 99% since the 1970s. The only other data series of comparable length (no long term indices are available for Scotia/Fundy, Newfoundland, and Labrador) are

Joint EIFAC/ICES WGEEL Report 2007 507
from the lower St. Lawrence River and Gulf of St. Lawrence, where four out of five time series declined. Prior to these declines, eels reared in Canada comprised a substantial portion of the breeding population of the species. The collapse of the Lake Ontario-Upper St. Lawrence component may have significantly affected total reproductive output, but time series of elver abundance, although relatively short, do not show evidence of an ongoing decline. Recent data suggest that declines may have ceased in some areas, however, numbers in Lake Ontario and the Upper St. Lawrence remain drastically lower than former levels, and the positive trends in some indicators for the Gulf of St. Lawrence are too short to provide strong evidence that this component is increasing. Possible causes of the observed decline may continue to impede recovery.
The Canadian Eel Working Group has developed a preliminary Management Plan for American eel. This plan, still under public consultation, includes a number of goals and objectives in order to rebuild overall abundance of American eel in Canada to its level in the mid-1980s. It is mainly based on the need to reduce eel mortality from all sources by 50% relative to the 1997–2002 average, to achieve a net gain in abundance and escapement by ensuring access to and passage from quality habitats, maintain and, where required, develop fishery-independent abundance indices, ensure presence of eels in areas where abundance has collapsed by stocking young eels, and develop a Canada/USA management plan.
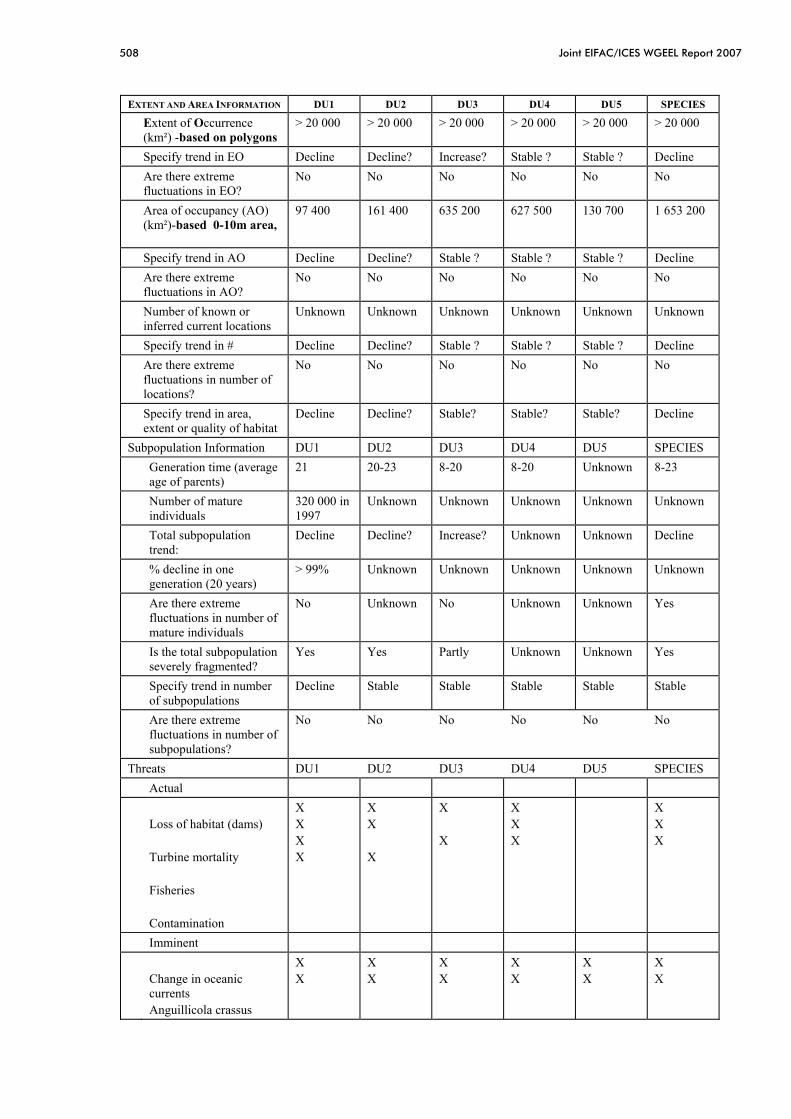
508 Joint EIFAC/ICES WGEEL Report 2007
EXTENT AND AREA INFORMATION DU1 DU2 DU3 DU4 DU5 SPECIES
Extent of Occurrence (km²) -based on polygons
> 20 000 > 20 000 > 20 000 > 20 000 > 20 000 > 20 000
Specify trend in EO Decline Decline? Increase? Stable ? Stable ? Decline Are there extreme
fluctuations in EO? No No No No No No
Area of occupancy (AO) (km²)-based 0-10m area,
97 400 161 400 635 200 627 500 130 700 1 653 200
Specify trend in AO Decline Decline? Stable ? Stable ? Stable ? Decline Are there extreme
fluctuations in AO? No No No No No No
Number of known or inferred current locations
Unknown Unknown Unknown Unknown Unknown Unknown
Specify trend in # Decline Decline? Stable ? Stable ? Stable ? Decline Are there extreme
fluctuations in number of locations?
No No No No No No
Specify trend in area, extent or quality of habitat
Decline Decline? Stable? Stable? Stable? Decline
Subpopulation Information DU1 DU2 DU3 DU4 DU5 SPECIES Generation time (average
age of parents) 21 20-23 8-20 8-20 Unknown 8-23
Number of mature individuals
320 000 in 1997
Unknown Unknown Unknown Unknown Unknown
Total subpopulation trend:
Decline Decline? Increase? Unknown Unknown Decline
% decline in one generation (20 years)
> 99% Unknown Unknown Unknown Unknown Unknown
Are there extreme fluctuations in number of mature individuals
No Unknown No Unknown Unknown Yes
Is the total subpopulation severely fragmented?
Yes Yes Partly Unknown Unknown Yes
Specify trend in number of subpopulations
Decline Stable Stable Stable Stable Stable
Are there extreme fluctuations in number of subpopulations?
No No No No No No
Threats DU1 DU2 DU3 DU4 DU5 SPECIES Actual
Loss of habitat (dams) Turbine mortality Fisheries Contamination
X X X X
X X X
X X
X X X
X X X
Imminent
Change in oceanic currents Anguillicola crassus
X X
X X
X X
X X
X X
X X

Joint EIFAC/ICES WGEEL Report 2007 509
EXTENT AND AREA INFORMATION DU1 DU2 DU3 DU4 DU5 SPECIES
Rescue Effect (immigration from outside source)
DU1 DU2 DU3 DU4 DU5 SPECIES
Status of outside subpopulation(s)? USA:
N/A N/A N/A N/A N/A N5
Is immigration known or possible?
Yes Yes Yes Yes Yes Yes
Would immigrants be adapted to survive in Canada?
Yes Yes Yes Yes Yes Yes
Is there sufficient habitat for immigrants in Canada?
Yes Yes Yes Yes Yes Yes
Is rescue from outside subpopulations likely?
Yes Yes Yes Yes Yes Yes
Quantitative Analysis DU1 DU2 DU3 DU4 DU5 SPECIES recruitment declines in one generation time (20 years)
>99% Unknown Unknown Unknown Unknown Unknown
CA.M. Literature references
Anonymous. 2007. American eel Management Plan. Draft: January 15 2007. Canadian Eel Working Group Fisheries and Oceans Canada, Ontario Ministry of Natural Resources, Ministère des Ressources naturelles et de la Faune du Québec 32 p.
Bernard, P. and D. Desrochers. 2006. Suivi des passes migratoires à anguille à le centrale de Beauharnois et au barrage de Chambly-2006. Milieu inc. Unité Environnement, Division Production, Hydro-Québec. 95 p.
Cairns, D.K., D.L. Omilusik, P.H. Leblanc, E.G. Atkinson, D.S. Moore and N. McDonald. 2007a. American eel abundance indicators in the southern Gulf of St. Lawrence. Canadian Data Report of Fisheries and Aquatic Sciences. 1192. iv+119 pp. Available from www.dfo-mpo.gc.ca/Library/328734.pdf
Cairns, D.K., V. Tremblay, J. Casselman, F. Caron, G. Verreault, Y. Mailhot, P. Dumont, R. Bradford, K. Clarke, Y. de Lafontaine, M. Lagacé, B. Jessop, R. Verdon and M. Feigenbaum. 2007b. American eel abundance indicators in Canada. Incomplete draft July 2007. Canadian Canadian Data Report of Fisheries and Aquatic Sciences.
Casselman, J.M. 2003. Dynamics of resources of the American eel, Anguilla rostrata: declining abundance in the 1990s, Pages 255–274, chapter 18, in K. Aida, K. Tsukamoto, K. Yamauchi, editors. Eel Biology, Springer-Verlag Tokyo.
Castonguay, M., P.V. Hodson, C.M. Couillard, M.J. Eckersley, J.D. Dutil, and G. Verreault. 1994. Why is recruitment of the American eel, Anguilla rostrata, declining in the St. Lawrence River and Gulf? Canadian Journal of Fisheries and Aquatic Sciences i. 51:479–488.
COSEWIC 2006. COSEWIC assessment and status report on the American eel Anguilla rostrata in Canada. Committee on the status of Endangered Wildlife in Canada. Ottawa. X + 71 pp. Available from www.sararegistry.gc.ca/status/showDocument_e.cfm?id=1007.
Couillard, C.M., P.V. Hodson, and M. Castonguay. 1997. Correlations between pathological changes and chemical contamination in American eels, Anguilla rostrata, from the St. Lawrence River. Canadian Journal of Fisheries and Aquatic Sciences 54: 1916–1927.
Dumont, P., M. LaHaye, J. Leclerc, and N. Fournier. 1998. Caractérisation des captures d’anguilles d’Amérique dans des pêcheries commerciales de la rivière Richelieu et du lac Saint-François en 1997. Pages 97-106 in M. Bernard, and C. Groleau (editors). Compte rendu du troisième atelier sur les pêches commerciales, Duschesnay, 13–15 janvier 1998.

510 Joint EIFAC/ICES WGEEL Report 2007
Québec, Ministère de l’Environnement et de la Faune, Direction de la faune et des habitats et Direction des affaires régionales.
Dutil, J.-D., M. Besner, and S.D. McCormick. 1987. Osmoregulatory and ion regulatory changes and associated mortalities during the transition of maturing American eels to a marine environment. American Fisheries Society Symposium 1:175-190.
Fournier, D. and F. Caron. 2005. Travaux de recherche sur l’anguille d’Amérique (Anguilla rostrata) de la Petite rivière de la Trinité en 2001 et synthèse des travaux de 1999 à 2001. Ministère des Ressources naturelles et de la Faune, Direction de la recherche sur la faune. 81 p.
Gray, R.W., and C.W. Andrews. 1971. Age and growth of the American eel (Anguilla rostrata (LeSueur)) in Newfoundland waters. Canadian Journal of Zoology 49: 121–128.
Hodson, P.V., M. Castonguay, C.M. Couillard, C. Desjardins, E. Pelletier, and R. McLeod. 1994. Spatial and temporal variations in chemical contamination of American eels, Anguilla rostrata, captured in the estuary of the St. Lawrence River. Canadian Journal of Fisheries and Aquatic Sciences. 51:464-478.
Jessop, B.M. 1987. Migrating American eels in Nova Scotia. Transactions of the American Fisheries Society 116: 161–170.
McGrath, K.J., J. Bernier, S. Ault, J.D. Dutil, and K. Reid. 2003. Differentiating downstream migrating American eels Anguilla rostrata from resident eels in the St. Lawrence River. Pages 315-327 in D.A. Dixon, editor. Biology, Management, and Protection of Catadromous Eels. American Fisheries Society Symposium 33, Missouri.
Tremblay, V. 2004. Reproductive strategy of female American eel (Anguilla rostrata) among five subpopulations in the St. Lawrence River watershed. Mémoire de Maîtrise en gestion de la faune et ses habitats. Université du Québec à Rimouski. 50 p.
Verreault, G. 2002. Dynamique de la sous-population d’anguilles d’Amérique (Anguilla rostrata) du bassin versant de la rivière du Sud-Ouest. Mémoire de Maîtrise en gestion de la faune et ses habitats. Société de la faune et des parcs du Québec, Direction de l’aménagement de la faune de la région du Bas St-Laurent. 112p.
Verreault, G., P. Pettigrew, R. Tardif, and G. Pouliot. 2003. The exploitation of the migrating silver American eel in the St. Lawrence River Estuary, Québec, Canada. Pages 235-234 in D.A. Dixon, editor. Biology, Management, and Protection of Catadromous Eels. American Fisheries Society Symposium 33, Missouri.
Copyright © 2022 FDOKUMEN