Agriculture, forestry and fishery statistics — 2020 edition
234
STATISTICAL BOOKS Agriculture, forestry and fishery statistics 2020 edition
-
Upload
khangminh22 -
Category
Documents
-
view
0 -
download
0
Transcript of Agriculture, forestry and fishery statistics — 2020 edition

S T A T I S T I C A L B O O K S
Agriculture, forestry and fishery statistics 2020 edition


Agriculture, forestry and fishery statistics 2020 edition

Manuscript completed in December 2020
The European Commission is not liable for any consequence stemming from the reuse of this publication.
Luxembourg: Publications Office of the European Union, 2020
© European Union, 2020
The reuse policy of European Commission documents is implemented based on Commission Decision 2011/833/EU of 12 December 2011 on the reuse of Commission documents (OJ L 330, 14.12.2011, p. 39).
Except otherwise noted, the reuse of this document is authorised under a Creative Commons Attribution 4.0 International (CC-BY 4.0) licence (https://creativecommons.org/licenses/by/4.0/). This means that reuse is allowed provided appropriate credit is given and any changes are indicated.
For any use or reproduction of elements that are not owned by the European Union, permission may need to be sought directly from the respective rightholders. The European Union does not own the copyright in relation to the following elements:
Maps, administrative boundaries © EuroGeographics © UN-FAO © Turkstat
The boundaries and names shown and the designations used on the maps do not imply official endorsement or acceptance by the European Union.
Theme: Agriculture, forestry and fisheriesCollection: Statistical books
Print: ISBN 978-92-76-21521-9 PDF: ISBN 978-92-76-21522-6ISSN 1977-2262 ISSN 2363-2488doi:10.2785/496803 doi:10.2785/143455Cat. No: KS-FK-20-001-EN-C Cat. No: KS-FK-20-001-EN-N

Agriculture, forestry and fishery statistics — 2020 edition 3
Foreword
ForewordThe European Green Deal is an action plan to make the EU’s economy sustainable, by turning climate and environmental challenges into opportunities. A key pillar in this deal is the ‘Farm to Fork strategy’ that aims to make food systems more sustainable.
The new Farm to Fork strategy has a number of aims: to make sure Europeans have access to healthy, affordable and sustainable food; to tackle climate change; to protect the environment and preserve biodiversity; to ensure a fair economic return in the supply chain; and, to increase organic farming.
A series of targets for 2030 have been set: among others, action will be taken to reduce the use of chemical and more hazardous pesticides by 50 %; to reduce fertilizer use by at least 20 %; and, to aim for 25 % of total farmland being used for organic farming. The European Commission also plans to cut food waste by half through legally binding targets.
This year’s edition of the Statistical Book on Agriculture, forestry and fishery statistics looks to build on recent changes in the publication and provide a more complete overview of the Farm to Fork chain. The flow of the publication follows a chain from the farm production stage, through the processing stage of food and beverages and the distribution stage, to the consumption stage. In so doing, the publication includes data on and analysis of new policy targets; this includes organic farms, and areas under organic farming, resource performance including pesticide and mineral fertiliser use, as well as the generation of waste along the chain.
Key messages are provided in each chapter, backed up by InfoGraphics and selected graphics. This is done to help readers follow the analysis and to help them build a picture of the latest changes in the sector.
This publication can also be found online. The most recent data can be freely downloaded from Eurostat’s dissemination database.
Please enjoy reading this year’s publication.
Christine WirtzActing Director, Sectoral and Regional Statistics

Agriculture, forestry and fishery statistics — 2020 edition4
Abstract
AbstractAgriculture, forestry and fishery statistics provides a selection of recent, topical data. Information is presented for the European Union (EU) and its Member States, and is supplemented (when available) with data for the United Kingdom, EFTA members, candidate countries to the EU and potential candidates. This publication aims to cover some of the most popular data within the domain of agriculture, forestry and fishery statistics as well as some of the wider food chain. It may be viewed as an introduction to European statistics in this area and provides a starting point for those who wish to explore the broad range of data that are freely available on Eurostat’s website: https://ec.europa.eu/eurostat.
Eurostat is the statistical office of the EU, situated in Luxembourg. Its mission is to provide high quality statistics and data on Europe.
EditorEdward Cook
Contact detailsEurostat Bâtiment Joseph Bech 5, rue Alphonse Weicker 2721 Luxembourg Internet: https://ec.europa.eu/eurostat E-mail: [email protected]
ProductionInforma s.à r.l. — Giovanni Albertone, Simon Allen and Andrew Redpath
Map productionJorgen Rasmussen(Eurostat, Unit E.4., Regional statistics and geographical information)Michael Harrop(Bilbomática, S.A.)
Illustrations and infographicsClaudia Daman(Publications Office of the European Union, Graphic design department)
AcknowledgementsThe editor would like to thank colleagues who were involved in checking the details of this publication and in particular: Ebba Barany, Oscar Gomez Prieto, Hans-Eduard Hauser, Arja Kärkkäinen, Marjo Kasanko, Pol Marquer, Boryana Milusheva, Cecilia Pop, Noora Puolamaa, Anton Roodhuijzen, Johan Selenius and Veronika Vysna.
Data extractionThe data presented in this statistical book were extracted in October and November 2020, with the exception of international trade data that were extracted in September 2020. The accompanying text was also drafted in October and November 2020.

Agriculture, forestry and fishery statistics — 2020 edition 5
Table of contents
ContentsForeword 3
Abstract 4
Introduction 8
1. Agriculture, forestry and fishery statistics — key messages 11
Key messages 12
2. Agriculture — the factors of production 15
Introduction 16
2.1. Farms and farmland 18
2.2. Farmers and the agricultural labour force 24
2.3. Agricultural capital and land values 25
Data sources and availability 29
3. Farm production 31
Introduction 32
3.1. Crops 34
3.2. Livestock and meat 50
3.3. Milk 57
Data sources and availability 63
4. Performance of the agricultural sector 65
Introduction 66
4.1. Value of agricultural output 68
4.2. Agricultural labour productivity 72
4.3. Resource performance of the agricultural sector 76
Data sources and availability 80
5. Forestry activities 83
Introduction 84
5.1. Forests and other wooded land 87
5.2. Forestry and logging — economic indicators and employment 92
5.3. Primary wood products 95
5.4. Wood-based manufacturing industries 98
Data sources and availability 103

Agriculture, forestry and fishery statistics — 2020 edition6
Table of contents
6. Fisheries activities 105
Introduction 106
6.1. Fisheries — the factors of production 108
6.2. Fisheries production — catches and aquaculture 112
6.3. Landings 119
Data sources and availability 121
7. Food and beverages processing 123
Introduction 124
7.1. Dairies and slaughterhouses 126
7.2. Manufacture of food products and beverages 127
7.3. Generation of waste 130
Data sources and availability 131
8. Trade in agricultural goods 133
Introduction 134
8.1. EU trade in agricultural products as a whole 136
8.2. EU trade in groups of agricultural products 137
8.3. Main trading partners in agricultural products 140
Data sources and availability 141
9. Food and beverage distribution 143
Introduction 144
9.1. Wholesalers, retailers and service providers in food and beverages 146
9.2. Transport of agricultural products and food products 147
Data sources and availability 154
10. Food and beverage consumption 155
Introduction 156
10.1. Consumption expenditure 158
10.2. Obesity 160
10.3. Generation of waste by households 161
Data sources and availability 162
Agriculture, forestry and fishery statistics — 2020 edition 7
Table of contents
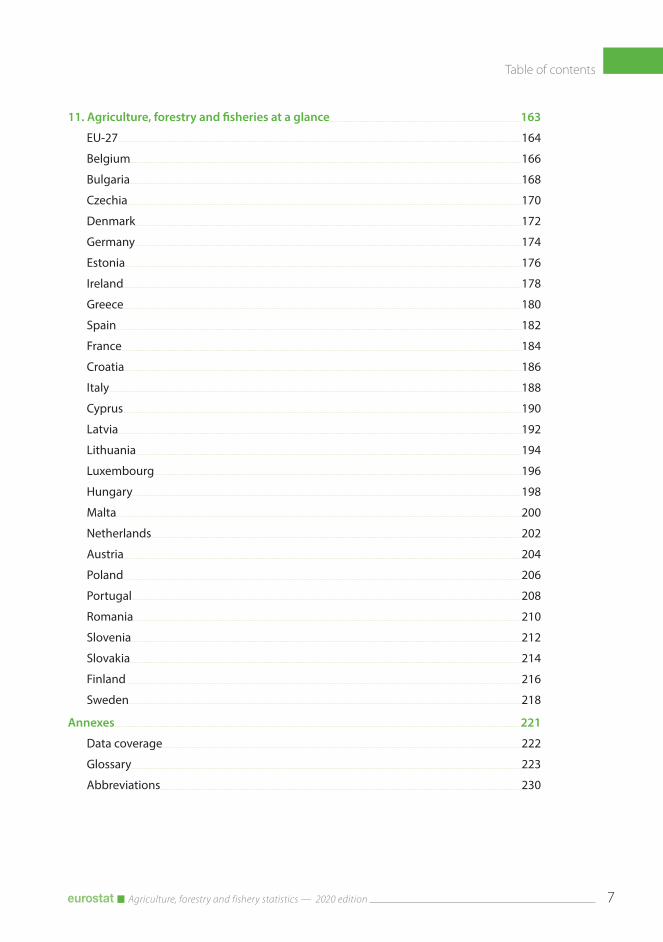
11. Agriculture, forestry and fisheries at a glance 163
EU-27 164
Belgium 166
Bulgaria 168
Czechia 170
Denmark 172
Germany 174
Estonia 176
Ireland 178
Greece 180
Spain 182
France 184
Croatia 186
Italy 188
Cyprus 190
Latvia 192
Lithuania 194
Luxembourg 196
Hungary 198
Malta 200
Netherlands 202
Austria 204
Poland 206
Portugal 208
Romania 210
Slovenia 212
Slovakia 214
Finland 216
Sweden 218
Annexes 221
Data coverage 222
Glossary 223
Abbreviations 230

Agriculture, forestry and fishery statistics — 2020 edition8
Introduction
IntroductionAgriculture, forestry and fishery statistics presents a selection of data on a wide range of topics for the European Union (EU-27 aggregate when available) and its Member States, as well as the United Kingdom, EFTA members, candidate countries to the EU and potential candidates. The data presented refer to the most recent reference years available at the time of preparing the publication, for the most part being either 2019 or 2018.
The official statistics presented in this publication are aimed at specialists (including EU and national policymakers, businesses, producers’ and consumers’ associations, consultancy bodies and trade unions) and generalists who have an interest in the subject.
As the statistical authority of the EU, Eurostat works in partnership with the national statistical offices and other national statistical authorities in the EU Member States to develop, produce and disseminate European statistics. The partnership for agricultural statistics has been going since the early 1950s under the umbrella of the European Agricultural Statistics System (EASS). Agricultural statistics support decision-making and policy design, implementation, monitoring and evaluation in areas related to agriculture, such as the common agricultural policy (CAP), climate change and environmental policies. Statistics are also required to support dialogue between the EU Member States and other partners.
On 1 June 2018, the European Commission presented legislative proposals on the CAP beyond 2020. These proposals refine the current objectives in order to (try to) make the CAP more responsive to current and future challenges. The nine objectives outlined for the future of the CAP are: (i) to ensure a fair income for farmers;
(ii) to increase competitiveness within agriculture; (iii) to rebalance the power in the food chain; (iv) climate change action; (v) environmental care; (vi) to preserve landscapes and biodiversity; (vii) to support generational renewal; (viii) vibrant rural areas; and (ix) to protect food and health quality.
The implementation of the new CAP will be measured against a set of indicators that covers all policy areas and provides information at various levels. Agricultural statistics collected by Eurostat cover the following domains: farm structures; economic accounts for agriculture, agricultural prices and price indices; agricultural production (crop and animal production); organic farming; orchards and vineyards; and agriculture and environment. The data are collected from a variety of sources (surveys at farm level, administrative sources, expert estimates, and so on).
The EU has no common forestry policy, but rather an EU forest strategy. Statistics are available to help support and inform discussion about forestry activities, particularly regarding the need to improve the long-term competitiveness of the EU’s forest sector, while providing a stimulus for the expansion of forest areas that are an important sink for greenhouse gases.
The EU’s common fisheries policy (CFP) sets catch limits, restricts the size of the fishing fleet that sets to sea, and lays down technical measures such as those relating to fishing gear. In addition, the CFP aims to help producers get a fair price for their produce and to ensure that consumers can have confidence in the quality of the seafood that they eat. The CFP focuses on the environmental, economic and social sustainability of fishing. Statistics on aquaculture, catches, landings and the fishing fleet are presented in this publication.

Agriculture, forestry and fishery statistics — 2020 edition 9
Introduction
The 2020 edition of Agriculture, forestry and fishery statistics is divided into 11 chapters:
• Chapter 1 — Agriculture, forestry and fishery statistics in the EU — key messages is an executive summary of the publication.
• Chapter 2 — Agriculture — the factors of production summarises a range of data covering types of farms, the people working in agriculture and agricultural capital. It presents an overview of farms with data on: the size and nature of their activity (including information on organic farming); those working in agriculture, especially farmers according to characteristics such as age, sex and level of education; investments in agriculture, agricultural land prices and rents.
• Chapter 3 — Farm production presents the most recent data on a wide range of the EU’s agricultural products, both in terms of output and prices; this is done for crops, livestock and meat, as well as milk.
• Chapter 4 — Performance of the agricultural sector covers economic developments and resource performance within the agricultural industry and presents data on output and input values.
• Chapter 5 — Forestry activities provides data on the EU’s forest area, forest ownership and timber resources, economic and employment figures for the forestry sector and wood production.
• Chapter 6 — Fisheries activities gives a statistical overview of fishery production, catches, aquaculture, landings of fishery products (product weight and value) and information pertaining to the EU’s fishing fleet by number of vessels, total gross tonnage and engine power.
• Chapter 7 — Food and beverage processing looks at the wider food chain. It analyses the businesses and persons employed in food and beverages manufacturing in the EU.
• Chapter 8 — Trade in agricultural goods presents EU international trade for various agricultural products and the EU’s main trading partners.
• Chapter 9 — Food and beverage distribution looks at the transport of agricultural and manufactured food products across the EU, by road and by inland waterways.
• Chapter 10 — Food and beverage consumption presents data on consumers, notably their expenditure on food, extent of obesity and the generation of household waste related to food.
• Chapter 11 — Agriculture, forestry and fishery statistics at a glance provides a statistical annex for the EU-27 and each of the EU Member States, covering a set of key indicators for the agricultural, forestry and fisheries sectors, as well as a set of pertinent messages regarding key agricultural developments.
This publication presents only a relatively small proportion of the statistics that are collected on agriculture, forestry and fisheries. More detailed data as well as methodological information both for these topics and a much broader range of economic, social and environmental themes can be found on the Eurostat website at: https://ec.europa.eu/eurostat. The Eurostat website also offers free access to databases, statistical articles, predefined tables, methodological documents and publications.


1 Agriculture, forestry and fishery statistics — key messages
1 Agriculture, forestry and fishery statistics — key messages
Agriculture, forestry and fishery statistics — 2020 edition12
Key messages
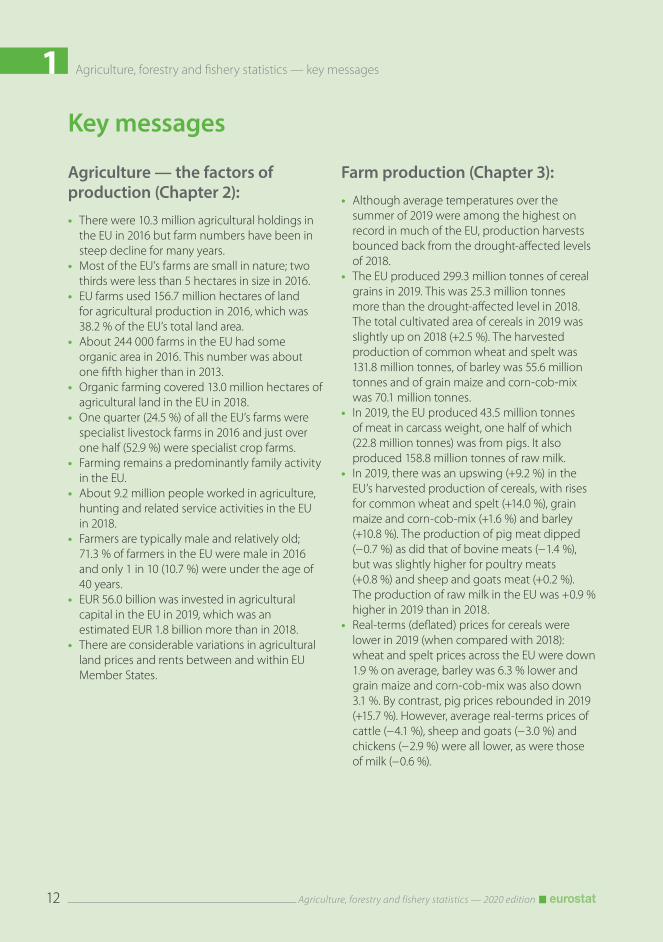
Agriculture — the factors of production (Chapter 2):
• There were 10.3 million agricultural holdings in the EU in 2016 but farm numbers have been in steep decline for many years.
• Most of the EU’s farms are small in nature; two thirds were less than 5 hectares in size in 2016.
• EU farms used 156.7 million hectares of land for agricultural production in 2016, which was 38.2 % of the EU’s total land area.
• About 244 000 farms in the EU had some organic area in 2016. This number was about one fifth higher than in 2013.
• Organic farming covered 13.0 million hectares of agricultural land in the EU in 2018.
• One quarter (24.5 %) of all the EU’s farms were specialist livestock farms in 2016 and just over one half (52.9 %) were specialist crop farms.
• Farming remains a predominantly family activity in the EU.
• About 9.2 million people worked in agriculture, hunting and related service activities in the EU in 2018.
• Farmers are typically male and relatively old; 71.3 % of farmers in the EU were male in 2016 and only 1 in 10 (10.7 %) were under the age of 40 years.
• EUR 56.0 billion was invested in agricultural capital in the EU in 2019, which was an estimated EUR 1.8 billion more than in 2018.
• There are considerable variations in agricultural land prices and rents between and within EU Member States.
Farm production (Chapter 3):
• Although average temperatures over the summer of 2019 were among the highest on record in much of the EU, production harvests bounced back from the drought-affected levels of 2018.
• The EU produced 299.3 million tonnes of cereal grains in 2019. This was 25.3 million tonnes more than the drought-affected level in 2018. The total cultivated area of cereals in 2019 was slightly up on 2018 (+2.5 %). The harvested production of common wheat and spelt was 131.8 million tonnes, of barley was 55.6 million tonnes and of grain maize and corn-cob-mix was 70.1 million tonnes.
• In 2019, the EU produced 43.5 million tonnes of meat in carcass weight, one half of which (22.8 million tonnes) was from pigs. It also produced 158.8 million tonnes of raw milk.
• In 2019, there was an upswing (+9.2 %) in the EU’s harvested production of cereals, with rises for common wheat and spelt (+14.0 %), grain maize and corn-cob-mix (+1.6 %) and barley (+10.8 %). The production of pig meat dipped (− 0.7 %) as did that of bovine meats (− 1.4 %), but was slightly higher for poultry meats (+0.8 %) and sheep and goats meat (+0.2 %). The production of raw milk in the EU was +0.9 % higher in 2019 than in 2018.
• Real-terms (deflated) prices for cereals were lower in 2019 (when compared with 2018): wheat and spelt prices across the EU were down 1.9 % on average, barley was 6.3 % lower and grain maize and corn-cob-mix was also down 3.1 %. By contrast, pig prices rebounded in 2019 (+15.7 %). However, average real-terms prices of cattle (− 4.1 %), sheep and goats (− 3.0 %) and chickens (− 2.9 %) were all lower, as were those of milk (− 0.6 %).

1Agriculture, forestry and fishery statistics — key messages
Agriculture, forestry and fishery statistics — 2020 edition 13
Performance of the agricultural sector (Chapter 4):
• Agriculture contributed 1.3 % to the EU’s GDP in 2019.
• The EU’s agricultural industry created (gross) value added of EUR 181.5 billion in 2019.
• Agricultural income per AWU, expressed as an index, rose 4.7 % across the EU in 2019. This was to a level that was almost 30 % higher than in 2010.
• The rising output volume of the EU’s agricultural industry has been underpinned by a rising use of input goods and services as a whole.
• The risk from pesticide use is in decline; across the EU that risk was estimated to have fallen 17 % between the average for the years 2011-2013 and 2018.
Forestry activities (Chapter 5):
• There are about 180 million hectares of forests and other wooded land in the EU, and the area has been expanding through natural growth and afforestation.
• Just over half a million people were employed in forestry and logging activities in the EU in 2018.
• Forestry and logging activities in the EU generated gross value added of EUR 26.2 billion in 2017.
• Three quarters of roundwood production in the EU went to supply wood-based industries in 2018; the remaining one quarter (22.7 %) went to fuelwood.
• Wood-based industries in the EU generated gross value added of EUR 138.6 billion in 2018; pulp and paper production accounted for one third of this.
• 3.1 million people were employed in the EU’s wood-based industries, accounting for 10.5 % of all people working in the manufacturing sector in 2018.
Fisheries activities (Chapter 6):
• The EU’s fishing fleet is getting smaller in number, capacity and power …
• … but EU catches still totalled 4.1 million tonnes of live weight in 2019.
• 1.1 million tonnes of aquaculture products were harvested in the EU in 2018.
• The fisheries industry in the EU employed about 163 000 people in 2018.
Food and beverage processing (Chapter 7):
• In 2018, there were about 289 000 enterprises involved in food and beverages production in the EU, employing 4.5 million people.
• 96 % of food and beverages enterprises in the EU are small, employing less than 50 people.
• The value of food and beverages produced in the EU was EUR 827.2 billion in 2019.
• The manufacture of food products, beverages and tobacco products in the EU generated 37.0 million tonnes of waste in 2018.
Trade in agricultural goods (Chapter 8):
• The EU’s trade in agricultural goods doubled in 13 years to EUR 324.8 billion in 2019.
• The value of trade in agricultural goods accounted for 8.0 % of the EU’s international trade in goods in 2019.
• The United Kingdom was the EU’s main trading partner in agricultural products in 2019, with trade worth EUR 60.4 billion.
• The United Kingdom was the main recipient of EU exports (23.2 %) of agricultural products in 2019 and was the main origin of EU imports (12.8 %).

1 Agriculture, forestry and fishery statistics — key messages
Agriculture, forestry and fishery statistics — 2020 edition14
Food and beverage distribution (Chapter 9):
• Across the EU in 2018, there were 10.8 million people employed in the wholesaling of and specialised retailing of food and beverages, and restaurants, bars, cafés and catering services.
• A combined 2.8 billion tonnes of primary agricultural, forestry and fisheries products, food products, beverages and tobacco were transported by road on EU registered trucks (over 3.5 tonnes of loading capacity) in 2019 …
• … over a payload-distance of about 500 billion kilometres in 2019.
• The vast majority of agricultural and food products were transported by road over distances of less than 300 kilometres.
Food and beverage consumption (Chapter 10):
• Food and beverages (including catering services) accounted for a combined 21.4 % of the final consumption expenditure of households, on average, across the EU in 2018.
• About one in every eight people over the age of 16 years in the EU (an estimated 11.9 %) had either some or a severe inability to afford a meal with meat, chicken, fish, or vegetarian equivalent every second day in 2018.
• Just over one half (an estimated 51.8 %) of the EU’s adult population over 18 years of age was classified as overweight in 2017.
• Eurostat estimates that the EU produced 70 million tonnes of food waste in 2016, which was equivalent to an average of 158 kilograms per inhabitant.

2 Agriculture — the factors of production

2 Agriculture — the factors of production
Agriculture, forestry and fishery statistics — 2020 edition16
156.7 million hectares of land in the EU were
used for agricultural production in 2016...
... this is about 38.2 % ofthe EU’s total land area
Two thirds of the EU’s farms areless than 5 hectares in size
Did youknow ...
There were10.3 million farms
in the EU in 2016
Farming is amale dominated profession with relatively few female farmers
71.3 % of the total were menin 2016
There are few young farmers; only about 1 in 10 EU farm managers (11 %) were under the age of 40 years in 2016
28.7 % of the total were womenin 2016
≈ 244 000 holdingsin the EU have someorganic area and this number is increasing
13.0 million hectares were used for organicfarming in 2018
Introduction
(1) See https://ec.europa.eu/info/food-farming-fisheries/key-policies/common-agricultural-policy/future-cap_en.(2) See https://ec.europa.eu/info/sites/info/files/food-farming-fisheries/key_policies/documents/eco_background_final_en.pdf.(3) See https://ec.europa.eu/info/sites/info/files/food-farming-fisheries/key_policies/documents/env_background_final_en.pdf.(4) See https://ec.europa.eu/info/sites/info/files/food-farming-fisheries/key_policies/documents/soc_background_final_en.pdf.
Farming is an activity that is about growing crops and raising livestock. It is the business of providing key primary ingredients for the food that we eat and much of what we drink. Farming draws on a set of resources to produce these agricultural goods, as well as agricultural services. These resources or ‘factors of production’ can be broadly categorised as land, labour, knowledge, capital and entrepreneurship.
Within the EU, the farming sector operates under the common agricultural policy (CAP). Just as agriculture needs to keep pace with scientific and technological advances, so the CAP needs to respond to developing challenges. The CAP has been reformed a number of times over the years and on 1 June 2018, the European Commission presented proposals for further changes beyond 2020. The proposed nine objectives of this future CAP (1) highlight the central role of farms and farmers in meeting challenges to do with climate
change, with creating vibrant rural areas, with preserving rural landscapes, with environmental care and with protecting food and health quality. These economic (2), environmental and climate-related (3) and socioeconomic challenges (4) require that farmers be at the heart of Europe’s rural communities. This helps explain why support for the generational succession of farms and encouragement of a new generation of farmers is also a key part of the new CAP proposal.
Understanding how much of these factors of production are available and how they are changing over time provides a key insight into how agriculture in the EU will meet these various challenges. This chapter analyses EU statistics on farms and farmers as well as agricultural capital and land values. Entrepreneurship is looked at within Chapter 4 on the ‘Performance of the agricultural sector’.

2Agriculture — the factors of production
Agriculture, forestry and fishery statistics — 2020 edition 17
156.7 million hectares of land in the EU were
used for agricultural production in 2016...
... this is about 38.2 % ofthe EU’s total land area
Two thirds of the EU’s farms areless than 5 hectares in size
Did youknow ...
There were10.3 million farms
in the EU in 2016
Farming is amale dominated profession with relatively few female farmers
71.3 % of the total were menin 2016
There are few young farmers; only about 1 in 10 EU farm managers (11 %) were under the age of 40 years in 2016
28.7 % of the total were womenin 2016
≈ 244 000 holdingsin the EU have someorganic area and this number is increasing
13.0 million hectares were used for organicfarming in 2018

2 Agriculture — the factors of production
Agriculture, forestry and fishery statistics — 2020 edition18
2.1. Farms and farmland
(5) The term ‘family farm’ refers to any farm under family management where 50 % or more of the regular agricultural labour force is provided by family members.
The collection of data under the farm structure survey (FSS) is carried out on a regular rather than annual basis. In part, this reflects the reality that changes in structural developments are difficult to identify on a year-to-year basis. In part, it also reflects the challenge of the time and expense required to establish and carry out surveys and censuses. The pragmatic approach adopted is to carry out decennial censuses and surveys every three or so years in-between. No new FSS has been carried out since the last Statistical Book in 2019. This year’s chapter on farms and farmland in the EU reviews the main messages previously provided and adds some updated analyses on organic farms.
2.1.1. Key messages updated from the 2019 edition of the Statistical Book:
• There were 10.3 million agricultural holdings in the EU in 2016One third (33.3 %) of the EU-27’s agricultural holdings (termed ‘farms’) were located in Romania, with a further one quarter found in Poland (13.7 %) and Italy (11.1 %).
• The vast majority of the EU’s farms are family farmsThe overwhelming majority (96.3 % in 2016) of the EU’s farms are classed as being family farms (5).
• Most of the EU’s farms are small in natureTwo thirds of the EU’s farms were less than 5 hectares in size in 2016. Although the average mean size of an agricultural holding in the EU was 15.2 hectares in 2016, only about 16 % of farms were this size or larger.
• EU farms can be broadly characterised as either (i) semi-subsistence (ii) small and medium-sized farms or (iii) large agricultural enterprisesOf the EU-27’s 10.3 million farms, 4.0 million had an economic size in terms of standard output below EUR 2 000 per year and were responsible for only 0.9 % of the EU’s total agricultural economic output. These very small farms are at the (semi-)subsistence end of the farming scale; about three quarters of such farms in the EU consumed more than one half of their own production.
A further 3.0 million farms had an economic output within the range of EUR 2 000-EUR 8 000 per year. Together these very small and small farms accounted for two thirds (68.3 %) of all farms in the EU in 2016 but were responsible for only 4.6 % the EU’s total agricultural economic output.
By contrast, the largest 278 000 farms (2.7 % of the EU total) each produced a standard output of EUR 250 000 per year or more in 2016 and were responsible for a majority (54.4 %) of the EU’s total agricultural economic output; these farms can be characterised as being large agricultural enterprises. Two in every five of these large farms had a legal or group holding form.
About 60 % of the standard output generated by agriculture across the EU-27 was from farms in France (18.1 %), Italy (15.3 %), Germany (14.5 %), and Spain (11.3 %) in 2016. Although Romania accounted for one third of the EU’s farms, it accounted for only 3.6 % of the EU’s standard output.

2Agriculture — the factors of production
Agriculture, forestry and fishery statistics — 2020 edition 19
• EU farms remain diverse in terms of what they grow or rearAbout one half (52.9 %) of all farms in 2016 could be categorised as being specialist crop farms; just under one third (31.7 %) of all farms were specialised in field cropping, about one fifth (19.3 %) were specialised in permanent crops, with the remainder (1.8 %) being specialist horticultural farms.
Another one quarter (24.5 %) of the EU’s farms were specialist livestock farms. Within this specialist livestock group, sheep, goats and other grazing livestock farms (5.7 % of all farms), specialist dairy farms (5.4 %) and specialist poultry farms (4.5 %) were the most numerous. Mixed farms comprise mixed crop-animal farms, mixed cropping farms and mixed livestock farms. As a whole, mixed farms accounted for just over one fifth of all farms (21.4 %). A percentage of farms were not classified.
• EU farms used 157 million hectares of land for agricultural production in 2016EU farms used 156.7 million hectares of land for agricultural production in 2016. A little over two thirds (68.5 %) of the utilised agricultural area of the EU was based in just six Member States; France used 27.8 million hectares for agricultural purposes in 2016, Spain 23.2 million hectares, Germany 16.7 million hectares, Poland 14.4 million hectares, Italy a further 12.6 million hectares and Romania 12.5 million hectares.
• Farms managed about 45 % of the total land area of the EU-27 in 2016Farms in the EU managed 38.2 % of the total land area of the EU-27 as UAA, as well as 6.6 % as wooded areas and 1.6 % as other unused land. Of the land used for agricultural production in
the EU, the vast majority (62.0 % in 2016) was arable land which was mainly used to produce crops for human and animal consumption. Permanent grassland accounted for a further one third (31.2 %) of the utilised agricultural area, and was mainly used to provide further fodder and forage for animals. The remaining area (5.5 %) was used for permanent crops such as fruit, olives and grape production.
A map of types of land cover in the EU (see Map 2.1.1) shows the strong correlation between cover-type and physical characteristics like mountains. Generally, the Member States with lower shares of agricultural cover had higher shares of forested areas.
• The number of farms in the EU has been in steep declineBearing in mind some methodological precautions, there were about 4.1 million fewer farms in the EU-27 in 2016 than in 2005, equivalent to a decline of just less than 30 %. The vast majority of the farms lost (about 83 %) were small farms of a size under 5 hectares. During this period, the largest reductions in farm numbers were recorded in Poland (an indicative loss of 1.1 million farms, or 43 %), Romania (an indicative loss of 0.8 million farms, or 20 %) and Italy (an indicative loss of 0.6 million farms, or 34 %).
• The amount of land used in the EU for agricultural production has remained steadyThe consolidation in the amount of agricultural land used in the EU reflects the growth in the number of the largest holdings and the land that they used for agricultural purposes.

2 Agriculture — the factors of production
Agriculture, forestry and fishery statistics — 2020 edition20
Map 2.1.1: Land cover, 2018(based on the most common form of land cover for a 1 km2 grid)
Administrative boundaries: © EuroGeographics © UN-FAO © Turkstat
0 200 400 600 800 km
Cartography: Eurostat — GISCO, 11/2020.
Source: Corine land cover 2018, European Environment Agency (EEA)
The designation of Kosovo is without prejudice to positions on status, and is in line with UNSCR 1244/1999 and the ICJ Opinion on the Kosovo Declaration of Independence.
ArtificialAgriculturalForestNatureInland water
Guadeloupe (FR)
0 25
Martinique (FR)
0 20
Guyane (FR)
0 100
Réunion (FR)
0 20
Açores (PT)
0 50
Madeira (PT)
0 20
Canarias (ES)
0 100
Malta
0 10
Liechtenstein
0 5
Mayotte (FR)
0 15
The designation of Kosovo is without prejudice to positions on status, and is in line w ith UNSCR 1244/1999 and the ICJ Opinion on the Kosovo Declaration of Independence.
Source: Corine land cover 2018, European Environment Agency (EEA)
2Agriculture — the factors of production
Agriculture, forestry and fishery statistics — 2020 edition 21
2.1.2. Organic farming:Organic farming is an agricultural method that aims to produce food using natural substances and processes. This means that organic farming tends to have a limited environmental impact as it encourages, among others: the responsible use of energy and natural resources; the maintenance of biodiversity; preservation of regional ecological balances; enhancement of soil fertility; maintenance of water quality; a high standard of animal welfare which requires farmers to meet the specific behavioural needs of animals. This type of farming looks to use many of the factors of production to produce agricultural goods in a more sustainable way than conventional farming.
EU regulations on organic farming are designed to provide a clear structure for the production of organic goods across the whole of the EU. This is to satisfy consumer demand for trustworthy organic products whilst providing a fair marketplace for producers, distributors and marketers (6).
About one quarter of a million holdings in the EU have some organic area; this number is increasing
There were about 244 000 agricultural holdings (here termed ‘farms’) in the EU that had some organic area in 2016.
A two-thirds (68.2 %) majority of organic farms in the EU were fully organic in 2016, the remaining one third having a mixture of organic and non-organic production. Among Member States, the share of organic farms that were fully organic was particularly high in Czechia (98.3 %), Austria (97.7 %), Germany (97.6 %) and Estonia (94.0 %).
The strongest growth in the number of farms with some organic area between 2013 and 2016 was for farms that were fully organic. Fully organic farms accounted for 1.6 % of all farms across the EU in 2016.
(6) See https://ec.europa.eu/info/food-farming-fisheries/farming/organic-farming/organics-glance_en.(7) For more details, see the Statistics Explained article on Organic farming statistics.
Organic farming covered 13.0 million hectares of agricultural land in the EU-27 in 2018, up sharply
The total organic area across the EU-27 in 2018 was 13.0 million hectares, corresponding to 8.0 % of the total utilised agricultural area. The total organic area is the sum of the ’area under conversion’ and the ’certified area’. Before an area can be certified as ‘organic’, it must undergo a conversion process, which may take 2-3 years depending on the crop (7).
A small majority of the EU’s total organic area was located in just four Member States: Spain (17.3 %), Italy (15.7 %), France (15.1 %) and Germany (9.4 %). These four Member States had a higher collective proportion of the organic area (57.5 %) than of total utilised agricultural area (51.3 % in 2016).
The total organic area in the EU increased by 3.5 million hectares between 2012 and 2018, equivalent to a rise of a just over one third (+37.2 %). This upward development was noted in all Member States, with one notable exception (see Figure 2.1.1). The increase in the EU as a whole was driven by the above-average growth in the total organic area in France (+97.3 % between 2012 and 2018, which added 1.0 million hectares of organic area) and in Italy (+67.7 %, which added 0.8 million hectares) and supported by expansions in Spain (+27.9 %), Germany (+27.2 %) and Sweden (+27.4 %). The fastest expansions in organic area over the reference period were in Bulgaria and Croatia where they tripled, adding a combined 160 000 hectares. The overall growth in the EU’s organic farm area was tempered by the relatively sharp reduction in Poland (− 26.1 %, equivalent to a loss of 171 000 hectares of organic area).

2 Agriculture — the factors of production
Agriculture, forestry and fishery statistics — 2020 edition22
Figure 2.1.1: Total organic area (fully converted and under conversion), 2012 and 2018(ha)
500 000
0
1 000 000
1 500 000
2 000 000
2 500 000
Spai
nFr
ance
Italy
Ger
man
yA
ustr
iaSw
eden
Czec
hia
Gre
ece
Pola
ndRo
man
iaFi
nlan
dLa
tvia
Den
mar
kLi
thua
nia
Port
ugal
Hun
gary
Esto
nia
Slov
akia
Bulg
aria
Irela
ndCr
oatia
Belg
ium
Net
herla
nds
Slov
enia
Cypr
usLu
xem
bour
gM
alta
Uni
ted
King
dom
Switz
erla
ndN
orw
ayIc
elan
d (1 )
Turk
eySe
rbia
Nor
th M
aced
onia
2012 2018
Note: no data available for Iceland (2012), North Macedonia (2012), Serbia (2012) and Turkey (2012). Preliminary data for Latvia (2018).
(1) 2017 data.
Source: Eurostat (online data code: org_cropar)
Organic farming is ‘mainstream’ in some Member States
From 2012 to 2018, the share of total organic area in the total utilised agricultural area (UAA) within the EU rose from 5.9 % to 8.0 %. There were some Member States where this share was much higher, most particularly Austria (24.1 %), Estonia (21.0 %) and Sweden (20.3 %). In contrast, there were Member States for whom the share of total organic area in the total utilised agricultural area was below, and sometimes well below, the EU average (see Figure 2.1.2); these included, among others, France (7.0 %), the Netherlands (3.5 %), Poland (3.3 %), and Romania (2.4 %).
The potential for organic production can also be indicated by the area under conversion as a percentage of the utilised agricultural area. The highest shares of area under conversion in 2018 using this measure were in Italy (3.6 %), Estonia (3.5 %) and Greece (3.3 %).
Arable land and permanent grassland account for vast majority of EU’s total organic crop area
Agricultural production area is divided into three main types of use: arable crops (mainly cereals, root crops, fresh vegetables, green fodder and industrial crops), permanent grassland (pastures and meadows), and permanent crops (fruit trees and berries, olive groves and vineyards). Organic arable land covered 6.0 million hectares across the EU-27 in 2018 and organic pastures and meadows (mostly used for grazing organic livestock) a further 5.6 million hectares; together these two types of land use accounted for about 90 % of the EU’s total organic crop area.
Among the four Member States that accounted for a small majority of the EU’s total organic area, a little over one half (52.8 %) of the total organic area in Spain was accounted for by permanent grassland, as was the case in Germany (54.8 %) and about one half (48.3 %) by arable land in Italy, as in France (57.3 %). Among other Member States, organic arable land dominated the total organic areas of Finland, Denmark and Sweden, with organic permanent grassland dominating in Ireland, Czechia and Slovenia (see Figure 2.1.3).

2Agriculture — the factors of production
Agriculture, forestry and fishery statistics — 2020 edition 23
Figure 2.1.3: Arable land crops, permanent grassland (pastures and meadows) and permanent crops, 2017(% of total organic area — fully converted and under conversion)
0
10
20
30
40
50
60
70
80
90
100
EU-2
7
Finl
and
Den
mar
kSw
eden
Rom
ania
Pola
ndM
alta
Lith
uani
aFr
ance
Esto
nia
Bulg
aria
Latv
iaCy
prus
Croa
tiaIta
lyLu
xem
bour
gG
erm
any
Net
herla
nds
Hun
gary
Aus
tria
Belg
ium
Slov
akia
Gre
ece
Spai
nPo
rtug
alCz
echi
aSl
oven
iaIre
land
Uni
ted
King
dom
Nor
way
Switz
erla
ndIc
elan
d (1 )
Nor
th M
aced
onia
Turk
eySe
rbia
Permanent cropsPermanent grasslandArable land
Note: provisional data for EU-27 and Latvia.
(1) 2017 data.
Source: Eurostat (online data code: org_cropar)
Figure 2.1.2: Share of total organic area (fully converted and under conversion) in total utilised agricultural area (UAA), 2018(%)
0
5
10
15
20
25
EU-2
7
Aus
tria
Esto
nia
Swed
enIta
lyCz
echi
aLa
tvia
Finl
and
Slov
enia
Slov
akia
Den
mar
kG
reec
eSp
ain
Lith
uani
aG
erm
any
Fran
ceCr
oatia
Belg
ium
Port
ugal
Cypr
usLu
xem
bour
gH
unga
ryN
ethe
rland
sPo
land
Irela
ndBu
lgar
iaRo
man
iaM
alta
Uni
ted
King
dom
Switz
erla
ndN
orw
ayIc
elan
d (1 )
Turk
eySe
rbia
Nor
th M
aced
onia
Note: provisional data for EU-27 and Latvia.
(1) 2017 data.
Source: Eurostat (online data code: org_cropar)

2 Agriculture — the factors of production
Agriculture, forestry and fishery statistics — 2020 edition24
2.2. Farmers and the agricultural labour force
(8) For more details on similar analyses, see the Statistics Explained article on Family farming in the EU.
Key messages updated from the 2019 edition of the Statistical Book:
• Agriculture remains a big employer within the EU; 9.2 million people worked in agriculture in 2018An estimated 9.2 million people worked in agriculture, hunting and related service activities in 2018, the equivalent of 4.4 % of total employment in the EU-27. Agriculture is a particularly big employer in Romania, accounting for just less than one in every four persons employed (23.3 % in agriculture, hunting and related service activities in 2017).
• Farming remains a predominantly family activityNine in every ten (89.8 %) people who worked regularly in agriculture in the EU were sole holders (farmer) or members of their families in 2016 (8).
• Farms managers are typically male and relatively oldSeven in every ten (71.3 %) farm managers on the EU-27’s 10.3 million holdings were male and a majority (57.8 %) were 55 years of age or more. Only about 1 in every 10 (10.7 %) farm managers was a young farmer under the age of 40 years. This top-heavy age structure underlines the policy interest in farm succession and the need to encourage a new generation of farmers.
The gender imbalance among farmers is particularly strong in the Netherlands; only 1 in about every 20 farmers (the equivalent of 5.2 %) was female in 2016. Female farmers were also particularly uncommon in Malta (6.0 % of all farmers), Denmark (7.7 %) and Germany (9.6 %).
• Elderly farm managers tend to work on the smallest farms (measured in economic terms)Four fifths (82.7 %) of the EU’s farm managers that were 65 years of age or older worked on very small (semi-subsistence) and small farms with a standard output of less than EUR 8 000 per year in 2016.
• Very few farm managers in the EU have full agricultural trainingMost farm managers in the EU only have practical experience; this was the case for 7 in every 10 (68.3 %) of them in 2016. Less than 1 in 10 (8.9 %) farm managers had full agricultural training, and the rest (22.7 %) had basic agricultural training.
• Fewer farms, fewer farmersAs the number of farms in the EU has declined, so has the number of farmers and those employed in agriculture; the share of people employed in agriculture fell from 6.4 % of total EU employment in 2005 to 4.6 % in 2016. The volume of work carried out can be measured in terms of full-time labour equivalents, with one annual work unit (AWU) being equivalent to one person working full-time. The volume of work carried out in agricultural activities across the EU declined by 3.2 million AWUs between 2005 and 2016, a decline of one quarter (− 25.9 %). The biggest losses were in Romania (1.0 million AWUs), Poland (0.6 million AWUs) and Bulgaria (0.4 million AWUs, equivalent to a 60 % decline).
• Young farmers getting scarcer but female farmers holding steadyYoung farmers are getting scarcer: in 2005, 6.9 % of farm managers in the EU were very young (defined here as under the age of 35 years) but this share had fallen to 5.1 % in 2016. The share of farm managers that are women, however, increased slightly (from 26.5 % in 2005 to 28.7 % in 2016).
2Agriculture — the factors of production
Agriculture, forestry and fishery statistics — 2020 edition 25
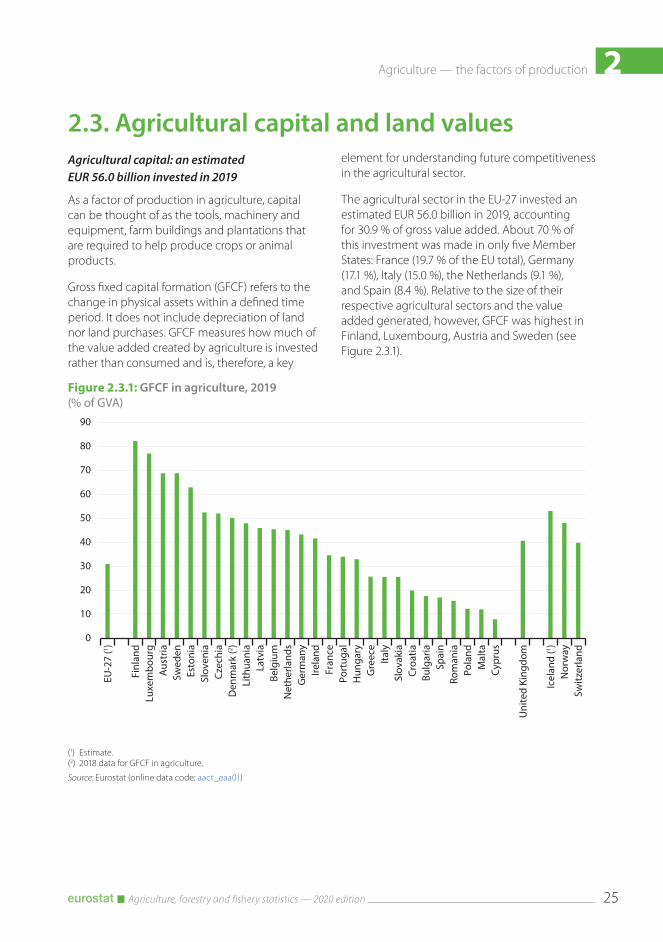
2.3. Agricultural capital and land valuesAgricultural capital: an estimated EUR 56.0 billion invested in 2019
As a factor of production in agriculture, capital can be thought of as the tools, machinery and equipment, farm buildings and plantations that are required to help produce crops or animal products.
Gross fixed capital formation (GFCF) refers to the change in physical assets within a defined time period. It does not include depreciation of land nor land purchases. GFCF measures how much of the value added created by agriculture is invested rather than consumed and is, therefore, a key
element for understanding future competitiveness in the agricultural sector.
The agricultural sector in the EU-27 invested an estimated EUR 56.0 billion in 2019, accounting for 30.9 % of gross value added. About 70 % of this investment was made in only five Member States: France (19.7 % of the EU total), Germany (17.1 %), Italy (15.0 %), the Netherlands (9.1 %), and Spain (8.4 %). Relative to the size of their respective agricultural sectors and the value added generated, however, GFCF was highest in Finland, Luxembourg, Austria and Sweden (see Figure 2.3.1).
Figure 2.3.1: GFCF in agriculture, 2019(% of GVA)
0
10
20
30
40
50
60
70
80
90
EU-2
7 (1 )
Finl
and
Luxe
mbo
urg
Aus
tria
Swed
enEs
toni
aSl
oven
iaCz
echi
aD
enm
ark
(2 )Li
thua
nia
Latv
iaBe
lgiu
mN
ethe
rland
sG
erm
any
Irela
ndFr
ance
Port
ugal
Hun
gary
Gre
ece
Italy
Slov
akia
Croa
tiaBu
lgar
iaSp
ain
Rom
ania
Pola
ndM
alta
Cypr
us
Uni
ted
King
dom
Icel
and
(1 )N
orw
aySw
itzer
land
(1) Estimate.(2) 2018 data for GFCF in agriculture.
Source: Eurostat (online data code: aact_eaa01)

2 Agriculture — the factors of production
Agriculture, forestry and fishery statistics — 2020 edition26
Figure 2.3.2: GFCF in agriculture, 2009‑2019(annual average growth rates, %)
−10
−5
0
5
10
15
EU-2
7 (1 )
Lith
uani
aCy
prus
Bulg
aria
Irela
ndCz
echi
aLa
tvia
Rom
ania
Esto
nia
Port
ugal
Hun
gary
Net
herla
nds
Italy
Pola
ndSl
oven
iaSw
eden
Aus
tria
Ger
man
yFr
ance
Spai
nFi
nlan
dBe
lgiu
mG
reec
eD
enm
ark
(2 )Lu
xem
bour
gSl
ovak
iaCr
oatia
Mal
ta
Uni
ted
King
dom
Icel
and
(1 )Sw
itzer
land
Nor
way
(1) 2009-2018.
Source: Eurostat (online data code: aact_eaa01)
The level of investment in EU agriculture was an estimated EUR 1.8 billion higher in 2019 than in 2018
The level of investment in EU agriculture in 2019 was an estimated EUR 1.8 billion more than in 2018 and EUR 7.3 billion more than in 2016. Although there have been some strong annual fluctuations at the level of the EU, there have been some clear trends at Member State level.
During the period between 2009 and 2019, there was particularly strong investment growth in Lithuania (an average annual growth rate of
12.6 %), in Cyprus (an average annual growth rate of 8.2 %), in Bulgaria, in Ireland and in Czechia (all with an average annual growth rate of between 7.5 and 7.7 %; see Figure 2.3.2). In the cases of Lithuania, Ireland and Czechia this growth was relatively steady. In the case of Cyprus, the rebound in investment was concentrated after 2015 and in the case of Bulgaria was restricted to the surge in 2018. In contrast, there were strong investment contractions over the same period in Slovakia (− 4.4 % per year on average), Croatia (an average − 6.9 % per year) and Malta (an average − 7.0 % per year).
2Agriculture — the factors of production
Agriculture, forestry and fishery statistics — 2020 edition 27
Figure 2.3.3: National and regional prices of arable land, 2018(EUR 1 000 per hectare)
0
20
40
60
80
100
120
140
Net
herla
nds
Italy
Luxe
mbo
urg
Irela
nd
Slov
enia
Den
mar
k
Spai
n
Gre
ece
Pola
nd
Swed
en
Finl
and
Czec
hia
Fran
ce
Bulg
aria
Rom
ania
Hun
gary
Lith
uani
a
Latv
ia
Slov
akia
Croa
tia
Esto
nia
Uni
ted
King
dom
National average, with minimum and maximum regional averages
Note: data for Belgium, Germany, Cyprus, Malta, Austria and Portugal are not available. Regions are shown at the NUTS 2 level, with the exception of the Estonia, Latvia, Lithuania and Luxembourg (NUTS 1).
Source: Eurostat (online data code: apri_lprc)
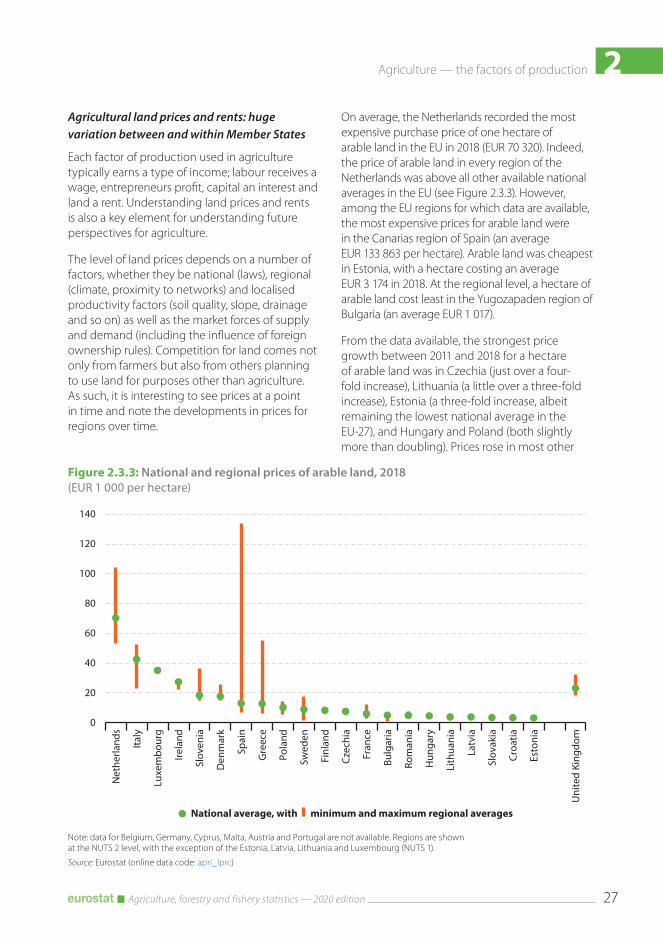
Agricultural land prices and rents: huge variation between and within Member States
Each factor of production used in agriculture typically earns a type of income; labour receives a wage, entrepreneurs profit, capital an interest and land a rent. Understanding land prices and rents is also a key element for understanding future perspectives for agriculture.
The level of land prices depends on a number of factors, whether they be national (laws), regional (climate, proximity to networks) and localised productivity factors (soil quality, slope, drainage and so on) as well as the market forces of supply and demand (including the influence of foreign ownership rules). Competition for land comes not only from farmers but also from others planning to use land for purposes other than agriculture. As such, it is interesting to see prices at a point in time and note the developments in prices for regions over time.
On average, the Netherlands recorded the most expensive purchase price of one hectare of arable land in the EU in 2018 (EUR 70 320). Indeed, the price of arable land in every region of the Netherlands was above all other available national averages in the EU (see Figure 2.3.3). However, among the EU regions for which data are available, the most expensive prices for arable land were in the Canarias region of Spain (an average EUR 133 863 per hectare). Arable land was cheapest in Estonia, with a hectare costing an average EUR 3 174 in 2018. At the regional level, a hectare of arable land cost least in the Yugozapaden region of Bulgaria (an average EUR 1 017).
From the data available, the strongest price growth between 2011 and 2018 for a hectare of arable land was in Czechia (just over a four-fold increase), Lithuania (a little over a three-fold increase), Estonia (a three-fold increase, albeit remaining the lowest national average in the EU-27), and Hungary and Poland (both slightly more than doubling). Prices rose in most other

2 Agriculture — the factors of production
Agriculture, forestry and fishery statistics — 2020 edition28
Figure 2.3.4: National and regional agricultural land rent prices, 2018(EUR per hectare)
0
200
400
600
800
1 000
1 200
1 400
1 600
1 800
2 000
Italy
(1 )
Net
herla
nds
Den
mar
k
Irela
nd
Aus
tria
Bulg
aria
Luxe
mbo
urg
Finl
and
Pola
nd
Hun
gary
Spai
n
Swed
en
Fran
ce
Slov
enia
(1 )
Czec
hia
Lith
uani
a
Mal
ta
Croa
tia
Latv
ia
Esto
nia
Slov
akia
Uni
ted
King
dom
(2 )
Nor
way
National average, with minimum and maximum regional averages
Note: data for Belgium, Germany, Greece, Cyprus, Portugal and Romania are not available.
(1) 2017 data.(2) No national average. 2016 data.
Source: Eurostat (online data code: apri_lprc)
Member States too, albeit at much lower rates. The notable exception was Greece, where the average price of arable land declined (by about − 17 % respectively overall in the period under consideration).
In all regions for which data are available buying arable land was more expensive than buying permanent grassland (as much as 20 times more expensive on the Greek islands of Voreio Aigaio). Likewise, buying irrigable arable land was more expensive than non-irrigable arable land in almost all regions (it was almost six times more expensive in the Spanish Región de Murcia).
Not all land is owned by the farmer working the land. Many farmers rent their land, as either a short- or long-term business decision. The cost of renting land is another factor that farmers have to absorb in their business. Mirroring the variation in arable land prices, annual rental prices of one
hectare of agricultural land (arable or permanent grassland) also vary starkly between countries and regions within countries.
Renting one hectare of agricultural land was most expensive in Italy (an average EUR 1 332 for the year in 2017), with the highest regional average in Lombardia (EUR 1 954 for the year). Rental prices in the Netherlands were also relatively high (an average EUR 832 per year in 2018), with the region of Flevoland having a rental price that was almost twice the national average (EUR 1 572 for the year). Renting agricultural land was cheapest on average in Slovakia (EUR 54 per hectare per year), although the cheapest regions in the EU for renting were Mellersta Norrland and Övre Norrland in Sweden (both EUR 27 per hectare per year in 2018) — see Figure 2.3.4.
As with land prices, renting permanent grassland was cheaper than renting arable land.

2Agriculture — the factors of production
Agriculture, forestry and fishery statistics — 2020 edition 29
Data sources and availability
Farm structure surveyAlmost all of the statistics for farms and farmers were drawn from the farm structure survey (FSS) for 2016. The FSS provides a wide range of information on agricultural holdings, including detailed data on farm labour force characteristics. The FSS is carried out in the form of an agricultural census every 10 years and as a sample survey every 3-4 years.
Organic farmingData are collected annually and provided by the EU Member States and the United Kingdom, Iceland, Norway, Switzerland, Turkey, North Macedonia, Montenegro and Serbia on the basis of a harmonised questionnaire. Data in this annual collection originate from the administrative data of national entities in charge of the certification of operators involved in the organic sector. Up until the reference year 2007, data provision was voluntary. From reference year 2008 onwards, data have had to be delivered following Commission Regulation (EC) No 889/2008, implementing Council Regulation (EC) No 834/2007.
Agricultural capitalGross fixed capital formation (GFCF) in agriculture is an indicator (a so-called ‘context indicator’) that reflects a trend that is likely to have an influence
on the implementation, achievements and performance of the CAP. The data on agricultural capital are taken from the economic accounts for agriculture. GFCF excludes deductible VAT and is taken in basic price terms.
Agricultural land prices and rentsAgricultural land prices and rents are now being collected on an annual basis and a common methodology has been developed a basis for comparable statistics. These datasets were made available publically in 2018.
Agricultural land prices refer to the price of one hectare of free agricultural land during the reference period (a calendar year). Depending on the Member State, these prices can be collected from the owner of the agricultural land who is selling (selling prices) or from the physical person/legal person/legal entity who is purchasing the land for agricultural purposes (purchase prices).
Agricultural land rents refer to the price of renting one hectare of agricultural land during the reference period (a calendar year). The renting price should be collected from the agricultural holdings renting the land for agricultural purposes (renting price paid).
The prices and rents expressed in national currency are converted into euro by using the corresponding annual exchange rate, to allow comparisons among Member States.


3 Farm production

3 Farm production
Agriculture, forestry and fishery statistics — 2020 edition32
Did youknow ...
299.3 million tonnes of cereal grains
In 2019 the EU produced... 55.6 million tonnes
of barley
131.8 million tonnes of common wheat and spelt
70.1 million tonnes of green maize andcorn-cob-mix
43.5 million tonnes of meat, about half ofwhich came from pigs 22.8 million tonnes 158.2 million tonnes
of raw milk
+9.2 % +14.0 % -0.7 % -1.4 % +0.8 % +0.2 % +0.9 %
-2.9 % -1.9 % +15.7 % -4.1 % -1.6 % - 3.0 % -0.6 %
Outputvolumes(2018-2019)
Deflated prices (2018-2019)
CEREALS WHEAT AND SPELT PIGS CATTLE POULTRY SHEEP AND GOATS MILK
IntroductionThere is a diverse range of natural environments, climates and farming practices across the European Union (EU), reflected in the broad array of food and drink products that are made available for human consumption and animal feed, as well as a range of inputs for non-food processes. Indeed, agricultural products form a major part of the cultural identity of the EU’s people and its regions.
Statistics on agricultural products may be used to analyse developments within agricultural markets in order to help distinguish between cycles and changing production patterns; they
can also be used to study how markets respond to policy actions. Agricultural product data also provide supply-side information, furthering understanding as regards price developments that are of particular interest to agricultural commodity traders and policy analysts.
This chapter presents statistics on crop production, livestock and meat production, milk and milk products in the EU, as well as data on agricultural prices available for single commodities and for larger aggregates in the form of price indices.

3Farm production
Agriculture, forestry and fishery statistics — 2020 edition 33
Did youknow ...
299.3 million tonnes of cereal grains
In 2019 the EU produced... 55.6 million tonnes
of barley
131.8 million tonnes of common wheat and spelt
70.1 million tonnes of green maize andcorn-cob-mix
43.5 million tonnes of meat, about half ofwhich came from pigs 22.8 million tonnes 158.2 million tonnes
of raw milk
+9.2 % +14.0 % -0.7 % -1.4 % +0.8 % +0.2 % +0.9 %
-2.9 % -1.9 % +15.7 % -4.1 % -1.6 % - 3.0 % -0.6 %
Outputvolumes(2018-2019)
Deflated prices (2018-2019)
CEREALS WHEAT AND SPELT PIGS CATTLE POULTRY SHEEP AND GOATS MILK

3 Farm production
Agriculture, forestry and fishery statistics — 2020 edition34
3.1. Crops
(9) The Joint Research Centre (JRC) produces a series of monthly bulletins on weather events for crop monitoring in Europe, from which much of this analysis is drawn. The analysis is conducted at the EU and Member State levels.
Crops can be broadly categorised into two groups, those that are annual and those that are perennial. Annual crops are those that do not last more than two growing seasons and typically only one. Perennial crops last for more than two growing seasons, either dying back after each season or growing continuously; these are also termed permanent crops. Annual crops can either be sown in the autumn and be winter hardy (so-called winter crops) to be harvested the following year or in the spring and summer of the following year to be harvested that year. In the EU, rapeseed, wheat, rye and triticale are typically winter crops, whereas maize, sunflowers, rice, soybeans, potatoes, and sugar beet are summer crops. Barley is common in both its winter and spring varieties.
Crop production is particularly sensitive to prevailing weather and climatic conditions at key times of the growing season. For example, depending on a plant’s stage of development, heavy spring frosts can damage the growth of cereals and destroy fruit blossoms. Likewise, spring-to-summer droughts and heat waves can cause significant yield losses, while strong winds and heavy rainfall can make harvesting difficult and compromise quality.
Meteorological and hydrological conditions therefore play an important role in both the levels and quality of crop production but they also have a knock-on effect on prices through the causal effect of supply and demand. It is for this reason that production levels and prices are brought together in this chapter. Of course, with the EU covering such a large area and including such diverse climates, the impacts of adverse weather conditions and extremes on production levels in one region may be offset by optimum conditions in another. However, where the production of certain crops is concentrated in a few regions, EU production levels will be particularly susceptible to weather conditions as well as to pest attacks.
Weather review
Historically warm summer across much of the EU in 2019
Plants need sunlight, water, healthy soils, air and heat to grow. Among the meteorological factors, temperature and precipitation are of particular significance for yields and production levels. The 2019 crop year in the EU experienced extreme weather events in terms of both temperatures and rainfall (9).
Autumn 2018: the very dry autumn across large parts of Europe complicated field preparations for sowing winter crops and then limited plant emergence and early crop development. The regions most affected were the northern half of France and Germany, north-western Poland, Czechia, eastern Slovakia and eastern Hungary, western and southern Romania, and western Bulgaria. Both the sowing and emergence of rapeseed, for which the optimal sowing window closes in September, were most impacted, resulting in smaller areas sown than originally planned and uneven stands of crops after emergence, part of which was replaced with spring or summer crops. In France, north-western Germany and southern Romania, weather conditions improved in late autumn but extended well into November in the other most affected regions.
Winter 2018‑2019: the winter was mild, without marked cold spells. However, large parts of southern Europe experienced precipitation deficit. The most distinct deficits were experienced in central, western and south-western parts of the Mediterranean region; although large parts of south-eastern and southern-central Europe were also affected. This aggravated the condition of crops that were already affected by the unfavourable autumnal weather conditions.
3Farm production
Agriculture, forestry and fishery statistics — 2020 edition 35
Spring 2019: the first half of spring brought favourable weather conditions to most parts of Europe, but continued precipitation deficits negatively affected winter crops in Spain and south-eastern Europe. This situation inverted in April, when there was well-above average rainfall in southern Europe (except the Iberian Peninsula). This replenished soil moisture reserves, with substantial benefits to winter crops and the early development of spring- and summer crops. Extremely wet conditions in north-eastern Italy and the western Balkan region caused serious delays to spring sowing activities. Meanwhile, large parts of northern-central Europe (in particular north-eastern Germany and northern Poland) experienced a marked rainfall deficit which started mid-March and got worse in April. By contrast, there was a wetter-than-usual April on the Iberian Peninsula, which was followed by the return of dry conditions in May, which then developed into a drought in southern regions.
After the mild winter had continued into early spring, the advanced winter crop development in most of Europe was then slowed down by a cold snap at the beginning of May.
These spells of warm-and-dry (April) and cold (May) weather also affected the emergence of spring and summer crops. In the most affected areas, seedlings did not develop properly, or were damaged by wind-blown dust from dry, sandy soils, or by pests to which weakened stands are more vulnerable. In northern Poland and north-eastern Germany this resulted in poor
stands over large areas, particular regarding sugar beet. In contrast, abundant rainfall in Italy, and southern-central and eastern Europe improved water supplies, but, combined with cold weather, hampered summer crop growth in large parts of these regions.
Summer 2019: the summer was warmer than usual in all EU Member States, except Portugal and northern Finland. In central Europe, the 2019 summer was the warmest or second warmest on record. Most parts of Europe were affected by several heatwaves, starting in June, and record-high daily maximum temperatures (above 40⁰C) were recorded in northern France, the Benelux countries and north-western Germany.
Rainfall was below average in the southern half of the Iberian Peninsula, as well as in northern France, most of Germany, Poland, Czechia, Austria, and Italy.
The yield potential of winter crops was negatively impacted in regions that had already been affected by a dry spring (in particular Spain, Germany, Poland), but in other regions (such as France) the negative effects of the hot summer conditions on winter crops remained very limited. For summer crops (maize, sunflowers, sugar beet, potatoes), yield potentials were negatively impacted in all regions affected by water deficit. Very favourable weather conditions with above-average rainfall prevailed in south-eastern Europe during most of the summer, but also there, hot and dry conditions in August negatively impacted the end of the season.

3 Farm production
Agriculture, forestry and fishery statistics — 2020 edition36
Map 3.1.1: Average temperatures in summer 2019(01 June to 31 August 2019, compared with summers between 1979 and 2018)
Administrative boundaries: © EuroGeographics © UN-FAO © Turkstat
The designation of Kosovo is without prejudice to positions on status, and is in line with UNSCR 1244/1999 and the ICJ Opinion on the Kosovo Declaration of Independence.
0 200 400 600 800 km
Guadeloupe (FR)
0 25
Martinique (FR)
0 20
Guyane (FR)
0 100
Réunion (FR)
0 20
Açores (PT)
0 50
Madeira (PT)
0 20
Canarias (ES)
0 100
Malta
0 10
Liechtenstein
0 5
Cartography: Eurostat — GISCO, 11/2020
Source: temperature data from MARS CGMS DB aggregated at NUTS level 3, weighted on arable land, with the exception of Albania, Bosnia and Herzegovina and Kosovo for which data were aggregated at commune level (or GAUL level 2).
Mayotte (FR)
0 15
Driest yearSecond driest (year)Third driest (year)Fourth driest (year)5th to 10th driest (year)Less dry than the 10th driest (year)Data not available
* The designation of Kosovo is without prejudice to positions on status, and is in line with UNSCR 1244/1999 and the ICJ Opinion on the Kosovo Declaration of Independence.
Source: temperature data from MARS CGMS DB aggregated at NUTS level 3, weighted on arable land, with the exception of Albania, Bosnia and Herzegovina and Kosovo* for which data were aggregated at commune level (or GAUL level 2).

3Farm production
Agriculture, forestry and fishery statistics — 2020 edition 37
Figure 3.1.1: Production of main cereals, EU‑27, 2009‑2019(million tonnes)
0
50
100
150
200
250
300
350
2009 2010 2011 2012 2013 2014 2015 2016 2017 2018 2019
OthersRye and maslin (2)Oats
BarleyGrain maize and corn-cob-mix (1)Common wheat and spelt
Note: ‘Rye and maslin’ includes mixture of rye with other winter sown cereals. ‘Others’ includes rice, triticale and sorghum.
(1) Includes estimate for Denmark, 2009.(2) Includes estimate for Italy, 2013.
Source: Eurostat (online data code: apro_cpnh1)
Cereals
The EU’s 2019 cereal harvest rebounded sharply from the drought-affected level in 2018
The harvested production of cereals (including rice) across the EU-27 was 299.3 million tonnes in 2019. This was 25.3 million tonnes more than the drought-affected level in 2018, the equivalent of a 9.2 % upswing. However, the harvested production of cereals remained below the record 308.2 million tonnes harvested in 2014 (see Figure 3.1.1).
France harvested 71.2 million tonnes of cereals in 2019, a little less than one quarter (23.8 %) of the EU-27’s total harvested production. Germany harvested 44.3 million tonnes (14.8 % of the EU total), Romania a further 30.4 million tonnes of cereals (10.2 % of the EU total) and Poland harvested 29.0 million tonnes (9.7 % of the EU total).
The rebound in the harvested production of cereals was prominent across central and northern Europe. Among the main cereal producing Member States, the harvested production of cereals was higher in France (+13.8 %), Germany (+16.7 %) and Poland (+8.3 %). The sharpest rates of rebound were in the Baltic and Scandinavian Member States as well as Cyprus. By contrast, harvested production in many southern European Member States was lower, including in Romania (− 3.6 %) and in Spain (− 18.6 %).
Higher harvests for most cereals
The EU-27 harvested 131.8 million tonnes of common wheat and spelt in 2019, the equivalent of 44.0 % of all cereal grains harvested (see Figure 3.1.2). This was 16.2 million tonnes more than in 2018, an increase of 14.0 %. The main reason for this upturn was the bounce back from the drought in 2018, although the cultivated area of common wheat and spelt was also higher (+3.7 %).

3 Farm production
Agriculture, forestry and fishery statistics — 2020 edition38
Figure 3.1.2: Main cereals, EU‑27, 2019(% share of EU-27 total cereals production)
Common wheat and spelt
44.0 %
Grain maize and corn-cob-mix
23.4 %
Barley18.6 %
Rye and winter cereal mixtures
(maslin)2.9 %
Durumwheat2.6 %
Oats2.3 % Others
6.2 %
EU-27 total299.3
million tonnes
Note: ‘Total cereals’ includes cereals for the production of grain (including seed). ‘Others’ includes rice, spring cereal mixtures, triticale, sorghum and buckwheat, millet, canary seed, etc.
Source: Eurostat (online data code: apro_cpnh1)
The harvested production of grain maize and corn-cob-mix for the EU-27 was 70.1 million tonnes in 2019, 1.1 million tonnes more than in 2018. Higher production levels in most Member States offset the relatively sharp decline (− 6.6 %) in Romania, which remained the main producer of this cereal and accounted for one quarter of the EU’s harvested production.
In 2019, the EU’s harvested production of barley was 10.8 % higher than in 2018 at 55.6 million tonnes, despite little change (− 0.1 %) in the area cultivated. The rebound from the drought-affected levels of 2018 was notable in many Member States including France (+22.8 %), and Germany (+21.0 %). The less favourable weather conditions on the Iberian Peninsula, however, resulted in a lower harvested production of barley in Spain (− 18.9 %).
It was a similar scenario for rye and maslin, the harvested production of which across the EU was one third higher (+33.3 %) in 2019 than in 2018. This recovery was also underpinned by a strong expansion in the area cultivated; a further 273 000 hectares of rye and maslin were harvested in 2019 than in 2018, an increase of 13.4 %. Production levels rebounded in a number of key producer countries like Germany (+47.1 %), Poland (+12.2 %) and Denmark (+85.4 %).
By contrast, the harvested production of oats in 2019 was little changed from the level in 2018 (+0.4 %). The reduction in cultivated area (− 6.9 %, or 177 000 hectares) was offset by higher yields in many Member States. Harvested production levels bounced back somewhat in Poland (+5.7 %), but strongly in Finland (+43.0 %) and Sweden (+84.6 %). Elsewhere, there were strong declines in harvested production, such as in Spain (− 45.6 %) and Germany (− 10.1 %).

3Farm production
Agriculture, forestry and fishery statistics — 2020 edition 39
Figure 3.1.3: Production of cereals by main producing Member States, 2019(% share of EU-27 totals)
France Romania France
Spain
Poland
Germany France Germany
Poland
Germany
Poland HungarySpain
Sweden
Denmark
Romania
BulgariaItaly
Finland
Spain
Others
Others Others Others Others
0
10
20
30
40
50
60
70
80
90
100
Common wheatand spelt
Grain maizeand corn-cob-mix
Barley Rye and wintercereal mixtures
(maslin)
Oats
DenmarkGermany
Poland
Spain
Sweden
Source: Eurostat (online data code: apro_cpnh1)
Centre – Val de Loire and Picardie most important regions for wheat production, Castilla y Léon for barley
At more a detailed level, the EU regions with the largest harvested production of common wheat and spelt were the two French regions of Centre — Val de Loire (5.1 million tonnes in 2019) and Picardie (4.9 million tonnes). A number of other French regions — Champagne-Ardenne, Pays de la Loire, Poitou-Charentes, Nord-Pas de Calais and Haute-Normandie — were also among the EU regions with the highest levels of production in 2019. The harvested production of common wheat and spelt was also relatively high in Bayern
(southern Germany), where 3.7 million tonnes were harvested (note that the statistics presented for Germany relate to NUTS level 1 regions).
The French region of Centre — Val de Loire was the region that harvested the most barley in 2019 (2.4 million tonnes). This was closely followed by the Spanish region of Castilla y Léon (2.3 million tonnes) and Champagne-Ardenne (2.2 million tonnes). Other key barley-producing areas were the German region of Bayern, renowned for its beer production (2.1 million tonnes), and the Spanish region of Castilla-la Mancha (1.9 million tonnes).
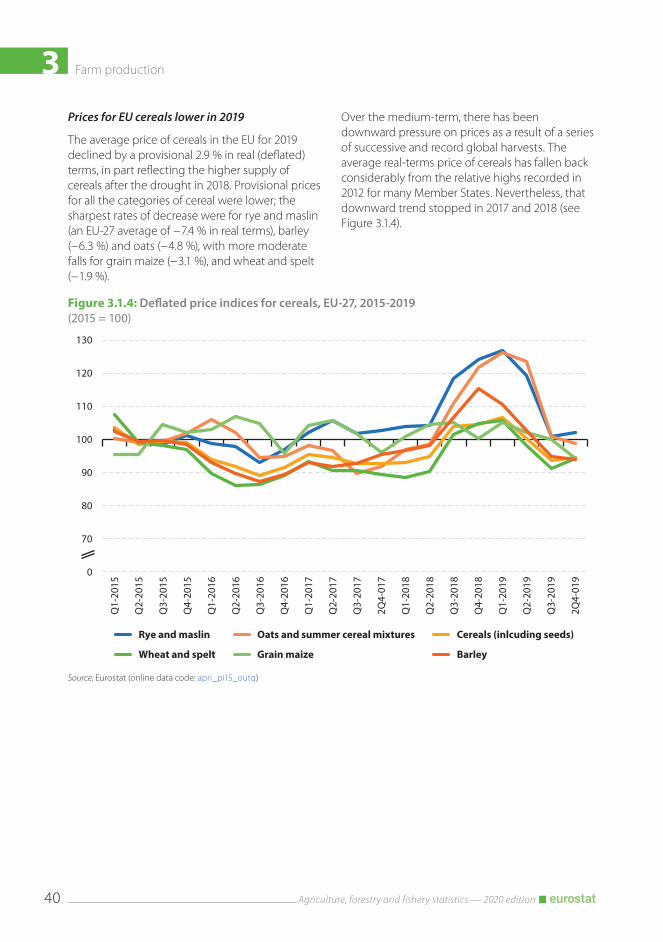
3 Farm production
Agriculture, forestry and fishery statistics — 2020 edition40
Figure 3.1.4: Deflated price indices for cereals, EU‑27, 2015‑2019(2015 = 100)
70
80
90
100
110
120
130
Q1-
2015
Q2-
2015
Q3-
2015
Q4-
2015
Q1-
2016
Q2-
2016
Q3-
2016
Q4-
2016
Q1-
2017
Q2-
2017
Q3-
2017
2Q4-
017
Q1-
2018
Q2-
2018
Q3-
2018
Q4-
2018
Q1-
2019
Q2-
2019
Q3-
2019
2Q4-
019
Rye and maslin
Wheat and spelt
Oats and summer cereal mixtures
Grain maize
Cereals (inlcuding seeds)
Barley
0
Source: Eurostat (online data code: apri_pi15_outq)
Prices for EU cereals lower in 2019
The average price of cereals in the EU for 2019 declined by a provisional 2.9 % in real (deflated) terms, in part reflecting the higher supply of cereals after the drought in 2018. Provisional prices for all the categories of cereal were lower; the sharpest rates of decrease were for rye and maslin (an EU-27 average of − 7.4 % in real terms), barley (− 6.3 %) and oats (− 4.8 %), with more moderate falls for grain maize (− 3.1 %), and wheat and spelt (− 1.9 %).
Over the medium-term, there has been downward pressure on prices as a result of a series of successive and record global harvests. The average real-terms price of cereals has fallen back considerably from the relative highs recorded in 2012 for many Member States. Nevertheless, that downward trend stopped in 2017 and 2018 (see Figure 3.1.4).
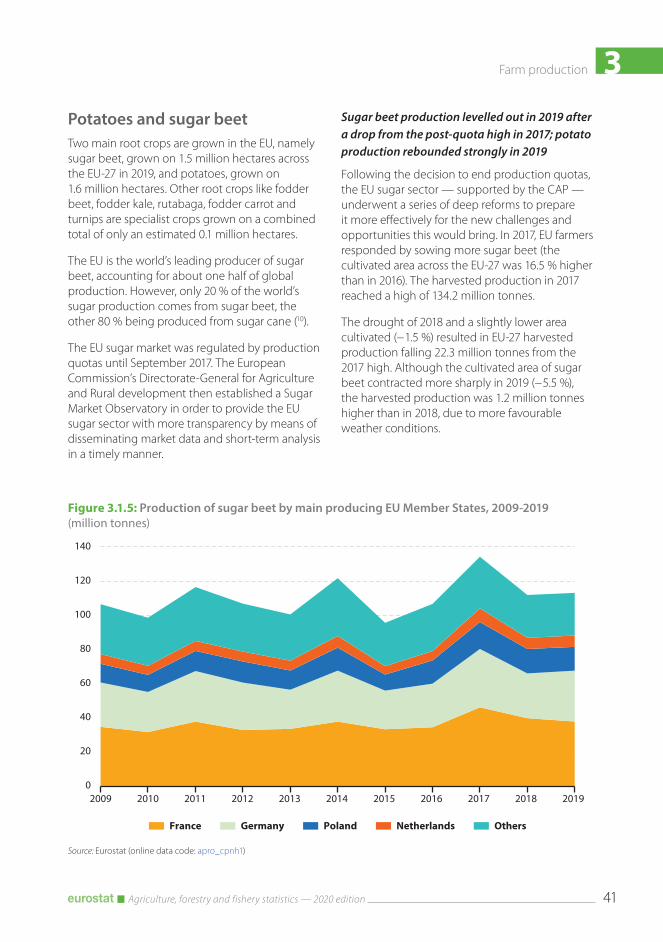
3Farm production
Agriculture, forestry and fishery statistics — 2020 edition 41
Figure 3.1.5: Production of sugar beet by main producing EU Member States, 2009‑2019(million tonnes)
0
20
40
60
80
100
120
140
2009 2010 2011 2012 2013 2014 2015 2016 2017 2018 2019
OthersNetherlandsPolandGermanyFrance
Source: Eurostat (online data code: apro_cpnh1)
Potatoes and sugar beetTwo main root crops are grown in the EU, namely sugar beet, grown on 1.5 million hectares across the EU-27 in 2019, and potatoes, grown on 1.6 million hectares. Other root crops like fodder beet, fodder kale, rutabaga, fodder carrot and turnips are specialist crops grown on a combined total of only an estimated 0.1 million hectares.
The EU is the world’s leading producer of sugar beet, accounting for about one half of global production. However, only 20 % of the world’s sugar production comes from sugar beet, the other 80 % being produced from sugar cane (10).
The EU sugar market was regulated by production quotas until September 2017. The European Commission’s Directorate-General for Agriculture and Rural development then established a Sugar Market Observatory in order to provide the EU sugar sector with more transparency by means of disseminating market data and short-term analysis in a timely manner.
Sugar beet production levelled out in 2019 after a drop from the post-quota high in 2017; potato production rebounded strongly in 2019
Following the decision to end production quotas, the EU sugar sector — supported by the CAP — underwent a series of deep reforms to prepare it more effectively for the new challenges and opportunities this would bring. In 2017, EU farmers responded by sowing more sugar beet (the cultivated area across the EU-27 was 16.5 % higher than in 2016). The harvested production in 2017 reached a high of 134.2 million tonnes.
The drought of 2018 and a slightly lower area cultivated (− 1.5 %) resulted in EU-27 harvested production falling 22.3 million tonnes from the 2017 high. Although the cultivated area of sugar beet contracted more sharply in 2019 (− 5.5 %), the harvested production was 1.2 million tonnes higher than in 2018, due to more favourable weather conditions.

3 Farm production
Agriculture, forestry and fishery statistics — 2020 edition42
Figure 3.1.6: Production of potatoes and sugar beet, 2019(thousand tonnes)
0 10 000 20 000 30 000 40 000 50 000
FranceGermany
PolandNetherlands
BelgiumSpain
DenmarkCzechia
RomaniaItaly
SwedenAustria
SlovakiaLithuaniaHungary
FinlandCroatiaGreece
PortugalIrelandLatvia
BulgariaCyprusEstonia
SloveniaLuxembourg
Malta
United Kingdom
SwitzerlandNorwayIceland
TurkeySerbia
North MacedoniaMontenegro
Bosnia and Herzegovina
Albania (1)Kosovo*
Potatoes (including seed potatoes) Sugar beet (excluding seed)(1) Potatoes, 2017.* This designation is without prejudice to positions on status, and is in line with UNSCR 1244 and the ICJ Opinion on the Kosovo Declaration of Independence.
Source: Eurostat (online data code: apro_cpnh1)

3Farm production
Agriculture, forestry and fishery statistics — 2020 edition 43
Figure 3.1.7: Deflated price indices for potatoes and sugar beet, EU‑27, 2015‑2019(2015 = 100)
60
80
100
120
140
160
2015 2016 2017 2018 2019
Potatoes (including seed potatoes) Sugar beet (excluding seed)
0
Source: Eurostat (online data code: apri_pi15_outa)
In 2019, the EU produced 113.1 million tonnes of sugar beet (see Figure 3.1.5), about 60 % of which came from France (33.6 %) and Germany (26.3 %) combined. France produced 38.0 million tonnes of sugar beet in 2019, which was 1.9 million tonnes less than in 2018 (a decline of 4.7 %). In large part, this reflected the sharp contraction in area cultivated (− 8.1 %). By contrast, 3.5 million more tonnes of sugar beet were produced in Germany in 2019 than in 2018. This strong rebound (+13.5 %) was despite a slightly lower area being cultivated (− 1.3 %).
The EU produced 51.2 million tonnes of potatoes in 2019, which was 4.4 million tonnes more than in 2018 (an increase of 9.4 %). Most of the main potato producing Member States had higher harvests in 2019: the 10.6 million tonnes produced by Germany in 2019 represented a year-on-year increase of 18.8 %; the 8.6 million tonnes produced in France, a rise of 8.9 %; the 7.0 million
tonnes produced in the Netherlands an increase of 15.5 %; and, the 4.0 million tonnes produced in Belgium was 32.3 % higher than in 2018. The main exceptions were the lower harvested production levels in Poland (− 11.4 %) and in Romania (− 13.1 %).
Continued fall in real-terms price for sugar beet, but further rise for potatoes, despite the rebound in production levels
Despite the strong rebound in the level of harvested potato production for the EU-27 as a whole, the average real-terms (deflated) price of potatoes for 2019 was almost one quarter higher (a provisional +23.6 %) than in 2018 (see Figure 3.1.7). By contrast, the average real-terms price of sugar beet declined further (a provisional − 7.7 %), continuing the downward trend noted since 2013 with market realignment.

3 Farm production
Agriculture, forestry and fishery statistics — 2020 edition44
Figure 3.1.8: Production of oilseeds, EU‑27, 2009‑2019(million tonnes)
0
5
10
15
20
25
2009 2010 2011 2012 2013 2014 2015 2016 2017 2018 2019
Rape and turnip rape seeds Sun�ower seed Soya
Source: Eurostat (online data code: apro_cpnh1)
Oilseeds
Further sharp fall in rape and turnip rape production in 2019 drives overall decline in oilseeds production
The EU cultivates three types of oilseed crop; the main two are rape and turnip rape, and sunflower, although soya is increasingly grown. The EU harvested an estimated 29.5 million tonnes of oilseeds in 2019, which was about 2.5 million tonnes less than in 2018.
The harvested production of rape and turnip rape seeds in the EU-27 was 15.3 million tonnes in 2019, which was 2.6 million tonnes less than in 2018 (the equivalent of a 14.7 % decline). In large part, this reflected a sharp contraction (− 19.0 %) in the cultivated area of rape and turnip rape, which was 1.2 million hectares less than in 2018 across the EU as a whole.
The harvested production of sunflower seeds across the EU in 2019 was 10.3 million tonnes (the equivalent of a 2.8 % rise on 2018), which was
driven by a sharp expansion (+7.8 %) in the area harvested. The relatively steady growth in soya production in the EU-27 was halted in 2019; there was a decline in the area harvested (− 5.0 %) and production (− 3.4 %). Nevertheless, the 2.8 million tonnes of soya produced in the EU-27 in 2019 was 1.9 million tonnes more than was harvested a decade earlier (see Figure 3.1.8).
Real-terms prices of rape and sunflower seeds flattened out in 2019 but fell sharply for soya
Real-terms (deflated) prices of oilseeds had fallen sharply and steadily in many Member States from relative peaks in 2012. In the cases of rape and turnip rape seed, and sunflower seeds this decline flattened out in 2019 (see Figure 3.1.9); for the EU-27 as a whole, average prices in 2019 for both types of oilseed were higher in real terms than in 2018 (both +1.2 % respectively). By contrast, the average real-terms price of soya for the EU-27 continued to decline sharply (a further − 5.8 % in 2019).

3Farm production
Agriculture, forestry and fishery statistics — 2020 edition 45
Figure 3.1.9: Deflated price indices for oilseeds, EU‑27, 2015‑2019(2015 = 100)
0
60
80
100
120
2015 2016 2017 2018 2019
Rape and turnip rape seeds Sun�ower seed Soya
Source: Eurostat (online data code: apri_pi15_outa)
FruitThe EU supports the fruit and vegetable sector through its market-management scheme, which has four broad goals:
• a more competitive and market-oriented sector;• fewer crisis-related fluctuations in producers’
income;• greater consumption of fruit and vegetables in
the EU; and• increased use of eco-friendly cultivation and
production techniques.
The EU produces millions of tonnes of fruit every year
The EU produces a wide range of fruit, berries and nuts. In 2019, the EU-27 produced 13.7 million tonnes of pome fruit (apples, pears and quinces), 7.3 million tonnes of stone fruit (peaches, nectarines, apricots, cherries, plums, sloes and
medlar), 2.5 million tonnes of sub-tropical and tropical fruits (such as figs, kiwis, avocados and bananas), 0.6 million tonnes of berries (excluding strawberries), and 1.1 million tonnes of nuts. In addition, the EU also produced 10.6 million tonnes of citrus fruit (such as oranges, satsumas, clementines, mandarins, lemons, limes and grapefruit) in 2019.
Spain and Italy are the main EU producers of fruit, but for some specific fruit other Member States were key producers.
One quarter of EU apple production in Poland; over one half of all EU oranges from Spain
Thousands of varieties of apple are grown worldwide, many of which have been created and selected to grow in varied climates. This has enabled commercial apple production to take place in almost all Member States. A little more than one quarter (26.6 %) of the EU-27’s harvested
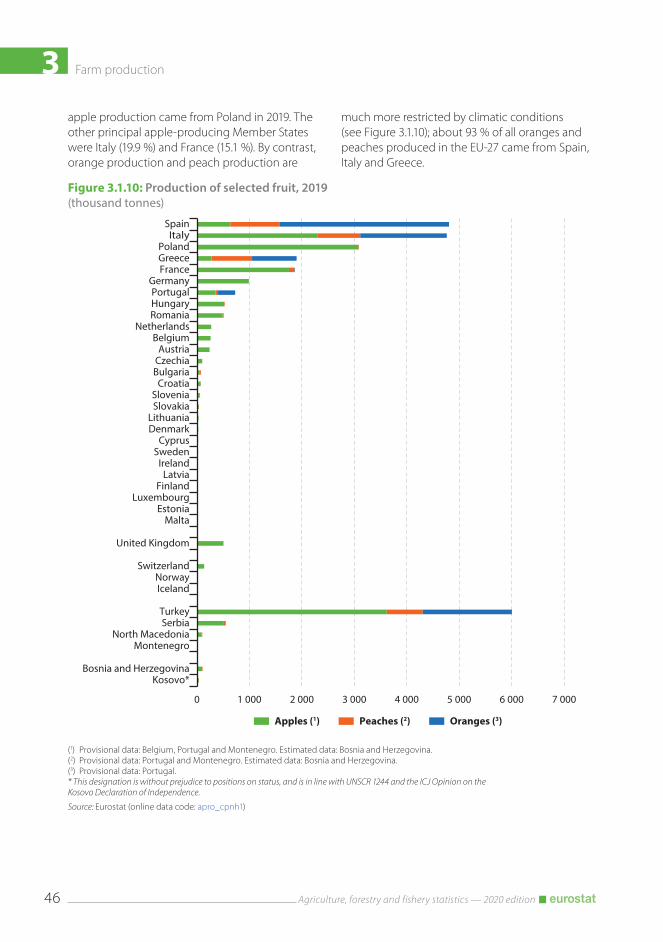
3 Farm production
Agriculture, forestry and fishery statistics — 2020 edition46
Figure 3.1.10: Production of selected fruit, 2019(thousand tonnes)
0 1 000 2 000 3 000 4 000 5 000 6 000 7 000
SpainItaly
PolandGreeceFrance
GermanyPortugalHungaryRomania
NetherlandsBelgium
AustriaCzechiaBulgaria
CroatiaSloveniaSlovakia
LithuaniaDenmark
CyprusSweden
IrelandLatvia
FinlandLuxembourg
EstoniaMalta
United Kingdom
SwitzerlandNorwayIceland
TurkeySerbia
North MacedoniaMontenegro
Bosnia and HerzegovinaKosovo*
Apples (1) Peaches (2) Oranges (3)
(1) Provisional data: Belgium, Portugal and Montenegro. Estimated data: Bosnia and Herzegovina.(2) Provisional data: Portugal and Montenegro. Estimated data: Bosnia and Herzegovina.(3) Provisional data: Portugal.* This designation is without prejudice to positions on status, and is in line with UNSCR 1244 and the ICJ Opinion on the Kosovo Declaration of Independence.
Source: Eurostat (online data code: apro_cpnh1)
apple production came from Poland in 2019. The other principal apple-producing Member States were Italy (19.9 %) and France (15.1 %). By contrast, orange production and peach production are
much more restricted by climatic conditions (see Figure 3.1.10); about 93 % of all oranges and peaches produced in the EU-27 came from Spain, Italy and Greece.

3Farm production
Agriculture, forestry and fishery statistics — 2020 edition 47
Figure 3.1.11: Production of selected vegetables, 2019(thousand tonnes)
0 2 000 4 000 6 000 8 000 10 000 12 000 14 000 16 000
SpainItaly
NetherlandsPolandFrance
Portugal (1)Germany
GreeceRomaniaBelgium
AustriaHungaryBulgariaSweden
DenmarkFinlandCzechia
LithuaniaSlovakia
IrelandCroatia
LatviaSlovenia
CyprusMalta
EstoniaLuxembourg
United Kingdom
SwitzerlandNorwayIceland
TurkeyAlbania (2)
North MacedoniaSerbia
Montenegro (3)
Bosnia and HerzegovinaKosovo*
Tomatoes Carrots Onions
(1) Provisional. (2) 2018 data.(3) Provisional data for tomatoes and onions.* This designation is without prejudice to positions on status, and is in line with UNSCR 1244 and the ICJ Opinion on the Kosovo Declaration of Independence.
Source: Eurostat (online data code: apro_cpnh1)
Vegetables
Italy and Spain produced about two thirds of the EU’s tomatoes in 2019; Spain and the Netherlands produced a little less than one half of the EU’s onions
The EU-27’s harvested production of fresh vegetables (including melons) was 60.9 million
tonnes in 2019, about 1.1 million tonnes more than in 2018. Within the group of fresh vegetables, the harvested production of tomatoes was 16.5 million tonnes in 2019, of onions was an estimated 6.1 million tonnes and of carrots an estimated 4.7 million tonnes.
Almost two thirds of the EU-27’s tomato production in 2019 came from Italy (5.3 million tonnes) and Spain (5.0 million tonnes). Despite
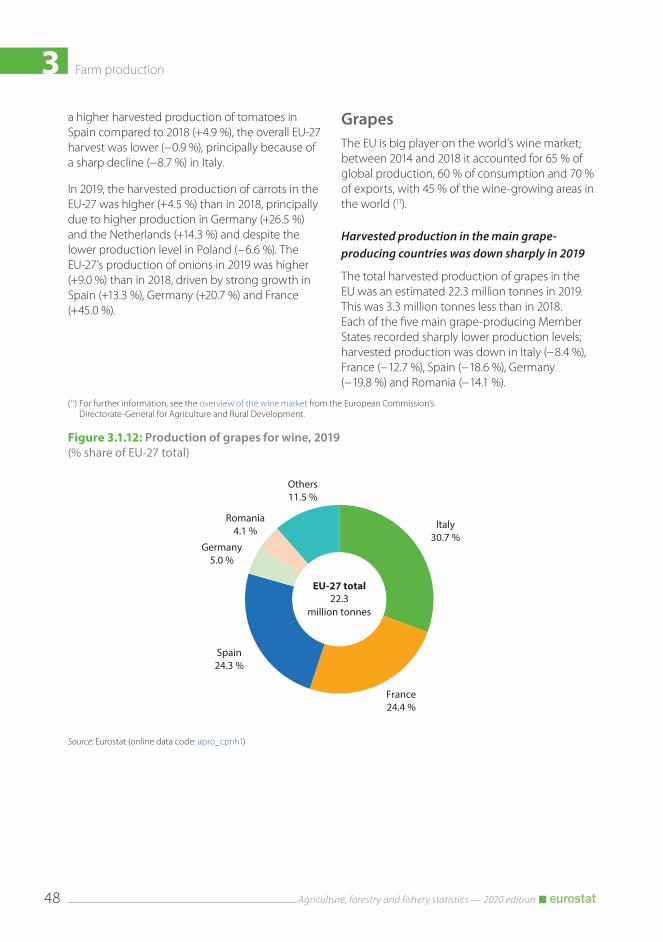
3 Farm production
Agriculture, forestry and fishery statistics — 2020 edition48
Figure 3.1.12: Production of grapes for wine, 2019(% share of EU-27 total)
Italy30.7 %
France24.4 %
Spain24.3 %
Germany5.0 %
Romania4.1 %
Others11.5 %
EU-27 total22.3
million tonnes
Source: Eurostat (online data code: apro_cpnh1)
a higher harvested production of tomatoes in Spain compared to 2018 (+4.9 %), the overall EU-27 harvest was lower (− 0.9 %), principally because of a sharp decline (− 8.7 %) in Italy.
In 2019, the harvested production of carrots in the EU-27 was higher (+4.5 %) than in 2018, principally due to higher production in Germany (+26.5 %) and the Netherlands (+14.3 %) and despite the lower production level in Poland (− 6.6 %). The EU-27’s production of onions in 2019 was higher (+9.0 %) than in 2018, driven by strong growth in Spain (+13.3 %), Germany (+20.7 %) and France (+45.0 %).
(11) For further information, see the overview of the wine market from the European Commission’s Directorate-General for Agriculture and Rural Development.
GrapesThe EU is big player on the world’s wine market; between 2014 and 2018 it accounted for 65 % of global production, 60 % of consumption and 70 % of exports, with 45 % of the wine-growing areas in the world (11).
Harvested production in the main grape-producing countries was down sharply in 2019
The total harvested production of grapes in the EU was an estimated 22.3 million tonnes in 2019. This was 3.3 million tonnes less than in 2018. Each of the five main grape-producing Member States recorded sharply lower production levels; harvested production was down in Italy (− 8.4 %), France (− 12.7 %), Spain (− 18.6 %), Germany (− 19.8 %) and Romania (− 14.1 %).

3Farm production
Agriculture, forestry and fishery statistics — 2020 edition 49
Figure 3.1.13: Production of olives for olive oil, 2019(% of EU-27 total harvested production)
Spain57.7 %
Italy21.7 %
Portugal10.0 %
Greece9.7 %
Others0.9 %
EU-27 total9.8
million tonnes
Source: Eurostat (online data code: apro_cpnh1)
OlivesThe EU is the largest producer of olive oil in the world, accounting for around two thirds of global production. Most of the world’s production comes from southern Europe, northern Africa and the Near East, as 95 % of the olive trees in the world are cultivated in the Mediterranean region. With production concentrated in a relatively small area, the effects of a disease outbreak can have significant implications. For this reason, steps are being taken as a precautionary measure against the spread of the Xylella fastidiosa bacterium (12) which arrived in Italy in 2013.
Spain is by far the largest producer of olives for olive oil in the EU
Olives often follow a two-year cycle, with a large crop followed by a smaller one. Sometimes the weather can make these cycles more pronounced.
(12) For further information see the plant health and biosecurity products webpages of the European Commission: https://ec.europa.eu/food/plant/plant_health_biosecurity/legislation/emergency_measures/xylella-fastidiosa/latest-developments_en.
Individual countries can have cycles that run counter to one another.
The total harvested production of olives for olive oil in the EU-27 was 9.8 million tonnes in 2019. This was 3.1 million tonnes less than the production level in 2018. This overall decline was due to a much lower harvested production in Spain, which accounted for about 72 % of all EU production in 2018. The production of olives for olive oil in Spain was 5.6 million tonnes in 2019, some 3.6 million tonnes less than in 2018. By contrast, the combined production in Italy and Portugal was up almost 0.5 million tonnes. Italy produced 2.1 million tonnes of olives for olive oil in 2019 and Portugal 1.0 million tonnes. The production level in Greece was similar to that in Portugal in 2019, but this should be seen against the pronounced downward trend noted since a harvest of 1.8 million tonnes was produced in 2012.

3 Farm production
Agriculture, forestry and fishery statistics — 2020 edition50
3.2. Livestock and meatStatistics on livestock and meat production (based on the slaughter of animals fit for human consumption) give some indication of supply-side developments and adjustments, which are important for monitoring the common agricultural policy (CAP).
One of the objectives of the first CAP was to secure the availability of food supplies for the people of the then European Economic Community. The CAP has evolved, requiring more agricultural market transparency for all actors and EU citizens. Statistics for livestock and meat, as with other agricultural products, help provide feedback on market signals.
In order to limit uncertainty, EU institutions in charge of market support interpret the market signals using livestock numbers for their forecasts. The number of breeders (for dairy or meat production) as well as animal stocks being grown and fattened, contribute to preparing measures that ensure a more stable — or at least more secure — market, which aims to benefit both EU consumers and farmers.
The European Commission has been active in harmonising animal health measures and systems of disease surveillance, diagnosis and control; it has also developed a legal framework for trade in live animals and animal products. Ensuring the high quality of food is one of the various challenges to be met in order to secure this food supply.
Livestock populationThe livestock population at any given moment describes the production system through the stocks of animals being farmed. The duration of a production cycle indicates how long is needed so that animals are ready to slaughter for meat, whilst others are being reared, or to give birth and in the case of cows, some sheep and goats can be milked.
The typical life-span of each of these groups in the cycle varies. For example, veal calves will typically be slaughtered within eight months, beef cattle within the first two and a half years and dairy cows within five years.
Detailed figures on the age, sex, category and type of animals in production cycles are collected at a regional and national level. This is done through livestock surveys that are either carried out once or twice a year.
In this publication only aggregated data for national livestock herds are analysed. More detailed figures for analysis are available in Eurostat’s free, online database.
Majority of livestock populations concentrated in just a few countries
The EU-27 has a substantial population of livestock: there were 143 million pigs, 77 million bovine animals and 74 million sheep and goats in 2019.
The majority of livestock are kept in just a few Member States (see Figure 3.2.1).
Almost three quarters of the EU’s 2019 bovine population was kept in France (23.5 %), Germany (15.1 %), Spain (8.6 %), Ireland (8.5 %), Italy (8.3 %) and Poland (8.1 %).
Almost three quarters of the EU’s pigs were found in Spain (21.8 %), Germany (18.2 %), France (9.4 %), Denmark (8.9 %), the Netherlands (8.3 %) and Poland (7.8 %).
Three quarters of the EU’s sheep were found in Spain (24.8%), Romania (16.6 %), Greece (13.5%), France (11.4 %) and Italy (11.2 %). Two thirds of the EU’s goats were found in Greece, Spain and Romania.

3Farm production
Agriculture, forestry and fishery statistics — 2020 edition 51
Figure 3.2.1: Livestock population, 2019(million heads)
0 10 000 20 000 30 000 40 000 50 000 60 000 70 000
SpainFrance (1)
Germany (2)Italy
RomaniaPoland
NetherlandsDenmark
GreeceIreland
BelgiumPortugal (3)
AustriaHungary
Sweden (4)CzechiaBulgaria
CroatiaFinland
SlovakiaLithuania
LatviaSlovenia
EstoniaCyprus
LuxembourgMalta
United Kingdom (5)
SwitzerlandIceland (6)
Turkey (7)Serbia
AlbaniaNorth Macedonia
Montenegro (3)
Bosnia and Herzegovina (8)Kosovo*
Bovine animals Pigs Sheep Goats
(1) Bovine animals, provisional.(2) Goats, estimate.(3) Provisional.(4) Sheep, provisional.(5) Goats, provisional.(6) 2018 data.(7) Cattle, 2018: Sheep and goats, 2017.(8) Estimates.* This designation is without prejudice to positions on status, and is in line with UNSCR 124 and the ICJ Opinion on the Kosovo Declaration of Independence.
Source: Eurostat (online data codes: apro_mt_lscatl, apro_mt_lspig, apro_mt_lssheep and apro_mt_lsgoat)

3 Farm production
Agriculture, forestry and fishery statistics — 2020 edition52
Figure 3.2.2: Livestock population, EU‑27, 2010‑2019 (index 2010 = 100 based on heads)
0
80
85
90
95
100
105
2010 2011 2012 2013 2014 2015 2016 2017 2018 2019
Pigs Bovine animals Goats Sheep
Note: indices for sheep and goats correspond to the sum of the available data from a consistent set of Member States, which includes all the Member States with a significant number of sheep and goats.
Source: Eurostat (online data codes: apro_mt_lscatl, apro_mt_lspig, apro_mt_lssheep and apro_mt_lsgoat)
Reduced EU livestock populations in 2019
Populations of the four main categories of livestock in the EU were all lower in 2019 than in 2018 (see Figure 3.2.2). This reflected various phenomena. In the case of pigs, the decline was from a relative high in 2017, in part explained by the strong rebound in exports of live pigs. In the
case of bovine animals, the declines coincided with the phasing-out of milk quotas in 2015.
Some of these changes have been within an overall downward trend. For example, the population of sheep has been in steep decline since at least the turn of the millennium, with there being 8.9 million less head in Spain.
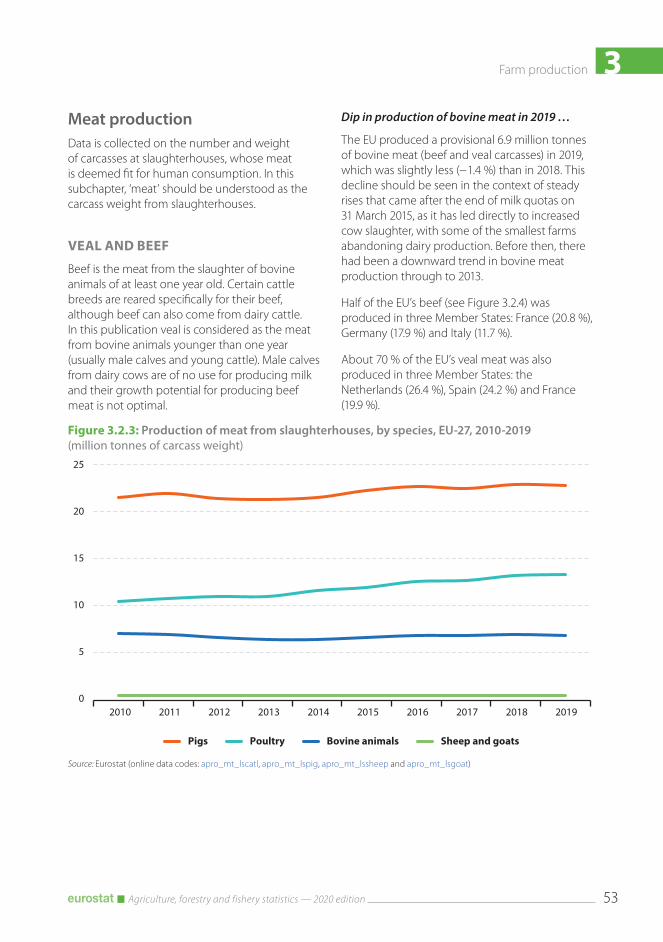
3Farm production
Agriculture, forestry and fishery statistics — 2020 edition 53
Figure 3.2.3: Production of meat from slaughterhouses, by species, EU‑27, 2010‑2019(million tonnes of carcass weight)
0
5
10
15
20
25
2010 2011 2012 2013 2014 2015 2016 2017 2018 2019
Pigs Poultry Bovine animals Sheep and goats
Source: Eurostat (online data codes: apro_mt_lscatl, apro_mt_lspig, apro_mt_lssheep and apro_mt_lsgoat)
Meat productionData is collected on the number and weight of carcasses at slaughterhouses, whose meat is deemed fit for human consumption. In this subchapter, ‘meat’ should be understood as the carcass weight from slaughterhouses.
VEAL AND BEEF
Beef is the meat from the slaughter of bovine animals of at least one year old. Certain cattle breeds are reared specifically for their beef, although beef can also come from dairy cattle. In this publication veal is considered as the meat from bovine animals younger than one year (usually male calves and young cattle). Male calves from dairy cows are of no use for producing milk and their growth potential for producing beef meat is not optimal.
Dip in production of bovine meat in 2019 …
The EU produced a provisional 6.9 million tonnes of bovine meat (beef and veal carcasses) in 2019, which was slightly less (− 1.4 %) than in 2018. This decline should be seen in the context of steady rises that came after the end of milk quotas on 31 March 2015, as it has led directly to increased cow slaughter, with some of the smallest farms abandoning dairy production. Before then, there had been a downward trend in bovine meat production through to 2013.
Half of the EU’s beef (see Figure 3.2.4) was produced in three Member States: France (20.8 %), Germany (17.9 %) and Italy (11.7 %).
About 70 % of the EU’s veal meat was also produced in three Member States: the Netherlands (26.4 %), Spain (24.2 %) and France (19.9 %).

3 Farm production
Agriculture, forestry and fishery statistics — 2020 edition54
Figure 3.2.4: Production of meat, 2019 (% share of EU-27 total, based on tonnes of carcass weight)
Spain 27.1 %
France 17.9 %
Greece 14.9 %
Ireland 13.6 %
Others 26.5 %
Sheep and goats
EU-27 total 0.5 million
tonnes
Netherlands26.4 %
Spain 24.2 %
France 19.9 %
Italy9.1 %
Others 20.4 %
Veal
EU-27 total1.0 million
tonnes
France 20.8 %
Germany17.9 %
Italy11.7 %
Ireland 10.4 %
Poland 9.4 %
Spain7.7 %
Others 22.1 %
Beef
EU-27 total5.9 million
tonnes
Germany23.0 %
Spain 20.4 %
France 9.7 %
Poland 8.7 %
Netherlands7.2 %
Denmark 6.6 %
Italy6.4 %
Others 18.2 %
PigsPoland 19.5 %
Spain 12.8 %
France
12.8 %Germany11.9 %
Italy10.3 %
Others 32.7 %
Poultry
EU-27 total22.8 million
tonnes
EU-27 total13.3 million
tonnes
Note: EU-27 estimates for veal, poultry, sheep and goats meat.
Source: Eurostat (online data code: apro_mt_pann)

3Farm production
Agriculture, forestry and fishery statistics — 2020 edition 55
… and strong decline in real-terms price
For the EU as a whole, the average real-terms (deflated) price for cattle in 2019 was down sharply (a provisional − 4.1 %) on the average in 2018. This continued the decline from the relative highs of 2012 and 2013.
PIG MEAT
Pig meat production in 2019 dipped from the peak in 2018 …
The EU produced a provisional 22.8 million tonnes of pig meat in 2019, a slight decline (− 0.7 %) from the relative peak level in 2018. To put this in context, production in 2019 remained 1.2 million tonnes higher than in 2010.
The two main pig meat producing Member States are Germany (5.2 million tonnes in 2019) and Spain (4.6 million tonnes). Whereas production in Germany was lower in 2019 (down − 2.2 %), which was the third successive annual contraction, it rose once again in Spain (+2.4 %, the sixth successive year of growth). There was also another year of strong growth in the Netherlands (+6.0 %).
… but the real-terms price of pigs jumped
The average real-terms (deflated) price of pigs in the EU jumped (a provisional +15.7 %) in 2019, back up to its level of 2017.
SHEEP AND GOAT MEAT
Unchanged sheep and goat meat production …
The EU produced an estimated 0.5 million tonnes of sheep and goat meat in 2019, which was similar to the level in 2018. Sheep meat accounted for the vast majority (about 90 %) of the combined total output.
Three quarters of the EU’s sheep meat was produced in Spain (27.6 % in 2019), France (18.4 %), Ireland (15.0 %) and Greece (11.7 %). The main producers of goat meat among the EU Member States are Greece and Spain.
… but a lower real-terms price
The average real-terms (deflated) price for sheep and goats across the EU in 2019 was lower (a provisional − 3.0%) than in 2018 and down markedly (− 7.5 %) on the average in 2015.
POULTRY
Poultry production in EU at high in 2019 …
The EU produced an estimated 13.3 million tonnes of poultry meat in 2019, a new high. Against the backdrop of an upward trend, this represented a small increase in production (+0.8 %). It pushed EU production some 2.8 million tonnes above the level recorded in 2010, a cumulative rise of a little over 25 %.
In 2019, the main poultry meat producers in the EU include Poland (2.6 million tonnes), Spain (1.7 million tonnes), France (1.7 million tonnes), Germany (1.6 million tonnes) and Italy (1.4 million tonnes). Among these key producers, production levels in Italy (+6.3 %), Spain (+4.2 %) and Poland (+1.9 %) rose more sharply than in the EU-27 as a whole and in Germany (both +0.8 %), but declined in France (− 2.0 %).
… but average real-terms price for poultry declined
When feed prices were particularly low in the period between 2013 and 2016, and with poultry meat production continuing to expand, the real-terms (deflated) price for poultry decreased. Although this downward pressure eased in 2017 and 2018, there was a further decline in 2019 (a provisional − 1.6 % in real terms).

3 Farm production
Agriculture, forestry and fishery statistics — 2020 edition56
Figure 3.2.5: Deflated price indices for selected animal outputs, EU‑27, 2015‑2019 (index 2015 = 100)
70
80
90
100
110
120
2015 2016 2017 2018 2019
Pigs Cattle Poultry Sheep and goats
0
Source: Eurostat (online data code: apri_pi15_outa)

3Farm production
Agriculture, forestry and fishery statistics — 2020 edition 57
Figure 3.3.1: Production and use of milk, EU‑27, 2019(million tonnes)
Milk produced on farms
158.2
Cows’ milk152.5
Ewes’ milk3.0
Goats’ milk2.5
Bu�alos’ milk0.3
Milk used on farms (1)
12.1
Milk deliveredto dairies
145.8
Cows’ milk143.1
Raw milk imported2.5
Milk used by dairies
147.9
Raw milk exported0.5
Products obtained110.8
Fresh products
Manufactured products
Other manufactured products0.1
Drinking milk23.4
Other fresh products14.8
Cheese10.1
Butter (2)2.3
Whey (3)54.8
Milk powder3.0
(1) In whole milk equivalent.(2) Includes other yellow fat dairy products; expressed in butter equivalent.(3) In liquid whey equivalent.
Source: Eurostat (online data codes: apro_mk_pobta and apro_mk_farm)
3.3. MilkThe abolition of milk quotas in 2015 resulted in a restructuring and further modernisation of the sector, including a re-orientation towards the most productive herds, more intense cross-border milk flows and increased volatility in production. Over recent years, milk prices have followed the global milk fat market.
There is no ‘typical’ European dairy cow breed, though the Friesian-Holstein is prevalent.
Milk production
Another rise in raw milk production to 158.2 million tonnes in 2019, 96 % of which was cows’ milk
The production of raw milk on the EU’s farms was a provisional 158.2 million tonnes in 2019, which
represents a year-on-year increase of 1.4 million tonnes. This higher level of EU-27 production can be put in some context by looking at production levels in the run-up to the abolition of quotas; EU farms produced 149.7 million tonnes of raw milk in 2014 and 145.1 million tonnes in 2013.
In 2019, the vast majority of raw milk is delivered to dairies; only 12.1 million tonnes was used on farms, either being consumed by the farmer and his family, sold directly to consumers, used as feed or processed directly. Of the 145.8 million tonnes of milk delivered to dairies, 143.1 million tonnes was cows’ milk, the rest being a combination of ewes’ milk, goats’ milk and buffalos’ milk (see Figure 3.3.1).

3 Farm production
Agriculture, forestry and fishery statistics — 2020 edition58
Figure 3.3.2: Dairy cows, milk production and the apparent milk yield, 2019
Denmark
Germany
Ireland
Spain
France
Italy
Netherlands
Poland
Romania
0
5
10
15
20
25
30
35
1 10 100 1 000 10 000
Dairy cows (thousand heads)
Raw
cow
s' m
ilk p
rodu
ced
(mill
ion
tonn
es)
Note: the line represents the average apparent milk yield across the EU (7 346 kg per cow) for a variable herd size. Countries above the line had a higher apparent yield per cow than the EU-27 average, and vice-versa.
Source: Eurostat (online data codes: apro_mk_farm and apro_mt_lscatl)
The average apparent milk yield per cow across the EU still rising
There are a number of factors that can affect individual milk yields but the apparent milk yield results from the structure of the dairy herd. In the EU, the apparent milk yield continued to rise in 2019, reaching 7 346 kg per dairy cow. As a national average, apparent yields were highest
in Denmark (9 973 kg per cow), Estonia (9 656 kg per cow) and Spain (9 178 kg per cow) and lowest in Bulgaria (3 627 kg per cow) and Romania (3 217 kg per cow). Among the main cows’ milk producing Member States, apparent yields were well-above the EU-27 average in Germany and the Netherlands but below average in Poland and Italy.

3Farm production
Agriculture, forestry and fishery statistics — 2020 edition 59
Figure 3.3.3: Collection of cows’ milk by dairies, 2019(% share of EU-27 total, tonnes)
Germany22.7 %
France17.2 %
Netherlands9.6 %
Poland8.5 %
Italy8.4 %
Ireland5.7 %
Spain5.1 %
Others22.7 %
EU-27 total143.1
million tonnes
Source: Eurostat (online data code: apro_mk_pobta)
One fifth of the EU’s cows’ milk was collected by dairies in Germany
Traditionally, hygiene rules have required that the collection of milk has been frequent and moved over a short distance between farms and dairies. The development of cooling tanks on farms and of bigger milk tankers have made this sanitary issue less critical. Meanwhile, the removal of national milk quotas has contributed to cross-border milk flows between farms and between dairies. Nevertheless, this is relatively limited.
In 2019, one fifth of the EU’s cows’ milk was produced by farms in Germany and a similar proportion (22.7 %) was processed by German dairies. Indeed, just as Germany, France, the Netherlands, Poland and Italy together provided about two thirds (64.3 %) of the raw cows’ milk produced, so they also accounted for a little over two thirds (66.5 %) of cows’ milk collected by dairies (see Figure 3.3.3).

3 Farm production
Agriculture, forestry and fishery statistics — 2020 edition60
Figure 3.3.4: Milk from animals other than cows, 2019(% share of total milk delivered to dairies)
0 10 20 30 40 50 60
EU-27 (1)
GreeceCyprus
SpainItaly
BulgariaFrance (2)Romania
NetherlandsPortugalBelgium
CroatiaSlovakia
Austria
Norway
AlbaniaMontenegro
Turkey
Note: little or no milk from animals other than cows is produced in the Member States that are not shown in this figure.
(1) Estimate.(2) Provisional.
Source: Eurostat (online data code: apro_mk_pobta)
Whilst cows’ milk is the major milk used by EU dairies, in several Member States other milks contribute significantly to milk production. In 2019, Spain produced 1.0 million tonnes of milk from ewes and goats, with Greece and France both producing 0.8 million tonnes. Italy produced 0.7 million tonnes of milk from animals other than cows and this included almost all of the EU’s production of milk from buffalos.
Whereas the collection of these other milks was dwarfed by that from cows in most countries, there were some exceptions. A majority (55.4 %) of the milk delivered to dairies in Greece came from ewes and goats in 2019 (see Figure 3.3.4). A little over one fifth (21.4 %) of the milk delivered to dairies in Cyprus also came from ewes and goats.

3Farm production
Agriculture, forestry and fishery statistics — 2020 edition 61
Figure 3.3.5: Deflated price indices for milk, EU‑27, 2015‑2019(2015 = 100)
0
85
90
95
100
105
110
115
120
Q1-
2015
Q2-
2015
Q3-
2015
Q4-
2015
Q1-
2016
Q2-
2016
Q3-
2016
Q4-
2016
Q1-
2017
Q2-
2017
Q3-
2017
Q4-
2017
Q1-
2018
Q2-
2018
Q3-
2018
Q4-
2018
Q1-
2019
Q2-
2019
Q3-
2019
Q4-
2019
Source: Eurostat (online data code: apri_pi15_outq)
Small decline in real-terms price of milk in 2019
The average real-terms (deflated) price of milk has fluctuated sharply in recent years (see Figure 3.3.5); a strong decline in 2016 was followed by a strong rebound in 2017. Compared with these changes, the real-terms price of milk was relatively stable in 2019 (− 0.6 % on average).
Among the principal milk-producing Member States, there were stronger than average declines in the real-terms price of milk in 2019 in Ireland (− 5.6 %), Germany (− 3.3 %), Poland (− 1.9 %) and the Netherlands (− 1.3 %). There were also higher prices, particularly in Italy (+4.4 %), Spain (+2.4 %) and France (+2.3 %).

3 Farm production
Agriculture, forestry and fishery statistics — 2020 edition62
Table 3.3.1: Utilisation of milk and dairy products obtained, EU‑27, 2019(million tonnes)
Utilisation of milk Product obtained Skimmed milk Whole milk
Total 2.0 145.9 –
Sub-total of processes generating skimmed milk − 53.7 60.1 –
Butter and yellow products − 40.4 44.0 2.3
Cream − 13.3 16.0 2.5
Sub-total of processes consuming skimmed milk 55.7 85.8 –
Drinking milk 9.8 13.6 23.4
Powder products 20.7 4.5 3.0
Concentrated milk 0.9 1.4 1.0
Acidified milk 1.6 6.0 7.7
Buttermilk 0.4 0.0 0.5
Cheese 15.5 57.6 10.1
Milk based drinks 1.0 0.7 1.8
Caseins 6.0 0.0 0.2
Other fresh products − 0.2 2.1 2.2
Source: Eurostat (online data codes: apro_mk_pobta and apro_mk_farm)
Milk products
Two thirds of all whole milk available to dairies in the EU-27 is used to make cheese and butter
The milk delivered to dairies is processed into a number of fresh and manufactured products. Dairy products are recorded in terms of their weight. It is thus difficult to compare the quantities of various products (for example, tonnes of fresh milk and of milk powder). The volume of whole or skimmed milk used in dairy processes provides more comparable figures (13).
In 2019, 145.9 million tonnes of the whole milk available to the EU’s dairy sector was processed.
Across the EU, the production of 2.3 million tonnes of butter and so-called ‘yellow products’ in 2019 required 44.0 million tonnes of whole milk (see Table 3.3.1). The production of butter and yellow products also generated 40.4 million tonnes of skimmed milk. Together with the 13.3 million tonnes generated through the fabrication of cream, this skimmed milk was used for the processing of other dairy products.
Indeed, 15.5 million tonnes of skimmed milk together with 57.6 million tonnes of whole milk were used to produce 10.1 million tonnes of cheese in the EU in 2019. Together, the production of cheese and butter used a little more than two thirds (69.6 %) of all the whole milk available to dairies in the EU.
The EU-27 also produced 23.4 million tonnes of drinking milk, from 9.8 million tonnes of skimmed milk and 13.6 million tonnes of whole milk. Drinking milk accounted for about one tenth (9.3 %) of all the whole milk used by dairies in 2019.
In 2019, 3.0 million tonnes of dairy powder products were produced in the EU-27 from 20.7 million tonnes of skimmed milk and 4.5 million tonnes of whole milk.
Germany produced about one fifth of the EU’s drinking milk (19.6 %), butter (18.7 %) and cheese (22.7 %) in 2019. The other main cheese producing Member States were France (a provisional 1.9 million tonnes, 19.2 % of the EU total), and Italy (1.3 million tonnes, 13.1 % of the EU total).

3Farm production
Agriculture, forestry and fishery statistics — 2020 edition 63
Data sources and availability
Crop statistics Statistics on crop products are collected under Regulation (EC) No 543/2009 and obtained by sample surveys, supplemented by administrative data and estimates based on expert observations. The sources vary from one EU Member State to another because of national conditions and statistical practices. National statistical institutes or Ministries of Agriculture are responsible for data collection in accordance with EU regulations. The finalised data sent to Eurostat are as harmonised as possible. Eurostat is responsible for establishing EU aggregates. The statistics that are collected on agricultural products relate to more than 100 individual crop products. Information is collected for the area under cultivation (expressed in 1 000 hectares), the quantity harvested (expressed in 1 000 tonnes) and the yield (expressed in tonnes per hectare). For some products, data at a national level may be supplemented by regional statistics at NUTS levels 1 or 2.
Livestock and meat statistics Livestock and meat statistics are collected by EU Member States under Regulation (EC) No 1165/2008, which covers bovine, pig, sheep and goat livestock; slaughtering statistics on bovine animals, pigs, sheep, goats and poultry; and production forecasts for beef, veal, pig meat, sheep meat and goat meat. Livestock surveys cover sufficient agricultural holdings to account for at least 95 % of the national livestock population, as determined by the last survey on the structure of agricultural holdings. Bovine and pig livestock statistics are produced twice a year, with reference to a given day in May/June and a given day in November/December. Those EU Member States whose bovine animal populations are below 1.5 million head or whose pig populations are below 3.0 million head may produce these statistics only once a year, with reference to a given day in November/December. The November/December results are available for all EU Member States and are used in this article. Sheep livestock statistics are only produced once a year, with reference to a given day in November/December, by those EU Member States whose sheep populations are 500 000 head or above; the same criteria and thresholds apply for statistics on goat populations.

3 Farm production
Agriculture, forestry and fishery statistics — 2020 edition64
Milk and milk product statistics Milk and milk product statistics are collected under Decision 1997/80/EC and implementing Directive 1996/16/EC. They cover farm production and the utilisation of milk, as well as the description (structure), collection and production activity of dairies. Due to the small number of dairy enterprises, national data are often subject to statistical confidentiality. Thus, providing EU totals in this context is a challenge and some of the information presented in the analysis is based on partial data for the Member States (which may exclude several countries). On the one hand, statistics from these few enterprises provide early estimates on trends. On the other, a complete overview of the dairy sector requires detailed information from farms and this means that the final figures on milk production are only available at an EU level about one year after the reference year. Dairy products are recorded in terms of weight. It is thus difficult to compare the various products (for example, fresh milk and milk powder). The volume of whole or skimmed milk used in the dairy processes provides more comparable figures.
Agricultural price statistics EU agricultural price statistics are based on voluntary agreements between Eurostat and the Member States. National statistical institutes or Ministries of Agriculture are responsible for collecting absolute prices and calculating corresponding average prices for their country, as well as for calculating price indices and periodically updating the weights. Price indices are reported quarterly and annually. Absolute prices are reported annually. The agricultural prices expressed in national currency are converted into euro by Eurostat using fixed exchange rates or financial market exchange rates, in order to allow comparisons between the Member States. Eurostat is responsible for calculating indices for the EU.

4 Performance of the agricultural sector

4 Performance of the agricultural sector
Agriculture, forestry and fishery statistics — 2020 edition66
Did youknow ...
The EU‘s agricultural industry created (gross) value added of
EUR 181.5 billion in 2019
181.5 billion
The risk from pesticide use across the EU-27 was estimated to have fallen 17 % between the average for the years 2011-2013 and 2018
Agriculturecontributed1.3 % tothe EU‘s GDPin 2019
2019€2010
€
Agricultural income per AWU
for the EU-27, expressed as an
index, rose 4.7 % in 2019. This was
almost 30 % higher than the level in 2010
Introduction
(14) For more information, see: A European Green Deal.(15) For an overview of the strategy and related documents, see https://ec.europa.eu/food/farm2fork_en.(16) For more information, see the Communication from the Commission on the European Green Deal.
The performance of the agricultural sector has traditionally been about how successful farming is in delivering primary agricultural products and services. However, it is increasingly taking on a green aspect, recognising the impact of agriculture on water, air and soil quality, land use diversity, ecologies, wildlife and climate change.
The European Green Deal (14) sets out how to make Europe the first climate-neutral continent by 2050. The Farm to Fork Strategy (15), for a fair, healthy and environmentally-friendly food system, was adopted by the European Commission on 20 May 2020 and lies at the heart of the Green Deal. Among other things, it addresses comprehensively the challenges of sustainable food systems by recognising that ‘food production still results in […] pollution, contributes to the loss of biodiversity and climate change, and consumes excessive amounts of natural resources’ (16). This is a reason for the goal to increase the area under organic farming to 25 % of the utilised agricultural area by 2030, a goal that goes hand-in-hand with measures to change resource performance. Individual targets to reduce dependency on chemical pesticides and antimicrobials, reduce excess fertilisation, and reduce waste will pave the way for a more sustainable food-chain.
Assessing the performance of the agricultural sector matters for a number of reasons:
• farming is a cornerstone of the rural community, one on which a number of ‘upstream’ sectors (such as machinery, animal healthcare and input businesses) and ‘downstream’ sectors (such as food processing, packaging and transport businesses) depend;
• farming is about providing a stable supply of safe, quality food;
• farming has a key role to play in preserving landscapes and biodiversity;
• farming has a key role to play in climate change action; and
• to support this, there is a need to ensure a fair income for farmers.
Economic impacts on farmers therefore not only influence future farming business decisions but also wider ecological and environmental business decisions and behaviour.
The performance of the agricultural sector as a whole can be conducted by bringing the information about the volume and price changes for agricultural goods and services under the umbrella of an accounting structure. To this end, the economic accounts for agriculture (EAA) provide a set of comparable data that provide an insight into:
• the economic viability of agriculture;• the income generated by farmers;• the structure and composition of agricultural
production and the inputs used in that production; and
• the relationships between prices and quantities of both outputs and inputs.
The resource performance of the agricultural sector is further enriched by analysing key targets of the European Green Deal. For this reason, analyses on sales of pesticides and the risks from their use, on fertiliser consumption, and on the generation of waste are also provided in this chapter.
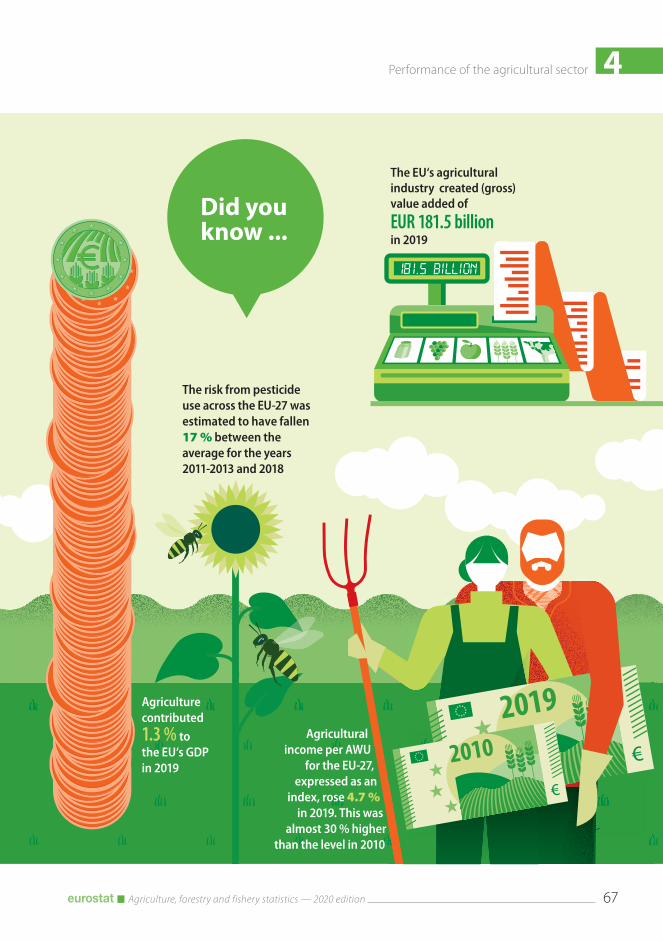
4Performance of the agricultural sector
Agriculture, forestry and fishery statistics — 2020 edition 67
Did youknow ...
The EU‘s agricultural industry created (gross) value added of
EUR 181.5 billion in 2019
181.5 billion
The risk from pesticide use across the EU-27 was estimated to have fallen 17 % between the average for the years 2011-2013 and 2018
Agriculturecontributed1.3 % tothe EU‘s GDPin 2019
2019€2010
€
Agricultural income per AWU
for the EU-27, expressed as an
index, rose 4.7 % in 2019. This was
almost 30 % higher than the level in 2010

4 Performance of the agricultural sector
Agriculture, forestry and fishery statistics — 2020 edition68
4.1. Value of agricultural outputAgriculture is an activity that falls within the primary sector of the economy, which is concerned with the extraction or harvesting of products from the earth. In an accounting context, an industry is a branch of economic activity. The term ‘agricultural industry’ is used to describe the branch of agricultural production but it should not be understood as inferring that agriculture is industrialised or that it is about the processing of raw materials. Indeed, the food and beverages processing industry is analysed in Chapter 7.
In this chapter, the term ‘agricultural industry’ is used only where precise accounting terms are required, with ‘agricultural sector’ being used elsewhere.
Agriculture contributed 1.3 % to the EU’s GDP in 2019
Agricultural production in the EU by the millions of predominantly small farms adds up to being big business, even without considering its importance as the key building block for the downstream food and beverage processing industry. The agricultural sector contributed EUR 176.4 billion towards the EU’s overall GDP in 2019. To put this in some context, the contribution of agriculture to the EU’s economy was only slightly less than the GDP of Greece in 2019, the 16th largest economy among the EU Member States.
This contribution (gross value added at producer prices, which is comparable to GDP at market prices), is the difference between the value of agricultural output and the value of various
input costs built up in the production process, adjusted for taxes and subsidies on products. It is therefore interesting to look at the structure and composition of the value of this agricultural production and the various inputs used.
The agricultural industry created an estimated added value of EUR 181.5 billion in 2019
The gross value added by the EU’s agricultural industry, which is the difference between the value of everything that the EU’s primary agricultural sector produced and the costs of the services and goods used in the production process, was an estimated EUR 181.5 billion in 2019. One way of looking at this is that for every 1 euro spent on the cost of goods and services used in the production process (known as intermediate consumption), the EU’s agricultural industry created added value of EUR 0.77. Whilst this relative value added was lower than the EUR 0.79 in 2017, it was still higher than all the other years since 2007.
The value of the output produced by the EU’s agricultural industry was an estimated EUR 418.0 billion in 2019
The value of everything that the EU’s agricultural industry produced in 2019 was an estimated EUR 418.0 billion; this includes the value of crops, of animals, of agricultural services, as well as some goods and services that were not strictly agricultural but which could not be separately measured.

4Performance of the agricultural sector
Agriculture, forestry and fishery statistics — 2020 edition 69
Figure 4.1.1: Output of the agricultural industry, EU‑27, 2019(% share of total output)
Crops52.8 %
Animals
Others8.6 %
38.6 %
Vegetables and horticultural plants
13.6 %
Cereals11.4 %
Fruits6.5 %
Forageplants6.0 %
Wine5.4 %
Industrialplants4.4 %Potatoes
3.4 %Olive oil
1.3 %Others0.6 %
Milk13.0 %
Pigs9.5 %
Cattle6.8 %
Poultry4.8 %
Eggs2.2 %
Otheranimals
1.8 %
Other animal products
0.6 %
Agriculturalservices
4.8 %
Secondaryactivities
3.7 %
Total output EUR 418.0
billion
Note: values at basic prices.
Source: Eurostat (online data code: aact_eaa01)
About one half (52.8 %) of the value of the total output of the EU’s agricultural industry in 2019 came from crops (EUR 220.5 billion), within which vegetables and horticultural plants and cereals were the most valuable crops (see Figure 4.1.1). About two fifths (38.6 %) of total output came from animals and animal products (EUR 161.4 billion), a majority coming from just milk and pigs. Agricultural services (EUR 20.0 billion) and inseparable non-agricultural activities (EUR 16.0 billion) contributed the rest (8.6 %).
Contributions from Member States varied significantly, reflecting differences in volumes
produced, prices received, as well as the mix of crops grown, animals reared, animal products collected and services offered. More than one half (58.6 %) of the total output value of the EU’s agricultural industry came from the ‘big four’ of France (EUR 77.0 billion), Germany (EUR 58.2 billion), Italy (EUR 57.8 billion) and Spain (EUR 51.7 billion). The next grouping of Member States were the Netherlands (EUR 29.1 billion), Poland (EUR 26.4 billion) and Romania (EUR 19.0 billion). Three quarters (76.4 %) of the total value of EU’s agricultural industry in 2019 came from these seven Member States.

4 Performance of the agricultural sector
Agriculture, forestry and fishery statistics — 2020 edition70
Figure 4.1.2: Output and price indices for the agricultural industry, EU‑27, 2005‑2019(2010 = 100)
75
100
125
2005
2006
2007
2008
2009
2010
2011
2012
2013
2014
2015
2016
2017
2018
2019
Nominal value Nominal price Volume
0
Note: values at basic prices.
Source: Eurostat (online data code: aact_eaa05)
Intermediate consumption costs for the EU’s agricultural industry were an estimated EUR 236.5 billion in 2019
Producing all this output incurred costs. Farmers had to make purchases of goods and services to be used as inputs in the production process; they bought things like seeds, fertilisers, animal feedingstuffs and fuel for their tractors as well as veterinary services, among other things. These input costs are termed ‘intermediate consumption’ in an accounting context. Intermediate consumption costs for the agricultural industry came to a total of EUR 236.5 billion for the EU as a whole in 2019.
Some costs are associated with the farming of animals; they required feed, which accounted for over one third (37.7 %) of total intermediate consumption costs, and veterinary services (a further 2.6 %). Likewise, some costs are associated
with crop farming; farmers required seeds and plants (5.4 % of total costs), many used plant protection products, herbicides, insecticides and pesticides (4.8 %) and fertilisers and soil improvers (6.5 %). Other costs are common to all types of farm, independent of whether specialist or mixed-type.
The value of the output produced by the EU’s agricultural industry reached a new peak in 2019
The estimated value of agricultural output in 2019 rose by 2.4 % in nominal terms to a new high, confirming the upward trend since 2009 (see Figure 4.1.2). This change in nominal value reflected slight rises in both the nominal price for agricultural goods and services as a whole (an estimated +1.3 %) as well as in the volume of output (an estimated +1.1 %).

4Performance of the agricultural sector
Agriculture, forestry and fishery statistics — 2020 edition 71
Figure 4.1.3: Indices of the value of output, intermediate consumption costs and value added generated by the agricultural industry, EU‑27, 2005‑2019(2010 = 100)
75
100
125
2005
2006
2007
2008
2009
2010
2011
2012
2013
2014
2015
2016
2017
2018
2019
Gross value addedindex
Output valueindex
Intermediate consumptioncosts index
0
Note: values at basic prices.
Source: Eurostat (online data code: aact_eaa05)
This rise in the output value of the EU’s agricultural industry in 2019 was driven by the developments in the values recorded in Germany (+10.6 %), Poland (+6.0 %), Romania (+4.2 %) and the Netherlands (+3.5 %). It should be noted that the highest rate of increase was in Latvia (+21.1 %). By contrast, there were declines in the values of the agricultural industries in a number of countries, including, France (− 1.6 %), Italy (− 1.2 %) and Spain (− 0.9 %).
The gross value added generated by the EU’s agricultural industry rose to a new peak in 2019
The cost of the intermediate goods and services used by the agricultural industry in 2019 was slightly higher than a year earlier (an estimated +0.8 %). This rate of increase was less, however, than the rate of increase in the value of agricultural output (an estimated +2.4 %), which resulted in a strong rise (+4.6 %) in the gross value added generated by the agricultural industry. Indeed, the gross value added generated by the agricultural industry in 2019 rose to a new peak level.

4 Performance of the agricultural sector
Agriculture, forestry and fishery statistics — 2020 edition72
4.2. Agricultural labour productivityThe economic performance of the agricultural industry can be measured in terms of net value added at factor cost, which is gross value added adjusted for the consumption of fixed capital, and subsidies and taxes on production. It is also known as factor income, as it is the remuneration available for all the factors of production.
Factor income in the EAA can be expressed per full-time labour equivalent. As such, it is considered a partial labour productivity measure; it is a measure of the net value added by the equivalent of each full-time worker in the agricultural industry. This indicator of performance is measured in real terms (adjusted for inflation) and expressed as an index. It should not be confused with total income of farming households or the income of a person working in agriculture.
To understand the development of this agricultural income measure, it is first necessary to understand the development of the agricultural labour amongst which this remuneration is notionally shared. With so much part-time, seasonal and unsalaried labour input in agriculture, the amount of work actually carried out in farming activities is best described when using a unit called the annual work unit (AWU). This unit expresses the volume of work done in full-time work equivalents.
Downward trend in the volume of agricultural labour in the EU continued in 2019
Agricultural labour input in the EU was the equivalent of an estimated 8.7 million full-time workers in 2019. These are the notional workers that are remunerated with agricultural income.
A majority of total agricultural labour input is non-salaried labour; it was the equivalent of an estimated 6.4 million full-time workers in 2019. Salaried labour was the equivalent of 2.3 million full-time workers in 2019. In a few Member States,
more salaried agricultural labour was used in 2019 than in 2018 (see Figure 4.2.1), in part reflecting hiring requirements at seasonal peaks. This was often in contrast to the overall decline in the total amount of agricultural labour used.
There is a long-established downward trend in the number of people working in the EU’s agricultural sector; during the period between 2005 and 2019, the average rate of decline in the volume of agricultural labour used across the EU as a whole was 2.5 % per year. The downward trend continued in 2019, at much the same rate (− 2.2 %) as the average for 2005-2019.
Lower volumes of labour input were used in most Member States in 2019, with particularly stark contractions continuing in Romania (− 4.9 %), Estonia (− 6.0 %), Lithuania (− 6.1 %), Hungary (− 8.4 %) and Bulgaria (− 13.5 %). By contrast, the volume of total agricultural labour used in Slovakia was considerably higher (+4.8 %) in 2019 than in 2018, although this should be seen against a persistent and strong contraction over the longer-term. There were also rises in Finland (+2.8 %), Cyprus (+1.4 %), Croatia (+0.9 %) and the Netherlands (+0.3 %).
Over the long-term, the volume of agricultural labour has been in steep and steady decline
The volume of total agricultural labour declined sharply in almost all Member States during the period between 2005 and 2019 (see Figure 4.2.2); the sharpest declines were in Bulgaria (an average − 8.2 % per year), Slovakia (− 5.5 % per year), Estonia (− 4.8 % per year) and Latvia (− 4.7 % per year). This contraction in the agricultural labour force reflected both push and pull factors; there have been great strides in mechanisation and efficiency on the one hand and, on the other, a wider choice of attractive job opportunities in other sectors of the economy. The main exceptions to this general trend were Malta (+1.6 % per year on average) and Ireland (+0.6 % per year on average).

4Performance of the agricultural sector
Agriculture, forestry and fishery statistics — 2020 edition 73
Figure 4.2.1: Agricultural labour input, 2018‑2019(%, annual rate of change)
−14
−12
−10
−8
−6
−4
−2
0
2
4
6
EU-2
7 (1 )
Slov
akia
Finl
and
Cypr
usCr
oatia
Net
herla
nds
Den
mar
k (1 )
Irela
ndM
alta
Pola
ndBe
lgiu
mIta
lyLa
tvia
Slov
enia
Aus
tria
Spai
nFr
ance
Port
ugal
Ger
man
ySw
eden
Czec
hia
Luxe
mbo
urg
Gre
ece
Rom
ania
Esto
nia
Lith
uani
aH
unga
ryBu
lgar
ia
Uni
ted
King
dom
Icel
and
(1 )Sw
itzer
land
Nor
way
Total labour input Salaried labour input
(1) Estimated.
Source: Eurostat (online data code: aact_ali02)
Figure 4.2.2: Agricultural labour input, 2005‑2019(%, average annual rate of change)
−10
−8
−6
−4
−2
0
2
4
6
EU-2
7 (1 )
Mal
taIre
land
Net
herla
nds
Italy
Slov
enia
Den
mar
k (1 )
Spai
nLu
xem
bour
gFr
ance
Ger
man
yBe
lgiu
mA
ustr
iaLi
thua
nia
Croa
tiaCy
prus
Czec
hia
Pola
ndSw
eden
Gre
ece
Hun
gary
Finl
and
Port
ugal
Rom
ania
Latv
iaEs
toni
aSl
ovak
iaBu
lgar
ia
Uni
ted
King
dom
Icel
and
(2 )Sw
itzer
land
Nor
way
Total labour input Salaried labour input
(1) Estimated.(2) Estimated for 2010 to 2019.
Source: Eurostat (online data code: aact_ali02)

4 Performance of the agricultural sector
Agriculture, forestry and fishery statistics — 2020 edition74
Figure 4.2.3: Agricultural income per annual work unit (indicator A), 2018‑2019(2010 = 100)
0
50
100
150
200
250
EU-2
7
Den
mar
kG
erm
any
Esto
nia
Lith
uani
aLa
tvia
Swed
enBu
lgar
iaBe
lgiu
mFi
nlan
dG
reec
eH
unga
ryPo
rtug
alCr
oatia
Pola
ndCz
echi
aCy
prus
Net
herla
nds
Rom
ania
Irela
ndM
alta
Spai
nIta
lyA
ustr
iaSl
ovak
iaFr
ance
Luxe
mbo
urg
Slov
enia
Uni
ted
King
dom
Icel
and
Nor
way
Switz
erla
nd
2019 index point (at arrow tip) 2018 index point (at arrow or line base)
Note: Member States are ordered from highest rate of change 2018-2019 to lowest, positive to negative.
Source: Eurostat (online data code: aact_eaa06)
The contraction in the total work input from non-salaried labour between 2005 and 2019 was more pronounced than for salaried labour at the level of the EU as a whole (− 3.2 % per year on average compared with − 0.3 % per year). There were higher levels of salaried labour input in Ireland (+4.6 % per year on average), Luxembourg (+3.5 % per year on average), Austria (+2.8 % per year on average), Denmark (+2.1 % per year on average) and Poland (+2.0 % per year on average) among others, but sharp declines in Slovakia (− 4.6 % per year on average), Greece (− 3.6 % per year on average), Czechia (− 3.2 % per year on average) and Romania (− 3.0 % per year on average).
Agricultural income as defined by real factor income per AWU for the EU-27 rose moderately in 2019 (+4.7 %)
Agricultural income, as defined by deflated (real) factor income per AWU and expressed as an index (called indicator A), for the EU as a whole was
an estimated 4.7 % higher in 2019 than it was in 2018. This reflected a slightly higher (+2.5 %) level of factor income than in 2018 that was notionally shared amongst a smaller agricultural labour input (− 2.2 %).
A majority of Member States recorded increases in this index of agricultural income in 2019 (see Figure 4.2.3). The sharpest upturns were in Denmark (+69.4 %), Germany (+48.0 %), Estonia (+32.5 %), Lithuania (+31.3 %) and Latvia (+26.7 %), all reflecting strong rebounds from the relatively steep declines in 2018 when there were severe drought conditions.
The more moderate rise in agricultural income per AWU at the level of the EU as a whole reflected lower agricultural incomes in three of the ‘big four’ agricultural producer-Member States; Spain (− 3.2 %), France (− 6.4 %) and Italy (− 3.9 %) registered declines. The sharpest rate of decrease was recorded for Slovenia (− 11.4 %), a year after it recorded the sharpest increase among Member States.
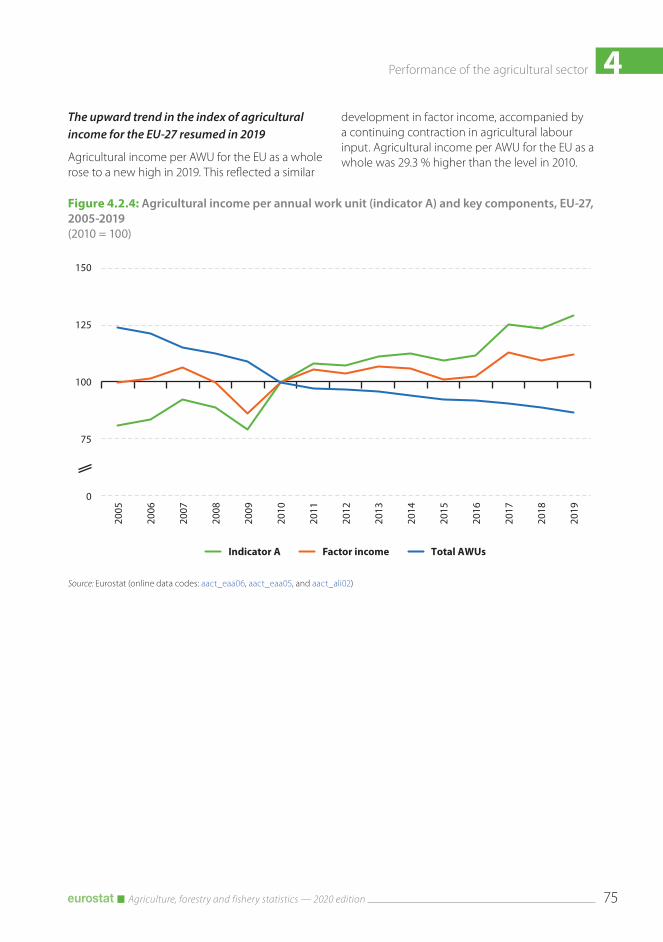
4Performance of the agricultural sector
Agriculture, forestry and fishery statistics — 2020 edition 75
Figure 4.2.4: Agricultural income per annual work unit (indicator A) and key components, EU‑27, 2005‑2019(2010 = 100)
75
100
125
150
2005
2006
2007
2008
2009
2010
2011
2012
2013
2014
2015
2016
2017
2018
2019
Indicator A Factor income Total AWUs
0
Source: Eurostat (online data codes: aact_eaa06, aact_eaa05, and aact_ali02)
The upward trend in the index of agricultural income for the EU-27 resumed in 2019
Agricultural income per AWU for the EU as a whole rose to a new high in 2019. This reflected a similar
development in factor income, accompanied by a continuing contraction in agricultural labour input. Agricultural income per AWU for the EU as a whole was 29.3 % higher than the level in 2010.

4 Performance of the agricultural sector
Agriculture, forestry and fishery statistics — 2020 edition76
Figure 4.3.1: Volume indices of agricultural output and of intermediate consumption, EU‑27, 2005‑2019(2005 = 100)
95
100
105
110
115
2005
2006
2007
2008
2009
2010
2011
2012
2013
2014
2015
2016
2017
2018
2019
Output of the agricultural industry Intermediate consumption
0
Source: Eurostat (online data code: aact_eaa05)
4.3. Resource performance of the agricultural sector
(17) The Europe 2020 strategy includes the Roadmap to a Resource Efficient Europe (COM(2011) 571) that outlines how the European economy can be transformed into a sustainable one by 2050.
There is increasing interest in the efficiency with which resources are used (17). In order to become more sustainable, an economy would need to decouple economic growth from resource use and its environmental impact.
To better monitor this sustainability, prices should reflect the real costs of resource use. However, the social and environmental outputs of farming activities are rarely priced. Indeed, so-called ‘green accounts’ for agriculture are far from being completed, nor the green efficiency indicators that could result from them. Likewise, total factor productivity indicators for agriculture that look at a measure of agricultural output against a combined measure of the input from intermediate consumption, land, labour and capital are also not yet available.
Some indication of the resource performance of agriculture can be derived, however, from the EAA by looking at trends in the ‘volumes’ of outputs generated and of the goods and services used up or ‘consumed’ as inputs in the production process. These volumes come from a decomposition of the values into price and volume components. These implicit volumes are not quantities; they are not measured in terms of kilograms or tonnes. They are termed ‘volumes’ because they capture not only changes related to quantity but also to quality as well as composition, which is important to bear in mind. As indices, they provide an overview of the trends in the volumes of inputs and outputs, which can be used for some productivity and performance measures.

4Performance of the agricultural sector
Agriculture, forestry and fishery statistics — 2020 edition 77
Figure 4.3.2: Change in the volume indices of agricultural output and of intermediate consumption, 2005‑2019(%)
−80
−60
−40
−20
0
20
40
60
80
EU-2
7
Belg
ium
Bulg
aria
Czec
hia
Den
mar
kG
erm
any
Esto
nia
Irela
ndG
reec
eSp
ain
Fran
ceCr
oatia
Italy
Cypr
usLa
tvia
Lith
uani
aLu
xem
bour
gH
unga
ryM
alta
Net
herla
nds
Aus
tria
Pola
ndPo
rtug
alRo
man
iaSl
oven
iaSl
ovak
iaFi
nlan
dSw
eden
Agricultural output Intermediate consumption
Source: Eurostat (online data code: aact_eaa05)
Rising output volume of agricultural industry but with rising volume of input goods and services as a whole
Over the reference period between 2005 and 2019, there was a relatively steady upward trend in the output volume of the EU’s agricultural industry (a total increase of +12.1 %). To a large extent, higher output volumes were underpinned by a greater volume (+6.5 %) of input goods and services consumed (see Figure 4.3.1). The medium-term trends suggest that there is little evidence of any decoupling of output growth from resource use at the EU level, although figures for 2019 hint that a change is possible.
Among Member States, there was also little suggestion of an apparent decoupling of agricultural output growth from intermediate consumption resource growth, with a few notable exceptions. Over the period between 2005 and 2019, agricultural industry output in Belgium grew by 14.8 % at the same time as the volume of intermediate consumption goods and services consumed declined by 28.4 %. Likewise, Finland and Slovenia also recorded rises in agricultural output over the same period (+5.9 % and +3.1 % respectively) at the same time as a reducing their consumption of intermediate consumption goods and services (− 16.4 % and − 9.9 % respectively). It should be borne in mind that these changes may, in part, reflect changes within the structure of the agricultural industries in these Member States as well as improved resource efficiency.
4 Performance of the agricultural sector
Agriculture, forestry and fishery statistics — 2020 edition78
Sales of pesticides unchanged but risk from pesticide use in decline
Sales of pesticides in the EU-27 were about 360 000 tonnes in 2018 and this was more or less unchanged in the period from 2011. The data on pesticide sales cover all types of sales, not only for use in farming but also, among others, forestry. The types of active substances used in pesticides are changing and volume is not indicative of the potential hazards associated with the use of pesticides. Harmonised risk indicator 1 (HRI1) estimates the trend in the risk from pesticide use (18); it covers all sectors of the economy.
The risk from pesticide use has been in decline over much of the past decade across the EU as a whole; compared with the average between the years 2011 to 2013, the risk from pesticide use is estimated to have declined by about 17 % through to 2018 (see Figure 4.3.3). During this timeframe, the risk of pesticide use declined in a majority of Member States, the steepest declines being in Romania (− 52 %) and Denmark (− 48 %). There were a few Member States, however, where the risk rose; among others, in Latvia the risk rose an estimated 40 % and in Finland an estimated 44 %. Such increases may occur for countries starting from a baseline much lower than the EU-average. Exchanging the use of low-volume chemical pesticides in storage buildings for the use of high-volume inert gases, and obligatory applications to fight particular plant problems are other reasons for an increase in HRI1.
(18) For more information, see the European Commission’s webpage on harmonised risk indicators.(19) For more information, see the Statistics Explained article:
Agri-environmental indicator — mineral fertiliser consumption.(20) OECD (2019), Accelerating Climate Action: Refocusing policies through a Well-being lens.(21) For more information, see the Statistics Explained article:
Agri-environmental indicator — gross nitrogen balance.(22) For more information, see the Statistics Explained article:
Agri-environmental indicator — risk of pollution by phosphorous.
Fertiliser consumption remains high
The consumption volume of mineral fertilisers, nitrogen and phosphorus, by agriculture remained high in the period 2007 to 2018; an estimated 11.3 million tonnes were used in 2018 (19).
When the nutrients used in agriculture are not absorbed by crops, their use is considered excessive and is linked to environmental issues regarding water pollution, the climate (20) and reduced biodiversity. The gross nitrogen balance provides an indication of the potential surplus of nitrogen (N) on agricultural land (kg N per hectare per year). The gross nitrogen balance for the EU-27 decreased from an estimated average of 51 kg N per hectare per year in the period 2004-2006 to 47 kg N per hectare per year in the period 2013-2015 (21). Mineral fertilisers accounted for 45 % of the nitrogen input in the EU in 2014, manure accounting for another 38 %.
The gross phosphorus balance provides insight into links between agricultural phosphorus use, losses of phosphorus to the environment, and the sustainable use of soil nutrient resources. A persistent surplus indicates potential environmental problems, such as phosphorus leaching resulting in pollution of drinking water and eutrophication of surface waters. A persistent deficit can impair the resource sustainability of agriculture soil through soil degradation, or soil mining, resulting in declining fertility in areas under crop or forage production. The gross phosphorus balance for the EU was 1.2 kg per hectare per year in the period 2013-2015, down from 3.9 kg per hectare per year in the period 2004-2006. This means that although there remains an annual surplus, the size of this annual surplus has declined; in the period between 2013-2015 it was about 30 % of what it was in the early 2000s (22).

4Performance of the agricultural sector
Agriculture, forestry and fishery statistics — 2020 edition 79
Figure 4.3.3: Risk from pesticide use, 2018(Index, 2011-2013 = 100)
0
20
40
60
80
100
120
140
160
EU-2
7
Rom
ania
Den
mar
kSw
eden
Gre
ece
Czec
hia
Croa
tiaLu
xem
bour
gPo
rtug
alIre
land
Belg
ium
Net
herla
nds
Spai
nPo
land
Mal
taG
erm
any
Bulg
aria
Hun
gary
Slov
akia
Lith
uani
aIta
lyFr
ance
Slov
enia
Aus
tria
Esto
nia
Cypr
usLa
tvia
Finl
and
Source: Eurostat (online data code: aei_hri)

4 Performance of the agricultural sector
Agriculture, forestry and fishery statistics — 2020 edition80
Data sources and availabilityThe EAA are a satellite account of the European system of accounts (ESA 2010). They cover the agricultural products and services produced over the accounting period sold by agricultural units, held in stocks on farms, or used for further processing by agricultural producers. The concepts of the EAA are adapted to the particular nature of the agricultural industry: for example, the EAA includes not only the production of grapes and olives but also the production of wine and olive oil by agricultural producers, if produced from own grapes and olives. It includes information on intra-unit consumption of crop products used in animal feed, as well as output accounted for by own account production of fixed capital goods and own final consumption of agricultural units.
The EAA comprises a production account, a generation of income account, an entrepreneurial income account and some elements of a capital account. For the production items, EU Member States transmit to Eurostat values at basic prices, as well as their components (values at producer prices, subsidies on products, and taxes on products).
The output of agricultural activity includes output sold (including trade in agricultural goods and services between agricultural units), changes in stocks, output for own final use (own final consumption and own-account gross fixed capital formation), output produced for further processing by agricultural producers, as well as intra-unit consumption of livestock feed products. The output of the agricultural industry is made up of the sum of the output of agricultural products and of the goods and services produced in inseparable non-agricultural secondary activities; animal and crop output are the main product categories of agricultural output.
Three indicators are computed in relation to agricultural income:
• an index of real income of factors in agricultural activity per AWU (indicator A);
• an index of real net agricultural entrepreneurial income, per unpaid AWU (indicator B);
• and the net entrepreneurial income of agriculture (indicator C).
The information presented on agricultural income relates to indicator A (the real income of factors in agriculture per AWU). This indicator corresponds to the real (deflated) net value added at factor cost of agriculture per AWU and is expressed as an index. Net value added at factor cost is calculated by subtracting from the value of agricultural output at basic prices the value of intermediate consumption, the consumption of fixed capital, and adding the value of (other) subsidies less taxes on production.
Agricultural price statistics provide information on the development of producer (output) prices for agricultural products and purchaser prices for the means of agricultural production (the intermediate consumption of goods and services within the production process). Data on prices are available for single commodities and for larger aggregates in the form of absolute prices and price indices.
The index of producer prices for agricultural products is based on sales of agricultural products, while the input index (for intermediate goods and services) is based on purchases of the means of agricultural production. Prices should be recorded at points which are as close as possible to those of the transactions which the farmer actually undertakes. This means that product prices should be recorded at the first marketing stage so as to best indicate the actual producer

4Performance of the agricultural sector
Agriculture, forestry and fishery statistics — 2020 edition 81
prices received by farmers. Similarly, the prices paid by farmers for their means of production should be recorded at the last marketing stage, that at which the items arrive on the farm, so as to best indicate the purchase prices paid by farmers. It is assumed, by convention, that the fertilisers and feeding stuffs purchased are used in the same production period and that there are no stocks on farm.
As regards spatial comparisons, the structure of the weights with respect to products and means of production reflect the value of the sales and purchases in each country during the base year (currently 2010 = 100); the weights therefore differ from one country to another.
Since the reference year 2011, statistics on pesticides have been collected under Regulation (EC) No 1185/2009, which established a common framework for the systematic production of Community statistics on sales and use of those pesticides which are plant protection products. The ‘harmonised classification of substances’ classifies each active substance in a major group, category of product and chemical class. For the purpose of this chapter, the term ‘pesticides’ refers to plant protection products and covers the following categories:
• fungicides and bactericides;• herbicides, haulm destructors and moss killers;• insecticides and acaricides;• molluscicides;• plant growth regulators;• other plant protection products.
Harmonised risk indicators were established in 2019 to estimate the trends in risk from pesticide use under Directive 2009/128/EC on the sustainable use of pesticides. Eurostat disseminates harmonised risk indicator 1 based on sales of pesticides. The indicator is an index with a baseline set to the average for 2011-2013.
Mineral fertiliser consumption is indicated by the evolution of the consumption of the nutrients nitrogen and phosphorus in mineral fertilisers by agriculture over time. Eurostat publishes two data sets on inorganic fertilisers. The first is collected from Member States and is an estimate of the nitrogen and phosphorus use in agriculture. The other data set is estimated consumption based on the sales of mineral fertiliser in the EU; these data are provided by a European trade association, Fertilizers Europe. The figures estimated by Fertilizers Europe are based on sales of mineral fertiliser and mostly correspond with the estimates of nitrogen and phosphorus use reported by countries, although they cannot be directly compared due to methodological differences.


5 Forestry activities

5 Forestry activities
Agriculture, forestry and fishery statistics — 2020 edition84
Introduction
(23) Communication from the Commission to the European Parliament, the Council, the European Economic and Social Committee and the Committee of the Regions, A new EU forest strategy: for forests and the forest-based sector; COM(2013) 659 final.
Forests are one of the world’s most important renewable resources, providing a wide range of benefits to society. Forests capture and store large quantities of carbon, thereby playing an important role in efforts to mitigate climate change. They impact positively on air and water quality, and are also a home to biodiversity. By binding soil, they limit soil erosion, protecting settlements and infrastructure from mudslides, while limiting the amount of sediment that may flow into rivers and lakes.
Forests are also an important resource for employment and economic development, in particular within rural areas. The vast majority of the EU’s forests are managed. This makes forestry an important land use activity, which provides a basis for economic diversification in rural areas. In addition to forestry and logging activities, the processing of wood and downstream industries using wood as an input are vital to economic development in many (rural) regions, as are a range of sporting, touristic and hospitality-related services that are provided by business (for example, hunting, fishing, hotels, campsites, wellness centres).
The common agricultural policy (CAP) supports the vibrancy and economic viability of rural communities through rural development measures. Such measures provide the main
source of support for the protection and the sustainable management of EU forests. Forestry measures help EU Member States to support multifunctional forests and sustainable forest management and combine them with other rural development measures (for example, advisory services, training, investments, cooperation) to address specific regional needs. They support the expansion of forests through afforestation and the establishment and renewal of agro-forestry systems. Other measures supporting the sustainable management of forests include: fire and natural disasters prevention; restoration after damage; investment for climate change adaptation and provision of environmental or amenity services; and, compensation for Natura 2000 and voluntary commitments. Moreover, rural development policy supports investments to improve the economic value of forests and pre-industrial wood processing.
The EU’s forest strategy (2015-2020) (23) provides a coherent framework for EU forest-related policies and the national forestry policies of the individual EU Member States. It promotes the concept of sustainable forest management, which aims to achieve a balanced development of the different functions of forests and an efficient use of resources.
5Forestry activities
Agriculture, forestry and fishery statistics — 2020 edition 85
The European Green Deal (24) is a comprehensive and ambitious package of measures to achieve a sustainable green transition, such that the EU will be carbon neutral by 2050. One of its many actions is a new EU forest strategy, a non-legislative initiative which, at the time of writing, the European Commission plans to prepare during the final quarter of 2020. Some of the key objectives for this new strategy will include effective afforestation, forest preservation and restoration, as well as reducing the impact and the extent of fires.
Climate change is having a negative impact on forest ecosystems, for example: an increase in forest fires; a higher risk of outbreaks of insects, pests or diseases; and more severe weather phenomena such as strong winds — all of which have the potential to damage forests. Forests themselves can play a role in mitigating climate change; as natural carbon sinks, they contribute to offset carbon emissions. It is therefore important to preserve, improve and increase forested areas, wetlands and peatlands in the EU (all of which play
(24) Communication from the Commission to the European Parliament, the Council, the European Economic and Social Committee and the Committee of the Regions, The European Green Deal; COM(2019) 640 final.
(25) Communication from the Commission to the European Parliament, the Council, the European Economic and Social Committee and the Committee of the Regions, Stepping up EU Action to Protect and Restore the World’s Forests; COM(2019) 352 final.
(26) Roundwood production (the term is also used as a synonym for removals in the context of forestry) comprises all quantities of wood removed from the forest and other wooded land, or other tree felling site during a defined period of time.
(27) Sawnwood is wood that has been produced either by sawing lengthways or by a profile-chipping process and, with a few exceptions, is greater than 6 millimetres (mm) in thickness.
a crucial role in removing carbon dioxide from the atmosphere), if the EU is to reach climate neutrality by 2050. Moreover, forests help deliver a number of ecosystem services, such as clean water and air, habitat for biodiversity, controlling erosion, and so on.
However, forest cover is shrinking in many parts of the world as a result of deforestation. As a follow-up to its communication on Stepping up EU Action to Protect and Restore the World’s Forests (25), the European Commission intends to take regulatory and non-regulatory measures to promote imported products and value chains that do not involve deforestation and forest degradation.
This chapter provides data on the EU’s forest area, growing stock and timber resources. It also presents a range of economic and employment statistics for the forestry sector, on the volume of roundwood (26) and sawnwood (27) production, as well as information on the performance of and employment within the EU’s wood-based manufacturing industries.
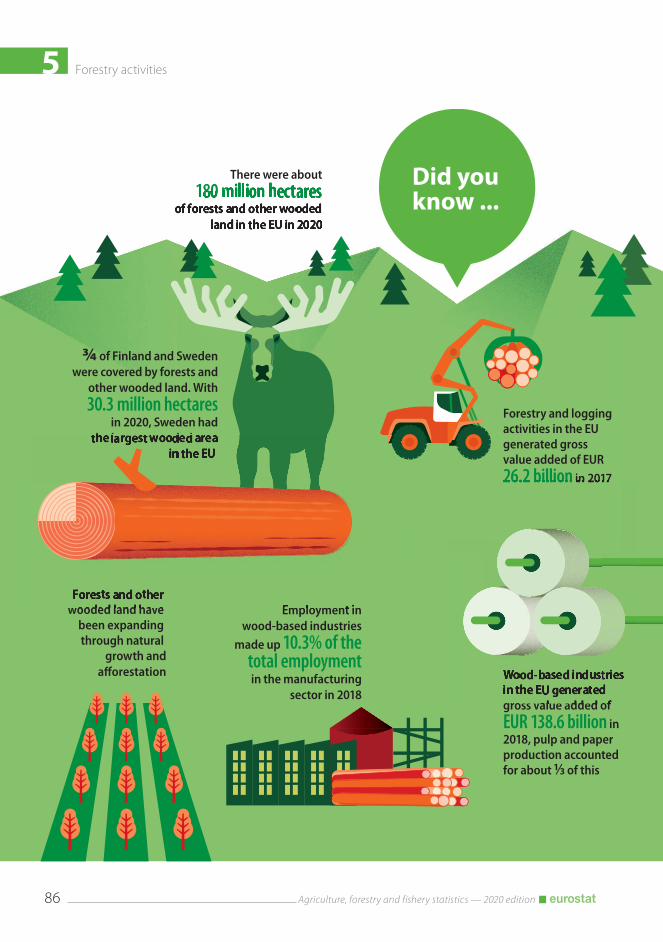
5 Forestry activities
Agriculture, forestry and fishery statistics — 2020 edition86
There were about 180 million hectares
of forests and other wooded land in the EU in 2020
million hectaresoded2020
180 mioof forests a
land
million hectand other wood in the EU in
Did youknow ...
¾ of Finland and Sweden were covered by forests and
other wooded land. With 30.3 million hectares
in 2020, Sweden had the largest wooded area
in the EU
Forests and other wooded land have
been expanding through natural
growth anda�orestation
Forestry and logging activities in the EU generated gross value added of EUR 26.2 billion in 2017
Wood-based industries in the EU generated gross value added of EUR 138.6 billion in 2018, pulp and paper production accounted for about 1⁄3 of this
Woin t
26.2 billion in 2017
triesd
f
ood-based industthe EU generated
al dd d
Employment in wood-based industries
made up 10.3% of the total employment in the manufacturing
sector in 2018
the largest woodded areain n the EU
Forests and otherooded land ha e E l t i
5Forestry activities
Agriculture, forestry and fishery statistics — 2020 edition 87
5.1. Forests and other wooded landWhat is a forest?
The Food and Agriculture Organization of the United Nations (FAO) defines a forest as lands of more than 0.5 hectares, with trees higher than 5 metres and a tree canopy cover of more than 10 %, which are not primarily under agricultural or urban land use. The FAO defines other wooded land as land of more than 0.5 hectares with a canopy cover of 5-10 % of trees able to reach a height of 5 metres in situ; or a canopy cover of more than 10 % when smaller trees, shrubs and bushes are included.
The EU has a wide variety of forests, reflecting diversity in climatic conditions, soil types, topography and altitude. They range from boreal forests with conifers in the cold north and at high altitudes, via broadleaf forests and mixed forests, to regions with transitional woodland and shrubs.
Climate change poses a serious threat to Europe’s forests. Changes in climate affect the forests’ rate of growth, their land coverage and the diversity of species that they support, while higher average temperatures may make them more susceptible to damage by pests or generate opportunities for invasive species that have the potential to cause serious damage to forests. In addition, climate change influences the frequency and intensity of extreme weather events such as storms and droughts (for example, with more frequent forest fires resulting from the drier conditions).
Map 5.1.1 provides a detailed portrait of the distribution and diversity of forest types across Europe.
EU forests and other wooded land covered 180 million hectares
In 2020, there were an estimated 180 million hectares of forests and other wooded land in the EU-27, corresponding to around 5 % of the global forested area. This area covered by forests and other wooded land equated to 45.1 % of the EU-27’s land area (in other words the total surface area excluding lakes and large rivers; see Figure 5.1.1), a slightly higher proportion than the area of land used for agriculture.
Through natural expansion of existing forests and afforestation (the creation of forests through planting trees and sowing tree seeds), the EU-27’s forested area has increased slowly during the last few decades. Between 1990 and 2020, the area covered by forests and other wooded land was estimated to have increased by 10.2 million hectares (an overall increase of +6.0 %).
Three quarters of Finland and Sweden were covered by forests and other wooded land
Among EU Member States, Sweden had the largest area of forests and other wooded land in 2020, an estimated 30.3 million hectares. The second largest area was recorded in Spain (28.0 million hectares), while Finland (23.2 million hectares) was the only other Member State to report in excess of 20 million hectares. France (18.1 million hectares), Italy and Germany (both 11.4 million hectares) had the next largest areas of forest and other wooded land. Together, these six Member States accounted for slightly more than two thirds of the EU-27’s total area that was covered by forests and other wooded land in 2020.
There were about 180 million hectares
of forests and other wooded land in the EU in 2020
million hectaresoded2020
180 mioof forests a
land
million hectand other wood in the EU in
Did youknow ...
¾ of Finland and Sweden were covered by forests and
other wooded land. With 30.3 million hectares
in 2020, Sweden had the largest wooded area
in the EU
Forests and other wooded land have
been expanding through natural
growth anda�orestation
Forestry and logging activities in the EU generated gross value added of EUR 26.2 billion in 2017
Wood-based industries in the EU generated gross value added of EUR 138.6 billion in 2018, pulp and paper production accounted for about 1⁄3 of this
Woin t
26.2 billion in 2017
triesd
f
ood-based industthe EU generated
al dd d
Employment in wood-based industries
made up 10.3% of the total employment in the manufacturing
sector in 2018
the largest woodded areain n the EU
Forests and otherooded land ha e E l t i

5 Forestry activities
Agriculture, forestry and fishery statistics — 2020 edition88
Map 5.1.1: Forest cover, 2018(based on the most common form of forest cover for a 1 km2 grid)
Administrative boundaries: © EuroGeographics © UN-FAO © Turkstat
0 200 400 600 800 km
Cartography: Eurostat — GISCO, 12/2020
Source: Corine Land Cover 2018, European Environment Agency (EEA)
Forest cover, 2018
This designation is without prejudice to positions on status, and is in line with UNSCR 1244/1999 and the ICJ Opinion on the Kosovo declaration of independence.
Guadeloupe (FR)
0 25
Martinique (FR)
0 20
Guyane (FR)
0 100
Réunion (FR)
0 20
Açores (PT)
0 50
Madeira (PT)
0 20
Canarias (ES)
0 100
Malta
0 10
Liechtenstein
0 5
Mayotte (FR)
0 15
or
Broad-leaved forestConiferous forestMixed forestTransitional woodland / shrubland
The designation of Kosovo is without prejudice to positions on status, and is in line with UNSCR 1244/1999 and the ICJ Opinion on the Kosovo declaration of independence.
Source: Corine land cover 2018, European Environment Agency (EEA)

5Forestry activities
Agriculture, forestry and fishery statistics — 2020 edition 89
In relative terms, forests and wooded land accounted for at least half of the total land area in eight of the EU Member States in 2020. The highest shares — about three quarters of the total land area — were recorded in Finland (76.2 %) and Sweden (74.5 %); Slovenia (62.8 %) had the next highest share. In Estonia, Latvia, Spain, Portugal and Greece some 50-60 % of the total land area was covered by forests and other wooded land. By contrast, forest and other wooded land covered no more than 1.7 % of the total land area of Malta, with relatively low shares also recorded in the Netherlands (11.0 %), Ireland (12.3 %) and Denmark (15.8 %).
As noted above, there was a gradual increase between 1990 and 2020 in the share of EU-27 land area that was covered by forests and other wooded land (+2.6 percentage points). This pattern was repeated in the vast majority of EU Member States, with 24 of them recording a change within the range of 0.0-5.0 percentage points. Sweden was the only Member State to record a reduction (albeit modest) in its share of land area covered by forests and other wooded land (− 0.4 percentage points). At the other end of the range, there were three Member States where the share of land area covered by forests and other wooded land increased between 1990 and 2020 at a notably faster pace: Croatia (+7.7 percentage points), Italy (+7.8 percentage points) and Cyprus (+18.9 percentage points).
Figure 5.1.1: Forest and other wooded land
−10
0
10
20
30
40
50
60
70
80
EU-2
7
Finl
and
Swed
enSl
oven
iaEs
toni
aLa
tvia
Spai
nPo
rtug
alG
reec
eA
ustr
iaCr
oatia
Cypr
usSl
ovak
iaIta
lyLu
xem
bour
gLi
thua
nia
Bulg
aria
Czec
hia
Fran
ceG
erm
any
Pola
ndRo
man
iaH
unga
ryBe
lgiu
mD
enm
ark
Irela
ndN
ethe
rland
sM
alta
Uni
ted
King
dom
Nor
way
Liec
hten
stei
nSw
itzer
land
Icel
and
Mon
tene
gro
Turk
eyN
orth
Mac
edon
iaA
lban
iaSe
rbia
Bosn
ia a
nd H
erze
govi
na
2020 (% share of land area) 1990-2020 (change in percentage points)
Note: estimates.
Source: Food and Agriculture Organization of the United Nations — Global Forest Resources Assessment, 2020

5 Forestry activities
Agriculture, forestry and fishery statistics — 2020 edition90
Sweden and Germany had the highest levels of timber resources
The timber resources available in forests and other wooded land not only reflect the area covered, but also the height and volume of trees that are growing, as well as forest density.
In 2020, the growing stocks of wood in forests and other wooded land in the EU-27 totalled
an estimated 27.6 billion cubic metres (see Figure 5.1.2). With almost 3.7 billion cubic metres (or 13.3 % of the EU-27 total) each, Sweden and Germany had the highest stocks of timber among EU Member States. There were also substantial stocks of wood in the forests and other wooded land of France (3.1 billion cubic metres or 11.1 %), Poland (2.7 billion cubic metres or 9.9 %), Finland (2.5 billion cubic metres or 8.9 %) and Romania (2.4 billion cubic metres or 8.5 %).
Figure 5.1.2: Growing stock of wood in forests and other wooded land, 2020(% share of EU-27 total)
Sweden 13.3 %
Germany 13.3 %
France 11.1 %
Poland 9.9 %Finland
8.9 %
Romania 8.5 %
Italy 5.2 %
Others30.0 %
EU-27 total growingstock of wood in forestsand other wooded land
27.6 billion m³over bark
Note: estimates. Malta: not applicable. Belgium and Portugal: 2015 instead of 2020. Spain: other wooded land, 2015 instead of 2020. EU-27: based on data available for the individual EU Member States.
Source: Food and Agriculture Organization of the United Nations — Global Forest Resources Assessment, 2020

5Forestry activities
Agriculture, forestry and fishery statistics — 2020 edition 91
Figure 5.1.3: Woodland on farms, 2016(%)
0
10
20
30
40
50
60
70
80
90
100
EU-2
7
Finl
and
Slov
enia
Aus
tria
Swed
enLa
tvia
Esto
nia
Ger
man
yLu
xem
bour
gPo
rtug
alD
enm
ark
Pola
ndCr
oatia
Italy
(1 )Fr
ance
Lith
uani
aSp
ain
Czec
hia
Irela
ndRo
man
iaH
unga
ryN
ethe
rland
sCy
prus
Slov
akia
Gre
ece
Belg
ium
Bulg
aria
Mal
ta
Uni
ted
King
dom
Nor
way
(2 )
Nor
th M
aced
onia
(2 )
Farms with woodland as a share of all farms Share of the total farm area covered by woodland
(1) Provisional.(2) 2013 instead of 2016.
Source: Eurostat (online data code: ef_lus_main)
9 out of every 10 farms in Finland and Slovenia had woodland (28)
The ownership structure of forests across the EU varies considerably from small family-run holdings, through publicly owned forests to large estates that are owned by investors. A majority of forested land in the EU is privately owned (around 60 %).
Many farm holdings in the EU also own woodland in addition to their agricultural areas, providing economic diversification that combines agricultural activities with forestry and logging. Ownership of woodland on farm holdings was relatively common among many of the
EU Member States that recorded large areas of forests and other wooded land. In Finland and Slovenia, around 9 out of 10 farms had some form of woodland on their holding (see Figure 5.1.3). The share of the total farm area that was covered by woodland was highest in Sweden (52.4 % of the land area owned by farm holdings), Finland (47.9 %) and Slovenia (42.8 %).

5 Forestry activities
Agriculture, forestry and fishery statistics — 2020 edition92
5.2. Forestry and logging — economic indicators and employmentForestry and logging play an important role in the economic development of many rural regions across the EU. In addition to the economic benefits generated directly from forestry and logging activities, wood is also a vital input to downstream wood-based industries, while it is increasingly being used (again) as an energy source.
Output from the EU-27’s forestry and logging activities was valued at EUR 55.8 billion in 2017
In 2017, the total output of forestry and logging (and related secondary) activities in the EU-27 was valued at EUR 55.8 billion at basic prices (see
Figure 5.2.1); this was somewhat higher (+2.6 %) than the value recorded in 2016.
Unsurprisingly, the EU Member States with some of the largest timber resources tended to record the highest levels of output from forestry and logging activities. For example, the output of these activities in Sweden was EUR 9.1 billion (16.3 % of the EU-27 total), closely followed by Germany (EUR 8.5 billion, or 15.3 %). There were also relatively high levels of output recorded in France (EUR 6.6 billion, or 11.9 %), Poland (EUR 5.6 billion, or 10.0 %) and Finland (EUR 5.2 billion, or 9.4 %).
Figure 5.2.1: Economic indicators for forestry and logging, 2017(EUR million)
0
1 000
2 000
3 000
4 000
5 000
6 000
7 000
8 000
9 000
10 000
Swed
enG
erm
any
Fran
cePo
land
Finl
and
(1 )Cz
echi
aIta
lyA
ustr
iaRo
man
iaSp
ain
(1 )Sl
ovak
iaPo
rtug
alLa
tvia
(1 )Es
toni
a (1 )
Bulg
aria
Den
mar
k (1 )
Slov
enia
Hun
gary
(1 )Li
thua
nia
Irela
nd (1 )
Belg
ium
(1 )Cr
oatia
Net
herla
nds
Gre
ece
(1 )Lu
xem
bour
gCy
prus
(1 )
Uni
ted
King
dom
Nor
way
Switz
erla
nd
Bosn
ia a
nd H
erze
govi
na
Output at basic prices Gross value added at basic prices
Note: Malta, not applicable.
(1) Estimates.
Source: Eurostat (online data code: for_eco_cp)

5Forestry activities
Agriculture, forestry and fishery statistics — 2020 edition 93
Trees growing in managed forests and the removal of logs were the main contributors to the output of forestry and logging
Figure 5.2.2 shows the main elements that contribute towards the total output of forestry and logging activities. In 2017, the largest contributions were generally made by the growth of forest trees (net increment) in managed forests (29) or by the output from logging activities (wood in the rough, hereafter referred to as industrial roundwood). However, a few EU Member States had a relatively high degree of specialisation in non-wood products (for example, cork or berries) or other forms of output (such as forestry-related services or products from secondary activities).
In Sweden, the output of industrial roundwood (logs) in 2017 was valued at EUR 4.4 billion (almost half of total forestry and logging output in Sweden). Germany also had a relatively high
level of output for industrial roundwood (EUR 4.2 billion), followed by France (EUR 2.7 billion) and Poland (EUR 2.4 billion).
Sweden also recorded the highest level of output among the EU Member States for the growth of forest trees (net increment) in managed forests (EUR 3.6 billion in 2017, which was almost 40 % of its forestry and logging output). Once again, the next highest levels of output were recorded for Germany (EUR 3.3 billion), France (EUR 2.4 billion) and Poland (EUR 2.3 billion).
Portugal was the main producer of cork in the EU; the output value of its non-wood products was EUR 282 million in 2017, more than one fifth (22.4 %) of its total output for forestry and logging.
Figure 5.2.2: Output at basic prices for forestry and logging, 2017(EUR million)
01 0002 0003 0004 0005 0006 0007 0008 0009 000
10 000
Swed
enG
erm
any
Fran
cePo
land
Finl
and
(1 )(2 )Cz
echi
aIta
lyA
ustr
iaRo
man
ia
Spai
n (1 )(2 )
Slov
akia
Port
ugal
Latv
ia (1 )(2 )
Esto
nia
(1 )(2 )Bu
lgar
ia
Den
mar
k (1 )(2 )
Slov
enia
Hun
gary
(1 )(2 )Li
thua
nia
(2 )Ire
land
(1 )(2 )Be
lgiu
m (1 )(2 )
Croa
tia
Net
herla
nds
(2 )G
reec
e (1 )(2 )
Luxe
mbo
urg
Cypr
us (1 )(2 )
Uni
ted
King
dom
Nor
way
Switz
erla
nd
Bosn
ia a
nd H
erze
govi
na
Non-woodproducts
Wood in therough
Trees (netincrement)
Total output atbasic prices
Others
Note: Malta, not applicable.
(1) Estimates.(2) Breakdown by type of product: partial information or not available.
Source: Eurostat (online data code: for_eco_cp )

5 Forestry activities
Agriculture, forestry and fishery statistics — 2020 edition94
Gross value added from forestry and logging was EUR 26.2 billion in 2017
Gross value added is defined as the value of output at basic prices minus the cost of goods and services consumed as intermediate inputs (at purchaser prices) to generate that output. In 2017, the gross value added of forestry and logging in the EU-27 was EUR 26.2 billion; this marked an increase (+1.5 %) on the level recorded in 2016. To put this into some context, forestry and logging activities accounted for 0.2 % of EU-27’s total gross value added in 2017, with the gross value added of the EU-27’s forestry and logging activities being approximately the same size as the GDP of Latvia.
Just over half of the EU-27’s total value added for forestry and logging came from four EU Member States: Finland, Sweden, France and Germany each recorded a level within the range of EUR 3.2 billion to EUR 3.8 billion in 2017. In relative terms, forestry and logging activities contributed less than 0.3 % of total gross value added in approximately half (13) of the Member States in 2017. This share stood at more than 1.0 % in three northern EU Member States: Estonia (1.2 %), Latvia (1.7 %) and Finland (1.9 %).
Just over half a million people were employed in forestry and logging activities across the EU
Forests are also an important source of employment for many rural areas, providing the basis for more diversified economic activities; forestry and logging, wood-based industries, tourism, environmental activities, as well as hunting.
The labour intensity of forestry and logging activities varies considerably between EU Member States. One important factor in this context is the potential to make efficient use of forest machinery, which in turn reflects (at least to some degree) the structure and characteristics of each forest, the density of growing stock, the tree species concerned, or the topography of the forested landscape.
In total, there were 511 000 persons employed in the EU-27’s forestry and logging sector in 2018. The largest workforces, as measured by the domestic employment concept of national accounts, were in Poland (73 300 persons employed), Romania (48 100 persons), Sweden (41 000 persons) and Germany (40 000 persons).
Figure 5.2.3: Overall change in the number of persons employed in forestry and logging, 2008‑2018(%)
−60
−50
−40
−30
−20
−10
0
10
20
30
40
50
EU-2
7
Hun
gary
Latv
iaIta
lyPo
rtug
alIre
land
Luxe
mbo
urg
Swed
enBu
lgar
iaD
enm
ark
Pola
ndSl
oven
iaG
erm
any
Finl
and
Cypr
usN
ethe
rland
sSl
ovak
iaBe
lgiu
mFr
ance
Lith
uani
aEs
toni
aA
ustr
iaRo
man
iaSp
ain
Czec
hia
Gre
ece
Croa
tia
Uni
ted
King
dom
Nor
way
Note: Malta, not applicable. Data are based on the domestic employment concept.
Source: Eurostat (online data code: nama_10_a64_e)

5Forestry activities
Agriculture, forestry and fishery statistics — 2020 edition 95
Employment numbers in forestry and logging activities across the EU-27 as a whole fell marginally (− 0.2 %) between 2008 and 2018 (see Figure 5.2.3). There was strong employment growth in some of the EU Member States, particularly: Hungary, which had the largest relative increase (up by almost 50 %, with an
additional 6 800 persons employed) and Poland, which had the largest absolute increase (an additional 11 300 persons employed; +18.2 %). By contrast, the largest overall declines in employment — in both relative and absolute terms — were recorded in Croatia (− 54.5 %, or 17 100 fewer persons employed).
5.3. Primary wood productsThe primary products from forestry and logging are industrial roundwood and fuelwood. Industrial roundwood is an important resource for wood-based industries, being the basis for sawnwood and veneers as well as for pulp and paper production. Fuelwood is a renewable energy source.
Roundwood production in the EU-27 was estimated to be 490 million cubic metres
In 2018, total roundwood production in the EU-27 was an estimated 489.8 million cubic metres under bark; this was higher (+5.5 %) than a year before and higher (+21.2 %) than in 2000. Roundwood
production in the EU-27 was relatively stable for non-coniferous tree species, whereas it fluctuated far more for coniferous tree species.
Industrial roundwood production from coniferous tree species accounted for three fifths of the EU-27’s total roundwood production in 2018 (60.4 % or 296.0 million cubic metres). Industrial roundwood production from non-coniferous tree species (16.9 %) and fuelwood from non-coniferous tree species (15.4 %) recorded broadly similar shares, leaving 7.3 % of the EU-27’s total roundwood production accounted for by fuelwood from coniferous species (see Figure 5.3.1).
Figure 5.3.1: Roundwood production, EU‑27, 2000‑2018(million m3 under bark)
0
100
200
300
400
500
600
2000 2001 2002 2003 2004 2005 2006 2007 2008 2009 2010 2011 2012 2013 2014 2015 2016 2017 2018
Industrial roundwoodconiferous
Industrial roundwoodnon-coniferous
Fuelwoodconiferous
Fuelwoodnon-coniferous
Note: estimates.
Source: Eurostat (online data code: for_remov)

5 Forestry activities
Agriculture, forestry and fishery statistics — 2020 edition96
Sweden produced 75.1 million cubic metres of roundwood in 2018; this represented a slight increase (+1.1 %) compared with a year before. The vast majority of roundwood production in Sweden could be attributed to industrial roundwood (rather than fuelwood); output of the former was approximately 10 times as high as for the latter.
Sweden, Germany (71.8 million cubic metres), Finland (68.3 million cubic metres), France (48.2 million cubic metres) and Poland (46.7 million cubic metres) together accounted
for almost two thirds (63.3 %) of the EU-27’s total roundwood production in 2018 (see Figure 5.3.2). A majority of roundwood production went for further processing in most of the EU Member States. However, there were some exceptions: for example, industrial roundwood and fuelwood were produced in almost equal quantities in France, while in Denmark (53.6 %; 2016 data), Italy (63.4 %), Greece (70.0 %; 2013 data), the Netherlands (75.6 %) and Cyprus (80.7 %) there was a higher share of fuelwood production than industrial roundwood production.
Figure 5.3.2: Roundwood production, 2018(million m3 under bark)
0
10
20
30
40
50
60
70
80
Swed
en
Ger
man
y (1 )
Finl
and
Fran
cePo
land
Czec
hia
Aus
tria
Spai
nRo
man
iaPo
rtug
al
Latv
ia (2 )
Esto
nia
Slov
akia
Lith
uani
aBu
lgar
ia
Italy
(1 )H
unga
ryCr
oatia
Slov
enia
Irela
nd
Den
mar
k (2 )
Net
herla
nds
(3 )G
reec
e (4 )
Luxe
mbo
urg
(1 )Cy
prus
Uni
ted
King
dom
Nor
way
(3 )Sw
itzer
land
Liec
hten
stei
n
FuelwoodIndustrial roundwood
Note: Malta, not applicable. Belgium: not available.
(1) Estimates.(2) 2016.(3) Fuelwood: estimate.(4) 2013.
Source: Eurostat (online data code: for_remov)

5Forestry activities
Agriculture, forestry and fishery statistics — 2020 edition 97
Germany and Sweden were the leading sawnwood producers
The total output of sawnwood across the EU-27 was estimated to be 109 million cubic metres in 2018; this was higher (+11.7 %) than it had been in 2008.
Germany and Sweden were the leading producers of sawnwood in the EU, accounting for 21.9 % and
16.9 % of the EU-27’s total output in 2018; Finland was the only other EU Member State to record a double-digit share (10.9 %). Over the period 2008 to 2018, the rising level of sawnwood production in the EU was principally driven by increases in production for Germany (up 4.6 million cubic metres or +23.7 %), Finland (up 2.0 million cubic metres or +19.8 %) and Romania (up 1.3 million cubic metres or +35.6 %).
Figure 5.3.3: Sawnwood production, 2008 and 2018(million m3)
0
5
10
15
20
25
Ger
man
ySw
eden
Finl
and
Aus
tria
Fran
ceRo
man
iaPo
land
Czec
hia
Latv
ia (1 )
Spai
nIta
lyEs
toni
aSl
ovak
iaCr
oatia
(2 )Li
thua
nia
Port
ugal
Irela
ndSl
oven
iaBu
lgar
ia (3 )
Hun
gary
Den
mar
k (1 )
Net
herla
nds
Gre
ece
(4 )Cy
prus
Luxe
mbo
urg
(1 )Be
lgiu
m (5 )
Uni
ted
King
dom
Nor
way
Switz
erla
ndLi
echt
enst
ein
(1 )
2008 2018
Note: Malta, not applicable.
(1) 2016 instead of 2018.(2) 2008: estimate.(3) Provisional.(4) 2013 instead of 2018; estimate.(5) 2018: not available.
Source: Eurostat (online data code: for_swpan)

5 Forestry activities
Agriculture, forestry and fishery statistics — 2020 edition98
5.4. Wood‑based manufacturing industriesThe EU-27’s wood-based manufacturing industries cover a broad range of downstream activities that are categorised within four subsectors: the manufacture of wood and wood products; the manufacture of paper and paper products (which includes the manufacture of pulp); printing and service activities related to printing; and, the manufacture of furniture.
Wood-based manufacturing industries form a key part of the EU-27’s manufacturing sector; there were close to 400 000 enterprises performing these activities in 2018, corresponding to almost one fifth of the total for the whole of the manufacturing sector.
Small and medium-sized enterprises dominate wood-based manufacturing industries
The 397 000 enterprises active in the EU-27’s wood-based manufacturing industries in 2018 (see Figure 5.4.1) employed 3.1 million persons, while they generated EUR 138.6 billion of value added. As such, wood-based manufacturing represented almost one in five (19.6 %) enterprises across the whole of the EU-27’s manufacturing sector in 2018. Comparing this with their share of manufacturing value added (7.1 %) it is apparent that small and medium-sized enterprises — defined as having less than 250 persons employed — dominated most wood-based manufacturing industries.
In 2018, the manufacture of wood and wood products accounted for just over two fifths (40.6 %) of all enterprises active in the EU-27’s wood-based manufacturing industries; somewhat lower shares were recorded for the manufacture of furniture (29.9 %) and for printing and service activities related to printing (24.9 %). The exception was the manufacture of paper and paper products, insofar as enterprises producing pulp
and paper tended to be, on average, considerably larger in size — reflecting high levels of energy- and capital-intensity. This subsector accounted for just 4.6 % of all wood-based manufacturing enterprises.
Wood-based manufacturing industries accounted for slightly more than one tenth of manufacturing employment
Wood-based manufacturing industries in the EU-27 employed 3.1 million persons in 2018, which was equivalent to 10.5 % of all people working in the manufacturing sector. Some wood-based manufacturing industries are relatively labour-intensive: almost one third (31.0 %) of the wood-based industries workforce was employed by furniture manufacturing enterprises and a similar share (30.1 %) by wood and wood products manufacturing enterprises. Lower shares were recorded for the more capital-intensive activities: those employed in the manufacture of paper and paper products (19.9 %) and printing and service activities related to printing (19.0 %) accounted for similar shares of the wood-based manufacturing industries workforce.
Pulp and paper production accounted for one third of the gross value added from wood-based manufacturing industries
Of the four wood-based manufacturing industries, the largest — in terms of gross value added — was paper and paper products manufacturing with EUR 48.1 billion in 2018, equivalent to just over one third of the total value added generated by the EU-27’s wood-based manufacturing industries. In 2018, the other three wood-based manufacturing industries generated levels of gross value added that were within the range of EUR 24.5 billion to EUR 35.0 billion.

5Forestry activities
Agriculture, forestry and fishery statistics — 2020 edition 99
Figure 5.4.1: Main indicators for wood‑based manufacturing industries, EU‑27, 2018(% share)
Manufacture of woodand wood products
40.3 %
Manufacture of paperand paper products
4.6 %
Printing and service activities
related to printing 24.8 %
Manufacture of furniture
30.2 %
Number of enterprises
Manufacture of woodand wood products
29.8 %
Manufacture of paperand paper products
20.3 %
Printing and service activities
related to printing 19.2 %
Manufacture of furniture
30.7 %
Number of persons employed
Manufacture of woodand wood products
25.3 %
Manufacture of paperand paper products
34.7 %
Printing and service activities
related to printing 17.7 %
Manufacture of furniture
22.4 %
Value added at factor cost
EU-27wood-based
manufacturing industries total
397 thousandenterprises
EU-27wood-based
manufacturing industries total
3.1 million persons
employed
EU-27wood-based
manufacturing industries total
EUR138.6 billion
Note: activities classified according to NACE Rev. 2 — manufacture of wood and wood products (Division 16); manufacture of paper and paper products (Division 17); printing and service activities related to printing (Group 18.1); manufacture of furniture (Division 31). Includes rounded estimates of low reliability.
Source: Eurostat (online data code: sbs_na_ind_r2)

5 Forestry activities
Agriculture, forestry and fishery statistics — 2020 edition100
All of the wood-based manufacturing industries recorded falling levels of employment between 2000 and 2019
The number of people employed in the EU-27 increased by more than 10 % overall during the last two decades. By contrast, employment in the manufacturing sector fell over the period from 2000 to 2019 (− 9.6 %) and there were even larger
declines for three wood-based manufacturing industries (see Figure 5.4.2). The number of persons employed in furniture manufacturing and the manufacture of wood and wood products fell by approximately one quarter (− 26.3 % and − 24.9 % respectively), while the rate of decline for the manufacture of paper and paper products (− 17.3 %) was also larger than the manufacturing average.
Figure 5.4.2: Employment index for wood‑based activities, EU‑27, 2000‑2019(2000 = 100)
0
60
70
80
90
100
110
2001 2003 2005 2007 2009 2011 2013 2015 2017 2019
Forestry and logging (1)
Manufacturing Manufacture of paper and paper products
Manufacture of wood and wood products Manufacture of furniture
Note: activities classified according to NACE Rev. 2 — forestry and logging (Division 02); manufacturing (Section C); manufacture of wood and wood products (Division 16); manufacture of paper and paper products (Division 17); manufacture of furniture (Division 31). 2000-2007: estimates for wood-based industries.
(1) 2018 and 2019: not available.
Source: Eurostat (online data code: sts_inlb_a and nama_10_a64_e)

5Forestry activities
Agriculture, forestry and fishery statistics — 2020 edition 101
Wood-based activities are male-dominated and are characterised by an ageing workforce
In keeping with many other primary or secondary sectors of the economy, the workforces of wood-based activities (forestry and logging and manufacturing industries) tend to be male-dominated.
In 2019, more than four out of every five members of the EU-27 workforce were men for forestry and logging (86.1 %) and for the manufacture of wood and wood products (83.4 %), while the
share of male employment was somewhat lower for the manufacture of furniture (77.3 %) and the manufacture of paper and paper products (71.0 %). All four of these shares were considerably higher than the average for the whole of the EU-27 economy, where men accounted for 54.1 % of the total workforce.
In recent decades, women have accounted for an increasing share of the EU-27 workforce. There was, however, little evidence to suggest that the proportion of women employed in wood-based activities was growing.
Figure 5.4.3: Employment in wood‑based activities, analysed by sex, EU‑27, 2019(% share)
0 10 20 30 40 50 60 70 80 90 100
Whole economy (all activities)
Manufacture of paper and paper products
Manufacture of furniture
Manufacture of wood and wood products
Forestry and logging
Males Females
Note: activities classified according to NACE Rev. 2 — forestry and logging (Division 02); manufacture of wood and wood products (Division 16); manufacture of paper and paper products (Division 17); manufacture of furniture (Division 31).
Source: Eurostat (online data code: lfsa_egan22d)

5 Forestry activities
Agriculture, forestry and fishery statistics — 2020 edition102
Nevertheless, during the period 2009 to 2019 there was a marked shift in the composition of the EU-27 workforce when analysed from a different angle. An increasing share of the workforce was composed of people aged 50 years or more. This reflects, at least in part, a change in the demographic structure of the EU-27 population: the baby-boomer cohort has started to enter retirement, with a lower number of young people joining the labour force (as a result of persistently low fertility rates and a growing proportion of young adults extending their time in education). The growing share of older people within the workforce for wood-based activities may also be attributed to younger people being more more inclined to move from rural areas (where wood-based activities are often located) to look for work in cities, whereas some older people are
more inclined to continue working in traditional manufacturing industries.
In 2019, some 30.6 % of people employed in the EU-27 economy were aged 50-64 years. The corresponding share for the largely manual activity of forestry and logging was somewhat lower at 26.2 %, while each of the wood-based manufacturing industries had a higher (than average) share of older people in their workforce. People aged 50-64 years accounted for 35.0 % of the EU-27 workforce for the manufacture of paper and paper products, while a further 4.2 % was composed of people aged 65 years or more. This relatively high share of older workers reflects, at least to some degree, the specialisation of Nordic Member States in the manufacture of paper and paper products, coupled with a later than average age for retirement (when compared with other EU Member States).
Figure 5.4.4: Employment in wood‑based activities, analysed by age, EU‑27, 2009 and 2019(% share)
0 10 20 30 40 50 60 70 80 90 100
Whole economy (all activities): 2009Whole economy (all activities): 2019
Forestry and logging: 2009Forestry and logging: 2019
Manufacture of wood and wood products: 2009Manufacture of wood and wood products: 2019
Manufacture of paper and paper products: 2009Manufacture of paper and paper products: 2019
Manufacture of furniture: 2009Manufacture of furniture: 2019
15-24 years 25-49 years 50-64 years ≥65 years (1)
Note: activities classified according to NACE Rev. 2 — forestry and logging (Division 02); manufacture of wood and wood products (Division 16); manufacture of paper and paper products (Division 17); manufacture of furniture (Division 31).
(1) Low reliability.
Source: Eurostat (online data code: lfsa_egan22d)

5Forestry activities
Agriculture, forestry and fishery statistics — 2020 edition 103
Data sources and availabilityEurostat produces annual data on forestry using two questionnaires:
• the joint forest sector questionnaire (JFSQ) for production and trade statistics for wood and wood products;
• European forest accounts (EFA).
Eurostat, the Timber Committee of the United Nations Economic Commission for Europe (UNECE), the Forestry Section of the United Nations Food and Agriculture Organization (FAO), and the International Tropical Timber Organization (ITTO) collect and collate statistics on the production and trade of wood through the JFSQ. Each partner collects data from a different part of the world; Eurostat is responsible for the data collection exercise for the EU Member States, the United Kingdom and EFTA countries.
The JFSQ provides data for supply balances of timber used for wood products and for energy, and for estimating the carbon contained in harvested wood products.
The collection of EFA forms part of an environmental satellite accounts initiative that was started in the late 1990s, using concepts that are aligned with national accounts, thus allowing links between the economy and the environment to be examined. The EFA data collection officially started in 2016; however, its predecessors, such as integrated environmental and economic accounting for forests (IEEAF) used the same concepts and definitions to collect data, through somewhat different questionnaires.
Note that the monetary values presented in this chapter are presented in current prices — in other words, the time series have not been adjusted for changes in prices (inflation).
Note also that in this 2020 edition, information presented on the area and growing stock of forests and wooded land have been sourced from the Food and Agriculture Organization of the United Nations — Global Forest Resources Assessment, 2020. This information was extracted from the FAO database in September 2020.

6 Fisheries activities
6 Fisheries activities
Agriculture, forestry and fishery statistics — 2020 edition106
1.1 million tonnes of aquaculture products were harvested in 2018
…but EU catches totalled 4.1 million tonnes of live weight in 2019
The EU’s �shing �eet is getting smaller in number, capacity and power…
Did youknow ...
The EU produced 5.7 million
tonnes
products in 2018
163 000 people were employed in the primary
in 2018
Introduction
(30) See: http://ec.europa.eu/fisheries/cfp/index_en.htm.
Fish are a renewable and mobile natural resource. Aside from aquaculture farming, fish are generally not owned until they have been caught. As such, fish stocks continue to be regarded as a common resource which needs to be managed collectively. This has led to a range of policies that regulate the amount of fishing at the EU level and more widely at sea basin level, as well as the types of fishing techniques and gear that can be used in fish capture.
The current common fisheries policy (CFP) of the EU (30) aims at an environmentally, economically and socially sustainable use of the common
resource including aquaculture production. The CFP is a set of rules for managing EU fishing fleets and for conserving fish stocks. Designed to manage a common resource, it gives all EU fishing fleets equal access to EU waters and fishing grounds and allows fishermen to compete fairly. The current policy stipulates that between 2015 and 2020 catch limits should be set that are sustainable and maintain fish stocks in the long term. Based on EU legislation, Eurostat produces statistics on catches and landings of fishery products, aquaculture and the EU fishing fleet.

6Fisheries activities
Agriculture, forestry and fishery statistics — 2020 edition 107
1.1 million tonnes of aquaculture products were harvested in 2018
…but EU catches totalled 4.1 million tonnes of live weight in 2019
The EU’s �shing �eet is getting smaller in number, capacity and power…
Did youknow ...
The EU produced 5.7 million
tonnes
products in 2018
163 000 people were employed in the primary
in 2018

6 Fisheries activities
Agriculture, forestry and fishery statistics — 2020 edition108
6.1. Fisheries — the factors of production
(31) Food and Agriculture Organization of the United Nations (FAO) major areas 21, 27, 34, 37, 41, 47, 51 (see Map 6.1.1).
(32) For further information, see the European Commission’s common fisheries policy website.
The EU’s fishing industry is managed. There is regulation on the amount of fishing at EU level and at sea basin level under the common fisheries policy (CFP). To better monitor and advise on this policy, there is interest in understanding the factors of production and how they are changing over time. These factors include the seas, fishing fleets and the labour force working in the fishing industry.
Seas and catch limitsEU statistical regulations on catching fish cover seven marine areas (31); these are the north-east Atlantic; north-west Atlantic; Mediterranean and Black Sea; eastern-central Atlantic: south-east Atlantic; south-west Atlantic; and, western Indian Ocean, within each of which are a number of seas. For example, within the north-east Atlantic region are, among others, the Barents Sea, the Norwegian Sea, the Baltic Sea, the North Sea, Iceland and Faroes Grounds, Rockall, West of Scotland, the Irish Sea, the Bay of Biscay, Portuguese Waters, Azores Grounds and East Greenland.
As a general rule, fishing vessels registered in the EU fishing fleet register have equal access to all the EU waters and resources that are managed under the CFP. Access to fisheries is normally authorised through a fishing license. The seas resources for most commercial fish species are, however, limited through total allowable catches that are set annually for various sea regions based on the scientific advice provided by advisory bodies like the International Council for the Exploration of the Sea and the Scientific, Technical and Economic Committee for Fisheries (32). For 2018, the European Council agreed to increase or maintain the previous year’s catch limits for 53 stocks and reduce them for 25 stocks.
The proximity of a port to sea often determines the focus of fishing activities. For example, Denmark’s fishing industry focuses on the north-east Atlantic area. One exception is Spain, for whom fishing activities are spread out across the different regions of the Atlantic and Indian Ocean for which EU data are collected, as well as other seas around the world. This spread of fishing grounds reflects the search for fish that have coldwater, coolwater or warmwater requirements.
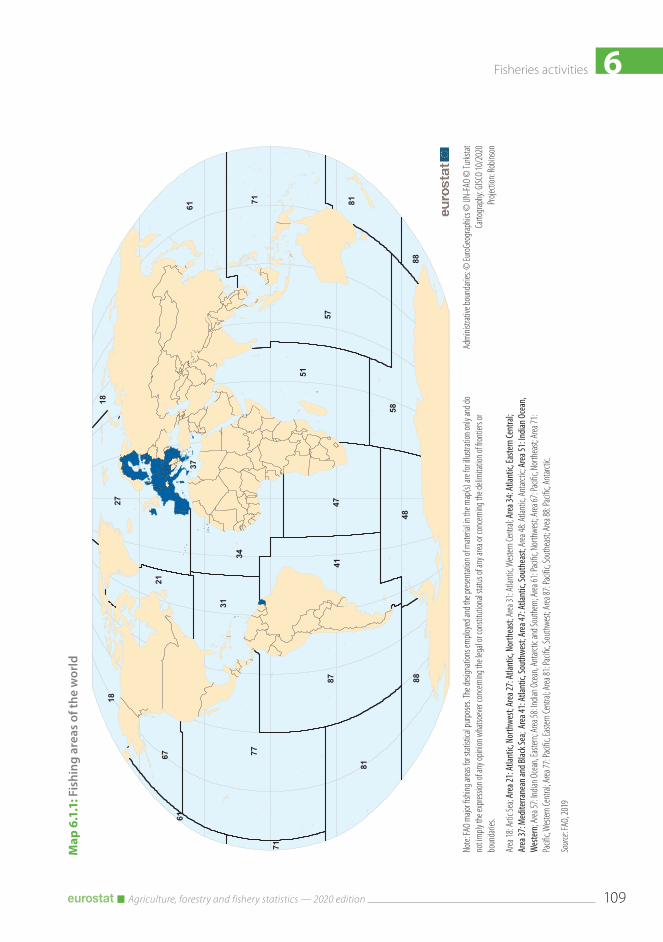
6Fisheries activities
Agriculture, forestry and fishery statistics — 2020 edition 109
Map
6.1
.1: F
ishi
ng a
reas
of t
he w
orld
77
5787
71
51
27
61
81
4741
4858
31
34
88
18
81
67
18
21
37
88
71
61
Adm
inistr
ative
boun
darie
s: ©
Euro
Geog
raphic
s © U
N-FA
O ©
Turks
tatCa
rtogr
aphy
: GISC
O 10
/202
0Pr
ojecti
on: R
obins
on
Note:
FAO
majo
r fish
ing ar
eas f
or st
atisti
cal p
urpo
ses.
The d
esign
ation
s em
ploye
d and
the p
resen
tation
of m
ateria
l in th
e map
(s) ar
e for
illus
tratio
n only
and d
o no
t imply
the e
xpres
sion o
f any
opini
on w
hatso
ever
conc
erning
the l
egal
or co
nstit
ution
al sta
tus o
f any
area
or co
ncern
ing th
e deli
mita
tion o
f fron
tiers
or
boun
darie
s.
Area
18: A
rtic S
ea; A
rea 2
1: At
lantic
, Nor
thwe
st; Ar
ea 27
: Atla
ntic,
Nor
thea
st; A
rea 31
: Atla
ntic,
Wes
tern C
entra
l; Are
a 34:
Atlan
tic, E
aste
rn Ce
ntra
l; Ar
ea 37
: Med
iterra
nean
and B
lack S
ea; A
rea 4
1: At
lantic
, Sou
thwe
st; Ar
ea 47
: Atla
ntic,
Sout
heas
t; Area
48: A
tlant
ic, A
ntarc
tic; A
rea 5
1: In
dian O
cean
, W
este
rn; A
rea 57
: India
n Oce
an, E
aster
n; Ar
ea 58
: India
n Oce
an, A
ntarc
tic an
d Sou
thern
; Area
61: P
acific
, Nor
thwe
st; A
rea 67
: Pac
ific, N
orth
east;
Area
71:
Pacifi
c, Wes
tern C
entra
l; Area
77: P
acific
, Eas
tern C
entra
l; Area
81: P
acific
, Sou
thwe
st; A
rea 87
: Pac
ific, S
outh
east;
Area
88: P
acific
, Ant
arctic
.
Source
: FAO
, 201
9
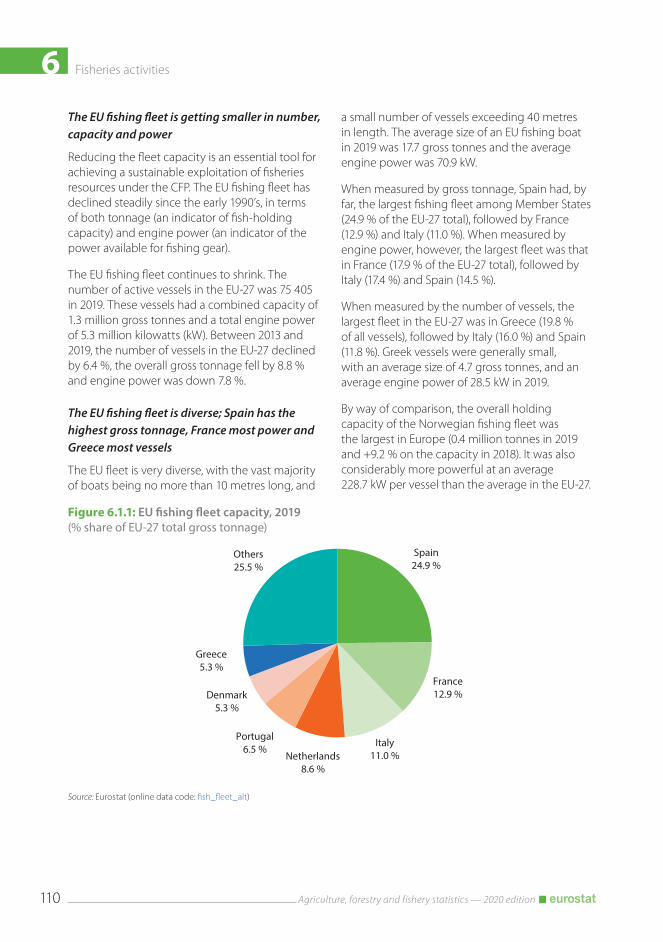
6 Fisheries activities
Agriculture, forestry and fishery statistics — 2020 edition110
Figure 6.1.1: EU fishing fleet capacity, 2019(% share of EU-27 total gross tonnage)
Spain24.9 %
France12.9 %
Italy11.0 %Netherlands
8.6 %
Portugal6.5 %
Denmark5.3 %
Greece5.3 %
Others25.5 %
Source: Eurostat (online data code: fish_fleet_alt)
The EU fishing fleet is getting smaller in number, capacity and power
Reducing the fleet capacity is an essential tool for achieving a sustainable exploitation of fisheries resources under the CFP. The EU fishing fleet has declined steadily since the early 1990’s, in terms of both tonnage (an indicator of fish-holding capacity) and engine power (an indicator of the power available for fishing gear).
The EU fishing fleet continues to shrink. The number of active vessels in the EU-27 was 75 405 in 2019. These vessels had a combined capacity of 1.3 million gross tonnes and a total engine power of 5.3 million kilowatts (kW). Between 2013 and 2019, the number of vessels in the EU-27 declined by 6.4 %, the overall gross tonnage fell by 8.8 % and engine power was down 7.8 %.
The EU fishing fleet is diverse; Spain has the highest gross tonnage, France most power and Greece most vessels
The EU fleet is very diverse, with the vast majority of boats being no more than 10 metres long, and
a small number of vessels exceeding 40 metres in length. The average size of an EU fishing boat in 2019 was 17.7 gross tonnes and the average engine power was 70.9 kW.
When measured by gross tonnage, Spain had, by far, the largest fishing fleet among Member States (24.9 % of the EU-27 total), followed by France (12.9 %) and Italy (11.0 %). When measured by engine power, however, the largest fleet was that in France (17.9 % of the EU-27 total), followed by Italy (17.4 %) and Spain (14.5 %).
When measured by the number of vessels, the largest fleet in the EU-27 was in Greece (19.8 % of all vessels), followed by Italy (16.0 %) and Spain (11.8 %). Greek vessels were generally small, with an average size of 4.7 gross tonnes, and an average engine power of 28.5 kW in 2019.
By way of comparison, the overall holding capacity of the Norwegian fishing fleet was the largest in Europe (0.4 million tonnes in 2019 and +9.2 % on the capacity in 2018). It was also considerably more powerful at an average 228.7 kW per vessel than the average in the EU-27.

6Fisheries activities
Agriculture, forestry and fishery statistics — 2020 edition 111
Figure 6.1.2: Employment in the EU fisheries industry and fisheries production, 2018(% share of EU-27 total)
0
5
10
15
20
25
Spai
n (1 )(2 )
Italy
(3 )
Gre
ece
(4 )(5 )
Fran
ce (3 )(4 )
Port
ugal
Pola
nd
Ger
man
y (4 )
Croa
tia
Net
herla
nds
(1 )
Irela
nd (2 )(6 )
Den
mar
k (7 )
Rom
ania
(4 )
Hun
gary
(4 )
Finl
and
Bulg
aria
Latv
ia (4 )(8 )
Czec
hia
Lith
uani
a (4 )
Swed
en (4 )
Mal
ta
Esto
nia
Cypr
us (1 )
Belg
ium
Aus
tria
Slov
akia
Slov
enia
Employment Production
Note: Luxembourg, no production.
(1) Provisional employment data.(2) Aquaculture data, estimated.(3) Catches data, provisional.(4) Employment data, 2017.(5) Catches data for Atlantic, East Central, 2015.(6) Catches data, 2017.(7) Catches data for Atlantic, Northwest, 2017.(8) Catches data for Atlantic Northeast, 2017 and for Atlantic Eastern Central, 2016.
Source: Eurostat (online data codes: nama_10_a64_e, fish_ca_main, fish_aq_q and fish_aq2a)
The 1 600 fishing vessels of Iceland in 2019 were also much larger and more powerful than the EU-27 average, with an average holding capacity of 94.2 gross tonnage per vessel and 269.6 kW per vessel.
The fisheries industry provided jobs in the EU for about 163 000 people in 2018
An estimated 163 000 people were employed in the EU-27’s primary fisheries industry in 2018, of which about one third were employed in the aquaculture subsector. About one quarter (23.7 %) of employment in the primary fisheries industry of the EU-27 in 2018 was in Spain. Indeed, three quarters of EU employment in the industry was
concentrated in just Spain, Italy, Greece, France and Portugal.
Italy, Greece and Portugal accounted for much higher proportions of employment in the EU fisheries industry than of fisheries production; together they accounted for 39.0 % of EU-27 employment in the industry, but only produced 13.0 % of production. Conversely, Denmark and the Netherlands had relatively low employment in fisheries (1.2 % and 1.8 % respectively of the EU total) but much higher shares of fisheries production (14.4 % and 8.2 % respectively). These contrasts highlight the differences between the fishing industries of some countries with a relatively large number of small vessels and others with a relatively small number of large vessels.

6 Fisheries activities
Agriculture, forestry and fishery statistics — 2020 edition112
Figure 6.2.1: Total production of fishery products, EU‑27, 2000‑2018(million tonnes of live weight)
0
1
2
3
4
5
6
7
8
2000
2001
2002
2003
2004
2005
2006
2007
2008
2009
2010
2011
2012
2013
2014
2015
2016
2017
2018
AquacultureCatches
Note: substitute years have been used where there are a limited number of confidential data for catches and aquaculture.
Source: Eurostat (online data codes: fish_ca_main, fish_aq_q and fish_aq2a)
6.2. Fisheries production — catches and aquaculture
(33) Figures on catches and landings for the EU exclude the EU’s landlocked Member States (Czechia, Luxembourg, Hungary, Austria and Slovakia). Luxembourg does not collect aquaculture statistics.
(34) The state of world fisheries and aquaculture, 2020 – FAO, available at: http://www.fao.org/3/ca9229en/online/ca9229en.html#fig3.
The monitoring of catches and aquaculture production is an essential tool for securing fish stocks and sustaining the common resources available in Europe’s large and rich fishing areas.
EU production of fishery products from catches and aquaculture estimated at 5.7 million tonnes in 2018
The EU-27’s (33) total production of fishery products in 2018 was an estimated 5.7 million tonnes of live weight equivalent (the mass or weight when removed from water). This represented about 3 % of the total world production of fishery products in 2018 (34).
Total production for the EU-27 in 2018 was down a little (− 0.6 %) on the level in 2017 and considerably down (− 18.5 %) on the corresponding level in 2000 (see Figure 6.2.1). The downward trend to 2012 and the subsequent upturn reflect parallel trends for catches, which account for four fifths of total fisheries production. This upturn in catches was despite a continued reduction in the size of the fishing fleet. The production of farmed aquatic organisms remained relatively stable.
About one half (49.0 %) of all EU-27 fisheries production from catches and aquaculture came from just three Member States in 2018; these were Spain (21.0 %), Denmark (14.4 %) and France (13.6 %). The slight decline in overall EU

6Fisheries activities
Agriculture, forestry and fishery statistics — 2020 edition 113
Figure 6.2.2: Catches by marine area, 2019(1 000 tonnes of live weight)
0 100 200 300 400 500 600 700 800 900
SpainDenmark (1)
France (2)Netherlands
Ireland (3)GermanyPortugal
PolandItaly (2)
SwedenFinland
Latvia (4)Lithuania
EstoniaGreeceCroatia
BelgiumBulgaria
RomaniaMalta
CyprusSlovenia
Atlantic, Northwest Atlantic, Northeast Atlantic, Eastern CentralMediterranean and Black Sea Atlantic, Southwest Atlantic, SoutheastIndian Ocean, Western
Note: Czechia, Luxembourg, Hungary, Austria and Slovakia, no catches.
(1) Estimate using 2017 data for Atlantic, Northwest.(2) Provisional.(3) 2017 data.(4) 2016 data.
Source: Eurostat (online data code: fish_ca_main)
production in 2018, principally reflected the mixed developments in these three Member States: production in Spain was moderately lower (− 1.5 %); production in Denmark fell back strongly (− 12.5 %), almost entirely due to the lower catches in the Northeast Atlantic; and, production in France rose strongly (+7.8 %) driven by higher catches in the Northeast Atlantic and the Indian Ocean.
By way of comparison, it is interesting to note that total fisheries production in Norway (3.6 million tonnes of live weight in 2018) was about 80 % of that of the EU-27 as a whole. Total production in Iceland (1.3 million tonnes in 2018) was slightly higher than in Spain, the EU-27’s biggest fisheries producer. Production in the United Kingdom (0.9 million tonnes in 2018) was slightly higher
than in Denmark, the EU-27’s second biggest fisheries producer.
EU catches in 2019 an estimated 4.1 million tonnes of live weight
Fish catches cover fish, molluscs, crustaceans and other aquatic animals, residues and aquatic plants that are taken for all purposes, by all types and class of vessel, gear and fishermen, operated in all the seven marine areas legally covered by EU statistical regulations. They cover catches in high-sea fishing areas, offshore, inshore or brackish water areas. The production from aquaculture and catches in fresh water is excluded. Although figures for the total production of fishery products are only available for 2018, statistics on catches are available for 2019.

6 Fisheries activities
Agriculture, forestry and fishery statistics — 2020 edition114
The total EU catch in 2019 was an estimated 4.1 million tonnes live weight, much less than the estimated 4.6 million tonnes in 2018. The level of catches in 2019 was back towards the low recorded in 2012.
The fishing fleets of Spain, Denmark, France and the Netherlands accounted for over one half (about 56 %) of the total amount of aquatic organisms caught by Member States in 2019 (see Figure 6.2.2). Catch levels were down in each of these countries, often sharply: they were moderately lower (− 4.9 % or 43 000 tonnes less) in Spain; they were one fifth lower (− 20.4 % or 160 000 tonnes less) in Denmark and in the Netherlands (− 22.6 %); and, one tenth less (− 10.6 %) in France. Catch levels in 2019 were lower than 2018 in many other Member States too, not least Germany (− 20.7 %) and Sweden (− 17.1 %). One of the main exceptions was the much higher catch level in Lithuania (+59.2 %), which was almost entirely from the higher catch in the Atlantic, Eastern Central area.
Spain and Portugal were the only Member States that took catches in all of the seven fishing areas covered by the EU catch statistics.
The vast majority of the EU catch is taken in the Atlantic, Northeast area
Although the European fishing fleet operates worldwide, about 70 % of all EU catches in the seven marine areas covered by EU statistical regulations were taken in the Atlantic, Northeast area (see Figure 6.2.3 and Map 6.1.1 for an overview of fishing areas). The key species caught in the Atlantic, Northeast area in 2019 were herring
(21.3 % of the live weight caught in this region), sprat (14.8 %), blue whiting (10.1 %) and mackerel (8.4 %).
About one fifth (22.1 %) of the EU-27’s total live-weight catch in the Atlantic, Northeast area was made by the fishing fleet of Denmark. Together, France (13.6 %), the Netherlands (10.6 %) and Spain (9.8 %) accounted for another one third of catches in the region.
About one tenth of the total EU catch was taken in the Mediterranean and Black Sea, where the main species caught were sardines (23.6 % of the EU catch in the area) and anchovies (16.7 %). Two fifths of the total EU-27 catch in this area was by Italy, with Greece (18.9 %), Spain (17.4 %), and Croatia (14.7 %) accounting for the vast majority of the rest.
About 8 % of the total EU catch was taken in the Atlantic, Eastern Central area, where the main catches were skipjack and yellowfin tuna, sardines and mackerel. Among Member States, Spain (36.6 %) and Lithuania (21.4 %) together accounted for the majority of catches in the area.
About 7 % of the total EU catch was taken in the Indian Ocean, Western area, where the main catch was tuna, particularly skipjack, yellowfin and bigeye tuna. About 70 % of the EU-27 catch in the area was by Spain, and most of the rest by France.
Only 5 % of the total EU catch was taken in three remaining marine areas. The main species caught in these areas were the following: hake in the Atlantic, Southwest area; blue sharks and skipjack tuna in the Atlantic, Southeast area; and redfish, cod and halibut in the Atlantic, Northwest area.

6Fisheries activities
Agriculture, forestry and fishery statistics — 2020 edition 115
Figure 6.2.3: Catches by marine area, EU‑27, 2019(% share of total catches, thousand tonnes of live weight)
Atlantic,Northeast
69.5 %
Mediterraneanand Black Sea
10.7 %
Atlantic,Eastern Central
7.9 %
Indian Ocean, Western
6.5 %
Atlantic,Southwest
3.3 %
Atlantic,Northwest
1.3 %
Atlantic,Southeast
0.7 %
EU-27 total 4.1 million
tonnes
Source: Eurostat (online data code: fish_ca_main)
Aquaculture: 1.1 million tonnes of aquatic organisms produced in the EU-27 in 2018, worth EUR 3.7 billion
Aquaculture is the production of fish and other aquatic organisms like molluscs and crustaceans under controlled conditions; it is an alternative to catching wild fish and takes place both inland and in marine areas. Aquaculture is a key component of both the CFP and the Blue Growth (35) agenda to support sustainable growth in the sector.
(35) For more information, see the maritime affairs section on the European Commission’s website.(36) The state of world fisheries and aquaculture, 2020 – FAO, available at:
http://www.fao.org/3/ca9229en/online/ca9229en.html#fig3, where it is noted that China dominates world aquaculture production (67.9 % of the total in 2018).
The EU-27 produced an estimated 1.1 million tonnes of aquatic organisms in 2018, corresponding to one fifth of the output of European fisheries as a whole. In terms of output, the EU’s aquaculture sector was the ninth largest worldwide, alongside Myanmar, with a 1.4 % share of the volume of global output in 2018 (36). The value of aquaculture production in the EU-27 was an estimated EUR 3.7 billion in 2018, about two fifths of the total value of the EU’s total production of fishery products.
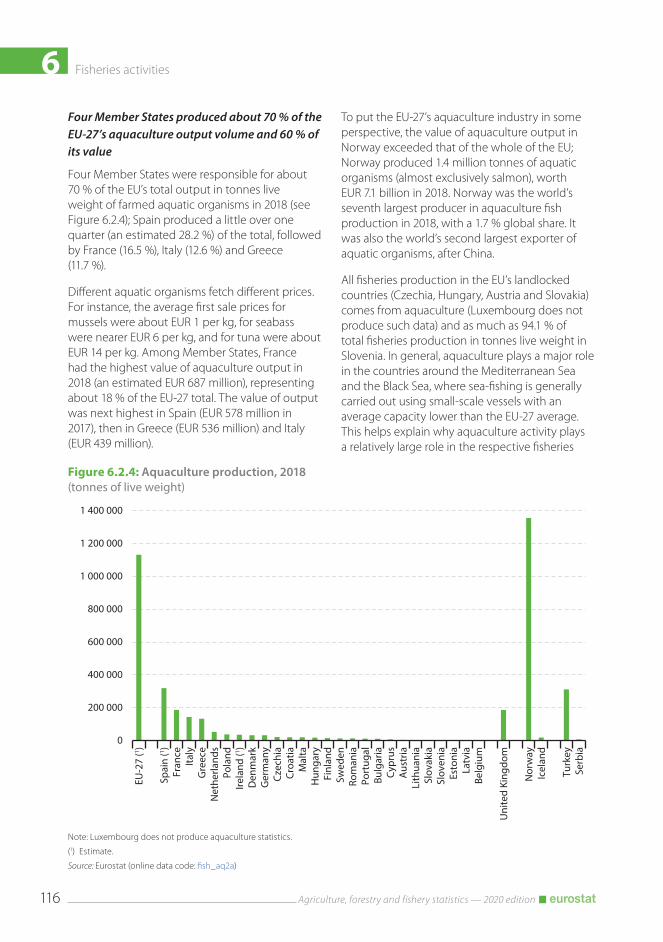
6 Fisheries activities
Agriculture, forestry and fishery statistics — 2020 edition116
Figure 6.2.4: Aquaculture production, 2018(tonnes of live weight)
0
200 000
400 000
600 000
800 000
1 000 000
1 200 000
1 400 000
EU-2
7 (1 )
Spai
n (1 )
Fran
ceIta
lyG
reec
eN
ethe
rland
sPo
land
Irela
nd (1 )
Den
mar
kG
erm
any
Czec
hia
Croa
tiaM
alta
Hun
gary
Finl
and
Swed
enRo
man
iaPo
rtug
alBu
lgar
iaCy
prus
Aus
tria
Lith
uani
aSl
ovak
iaSl
oven
iaEs
toni
aLa
tvia
Belg
ium
Uni
ted
King
dom
Nor
way
Icel
and
Turk
eySe
rbia
Note: Luxembourg does not produce aquaculture statistics.
(1) Estimate.
Source: Eurostat (online data code: fish_aq2a)
Four Member States produced about 70 % of the EU-27’s aquaculture output volume and 60 % of its value
Four Member States were responsible for about 70 % of the EU’s total output in tonnes live weight of farmed aquatic organisms in 2018 (see Figure 6.2.4); Spain produced a little over one quarter (an estimated 28.2 %) of the total, followed by France (16.5 %), Italy (12.6 %) and Greece (11.7 %).
Different aquatic organisms fetch different prices. For instance, the average first sale prices for mussels were about EUR 1 per kg, for seabass were nearer EUR 6 per kg, and for tuna were about EUR 14 per kg. Among Member States, France had the highest value of aquaculture output in 2018 (an estimated EUR 687 million), representing about 18 % of the EU-27 total. The value of output was next highest in Spain (EUR 578 million in 2017), then in Greece (EUR 536 million) and Italy (EUR 439 million).
To put the EU-27’s aquaculture industry in some perspective, the value of aquaculture output in Norway exceeded that of the whole of the EU; Norway produced 1.4 million tonnes of aquatic organisms (almost exclusively salmon), worth EUR 7.1 billion in 2018. Norway was the world’s seventh largest producer in aquaculture fish production in 2018, with a 1.7 % global share. It was also the world’s second largest exporter of aquatic organisms, after China.
All fisheries production in the EU’s landlocked countries (Czechia, Hungary, Austria and Slovakia) comes from aquaculture (Luxembourg does not produce such data) and as much as 94.1 % of total fisheries production in tonnes live weight in Slovenia. In general, aquaculture plays a major role in the countries around the Mediterranean Sea and the Black Sea, where sea-fishing is generally carried out using small-scale vessels with an average capacity lower than the EU-27 average. This helps explain why aquaculture activity plays a relatively large role in the respective fisheries

6Fisheries activities
Agriculture, forestry and fishery statistics — 2020 edition 117
Figure 6.2.5: Main species in aquaculture production, EU‑27, 2018(% shares of total aquaculture production)
0 5 10 15 20
Trout
Seabass, European
Seabream, gilthead
Oyster
Tuna, blue�n
Mussel, Mytilus spp
Clam
Carp
Salmon
Turbot
In terms of euros
0 15 30 45
Mussel, Mytilus spp
Trout
Oyster
Seabream, gilthead
Seabass, European
Carp
Clam
Tuna, blue�n
Salmon
Turbot
In terms of tonnes
Source: Eurostat (online data code: fish_aq2a)
industries of Malta (accounting for 88.3 % of total fisheries production in tonnes live weight in 2018), Cyprus (83.3 %), Greece (63.1 %), Romania (61.4 %), Bulgaria (55.7 %) and Italy (41.4 %).
EU aquaculture production focussed on finfish species and molluscs
Finfish (particularly, trout, seabream, seabass, carp, tuna and salmon) and molluscs (particularly, mussels, oysters and clams) together accounted for almost all of aquaculture production by weight in the EU in 2018.
Rainbow trout were the most valuable species farmed in the EU in 2018, accounting for about 17 % of all aquaculture production. The farmed production of seabass, seabream, oysters and bluefin tuna were the next most valuable (see Figure 6.2.5).
A high degree of country specialisation within EU
Within the EU, the aquaculture sector is highly specialised at the level of EU Member States.
Spain produced about 7 in every 10 tonnes of the EU’s farmed Mediterranean mussels (Mytilus
galloprovincialis) in 2018, largely due to its rafts in the estuaries of northern Spain using the ‘off bottom’ method. Blue mussels (Mytilus edulis) were farmed in the Atlantic, Northeast area by the Netherlands (about 37 % of the EU total in 2018) and France (about 36 %), and Ireland (an estimated 11 %). Both ‘off bottom’ (preferred in Ireland) and ‘on-bottom’ methods (preferred in the Netherlands) were used.
Greece produced about 61 % of the EU’s farmed production of gilthead seabream (Sparus aurata) and 55 % of European seabass (Dicentrarchus labrax) in 2018. Czechia and Poland were the leading EU producers of common carp (Cyprinus carpio), together producing about 45 % of the EU total. At world level, common carp was the third most farmed finfish species.
Within the EU, pacific cupped oysters (Crassostrea gigas) were produced mainly in France (about 86 % in 2018). Worldwide, about 30 % of all molluscs produced in 2018 were cupped oysters. Italy produced the vast majority (about 78 % in 2018) of the EU’s farmed Japanese carpet shell (Ruditapes philippinarum). At world level, it was the second most produced species among the molluscs (24 % of the total in 2018).

6 Fisheries activities
Agriculture, forestry and fishery statistics — 2020 edition118
Figure 6.2.6: Aquaculture production and value, EU‑27 and Norway, 2008‑2018(2010 = 100)
0
25
50
75
100
125
150
175
200
2008 2009 2010 2011 2012 2013 2014 2015 2016 2017 2018
Norway (EUR) EU-27 (EUR) Norway (tonnes) EU-27 (tonnes)
Note: includes Member State estimates for EU-27 figures.
Source: Eurostat (online data code: fish_aq2a)
Atlantic bluefin tuna (Thunnus thynnus) were farmed in cages in only three Member States: Malta accounted for about 61 % of EU farmed production of bluefin tuna, the rest being produced in Spain and Croatia. While Malta and Croatia farmed Atlantic tuna in the Mediterranean Sea only, Spain also farmed a small proportion in the Atlantic, Northeast area.
Ireland was responsible for about 90 % of 13 000 tonnes of farmed salmon in the EU in 2018. However, the quantity farmed was far below the 156 000 tonnes farmed in the United Kingdom and the 1.3 million tonnes farmed in Norway. At world level, Atlantic salmon (Salmo salar) was the ninth most produced finfish species.
The production of farmed rainbow trout (Oncorhynchus mykis) in the EU is something of an exception to the general observation about country specialisation; rainbow trout were farmed in 23 EU countries. One-half of the farmed live-weight of rainbow production in the EU in 2018 came from the combined output of Italy and
France (both about 19 % of the EU total) and Denmark (about 16 %). Fish were farmed either in inland freshwater (about four fifths of the total) or in the saltwater of the Atlantic, Northeast area, and mainly in tanks (about 60 %).
Steady level of EU aquaculture production volume but rising value
Between 2008 and 2018, the volume of EU aquaculture production remained relatively stable (see Figure 6.2.6). Nevertheless, the value of this output increased relatively steadily and was an estimated one third higher in 2018 than in 2008.
During a similar period, there was a sharp increase in both the volume and value of Norwegian aquaculture production. The volume of aquaculture production in Norway bounced back in 2018 (+3.6 %) from the reduced level in 2017, which had been affected by a sea lice issue with salmon. The overall value of aquaculture production in 2018 was also higher than 2017 (+1.4 %).

6Fisheries activities
Agriculture, forestry and fishery statistics — 2020 edition 119
Figure 6.3.1: Landings in selected countries and EU‑27, 2019
0
500
1 000
1 500
2 000
2 500
3 000
3 500
4 000
EU-2
7 (1 )
Den
mar
k (2 )
Spai
nN
ethe
rland
s (1 )
Fran
ce (3 )
Italy
(3 )
Nor
way
Icel
and
(4 )
Turk
ey
(1 0
00 to
nnes
)
Quantity
0
1 000
2 000
3 000
4 000
5 000
6 000
7 000EU
-27
(1 )
Den
mar
k (2 )
Spai
nN
ethe
rland
s (1 )
Fran
ce (3 )
Italy
(3 )
Nor
way
Icel
and
(4 )
Turk
ey
(mill
ion
EUR)
Value
(1) Estimate.(2) 2016 data.(3) Provisional, 2018 data.(4) 2018 data.
Source: Eurostat (online data code: fish_ld_main)
6.3. LandingsEurostat’s landings statistics relate to fishery products (product weight and value) landed by EU/EAA vessels on EU/EAA territory. Landings from non EU/EAA vessels or landings outside the EU/EAA territory are excluded. Landlocked EU countries without a marine fishing fleet are not included.
About 3.8 million tonnes (product weight) landed in EU in 2019
A mixture of confidential and, as yet, unavailable figures for 2019 concerning some of the key fishing Member States means that the estimates
for the EU could be subject to considerable revision. It is for this reason that EU figures are presented in broad terms. Nevertheless, they give a clear indication of the size of the industry and its importance in some Member States.
The amount of fish landed in the EU in 2019 is estimated to have been about 3.8 million tonnes product weight.
Denmark accounted for about one fifth (0.9 million tonnes in 2016) of the EU landings, Spain another fifth (0.8 million tonnes in 2019) and the Netherlands about one tenth (an estimated 0.5 million tonnes in 2019).

6 Fisheries activities
Agriculture, forestry and fishery statistics — 2020 edition120
Among the Member States for which 2019 data are available, the quantity of landings was down considerably in the Netherlands (an estimated − 17.0 % or 93 000 tonnes) and in Poland (− 10.7 % or 13 000 tonnes), but higher in Portugal (+13.8 % or 18 000 tonnes) and Estonia (+27.5 % or 17 000 tonnes). By way of comparison, landings to ports in Norway were moderately lower than in 2018 (− 2.9 % or 56 000 tonnes) at 1.9 million tonnes.
Quantity and value of EU landings down slightly in 2019
The estimated fall in the quantity of total fishery products landed in the EU in 2019 looks to have been accompanied by a decline in the value of landings to an estimated total of EUR 6.3 billion
(see Figure 6.3.1). Nevertheless, it should be borne in mind that this figure is subject to data availability.
Among Member States for which 2019 data are available, the value of the fish landed in Spain was higher than in any other Member State, reflecting the high value attached to its landings of species like tuna, hake, swordfish, squid and pilchards. However, the value of landings in Spain fell to EUR 1.9 billion in 2019. The value of landings in the Netherlands fell sharply (− 23.3 % on the value in 2018) to EUR 0.4 billion. In contrast, the value of landings in Portugal increased sharply (+16.0 % on 2018) to EUR 0.3 billion.

6Fisheries activities
Agriculture, forestry and fishery statistics — 2020 edition 121
Data sources and availabilityFisheries statistics are collected by Eurostat from official national sources for the EU Member States and members of the European Economic Area (EEA). The statistics are collected using internationally agreed concepts and definitions developed by the Coordinating Working Party (CWP), comprising Eurostat and several other international organisations with responsibilities in fisheries statistics.
European fisheries production statistics include production from catches and aquaculture. Catches refer to fishery products taken for all purposes (commercial, industrial, recreational and subsistence) by all types and classes of fishing units (including fishermen, vessels, gear, and so on). The flag of the fishing vessel is used as the primary indication of the nationality of the catch. In addition to catches, Eurostat also collects statistics on landings which relate to all fishery products (expressed as product weight) landed in the reporting country, regardless of the nationality of the vessel making the landings. Landings by vessels of the reporting country in non-EU ports and imported into the EU are to be included as well. Aquaculture production refers to the farming of aquatic (freshwater or saltwater) organisms, under controlled conditions. Aquaculture implies some form of intervention in the natural rearing process such as regular stocking, feeding and protection from predators. Farming also implies individual or corporate ownership of the stock being cultivated.
Catch statistics are submitted to Eurostat by EEA member countries in compliance with the following EU legislation:
• Regulation (EC) No 218/2009 of the European Parliament and of the Council of 11 March 2009 on the submission of nominal catch statistics by Member States fishing in the north-east Atlantic (OJ L87 of 31.03.2009);
• Regulation (EC) No 217/2009 of the European Parliament and of the Council of 11 March 2009 on the submission of catch and activity statistics by Member States fishing in the north-west Atlantic (OJ L87 of 31.03.2009);
• Regulation (EC) No 216/2009 of the European Parliament and of the Council of 11 March 2009 on the submission of nominal catch statistics by Member States fishing in certain areas other than those of the North Atlantic (OJ L87 of 31.03.2009, p. 1).
The statistics are reported as the live weight equivalent of the landings (in other words, the landed weight of a product to which an appropriate conversion factor has been applied). Therefore excluded are quantities of fishery products which are caught but not landed. For statistics on landings, each country reports annual data on the quantities and values of fishery products landed in its ports under the terms of Regulation (EC) No 1921/2006 of 18 December 2006 on the submission of statistical data on landings of fishery products in EU Member States and repealing Council Regulation (EEC) No 1382/91 (OJ L403 of 30 December 2006). For aquaculture statistics, the national authorities submit aquaculture production statistics to Eurostat under the terms of Regulation (EC) No 762/2008 of 9 July 2008 on the submission by Member States of statistics on aquaculture and repealing Council Regulation (EC) No 788/96 (OJ L218 of 13.08.2008).
Concerning the fishing fleet, statistics for the EU Member States are derived from the Community Fishing Fleet Register maintained by the European Commission’s Directorate-General for Maritime Affairs and Fisheries. Statistics for Iceland and Norway are compiled from fleet files submitted by their national authorities.


7 Food and beverages processing
7 Food and beverages processing
Agriculture, forestry and fishery statistics — 2020 edition124
7
In 2018, there were about289 000 enterprises
involved in food andbeverages production in
the EU-27, employing4.5 million people
F ood B ever a ges
96 % of food and In 2018,
beverages enterprises were micro or small, employing
less than 50 people
Did youknow ...
50 50 50 50 50
50 50 50 50 50
50 50 50 50 50
50 50 50 50 50
50 50 50 50 50€
billionEURO827
In 2019, the sold production of food and beverages in the EU was
EUR 827 billion
The manufacture of food products, beverages and tobacco products in the EU-27 generated an estimated 22.4 million tonnes of animal and vegetal wastes in 2018
IntroductionThe food system is much wider than primary agricultural production; it also covers food preparation and sales. Farming is the activity of growing, rearing and harvesting primary products. However, before food and beverages arrive on the table, they have often been processed, packaged, transported, distributed and marketed.
The EU’s common agricultural policy (CAP) recognises these links with its aims to ‘ensure a stable supply of affordable food’, to ‘keep the rural economy alive by promoting jobs in farming, agri-foods industries and associated sectors’ and ‘to protect food and health quality’.
In order to get a clearer picture of this chain from ‘farm to fork’, it is important to move beyond an analysis of only primary agricultural production. There is a range of legislation that food and beverages enterprises must adhere to, in order to help ensure animal, food and health quality. These include laws on food hygiene, additives and residues, labelling, live animal transport (such as length of journey, safe loading and unloading practices, appropriate space, water, feed and rest) and slaughtering practices.

7Food and beverages processing
Agriculture, forestry and fishery statistics — 2020 edition 125
7
In 2018, there were about289 000 enterprises
involved in food andbeverages production in
the EU-27, employing4.5 million people
F ood B ever a ges
96 % of food and In 2018,
beverages enterprises were micro or small, employing
less than 50 people
Did youknow ...
50 50 50 50 50
50 50 50 50 50
50 50 50 50 50
50 50 50 50 50
50 50 50 50 50€
billionEURO827
In 2019, the sold production of food and beverages in the EU was
EUR 827 billion
The manufacture of food products, beverages and tobacco products in the EU-27 generated an estimated 22.4 million tonnes of animal and vegetal wastes in 2018

7 Food and beverages processing
Agriculture, forestry and fishery statistics — 2020 edition126
7.1. Dairies and slaughterhousesFor animal food products, the first processing stage is at the dairy or in slaughterhouses. Dairy enterprises either purchase from milk collection centres or, more typically, directly from farms with a view to transforming milk into milk products. Slaughterhouses in the EU are registered and approved establishments used for slaughtering and dressing animals, whose meat is intended for human consumption. Their activity is not normally considered as processing but, for a balanced overview, they are included in the analysis.
DairiesThere were about 4 900 dairy enterprises across the EU-27 in 2018. A high proportion of these were in southern EU Member States; Italy alone had almost 1 200 dairies and Greece about 800 dairies.
In most Member States, these dairies were relatively small, collecting less than 5 000 tonnes of milk per year. For example, 70 % of dairies in Italy collected less than 5 000 tonnes of milk per year and about 94 % of all dairies in Greece. However, there are some exceptions. A few Member States had a small number of relatively large dairies that collected more than 100 000 tonnes of milk per year; this included Ireland (about one third of its 38 dairies), the Netherlands (12 of its 30 dairies), Lithuania (6 of its 14 dairies), and Germany (53 of its 115 dairies).
There has been considerable consolidation of the dairy market within the EU. For example, the number of dairy enterprises in Italy, France and Germany halved or more than halved in the period between 1994 and 2018.
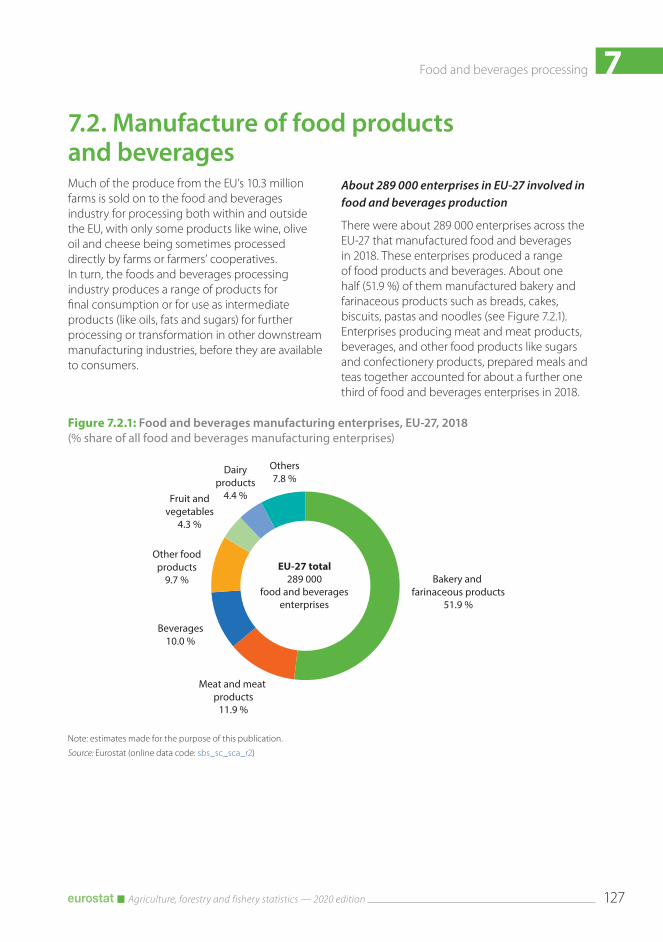
7Food and beverages processing
Agriculture, forestry and fishery statistics — 2020 edition 127
Figure 7.2.1: Food and beverages manufacturing enterprises, EU‑27, 2018(% share of all food and beverages manufacturing enterprises)
Bakery and farinaceous products
51.9 %
Meat and meat products
11.9 %
Beverages10.0 %
Other foodproducts
9.7 %
Fruit andvegetables
4.3 %
Dairyproducts
4.4 %
Others7.8 %
EU-27 total289 000
food and beverages enterprises
Note: estimates made for the purpose of this publication.
Source: Eurostat (online data code: sbs_sc_sca_r2)
7.2. Manufacture of food products and beveragesMuch of the produce from the EU’s 10.3 million farms is sold on to the food and beverages industry for processing both within and outside the EU, with only some products like wine, olive oil and cheese being sometimes processed directly by farms or farmers’ cooperatives. In turn, the foods and beverages processing industry produces a range of products for final consumption or for use as intermediate products (like oils, fats and sugars) for further processing or transformation in other downstream manufacturing industries, before they are available to consumers.
About 289 000 enterprises in EU-27 involved in food and beverages production
There were about 289 000 enterprises across the EU-27 that manufactured food and beverages in 2018. These enterprises produced a range of food products and beverages. About one half (51.9 %) of them manufactured bakery and farinaceous products such as breads, cakes, biscuits, pastas and noodles (see Figure 7.2.1). Enterprises producing meat and meat products, beverages, and other food products like sugars and confectionery products, prepared meals and teas together accounted for about a further one third of food and beverages enterprises in 2018.

7 Food and beverages processing
Agriculture, forestry and fishery statistics — 2020 edition128
Figure 7.2.2: Food and beverages manufacturing enterprises and persons employed, 2018(% share of EU-27 total)
France 19.0 %
Italy 18.9 %
Spain 10.2 %Germany
9.9 %
Poland
6.6 %
Greece
5.6 %
Others 29.8 %
Enterprises
Germany21.8 %
France14.8 %
Italy10.1 %Poland
10.1 %
Spain9.6 %
Romania4.1 %
Others29.5 %
Persons employed
Source: Eurostat (online data code: sbs_na_sca_r2)
4.5 million people were employed in food and beverages manufacturing across the EU in 2018
Food and beverages enterprises provided employment to 4.5 million people and generated about EUR 1 100 billion of turnover in 2018.
France and Italy had the largest number of food and beverages enterprises (see Figure 7.2.2). However, Germany employed the most people in this sector (21.8 % of the EU-27 total), followed by France (14.8 %).
Most food and beverages enterprises in the EU are micro or small, employing less than 50 persons
The overwhelming majority (about 96 %) of all food and beverages enterprises in the EU were micro or small, employing less than 50 persons. Indeed, micro enterprises employing less than 10 persons accounted for four fifths (79.7 %) of all food and beverages enterprises in 2018.
Medium-sized enterprises (employing between 50 and 249 persons) and large enterprises (employing more than 250 persons) together accounted for a minority of food and beverages enterprises in all Member States in 2018; the highest shares
were in Luxembourg (14.9 %), Germany (10.5 %), Latvia (9.3 %), Estonia (9.1 %) and Denmark (8.9 %) and the lowest in Italy (1.9 %) and France (1.8 % in 2017).
The value of food and beverages produced in the EU-27 was EUR 827.2 billion in 2019
The production of food and beverages in the EU-27 was valued at an estimated EUR 827.2 billion in 2019. This was double the value of the primary agricultural products (EUR 412 billion) from the EU’s agricultural industry.
For the 375 food and beverages product categories for which data are collected, the value produced in Germany in 2019 was the highest among Member States (an estimated EUR 155.3 billion), followed by Italy (EUR 127.3 billion) and France (EUR 118.9 billion).
The five main food, feed and beverages producer Member States, which also include Spain and Poland, accounted for the majority of the value of 9 of the top 10 products manufactured in the EU in 2019 (see Figure 7.2.3). Nevertheless, there was some specialisation among Member States, even for the 10 most highly valued products.

7Food and beverages processing
Agriculture, forestry and fishery statistics — 2020 edition 129
Figure 7.2.3: Top 10 food and beverage products with the highest value of sold production, 2019(EUR million)
0 5 000 10 000 15 000 20 000 25 000 30 000 35 000
Cheese, non-processed (1)
Beer (2)
Fresh bread (3)
Cake & pastries (4)
Pig meat cuts, fresh or chilled (5)
Sausages (6)
Soft drinks (7)
Beef and veal cuts, fresh or chilled
Poultry feed preparations (8)
Chicken cuts, fresh or chilled
Germany France Italy Spain Poland Others
(1) Grated, powdered, blue-veined and other non-processed cheese (excluding fresh cheese, whey cheese and curd). Germany: 2017.(2) Beer made from malt (excluding non-alcoholic beer, beer containing ≤ 0.5 % by volume of alcohol, alcohol duty).(3) Fresh bread containing by weight in the dry matter state ≤ 5 % of sugars and ≤ 5 % of fat (excluding with added honey; eggs; cheese
or fruit).(4) Cake and pastry products; other bakers’ wares with added sweetening matter.(5) Fresh or chilled pig meat (including fresh meat packed with salt as a temporary preservative; excluding carcases, hams and cuts
thereof with bone in).(6) Sausages and similar products of meat, offal or blood and food preparations based thereon (excluding liver sausages and prepared
meals and dishes).(7) Waters, with added sugar, other sweetening matter or flavoured, i.e. soft drinks (including mineral and aerated).(8) Preparations used for farm animal feeding (excluding premixtures): poultry.
Source: Eurostat (https://ec.europa.eu/eurostat/web/prodcom/data/excel-files-nace-rev.2)
Among the food, feed and beverage products manufactured in the EU-27, non-processed cheese was the most valuable in 2019 (at EUR 30.2 billion). This market is of particular importance to the EU’s dairy farmers. The value of non-processed cheese produced by enterprises in France (EUR 7.0 billion in 2019), Italy (EUR 5.8 billion) and Germany (EUR 5.5 billion) accounted for a majority of the EU-27 total.
Beer (from malt but excluding non-alcoholic beer) was the second most valuable food, feed and beverages product manufactured in the EU-27 in 2019 (at EUR 29.0 billion). This market is of particular importance to farmers growing malted barley (but also some other grains) and hops. The value of beer (from malt but excluding non-alcoholic
beer) produced by enterprises in Germany in 2019 (EUR 5.9 billion) accounted for one fifth of the total produced in the EU-27. There was also some specialisation in Spain (13.3 % of the EU total) and Belgium (10.2 % of the EU total in 2017).
Among various specialisations, enterprises in Austria accounted for a little less than one quarter (23.7 % in 2019) of the value of all soft drinks (with added sugar, other sweeteners or flavoured) produced in the EU. The value of cuts of chicken produced by enterprises in the Netherlands (17.7 % of the EU total in 2019) was higher than any other Member State. A little over one tenth (10.9 %) of the total value of the EU’s cuts of beef and veal in 2019 came from Ireland, only behind France (23.2 %) and Germany (14.7 %).
7 Food and beverages processing
Agriculture, forestry and fishery statistics — 2020 edition130
7.3. Generation of wasteThe manufacture of food products, beverages and tobacco products in the EU-27 generated 37.0 million tonnes of waste in 2018, which was 1.6 % of all the waste produced by economic activities and households in the EU. About 60 % of all the waste from the manufacture of food products, beverages and tobacco products was animal and vegetal wastes (both hazardous and non-hazardous). This includes animal and
plant-tissue waste, sludge, waste from preserving agents, greases and oils, and biodegradable waste.
The manufacture of food products, beverages and tobacco products in the EU-27 generated an estimated 22.4 million tonnes of animal and vegetal wastes (both hazardous and non-hazardous) in 2018. This was about 1.6 million tonnes more than in 2014.
7Food and beverages processing
Agriculture, forestry and fishery statistics — 2020 edition 131
Data sources and availabilityStructural business statistics (SBS) describe the structure, conduct and performance of economic activities, down to the most detailed activity level (several hundred economic sectors). SBS are transmitted annually by the EU Member States on the basis of a legal obligation from 1995 onwards.
SBS covers all activities of the business economy with the exception of agricultural activities and personal services and the data are provided by all EU Member States, Norway and Switzerland, some candidate countries and potential candidates. The data are collected by domain of activity (annex): Annex I — Services, Annex II — Industry, Annex III — Trade and Annex IV— Construction, and by datasets. Each annex contains several datasets as indicated in the SBS Regulation.
Data are mainly collected by national statistical institutes (NSIs) by means of statistical surveys, business registers or from various administrative sources. Regulatory or controlling national offices for financial institutions or central banks often provide the information required for the financial sector (NACE Rev. 2 Section K).
Member States apply various statistical methods, according to the data source, such as grossing up, model based estimation or different forms of imputation, to ensure the quality of the SBS produced.
PRODCOM statistics provide detailed information on the quantity of production sold during the survey period, the value of production sold during the survey period, and for some products, the quantity of total production during the survey period. The PRODCOM survey is based on the PRODCOM list, consisting of about 3 900 products. The 8-digit codes used in the list are based on the 6-digit CPA headings. From 2008 onwards, the PRODCOM code is linked to CPA 2008 and NACE Rev. 2. The link to NACE enables the NSIs to use the business register to identify the enterprises likely to be manufacturing the products.
The PRODCOM list is revised every year.
In order to monitor the implementation of waste policy, in particular compliance with the principles of recovery and safe disposal, reliable statistics on the production and management of waste from businesses and private households are required. In 2002, Regulation (EC) No 2150/2002 on waste statistics was adopted, creating a framework for harmonised Community statistics in this field.
Starting with reference year 2004, the regulation requires EU Member States to provide data on the generation, recovery and disposal of waste every two years. Data on waste generation and treatment are currently available for even reference years from 2004 to 2018.


8 Trade in agricultural goods
8 Trade in agricultural goods
Agriculture, forestry and fishery statistics — 2020 edition134
Did youknow ...
Trade in agricultural goods accounted for 8.0 % of total EU international trade in goods in 2019
EU trade inagricultural
goods wasEUR 325 billion
in 2019, slightly more than double
what it was in 2006
The United Kingdomwas the main recipientof EU exports (23.2 %)
of agricultural productsin 2019 and was the
main origin of EU imports (12.8 %)
€
€
2006
2019
The United Kingdom was the EU’s main trading partner in agricultural products in 2019, with such trade worthEUR 60.4 billion
billionEURO60.4
€
IntroductionAgricultural trade is the action of buying and selling agricultural goods and services. Where countries can produce a surplus, this can be traded for other goods and services. Why trade agricultural goods? There are many possible reasons, reflecting the fact that no local alternatives exist (some crops are only grown in certain climates for example), or that some countries and regions can offer goods that are cheaper, of better quality, safe, sustainably produced and nutritious. In turn, this trade can help provide foreign currency, support employment in export industries, support industry incomes and provide consumers with quality goods at competitive prices on a more year-round basis.
Statistics on the international trade in agricultural goods are fundamental to the evaluation and understanding of issues related to political agendas such as trade negotiations, food security, cooperation and aid towards developing countries, and global sustainability. Data on the trade in agriculture goods are used for two of the common EU policies: the common agricultural policy (CAP) and the common trade policy that manages trade relations with non-EU countries. These are major policy areas of the EU on which decisions are taken at Community level.
This chapter focuses on the trade in agricultural goods only between the EU and countries outside the EU (extra-EU trade flows), including trade with the United Kingdom. These goods cover animals and animal products, crop products and foodstuffs.

8Trade in agricultural goods
Agriculture, forestry and fishery statistics — 2020 edition 135
Did youknow ...
Trade in agricultural goods accounted for 8.0 % of total EU international trade in goods in 2019
EU trade inagricultural
goods wasEUR 325 billion
in 2019, slightly more than double
what it was in 2006
The United Kingdomwas the main recipientof EU exports (23.2 %)
of agricultural productsin 2019 and was the
main origin of EU imports (12.8 %)
€
€
2006
2019
The United Kingdom was the EU’s main trading partner in agricultural products in 2019, with such trade worthEUR 60.4 billion
billionEURO60.4
€
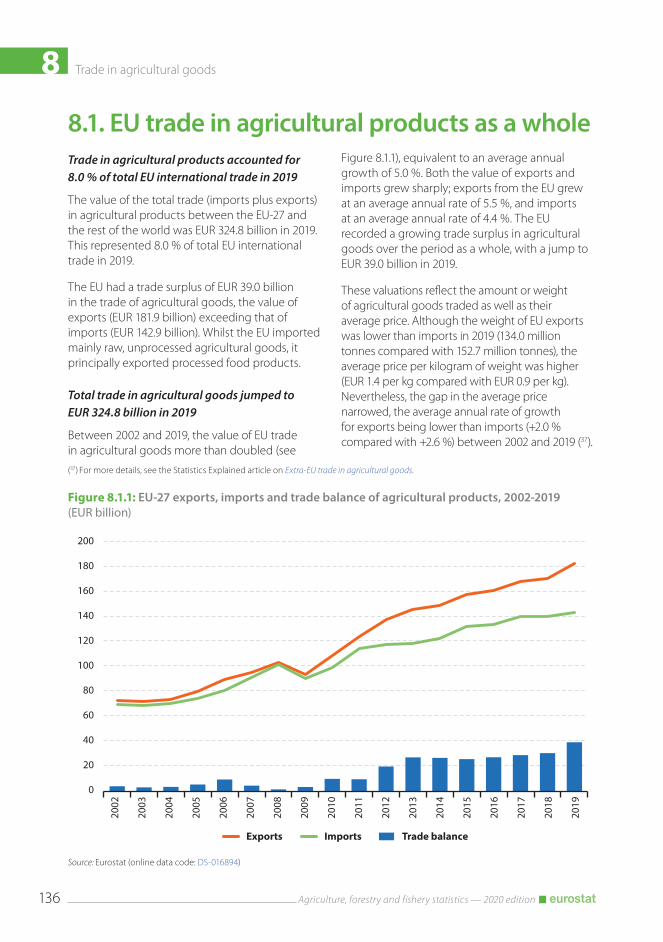
8 Trade in agricultural goods
Agriculture, forestry and fishery statistics — 2020 edition136
Figure 8.1.1: EU‑27 exports, imports and trade balance of agricultural products, 2002‑2019(EUR billion)
0
20
40
60
80
100
120
140
160
180
200
2002
2003
2004
2005
2006
2007
2008
2009
2010
2011
2012
2013
2014
2015
2016
2017
2018
2019
Trade balanceExports Imports
Source: Eurostat (online data code: DS-016894)
8.1. EU trade in agricultural products as a whole
(37) For more details, see the Statistics Explained article on Extra-EU trade in agricultural goods.
Trade in agricultural products accounted for 8.0 % of total EU international trade in 2019
The value of the total trade (imports plus exports) in agricultural products between the EU-27 and the rest of the world was EUR 324.8 billion in 2019. This represented 8.0 % of total EU international trade in 2019.
The EU had a trade surplus of EUR 39.0 billion in the trade of agricultural goods, the value of exports (EUR 181.9 billion) exceeding that of imports (EUR 142.9 billion). Whilst the EU imported mainly raw, unprocessed agricultural goods, it principally exported processed food products.
Total trade in agricultural goods jumped to EUR 324.8 billion in 2019
Between 2002 and 2019, the value of EU trade in agricultural goods more than doubled (see
Figure 8.1.1), equivalent to an average annual growth of 5.0 %. Both the value of exports and imports grew sharply; exports from the EU grew at an average annual rate of 5.5 %, and imports at an average annual rate of 4.4 %. The EU recorded a growing trade surplus in agricultural goods over the period as a whole, with a jump to EUR 39.0 billion in 2019.
These valuations reflect the amount or weight of agricultural goods traded as well as their average price. Although the weight of EU exports was lower than imports in 2019 (134.0 million tonnes compared with 152.7 million tonnes), the average price per kilogram of weight was higher (EUR 1.4 per kg compared with EUR 0.9 per kg). Nevertheless, the gap in the average price narrowed, the average annual rate of growth for exports being lower than imports (+2.0 % compared with +2.6 %) between 2002 and 2019 (37).

8Trade in agricultural goods
Agriculture, forestry and fishery statistics — 2020 edition 137
8.2. EU trade in groups of agricultural productsAgricultural products can be subdivided into three main groups: animals and animal products, crop products and foodstuffs. Foodstuffs accounted for a majority (54.3 %) of the agricultural goods exported from the EU in 2019 and were valued at EUR 98.8 billion (see Figure 8.2.1). The value of crop and animal and animal product exports from the EU were both EUR 41.6 billion.
The composition of the EU’s agricultural imports was rather different to its exports; foodstuffs accounted for one third (34.0 %) of the value of EU imports, crop products almost 45 % and animals and animal products a little over one fifth (21.5 %).
Each of these three groups can be further subdivided to the level of product categories (see Figure 8.2.2).
The animals and animal products group consists of live animals, meat, fish, crustaceans and aquatic invertebrates, dairy produce, eggs, honey, and other products of animal origin. The EU had a trade surplus of EUR 7.3 billion in this product category in 2019. Trade surpluses for ‘dairy produce, birds’ eggs, natural honey and
edible products of animal origin not elsewhere specified or included‘ (which includes cheeses, milk and yoghurts; EUR 12.5 billion), ‘meat and edible meat offal’ (EUR 9.9 billion) and ‘live animals’ (EUR 2.8 billion), offset the deficit (EUR 17.7 billion) for fish, crustaceans and aquatic invertebrates.
Crop products include cereals, vegetables, horticultural products, fruit, coffee and fats and oils. The EU had a trade deficit of EUR 25.3 billion for crop products in 2019, largely stemming from deficits in the trade of ‘edible fruit and nuts’ (EUR 13.9 billion), ‘coffee, tea, mate and spices’ (EUR 7.6 billion) and ‘oilseeds and oleaginous fruits’ (EUR 7.1 billion).
Foodstuffs consist of various types of processed goods derived from crop and animal products, such as sugar, beverages, tobacco and prepared animal fodder. The EU had a trade surplus of EUR 51.1 billion in this category in 2019. The trade surplus was driven by trade surpluses for ’beverages, spirits and vinegar’ (EUR 25.7 billion) and ‘preparations of cereals, flour, starch or milk’ (EUR 13.7 billion).
Figure 8.2.1: EU‑27 exports and imports of agricultural products, 2019(% share of agricultural exports/imports)
Animal products 22.8 %
22.9 %
Foodstu�s54.3 %
Exports
Animal products 21.5 %
Vegetable productsVegetable products
44.5 %
Foodstu�s34.0 %
Imports
Source: Eurostat (online data code: DS-016894)

8 Trade in agricultural goods
Agriculture, forestry and fishery statistics — 2020 edition138
How have the trade balances of these three categories of agricultural products changed?
In the period between 2002 and 2019, the EU’s trade surplus in foodstuffs grew relatively steadily, the deficit for crops widened and for animals and animal products the sharp rise in the surplus between 2009 and 2013 was maintained and then grew again in 2019.
The EU’s trade in foodstuffs was consistently in surplus between 2002 and 2019. The value of EU exports in such products grew at a faster rate (an average annual rate of +5.8 %) than imports (an average annual rate of +3.6 %). As a result, the trade surplus grew from EUR 11.2 billion in 2002 to EUR 50.1 billion in 2019.
Over the same reference period, the trade deficit in crop products almost tripled, from EUR − 7.8 billion in 2002 to EUR − 22.0 billion in 2019. There was a trade surplus of EUR 10.8 billion in animals and animal products in 2019, representing a stark turnaround from the relatively balanced trade position in the period between 2002 and 2009.

8Trade in agricultural goods
Agriculture, forestry and fishery statistics — 2020 edition 139
Figure 8.2.2: EU‑27 exports and imports of agricultural products, 2019(EUR million)
0
5 00
0
10 0
00
15 0
00
20 0
00
25 0
00
30 0
00
35 0
00
40 0
00
Animal product exports
Animal product imports
Crop product exports
Crop product imports
Foodstu�s exports
Foodstu�s imports
Live animals
Meat and edible meat offal
Fish and crustaceans, molluscs & other aquatic invertebrates
Dairy produce; birds’ eggs; natural honey and edible products of animal origin n.e.s. or included
Products of animal origin, n.e.s. or included
Live trees & other plants; bulbs, roots & the like; cut flowers & ornamental foliage
Edible vegetables and certain roots and tubers
Edible fruit and nuts; peel of citrus fruits or melons
Coffee, tea, maté and spices
Cereals
Products of the milling industry; malt; starches; inulin; wheat glutin
Oil seeds & oleaginous fruits; miscellaneous grains, seeds & fruit;industrial or medicinal plants; straw and fodder
Lac; gums, resins and other vegetable saps and extracts
Vegetable plaiting materials; vegetable products n.e.s. or included
Animal or vegetable fats and oils and their cleavage products;prepared edible fats; animal or vegetable waxes
Preparations of meat, of fish or of crustaceans, molluscs or other aquatic invertebrates
Sugars and sugar confectionery
Cocoa and cocoa preparations
Preparations of cereals, flour, starch or milk; pastrycooks’ products
Preparations of vegetables, fruit, nuts or other parts of plants
Miscellaneous edible preparations
Beverages, spirits and vinegar
Residues & waste from the food industries; prepared animal fodder
Tobacco and manufactured tobacco substitutes
Source: Eurostat (Comext data code: DS-016894)

8 Trade in agricultural goods
Agriculture, forestry and fishery statistics — 2020 edition140
Figure 8.3.1: EU‑27 exports and imports of agricultural products by main partner, 2019(% share and EUR billion)
United Kingdom United Kingdom
23.2 %
United States 11.9 %
China7.7 %
Switzerland4.7 %Japan
4.0 %
Russia 3.7 %
Others 44.7 %
Exports
12.8 %Brazil7.4 %
United States 7.3 %
Norway 5.1 %
Ukraine 4.9 %
China4.7 %
Others 57.9 %
Imports
EUR 181.9 billion
EUR 142.9 billion
Total exports
Total imports
Source: Eurostat (online data code: DS-018995)
8.3. Main trading partners in agricultural productsThe United Kingdom is the EU’s main trading partner in agricultural products
The EU exported agricultural goods to the United Kingdom to the value of EUR 42.2 billion in 2019, accounting for a little less than one quarter (23.2 %) of the total value of the EU’s exports of agricultural goods, and imported agricultural goods to the value of EUR 18.3 billion, 12.8 % of such imports (see Figure 8.3.1). The United Kingdom was the main export destination for foodstuffs (23.3 % of all EU exports within this product group), crop products (23.0 %) and animal products (23.2 %).
The United States of America (USA) was the second largest trading partner with the EU in agricultural goods. The EU exported
agricultural goods to the USA that were valued at EUR 21.7 billion in 2019, accounting for 11.9 % of the total value of the EU’s exports of agricultural goods, and imported agricultural goods from the USA valued at EUR 10.4 billion, which accounted for 7.3 % of such imports.
The value of agricultural goods imported by the EU from Brazil (EUR 10.6 billion) was higher than imports from all other countries with the exception of the United Kingdom. About one half (48.1 %) of these imports concerned crop products. Norway was by far the largest exporter of animals and animal products to the EU, supplying about one fifth (21.5 %) of the total in 2019. Almost all of these animals and animal products from Norway, which were valued at EUR 6.6 billion, were fish.

8Trade in agricultural goods
Agriculture, forestry and fishery statistics — 2020 edition 141
Data sources and availabilityThe data source for EU trade data is Eurostat’s COMEXT database. More specifically, COMEXT is the reference database for international trade in goods. It provides access not only to both recent and historical data from the EU Member States but also to statistics of a significant number of non-EU countries.
Agricultural products are classified according to the sub-headings of the combined nomenclature (CN), based on the international classification known as the harmonized commodity description and coding system administered by the World Customs Organization. The 24 chapters (2-digit codes) of agricultural products in the CN are grouped into three major types: animal, vegetable and foodstuff products. In this analysis, the chapters are termed categories and the three groups are re-termed as in agricultural statistics, namely as animal and animal products, crops products and foodstuffs products. Chapter 15 (animal or vegetable fats and oils and their cleavage products; prepared edible fats; animal or vegetable waxes) is included in vegetables.
EU data are compiled according to Community guidelines and may, therefore, differ from national data published by Member States. Statistics on extra-EU trade are calculated as the sum
of trade of each of the 27 Member States with countries outside the EU. In other words, the EU is considered as a single trading entity and trade flows are measured into and out of the area, but not within it.
Classifications In international trade statistics, several classifications are used. Apart from the harmonised commodity description and coding system, data on trade are also available in the United Nations’ standard international trade classification (SITC Revision 4) and in the broad economic categories classification, the latter using end-use categories more adapted to economic analysis.
Unit of measureTrade values are expressed in millions (10⁶) or in billions (10⁹) of euros. They correspond to the statistical value, in other words, to the amount which would be invoiced in case of sale or purchase at the national border of the reporting country. It is called a FOB value (free-on-board) for exports and a CIF value (cost, insurance, freight) for imports.


9 Food and beverage distribution

9 Food and beverage distribution
Agriculture, forestry and fishery statistics — 2020 edition144
Did youknow ...
A combined 2.8 billion tonnes of primary
products, beverages and tobacco were transported by road on EU registered trucks in 2019…
…over a payload-distance of 500 billion kilometres
There were employed in the wholesaling of and the specialised retailing of food and beverages, and restaurants, bars, cafés and catering services in 2017
10.8 million people
Introduction
(38) For more information, see the European Commission’s webpage on food contacts materials.
Food and beverage distributors operate between producers and consumers; they comprise wholesalers and retailers. In a simplified form, wholesalers can be thought of as the intermediaries operating between producers and retailers or between two producers.
The ability to trace food through the distribution chain helps ensure food safety, while reducing disruption to trade. Based on EU legislation, traceability has been compulsory since 2005 for all enterprises involved in food and animal feed. This is to ensure that it is possible to identify where products have come from and where they are going.
Food comes into contact with many materials and articles during its production, processing, storage, preparation and serving, before its eventual consumption. These so-called food contact materials (FCMs) should be sufficiently inert so that their constituents neither adversely affect consumer health nor influence the quality of the food. To ensure the safety of FCMs, and to facilitate the free movement of goods, EU law provides for binding rules that business operators must comply with. This safety measure covers containers for transporting food and packaging materials safety and inertness for all food contact materials (38).

9Food and beverage distribution
Agriculture, forestry and fishery statistics — 2020 edition 145
Did youknow ...
A combined 2.8 billion tonnes of primary
products, beverages and tobacco were transported by road on EU registered trucks in 2019…
…over a payload-distance of 500 billion kilometres
There were employed in the wholesaling of and the specialised retailing of food and beverages, and restaurants, bars, cafés and catering services in 2017
10.8 million people
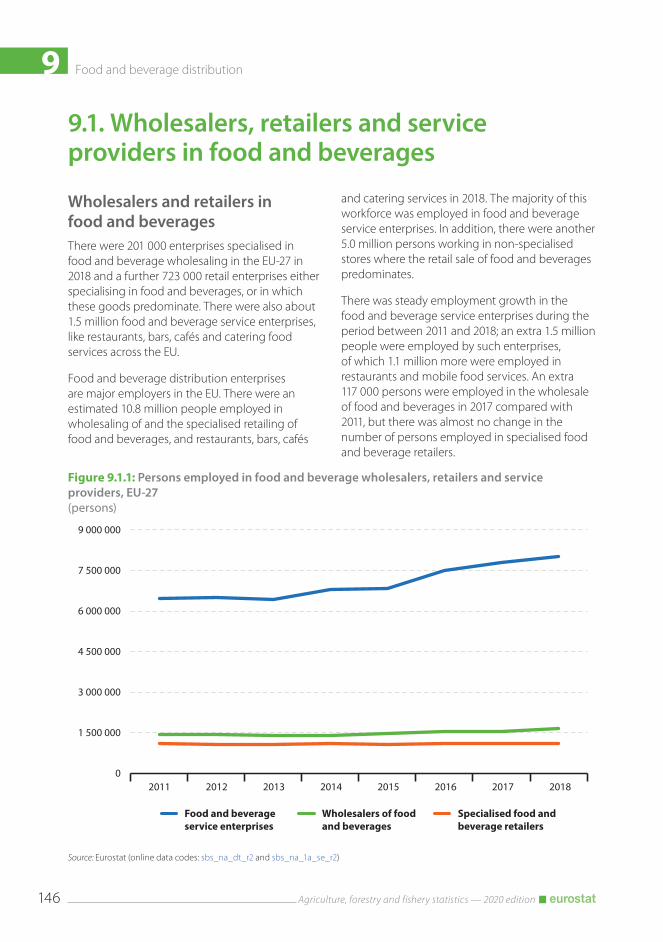
9 Food and beverage distribution
Agriculture, forestry and fishery statistics — 2020 edition146
Figure 9.1.1: Persons employed in food and beverage wholesalers, retailers and service providers, EU‑27(persons)
0
1 500 000
3 000 000
4 500 000
6 000 000
7 500 000
9 000 000
2011 2012 2013 2014 2015 2016 2017 2018
Food and beverageservice enterprises
Wholesalers of foodand beverages
Specialised food andbeverage retailers
Source: Eurostat (online data codes: sbs_na_dt_r2 and sbs_na_1a_se_r2)
9.1. Wholesalers, retailers and service providers in food and beverages
Wholesalers and retailers in food and beveragesThere were 201 000 enterprises specialised in food and beverage wholesaling in the EU-27 in 2018 and a further 723 000 retail enterprises either specialising in food and beverages, or in which these goods predominate. There were also about 1.5 million food and beverage service enterprises, like restaurants, bars, cafés and catering food services across the EU.
Food and beverage distribution enterprises are major employers in the EU. There were an estimated 10.8 million people employed in wholesaling of and the specialised retailing of food and beverages, and restaurants, bars, cafés
and catering services in 2018. The majority of this workforce was employed in food and beverage service enterprises. In addition, there were another 5.0 million persons working in non-specialised stores where the retail sale of food and beverages predominates.
There was steady employment growth in the food and beverage service enterprises during the period between 2011 and 2018; an extra 1.5 million people were employed by such enterprises, of which 1.1 million more were employed in restaurants and mobile food services. An extra 117 000 persons were employed in the wholesale of food and beverages in 2017 compared with 2011, but there was almost no change in the number of persons employed in specialised food and beverage retailers.
9Food and beverage distribution
Agriculture, forestry and fishery statistics — 2020 edition 147
9.2. Transport of agricultural products and food productsThe chain from ‘farm to fork’ relies on transport to get raw agricultural output and food from producers to consumers, often via warehouses, food processing facilities, wholesalers and retailers. The length of that journey and the modal network that the food takes can vary considerably; among many other factors, it depends on the perishable nature of the goods and the requirements to keep it fresh and in good quality. For example, some agricultural and food products will need to be kept frozen, others chilled or in a controlled atmosphere, whilst others will be transported dry or in air-conditioned storage. Optimum storage and treatment conditions are vital to ensure that the food that consumers buy is not just safe to eat but of a high quality. Before and during transport, therefore, elements like time and temperature control, sterilization, pasteurization, dehydration and canning are considered.
Only a partial picture of the transport of agricultural and food products can be given from the official data that are available. Nevertheless, it demonstrates the scale of agricultural and food transport in the EU, how reliant parts of the chain are on each other and some of the key transport flows.
This section looks at some details concerning freight transport in the EU by road and inland waterways. Data on rail, air and sea transport by type of goods are currently unavailable or too provisional for data analysis.
Every year, EU-registered trucks transport billions of tonnes of agricultural products and food products by road …
About 1.2 billion tonnes of primary agriculture, hunting, forestry and fishery products were transported by EU-registered trucks (over 3.5 tonnes of loading capacity) on roads in 2019. This includes both EU-produced goods and imports from outside the EU. A further 1.6 billion
tonnes of food products, beverages and tobacco were driven by EU-registered trucks in 2019.
It should be noted that these figures do not take into account the weight of products transported on EU roads by non-EU registered trucks nor by vehicles with a loading capacity smaller than 3.5 tonnes. This is important to note in those EU Member States that have an EU external border, as a part of international transport is not covered by these statistics.
… over a payload-distance of about 500 billion kilometres in 2019
A unit of measure of freight transport is the tonne-kilometre (t-km). This represents the transport of one tonne of goods by a given transport mode over a distance of one kilometre. For the purpose of this publication, this measurement is referred to as a ‘payload-distance’. Agriculture, hunting, forestry and fishery products were transported by EU-registered trucks, with a loading capacity of 3.5 tonnes or more, for a payload-distance of 197 billion tonne-kilometres in 2019. Food products, beverages and tobacco were transported for a further 303 billion tonne-kilometres in 2019. To put this in some context, this was the equivalent of an average distance of 177 km for every tonne of these goods transported by road.
By way of comparison, metal ores and peat were transported by road for a payload-distance of 138 billion tonne-kilometres in 2019, and other non-metallic mineral products for 146 billion tonne-kilometres; these were the next largest product groups.
Continued growth in EU road freight transport of agricultural and food products
Between 2010 and 2019, the tonnage of agriculture, hunting, forestry and fishery products transported by EU-registered trucks continued

9 Food and beverage distribution
Agriculture, forestry and fishery statistics — 2020 edition148
Figure 9.2.1: Transport of agriculture, hunting, forestry and fishery products as well as food products, beverages, and tobacco by road in the EU‑27, 2010‑2019
Food products, beverages and tobacco Agriculture, forestry and �shery products
0
500 000
1 000 000
1 500 000
2 000 000
2010
2011
2012
2013
2014
2015
2016
2017
2018
2019
Tonnes transported by road(thousand tonnes)
0
90 000
180 000
270 000
360 000
2010
2011
2012
2013
2014
2015
2016
2017
2018
2019
Road payload-distance(million t-km)
Note: 2018 figures include the 2017 figure for Belgium for agriculture, forestry and fishery products and the 2017 figure for Finland for food products, beverages and tobacco. 2010 figures for food products, beverages and tobacco: confidential.
Source: Eurostat (online data code: road_go_ta_tg)
to increase (+11.2 % in total). The total payload-distance for these products rose even more sharply (+16.3 % overall), suggesting that the average distance travelled by road of 1 tonne of goods had lengthened by about 7 km. There was a similar development for food products, beverages and tobacco; the quantity transported by EU-registered trucks and the total payload-distance increased (+19.9 % and +22.8 % between 2011 and 2019).
Agricultural products and food products represent the largest share of road freight transport payload-distance
A wide range of products are transported by EU-registered trucks but the payload-distance by road of the combined product groups of agriculture, hunting, forestry and fishery products and food products, beverages and tobacco
was more than that of any other product group in 2018. These combined groups of goods accounted for 27.4 % of the payload-distance of all road freight transport on EU-registered trucks and 20.7 % of all the road freight tonnes in 2018. By way of comparison, metal ores and peat accounted for 7.8 % of all freight payload-distance by EU-registered trucks and 25.8 % of all road freight tonnes, and other non-metallic mineral products 7.9 % and 12.2 % of the total respectively.
The vast majority of agricultural and food products are transported by road over distances of less than 300 km
A large majority (85.4 % of the goods in tonnes, 2019) of agriculture, hunting, forestry and fisheries products transported by EU-registered trucks were carried over distances of less than 300 km. This was also the case (79.8 %) for food products,

9Food and beverage distribution
Agriculture, forestry and fishery statistics — 2020 edition 149
Figure 9.2.2: Road transport of agriculture, hunting, forestry and fishery products, by type of transport, 2019(thousand tonnes)
0 50 000 100 000 150 000 200 000 250 000
FranceGermany
SpainPoland
ItalyNetherlands
FinlandSwedenCzechiaSlovakia
DenmarkHungary
GreeceAustria
BelgiumBulgaria
RomaniaPortugal
IrelandLatvia
LithuaniaSlovenia
EstoniaCroatiaCyprus
Luxembourg
United Kingdom
Switzerland
National transport International transport — loaded International transport — unloaded
Source: Eurostat (online data codes: road_go_na_tgtt, road_go_ia_lgtt and road_go_ia_ugtt)
beverages and tobacco products. Indeed, in both cases a majority (68.3 % and 58.8 % respectively) of these products were transported over distances of less than 150 km. In large part this reflects the perishable nature of many (particularly fresh) agricultural and food products as well as their widespread availability from regional producers. It also fits with the stated policy aim to move an increasingly high proportion of the transport of goods over 300 km onto trains or inland waterways as a more environmentally friendly means of transport over long distances (39).
(39) COM (2011) 144 final: White paper: Roadmap to a Single European Transport Area — Towards a competitive and resource efficient transport system. It includes the aim that ’30 % of road freight over 300 km should shift to other modes such as rail or waterborne transport by 2030, and more than 50 % by 2050’.
Vast majority of road freight transport of agricultural and food products carried out within a Member State
National road freight transport, which is carried out between two places located in the same country by a vehicle registered in that country, was the largest component of the road freight transport of agriculture, hunting, forestry and fishery products, and of food products in the EU, as was the case for other products. The other key component is international road transport between two places in two different countries, split between place of loading and unloading.

9 Food and beverage distribution
Agriculture, forestry and fishery statistics — 2020 edition150
Figure 9.2.3: Road freight transport of agriculture, hunting, forestry and fishery products as well as food products, beverages and tobacco, 2019(% share of EU-27 total, tonne-kilometres)
Spain22.6 %
France15.7 %
Poland12.1 %
Germany 9.5 %
Italy5.9 %
Netherlands4.5 %
Others29.7 %
Transport of agriculture, huntingforestry and �shery products
Spain18.2 %
Germany 16.6 %
Poland16.5 %
France9.0 %
Italy7.7 %
Netherlands4.6 %
Others27.4 %
Transport of food products,beverages and tobacco
Source: Eurostat (online data code: road_g_ta_tg)
Cross-trade transport that uses transport registered in a country other than the country of loading or unloading as well as cabotage transport performed on the national territory of a country different to that of the registered vehicle are much smaller segments of the market and are not covered here.
National transport dominated road freight transport of agriculture, hunting, forestry and fishery products in all Member States (see Figure 9.2.2). Only in a few Member States, like the Netherlands and Belgium, where there are important cargo ports, as well as Slovenia, Luxembourg and Croatia, was the share of international freight transport of agriculture, hunting, forestry and fisheries products above 20 %.
About 60 % of the payload-distance by EU-registered trucks with agriculture, hunting, forestry and fishery products was done by trucks registered in just four Member States in 2019; Spain (22.6 %), France (15.7 %), Poland (12.1 %) and Germany (9.5 %). Likewise, about 60 % of the payload-distance of food products, beverages and tobacco was by trucks registered in four Member States in 2019: Spain (18.2 %), Germany (16.6 %), Poland (16.5 %) and France (12.8 %).
International road freight transport of agricultural products reliant on some key routes
Loading and unloading destinations can be used to get an idea of the road routes used for the international transport of agricultural and food products. An indication is given here only for
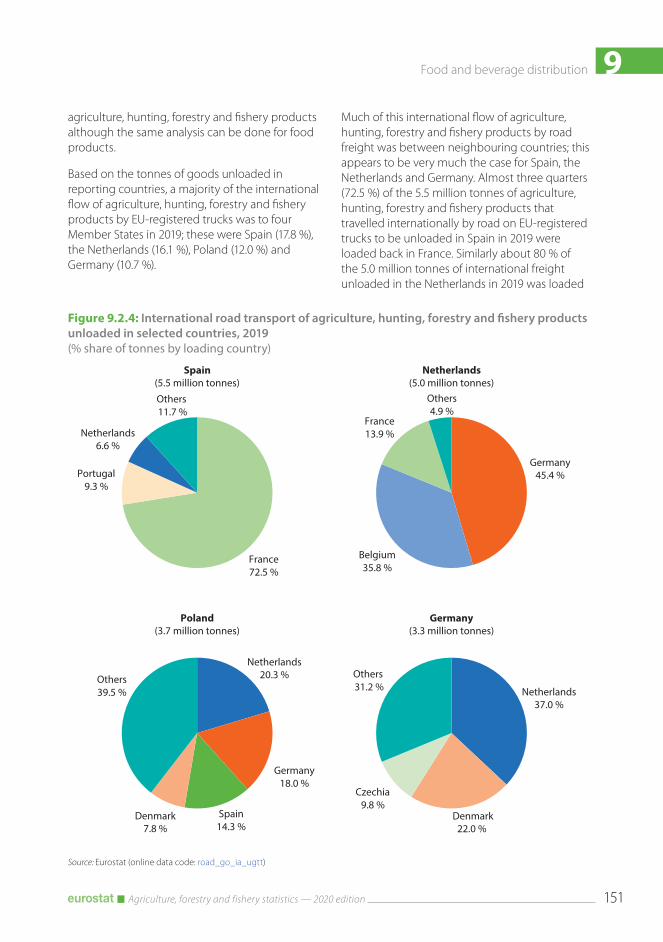
9Food and beverage distribution
Agriculture, forestry and fishery statistics — 2020 edition 151
Figure 9.2.4: International road transport of agriculture, hunting, forestry and fishery products unloaded in selected countries, 2019(% share of tonnes by loading country)
France 72.5 %
Portugal 9.3 %
Netherlands6.6 %
Others 11.7 %
Spain(5.5 million tonnes)
Germany45.4 %
Belgium 35.8 %
France 13.9 %
Others4.9 %
Netherlands(5.0 million tonnes)
Netherlands20.3 %
Germany 18.0 %
Spain 14.3 %
Denmark7.8 %
Others39.5 %
Poland(3.7 million tonnes)
Netherlands37.0 %
Denmark22.0 %
Czechia 9.8 %
Others 31.2 %
Germany(3.3 million tonnes)
Source: Eurostat (online data code: road_go_ia_ugtt)
agriculture, hunting, forestry and fishery products although the same analysis can be done for food products.
Based on the tonnes of goods unloaded in reporting countries, a majority of the international flow of agriculture, hunting, forestry and fishery products by EU-registered trucks was to four Member States in 2019; these were Spain (17.8 %), the Netherlands (16.1 %), Poland (12.0 %) and Germany (10.7 %).
Much of this international flow of agriculture, hunting, forestry and fishery products by road freight was between neighbouring countries; this appears to be very much the case for Spain, the Netherlands and Germany. Almost three quarters (72.5 %) of the 5.5 million tonnes of agriculture, hunting, forestry and fishery products that travelled internationally by road on EU-registered trucks to be unloaded in Spain in 2019 were loaded back in France. Similarly about 80 % of the 5.0 million tonnes of international freight unloaded in the Netherlands in 2019 was loaded

9 Food and beverage distribution
Agriculture, forestry and fishery statistics — 2020 edition152
either back in Germany (45.4 %) or in Belgium (35.8 %). About two thirds of the 3.3 million tonnes of international freight of agriculture, hunting, forestry and fishery products that were unloaded in Germany in 2019 were loaded in the neighbouring countries of the Netherlands, Denmark and Czechia.
There were longer journeys transporting agriculture, hunting, forestry and fishery products to Poland. The Netherlands was the principal loading Member State for such goods to Poland (20.3 % of the total) and Spain was the third main loading destination (accounting for 14.3 % of the total unloaded in Poland).
Inland waterways transport of agricultural and food products only 2 % of equivalent freight tonnes sent by road
Whilst road transport is a key modal form for the transport of freight goods, the EU also has about 41 000 km of waterways and canals that are used to link cities and regions. Of the 18 Member States that have inland waterways and canals, a dozen of them have interconnected networks that allow cross-border traffic. The main river networks include the Rhine and its tributaries such as the Main, Mosel, Neckar and Sarre, as well as the Danube and Elbe, which are often connected to canal networks, of which those in Belgium and the Netherlands are the most widespread.
Europe’s inland waterways were responsible for transporting a further 38.7 million tonnes of agriculture, hunting, forestry and fishery products, with a payload-distance of 16.9 billion tonne-kilometres in 2019. Likewise, a further 20.9 million tonnes of food products, beverages and tobacco
were transported along the EU’s inland waterways in 2019, with a payload-distance of 5.5 billion tonne-kilometres. Together these products represented 11.4 % of the total freight tonnes transported on the EU’s inland waterways in 2018 and 16.0 % of the total payload-distance.
Less agricultural products sent by inland waterways in 2019 than 2014
It should be borne in mind that annual changes in inland waterways transport freight loads and performance can be impacted by water levels (either too high or too low) and whether or not navigability is affected. Over the medium-term though some trends can be determined, despite the upturn in traffic in 2019 (see Figure 9.2.5).
Since a relative peak in 2014, the tonnes of agriculture, hunting, forestry and fishery products transported by inland waterways have declined, from 42.0 million tonnes to about 38.7 million tonnes in 2019. Between 2014 and 2019, the payload-distance over which agriculture, hunting, forestry and fishery products were transported on inland waterways declined even faster. Similarly, there were also declines in the freight tonnes and payload-distance of food products, beverages and tobacco since their relative peak in 2015.
For both product groups, the steeper rates of decline in the total payload-distance (t-km) than in tonnes carried suggest a marked shortening in average distances over time.
The vast majority of the freight on the EU’s waterways was carried by vessels navigating through only a few Member States. As freight is often recorded multiple times as it travels across borders, figures for Member States on tonnes

9Food and beverage distribution
Agriculture, forestry and fishery statistics — 2020 edition 153
Figure 9.2.5: Transport of agriculture, hunting, forestry and fishery products as well as food products, beverages, and tobacco by inland waterways in the EU‑27, 2010‑2019
Agriculture, forestry and �shery products Food products, beverages and tobacco
0
10
20
30
40
50
2010
2011
2012
2013
2014
2015
2016
2017
2018
2019
Tonnes transported by inland waterways
(million tonnes)
0
5 000
10 000
15 000
20 000
25 000
2010
2011
2012
2013
2014
2015
2016
2017
2018
2019
Inland waterways payload-distance
(million t-km)
Source: Eurostat (online data code: iww_go_atygo)
transported do not sum to EU totals. With this in mind, the Netherlands recorded vessels carrying a total of 29.8 million tonnes of agriculture, hunting, forestry and fishery products, and food products, beverages and tobacco in 2019 and Germany recorded vessels carrying 21.5 million tonnes of such products. France recorded vessels carrying more agriculture, hunting, forestry and fishery products (at 13.6 million tonnes) than any other Member State in 2019 but relatively little in the way of food products, beverages and tobacco (1.3 million tonnes).
About 70 % of the payload-distance of agriculture, hunting, forestry and fisheries products and food products, beverages and tobacco on inland waterways within the EU-27 was carried on the waterways of Germany (32.2 %), Romania (19.4 %) and the Netherlands (17.8 %) in 2019. A further 20 % of the EU total was carried along the waterways of France (10.4 %) and Bulgaria (9.0 %).

9 Food and beverage distribution
Agriculture, forestry and fishery statistics — 2020 edition154
Data sources and availabilityStructural business statistics (SBS) describe the structure and performance of businesses in the EU. They cover the ‘business economy’ (NACE Rev. 2 Sections B to N and Division 95) which includes industry, construction, distributive trades, and services.
The statistics can be broken down to a very detailed sectoral level (in other words, several hundred economic activities). Thus, the information available from SBS is more detailed than data from short-term business statistics and national accounts. The main variables within SBS are expressed as monetary values or as counts, for example for the numbers of enterprises or persons employed.
Data on the carriage of goods by roads are derived from micro-data collected in the context of Regulation (EU) No 70/2012 of the European
Parliament and of the Council on statistical returns in respect of the carriage of goods by road. The figures are aggregated on the basis of sample surveys carried out by the reporting countries. The data cover tonnes, tonne-kilometres, vehicle-kilometres and numbers of journeys. Road freight transport statistics are reported by Member States for vehicles registered in their country.
Inland waterway transport statistics provide information on the quantity and performance of freight transport on the EU’s inland waterway network. They are reported on the basis of the ‘territoriality principle’ which means that each Member State reports the loading, unloading and movements of goods that take place on its national territory, irrespective of country of origins of enterprises or place of first loading and final unloading.

10 Food and beverage consumption

10 Food and beverage consumption
Agriculture, forestry and fishery statistics — 2020 edition156
Did youknow ...
On average, 21.4 %
expenditure of households in the EU-27 was spent on food, beverages and catering services in 2018
A little more thanone half (an estimated 51.8 %) of the EU-27’s adult population over 18 years of age
overweight in 2017
On average across theEU-27 in 2016, each
person generated158 kg offood waste
IntroductionFood and beverages are vital for satisfying physiological needs of hunger and thirst. As such, food and beverages are a recurrent expenditure item for almost all households. There is a wide variety of food and drinks available to EU citizens.
Purchases often reflect local, regional and national cuisine and form part of the national cultural identity of a Member State.

10Food and beverage consumption
Agriculture, forestry and fishery statistics — 2020 edition 157
Did youknow ...
On average, 21.4 %
expenditure of households in the EU-27 was spent on food, beverages and catering services in 2018
A little more thanone half (an estimated 51.8 %) of the EU-27’s adult population over 18 years of age
overweight in 2017
On average across theEU-27 in 2016, each
person generated158 kg offood waste

10 Food and beverage consumption
Agriculture, forestry and fishery statistics — 2020 edition158
Figure 10.1.1: Structure of household consumption, 2018(% of total household consumption expenditure)
0
5
10
15
20
25
30
35
EU-2
7
Ger
man
y
Luxe
mbo
urg
Den
mar
k
Net
herla
nds
Belg
ium
Fran
ce
Swed
en
Finl
and
Slov
enia
Aus
tria
Cypr
us
Pola
nd
Italy
Irela
nd
Slov
akia
Bulg
aria
Czec
hia
Mal
ta
Spai
n
Port
ugal
Croa
tia
Latv
ia
Lith
uani
a
Hun
gary
Gre
ece
(1 )Es
toni
a
Rom
ania
Catering servicesAlcoholic beveragesNon-alcoholic beveragesFood
(1) 2017 data.
Source: Eurostat (online data code: nama_10_co3_p3)
10.1. Consumption expenditureFood and beverages (including catering services) accounted for a combined 21.4 % of the final consumption expenditure of households, on average, across the EU-27 in 2018. Of this total, an average 11.8 % was spent on food, 6.8 % on catering services, 1.6 % on alcoholic beverages and 1.2 % on non-alcoholic beverages.
There are considerable differences in the proportion of household income spent on food and beverage products within the EU (see Figure 10.1.1). Among the Member States, the lowest shares of household consumption expenditure on food, beverages and catering services was in Germany (16.4 %) and then Luxembourg (17.2 %). By contrast, the highest shares were in Romania (30.9 %) and Estonia (30.8 %).
For most people, food and beverages are essential items of expenditure, although for many people
there is food poverty. About one in every eight people over the age of 16 years in the EU-27 (an estimated 11.9 %) had either some or a severe inability to afford a meal with meat, chicken, fish, or vegetarian equivalent every second day in 2018. The proportion was highest (13.8 %) in the age range of people aged 55 to 64 years old.
In some Member States, this measure of food poverty was relatively acute. In Bulgaria, about two in every five people (43.8 %) aged 16 years or more had some inability or a severe inability to afford a meal with meat, chicken, fish or vegetarian equivalent every second day in 2018 (see Figure 10.1.2). In Lithuania, Romania, Slovakia and Hungary the equivalent proportion was about one in every five people aged 16 years or more. Nevertheless, food poverty in the EU has been in decline in almost all Member States since about 2012 and particularly in the aforementioned Member States.
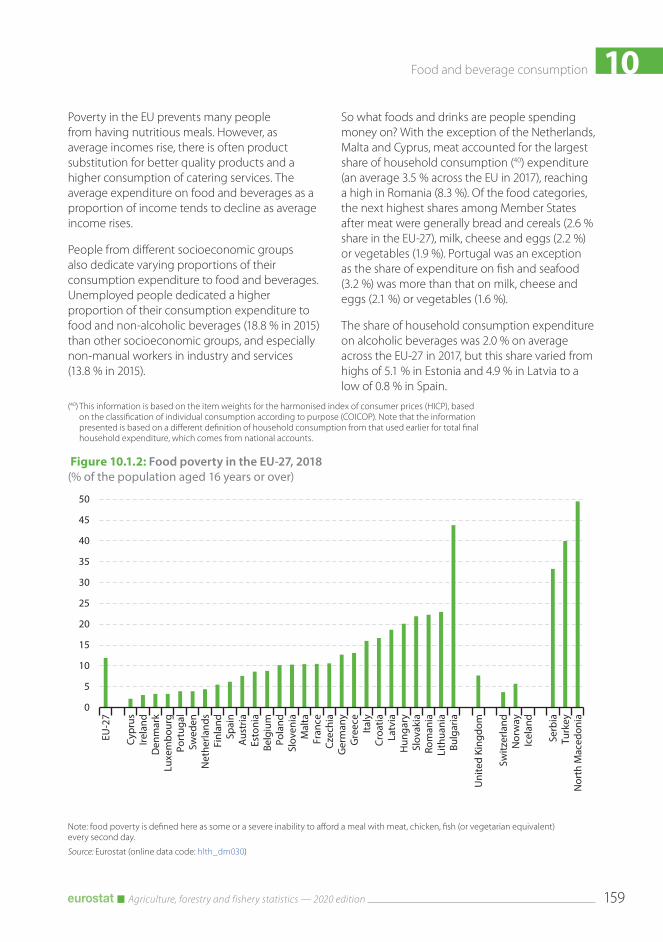
10Food and beverage consumption
Agriculture, forestry and fishery statistics — 2020 edition 159
Figure 10.1.2: Food poverty in the EU‑27, 2018(% of the population aged 16 years or over)
0
5
10
15
20
25
30
35
40
45
50
EU-2
7
Cypr
usIre
land
Den
mar
kLu
xem
bour
gPo
rtug
alSw
eden
Net
herla
nds
Finl
and
Spai
nA
ustr
iaEs
toni
aBe
lgiu
mPo
land
Slov
enia
Mal
taFr
ance
Czec
hia
Ger
man
yG
reec
eIta
lyCr
oatia
Latv
iaH
unga
rySl
ovak
iaRo
man
iaLi
thua
nia
Bulg
aria
Uni
ted
King
dom
Switz
erla
ndN
orw
ayIc
elan
d
Serb
iaTu
rkey
Nor
th M
aced
onia
Note: food poverty is defined here as some or a severe inability to afford a meal with meat, chicken, fish (or vegetarian equivalent) every second day.
Source: Eurostat (online data code: hlth_dm030)
Poverty in the EU prevents many people from having nutritious meals. However, as average incomes rise, there is often product substitution for better quality products and a higher consumption of catering services. The average expenditure on food and beverages as a proportion of income tends to decline as average income rises.
People from different socioeconomic groups also dedicate varying proportions of their consumption expenditure to food and beverages. Unemployed people dedicated a higher proportion of their consumption expenditure to food and non-alcoholic beverages (18.8 % in 2015) than other socioeconomic groups, and especially non-manual workers in industry and services (13.8 % in 2015).
(40) This information is based on the item weights for the harmonised index of consumer prices (HICP), based on the classification of individual consumption according to purpose (COICOP). Note that the information presented is based on a different definition of household consumption from that used earlier for total final household expenditure, which comes from national accounts.
So what foods and drinks are people spending money on? With the exception of the Netherlands, Malta and Cyprus, meat accounted for the largest share of household consumption (40) expenditure (an average 3.5 % across the EU in 2017), reaching a high in Romania (8.3 %). Of the food categories, the next highest shares among Member States after meat were generally bread and cereals (2.6 % share in the EU-27), milk, cheese and eggs (2.2 %) or vegetables (1.9 %). Portugal was an exception as the share of expenditure on fish and seafood (3.2 %) was more than that on milk, cheese and eggs (2.1 %) or vegetables (1.6 %).
The share of household consumption expenditure on alcoholic beverages was 2.0 % on average across the EU-27 in 2017, but this share varied from highs of 5.1 % in Estonia and 4.9 % in Latvia to a low of 0.8 % in Spain.

10 Food and beverage consumption
Agriculture, forestry and fishery statistics — 2020 edition160
10.2. Obesity
(41) For more information, see https://ec.europa.eu/health/nutrition_physical_activity/policy/strategy_en.
The European Commission has had a number of initiatives that promote healthy and sustainable diets. Among these was the 2007 initiative on nutrition, overweight and obesity-related health issues (41) which encompassed initiatives on food labelling, school fruit and milk schemes, on sport and on research projects. Among other objectives were: the avoidance of nutritional deficiencies and of direct health problems of being overweight; the promotion of safe and sustainable food; a reduction in food waste; and, improved animal welfare. The direct health problems related to being overweight or obese also have an economic impact as costs related to treatments for weight-related illnesses. Obesity causes a range of chronic diseases, including diabetes, cancers and heart disease. The body mass index (BMI) is defined as a person’s weight in kilograms divided by the square of their height.
One half (an estimated 51.8 %) of the EU-27’s adult population over 18 years of age was classified as overweight in 2017 (see Figure 10.2.1). A little over one third (36.9 %) of the EU’s adult population was pre-obese (with a BMI over 25 but less than 30) and about
one in every seven adults (14.9 %) was classified as obese (with a BMI greater than 30) in 2017.
The Member States with the highest proportions of their adult populations (aged 18 years or over) that were overweight in 2017 were Croatia (60.9 %), Finland (61.1 %), Malta (62.2 %), Czechia (62.3 %) and Romania (62.9 %). Italy and France had the lowest proportions (44.9 % in 2014 and 46.1 % in 2017 respectively).
These proportions appear to be rising. This was the case for the overwhelming majority of the Member States for which data are available from 2008. In some Member States, the proportion of the adult population that was overweight rose significantly: in Bulgaria it rose from 50.8 % in 2008 to 59.5 % in 2017 and in Romania from 50.3 % in 2008 to 62.9 % in 2017.
The proportion of overweight adults (those that were pre-obese and obese) grew steadily with age in the survey year. A little more than one fifth (22.2 % in 2014) of young adults aged 18 to 24 years were pre-obese or obese across the EU-27. However, nearer two thirds (66.4 % in 2014) of adults aged between 65 and 74 years were pre-obese or obese.
Figure 10.2.1: Overweight adult populations, 2017(% of the adult population aged 18 years or over)
0
10
20
30
40
50
60
70
EU-2
7 (1 )
Italy
(2 )Fr
ance
Net
herla
nds
Den
mar
k (2 )
Belg
ium
Luxe
mbo
urg
Swed
en (2 )
Aus
tria
Spai
nG
erm
any
(2 )Sl
oven
iaCy
prus
Port
ugal
Slov
akia
Pola
ndEs
toni
aLi
thua
nia
Hun
gary
Gre
ece
(2 )La
tvia
Irela
ndBu
lgar
iaCr
oatia
Finl
and
Mal
taCz
echi
aRo
man
ia
Uni
ted
King
dom
Nor
way
Serb
iaN
orth
Mac
edon
ia
ObesePre-obese
(1) Estimate.(2) 2014 data.
Source: Eurostat (online data code: sdg_02_10)

10Food and beverage consumption
Agriculture, forestry and fishery statistics — 2020 edition 161
10.3. Generation of waste by households
(42) For more information on food waste, visit the European Commission’s website: https://ec.europa.eu/food/safety/food_waste/eu_actions_en.
Reducing food loss and waste is an integral part of the Action Plan of the European Commission’s Farm to Fork strategy towards a sustainable EU food system that safeguards food security and ensures access to healthy diets sourced from a healthy planet (42).
Within the EU-27, households generated 189.8 million tonnes of waste in 2018, equivalent to 8.2 % of all the waste generated by economic activities and households. This waste includes plastics, metals and clothing among much more, but also includes food waste.
Within the three classification categories of animal and mixed food waste, vegetal waste, and mixed household waste are types of food waste. Eurostat estimates that the EU-27 produced 70 million tonnes of food waste in 2016, which was the equivalent of 158 kg per inhabitant over the year across the EU. As such, just over one third of all the household waste produced in the EU-27 in 2016 was considered food waste.
During the short time series for which data are available, there was little change in food waste levels: food waste in 2012 was an estimated 69 million tonnes, the equivalent of 157 kg per inhabitant over the year.

10 Food and beverage consumption
Agriculture, forestry and fishery statistics — 2020 edition162
Data sources and availability
(43) Details on the project and outputs regarding the 2012 reference year are described in Eurostat’s The “food waste plug-in” — reference year 2012, Project description and outputs: https://circabc.europa.eu/ui/group/b01d2930-990e-44fb-9121-a9a6b00a1283/library/ec3f307e-1107-4d5e-8f7e-12d2ff43b464/details.
Final consumption expenditure in national accountsEurostat collects data on household final consumption expenditure according to the international classification of individual consumption by purpose (COICOP) in the framework of ESA 2010. The transmission requirements for each dataset are defined in ESA 2010 transmission programme. For COICOP data these are t+9 months after the reference period.
Household consumption expenditure is classified by consumption purpose according to the COICOP classification (see also Commission Regulation (EC) No 113/2002 of 23 January 2002). Relevant COICOP categories at three-digit level for this chapter are as follows:
• P010 — food and non-alcoholic beverages;• P011 — food;• P012 — non-alcoholic beverages;• P021 — alcoholic beverages;• P111 — catering services.
Harmonised indices of consumer pricesHarmonised indices of consumer prices (HICPs) are economic indicators constructed to measure the changes over time in the prices of consumer goods and services acquired by households. HICPs give comparable measures of inflation between the Member States and some other countries. They are calculated according to a harmonised approach and a single set of definitions. The coverage of HICPs is defined in terms of ‘household final monetary consumption expenditure’, by reference to national accounts concepts (ESA 2010).
Body mass index statisticsThe European health interview survey (EHIS) and the EU’s statistics on income and living conditions (EU-SILC) are the sources of information for body mass index (BMI) statistics. The aim is to provide harmonised statistics across the EU Member States in relation to the respondents’ health status, lifestyle (health determinants) and their use of healthcare services. The BMI is a measure of a person’s weight relative to their height that links fairly well with body fat. The BMI is accepted as the most useful measure of obesity for adults (those aged 18 years and over) when only weight and height data are available. It is calculated as a person’s weight (in kilograms) divided by the square of his or her height (in metres).
BMI (kg/m²) = weight (kg) / (height (m))²
The following subdivision (according to the WHO) is used to classify results for the BMI:
• < 18.50: underweight;• ≥ 18.50 - < 25: normal range;• ≥ 25: overweight;• ≥ 30: obese.
Food waste statisticsEurostat has been working together with Member States to see how food waste data could be collected within the data collection framework set by the Waste Statistics Regulation (EC 2150/2002). In order to get more information on the EWC-Stat items that might contain food waste, the food waste plug-in consisted of a disaggregation of some data by list of waste code and by NACE activity. Data on food waste estimations from the Member States are voluntary (43).

11 Agriculture, forestry and fisheries at a glance

11 Agriculture, forestry and fisheries at a glance
Agriculture, forestry and fishery statistics — 2020 edition164
Did you know that...
• Having fallen (− 1.4 %) in 2018, the index of agricultural factor income per annual work unit grew (+4.7 %) in 2019 to reach a new peak. The index was three fifths (+60.1 %) above the level of 2005.
• The output of the agricultural industry was valued at EUR 418.0 billion in 2019, an increase (+2.4 %) compared with 2018.
• The harvested production of cereals increased sharply (+9.2 %) to 299.3 million tonnes in 2019. Part of this increase reflected a rebound from a relatively low harvest in 2018 due to that year’s drought in many regions of central and northern Europe.
• The production of some types of meat (measured in carcass weight) decreased in 2019, notably bovine meat (− 1.4 %) and pig meat (− 0.7 %). By contrast, there was another rise in raw milk production (+0.9 %) to 158.2 million tonnes in 2019, continuing an upward trend.
• Output prices for cereals were lower (− 2.9 %) in 2019 than in 2018 in real (deflated) terms; there were falls for all major types of cereals. By contrast, there were increases for potatoes (+23.6 %) and tomatoes (+13.5 %). The real-terms price index for animals increased (+4.5 %) in 2019, reflecting a large increase recorded for pigs (+15.7 %) balanced against decreases for the other major types of meat: poultry (− 1.6 %), sheep and goats (− 3.0 %), and cattle (− 4.1 %). Following strong fluctuations in recent years, the average milk price was relatively stable in 2019 (− 0.6 %).
Figure 11.1b: Output value of the agricultural industry, 2019(% of total output, at basic prices)
0 5 10 15
CerealsIndustrial crops
Forage plantsVegetables (1)
PotatoesFruit
WineOlive oil
Other crops; crop productsCattle
PigsSheep and goats
PoultryOther animals
MilkEggs
Other animal productsServices; secondary act.
Note: estimates. (1) Including also horticultural plants.
Source: Eurostat (online data code: aact_eaa01)
Figure 11.1a: Index of agricultural factor income per annual work unit, 2005‑2019(2005 = 100)
0
20
40
60
80
100
120
140
160
180
2005
2006
2007
2008
2009
2010
2011
2012
2013
2014
2015
2016
2017
2018
2019
Note: index rescaled from 2010 = 100 to 2005 = 100. 2019: estimate.
Source: Eurostat (online data code: aact_eaa06)
Key information Year Value Unit
Gross domestic product (GDP) 2019 13 963.6 EUR billion
Population on 1 January 2019 446.8 million
Land area 2016 4 104 251 km²
Farmland 2016 1 566 653 km²
Share of farmland in land area 2016 38.2 %
Source: Eurostat (online data codes: nama_10_gdp, demo_pjan, reg_area3 and ef_m_farmleg)
EU‑27

11Agriculture, forestry and fisheries at a glance
Agriculture, forestry and fishery statistics — 2020 edition 165
Table 11.1: Key indicators for agriculture, forestry and fisheries for the EU‑27
Farms and farmland Year Value UnitFarmland: utilised agricultural area (UAA) 2016 156 665 thousand hectaresFarms (agricultural holdings) 2016 10 282 700 number
Share of very small farms (with < EUR 8 000 of standard output) (1) 2016 68.3 %
Farmers Year Value UnitEmployment in agriculture as a share of total employment (2) 2018 4.4 %Total labour force in agriculture 2019 8 739.7 thousand annual work unitsYoung farmers (under 40 years old) as a share of all farm managers 2016 10.7 %
Economic performance of agriculture Year Value UnitContribution of agriculture to gross domestic product 2019 1.3 %Gross value added (at basic prices) 2019 181 470 EUR millionValue of agricultural industry output (production value at basic prices) 2019 417 984 EUR million
Value of crop output 2019 220 502 EUR millionValue of animal output 2019 161 416 EUR million
Annual change in agricultural factor income per annual work unit (indicator A) 2019 4.7 %
Agri-environmental indicators Year Value UnitArea under organic farming as a share of the UAA 2018 8.0 %Area under conversion to organic farming as a share of the UAA 2018 : %Change in the harmonised risk indicator 1 for pesticides compared with the average for 2011‑2013
2018 − 17 %
Agricultural production Year Value UnitCereals (including rice) 2019 299 309 thousand tonnesRoot crops 2019 166 853 thousand tonnesFresh vegetables 2019 60 905 thousand tonnesPermanent crops 2019 70 642 thousand tonnesMilk 2019 158 204 thousand tonnesBovine meat 2019 6 907 thousand tonnesPig meat 2019 22 768 thousand tonnesPoultry meat 2019 13 300 thousand tonnes
Forestry Year Value UnitForest and other wooded land 2020 180 262 thousand hectaresPersons employed in forestry and logging 2017 483.7 thousand annual work unitsGross value added (at basic prices) 2017 26 221 EUR millionRoundwood (under bark) 2018 378 694 thousand cubic metres
Fisheries Year Value UnitFishing fleet 2019 1 335 750 gross tonnagePersons employed in fishing and aquaculture 2018 163.5 thousandTotal catches (major fishing areas) 2019 4 100 000 tonnes live weightTotal aquaculture production (quantity) 2018 1 100 000 tonnes live weightTotal aquaculture production (value) 2018 3 720 EUR million
(1) Excluding farms with no standard output in Luxembourg, Malta and Finland.(2) Includes 2017 data for Romania and Sweden.
Source: Eurostat (online data codes: ef_m_farmleg, nama_10_a64_e, aact_ali01, ef_m_farmang, nama_10_gdp, aact_eaa01, aact_eaa06, org_cropar, farm structure survey — 2016, aei_fm_salpest09, aei_pr_gnb, apro_cpnh1, apro_mk_farm, apro_mt_pann, for_area, for_awu, for_eco_cp, for_remov, fish_fleet_alt, fish_ca_main and fish_aq2a) and Food and Agriculture Organization of the United Nations — Global Forest Resources Assessment, 2020

11 Agriculture, forestry and fisheries at a glance
Agriculture, forestry and fishery statistics — 2020 edition166
Did you know that...
• Having fallen (− 11.1 %) in 2018, agricultural factor income per annual work unit rebounded in 2019 (+13.6 %). Nevertheless, it remained below (− 17.8 %) its most recent peak level which was recorded in 2012.
• The output value of the agricultural industry was EUR 8.7 billion in 2019, an increase of +6.2 % over 2018. This overall rise in value reflected higher values for animal output (+5.4 %), notably for pigs (+21.9 %), and for crop output (+7.3 %), notably for fresh vegetables (+14.6 %).
• The production of bovine, poultry and pig meat in 2019 was lower than in 2018 (− 4.9 %, − 4.6 % and − 3.2 % respectively). For poultry meat this was the first fall since 2013. The price of poultry also declined in real-terms in 2019 (an average − 4.6 %). By contrast, there was a strong rebound in the price of pigs (+24.8 %) after the fall in 2018, and slight increase in the real-terms price of cattle (+1.0 %). The production of raw milk increased (+2.6 %) in 2019, continuing the unbroken upward trend started in 2013. The real-terms output price of milk remained broadly stable (+0.2 %).
• A rebound from the previous year’s drought conditions lifted the production of a number of crop products. In particular, the harvested production of fresh vegetables (+8.9 %), cereals (+16.9 %) and potatoes (+32.3 %) were notably higher in 2019. With higher harvested production levels, so real-terms output prices fell sharply for potatoes (− 25.3 %) and cereals (− 10.2 %), although not for fresh vegetables (+4.8 %).
Figure 11.2b: Output value of the agricultural industry, 2019(% of total output, at basic prices)
0 5 10 15 20
CerealsIndustrial crops
Forage plantsVegetables (1)
PotatoesFruit
WineOlive oil
Other crops; crop productsCattle
PigsSheep and goats
PoultryOther animals
MilkEggs
Other animal productsServices; secondary act.
(1) Including also horticultural plants.
Source: Eurostat (online data code: aact_eaa01)
Figure 11.2a: Index of agricultural factor income per annual work unit, 2005‑2019(2005 = 100)
0
20
40
60
80
100
120
140
160
2005
2006
2007
2008
2009
2010
2011
2012
2013
2014
2015
2016
2017
2018
2019
Note: index rescaled from 2010 = 100 to 2005 = 100.
Source: Eurostat (online data code: aact_eaa06)
Key information Year Value Unit Share of EU‑27 total (%)
Gross domestic product (GDP) 2019 476.2 EUR billion 3.4
Population on 1 January 2019 11.5 million 2.6
Land area 2016 30 451 km² 0.7
Farmland 2016 13 543 km² 0.9
Share of farmland in land area 2016 44.5 % –
Source: Eurostat (online data codes: nama_10_gdp, demo_pjan, reg_area3 and ef_m_farmleg)
Belgium

11Agriculture, forestry and fisheries at a glance
Agriculture, forestry and fishery statistics — 2020 edition 167
Table 11.2: Key indicators for agriculture, forestry and fisheries for Belgium
Farms and farmland Year Value UnitShare of EU-27
total (%)Farmland: utilised agricultural area (UAA) 2016 1 354 thousand hectares 0.9Farms (agricultural holdings) 2016 36 890 number 0.4
Share of very small farms (with < EUR 8 000 of standard output) 2016 6.2 % –
Farmers Year Value UnitEU-27 average/
totalEmployment in agriculture as a share of total employment (1) 2018 1.2 % 4.4Total labour force in agriculture 2019 55.6 thousand annual work units 8 739.7Young farmers (under 40 years old) as a share of all farm managers 2016 10.2 % 10.7
Economic performance of agriculture Year Value UnitShare of EU-27
total (%)Contribution of agriculture to gross domestic product 2019 0.5 % –Gross value added (at basic prices) 2019 2 448 EUR million 1.3Value of agricultural industry output (production value at basic prices) 2019 8 713 EUR million 2.1
Value of crop output 2019 3 905 EUR million 1.8Value of animal output 2019 4 730 EUR million 2.9
Annual change in agricultural factor income per annual work unit (indicator A) 2019 13.6 % –
Agri-environmental indicators Year Value UnitEU-27 average/
totalArea under organic farming as a share of the UAA 2018 6.6 % 8.0Area under conversion to organic farming as a share of the UAA 2018 0.9 % :Change in the harmonised risk indicator 1 for pesticides compared with the average for 2011‑2013
2018 − 28 % − 17
Agricultural production Year Value UnitShare of EU-27
total (%)Cereals (including rice) 2019 2 904 thousand tonnes 1.0Root crops 2019 9 519 thousand tonnes 5.7Fresh vegetables 2019 2 222 thousand tonnes 3.6Permanent crops 2019 608 thousand tonnes 0.9Milk 2019 4 395 thousand tonnes 2.8Bovine meat 2019 264 thousand tonnes 3.8Pig meat 2019 1 039 thousand tonnes 4.6Poultry meat 2019 448 thousand tonnes 3.4
Forestry Year Value UnitShare of EU-27
total (%)Forest and other wooded land 2020 722 thousand hectares 0.4Persons employed in forestry and logging 2017 2.3 thousand annual work units 0.5Gross value added (at basic prices) 2017 83 EUR million 0.3Roundwood (under bark) 2018 : thousand cubic metres :
Fisheries Year Value UnitShare of EU-27
total (%)Fishing fleet 2019 12 914 gross tonnage 1.0Persons employed in fishing and aquaculture 2018 0.4 thousand 0.2Total catches (major fishing areas) 2019 21 061 tonnes live weight 0.5Total aquaculture production (quantity) 2018 0 tonnes live weight 0.0Total aquaculture production (value) 2018 0 EUR million 0.0
(1) EU-27 average: includes 2017 data for Romania and Sweden.
Source: Eurostat (online data codes: ef_m_farmleg, nama_10_a64_e, aact_ali01, ef_m_farmang, nama_10_gdp, aact_eaa01, aact_eaa06, org_cropar, farm structure survey — 2016, aei_fm_salpest09, aei_pr_gnb, apro_cpnh1, apro_mk_farm, apro_mt_pann, for_area, for_awu, for_eco_cp, for_remov, fish_fleet_alt, fish_ca_main and fish_aq2a) and Food and Agriculture Organization of the United Nations — Global Forest Resources Assessment, 2020

11 Agriculture, forestry and fisheries at a glance
Agriculture, forestry and fishery statistics — 2020 edition168
Did you know that...
• Agricultural factor income per annual work unit increased (+14.1 %) in 2019, returning to the generally upward trend that was interrupted in 2018. As such, a new peak was recorded for this indicator, which was 3.1 times as high in 2019 as it had been in 2005. Nevertheless, it should be noted that agricultural labour input in 2019, measured in annual work units, was approximately one third of its level in 2005.
• The output value of the agricultural industry was EUR 4.3 billion in 2019, slightly higher (+0.6 %) than in 2018. The sharp rise in the value of animal output (+9.2 %), which was driven by the strong increase in the value of sheep and goats (+86.3 %), was largely offset by the fall in the value of crop output (− 2.3 %).
• The harvested production of cereals in 2019 was (+10.1 %) higher than in 2018. The higher production figure for cereals as a whole reflected an increase in the harvested production level of grain maize and corn-cob-mix (+14.7 %) and wheat and spelt (+5.7 %). The output price of cereals fell (− 5.2 %) in real (deflated) terms in 2019, reflecting among other factors the increased level of harvested production.
• Production of poultry meat declined slightly in 2019 (− 0.7 %), while pig meat production fell somewhat more strongly (− 2.3 %) and bovine meat production slumped (− 24.1 %). The fall in pig meat production was the first since 2010. There were higher real-terms prices for cattle (+11.7 %), poultry (+9.2 %) and pigs (+4.5 %). Raw milk production also fell strongly (− 8.4 %), continuing the downward trend started in 2014. Despite the fall in the level of milk production, the real-terms output price fell slightly (− 0.8 %).
Figure 11.3b: Output value of the agricultural industry, 2019(% of total output, at basic prices)
0 5 10 15 20 25 30 35
CerealsIndustrial crops
Forage plantsVegetables (1)
PotatoesFruit
WineOlive oil
Other crops; crop productsCattle
PigsSheep and goats
PoultryOther animals
MilkEggs
Other animal productsServices; secondary act.
(1) Including also horticultural plants.
Source: Eurostat (online data code: aact_eaa01)
Figure 11.3a: Index of agricultural factor income per annual work unit, 2005‑2019(2005 = 100)
0
50
100
150
200
250
300
350
2005
2006
2007
2008
2009
2010
2011
2012
2013
2014
2015
2016
2017
2018
2019
Note: index rescaled from 2010 = 100 to 2005 = 100.
Source: Eurostat (online data code: aact_eaa06)
Key information Year Value Unit Share of EU‑27 total (%)
Gross domestic product (GDP) 2019 61.2 EUR billion 0.4
Population on 1 January 2019 7.0 million 1.6
Land area 2016 110 001 km² 2.7
Farmland 2016 44 685 km² 2.9
Share of farmland in land area 2016 40.6 % –
Source: Eurostat (online data codes: nama_10_gdp, demo_pjan, reg_area3 and ef_m_farmleg)
Bulgaria

11Agriculture, forestry and fisheries at a glance
Agriculture, forestry and fishery statistics — 2020 edition 169
Table 11.3: Key indicators for agriculture, forestry and fisheries for Bulgaria
Farms and farmland Year Value UnitShare of EU-27
total (%)Farmland: utilised agricultural area (UAA) 2016 4 469 thousand hectares 2.9Farms (agricultural holdings) 2016 202 720 number 2.0
Share of very small farms (with < EUR 8 000 of standard output) 2016 81.0 % –
Farmers Year Value UnitEU-27 average/
totalEmployment in agriculture as a share of total employment (1) 2018 17.1 % 4.4Total labour force in agriculture 2019 190.4 thousand annual work units 8 739.7Young farmers (under 40 years old) as a share of all farm managers 2016 14.0 % 10.7
Economic performance of agriculture Year Value UnitShare of EU-27
total (%)Contribution of agriculture to gross domestic product 2019 2.7 % –Gross value added (at basic prices) 2019 1 906 EUR million 1.1Value of agricultural industry output (production value at basic prices) 2019 4 348 EUR million 1.0
Value of crop output 2019 2 883 EUR million 1.3Value of animal output 2019 1 112 EUR million 0.7
Annual change in agricultural factor income per annual work unit (indicator A) 2019 14.1 % –
Agri-environmental indicators Year Value UnitEU-27 average/
totalArea under organic farming as a share of the UAA 2018 2.6 % 8.0Area under conversion to organic farming as a share of the UAA 2018 0.9 % :Change in the harmonised risk indicator 1 for pesticides compared with the average for 2011‑2013
2018 − 17 % − 17
Agricultural production Year Value UnitShare of EU-27
total (%)Cereals (including rice) 2019 11 132 thousand tonnes 3.7Root crops 2019 198 thousand tonnes 0.1Fresh vegetables 2019 551 thousand tonnes 0.9Permanent crops 2019 413 thousand tonnes 0.6Milk 2019 940 thousand tonnes 0.6Bovine meat 2019 5 thousand tonnes 0.1Pig meat 2019 78 thousand tonnes 0.3Poultry meat 2019 114 thousand tonnes 0.9
Forestry Year Value UnitShare of EU-27
total (%)Forest and other wooded land 2020 3 917 thousand hectares 2.2Persons employed in forestry and logging 2017 12.0 thousand annual work units 2.5Gross value added (at basic prices) 2017 233 EUR million 0.9Roundwood (under bark) 2018 3 680 thousand cubic metres 1.0
Fisheries Year Value UnitShare of EU-27
total (%)Fishing fleet 2019 6 029 gross tonnage 0.5Persons employed in fishing and aquaculture 2018 1.6 thousand 1.0Total catches (major fishing areas) 2019 10 269 tonnes live weight 0.3Total aquaculture production (quantity) 2018 10 758 tonnes live weight 1.0Total aquaculture production (value) 2018 29 EUR million 0.8
(1) EU-27 average: includes 2017 data for Romania and Sweden.
Source: Eurostat (online data codes: ef_m_farmleg, nama_10_a64_e, aact_ali01, ef_m_farmang, nama_10_gdp, aact_eaa01, aact_eaa06, org_cropar, farm structure survey — 2016, aei_fm_salpest09, aei_pr_gnb, apro_cpnh1, apro_mk_farm, apro_mt_pann, for_area, for_awu, for_eco_cp, for_remov, fish_fleet_alt, fish_ca_main and fish_aq2a) and Food and Agriculture Organization of the United Nations — Global Forest Resources Assessment, 2020

11 Agriculture, forestry and fisheries at a glance
Agriculture, forestry and fishery statistics — 2020 edition170
Did you know that...
• Agricultural factor income per annual work unit in 2019 was higher (+4.3 %) than in 2018 and back towards the recent peak level in 2016. The index level in 2019 was 87.0 % higher than in 2005.
• The output value of the agricultural industry was EUR 5.5 billion in 2019, representing a year-on-year increase of 3.6 %. Nearly two thirds of this total value came from cereals (+3.3 % compared with the value for 2018), milk (+1.4 %), industrial crops (− 10.3 %) and forage plants (+31.9 %).
• Following on from the severe drought in most regions in 2018, the harvested production of many key crops increased in 2019. This included cereals as a whole (+9.7 %) and more specifically wheat and spelt (+8.9 %), barley (+7.0 %) and grain maize and corn-cob-mix (+26.8 %), as well as plants harvested green (+22.0 %) and potatoes (+6.7 %). The increase in the harvested production of cereals and potatoes in 2019 was accompanied by an increase in output prices in real (deflated) terms (+3.8 % and +33.9 % respectively). The price of oilseeds also rose (+2.7 %), accompanying a sharp decline in the harvested production (− 17.4 %).
• Production of pig meat fell slightly (− 0.6 %) in 2019, the fifth consecutive annual fall. The average real-terms (deflated) price of pigs, however, climbed (+13.3 %) after falling sharply in 2018. The production of poultry meat (+2.3 %) and bovine meat (+1.8 %) grew, the former continuing an upward rebound that started in 2014. By contrast, real-terms prices of poultry (− 0.3 %) and cattle (− 5.1 %) declined. The production of raw milk was almost unchanged (− 0.2 %) in 2019 after several years (at least since 2013) of expanding production; this was accompanied by almost no change in the average real-terms price of raw milk (+0.2 %).
Figure 11.4b: Output value of the agricultural industry, 2019(% of total output, at basic prices)
0 5 10 15 20 25
CerealsIndustrial crops
Forage plantsVegetables (1)
PotatoesFruit
WineOlive oil
Other crops; crop productsCattle
PigsSheep and goats
PoultryOther animals
MilkEggs
Other animal productsServices; secondary act.
(1) Including also horticultural plants.
Source: Eurostat (online data code: aact_eaa01)
Figure 11.4a: Index of agricultural factor income per annual work unit, 2005‑2019(2005 = 100)
0
20
40
60
80
100
120
140
160
180
200
2005
2006
2007
2008
2009
2010
2011
2012
2013
2014
2015
2016
2017
2018
2019
Note: index rescaled from 2010 = 100 to 2005 = 100.
Source: Eurostat (online data code: aact_eaa06)
Key information Year Value Unit Share of EU‑27 total (%)
Gross domestic product (GDP) 2019 223.9 EUR billion 1.6
Population on 1 January 2019 10.6 million 2.4
Land area 2016 77 212 km² 1.9
Farmland 2016 34 554 km² 2.2
Share of farmland in land area 2016 44.8 % –
Source: Eurostat (online data codes: nama_10_gdp, demo_pjan, reg_area3 and ef_m_farmleg)
Czechia

11Agriculture, forestry and fisheries at a glance
Agriculture, forestry and fishery statistics — 2020 edition 171
Table 11.4: Key indicators for agriculture, forestry and fisheries for Czechia
Farms and farmland Year Value UnitShare of EU-27
total (%)Farmland: utilised agricultural area (UAA) 2016 3 455 thousand hectares 2.2Farms (agricultural holdings) 2016 26 530 number 0.3
Share of very small farms (with < EUR 8 000 of standard output) 2016 31.7 % –
Farmers Year Value UnitEU-27 average/
totalEmployment in agriculture as a share of total employment (1) 2018 2.6 % 4.4Total labour force in agriculture 2019 102.0 thousand annual work units 8 739.7Young farmers (under 40 years old) as a share of all farm managers 2016 10.2 % 10.7
Economic performance of agriculture Year Value UnitShare of EU-27
total (%)Contribution of agriculture to gross domestic product 2019 0.8 % –Gross value added (at basic prices) 2019 1 759 EUR million 1.0Value of agricultural industry output (production value at basic prices) 2019 5 498 EUR million 1.3
Value of crop output 2019 3 113 EUR million 1.4Value of animal output 2019 2 058 EUR million 1.3
Annual change in agricultural factor income per annual work unit (indicator A) 2019 4.3 % –
Agri-environmental indicators Year Value UnitEU-27 average/
totalArea under organic farming as a share of the UAA 2018 14.8 % 8.0Area under conversion to organic farming as a share of the UAA 2018 1.3 % :Change in the harmonised risk indicator 1 for pesticides compared with the average for 2011‑2013
2018 − 39 % − 17
Agricultural production Year Value UnitShare of EU-27
total (%)Cereals (including rice) 2019 7 646 thousand tonnes 2.6Root crops 2019 4 298 thousand tonnes 2.6Fresh vegetables 2019 226 thousand tonnes 0.4Permanent crops 2019 195 thousand tonnes 0.3Milk 2019 3 156 thousand tonnes 2.0Bovine meat 2019 73 thousand tonnes 1.1Pig meat 2019 210 thousand tonnes 0.9Poultry meat 2019 168 thousand tonnes 1.3
Forestry Year Value UnitShare of EU-27
total (%)Forest and other wooded land 2020 2 677 thousand hectares 1.5Persons employed in forestry and logging 2017 21.7 thousand annual work units 4.5Gross value added (at basic prices) 2017 1 200 EUR million 4.6Roundwood (under bark) 2018 21 443 thousand cubic metres 5.7
Fisheries Year Value UnitShare of EU-27
total (%)Fishing fleet 2019 – gross tonnage –Persons employed in fishing and aquaculture 2018 1.5 thousand 0.9Total catches (major fishing areas) 2019 – tonnes live weight –Total aquaculture production (quantity) 2018 21 750 tonnes live weight 2.0Total aquaculture production (value) 2018 49 EUR million 1.3
(1) EU-27 average: includes 2017 data for Romania and Sweden.
Source: Eurostat (online data codes: ef_m_farmleg, nama_10_a64_e, aact_ali01, ef_m_farmang, nama_10_gdp, aact_eaa01, aact_eaa06, org_cropar, farm structure survey — 2016, aei_fm_salpest09, aei_pr_gnb, apro_cpnh1, apro_mk_farm, apro_mt_pann, for_area, for_awu, for_eco_cp, for_remov, fish_fleet_alt, fish_ca_main and fish_aq2a) and Food and Agriculture Organization of the United Nations — Global Forest Resources Assessment, 2020

11 Agriculture, forestry and fisheries at a glance
Agriculture, forestry and fishery statistics — 2020 edition172
Did you know that...
• After a strong decrease (− 24.9 %) in 2018, agricultural factor income per annual work unit rebounded (+69.4 %) in 2019 to the highest level since its 2012 peak.
• The output value of the agricultural industry rose strongly (+12.7 %) to EUR 11.6 billion in 2019. This increase in large part reflected higher output values for pigs (+16.7 %), cereals (+40.2 %) and forage plants (+28.2 %), which together accounted for one half (49.8 %) of the total output value in 2019. The output value of milk (with an 18.3 % share of the total output value) fell by 1.0 %.
• Production of pig meat (− 5.2 %) and bovine meat (− 3.6 %) fell in 2019, while the production of poultry meat increased (+7.5 %). After expanding every year since 2012, the level of production of raw milk was unchanged in 2019 compared with 2018.
• The rebound in 2019 from the drought conditions experienced in 2018 resulted in higher harvested production levels of all major crops: oilseeds (+49.0 %), plants harvested green (+39.3 %), cereals (+37.5 %) and root crops (+22.8 %). The higher levels of harvested production in 2019 of several major crops were accompanied by higher output prices in real-terms (deflated): sugar beet (+20.6 %), cereals (+2.3 %), potatoes (+1.5 %) and oilseeds (+0.7 %).
• After the sharp fall in 2018 (− 18.2 %), the average real-terms price of pigs rebounded strongly (+27.5 %) in 2019. The real-terms output price for milk fell back further (− 4.4 % in 2019) from the relatively high level in 2017.
Key information Year Value Unit Share of EU‑27 total (%)
Gross domestic product (GDP) 2019 312.7 EUR billion 2.2
Population on 1 January 2019 5.8 million 1.3
Land area 2016 41 987 km² 1.0
Farmland 2016 26 146 km² 1.7
Share of farmland in land area 2016 62.3 % –
Source: Eurostat (online data codes: nama_10_gdp, demo_pjan, reg_area3 and ef_m_farmleg)
Figure 11.5b: Output value of the agricultural industry, 2019(% of total output, at basic prices)
0 5 10 15 20 25 30
CerealsIndustrial crops
Forage plantsVegetables (1)
PotatoesFruit
WineOlive oil
Other crops; crop productsCattle
PigsSheep and goats
PoultryOther animals
MilkEggs
Other animal productsServices; secondary act.
Note: estimates. (1) Including also horticultural plants.
Source: Eurostat (online data code: aact_eaa01)
Figure 11.5a: Index of agricultural factor income per annual work unit, 2005‑2019(2005 = 100)
0
20
40
60
80
100
120
140
160
180
200
2005
2006
2007
2008
2009
2010
2011
2012
2013
2014
2015
2016
2017
2018
2019
Note: index rescaled from 2010 = 100 to 2005 = 100. 2019: estimate.
Source: Eurostat (online data code: aact_eaa06)
Denmark

11Agriculture, forestry and fisheries at a glance
Agriculture, forestry and fishery statistics — 2020 edition 173
Table 11.5: Key indicators for agriculture, forestry and fisheries for Denmark
Farms and farmland Year Value UnitShare of EU-27
total (%)Farmland: utilised agricultural area (UAA) 2016 2 615 thousand hectares 1.7Farms (agricultural holdings) 2016 35 050 number 0.3
Share of very small farms (with < EUR 8 000 of standard output) 2016 11.5 % –
Farmers Year Value UnitEU-27 average/
totalEmployment in agriculture as a share of total employment (1) 2018 2.1 % 4.4Total labour force in agriculture 2019 53.7 thousand annual work units 8 739.7Young farmers (under 40 years old) as a share of all farm managers 2016 6.6 % 10.7
Economic performance of agriculture Year Value UnitShare of EU-27
total (%)Contribution of agriculture to gross domestic product 2019 1.1 % –Gross value added (at basic prices) 2019 3 499 EUR million 1.9Value of agricultural industry output (production value at basic prices) 2019 11 629 EUR million 2.8
Value of crop output 2019 4 215 EUR million 1.9Value of animal output 2019 6 672 EUR million 4.1
Annual change in agricultural factor income per annual work unit (indicator A) 2019 69.4 % –
Agri-environmental indicators Year Value UnitEU-27 average/
totalArea under organic farming as a share of the UAA 2018 9.8 % 8.0Area under conversion to organic farming as a share of the UAA 2018 2.6 % :Change in the harmonised risk indicator 1 for pesticides compared with the average for 2011‑2013
2018 − 48 % − 17
Agricultural production Year Value UnitShare of EU-27
total (%)Cereals (including rice) 2019 9 630 thousand tonnes 3.2Root crops 2019 5 131 thousand tonnes 3.1Fresh vegetables 2019 282 thousand tonnes 0.5Permanent crops 2019 36 thousand tonnes 0.1Milk 2019 5 615 thousand tonnes 3.5Bovine meat 2019 125 thousand tonnes 1.8Pig meat 2019 1 499 thousand tonnes 6.6Poultry meat 2019 159 thousand tonnes 1.2
Forestry Year Value UnitShare of EU-27
total (%)Forest and other wooded land 2020 665 thousand hectares 0.4Persons employed in forestry and logging 2017 6.0 thousand annual work units 1.2Gross value added (at basic prices) 2017 296 EUR million 1.1Roundwood (under bark) 2016 1 468 thousand cubic metres 0.4
Fisheries Year Value UnitShare of EU-27
total (%)Fishing fleet 2019 70 906 gross tonnage 5.3Persons employed in fishing and aquaculture 2018 2.0 thousand 1.2Total catches (major fishing areas) 2017 904 450 tonnes live weight :Total aquaculture production (quantity) 2018 32 167 tonnes live weight 2.9Total aquaculture production (value) 2018 : EUR million :
(1) EU-27 average: includes 2017 data for Romania and Sweden.
Source: Eurostat (online data codes: ef_m_farmleg, nama_10_a64_e, aact_ali01, ef_m_farmang, nama_10_gdp, aact_eaa01, aact_eaa06, org_cropar, farm structure survey — 2016, aei_fm_salpest09, aei_pr_gnb, apro_cpnh1, apro_mk_farm, apro_mt_pann, for_area, for_awu, for_eco_cp, for_remov, fish_fleet_alt, fish_ca_main and fish_aq2a) and Food and Agriculture Organization of the United Nations — Global Forest Resources Assessment, 2020

11 Agriculture, forestry and fisheries at a glance
Agriculture, forestry and fishery statistics — 2020 edition174
Did you know that...
• Agricultural factor income per annual work unit rebounded strongly in 2019 (+48.0 %) after its sharp decrease (− 27.0 %) in 2018.
• The output value of the agricultural industry was EUR 58.2 billion in 2019, the second highest among EU Member States and higher (+10.6 %) than in 2018. Output values of five key products were substantially higher: milk (+6.9 %), pigs (+14.5 %), cereals (+28.7 %), potatoes (+48.5 %) and forage plants (+65.4 %).
• The harvested production of most crops increased in 2019 after the drought in 2018. The production of total cereals was higher (+16.7 %), with notable increases for common wheat and spelt (+13.8 %) and barley (+21.0 %). The harvested production of root crops increased (+14.6 %), including that of potatoes (+18.8 %).
• Germany had the highest production among the EU Member States of pig meat (5.2 million tonnes of carcass weight) and of milk (33.1 million tonnes) in 2019. Pig meat production declined (− 2.2 %) in 2019, a third consecutive annual fall. The production of poultry meat (+0.8 %) and bovine meat (+0.4 %) increased slightly in 2019. Raw milk production in 2019 was unchanged compared with 2018.
• Accompanying the higher domestic supplies of many crops, there were also lower real-terms (deflated) output prices, including those for cereals (− 8.8 %), fresh vegetables (− 4.1 %) and sugar beet (− 1.4 %). By contrast, despite higher supplies, the price of potatoes rose strongly (+26.2 %). In the animal and animal products sector, there was a sharp increase in the average real-terms price of pigs (+20.0 %) but a decline in that of milk (− 3.3 %).
Key information Year Value Unit Share of EU‑27 total (%)
Gross domestic product (GDP) 2019 3 449.1 EUR billion 24.7
Population on 1 January 2019 83.0 million 18.6
Land area 2016 353 296 km² 8.6
Farmland 2016 167 153 km² 10.7
Share of farmland in land area 2016 47.3 % –
Source: Eurostat (online data codes: nama_10_gdp, demo_pjan, reg_area3 and ef_m_farmleg)
Figure 11.6b: Output value of the agricultural industry, 2019(% of total output, at basic prices)
0 5 10 15 20
CerealsIndustrial crops
Forage plantsVegetables (1)
PotatoesFruit
WineOlive oil
Other crops; crop productsCattle
PigsSheep and goats
PoultryOther animals
MilkEggs
Other animal productsServices; secondary act.
(1) Including also horticultural plants.
Source: Eurostat (online data code: aact_eaa01)
Figure 11.6a: Index of agricultural factor income per annual work unit, 2005‑2019(2005 = 100)
0
20
40
60
80
100
120
140
160
180
2005
2006
2007
2008
2009
2010
2011
2012
2013
2014
2015
2016
2017
2018
2019
Note: index rescaled from 2010 = 100 to 2005 = 100.
Source: Eurostat (online data code: aact_eaa06)
Germany
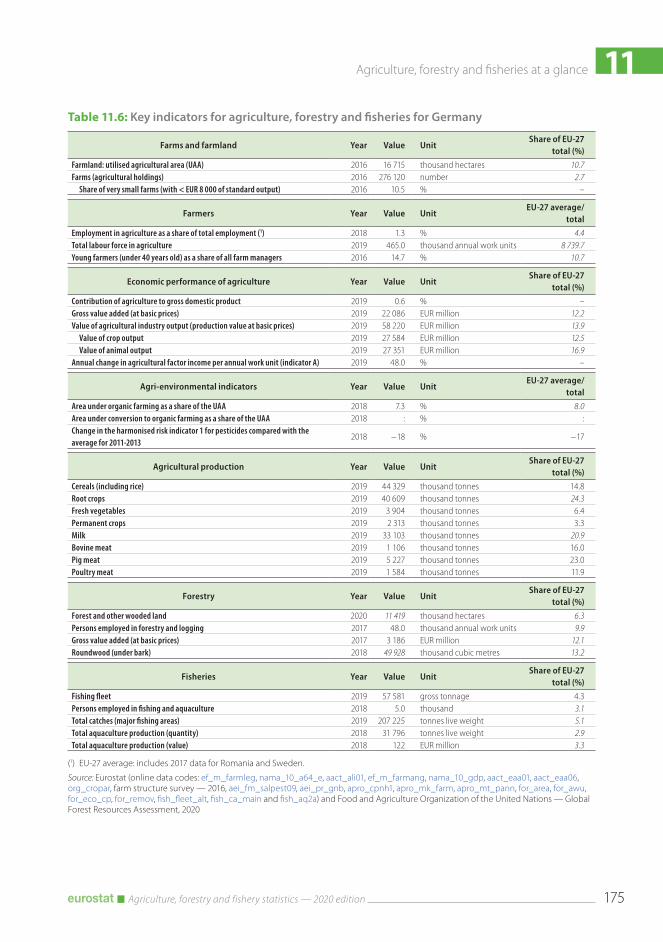
11Agriculture, forestry and fisheries at a glance
Agriculture, forestry and fishery statistics — 2020 edition 175
Table 11.6: Key indicators for agriculture, forestry and fisheries for Germany
Farms and farmland Year Value UnitShare of EU-27
total (%)Farmland: utilised agricultural area (UAA) 2016 16 715 thousand hectares 10.7Farms (agricultural holdings) 2016 276 120 number 2.7
Share of very small farms (with < EUR 8 000 of standard output) 2016 10.5 % –
Farmers Year Value UnitEU-27 average/
totalEmployment in agriculture as a share of total employment (1) 2018 1.3 % 4.4Total labour force in agriculture 2019 465.0 thousand annual work units 8 739.7Young farmers (under 40 years old) as a share of all farm managers 2016 14.7 % 10.7
Economic performance of agriculture Year Value UnitShare of EU-27
total (%)Contribution of agriculture to gross domestic product 2019 0.6 % –Gross value added (at basic prices) 2019 22 086 EUR million 12.2Value of agricultural industry output (production value at basic prices) 2019 58 220 EUR million 13.9
Value of crop output 2019 27 584 EUR million 12.5Value of animal output 2019 27 351 EUR million 16.9
Annual change in agricultural factor income per annual work unit (indicator A) 2019 48.0 % –
Agri-environmental indicators Year Value UnitEU-27 average/
totalArea under organic farming as a share of the UAA 2018 7.3 % 8.0Area under conversion to organic farming as a share of the UAA 2018 : % :Change in the harmonised risk indicator 1 for pesticides compared with the average for 2011‑2013
2018 − 18 % − 17
Agricultural production Year Value UnitShare of EU-27
total (%)Cereals (including rice) 2019 44 329 thousand tonnes 14.8Root crops 2019 40 609 thousand tonnes 24.3Fresh vegetables 2019 3 904 thousand tonnes 6.4Permanent crops 2019 2 313 thousand tonnes 3.3Milk 2019 33 103 thousand tonnes 20.9Bovine meat 2019 1 106 thousand tonnes 16.0Pig meat 2019 5 227 thousand tonnes 23.0Poultry meat 2019 1 584 thousand tonnes 11.9
Forestry Year Value UnitShare of EU-27
total (%)Forest and other wooded land 2020 11 419 thousand hectares 6.3Persons employed in forestry and logging 2017 48.0 thousand annual work units 9.9Gross value added (at basic prices) 2017 3 186 EUR million 12.1Roundwood (under bark) 2018 49 928 thousand cubic metres 13.2
Fisheries Year Value UnitShare of EU-27
total (%)Fishing fleet 2019 57 581 gross tonnage 4.3Persons employed in fishing and aquaculture 2018 5.0 thousand 3.1Total catches (major fishing areas) 2019 207 225 tonnes live weight 5.1Total aquaculture production (quantity) 2018 31 796 tonnes live weight 2.9Total aquaculture production (value) 2018 122 EUR million 3.3
(1) EU-27 average: includes 2017 data for Romania and Sweden.
Source: Eurostat (online data codes: ef_m_farmleg, nama_10_a64_e, aact_ali01, ef_m_farmang, nama_10_gdp, aact_eaa01, aact_eaa06, org_cropar, farm structure survey — 2016, aei_fm_salpest09, aei_pr_gnb, apro_cpnh1, apro_mk_farm, apro_mt_pann, for_area, for_awu, for_eco_cp, for_remov, fish_fleet_alt, fish_ca_main and fish_aq2a) and Food and Agriculture Organization of the United Nations — Global Forest Resources Assessment, 2020

11 Agriculture, forestry and fisheries at a glance
Agriculture, forestry and fishery statistics — 2020 edition176
Did you know that...
• Agricultural factor income per annual work unit increased sharply in 2019 (+32.5 %), after a downturn in 2018 (− 22.7 %).
• The output value of the agricultural industry was EUR 1.0 billion in 2019, which was up sharply (+16.1 %) on 2018. More than three fifths of this output value came from milk, cereals, industrial crops (mainly oilseeds) and pigs. The output value of all of these key products increased, in several cases strongly: industrial crops (+57.9 %) and cereals (+49.0 %).
• Drought conditions in many areas hit harvests in 2018; production subsequently rebounded. In 2019, there was considerable growth for harvested production levels of cereals (+76.6 %) and oilseeds (+67.0 %). After increasing in 2018, there was further growth in the level of harvested production of green maize (+49.8 %) and fresh vegetables (+48.2 %) in 2019. With higher production, there were lower real-terms prices for cereals (− 6.8 %) and oilseeds (− 1.0 %) but higher prices for potatoes (+24.8 %) and fresh vegetables (+14.5 %).
• The production of pig meat continued to increase (+4.3 % in 2019), the eighth annual increase in the last 10 years since a relative low in 2009. The price of pigs also increased strongly in real (deflated) terms (+8.3 %). By contrast, bovine meat production was stable (+0.1 %) but the average price for cattle fell sharply (− 6.1 %). Raw milk production increased in 2019 (+3.0 %), the 13th annual increase in the last 16 years since rebounding from a low in 2003. The average real-terms price of milk, however, declined a little further (− 1.4 %) from the relative high in 2017.
Figure 11.7b: Output value of the agricultural industry, 2019(% of total output, at basic prices)
0 5 10 15 20 25
CerealsIndustrial crops
Forage plantsVegetables (1)
PotatoesFruit
WineOlive oil
Other crops; crop productsCattle
PigsSheep and goats
PoultryOther animals
MilkEggs
Other animal productsServices; secondary act.
(1) Including also horticultural plants.
Source: Eurostat (online data code: aact_eaa01)
Figure 11.7a: Index of agricultural factor income per annual work unit, 2005‑2019(2005 = 100)
0
20
40
60
80
100
120
140
160
180
200
220
2005
2006
2007
2008
2009
2010
2011
2012
2013
2014
2015
2016
2017
2018
2019
Note: index rescaled from 2010 = 100 to 2005 = 100.
Source: Eurostat (online data code: aact_eaa06)
Key information Year Value Unit Share of EU‑27 total (%)
Gross domestic product (GDP) 2019 28.1 EUR billion 0.2
Population on 1 January 2019 1.3 million 0.3
Land area 2016 43 466 km² 1.1
Farmland 2016 9 951 km² 0.6
Share of farmland in land area 2016 22.9 % –
Source: Eurostat (online data codes: nama_10_gdp, demo_pjan, reg_area3 and ef_m_farmleg)
Estonia

11Agriculture, forestry and fisheries at a glance
Agriculture, forestry and fishery statistics — 2020 edition 177
Table 11.7: Key indicators for agriculture, forestry and fisheries for Estonia
Farms and farmland Year Value UnitShare of EU-27
total (%)Farmland: utilised agricultural area (UAA) 2016 995 thousand hectares 0.6Farms (agricultural holdings) 2016 16 700 number 0.2
Share of very small farms (with < EUR 8 000 of standard output) 2016 66.0 % –
Farmers Year Value UnitEU-27 average/
totalEmployment in agriculture as a share of total employment (1) 2018 2.3 % 4.4Total labour force in agriculture 2019 18.9 thousand annual work units 8 739.7Young farmers (under 40 years old) as a share of all farm managers 2016 15.5 % 10.7
Economic performance of agriculture Year Value UnitShare of EU-27
total (%)Contribution of agriculture to gross domestic product 2019 1.0 % –Gross value added (at basic prices) 2019 282 EUR million 0.2Value of agricultural industry output (production value at basic prices) 2019 998 EUR million 0.2
Value of crop output 2019 503 EUR million 0.2Value of animal output 2019 418 EUR million 0.3
Annual change in agricultural factor income per annual work unit (indicator A) 2019 32.5 % –
Agri-environmental indicators Year Value UnitEU-27 average/
totalArea under organic farming as a share of the UAA 2018 21.0 % 8.0Area under conversion to organic farming as a share of the UAA 2018 3.5 % :Change in the harmonised risk indicator 1 for pesticides compared with the average for 2011‑2013
2018 31 % − 17
Agricultural production Year Value UnitShare of EU-27
total (%)Cereals (including rice) 2019 1 625 thousand tonnes 0.5Root crops 2019 86 thousand tonnes 0.1Fresh vegetables 2019 58 thousand tonnes 0.1Permanent crops 2019 3 thousand tonnes 0.0Milk 2019 822 thousand tonnes 0.5Bovine meat 2019 9 thousand tonnes 0.1Pig meat 2019 45 thousand tonnes 0.2Poultry meat 2019 : thousand tonnes :
Forestry Year Value UnitShare of EU-27
total (%)Forest and other wooded land 2020 2 533 thousand hectares 1.4Persons employed in forestry and logging 2017 5.5 thousand annual work units 1.1Gross value added (at basic prices) 2017 249 EUR million 1.0Roundwood (under bark) 2018 7 353 thousand cubic metres 1.9
Fisheries Year Value UnitShare of EU-27
total (%)Fishing fleet 2019 15 707 gross tonnage 1.2Persons employed in fishing and aquaculture 2018 0.7 thousand 0.4Total catches (major fishing areas) 2019 83 626 tonnes live weight 2.0Total aquaculture production (quantity) 2018 944 tonnes live weight 0.1Total aquaculture production (value) 2018 4 EUR million 0.1
(1) EU-27 average: includes 2017 data for Romania and Sweden.
Source: Eurostat (online data codes: ef_m_farmleg, nama_10_a64_e, aact_ali01, ef_m_farmang, nama_10_gdp, aact_eaa01, aact_eaa06, org_cropar, farm structure survey — 2016, aei_fm_salpest09, aei_pr_gnb, apro_cpnh1, apro_mk_farm, apro_mt_pann, for_area, for_awu, for_eco_cp, for_remov, fish_fleet_alt, fish_ca_main and fish_aq2a) and Food and Agriculture Organization of the United Nations — Global Forest Resources Assessment, 2020

11 Agriculture, forestry and fisheries at a glance
Agriculture, forestry and fishery statistics — 2020 edition178
Did you know that...
• Agricultural factor income per annual work unit was almost unchanged (+0.5 %) in 2019, having fallen back (− 11.3 %) in 2018 from a peak recorded in 2017. As such, the 2019 index level remained slightly lower (− 3.1 %) than it had been in 2005.
• The output value of the agricultural industry in 2019 was EUR 8.5 billion (− 1.9 % compared with 2018). The agricultural industry is focused on cattle-related activities: the output value of milk (EUR 2.6 billion in 2019; +1.7 %), cattle (EUR 2.3 billion; − 1.1 %) and forage plants (EUR 1.0 billion; − 20.0 %) together accounted for 68.7 % of total output value in 2019.
• The production of raw milk grew strongly (+5.3 %) in 2019, reaching a new high of 8.2 million tonnes. This represents an increase in raw milk production of 2.6 million tonnes since 2015 when milk quotas were abolished. During this period, the number of dairy cows increased by about 186 000 head. The average real-terms price for milk in 2019 declined strongly (− 5.6 %), following on from a similar rate of decline in 2018 (− 6.6 %), after it had surged in 2017 (+32.8 %).
• After three years of expansion, in 2019 the production level of bovine meat levelled off (− 0.4 %). The real-terms output price for cattle declined (− 6.5 %). The production of pig meat also remained similar to that recorded in 2018 (+0.4 %) but the real-terms price of pigs rebounded strongly (+17.4 %) after the fall in 2018.
• The harvested production of green maize, which is used to feed cattle, was moderately less (− 3.4 %) than the relative high in 2018.
Key information Year Value Unit Share of EU‑27 total (%)
Gross domestic product (GDP) 2019 356.1 EUR billion 2.5
Population on 1 January 2019 4.9 million 1.1
Land area 2016 68 655 km² 1.7
Farmland 2016 48 837 km² 3.1
Share of farmland in land area 2016 71.1 % –
Source: Eurostat (online data codes: nama_10_gdp, demo_pjan, reg_area3 and ef_m_farmleg)
Figure 11.8b: Output value of the agricultural industry, 2019(% of total output, at basic prices)
0 5 10 15 20 25 30 35
CerealsIndustrial crops
Forage plantsVegetables (1)
PotatoesFruit
WineOlive oil
Other crops; crop productsCattle
PigsSheep and goats
PoultryOther animals
MilkEggs
Other animal productsServices; secondary act.
(1) Including also horticultural plants.
Source: Eurostat (online data code: aact_eaa01)
Figure 11.8a: Index of agricultural factor income per annual work unit, 2005‑2019(2005 = 100)
0
20
40
60
80
100
120
2005
2006
2007
2008
2009
2010
2011
2012
2013
2014
2015
2016
2017
2018
2019
Note: index rescaled from 2010 = 100 to 2005 = 100.
Source: Eurostat (online data code: aact_eaa06)
Ireland

11Agriculture, forestry and fisheries at a glance
Agriculture, forestry and fishery statistics — 2020 edition 179
Table 11.8: Key indicators for agriculture, forestry and fisheries for Ireland
Farms and farmland Year Value UnitShare of EU-27
total (%)Farmland: utilised agricultural area (UAA) 2016 4 884 thousand hectares 3.1Farms (agricultural holdings) 2016 137 560 number 1.3
Share of very small farms (with < EUR 8 000 of standard output) 2016 31.6 % –
Farmers Year Value UnitEU-27 average/
totalEmployment in agriculture as a share of total employment (1) 2018 4.6 % 4.4Total labour force in agriculture 2019 160.7 thousand annual work units 8 739.7Young farmers (under 40 years old) as a share of all farm managers 2016 8.5 % 10.7
Economic performance of agriculture Year Value UnitShare of EU-27
total (%)Contribution of agriculture to gross domestic product 2019 0.8 % –Gross value added (at basic prices) 2019 2 874 EUR million 1.6Value of agricultural industry output (production value at basic prices) 2019 8 522 EUR million 2.0
Value of crop output 2019 1 897 EUR million 0.9Value of animal output 2019 6 163 EUR million 3.8
Annual change in agricultural factor income per annual work unit (indicator A) 2019 0.5 % –
Agri-environmental indicators Year Value UnitEU-27 average/
totalArea under organic farming as a share of the UAA 2018 2.6 % 8.0Area under conversion to organic farming as a share of the UAA 2018 1.1 % :Change in the harmonised risk indicator 1 for pesticides compared with the average for 2011‑2013
2018 − 31 % − 17
Agricultural production Year Value UnitShare of EU-27
total (%)Cereals (including rice) 2019 2 396 thousand tonnes 0.8Root crops 2019 382 thousand tonnes 0.2Fresh vegetables 2019 151 thousand tonnes 0.2Permanent crops 2019 20 thousand tonnes 0.0Milk 2019 8 245 thousand tonnes 5.2Bovine meat 2019 620 thousand tonnes 9.0Pig meat 2019 304 thousand tonnes 1.3Poultry meat 2019 167 thousand tonnes 1.3
Forestry Year Value UnitShare of EU-27
total (%)Forest and other wooded land 2020 848 thousand hectares 0.5Persons employed in forestry and logging 2017 3.3 thousand annual work units 0.7Gross value added (at basic prices) 2017 53 EUR million 0.2Roundwood (under bark) 2018 3 330 thousand cubic metres 0.9
Fisheries Year Value UnitShare of EU-27
total (%)Fishing fleet 2019 65 491 gross tonnage 4.9Persons employed in fishing and aquaculture 2018 2.7 thousand 1.6Total catches (major fishing areas) 2017 246 760 tonnes live weight :Total aquaculture production (quantity) 2018 35 252 tonnes live weight 3.2Total aquaculture production (value) 2018 167 EUR million 4.5
(1) EU-27 average: includes 2017 data for Romania and Sweden.
Source: Eurostat (online data codes: ef_m_farmleg, nama_10_a64_e, aact_ali01, ef_m_farmang, nama_10_gdp, aact_eaa01, aact_eaa06, org_cropar, farm structure survey — 2016, aei_fm_salpest09, aei_pr_gnb, apro_cpnh1, apro_mk_farm, apro_mt_pann, for_area, for_awu, for_eco_cp, for_remov, fish_fleet_alt, fish_ca_main and fish_aq2a) and Food and Agriculture Organization of the United Nations — Global Forest Resources Assessment, 2020
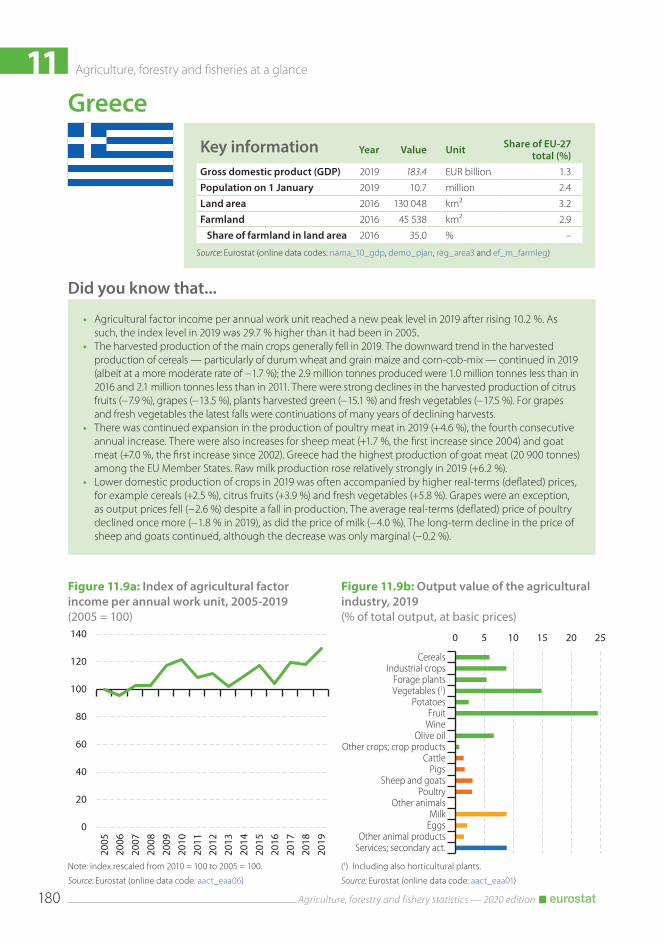
11 Agriculture, forestry and fisheries at a glance
Agriculture, forestry and fishery statistics — 2020 edition180
Did you know that...
• Agricultural factor income per annual work unit reached a new peak level in 2019 after rising 10.2 %. As such, the index level in 2019 was 29.7 % higher than it had been in 2005.
• The harvested production of the main crops generally fell in 2019. The downward trend in the harvested production of cereals — particularly of durum wheat and grain maize and corn-cob-mix — continued in 2019 (albeit at a more moderate rate of − 1.7 %); the 2.9 million tonnes produced were 1.0 million tonnes less than in 2016 and 2.1 million tonnes less than in 2011. There were strong declines in the harvested production of citrus fruits (− 7.9 %), grapes (− 13.5 %), plants harvested green (− 15.1 %) and fresh vegetables (− 17.5 %). For grapes and fresh vegetables the latest falls were continuations of many years of declining harvests.
• There was continued expansion in the production of poultry meat in 2019 (+4.6 %), the fourth consecutive annual increase. There were also increases for sheep meat (+1.7 %, the first increase since 2004) and goat meat (+7.0 %, the first increase since 2002). Greece had the highest production of goat meat (20 900 tonnes) among the EU Member States. Raw milk production rose relatively strongly in 2019 (+6.2 %).
• Lower domestic production of crops in 2019 was often accompanied by higher real-terms (deflated) prices, for example cereals (+2.5 %), citrus fruits (+3.9 %) and fresh vegetables (+5.8 %). Grapes were an exception, as output prices fell (− 2.6 %) despite a fall in production. The average real-terms (deflated) price of poultry declined once more (− 1.8 % in 2019), as did the price of milk (− 4.0 %). The long-term decline in the price of sheep and goats continued, although the decrease was only marginal (− 0.2 %).
Figure 11.9b: Output value of the agricultural industry, 2019(% of total output, at basic prices)
0 5 10 15 20 25
CerealsIndustrial crops
Forage plantsVegetables (1)
PotatoesFruit
WineOlive oil
Other crops; crop productsCattle
PigsSheep and goats
PoultryOther animals
MilkEggs
Other animal productsServices; secondary act.
(1) Including also horticultural plants.
Source: Eurostat (online data code: aact_eaa01)
Figure 11.9a: Index of agricultural factor income per annual work unit, 2005‑2019(2005 = 100)
0
20
40
60
80
100
120
140
2005
2006
2007
2008
2009
2010
2011
2012
2013
2014
2015
2016
2017
2018
2019
Note: index rescaled from 2010 = 100 to 2005 = 100.
Source: Eurostat (online data code: aact_eaa06)
Key information Year Value Unit Share of EU‑27 total (%)
Gross domestic product (GDP) 2019 183.4 EUR billion 1.3
Population on 1 January 2019 10.7 million 2.4
Land area 2016 130 048 km² 3.2
Farmland 2016 45 538 km² 2.9
Share of farmland in land area 2016 35.0 % –
Source: Eurostat (online data codes: nama_10_gdp, demo_pjan, reg_area3 and ef_m_farmleg)
Greece

11Agriculture, forestry and fisheries at a glance
Agriculture, forestry and fishery statistics — 2020 edition 181
Table 11.9: Key indicators for agriculture, forestry and fisheries for Greece
Farms and farmland Year Value UnitShare of EU-27
total (%)Farmland: utilised agricultural area (UAA) 2016 4 554 thousand hectares 2.9Farms (agricultural holdings) 2016 684 950 number 6.7
Share of very small farms (with < EUR 8 000 of standard output) 2016 67.7 % –
Farmers Year Value UnitEU-27 average/
totalEmployment in agriculture as a share of total employment (1) 2018 10.6 % 4.4Total labour force in agriculture 2019 416.9 thousand annual work units 8 739.7Young farmers (under 40 years old) as a share of all farm managers 2016 8.3 % 10.7
Economic performance of agriculture Year Value UnitShare of EU-27
total (%)Contribution of agriculture to gross domestic product 2019 3.1 % –Gross value added (at basic prices) 2019 6 141 EUR million 3.4Value of agricultural industry output (production value at basic prices) 2019 11 880 EUR million 2.8
Value of crop output 2019 8 261 EUR million 3.7Value of animal output 2019 2 563 EUR million 1.6
Annual change in agricultural factor income per annual work unit (indicator A) 2019 10.2 % –
Agri-environmental indicators Year Value UnitEU-27 average/
totalArea under organic farming as a share of the UAA 2018 9.3 % 8.0Area under conversion to organic farming as a share of the UAA 2018 3.3 % :Change in the harmonised risk indicator 1 for pesticides compared with the average for 2011‑2013
2018 − 41 % − 17
Agricultural production Year Value UnitShare of EU-27
total (%)Cereals (including rice) 2019 2 947 thousand tonnes 1.0Root crops 2019 550 thousand tonnes 0.3Fresh vegetables 2019 2 201 thousand tonnes 3.6Permanent crops 2019 5 120 thousand tonnes 7.2Milk 2019 1 959 thousand tonnes 1.2Bovine meat 2019 33 thousand tonnes 0.5Pig meat 2019 81 thousand tonnes 0.4Poultry meat 2019 230 thousand tonnes 1.7
Forestry Year Value UnitShare of EU-27
total (%)Forest and other wooded land 2020 6 537 thousand hectares 3.6Persons employed in forestry and logging 2017 9.3 thousand annual work units 1.9Gross value added (at basic prices) 2017 66 EUR million 0.2Roundwood (under bark) 2018 : thousand cubic metres :
Fisheries Year Value UnitShare of EU-27
total (%)Fishing fleet 2019 70 776 gross tonnage 5.3Persons employed in fishing and aquaculture 2018 20.6 thousand 12.6Total catches (major fishing areas) 2019 82 232 tonnes live weight 2.0Total aquaculture production (quantity) 2018 132 413 tonnes live weight 12.0Total aquaculture production (value) 2018 536 EUR million 14.4
(1) EU-27 average: includes 2017 data for Romania and Sweden.
Source: Eurostat (online data codes: ef_m_farmleg, nama_10_a64_e, aact_ali01, ef_m_farmang, nama_10_gdp, aact_eaa01, aact_eaa06, org_cropar, farm structure survey — 2016, aei_fm_salpest09, aei_pr_gnb, apro_cpnh1, apro_mk_farm, apro_mt_pann, for_area, for_awu, for_eco_cp, for_remov, fish_fleet_alt, fish_ca_main and fish_aq2a) and Food and Agriculture Organization of the United Nations — Global Forest Resources Assessment, 2020

11 Agriculture, forestry and fisheries at a glance
Agriculture, forestry and fishery statistics — 2020 edition182
Did you know that...
• The marked upward trend in agricultural factor income per annual work unit that had been recorded between 2008 and 2016 faltered, with relatively small and consecutive falls in 2017, 2018 and 2019 (− 3.2 %). Combining these falls, the index level in 2019 was 5.8 % below its 2016 peak.
• The output value of the agricultural industry decreased slightly (− 0.9 %) in 2019, falling to EUR 51.7 billion, the fourth largest value among the EU Member States.
• Spain had the highest production among the EU Member States of fresh vegetables (15.4 million tonnes), citrus fruits (6.0 million tonnes) and olives (6.0 million tonnes). After relatively high production levels in 2018, many crops had lower harvest levels in 2019; this included cereals (− 18.6 %) and several permanent crops like citrus fruit (− 11.3 %), grapes (− 17.7 %) and olives (− 39.3 %). By contrast, the harvested production of fresh vegetables in 2019 was higher (+6.2 %) than in 2018.
• The upward trend in pig (+2.4 %) and poultry meat (+4.2 %) production continued in 2019. Spain had the highest production for sheep meat (121 300 tonnes) among the EU Member States, its output increasing 1.4 % in 2019. Raw milk production increased (+1.7 %) in 2019, continuing the upward trend started in 2008.
• Output prices of most permanent crops fell in real (deflated) terms in 2019, for example for olives (− 19.3 %), fresh fruit (excluding citrus fruit and grapes; − 18.7 %), citrus fruits (− 14.4 %) and grapes (− 4.5 %). Output prices for fresh vegetables also fell (− 3.9 %), as they did for potatoes (− 2.2 %) and sugar beet (− 10.2 %). By contrast, price increases were recorded for cereals (+1.9 %) and oilseeds (+2.2 %). Whereas the output price fell for most animals, there was a strong rise (+9.5 %) for pigs.
Figure 11.10b: Output value of the agricultural industry, 2019(% of total output, at basic prices)
0 5 10 15 20
CerealsIndustrial crops
Forage plantsVegetables (1)
PotatoesFruit
WineOlive oil
Other crops; crop productsCattle
PigsSheep and goats
PoultryOther animals
MilkEggs
Other animal productsServices; secondary act.
(1) Including also horticultural plants.
Source: Eurostat (online data code: aact_eaa01)
Figure 11.10a: Index of agricultural factor income per annual work unit, 2005‑2019(2005 = 100)
0
20
40
60
80
100
120
140
2005
2006
2007
2008
2009
2010
2011
2012
2013
2014
2015
2016
2017
2018
2019
Note: index rescaled from 2010 = 100 to 2005 = 100.
Source: Eurostat (online data code: aact_eaa06)
Key information Year Value Unit Share of EU‑27 total (%)
Gross domestic product (GDP) 2019 1 244.8 EUR billion 8.9
Population on 1 January 2019 46.9 million 10.5
Land area 2016 502 654 km² 12.2
Farmland 2016 232 298 km² 14.8
Share of farmland in land area 2016 46.2 % –
Source: Eurostat (online data codes: nama_10_gdp, demo_pjan, reg_area3 and ef_m_farmleg)
Spain

11Agriculture, forestry and fisheries at a glance
Agriculture, forestry and fishery statistics — 2020 edition 183
Table 11.10: Key indicators for agriculture, forestry and fisheries for Spain
Farms and farmland Year Value UnitShare of EU-27
total (%)Farmland: utilised agricultural area (UAA) 2016 23 230 thousand hectares 14.8Farms (agricultural holdings) 2016 945 020 number 9.2
Share of very small farms (with < EUR 8 000 of standard output) 2016 52.7 % –
Farmers Year Value UnitEU-27 average/
totalEmployment in agriculture as a share of total employment (1) 2018 3.7 % 4.4Total labour force in agriculture 2019 854.7 thousand annual work units 8 739.7Young farmers (under 40 years old) as a share of all farm managers 2016 8.6 % 10.7
Economic performance of agriculture Year Value UnitShare of EU-27
total (%)Contribution of agriculture to gross domestic product 2019 2.2 % –Gross value added (at basic prices) 2019 28 066 EUR million 15.5Value of agricultural industry output (production value at basic prices) 2019 51 669 EUR million 12.4
Value of crop output 2019 29 993 EUR million 13.6Value of animal output 2019 19 907 EUR million 12.3
Annual change in agricultural factor income per annual work unit (indicator A) 2019 − 3.2 % –
Agri-environmental indicators Year Value UnitEU-27 average/
totalArea under organic farming as a share of the UAA 2018 9.3 % 8.0Area under conversion to organic farming as a share of the UAA 2018 1.3 % :Change in the harmonised risk indicator 1 for pesticides compared with the average for 2011‑2013
2018 − 22 % − 17
Agricultural production Year Value UnitShare of EU-27
total (%)Cereals (including rice) 2019 19 942 thousand tonnes 6.7Root crops 2019 5 167 thousand tonnes 3.1Fresh vegetables 2019 15 439 thousand tonnes 25.3Permanent crops 2019 22 697 thousand tonnes 32.1Milk 2019 8 560 thousand tonnes 5.4Bovine meat 2019 695 thousand tonnes 10.1Pig meat 2019 4 641 thousand tonnes 20.4Poultry meat 2019 1 705 thousand tonnes 12.8
Forestry Year Value UnitShare of EU-27
total (%)Forest and other wooded land 2020 27 954 thousand hectares 15.5Persons employed in forestry and logging 2017 17.8 thousand annual work units 3.7Gross value added (at basic prices) 2017 995 EUR million 3.8Roundwood (under bark) 2018 15 457 thousand cubic metres 4.1
Fisheries Year Value UnitShare of EU-27
total (%)Fishing fleet 2019 332 454 gross tonnage 24.9Persons employed in fishing and aquaculture 2018 38.8 thousand 23.7Total catches (major fishing areas) 2019 837 216 tonnes live weight 20.4Total aquaculture production (quantity) 2017 314 958 tonnes live weight 27.6Total aquaculture production (value) 2017 578 EUR million :
(1) EU-27 average: includes 2017 data for Romania and Sweden.
Source: Eurostat (online data codes: ef_m_farmleg, nama_10_a64_e, aact_ali01, ef_m_farmang, nama_10_gdp, aact_eaa01, aact_eaa06, org_cropar, farm structure survey — 2016, aei_fm_salpest09, aei_pr_gnb, apro_cpnh1, apro_mk_farm, apro_mt_pann, for_area, for_awu, for_eco_cp, for_remov, fish_fleet_alt, fish_ca_main and fish_aq2a) and Food and Agriculture Organization of the United Nations — Global Forest Resources Assessment, 2020

11 Agriculture, forestry and fisheries at a glance
Agriculture, forestry and fishery statistics — 2020 edition184
Did you know that...
• Agricultural factor income per annual work unit rose strongly (+13.9 %) in 2018 and reached its highest level during the period since 2005. However, in 2019 the index fell back (− 6.4 %) from this peak.
• Output from the agricultural industry was valued at EUR 77.0 billion in 2019, the highest value among the EU Member States; this was slightly lower (− 1.6 %) than in the previous year. The value of crop output fell (− 4.0 %) while that of animal output increased (+2.3 %).
• France had the largest harvests among the EU Member States for cereals (71.2 million tonnes), root crops (47.3 million tonnes) and oilseeds (5.3 million tonnes). The production of cereals as a whole rebounded (+13.8 %) in 2019, having fallen in 2018, with increases reported for all major types of cereal. Falls were recorded for root crops (− 2.4 %), plants harvested green (− 3.2 %), oilseeds (− 20.5 %) and grapes (− 12.4 %).
• France had the highest production of bovine meat (1.4 million tonnes) among the EU Member States. In 2019, production of bovine meat fell (− 2.2 %), as it did for poultry meat (− 2.0 %) and sheep meat (− 0.6 %). By contrast production of pig meat increased (+0.9 %).
• Lower prices in real (deflated) terms for cereals (− 3.0 %) and fresh fruit (− 7.6 %) in 2019 accompanied their increased production levels. The output price for grapes (− 5.1 %) and wine (− 5.6 %) also fell, as did that for sugar beet (− 20.6 %). Output price increases were recorded for potatoes (+38.3 %), fresh vegetables (+5.2 %) and oilseeds (+4.8 %). Output prices for pigs (+20.3 %) and poultry (+1.4 %) rose, while the price for cattle fell (− 2.4 %).
Figure 11.11b: Output value of the agricultural industry, 2019(% of total output, at basic prices)
0 5 10 15
CerealsIndustrial crops
Forage plantsVegetables (1)
PotatoesFruit
WineOlive oil
Other crops; crop productsCattle
PigsSheep and goats
PoultryOther animals
MilkEggs
Other animal productsServices; secondary act.
(1) Including also horticultural plants.
Source: Eurostat (online data code: aact_eaa01)
Figure 11.11a: Index of agricultural factor income per annual work unit, 2005‑2019(2005 = 100)
0
20
40
60
80
100
120
140
160
2005
2006
2007
2008
2009
2010
2011
2012
2013
2014
2015
2016
2017
2018
2019
Note: index rescaled from 2010 = 100 to 2005 = 100.
Source: Eurostat (online data code: aact_eaa06)
Key information Year Value Unit Share of EU‑27 total (%)
Gross domestic product (GDP) 2019 2 425.7 EUR billion 17.4
Population on 1 January 2019 67.0 million 15.0
Land area 2016 633 886 km² 15.4
Farmland 2016 278 142 km² 17.8
Share of farmland in land area 2016 43.9 % –
Source: Eurostat (online data codes: nama_10_gdp, demo_pjan, reg_area3 and ef_m_farmleg)
France

11Agriculture, forestry and fisheries at a glance
Agriculture, forestry and fishery statistics — 2020 edition 185
Table 11.11: Key indicators for agriculture, forestry and fisheries for France
Farms and farmland Year Value UnitShare of EU-27
total (%)Farmland: utilised agricultural area (UAA) 2016 27 814 thousand hectares 17.8Farms (agricultural holdings) 2016 456 520 number 4.4
Share of very small farms (with < EUR 8 000 of standard output) 2016 18.9 % –
Farmers Year Value UnitEU-27 average/
totalEmployment in agriculture as a share of total employment (1) 2018 2.5 % 4.4Total labour force in agriculture 2019 726.1 thousand annual work units 8 739.7Young farmers (under 40 years old) as a share of all farm managers 2016 15.6 % 10.7
Economic performance of agriculture Year Value UnitShare of EU-27
total (%)Contribution of agriculture to gross domestic product 2019 1.3 % –Gross value added (at basic prices) 2019 31 920 EUR million 17.6Value of agricultural industry output (production value at basic prices) 2019 77 024 EUR million 18.4
Value of crop output 2019 43 353 EUR million 19.7Value of animal output 2019 26 571 EUR million 16.5
Annual change in agricultural factor income per annual work unit (indicator A) 2019 − 6.4 % –
Agri-environmental indicators Year Value UnitEU-27 average/
totalArea under organic farming as a share of the UAA 2018 7.0 % 8.0Area under conversion to organic farming as a share of the UAA 2018 1.8 % :Change in the harmonised risk indicator 1 for pesticides compared with the average for 2011‑2013
2018 1 % − 17
Agricultural production Year Value UnitShare of EU-27
total (%)Cereals (including rice) 2019 71 208 thousand tonnes 23.8Root crops 2019 47 329 thousand tonnes 28.4Fresh vegetables 2019 5 552 thousand tonnes 9.1Permanent crops 2019 8 416 thousand tonnes 11.9Milk 2019 25 909 thousand tonnes 16.4Bovine meat 2019 1 428 thousand tonnes 20.7Pig meat 2019 2 200 thousand tonnes 9.7Poultry meat 2019 1 698 thousand tonnes 12.8
Forestry Year Value UnitShare of EU-27
total (%)Forest and other wooded land 2020 18 096 thousand hectares 10.0Persons employed in forestry and logging 2017 28.7 thousand annual work units 5.9Gross value added (at basic prices) 2017 3 322 EUR million 12.7Roundwood (under bark) 2018 25 721 thousand cubic metres 6.8
Fisheries Year Value UnitShare of EU-27
total (%)Fishing fleet 2019 172 656 gross tonnage 12.9Persons employed in fishing and aquaculture 2018 20.0 thousand 12.2Total catches (major fishing areas) 2019 525 122 tonnes live weight 12.8Total aquaculture production (quantity) 2018 186 775 tonnes live weight 17.0Total aquaculture production (value) 2018 687 EUR million 18.5
(1) EU-27 average: includes 2017 data for Romania and Sweden.
Source: Eurostat (online data codes: ef_m_farmleg, nama_10_a64_e, aact_ali01, ef_m_farmang, nama_10_gdp, aact_eaa01, aact_eaa06, org_cropar, farm structure survey — 2016, aei_fm_salpest09, aei_pr_gnb, apro_cpnh1, apro_mk_farm, apro_mt_pann, for_area, for_awu, for_eco_cp, for_remov, fish_fleet_alt, fish_ca_main and fish_aq2a) and Food and Agriculture Organization of the United Nations — Global Forest Resources Assessment, 2020
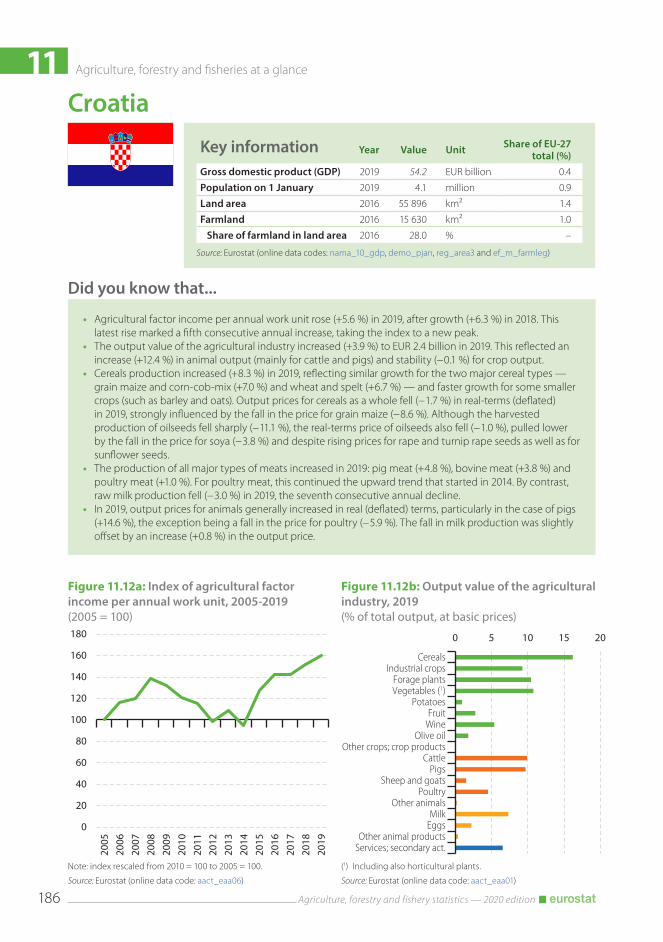
11 Agriculture, forestry and fisheries at a glance
Agriculture, forestry and fishery statistics — 2020 edition186
Did you know that...
• Agricultural factor income per annual work unit rose (+5.6 %) in 2019, after growth (+6.3 %) in 2018. This latest rise marked a fifth consecutive annual increase, taking the index to a new peak.
• The output value of the agricultural industry increased (+3.9 %) to EUR 2.4 billion in 2019. This reflected an increase (+12.4 %) in animal output (mainly for cattle and pigs) and stability (− 0.1 %) for crop output.
• Cereals production increased (+8.3 %) in 2019, reflecting similar growth for the two major cereal types — grain maize and corn-cob-mix (+7.0 %) and wheat and spelt (+6.7 %) — and faster growth for some smaller crops (such as barley and oats). Output prices for cereals as a whole fell (− 1.7 %) in real-terms (deflated) in 2019, strongly influenced by the fall in the price for grain maize (− 8.6 %). Although the harvested production of oilseeds fell sharply (− 11.1 %), the real-terms price of oilseeds also fell (− 1.0 %), pulled lower by the fall in the price for soya (− 3.8 %) and despite rising prices for rape and turnip rape seeds as well as for sunflower seeds.
• The production of all major types of meats increased in 2019: pig meat (+4.8 %), bovine meat (+3.8 %) and poultry meat (+1.0 %). For poultry meat, this continued the upward trend that started in 2014. By contrast, raw milk production fell (− 3.0 %) in 2019, the seventh consecutive annual decline.
• In 2019, output prices for animals generally increased in real (deflated) terms, particularly in the case of pigs (+14.6 %), the exception being a fall in the price for poultry (− 5.9 %). The fall in milk production was slightly offset by an increase (+0.8 %) in the output price.
Figure 11.12b: Output value of the agricultural industry, 2019(% of total output, at basic prices)
0 5 10 15 20
CerealsIndustrial crops
Forage plantsVegetables (1)
PotatoesFruit
WineOlive oil
Other crops; crop productsCattle
PigsSheep and goats
PoultryOther animals
MilkEggs
Other animal productsServices; secondary act.
(1) Including also horticultural plants.
Source: Eurostat (online data code: aact_eaa01)
Figure 11.12a: Index of agricultural factor income per annual work unit, 2005‑2019(2005 = 100)
0
20
40
60
80
100
120
140
160
180
2005
2006
2007
2008
2009
2010
2011
2012
2013
2014
2015
2016
2017
2018
2019
Note: index rescaled from 2010 = 100 to 2005 = 100.
Source: Eurostat (online data code: aact_eaa06)
Key information Year Value Unit Share of EU‑27 total (%)
Gross domestic product (GDP) 2019 54.2 EUR billion 0.4
Population on 1 January 2019 4.1 million 0.9
Land area 2016 55 896 km² 1.4
Farmland 2016 15 630 km² 1.0
Share of farmland in land area 2016 28.0 % –
Source: Eurostat (online data codes: nama_10_gdp, demo_pjan, reg_area3 and ef_m_farmleg)
Croatia

11Agriculture, forestry and fisheries at a glance
Agriculture, forestry and fishery statistics — 2020 edition 187
Table 11.12: Key indicators for agriculture, forestry and fisheries for Croatia
Farms and farmland Year Value UnitShare of EU-27
total (%)Farmland: utilised agricultural area (UAA) 2016 1 563 thousand hectares 1.0Farms (agricultural holdings) 2016 134 460 number 1.3
Share of very small farms (with < EUR 8 000 of standard output) 2016 68.9 % –
Farmers Year Value UnitEU-27 average/
totalEmployment in agriculture as a share of total employment (1) 2018 5.1 % 4.4Total labour force in agriculture 2019 176.4 thousand annual work units 8 739.7Young farmers (under 40 years old) as a share of all farm managers 2016 10.5 % 10.7
Economic performance of agriculture Year Value UnitShare of EU-27
total (%)Contribution of agriculture to gross domestic product 2019 1.9 % –Gross value added (at basic prices) 2019 1 134 EUR million 0.6Value of agricultural industry output (production value at basic prices) 2019 2 423 EUR million 0.6
Value of crop output 2019 1 397 EUR million 0.6Value of animal output 2019 868 EUR million 0.5
Annual change in agricultural factor income per annual work unit (indicator A) 2019 5.6 % –
Agri-environmental indicators Year Value UnitEU-27 average/
totalArea under organic farming as a share of the UAA 2018 6.9 % 8.0Area under conversion to organic farming as a share of the UAA 2018 3.1 % :Change in the harmonised risk indicator 1 for pesticides compared with the average for 2011‑2013
2018 − 38 % − 17
Agricultural production Year Value UnitShare of EU-27
total (%)Cereals (including rice) 2019 3 499 thousand tonnes 1.2Root crops 2019 888 thousand tonnes 0.5Fresh vegetables 2019 166 thousand tonnes 0.3Permanent crops 2019 291 thousand tonnes 0.4Milk 2019 615 thousand tonnes 0.4Bovine meat 2019 45 thousand tonnes 0.7Pig meat 2019 78 thousand tonnes 0.3Poultry meat 2019 67 thousand tonnes 0.5
Forestry Year Value UnitShare of EU-27
total (%)Forest and other wooded land 2020 2 557 thousand hectares 1.4Persons employed in forestry and logging 2017 13.8 thousand annual work units 2.9Gross value added (at basic prices) 2017 196 EUR million 0.7Roundwood (under bark) 2018 3 214 thousand cubic metres 0.8
Fisheries Year Value UnitShare of EU-27
total (%)Fishing fleet 2019 44 361 gross tonnage 3.3Persons employed in fishing and aquaculture 2018 4.9 thousand 3.0Total catches (major fishing areas) 2019 64 020 tonnes live weight 1.6Total aquaculture production (quantity) 2018 19 680 tonnes live weight 1.8Total aquaculture production (value) 2018 120 EUR million 3.2
(1) EU-27 average: includes 2017 data for Romania and Sweden.
Source: Eurostat (online data codes: ef_m_farmleg, nama_10_a64_e, aact_ali01, ef_m_farmang, nama_10_gdp, aact_eaa01, aact_eaa06, org_cropar, farm structure survey — 2016, aei_fm_salpest09, aei_pr_gnb, apro_cpnh1, apro_mk_farm, apro_mt_pann, for_area, for_awu, for_eco_cp, for_remov, fish_fleet_alt, fish_ca_main and fish_aq2a) and Food and Agriculture Organization of the United Nations — Global Forest Resources Assessment, 2020

11 Agriculture, forestry and fisheries at a glance
Agriculture, forestry and fishery statistics — 2020 edition188
Did you know that...
• Agricultural factor income per annual work unit in 2019 was lower (− 3.9 %) than in 2018, losing some of the gains (+12.2 %) made when it peaked in 2018.
• The output value of the agricultural industry fell slightly (− 1.2 %) in 2019 to EUR 57.8 million, the third highest value among the EU Member States. The value of crop output fell (− 3.1 %), while that of animal output increased slightly (+0.9 %).
• Among the EU Member States, Italy had the highest harvested productions of fruit (excluding citrus fruit and grapes), berries and nuts and grapes. The harvested production of grapes for wine was much lower in 2019 (− 8.4 %), although this was accompanied by a similarly sharp decline in the real (deflated) price of wine (− 9.9 %). Similarly, the harvested production of fruit (excluding citrus fruit and grapes), berries and nuts in 2019 was down sharply (− 6.4 %) but the price of fresh fruit (excluding citrus fruit and grapes) was also down strongly (− 7.0 % in real terms). On the other hand, the output price of fresh vegetables as a whole rose strongly (+9.0 %) despite a small rise in the harvested production (+0.8 %).
• In 2019, the only increase in production among the major meat types was for poultry meat (+6.3 %), with the production of bovine meat (− 3.6 %) as well as pig meat (− 1.6 %) falling. In real-terms, (deflated) output prices for poultry (− 2.3 %), cattle (− 1.5 %) and pigs (− 0.9 %) fell. Production of raw milk grew moderately (+1.3 %), its fourth consecutive annual increase, and was accompanied by a real-terms increase in output prices (+4.4 %).
Figure 11.13b: Output value of the agricultural industry, 2019(% of total output, at basic prices)
0 5 10 15 20
CerealsIndustrial crops
Forage plantsVegetables (1)
PotatoesFruit
WineOlive oil
Other crops; crop productsCattle
PigsSheep and goats
PoultryOther animals
MilkEggs
Other animal productsServices; secondary act.
(1) Including also horticultural plants.
Source: Eurostat (online data code: aact_eaa01)
Figure 11.13a: Index of agricultural factor income per annual work unit, 2005‑2019(2005 = 100)
0
20
40
60
80
100
120
140
2005
2006
2007
2008
2009
2010
2011
2012
2013
2014
2015
2016
2017
2018
2019
Note: index rescaled from 2010 = 100 to 2005 = 100.
Source: Eurostat (online data code: aact_eaa06)
Key information Year Value Unit Share of EU‑27 total (%)
Gross domestic product (GDP) 2019 1 789.7 EUR billion 12.8
Population on 1 January 2019 60.4 million 13.5
Land area 2016 297 734 km² 7.3
Farmland 2016 125 982 km² 8.0
Share of farmland in land area 2016 42.3 % –
Source: Eurostat (online data codes: nama_10_gdp, demo_pjan, reg_area3 and ef_m_farmleg)
Italy

11Agriculture, forestry and fisheries at a glance
Agriculture, forestry and fishery statistics — 2020 edition 189
Table 11.13: Key indicators for agriculture, forestry and fisheries for Italy
Farms and farmland Year Value UnitShare of EU-27
total (%)Farmland: utilised agricultural area (UAA) 2016 12 598 thousand hectares 8.0Farms (agricultural holdings) 2016 1 145 710 number 11.1
Share of very small farms (with < EUR 8 000 of standard output) 2016 50.6 % –
Farmers Year Value UnitEU-27 average/
totalEmployment in agriculture as a share of total employment (1) 2018 3.4 % 4.4Total labour force in agriculture 2019 1 103.0 thousand annual work units 8 739.7Young farmers (under 40 years old) as a share of all farm managers 2016 7.9 % 10.7
Economic performance of agriculture Year Value UnitShare of EU-27
total (%)Contribution of agriculture to gross domestic product 2019 1.8 % –Gross value added (at basic prices) 2019 32 928 EUR million 18.1Value of agricultural industry output (production value at basic prices) 2019 57 829 EUR million 13.8
Value of crop output 2019 31 403 EUR million 14.2Value of animal output 2019 15 805 EUR million 9.8
Annual change in agricultural factor income per annual work unit (indicator A) 2019 − 3.9 % –
Agri-environmental indicators Year Value UnitEU-27 average/
totalArea under organic farming as a share of the UAA 2018 15.2 % 8.0Area under conversion to organic farming as a share of the UAA 2018 3.6 % :Change in the harmonised risk indicator 1 for pesticides compared with the average for 2011‑2013
2018 − 9 % − 17
Agricultural production Year Value UnitShare of EU-27
total (%)Cereals (including rice) 2019 16 132 thousand tonnes 5.4Root crops 2019 3 123 thousand tonnes 1.9Fresh vegetables 2019 12 253 thousand tonnes 20.1Permanent crops 2019 18 311 thousand tonnes 25.9Milk 2019 13 300 thousand tonnes 8.4Bovine meat 2019 780 thousand tonnes 11.3Pig meat 2019 1 448 thousand tonnes 6.4Poultry meat 2019 1 366 thousand tonnes 10.3
Forestry Year Value UnitShare of EU-27
total (%)Forest and other wooded land 2020 11 432 thousand hectares 6.3Persons employed in forestry and logging 2017 39.8 thousand annual work units 8.2Gross value added (at basic prices) 2017 2 158 EUR million 8.2Roundwood (under bark) 2018 2 213 thousand cubic metres 0.6
Fisheries Year Value UnitShare of EU-27
total (%)Fishing fleet 2019 146 272 gross tonnage 11.0Persons employed in fishing and aquaculture 2018 27.8 thousand 17.0Total catches (major fishing areas) 2019 180 737 tonnes live weight 4.4Total aquaculture production (quantity) 2018 142 726 tonnes live weight 13.0Total aquaculture production (value) 2018 439 EUR million 11.8
(1) EU-27 average: includes 2017 data for Romania and Sweden.
Source: Eurostat (online data codes: ef_m_farmleg, nama_10_a64_e, aact_ali01, ef_m_farmang, nama_10_gdp, aact_eaa01, aact_eaa06, org_cropar, farm structure survey — 2016, aei_fm_salpest09, aei_pr_gnb, apro_cpnh1, apro_mk_farm, apro_mt_pann, for_area, for_awu, for_eco_cp, for_remov, fish_fleet_alt, fish_ca_main and fish_aq2a) and Food and Agriculture Organization of the United Nations — Global Forest Resources Assessment, 2020

11 Agriculture, forestry and fisheries at a glance
Agriculture, forestry and fishery statistics — 2020 edition190
Did you know that...
• Agricultural factor income per annual work unit rose slightly (+2.6 %) in 2019 after a fall (− 3.9 %) in 2018. • The output value of the agricultural industry increased (+5.9 %) to EUR 0.8 billion in 2019. More than three
fifths of this output value came from milk, pigs, poultry, fresh vegetables and fruits. While the output value increased for poultry (+5.6 %), milk (+5.3 %) and pigs (+3.7 %), there were decreases for fresh vegetables (− 2.1 %) and fruit (− 3.5 %). The value of the small cereals crop doubled (+104.5 %).
• Raw milk production continued to increase strongly (+5.3 %) in 2019, driven by a further marked expansion in the number of dairy cows (+9.8 %). Despite higher production, the real-terms (deflated) price of milk also continued to increase (+1.8 %). The production of most meat products increased in 2019, the exception being sheep meat (− 6.4 %). For poultry meat, the increase (+5.7 %) in 2019 was the fifth consecutive annual increase. In real terms, output prices for sheep and goats (+7.1 %) and pigs (+1.6 %) increased, but were relatively unchanged for poultry (− 0.3 %) and cattle (− 0.4 %).
• The harvested production of fresh vegetables in 2019 was lower (− 6.1 %, the fifth consecutive annual fall) than in 2018, as was the production of citrus fruits (− 10.4 %, the fourth consecutive annual fall). The harvested production of cereals in 2019 was more than double (+138.9 %) that of 2018 when conditions during the growing season had been dry. Alongside the large increase in the cereals harvest in 2019, the output price dropped (− 2.4 %) in real (deflated) terms. Increases in output prices for potatoes (+54.5 %) and fresh vegetables (+22.5 %) accompanied lower harvests. The output price of citrus fruits fell modestly (− 2.6 %).
Figure 11.14b: Output value of the agricultural industry, 2019(% of total output, at basic prices)
0 5 10 15 20 25 30
CerealsIndustrial crops
Forage plantsVegetables (1)
PotatoesFruit
WineOlive oil
Other crops; crop productsCattle
PigsSheep and goats
PoultryOther animals
MilkEggs
Other animal productsServices; secondary act.
(1) Including also horticultural plants.
Source: Eurostat (online data code: aact_eaa01)
Figure 11.14a: Index of agricultural factor income per annual work unit, 2005‑2019(2005 = 100)
0
20
40
60
80
100
120
2005
2006
2007
2008
2009
2010
2011
2012
2013
2014
2015
2016
2017
2018
2019
Note: index rescaled from 2010 = 100 to 2005 = 100.
Source: Eurostat (online data code: aact_eaa06)
Key information Year Value Unit Share of EU‑27 total (%)
Gross domestic product (GDP) 2019 22.3 EUR billion 0.2
Population on 1 January 2019 0.9 million 0.2
Land area 2016 9 213 km² 0.2
Farmland 2016 1 119 km² 0.1
Share of farmland in land area 2016 12.1 % –
Source: Eurostat (online data codes: nama_10_gdp, demo_pjan, reg_area3 and ef_m_farmleg)
Cyprus
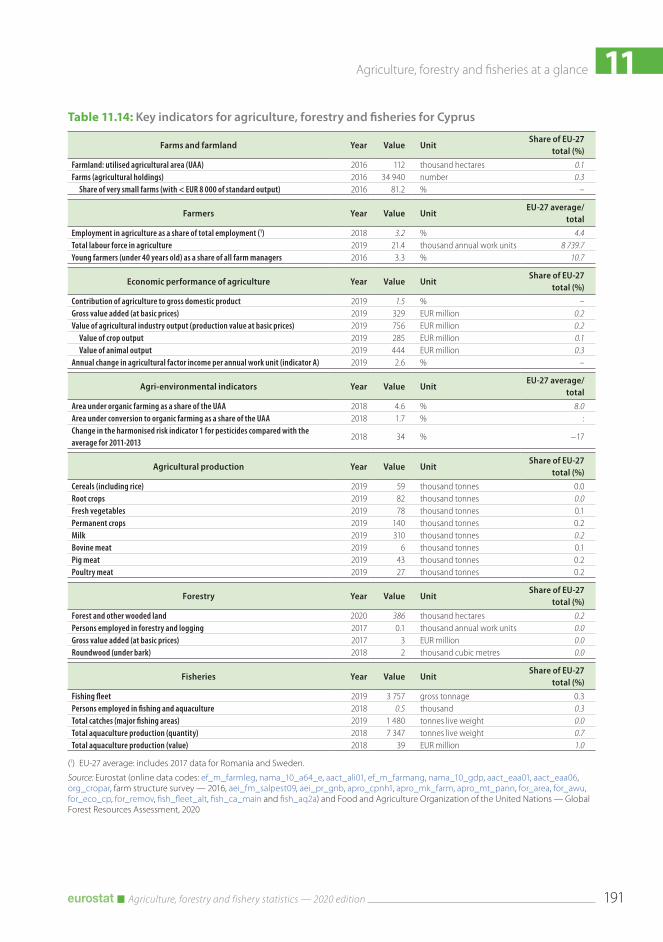
11Agriculture, forestry and fisheries at a glance
Agriculture, forestry and fishery statistics — 2020 edition 191
Table 11.14: Key indicators for agriculture, forestry and fisheries for Cyprus
Farms and farmland Year Value UnitShare of EU-27
total (%)Farmland: utilised agricultural area (UAA) 2016 112 thousand hectares 0.1Farms (agricultural holdings) 2016 34 940 number 0.3
Share of very small farms (with < EUR 8 000 of standard output) 2016 81.2 % –
Farmers Year Value UnitEU-27 average/
totalEmployment in agriculture as a share of total employment (1) 2018 3.2 % 4.4Total labour force in agriculture 2019 21.4 thousand annual work units 8 739.7Young farmers (under 40 years old) as a share of all farm managers 2016 3.3 % 10.7
Economic performance of agriculture Year Value UnitShare of EU-27
total (%)Contribution of agriculture to gross domestic product 2019 1.5 % –Gross value added (at basic prices) 2019 329 EUR million 0.2Value of agricultural industry output (production value at basic prices) 2019 756 EUR million 0.2
Value of crop output 2019 285 EUR million 0.1Value of animal output 2019 444 EUR million 0.3
Annual change in agricultural factor income per annual work unit (indicator A) 2019 2.6 % –
Agri-environmental indicators Year Value UnitEU-27 average/
totalArea under organic farming as a share of the UAA 2018 4.6 % 8.0Area under conversion to organic farming as a share of the UAA 2018 1.7 % :Change in the harmonised risk indicator 1 for pesticides compared with the average for 2011‑2013
2018 34 % − 17
Agricultural production Year Value UnitShare of EU-27
total (%)Cereals (including rice) 2019 59 thousand tonnes 0.0Root crops 2019 82 thousand tonnes 0.0Fresh vegetables 2019 78 thousand tonnes 0.1Permanent crops 2019 140 thousand tonnes 0.2Milk 2019 310 thousand tonnes 0.2Bovine meat 2019 6 thousand tonnes 0.1Pig meat 2019 43 thousand tonnes 0.2Poultry meat 2019 27 thousand tonnes 0.2
Forestry Year Value UnitShare of EU-27
total (%)Forest and other wooded land 2020 386 thousand hectares 0.2Persons employed in forestry and logging 2017 0.1 thousand annual work units 0.0Gross value added (at basic prices) 2017 3 EUR million 0.0Roundwood (under bark) 2018 2 thousand cubic metres 0.0
Fisheries Year Value UnitShare of EU-27
total (%)Fishing fleet 2019 3 757 gross tonnage 0.3Persons employed in fishing and aquaculture 2018 0.5 thousand 0.3Total catches (major fishing areas) 2019 1 480 tonnes live weight 0.0Total aquaculture production (quantity) 2018 7 347 tonnes live weight 0.7Total aquaculture production (value) 2018 39 EUR million 1.0
(1) EU-27 average: includes 2017 data for Romania and Sweden.
Source: Eurostat (online data codes: ef_m_farmleg, nama_10_a64_e, aact_ali01, ef_m_farmang, nama_10_gdp, aact_eaa01, aact_eaa06, org_cropar, farm structure survey — 2016, aei_fm_salpest09, aei_pr_gnb, apro_cpnh1, apro_mk_farm, apro_mt_pann, for_area, for_awu, for_eco_cp, for_remov, fish_fleet_alt, fish_ca_main and fish_aq2a) and Food and Agriculture Organization of the United Nations — Global Forest Resources Assessment, 2020

11 Agriculture, forestry and fisheries at a glance
Agriculture, forestry and fishery statistics — 2020 edition192
Did you know that...
• There has been a strong upward trend in agricultural factor income per annual work unit since 2005, despite relatively large falls in 2008, 2013, 2016 and 2018 and smaller falls in 2009 and 2011. These were more than outweighed by increases in other years (for example, +26.7 % in 2019). As such, the index level in 2019 was higher (+138.4 %) than in 2005 and was also higher than in any intervening year.
• The output value of the agricultural industry increased (+21.1 %) in 2019 to EUR 1.6 billion. Output values increased for the three largest products in 2019: cereals (+42.7 %), milk (+4.4 %) and industrial crops (+60.6 %).
• After three years of declining harvests, cereals production in 2019 rebounded (+53.8 %). The relatively large wheat and spelt harvest increased (+65.6 %). The production of oilseeds (almost exclusively rape and turnip rape seeds) also rebounded strongly (+76.5 %).
• The production of pig (+5.2 %) and poultry meat and (+5.1 %) increased in 2019, continuing well-established upwards trends (leaving aside the moderate fall recorded for poultry meat in 2018). By contrast, the production of bovine meat fell (− 6.9 %), its third consecutive annual fall. The production of raw milk was relatively unchanged compared with 2018 (− 0.2 %).
• Output prices for cereals decreased (− 7.7 %) in real (deflated) terms while those for oilseeds increased (+2.9 %). Output prices also rose for pigs (+16.1 %), poultry (+4.4 %) and milk (+0.7 %).
Figure 11.15b: Output value of the agricultural industry, 2019(% of total output, at basic prices)
0 5 10 15 20 25 30 35
CerealsIndustrial crops
Forage plantsVegetables (1)
PotatoesFruit
WineOlive oil
Other crops; crop productsCattle
PigsSheep and goats
PoultryOther animals
MilkEggs
Other animal productsServices; secondary act.
(1) Including also horticultural plants.
Source: Eurostat (online data code: aact_eaa01)
Figure 11.15a: Index of agricultural factor income per annual work unit, 2005‑2019(2005 = 100)
0
50
100
150
200
250
2005
2006
2007
2008
2009
2010
2011
2012
2013
2014
2015
2016
2017
2018
2019
Note: index rescaled from 2010 = 100 to 2005 = 100.
Source: Eurostat (online data code: aact_eaa06)
Key information Year Value Unit Share of EU‑27 total (%)
Gross domestic product (GDP) 2019 30.5 EUR billion 0.2
Population on 1 January 2019 1.9 million 0.4
Land area 2016 63 290 km² 1.5
Farmland 2016 19 309 km² 1.2
Share of farmland in land area 2016 30.5 % –
Source: Eurostat (online data codes: nama_10_gdp, demo_pjan, reg_area3 and ef_m_farmleg)
Latvia

11Agriculture, forestry and fisheries at a glance
Agriculture, forestry and fishery statistics — 2020 edition 193
Table 11.15: Key indicators for agriculture, forestry and fisheries for Latvia
Farms and farmland Year Value UnitShare of EU-27
total (%)Farmland: utilised agricultural area (UAA) 2016 1 931 thousand hectares 1.2Farms (agricultural holdings) 2016 69 930 number 0.7
Share of very small farms (with < EUR 8 000 of standard output) 2016 76.8 % –
Farmers Year Value UnitEU-27 average/
totalEmployment in agriculture as a share of total employment (1) 2018 5.1 % 4.4Total labour force in agriculture 2019 70.0 thousand annual work units 8 739.7Young farmers (under 40 years old) as a share of all farm managers 2016 9.5 % 10.7
Economic performance of agriculture Year Value UnitShare of EU-27
total (%)Contribution of agriculture to gross domestic product 2019 1.6 % –Gross value added (at basic prices) 2019 550 EUR million 0.3Value of agricultural industry output (production value at basic prices) 2019 1 629 EUR million 0.4
Value of crop output 2019 943 EUR million 0.4Value of animal output 2019 528 EUR million 0.3
Annual change in agricultural factor income per annual work unit (indicator A) 2019 26.7 % –
Agri-environmental indicators Year Value UnitEU-27 average/
totalArea under organic farming as a share of the UAA 2018 14.5 % 8.0Area under conversion to organic farming as a share of the UAA 2017 2.7 % :Change in the harmonised risk indicator 1 for pesticides compared with the average for 2011‑2013
2018 40 % − 17
Agricultural production Year Value UnitShare of EU-27
total (%)Cereals (including rice) 2019 3 163 thousand tonnes 1.1Root crops 2019 231 thousand tonnes 0.1Fresh vegetables 2019 77 thousand tonnes 0.1Permanent crops 2019 14 thousand tonnes 0.0Milk 2019 981 thousand tonnes 0.6Bovine meat 2019 15 thousand tonnes 0.2Pig meat 2019 38 thousand tonnes 0.2Poultry meat 2019 35 thousand tonnes 0.3
Forestry Year Value UnitShare of EU-27
total (%)Forest and other wooded land 2020 3 519 thousand hectares 2.0Persons employed in forestry and logging 2017 17.2 thousand annual work units 3.6Gross value added (at basic prices) 2017 393 EUR million 1.5Roundwood (under bark) 2016 11 094 thousand cubic metres 3.2
Fisheries Year Value UnitShare of EU-27
total (%)Fishing fleet 2019 13 406 gross tonnage 1.0Persons employed in fishing and aquaculture 2018 1.5 thousand 0.9Total catches (major fishing areas) 2016 114 655 tonnes live weight :Total aquaculture production (quantity) 2018 828 tonnes live weight 0.1Total aquaculture production (value) 2018 2 EUR million 0.1
(1) EU-27 average: includes 2017 data for Romania and Sweden.
Source: Eurostat (online data codes: ef_m_farmleg, nama_10_a64_e, aact_ali01, ef_m_farmang, nama_10_gdp, aact_eaa01, aact_eaa06, org_cropar, farm structure survey — 2016, aei_fm_salpest09, aei_pr_gnb, apro_cpnh1, apro_mk_farm, apro_mt_pann, for_area, for_awu, for_eco_cp, for_remov, fish_fleet_alt, fish_ca_main and fish_aq2a) and Food and Agriculture Organization of the United Nations — Global Forest Resources Assessment, 2020

11 Agriculture, forestry and fisheries at a glance
Agriculture, forestry and fishery statistics — 2020 edition194
Did you know that...
• Agricultural factor income per annual work unit increased strongly (+31.3 %) in 2019, more than offsetting the fall (− 24.9 %) recorded in 2018.
• The output value of the agricultural industry increased strongly (+10.4 %) to EUR 3.2 billion in 2019. The output values for the two largest crops were higher: cereals (+18.9 %) and industrial crops (+28.1 %). For animal output, the value of milk (− 3.0 %) and poultry (− 6.9 %) fell while that of pigs (+15.5 %) rose.
• The production of cereals in 2019 rebounded (+30.2 %) after three years of declining harvests. The production of wheat and spelt (which accounted for nearly three quarters of cereals production) bounced back from the drought-affected harvest in 2018 (+35.4 %). Root crop production also bounced back (+12.7 %) as did rape and turnip rape seeds (+58.9 %).
• The production of raw milk fell for the fourth consecutive year (− 1.3 % in 2019). This reduction was underpinned by a fall (− 12.2 % between 2015 and 2019) in the size of the dairy herd. The production of poultry meat decreased sharply (− 7.4 %) in 2019, while the production of bovine meat (+5.4 %) and pig meat (+11.0 %) increased.
• Output prices increased in real (deflated) terms for root crops (potatoes +28.7 % and sugar beet +20.3 %) and for oilseeds (+1.7 %) in 2019, while a slight fall (− 0.8 %) was recorded for cereals. The output price of poultry was almost unchanged (+0.1 %), while a slight fall (− 0.6 %) was recorded for milk.
Figure 11.16b: Output value of the agricultural industry, 2019(% of total output, at basic prices)
0 5 10 15 20 25 30 35
CerealsIndustrial crops
Forage plantsVegetables (1)
PotatoesFruit
WineOlive oil
Other crops; crop productsCattle
PigsSheep and goats
PoultryOther animals
MilkEggs
Other animal productsServices; secondary act.
(1) Including also horticultural plants.
Source: Eurostat (online data code: aact_eaa01)
Figure 11.16a: Index of agricultural factor income per annual work unit, 2005‑2019(2005 = 100)
0
20
40
60
80
100
120
140
160
180
200
2005
2006
2007
2008
2009
2010
2011
2012
2013
2014
2015
2016
2017
2018
2019
Note: index rescaled from 2010 = 100 to 2005 = 100.
Source: Eurostat (online data code: aact_eaa06)
Key information Year Value Unit Share of EU‑27 total (%)
Gross domestic product (GDP) 2019 48.8 EUR billion 0.3
Population on 1 January 2019 2.8 million 0.6
Land area 2016 62 643 km² 1.5
Farmland 2016 29 246 km² 1.9
Share of farmland in land area 2016 46.7 % –
Source: Eurostat (online data codes: nama_10_gdp, demo_pjan, reg_area3 and ef_m_farmleg)
Lithuania
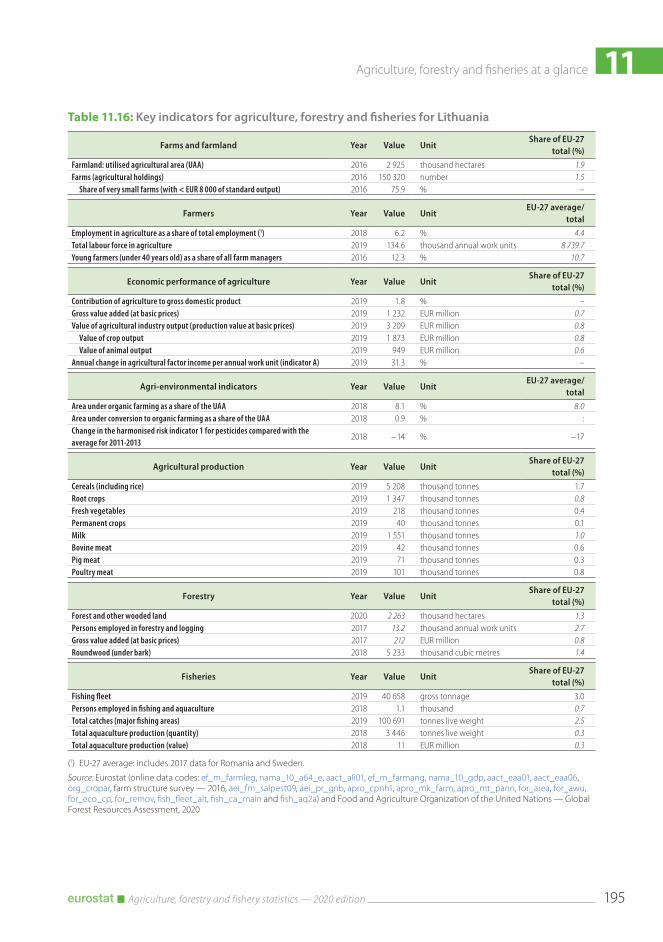
11Agriculture, forestry and fisheries at a glance
Agriculture, forestry and fishery statistics — 2020 edition 195
Table 11.16: Key indicators for agriculture, forestry and fisheries for Lithuania
Farms and farmland Year Value UnitShare of EU-27
total (%)Farmland: utilised agricultural area (UAA) 2016 2 925 thousand hectares 1.9Farms (agricultural holdings) 2016 150 320 number 1.5
Share of very small farms (with < EUR 8 000 of standard output) 2016 75.9 % –
Farmers Year Value UnitEU-27 average/
totalEmployment in agriculture as a share of total employment (1) 2018 6.2 % 4.4Total labour force in agriculture 2019 134.6 thousand annual work units 8 739.7Young farmers (under 40 years old) as a share of all farm managers 2016 12.3 % 10.7
Economic performance of agriculture Year Value UnitShare of EU-27
total (%)Contribution of agriculture to gross domestic product 2019 1.8 % –Gross value added (at basic prices) 2019 1 232 EUR million 0.7Value of agricultural industry output (production value at basic prices) 2019 3 209 EUR million 0.8
Value of crop output 2019 1 873 EUR million 0.8Value of animal output 2019 949 EUR million 0.6
Annual change in agricultural factor income per annual work unit (indicator A) 2019 31.3 % –
Agri-environmental indicators Year Value UnitEU-27 average/
totalArea under organic farming as a share of the UAA 2018 8.1 % 8.0Area under conversion to organic farming as a share of the UAA 2018 0.9 % :Change in the harmonised risk indicator 1 for pesticides compared with the average for 2011‑2013
2018 − 14 % − 17
Agricultural production Year Value UnitShare of EU-27
total (%)Cereals (including rice) 2019 5 208 thousand tonnes 1.7Root crops 2019 1 347 thousand tonnes 0.8Fresh vegetables 2019 218 thousand tonnes 0.4Permanent crops 2019 40 thousand tonnes 0.1Milk 2019 1 551 thousand tonnes 1.0Bovine meat 2019 42 thousand tonnes 0.6Pig meat 2019 71 thousand tonnes 0.3Poultry meat 2019 101 thousand tonnes 0.8
Forestry Year Value UnitShare of EU-27
total (%)Forest and other wooded land 2020 2 263 thousand hectares 1.3Persons employed in forestry and logging 2017 13.2 thousand annual work units 2.7Gross value added (at basic prices) 2017 212 EUR million 0.8Roundwood (under bark) 2018 5 233 thousand cubic metres 1.4
Fisheries Year Value UnitShare of EU-27
total (%)Fishing fleet 2019 40 658 gross tonnage 3.0Persons employed in fishing and aquaculture 2018 1.1 thousand 0.7Total catches (major fishing areas) 2019 100 691 tonnes live weight 2.5Total aquaculture production (quantity) 2018 3 446 tonnes live weight 0.3Total aquaculture production (value) 2018 11 EUR million 0.3
(1) EU-27 average: includes 2017 data for Romania and Sweden.
Source: Eurostat (online data codes: ef_m_farmleg, nama_10_a64_e, aact_ali01, ef_m_farmang, nama_10_gdp, aact_eaa01, aact_eaa06, org_cropar, farm structure survey — 2016, aei_fm_salpest09, aei_pr_gnb, apro_cpnh1, apro_mk_farm, apro_mt_pann, for_area, for_awu, for_eco_cp, for_remov, fish_fleet_alt, fish_ca_main and fish_aq2a) and Food and Agriculture Organization of the United Nations — Global Forest Resources Assessment, 2020

11 Agriculture, forestry and fisheries at a glance
Agriculture, forestry and fishery statistics — 2020 edition196
Did you know that...
• Agricultural factor income per annual work unit decreased (− 7.5 %) in 2019, following on from a rise (+5.4 %) in 2018. As a result, the 2019 index level was about one third below (− 31.3 %) its peak recorded in 2007.
• The output value of the agricultural industry decreased slightly (− 0.5 %) in 2019 to EUR 433 million. The agricultural industry is heavily based around the cattle sector: milk, forage plants and cattle accounted for 69.2 % of the total output value.
• Production levels of bovine meat (+3.0 %) and pig meat (+0.6 %) increased in 2019; for bovine meat, this was the continuation of an upward trend started in 2014. The production of raw milk increased (+3.2 %), also continuing a trend going back at least until 2014.
• The production of plants harvested green for use as fodder fell (− 5.8 %) in 2019, while there was an increase (+3.7 %) in the production of cereals (a third consecutive annual increase), reflecting increases for most types of cereals. The grape harvest in 2019 was considerably smaller (− 43.9 %) than the 2018 harvest.
• There was a moderate increase (+1.4 %) in the average real-terms (deflated) price for milk in 2019. By contrast, the real-terms (deflated) price of cattle decreased (− 2.7 %).
Figure 11.17b: Output value of the agricultural industry, 2019(% of total output, at basic prices)
0 5 10 15 20 25 30 35
CerealsIndustrial crops
Forage plantsVegetables (1)
PotatoesFruit
WineOlive oil
Other crops; crop productsCattle
PigsSheep and goats
PoultryOther animals
MilkEggs
Other animal productsServices; secondary act.
(1) Including also horticultural plants.
Source: Eurostat (online data code: aact_eaa01)
Figure 11.17a: Index of agricultural factor income per annual work unit, 2005‑2019(2005 = 100)
0
20
40
60
80
100
120
2005
2006
2007
2008
2009
2010
2011
2012
2013
2014
2015
2016
2017
2018
2019
Note: index rescaled from 2010 = 100 to 2005 = 100.
Source: Eurostat (online data code: aact_eaa06)
Key information Year Value Unit Share of EU‑27 total (%)
Gross domestic product (GDP) 2019 63.5 EUR billion 0.5
Population on 1 January 2019 0.6 million 0.1
Land area 2016 2 586 km² 0.1
Farmland 2016 1 307 km² 0.1
Share of farmland in land area 2016 50.5 % –
Source: Eurostat (online data codes: nama_10_gdp, demo_pjan, reg_area3 and ef_m_farmleg)
Luxembourg

11Agriculture, forestry and fisheries at a glance
Agriculture, forestry and fishery statistics — 2020 edition 197
Table 11.17: Key indicators for agriculture, forestry and fisheries for Luxembourg
Farms and farmland Year Value UnitShare of EU-27
total (%)Farmland: utilised agricultural area (UAA) 2016 131 thousand hectares 0.1Farms (agricultural holdings) 2016 1 970 number 0.0
Share of very small farms (with < EUR 8 000 of standard output) (1) 2016 8.1 % –
Farmers Year Value UnitEU-27 average/
totalEmployment in agriculture as a share of total employment (2) 2018 0.7 % 4.4Total labour force in agriculture 2019 3.3 thousand annual work units 8 739.7Young farmers (under 40 years old) as a share of all farm managers 2016 15.2 % 10.7
Economic performance of agriculture Year Value UnitShare of EU-27
total (%)Contribution of agriculture to gross domestic product 2019 0.2 % –Gross value added (at basic prices) 2019 119 EUR million 0.1Value of agricultural industry output (production value at basic prices) 2019 433 EUR million 0.1
Value of crop output 2019 158 EUR million 0.1Value of animal output 2019 236 EUR million 0.1
Annual change in agricultural factor income per annual work unit (indicator A) 2019 − 7.5 % –
Agri-environmental indicators Year Value UnitEU-27 average/
totalArea under organic farming as a share of the UAA 2018 4.4 % 8.0Area under conversion to organic farming as a share of the UAA 2018 0.5 % :Change in the harmonised risk indicator 1 for pesticides compared with the average for 2011‑2013
2018 − 38 % − 17
Agricultural production Year Value UnitShare of EU-27
total (%)Cereals (including rice) 2019 160 thousand tonnes 0.1Root crops 2019 16 thousand tonnes 0.0Fresh vegetables 2019 4 thousand tonnes 0.0Permanent crops 2019 13 thousand tonnes 0.0Milk 2019 424 thousand tonnes 0.3Bovine meat 2019 10 thousand tonnes 0.1Pig meat 2019 13 thousand tonnes 0.1Poultry meat 2019 0 thousand tonnes 0.0
Forestry Year Value UnitShare of EU-27
total (%)Forest and other wooded land 2020 91 thousand hectares 0.1Persons employed in forestry and logging 2017 0.6 thousand annual work units 0.1Gross value added (at basic prices) 2017 32 EUR million 0.1Roundwood (under bark) 2018 363 thousand cubic metres 0.1
Fisheries Year Value UnitShare of EU-27
total (%)Fishing fleet 2019 – gross tonnage –Persons employed in fishing and aquaculture 2018 0.0 thousand 0.0Total catches (major fishing areas) 2019 – tonnes live weight –Total aquaculture production (quantity) 2018 0 tonnes live weight 0.0Total aquaculture production (value) 2018 0 EUR million 0.0
(1) Excluding farms with zero standard output.(2) EU-27 average: includes 2017 data for Romania and Sweden.
Source: Eurostat (online data codes: ef_m_farmleg, nama_10_a64_e, aact_ali01, ef_m_farmang, nama_10_gdp, aact_eaa01, aact_eaa06, org_cropar, farm structure survey — 2016, aei_fm_salpest09, aei_pr_gnb, apro_cpnh1, apro_mk_farm, apro_mt_pann, for_area, for_awu, for_eco_cp, for_remov, fish_fleet_alt, fish_ca_main and fish_aq2a) and Food and Agriculture Organization of the United Nations — Global Forest Resources Assessment, 2020

11 Agriculture, forestry and fisheries at a glance
Agriculture, forestry and fishery statistics — 2020 edition198
Did you know that...
• The upward trend in agricultural factor income per annual work unit continued in 2019, with the index rising (+7.7 %) to a new peak. The index more than doubled during the period between 2005 and 2019.
• The output value of the agricultural industry increased (+3.3 %) in 2019, to reach EUR 8.7 billion. Close to half of this total output value was accounted for by only three types of products: whereas the value of cereals and poultry output rose (+2.8 % and +1.1 % respectively) that of industrial crops fell (− 3.0 %).
• There was a further increase (+5.1 %) in the harvested production of cereals in 2019, which was underpinned by an expansion in the area cultivated (+3.8 %). This overall rise in harvested cereal production reflected increases for all types of cereals and in particular (+20.8 %) for barley. By contrast, the harvested production of oilseeds fell sharply (− 7.4 %), principally due to the sharp reduction (− 8.1 %) in the area cultivated.
• Developments in the production levels of the two major types of meat diverged somewhat in 2019, with an increase for poultry meat (+1.5 %) and a relatively stable development (− 0.2 %) for pig meat; 2019 was the first year since 2013 in which the production of pig meat fell.
• There was a fall (− 3.3 %) in the average real-terms (deflated) price of cereals as a whole in 2019, within which the average price of grain maize fell more strongly (− 6.0 %). The smaller domestic supply of oilseeds in 2019 was accompanied by a small rise (+1.4 %) in real terms in the average price of oilseeds, although within this average there was a stronger price rise for rape and turnip rape (+4.0 %). The real-terms price of poultry declined once again (− 1.4 %).
Figure 11.18b: Output value of the agricultural industry, 2019(% of total output, at basic prices)
0 5 10 15 20 25 30
CerealsIndustrial crops
Forage plantsVegetables (1)
PotatoesFruit
WineOlive oil
Other crops; crop productsCattle
PigsSheep and goats
PoultryOther animals
MilkEggs
Other animal productsServices; secondary act.
(1) Including also horticultural plants.
Source: Eurostat (online data code: aact_eaa01)
Figure 11.18a: Index of agricultural factor income per annual work unit, 2005‑2019(2005 = 100)
0
20
40
60
80
100
120
140
160
180
200
220
240
2005
2006
2007
2008
2009
2010
2011
2012
2013
2014
2015
2016
2017
2018
2019
Note: index rescaled from 2010 = 100 to 2005 = 100.
Source: Eurostat (online data code: aact_eaa06)
Key information Year Value Unit Share of EU‑27 total (%)
Gross domestic product (GDP) 2019 146.1 EUR billion 1.0
Population on 1 January 2019 9.8 million 2.2
Land area 2016 91 248 km² 2.2
Farmland 2016 46 706 km² 3.0
Share of farmland in land area 2016 51.2 % –
Source: Eurostat (online data codes: nama_10_gdp, demo_pjan, reg_area3 and ef_m_farmleg)
Hungary

11Agriculture, forestry and fisheries at a glance
Agriculture, forestry and fishery statistics — 2020 edition 199
Table 11.18: Key indicators for agriculture, forestry and fisheries for Hungary
Farms and farmland Year Value UnitShare of EU-27
total (%)Farmland: utilised agricultural area (UAA) 2016 4 671 thousand hectares 3.0Farms (agricultural holdings) 2016 430 000 number 4.2
Share of very small farms (with < EUR 8 000 of standard output) 2016 83.2 % –
Farmers Year Value UnitEU-27 average/
totalEmployment in agriculture as a share of total employment (1) 2018 3.6 % 4.4Total labour force in agriculture 2019 358.9 thousand annual work units 8 739.7Young farmers (under 40 years old) as a share of all farm managers 2016 12.6 % 10.7
Economic performance of agriculture Year Value UnitShare of EU-27
total (%)Contribution of agriculture to gross domestic product 2019 2.2 % –Gross value added (at basic prices) 2019 3 584 EUR million 2.0Value of agricultural industry output (production value at basic prices) 2019 8 722 EUR million 2.1
Value of crop output 2019 4 995 EUR million 2.3Value of animal output 2019 3 096 EUR million 1.9
Annual change in agricultural factor income per annual work unit (indicator A) 2019 7.7 % –
Agri-environmental indicators Year Value UnitEU-27 average/
totalArea under organic farming as a share of the UAA 2018 3.9 % 8.0Area under conversion to organic farming as a share of the UAA 2018 0.7 % :Change in the harmonised risk indicator 1 for pesticides compared with the average for 2011‑2013
2018 − 16 % − 17
Agricultural production Year Value UnitShare of EU-27
total (%)Cereals (including rice) 2019 15 698 thousand tonnes 5.2Root crops 2019 1 175 thousand tonnes 0.7Fresh vegetables 2019 1 458 thousand tonnes 2.4Permanent crops 2019 1 185 thousand tonnes 1.7Milk 2019 1 967 thousand tonnes 1.2Bovine meat 2019 30 thousand tonnes 0.4Pig meat 2019 435 thousand tonnes 1.9Poultry meat 2019 533 thousand tonnes 4.0
Forestry Year Value UnitShare of EU-27
total (%)Forest and other wooded land 2020 2 253 thousand hectares 1.2Persons employed in forestry and logging 2017 20.6 thousand annual work units 4.3Gross value added (at basic prices) 2017 249 EUR million 0.9Roundwood (under bark) 2018 3 038 thousand cubic metres 0.8
Fisheries Year Value UnitShare of EU-27
total (%)Fishing fleet 2019 – gross tonnage –Persons employed in fishing and aquaculture 2018 1.4 thousand 0.9Total catches (major fishing areas) 2019 – tonnes live weight –Total aquaculture production (quantity) 2018 17 900 tonnes live weight 1.6Total aquaculture production (value) 2018 39 EUR million 1.0
(1) EU-27 average: includes 2017 data for Romania and Sweden.
Source: Eurostat (online data codes: ef_m_farmleg, nama_10_a64_e, aact_ali01, ef_m_farmang, nama_10_gdp, aact_eaa01, aact_eaa06, org_cropar, farm structure survey — 2016, aei_fm_salpest09, aei_pr_gnb, apro_cpnh1, apro_mk_farm, apro_mt_pann, for_area, for_awu, for_eco_cp, for_remov, fish_fleet_alt, fish_ca_main and fish_aq2a) and Food and Agriculture Organization of the United Nations — Global Forest Resources Assessment, 2020
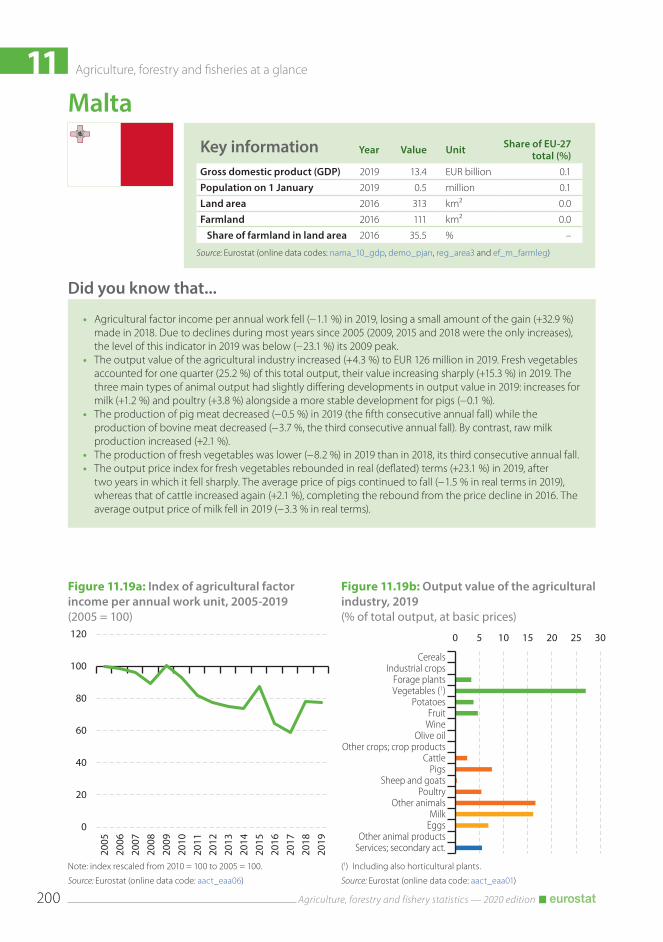
11 Agriculture, forestry and fisheries at a glance
Agriculture, forestry and fishery statistics — 2020 edition200
Did you know that...
• Agricultural factor income per annual work fell (− 1.1 %) in 2019, losing a small amount of the gain (+32.9 %) made in 2018. Due to declines during most years since 2005 (2009, 2015 and 2018 were the only increases), the level of this indicator in 2019 was below (− 23.1 %) its 2009 peak.
• The output value of the agricultural industry increased (+4.3 %) to EUR 126 million in 2019. Fresh vegetables accounted for one quarter (25.2 %) of this total output, their value increasing sharply (+15.3 %) in 2019. The three main types of animal output had slightly differing developments in output value in 2019: increases for milk (+1.2 %) and poultry (+3.8 %) alongside a more stable development for pigs (− 0.1 %).
• The production of pig meat decreased (− 0.5 %) in 2019 (the fifth consecutive annual fall) while the production of bovine meat decreased (− 3.7 %, the third consecutive annual fall). By contrast, raw milk production increased (+2.1 %).
• The production of fresh vegetables was lower (− 8.2 %) in 2019 than in 2018, its third consecutive annual fall.• The output price index for fresh vegetables rebounded in real (deflated) terms (+23.1 %) in 2019, after
two years in which it fell sharply. The average price of pigs continued to fall (− 1.5 % in real terms in 2019), whereas that of cattle increased again (+2.1 %), completing the rebound from the price decline in 2016. The average output price of milk fell in 2019 (− 3.3 % in real terms).
Figure 11.19b: Output value of the agricultural industry, 2019(% of total output, at basic prices)
0 5 10 15 20 25 30
CerealsIndustrial crops
Forage plantsVegetables (1)
PotatoesFruit
WineOlive oil
Other crops; crop productsCattle
PigsSheep and goats
PoultryOther animals
MilkEggs
Other animal productsServices; secondary act.
(1) Including also horticultural plants.
Source: Eurostat (online data code: aact_eaa01)
Figure 11.19a: Index of agricultural factor income per annual work unit, 2005‑2019(2005 = 100)
0
20
40
60
80
100
120
2005
2006
2007
2008
2009
2010
2011
2012
2013
2014
2015
2016
2017
2018
2019
Note: index rescaled from 2010 = 100 to 2005 = 100.
Source: Eurostat (online data code: aact_eaa06)
Key information Year Value Unit Share of EU‑27 total (%)
Gross domestic product (GDP) 2019 13.4 EUR billion 0.1
Population on 1 January 2019 0.5 million 0.1
Land area 2016 313 km² 0.0
Farmland 2016 111 km² 0.0
Share of farmland in land area 2016 35.5 % –
Source: Eurostat (online data codes: nama_10_gdp, demo_pjan, reg_area3 and ef_m_farmleg)
Malta

11Agriculture, forestry and fisheries at a glance
Agriculture, forestry and fishery statistics — 2020 edition 201
Table 11.19: Key indicators for agriculture, forestry and fisheries for Malta
Farms and farmland Year Value UnitShare of EU-27
total (%)Farmland: utilised agricultural area (UAA) 2016 11 thousand hectares 0.0Farms (agricultural holdings) 2016 9 210 number 0.1
Share of very small farms (with < EUR 8 000 of standard output) (1) 2016 84.3 % –
Farmers Year Value UnitEU-27 average/
totalEmployment in agriculture as a share of total employment (2) 2018 0.8 % 4.4Total labour force in agriculture 2019 5.0 thousand annual work units 8 739.7Young farmers (under 40 years old) as a share of all farm managers 2016 7.1 % 10.7
Economic performance of agriculture Year Value UnitShare of EU-27
total (%)Contribution of agriculture to gross domestic product 2019 0.5 % –Gross value added (at basic prices) 2019 61 EUR million 0.0Value of agricultural industry output (production value at basic prices) 2019 126 EUR million 0.0
Value of crop output 2019 49 EUR million 0.0Value of animal output 2019 70 EUR million 0.0
Annual change in agricultural factor income per annual work unit (indicator A) 2019 − 1.1 % –
Agri-environmental indicators Year Value UnitEU-27 average/
totalArea under organic farming as a share of the UAA 2018 0.4 % 8.0Area under conversion to organic farming as a share of the UAA 2018 0.1 % :Change in the harmonised risk indicator 1 for pesticides compared with the average for 2011‑2013
2018 − 19 % − 17
Agricultural production Year Value UnitShare of EU-27
total (%)Cereals (including rice) 2019 0 thousand tonnes 0.0Root crops 2019 9 thousand tonnes 0.0Fresh vegetables 2019 51 thousand tonnes 0.1Permanent crops 2019 5 thousand tonnes 0.0Milk 2019 44 thousand tonnes 0.0Bovine meat 2019 1 thousand tonnes 0.0Pig meat 2019 4 thousand tonnes 0.0Poultry meat 2019 4 thousand tonnes 0.0
Forestry Year Value UnitShare of EU-27
total (%)Forest and other wooded land 2020 1 thousand hectares 0.0Persons employed in forestry and logging 2017 0.0 thousand annual work units 0.0Gross value added (at basic prices) 2017 0 EUR million 0.0Roundwood (under bark) 2017 0 thousand cubic metres 0.0
Fisheries Year Value UnitShare of EU-27
total (%)Fishing fleet 2019 6 502 gross tonnage 0.5Persons employed in fishing and aquaculture 2018 0.7 thousand 0.4Total catches (major fishing areas) 2019 2 230 tonnes live weight 0.1Total aquaculture production (quantity) 2018 19 291 tonnes live weight 1.8Total aquaculture production (value) 2018 243 EUR million 6.5
(1) Excluding farms with zero standard output.(2) EU-27 average: includes 2017 data for Romania and Sweden.
Source: Eurostat (online data codes: ef_m_farmleg, nama_10_a64_e, aact_ali01, ef_m_farmang, nama_10_gdp, aact_eaa01, aact_eaa06, org_cropar, farm structure survey — 2016, aei_fm_salpest09, aei_pr_gnb, apro_cpnh1, apro_mk_farm, apro_mt_pann, for_area, for_awu, for_eco_cp, for_remov, fish_fleet_alt, fish_ca_main and fish_aq2a) and Food and Agriculture Organization of the United Nations — Global Forest Resources Assessment, 2020

11 Agriculture, forestry and fisheries at a glance
Agriculture, forestry and fishery statistics — 2020 edition202
Did you know that...
• Agricultural factor income per annual work unit increased slightly (+2.1 %) in 2019 after the larger fall (− 16.7 %) recorded in 2018, having reached a peak level in 2017.
• The output value of the agricultural industry increased (+3.5 %) to EUR 29.1 billion in 2019. The output value for three of the four largest key products increased in 2019: plants and flowers (+1.5 %), pigs (+31.6 %) and fresh vegetables (+9.61 %). By contrast, the output value of milk fell (− 1.0 %).
• The harvested production of fresh vegetables as a whole in 2019 was higher (+3.8 %) than in 2018, which included a strong rise for carrots (+14.3 %). There was a strong rebound in the volumes of potatoes harvested (+15.5 %) and cereals (+18.8 %) after the relatively poor harvests of 2018.
• The production of raw milk on farms increased (+3.6 % in 2019) to 14.9 million tonnes, which is 2.0 million tonnes more than in 2014. Although the dairy herd in 2019 was larger than in 2018, it was slightly less than in 2014. The production of pig meat grew strongly (+6.0 %) in 2019.
• The higher harvested production of fresh vegetables in 2019 was accompanied by a strong increase (+6.0 %) in the average real (deflated) price, with particularly strong increases for cabbages, cauliflowers and tomatoes. Even though there was a lower production of fruits (other than citrus fruits and grapes) in 2019, there was also a steep fall (− 24.6 %) in the output price in real (deflated) terms, driven by falls for dessert apples (− 30.4 %) and pears (− 27.3 %). By contrast, despite a rebound in the harvested production of potatoes, there was also a sharp rise in price (+13.3 % in real terms). Output prices for pigs rose steeply (+23.0 %). Milk prices fell moderately (− 1.3 %).
Figure 11.20b: Output value of the agricultural industry, 2019(% of total output, at basic prices)
0 5 10 15 20 25 30 35
CerealsIndustrial crops
Forage plantsVegetables (1)
PotatoesFruit
WineOlive oil
Other crops; crop productsCattle
PigsSheep and goats
PoultryOther animals
MilkEggs
Other animal productsServices; secondary act.
(1) Including also horticultural plants.
Source: Eurostat (online data code: aact_eaa01)
Figure 11.20a: Index of agricultural factor income per annual work unit, 2005‑2019(2005 = 100)
0
20
40
60
80
100
120
140
2005
2006
2007
2008
2009
2010
2011
2012
2013
2014
2015
2016
2017
2018
2019
Note: index rescaled from 2010 = 100 to 2005 = 100.
Source: Eurostat (online data code: aact_eaa06)
Key information Year Value Unit Share of EU‑27 total (%)
Gross domestic product (GDP) 2019 810.2 EUR billion 5.8
Population on 1 January 2019 17.3 million 3.9
Land area 2016 34 188 km² 0.8
Farmland 2016 17 963 km² 1.1
Share of farmland in land area 2016 52.5 % –
Source: Eurostat (online data codes: nama_10_gdp, demo_pjan, reg_area3 and ef_m_farmleg)
Netherlands

11Agriculture, forestry and fisheries at a glance
Agriculture, forestry and fishery statistics — 2020 edition 203
Table 11.20: Key indicators for agriculture, forestry and fisheries for the Netherlands
Farms and farmland Year Value UnitShare of EU-27
total (%)Farmland: utilised agricultural area (UAA) 2016 1 796 thousand hectares 1.1Farms (agricultural holdings) 2016 55 680 number 0.5
Share of very small farms (with < EUR 8 000 of standard output) 2016 4.2 % –
Farmers Year Value UnitEU-27 average/
totalEmployment in agriculture as a share of total employment (1) 2018 2.1 % 4.4Total labour force in agriculture 2019 156.4 thousand annual work units 8 739.7Young farmers (under 40 years old) as a share of all farm managers 2016 8.7 % 10.7
Economic performance of agriculture Year Value UnitShare of EU-27
total (%)Contribution of agriculture to gross domestic product 2019 1.4 % –Gross value added (at basic prices) 2019 11 269 EUR million 6.2Value of agricultural industry output (production value at basic prices) 2019 29 138 EUR million 7.0
Value of crop output 2019 14 380 EUR million 6.5Value of animal output 2019 11 172 EUR million 6.9
Annual change in agricultural factor income per annual work unit (indicator A) 2019 2.1 % –
Agri-environmental indicators Year Value UnitEU-27 average/
totalArea under organic farming as a share of the UAA 2018 3.5 % 8.0Area under conversion to organic farming as a share of the UAA 2018 0.3 % :Change in the harmonised risk indicator 1 for pesticides compared with the average for 2011‑2013
2018 − 23 % − 17
Agricultural production Year Value UnitShare of EU-27
total (%)Cereals (including rice) 2019 1 587 thousand tonnes 0.5Root crops 2019 13 606 thousand tonnes 8.2Fresh vegetables 2019 4 773 thousand tonnes 7.8Permanent crops 2019 690 thousand tonnes 1.0Milk 2019 14 944 thousand tonnes 9.4Bovine meat 2019 424 thousand tonnes 6.1Pig meat 2019 1 628 thousand tonnes 7.2Poultry meat 2019 : thousand tonnes :
Forestry Year Value UnitShare of EU-27
total (%)Forest and other wooded land 2020 370 thousand hectares 0.2Persons employed in forestry and logging 2017 2.0 thousand annual work units 0.4Gross value added (at basic prices) 2017 141 EUR million 0.5Roundwood (under bark) 2018 766 thousand cubic metres 0.2
Fisheries Year Value UnitShare of EU-27
total (%)Fishing fleet 2019 115 458 gross tonnage 8.6Persons employed in fishing and aquaculture 2018 3.0 thousand 1.8Total catches (major fishing areas) 2019 319 036 tonnes live weight 7.8Total aquaculture production (quantity) 2018 53 004 tonnes live weight 4.8Total aquaculture production (value) 2018 96 EUR million 2.6
(1) EU-27 average: includes 2017 data for Romania and Sweden.
Source: Eurostat (online data codes: ef_m_farmleg, nama_10_a64_e, aact_ali01, ef_m_farmang, nama_10_gdp, aact_eaa01, aact_eaa06, org_cropar, farm structure survey — 2016, aei_fm_salpest09, aei_pr_gnb, apro_cpnh1, apro_mk_farm, apro_mt_pann, for_area, for_awu, for_eco_cp, for_remov, fish_fleet_alt, fish_ca_main and fish_aq2a) and Food and Agriculture Organization of the United Nations — Global Forest Resources Assessment, 2020

11 Agriculture, forestry and fisheries at a glance
Agriculture, forestry and fishery statistics — 2020 edition204
Did you know that...
• Agricultural factor income per annual work unit decreased (− 5.6 %) in 2019, following a similar rate of decline (− 5.4 %) in 2018.
• The output value of the agricultural industry in 2019 was slightly higher (+1.6 %) than a year before, reaching EUR 7.5 billion. Within this total, the value of milk output in 2019 was a little less than a year earlier (− 1.0 %), but the output value of pigs jumped higher (+17.8 %) to overtake cattle (− 3.9 %) in value terms.
• For the first time since 2005, the level of raw milk production fell, although only slightly (− 1.0 %). This was accompanied by a small decline in the real-terms (deflated) price of milk (− 1.6 %).Production levels of both pig meat (− 1.5 %) and bovine meat (− 1.6 %) decreased moderately in 2019. Whereas the price of pigs increased (+16.2 %), the price of cattle fell (− 4.9 %).
• The harvested production of cereals as a whole in 2019 bounced back (+12.8 %) from the drought-affected levels of 2018. The production of grain maize and corn-cob-mix (+7.9 %), wheat and spelt (+16.8 %) and barley (+19.8 %) all increased. The production of plants harvested green increased (+4.4 %). The largest rates of decline were for fruits: grapes (− 15.6 %) and fruit (other than citrus fruits and grapes), berries and nuts (− 44.1 %); the latter was mainly due to a fall (− 38.3 %) for apples.
• Alongside the increase in the cereals harvest in 2019, there was a decrease in the average real-terms (deflated) output price (− 6.6 %). Rising output prices were recorded for potatoes (+14.3 %), fresh vegetables (+12.9 %) and oilseeds (+1.6 %). Among those crops for which harvested production had fallen, price rises were recorded for grapes (+13.6 %) and sugar beet (+17.4 %).
Figure 11.21b: Output value of the agricultural industry, 2019(% of total output, at basic prices)
0 5 10 15 20
CerealsIndustrial crops
Forage plantsVegetables (1)
PotatoesFruit
WineOlive oil
Other crops; crop productsCattle
PigsSheep and goats
PoultryOther animals
MilkEggs
Other animal productsServices; secondary act.
(1) Including also horticultural plants.
Source: Eurostat (online data code: aact_eaa01)
Figure 11.21a: Index of agricultural factor income per annual work unit, 2005‑2019(2005 = 100)
0
20
40
60
80
100
120
140
2005
2006
2007
2008
2009
2010
2011
2012
2013
2014
2015
2016
2017
2018
2019
Note: index rescaled from 2010 = 100 to 2005 = 100.
Source: Eurostat (online data code: aact_eaa06)
Key information Year Value Unit Share of EU‑27 total (%)
Gross domestic product (GDP) 2019 397.6 EUR billion 2.8
Population on 1 January 2019 8.9 million 2.0
Land area 2016 82 519 km² 2.0
Farmland 2016 26 698 km² 1.7
Share of farmland in land area 2016 32.4 % –
Source: Eurostat (online data codes: nama_10_gdp, demo_pjan, reg_area3 and ef_m_farmleg)
Austria

11Agriculture, forestry and fisheries at a glance
Agriculture, forestry and fishery statistics — 2020 edition 205
Table 11.21: Key indicators for agriculture, forestry and fisheries for Austria
Farms and farmland Year Value UnitShare of EU-27
total (%)Farmland: utilised agricultural area (UAA) 2016 2 670 thousand hectares 1.7Farms (agricultural holdings) 2016 132 500 number 1.3
Share of very small farms (with < EUR 8 000 of standard output) 2016 31.6 % –
Farmers Year Value UnitEU-27 average/
totalEmployment in agriculture as a share of total employment (1) 2018 3.0 % 4.4Total labour force in agriculture 2019 116.2 thousand annual work units 8 739.7Young farmers (under 40 years old) as a share of all farm managers 2016 22.2 % 10.7
Economic performance of agriculture Year Value UnitShare of EU-27
total (%)Contribution of agriculture to gross domestic product 2019 0.8 % –Gross value added (at basic prices) 2019 3 080 EUR million 1.7Value of agricultural industry output (production value at basic prices) 2019 7 483 EUR million 1.8
Value of crop output 2019 3 169 EUR million 1.4Value of animal output 2019 3 598 EUR million 2.2
Annual change in agricultural factor income per annual work unit (indicator A) 2019 − 5.6 % –
Agri-environmental indicators Year Value UnitEU-27 average/
totalArea under organic farming as a share of the UAA 2018 24.1 % 8.0Area under conversion to organic farming as a share of the UAA 2018 : % :Change in the harmonised risk indicator 1 for pesticides compared with the average for 2011‑2013
2018 29 % − 17
Agricultural production Year Value UnitShare of EU-27
total (%)Cereals (including rice) 2019 5 417 thousand tonnes 1.8Root crops 2019 2 722 thousand tonnes 1.6Fresh vegetables 2019 611 thousand tonnes 1.0Permanent crops 2019 637 thousand tonnes 0.9Milk 2019 3 820 thousand tonnes 2.4Bovine meat 2019 230 thousand tonnes 3.3Pig meat 2019 502 thousand tonnes 2.2Poultry meat 2019 : thousand tonnes :
Forestry Year Value UnitShare of EU-27
total (%)Forest and other wooded land 2020 4 029 thousand hectares 2.2Persons employed in forestry and logging 2017 19.0 thousand annual work units 3.9Gross value added (at basic prices) 2017 1 072 EUR million 4.1Roundwood (under bark) 2018 13 949 thousand cubic metres 3.7
Fisheries Year Value UnitShare of EU-27
total (%)Fishing fleet 2019 – gross tonnage –Persons employed in fishing and aquaculture 2018 0.4 thousand 0.3Total catches (major fishing areas) 2019 – tonnes live weight –Total aquaculture production (quantity) 2018 4 084 tonnes live weight 0.4Total aquaculture production (value) 2018 26 EUR million 0.7
(1) EU-27 average: includes 2017 data for Romania and Sweden.
Source: Eurostat (online data codes: ef_m_farmleg, nama_10_a64_e, aact_ali01, ef_m_farmang, nama_10_gdp, aact_eaa01, aact_eaa06, org_cropar, farm structure survey — 2016, aei_fm_salpest09, aei_pr_gnb, apro_cpnh1, apro_mk_farm, apro_mt_pann, for_area, for_awu, for_eco_cp, for_remov, fish_fleet_alt, fish_ca_main and fish_aq2a) and Food and Agriculture Organization of the United Nations — Global Forest Resources Assessment, 2020

11 Agriculture, forestry and fisheries at a glance
Agriculture, forestry and fishery statistics — 2020 edition206
Did you know that...
• Having fallen (− 6.4 %) in 2018, agricultural factor income per annual work unit increased (+4.6 %) in 2019, almost returning to its 2017 peak level.
• The output value of the agricultural industry was EUR 26.4 billion in 2019, higher (+5.1 %) than in 2018. The values of crop output (+7.3 %) and animal output (+3.4 %) both increased.
• Among the EU Member States, Poland had the highest production of poultry meat (2.6 million tonnes). Poultry meat production increased (+1.9 %) in 2019, continuing its unbroken upward development since the start of the time series in 2003. By contrast, pig production fell sharply (− 5.0 %) and that of bovine meat declined slightly (− 0.8 %). Raw milk production increased (+2.3 %) in 2019, continuing a generally upward pattern recorded in recent years. The real-terms (deflated) output price for pigs increased strongly (+19.0 %), while that for cattle fell (− 10.2 %) and that for poultry stayed relatively unchanged (− 0.1 %).
• In 2019, the cereals harvest rebounded (+8.3 %) after a drought-hit harvest in 2018. By contrast, many other crops had lower production levels in 2019: root crops (− 5.7 %), plants harvested green (− 6.9 %), and fruits (other than citrus fruits and grapes), berries and nuts (− 23.0 %).
• Output prices for cereals (− 1.5 %) and oilseeds (− 3.1 %) fell in real (deflated) terms in 2019, reflecting among other factors their increased production. By contrast, output prices for fresh vegetables increased (+24.3 %) and those for potatoes more than doubled (+111.5 %). Despite a lower level of harvested production, output prices for fresh fruit (excluding citrus fruit and grapes) fell (− 6.5 %).
Figure 11.22b: Output value of the agricultural industry, 2019(% of total output, at basic prices)
0 5 10 15 20
CerealsIndustrial crops
Forage plantsVegetables (1)
PotatoesFruit
WineOlive oil
Other crops; crop productsCattle
PigsSheep and goats
PoultryOther animals
MilkEggs
Other animal productsServices; secondary act.
(1) Including also horticultural plants.
Source: Eurostat (online data code: aact_eaa01)
Figure 11.22a: Index of agricultural factor income per annual work unit, 2005‑2019(2005 = 100)
020406080
100120140160180200220240260
2005
2006
2007
2008
2009
2010
2011
2012
2013
2014
2015
2016
2017
2018
2019
Note: index rescaled from 2010 = 100 to 2005 = 100.
Source: Eurostat (online data code: aact_eaa06)
Key information Year Value Unit Share of EU‑27 total (%)
Gross domestic product (GDP) 2019 532.3 EUR billion 3.8
Population on 1 January 2019 38.0 million 8.5
Land area 2016 307 236 km² 7.5
Farmland 2016 144 057 km² 9.2
Share of farmland in land area 2016 46.9 % –
Source: Eurostat (online data codes: nama_10_gdp, demo_pjan, reg_area3 and ef_m_farmleg)
Poland
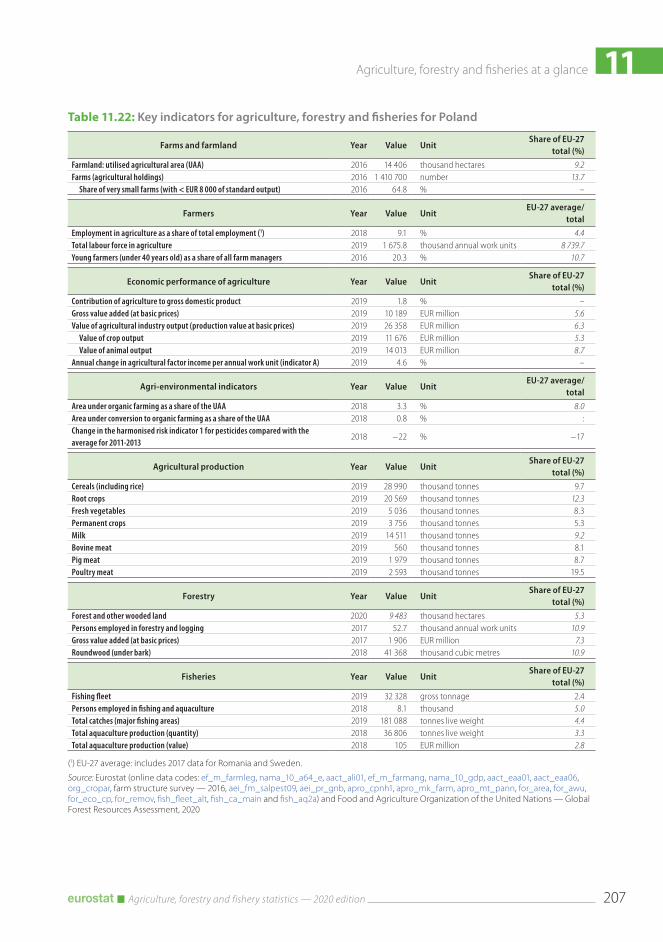
11Agriculture, forestry and fisheries at a glance
Agriculture, forestry and fishery statistics — 2020 edition 207
Table 11.22: Key indicators for agriculture, forestry and fisheries for Poland
Farms and farmland Year Value UnitShare of EU-27
total (%)Farmland: utilised agricultural area (UAA) 2016 14 406 thousand hectares 9.2Farms (agricultural holdings) 2016 1 410 700 number 13.7
Share of very small farms (with < EUR 8 000 of standard output) 2016 64.8 % –
Farmers Year Value UnitEU-27 average/
totalEmployment in agriculture as a share of total employment (1) 2018 9.1 % 4.4Total labour force in agriculture 2019 1 675.8 thousand annual work units 8 739.7Young farmers (under 40 years old) as a share of all farm managers 2016 20.3 % 10.7
Economic performance of agriculture Year Value UnitShare of EU-27
total (%)Contribution of agriculture to gross domestic product 2019 1.8 % –Gross value added (at basic prices) 2019 10 189 EUR million 5.6Value of agricultural industry output (production value at basic prices) 2019 26 358 EUR million 6.3
Value of crop output 2019 11 676 EUR million 5.3Value of animal output 2019 14 013 EUR million 8.7
Annual change in agricultural factor income per annual work unit (indicator A) 2019 4.6 % –
Agri-environmental indicators Year Value UnitEU-27 average/
totalArea under organic farming as a share of the UAA 2018 3.3 % 8.0Area under conversion to organic farming as a share of the UAA 2018 0.8 % :Change in the harmonised risk indicator 1 for pesticides compared with the average for 2011‑2013
2018 − 22 % − 17
Agricultural production Year Value UnitShare of EU-27
total (%)Cereals (including rice) 2019 28 990 thousand tonnes 9.7Root crops 2019 20 569 thousand tonnes 12.3Fresh vegetables 2019 5 036 thousand tonnes 8.3Permanent crops 2019 3 756 thousand tonnes 5.3Milk 2019 14 511 thousand tonnes 9.2Bovine meat 2019 560 thousand tonnes 8.1Pig meat 2019 1 979 thousand tonnes 8.7Poultry meat 2019 2 593 thousand tonnes 19.5
Forestry Year Value UnitShare of EU-27
total (%)Forest and other wooded land 2020 9 483 thousand hectares 5.3Persons employed in forestry and logging 2017 52.7 thousand annual work units 10.9Gross value added (at basic prices) 2017 1 906 EUR million 7.3Roundwood (under bark) 2018 41 368 thousand cubic metres 10.9
Fisheries Year Value UnitShare of EU-27
total (%)Fishing fleet 2019 32 328 gross tonnage 2.4Persons employed in fishing and aquaculture 2018 8.1 thousand 5.0Total catches (major fishing areas) 2019 181 088 tonnes live weight 4.4Total aquaculture production (quantity) 2018 36 806 tonnes live weight 3.3Total aquaculture production (value) 2018 105 EUR million 2.8
(1) EU-27 average: includes 2017 data for Romania and Sweden.
Source: Eurostat (online data codes: ef_m_farmleg, nama_10_a64_e, aact_ali01, ef_m_farmang, nama_10_gdp, aact_eaa01, aact_eaa06, org_cropar, farm structure survey — 2016, aei_fm_salpest09, aei_pr_gnb, apro_cpnh1, apro_mk_farm, apro_mt_pann, for_area, for_awu, for_eco_cp, for_remov, fish_fleet_alt, fish_ca_main and fish_aq2a) and Food and Agriculture Organization of the United Nations — Global Forest Resources Assessment, 2020

11 Agriculture, forestry and fisheries at a glance
Agriculture, forestry and fishery statistics — 2020 edition208
Did you know that...
• The upward trend in agricultural factor income per annual work unit, which started in 2012, continued in 2019 (with growth of 6.0 %).
• The output value of the agricultural industry increased (+3.2 %) in 2019 to reach EUR 8.1 billion. The value of crop output (+2.1 %) and animal output (+5.0 %) both increased.
• There was a slight decline (− 0.6 %) in the harvested production of cereals in 2019, continuing a downward trend; an increase in the grain maize and corn-cob-mix harvest (+4.9 %) was in contrast to the lower harvested production of several other cereal crops. There was a much higher harvested production of fresh vegetables (+10.2 %), underpinned by the rise in the production of tomatoes (+16.1 %) and of olives (+35.0 %). The harvest of grapes (+7.6 %) and fruits (other than citrus fruits and grapes), berries and nuts (+15.1 %) also increased, the latter mainly due to the increase (+34.8 %) for apples.
• The production of pig meat (+1.2 %) and poultry meat (+1.8 %) increased, the latter continuing its upward trend that started in 2014. By contrast, the production of bovine meat fell (− 1.9 %). Raw milk production was higher (+1.6 %) in 2019.
• Output price developments in real (deflated) terms in 2019 for crops often reflected changes in domestic supply. Fresh vegetables were an exception, with the average price increasing (+4.0 %), despite overall production growth. Output prices for pigs (+12.5 %) and poultry (+1.0 %) both increased, while prices for cattle fell (− 0.8 %). Milk output prices were relatively stable (− 0.2 %).
Figure 11.23b: Output value of the agricultural industry, 2019(% of total output, at basic prices)
0 5 10 15 20 25
CerealsIndustrial crops
Forage plantsVegetables (1)
PotatoesFruit
WineOlive oil
Other crops; crop productsCattle
PigsSheep and goats
PoultryOther animals
MilkEggs
Other animal productsServices; secondary act.
(1) Including also horticultural plants.
Source: Eurostat (online data code: aact_eaa01)
Figure 11.23a: Index of agricultural factor income per annual work unit, 2005‑2019(2005 = 100)
0
20
40
60
80
100
120
140
160
2005
2006
2007
2008
2009
2010
2011
2012
2013
2014
2015
2016
2017
2018
2019
Note: index rescaled from 2010 = 100 to 2005 = 100.
Source: Eurostat (online data code: aact_eaa06)
Key information Year Value Unit Share of EU‑27 total (%)
Gross domestic product (GDP) 2019 213.3 EUR billion 1.5
Population on 1 January 2019 10.3 million 2.3
Land area 2016 90 996 km² 2.2
Farmland 2016 36 417 km² 2.3
Share of farmland in land area 2016 40.0 % –
Source: Eurostat (online data codes: nama_10_gdp, demo_pjan, reg_area3 and ef_m_farmleg)
Portugal

11Agriculture, forestry and fisheries at a glance
Agriculture, forestry and fishery statistics — 2020 edition 209
Table 11.23: Key indicators for agriculture, forestry and fisheries for Portugal
Farms and farmland Year Value UnitShare of EU-27
total (%)Farmland: utilised agricultural area (UAA) 2016 3 642 thousand hectares 2.3Farms (agricultural holdings) 2016 258 980 number 2.5
Share of very small farms (with < EUR 8 000 of standard output) 2016 72.8 % –
Farmers Year Value UnitEU-27 average/
totalEmployment in agriculture as a share of total employment (1) 2018 7.9 % 4.4Total labour force in agriculture 2019 234.4 thousand annual work units 8 739.7Young farmers (under 40 years old) as a share of all farm managers 2016 4.2 % 10.7
Economic performance of agriculture Year Value UnitShare of EU-27
total (%)Contribution of agriculture to gross domestic product 2019 1.4 % –Gross value added (at basic prices) 2019 3 193 EUR million 1.8Value of agricultural industry output (production value at basic prices) 2019 8 084 EUR million 1.9
Value of crop output 2019 4 681 EUR million 2.1Value of animal output 2019 2 984 EUR million 1.8
Annual change in agricultural factor income per annual work unit (indicator A) 2019 6.0 % –
Agri-environmental indicators Year Value UnitEU-27 average/
totalArea under organic farming as a share of the UAA 2018 5.9 % 8.0Area under conversion to organic farming as a share of the UAA 2018 0.5 % :Change in the harmonised risk indicator 1 for pesticides compared with the average for 2011‑2013
2018 − 34 % − 17
Agricultural production Year Value UnitShare of EU-27
total (%)Cereals (including rice) 2019 1 099 thousand tonnes 0.4Root crops 2019 491 thousand tonnes 0.3Fresh vegetables 2019 2 326 thousand tonnes 3.8Permanent crops 2019 3 039 thousand tonnes 4.3Milk 2019 2 072 thousand tonnes 1.3Bovine meat 2019 92 thousand tonnes 1.3Pig meat 2019 366 thousand tonnes 1.6Poultry meat 2019 352 thousand tonnes 2.6
Forestry Year Value UnitShare of EU-27
total (%)Forest and other wooded land 2020 4 855 thousand hectares 2.7Persons employed in forestry and logging 2017 14.1 thousand annual work units 2.9Gross value added (at basic prices) 2017 871 EUR million 3.3Roundwood (under bark) 2018 12 767 thousand cubic metres 3.4
Fisheries Year Value UnitShare of EU-27
total (%)Fishing fleet 2019 87 278 gross tonnage 6.5Persons employed in fishing and aquaculture 2018 15.1 thousand 9.3Total catches (major fishing areas) 2019 183 972 tonnes live weight 4.5Total aquaculture production (quantity) 2018 11 766 tonnes live weight 1.1Total aquaculture production (value) 2018 97 EUR million 2.6
(1) EU-27 average: includes 2017 data for Romania and Sweden.
Source: Eurostat (online data codes: ef_m_farmleg, nama_10_a64_e, aact_ali01, ef_m_farmang, nama_10_gdp, aact_eaa01, aact_eaa06, org_cropar, farm structure survey — 2016, aei_fm_salpest09, aei_pr_gnb, apro_cpnh1, apro_mk_farm, apro_mt_pann, for_area, for_awu, for_eco_cp, for_remov, fish_fleet_alt, fish_ca_main and fish_aq2a) and Food and Agriculture Organization of the United Nations — Global Forest Resources Assessment, 2020

11 Agriculture, forestry and fisheries at a glance
Agriculture, forestry and fishery statistics — 2020 edition210
Did you know that...• The generally upward development of agricultural factor income per annual work unit since a low in 2007
continued in 2019, increasing slightly (+1.0 %) to a new peak.• The output value of the agricultural industry rose (+2.2 %) in 2019 to EUR 19.0 billion; more than two thirds
(70.0 %) of this total value came from crop products.• The total cereals harvest in 2019 was lower (− 3.6 %) than in 2018, as a fall in grain maize and corn-cob-mix
(− 6.6 %) outweighed smaller increases for other large crops; this was the first contraction in the cereals harvest since 2015. Most other crops also experienced a fall in harvested production: oilseeds (− 6.9 %, again the first contraction since 2015), fresh vegetables (− 8.9 %), root crops (− 11.4 %), plants harvested green (− 12.2 %) and fruits (other than citrus fruits and grapes), berries and nuts (− 18.4 %).
• There was a sharp fall in the production of pig meat (− 6.2 %) in 2019, in contrast to increased poultry meat production (+6.6 %). Whereas the price for pigs increased (+9.6 % in real terms), prices for cattle (− 1.7 %) and poultry (− 1.3 %) fell. Production of raw milk declined further (− 2.3 %), the level in 2019 being 464 000 tonnes less than in 2014 in part reflecting the fact that the dairy herd declined by 50 000 head during the same period. The average real-terms price of milk in 2019 was higher than a year earlier (+3.3 %).
• The slight fall (− 0.3 %) in output prices in real (deflated) terms for cereals as a whole in 2019 was principally due to a fall for grain maize (− 3.2 %). The decrease (− 3.4 %) for oilseeds reflected relatively large falls for soya (− 8.1 %) and sunflower seeds (− 5.0 %). Most of the other major crops that had lower levels of production in 2019 experienced higher prices, for example, potatoes (+47.7 %), grapes (+16.3 %), fresh fruit (excluding citrus fruit and grapes; +11.3 %), and fresh vegetables (+8.1 %).
Figure 11.24b: Output value of the agricultural industry, 2019(% of total output, at basic prices)
0 5 10 15 20 25 30
CerealsIndustrial crops
Forage plantsVegetables (1)
PotatoesFruit
WineOlive oil
Other crops; crop productsCattle
PigsSheep and goats
PoultryOther animals
MilkEggs
Other animal productsServices; secondary act.
(1) Including also horticultural plants.
Source: Eurostat (online data code: aact_eaa01)
Figure 11.24a: Index of agricultural factor income per annual work unit, 2005‑2019(2005 = 100)
0
20
40
60
80
100
120
140
160
180
2005
2006
2007
2008
2009
2010
2011
2012
2013
2014
2015
2016
2017
2018
2019
Note: index rescaled from 2010 = 100 to 2005 = 100.
Source: Eurostat (online data code: aact_eaa06)
Key information Year Value Unit Share of EU‑27 total (%)
Gross domestic product (GDP) 2019 223.3 EUR billion 1.6
Population on 1 January 2019 19.4 million 4.3
Land area 2016 234 270 km² 5.7
Farmland 2016 125 025 km² 8.0
Share of farmland in land area 2016 53.4 % –
Source: Eurostat (online data codes: nama_10_gdp, demo_pjan, reg_area3 and ef_m_farmleg)
Romania

11Agriculture, forestry and fisheries at a glance
Agriculture, forestry and fishery statistics — 2020 edition 211
Table 11.24: Key indicators for agriculture, forestry and fisheries for Romania
Farms and farmland Year Value UnitShare of EU-27
total (%)Farmland: utilised agricultural area (UAA) 2016 12 503 thousand hectares 8.0Farms (agricultural holdings) 2016 3 422 030 number 33.3
Share of very small farms (with < EUR 8 000 of standard output) 2016 94.6 % –
Farmers Year Value UnitEU-27 average/
totalEmployment in agriculture as a share of total employment 2017 22.8 % 4.5Total labour force in agriculture 2019 1 402.0 thousand annual work units 8 739.7Young farmers (under 40 years old) as a share of all farm managers 2016 7.4 % 10.7
Economic performance of agriculture Year Value UnitShare of EU-27
total (%)Contribution of agriculture to gross domestic product 2019 3.9 % –Gross value added (at basic prices) 2019 8 786 EUR million 4.8Value of agricultural industry output (production value at basic prices) 2019 18 964 EUR million 4.5
Value of crop output 2019 13 269 EUR million 6.0Value of animal output 2019 3 925 EUR million 2.4
Annual change in agricultural factor income per annual work unit (indicator A) 2019 1.0 % –
Agri-environmental indicators Year Value UnitEU-27 average/
totalArea under organic farming as a share of the UAA 2018 2.4 % 8.0Area under conversion to organic farming as a share of the UAA 2018 1.2 % :Change in the harmonised risk indicator 1 for pesticides compared with the average for 2011‑2013
2018 − 52 % − 17
Agricultural production Year Value UnitShare of EU-27
total (%)Cereals (including rice) 2019 30 412 thousand tonnes 10.2Root crops 2019 3 798 thousand tonnes 2.3Fresh vegetables 2019 2 384 thousand tonnes 3.9Permanent crops 2019 2 406 thousand tonnes 3.4Milk 2019 4 340 thousand tonnes 2.7Bovine meat 2019 44 thousand tonnes 0.6Pig meat 2019 343 thousand tonnes 1.5Poultry meat 2019 482 thousand tonnes 3.6
Forestry Year Value UnitShare of EU-27
total (%)Forest and other wooded land 2020 6 945 thousand hectares 3.9Persons employed in forestry and logging 2017 47.8 thousand annual work units 9.9Gross value added (at basic prices) 2017 1 308 EUR million 5.0Roundwood (under bark) 2018 10 436 thousand cubic metres 2.8
Fisheries Year Value UnitShare of EU-27
total (%)Fishing fleet 2019 1 529 gross tonnage 0.1Persons employed in fishing and aquaculture 2017 2.0 thousand 1.2Total catches (major fishing areas) 2019 7 149 tonnes live weight 0.2Total aquaculture production (quantity) 2018 12 298 tonnes live weight 1.1Total aquaculture production (value) 2018 34 EUR million 0.9
Source: Eurostat (online data codes: ef_m_farmleg, nama_10_a64_e, aact_ali01, ef_m_farmang, nama_10_gdp, aact_eaa01, aact_eaa06, org_cropar, farm structure survey — 2016, aei_fm_salpest09, aei_pr_gnb, apro_cpnh1, apro_mk_farm, apro_mt_pann, for_area, for_awu, for_eco_cp, for_remov, fish_fleet_alt, fish_ca_main and fish_aq2a) and Food and Agriculture Organization of the United Nations — Global Forest Resources Assessment, 2020

11 Agriculture, forestry and fisheries at a glance
Agriculture, forestry and fishery statistics — 2020 edition212
Did you know that...
• After a large increase (+39.0 %) in 2018 which had established a new peak, agricultural factor income per annual work unit fell (− 11.4 %) in 2019.
• The output value of the agricultural industry was EUR 1.3 billion in 2019, lower (− 3.3 %) than in 2018. This fall in output value was driven by a fall for crops (− 7.9 %), there being a rise for animal output (+3.2 %).
• Cereals (+7.6 %) and fresh vegetables (+19.4 %) were the two major crops for which higher production was reported in 2019 than in 2018. Decreases were recorded in the production of plants harvested green (− 2.6 %), grapes (− 17.3 %) and fruits (other than citrus fruits and grapes), berries and nuts (− 35.2 %).
• Poultry meat production was moderately higher (+1.2 %) in 2019 than in 2018, the fourth consecutive annual increase. Somewhat larger increases were recorded for bovine meat (+2.5 %) and pig meat (+6.3 %). Raw milk production in 2019 was slightly lower (− 0.9 %) in 2019, the third consecutive annual decrease.
• Alongside a higher harvested production in 2019, the real-terms (deflated) price of fresh vegetables was also up (+5.1 %). The fall in output prices for cereals (− 9.1 %) largely mirrored an increase in domestic supply. Equally, prices for grapes (+8.3 %) and potatoes (+44.2 %) were higher alongside lower levels of harvested production. Despite the large fall in the production of fruit from the bumper 2018 harvest level, the output price index for fresh fruit (excluding citrus fruit and grapes) was also down strongly (− 12.7 %), reflecting a large fall in the average price of dessert apples (− 21.0 %). The output price for pigs increased strongly (+13.2 %). Cattle prices fell (− 3.0 %) while the output price for milk increased (+5.1 %).
Figure 11.25b: Output value of the agricultural industry, 2019(% of total output, at basic prices)
0 5 10 15 20
CerealsIndustrial crops
Forage plantsVegetables (1)
PotatoesFruit
WineOlive oil
Other crops; crop productsCattle
PigsSheep and goats
PoultryOther animals
MilkEggs
Other animal productsServices; secondary act.
(1) Including also horticultural plants.
Source: Eurostat (online data code: aact_eaa01)
Figure 11.25a: Index of agricultural factor income per annual work unit, 2005‑2019(2005 = 100)
0
20
40
60
80
100
120
140
160
2005
2006
2007
2008
2009
2010
2011
2012
2013
2014
2015
2016
2017
2018
2019
Note: index rescaled from 2010 = 100 to 2005 = 100.
Source: Eurostat (online data code: aact_eaa06)
Key information Year Value Unit Share of EU‑27 total (%)
Gross domestic product (GDP) 2019 48.4 EUR billion 0.3
Population on 1 January 2019 2.1 million 0.5
Land area 2016 20 145 km² 0.5
Farmland 2016 4 884 km² 0.3
Share of farmland in land area 2016 24.2 % –
Source: Eurostat (online data codes: nama_10_gdp, demo_pjan, reg_area3 and ef_m_farmleg)
Slovenia

11Agriculture, forestry and fisheries at a glance
Agriculture, forestry and fishery statistics — 2020 edition 213
Table 11.25: Key indicators for agriculture, forestry and fisheries for Slovenia
Farms and farmland Year Value UnitShare of EU-27
total (%)Farmland: utilised agricultural area (UAA) 2016 488 thousand hectares 0.3Farms (agricultural holdings) 2016 69 900 number 0.7
Share of very small farms (with < EUR 8 000 of standard output) 2016 58.8 % –
Farmers Year Value UnitEU-27 average/
totalEmployment in agriculture as a share of total employment (1) 2018 6.4 % 4.4Total labour force in agriculture 2019 77.3 thousand annual work units 8 739.7Young farmers (under 40 years old) as a share of all farm managers 2016 9.1 % 10.7
Economic performance of agriculture Year Value UnitShare of EU-27
total (%)Contribution of agriculture to gross domestic product 2019 1.2 % –Gross value added (at basic prices) 2019 561 EUR million 0.3Value of agricultural industry output (production value at basic prices) 2019 1 325 EUR million 0.3
Value of crop output 2019 735 EUR million 0.3Value of animal output 2019 571 EUR million 0.4
Annual change in agricultural factor income per annual work unit (indicator A) 2019 − 11.4 % –
Agri-environmental indicators Year Value UnitEU-27 average/
totalArea under organic farming as a share of the UAA 2018 10.0 % 8.0Area under conversion to organic farming as a share of the UAA 2018 1.3 % :Change in the harmonised risk indicator 1 for pesticides compared with the average for 2011‑2013
2018 9 % − 17
Agricultural production Year Value UnitShare of EU-27
total (%)Cereals (including rice) 2019 642 thousand tonnes 0.2Root crops 2019 92 thousand tonnes 0.1Fresh vegetables 2019 120 thousand tonnes 0.2Permanent crops 2019 174 thousand tonnes 0.2Milk 2019 626 thousand tonnes 0.4Bovine meat 2019 36 thousand tonnes 0.5Pig meat 2019 24 thousand tonnes 0.1Poultry meat 2019 70 thousand tonnes 0.5
Forestry Year Value UnitShare of EU-27
total (%)Forest and other wooded land 2020 1 265 thousand hectares 0.7Persons employed in forestry and logging 2017 7.2 thousand annual work units 1.5Gross value added (at basic prices) 2017 267 EUR million 1.0Roundwood (under bark) 2018 3 921 thousand cubic metres 1.0
Fisheries Year Value UnitShare of EU-27
total (%)Fishing fleet 2019 673 gross tonnage 0.1Persons employed in fishing and aquaculture 2018 0.2 thousand 0.1Total catches (major fishing areas) 2019 120 tonnes live weight 0.0Total aquaculture production (quantity) 2018 1 938 tonnes live weight 0.2Total aquaculture production (value) 2018 6 EUR million 0.2
(1) EU-27 average: includes 2017 data for Romania and Sweden.
Source: Eurostat (online data codes: ef_m_farmleg, nama_10_a64_e, aact_ali01, ef_m_farmang, nama_10_gdp, aact_eaa01, aact_eaa06, org_cropar, farm structure survey — 2016, aei_fm_salpest09, aei_pr_gnb, apro_cpnh1, apro_mk_farm, apro_mt_pann, for_area, for_awu, for_eco_cp, for_remov, fish_fleet_alt, fish_ca_main and fish_aq2a) and Food and Agriculture Organization of the United Nations — Global Forest Resources Assessment, 2020
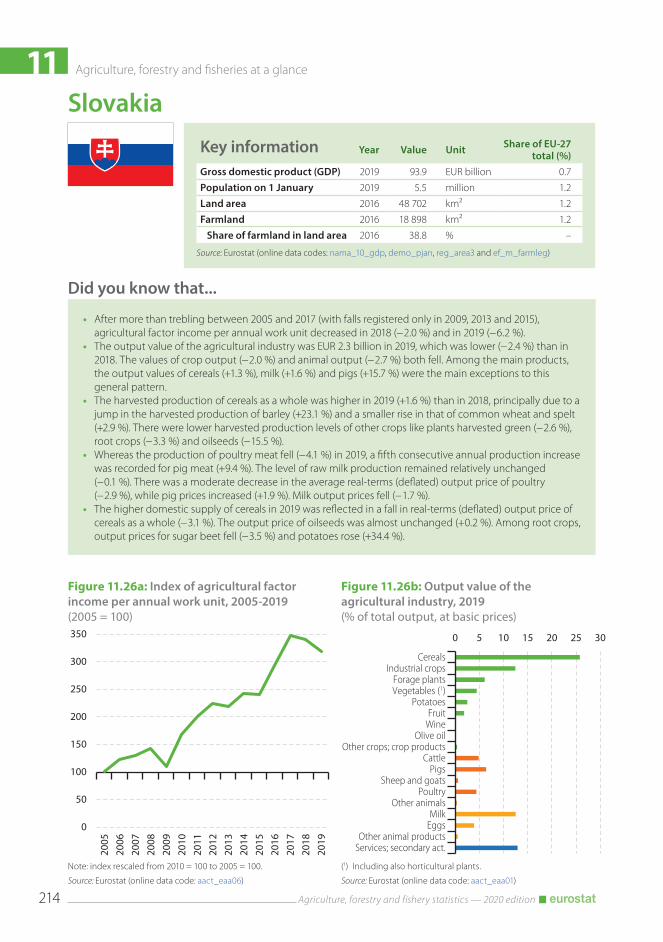
11 Agriculture, forestry and fisheries at a glance
Agriculture, forestry and fishery statistics — 2020 edition214
Did you know that...
• After more than trebling between 2005 and 2017 (with falls registered only in 2009, 2013 and 2015), agricultural factor income per annual work unit decreased in 2018 (− 2.0 %) and in 2019 (− 6.2 %).
• The output value of the agricultural industry was EUR 2.3 billion in 2019, which was lower (− 2.4 %) than in 2018. The values of crop output (− 2.0 %) and animal output (− 2.7 %) both fell. Among the main products, the output values of cereals (+1.3 %), milk (+1.6 %) and pigs (+15.7 %) were the main exceptions to this general pattern.
• The harvested production of cereals as a whole was higher in 2019 (+1.6 %) than in 2018, principally due to a jump in the harvested production of barley (+23.1 %) and a smaller rise in that of common wheat and spelt (+2.9 %). There were lower harvested production levels of other crops like plants harvested green (− 2.6 %), root crops (− 3.3 %) and oilseeds (− 15.5 %).
• Whereas the production of poultry meat fell (− 4.1 %) in 2019, a fifth consecutive annual production increase was recorded for pig meat (+9.4 %). The level of raw milk production remained relatively unchanged (− 0.1 %). There was a moderate decrease in the average real-terms (deflated) output price of poultry (− 2.9 %), while pig prices increased (+1.9 %). Milk output prices fell (− 1.7 %).
• The higher domestic supply of cereals in 2019 was reflected in a fall in real-terms (deflated) output price of cereals as a whole (− 3.1 %). The output price of oilseeds was almost unchanged (+0.2 %). Among root crops, output prices for sugar beet fell (− 3.5 %) and potatoes rose (+34.4 %).
Figure 11.26b: Output value of the agricultural industry, 2019(% of total output, at basic prices)
0 5 10 15 20 25 30
CerealsIndustrial crops
Forage plantsVegetables (1)
PotatoesFruit
WineOlive oil
Other crops; crop productsCattle
PigsSheep and goats
PoultryOther animals
MilkEggs
Other animal productsServices; secondary act.
(1) Including also horticultural plants.
Source: Eurostat (online data code: aact_eaa01)
Figure 11.26a: Index of agricultural factor income per annual work unit, 2005‑2019(2005 = 100)
0
50
100
150
200
250
300
350
2005
2006
2007
2008
2009
2010
2011
2012
2013
2014
2015
2016
2017
2018
2019
Note: index rescaled from 2010 = 100 to 2005 = 100.
Source: Eurostat (online data code: aact_eaa06)
Key information Year Value Unit Share of EU‑27 total (%)
Gross domestic product (GDP) 2019 93.9 EUR billion 0.7
Population on 1 January 2019 5.5 million 1.2
Land area 2016 48 702 km² 1.2
Farmland 2016 18 898 km² 1.2
Share of farmland in land area 2016 38.8 % –
Source: Eurostat (online data codes: nama_10_gdp, demo_pjan, reg_area3 and ef_m_farmleg)
Slovakia

11Agriculture, forestry and fisheries at a glance
Agriculture, forestry and fishery statistics — 2020 edition 215
Table 11.26: Key indicators for agriculture, forestry and fisheries for Slovakia
Farms and farmland Year Value UnitShare of EU-27
total (%)Farmland: utilised agricultural area (UAA) 2016 1 890 thousand hectares 1.2Farms (agricultural holdings) 2016 25 660 number 0.2
Share of very small farms (with < EUR 8 000 of standard output) 2016 68.3 % –
Farmers Year Value UnitEU-27 average/
totalEmployment in agriculture as a share of total employment (1) 2018 1.9 % 4.4Total labour force in agriculture 2019 44.5 thousand annual work units 8 739.7Young farmers (under 40 years old) as a share of all farm managers 2016 19.0 % 10.7
Economic performance of agriculture Year Value UnitShare of EU-27
total (%)Contribution of agriculture to gross domestic product 2019 0.5 % –Gross value added (at basic prices) 2019 521 EUR million 0.3Value of agricultural industry output (production value at basic prices) 2019 2 261 EUR million 0.5
Value of crop output 2019 1 212 EUR million 0.5Value of animal output 2019 757 EUR million 0.5
Annual change in agricultural factor income per annual work unit (indicator A) 2019 − 6.2 % –
Agri-environmental indicators Year Value UnitEU-27 average/
totalArea under organic farming as a share of the UAA 2018 9.9 % 8.0Area under conversion to organic farming as a share of the UAA 2018 0.7 % :Change in the harmonised risk indicator 1 for pesticides compared with the average for 2011‑2013
2018 − 16 % − 17
Agricultural production Year Value UnitShare of EU-27
total (%)Cereals (including rice) 2019 4 104 thousand tonnes 1.4Root crops 2019 1 440 thousand tonnes 0.9Fresh vegetables 2019 126 thousand tonnes 0.2Permanent crops 2019 84 thousand tonnes 0.1Milk 2019 916 thousand tonnes 0.6Bovine meat 2019 8 thousand tonnes 0.1Pig meat 2019 63 thousand tonnes 0.3Poultry meat 2019 72 thousand tonnes 0.5
Forestry Year Value UnitShare of EU-27
total (%)Forest and other wooded land 2020 1 946 thousand hectares 1.1Persons employed in forestry and logging 2017 19.7 thousand annual work units 4.1Gross value added (at basic prices) 2017 426 EUR million 1.6Roundwood (under bark) 2018 9 079 thousand cubic metres 2.4
Fisheries Year Value UnitShare of EU-27
total (%)Fishing fleet 2019 – gross tonnage –Persons employed in fishing and aquaculture 2018 0.3 thousand 0.2Total catches (major fishing areas) 2019 – tonnes live weight –Total aquaculture production (quantity) 2018 2 247 tonnes live weight 0.2Total aquaculture production (value) 2018 6 EUR million 0.1
(1) EU-27 average: includes 2017 data for Romania and Sweden.
Source: Eurostat (online data codes: ef_m_farmleg, nama_10_a64_e, aact_ali01, ef_m_farmang, nama_10_gdp, aact_eaa01, aact_eaa06, org_cropar, farm structure survey — 2016, aei_fm_salpest09, aei_pr_gnb, apro_cpnh1, apro_mk_farm, apro_mt_pann, for_area, for_awu, for_eco_cp, for_remov, fish_fleet_alt, fish_ca_main and fish_aq2a) and Food and Agriculture Organization of the United Nations — Global Forest Resources Assessment, 2020

11 Agriculture, forestry and fisheries at a glance
Agriculture, forestry and fishery statistics — 2020 edition216
Did you know that...
• Agricultural factor income per annual work unit in 2019 was higher (+12.1 %) in 2019 than a year earlier. Despite this upward development, the index indicator level remained below (− 9.6 %) its 2010 peak, but was higher (+11.8 %) than it had been in 2005.
• The output value of the agricultural industry rose (+6.2 %) in 2019, reaching EUR 4.7 billion. The value of crop output grew strongly in 2019 (+22.4 %) and contrasted with the slight fall (− 1.2 %) recorded for animal output. Milk, cereals and cattle together accounted for close to half (45.7 %) of total output value. Of these, the value of total cereals output increased strongly (+47.1 %).
• The production of all three major types of meat increased in 2019: pig meat (+0.9 %), poultry meat (+2.8 %) and bovine meat (+0.8 %); for poultry meat this continued the upward trend since 2010. The production of raw milk decreased slightly (− 1.0 %) in 2019, a fourth consecutive annual decrease.
• The three main categories of crops all experienced higher harvested production levels in 2019 compared with the drought-hit levels of 2018: cereals (+45.9 %, the first increase since 2014), plants harvested green (+27.2 %) and root crops (+17.2 %).
• The large rebound in cereals production was accompanied by a relatively modest rise in output prices in real (deflated) terms (+2.4 % on average). Output price developments for the two main root crops diverged: sugar beet (− 3.3 %) and potatoes (+4.4 %). Output prices increased for pigs (+2.8 %), poultry (+2.2 %) and cattle (+0.3 %); by contrast, a fall (− 2.4 %) was recorded for milk.
Figure 11.27b: Output value of the agricultural industry, 2019(% of total output, at basic prices)
0 5 10 15 20 25
CerealsIndustrial crops
Forage plantsVegetables (1)
PotatoesFruit
WineOlive oil
Other crops; crop productsCattle
PigsSheep and goats
PoultryOther animals
MilkEggs
Other animal productsServices; secondary act.
(1) Including also horticultural plants.
Source: Eurostat (online data code: aact_eaa01)
Figure 11.27a: Index of agricultural factor income per annual work unit, 2005‑2019(2005 = 100)
0
20
40
60
80
100
120
140
2005
2006
2007
2008
2009
2010
2011
2012
2013
2014
2015
2016
2017
2018
2019
Note: index rescaled from 2010 = 100 to 2005 = 100.
Source: Eurostat (online data code: aact_eaa06)
Key information Year Value Unit Share of EU‑27 total (%)
Gross domestic product (GDP) 2019 240.6 EUR billion 1.7
Population on 1 January 2019 5.5 million 1.2
Land area 2016 304 316 km² 7.4
Farmland 2016 22 331 km² 1.4
Share of farmland in land area 2016 7.3 % –
Source: Eurostat (online data codes: nama_10_gdp, demo_pjan, reg_area3 and ef_m_farmleg)
Finland

11Agriculture, forestry and fisheries at a glance
Agriculture, forestry and fishery statistics — 2020 edition 217
Table 11.27: Key indicators for agriculture, forestry and fisheries for Finland
Farms and farmland Year Value UnitShare of EU-27
total (%)Farmland: utilised agricultural area (UAA) 2016 2 233 thousand hectares 1.4Farms (agricultural holdings) 2016 49 710 number 0.5
Share of very small farms (with < EUR 8 000 of standard output) (1) 2016 23.4 % –
Farmers Year Value UnitEU-27 average/
totalEmployment in agriculture as a share of total employment (2) 2018 2.5 % 4.4Total labour force in agriculture 2019 61.6 thousand annual work units 8 739.7Young farmers (under 40 years old) as a share of all farm managers 2016 8.8 % 10.7
Economic performance of agriculture Year Value UnitShare of EU-27
total (%)Contribution of agriculture to gross domestic product 2019 0.4 % –Gross value added (at basic prices) 2019 1 401 EUR million 0.8Value of agricultural industry output (production value at basic prices) 2019 4 745 EUR million 1.1
Value of crop output 2019 1 766 EUR million 0.8Value of animal output 2019 2 253 EUR million 1.4
Annual change in agricultural factor income per annual work unit (indicator A) 2019 12.1 % –
Agri-environmental indicators Year Value UnitEU-27 average/
totalArea under organic farming as a share of the UAA 2018 13.1 % 8.0Area under conversion to organic farming as a share of the UAA 2018 2.7 % :Change in the harmonised risk indicator 1 for pesticides compared with the average for 2011‑2013
2018 44 % − 17
Agricultural production Year Value UnitShare of EU-27
total (%)Cereals (including rice) 2019 3 982 thousand tonnes 1.3Root crops 2019 1 120 thousand tonnes 0.7Fresh vegetables 2019 293 thousand tonnes 0.5Permanent crops 2019 12 thousand tonnes 0.0Milk 2019 2 374 thousand tonnes 1.5Bovine meat 2019 87 thousand tonnes 1.3Pig meat 2019 169 thousand tonnes 0.7Poultry meat 2019 139 thousand tonnes 1.0
Forestry Year Value UnitShare of EU-27
total (%)Forest and other wooded land 2020 23 155 thousand hectares 12.8Persons employed in forestry and logging 2017 20.4 thousand annual work units 4.2Gross value added (at basic prices) 2017 3 784 EUR million 14.4Roundwood (under bark) 2018 60 530 thousand cubic metres 16.0
Fisheries Year Value UnitShare of EU-27
total (%)Fishing fleet 2019 15 723 gross tonnage 1.2Persons employed in fishing and aquaculture 2018 1.7 thousand 1.0Total catches (major fishing areas) 2019 139 195 tonnes live weight 3.4Total aquaculture production (quantity) 2018 14 323 tonnes live weight 1.3Total aquaculture production (value) 2018 66 EUR million 1.8
(1) Excluding farms with zero standard output.(2) EU-27 average: includes 2017 data for Romania and Sweden.
Source: Eurostat (online data codes: ef_m_farmleg, nama_10_a64_e, aact_ali01, ef_m_farmang, nama_10_gdp, aact_eaa01, aact_eaa06, org_cropar, farm structure survey — 2016, aei_fm_salpest09, aei_pr_gnb, apro_cpnh1, apro_mk_farm, apro_mt_pann, for_area, for_awu, for_eco_cp, for_remov, fish_fleet_alt, fish_ca_main and fish_aq2a) and Food and Agriculture Organization of the United Nations — Global Forest Resources Assessment, 2020

11 Agriculture, forestry and fisheries at a glance
Agriculture, forestry and fishery statistics — 2020 edition218
Did you know that...
• Agricultural factor income per annual work unit rebounded quite strongly in 2019 (+16.4 %) from the fall (− 20.7 %) recorded the previous year. The level of this indicator in 2019 was below (− 7.7 %) its 2017 peak but above (+31.4 %) its level in 2005.
• The output value of the agricultural industry increased (+1.6 %) to EUR 6.0 billion in 2019. The value of crop output increased sharply (+8.1 %) whereas that of animal output fell (− 2.1 %). The increase in the value of crop output reflected strong rises for cereals (+34.4 %) and industrial crops (+49.8 %).
• The production of cereals (+88.6 %), plants harvested green (+40.8 %), potatoes (+17.1 %) and sugar beet (+19.5 %) were all higher in 2019 than in 2018, as harvests rebounded from the previous year’s drought. The relatively small harvests of oilseeds (+74.0 %) and fresh vegetables (+12.3 %) also increased.
• Among the three major types of meat, production fell for pig meat (− 3.5 %) while it increased for poultry meat (+4.6 %) and bovine meat (+2.0 %). The gradual slide in the production of raw milk since the abolition of quotas continued in 2019 (− 2.0 %), a fourth consecutive annual fall.
• The rebound in cereals production in 2019 was reflected in a lower real-terms (deflated) output price (− 24.2 %). Similarly, the increase in harvested production of fresh vegetables was accompanied by a fall in the average price (− 5.4 %). Despite higher production, the prices of potatoes (+0.9 %) and oilseeds (+1.8 %) increased moderately. Output prices also increased moderately for pigs (+0.4 %), cattle (+1.2 %) and milk (+1.3 %).
Figure 11.28b: Output value of the agricultural industry, 2019(% of total output, at basic prices)
0 5 10 15 20
CerealsIndustrial crops
Forage plantsVegetables (1)
PotatoesFruit
WineOlive oil
Other crops; crop productsCattle
PigsSheep and goats
PoultryOther animals
MilkEggs
Other animal productsServices; secondary act.
(1) Including also horticultural plants.
Source: Eurostat (online data code: aact_eaa01)
Figure 11.28a: Index of agricultural factor income per annual work unit, 2005‑2019(2005 = 100)
0
20
40
60
80
100
120
140
160
2005
2006
2007
2008
2009
2010
2011
2012
2013
2014
2015
2016
2017
2018
2019
Note: index rescaled from 2010 = 100 to 2005 = 100.
Source: Eurostat (online data code: aact_eaa06)
Key information Year Value Unit Share of EU‑27 total (%)
Gross domestic product (GDP) 2019 474.2 EUR billion 3.4
Population on 1 January 2019 10.2 million 2.3
Land area 2016 407 300 km² 9.9
Farmland 2016 30 126 km² 1.9
Share of farmland in land area 2016 7.4 % –
Source: Eurostat (online data codes: nama_10_gdp, demo_pjan, reg_area3 and ef_m_farmleg)
Sweden

11Agriculture, forestry and fisheries at a glance
Agriculture, forestry and fishery statistics — 2020 edition 219
Table 11.28: Key indicators for agriculture, forestry and fisheries for Sweden
Farms and farmland Year Value UnitShare of EU-27
total (%)Farmland: utilised agricultural area (UAA) 2016 3 013 thousand hectares 1.9Farms (agricultural holdings) 2016 62 940 number 0.6
Share of very small farms (with < EUR 8 000 of standard output) 2016 39.3 % –
Farmers Year Value UnitEU-27 average/
totalEmployment in agriculture as a share of total employment 2017 1.2 % 4.5Total labour force in agriculture 2019 54.8 thousand annual work units 8 739.7Young farmers (under 40 years old) as a share of all farm managers 2016 10.1 % 10.7
Economic performance of agriculture Year Value UnitShare of EU-27
total (%)Contribution of agriculture to gross domestic product 2019 0.3 % –Gross value added (at basic prices) 2019 1 553 EUR million 0.9Value of agricultural industry output (production value at basic prices) 2019 5 999 EUR million 1.4
Value of crop output 2019 2 804 EUR million 1.3Value of animal output 2019 2 602 EUR million 1.6
Annual change in agricultural factor income per annual work unit (indicator A) 2019 16.4 % –
Agri-environmental indicators Year Value UnitEU-27 average/
totalArea under organic farming as a share of the UAA 2018 20.3 % 8.0Area under conversion to organic farming as a share of the UAA 2018 2.4 % :Change in the harmonised risk indicator 1 for pesticides compared with the average for 2011‑2013
2018 − 44 % − 17
Agricultural production Year Value UnitShare of EU-27
total (%)Cereals (including rice) 2019 6 148 thousand tonnes 2.1Root crops 2019 2 876 thousand tonnes 1.7Fresh vegetables 2019 345 thousand tonnes 0.6Permanent crops 2019 25 thousand tonnes 0.0Milk 2019 2 704 thousand tonnes 1.7Bovine meat 2019 140 thousand tonnes 2.0Pig meat 2019 240 thousand tonnes 1.1Poultry meat 2019 164 thousand tonnes 1.2
Forestry Year Value UnitShare of EU-27
total (%)Forest and other wooded land 2020 30 344 thousand hectares 16.8Persons employed in forestry and logging 2017 41.0 thousand annual work units 8.5Gross value added (at basic prices) 2017 3 523 EUR million 13.4Roundwood (under bark) 2018 68 300 thousand cubic metres 18.0
Fisheries Year Value UnitShare of EU-27
total (%)Fishing fleet 2019 23 290 gross tonnage 1.7Persons employed in fishing and aquaculture 2017 1.0 thousand 0.6Total catches (major fishing areas) 2019 178 137 tonnes live weight 4.3Total aquaculture production (quantity) 2018 13 094 tonnes live weight 1.2Total aquaculture production (value) 2018 51 EUR million 1.4
Source: Eurostat (online data codes: ef_m_farmleg, nama_10_a64_e, aact_ali01, ef_m_farmang, nama_10_gdp, aact_eaa01, aact_eaa06, org_cropar, farm structure survey — 2016, aei_fm_salpest09, aei_pr_gnb, apro_cpnh1, apro_mk_farm, apro_mt_pann, for_area, for_awu, for_eco_cp, for_remov, fish_fleet_alt, fish_ca_main and fish_aq2a) and Food and Agriculture Organization of the United Nations — Global Forest Resources Assessment, 2020


Annexes

Agriculture, forestry and fishery statistics — 2020 edition222
Data coverage
Data coverageEurostat online databases contain a large amount of metadata that provides information on the status of particular values or data series. In order to improve the readability of this statistical book, only the most significant information has been included under the tables, figures and maps. The following symbols are used in tables, where appropriate:
Italic data value is forecasted, provisional or estimated and is likely to change;
: not available, confidential or unreliable value;
– not applicable.
This publication generally presents information for the EU-27 (an aggregate for the 27 Member States of the EU), as well as the individual EU Member States. The order of the Member States in tables generally follows their order of protocol; in other words, the alphabetical order of the countries’ names in their respective languages. In figures, the countries are ranked according to the values of a particular indicator.
The EU-27 aggregate is provided when information for all of the countries is available, or if an estimate has been made for missing information. Any incomplete totals that are created are footnoted systematically.
When available, information is also presented for the United Kingdom, EFTA countries, candidate countries to the EU and potential candidates. In the event that data for any of these non-member countries are not available, they have been excluded from the tables, figures and maps presented.
If data are not available for a particular country, then efforts have been made to fill tables, figures and maps with data for previous reference periods (these exceptions are footnoted); generally, an effort has been made to go back at least two reference years for those countries that do not have the most recent information available, for example showing data for 2017 or 2018 if data for 2019 are not (yet) available.

Agriculture, forestry and fishery statistics — 2020 edition 223
Glossary
Glossary
Agricultural holdingThis is a single unit, in both technical and economic terms, operating under a single management, which undertakes agricultural activities within the economic territory of the EU, either as its primary or secondary activity. Other supplementary (non-agricultural) products and services may also be provided by the holding.
Agricultural income per AWUThe main indicator for agricultural income is ‘factor income per annual work unit’ (AWU), which is generally expressed as an index.
Animal outputAnimal output comprises the sales, changes in stock levels, and the products used for processing and own final use by producers.
Annual work unit (AWU)One annual work unit corresponds to the work performed by one person who is occupied on an agricultural holding on a full-time basis. Full-time means the minimum hours required by the relevant national provisions governing contracts of employment. If the national provisions do not indicate the number of hours, then 1 800 hours are taken to be the minimum annual working hours: equivalent to 225 working days of eight hours each.
AquacultureAquaculture, also known as aquafarming or fish farming, refers to the farming of aquatic (freshwater or saltwater) organisms, such as fish, molluscs, crustaceans and plants for human use or consumption, under controlled conditions. Aquaculture implies some form of intervention in the natural rearing process to enhance
production, including regular stocking, feeding and protection from predators. Farming also implies individual or corporate ownership of, or contractual rights to, the stock being cultivated.
Arable landArable land is land worked (ploughed or tilled) regularly, generally under a system of crop rotation.
Basic priceThe basic price is the amount receivable by the producer from the purchaser for a unit of a good or service produced as output minus any tax payable, and plus any subsidy receivable, by the producer as a consequence of its production or sale.
BovineA bovine refers to a domestic animal of the species Bos taurus (cattle) or Bubalus bubalis (water buffalo), and also includes hybrids like Beefalo.
A distinction can be made by the age of the animal (less than one year old, aged between one and two years, and two years and over), with a further division between male and female bovines.
Carcass weightThe definition of carcass weight depends on the animal species under consideration:
• for pigs, it is the weight of the slaughtered pig’s cold body, either whole or divided in half along the mid-line, after being bled and eviscerated and after removal of the tongue, bristles, hooves, genitalia, flare fat, kidneys and diaphragm;

Agriculture, forestry and fishery statistics — 2020 edition224
Glossary
• for cattle, it is the weight of the slaughtered animal’s cold body after being skinned, bled and eviscerated, and after removal of the genitalia, the limbs, the head, the tail, the kidneys and kidney fats, and the udder;
• for sheep and goats, it is the weight of the slaughtered animal’s cold body after having been bled, skinned and eviscerated, and after removal of the head, feet, tail and genitalia. Kidneys and kidney fats are included in the carcass weight;
• for poultry, it is the weight of the cold body of the slaughtered farmyard poultry after being bled, plucked and eviscerated; the weight includes poultry offal, with the exception of foie gras.
For other species, ‘carcass weight’ is considered to be the weight of the slaughtered animal’s cold body.
CattleCattle refer to domestic animals of the species Bos taurus (cattle) and Bubalus bubalis (water buffalo); together are called bovines.
CerealsCereals include wheat (common wheat and spelt and durum wheat), rye, maslin, barley, oats, mixed grain other than maslin, grain maize and corn cob mix, sorghum, triticale, rice and other cereal crops such as buckwheat, millet and canary seed.
Common agricultural policy (CAP)The common agricultural policy (CAP) is the EU’s agricultural policy. The CAP is an area in which competence is shared between the EU and its Member States. Under Article 33 of the Treaty establishing the European Community, its aims are to ‘ensure reasonable prices for Europe’s consumers and fair incomes for farmers, in particular through the common organisation of
agricultural markets and by enforcing compliance with the principles adopted at the Stresa Conference in 1958, namely single prices, financial solidarity and Community preference’.
The CAP is one of the most important EU policies from a budget point of view. Qualified majority voting in the Council and consultation with the European Parliament decide policy. The CAP has fulfilled its main goal of food self-sufficiency in the EU. Major policy changes, however, proved necessary in order to correct imbalances and overproduction resulting from the CAP. Therefore, its aims have changed in the course of time, and the instruments used have also developed as a result of successive reforms.
Common fisheries policy (CFP)The common fisheries policy (CFP) is the EU’s policy for managing fisheries in the waters of the EU Member States. Its objectives are to:
• increase productivity;• stabilise markets;• ensure security of supply and reasonable prices
to the consumer.
Although a CFP was already provided for in the Treaty of Rome in 1957, it did not become a common policy in the full sense of the term until 1983. The CFP has the same legal basis (Articles 32 to 38 of the EC Treaty) as the CAP and shares the same aims mentioned above. Like the CAP, the CFP is a shared responsibility of the EU and its Member States. Successive reforms of the CFP have added new aims to its initial goals, namely:
• sustainable exploitation of resources;• protection of the environment;• safeguards for a high level of human health
protection;• contributing to economic and social cohesion.
Protection of fish stocks and the marine environment are key issues for the CFP given the threat posed by resource depletion.

Agriculture, forestry and fishery statistics — 2020 edition 225
Glossary
CowA cow is a female bovine that has calved (including any aged less than two years). A dairy cow is a cow kept exclusively or principally for the production of milk for human consumption and/or other dairy produce.
Crop outputCrop output comprises sales, changes in stock levels, and crop products used as animal feedstuffs, or for processing and own final use by the producers.
Family labour forceThe family labour force of the agricultural holding in the context of the farm structure survey (FSS) refers to persons who carry out farm work on the holding and are classified either as a holder or the members of the sole holder’s family. The term family workers is also used with the same meaning.
Farm labour forceThe farm labour force of the holding includes all persons having completed their compulsory education (having reached school-leaving age) who carried out farm work on the holding during the 12 months ending on the reference day of the survey. All persons of retirement age who continue to work on the holding are included in the farm labour force.
Farm managerA farm manager or manager of the agricultural holding is the natural person responsible for the normal daily financial and production routines of running the holding concerned. There can be only one manager on the holding.
Farm structure surveyThe farm structure survey (FSS), also known as the survey on the structure of agricultural holdings, is carried out by all EU Member States. The FSS is conducted consistently throughout the EU with a common methodology at a regular base and provides therefore comparable and representative statistics across countries and time, at regional levels (down to NUTS level 3). Every three or four years the FSS is carried out as a sample survey, and once in 10 years as a census.
FeedFeed (or feeding stuff) is any substance or product, including additives, whether processed, partially processed or unprocessed, intended to be used for oral feeding to animals.
FertiliserA fertiliser is a substance used in agriculture to provide crops with vital nutrients to grow (such as nitrogen (N), phosphorus (P) and potassium (K)). Fertilisers can be divided into inorganic fertilisers (also called mineral, synthetic or manufactured) and organic fertilisers. Organic fertilisers include manure, compost, sewage sludge and industrial waste.
Fishing areaGeographical fishing areas in the EU’s common fisheries policy (CFP) are defined for a number of specific areas of water, including:
• the Northeast Atlantic, which is roughly the area to the east of 42°W longitude and north of 36°N latitude, including the waters of the Baltic Sea (also referred to as the Food and Agriculture Organization Major Fishing Area 27);
• the Northwest Atlantic, which is the region that is roughly the area to the west of 42°W longitude and north of 35°N latitude (also referred to as the Food and Agriculture Organization Major Fishing Area 21);

Agriculture, forestry and fishery statistics — 2020 edition226
Glossary
• the Eastern Central Atlantic, which is the region to the east of 40°W longitude between latitudes 36°N and 6°S (also referred to as the Food and Agriculture Organization Major Fishing Area 34);
• the Mediterranean and Black Sea, which is also referred to as the Food and Agriculture Organization Major Fishing Area 37.
Fish catchFish catch (or simply catch) refers to catches of fishery products including fish, molluscs, crustaceans and other aquatic animals, residues and aquatic plants that are:
• taken for all purposes (commercial, industrial, recreational and subsistence);
• taken by all types and classes of fishing units (including fishermen, vessels, gear, and so on);
• operated in fresh and brackish water areas, and in inshore, offshore and high-seas fishing areas.
The catch is normally expressed in live weight and derived by the application of conversion factors to the actual landed or product weight. Up to 2014, catch statistics exclude quantities of fishery products which are caught but which, for a variety of reasons, are not landed. As a result of the landing obligation foreseen in the renewed CFP and gradually introduced as from 2015, all catches should be kept on board, landed and counted. Production from aquaculture is excluded from catch statistics.
Fishing fleetThe data on the number of fishing vessels, the fishing fleet, in general refer to the fleet size as recorded on 31 December of the specified reference year. The data are derived from the national registers of fishing vessels which are maintained according to Commission Regulation (EC) No 26/2004 which specifies the information on vessel characteristics to be recorded.
ForestsForests are defined as land with tree crown cover (meaning all parts of the tree above ground level including its leaves, branches and so on), or equivalent stocking level, of more than 10 % and with an area of more than 0.5 hectares (ha). The trees should be able to reach a minimum height of five metres at maturity in situ.
GoatsA goat is a domestic animal of the subspecies Capra aegagrus hircus.
Grazed areaThe grazed area is the total area of pastures owned, rented or otherwise allocated to the agricultural holding on which animals are kept for grazing during the reference year. The grazed area can also be harvested by mowing or other means. It includes all grasslands that are grazed, independent of whether they are temporary or permanent in nature. Permanent grasslands no longer used for production purposes are however excluded, as well as common lands not allotted to individual holdings.
Gross value added (GVA)Gross value added (GVA) is output at market prices minus intermediate consumption at purchaser prices; it is a balancing item of the national accounts’ production account:
• GVA at producer prices is output at producer prices minus intermediate consumption at purchaser prices — the producer price is the amount receivable by the producer from the purchaser for a unit of a product minus value added tax (VAT), or similar deductible tax, invoiced to the purchaser;

Agriculture, forestry and fishery statistics — 2020 edition 227
Glossary
• GVA at basic prices is output at basic prices minus intermediate consumption at purchaser prices — the basic price is the amount receivable by the producer from the purchaser for a unit of a product minus any tax on the product plus any subsidy on the product;
• GVA at factor cost is not a concept explicitly used in national accounts — it can be derived by subtracting other taxes on production from GVA at basic prices and adding other subsidies on production.
Joint forest sector questionnaireThe joint forest sector questionnaire (JFSQ) is an initiative of the International Tropical Timber Organisation (ITTO), the United Nations Economic Commission for Europe (UNECE), the Food and Agriculture Organization of the United Nations (FAO) and Eurostat to collect statistics on the world timber situation. Each agency collects data from the countries for which it is responsible, with Eurostat compiling information for the EU Member States, the United Kingdom and EFTA countries.
Kitchen gardensKitchen gardens are areas of an agricultural holding devoted to the cultivation of agricultural products not intended for selling but for consumption by the farm holder and his household.
Land useLand use refers to the socioeconomic purpose of the land. Areas of land can be used for residential, industrial, agricultural, forestry, recreational, transport purposes and so on.
Live weight of fishery productsThe live weight of fishery products is derived from the landed or product weight by the application of certain factors and is designed to represent the actual weight of the fishery product as it was
taken from the water and before being subjected to any processing or other operations.
Livestock surveyThe livestock survey provides information about the livestock population in the EU, as well as information at a national and regional level — it is more detailed than the farm structure survey (FSS), providing more animal categories in its classification of livestock. It is conducted once a year, in December, in all of the EU Member States and in May/June for bovine animals and pigs in the Member States with the largest herds.
Livestock unit (LSU)A livestock unit (LSU) is a reference unit which facilitates the aggregation of livestock from various species and age as per convention, via the use of specific coefficients established initially on the basis of the nutritional or feed requirement of each type of animal. The reference unit used for the calculation of livestock units (= 1 LSU) is the grazing equivalent of one adult dairy cow producing 3 000 kg of milk annually, without additional concentrated foodstuffs.
Meat productionMeat production is the delivery of live animals by agriculture (in other words, excluding livestock renewal) whose meat fits needs for human consumption (in other words, excluding removals and losses). The slaughterhouses are the first points where this fate becomes certain and their activity reflects meat production. Keep in mind though that animals slaughtered may have been produced abroad and that the live animals delivered may be slaughtered abroad.
In the present publication, slaughtering in the slaughterhouses of the EU Member States is called meat production. This definition applies to bovine animals, pigs, sheep, goats and poultry.

Agriculture, forestry and fishery statistics — 2020 edition228
Glossary
MilkMilk is produced by the secretion of the mammary glands of cows, ewes, goats or buffaloes. Farms produce milk for two distinct purposes: to distribute to dairies as well as for domestic consumption, direct sale and cattle feed.
Non‑family labourThe non-family labour force of the agricultural holding in the context of the farm structure survey (FSS) refers to persons directly employed by the holding. They can be classified as:
• non-family labour regularly employed — all persons other than the holder and members of his/her family doing farm work and receiving any kind of remuneration (salary, wages, profits or other payments including payment in kind) from the agricultural holding;
• non-family labour employed on a non-regular basis — all persons other than the holder and members of his/her family doing farm work and receiving any kind of remuneration from the agricultural holding who did not work each week on the agricultural holding in the 12 months ending on the reference day of the survey; this category usually covers seasonal workers.
Permanent cropsPermanent crops are tree/shrub crops not grown in rotation, but occupying the soil and yielding harvests for several (usually more than five) consecutive years. Permanent crops mainly consist of fruit and berry trees, bushes, vines and olive trees.
Permanent grassland and meadowPermanent grassland and meadow is land used permanently (for several — usually more than five — consecutive years) to grow herbaceous forage crops, through cultivation (sown) or naturally (self-seeded); it is not, therefore, included in the
crop rotation scheme on the agricultural holding. Permanent grassland and meadow can be either used for grazing by livestock, or mowed for hay or silage (stocking in a silo).
PigA pig is a domesticated animal of the species Sus. A distinction is made between pigs, piglets, fattening pigs and breeding pigs.
PoultryPoultry refers to domestic birds of the following species: Gallus gallus (hens and chickens); Meleagris spp. (turkeys); Anas spp. and Cairina moschata (ducks); Anser anser dom. (geese); Coturnix spp. (quail); Phasianus spp. (pheasants); Numida meleagris dom. (guineafowl); Columbinae spp. (pigeons); Struthio camelus (ostriches). It excludes, however, birds raised in confinement for hunting purposes and not for meat production.
Regular agricultural labour forceThe regularly employed labour force of an agricultural holding in the context of the farm structure survey (FSS) refers to the directly employed persons who carried out farm work every week on the holding during the 12 months ending on the reference day of the survey, irrespective of length of the working week. The regularly employed labour force may be classified either as family labour or non-family labour regularly employed.
Roundwood productionRoundwood production (the term is also used as a synonym for removals in the context of forestry) comprises all quantities of wood removed from forests and other wooded land, or other tree felling site during a defined period of time.

Agriculture, forestry and fishery statistics — 2020 edition 229
Glossary
SawnwoodSawnwood is wood that has been produced either by sawing lengthways or by a profile-chipping process and, with a few exceptions, is greater than 6 millimetres (mm) in thickness.
SheepSheep are domesticated animals of the species Ovis aries kept in flocks mainly for their wool or meat.
SlaughterhouseA slaughterhouse is an officially registered and approved establishment used for slaughtering and dressing animals whose meat is intended for human consumption.
Standard output (SO)The standard output (SO) of an agricultural product (crop or livestock) is the average monetary value of the agricultural output at farm-gate price, in euro per hectare or per head of livestock. A regional coefficient for each product is applied, as an average value over a reference period (five years). The sum of all the standard outputs per hectare of crop and per head of livestock for a farm is a measure of its overall economic size, expressed in euro.
Utilised agricultural area (UAA)The utilised agricultural area (UAA) describes the area used for farming. It includes the land categories: arable land; permanent grassland; permanent crops, and; other agricultural land such as kitchen gardens (even if they only represent small share of the total UAA). The term does not include unused agricultural land, woodland and land occupied by buildings, farmyards, tracks, ponds, and so on.

Agriculture, forestry and fishery statistics — 2020 edition230
Abbreviations
Abbreviations
UNITS OF MEASUREMENT% per centAWU annual work unitEUR euroha hectarekg kilogramkm² square kilometrekW kilowatt
LSU livestock unitm³ cubic metretoe tonne of oil equivalenttonne 1 000 kgTLW tonnes live weightt-km tonne-kilometre
OTHER ABBREVIATIONSAEI agri-environmental indicatorsCAP common agricultural policyCCM corn cob mixCFP common fisheries policyCLRTAP Convention on Long-range
Transboundary Air PollutionCOM communicationCO₂ carbon dioxideCMO common market organisationEAA economic accounts for agricultureEC 1. European Community
2. European CommissionEEA European Environment AgencyEEC European Economic CommunityEMEP European monitoring and evaluation
programmeEurostat statistical office of the European UnionFAO Food and Agriculture Organization (of
the United Nations)FlEGT forest law enforcement, governance and
tradeFSS farm structure surveyHICP harmonised index of consumer prices
ICT information and communication technologies
IPCC intergovernmental panel on climate change
ISCED international standard classification of education
K potassiumLFS labour force surveyLSU livestock unitLULUCF land-use, land change and forestryNUTS classification of territorial units for
statisticsPDO protected designation of originPGI protected geographical indicationSILC statistics on income and living
conditionsSO standard outputUAA utilised agricultural areaUNECE United Nations Economic Commission
for EuropeUNFCCC United Nations Framework Convention
on Climate Change

Getting in touch with the EUIn person
All over the European Union there are hundreds of Europe Direct information centres. You can find the address of the centre nearest to you at: https://europa.eu/european-union/contact_en
On the phone or by email
Europe Direct is a service that answers your questions about the European Union. You can contact this service:• by freephone: 00 800 6 7 8 9 10 11 (certain operators may charge for these calls),• at the following standard number: +32 22999696 or• by email via: https://europa.eu/european-union/contact_en
Finding information about the EUOnline
Information about the European Union in all the official languages of the EU is available on the Europa website at: https://europa.eu/european-union/index_en
EU publications
You can download or order free and priced EU publications at: https://publications.europa.eu/en/publications. Multiple copies of free publications may be obtained by contacting Europe Direct or your local information centre (see https://europa.eu/european-union/contact_en).
EU law and related documents
For access to legal information from the EU, including all EU law since 1952 in all the official language versions, go to EUR-Lex at: https://eur-lex.europa.eu
Open data from the EU
The EU Open Data Portal (https://data.europa.eu/euodp/en) provides access to datasets from the EU. Data can be downloaded and reused for free, for both commercial and non-commercial purposes.

Print: KS-FK-20-001-EN-C
PDF:
KS-FK-20-001-EN-N
Print: ISBN 978-92-76-21520-2 doi:10.2785/496803PDF: ISBN 978-92-76-21522-6 doi:10.2785/143455
Agriculture, forestry and fishery statistics2020 EDITION
Agriculture, forestry and fishery statistics provides a selection of recent, topical data. Information is presented for the European Union (EU) and its Member States, and is supplemented (when available) with data for the United Kingdom, EFTA members, candidate countries to the EU and potential candidates. This publication aims to cover some of the most popular data within the domain of agriculture, forestry and fishery statistics as well as some of the wider food chain. It may be viewed as an introduction to European statistics in this area and provides a starting point for those who wish to explore the broad range of data that are freely available on Eurostat’s website.
For more informationhttps://ec.europa.eu/eurostat/