SELF-ASSEMBLED POLYMER NANOCOMPOSITES ... - CORE
152
SELF-ASSEMBLED POLYMER NANOCOMPOSITES AND THEIR NETWORKS By NITIN VIKAS PATIL Bachelor of Polymer Engineering and Technology University Institute of Chemical Technology Mumbai, Maharashtra; India 2006 Submitted to the Faculty of the Graduate College of the Oklahoma State University in partial fulfillment of the requirements for the Degree of DOCTOR OF PHILOSOPHY December, 2013
-
Upload
khangminh22 -
Category
Documents
-
view
1 -
download
0
Transcript of SELF-ASSEMBLED POLYMER NANOCOMPOSITES ... - CORE

SELF-ASSEMBLED POLYMER
NANOCOMPOSITES AND THEIR NETWORKS
By
NITIN VIKAS PATIL
Bachelor of Polymer Engineering and Technology
University Institute of Chemical Technology
Mumbai, Maharashtra; India
2006
Submitted to the Faculty of the
Graduate College of the
Oklahoma State University
in partial fulfillment of
the requirements for
the Degree of
DOCTOR OF PHILOSOPHY
December, 2013

ii
SELF-ASSEMBLED POLYMER NANOCOMPOSITES
AND THEIR NETWORKS
Dissertation Approved:
Dr. Jeffery L. White
Dissertation Adviser
Dr. Frank D. Blum
Dr. Kevin D. Ausman
Dr. Allen Applett
Dr. Rob Whiteley
.

iii Acknowledgements reflect the views of the author and are not endorsed by committee members or Oklahoma State University
ACKNOWLEDGEMENTS
I would like to express deepest gratitude to my advisor Dr. Jeffery L. White for
his guidance, support, motivation, enthusiasm, and immense knowledge. I would also like
to acknowledge Pandit. Shri Ram Sharma Acharya for making me an ethical and
principled human being.
I would like to thank my committee members: Dr. Frank D. Blum, Dr. Kevin D.
Ausman, Dr. Allen Apblett, and Dr. Rob Whiteley for their valuable comments. I would
like to give special thanks to Dr. Warren T. Ford, Dr. Brian P. Grady, Dr. Frank D. Blum,
and Dr. Nicholas F. Materer for allowing me to use their instruments.
Additional thank to my past and present lab mates: Dr. Rosimar Truitt, Dr. Lance
Gill, Dr. Gaumani Gyanwali, Josh, Jessica, Dr. Andrew Clough, Tapash, Chen, Jarred,
and Mathis for their valuable comments in my PhD research. I would like to thank my
friends: Sovan, Atri, Harshwardhan, Chakkaravarthy, Farai, Joseph, and Lakshmi for
making my stay at OSU exciting.
Last, I would like to thank my parents, brothers, wife, sister-in law, my nephew
Bhargav, and my son Savya for their support, encouragement, love, and motivation
throughout my doctorate studies.

iv
Name: NITIN VIKAS PATIL
Date of Degree: DECEMBER, 2013
Title of Study: SELF-ASSEMBLED POLYMER NANOCOMPOSITES AND THEIR
NETWORKS
Major Field: CHEMISTRY
Abstract:
This dissertation describes new routes to synthesize polymer nanocomposite
networks via self-assembly. Polymerizable structure directing agents (referred to as
surfmers) obtained by end-group functionalization preserves the structure-directing
capabilities of the surfactant for templating ordered mesoporous silica particle growth,
while simultaneously generating a reactive matrix for polymer network formation
through reactive end groups in the presence of intimately mixed mesoporous silicates. A
combination of small angle X-ray scattering, surface area, and microscopy experiments
on mesoporous silica indicated the structure directing capabilities of surfmers. Free-
radical polymerization of the surfmer leads to novel crosslinked nanocomposites
networks. Multiple experiments, including gel permeation chromatography, swelling, and
solid state NMR experiments on polymer nanocomposites gave evidence of the
polymerization of surfmer leading to formation of crosslink networks. Polymer
nanocomposites with varied silica content were prepared. Effects of silica content on
polymer nanocomposites were studied on rheometer. Results obtained from rheological
experiments indicate that the storage (G’) and loss modulus (G”) increases with increase
in the content of mesoporous silica. In this way, the nanocomposites networks obtained
via self-assembly shows independent behavior with respect to frequency in rheological
experiments. Additionally, this self-assembled route was extended to synthesize
biodegradable and biocompatible polymer nanocomposites networks. The nanocomposite
networks obtained with 15% of silica content showed the increase in storage modulus by
two orders of magnitude in rheological experiments.

v
TABLE OF CONTENTS
Chapter Page
I. INTRODUCTION ......................................................................................................1
1.1 Polymer Composites ..........................................................................................1
1.2 Factors affecting the properties of polymer composites ....................................2
1.2.1 Interfacial Adhesion ..................................................................................2
1.2.2 Orientation of inorganic fillers in polymer matrix ....................................3
1.2.3 Dispersion of inorganic fillers into polymer matrix .................................4
1.3 Polymers ............................................................................................................4
1.4 Properties of Polymer Composites...................................................................10
1.5 Mesoporous Silica ............................................................................................12
1.6.1 True Crystal Liquid Templating .............................................................16
1.6.2 Co-operative Self-Assembly ...................................................................16
1.6.3 Evaporation Induced Self-Assembly ......................................................17
1.6.4 Exo-templating ........................................................................................18
1.6 Motivation ........................................................................................................19
1.7.1 Co-condensation Method ........................................................................21
1.7.2 Post-functionalization Method ................................................................23
1.7.3 Sol-gel Method........................................................................................24
1.7 Approach ..........................................................................................................26
1.8 Research Objectives .........................................................................................27
1.9 Experimental Techniques .................................................................................28
1.9.1 Physisorption...........................................................................................28
1.9.2 Differential Scanning Calorimetry ..........................................................32
1.9.3 Thermal Gravimetric Analysis ................................................................33
1.9.4 Gel Permeation Chromatorgraphy ..........................................................34
1.9.5 Rheology .................................................................................................36
1.9.6 Small Angle X-ray Scattering .................................................................39
1.9.7 Nuclear Magnetic Resonance .................................................................40
1.9.7.1 Bloch Decay experiments ........................................................45
1.9.7.2 Cross-Polarization experiments ...............................................46
1.10 Structure of dissertation .................................................................................48
1.11 References ......................................................................................................48

vi
Chapter Page
II. POLYMERIZATION STRUCTURE DIRECTING AGENTS THAT ENABLE IN-
SITU SYNTHESES OF COMPOSITE MATERIALS .........................................58
2.1 Introduction ......................................................................................................59
2.2 Experimental ....................................................................................................60
2.2.1 Materials .................................................................................................60
2.2.2 Characterization ......................................................................................61
2.2.3 Synthesis of monoallyl Pluronic P123 ....................................................61
2.2.4 Synthesis of SBA-15 and SBA-15 analogues .........................................62
2.2.5 Polymerization of monoallyl pluronic P123 ...........................................62
2.2.6 Characterization of extent of end-group functionalization in aP123 ......63
2.3 Results and Discussion ....................................................................................64
2.3.1 Generating functionalized templates.......................................................64
2.3.2 Polymerizing the reactive template .........................................................68
2.3.3 Inter-particle versus intra-particle polymerizations and bulk properties 70
2.4 Conclusions ......................................................................................................72
2.5 References ........................................................................................................73
III. Self-ASSEMBLED POLYMER NANOCOMPOSITES AND THEIR NETWORKS
................................................................................................................................76
3.1 Introduction ......................................................................................................77
3.2 Experimental ....................................................................................................78
3.2.1 Materials .................................................................................................78
3.2.2 Characterization ......................................................................................78
3.2.3 Synthesis of acrylated- and styrenated- functionalized pluronic P123 ...78
3.2.2 Synthesis of SBA-15 and SBA-15 analogues (acryP123 and styrP123) 79
3.2.3 Characterization of end-group functionalization in acry/styrP123 .........80
3.2.4 Preparation of polymer nanocomposites .................................................82
3.3 Linear Viscoelastic Measurements ..................................................................84
3.4 Small Angle X-ray Scattering Measurements..................................................84
3.5 Results and Discussion ....................................................................................85
3.6 Conclusions ......................................................................................................93
3.7 References ........................................................................................................94
IV. CREATING POLYMER TEMPLATES AND THEIR USE IN THE IN-SITU
SYNTHESIS OF BIODEGRADABLE NANOCOMPOSITES ...........................97
4.1 Introduction ......................................................................................................98
4.2 Experimental ....................................................................................................99
4.2.1 Materials .................................................................................................99
4.2.2 Characterization ......................................................................................99

vii
4.2.3 Synthesis of PECE-4K and PECE-6K triblock copolymers .................100
4.2.2 PECE end-group functionalization to form acrylated-PECE................102
4.2.3 PECE-templated porous-silica formation .............................................102
4.2.4 Preparation of polymer nanocomposites from PECE/silica products ...103
4.3 Linear Viscoelastic Measurements ................................................................104
4.4 Small Angle X-ray Scattering Measurements................................................104
4.5 Results and Discussion ..................................................................................104
4.6 Conclusions ....................................................................................................114
4.7 References ......................................................................................................115
V. FUTURE WORK ..................................................................................................119
APPENDICES ...........................................................................................................121

viii
LIST OF TABLES
Table Page
1.1 Silane coupling agents ........................................................................................26
2.1 Pore size distibutions, BET surface area, and d-spacing of mesoporous silica
prepared using aP123 and P123 ................................................................................68
3.1 Pore size distibutions, BET surface area, and d-spacing of mesoporous silica
prepared using styrP123, acryP123, and P123……………………………………80
3.2 Composition of SBA15acryP123 polymer nanocomposites...............................83
4.1 Composition of MSacryPECE polymer nanocomposites .................................103
4.2 BET surface area and pore volume ...................................................................106

ix
LIST OF FIGURES
Figure Page
1.1 Chemical structures of a) poly(isoprene) a naturally occurring polymer and b)
poly(vinyl chloride)-synthetic polymers ........................................................................5
1.2 Different types of branching in polymers: a) linear, b) branched, c) cross-linked, and
d) dendrimers…………………………………………………………….....................6
1.3 Condensation polymerization technique for synthesis of polyesters .......................6
1.4 Free-radical polymerization sequence .....................................................................7
1.5Arrangements of monomers to form: a) random, b) alternating, c) block, and d)
gradient copolymers…………………………………………………………………...8
1.6 Schematic representation of graft copolymers .........................................................8
1.7 Molecular weight distributions: a) narrow and b) broad .......................................10
1.8 a) Dumbbell shaped polymer/ polymer composites specimen and b) typical stress-
strain curve for polymers .............................................................................................11
1.9 Stress-strain curves of a) Soft and weak, b) soft and tough, c) hard and brittle, d) hard
and strong, and e) hard and tough polymeric materials ...............................................11
1.10 Classification of nanoporous materials ................................................................12
1.11 Sol-gel hydrolysis and condensation reactions ....................................................13
1.12 Types of electrostatic interactions: a) S+I-, b) S
+X
-I+, c) S
-I+, and d) S
-M
+I+ that can
occur between surfactant and silica species .................................................................14

x
1.13 Silica precursors under different pH ....................................................................15
1.14 Mechanism of mesoporus silica formation by a) true liquid crystal templating and b)
co-operative self-assembly routes ................................................................................17
1.15 Schematic representation of EISA approach .......................................................18
1.16 Schematic representation of exo-template approach for mesoporous materials .19
1.17 TEM images of mesoporous silica pores of a) cubic, b) hexagonal, and c) SEM
image spherical shapes .................................................................................................20
1.18 Comparison of articles published on a) polymer silica nanocomposites and b)
polymer mesoporous silica nanocomposites from 1998 to 2012 .................................20
1.19 Mesoporous silica/polymer nanocomposites by co-condensation approach .......22
1.20 Mesoporous silica/polymer nanocomposites using post-functionalization approach
......................................................................................................................................24
1.21 Polymer nanocomposites using the sol-gel approach ..........................................25
1.22 Schematic representation of ring-opening polymerization of D,L-lactide inside the
mesoporous silica .........................................................................................................25
1.23 Schematic representation of polymerizable structure directing agent approach for the
synthesis of polymer mesoporous silica nanocomposites……………………………27
1.24 Schematic representation of physisorption experiments ......................................29
1.25 a) Isotherms and b) hysteresis loop of type IV isotherm .....................................30
1.26 Typical BET plot..................................................................................................31
1.27 Schematic representation of DSC cell .................................................................32
1.28 Typical DSC thermogram ....................................................................................33
1.29 Typical TGA thermogram ....................................................................................34

xi
1.30 Schematic representation of Agilent 1100 series Gel Permeation Chromatography
......................................................................................................................................35
1.31 a) Calibration curve using polystyrene standards and b) GPC chromatrogram of
unknown sample ..........................................................................................................36
1.32 Mechanical analog of a viscoelastic liquid ..........................................................37
1.33 Schematic representation of parallel plates used in Rheometeric scientific RSA
II……………………………………………………………………………………..38
1.34 Plot of G’ with respect to frequency of a viscoelastic material ...........................39
1.35 Schematic representation of a) SAXS instrument and b) diffraction of rays from
sample ..........................................................................................................................40
1.36 Splitting of energy levels in the presence of the external magnetic field (Bo) ....41
1.37 Axis of rotation of nucleus in the presence of the external magnetic field (Bo) ..42
1.38 Bulk magnetization of the spins aligned in the direction of the external magnetic
field ..............................................................................................................................43
1.39 Two spin system in the magnetic field Bo ...........................................................44
1.40 Sample rotor at magic angle with respect to applied magnetic field (Bo) ...........45
1.41 a) Pulse diagram of Bloch decay experiment and b) vector model representation of
spins after 90o pulse .....................................................................................................46
1.42 Zeeman splitting occurring at Hartmaan-Hahn condition ...................................47
1.43 Pulse diagram of CP/MAS NMR .........................................................................47
2.1 600 MHz 13
C solution NMR spectrum acquired with 1H decoupling of (bottom) pure
P123 starting material and (top) allyl-functionalized aP123 following reaction according
to Scheme 1. End group signals are shown in the aP123 inset ...................................64

xii
2.2 a) Schematic representation of synthesis of mesoporous materials and polymer
composite networks using the allyl-modified P123 surfactant, and b) Expanded view of
channel interior showing reaction (denoted by green lines) between olefinic ends of
neighboring template molecules ..................................................................................66
2.3 SAXS data of SBA15P123 and SBA15_aP123, denoted by solid and dotted lines
respectively ..................................................................................................................67
2.4 TGA data of SBA15P123 and SBA15_aP123, denoted by solid and dotted lines
respectively ..................................................................................................................67
2.5 GPC chromatograms of a) pure P123, b) aP123, c) polymerized aP123, and d)
polymer extracted from the composite following polymerization of aP123 template
molecules in-situ. No change in molecular weight was observed for control experiments
involving pure P123 in the same acid-catalyzed reaction. GPC flow rates were 1 ml/min
......................................................................................................................................69
2.6 Solid-state 1H
13C CP (cross-polarization)/MAS spectra for (a) the P123 surfactants
in normal uncalcined SBA-15 following synthesis, and (b) the organic fraction generated
by polymerizing the aP123 structure-directing agents inside and around the SBA-15
following crystallization ..............................................................................................70
2.7 Pellets formed from (a) polymerized aP123/SBA-15 composite versus (b) versus
aP123/SBA-15 without the polymerization step. Both pellets contain ca. 30-33 wt%
organic content. (c) Pellet from polymerized composite in CH2Cl2, at the bottom of the
vial, and (d) the corresponding unpolymerized control pellet floating near the surface.
The two pellets were placed in each solvent container at exactly the same time, which
was 1 minute prior to taking the photo ........................................................................72

xiii
3.1 600 MHz 13
C solution NMR spectrum acquired with 1H decoupling of (bottom) pure
P123 starting material and (top) acrylate-functionalized acryP123 following reaction
according to Scheme 1. End group signals are shown in the acryP123 inset, exhibiting
the characteristic vinyl signals between 120 and 130 ppm ..........................................81
3.2 600 MHz 13
C solution NMR spectrum acquired with 1H decoupling of (bottom) pure
P123 starting material and (top) styrenate-functionalized styrP123 following reaction
according to Scheme 1. End group signals are shown in the styrP123 inset, exhibiting the
characteristic styrene between 125 and 140 ppm ........................................................82
3.3 SAXS data for (a) SBA15P123; (b) SBA15_styrP123; (c) SBA15_styrP123 after
polymerization of the astyrP123; (d) same as (a); (e) SBA15_acryP123; and (f)
SBA15_acryP123 following polymerization. Diffractograms in (c) and (f) were acquired
without calcination, and thus in the presence of the polymer product in and around the
silica mesopores ...........................................................................................................86
3.4 Adsorption-desorption curves (on left) and pore size distribution (on right) of
SBA15_P123 (a, d); SBA15_acryP123 (b, e); and SBA15_styrP123 (c, f). ...............87
3.5 TEM micrographs for (a) SBA15P123, (b) SBA15_acryP123, and (c)
SBA15_styrP123..........................................................................................................88
3.6 TGA results for polymer nanocomposites made using acryP123 composites with a)
0% b) 10 %; c) 20 %; and d) 70 wt% silica content ....................................................89
3.7 Images acquired for THF-swollen of polymer nanocomposites using acryP123 (on
left) and styrP123 (on right) of a) respective functionalized P123 i.e. acryP123 on left and
styrP123 on right b) 0% c) 70 % t; d) 10 %; and e) 20 wt% silica content .................90
3.8 Solid-state 1H
13C CP (cross-polarization)/MAS spectra for (a) the acryP123

xiv
template in uncalcined SBA-15 following synthesis but prior to polymerization, (b) the
organic fraction generated by polymerizing the acryP123 structure-directing agents inside
and around the SBA-15 following crystallization, corresponding to a 30 wt% polymer
composite, and (c) same starting material as in (a) but with additional acryP123 added
prior to polymerization, resulting in a polymerized composite with 80 wt % organic
fraction .........................................................................................................................91
3.9 Storage moduli (G’) and loss moduli (G”) collected from strain sweep (top row) and
frequency sweep (bottom row) of acryP123 nanocomposite networks with a) 0%, b) 10%,
and c) 20 wt% silica content ........................................................................................92
3.10 Storage moduli (G’) and loss moduli (G”) collected from strain sweep (top row) and
frequency sweep (bottom row) of styrP123 nanocomposite networks with a) 0%, b) 10%,
and c) 20 wt% silica content ........................................................................................93
4.1 (a) Nitrogen adsorption-desorption isotherm for calcined silica synthesized using the
non-ionic PECE-6K template, and (b) pore size distribution for the same material as in
(a) ...............................................................................................................................106
4.2 TEM images for silica templated by (a) the PECE4K macromer and (b) the PECE6K
macromer, obtained following calcination to remove the PECE. The open channels/pores
appear dark in the image. SAXS results (wavelength = 1.54 Å) for silica (c) templated by
PECE4K, and (d) templated by PECE6K ..................................................................107
4.3 SEM images for silica templated by the acrylated-PECE6K macromer at (a) 20,000×
and (b) 210,000× magnification .................................................................................108
4.4 (a) Images acquired for 1,4-dioxane swollen polymerized acrylated-PECE6K (far left)
and (proceeding to the right) its 5, 10, and 15 wt% silica nanocomposites following

xv
polymerization. The black mark on each vial indicates the starting volume of the
networked material before swelling. (b) Solvent uptake capacities for polymerized pure
acrylated-PECE6K and its nanocomposite networks, where solvent uptake capacity is
defined as (solvent mass/mass swollen network)*100 ..............................................110
4.5 Storage moduli (G’) and loss moduli (G”) collected from strain sweep (top row) and
frequency sweep (bottom row) of (♦) polymerized PECE6K; (▲) polymer
nanocomposite network with 5, (Δ) 7.5, (●) 10, (○) 12.5 , and (■) 15 wt. % silica content
....................................................................................................................................112
4.6 Plot of storage modulus G’ (log scale) taken at 1 rad/s versus weight percentage of
silica for nanocomposites prepared in-situ using the PECE6K template. Data were
acquired at 60oC .........................................................................................................113
4.7 General schematic representation of self-assembly and synthesis of polymer
composites using acrylated-PECE macromer templates. After organization of the
mesoporous silica matrix occurs, polymerization between PECE macromers takes place
within and outside of those particles. The small orange circles in the lower left frame of
the reaction scheme are an idealized representation of individual particles in the network,
which of course are not regularly arrayed as shown. Cross-linking to form networks
occurred due to the reactivity of macromers that contain acrylate groups on both chain
ends ............................................................................................................................114

xvi
LIST OF SCHEMES
Schemes Page
2.1 Formation of ester linkage .....................................................................................60
2.2 Functionalization of pluronic P123 with allyl group .............................................62
2.3 Polymerization of allyl group ................................................................................63
3.1 Reaction scheme for the formation of acryP123 and styrP123..............................79
3.2 Polymerization of acrylic group .............................................................................84
3.3 Polymerization of styrenic group ...........................................................................84
4.1 Reaction scheme for formation of triblock copolymer PECE .............................101
xvii
LIST OF ABBREVIATIONS
ATRP Atom Transfer Radical Poymerization
AIBN Azo bisisobutyronitrile
BDDT Brunauer Deming Deming Teller
BET Brunauer Emmett Teller
BJH Barrett Joyner Halenda
CP Cross polarization
CPC Cetyl pyridinium chloride
CTAB Cetyl trimethyl ammonium bromide
DGEBA Diglycidylether of bisphenol A
DSC Differential Scanning Calorimetry
EISA Evaporation Induced Self-Assembly
GMA Glycidyl methacrylate
GPC Gel Permeation Chromatography
HDPE High density polyethylene
HMDI Hexamethylene diisocyanate
IUPAC International Union Pure and Applied Chemistry
IV Intrinsic viscosity
KIT Korea Advanced Institute of Science & Technology
MAS Magic Angle Spinning
MCM Mesoporous Crystalline Materials

xviii
Mn Number average molecular weight
Mw Weight average molecular weight
NMR Nuclear Magnetic Resonance
PE Polyethylene
PECE poly(ethylene oxide)-b-poly(caprolactone)-b-poly(ethylene oxide)
PEG Polyethylene glycol
PET Poly(ethylene terephthalate)
PMMA Poly(methyl methacrylate)
PNIPAM Poly(N-isopropyl acrylamide)
PP Polypropylene
PS Polystyrene
PVAc Poly(vinyl acetate)
PVC Poly(vinyl chloride)
RAFT Reverse Addition Fragmentation Chain Transfer
RI Refractive Index
RV Retention Volume
SAXS Small Angle X-Ray Scattering
SBA Santa Barbara Amorphous
SDS Sodium dodecyl sulfate
Tc Crystallization temperature
Tg Glass transition temperature
Tm Melting temperature
TEOS Tetraethylorthosilicate
TGA Thermal Gravimetric Analysis
THF Tetrahydrofuran

xix
TLCT True Liquid Crystal Templating
TMOS Tetramethylorthosilicate
VBC Vinylbenzyl chloride
ssNMR solid-state Nuclear Magnetic Resonance

1
CHAPTER I
INTRODUCTION
1.1 Polymer Composites
Composites are materials that consist of two or more components which are chemically
and physically different and are phase separated by a distinct interface. Composites have superior
mechanical properties and can be uniquely different than the properties of their constituents. They
have found successful application in aircraft structures, electronics, sensors, constructions,
coatings, and packaging for biomedical equipment.1-12
Advantages such as low weight but high
mechanical strength, corrosion resistance, durability, high fatigue strength, and faster assembly
have made these materials desirable. 11,12
The two components in composites are matrix and filler, sometimes referred to as the
reinforcing agent. The constituent that is continuous and the present in greater quantity is called
the matrix. The main purpose of the matrix is to bind and distribute the fillers uniformly such that
in the event of external applied force, the force will be distributed evenly.11,12
Most commonly,
one looks at how the matrix properties are improved after incorporation of other constituents.
Fillers such as sheets, fibers, or particles are the constituents of the composites which are
embedded in the matrix uniformly. In most cases, the fillers are stronger and stiffer than the
matrix.

2
Composites are classified in three categories based on the matrix: ceramic, metal, and
polymer matrix composites. The scope of this research is limited to polymer matrix composites.
Polymer matrix composites are more popular than ceramic and metal matrix composites due to
the ease of fabrication and when fillers are in size of 1-100 nm, they are referred to as polymer
nanocomposites. An interesting feature of polymer nanocomposites is the dramatic increase in
mechanical properties after the incorporation of small amounts of inorganic fillers.
Several polymer nanocomposites have been synthesized and studied to date for targeted
properties and applications by changing polymers with different inorganic fillers such as
nanotubes, silicates, nanoparticles of metals, metal oxides, and semiconductors. Polymer silica
nanocomposites are most commonly studied in the literature and have numerous applications.
1.2 Factors affecting the properties of polymer composites. In addition to the type of fillers
and polymers used, factors that also govern the properties of the final polymer nanocomposites
are the interaction between the polymer chains and silica particles i.e. interfacial adhesion, the
size and geometry of inorganic fillers, and dispersion of fillers into the organic polymer matrix.
1.2.1 Interfacial Adhesion
Since the composites are formed from mixing two components, the resulting properties
strongly depends on the interaction of the filler with the matrix. For instance, the large differences
in chemical and physical properties of the polymer and silica can often cause an unwanted phase
separation leading to poor properties of the polymer silica nanocomposites. To achieve the good
mechanical properties the interfacial adhesion should be strong. Effective interfacial adhesion can
be brought by either chemical or physical modification to the inorganic fillers.

3
Chemical modification with modifying agents or grafting polymers leads to strong
interfacial adhesion between polymer and silica via covalent bonds. Modifying agents such as
silanes are the most effective as they generally possess active functional groups that can interact
chemically with polymers. Other modifying agents such as epichlorohydrin, digylcidyl ether of
bisphenol A (DGEBA), glycidyl methacrylate (GMA), and octadecylamine have also been used
to improve the interfacial adhesion.13-20
Grafting polymer chains have also been shown to
improve the interfacial adhesion between silica and polymer. Zhang and co-workers have used an
irradiation technique to graft polymer onto silica and found that the final polymer
nanocomposites have increased mechanical properties. Also, the structure-properties relationship
can easily be tailored in nanocomposites using grafting technique by changing the polymeric
grafting species.21-28
Physical modification using surface active agents (also referred as surfactants) have also
proven effective in reducing the interfacial tension by adsorption onto the silica. The principle of
surfactant treatment is the preferential adsorption of polar head groups onto the silica via
hydrogen bonding.29-32
Reculusa et al., have modified the surface of silica by adsorbing
hydrophilic poly(ethylene oxides) via hydrogen bonds with silanol groups of silica.33
1.2.2 Orientation of inorganic fillers in polymer matrix
Inorganic fillers can come with defined shapes. For instance, reinforcing silica particles
can have an ordered geometric shape, such as spherical, cubic, platelet, or hexagonal.15,16,34,35
The
orientation of these shapes in the polymer matrix can have drastic effects on the properties of the
final polymer composites. The improved mechanical property is generally obtained from
anisotropic interconnection of filler particles.
.
4
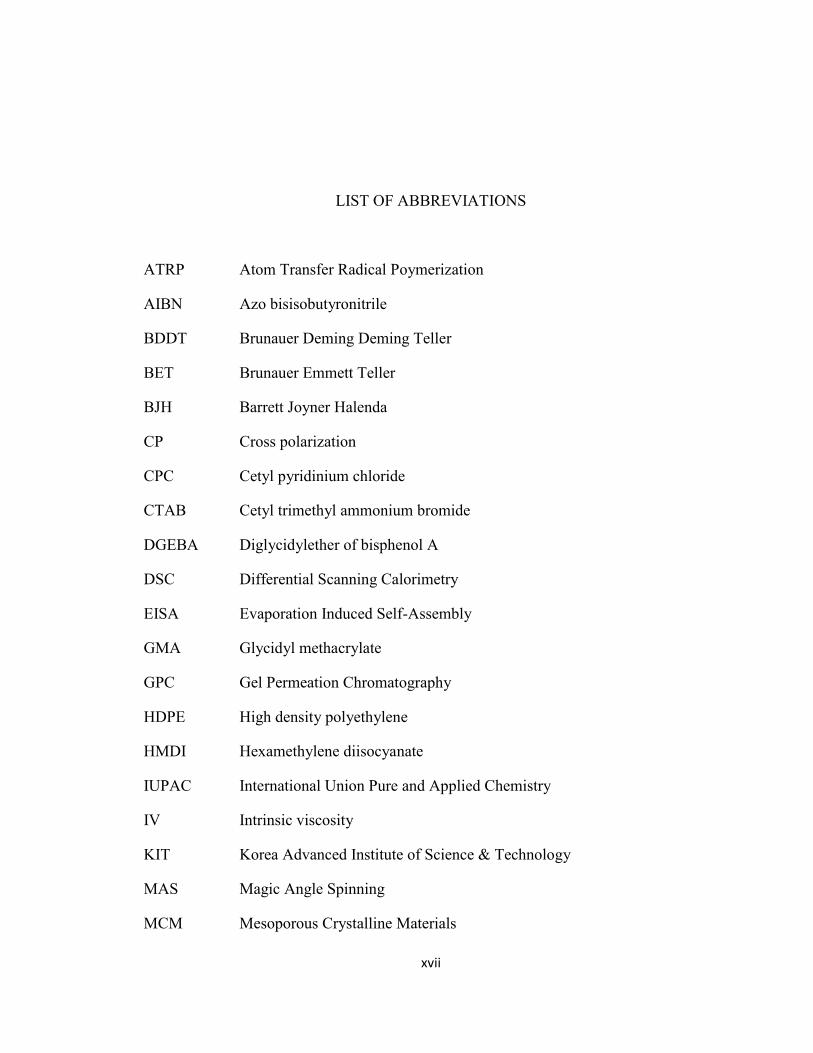
1.2.3 Dispersion of inorganic fillers into organic matrix
The simplest method for preparing polymer silica nanocomposites is the direct mixing of
silica into the polymer matrix. The effective dispersion of fillers is difficult as they tend to
agglomerate in the polymer matrix. Melt and solution blending are the two most commonly used
techniques for dispersion of fillers in the polymer matrix.
Melt blending is a mixing of inorganic silica into the molten state of a polymer. The most
common polymer matrixes used are polyethylene (PE), polypropylene (PP), poly(methyl
methacrylate) (PMMA), polystyrene (PS), poly(vinyl acetate) (PVAc), poly(ethylene
terephthalate) (PET), poly(lactide), poly(hydroxyalkanoate), styrene-butadiene rubber, and
perfluoropolymer.36-40
High shear and rate of mixing is important for a homogenous dispersion of
silica into the polymer matrix. However, it is difficult to disperse silica into a polymer with a high
viscosity i.e. high molecular weight polymer.
Solution blending is a liquid-state powder processing method that results in good
molecular level mixing of silica and hence is widely used in material preparation and processing.8
The polymer is first dissolved in a solvent followed by silica addition into solution while stirring.
After removal of the solvent by evaporation, the resulting final polymer nanocomposites exhibits
well dispersed silica throughout the polymer matrix.41-43
1.3 Polymers
Polymers are macromolecules composed of many small (monomeric) repeating units.
Polymers are sometimes also described as high molecular weight substances. Polymers are
classified into categories based on occurrence, branching, and polymerization techniques.44, 45
Polymers can be classified as either naturally occurring polymers or synthetic polymers.
Naturally occurring polymers include poly(isoprene), silk, proteins, starches, and cellulose

5
(shown in Figure 1.1). Synthetic polymers include materials such as poly(ethylene terephthalate),
poly(vinyl chloride), nylon, and rubbers (shown in Figure 1.1).
Figure 1.1. Chemical structures of a) poly(isoprene) a naturally occurring polymer and b)
poly(vinyl chloride)-synthetic polymers.44,45
The properties of polymers are affected not only by their molecular weight, but also the
number of branch or linkage in the chain. In other words, the polymer with the same type of
monomeric units and molecular weight can have different properties depending upon the
branching. The polymers can be classified into four categories based on branching: a) linear, b)
branched, c) cross-linked polymers, d) star or dendrimers. 44, 45
A linear polymer consists of single backbone chain atoms to which the substituents are
attached. Polyethylene (PE), poly(vinyl chloride) (PVC), PMMA, and poly(acrylonitrile) are
typical examples of linear polymers. These polymers are easily soluble in some solvents.
Polymers with branches at intervals along the long polymer chain are referred as branched
polymers. The amount of branching affects the physical properties such as solubility, viscosity,
and elasticity. Highly branched polymers may swell in certain solvents. High density
polyethylene (HDPE) is a typical example of branched polymers. Such materials either swell or
do not dissolve in the solvents. The amount by which the polymer swells depends on the degree
of cross-linking. Interesting polymeric architecture like star shaped with 5 or 6 arms and tree like
structures were synthesized from the multifunctional core (shown in Figure 1.2). 44, 45
a b

6
Figure 1.2. Different types of branching in polymers: a) linear, b) branched, c) cross-linked, and
d) dendrimers. 44, 45
Polymers can be synthesized in one of two polymerization techniques: condensation or
addition. Condensation polymerization occurs when the two or more molecules reacts with each
other with the loss of small organic molecules such as water, and ammonia (shown in Figure
1.3). Nylon, polyesters, phenol-formaldehyde, urea-formaldehyde, and alkyd resins are the
examples of condensation polymers. In this, the reactive functional groups react to form dimer,
and dimer reacts with dimers to from tetramers, and so on. As a result, the disappearance of
monomer at the early stage is observed and hence results in broad molecular weight
distribution.44, 45
Figure 1.3. Condensation polymerization technique for synthesis of polyesters.44, 45
In addition polymerization, macromolecules are formed from linking the monomeric
species without the loss of any organic molecules. This polymerization involves the breaking of
pi bonds followed by the formation of sigma bonds between the monomers. This polymerization
has three steps: Initiation, propagation, and termination (shown in Figure 1.4). Firstly, the
monomer species are initiated followed by propagation in which the monomers are added to the
chain and finally termination occurs when the two free radical reacts together to form a covalent
bond.
a b c d

7
Figure 1.4. Free-radical polymerization sequence.44, 45
Addition of the monomers is not only restricted to one specific type of monomer.
Polymers with two or more different types of monomers are called copolymers. For example, if
styrene and acrylonitrile are allowed to polymerize, it will result in a long chain of polymer
consisting of both monomer species. Such arrangements of monomers lead to four different types
of copolymers: a) random copolymers, where monomers ‘A’ and ‘B’ are randomly distributed
throughout the polymer chain b) alternating copolymers where the two monomers are arranged in
a regular alternating sequence throughout the polymer chain, c) block copolymers where a block
of monomer ‘A’ is connected to a block of monomer ‘B’, and d) gradient copolymers where a
gradual change occurs in monomer composition from mostly monomer ‘A’ to mostly monomer
‘B’ in the polymer chain (shown in Figure 1.5). The arrangements are tailored on the basis of
reactivity ratios and sequential addition of monomers.

8
Figure 1.5. Arrangements of monomers to form: a) random, b) alternating, c) block, and d)
gradient copolymers.44, 45
Telechelic polymers such as graft copolymers were developed over the course of research
in designing polymer architecture. In these copolymers, the polymer from monomer B is grafted
onto the polymer chain length of A as shown in the Figure 1.6.
Figure 1.6. Schematic representation of graft copolymers.44, 45
There are two classes of polymers based on their behavior when exposed to heat. The
thermoplastic softens and will melt when heated. 44, 45
Hence, one can easily change the shape of
thermoplastic materials. Polystyrene, polyethylene, polypropylene, and any linear polymers are
examples of thermoplastic polymers. Thermosetting polymers are cross-linked polymers and
hence rigid. Once shaped, such polymers cannot be re-shaped. Phenol-formaldehyde and
polyurethane are examples of thermosetting resins.
The distinguishing features of polymers are molecular weight and glass transition
temperature (Tg). Small organic molecules have definite molecular weight, whereas polymers do
not. Given a polymeric sample, it will have different chain lengths produced from the initiator

9
radicals depending on the degree of polymerization. 44, 45
Hence, molecular weights of polymers
are usually reported as averages. Experimentally determined molecular weight averages for
polymers are: number average molecular weight (Mn), weighted average molecular weight (Mw),
viscosity average molecular weight (Mv), and z-average molecular weight (Mz). Out of those the
two most commonly reported are Mn and Mw. They are calculated from the equations 1 and 2. 44
,45
i
iin
N
MNM
(1)
ii
iin
MN
MNM
2
(2)
where, Mn is the number average molecular weight, Mw is the weight average molecular weight,
Ni is the number of repeating units, and Mi is the molecular weight of each repeating unit.
The polydispersity index, defined as the ratio Mw/Mn, is a measure of molecular weight
distribution. If the polydispersity index is close to 1, then the molecular weight distribution is
narrow (shown in Figure 1.7a). This occurs in addition polymers. A broad molecular weight
distribution is generally observed when the polydispersity index is above 2 (shown in Figure
1.7b). This occurs in condensation polymers.

10
Figure 1.7. Molecular weight distributions: a) narrow and b) broad.44,45
Most polymers have amorphous and crystalline regions. What differs is the percentage of
each region in the polymer chains. A single polymer occurs in different forms glassy or rubbery
depending on the temperature. The temperature above which it is rubbery and below which it is
glassy in state is called as glass transition temperature (Tg). For instance, the glass transition
temperature of polystyrene is 90oC. The polystyrene if used below its Tg will behave like a rigid
glass as the structural mobility of amorphous domains are restricted. Conversely, if it is used
above Tg the polymer chains will have some degree of movement and hence will behave like
rubber. Therefore, linear polymers possess Tg as they possess free chains, whereas highly
crosslinked or thermoset polymers do not. 44, 45
1.4 Properties of polymer composites
Polymer and polymer composites are well known for light weight but high mechanical
strength. One can easily extract the mechanical properties from the stress-strain plot. Stress is the
force applied per unit cross-sectional area, while strain is the response of the sample under a
given stress. The typical stress-strain curve and commonly used shape of specimen for
characterizing mechanical properties of polymer or polymer composites are shown in Figure 1.8.
a
b

11
Figure 1.8. a) Dumbbell shaped polymer/ polymer composites specimen and b) typical stress-
strain curve for polymers.44, 48
Young’s modulus which is the ratio of stress to strain is a measure of stiffness. The
toughness is the measure of resistance to breaking. The tensile strength (also referred to as
Ultimate strength) is the maximum stress the material can withstand. For instance, if the material
is soft, then it will yield more. If the material is brittle it will yield less. Figure 1.6 shows the
characteristic stress-strain curves of five different types of materials.
Figure 1.9. Stress-strain curves of a) Soft and weak, b) soft and tough, c) hard and brittle, d) hard
and strong, and e) hard and tough polymeric materials.44, 45
a b

12
1.5 Mesoporous Silica
This dissertation focuses on using mesoporous silica as inorganic filler. The most
generalized definition of a porous material is a continuous and solid network of material filled
with voids. Nanoporous materials are less than 100 nm in pore diameter. According to IUPAC
nomenclature, the pores are classified into three categories based on the size: a) micropores (pore
diameter less than 2 nm, b) mesopores (pore diameter between 2 nm and 50 nm), and c)
macropores (pore diameter more than 50 nm). Pores can also be classified based on their
framework: a) purely inorganic, b) organic-inorganic hybrid, and c) purely inorganic (shown in
Figure 1.10).
Classification of Nanoporous
materials
Depending upon pore size Depending upon framework building blocks
Microporous materials.
Pore diameter < 2 nm.
e.g. zeolites, Metal-
organic framework
(MOF)
Mesoporous materials.
Pore diameter 2-50 nm.
e.g. MCM41, SBA15
Macroporous materials.
Pore diameter > 50 nm.
e.g. sponge, cotton
Purely inorganic.
e.g. silica, silica
mixed oxides
Organic-inorganic hybrid.
e.g. Periodic mesoporous
silica, organo silica
Purely organic.
e.g. Mesoporous polymer or
carbon
Figure 1.10. Classification of nanoporous materials.49
Mesoporous materials can be ordered or disordered in nature. The hydrolysis and
polycondensation reactions of the silica precursors to synthesis mesoporous silica are the same

13
that occur in sol-gel process. Disordered mesoporous silica like KIT-1 (Korea Advanced Institute
of Science and Technology number 1) has uniform channels but a disordered shape as the result
of uncontrolled sol-gel reactions. Controlled polycondensation using the surfactant assisted self-
assembly pathway leads to ordered mesoporous silica, having a defined shape with uniform and
regular arrangements of pores. Hydrolysis of an alkoxy group attached to silica results in
hydroxyl silica species. These hydroxylated silica species, upon condensation by reacting with
either the hydroxyl group or the alkoxy of the other silica species, results in the formation of
silica.
Hydrolysis:
Condensation:
Figure 1.11. Sol-gel hydrolysis and condensation reactions.50-53
Surfactants have both hydrophobic and hydrophilic components. It controls the sol-gel
reactions (shown in Figure 1.11) and can tune the size, shape, and ordered arrangement of pores.
In aqueous solution, the hydrophilic part of surfactants interacts with the water whereas the
hydrophobic part stays away from the water molecules. Beyond some concentration, the
surfactants arrange as micelles in either 3D spherical or 2D rod like arrays; such concentration is
called as critical micelle concentration. This arrangement of micelles helps in pore generation.

14
Surfactants are classified into three categories depending upon the charge: a) cationic such as
cetyl trimethylammonium bromide (CTAB), cetyl pyridinium chloride (CPC); b) anionic such as
sodium dodecyl sulfate (SDS), lauric acid; and c) Non-ionic (pluronic P123, F127).49
Interactions between inorganic components and organic templates are among the most
important thermodynamic drivers that usually determine the feasibility of mesostructure
formation and its topology. Each of the four electrostatic interactions given below can occur
under a wide range of pHs, temperatures, and the type of surfactant used. The interactions are:
S+I
-, S
-I
+, S
-M
+I+, and S
+X
-I+ where S is the surfactant, I is the inorganic phase, M is the
intermediate ion, and X is the mediating species (shown in Figure 1.12).50-55
The charge on the
inorganic species has to be controlled by pH. The pH at which the charge of molecules is zero is
called isoelectric point. The isoelectric point of silica species is 2. Silica species has positive
charge at pH < 2, whereas pH > 2 silica has negative charge. Figure 1.13 below shows the
hydrolysis and condensation of silica precursors under different pH conditions.
Figure 1.12. Types of electrostatic interactions: a) S+I-, b) S
+X
-I+, c) S
-I
+, and d) S
-M
+I
+ that can
occur between surfactant and silica species.49
a b
c d

15
Figure 1.13. Silica precursors under different pH.49
The first mesoporous silica MCM41 (Mesoporous Crystalline Materials) prepared by
Mobil Oil Corporation scientists in 1992 was synthesized at basic condition, where silica species
have negative charge using cationic surfactant CTAB via S+I
- interaction.
56, 57 Che et al.,
synthesized silica using organoalkoxy silane with quaternary ammonium silica as a co-structure
directing agent via S-I+ interactions.
58 Mesoporous silica MCM41 has high surface area (>1000
m2/g), with hexagonal pores and thinner walls. Due to the thinner walls, they do not have good
hydrolytic stability. As a result, many researchers investigated strategies to make thicker walls. In
1998, Stucky and co-workers synthesized mesoporous silica SBA15 with thicker walls, 2D
hexagonal pores, and high surface area using a non-ionic surfactant through S+X
-I
+ interactions.
59
To date, four routes have been successfully developed leading to mesoporous silica are
true liquid crystal templating (TLCT), co-operative self-assembly, evaporation-induced self-
assembly (EISA), and exo-templating. All of these routes were developed in order to tune the
pore size and ordered framework of silica/other meso-structured materials.

16
1.5.1 True Liquid Crystal Templating (TLCT)
MCM41 mesoporous family is not only the first reported mesoporous silica materials
with mesophases, but also with well-ordered hexagonal silica channels. MCM41 attracted many
scientists to understand the mechanism of its formation. In this mechanism, liquid crystal
mesophases are involved in the surfactant self-assembly to synthesized ordered mesoporous
silica. Attard and coworkers proposed and observed that at high concentration of surfactant and
under specific pH and temperature conditions, the cylindrical rod like micelles lyotropic liquid-
crystalline mesophases are formed without requiring the presence of inorganic precursors to get
the mesostructure framework (shown in Figure 1.14a).60
Deposition followed by condensation of
inorganic species onto and in between the rod-like micelles results in the composite materials
where organic surfactant lies inside the mesostructured silica. Pores are obtained by removing the
surfactant. Calcination is the thermal treatment to remove surfactant by oxidative
decomposition.54, 58, 61-63
Solvent extraction is another process to remove surfactant from
mesophases of silica.
1.5.2 Co-operative Self-Assembly
The TCLT mechanism can be applied where the surfactant concentration is high.
However, the mesoporous silicas are also formed at very low concentration of silicate and
surfactant in strongly basic conditions. Therefore, an alternative mechanism was proposed where
the formation of cylindrical micelles of surfactant, adsorption of the silica species, and
condensation of silica precursors occurs at the same time (shown in Figure 1.14b). 54, 58, 61-63
Steel
et al. confirmed the formation of highly ordered mesoporous silica using 14
N nuclear magnetic
resonance (NMR spectroscopy).64
They proposed that the hexagonal mesophases of surfactant
molecules were organized after the incorporation of siliceous species.

17
There are reports on the mechanism of mesoporous silica formation using experimental
techniques like X-ray diffraction combined with 29
Si magic-angle spinning (MAS) solid state
NMR spectroscopy.65
Huo et al., proposed that under basic conditions, the negatively charged
silica (I-) bind to the cationic head groups of the surfactant. The S
+I
- interactions lead to
thermodynamically favored lamellar configurations at the early stages followed by
polycondensation of the silicate species and solidification of the layers resulting in hexagonal
mesophases.
Figure 1.14. Mechanism of mesoporus silica formation by a) true liquid crystal templating and b)
co-operative self-assembly routes.55
1.5.3 Evaporation-Induced Self-Assembly (EISA)
As the name suggests, this method is based on the formation of meso-structured phases
by evaporating volatile solvents from dilute solutions containing silica precursors and surfactant.
Brinker et al. have reported the mesostructured silica thin films using TEOS and poly(styrene)-b-
poly(ethylene oxide) diblock copolymers via the EISA approach. 54, 58, 61-63
In this method
surfactant, inorganic species and silica precursors are allowed to interact in the presence of
solvent such as tetrahydrofuran (THF) or ethanol (shown in Figure 1.15). The mesostructured
film was then cast by evaporation of the solvent. The film consisting of inorganic-organic hybrid
mesophases which is formed after evaporation of solvent is flexible due to low degree of
polycondensation of inorganic species. Hydrothermal treatment of such soft materials leads to

18
ordering of the organic-inorganic framework. This route is also used for synthesis of non-silica
based mesoporous silica. Li et al. have synthesized 2D hexagonal mesoporous silica and phenolic
resins using amphiphilic poly(ethylene oxide)-b-poly(caprolactone) diblock copolymer. 66a, 66b
Figure 1.15. Schematic representation of EISA approach.49
1.5.4 Exo-templating route
Mesoporous organic polymer resins, carbons and other metal oxides are synthesized via
exo-templating methods. This route is also known as hard-templating or nano casting method. In
this method, the mesoporous matrix is used as a template. The spaces of such templates are first
impregnated by inorganic/organic precursor, followed by curing the precursor inside the template
at high temperature. In this way, the pores of the template are copied as a negative image (shown
in Figure 1.16). Upon removal of the template, the cured material possesses high surface area and
shape as the template used. Ryoo et al. synthesized mesoporous carbon by exo-template route. 54,
58, 61-63 They used mesoporous silica MCM41 as the exotemplate and then filled the pores with
sucrose and sulfuric acid as the catalyst in aqueous solution. Upon curing at high temperature,
sucrose was converted into carbon. Removal of the mesoporous silica template resulted in a

19
mesoporous carbon which had an identical shape as that of MCM41. Recently, many metal
oxides have been synthesized using this method.
Figure 1.16. Schematic representation of exo-template approach for mesoporous materials.
54,58,
61-63
1.6 Motivation
Since the publication of the first paper on ordered hexagonal mesoporous silica MCM41
in 1992 by Mobil Oil Corporation Scientists,56,57
attracted material scientists to use it as inorganic
filler in polymer nanocomposites. Because mesoporous silica possess high surface area, ordered
structure, and allows ease of functionalization of the nanopores, mesoporous silica polymer
nanocomposites have found application in catalysis, drug delivery, sensor technology, and gas
storage.67-70
Following any of the four mechanism described in section 1.5; mesopores of silica
can be tailored to spherical, cubic, or hexagonal shapes depending on structure directing agents
and reaction conditions (shown in Figure 1.17).

20
Figure 1.17. TEM images of mesoporous silica pores of a) cubic, b) hexagonal, and c) SEM
image spherical shapes.71, 72
Figure 1.18 illustrates that there is a dramatic increase in interest on studying polymer
silica nanocomposites as compared to polymer mesoporous silica nanocomposites. A major
problem for use of mesoporous silica in synthesizing polymer nanocomposites is difficulty of
filling pores with polymers.
Figure 1.18. Comparison of articles published on a) polymer silica nanocomposites and b)
polymer mesoporous silica nanocomposites from 1998 to 2012. The data is extracted from
scifinder.
Mesoporous silica MCM41 possess pore diameter from 2-10 nm, with high surface area,
and thinner silica walls. Thinner walls of MCM41 yield polymer nanocomposites with poor
a b c
21
mechanical properties. Hence limit its use in synthesizing polymer nanocomposites. There have
been many attempts to synthesize mesoporous silica with thicker walls. In 1998, Stucky et al.,
reported mesoporous silica SBA15 (Santa Barbara Amorphous 15) with thicker walls, two
dimensional hexagonal pores, and a high surface area using non-ionic surfactant.59
Such unique
pores provide scaffolds for the fabrication of hybrid organic-inorganic nanocomposites. There are
three approaches to synthesize polymer nanocomposites using mesoporous silica as filler: 1) co-
condensation, 2) post-synthetic functionalization (also known as grafting), and 3) the sol-gel
method.
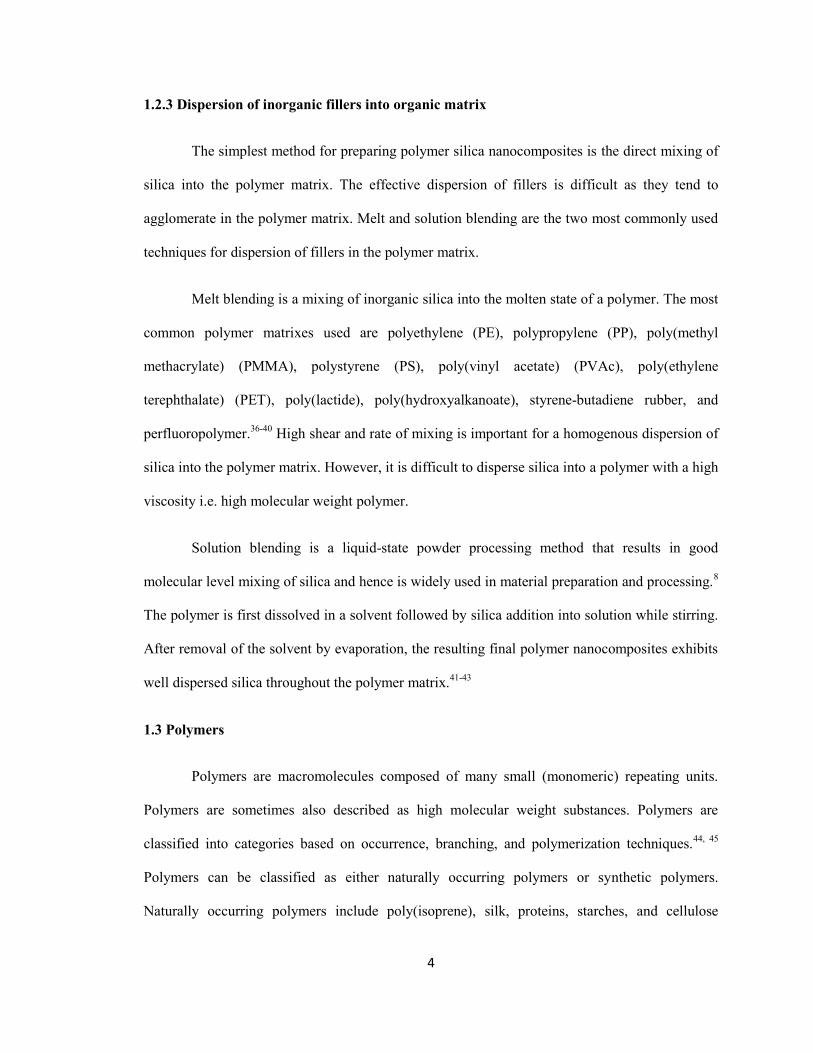
1.6.1. Co-condensation Method
In this method, organically modified mesoporous silica is synthesized by the co-
condensation of tri-alkoxyorganosilanes [R’Si(OR)3 R’ being the monomeric unit] with tetra-
alkoxyorganosilanes [Si(OR)4] in the presence of structure directing agents. Polymerizing the
organic group results in polymer nanocomposites networks wherein mesoporous channels are
filled with polymers. Ji et al. have synthesized poly(propyl methacrylate) mesoporous silica
nanocomposites using (3-Trimethoxysilyl)propyl methacrylate.73
These composites have shown
improved tensile strength, modulus, and toughness resulted from chemical bonding of silica with
polymer chains within mesoporous silica channels. Schematic representation of synthesizing
polymer nanocomposites using co-condensation is shown in Figure 1.19.

22
Figure 1.19. Mesoporous silica/polymer nanocomposites by co-condensation approach.73
The groups of Mann, Macquarrie, and Stein have shown the possibilities of modified
mesoporous silica using co-condensation method with different organic groups.55, 74, 75
The
organic groups such as amino, cyano, vinyl, allyl, organophosphine, alkyl, thiol, or aromatic
groups can be incorporated in the pores of mesoporous silica using silane coupling agents.55, 76
Table 1.1 shows typical silane coupling agents. Polymerization of vinyl acetate, styrene, methyl
acrylate, and acrylate has been carried out in the pore channels of the mesoporous silica.
In addition to a being one-pot synthesis, this method has the advantage of strong covalent
chemical bonding of filler with the polymer matrix resulting in improved mechanical properties.
However, the increase in the density of the organic groups inside the pores will disrupt the
ordered mesoporous silica. Thermal treatment to create the pores will destroy the organic groups
and hence the pores have to be generated by solvent extraction.

23
Table 1.1. Silane coupling agents.8, 55
Name Structure
1. 3-aminopropyltriethoxysilane
2. 3-aminopropyltrimethoxysilane
3. 3-trimethoxysilylpropyl methacrylate
4. Vinyltriethoxysilane
5. Vinyltrimethoxysilane
6. 3-isocyanatopropyltriethoxylsilane
7. Methacryloxymethyltriethoxysilane
1.6.2. Post-functionalization
Grafting refers to surface modification of mesoporous silica with organic groups.
Exploiting the hydroxyl groups in the pores of mesoporous silica, one can easily connect the
ATRP/RAFT initiator leading to preparation of polymer nanocomposites by two routes: “grafting
to” and “grafting from”. The “grafting to” refers to the attachment of polymers to mesoporous
silica, but also some generates non-grafted chains.
Mesoporous silica MCM41 composites with polystyrene, polyacrylonitrile, PMMA,
polypeptide, and PNIPAMM have been synthesized using a “grafting from” controlled radical
polymerization method.77-80
The initiator is attached to the mesoporous silica, followed by the

24
polymerization of the monomeric species. Since, the initiator is attached after the pores have been
created; thermal calcination is not an issue. However, if the organic group (i.e. monomers) is
large and reacts preferentially during the initial stages of modification near the opening of the
pores of the mesoporous silica, pore blocking may occur which can in turn lead to
inhomogeneous distribution of organic groups over the mesoporous silica channels. The
schematic representation of post-functionalization is shown in Figure 1.20.
Figure 1.20. Mesoporous silica/polymer nanocomposites using post-functionalization approach.81
1.6.3. Sol-gel method
In this method, the monomer or polymer is well dispersed in the silica precursor (TEOS
or TMOS) which after hydrolysis and polycondensation of the silica precursor results in the
polymer nanocomposites. This chemistry is performed in any one of the following polymerization
techniques: emulsion, emulsifier-free emulsion polymerization, mini-emulsion and dispersion.8
Polymerization techniques mentioned above result in homogenously dispersed silica into
the polymer matrix. Unlike co-condensation or post-synthetic functionalization, the silica is not
covalently linked to the polymer. Networks formed between the two components are due to
strong hydrogen-bonding interaction. The hydrogen bonding reduces interfacial tension between
the two components which retards phase separation during network formation. Most of the
polymers like PMMA, PVAc, poly(hydroxystyrene), and poly(vinylpyrrolidone) interact with the
inorganic phases, but when the monomer or polymer does not possess these groups to interact

25
with silica via hydrogen bonding, compatibilizers are added.8, 81, 83
Figure 1.21 shown below
represents the synthesis of polymer nanocomposites via the sol-gel method.
Figure 1.21. Polymer nanocomposites using the sol-gel approach.
In previous research, our group synthesized polymer mesoporous silica nanocomposites
using grafting approach. We successfully loaded tin catalyst on the mesoporous silica channels of
MCM41 via hydroxyl groups. Ring opening polymerization of D,L-lactide monomer was
employed in the presence of a tin catalyst resulting in the biopolymer nanocomposites from inside
to outside of the MCM41 silica channels. The schematic diagram of synthesis of biopolymer
composites is shown in Figure 1.22.
Figure 1.22. Schematic representation of ring-opening polymerization of D,L-lactide inside the
mesoporous silica.84
Whilst most of the approaches discussed above produce polymer nanocomposites
retaining the mesostructure of the silica, they involve three or more steps in generating polymer
nanocomposites or networks. Even the one-pot co-condensation approach can only incorporate a
small percentage of monomers inside the mesoporous silica channels. These limitations motivated

26
the need of a new strategy for synthesizing biopolymer nanocomposites with a reduced number of
steps while retaining the internal surface area of mesoporous silica.
1.7 Approach
The efforts made so far in synthesizing mesoporous silica reinforced polymer
nanocomposites were focused on functionalizing the pore walls with organic components which
upon polymerization results in nanocomposites. Here we propose an alternative approach of
synthesizing the polymer nanocomposites, focusing on functionalizing structure directing agents
used for preparing the mesoporous silica with polymerizable organic components. Such
polymerizable structure directing agents, also referred as “surfmers” are chemically composed of
hydrophobic, hydrophilic, and monomeric units (either on the chain ends or on the backbone of
surfactants). The concept of functional and reactive surfactants is not new in the field of micelle
polymerization, but their successful application to the synthesis of ordered siliceous-based
composite materials has been limited to small-molecule ionic templates.
Surfmers template the growth of inorganic species (SiO2) by a co-operative self-
assembled approach resulting in mesostructured silica channels similar to SBA15 as discussed in
section 1.5. Before calcination, all silica based mesophases are organic-inorganic composite
materials. Polymerizing the surfmers at this stage results in mesoporous channels filled with
polymer that extends out, connecting other silica particles leading to intimately mixed
nanocomposite networks that cannot phase separate. The schematic representation of this strategy
is shown in Figure 1.23. Unlike previous reports, there is no chemical grafting to the interior or
exterior of the mesoporous silica surface, nor is there any separation of the components at any
time during the synthesis.

27
Figure 1.23. Schematic representation of polymerizable structure directing agent approach for the
synthesis of polymer mesoporous silica nanocomposites.
1.8 Research Objectives
This dissertation focuses on the synthesis of polymer mesoporous silica nanocomposites
and their networks using a polymerizable structure directing approach which fulfills the following
two objectives.
Objective 1: The key component of the research is the polymerizable structure directing agents
that can template the growth of silica. This objective aims at synthesizing two different
polymerizable structure directing agents (surfmers) by end-group functionalization of
approximately one of the chain ends of: a) poly(ethylene oxide)-b-poly(propylene oxide)-b-
poly(ethylene oxide) triblock copolymer (pluronic P123), or b) poly(ethylene oxide)-b-
poly(caprolactone)-b-poly(ethylene oxide) triblock copolymer with monomeric units (allylic,
acrylic, or styrenic).

28
Objective 2: This objective aims at synthesizing mesoporous silica using surfmers synthesized in
objective 1, by co-operative self-assembly approach. At this stage, the mesoporous silica
developed has organic component (surfmer) inside the pores of silica. Polymerizing the surfmer
will generate the biodegradable nanocomposite networks wherein mesopores are completely
filled with polymer; and whose total organic/inorganic ratio may be controlled
1.9 Experimental Techniques
Mesoporous silica and polymer nanocomposite networks synthesized are characterized by variety
of experimental techniques as described below.
1.9.1 Physisorption experiments
Physisorption, also known as physical adsorption, is a process in which molecules get
adsorbed onto the substrates by means of van der Waals forces of attraction. This technique is
used to characterize the type of pores, surface area, pore size distribution, and wall thickness of
the substrate without damaging the substrate.
Samples must be degassed to remove any moisture in order to properly determine the
surface area and adsorption-desorption profile of nitrogen gas. This is usually done by heating at
higher temperature (generally 100oC) under reduced pressure for several hours in the glass-bulb
sample holder. A glass rod is inserted in the sample holder to avoid any artifacts caused by dead
volume. The measurement is performed at low temperature using liquid nitrogen in order to
provide a strong physical interaction between the gas molecules and the substrate. The adsorbate
(nitrogen gas) is then inserted in the sample holder using calibrated piston and the amount of gas
adsorbed-desorbed is collected with respect to relative pressure. The schematic representation of
the experiment is shown in Figure 1.24.

29
Figure 1.24. Schematic representation of physisorption experiments.84
A) Adsorption Isotherm
An adsorption isotherm is the quantitative relationship between the amount of gas
adsorbed by unit mass of substrate (the adsorbent) and the relative pressure (p/po) of the gas at
constant temperature. According to the Brunauer, Deming, Deming, and Teller (BDDT) IUPAC
classification IUPAC nomenclature (1984), the adsorption isotherms are classified into six
different types as shown in the Figure 1.25a.
Type I isotherm is characteristic of microporous adsorbents. At low relative pressures,
micropores are being filled as seen by a steep increase in the amount of gas adsorbed. After the
pores are filled completely, the entire surface of adsorbent is covered by gas as seen by the
horizontal plateau. Type II isotherm is characteristic of non-porous adsorbents. Type III and V
isotherms are uncommon. An increase in the amount of adsorbed gas takes place at a higher
relative pressure, which is caused by very weak interactions between the adsorbent and
adsorptive. Type VI represents an isotherm of stepwise multilayer adsorption of uniform non-
porous adsorbents.87-88

30
.
Figure 1.25. a) Isotherms and b) hysteresis loop of type IV isotherm.86
The most common hysteresis loop observed in the case of mesoporous substrates is H1,
with fewer exhibiting H2 loop, and H3 is observed rarely. Mesoporous silica shows Type IV H2
loop indicating even pores with interconnecting channels. H4 hysteresis loop is often seen in
narrow slit-like pores.
B) Surface Area Determination: BET Theory
The theory is named after the three scientists Brunauer, Emmett, and Teller. It is a
modification of Langmuir adsorption isotherm. Following are the assumptions of BET theory:85
1) Adsorption of the first adsorptive layer is assumed to take place on an array of surface sites of
uniform energy.
2) Adsorbate layers stack one above the other. When, p = po (the saturated vapor pressure of the
adsorptive), an infinite number of layers will form.
3) At equilibrium, the rates of condensation and evaporation are the same for each individual
layer.
4) No interactions exists between the adsorbate molecules.
a b

31
The surface area of the adsorbent is determined by the following BET equation 3.
omm
o
p
p
CW
C
CW
p
pW
11
1
1 (3)
Plotting a graph of
1
1
op
p with respect to relative pressure (shown in Figure 26), one
will get the slope (s) and intercept (i) which corresponds to equation 4. Wm (amount of monolayer
adsorbed gas) can be calculated from equation 4. The specific surface area (S) are calculated from
equation 5.
Figure 1.26. Typical BET plot.85
CW
Cs
m
1 and
CW
Ci
m
1 (4)
M
ANWS csm
t
(5)
Note that,‘s’ and ‘i’ are the slope and intercept respectively. ‘St’ is the total surface area, ‘Wm’ is
the amount of monolayer adsorbed gas, ‘N’ is the avogadro’s number, ‘Acs’ is the cross-sectional
area of the adsorbate (nitrogen) which is 16.2 Ȧ2 for nitrogen gas, ‘M’ is the molecular weight of

32
nitrogen, and ‘w’ is the weight of the sample. The specific surface area is calculated from total
surface area as shown in equation 6.
w
SS t (6)
1.9.2 Differential Scanning Calorimetry (DSC)
DSC is a technique to determine the temperature at which the local segmental motions of
polymeric chains can occur. Thermal properties of polymers such as glass transition temperature
(Tg), melting temperature (Tm), and crystallization temperature (Tc) can be determined using
DSC. The schematic representation of the DSC instrument and the typical DSC thermogram are
shown in Figure 1.27 and 1.28 respectively. The pan that contains a polymer is referred to as
“sample pan” whereas the one without the polymer is referred to as “reference pan”. In DSC
experiments, the sample and reference pans are heated at the same rate and at the same time. The
difference in the heat flow of sample and reference pans are recorded and plotted as the function
of temperature.
Figure 1.27. Schematic representation of DSC cell.89

33
Figure 28. Typical DSC thermogram.90
To extract the information from thermogram, one should know the first order and second
order transition. The first order transition is the transition which involves both latent heat (heat
given off or absorbed) and heat capacity. Polymers melt by absorbing heat and therefore melting
is an endothermic process. Polymers crystallize by giving off heat and therefore are an
exothermic process. The second order transition involves only the change in heat capacity such as
glass transition temperature. As polymers have high heat capacity at the glass transition
temperature, therefore the small increase in temperature will increase the heat flow.
1.9.3 Thermal Gravimetric Analysis (TGA)
Thermal gravimetric analysis is useful particularly in determining the percentage of
organic content in polymer nanocomposites. In this method, the mass loss is determined as the
function of temperature using high precision balance. The typical TGA thermogram is shown in
Figure 1.29. TGA is equipped with the balance that keeps that track of mass loss during the
degradation of polymer or any organic materials is with respect to temperature. In some cases,
materials are decomposed in the presence of inert atmosphere to eliminate the formation of side
products. The typical experiment consists of three steps: a) the aluminum pan is tared on the
balance, b) sample is transferred on the pan which is then loaded on balance, and c) sample is
then heated from room temperature to 600oC at 20
oC per minute under air flow.

34
Figure 1.29. The typical TGA thermogram.91
1.9.4 Gel Permeation Chromatography (GPC)
Gel permeation chromatography, also referred to as “Size-Exclusion Chromatography”,
is the separation of polymers on the basis of size. GPC has become most prominent and widely
used method for estimating molecular weights and their distributions. It is an indirect method of
determining Mn and Mw of the polymers. Often, the separation takes place in a chromatographic
column made from highly crosslinked porous polystyrene, but other column types are also
available.44, 45
A schematic representation of a typical GPC instrument is shown in the Figure 1.30.
GPC consists of 1) a pump which pushes the solvent into the instrument, 2) an injection port to
introduce the sample into the column, 3) columns to hold the stationary phase, 4) one or more
detectors (generally refractive index detectors) to detect the polymeric components as they leave
the column, and 5) software to control the different parts of the instrument, calculate, and display
the results.

35
Figure 1.30. Schematic representation of Agilent 1100 series Gel Permeation Chromatography.
The instrument used in this research is an Agilent Technologies 1100 series. The
calibration curve (molecular weight vs elution time) is plotted using the six different molecular
weights of polystyrene or poly(ethylene oxide) standards whose polydispersity index is close to
1.0 (shown in Figure 1.31a). The procedure is as follows: 1) Inject the series of standards
polymer, 2) Measure the retention volume of the resulting RI peak apex, 3) Construct a
calibration curve of Log(MW *IV) vs. retention volume. In the analysis of our unknown sample,
each data point (retention volume, RV) we can look up on the calibration curve to find RVi =
Log(MWi • IVi). Where, RVi , MWi, and IVi are the retention volume, molecular weight, and
intrinsic viscosity of the unknown polymer. The polymer solution is then introduced into the
columns. Intrinsic viscosity (IV) is measured by viscosity detector coupled with refractive index
detector.

36
Figure 1.31. a) Calibration curve using polystyrene standards and b) GPC chromatrogram of
unknown sample.92
1.9.5 Rheology
Rheology is the study of deformation and flow of matter. It helps in understanding the
material behaviors such as elastic, viscous, or viscoelastic. The polymeric materials are visco-
elastic, in other words they show both elastic and viscous behaviors. In order to extract the
information from the rheological experiments, the terms such as stress and strain are important to
understand. The stress is the applied force per unit area of the sample whereas; strain is the ratio
of change in length to the original length of the sample.
The elasticity deals with the mechanical properties of solid where the stress (σ) is
proportional to strain (ε) which obeys the Hooke’s law. Viscosity deals with the properties of
liquids where stress (σ) is proportional to the shear rate (η) as which obeys the Newton’s law. The
viscoelastic behavior of the polymers is explained by spring and dashpot model (shown in Figure
1.32). If they are placed in series, the resulting Maxwell element exhibits flow plus elasticity on
a
b
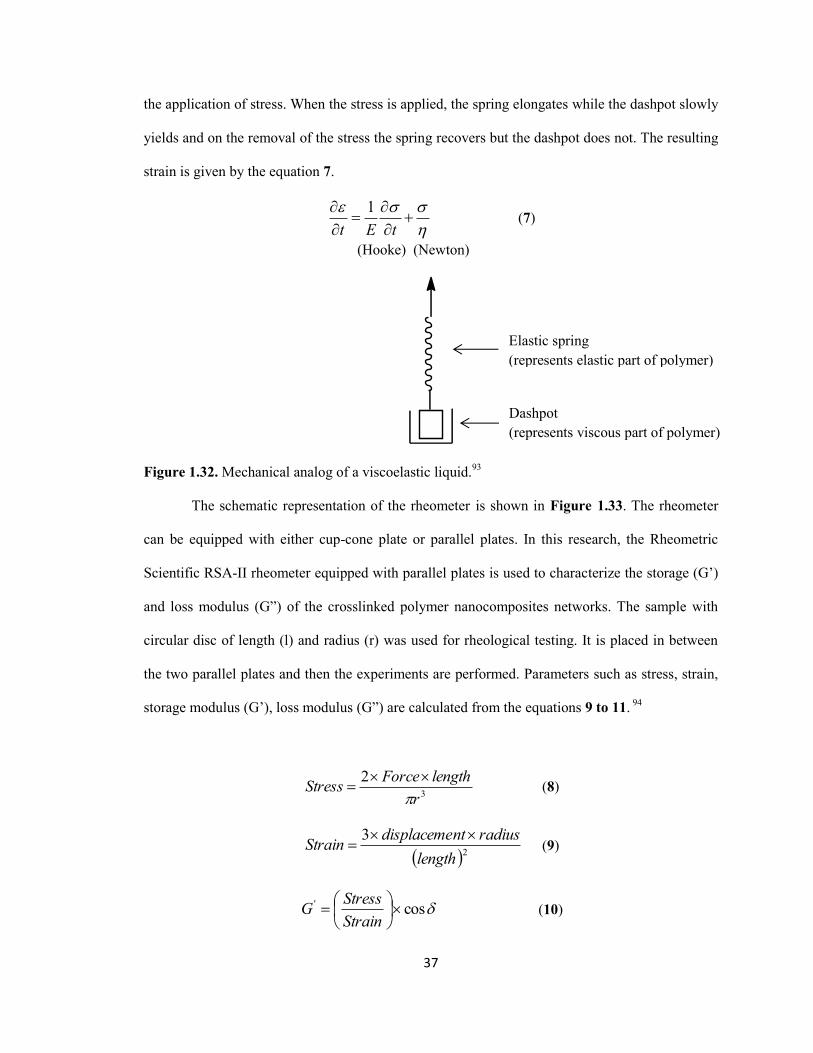
37
the application of stress. When the stress is applied, the spring elongates while the dashpot slowly
yields and on the removal of the stress the spring recovers but the dashpot does not. The resulting
strain is given by the equation 7.
tEt
1 (7)
(Hooke) (Newton)
Figure 1.32. Mechanical analog of a viscoelastic liquid.93
The schematic representation of the rheometer is shown in Figure 1.33. The rheometer
can be equipped with either cup-cone plate or parallel plates. In this research, the Rheometric
Scientific RSA-II rheometer equipped with parallel plates is used to characterize the storage (G’)
and loss modulus (G”) of the crosslinked polymer nanocomposites networks. The sample with
circular disc of length (l) and radius (r) was used for rheological testing. It is placed in between
the two parallel plates and then the experiments are performed. Parameters such as stress, strain,
storage modulus (G’), loss modulus (G”) are calculated from the equations 9 to 11. 94
3
2
r
lengthForceStress
(8)
23
length
radiusntdisplacemeStrain
(9)
cos'
Strain
StressG (10)
Elastic spring
(represents elastic part of polymer)
Dashpot
(represents viscous part of polymer)

38
sin"
Strain
StressG (11)
Figure 1.33. Schematic representation of parallel plates used in Rheometeric scientific RSA II.94
Viscoelastic properties are investigated using rheological experiments such as strain
sweep, frequency sweep, or temperature sweep. Strain sweep are the experiments where G’ and
G” are measured as the function of strain at constant frequency and temperature. Frequency
sweep are the experiments where G’ and G” are measured as the function of frequency at constant
strain and temperature. The linear viscoelastic region is determined by performing the strain
sweep and then frequency sweep data is collected to calculate the storage modulus (G’) and loss
modulus (G”). The polymer behavior can be easily predicted from the logarithmic plots of storage
and loss modulus as the function of frequency.

39
Figure 1.34. Plot of G’ with respect to frequency of a viscoelastic material. 93
If G’ < G” at low frequency, then polymer dissipates energy and behaves as viscous
liquid. If G’ > G” at higher frequency, then the polymer becomes more rigid and behaves as
elastic (shown in Figure 1.34). In crosslinked polymer, G’ and G” are independent of the
frequency indicating perfect network formation. The tan delta which is the ratio of loss modulus
to storage modulus describes the balance between viscous and elastic behaviors of polymer.
1.9.6 Small Angle X-Ray Scattering (SAXS)
SAXS is a non-destructive technique to characterize materials (in solid, liquid, or gels)
for crystallite structure, size, and recognition of amorphous phases. Figure 1.35a shows the
typical schematic representation of SAXS. When monochromatic wavelength of x-rays hits the
sample, it generates the scattered rays. The intensity of the scatted rays is collected as the function
of scattering angle 2θ. These scattered rays create constructive interference that satisfies the
Bragg’s Law (nλ = 2d sin θ; where n is an integer, λ is the wavelength of the incident light, d is
the spacing between the planes of atomic lattices, and θ is the angle between the incident rays and
the scattering planes). The plot of scattered intensity versus scattering angle obtained is then
compared with the International Centre for Diffraction Data database. Figure 1.35b shows the
interaction of x-rays with the sample.

40
Figure 1.35. Schematic representation of a) SAXS instrument and b) diffraction of rays from
sample.95
1.9.7 Nuclear Magnetic Resonance
NMR is the powerful analytical tool to determine the chemical structure. It was co-
discovered by Bloch and Purcell, who received Nobel Prize in 1952 for detecting the protons
signals from water and paraffin wax respectively. In NMR, the experiments are performed on the
nuclei of atoms with angular momentum (ћ I ); therefore the magnetic moment ( ) is calculated
by equations 12 and 13.
θ
a
b

41
I (12)
sm (13)
where, is the magnetogyric ratio and is constant for each nucleus, I is the nuclear spin (un-
observable), ms is spin quantum number, and ћ is the planck’s constant.
Nuclei with overall nuclear spin ( I ) not equal to zero are called as spin active nuclei.
Quantum mechanics tells that the nuclear spin ( I ) will have (2 I +1) orientations. In the absence
of external magnetic field, these orientations are of equal energy. When the external magnetic
field (Bo) is applied, then the energy levels splits. Such splitting is called as Zeeman splitting
(shown in Figure 1.36). The initial population in the energy levels can be calculated by
Boltzmann distribution (equation 14).
kT
E
eN
N(14)
where, N+ is the number of spins in the lower energy level, N
- is the number of spins in the upper
energy level, E is the energy difference between the energy levels, k is the Boltzmann constant,
and T is the temperature in kelvin.
Figure 1.36. Splitting of energy levels in the presence of the external magnetic field (Bo).96
2
ohBE

42
It is possible to excite these nuclei into the higher level with electromagnetic radiation.
The frequency of radiation needed is determined by the difference in energy between the energy
levels. When the energy is removed, the energized nuclei relax back to the alpha state. The
fluctuation of the magnetic field associated with this relaxation process is called resonance and
this resonance can be detected and converted into the peaks that we see in an NMR spectrum.96-98
Figure 1.37. Axis of rotation of nucleus in the presence of the external magnetic field (Bo).96-98
Let’s consider the nucleus with nuclear spin ½. In the absence of the external magnetic
field, the nucleus spins in its own axis. However, in the presence of the external magnetic field,
the axis of rotation of nucleus precesses around the magnetic field (shown in the Figure 1.37).
The frequency of precession is called as Larmor frequency (ωo)96
and is expressed in equation 15.
oo B (15)
When the sample is placed in the external magnetic field Bo, the net magnetic moments at
equilibrium aligned in the direction of the external magnetic field (shown in Figure 1.38). This
net magnetization can be fluctuated by applying a type of electromagnetic radiation (i.e. radio
frequency waves) for a short period of time. The signals generated by the relaxation process (i.e.
resonance) of the spins are detected and Fourier-transformed to yield a spectrum.

43
Figure 1.38. Bulk magnetization of the spins aligned in the direction of the external magnetic
field.96, 97
Spins also experience internal interactions in addition to external. Consider two spin
systems with nuclear spins 1ˆ
zI and 2ˆ
zI shown in Figure 1.39, the interactions between those
nuclear spins could be a) dipole-dipole also called as “Dipolar coupling, b) Scalar coupling or J-
coupling, c) Quadrapolar coupling, and d) Chemical shift. The dipolar interactions results from
interaction of one nuclear spin with a magnetic field generated by another nuclear spin. This is a
direct through space interaction. Dipolar Hamiltonian energy can be expressed in dipolar alphabet
shown is equation 16. Notice that only term A contributes to heteronuclear spin pairs and both A
and B contributes to homonuclear spin pairs (shown in equations 17 and 18). Other dipolar
alphabets contribute to spin relaxation (shown in equations 19-22).
FEDCBAr
H oD
3
2
21
4ˆ
(16)
)1cos3)(( 2
21 zz IIA (17)
1cos34
1 2
2121
IIIIB (18)
iIIIIC Zz
expcossinˆˆˆˆ
2
31221 (19)

44
iIIIID Zz expcossinˆˆˆˆ2
31221
(20)
2expsinˆˆ4
3 2
21 iIIE
(21)
2expsinˆˆ4
3 2
21 iIIF
(22)
Where, 1 and
2 are the magnetogyric ratios of the nuclei; 1ˆ
zI and 2ˆ
zI are the nuclear spins; 1
I
and 1
I are the spins down and up of nucleus 1; 2
I and 2I are the spins down and up of the
nucleus 2; θ and are the arrangement of the nuclear spins 1 and 2 in X-Y plane; and r is the
internuclear distance between nuclei.
Figure 1.39. Two spin system in the magnetic field Bo. 96,97
Dipolar Hamiltonian energy terms A and B contain 1cos3 2 . To eliminate the
dipolar coupling, the sample is placed at when θ=54.7o, 1cos3 2 becomes zero. Hence, to
eliminate the dipolar coupling, the sample is placed at θ=54.7o (shown in Figure 1.40). Scalar
coupling results from the indirect magnetic interactions of nuclear spins with each other through
θ

45
the involvement of the electrons. Quadrupolar coupling results from the electric interactions of
nuclei with nuclear spin > ½ with the surrounding electric fields.96, 97
Figure 1.40. Sample rotor at magic angle with respect to applied magnetic field (Bo) .96, 97
Since the nucleus responds to the external applied effective magnetic field. This change
in the effective field on the nuclear spin causes the NMR signal frequency to shift. This shift is
called as chemical shift (δ). It is calculated from the equation 23. The magnitude of the shift
depends upon the type of nucleus and the details of the electron motion in the nearby atoms and
molecules.
610
frequencyoperating
vv rs (23)
where, and are the frequencies of the sample and reference respectively.
1.9.7.1 Bloch decay experiments
It is a simple single pulse experiment for observing 13
C carbon. The pulse diagram of
Bloch decay experiment is shown in the Figure 1.41. The bulk magnetization of carbon atoms are
switched to the Y axis by applying 90o radio frequency (r.f.) pulse on the carbon. The carbon
signal is then detected while decoupling proton. This detected signal is called a free-induction
decay which is then Fourier transformed to get the spectrum.
Bo
θ = 54.74o
θ

46
Figure 1.41. a) Pulse diagram of Bloch decay experiment and b) vector model representation of
spins after 90o pulse.
96, 97
1.9.7.2 Cross polarization experiment (CP/MAS NMR)
13C CP NMR coupled with MAS are the most commonly used NMR experiments. In this
technique, the polarization from the abundant nuclei (such as 1H,
19F, and
31P) is transferred to the
dilute spins (such as 13
C). CP/MAS NMR enhances the sensitivity of dilute nuclei but is not
quantitative.
In order to transfer the polarization, one needs to match the Zeeman splitting (i.e. ΔE) of
both abundant and rare nuclei (shown in Figure 1.42). The key to obtain efficient cross
polarization is setting the Hartmaan-Hahn match properly. In such cases, the radio frequency
fields of the dilute spins are set equal to abundant spins by adjusting the pulse widths (π/2) of
protons and carbons. The two spin systems (abundant and rare) are coupled through dipolar
interactions and since both spin types precess with the same frequencies, the energy can be
transferred from abundant to dilute nuclei to enhance the signal.
90o pulse
on x-axis
a b
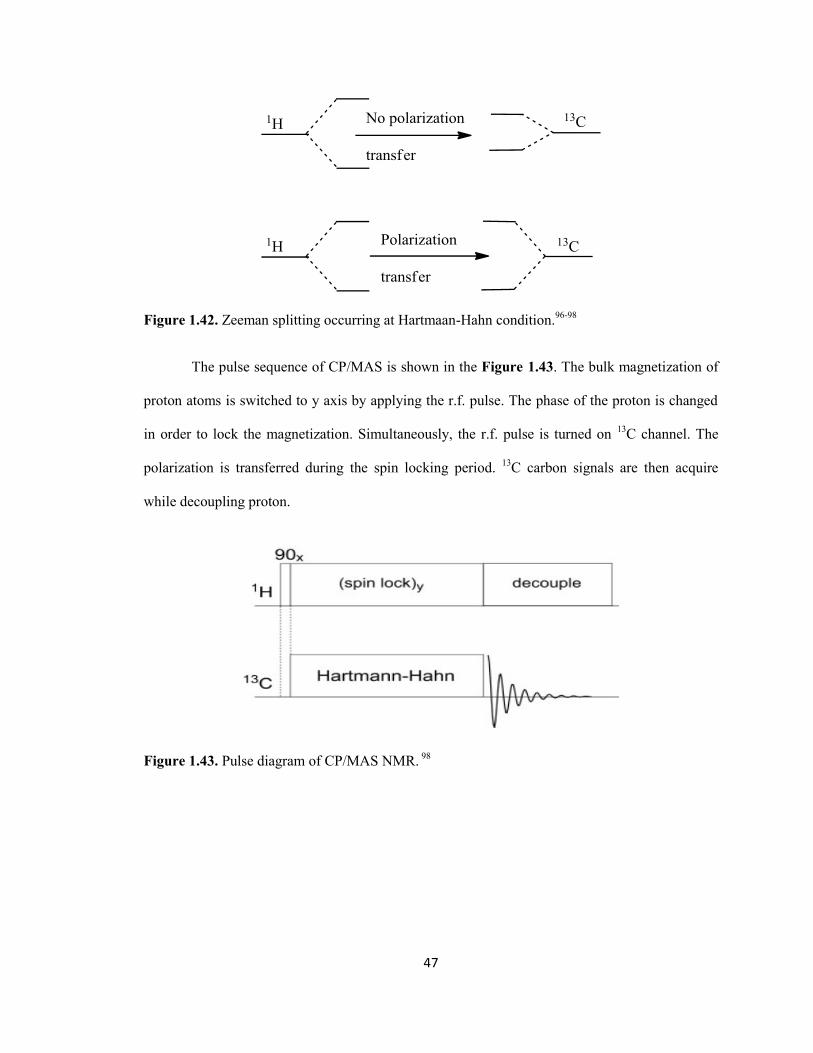
47
Figure 1.42. Zeeman splitting occurring at Hartmaan-Hahn condition.96-98
The pulse sequence of CP/MAS is shown in the Figure 1.43. The bulk magnetization of
proton atoms is switched to y axis by applying the r.f. pulse. The phase of the proton is changed
in order to lock the magnetization. Simultaneously, the r.f. pulse is turned on 13
C channel. The
polarization is transferred during the spin locking period. 13
C carbon signals are then acquire
while decoupling proton.
Figure 1.43. Pulse diagram of CP/MAS NMR. 98

48
1.10 Structure of the dissertation
Chapter 2 discusses the first proof of concept which includes detailed synthesis and
characterization of polymer silica nanocomposites using allyl functionalized pluronic P123
(aP123). Its limitation for generating composites with high organic content is also mentioned.
Chapter 3 is an extension of the new strategy focusing on synthesizing two different surfmers
(acrylated P123 and styrenatedP123) followed by preparing mesoporous silica/ polymer
nanocomposites. Polymer mesoporous silica nanocomposites with different organic content were
prepared and their rheological properties are studied. Chapter 4 focuses on application of
approach on different surfmer that is biodegradable and biocompatible which is acrylated
poly(ethylene oxide)-b-poly(caprolactone)-b-poly(ethylene oxide) triblock copolymer for the
synthesis of mesoporous silica and generating nanocomposites networks from them.
1.11 References
1. Li, F. S.; Zhou, S. X.; Wu, L. M. Preparation and Characterization of UV-curable MPS-
modified Silica Nanocomposite Coats. J. Appl. Polym. Sci. 2005, 98, 2274-2281.
2. Li, F. S.; Zhou, S. X.; Gu, G. X.; You, B.; Wu, L. M. Preparation and Characterization of
Ultraviolet Curable Nanocomposite Coatings Initiated by Benzophenone/n-methyl
diethanolamine. J. Appl. Polym. Sci. 2005, 96, 912-918.
3. Li, F. S.; Zhou, S. X.; Wu, L. M. Effects of Preparation Method on Microstructure and
Properties of UV-curable Nanocomposite Coatings Containing Silica. J. Appl. Polym. Sci.
2005, 98, 1119-1124.
4. Li, F. S.; Zhou, S. X.; You, B.; Wu, L. M. Kinetic Investigations on the UV-induced
Photopolymerization of Nanocomposites by FTIR Spectroscopy. J. Appl. Polym. Sci. 2005,
99, 1429-1436.

49
5. Sangermano, M.; Malucelli, G.; Amerio, E.; Priola, A.; Billi, E.; Rizza, G.
Photopolymerization of Epoxy Coatings Containing Silica Nanoparticles. Prog. Org. Coat.
2005, 54, 134-138.
6. Su, Y. L. Preparation of polydiacetylene/silica nanocomposite for use as a
chemosensor. React. Funct. Polym. 2006, 66, 967-973
7. Jang, J.; Ha, J.; Lim, B. Synthesis and Characterization of Monodisperse Silica-Polyaniline
Core-Shell Nanoparticles. Chem. Commun. 2006, 1622-1624.
8. Zou, H.; Wu,S.; Shen, J. Polymer/Silica Nanocomposites: Preparation, Characterization,
Properties, and Applications. Chem. Rev. 2008, 108, 3893–3957.
9. Saheb, D. N.; Jog, J. P. Natural Fiber Polymer Composites: A Review. Adv. Poly. Tech. 1999,
18, 351-363.
10. Barkoula, N. M.; Piefis, T.; Schimanski, T.; Loos, J. Processing of Single Polymer
Composites Using the Concept of Constrained Fibers. Polym. Compos. 2005, 26, 114-120.
11. J.Y.Sheikh-Ahmad, Introduction to Polymer composites, Machining of Polymer Composites.
2009 Chapter 1, 1-35.
12. Sant Kumar Malhotra, Koichi Goda, and Meyyarappallil Sadasivan Sreekela, Polymer
composites Volume 1 Chapter 1 Advances in Polymer composites: Macro-and
Microcomposites-State of Art, New Chalenges, and Oppurtunities, 2012, 1-16
13. Kang, S.; Hong, S. I.; Choe, C. R.; Park, M.; Rim, S.; Kim, J. Preparation and
Characterization of Epoxy Composites Filled with Functionalized Nanosilica Particles
Obtained via Sol–Gel Process. Polymer 2001, 42, 879-887.
14. Sugimoto, H.; Daimatsu, K.; Nakanishi, E.; Ogasawara, Y.; Ya sumura, T.; Inomata, K.
Preparation and Properties of Poly(methylmethacrylate)–Silica Hybrid Materials
Incorporating Reactive Silica Nanoparticles. Polymer 2006, 47, 3754-3759.
15. Liu, Y. L.; Hsu, C. Y.; Wang, M. L.; Chen, H. S. A Novel Approach of Chemical
Functionalization on Nano-Scaled Silica Particles. Nanotechnology 2003, 14, 813-819.

50
16. Liu, Y. L.; Hsu, C. Y.; Hsu, K. Y. Poly(methylmethacrylate)-silica nanocomposites films
from surface-functionalized silica nanoparticles. Polymer 2005, 46, 1851-1856.
17. Liu, Y.L.; Hsu, C. Y.; Su, Y. H.; Lai, J. Y. Chitosan-Silica Complex Membranes from
Sulfonic Acid Functionalized Silica Nanoparticles For Pervoporation Dehydration of
Ethanol-Water Solutions. Biomacromolecules 2005, 6, 368-373.
18. Su, Y. H.; Wei, T. Y.; Hsu, C. H.; Liu, Y. L.; Sun, Y. M.; Lai, J. Y. Using a Novel Sulfonated
Silica Nanoparticles for Nafion® Membrane for Direct Methanol Fuel Cell. Desalination
2006, 200, 656-657.
19. Su, Y. H.; Liu, Y. L.; Sun, Y. M.; Lai, J. Y.; Wang, D. M.; Gao, Y.; Liu, B. J.; Guiver, M. D.
Proton exchange membranes modified with sulfonated silica nanoparticles for direct
methanol fuel cells. J. Membr. Sci. 2007, 296, 21-28.
20. Moncada, E.; Quijada, R.; Retuert, J. Nanoparticles Prepared by the Sol–Gel Method and
Their Use in the Formation of Nanocomposites with Polypropylene. Nanotechnology 2007,
18, 335606-335612.
21. Wu, C. L.; Zhang, M. Q.; Rong, M. Z.; Friedrich, K. Silica Nanoparticles Filled
Polypropylene: Effects of Particle Surface Treatment, Matrix Ductility and Particle Species
on Mechanical Performance of the Composites. Compos. Sci. Technol. 2005, 65, 635-645.
22. Rong, M. Z.; Zhang, M. Q.; Zheng, Y. X.; Zeng, H. M.; Walter, R.; Friedrich, K. Irradiation
Graft Polymerization on Nano-Inorganic Particles: An Effective Means to Design
Polymer-Based Nanocomposites. J. Mater. Sci. Lett. 2000, 19, 1159-1161.
23. Rong, M. Z.; Zhang, M. Q.; Zheng, Y. X.; Zeng, H. M.; Walter, R.; Friedrich, K. Structure–
Property Relationships of Irradiation Grafted Nano-Inorganic Particle Filled Polypropylene
Composites. Polymer 2001, 42, 167-183.
24. Zhang, M. Q.; Rong, M. Z.; Zeng, H. M.; Schmitt, S.; Wetzel, B.; Friedrich, K. Atomic force
microscopy study on structure and properties of irradiation grafted silica particles in
polypropylene-based nanocomposites. J. Appl. Polym. Sci. 2001, 80, 2218-2227.

51
25. Rong, M. Z.; Zhang, M. Q.; Zheng, Y. X.; Zeng, H. M.; Friedrich, K. Improvement of
Tensile Properties of Nano-SiO2/PP Composites In Relation to Percolation Mechanism.
Polymer 2001, 42, 3301-3304.
26. Wu, C. L.; Zhang, M. Q.; Rong, M. Z.; Lehmann, B.; Friedrich, K. Deformation
Characteristics of Nano-SiO2 filled Poly(propylene) Composites. Polym. Polym. Compos.
2003, 11, 559-562.
27. Ruan, W. H.; Zhang, M. Q.; Rong, M. Z.; Friedrich, K. Polypropylene Composites Filled
with In-Situ Grafting Polymerization Modified Nano-Silica Particles. J. Mater. Sci. 2004, 39,
3475-3478.
28. Rong, M. Z.; Zhang, M. Q.; Pan, S. L.; Friedrich, K. Interfacial Effects in Polypropylene–
Silica Nanocomposites. J. Appl. Polym. Sci. 2004, 92, 1771-1781.
29. Ahn, S. H.; Kim, S. H.; Lee, S. G. Surface-Modified Silica Nanoparticle–Reinforced
Poly(ethylene 2,6-naphthalate). J. Appl. Polym. Sci. 2004, 94, 812-818.
30. Lai, Y. H.; Kuo, M. C.; Huang, J. C.; Chen, M. On the PEEK Composites Reinforced by
Surface-Modified Nano-Silica. Mater. Sci. Eng. A. 2007, 458, 158-169.
31. Ding, X. F.; Zhao, J. Z.; Liu, Y. H.; Zhang, H. B.; Wang, Z. C. Silica Nanoparticles
Encapsulated by Polystyrene via Surface Grafting and In-situ Emulsion Polymerization.
Mater. Lett. 2004, 58, 3126-3130.
32. Ding, X. F.; Wang, Z. C.; Han, D. X.; Zhang, Y. J.; Shen, Y. F.; Wang, Z. J.; Niu, L. An
Effective Approach to Synthesis of Poly(methyl methacrylate)/Silica Nanocomposites.
Nanotechnology 2006, 17, 4796-4801.
33. Reculusa, S.; Poncet-Legrand, C.; Ravaine, S.; Mingotaud, C.; Duguet, E.; Bourgeat-Lami, E.
Syntheses of Raspberrylike Silica/Polystyrene Materials. Chem. Mater. 2002, 14, 2354-2359.
34. Mishra, J.; Hwang, K. J.; Ha, C. S. Preparation, Mechanical and Rheological Properties of a
Thermoplastic Polyolefin (TPO)/Organoclay Nanocomposite with Reference to the Effect of

52
Maleic Anhydride Modified Polypropylene as a Compatibilizer. Polymer 2005, 46, 1995–
2002.
35. Ray, S. S.; Okamoto, M. Polymer/Layered Silicate Nanocomposites: A Review From
Preparation to Processing. Prog. Polym. Sci. 2003, 28, 1539–1641.
36. Garcı´a, M.; Vliet, G.; Jain, S.; Schrauwen, B. A. G.; Sarkissov, A.; Zyl, W. E.; Boukamp, B.
Poly(propylene)/ SiO2 Nanocomposites with Improved Mechanical Properties. Rev. Adv.
Mater. Sci. 2004, 6, 169-175.
37. Tanahashi, M.; Hirose, M.; Lee, J. C.; Takeda, K. Organic/Inorganic Nanocomposites
Prepared by Mechanical Smashing of Agglomerated Silica Ultrafine Particles in Molten
Thermoplastic Resin. Polym. Adv. Technol. 2006, 17, 981-990.
38. Kontou, E.; Anthoulis, G. The Effect of Silica Nanoparticles on the Thermomechanical
Properties of Polystyrene. J. App. Polym. Sci. 2007, 105, 1723
39. Katsikis, N.; Zahradnik, F.; Helmschrott, A.; Mu¨nstedt, H.; Vital, A. Thermal Stability of
Poly(methyl methacrylate)/Silica Nano- and Microcomposites as Investigated by Dynamic-
Mechanical Experiments. Polym. Degrad. Stab. 2007, 92, 1966-1976.
40. Tanahashi, M.; Hirose, M.; Watanabe, Y.; Lee, J. C.; Takeda, K. J. Silica/Perfluoropolymer
Nanocomposites Fabricated by Direct Melt-Compounding: A Novel Method without Surface
Modification on Nano-Silica. Nanosci. Nanotechnol. 2007, 7, 2433-2442.
41. Naderi, N.; Sharifi-Sanjani, N.; Khayyat-Naderi, B.; Faridi-Majidi, R. Preparation of organic–
inorganic nanocomposites with core-shell structure by inorganic powders. J. Appl. Polym.
Sci. 2006, 99, 2943-2950.
42. Zhang, Q.; Archer, L. A. Poly(ethylene oxide)/Silica Nanocomposites: Structure and
Rheology. Langmuir 2002, 18, 10435-10442.
43. Zhang, Q.; Archer, L. A. Optical Polarimetry and Mechanical Rheometry of Poly(ethylene
oxide)-Silica Dispersions. Macromolecules 2004, 37, 1928-1936.

53
44. Odian, G. Principles of Polymerization. 4th edition, John Wiley & Sons, Inc.: New Jersey,
2004.
45. Allcock, H. R.; Lampe, F, W.; Mark, J. E. Contemporary Polymer Chemistry, 3rd
edition,
Pearson Prentice Hall: New Jersey, 2003.
46. http://www.custompartnet.com/wu/InjectionMolding
47. http://www.substech.com/dokuwiki/doku.php?id=compression_molding_of_polymers
48. http://archive.nrc-cnrc.gc.ca/eng/ibp/irc/cbd/building-digest-157.html
49. Pal, N.; Bhaumik, A. Soft Templating Strategies for the Synthesis of Mesoporous Materials:
Inorganic, Organic–Inorganic Hybrid and Purely Organic Solids. Adv. in Colloid. Inter. Sci.
2013, 189–190, 21–41.
50. Naik, B.; Ghosh, N. N. A Review on Chemical Methodologies for Preparation of Mesoporous
Silica and Alumina Based Materials. Recent Pat Nanotechnol. 2009, 3, 213-224.
51. Wu, S. H.; Mou, C. Y.; Lin, H. P. Synthesis of Mesoporous Silica Nanoparticles. Chem.
Soc. Rev. 2013, 42, 3862-3875.
52. Hench, L. L.; West, J. L. The Sol-Gel Process. Chem. Rev. 1990, 90, 33–72.
53. Soler-Illia, G. J.; Azzaroni, O. Multifunctional Hybrids by Combining Ordered Mesoporous
Materials and Macromolecular Building Blocks. Chem Soc Rev. 2011, 40, 1107-1150.
54. Wan, Y.; Zhao, D. On the Controllable Soft-Templating Approach to Mesoporous Silicates
Chem. Rev. 2007, 107, 2821-2860.
55. Hoffmann, F.; Cornelius, M.; Morell, J.; Fröba, M. Silica-Based Mesoporous Organic–
Inorganic Hybrid Materials. Angew. Chem. Int. Ed. 2006, 45, 3216 – 3251.
56. Kresge, C. T.; Leonowicz, M. E.; Roth, W. J.; Vartuli, J. C.; Beck, J. S. Ordered Mesoporous
Molecular Sieves Synthesized by a Liquid-Crystal Template Mechanism. Nature 1992, 359,
710–712.
57. Beck, J. S.; Vartuli, J. C.; Roth, W. J.; Leonowicz, M. E.;. Kresge, C. T.; Schmitt, K. D.; Chu,
C. T.-W.; Olson, D. H.; Sheppard, E. W.; McCullen, S. B.; Higgins, J. B., Schlenker, J. L. A

54
New Family of Mesoporous Molecular Sieves Prepared with Liquid Crystal Templates. J.
Am. Chem. Soc. 1992, 114, 10834–10843.
58. Che, S.; Alfonso, E.; Bennett, G.; Yokoi, T.; Sakamoto, K.; Kunieda, H.; Osamu T.; Tatsumi,
T. A Novel Anionic Surfactant Templating Route for Synthesizing Mesoporous Silica with
Unique Structure. Nature Mater. 2003, 2, 801 – 805.
59. Zhao, D.; Feng, J.; Huo, Q.; Melosh, N.; Fredrickson, G. H.; Chmelka, B. F.; Stucky, G. D.
Triblock Copolymer Syntheses of Mesoporous Silica with Periodic 50 to 300 Angstrom
Pores. Science 1998, 279, 548-552.
60. Attard, G. S.; Glyde, J. C.; Goltner, C. G. Liquid-Crystalline Phases as Templates for the
Synthesis of Mesoporous Silica. Nature 1995, 378, 366-368.
61. Selvam , P.; Bhatia, S. K.; Sonwane, C. G. Recent Advances in Processing and
Characterization of Periodic Mesoporous MCM-41 Silicate Molecular Sieves. Ind. Eng.
Chem. Res. 2001, 40, 3237–3261.
62. Asefa, T.; Tao, Z. Mesoporous Silica and Organosilica Materials — Review of their
Synthesis and Organic Functionalization. Can. J. Chem. 2012, 90, 1015-1031.
63. Eric, M.; Muñoz, R.; Acuña, R. H. Sol Gel-Derived SBA-16 Mesoporous Material. Int. J.
Mol. Sci. 2010, 11, 3069–3086.
64. Steel, A; Carr S.W.; Anderson, M.W. 14
N NMR Study of Surfactant Mesophases in the
Synthesis of Mesoporous silicates. J.Chem. Soc.Chem.Commun. 1994, 13, 1571-1572.
65. Huo, Q.; Margolese, D. I.; Ciesla, U.; Demuth, D. G.; Feng, P.; Gier, T. E.; Sieger, P.;
Firouzi, A.; Chmelka, B. F.; Schu¨th, F.; Stucky, G. D. Organization of Organic Molecules
with Inorganic Molecular Species into Nanocomposite Biphase Arrays. Chem. Mater.1994, 6,
1176–1191.
66. a) Li, J. G.; Chang, Y. H.; Lin, Y. S.; Kuo, S. W. Templating Amphiphilic Poly(ethylene
oxide-b-ε-caprolactone) Diblock Copolymers Provides Ordered Mesoporous Silicas With
Large Tunable Pores. RSC Adv. 2012, 2, 12973-12982. b) Li, J. G.; Kuo, S. W. Phase

55
Behaviour of Mesoporous Nanostructures Templated by Amphiphilic Crystalline Diblock
Copolymers of Poly(ethylene oxide-b-ε-caprolactone). RSC Advances 2011, 1, 1822–1833.
67. Abdalla, Z. E. A.; Li, B.; Tufail, A. Direct Synthesis of Mesoporous
(C19H42N)4H3(PW11O39)/SiO2 and its Catalytic Performance in Oxidative Desulfurization.
Colloids Surfaces A: Physicochem. Engineer. Aspects 2009, 341, 86-92.
68. Ooi, Y.S.; Bhatia, S. Aluminum-Containing SBA-15 as Cracking Catalyst for the Production
of Biofuel from Waste Used Palm Oil. Microporous Mesoporous Mat. 2007, 102, 310-317.
69. Pasqua, L., Cundari, S.; Ceresa, C.; Cavaletti, G. Recent Development, Applications and
Perspectives of Mesoporous Silica Particles in Medicine and Biotechnology. Current Med.
Chem. 2009, 16, 3054-3063.
70. Zornoza, B., S.; Irusta, C.; Tellez; Coronas, J. Mesoporous Silica Sphere Polysulfone Mixed
Matrix Membranes for Gas Separation. Langmuir, 2009, 25, 5903-5909.
71. Sayari, A. Novel Synthesis of High-Quality MCM-48 Silica. J. Am. Chem. Soc. 2000, 122,
6504-6505.
72. Wang, X.; Wang, P.; Dong, Z.; Dong, Z.; Ma, Z.; Jiang, J.; Li, R.; Ma, J. Highly Sensitive
Fluorescence Probe Based on Functional SBA-15 for Selective Detection of Hg2+
Nanoscale.
Res Lett. 2010, 5, 1468–1473.
73. Ji, X.; Hampsey, J. E.; Hu, Q.; He, J.; Yang, Z.; Lu, Y. Mesoporous Silica-Reinforced
Polymer Nanocomposites. Chem. Mater. 2003, 15, 3656-3662.
74. Burkett, S. L.; Sims, S. D.; Mann, S. Synthesis of Hybrid Inorganic-Organic Mesoporous
Silica by Co-condensation of Siloxane and Organosiloxane Precursors. Chem. Commun.
1996, 1367 –1368
75. Macquarrie, D. J. Direct Preparation of Organically Modified MCM-41 type Materials.
Preparation and Characterization of aminopropyl-MCM and 2-Cyanoethyl-MCM. Chem.
Commun. 1996, 1961 – 1962.

56
76. Lim, M. H.; Blanford, C. F.; Stein, A. Synthesis and Characterization of Reactive Vinyl-
Functionalized MCM-41: Probing the Internal Pore Structure by a Bromination Reaction. J.
Am. Chem. Soc. 1997, 119, 4090 – 4091.
77. Kruk, M.; Dufour, B.; Celer, E. B.; Kowalewski, T.; Jaroniec, M.; Matyjaszewski, K.
Grafting Monodisperse Polymer Chains from Concave Surfaces of Ordered Mesoporous
Silicas. Macromolecules 2008, 41, 8584-8591.
78. Audouin, F.; Blas, H.; Pasetto, P.; Beaunier, P.; Boissière, C.; Sanchez ,C.; Save, M.;
Charleux , B. Structured Hybrid Nanoparticles via Surface-Initiated ATRP of Methyl
Methacrylate from Ordered Mesoporous Silica. Macromol. Rapid Comm. 2008, 29, 914-921.
79. Anwander, R.; Nagl, I.; Zapilko, C.; Widenmeyer, M. Methyl Methacrylate Polymerization at
Samarium(II)-Grafted MCM-41. Tetrahedron 2003, 59, 10567-10574.
80. Lunn, J.D.; Shantz, D.F. Peptide Brush-Ordered Mesoporous Silica Nanocomposite
Materials. Chem. Mater. 2009, 21, 3638-3648.
81. Tong, X.; Tang, T.; Zhu, N.; Feng, Z. L.; Huang, B. T. Polymer/Silica Nanoscale Hybrids
through Sol-Gel Method Involving Emulsion Polymers. Chem. J. Chin. Univ. 2002, 23, 306-
309.
82. Tong, X.; Tang, T.; Zhang, Q. L.; Feng, Z. L.; Huang, B. T. Polymer/Silica Nanoscale
Hybrids through Sol-Gel Method Involving Emulsion Polymers. I. Morphology of Poly(butyl
methacrylate)/SiO2. J. Appl. Polym. Sci. 2002, 83, 446-454.
83. Tong, X.; Tang, T.; Feng, Z. L.; Huang, B. T. Preparation of Polymer/Silica Nanoscale
Hybrids thorugh through Sol-Gel Method Involving Emulsion Polymers. II. Morphology of
Poly(ethyl methacrylate)/SiO2. J. Appl. Polym. Sci. 2002, 86, 3532-3536.
84. http://cnx.org/content/m38278/latest/?collection=col10699/latest
85. Gary Attard and Colin Barnes; Surfaces Oxford Science Publications
86. Tompsett, G. A.; Krogh, L.; Griffin, D. W.; Conner, W. C. Hysteresis and Scanning Behaviour
of Mesoporous Molecular Seives. Langmuir 2005, 21, 8214-8225.

57
87. Barrett, E. P.; Joyner, L. G.; Halenda, P. P. The Determination of Pore Volume and Area
Distributions in Porous Substances. J. Am. Chem. Soc. 1951, 73, 373-380.
88. Maglara, E.; Kaminski, R.; Conner, W. C. In Characterization of Porous Solids IV;
McEnaney, B., Mays, T.J., Rouquerol, J., Rodrigues-Reinoso, F., Sing, K. S. W., Unger, K.
K.; Royal Society of Chemistry:London, 1997.
89. Wolfinger, M. G. Influence of the Emissivity of the Sample on Differential Scanning
Calorimetry Measurements. Thermochimica Acta 2001, 372, 11-18.
90. http://www.pslc.ws/macrog/mpm/analysis/dsc.htm
91. Hwang, D. H.; Lee, J. I.; Cho, N. S.; Shim, H. K. Light-emitting Properties of a Germyl-
Substituted PPV Derivative Synthesized via a Soluble Precursor. J. Mater. Chem. 2004, 14,
1026-1030.
92.http://www.malvern.com/labeng/technology/gel_permeation_chromatography_theory/universa
l_calibration_gpc_theory.htm
93. Tardos, T. F. Rheology of Dispersions: Principles and Applications; Wiley-VCH, Weinheim,
Germany; 2010.
94. Walberer, J. A.; McHugh, A. J. The Linear Viscoelastic Behavior of Highly Filled
Poly(dimethylsiloxane) Measured in Shear and Compression. J. Rheol. 2001, 45, 187-201.
95. http://iramis.cea.fr/scm/lions/techniques/saxs/
96. Levitt, M. H. Spin Dynamics: Basics of Nuclear Magnetic Resonance; 2nd
edition; Wiley: The
University of Southampton, UK; 2008.
97. Deur, M. J. Introduction to Solid-State NMR Spectroscopy; Blackwell: Department of
Chemistry, University of Cambridge, 2004.
98. Taylor, R.E. Setting Up 13
C CP/MAS Experiments. Concepts in Magnetic Resonance Part
A, 2004, 22A, 37–49.

58
CHAPTER II
POLYMERIZABLE STRUCTURE DIRECTING AGENTS THAT ENABLE
IN-SITU SYNTHESES OF COMPOSITE MATERIALS
Abstract. The triblock copolymer of ethylene oxide (EO) and propylene oxide (PO) EO20-PO70-
EO20 commercially known as pluronic P123 have been used in synthesizing mesoporous silica as
surfactant. Synthetic modifications to block-copolymer structure directing agents lead to
polymerizable macromers suitable for templating the growth of mesoporous silica particles, and
which can subsequently react in-situ to form an extended nanocomposite network. This chapter
focuses on functionalization of pluronic P123 with allyl chloride and it was investigated whether
allyl functionalized P123 preserved the structure-directing capabilities of the triblock polymer for
templating ordered mesoporous silica growth. The in-situ polymerization of the triblock
templates following silica particle growth results in a true single-phase nanocomposite,
characterized by intimately mixed organic-inorganic fractions and
interpenetrating/interconnecting chains in and between the inorganic particles.

59
2.1 Introduction
Polymer composites lie at the interface between organic and inorganic realms and
combine the distinct properties of each in one single component. Composites have been targeted
as promising materials due to the advantages that the organic and inorganic components bring
into one system.1,2
Most commonly, composites are prepared via sequential synthetic schemes, in
which the inorganic component is prepared separately, and then mixed with the organic
components to create the composite. Mesoporous silica SBA15 has been used by material
scientists to use it as an inorganic filler in polymer nanocomposites because of its high surface
area, thick walls, and well-ordered hexagonal pores. The most common routes for the synthesis of
polymer nancomposites is by introducing the monomer and completing the polymerization in the
presence of the inorganic reinforcing agent,3-7
by post-synthetic grafting,8 or by simply grafting
the mesoporous silica particles together using the monomer and ATRP routes.9,10
Co-
condensation is another one-pot synthetic route to prepare organically modified mesoporous
silica. Organic groups such as acrylate, vinyl, allyl, or styryl can be polymerized to form
mesoporus silica/polymer nanocomposites.11
In this contribution, we investigated an alternative approach to polymer composites that
used polymerizable structure-directing agents that can template formation of high-surface area
mesoporous silica, and then react with other template molecules to generate an organic network
through, around, and in between the silica particles in an in-situ approach. The concept of
functional and reactive surfactants,12
often referred to as “surfmers”,13-15
is not new in the field of
micelle polymerization, but the successful application to synthesis of ordered siliceous-based
nanocomposites has not been demonstrated.
The surfactant generally used for synthesis of mesoporous silica SBA15, is as triblock
copolymer of poly(ethylene oxide)-b-poly(propylene oxide)-b-poly(ethylene oxide) that is
referred to as pluronic P123. Synthetic end-group modification of pluronic P123 is required to
make it a polymerizable structure directing agent. There are many reports in literature about end-

60
group modification (with thiol, acrylic, cyano, carboxylic acid) of pluronic P123 focusing on
either hydrogel materials or critical micellar properties of surfactants.16-19
Carboxylic acid
functionalized pluronic P123 (carboxyP123) has been demonstrated to have the structure
directing capabilities for ordered mesoporous silica. However, there are some problems
associated with its use in polymer nanocomposites: 1) The polymerization of carboxyP123
involves longer reaction times in the presence of solvent, which can remove the carboxyP123
from mesoporous silica and 2) If the water is not removed from the reaction mixture, the degree
of polymerization will be lower (shown in Scheme 2.1). The structural and surface properties of
mesoporous silica made using carboxyP123 are provided in appendix A1-A4.
In this contribution, we describe the synthesis and use of polymerizable surfactants based
on allylic modified ethylene oxide/propylene oxide (Pluronic P123) triblock copolymers that
serve the dual function of template and macromer, to create organic/inorganic composite
materials.
2.2 Experimental
2.2.1 Materials
Pluronic P123 was purchased from Sigma Aldrich and used as such for functionalization
reactions. Allyl bromide was purchased from Alfa Aesar and purified before use. All organic
solvents were obtained from Pharmco-AAPER.
Scheme 2.1. Formation of ester linkage.

61
2.2.2 Characterization
Surface area of mesoporous silica SBA15 and their analogues were determined on
Nova2200e Quantachrome instruments. Transmission electron micrographs were acquired on
JEOL JEM-2100 with Evex EDS.
600 MHz liquid NMR spectrometer (Varian) was used to determine 13
C NMR (in CDCl3)
to determine the functionalized pluronic P123 at 40oC at the spinning speed of 20Hz. The solution
temperature was equilibrated for 10 minutes before the measurements.
13
C CP/MAS experiments were performed on the composites on 300MHz solid state
NMR spectrometer (Bruker) equipped with 4mm probe at spinning speed of 5 kHz at room
temperature. Percentage organic content was determined by heating the samples on TA
instruments Hi-ResTGA2950 from room temperature to 600oC with the ramp rate of 20
oC/min
under air flow.
Molecular weights were determined using Agilent 1100 series equipped with refractive
index detector. 5 mg of polymer material was dissolved in 1 ml of tetrahydrofuran (THF).
Polyethylene glycol standards were utilized as reference. THF was eluting solvent at a flow rate
of 1 ml/min, and two PLgel Mixed-C columns in series were used for separation of polymeric
material.
2.2.3 Synthesis of monoallyl Pluronic P123 (aP123). In a 250 ml two-necked flask, Pluronic
P123 (1mmol) was dissolved in 100 mL anhydrous tetrahydrofuran (THF) in an inert atmosphere.
The solution was cooled to 0o C and stirred at 400 rpm. The sodium metal (1.5 mmol), sliced into
small pieces, was added to the above solution and heated at 60oC till all the sodium reacts with
the hydroxyl groups. The allyl bromide (1.25 mmol) was then added dropwise into the reaction
mixture which was then stirred at 60oC for 24 hours. The precipitated sodium bromide was
removed by filtration. The product was obtained by evaporating the THF in a rotary evaporator
and was subsequently purified by extraction into dichloromethane. The solvent was then removed

62
in a rotary evaporator. Functionalized allyl P123 with 90% yield was isolated. The reaction
scheme is shown below in Scheme 2.2.
2.2.4 Synthesis of SBA-15 and SBA-15 analogues. The molar composition for the synthesis of
SBA-15 or SBA-15 type materials was TEOS:P123/aP123 :HCl:H2O = 1: 0.0016 : 5.54 : 182.82,
where TEOS is tetraethylorthosilicate. In a typical synthesis, 4 g of P123 or aP123 was
dissolved in 30 mL of de-ionized water and stirred for 3 hours at room temperature, and 112 mL
of 2.133 M HCl was added drop-wise and the mixture was stirred for 2 hours. The resulting
solution was then heated to 40 oC and 9 g of TEOS was added drop-wise and stirring was
continued for 20 hours. The reaction mixture was then aged at 100oC for 24 hours under static
conditions. The solution was divided into two equal quantities: half of the solution was kept at the
same pH and other half was adjusted to neutral pH. The materials from each solution were
washed with excess de-ionized water, dried overnight, and calcined at 550oC for 7 hours using a
temperature ramp of 1oC/min. Using TGA, XRD, and BET analyses verified that crystalline
mesoporous SBA-15 siliceous materials were formed in the presence of either P123 or aP123.
2.2.5 Polymerization of pluronic P123 monoallyl ether (aP123). 2ml of 2M dil. H2SO4 was
added to 1 gram of aP123 and the reaction mixture was heated to 60oC for 4 hours. The
polymerization scheme is shown in Scheme 2.3. As described in the text (vide infra), GPC
Scheme 2.2. Functionalization of pluronic P123 with allyl group.

63
analysis of the polymeric component revealed that a high molecular weight organic phase formed
by cationic polymerization.
2.2.6 Characterization of extent of end-group functionalization in aP123. Shown below in
Figure 1 is the 600-MHz solution 13
C NMR spectrum of aP123. The spectrum was obtained with
gated decoupling to minimize Nuclear Overhauser effects. In order to preserve the structure-
directing capabilities of P123, we targeted ca. 50% conversion of hydroxyl groups to
olefinic/allyl groups in the allybromide reaction. In other words, we wanted an average of one
olefinic and one hydroxyl chain end per aP123 molecule. From Figure 2.1, which compares the
starting P123 spectrum to the product aP123 spectrum, one observes based on the relative
intensities of the 60, 67, 116, and 136 ppm end-group peaks in the two spectra that this target was
achieved. Note that the starting P123 in Figure 1 has only the characteristic 60-ppm end group
peak for the methylene group adjacent the terminal hydroxyl.
Scheme 2.3. Polymerization of allyl group.

64
144 136 128 120 112 104 96 88 80 72 64 56 48 40 32 24 16 8 0
130 120 110
Chemical Shift (ppm)
a
b
x-1 y x-1O
OO
OO
OH
136
116
60
17
67.5 65.0 62.5 60.0
2.2.7 Extraction of polymerized aP123 from SBA15_aP123
Polymerized aP123 was extracted by refluxing 1 g of SBA15_aP123 composite with
ethanol for 2 days. The mixture was filtered and the solvent was then removed by rotary
evaporator. GPC analysis of the polymeric component revealed that a high molecular weight
organic phase formed in the composite.
2.3 Results and Discussion
2.3.1 Generating functionalized templates. Nonionic triblock copolymers based on
polyethylene oxide and a central polypropylene oxide block) denoted here as PEO-PPO-PEO
(commonly referred to by their Pluronic trade name, have garnered widespread attention for the
synthesis of SBA-15 mesoporous silicas.20, 21
Here, we use Pluronic P123 (P123), HO-(PEO)20-
(PPO)70-(PEO)20-H, as the template for SBA-15 formation, but employ functionalization methods
to convert one end group to a reactive olefinic moiety. Allyl bromide, when reacted with P123 in
Figure 2.1. 600 MHz 13
C solution NMR spectrum acquired with 1H decoupling
of (bottom) pure P123 starting material and (top) allyl-functionalized aP123
following reaction according to Scheme 1. End group signals are shown in the
aP123 inset.

65
the presence of sodium metal and THF in an inert atmosphere, leads to a monoallyl-
functionalized P123 as described above in Figure 2.1. Reaction stoichiometries were selected to
convert approximately one hydroxyl end-group per P123 chain to an olefinic end group, as
depicted schematically in Figure 2.2. In this way, each modified P123 is rendered bifunctional,
and capable of acid-catalyzed polymerization through the olefinic end groups with surrounding
template molecules as shown in Figure 2.2. Given that the structure-directing characteristics of
the allyl-modified P123, denoted in this paper as aP123, are not known, the fact that aP123
preserves P123’s mesoporous silica structure-directing capabilities were first established.
Standard literature synthesis conditions20
for SBA-15 preparation, using in separate experiments
P123 or aP123, yielded materials both before and after calcination that are by all measures
identical. Figure 2.3 compares the powder XRD results from materials synthesized using the
control P123 and the modified aP123, prior to calcination, both of which contain characteristic
diffraction peaks consistent with published SBA-15 topologies. TGA results in Figure 2.4
indicate that the P123 and aP123 content of the respective ordered silica products is the same at
33 mass percent, as is the decomposition temperature at 200oC, albeit with the caveat that the
aP123 material exhibits a sharper mass loss. The sharper mass-loss transition in the aP123
material is reproducible over many runs, but at this time, we are not certain why this behavior is
observed.
While our goal is not creating calcined mesoporous silicas, the BET surface area
following calcination is the key indicator of the ordering induced by each template. Table 3.1
shows the physicochemical properties of mesoporous silica using pluronic P123 and aP123.
Experimental results for the calcined aP123 SBA material and SBA15 was 921 m2/g and 945
m2/g surface area respectively. This result was replicated, and the essentially identical surface
area for aP123 SBA-15 was also observed for experiments in which the solution was neutralized
to a pH = 7 prior to drying. Clearly, the olefinic group on one end of the aP123 templates does

66
not alter the ability to form micelles in the aqueous environment, or to template crystallization of
ordered mesoporous silica. However, separate experiments revealed that P123 modified to
contain an olefinic group on both chain ends, i.e., di-allyl with no hydroxyl groups, did not lead to
SBA synthesis (vide infra).
a.
b.
Figure 2.2. a) Schematic representation of synthesis of mesoporous materials and
polymer composite networks using the allyl-modified P123 surfactant, and b)
Expanded view of channel interior showing reaction (denoted by green lines)
between olefinic ends of neighboring template molecules. The small orange
hexagons in the last frame of 2a represent individual SBA particles in the network.

67
Figure 2.3. Small-Angle X-Ray Scattering of SBA15P123 and SBA15_aP123, denoted by solid
and dotted lines respectively
Figure 2.4. TGA data of SBA15P123 and SBA15_aP123, denoted by solid and dotted lines
respectively. Mass loss for each is 33 wt%.
0 0.5 1 1.5 22θ
Inte
nsi
ty
2θ (degrees)
Inte
nsi
ty
0
20
40
60
80
100
120
0 100 200 300 400 500
Temperature (oC)
% W
eigh
t

68
Table 2.1 Pysicochemical properties of mesoporous silica prepared using pluronic P123 and
aP123. SAXS was used to determine the d-spacing. Pore size distributions and BET surface area
were determined using N2-adsorption-desorption experiments.
2.3.2 Polymerizing the reactive template. Dilute sulfuric acid addition to the
aP123/mesoporous silica product mixture following SBA crystallization catalyzed the in-situ
polymerization of the aP123 through the olefinic groups, as depicted in Figure 2. To confirm that
polymerization took place, the resulting polymeric fraction was extracted by dissolving the final
organic/silica composite material in 50C ethanol for 48 hours. As controls, GPC analysis of
pure P123 and pure aP123 prior to any reaction are shown in Figures 2.5a and 2.5b.
Monodisperse poly(ethylene gylcol) (PEG) standards were used to calibrate the GPC, and the
resulting elution time for the pure P123 agreed with its known molecular weight (5700 g/mole).
In another control experiment, pure aP123 was reacted with sulfuric acid at the same
concentration to ensure that their polymerization occurred, and the high molecular weight peak
(broad signal near 6 minutes) shown in Figure 2.5c indicates that the chemistry leads to
polymerization of the aP123 macromers. Finally, Figure 2.5d shows the GPC result for the
polymeric fraction extracted from the final organic/silica composite material, after crystallization
and polymerization. The results are similar to 2.5c, indicating that higher molecular weight
species (up to 115,000 g/mol) are formed from the reaction of the aP123 structure directing agent
molecules in the composite. TGA analysis of the washed and dried composite, after extraction of
the polymer used to generate Figure 2.5d, revealed that 13 wt% of the polymer remained in the
SBA channels after extraction, consistent with formation of higher molecular species like those
depicted in Figure 2.2.
Mesoporous
silica
d-spacing (100)
Å
BET Surface area
(m2/g)
Pore size
(Å)
SBA15_P123 100.40 945 32
SBA15_aP123 106.50 921 33

69
Figure 2.5. GPC chromatograms of a) pure P123, b) aP123, c) polymerized aP123, and d)
polymer extracted from the composite following polymerization of aP123 template molecules in-
situ. No change in molecular weight was observed for control experiments involving pure P123
in the same acid-catalyzed reaction. GPC flow rates were 1 ml/min
The 33 wt% organic content of the material described above is defined by the initial
surfactant/TEOS reaction stoichiometry. However, adding additional aP123 at the time the
sulfuric acid catalyst is added (to the dried aP123/SBA-15 product described in Figures 2.3 and
2.4) can create final products with much higher organic content. As depicted in Figure 2.5a, the
polymerization proceeds through the olefinic groups, resulting in highly branched structures. One
could easily add aP123 that contained olefinic groups on each chain end, i.e. a di-olefinic aP123,
and then the entire chain backbone would be incorporated into the growing network. However,
this could only be added after formation of SBA-15 using mono-olefinic aP123, i.e., at the point
of acid addition to effect polymerization, since di-olefinic aP123 does not lead to stable micelle
formation and SBA crystallization.
Solid-state NMR spectra for the washed and dried aP123 composite unequivocally
indicate that polymerization of the functionalized templates occurs. Figure 2.6 below compares

70
the 13
C CP/MAS data for the P123 molecules in as-synthesized SBA-15, versus that for the
aP123/SBA-15 route followed by polymerization. The peak at 31 ppm in Figure 2.6b indicates
that polymerization through the olefinic end groups has occurred in the composite synthesis,
thereby generating a series of aliphatic CH2 groups in the chain. Single-pulse 13
C MAS spectra
confirm this assignment (not shown); the same peaks are present albeit with slightly different
relative intensities as expected for cross-polarization versus one-pulse experiments.
140 120 100 80 60 40 20 0
Chemical shift (ppm)
2.3.3 Inter-particle versus intra-particle polymerizations and bulk properties. The minimum
organic content in the composite, as defined by the initial stoichiometry required to crystallize
SBA-15 from solution, is 33 wt% aP123. While adding more aP123 at the point of catalytic acid
addition can easily increase this value, our experiments indicate that even at this lower limit,
polymerization occurs between aP123 macromers both inside and outside of the SBA particle
channels. Polymerization outside of the channels is required for inter-particle connectivity and
true composite properties. To assess the degree to which inter-particle polymerization occurred,
Figure 2.6. Solid-state 1H
13C CP (cross-polarization)/MAS spectra for (a) the P123
surfactants in normal uncalcined SBA-15 following synthesis, and (b) the organic fraction
generated by polymerizing the aP123 structure-directing agents inside and around the SBA-15
following crystallization. The arrow denotes the new aliphatic CH2 moieties formed from the
reaction.
b.
a.
a.
-CH3
-OCH2
-
-CH2-

71
two different materials were pressed into cylindrical pellets at room temperature using a Carver
press. The two samples were chemically identical, composed of the aP123/SBA-15 mixture
following crystallization, washing, and drying. However, one of the two samples was
polymerized, while the other was not. Figures 2.4c, 2.4d, and 2.5b prove polymerization occurs,
and if that polymerization is only limited to the interior of the mesoporous silica, then pellets
formed from unpolymerized (but still filled with unreacted aP123) and the polymerized material
should exhibit essentially identical physical properties. Figure 2.7a and 2.7b compares the
images of the pellets formed from each material at 3000-psi plate pressure and room temperature.
The unpolymerized material, which exhibits the white color expected for silica, does not form a
stable pellet at this pressure, as indicated by the large crack through the bulk material. Indeed, the
pellet crumbled when removed from the mold. In contrast, the darker colored polymerized
composite pellet forms a tough, stable pellet that may be removed and handled. The color change
itself is indicative of polymerization, as this color change is also observed in control experiments
involving polymerization of the pure aP123 in the absence of the silica. Similar results were
obtained in multiple experiments. If the plate pressure was increased to 5000 psi, then an
apparently stable pellet could be made from the unpolymerized sample, but it’s surface was
chalky and easily removed by simply rubbing one’s finger across it. More importantly, solvent
exposure experiments clearly demonstrated that inter-particle connectivity occurred in the
polymerized aP123/SBA-15 sample. When the 5000-psi unpolymerized pellet was dropped into
dichloromethane, it immediately rose to the surface while simultaneously releasing visible air
bubbles. After a few minutes, no more bubbles were observed and the pellet settled to the bottom
of the beaker. In marked contrast, the 3000-psi polymerized aP123/SBA-15 pellet, like that
shown in Figure 2.6a, immediately settled to the bottom of beaker filled with dichloromethane,
and no air bubbles were ever released. The pellet was stable in the solution for several hours,
with little change in its shape or color. The unpolymerized pellet, formed at the higher 5000-psi
pressure, developed multiple cracks and began to disintegrate after only one hour in solvent.

72
Figure 2.7c and 2.7d show the polymerized versus unpolymerized aP123/SBA-15 pellets in
dichloromethane, respectively. In total, these experiments prove that polymerization occurs
between the particles, and not just within their intracrystalline channels, even for the minimum 33
wt% organic content.
2.4 Conclusions
A novel route to organic/inorganic composite materials has been described, which utilizes
end-group functionalization of existing structure-directing agents to enable in-situ synthetic
methods. Using allyl-functionalized P123 as a template, we have shown that crystallization of
SBA-15 is preserved but that following the crystallization, the template readily polymerizes to
form a composite containing high molecular weight polymer filling and surrounding the SBA-15
crystallites in an intimately mixed arrangement. However, the extent of polymerization is low.
Therefore, there is a need of reactive monomeric unit on triblock surfactant.
Figure 2.7. Pellets formed from (a) polymerized aP123/SBA-15 composite versus (b) versus
aP123/SBA-15 without the polymerization step. Both pellets contain ca. 33 wt% organic content.
(c) Pellet from polymerized composite in CH2Cl2, at the bottom of the vial, and (d) the
corresponding unpolymerized control pellet floating near the surface. The two pellets were placed
in each solvent container at exactly the same time, which was 1 minute prior to taking the photo.
a. b.
c. d.

73
2.5 References
1. Limm M.H.; Blanford, C.F.; Stein, A. Synthesis and Characterization of a Reactive Vinyl-
Functionalized MCM41: Probing the Internal Pore Structure by a Bromination Reaction. J.
Am. Chem. Soc. 1997, 119, 4090-4091.
2. Bitinis, N.; Hernandez, M.; Verdejo, R.; Kenny, J. M.; Lopez-Manchado, M. A. Recent
Advances in Clay/Polymer Nanocomposites. Adv. Mater. 2011, 23, 5229-5236.
3. He, J.; Shen, Y.; Evans, D. G.; Duan, X. Nanocomposite Structure Based on Silylated MCM-
48 and Poly(vinyl acetate). Chem. Mater. 2003, 15, 3894-3902.
4. Landry, C. J. T.; Coltrain, B. K.; Brady, B. K. In-situ Polymerization of Tetraethylorthosilane
in Poly(methyl methacrylate): Morphology and Dynamic Mechanical Properties. Polymer
1992, 33, 1486-1495.
5. Xu, L.; Hiroyoshi, N.; Evangelos, M.; Ramanan, K. Tailored Nanocomposites of
Polypropylene with Layered Silicates. Macromolecules 2009, 42, 3795-3803.
6. Rovira-Truitt, R.; Patil, N.; White, J. L. Synthesis and Characterization of Biopolymer
Composites from the Inside Out. Macromolecules 2009, 42, 7772-7780.
7. Choi, M.; Kleitz, F.; Liu, D.; Lee, H. Y.; Wha-Seung, A.; Ryoo, R. Controlled Polymerization
in Mesoporous Silica Toward the Design of Organic-Inorganic Composite Nanoporous
Materials. J. Am. Chem. Soc. 2005, 127,1924-1932.
8. Lunn, J. D.; Shantz, D. F. Peptide Brush-Ordered Mesoporous Silica Nanocomposite
Materials. Chem. Mater. 2009, 21, 3638-3648.
9. Kruk, M.; Dufour, B.; Celer, E. B.; Kowalewski, T.; Jaroniec, M.; Matyjaszewiski, K.
Grafting Monodisperse Polymer Chains from Concave Surfaces of Ordered Mesoporous
Silica. Macromolecules 2008, 41, 8584-8591.
10. Pasetto, P.; Blas, H.; Audouin, F.; Boissiere, C.; Sanchez, C.; Save, M.; Charleux, B.
Mechanistic Insight into Surface- Intiated Polymerization of Methyl methacrylate and
74
Styrene via ATRP from Ordered Mesoporous Silica Nanoparticles. Macromolecules 2009, 42,
5983-5995.
11. El Kadib, A.; Katir, N.; Finiels, A.; Castel, A.; Marcotte, N.; Molvinger, K.; Biolley, C.;
Gaveau, P.; Bousmina, M.; Brunel, D. Mesostructured Fatty Acid-Tethered Silicas: Sustaining
the Order by Co-templating with Bulky Precursors. Dalton Trans. 2013, 42, 1591-1602.
12. Hsu, Y-C.; Hsu, Y-T.; Hsu, H-Y.; Yang, C-M. Facile Synthesis of Mesoporous Silica SBA-15
with Additional Intra-Particle Porosities. Chem. Mater. 2007, 19, 1120-1126.
13. Summers, M.; Eastoe, J. Applications of Polymerizable Surfactants. Adv. Colloid Interface
Sci. 2003, 100–102, 137-152.
14. Dreja, M.; Tieke, B. Microemulsions with Polymerizable Surfactants γ-ray Induced
Copolymerizations of Styrene and 11-(acryloyloxy)undecyltrimethyl ammonium bromide in
Three Component Cationic Microemulsion. Macromol. Rapid Commun. 1996, 17, 825-833.
15. Li, T. D.; Gan, L. M.; Chew, C. H.; Teo, W. K.; Gan, L. H. Preparation of Ultrafiltration
Membranes by Direct Microemulsion Polymerization Using Polymerizable Surfactants.
Langmuir 1996, 12, 5863-5868.
16. Bromberg, L. Polyether-Modified Poly(acrylic acid): Synthesis and Applications. Ind. Eng.
Chem. Res. 1998, 37, 4267-4274.
17. Custers, J. P. A.; van den Broeke, L. J. P.; Keurentjes, J. T. F. Phase Behavior and Micellar
Properties of Carboxylic Acid End Group Modified Pluronic Surfactants. Langmuir 2007, 23,
12857-12863.
18. Niu, G.; Zhang, H.; Song, L.; Cui, X.; Cao, H.; Zheng, Y.; Zhu,S.; Yang, Z.; Yang, H.
Thiol/Acrylate-Modified PEO-PPO-PEO Triblocks Used as Reactive and Thermosensitive
Copolymers. Biomacromolecules 2008, 9, 2621–2628.
19. Elluru, M.; Ma, H.; Hadjiargyrou, M.; Hsiao, B. S.; Chu, B. Synthesis and Characterization of
Biocompatible Hydrogel using Pluronics-based Block Copolymers. Polymer 2013, 54, 2088-
2095.

75
20. Zhao, D.; Feng, J.; Huo, Q.; Melosh, N.; Fredrickson, G. H.; Chmelka, B. F.; Stucky, G. D.
Triblock Copolymer Syntheses of Mesoporous Silica with Periodic 50 to 300 Angstrom
Pores. Science 1998, 279, 548-552.
21. Ruthstein, S.; Schmidt, J.; Kesselman, E.; Talmon, Y.; Goldfarb, D. Resolving Intermediate
Solution Structures During the Formation of Mesoporous SBA-15. J. Am. Chem. Soc. 2006,
128, 3366-3374.

76
CHAPTER III
SELF-ASSEMBLED POLYMER NANOCOMPOSITES AND THEIR NETWORKS
Abstract. In this research, we functionalized the triblock copolymer pluronic P123 with reactive
monomeric units such as acryl and styryl groups. Nanocomposite networks prepared using
acryl/styryl modified pluronic P123 via self-assembly shown improved storage and loss modulus.
It was observed that the storage and loss modulus of nanocomposites obtained were independent
of frequency in rheological experiments indicating the formation of perfect networks.

77
3.1 Introduction
Polymer silica nanocomposites are a promising class of hybrid materials and have found
applications in catalysis, drug delivery, sensor technology, and gas storage.1-5
Polymer composite
properties largely depend on homogenous distribution of the inorganic component in the polymer
matrix. There are three approaches for synthesis of mesoporous silica polymer nanocomposites.
One approach is to form organically modified mesoporous silica by co-condensation method
followed by polymerization of the organic groups.6,7
Another approach is to anchor the polymer
either by the “grafting to” or the “grafting from” method on the mesoporous silica via hydroxyl
groups.8-10
The third approach is to mix polymer with the silica or silica precursors.11, 12
In Chapter 2, we showed the successful application of self-assembled approach to
synthesize polymer nanocomposites networks using polymerizable structure directing agent allyl
P123 (aP123). However, the degree of polymerization of the allyl group was found to be low.
Hence, there is a necessity to functionalize triblock copolymer with reactive monomeric moieties
to create nanocomposite networks.
In this chapter, we detail the end-group functionalization of the Pluronic
-based
copolymers to attach either one or two reactive end groups, which in this case are either styrl- or
acrylate-based as shown in Scheme 1. Based on the choice of end-group, final products can be
made which are either (1) nanocomposites that contain only physical chain entanglements, or (2)
chemically cross-linked nanocomposite networks. In either case, the organic to inorganic
composition ratios may be systematically varied in the final materials, as shown by several
chemical, spectroscopic, and microscopic characterization methods described herein. The
following sections will describe the polymeric surfactant functionalization chemistry, templating
and growth of ordered mesoporous SBA-type silica using the modified surfactants, reactions of
the modified surfactants with one another to create the continuous organic phase within and
between the mesoporous silica particles, and network formation.

78
3.2 Experimental
3.2.1 Materials
Pluronic P123 was purchased from Sigma Aldrich and used as such for functionalization
reactions. Acryloyl chloride and vinyl benzyl chloride was purchased from Alfa Aesar and
Aldrich. All organic solvents were obtained from Pharmco-AAPER.
3.2.2 Characterization
Surface area of mesoporous silica SBA15 and their analogues were determined on
Nova2200e Quantachrome instruments. Transmission electron micrographs were acquired on
JEOL JEM-2100 with Evex EDS.
600 MHz liquid NMR spectrometer (Varian) was used to determine 13
C NMR (in
deuterated dimethyl sulfoxide) to determine the functionalized pluronic P123 at 40oC at the
spinning speed of 20Hz. The solution temperature was equilibrated for 10 minutes before the
measurements.
13
C CP/MAS experiments were performed on the composites on 300MHz solid state
NMR spectrometer (Bruker) equipped with 4mm probe at spinning speed of 5 kHz at room
temperature. Percentage organic content were determined on TA instruments Hi-ResTGA2950.
3.2.3 Synthesis of acrylated- and styrenated-functionalized Pluronic P123 (denoted as
acryP123 and styrP123, respectively). Pluronic P123 was purchased from Sigma Aldrich and
used as such for functionalization reactions. All organic solvents were obtained from Pharmco-
AAPER. In a 250 ml two-necked flask, Pluronic P123 (1mmol) was dissolved in 100 mL
anhydrous tetrahydrofuran (THF) in an inert atmosphere. The solution was cooled to 0o C and
stirred at 400 rpm. 1.25 mmol of acryloyl chloride or 1.25 mmol of Vinyl benzyl chloride (VBC)
and triethyl amine (1.25 mmol) were added to the stirred solution. The reagents were reacted for
24 hours (shown in Scheme 3.1). The triethyl ammonium chloride salt formed was separated by

79
filtration. Dichloromethane was removed by rotary vaporization. The product was dried in a
vacuum oven for 24hrs at 60oC. Functionalized pluronic P123 with 95% yield was isolated.
Chloride ion test was performed to check the formation of triethyl ammonium chloride by adding
silver nitrate solution to the recovered salt. Yellow colored precipitate of silver chloride that turns
brown upon exposure of light confirms the formation of product.
Scheme 3.1. Reaction scheme for the formation of acryP123 and styrP123
3.2.4 Synthesis of SBA-15 and SBA-15 analogues (acryP123 and styrP123). The molar
composition for the synthesis of SBA-15 or SBA-15 type materials is TEOS: P123 (or acryP123
or styrP123): HCl : H2O = 1: 0.016 : 5.54 : 182.82. In a typical synthesis, 4 g of P123 was
dissolved in 30 mL of de-ionized water and stirred for 3 hours at room temperature. 112 mL of
2.133 M of HCl was added drop-wise and kept under stirring for 2 hours. The above solution was
then heated to 40oC and 9 g of TEOS was added drop-wise and stirred for 20 hours. The reaction
mixture was aged at 100oC for 24 hours under static conditions. The mesoporous silica was
filtered and rinsed with excess de-ionized water, dried on bench overnight, and calcined at 550 oC
for 7 hours at the ramp of 1oC/min. As described in the text, TGA, SAXS, pore size distributions,

80
and BET analysis verified that crystalline mesoporous SBA-15 siliceous materials were formed in
the presence of either P123 or acryP123 or styrP123 (Table 3.1).
Table 3.1 Pysicochemical properties of mesoporous silica prepared using pluronic P123 and
aP123. SAXS was used to determine the d-spacing. Pore size distributions and BET surface area
were determined using N2-adsorption-desorption experiments.
3.2.5 Characterization of end-group functionalization in acryP123 and styrP123. Shown
below in Figure 3.1 is the 600-MHz solution 13
C NMR spectrum of acryP123 following a typical
conversion of the type shown in the right side of Scheme 1. The spectrum was obtained with
gated decoupling to minimize Nuclear Overhauser effects. In order to preserve the structure-
directing capabilities of P123, we targeted ca. 50% conversion of hydroxyl groups to acrylate or
styrenate groups in the respective acryloyl chloride or vinyl benzyl chloride reactions. In other
words, we wanted an average of one acrylate/styrenate unit and one hydroxyl chain end per
acryP123 or styrP123 molecule. From Figure 3.1, which compares the starting P123 spectrum to
the product acryP123, one observes based on the relative intensities of the 60, 67, 124, and 128
ppm end-group peaks in the two spectra that this target was, on average, achieved. Note that the
starting P123 in Figure 3.1 has only the characteristic 60-ppm end group peak for the methylene
group adjacent the terminal hydroxyl. FTIR spectra (not shown here) clearly showed the acrylate
carbonyl stretch at 1725 cm-1
after functionalization and purification.
Block copolymer d-spacing (100)
Å
BET Surface area
(m2/g)
Pore size
(Å)
SBA15_P123 100.40 945 32
SBA15_acryP123 113.10 930 30
SBA15_styrP123 108.90 1146 32

81
Similarly, Figure 3.2 shows the comparable 600-MHz solution 13
C NMR spectrum of
styrP123 following a typical conversion of the type shown in the right side of Scheme 1. The
peaks in the inset demonstrate that on average, the reaction conditions yielded about 50%
functionalization of the hydroxyl end groups on P123.
200 190 180 170 160 150 140 130 120 110 100 90 80 70 60 50 40 30 20 10 0
160 140 120
60 55
Chemical Shift (ppm)
OO
OO
OOH
O
60
17
128
124
166
64
x-1 x-1y
Figure 3.1. 600 MHz 13
C solution NMR spectrum acquired with 1H decoupling of (bottom)
pure P123 starting material and (top) acrylate-functionalized acryP123 following reaction
according to Scheme 1. End group signals are shown in the acryP123 inset, exhibiting the
characteristic vinyl signals between 120 and 130 ppm.

82
200 190 180 170 160 150 140 130 120 110 100 90 80 70 60 50 40 30 20 10 0
Chemical Shift (ppm)
130 120
60
64
x-1 x-1y
113.6
128.6 136.1
138
127.9
137.1
OO
OO
OOH
17
3.2.6 Preparation of polymer nanocomposites from acryP123 (or styrP123) and
SBA15acryP123 or SBA15styrP123. Polymer nanocomposites were obtained by
polymerization of acrylate (shown in Scheme 3.2) or styrenated- P123 (shown in Scheme 3.3) via
free radical polymerization method. To prepare control materials of reacted acrylated-P123 or
styrenated P123 in the absence of mesoporous silica SBA15, 1 g of acrylated-P123 (or
styrenated-P123) was dissolved in 1 ml of dry THF. The vial was purged with ultra-high purity
argon to remove any oxygen. To this, 0.1 wt. % (with respect to the organic content) azobis-
isobutyronitrile (AIBN) was added and the temperature was then raised to 75-80oC. The reaction
mixture was stirred for 30 minutes. The solvent was evaporated and the trace amount of solvent
Figure 3.2. 600 MHz 13
C solution NMR spectrum acquired with 1H decoupling of (bottom) pure
P123 starting material and (top) styrene-functionalized styrP123 following reaction according to
Scheme 1. End group signals are shown in the styrP123 inset, exhibiting the characteristic
styrene between 125 and 140 ppm.

83
was removed in vacuum oven at room temperature. As described below, a cross-linked polymer
network was obtained from this control reaction. Table 3.2 below shows the composition of the
silica and acryP123 to synthesize polymer nanocomposite with different organic contents.
Table 3.2 Composition of polymer nanocomposites
Composites from SBA15_acryP123
SBA15_acryP123
(g)
acryP123
(g)
Polymer composite with 30% organic content 0.1 -
Polymer composite with 80% organic content 0.1 0.18
Polymer composite with 90% organic content 0.1 0.60
Polymerized acryP123 - 0.1
An essentially identical procedure was used when generating the composites or
composite networks, except that the starting material was the dried as-synthesized
SBA15acryP123 or SBA15styrP123 product. As synthesized, SBA15acryP123 or
SBA15styrP123contains 30-wt. % acrylated- or styrenated- P123, to which was added additional
acryP123 or styrP123 in dry THF that would react with the silica-bound template molecules to
generate the desired organic content nanocomposite. Subsequently, 0.1 wt. % (with respect to the
organic content) azobis-isobutyronitrile (AIBN) was added and the temperature was then raised to
75-80oC. The reaction mixture was stirred for 15 minutes. We successfully prepared 10 and 20
wt% silica content composites/composite networks using this one-pot strategy.

84
3.3 Linear Viscoelastic Measurements. Linear viscoelastic measurements were performed with
a Rheometric Scientific RSA II to measure loss and storage moduli as a function of strain using
oscillating compression geometry. 10-mm parallel plate fixtures were used and measurements
were made at room temperature with a gap size of ca.1.2 mm dimensions which are in the range
where such measurements are expected to give G’ and G”.13
Walberer and McHugh describe
how force data from this type of measurement was converted to G’ and G” by making the
lubrication approximation;12
however no instrumental inertia correction was required for this
diameter plate according to instrument readings as well as data supplied by the manufacturer.
3.4 Small-Angle X-ray Scattering Measurements. Small-angle X-ray scattering measurements
were made in transmission with a SMax-3000 from Rigaku equipped with a CuKα source and a
10 cm x 10 cm 2-D wire detector placed approximately 150 cm from the sample position. Silver
behenate was used to determine the exact pixel to q (q=4sin/; =0.5*scattering angle, =1.54
Å) conversion. Data were also corrected for pixel-to-pixel intensity variations as measured via
exposing the plate to radiation emanating from an 55
Fe source.
Scheme 3.2 Scheme 3.3

85
3.5 Results and Discussion
3.5.1 Generating mesoporous silica from the functionalized non-ionic template/macromers.
Nonionic triblock copolymers based on polyethylene oxide and a central polypropylene oxide
block, denoted here as PEO-PPO-PEO and commonly referred to by their Pluronic trade name,
have garnered widespread attention for synthesis of SBA-15 mesoporous silicas.14, 15
Here, we use
Pluronic P123 (P123), HO-(PEO)20-(PPO)70-(PEO)20-H, as the template for SBA-15 formation,
but employ functionalization methods to convert one end group to a reactive olefinic moiety.
Vinyl benzyl chloride or acryloyl chloride, when reacted with P123 as described above in Scheme
1 and in the Experimental section, yields bifunctional styrP123 or acryP123, respectively.
Reaction stoichiometries were selected to convert approximately one hydroxyl end-group per
P123 chain, as described in Figures 3.1 and 3.2. In this way, each modified P123 is rendered
bifunctional, and capable of subsequent polymerization through the olefinic end groups with
surrounding template molecules, effectively as macromers. Given that the structure-directing
characteristics of styrP123 and acryP123 are not known, we first established that both non-ionic
surfactant macromers preserves P123’s mesoporous silica structure-directing capabilities.
Standard literature synthesis conditions14
for SBA-15, using in separate experiments P123 versus
styrP123 versus acryP123, yielded mesoporous materials both before and after calcination that
are by all measures have shown the similar peaks. Figure 3.3 compares the powder SAXS results
from materials synthesized using the control P123 (3.3a, 3.3d), the modified styrP123 (3.3b), and
acryP123 (3.3e) prior to calcinations. Both the styrP123 and acryP123 materials exhibit the
specific diffraction peaks consistent with published SBA-15 topologies. Finally, Figures 3.3c and
3.3f show the results for the X-ray scattering in the polymerized composite, i.e., after reaction in
which the styrP123 or acryP123 template macromers form the polymeric phase as shown in
Schemes 3.2 and 3.3. Clearly, the mesoporous ordered silica structure is preserved following
polymerization. Additional information about the polymerization step is discussed below.

86
While creating calcined mesoporous silicas is not the end goal, the BET surface areas
and pore size distributions following calcination are key indicators that the modified templates
still function as templates, and compliment the SAXS data discussed above The styrenic group on
one end of the styrP123 templates does not alter the ability to form micelles in the aqueous
environment, or to template crystallization of ordered mesoporous silica due to the fact that it
produces the high surface of the calcined and dried styrP123SBA material.
For acryP123 template synthesis, the resulting mesoporous silica surface area was 930
m2/g which is similar to that expected for SBA-15 structures synthesized from the
unfunctionalized P123. Average pore diameters, and pore size distributions, were measured via
BJH N2 adsorption/desorption experiments16
and were essentially similar for P123, styrP123, and
acryP123-templated silicas. Average pore diameters were 3.2, 3.2, and 3.0 nm, respectively.
Figure 3.4 shows the adsorption-desorption profiles (on left) and pore size distribution (on right)
of mesoporous silica SBA15, SBA15_acryP123, and SBA15_styrP123.
Figure 3.3. SAXS data for (a) SBA15P123; (b) SBA15_styrP123; (c) SBA15_styrP123 after
polymerization of the astyrP123; (d) same as (a); (e) SBA15_acryP123; and (f) SBA15_acryP123
following polymerization. Diffractograms in (c) and (f) were acquired without calcination, and thus in
the presence of the polymer product in and around the silica mesopores.
d
e
f
a
b
c

87
0
200
400
600
800
0 0.2 0.4 0.6 0.8 1Relative pressure (p/po)
Volu
me
@ S
TP
(cc
/gm
)
a
0
0.04
0.08
0.12
0.16
10 20 30 40 50 60Radius (Ao)
Volu
me
adso
rbed
(cc
/Ao/g
) d
0
200
400
600
800
0 0.2 0.4 0.6 0.8 1
Volu
me
@ S
TP
(cc
/gm
)
Relative presssure (p/po)
b
0
0.02
0.04
0.06
0.08
0.1
0.12
10 20 30 40 50 60
Radius (Ao)
Volu
me
adso
rbed
(cc
/Ao/g
) e
0
200
400
600
800
0 0.2 0.4 0.6 0.8 1Relative pressure (p/po)
Volu
me
at S
TP
(cc
/gm
)
c
0
0.01
0.02
0.03
0.04
0.05
10 20 30 40 50 60
Radius (Ao)
Volu
me
(cc/
Ao/g
m)
f
Figure 3.4. Adsorption-desorption curves (on left) and pore size distribution (on right) of
SBA15_P123 (a, d); SBA15_acryP123 (b, e); and SBA15_styrP123 (c, f) respectively.

88
Figures 3.5a-c shows representative TEM results for SBA-15 prepared from P123 in the
traditional manner (SBA15_P123), SBA-15 prepared from acryP123 (SBA15_acryP123), and
SBA-15 prepared from styrP123 (SBA15_styrP123). In all three cases, the characteristic ca. 4
nm hexagonally-arrayed channels are observed. Again, the goal with these detailed
characterizations is to show that modified surfactant macromers preserve SBA-15 templating,
while providing the added post-synthetic polymerization capability needed to form a continuous
organic phase both within and outside of the mesoporous silica particles. Note that the scale for
Figure 3.5b and 3.5c is twice that shown in 3.5a.
The SBA15_acryP123 and SBA15_styrP123 composites, as synthesized, contain 30 wt%
organic content as defined by the initial surfactant/TEOS reaction stoichiometry. However,
adding additional acryP123 or styrP123 added at the time of polymerization yields final products
with much higher organic content. In this way, we have systematically and repeatedly generated
composites with up to 20 wt% silica content, as verified by TGA analysis on the final washed and
dried products. Representative TGA results for the composites made from SBA15_acryP123
(i.e., the same dried starting materials used to generate the swollen samples in Figure 3.7) are
shown in Figure 3.6, with silica contents of 0, 10, 20, and 70 wt%. Figure 3.6a also shows the
control experiment for the polymerization of pure acryP123; similar results were obtained for
styrP123-generated composites.
20 nm
a b
a
c
a
Figure 3.5. TEM micrographs for (a) SBA15P123, (b) SBA15_acryP123, and (c)
SBA15_styrP123. Images (a) is at , at 100,000 magnification, while (b) and (c) is at 50,000
magnification.
40 nm 40 nm

89
Shown in Figure 3.7 are a series of solvent-swelling images in tetrahydrofuran,
comparing pure acryP123 and composites derived from polymerizing acryP123 in the
mesoporous host. From Figure 3.7a, we observe that there is essentially no swelling for
acryP123, but polymerized acryP123 (3.7b) exhibits a large volume-swelling ratio. The
organic/inorganic composites prepared from the polymerization of the acryP123 are shown in
3.7c-3.7e; all exhibit significant solvent swelling and none were soluble in any common solvent.
Figure 3.6. TGA results for polymer nanocomposites made using acryP123 composites with a)
0% b) 10 % ; c) 20 %; and d) 70 wt% silica content.

90
Figure 3.8 shows a similar set of CP/MAS results for the acryP123/SBA15 system
reveals that polymerization of the acryP123 templates takes place inside and around the SBA-15.
The 30 wt% composite in 3.8b exhibits a complex, broad signal for the carbonyl group, ranging
from 164-180 ppm, which is absent in the unpolymerized sample (3.8a), and is also not visible in
the higher organic content composite in 3.8c. This indicates that the polymerization does occur
between adjacent macromers within the constrained SBA-15 channels in the as-prepared
composite, prior to adding any additional acryP123, which is important since polymer chain
connectivity through the SBA-15 channels is required if the organic phase is to be continuous
throughout the material. Again, the swollen network results in Figure 3.7c clearly indicate that
polymerization has also occurred outside of the SBA-15 channels as well even for the 30 wt%
composite to which no additional acryP123 was added prior to polymerization. The carbonyl
signals are not observed in the CP spectrum of composite with 80 wt% of organic content as the
bulk-averaged behavior of organic phase is much more mobile than the 30 % material, the latter
of which has the majority of its chain density within the SBA-15 channels.
Figure 3.7. Images acquired for THF-swollen of polymer nanocomposites using acryP123 (on
left) and styrP123 (on right) of a) respective functionalized P123 i.e. acryP123 on left and
styrP123 on right b) 0% c) 70 % t; d) 10 %; and e) 20 wt% silica content
a b c d e a b c d e

91
200 180 160 140 120 100 80 60 40 20 0
Chemical Shift (ppm)
The rheological experiments i.e. strain sweep and frequency sweep were performed at
room temperature on a parallel plate RSAII rheometer from TA instruments on both acryP123
(Figure 3.9) and styrP123 (Figure 3.10) nanocomposites. Linear viscoelastic regimes (LVR)
were experimentally determined at 1Hz frequency with variable strain measurements (0.01 to
10%). The top row of Figure 3.9 shows that the LVR of the nanocomposites are in between
0.01% to 0.15% strain of acryP123 nanocomposites. In accordance with the strain sweep data,
frequency sweep data was then collected at 0.15% strain and is shown in the bottom row of
Figure 3.9. The frequency sweep data indicates that the modulus increases as the increase in
content of silica of polymer nanocomposites. Also, the storage and loss modulus of the
Figure 3.8. Solid-state 1H
13C CP (cross-polarization)/MAS spectra for (a) the acryP123
template in uncalcined SBA-15 following synthesis but prior to polymerization, (b) the
organic fraction generated by polymerizing the acryP123 structure-directing agents inside and
around the SBA-15 following crystallization, corresponding to a 30 wt% polymer composite,
and (c) same starting material as in (a) but with additional acryP123 added prior to
polymerization, resulting in a polymerized composite with 80 wt % organic fraction .
-CH3
C=O
a.
b.
c.
-OCH2 -

92
nanocomposites are independent of the frequency which draws the conclusion that the chemistry
leads to the formation of perfectly network nanocomposites.
100
1000
10000
100000
1000000
0.001 0.01 0.1 1 10%Strain
G'
a
b
c
100
1000
10000
100000
1000000
0.001 0.01 0.1 1 10%Strain
G"
a
b
c
100
1000
10000
100000
1000000
0.1 1 10 100Frequency (rad/s)
G'
a
b
c
100
1000
10000
100000
1000000
0.1 1 10 100
G"
Frequency (rad/s)
a b
c
Figure 3.9. Storage moduli (G’) and loss moduli (G”) collected from strain sweep (top row) and
frequency sweep (bottom row) of acryP123 nanocomposite networks with a) 0%, b) 10%, and
c) 20 wt% silica content.

93
3.6 Conclusions
A novel route to organic/inorganic composite materials has been introduced, which
utilizes end-group functionalization of existing structure-directing agents to enable self-assembly
synthetic methods that generate intimately-mixed nanocomposites. Using acrylate- or styrenate-
functionalized P123 as a template, we have shown that crystallization of SBA-15 is preserved but
that following the crystallization, the template readily polymerizes to form a composite
100
1000
10000
100000
1000000
0.001 0.01 0.1 1 10
%Strain
G'
a
b
c
100
1000
10000
100000
1000000
0.001 0.01 0.1 1 10
% Strain
G"
a
b
c
100
1000
10000
100000
1000000
0.1 1 10 100
G'
Frequency (rad/s)
a
b
c
100
1000
10000
100000
1000000
0.1 1 10 100
G"
Frequency (rad/s)
a
b
c
Figure 10. Storage moduli (G’) and loss moduli (G”) collected from strain sweep (top row) and
frequency sweep (bottom row) of styrP123 nanocomposite networks with a) 0%, b) 10%, and
c) 20 wt% silica content.

94
containing high molecular weight polymer filling and surrounding the SBA-15 crystallites in an
intimately mixed arrangement. The acrylate-functionalized P123/styrenated-functionalized P123
route also introduces network properties to the nanocomposites. The network showed increase in
storage and loss modulus with increase in silica content. This new self-assembly approach has
driven us to synthesize new non-ionic polymer surfactant molecules that are not based on P123,
but include polyethylene oxide, polycaprolactone, and polylactide blocks with end group
functionalization to telechelic macromers. Such telechelics should enable synthesis of polymer
composites that are both biocompatible and truly bioremedial. These new materials, as well as
thorough investigations of physical and mechanical properties for the composites described here,
will be discussed in the next chapter.
3.7 References
1. Abdalla, Z. E. A.; Li, B.; Tufail, A. Direct Synthesis of Mesoporous
(C19H42N)4H3(PW11O39)/SiO2 and its Catalytic Performance in Oxidative Desulfurization.
Colloids Surfaces A: Physicochem. Engineer. Aspects 2009, 341, 86-92.
2. Ooi, Y.S.; Bhatia, S. Aluminum-Containing SBA-15 as Cracking Catalyst for the Production
of Biofuel from Waste Used Palm Oil. Microporous Mesoporous Mat. 2007, 102, 310-317.
3. Pasqua, L., Cundari, S.; Ceresa, C.; Cavaletti, G. Recent Development, Applications and
Perspectives of Mesoporous Silica Particles in Medicine and Biotechnology. Current Med.
Chem. 2009, 16, 3054-3063.
4. Zornoza, B., S.; Irusta, C.; Tellez; Coronas, J. Mesoporous Silica Sphere Polysulfone Mixed
Matrix Membranes for Gas Separation. Langmuir, 2009, 25, 5903-5909.
5. Zou, H.; Wu,S.; Shen, J. Polymer/Silica Nanocomposites: Preparation, Characterization,
Properties, and Applications. Chem. Rev. 2008, 108, 3893–3957.

95
6. Burkett, S. L.; Sims, S. D.; Mann, S. Synthesis of Hybrid Inorganic-Organic Mesoporous
Silica by Co-condensation of Siloxane and Organosiloxane Precursors. Chem. Commun.
1996, 1367 –1368.
7. Macquarrie, D. J. Direct Preparation of Organically Modified MCM-41 type Materials.
Preparation and Characterization of aminopropyl-MCM and 2-Cyanoethyl-MCM. Chem.
Commun. 1996, 1961 – 1962.
8. Kruk, M.; Dufour, B.; Celer, E. B.; Kowalewski, T.; Jaroniec, M.; Matyjaszewski, K.
Grafting Monodisperse Polymer Chains from Concave Surfaces of Ordered Mesoporous
Silicas. Macromolecules 2008, 41, 8584-8591.
9. Audouin, F.; Blas, H.; Pasetto, P.; Beaunier, P.; Boissière, C.; Sanchez ,C.; Save, M.;
Charleux , B. Structured Hybrid Nanoparticles via Surface-Initiated ATRP of Methyl
Methacrylate from Ordered Mesoporous Silica. Macromol. Rapid Comm. 2008, 29, 914-921.
10. Anwander, R.; Nagl, I.; Zapilko, C.; Widenmeyer, M. Methyl Methacrylate Polymerization at
Samarium(II)-Grafted MCM-41. Tetrahedron 2003, 59, 10567-10574.
11. Landry, C. J. T.; Coltrain, B. K.; Brady, B. K. In-Situ Polymerization of Tetraethylorthosilane
in Poly(methyl methacrylate): Morphology and Dynamic Mechanical Properties. Polymer
1992, 33, 1486-1495.
12. Petrovic, Z. S.; Javni, I.; Waddon, A.; Banhegyi, G. Structure and Properties of
Polyurethane–Silica Nanocomposites. J. Appl. Polym. Sci. 2000, 76, 133-151.
13. Walberer, J. A.; McHugh, A. J. The Linear Viscoelastic Behavior of Highly Filled
Poly(dimethylsiloxane) Measured in Shear and Compression. J. Rheol. 2001, 45, 187-201.
14. Zhao, D.; Feng, J.; Huo, Q.; Melosh, N.; Fredrickson, G. H.; Chmelka, B. F.; Stucky, G. D.
Triblock Copolymer Syntheses of Mesoporous Silica with Periodic 50 to 300 Angstrom
Pores. Science 1998, 279, 548-552.
96
15. Ruthstein, S.; Schmidt, J.; Kesselman, E.; Talmon, Y.; Goldfarb, D. Resolving Intermediate
Solution Structures During the Formation of Mesoporous SBA-15. J. Am. Chem. Soc. 2006,
128, 3366-3374.
16. Tompsett, G. A.; Krogh, L.; Griffin, D. W.; Conner, W. C. Hysteresis and Scanning Behaviour
of Mesoporous Molecular Seives. Langmuir 2005, 21, 8214-8225.

97
CHAPTER IV
CREATING POLYMER TEMPLATES AND THEIR USE IN THE
IN-SITU SYNTHESIS OF BIODEGRADABLE NANOCOMPOSITES
Abstract. A biodegradable polyethyleneoxide-polycaprolactone-polyethyleneoxide (PEO-PCL-
PEO or PECE) triblock polymer was synthesized as a structure-directing agent for high-surface
area silica formation. Systematic end-group functionalization of the triblock polymer, prior to its
use as a structure-directing agent for high-surface area silica growth, imparts an additional
reactive function that is exploited to grow a continuous organic phase within and around the silica
particles. With this strategy, the biodegradable triblock is both a template and a macromer whose
dual function leads to in-situ generation of an intimately mixed biopolymer/nanoporous-silica
nanocomposite that is biodegradable and in theory biocompatible, and whose modulus is
comparable to other non-biodegradable materials.

98
4.1 Introduction
Creating new hybrid materials able to satisfy multiple performance constraints in
engineering, biomedical, and consumer product applications requires novel synthetic strategies.
Polymer composites, or nanocomposites, composed of natural or synthetic polymers and natural
or synthetic siliceous sources, including clays, have been targeted as promising materials during
the last decade.1,2
Most commonly, silica-based composites are prepared via sequential synthetic
schemes, in which the silica component is prepared separately, and then mixed with the organic
components to create the composite. Achieving homogeneous and intimately mixed distributions
of the organic and inorganic constituents is challenging, especially for cases where the polymer
(at its final molecular weight) and inorganic reinforcing agent of choice are combined via melt- or
solvent-mixing. This limitation may be addressed by introducing the monomer and completing
the polymerization in the presence of the inorganic reinforcing agent3-7
or by grafting the
mesoporous silica particles together using the organic-phase monomer.9-11
One area where
composites are poised to have increased impact is in the design of materials that are
biocompatible and biodegradable. New synthetic routes for in-situ/self-assembled preparation of
composites from constituent precursors could enable new applications.
In this contribution, we propose an alternative approach where both the inorganic and
organic phases self-assemble from their respective building blocks, each in the presence of the
other, thereby ensuring an intimately mixed homogeneous product that cannot phase segregate.
Unlike previous reports, there is no chemical grafting to the interior or exterior of the nanoporous
silica surface, nor is there any separation of the components at any time during the synthesis. A
key component of this work is the creation of polymerizable biodegradable structure-directing
agents that can template formation of high-surface area mesoporous silica, and react with other
template molecules to generate a biodegradable organic network through, around, and in between
the silica particles in an in-situ approach. The concept of functional and reactive surfactants,12

99
often referred to as “surfmers”,13-15
is not new in the field of micelle polymerization, but their
successful application to synthesis of ordered silica-based composite materials has been limited to
ionic small-molecule templates.16,17
Non-ionic, biodegradable, biocompatible macromolecular
surfactants that serve both the structure-directing and “monomer” role, and whose structure and
reactivity can be controlled through rational end-group chemistries, have not been reported. In
this contribution, we describe the synthesis and application of end-group functionalized EO23-
CL16-EO23 (polyethylene oxide-polycaprolactone-polyethylene oxide or PECE-4K, where 4K
denotes the molecular weight of the template) and EO45-CL16-EO45 (PECE-6K) triblock
polymers, which serve the dual function of both template and macromer in chemistry that leads to
hybrid nanocomposite biomaterials. After nanoporous silica particles form around the triblock
polymer micelles, the triblock polymer chains can react to yield a high molecular-weight
continuous phase originating from within the mesoporous silica channels. Details for the triblock
synthesis, functionalization, and nanocomposite formation are given in the following sections, as
well as preliminary information on the overall physical properties of the biopolymer
nanocomposite.
4.2 Experimental
4.2.1 Materials
Polyethylene glycols of Mn=2000 g/mol and Mn=1000 g/mol were purchased from Alfa
Aesar. Polycaprolactone diol (Mn=2000) was purchased from Sigma Aldrich and used as received
for triblock copolymer synthesis. Acryloyl chloride was purchased from Alfa Aesar. All organic
solvents were obtained from Pharmco-AAPER.
4.2.2 Characterization
Surface area of mesoporous silica was determined on Nova2200e Quantachrome
instruments. Transmission electron micrographs were acquired on JEOL JEM-2100 with Evex
EDS. Scanning electron micrographs were acquired from FEI Quanta 600 field emission gun

100
ESEM with Evex EDS and HKL EBSD. 400 MHz liquid NMR spectrometer (Varian) was used
to determine 1H NMR (in CDCl3) to determine the functionalized PECE at room temperature at
the spinning speed of 20Hz.
4.2.3 Synthesis of PECE-4K and PECE-6K triblock polymers. PECE synthesis was carried
out in solution, using as-received polycaprolactone diol (Sigma, molecular weight = 2000 g/mol)
and polyethylene glycol (Alfa Aesar, molecular weight = 1000 for PECE-4K and molecular
weight = 2000 g/mol for PECE-6K) as the primary reagents.18-20
In a typical synthesis, 2 mmol of
hexamethylene diisocyanate (HMDI) and 15 ml of dry toluene were mixed and heated to 60-65oC
under stirring and in an argon atmosphere. Then, 50 ml of a 1-mmol polycaprolactone-diol
solution was added drop wise for one hour. The reaction was heated to 80-85oC and held for 10
hours. This reaction produced polycaprolactone terminated on each chain end with a reactive
hexamethylene isocyanate group. Subsequent addition of 50 ml of a 2 mmol polyethylene glycol
solution, at temperature, yielded the triblock copolymer after 24 hours. (A one-pot synthesis
easily avoids the problem of moisture contamination and reaction of the polycaprolactone
hexamethylene isocyanate prepolymer, which leads to cross-linked gels). After isolation by
precipitation into diethyl ether, the polymer was dissolved in dichloromethane and re-precipitated
by slowly adding diethyl ether. The solvent was removed by rotary evaporation, followed by 24
hours at 50oC in a vacuum oven to remove any residual solvent. The triblock copolymer PECE
with 95% yield was isolated. The key step in the reliable synthesis of the triblock is the use of the
hexamethylene diisocyanate linker. The overall reaction is shown in Scheme 4.1 for the PECE-
4K system, and was similar for the PECE-6K synthesis.

101
Infrared spectroscopy on the isolated polycaprolactone product after reaction with HDMI,
but prior to ethylene glycol addition, showed the characteristic peak for the –N=C=O stretch at
2280 cm-1
, which disappeared after reaction with the ethylene oxide blocks. 1H solution NMR
confirmed that the triblock had been formed. Specifically, the ratio of the PEG CH2 hydrogen
signal to that of the CH2 group alpha to the PCL carbonyl carbon was 5.7:1, which is statistically
identical to the expected ratio of 5.65:1 for the EO23-CL16-EO23 (PECE-4K) product. The
molecular weight from NMR analysis of the PECE-6K also agreed with the theoretical
expectation for an EO45-CL16-EO45 triblock, in that the ratio of PEG CH2 hydrogen signal to that
of the CH2 group alpha to the PCL carbonyl carbon in PECE-6K was 11.25:1, statistically
identical to the expected 11.3:1. Complete infrared and quantitative NMR data are provided in the
appendix C1. Analysis of the peak areas for the amide hydrogen signal in the HDMI linker
Scheme 4.1. Synthesis of triblock copolymer PECE

102
confirms that there are four such hydrogens per polymer, again in agreement with expectations
for the triblock product as shown in Scheme 4.1.
4.2.4 PECE end-group functionalization to form acrylated-PECE. In order to render each
PECE chain reactive, the hydroxyl end groups were converted to an acrylate moiety. One
millimole of PECE (4K or 6K) was dissolved in 100 ml of dry toluene under a dry argon
atmosphere in a two-necked round bottom flask, to which was added 1.1 mmol of acryloyl
chloride and 1.1 mmol of triethyl amine. This reaction mixture was refluxed for 24 hours in inert
atmosphere. Triethylammonium chloride salt formed by the reaction was removed via filtration.
The filtrate containing acrylated PECE (4K or 6K) was then precipitated in cold hexane, followed
by dissolution in toluene and re-precipitation in cold hexane. The product was dried at room
temperature overnight in a vacuum oven. Functionalized PECE with 85% yiled was isolated.
NMR data provided in the appendix C2 confirm the presence of the acrylate moiety on the
PECE’s. The molar ratios were selected such that on average, one hydroxyl end-group per chain
would be functionalized, but of course the final product will be a mixture of chains containing
zero, one, and two acrylate end groups per chain.
4.2.5 PECE-templated porous-silica formation. The molar composition for the targeted
synthesis of mesoporous silica was tetraethoxyorthosilicate (TEOS) : PECE/acrylated-PECE :
HCl : H2O = 1: 0.016 : 5.54 : 182.82. PECE (2.76 gms for PECE4K and 4.14 gms for PECE6K)
was dissolved in 40 ml of tetrahydrofuran (THF), as this weight of copolymer is not completely
soluble in water. To this mixture was added 30 ml of deionized water, which as then stirred for
three hours. Subsequently, 113 ml of 2.1 M HCl was added dropwise to the solution. After
stirring for two hours, the solution was heated to 40oC and 9 g of TEOS was added, followed by
an additional 48 hours stirring. The mixture was then transferred to a Parr reactor and heated
under static conditions for 24-48 hours at 100oC. After cooling, the silica product was filtered
and washed with 40 milliters of THF, excess deionized water, and then dried on the bench

103
overnight. The same procedure was followed for pure PECE or acrylated-PECE. TGA
measurements showed that the as-prepared silica contained 14 wt% PECE6K. For the surface-
area and porosity characterization of the nanoporous silica discussed below, the PECE or
acrylated-PECE template was removed by calcination at 550oC.
4.2.6 Preparation of polymer nanocomposites from PECE/silica products. To prepare control
materials of reacted acrylated-PECE6K in the absence of porous silica, 1 g of acrylated-PECE6K
was dissolved in 1 ml of dry THF. The vial was purged with ultra-high pure argon to remove any
oxygen. To this, 0.1 wt. % (with respect to the organic content) azobis-isobutyronitrile (AIBN)
was added and the temperature was then raised to 75-80oC. The reaction mixture was stirred for
15 minutes. The solvent was evaporated and the trace amount of solvent was removed in vacuum
oven at room temperature. As described below, a cross-linked polymer network was obtained
from this control reaction. Table 4.1 below shows the composition of the silica and acryPECE to
synthesize polymer nanocomposite with different inorganic contents.
Table 4.1. Composition of polymer nanocomposites
Polymer
composites with
silica contents
MSacryPECE6k
(g) acryPECE6k (g)
0 - 1
7.5 0.1 3.34
5 0.1 1.62
10 0.1 0.76
12.5 0.1 0.588
15 0.1 0.473
An essentially identical procedure was used when generating the composites or
composite networks, except that the starting material was the dried as-synthesized PECE6K/silica
product. As synthesized, the starting composites contained 14-wt. % acrylated-PECE6K, to
which was added additional acrylated-PECE6K that would react with the silica-bound template
molecules to generate the desired organic content nanocomposite. Subsequently, 0.1 wt. % (with

104
respect to the organic content) azobis-isobutyronitrile (AIBN) was added and the temperature was
then raised to 75-80oC. The reaction mixture was stirred for 30 minutes. We successfully
prepared 5, 7.5, 10, 12.5, and 15 wt. % silica content composites/composite networks using this
one-pot strategy.
4.3 Linear Viscoelastic Measurements. Linear viscoelastic measurements were performed with
a Rheometric Scientific RSA II to measure loss and storage moduli as a function of temperature
using oscillating compression geometry. 10-mm parallel plate fixtures were used and
measurements were made at 60oC with a gap size of 1.2 mm, dimensions which are in the range
where such measurements are expected to give G’ and G”.21
Walberer and McHugh describe
how force data from this type of measurement was converted to G’ and G” by making the
lubrication approximation;21
however no instrumental inertia correction was required for this
diameter plate according to instrument readings as well as data supplied by the manufacturer.
4.4 Small-angle X-ray Scattering Measurements. Small-angle x-ray scattering measurements
were made in transmission with a SMax-3000 from Rigaku equipped with a CuKα source and a
10 cm x 10 cm 2-D wire detector placed approximately 150 cm from the sample position. Silver
behenate was used to determine the exact pixel to q (q=4sin/;=0.5*scattering angle,
=1.54 Å) conversion. Data were also corrected for pixel-to-pixel intensity variations as
measured via exposing the plate to radiation emanating from an 55
Fe source.
4.5 Results and Discussion
Two key questions must be addressed in order to determine if the in-situ and dual
structure-directing agent/macromer approach is a successful method for general application.
First, does the end group-functionalized PECE copolymer template the formation of high-surface
area silica?22,23
Second, are the acrylate end-groups sufficiently reactive and accessible to
generate a continuous organic phase using reasonable chemistry? In addition, one would like to

105
know if the overall organic content can be varied systematically, if the physical properties are
attractive, and if they track the composition distribution in a predictable manner. Triblock
copolymers made from ethylene-oxide and propylene oxide segments, known commercially as
Pluronics®, are well known as structure-directing agents in the synthesis of ordered mesoporous
silica, including SBA-15.17-19
These templates are usually removed from the porous silica
following its synthesis either by high-temperature calcination or chemical methods, and more
importantly, they are neither biocompatible, biodegradable, nor polymerizable macromolecules.
As described in the experimental section and Scheme 1, PECE molecular weights of 4K
and 6K were assembled from their constituents. Two different values were used to determine if
the average pore diameter of the resulting high-surface area silica could be varied, based on the
assumption that the size of the micelle formed by the PECE template depended on the molecular
weight. Results from nitrogen adsorption BET surface area measurements and BJH average pore
diameter calculations are given in Table 1 for silica made from the PECE and the acrylated PECE
macromers. The PECE templates were removed via calcination prior to surface area and porosity
characterization. Table 4.2 clearly shows the PECE structure-directing agents template the
formation of high-surface area silica, and the average pore diameter for the PECE-6K induced
synthesis exceeds that of the PECE-4K process. The surface areas reported in Table 1 are in the
expected range for mesoporous silicas; surface areas for known systems like MCM-4124-27
and
SBA-1528,29
are reported in the literature ranging from 700-1100 m2/g, depending on synthesis
conditions.

106
Silica product from: Surface area (m
2/g) Pore diameter (Å)
a
MS_PECE6K 730 36
MS_PECE4K 848 32
MS_acryPECE6K 952 40
MS_acryPECE4K 831 36
Figure 4.1 shows a representative adsorption/desorption isotherm and pore size
distribution for the silica product templated by the acrylated PECE-6K macromer. Similar results
were obtained for PECE-4K materials. The isotherm in 1a is consistent with Type IV behavior
and displays the characteristic hysteresis indicative of mesoporosity.30
Figure 1b indicates that the
average pore diameter is 38-39 Å, calculated using a BJH model to analyze the data.31,32
In answer
to the first posed question above, this new non-ionic surfactant PECE generates high-surface area
mesoporous silica with a narrow pore size distribution. To be more specific, the width of the pore
size distribution as measured by the width at half-height of the distribution in 1b was 2.5 Å in
radius, or 5 Å in pore/channel diameter. For the materials made with the PECE4K template, the
width at half-height of the pore diameter distribution was larger at 14 Å.
Table 4.2. BET surface area and pore volume results from nitrogen adsorption and
desorption techniques.
a. values calculated using BJH model.31

107
The results in Figure 4.1 are supported by representative TEM images of both the
PECE4K- and PECE6K-templated silicas, as shown in Figures 4.2a and 4.2b, in which 30-40 Å
channels (dark) and 150-160 Å thick walls are clearly distinguished. Small angle x-ray scattering
(SAXS) experiments were completed using an SMax3000 instrument, which has the ability to
detect scattering vectors in the range of 0.008-0.24 A-1
. For the PECE6K silica, a principal
scattering peak (2θ = 0.30o) is observed as shown in Figure 4.2d, which corresponds to the
scattering vector q = 0.021 A-1
or a long period spacing of 290 Å assuming Bragg’s law.
Similarly, the 2θ = 0.46o scattering angle for the PECE4K silica corresponds to a scattering vector
q = 0.033 A-1
or a long period spacing of 190 Å (Figure 4.2c). Together, these results indicate an
increased wall thickness for the silicas prepared from the new PECE templates, as compared to
traditional mesoporous SBA15, which exhibits a scattering vector q = 0.06A-1
and average pore
diameters of 38-40 Å.
Figure 4.1. (a) Nitrogen adsorption-desorption isotherm for calcined silica synthesized using the
non-ionic PECE-6K template, and (b) pore size distribution for the same material as in (a).
a. b.

108
A typical scanning electron microscopy (SEM) result is shown in Figure 4.3 for the same
PECE6K shown in Figure 4.2b, i.e., after calcination to remove the PECE6K template. Again, to
avoid confusion, the PECE template is only removed for analysis of the resulting silica by surface
area, SAXS, and microscopy methods. To make composites, the acrylated-PECE template is left
inside the channels of the silica so that it can react with other acrylated-PECE in order to form the
continuous organic phase. In the low magnification image shown in Figure 4.3a, one observes a
highly anisotropic particle shape, as was observed in most images. Typically, particle dimensions
Figure 4.2. TEM images for silica templated by (a) the PECE4K macromer and (b) the PECE6K
macromer, obtained following calcination to remove the PECE. The open channels/pores appear
dark in the image. SAXS results (wavelength = 1.54 Å) for silica (c) templated by PECE4K, and
(d) templated by PECE6K.
a.
b. d.
c. 100 nm
100 nm

109
appeared to range from 1-10 µm’s. More interesting is the high magnification image in 4.3b, in
which one observes porosity defined by wall dimensions (30-33 nm) that generally agree with
those reported in Figure 4.2, albeit with reduced accuracy relative to the TEM and SAXS results.
The key conclusion is that the acrylated-PECE templates the formation of a mesoporous silica,
and unless the PECE is removed by calcination, it will remain inside the mesoporous silica
available for subsequent polymerization reactions.
Control reactions using pure acrylated-PECE4K and acrylated-PECE6K were used to
address the second question, regarding reactivity of functionalized PECE surfactants. If AIBN-
initiated end-group chemistry does not lead to polymerization in the pure acrylated-PECE, then
polymerization of the PECE template/silica composites to form the extended nanocomposite
network will not work. The control reactions generated a viscous gel that was not soluble in
common solvents, but swelled in a manner consistent with formation of a cross-linked polymer
network. Such network formation is expected, given the presence of some di-acrylated PECE
chains, and similarly, there may also exist some completely unreacted chains due to template
molecules with no acrylate end groups. Given the successful end-group reactions in the pure
Figure 4.3. SEM images for silica templated by the acrylated-PECE6K macromer at (a) 20,000×
and (b) 210,000× magnification.
400 nm 5 µm a. b.

110
PECE controls, free radical polymerization of the PECE templates that are present within and
around the mesoporous silica hosts following silica synthesis generated a crosslinked
nanocomposite network in which the high-surface area silica particles were distributed
throughout the matrix. In all cases, as shown in Figure 4.4a, the resulting PECE/silica
nanocomposites swelled, but the overall swell ratio and solvent uptake capacities decreased with
increasing mesoporous silica incorporation.
Figure 4.4. (a) Images acquired for 1,4-dioxane swollen polymerized acrylated-PECE6K (far left)
and (proceeding to the right) its 5, 10, and 15 wt% silica nanocomposites following
polymerization. The black mark on each vial indicates the starting volume of the networked
material before swelling. (b) Solvent uptake capacities for polymerized pure acrylated-PECE6K
and its nanocomposite networks, where solvent uptake capacity is defined as (solvent mass/mass
swollen network)*100.
a.
a.
0
20
40
60
80
100
% S
olv
ent
up
tak
e ca
paci
ty
b.
PECE6K
5 wt%
10 wt%
15 wt%
a.

111
Linear viscoelastic regimes for rheological experiments were determined at 1 Hz
frequency with variable strain measurements (0.01 to 10%). The top row of Figure 4.5 shows
that the linear viscoelastic region of the nanocomposite materials is in the 0.01% to 1% strain
region. In accordance with the strain sweep data, frequency sweep data was then collected at
0.15% strain and is shown in the bottom of Figure 4.5. The frequency sweep data indicates that
the modulus increases almost 2 orders of magnitude with the addition of 15 wt. % silica.
Considering the case of no added silica, the terminal behavior at low frequency does not reach
that of a linear polymer (G’ ~ w2 and G” ~ w on a log scale) but also does not reach that of a
highly crosslinked polymer either. Also, there is no evidence of a percolation transition in this
data, as shown in Figure 4.6, since the modulus increases almost linearly with loading in the
logarithmic plot. Adding silicas of various types are known to improve the modulus in polymers;
at this first stage in the project it appears that having the silica formed in-situ in the composite
does not necessarily result in a lower percolation threshold relative to traditional mixing.
Theoretical calculations predict that 30 wt. % silica is required to reach the percolation threshold,
which is above the 15 % limit here, but reports vary widely as to actual amounts required.33

112
Figure 4.5. Storage moduli (G’) and loss moduli (G”) collected from strain sweep (top row)
and frequency sweep (bottom row) of (♦) polymerized PECE6K; (▲) polymer
nanocomposite network with 5, (Δ) 7.5, (●) 10, (○) 12.5 , and (■) 15 wt. % silica content.

113
From the experimental results described above, we propose the schematic in Figure 4.7
to depict a molecular view of the chemistry leading to the nanocomposite network formation.
TEOS molecules organize around the PECE polymer micelles in the synthesis gel, and slowly
react in the acidic solution to form the covalent silica network. The PECE polymer molecules
remain in the channels and voids of the silica, and react with one another and additional PECE
polymers (depending on the desired organic content) at the time the AIBN initiator is added.
Because both monofunctional and bifunctional acrylated-PECE polymers exist in the reaction
mixture, the organic phase is a branched and cross-linked network, as illustrated in Figure 4.7.
Again, if the PECE is removed prior to network reactions via calcination, then the ca. 900 m2/g
silica is available for other uses.
1
10
100
1000
10000
100000
1000000
0 5 10 15 20
G'
(Pa)
% Silica
Figure 4.6. Plot of storage modulus G’ (log scale) taken at 1 rad/s
versus weight percentage of silica for nanocomposites prepared in-
situ using the PECE6K template. Data were acquired at 60oC.

114
4.6 Conclusions
A new ethylene oxide/caprolactone based biomacromolecular surfactant was synthesized
and converted to a reactive macromer via acrylate end group functionalization. The resulting
triblock polymers organize the formation of high-surface area silica around their micelles,
ultimately leading to the growth of hybrid organic/inorganic building blocks that can react via
free-radical polymerization to form nanocomposite networks. Crosslinking occurs due to the
presence of diacrylate-functionalized triblocks, and when this occurs in the presence of the
Figure 4.7. General schematic representation of self-assembly and synthesis of polymer composites using
acrylated-PECE macromer templates. After organization of the mesoporous silica matrix occurs,
polymerization between PECE macromers takes place within and outside of those particles. The small
orange circles in the lower left frame of the reaction scheme are an idealized representation of individual
particles in the network, which of course are not regularly arrayed as shown. Cross-linking to form
networks occurred due to the reactivity of macromers that contain acrylate groups on both chain ends.

115
macromer/high-surface area silica products, the resulting nanocomposite network has a
distribution of purely covalent nodes as well as nodes formed by the functional silica particles
themselves. The resulting storage and loss moduli show significant increases as the silica content
increases. The final composite should be both biodegradable and biocompatible given that its
constituents are based on ethylene oxide and caprolactone, and future work will focus on
exploring applications that exploit these properties.
4.7 References
1. Wight, A. P; Davis, M. E. Design and Preparation of Organic-Inorganic Hybrid Catalysts.
Chem. Rev. 2002, 102, 3589-3614.
2. Bitinis, N.; Hernandez, M.; Verdejo, R.; Kenny, J. M.; Lopez-Manchado, M. A. Recent
Advances in Clay/Polymer Nanocomposites. Adv. Mater. 2011, 23, 5229-5236.
3. He, J.; Shen, Y.; Evans, D. G.; Duan, X. Nanocomposite Structure Based on Silylated MCM-
48 and Poly(vinyl acetate). Chem. Mater. 2003, 15, 3894-3902.
4. Landry, C. J. T.; Coltrain, B. K.; Brady, B. K. In-situ Polymerization of Tetraethylorthosilane
in Poly(methyl methacrylate): Morphology and Dynamic Mechanical Properties. Polymer
1992, 33, 1486-1495.
5. Xu, L.; Hiroyoshi, N.; Evangelos, M.; Ramanan, K. Tailored Nanocomposites of
Polypropylene with Layered Silicates. Macromolecules 2009, 42, 3795-3803.
6. Rovira-Truitt, R.; Patil, N.; White, J. L. Synthesis and Characterization of Biopolymer
Composites from the Inside Out. Macromolecules 2009, 42, 7772-7780.
7. Choi, M.; Kleitz, F.; Liu, D.; Lee, H. Y.; Wha-Seung, A.; Ryoo, R. Controlled Polymerization
in Mesoporous Silica Toward the Design of Organic-Inorganic Composite Nanoporous
Materials. J. Am. Chem. Soc. 2005, 127,1924-1932.
8. Lunn, J. D.; Shantz, D. F. Peptide Brush-Ordered Mesoporous Silica Nanocomposite
Materials. Chem. Mater. 2009, 21, 3638-3648.

116
9. Kruk, M.; Dufour, B.; Celer, E. B.; Kowalewski, T.; Jaroniec, M.; Matyjaszewiski, K.
Grafting Monodisperse Polymer Chains from Concave Surfaces of Ordered Mesoporous
Silica. Macromolecules 2008, 41, 8584-8591.
10. Pasetto, P.; Blas, H.; Audouin, F.; Boissiere, C.; Sanchez, C.; Save, M.; Charleux, B.
Mechanistic Insight into Surface- Intiated Polymerization of Methyl methacrylate and
Styrene via ATRP from Ordered Mesoporous Silica Nanoparticles. Macromolecules 2009, 42,
5983-5995.
11. El Kadib, A.; Katir, N.; Finiels, A.; Castel, A.; Marcotte, N.; Molvinger, K.; Biolley, C.;
Gaveau, P.; Bousmina, M.; Brunel, D. Mesostructured Fatty Acid-Tethered Silicas: Sustaining
the Order by Co-templating with Bulky Precursors. Dalton Trans. 2013, 42, 1591-1602.
12. Hsu, Y-C.; Hsu, Y-T.; Hsu, H-Y.; Yang, C-M. Facile Synthesis of Mesoporous Silica SBA-15
with Additional Intra-Particle Porosities. Chem. Mater. 2007, 19, 1120-1126.
13. Summers, M.; Eastoe, J. Applications of Polymerizable Surfactants. Adv. Colloid Interface
Sci. 2003, 100–102, 137-152.
14. Dreja, M.; Tieke, B. Microemulsions with Polymerizable Surfactants γ-ray Induced
Copolymerizations of Styrene and 11-(acryloyloxy)undecyltrimethyl ammonium bromide in
Three Component Cationic Microemulsion. Macromol. Rapid Commun. 1996, 17, 825-833.
15. Li, T. D.; Gan, L. M.; Chew, C. H.; Teo, W. K.; Gan, L. H. Preparation of Ultrafiltration
Membranes by Direct Microemulsion Polymerization Using Polymerizable Surfactants.
Langmuir 1996, 12, 5863-5868.
16. Li, G. T.; Bhosale, S.; Li, F. T.; Zhang, Y. H.; Guo, R. R.; Zhu, H.; Fuhrhop, J. H. Template
Synthesis of Functionalized Polystyrene in Ordered Silicate Channels Chem. Comm. 2004,
15, 1760-1761.
17. Li, G. T.; Bhosale, S.; Li, F. T.; Wang, T. Y.; Zhang, Y.; Zhu, H.; Fuhrhop, J. H. Gram-Scale
Synthesis of Submicrometer-Long Polythiophene Wires in Mesoporous Silica Matrices.
Angew. Chem. Int. Ed. 2003, 42, 3818-3821.

117
18. Petrova, S.; Miloshev, S.; Mateva, R.; Iliev, I. Synthesis of amphiphilic PEG-PCL-PEG
triblock copolymers. J. Univ. Chem. Tech. and Metallurgy 2008, 43, 199.
19. Hwang, M. J.; Joo, M. K.; Choi, B. G.; Park, M. H.; Hamley, I. W.; Jeong, B. Multiple Sol-
Gel Transitions of PEG-PCL-PEG Triblock Copolymer Aqueous Solution Macromol. Rapid
Commun. 2010, 31, 2064.
20. Hwang, M. J.; Suh, M. J.; Bae, Y. H.; Kim, S.W.; Jeong, B. Caprolactonic Poloxamer
Analog: PEG-PCL-PEG. Biomacromolecules 2005, 6, 885-890.
21. Walberer, J. A.; McHugh, A. J. The Linear Viscoelastic Behavior of Highly Filled
Polydimethylsiloxane Measured in Shear and Compression. J. Rheol. 2001, 45, 187-201.
22. Li, J. G.; Chang, Y. H.; Lin, Y. S.; Kuo, S. W. Templating Amphiphilic Poly(ethylene oxide-b-
ε-caprolactone) Diblock Copolymers Provides Ordered Mesoporous Silicas With Large
Tunable Pores. RSC Adv. 2012, 2, 12973-12982.
23. Li, J. G.; Kuo, S. W. Phase Behaviour of Mesoporous Nanostructures Templated by
Amphiphilic Crystalline Diblock Copolymers of Poly(ethylene oxide-b-ε-caprolactone). RSC
Advances 2011, 1, 1822–1833.
24. Beck, J. S.; Vartuli, J. C.; Roth, W. J.; Leonowicz, M. E.; Kresge, C. T.; K., Schmitt, D.;
Chu, C. T.-W.; Olson, D. H.; Sheppard, E. W.; McCullen, S. B.; Higgins, J. B.; Shchlenker, J.
L. A New Family of Mesoporous Molecular Sieves Prepared With Liquid Crystal Templates.
J. Am. Chem. Soc. 1992, 114, 10834-10843.
25. Chen, C. Y.; Li, H. X.; Davis, M. E. Studies on Mesoporous Materials: I. Synthesis and
Characterization of MCM-41. Microporous Mater. 1993, 2, 17-26.
26. Huo, Q.; Margolese, D. Y.; Ciesla, U.; Feng, P.; Gier, T. E.; Sieger, P.; Leon, R.; Petroff, P.
M.; Schuth, F.; Stucky, G. D. Generalized Synthesis of Periodic Surfactant/Inorganic
Composite Materials. Nature 1994, 368, 317-321.

118
27. Corma, A., Kan, Q., Navarro, M. T.; Perez-Pariente, J.; Rey, F. Synthesis of MCM-41 With
Different Pore Diameters Without Addition of Auxiliary Organics. Chem. Mater. 1997, 9,
2123-2126.
28. Zhao, D.; Feng, J.; Huo, Q.; Melosh, N.; Fredrickson, G. H.; Chmelka, B. F.; Stucky, G. D.
Triblock Copolymer Syntheses of Mesoporous Silica with Periodic 50 to 300 Angstrom
Pores. Science 1998, 279, 548-552.
29. Mesa, M.; Sierra, L.; Guth, J. Contribution to the study of the formation mechanism of
mesoporous SBA-15 and SBA-16 type silica particles in aqueous acid solutions. Microporous
and Mesoporous Mater. 2008, 112, 338-350.
30. Tompsett, G. A.; Krogh, L.; Griffin, D. W.; Conner, W. C. Hysteresis and Scanning Behaviour
of Mesoporous Molecular Seives. Langmuir 2005, 21, 8214-8225.
31. Barrett, E. P.; Joyner, L. G.; Halenda, P. P. The Determination of Pore Volume and Area
Distributions in Porous Substances. J. Am. Chem. Soc. 1951, 73, 373-380.
32. Maglara, E.; Kaminski, R.; Conner, W. C. In Characterization of Porous Solids IV;
McEnaney, B., Mays, T.J., Rouquerol, J., Rodrigues-Reinoso, F., Sing, K. S. W., Unger, K.
K.; Royal Society of Chemistry:London, 1997
33. Lunn, J. D.; Shantz, D. F. Peptide Brush-Ordered Mesoporous Silica Nanocomposite
Materials. Chem. Mater. 2009, 21, 3638-3648.
34. Zhang, Q.; Archer, L. A. Poly(ethylene oxide)/Silica Nanocomposites: Structure and
Rheology. Langmuir 2002, 18, 10435-10442.

119
CHAPTER V
FUTURE WORK
Apart from three routes: co-condensation, post-grafting, and sol-gel; we have developed
another route to synthesis polymer nanocomposites via self-assembly. We have shown the
application of surfmer to synthesis polymer nanocomposites with increased mechanical strength
via network formation. Such crosslinked networks are difficult to transform the polymer
nanocomposites into a desired shape using any fabrication techniques. The crosslinking resulted
due to the mixture of mono- and bi- functionalized surfmer. Future work will include the
separation of bi-functionalized from mono-functionalized surfmer. It would be interesting to
synthesize the polymer nanocomposites via aforementioned self-assembly using mono-
functionalized surfmer. In this way, the obtained polymer nanocomposites will be thermoplastic
and can be shaped for desired application. The characterization such as tensile strength, impact
resistance, and flexural strength will be performed in order to determine its mechanical property.
It is also important to compare the mechanical properties of the polymer nanocomposites
obtained via self-assemble route with the traditional polymer nanocomposites containing non-
porous silica (such as Cab-O-Sil) as an inorganic component.
We have shown the application of biocompatible and biodegradable poly(ethylene
oxide)-poly(caprolactone)-poly(ethylene oxide) (PECE) triblock copolymer as structure directing
agent to organize the mesoporous silica. The mesoporous silica obtained has high surface area

120
and thick walls with some degree of disordered structure. Future work will include the fine tuning
of the type of silica precursors and reaction conditions useful to obtain the resolved structural
features of mesoporous silica using PECE as surfactant. The characterization such as adsorption-
desorption, BET surface area, TEM, SEM, and SAXS will be performed to observe the structure
of mesoporous silica.
When silica used as additives, they are first pre-treated with the modifying agents to
minimize the interfacial adhesion. The mesoporous silica synthesized in this research work
possess reactive component inside the pores. Therefore, it will be interesting to find its
application as additives as such silica does not require pre-treatment.

121
APPENDICES
A1. End-group functionalization of triblock copolymer pluronic P123.
Pluronic P123 was purchased from Sigma Aldrich and used as such for functionalization
reactions. All organic solvents were obtained from Pharmco-AAPER. In a 250 ml two-necked
flask, Pluronic P123 (1mmol) was dissolved in 100 mL anhydrous tetrahydrofuran (THF) in an
inert atmosphere. 4mmol of the Jones reagent (a solution of chromium trioxide in a diluted
sulphuric acid) is added to the stirred solution. The reactants are allowed to react for 24hours at
room temperature. The excess Jones reagent was then quenched using saturated solution of
sodium bi-sulphite. The product was then extracted using dichloromethane. The product was
recovered by evaporating dichlormethane.
Scheme A1. Oxidation of pluronic P123 using Jones reagent

122
A2. Characterization of carboxy P123. Shown below in Figure A1 is the 600-MHz solution 13
C
NMR spectrum of carboxyP123. The spectrum was obtained with gated decoupling to minimize
Overhauser effects. In order to preserve the structure-directing capabilities of P123, we targeted
ca. 50% conversion of hydroxyl groups to carboxylic acid group in the oxidation reaction. In
other words, we wanted an average of one carboxylic acid and one hydroxyl chain end per
carboxyP123 molecule. From Figure A1, which compares the starting P123 spectrum to the
product carboxyP123 spectrum, one observes based on the relative intensities of the 60, 67, and
172 ppm end-group peaks in the two spectra that this target was achieved. Note that the starting
P123 in Figure 1 has only the characteristic 60-ppm end group peak for the methylene group
adjacent the terminal hydroxyl.
Figure A2.1. 600 MHz 13
C solution NMR spectrum acquired with 1H decoupling of (bottom)
pure P123 starting material and (top) carboxy-functionalized P123 following reaction
according to Scheme A1. End group signals are shown in the carboxyP123 inset.
200 180 160 140 120 100 80 60 40 20 0
Chemical Shift (ppm)

123
A3. Synthesis of SBA-15 and SBA-15 analogues. The molar composition for the synthesis of
SBA-15 or SBA-15 type materials is TEOS:P123/carboxyP123 :HCl:H2O = 1: 0.0016 : 5.54 :
182.82, where TEOS is tetraethylorthosilicate. In a typical synthesis, 4 g of P123 or
carboxyP123 was dissolved in 30 mL of de-ionized water and stirred for 3 hours at room
temperature, and 112 mL of 2.133 M HCl was added drop-wise and kept under stirring for 2
hours. The above solution was then heated to 40 oC and 9 g of TEOS was added drop-wise and
stirred for 20 hours. The reaction mixture was aged at 100oC for 24 hours under static conditions.
The materials from each solution was washed with excess de-ionized water, dried overnight, and
calcined at 550oC for 7 hours using a temperature ramp of 1
oC/min. As described in the text,
TGA, XRD, and BET analysis verified that crystalline mesoporous SBA-15 siliceous materials
were formed in the presence of either P123 or carboxyP123.
A4. Characterization of SBA15_carboxyP123.
Figure A4.1a and A4.1b shows a representative adsorption/desorption isotherm and pore
size distribution for the silica product templated by the carboxyP123. The isotherm in A4.1a is
consistent with Type IV behavior and displays the characteristic hysteresis indicative of
mesoporosity. Figure A4.1b indicates that the average pore diameter is 32 Å, calculated using a
BJH model to analyze the data. For carboxyP123 template synthesis, the resulting mesoporous
silica surface area was 900 m2/g identical to that expected for SBA-15 structures synthesized
from the unfunctionalized P123.

124
The characteristic ca. 4 nm hexagonally-arrayed channels are observed in transimission
electron microscopy image of SBA15_carboxyP123 (shown in Figure A4.2a). Figure A4.2b
compares the powder SAXS results from materials synthesized using the control P123 and
carboxyP123 prior to calcinations. SBA15_carboxyP123 materials exhibit the specific
diffraction peaks consistent with published SBA-15 topologies.
0
100
200
300
400
500
600
700
800
0 0.2 0.4 0.6 0.8 1
Volu
me
@ S
TP
(cc
/gm
)
Relative pressure (p/po)
a 0
0.02
0.04
0.06
0.08
0.1
0.12
10 20 30 40 50 60
Volu
me
adso
rbed
(cc
/Ao/g
)
Radius (Ao)
b
Figure A4.1. a) adsorption-desorption curves and b) pore size distribution of
SBA15_carboxyP123
40nm
a b
Figure A4.2. a) TEM image and b) SAXS data of SBA15_carboxyP123. SAXS plot of
SBA15_P123 is shown in solid line while SBA15_carboxyP123 is shown in dotted line.

125
B1. Thermal Gravimetric Analysis of Polymernanocomposites from styrP123 and
SBA15_styrP123.
Percentage organic contents of the polymer nanocomposites were determined on TA-instruments
Hi-ResTGA2950. The samples were heated from room temperature to 500oC with a ramp rate of
20oC/min under air flow. Figure B1.1 shows the THGA thermograms of polymer
nanocomposites.
0
20
40
60
80
100
120
0 100 200 300 400 500
Temperature (oC)
a b
c
Figure B1.1. TGA thermograms of polymer nanocomposites prepared using styrP123 and
SBA15_styrP123 with a) 0%, b) 10%, and c) 20% silica content.

126
B2. Fourier Transform Infra-red of acryP123.
Fourier transform infrared (FT-IR) spectra were obtained in the wave number range 600-4000
cm-1
using a Perkin Elmer Fourier transform infrared spectrometer using the NaCl plates with 32
scans. Figure B2.1 shown below is a series of FTIR spectra of pluronic P123, acryloyl chloride,
and acryP123. The presence of carbonyl stretch ca. 1725cm-1
in acryP123 (Figure B2.1c)
confirms the functionalization of pluronic P123.
Figure B2.1 FTIR spectra for a) pluronic P123, b) acryloyl chloride, and c) acryP123. The arrow
denotes the carbonyl stretch from acrylic group.
a
b
c

127
C1. Characterization of the PECE (poly-ethylene oxide-caprolactone-ethylene oxide)
triblock copolymer. The overall reaction scheme is reproduced below for clarity. In order to
verify that the triblock copolymer sequence was produced, quantitative analysis of the 400 MHz
1H solution NMR data was required.
Figure C1.1 and C1.2 show the NMR data of PECE4K and PECE6K, with peaks labeled
according to the structure scheme provided above. The most intense peak, labeled b at 3.6 ppm,
arises from the ethylene oxide blocks, while the 4.0 ppm peak labeled a originates from the
caprolactone block. Given that the caprolactone reagent is a diol, there are four additional
ethylene oxide units that contribute eight hydrogens to the b signal. If the washed and purified
product exists as the 4000 molecular weight triblock copolymer, the ratio of signal b to signal a in
Figure S1 should be 5.65:1, as there are 198 ethylene oxide hydrogens and 34 caprolactone
hydrogens for the groups in the respective signals b and a. From the integral regions shown

128
below each peak, we see that the ratio 0.46:0.08 = 5.75:1. Furthermore, peak c arises from the
four urethane linkages per triblock, giving rise to four chemically unique hydrogens. As such, the
ratio of its intensity to peak b should be 192:4, or 48:1. From the integral regions below each
peak, we observe that the experimental ratio is 46:1, in agreement with the structure. Similar
calculations on PECE6K confirm the molecular weight of that triblock copolymer as 6000.
10 9 8 7 6 5 4 3 2 1 0
0.460.080.01
Chemical Shift (ppm)
c
ba
Figure C1.1. 400 MHz 1H solution NMR data for the PECE4K triblock copolymer, with
peaks labeled according the scheme on top. The solvent was CDCl3.

129
10 9 8 7 6 5 4 3 2 1 0
0.900.080.01
Chemical Shift (ppm)
a
b
c
The molecular weight of each block of triblock copolymer PECE4K and PECE6K is
calculated from the equations shown below. Ib (3.63ppm), Ia (4.93), and Ic (4.05) are the
intensities of protons of methylene of PEG, urethane, and ε-methylene from carbonyl carbon of
PCL, respectively. 2X and Y are the respective blocks of polycaprolactone and polyethylene
glycol respectively. It can be concluded that polyethylene glycol PEG are attached to both ends of
polycaprolactone diol PCLvia urethane linkage in both: PECE4K and PECE6K.
4
)4(2 Y
I
I
c
b (1)
4
)(4 X
I
I
c
a (2)
)114(2)( XPCLM n (3)
)44(2)( YPEGM n (4)
)()()( PCLMPEGMPECEM nnn (5)
Figure C1.2. 400 MHz 1H solution NMR data for the PECE6K triblock copolymer, with peaks
labeled according the scheme on top. The solvent was CDCl3.

130
FTIR results support formation of the triblock PECE as shown in the schematic. Shown
below in Figure C1.3 are a series of spectra obtained for the pure components (a and b), the
reaction product of polycaprolactone (PCL) with HDMI (hexamethylene diisocyanate) in C1.3c,
and the final triblock copolymer in C1.3d. The arrow between S3c and S3d indicates the
expected loss of the N=C=O stretch at 2280 cm-1
following reaction of the PCL-HDMI product
with PEO.
C2. End group functionalization of PECE with acryloyl chloride:
The hydroxyl groups of PECE (4K or 6K) were converted to acrylate group using
acryloyl chloride. The mole ratios were selected in such a way that on an average only one
hydroxyl groups were converted to acrylate moiety. Shown in Figure B2.1 and B2.2 are the 1H
liquid NMR acrylated PECE (4K and 6K). The presence of acrylate groups confirms the
successful functionalization of PECE with acrylate groups. Comparing the integrals of acrylate,
urethane, methylene of poly(ethylene glycol), and ε-methylene (relative to the carbonyl group) of
5001000150020002500300035004000Wavenumbers (cm-1)
Figure C1.3. FTIR spectra for (a) pure PCL, (b) pure polyethylene oxide, (c) the PCL-
HDMI reaction product, and (d) the PECE triblock copolymer. The arrow denotes the
loss of the N=C=O stretch at 2280 cm-1
following reaction of the PCL-HDMI product
with PEO.
a.
b.
c.
d.

131
polycaprolactone groups, it can be concluded that, on average one acrylate group is attached to
each PECE chain. However, the final product will be a mixture of chains containing zero, one,
and two acrylate end groups per chain.
10 9 8 7 6 5 4 3 2 1 0
0.460.080.010.01
Chemical shift (ppm)
CH2 CH
b
a
c
Figure C2.1. 400 MHz 1H solution NMR data of acryPECE4K triblock copolymer in CDCl3,
with peaks labeled according the chemical structure shown above the spectra.

132
10 9 8 7 6 5 4 3 2 1 0
0.900.080.010.01
Chemical shift (ppm)
CH2 CH
b
a
c
Figure C2.2. 400 MHz 1H solution NMR data of acryPECE6K triblock copolymer in CDCl3,
with peaks labeled according the chemical structure shown above the spectra.

VITA
Nitin Vikas Patil
Candidate for the Degree of
Doctor of Philosophy
Thesis: SELF-ASSEMBLED POLYMER NANOCOMPOSITES AND THEIR
NETWORKS
Major Field: Chemistry
Biographical:
Education:
Completed the requirements for the Doctor of Philosophy in Polymer chemistry
at Oklahoma State University, Stillwater, Oklahoma, in December in 2013.
Completed the requirements for the Bachelor of Polymer Engineering and
Technology in Polymer at University Institute of Chemical Technology,
Mumbai, Maharashtra, India in 2006.
Experience:
Employed by Asian Paints Ltd., Mumbai, India as Polymer Technologist from
May 2006-Feb 2008; employed by Oklahoma State University, as graduate
research and teaching assistant, 2008 to present.
Professional Memberships:
American Chemical Society (ACS)
ACS, Cellulose and Renewable Materials
ACS, Division of Polymer Chemistry