Holographic recording in charged photopolymerisable nanocomposites

Probabilistic Engineering Mechanics 23 (2008) 456–470www.elsevier.com/locate/probengmech
A multiscale Monte Carlo finite element method for determining mechanicalproperties of polymer nanocomposites
P.D. Spanosa,∗, A. Kontsosb
a L.B. Ryon Chair in Engineering, Rice University MS-321, Houston, TX, 77251-1892, United Statesb Department of Mechanical Engineering and Materials Science, Rice University MS-321, Houston, TX, 77251-1892, United States
Received 23 August 2007; accepted 10 September 2007Available online 29 February 2008
Abstract
This paper introduces a multiscale Monte Carlo finite element method (MCFEM) for determining mechanical properties of polymernanocomposites (PNC) that consist of polymers reinforced with single-walled carbon nanotubes (SWCNT). Note that several approaches discussedin the open literature suggest values for the mechanical properties of PNC that differ significantly from the corresponding ones derived byexperimental procedures. This discrepancy is addressed by the proposed MCFEM which accounts for the effect of the non-uniform dispersion anddistribution of SWCNT in polymers in the macroscopic mechanical behavior of PNC. Specifically, the method uses a multiscale homogenizationapproach to link the structural variability at the nano-/micro scales with the local constitutive behavior. Subsequently, the method incorporates aFE scheme to determine the Young’s modulus and Poisson Ratio of PNC. The use of the computed properties in macroscale modeling is validatedby comparison with experimental tensile test data.c© 2008 Elsevier Ltd. All rights reserved.
Keywords: Polymer nanocomposites; Mechanical properties; Multiscale modeling; Homogenization; Finite elements; Monte Carlo methods
1. Introduction
The discovery of carbon nanotubes (CNT) by Iijima [1]has resulted in an intense research effort in the areaof nanotechnology. In engineering applications, single-walled carbon nanotubes (SWCNT), due to their desirablemechanical properties [2], have been used to enhancethe mechanical behavior of polymers [3–7]. However,experimentally measured mechanical properties of PNCare found to be different from the corresponding onesdetermined by analytical and/or numerical models [8]. Thisdiscrepancy is caused by the inability to accurately modelthe mechanical properties of the constituent phases in PNC,the approximations and assumptions made ignoring criticalexperimental information about the SWCNT dispersion andspatial distribution in polymers, and the uncertainties related tothe testing and measuring procedures. Consequently, the actualmechanical properties of PNC are also uncertain, and therefore
∗ Corresponding author. Tel.: +1 713 348 4909; fax: +1 713 348 5191.E-mail address: [email protected] (P.D. Spanos).
0266-8920/$ - see front matter c© 2008 Elsevier Ltd. All rights reserved.doi:10.1016/j.probengmech.2007.09.002
the risk of implementing PNC in engineering applications isstill elevated.
A number of parameters pertinent to the structure of PNCdetermine the reinforcement function of SWCNT. Specifically,the size, shape, orientation, dispersion and spatial distributionof SWCNT in polymers, as well as the interfacial propertiesbetween the matrix and the reinforcement phase affect theoverall mechanical behavior of PNC. Therefore, to achievesignificant improvement of the mechanical properties of PNC,control of the mixing of SWCNT with polymers is required [4].However, the atomically smooth surface of SWCNT incombination with their large aspect ratios (i.e. the fractionof their length over their diameter) causes the formation ofbundles, agglomerates, and clusters after mixing with polymers,as reported by Li et al. [7], Gojny et al. [9] and Loos et al. [10].Consequently, the nano-/microsized heterogeneities createdwhen incorporating SWCNT in polymers must be modeled todetermine their effects on the overall mechanical behavior ofPNC.
This paper introduces a hierarchical-multiscale method tomodel the spatial randomness induced in polymers by the

P.D. Spanos, A. Kontsos / Probabilistic Engineering Mechanics 23 (2008) 456–470 457
Fig. 1. Images of cross-sections of PNC at different magnifications: (a) [11] and (b) [8] and (c) [12]. SWCNT agglomerates and clusters of various sizes can beseen at the nano-/microscale.
non-uniform distribution of SWCNT, and to quantify itseffect on the mechanical properties of PNC. Therefore, theproposed method treats PNC as random heterogeneous media.In addition, the method takes into consideration the mechanicalproperties of the constituent phases, as well as the dispersioncharacteristics of the SWCNT in polymers in a homogenizationmodel that yields estimates of the local mechanical propertiesof PNC. These local properties are subsequently used in aMonte Carlo finite element scheme that determines overallmechanical properties of PNC.
2. Polymer nanocomposites as random heterogeneousmedia
Carbon nanotubes have been already used in novelcomposite materials for modern engineering applications [3].However, difficulties related to the existing fabricationprocedures hinder the efforts to harness the rich potential ofSWCNT as reinforcements. Despite the various attempts toresolve critical issues related to PNC production, the dispersioncharacteristics of the reinforcement phase in PNC remainhighly uncertain. Therefore, PNC are viewed in this articleas random heterogeneous media. The term “random” is usedto denote random behavior and uncertainties in the local andoverall material behavior of PNC; the term “heterogeneous”refers to the non-uniform spatial distribution of inclusions inPNC.
The MCFEM presented in this article quantifies the effectsof randomly distributed heterogeneities at the nano-/microscale,such as the ones shown in Fig. 1, on the mechanical propertiesof PNC. Fig. 1 shows that the spatial distribution of SWCNTin polymers often presents significant local variations whichare represented by the different color intensities in the images;darker areas correspond to higher concentrations of SWCNT.The proposed method models the local variations in thedistribution of SWCNT in polymers by developing a randomfield model. This approach is more pragmatic compared toother models suggested in the literature since it representsthe local characteristics of actual PNC by using a suitablestatistical descriptor; it is, further, more generic since instead ofattempting to reproduce the exact structure of PNC at the nano-/microscale using computationally demanding and unreliable
Fig. 2. The proposed multiscale Monte Carlo finite elements method(MCFEM) for determining mechanical properties of PNC. Informationobtained at the nanoscale is used at the microscale to compute estimates forthe macroscopic mechanical behavior of PNC.
models, it develops a modeling scheme which directly linksinformation about the random structure of PNC at the nano-/microscales with their local and overall constitutive behavior.
3. The proposed multiscale stochastic finite elementmethod
The method proposed for determining overall mechanicalproperties of PNC is a multiscale method that comprises aseries of models in the hierarchical scheme shown in Fig. 2.Specifically, Fig. 2 describes the flow of information from thenano- to the macroscale in the proposed MCFEM. The variousmodels used and/or developed in the proposed method arepresented in Section 3.
3.1. Definition of a representative material region
The first step in determining the mechanical properties ofPNC by the proposed MCFEM is the choice of an appropriatematerial volume similar to the so-called “representative volumeelement” (RVE) used in solid mechanics. Hill [13] defined the

458 P.D. Spanos, A. Kontsos / Probabilistic Engineering Mechanics 23 (2008) 456–470
Fig. 3. The scales involved in the definition of the representative volumeelement by Ostoja-Starzewski [14].
concept of RVE as a part of the solid that is “(a) structurallyentirely typical of the whole mixture on average and (b)contains a sufficient number of inclusions for the overall modulito be effectively independent of the surface values of tractionand displacement, so long as these values are macroscopicallyuniform”. Furthermore, Ostoja-Starzewski [14] proposed aseparation of scales technique to define a RVE. These scales areillustrated in Fig. 3 and are (i) the nano-/microscale, d , which isassociated with the size of the inclusion, (ii) the mesoscale L ,which has the dimensions of the RVE, and (iii) the macroscale,which corresponds to the physical dimensions of the solid. Ifδ denotes the ratio L/d , then the concept of RVE is definedfor δ → ∞. Hence, for any finite δ the considered volume isnot a RVE and, therefore, the determined mechanical propertiesdepend on the dimensions of the material volume element,creating in this way a sort of scale effect.
The proposed method uses the RVE definition by Ostoja-Starzewski, and the related scale effect to define the materialvolume defined in Fig. 4. This volume is called “materialregion” (MR) and corresponds to a portion of a cross-section ofPNC. For example, Fig. 1 shows representative MRs obtainedby using advanced microscopy techniques. The advantage ofthe proposed MR over other candidate volume elements is thatit homogenizes the material structure in two different scales:the one defined by the sub-element material structure in eachfinite element (FE) and the other specified in the overall MR.The following sections describe the multiscale homogenizationperformed by the proposed method.
3.2. Identification of randomness and random field model
In PNC, the existence of structural heterogeneities, such asSWCNT bundles, agglomerates and clusters has been verifiedby microscopy images and experimental characterizationtechniques [7,10]. These heterogeneities induce randomness inthe structure of PNC and, therefore, they affect their local andoverall constitutive behavior. In general, the spatial variationsin the local mechanical properties of PNC have not been takeninto account in models reported in the literature for determiningthe mechanical behavior of PNC. However, randomness in themechanical properties and structure of materials has been thefocus of several studies in the area of probabilistic engineeringmechanics. For example, the book by Ghanem and Spanos [15]and the article by Graham and Baxter [16] present pertinentmodels.
To incorporate the effect of the non-uniform spatialdistribution of SWCNT in polymers in the computed
mechanical properties of PNC, the proposed method quantifiesthe variations of the SWCNT volume fraction observed inimages, such as the ones shown in Fig. 1. Hence, Fig. 5shows the identification and modeling procedure of the materialrandomness in PNC.
Specifically, Fig. 5 shows that the method uses a gridof material points in the MR to model the variationsobserved in the SWCNT volume fraction values. The relativeconcentrations of SWCNT in the MR are assumed to bestatistically equivalent to the total amount of nanotubes in PNC.Therefore,
υ = υSWCNT + υPolymer = 1, (1)
where
υSWCNT =V SWCNT
V. (2)
In Eq. (1), υ is the total, υSWCNT is the SWCNT and υPolymerthe polymer volume fraction values, respectively. In Eq. (2),V denotes the total volume of the MR shown in Fig. 5 andV SWCNT is the volume occupied by the SWCNT.
Based on the procedure described in Fig. 5, the methoddevelops a random field model to represent the local variationsof the SWCNT volume fraction values in PNC. Therefore,volume fraction values are modeled by random variables (RV)that are sampled, in lack of precise experimental informationabout the actual structure of PNC, from three differentprobability distribution functions (PDFs). The particulardistributions used are the uniform, beta and log-normal; theyare shown in Eqs. (3)–(5). The selected distributions providedifferent statistical information pertinent to the dispersion ofSWCNT in polymers. Hence, the uniform distribution suggeststhat all SWCNT volume fraction values in a specific range areequally likely to occur, while the beta and log-normal onescorrespond to non-symmetrical distributions.
f (x) =1
b − a, a < x < b (3)
f (x) =Γ (a + b)
Γ (a)Γ (b)xa−1(1 − x)b−1,
0 < x < 1, a > 0, b > 0 (4)
f (x) =1
x√
2πσ 2e
(− ln x−µ)
2σ2 , x ≥ 0. (5)
The mean value of the distributions defined in Eqs. (3)–(5) isset equal to the SWCNT volume fraction values determined byexperimental information. In addition, their standard deviationsare chosen based on the fact that volume fraction values cannotbe negative or larger than 1.
Subsequently, the random field model groups the RV ofvolume fraction values in the vector defined in Eq. (6).
G = (g1, g2, . . . , gN ) (6)
which is further defined to represent a discretization ofa continuous, univariate, two-dimensional and homogeneousrandom field (RF) [17–19]. Therefore, if G(x, y) denotes amaterial random field in PNC, then the random field model

P.D. Spanos, A. Kontsos / Probabilistic Engineering Mechanics 23 (2008) 456–470 459
Fig. 4. The proposed material region (MR) for determining mechanical properties of PNC. The selected MR corresponds to a portion of a cross-section of the actualPNC and coincides with images obtained by microscopy techniques.
Fig. 5. The procedure followed to quantify the structural randomness in PNC. A grid of material points is selected in the MR. At each point, a random value for thelocal volume fraction is assigned to model the variations in the spatial distribution of SWCNT in polymers.
Fig. 6. The random field of SWCNT volume fraction values in structures ofPNC. This random field is discretized in a number of points; the values of thefield at those points are used in the proposed method.
generates vectors of SWCNT volume fraction values whichcorrespond to locations in the defined MR as shown in Fig. 6.
Therefore,
GiN = G(x p, yq), p = 1, . . . , Nx ; q = 1, . . . , Ny (7)
denotes the i th sample of a random vector of volume fractionvalues in a grid of Nx × Ny = N points. Hence, the methoduses the random field model to generate a population of randomvectors similar to the one defined in Eq. (6). These vectorsare subsequently used in the Monte Carlo finite element modeldescribed in Section 3.3.
3.3. Monte Carlo finite element model
Monte Carlo simulations (MCS) [20] have been used inmodeling of the mechanical behavior of random media [15,16].The key advantage of the MCS compared to other stochasticfinite elements methods, such as the perturbation [21],reliability [22] and spectral methods [15], stems from the factthat they do not require modifications of the deterministicformulation of the finite elements (FE) problem of interest.Hence, in the case of elasticity problems the standard FE

460 P.D. Spanos, A. Kontsos / Probabilistic Engineering Mechanics 23 (2008) 456–470
Fig. 7. The finite element model used in the MCFEM to determine mechanical properties of PNC.
formulation which leads to the element stiffness matrix
[K FE] =
∫VFE
[M]T[T ][M]dV (8)
can be used. In Eq. (8), [M] is a matrix of shape functions usedin the FE approximation and [T ] is the material stiffness tensor.In MC methods and for isotropic materials, [T ] is defined inEq. (9) for plane-stress conditions
[T ] =E
1 − v2
1 v 0v 1 0
0 01 − v
2
; (9)
the two material properties E and v, which correspond to theYoung’s modulus and Poisson ratio, are random parameters inMCS; their values are computed in each simulation by variousmodels depending on the MC method used.
The MCFEM proposed in this article uses the randomfield model described in Section 3.2 in combination with thehomogenization model presented in subsequent sections tocompute estimates of local mechanical properties of PNC. Todetermine overall mechanical properties, the proposed MCFEMsolves numerically in MATLAB the elasticity problem of a thinplate in plane stress conditions shown in Fig. 7. The out-of-plane dimension of the model presented in Fig. 7 is assumed tobe significantly smaller with respect to the width W and lengthL to justify the assumption of a thin plate. Specifically, the in-plane dimensions are assumed to be equal to 1 and the out-of-plane thickness is equal to 0.01. The applied in-plane static loadP is equal to 10 MPa; four-node isoparametric FE are used inthis paper.
The FE discretization shown in Fig. 7 is achieved by usingthe RF discretization described in Section 3.2. Specifically,the grid of material points used by the RF model to quantifythe SWCNT volume fraction in the MR is further used todiscretize the two-dimensional medium shown in Fig. 7. Hence,the numerically generated values for the local SWCNT volumefraction are assumed to be constant in square areas around eachgrid point. Each of these areas in the MR is assumed to be aFE. This kind of FE discretization which coincides with the RF
discretization corresponds to the midpoint method developedby Der Kiureghian and Ke [19]. Zeldin and Spanos [18]showed that the midpoint method results in overestimationsof the associated solutions, a finding that has been taken intoconsideration in the results shown in Section 4.
Given the FE discretization shown in Fig. 7, a statisticallysufficient number of realizations of the random vector thatrepresents the spatial variation of the SWCNT volume fractionis generated for each distribution defined in Eqs. (3)–(5) and foreach number of grid points in the selected MR. To determinethe effect of the total number of grid points on the computedvalues of the mechanical properties of PNC grids that compriseequal number of points in the x and y directions of the MRare considered; the total numbers of grid points used are 1,4, 9, 16, 25, 36, 49, 64, 81 and 100. For each realization, theFE problem described in Fig. 7 is solved and the ensemble ofcomputed values yields estimates for the mechanical propertiesof the PNC. Ostoja-Starzewski and Wang [23], as well asSwaminathan et al. [24] show that by increasing the FE meshsize the variability of the computed overall material propertiesdecreases. This finding is verified in Section 4 of this article.
3.4. Homogenization model
To determine the overall mechanical properties of PNCusing the FE model presented in Fig. 7 the MCFEM firstdetermines the local material properties in each FE. Therefore,the method models PNC at the sub-element level by the two-phase medium shown in Fig. 8. Shi et al. [25] originally usedthis model in combination with a micromechanics method todetermine the effect of SWCNT agglomeration and dispersionin the mechanical properties of carbon nanotube-reinforcedcomposites.
Based on the model shown in Fig. 8, PNC are modeledat a sub-element level as two-phased media comprising ahybrid matrix and spherical inclusions, both of which consist ofpolymer reinforced with perfectly bonded, straight, randomlyoriented and uniformly dispersed SWCNT with specific aspectratios. Hence, if V FE is the total volume of each FE, then
V FE= V FE
hybrid + V FEinclusions, (10)

P.D. Spanos, A. Kontsos / Probabilistic Engineering Mechanics 23 (2008) 456–470 461
Fig. 8. The sub-element material structure in each finite element used in theproposed MCFEM.
where V FEhybrid is the volume occupied by the hybrid matrix and
V FEinclusions is the corresponding volume of inclusions. Therefore,
the number of spherical inclusions in each FE is quantified bythe agglomeration index defined in Eq. (11)
ξ =V FE
inclusions
V FE . (11)
From the definition of ξ in Eq. (11), it can be concluded that thecloser to 1 the agglomeration index is, the more homogeneousthe PNC becomes.
Furthermore, if V C is the volume occupied by the nanotubes,then
V C= V C
hybrid + V Cinclusions, (12)
where V Chybrid and V C
inclusions are the SWCNT volumes in themodified matrix and spherical inclusions, respectively. Basedon Eq. (12), the method quantifies the amount of SWCNT ineach phase by using the dispersion index defined in Eq. (13).
ζ =V C
inclusions
V C . (13)
According to the definition in Eq. (13), the closer to 1 thedispersion index is for ζ > ξ , the more heterogeneous the PNCbecomes; if ζ = ξ all nanotubes are uniformly distributed. Inaddition, the local SWCNT volume fraction in each FE can beexpressed as,
υFESWCNT = υ
hybridSWCNT + υ inclusions
SWCNT . (14)
To determine the local material properties in each FE, theMCFEM implements the Mori–Tanaka (MT) method [26,27].In determining the mechanical properties of composite media,the MT method takes into consideration a number of materialparameters, such as the volume fraction, aspect ratios, shapeand orientation of the constituent phases. The MT method canbe further modified to incorporate the agglomeration modelpresented in Fig. 8, as shown by Shi et al. [25].
Fig. 9 presents schematically the homogenization procedureaccording to the MT method. The material shown in Fig. 9comprises a matrix and an inclusion phase which consists ofa number of ellipsoidal particles. The indices “m” and “e” areused to denote the matrix and the inclusion phases, respectively.The two phases are assumed homogeneous, linearly elastic andperfectly bonded. If a uniform strain εS is applied on the surface
Fig. 9. The homogenization procedure in the Mori–Tanaka method.
∂V , then the linear surface displacements are
uS= εSx on ∂V, (15)
where x is a position vector which is relative to a Cartesiancoordinate system.
The average strains in the material include the contributionof both phases and can be expressed as
ε = υmεm + υe {εe}, (16)
where υm and υe are the matrix and inclusion volume fractions;εm and εe are the average strains in the two phases. Thecurly brackets in Eq. (16) denote averaging over all possibleorientations of the ellipsoidal inclusions in the matrix. Theoverall strains and stresses in the composite are:
ε = Ceffσ (17)
and
σ = Teffε (18)
where Ceff and Teff are the effective compliance and stiffnesstensors of the equivalent homogenous material shown in Fig. 8.Benveniste [26] showed that the effective tensors are equal to
Ceff= Cm + υe {(Ce − Cm)A} [υmI + υe {A}]
−1 (19)
and
Teff= Tm + υe {(Te − Tm)B} [υmI + υe {B}]
−1, (20)
where I is the fourth-order identity tensor; Ci , Ti , i = m, eare the compliance and stiffness tensors of the matrix and theinclusions; A and B are orientation dependent tensors definedas
A = TeBCm (21)
and
B = [I + ST−1m (Te − Tm)]−1. (22)
In Eq. (22), S denotes the fourth-order Eshelby tensor whichis independent of the mechanical properties of the inclusionsand relates the strains in them to the perturbation of theuniform strain field in the heterogeneous RVE caused bytheir presence [27]. If the matrix is isotropic then S dependsonly on the Poisson ratio of the matrix and the aspect ratioof the inclusions [27]. In this case, Qiu and Weng [28]provide the Eshelby tensor for inclusions with various shapes

462 P.D. Spanos, A. Kontsos / Probabilistic Engineering Mechanics 23 (2008) 456–470
and aspect ratios. Hence, for the spherical inclusions shownin Fig. 7, there is an analytical expression of the Eshelbytensor which can be directly used in Eq. (22). Furthermore,Benveniste [26] showed that Eqs. (19)-(20) are consistent and,therefore,
Ceff= [Teff
]−1. (23)
As shown in Eqs. (17)–(22) to determine the effectivemechanical properties of the two-phase medium in Fig. 9using the homogenization scheme described in this section, anumber of parameters need to be specified. These parametersinclude the volume fraction values, the compliance or stiffnesstensors of the two phases, as well as the aspect ratio of theinclusions. In the case of the PNC modeled in this article,polymers are assumed to be isotropic, and therefore theirYoung’s modulus (YM) and Poisson ratio (PR) is needed. Theseproperties have been either measured experimentally or can befound in the literature as shown in Section 4. In the case ofSWCNT, there are significant difficulties in the experimentalprocedures used to characterize their material properties [29].Therefore, suggested values in the literature are often basedon theoretical ab initio, molecular dynamics, continuum andhybrid approaches which only provide estimates of the actualproperties. For example, Popov et al. [30], Odegard et al. [31]and Pipes et al. [32] report values for the YM of SWCNT.
Furthermore, to determine the mechanical properties ofSWCNT-reinforced polymers using micromechanics methods,the material properties of solid nanotubes must be determined.These equivalent solid nanotubes must have the samegeometrical characteristics as the hollow ones used in thefabrication process to facilitate the computation of volumefraction values. Consequently, the MT homogenization modelincorporated in the proposed MCFEM uses the modelsuggested by Odegard et al. [31] to determine the mechanicalproperties of SWCNT. This model effectively converts hollowSWCNT to equivalent solid fibers following the multiscaleapproach shown in Fig. 9.
The model shown in Fig. 10 uses molecular informationto determine the properties of equivalent solid fibers at themicroscale and, therefore, it can be directly incorporatedin the homogenization model of the MCFEM. To obtainequivalent solid fibers given the characteristics of the SWCNTin fabrication, the model shown on the left of Fig. 10 isdeveloped by Odegard et al. using molecular dynamics (MD)simulations.
The MD model represents the equilibrium structure of thesystem which consists of SWCNT surrounded by polymermolecules. Based on the MD model, a suitable RVE isdefined as shown in the equivalent-truss model (ETM) inFig. 10(center). The ETM serves as the intermediate linkbetween the molecular and the equivalent continuum modelalso shown in Fig. 10(right). This continuum model is assumedto represent a linear elastic and homogeneous solid fiber which,as reported by Odegard et al., has transverse anisotropy. Hence,five independent elastic parameters need to be determined toobtain the stiffness or compliance tensor of the equivalent solidSWCNT. To determine the elastic parameters of the equivalent
Fig. 10. The three-stage multiscale method proposed by Odegard et al. [31] isused in the proposed MCFEM to determine the mechanical properties of theSWCNT.
solid SWCNT, Odegard et al. use MD to compute the strainenergy of the MD model under specified loading conditions.The same loading conditions are applied on the ETM and ananalytical formula is obtained for the strain energy of thismodel. Then, by equating the energies of the MD model andthe ETM, the unknown parameters for the strain energy of theETM are computed. Subsequently, the strain energy of the ETMis used to determine the five independent elastic parametersof the solid SWCNT. Section 4 presents information aboutthe geometrical characteristics and elastic parameters of theequivalent solid fibers determined by the method proposed byOdegard et al.
The material properties of the equivalent solid fibersdetermined in [31] take into consideration the interactions ofthe SWCNT with their neighboring polymer molecules, asshown in the molecular model of Fig. 10. Thus, the assumptionof perfect bonding between the SWCNT and the matrix inthe proposed MCFEM is justified by the use of the modeldeveloped by Odegard et al.
Furthermore, to determine the SWCNT volume fractionbased on experimental information, Eq. (24) is used [32]
υSWCNT =wSWCNTρPOLYMER
wSWCNTρPOLYMER + (1 − wSWCNT)ρSWCNT. (24)
In Eq. (24), wSWCNT denotes the SWCNT weight percentage,which is known by the experimental fabrication procedure.In addition, ρPOLYMER and ρSWCNT are the densities of thepolymer and the SWCNT, respectively. The density of thepolymer is known by the manufacturer and can be found in theliterature, while the SWCNT density can be expressed as
ρSWCNT =4N Mw
π NAd2 . (25)
In Eq. (25), Mw is the atomic weight of carbon, NA isAvogadro’s number and N is used to express the number ofcarbon atoms per unit length and is equal to [32],
N =4√
n2 + nm + m2
3b, (26)

P.D. Spanos, A. Kontsos / Probabilistic Engineering Mechanics 23 (2008) 456–470 463
Table 1Polymer material properties
EPON 862 PVA
Young’s modulus (GPa) 2.026 4Poisson ratio 0.3 0.48Density (g/cm3) 1.125 1.19
where b is the bond length between two carbon atoms which inthe case of SWCNT is equal to 0.142 nm. The parameters n andm in Eq. (26) define the chiral vector of the SWCNT [32].
The homogenization model described in this section is usedin the proposed MCFEM to compute the elastic parametersof the hybrid matrix and the inclusions defined in Fig. 8.Subsequently, the same model is used in each FE to compute thelocal mechanical properties of the PNC, as shown in Section 4.
4. Results and discussion
The proposed MCFEM is used in Section 4 to determinemechanical properties of two particular PNC reported in theliterature. Information about the production, characterizationand testing of these PNC is used in this section to chooseparameters of the method and to validate the numerical results.For convenience, the first PNC which consists of a SWCNT-reinforced EPON 862 matrix is referred to as Case 1; itcorresponds to the material presented by Zhu et al. [5]. Thesecond composite material comprises a SWCNT-reinforcedPVA matrix and is called Case 2; it has been experimentallycharacterized by Paiva et al. [6]. Table 1 presents the isotropicmaterial properties and densities of the two polymers. The YMvalues in Table 1 are measured experimentally by Zhu et al. andPaiva et al. In addition, Seidel and Lagoudas [8] report the valuefor the PR of the polymer in Case 1, while the correspondingvalue for the polymer in Case 2 was found in the literature.Furthermore, Table 2 provides the five independent elasticconstants of the stiffness tensor of the transversely isotropicequivalent solid SWCNT computed by the model developed byOdegard et al. [31]. All solid fibers in this model are assumedto have the same diameter which was computed to be equal to1.8 nm. Consequently, based on Eq. (25) all solid fibers havealso the same density equal to 1.371 g/cm3. In addition, theMCFEM uses the same aspect ratio value for all nanotubesin the two PNC. The value chosen is equal to 200; it agreeswith experimental studies reported in the literature [33,34]. Forthis value of aspect ratio and given the diameter computedin [31], the resulting nanotube length is approximately equalto 111 nm. Consequently, the assumption of straight SWCNTin the micromechanics homogenization method is valid for thisnanotube length. Moreover, Table 3 summarizes the reportedexperimental findings for the YM of both PNC. The resultsinclude the mean value, obtained by averaging a number of YMestimates measured by testing similar samples, plus and minusone standard deviation.
Using the density values of the polymers and the nanotubes,the SWCNT volume fraction values in Case 1 are found equalto 0.822% and 3.306%, using Eq. (24). The correspondingvalues in Case 2 are equal to 2.28% and 4.58%, respectively. In
Table 2SWCNT material properties
E11 (GPa) 450.47E22 (GPa) 12.13G12 (GPa) 27G23 (GPa) 4.4ν12 0.42
Table 3Experimental results
Case 1 Case 2
Weight percent 1 4 2.5 5Young’s modulus(GPa)
2.65±0.125 3.44±0.253 5.6±0.4 6.2 ± 0.1
each case, the two volume fraction values involved are referredto as VF1 and VF2. Based on the SWCNT volume fraction,the random field model presented in Section 3 is used in theproposed MCFEM to numerically generate realizations of therandom vector defined in Eq. (6). It is noted, that the meanvalue in each realization is always factored to be equal toeither VF1 or VF2 to comply with the fabrication procedures.Fig. 11 shows examples of such realizations which includevalues sampled from the PDFs defined in Eqs. (3)–(5); theirmean value is equal to VF2 of Case 1; the distributions havethe same standard deviation to show the differences observedby using each one of them. The effect of the standard deviationon the numerically computed values of the overall mechanicalproperties of PNC is further investigated in this section.
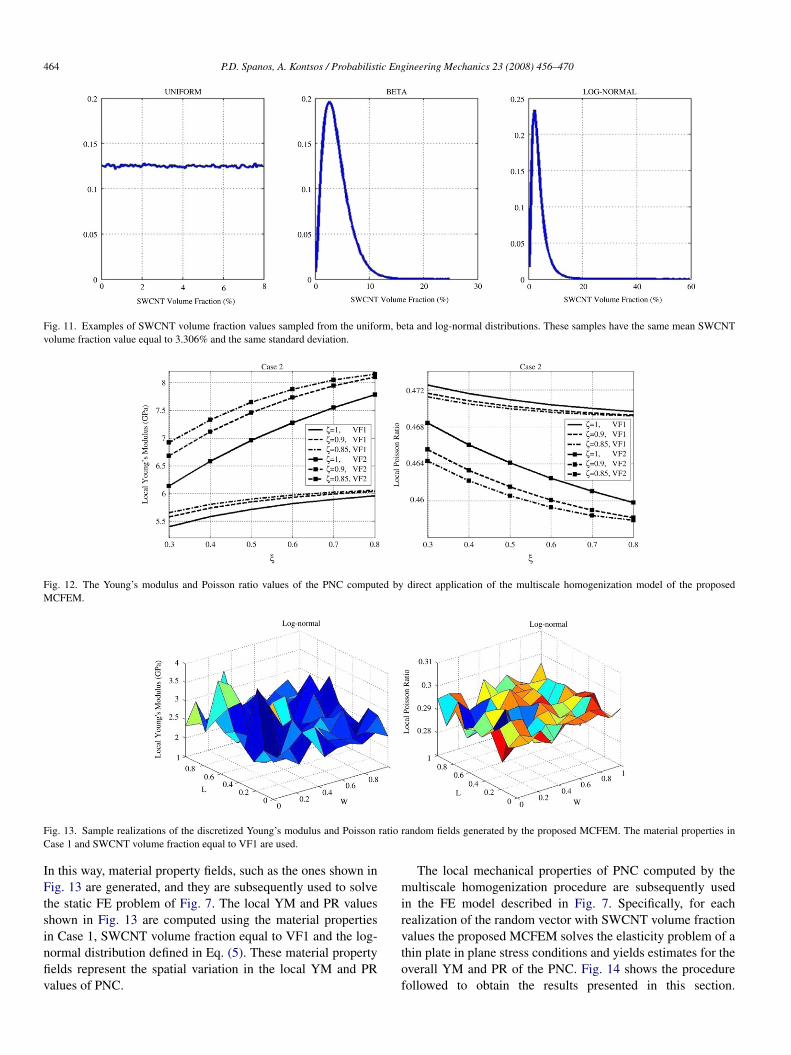
Based on the values for the local SWCNT volume fractioncomputed by the random field model, such as the ones shown inFig. 11, the proposed MCFEM determines the local mechanicalproperties of the PNC in each FE by using the multiscalehomogenization model described in Section 3. To apply thismodel, the agglomeration and dispersion indices defined inEqs. (11) and (13) must be determined. The homogenizationmodel computes these indices adaptively by using the valuefor the local SWCNT volume fraction in each FE and bychoosing the degree of heterogeneity in the MR based on theexperimental information. For example, Zhu et al. [5] reportthat for SWCNT volume fraction values greater than 4%, theviscosity of PNC is high and therefore the SWCNT dispersionin the polymer presents non-uniform characteristics. Hence, byincreasing the SWCNT volume fraction the heterogeneities inthe PNC are expected to increase. Fig. 12 shows the effect of theagglomeration and dispersion indices on the computed valuesfor the local mechanical properties by the homogenizationmodel described in Section 3.4.
Specifically, Fig. 12 shows that the closer to 1 thedispersion index is the more heterogeneous the PNC becomes.Consequently, as ζ increases the local YM values decrease andthe corresponding PR values increase. Similarly, it is seen inFig. 12 that the closer to 0 the agglomeration index is, the moreheterogeneous the PNC become. Consequently, as ξ decreasesthe local YM values decrease and the PR ones increase.
The homogenization model is further used to compute thelocal YM and PR values in the FE of the model shown in Fig. 7.
464 P.D. Spanos, A. Kontsos / Probabilistic Engineering Mechanics 23 (2008) 456–470
Fig. 11. Examples of SWCNT volume fraction values sampled from the uniform, beta and log-normal distributions. These samples have the same mean SWCNTvolume fraction value equal to 3.306% and the same standard deviation.
Fig. 12. The Young’s modulus and Poisson ratio values of the PNC computed by direct application of the multiscale homogenization model of the proposedMCFEM.
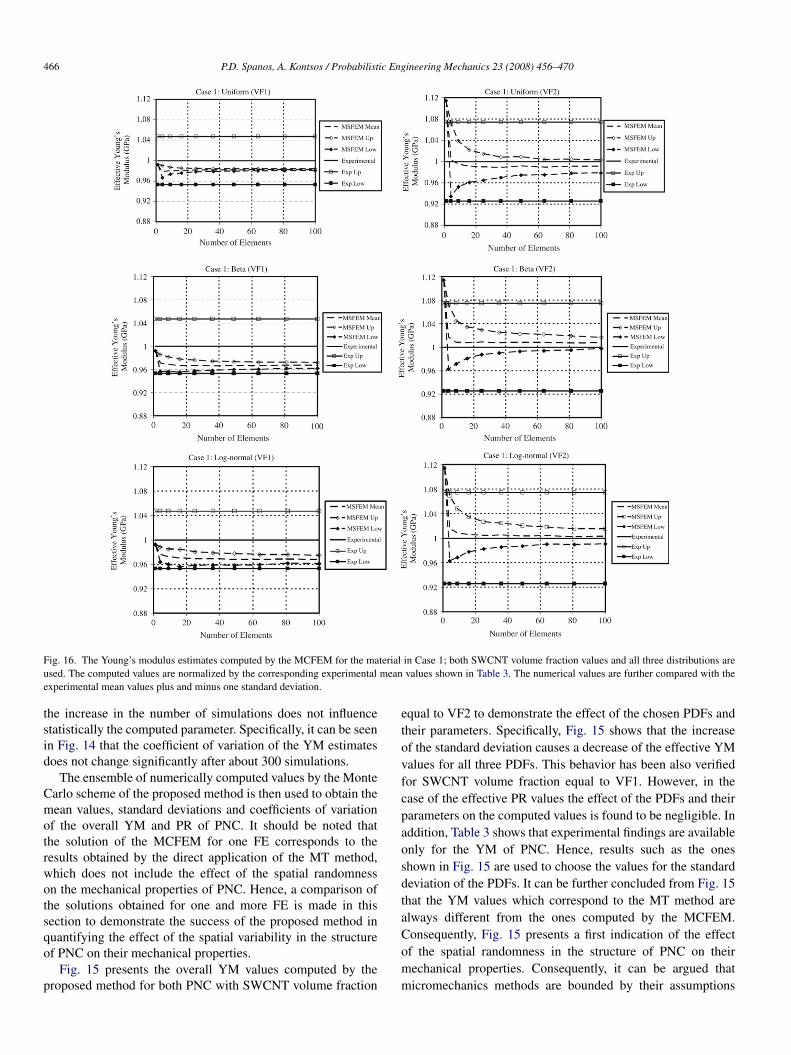
Fig. 13. Sample realizations of the discretized Young’s modulus and Poisson ratio random fields generated by the proposed MCFEM. The material properties inCase 1 and SWCNT volume fraction equal to VF1 are used.
In this way, material property fields, such as the ones shown inFig. 13 are generated, and they are subsequently used to solvethe static FE problem of Fig. 7. The local YM and PR valuesshown in Fig. 13 are computed using the material propertiesin Case 1, SWCNT volume fraction equal to VF1 and the log-normal distribution defined in Eq. (5). These material propertyfields represent the spatial variation in the local YM and PRvalues of PNC.
The local mechanical properties of PNC computed by themultiscale homogenization procedure are subsequently usedin the FE model described in Fig. 7. Specifically, for eachrealization of the random vector with SWCNT volume fractionvalues the proposed MCFEM solves the elasticity problem of athin plate in plane stress conditions and yields estimates for theoverall YM and PR of the PNC. Fig. 14 shows the procedurefollowed to obtain the results presented in this section.

P.D. Spanos, A. Kontsos / Probabilistic Engineering Mechanics 23 (2008) 456–470 465
Fig. 14. The procedure followed in the Monte Carlo simulations to compute values for the overall YM of PNC.
Fig. 15. The Young’s modulus values computed by the proposed MCFEM versus the number of finite elements for both PNC, SWCNT volume fraction equal toVF2, all three distributions and a variety of values for their standard deviations.
Hence, the random field model generates a vector of SWCNTvolume fraction values. These values are used by thehomogenization model to compute estimates of, e.g. the local
YM of PNC. The local estimates are subsequently used inthe FE model to compute a value of the overall YM. Thisprocedure is repeated a number of times, as seen in Fig. 14 until
466 P.D. Spanos, A. Kontsos / Probabilistic Engineering Mechanics 23 (2008) 456–470
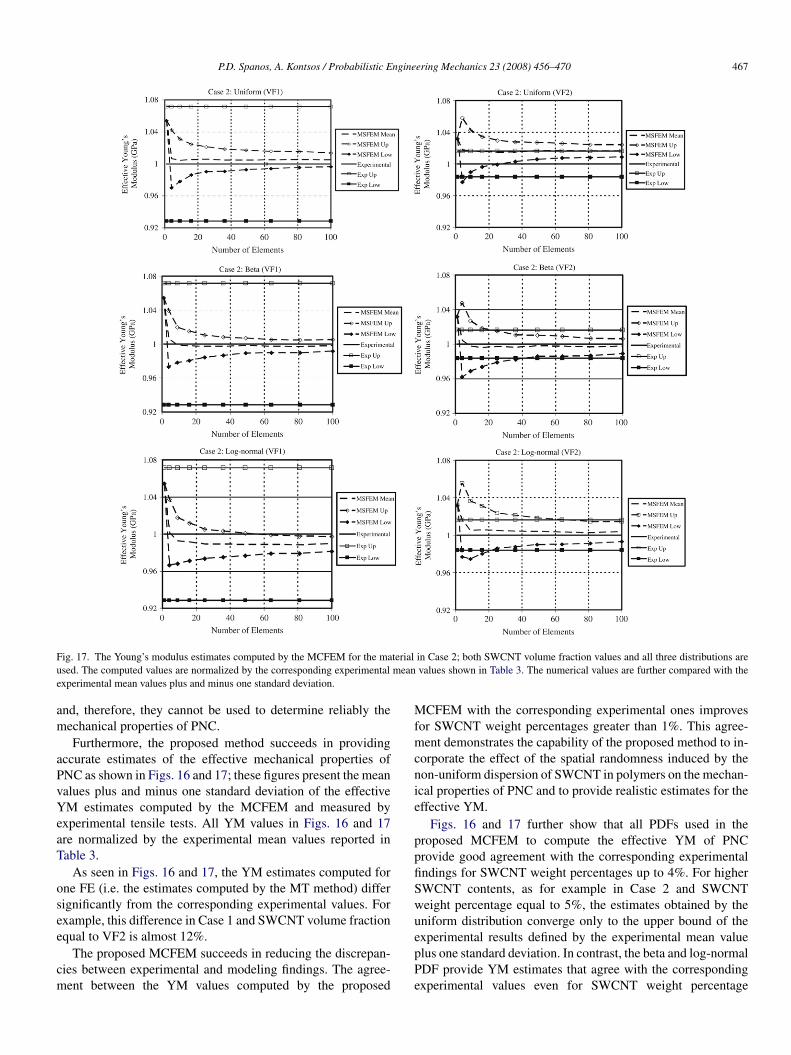
Fig. 16. The Young’s modulus estimates computed by the MCFEM for the material in Case 1; both SWCNT volume fraction values and all three distributions areused. The computed values are normalized by the corresponding experimental mean values shown in Table 3. The numerical values are further compared with theexperimental mean values plus and minus one standard deviation.
the increase in the number of simulations does not influencestatistically the computed parameter. Specifically, it can be seenin Fig. 14 that the coefficient of variation of the YM estimatesdoes not change significantly after about 300 simulations.
The ensemble of numerically computed values by the MonteCarlo scheme of the proposed method is then used to obtain themean values, standard deviations and coefficients of variationof the overall YM and PR of PNC. It should be noted thatthe solution of the MCFEM for one FE corresponds to theresults obtained by the direct application of the MT method,which does not include the effect of the spatial randomnesson the mechanical properties of PNC. Hence, a comparison ofthe solutions obtained for one and more FE is made in thissection to demonstrate the success of the proposed method inquantifying the effect of the spatial variability in the structureof PNC on their mechanical properties.
Fig. 15 presents the overall YM values computed by theproposed method for both PNC with SWCNT volume fraction
equal to VF2 to demonstrate the effect of the chosen PDFs andtheir parameters. Specifically, Fig. 15 shows that the increaseof the standard deviation causes a decrease of the effective YMvalues for all three PDFs. This behavior has been also verifiedfor SWCNT volume fraction equal to VF1. However, in thecase of the effective PR values the effect of the PDFs and theirparameters on the computed values is found to be negligible. Inaddition, Table 3 shows that experimental findings are availableonly for the YM of PNC. Hence, results such as the onesshown in Fig. 15 are used to choose the values for the standarddeviation of the PDFs. It can be further concluded from Fig. 15that the YM values which correspond to the MT method arealways different from the ones computed by the MCFEM.Consequently, Fig. 15 presents a first indication of the effectof the spatial randomness in the structure of PNC on theirmechanical properties. Consequently, it can be argued thatmicromechanics methods are bounded by their assumptions
P.D. Spanos, A. Kontsos / Probabilistic Engineering Mechanics 23 (2008) 456–470 467
Fig. 17. The Young’s modulus estimates computed by the MCFEM for the material in Case 2; both SWCNT volume fraction values and all three distributions areused. The computed values are normalized by the corresponding experimental mean values shown in Table 3. The numerical values are further compared with theexperimental mean values plus and minus one standard deviation.
and, therefore, they cannot be used to determine reliably themechanical properties of PNC.
Furthermore, the proposed method succeeds in providingaccurate estimates of the effective mechanical properties ofPNC as shown in Figs. 16 and 17; these figures present the meanvalues plus and minus one standard deviation of the effectiveYM estimates computed by the MCFEM and measured byexperimental tensile tests. All YM values in Figs. 16 and 17are normalized by the experimental mean values reported inTable 3.
As seen in Figs. 16 and 17, the YM estimates computed forone FE (i.e. the estimates computed by the MT method) differsignificantly from the corresponding experimental values. Forexample, this difference in Case 1 and SWCNT volume fractionequal to VF2 is almost 12%.
The proposed MCFEM succeeds in reducing the discrepan-cies between experimental and modeling findings. The agree-ment between the YM values computed by the proposed
MCFEM with the corresponding experimental ones improvesfor SWCNT weight percentages greater than 1%. This agree-ment demonstrates the capability of the proposed method to in-corporate the effect of the spatial randomness induced by thenon-uniform dispersion of SWCNT in polymers on the mechan-ical properties of PNC and to provide realistic estimates for theeffective YM.
Figs. 16 and 17 further show that all PDFs used in theproposed MCFEM to compute the effective YM of PNCprovide good agreement with the corresponding experimentalfindings for SWCNT weight percentages up to 4%. For higherSWCNT contents, as for example in Case 2 and SWCNTweight percentage equal to 5%, the estimates obtained by theuniform distribution converge only to the upper bound of theexperimental results defined by the experimental mean valueplus one standard deviation. In contrast, the beta and log-normalPDF provide YM estimates that agree with the correspondingexperimental values even for SWCNT weight percentage

468 P.D. Spanos, A. Kontsos / Probabilistic Engineering Mechanics 23 (2008) 456–470
Fig. 18. The coefficient of variation (C.O.V.) of the Young’s modulus estimates computed by the MCFEM and presented in Figs. 17 and 18 versus the number offinite elements.
equal to 5%. Consequently, it can be argued that for smallamounts of SWCNT in polymers, the spatial distribution ofthe SWCNT can be described by symmetric distributions, suchas the uniform one. However, as the SWCNT volume fractionincreases, the formation of agglomerates in the PNC structureresults in a non-symmetric SWCNT dispersion behavior whichcan be more accurately modeled by the use of PDF such as thebeta and the lognormal ones.
Furthermore, Fig. 18 shows the effect of the number of FEused in the proposed MCFEM on the computed estimates forthe effective YM of PNC. As seen in these figures, by increasingthe FE mesh size, the coefficient of variation (COV) of thecomputed values decreases. This result is a consequence of thescale effect induced by the finite dimensions of the MR definedin Fig. 4 and demonstrates the dependence of the computedYM values on the number of grid points chosen to quantify theSWCNT.
Fig. 18 in combination with Figs. 16 and 17 can be used todetermine the required number of FE or equivalently of grid
points to compute reliable estimates of the effective mechanicalproperties of PNC. Hence, for the two PNC modeled in thispaper, a number of FE equal to 100 (i.e. a grid of 10×10 points)is sufficient to compute reliable estimates of the overall YM.
Fig. 19 presents the values for the overall PR of PNCcomputed by the proposed method and compared withthe values obtained by directly applying the multiscalehomogenization model presented in Section 3. No experimentaldata are available for comparison in the case of the PR ofPNC. Fig. 19 shows that the effect of the spatial randomnessin the structure of PNC on their overall PR is negligible.Consequently, it can be argued that the estimates of the overallPR of PNC obtained by the MT method are reliable.
5. Concluding remarks
This paper has presented a multiscale Monte Carlofinite element method (MCFEM) which determines reliablymechanical properties of polymer nanocomposites (PNC) thatconsist of polymers reinforced with single-walled carbon

P.D. Spanos, A. Kontsos / Probabilistic Engineering Mechanics 23 (2008) 456–470 469
Fig. 19. The Poisson ratio estimates for both PNC computed by the MCFEM.
nanotubes (SWCNT). The proposed method identifies thespatial randomness induced in PNC by the non-uniformdispersion of SWCNT as a cause of the discrepanciesobserved between modeling and experimental findings aboutthe mechanical behavior of PNC. Hence, the method developsa multiscale modeling strategy, in which PNC are treatedas random heterogeneous media. Specifically, the nano-/microstructure of PNC is modeled at a local level; localinformation about the SWCNT dispersion is determined andsubsequently used in a homogenization model that yields thelocal mechanical properties of PNC. Next, the local mechanicalproperties are used to solve a finite elements problem whichcomputes estimates for the overall mechanical behavior ofPNC. The statistical analysis of the ensemble of the numericallygenerated results yields values for the Young’s modulus andPoisson ratio of PNC. The derived results capture the effect ofthe spatial randomness in the structure of PNC on their overalleffective properties. In addition, the numerical results agreewith pertinent experimental findings. Clearly, this article hasfocused on a new aspect of modeling PNC, and has providedestimates of their mechanical properties at the macroscale. Ithas also captured the effects of the non-homogenous/ non-uniform dispersion of SWCNT in polymers on the mechanicalbehavior of PNC; obviously this procedure can be applied, withproper constitutive laws modification, to capture similar effectson the thermal and electrical properties of PNC enriched withSWCNT.
Acknowledgement
The authors are grateful for the financial support receivedfrom the Air Force Research Laboratory/ Clarkson AerospaceInc. to Rice University.
References
[1] Iijima S. Helical microtubules of graphite carbon. Nature 1991;364:56–8.[2] Qian D, Wagner GJ, Liu WK. Mechanics of carbon nanotubes. Applied
Mechanics Reviews 2002;55(6):495–533.[3] Njuguna J, Pielichowski K. Polymer nanocomposites for aerospace
applications: Properties. Advanced Engineering Materials 2003;5(11):769–78.
[4] Zhang X, Liu T, Sreekumar TV, et al. Poly(vinyl alcohol)/ SWCNTComposite Film. Nano Letters 2003;3(9):1285–8.
[5] Zhu J, Peng H, Rodriguez-Macias F, et al. Reinforcing epoxy polymercomposites through covalent integration of functionalized nanotubes.Advanced Functional Materials 2004;14(7):643–8.
[6] Paiva MC, Zhou B, Fernando KAS, Lin Y, Kennedy JM, Sun Y-P. Mechanical and morphological characterization of polymer-carbonnanocomposites from functionalized carbon nanotubes. Carbon 2004;42:2849–54.
[7] Li X, Gao H, Scrivens WA, et al. Nanomechanical characterizationof single-walled carbon nanotubes reinforced epoxy composites.Nanotechnology 2004;15:1416–23.
[8] Seidel GD, Lagoudas DC. Micromechanical analysis of the effectiveelastic properties of carbon nanotube reinforced composites. Mechanicsof Materials 2006;38:884–907.
[9] Gojny FH, Wichmann MHG, Fiedler B, Schulte K. Influence ofdifferent carbon nanotubes on the mechanical properties of epoxy matrixcomposites. — A comparative study. Composites Science and Technology2005;65:2300–13.
[10] Loos J, Alexeev A, Grossiord N, Koning CE, Regev O. Visualization ofsingle-wall carbon nanotube (SWNT) networks in conductive polystyrenenanocomposites by charge contrast imaging. Ultramicroscopy 2005;104:160–7.
[11] Gojny FH, Wichmann MHG, Kopke U, Fiedler B, Schulte K. Carbonnanotube-reinforced epoxy-composites: Enhanced stiffness and fracturetoughness at low nanotube content. Composites Science and Technology2004;64:2363–71.
[12] Kashiwagi T, Du F, Winey KI, et al. Flammability properties of polymernanocomposites with single-walled carbon nanotubes: Effects of nanotubedispersion and concentration. Polymer 2005;46:471–81.
[13] Hill R. Elastic properties of reinforced solids: Some theoretical principles.Journal of Mechanics and Physics of Solids 1963;10:357–72.

470 P.D. Spanos, A. Kontsos / Probabilistic Engineering Mechanics 23 (2008) 456–470
[14] Ostoja-Starzewski M. Material spatial randomness: From statistical torepresentative volume element. Probabilistic Engineering Mechanics2006;21:112–32.
[15] Ghanem R, Spanos PD. Stochastic finite elements: A spectral approach.New York: Springer-Verlag; 1991.
[16] Graham LL, Baxter SC. Simulation of local material properties basedon moving-window GMC. Probabilistic Engineering Mechanics 2001;17:295–305.
[17] Vanmarcke E. Random fields: Analysis and synthesis. Cambridge (MA):The MIT Press; 1983.
[18] Zeldin BA, Spanos PD. On random field discretization in stochastic finiteelements. Journal of Applied Mechanics 1998;65:320–7.
[19] Der Kiureghian A, Ke J-B. The stochastic finite element method instructural reliability. Probabilistic Engineering Mechanics 1988;3(2):83–91.
[20] Fishman GS. Monte Carlo-Concepts, algorithms and applications. NewYork: Springer-Verlag; 1996.
[21] Kleiber M, Hien TD. The stochastic finite element method: Basic per-turbation technique and computer implementation. Chichester (England):Wiley; 1992.
[22] Haldar A, Mahadevan S. Reliability assessment using stochastic finiteelement analysis. New York: John Wiley & Sons; 2000.
[23] Ostoja-Starzewski M, Wang X. Stochastic finite elements as abridge between random material microstructure and global response.Computational Methods in Applied Mechanics and Engineering 1999;168:35–49.
[24] Swaminathan S, Ghosh S, Pagano NJ. Statistically equivalent representa-tive volume elements for unidirectional composite microstructures: Part I-without damage. Journal of Composite Materials 2006;40(7):583–604.
[25] Shi D-L, Huang YY, Hwang K-C, Gao H. The effect of nanotube wavinessand agglomeration on the elastic property of carbon nanotube-reinforcedcomposites. Journal of Engineering Materials and Technology 2004;126:250–7.
[26] Benveniste Y. A new approach to the application of Mori–Tanaka’s theoryin composite materials. Mechanics of Materials 1987;6:147–57.
[27] Nemat-Nasser S, Hori M. Micromechanics: Overall properties ofheterogeneous materials. Amsterdam: North-Holland; 1999.
[28] Qiu YP, Weng GJ. On the application of Mori–Tanaka’s theory involvingtransversely isotropic spheroidal inclusions. International Journal ofEngineering Science 1990;28(11):1121–37.
[29] Yu M-F, Files BS, Arepalli S, Ruoff RS. Tensile loading of ropes of singlewall carbon nanotubes and their mechanical properties. Physical ReviewLetters 2000;84(24):5552–5.
[30] Popov VN, Van Doren VE, Balkanski M. Elastic properties of crystals ofsingle-walled carbon nanotubes. Solid State Communications 2000;114:395–9.
[31] Odegard GM, Gates TS, Wise KE, Park C, Siochi EJ. Constitutivemodeling of nanotube-reinforced polymer composites. CompositesScience and Technology 2003;63:1671–87.
[32] Pipes RB, Frankland SJV, Hubert P, Saether E. Self-consistent propertiesof carbon nanotubes and hexagonal arrays as composite reinforcements.Composites Science and Technology 2003;63:1349–58.
[33] Thostenson ET, Chou T-W. On the elastic properties of carbon nanotube-based composites: Modeling and characterization. Journal of AppliedPhysics D: Applied Physics 2003;36:573–82.
[34] Khabashesku VN, Margrave JL, Barrera EV. Functionalized carbon nan-otubes and nanodiamonds for engineering and biomedical applications.Diamond & Related Materials 2005;14:859–66.
Copyright © 2022 FDOKUMEN