Electrical Properties of Self-Assembled Nano-Schottky Diodes
Upload
khangminh22Category
view
0download
0
1
Inhibitory synapses are repeatedly assembled
and removed at persistent sites in vivo
by
Katherine L. Villa
B.S., M.S. Molecular and Cellular Biology
The Johns Hopkins University, Baltimore, 2007, 2008
Submitted to the Department of Biology in
Partial Fulfillment of the Requirements for the Degree of
Doctor of Philosophy in Biology at
The Massachusetts Institute of Technology
February 2016
© Massachusetts Institute of Technology
All rights reserved
Signature of Author: ____________________________________________________________
Department of Biology
November 6, 2015
Certified by: __________________________________________________________________
Elly Nedivi
Professor of Brain & Cognitive Sciences and Biology
Thesis Supervisor
Accepted by: _________________________________________________________________
Michael Hemann
Associate Professor of Biology
Co-Chair, Biology Graduate Committee

2
3
Inhibitory synapses are repeatedly assembled
and removed at persistent sites in vivo
by
Katherine L. Villa
Submitted to the Department of Biology
on November 6th, 2015 in Partial Fulfillment of the
Requirements for the Degree of
Doctor of Philosophy in Biology
Abstract
Structural plasticity, the rewiring of synaptic connections, occurs not only during development, but is prevalent in the adult brain and likely represents the physical correlate of learning and memory. Removal or addition of excitatory and inhibitory synaptic inputs onto a neuron can affect their relative influence on excitation in specific dendritic segments, and ultimately regulate neuronal firing. However, the structural dynamics of excitatory and inhibitory synapses in vivo, and their relation to each other, is not well understood. To gain insight into synaptic remodeling in the adult brain in vivo, we used dual- and triple- color two-photon imaging to track the dynamics of all inhibitory and excitatory synapses onto a given neuron in the cerebral cortex at different timescales. By studying synaptic changes over 4-day or 24-hour intervals we were able to determine that inhibitory synapses are remarkably dynamic in vivo. We found that Inhibitory synapses occur not only on the dendritic shaft, but also a significant fraction is present on dendritic spines, alongside an excitatory synapse. Inhibitory synapses on these dually innervated spines are remarkably dynamic and in stark contrast to the stability of excitatory synapses on the same spines. Many of the inhibitory synapses on dendritic spines repeatedly disappear and reappear in the same location. These reversible structural dynamics indicate a fundamentally new role for inhibitory synaptic remodeling – flexible, input-specific modulation of stable excitatory connections. To determine whether synapse dynamics are regulated by experience-dependent plasticity, we performed monocular deprivation, finding that an ocular dominance shift reduces inhibitory synaptic lifetime and increases recurrence. To investigate the molecular mechanism of rapid inhibitory synapse appearance and removal, I am currently testing molecular interventions that influence the clustering of gephyrin, a scaffolding molecule that anchors inhibitory receptors at postsynaptic sites.
Thesis Supervisor: Elly Nedivi
Title: Professor of Brain & Cognitive Sciences and Biology

4
Acknowledgements
I first and foremost would like to thank my advisor, Elly Nedivi, who is quite literally the
best PhD advisor I could have asked for. Elly has taught me so much about being a top-caliber
scientist, a great writer, and balancing a successful career with being a great mother. I would
like to thank her for her hands on mentoring, especially for helping me get through writing, which
has always been my least favorite part.
I would also like to thank my committee Troy Littleton, Martha Constantine-Patton, and Jeffrey
Lichtman, for their helpful scientific input, for sharing equipment, and also to Troy for organizing
the MCN program which has brought so many interesting talks to our building.
I would like to thank my undergraduate advisor, Victor Corces, one of the kindest, most
supportive people I have ever met, who first opened my eyes for loving science and exploring
interesting questions.
I will of course always be indebted to my great colleagues in the Nedivi lab, especially Jerry
Chen, who taught me everything I know about 2 photon imaging, and Sven Loebrich, who
helped me learn cloning, cell culture, and anything else I ever asked him about. I also want to
thank the rest of the imaging team, Ronen Eavri, Jaichandar Subramanian, Peter Wang, and
Aygul Balcioglu-Dutton, for their help, support, and troubleshooting along the way. Also, to
everyone else who overlapped with me in the Nedivi lab: Jenifer Leslie, Genevieve Flanders,
Zachary Tong, Marc Benoit, Mette Rathje, and Charles Moss, who created such a friendly and
entertaining lab environment.
Most importantly, I need to thank Kalen Berry, without whose programing knowledge, tinkering
skills, and helpful attitude, our paper never would have been completed. Thank you Kalen for
making up for the holes in my skillset and for being such a pleasure to work with every single
day.
To my collaborators Jae Won Cha and Peter So, thank you for building the microscope that I
used on a daily basis to perform my research. To Yoshiyuki Kubota, thank you for completing
the electron microscopy that was essential for validating our work and asking interesting follow-
up questions, and for many stimulating conversations. To Won Chan Oh and Hyung-Bae Kwon,
who I met recently, but who contributed such an interesting electrophysiology experiment to our
paper.

5
Thank you to the funding agencies who have supported my graduate education and provided
funding to complete this work: MIT’s pre-doctoral training grant through the NIH, my personal
NRSA fellowship, and to the National Eye Institute, which continues to support the Nedivi lab.
To all my friends at MIT, in Boston, and in New Jersey: Daisy, Izarys, Katie G (aka Katie #2),
Rini, Ann, Jim, Angie, Kristina, Catie Thompson (Catie with a C), Dave Hall!, Bill, Leah, and
everyone who made my time at MIT so much fun.
Of course, I owe infinite gratitude to my family: To my parents for always always supporting me
and all my crazy hard-headed ideas; to my late grandparents, Nanny and Poppy, for instilling a
love of learning when I was just a baby; to my current gray haired ladies, Ginga, Aunt Mickey,
and Aunt Isabell who kept the pressure on for me to finish grad school and get a real job, and
for always reminding me what is really important in life, to my beloved tios, Auntie, Uncle, Aunt
Pammy, and Uncle Billy, for their constant love and support, to my cousin Gina for being such
an inspiration to me, and to my younger sister Rachel who inspired me to be someone worthy of
looking up to (and for being so beautiful ;P).
Finally I want to thank my husband and soul mate, Juan Alvarez. Even though I never believed
in soul mates before meeting you, every day I am with you provides more evidence against my
prior hypothesis. You complement me in every way imaginable and I am a better person
because of you. I am so lucky to have found someone who not only makes me happier each
and every day, but who also understands the demands of a scientific career.

6
Table of Contents
Chapter 1 - Introduction .......................................................................................................... 8
Organization of synapses across the dendritic arbor .............................................................. 9
First views through Golgi staining and electron microscopy .............................................. 9
Synaptic visualization by new in vivo fluorescent labeling methods ..................................12
Circuit rewiring through experience dependent plasticity .......................................................14
Conclusion ............................................................................................................................15
Chapter 2 - Clustered dynamics of inhibitory synapses and dendritic spines in the adult
neocortex .................................................................................................................................17
Abstract .................................................................................................................................17
Introduction ...........................................................................................................................18
Results ..................................................................................................................................19
Simultaneous In Vivo Imaging of Inhibitory Synapses and Dendritic Spines .....................19
Teal-Gephyrin Puncta Correspond to Inhibitory Synapses ...............................................22
Differential Distribution of Inhibitory Spine and Shaft Synapses .......................................24
Inhibitory Spine and Shaft Synapses are Kinetically Distinct ............................................26
Inhibitory Synapse and Dendritic Spine Changes Are Locally Clustered ..........................28
Discussion .............................................................................................................................31
Supplementary Figures .........................................................................................................36
Experimental Procedures ......................................................................................................39
Chapter 3 - Inhibitory synapses are repeatedly assembled and removed at persistent
sites in vivo .............................................................................................................................47
Abstract .................................................................................................................................47
Introduction ...........................................................................................................................48
Results ..................................................................................................................................50
Triple-color labeling of pyramidal cells .............................................................................50
Teal-gephyrin and PSD-95-mCherry puncta represent inhibitory and excitatory synapses,
respectively ........................................................................................................................52
Teal-gephyrin puncta on dually innervated spines represent functional GABAergic
synapses............................................................................................................................54
The majority of excitatory synapses and the spines that bear them are stable .................56
Inhibitory synapses disappear and appear again in the same location .............................58
Kinetics of inhibitory synaptic dynamics are altered in experience dependent plasticity ...60
Inhibitory axons appear to remain in place after loss of a recurrent inhibitory synapse .....63

7
Discussion .............................................................................................................................65
Supplemental Data ................................................................................................................69
Experimental Procedures ......................................................................................................78
Chapter 4 - Probing the molecular mechanism of rapid inhibitory dynamics ....................88
Abstract .................................................................................................................................88
Introduction ...........................................................................................................................89
Results ..................................................................................................................................91
Generation of gephyrin S268A and S270A expression plasmids ......................................91
In vivo 2-photon imaging of L2/3 pyramidal cells expressing mutant gephyrin ..................91
Density of spines and synapses of gephyrin mutants .......................................................92
Dynamics of spines and synapses in gephyrin mutants ....................................................93
Discussion .............................................................................................................................95
Methods ................................................................................................................................96
Chapter 5 – Conclusion ........................................................................................................ 102
Inhibitory synapses are repeatedly assembled and removed from persistent sites ......... 105
Functional implications of inhibitory synaptic placement across the dendritic arbor ........ 107
Molecular mechanism of rapid gephyrin dynamics ......................................................... 110
Future Experiments ........................................................................................................ 110
References ............................................................................................................................ 113
8
Chapter 1 - Introduction
Parts of this chapter will be published in:
KL Villa, E Nedivi. “Excitatory and inhibitory synaptic placement and functional implications.”
Dendrites: development and disease. Ed. Kazuo Emoto, Rachel Wong, Eric Huang and Casper
Hoogenraad. 2015. Springer. In press.
Synaptic transmission between neurons is the basic unit of communication in neural
circuits. The neurotransmitter synthesized and released at the synapse is the basis for
classification of neurons as excitatory or inhibitory. Glutamatergic neurons, releasing glutamate,
excite postsynaptic cells, while GABAergic neurons, releasing GABA (γ-aminobutyric acid),
inhibit them. The relative number and distribution of excitatory and inhibitory synaptic inputs
across individual dendrites and neurons are the hardware of local dendritic and cellular
computations and therefore key to information processing in the brain. The delicate balance
between excitation and inhibition is essential for precise nervous system function and plasticity,
as its perturbation has been associated with disorders ranging from epilepsy (Mohler et al.,
2004), to autism (Rubenstein and Merzenich, 2003), and mental retardation (Dani et al., 2005;
Kleschevnikov et al., 2004), as well as neuropsychatric disorders such as schizophrenia (Lewis
et al., 2005). Here, we discuss the structural and functional observations that have guided the
understanding of excitatory and inhibitory synaptic organization across the neuronal arbor, and
the subcellular targeting properties of both excitatory and inhibitory subtypes. We focus primarily
on the adult mammalian cortex, where excitatory and inhibitory cell types, their connectivity, and
its functional implications have been best characterized. Deep understanding of the structural
distribution of synaptic inputs, and how those structures change over time, is important for the
accurate modeling of neurons and for an understanding of how summing inputs across the
dendritic arbor can engender the firing patterns of a particular cell.
9
Organization of synapses across the dendritic arbor
First views through Golgi staining and electron microscopy
Pyramidal neurons
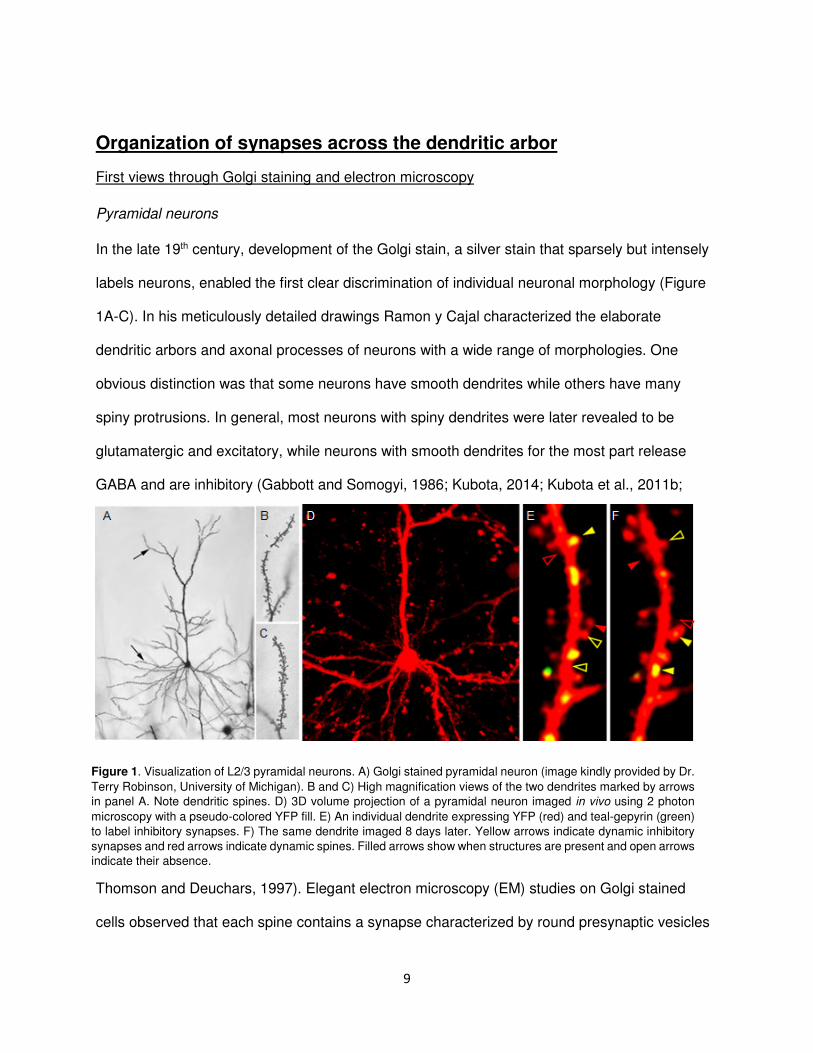
In the late 19th century, development of the Golgi stain, a silver stain that sparsely but intensely
labels neurons, enabled the first clear discrimination of individual neuronal morphology (Figure
1A-C). In his meticulously detailed drawings Ramon y Cajal characterized the elaborate
dendritic arbors and axonal processes of neurons with a wide range of morphologies. One
obvious distinction was that some neurons have smooth dendrites while others have many
spiny protrusions. In general, most neurons with spiny dendrites were later revealed to be
glutamatergic and excitatory, while neurons with smooth dendrites for the most part release
GABA and are inhibitory (Gabbott and Somogyi, 1986; Kubota, 2014; Kubota et al., 2011b;
Thomson and Deuchars, 1997). Elegant electron microscopy (EM) studies on Golgi stained
cells observed that each spine contains a synapse characterized by round presynaptic vesicles
Figure 1. Visualization of L2/3 pyramidal neurons. A) Golgi stained pyramidal neuron (image kindly provided by Dr.
Terry Robinson, University of Michigan). B and C) High magnification views of the two dendrites marked by arrows
in panel A. Note dendritic spines. D) 3D volume projection of a pyramidal neuron imaged in vivo using 2 photon
microscopy with a pseudo-colored YFP fill. E) An individual dendrite expressing YFP (red) and teal-gepyrin (green)
to label inhibitory synapses. F) The same dendrite imaged 8 days later. Yellow arrows indicate dynamic inhibitory
synapses and red arrows indicate dynamic spines. Filled arrows show when structures are present and open arrows
indicate their absence.

10
and a robust postsynaptic density (Hersch and White, 1981; LeVay, 1973; Parnavelas et al.,
1977). These asymmetric synapses, classified as type 1 synapses, are innervated by axons of
glutamatergic neurons (Baude et al., 1993). While there are a few reports of specific cell
regions on particular types of neurons where type 1 synapses are localized directly on the
dendritic shaft (Megias et al., 2001; Parnavelas et al., 1977), this is generally not the case.
Given that the vast majority of spines, with the exception of some very thin spines (about 2-4%
of total cortical spines) (Arellano et al., 2007; Hersch and White, 1981; White and Rock,
1980), have a single type 1 excitatory synapse (Harris et al., 1992; LeVay, 1973) it was
reasonable to assume that each spine can serve as a readily identifiable structural surrogate for
an excitatory synapse. Thus, for spiny pyramidal neurons, dendritic spine distributions as seen
by Golgi stain or by filling cells with a fluorescent dye could inform as to the placement of
excitatory synapses across the dendritic arbor (Elston and Rosa, 1997; Larkman, 1991;
Trommald et al., 1995).
There is a great variety in the density of spines between cells, and between different
branches on the same cell. To give a general sense of spine distributions, spine density is low
within 40 µm of the cell body, reaching a maximum density in a region 40-130 µm from the
soma, and then gradually decreasing toward a dendrite’s distal tips (Megias et al., 2001). On the
distal branches of pyramidal cells, spine density can range from 0 to 70 spines per 10 µm
(Megias et al., 2001) with the highest spine density often found on the thickest dendrites, usually
the primary apical dendrite. The total number of spines on spiny excitatory neurons typically
ranges from 5,000 – 35,000 spines per cell, ultimately depending on the total dendritic length,
with L5 pyramidal cells generally having longer total dendrite length and therefore more
synapses than L2/3 pyramidal cells, for example (Larkman, 1991).
Inhibitory synapses innervated by the axons of GABAergic neurons, classified by EM as
type 2, or symmetric synapses, are typified by a symmetric synaptic cleft, due to a minimal

11
postsynaptic density, as well as flattened presynaptic vesicles (Davis and Sterling, 1979).
Unfortunately, since type 2 inhibitory synapses lack a morphological surrogate, their distribution
patterns cannot be discriminated by Golgi staining alone. Laborious EM reconstructions of
relatively small neuronal regions have shown excitatory to inhibitory synaptic ratios along
pyramidal dendrites ranging from 6.5 - 12.5 to 1 (Davis and Sterling, 1979). As previously
mentioned, the cell body and proximal dendrites of excitatory neurons typically lack spines.
However, they are often densely innervated by type 2 synapses. In the aspiny region of the
proximal dendrites, inhibitory synapse density can be as high as 17 synapses per 10 µm
(Megias et al., 2001). EM studies also show that on excitatory dendrites, the majority of type 2
inhibitory synapses are located on the dendritic shaft at a density of about 3 per 10 µm (Hersch
and White, 1981). Inhibitory synapses can also be located on dendritic spines adjacent to
excitatory synapses (Parnavelas et al., 1977), as well as on the axon initial segment (Hersch
and White, 1981; Westrum, 1966). It was later found that inhibitory axons from different
inhibitory neuron subtypes specifically target discrete regions of their postsynaptic pyramidal cell
partners (this is discussed in greater detail further in the chapter).
Non-pyramidal neurons
The dendrites of inhibitory neurons, in general, do not contain spines. However, a small
subset of inhibitory neurons have dendritic spines (Azouz et al., 1997; Feldman and Peters,
1978), with densities that range from 0.3 to 7 spines per 10 µm (Kawaguchi et al., 2006; Keck et
al., 2011). Like spiny pyramidal cells, the cell body and most proximal dendrites of spiny
interneurons within 30 µm of the soma lack spines (Kawaguchi et al., 2006).
Immunohistochemistry experiments show that the majority of spines on these interneurons
colocalize with Vglut1 but not VGAT, indicating that they mostly harbor excitatory synapses
(Keck et al., 2011). The proportion of excitatory synapses located along the shaft of spiny

12
inhibitory dendrites has not been established. We also know little about the distribution of
inhibitory synapses on spiny interneurons (Gulyas et al., 1992).
Aspiny interneurons receive both excitatory and inhibitory inputs onto their soma and
proximal dendrites (Davis and Sterling, 1979), with a higher density along their distal dendrites
(Parnavelas et al., 1977). Similarly to inhibitory synapses on pyramidal cells, both excitatory
synapses and inhibitory synapses onto dendrites of aspiny inhibitory neurons cannot be
visualized through a morphological surrogate and could initially be examined only by EM on
relatively small arbor segments or by immunohistochemistry. EM reconstructions of isolated
branches from different inhibitory neuron types provides anecdotal evidence related to their
synaptic densities (Gulyas et al., 1999; Gulyas et al., 1992).
Synaptic visualization by new in vivo fluorescent labeling methods
Golgi staining gave us a first view of dendritic spine distributions, and EM studies were
first to shed light on the fundamental layout of excitatory and inhibitory synaptic distributions on
different neuronal types. Yet, both methods have inherent limitations. As a cell fill, Golgi stain
can at best identify spines on cells with defined morphology and location, while all inhibitory
synapses as well as excitatory synapses on aspiny dendrites remain invisible. EM is limited by
the difficulty of reconstructing large dendritic segments. EM reconstruction of an entire cell
would require a heroic effort, one rarely attempted (see (White and Rock, 1980) for a
reconstruction of an entire spiny stellate neuron). Both Golgi staining and EM reconstructions
necessitate tissue fixation and cannot be used for visualizing structural dynamics. Thus, our
initial view of synaptic distributions was constrained by the limitations of the Golgi and EM
methods.
Recently, imaging of fluorescently-labeled cells in vivo has provided a new view not only
of dendritic spine distributions, but also of excitatory and inhibitory synapses as well as the
13
dynamics of these structures (Figure 1D-F). This is accomplished using two-photon imaging,
which has several advantages over conventional light microscopy. Because two-photon
excitation occurs when two photons simultaneously excite a fluorescent molecule, the
wavelength of excitation is twice that of conventional microscopy, and these longer wavelengths
are more effective at penetrating deep into tissue with less scattering. Thus the use of two-
photon microscopy allows imaging of structures up to 400 µm deep within the cortex.
Additionally, two-photon microscopy uses focal point scanning of a laser, which allows high
resolution imaging and reduces background noise, as only a single point is excited at a time.
This also reduces photobleaching.
The first studies using two-photon imaging on neurons fluorescently labeled with green
fluorescent protein (GFP) showed that in adult animals dendrites of pyramidal neurons are very
stable (Grutzendler et al., 2002; Mizrahi and Katz, 2003; Trachtenberg et al., 2002), but
dendritic spines are highly dynamic (Trachtenberg et al., 2002), implying a capacity for synaptic
removal and addition. Spine dynamics of excitatory as well as spiny inhibitory neurons can be
further increased upon sensory deprivation (Hofer et al., 2009; Holtmaat et al., 2009; Holtmaat
et al., 2006; Trachtenberg et al., 2002). Dynamics differ dependent on deprivation protocol and
cortical lamina, consistent with the view that they reflect specific circuit alterations. Although it
has been shown that spines that persist for more than 4 days always acquire an excitatory
synapse, specific labeling of the excitatory synapse is necessary to observe synaptic dynamics
at shorter timescales. Though spines serve as a rough structural surrogate for excitatory
synapses, there is no structural marker of inhibitory synapses, rendering them invisible.
Synaptic labeling of inhibitory synapse is necessary in order to classify their distribution and
dynamics in vivo.
In contrast to the stability of excitatory dendritic branches, inhibitory dendrites are
capable of growth and retraction in vivo (Brown et al., 2011; Holtmaat et al., 2009; Lee et al.,

14
2006) and their dynamics are influenced by sensory manipulations (Brown et al., 2011). The
boutons of inhibitory neurons are also capable of remodeling. Thus, synaptic distributions are
not necessarily rigid. Rather, both excitatory and inhibitory synapses are dynamic structures and
their remodeling potentially underlies functional plasticity.
Circuit rewiring through experience dependent plasticity
While the overall structure of synaptic inputs is important for understanding the
integration of signals at any particular point in time, a key feature of the brain is its ability to
learn and adapt in response to experience. Learning directly results in structural changes in the
connections between neurons, and the brain is capable of remodeling these connections
throughout life. One well-established system used to study cortical plasticity is by using
Monocular Deprivation (MD), the closure of one eye, to induce an ocular dominance shift in
binocular visual cortex. When the eye is closed for a period of time, there is a reduction in the
cortical response to the closed eye, and an increase in the response to the open eye. In some
mammals a MD only affects the cortex early in development during a critical period, but in mice
an MD causes an ocular dominance shift even in adults (Frenkel et al., 2006; Sato and Stryker,
2008).
Inhibition plays a fundamental role in ocular dominance both during development and in
adult mice. During development, the onset and closure of the critical period for ocular
dominance plasticity is triggered by the maturation of GABAergic interneurons (Fagiolini and
Hensch, 2000; Huang et al., 1999). Loss of visual input through MD results in a decreased
expression of GABA and GAD, the GABA synthesizing enzyme, from the deprived eye column
in visual cortex (Hendry and Jones, 1988). Thus, loss of visual experience, such as through MD
or dark rearing, results in a loss of inhibition, which has been shown to restore a juvenile form of
15
plasticity in the adult cortex (He et al., 2006). The structural consequence of the reduction of
inhibition seen after MD or sensory deprivation, is that inhibitory neurons themselves remodel
both their axons and dendrites (Brown et al., 2011; Chen et al., 2011; Keck et al., 2011; Pieraut
et al., 2014; Schuemann et al., 2013; Wierenga et al., 2008). This remodeling is also seen in
inhibitory neurons after treatment with the selective serotonin reuptake inhibitor, fluoxetine,
which has also been shown to restore a juvenile state of plasticity in adults (Chen et al., 2011;
Maya Vetencourt et al., 2008). This suggests that the reduction of inhibition is sufficient to
create a permissive environment allowing for increased plasticity of excitatory neurons.
However, it was not known if these effects occur within a single cell or only in the context of a
larger circuit.
Conclusion
The precise way in which excitatory and inhibitory inputs are integrated within a single
neuron, and how this integration supports computation in functioning networks, are still critical
questions in neuroscience today. Despite advances in our knowledge, we still have limited
experimental evidence of the fine-scale synaptic architecture across the neuronal arbor of
individual cells of different types, and we know even less of the functional interactions between
synaptic excitation and inhibition (Chadderton et al., 2014).
When we began this work, there was no way to study the distribution or dynamics of
inhibitory synapses in vivo. By tagging the postsynaptic scaffolding protein, gephyrin, with a
florescent marker we were able to observe the changes in inhibitory synapses in a living mouse
brain. We also used a fluorescently labeled PSD-95 to simultaneously track all inhibitory and
excitatory synapses on a single cell. We focused on how these synapses change under
baseline conditions and after Monocoular Deprivation (MD) as a model of experience-

16
dependant plasticity. My research has provided important insights on how inhibitory synapses
rapidly remodel in vivo, with implications for the regulation of cortical plasticity at the level of
individual cells and circuits.
17
Chapter 2 - Clustered dynamics of inhibitory synapses
and dendritic spines in the adult neocortex
Portions of this chapter have been published in:
JL Chen, KL Villa, JW Cha, P So, Y Kubota, E Nedivi 2012. “Clustered Dynamics of Inhibitory
Synapses and Dendritic Spines in the Adult Neocortex.” Neuron 74, 361-373.
Contributions: Figures and published manuscript prepared by Jerry Chen. I assisted with sample preparation for Fig. 2 and data collection and analysis for Figs. 3-5 (numbered 2.2-2.5 in the thesis), and S1-S3 in the paper, numbered 2.6-2.8 in this thesis. Immuno EM and reconstruction performed by Yoshiyuki Kubota.
Abstract
An important feature of brain function is the capacity to dynamically adapt in response to
the environment, which is achieved by the remodelling of synaptic connections. In the case of
excitatory synapses on excitatory neurons, dendritic spine dynamics have served as a structural
surrogate for monitoring synaptic rearrangements in vivo. For inhibitory synapses, the lack of
such a surrogate necessitates their direct visualization. We performed dual color two-photon
imaging to simultaneously monitor inhibitory synapse and dendritic spine rearrangement onto
pyramidal neurons in the adult mammalian cortex. This is the first instance of inhibitory synapse
imaging in vivo. We found that 1/3 of inhibitory synapses are located not on the dendritic shaft,
as commonly thought, but on dendritic spines, and that spine synapses are more prevalent at
apical dendrites. Further, chronic monitoring of these two synapse classes showed that they
have different capacities for turnover during normal and altered sensory experience. Monocular
deprivation results in a loss of inhibitory synapses on the shaft and on spines. Inhibitory
synapse dynamics are temporally and spatially clustered with turnover of dendritic spines. Our
findings provide in vivo evidence for local coordinated rearrangements between diverse sets of
synaptic inputs.

18
Introduction
The ability of the adult brain to change in response to experience arises from coordinated
modifications of a highly diverse set of synaptic connections. These modifications include the
strengthening or weakening of existing connections, as well as new synapse formation or
elimination. The persistent nature of structural synaptic changes make them particularly
attractive as cellular substrates for long-term changes in connectivity, such as might be required
for learning and memory. Sensory experience can produce parallel changes in excitatory and
inhibitory synapse density in the cortex (Knott et al., 2002), and the interplay between excitatory
and inhibitory synaptic transmission serves an important role in adult brain plasticity (Spolidoro
et al., 2009). Excitatory and inhibitory inputs both participate in the processing and integration of
local dendritic activity (Sjostrom et al., 2008), suggesting that they are coordinated at the
dendritic level. However, the manner in which these changes are orchestrated and the extent to
which they are spatially clustered are unknown.
Evidence for the gain and loss of synapses in the adult mammalian cortex has
predominantly used dendritic spines as a proxy for excitatory synapses on excitatory pyramidal
neurons. The vast majority of excitatory inputs to pyramidal neurons synapse onto dendritic
spine protrusions that stud the dendrites of these principal cortical cells (Peters, 2002) and to a
large approximation are thought to provide a one-to-one indicator of excitatory synaptic
presence, when the spine persists for more than 4 days (Holtmaat and Svoboda, 2009).
Inhibitory synapses onto excitatory neurons target a variety of subcellular domains, including the
cell body, axon initial segment, and dendritic shaft, as well as some dendritic spines. Unlike
monitoring of excitatory synapse elimination and formation on neocortical pyramidal neurons,
there is no morphological surrogate for the visualization of inhibitory synapses. Inhibitory
synapse dynamics has been inferred from in vitro and in vivo monitoring of inhibitory axonal
bouton remodeling (Chen et al., 2011; Keck et al., 2011; Wierenga et al., 2008). However,
imaging of presynaptic structures does not provide information regarding the identity of the
postsynaptic cell or their subcellular sites of contact. In addition, monitoring of either dendritic

19
spine or inhibitory bouton dynamics has thus far utilized a limited field of view and has not
provided a comprehensive picture of how these dynamics are distributed and potentially
coordinated across the entire arbor.
Here, we simultaneously monitored inhibitory synapse and dendritic spine remodeling
across the entire dendritic arbor of cortical L2/3 pyramidal neurons in vivo during normal and
altered sensory experience. We found that inhibitory synapses on dendritic shafts and spines
differ in their distribution across the arbor, consistent with different roles in dendritic integration.
These two inhibitory synapse populations also display distinct temporal responses to visual
deprivation, suggesting different involvements in early versus sustained phases of experience-
dependent plasticity. Finally, we find that the rearrangements of inhibitory synapses and
dendritic spines are locally clustered, mainly within 10 µm of each other, the spatial range of
local intracellular signaling mechanisms, and that this clustering is influenced by experience.
Results
Simultaneous In Vivo Imaging of Inhibitory Synapses and Dendritic Spines
In order to label inhibitory synapses for in vivo imaging, we generated a Cre-dependent
plasmid expressing Gephyrin, a post-synaptic scaffolding protein exclusively found at
GABAergic and glycinegic synapses (Craig et al., 1996), fused to Teal flourescent protein (Teal-
Gephyrin) (Fig. 2.1A). This construct was co-electroporated with two additional plasmids: a Cre-
dependent enhanced yellow fluorescent protein (eYFP) plasmid as a dendritic and spine fill and
limiting amounts of a Cre construct. Since the Teal-Gephrin and the eYFP expression cassettes
were inserted in the antisense orientation each flanked by two sets of Cre recombination sites,
only cells expressing both constructs as well as Cre could show labelling, ensuring all labelled
cells were dually labelled for Teal-Gephrin and eYFP. Limiting Cre amounts allowed sparse
labeling for single cell imaging and reconstruction. Electroporations were performed in utero on
E16 embryos of pregnant C57Bl6 mice, targeting the lateral ventricle to label cortical progenitors
20
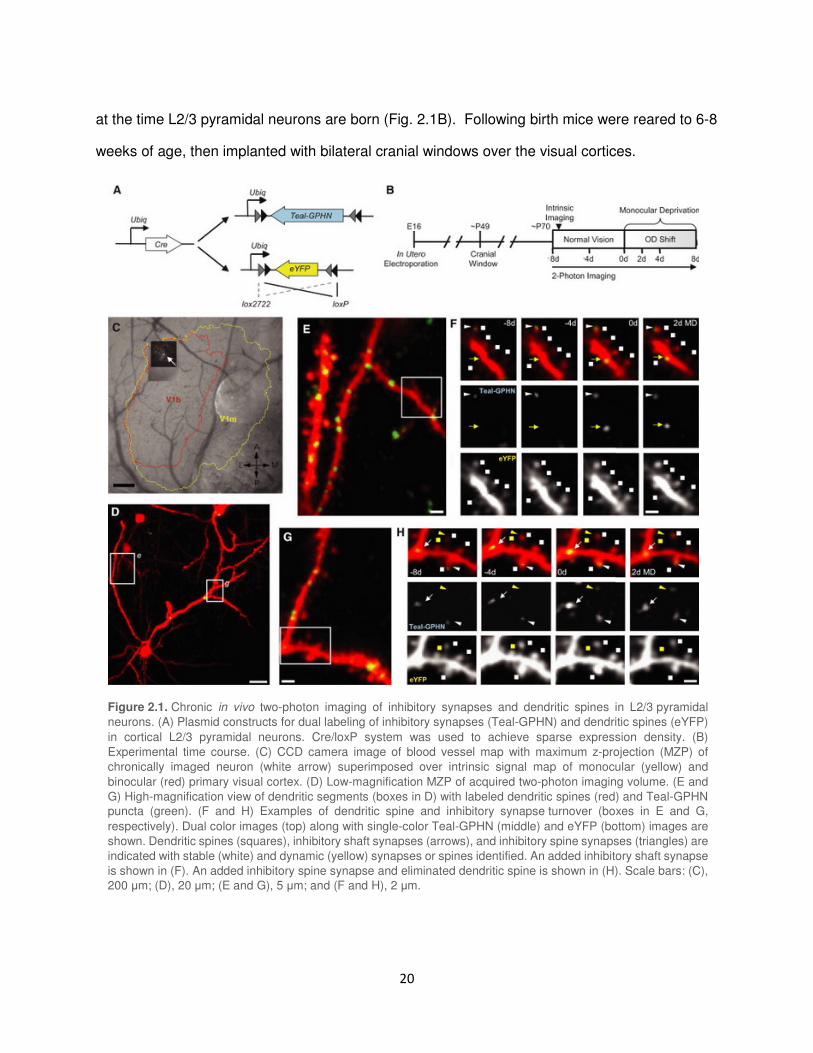
at the time L2/3 pyramidal neurons are born (Fig. 2.1B). Following birth mice were reared to 6-8
weeks of age, then implanted with bilateral cranial windows over the visual cortices.
Figure 2.1. Chronic in vivo two-photon imaging of inhibitory synapses and dendritic spines in L2/3 pyramidal
neurons. (A) Plasmid constructs for dual labeling of inhibitory synapses (Teal-GPHN) and dendritic spines (eYFP)
in cortical L2/3 pyramidal neurons. Cre/loxP system was used to achieve sparse expression density. (B)
Experimental time course. (C) CCD camera image of blood vessel map with maximum z-projection (MZP) of
chronically imaged neuron (white arrow) superimposed over intrinsic signal map of monocular (yellow) and
binocular (red) primary visual cortex. (D) Low-magnification MZP of acquired two-photon imaging volume. (E and
G) High-magnification view of dendritic segments (boxes in D) with labeled dendritic spines (red) and Teal-GPHN
puncta (green). (F and H) Examples of dendritic spine and inhibitory synapse turnover (boxes in E and G,
respectively). Dual color images (top) along with single-color Teal-GPHN (middle) and eYFP (bottom) images are
shown. Dendritic spines (squares), inhibitory shaft synapses (arrows), and inhibitory spine synapses (triangles) are
indicated with stable (white) and dynamic (yellow) synapses or spines identified. An added inhibitory shaft synapse
is shown in (F). An added inhibitory spine synapse and eliminated dendritic spine is shown in (H). Scale bars: (C),
200 µm; (D), 20 µm; (E and G), 5 µm; and (F and H), 2 µm.

21
Allowing 2-3 weeks for recovery (Lee et al., 2008), labeled neurons were identified and 3D-
volume images were acquired using a custom built two-channel two-photon microscope.
Imaging of eYFP-labeled neuronal morphology and Teal-labeled Gephyrin puncta was
Figure 2.2. Teal-gephyrin puncta correspond to inhibitory synapses. (A) In vivo image of an eYFP- (red) and Teal-
Gephyrin-labeled (green) dendrite. Letters indicate identified dendritic spines; numbers indicate identified inhibitory
synapses. (B) Reidentification of the same imaged dendrite in fixed tissue after immunostaining for eYFP. (F)
Serial-section electron microscopy (SSEM) reconstruction of the in vivo imaged dendrite (in green) with identified
GABAergic synapses (in red), non-GABAergic synapses (in blue), and unidentified spine-synapses (arrows). (D–
F) High-magnification view of region outlined in (C) with merged (top-left panels), eYFP only (top-middle panels),
Teal-Gephyrin only (top-right panels) in vivo images and SSEM reconstruction (bottom panel). (G) Electron
micrograph of inhibitory shaft synapse “1” in (D) identified by a GABAergic presynaptic terminal visualized by
postembedding GABA immunohistochemistry with 15 nm colloidal gold particles (black circles identify GABAergic
presynaptic terminal) contacting eYFP-labeled dendritic shaft (DAB staining, red arrows mark synaptic cleft). (H)
Electron micrograph of doubly innervated dendritic spine ‘d2’ in (E) with inhibitory synapse (red arrows mark
synaptic cleft) and excitatory synapse (blue arrows mark synaptic cleft). Scale bars: (A–C), 1 µm; (D–F, top panels),
1 µm; (D–F, bottom panels), 500 nm; and (G and H), 100 nm.
22
performed by simultaneous excitation of eYFP and Teal and resolution by wavelength
separation into two detection channels followed by post-hoc spectral linear un-mixing. In
addition, cortical maps of monocular and binocular primary visual cortex were obtained by
optical imaging of intrinsic signals and blood vessel maps were used to identify the location of
imaged cells with respect to these regions (Fig. 2.1C). Cells in binocular visual cortex were
imaged at 4 day intervals, initially for 8 days of normal visual experience followed by 8 days of
monocular deprivation by eyelid suture (MD) with an intermediate imaging session at 2 days
MD. In vivo imaging of electroporated neurons shows distinct labeling of neuronal morphology
by eYFP with clear resolution of dendritic spines. Teal-Gephyrin was visualized as clear
punctate labeling along the dendritic shaft and on a small fraction of dendritic spines (Fig. 2.1D,
E). The majority of Teal-Gephyrin puncta were stable and could reliably be re-identified over
multiple days and imaging sessions. Examples of puncta turnover was also observed over
multiple imaging sessions wherein individual puncta appeared and persisted, or disappeared
and remained eliminated.
Teal-Gephyrin Puncta Correspond to Inhibitory Synapses
To demonstrate that Teal-Gephyrin puncta visualized in vivo correspond to inhibitory
synapses, we performed serial section immunoelectron microscopy (SSEM) on an in vivo
imaged L2/3 pyramidal neuron dendrite labeled with eYFP/Teal-Gephyrin (Fig. 2.2A).
Immediately after two-photon imaging, the brain was fixed, sectioned, and stained with an
antibody to eYFP followed by a biotin-conjugated secondary and detected with nickel-
diaminobenzidine (DAB; Fig. 2.2B). A 30 µm dendritic segment with strong DAB staining was
relocated and then further cut into serial ultrathin sections and processed for postembedding
GABA immunohistochemistry to discriminate between inhibitory and excitatory presynaptic
terminals.

23
The robustness of the nickel-DAB staining was such that it frequently obscured most of
the postsynaptic dendritic compartment, including the postsynaptic density, of many synaptic
contacts. Visualization of the postsynaptic density is considered an important criterion for
identifying synapses, and in some cases, a postsynaptic membrane specialization could be
discerned despite the DAB staining, but other important criteria include aggregation of synaptic
small vesicles at the presynaptic junction, and a clear synaptic cleft structure between the pre-
and postsynaptic junction. Contacts were categorized as synapses only if all or at least two of
these criteria were present in at least a few serial ultrathin sections. The densities of GABA
marker colloidal gold particles were clearly different between GABA-positive and GABA-
negative presynaptic terminals, and a terminal was categorized as GABA-positive if a high
particle density was found in the presynaptic terminal across multiple serial ultrathin sections.
The reconstructed segment contained 26 dendritic spines observed in vivo, which were
reidentified after SSEM-reconstruction and all found to bear synaptic contacts (Fig. 2.2C). Six
additional spines, each with a single excitatory synapse, were identified by SSEM but not
visualized in vivo, likely because of their orientation perpendicular to the imaging plane. Eleven
filopodia-like structures without synaptic contacts were also found. These possessed very thin
necks (50–250 nm in width) and were also unresolved by two-photon microscopy. This suggests
that whereas dendritic spines imaged in vivo indeed closely represent excitatory synaptic
contacts, in vivo imaging potentially underestimates their true number by as much as 20%.
All ten of the Teal-Gephyrin puncta visualized in vivo corresponded with GABAergic
synapses found by SSEM. Six were localized on the dendritic shaft while four were located on
dendritic spines (Figures 2.2C–2.2G). Three out of the four dendritic spines bearing inhibitory
synapses were found to be co-innervated with an excitatory synapse (Figures 2H). Although a
coinnervated excitatory synapse was not found on the remaining spine, this is likely due to
known limitations of the SSEM reconstruction (Kubota et al., 2009). The proportion of doubly
innervated dendritic spines observed on this segment is comparable to previously reported

24
results (Kubota et al., 2007). Further SSEM reconstruction of the surrounding neuropil revealed
additional GABAergic processes touching the imaged dendrite without forming synaptic contact.
No Teal-Gephyrin puncta were observed in vivo at these points of contact. These results
confirm that imaged Teal-Gephyrin puncta correspond one-to-one with GABAergic inhibitory
synapses.
Differential Distribution of Inhibitory Spine and Shaft Synapses
To date, data regarding inhibitory synapse distribution on L2/3 pyramidal cell dendrites
and its relation to dendritic spine distribution has only been estimated from volumetric density
measurements (DeFelipe et al., 2002). We first used the Teal-Gephrin labeling to characterize
the distribution of inhibitory spine and inhibitory shaft synapses as well as dendritic spines along
the dendritic arbor of imaged L2/3 pyramidal neurons. The density of dendritic spines was 4.42
± 0.27 per 10 µm length of dendrite (Fig. 2.3A). From these spines, a small fraction (13.60 ±
1.38%) bore inhibitory synapses with a density of 0.71 ± 0.11 per 10 µm. Inhibitory synapses
along the dendritic shaft were more abundant than inhibitory spine synapses with a density of
1.68 ± 0.08 per 10 µm. While there was no difference in dendritic spine and inhibitory shaft
synapse density in apical versus basal dendrites, apical dendrites contained a higher density of
inhibitory spine synapses compared to basal dendrites (Mann-Whitney U test, P < 0.05) (Fig.
2.3B). When spine and synapse distribution were measured along the dendrite as a function of
distance from the cell soma, their density along both apical and basal dendrites was found to be
constant regardless of proximal or distal location (Fig. 2.3C). In contrast, the density of
inhibitory spine synapses on apical dendrites increased with increasing distance from the cell
soma suggesting that a larger fraction of dendritic spines bear inhibitory synapses at distal
apical dendrites. Inhibitory spine synapse density was two-fold higher at locations along the
apical dendrites greater than 125µm from the cell soma as compared to proximal locations
along the same dendritic tree (Mann-Whitney U test, P < 0.05) (Fig. 2.3D), resulting in a two-fold
increase in the ratio of inhibitory spine synapses to dendritic spines (Mann-Whitney U test, P <

25
0.05) (Fig. 2.3E). Identical analysis performed ex vivo in 50 µm coronal sections yielded the
same results, validating the reliability of our in vivo imaging-based quantifications and showing
that imaging depth does not diminish the fidelity of synapse scoring in the depth range that we
are imaging (Fig. 2.6). These findings demonstrate that while the distribution of inhibitory shaft
synapses is constant throughout the dendritic field, inhibitory spine synapse distribution is non-
uniform with highest density at distal apical dendrites.
Figure 2.3. Dendritic distribution of inhibitory shaft and spine synapses. (A) Dendritic density of dendritic spines,
inhibitory shaft synapses, and inhibitory spine synapses per cell. (B) Density per dendrite in apical versus basal
dendrites of dendritic spines (left), inhibitory shaft synapses (middle), and inhibitory spine synapses (right). (C)
Dendritic density as a function of distance from the cell soma in apical (black) and basal (red) dendrites for dendritic
spines (top panel), inhibitory shaft synapses (middle panel), and inhibitory spine synapses (bottom panel). (D)
Density of inhibitory spine (left) and inhibitory shaft (right) synapses in proximal (0–125 µm from soma) versus
distal (125–200 µm from soma) apical dendrites. (E) Ratio of inhibitory spine (left) and inhibitory shaft (right)
synapses to dendritic spines in proximal (0–125 µm from soma) versus distal (125–200 µm from soma) apical
dendrites. n = 14 cells from 6 animals for (A, C–E); n = 43 apical dendrites, 40 basal dendrites for (B); p < 0.05.
Error bars, SEM.
26
Inhibitory Spine and Shaft Synapses are Kinetically Distinct
Given their differential anatomical distribution, we next asked if inhibitory spine and shaft
synapses also differ in their capacities for synaptic rearrangement during normal experience or
MD (Fig. 2.1B, 2.4A). The majority of inhibitory synapse rearrangements observed were
persistent (persisting for at least two imaging sections), with only a small fraction of events
transiently lasting for only one imaging session, 4.20% ± 2.56% of all events in the case of
inhibitory shaft synapses and 9.00% ± 3.97% for inhibitory spine synapses (Fig. 2.7A and
2.7B). During normal experience, inhibitory shaft synapses and dendritic spines showed similar
fractional turnover rates with 5.36±0.97% shaft synapses and 5.26±0.89% dendritic spines
remodeling over an 8 day period (Fig. 2.4B). Inhibitory spine synapses, whether stable or
dynamic, were exclusively located on stable, persistent spines. These synapses were
fractionally, highly dynamic compared to both dendritic spines and shaft synapses with
18.84±5.50% of inhibitory spine synapses remodeling over an 8 day period of normal vision
(dendritic spines versus inhibitory spine synapses, Wilcoxon rank sum test, p < 0.05; inhibitory
shaft synapses versus inhibitory spine synapses, Wilcoxon rank sum test, p < 0.05).
In the adult mouse, a prolonged MD produces an ocular dominance (OD) shift in the
binocular visual cortex, characterized by a slight weakening of deprived-eye inputs and a
strengthening of non-deprived eye inputs (Frenkel et al., 2006). We observed no increase in
spine gain or loss on L2/3 pyramidal neurons during MD (Fig. 2.4C). For inhibitory shaft
synapses, MD increased the fractional rate of synapse loss to 1.05±0.42% per day during the
first two days of MD (Wilcoxon rank sum test, P < 0.05). This increase in synapse loss
persisted throughout the entire 8 days of MD (control vs. 2-4d MD, P < 0.01; control vs. 4-8d
MD, p < 0.001, Wilcoxon rank sum test). A much larger increase in the fractional rate of
synapse loss was observed for inhibitory spine synapses to 6.52±1.98% per day from 0-2d MD
(control versus 0-2d MD, Wilcoxon rank sum test, p < 0.01). However, this fractional increase
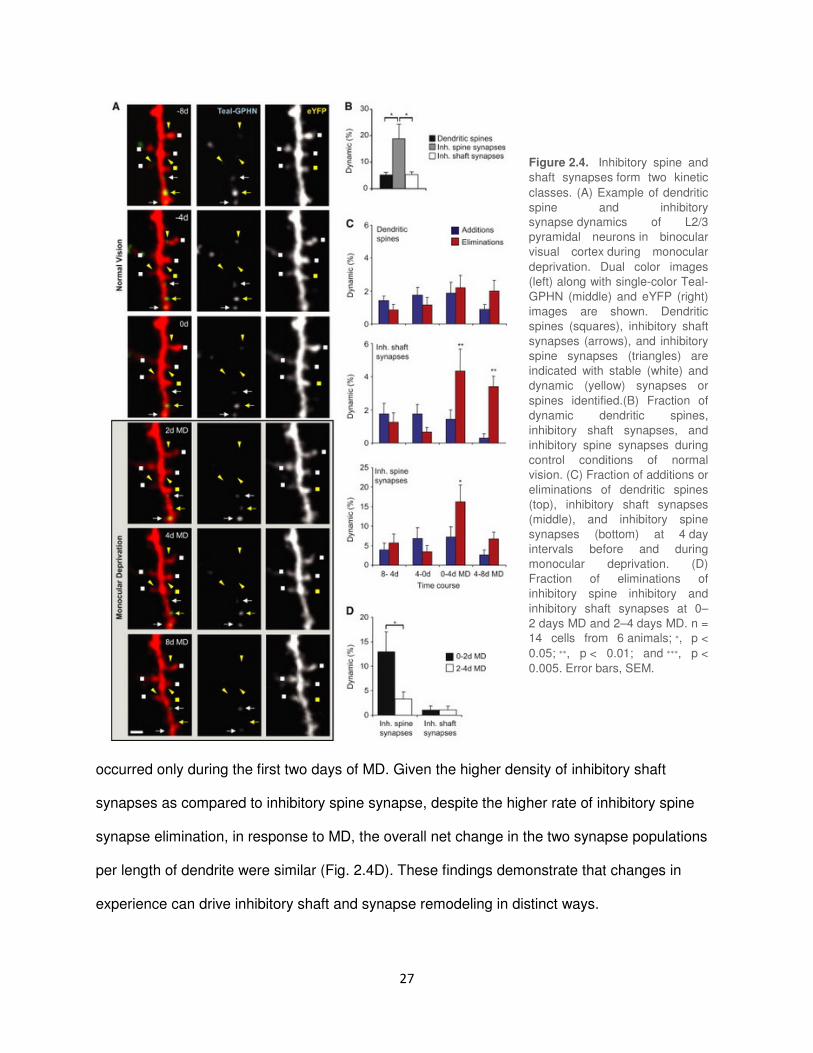
27
occurred only during the first two days of MD. Given the higher density of inhibitory shaft
synapses as compared to inhibitory spine synapse, despite the higher rate of inhibitory spine
synapse elimination, in response to MD, the overall net change in the two synapse populations
per length of dendrite were similar (Fig. 2.4D). These findings demonstrate that changes in
experience can drive inhibitory shaft and synapse remodeling in distinct ways.
Figure 2.4. Inhibitory spine and
shaft synapses form two kinetic
classes. (A) Example of dendritic
spine and inhibitory
synapse dynamics of L2/3
pyramidal neurons in binocular
visual cortex during monocular
deprivation. Dual color images
(left) along with single-color Teal-
GPHN (middle) and eYFP (right)
images are shown. Dendritic
spines (squares), inhibitory shaft
synapses (arrows), and inhibitory
spine synapses (triangles) are
indicated with stable (white) and
dynamic (yellow) synapses or
spines identified.(B) Fraction of
dynamic dendritic spines,
inhibitory shaft synapses, and
inhibitory spine synapses during
control conditions of normal
vision. (C) Fraction of additions or
eliminations of dendritic spines
(top), inhibitory shaft synapses
(middle), and inhibitory spine
synapses (bottom) at 4 day
intervals before and during
monocular deprivation. (D)
Fraction of eliminations of
inhibitory spine inhibitory and
inhibitory shaft synapses at 0–
2 days MD and 2–4 days MD. n =
14 cells from 6 animals; ∗, p <
0.05; ∗∗, p < 0.01; and ∗∗∗, p <
0.005. Error bars, SEM.

28
Inhibitory Synapse and Dendritic Spine Changes Are Locally Clustered
Long-term plasticity induced at one dendritic spine can coordinately alter the threshold
for plasticity in nearby neighboring spines (Govindarajan et al., 2011; Harvey and Svoboda,
2007). Electrophysiological studies suggest that plasticity of inhibitory and excitatory synapses
may also be coordinated at the dendritic level. Calcium influx and activation of calcium-
dependent signaling molecules that lead to long-term plasticity at excitatory synapses can also
induce plasticity at neighboring inhibitory synapses (Lu et al., 2000; Marsden et al., 2010).
Conversely, inhibitory synapses can influence excitatory synapse plasticity by suppressing
calcium-dependent activity along the dendrite (Miles et al., 1996). Given the limited spatial
extent of these signaling mechanisms (Harvey and Svoboda, 2007), we looked for evidence of
local clustering between excitatory and inhibitory synaptic changes.
We first looked at the distribution of dynamic events resulting in persistent changes (both
additions and eliminations) on each dendritic segment (68.1 ± 2.9 µm in length) as defined by
the region from one branch point to the next or from branch tip to the nearest branch point.
During normal visual experience, 58.2% ± 7.6% of dendritic segments per cell contained both a
dynamic inhibitory (spine or shaft) synapse and a dynamic dendritic spine (Fig. 2.5A). On these
dendritic segments, a large fraction of dynamic inhibitory synapses and dendritic spines were
found to be located within 10 µm of each other, suggesting that these changes were clustered
(dynamic spines to nearby dynamic inhibitory synapses, repeated-measures ANOVA, p < 1 ×
10−10; dynamic inhibitory synapses to nearby dynamic spines, repeated-measures ANOVA, p <
0.0005; Fig. 2.5B and 2.8A). To determine whether clustering of dynamic inhibitory synapses
with dynamic spines were merely a reflection of the dendritic distribution of inhibitory synapses
and spines, we performed nearest neighbor analysis between every monitored dynamic and
stable inhibitory synapse and every dynamic and stable spine (Fig. 2.5C). We found that
inhibitory synapse changes occur in closer proximity to dynamic dendritic spines as compared
29
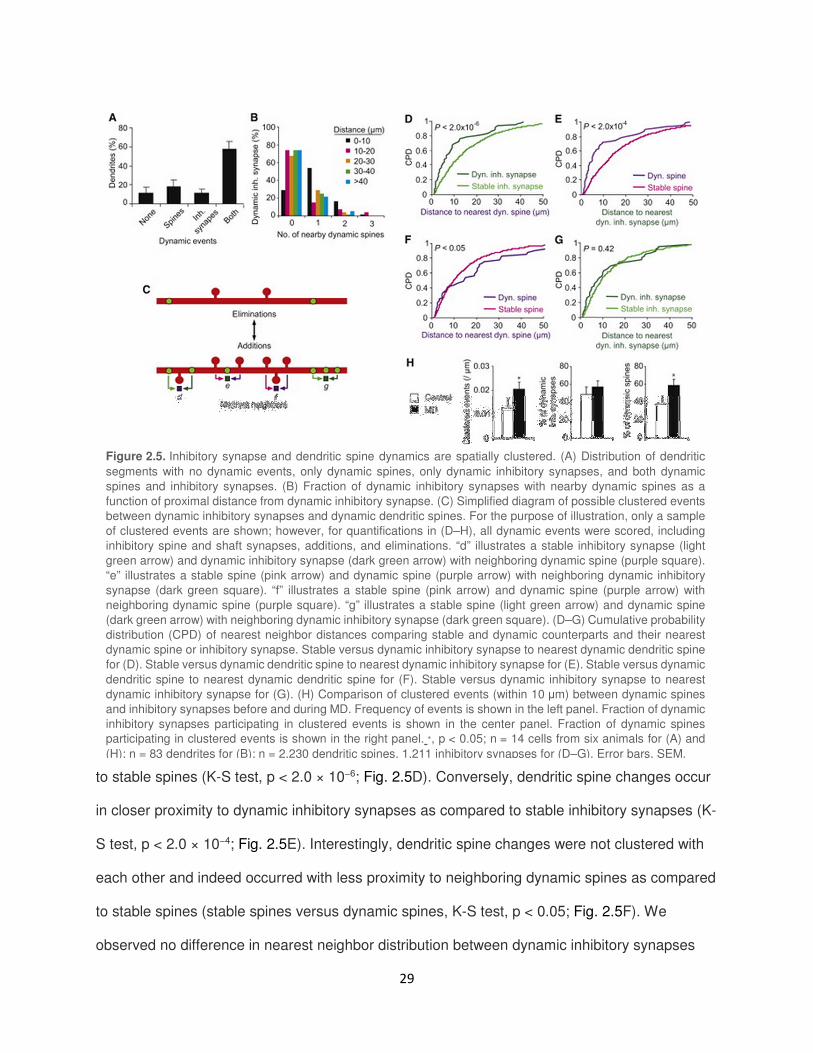
to stable spines (K-S test, p < 2.0 × 10⁻⁶; Fig. 2.5D). Conversely, dendritic spine changes occur
in closer proximity to dynamic inhibitory synapses as compared to stable inhibitory synapses (K-
S test, p < 2.0 × 10⁻⁴; Fig. 2.5E). Interestingly, dendritic spine changes were not clustered with
each other and indeed occurred with less proximity to neighboring dynamic spines as compared
to stable spines (stable spines versus dynamic spines, K-S test, p < 0.05; Fig. 2.5F). We
observed no difference in nearest neighbor distribution between dynamic inhibitory synapses
Figure 2.5. Inhibitory synapse and dendritic spine dynamics are spatially clustered. (A) Distribution of dendritic
segments with no dynamic events, only dynamic spines, only dynamic inhibitory synapses, and both dynamic
spines and inhibitory synapses. (B) Fraction of dynamic inhibitory synapses with nearby dynamic spines as a
function of proximal distance from dynamic inhibitory synapse. (C) Simplified diagram of possible clustered events
between dynamic inhibitory synapses and dynamic dendritic spines. For the purpose of illustration, only a sample
of clustered events are shown; however, for quantifications in (D–H), all dynamic events were scored, including
inhibitory spine and shaft synapses, additions, and eliminations. “d” illustrates a stable inhibitory synapse (light
green arrow) and dynamic inhibitory synapse (dark green arrow) with neighboring dynamic spine (purple square).
“e” illustrates a stable spine (pink arrow) and dynamic spine (purple arrow) with neighboring dynamic inhibitory
synapse (dark green square). “f” illustrates a stable spine (pink arrow) and dynamic spine (purple arrow) with
neighboring dynamic spine (purple square). “g” illustrates a stable spine (light green arrow) and dynamic spine
(dark green arrow) with neighboring dynamic inhibitory synapse (dark green square). (D–G) Cumulative probability
distribution (CPD) of nearest neighbor distances comparing stable and dynamic counterparts and their nearest
dynamic spine or inhibitory synapse. Stable versus dynamic inhibitory synapse to nearest dynamic dendritic spine
for (D). Stable versus dynamic dendritic spine to nearest dynamic inhibitory synapse for (E). Stable versus dynamic
dendritic spine to nearest dynamic dendritic spine for (F). Stable versus dynamic inhibitory synapse to nearest
dynamic inhibitory synapse for (G). (H) Comparison of clustered events (within 10 µm) between dynamic spines
and inhibitory synapses before and during MD. Frequency of events is shown in the left panel. Fraction of dynamic
inhibitory synapses participating in clustered events is shown in the center panel. Fraction of dynamic spines
participating in clustered events is shown in the right panel. ∗, p < 0.05; n = 14 cells from six animals for (A) and
(H); n = 83 dendrites for (B); n = 2,230 dendritic spines, 1,211 inhibitory synapses for (D–G). Error bars, SEM.

30
and their dynamic or stable inhibitory counterparts (Fig. 2.5G). These results demonstrate that
dendritic spine-inhibitory synapse changes are spatially clustered along dendritic segments,
whereas dendritic spine-dendritic spine changes and inhibitory synapse-inhibitory synapse
changes are not. Clustered dynamics were the same for inhibitory shaft or spine synapses in
relation to the nearest dynamic dendritic spine (Fig. 2.8B).
We next asked how altering sensory experience through MD affects clustering of
inhibitory synapse and dendritic spine changes. We found that clustering between dynamic
inhibitory synapses and dendritic spines persisted during MD (Fig. 2.8C) with a similar spatial
distribution compared to control conditions (Fig. 2.8D). We compared the frequency of clustered
events during normal vision and MD by quantifying the number of inhibitory synapses and
dendritic spine changes occurring within 10 µm of each other. MD increased the frequency of
clustered events from 0.013 ± 0.004 to 0.020 ± 0.003 per µm dendrite (Wilcoxon rank-sum test,
p < 0.05; Fig. 2.5H). Since MD increases inhibitory synapse but not dendritic spine dynamics,
we asked how an increase in clustered events could occur without a concurrent change in
dendritic spine remodeling. We found that whereas the fraction of dynamic spines did not
increase in response to MD (Fig. 2.4B–2.4D), the fraction of dynamic spines participating in
clustered events increased from 38.4% ± 9.0% to 59.0% ± 7.7% during MD (Wilcoxon rank-sum
test, p < 0.05).
To rule out the possibility that the increased clustering during MD is simply the result of
the increased presence of dynamic inhibitory synapses, we calculated the likelihood that a
dendrite with a dynamic spine and dynamic inhibitory synapse would be located within 10 µm of
each other assuming these events were not clustered. Based on the density of dendritic spines,
8.3 ± 0.5 spines are located within 10 µm of a dynamic inhibitory synapse. During MD, 6.4% ±
1.0% of spines are dynamic, 88.9% ± 8.3% of which are located on dendrites with dynamic
inhibitory synapses. If changes are not clustered, we calculated a 44.1% ± 7.2% probability that
a dynamic spine would be within 10 µm of a dynamic inhibitory synapse. However, we find that
31
a significantly larger number, 74.3% ± 7.6% of dynamic spines are within 10 µm of a dynamic
inhibitory synapse (Wilcoxon rank-sum test, p < 0.005). Conversely, 4.8 ± 0.3 inhibitory
synapses are located within 10 µm of a dynamic spine. During MD, 13.6% ± 2.0% of inhibitory
synapses are dynamic, 83.1% ± 4.8% of which are located on dendrites with dynamic spines.
We calculated a 50.5% ± 5.0% probability that a dynamic spine would be within 10 µm of a
dynamic inhibitory synapse if changes are unclustered. Here again, we find a significantly larger
number of 75.2% ± 5.1% of dynamic inhibitory synapses located within 10 µm of a dynamic
spine (Wilcoxon rank-sum test, p < 0.001). These results demonstrate that the percent of
clustered dynamic spines and inhibitory synapses in response to MD is significantly higher than
would be expected simply based on the increased fraction of dynamic inhibitory synapses. This
suggests that whereas MD does not alter the overall rate of spine turnover on L2/3 pyramidal
neurons, it does lead to increased coordination of dendritic spine rearrangement with the
dynamics of nearby inhibitory synapses.
Discussion
By large-volume imaging of inhibitory synapses directly on a defined cell type, L2/3
pyramidal neurons, we have characterized the distribution of inhibitory spine and shaft synapses
across the dendritic arbor and measured their remodeling kinetics during normal experience and
in response to MD. We have validated that gephyrin is a faithful marker of inhibitory synapses
through validation by SSEM. Surprisingly we found that inhibitory synapses on dendritic spines
are highly prevalent. Dually innervated spines harboring both an excitatory and an inhibitory
synapse had previously been reported by EM (Fifkova et al., 1992; Kisvarday et al., 1985; Knott
et al., 2002; Kubota et al., 2007; Megias et al., 2001; Parnavelas et al., 1977). However, the
fluorescent labeling provided an orders of magnitude larger sample size as compared to EM,
leading to the realization that on average a third of inhibitory synapses on L2/3 pyramidal

32
neurons reside on spines. Our large volume imaging of entire L2/3 pyramidal neurons labeled
with fluorescent gephyrin in addition to a cell fill, allows the first quantitative look at inhibitory
synapse distributions across the dendritic arbors of this cell type: on average 5 spines and 2
inhibitory synapses per 10 µm. Both spines and inhibitory shaft synapses are distributed
relatively uniformly across the spiny region of the dendritic arbor. In contrast, inhibitory spine
synapses were found to be denser on the apical tuft than on basal and proximal dendrites.
We find that inhibitory synapses targeting dendritic spines and dendritic shafts are
uniquely distributed and display distinct temporal kinetics in response to experience. In addition,
by simultaneous monitoring of inhibitory synapses and dendritic spines across the arbor, we
found that their dynamics are locally clustered within dendrites and this clustering can be further
driven by experience.
We speculate that the differential distribution of inhibitory spine and shaft synapses may
reflect differences in connectivity patterns across dendritic compartments as well as different
roles in the processing of local dendritic activity. Functionally, dendritic inhibition has been
shown to suppress calcium-dependent activity along the dendrite (Miles et al., 1996), originating
from individual excitatory synaptic inputs as well as back-propagating action potentials (bAPs)
from the soma. Local excitation arising from dendritic and NMDA spikes can spread for 10–20
µm and evoke elevated levels of calcium along the dendrite (Golding et al., 2002; Schiller et al.,
1997). Our finding that shaft inhibitory synapses are uniformly distributed across dendrites,
whereas inhibitory spine synapses are twice as abundant along distal apical dendrites
compared to other locations suggest that these two types of synapses have different roles in
shaping dendritic activity. The regular distribution of inhibitory shaft synapses may reflect their
ability to broadly regulate activity from multiple excitatory synaptic inputs and from bAPs,
influencing the integration of activity from mixed sources.
The nonuniform distribution of inhibitory spine synapses may reflect differences in the
relative sources of calcium influx at their respective locales. For example, the amplitude of bAPs

33
along dendrites decreases with increasing distance from the soma. Whereas bAPs can routinely
produce calcium influx into the most distal parts of basal dendrites, detectable calcium influx into
the more distal regions of apical dendrites has only been demonstrated under the most stringent
conditions (Larkum and Nevian, 2008). The increased density of inhibitory spine synapses at
distal apical dendrites, a region in which calcium activity is likely to be more dominated by
synaptic inputs than bAPs may reflect an increased relevance in the modulation of individual
synaptic inputs. Indeed, we—along with others (Knott et al., 2002; Kubota et al., 2007)—have
shown that dendritic spines with inhibitory synapses are co-innervated with an excitatory
synapse, suggesting that they may gate synaptic activity of individual excitatory synaptic inputs.
Recently, it has been shown that inhibitory synapses on dendritic spines are capable of blocking
excitatory currents on the spines which they are located (Chiu et al., 2013). The distribution of
inhibitory spine synapses may also relate to the different sources of excitatory connections onto
the apical dendrite, suggesting they may be involved in gating specific types of inputs. The
apical tuft of L2/3 pyramidal neurons receives a larger proportion of excitatory inputs from more
distant cortical and subcortical locations compared to other parts of the dendritic arbor
(Spruston, 2008). Subcortical afferents have been identified as the excitatory input that co-
innervates spines with inhibitory synapses (Kubota et al., 2007), suggesting that these inhibitory
contacts are ideally situated to directly modulate feed-forward sensory-evoked activity in the
cortex. Interestingly, we find that all of these co-innervated spines are stable, both during normal
experience and MD, regardless of the dynamics of the inhibitory spine synapse. This suggests
that subcortical inputs entering the cortex onto dually innervated spines are likely to be directly
gated by inhibition at their entry level, the spine, but because of the structural stability of these
feed forward inputs, their functional modification would have to rely on removal/addition of the
gating inhibitory input. This particular type of excitatory synapse may be much more directly
influenced by the inhibitory network than excitatory synapses on singly innervated spines that
are exposed to the inhibitory network only at the level of the dendrite.

34
Inhibitory synapses are quite responsive to changes in sensory experience. Focal retinal
lesions have been shown to produce large and persistent losses in axonal boutons in the adult
mouse visual cortex (Keck et al., 2011). Our ability to distinguish inhibitory spine and shaft
synapses provide insight into the degree of inhibitory synapse dynamics in the adult visual
cortex. We find that in binocular visual cortex, MD produces a relatively large initial increase in
inhibitory spine synapse loss. Acute changes in inhibitory spine synapse density have also been
observed in the barrel cortex after 24 hr of whisker stimulation (Knott et al., 2002), further
supporting the notion that these synapses are highly responsive and well suited to modulate
feed-forward sensory-evoked activity. Whereas inhibitory spine synapses are responsive to the
initial loss of sensory input, the sustained increase in inhibitory shaft synapse loss we observe
parallels the persistent absence of deprived-eye input and may serve the broader purpose of
maintaining levels of dendritic activity and excitability during situations of reduced synaptic drive.
These losses in inhibitory synapses are consistent with findings that visual deprivation produces
a period of disinhibition in adult visual cortex (Chen et al., 2011; He et al., 2006; Hendry and
Jones, 1988; Keck et al., 2011) that is permissive for subsequent plasticity (Chen et al., 2011)
(Harauzov et al., 2010) (Maya Vetencourt et al., 2008).
Finally, models for synaptic clustering have been proposed as a means to increase the
computational capacity of dendrites (Larkum and Nevian, 2008) and as a form of long-term
memory storage (Govindarajan et al., 2006). These models have generally been derived from
evidence of coordinated plasticity between excitatory synapses (Govindarajan et al., 2011;
Harvey and Svoboda, 2007). We find that clustered plasticity at the level of synapse formation
and elimination can also occur between excitatory and inhibitory synapses and that these
changes occur mainly within 10 µm of each other. This is a distance at which calcium influx and
calcium-dependent signaling molecules from individual excitatory inputs can directly influence
the plasticity of neighboring excitatory synapses (Govindarajan et al., 2011; Harvey and
Svoboda, 2007). These findings provide evidence that experience-dependent plasticity in the

35
adult cortex is a highly orchestrated process, integrating changes in excitatory connectivity with
the active elimination and formation of inhibitory synapses.

36
Supplementary Figures
Figure 2.6. Ex vivo analysis of dendritic spine and inhibitory synapse distribution. (A) Density (left) and ratio to
dendritic spines (right) of inhibitory spine and shaft synapses in proximal (0- 125µm from soma) versus distal (125-
200µm from soma) apical dendrites measured in 50 µm coronal sections of L2/3 pyramidal dendrites expressing
eYFP/Teal-Gephyrin, counterstained with anti-VGAT (n = 5 cells from 5 mice). (B) Two-photon imaging of
eYFP/Teal-Gephyrin labeled dendrite taken in vivo at ~200 µm below the pial surface and ex vivo in a fixed 50 µm
slice section. Letters indicate re-identified Teal-Gephyrin puncta. (C) Quantification of the 9 fraction of
corresponding dendritic spines and inhibitory synapses along individual dendritic segments in one cell imaged in
vivo and ex vivo in 50 µm slice sections as a function of in vivo imaging depth. (D) Fraction of corresponding
dendritic spines and inhibitory synapses for one cell imaged in vivo and ex vivo in 50 µm slice sections binned by
in vivo imaging depth (n = 157 dendritic spines, 95 inhibitory synapses). (*P < 0.05) Scale bar: 5 µm.

37
Figure 2.7. Most inhibitory synapse dynamics are persistent and uniformly distributed across imaging intervals (A)
Fraction of transient changes out of total number of inhibitory spine or shaft synapses before and after MD is
negligible. (B) Fraction of transient changes out of total dynamic events for inhibitory spine or shaft synapses before
and after MD is small. (C) Dendritic spine, inhibitory spine synapse, and inhibitory shaft synapse dynamics
monitored across 16 days of normal experience at 4 day intervals, shows no bias towards increased eliminations
with consecutive imaging sessions. (n = 3 cells).

38
Figure 2.8. Additional analysis of clustered events. (A) Fraction of dynamic spines with nearby dynamic inhibitory
spines as a function of proximal distance from dynamic spine. (B-D) Cumulative probability distribution (CPD) of
nearest neighbor distances comparing (B) Dynamic inhibitory shaft synapse vs. dynamic inhibitory spine synapse
to nearest dynamic dendritic spine. (C) Stable vs. dynamic inhibitory synapse to nearest dynamic dendritic spine
during MD. (D) Dynamic inhibitory synapse to nearest dynamic dendritic spine during control vs. MD. (n = 2230
dendritic spines, 1211 inhibitory synapses).
39
Experimental Procedures
Generation of Expression Plasmids
For construction of the Cre expression plasmid (pFsynCreW), a Cre insert with 5′ NheI and 3′
EcoRI restriction sites was generated by PCR amplification from a WGA-Cre AAV vector
(Gradinaru et al., 2010) and subcloned into a pLL3.7syn lentiviral expression plasmid (Rubinson
et al., 2003). The Cre-dependent eYFP expression plasmid (pFUdioeYFPW) was constructed
by subcloning a “double” floxed inverse orientation (dio) eYFP expression cassette (a gift from
K. Deisseroth) into the pFUGW lentiviral expression plasmid (Lois et al., 2002), replacing
the GFP coding region between the 5′ BamHI and 3′ EcoRI restriction sites. The Cre-dependent
Teal-gephyrin expression plasmid (pFUdioTealGephyrinW) was constructed as follows. First, a
Teal insert was generated by PCR amplification of Teal (Allele Biotech, San Diego, CA, USA)
with added 5′ NheI and 3′ EcoRI restriction sites and subcloned into the pLL3.7syn lentiviral
expression plasmid. Next, Gephyrin with 5′ BsrGI and 3′ MfeI restriction sites was generated by
PCR amplification from a GFP-Gephyin expression plasmid (Fuhrmann et al., 2002) and
subcloned into the Teal expression plasmid using the BsrGI and EcoRI sites to generate a Teal-
Gephryin fusion protein. Finally, Teal-Gephyrin with 5′ BsiWI and 3′ NheI restriction sites
was PCR amplified from this plasmid and subcloned into the Cre-dependent eYFP expression
plasmid described above, replacing eYFP in the dio expression cassette.
In Utero Electroporation
All animal work was approved by the Massachusetts Institute of Technology Committee on
Animal Care; it conforms to the National Institutes of Health guidelines for the use and care of
vertebrate animals. L2/3 cortical pyramidal neurons were labeled by in utero electroporation on
E16 timed pregnant C57BL/6J mice (Charles River, Wilmington, MA, USA) as previously
described (Tabata and Nakajima, 2001). pFUdioeYFPW,

40
pFUdioTealGephyrinW, pFUCreW plasmids were dissolved in 10 mM Tris ± HCl (pH 8.0) at a
10:5:1 molar ratio for a final concentration of 1 µg/µl along with 0.1% of Fast Green (Sigma-
Aldrich, St. Louis, MO, USA). The solution, containing 1-2 µl of plasmid, was delivered into
the lateral ventricle with a 32 gauge Hamilton syringe (Hamilton Company, Reno, NV, USA).
Five pulses of 35–40 V (duration 50 ms, frequency 1 Hz) were delivered, targeting the visual
cortex, using 5 mm diameter tweezer-type platinum electrodes connected to a square wave
electroporator (Harvard Apparatus, Holliston, MA, USA).
Cranial Window Implantation
Mice born after in utero electroporation were bilaterally implanted with cranial windows at
postnatal days 42–57 as previously described (Lee et al., 2008). Sulfamethoxazole (1 mg/ml)
and trimethoprim (0.2 mg/ml) were chronically administered in the drinking water through the
final imaging session to maintain optical clarity of implanted windows.
Optical Intrinsic Signal Imaging
For functional identification of monocular and binocular visual cortex, optical imaging of intrinsic
signal and data analysis were performed as described previously (Kalatsky and Stryker, 2003).
Mice were anesthetized and maintained on 0.5%–0.8% isofluorane supplemented by
chloroprothixene (10 mg/kg, i.m.) and placed in a stereotaxic frame. Heart rate was continuously
monitored. For visual stimuli, a horizontal bar (5° in height and 73° in width) drifting up with a
period of 12 s was presented for 60 cycles on a high refresh rate monitor positioned 25 cm in
front of the animal. Optical images of visual cortex were acquired continuously under 610 nm
illumination with an intrinsic imaging system (LongDaq Imager 3001/C; Optical Imaging Inc.,
New York, NY, USA) and a 2.5×/0.075 NA (Zeiss, Jena, Germany) objective. Images were
spatially binned by 4×4 pixels for analysis. Cortical intrinsic signal was obtained by extracting
the Fourier component of light reflectance changes matched to the stimulus frequency, whereby
41
the magnitudes of response in these maps are fractional changes in reflectance. The magnitude
maps were thresholded at 30% of peak response amplitude to define a response
region. Primary visual cortex was determined by stimulation of both eyes. Binocular visual
cortex was determined by stimulation of the ipsilateral eye. Monocular visual cortex was
determined by subtracting the binocular visual cortex map from the primary visual cortex map.
Monocular Deprivation
Monocular deprivation was performed by eyelid suture. Mice were anesthetized with 1.25%
avertin (7.5 ml/kg IP). Lid margins were trimmed and triple antibiotic ophthalmic ointment
(Bausch & Lomb, Rochester, NY, USA) was applied to the eye. Three to five mattress stitches
were placed using 6-0 vicryl along the extent of the trimmed lids. Suture integrity was inspected
directly prior to each imaging session. Animals whose eyelids did not seal fully shut or had
reopened were excluded from further experiments.
Serial Section Immunoelectron Microscopy
For post hoc localization of previously in vivo imaged dendrites, blood vessels were labeled
with a tail vein injection of fixable rhodamine dextran (5% in PBS, 50 µl; Invitrogen, Carlsbad,
CA, USA) delivered 30 min prior to perfusion. Animals were fixed and perfused with an initial
solution of 250 mM sucrose, 5 mM MgCl2 in 0.02 M phosphate buffer (PB; pH 7.4), followed by
4% paraformaldehyde containing 0.2% picric acid and 0.5% glutaraldehyde in 0.1 M PB.
Following perfusion and fixation, cranial windows were removed and penetrations of DiR
(Invitrogen) were made into cortex around the imaged region. Brains were removed, 50 µm thin
sections were cut parallel to the imaging plane and visualized with an epifluorescence
microscope. The brain section containing the branch tip of interest was identified by combining
in vivo two-photon images and blood vessel maps with post hoc blood vessel labeling and DiR
penetrations. The identified section was prepared for immunoelectron microscopy as previously

42
described (Kubota et al., 2009). Imaged dendrites were stained by immunohistochemistry using
an antiserum against eGFP (1: 2,000; kind gift from Dr. Nobuaki Tamamaki, Kumamoto
University, Japan), followed by biotin-conjugated secondary antiserum (1:200; BA-1000, Vector
Laboratories, Burlingame, CA, USA) and then the ABC kit (PK-6100, Vector Laboratories). The
neurons were labeled with 0.02% DAB, 0.3% nickel in 0.05 M Tris-HCl buffer (pH 8.0). Prepared
sections were then serially resectioned at 50 nm thickness using an ultramicrotome (Reichert
Ultracut S, Leica Microsystems, Wetzlar, Germany). The ultrathin sections were incubated with
an antiserum against GABA (1:1,000; A-2052, Sigma-Aldrich) in 0.1% Triton X-100, 0.05 M Tris-
HCl buffer, followed by 15 nm colloidal gold conjugated secondary antiserum (1:100;
EM.GAR15, British Biocell International, Cardiff, UK; (Kawaguchi and Kubota, 1998). Whereas
DAB staining can obscure postsynaptic structures, postembedding GABA immunoreactivity has
been demonstrated to detect 100% of inhibitory presynaptic terminals (Kawaguchi and Kubota,
1998). The stained dendrite was imaged from 136 serial ultra thin sections using TEM (Hitachi
H-7000 equipped with AMT CCD camera XR-41, Hitachi, Japan). Image reconstruction and
analysis was performed with Reconstruction (http://synapses.clm.utexas.edu/tools/index.stm).
Two-Photon Imaging
Starting at three weeks after cranial window surgery, allowing sufficient time for recovery, adult
mice were anesthetized with 1.25% avertin (7.5 ml/kg IP). Anaesthesia was monitored by
breathing rate and foot pinch reflex and additional doses of anesthetic were administered during
the imaging session as needed. In vivo two-photon imaging was performed using a custom-built
microscope, including a custom-made stereotaxic restraint affixed to a stage insert and custom
acquisition software modified for dual channel imaging. The light source for two-photon
excitation was a commercial Mai Tai HP Ti:Sapphire laser (Spectra-Physics, Santa Clara, CA,
USA) pumped by a 14 W solid state laser delivering 100 fs pulses at a rate of 80 MHz with the
power delivered to the objective ranging from approximately 37–50 mW depending on imaging

43
depth. Z-resolution was obtained with a piezo actuator positioning system (Piezosystem Jena,
Jena, Germany) mounted to the objective. The excitation wavelength was 915 nm, with the
excitation signal passing through a 20x/1.0 NA water immersion objective (Plan-Apochromat,
Zeiss, Jena, Germany). After exclusion of excitation light with a barrier filter, emission photons
were spectrally separated by a dichroic mirror (520 nm) followed by bandpass filters (485/70
and 560/80 nm) and then collected by two independent photomultiplier tubes. An initial low-
resolution imaging volume (500 nm/pixel XY-resolution, 4 µm/frame Z-resolution) encompassing
a labeled cell was acquired to aid in selecting the region of interest for chronic imaging. All
subsequent imaging for synapses and dendritic spine monitoring was performed at higher
resolution (250 nm/pixel XY-resolution, 0.9 µm/frame Z-resolution). Two-photon raw scanner 16
bit data was processed for spectral linear unmixing and converted into an 8 bit RGB image z-
stack using Matlab and ImageJ (National Institutes of Health, Bethesda, MD, USA).
Spectral Linear Unmixing and Image Processing
Spectral linear unmixing is based on the fact that the total photon count recorded at each pixel
in a given channel is the linear sum of the spectral contribution of each fluorophore weighted by
its abundance. For a dual channel detection system, the contribution of two fluorophores can be
represented by the following equations:
J 1 (x,y)=s 1 , 1×I 1 (x,y)+s 1 , 2×I 2 (x,y) , (1)
J 2 (x,y)=s 2 , 1×I 1 (x,y)+s 2 , 2×I 2 (x,y) , (2)
where J is the total signal per channel, I is the fluorophore abundance, and S is the contribution
of that fluorophore. These equations can be expressed as a matrix:
[J ]= [S] [ I ] , (3)
whereby the unmixed image [I] can be calculated using the inverse matrix of S:
[ I ]=[S] − 1 [J] . (4)

44
Assuming the detected signal in both channels represents the total spectral contribution for both
fluorophores:
s 1 , 1+s 2 , 1=1, (5)
s 1 , 2+s 2 , 2=1. (6)
[S] was determined experimentally by dual channel acquisition of single excitation two-photon
images of cell culture with single fluorophore expression, adjusting laser power and dwell time
to achieve photon count levels approximating in vivo signal intensity. The mean contribution for
each fluorophore into each channel representing the reference spectra from the acquired
images was calculated using Matlab (Mathworks, Natick, MA, USA). These values were
subsequently used for spectral linear unmixing of dual channel 16 bit two-photon raw scanner
data into an 8 bit RGB image z-stack using Matlab and ImageJ (National Institutes of Health). S
measured from in-vivo-labeled samples was similar to the in vitro determined value, and
spectral unmixing with either the in vitro or in vivo values yielded essentially the same result.
Simulations were performed to validate that the 200–250 µm imaging depth used for our data
acquisition is well within the signal intensity range, where spectral unmixing can work reliably.
Data and Statistical Analysis
For whole-cell dendritic arbor reconstruction and analysis of dendritic morphology, 3D stacks
were manually traced in Neurolucida (MicroBrightField, Inc., Williston, VT, USA). The
main apical trunk of each cell was excluded from analysis as its orientation was perpendicular to
image stacks and thus could not be reconstructed at high resolution. Dendrites are defined as
dendritic segments stretching from one branch point to the next branch point or from one branch
point to the branch tip. Dendritic spine and inhibitory synapse tracking and analysis was
performed using V3D (Peng et al., 2010). Dendritic spine analysis criteria were as previously
described (Holtmaat et al., 2009). Using these scoring criteria, the lack of image volume rotation
from imaging session to session may have resulted in some z-projecting dendritic spines being

45
left unscored. This did not influence quantification of spine dynamics due to their low incidence
and the fractional scoring. Inhibitory synapses were identified as puncta colocalized to the
dendrite of interest with a minimal size of 3×3 or 8–9 clustered pixels (0.56 µm2) with a minimal
average signal intensity of at least four times above shot noise background levels. Comparing
the measured pixel dimensions of two-photon imaged synapses with their size measured after
EM reconstruction, shows that the pixel dimensions of these synapses range from 8–31 pixel
clusters and correlate with their true physical dimensions. This confirms that a threshold of 3×3
pixels would be sufficient for identifying virtually any synapse.
Transient changes were defined as dendritic spines or synapses that appeared or
disappeared for only one imaging session. For persistent changes, spines or synapses that
appeared and persisted for at least two consecutive imaging sessions were scored as additions,
with the exception of additions occurring between the second-to-last and last imaging session.
Spines or synapse that disappeared and remained absent for at least two consecutive imaging
sessions were scored as eliminations, with the exception of eliminations occurring between the
first and second imaging session. Only persistent spine and synapse changes were used for
measuring turnover rates and clustered dynamics. In total, 2,230 dendritic spines and 1,211
inhibitory synapses from 83 dendritic segments in 14 cells from 6 animals were followed over 6
imaging sessions.
For each cell, the fractional rate of additions and eliminations were defined as the
percentage of dendritic spines or inhibitory synapses added or eliminated, respectively, between
two successive imaging sessions out of the total number of dendritic spines or inhibitory
synapses divided by the number of days between imaging sessions. The Wilcoxon rank-sum
test, Mann-Whitney U-test, or repeated-measures ANOVA and Tukey's post hoc test were used
for statistical analysis of time course data or dendritic density, where n indicates the number of
cells or dendritic segments. The Kolmogorov-Smirnov test was used for statistical analysis of

46
nearest neighbor distance distributions, where n indicates the number of dendritic spines or
inhibitory synapses. All error bars are SEM.
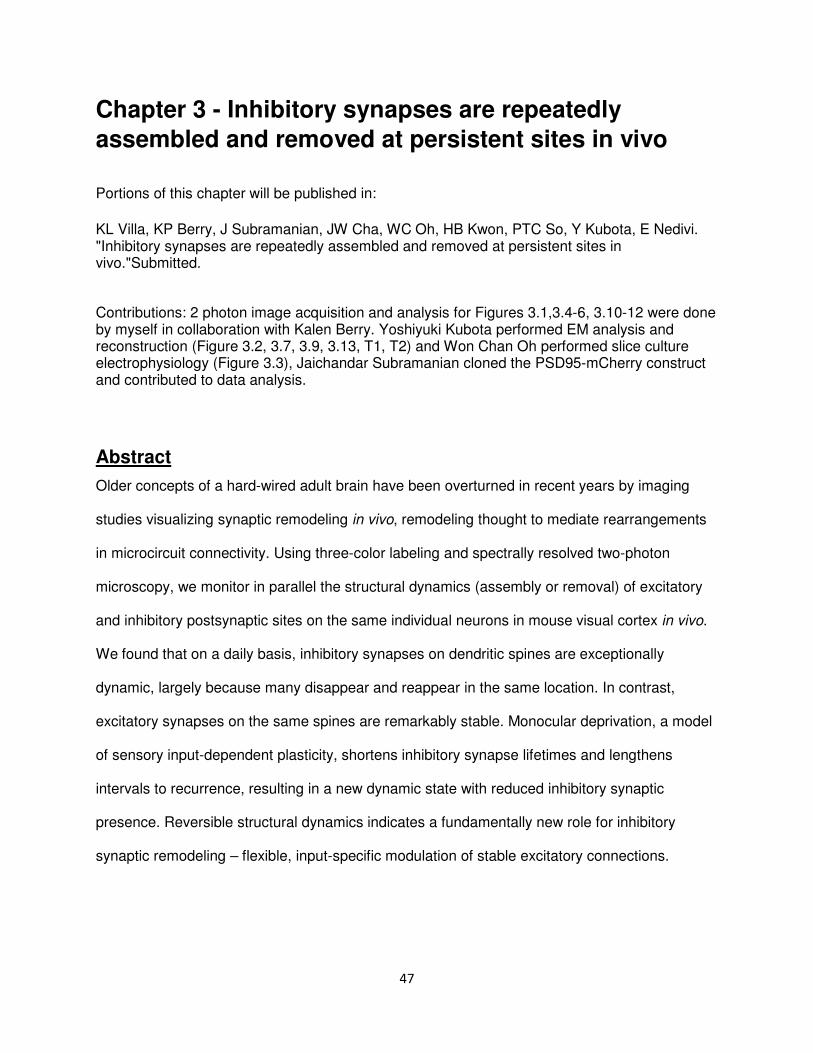
47
Chapter 3 - Inhibitory synapses are repeatedly
assembled and removed at persistent sites in vivo
Portions of this chapter will be published in:
KL Villa, KP Berry, J Subramanian, JW Cha, WC Oh, HB Kwon, PTC So, Y Kubota, E Nedivi. "Inhibitory synapses are repeatedly assembled and removed at persistent sites in vivo."Submitted.
Contributions: 2 photon image acquisition and analysis for Figures 3.1,3.4-6, 3.10-12 were done by myself in collaboration with Kalen Berry. Yoshiyuki Kubota performed EM analysis and reconstruction (Figure 3.2, 3.7, 3.9, 3.13, T1, T2) and Won Chan Oh performed slice culture electrophysiology (Figure 3.3), Jaichandar Subramanian cloned the PSD95-mCherry construct and contributed to data analysis.
Abstract
Older concepts of a hard-wired adult brain have been overturned in recent years by imaging
studies visualizing synaptic remodeling in vivo, remodeling thought to mediate rearrangements
in microcircuit connectivity. Using three-color labeling and spectrally resolved two-photon
microscopy, we monitor in parallel the structural dynamics (assembly or removal) of excitatory
and inhibitory postsynaptic sites on the same individual neurons in mouse visual cortex in vivo.
We found that on a daily basis, inhibitory synapses on dendritic spines are exceptionally
dynamic, largely because many disappear and reappear in the same location. In contrast,
excitatory synapses on the same spines are remarkably stable. Monocular deprivation, a model
of sensory input-dependent plasticity, shortens inhibitory synapse lifetimes and lengthens
intervals to recurrence, resulting in a new dynamic state with reduced inhibitory synaptic
presence. Reversible structural dynamics indicates a fundamentally new role for inhibitory
synaptic remodeling – flexible, input-specific modulation of stable excitatory connections.
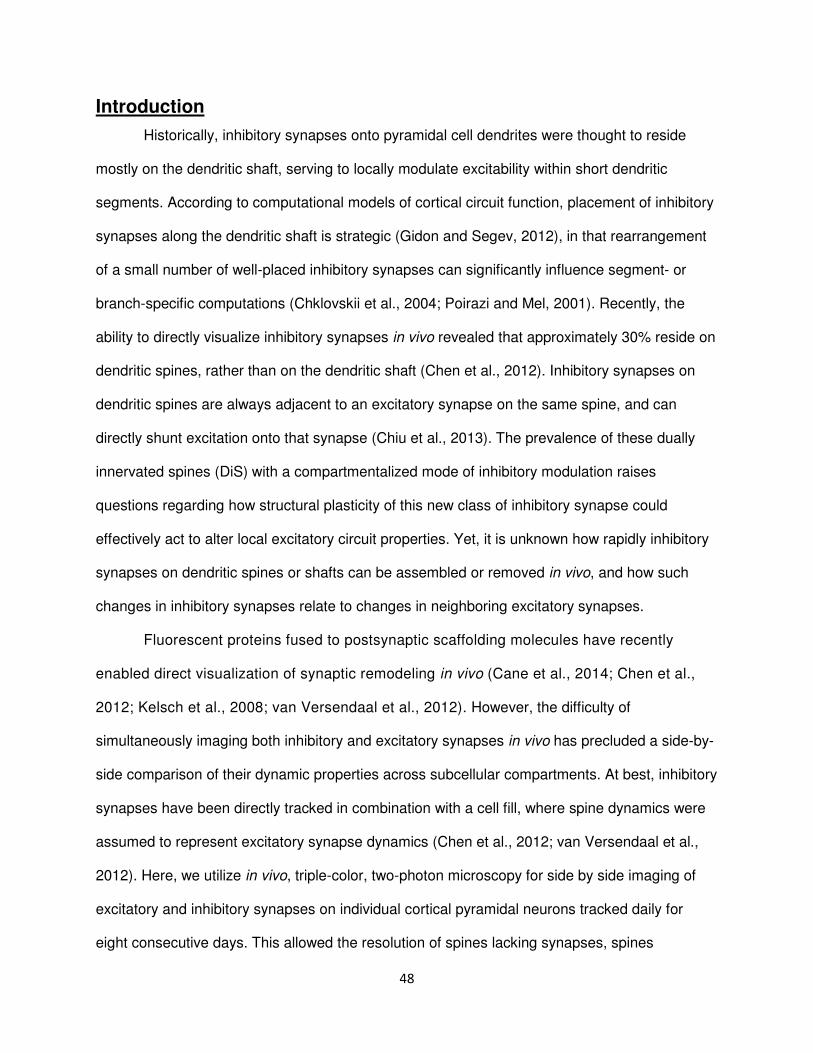
48
Introduction
Historically, inhibitory synapses onto pyramidal cell dendrites were thought to reside
mostly on the dendritic shaft, serving to locally modulate excitability within short dendritic
segments. According to computational models of cortical circuit function, placement of inhibitory
synapses along the dendritic shaft is strategic (Gidon and Segev, 2012), in that rearrangement
of a small number of well-placed inhibitory synapses can significantly influence segment- or
branch-specific computations (Chklovskii et al., 2004; Poirazi and Mel, 2001). Recently, the
ability to directly visualize inhibitory synapses in vivo revealed that approximately 30% reside on
dendritic spines, rather than on the dendritic shaft (Chen et al., 2012). Inhibitory synapses on
dendritic spines are always adjacent to an excitatory synapse on the same spine, and can
directly shunt excitation onto that synapse (Chiu et al., 2013). The prevalence of these dually
innervated spines (DiS) with a compartmentalized mode of inhibitory modulation raises
questions regarding how structural plasticity of this new class of inhibitory synapse could
effectively act to alter local excitatory circuit properties. Yet, it is unknown how rapidly inhibitory
synapses on dendritic spines or shafts can be assembled or removed in vivo, and how such
changes in inhibitory synapses relate to changes in neighboring excitatory synapses.
Fluorescent proteins fused to postsynaptic scaffolding molecules have recently
enabled direct visualization of synaptic remodeling in vivo (Cane et al., 2014; Chen et al.,
2012; Kelsch et al., 2008; van Versendaal et al., 2012). However, the difficulty of
simultaneously imaging both inhibitory and excitatory synapses in vivo has precluded a side-by-
side comparison of their dynamic properties across subcellular compartments. At best, inhibitory
synapses have been directly tracked in combination with a cell fill, where spine dynamics were
assumed to represent excitatory synapse dynamics (Chen et al., 2012; van Versendaal et al.,
2012). Here, we utilize in vivo, triple-color, two-photon microscopy for side by side imaging of
excitatory and inhibitory synapses on individual cortical pyramidal neurons tracked daily for
eight consecutive days. This allowed the resolution of spines lacking synapses, spines

49
innervated by a single excitatory synapse, termed singly innervated spines (SiS), and spines
innervated by both an excitatory and an inhibitory synapse, termed dually innervated spines
(DiS), as unique populations with different dynamic properties. Monitoring the short-term
dynamics of excitatory synapses on SiS vs DiS showed that excitatory synapses on DiS were
remarkably stable as compared to those on SiS. Further, side-by-side comparison of excitatory
and inhibitory synapses residing on the same DiS, revealed a stark contrast between the
stability of the excitatory synapse and the unusually dynamic nature of the inhibitory synapse on
the same spine.
The percentage of dynamic structures seen with daily interval imaging were surprisingly
high in comparison to previous studies imaging at 4-day intervals (Chen et al., 2012), indicating
that many dynamic events are quickly reversed and therefore undetected with less frequent
imaging. This was most pronounced for inhibitory synapses on DiS, which frequently
disappeared and then reappeared in the same location. EM reconstruction of spines after the
postsynaptic element of a recurrent inhibitory synapse disappeared, in some cases revealed
that the presynaptic inhibitory axon remained in place, potentially serving as a placeholder for
the synapse’s return. This new, recurrent type of synaptic structural dynamics provides a
potential mechanism for reversible gating of specific excitatory connections.
Monocular deprivation (MD), a model of sensory input-dependent plasticity, significantly
increased the number of dynamic inhibitory events, compared to normal experience (NE). After
MD, dynamic inhibitory synapses are present for fewer consecutive days and inhibitory spine
synapses are gone longer before reoccurring. These results show that the observed disinhibition
previously seen by our lab and others (Chen et al., 2011; Chen et al., 2012; van Versendaal et
al., 2012) in response to adult MD is not just a matter of a one-time inhibitory synaptic loss upon
deprivation. Rather, MD results in a transition to a new dynamic state for inhibitory synapses
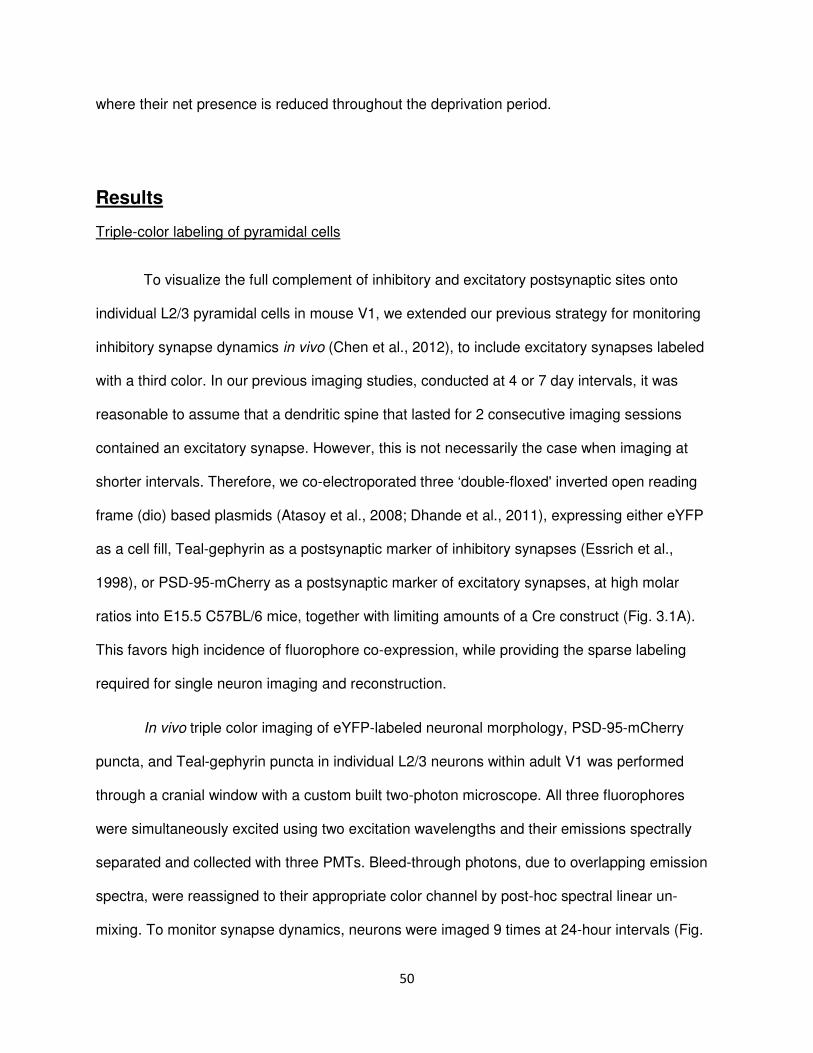
50
where their net presence is reduced throughout the deprivation period.
Results
Triple-color labeling of pyramidal cells
To visualize the full complement of inhibitory and excitatory postsynaptic sites onto
individual L2/3 pyramidal cells in mouse V1, we extended our previous strategy for monitoring
inhibitory synapse dynamics in vivo (Chen et al., 2012), to include excitatory synapses labeled
with a third color. In our previous imaging studies, conducted at 4 or 7 day intervals, it was
reasonable to assume that a dendritic spine that lasted for 2 consecutive imaging sessions
contained an excitatory synapse. However, this is not necessarily the case when imaging at
shorter intervals. Therefore, we co-electroporated three ‘double-floxed' inverted open reading
frame (dio) based plasmids (Atasoy et al., 2008; Dhande et al., 2011), expressing either eYFP
as a cell fill, Teal-gephyrin as a postsynaptic marker of inhibitory synapses (Essrich et al.,
1998), or PSD-95-mCherry as a postsynaptic marker of excitatory synapses, at high molar
ratios into E15.5 C57BL/6 mice, together with limiting amounts of a Cre construct (Fig. 3.1A).
This favors high incidence of fluorophore co-expression, while providing the sparse labeling
required for single neuron imaging and reconstruction.
In vivo triple color imaging of eYFP-labeled neuronal morphology, PSD-95-mCherry
puncta, and Teal-gephyrin puncta in individual L2/3 neurons within adult V1 was performed
through a cranial window with a custom built two-photon microscope. All three fluorophores
were simultaneously excited using two excitation wavelengths and their emissions spectrally
separated and collected with three PMTs. Bleed-through photons, due to overlapping emission
spectra, were reassigned to their appropriate color channel by post-hoc spectral linear un-
mixing. To monitor synapse dynamics, neurons were imaged 9 times at 24-hour intervals (Fig.
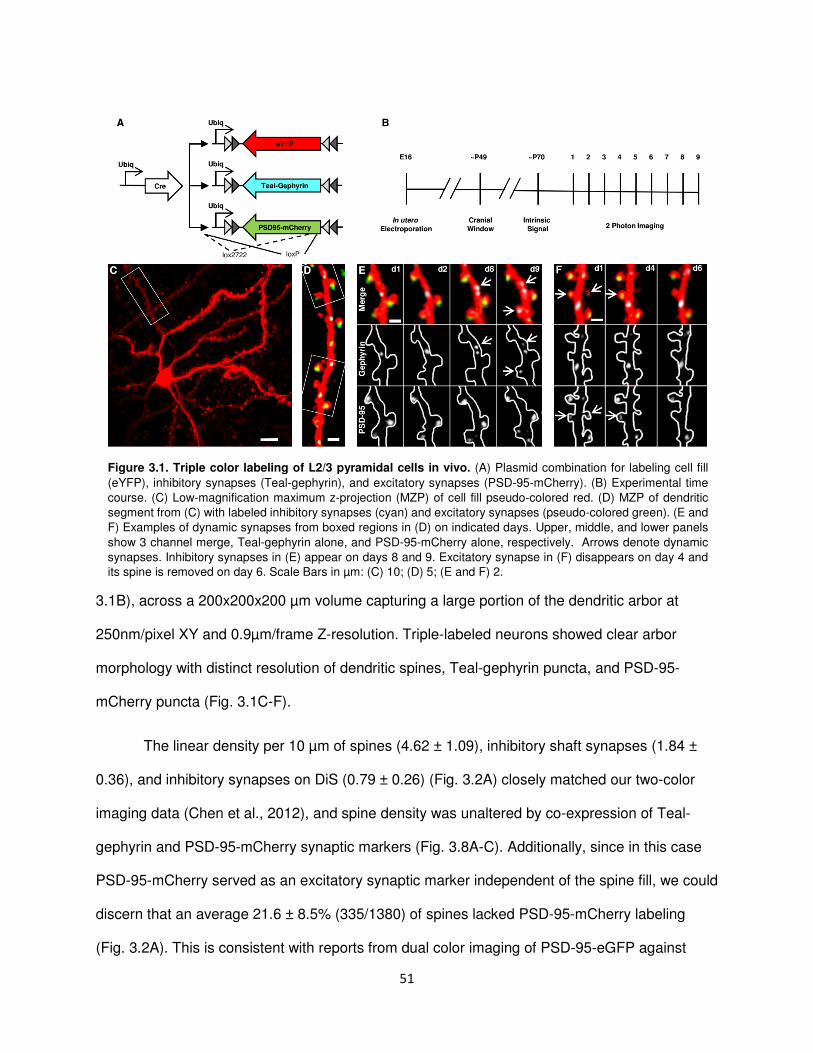
51
3.1B), across a 200x200x200 µm volume capturing a large portion of the dendritic arbor at
250nm/pixel XY and 0.9µm/frame Z-resolution. Triple-labeled neurons showed clear arbor
morphology with distinct resolution of dendritic spines, Teal-gephyrin puncta, and PSD-95-
mCherry puncta (Fig. 3.1C-F).
The linear density per 10 µm of spines (4.62 ± 1.09), inhibitory shaft synapses (1.84 ±
0.36), and inhibitory synapses on DiS (0.79 ± 0.26) (Fig. 3.2A) closely matched our two-color
imaging data (Chen et al., 2012), and spine density was unaltered by co-expression of Teal-
gephyrin and PSD-95-mCherry synaptic markers (Fig. 3.8A-C). Additionally, since in this case
PSD-95-mCherry served as an excitatory synaptic marker independent of the spine fill, we could
discern that an average 21.6 ± 8.5% (335/1380) of spines lacked PSD-95-mCherry labeling
(Fig. 3.2A). This is consistent with reports from dual color imaging of PSD-95-eGFP against
Figure 3.1. Triple color labeling of L2/3 pyramidal cells in vivo. (A) Plasmid combination for labeling cell fill
(eYFP), inhibitory synapses (Teal-gephyrin), and excitatory synapses (PSD-95-mCherry). (B) Experimental time
course. (C) Low-magnification maximum z-projection (MZP) of cell fill pseudo-colored red. (D) MZP of dendritic
segment from (C) with labeled inhibitory synapses (cyan) and excitatory synapses (pseudo-colored green). (E and
F) Examples of dynamic synapses from boxed regions in (D) on indicated days. Upper, middle, and lower panels
show 3 channel merge, Teal-gephyrin alone, and PSD-95-mCherry alone, respectively. Arrows denote dynamic
synapses. Inhibitory synapses in (E) appear on days 8 and 9. Excitatory synapse in (F) disappears on day 4 and
its spine is removed on day 6. Scale Bars in µm: (C) 10; (D) 5; (E and F) 2.
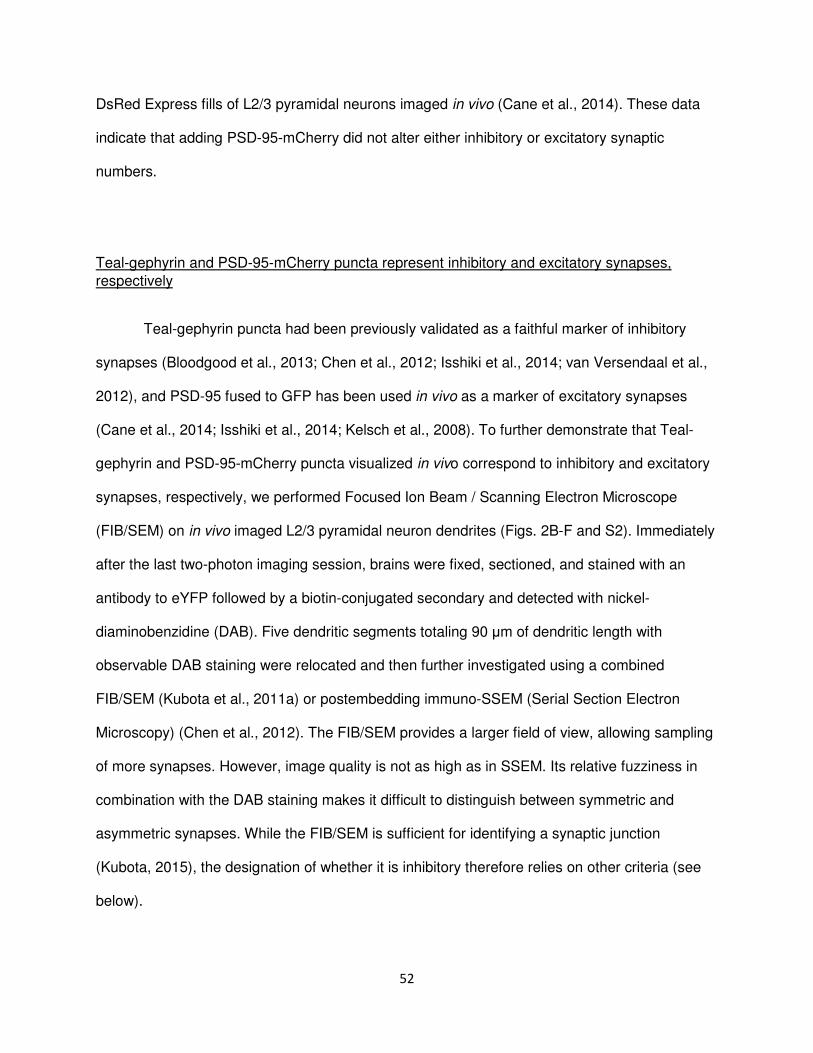
52
DsRed Express fills of L2/3 pyramidal neurons imaged in vivo (Cane et al., 2014). These data
indicate that adding PSD-95-mCherry did not alter either inhibitory or excitatory synaptic
numbers.
Teal-gephyrin and PSD-95-mCherry puncta represent inhibitory and excitatory synapses,
respectively
Teal-gephyrin puncta had been previously validated as a faithful marker of inhibitory
synapses (Bloodgood et al., 2013; Chen et al., 2012; Isshiki et al., 2014; van Versendaal et al.,
2012), and PSD-95 fused to GFP has been used in vivo as a marker of excitatory synapses
(Cane et al., 2014; Isshiki et al., 2014; Kelsch et al., 2008). To further demonstrate that Teal-
gephyrin and PSD-95-mCherry puncta visualized in vivo correspond to inhibitory and excitatory
synapses, respectively, we performed Focused Ion Beam / Scanning Electron Microscope
(FIB/SEM) on in vivo imaged L2/3 pyramidal neuron dendrites (Figs. 2B-F and S2). Immediately
after the last two-photon imaging session, brains were fixed, sectioned, and stained with an
antibody to eYFP followed by a biotin-conjugated secondary and detected with nickel-
diaminobenzidine (DAB). Five dendritic segments totaling 90 µm of dendritic length with
observable DAB staining were relocated and then further investigated using a combined
FIB/SEM (Kubota et al., 2011a) or postembedding immuno-SSEM (Serial Section Electron
Microscopy) (Chen et al., 2012). The FIB/SEM provides a larger field of view, allowing sampling
of more synapses. However, image quality is not as high as in SSEM. Its relative fuzziness in
combination with the DAB staining makes it difficult to distinguish between symmetric and
asymmetric synapses. While the FIB/SEM is sufficient for identifying a synaptic junction
(Kubota, 2015), the designation of whether it is inhibitory therefore relies on other criteria (see
below).
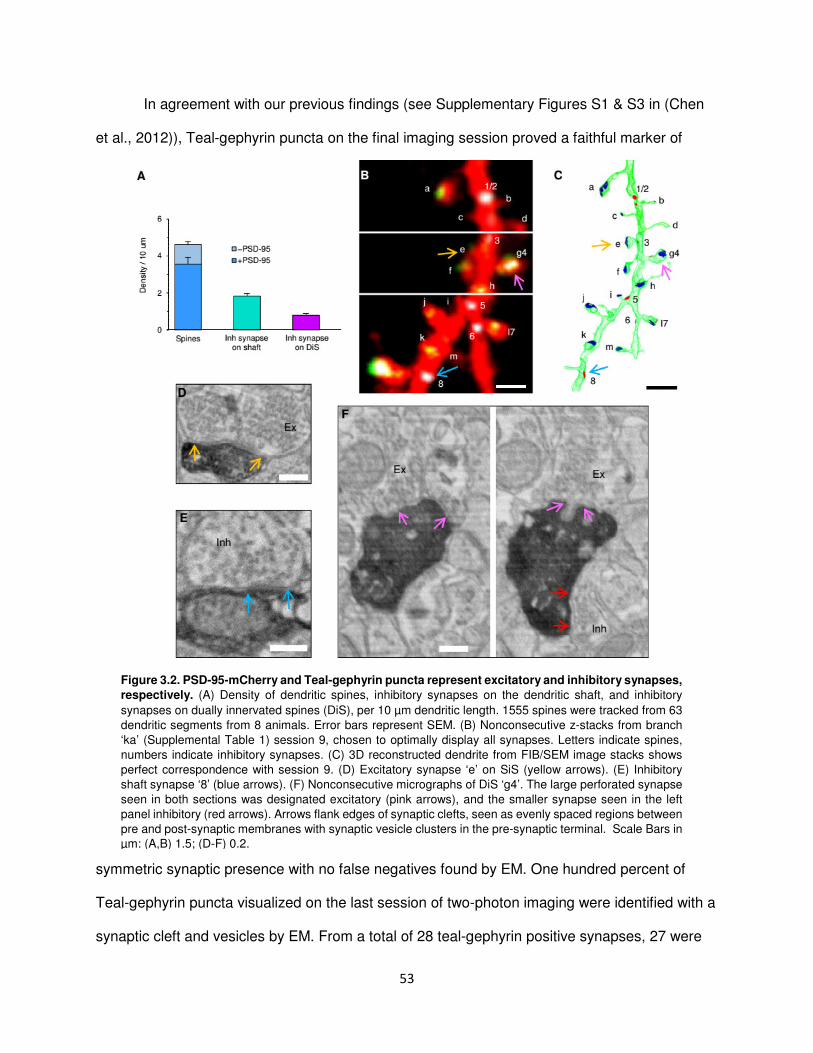
53
In agreement with our previous findings (see Supplementary Figures S1 & S3 in (Chen
et al., 2012)), Teal-gephyrin puncta on the final imaging session proved a faithful marker of
symmetric synaptic presence with no false negatives found by EM. One hundred percent of
Teal-gephyrin puncta visualized on the last session of two-photon imaging were identified with a
synaptic cleft and vesicles by EM. From a total of 28 teal-gephyrin positive synapses, 27 were
Figure 3.2. PSD-95-mCherry and Teal-gephyrin puncta represent excitatory and inhibitory synapses,
respectively. (A) Density of dendritic spines, inhibitory synapses on the dendritic shaft, and inhibitory
synapses on dually innervated spines (DiS), per 10 µm dendritic length. 1555 spines were tracked from 63
dendritic segments from 8 animals. Error bars represent SEM. (B) Nonconsecutive z-stacks from branch
‘ka’ (Supplemental Table 1) session 9, chosen to optimally display all synapses. Letters indicate spines,
numbers indicate inhibitory synapses. (C) 3D reconstructed dendrite from FIB/SEM image stacks shows
perfect correspondence with session 9. (D) Excitatory synapse ‘e’ on SiS (yellow arrows). (E) Inhibitory
shaft synapse ‘8’ (blue arrows). (F) Nonconsecutive micrographs of DiS ‘g4’. The large perforated synapse
seen in both sections was designated excitatory (pink arrows), and the smaller synapse seen in the left
panel inhibitory (red arrows). Arrows flank edges of synaptic clefts, seen as evenly spaced regions between
pre and post-synaptic membranes with synaptic vesicle clusters in the pre-synaptic terminal. Scale Bars in
µm: (A,B) 1.5; (D-F) 0.2.
54
confirmed as inhibitory according to at least one of the following criteria: 1) they were located on
the dendritic shaft; 2) they stained positive for GABA thorough post-hoc immuno-EM; 3) we
were able to trace the axon to another symmetric synapse formed onto a cell lacking DAB
staining; 4) Two terminals were clearly visible on a DiS and the excitatory terminal was validated
by other criteria (Fig. 3.2B-F, Fig. S3.2, Table T1). Inhibitory synapses on spines were
exclusively found on spines that also contained an excitatory synapse (DiS).
PSD-95-mCherry puncta visualized on the last imaging session in vivo corresponded to
asymmetric (excitatory) synapses, with no false positives (Fig. 3.2B-F, Fig. S3.2, Table T1).
From a total of 17 PSD-95-mCherry puncta, 100% were validated as excitatory synapses by the
following criteria: 1) Location on a SiS; 2) clear postsynaptic density observed despite DAB
staining; 3) perforated synapse; 4) backtracing the excitatory axon to its nearest asymmetric
synapse onto a non-DAB stained cell. Some very small or newly formed excitatory synapses
were seen by EM, but not observed with PSD-95-mCherry in vivo (6 in total), potentially due to
the presence of MAGUKs other than PSD-95. Immature synapses containing MAGUKs such as
MAP102 or SAP97 and lacking PSD-95 have been reported early in development (Elias et al.,
2008; Sans et al., 2000) and by EM in the adult rat visual cortex (Aoki et al., 2001).
Teal-gephyrin puncta on dually innervated spines represent functional GABAergic synapses
To confirm that Teal-gephyrin puncta represent functional GABAergic synapses and that
lack of a Teal-gephyrin punctum indicates the absence of a functional GABAergic synapse, we
performed two-photon GABA uncaging and electrophysiological recordings in organotypic slice
cultures of L2/3 pyramidal neurons expressing tdTomato and Teal-gephyrin. CDNI-GABA was
uncaged adjacent to spines with or without Teal-gephyrin puncta (Fig. 3.3A). Spines containing
55
Teal-gephyrin puncta evoked an average uncaging-evoked inhibitory postsynaptic current
(uIPSC) of 5.80 ± 0.21 pA, and spines lacking Teal-gephyrin puncta evoked an average uIPSC
of 1.92 ± 0.13 pA (Fig. 3.3B-C). Spines with and without gephyrin showed little overlap in terms
of uIPSC amplitudes (Fig. 3.3D). The uIPSCs evoked by GABA uncaging adjacent to spines
Figure 3.3. Teal-gephyrin puncta on dually innervated spines represent functional GABAergic synapses.
(A) Representative image of a dendritic segment from an L2/3 pyramidal neuron in organotypic slice culture
expressing tdTomato (red) and Teal-gephyrin (green). Arrowhead marks a gephyrin positive spine. Crosses
indicate two-photon GABA uncaging spots. Scale bar= 1µm. (B) Representative uIPSC traces evoked from a spine
positive for gephyrin (1, green) and its neighboring gephyrin-negative spine (2, red). Arrowheads indicate onset of
GABA uncaging. (C) Summary graph of uIPSC amplitudes from gephyrin positive spines (green bar; n = 42 spines,
18 cells) and spines lacking gephyrin puncta (red bar; n = 44 spines. **p < 0.01 by two-tailed student’s t-test). (D)
Segregation of uIPSC amplitudes between spines with gephyrin puncta (green circles) and lacking puncta (red
circles). (E) Gephyrin negative spines (red) clearly segregate from gephyrin positive spines (green). Positive
correlation between uIPSCs and Teal-gephyrin signal intensity (r = 0.53 by Pearson’s correlation; p < 0.01) and no
correlation between uIPSC and background gephyrin intensity of gephyrin negative spines (r=-0.09 by Pearson’s
correlation; p=0.56; n = 42 spines, 18 cells). Error bars are S.E.M.
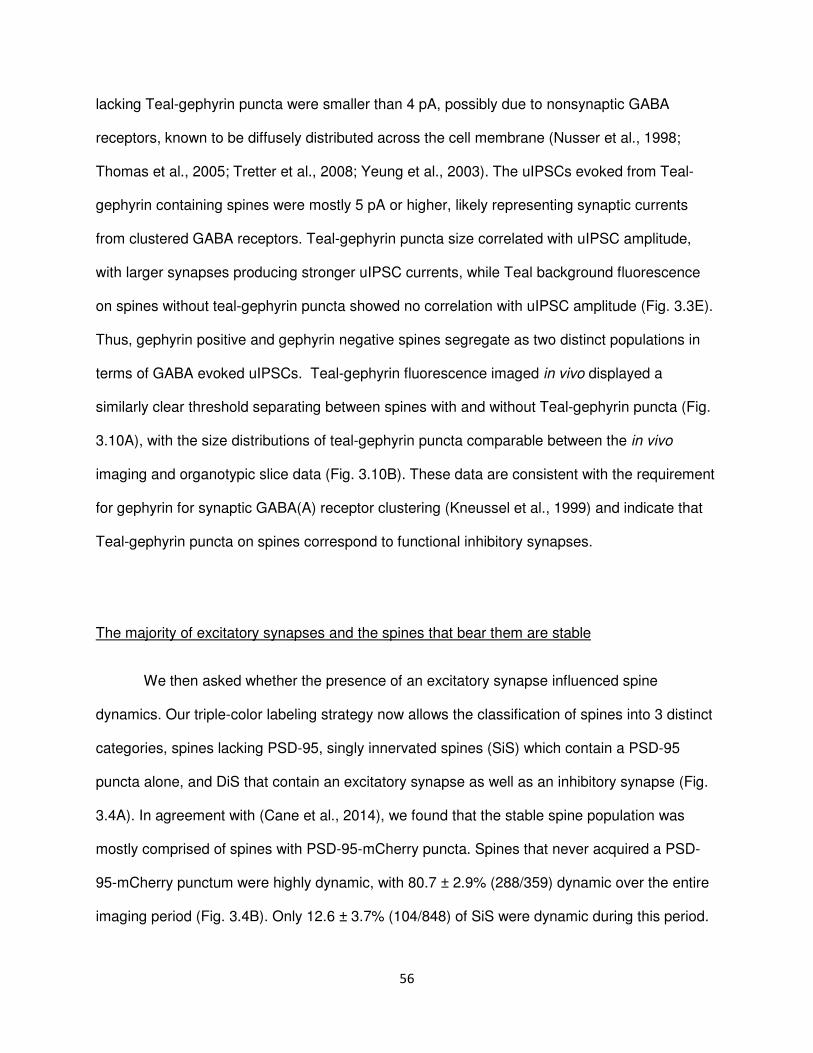
56
lacking Teal-gephyrin puncta were smaller than 4 pA, possibly due to nonsynaptic GABA
receptors, known to be diffusely distributed across the cell membrane (Nusser et al., 1998;
Thomas et al., 2005; Tretter et al., 2008; Yeung et al., 2003). The uIPSCs evoked from Teal-
gephyrin containing spines were mostly 5 pA or higher, likely representing synaptic currents
from clustered GABA receptors. Teal-gephyrin puncta size correlated with uIPSC amplitude,
with larger synapses producing stronger uIPSC currents, while Teal background fluorescence
on spines without teal-gephyrin puncta showed no correlation with uIPSC amplitude (Fig. 3.3E).
Thus, gephyrin positive and gephyrin negative spines segregate as two distinct populations in
terms of GABA evoked uIPSCs. Teal-gephyrin fluorescence imaged in vivo displayed a
similarly clear threshold separating between spines with and without Teal-gephyrin puncta (Fig.
3.10A), with the size distributions of teal-gephyrin puncta comparable between the in vivo
imaging and organotypic slice data (Fig. 3.10B). These data are consistent with the requirement
for gephyrin for synaptic GABA(A) receptor clustering (Kneussel et al., 1999) and indicate that
Teal-gephyrin puncta on spines correspond to functional inhibitory synapses.
The majority of excitatory synapses and the spines that bear them are stable
We then asked whether the presence of an excitatory synapse influenced spine
dynamics. Our triple-color labeling strategy now allows the classification of spines into 3 distinct
categories, spines lacking PSD-95, singly innervated spines (SiS) which contain a PSD-95
puncta alone, and DiS that contain an excitatory synapse as well as an inhibitory synapse (Fig.
3.4A). In agreement with (Cane et al., 2014), we found that the stable spine population was
mostly comprised of spines with PSD-95-mCherry puncta. Spines that never acquired a PSD-
95-mCherry punctum were highly dynamic, with 80.7 ± 2.9% (288/359) dynamic over the entire
imaging period (Fig. 3.4B). Only 12.6 ± 3.7% (104/848) of SiS were dynamic during this period.
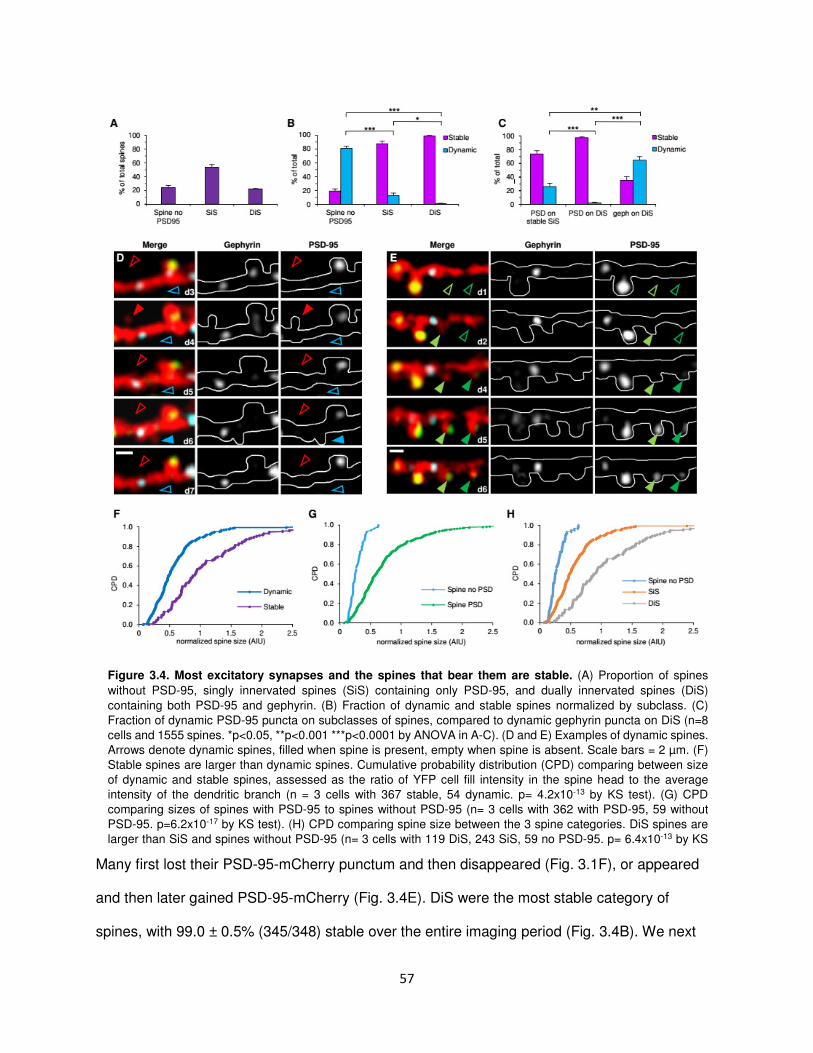
57
Many first lost their PSD-95-mCherry punctum and then disappeared (Fig. 3.1F), or appeared
and then later gained PSD-95-mCherry (Fig. 3.4E). DiS were the most stable category of
spines, with 99.0 ± 0.5% (345/348) stable over the entire imaging period (Fig. 3.4B). We next
Figure 3.4. Most excitatory synapses and the spines that bear them are stable. (A) Proportion of spines
without PSD-95, singly innervated spines (SiS) containing only PSD-95, and dually innervated spines (DiS)
containing both PSD-95 and gephyrin. (B) Fraction of dynamic and stable spines normalized by subclass. (C)
Fraction of dynamic PSD-95 puncta on subclasses of spines, compared to dynamic gephyrin puncta on DiS (n=8
cells and 1555 spines. *p<0.05, **p<0.001 ***p<0.0001 by ANOVA in A-C). (D and E) Examples of dynamic spines.
Arrows denote dynamic spines, filled when spine is present, empty when spine is absent. Scale bars = 2 µm. (F)
Stable spines are larger than dynamic spines. Cumulative probability distribution (CPD) comparing between size
of dynamic and stable spines, assessed as the ratio of YFP cell fill intensity in the spine head to the average
intensity of the dendritic branch (n = 3 cells with 367 stable, 54 dynamic. p= 4.2x10⁻¹³ by KS test). (G) CPD
comparing sizes of spines with PSD-95 to spines without PSD-95 (n= 3 cells with 362 with PSD-95, 59 without
PSD-95. p=6.2x10⁻¹⁷ by KS test). (H) CPD comparing spine size between the 3 spine categories. DiS spines are
larger than SiS and spines without PSD-95 (n= 3 cells with 119 DiS, 243 SiS, 59 no PSD-95. p= 6.4x10⁻¹³ by KS

58
examined the dynamics of PSD-95 puncta on spines and asked, ‘how do the dynamics of
excitatory synapses differ from the dynamics of inhibitory synapses on spines?’ We found that,
while PSD-95 puncta on stable SiS are occasionally dynamic (26.2 ± 4.7% dynamic, 177/744),
PSD-95 puncta on DiS are extremely stable (97.8 ± 1.0% stable, 340/348), in stark contrast to
inhibitory synapses on DiS, the majority of which (64.8 ± 5.3%, 215/348) are dynamic (Fig.
3.4C, p<0.0001 by one-way ANOVA with Tukey’s Multiple Comparison Test).
Other studies have shown that larger spines are more likely to be stable (Holtmaat et al.,
2005; Trachtenberg et al., 2002). Consistent with these results, we found that dynamic spines
are significantly smaller than stable spines (Fig. 3.4F, p= 4.2 x10⁻¹³ by KS test), and that spines
lacking PSD-95 are smaller than spines containing PSD-95 (Fig. 3.4G, p=6.2x10⁻¹⁷ by KS test).
With the addition of the Teal-gephyrin label, we were able to separate spines with PSD-95 into
two populations, distinguishing SiS from DiS. This revealed that SiS are significantly smaller
than DiS (Fig. 3.4H, p= 6.4x10⁻¹³ by KS test). Thus, the stability of DiS could be due to
increased stabilization resulting from either the presence of two synapses or the larger size of
DiS, although these two factors are likely related.
Inhibitory synapses disappear and appear again in the same location
We find that inhibitory synapses on DiS are by far the most dynamic population,
significantly more dynamic than either spines or inhibitory synapses on the dendritic shaft (Fig.
3.5A, p<0.001 by ANOVA with Tukey’s Multiple Comparison Test). The percentage of dynamic
inhibitory synapses seen with daily interval imaging were surprisingly high in comparison to
previous studies imaging at 4-day intervals (Chen et al., 2012), with 25.7 ± 3.9% (335/1380) of
spines, 19.0 ± 2.3% (89/534) of inhibitory synapses on the dendritic shaft, and 64.2 ± 5.3%
(175/304) of inhibitory synapses on DiS dynamic. This was not due to increased
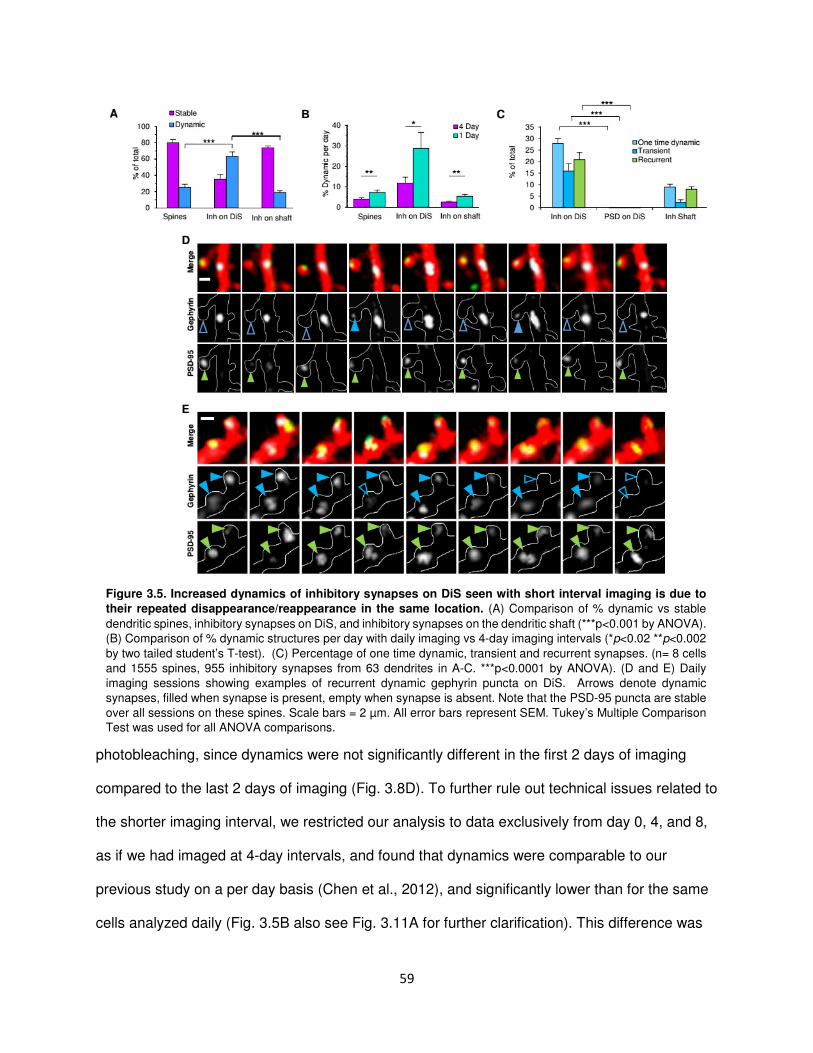
59
photobleaching, since dynamics were not significantly different in the first 2 days of imaging
compared to the last 2 days of imaging (Fig. 3.8D). To further rule out technical issues related to
the shorter imaging interval, we restricted our analysis to data exclusively from day 0, 4, and 8,
as if we had imaged at 4-day intervals, and found that dynamics were comparable to our
previous study on a per day basis (Chen et al., 2012), and significantly lower than for the same
cells analyzed daily (Fig. 3.5B also see Fig. 3.11A for further clarification). This difference was
Figure 3.5. Increased dynamics of inhibitory synapses on DiS seen with short interval imaging is due to
their repeated disappearance/reappearance in the same location. (A) Comparison of % dynamic vs stable
dendritic spines, inhibitory synapses on DiS, and inhibitory synapses on the dendritic shaft (***p<0.001 by ANOVA).
(B) Comparison of % dynamic structures per day with daily imaging vs 4-day imaging intervals (*p<0.02 **p<0.002
by two tailed student’s T-test). (C) Percentage of one time dynamic, transient and recurrent synapses. (n= 8 cells
and 1555 spines, 955 inhibitory synapses from 63 dendrites in A-C. ***p<0.0001 by ANOVA). (D and E) Daily
imaging sessions showing examples of recurrent dynamic gephyrin puncta on DiS. Arrows denote dynamic
synapses, filled when synapse is present, empty when synapse is absent. Note that the PSD-95 puncta are stable
over all sessions on these spines. Scale bars = 2 µm. All error bars represent SEM. Tukey’s Multiple Comparison
Test was used for all ANOVA comparisons.
60
particularly robust for inhibitory synapses on DiS, with 28.8 ± 7.7% dynamic per day when
imaged and analyzed at daily intervals vs. 11.8 ± 2.9% dynamic per day when analyzed only for
4-day intervals. The increase in dynamic events when imaging at short intervals indicates that
many dynamic events are quickly reversed and therefore undetected with less frequent imaging
(examples in Fig 5D-E).
Given the stunning prevalence of short-lived dynamics for the inhibitory synapse
population on DiS, we classified synapses by their dynamic history across the entire 9-day
imaging period. We defined synapses that change once (appear or disappear) and don’t change
again within our imaging time frame as one-time dynamic, that appear once and disappear as
transient, and those that disappear and reappear at least once as recurrent. Approximately half
of the dynamic inhibitory synapses on dendritic shafts, 9.2 ± 1.3% (44/517), were in the one-
time dynamic category, 2.2 ± 0.9% (8/517) transient, and 7.7 ± 1.1% (36/517) recurrent (Fig.
3.5C). Inhibitory synapses on DiS exhibited significantly more of each dynamic category, with
28.8 ± 2.4% (98/348) one-time dynamic, 16.0 ± 3.5% (50/348) transient, and as many as 19.5 ±
2.5% (67/348) of total synapses exhibiting recurrent dynamics. The rapid insertion and removal
of inhibitory synapses on DiS is in striking contrast to the stability of excitatory synapses on the
same spines, which when broken down into these categories are 0.004 ± 0.004% (1/348) one-
time dynamic, 0.008 ± 0.008% (2/348) transient and 0.008 ± 0.008% (4/248) recurrent (Fig.
3.5C, p<0.0005 by ANOVA with Tukey’s Multiple Comparison Test).
Kinetics of inhibitory synaptic dynamics are altered in experience dependent plasticity
We next investigated whether the rapid inhibitory synaptic dynamics revealed by short
interval imaging reflect circuit modifications in response to visual experience. In the adult
mouse, MD of at least 7 days produces a functional ocular dominance (OD) shift in binocular
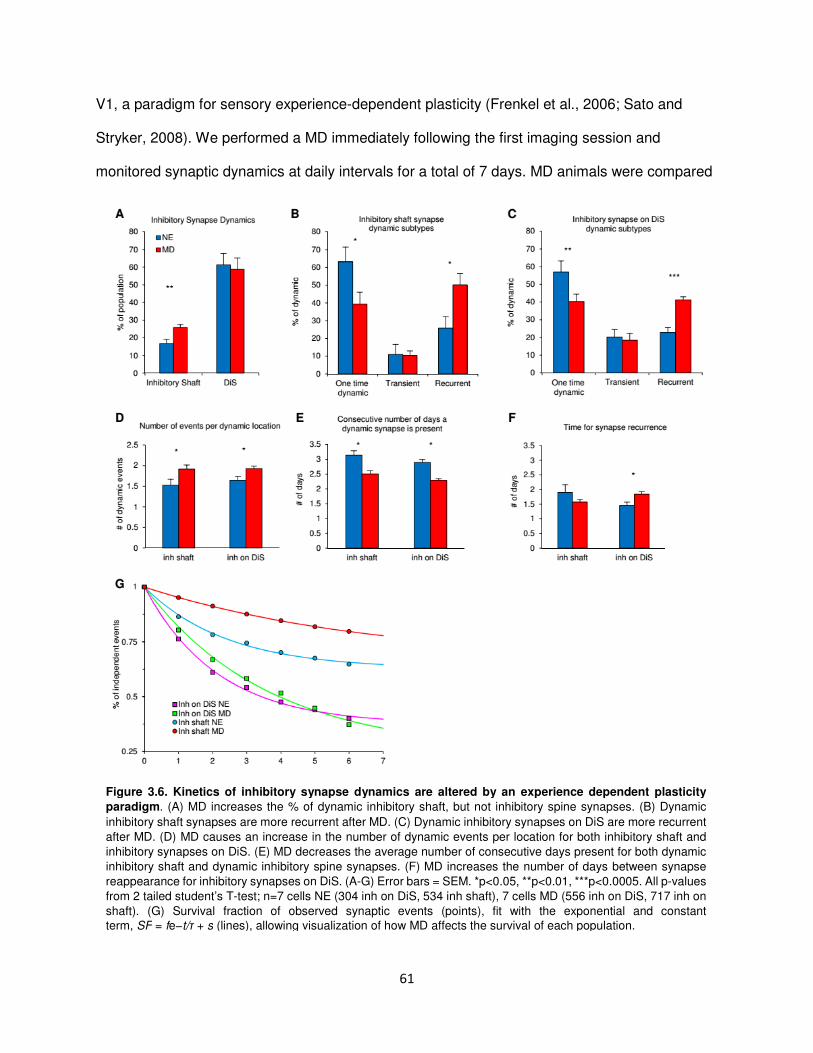
61
V1, a paradigm for sensory experience-dependent plasticity (Frenkel et al., 2006; Sato and
Stryker, 2008). We performed a MD immediately following the first imaging session and
monitored synaptic dynamics at daily intervals for a total of 7 days. MD animals were compared
Figure 3.6. Kinetics of inhibitory synapse dynamics are altered by an experience dependent plasticity
paradigm. (A) MD increases the % of dynamic inhibitory shaft, but not inhibitory spine synapses. (B) Dynamic
inhibitory shaft synapses are more recurrent after MD. (C) Dynamic inhibitory synapses on DiS are more recurrent
after MD. (D) MD causes an increase in the number of dynamic events per location for both inhibitory shaft and
inhibitory synapses on DiS. (E) MD decreases the average number of consecutive days present for both dynamic
inhibitory shaft and dynamic inhibitory spine synapses. (F) MD increases the number of days between synapse
reappearance for inhibitory synapses on DiS. (A-G) Error bars = SEM. *p<0.05, **p<0.01, ***p<0.0005. All p-values
from 2 tailed student’s T-test; n=7 cells NE (304 inh on DiS, 534 inh shaft), 7 cells MD (556 inh on DiS, 717 inh on
shaft). (G) Survival fraction of observed synaptic events (points), fit with the exponential and constant
term, SF = fe−t/τ + s (lines), allowing visualization of how MD affects the survival of each population.
62
to animals who had normal vision (normal experience NE) for the same period. We found that
MD caused a significant increase in the percent of dynamic inhibitory synapses on shafts (NE
16.9% ± 2.3% (89/534) vs. MD 25.8% ± 1.7% (186/717); p<.01 by two-tailed student’s t-test),
but not on DiS (NE 61.3% ± 6.6% (175/304) vs. MD 58.7% ± 6.6% (283/556); p>.05 by two-
tailed student’s t-test) (Fig 6A) or spines with or without PSD-95 (Fig. 3.12). The PSD-95-
mCherry puncta on DiS are also unaffected by MD.
After MD, both shaft and spine inhibitory synapse populations showed a significant
increase in the number of recurrent events (Fig 6B-C) (% recurrent inhibitory synapses on DiS:
NE 22.8 ± 2.8% (40/175) vs. MD 41.2 ± 1.8% (115/283); p<0.0002; on shaft: NE 25.9 ± 6.5%
(24/89) vs. MD 50.2 ± 6.3% (91/186); p<0.02 by two-tailed student’s t-test). This was at the
expense of one-time changes, which were significantly lower for both populations (% one-time
dynamic inhibitory synapses on DiS: NE 57.0 ± 6.2% (99/175) vs. MD 40.3 ± 4.1% (125/283);
p<0.05; on shaft: NE 63.1 ± 8.4% (52/89) vs. MD 39.4 ± 6.7% (74/186); p<0.05 by two-tailed
student’s t-test). Thus, inhibitory shaft synapses from a stable pool are recruited during MD to
the dynamic population, while inhibitory synapses on DiS, which are already quite dynamic
under naïve conditions, are not. For both inhibitory synapse types, MD shifts dynamics event
from the one-time dynamic to the recurrent category. This increase in recurrence is reflected in
more dynamic events per synaptic location (Fig 6D) (inhibitory synapses on DiS: NE 1.6 ± 0.1
vs. MD 1.9 ± 0.06; p<0.03 by two-tailed student’s t-test; Inhibitory synapses on Shaft: NE 1.5 ± 0.2 vs. MD 1.9 ± 0.1; p<0.05 by two-tailed student’s t-test). Additionally, the average number
of days dynamic synapses are present after MD is decreased in both synapse populations (Fig
6E) (inhibitory synapses on DiS: NE 2.9 ± 0.2 vs. MD 2.3 ± 0.1; p<.05 by two-tailed student’s
t-test; inhibitory synapses on shaft: NE 3.1 ± 0.3 vs. MD 2.5 ± 0.09 ; p<.05 by two-tailed
student’s t-test). Recurrent inhibitory synapses on DiS were also absent for more days before
63
reoccurring after MD (Fig 6F) (NE 1.5 ± 0.1 vs. MD 1.8 ± 0.09; p<0.03 by two-tailed student’s
t-test).
To quantify how the differences in inhibitory synapse dynamics after MD impacted their
overall lifetime, we calculated the survival fractions for each population, and fit an exponential
curve to these values (Fig 6G). The exponential fit is a convenient metric for the mean lifetime
(τ) of each inhibitory synapse population. MD decreased the lifetime of inhibitory synapses on
DiS (NE τ = 3.62 MD; τ = 2.15). The same is true for inhibitory synapses on the shaft (NE τ =
6.69 MD; τ = 2.40) (Fig 6E, G). We hypothesized that the increase in the dynamic inhibitory
shaft population after MD, combined with the shorter mean lifetimes of both dynamic inhibitory
synapse populations, would result in a net disinhibition after MD. When we pool the number of
imaging sessions each inhibitory synapse was present, there is a significant decrease in
inhibitory synapse presence after MD (NE mean time present 5.95; N=838 inhibitory synapses;
MD mean time present 5.75; N=1273 inhibitory synapses; p=0.0058 Wilcoxon Rank-Sum test,
one tailed). Overall, these data show that rapid inhibitory synapse dynamics are responsive to
sensory manipulations and likely reflect circuit adaptations to the visual environment. Further,
disinhibition caused by MD, is not simply a result of one-time inhibitory synaptic loss, but rather
a destabilization of inhibitory synapses, resulting in a new dynamic state where they are more
dynamic and less likely to be present.
Inhibitory axons appear to remain in place after loss of a recurrent inhibitory synapse
The ability of inhibitory synapses on DiS to repeatedly return to the same location within
24-48 hours suggested that other elements might remain stable at the same locale to serve as a
landmark or placeholder. To explore this, we fixed brains for EM immediately following the last
in vivo imaging session. We specifically searched for DiS that had lost a recurrent inhibitory

64
synapse within 24-48 hours prior to fixation to determine if any synaptic structural elements
were visible by EM. Five inhibitory synapses on DiS that were present on multiple non-
consecutive imaging sessions, but absent on session 9 (three shown in Fig. 3.5D-E), had no
Figure 3.7. EM reconstruction of recurrent inhibitory synapses lost within 24-48 hours of fixation and their
presynaptic afferents. (A) 2-photon image from session 9 of the region in Fig. 3.5D. (B) 3D reconstructions of this
region. Left panel shows the spine ‘a’ which lacks an inhibitory synapse on session 9. Right panel shows the
presynaptic inhibitory axon (red) which makes a symmetric synapse (purple arrow) on a neighboring dendrite (sky
blue). (C) EM micrograph of spine ‘a’ (left) with presynaptic excitatory terminal in blue and adjacent inhibitory
terminal in red. Yellow arrowhead indicates probable location of the recently disappeared inhibitory synapse. Bold
white arrow indicates excitatory synapse. Right panel shows clear symmetric inhibitory synapse (purple arrow) onto
neighboring (sky blue) dendrite. (D) 2-photon image from session 9 of the region in Fig. 3.5E. (E) Reconstruction
of spines ‘j’ and ‘k’ which both lacked inhibitory synapses on the final imaging session. Note that spine ‘k’ is a z-
projecting spine. Putative inhibitory axon terminals in red. (F) EM micrograph of spine ‘k’, blue arrowhead indicates
where inhibitory synapse may have previously been located. (G) 3D reconstruction of another dendrite (Fig. 3.9E,
Movie M1), yellow and black arrows indicate the inhibitory synapses on DiS and shaft, respectively. Reconstructed
presynaptic inhibitory axon colored red. (H) A multisynaptic bouton (MSB) contacts both the DiS and the inhibitory
dendrite (yellow). (I) Left panel shows complete reconstruction of all 4 dendrites targeted by the MSB. Right panel
shows this region with red and yellow segments removed to visualize the synapses onto excitatory dendrites. (J)
EM micrograph with presynaptic excitatory axon in dark blue, DiS in black, presynaptic inhibitory axon (MSB) in
red, postsynaptic dendrites in light blue and purple. Bold white arrow indicates excitatory synapse (for more detail
see Fig. 3.12B). Scale Bars in µm: (A,B,D,E) 1.25; (C,F,J) 0.2; (G,H,I) 0.5.

65
discernable inhibitory synaptic junction visible by EM (Fig. 3.7, Fig. 3.13A, Table T2). However,
in four cases a putative inhibitory presynaptic terminal with a few vesicles was present adjacent
to an excitatory synapse on the same spines. Two of these axon terminals could be traced to
symmetric synapses formed onto a non-DAB stained cell confirming they were in fact inhibitory
afferents. (Fig. 3.7B-C,E-F).
For one of the recurrent inhibitory synapses, present on sessions 4-6 and not 9, a very
tiny synaptic contact was visible, although its size, 0.010 square microns on one section, would
not normally be scored positive by EM (Fig. 3.7G-J, Fig. 3.9E, Fig. 3.13B). This site also
retained its presynaptic terminal, a rather promiscuous multi-synaptic bouton, which contacted
the DiS of interest, and also formed large symmetric synapses on two other excitatory dendrites
and on one inhibitory dendrite. This bouton is particularly interesting because it shows that the
inhibitory axon is able to form synapses onto a diverse range of targets: onto the dendritic shaft
and the DiS of pyramidal neurons, but also onto inhibitory dendrites. This axon also formed a
large inhibitory shaft synapse next to the DiS, on the same dendrite. This large multisynaptic
bouton is highly unlikely to retract when the synapse is lost from the DiS, considering it is
anchored by three other synaptic connections. Taken together, these data suggest that loss of
gephyrin from inhibitory synapses on DiS, even for a short interval, represents loss of a synaptic
junction. Further, even after the postsynaptic gephyrin has disappeared, we have observed 4/5
cases where the putative inhibitory axon remains in place, potentially enabling the rapid
reappearance of Teal-gephyrin puncta and the reformation of the inhibitory synapse.
Discussion
The loss and gain of spines observed in vivo has long been assumed to represent the
remodeling of excitatory connections: specifically, a permanent loss or gain of contact with the
66
presynaptic cell. When a new spine is formed, if it lasts for at least 4 days, it will gain an
excitatory synapse and persist for months (Cane et al., 2014; Holtmaat et al., 2005). In
agreement with recent observations (Cane et al., 2014), we find that the majority of spine
dynamics are due to a short lived population of spines that never acquire PSD-95 puncta, and
thus, are unlikely to represent functional changes in circuitry. Our three-color imaging has also
enabled further distinction of spines with PSD-95 into SiS or DiS. We find that DiS are the
largest and most stable of all spine classes. Since spine size is well known to correlate with
stability (Prange and Murphy, 2001) (De Roo et al., 2008; Ehrlich et al., 2007) as is synaptic
presence (Cane et al., 2014), the increased stability of DiS could be a function of their large size
or the presence of two synapses, although these factors are likely related.
We have previously shown that inhibitory synapses on DiS are more dynamic than shaft
inhibitory synapses or spines (Chen et al., 2012). Here we show that they are also more
dynamic than excitatory synapses, and in particular when compared against the extreme
stability of excitatory synapses on DiS. Our short interval imaging protocol reveals that a large
proportion of dynamic inhibitory synapses, in particular inhibitory synapses on DiS, are transient
or recurrent. Even this large fraction may be an underestimate as events currently scored as
one-time dynamic could potentially resolve as transient or recurrent if we were able to image
longer than 9 daily sessions, or potentially when imaging at even shorter intervals. This
repeated insertion and removal of inhibitory synapses at stable sites is unlikely to serve the
purpose of rearranging circuitry in terms of testing or exchanging presynaptic partners, as has
been the model for excitatory synapse remodeling (Chen and Nedivi, 2010; Nimchinsky et al.,
2002). Inhibitory synaptic remodeling on DiS may serve a fundamentally different purpose. It
has been shown, in vivo, that GABA uncaging can reduce Ca2+ transients within spines (Chiu et
al., 2013). Inhibitory synapse removal and insertion on DiS could enable flexible, input specific
modulation of a stable excitatory synapse. Further, the size of individual inhibitory synapses can
vary up to 3 fold across imaging sessions (Figure 11B and C), suggesting that inhibitory spine

67
synapses can potentially fine tune their excitatory partner on a DiS beyond a yes/no switch.
Considering that DiS often receive direct excitatory input from thalamus (Kubota et al., 2007;
van Versendaal et al., 2012), feed forward connections are likely to be particularly influenced by
this previously unsuspected mode of inhibitory modulation.
Rapid inhibitory synapse dynamics are responsive to sensory manipulations. However,
rather than abrupt inhibitory synaptic loss followed by gradual recovery (Chen et al., 2011; Chen
et al., 2012; van Versendaal et al., 2012), we find that MD causes a destabilization of inhibitory
synapses, and transition to a new dynamic state where they are more dynamic and less likely to
be present. Inhibitory shaft synapses are recruited from the stable population into the dynamic
pool, both dynamic inhibitory synapse populations show shorter mean lifetimes, and inhibitory
synapses on DIS show longer time to recurrence. Disinhibition through inhibitory synaptic loss
after sensory deprivation is consistent with studies showing that whisker stimulation leads to an
increase in the number of inhibitory synapses on spines (Knott et al., 2002). Inhibitory synapse
dynamics are clearly sensitive to activity levels in the excitatory circuits they modulate.
EM reconstruction of sites previously occupied by recurrent gephyrin, suggests that
nearby inhibitory axons are well situated to serve as placeholders or nucleation sites for the
return of inhibitory synapses. This is consistent with cell culture studies showing that two days of
TTX treatment results in the loss of postsynaptic, but not presynaptic inhibitory synapses
(Kilman et al., 2002), and this loss of inhibition is completely and rapidly reversible (Rutherford
et al., 1997). This ability of inhibitory synapses to rapidly remodel in response to changes in
activity levels in cell culture (Kilman et al., 2002; Marty et al., 1997; Rutherford et al., 1997), and
in vivo (Chen et al., 2012; van Versendaal et al., 2012) is an important homeostatic mechanism
for maintaining a stable excitatory/inhibitory balance in cortical circuits (Nelson and Turrigiano,
2008; Turrigiano, 2011). Thus, the rapid addition and removal of inhibitory synapses at stable
sites that we show for the first time in vivo may serve to not only to reversibly regulate individual

68
synaptic contacts on DiS and dendritic excitability locally, but to more broadly regulate
homeostatic drive onto individual pyramidal neurons (Kilman et al., 2002; Turrigiano and
Nelson, 2004). Since these dynamics occur without complete dismantling of the inhibitory
afferent, recruitment of an inhibitory synapse may be guided by activity of the nearby excitatory
synapse.
It is interesting to note that for inhibitory synapses imaged in vivo, as well as in
organotypic slice culture there is a clear threshold for scoring Teal-gephyrin positive puncta that
corresponds to the emergence of GABA evoked uIPSCs. This suggests that GABA receptor
clustering by gephyrin may require a critical aggregation step that specifies emergence of an
inhibitory synapse.
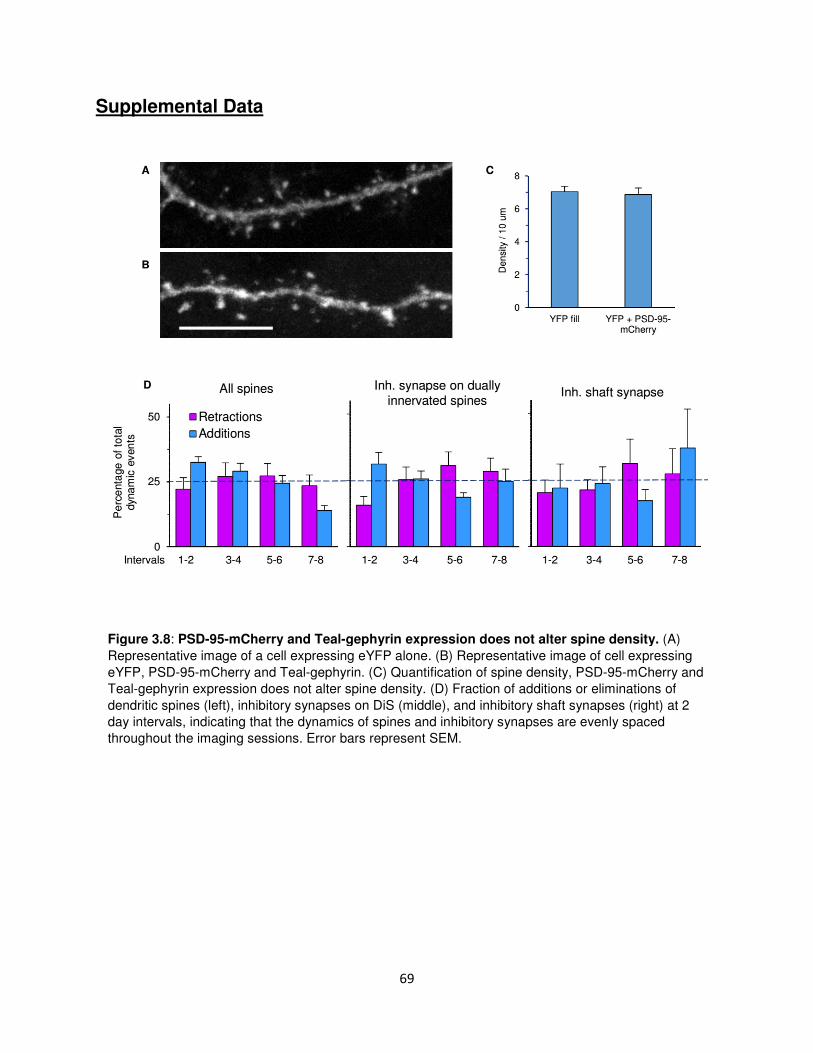
69
Supplemental Data
Figure 3.8: PSD-95-mCherry and Teal-gephyrin expression does not alter spine density. (A)
Representative image of a cell expressing eYFP alone. (B) Representative image of cell expressing
eYFP, PSD-95-mCherry and Teal-gephyrin. (C) Quantification of spine density, PSD-95-mCherry and
Teal-gephyrin expression does not alter spine density. (D) Fraction of additions or eliminations of
dendritic spines (left), inhibitory synapses on DiS (middle), and inhibitory shaft synapses (right) at 2
day intervals, indicating that the dynamics of spines and inhibitory synapses are evenly spaced
throughout the imaging sessions. Error bars represent SEM.
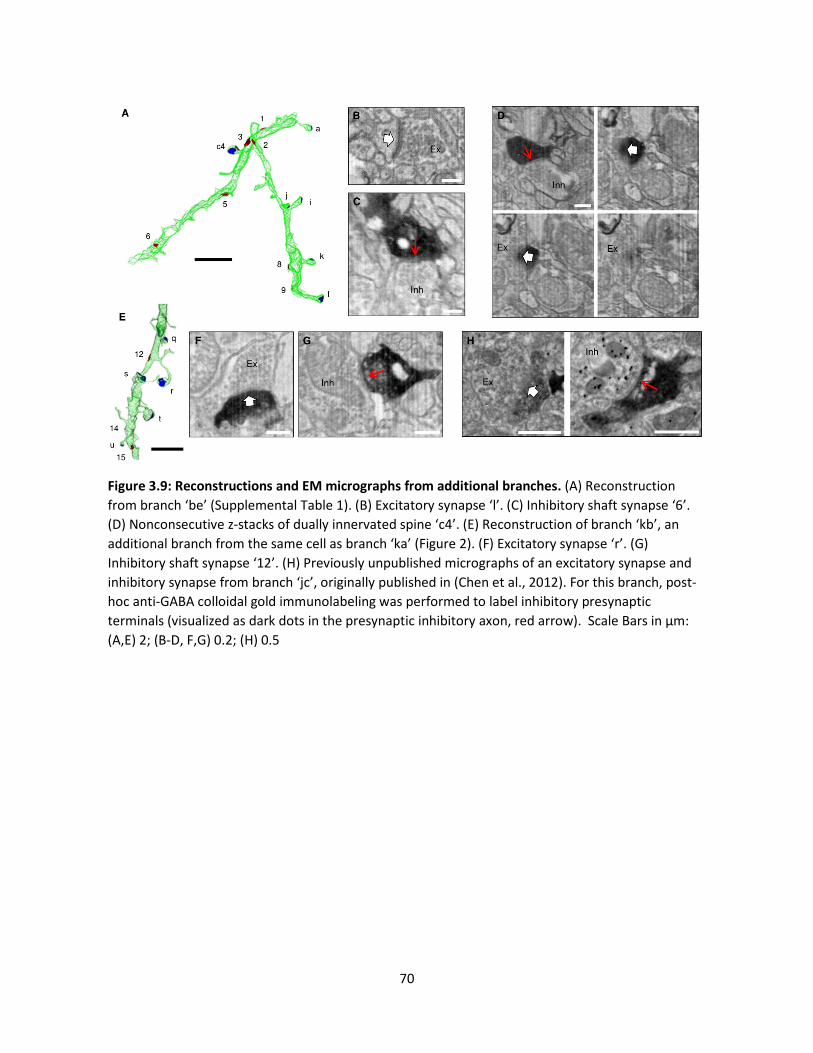
70
Figure 3.9: Reconstructions and EM micrographs from additional branches. (A) Reconstruction
from branch ‘be’ (Supplemental Table 1). (B) Excitatory synapse ‘l’. (C) Inhibitory shaft synapse ‘6’.
(D) Nonconsecutive z-stacks of dually innervated spine ‘c4’. (E) Reconstruction of branch ‘kb’, an
additional branch from the same cell as branch ‘ka’ (Figure 2). (F) Excitatory synapse ‘r’. (G)
Inhibitory shaft synapse ‘12’. (H) Previously unpublished micrographs of an excitatory synapse and
inhibitory synapse from branch ‘jc’, originally published in (Chen et al., 2012). For this branch, post-
hoc anti-GABA colloidal gold immunolabeling was performed to label inhibitory presynaptic
terminals (visualized as dark dots in the presynaptic inhibitory axon, red arrow). Scale Bars in µm:
(A,E) 2; (B-D, F,G) 0.2; (H) 0.5
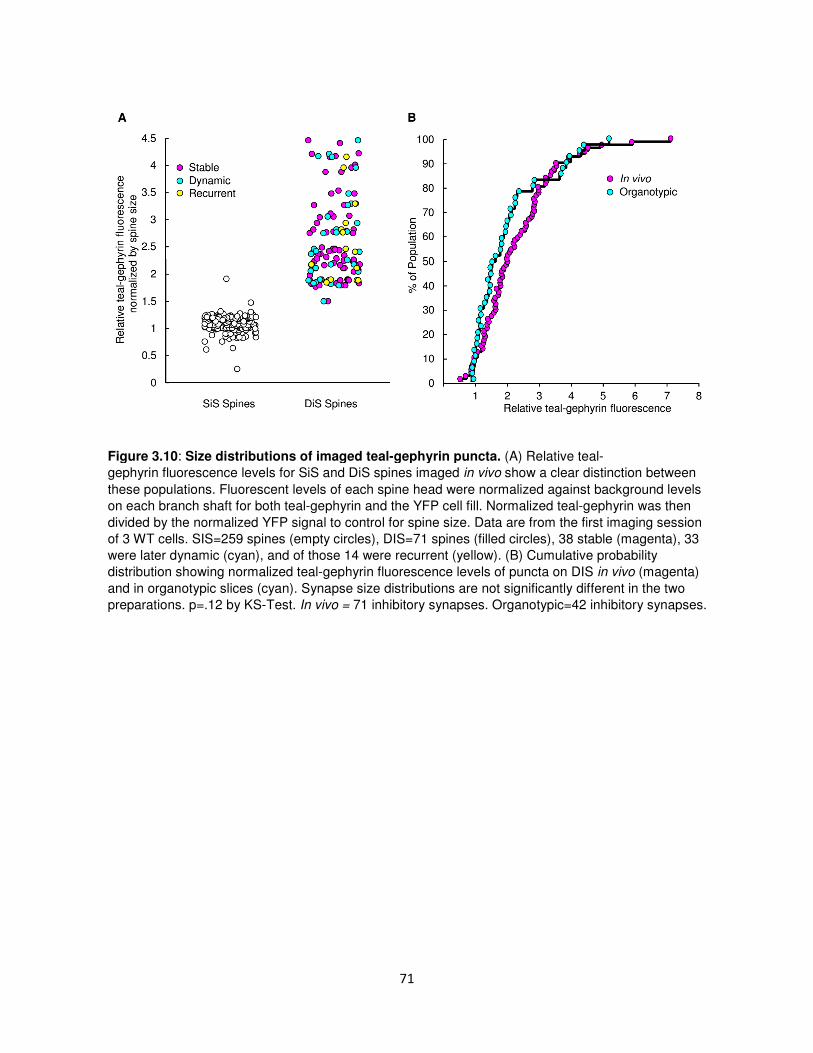
71
Figure 3.10: Size distributions of imaged teal-gephyrin puncta. (A) Relative teal-
gephyrin fluorescence levels for SiS and DiS spines imaged in vivo show a clear distinction between
these populations. Fluorescent levels of each spine head were normalized against background levels
on each branch shaft for both teal-gephyrin and the YFP cell fill. Normalized teal-gephyrin was then
divided by the normalized YFP signal to control for spine size. Data are from the first imaging session
of 3 WT cells. SIS=259 spines (empty circles), DIS=71 spines (filled circles), 38 stable (magenta), 33
were later dynamic (cyan), and of those 14 were recurrent (yellow). (B) Cumulative probability
distribution showing normalized teal-gephyrin fluorescence levels of puncta on DIS in vivo (magenta)
and in organotypic slices (cyan). Synapse size distributions are not significantly different in the two
preparations. p=.12 by KS-Test. In vivo = 71 inhibitory synapses. Organotypic=42 inhibitory synapses.

72
Figure 3.11: Synapse dynamics are stochastic and the size of inhibitory synapses vary over
time. (A) Percentage of dynamic events when comparing: (a) session 1 to session 2 (daily change
with one day imaging), (b) session 1 to session 5 (as if imaging had been done once every four days),
(c) cumulative changes from session 1 to session 5 under conditions of daily imaging. (d) ‘b’ divided
by 4 to calculate daily dynamics under conditions of 4 day imaging. (e) ‘c’ divided by 4 to calculate
daily dynamics in conditions of daily imaging. ‘d’ and ‘e’ are represented in Figure 5b. (B) Inhibitory
synapses on DiS that went away and returned again change size over time. n=8 synapses from 2
cells. (C) Stable inhibitory synapses on DiS that were present in every imaging session still fluctuate
in size over time. n=11 synapses from 2 cells. Synapse size was calculated by summing the intensity
of a teal-gephyrin puncta in a 3x3 pixel ROI from the Z frame where the signal was brightest,
normalizing to background shaft gephyrin signal and then to normalized YFP signal to control for
spine size.
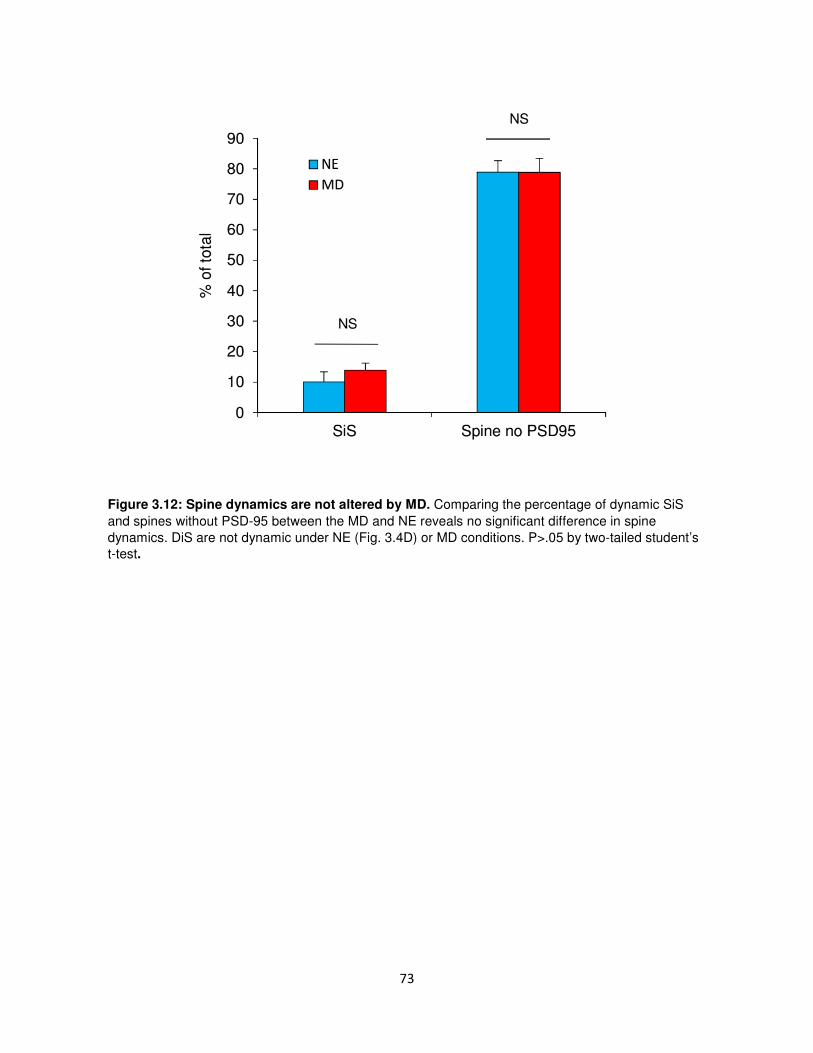
73
Figure 3.12: Spine dynamics are not altered by MD. Comparing the percentage of dynamic SiS
and spines without PSD-95 between the MD and NE reveals no significant difference in spine
dynamics. DiS are not dynamic under NE (Fig. 3.4D) or MD conditions. P>.05 by two-tailed student’s
t-test.

74
Supplemental Figure 3.13: Series of consecutive EM micrographs for DiSs showing loss of
inhibitory synaptic contact. (A) EM micrograph from Figure 7C as a series of consecutive z stacks
with 12 nm step between stacks. (B) EM micrograph from Figure 7J as a series of consecutive z
stacks with 12 nm step between stacks.

75
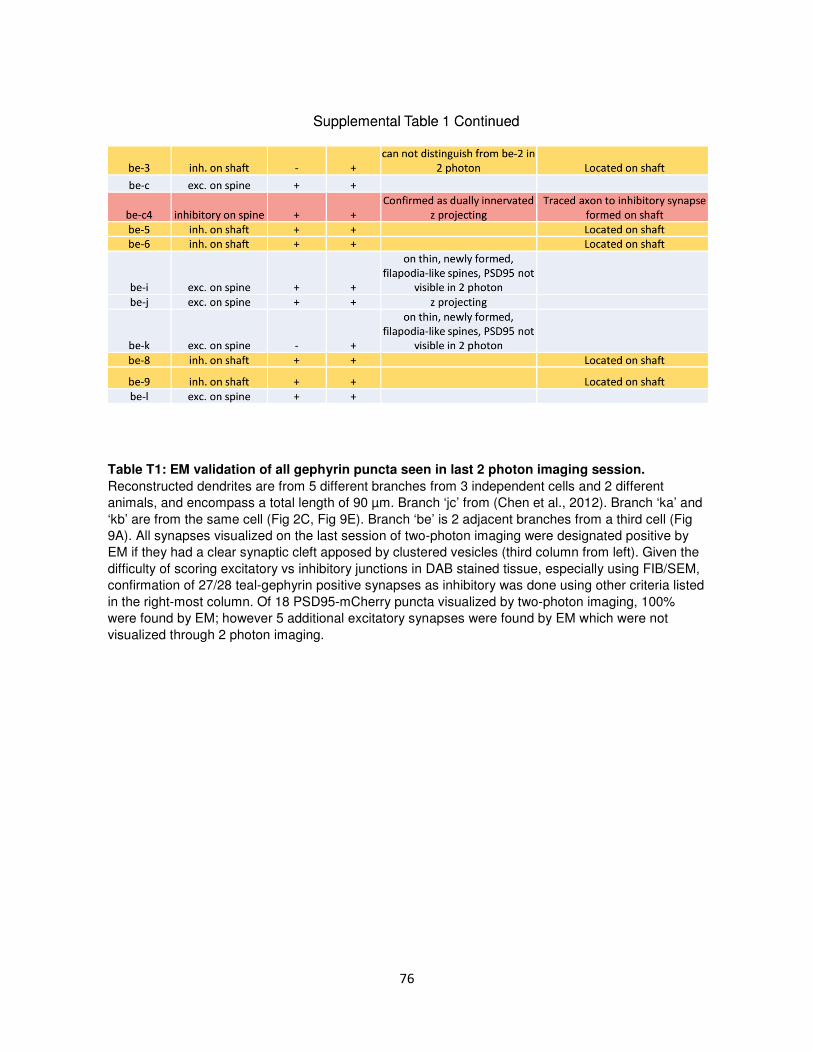
76
Table T1: EM validation of all gephyrin puncta seen in last 2 photon imaging session.
Reconstructed dendrites are from 5 different branches from 3 independent cells and 2 different
animals, and encompass a total length of 90 µm. Branch ‘jc’ from (Chen et al., 2012). Branch ‘ka’ and
‘kb’ are from the same cell (Fig 2C, Fig 9E). Branch ‘be’ is 2 adjacent branches from a third cell (Fig
9A). All synapses visualized on the last session of two-photon imaging were designated positive by
EM if they had a clear synaptic cleft apposed by clustered vesicles (third column from left). Given the
difficulty of scoring excitatory vs inhibitory junctions in DAB stained tissue, especially using FIB/SEM,
confirmation of 27/28 teal-gephyrin positive synapses as inhibitory was done using other criteria listed
in the right-most column. Of 18 PSD95-mCherry puncta visualized by two-photon imaging, 100%
were found by EM; however 5 additional excitatory synapses were found by EM which were not
visualized through 2 photon imaging.
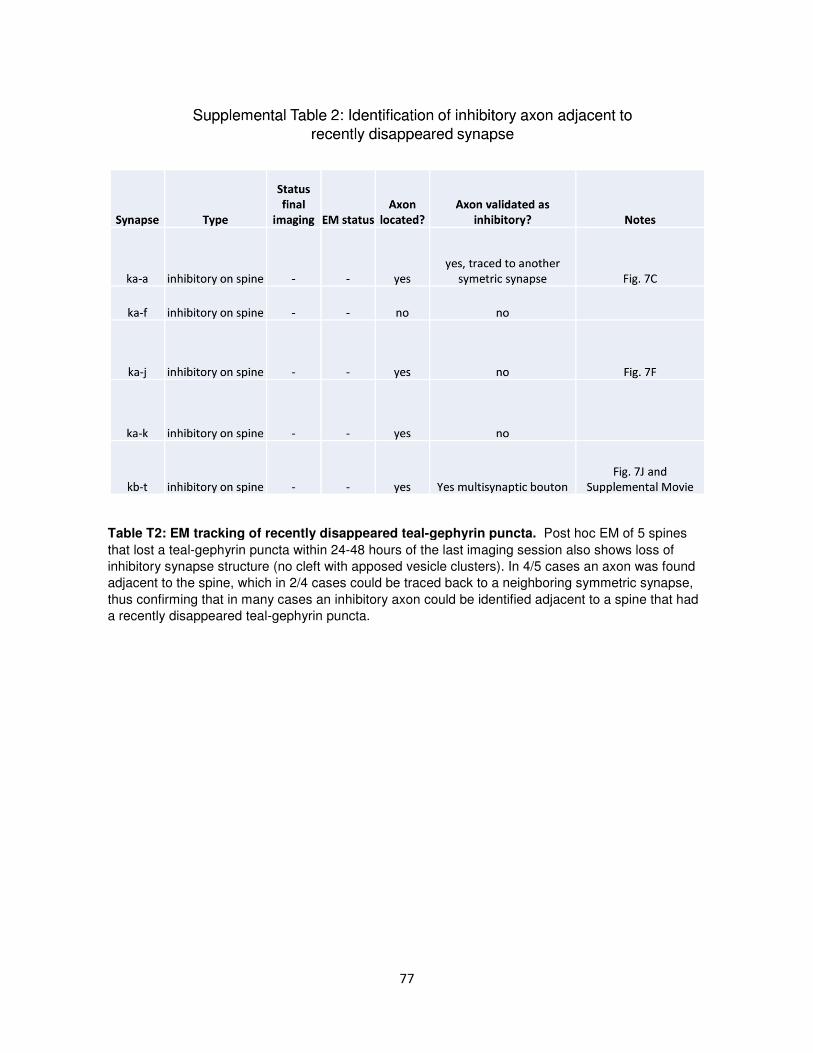
77
Table T2: EM tracking of recently disappeared teal-gephyrin puncta. Post hoc EM of 5 spines
that lost a teal-gephyrin puncta within 24-48 hours of the last imaging session also shows loss of
inhibitory synapse structure (no cleft with apposed vesicle clusters). In 4/5 cases an axon was found
adjacent to the spine, which in 2/4 cases could be traced back to a neighboring symmetric synapse,
thus confirming that in many cases an inhibitory axon could be identified adjacent to a spine that had
a recently disappeared teal-gephyrin puncta.

78
Experimental Procedures
Generation of Expression Plasmids
The Cre-dependent eYFP and Teal-gephyrin plasmids (pFUdioeYFPW, pFUdioTealGephyrinW)
have been described previously in (Chen et al., 2012), and the Cre plasmid in (Subramanian et
al., 2013). To generate a Cre-dependent PSD-95-mCherry within a dio cassette, PSD-95
lacking a stop codon was first amplified with an added 5’Nhe1 site from pFuPSD-95-TealW (gift
from Jerry Chen), then cloned into pcDNA3 (Invitrogen) between the KpnI and EcoRI sites, to
create pcDNA3-PSD-95. mCherry was amplified from pcDNA3.3-mCherry (Addgene) with an
added 3’AgeI site, then cloned into pcDNA3-PSD-95 between the EcoRI and XhoI sites to make
pcDNA3-PSD-95-mCherry. PSD-95-mCherry was then removed by NheI and AgeI digestion
and subcloned into the Cre dependent plasmid pFudio-AscI-AgeI-NheIW, generated by
replacing eYFP in pFudio-eYFPW with a linker sequence containing the AgeI restriction site.
In Utero Electroporation
All animal experiments were approved by the Massachusetts Institute of Technology Committee
on Animal Care and meet the National Institute of Health guidelines for the use and care of
vertebrate animals. In utero electroporation on E15.5 timed pregnant C57BL/6J mice was
performed to label L2/3 cortical pyramidal neurons, as previously described (Tabata and
Nakajima, 2001). Animals were co-electroporated with Cre-dependent constructs expressing
eYFP, PSD-95-mCherry, or Teal-gephyrin along with a plasmid expressing Cre recombinase at
a ratio of 10:10:5:1, respectively (total DNA concentration 2 µg/µL), with 0.1% Fast Green for
visualization. A total of 0.75 µl of the plasmid solution was injected into the right lateral ventricle
with a 32 gauge Hamilton syringe (Hamilton Company, Reno, NV, USA). Five pulses of 36V
(duration 50 ms, frequency 1 Hz) targeting the visual cortex were delivered from a square wave
79
electroporator (ECM830; Harvard Apparatus, Holliston, MA, USA) using 5 mm diameter
platinum electrodes (Protech International, Boerne, TX, USA).
Cranial Window Implantation
After in utero electroporation, pups were reared to adulthood (P42-57) and implanted with a 5
mm cranial window over the right hemisphere, as described (Lee et al., 2008).
Sulfamethoxazole (1 mg/ml) and trimethoprim (0.2 mg/ml) were chronically administered in the
drinking water to maintain optical clarity of implanted windows.
Optical Intrinsic Signal Imaging
To identify binocular visual cortex, optical imaging of intrinsic signal and data analysis were
performed as described previously (Kalatsky and Stryker, 2003). Mice were anesthetized and
maintained on 0.25%-0.75% isofluorane and secured in a stereotaxic frame. A horizontal bar (5o
in height and 73o in width) drifting upward with a periodicity of 12 s was presented for 60 cycles
on a high refresh rate monitor 25 cm in front of the animal. Optical images of visual cortex were
acquired continuously under 610 nm illumination with an intrinsic imaging system (LongDaq
Imager 3001/C; Optical Imaging Inc., New York, NY, USA) through a 2.5x/0.075 NA objective
(Zeiss, Jena, Germany). Images were spatially binned by 4x4 pixels for analysis and cortical
intrinsic signal was computed by extracting the Fourier component of light reflectance changes
matched to stimulus frequency. Response magnitude was the fractional change in reflectance,
and the magnitude maps were thresholded at 30% of peak response amplitude. Binocular visual
cortex was delineated upon stimulation of the ipsilateral eye only.
80
Two-photon imaging
Animals were allowed 2 weeks for recovery after cranial window surgery. When windows
cleared, labeled cells in binocular visual cortex were screened for the presence of all 3
fluorescent labels. Cells that exhibited high background labeling with synaptic labels or any
ectopic clumps of synaptic proteins were not used for experiments. This selection process
ensured that all imaged cells had similar levels of fluorescent labeling. Only one cell was
imaged per animal. For eight mice with normal visual experience in vivo two-photon imaging
was performed daily for 9 consecutive sessions using a custom-built microscope with custom
acquisition software to enable triple color imaging. For each imaging session, mice were
anesthesized with isofluorane (0.75%-1.25%) and secured in a stereotaxic frame. Fluorophores
were simultaneously excited with a commercial Mai Tai HP Ti: Sapphire laser (Spectra-Physics,
Santa Clara, CA, USA) at 915 nm to excite eYFP and Teal, and a Chameleon Compact OPO
(Coherent, Santa Clara, CA, USA) at 1085 nm to excite mCherry. The outputs of the two
excitation lasers were combined at a polarized beam splitter with orthogonal polarization
directions, and delivered to the two-photon microscope through the same beam path. After
scanning with a galvonometric XY-scanning mirrors (6215H, Cambridge Technology) and a
piezo actuator Z-positioning system (Piezosystem Jena, Jena, Germany), the two laser beams
were focused by a 20x/1.0 NA water immersion objective lens (W Plan-Apochromat; Zeiss,
Jena, Germany) to the same focal volume location in the specimen, within one pixel size
accuracy. These lasers produce ~100 fs unsynchronized pulses at a rate of 80 MHz. The power
delivered by each laser to the specimen ranged from approximately 35-50 mW depending on
imaging depth. The emission signals from the three fluorophores were collected by the same
objective lens, passed through an IR blocking filter (E700SP; Chroma Technology, Bellows
Falls, VT, USA), and were separated according to their emission spectra by dichroic mirrors at
520 nm and 560 nm. After passing through three independent bandpass filters (485/70m,

81
550/100m, and 605/75m) the three emission signals were collected simultaneously onto 3
separate PMTs. Imaging for synapse monitoring was performed at high resolution (250 nm/pixel
XY-resolution, 0.9 µm/frame Z-resolution). Two-photon raw scanner data was processed for
spectral linear unmixing and converted into a RGB image z-stack using Matlab and ImageJ
(National Institutes of Health, Bethesda, MD, USA).
Monocular Deprivation
Monocular deprivation was performed by eyelid suture immediately after the first imaging
session. Mice were anesthetized with 2% isoflurane, lid margins were trimmed and triple
antibiotic ophthalmic ointment (Bausch & Lomb, Rochester, NY, USA) was applied to the eye.
Four to five individual stitches were placed using 6-0 vicryl along the extent of the trimmed lids.
Daily imaging sessions were performed for six additional sessions after MD. Suture integrity
was inspected directly prior to each imaging session. Animals whose eyelids did not seal fully or
had reopened were excluded from further experiments. A total of seven mice with successful
MD and no photobleaching were used for analysis.
Spectral Linear Unmixing and Image Processing
Spectral linear unmixing for three colors was performed using a similar approach as previously
described for two color unmixing (Chen et al., 2012). Briefly, spectral linear unmixing is based
on the fact that the total photon count at each pixel in a given channel is the linear sum of the
spectral contribution of each fluorophore weighted by its abundance. For a triple channel
detection system, the contribution of three fluorophores can be represented by the following
equations.

82
J1(x,y)=s1.1 x I1 (x,y) + s1.2 x I2 (x,y) + s1.3 x I3 (x,y)
J2(x,y)=s2.1 x I1 (x,y) + s2.2 x I2 (x,y) + s2.3 x I3 (x,y)
J3(x,y)=s3.1 x I1 (x,y) + s3.2 x I2 (x,y) + s3.3 x I3 (x,y)
Where J is the total signal per channel, I is the fluorophore abundance, and S is the contribution
of that fluorophore. These equations can be expressed as a matrix:
[J]=[S][I],
whereby the unmixed image [I] can be calculated using the inverse matrix of S:
[I]=[S]-1 [J].
Assuming the detected signal in both channels represents the total spectral contribution for all
three fluorophores:
s1.1 + s2.1 + s3.1 = 1
s1.2 + s2.2 + s3.2 = 1
s1.3 + s2.3 + s3.3 = 1
[S] was determined experimentally from two-photon images of HEK cell cultures expressing
single fluorophores and excited by both lasers at the same wavelengths used in vivo. Average
laser power was adjusted to achieve photon count levels approximating in vivo signal intensity.
We have previously shown that S derived from cell culture and in vivo data is interchangeable
(Chen et al., 2012). The mean contribution for each fluorophore into each channel (s1.1 – 3.3) was
calculated using Matlab (Mathworks, Natick, MA, USA). These values were subsequently used
for spectral linear unmixing of triple channel two-photon raw scanner data into a RBG image z-
stack using Matlab and ImageJ (National Institutes of Health). For all figures, images are

83
filtered and interpolated for optimal visualization. 3D image stacks are converted into maximum
intensity z-projections where noted in figure legends.
Data Analysis
Dendritic spines, PSD-95 containing excitatory synapses, and inhibitory synapses were scored
manually with a custom-written 4D point tracking system implemented in Fiji (Schindelin et al.,
2012) using a modified version of the ObjectJ plugin
(https://sils.fnwi.uva.nl/bcb/objectj/index.html). To avoid individual scoring bias, each cell was
independently scored by two investigators. Dendritic spine analysis criteria was defined as
previously described (Chen et al., 2012; Holtmaat and Svoboda, 2009). Because of the bright
labeling on the soma and axon initial segment, individual contacts in these regions could not be
resolved and analysis was restricted to dendrites starting approximately 40 microns from the
soma to the most distal tips. Because z-projecting spines lacking PSD-95 could not be
visualized, for consistency, all z-projecting spines were excluded from analysis, even those
which contained PSD-95. Gephyrin puncta were scored as synapses if they were at least 3x3
pixels, or 8–9 clustered pixels (0.56 µm2) in size, with a minimal average signal intensity of at
least four times above shot noise background levels, and were present in 2 consecutive z
planes. PSD-95 puncta were scored as synapses if they were least 2x2 pixels, or 4-5 clustered
pixels (0.27 µm2) in size with a minimal average signal intensity of at least four times above shot
noise background levels and were present in 2 consecutive z planes. EM validation confirmed
that these criteria represent inhibitory and excitatory synapses, respectively, with no false
positives. In general, the PSD-95-mCherry fluorophore was more prone to bleaching than YFP
or Teal-gephyrin. Cells that lost PSD-95-mCherry were not analyzed further. One-time dynamic
changes were defined as any structure that changed one time and never changed again.

84
Changes were scored as transient if a structure was added and later removed in a subsequent
imaging session. Changes were scored as recurrent if structures appeared, then disappeared,
and then appeared again at the same site; or conversely, ever disappeared and then
reappeared more than once in the same location. At least 25 spines and synapses were
counted per branch and at least 200 structures were counted per animal. Dendritic arbors were
manually traced in Neurolucida (MicroBrightField, Inc., Williston, VT, USA) to quantify the length
of scored branches.
In the normal experience dataset, we tracked a total of 1555 spines and 955 inhibitory
synapses on 62 dendritic segments from 8 animals. These included 30 basal, and 32 apical
dendrites, with a combined branch length of 3.01 mm, 1.63mm basal and 1.42mm apical.
Analysis for 1 animal was restricted to sessions 1-7 and another to sessions 1-6 due to photo-
bleaching of PSD-95-mCherry in later sessions. The animal with 6 sessions was not included in
the comparisons with the MD cells.
In the MD dataset, 1500 spines and 1273 inhibitory synapses were tracked over 7
consecutive imaging sessions. In all, 43 dendritic segments from 7 animals, 22 basal and 21
apical dendrites, with a combined branch length of 2.83mm, 1.54mm basal and 1.29mm apical.
All comparisons between MD and Normal Experience datasets were done using only the first 7
imaging sessions of all cells.
Spine size calculations were performed by placing a 5x5 pixel box in the most prominent
z frame around the spine head, subtracting background fluorescent levels and normalizing to
the average dendritic shaft intensity, as performed in (Holtmaat et al., 2005). Cumulative
probability distributions were calculated in Matlab and significance was determined by a two-
sample Kolmogorov-Smirnov test.
85
Focused Ion Beam/ Scanning Electron Microscopy
To demonstrate that Teal-gephyrin and PSD-95-mCherry puncta visualized in vivo correspond
to synapses, we performed serial section immuno-EM on in vivo imaged L2/3 pyramidal neuron
dendrites labeled with eYFP, Teal-gephyrin, and PSD-95-mCherry. Immediately after two-
photon imaging, the brain was fixed with 4% paraformaldehyde, 1% glutaraldehyde and 0.2 %
picric acid in 0.1 M PB, cut to 50 µm sections, and stained with an antiserum to GFP (1:2000
dilution, rabbit antiserum, gift from Dr. Tamamaki, Kyoto University) followed by a biotin-
conjugated secondary and then detected with nickel diaminobenzidine (Ni-DAB). Tissue was
then flat-embedded in Epon. Four dendritic segments with identifiable DAB staining were
relocated and then further investigated using a combined FIB/SEM (Focused Ion Beam /
Scanning Electron Microscope)(Kubota et al., 2011a). For EM observation, the Epon block
containing the dendritic segments was glued to a stainless-steel sample holder using silver
paste to avoid charging the epoxy. The top surface was coated by several 10 nm thick layers of
iridium using a sputter coater. The mounted block was transferred in a FIB/SEM, (Hitachi
MI4000L, Tokyo, Japan) which contains two beams that intersect at a right angle.The dendritic
segments were identified by SEM imaging on the top surface of the block using guidance lines
intersecting at right angles that were etched shallowly using the FIB, and by comparing this to
light microscopy images obtained earlier. The top region was protected by ion beam induced
deposition of platinum (52um*20um area, 1nA ion beam current, 900 sec deposition time). After
the coarse milling process by the FIB, the freshly exposed surface of the block was imaged at 1
kV acceleration potential and 1nA beam current using the in-lens detector with 10 µsec dwell
time/pixel. High resolution imaging was achieved by low kV imaging and detection of the
secondary electrons of the stained tissue surface. Using contrast inversion, TEM-like contrast
and comparable imaging information was obtained. Using the ‘Multi-Cut & See’ function, seven
adjacent images of 2000 x 2000 store resolution were acquired serially after milling the block

86
surface at 12 nm z-steps. Between 1183 and 1641 serial section images were acquired for each
image stack. The milling time was 26 seconds/slice and, the imaging time was about 40
sec/image, or 280 seconds for all 7 images. In total, the image acquisition took 7 days. The
serial image alignment was done using a homemade script for Matlab (kindly provided by Dr.
Shawn Mikula, Max Planck Institute, Heidelberg, Germany). The dendritic and synaptic
structures were rendered using the 3D reconstruction software, Reconstruct(Fiala, 2005)
(available at http://synapses.clm.utexas.edu/tools/index.stm). Synapses were scored according
to 3 criteria, the presence of a postsynaptic density, the aggregation of small synaptic vesicles
within the presynaptic terminal, and a clear synaptic cleft structure between the pre and
postsynaptic membranes at a distance of approximately 20 nm between two parallel
membranes. Contacts with DAB staining obscuring the postsynaptic compartment were only
categorized as inhibitory synapses if they were validated though 1) location on the dendritic
shaft, 2) backtracing the axon to another symmetric synapse formed onto a cell lacking DAB
staining, or 3) if two terminals were clearly visible on a DiS and the excitatory terminal was
validated by other criteria.
Preparation of organotypic slice cultures and DNA transfection
Organotypic slice cultures from mouse visual cortex were prepared from P3-P4 C57BL/6 mice
(Stoppini et al., 1991), and transfected 3-4 days before imaging/uncaging experiments using
biolistic gene transfer (180 psi)(Woods and Zito, 2008). The same Cre-dependent Teal-
gephyrin, and Cre plasmids used for the in vivo studies were coated onto 6-7 mg of gold
particles together with a tdTomato plasmid (Kwon et al., 2012) for cell fill (12 µg of tdTomato, 18
µg of Teal-gephyrin, and 16 µg of Cre).

87
Two-photon slice imaging and GABA uncaging
Imaging and uncaging were performed at 19-22 days in vitro (DIV) on transfected layer 2/3
pyramidal neurons within 40 µm of the slice surface at room temperature in recirculating artificial
cerebrospinal fluid (ACSF; in mM: 127 NaCl, 25 NaHCO3, 1.25 NaH2PO4, 2.5 KCl, 25 D-
glucose, aerated with 95% O2 /5 % CO2) in the presence of 2 mM CaCl2, 1 mM MgCl2, 1 mM
CDNI-GABA, and 0.001 mM TTX. For each neuron, image stacks (512 x 512 pixels; 0.035 µm /
pixel) with 1 µm z-steps were collected from one segment of secondary or tertiary apical
dendrites 30-50 µm from the soma using a two-photon microscope (Prairie Technologies, Inc)
with a pulsed Ti::sapphire laser (Mai Tai DeepSee, Spectra Physics) tuned to 930 nm (2-2.5
mW at the sample). To record uncaging-evoked inhibitory postsynaptic currents (uIPSCs), layer
2/3 pyramidal neurons were patched in voltage-clamp configuration (electrode resistances 5-8
MΩ, Vhold = +10 mV) using cesium-based internal solution (in mM: 135 Cs-methanesulfonate,
10 HEPES, 10 Na2 phosphocreatine, 4 MgCl2, 4 Na2-ATP, 0.4 Na-GTP, 3 Na L-ascorbate,
0.02 Alexa 594, ~300 mOsm, ~pH 7.25) in ACSF. For GABA uncaging, 720 nm light was
delivered 0.5 µm away from the target spine with a power of 18~20 mW for 3 ms. uIPSC
amplitudes from individual spines were quantified as the average of 8-10 pulses at 0.15 Hz.
Teal-gephyrin expression level in individual spines was measured from background-
subtracted and bleed-through-corrected green fluorescence intensities using the integrated pixel
intensity of a boxed region of interest (ROI) surrounding the spine head, as described (Woods et
al., 2011). In brief, relative Teal-gephyrin enrichment in spines was calculated by normalizing
the green fluorescence intensities (as described above) for each individual spine to the mean
green fluorescence intensities measured from four ROIs on the dendritic shaft: “spine with
gephyrin” (expression level > mean ) vs. “spine lacking gephyrin” (expression level < mean).
88
Chapter 4 - Probing the molecular mechanism of rapid
inhibitory dynamics
Contribution: All experiments and figures by Katherine Villa.
Abstract
We have previously shown that inhibitory synapses are remarkably dynamic in vivo and
are capable of disappearing and reappearing at stable sites on a timescale of days. The
mechanism for rapid synapse assembly and disassembly is likely to depend on postsynaptic
signaling cascades that regulate aggregation of the inhibitory post-synaptic scaffolding protein
gephrin required for synaptic clustering of inhibitory receptors. Activation of these postsynaptic
signaling cascades is potentially triggered by changes in membrane potential, influenced by
local synaptic activity. To examine the molecular mechanisms of rapid gephyrin dynamics
observed in vivo, I have created serine to alanine mutations in residues 268 and 270 of gephyrin
(S268A, S270A) by site-directed mutagenesis and assessed their effect on inhibitory synapse
dynamics. The S268 and S270 sites are phosphorylated by intracellular signaling cascades and
degraded by the calcium-activated protease, calpain, which may indicate that inhibitory synaptic
removal is mediated by neuronal activity. Preliminary results indicate that gephyrin S270A
mutants may display higher density of inhibitory synapses on dually innervated spines and more
recurrent dynamics of inhibitory shaft synapses. This could indicate that the phosphorylation at
residue 270 of gephyrin inhibits the rapid re-formation of inhibitory synapses.
89
Introduction
Inhibitory GABA-A receptors are clustered at inhibitory synapses in the cortex by the
postsynaptic protein gephyrin, a protein which self-assembles into a scaffold and interacts with
the cytoskeleton (Tyagarajan and Fritschy, 2014). Interestingly, gephyrin likely evolved from the
molybdenum cofactor (MoCo) synthesizing enzyme in bacteria, and the mammalian gephyrin
protein still possesses MoCo synthesis functions. Mice deficient in gephyrin die early postnatally
and display a loss of GABA-A receptor subtypes from postsynaptic sites. Restoration of MoCo
synthesis in gephyrin knockout mice does not rescue lethality, indicating that it is gephyrin
clustering of GABA receptors (and glycine receptors outside the cortex) which is essential for
life (Grosskreutz et al., 2003).
Gephyrin is post-translationally modified at several residues, as identified by mass-
spectroscopy (Schwarz et al., 2001; Tyagarajan et al., 2011; Zita et al., 2007). The
phosphorylation of gephyrin plays an important role in the regulation of its localization, stability,
and interactions with other proteins (Tyagarajan et al., 2013; Wuchter et al., 2012). Gephyrin
serine residues 270 and 268 are phosphorylated by glycogen synthase kinase 3β (GSK-3β) and
extracellular signal-regulated kinases 1 and 2 (ERK1/2), respectively.
Both GSK-3β and ERK1/2 have been shown to play important roles at synapses. GSK-
3β, which is abundantly expressed in neurons, is inhibited by phosphorylation at serine 9, which
is performed by many regulatory proteins, including PI3K-Akt, protein kinase A (PKA), and
protein kinase C, among others. This inhibition of GSK-3β occurs during the induction of LTD
(Hooper et al., 2007), and in dendrites during synaptogenesis and leads to dendritic growth
during development (Rui et al., 2013). Dysregulation of GSK3 is linked neurological conditions
such as Alzheimer's disease and other forms of neurodegeneration, and over-activation of GSK-
3β leads to neuronal apoptosis (Kaytor and Orr, 2002). ERK1/2 is activated by neurotrophins,
neuronal activity, BDNF, or cAMP and plays roles in the differentiation, survival, and adaptive
90
responses of neurons in vivo (Cavanaugh et al., 2001). BDNF activation causes an increase in
dendritic spine density which is mediated through the activation of ERK1/2 (Alonso et al., 2004).
The phosphorylation of gephyrin at S268 is therefore likely to increase upon neuronal
activity (through the activation of BDNF and ERK1/2), while phosphorylation of S270 is likely to
be inhibited by neuronal activity, as GSK-3β is inhibited by activity. Once gephyrin is
phosphorylated at either of these residues, it is more likely to be degraded by calpain, a
calcium-activated protein kinase (Tyagarajan et al., 2011). The degradation of gephyrin after
phosphorylation reduces amplitude and frequency of miniature GABAergic postsynaptic
currents (Tyagarajan et al., 2011).
Phosphorylation at the S268 and S270 sites has different effects on gephyrin clustering
in neuronal cell culture. Expression of gephyrin with S270 mutated to alanine (S270A), making it
phosphorylation incompetent at this site, increases the density of gephyrin clusters in cultured
neurons (Tyagarajan et al., 2011). When S270 is mutated to glutamic acid (S270E), which acts
as a phospho-mimic, there is a decrease in the density of gephyrin clusters.
Similar experiments with a S268A mutation results in a higher density of gephyrin
clusters that are larger in size than wild type gephyrin (Tyagarajan et al., 2013). While in the
presence of endogenous gephyrin the S268E mutation showed no significant effect on the
density or size of gephyrin clusters, when endogenous gephyrin was knocked down in
combination with expression of the mutants, the phenotypes of the S268A and S268E were
altered. Through experiments combining the S268 and S70 mutants, it was determined that the
two phosphorylation sites interact with each other and that the S268 location determines
gephyrin cluster size and the S270 location determines cluster density. Dephosphorylation at

91
S268 leads to larger size but lower density, whereas dephosphorylation at S270 leads to
smaller size and increased density in culture.
To determine if phosphorylation of gephyrin at the S268 and S270 sites regulates the
density and size of gephyrin clusters in vivo, and whether this plays a role in recurrent gephyrin
dynamics, I will mutate these sites from serines to alanines, rendering them phospho-
incompetent, and abolishing the degradation of gephyrin by calpain. We hypothesize that
S268A and S270A mutants would be more stable in vivo, thus preventing rapid inhibitory
synapse assembly and disassembly.
Results
Generation of gephyrin S268A and S270A expression plasmids
The gephyrin coding cDNA was PCR amplied from pFUdioTealGephyrinW (Chen et al.,
2012) and inserted into the pENTRY vector (ThermoFisher). The gephyrin cDNA was seperately
mutated to create S268A or S270A mutants by PCR mutagenesis using the GeneArt Site-
directed mutagenesis system (ThermoFisher), and sequenced to confirm correct mutagenesis.
The two mutated teal-gephyrin in the pENTRY vectors were cloned back into the
pFUdioTealGephyrinW vector using the Asc1 and Nhe1 restriction sites.
In vivo 2-photon imaging of L2/3 pyramidal cells expressing mutant gephyrin
E16.5 mice were in utero electroporated with three ‘double-floxed’ inverted open reading
frame (dio) plasmids, expressing either eYFP as a cell fill, PSD-95-mCherry as a postsynaptic
marker of excitatory synapses, or teal-gephyrin S268A or S270A as a mutant marker of
inhibitory synapses, with limiting amounts of a Cre plasmid.
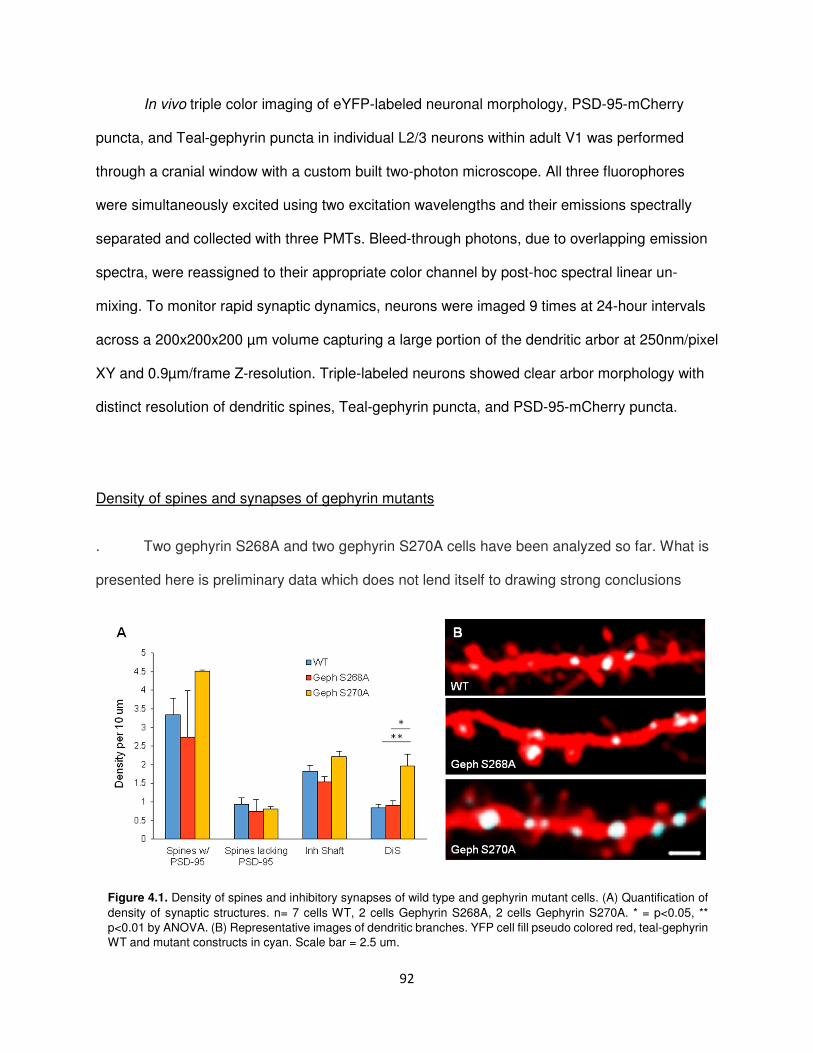
92
In vivo triple color imaging of eYFP-labeled neuronal morphology, PSD-95-mCherry
puncta, and Teal-gephyrin puncta in individual L2/3 neurons within adult V1 was performed
through a cranial window with a custom built two-photon microscope. All three fluorophores
were simultaneously excited using two excitation wavelengths and their emissions spectrally
separated and collected with three PMTs. Bleed-through photons, due to overlapping emission
spectra, were reassigned to their appropriate color channel by post-hoc spectral linear un-
mixing. To monitor rapid synaptic dynamics, neurons were imaged 9 times at 24-hour intervals
across a 200x200x200 µm volume capturing a large portion of the dendritic arbor at 250nm/pixel
XY and 0.9µm/frame Z-resolution. Triple-labeled neurons showed clear arbor morphology with
distinct resolution of dendritic spines, Teal-gephyrin puncta, and PSD-95-mCherry puncta.
Density of spines and synapses of gephyrin mutants
. Two gephyrin S268A and two gephyrin S270A cells have been analyzed so far. What is
presented here is preliminary data which does not lend itself to drawing strong conclusions
Figure 4.1. Density of spines and inhibitory synapses of wild type and gephyrin mutant cells. (A) Quantification of
density of synaptic structures. n= 7 cells WT, 2 cells Gephyrin S268A, 2 cells Gephyrin S270A. * = p<0.05, **
p<0.01 by ANOVA. (B) Representative images of dendritic branches. YFP cell fill pseudo colored red, teal-gephyrin
WT and mutant constructs in cyan. Scale bar = 2.5 um.
93
about the nature of these mutations in vivo. We have found that S270A mutants have a higher
density of dually innervated spines compared to wild type gephyrin cells (Fig. 4.1A). This
matches with the phenotype of gephyrin S270A mutants seen in vitro. Of the two gephyrin
S268A cells analyzed, one had a very low density of spines (most of which contained inhibitory
synapses) and the other had a spine density similar to wild type. It may be possible that
gephyrin S268A mutants will show a lower spine density than WT cells, but analysis on more
cells is needed. From in vitro data, we would expect the S268A mutant to exhibit a higher
density of inhibitory synapses than in cells only expressing wild type gephyrin. Gephyrin S270A
cells display a trend of having a higher density of spines, which may become significant when
more data is analyzed. The reason that we expected gephyrin S268A and S270A to have higher
densities of inhibitory synapses is because these mutations make it impossible for the mutant
gephyrin protein to be phosphorylated and then degraded by calpain, potentially reducing the
instances of rapid inhibitory synapse disassembly. The possible trend of S268A mutants to have
lower spine density, and S270A mutants to have a higher spine density is an unexpected result
and could be indicative of the relationship between gephyrin dynamics and spine plasticity,
though again, we need to analyze more cells before we can draw significant conclusions.
Dynamics of spines and synapses in gephyrin mutants
Based on the in vitro results and proposed mechanism of gephyrin phosphorylation and
degradation, we hypothesized that gephyrin S268A and S270A mutants would be more stable
than wild type gephyrin. However, this is not what we have observed thus far. There is a
statistically significant increase in the dynamics of inhibitory shaft synapses in gephyrin S270A
mutants, from 19 ± 2% in wildtype to 36 ± 3% in S270A (p<0.05 by ANOVA). The gephyrin
S268A mutant is trending to have lower dynamics of inhibitory synapses on dually innervated
spines, but this is not yet statistically significant with n=2 cells.

94
We further classified the dynamic inhibitory synapses as one time dynamic, transient, or
recurrent (Fig. 4.2). There was no statistically significant difference in the percent of dynamic
synapses that were in each of these three categories for inhibitory synapses that are located on
dually innervated spines, but again, there was a large variance between the two gephyrin
S268A mutant cells, which may show a difference when more data is added. We did, however,
find that the percentage of recurrent inhibitory shaft synapses increased from 23 ± 3% in wild
type to 58 ± 3% in S270A mutants. Again, this was unexpected because we expected more
stability of inhibitory synapses, both on the shaft and on spines, in the two gephyrin mutants.
This result seems to indicate that the phosphorylation of gephyrin does not affect stable
clusters, but does influence how quickly gephyrin monomers can form clusters. When gephyrin
is dephosphorylated at S270, it is able to reform clusters more quickly than wild type gephyrin.
Figure 4.2. Inhibitory shaft synapses are more dynamic in gephyrin S270A mutants. (A) There is an
increase in the % of inhibitory shaft synapses that are dynamic in the gephyrin S270A mutant (p<0.05
by ANOVA), but no differences in gephyrin S268A mutants. (B) No statistically significant differences
in the % of dynamic inhibitory synapses that are one time dynamic, transient, or recurrent in the
gephyrin mutants. (C) There is a statistically significant increase in the percentage of recurrent shaft
inhibitory synapses in the gephyrin S270A mutant (p<0.05 by ANOVA).

95
Discussion
We have found that by mutating the serine 270 residue to alanine, and making a
phospho-incompetent gephyrin, there is an increased density of gephyrin clusters on dually
innervated spines as well as an increase in recurrent dynamics of inhibitory synapses on the
dendritic shaft. We still need to acquire and analyze more data on the S268A mutants to reach
conclusions regarding the role of phosphorylation at this residue in vivo.
It is possible that the dephosphorylation of gephyrin at S270 has no effect on stable
gephyrin clusters but does influence how quickly gephyrin monomers are able to assemble into
clusters to form inhibitory synapses. A major caveat to these results is that the mutant gephyrin
constructs are expressed in cells that still express unlabeled endogenous wild type gephyrin
protein. This could be obscuring the phenotype of the gephyrin mutants and making the
changes in their dynamics less pronounced. One way to overcome the effect of endogenous
wild type gephyrin would be to co-electoporate our constructs with a construct containing an
shRNA against wild type gephyrin.
It also remains to be tested whether the increased density of gephyrin clusters seen in
vivo represent functional synapses. This would need to be tested by localized GABA uncaging
and electrophysiological recordings in slice culture.
96
Methods
Generation of Expression Plasmids
The Cre-dependent eYFP, Teal-gephyrin, and PSD-95-mCherry plasmids (pFUdioeYFPW,
pFUdioTealGephyrinW, pFUdioPSD-95-mCherryW) have been described previously in (Chen et
al., 2012), and the Cre plasmid in (Subramanian et al., 2013). To generate Cre-dependent
Teal-gephyrin plasmids with the S268A and S270A mutations within a dio cassette, the gephyrin
cassette of pFUdioTealGephyrinW was PCR amplified and ligated into a pEntry/d-Topo vector
(ThermoFisher Scientific). The primers for this reaction were (5’ –CACCGGCGCGCCGTACG-
3’) and (5’- AAAGCTAGCCCGCCACCATG-3’) to insert the Entry sequence and preserve the
Asc1 and Nhe1 restriction sites for later cloning. The p-EntryTealGephyrin vector was
mutagenized by PCR mutagenesis using the following primers: S268A sense (5’-
TCCCTTAGCACTACTCCTGCCGAGTCGCCCCGTGCCCAGGCTACA- 3’),
Antisense (5’- TGTAGCCTGGGCACGGGGCGACTCGGCAGGAGTAGTGCTAAGGGA -3’),
S270A sense (5’- TCCCTTAGCACTACTCCTTCAGAGGCCCCCCGTGCCCAGGCTACA -3’),
S270A antisense (5’- TGTAGCCTGGGCACGGGGGGCCTCTGAAGGAGTAGTGCTAAGGGA -
3’). After sequencing to confirm successful mutagenesis and no insertion of unwanted
mutations, the mutants were cloned back into the pFUdioTealGephyrinW plasmid using the
Asc1 and Nhe1 restriction sites.
In Utero Electroporation
All animal experiments were approved by the Massachusetts Institute of Technology Committee
on Animal Care and meet the National Institute of Health guidelines for the use and care of
vertebrate animals. In utero electroporation on E15.5 timed pregnant C57BL/6J mice was
performed to label L2/3 cortical pyramidal neurons, as previously described (Tabata and
97
Nakajima, 2001). Animals were co-electroporated with Cre-dependent constructs expressing
eYFP, PSD-95-mCherry, or Teal-gephyrin mutants S268A or S270A along with a plasmid
expressing Cre recombinase at a ratio of 10:10:5:1, respectively (total DNA concentration 2
µg/µL), with 0.1% Fast Green for visualization. A total of 0.75 µl of the plasmid solution was
injected into the right lateral ventricle with a 32 gauge Hamilton syringe (Hamilton Company,
Reno, NV, USA). Five pulses of 36V (duration 50 ms, frequency 1 Hz) targeting the visual
cortex were delivered from a square wave electroporator (ECM830; Harvard Apparatus,
Holliston, MA, USA) using 5 mm diameter platinum electrodes (Protech International, Boerne,
TX, USA).
Cranial Window Implantation
After in utero electroporation, pups were reared to adulthood (P42-57) and implanted with a 5
mm cranial window over the right hemisphere, as described (Lee et al., 2008).
Sulfamethoxazole (1 mg/ml) and trimethoprim (0.2 mg/ml) were chronically administered in the
drinking water to maintain optical clarity of implanted windows.
Two-photon imaging
Animals were allowed 1-2 weeks for recovery after cranial window surgery. When windows
cleared, labeled cells in binocular visual cortex were screened for the presence of all 3
fluorescent labels. Cells that exhibited high background labeling with synaptic labels or any
ectopic clumps of synaptic proteins were not used for experiments. This selection process
ensured that all imaged cells had similar levels of fluorescent labeling. Only one cell was
imaged per animal. For eight mice with wild type gephyrin, 2 mice with S268A, and 2 mice with
S270A, in vivo two-photon imaging was performed daily for 9 consecutive sessions using a
custom-built microscope with custom acquisition software to enable triple color imaging. For
each imaging session, mice were anesthesized with isofluorane (0.75%-1.25%) and secured in
98
a stereotaxic frame. Fluorophores were simultaneously excited with a commercial Mai Tai HP
Ti: Sapphire laser (Spectra-Physics, Santa Clara, CA, USA) at 915 nm to excite eYFP and Teal,
and a Chameleon Compact OPO (Coherent, Santa Clara, CA, USA) at 1085 nm to excite
mCherry. The outputs of the two excitation lasers were combined at a polarized beam splitter
with orthogonal polarization directions, and delivered to the two-photon microscope through the
same beam path. After scanning with a galvonometric XY-scanning mirrors (6215H, Cambridge
Technology) and a piezo actuator Z-positioning system (Piezosystem Jena, Jena, Germany),
the two laser beams were focused by a 20x/1.0 NA water immersion objective lens (W Plan-
Apochromat; Zeiss, Jena, Germany) to the same focal volume location in the specimen, within
one pixel size accuracy. These lasers produce ~100 fs unsynchronized pulses at a rate of 80
MHz. The power delivered by each laser to the specimen ranged from approximately 35-50 mW
depending on imaging depth. The emission signals from the three fluorophores were collected
by the same objective lens, passed through an IR blocking filter (E700SP; Chroma Technology,
Bellows Falls, VT, USA), and were separated according to their emission spectra by dichroic
mirrors at 520 nm and 560 nm. After passing through three independent bandpass filters
(485/70m, 550/100m, and 605/75m) the three emission signals were collected simultaneously
onto 3 separate PMTs. Imaging for synapse monitoring was performed at high resolution (250
nm/pixel XY-resolution, 0.9 µm/frame Z-resolution). Two-photon raw scanner data was
processed for spectral linear unmixing and converted into a RGB image z-stack using Matlab
and ImageJ (National Institutes of Health, Bethesda, MD, USA).
Spectral Linear Unmixing and Image Processing
Spectral linear unmixing for three colors was performed using a similar approach as previously
described for two color unmixing (Chen et al., 2012). Briefly, spectral linear unmixing is based
on the fact that the total photon count at each pixel in a given channel is the linear sum of the
spectral contribution of each fluorophore weighted by its abundance. For a triple channel

99
detection system, the contribution of three fluorophores can be represented by the following
equations.
J1(x,y)=s1.1 x I1 (x,y) + s1.2 x I2 (x,y) + s1.3 x I3 (x,y)
J2(x,y)=s2.1 x I1 (x,y) + s2.2 x I2 (x,y) + s2.3 x I3 (x,y)
J3(x,y)=s3.1 x I1 (x,y) + s3.2 x I2 (x,y) + s3.3 x I3 (x,y)
Where J is the total signal per channel, I is the fluorophore abundance, and S is the contribution
of that fluorophore. These equations can be expressed as a matrix:
[J]=[S][I],
whereby the unmixed image [I] can be calculated using the inverse matrix of S:
[I]=[S]-1 [J].
Assuming the detected signal in both channels represents the total spectral contribution for all
three fluorophores:
s1.1 + s2.1 + s3.1 = 1
s1.2 + s2.2 + s3.2 = 1
s1.3 + s2.3 + s3.3 = 1
[S] was determined experimentally from two-photon images of HEK cell cultures expressing
single fluorophores and excited by both lasers at the same wavelengths used in vivo. Average
laser power was adjusted to achieve photon count levels approximating in vivo signal intensity.
We have previously shown that S derived from cell culture and in vivo data is interchangeable
(Chen et al., 2012). The mean contribution for each fluorophore into each channel (s1.1 – 3.3) was
calculated using Matlab (Mathworks, Natick, MA, USA). These values were subsequently used
for spectral linear unmixing of triple channel two-photon raw scanner data into a RBG image z-

100
stack using Matlab and ImageJ (National Institutes of Health). For all figures, images are
filtered and interpolated for optimal visualization. 3D image stacks are converted into maximum
intensity z-projections where noted in figure legends.
Data Analysis
Dendritic spines, PSD-95 containing excitatory synapses, and inhibitory synapses were scored
manually with a custom-written 4D point tracking system implemented in Fiji (Schindelin et al.,
2012) using a modified version of the ObjectJ plugin
(https://sils.fnwi.uva.nl/bcb/objectj/index.html). To avoid individual scoring bias, each cell was
independently scored by two investigators. Dendritic spine analysis criteria was defined as
previously described (Chen et al., 2012; Holtmaat and Svoboda, 2009). Because of the bright
labeling on the soma and axon initial segment, individual contacts in these regions could not be
resolved and analysis was restricted to dendrites starting approximately 40 microns from the
soma to the most distal tips. Because z-projecting spines lacking PSD-95 could not be
visualized, for consistency, all z-projecting spines were excluded from analysis, even those
which contained PSD-95. Gephyrin puncta were scored as synapses if they were at least 3x3
pixels, or 8–9 clustered pixels (0.56 µm2) in size, with a minimal average signal intensity of at
least four times above shot noise background levels, and were present in 2 consecutive z
planes. PSD-95 puncta were scored as synapses if they were least 2x2 pixels, or 4-5 clustered
pixels (0.27 µm2) in size with a minimal average signal intensity of at least four times above shot
noise background levels and were present in 2 consecutive z planes. EM validation confirmed
that these criteria represent inhibitory and excitatory synapses, respectively, with no false
positives. In general, the PSD-95-mCherry fluorophore was more prone to bleaching than YFP
or Teal-gephyrin. Cells that lost PSD-95-mCherry were not analyzed further. One-time dynamic
changes were defined as any structure that changed one time and never changed again.
Changes were scored as transient if a structure was added and later removed in a subsequent

101
imaging session. Changes were scored as recurrent if structures appeared, then disappeared,
and then appeared again at the same site; or conversely, ever disappeared and then
reappeared more than once in the same location. At least 25 spines and synapses were
counted per branch and at least 200 structures were counted per animal. Dendritic arbors were
manually traced in Neurolucida (MicroBrightField, Inc., Williston, VT, USA) to quantify the length
of scored branches.

102
Chapter 5 – Conclusion
Inhibitory synapses dynamically regulate the integration of neuronal signals and the
firing of individual neurons, and a proper balance between excitation and inhibition is critical for
normal brain function. The precise timing of inhibitory up- and down- regulation during
development has been implicated in the opening and closure of critical periods (Fagiolini and
Hensch, 2000; Huang et al., 1999), and in adults, there is evidence that reduction in inhibitory
tone can open the door for increased plasticity (Chen et al., 2011; Harauzov et al., 2010). Thus
gaining deeper insight into the distribution and dynamics of inhibitory synapses, and how they
relate to excitatory synapses, is essential for understanding the function, not only of a given
neuron within its neural circuit, but also of plasticity mechanisms. Only recently has the
expression of fluorescent proteins fused to postsynaptic scaffolding molecules enabled direct
synaptic visualization in vivo. Fluorescent proteins fused either to PSD-95, as a post synaptic
marker of excitatory synapses, or gephyrin, as a post synaptic marker of inhibitory
synapses, together with a separate cell fill to outline their location on the arbor has allowed
a direct assessment of excitatory and inhibitory synaptic distribution patterns on cortical
pyramidal cells, and their dynamics at different cellular locales.
Clustered dynamics of inhibitory synapses and dendritic spines in the adult neocortex
Using dual-color two photon microscopy, we labeled inhibitory synapses and used a cell fill
to track spines on L2/3 pyramidal neurons. Although inhibitory synapses on spines had been
anecdotally observed before, through electron microcopy studies on short dendritic segments,
by labeling inhibitory synapses in vivo across the entire dendritic arbor, we observed that
inhibitory synapses on spines account for 1/3 of the total population of inhibitory synapses, a
much greater proportion than had previously been thought. Further, we found these synapses to

103
be non-uniformly distributed across the arbor, with the highest density at the apical tuft.
Inhibitory synapses on dendritic spines have been shown to specifically gate depolarization by
the excitatory synapse located on the same spine (Chiu et al., 2013), suggesting they play a
different inhibitory role than shaft synapses. While inhibitory synapses on spines specifically
inhibit the excitatory synapse on that same spine, inhibitory synapses on the shaft have a
broader effect on the integration of many excitatory synapses along that branch. By showing the
prevalence of inhibitory synapse population and their non-uniform distribution, we introduce a
new player with a previously unrecognized role to the modeling of synaptic integration along the
dendritic arbor.
The discovery that 29.7% of inhibitory synapses are located on spines was very surprising,
since data from electron microscopy studies show less frequent incidence of these synapses. In
a complete reconstruction of all synaptic connections from an approximately 20 µm length (1500
µm3 volume) area in L5, It was found that 81% of inhibitory synapses are located on the shaft,
and only 19% of inhibitory synapses are located on spines (Kasthuri et al., 2015). This
discrepancy could be due to the small number of inhibitory synapses counted in the EM dataset
(86 inhibitory synapses), or could potentially be because there are fewer inhibitory synapses on
spines in L5 as compared to L2/3. Indeed, we have seen that there is a greater density of
inhibitory synapses on spines in the more superficial region of L2/3 than the deeper region of
L2/3, suggesting that different layers of cortex have a different distribution of inhibitory synapses
on spines. Although it is unlikely that the exogenous Teal-gephyrin expression is inducing the
formation of additional inhibitory synapses, we cannot formally rule it out. Why do we believe
that our teal-gephyrin plasmid is not inducing an increase in the number of inhibitory synapses
due to increased concentration of gephyrin in the cell? The dio lentiviral plasmids are known to
be low expressing, and unlikely to cause overexpression. Expression of PSD-95-mCherry,
which had previously been shown to cause an increase in spine density, did not do so in our

104
experiments using the same expression plasmid as for the Teal-gephyrin. Other studies have
used tagged gephyrin in vivo and seen no evidence that its expression causes an increase in
the density of inhibitory synapses (Chen et al., 2015; van Versendaal et al., 2012). Most
importantly, studies using in vivo electrophysiology have reported that 51% of randomly imaged
spines on L/2 neurons showed significant inhibition of calcium signaling upon GABA uncaging
(Chiu et al., 2013), numbers that are closer to ours.
By imaging cells every four days, we found that inhibitory synapses on dendritic spines and
shafts display different kinetics of dynamics in vivo. Inhibitory synapses on dendritic spines are
much more dynamic than those located on the shaft during normal experience. Monocular
deprivation (MD), a model of experience-dependent plasticity, also causes differential changes
in inhibitory shaft and spine synapses. While both types of inhibitory synapses are lost after MD,
inhibitory synapses on the shaft are lost consistently over an 8-day period, while inhibitory
synapses on spines are lost primarily in the first 2 days after MD. This also implies that the
spine and shaft inhibitory synapses play different roles in the regulation of neuronal signaling
during experience-dependent plasticity. Z-projecting inhibitory synapses on spines would be
scored as shaft synapses, and this could be slightly increasing our rate of dynamics observed
for inhibitory shaft synapses.
An additional finding, enabled by our ability to visualize both spines and inhibitory synapses
was that inhibitory synapse dynamics and dendritic spine dynamics are preferentially clustered
within 10 µm on dendritic branches. It has been shown that calcium-dependent signaling
molecules can diffuse at approximately a 10 µm distance to influence the plasticity of
neighboring synapses (Govindarajan et al., 2011; Harvey and Svoboda, 2007). However, we did
not observe clustering between two dynamic excitatory synapses, or between two neighboring
inhibitory synapses, only between dynamic excitatory and inhibitory synapses. This opens
questions regarding the timescale of these clustered dynamics, as well as the order and valance
105
of the changes. Do inhibitory synapse changes precede those of excitatory synapses? If there is
a loss of an inhibitory synapse, is there a corresponding loss or gain of an excitatory synapse?
These are interesting questions that remain to be answered, but will require analysis of larger
data sets.
Inhibitory synapses are repeatedly assembled and removed from persistent sites
As a first step to investigating the temporal relationship between inhibitory synapse and
spine dynamics, we reduced our imaging interval from 4 days to 24 hours. To perform these
experiments we needed a way to also label excitatory synapses, since on short time scales one
cannot assume that newly formed spines represent excitatory synaptic presence. Dual color
studies with PSD-95-GFP labeling in addition to a cell fill in vivo shows that most stable spines
have large PSD-95 puncta, but a small population are devoid of a PSD95 label (Cane et al.,
2014). A recent EM study shows that only 5% of spines lack an excitatory synapse dendrites
(Kasthuri et al., 2015). Unlike the gephyrin, which is a faithful marker of inhibitory synapses of all
sizes, PSD-95 is only thought to be present at large, mature synapses. Smaller, immature
spines contain other scaffolding molecules, such as PSD93 or SAP 102 instead of PSD-95(Aoki
et al., 2001; Elias et al., 2008; Sans et al., 2000). The 20% of spines lacking PSD-95 that we
observe are highly dynamic and are therefore likely to contain small immature synapses that
lack PSD95. Adding a third color, PSD-95-mCherry, to our labeling allowed us to confirm that all
spines which have an inhibitory synapse also have an excitatory synapse, and were thus
termed dually innervated spines (DiS).
By imaging at 24 hour intervals, we surprisingly found that, while PSD-95 puncta are
mostly stable, inhibitory synapses rapidly appear and disappear from the same locations. Both
inhibitory shaft synapses and inhibitory synapses on DiS display this behavior, though inhibitory
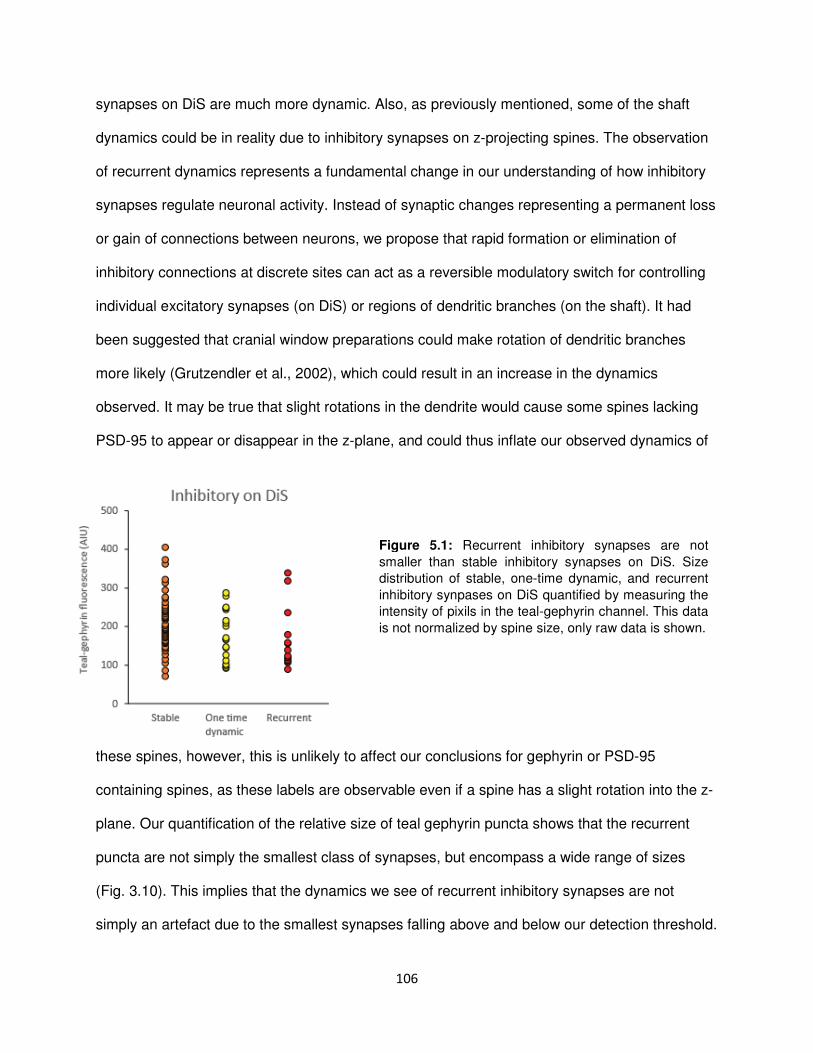
106
synapses on DiS are much more dynamic. Also, as previously mentioned, some of the shaft
dynamics could be in reality due to inhibitory synapses on z-projecting spines. The observation
of recurrent dynamics represents a fundamental change in our understanding of how inhibitory
synapses regulate neuronal activity. Instead of synaptic changes representing a permanent loss
or gain of connections between neurons, we propose that rapid formation or elimination of
inhibitory connections at discrete sites can act as a reversible modulatory switch for controlling
individual excitatory synapses (on DiS) or regions of dendritic branches (on the shaft). It had
been suggested that cranial window preparations could make rotation of dendritic branches
more likely (Grutzendler et al., 2002), which could result in an increase in the dynamics
observed. It may be true that slight rotations in the dendrite would cause some spines lacking
PSD-95 to appear or disappear in the z-plane, and could thus inflate our observed dynamics of
these spines, however, this is unlikely to affect our conclusions for gephyrin or PSD-95
containing spines, as these labels are observable even if a spine has a slight rotation into the z-
plane. Our quantification of the relative size of teal gephyrin puncta shows that the recurrent
puncta are not simply the smallest class of synapses, but encompass a wide range of sizes
(Fig. 3.10). This implies that the dynamics we see of recurrent inhibitory synapses are not
simply an artefact due to the smallest synapses falling above and below our detection threshold.
Figure 5.1: Recurrent inhibitory synapses are not
smaller than stable inhibitory synapses on DiS. Size
distribution of stable, one-time dynamic, and recurrent
inhibitory synpases on DiS quantified by measuring the
intensity of pixils in the teal-gephyrin channel. This data
is not normalized by spine size, only raw data is shown.
107
To further demonstrate this point, we quantified the size of teal-gephyrin puncta without
normalization to spine size (Figure 5.1), and again we see that the size of recurrent gephyrin
puncta is no smaller than that of stable gephyrin puncta. While it is true that when we fail to see
a gephyrin puncta with two photon imaging, it may be the case that a few gephyrin molecules
are still present but fall below our detection threshold, however the electrophysiology
experiments (Fig. 3.3) argue against this as there was a clear distinction in uIPSC amplitude
between spines containing and spines lacking gephyrin puncta.
We also found that DiS are the largest spines, and the most stable. The excitatory
synapses on these spines are also extremely stable. There is some evidence that DiS may be
innervated by excitatory afferents from the thalamus (Kubota et al., 2007), suggesting that the
inhibitory synapses on these spines exert specific control over stable feed-forward sensory
inputs. The presence or absence of the inhibitory synapses on DiS is strongly affected by
sensory experience. MD causes their destabilization, and a transition to a more dynamic state.
Functional implications of inhibitory synaptic placement across the dendritic arbor
The placement and activity of inhibitory synapses plays a critical role in the integration of
signals along dendrites. Individual pyramidal cells can receive thousands of excitatory synaptic
inputs that can be functionally diverse. Yet, the action potential output of most pyramidal
neurons is sparse and narrowly tuned. This restriction of action potential firing to a defined
sensory range within a limited temporal window is brought about by the integration of excitatory
synaptic events combined with the local influence of inhibition (reviewed in (Chadderton et al.,
2014). Inhibition has a major influence on the effective output of neurons at multiple levels.
Individual inhibitory synapses on spines can veto individual spine conductances (Chiu et al.,
2013). Inhibitory shaft synapses can influence excitatory integration within local dendritic
segments (Kim et al., 1995; Perez-Garci et al., 2006; Willadt et al., 2013). On a more cellular
108
scale, PV cell innervation of the soma (Pouille and Scanziani, 2001), or chandelier cell
innervation of the axon initial segment (Woodruff et al., 2011) can cancel axonal output. In the
latter cases, the high density of inhibitory synapses on the cell body and axon initial segment (Di
Cristo et al., 2004; Miles et al., 1996; Woodruff et al., 2010) suggests that synchronous firing of
many synapses would be needed for effective inhibition in these locales, and the firing of a
single inhibitory synapse would have a negligible effect on outcome. This is in contrast to
dendritically targeted inhibition, where individual synapse changes could have a dramatic effect
on the computation of dendritic integration for specific branches.
How are excitatory and inhibitory inputs integrated functionally at the level of individual
dendritic branches and how does that influence overall neuronal firing? Clearly, local integration
of excitatory and inhibitory synaptic activity is influenced by individual synaptic strength, timing,
and location on the dendrite. Theoretical modeling predicts that activation of multiple distributed
inhibitory synapses across the dendritic arbor can result in a global inhibition (Gidon and Segev,
2012). However, experiments suggest that the influence of individual inhibitory synapses is
locally restricted to the branch they target (Stokes et al., 2014), perhaps even to individual
spines (Chiu et al., 2013). Thus, functional pairing or clustering of relevant excitatory synapses
on particular dendritic segments with their inhibitory neighbors is highly relevant to dendritic
integration. Moreover the local constellation of such pairing or clustering is likely to have a
different influence depending on their more global location along the arbor.
Dendritically targeted inhibition can limit initiation of dendritic Ca2+ spikes in both
hippocampal and cortical pyramidal neurons (Buhl et al., 1994; Karube et al., 2004; Kim et al.,
1995; Larkum et al., 1999; Perez-Garci et al., 2006; Willadt et al., 2013), so that they are
initiated only in response to inputs encoding particular functional features. Recent experiments
in slice culture have shown that single inhibitory synapses can completely inhibit a back-
propagating action potential (Mullner et al., 2015). Mathematical models focusing on spike
109
activity within dendrites have shown that “off path” inhibitory synapses, where the inhibitory
synapse is located distally to the excitatory synapse, are more effective at preventing the
initiation of dendritic spikes (Gidon and Segev, 2012). Thus, the influence of inhibition on spike
initiation can actually be more powerful when inhibitory synapses are located on distal dendrites
rather than proximal dendrites and in a constellation where the inhibitory synapse is distal to its
functionally paired excitatory synapse (Gidon and Segev, 2012; Li et al., 2014). Conversely, in
cases where a dendritic spike has already been successfully initiated, an ‘on path’ inhibitory
synapse, located between the excitatory synapse and the soma, is the most effective way to
dampen the signal (Gidon and Segev, 2012; Hao et al., 2009; Zhang et al., 2013).
Our in vivo work demonstrated that dynamic inhibitory synapses are likely to be located
within 10 µm of dynamic spines, and this clustering of dynamic events increases upon sensory
deprivation (Chen et al., 2012). It has been suggested that a loss of inhibition creates a
permissive environment for excitatory synaptic changes (Chen et al., 2011; Harauzov et al.,
2010; Maya Vetencourt et al., 2008) because it broadens the window of spike timing dependent
plasticity (Bi and Poo, 2001; Higley and Contreras, 2006; Song et al., 2000; Spruston, 2008).
The loss of an inhibitory synapse could create a permissive environment for neighboring
excitatory synaptic gain or loss, while the addition of an inhibitory synapse could suppress
plasticity in neighboring dendritic regions. Inhibitory inputs could also limit the ability to promote
excitatory synaptic clustering through plasticity mechanisms. Thus, the specific placement of
inhibitory synapses can regulate which excitatory synapses are able to undergo plasticity.
Further, a recent modeling study suggests that the placement of inhibitory synapses can result
in LTP, LTD, or a lack of plasticity in specific neighboring dendritic segments (Bar-Ilan et al.,
2012), highlighting the importance on the placement of inhibitory synapses on the valance of
plasticity at neighboring excitatory synapses.
110
Molecular mechanism of rapid gephyrin dynamics
Based on our observation that inhibitory synapses can rapidly disappear and reappear
from the same location in vivo, we wanted to explore the molecular mechanism that is the basis
for these rapid dynamics. We hypothesize that the rapid recurrence of inhibitory synapses is
due to the fact that the inhibitory axon that remains abutting the postsynaptic compartment
could serve as a placeholder for the return of the inhibitory synapse in that same location. Thus,
the decision to form or destroy a synapse may depend on the activity within the postsynaptic
cell. This suggests that there may be activity-dependent signaling mechanisms occurring within
the postsynaptic cell which regulate the stability of gephyrin.
One possibility for the regulation of gephyrin stability is the signaling pathways that result
in the phosphorylation of gephyrin at the serine 268 and 270 residues, which results in the
degradation of gephyrin by calpain, a calcium-activate protease (Fig. 5.1). Phosphorylation of
S268 is performed by ERK1/2, which is known to be activated by increased neuronal activity
and activated BDNF. Phosphorylation at S270 is performed by GSK-3β, which may be inhibited
by activity, because it is inhibited during LTD stimulation protocols. Thus the two serine residues
seem to be phosphorylated under different conditions of neuronal activity, and mutants display
different clustering phenotypes in cell culture experiments.
In order to explore the molecular alterations and pathways that could lead to the rapid
disassembly and reassembly of gephyrin in vivo, we created gephyrin S268A and S270A
phospho-abolishing mutations. Preliminary results indicate that the S270A mutation increases
the density of inhibitory synapses on DiS and increases the rapid dynamics of inhibitory
synapses on the dendritic shaft. This seems to indicate that the dephosphorylation of gephyrin
S270 does not affect established gephyrin clusters, because they do not show increased
stability as expected. However, the dephosphorylation of S270 may slow the degradation of
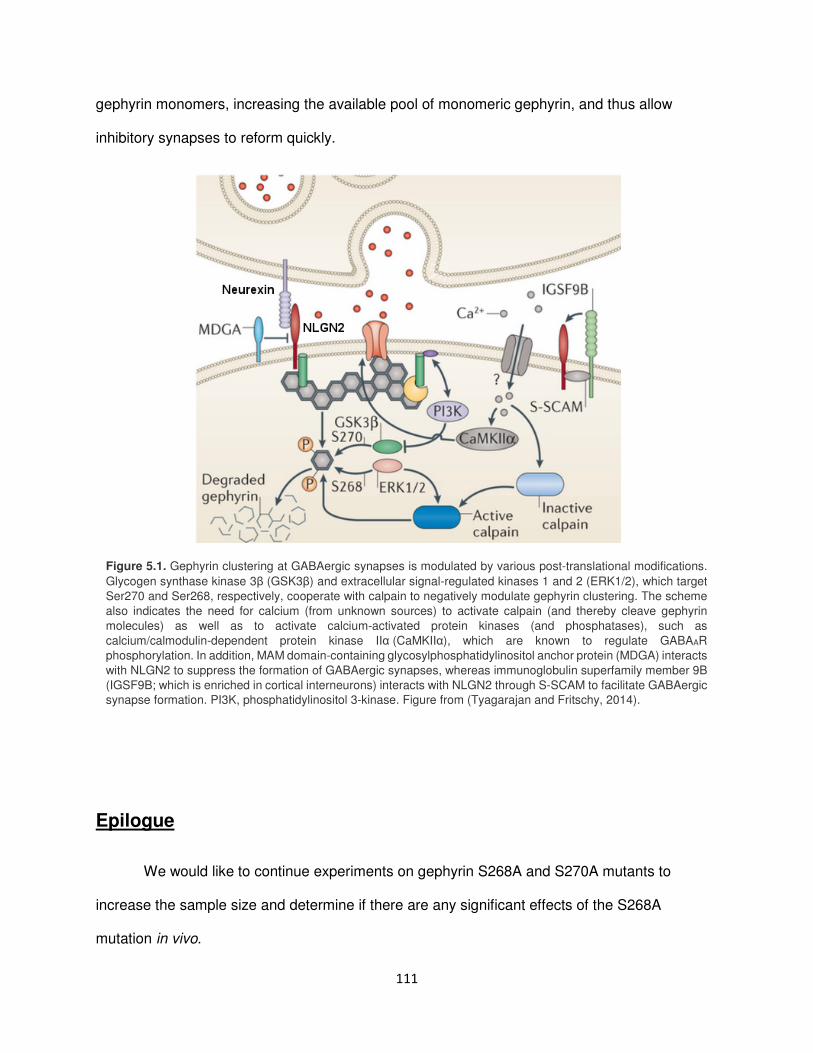
111
gephyrin monomers, increasing the available pool of monomeric gephyrin, and thus allow
inhibitory synapses to reform quickly.
Epilogue
We would like to continue experiments on gephyrin S268A and S270A mutants to
increase the sample size and determine if there are any significant effects of the S268A
mutation in vivo.
Figure 5.1. Gephyrin clustering at GABAergic synapses is modulated by various post-translational modifications.
Glycogen synthase kinase 3β (GSK3β) and extracellular signal-regulated kinases 1 and 2 (ERK1/2), which target
Ser270 and Ser268, respectively, cooperate with calpain to negatively modulate gephyrin clustering. The scheme
also indicates the need for calcium (from unknown sources) to activate calpain (and thereby cleave gephyrin
molecules) as well as to activate calcium-activated protein kinases (and phosphatases), such as
calcium/calmodulin-dependent protein kinase IIα (CaMKIIα), which are known to regulate GABAAR
phosphorylation. In addition, MAM domain-containing glycosylphosphatidylinositol anchor protein (MDGA) interacts
with NLGN2 to suppress the formation of GABAergic synapses, whereas immunoglobulin superfamily member 9B
(IGSF9B; which is enriched in cortical interneurons) interacts with NLGN2 through S-SCAM to facilitate GABAergic
synapse formation. PI3K, phosphatidylinositol 3-kinase. Figure from (Tyagarajan and Fritschy, 2014).
112
We also want to test the effect of neuronal activity on gephyrin dynamics. Since gephyrin
is degraded by calpain, a calcium-activated enzyme, it is likely that neuronal activity can alter
the activity of calpain, and thus the stability or rate of formation of gephyrin clusters. We would
like to see what affect altering neuronal activity would have on wild type gephyrin, and if this
effect is altered by the expression of gephyrin mutants. It is possible to activate or silence
individual postsynaptic neurons by expressing DREADD constructs or using optogenetics, and
then exploring how alterations in activity affect the dynamics of wild type gephyrin. It would be
interesting to see if activating the postsynaptic neuron has the immediate effect of increasing
the number of inhibitory synapses, as would be expected with the homeostatic hypothesis, or if
it causes the activation of calpain, which would result in the degradation of gephyrin.
Interestingly, a recent study in hippocampal slice cultures explored the activity-dependent
modulation of gephyrin dynamics (Flores et al., 2015). Carbachol treatment, a learning-related
protocol which induces structural plasticity, caused an increase in the density and size of
gephyrin clusters, and a theta-burst stimulation produced the same effect, which was prevented
by the blockade of NMDA receptors. Treatment with the GABA-A receptor blocker gabazine,
also induced and increase in the size and density of gephyrin clusters, and 24 hour optogenetic
stimulation had the same effect. These results suggest that gephyrin synaptic dynamics are
homeostatically regulated, and it would be interesting to explore these ideas further in vivo.
113
References
Alonso, M., Medina, J.H., and Pozzo-Miller, L. (2004). ERK1/2 activation is necessary for BDNF to increase dendritic spine density in hippocampal CA1 pyramidal neurons. Learn Mem 11, 172-178. Aoki, C., Miko, I., Oviedo, H., Mikeladze-Dvali, T., Alexandre, L., Sweeney, N., and Bredt, D.S. (2001). Electron microscopic immunocytochemical detection of PSD-95, PSD-93, SAP-102, and SAP-97 at postsynaptic, presynaptic, and nonsynaptic sites of adult and neonatal rat visual cortex. Synapse 40, 239-257. Arellano, J.I., Espinosa, A., Fairen, A., Yuste, R., and DeFelipe, J. (2007). Non-synaptic dendritic spines in neocortex. Neuroscience 145, 464-469. Atasoy, D., Aponte, Y., Su, H.H., and Sternson, S.M. (2008). A FLEX switch targets Channelrhodopsin-2 to multiple cell types for imaging and long-range circuit mapping. J Neurosci 28, 7025-7030. Azouz, R., Gray, C.M., Nowak, L.G., and McCormick, D.A. (1997). Physiological properties of inhibitory interneurons in cat striate cortex. Cereb Cortex 7, 534-545. Bar-Ilan, L., Gidon, A., and Segev, I. (2012). The role of dendritic inhibition in shaping the plasticity of excitatory synapses. Frontiers in neural circuits 6, 118. Baude, A., Nusser, Z., Roberts, J.D., Mulvihill, E., McIlhinney, R.A., and Somogyi, P. (1993). The metabotropic glutamate receptor (mGluR1 alpha) is concentrated at perisynaptic membrane of neuronal subpopulations as detected by immunogold reaction. Neuron 11, 771-787. Bi, G., and Poo, M. (2001). Synaptic modification by correlated activity: Hebb's postulate revisited. Annu Rev Neurosci 24, 139-166. Bloodgood, B.L., Sharma, N., Browne, H.A., Trepman, A.Z., and Greenberg, M.E. (2013). The activity-dependent transcription factor NPAS4 regulates domain-specific inhibition. Nature 503, 121-125. Brown, K.N., Chen, S., Han, Z., Lu, C.H., Tan, X., Zhang, X.J., Ding, L., Lopez-Cruz, A., Saur, D., Anderson, S.A., et al. (2011). Clonal production and organization of inhibitory interneurons in the neocortex. Science 334, 480-486. Buhl, E.H., Halasy, K., and Somogyi, P. (1994). Diverse sources of hippocampal unitary inhibitory postsynaptic potentials and the number of synaptic release sites. Nature 368, 823-828. Cane, M., Maco, B., Knott, G., and Holtmaat, A. (2014). The relationship between PSD-95 clustering and spine stability in vivo. J Neurosci 34, 2075-2086.
114
Cavanaugh, J.E., Ham, J., Hetman, M., Poser, S., Yan, C., and Xia, Z. (2001). Differential regulation of mitogen-activated protein kinases ERK1/2 and ERK5 by neurotrophins, neuronal activity, and cAMP in neurons. J Neurosci 21, 434-443. Chadderton, P., Schaefer, A.T., Williams, S.R., and Margrie, T.W. (2014). Sensory-evoked synaptic integration in cerebellar and cerebral cortical neurons. Nat Rev Neurosci 15, 71-83. Chen, J.L., Lin, W.C., Cha, J.W., So, P.T., Kubota, Y., and Nedivi, E. (2011). Structural basis for the role of inhibition in facilitating adult brain plasticity. Nat Neurosci 14, 587-594. Chen, J.L., and Nedivi, E. (2010). Neuronal structural remodeling: is it all about access? Curr Opin Neurobiol 20, 557-562. Chen, J.L., Villa, K.L., Cha, J.W., So, P.T., Kubota, Y., and Nedivi, E. (2012). Clustered dynamics of inhibitory synapses and dendritic spines in the adult neocortex. Neuron 74, 361-373. Chiu, C.Q., Lur, G., Morse, T.M., Carnevale, N.T., Ellis-Davies, G.C., and Higley, M.J. (2013). Compartmentalization of GABAergic inhibition by dendritic spines. Science 340, 759-762. Chklovskii, D.B., Mel, B.W., and Svoboda, K. (2004). Cortical rewiring and information storage. Nature 431, 782-788. Craig, A.M., Banker, G., Chang, W., McGrath, M.E., and Serpinskaya, A.S. (1996). Clustering of gephyrin at GABAergic but not glutamatergic synapses in cultured rat hippocampal neurons. J Neurosci 16, 3166-3177. Dani, V.S., Chang, Q., Maffei, A., Turrigiano, G.G., Jaenisch, R., and Nelson, S.B. (2005). Reduced cortical activity due to a shift in the balance between excitation and inhibition in a mouse model of Rett syndrome. Proc Natl Acad Sci U S A 102, 12560-12565. Davis, T.L., and Sterling, P. (1979). Microcircuitry of cat visual cortex: classification of neurons in layer IV of area 17, and identification of the patterns of lateral geniculate input. J Comp Neurol 188, 599-627. De Roo, M., Klauser, P., Mendez, P., Poglia, L., and Muller, D. (2008). Activity-dependent PSD formation and stabilization of newly formed spines in hippocampal slice cultures. Cereb Cortex 18, 151-161. DeFelipe, J., Alonso-Nanclares, L., and Arellano, J.I. (2002). Microstructure of the neocortex: comparative aspects. J Neurocytol 31, 299-316. Dhande, O.S., Hua, E.W., Guh, E., Yeh, J., Bhatt, S., Zhang, Y., Ruthazer, E.S., Feller, M.B., and Crair, M.C. (2011). Development of single retinofugal axon arbors in normal and beta2 knock-out mice. J Neurosci 31, 3384-3399. Di Cristo, G., Wu, C., Chattopadhyaya, B., Ango, F., Knott, G., Welker, E., Svoboda, K., and Huang, Z.J. (2004). Subcellular domain-restricted GABAergic innervation in primary visual cortex in the absence of sensory and thalamic inputs. Nat Neurosci 7, 1184-1186. Ehrlich, I., Klein, M., Rumpel, S., and Malinow, R. (2007). PSD-95 is required for activity-driven synapse stabilization. Proc Natl Acad Sci U S A 104, 4176-4181.
115
Elias, G.M., Elias, L.A., Apostolides, P.F., Kriegstein, A.R., and Nicoll, R.A. (2008). Differential trafficking of AMPA and NMDA receptors by SAP102 and PSD-95 underlies synapse development. Proc Natl Acad Sci U S A 105, 20953-20958. Elston, G.N., and Rosa, M.G. (1997). The occipitoparietal pathway of the macaque monkey: comparison of pyramidal cell morphology in layer III of functionally related cortical visual areas. Cereb Cortex 7, 432-452. Essrich, C., Lorez, M., Benson, J.A., Fritschy, J.M., and Luscher, B. (1998). Postsynaptic clustering of major GABAA receptor subtypes requires the gamma 2 subunit and gephyrin. Nat Neurosci 1, 563-571. Fagiolini, M., and Hensch, T.K. (2000). Inhibitory threshold for critical-period activation in primary visual cortex. Nature 404, 183-186. Feldman, M.L., and Peters, A. (1978). The forms of non-pyramidal neurons in the visual cortex of the rat. J Comp Neurol 179, 761-793. Fiala, J.C. (2005). Reconstruct: a free editor for serial section microscopy. J Microsc 218, 52-61. Flores, C.E., Nikonenko, I., Mendez, P., Fritschy, J.M., Tyagarajan, S.K., and Muller, D. (2015). Activity-dependent inhibitory synapse remodeling through gephyrin phosphorylation. Proc Natl Acad Sci U S A 112, E65-72. Frenkel, M.Y., Sawtell, N.B., Diogo, A.C., Yoon, B., Neve, R.L., and Bear, M.F. (2006). Instructive effect of visual experience in mouse visual cortex. Neuron 51, 339-349. Fuhrmann, J.C., Kins, S., Rostaing, P., El Far, O., Kirsch, J., Sheng, M., Triller, A., Betz, H., and Kneussel, M. (2002). Gephyrin interacts with Dynein light chains 1 and 2, components of motor protein complexes. J Neurosci 22, 5393-5402. Gabbott, P.L., and Somogyi, P. (1986). Quantitative distribution of GABA-immunoreactive neurons in the visual cortex (area 17) of the cat. Exp Brain Res 61, 323-331. Gidon, A., and Segev, I. (2012). Principles governing the operation of synaptic inhibition in dendrites. Neuron 75, 330-341. Golding, N.L., Staff, N.P., and Spruston, N. (2002). Dendritic spikes as a mechanism for cooperative long-term potentiation. Nature 418, 326-331. Govindarajan, A., Israely, I., Huang, S.Y., and Tonegawa, S. (2011). The dendritic branch is the preferred integrative unit for protein synthesis-dependent LTP. Neuron 69, 132-146. Govindarajan, A., Kelleher, R.J., and Tonegawa, S. (2006). A clustered plasticity model of long-term memory engrams. Nat Rev Neurosci 7, 575-583. Gradinaru, V., Zhang, F., Ramakrishnan, C., Mattis, J., Prakash, R., Diester, I., Goshen, I., Thompson, K.R., and Deisseroth, K. (2010). Molecular and cellular approaches for diversifying and extending optogenetics. Cell 141, 154-165.

116
Grosskreutz, Y., Betz, H., and Kneussel, M. (2003). Rescue of molybdenum cofactor biosynthesis in gephyrin-deficient mice by a Cnx1 transgene. Biochem Biophys Res Commun 301, 450-455. Grutzendler, J., Kasthuri, N., and Gan, W.B. (2002). Long-term dendritic spine stability in the adult cortex. Nature 420, 812-816. Gulyas, A.I., Megias, M., Emri, Z., and Freund, T.F. (1999). Total number and ratio of excitatory and inhibitory synapses converging onto single interneurons of different types in the CA1 area of the rat hippocampus. J Neurosci 19, 10082-10097. Gulyas, A.I., Miettinen, R., Jacobowitz, D.M., and Freund, T.F. (1992). Calretinin is present in non-pyramidal cells of the rat hippocampus--I. A new type of neuron specifically associated with the mossy fibre system. Neuroscience 48, 1-27. Hao, J., Wang, X.D., Dan, Y., Poo, M.M., and Zhang, X.H. (2009). An arithmetic rule for spatial summation of excitatory and inhibitory inputs in pyramidal neurons. Proc Natl Acad Sci U S A 106, 21906-21911. Harauzov, A., Spolidoro, M., DiCristo, G., De Pasquale, R., Cancedda, L., Pizzorusso, T., Viegi, A., Berardi, N., and Maffei, L. (2010). Reducing intracortical inhibition in the adult visual cortex promotes ocular dominance plasticity. J Neurosci 30, 361-371. Harris, K.M., Jensen, F.E., and Tsao, B. (1992). Three-dimensional structure of dendritic spines and synapses in rat hippocampus (CA1) at postnatal day 15 and adult ages: implications for the maturation of synaptic physiology and long-term potentiation. J Neurosci 12, 2685-2705. Harvey, C.D., and Svoboda, K. (2007). Locally dynamic synaptic learning rules in pyramidal neuron dendrites. Nature 450, 1195-1200. He, H.Y., Hodos, W., and Quinlan, E.M. (2006). Visual deprivation reactivates rapid ocular dominance plasticity in adult visual cortex. J Neurosci 26, 2951-2955. Hendry, S.H., and Jones, E.G. (1988). Activity-dependent regulation of GABA expression in the visual cortex of adult monkeys. Neuron 1, 701-712. Hersch, S.M., and White, E.L. (1981). Quantification of synapses formed with apical dendrites of Golgi-impregnated pyramidal cells: variability in thalamocortical inputs, but consistency in the ratios of asymmetrical to symmetrical synapses. Neuroscience 6, 1043-1051. Higley, M.J., and Contreras, D. (2006). Balanced excitation and inhibition determine spike timing during frequency adaptation. J Neurosci 26, 448-457. Hofer, S.B., Mrsic-Flogel, T.D., Bonhoeffer, T., and Hubener, M. (2009). Experience leaves a lasting structural trace in cortical circuits. Nature 457, 313-317. Holtmaat, A., Bonhoeffer, T., Chow, D.K., Chuckowree, J., De Paola, V., Hofer, S.B., Hubener, M., Keck, T., Knott, G., Lee, W.C., et al. (2009). Long-term, high-resolution imaging in the mouse neocortex through a chronic cranial window. Nat Protoc 4, 1128-1144.
117
Holtmaat, A., and Svoboda, K. (2009). Experience-dependent structural synaptic plasticity in the mammalian brain. Nat Rev Neurosci 10, 647-658. Holtmaat, A., Wilbrecht, L., Knott, G.W., Welker, E., and Svoboda, K. (2006). Experience-dependent and cell-type-specific spine growth in the neocortex. Nature 441, 979-983. Holtmaat, A.J., Trachtenberg, J.T., Wilbrecht, L., Shepherd, G.M., Zhang, X., Knott, G.W., and Svoboda, K. (2005). Transient and persistent dendritic spines in the neocortex in vivo. Neuron 45, 279-291. Hooper, C., Markevich, V., Plattner, F., Killick, R., Schofield, E., Engel, T., Hernandez, F., Anderton, B., Rosenblum, K., Bliss, T., et al. (2007). Glycogen synthase kinase-3 inhibition is integral to long-term potentiation. Eur J Neurosci 25, 81-86. Huang, Z.J., Kirkwood, A., Pizzorusso, T., Porciatti, V., Morales, B., Bear, M.F., Maffei, L., and Tonegawa, S. (1999). BDNF regulates the maturation of inhibition and the critical period of plasticity in mouse visual cortex. Cell 98, 739-755. Isshiki, M., Tanaka, S., Kuriu, T., Tabuchi, K., Takumi, T., and Okabe, S. (2014). Enhanced synapse remodelling as a common phenotype in mouse models of autism. Nat Commun 5, 4742. Kalatsky, V.A., and Stryker, M.P. (2003). New paradigm for optical imaging: temporally encoded maps of intrinsic signal. Neuron 38, 529-545. Karube, F., Kubota, Y., and Kawaguchi, Y. (2004). Axon branching and synaptic bouton phenotypes in GABAergic nonpyramidal cell subtypes. J Neurosci 24, 2853-2865. Kasthuri, N., Hayworth, K.J., Berger, D.R., Schalek, R.L., Conchello, J.A., Knowles-Barley, S., Lee, D., Vazquez-Reina, A., Kaynig, V., Jones, T.R., et al. (2015). Saturated Reconstruction of a Volume of Neocortex. Cell 162, 648-661. Kawaguchi, Y., Karube, F., and Kubota, Y. (2006). Dendritic branch typing and spine expression patterns in cortical nonpyramidal cells. Cereb Cortex 16, 696-711. Kawaguchi, Y., and Kubota, Y. (1998). Neurochemical features and synaptic connections of large physiologically-identified GABAergic cells in the rat frontal cortex. Neuroscience 85, 677-701. Kaytor, M.D., and Orr, H.T. (2002). The GSK3 beta signaling cascade and neurodegenerative disease. Curr Opin Neurobiol 12, 275-278. Keck, T., Scheuss, V., Jacobsen, R.I., Wierenga, C.J., Eysel, U.T., Bonhoeffer, T., and Hubener, M. (2011). Loss of sensory input causes rapid structural changes of inhibitory neurons in adult mouse visual cortex. Neuron 71, 869-882. Kelsch, W., Lin, C.W., and Lois, C. (2008). Sequential development of synapses in dendritic domains during adult neurogenesis. Proc Natl Acad Sci U S A 105, 16803-16808.

118
Kilman, V., van Rossum, M.C., and Turrigiano, G.G. (2002). Activity deprivation reduces miniature IPSC amplitude by decreasing the number of postsynaptic GABA(A) receptors clustered at neocortical synapses. J Neurosci 22, 1328-1337. Kim, H.G., Beierlein, M., and Connors, B.W. (1995). Inhibitory control of excitable dendrites in neocortex. J Neurophysiol 74, 1810-1814. Kleschevnikov, A.M., Belichenko, P.V., Villar, A.J., Epstein, C.J., Malenka, R.C., and Mobley, W.C. (2004). Hippocampal long-term potentiation suppressed by increased inhibition in the Ts65Dn mouse, a genetic model of Down syndrome. J Neurosci 24, 8153-8160. Kneussel, M., Brandstatter, J.H., Laube, B., Stahl, S., Muller, U., and Betz, H. (1999). Loss of postsynaptic GABA(A) receptor clustering in gephyrin-deficient mice. J Neurosci 19, 9289-9297. Knott, G.W., Quairiaux, C., Genoud, C., and Welker, E. (2002). Formation of dendritic spines with GABAergic synapses induced by whisker stimulation in adult mice. Neuron 34, 265-273. Kubota, Y. (2014). Untangling GABAergic wiring in the cortical microcircuit. Curr Opin Neurobiol 26, 7-14. Kubota, Y. (2015). New developments in electron microscopy for serial image acquisition of neuronal profiles. Microscopy (Oxf) 64, 27-36. Kubota, Y., Hatada, S., Kondo, S., Karube, F., and Kawaguchi, Y. (2007). Neocortical inhibitory terminals innervate dendritic spines targeted by thalamocortical afferents. J Neurosci 27, 1139-1150. Kubota, Y., Hatada, S.N., and Kawaguchi, Y. (2009). Important factors for the three-dimensional reconstruction of neuronal structures from serial ultrathin sections. Frontiers in neural circuits 3, 4. Kubota, Y., Karube, F., Nomura, M., Gulledge, A.T., Mochizuki, A., Schertel, A., and Kawaguchi, Y. (2011a). Conserved properties of dendritic trees in four cortical interneuron subtypes. Sci Rep 1, 89. Kubota, Y., Shigematsu, N., Karube, F., Sekigawa, A., Kato, S., Yamaguchi, N., Hirai, Y., Morishima, M., and Kawaguchi, Y. (2011b). Selective coexpression of multiple chemical markers defines discrete populations of neocortical GABAergic neurons. Cereb Cortex 21, 1803-1817. Kwon, H.B., Kozorovitskiy, Y., Oh, W.J., Peixoto, R.T., Akhtar, N., Saulnier, J.L., Gu, C., and Sabatini, B.L. (2012). Neuroligin-1-dependent competition regulates cortical synaptogenesis and synapse number. Nat Neurosci 15, 1667-1674. Larkman, A.U. (1991). Dendritic morphology of pyramidal neurones of the visual cortex of the rat: III. Spine distributions. J Comp Neurol 306, 332-343. Larkum, M.E., and Nevian, T. (2008). Synaptic clustering by dendritic signalling mechanisms. Curr Opin Neurobiol 18, 321-331.
119
Larkum, M.E., Zhu, J.J., and Sakmann, B. (1999). A new cellular mechanism for coupling inputs arriving at different cortical layers. Nature 398, 338-341. Lee, W.C., Chen, J.L., Huang, H., Leslie, J.H., Amitai, Y., So, P.T., and Nedivi, E. (2008). A dynamic zone defines interneuron remodeling in the adult neocortex. Proc Natl Acad Sci U S A 105, 19968-19973. Lee, W.C., Huang, H., Feng, G., Sanes, J.R., Brown, E.N., So, P.T., and Nedivi, E. (2006). Dynamic remodeling of dendritic arbors in GABAergic interneurons of adult visual cortex. PLoS Biol 4, e29. LeVay, S. (1973). Synaptic patterns in the visual cortex of the cat and monkey. Electron microscopy of Golgi preparations. J Comp Neurol 150, 53-85. Lewis, D.A., Hashimoto, T., and Volk, D.W. (2005). Cortical inhibitory neurons and schizophrenia. Nat Rev Neurosci 6, 312-324. Li, S., Liu, N., Zhang, X.H., Zhou, D., and Cai, D. (2014). Bilinearity in spatiotemporal integration of synaptic inputs. PLoS Comput Biol 10, e1004014. Lois, C., Hong, E.J., Pease, S., Brown, E.J., and Baltimore, D. (2002). Germline transmission and tissue-specific expression of transgenes delivered by lentiviral vectors. Science 295, 868-872. Lu, Y.M., Mansuy, I.M., Kandel, E.R., and Roder, J. (2000). Calcineurin-mediated LTD of GABAergic inhibition underlies the increased excitability of CA1 neurons associated with LTP. Neuron 26, 197-205. Marsden, K.C., Shemesh, A., Bayer, K.U., and Carroll, R.C. (2010). Selective translocation of Ca2+/calmodulin protein kinase IIalpha (CaMKIIalpha) to inhibitory synapses. Proc Natl Acad Sci U S A 107, 20559-20564. Marty, S., Berzaghi Mda, P., and Berninger, B. (1997). Neurotrophins and activity-dependent plasticity of cortical interneurons. Trends Neurosci 20, 198-202. Maya Vetencourt, J.F., Sale, A., Viegi, A., Baroncelli, L., De Pasquale, R., O'Leary, O.F., Castren, E., and Maffei, L. (2008). The antidepressant fluoxetine restores plasticity in the adult visual cortex. Science 320, 385-388. Megias, M., Emri, Z., Freund, T.F., and Gulyas, A.I. (2001). Total number and distribution of inhibitory and excitatory synapses on hippocampal CA1 pyramidal cells. Neuroscience 102, 527-540. Miles, R., Toth, K., Gulyas, A.I., Hajos, N., and Freund, T.F. (1996). Differences between somatic and dendritic inhibition in the hippocampus. Neuron 16, 815-823. Mizrahi, A., and Katz, L.C. (2003). Dendritic stability in the adult olfactory bulb. Nat Neurosci 6, 1201-1207. Mohler, H., Fritschy, J.M., Crestani, F., Hensch, T., and Rudolph, U. (2004). Specific GABA(A) circuits in brain development and therapy. Biochem Pharmacol 68, 1685-1690.
120
Mullner, F.E., Wierenga, C.J., and Bonhoeffer, T. (2015). Precision of Inhibition: Dendritic Inhibition by Individual GABAergic Synapses on Hippocampal Pyramidal Cells Is Confined in Space and Time. Neuron 87, 576-589. Nelson, S.B., and Turrigiano, G.G. (2008). Strength through diversity. Neuron 60, 477-482. Nimchinsky, E.A., Sabatini, B.L., and Svoboda, K. (2002). Structure and function of dendritic spines. Annu Rev Physiol 64, 313-353. Parnavelas, J.G., Sullivan, K., Lieberman, A.R., and Webster, K.E. (1977). Neurons and their synaptic organization in the visual cortex of the rat. Electron microscopy of Golgi preparations. Cell Tissue Res 183, 499-517. Peng, H., Ruan, Z., Long, F., Simpson, J.H., and Myers, E.W. (2010). V3D enables real-time 3D visualization and quantitative analysis of large-scale biological image data sets. Nat Biotechnol 28, 348-353. Perez-Garci, E., Gassmann, M., Bettler, B., and Larkum, M.E. (2006). The GABAB1b isoform mediates long-lasting inhibition of dendritic Ca2+ spikes in layer 5 somatosensory pyramidal neurons. Neuron 50, 603-616. Peters, A. (2002). Examining neocortical circuits: some background and facts. J Neurocytol 31, 183-193. Pieraut, S., Gounko, N., Sando, R., 3rd, Dang, W., Rebboah, E., Panda, S., Madisen, L., Zeng, H., and Maximov, A. (2014). Experience-dependent remodeling of basket cell networks in the dentate gyrus. Neuron 84, 107-122. Poirazi, P., and Mel, B.W. (2001). Impact of active dendrites and structural plasticity on the memory capacity of neural tissue. Neuron 29, 779-796. Pouille, F., and Scanziani, M. (2001). Enforcement of temporal fidelity in pyramidal cells by somatic feed-forward inhibition. Science 293, 1159-1163. Prange, O., and Murphy, T.H. (2001). Modular transport of postsynaptic density-95 clusters and association with stable spine precursors during early development of cortical neurons. J Neurosci 21, 9325-9333. Rubenstein, J.L., and Merzenich, M.M. (2003). Model of autism: increased ratio of excitation/inhibition in key neural systems. Genes, brain, and behavior 2, 255-267. Rubinson, D.A., Dillon, C.P., Kwiatkowski, A.V., Sievers, C., Yang, L., Kopinja, J., Rooney, D.L., Zhang, M., Ihrig, M.M., McManus, M.T., et al. (2003). A lentivirus-based system to functionally silence genes in primary mammalian cells, stem cells and transgenic mice by RNA interference. Nat Genet 33, 401-406. Rui, Y., Myers, K.R., Yu, K., Wise, A., De Blas, A.L., Hartzell, H.C., and Zheng, J.Q. (2013). Activity-dependent regulation of dendritic growth and maintenance by glycogen synthase kinase 3beta. Nat Commun 4, 2628.

121
Rutherford, L.C., DeWan, A., Lauer, H.M., and Turrigiano, G.G. (1997). Brain-derived neurotrophic factor mediates the activity-dependent regulation of inhibition in neocortical cultures. J Neurosci 17, 4527-4535. Sans, N., Petralia, R.S., Wang, Y.X., Blahos, J., 2nd, Hell, J.W., and Wenthold, R.J. (2000). A developmental change in NMDA receptor-associated proteins at hippocampal synapses. J Neurosci 20, 1260-1271. Sato, M., and Stryker, M.P. (2008). Distinctive features of adult ocular dominance plasticity. J Neurosci 28, 10278-10286. Schiller, J., Schiller, Y., Stuart, G., and Sakmann, B. (1997). Calcium action potentials restricted to distal apical dendrites of rat neocortical pyramidal neurons. J Physiol 505 ( Pt 3), 605-616. Schindelin, J., Arganda-Carreras, I., Frise, E., Kaynig, V., Longair, M., Pietzsch, T., Preibisch, S., Rueden, C., Saalfeld, S., Schmid, B., et al. (2012). Fiji: an open-source platform for biological-image analysis. Nat Methods 9, 676-682. Schuemann, A., Klawiter, A., Bonhoeffer, T., and Wierenga, C.J. (2013). Structural plasticity of GABAergic axons is regulated by network activity and GABAA receptor activation. Frontiers in neural circuits 7, 113. Schwarz, G., Schrader, N., Mendel, R.R., Hecht, H.J., and Schindelin, H. (2001). Crystal structures of human gephyrin and plant Cnx1 G domains: comparative analysis and functional implications. J Mol Biol 312, 405-418. Sjostrom, P.J., Rancz, E.A., Roth, A., and Hausser, M. (2008). Dendritic excitability and synaptic plasticity. Physiol Rev 88, 769-840. Song, S., Miller, K.D., and Abbott, L.F. (2000). Competitive Hebbian learning through spike-timing-dependent synaptic plasticity. Nat Neurosci 3, 919-926. Spolidoro, M., Sale, A., Berardi, N., and Maffei, L. (2009). Plasticity in the adult brain: lessons from the visual system. Exp Brain Res 192, 335-341. Spruston, N. (2008). Pyramidal neurons: dendritic structure and synaptic integration. Nature Reviews Neuroscience 9, 206-221. Stokes, C.C., Teeter, C.M., and Isaacson, J.S. (2014). Single dendrite-targeting interneurons generate branch-specific inhibition. Frontiers in neural circuits 8, 139. Stoppini, L., Buchs, P.A., and Muller, D. (1991). A simple method for organotypic cultures of nervous tissue. J Neurosci Methods 37, 173-182. Subramanian, J., Dye, L., and Morozov, A. (2013). Rap1 signaling prevents L-type calcium channel-dependent neurotransmitter release. J Neurosci 33, 7245-7252. Tabata, H., and Nakajima, K. (2001). Efficient in utero gene transfer system to the developing mouse brain using electroporation: visualization of neuronal migration in the developing cortex. Neuroscience 103, 865-872.

122
Thomson, A.M., and Deuchars, J. (1997). Synaptic interactions in neocortical local circuits: dual intracellular recordings in vitro. Cereb Cortex 7, 510-522. Trachtenberg, J.T., Chen, B.E., Knott, G.W., Feng, G., Sanes, J.R., Welker, E., and Svoboda, K. (2002). Long-term in vivo imaging of experience-dependent synaptic plasticity in adult cortex. Nature 420, 788-794. Trommald, M., Jensen, V., and Andersen, P. (1995). Analysis of dendritic spines in rat CA1 pyramidal cells intracellularly filled with a fluorescent dye. J Comp Neurol 353, 260-274. Turrigiano, G. (2011). Too many cooks? Intrinsic and synaptic homeostatic mechanisms in cortical circuit refinement. Annu Rev Neurosci 34, 89-103. Turrigiano, G.G., and Nelson, S.B. (2004). Homeostatic plasticity in the developing nervous system. Nat Rev Neurosci 5, 97-107. Tyagarajan, S.K., and Fritschy, J.M. (2014). Gephyrin: a master regulator of neuronal function? Nat Rev Neurosci 15, 141-156. Tyagarajan, S.K., Ghosh, H., Yevenes, G.E., Imanishi, S.Y., Zeilhofer, H.U., Gerrits, B., and Fritschy, J.M. (2013). Extracellular signal-regulated kinase and glycogen synthase kinase 3beta regulate gephyrin postsynaptic aggregation and GABAergic synaptic function in a calpain-dependent mechanism. J Biol Chem 288, 9634-9647. Tyagarajan, S.K., Ghosh, H., Yevenes, G.E., Nikonenko, I., Ebeling, C., Schwerdel, C., Sidler, C., Zeilhofer, H.U., Gerrits, B., Muller, D., et al. (2011). Regulation of GABAergic synapse formation and plasticity by GSK3beta-dependent phosphorylation of gephyrin. Proc Natl Acad Sci U S A 108, 379-384. van Versendaal, D., Rajendran, R., Saiepour, M.H., Klooster, J., Smit-Rigter, L., Sommeijer, J.P., De Zeeuw, C.I., Hofer, S.B., Heimel, J.A., and Levelt, C.N. (2012). Elimination of inhibitory synapses is a major component of adult ocular dominance plasticity. Neuron 74, 374-383. Westrum, L.E. (1966). Synaptic contacts on axons in the cerebral cortex. Nature 210, 1289-1290. White, E.L., and Rock, M.P. (1980). Three-dimensional aspects and synaptic relationships of a Golgi-impregnated spiny stellate cell reconstructed from serial thin sections. J Neurocytol 9, 615-636. Wierenga, C.J., Becker, N., and Bonhoeffer, T. (2008). GABAergic synapses are formed without the involvement of dendritic protrusions. Nat Neurosci 11, 1044-1052. Willadt, S., Nenniger, M., and Vogt, K.E. (2013). Hippocampal feedforward inhibition focuses excitatory synaptic signals into distinct dendritic compartments. PLoS One 8, e80984. Woodruff, A.R., Anderson, S.A., and Yuste, R. (2010). The enigmatic function of chandelier cells. Front Neurosci 4, 201. Woodruff, A.R., McGarry, L.M., Vogels, T.P., Inan, M., Anderson, S.A., and Yuste, R. (2011). State-dependent function of neocortical chandelier cells. J Neurosci 31, 17872-17886.

123
Woods, G., and Zito, K. (2008). Preparation of gene gun bullets and biolistic transfection of neurons in slice culture. J Vis Exp. Woods, G.F., Oh, W.C., Boudewyn, L.C., Mikula, S.K., and Zito, K. (2011). Loss of PSD-95 enrichment is not a prerequisite for spine retraction. J Neurosci 31, 12129-12138. Wuchter, J., Beuter, S., Treindl, F., Herrmann, T., Zeck, G., Templin, M.F., and Volkmer, H. (2012). A comprehensive small interfering RNA screen identifies signaling pathways required for gephyrin clustering. J Neurosci 32, 14821-14834. Zhang, D., Li, Y., Rasch, M.J., and Wu, S. (2013). Nonlinear multiplicative dendritic integration in neuron and network models. Front Comput Neurosci 7, 56. Zita, M.M., Marchionni, I., Bottos, E., Righi, M., Del Sal, G., Cherubini, E., and Zacchi, P. (2007). Post-phosphorylation prolyl isomerisation of gephyrin represents a mechanism to modulate glycine receptors function. EMBO J 26, 1761-1771.
Copyright © 2022 FDOKUMEN