Direct imaging of lateral movements of AMPA receptors inside synapses
Upload
independentCategory
view
1download
0
Remodeling of Hippocampal SynapsesAfter Hippocampus-Dependent
Associative Learning
YURI GEINISMAN,*1 JOHN F. DISTERHOFT,1 HANS JØRGEN G. GUNDERSEN,2
MATTHEW D. MCECHRON,1 INNA S. PERSINA,1 JOHN M. POWER,1
EDDY A. VAN DER ZEE,1AND MARK J. WEST3
1Department of Cell and Molecular Biology, Northwestern University Medical School,Chicago, Illinois 60611
2Stereological Research Laboratory, University of Aarhus, 8000 Aarhus C, Denmark3Institute for Neurobiology, University of Aarhus, 8000 Aarhus C, Denmark
ABSTRACTThe aim of this study was to determine whether hippocampus-dependent associative learn-
ing involves changes in the number and/or structure of hippocampal synapses. A behavioralparadigm of trace eyeblink conditioning was used. Young adult rabbits were given daily 80 trialsessions to a criterion of 80% conditioned responses in a session. During each trial, the condi-tioned (tone) and unconditioned (corneal airpuff) stimuli were presented with a stimulus-free ortrace interval of 500 msec. Control rabbits were pseudoconditioned by equal numbers of randompresentations of the same stimuli. Brain tissue was taken for morphological analyses 24 hoursafter the last session. Synapses were examined in the stratum radiatum of hippocampal subfieldCA1. Unbiased stereological methods were used to obtain estimates of the total number ofsynapses in this layer as well as the area of the postsynaptic density. The data showed that thetotal numbers of all synaptic contacts and various morphological subtypes of synapses did notchange in conditioned animals. The area of the postsynaptic density, however, was significantlyincreased after conditioning in axospinous nonperforated synapses. This structural alterationmay reflect an addition of signal transduction proteins (such as receptors and ion channels) andthe transformation of postsynaptically silent synapses into functional ones. The findings ofthe present study indicate that cellular mechanisms of hippocampus-dependent associativelearning include the remodeling of existing hippocampal synapses. Further studies examiningvarious time points along the learning curve are necessary to clarify the issue of whether thesemechanisms also involve the formation of additional synaptic contacts. J. Comp. Neurol. 417:49–59, 2000. © 2000 Wiley-Liss, Inc.
Indexing terms: structural synaptic plasticity; trace eyeblink conditioning; unbiased stereology;
postsynaptic density; silent synapses; rabbit hippocampus
Cellular mechanisms of learning and memory have longbeen believed to include alterations in synapse numberand structure (Ramon y Cajal, 1893; Tanzi, 1893). Thevalidity of this notion was explored in a number of quan-titative electron microscopic studies of the vertebratebrain (for reviews see Greenough and Bailey, 1988; Baileyand Kandel, 1993). The vast majority of the previous stud-ies reported that the numerical density of synapses wasincreased as a consequence of learning of new behaviors.This was the most consistent observation, even though theeffect of a variety of behavioral tasks was evaluated andthe synapses were quantified in different brain regions.
Several groups have attempted to detect learning-induced changes in synapse number in the hippocampalformation, which is a brain region that is crucially impor-
tant for certain forms of learning and memory (Wallen-stein et al., 1998). Increases in the synaptic numerical
Grant sponsor: NIH/NINDS; Grant number: 5 RO1 NS34582; Grantsponsor: National Institutes of Health/National Institute on Aging; Grantnumber: 1 RO1 AG17139.
Dr. Persina’s current address is: Department of Psychiatry and BehavioralSciences, The Chicago Medical School, North Chicago, IL 60064.
Dr. Van Der Zee’s current address is: Department of Zoology, Universityof Groningen, 9751 NN Haren, The Netherlands.
*Correspondence to: Dr. Yuri Geinisman, Department of CM Biology,Northwestern University Medical School, 303 East Chicago Avenue, Chi-cago, IL 60611. E-mail: [email protected]
Received 2 February 1999; Revised 7 October 1999; Accepted 13 October1999
THE JOURNAL OF COMPARATIVE NEUROLOGY 417:49–59 (2000)
© 2000 WILEY-LISS, INC.

density per unit area have been found to occur in thestratum radiatum of the CA1 subfield of the rat hippocam-pus after brightness discrimination conditioning (Wenzelet al., 1980) and in the molecular layer of the rat dentategyrus after one-way active avoidance conditioning (VanReempts et al., 1992). The numerical density of dendriticspines per unit volume has also been determined to in-crease in the molecular layer of the rat dentate gyrus afterpassive avoidance conditioning (O’Malley et al., 1998). Incontrast, spatial learning in the Morris water maze hasbeen demonstrated to have no effect on the synaptic nu-merical density per unit volume in the rat CA1 stratumradiatum and dentate gyrus molecular layer (Rusakov etal., 1997). Because of the discrepancies in the data regard-ing learning-induced alterations in the numerical densityof synapses in the hippocampal formation, we decided todetermine, with the aid of modern stereological ap-proaches, whether hippocampus-dependent associativelearning is accompanied by changes in the number andstructure of hippocampal synapses.
The behavioral paradigm of trace eyeblink conditioningwas used in our study because it is a form of associativelearning that is known to depend on the structural integ-rity of the hippocampal formation. This brain region isinvolved most critically in associative learning and mem-ory when the events that must be associated together arediscontiguous, i.e., do not overlap in terms of their tempo-ral and spatial positioning (for a review see Wallenstein etal., 1998). With the trace eyeblink paradigm, the condi-tioned stimulus (tone) not only precedes the unconditionedstimulus (airpuff), but is also separated from it by astimulus-free, or “trace,” interval. Correspondingly, le-sions of the hippocampus have been shown to preventacquisition of the trace eyeblink conditioned response inrabbits (Solomon et al., 1986; Moyer et al., 1990; Kim etal., 1995).
Electrophysiologically, it has been demonstrated thattrace eyeblink conditioning in rabbits is accompanied byincreases in the synaptic responsiveness (Power et al.,1997) and the postsynaptic excitability (DeJonge et al.,1990; Moyer et al., 1996) of CA1 pyramidal neurons. Theexcitability of the neurons is maximally enhanced 24hours after learning (Moyer et al., 1996). At this timepoint, the immunoreactivity of PKCg (i.e., g-isoform ofCa21-dependent protein kinase C) has also been shown toincrease in the rabbit hippocampus (Van der Zee et al.,1997). The learning-induced change in this enzyme, whichhas been implicated in synaptic plasticity, involves theapical dendrites of CA1 pyramidal cells in the CA1 stra-tum radiatum.
Based on these data, synapses were analyzed morpho-logically in the rabbit CA1 stratum radiatum 24 hoursafter trace eyeblink conditioning. The total number ofsynapses in this layer and the area of their postsynapticdensity (PSD) were estimated, using unbiased samplingand counting procedures of modern stereology (Cruz-Oriveand Weibel, 1990; Mayhew and Gundersen, 1996; Howardand Reed, 1998; West, 1999). Each conditioned animalwas compared to a pseudoconditioned one that received anequal number of the conditioned and unconditioned stim-uli presented in a random order. This provided an ade-quate control for possible activity-dependent structuralalterations.
We report here that trace eyeblink conditioning is fol-lowed by an enlargement of the PSD area in axospinous
nonperforated synapses, but does not involve a change inthe total number of synaptic contacts in the CA1 stratumradiatum 24 hours after behavioral acquisition to a learn-ing criterion. These data have been published in an ab-stract form (Geinisman et al., 1998).
MATERIALS AND METHODS
Experimental animals and behavioraltraining
Female New Zealand albino rabbits (Oryctolagus cunic-ulus), 8–10 weeks of age, were purchased from HazeltonRabbitry (Denver, PA). Animal care was approved andmanaged by Northwestern University’s Animal Care andUse Committee in compliance with National Institutes ofHealth guidelines. An important characteristic of femalerabbits is the absence of the estrous cycle. These animalsare induced ovulators, and their ovulation-provokingsurges of luteinizing hormone are generated by mating(Hill and Wyse, 1989). Therefore, it was not necessary tocontrol for the hormonal stage of the female rabbits exam-ined.
The animals were trained in pairs and received eithertrace eyeblink conditioning or, as a control, pseudocondi-tioning according to an established experimental protocol(Moyer et al., 1990, 1996; Power et al., 1997; Van der Zeeet al., 1997; DeJonge et al., 1990). Conditioned rabbitswere given an 80-trial session per day until they reacheda criterion of 80% conditioned responses during a session.To reach criterion, 5–10 training sessions were required.During each trial, the conditioned stimulus (CS; 100 msec,85 dB, 6 kHz tone) and the unconditioned stimulus (US;150 msec, 3.0-psi corneal airpuff) were presented with anintervening trace interval of 500 msec. An eyeblink re-sponse was considered to be conditioned if it occurred afterCS onset and before US onset. Pseudoconditioned rabbitsthat received random presentations of the CS and USwere trial- and session-matched with conditioned rabbits.Nine pairs of conditioned and pseudoconditioned animalswere examined morphologically. Protocols for perfusionfixation, tissue processing, unbiased sampling, and count-ing have been described in detail elsewhere (Geinisman etal., 1996a), and they were followed in this work.
Tissue fixation and processing
Brain tissue was taken for morphological analyses 24hours after the last training session. Animals were deeplyanaesthetized with a combination of xylazine (6 mg/kg,i.m.) and ketamine hydrochloride (45 mg/kg, i.m.) followed15 minutes later by pentobarbital sodium (75 mg/kg, i.m.).Transcardiac perfusion was then performed in three con-secutive steps: (1) phosphate-buffered saline (pH 5 7.3)containing heparin sodium (10 U/ml) injected at a rate of50 ml/minute for 45 seconds (;40 ml); (2) 1% paraformal-dehyde, 1.25% glutaraldehyde, and 0.02 mM CaCl2 in 0.12M phosphate buffer, pH 5 7.3, perfused initially at a rateof 50 ml/minute for 10 minutes (500 ml) and thereafter ata rate of 25 ml/minute for additional 20 minutes (500 ml);(3) the same fixative at twice the aldehyde concentrationdelivered at a rate of 25 ml/minute for 12 minutes (300ml). All solutions were warmed to 37°C and administeredwith a peristaltic pump. After the perfusion, animals wereplaced in sealed plastic bags and kept in a refrigerator for2 hours at 4°C. The brain was then removed and the left
50 Y. GEINISMAN ET AL.

hemisphere postfixed in the double strength fixative at4°C overnight.
After postfixation, the left hippocampal formation wasdissected free, physically straightened to diminish its nat-ural curvature (Gaarskjaer, 1978), and cut, perpendicularto its septotemporal axis, into 11–14 consecutive slabsusing a tissue chopper equipped with a microdrive. Theposition of the first cut within the first 1.5-mm intervalfrom the septal pole was determined randomly and thesubsequent cuts were placed at a uniform interval of 1.5mm from each other. The slabs obtained from each pair ofconditioned and pseudoconditioned animals were codedand simultaneously processed for microscopy. Tissue wasrinsed in cold 0.12 M phosphate buffer, treated with OsO4(2% solution in 0.12 M phosphate buffer for 90 minutes at4°C) and rinsed again in the buffer at room temperature.Subsequently, the slabs were dehydrated in ethanol solu-tions of increasing concentrations, treated with propyleneoxide, left overnight in a mixture (1:1) of propylene oxide–Araldite 502, flat embedded in Araldite using disk blockembedding molds, and cured in an oven at 60°C for 48hours.
Estimation of the total volume of the CA1stratum radiatum
The total volume of the CA1 stratum radiatum wasestimated by point counting at the light microscopic level,according to the Cavalieri principle. Because it could notbe assumed that the thickness of the slabs was unalteredduring the embedding procedure, the slab thickness wasmeasured using an inverted microscope equipped with aneyepiece micrometer at a total magnification of 183. His-tological sections (3-mm-thick) were then prepared fromthe septal face of each tissue slab, so that the distancebetween the sections was equal to the thickness of theembedded slabs.
The borders of the CA1 subregion of the rabbit hip-pocampus could be reliably delineated in such sectionsstained with azure II–methylene blue. Although the CA1subregion is continuous with the CA2 subfield and subic-ular complex, it can be unequivocally distinguished fromthese two hippocampal subdivisions. The giant pyramidalcells, typical of the CA3 subfield, are also present in theCA2 pyramidal layer, but are never observed in the CA1stratum pyramidale, which contains relatively small py-ramidal cells (Hjorth-Simonsen and Zimmer, 1975;Hjorth-Simonsen, 1977). The CA1 border with the subic-ular complex is clearly demarcated by an abrupt termina-tion of a bundle of perforant path fibers that pass throughthe CA1 subregion (Lorento de No, 1934). Within thissubregion, the extent of the stratum radiatum is limitedby the stratum pyramidale on one side and bundle ofperforant path fibers on the other (Hjorth-Simonsen andZimmer, 1975).
Sectional profiles of the CA1 stratum radiatum weredelineated according to the boundaries specified aboveand their outlines were drawn with the aid of a projectionmicroscope at a final magnification of 413. The area ofeach sectional profile was estimated by point counting. Atransparent lattice of counting points that had a quadraticarrangement was randomly placed over an outline of asectional profile. The number of points falling on the pro-file was counted. The density of points in the lattice wasadjusted so that a total of 120–150 points would hit theentire set of sectional profiles. The total volume of the CA1
stratum radiatum was calculated as the product of thesum of points hitting the entire set of sectional profiles,the tissue area associated with each point, and the aver-age slab thickness.
Selection of fields in which to samplesynapses
Synapses were sampled with an equal probability alongall three axes of the CA1 stratum radiatum. Sampling wasperformed randomly along the septotemporal axis (by vir-tue of preparing ultrathin sections from the same face oftissue slabs that were cut in a uniform random fashion)and in a systematic random manner along the other twoaxes of the CA1 stratum radiatum. For practical reasons,it was decided to limit the number of sampling fields to sixper animal.
Initially, the location of the sampling fields was deter-mined along the CA2–subicular axis. The length of theCA1 stratum radiatum along this axis was measured oneach drawing of sectional profiles. The cumulative lengthwas then calculated and divided into six uniform inter-vals. The lateral edge of each sampling field was markedon a profile drawing at the defined interval after randomplacement within the first interval. The markings werestraight lines that crossed the width of the CA1 stratumradiatum in a direction perpendicular to the CA2–subicular axis and parallel to the cell body–apical dendriteaxis.
In the next step, the location of the sampling fields alongthe cell body–apical dendrite axis was determined using asubset of six selected sectional profiles that representedsix different tissue slabs. Each of these profiles wasmarked by a straight line drawn along the cell body–apicaldendrite axis as indicated above. The length of the lineswas measured on profile drawings, and the cumulativelength was calculated and divided into six uniform inter-vals. Positions of the proximal (in relation to the pyrami-dal cell bodies) edges of the sampling fields were markedon profile drawings at the defined intervals after a randomplacement within the first interval.
Each selected slab was trimmed down to prepare aseries of 31–38 consecutive ultrathin sections from theseptal slab face. The first trimming cut, which formed thelateral edge of a sampling field, was made according to itsposition indicated on a sectional profile drawing in rela-tion to the surrounding blood vessels. The following trim-ming cuts were made so as to prepare sections that hadthe shape of a trapezoid with its longest side formed by thefirst cut. The ultrathin sections spanned the entire widthof the CA1 stratum radiatum, from the stratum pyrami-dale to the bundle of perforant path fibers. Each series ofultrathin sections was counterstained with uranyl acetateand lead citrate, mounted on a single-slot grid coated withcollodion-carbon, and used to obtain electron micrographsof a sampling field.
At the electron microscopic level, two edges of a givensampling field were identified to determine its location inultrathin sections. The lateral edge was demarcated bythe long side of the section, and the proximal edge wasdefined by its distance from the pyramidal cell layer. Thisdistance was initially measured on the drawings of thesectional profiles and then assessed in the electron micro-scope with the aid of the field delineator of the microscopescreen. Because a sampling field had to be photographedin corresponding parts of consecutive ultrathin sections in
51SYNAPSE REMODELING INDUCED BY ASSOCIATIVE LEARNING

a series, only straight ribbons of ultrathin sections wereused. The sections were aligned by placing a prominenttissue landmark (such as a transversely sectioned myelin-ated fiber) on the same position on the microscope screen.Electron micrographs were taken at an initial magnifica-tion of 8,0003 and enlarged photographically to a finalmagnification of 20,0003. At this final magnification, allsynaptic contacts could be unequivocally identified and arelatively large number of synapses could be sampled. Amagnification standard (grating replica) was photo-graphed and printed with each series of electron micro-graphs.
Synapse counting with disectors
The stereological disector technique (Sterio, 1984; Gun-dersen, 1986) was used to count synapses. Each disectorconsisted of micrographs of two adjacent ultrathin sec-tions, a reference section, and a look-up section immedi-ately above it. A transparency with an unbiased countingframe (Gundersen, 1977) was superimposed over a refer-ence section micrograph. The edges of the frame and mi-crograph were separated by a distance (guard area) thatexceeded the largest linear dimension of the largest PSDprofile. Synapses were identified on the reference sectionmicrograph, with the aid of micrographs of adjacent serialsections, by the presence of synaptic vesicles and a PSD,the latter being used as a counting unit. Then synapseswere labeled on the reference section micrograph if theirPSD profiles were located either entirely or partly withinthe frame and did not intersect the forbidden edges of theframe and their extensions. Two or more profiles belong-ing to the same PSD of a perforated synapse were con-nected by an imaginary straight line and treated as asingle entity. Finally, only those labeled synapses thathad a PSD profile in the reference, but not in the look-up,section were counted. The last 8–10 sections of each serieswere not used as disectors to ensure that PSDs of allsampled synapses were included in their entirety in thesection series.
Estimation of the numerical density and thetotal number of synapses in the CA1
stratum radiatum
To estimate the synaptic numerical density per unitvolume, it is necessary to know the volume of the disector.This volume is limited by the counting frame area and thedisector height, which is the distance between correspond-ing surfaces of the two sections. When the disector con-sists of two immediately adjacent sections, its height isequal to the thickness of the reference section. The sectionthickness was estimated with Small’s method of minimalfolds as described by Weibel (1979) and Royet (1991) be-cause this method provides accurate estimates of sectionthickness compared with other techniques (Calverley etal., 1988; De Groot, 1988; Hunter and Stewart, 1989). Aminimal fold is an artifact formed by a slight pinching ofa section. Because the minimal fold stands upright, itswidth is equal to twice the section thickness. Minimalfolds were photographed at a magnification of 100,0003and their width was measured directly on the negatives.Some ultrathin sections of each series did not containminimal folds. Therefore, the mean section thickness of allthose sections that contained minimal folds was used tocalculate the height of the disectors.
The mean area of the unbiased counting frame was 79.0mm2, the mean disector height was 0.080 mm, and themean disector volume was 6.32 mm3. The latter value wasused to calculate the numerical density of synapses perunit volume as the quotient of the mean number of syn-apses counted per disector and the mean volume of thedisectors. The total number of synapses in the total vol-ume of the CA1 stratum radiatum was calculated as theproduct of the volume and synaptic numerical density.
Estimates of the total number of synaptic contacts re-ported here were made by counting axospinous perforatedand axodendritic synapses with 144 disectors (24 disectorsper serially sectioned field) and axospinous nonperforatedsynapses with 18 disectors (3 disectors per field) in eachanimal. This resulted in relatively large samples of ax-ospinous perforated synapses (102–221, mean 5 159) andaxospinous nonperforated synapses (133–175, mean 5154) per animal. The size of the sample of axodendriticsynapses was smaller (11–36, mean 5 26). Additionally,estimates of total number were also obtained separatelyfor each of the following morphological categories of syn-apses: (1) all axospinous; (2) axospinous nonperforated;axospinous perforated with (3) fenestrated, (4) horseshoe-shaped, and (5) segmented PSDs, (6) multiple transmis-sion zones or (7) spine partitions; (8) axospinous with apostsynaptic concavity of the synaptic apposition zone;and (9) axodendritic asymmetrical synapses. There wasan overlap between some synaptic categories. A propor-tion of synapses with fenestrated, horseshoe-shaped, andsegmented PSDs was included in the category character-ized by the presence of spine partitions. Similarly, someperforated and nonperforated axospinous synapses alsobelonged to the category exhibiting a postsynaptic con-cavity.
Estimation of the PSD area
The length of PSD profiles (Fig. 1) was measured (at anadditional magnification of 53) on electron micrographs ofconsecutive serial sections through each sampled synapseto estimate the PSD area. Biases related to overprojection(i.e., apparent enlargement of opaque profile images be-cause of the finite thickness of transparent sections) weretaken into account by subtracting the maximal profilelength from the sum of lengths of all sectional profilesbelonging to a given PSD (cf. Gundersen, 1986). The areaof the PSD was estimated as ai 5 (4t#/p)(S,i 2 max,i),where ,i is the length of each PSD sectional profile in theith synapse, max,i is the PSD maximal profile length, t# isthe average section thickness, and 4/p is the factor thatmakes the area estimate correct for isotropically orientedPSDs. In those rare cases (1:555) when a PSD was visiblein only one section, its area was estimated as ai 5 0. Foraxospinous perforated synapses that have a PSD consist-ing of two or more distinct segments, the area of the PSDplate was determined separately for each individual seg-ment as indicated above. The sum of the individual valueswas used as an estimate of the total area of the entiresegmented PSD. For other axospinous perforated syn-apses, the length of each discontinuous PSD profile wasexpressed as the sum of lengths of its separate fragments.
Statistical treatment of the data
Differences between conditioned and pseudoconditionedanimals, with regard to the volume of the CA1 stratumradiatum, the number of synapses in this layer, and the
52 Y. GEINISMAN ET AL.

area of their PSDs, were examined for statistical signifi-cance. Tests for matched pairs were used because of thepaired design of the behavioral experiment. Conditionedand pseudoconditioned rabbits were trained in pairs onthe same days. Furthermore, animals in each pair re-ceived the same numbers of daily training sessions andthe same numbers of the conditioned and unconditionedstimuli. These were different for different pairs because ofa variation in the rate of reaching the behavioral criterionamong conditioned animals.
Individual estimates of the mean total number of syn-apses belonging to a given morphological category and ofthe mean area of their PSDs were used as the units of
observation. Mean values tend to be distributed normally.Moreover, initial analyses of heterogeneity of varianceswith the test for dependent samples (Howell, 1982)showed that differences between the variances of thegroup means were not significant for the comparison ofCA1 stratum radiatum volumes, for most (10 of 12) com-parisons of synapse numbers and for all comparisons ofPSD areas. For these reasons, the t-test for matched pairswas used for the statistical treatment of the data with theexception of the following two cases. The heterogeneity ofvariance test for dependent samples reached significancefor only those two subtypes of axospinous perforated syn-apses that exhibited a horseshoe-shaped PSD (t 5 2.244,
Fig. 1. Electron micrographs of consecutive serial sections (a,b)show the neuropil in the rabbit CA1 stratum radiatum. Representa-tive axospinous perforated and nonperforated synapses are indicated
by open and closed arrows, respectively. Profiles of the postsynapticdensities in these synapses are marked by arrowheads in (a). Scalebar 5 0.5 mm.
53SYNAPSE REMODELING INDUCED BY ASSOCIATIVE LEARNING

df 5 7, P , 0.05) or spine partitions (t 5 2.226, df 5 7, P ,0.05). In these two cases, the data were analyzed with theWilcoxon signed rank test for matched pairs because it isa nonparametric test that does not rely on an assumptionabout the equality of variances in the populations fromwhich the samples under comparison were drawn.
The present study included an examination of variousmorphological subtypes of synapses. For this reason, mul-tiple paired t-tests were used. Statistical analyses involv-ing multiple t-tests are known to increase the probabilityof a type I statistical error. Therefore, when a differencebetween conditioned and pseudoconditioned animals onthe morphological measures used was found to be statis-tically significant with the paired t-test, a Bonferroni cor-rection for the level of significance was applied to reducethe probability of a type I statistical error.
RESULTS
Inspection of electron micrographs of serial sections re-vealed that the synaptic population of the CA1 stratumradiatum consists of axodendritic synapses on dendriticshafts and axospinous synapses on dendritic spines. Axo-dendritic synapses are encountered rarely, and the vastmajority (98%) of synaptic contacts belong to the axospi-nous category. Axospinous junctions may be subdividedinto large perforated synapses, which exhibit a discontin-uous PSD profile in at least one serial section, and smallnonperforated synapses, which show a continuous PSDprofile in all consecutive sections (Fig. 1).
Stability of total synapse number in theCA1 stratum radiatum after trace
eyeblink conditioning
Axospinous perforated and nonperforated synapses, aswell as axodendritic junctions, were quantified separately,and their total numbers were added together to obtainunbiased estimates of the total number of all synapses inthe CA1 stratum radiatum. The results showed that thetotal volume of the CA1 stratum radiatum and the totalnumber of synapses in this layer were virtually the samein conditioned and pseudoconditioned animals (Table 1).The group means of the total number of synapses differedby 0.07%, demonstrating that trace eyeblink conditioningis not accompanied by a net increase in synapse number24 hours after successful acquisition of the conditionedresponse.
Because the total number of synaptic contacts was notaltered by conditioning, it was deemed appropriate to testthe hypothesis (Tanzi, 1893) that learning-induced remod-eling of existing synapses was involved. Initially, we ex-plored the possibility that some morphological subtypes ofsynapses had been transformed into other, presumablymore efficacious subtypes. It has previously been reportedthat the numerical density of certain synaptic subtypesincreases after learning (Vrensen and Nunes Cardozo,1981; Van Reempts et al., 1992) and the induction ofhippocampal long-term potentiation (Lee et al., 1980;Chang and Greenough, 1984; Desmond and Levy, 1986;Schuster et al., 1990; Geinisman et al., 1993, 1996b; Buchsand Muller, 1996). Quantitative analyses of the synapticsubtypes implicated in learning- and LTP-induced plastic-ity revealed that their total numbers did not change sig-nificantly after trace eyeblink conditioning (Table 2).
Enlargement of the PSD area in axospinousnonperforated synapses after trace
eyeblink conditioning
The other possibility explored was that synaptic trans-mission zones, which are delineated postsynaptically bythe PSD, enlarge as a consequence of conditioning. Theresults of previous studies based on the analysis of singlesections have indicated that the length of PSD profilesincreases after acquisition of a new behavior (DeVoogd etal., 1985; Horn et al., 1985; Van Reempts et al., 1992;Stewart and Rusakov, 1995). We measured the length of
TABLE 1. Total Volume of the CA1 Stratum Radiatum and the Total Number of Synapses in This Layer in Conditioned (CD)and Pseudoconditioned (PC) Rabbits1
Pair ofanimals
Total volume (mm3) Total number of synapses (3106)
CD rabbits PC rabbits DCD-PC CD rabbits PC rabbits DCD-PC
1 14.4 16.5 22.1 20,980 23,480 22,5002 16.7 15.4 1.3 26,039 22,727 3,3123 15.9 15.7 0.2 25,614 26,740 21,1264 17.4 13.3 4.1 25,736 22,228 3,5085 14.1 15.8 21.7 23,116 24,776 21,6606 15.4 16.6 21.2 24,774 25,407 26337 14.9 12.8 2.1 21,923 22,222 22998 14.0 15.6 21.6 23,582 24,084 25029 12.7 11.7 1.0 17,639 17,588 51Mean 15.1 14.8 0.233 23,250 23,267 16.8SE 0.487 0.587 0.695 915 869 690P 0.746 0.981
1DCD-PC, differences between values estimated for paired conditioned and pseudoconditioned rabbits; P, significance of differences between the groups of conditioned andpseudoconditioned rabbits evaluated with the two-tailed t-test for matched pairs.
TABLE 2. Group Means (6 SE) of Total Synapse Number Estimated forVarious Morphological Categories of Synaptic Contacts in the CA1 Stratum
Radiatum of Conditioned (CD) and Pseudoconditioned (PC) Rabbits
Synapse category
Mean synapse number (3106)
CD group PC group
All axospinous 22,809 6 911 22,851 6 843All axospinous perforated 2,443 6 131 2,734 6 214Axospinous perforated
with a fenestrated PSD1 712 6 70 894 6 95with a horseshoe-shaped PSD 938 6 42 1.028 6 89with a segmented PSD 793 6 61 811 6 80with multiple transmission zones 690 6 156 698 6 64with spine partitions 1,487 6 83 1,666 6 177
Axospinous with a postsynaptic concavity 4,406 6 284 4,519 6 330All axodendritic 458 6 41 399 6 48Axodendritic asymmetrical 279 6 36 239 6 35
1PSD, postsynaptic density.
54 Y. GEINISMAN ET AL.
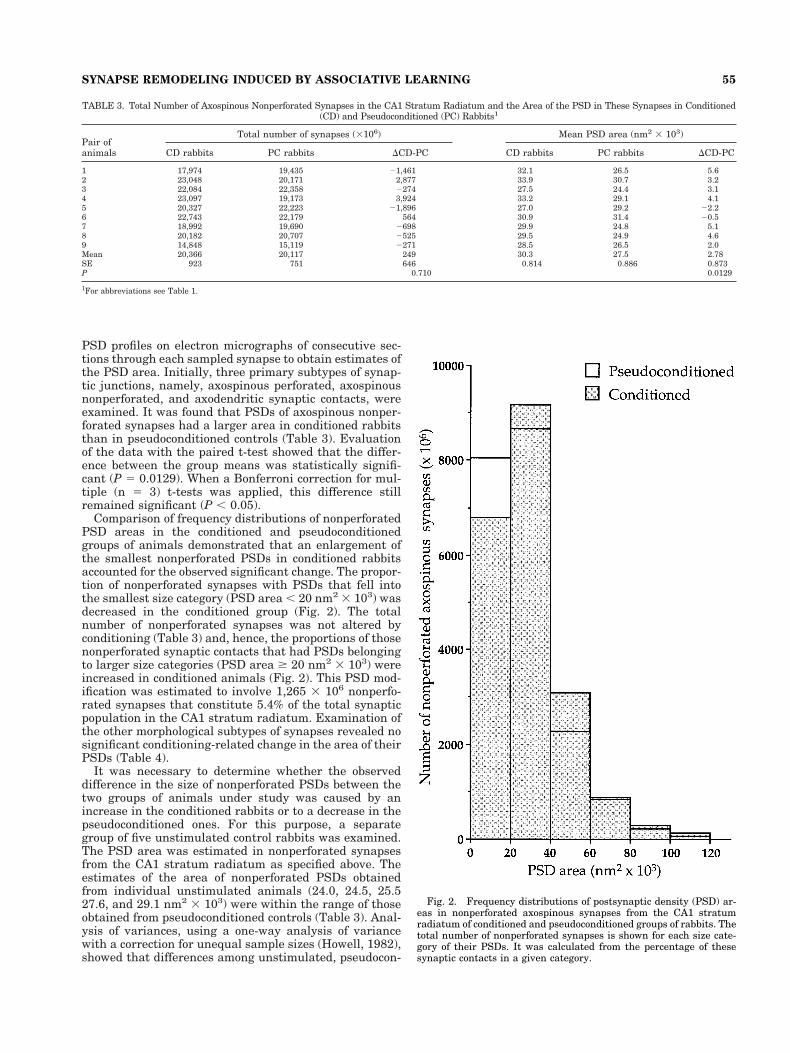
PSD profiles on electron micrographs of consecutive sec-tions through each sampled synapse to obtain estimates ofthe PSD area. Initially, three primary subtypes of synap-tic junctions, namely, axospinous perforated, axospinousnonperforated, and axodendritic synaptic contacts, wereexamined. It was found that PSDs of axospinous nonper-forated synapses had a larger area in conditioned rabbitsthan in pseudoconditioned controls (Table 3). Evaluationof the data with the paired t-test showed that the differ-ence between the group means was statistically signifi-cant (P 5 0.0129). When a Bonferroni correction for mul-tiple (n 5 3) t-tests was applied, this difference stillremained significant (P , 0.05).
Comparison of frequency distributions of nonperforatedPSD areas in the conditioned and pseudoconditionedgroups of animals demonstrated that an enlargement ofthe smallest nonperforated PSDs in conditioned rabbitsaccounted for the observed significant change. The propor-tion of nonperforated synapses with PSDs that fell intothe smallest size category (PSD area , 20 nm2 3 103) wasdecreased in the conditioned group (Fig. 2). The totalnumber of nonperforated synapses was not altered byconditioning (Table 3) and, hence, the proportions of thosenonperforated synaptic contacts that had PSDs belongingto larger size categories (PSD area $ 20 nm2 3 103) wereincreased in conditioned animals (Fig. 2). This PSD mod-ification was estimated to involve 1,265 3 106 nonperfo-rated synapses that constitute 5.4% of the total synapticpopulation in the CA1 stratum radiatum. Examination ofthe other morphological subtypes of synapses revealed nosignificant conditioning-related change in the area of theirPSDs (Table 4).
It was necessary to determine whether the observeddifference in the size of nonperforated PSDs between thetwo groups of animals under study was caused by anincrease in the conditioned rabbits or to a decrease in thepseudoconditioned ones. For this purpose, a separategroup of five unstimulated control rabbits was examined.The PSD area was estimated in nonperforated synapsesfrom the CA1 stratum radiatum as specified above. Theestimates of the area of nonperforated PSDs obtainedfrom individual unstimulated animals (24.0, 24.5, 25.527.6, and 29.1 nm2 3 103) were within the range of thoseobtained from pseudoconditioned controls (Table 3). Anal-ysis of variances, using a one-way analysis of variancewith a correction for unequal sample sizes (Howell, 1982),showed that differences among unstimulated, pseudocon-
TABLE 3. Total Number of Axospinous Nonperforated Synapses in the CA1 Stratum Radiatum and the Area of the PSD in These Synapses in Conditioned(CD) and Pseudoconditioned (PC) Rabbits1
Pair ofanimals
Total number of synapses (3106) Mean PSD area (nm2 3 103)
CD rabbits PC rabbits DCD-PC CD rabbits PC rabbits DCD-PC
1 17,974 19,435 21,461 32.1 26.5 5.62 23,048 20,171 2,877 33.9 30.7 3.23 22,084 22,358 2274 27.5 24.4 3.14 23,097 19,173 3,924 33.2 29.1 4.15 20,327 22,223 21,896 27.0 29.2 22.26 22,743 22,179 564 30.9 31.4 20.57 18,992 19,690 2698 29.9 24.8 5.18 20,182 20,707 2525 29.5 24.9 4.69 14,848 15,119 2271 28.5 26.5 2.0Mean 20,366 20,117 249 30.3 27.5 2.78SE 923 751 646 0.814 0.886 0.873P 0.710 0.0129
1For abbreviations see Table 1.
Fig. 2. Frequency distributions of postsynaptic density (PSD) ar-eas in nonperforated axospinous synapses from the CA1 stratumradiatum of conditioned and pseudoconditioned groups of rabbits. Thetotal number of nonperforated synapses is shown for each size cate-gory of their PSDs. It was calculated from the percentage of thesesynaptic contacts in a given category.
55SYNAPSE REMODELING INDUCED BY ASSOCIATIVE LEARNING

ditioned, and conditioned rabbits with respect to thenonperforated PSD area were statistically significant[F0.025(2.20) 5 5.23, P , 0.025]. Post hoc comparison of thedata with the Student–Newman–Keuls test revealed thatthe conditioned group was significantly different on thismeasure as compared with both the unstimulated andpseudoconditioned group. The difference between the lat-ter two groups, however, was not significant. Accordingly,the mean values of the area of nonperforated PSDs esti-mated for the groups of unstimulated and pseudocondi-tioned animals (26.1 6 0.964 and 27.5 6 0.886 nm2 3 103,respectively) differed by only 5.4%. These data indicatethat the relative enlargement of the nonperforated PSDarea in conditioned animals, as compared to pseudocondi-tioned animals, represents a conditioning-induced in-crease in the PSD size.
DISCUSSION
The results presented here indicate that trace eyeblinkconditioning is associated with remodeling of the PSD inexisting synaptic contacts, but does not involve a changein the total number of synapses in the CA1 stratum ra-diatum of rabbits examined 24 hours after learning to abehavioral criterion. The increase in the PSD area ob-served after trace eyeblink conditioning may be related toan enhancement of the efficacy of synaptic transmission,which is believed to be necessary for learning (Tanzi,1893; Hebb, 1975; Konorski, 1948). The PSD containssignal transduction proteins, such as postsynaptic recep-tors and ion channels (Ziff, 1997; Kennedy, 1998). Thelearning-induced enlargement in the PSD area may reflectan addition of these components and, hence, an augmen-tation of synaptic efficacy.
The recent discovery of “silent” synapses provides sup-port for this supposition. Electrophysiological experimentshave revealed that a high proportion of synaptic contactsin the rat CA1 stratum radiatum exhibit functionalN-methyl-D-aspartate (NMDA) receptors, but not func-tional a-amino-3-hydroxy-5-methyl-4-isoxazoleproprionate(AMPA) receptors (Issac et al., 1995; Liao et al., 1995).This makes such synapses postsynaptically silent in thatthey do not generate a synaptic response to a release of aneurotransmitter at normal resting potentials. Immuno-cytochemical studies have also demonstrated that somehippocampal axospinous synapses exhibit only NMDA,but not AMPA, receptor immunoreactivity (Desmond andWeinberg, 1998; He et al., 1998; Petralia et al., 1999;
Takumi et al., 1999). It is a lack of AMPA receptors andnot their inactive state that accounts for this phenomenon(Nusser et al., 1998; Takumi et al., 1999). Of special im-portance is the observation that silent synapses acquireAMPA-type responses after induction of hippocampallong-term potentiation (LTP) (Issac et al., 1995; Liao et al.,1995), indicating that silent synapses may be transformedinto active synaptic contacts as a result of LTP induction(Malenka and Nicoll, 1997). Because hippocampal LTPis widely regarded as a synaptic model of memory (Blissand Collingridge, 1993), it seems reasonable to hypothe-size that the same synaptic modification may take placeas a consequence of hippocampus-dependent associativelearning.
It has been demonstrated that the ratio between AMPAand NMDA receptors is directly proportional to the PSDsize in axospinous nonperforated synapses from the ratCA1 stratum radiatum and that the AMPA receptor num-ber regresses to zero when a PSD diameter is smaller than180 nm (Takumi et al., 1999). This suggests that the PSDmay increase in size because of the insertion of AMPAreceptors, which is necessary for the silent synapses lack-ing these receptors to become active. Notably, only thesmallest nonperforated PSDs were increased in their areain conditioned animals (Fig. 2). The observed enlargementof the PSD after trace eyeblink conditioning may thereforerepresent a structural correlate of the transformation ofsilent synapses into functional ones.
An intriguing observation made in our study is that thelearning-induced increase in the PSD area selectively in-volved only nonperforated axospinous synapses. None of theother synaptic subtypes exhibited an alteration of this type.A characterization of nonperforated synaptic contacts pro-vides a plausible explanation for this observation. An exam-ination of axospinous synapses in the molecular layer of therat dentate gyrus has shown that about 67% of nonperfo-rated synapses do not exhibit AMPA receptor immunoreac-tivity, whereas the size of AMPA-immunonegative fractionof perforated synapses (;30%) is at least twice smaller (Des-mond and Weinberg, 1998). In the rabbit CA1 stratum ra-diatum, the ratio of nonperforated to perforated synapses is7.4:1 (compare Tables 2 and 3). Thus, the pool of silentaxospinous synapses lacking AMPA receptors appears toconsist primarily of those synaptic junctions that have arelatively small nonperforated PSD. Provided AMPA recep-tor clusters are inserted into PSDs of silent synaptic contactsafter trace eyeblink conditioning, the resulting increase inthe PSD area would be detected predominantly, if not exclu-sively, in nonperforated axospinous synapses.
In view of the above considerations, one would expect thatan augmentation of synaptic transmission is likely to occurin the rabbit CA1 stratum radiatum after acquisition of thetrace eyeblink conditioned response. Power et al. (1997)tested the validity of such a prediction. In their study, rab-bits were conditioned according to the protocol describedabove. Dendritic field potentials were recorded extracellu-larly from the CA1 stratum radiatum in hippocampal slicesafter Schaffer collateral stimulation. The results showedthat synaptic responses, as measured by the dendritic exci-tatory postsynaptic potential (EPSP) slope, were markedlyand significantly augmented in conditioned animals 1 hourafter the last training session relative to those recorded frompseudoconditioned or unstimulated controls. Although aclear trend toward an increase in the dendritic EPSP slopewas observed 24 hours after conditioning, it was not statis-
TABLE 4. Group Means (6 SE) of the Postsynaptic Density AreaEstimated for Various Morphological Categories of Synapses in the
CA1 Stratum Radiatum of Conditioned (CD) andPseudoconditioned (PC) Rabbits
Synapse category
Mean PSD area (nm2 3 103)
CD group PC group
All axospinous perforated 86.0 6 2.76 82.5 6 2.62Axospinous perforated
with a fenestrated PSD1 88.2 6 3.75 83.6 6 3.38with a horseshoe-shaped PSD 85.2 6 3.06 78.3 6 3.06with a segmented PSD 85.5 6 3.53 86.6 6 2.94with multiple transmission zones 85.6 6 3.82 88.6 6 2.75with spine partitions 88.1 6 2.85 87.7 6 2.13
Axospinous with a postsynaptic concavity 84.8 6 3.11 81.9 6 2.42All axodendritic 58.0 6 2.74 63.6 6 3.44Axodendritic asymmetrical 65.4 6 4.79 69.1 6 3.86
1PSD, postsynaptic density.
56 Y. GEINISMAN ET AL.

tically significant. To determine whether this trend was areflection of an actual change, an attempt was made to lowerthe interanimal variation by eliminating the variabilitystemming from differences among various cohorts of rabbits(J.M. Power, unpublished observations). The data were re-examined by comparing only those animals that belonged tothe same cohort (i.e., that were delivered by the supplier atthe same time and trained on the same days). Pseudocondi-tioned controls were not available for within-cohort compar-isons. However, the EPSP slope values of the pseudocondi-tioned rabbits were identical to those of the unstimulatedrabbits. When compared with unstimulated controls fromthe same cohort, conditioned animals showed a significantaugmentation of synaptic responses 24 hours after reachingbehavioral criterion. The magnitude of the change was thesame as that estimated 1 hour after conditioning. Thus,acquisition of the trace eyeblink conditioned response is as-sociated with an augmentation of impulse transmission atSchaffer collateral–CA1 pyramidal cell synapses. Thislearning-related synaptic enhancement appears to last for atleast 24 hours after the cessation of training, and it was at 24hours after the last training session that we observed thestructural modification of nonperforated PSDs describedhere.
Our data demonstrating that associative learning doesnot involve an increase in the total number of synapses 24hours after conditioning are in marked contrast with thoseof earlier electron microscopic studies of the vertebratebrain (Wenzel et al., 1980; Vrensen and Nunes Cardozo,1981; DeVoogd et al., 1985; Stewart et al., 1987; Hunterand Stewart, 1989; Black et al., 1990; Van Reempts et al.,1992; Kleim et al., 1996, 1997; O’Malley et al., 1998). Theprevious studies reported learning-related increases inthe numerical density of synapses, which in general hasled to the conclusion that there is learning-induced syn-aptogenesis (Greenough and Bailey, 1988; Bailey andKandel, 1993). This conclusion is consistent with the hy-pothesis (Ramon y Cajal, 1893) that structural substratesof learning may include the formation of additional syn-aptic contacts.
The discrepancy between the results reported here andthose of the previous work may be explained in a numberof ways. One of these is that various forms of learning maybe accompanied by different patterns of structural synap-tic alterations. Some forms of associative learning, such astrace eyeblink conditioning, may trigger a remodeling ofexisting synapses, whereas others may evoke a net syn-aptogenesis. Another possibility is that trace eyeblink con-ditioning may induce an increase in the total number ofsynapses in the CA1 stratum oriens, where the basaldendrites of CA1 pyramidal neurons are located, ratherthan in the CA1 stratum radiatum, which contains theapical dendrites. This supposition is compatible with thedata obtained by means of confocal microscopy. Spatialtraining of rats was found to be followed by an increase inthe number of spines on the basal dendrites of CA1 pyra-midal cells with no change in the spine density on theapical dendrites (Moser et al., 1994; 1997). One morepossibility is suggested by the dynamic nature of thelearning phenomenon. Various phases of the acquisition/consolidation process may involve either a remodeling ofsynaptic contacts or a net synaptogenesis. In fact, thereare data suggesting that changes in PSD dimensions mayoccur early after conditioning and may be followed later byan increase in the numerical density of synapses (Stewart
and Rusakov, 1995). In our study, synapses were quanti-fied only at one defined time point relative to behavioralacquisition. If stereological analyses were performed atvarious time points along the learning curve, an increasein synapse number resulting from trace eyeblink condi-tioning might have been detected as well.
It is also conceivable, however, that the results of someof the earlier quantitative electron microscopic studieswere affected by the less robust methodology available atthe time they were carried out. Uniform random samplingthroughout the entire region of interest was not usuallyperformed in these studies, and the sampling of synapseswas confined only to a certain part of the region. Selectivesampling of this type is potentially biased (Coggeshall andLekan, 1996). It results in estimates that may be charac-teristic only of a subset of synapses in the regional seg-ment selected for analyses. Moreover, most previous stud-ies cited above used single ultrathin sections foridentifying and counting synapses (Wenzel et al., 1980;Vrensen and Nunes Cardozo, 1981; DeVoogd et al., 1985;Stewart et al., 1987; Hunter and Stewart, 1989; Black etal., 1990; Van Reempts et al., 1992). An unequivocal iden-tification of synapses can only be achieved when synapticcontacts are visualized in consecutive serial sections (Gei-nisman et al., 1996a). In addition, counts of synaptic pro-files in single sections provide estimates of synapse num-ber that may be biased by several factors, including thesize, shape, and orientation of synaptic contacts, the sec-tion thickness, truncation, and overprojection (cf. Gun-dersen, 1986; West, 1993). The magnitude and direction ofthe biases may be different in conditioned and controlanimals. If various forms of learning involve an enlarge-ment of the PSD, this may explain why the most consis-tent observation made in the earlier studies was an in-crease in the numerical density of synapses (Greenoughand Bailey, 1988; Bailey and Kandel, 1993). Profiles of thelarger PSDs would have been observed more frequently insingle random sections than those of the smaller PSDs.Because the PSD was used to identify and count synapses,the estimates of synapse number would have been system-atically larger in animals that had learned a given behav-ioral task than in the controls, even though there were nodifferences in the total number of synapses.
Another methodological problem of the earlier studies isthat their results were most often expressed in terms ofthe number of synapses per unit area or volume of tissue(Wenzel et al., 1980; Vrensen and Nunes Cardozo, 1981;DeVoogd et al., 1985; Stewart et al., 1987; Hunter andStewart, 1989; Van Reempts et al., 1992; Rusakov et al.,1997; O’Malley et al., 1998). Such density estimates, asopposed to those of the total number, are affected bychanges in tissue volume that result from processing formicroscopy. It was not determined, however, whether ornot these changes were different in the conditioned andcontrol animals examined. To circumvent this problem,the ratio of synapses to principal postsynaptic neuronswas estimated in two recent studies (Kleim et al., 1996;1997). Because both the principal neurons and the inter-neurons form postsynaptic elements in the regions exam-ined, the latter approach relies on the unverified assump-tion that the number of synaptic contacts involving theinterneurons is not altered by learning.
By using unbiased stereological methods to obtain esti-mates of total synapse number and PSD area, we haveavoided many of the difficulties associated with the inter-
57SYNAPSE REMODELING INDUCED BY ASSOCIATIVE LEARNING

pretation of the data obtained with previously availablemethodologies. Here we present evidence that cellularmechanisms of hippocampus-dependent associative learn-ing include the remodeling of existing hippocampal syn-apses. Further studies are necessary to elucidate the prob-lem of whether these mechanisms also involve theformation of additional synaptic contacts.
ACKNOWLEDGMENTS
We thank R. W. Berry, M.-M. Mesulam, and E. Mugnainiof Northwestern University for critical review of the manu-script, and W. Goossens for skillful technical assistance.
LITERATURE CITED
Bailey CH, Kandel ER. 1993. Structural changes accompanying memorystorage. Annu Rev Physiol 55:397–426.
Black JE, Isaaks KR, Anderson BJ, Alcantara AA, Greenough WT. 1990.Learning causes synaptogenesis, whereas motor activity causes angio-genesis, in cerebellar cortex of adult rats. Proc Natl Acad Sci USA87:5568–5572.
Bliss TVP, Collingridge GL. 1993. A synaptic model of memory: long-termpotentiation in the hippocampus. Nature 361:31–39.
Buchs P-A, Muller D. 1996. Induction of long-term potentiation is associ-ated with major ultrastructural changes of activated synapses. ProcNatl Acad Sci USA 93:8040–8045.
Calverley PKS, Bedi KS, Jones DG. 1988. Estimation of the numericaldensity of synapses in rat neocortex. Comparison of the “disector” withan “unfolding” method. J Neurosci Methods 23:195–205.
Chang F-L, Greenough WT. 1984. Transient and enduring morphologicalcorrelates of synaptic activity and efficacy change in the rat hippocam-pal slice. Brain Res 309:35–46.
Coggeshall RE, Lekan HA. 1996. Methods for determining numbers of cellsand synapses: a case for more uniform standards of review. J CompNeurol 364:6–15.
Cruz-Orive LM, Weibel ER. 1990. Recent stereological methods for cellbiology: a brief survey. Am J Physiol 258:L148–L156.
De Groot DMG. 1988. Comparison of methods for the estimation of thethickness of ultrathin tissue sections. J Microsc (Lond) 151:23–42.
DeJonge MC, Black J, Deyo RA, Disterhoft JF. 1990. Learning-inducedafterhyperpolarization reductions in hippocampus are specific for celltype and potassium conductance. Exp Brain Res 80:456–462.
Desmond NL, Levy WB. 1986. Changes in the numerical density of syn-aptic contacts with long-term potentiation in the hippocampal dentategyrus. J Comp Neurol 253:466–475.
Desmond NL, Weinberg RJ. 1998. Enhanced expression of AMPA receptorprotein at perforated axospinous synapses. NeuroReport 9:857–860.
DeVoogd TJ, Nixdorf B, Nottenbohm F. 1985. Synaptogenesis and changesin synaptic morphology related to acquisition of new behavior. BrainRes 329:304–308.
Gaarskjaer FB. 1978. Organization of the mossy fiber system of the ratstudied in extended hippocampi. I. Terminal area related to number ofgranule and pyramidal cells. J Comp Neurol 178:49–72.
Geinisman Y, deToledo-Morrell L, Morrell F, Heller RE, Rossi M, ParshallRF. 1993. Structural synaptic correlate of long-term potentiation: for-mation of axospinous synapses with multiple, completely partitionedtransmission zones. Hippocampus 3:435–446.
Geinisman Y, Gundersen HJG, Van der Zee E, West MJ. 1996a. Unbiasedstereological estimation of the total number of synapses in a brainregion. J Neurocytol 25:805–819.
Geinisman Y, deToledo-Morrell L, Morrell F, Persina IS, Beatty MA.1996b. Synapse restructuring associated with the maintenance phaseof hippocampal long-term potentiation. J Comp Neurol 368:413–423.
Geinisman Y, Disterhoft JF, Gundersen HJG, McEchron MD, Persina IS,Power JM, Van der Zee EA, West MJ. 1998. Trace eyeblink condition-ing induces a restructuring of preexisting synapses, rather than syn-aptogenesis. Soc Neurosci Abstr 24:1422.
Greenough WT, Bailey CH. 1988. The anatomy of a memory: convergenceof results across a diversity of tests. Trends Neurosci 11:142–147.
Gundersen HJG. 1977. Notes on the estimation of the numerical density ofarbitrary profiles: the edge effect. J Microsc (Lond) 111:219–223.
Gundersen HJG. 1986. Stereology of arbitrary particles. A review of unbiasednumber and size estimators and the presentation of some new ones, inmemory of William R. Thompson. J Microsc (Lond) 143:219–223.
He Y, Janssen WJM, Morrison, JH. 1998. Synaptic coexistence of AMPAand NMDA receptors in the rat hippocampus: a postembedding immu-nogold study. J Neurosci Res 54:444–449.
Hebb DO. 1975. The organization of behavior. New York: John Wiley &Sons.
Hill RW, Wyse GA. 1989. Animal physiology, 2nd ed. New York: Harper& Row.
Hjorth-Simonsen A. 1977. Distribution of commissural afferents to thehippocampus of the rabbit. J Comp Neurol 176:495–514.
Hjorth-Simonsen A, Zimmer J. 1975. Crossed pathways from the entorhinalarea to the fascia dentata. I. Normal in rabbits. J Comp Neurol 161:57–70.
Horn G, Bradley P, McCabe BJ. 1985. Changes in the structure of synapseassociated with learning. J Neurosci 5:3161–3168.
Howard CV, Reed MG. 1998. Unbiased stereology: three-dimensional mea-surement in microscopy. Oxford: Bios Scientific.
Howell DC. 1982. Statistical methods for psychology, 2nd ed. Boston:PWS-Kent.
Hunter A, Stewart MG. 1989. A quantitative analysis of the synapticdevelopment of the lobus parolfactorius of the chick (Gallus domesti-cus). Exp Brain Res 78:425–434.
Isaac JTR, Nicoll RA, Malenka RC. 1995. Evidence for silent synapses:implications for the expression of LTP. Neuron 15:427–434.
Kennedy MB. 1998. Signal transduction molecules at the glutamatergicpostsynaptic membrane. Brain Res Rev 26:243–257.
Kim JJ, Clark RE, Thompson RF. 1995. Hippocampectomy impairs thememory of recently, but not remotely, acquired trace eyeblink condi-tioned responses. Behav Neurosci 109:195–203.
Kleim JA, Lussing E, Schwarz ER, Comery TA, Greenough WT. 1996.Synaptogenesis and fos expression in the motor cortex of the adult ratafter motor skill learning. J Neurosci 16:4529–4535.
Kleim JA, Vij K, Ballard DH, Greenough WT. 1997. Learning-dependentsynaptic modifications in the cerebellar cortex of the adult rat persistfor at least four weeks. J Neurosci 17:717–721.
Konorski J. 1948. Conditioned reflexes and neuron organization. Cam-bridge: Cambridge University Press.
Lee KS, Schottler F, Oliver M, Lynch G. 1980. Brief bursts of high-frequency stimulation produce two types of structural change in rathippocampus. J Neurophysiol 44:247–258.
Liao D, Hessler NA, Malinow R. 1995. Activation of postsynaptically silentsynapses during pairing-induced LTP in CA1 region of hippocampalslice. Nature 375:400–404.
Lorente de No R. 1934. Studies on the structure of the cerebral cortex. II.Continuation of the study of the ammonic system. J Psychol Neurol46:113–177.
Malenka RC, Nicoll RA. 1997. Silent synapses speak up. Neuron 19:473–476.Mayhew TM, Gundersen HJG. 1996. “If you assume, you can make an ass
out of u and me”: a decade of the disector for stereological counting ofparticles in 3D space. J Anat 188:1–15.
Moser M-B, Trommald M, Anderson P. 1994. An increase in dendritic spinedensity on hippocampal CA1 pyramidal cells following spatial learningin adult rats suggests the formation of new synapses. Proc Natl AcadSci USA 91:12673–12675.
Moser M-B, Trommald M, Egeland T, Anderson P. 1997. Spatial training ina complex environment and isolation alter the spine distribution dif-ferently in rat CA1 pyramidal cells. J Comp Neurol 380:373–381.
Moyer JR Jr, Deyo RA, Disterhoft JF. 1990. Hippocampectomy disruptstrace eye-blink conditioning in rabbits. Behav Neurosci 104:243–252.
Moyer JR Jr, Thompson LT, Disterhoft JF. 1996. Trace eyeblink condition-ing increases CA1 excitability in a transient and learning-specific man-ner. J Neurosci 16:5536–5546.
Nusser Z, Lujan R, Laube G, Roberts JDB, Molnar E, Somogyi P. 1998. Celltype and pathway dependence of synaptic AMPA receptor number andvariability in the hippocampus. Neuron 21:545–559.
O’Malley A, O’Connel C, Regan CM. 1998. Ultrastructural analysis revealsavoidance conditioning to induce a transient increase in hippocampaldentate spine density in the 6 h post-training period of consolidation.Neuroscience 87:607–613.
Petralia RS, Esteban JA, Wang Y-X, Partridge JG, Zhao H-M, WentholdRJ, Malinow R. 1999. Selective acquisition of AMPA receptors overpostnatal development suggests a molecular basis for silent synapses.Nature Neurosci 2:31–36.
58 Y. GEINISMAN ET AL.

Power JM, Thompson LT, Moyer JR Jr, Disterhoft JF. 1997. Enhancedsynaptic transmission in CA1 hippocampus after eyeblink condition-ing. J Neurophysiol 78:1184–1187.
Ramon y Cajal S. 1893. Neue Darstellung vom histologischen Bau desCentralnervensystem. Arch Anat Physiol 319–428.
Royet J-P. 1991. Stereology: a method for analyzing images. Prog Neuro-biol 37:433–474.
Rusakov DA, Davies HA, Harrison E, Diana G, Richter-Levin G, Bliss TVP,Stewart MG. 1997. Ultrastructural synaptic correlates of spatial learn-ing in rat hippocampus. Neuroscience 80:69–77.
Schuster T, Krug M, Wenzel J. 1990. Spinules in axospinous synapses ofthe rat dentate gyrus: changes in density following long-term potenti-ation. Brain Res 523:171–174.
Solomon PR, Van der Schaaf EV, Thompson RF, Weisz DJ. 1986. Hip-pocampus and trace conditioning of the rabbit’s classically conditionednictitating membrane response. Behav Neurosci 100:729–744.
Sterio DC. 1984. The unbiased estimation of number and sizes of arbitraryparticles using the disector. J Microsc (Lond) 134:127–136.
Stewart MG, Csillag A, Rose SPR. 1987. Alterations in synaptic structurein the paleostriatal complex of the domestic chick, Gallus domesticus,following passive avoidance training. Brain Res 426:69–81.
Stewart MG, Rusakov DA. 1995. Morphological changes associated withstages of memory formation in the chick following passive avoidancetraining. Behav Brain Res 66:21–28.
Takumi Y, Ramirez-Leon V, Laake P, Rinvik E, Ottersen OP. 1999. Dif-ferent modes of expression of AMPA and NMDA receptors in hippocam-pal synapses. Nature Neurosci 2:618–624.
Tanzi E. 1893. I fatti i le induzioni nell’odierna istologia del sistemanervoso. Riv Sperim Freniatr Med Leg 19:419–472.
Van der Zee EA, Kronforst-Collins MA, Maizels ET, Hunziger-Dunn M,Disterhoft JF. 1997. g isoform-selective changes in PKC immunoreac-tivity after trace eyeblink conditioning in the rabbit hippocampus.Hippocampus 7:271–285.
Van Reempts J, Dikova M, Webrouck L, Clincke G, Borgers M. 1992.Synaptic plasticity in rat hippocampus associated with learning. BehavBrain Res 51:179–183.
Vrensen G, Nunes Cardozo J. 1981. Changes in size and shape of synapticconnections after visual training: an ultrastructural approach to syn-aptic plasticity. Brain Res 218:79–97.
Wallenstein GV, Eichenbaum H, Hasselmo ME. 1998. The hippocampus asan associator of discontiguous events. Trends Neurosci 21:317–323.
Weibel ER. 1979. Stereological methods, vol 1. Practical methods for bio-logical morphometry. New York: Academic Press.
Wenzel J, Kammerer E, Kirsche W, Matthies H, Wenzel M. 1980. Electronmicroscopic and morphometric studies on the synaptic plasticity in thehippocampus of the rat following conditioning. J Hirnforsch 21:647–654.
West MJ. 1993. New stereological methods for counting neurons. NeurobiolAging 14:275–285.
West MJ. 1999. Stereological methods for estimating the total number ofneurons and synapses: issues of precision and bias. Trends Neurosci22:51–61.
Ziff EB. 1997. Enlightening the postsynaptic density. Neuron 19:1163–1174.
59SYNAPSE REMODELING INDUCED BY ASSOCIATIVE LEARNING
Copyright © 2022 FDOKUMEN