Predicting Protein-Protein Interactions through Associative Classification Technique
Upload
khangminh22Category
view
2download
0
HAL Id: tel-02533679https://tel.archives-ouvertes.fr/tel-02533679
Submitted on 6 Apr 2020
HAL is a multi-disciplinary open accessarchive for the deposit and dissemination of sci-entific research documents, whether they are pub-lished or not. The documents may come fromteaching and research institutions in France orabroad, or from public or private research centers.
L’archive ouverte pluridisciplinaire HAL, estdestinée au dépôt et à la diffusion de documentsscientifiques de niveau recherche, publiés ou non,émanant des établissements d’enseignement et derecherche français ou étrangers, des laboratoirespublics ou privés.
Study of associative learning with a sensorypreconditioning task using an eye-tracking system withdifferent conditioning variables and testing the role of
verbal strategiesCharlotte Renaux
To cite this version:Charlotte Renaux. Study of associative learning with a sensory preconditioning task using an eye-tracking system with different conditioning variables and testing the role of verbal strategies. Psy-chology. Université de Lille, 2019. English. �NNT : 2019LILUH047�. �tel-02533679�

Thèse pour obtenir le grade de
DOCTEUR DE L’UNIVERSITE DE LILLE NORD DE FRANCE
Discipline : Psychologie
Présentée et soutenue publiquement le 25/01/2019 par
Charlotte RENAUX
Study of associative learning with a sensory preconditioning task
using an eye-tracking system with different conditioning variables and
testing the role of verbal strategies.
Sous la direction du
Pr. Vinca Rivière
Et codirection du Pr Laurent Madelain
En collaboration avec Dr. Paul Craddock & Pr. Ralph R. Miller
Composition du Jury :
Jan de Houwer, examinateur
Liat Levita, rapporteur
Gonzalo Urcelay, rapporteur
Odile Viltart, examinatrice

2
Remerciements
Je tiens à remercier,
L’ensemble des participants et leurs familles,
Les personnes présentes après la soutenance, pour leur soutien et leur aide,
Le laboratoire SCALab, les collègues du SACS Paris et plus particulièrement
Laurent Ott pour la programmation et les outils statistiques,
Dr. Odile Viltart pour son grand soutien post-soutenance,
Les derniers survivants du service pour leur calme légendaire et leur mansuétude,
Mes proches de Lille et de Paris, en particulier
Joelle pour son humour, ses relectures et les gâteaux,
Julie pour sa présence et ses conseils de grande personne,
Sébastien pour sa patience et son soutien inébranlables,
Mes parents, financeurs de cette thèse pendant ses deux premières années,
Le Pr. Ralph R. Miller, thanks for your kindness, your knowledge and your precious attendance
in our cooperation,
Le Dr. Paul Craddock, pour sa bienveillance et son aide précieuse depuis de nombreuses années,
Le Pr. Vinca Rivière, pour la liberté qu’elle m’a donnée, son grand soutien et la mise à
disposition de tous les moyens dont j’avais besoin afin de réaliser au mieux ce projet de
recherche.

3
Table des matières
Remerciements ……………….………………………………………….…………….…....... 2
Résumé ……………….……………………………...……….……………....…..…………... 7
Préambule/ Foreword ………………………………………………...………...…………10/12
PART 1 :
Elaboration of a SPC procedure without using any instructions in humans …………………. 14
CHAPTER 1 : INTRODUCTION ……………..………………………..……………….. 15-25
1. History of SPC ………………………………………………………………………. 15
1.1.Conditioned emotional responses (Watson & Rayner, 1920) …………………… 15
1.2. First experiments of first-order and second-order conditioning (Pavlov, 1927) ... 16
1.3. SPC, emerged and developped through species ………………………………… 17
2. Visual attention and eye-tracking ……………………………………………………. 20
2.1. Visual attention as a measure of attention ……………………………………… 20
2.2. Uses of visual attention in paradigms …………………………………………... 22
3. Anticipatory and avoidance responses in Pavlovian conditioning ………………….. 24
3.1.Adaptative nature of anticipatory and avoidance responses ……….……………. 24
3.2.Focus on anticipatory responses ………………………………………………… 25
3.3. Focus on avoidance responses ………………………………………………….. 26
CHAPTER 2 : CREATION OF A SPC PROCEDURE……………………………..…… 28-43
1. Sensory preconditioning paradigm …………………………………………..……… 28
2. Choice of CSs, US+, and US- ……………………………………………………….. 29
2.1. Choice of CSs …………………………………………………………………… 29
2.2. Choice of US+ and US- ………………………………………………………… 31
2.3.Choice of the background on the computer screen ……………………………… 32
3. Time choices according temporal contiguity ……………………………………….... 32
3.1. Temporal coding hypothesis ……………………………………………………. 33
3.2. In our experiment ……………………………………...……………………….. 34
4. Sensory preconditioning corpus ……………………………………………………... 34
4.1.Phase 1 ………………………………………………………………………...… 34
4.2.Phase 2 …………………………………………………………………………... 34
4.3.Test ……………………………………………………………………………… 38
5. Choice of measure (i.e. dependent variable) ………………………………………… 39
5.1.Reaction times between CSs presentations and CR, and distance traveled by eye’s
participants ………………………………...……………………………………. 39
5.2.Pupil diameters ………………………………………………………………….. 42
5.3.Eye gaze …………………………………………………………………………. 42
CHAPTER 3: SPATIAL CONTIGUITY AND SPC……………………......…………… 44-54
1. Introduction …………………………………………………………………………. 44

4
1.1.First-order conditioning and spatial contiguity …………………………………. 44
1.2.Higher-order conditioning and spatial contiguity ………………………………. 45
1.3.In our experiment ……………………………………………………………….. 46
2. Method ………………………………………………………………………………. 47
2.1.Participants ……………………………………………………………………… 47
2.2.Apparatus …………….………………………………………………………….. 47
2.3.Materials …………...……………………………………………………………. 47
2.4.Procedure ……………………………………………………………...………… 48
3. Results ………………………………………………………………………………. 49
3.1.Statistical issues …………………………………………………………………. 50
3.2.Statistical analysis ……………………………………………………………….. 50
4. Discussion …………………………………………………………………………… 53
CHAPTER 4 :
NUMBER OF STIMULI PAIRINGS IN PHASE 1 OF SPC IN ADULTS …………..…. 55-63
1. Introduction …………………………………………………………………………. 55
1.1.Number of stimuli pairings in higher-order conditioning studies ……………….. 56
1.2. In our experiment ……………………………………………………………….. 57
2. Method ……………………………………………………………………..………... 57
2.1.Participants …………………………………………………………...…............ 57
2.2.Materials …………………………………………………………………...……. 57
2.3.Procedure …………………………………………………………………..……. 58
3. Results ……………………...………………………………..……………………… 59
3.1. Statistical issues ………………………………………………………………… 60
3.2. Statistical analysis …………………………………………………………….… 60
4. Discussion ………………………………………………………………………….... 62
CHAPTER 5 : ROLE OF TRIAL REPETITION FOR ELDERLY …………..…………. 64-73
1. Introduction …………………………………………..…...………………………… 64
1.1. Beneficial role of repetition ………………………..……………………………. 64
1.2.Repetition in elderly with dementia ……………………………………………. 65
1.3. In our experiment ……………………………………………………………….. 66
2. Method ………………..………………………………………………………..……. 67
3. Results ………………………...…………………………………………………..… 67
3.1. Statistical issues ………………………………………………...………………. 67
3.2. Statistical analysis ………………………………………………………………. 68
3.3.. Comparison between adults and seniors across 10 or 20 pairings presentations . 71
4. Discussion ……………………………………………………………..….…………. 72
General conclusion of Part 1 ……………………………………………………………...…. 74
Résumés en français Part 1 ………………………………………………………………….. 75
PART 2 :
Influence of verbal behavior on conditioned responding ………..………...………………… 79

5
CHAPTER 1 : INTRODUCTION …………………………………………...…...……… 80-89
1. Development of verbal behavior in humans ………………………...…..…………… 80
1.1.Verbal behavior considered as an operant ……………………………………….. 80
1.2.Emergence of verbal behaviors in babies ………………………………………... 81
1.3.Acquisition of verbal skills according Denney’s model (1982, 1984) ………...… 82
1.4.Development of verbal behaviors thanks operant procedures …………………… 83
2. Verbal strategies in the establishment of SPC ………………………...…………..…. 85
2.1.Influence of instructions in experimental tasks …………………………………. 85
2.2.Use of instructions in SPC procedures …………………………………………… 86
3. Using an SPC task ……………………………………...……………….………..….. 87
3.1.Apparatus ………………………………………………………………...……… 87
3.2.Materials …………………...……………………………………………………. 88
3.3.Procedure ……………………………...………………………………………… 88
CHAPTER 2 : SPC IN NON VERBAL BABIES ………………………….………….… 90-96
1. Introduction …………………………………………….............…………………… 90
1.1.Demonstrations of associative learning in babies ……………………………… 90
1.2.Second-order conditioning in infants rats (Cheatle and Rudy, 1978) …………… 91
2. Participants ………………..……………………………………………….……..…. 92
3. Results ………………………...………………………………………………..…… 92
3.1.Statistical issues …………………………………………………………………. 92
3.2.Statistical analysis ……………………………………………………………….. 93
4. Discussion ……………………………………………………………….………..…. 95
CHAPTER 3 : SPC IN NON VERBAL AND VERBAL AUTISTIC CHILDREN….... 97-104
1. Introduction …………………………………………….............…………………… 97
1.1.Joint attention and verbal behavior in autistic children ………………...……….. 97
1.2.Categorization skills in autistic children ………………………………..……..… 98
1.3.Associative learning in autistic children ………………….…………..…………. 98
1.4.In our experiment ……………………………………………………………… 100
2. Participants ………………..……………………………………………….………. 100
3. Results ………………………...…………………………………………………… 101
3.1.Statistical issues ………………………………………………………………... 101
3.2.Statistical analysis ……………………………………………………………… 102
4. Discussion ……………………………………………………………….…………. 104
CHAPTER 4 : SPC AND DEMENTIA ……………………………………..………… 105-112
1. Introduction ……………………………………………...........…………………… 105
1.1.Respondent and operant conditioning and elderly with dementia ……………… 105
1.2.In our experiment ………………………………………………………………. 107
2. Participants ………………..……………………………………………….………. 107
3. Results ………………………...…………………………………………………… 108
3.1.Statistical issues …………………………………………………...…………… 108
3.2.Statistical analysis ……………………………………………………………… 109

6
4. Discussion ……………………………………………………………….…………. 111
CHAPTER 5 : SPC ACROSS AGES ………………..……………………..…………. 113-119
1. Introduction ……………………………………………...........…………………… 113
1.1.Piaget’s assumption about Development ……………………………………… 113
1.2.Verbal strategies and developmental models ………………………………….. 113
1.3. In our experiment ……………………………………………………………… 114
2. Participants ………………..……………………………………………….………. 114
3. Results ………………………...…………………………………………………… 115
3.1.Statistical issues ……………………………...………………………………… 115
3.2.Statistical analysis ……………………………………………………………… 116
4. Discussion ……………………………………………………………….…………. 118
Résumés en français Part 2 …………………………………………………………………. 120
GENERAL DISCUSSION : ……………………………………………………………….. 122
1. Summary and clinical applications …………………...……………………………. 123
1.1. Resume of findings ……………………………………………………………. 123
1.2. Clinical applications …………………………………………………………… 124
2. Limitations and critiques of our experimental task …………………..…………….. 127
3. Theoretical issues ……………………………………………………...…………… 129
3.1. Biologicial determinant” and individual survival ……………………………….129
3.2. Compound stimulus and equivalence relations in the establishment of SPC ….. 130
3.3. Reflexions about verbal strategies …………………………………………….. 133
Articles and Communications ……………………………………………………………... 134
References …………………………………………………...…………………………….. 135
Annexes ……………………………………………………………………………………. 149

7
Résumé
Ce projet de thèse visait à étudier un phénomène particulier du conditionnement d’ordre
supérieur par l’utilisation du paradigme du pré-conditionnement sensoriel (PCS, Brogden,
1939). Dans une première phase, deux stimuli conditionnés (SCs) ont été associés l’un à l’autre
un certain nombre de fois (Phase 1, SC2-SC1), avant que l’un (SC1) soit associé à un stimulus
inconditionné (SI) provoquant ainsi une réponse conditionnée (RC) de l’organisme (Phase 2 :
SC1-SI). On parle de SPC lorsque le stimulus conditionné SC2, qui n’avait jamais été associé
directement au stimulus inconditionné, provoque cette même réponse conditionnée.
Les résultats disparates de la littérature scientifique ont démontré maintes fois ce phénomène
chez différentes espèces animales. Un des objectifs de cette thèse a été de répliquer une même
tâche à travers différents groupes expérimentaux en utilisant la réponse oculaire comme mesure,
via un système d’eye-tracking, évitant ainsi l’utilisation de consignes écrites ou verbales.
Combiné à un ordinateur conventionnel, nous avons ainsi recueilli les temps de fixations
visuelles de chaque participant. Lors de ces expérimentations, les participants étaient libres de
tout mouvement et devaient regarder l’écran de l’ordinateur afin de réaliser la tâche. Notre
paradigme a été de présenter simultanément dans une première phase deux SCs (SC2-SC1 et
SC4-SC3) un certain nombre de fois, avant d’associer SC4 et SC2 respectivement à un SI
aversif ou appétitif. Lors de cette phase, les participants devaient apprendre à anticiper
l’apparition de SI+ (c.à.d. le SI appétitif correspondant à un court extrait vidéo) en présence de
SC1 et à anticiper l’apparition de SI- (c.à.d. un son aversif) en présence de SC3. Un critère
d’acquisition était requis afin de passer au test final, au cours duquel les participants étaient
testés sur leur capacité à répondre à SC2 et SC4 conformément à la nature du SI qui a suivi le
SC auquel ils étaient associés.
Ainsi, ce travail a fait l’objet de deux parties de recherches. La première partie étudiait la
réponse de SPC selon certains paramètres environnementaux (contiguïté des stimuli
conditionnés et nombre de présentations de ces stimuli) afin de créer une procédure
expérimentale permettant l’observation de ce type de réponse sans utilisation d’instructions. Le
second axe s’intéressait à l’évolution de cette réponse à travers les âges en soutenant
l’hypothèse que la présence de comportements verbaux n’était pas nécessaire pour
l’observation de la réponse conditionnée. Afin de tester cette hypothèse, nous avons choisi des
personnes présentant des compétences verbales limitées (c.à.d. enfants avec troubles autistiques

8
non verbaux et personnes âgées avec démences séniles) et des participants n’ayant pas encore
accès au langage (c.à.d. bébés entre 4 et 9 mois).
Partie 1
Notre première étude comparait les effets de la contiguïté spatiale sur la réponse conditionnée.
Pour cela, la distance entre deux SCs a été manipulée en laissant soit un espace entre les deux
stimuli présentés (condition A), soit en les rapprochant de manière à ce qu’aucun intervalle
spatial entre les deux stimuli ne soit visible (condition B). Au test, nos résultats ont clairement
indiqué un taux de fixation visuelle anticipatoire plus élevé sur la zone du SI+ lorsque SC2
apparaissait en condition B plutôt qu’en condition A. Ce travail montrant l’avantage d’une
contiguïté sur la réponse conditionnée a été présenté oralement à l’ABAI Denver 2017 et a fait
l’objet d’une publication dans Behavioural Processes.
Les deux expériences suivantes visaient à étudier le rôle du nombre de présentations des
appariements de SCs en phase 1 sur la réponse conditionnée en phase test, chez le sujet adulte
jeune et chez le sénior. Nous avons ainsi varié le nombre de présentations des couples de stimuli
en les présentant 10 fois (condition ad10 pairings et se10 pairings) ou 20 fois (condition ad20
pairings et se20 pairings). Les résultats ont montré un taux d’erreurs d’apprentissage plus
conséquent lorsque les stimuli avaient été présentés plus souvent (conditions ad20 pairings et
se20 pairings). Chez l’adulte comme chez le sénior, un nombre élevé de répétitions des stimuli
semble détériorer la performance du participant. Ce travail a été présenté lors d’une
communication orale à l’ABAI Paris 2018. Les résultats mis en exergue dans cet axe ont permis
la réalisation d’une tâche expérimentale spécifique afin d’observer au mieux les réponses
conditionnées attendues, sans utiliser d’instructions. Cette tâche a ensuite été répliquée à travers
les groupes expérimentaux présentés dans la Partie 2.
Partie 2
Dans cet axe, un premier aspect développemental a été exploré en utilisant une tâche de PCS
chez des participants n’ayant pas encore accès au langage ; des bébés âgés entre 4 et 9 mois.
L’objectif ici était de tester ce type d’apprentissage réputé comme faisant appel à des
compétences relatives au langage. L’expérience a ainsi été réalisée chez le bébé âgé de 4 à 9
mois sans trouble développemental. Les bébés étaient placés dans une chaise adaptée à leur
taille et leur permettant de fixer les stimuli sur l’écran de l’ordinateur. Nous avons observé un
taux de fixation visuelle élevée sur la zone où apparaissait le SI+ lorsque SC1 et SC2 étaient
présentés. À l’inverse, les bébés évitaient l’émission du son aversif SI- lorsque SC3 et SC4
apparaissaient. Ici, nous avons donc observé une réponse de PCS chez des individus dépourvus

9
de stratégies verbales et à un stade développemental précoce. Ces travaux remettent en question
les prérequis à l’établissement de compétences complexes faisant appel à la mémoire. Cette
étude a été présentée à l’ABAI San Diego 2018.
Une deuxième étude concernait le conditionnement d’ordre supérieur chez les enfants avec
troubles autistiques. Chez l’humain, ce conditionnement est généralement expliqué par
l’utilisation de stratégies verbales (Jara et al., 2006). Cependant, les enfants avec troubles
autistiques présentent des défauts de stratégies verbales, notamment par un dysfonctionnement
des comportements verbaux dans le répertoire comportemental de l’individu. A notre
connaissance, aucune expérience n’avait testé le pré-conditionnement sensoriel chez les enfants
avec troubles autistiques, malgré l’existence de nombreux programmes expérimentaux se
focalisant sur l’apprentissage de comportements verbaux. Nous avons donc testé deux groupes
d’enfants diagnostiqués comme ayant des troubles autistiques : des enfants verbaux et des
enfants non verbaux, tous pris en charge par des services de type ABA. Nous avons observé
indifféremment des taux élevés de fixations visuelles pour la zone du SI+ lorsque le SC2 était
présenté à un enfant non verbal ou verbal. Ces résultats ont soutenu notre hypothèse que le
comportement verbal n’est pas nécessaire à l’établissement du conditionnement d’ordre
supérieur. Cette étude fait l’objet d’une soumission à un journal scientifique et a également été
présentée à l’ABAI Miami 2018.
Enfin, une dernière étude s’est focalisée sur la réponse conditionnée chez le sénior médicalisé
en service EHPAD et souffrant de démence sénile. L’objectif était d’étudier l’absence de
comportements verbaux chez des individus âgés dont les capacités mnésiques étaient
impactées. Un groupe de personnes âgées avec démence sénile a été ainsi comparé à un groupe
contrôle de personnes âgées ne présentant pas de démence. Nous avons observé, ici, un meilleur
évitement du SI- chez la personne âgée avec démence sénile, en comparaison de la personne
âgée non démente. Cela suggère donc un meilleur apprentissage de l’évitement d’un stimulus
aversif chez des personnes âgées démentes et hospitalisées en EHPAD. Ces résultats font l’objet
d’une soumission en journal scientifique et ont aussi été présentés à SQAB Denver 2017.
Mots clés : apprentissage associatif, PCS, poursuite visuelle, contiguïté spatiale, répétition,
développement, comportement verbal.

10
Préambule
Depuis les travaux de Pavlov (1927), de nombreux chercheurs se sont focalisés sur
l’établissement de conditionnements d’ordres supérieurs. Entre autres, Brodgen (1939, 1942 &
1947) a étudié le paradigme de pré-conditionnement sensoriel (PCS) chez plusieurs espèces
animales. Ses travaux ont souligné la difficulté d’observer un tel phénomène d’apprentissage
associatif, quelle que soit l’espèce animale testée. En 1942, Brodgen réplique chez l’homme
une procédure expérimentale permettant d’observer du PCS chez le chien. Dans cette étude,
Brodgen (1942) souligne qu’aucune réponse de PCS n’a été observée chez l’humain en
comparaison aux travaux effectués chez l’espèce canine. Quelques années plus tard, Brogden
(1947) ajoute des instructions écrites à sa tâche expérimentale destinée à tester le PCS chez
l’homme. Par cet intermédiaire, Brodgen (1947) observe de meilleurs taux de PCS chez
l’homme après avoir posé des questions explicites en test concernant les associations possibles
entre les différents stimuli présentés. Ainsi, Brogden (1942, 1947) souligna l’importance de
l’utilisation d’instructions dans les tâches expérimentales étudiant le PCS.
Dès lors, les rares études étudiant ce type d’apprentissage associatif chez l’humain ont utilisé
des instructions écrites dans leurs paradigmes expérimentaux (cf. Jara et al., 2006, & Craddock
et al., 2014, pour exemples). La question principale de cette thèse était de déterminer pourquoi
l’observation de PCS était impossible chez l’humain sans utilisation d’instructions. En effet,
l’hypothèse prédominante concernant l’établissement du PCS chez l’humain repose
essentiellement sur la formation de stratégies verbales favorisées par l’insertion d’instructions
expérimentales. Or, de nombreux chercheurs ont observé chez d’autres espèces animales des
taux élevés de PCS sans utiliser la moindre instruction. En effet, ce type d’apprentissage a été
observé chez les pigeons (cf. Reid et al., 1952), les poissons (cf. Hall et al., 1995), ainsi que
chez les abeilles (Müller et al., 2000). Notre premier objectif de recherche consistait donc à
observer l’établissement d’un tel apprentissage associatif chez l’homme dans une tâche
n’utilisant pas d’instructions et ainsi similaire aux paradigmes expérimentaux utilisés dans
d’autres espèces animales. Le second objectif consistait à observer l’évolution de cette réponse
conditionnée à travers différents âges car la plupart des études focalisées sur le PCS ont été
uniquement testées de jeunes adultes. Enfin, le dernier objectif consistait à émettre l’hypothèse
que l’utilisation de stratégies verbales n’était pas nécessaire à l’observation de PCS chez
l’humain. Nous avons observé cette réponse conditionnée chez le bébé, l’enfant non vocal avec
des troubles autistiques, ainsi que chez la personne âgée avec ou sans démence sénile. Ces

11
différentes populations aux stades développementaux divers comportent toutes des défauts
concernant l’élaboration de stratégies verbales.
Ce travail de recherche se découpe en deux parties distinctes :
- La première partie décrit la procédure utilisée pour observer le PCS chez l’humain sans
utilisation d’instructions.
- La deuxième partie est focalisée sur l’étude de cette réponse à travers différents stades
développementaux avec défaut de stratégies verbales.

12
Foreword
Since Pavlov’s seminal work (1927), many researchers have focused on the establishment of
higher order conditioning. Brodgen (1939, 1942, & 1947) studied conditioning within the
sensory preconditioning paradigm (SPC) in several different animal species. His work
highlighted that learning could occur without being evident to an observer. Moreover, it
challenged Thorndike’s (1931) Theory of Reinforcement which posited that learning required
the delivery of a biologically significant outcome such as food or electric shock. In both of these
respects, it served as the Pavlovian analogue of Tolman’s (1930) demonstration of « latent
learning » in rats allowed to explore mazes devoid of reinforcement at the time of exploration.
In 1942, Brodgen replicated in humans the procedure that he had previously used to
demonstrate SPC in dogs. In this study, Brodgen (1942) observed that no sensory
preconditioning response in humans in contrast to the SPC responses he had previously
observed in the canine species. A few years later, Brogden (1947) added written instructions
into his experimental task to assess SPC in humans. With the instructions, Brodgen observed
an appreciable degree of SPC in humans after he asked participants explicit questions at test
concerning the possible associations between the different conditioned stimuli (CS) presented.
Thus, Brogden (1942, 1947) emphasized the need for using verbal instructions in order to
observe SPC in humans.
Therefore, the few subsequent reports of SPC in humans used written instructions in their
experimental paradigms (see Jara et al., 2006, & Craddock et al., 2014, for examples). The main
problematic was to determine whether the observation of SPC was truly impossible in humans
without the use of instructions. In fact, the predominant hypothesis concerning the
establishment of SPC in humans rests essentially on the formation of verbal strategies promoted
by the presentation of experimental instructions. However, many researchers have observed
high rates of SPC in other animal species without using any instructions. For example, SPC had
been observed in pigeons (see Reid et al., 1952), fishes (Hall et al., 1995), and bees (Müller et
al., 2000). ). Thus, the first primary research goal was to seek SPC in humans using a non-
instructional task, similar to experimental paradigms used with other animal species. A second
objective was to assess potential differences in SPC across different developmental ages
because most of the studies tested SPC only in young adults. A final goal was to assess whether
SPC could be observed in humans without their using verbal strategies. In order to answer this
last question, we tested for SPC in babies, and non vocal children with autistic disorders, as
13
well as in the elderly with or without severe senile dementia. Lack of verbal strategies had been
demonstrated in those populations.
Thus, this research was divided into two parts:
- A first part in which a procedure to observe SPC in humans without using instructions
was developed.
- A second part in which SPC was studied across different developmental stages with
lacks of verbal strategies.

14
PART 1 :
Elaboration of a SPC procedure without using any
instructions in humans.

15
CHAPTER 1 : INTRODUCTION
Chapter 1 introduces (1) the history of SPC, (2) some studies concerning visual attention
measured by eye-tracking system, (3) then anticipatory and avoidance responses in Pavlovian
conditioning.
1. History of SPC
SPC is a type of higher-order conditioning because that type of learning is more complex than
simple dyadic conditioning with CS US. According to Miltenberger's definition (2011),
higher order conditioning is observed when a neutral stimulus (NS) is paired with a conditioned
stimulus (CS), thus becoming itself a CS eliciting a conditioned response (CR). Since the
beginning of the 20th century, this kind of learning had been the subject of many studies in
several animal species, especially in humans for its relationship to conditioned emotional
responses.
1.1. Conditioned emotional responses with Watson and Rayner’s work (1920) :
The first historically important study concerning this type of conditioning was Watson and
Rayner’s work (1920), focused on the conditioned emotional responses (CER) in young
humans. It should be noted here that this experimentation could no longer take place today
because of the ethical and deontological issues it would rise. In that study, the child tested was
the famous 11-month-old Little Albert, a nurse’s the son who was accustomed to the hospital
environment. Before the initial experiment, the child had been determined to be "robust and
stable" (Watson & Rayner, 1920), and that there was no fear observed as a result of presentation
of rodents in the laboratory. Initially, the researchers struck a metal bar (US) with a hammer,
causing the child to cry (UR). Then, a rat (NS) was introduced into the experiment. When Albert
touched the rat, the experimenter hit the metal bar with the hammer causing Albert to cry. After
several blocks of presentations, the presence of the rat (CS) alone elicited Albert’s tears and
cries (CR). A few months later, Watson and Rayner placed again Albert in front of a rat, a
rabbit, a dog, a fur coat and cotton wool. After each presentation of the rat, a negative emotional
response was observed. The same conditioned fear was observed when the rabbit and the fur
coat were individually presented to the child, while no negative emotional reaction appeared in
the presence of the dog or the cotton wool. Watson and Rayner concluded that most fears
conditioned in humans could be established and maintained in the long term by this type of
learning. Studies of conditioned fear in species other than rats have raised many questions

16
concerning Watson and Rayner’s work (1920). Harris (1979) reported some errors in the
scientific literature concerning Watson and Rayner's experimentation. For example, many
studies referred to a conditioned fear of white items in the Watson and Rayner (1920)
experiment, which was not presently the case (for example, see Helms & Turner, 1976).
Although it is possible that such conditioned fears could have arisen from an overgeneralization
of stimuli (Carr, 1925), it is difficult to be certain about it because of the lack of appropriate
control conditions. Nevertheless, the report of Watson and Rayner demonstrated that
conditioned fear initially neutral stimulus was possible as a result of pairings with
unconditioned stimuli.
1.2. First experiments of first order and second order conditioning with Pavlov (1927) :
At the same time, Pavlov (1927) published in his renowned book Conditioned Reflexes the
principles of Pavlovian conditioning by studying salivary responses in dogs. One of the most
famous examples of first order conditioning concerns the sound of a metronome associated with
food, eliciting alone the salivary response in the dog. Initially, the presence of food (US) caused
the unconditioned response of salivation (UR). Then, a neutral sound (NS) from a metronome
was presented before food delivery on successive trials. At tests, Pavlov (1927) observed the
same conditioned salivary response (CR) to the mere presentation of the metronome (CS).
Pavlov’s demonstration led to the view that a biologically significant outcome was necessary
for conditioning to occur, despite the fact that conclusion currently going beyond the evidence.
Specifically, to become a CS, Pavlov suggested that stimulus had to be a more important
"biological determinant" than the US with which it was being paired. This implied that an
effective outcome in conditioning had to be a "biological determinant" (i.e., an US capable of
eliciting an UR).
In the framework of the experimental preparation described previously, Pavlov (1927)
associated various NSs with the sound of the conditioned metronome (CS), causing these
previously neutral stimuli to now elicit the same CR of salivation as the metronome. For
example, a light (NS) paired with the conditioned metronome over several trials came to elicit
conditioned salivation in the dog. Pavlov described this learning as second order conditioning
(i.e., the lowest level of higher order conditioning). Then, another neutral stimulus such as the
odor was paired with light several times, and came to elicit the same salivation response (i.e.,
third order conditioning). Pavlov observed a diminution of the saliva amount with each higher
successively higher order of conditioning. Indeed, the saliva recovered in the cup after each test
was less and less abundant after second order conditioning compared to first order conditioning.

17
These results were observed up to fifth order conditioning by other researchers such as Finch
and Culler (1935) using thoracic shocks as negative unconditioned stimuli in the canine species,
the unconditioned response here being the avoidance of shocks.
1.3. SPC, emerged and developped through species :
Later, Brogden (1939) focused on another type of second order conditioning in dogs. Brogden
noted the relative difficulty in obtaining second order conditioning in canines. Initially NS
(ringing bell, air blast, light and brief noise) were paired with food 200 times each.
Subsequently, out of ten tested dogs, only four dogs could be conditioned on several levels of
higher order conditioning. Therefore, Brogden (1939) emphasized the difficulty to observe
second order conditioning (i.e., CS1-US followed by CS2-CS1). Toward better understanding
why this sort of second order conditioning was difficult, Brogden introduced SPC. In SPC, in
a first phase, two stimuli (CS1 and CS2) are presented a number of times together without the
presentation of an US (i.e., the preconditioning phase). In a second phase, CS1 is paired with
the US, thereby causing CS1 to elicit a CR. At tests, the same CR is elicited by CS2 as CS1,
albeit weaker, despite CS2 never having been paired with the US (Figure 1).
Figure 1. Representation of SPC from Principles of Learning and Behavior, Figure 4.5 page 99
(Domjan, 2014)
Since the introduction of SPC by Brogden (1939), the data concerning the observation of this
type of second order conditioned response are disparate from one species to another and as a
function of certain variations of experimental parameters that we will develop in the next
paragraph (see Table 1). For example, Prewitt (1967) observed SPC in rats by simultaneous
pairings of a brief sound with a flash of light, followed by one of these stimuli being associated
with an electric shock (US) with the result that the other stimulus came to elicit a negative
emotional conditioned response (CER). Compared with control groups for which the stimuli
were presented either separately or sequentially, Prewitt (1967) observed a higher CER-
frequency in rats that experienced CSs presented simultaneously in the first phase. Although
other studies demonstrated SPC in pigeons (Reid, 1952), bees (Müller, Gerber, Hellstern,
Hammer, & Menzel, 2000), and fishes (Hall & Suboski, 1995), Brogden (1942, 1947) reported
CS2 CS1 CS1 US CS2
CR CR

18
difficulty in observing this type of learning in humans without the use of instructions in the
experimental tasks. We will elaborate on Brogden’s research in Axis 2.
As a consequence of Brogden’s (1942, 1947) reports, many researchers subsequently used
instructions in SPC experimental paradigms with human subjects. For example, we previously
used instructions when we used reaction times to assess SPC in humans (Craddock, Renaux,
Lefèvre, Nelson, & Molet, 2014). In a first phase, different stimulus pairs were presented
interspersed (e.g., pairing different primary colors with different letters of the alphabet (Phase
1: CS2 - CS1). Then, one of these stimuli was associated with the appearance of a picture (Phase
2 : CS1 - US+). In a control condition, CS3 was associated with the non-appearance of the
picture. At tests, subjects were asked to click on the "Yes" icon when he thought that the
stimulus presented would be followed by the picture. If participants thought that the stimulus
was not going to be followed by the picture, they had to press the "No" icon. Written instructions
appeared on the computer screen and were standardized for all participants. The response rate
for "Yes" when the stimulus appeared on the screen and the reaction times for the participant's
response (i.e., the appearance of the CS1, CS2 or CS3 stimulus) were recorded. Results showed
a higher conditioned response rate for "Yes" when CS1 was presented on the screen, as well as
a lower rate when CS2 appeared. We observed similar results for reaction times: participants
answered "Yes" more quickly when CS1 was presented compared to CS2. Although
conditioned response rates were higher after CS1 than CS2. But critically, the response rate for
CS2 was significantly higher than the response rate recorded for CS3 presentation. Thus, this
experiment demonstrated SPC (relative to control conditions lacking either the Phase 1 or Phase
2 pairings) using written instructions at tests in humans. The specific form of the instructions
here were « Do you think the picture will appear ? » after CS presentation at test. However, the
use of instructions assume certain levels of subjective understanding that could be specific to
each participant. That is why we wanted to determine whether we could create a successful SPC
procedure for humans without using any instructions.
The diversity of conditioned and unconditioned stimuli within several animal species shows us
the universal character of SPC (Table 1). Our research was concerned with the establishment
of SPC in humans. For this purpose, one of our objectives was to develop an experimental task
similar to other tasks used in animals, where verbal and/or written instruction could be avoided
through the use of an eye tracking system.

19
Species
Authors
CS in Phase 1
US in Phase 2
Use of
instructions ?
SPC
observed ?
Rat
Berridge &
Schulkin
(1989)
Gustatory
US+ et US- :
aversive and
appetitive food
No
Yes
Rat
Lavin (1976) Olfactory US- : aversive
food
No Yes
Rat and
rabbit
Pfautz,
Donegan, &
Wagner
(1978).
Sound and
visual
US- : shock
No
Yes
Rat
Rizley &
Rescorla
(1972)
Sound and
visual
US- : shock
No
Yes
Rat
Ward-
Robinson &
Hall (1996)
Sound and
visual
US- : shock
No
Yes
Rat
Ward-
Robinson &
Hall (1998)
Olfactory
US- : aversive
odor
No
Yes
Bee
Müller,
Gerber,
Hellstern,
Hammer, &
Menzel
(2000)
Gustatory
US+ : sucrose
solution
No
Yes
Fish
Hall &
Suboski
(1995)
Olfactory and
visual
US- : aversive
solution
No
Yes
Human Brogden
(1942)
Sound and
visual
US+ : pression
on a lever
No No
Human Brogden
(1947)
Sound and
visual
US+ : pression
on a lever
No No
Human Chernikoff &
Brogden
(1949)
Sound and
visual
US+ : pression
on a lever
Yes Yes
Human
Craddock &
al. (2014)
Visual
US+ : pression
on « Yes »
Yes
Yes
Table 1. Sensory preconditioning in various species with or without using instructions.

20
2. Visual attention and eye-tracking
Throughout this research, we used eye tracking systems, relying on the phenomenon of visual
attention as measured by eye gaze and fixation times.
2.1. Visual attention as a measure of attention :
Visual attention is a phenomenon that has been studied for over a hundred years. Its study was
initially limited to the observation of eye movements and subsequently become more complex
thanks to the development of modern engineering to measure and record foveal direction. In
1925, Von Helmholtz considered visual attention as an indispensable part of visual perception.
More precisely, Von Helmholtz was interested in displacements of eye movements with respect
to speficic spatial areas, thus suggesting that those movements were indicative of attention.
Subsequently, James (1981) suggested that visual attention may reflect the intent and
willingness to look at a specific item by the individual. Yarbus (1967) was one of the first to
study ocular pursuits by presenting a scenic image to participants, who were subsequently asked
questions about the scene. For each question, participants' eye movements were recorded and
the direction of their gaze varied according to the relevant information needed to answer the
question asked to participants. These results are illustrated below in Figure 2. A picture located
at the top left was the scene that participants had to observe and illustrated an excerpt from the
daily life of a social group. For recording 1, participants were asked to view this scene freely.
A large number of ocular pursuits throughout the picture area were then recorded. For recording
2, the participants had to estimate the socio-economic level of the characters. Yarbus (1967)
found more eye fixations on the contextual cues during recording 2, with participants looking
in part at the pictures on the wall of the image and tableware on the table in the image. For
recording 3, the instruction was to estimate the age of the characters. Results showed that
participants mainly looked at the characters' faces before giving their estimates. Subsequently,
the participants had to guess what the people in the image were doing before the arrival of the
visitor (recording 4), remember their clothes (recording 5), the location of the characters and
objects (recording 6) and estimate the time of the last visit of the guest (recording 7).

21
Figure 2. Yarbus’s experiment (1967).
Since Yarbus’s work (1967), many theories had been proposed with respect to visual attention.
These are summarized in a short book by Gregory (2000). Among these theories, Posner et al.
(1980) suggested an attentional mechanism in which visual attention would function as a
"spotlight" in front of a cinema scene (from the original term "spotlight"). These authors
differentiated two features of visual attention: orientation and detection. Orientation is a focal
point of attention on which the subject focuses, whereas detection depends on the sensitivity to
the target stimulus relative to the context in which it is situated. If we go back to the work of
Yarbus (1967), the focus of orientation is indicated by areas with large numbers of visual

22
fixations; detection corresponds to the movements of these fixations in the form of the singular
features within areas as recorded in Figure 2.
2.2. Uses of visual attention in paradigms :
Nowadays, studies of visual attention are predicated on the assumption that visual attention
objectively reflects the attention that an individual directs to a given visual stimulus
(Duchowski, 2007). For example, Kruschke, Kappenman, and Hetrick (2005) tested some
Pavlovian phenomena such as blocking using an eye-tracking system to test an attentional
hypothesis. This preparation allowed the researchers to objectively argue that the blocking
phenomenon results from diminished visual fixation on the added (i.e., blocked) stimulus. In
addition, many researchers such as Kaakinen, Hyönä and Keenan (2002) have reported higher
visual fixation times on relevant stimuli than irrelevant stimuli in experimental tasks. For
example, participants view more precursor stimuli for "biologically critical" events than stimuli
that are not followed by any event.
Within psychological research, visual attention is often used in the study of facial expressions
which can be tracked and partially recognized thanks to the continuing improvement of
computer systems (Black & Yacoob, 1995). For example, Fuchs (1967) used an eye-tracking
system in monkeys to observe and study monkey’s eye movements during emotional states.
Monkeys are often studied with respect to facial expressions because of their similarities with
humans. In his study, Fuchs examined several possible measures such as velocity’s eye
movements, the number of ocular saccades, and the latency eye movement from one stimulus
presentation to the targeted zone. In this way, many researchers use eye-tracking systems for
therapeutic as well as experimental purposes for the many benefits provided by these systems.
Indeed, visual attention can be a near universal measure for humans within the visual domain
because the ocular response in humans develops in uterine life and is maintained globally stable
throughout life. Gredebäck, Johnson and Hofsten (2009) consider this measure to be relevant
for the baby and toddler, in that it allows experimenters to avoid the use of written instructions
that would not be understood by subjects. Isaacowitz, Wadlinger, Goren, and Wilson (2006)
used eye tracking for older adults for similar reasons in a learning task. In adults, eye-tracking
is often used for commercial purposes and allows experimenters to objectively observe product
preferences via specific eye fixations of participants (Wedel & Pieters, 2008). Recently, eye-
tracking systems have also been used to study learning about the use of new media products,
and how to facilitate this learning by inserting applications and other tools relevant to the
individual (Van Gog & Scheiter, 2010). Moreover, attentional models of some behavioral

23
disorders such as depression (Kellough, Beevers, Ellis, & Wells, 2008), affective disorders
found in bipolar or schizophrenic patients (Iacono, Peloquin, Lumry , Valentine, & Tuason,
1982, Armstrong and Olatunji, 2012), and patients with neuromuscular disorders (Wachtman,
VanSwearingen, & Manders, 2001) assume that deficient attention underlines some of the
symptoms and can be assessed with eye-tracking systems.
In our study, ocular fixation response time was the common measure to all of our experimental
populations from the baby to the elderly. This measure has proved useful for testing learning in
people with developmental disorders like in the autism spectrum and senile dementia because
ocular fixations do not require the acquisition of social and verbal skills. For example, a non-
verbal child with severe autistic disorder could not have answered questions from the examiner.
The same is true for a 6-month-old baby and for a non-verbal elderly person with senile
dementia. Using an eye-tracking system, Klin et al. (2002) demonstrated different visual
fixation patterns in autistic children compared to typical children. All participants were placed
in front of a computer screen and had to look at the movies presented. Autistic children could
be seen to have social deficits because of a lack of gaze on the relevant stimuli in order to
engage in efficient communication. Indeed, typical children (controls) look at the
experimenter’s eyes during social interaction, while autistic children used to look at the
experimenter’s mouth or clothes during social interaction. By using eye tracking systems, Klin
et al. demonstrated differences in visual fixation during social and nonsocial stimulus
presentations. For example, the experimenter’s eyes were more fixated by typical children
compared to autistic children during social interaction. Controversially the experimenter’s body
zones were more fixated by autistic children compared to typical children (see Figure 3).
Figure 3. Representative still frame used of coding of visual fixation patterns across groups and
box plots comparisons of visual fixation time on the mouth, eyes, body, and objects regions for
autistic children and typically developing viewers, from Klin and al. (2002) experiment.

24
Using eye fixation as a response allowed us to study higher order conditioning learning in
atypical populations. Since the use of instructions was considered necessary for the observation
of SPC in humans (Chernikoff & Brogden, 1949), no study to date has highlighted this sort of
learning in subjects with verbal deficiencies. In addition, ocular fixation allowed us to avoid
any costly behavioral response such as fine motor skills (e.g., pushing a button) or global motor
skills (e.g., raising a hand to indicate the presence of a stimulus ). Depending on the
experimental groups, some individuals would not have been able to emit this type of behavior.
For example, a 6-month-old baby could not press a button as quickly as an adult, which would
have induced many experimental biases.
Thus, we were able to place each participant in front of the same behavioral task, free of any
movement other than the eyes, with the only requirement being that they look at the screen of
the computer. Thanks to eye tracking systems and eye gaze as a measure, we had the
opportunity to create an experimental task closer to that used with other species, that is, devoid
of any instructions.
3. Anticipatory and avoidance responses in Pavlovian conditioning :
In our study, participants had to anticipate the appearance of an US+ and to avoid the emission
of an US-.
3.1. Adaptative nature of anticipatory and avoidance responses :
Pavlov (1927) referred to anticipation and avoidance responses in observations reported in his
book Conditioned Reflexes. Pavlov observed that the conditioned salivatory response could be
elicited even before food was delivered to the dog. Thus, Pavlov spoke about a possible adaptive
nature of the conditioned reflex; the presence of a stimulus present in the environment could
prepare the organism for the reception of food. Presumably, salivation present in the mouth of
the animal immediately before receiving food would allow better ingestion and digestion. Even
if Pavlov had not clearly defined these observations as anticipatory behavior, his work showed
that there was no incompatibility between Pavlovian conditioning and the establishment of
anticipatory responses.
Vast numbers of Pavlovian conditioning studies had been conducted since Pavlov's (1927)
seminal work. Today, anticipatory and avoidance behaviors have been reported in many animal
species. Hollis (1989) investigated the anticipation response in sexual behavior in blue gourami
fish and showed that both males and females learned to anticipate the behavior of their mating

25
partners in order to reproduce more efficiently. Anticipatory behaviors are established when
environmental stimuli are frequently accompanied by biologically important events for the
individual (Hollis, 1989). Stormark, Hugdhahl, and Posner (1999) also noted that the reaction
times of anticipated responses are faster compared to reaction times of unanticipated responses.
In their experiment, Stormark et al. paired a previously neutral stimulus with an aversive sound
(US-), measuring the electrodermal responses of individuals in the presence of the US-. When
the stimulus previously paired with the aversive sound was presented, Stormark et al. observed
a shorter reaction time of the electrodermal response to the US- compared to a stimulus never
associated with the US-.
Domjan (2005) listed the diversity of anticipatory behaviors in various areas such as eating,
sexual, addictive, escape, and emotional reactions. Because our experimental task focused on
the anticipation of a US+ and the avoidance of a US-, we will illustrate below these two
phenomena in order to discuss about their adaptive value.
3.2. Focus on anticipatory responses :
With regard to the anticipation of an US+ event, or a CR to a CS previously paired with the
US+, Cusato and Domjan (1998) illustrated anticipatory responses based on earlier
observations of Schwartz and Schwartz (1949) research with Japanese quail. In their
preparation, when a male quail saw a quail in his natural environment, he saw only one part of
the other bird’s body, namely the neck and head of the other individual. By approaching these
visual stimuli (head and neck), the male could differentiate whether the individual was a male
or a female in order to have the opportunity to copulate with a female. Cusato and Domjan
replicated this natural sequence in the laboratory, presenting to male quails pictures of heads
and necks of different specimens. They observed that male quails did not emit the behavior of
copulating when exposed to pictures of the heads and necks of females. Subsequently, Cusato
and Domjan (1998) physically presented a female quail (US+) with which the male copulated,
following the presentation of the previously neutral pictures. Thereafter, the mere presentation
of pictures elicited anticipatory copulatory behaviors in the male subject, that would then
attempt to copulate with the presented artificial head and neck. In another experiment, Cusato
and Domjan paired another neutral stimulus with the CS pictures and observed anticipatory
copulation responses in males at the mere presentation of the initially neutral stimulus. Thus,
in that study, the authors demonstrated anticipatory responses using a second order conditioning
procedures.

26
3.3. Focus on avoidance responses :
Regarding avoidance responses, it would be informative to first present an example of
unconditioned fear. Ohman and Mineka (2001, 2003) focused on negative emotional reactions
in humans and monkeys after presenting a snake illustration (US-). In the natural environment,
conditioned fears are caused by the appearance of precursor stimuli of an aversive event. Such
precursors are easily observable with respect to predator-prey interactions. Ohman and Mineka
recorded the electrodermal responses of humans and monkeys following snake illustration (US-
) presentations compared to NS. Their results showed a higher electrodermal response when
US- was presented to the individual. Here, Ohman and Mineka (2001, 2003) highlighted the
phylogenetic character of this reflex, the simple hissing of a snake (US-) causing unconditioned
fear (UR) in many mammals - this type of reflex being necessary for the survival of an
individual over many prior generations. Cook, Hodes, and Lang (1986) confirmed these results
in humans comparing the hissing of a snake with the sound of a firearm. Cook et al. observed
electrodermal responses and higher heart rates in humans after the hissing of a snake compared
to the sound of the firearm. However, the evolutionary nature of unconditioned stimuli should
be noted, considering that the results of this experiment may differ today given recent societal
events including the massive use of firearms. Thus, these studies illustrated the notion of
avoidance: with the presentation of an US-, avoidance behavior will be emitted by the
individual to escape to the potentially dangerous stimulus in the interests of survival.
An avoidance response is generally defined as a behavior that prevents contact with an aversive
stimulus (Catania, 1992). Researchers used to study it within the avoidance paradigm in which
an initially neutral stimulus is a precursor to an aversive stimulus. In our experiments, we used
the same paradigm in which a visual stimulus CS3 was associated with an US- aversive sound.
Similarly, Myers, Cohn, and Clark (2005) studied avoidance responses to an aversive stimulus
in mice that were placed in an experimental box consisting of two parts separated by a corridor.
In their experiment, an initially neutral stimulus (i.e., a light) was followed by an air jet (i.e.,
US-), these stimuli pairs being randomly presented in each part of the experimental box.
Researchers noticed that the mouse escaped from the jet of air as soon as it was emitted in one
part of the box, by taking refuge in the other part. After several NS-US- pairings, Myers and al.
observed that the mouse avoided the aversive stimulus as soon as the light (CS) was presented
in the box. Thus, the initially neutral stimulus became precursor to the occurrence of an aversive
event that the mouse could avoid at the onset of the conditioned stimulus.

27
These different examples demonstrate the adaptive function of anticipation and avoidance
behaviors. Indeed, anticipation could be considered as necessary for the survival and
reproduction of the individual (Cusato & Domjan, 1998) and avoidance presumably prolongs
this survival by minimizing proximity with potentially dangerous stimuli (Myers, Cohn, &
Clark, 2005). This point of view is supported by many researchers such as Domjan (2005) or
more recently Jozefowiez (2014): anticipatory behaviors favor and maximize contact with
appetitive events and, conversely, avoid contact with aversive and harmful stimuli.
Therefore, we adapted the concepts of anticipatory and avoidance behaviors for our
experimental task. Those type of behaviors have not previously been frequently studied in
higher-order conditioning. One of our objectives was to observe these anticipatory behaviors
as a function of manipulated environmental variables.

28
CHAPTER 2 : CREATION OF A SPC PROCEDURE
1. Sensory preconditioning paradigm :
We studied associative learning using a sensory preconditioning task. Associative learning is
assumed to have occurred when as a consequence of a cue-outcome pairing treatment, the
presentation of one stimulus elicits behavior related to the other stimulus (Godefroid, 2001).
This type of learning has been studied since Aristotle, who proposed three principles for the
establishment of associations : contiguity, similarity, and contrast (cited by Warren, 1921). Of
these, the contiguity principle had been widely studied over the last century (see Chapter 3),
and states that if two events repeatedly occur together in time and space, they will become
associated. The similar and contrast principle states that two stimuli will become associated if
they share similarities in some respects (e.g., both are round and green) or have some
contrasting characteristics (e.g., one short stimulus versus one tall stimulus). Those principles
are still examined today, and there is still no widely held consensus that defining mechanisms
of associative learning.
In our study, we used several CSs as CS1 and CS2 in order to observe an SPC phenomenon.
Specifically, a US+ (i.e., an entertaining movie clip as positively reinforcing unconditioned
stimulus) was presented after CS1 appearance in Phase 2. As a control condition, we used two
other CSs identified here as CS3 and CS4, with CS3 being paired with a US- (i.e., an aversive
sound as negatively reinforcing unconditioned stimulus) in Phase 2. See Figure 4 :
Figure 4. Representation of SPC configuration used in our experimental task using both US+
and US- in Phase 2.
CS2 CS1 CS1 US+ CS2
CR+ CR+
CS4 CS3 CS3 US- CS4
CR- CR-

29
The use of control conditions in SPC in some studies has focused on the higher order
conditioning aspects (see Craddock et al., 2014). Using CS3 and CS4 in a control condition
confirmed a better discrimination of conditioned responses after CS2 and CS1 presentations
with CS1 paired with a US+, compared to other CS4 and CS3 presentations with CS3 paired
with a US-. Thanks to the control conditions used, SPC observed upon CS2 presentation on test
trials could not be viewed as a spurious or pseudoconditioned response because participants
had to emit different conditioned responses according to specific CSs to pass the experimental
task for SPC. Thus, participants had to anticipate the appearance of US+ and to avoid the
emission of US- in Phase 2. We recorded conditioned responses after CS2 and CS4
presentations at tests.
2. Choice of CSs, US+ and US- :
Conditioned and unconditioned stimuli used in SPC experiments with impaired humans have
to be both easily discriminable and not painful. Indeed, experiments with other species can use
electric shock as US- (e.g., Pfautz et al., 1978 ; Rizley & Rescorla, 1972 ; Ward-Robinson et
al., 1996) or aversive odors (Hall & Suboski, 1995 ; Ward-Robinson et al., 1998). Primary
needs can be exploited with the use of appetitive food as US+ (e.g., Müller et al., 2000).
Conditioned stimuli used as CS1, CS2, CS3 and CS4 are sometimes auditory and visual
(Brogden, 1939 ; Rizley & Rescorla, 1972 ; Ward-Robinson et al., 1998), olfactory (Lavin,
1976 ; Ward-Robinson, 1998) or gustatory (Berridge & Schulkin, 1989 ; Müller et al., 2000).
Because of evident ethical considerations, we could not use shock as a US- or food as US+ in
humans. Thus, the conditioned and unconditioned stimuli we used in our experiment were
similar to other CSs used in conditioning studies focused on humans.
2.1 Choice of CSs :
Concerning the choice of the stimuli used as CS1, CS2, CS3 and CS4, we had to identify stimuli
that would be discriminable by all participants (from babies to impaired elderly). In prior second
order conditioning studies, we had used letters and numbers as conditioned stimuli (see in
Figure 5 some stimuli from Craddock, Wasserman, Polack, Kosinski, Renaux, & Miller, 2017 ;
Nelson, Craddock, Molet & Renaux, 2017) :

30
Figure 5. Representations of CSs used in Craddock and al. (2017) and Neslon and al. (2017)
experiments.
We observed higher order conditioning with both letters and numbers as CSs. However,
because we wanted to tested participants with verbal deficiencies, using letters and numbers
seemed inappropriate. Primary colors and shapes are discriminable from the first months of
human life and across the life span (Smith et al., 1992). Thus, we selected 6 cm x 6 cm colored
geometric squares as we had previously used in one study with normal adults (see Figure 6 from
Craddock, Renaux, Lefèvre, Nelson, & Molet, 2014) :
Figure 6. Representations of CSs used in Craddock and al. (2014) experiment.
In Chapter 3, we created CSs based on stimuli used in a SPC procedure published in 2014. We
added geometric shapes within the colored squares in order to add a further discriminative
element to each CS. In summary, each CS1, CS2, CS3 and CS4 was a distinct shape and color.
See Figure 7 :
Figure 7 : Representations of CSs used in Chapter 3.

31
We observed higher-order conditioning after CSs presentations in Part 1 as described in Chapter
3. Nonetheless, a concern about experiments with elderly subjects arose with respect to the size
of shapes within the CSs. Because each characteristic of the CS had to be discriminable by the
elderly, we created 6 cm x 6 cm simpler and more visible stimuli (see Figure 8) which were
used in all chapters except Chapter 3. For each participant, one CS was chosen among those
previous stimuli and was defined as CS1 ; and it was always the same CS1 for each participant.
CS2, CS3 and CS4 were defined by the same way.
Figure 8 : Representations of CSs used of all participants in Chapter 4 - 5 as CS1, CS2, CS3
and CS4.
Additionally, the paired conditioned stimuli were presented simultaneously as CS2-CS1 and
CS4-CS3 dyads. We used simultaneous pairings instead of sequential pairings because some
studies found higher rates of higher order conditioning using simultaneous pairings rather than
sequential (see Barnet et al., 1991 ; Rescorla, 1980 ; Rescorla, 1982).
2.2 Choice of US+ and US- :
Sensory preconditioning paradigms tested in humans often used points or virtual money as US+
(see Craddock, Wasserman, Polack, Kosinski, Renaux, & Miller, 2017 ; Nelson, Craddock,
Molet, & Renaux, 2017) and sometimes still pictures (Craddock, Renaux, Lefèvre, Nelson, &
Molet, 2014). Other studies focused on conditioning used video clips as efficient US+ thanks
to the availability of bimodal sensory inputs (e.g., Courtney et al., 2010 ; Tong et al., 2007).
Thus, we created short entertaining film clips from well-known cartoon movies as US+s with a
duration of 2s – the same duration of other stimulus presentations in our experiment. The 2s
presentation of the US+s appeared in a 13 cm x 8 cm rectangle in a corner of the computer
screen, as seen in Figure 9 :

32
Figure 9 : Representations of 13 cm x 8 cm US+ appearing in one corner of the computer screen.
To our knowledge, no study in humans concerned with SPC ever used an US- in tasks. I had
previously examined Pavlovian conditioning using aversive sounds in human participants. An
important study informing my choice of US- was Water et al.’s (2009) research which focused
on childhood anxiety. In that study, Waters et al. tested acquisition and extinction of
conditioned responses in 17 anxious children, using geometric shapes as US+s and loud sound
as US-s. Waters et al. recorded subjective verbal responses concerning the CSs and skin
conductance responses in anxious children compared to non-anxious control children. In that
study, the loud sound proved to serve as an efficient US- because the rate of conditioned
responses was high after its presentation and was maintained over trials in both groups. Thus,
in the present research we used a similar 100 dB loud sound as a US- with a duration of 2s –
the same duration as the US+s and other stimuli. The 2s presentation of US- was emited by the
computer as the US+.
2.3 Choice of the background on the computer screen :
Finally, we had to consider the background of the computer screen. Indeed, eye tracking
systems require specific light conditions between white light and penumbra, in order to track
the pupils of participants. A white background during experimental tasks is tiring for
participants who are placed in front of the computer screen for several minutes, while black
backgrounds contrast too little with colors of CSs. Thus, we used a gray background as was
used in other experiments (Craddock et al., 2014, for example).
3. Time choices according temporal contiguity
In Pavlovian conditioning, high rates of conditioning are seen to be facilitated by their temporal
duration being short as well as the temporal relationships between the onsets of the two events
(Pavlov, 1927). For example, a close proximity in time between two events is necessary for the
establishment of first- and higher-order conditioning. However, the role of temporal contiguity
was little considered in the traditional theories of associative learning (e.g., Pearce & Hall,

33
1981 ; Rescorla & Wagner, 1972). According to those models, animals do not learn the
temporal relationships between two events in Pavlovian conditioning preparations.
3.4.Temporal coding hypothesis :
Somewhat more recently, some authors proposed the so-called temporal coding hypothesis
(Barnet et al., 1991 ; Miller et Barnet, 1993), which posited that temporal information between
two events are necessary for the establishment of Pavlovian paradigms. Specifically, Barnet et
al. (1991) focused on higher order conditioning and argued that higher order stimuli (i.e., CS2)
were established as predictors of first order stimuli that were associated with USs. Their studies
supported the view that simple contiguity between two events was sufficient for associative
acquisition in first order conditioning and SPC.
Barnet et al. (1991) used an SPC procedure with rats in which sounds and lights served as CS3-
CS1 and CS4-CS2, which were presented in a first phase of treatment. In a second phase, first
order conditioning was implemented using forward or backward order training (i.e., CS1 US
in forward order conditioning ; US CS2 in backward order conditioning), associating CSs
with a loud sound which elicited a conditioned response consisting of suppression of drinking.
CS1 and CS2 were presented for 5s whereas CS3 and CS4 10s. More specifically, Barnet et al.
first presented CS4 for 5s alone before presenting CS2 for 5s. The same was done for CS3 and
CS1. In the second phase, the US was a 0.5s, 0.8 mA foot shock, and was presented both before
CS2 (i.e., backward order) and after CS1 (i.e., forward order). There was no gap between paired
events (i.e., neither in Phase 1 nor in Phase 2). Barnet et al. observed SPC responding after both
backward and forward conditioning. Notably, there was a higher conditioned response rate with
backward conditioning compared to forward conditioning. Thus, the authors highlighted the
important role of temporal information for encoding US-CS relationship influencing
conditioned responses after higher order stimulus presentations, using short time intervals
between event occurrences.
Matzel, Held, and Miller (1988) examined SPC using forward, simultaneous, and backward
arrangements. In that study, duration of CSs (i.e., click and tone) and of a constant current US-
(i.e., foot shock) were equally presented for 5s. SPC was observed after forward, simultaneous
and backward conditioning arrangements. Thus, Matzel et al. confirmed that predictive
information (i.e., forward order conditioning) was not necessary for the establishment of higher-
order conditioning and that temporal relationships between events are actually encoded as part
of associative learning.

34
3.5. In our experiment :
In a previous experiment of our own (Craddock et al., 2014), we used 2s duration in Phase 1
(i.e., CSs simultaneous pairings), first order conditioning in phase 2 (i.e., CS1-US) and then a
test trial (i.e., CS2) in typical young adults. In that study, participants were aged between 4
months and 93 years old. In pretest, I tested with the same 2s trials on a few children and a few
elderly, and observed conditioned responses. Thus, we used 2s duration trials in our SPC
paradigm. In a first phase, CSs were simulateously presented at the center of the screen for 2s
immediately followed by another pairing of CSs (Phase 1 : CS2-CS1 then CS4-CS3). In the
second phase, CS1 appeared at the center of the computer screen and was immediately followed
by a 2s US+ ; while CS3 was immediately followed by a 2s US- if participants looked at the
target zone. At the test, we presented CS2 and CS4 with 2s test trials.
4. Sensory Preconditioning Corpus
In the previous chapters, we explained the basis for our choices concerning conditioned and
unconditioned stimuli to be presented within specific 2s intervals. We used an eye-tracking
system in conjunction with a conventional computer (Dell Model Optiplex 7010) equipped with
infrared cameras that monitored eye movements (FaceLAB#5.1). At the beginning of the
experiment, participants first had to sign an informed consent form (see Appendix 1) where
they read in French, « The duration of the experiment is approximately 10 minutes. During this
time, you will be exposed to different stimuli that appear on the computer screen. Your eye
movements will be recorded with an eye-tracking system to determine your visual fixation
times. This experiment is composed of 4 phases: a first calibration phase necessary for good
monitoring by the eye-tracking system; a second phase in which two stimuli will appear
simultaneously; a third phase in which a stimulus will appear and will be followed or not
followed by another stimulus. Finally, there will be a test phase composed of stimuli already
observed. ». Then we provided only one oral instruction which was « Please sit dawn and look
at the computer screen » before the beginning of the experiment. Our SPC paradigm consisted
of the three phases described below.
4.1 Phase 1 :
In a first phase, simultaneous CS2-CS1 and simultaneous CS4-CS3 pairings were presented at
the center of the computer screen for 2s each. See Figure 10.

35
Figure 10 : Representations of simultaneous CS2-CS1 and simultaneous CS4-CS3 pairings in
Phase 1.
We counterbalanced the position of CSs in pairing presentations : sometimes CS1 was
presented on the left apparatus CS2-CS1 ; sometimes on the right. The same thing was done
with CS4-CS3 pairings. Our goal was to avoid some irrelevant learning : participants did not
have to learn the spatial localisation of one CS but had to learn color and shape CS. At the end
of Phase 1, eye gaze on the CS2-CS1 and CS4-CS3 zones was recorded (i.e., times of visual
fixation on each of these zones).
4.2 Phase 2 :
At the beginning of the second phase, CS1 appeared at the center of the screen and was
immediately followed by a fixation cross in the appropriate zone of the screen. As soon as
participants looked at the cross, an US+ was delivered for 2s (see Figure 11). To avoid the use
of instructions, we shaped conditioned responses with visual guidance. Specifically, we used a
stimulus fading procedure described by Krantz and McClannahan (1998) in which stimuli first
appeared in full lines before being presented as dots as shaping progressed (see below for
further description of the shaping procedure). For each participant, US+ was always presented
in the same US zone, randomly assigned between four zones and the zone that the participants’
looking at produced US- was also randomly assigned to each participant and consistent within
each participant.

36
Figure 11 : Representation of CS1 US+ in Phase 2 with visual guidance using a full-line
cross. The cartoon movie was presented when participants looked on the zone indicated by
the red box (which participants did not see).
Concerning CS3, its first presentation was followed by an aversive sound (i.e., US-) in order to
expose participants to all contingencies. Then, CS3 appeared alone at the center of the screen
and was immediately followed by a 2s US- only if participants looked at the US+ zone. If
participants did not look at the US+ zone during CS3 presentations, no US- was delivered and
trial terminated after 2s (see Figure 12).
Figure 12 : Representation of CS3 US- in Phase 2 with visual guidance using a full-line
cross. The aversive sound was emitted when participants looked on the targeted zone
indicated by the red box (which participants did not see).
We used an acquisition criterion to fade out the visual guidance within successive [CS1 US+]
and [CS3 US-] trials. Specifically, after three successive anticipatory responses toward US+
upon CS1 presentations and three successive avoidance responses of US- upon CS3
presentations, the full cross became a dotted cross according to conventional behavioral fading
procedures (see Krantz & McClannahan, 1998). Then, the dotted cross was completely removed
following three consecutive correct anticipatory and avoidance responses. Thus, at the end of
the second phase, all participants succeeded in anticipating the US+ by looking at the US+ zone
after CS1 presentation ; while avoiding US- by avoiding the US+ zone after CS3 presentation.
As soon as the CS1 appeared, participants looked at the US+ zone. Moreover, participants did

37
not look at the US+ zone when CS3 appeared to avoid the US- presentation (see Figures 13 &
14).
Figure 13 : Representation of CS1 US+ in Phase 2 without visual guidance. As soon as CS1
appeared, participants typically looked at the US+ zone.
Figure 14 : Representation of CS3 US- in Phase 2 without visual guidance. As soon as CS3
appeared, participants typically avoided US- presentation by not looking at the US+ zone.
We further constrained the SPC procedure so that participants had to look first at the CSs before
looking at any zones of the screen for an outcome to occur. Thus, participants had to look first
at the CS1 presented before looking at the US+ zone for the movie clip to be presented;
correspondingly they had to first look at the CS3 before looking at other zones in the computer
screen except the US+ zone to avoid the loud noice. If participants looked at the US+ zone
directly after CS1 appearance, the eye tracker recorded a « 1 » response. If participants looked
another zone before targetting the US zone after CS1 presentation, the eye tracker recorded a
« 0 ». After CS3, if participants looked at any zone except the US+ zone, that trial was coded
as a « 0 » for the SPC sensory preconditioning task ; additionally, we recorded eye gaze for
each zone. If participants failed in Phase 2 (i.e., did not anticipate the US+ and/or did not avoid
the US-), the experiment ended after 20 minutes of unsuccessful training (i.e., participants who
did not reach the learning criterion were eliminated from the experiment). Thus, participants
who reached our experimental task criterion were tested during the next 7-15 minutes, while

38
participants who failed could try during 35 minutes before being stopped and removed from
our experimentation (i.e. calibration time of 15 minutes + 20 minutes in Phase 2).
4.3 Test :
Following Phase 2, we tested CS2 only one time and CS4 only one time, because of quick
extinction effects that have been reported following higher order stimuli presented without USs
(Maztel et al., 1988). We counterbalanced across participants the test order : sometimes CS2
was tested first, sometimes CS4 was (Test : CS2 / CS4, or CS4 / CS2).
When CS2 was presented at test during a 2s trial, we recorded eye gaze on each computer zone.
Because CS2 had been paired with CS1 in Phase 1, and CS1 being associated with US+ in
Phase 2, we assumed that a conditioned response would be observed in the US zone after the
CS2 presentation. When CS4 appeared, we expected no eye gaze on the US- zone, because CS4
was firstly paired with CS3 in Phase 1, and CS3 had been paired with the US- in Phase 2. See
Figure 15.
Figure 15 : Representation of CS2 and CS4 tests. The red box was not seen by participants
and was only used by the computer to automatically define the targeted zone.
Our total experiment duration was approximately 7-15 minutes, depending on participants’
performances in Phase 2. If participants failed in Phase 2 (i.e., do not anticipate the US+ and/or
do not avoid the US-), the experiment ended after 20 minutes of incorrect responses in Phase
2. Thus, participants who quickly reached our experimental training criteria were tested within
7-15 minutes, whereas participants who failed could try for up to 35 minutes before being
stopped and removed from the experiment. Concerning the location of US zone, we
counterbalanced the position of each zone across participants, which was always consistent for
each participant. Thus, US zone could be at the bottom left, bottom right, top left or top
right (see Figure 16). The size of each zone was the size of the US+ (i.e., 13 cm x 8 cm), which
means there was a center zone which was not monitored by eye-tracking system. This is an
additional weakness of the experimental paradigm. When participants looked anywhere other

39
than at one of the four monitored zones, we did not monitor where participants were looking,
including in this center zone.
Figure 16 : Possible spatial configurations across participants. The black boxes were not seen
by participants and were only considered by computer software.
5. Choice of measures (i.e., dependent variable) :
Eye tracking systems record a large amount of raw data. From these data, I focused on different
possible measures such as reaction times (RTs) between CSs presentations and conditioned
response emissions, distance traveled by the participants’ gaze, participants’ pupil diameters,
and finally eye gaze duration. In this part, I will introduce some possible recorded measures,
and explain why I focused on eye gaze as the dependent variable across all of the experimental
groups.
5.1 Reaction times between CSs presentations and CR, and distance traveled by the
eye’s participants :
In a previous study of ours focused on SPC (Craddock et al., 2014), we used RTs of participants
who had to press a button « Yes » or « No » to say whether one specific CS was a predictor of
a US+. Contrary to the present experiments, that previous study did not use an eye-tracking
system. In the present series, I first looked at RTs across participants groups (see Table 2).

40
Group N’participants RT mean (s) SD min (s) max (s)
adults 10 pairings 20 1,038 0,54 0,1 1,98
adults 20 pairings 20 1,217 0,52 0,12 1,99
seniors 10 pairing 20 1,109 0,57 0,1 1,99
seniors 20 pairings 20 1,341 0,61 0,13 1,99
adults a spatial 20 1,09 0,51 0,11 1,98
adults b spatial 20 1,172 0,53 0,1 1,99
babies 24 1,001 0,51 0,1 1,99
typical children 20 1,174 0,53 0,11 1,99
verbal autistic children 11 1,25 0,56 0,1 1,98
non-verbal autistic
children 14 1,182 0,55 0,1 1,99
typical seniors 20 1,402 0,59 0,12 1,99
seniors with dementia 20 1,388 0,54 0,11 1,99
Table 2 : Reaction time means (s), Standard Deviation, min (s) and max (s) values for each
experimental group.
I noticed a huge variability in RTs within participants and also large inter-participant
differences, perhaps because of the visual aspect of conditioned responses used. For example,
see in tables 3 and 4 two participants’ results at the end of Phase 2 and Test – RTs are written
in red. « NaN » signifies that the participant did not look at the US zone after looking at the CS.
We concluded that RTs were poor measures for my experimental task because of the huge
intra-participant and inter-participant variability of RTs as have also been highlighted by other
studies like Kellough et al. (2008), who ultimately focused on eye gaze rather than other
measures. Our inspection of the data led to the same concerns with respect to the distance
traveled by participants’ eyes. Moreover, the distance between CS1 and US+ was always the
same because of the reinforcement corridor, where participants firstly had to look at CS1 before
targeting the US+ zone that delivered the 2s US+. The same problem arose for the test of CS2.

41
Participant X1 :
Time
elapsed
Number of
trial Phase CS Response Cotation RT (s)
103.004 21 2 3 0 1 NaN
112.760 22 2 1 1 1 0.225
119.249 23 2 3 0 1 NaN
126.644 24 2 1 1 1 0.000
135.264 25 2 3 1 0 1.603
141.748 26 2 3 0 1 NaN
149.196 27 2 1 1 1 0.121
155.691 28 2 3 0 1 NaN
163.312 29 2 1 1 1 0.804
169.813 30 2 3 0 1 NaN
Time Trial Phase CS Behavior Point RT
178.199 31 3 2 1 1 1.324
186.577 32 3 4 0 1 NaN
Table 3 : Example of RTs observed in Phase 2 and Test for Participant X1.
Participant X2 :
Time
elapsed
Number of
trials Phase CS Response Cotation RT (s)
105.671 21 2 1 1 1 1.704
112.164 22 2 3 0 1 NaN
121.396 23 2 1 1 1 1.689
127.951 24 2 3 1 0 0.520
134.439 25 2 3 0 1 NaN
143.579 26 2 1 1 1 0.709
150.057 27 2 3 0 1 NaN
159.156 28 2 1 1 1 1.685
165.636 29 2 3 0 1 NaN
Time Trial Phase CS Behavior Point RT
174.044 30 3 2 1 1 0.107
182.420 31 3 4 0 1 NaN
Table 4 : Example of RTs observed in Phase 2 and Test for Participant X2.

42
5.2. Pupil diameters :
A central limitation of my eye tracking equipment is that no pupil diameters could be recorded
because of technological reasons. It could have been an interesting measure as reported in
several published papers for emotional aspect (e.g., Bradely et al., 2008 ; Morimoto et al.,
2000).
5.3. Eye gaze :
Finally, I examined eye gaze as an efficient measure to test the SPC paradigm I created. Eye
gaze is considering as an efficient measure in visual attention paradigms because of its universal
aspect (e.g., Kellough et al., 2008 ; Morimoto et al., 2005). Eye gaze data have been used in
ophthalmology, neurology, psychology, and related areas to study oculomotor characteristics
and abnormalities, and their relation to cognition and mental states. The main advantage of eye
gaze is that there are poor intra-participant and inter-participant variability with short duration
presentations (Morimoto et al., 2005). In our experimental task, we used this kind of measure
because we wanted to study the differences of associative responses across the lifespan, without
any bias caused by intra-individual differences about latences of ocular reflexes (as observed
with RTs). Thus, the eye tracking system accurately recorded eye gaze for each zone of the
computer screen for each participant. Specifically, after 2s of CS2 and 2s of CS4 presentations,
eye gaze was recorded for each zone with respect to the last 2s.
For each participant, we obtained the following data concerning the amount of gaze time spent
in each zone of the computer screen (see Table 5) :
Participant 35 ZUS(s) Z1(s) Z2(s) Z3(s)
CS1 85.62 0 14.38 0
CS2 46.39 15.19 5.12 33.3
CS3 0 100 0 0
CS4 0 0 65.39 34.61
37 ZUS(s) Z1(s) Z2(s) Z3(s)
CS1 100 0 0 0
CS2 100 0 0 0
CS3 0 0 100 0
CS4 0 0 0 0
Table 5 : Representations of the amount of time of eye gaze data for participants numbers 35
and 37 on ZUS, Z1, Z2, and Z3, after CSs presentations.

43
For CS1 and CS3, we obtained the mean percent of eye gaze by using all trials in Phase 2 where
CS1 and CS3 were presented without any visual guidance. For CS2 and CS4, we obtained the
mean percent of eye gaze for each single trial in Test after CS2 and CS4 presentation. As
explained in next chapters, mean percent of eye gaze for each single trial after CS2 and CS4
presentations were transformed in dichotomous measure.
As can be seen in Table 5, participants typically targeted one zone after a CS presentation.
Participant 37 looked only US zone after CS1 presentation, the same thing for CS2 (i.e.,
quotation « 1 »). After CS3 presentation, we observed a high visual fixation in Z2, while
participants did not look at the zones at all after CS4 presentation (i.e., quotation 0). In that
case, participant looked at the center of the screen where the stimulus appeared. If participants
did not look at the computer screen (which sometimes happened at the beginning of the
experiment, but not after Phase 1), the experimental task was momentarily stopped until the
participant looked again at the computer screen. If this happens, a « Err » message was recorded
and participant was removed from our experiment.

44
CHAPTER 3 :SPATIAL CONTIGUITY AND SPC
In order to create an experimental task to assess SPC in humans without using any instructions,
we investigated some parameters considered to be central to the establishment of higher order
conditioning in other species. Indeed, temporal and spatial contiguity are often discussed as
being critical in first and higher order conditioning. That is why the role of spatial contiguity is
discussed below.
1. Introduction :
Warren (1921) reported Aristotle’s thoughts from On memory and Reminiscience which
focused on the role of spatial and temporal contiguity in the establishment of associative
learning. Based on observation, Aristotle proposed that the two closer events were physically
and temporally, the better the subsequent recall of one given presentation of the other. Since
then, many studies have confirmed his reflections in the temporal domain as underlined by
Savastano and Miller (1998), while the role of spatial contiguity has been less studied.
1.1. First order conditioning and spatial contiguity :
Wasserman, Franklin, and Hearst (1974) is one of the better known reports that focused on the
role of spatial contiguity in Pavlovian conditioning. Here, the behavior of pigeons pecking a
response key to obtain food was studied. In a first phase, a light was paired with the delivery of
feed independent of the pigeon’s behavior. Subsequently, at the mere presentation of this light,
the pigeon pecked the keylight obtaining food. In parallel, another light discriminated by the
pigeon was associated with key pecking not being reinforced with food. When this light
appeared in the box, the pigeon did not go to the food hopper and did not get food. In a second
phase, Wasserman et al. manipulated the spatial location of these lights, bringing them closer
to the hopper. In an experimental condition, the lights appeared near the response key. In
another condition, these lights were positioned opposite the feeder. Wasserman et al. observed
that the accuracy of the discriminative behavior was higher in the condition where the CS+
keylight was close to the hopper (source of the US). Although these results are questionable
because of possible cost-of-response biases in the condition that the two stimuli were distant
from each other, the authors demonstrated that the spatial contiguity between these two stimuli
favored emergence of the target behavior.
Cabrera and Vila (1986) found similar results in a learning task where the pigeon had to press
keylight (CS) delivering food when a light (CS) appeared with a small or large located distance
from the lever. In one of their experiments, two experimental conditions were tested: a first in

45
which the keylight was close to the hopper and a second where this light was placed at the
opposite end away from it. Thus, spatial contiguity was tested with 5 possible localization (i.e.
A ; B ; C ; D and E) : A condition was the closest zone to the food hopper, B was a position
with a little more distance between the keylight and the hopper, until the farthest placement E
where the distance between keylight and hopper was greatest. Cabrera and Vila observed that
the rate of conditioned responses was higher in the condition where the light was close to the
hopper, compared to the condition where the keylight appeared at its opposite extreme.
Similarly, Christie (1996) demonstrated the role of spatial contiguity in a task with a
reinforcement delay. Doves were placed in a box where a light (CS) was placed from 11 cm or
74 cm from a hopper (US) which allowed access to food. In addition, the time to obtain food
after the light came on ranged randomly up to 5 seconds for each dove. Mean proximity and
number of approaches were recorded in both experimental conditions. Christie (1996) observed
a higher number of approaches in the condition in which the light was placed close (11 cm) to
the keylight, regardless of the delay in obtaining the food.
Thus, the role of spatial contiguity had been demonstrated in first order conditioning. The
studies previously described highlighted the need to experimentally assess the role of spatial
contiguity in higher order conditioning, specifically on the role of spatial contiguity between
CS2-CS1 pairings.
1.2.Higher order conditioning and spatial contiguity :
Unfortunately, there are very few studies focused on the role of spatial contiguity in the
establishment of higher order conditioning. One of those is the famous study of Rescorla and
Cunnighman (1979). In that study, Rescorla and Cunnigham presented to pigeons a CS1
associated with a US in Phase 1, followed by several presentations of CS2-CS1 pairings in
Phase 2. More specifically, a light (CS1) was associated with pecking a response key, thus
enabling food delivery. Later, this light (CS1) was paired several times with another light (CS2)
without presence of the response key. Second-order conditioning was observed when the
conditioned response of pecking the key was elicited after CS2 presentation. Here, Rescorla
and Cunnigham manipulated the distance between the two CS2-CS1 stimuli: these stimuli were
either presented separately or close together. In one condition, CS2 and CS1 were presented
together in the same side of the box ; in another condition one CS was presented on one side of
the box and the other CS at the opposite side. Results showed a higher conditioned response
rate of pecking in the presence of CS2 alone in the condition when CS2 and CS1 had been

46
presented on the same side of the box, compared to the response rate observed in the condition
where CS2 and CS1 were presented spatially separated. Thus, Rescorla and Cunnigham
highlighted the role of the spatial contiguity in the establishment of higher order conditioning
using a second order conditioning procedures (not to be confused with SPC in which the two
phases of training are reversed relative to second order conditioning).
There is, however, a huge difference between the tasks described previously and our
experimental task. All those experiments implied a spatial contiguity between a conditioned
stimulus (CS) and an unconditioned stimulus (US, i.e., a biologically significant stimulus)
during the pairings presentations (Cabera & Vila, 1986, Christie, 1996, Wasserman, et al.,
1974). The same is true for the second order procedure mentioned above: the US was paired
with CS1 in phase 1 (Rescorla & Cunnigham, 1979). Critically, West et al. (2009) argued that
the success of second order conditioning depended on the US to receive greater attention
compared to other stimuli used in higher order conditioning. In that study, several biological
determinants were presented to humans. Precisely, participants were exposed to neutral faces
(NS) compared to facial expressions of joy and anger (US). Gaze time was recorded for all
faces. West et al. observed a higher gaze time on faces with facial expressions of joy and anger
compared to neutral faces. In addition, the attention paid to neutral faces was higher when these
initial NSs that had been paired with faces of joy and anger than when they had not been. When
West et al. paired neutral faces with joy and anger faces (NS-CS), the neutral stimuli were
more looked at more after being paired with CSs.
1.3. In our experiment :
To our knowledge, no study of SPC has ever manipulated spatial contiguity. Here we asked
whether, when the two neutral stimuli (CS2 and CS1) are close to each other during Phase 1,
conditioned responding to CS2 at the test would be stronger than when CS2 and CS1 were
more distant from each other. The present experiment examined the role of spatial contiguity
using two experimental conditions: a space between CS2 and CS1 (A) and no space between
CS2 and CS1 (B). The procedure consisted of three phases: Phase 1 in which two neutral
stimuli (CS2 and CS4) were each simultaneously paired with another neutral stimulus, that
is, CS2-CS1 and CS4-CS3 were presented; and Phase 2 in which CS1 was sequentially paired
with a US+ (potentially making it an effective CS for US+) and CS3 was paired with a US-
(potentially making it an effective CS for US-). Cue offset and US onset were simultaneous
in Phase 2. Then, in Phase 3 all four cues were tested independently. Critically, in Phase 1 the

47
two stimulus elements of each pair were separated by 100 pixels in Condition A, whereas they
were immediately adjacent in Condition B. Except for the different in inter-stimulus distance
during Phase 1, exactly the same procedures were used in Conditions A and B.
2. Method :
2.1. Participants :
Forty French university students (27 females and 13 males; 18-30 years old) volunteered;
participants were randomly assigned to one of two groups (A or B, ns = 20). Each participant
read and signed an informed consent form prior to the experiment. The experiment had been
approved by the University of Lille Institutional Review Board.
2.2. Apparatus :
An eye-tracking system was used in conjunction with a conventional computer. Participants
faced a computer screen (Dell Model Optiplex 7010) equipped with infrared cameras that
monitored eye movements. The eye-tracking system (FaceLAB#5.1) recorded the
participants’ eye movements including visual fixations. There was no physical restraint of
participants’ heads because the system was programmed to track the participants’ visual
focus, even when they moved their heads. Thus, participants were only required to watch the
computer screen. This system facilitated our not having to provide participants with any
explicit instructions.
2.3. Materials :
The CSs were four 6 cm x 6 cm colored squares (red, blue, green, and yellow), each containing
different shapes (triangles, squares, rounds, or stars). For each participant, the CSs were
randomly created combining a unique color and a unique shape (see Chapter 2 for examples).
Thirty 2s, video cartoon clips of pleasant scenes were used as US+ and one of them, randomly
selected without replacement, was presented immediately after each correct response during
Phase 2. Each video included action by cartoon characters such as Kung Fu Panda, Dragons,
or Kuzco. A single 100 dB, 2s, unpleasant sound was used as US- and was emitted from the
computer’s two speakers for each error during Phase 2.
The four colored squares were presented at the center of the computer screen. The 2s
presentations of the US+ were presented in a 13 cm x 8 cm rectangle in a corner of the screen
and US- (an aversive noise) was also produced by the computer. The experimental procedure
was controlled by Matlab 7.0 software, which was also used to analyze the data.
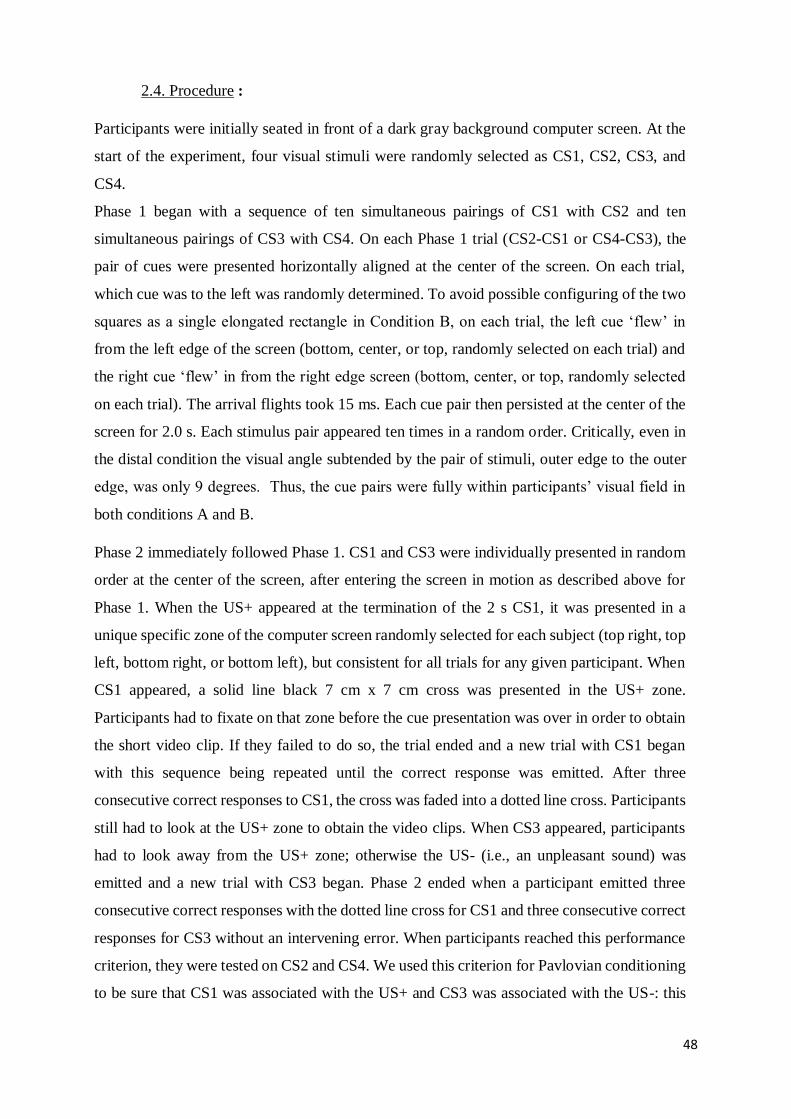
48
2.4. Procedure :
Participants were initially seated in front of a dark gray background computer screen. At the
start of the experiment, four visual stimuli were randomly selected as CS1, CS2, CS3, and
CS4.
Phase 1 began with a sequence of ten simultaneous pairings of CS1 with CS2 and ten
simultaneous pairings of CS3 with CS4. On each Phase 1 trial (CS2-CS1 or CS4-CS3), the
pair of cues were presented horizontally aligned at the center of the screen. On each trial,
which cue was to the left was randomly determined. To avoid possible configuring of the two
squares as a single elongated rectangle in Condition B, on each trial, the left cue ‘flew’ in
from the left edge of the screen (bottom, center, or top, randomly selected on each trial) and
the right cue ‘flew’ in from the right edge screen (bottom, center, or top, randomly selected
on each trial). The arrival flights took 15 ms. Each cue pair then persisted at the center of the
screen for 2.0 s. Each stimulus pair appeared ten times in a random order. Critically, even in
the distal condition the visual angle subtended by the pair of stimuli, outer edge to the outer
edge, was only 9 degrees. Thus, the cue pairs were fully within participants’ visual field in
both conditions A and B.
Phase 2 immediately followed Phase 1. CS1 and CS3 were individually presented in random
order at the center of the screen, after entering the screen in motion as described above for
Phase 1. When the US+ appeared at the termination of the 2 s CS1, it was presented in a
unique specific zone of the computer screen randomly selected for each subject (top right, top
left, bottom right, or bottom left), but consistent for all trials for any given participant. When
CS1 appeared, a solid line black 7 cm x 7 cm cross was presented in the US+ zone.
Participants had to fixate on that zone before the cue presentation was over in order to obtain
the short video clip. If they failed to do so, the trial ended and a new trial with CS1 began
with this sequence being repeated until the correct response was emitted. After three
consecutive correct responses to CS1, the cross was faded into a dotted line cross. Participants
still had to look at the US+ zone to obtain the video clips. When CS3 appeared, participants
had to look away from the US+ zone; otherwise the US- (i.e., an unpleasant sound) was
emitted and a new trial with CS3 began. Phase 2 ended when a participant emitted three
consecutive correct responses with the dotted line cross for CS1 and three consecutive correct
responses for CS3 without an intervening error. When participants reached this performance
criterion, they were tested on CS2 and CS4. We used this criterion for Pavlovian conditioning
to be sure that CS1 was associated with the US+ and CS3 was associated with the US-: this

49
first order conditioning is known to be necessary to reveal any SPC established during Phase
1 (e.g., Rescorla, 1980).
CS2 and CS4 were each separately tested once, entering in motion as described before. We
used a single test trial for each cue to avoid extinction effects that would have permitted early
test trials to reduce the sensitivity of subsequent test trials. The critical question was whether
participants would anticipate the appearance of a movie clip when CS2 or CS4 was presented.
Testing was in extinction; that is, even if participants looked at the US+ zone, no video clip
was presented. To avoid possible order-of-testing effects, we controlled for whether the first
test trial was a CS2 or a CS4 presentation. For 10 participants in each condition, testing began
with the CS2 trial followed by the CS4 trial; for the other ten participants in each condition,
the order was reversed.
The experiment used one dependent variable: eye gaze on the different zones of the computer
screen which was recorded by the eye-tracking system and Matlab 7.0. During Phase 2 and
testing, eye gaze to different zones was recorded from the beginning of each trial (i.e., CS
onset) to its termination (i.e., time of CS termination regardless of whether a US was
presented). For CS1 and CS3 presentations during Phase 2, percent of CS1 trials and percent
of CS3 trials with CRs were calculated for each participant. This percentage per participant
was then used to compute means eye gaze across participants within each of the two groups.
The same procedure was used for CS2 and CS4 test trials except there was only one trial per
CS. Thus, we used the percentage of participants responding to CS2 and CS4 instead of mean
eye gaze. CS2 and CS4 were considered as targeted if visual fixation times were higher in the
US zone compared to othercomputers’ zones after CSs presentations.
3. Results :
All results were collected at the end of the experiment by the Matlab© software, and were
analyzed with conventional statistical techniques. Using the G*Power 3.1 software (Faul,
Erdfelder, Buchner, & Lang, 2009), we calculated the estimated sample size necessary to
observe an average effect (f = 0.5) with an α = 0.05 and a power of 0.80. With the main analysis
viewed as a comparison of the means of two independent groups, we obtained a recommended
sample size of at least 106 participants, with at least 53 participants per group. However,
despite this recommended group size, in this study we managed to recruit only 40 participants,
with 20 in each group. Hence, we conducted our analysis with nonparametric statistics to
our interpretations of these results.
3.1. Statistical issues :

50
Some floor and ceiling effects were observed and variance in the results was artificially low
across participants within our experimental groups. Moreover, our samples did not yield
normality in the data within groups. See below the statistical nonparametric tests used in order
to illuminate the results of the experimental task with p (<.05).
- The Mann-Whitney U test (also called the Mann-Whitney Wilcoxon) is a
nonparametric test of the null hypothesis that is equally likely that a randomly selected
value from one sample will be greater or lesser than another value selected from a
second sample. The Mann-Whitney U test does not require that the data be normally
distributed and is considered to be an efficient test to determine whether two
independent samples come from the same distribution. We used the Mann-Whitney U
test in previous studies (i.e., Craddock et al., 2014 ; Renaux et al., 2017).
- Fisher’s exact test : Fisher’s exact test is a statistical significance test used in the
analysis of contingency tables. Fisher’s exact test is commonly used when sample sizes
are small, although the test is efficient for all sample sizes. Thanks to Fisher’s test, the
significance of the data’s deviation from the null hypothesis can be calculated rather
than relying on an approximation that becomes exact only in the limit as the sample size
grows to infinity, as with many statistical tests.
- The Cliff's Delta statistic is a nonparametric effect size measure that quantifies the
amount of difference between two groups of observations beyond p-value interpretation.
3.2. Statistical analysis :
3.2.1. Phase 1 :
Figure 16 shows visual fixation duration for CS1-CS2 and CS3-CS4 trials presented in Phase
1. There was no statistical difference in visual fixation duration between the A and B
conditions (respectively, U = 144.00, p = .13 and U = 136.50, p = .09) nor between the two
types of stimuli pairs (for condition A, W = -.71, p = .48 and for condition B, W = -.83, p =
.41). That is, visual fixation duration was approximately the same for CS1-CS2 and CS3-CS4
presentations in both conditions: 87.45% of visual fixation for CS1-CS2 in condition A and
82.79% in condition B; 89.70% of visual fixation for CS3-CS4 in condition A and 82.51% in
condition B. Note that the statistically nonsignificant tendency for more fixation time in
condition A than condition B would, if anything, favor better conditioning in condition A than
B. This would be contrary to the expectation that the closer spatial contiguity of cues in
condition B than A would encourage stronger conditioning in condition B than A.

51
Figure 16. Mean percent of Phase 1 trial duration in which participants visually fixated on the
stimulus pairs (CS2-CS1 and CS4-CS3) at the center of the screen. With 2 s trials and 10 trials
of each type, the maximum fixation time was 20 s for each stimulus pair. Error brackets
represent SEMs.
3.2.2. Phase 2 :
Phase 2 first-order conditioning results are depicted in Figure 17. Not surprisingly, there was
higher responding to CS1 than to CS3 both in condition A (W = 151, p = .005, Cliff’s d = 1.0)
and in condition B (W = 166, p = .002, Cliff’s d = 0.9). Thus, all participants finally
approached the US+ location when CS1 appeared and avoided the US- location when CS3
was presented. No interaction was observed between Condition and Cue. Consequently, it is
implausible that any differences observed in SPC test performance were caused by differences
other than those in Phase 2 conditioning.
0
10
20
30
40
50
60
70
80
90
100
CS1-CS2 CS3-CS4
Per
cen
t of
Ph
ase
1 t
rial
s w
ith
fix
atio
ns
on
th
e
stim
ulu
s p
air.
Stimuli pairings
A B

52
Figure 17. Mean percent of CS1 and CS3 trials with visual fixation to the US+ video site
during Phase 2. Error brackets represent SEMs.
3.2.3. Test of CS2 and CS4 :
Figure 18 displays the number of participants exhibiting SPC responses at the test as defined
by visually responding to CS2 (i.e., visual fixation to the US+ site). In Condition A, SPC was
observed in only 8 of the 20 participants (i.e., 40%) compared to 16 of the 20 in Condition B
(i.e., 80%), Fisher’s exact test p = .013. Thus, we demonstrated that SPC is greater when the
neutral stimuli in Phase 1 were presented adjacent compared to a condition when there was a
distance between them. There was no difference between conditions A and B in the low
percent of participants with saccades to the site of US+ in response to CS4. One cannot
differentiate here between participants actively looking away from the site of US+ and no
SPC to S4 having occurred. Notably, our SPC task actually consisted of two tasks,
approaching the US+ location given CS2 and avoiding the US+ location given CS4. However,
as avoiding the US+ location on CS4 test trials was not distinguishable from an absence of
learning, only the greater responding to CS2 in condition B in contrast to condition A is
indicative of increased SPC with greater spatial contiguity.
0
10
20
30
40
50
60
70
80
90
100
CS1 CS3
Per
cen
tage
of
resp
on
ses
in P
has
e 2
Stimuli CS1 and CS3 across Conditions A & B
A B

53
Figure 18. Percentage of participants during the SPC test exhibiting visual fixation to the
video site during the CS2 test and absence of saccades to the video site during the CS4 test in
conditions A and B.
4. Discussion :
Our results show a greater SPC response in condition B compared to condition A, whereas
there was no difference between the two conditions in first order responding to CS1 nor to
CS3. The experiment demonstrated that spatial contiguity enhances the formation of
associations in SPC. When neutral stimuli were adjacent (i.e., condition B), we observed
greater SPC compared to a condition in which the CSs were separated (i.e., condition A). This
observation replicates what previous studies found with regard to the effect of spatial
contiguity on higher order conditioning when one of the stimuli had already been made
biologically significant through prior conditioning (i.e., second order conditioning; Rescorla
and Cunningham, 1979). Thus, the present observations lend support to the conclusion that
spatial contiguity, like temporal contiguity, facilitates higher order conditioning just as it is
well known to facilitate first order conditioning.
The importance of spatial contiguity to conditioning is already incorporated into numerous
applications. For example, the benefits of good spatial contiguity are already used in applied
behavior analysis for training individuals with developmental disabilities (Barnes, Smeets, &
Leader, 1996). Here we observed higher conditioned responses to a neutral stimulus that was
previously paired with another neutral stimulus when the two cues were closer together in
space. As this parallels prior observations concerning the important of spatial proximity for
first order conditioning, SPC’s dependence on spatial contiguity seems to add weight to the
0
10
20
30
40
50
60
70
80
90
100
CS2 CS4
Per
cen
tag
e of
par
tici
pan
ts r
esp
on
din
g to
CS
2 a
nd C
S4.
Stimuli across Conditions A & B
A B

54
view that associative learning between neutral stimuli is driven by the same processes that
govern the acquisition of associations between stimuli when one of them is biologically
significant. Notably, this conclusion is contrary to that of at least some other research (e.g.,
Rescorla, 1981) that suggests that SPC involves different processes than first order
conditioning.
One final aspect of the present data is worthy of note. Associations between two adjacent stimuli
were established despite participants’ being given no instructions and the associates both
lacking biological significance. This suggests that SPC is a default process that occurs whenever
subjects attend to presented stimuli. This preparation in conjunction with our observation of
SPC could provide an opportunity to use behavioral procedures to assess basic associative
learning in individuals lacking verbal abilities (e.g., dementia, infancy), as SPC responses such
as ours can be obtained without using any instructions or restraints.

55
CHAPTER 4 :
NUMBER OF STIMULI PAIRINGS IN PHASE 1 OF SPC IN ADULTS
Another concern presents in the first and higher order conditioning literature in rats and pigeons
is the number of stimuli pairings used in experimental tasks. Because we wanted to test the
same conditioned response across ages (i.e., young adults and the elderly), we had to examine
the role of the number of pairings on conditioned responding – seeking a number that would
work the same for young and elderly humans.
1. Introduction :
Many studies have tried to evaluate the minimum required number of CS-US pairings for first
order conditioning (for review, see DeHouwer, Thomas, & Baeyens, 2001, p.856-857). For
example, several studies showed that the rate of conditioned response increased monotonically
with the number of stimuli pairings. Baeyens, Eelen, Crombez, and VanDerBergh (1992)
observed such a phenomenon on electrodermal responses after visual stimuli presentations. In
that study, stimuli were presented 2, 5, 10 or 20 times. Baeyens and al., observed a higher rate
of electrodermal response after ten stimuli presentations. Then, a decrease of the response rate
was observed after the tenth pairing until the end of the experiment. However, authors
demonstrated a better recall of those stimuli after 20 presentations and stated that the more the
stimuli were presented, the better its recall was.
Such conclusions were not shared by other researchers like Martin and Levey (1987). In
addition, Stuart, Shimp, and Engle (1987) demonstrated that a single CS-US pairing could be
sufficient to establish a conditioned response. In their experiment, Stuart et al., paired visual
conditioned stimuli with outcomes of negative or positive valence. Conditioned responses were
recorded starting with the first CS-US presentation. Here, Stuart and al. emphasized the
significance of the valence of the US they used, which were human facial expressions such as
happiness (US+) and anger (US-). In Pavlovian conditioning, Urcelay et al. (2012) highlighted
a phenomenon called « the post-peak depression » based on previous work by Pavlov
(1927). In a first experiment, four groups of rats received 5, 10, 20, or 50 pairings of a clicker
followed by a footshock. At tests, all rats were tested for suppression linking. Urcelay and al.
(2012) observed a decreased suppression to the CS at test after increasing the number of
reinforced trials in the training context. Precisely, the conditioned response was lower after 50
pairings compared to 5, 10, and 20 pairings conditions. There were no differences in the degree

56
of suppression response across the 5, 10, and 20 pairings groups, which is in contrast with
Baeyens’s (1992) works.
1.1. Number of stimuli pairings in higher order conditioning studies :
Few studies focused on the role of the number of stimuli pairings in the establishment of higher-
order conditioning. Prewitt (1967) was one of the first scientists to study that parameter in the
establishment of SPC. In that study, 72 rats were exposed to 0, 1, 4, 16 or 64 stimulus pairings,
one of those stimuli being paired with an emotional US in the second phase of the task. CSs
were composed of a light and a tone, with one of those then being paired with a footshock (US-
) when rats were close to a food area. Prewitt (1967) observed a higher rate of SPC after 16
stimuli pairings presented in first phase compared to other conditions. In addition, they
observed that the response rate was significantly lower after 64 stimuli pairings presented in
first phase as compared to the response rate after 16 pairings in the first phase. Prewitt discussed
the disparity of his results as compared to those of his contemporaries.
A few years later, Yin, Barnet, and Miller (1994) studied second order conditioning. In that
study, the stimuli pairings were presented 12 or 24 times in a second phase of the paradigm.
Here, sounds (CSs) were presented to rats after being associated with a footshock (US-).
Conditioned responding was observed at the test in the form of a decrease in the number of
licks in the water dispenser when CS1 or CS2 was presented. Results showed a decrease in
licking after CS1 presentation in all experimental conditions. When CS2 was presented, the
conditioned decrease in licking was greater after 12 stimuli pairing presentations compared to
24 stimulus pairings in the second phase. Yin et al. concluded that the number of stimuli
pairings was crucial in the observation of higher conditioning. Indeed, too many stimuli pairing
presentations could be antagonistic to that kind of associative learning. Subsequently, Stout,
Escobar, and Miller (2004) confirmed these results by presenting 0, 4, 20, or 100 CSs pairings
to rats, one of those stimuli then being paired with a footshock (US-). Once again, Stout and
al., (2004) observed a decrease of the conditioned stimulus control of behavior by the 20th
stimulus pairing in second phase.
Thus, those studies underline the role of the number of stimulus pairings in the establishment
of higher order conditioning when an aversive unconditioned stimulus US- was used. Here, we
note that no experiment to our knowledge focused on that experimental variable using an
appetitive unconditioned stimulus US+. One of my goals was to assess the impact of the number
of CS-CS stimuli pairings using both a US+ and a US- in the SPC paradigm.

57
1.2. In our experiment :
The number of stimuli pairings of CS2-CS1 and CS4-CS3 was thus manipulated, presenting
each stimulus pairing 10 times (condition ad10 pairings) or 20 times (condition ad20 pairings)
in the first phase of the SPC task. Specifically, CS1 was simultaneoulsy presented with CS2
several times (10 or 20 times across conditions). The same procedure was used between CS3
and CS4 presentations. In the second phase, CS1 was followed by an appetitive unconditioned
stimulus US+ while CS3 was paired with an aversive unconditioned stimulus US-. In tests,
visual fixation times were recorded for each participant to the different computer areas after
individual presentations of CS2 and CS4. This methodology was the same for both
experimental conditions, except for the number of stimuli pairings presented in the first phase
of the SPC task. In condition ad10 pairings, stimulus pairings CS2-CS1 and CS4-CS3 were
simultaneoulsy presented 10 times with the two types of trials in randon order. In condition
ad20 pairings, stimulus pairings were presented in the same way 20 times. Our hypothesis was
that we would observe a lower visual fixation rate on the US+/- zone in condition ad20 pairings
when CS2 was presented compared to condition ad10 pairings. In addition, we sought to
observe the same results showed by Prewitt (1967) with another SPC task, that is, the avoidance
of an aversive stimulus US- (i.e., in our study, the US- was a loud sound). In our experience,
such an observation would result in a low rate of visual fixation on the US+/- zone after the
presentation of CS4 in condition ad20 pairings.
2. Method :
2.1. Participants :
Forty French university students (29 females and 11 males ; 19 (min) and 35 (max) years old)
volunteered ; participants were randomly assigned to one of the two groups (ad10 pairings or
ad20 pairings, ns = 20). Each participant read and signed an informed consent form prior to the
experiment. That experiment had been approved by the University of Lille Institutional Review
Board.
2.2. Material :
An eye-tracking system was used in conjunction with a conventional computer. Participants
faced a computer screen (Dell Model Optiplex 7010) equipped with infrared cameras that
monitored eye movements. The eye-tracking system (FaceLAB#5.1) recorded the
participants’ eye movements including visual fixations. There was no physical restraint of
participants’ heads because the system was programmed to track the participants’ visual focus

58
even when they moved their heads. Thus, participants were only required to watch the
computer screen. This system facilitated our avoiding giving participants any explicit
instructions.
The CSs were four colored geometric shapes (red, blue, green, and yellow, see Figure 8
Chapter 2 for examples). Thirty 2 s, video cartoon clips of pleasant scenes were used as US+
and one of them, randomly selected without replacement, was presented immediately after
each correct response during Phase 2. Each video included action by cartoon characters such
as Kung Fu Panda, Dragons, or Kuzco. A single 100 dB, 2 s, unpleasant sound was used as
US- and was emitted from the computer’s two speakers for each error during Phase 2.
The four colored geometric shapes were presented on the center of the computer screen. The
2 s presentations of the US+ were presented in a 13 cm x 8 cm rectangle in a corner of the
screen, and US- (an aversive noise) were both produced by the computer. The experimental
procedure was controlled by Matlab 7.0 software, which was also used to analyze the data.
2.3. Procedure :
The following procedure is similar to the one presented in Chapter 3, except for the parameters
concerning the number of stimulus pairings in Phase 1 and the shapes of the CSs.
Participants were initially seated in front of a dark gray background computer screen. At the
start of the experiment, four visual stimuli were randomly selected as CS1, CS2, CS3, and
CS4. Phase 1 began with a random sequence of simultaneous pairings of CS1 with CS2 and
simultaneous pairings of CS3 with CS4. In condition ad10 pairings, stimuli pairings were
presented 10 times. In condition ad20 pairings, stimulus pairings were presented 20 times.
On each Phase 1 trial (CS2-CS1 or CS4-CS3), the pair of cues were presented contiguously,
horizontally aligned at the center of the screen. On each trial, which cue was to the left was
randomly determined. The stimuli ‘flew’ onto the screen as described in Chapter 3. Each cue
pair then persisted at the center of the screen for 2s. Each stimulus pair appeared ten times in
a random order.
Phase 2 immediately followed Phase 1. CS1 and CS3 were individually presented in random
order at the center of the screen, after entering the screen in motion as described in Chapter
3. When the US+ appeared at the termination of CS1, it was presented in a unique specific
zone of the computer screen randomly selected for each subject (top right, top left, bottom
right, or bottom left), but consistent for all trials for any given participant. When CS1
appeared, a solid line black 7 cm x 7 cm cross was presented in the US+ zone. Participants
had to look at that zone before the cue presentation was over in order to obtain the short video

59
clip. If they failed to do so, the trial ended up and a new trial with CS1 began until the correct
response was emitted. After three consecutive correct responses to CS1, the cross was faded
into a dotted line cross. Participants still had to look at the US+ zone to obtain the video clips.
When CS3 appeared, participants had to look away from the US+ zone; otherwise the US-
(i.e., an unpleasant sound) was emitted and a correction trial with CS3 began. Phase 2 ended
when a participant emitted three consecutive correct responses with the dotted line cross for
CS1 and three consecutive correct responses for CS3 without an intervening error. We used
this criterion for Pavlovian conditioning to be sure that CS1 was associated with the US+ and
CS3 was associated with the US-: this first order conditioning was necessary to reveal any
SPC established during Phase 1.
CS2 and CS4 were each separately tested once, entering in motion as described before. We
used a single test trial for each cue to avoid extinction effects that would have permitted early
test trials to reduce the sensitivity of subsequent test trials. We investigated whether
participants would anticipate the appearance of a movie clip when CS2 or CS4 was presented.
Testing was conducted in extinction; that is, even if participants looked at the US+ zone, no
video clip was presented. To avoid possible order-of-testing effects, we controlled for whether
the first test trial was a CS2 or a CS4 presentation. For 10 participants in each condition,
testing began with the CS2 trial followed by the CS4 trial; for the other ten participants in
each condition, the order was reversed.
That experiment used eye gaze as dependent variable, like in Chapter 3. Eye gaze on the
different zones of the computer screen was recorded by the eye-tracking system and Matlab
7.0. During Phase 2 and testing, eye gaze to the different zones was recorded from the
beginning of each trial (i.e., CS onset) to its termination (i.e., time of CS termination
regardless of whether a US was presented). For CS1 and CS3 presentations during Phase 2,
percent of CS1 trials and percent of CS3 trials with CRs were calculated for each participant.
This percentage per participant was then used to compute means eye gaze across participants
within each of the two groups. The same procedure was used for CS2 and CS4 test trials
except there was only one trial per CS.
3. Results
All results were collected at the end of the experiment by the Matlab© software, and were
analyzed with conventional statistical techniques. Using the G*Power 3.1 software (Faul,
Erdfelder, Buchner, & Lang, 2009), we calculated the estimated sample size necessary to
observe an average effect (f = 0.5) with an α = 0.05 and a power of 0.80. With the main analysis

60
viewed as a comparison of the means of two independent groups, we obtained a recommended
sample size of at least 106 participants, with at least 53 participants per group. However,
despite this recommended group size, in this study we managed to recruit only 40 participants,
with 20 in each group. Hence, we conducted our analysis with nonparametric statistics to
our interpretations of these results.
3.1. Statistical issues :
We used the same statistical tools in Chapter 3 (Renaux et al., 2017) :
- The Mann-Whitney U test (also called the Mann-Whitney Wilcoxon) is a
nonparametric test of the null hypothesis that is equally likely that a randomly selected
value from one sample will be greater or lesser than another value selected from a
second sample. The Mann-Whitney U test does not require that the data be normally
distributed and is considered to be an efficient test to determine whether two
independent samples come from the same distribution. We used the Mann-Whitney U
test in previous studies (i.e., Craddock et al., 2014 ; Renaux et al., 2017).
- Fisher’s exact test : Fisher’s exact test is a statistical significance test used in the
analysis of contingency tables. Fisher’s exact test is commonly used when sample sizes
are small, although the test is efficient for all sample sizes. Thanks to Fisher’s test, the
significance of the data’s deviation from the null hypothesis can be calculated rather
than relying on an approximation that becomes exact only in the limit as the sample size
grows to infinity, as with many statistical tests.
- The Cliff's Delta statistic is a nonparametric effect size measure that quantifies the
amount of difference between two groups of observations beyond p-value interpretation.
3.2. Statistical analysis :
3.2.1. Phase 1 :
Figure 19 shows visual fixation duration for CS1-CS2 and CS3-CS4 trials presented in Phase
1. There was no statistical difference between the two types of stimuli pairs (W = -.35, p =
.72), nor between the ad10 pairings and ad20 pairings conditions (respectively, U = 112.00,
p = .17 and U = 152.00, p = .19). That is, visual fixation duration was approximately the same
for CS1-CS2 and CS3-CS4 presentations in ad10 pairings and ad20 pairings: 88.75% of
visual fixation for CS1-CS2 in condition ad10 pairings and 62.95% in condition ad20
parings; 84.30% of visual fixation for CS3-CS4 in condition ad10 pairings and 67.95% in
condition ad20 pairings.
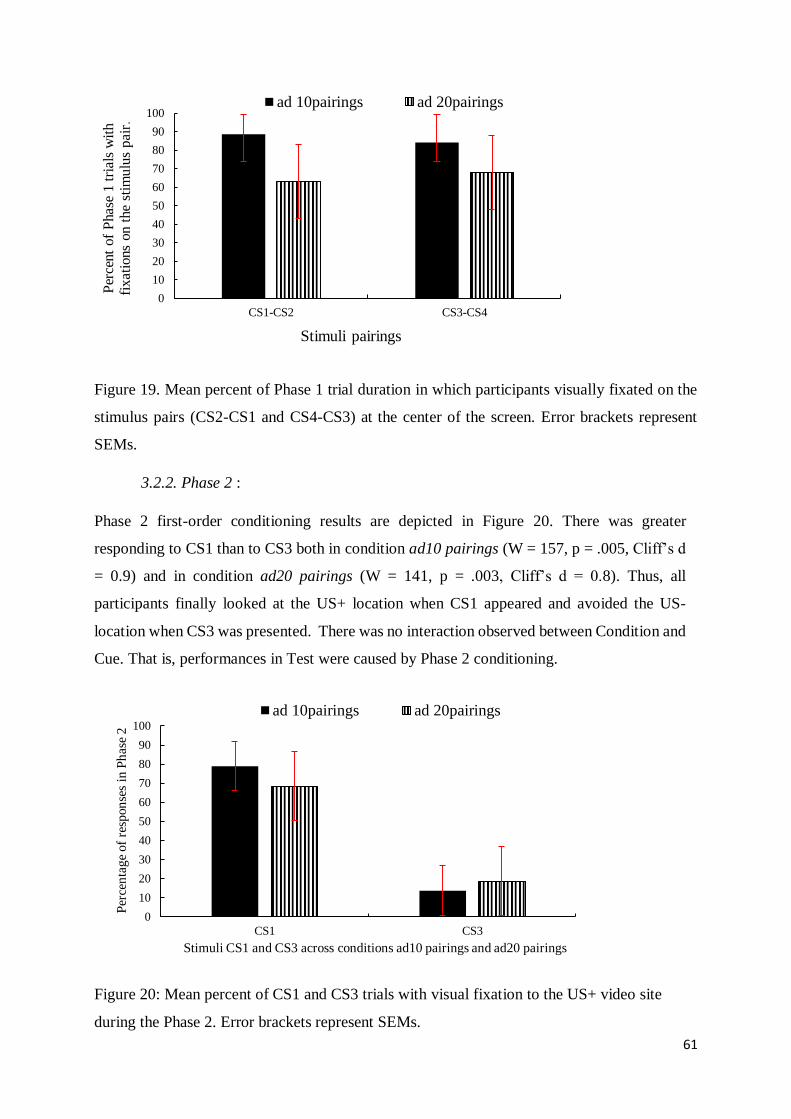
61
Figure 19. Mean percent of Phase 1 trial duration in which participants visually fixated on the
stimulus pairs (CS2-CS1 and CS4-CS3) at the center of the screen. Error brackets represent
SEMs.
3.2.2. Phase 2 :
Phase 2 first-order conditioning results are depicted in Figure 20. There was greater
responding to CS1 than to CS3 both in condition ad10 pairings (W = 157, p = .005, Cliff’s d
= 0.9) and in condition ad20 pairings (W = 141, p = .003, Cliff’s d = 0.8). Thus, all
participants finally looked at the US+ location when CS1 appeared and avoided the US-
location when CS3 was presented. There was no interaction observed between Condition and
Cue. That is, performances in Test were caused by Phase 2 conditioning.
Figure 20: Mean percent of CS1 and CS3 trials with visual fixation to the US+ video site
during the Phase 2. Error brackets represent SEMs.
0
10
20
30
40
50
60
70
80
90
100
CS1-CS2 CS3-CS4
Per
cent
of
Phase
1 t
rials
wit
h
fix
ati
ons
on t
he
stim
ulu
s p
air
.
Stimuli pairings
ad 10pairings ad 20pairings
0
10
20
30
40
50
60
70
80
90
100
CS1 CS3
Per
cen
tage
of
resp
on
ses
in P
has
e 2
Stimuli CS1 and CS3 across conditions ad10 pairings and ad20 pairings
ad 10pairings ad 20pairings

62
3.2.3. Test of CS2 and CS4 :
Figure 21 displays the number of participants exhibiting SPC responses at test. In condition
ad10 pairings, visual fixation after CS2 presentation was observed in 15 of the 20 participants
(i.e., 75%) compared to 14 of the 20 in condition ad20 pairings (i.e., 70%), Fisher’s exact test
p = 1. We observed a difference in visual fixation after CS4 presentation. In condition ad10
pairings, visual fixation after CS4 presentation was observed in only 4 of the 20 participants
(i.e., 20%) compared to 11 of the 20 in condition ad20 pairings (i.e., 55%), Fisher’s exact test
p = .048.
Figure 21. Percentage of participants during the SPC test exhibiting visual fixation to the
video site during the CS2 test and absence of visual fixation to the video site during the CS4
test in conditions ad10 pairings and ad20 pairings.
5. Discussion :
Thus, we observed a better avoidance response when the neutral stimuli in Phase 1 were
presented 10 times compared to a condition when stimuli were presented 20 times. There was
no difference between conditions ad10 pairings and ad20 pairings concerning anticipatory
phenomenon with responses to CS2.
Our results conceptually replicate the work of Prewitt (1967) who observed a higher rate of
avoidance responses in rats after a moderate number of CS2-CS1 pairings when CS1 was
subsequently paired with an unconditioned stimulus US- in an SPC task. Our work is also
consistent with results found in other higher order conditioning procedures (Yin et al., 1994,
0
10
20
30
40
50
60
70
80
90
100
CS2 CS4
Per
centa
ge
of
par
tici
pan
ts r
espondin
g to C
S2
and C
S4.
Stimuli across conditions ad10 and ad20 pairings
ad 10pairings ad 20pairings

63
Stout et al., 2004) and others focusing on first order conditioning. For example, Baeyens et al.
(1992) demonstrated that electrodermal response rates were maximal after 10 CS-US
presentations and then decreased as the number of presentations increased to 20. Urcelay et al.
(2012) also demonstrated the effect of "extended reinforced training" on the conditioned
response. In that experiment, a cohort of rats was exposed to an increasing number of electric
shocks (i.e., 5, 10, 20, and 50 presentations) contingent delivered after the appearance of a
stimulus. Urcelay et al. (2012) observed a gradual decrease of the conditioned response rate as
the number of trials increased.
Compared to the studies mentioned above, our results highlight the role of the number of stimuli
pairings presented in the first phase in a higher order conditioning involving an appetitive
unconditioned stimulus US+. In our experiment, we observed a higher rate of avoidance
response with a lower number of stimuli pairing presentations, using US- in a SPC procedure.
Here, the number of stimuli pairings seems to affect both CS-CS/US- conditioning relations,
but not CS-CS/US+ conditioning relations. Therefore, we can conclude that the role of the
number of stimuli pairings is critical in the establishment of associative learning, including
SPC. When participants are confronted to a large number of stimuli pairings, weaker rates of
conditioned response will be observed.
Explanations of the role of the number of stimuli pairings differ and are diversely discussed
across the various papers reporting higher order conditioning. For example, Yin et al. (1994)
and Stout et al. (2004) focused on the second order conditioning paradigm, which is related to
the SPC paradigm but differs in the order of the two phases of training. In the Second-Order
Conditioning procedure, these researchers explained the role of the number of stimuli pairings
presented in the second phase in terms of extinction of the CS1-US association acquired in
phase one. From a temporal point of view, the higher the number of CS2-CS1 presentations in
the second phase, the more the CS1-US association of the first phase will be extinguished. So,
few stimulus pairings presented in the second phase of Second-Order Conditioning could
facilitate the observation of that kind of associative learning in the test phase. This account does
not directly apply to SPC, but an analogous one might. In SPC, possibly the CS2-CS1 pairing
acquired in Phase 1 is partially extinguished over many CS1-US pairings.

64
CHAPTER 5 :
ROLE OF TRIAL REPETITION FOR ELDERLY PEOPLE
In the previous chapters, we demonstrated that a limited number of stimuli pairings presented
in the first phase of SPC was beneficial for its establishment (i.e., using US-). However, some
geriatric studies have suggested that learning performances of elderly people differ from typical
young adults. According to those studies, it was proposed that repetition had a more beneficial
role in the acquisition of learning by the elderly compared to younger people. Moreover,
because our next axis of research is concerned with the ontogeny of the SPC response through
the human life span, it seems essential to test the effect of repetition on learning in elderly
people. However, if large differences were observed between the elderly compared to younger
people in basic learning, we could not use the same experimental task paradigm. 1. Introduction :
1.1. Beneficial role of repetition :
Some studies in geriatrics focused on the role of repetition in the elderly people with the aim of
acquiring and maintaining learning at that developmental stage. For example, Law, Hawkins,
and Craik (1988) compared performances of young adults with performance of seniors on a
similar task of visual stimuli recall (here, different pictures). These authors observed lower
performances in seniors in comparison to the younger participants. However, performances in
elderly people were improved in the context where the stimuli were more often repeated.
According to the study of Law et al. (1988), the effect of repetition does not appear to be as
important in young adults in most experimental recall tasks. On the contrary, Swick and Knight
(1997) demonstrated that repetition was beneficial in the recall of words and non-words in
young adults as well as in elderly people. In that experiment, participants had to keep in mind
lists of non-words (i.e., unknown words) and lists of words (i.e., existing words). The
experimental task was to remember the items presented and determine whether each item was
an existing word. Each word was repeated one to three times across experimental groups (i.e.,
young adults and elderly people). Swick et al. reported a higher recall rate in both experimental
groups when the stimuli were repeated three times rather than only once. In addition, these
authors found that stimulus repetitions were essential for seniors when they were asked to repeat
and to discriminate an existing word from an unknown word.
Thus, different processes involved in verbal skills were highlighted by Swick and al. : repetition
of stimuli seems to be necessary in elderly people for the differentiation between non-word and

65
word, but not for the simplest recall of the existing words. Conversely, repetition seems to have
a significant effect on the young adults recalling stimuli, whereas the discrimination between
non-words and words was not influenced by the stimuli repetition. In conclusion, Swick and
Knight supported the beneficial role of repetition in learning about discrimination in seniors. In
our behavioral task, which could be considered a discriminative task, we wanted to test the
potential beneficial effect of the stimuli repetitions presented in the first phase of SPC on the
conditioned response observed in tests.
1.2.Repetition in elderly with dementia :
Here, the role of repetition concerns neurodegenerative diseases possibly producing an
impairment of memory and a general decrease in intellectual skills. Based on the hypothesis
that verbal behavior may affect associative learning, one of our experimental groups was elderly
people with senile dementia. We focused on the role of repetition of pairings in the
establishment of SPC within this population. Camp and Shaller (1989) illustrated the effect of
repetition in a representative study case in a hospital caring for elderly people with senile
dementia. In their study, a 68-year-old patient had been hospitalized for several months in a
retirement home specializing in cognitive impairment. This patient was hospitalized with many
cognitive impairments, in addition to excessive alcohol consumption which compromised his
safety outside the center. The learning task was to remember the given names and surnames of
four staff members in the health center. The procedure consisted of presenting to the patient
photos of the various staff members at varying time intervals of 5, 10, 20, 40, 60, 90, and 120
seconds. The patient was placed in front of an experimenter who presented pictures to him one
by one according to specific intervals. For each picture presented, the patient had to declare the
name of the individual corresponding to the picture. If the answer was correct, the trial was
completed and the experimenter showed another picture. If the answer was incorrect, the test
was repeated until the patient succeeded. The social reinforcer used in this case study was
enhanced attention of the experimenter when the patient's performance was correct. In addition,
Camp and Shaller followed up after six months and found that the patient's recall performance
was largely correct. The beneficial effect of repetition highlighted in this case study was also
found in other Alzheimer's patients with the same previously described procedure (Camp,
1989). Using a similar procedure, Ferraro, Balota, and Connor (1993) emphasized the role of
repetition in typical elderly individuals and elderly people with Alzheimer’s syndrome.
Nowadays, repetition is widely considered to have an important impact on the establishment of
learning in elderly people, with or without senile dementia. Although its effects have been

66
demonstrated, frequency of repetition has not been tested in the studies presented above (e.g.,
Law & al., 1988). For example, Fleishman and Gabrieli (1998) reviewed studies that do not
demonstrate the beneficial effect of repetition on learning in patients with Alzheimer's disease.
Jacoby (1999) demonstrated the ironic effects of repetition on the performance of young adults
and seniors. In this experiment, participants had to answer "yes" or "no" to words with respect
to whether they had already been stated by an experimenter. The author observed that the more
the stimuli were repeated, the more the number of recall errors increased in adults and seniors.
Also, the number of repetitions was correlated with auto-aggressive behaviors at the end of the
experiment. Therefore, Jacoby (1999) concluded that a high repetition frequency could perturb
individuals learning, with negative consequences for performances.
1.3. In our experiment :
The goal of our experiment was to determine the effect of repetition on SPC in typical adults
and seniors. Because the results had been demonstrated as disparate between young adults and
seniors, we wanted to determine whether these performances would differ specifically in our
SPC task. For each participant of this research, the task was only to look at the screen of the
computer, which was a readily produced response by seniors who might have had difficulty if
the task required using modern materials such as a tablet electronic or iPhones.
The procedure used was the same as was used with younger adults, as reported in Chapter 4.
The number of CS2-CS1 and CS4-CS3 pairing presentations was again manipulated. Stimuli
pairings were presented 10 times (condition se10 pairings – se for seniors) or 20 times
(condition se20 pairings). CS1 was simultaneously presented with CS2 10 or 20 times
depending on the condition. The same procedure was applied for CS3 with CS4. In a second
phase, CS1 was followed by an unconditioned stimulus US+ while CS3 was followed by
another unconditioned stimulus US-. Finally, the test phase consisted of recording the visual
fixations of seniors when CS2 and CS4 were individually presented on the computer screen.
This methodology was the same for both experimental conditions (se10 pairings and se20
pairings), except for the number of stimulus pairings presented in Phase 1. In the se10pairings
condition, the CS2-CS1 and CS4-CS3 pairings were presented simultaneously and randomly
10 times. In se20 pairings, stimuli pairings were presented in the same way 20 times. Our
hypothesis was that the visual fixation rate would be lower on the US zone in the se20 pairings
condition when SC2 appeared.

67
2. Method :
2.1. Participants :
Forty French elderly people (27 women and 13 men, aged between 65 and 83 years old)
volunteered; participants were randomly assigned to one of two groups (se10 pairings or se20
pairings, ns = 20). Each participant read and signed an informed consent form prior to the
experiment. The experiment had been approved by the University of Lille Institutional
Review Board. No diagnosis of senile dementia was declared.
2.2. Material :
This experiment was identical to the previous experiment, except the age of the experimental
groups. Therefore, material is the same previously described (see Chapter 4).
2.3. Procedure :
For the reasons mentioned above, the Procedure was identical to that was described in Chapter
4.
3. Results :
All results were collected at the end of the experiment by the Matlab© software, and were
analyzed with conventional statistical techniques. Using the G*Power 3.1 software (Faul,
Erdfelder, Buchner, & Lang, 2009), we calculated the estimated sample size necessary to
observe an average effect (f = 0.5) with an α = 0.05 and a power of 0.80. With the main analysis
viewed as a comparison of the means of two independent groups, we obtained a recommended
sample size of at least 106 participants, with at least 53 participants per group. However,
despite this recommended group size, in this study we managed to recruit only 40 participants,
with 20 in each group. Hence, we conducted our analysis with nonparametric statistics to
our interpretations of these results.
3.1. Statistical issues :
Some floor and ceiling effects were observed and variance in the results was artificially low
across participants within our experimental groups. Moreover, our samples did not yield
normality in the data within groups. See below the statistical nonparametric tests used in order
to illuminate the results of the experimental task with p (<.05).
- A Kruskal-Wallis test by ranks, also called a one-way ANOVA on ranks, is a
nonparametric method to test whether samples originate from the same distribution.

68
This test is often used for comparing more than two independent samples of equal
sample sizes. The Kruskal-Wallis test is a required recursor for other nonparametric
tests such as the Mann-Whitney test. A significant Kruskal-Wallis test indicates that at
least one sample stochastically dominates one other sample. However, the test can not
identify which sample is the source of the stochastic dominance. That is why other
nonparametric tests had to be conducted following a significant Kruskal-Wallis test.
In our experiment, Kruskal-Wallis tests had been conducted in 3.3. between ad10
pairings, ad20 pairings, se10 pairings and se20 pairings. We could not use that test
before because we only had two samples to assess.
- The Mann-Whitney U test (also called the Mann-Whitney Wilcoxon) is a
nonparametric test of the null hypothesis that is equally likely that a randomly selected
value from one sample will be greater or lesser than another value selected from a
second sample. The Mann-Whitney U test does not require that the data be normally
distributed and is considered to be an efficient test to determine whether two
independent samples come from the same distribution. We used the Mann-Whitney U
test in previous studies (i.e., Craddock et al., 2014 ; Renaux et al., 2017).
- Fisher’s exact test : Fisher’s exact test is a statistical significance test used in the
analysis of contingency tables. Fisher’s exact test is commonly used when sample sizes
are small, although the test is efficient for all sample sizes. Thanks to Fisher’s test, the
significance of the data’s deviation from the null hypothesis can be calculated rather
than relying on an approximation that becomes exact only in the limit as the sample size
grows to infinity, as with many statistical tests.
- The Cliff's Delta statistic is a nonparametric effect size measure that quantifies the
amount of difference between two groups of observations beyond p-value interpretation.
3.2. Statistical analysis :
3.2.1. Phase 1 :
Figure 22 shows visual fixation duration for CS1-CS2 and CS3-CS4 trials presented in Phase
1. There was no statistical difference between the two types of stimuli pairs (W = -.45, p =
.65), nor between the se10 pairings and se20 pairings conditions (respectively, U = 166.00,
p = .36 and U = 175.00, p = .49). Precisely, visual fixation durations were approximately the
same for CS1-CS2 and CS3-CS4 presentations in se10 pairings and se20 pairings: 43.73%
of visual fixation for CS1-CS2 in condition se10 pairings and 49.69% in condition se20
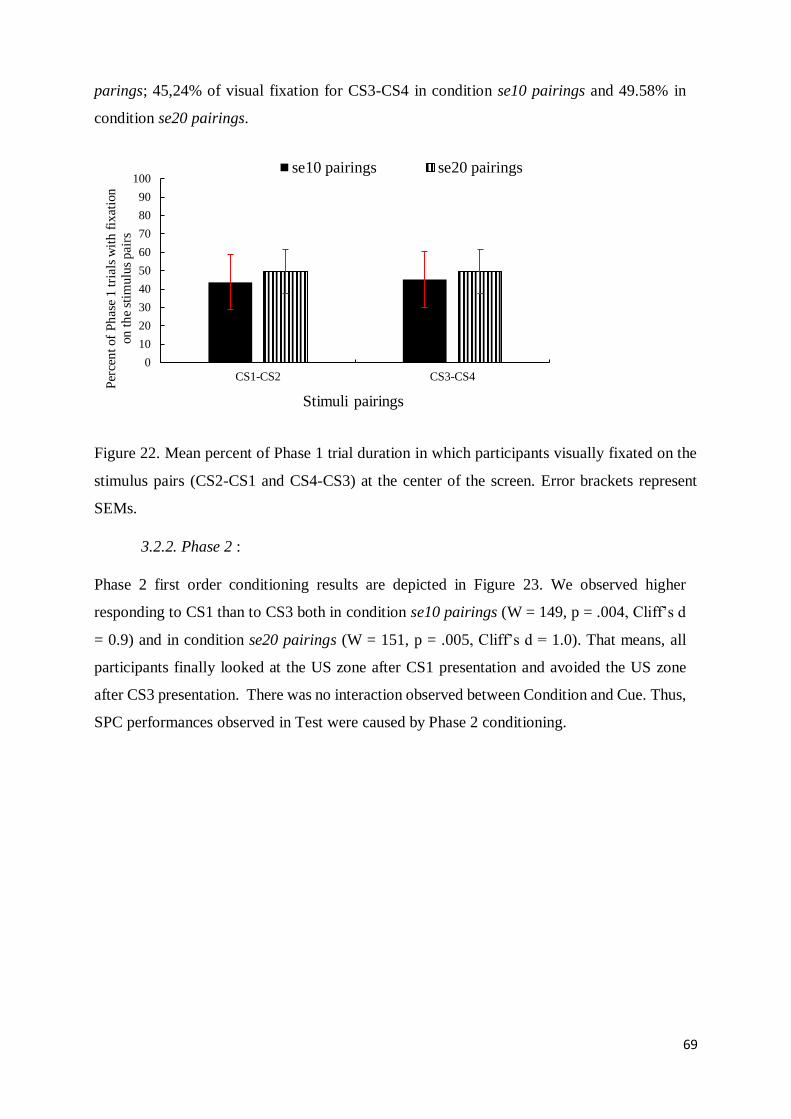
69
parings; 45,24% of visual fixation for CS3-CS4 in condition se10 pairings and 49.58% in
condition se20 pairings.
Figure 22. Mean percent of Phase 1 trial duration in which participants visually fixated on the
stimulus pairs (CS2-CS1 and CS4-CS3) at the center of the screen. Error brackets represent
SEMs.
3.2.2. Phase 2 :
Phase 2 first order conditioning results are depicted in Figure 23. We observed higher
responding to CS1 than to CS3 both in condition se10 pairings (W = 149, p = .004, Cliff’s d
= 0.9) and in condition se20 pairings (W = 151, p = .005, Cliff’s d = 1.0). That means, all
participants finally looked at the US zone after CS1 presentation and avoided the US zone
after CS3 presentation. There was no interaction observed between Condition and Cue. Thus,
SPC performances observed in Test were caused by Phase 2 conditioning.
0
10
20
30
40
50
60
70
80
90
100
CS1-CS2 CS3-CS4
Per
cen
t of
Ph
ase
1 t
rial
s w
ith
fix
atio
n
on
th
e st
imulu
s pai
rs
Stimuli pairings
se10 pairings se20 pairings

70
Figure 23: Mean percent of CS1 and CS3 trials with visual fixation to the US+ video site
during Phase 2. Error brackets represent SEMs.
3.2.3. Test of CS2 and CS4 :
Figure 24 represents the number of participants exhibiting SPC responses at test. We observed
high visual fixation times to the US zone after CS2 presentation. Precisely : in condition se10
pairings, visual fixation after CS2 presentation was observed in 16 of the 20 participants (i.e.,
80%) compared to 14 of the 20 in condition se20 pairings (i.e., 70%), Fisher’s exact test p =
1. More interesting, we observed a difference in visual fixation after CS4 presentation across
conditions. In condition se10 pairings, visual fixation after CS4 presentation was observed in
only 3 of the 20 participants (i.e., 15%) compared to 12 of the 20 in condition se20 pairings
(i.e., 60%), Fisher’s exact test p = .04.
Figure 24. Percentage of participants during the SPC test exhibiting visual fixation to the
video site during the CS2 test and absence of visual fixation to the video site during the CS4
test in conditions se10 pairings and se20 pairings.
0
10
20
30
40
50
60
70
80
90
100
CS1 CS3
Per
cen
tage
of
resp
on
ses
in P
has
e 2
Stimuli CS1 and CS3 across conditions se10 pairings and se20 pairings
se 10pairings se 20pairings
0
10
20
30
40
50
60
70
80
90
100
CS2 CS4
Per
cen
tag
e of
par
tici
pan
ts
resp
on
din
g to C
S2
an
d C
S4
.
Stimuli across conditions se10 and se20 pairings
se 10pairings se 20pairings

71
3.3. Comparison between adults and seniors across 10 or 20 pairing presentations :
The present aim is to provide a comparison across the different groups in Chapters 4 and 5.
Thus, we examined the visual fixation times for US zone for each participant of all groups and
performed a Kruskal-Wallis (Khi2) test. Using the G*Power 3.1 software (Faul, Erdfelder,
Buchner, & Lang, 2009), we calculated the sample size necessary to observe an average effect
(f = 0.5) with an α = 0.05 and a power of 0.80. With the main analysis viewed as a comparison
of means from more than two independent groups (4 groups), we obtained a sample size of at
least 48 participants, with at least 12 participants in each group. In line with these
recommendations, for these comparisons, we already had 80 participants, with 20 in each group.
Thus, this analysis was properly powered.
3.3.1 : Phase 1 :
We observed significant differences of percentage of visual fixation in all groups for CS1-CS2
presentations (Khi2 : 22,13 ; p < .01) and CS3-CS3 presentations (Khi2 : 19,88 ; p < .01).
Specifically, between ad10 pairings and se10 pairings, CS1-CS2 presentation was more
targeted by ad10 pairings compared to se10 pairings (U : 47,00 ; p < .01) ; the same for CS3-
CS4 presentations (U : 53,00 ; p < .01). In addition, we observed such differences between ad10
pairings and se20 pairings. Precisely, CS1-CS2 presentation was more targeted by ad10
pairings compared to se20 pairings (U : 59,50 ; p < .01) ; the same for CS3-CS4 presentation
(U : 72,00 ; p < .05).
Between ad20 pairings and se10 pairings, we observed differences of visual fixations on CS1-
CS2 and CS3-CS4 presentations. Precisely, CS1-CS2 was relatively more fixated by ad20
pairings compared to se10 pairings (U : 129,50 ; p = .057), and CS3-CS4 was more fixated by
ad20 pairings compared to se10 pairings (U : 111,00 ; p < .05).
Comparing ad20 pairings and se20 pairings, CS3-CS4 was relatively more fixated by ad20
pairings compared to se20 pairings (U : 130,00 ; p = .058) ; there were no differences of visual
fixation for CS1-CS2 presentation between ad20 pairings and se20 pairings.
Thus, we observed general differences of visual fixation on CS1-CS2 and CS3-CS4
presentations between adults and seniors. Surprisingly, such differences do not seem to infer
on first order and second order conditioning.

72
3.3.1 : Phase 2 and Test :
First, we observed significant differences of percentage of visual fixation in all groups for ZUS
(Khi2 : 10,25 ; p < .05) after CS2 presentation, and for ZUS (Khi2 : 11,98 ; p < .01) after CS3
presentation. Specifically, between ad10 pairings and ad20 pairings, ZUS was targeted more
by ad10 pairings compared to ad20 pairings after CS2 presentation (U : 98,50 ; p < .05). Thus,
we can conclude that second order conditioning was more pronounced in adults exposed to the
fewer number pairing presentations in Phase 1.
Between ad10 pairings and se10 pairings, we did not observe significant differences about
visual fixation times.
Comparing ad10 pairings and se20 pairings, ZUS was targeted more by se20 pairings than by
ad10 pairings after CS3 presentation (U : 146,00 ; p < .05), which was unexpected because
participants had to avoid ZUS after CS3 and CS4 presentations in order to avoid the aversive
noise.
Comparing ad20 pairings and se10 pairings, ZUS zone was targeted more by se10 pairings
compared to ad20 pairings after CS2 presentation (U : 109,00 ; p < .01), while ZUS was
targeted more by ad20 pairings compared to se10 pairings after CS3 presentation (U : 126,00 ;
p < .01). Here, we can conclude that rates of second order conditioning are better in se10
pairings compared to ad20 pairings.
Finally, ZUS was targeted more by se20 pairings compared to se10 pairings after CS3
presentation (U : 136,50 ; p < .05), which was again an unexpected observation because
participants had to avoid ZUS after CS3 presentation.
In conclusion, we demonstrated that the number of stimuli pairings in Phase 1 was a determinant
in the establishment of SPC in adults and seniors.
4. Discussion
In summary, we observed higher rates of visual fixations on the US+/- area when CS2 was
presented in condition se10 pairings compared to the se20 pairings condition. Moreover, many
errors were observed among seniors: the elderly people had a tendency to look at the US+/-
area during the presentation of CS3, and avoided this area when CS2 was presented in the se20
pairings condition. Thus, we find here the "ironic effect" described and named by Jacoby
(1999): a high frequency of stimulus repetition among seniors does not improve their learning.

73
On the contrary, this repetition seems to have a disruptive effect on the conditioned response
tested in our experiment in the young adults and in the elderly participants.
However, our results in Chapters 4 and 5 are not congruent with some geriatric studies focusing
on the memory in seniors with or without senile dementia. Indeed, some authors agreed that
large numbers of repetition of stimulus presentations to seniors without senile dementia is
beneficial for their learning (Law, Hawkins, & Craik, 1988, Swick & Knight, 1997). Other
authors have been implementing behavioral therapies using large amounts of repetition as a
primary tool to maintain learning of patients with Alzheimer's disease, or with related dementia
(Camp & Shaller 1989 ; Camp, 1989 ; Ferraro, Balota, et al. Connor, 1993). Indeed, we set up
a behavioral program to recover writing skills for a senior who had a stroke (Renaux, Rivière,
& Nuchadee, 2017). The repetition exercise here consisted of writing on a sheet of paper the
words spoken by the experimenter. The difficulty of the words was measured by its frequency
in the current use of the French language. Reinforcers were social by the experimenter and
consisted of additional time with the experimenter added based on the patient's performance at
the end of the session. During this time, the experimenter spoke of various and varied subjects.
When the patient wrote the word correctly, additional reinforcement time was added and the
experimenter stated the next word. When the patient did not write the word, we verbally guided
the correct answer and then repeated the word until it was well produced. Here, our goal was
not to highlight the benefits of repetition, but rather to use it as a tool in the rehabilitation of a
writing skill.
In the subsequent chapters, we will explore whether the 10 presentations of stimuli in phase 1
would be sufficient to establish SPC responding in seniors with neurodegenerative diseases
such as Alzheimer. If we go back to the example of Camp and Shaller (1989), many trials were
necessary to establish correct reminders concerning the association between faces and names
of staff members of the hospital center. The authors explained that it was necessary to repeat
visual stimuli because behavioral disorders related to senile dementia interfered with the
learning of that discrimination.

74
General Conclusion of Part 1
In that first part, we focused on the development of an SPC procedure which could be applied
to both very young and elderly people. Chapter 3 tested two conditions A and B in which the
distance between CSs presented in Phase 1 was manipulated. We observed a better rate of SPC
when there was no distance at all between CSs presented in Phase 1. In chapters 4 and 5, we
focused on the number of CSs pairings presented in Phase 1 by using 10 or 20 presentations in
young and elderly people. In both groups, we observed better rates of conditioned responding
during CS4 presentations with 10 than 20 pairings in Phase 1, while results concerning
responses during CS2 presentations were disputable.
The central conclusion of these first three experiments is we created an SPC paradigm that
worked successfully in young and elderly people without using any explicit instructions, except
for “Sit down and look at the computer screen please” at the beginning of the
experiment. These experiments were costly to us in terms of time and effort, but necessary for
the execution of Part 2. As a result of this research, our final experimental procedure as used in
Part 2 could be considered similar to the experimental procedures that have been used to test
SPC in nonhuman animals. The main weaknesses that we should mention concern our
experimental measures. Concerning anticipatory responses, we controlled the first eye gaze
emitted by participants at the beginning of CS1 and CS2 presentations : participants had to look
at the CS before targeting the US zone in order to obtain reinforcement. In this way, we could
be certain that the first zone targeted after CS2 emission was the US zone or reinforcement was
not delivered. Conversely, we did not record the first saccade after CS3 and CS4 presentations.
It means that we didn’t know where participants firstly looked at one specific zone after CS3
and CS4 occurrences. Thus, we can discuss zone preferences during CS3 and CS4
presentations, but we can not assume which zone had been targeted first.

75
Résumés Partie 1
Ci-dessous un résumé en français de différents points abordés dans cette Partie 1.
1. Histoire du pré-conditionnement sensoriel :
Relatif à l’apprentissage associatif, le pré-conditionnement sensoriel (PCS) est considéré
comme étant un conditionnement d’ordre supérieur dans la mesure où son établissement est
plus complexe qu’un conditionnement dyadique de type CS-US. Pavlov (1927) a été le premier
à démontrer ce phénomène par l’intermédiaire de procédures de conditionnement de second-
ordre (SC1-SI suivi des présentations SC2-SC1). Par la suite, Brogden (1939) a observé puis
défini ce conditionnement de second ordre comme PCS. Ce type de conditionnement implique
une première phase dans laquelle deux stimuli conditionnés sont présentés ensemble (Phase 1:
SC2-SC1). Dans une seconde phase, un des deux stimuli est associé avec un SI provoquant une
RI (Phase 2: SC1-SI). En test, la même réponse comportementale est observée après
présentation de SC2, même si SC2 n’a jamais été directement associé au préalable avec le SI.
Depuis sa mise en exergue en 1939, le PCS a été examiné chez de nombreuses espèces animales.
Chez l’humain, Brogden a toujours souligné la nécessité d’insérer des instructions dans les
paradigmes expérimentaux afin d’observer ce type d’apprentissage associatif. En effet, les
travaux de Brogden (1942, 1947) ont démontré que le PCS ne pouvait pas être observé chez
l’humain sans utilisation d’instructions. Ainsi, de nombreuses études ayant pour objet d’étude
l’établissement du PCS chez l’humain utilisent des instructions (pour exemples, Chernikoff et
Brogden, 1949 ; Craddock, Renaux, Lefèvre, Nelson et Molet, 2014). À travers ce projet de
recherche, nous voulions créer une procédure comportementale similaire aux paradigmes
utilisés chez les autres animaux, afin d’observer du PCS chez l’humain sans utiliser
d’instruction.
2. Attention visuelle et poursuite oculaire :
Nous avons utilisé un système de poursuite oculaire permettant d’enregistrer les temps de
fixations visuelles comme mesure comportementale dans l’étude du PCS. L’attention visuelle
est étudiée depuis des dizaines d’années (voir Von Helmholtz, 1925 ; James, 1981 ; Yarbus,
1967, pour exemples), et est considérée aujourd’hui comme reflétant objectivement l’attention
que porte un individu sur un stimulus ciblé (Duchowski, 2007). Concernant le conditionnement
pavlovien, Kruschke, Kappenman, et Hetrick (2005) ont enregistré les fixations visuelles afin
de tester le rôle de l’hypothèse attentionnelle dans le phénomène de blocage. Par l’intermédiaire
de l’eye-tracking, les auteurs ont mis en évidence le défaut d’attention visuelle sur le stimulus

76
bloqué. De plus, Kaakinen, Hyönä, et Keenan (2002) ont démontré des préférences de fixation
visuelle pour des stimuli considérés comme étant pertinents en comparaison à des stimuli non
pertinents pour la survie de l’individu. En psychologie, l’attention visuelle enregistrée par les
systèmes d’eye-tracking est souvent exploitée dans la reconnaissance des expressions faciales
(Black et Yacoob, 1995) et à des fins commerciales (Wedel et Pieters, 2008). De nombreux
chercheurs considèrent l’attention visuelle comme étant une mesure pertinente pour l’étude de
populations n’ayant pas ou très peu accès au langage, tels que les bébés (Gredebäck, Johnson,
et Hofsten, 2009) et les personnes âgées (Isaacowitz, Wadlinger, Goren, et Wilson, 2006).
Dans mon travail de recherche, l’attention visuelle a été la mesure commune des différents
groupes expérimentaux (c.à.d. du bébé à la personne âgée). Ne nécessitant pas de compétences
langagières pour être utilisée, cette mesure a été considérée comme étant pertinente auprès de
nos populations ayant des défauts de stratégies verbales. En effet, un enfant non-verbal avec
troubles autistiques n’aurait pas pu répondre à nos questions, mais pouvait regarder l’écran de
l’ordinateur lors du paradigme expérimental. En ce sens, notre étude était similaire aux
procédures comportementales utilisées chez les autres animaux.
3. Réponses anticipatoires et d’évitement dans le conditionnement pavlovien :
Dans notre paradigme expérimental, les participants devaient anticiper l’apparition d’un SI+ et
éviter celle d’un SI-. Pavlov (1927) avait observé des réponses anticipatoires de salivation (RC)
avant présentation de la nourriture (SI+) après plusieurs présentations SC-SI. C’est ainsi que
Pavlov argumentait de la valeur adaptative des réflexes conditionnés, la présence du stimulus
pouvant être considérée comme une préparation à l’ingestion et digestion de la nourriture par
l’organisme. Par exemple, la salivation émise avant présentation de nourriture permettrait de
préparer l’organisme à recevoir de manière optimale la nourriture –favorisant ainsi la survie de
l’individu.
Depuis les travaux de Pavlov (1927), de nombreuses études se sont penchées sur les réponses
d’anticipation et d’évitement dans le domaine des comportements alimentaires, sexuels,
addictifs, de fuites ou encore des expressions faciales (voir revue de Domjan, 2005). Nous
considérons aujourd’hui ces réponses comme étant essentielles à la survie et à la reproduction
d’un individu (voir pour exemple Cusato et Domjan, 1998) permettant à cet individu d’éviter
tout stimulus dangereux présent dans l’environnement (voir pour exemple Myers, Cohn et
Clark, 2005).
A travers ce projet de recherche, nous avons voulu observer ces réponses comportementales à
travers différents groupes expérimentaux par l’anticipation d’un SI+ et l’évitement d’un SI-.
77
Notre hypothèse était d’observer ces réponses dans chaque groupe en raison de leur fonction
adaptative.
4. Contiguïté spatiale et conditionnement d’ordre supérieur :
Afin de créer une procédure expérimentale pouvant observer du PCS sans utiliser d’instruction,
nous nous sommes intéressés à plusieurs paramètres faisant l’objet de débats divers et de
résultats contradictoires dans la littérature scientifique. En effet, puisqu’il fallait créer une
procédure sans instruction chez l’humain, nous avons dû nous baser sur les recherches
effectuées chez les autres espèces animales. Les notions de contiguïtés spatiales et temporelles
sont souvent soulevées dans l’établissement de conditionnement de premier ordre et d’ordre
supérieur. Les travaux relatifs à la contiguité spatiale sont assez unanimes sur l’importance de
la contiguïté temporelle entre deux stimuli. Nous développons dans le chapitre 2 en quoi ces
études ont guidé nos choix concernant les intervalles de temps utilisés dans la procédure
expérimentale créée.
Concernant la contiguité spatiale, très peu étudiée dans le conditionnement d’ordre supérieur,
quelques études mettent en exergue le rôle de la proximité entre deux stimuli (SC-SI) sur la
fréquence d’apparition de la réponse comportementale ciblée. En effet, au plus le stimulus
conditionné est physiquement proche du SI, meilleure est la réponse conditionnée observée en
test (Wasserman et al., 1974 ; Cabrera and Vila, 1986 pour exemples). Concernant le
conditionnement d’ordre supérieur, Rescorla et Cunnigham (1979) ont démontré dans une tâche
de second ordre apparentée au pré-conditionnement sensoriel le rôle de la contiguité spatiale
entre les SCs sur la réponse associative.
Néanmoins, aucune étude à notre connaissance ne s’est intéressée au rôle de la contiguité
spatiale dans le paradigme de PCS. Les résultats obtenus sont présentés et discutés dans le
chapitre 3.
5. Nombre de présentations de stimuli dans l’établissement de conditionnement
d’ordre supérieur :
Parallèlement au rôle de la contiguité spatiale dans l’établissement de conditionnement d’ordre
supérieur, le nombre de présentations de stimuli est également un sujet régulièrement
controversé selon l’âge du participant ou de la présence de certains troubles développementaux.
C’est pourquoi, nous nous sommes intéressés au rôle du nombre de répétitions des présentations
de stimuli sur la réponse conditionnée auprès de jeunes adultes et de personnes âgées. L’objectif
était de pouvoir déterminer par la suite un nombre optimal de présentations de stimuli similaires
chez le jeune adulte et la personne âgée.

78
Chez le jeune adulte, il a été démontré qu’un nombre élevé de présentations de stimuli diminuait
le taux de réponse conditionnée mesurée en conditionnement de premier ordre et d’ordre
supérieur (Prewitt, 1967 ; Yin et al., 1994 ; pour exemples). Les travaux effectués chez la
personne âgée controversent ces résultats. En effet, certaines études soutiennent le rôle
fondamental de la répétition dans le maintien des performances de la personne âgée (Swick et
al.,1997 pour l’exemple) alors que d’autres affirment le contraire (Camp et al., 1989). En ce
sens, Jacoby (1999) affirme qu’un nombre excessif de répétitions peut avoir des effets
« ironiques » sur les performances des personnes âgées, facilitant l’émission d’erreurs
d’apprentissage.
Ainsi, les chapitres 4 et 5 avaient pour objectif de tester les performances de jeunes adultes ainsi
que de personnes âgées avec une procédure expérimentale similaire variant le nombre de stimuli
présentés en phase 1 de PCS.

79
Part 2 :
Influence of verbal behavior on conditioned
responding.

80
CHAPTER 1 : INTRODUCTION
Chapter 1 introduces (1) the development of verbal behavior in humans, (2) the role of verbal
strategies in the establishment of SPC, (3) then the SPC task used in Part 2.
1. Development of verbal behavior in humans :
Humans are social animals, ordinarily living amidst one another. One social characteristic of
humans is the use of written and oral words to communicate and likely to internally process
information. We use the term verbal behavior in reference to all of these social behaviors. Lee
(1981) considered language as a modulator of environmental-behavioral relationships, focusing
on the language skills of children with autism spectrum disorders in comparison with children
without developmental disorders. Indeed, language is often considered in terms of its structure
(grammar, vocabulary, unobservable mental representations), rather than in terms of the
objective environmental conditions influencing the speaker / writer to behave as she does. To
support this point of view, Catania (1998) used the term "referent language" involved in the
naming of objects by words and stipulated (p. 239):
« We also speak of language as if it were directed toward events or objects. We say that words
or sentences refer to, deal with, speak of, call attention to, or are about things. The language of
reference implicitly includes the direction from verbal behavior to environment. Every day
language doesn’t include words that emphasize the opposite direction. What if our everyday
language has prejudiced us about the ways in which our verbal behavior works ? We hardly
ever say that we utter nouns in the presence of the relevant objects or that sentences are
occasioned by relevant events. Instead, we say that words refer to objects or that sentences are
about events. There are good reasons for these usages ; … [but] they may be misleading in an
analysis of the behavior of speakers and listeners or reader and writers ».
1.1. Verbal behavior considered as an operant :
Since Catania (1998), some authors refer strictly to language for the study of language skills
(Baer and Guess, 1971), while others refer to a wide range of social behaviors such as gestures
and mimicry (Hockett, 1968). In this line, Skinner introduced in 1957 in his famous book
"Verbal Behavior" the concept of verbal behavior and defines it by its function rather than its
structure. In contrast to the terms "language" and "language competence", verbal behavior
refers to a speaker's behavioral response to the environmental conditions that establish and
maintain that behavior. In my research, I therefore consider verbal behavior by its function
whether this behavior is textual, oral or signed. Although this behavior is generally studied in

81
the form of voice or written responses, there are verbal behaviors internal to the individual that
are difficult to be observed. Skinner (1957) devoted a whole chapter to internal verbal behaviors
in which he developed how thought could be assimilated into verbal behavior, and maintained
by its consequences on the individual himself (p. 449):
« The simplest and most satisfactory view is that thought is simply behavior – verbal or
nonverbal, covert or overt. It is not some mysterious process responsible for behavior but the
very behavior itself in all the complexity of its controlling relations, with respect to both men
the behavior and the environment in which he lives. The concepts and methods which have
emerged from the analysis of behavior, verbal or otherwise, are most appropriate to the study
of what has traditionally been called the human mind ». Thus, our research focused on this type
of verbal behavior defined as "rule-governed behavior" by Skinner in 1969. Rule-governed
behaviors include verbal behaviors that affect the listener’s (or the sender’s) behavior, such as
instructions, advice, or laws. From a behavioral point of view, the establishment and
maintenance of these behaviors is complex because many factors encourage and maintain
verbal behavior (Parrott, 1987). In addition, these behaviors have the characteristics of
reflecting clearly defined reinforcement contingencies. For example, "Insert the coffee capsule
and press the ON button" is a clear instruction to be followed in order to obtain coffee via a
specific machine. More generally, ruled governed behaviors follow the contingencies SD : R
SR (Skinner, 1969). For example, a behavior emitted by an individual is governed by the
rules when he does not smoke in a place where smoking is prohibited, or when he follows GPS
directions to find his way, or when he buys a product under the guidance of an expert salesman.
Verbal behaviors are governed by the rules and are acquired gradually throughout the life of an
individual. According to Skinner (1957), the development of verbal behavior begins with
babbling. In babbling, babies randomly emit a variety of sounds reinforced by parents /
caregivers. As a result, the number of babbling increases and verbal behaviors are increasingly
discriminated, with caregivers reinforcing more and more sounds recognizable in their native
language. This is how the many random sounds of babies are shaped by the sounds of the
caregiver’s language and selected by its consequences.
1.2. Emergence of verbal behaviors in babies :
Indeed, from the first month of life, the baby can distinguish syllables like pa and ba. There are
so-called ‘tweets’ emitted during the first two months of life, these tweets oscillating between
the emission of tears and noises of satisfaction. Around the age of six months, the baby can
recognize two-syllable words such as papa or baba and can also discriminate among the sounds

82
of many different languages. At this age, babies emit sounds composed of syllables such as ba,
da, pa and can repeat them continually (‘dadadadadada’), thus forming what we call babbling.
Until the age of 9-10 months, babies can emit a variety of sounds suitable for different
languages. Then, this variety will be extinguished to preserve only the sounds reinforced by the
peers, sounds being generally part of their native language (Oller, 1981).
Fenson et al. (1994) showed that babies appeared to understand 20 to 30 words spoken by
parents as young as 10 months of age. Such skills increase exponentially in the following
months. Fenson et al. asked a large cohort of mothers to write the list of words that their babies
seemed to understand by the babies’ looking at the specific word item when it was pronounced
by the mother. Subsequently, the first clear word spoken is issued around 12/13 months and is
applied to many items. Gradually, the baby learns each word according to the item and the
context in which the object is presented to form simple sentences at the age of 18 months when
the repertoire of the child includes at least 50 words (Boudreault et al., 2007). These first
sentences are generally composed of two to three words such as "Dada eat", and develop into
complex sentences between 27 and 36 months.
1.3. Acquisition of verbal skills according to Denney’s model (1982, 1984) :
The vocabulary of the child explodes between the age of 2 and 6 years when the child quickly
learns the words associated with many items, up to 10 items per day (Anglin, 1996). With the
beginning of schooling, researchers generally believe that verbal behavior further increases in
quantity and complexity. The rate of acquisition of such skills by an individual gradually
decreases with age, from age 30 onwards according to Denney's model (1982, 1984). According
to this model, further enhancement of the verbal skills of an individual tends to decrease over
the years, and eventually begins to decline (see Figure 25).
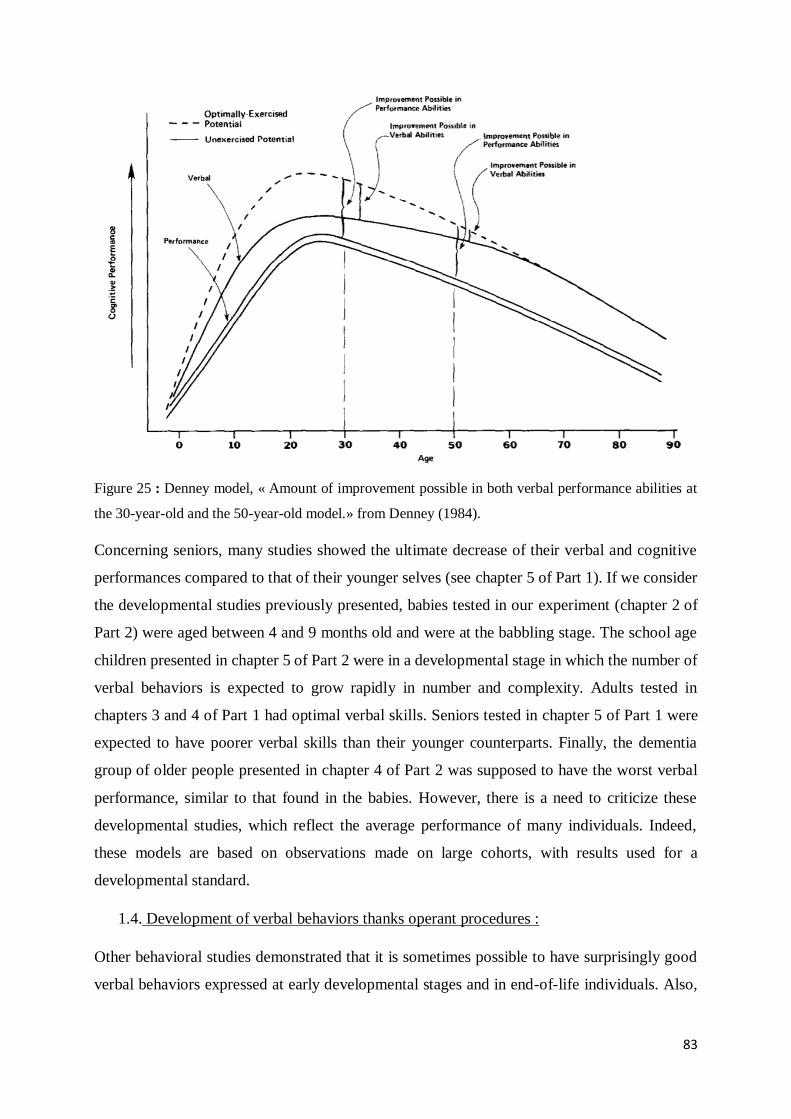
83
Figure 25 : Denney model, « Amount of improvement possible in both verbal performance abilities at
the 30-year-old and the 50-year-old model.» from Denney (1984).
Concerning seniors, many studies showed the ultimate decrease of their verbal and cognitive
performances compared to that of their younger selves (see chapter 5 of Part 1). If we consider
the developmental studies previously presented, babies tested in our experiment (chapter 2 of
Part 2) were aged between 4 and 9 months old and were at the babbling stage. The school age
children presented in chapter 5 of Part 2 were in a developmental stage in which the number of
verbal behaviors is expected to grow rapidly in number and complexity. Adults tested in
chapters 3 and 4 of Part 1 had optimal verbal skills. Seniors tested in chapter 5 of Part 1 were
expected to have poorer verbal skills than their younger counterparts. Finally, the dementia
group of older people presented in chapter 4 of Part 2 was supposed to have the worst verbal
performance, similar to that found in the babies. However, there is a need to criticize these
developmental studies, which reflect the average performance of many individuals. Indeed,
these models are based on observations made on large cohorts, with results used for a
developmental standard.
1.4. Development of verbal behaviors thanks operant procedures :
Other behavioral studies demonstrated that it is sometimes possible to have surprisingly good
verbal behaviors expressed at early developmental stages and in end-of-life individuals. Also,

84
there are distinction changes in verbal behavior that emerge in the presence of developmental
disorders such as autism spectrum disorders or disorders found in senile dementia.
Pelaez et al. (2011), for example, demonstrated that vocal imitation of new syllables was
possible in infants between three and eight months of age. In this experiment, the baby was
lying on a bed and one of the parents or caregivers was positioned above him. The task was to
produce a sound in front of the baby with some upward intonation. When the baby repeated the
sound, the parent strengthened socially by emitting another sound different from the first by
physically stimulating the baby by caresses. In this manner, Pelaez et al. showed that many new
sounds could be emitted in a few trials by babies aged three to eight months, just by reinforcing
babies’ variability of the sounds emitted during an interaction with a caregiver.
In young children with or without developmental disorders, many behavioral procedures also
exist to improve their language skills. Sundberg and Michael (2001) reviewed the different
results obtained through operant procedures on the emergence of verbal behaviors in children
and adults with autism spectrum disorders. For example, Sundberg et al. (2000) used verbal
guidance for verbal behavior in two non-verbal children with autism spectrum disorders. In this
procedure, the educator has to verbally guide the child, "What is it?” while looking at an item,
and the child has to answer with a word for the designated item. If the child did not utter the
appropriate word (i.e., if no word is emitted, or if an incorrect word is emitted), the educator
repeats the word until the child pronounces it correctly. A reinforcer is delivered according to
the performance of the child. The verbal guidance "What is it? " is faded as the child's correct
answer increases. Thus, Sundberg et al. (2000) noted the emergence and the increase of
spontaneous verbal behavior in those two initially non-verbal children.
Moreover, the learning of verbal behaviors is also possible in seniors, even after a cerebral
vascular stroke. For example, we implemented a behavioral procedure aimed at increasing the
verbal behavior of an elderly person hospitalized in a geriatric center after a stroke (Renaux et
al., 2017). We worked on the writing of words dictated by an educator by gradually shaping the
frequency of use of the words by the elderly person. The beginning of the interventions
consisted of the patient’s writing simple words such as "the" and "I". As the patient's
performance progressed, we made the written work requirement more difficult by using less
frequent words such as "president" or "secretary". The task was to spell out a word that the
patient had to write. If the patient wrote the word correctly, additional time for access to the
reinforcing agent (e.g., a preferred book) was added and the educator named another word. If
the patient did not write the word or was mistaken in the spelling, the educator verbally guided

85
the patient by repeating the word until the correct word was written by the patient. Thus, we
observed a relearning of verbal behaviors of this patient, with performances maintained over
time and visible on a follow-up six months after the end of care.
2. Verbal strategies in the establishment of SPC :
Skinner (1969) stated that beyond its social aspects, verbal behavior (such as instruction) can
affect behaviors initially governed by other reinforcing contingencies. One of the best ways to
observe this effect is to compare the performance of individuals on an experimental task with
or without instructions. If the behavior results diverge as a function of instructions, this
reinforces Skinner’s position.
2.1.Influence of instructions in experimental tasks :
Several authors have studied the effect of human instructions in various reinforcement tasks.
For example, Lippman and Meyer (1967) studied human performance on a fixed-interval
reinforcement task. A group of participants who were not exposed to the authors' written
instructions constituted a control group. The experimental group received a common set of
written instructions during the experiment. The task was to accumulate points by pressing a
response lever, a task that is considered reinforcing in humans (Weiner, 1964). Lippman and
Meyer observed that patterns of behavioral responses differed according to the instructions
given during the experiment. Indeed, when the instructions said that the points were going to
be delivered for responses a certain time t after the last reinforcement, participants pressed
significantly less on the response lever (typical pattern found in fixed interval reinforcement)
compared to the other condition. On the contrary, when the instructions specified to the
participants that the number of points would depend on the number of presses on the lever,
authors observed more constant and higher rates of responses. Thus, Lippman and Meyer (1967)
demonstrated that written instructions can modulate individuals' nonverbal behaviors,
consistent with Skinner's (1969) views.
Bandura (1974) said there is a parallel between these instructions and modeling because verbal
behaviors could ‘model’ the behavioral responses expected by the individual himself.
Bandura’s views imply that the reinforcement expected by an individual is decisive in the
emergence of the person’s behavioral responses. These written or verbal instructions are also
considered to be rule-governed behaviors, as participants come to emit the expected behavioral
responses more quickly when instructions are given (Buskist and Miller, 1986).

86
The improvement in performance obtained with instructions is all the more pronounced in
deferred reinforcement procedures. It is easy to observe in everyday life behaviors that are
reinforced in a delayed manner (Luciano, 2000). An employee will work every day to receive
his pay only at the end of the month; students must do homework before a deadline followed
by delayed feedback. When instructions are given concerning reinforcement contingencies, the
behavioral response rates typically are higher. In this sense, Schlinger and Blakely (1987)
classified rule-governed behaviors as events that alter the function of nonverbal behaviors. For
example, before an aircraft takes off, a traveler on a plane receives the instruction "in case of a
disturbance, place the yellow mask in front of your seat over your mouth and breathe normally".
In this case, the instruction provides a very clear rule to follow in a particular context (i.e., in a
danger situation) about a specific stimulus (i.e., the yellow mask). Without this instruction, we
could anticipate that the individual might manipulate this object in a variable way, probably
asking the steward about its functionality if there was still time to get help. Here the verbal
instruction controls the delayed behavior that the traveler is to emit in case of danger.
1.3. Use of instructions in SPC procedures :
All of these studies led us to believe that verbal behaviors could also play a role in the
observation of SPC in humans as opposed to nonhuman animals. Since Brogden (1939)
highlighted SPC, relatively few studies have examined this phenomenon in humans. Brogden
(1947, 1949) himself said that the observation of this second-order conditioned response
required the use of written instructions given to participants. Without these instructions, no SPC
could be observed in humans. Works of Jara et al. (2006) on a second order conditioning tasks
(SOC) converged with Brogden's (1947, 1949) views. In their study, a disease name (CS1) was
associated with serious health problems (US-). Subsequently, the name of a chemical substance
(CS2) was associated with the name of the disease (CS1). A control condition was present with
another disease name (CS3) causing different disorders and associated with another chemical
substance (CS4). The question asked to the participant at the end of the experiment was to
establish the cause of the health problems of a patient X suffering from CS1 or CS3 related
disorders. Jara et al. found that most participants gave the correct name of the disease (CS1 or
CS3) based on the health problems described. Participants could also give the name of the
chemical (CS2 or CS4) associated with this disease (CS2 for CS1, CS4 for CS3). Jara et al.
concluded that the observation of the conditioned second order response, evidenced by the
responses to CS2 and CS4 was explained by participants' ability to form verbal strategies on
causal tasks. More specifically, individuals were able to infer causal relationships between a
cause and its consequence, thanks to the information given in advance.

87
However, in Part 1 we observed significant rates of conditioned responses, even despite our
task lacking any explicit verbal or written instructions about the purpose of our experiment.
One possible criticism is that participants might have created verbal strategies themselves,
relevant to the experimental task they faced. We can not categorically refute this criticism
because we did not operatively ask the participants if they had mentally created verbal
strategies. Moreover, the observation of verbal behaviors internal to the individual is difficult
to objectively assess. This is why our Part 2 is focused on SPC observations with individuals
who have no verbal behavior, or who have distinct disability in verbal skills. To our knowledge,
no study interested in SPC to date tested this phenomenon with this type of population.
3. Using an SPC Task
This part presents the SPC task used among those next chapters of Part 2, in babies (i.e.,
chapter 2), autistic children (i.e., chapter 3) and elderly people with dementia (i.e., chapter 4).
That procedure was detailed in Part 1, chapter 2 (see pages 31-46).
3.1 Apparatus :
An eye-tracking system was used in conjunction with a conventional computer. Participants
faced a computer screen (Dell Model Optiplex 7010) equipped with infrared cameras that
monitored eye movements. The eye-tracking system (FaceLAB#5.1) recorded the
participants’ eye movements including both saccades and visual fixations. There was no
physical restraint of participants’ heads because the system was programmed to track the
participants’ visual focus, even when they moved their heads. Thus, participants only had to
watch the computer screen. This system facilitated our providing participants with no explicit
instructions. Importantly, eye gaze measure can be considered as one potential measure of
attention and numerous researchers have reported longer duration fixations on task-relevant
stimuli than irrelevant stimuli.
3.2 Materials :
The CSs were four colored geometric shapes such as squares, triangles, circles and stars (red,
blue, green, and yellow). For each participant, the CSs were randomly selected, combining a
unique color and a unique shape. Thirty 2 s, video cartoon clips of pleasant scenes were used
as the US+ and one of them, randomly selected without replacement, was presented
immediately upon the participant looking at the target zone of the computer monitor on each
CS1-US+ trial during Phase 2. Each video included action by cartoon characters such as Kung

88
Fu Panda, Dragons, or Kuzco. A single 2 s unpleasant sound was used as the US- and was
emitted from the computer’s two speakers if the participant looked at the target zone when
CS3 was presented during Phase 2. The four colored geometric shapes were presented on the
center of the computer screen. The 2 s presentations of the US+, presented in a 13 cm x 8 cm
rectangle in a corner of the screen, and US- (the aversive noise) were both produced by the
computer. The experimental procedure was controlled by Matlab 7.0 software, which was
also used to analyze the data.
3.3 Procedure :
Participants were initially seated in front of a dark grey background computer screen. At the
start of the experiment, four visual stimuli were randomly selected as CS1, CS2, CS3, and
CS4 for each participant.
Phase 1 began with a sequence of ten simultaneous pairings of CS1 with CS2 and ten
simultaneous pairings of CS3 with CS4 (see Results in chapters 4 and 5 of Part 1). These
stimuli were presented simultaneously and spatially close (i.e., no distance between stimuli)
to each other (see Results in chapter 3 of Part 1). To capture the attention of participants, cues
initially appeared at random points along the edges of the screen and ‘flew’ to the center of
the screen over 15 ms. On each trial, a pair of cues (CS2-CS1 or CS4-CS3) were presented
horizontally aligned at the center of the screen. Which cue was to the left was randomly
determined for each trial. Each cue pair then persisted at the center of the screen for 2 s. Each
stimulus pair appeared ten times interspersed in a random order.
Phase 2 immediately followed Phase 1. CS1 and CS3 were individually presented in random
order at the center of the screen, after entering the screen in motion as described above for
Phase 1. When the US+ appeared at the termination of CS1, it was presented in a randomly
selected specific zone of the computer screen (i.e., top right, top left, bottom right, or bottom
left), but consistent on all trials for any given participant. During presentation of CS1, a solid
line black 7 cm x 7 cm cross was presented in the US+ zone. Participants had to fixate on that
zone before the cue presentation was over in order to obtain the short video clip; hence, the
task was actually instrumental. If they failed to do so, the trial ended up and a new trial with
CS1 began until the ‘correct’ response was emitted. After three correct responses to CS1, the
cross was faded into a dotted line cross. Participants still had to look at the US+ zone to obtain
the video clips. When CS3 appeared, participants had to look away from the US+ zone;
otherwise the US- (i.e., an unpleasant sound) was emitted and a new trial with CS3 began.
Phase 2 ended when a participant emitted three consecutive correct responses with the dotted

89
line cross for CS1 and three consecutive correct responses for CS3 without an intervening
error. When participants reached this performance criterion, they were tested on CS2 and
CS4. We used this criterion to be certain that CS1 was associated with the US+ and CS3 was
associated with the US-: this first order conditioning was necessary to reveal any SPC
established during Phase 1.
CS2 and CS4 were each tested once separately, entering in ‘flight’ from the edge as described
for Phase 1. We used a single test trial for each cue to avoid extinction effects that would have
permitted early test trials to reduce the sensitivity of subsequent test trials. The critical
question was whether participants would anticipate the appearance of a movie clip when CS2
or CS4 was presented. Testing was in extinction; that is, even if participants looked at the
US+ zone, no video clip nor aversive noise was presented. To avoid possible order-of-testing
effects, we controlled for whether the first test trial was a CS2 or a CS4 presentation. For 10
participants in each condition, testing began with the CS2 trial followed by the CS4 trial; for
the other ten participants in each condition, the order was reversed.

90
CHAPTER 2 :
SPC IN NON-VERBAL BABIES (4-9 months)
Babies participating in our experiment were aged between 4 and 9 months and were thus
considered to be non-verbal individuals because the babbling emitted does not seem to have a
social function. In addition, babies do not appear to use verbal strategies in their learning
(Makin, 2007).
1. Introduction :
1.1. Demonstrations of associative learning in babies :
The study of Bhat, Galloway and Landa (2010) aroused our curiosity that associative learning
had in fact been demonstrated in 6-month-old babies. The purpose of that study was to compare
visual attention performances among a large cohort of babies, some of these babies being
suspected of developing autism spectrum disorders. Thus, 25 babies without developmental
disorders were compared to 25 other babies with risks of developing autistic disorders on a task
of "object-social learning" (Bhat et al.). Early signs of autism spectrum disorders include non-
response to social interaction, lack of attention to others, and lack of eye tracking during social
interaction. These authors were therefore interested in ocular fixation times in infants in order
to detect defects in visual fixations in social interactions as early as 6 months of age. In that
experiment, babies were placed in a suitable chair in front of a joystick connected to a speaker
device emitting music. The experimental task was to use a joystick to activate music clips. As
soon as the baby was able to trigger the music, one of his parents socially reinforced that
behavior. The visual fixation times on the parent's face and on the joystick were recorded. Bhat
and al. observed a higher visual fixation time on non-social stimuli in high-risk infants
compared to control-group infants. In addition, all of their babies had successfully used the
joystick to access the music. The authors talked about associative learning between the joystick
and receiving a reinforcing item (i.e., music in their experiment).
These results are also supported by many authors who focused on the development of memory
in humans. Rovee-Collier (1997) underlined the differentiation between procedural memory
and declarative memory, procedural memory being considered as primitive and the declarative
as requiring the acquisition of social skills such as language. Rovee-Collier (1997) focused on
the development of memory in individuals with developmental disorders, especially children
with autistic disorders. Prevailing thought decades ago was that declarative memory should be
deficient in these individuals who lack social skills. However, Rovee-Collier (1997) showed
that learning requiring access to a declarative memory was found in children with autistic

91
disorders. The author thus concluded that declarative and procedural memory both followed the
same developmental processes and that language skills were not necessary for this
development. Today, it is thought that typical 3-month-old babies can quickly learn causal
relationships (Rovee-Collier et al., 2001). These results led us to believe that an observation of
SPC could be possible with human babies, although this type of conditioning has never
previously been observed in this population.
1.2. Second order conditioning in infants rats (Cheatle and Rudy, 1978) :
Cheatle and Rudy (1978) demonstrated the existence of second order conditioning in infant
rats. In that experiment, the researchers collected 29 babies at birth (D0) from a litter of female
rats raised in the laboratory and tested them at the 7th day post-birth (D7). One of the first
senses developed in the rat is olfaction. In that way, Cheatle and Rudy used a phylogenetically
aversive odor for the baby rat (US-). In a first phase, a drop of lemon (CS1) was followed by
the presentation of the aversive odor (US-). Then in a second phase, the drop of lemon (CS1)
was followed by a drop of orange extract (CS2) in a single trial. Authors then assessed the
exploratory behaviors to the different stimuli presented at the test, depending on the
experimental conditions in which the baby rats were confronted. Indeed, a control group of
baby rats was also confronted with a pairing of lemon (CS1) and orange (CS2) extracts without
the CS1-US- pairing. Very quickly, Cheatle and Rudy observed that babies who had been
exposed in the first phase to US- were approaching CS1 less and less when it was presented,
compared to the control group. The same was found with the orange extract CS2. Thus, Cheatle
and Rudy demonstrated first and second order conditioning in the 7-day-old rat, after pairing
two conditioned CS1 and CS2 stimuli together, one having been previously exposed with an
aversive odor US-.
The studies described above speaks to many questions concerning the establishment of
associative learning at a very early developmental stage. Our behavioral task used
discriminative auditory and visual stimuli for babies aged 4 months and older who do not have
verbal strategies in their behavioral repertoire. The goal of this chapter, therefore, was to
observe whether or not an SPC response occurred in an associative learning situation described
as complex because it requires recall of associations CS2-CS1-US for individuals at a very early
developmental stage. According to the hypothesis of verbal strategies in the establishment of
associative learning, we should not observe such a conditioned response in human babies.Our
behavioral procedure has been explained previously in Part 1. We used the same eye-tracking

92
system that allowed the baby to be free to move. No written or oral instructions were used
during this experiment.
2. Participants :
Twenty-four babies (11 girls and 13 boys/ 28 babies initially tested, 4 rejected
because excessive crying) participated in this experiment, all aged between 4 and 9 months.
The average age of participants was 5.79 months (SD : 1,60). No deficiency or developmental
disorder was observed within these participants. In addition, the babies had no predisposition
to developmental disorders such as autism spectrum disorders.
Each parent read and signed the consent form before the start of the experiment. Babies were
placed on baby chairs in front of the computer screen so that each baby could watch the stimuli
presented on the computer screen. The parent could stand behind the baby or behind a tinted
window to observe the development of the experimental task.
Calibration of eye-tracking system was harder compared to calibration for typical adults.
Indeed, for each baby we had to respect their sleep cycle and to choose with his/her parents the
best time during awareness in order to have his/her attention for 30 minutes. For calibration,
we used an amusing movie cartoon instead of typical red points that are used with typical adults.
Thus, babies were motivated to look at calibration points before the beginning of the
experiment. Unfortunately, we stopped the experiment for four babies who cried a lot after US-
presentation during Phase 1. Thus, we present results for 24 babies instead of 28.
The babies were free to move in the babychair, as the eye-tracking system did not restrain him
physically. If a baby began to cry, the experiment was momentary stopped and we waited for a
quiet time to restart the experiment. The parent could also signal the experimenter to note
suspicious or precursors of disruptive behavior in of their child.
3.Results :
All results were collected at the end of the experiment by the Matlab© software, and were
analyzed with conventional statistical techniques.
3.1. Statistical issues :
Floor and ceiling effects were observed and the variance of results was artificially low within
babies. Moreover, within participants our data did not exhibit normal distributions. Thus, we
used nonparametric tests to analyze visual fixation times on the CS1-CS2 and CS3-CS4

93
presentations, and on the US zone. See below the statistical nonparametric tests used in order
to illuminate the results of the experimental task with p (<.05), used in Renaux et al. (2017) :
- The Mann-Whitney U test (also called the Mann-Whitney Wilcoxon) is a
nonparametric test of the null hypothesis that is equally likely that a randomly selected
value from one sample will be greater or lesser than another value selected from a
second sample. The Mann-Whitney U test does not require that the data be normally
distributed and is considered to be an efficient test to determine whether two
independent samples come from the same distribution.
- Fisher’s exact test : Fisher’s exact test is a statistical significance test used in the
analysis of contingency tables. Fisher’s exact test is commonly used when sample sizes
are small, although the test is efficient for all sample sizes. Thanks to Fisher’s test, the
significance of the data’s deviation from the null hypothesis can be calculated rather
than relying on an approximation that becomes exact only in the limit as the sample size
grows to infinity, as with many statistical tests.
3.2. Statistical analysis :
3.2.1. Phase 1 :
Figure 26 shows visual fixation duration for CS1-CS2 and CS3-CS4 trials presented in Phase
1 in babies. There was no statistical difference between the two types of stimuli pairs (W = -
.49, p = .96). Thus, visual fixation durations were approximately the same for CS1-CS2 and
CS3-CS4 presentations in babies: 83.42% of visual fixation for CS1-CS2 and 83.77% of
visual fixation for CS3-CS4 presentation.

94
Figure 26. Mean percent of Phase 1 trial durations in which babies visually fixated on the
stimulus pairs (CS2-CS1 and CS4-CS3) at the center of the screen. Error brackets represent
SEMs.
3.2.2. Phase 2 :
Figure 27 illustrated Phase 2 first-order conditioning results. We observed higher responses
rates to CS1 than to CS3 in babies (W = 150, p = .004). Thus, all babies looked at the US zone
after CS1 presentation and avoided the US zone after CS3 presentation. No interaction was
observed between Condition and Cue. That is, conditioned responses in CS2 and CS4 tests
were caused by Phase 2 conditioning.
Figure 27: Mean percent of CS1 and CS3 trials with visual fixation to the US+ video site
during Phase 2 in babies. Error brackets represent SEMs.
0
10
20
30
40
50
60
70
80
90
100
CS1-CS2 CS3-CS4
Per
cen
t of
Ph
ase
1 t
rial
s w
ith
fix
atio
ns
on
th
e st
imulu
s pai
r.
Stimuli pairings
BABIES
0
10
20
30
40
50
60
70
80
90
100
CS1 CS3
Per
cen
tage
of
resp
on
ses
in P
has
e 2
Stimuli CS1 and CS3 across conditions A and B
BABIES
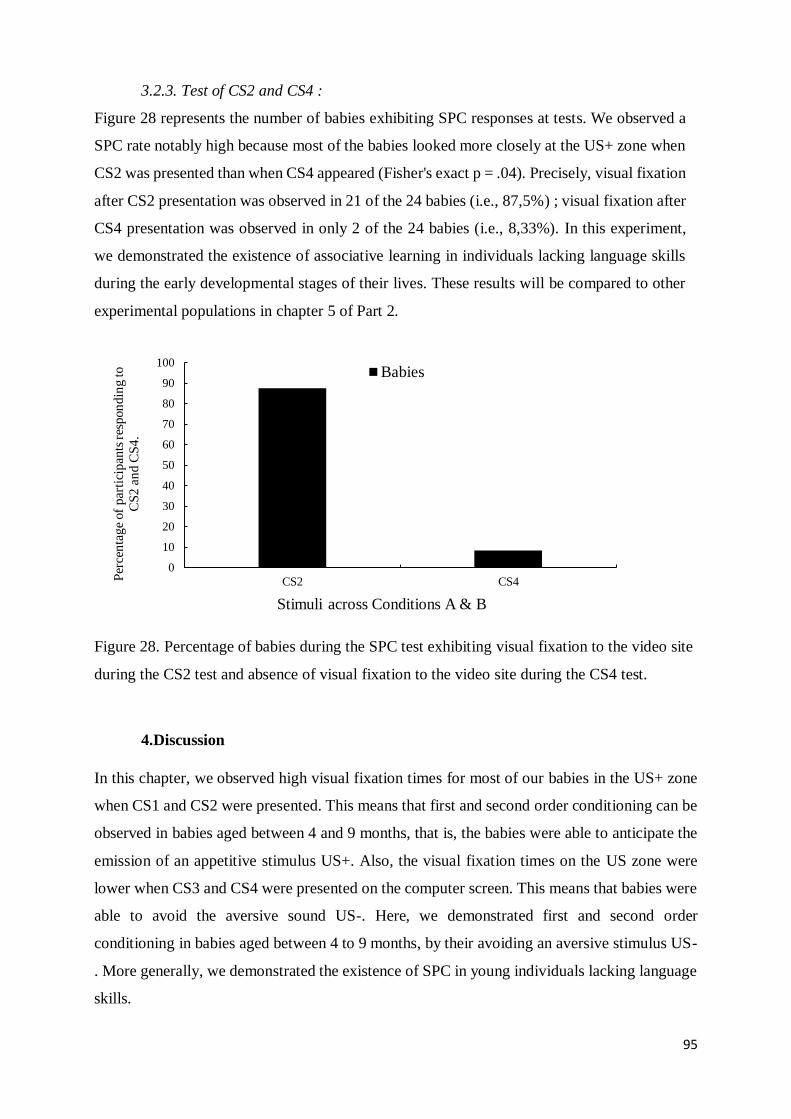
95
3.2.3. Test of CS2 and CS4 :
Figure 28 represents the number of babies exhibiting SPC responses at tests. We observed a
SPC rate notably high because most of the babies looked more closely at the US+ zone when
CS2 was presented than when CS4 appeared (Fisher's exact p = .04). Precisely, visual fixation
after CS2 presentation was observed in 21 of the 24 babies (i.e., 87,5%) ; visual fixation after
CS4 presentation was observed in only 2 of the 24 babies (i.e., 8,33%). In this experiment,
we demonstrated the existence of associative learning in individuals lacking language skills
during the early developmental stages of their lives. These results will be compared to other
experimental populations in chapter 5 of Part 2.
Figure 28. Percentage of babies during the SPC test exhibiting visual fixation to the video site
during the CS2 test and absence of visual fixation to the video site during the CS4 test.
4.Discussion
In this chapter, we observed high visual fixation times for most of our babies in the US+ zone
when CS1 and CS2 were presented. This means that first and second order conditioning can be
observed in babies aged between 4 and 9 months, that is, the babies were able to anticipate the
emission of an appetitive stimulus US+. Also, the visual fixation times on the US zone were
lower when CS3 and CS4 were presented on the computer screen. This means that babies were
able to avoid the aversive sound US-. Here, we demonstrated first and second order
conditioning in babies aged between 4 to 9 months, by their avoiding an aversive stimulus US-
. More generally, we demonstrated the existence of SPC in young individuals lacking language
skills.
0
10
20
30
40
50
60
70
80
90
100
CS2 CS4Per
cen
tag
e of
par
tici
pan
ts r
esp
on
din
g to
CS
2 a
nd
CS
4.
Stimuli across Conditions A & B
Babies

96
In comparison to previous mentioned studies, our results confirmed some specific works which
observed second order associative learning in young rats (Cheatle and Rudy, 1978) or
establishment of declarative memory in humans (Rovee-Collier et al., 2000). Here again, our
results highlighted the establishment of skills using memory without verbal skills. Indeed, it
seems that such associative learning does not depend on verbal skills in humans. Thus, we put
forward the hypothesis that the verbal behavior is not a facilitator of the SPC response.

97
CHAPTER 3 :
SPC IN NON-VERBAL AND VERBAL AUTISTIC CHILDREN
In chapter 3, we tested one of the hypotheses concerning the establishment of SPC in humans.
Indeed, this type of conditioning is generally explained by the use of verbal strategies in humans
(Jara et al., 2006). Deficits in verbal strategies and more generally disorders in verbal skills
have been demonstrated in verbal and non-verbal children with autism spectrum disorders
(Anderson, Lord, Risi, DiLavore, Shulman, Thurm, ... and Pickles 2007, Baron-Cohen, Leslie
and Frith 1985, Happé 1995, McEvoy Rogers and Pennington 1993, Mundy Sigman and Kasari
1990, Ornitz Guthrie and Farley 1977, Ungerer and Sigman 1987).
1. Introduction :
1.1. Joint attention and verbal behavior in autistic children :
Anderson et al. (2007) studied a cohort of 205 children with autistic disorders aged 2, 3, 5 or 9
years old, assessing language skills using psychometric assessments and also assessing joint
attention in each participant. Joint attention is considered as a core social skill based on basic
visual discrimination and defined as the capacity to use eye contact and cues to coordinate
attention with someone on a stimulus (Pelaez, 2009). In other words, it implies shared
awareness of a stimulus. Anderson et al. (2007) observed a great variability in the results
obtained and noticed a diversity of verbal disorders within the cohort ranging from disorders in
verbal and non-verbal expression to failure to respond to simple instructions. Joint attention
was one of the phenomena observed in that study and is an often observed in autistic children :
children were asked to point a specific tool (e.g., a spoon), then they had to look at the tool
before pointing to it for the experimenter.The authors demonstrated that the results of joint
attention tests were good predictors of the child's future language level. In addition, authors
found that the poorer the language skills, the more prone the child would be to emit socially
inadequate behaviors, with these behaviors having a considerable negative impact on the life of
the individual. Similarly, McEvoy et al. (1993) compared the verbal skills of children with
autistic disorders to other school children without autistic disorders. Here, the executive
function (i.e., how to solve a problem) and social communication were studied. McEvoy et al.
found that children with autistic disorders had more difficulty in resolving tasks but persevered
more than their peers without autistic disorders. Also, as already pointed out by Anderson and
al. (2007), these authors observed a lack of joint attention in children with autistic disorders, as
well as a defect in verbal communication with their peers. This lack of joint attention was also

98
found in 45-month-old children followed for 13 months who were suspected for autism
spectrum disorders (Mundy et al., 1990). A correlation between joint attention capacity and the
emergence of verbal behaviors were observed: the more the joint attention was deficient, the
greater the delay in emergence of verbal behaviors. Thus, these authors considered visual
attention as a good behavioral measure of autism in children, and they worked to improve joint
attention in autistic children.
1.2. Categorization skills in autistic children :
In addition, Ungerer et al. (1987) studied receptive language and categorization skills in
children with autistic disorders compared to peers without developmental disorders. The task
was for the autistic child to put into boxes several items when they were subsequently presented
one by one according to their shapes, colors and functions, then to name these items presented
on flashcards. Ungerer et al. (1987) observed significantly lower performance in children with
autistic disorders compared to the control group. Nowadays, we know that individuals with
autistic disorders have developmental delays in many areas such as motor skills,
communication and perception, at least during the first two years of life (Ornitz et al. 1977).
Baron-Cohen et al. (1985) claimed that individuals with autistic disorders could not predict
events or infer facial expressions of others. Happé (1995) modulated these conclusions by
experimenting with social event anticipation tasks on individuals with autism spectrum
disorders in comparison to individuals without developmental disorders. In that experiment,
Happé observed that the learning of anticipatory behaviors (e.g., completing a story initiated by
three flashcards presented in a specific order) was possible in individuals with autistic disorders,
but that the acquisition time was longer compared to that observed in typical individuals. This
author also pointed out that this acquisition was faster when the individual had good language
skills. Happé’s data suggested that establishment of anticipatory responses in children with
autism spectrum disorders was possible, contrary to other studies (Ornitz et al., 1977 ; Baron-
Cohen et al., 1985).
1.3. Associative learning in autistic children :
Moreover, some studies focusing on associative learning in children with autistic disorders
challenged the results observed in previous studies (Bhat, Galloway and Landa, 2010, Preissler,
2008). For example, Preissler studied associative learning between words and images in verbal
children with autistic disorders. The experimental task consisted of presenting an image of an
item (e.g., a spoon) with the associated verbal word ("spoon"). The child had to repeat the word
specific to the image of the item presented. Subsequently, these images were associated with

99
real objects, and the child had to name it. Preissler showed that verbal children with autistic
disorders had performances similar to children without developmental disabilities in this
discrimination task and in naming items. This study can not be readily generalized to our
experiment because no stimulus had been associated with an unconditioned stimulus in
Preissler’s work. Similarly, Bhat et al. (2010) obtained the same results in a discrimination tasks
similar to the study of Preissler by recording the visual fixation times of children with autistic
disorders and varying social (e.g., human faces) and non-social stimuli (e.g., usual objects like
a toy, a chair, or spoon). Thus, these authors demonstrated that associative learning between
social and non-social stimuli was possible with autistic children, even though visual fixation
times differed greatly across the nature of the different stimuli. Indeed, the visual fixation times
were lower when a social stimulus was presented, compared to a non-social stimulus in autistic
children compared to children without developmental disorders – which is a characteristic
observed with autistic children who mostly have a preference for non-social stimuli compared
to social stimuli.
To our knowledge, no prior research has used the SPC procedure with this population, despite
the existence of many experimental works focused on the learning of verbal behaviors. For
example, Sherer et al. (2001) developed a tool to teach the language skills to children with
autism spectrum disorders. The goal of the authors was to develop these skills through the use
of therapeutic videos. The child had to answer questions from a computer with different videos
on various topics such as "What do you like doing on weekends?" or "What do you like to eat?
". Audiovisual feedback was given to the child at the end of the test. In this experiment, the
children were able to emit words from their behavioral repertoire as well as to make short
sentences. The tools used in that experiment thus allowed the development and generalize of
these skills with respect to various subjects as preferred food or preferred games (Sherer et al.,
2001). Concerning the emergence of verbal behaviors in non-verbal children with autism
spectrum disorders, the work of Koegel et al. (1987, 1988) introduced some possible behavioral
therapies. Koegel et al. (1987) emphasized the importance of working on functional behavioral
responses in individuals with autism spectrum disorders. These authors determined how to
manipulate environmental variables, both in terms of antecedents and consequences, in order
to facilitate the emergence of verbal behaviors with non-verbal children. For each child,
experimenters used stimuli and natural reinforcers to train the verbal behavior for two hours a
day. For example, a bottle of water was placed on the work table and the experimenter verbally
guided the child to sound [o] for water later. Koegel et al. (1987) observed an increase in the
number of verbal behaviors in children with autistic disorders, these children having been

100
initially non-verbal. Subsequently, Koegel et al. (1988) demonstrated the emergence of those
verbal behaviors can be improved by first using topics of reinforcing conversations for the
individual, then changing the themes within therapy. Thus, a preference assessment was
conducted at the beginning of the session for each individual, and then worked on the verbal
behaviors associated with the child's preferred reinforcer.
1.4. In our experiment :
In this chapter, we tested two groups of children diagnosed as having autism spectrum
disorders: verbal children and non-verbal children, all supported by ABA services. Because the
establishment of SPC is presumably based on higher reasoning processes (Jara et al, 2006), and
SPC had not found with children with autism spectrum disorders (Ornitz et al., 1977 for
example), we expected not to observe this type of learning in our two experimental groups.
However, because the use of verbal strategies had been proved facilitative for the establishment
of associative learning (Brogden et al., 1947, Jara et al, 2006), we hypothesized that the SPC
rate observed would be higher in the verbal children in comparison to the non-verbal children.
No comparison with children without developmental disabilities will be made in this chapter
because there are important environmental variables separating these two populations. The
experimental task for the two experimental groups was therefore the same as the one described
before.
2. Participants
Twenty-five children (7 girls and 18 boys) diagnosed as having autism spectrum disorder
participated in this experiment, aged between 4 and 9 years old (mean : 7,02 years old ; SD :
2,2). The verbal skills of each child were assessed using the Peabody Picture Vocabulary Scale
(PPVT©). Following the PPVT, each participant was placed in the experimental group "verbal"
or "non-verbal" according to their performance (see Appendix 2).
Thus, 11 children (of 17 children tested) with autism spectrum disorders are part of the verbal
group and 14 other children (of 19 children tested) were assigned to the non-verbal group. Each
legal guardian first read and signed a consent form, and could also attend the session by standing
behind a tinted window so that the child would not be disturbed by the presence of one of his
parents. Each child could leave the experience at any time, not being physically restrained by
the eye-tracking apparatus. The experimenter could also terminate the experiment if he saw a
behavioral disorder emitted by the participant. For example, if a self-injurious behavior was
emitted during the experiment, the experimenter ended the experimental task.

101
We excluded 11 autistic children (specifically, 6 verbal children and 5 non-verbal children)
because of behavioral disorders. For the safety of participants, experimenters and materials, we
stopped the experimental task when a behavioral disorder was emitted. Data of those 11 autistic
children are not presented.
3.Results :
All results were collected at the end of the experiment by the Matlab© software, and were
analyzed with conventional statistical techniques. Using the G*Power 3.1 software (Faul,
Erdfelder, Buchner, & Lang, 2009), we calculated the estimated sample size necessary to
observe an average effect (f = 0.5) with an α = 0.05 and a power of 0.80. With the main analysis
viewed as a comparison of the means of two independent groups, we obtained a recommended
sample size of at least 106 participants, with at least 53 participants per group. However,
despite this recommended group size, in this study we managed to recruit only 25 participants,
with 11 and 14 in each group. Hence, we conducted our analyses with nonparametric statistics
to our interpretations of these results.
3.1. Statistical issues :
For the same reasons explained in previous chapters, see below the statistical nonparametric
tests used in order to illuminate the results of the experimental task with p (<.05) :
- The Mann-Whitney U test (also called the Mann-Whitney Wilcoxon) is a
nonparametric test of the null hypothesis that is equally likely that a randomly selected
value from one sample will be greater or lesser than another value selected from a
second sample. The Mann-Whitney U test does not require that the data be normally
distributed and is considered to be an efficient test to determine whether two
independent samples come from the same distribution.
- Fisher’s exact test : Fisher’s exact test is a statistical significance test used in the
analysis of contingency tables. Fisher’s exact test is commonly used when sample sizes
are small, although the test is efficient for all sample sizes. Thanks to Fisher’s test, the
significance of the data’s deviation from the null hypothesis can be calculated rather
than relying on an approximation that becomes exact only in the limit as the sample size
grows to infinity, as with many statistical tests.
- The Cliff's Delta statistic is a nonparametric effect size measure that quantifies the
amount of difference between two groups of observations beyond p-value interpretation.

102
3.2. Statistical analysis :
3.2.1. Phase 1 :
Figure 29 shows visual fixation duration for CS1-CS2 and CS3-CS4 trials presented in Phase
1. No statistical difference between the two types of stimuli pairs were observed (W = -.40, p
= .97), nor between the verbal and non-verbal autistic children (respectively, U = 66.00, p =
.55 and U = 73.00, p = .27). Visual fixation durations were approximately the same for CS1-
CS2 and CS3-CS4 presentations in verbal and non verbal children: 44.57% of the visual
fixation for CS1-CS2 in condition verbal and 43.92% in condition non-verbal; 43,92% of
visual fixation for CS3-CS4 in condition verbal and 45.16% in condition non-verbal.
Figure 29. Mean percent of Phase 1 trial duration in which autistic children visually fixated on
the stimulus pairs (CS2-CS1 and CS4-CS3) at the center of the screen. Error brackets represent
SEMs.
3.2.2. Phase 2 :
Phase 2 first order conditioning results are illustrated in Figure 30. We observed greater
responding to CS1 than to CS3 both in condition verbal (W = 144, p = .003, Cliff’s d = 0.9)
and in condition non-verbal (W = 147, p = .004, Cliff’s d = 0.9). That means, all autistic
children looked at the US zone after CS1 presentation and avoided the US zone after CS3
presentation. No significant difference was demonstrated between the two experimental
groups of verbal or non-verbal children with autism spectrum disorders. In addition, there was
no interaction observed between Condition and Cue. Thus, SPC performances observed in
Test were caused by Phase 2 conditioning.
0
10
20
30
40
50
60
70
80
90
100
CS1-CS2 CS3-CS4Per
cen
t of
Ph
ase
1 t
rial
s w
ith
fix
atio
ns
on
the
stim
ulu
s p
air.
Stimuli pairings
VERBAL NON-VERBAL

103
Figure 30: Mean percent of CS1 and CS3 trials with visual fixation to the US+ video site
during Phase 2 in verbal and non-verbal autistic children. Error brackets represent SEMs.
3.2.3. Test of CS2 and CS4 :
Figure 31 represents the number of autistic children exhibiting SPC responses at tests. At the
end of the second phase, both experimental groups showed high levels of visual fixation on
the US+ zone when CS2 was presented. Precisely, visual fixation after CS2 presentation was
observed in 9 of the 11 in condition verbal (i.e., 81,81%) compared to 8 of the 14 in condition
non-verbal (57,14%), Fisher’s exact test p = .44). Visual fixation after CS4 presentation was
observed in 0 of the 11 in condition verbal (i.e., 0%) compared to 1 of the 14 in condition
non-verbal (i.e., 7,14%), Fisher’s exact test p = 1. Thus, no significant difference was
demonstrated between the two experimental groups of verbal or non-verbal children with
autism spectrum disorders.
0
10
20
30
40
50
60
70
80
90
100
CS1 CS3
Per
cen
tag
e of
resp
on
ses
in P
has
e 2
Stimuli CS1 and CS3 across conditions A and B
verbal non-verbal

104
Figure 31. Percentage of autistic children during the SPC test exhibiting visual fixation to the
video site during the CS2 test and absence of visual fixation to the video site during the CS4
test in conditions verbal and non-verbal.
4. Discussion :
In this chapter, we observed high visual fixation rates in the US+ zone when CS1 and CS2 were
presented to participants; demonstrating first and second order conditioning in verbal and non-
verbal children with anticipatory responses to appetitive stimuli. In addition, we found that
visual fixation rates were lower after the presentations of CS3 and CS4. This is also a
demonstration of first and second order conditioning of aversive stimuli avoidance responses.
Therefore, our data are consistent with some studies that have demonstrated the existence of
second order associative learning between conditioned stimuli in children with autistic
disorders (Bhat, Galloway and Landa, 2010, Preissler, 2008). In this experiment, we
demonstrated the same type of learning with biologically critical stimuli (i.e., unconditioned
appetitive and aversive stimuli).
Because we did not observe lower visual fixation rates in non-verbal children with autistic
disorders compared to verbal children, verbal behavior does not appear to be beneficial for the
establishment of SPC. From this point of view, our study did not support the work of Happé
(1995) who stated that verbal behavior improves the skills of children with autism spectrum
disorders. Indeed, our study showed that non-verbal children looked at the US+ area when CS2
was presented, and also avoided this area when CS4 appeared as did their peers with verbal
skills. Therefore, these results supported our hypothesis that verbal behavior is not necessary
for the establishment of SPC.
0
10
20
30
40
50
60
70
80
90
100
CS2 CS4Per
cen
tag
e of
par
tici
pan
ts r
esp
on
din
g to
CS
2 a
nd C
S4.
Stimuli across Conditions A & B
verbal non-verbal

105
CHAPTER 4 : SPC IN DEMENTIA
The increase of general cognitive deficits seen in dementia has led to the development of new
tools using informant and performance screening methods to assess cognitive functioning in
impaired individuals (Galvin, 2018). Specifically, evaluations of learning and memory in
dementia patients have highlighted deficits in recall and attention compared to elderly controls
(Grober and Buschke, 1987). Jointly, the observed decline in cognitive abilities is correlated
with affective disturbances including emotional deficits and apathy, which are initially
noticeable in patients with mild dementia (Derouesne, Thibault, Lagha‐Pierucci, Baudouin‐
Madec, Ancri, and Lacomblez, 1999).
1. Introduction :
1.1. Respondent and operant conditioning and the elderly with dementia :
Despite the widely observed general cognitive decline seen in dementia, some behavioral
learning is seen in dementia patients permitting the treatment of escape and aggressive
behaviors (Rogers, Holm, Burgio, Granieri, Hsu, Hardin, and McDowell, 1999; Baker,
Hanley and Mathews, 2006; Buchanan and Fisher, 2002). Moreover, training in occupational
activities often enhances morning care routines like toileting or dressing and can reduce
disruptive behaviors (Rogers, Holm, Burgio, Granieri, Hsu, Hardin, and McDowell, 1999).
Escape and aggressive behaviors in nursing homes can be reduced by reinforcing appropriate
behaviors (Baker, Hanley and Mathews, 2006) or with the use of music contingently delivered
immediately after compliant behavior occurrences (Buchanan and Fisher, 2002). Such
successful escape and appetitive conditioned behaviors can often be viewed within the
framework of associative learning. In typical associative learning experiments with
nonhuman, a conditioned signal (e.g., a tone or a flash light) precedes the occurrence of an
unconditioned stimulus (e.g., an aversive electric shock) and subjects subsequently avoid the
conditioned signal if possible. The dominant theoretical account of the conditioned avoidance
is that it is acquired and maintained by a combination of respondent and operant conditioning
(e.g., Dymond and Roche, 2009). First, respondent conditioning is implemented by the
warning signal becoming a conditioned stimulus (CS) because of its prior pairings with the
unconditioned aversive stimulus (US). Thus, avoidance responses occur in the presence of the
CS because it evokes fear. Operant conditioning takes place when an avoidance response is
emitted in the presence of the CS and is maintained by the escape from the CS and by the
consequent reduction in fear. This learning is subsequently maintained by knowledge of the

106
relation between the avoidance response and the absence of the US (Dymond and Roche,
2009), involving multiple neural systems such as the cerebellum and the prefrontal cortex
(Molchan, Sunderland, McIntosh, Herscovitch, and Schreurs, 1994), which are typically
degenerated in dementia (Strich, 1956). Multiple correlations between degenerated brain
areas and losses of cognitive abilities (Terry, Masliah, Salmon, Butters, DeTeresa, Hill and
Katzman, 1991 ; Fischer, Gage, and Björklund, 1989) led researchers to think that associative
learning could not be observed in patients with dementia.
However, some studies focused our attention on the use of experimental tasks based on
operant conditioning. Spira and Edelstein (2007) conducted an experiment in order to evaluate
operant conditioning in four typical elderly compared to four elderly with Alzheimer’s
disease, using a button-pressing task and a single subject design. In that study, the elderly had
to seat in front of a computer screen connected to a joystick, with which they had to put coins
into the box when coins are given. A coin-delivery mechanism was used in order to deliver
reinforcers according to the elderly’s responses constituting different reinforcement
conditions. Indeed, Spira and Edelstein (2007) tested transitions in the elderly with fixed ratio
(FR), fixed interval (FI) and extinction (EXT) schedules. Many previous studies have focused
on the sensitivity to those schedules in typical adults (e.g., Haye, Brownstein, Haas &
Greenway, 1986). Spira and Edelstein observed in both groups (i.e., typical elderly and elderly
with dementia) the same patterns of operant conditioning according typical patterns
demonstrated in typical adults. This was an interesting result because the elderly with
dementia emitted the same conditioned responses compared to typical elderly people. In
addition, the authors observed a higher sensitivity to the FI-EXT transition in the dementia
group compared to the control group, which suggests that the elderly with dementia are more
sensitive to the no-reinforcement schedule compared to the elderly without dementia. Such
results supported the possible effectiveness of non-drug therapies for elderly with dementia.
Gräsel, Wiltfang and Kornhuber (2002) reviewed numerous non-drug therapies in elderly
with dementia, including the use of classical and operant conditioning. The authors
encouraged the use of behavioral therapies that aim to recover lost skills elderly (e.g., reading,
writing), or to enhance some abilities (e.g., use a specific tool of the home care) using operant
conditioning. Many of those studies involve associative learning, even if the authors did not
mention it. For example, Spira and Edelstein (2007) used a tone paired with a light before
each trial in order to signify to elderly people that a new trial began and that coins are going
to be delivered. Here, both tone (CS1) and light (CS2) were associated with the US+ (i.e.,
coins delivered). Thus, each participant was ready to pick up coins from the box as soon as

107
they heard and saw the light and the tone at the beginning of each trial. In that study, the goal
of Spira and Edelstein was not to examine SPC, in that light and tone were always presented
together and there was no test after tone or light presented alone. Thus, all that they examined
was first order conditioning.
1.2.In our experiment :
Toward assessing associative learning in dementia patients, the present experiment used a
SPC (Brogden, 1939) procedure implemented with an eye-tracking system. The use of an eye-
tracking system facilitated our avoiding the use of instructions, which might have confounded
learning with comprehension of verbal instructions. This point is important because of the
possibility of instructions being misunderstood by participants with cognitive disabilities. The
preparation also permitted participants to exit the experiment if they wanted because there
was no physical restraint, and they would just have had to look away from the computer screen
or close their eyes. To our knowledge, SPC has never before been examined in dementia
patients. Basically, we asked whether such relatively complex learning (i.e., associative
chains such as CS2-CS1-US) could be observed in dementia.
The present experiment examined SPC in two experimental groups: twenty typical elderly
people (seniors [Sen]) and twenty elderly patients with a diagnosis of dementia (Dem).
Exactly the same procedure was used in both groups.
2. Participants
Twenty typical elderly (11 females and 9 males; 71 and 96 years old, mean age 87,0 years old,
SD : 1,16) volunteers were assigned to the control group Senior. Each participant read and
signed an informed consent form prior to the experiment.
Twenty patients with diagnoses of dementia (13 females and 7 males; 78 and 95 years old, mean
age 88,8 years old, SD : 1,32) were assigned to the experimental group Dementia. Each
participant passed a PATHOS© evaluation and presented severe dementia with lacks of verbal
abilities and attention (see Appendix 3). PATHOS© provided a personal evaluation of the
deficits and the specific needs of health care (Benhamou, Berti, Brodner, De Andres, Draisci,
Moreno-Azcoita et Viel, 2008). A member of each dementia patient’s family read and signed
an informed consent form prior to the experiment.
Participants could exit the experiment if they wanted it, or if experimenters observed distressed
behavior. In this study, only one participant had been excluded in the dementia group, because
of a hypersomnia during the experimental task in Phase 1 (during which CS2-CS1 and CS4-

108
CS3 pairing presentations occurred). Results of the sleepy participant will not be presented in
that chapter 4.
The experiment was approved by the University of Lille Institutional Review Board. 3.Results
All results were collected at the end of the experiment by the Matlab© software, and were
analyzed with conventional statistical techniques. Using the G*Power 3.1 software (Faul,
Erdfelder, Buchner, & Lang, 2009), we calculated the estimated sample size necessary to
observe an average effect (f = 0.5) with an α = 0.05 and a power of 0.80. With the main analysis
viewed as a comparison of the means of two independent groups, we obtained a recommended
sample size of at least 106 participants, with at least 53 participants in each group. However,
despite this recommended group size, in this study we managed to recruit only 40 participants,
with 20 in each group. Hence, we conducted our analyses with nonparametric analyses to
our interpretations of these results.
3.1. Statistical issues :
For the same reasons explained in previous chapters, see below the statistical nonparametrics
tests used in order to illuminate the results of the experimental task with p (<.05) :
- The Mann-Whitney U test (also called the Mann-Whitney Wilcoxon) is a
nonparametric test of the null hypothesis that is equally likely that a randomly selected
value from one sample will be greater or lesser than another value selected from a
second sample. The Mann-Whitney U test does not require that the data be normally
distributed and is considered to be an efficient test to determine whether two
independent samples come from the same distribution.
- Fisher’s exact test : Fisher’s exact test is a statistical significance test used in the
analysis of contingency tables. Fisher’s exact test is commonly used when sample sizes
are small, although the test is efficient for all sample sizes. Thanks to Fisher’s test, the
significance of the data’s deviation from the null hypothesis can be calculated rather
than relying on an approximation that becomes exact only in the limit as the sample size
grows to infinity, as with many statistical tests.
- The Cliff's Delta statistic is a nonparametric effect size measure that quantifies the
amount of difference between two groups of observations beyond p-value interpretation.

109
3.2. Statistical analysis :
3.2.1. Phase 1 :
Figure 32 illustrates visual fixation duration for CS1-CS2 and CS3-CS4 trials presented in
Phase 1 in elderly people. There was no statistical difference between the two types of stimuli
pairs (W = -.48, p = .63). However, we observed significant differences of visual fixations
between the dementia and control, (respectively, U = 48.00, p < .01 and U = 45.00, p < .01).
Precisely, visual fixation durations were higher for CS1-CS2 and CS3-CS4 presentations in
control compared to dementia: 84.45% of visual fixation for CS1-CS2 in condition control
and 44.42% in condition dementia ; 84,44% of visual fixation for CS3-CS4 in condition
control and 45.14% in condition dementia.
Figure 32. Mean percent of Phase 1 trial duration in which the elderly visually fixated on the
stimulus pairs (CS2-CS1 and CS4-CS3) at the center of the screen. Error brackets represent
SEMs.
3.2.2. Phase 2 :
Figure 33 present Phase 2 first order conditioning results. Once again, we observed greater
responding to CS1 than to CS3 both in condition dementia (W = 157, p = .003, Cliff’s d =
1.0) and in condition control (W = 143, p = .004, Cliff’s d = 0.9). That means, all participants
finally looked at the US zone after CS1 presentation and avoided the US zone after CS3
presentation. Note that we did not observe differences between groups instead of the
significant different visual fixation times in CS1-CS2 and CS3-CS4 presentation in Phase 1.
0
10
20
30
40
50
60
70
80
90
100
CS1-CS2 CS3-CS4
Per
cen
t of
Ph
ase
1 t
rial
s w
ith
fix
atio
ns
on
th
e st
imu
lus
pai
r.
Stimuli pairings
DEMENTIA CONTROL

110
Figure 33: Mean percent of CS1 and CS3 trials with visual fixation to the US+ video site
during Phase 2 in the elderly people (dementia compared to control). Error brackets represent
SEMs.
3.2.3. Test of CS2 and CS4 :
Figure 34 represents the number of participants exhibiting SPC responses at tests. No
significant difference between groups was found either for CS2 test trial (Fisher exact p = 1
for both conditions). Precisely: in condition dementia, visual fixation after CS2 presentation
was observed in 12 of the 20 participants (i.e., 60%) compared to 10 of the 20 in condition
control (i.e., 50%). No significant differences between groups in the proportion of avoidance
of the US zone was obtained for CS4 test (Fisher exact p’s = 0.75). Precisely: in condition
dementia, visual fixation after CS4 presentation was observed in 1 of the 20 participants (i.e.,
5%) compared to 2 of the 20 in condition control (i.e., 10%).
Thus, both groups learned both first order conditioning and SPC avoidance of the aversive US,
and the two groups did so similarly.
0
10
20
30
40
50
60
70
80
90
100
CS1 CS3
Per
cen
tage
of
resp
on
ses
in P
has
e 2
Stimuli CS1 and CS3 across conditions A and B
DEMENTIA CONTROL

111
Figure 34. Percentage of elderly during the SPC test exhibiting visual fixation to the video site
during the CS2 test and absence of visual fixation to the video site during the CS4 tests in
conditions dementia and control.
4. Discussion
The results showed that patients with dementia, like healthy elderly people, learn first order
and higher order associations such as those required in SPC. SPC has an appreciable adaptive
value (Kaakinen, Hyönä, and Keenan, 2002) in that it extends the number of CSs associated
with a US to CSs that was never directly paired with the US in that, when a cue is actually
paired with the US, all other cues previously associated with that cue will inherit the
conditioned response. Trivially, this process allows avoidance of outcomes in the presence of
cues that were never paired with an aversive US as well as contributing to rapid learning of
events that predict safe or appetitive outcomes.
An ability of dementia patients to escape aversive stimuli has already been reported without
referring to Pavlovian processes (Rogers, Holm, Burgio, Granieri, Hsu, Hardin, and
McDowell, 1999; Baker, Hanley and Mathews, 2006; Buchanan and Fisher, 2002).
Nevertheless, demonstrating SPC with dementia patients is, somehow, surprising in the sense
that SPC is thought to call upon the representation in memory of the CS that was actually
paired with the US (i.e., CS1). More specifically, if CS2 (which was formerly paired with
CS1) evokes the US representation or the unconditioned response (UR) at test, it is
presumably because CS2 evokes the representation of CS1 and consequently its association
with the US or the UR (Rizley and Rescorla, 1972).
0
10
20
30
40
50
60
70
80
90
100
CS2 CS4Per
cen
tage
of
par
tici
pan
ts r
espon
din
g to C
S2
and
CS
4.
Stimuli across Conditions A & B
DEMENTIA CONTROL

112
Interestingly, the current data shows not only the ability of dementia patients to use
memorized associations on which new associations can be built, but they also show temporo-
spatial abilities required for avoidance responses. Nearly all dementia patients in our study
avoided US- by not looking at the US zone after CS4 presentation. The patients’ strategy
suggests that they could localize events in space and choose at what time to gaze at or away
from the US zone. More generally, the current study seriously qualifies the assumption of
impairment in dementia at least for basic associative learning and memory.

113
Chapter 5: SPC across ages
In the previous chapters, we demonstrated in several populations first order and second order
conditioning. The aim of the present chapter is to focus on the first and second order
conditioning across several developmental groups (i.e., babies, children, adults and seniors).
1. Introduction :
1.1. Piaget’s assumption about Development :
Works by Jean Piaget (1896-1980) are very influential in French Contemporay Psychology,
especially in the human development area. One of Piaget’s goals was to determine how thinking
developed in humans. His work was partially focused on studies of childhood in which he
observed how children failed in a task before succeeding in it (Piaget, 1952, 1970, 1977). From
his observations, Piaget described several developmental periods concerning the human
cognitive development. A first period from birth to the age of 2 years is called the
« sensorimotor period, » in which babies explore their environment by touching and tasting. By
the end of that period, children begin to use appropriate words to identify items. A second period
focused on ages between 2 and 7 years old, and is called « preoperative period ». Piaget
stipulated that children in this period begin to use words in order to think and to communicate
with someone else, using a simple logic around the age of 6 years old. A third period includes
the ages between 7 and 12 years old, and is called the « period of concrete operations ». Here,
children expand their vocabulary and use complex logic (e.g., mathematical processes like
addition and division), and have a mental representation of familiar items. According to Piaget,
deductive thought with complex learning is possible starting at 12 years old. In that final
developmental period (called the « formal operation period »), young adults are able to imagine
familiar and new items, mentally organize complex ideas, and solve complex problems.
1.2. Verbal strategies and developmental models :
Other developmental models focus on verbal behaviors, which are the focus of our study. The
development of verbal behavior in infancy was described in early pages of chapter 1. We
highlighted Denney’s model (1982, 1984), which stipulated that the number and complexity of
verbal abilities increase with the beginning of schooling before gradually decreasing starting at
30 of age. Denney’s (1984) model compares cognitive performance in humans aged between 0
and 90 years old. Generally speaking, we observe low cognitive performance at birth, which
increases gradually up to about 20 years of age with training, and without training, although

114
training enhances the progress. Developmental approaches consider this enhancement to be a
product of schooling provided by both academic situations and social interactions. After 30
years of age, Denney’s model assumes that general performance gradually decreases. That
decrease can be moderated by a performance training, although ultimately the decrease is
inevitable. Denney’s research caused him to modulate his model based on non-normative
subjects who showed higher performances than expected based on their chronological age. For
example, in select instances, the general performance of a senior could be better than that of a
young adult’s.
According to Denney’s model and Piaget’s work, we assumed that verbal abilities would
different across our experimental groups. Indeed, babies have a deficiency in verbal ability
relative to adults, children at 5-6 years of age begin to develop their abilities, young adults have
optimal verbal abilities, and seniors have better verbal abilities compared to children and babies
but lower abilities compared to young adults. Because one hypothesis concerning the
establishment of SPC is focused on the use of verbal strategies (e.g., Brogden, 1947, 1949 ; Jara
et al., 2006), we might predict that there would be differences in conditioned responding across
developmental groups. Specifically, if our experimental task required the use of such verbal
abilities, adults and seniors should have better rates of conditioned responding, compared to
babies and children.
1.3. In our experiment :
In the present chapter, we compare individuals of several developmental ages without
developmental disabilities (i.e., without autistic children and elderly with dementia). The goal
was to compare typical individuals who followed a typical developmental process. It is known
that autistic children and the elderly with dementia do not follow the typical developmental
states. We used specific evaluations according to the developmental disorders (e.g., ABLLS®-
R for autistic children ; PATHOS© for the elderly with dementia). Thus, this chapter focuses
on four developmental stages : babies, children, adults, and seniors.
2. Participants
This chapter compares four experimental groups :
- Baby group : Twenty-four babies (11 girls and 13 men , mean age 5,79 months , SD :
1,50) (i.e., chapter 1 of Part 2).

115
- Children group : Twenty typical children (13 girls and 7 boys , mean age 5,26 years
old , SD : 0,51) enrolled at the kindergarten Prévert located at Lille (i.e., not presented
in the previous chapters). None of these children had any developmental disability.
- Adult group : Twenty French university students (14 women and 6 men , mean age
23,8 years old , SD : 1,2) (i.e., chapter 2 of Part 1, condition ad10 pairings).
- Senior Group : Twenty French seniors (13 women and 7 men , mean age 69,55 years
old , SD : 1,7).(i.e., chapter 3 of Part 1, condition se10 pairings).
All groups were examined using the same experimental task with the same eye-tracking
system. Each participant or tutor’s participant read and signed an informed consent form prior
to the experiment. The experiment had been approved by the University of Lille Institutional
Review Board.
3. Results :
All results were collected at the end of the experiment by the Matlab© software, and were
analyzed with conventional statistical techniques. Using the G*Power 3.1 software (Faul,
Erdfelder, Buchner, & Lang, 2009), we calculated the estimated sample size required to observe
an average effect (f = 0.5) with an α = 0.05 and a power of 0.80. With the main analysis viewed
as a comparison of the means of more than two independent groups (4 groups), we obtained a
sample size of at least 48 participants, with at least 12 participants in each group. In line with
these recommendations, for these comparisons, we already had 88 participants, with at least 20
participants in each group. Thus, this analysis was properly powered.
The goal of chapter 5 is to compare the percentages of visual fixation times among several
experimental groups : babies, children, adults and seniors. Here, we will not present in detail
the data already reported in the previous chapters for each group. The present aim is to provide
a comparison across the different developmental groups. Thus, we examined on the visual
fixation times for CS1-CS2/ CS3-CS4 zones and US zone for each participant of all groups and
performed a Kruskal-Wallis test.
3.1. Statistical issues :
As explained in the previous chapters, we used the statistical nonparametric tests below :
- A Kruskal-Wallis test by ranks, also called a one-way ANOVA on ranks, is a
nonparametric method to test whether samples originate from the same distribution.
This test is often used for comparing more than two independent samples of equal
sample sizes. The Kruskal-Wallis test is a required recursor for other nonparametric

116
tests such as the Mann-Whitney test. A significant Kruskal-Wallis test indicates that at
least one sample stochastically dominates one other sample. However, the test can not
identify which sample is the source of the stochastic dominance. That is why other
nonparametric tests had to be conducted following a significant Kruskal-Wallis test.
- The Mann-Whitney U test (also called the Mann-Whitney Wilcoxon) is a
nonparametric test of the null hypothesis that is equally likely that a randomly selected
value from one sample will be greater or lesser than another value selected from a
second sample. The Mann-Whitney U test does not require that the data be normally
distributed and is considered to be an efficient test to determine whether two
independent samples come from the same distribution.
3.2. Statistical analysis :
3.2.1. Phase 1 :
First, we observed significant differences of percentage of visual fixation times in all groups
for CS1-CS2 and CS3-CS4 zones (Khi2 : 25,42 ; p < .05). Mann-Whitney test revealed that
there was no difference of percentage of visual fixation times between babies and children for
CS1-CS2 presentation (U : 223,00 ; NS) nor for CS3-CS4 presentation (U : 223,50 ; NS). In
addition, there was no difference in the percentage of visual fixation times between babies and
adults for CS1-CS2 presentation (U : 208,50 ; NS) and CS3-CS4 presentation (U : 226,00 ; NS).
However, we observed a higher percentage of visual fixation times in babies compared to the
elderly for both stimuli pairings CS1-CS2 (U : 62,00 ; p < .01) and CS3-CS4 (U : 56,00 ; p <
.01).
Comparing children with adults, there was no difference in the percentage of visual fixation
times for CS1-CS2 presentation (U : 152, 50 ; NS) nor for CS3-CS4 presentation (U : 167,00 ;
NS). However, we observed higher percentage of visual fixation times in children compared to
the elderly for CS1-CS2 presentation (U : 61,50 ; p <.01) and for CS3-CS4 presentation (U :
47,00 ; p < .01). The same was observed between adults and elderly. That is, we obtained higher
percentage of visual fixation times in adults compared to elderly for CS1-CS2 presentation (U :
47,00 ; p < .01) and for CS3-CS4 presentation (U : 53,00 ; p < .01).
In conclusion, CS1-CS2 and CS3-CS4 presentations were more targeted by babies, children
and adults, compared to the elderly.

117
3.2.2. Phase 2 and Test :
First, we observed significant differences of percentage of visual fixation times in all groups
for US zone (Khi2 : 9,42 ; p < 0.05). A Mann-Whitney test revealed that there was a general
(i.e., all US zones pooled) difference in the percentage of visual fixation time between babies
and adults (U : 129,5 ; p < 0,01), and between children and adults (U : 129,5 ; p < 0.05). There
was no difference in the percentage of visual fixation time between babies and children (U :
210,00 ; NS), nor between babies and seniors (U : 204 ; NS), nor between children and seniors
(U : 193 ; NS), nor between adults and seniors (U : 149,5 : NS). In conclusion, there are general
differences of percentage of visual fixation times in Phase 2 and in Test between babies and
adults, and between children and adults (see Figure 28) :
Figure 35 : Differences of percentage of visual fixation in Phase 2 and Test for all zones for
each experimental group (Khi2 : 9,42 ; p < 0,05), « * » means p < .05 , « ** » means p < .01.
Second, there were visual differences for all groups concerning fixation times on ZUS after
CS1 presentation (Khi2 : 21,47 ; p < 0.01), and after CS3 presentation (Khi2 : 30,07 ; p < 0.01).
Thus, we tested those differences between specific groups for the US zone previously noted.
No analysis was conducted on other zones because Kruskal-Wallis test showed there are no
overall differences of visual fixation times for these zones.
Specifically, ZUS was more targeted by children compared to babies after CS1 presentation
(U : 133 ; p < 0.01), whereas ZUS was more targeted by babies after CS3 presentation (U :
100 ; p < 0,01). Thus, we can conclude that first order conditioning is more pronounced in

118
children than in babies because of the higher rate of responses for children on ZUS after CS1
presentation. However, we have to remember that all participants succeeded Phase 2 of the
experimental task, showing clear establishment of first order conditioning. The results
presented previously reveal that first order conditioning was better in children compared to
babies.
Between babies and adults, ZUS was more targeted by adults compared to babies after CS1
presentation (U : 49,00 ; p < 0.01), whereas ZUS was more targeted by babies after CS3
presentation (U : 130, 00 ; p < 0,05). Once again, we see that first order conditioning was more
pronounced in adults compared to babies (i.e., better visual fixation on ZUS after CS1
presentation) despite first order conditioning having been demonstrated in all groups.
Between babies and seniors, ZUS was more targeted by seniors compared to babies after CS1
presentation (U : 147,00 ; p < 0,05), whereas ZUS was more targeted by babies after CS3
presentation (U : 106,00 ; p < 0,01).
Between children and adults, there were no other differences about US zone between children
and adults, nor between children and seniors, nor between adults and seniors.
In conclusion, all participants reached the criterion of Phase 2, demonstrating a presence of first
order conditioning. Nonetheless, ZUS was more targeted by children, adults and seniors
compared to babies after CS1 presentation. That implies that first order conditioning was more
pronounced with those three populations with respect to anticipatory responding. There was no
other significant difference concerning first order conditioning after presentation of CS3, nor
concerning the second order conditioning after CS2 and CS4 presentations.
4. Discussion
The aim of the present chapter was to compare the conditioned responses observed between
four different developmental ages. A nonparametric ANOVA (i.e., Kruskal-Wallis test) found
that there were only overall differences of visual fixation times during Phase 2 and Test between
babies and adults, and between children and adults. That is, ZUS was targeted more by children,
adults and seniors compared to babies after CS1 presentation, whereas ZUS was targeted more
by babies compared to others after CS3 presentation. No other significant differences were
detected concerning ZUS. We conclude that first order conditioning was more pronounced in
children, adults and seniors after CS1 presentation than in babies, despite babies finally
reaching the learning criterion of Phase 2. Moreover, those differences seemed to have no

119
influence on second order conditioning in babies because there were no significant differences
between groups for visual fixation on ZUS after CS2.
Our results differed from prevailing developmental models (e.g., Denney 1984 model) in the
sense that there were no differences in anticipatory responding (i.e., conditioned responses after
CS1 presentation) across children, adults and seniors, nor for a second order conditioning (i.e.,
conditioned responses after CS2 and CS4 presentations) across all groups (i.e., babies
included). Our results imply that verbal abilities are not necessary for the establishement of
SPC, with this being demonstrated with different developmental groups characterized partially
by distinctly different verbal abilities. One limitation of our study (developed in the General
discussion) is that it does not assume one hypothesis concerning the establishment of SPC, but
just questions the need for verbal abilities in the establishment of SPC.

120
Résumés Partie 2
Ci-dessous un résumé en français de différents points abordés dans cette Partie 2.
1. Développement du comportement verbal
Les humains sont des animaux sociaux, vivant la plupart du temps les uns avec les autres. Une
de leurs caractéristiques sociales est la communication, avec l’utilisation de mots oraux, écrits,
gestuels, ou encore par l’intermédiaire de signes. En 1957, Skinner a introduit le terme de
«comportement verbal» et l'a défini par sa fonction plutôt que par sa structure. Ainsi, le
comportement verbal fait référence à la réponse comportementale d’un locuteur émise en
fonction de conditions environnementales qui établissent et maintiennent ce comportement.
Skinner (1957) considère la « pensée » comme une réponse comportementale interne aux
individus. Dans notre étude, nous nous sommes concentrés sur les « comportements gouvernés
par les règles » (Skinner, 1969) qui ont un effet sur l'auditeur (ou l'individu lui-même), tels que
les instructions, les lois et les conseils. Comme tout autre comportement (verbal), les
comportements gouvernés par les règles se développent et se maintiennent tout au long de la
vie des individus. Les bébés que nous avons testés étaient au stade de babillage, considéré
comme un stade de « non raison » (Fenson et al., 1994). Selon les modèles de développement
(comme Denney, 1984), les compétences verbales sont primaires pendant l’enfance et
commencent à se développer avec le début de la scolarité pour atteindre une performance
optimale vers 20-30 ans, suivie d’une diminution des capacités jusqu’à la fin de la vie.
Cependant, certaines procédures comportementales montrent une possible émergence et
amélioration de ces capacités verbales, par exemple chez les enfants de 3 à 8 ans (Pelaez et al.,
2011), chez les enfants autistes non verbaux (Sundberg et al., 2000) et chez les personnes âgées
avec déficience verbale (Renaux et al., 2017). Ainsi, dans notre recherche, nous avons considéré
les comportements verbaux comme des opérants.
2. Stratégies verbales et PCS :
Au-delà de son aspect social, Skinner (1969) a stipulé que le comportement verbal, tel que des
instructions, pouvait affecter les comportements différemment de leurs contingences de
renforcement initiales. Plus tard, Bandura (1974) affirmait que les comportements verbaux
pouvaient moduler les réponses comportementales attendues par l'individu lui-même et / ou par
l'expérimentateur. Des études telles que celles de Lippman et Meyer (1967) ont confirmé cette
hypothèse en démontrant différents patterns de réponses en fonction des instructions données
aux participants lors de la tâche expérimentale.

121
De tels travaux laissent penser que les comportements verbaux pourraient également moduler
les réponses conditionnées observées dans les études se focalisant sur le PCS chez l’humain.
Brogden (1942, 1947) a lui-même déclaré que les instructions étaient essentielles à l'observation
du PCS. Ainsi, cet apprentissage associatif a été étudié chez des adultes typiques capables de
lire des instructions données (voir, Craddock et al., 2014; Molet et al., 2010). Par exemple, Jara
et al. (2006) ont utilisé une procédure de conditionnement de second ordre dans laquelle ils ont
démontré que les individus étaient capables de former des stratégies verbales sur des tâches
causales. Plus spécifiquement, les individus étaient apparemment capables d'inférer des
relations de cause à effet entre cause et conséquence d'un événement, grâce aux informations
données dans les instructions. En réalité, peu d’efforts ont été déployés pour déterminer si les
instructions étaient réellement nécessaires dans cette tâche expérimentale.
Cependant, nos résultats développés dans la Partie 1 ont montré que le phénomène de SPC avait
été observé sans l'utilisation d'instructions chez des individus typiques. Pour tester l'influence
de stratégies verbales dans le PCS, nous avons répliqué notre procédure sur des individus
dépourvus de compétences verbales tels que les bébés, ou présentant une déficience verbale
observée chez les enfants avec troubles autistiques et les personnes âgées atteintes de démences.

122
General discussion

123
1.SUMMARY AND CLINICAL APPLICATIONS
1.1 Resume of findings :
My work focused on a specific type of associative learning: Sensory preconditioning. Since its
introduction by Brogden in 1939, few studies have studied this type of learning in humans.
Furthermore, to our knowledge no study tried to observe SPC in individuals lacking of verbal
abilities, whereas one of the theories concerning the establishment of SPC is based on the use
of rule-governed behaviors in humans. In our experimental task, all participants were free to
move and placed in front of a computer screen, where the task was to look at the screen. No
instructions were issued because using instructions was not feasible with individuals with
behavioral disorders such as nonverbal children with autistic disorders or elderly people with
severe senile dementia. Thus, visual fixation time as the dependent variable allowed us to study
of SPC in individuals at different developmental stages and being deprived/deficient in
language skills.
Thus, for the first time in research, we sought to control the environmental parameters allowing
the observation of a SPC response by repealing the use of written instructions during the
experimentation (Part 1). In the first experiment (chapter 3 of Part 1), we demonstrated the role
of spatial contiguity in the establishment of SPC by comparing the conditioned response rate in
a condition in which stimuli were presented adjacently in phase 1 (i.e., condition B), compared
to present distantly one another (i.e., condition A). The results indicated that closer spatial
contiguity played a beneficial role in the observation of SPC. Then we were focused on the
number of CS2-CS1 and CS4-CS3 pairing presentations in Phase 1 of the tasks, due to the
results in the literature being controversial on this subject. Thus, we presented either 10 or 20
pairings of stimuli to different experimental groups, and subsequently found a better rate of
SPC at test for the condition in which the stimuli had been presented only 10 times instead of
20. In addition, we found similar results in seniors, demonstrating that repetition of stimuli
beyond 10 was not beneficial for the establishment of SPC in humans (see chapter 4 & 5 in Part
1).
The results obtained and presented in these first three chapters led us to develop a similar
experimental task for the atypical populations tested in Part 2.
First we tested babies 4 to 9 months old who seemingly lacked any verbal abilities. We
observed high levels of SPC in this population, with most babies correctly anticipating the onset
of the US + and avoiding the US- (see chapter 2 of Part 2). Then we tested the same paradigm
in verbal and non-verbal children all with autism spectrum disorders. Here, we did not observe

124
any differences in associative learning between the two populations, with SPC rates being high
among all children (see chapter 3 of Part 2). Thirdly, we tested elderly people with senile
dementia in comparison to a group of elderly people without senile dementia. Once again, we
did not find any significant differences in the anticipatory responses of US+ and the avoidance
response of US- in the two experimental groups (see chapter 4 of Part 2). Finally, we assessed
the development of SPC across several developmental groups, ultimately challenging
contemporary developmental models and general conceptions of human cognition (see chapter
5).
The overall results obtained suggest that verbal behaviors are not necessary for the
establishment of complex learning that involves the establishment of associations between
different conditioned stimuli. Moreover, we demonstrated that this type of learning is present
in all populations tested, regardless of their developmental stages.
1.2 Clinical applications :
That research was essentially an exploratory study in that SPC had not previously been tested
with eye-tracking system while avoiding any instructions during the experimental task with
atypical populations. That research was not funded, and I worked as a psychologist specialized
in Applied Behavior Analysis for 3 years carrying for autistic children, adults with
developmental disorders and elderly people with dementia. My research work can be applied
to various clinical approaches – and I applied it in my clinical work among my findings.
1.2.1 Spatial contiguity and SPC :
In chapter 3 (Part 1), we demonstrated that rates of conditioned responses (i.e., avoidance and
anticipatory responses) were better in a condition in which stimuli were presented contiguously
in Phase 1, in comparison to a condition where there was a small space between those stimuli.
Those results were innovative for the SPC study and congruent with other studies focused on
the role of spatial contiguity in the establishment of associative learning. With respect to clinical
applications, these results led us to consider a reorganization of the therapeutic environment in
some circumstances. Indeed, in order to facilitate learning in individuals with disabilities, we
can change the spatial organization of specific items used in learning. For example, if we trained
an autisitic child to associate one written word with its corresponding object, we should place
the two stimuli very close to each other in order to facilitate the association learning, instead of
separating them by a large distance. Obviously, this type of procedure could be used with any
individual for any learning. In France, in typical classrooms written words/ written cues are
always posted at a specific place on a wall, which is not a good location for some young

125
students. Indeed, every student learns in a different way with a specific speed of learning; and
sometimes cues have to be replaced according to the needs of those students (e.g., a teacher can
move a specific cue to place it next to the problem item for such students).
1.2.2. Impact of the number of pairing presentations :
In chapters 4 and 5 (Part 1), we observed better rates of avoidance responses after 10 pairing
presentations rather than 20, in young and elderly people. Here, those surprising results
underlined the futility of items repetitions in specific situations. For example, in geriatric
institutes it is often used to say, “Repeat it, it’s an old man/woman”. Thus, you can hear most
of the time the same speech repeated by caregivers to elderly people with dementia or without
dementia (i.e., which means elderly without dementia who are hospitalized for physical
disabilities). Our results supported the assumption that repetition of stimuli is not always a good
solution for individuals. For example, we tried to train a typical bedridden elderly person to
press an emergency button connected to his bed that would ring in the nurses’ office in case of
emergency. We proceeded to train him in order to anticipate a real emergency. The prompt was
a visual page full of instructions explaining how to use the emergency button. Nurses presented
those instruction pages several times before pressing the emergency button for the bedridden
elderly. In that study, if I observed a failure in the press button response, I asked myself several
questions before asking the nurse to again present the same visual prompt:
- Is there a physiological cause? (i.e., sudden hearing and / or visual loss, dementia, etc.)
- Is the stimulus too complex for the individual ?
- Can I change the stimulus characteristics in order to make it more prominent ?
- Can I manipulate the consequences of the response associated with that stimulus ? (i.e.,
use of reinforcement)
Here again, the clinical questions concerning the role of repetitions on the patient’s training
could be generalized to any individual on any learning task.
1.2.3. Our experimental task as training or verification tool for atypical populations :
Part 2 underlined the possibility of testing atypical populations on a experimental task that
avoids the use of instructions. Specifically, we succeeded in testing babies, children, autistic
children and elderly people with dementia all with the same apparatus on the same experimental
procedure. The central benefit of our experimental task is that participants did not need to
read/understand written or oral instructions that are often necessary in other studies focused on
human learning.
126
In that sense, our experimental task could be used in various areas simply by changing the
stimuli used. More generally, we could study the same avoidance and anticipatory responses in
visual measures on various populations faced with different stimuli. In the present procedure,
we used colored shapes as CS1, CS2, CS3 and CS4. For a clinical work, we could change the
nature of those stimuli in order to facilitate the learning of some specific ability. For example,
if we want to facilitate a training procedure in which a non-verbal adult had to learn the
pedestrian traffic laws, we could change the CSs to cues relevant to the immediate task (e.g.,
red fire – “stop” – US- and green fire – “drive” – US+). Here we could check the anticipatory
and avoidance responses by targeted the eye movements of that individual. Of course, that kind
of learning would be only the first step in training the individual with respect to the traffic laws.
Such clinical applications could also be used in the treatment of phobias, and other pathologies
characterized by an atypical aversion for specific stimuli. Here, our experimental task could be
used as a verification tool thanks to the avoidance response objectively obtained from the eye
movements of these individuals. For example, consider a woman with anorexia nervosa who
developed an aversion for high-fat food and an excessive preference for salads (i.e., low protein
rate food). We could replace our CSs with pictures of foods and observe the evolution of the
anticipatory and avoidance responses in the anorexia woman, during behavioral therapy. Here,
we could expect a decreasing rate of avoidance responses for high-fat food developing
gradually as the treatment progressed.

127
2. LIMITATIONS AND CRITIQUES OF OUR EXPERIMENTAL TASK
A first issue concerning our research is the number of participants for each experimental group.
In Part 1, we tested 40 adults in chapter 3 (i.e., 20 in each condition), 40 adults in chapter 4 (i.e.,
20 in each condition) and 40 seniors in chapter 5 (i.e., 20 in each condition). In Part 2, we tested
24 babies in chapter 2, 25 autistic children (i.e., 11 verbal and 14 non verbal children) in chapter
3, 40 seniors (i.e., 20 typical elderly and 20 elderly with dementia) in chapter 4, and 20 typical
children compared to other groups in chapter 5. Thus, we obtained results for only 229
participants. Obviously, it would have been better if the number of participants had been higher
than 20 per condition for statistical reasons (e.g., ability to use parametric statistics), and if I
could test other ages (e.g., 12-13 years old participants).
A second issue is that the results obtained in chapter 3, 4, and 5 of Part 1 have to be considered
with caution due to my only examining the two specific experimental conditions tested. In
chapter 3, I tested the role of spatial contiguity with only two experimental conditions A and B
: stimuli separated with a small space (i.e., separation of 6 cm between stimuli) versus
contiguous stimuli (i.e. 0 cm between stimuli). We observed better rates of conditioned
responses when stimuli were contiguously presented, asserting that a closer spatial contiguity
facilitated the establishment of SPC. It’s important to say that we could test lots of other
experimental conditions like different distances between the stimuli presented (e.g., 0, 2, 4, 6,
and 8 cm) in order to observe the possible variations of conditioned responding. In chapters 4
and 5, we focused on the role of the number of pairing presentations in Phase 1 on the degree
of conditioned responding. We asserted that rates of responses were better after 10 pairings
compared to 20 pairings in Phase 1 for adults and seniors. It would be desirable in a future study
to more widely manipulate the number of pairing presentations in Phase 1. Those ideas will be
implemented by students in Master (University of Lille). For now, one Master class student is
focusing on two additional conditions in which stimuli pairings are presented 30 or 40 times in
typical adults. Those data will be considered for a future publication in which chapter 4
manipulations will be completed with two additional experimental conditions (i.e., with a total
of 4 conditions 10, 20, 30 and 40 pairing presentations).
Another limitation of our experimental task, the main one in fact, concerns the assumption of
the use of verbal strategies in the establishment of SPC. Some authors believe that verbal
processes underlie associative learning, such as SPC (see Introduction of Part 2). My
experiments (like other experiments) indicate that associative learning can occur without verbal
processes. Of course, my data do not refute the possibility that some associative learning could

128
be mediated by verbal processes, only that this is not true for all associative learning.
Furthermore, the lack of verbal skills of some subjects (e.g., babies, non-verbal autistic children,
the elderly with dementia) strongly suggests that the learning these subjects evidenced was
mediated by something other than verbal processes. Beyond that exclusion, the present
experiment does not test or speak to what did mediate the learning that was observed (despite
the hypotheses that are discussed in the next few pages).
Finally, one other limitation of our experimental is the non-use of other materials which could
have been added to the eye-tracking system. Indeed, our experiment focused on anticipatory
and avoidance responses, using US+ and US- as unconditioned stimuli. However, it would have
been interesting to add some emotional assessment possibly with electrodermal measures in
order to verify whether there were positive emotional reactions after US+ presentations and
negative emotional reactions after US- presentations. In the present experimental task, although
we observed significant anticipatory responses after CS1 presentations and significant
avoidance responses after CS3 presentations, we only tested them with eye movements of the
participants. Future research on the topic could consider the addition of materials like an
electrodermal measuring device, and emotional trackers such as facial expressions that are
recognized by computer systems. Also, we could test another avoidance response using an eye
blink conditioning system, in which a air jet is emitted toward the eye of the participant. Of
course, we would have to consider the ethics here, especially for individuals with disabilities
and individuals more likely to develop aggressive behaviors after aversive stimuli
presentations.

129
3. THEORETICIAL ISSUES
The results observed in the several chapters here question some fundamental issues in
associative learning. Because my thesis was an explanatory study, I did not advance any specific
theory concerning the establishment of SPC. I simply discussed about one hypothesis
concerning the necessary use of verbal strategies in the establishment of SPC. Here I very
briefly propose some hypotheses concerning the possible observation of SPC specific to my
work (see 1 and 2 below) and we could discuss about the subjective evaluation of verbal
strategies (see 3 below).
1. “Biological determinant” and individual survival :
1.1. US+ and US- as biological determinants for participants :
The main surprising result of my work is probably the observation of similar conditioned
responses in several highly divergent developmental groups. To my knowledge, no prior study
focused on SPC with such a large variety of populations (i.e., babies, typical children, children
with autistic disorders, typical adults, typical seniors, and seniors with dementia). One
hypothesis concerning those results is suggested by the choice of unconditioned stimuli used in
these experiments. Indeed, used as experimental measures the anticipation and avoidance
responses are viewed as fundamentally necessary for the survival of organisms (Domjan, 2005).
Here, we can hypothesize that the present CSs associated with US + and US- emissions have
through associative learning become real "biological determinants" ostensibly for survival in
all of the participants. Of course, we can imagine that our experiment was differentially
perceived by each individual according to his/her developmental stage. Babies and elderly
probably have never before been exposed to this type of task and material in a laboratory
context.
1.2. Respondent conditioning prior higher abilities :
Razran (1955) pointed out that associative learning was more prevalent in young children and
other "underdeveloped" (Razran’s term, 1955) species compared to adults. Indeed, Razran
stated that young children used their primary abilities (i.e., conditioned reflexes) in learning
tasks whereas adults, who are at a more advanced stage of development, used cognitive skills
to solve the task. However, Razran wondered about his own results because they had not been
replicated experimentally by other researchers. In our study, contrary to what Razran said, we
do not find better rates of anticipation and avoidance responses among young children aged 5

130
to 6 compared with other experimental groups. However, we only demonstrated it within a SPC
procedure.
1.3. Persistence of averse conditioning :
Concerning rates of avoidance responses in all participants, many studies observed that aversive
conditioning persists throughout an individual's life, more than with appetite reinforcement
(Waters et al., 2017 ). This would suggest that aversive conditioning is essential for the survival
of the individual, from an early age to the end. In their study, Waters et al. presented a CS1
geometric shape with US- aversive noise on several trials to young children, adolescents and
adults. A fear conditioned response after the presentation of CS1 was observed in all three
experimental groups, demonstrating the aversive nature of the sounds used as a US in their
experiment. Waters et al. also observed that this conditioned fear persisted longer in children
compared to other experimental groups, even after extinction treatment. Therefore, once again,
we might assume that the US- used in our research was a powerful "biological determinant" for
the survival of all participants with respect to a task using an avoidance response of an US-
such as mine.
2. Compound stimulus and equivalence relations in the establishment of SPC :
Another characteristic of our work is that we observed SPC without using written or oral
instructions, unlike some studies in humans (e.g., Brogden, 1942, 1947; Jara et al. 2006;
Craddock et al., 2014). The results we obtained concerning the role of spatial contiguity in the
establishment of SPC (see Chapter 3 of Part 1) confirm the remarks of McLaren and Mackintosh
(2000) on the role of compound stimulus in associative learning.
2.1.Use of compound stimuli in Mackintosh and al. (1991) and in our experiment :
In their review, the authors highlighted the many studies that have observed associative learning
in nonhuman species using compound stimuli as linked by within-compound associations. For
example, the Mackintosh, Kaye, and Bennett (1991) study used compound versus non-
compound stimuli in rats by observing their approach behaviors. Here, different sensory stimuli
were associated at the same time, and then one of them was followed by the occurrence of the
appetitive smell of food. Mackintosh et al. (1991) thus observed approach behaviors on the two
conditioned stimuli previously presented as a first phase compound stimulus, rather than when
these two stimuli were presented separately. Beyond the role of spatial contiguity on SPC
demonstrated in our experiment, we may also consider having introduced compound (CS2-

131
CS1) and (CS4-CS3) stimuli to the participants, since these two stimuli were adjacent and
contiguous to each other. Other (see Figure 36):
Figure 36: Example of CSs presented in Chapter 3 of Part 1, when there was no space between
CSs.
2.2. Description of equivalence relations :
Therefore, we can question the formation of compound stimuli. How two stimuli close to each
other could form a single compound configured stimulus? If we look at Figure 36, might a
participant be visualizing one two-color stimulus, instead of two stimuli of different colors?
One hypothesis concerns the equivalence relations. Pierce and Cheney (2013) illustrated
equivalence relations in this example, p. 283-284:
« For most Americans, the flag is a significant symbol. When we see the flag, we may think or
the United States, mother, and apple pie. This suggests that symbolic behavior involves the
training of stimulus equivalence. The presentation of one class of stimuli (e.g., flags) occasions
responses made to other stimulus classes (e.g., countries). This seems to be what we mean when
we say that the flag stands for, represents, or signifies our country. Equivalence relations such
as these are important aspect of human behavior. For example, in teaching a child to read,
spoken words (names of animals) are trained to visual stimuli (pictures of animals) and then to
written symbols (written words for animals). Eventually, the written word is then said to stand
for (or mean) the actual object, in the same sense that the flag stands for a country. ». Thus,
Americans regard their flag as a compound stimulus, not as a set of diverse and varied stimuli
such as white stars, a blue rectangle, and red and white horizontal lines.
Three major equivalence relationships have been highlighted. First, we speak of a symmetry
relation when a class A stimulus is interchangeable with a class B stimulus (if A = B then B =
A). More basically, we also talk about reflexivity when a stimulus A is found in A. Symmetry
and reflexivity are considered as elementary laws. For example, we present a child with a

132
stimulus A (e.g., the number "2"). We speak of reflexivity if the child is able to show us the
number "2" among several numbers "1; 3; 5; 2; 7 ". If the child is able to give two items {X;
X} (= B) when we present him the stimulus A "2", we speak of symmetry relation. Finally,
transitivity is the third equivalence relation between different stimuli. In this relation, if A = B
and B = C then A = C. For example, we are talking about transitivity if the child is able to
associate the word "two" (= C) with the number "2" (= A ) and the right amount {X; X}.
2.3. Test of equivalence relationships :
Such equivalence relationships have been studied many times in diverse animal species in the
form of "Matching-to-sample" procedures (Catania, 1984). For example, reflexivity is tested in
this type of procedure by presenting to the animal a specific geometric shape, which it must
then find later among two geometrical shapes. Catania et al. (1989) studied equivalence
relationships in young children through verbal behaviors. In a first experimental phase where
the reflexivity was tested, the authors presented the child with a star in the center of the screen
which he had to point out later among various added items (see Figure 37). The aim of Catania
et al. was, among other things, to study the emergence and development of verbal behaviors in
young children.
Figure 37: Example of Catania et al. (1989) experiment testing the reflexivity relation in
children.
In our study, we can invoke the reflexive relationship because the CSs belonged to the same
class of stimuli. For this, we must consider the two CSs forming a compound stimulus. Thus,
our compound stimulus A presented in the first phase of SPC may have caused a second phase
conditioned response mediated by one of its components CS1 or CS3, as well as in the test
phase after presentation of its other component CS2 or CS4. As a result, we see opportunity of
the equivalence relation of reflexivity "A (in the second phase of SPC) = A (found in tests)".

133
Although we can draw a parallel between reflexive relations and the establishment of
associative learning such as SPC, we can not currently explain the formation of these
equivalence relationships, which seem to be present as early as 4 months of life until old age.
3. Reflexions about verbal strategies :
Finally, a large theoretical issue of my work concerns the study of verbal strategies. In the
present research, I focused on verbal behaviors and verbal abilities, which were evaluated for
autistic children and seniors with dementia – but not for all experimental groups. Obviously, it
is pertinent to say that all verbal behaviors were not considered in that research. Here, I affirmed
that verbal behaviors did not have an impact in the establishment of SPC, but there are
limitations because I considered only one part of those verbal behaviors. As Skinner mentioned
(1957), thoughts can be considered like any operants, but are difficult to observe. In adults, I
certainly should have asked to participants what kind of logic process they followed to succeed
the experiment – which I did not do it. That kind of questionnaire could not be used with atypical
populations tested like non-verbal autistic children or seniors with dementia.
Also, I assumed that non-verbal populations have a profound lack of verbal strategies. Here
again, we can entertain some opposing views because covert verbal strategies can not be
objectively observed in these kinds of populations. It seems easy to imagine that there are other
logic processes in non-verbal populations, associated with verbal strategies or with totally other
kinds of deductive processes. The establishment of SPC in those atypical populations certainly
concerns other strategies, inaccessible and misunderstood for now.

134
Articles and communications
1. Articles
- Renaux, C., Rivière, V., & Nuchadee, M.L.J. (2017). Increased writing performance using a
shaping procedure with a patient with sequelae caused by cardiovascular accident. Journal of
Ageing Research and Healthcare, Vol2, 32-39.
- Renaux, C., Rivière, V., Craddock, P., & Miller, R. R. (2017). Role of spatial contiguity in
sensory preconditioning with humans. Behavioural Processes, 142, 141-145.
- Nelson, J. B., Craddock, P., Molet, M., & Renaux, C. (2017). Recovery of attention with
renewal. Learning & Memory, 24, 637-640.
- Craddock, P., Wasserman, J.S., Polack, C.W., Kosinski, T., Renaux, C., & Miller, R.R.
(2017). Associative structure of second-order conditioning in humans. Learning & Behavior,
46, 1-11.
- Craddock, P, Renaux, C., Lefèvre, F., Nelson, J.B., Molet, M. (2014). Integration of multiple
memories in sensory preconditioning. Behavioral Processes, 108, 94-97.
2. Communications
- Renaux, C., Rivière, V., Craddock, P., & Miller, R.R. (2018, May). Associative learning in
babies : Higher-order conditioning without verbal skills. Poster presented at ABAI San Diego,
25-27th May, USA .
- Renaux, C., Rivière, V., Craddock, P., & Miller, R.R. (2018, February). Associative learning
in non-verbal autistic children : Verbal processing hypothesized as a mediator of associative
learning. Poster presented at ABAI Miami, 23-25th February, USA .
- Renaux, C., Rivière, V., Craddock, P., & Miller, R.R. (2017, November). Number of stimuli
presentations for the observation of sensory preconditioning. Oral Communication presented at
International ABAI Paris, 14-15th November, France.
- Renaux, C., Rivière, V., Craddock, P., & Miller, R.R. (2017, May). Spatial contiguity's
contribution to the formation of associations between neutral stimuli. Poster presented at the
ABAI Denver, USA.

135
- Renaux, C., Rivière, V., Craddock, P., & Miller, R.R. (2017, May). Associative learning in
dementia : Implications for the role of verbal strategies in associative learning. Poster presented
at SQAB Denver, USA.
- Renaux, C., & Rivière, V. (2015, November). The use of eye-tracking system in experimental
behavior analysis, Second-order conditioning in young children and elderly people, with or
without verbal skills. Poster presented at The new technologies at the services of Neurosciences,
Lille, France.
References
Anderson, D. K., Lord, C., Risi, S., DiLavore, P. S., Shulman, C., Thurm, A., ... &
Pickles, A. (2007). Patterns of growth in verbal abilities among children with autism
spectrum disorder. Journal of consulting and clinical psychology, 75(4), 594.
Anglin, J. M., Alexander, T. M., & Johnson, C. J. (1996). Word learning and the
growth of potentially knowable vocabulary. Submitted for publication.
Armstrong, T., & Olatunji, B. O. (2012). Eye tracking of attention in the affective
disorders: A meta-analytic review and synthesis. Clinical psychology review, 32(8), 704-
723.
Baeyens, F., Eelen, P., Crombez, G., & Van den Bergh, O. (1992). Human evaluative
conditioning: Acquisition trials, presentation schedule, evaluative style and contingency
awareness. Behaviour research and therapy, 30(2), 133-142.
Baer, D. M., & Guess, D. (1971). Receptive training of adjectival inflections in
mental retardates 1. Journal of Applied Behavior Analysis, 4(2), 129-139.
Bandura, A. (1974). Behavior theory and the models of man. American
psychologist, 29(12), 859.
Baker, J. C., Hanley, G. P., & Mathews, R. M. (2006). Staff-administered functional
analysis and treatment of aggression by an elderly with dementia. Journal of Applied
Behavior Analysis, 39(4), 469-474.

136
Barnet, R. C., Arnold, H. M., & Miller, R. R. (1991). Simultaneous conditioning
demonstrated in second-order conditioning: Evidence for similar associative structure in
forward and simultaneous conditioning. Learning and Motivation, 22(3), 253-268.
Barnet, R. C., Cole, R. P., & Miller, R. R. (1997). Temporal integration in second-
order conditioning and sensory preconditioning. Animal Learning & Behavior, 25(2), 221-
233.
Barnes, D., Smeets, P. M., & Leader, G. (1996). 9 New Procedures for establishing
emergent matching performances in children and adults: Implications for stimulus
equivalence. In Advances in Psychology (Vol. 117, pp. 153-171). North-Holland.
Baron-Cohen, S., Leslie, A. M., & Frith, U. (1985). Does the autistic child have a
“theory of mind”?. Cognition, 21(1), 37-46.
Berridge, K. C., & Schulkin, J. (1989). Palatability shift of a salt-associated incentive
during sodium depletion. The Quarterly journal of experimental psychology, 41(2), 121-
138.
Bhat, A. N., Galloway, J. C., & Landa, R. J. (2010). Social and non‐social visual
attention patterns and associative learning in infants at risk for autism. Journal of Child
Psychology and Psychiatry, 51(9), 989-997.
Black, M. J., & Yacoob, Y. (1995, June). Tracking and recognizing rigid and non-
rigid facial motions using local parametric models of image motion. In Computer Vision,
1995. Proceedings., Fifth International Conference on (pp. 374-381). IEEE.
Boudreault, M. C., Cabirol, É. A., Trudeau, N., Poulin-Dubois, D., & Sutton, A.
(2007). Les inventaires MacArthur du développement de la communication: validité et
données normatives préliminaires. Revue canadienne d’orthophonie et d’audiologie, 31(1),
27-37.
Bradley, M. M., Miccoli, L., Escrig, M. A., & Lang, P. J. (2008). The pupil as a
measure of emotional arousal and autonomic activation. Psychophysiology, 45(4), 602-607.
Brogden, W. J. (1939). Sensory pre-conditioning. Journal of Experimental
Psychology, 25(4), 323-332.
Brogden, W. J. (1942). Tests of sensory pre-conditioning with human
subjects. Journal of Experimental Psychology, 31(6), 505-517.

137
Brogden, W. J. (1947). Sensory preconditioning of human subjects. Journal of
Experimental Psychology, 37(6), 527-539.
Buchanan, J. A., & Fisher, J. E. (2002). Functional assessment and noncontingent
reinforcement in the treatment of disruptive vocalization in elderly dementia
patients. Journal of Applied Behavior Analysis, 35(1), 99-103.
Buskist, W. F., & Miller, H. L. (1986). Interaction between rules and contingencies
in the control of human fixed-interval performance. The Psychological Record, 36(1), 107.
Cabrera, R., & Vila, J. (1986). La localización espacial del estímulo. Revista
Mexicana de Análisis de la Conducta, 12(1), 19-32.
Camp, C.J., & Schaller, J.R. (1989). Epilogue : spaced-retrieval memory training in
an adult day-care center. Educational Gerontology, 15, 641-648.
Camp, C. J. (1989). Facilitation of new learning in Alzheimer's disease. Memory
and aging; theory, research, and practice.
Cheatle, M. D., & Rudy, J. W. (1978). Analysis of second-order odor-aversion
conditioning in neonatal rats: Implications for Kamin's blocking effect. Journal of
Experimental Psychology: Animal Behavior Processes, 4(3), 237.
Chernikoff, R., & Brogden, W. J. (1949). The effect of instructions upon sensory
pre-conditioning of human subjects. Journal of Experimental Psychology, 39(2), 200-207.
Carr, H. A. Psychology: A study of mental activity. NewYork: Longmans, Green,
1925.
Catania, A. C., Horne, P., & Lowe, C. F. (1989). Transfer of function across
members of an equivalence class. The Analysis of Verbal Behavior, 7(1), 99-110.
Catania, A. C. (1992). Learning (3rd edn). Prentice Hall Inc.
Christie, J. (1996). Spatial contiguity facilitates Pavlovian
conditioning. Psychonomic bulletin & review, 3(3), 357-359.
Cook, E. W., Hodes, R. L., & Lang, P. J. (1986). Preparedness and phobia: effects
of stimulus content on human visceral conditioning. Journal of abnormal
psychology, 95(3), 195.
Cooper, J. O., Heron, T. E., & Heward, W. L. (2007). Applied behavior analysis.

138
Courtney, C. G., Dawson, M. E., Schell, A. M., Iyer, A., & Parsons, T. D. (2010).
Better than the real thing: Eliciting fear with moving and static computer-generated
stimuli. International Journal of Psychophysiology, 78(2), 107-114.
Craddock, P., Renaux, C., Lefèvre, F., Nelson, J. B., & Molet, M. (2014). Integration
of multiple memories in sensory preconditioning. Behavioural processes, 108, 94-97.
Cusato, B., & Domjan, M. (1998). Special efficacy of sexual conditioned stimuli
that include species typical cues: Tests with a conditioned stimuli preexposure
design. Learning and Motivation, 29(2), 152-167.
Cusato, B., & Domjan, M. (2001). Second-order sexual conditioning in male
domesticated quail. In annual meetings of the Southwest Psychological Association,
Houston, TX.
De Houwer, J., Thomas, S., & Baeyens, F. (2001). Association learning of likes and
dislikes: A review of 25 years of research on human evaluative conditioning. Psychological
bulletin, 127(6), 853.
Denney, N. W. (1982). Aging and cognitive changes. Handbook of developmental
psychology, 807-827.
Denney, N. W. (1984). A model of cognitive development across the life
span. Developmental Review, 4(2), 171-191.
Derouesne, C., Thibault, S., Lagha‐Pierucci, S., Baudouin‐Madec, V., Ancri, D., &
Lacomblez, L. (1999). Decreased awareness of cognitive deficits in patients with mild
dementia of the Alzheimer type. International Journal of Geriatric Psychiatry, 14(12),
1019-1030.
Domjan, M. (2005). Pavlovian conditioning: A functional perspective. Annu. Rev.
Psychol., 56, 179-206.
Domjan, M. (2014). The principles of learning and behavior. Nelson Education.
Duchowski, A. T. (2007). Eye tracking methodology. Theory and practice, 328.
Dymond, S., & Roche, B. (2009). A contemporary behavior analysis of anxiety and
avoidance. The Behavior Analyst, 32(1), 7-27.
Eisenberg, A. R., & Garvey, C. (1981). Children's use of verbal strategies in
resolving conflicts. Discourse processes, 4(2), 149-170.

139
Fenson, L., Dale, P. S., Reznick, J. S., Bates, E., Thal, D. J., Pethick, S. J., ... &
Stiles, J. (1994). Variability in early communicative development. Monographs of the
society for research in child development, i-185.
Fuchs, A. F. (1967). Saccadic and smooth pursuit eye movements in the
monkey. The Journal of Physiology, 191(3), 609-631.
Gräsel, E., Wiltfang, J., & Kornhuber, J. (2003). Non-drug therapies for dementia:
An overview of the current situation with regard to proof of effectiveness. Dementia And
Geriatric Cognitive Disorders, 15(3), 115-125. doi:10.1159/000068477
Gredebäck, G., Johnson, S., & von Hofsten, C. (2009). Eye tracking in infancy
research. Developmental neuropsychology, 35(1), 1-19.
Grégoire, A. (1979). L'apprentissage du langage: les deux premières années (Vol.
1). Librairie Droz.
Gregory, R. L. (1990). Eye and Brain: The Psychology of Seeing. Princeton, NJ:
Princeton University Press.
Grober, E., & Buschke, H. (1987). Genuine memory deficits in
dementia. Developmental Neuropsychology, 3(1), 13-36.
Hall, D., & Suboski, M. D. (1995). Sensory preconditioning and secord-order
conditioning of alarm reactions in zebra danio fish (Brachydanio rerio). Journal of
Comparative Psychology, 109(1), 76.
Happé, F. G. (1995). The role of age and verbal ability in the theory of mind task
performance of subjects with autism. Child development, 66(3), 843-855.
Harris, B. (1979). Whatever happened to little Albert?. American
psychologist, 34(2), 151.
Helmholtz, H. V. (1925). Treatise on psychological optics. Optical Society of
America, 3, 482.
Helms, D. B., & Turner, J. S. (1976). Exploring child behavior. WB Saunders
Company.
Hinztman, D.L. (1976). Psychology of learning and motivation, 10, 47-91.

140
Hollis, K. L., Cadieux, E. L., & Colbert, M. M. (1989). The biological function of
Pavlovian conditioning: A mechanism for mating success in the blue gourami (Trichogaster
trichopterus). Journal of Comparative Psychology, 103(2), 115.
Faul, F., Erdfelder, E., Buchner, A., & Lang, A. G. (2009). Statistical power analyses
using G* Power 3.1: Tests for correlation and regression analyses. Behavior research
methods, 41(4), 1149-1160.
Fenson, L., Dale, P. S., Reznick, J. S., Bates, E., Thal, D. J., Pethick, S. J., ... &
Stiles, J. (1994). Variability in early communicative development. Monographs of the
society for research in child development, i-185.
Ferraro, F.R., Balota, D.A., & Connor, L.T. (1993). Implicit memory and the
formation of new associations in nondemented Parkinson’s disease individuals and
individuals with senile dementia of the Alzheimer type : a serial reaction time (SRT)
investigation. Brain and Cognition, 21, 163-180.
Finch, G., & Culler, E. (1935). Relation of forgetting to experimental extinction. The
American Journal of Psychology, 47(4), 656-662.
Fischer, W., Gage, F. H., & Björklund, A. (1989). Degenerative changes in forebrain
cholinergic nuclei correlate with cognitive impairments in aged rats. European Journal of
Neuroscience, 1(1), 34-45.
Fleischman, D.A., & Gabrieli, J.D.E. (1998). Repetition priming in normal aging
and Alzheimer’s Disease : A review of findings and theories. Psychology and aging, 13(1),
88-119.
Galvin, J. E. (2018). Using informant and performance screening methods to detect
mild cognitive impairment and dementia. Current Geriatrics Reports, 1-7.
Godefroid, J. (2001). Psychologie: science humaine et science cognitive. De Boeck
Supérieur.
Hockett, C. F. (1968). The State of the Art (= Ianua linguarum, series minor 73). La
Haye et Paris, Mouton.
Iacono, W. G., Peloquin, L. J., Lumry, A. E., Valentine, R. H., & Tuason, V. B.
(1982). Eye tracking in patients with unipolar and bipolar affective disorders in
remission. Journal of Abnormal Psychology, 91(1), 35-44.

141
Isaacowitz, D. M., Wadlinger, H. A., Goren, D., & Wilson, H. R. (2006). Selective
preference in visual fixation away from negative images in old age? An eye-tracking
study. Psychology and Aging, 21(1), 40-48.
Jacoby, L.J. (1999). Ironic effects of repetition : measuring age related differences
in memory. Journal of Experimental Psychology : Learning, Memory, and Cognition, 25(1),
3-22.
James, W. (1981). The Principles of Psychology (Vol. I). Cambridge, MA: Harvard
University Press. (See: James, William, The Principles of Psychology, H. Holt and Co.,
New York, 1890.)
Jara, E., Vila, J., & Maldonado, A. (2006). Second-order conditioning of human
causal learning. Learning and motivation, 37(3), 230-246.
Jozefowiez, J. (2014). The many faces of Pavlovian conditioning. International
Journal of Comparative Psychology, 27(4).
Kaakinen, J. K., Hyönä, J., & Keenan, J. M. (2002). Perspective effects on online
text processing. Discourse processes, 33(2), 159-173.
Kellough, J. L., Beevers, C. G., Ellis, A. J., & Wells, T. T. (2008). Time course of
selective attention in clinically depressed young adults: An eye tracking study. Behaviour
research and therapy, 46(11), 1238-1243.
Klin, A., Jones, W., Schultz, R., Volkmar, F., & Cohen, D. (2002). Visual fixation
patterns during viewing of naturalistic social situations as predictors of social competence
in individuals with autism. Archives of general psychiatry, 59(9), 809-816.
Koegel, R. L., O'dell, M. C., & Koegel, L. K. (1987). A natural language teaching
paradigm for nonverbal autistic children. Journal of autism and developmental
disorders, 17(2), 187-200.
Koegel, R. L., O'Dell, M., & Dunlap, G. (1988). Producing speech use in nonverbal
autistic children by reinforcing attempts. Journal of autism and developmental
disorders, 18(4), 525-538.
Krantz, P. J., & McClannahan, L. E. (1998). Social interaction skills for children
with autism: A script‐fading procedure for beginning readers. Journal of applied behavior
analysis, 31(2), 191-202.

142
Kruschke, J. K., Kappenman, E. S., & Hetrick, W. P. (2005). Eye gaze and individual
differences consistent with learned attention in associative blocking and
highlighting. Journal of Experimental Psychology: Learning, Memory, and
Cognition, 31(5), 830.
Lavin, M. J. (1976). The establishment of flavor-flavor associations using a sensory
preconditioning training procedure. Learning and Motivation, 7(2), 173-183.
Law, L., Hawkins, S.A., & Craik, F.I.M. (1998). Repetition-Induced Belief in the
Elderly : Rehabilitating Age-Related Memory Deficits. J Consum Res, 25(2), 91-107.
Lee, V. L. (1981). Prepositional phrases spoken and heard. Journal of the
Experimental Analysis of Behavior, 35(2), 227-242.
Lippman, L. G., & Meyer, M. E. (1967). Fixed interval performance as related to
instructions and to subjects’ verbalizations of the contingency. Psychonomic Science, 8(4),
135-136.
Luciano, M. C. (2000). Applications of research on rule-governed
behavior. Experimental and applied analysis of human behavior, 181-204.
Mackintosh, N. J., Kaye, H., & Bennett, C. H. (1991). Perceptual learning in flavour
aversion conditioning. The Quarterly Journal of Experimental Psychology Section
B, 43(3b), 297-322.
Makin, L. (2006). Literacy 8–12 months: what are babies learning?. Early
Years, 26(3), 267-277.
Martin, I., & Levey, A. B. (1987). Learning what will happen next: Conditioning,
evaluation, and cognitive processes. In G. Davey (Ed.), Cognitive processes and Pavlovian
conditioning in humans (pp. 57-81). Oxford, England: John Wiley & Sons.
Matzel, L. D., Held, F. P., & Miller, R. R. (1988). Information and expression of
simultaneous and backward associations: Implications for contiguity theory. Learning and
motivation, 19(4), 317-344.
McEvoy, R. E., Rogers, S. J., & Pennington, B. F. (1993). Executive function and
social communication deficits in young autistic children. Journal of child psychology and
psychiatry, 34(4), 563-578.

143
McLaren, I. P. L., & Mackintosh, N. J. (2000). An elemental model of associative
learning: I. Latent inhibition and perceptual learning. Animal Learning & Behavior, 28(3),
211-246.
Miltenberger, R. G. (2011). Behavior modification: Principles and procedures.
Cengage Learning.
Molchan, S. E., Sunderland, T., McIntosh, A. R., Herscovitch, P., & Schreurs, B. G.
(1994). A functional anatomical study of associative learning in humans. Proceedings of the
National Academy of Sciences, 91(17), 8122-8126.
Molet, M., Jozefowiez, J., & Miller, R. R. (2010). Integration of spatial relationships
and temporal relationships in humans. Learning & behavior, 38(1), 27-34.
Morimoto, C. H., Koons, D., Amir, A., & Flickner, M. (2000). Pupil detection and
tracking using multiple light sources. Image and vision computing, 18(4), 331-335.
Morimoto, C. H., & Mimica, M. R. (2005). Eye gaze tracking techniques for
interactive applications. Computer vision and image understanding, 98(1), 4-24.
Muller, D., Gerber, Bertram, Hellstern, Frank, Hammer, Martin, & Menzel, Randolf.
(2000). Sensory preconditioning in honeybees. Journal of Experimental Biology, 203(8),
1351-1364.
Mundy, P., Sigman, M., & Kasari, C. (1990). A longitudinal study of joint attention
and language development in autistic children. Journal of Autism and developmental
Disorders, 20(1), 115-128.
Myers, T. M., Cohn, S. I., & Clark, M. G. (2005). Acquisition and performance of
two-way shuttlebox avoidance: Effects of aversive air intensity. Learning and
Motivation, 36(3), 312-321.
Öhman, A., & Mineka, S. (2001). Fears, phobias, and preparedness: toward an
evolved module of fear and fear learning. Psychological review, 108(3), 483.
Öhman, A., & Mineka, S. (2003). The malicious serpent: Snakes as a prototypical
stimulus for an evolved module of fear. Current directions in psychological science, 12(1),
5-9.
Oller, D. K. (1981). Infant vocalizations: Exploration and reflexivity. Language
behavior in infancy and early childhood, 85-103.

144
Ornitz, E. M., Guthrie, D., & Farley, A. H. (1977). The early development of autistic
children. Journal of autism and childhood schizophrenia, 7(3), 207-229.
Parrott, L. J. (1987). Rule-governed behavior: An implicit analysis of reference. BF
Skinner: Consensus and controversy, 265-276.
Pavlov, I. P. (1927). Conditional reflexes: an investigation of the physiological
activity of the cerebral cortex.
Peláez, M. (2009). Joint attention and social referencing in infancy as precursors of
derived relational responding. Derived relational responding: Applications for learners
with autism and other developmental disabilities, 63-78.
Pelaez, M., Virues‐Ortega, J., & Gewirtz, J. L. (2011). Reinforcement of
vocalizations through contingent vocal imitation. Journal of Applied Behavior
Analysis, 44(1), 33-40.
Pfautz, P. L., Donegan, N. H., & Wagner, A. R. (1978). Sensory preconditioning
versus protection from habituation. Journal of Experimental Psychology: Animal Behavior
Processes, 4(3), 286.
Pierce, W. D., & Cheney, C. D. (2013). Behavior analysis and learning. Psychology
Press.
Posner (Ed.), Foundations of cognitive science (pp. 631-682). Cambridge, MA, US:
The MIT Press.
Preissler, M. A. (2008). Associative learning of pictures and words by low-
functioning children with autism. Autism, 12(3), 231-248.
Prewitt, E. P. (1967). Number of preconditioning trials in sensory preconditioning
using CER training. Journal of comparative and physiological psychology, 64(2), 360.
Razran, G. (1955). A note on second-order conditioning—and secondary
reinforcement. Psychological Review, 62(5), 327.
Reid, R. L. (1952). A test of sensory pre-conditioning in pigeons. Quarterly Journal
of Experimental Psychology, 4(2), 49-56.
Renaux, C., Rivière, V., Craddock, P., & Miller, R. R. (2017). Role of Spatial
Contiguity in Sensory Preconditioning with Humans. Behavioural Processes, 142, 141-145.

145
Renaux, C., Rivière, V., & Nuchadee, M.L.J. (2017). Increase Writing Performance
using a Shaping Procedure with a Patient with Sequelae caused by Cardiovascular
Accident. Journal of Ageing Research and Healthcare, Vol2(1), 32-39.
Rescorla, R. A. (1980). Simultaneous and successive associations in sensory
preconditioning. Journal of Experimental Psychology: Animal Behavior Processes, 6(3),
207.
Rescorla, R.A., & Cunnigham, C.L. (1979). Spatial contiguity facilitates pavlovian
second-order conditioning. Journal of Experimental Psychology : Animal Behavior
Processes, 5(2), 152-161.
Rescorla, R. A. (1982). Simultaneous second-order conditioning produces SS
learning in conditioned suppression. Journal of Experimental psychology: animal Behavior
processes, 8(1), 23.
Rizley, R. C., & Rescorla, R. A. (1972). Associations in second-order conditioning
and sensory preconditioning. Journal of comparative and physiological psychology, 81(1),
1.
Rogers, J. C., Holm, M. B., Burgio, L. D., Granieri, E., Hsu, C., Hardin, M., &
McDowell, B. J. (1999). Improving morning care routines of nursing home residents with
dementia. Journal of the American Geriatrics Society, 47(9), 1049-1057.
Rovee-Collier, C. (1997). Dissociations in infant memory: Rethinking the
development of implicit and explicit memory. Psychological review, 104(3), 467.
Rovee-Collier, C., Hayne, H., & Colombo, M. (2000). The development of implicit
and explicit memory (Vol. 24). John Benjamins Publishing.
Savastano, H. I., & Miller, R. R. (1998). Time as content in Pavlovian
conditioning. Behavioural Processes, 44(2), 147-162.
Sherer, M., Pierce, K. L., Paredes, S., Kisacky, K. L., Ingersoll, B., & Schreibman,
L. (2001). Enhancing conversation skills in children with autism via video technology:
Which is better,“self” or “other” as a model?. Behavior modification, 25(1), 140-158.
Schlinger, H., & Blakely, E. (1987). Function-altering effects of contingency-
specifying stimuli. The Behavior Analyst, 10(1), 41-45.
Skinner, B. F. (2014). Verbal behavior. BF Skinner Foundation.

146
Skinner, B. F. (2014). Contingencies of reinforcement: A theoretical analysis (Vol.
3). BF Skinner Foundation.
Smith, L. B., & Heise, D. (1992). Perceptual similarity and conceptual structure.
In Advances in psychology (Vol. 93, pp. 233-272). North-Holland.
Stormark, K. M., Hugdahl, K., & Posner, M. I. (1999). Emotional modulation of
attention orienting: A classical conditioning study. Scandinavian Journal of
Psychology, 40(2), 91-99.
Stout, S., Escobar, M., & Miller, R.R. (2004). Trial number and compound stimuli
temporal relationship as joint determinants of second-order conditioning and conditioned
inhibition. Learning & Behavior, 32(2), 230-239.
Stuart, E. W., Shimp, T. A., & Engle, R. W. (1987). Classical conditioning of
consumer attitudes: Four experiments in an advertising context. Journal of consumer
research, 14(3), 334-349.
Schwartz, C. W., & Schwartz, E. R. (1949). Reconnaissance of the game birds in
Hawaii.
Spira, A. P., & Edelstein, B. A. (2007). Operant conditioning in older adults with
Alzheimer's disease. The Psychological Record, 57(3), 409-427.
Sundberg, M. L., Endicott, K., & Eigenheer, P. (2000). Using intraverbal prompts to
establish tacts for children with autism. The Analysis of Verbal Behavior, 17(1), 89-104.
Sundberg, M. L., & Michael, J. (2001). The benefits of Skinner’s analysis of verbal
behavior for children with autism. Behavior modification, 25(5), 698-724.
Swick, D. & Knight, R.T. (1997). Event-related potentials differenciate the effects
in aging on world and nonword repetition in explicit and implicit memory tasks. Journal of
Experimental Psychology, 23(1), 123-142.
Terry, R. D., Masliah, E., Salmon, D. P., Butters, N., DeTeresa, R., Hill, R., ... &
Katzman, R. (1991). Physical basis of cognitive alterations in Alzheimer's disease: synapse
loss is the major correlate of cognitive impairment. Annals of Neurology, 30(4), 572-580.
Tong, C., Bovbjerg, D. H., & Erblich, J. (2007). Smoking-related videos for use in
cue-induced craving paradigms. Addictive behaviors, 32(12), 3034-3044.
147
Ungerer, J. A., & Sigman, M. (1987). Categorization skills and receptive language
development in autistic children. Journal of Autism and Developmental Disorders, 17(1),
3-16.
Urcelay, G. P., Witnauer, J. E., & Miller, R. R. (2012). The dual role of the context
in postpeak performance decrements resulting from extended training. Learning &
Behavior, 40(4), 476-493.
Van Gog, T., & Scheiter, K. (2010). Eye tracking as a tool to study and enhance
multimedia learning.
Wachtman, G. S., Cohn, J. F., VanSwearingen, J. M., & Manders, E. K. (2001).
Automated tracking of facial features in patients with facial neuromuscular
dysfunction. Plastic and reconstructive surgery, 107(5), 1124-1133.
Warren, H.C. (1921). A history of the association psychology, New York :
Scribner’s.
Ward-Robinson, J., & Hall, G. (1996). Backward sensory preconditioning. Journal
of Experimental Psychology: Animal Behavior Processes, 22(4), 395-404.
Ward-Robinson, J., Symonds, M., & Hall, G. (1998). Context specificity of sensory
preconditioning: Implications for processes of within-event learning. Animal Learning &
Behavior, 26(2), 225-232.
Waters, A. M., Theresiana, C., Neumann, D. L., & Craske, M. G. (2017).
Developmental differences in aversive conditioning, extinction, and reinstatement: A study
with children, adolescents, and adults. Journal of experimental child psychology, 159, 263-
278.
Watson, J. B., & Rayner, R. (1920). Conditioned emotional reactions. Journal of
experimental psychology, 3(1), 1.
Wasserman, E. A., Franklin, S. R., & Hearst, E. (1974). Pavlovian appetitive
contingencies and approach versus withdrawal to conditioned stimuli in pigeons. Journal of
comparative and physiological psychology, 86(4), 616.
Wedel, M., & Pieters, R. (2008). Eye tracking for visual marketing. Foundations
and Trends® in Marketing, 1(4), 231-320.

148
Weiner, H. (1964). Conditioning history and human fixed-interval performance
1. Journal of the Experimental Analysis of Behavior, 7(5), 383-385.
West, G. L., Anderson, A. A., & Pratt, J. (2009). Motivationally significant stimuli
show visual prior entry: Evidence for attentional capture. Journal of Experimental
Psychology: Human Perception and Performance, 35(4), 1032.
Yarbus, A. L. (1967). Eye Movements and Vision. New York: Plenum Press.
Yin, H., Barnet, C., & Miller, R.R. (1994). Second-Order Conditioning and
Pavlovian Conditioned Inhibition : Operational Similaries and Differences. Journal of
Experimental Psychology : Animal Behavior Processes, 20(4), 419-428.

149
Annexes

150
NOTE D’INFORMATION DES PARTICIPANTS
…………………………………………………………………………………………………………………………………………………………………………………………………………………………………
La durée de la passation est d’environ 10 minutes. Pendant cette période, vous serez amené à regarder
différents stimuli qui apparaissent sur l’écran de l’ordinateur. Vos saccades oculaires seront
enregistrées via un système d’eye-tracking, afin de déterminer post-test vos temps de fixations
visuelles, et vos différentes poursuites oculaires. Cette expérience se déroule en 4 phases : une
première phase de calibration nécessaire au bon fonctionnement de l’eye-tracking ; une seconde
phase où deux stimuli apparaîtront de manière simultanée ; une troisième phase où un stimulus
apparaîtra et sera suivi ou non d’un autre stimulus. Enfin, vous aurez une phase test composée de
stimuli déjà observés.
Dans le cadre de cette recherche, un traitement de vos données va être mis en œuvre pour permettre
d’analyser les résultats. A cette fin, les données vous concernant seront transmises au Promoteur de
la recherche ou aux personnes ou sociétés agissant pour son compte. Ces données seront identifiées
par un numéro de code et seront donc anonymes. Ces données sont donc susceptibles d’être utilisées
dans le cadre de cette recherche et d’être traitées.
Vous êtes libre d'accepter ou de refuser de participer à cette étude. A tout moment, vous êtes en droit d’arrêter l’expérience sans encourir aucune responsabilité ni préjudice de ce fait.
Cette étude sera menée sous l’investigation de Charlotte Renaux et sous la supervision du Pr Vinca Rivière. Pour toute question relative à l’étude, les coordonnées de l’investigatrice sont :
Mme RENAUX Charlotte
Signature participant : Signature proposant :
151
CONSENTEMENT DE PARTICIPATION
MINEURS
Le laboratoire SCALab vous propose de participer à une tâche de fixation visuelle via un ordinateur équipé
d’un système d’eye-tracking, dans le but d’étudier le conditionnement d’ordre supérieur. Cette étude est
menée sous l’investigation de Charlotte Renaux et sous la supervision du Pr Vinca Rivière.
Nous vous informons que :
- Vous pouvez à tout moment interrompre votre participation sans avoir à le justifier. - Vous pouvez prendre connaissance des résultats de l’étude dans sa globalité lorsqu’elle sera
achevée. - Les données recueillies demeureront strictement confidentielles.
Mr et Mme autorise / n’autorise
pas leur enfant à participer à l’étude présentée
conjointement. (Rayer la mention non souhaitée)
Compte-tenu des informations qui m’ont été transmises :
A remplir par le participant de plus de 12ans
cocher les cases appropriées en fonction de votre volonté (OUI / NON)
OUI NON
1) J’accepte librement et volontairement de participer à la recherche
Fait le / / à
Signature du participant : Signature des parents : Signature de l’investigateur:
Appendix 1 : Informations and prior consent
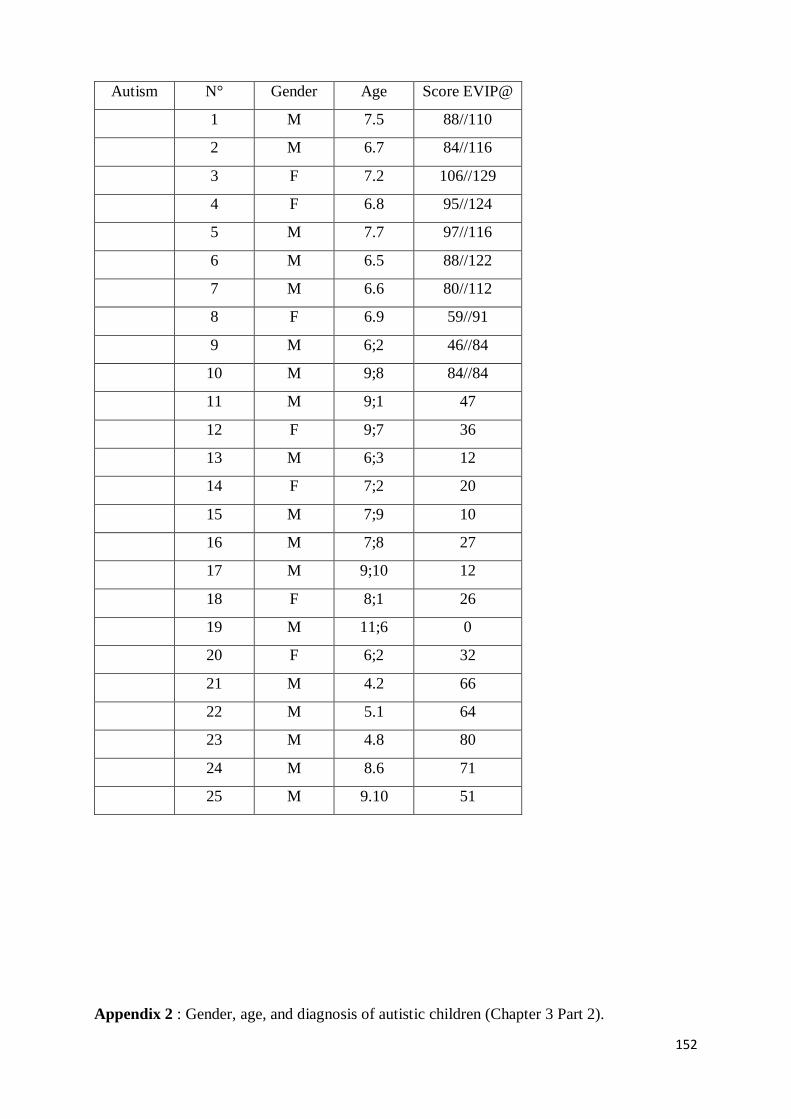
152
Autism N° Gender Age Score EVIP@
1 M 7.5 88//110
2 M 6.7 84//116
3 F 7.2 106//129
4 F 6.8 95//124
5 M 7.7 97//116
6 M 6.5 88//122
7 M 6.6 80//112
8 F 6.9 59//91
9 M 6;2 46//84
10 M 9;8 84//84
11 M 9;1 47
12 F 9;7 36
13 M 6;3 12
14 F 7;2 20
15 M 7;9 10
16 M 7;8 27
17 M 9;10 12
18 F 8;1 26
19 M 11;6 0
20 F 6;2 32
21 M 4.2 66
22 M 5.1 64
23 M 4.8 80
24 M 8.6 71
25 M 9.10 51
Appendix 2 : Gender, age, and diagnosis of autistic children (Chapter 3 Part 2).

153
Patients
Dem
N° Gender Age PATHOS@
01 F 88 534
02 F 88 228
03 F 91 614
04 F 78 554
05 F 95 234
06 M 94 254
07 M 80 240
08 M 87 249
09 F 81 170
10 F 87 146
11 M 93 86
12 M 90 182
13 F 94 267
14 M 88 638
15 F 88 235
16 F 93 59
17 F 93 212
18 F 87 188
19 F 91 57
20 M 90 431
Appendix 3 : Gender, age, and diagnosis of dementia participants (Chapter 4 Part 2).

154
Abstract
Brogden (1939) demonstrated sensory preconditioning (SPC) in which two conditioned stimuli
(CS) are paired in a first phase (Phase 1 : CS2-CS1), before pairing one of them with an
unconditioned stimulus (US) (Phase 2 : CS1-US). SPC is said to have occurred when CS2 elicits
the conditioned response (CR), despite the fact that it never having been directly paired with
the US. In humans, Brogden (1942 ; 1947) emphasized as necessarily the use of explicit
instructions in order to observe such an associative response. In the present study, we wanted
to use an SPC procedure in humans similar to that used with other species, which means using
procedures without any verbal instructions. We used visual fixation as the common measure of
all of our experimental groups (i.e., babies, children, adults, seniors, and dementia patients).
We examined the SPC procedure using eye tracking as our dependent variable in populations
with verbal disabilities, like autistic children and elderly people with dementia, because visual
fixation does not require verbal abilities to be implemented.
Our research focused on SPC among different conditioning variables (Part 1) and testing the
role of verbal strategies on that kind of associative learning (Part 2). In addition, we observed
that associative learning at several stages of development. First, we observed high rates of SPC
in all experimental groups instead of impaired behavior that would have been consistent with
predictions of developmental and psychopathological models about limited cognitive
performance in very young, very old, and cognitively impaired subjects (i.e., autism and
dementia). Some parallels with equivalence relations and adaptative functions are discussed.
Keywords : associative learning, SPC, visual fixation, spatial contiguity, repetition,
development, verbal behavior.
Copyright © 2022 FDOKUMEN