SELF-ASSOCIATIVE PERIODIC TABLE OF THE ELEMENTS BY NEURAL NETWORKS
Upload
khangminh22Category
view
3download
0
Role of Prefrontal and Parietal Cortices inAssociative Learning
John R. Anderson, Dana Byrne, Jon M. Fincham and Pat Gunn
Psychology Department, Carnegie Mellon University,
Pittsburgh, PA 15213, USA
Two studies were performed that compared a ‘‘Paired’’ condition inwhich participants studied paired associates with a ‘‘Generated’’condition in which participants completed word fragments toproduce paired associates. In both tasks, participants wereresponsible for memory of the material either studied or generated.The experiments revealed significant differences between theresponses of a predefined prefrontal region and a predefinedparietal region. The parietal region responded more in theGenerated condition than the Paired condition, whereas therewas no difference in the prefrontal region. On the other hand, theprefrontal region responded to the delay between study and test inboth the Paired and Generated conditions, whereas the parietalregion only responded to delay in the Generated condition. Thispattern of results is consistent with the hypothesis that the parietalregion is responsive to changes in problem representation and theprefrontal region to retrieval operations. An information-processingmodel embodying these assumptions was fit to the blood oxygenlevel--dependent responses in these regions.
Keywords: associative learning, encoding, memory, parietal cortex,prefrontal cortex
Introduction
The prefrontal region has been repeatedly implicated in imaging
research as important for memory (e.g., Buckner et al. 1999;
Lepage et al. 2000; Fletcher and Henson 2001; Wagner et al.
2001; Cabeza et al. 2002; Sohn et al. 2003, 2005; Thompson-
Schill 2003; Wheeler and Buckner 2003; Kohler et al. 2004;
Badre et al. 2005; Dobbins and Wagner 2005). These imaging
results are not particularly surprising given evidence about the
memory deficits associated with prefrontal lesions (Stuss and
Benson 1984; Shimamura 1995), although such lesions tend to
be not as devastating to memory as temporal lesions (Squire
1992; Cohen and Eichenbaum 1993). As noted in the recent
review of Wagner et al. (2005), there is also evidence that the
posterior parietal region is implicated in studies of memory
(e.g., Habib and Lepage 1999; Buckner and Wheeler 2001; Rugg
et al. 2002) even though lesions to this parietal region do not
tend to be associated with deficits in memory. A classic finding
in these studies is that there is greater parietal activation in
recognition memory experiments when old items are correctly
recognized than when foils are correctly rejected. Although
most data implicating the parietal region come from recogni-
tion and source memory experiments, this paper will show that
parietal regions are also active in associative recall tasks.
Cabeza et al. (2003) noted that the parietal and prefrontal
regions are part of a general circuit that also includes the
anterior cingulate and thalamic regions and that these areas
tend to be involved in a number of attention tasks (see also
Dosenbach et al. 2006). They argue that activity in all these
regions may reflect more general processes than just memory.
Based on the ACT-R theory (Anderson, Bothell, et al. 2004), we
have developed an interpretation of the activity in this circuit
(e.g., Anderson 2005; Anderson et al. 2007; Danker and
Anderson 2007) and have argued that different regions serve
different functions. In particular, the prefrontal region serves
a more pure memory function, being engaged by storage and
retrieval operations, whereas the posterior parietal region is
engaged by changes in problem representation. There is
considerable evidence to support the assumption that the
parietal region plays an important role in visual--spatial and
verbal representations. It is engaged in verbal encoding (Dava-
chi et al. 2001; Clark and Wagner 2003), mental rotation
(Alivisatos and Petrides 1997; Richter et al. 1997; Carpenter
et al. 1999; Heil 2002; Zacks et al. 2002), and visual--spatial
strategies in a variety of contexts (Dehaene et al. 1999; Reichle
et al. 2000; Sohn et al. 2004). A number of other researchers
have also proposed a representational role for the parietal
region (e. g., Bunge et al. 2002; Shannon and Buckner 2004).
Many tasks, including memory tasks, will engage both the
representational and retrieval activities. For instance, in a recall
trial for a paired-associate task like the one described here, the
participant must first represent the stimulus, then engage in
retrieval, and then represent the retrieved response. If
representational activities engage the parietal and retrieval
activities engage the prefrontal, it is not surprising that the
activities of these 2 regions are frequently correlated. (Perhaps
the reason why the posterior parietal region is more active
when old items are recognized than when foils are rejected is
that participants are representing their memory of the re-
trieved item). To disentangle these regions, one needs
a manipulation that will affect only the difficulty of the
retrieval or only the difficulty of the representation. Sohn
et al. (2003, 2005) report a series of studies that manipulated
the difficulty of the retrieval process but not the difficulty of
the representational process. According to the ACT-R theory,
fan (a manipulation of associative interference) should slow
the retrieval of the item but should have no effect on the
representational processes that are invoked to represent the
probe and the eventual result of the retrieval. Corresponding
to this theoretical analysis, Sohn et al. found robust activation
in both prefrontal and parietal regions, but fan only affected
the level of activation in the prefrontal region. The purpose
of the current experiments is to go beyond the demonstration
of the previous Sohn et al. experiments by using a double dis-
sociation, with one factor influencing the difficulty of the
representation and another factor affecting the difficulty of the
retrieval operation.
Cerebral Cortex April 2008;18:904--914
doi:10.1093/cercor/bhm123
Advance Access publication August 3, 2007
� The Author 2007. Published by Oxford University Press. All rights reserved.
For permissions, please e-mail: [email protected]
Dow
nloaded from https://academ
ic.oup.com/cercor/article/18/4/904/282477 by guest on 24 July 2022
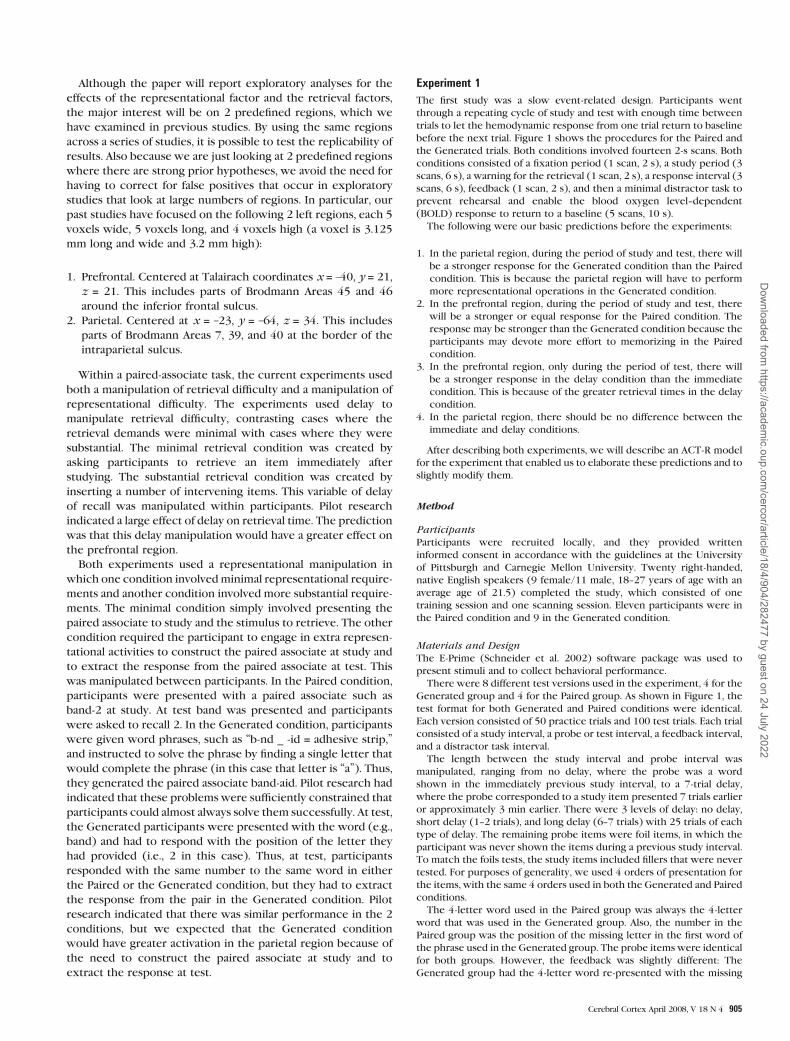
Although the paper will report exploratory analyses for the
effects of the representational factor and the retrieval factors,
the major interest will be on 2 predefined regions, which we
have examined in previous studies. By using the same regions
across a series of studies, it is possible to test the replicability of
results. Also because we are just looking at 2 predefined regions
where there are strong prior hypotheses, we avoid the need for
having to correct for false positives that occur in exploratory
studies that look at large numbers of regions. In particular, our
past studies have focused on the following 2 left regions, each 5
voxels wide, 5 voxels long, and 4 voxels high (a voxel is 3.125
mm long and wide and 3.2 mm high):
1. Prefrontal. Centered at Talairach coordinates x = –40, y = 21,
z = 21. This includes parts of Brodmann Areas 45 and 46
around the inferior frontal sulcus.
2. Parietal. Centered at x = –23, y = –64, z = 34. This includes
parts of Brodmann Areas 7, 39, and 40 at the border of the
intraparietal sulcus.
Within a paired-associate task, the current experiments used
both a manipulation of retrieval difficulty and a manipulation of
representational difficulty. The experiments used delay to
manipulate retrieval difficulty, contrasting cases where the
retrieval demands were minimal with cases where they were
substantial. The minimal retrieval condition was created by
asking participants to retrieve an item immediately after
studying. The substantial retrieval condition was created by
inserting a number of intervening items. This variable of delay
of recall was manipulated within participants. Pilot research
indicated a large effect of delay on retrieval time. The prediction
was that this delay manipulation would have a greater effect on
the prefrontal region.
Both experiments used a representational manipulation in
which one condition involvedminimal representational require-
ments and another condition involved more substantial require-
ments. The minimal condition simply involved presenting the
paired associate to study and the stimulus to retrieve. The other
condition required the participant to engage in extra represen-
tational activities to construct the paired associate at study and
to extract the response from the paired associate at test. This
was manipulated between participants. In the Paired condition,
participants were presented with a paired associate such as
band-2 at study. At test band was presented and participants
were asked to recall 2. In the Generated condition, participants
were given word phrases, such as ‘‘b-nd _ -id = adhesive strip,’’
and instructed to solve the phrase by finding a single letter that
would complete the phrase (in this case that letter is ‘‘a’’). Thus,
they generated the paired associate band-aid. Pilot research had
indicated that these problems were sufficiently constrained that
participants could almost always solve them successfully. At test,
the Generated participants were presented with the word (e.g.,
band) and had to respond with the position of the letter they
had provided (i.e., 2 in this case). Thus, at test, participants
responded with the same number to the same word in either
the Paired or the Generated condition, but they had to extract
the response from the pair in the Generated condition. Pilot
research indicated that there was similar performance in the 2
conditions, but we expected that the Generated condition
would have greater activation in the parietal region because of
the need to construct the paired associate at study and to
extract the response at test.
Experiment 1
The first study was a slow event-related design. Participants went
through a repeating cycle of study and test with enough time between
trials to let the hemodynamic response from one trial return to baseline
before the next trial. Figure 1 shows the procedures for the Paired and
the Generated trials. Both conditions involved fourteen 2-s scans. Both
conditions consisted of a fixation period (1 scan, 2 s), a study period (3
scans, 6 s), a warning for the retrieval (1 scan, 2 s), a response interval (3
scans, 6 s), feedback (1 scan, 2 s), and then a minimal distractor task to
prevent rehearsal and enable the blood oxygen level--dependent
(BOLD) response to return to a baseline (5 scans, 10 s).
The following were our basic predictions before the experiments:
1. In the parietal region, during the period of study and test, there will
be a stronger response for the Generated condition than the Paired
condition. This is because the parietal region will have to perform
more representational operations in the Generated condition.
2. In the prefrontal region, during the period of study and test, there
will be a stronger or equal response for the Paired condition. The
response may be stronger than the Generated condition because the
participants may devote more effort to memorizing in the Paired
condition.
3. In the prefrontal region, only during the period of test, there will
be a stronger response in the delay condition than the immediate
condition. This is because of the greater retrieval times in the delay
condition.
4. In the parietal region, there should be no difference between the
immediate and delay conditions.
After describing both experiments, we will describe an ACT-R model
for the experiment that enabled us to elaborate these predictions and to
slightly modify them.
Method
Participants
Participants were recruited locally, and they provided written
informed consent in accordance with the guidelines at the University
of Pittsburgh and Carnegie Mellon University. Twenty right-handed,
native English speakers (9 female/11 male, 18--27 years of age with an
average age of 21.5) completed the study, which consisted of one
training session and one scanning session. Eleven participants were in
the Paired condition and 9 in the Generated condition.
Materials and Design
The E-Prime (Schneider et al. 2002) software package was used to
present stimuli and to collect behavioral performance.
There were 8 different test versions used in the experiment, 4 for the
Generated group and 4 for the Paired group. As shown in Figure 1, the
test format for both Generated and Paired conditions were identical.
Each version consisted of 50 practice trials and 100 test trials. Each trial
consisted of a study interval, a probe or test interval, a feedback interval,
and a distractor task interval.
The length between the study interval and probe interval was
manipulated, ranging from no delay, where the probe was a word
shown in the immediately previous study interval, to a 7-trial delay,
where the probe corresponded to a study item presented 7 trials earlier
or approximately 3 min earlier. There were 3 levels of delay: no delay,
short delay (1--2 trials), and long delay (6--7 trials) with 25 trials of each
type of delay. The remaining probe items were foil items, in which the
participant was never shown the items during a previous study interval.
To match the foils tests, the study items included fillers that were never
tested. For purposes of generality, we used 4 orders of presentation for
the items, with the same 4 orders used in both the Generated and Paired
conditions.
The 4-letter word used in the Paired group was always the 4-letter
word that was used in the Generated group. Also, the number in the
Paired group was the position of the missing letter in the first word of
the phrase used in the Generated group. The probe items were identical
for both groups. However, the feedback was slightly different: The
Generated group had the 4-letter word re-presented with the missing
Cerebral Cortex April 2008, V 18 N 4 905
Dow
nloaded from https://academ
ic.oup.com/cercor/article/18/4/904/282477 by guest on 24 July 2022

letter capitalized to indicate that it had been the correct response or
with all the letters remaining lower case to indicate that this probe item
had no missing letters and was indeed a foil. In the Paired group, the
feedback consisted of either the correct number or an X to indicate that
the item was a foil.
An n-back task (Owen et al. 2005) was used as a distractor task to
prevent rehearsal between trials. Early pilot data revealed that when the
participants were given 12 s to stare at a blank screen, they created
numerous rehearsal strategies. The presentation of 3-letter words was
chosen rather than pictures to prevent the possibility of watching the
pictures while vocally rehearsing the study items. An n-back of 1 was
used which simply requires participants to detect repetitions of words.
Although this is a very easy task, it still served to prevent rehearsal.
Procedure
During the information session, 2--3 days prior to the scan, the
experimenter gave instructions and showed the participant several
sample trials. Then the participants completed a short series of practice
trials. The participants were given the opportunity to ask clarifying
questions or to repeat the practice trials if they were showing low
accuracy.
During the scan session, participants completed 5 blocks of 30 trials
each. The first 10 trials were for warm-up, and the remaining 20 trials
included 5 each of no delay, short delay, long delay, and filler. Thus,
there were 25 observations per participant in each condition of interest.
A trial consisted of several components as illustrated in Figure 1. A star
was presented for 2 s as a fixation point. Then, during the study interval
of 6 s, a phrase fragment was presented for the Generated group and
a word-number pair for the Paired group. During this interval, the
participants in the Generated group were required to determine which
letter was needed to complete the phrase in order to successfully
complete the word phrase fragment. Participants in the Paired group
were to study the word--number pair and were encouraged to think of an
elaborative link between the 2 (such as interpreting the pair band-2 as
referring to the White Stripes—a musical band with just 2 members) to
improve their performance when later presented with the probe.
Next, a brief blank screen was shown, followed by a plus sign which
served as a warning signal that the probe was about to appear. The probe
was always a 4-letter word and appeared for a maximum of 6 s. If the
participant responded, the trial moved immediately forward. If the
participant did not respond, the trial moved forward at the end of
the 6 s. During this interval, the word should act as a prompt to the
participant. The participants in the Generated group were to recall
the position of the letter they had generated. The participants in the
Paired groupwere to recall the number they had studied with that word.
All participants used a data glove to respond. For the participants in
the Generated group, each of the 4 fingers mapped to the 4-letter
positions in the probe word. For the participants in the Paired group,
each of the 4 fingers mapped to the numbers between 1 and 4. A thumb
press indicated a foil.
Following the feedback, the 1-back task was given. A subset of 16
three-letter words was presented randomly, and the participant
responded with a thumb press whenever a word was repeated.
Following the end of the 1-back component, the next item was
presented for study, thus beginning the next trial.
Functional Magnetic Resonance Imaging Procedures and
Preprocessing
Imaging data were collected with a Siemens 3T Allegra Scanner using
a standard radio frequency head coil. Each functional volume contained
34 oblique axial slices (3.20 mm thickness, 64 3 64 matrix, 3.125 mm2
in-plane resolution) parallel to the anterior commissure—posterior
commissure (AC--PC) plane, with the 24th slice from the superior
centered at the AC--PC line. Functional images were acquired using
a gradient echo-planar image acquisition sequence (2000 ms time
repetition, 30 ms time echo, 70� flip angle, 200 mm field of view (FOV),
0 slice gap). Functional acquisition was event related, with image
acquisition synchronized to stimulus onset, such that 14 volumes, each
with 34 slices, were acquired during each 28-s trial. Anatomical images
were acquired using a standard T1-weighted spin-echo pulse sequence
at the identical slice location as the functional images using a finer in-
plane resolution (3.2 mm thickness, 200 mm FOV, 256 3 256 matrix,
0.78125 mm2 in-plane resolution).
Preprocessing of the functional imaging data included 6-parameter
rigid-body motion correction using automated image registration (Woods
et al. 1992). Data were then spatially transformed into a common space
using the transformation obtained by co-registering anatomical images
to a common reference structural magnetic resonance imaging image by
means of a 12-parameter automatic algorithm AIR (Woods et al. 1998)
and then smoothed with a 6-mm full-width-half-max 3-D Gaussian filter
to accommodate individual differences in anatomy.
Results
Behavioral Results
Figure 2 shows the accuracy and latency results. Analyses of variance
(ANOVA) were performed on the effects of delay and study condition.
With respect to accuracy, there was a significant decrease in accuracy
as the length of the delay increased, from 95% at the no delay to 70% at
the long delay (F2,36 = 26.57, P < 0.0001, mean standard error [MSE] =0.011). There was no significant difference between the Paired and
Generated groups for targets (F1,18 = 0.04, MSE = .034). There was also
no significant difference between the 2 groups for foil items (F1,18 =0.183, MSE = 0.003).
Increase in delay also led to a significant increase in response time.
The response times for the items answered correctly increased from
1183ms at the no delay to 2411ms at the long delay (F2,36 = 118.113, P <
0.0001, MSE = 70221). The increase in response time for the targets
occurred for both the Generated and the Paired groups, and there was
no significant difference between the 2 groups (F1,18 = 1.51, MSE =323543). However, there was a significant difference between the 2
groups for foil items (F1,18 = 14.795, P < 0.001, MSE = 3966948) as
the response time for correct responses on foil items was 2580 ms for
the Generated group but 1689 ms for correct responses on foil items
for the Paired group.
Whereas there is a latency difference between short and long delays
(279 ms, t19 = 3.71, P < 0.005), the much larger difference is between
short and no delay (949 ms, t19 = 10.76, P < 0.0001). Because the major
effect of latency was between no delay versus longer delays, this
contrast was used in the imaging analyses (averaging together short
and long delays).
Confirmatory Imaging Analysis
BOLD responses reported throughout this paper were computed using
the response of the first scan of a trial as the baseline from which
percent change was calculated over the remaining time course of the
trial. Figure 3 shows these percent change measures for the predefined
parietal and prefrontal regions. For purposes of initial analysis scans 3--6
were defined as ‘‘early’’ scans reflecting the encoding (study was during
Figure 1. A comparison of the procedures in the Paired and Generated conditions.
906 Role of Cortices in Associative Learning d Anderson et al.
Dow
nloaded from https://academ
ic.oup.com/cercor/article/18/4/904/282477 by guest on 24 July 2022

scans 2-4) and scans 8--11 as ‘‘late’’ scans reflecting the retrieval (probe
was during scans 6--8). The early and late scans were offset from the
study and probe periods to reflect the lagged character of the
hemodynamic response. A 2 3 2 3 2 3 2 ANOVA was performed on
the average values in these areas in which the factors were region
(parietal vs. prefrontal), study (Paired vs. Generated), retention (imme-
diate vs. delayed), and scan (early vs. late). There was a significant
region-by-study interaction (F1,18 = 12.91, P < 0.005, MSE = 0.034). As
predicted, the Generated condition showed significantly greater acti-
vation than the Paired condition in the parietal region (t18 = 2.85, P <
0.05 (all significance levels for t statistics are based on 2-tailed tests) and
the difference in the prefrontal region is not significant (t18 = –0.79). The
only other significant effect was a retention-by-scan interaction (F1,18 =31.91; P < 0.0001) such that the effect of retention condition was only
significant in the late scans. As predicted, there is a large and significant
retention effect during the late scans in the prefrontal region (0.16%,
t19 = 3.91, P < 0.001) but there is also an unpredicted and equally large
retention effect in the parietal region (0.18%, t19 = 3.81, P < .005).
Breaking down the retention effect by study conditions and regions,
there are significant effects for Paired-prefrontal (15%, t10 = 2.45, P <
0.05), Generated-prefrontal (18%, t8 = 2.97, P < 0.05), and Generated-
parietal (25%, t8 = 3.88, P < 0.001), but the effect is only marginal for the
Paired-parietal (13%, t10 = 1.84, P < 0.10).
While not displayed in Figure 3, if we calculate the response in the
late scans for short and long delay, there is a greater response for long
delay than short delay (8% difference in the prefrontal and 4% in the
parietal), but neither difference is statistically significant (t19 = 1.65 for
prefrontal and t19 = 1.32 for parietal). The rather weak imaging effect is
not surprising given the rather weak behavioral effect (see Fig. 2).
Exploratory Imaging Analysis
This section will report exploratory analyses to determine what other
regions might be reliably responding to the manipulations of the
experiment. Functional imaging data were analyzed using mixed-effects
ANOVA models (Braver et al. 1997; Snitz et al. 2005) within the Neuro
Imaging Software system (http://kraepelin.wpic.pitt.edu/nis/index.html).
Two exploratory analyses were performed. In the first analysis,
participant was treated as a random factor and within-participant
factors included Delay (2 values: none and delay) and Scan (14). This
analysis was used to identify brain areas that showed differential BOLD
profiles in response to the Delay factor, indicated by a significant Delay-
by-Scan interaction. The second exploratory analysis again treated
participant as a random factor, with Group (2 values: Paired and
Generated) as a fixed effects between-participant factor and Scan as
a within-participant factor. This analysis was used to identify brain areas
that showed differential BOLD profiles in response to the varied
demands in the Paired and Generated conditions, indicated by a signif-
icant Group-by-Scan interaction. In both analyses, the lower bound
degrees of freedom (df) correction was applied to correct for non-
sphericity due to nonindependence of scans. An alpha level of P < 0.05
was used in both analyses. To correct for multiple comparisons issues,
only those regions having a contiguous cluster size of 30 or more
significant voxels are reported (Forman et al. 1995).
Table 1 reports the regions found in the 2 analyses. The significant
interactions that identified these regions can usually be characterized by
the total magnitude of the average BOLD response (computed as
percent change from scan 1) over the within-trial time course activity
during a particular condition. This measure can be thought of as a proxy
for total work performed over the period of a trial (Anderson et al.
2004). Table 1 reports, for each region, for each condition, the sum of
the percentages over the 14 scans comprising a trial.
The delay-by-scan interaction revealed one large left-sided region,
which included the predefined prefrontal and parietal regions. To
identify the foci of activity in this large region, a more conservative alpha
level of P < 0.01 was used and showed 2 foci of activation, 1 in left
parietal cortex overlapping our predefined parietal region and 1 in left
prefrontal cortex, overlapping our predefined prefrontal region. The
Figure 2. Behavioral results from Experiment 1: (a) Probability of correct recall; (b)Latency of correct recall.
Figure 3. fMRI results from Experiment 1: (a) BOLD response in the predefinedposterior parietal region; (b) BOLD response in the predefined prefrontal region.
Cerebral Cortex April 2008, V 18 N 4 907
Dow
nloaded from https://academ
ic.oup.com/cercor/article/18/4/904/282477 by guest on 24 July 2022

delay-by-scan interaction also revealed right-sided regions homologous
to the predefined prefrontal and parietal regions. The group-by-scan
interaction revealed a left-sided parietal region close to the predefined
region. The group-by-scan analysis also found 2 left-sided prefrontal
regions (b2 and b6) behaving similarly to the predefined prefrontal, but
neither of these is particularly close to the predefined region. It will be
important to determine which of these exploratory regions can be
replicated in a second study.
Experiment 2
Experiment 2 was an attempt to replicate the first experiment with one
difference. To better separate the encoding phase from the retrieval
phase, we inserted 2 additional scans (4 s) between them and then took
2 scans away from the final 1-back phase. Participants were recruited
locally, and they provided written informed consent in accordance with
the guidelines at the University of Pittsburgh and Carnegie Mellon
University. Twenty right-handed, native English speakers (10 female/10
male, 18--26 years of age with an average of age of 21.1 years) completed
the study, which consisted of one information session and one scanning
session. Eleven participants were in the Paired condition and 9 in the
Generated condition (11 participants were recruited in the Generated
condition but 2 were lost because of errors in the scanning parameters).
Results
Behavioral Results
Figure 4 shows the accuracy and latency results. The analyses contrasted
no delay probes, short delay probes (1-2 trials), and long delay probes (6-
7 trials). There was a significant decrease in accuracy as the length of
the delay increased, from 93% at the no delay to 61% at the long delay
(F2,36 = 52.52, P < 0.0001, MSE = 0.007). There was no significant
difference between the 2 groups on targets (F1,18 = 0.29, MSE = 0.045) orfoil items (F1,18 = 0.39, MSE = 0.023).
Delay also had a significant impact on response time as the increase in
delay led to an overall increase in response time. The response times for
the items answered correctly increased from 1666 ms at the no delay to
2550 ms at the long delay (F2,36 = 67.68, P < 0.0001, MSE = 71706). The
Generated group is marginally slower than the Paired group on targets
(F1,18 = 3.52, P < 0.10, MSE = 645249). There was also a significant
difference between the 2 groups for foil items (F1,18 = 11.294, P < 0.005,
MSE = 338321) with the Generated group again longer.
The behavioral results are quite consistent between the 2 experi-
ments. Similar to experiment 1, the short and long delays are averaged
together in the functional magnetic resonance imaging (fMRI) analyses,
although again the difference between the 2 delays is statistically
significant (t19 = 2.18, P < 0.05).
Confirmatory Imaging Analysis
Figure 5 shows the BOLD responses as percent change from the
baseline at scan 1. For purposes of initial analysis scans 3--8 were defined
as early scans reflecting the encoding (study was during scans 2--4) and
scans 9--14 as late scans reflecting the retrieval (probe was during scans
8--10). This analysis replicated the 2 significant interactions of the
previous study. There was a significant region-by-study interaction
(F1,18 = 8.49, P < 0.01, MSE = 0.023). As predicted, the Generated
condition was significantly greater than the Paired condition in the
parietal (t18 = 2.40, P < 0.05) and the difference in the prefrontal is not
significant (t18 = –0.38). The retention-by-scan interaction was also
significant (F1,18 = 25.30; P < 0.0001) such that the effect of retention
condition was only significant in the late scans. This time, however, fo-
cusing just on the late scans, there was a significant retention-by-region
interaction (F1,18 = 10.02, P < 0.01,MSE = 0.004). As predicted, the effect ofdelay was greater in prefrontal. The difference between delay and
immediate was significant in 3 of the 4 comparisons: Generated-prefrontal
(0.22%, t8 = 5.49,P < 0.001), Paired-prefrontal (0.12% -- t10 = 4.82, P < .001),and Generated-parietal (0.14%, t8 = 2.90, P < 0.05). Again, the effect is onlymarginal in the Paired-parietal (0.05% -- t10 = 2.14, P < 0.1).
The outcome of these 4 comparisons of retention effects is quite
consistent between the 2 experiments. Given that both experiments
show a marginal retention effect in the Paired-parietal condition, we
should probably consider that there is an effect in this condition as well.
Indeed, a t-test over the 2 experiments finds a significant retention effect
in the Paired-parietal condition (0.09% -- t10 = 2.46, P < 0.05). However, t-
tests also confirm that the size of the effect in the Paired-parietal is
smaller than the size of the effect in any other condition (14% Paired-
prefrontal, 20% Generated-Parietal, and 20% Generated-Prefrontal).
Table 1Results of Exploratory Analyses of Experiment 1 (Except were noted P\ 0.05)
Region of Interest Brodmann Areas Voxel Count Stereotaxic Coordinates (mm) Condition 1 Condition 2
x y z
Delay-by-scan Immed. DelaySupplementary Motor, Anterior Cingulate Cortex 6, 8, 24, 32 591 1 20 44 1.66% 2.22%L. Motor, Prefrontal, Posterior Parietal 2, 4, 7, 39, 40,45,46 3406 �33 �8 31 2.59% 3.13%L. Post Parietal (P\ 0.01) 7, 40 220 �25 �57 41 3.66% 5.10%L. Prefrontal (P\ 0.01) 9, 46 455 �45 12 31 3.24% 4.22%
R. Supramarginal Gyrus 40 619 56 �43 27 0.49% �0.75%Precuneus 7 32 5 �52 48 2.07% 1.37%R. Prefrontal 9, 45, 46 188 45 27 28 2.01% 2.39%R. Posterior Parietal 7, 39, 40 135 33 �57 40 2.82% 3.34%Polar Frontal 9,10 89 2 54 14 �1.13% �2.17%Posterior Cingulate 23, 31 118 �2 �31 29 1.70% 2.15%R. Anterior Prefrontal 10 94 32 47 3 0.32% 1.34%R. Precentral Gyrus 6 50 55 2 9 2.41% 0.65%R. Anterior Insula 13 225 34 22 4 1.57% 2.14%R. Temporal Gyrus 21, 22 68 59 �23 �2 0.45% 0.00%L. Temporal Gyrus 21, 22 45 �61 �26 �2 0.64% 1.06%R. Occipital Gyrus 18,19 60 26 �85 4 �2.58% �2.33%L. Fusiform Gyrus 39 61 �43 �54 �7 1.82% 1.86%L. Occipital Gyrus 18 85 �28 �87 �2 �2.25% �1.88%
Group-by-Scan Paired GeneratedSupplementary Motor, Anterior Cingulate Cortex 6, 8, 24, 32 348 9 12 53 2.74% 1.23%L. Prefrontal 6 61 �32 2 45 2.13% 1.55%L. Posterior Parietal 40 21 �42 �55 47 3.61% 5.40%R. Posterior Parietal 39 117 37 �64 39 2.25% 2.73%L. Posterior Parietal 39 78 �26 �59 38 3.05% 5.86%L. Anterior Prefrontal 10 78 �30 48 15 3.49% 1.37%L. Occipital Gyrus 17, 18 354 �21 �84 6 1.09% 3.89%R. Occipital Gyrus 17, 18 177 17 �88 12 1.37% 3.57%
Note: L, left; R, right.
908 Role of Cortices in Associative Learning d Anderson et al.
Dow
nloaded from https://academ
ic.oup.com/cercor/article/18/4/904/282477 by guest on 24 July 2022

With respect to the parietal region, both Experiments 1 and 2 show
a much greater late response in the Generated delay condition than
in any of other 3 conditions. Perhaps, participants in the Generated
condition had to extract the answer in the delayed condition but could
use their still active memory instead in the immediate condition.
If we break the delay condition down into short and long, there is a 4%
greater late response for long delay than short delay in the Prefrontal but
a 3% weaker response in the parietal. Neither effect is statistically
significant (t19 = 1.30 for prefrontal and t19 = –1.03 for parietal).
However, if we combine these effects with the first experiment, the
average effect for the prefrontal is 6%, which is marginally significant
(t39 = 1.76, P < 0.10), whereas the effect for the parietal is just 1% and
it is not significant (t39 = 0.33). Furthermore, over the 2 experiments,
the difference between the prefrontal and parietal effects is significant
(t39 = 2.19, P < 0.05).
Exploratory Imaging Analysis
Exploratory analyses were performed as in Experiment 1, using mixed-
effects ANOVA models and focusing on the delay-by-scan and group-
by-scan interactions in order to reveal the brain areas showing BOLD
response profiles differentially affected by the experimental manipu-
lations. Table 2 summarizes the regions shown to have significant
effects. The delay-by-scan analysis found two large regions containing
the predefined parietal and predefined prefrontal. Raising the signifi-
cance level to P < 0.01 identified 2 subregions almost identical in
location to the subregions identified by the same analysis in Experiment
1. Besides the predefined regions, this delay-by-scan analysis found
a number of common areas in the two experiments that display similar
responses. These are as follows
1. A large region involving the supplementary motor area and anterior
cingulate cortex that responds more strongly in the delay condition
than the immediate condition.
2. A right supramarginal region that displays a negative response.
3. A posterior cingulate region. However, the direction of the response
is different in the two experiments -- positive in Experiment 1 and
negative in Experiment 2.
4. A right anterior prefrontal region that only responds in the delay
condition.
5. Right and left occipital regions that display negative responses.
The group-by-scan interaction failed to find any regions overlapping
the predefined. In general, all the regions found with the group-by-scan
interaction were lower in the brain than the predefined regions. The
only region that overlaps between these experiments is the large visual
region in the occipital lobe (b7 and b8 in that Experiment 1 and b3 in
Experiment 2), where a much stronger response is obtained in the
Generated condition. This happens during the encoding period and
presumably reflects visual examination of the stimulus trying to solve the
puzzle. There is no difference in activity during the recall phase in this
occipital region.Theoccipital area that displays thispattern ismuch larger
than the occipital areas that are revealed in the delay-by-scan analysis.
Information-Processing Model
Anderson (2005) describes a general methodology, based on the ACT-R
theory (Anderson et al. 2004), for taking the processing time estimates
from an information-processing model and mapping these onto pre-
dictions for the BOLD response in various brain regions. An ACT-R
implementation of the information-processing model described in Sohn
et al. (2005) can provide the processing times to predict the BOLD
responses in the parietal and prefrontal regions for the current experi-
ments. Figure 6 illustrates the major steps in the model (an ACT-Rmodel
implementing these steps is available from the model’s link at the ACT-R
website (http://act-r.psy.cmu.edu) under the title of this paper) for each
of the 4 major conditions of these experiments and can be put into
correspondence with the experimental events illustrated in Figure 1.
The sequence of events begins with the encoding of fixation and
continues through to the generation of a response. Although we have
illustrated activity in the visual (blue) and manual (yellow) modules,
the predictions depend on the imaginal (green) module which isFigure 5. fMRI results from Experiment 2: (a) BOLD response in the predefinedposterior parietal region; (b) BOLD response in the predefined prefrontal region.
Figure 4. Behavioral results from Experiment 2: (a) Probability of correct recall; (b)Latency of correct recall.
Cerebral Cortex April 2008, V 18 N 4 909
Dow
nloaded from https://academ
ic.oup.com/cercor/article/18/4/904/282477 by guest on 24 July 2022

responsible for creating problem representations and declarative (red)
module which responds to retrieval operations.
Upon the presentation of the study material, the model spends 200 ms
either encoding the pair (Paired condition) or the fragment (Generated
condition). In the Paired condition, the participant is instructed to
retrieve an elaboration to help remember the pair, whereas in the
Generated condition, they have to retrieve a phrase that completes the
fragment. As a simplifying assumption, we assumed that these 2 retrieval
operations took the same time. Thus, the only difference during study
between the 2 conditions is that there is an extra imaginal operation
required in the Generated condition to extract the position of the letter
from the retrieved information.
In the immediate conditions, recall performance is very similar for the
Paired and Generated conditions. In both cases the prompt is encoded,
then a retrieval operation returns either the pair that has just been
studied (Paired condition) or the position (Generated condition), then
the result of the retrieval is represented, and finally the response is
generated. The time to retrieve the pair or position is relatively brief
because this material has just been encoded and is still active. However,
at delay, the elaborations and phrases used in the study phase are more
active (as we will detail further below) and so it is more rapid and
successful to retrieve these rather than the pair or position. In the
Generated condition, after the retrieval, an extra imaginal operation is
required to extract the letter position from the phrase.
Table 3 presents a summary of the times for all the stages in Figure 6.
Figure 7 compares the predicted times from the model for the test
phase with the actual observed times.
The timing of all the operations, except the retrieval operations come
from the default values in the ACT-R architecture. The retrieval times, T,
are determined by the activation of the memories, A, according to the
ACT-R retrieval equation:
T = F e–A;
where F is the latency scale parameter and was estimated at 270 ms for
these experiments. The activations themselves are determined by the
time, t because they were rehearsed according to the formula:
A = lnðB + t– 0:5Þ;
where B is a prior activation boost, which is 0 in the case of new
memories and was estimated to be 0.1 (a second estimated parameter)
in the case of the prior elaboration (Paired condition) or phrase
(Generated condition). The 0.5 in this equation is the default decay
rate assumed in the ACT-R architecture. Thus, the activation of the
elaboration or phrase during study is just ln(0.1) and its latency for
retrieval will be 2.7 s. At the time of test, the activation of these elements
will be approximately ln(0.1 + (3 + d)– 0.5), where d is the delay between
study and test. The activation of the specific memory will be approx-
imately ln(d–0.5). Note in Figure 6 that the retrieval of the elaboration or
phrase completes approximately 3 s before the end of the study. In ACT-
R, this results in the delay of the specific memory being approximately 3
s less than the delay for prior memory. This accounts for the d in the
expression for the specific and the 3 + d in the expression for the prior
memories. In an immediate test, the specific memory will be more active
reflecting the shorter interval between the end of the study and
beginning of recall. However, in a delayed test the long-term elaboration
or phrase will be more active than the specific memory reflecting the
additional 0.1 to reflect prior experience.
The 2 parameters estimated to fit the latency data were the latency
scale of 270 ms and the prior strength of 0.1 for elaborations and
phrases. With these parameters, we could determine the timing and
duration of all the retrieval and imaginal operations. With the timing
parameters set to fit the behavioral latencies, a BOLD response that
reflects encoding times can be calculated for the parietal region and
a BOLD response that reflects the retrieval times can be calculated for
the prefrontal region. For a particular region, let D(x) be a 0--1 demand
function reflecting when a region is active according to Figure 6. Then
one can then get a predicted BOLD response, B(t), for a region by
convolving the demand functions with a standard hemodynamic
function H(t):
Bðt Þ = M
Z t
0
DðxÞH ðt –xÞdx :
In past research, we have used a standard gamma function for the
hemodynamic function, as is the custom (e.g., Boyton et al. 1996; Cohen
1997; Dale and Buckner 1997; Friston et al. 1998; Glover 1999):
H ðt Þ = t
s
� �be
– t=s;
where s is the time scale and b is exponent. However, the character-
ization of the BOLD response is conceptually cleaner if the simple
gamma function is replaced with the gamma function from statistics,
which has the convenient property that it always integrates to 1:
Table 2Results of Exploratory Analyses of Experiment 2 (Except were noted P\ 0.05)
Region of Interest Brodman Areas Voxel Count Stereotaxic Coordinates (mm)
x y z Condition 1 Condition 2
Delay-by-scan Immed. DelaySupplementary Motor, Anterior Cingulate Cortex 6, 8, 24, 32 519 1 19 43 0.20% 1.30%L. Posterior Parietal 7, 40 664 �40 �47 46 0.67% 1.49%L. Post Parietal (P\ 0.01) 7, 40 150 �26 �59 45 0.95% 1.94%
L. Motor and Prefrontal, Thalamus 9, 10, 45, 46 1834 �27 9 15 0.80% 1.70%L Prefrontal (P\ 0.01) 9, 46 229 �45 12 31 1.72% 3.05%
R. Prefrontal 9 65 47 7 34 �1.88% �0.97%R. Posterior Parietal 7, 39 43 34 �63 44 �1.01% �0.45%R. Prefrontal and Insula 13, 45 262 37 21 7 �0.31% 0.65%R. Supramarginal Gyrus 40 137 50 �50 28 �1.05% �1.21%R. Anterior Prefrontal 10 78 38 51 9 �0.79% 0.63%Posterior Cingulate 23, 31 62 1 �28 27 �0.92% �0.07%L. Occipital Gyrus 18, 19 90 �30 �88 3 �3.73% �3.29%R. Occipital Gyrus 18, 19 49 29 �91 4 �5.53% �4.42%Red Nucleus 45 1 �19 �8 0.48% 0.71%L. Fusiform Gyrus 39 60 �44 �54 �4 �0.40% �0.01%
Group-by-Scan Paired GeneratedPolar Frontal 9, 10 42 �5 54 18 1.70% �0.39%L. M. Temporal Gyrus 39 41 �45 �65 28 1.25% �0.57%L and R Occipital 17, 18, 19 2112 1 �82 9 1.16% 2.31%R. S. Temporal Gyrus 13 103 51 �47 18 �0.41% �3.04%Anterior Cingulate 32 49 �3 45 �6 2.11% 0.58%L. Thalamus — 25 �17 �28 2 0.39% 0.99%
Note: L, left; R, right; M, medial; S, superior
910 Role of Cortices in Associative Learning d Anderson et al.
Dow
nloaded from https://academ
ic.oup.com/cercor/article/18/4/904/282477 by guest on 24 July 2022

H ðt Þ = ta –1
e– t=s
saCðaÞ ;
whereC is the gamma function (the factorial is a special case: for integer
a, C(a + 1) = a!).
Themodeof the statistical gamma function is (a –1)3 s, themean isa3
s, and its variance is a 3 s2. One can convert from the first formulation to
the second by setting b = a – 1 and changing the magnitude scale. The
statistics formulation makes magnitude values, M, comparable across
regions that might vary in their exponent and time scale.
To focus on the interaction between the study conditions of Paired
and Generated and the manipulation of immediate versus delay, we
averaged over the 2 experiments and fit the model to the average data.
Figure 8 offers a comparison of model and average data.
To fit the data, we needed to estimate the parameters governing the
hemodynamic function for parietal and prefrontal regions. These
parameters are
M, the magnitude of activity in a region,
a, the shape of the hemodynamic function,
s, the time scale.
Constraining the shape parameter to be an integer, the best-fitting
parameters for the parietal region were M = 9.89%, a = 4, s = 1.79 s and
for the prefrontal region the values were M = 1.61%, a = 3, s = 2.95 s.
Each condition for each region has 13 free data points (the first is
constrained to equal 0 as baseline). Thus, there are 13 free scans 3 2
regions 3 4 conditions for 104 df. Subtracting the 6 parameters
estimated for the hemodynamic function means that the fit to the
data has 98 df per experiment.
The significance of the deviations between data and prediction can be
measured by a chi-square statistic
v2 =+
iðXi – �XiÞ2
s �X2 ;
where the numerator is the sum of the squared deviations between the
predictions and the mean values observed and the denominator gives
the variance of the mean estimated from the interaction between
condition and participants. The chi-square value was 77.43, which is not
a significant deviation between prediction and observation. Therefore,
the fits to these experiments are acceptable.
To test how much evidence the model fits provided for the proposed
interpretations of the prefrontal and parietal regions, we tried crossing
the associations and using the imaginal activity to predict the prefrontal
region and the declarative activity to predict the parietal region. Again 6
parameters were estimated for each experiment. The chi-square value
was 344.44, which indicates highly significant deviations in the
predictions.
While we have fit the model averaging together the short and long
delay, we noted that there was a difference in the prefrontal response to
these 2 delays. Figure 9 shows the predictions of the model to the
prefrontal data with short and long delay separated, using the same
parameters as Figure 8.
Conclusions
The predictions given at the beginning of the paper were
made in advance of the detailed model in Figure 6. It is worth
Table 3Time Parameters for Model in Figure 6
PairedNoDelay
PairedShortDelay
PairedLongDelay
GeneratedNoDelay
GeneratedShortDelay
GeneratedLongDelay
StudyVisual Encoding 200 ms 200 ms 200 ms 200 ms 200 ms 200 msRepresent Encoding 250 ms 250 ms 250 ms 250 ms 250 ms 250 msRetrieval 2700 ms 2700 ms 2700 ms 2700 ms 2700 ms 2700 msPosition Extraction 250 ms 250 ms 250 ms
TestVisual Encoding 200 ms 200 ms 200 ms 200 ms 200 ms 200 msRetrieval 470 ms 1200 ms 1540 ms 470 ms 1200 ms 1540 msRepresent Retrieval 250 ms 250 ms 250 ms 250 ms 250 ms 250 msExtract Response 250 ms 250 msMotor 450 ms 450 ms 450 ms 450 ms 450 ms 450 ms
Note: Immediate retrieval times are averaged over the 2-s delay in Experiment 1 and 6-s delay in
Experiment 2. The Delay retrieval times are also averaged over short and long delays. Visual,
Representational, and Manual actions include a 50-ms production.
Figure 7. Predictions of the model for latencies and observed latencies, averagingover the 2 experiments.
Figure 6. A representation of the sequence of module activity in different conditionsof the experiment. Blue denotes activity in the visual module, green in the imaginal(parietal) module, red in the declarative retrieval (prefrontal) module, and yellow in themanual module. The retrieval boxes and delays between activity are not drawn toscale.
Cerebral Cortex April 2008, V 18 N 4 911
Dow
nloaded from https://academ
ic.oup.com/cercor/article/18/4/904/282477 by guest on 24 July 2022

revisiting these predictions in light of the average results and
model predictions in Figure 8.
1. In the parietal region, during the period of study and test,
there will be a stronger response for the Generated
condition than the Paired condition. This was clearly
confirmed and was produced in the model by the extra
encoding times in the Generated condition to extract the
position during study and test when there was a delay (see
Fig. 6).
2. In the prefrontal region, during the period of study and test,
there will be a stronger or equal response for the Paired
condition. The model in Figure 6 predicts no difference and
Figure 8 confirms that there was virtually no difference.
3. In the prefrontal region, only during the period of test, there
will be a stronger response in the delay condition than the
immediate condition. This was confirmed and produced in
the model because of the longer retrieval times.
4. In the parietal region, there should be no difference
between the immediate and delay condition. This prediction
was not confirmed but the model actually produced a delay
effect in the parietal region for the Generated condition.
This is because of the extra encoding operation to extract
the position in the delay condition.
One value of an explicit model is that it can reveal errors in
predictions based on an informal understanding of a theory. This
is the case for prediction 4 above. We failed to recognize that
the time to extract the position in the delay condition would
produce a greater parietal response in the Generated delay
condition. The model predicts no difference between the late
parietal activation in 3 conditions—Generated immediate,
Paired immediate, and Paired delay and that these should all
show less activation than the late parietal activation in the
Generated delay condition. Figure 8(a) appears to support this
prediction. This implies a significant t-value comparing late
parietal activity in the Generated delay condition with late
parietal activity in any other condition. Over the 2 experiments,
there were 6 such t-tests and all were significant. It also predicts
no significant t-tests comparing late parietal activity in the other
3 conditions. Over the 2 experiments, there were 6 such t-tests
and none were significant, although as noted earlier if one
combines the 2 experiments there is greater parietal activity in
the delay Paired condition than the immediate Paired condition.
More generally, note that this study once again replicates the
finding of both parietal and prefrontal involvement in a memory
task. As is particularly apparent in Experiment 2 with a longer
delay between study and test, both regions respond to the
memory structure of the experiment (see Fig. 5). The goal of
this research was to try to separate out the degree to which the
regions respond to the representational versus the mnemonic
demands of the task. These experiments and the accompanying
model support the view that the prefrontal region responds to
the memory demands and the parietal region responds to the
representational demands.
Although the interpretation of the prefrontal region seems
uniformly supported by these experiments, one result does
complicate the interpretation of the parietal region. By com-
bining the 2 experiments, we were able to confirm a weak but
significant retention effect in the parietal region in the Paired
condition. This is an effect not predicted by the model and does
suggest that the parietal region does respond to a manipulation
that we have interpreted as only affecting memory demands.
Perhaps, our predefined parietal region does not uniquely
reflect a single encoding function that we ascribe to it.
However, an alternative interpretation was suggested by Bunge
et al. (2002) in another effort to separate parietal from pre-
frontal function in a different task. They found a parietal region
with nearly the same coordinates as ours. This region appeared
to respond to a representational function that, they too, had
assigned to this region, but also a selection function that they
Figure 9. Response in the prefrontal region for each delay condition. Dotted linesconnect the data points and solid lines are the predictions of the model.
Figure 8. Predictions of the information-processing model for parietal and prefrontalregions of interest for the 2 experiments. Dotted lines connect the data points and solidlines are the predictions of the model.
912 Role of Cortices in Associative Learning d Anderson et al.
Dow
nloaded from https://academ
ic.oup.com/cercor/article/18/4/904/282477 by guest on 24 July 2022

had assigned to prefrontal regions. They proposed that the
parietal region needed to represent the choices longer in
conditions where selection took longer. Similarly, it may be
the case that there is some increased demand in our experiment
for re-representation of the stimulus during periods of longer
retrieval. This might create the weak but significant effect of
delay in the parietal region that we found in the Paired
condition.
The results of these experiments are relevant to a number of
other research efforts concerned with the function of the
prefrontal and parietal cortices. With respect to the prefrontal,
there has been a considerable amount of research suggesting
that a region very close to our predefined prefrontal region is
activated in conditions that require difficult selections among
retrieved information (e.g., Thompson-Schill et al. 1997; Moss
et al. 2005). On the other hand, it has been argued that these
effects are due to greater retrieval demands in the more difficult
conditions (Wagner et al. 2001; Martin and Cheng 2006). It has
also been argued that a more anterior prefrontal region is
sensitive to retrieval while this region is sensitive to selection
demands (Badre et al. 2005; Gold et al. 2006). Recently,
Thompson-Schill and Botvinick (2006) suggest that the distinc-
tion between retrieval and selection may be a false dichotomy,
and certainly, it is not a distinction that has any meaning in the
ACT-R architecture. What drives the magnitude of response is
the amount of time that this region has to hold the cues for
retrieval and this time will increase when selection is hard. That
being said, the effect of delay on activation in this region does
seem difficult to accommodate in views that ascribe a distinct
role to selection different from retrieval. The selection demands
should remain constant with delay; the only effect of delay
should be to make the information less available for retrieval.
It is clear from the literature that different prefrontal regions
are involved in retrieval and that they are responsive to
somewhat different factors. Our experiments did not find an
anterior prefrontal region corresponding to the one found by
Badre et al. and Gold et al. (the exploratory analysis did find
a right anterior prefrontal region responsive to delay, but the
other research has found left regions), and therefore, these
experiments do not contribute to an understanding of the
difference between this region and the one found in this
experiment. Going beyond the results of this experiment or
any other specific experiment, however, one can ask how the
ACT-R theory would deal with evidence for functional hetero-
geneity along the inferior frontal gyrus during retrieval. No one
has yet successfully articulated the functional differences
among prefrontal regions in terms of the ACT-R architecture,
and so this remains a challenge for further development of the
theory. The ACT-R theory has evolved in response to brain
imaging data (Anderson 2005), separating out control functions
(ascribed to the anterior cingulate cortex) from representa-
tional functions (ascribed to the parietal cortex). Originally,
both functions were ascribed to a single module in the theory.
We might imagine a similar development in declarative memory
functions.
In their review of parietal contributions to memory, Wagner
et al. (2005) note that most of the fMRI data come from
recognition and source recognition paradigms. Wagner et al.
identify 2 regions that consistently show an old--new effect,
a precuneus regions and a region in the lateral parietal cortex.
Curiously, our parietal region lies intermediate between these 2
regions. Wagner et al. identify as a question for future research
whether paradigms like cued recall will provide additional
evidence for a parietal role in memory. Our research has
indicated that our parietal region is at most weakly affected
by delay in a standard paired associate condition. Sohn et al.
(2005) also found a weak effect of fan that was not significant. It
would seem that the prefrontal cortex is much more sensitive
to memory manipulations in associative tasks.
Funding
National Institute of Mental Health (MH068243 to J.R.A.).
Notes
We would like to thank Jared Danker, Jennifer Ferris, Myeong-Ho, Sohn,
and Anthony Wagner for their comments on the paper. Conflicts of
Interest: None declared.
Address correspondence to email: [email protected].
References
Alivisatos B, Petrides M. 1997. Functional activation of the human brain
during mental rotation. Neuropsychologia. 35:111--118.
Anderson JR. 2005. Human symbol manipulation within an integrated
cognitive architecture. Cogn Sci. 29:313--342.
Anderson JR, Bothell D, ByrneMD, Douglass S, Lebiere C, Qin Y. 2004. An
integrated theory of mind. Psychol Rev. 111:1036--1060.
Anderson JR, Qin Y, Stenger VA, Carter CS. 2004. The relationship of
three cortical regions to an information-processing model. J Cogn
Neurosci. 16:637--653.
Anderson JR, Qin Y, Yung K-J, Carter CS. 2007. Information-processing
modules and their relative modality specificity. Cogn Psychol.
54:185--217.
Badre D, Poldrack RA, Pare-Blagoev EJ, Insler RZ, Wagner AD. 2005.
Dissociable controlled retrieval and generalized selection mecha-
nisms in ventrolateral prefrontal cortex. Neuron. 47:907--918.
Braver TS, Cohen JD, Nystrom LE, Jonides J, Smith E, Noll DC. 1997. A
parametric study of prefrontal cortex involvement in human
working memory. Neuroimage. 5:49--62.
Buckner RL, KelleyWM, Petersen SE. 1999. Frontal cortex contributes to
human memory formation. Nat Neurosci. 2:311--314.
Buckner RL, Wheeler ME. 2001. The cognitive neuroscience of
remembering. Nat Rev Neurosci. 2:624--634.
Bunge SA, Hazeltine E, Scanlon MD, Rosen AC, Gabrieli JDE. 2002.
Dissociable contributions of prefrontal and parietal cortices to
response selection. Neuroimage. 17:1562--1571.
Cabeza R, Dolcos F, Graham R, Nyberg L. 2002. Similarities and
differences in the neural correlates of episodic memory retrieval
and working memory. Neuroimage. 16:317--330.
Cabeza R, Dolcos F, Prince SE, Rice HJ, Weissman DH, Nyberg L. 2003.
Attention-related activity during episodic memory retrieval: a cross-
function fMRI study. Neuropsychologia. 41:390--399.
Carpenter PA, Just MA, Keller TA, Eddy W, Thulborn K. 1999. Graded
function activation in the visuospatial system with the amount of
task demand. J Cogn Neurosci. 11:9--24.
Clark D, Wagner AD. 2003. Assembling and encoding word representa-
tions: fMRI subsequent memory effects implicate a role for phono-
logical control. Neuropsychologia. 41:304--317.
Cohen NJ, Eichenbaum HE. 1993. Memory, amnesia, and the hippocam-
pal system. Cambridge (MA): MIT Press.
Danker JF, Anderson JR. 2007. The roles of prefrontal and posterior
parietal cortex in algebra problem solving: a case of using cognitive-
modeling to inform neuroimaging data. Neuroimage. 35:1365--1377.
Davachi L, Maril A, Wagner AD. 2001. When keeping in mind supports
later bringing to mind: neural markers of phonological rehearsal
predict subsequent remembering. J Cogn Neurosci. 13:1059--1070.
Dehaene S, Spelke E, Pinel P, Stanescu R, Tsivkin S. 1999. Sources of
mathematical thinking: behavioral and brain-imaging evidence.
Science. 284:970--974.
Dobbins IG, Wagner AD. 2005. Domain-general and domain-sensitive
prefrontal mechanisms for recollecting events and detecting nov-
elty. Cereb Cortex. 15:1768--1778.
Cerebral Cortex April 2008, V 18 N 4 913
Dow
nloaded from https://academ
ic.oup.com/cercor/article/18/4/904/282477 by guest on 24 July 2022

Dosenbach NUF, Visscher KM, Palmer ED, Miezin FM, Wenger KK, Kang
HC, Burgund ED, Grimes AL, Schlaggar BL, Petersen SE. 2006. A core
system for the implementation of task sets. Neuron. 50:799--812.
Fletcher PC, Henson RNA. 2001. Frontal lobes and human memory:
insights from functional neuroimaging. Brain. 124:849--881.
Forman SD, Cohen JD, Fitzgerald M, EddyWF, MintunMA, Noll DC. 1995.
Improved assessment of significant activation in functional magnetic
resonance imaging fMRI : use of a cluster-size threshold. Magn Reson
Med. 33:636--647.
Gold BT, Balota DA, Jones SJ, Powell DK, Smith CD, Andersen AH. 2006.
Dissociation of automatic and strategic lexical semantics: fMRI
evidence for differing roles of multiple frontotemporal regions.
J Neurosci. 26:6523--6532.
Habib R, Lepage M. 1999. Novelty assessment in the brain. In: Tulving E,
editor. Memory, consciousness, and the brain. Philadelphia (PA):
Psychology Press. p. 265--277.
Heil M. 2002. Early career award: the functional significance of ERP
effects during mental rotation. Psychophysiology. 39:535--545.
Kohler S, Paus T, Buckner RL, Milner B. 2004. Effects of left inferior
prefrontal stimulation on episodic memory formation: Two-stage
fMRI-rTMS study. J Cog Neurosci. 16:178--188.
Lepage M, Ghaffar O, Nyberg L, Tulving E. 2000. Prefrontal cortex and
episodic memory retrieval mode. Proc Natl Acad Sci USA.
97:506--511.
Martin RC, Cheng Y. 2006. Selection demands versus association
strength in the verb generation task. Psychon Bull Rev. 13:396--401.
Moss HE, Fletcher PC, Abdallah S, Pilgrim LK, Acres K, Bright P, Tyler LK.
2005. Selecting among competing alternatives: selection and
controlled retrieval in the left prefrontal cortex. Cereb Cortex.
15:1723--1735.
Owen A, Laird A, Bullmore E. 2005. N-back working memory paradigm:
a meta-analysis of normative functional neuroimaging studies. Hum
Brain Mapp. 25:46--59.
Reichle ED, Carpenter PA, Just MA. 2000. The neural basis of strategy and
skill in sentence-picture verification. Cogn Psychol. 40:261--295.
Richter W, Ugurbil K, Georgopoulos A, Kim S-G. 1997. Time-resolved
fMRI of mental rotation. Neuroreport. 8:3697--3702.
Rugg MD, Olten IJ, Henson RN. 2002. The neural basis of episodic
memory: evidence from functional neuroimaging. Philos Trans R Soc
Lond B Biol Sci. 357:1097--1110.
Schneider W, Eschman A, Zuccolotto A. 2002. E-prime user’s guide.
Pittsburgh (PA): Psychology Software Tools Inc.
Shannon BJ, Buckner RL. 2004. Functional-anatomic correlates of
memory retrieval that suggest nontraditional processing roles for
multiple distinct regions within posterior parietal cortex. J Neurosci.
24:10084--10092.
Shimamura AP. 1995. Memory and frontal lobe function. In: Gazzaniga
MS, editor. The cognitive neurosciences. Cambridge (MA): MIT
Press. p. 803--813.
Snitz BE, MacDonald A 3rd, Cohen JD, Cho RY, Becker T, Carter CS.
2005. Lateral and medial hypofrontality in first-episode schizophre-
nia: functional activity in a medication-naıve state and effects of
short-term atypical antipsychotic treatment. Am J Psychiatry.
162:2322--2329.
Sohn M-H, Goode A, Koedinger KR, Stenger VA, Carter CS, Anderson JR.
2004. Behavioral equivalence does not necessarily imply neural
equivalence: evidence in mathematical problem solving. Nat
Neurosci. 7:1193--1194.
Sohn M-H, Goode A, Stenger VA, Carter CS, Anderson JR. 2003.
Competition and representation during memory retrieval: roles of
the prefrontal cortex and the posterior parietal cortex. Proc Natl
Acad Sci USA. 100:7412--7417.
Sohn M-H, Goode A, Stenger VA, Jung K-J, Carter CS, Anderson JR. 2005.
An information-processing model of three cortical regions: evidence
in episodic memory retrieval. Neuroimage. 25:21--33.
Squire LR. 1992. Memory and the hippocampus: a synthesis from
findings with rats, monkeys, and humans. Psychol Rev. 99:195--231.
Stuss DT, Benson DF. 1984. Neuropsychological studies of the frontal
lobes. Psychol Bull. 95:3--28.
Thompson-Schill SL. 2003. Neuroimaging studies of semantic memory:
inferring ‘‘how’’ from ‘‘where.’’ Neuropsychologia. 41:280--292.
Thompson-Schill SL, Botvinick MM. 2006. Resolving conflict: a response
to Martin and Cheng 2006. Psychon Bull Rev. 13:402--408.
Thompson-Schill SL, D’Esposito M, Aguirre GK, Farah MJ. 1997. Role
of left prefrontal cortex in retrieval of semantic knowledge: a
re-evaluation. Proc Natl Acad Sci USA. 94:14792--14797.
Wagner AD, Maril A, Bjork RA, Schacter DL. 2001. Prefrontal contribu-
tions to executive control: fMRI evidence for functional distinctions
within lateral prefrontal cortex. Neuroimage. 14:1337--1347.
Wagner AD, Shannon BJ, Kahn I, Buckner RL. 2005. Parietal lobe
contributions to episodic memory retrieval. Trends Cogn Sci.
9:445--453.
Wheeler ME, Buckner RL. 2003. Functional dissociation among compo-
nents of remembering: control, perceived oldness, and content.
J Neurosci. 23:3869--3880.
Woods RP, Grafton ST, Holmes CJ, Cherry SR, Mazziotta JC. 1998.
Automated image registration: I. General methods and intra-
participant, intramodality validation. J Comput Assisted Tomogr.
22:139.
Zacks JM, Ollinger JM, Sheridan MA, Tversky B. 2002. A parametric
study of mental spatial transformation of bodies. Neuroimage. 16:
857--872.
914 Role of Cortices in Associative Learning d Anderson et al.
Dow
nloaded from https://academ
ic.oup.com/cercor/article/18/4/904/282477 by guest on 24 July 2022
Copyright © 2022 FDOKUMEN