Secondary osteon size and collagen/lamellar organization (в ...
13
Secondary osteon size and collagen/lamellar organization (‘‘osteon morphotypes’’) are not coupled, but potentially adapt independently for local strain mode or magnitude John G. Skedros ⇑ , Kendra E. Keenan, Tyler J. Williams, Casey J. Kiser Bone and Joint Research Laboratory, Department of Veterans Affairs Medical Center, Salt Lake City, UT, USA The University of Utah Department of Orthopedic Surgery, Salt Lake City, UT, USA article info Article history: Received 25 June 2012 Received in revised form 27 September 2012 Accepted 8 October 2012 Available online 1 November 2012 Keywords: Osteon Collagen orientation Strain mode Strain magnitude Bone adaptation Chimpanzee femur Human femur Deer calcaneus Equine calcaneus Equine radius Sheep radius abstract In bone, matrix slippage that occurs at cement lines of secondary osteons during loading is an important toughening mechanism. Toughness can also be enhanced by modifications in osteon cross-sectional size (diameter) for specific load environments; for example, smaller osteons in more highly strained ‘‘com- pression’’ regions vs. larger osteons in less strained ‘‘tension’’ regions. Additional osteon characteristics that enhance toughness are distinctive variations in collagen/lamellar organization (i.e., ‘‘osteon morpho- types’’). Interactions might exist between osteon diameter and morphotype that represent adaptations for resisting deleterious shear stresses that occur at the cement line. This may be why osteons often have a peripheral ring (or ‘‘hoop’’) of highly oblique/transverse collagen. We hypothesized that well devel- oped/distinct ‘‘hoops’’ are compensatory adaptations in cases where increased osteon diameter is mechanically advantageous (e.g., larger osteons in ‘‘tension’’ regions would have well developed/distinct ‘‘hoops’’ in order to resist deleterious consequences of co-existing localized shear stresses). We tested this hypothesis by determining if there are correlations between osteon diameters and strongly hooped mor- photypes in ‘‘tension’’, ‘‘compression’’, and ‘‘neutral axis’’ regions of femora (chimpanzees, humans), radii (horse, sheep) and calcanei (horse, deer). The results reject the hypothesis—larger osteons are not asso- ciated with well developed/distinct ‘‘hoops’’, even in ‘‘tension regions’’ where the effect was expected to be obvious. Although osteon diameter and morphotype are not coupled, osteon diameters seem to be associated with increased strain magnitudes in some cases, but this is inconsistent. By contrast, osteon morphotypes are more strongly correlated with the distribution of tension and compression. Published by Elsevier Inc. 1. Introduction One beneficial result of remodeling of compact (cortical) bone with secondary osteons (Haversian systems) in non-elderly indi- viduals is that tissue mechanical properties, especially fatigue resistance and toughness, 1 can be improved by the introduction of osteonal interfaces, including cement lines and interlamellar seams (Launey et al., 2010a; Nalla et al., 2005a,b; Skedros et al., 2005). In this context, the mechanical benefits of increased concentrations of secondary osteons have been compared to the fibers in a fiber-rein- forced ceramic matrix composite material (Doblaré et al., 2004; Hogan, 1992; Martin et al., 1998; Mohsin et al., 2006; Najafi et al., 2009; Yeni et al., 1997). An important observation is the finding that the population densities of osteons with specific patterns of lamellar and collagen organization are increased in loading environments that are characterized by local prevalence/predominance of a spe- cific strain mode (tension, compression, or shear) (Riggs et al., 1993a; Skedros, 2012; Skedros et al., 2009, 2011a). Hence, in addi- tion to the potential for modifying the presence and complexity of their interfaces (Crescimanno and Stout, 2012; Keenan et al., 2010; Robling and Stout, 1999; Skedros et al., 2007a), matrix organization of osteons can be modified in ways that are mechanically adaptive. These specific osteon ‘‘types’’ have been described as ‘‘osteon morphotypes’’; this characterization is largely based on the 1047-8477/$ - see front matter Published by Elsevier Inc. http://dx.doi.org/10.1016/j.jsb.2012.10.013 ⇑ Corresponding author. Address: 5323 South Woodrow Street, Suite 200, Salt Lake City, UT 84107, USA. Fax: +1 801 747 1023. E-mail address: [email protected] (J.G. Skedros). 1 Toughness refers to the amount of energy required to fracture a material; the more the overall amount of energy consumed, the ‘tougher’ the material (Zioupos and Currey, 1998). Tough materials resist damage propagation but do not necessarily resist damage formation. Toughness tests typically involve propagating a crack in a controlled direction through a specimen machined into a specific shape for this test. Toughness measurements obtained from these ‘formal’ toughness tests are different from the ‘toughness’ that is often ‘informally’ used (as in this study) to describe the energy absorbed by a specimen during a more conventional failure test. In this case, energy absorption is measured as the area under the stress/strain curve (Turner and Burr, 1993), which is an indirect measure of propagation toughness (Vashishth, 2004). Journal of Structural Biology 181 (2013) 95–107 Contents lists available at SciVerse ScienceDirect Journal of Structural Biology journal homepage: www.elsevier.com/locate/yjsbi
-
Upload
khangminh22 -
Category
Documents
-
view
0 -
download
0
Transcript of Secondary osteon size and collagen/lamellar organization (в ...
Journal of Structural Biology 181 (2013) 95–107
Contents lists available at SciVerse ScienceDirect
Journal of Structural Biology
journal homepage: www.elsevier .com/locate /y jsbi
Secondary osteon size and collagen/lamellar organization (‘‘osteon morphotypes’’)are not coupled, but potentially adapt independently for local strain modeor magnitude
John G. Skedros ⇑, Kendra E. Keenan, Tyler J. Williams, Casey J. KiserBone and Joint Research Laboratory, Department of Veterans Affairs Medical Center, Salt Lake City, UT, USAThe University of Utah Department of Orthopedic Surgery, Salt Lake City, UT, USA
a r t i c l e i n f o
Article history:Received 25 June 2012Received in revised form 27 September 2012Accepted 8 October 2012Available online 1 November 2012
Keywords:OsteonCollagen orientationStrain modeStrain magnitudeBone adaptationChimpanzee femurHuman femurDeer calcaneusEquine calcaneusEquine radiusSheep radius
1047-8477/$ - see front matter Published by Elsevierhttp://dx.doi.org/10.1016/j.jsb.2012.10.013
⇑ Corresponding author. Address: 5323 South WoLake City, UT 84107, USA. Fax: +1 801 747 1023.
E-mail address: [email protected] (J.G. Sked1 Toughness refers to the amount of energy require
more the overall amount of energy consumed, the ‘tougCurrey, 1998). Tough materials resist damage propagresist damage formation. Toughness tests typically invcontrolled direction through a specimen machined intoToughness measurements obtained from these ‘formalfrom the ‘toughness’ that is often ‘informally’ used (asenergy absorbed by a specimen during a more conventenergy absorption is measured as the area under the sBurr, 1993), which is an indirect measure of propagation
a b s t r a c t
In bone, matrix slippage that occurs at cement lines of secondary osteons during loading is an importanttoughening mechanism. Toughness can also be enhanced by modifications in osteon cross-sectional size(diameter) for specific load environments; for example, smaller osteons in more highly strained ‘‘com-pression’’ regions vs. larger osteons in less strained ‘‘tension’’ regions. Additional osteon characteristicsthat enhance toughness are distinctive variations in collagen/lamellar organization (i.e., ‘‘osteon morpho-types’’). Interactions might exist between osteon diameter and morphotype that represent adaptationsfor resisting deleterious shear stresses that occur at the cement line. This may be why osteons often havea peripheral ring (or ‘‘hoop’’) of highly oblique/transverse collagen. We hypothesized that well devel-oped/distinct ‘‘hoops’’ are compensatory adaptations in cases where increased osteon diameter ismechanically advantageous (e.g., larger osteons in ‘‘tension’’ regions would have well developed/distinct‘‘hoops’’ in order to resist deleterious consequences of co-existing localized shear stresses). We tested thishypothesis by determining if there are correlations between osteon diameters and strongly hooped mor-photypes in ‘‘tension’’, ‘‘compression’’, and ‘‘neutral axis’’ regions of femora (chimpanzees, humans), radii(horse, sheep) and calcanei (horse, deer). The results reject the hypothesis—larger osteons are not asso-ciated with well developed/distinct ‘‘hoops’’, even in ‘‘tension regions’’ where the effect was expected tobe obvious. Although osteon diameter and morphotype are not coupled, osteon diameters seem to beassociated with increased strain magnitudes in some cases, but this is inconsistent. By contrast, osteonmorphotypes are more strongly correlated with the distribution of tension and compression.
Published by Elsevier Inc.
1. Introduction
One beneficial result of remodeling of compact (cortical) bonewith secondary osteons (Haversian systems) in non-elderly indi-viduals is that tissue mechanical properties, especially fatigueresistance and toughness,1 can be improved by the introduction of
Inc.
odrow Street, Suite 200, Salt
ros).d to fracture a material; the
her’ the material (Zioupos andation but do not necessarilyolve propagating a crack in aa specific shape for this test.
’ toughness tests are differentin this study) to describe theional failure test. In this case,tress/strain curve (Turner and
toughness (Vashishth, 2004).
osteonal interfaces, including cement lines and interlamellar seams(Launey et al., 2010a; Nalla et al., 2005a,b; Skedros et al., 2005). Inthis context, the mechanical benefits of increased concentrations ofsecondary osteons have been compared to the fibers in a fiber-rein-forced ceramic matrix composite material (Doblaré et al., 2004;Hogan, 1992; Martin et al., 1998; Mohsin et al., 2006; Najafi et al.,2009; Yeni et al., 1997). An important observation is the finding thatthe population densities of osteons with specific patterns of lamellarand collagen organization are increased in loading environmentsthat are characterized by local prevalence/predominance of a spe-cific strain mode (tension, compression, or shear) (Riggs et al.,1993a; Skedros, 2012; Skedros et al., 2009, 2011a). Hence, in addi-tion to the potential for modifying the presence and complexity oftheir interfaces (Crescimanno and Stout, 2012; Keenan et al., 2010;Robling and Stout, 1999; Skedros et al., 2007a), matrix organizationof osteons can be modified in ways that are mechanically adaptive.These specific osteon ‘‘types’’ have been described as ‘‘osteonmorphotypes’’; this characterization is largely based on the
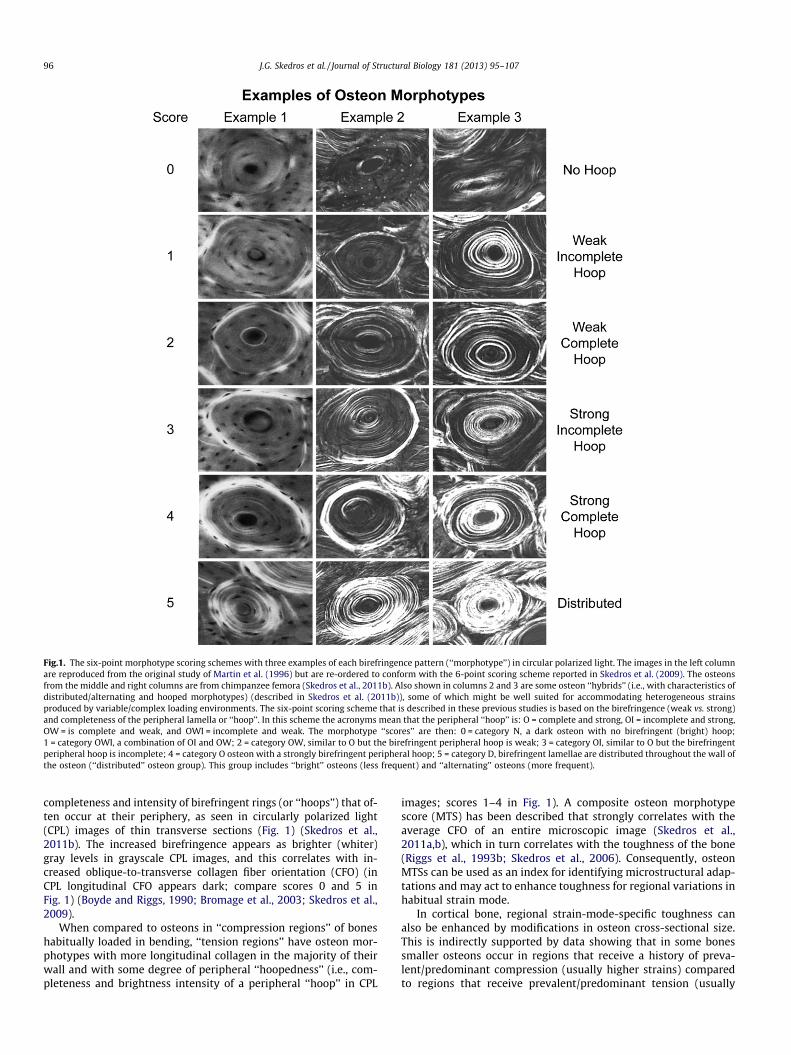
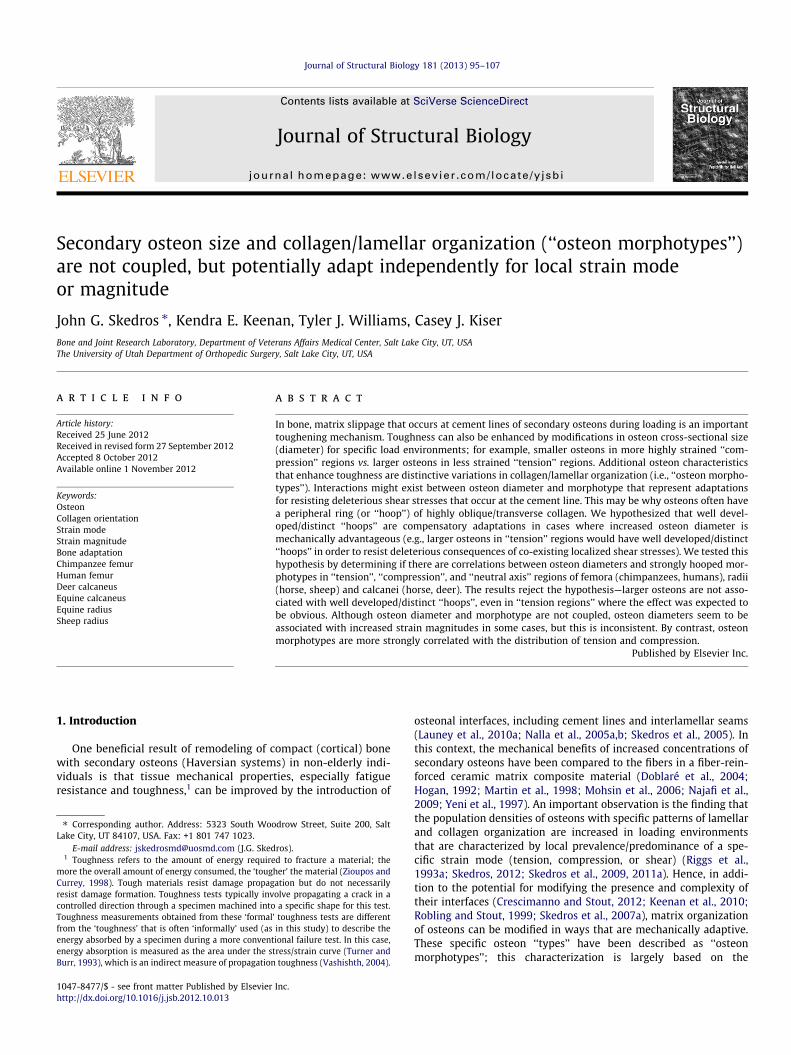
Fig.1. The six-point morphotype scoring schemes with three examples of each birefringence pattern (‘‘morphotype’’) in circular polarized light. The images in the left columnare reproduced from the original study of Martin et al. (1996) but are re-ordered to conform with the 6-point scoring scheme reported in Skedros et al. (2009). The osteonsfrom the middle and right columns are from chimpanzee femora (Skedros et al., 2011b). Also shown in columns 2 and 3 are some osteon ‘‘hybrids’’ (i.e., with characteristics ofdistributed/alternating and hooped morphotypes) (described in Skedros et al. (2011b)), some of which might be well suited for accommodating heterogeneous strainsproduced by variable/complex loading environments. The six-point scoring scheme that is described in these previous studies is based on the birefringence (weak vs. strong)and completeness of the peripheral lamella or ‘‘hoop’’. In this scheme the acronyms mean that the peripheral ‘‘hoop’’ is: O = complete and strong, OI = incomplete and strong,OW = is complete and weak, and OWI = incomplete and weak. The morphotype ‘‘scores’’ are then: 0 = category N, a dark osteon with no birefringent (bright) hoop;1 = category OWI, a combination of OI and OW; 2 = category OW, similar to O but the birefringent peripheral hoop is weak; 3 = category OI, similar to O but the birefringentperipheral hoop is incomplete; 4 = category O osteon with a strongly birefringent peripheral hoop; 5 = category D, birefringent lamellae are distributed throughout the wall ofthe osteon (‘‘distributed’’ osteon group). This group includes ‘‘bright’’ osteons (less frequent) and ‘‘alternating’’ osteons (more frequent).
96 J.G. Skedros et al. / Journal of Structural Biology 181 (2013) 95–107
completeness and intensity of birefringent rings (or ‘‘hoops’’) that of-ten occur at their periphery, as seen in circularly polarized light(CPL) images of thin transverse sections (Fig. 1) (Skedros et al.,2011b). The increased birefringence appears as brighter (whiter)gray levels in grayscale CPL images, and this correlates with in-creased oblique-to-transverse collagen fiber orientation (CFO) (inCPL longitudinal CFO appears dark; compare scores 0 and 5 inFig. 1) (Boyde and Riggs, 1990; Bromage et al., 2003; Skedros et al.,2009).
When compared to osteons in ‘‘compression regions’’ of boneshabitually loaded in bending, ‘‘tension regions’’ have osteon mor-photypes with more longitudinal collagen in the majority of theirwall and with some degree of peripheral ‘‘hoopedness’’ (i.e., com-pleteness and brightness intensity of a peripheral ‘‘hoop’’ in CPL
images; scores 1–4 in Fig. 1). A composite osteon morphotypescore (MTS) has been described that strongly correlates with theaverage CFO of an entire microscopic image (Skedros et al.,2011a,b), which in turn correlates with the toughness of the bone(Riggs et al., 1993b; Skedros et al., 2006). Consequently, osteonMTSs can be used as an index for identifying microstructural adap-tations and may act to enhance toughness for regional variations inhabitual strain mode.
In cortical bone, regional strain-mode-specific toughness canalso be enhanced by modifications in osteon cross-sectional size.This is indirectly supported by data showing that in some bonessmaller osteons occur in regions that receive a history of preva-lent/predominant compression (usually higher strains) comparedto regions that receive prevalent/predominant tension (usually
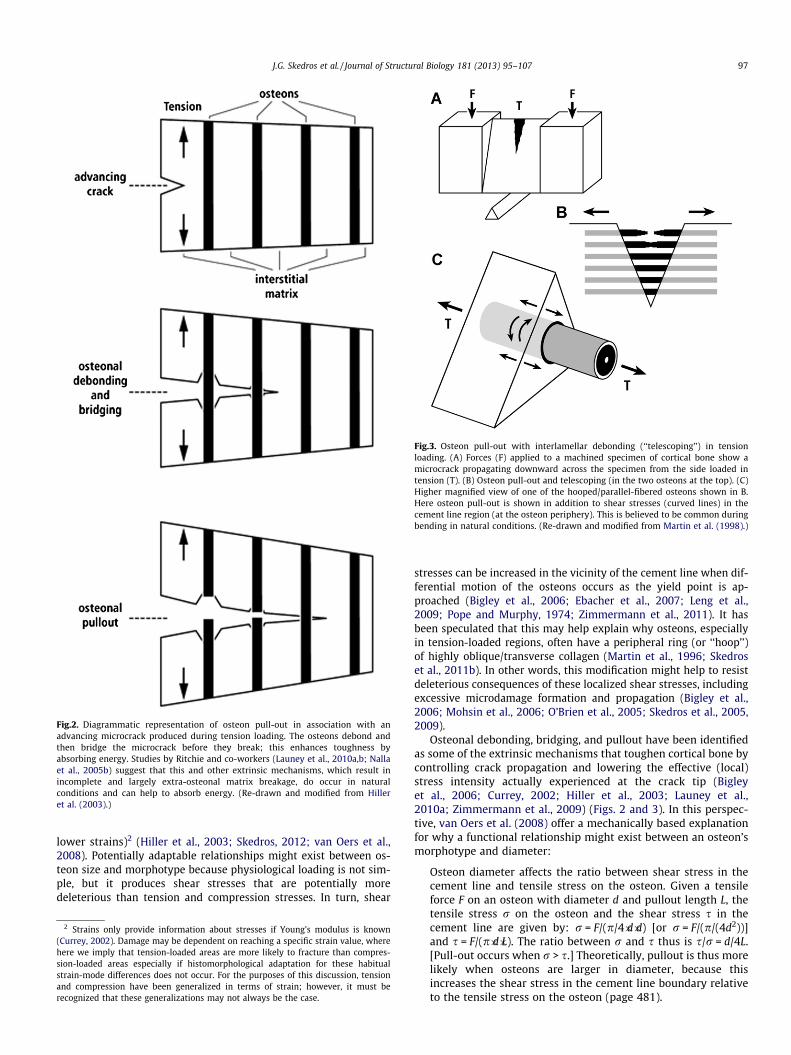
Fig.2. Diagrammatic representation of osteon pull-out in association with anadvancing microcrack produced during tension loading. The osteons debond andthen bridge the microcrack before they break; this enhances toughness byabsorbing energy. Studies by Ritchie and co-workers (Launey et al., 2010a,b; Nallaet al., 2005b) suggest that this and other extrinsic mechanisms, which result inincomplete and largely extra-osteonal matrix breakage, do occur in naturalconditions and can help to absorb energy. (Re-drawn and modified from Hilleret al. (2003).)
Fig.3. Osteon pull-out with interlamellar debonding (‘‘telescoping’’) in tensionloading. (A) Forces (F) applied to a machined specimen of cortical bone show amicrocrack propagating downward across the specimen from the side loaded intension (T). (B) Osteon pull-out and telescoping (in the two osteons at the top). (C)Higher magnified view of one of the hooped/parallel-fibered osteons shown in B.Here osteon pull-out is shown in addition to shear stresses (curved lines) in thecement line region (at the osteon periphery). This is believed to be common duringbending in natural conditions. (Re-drawn and modified from Martin et al. (1998).)
J.G. Skedros et al. / Journal of Structural Biology 181 (2013) 95–107 97
lower strains)2 (Hiller et al., 2003; Skedros, 2012; van Oers et al.,2008). Potentially adaptable relationships might exist between os-teon size and morphotype because physiological loading is not sim-ple, but it produces shear stresses that are potentially moredeleterious than tension and compression stresses. In turn, shear
2 Strains only provide information about stresses if Young’s modulus is known(Currey, 2002). Damage may be dependent on reaching a specific strain value, wherehere we imply that tension-loaded areas are more likely to fracture than compres-sion-loaded areas especially if histomorphological adaptation for these habitualstrain-mode differences does not occur. For the purposes of this discussion, tensionand compression have been generalized in terms of strain; however, it must berecognized that these generalizations may not always be the case.
stresses can be increased in the vicinity of the cement line when dif-ferential motion of the osteons occurs as the yield point is ap-proached (Bigley et al., 2006; Ebacher et al., 2007; Leng et al.,2009; Pope and Murphy, 1974; Zimmermann et al., 2011). It hasbeen speculated that this may help explain why osteons, especiallyin tension-loaded regions, often have a peripheral ring (or ‘‘hoop’’)of highly oblique/transverse collagen (Martin et al., 1996; Skedroset al., 2011b). In other words, this modification might help to resistdeleterious consequences of these localized shear stresses, includingexcessive microdamage formation and propagation (Bigley et al.,2006; Mohsin et al., 2006; O’Brien et al., 2005; Skedros et al., 2005,2009).
Osteonal debonding, bridging, and pullout have been identifiedas some of the extrinsic mechanisms that toughen cortical bone bycontrolling crack propagation and lowering the effective (local)stress intensity actually experienced at the crack tip (Bigleyet al., 2006; Currey, 2002; Hiller et al., 2003; Launey et al.,2010a; Zimmermann et al., 2009) (Figs. 2 and 3). In this perspec-tive, van Oers et al. (2008) offer a mechanically based explanationfor why a functional relationship might exist between an osteon’smorphotype and diameter:
Osteon diameter affects the ratio between shear stress in thecement line and tensile stress on the osteon. Given a tensileforce F on an osteon with diameter d and pullout length L, thetensile stress r on the osteon and the shear stress s in thecement line are given by: r = F/(p/4�d�d) [or r = F/(p/(4d2))]and s = F/(p�d�L). The ratio between r and s thus is s/r = d/4L.[Pull-out occurs when r > s.] Theoretically, pullout is thus morelikely when osteons are larger in diameter, because thisincreases the shear stress in the cement line boundary relativeto the tensile stress on the osteon (page 481).
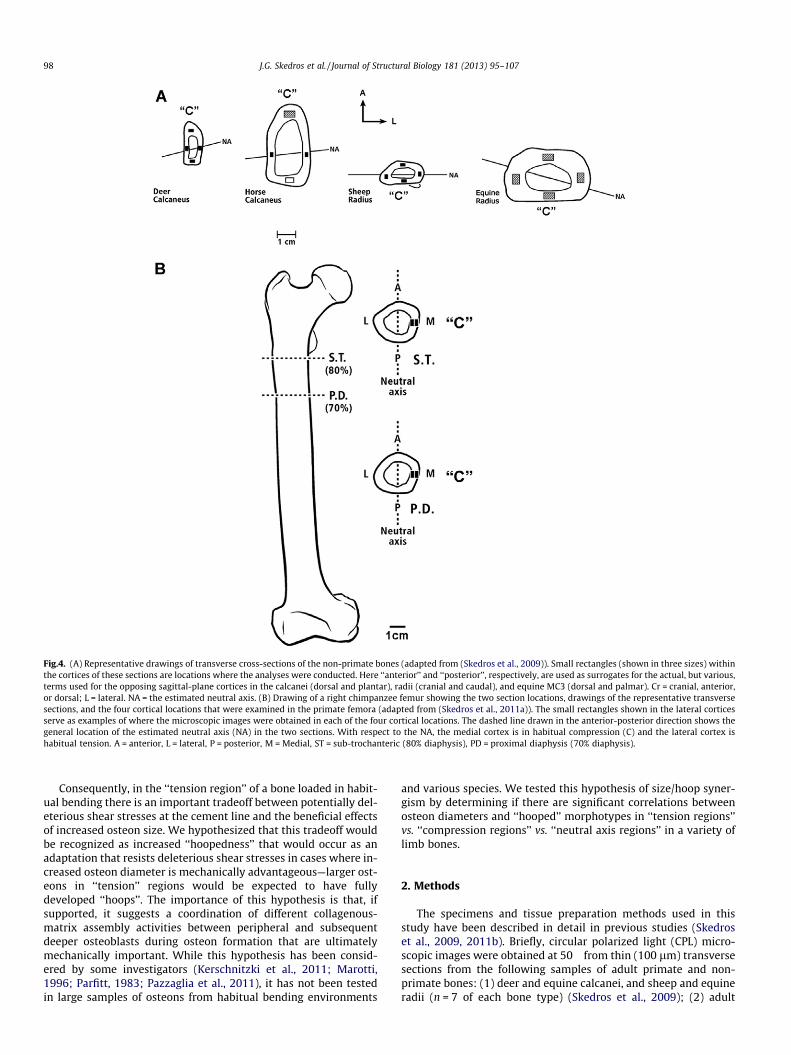
Fig.4. (A) Representative drawings of transverse cross-sections of the non-primate bones (adapted from (Skedros et al., 2009)). Small rectangles (shown in three sizes) withinthe cortices of these sections are locations where the analyses were conducted. Here ‘‘anterior’’ and ‘‘posterior’’, respectively, are used as surrogates for the actual, but various,terms used for the opposing sagittal-plane cortices in the calcanei (dorsal and plantar), radii (cranial and caudal), and equine MC3 (dorsal and palmar). Cr = cranial, anterior,or dorsal; L = lateral. NA = the estimated neutral axis. (B) Drawing of a right chimpanzee femur showing the two section locations, drawings of the representative transversesections, and the four cortical locations that were examined in the primate femora (adapted from (Skedros et al., 2011a)). The small rectangles shown in the lateral corticesserve as examples of where the microscopic images were obtained in each of the four cortical locations. The dashed line drawn in the anterior-posterior direction shows thegeneral location of the estimated neutral axis (NA) in the two sections. With respect to the NA, the medial cortex is in habitual compression (C) and the lateral cortex ishabitual tension. A = anterior, L = lateral, P = posterior, M = Medial, ST = sub-trochanteric (80% diaphysis), PD = proximal diaphysis (70% diaphysis).
98 J.G. Skedros et al. / Journal of Structural Biology 181 (2013) 95–107
Consequently, in the ‘‘tension region’’ of a bone loaded in habit-ual bending there is an important tradeoff between potentially del-eterious shear stresses at the cement line and the beneficial effectsof increased osteon size. We hypothesized that this tradeoff wouldbe recognized as increased ‘‘hoopedness’’ that would occur as anadaptation that resists deleterious shear stresses in cases where in-creased osteon diameter is mechanically advantageous—larger ost-eons in ‘‘tension’’ regions would be expected to have fullydeveloped ‘‘hoops’’. The importance of this hypothesis is that, ifsupported, it suggests a coordination of different collagenous-matrix assembly activities between peripheral and subsequentdeeper osteoblasts during osteon formation that are ultimatelymechanically important. While this hypothesis has been consid-ered by some investigators (Kerschnitzki et al., 2011; Marotti,1996; Parfitt, 1983; Pazzaglia et al., 2011), it has not been testedin large samples of osteons from habitual bending environments
and various species. We tested this hypothesis of size/hoop syner-gism by determining if there are significant correlations betweenosteon diameters and ‘‘hooped’’ morphotypes in ‘‘tension regions’’vs. ‘‘compression regions’’ vs. ‘‘neutral axis regions’’ in a variety oflimb bones.
2. Methods
The specimens and tissue preparation methods used in thisstudy have been described in detail in previous studies (Skedroset al., 2009, 2011b). Briefly, circular polarized light (CPL) micro-scopic images were obtained at 50� from thin (100 lm) transversesections from the following samples of adult primate and non-primate bones: (1) deer and equine calcanei, and sheep and equineradii (n = 7 of each bone type) (Skedros et al., 2009); (2) adult
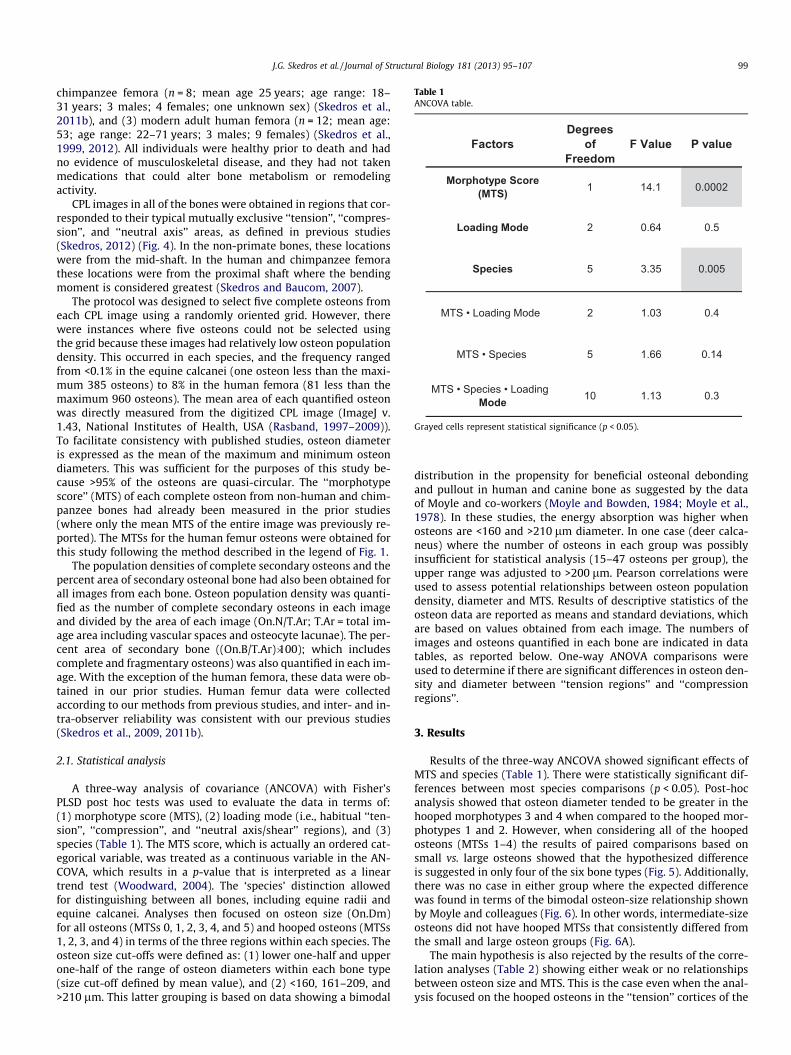
Table 1ANCOVA table.
FactorsDegrees
of Freedom
F Value P value
Morphotype Score (MTS) 1 14.1 0.0002
Loading Mode 2 0.64 0.5
Species 5 3.35 0.005
MTS • Loading Mode 2 1.03 0.4
MTS • Species 5 1.66 0.14
MTS • Species • Loading Mode 10 1.13 0.3
Grayed cells represent statistical significance (p < 0.05).
J.G. Skedros et al. / Journal of Structural Biology 181 (2013) 95–107 99
chimpanzee femora (n = 8; mean age 25 years; age range: 18–31 years; 3 males; 4 females; one unknown sex) (Skedros et al.,2011b), and (3) modern adult human femora (n = 12; mean age:53; age range: 22–71 years; 3 males; 9 females) (Skedros et al.,1999, 2012). All individuals were healthy prior to death and hadno evidence of musculoskeletal disease, and they had not takenmedications that could alter bone metabolism or remodelingactivity.
CPL images in all of the bones were obtained in regions that cor-responded to their typical mutually exclusive ‘‘tension’’, ‘‘compres-sion’’, and ‘‘neutral axis’’ areas, as defined in previous studies(Skedros, 2012) (Fig. 4). In the non-primate bones, these locationswere from the mid-shaft. In the human and chimpanzee femorathese locations were from the proximal shaft where the bendingmoment is considered greatest (Skedros and Baucom, 2007).
The protocol was designed to select five complete osteons fromeach CPL image using a randomly oriented grid. However, therewere instances where five osteons could not be selected usingthe grid because these images had relatively low osteon populationdensity. This occurred in each species, and the frequency rangedfrom <0.1% in the equine calcanei (one osteon less than the maxi-mum 385 osteons) to 8% in the human femora (81 less than themaximum 960 osteons). The mean area of each quantified osteonwas directly measured from the digitized CPL image (ImageJ v.1.43, National Institutes of Health, USA (Rasband, 1997–2009)).To facilitate consistency with published studies, osteon diameteris expressed as the mean of the maximum and minimum osteondiameters. This was sufficient for the purposes of this study be-cause >95% of the osteons are quasi-circular. The ‘‘morphotypescore’’ (MTS) of each complete osteon from non-human and chim-panzee bones had already been measured in the prior studies(where only the mean MTS of the entire image was previously re-ported). The MTSs for the human femur osteons were obtained forthis study following the method described in the legend of Fig. 1.
The population densities of complete secondary osteons and thepercent area of secondary osteonal bone had also been obtained forall images from each bone. Osteon population density was quanti-fied as the number of complete secondary osteons in each imageand divided by the area of each image (On.N/T.Ar; T.Ar = total im-age area including vascular spaces and osteocyte lacunae). The per-cent area of secondary bone ((On.B/T.Ar)�100); which includescomplete and fragmentary osteons) was also quantified in each im-age. With the exception of the human femora, these data were ob-tained in our prior studies. Human femur data were collectedaccording to our methods from previous studies, and inter- and in-tra-observer reliability was consistent with our previous studies(Skedros et al., 2009, 2011b).
2.1. Statistical analysis
A three-way analysis of covariance (ANCOVA) with Fisher’sPLSD post hoc tests was used to evaluate the data in terms of:(1) morphotype score (MTS), (2) loading mode (i.e., habitual ‘‘ten-sion’’, ‘‘compression’’, and ‘‘neutral axis/shear’’ regions), and (3)species (Table 1). The MTS score, which is actually an ordered cat-egorical variable, was treated as a continuous variable in the AN-COVA, which results in a p-value that is interpreted as a lineartrend test (Woodward, 2004). The ‘species’ distinction allowedfor distinguishing between all bones, including equine radii andequine calcanei. Analyses then focused on osteon size (On.Dm)for all osteons (MTSs 0, 1, 2, 3, 4, and 5) and hooped osteons (MTSs1, 2, 3, and 4) in terms of the three regions within each species. Theosteon size cut-offs were defined as: (1) lower one-half and upperone-half of the range of osteon diameters within each bone type(size cut-off defined by mean value), and (2) <160, 161–209, and>210 lm. This latter grouping is based on data showing a bimodal
distribution in the propensity for beneficial osteonal debondingand pullout in human and canine bone as suggested by the dataof Moyle and co-workers (Moyle and Bowden, 1984; Moyle et al.,1978). In these studies, the energy absorption was higher whenosteons are <160 and >210 lm diameter. In one case (deer calca-neus) where the number of osteons in each group was possiblyinsufficient for statistical analysis (15–47 osteons per group), theupper range was adjusted to >200 lm. Pearson correlations wereused to assess potential relationships between osteon populationdensity, diameter and MTS. Results of descriptive statistics of theosteon data are reported as means and standard deviations, whichare based on values obtained from each image. The numbers ofimages and osteons quantified in each bone are indicated in datatables, as reported below. One-way ANOVA comparisons wereused to determine if there are significant differences in osteon den-sity and diameter between ‘‘tension regions’’ and ‘‘compressionregions’’.
3. Results
Results of the three-way ANCOVA showed significant effects ofMTS and species (Table 1). There were statistically significant dif-ferences between most species comparisons (p < 0.05). Post-hocanalysis showed that osteon diameter tended to be greater in thehooped morphotypes 3 and 4 when compared to the hooped mor-photypes 1 and 2. However, when considering all of the hoopedosteons (MTSs 1–4) the results of paired comparisons based onsmall vs. large osteons showed that the hypothesized differenceis suggested in only four of the six bone types (Fig. 5). Additionally,there was no case in either group where the expected differencewas found in terms of the bimodal osteon-size relationship shownby Moyle and colleagues (Fig. 6). In other words, intermediate-sizeosteons did not have hooped MTSs that consistently differed fromthe small and large osteon groups (Fig. 6A).
The main hypothesis is also rejected by the results of the corre-lation analyses (Table 2) showing either weak or no relationshipsbetween osteon size and MTS. This is the case even when the anal-ysis focused on the hooped osteons in the ‘‘tension’’ cortices of the
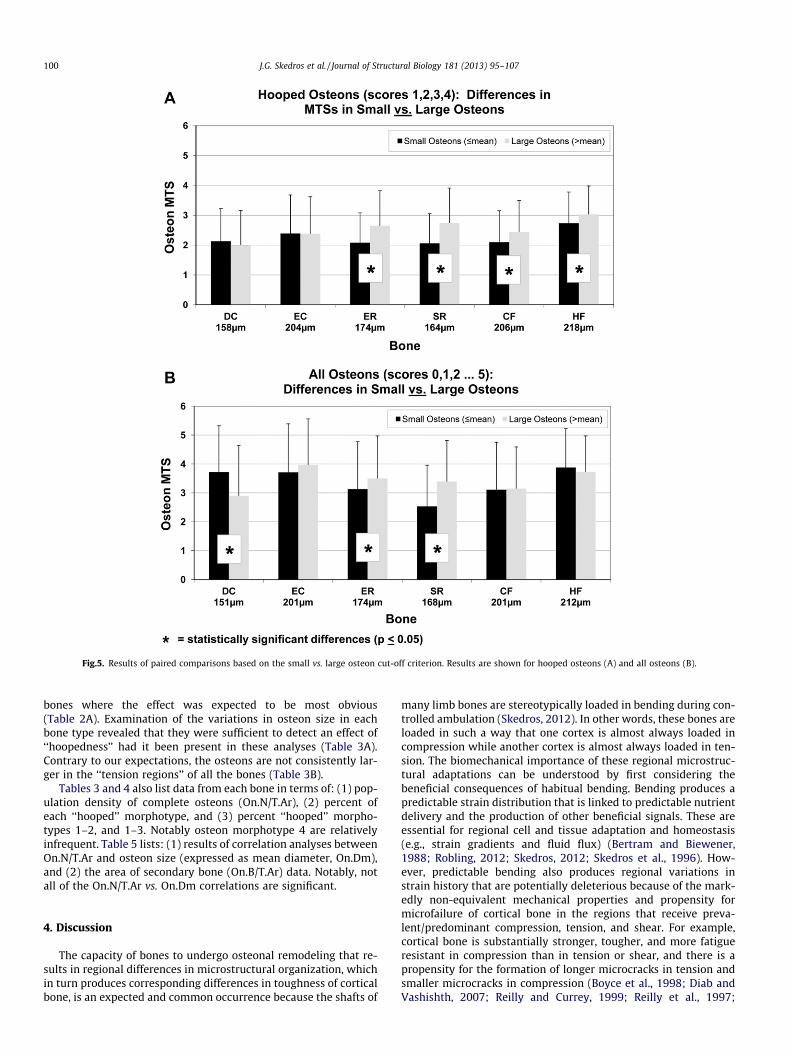
Fig.5. Results of paired comparisons based on the small vs. large osteon cut-off criterion. Results are shown for hooped osteons (A) and all osteons (B).
100 J.G. Skedros et al. / Journal of Structural Biology 181 (2013) 95–107
bones where the effect was expected to be most obvious(Table 2A). Examination of the variations in osteon size in eachbone type revealed that they were sufficient to detect an effect of‘‘hoopedness’’ had it been present in these analyses (Table 3A).Contrary to our expectations, the osteons are not consistently lar-ger in the ‘‘tension regions’’ of all the bones (Table 3B).
Tables 3 and 4 also list data from each bone in terms of: (1) pop-ulation density of complete osteons (On.N/T.Ar), (2) percent ofeach ‘‘hooped’’ morphotype, and (3) percent ‘‘hooped’’ morpho-types 1–2, and 1–3. Notably osteon morphotype 4 are relativelyinfrequent. Table 5 lists: (1) results of correlation analyses betweenOn.N/T.Ar and osteon size (expressed as mean diameter, On.Dm),and (2) the area of secondary bone (On.B/T.Ar) data. Notably, notall of the On.N/T.Ar vs. On.Dm correlations are significant.
4. Discussion
The capacity of bones to undergo osteonal remodeling that re-sults in regional differences in microstructural organization, whichin turn produces corresponding differences in toughness of corticalbone, is an expected and common occurrence because the shafts of
many limb bones are stereotypically loaded in bending during con-trolled ambulation (Skedros, 2012). In other words, these bones areloaded in such a way that one cortex is almost always loaded incompression while another cortex is almost always loaded in ten-sion. The biomechanical importance of these regional microstruc-tural adaptations can be understood by first considering thebeneficial consequences of habitual bending. Bending produces apredictable strain distribution that is linked to predictable nutrientdelivery and the production of other beneficial signals. These areessential for regional cell and tissue adaptation and homeostasis(e.g., strain gradients and fluid flux) (Bertram and Biewener,1988; Robling, 2012; Skedros, 2012; Skedros et al., 1996). How-ever, predictable bending also produces regional variations instrain history that are potentially deleterious because of the mark-edly non-equivalent mechanical properties and propensity formicrofailure of cortical bone in the regions that receive preva-lent/predominant compression, tension, and shear. For example,cortical bone is substantially stronger, tougher, and more fatigueresistant in compression than in tension or shear, and there is apropensity for the formation of longer microcracks in tension andsmaller microcracks in compression (Boyce et al., 1998; Diab andVashishth, 2007; Reilly and Currey, 1999; Reilly et al., 1997;
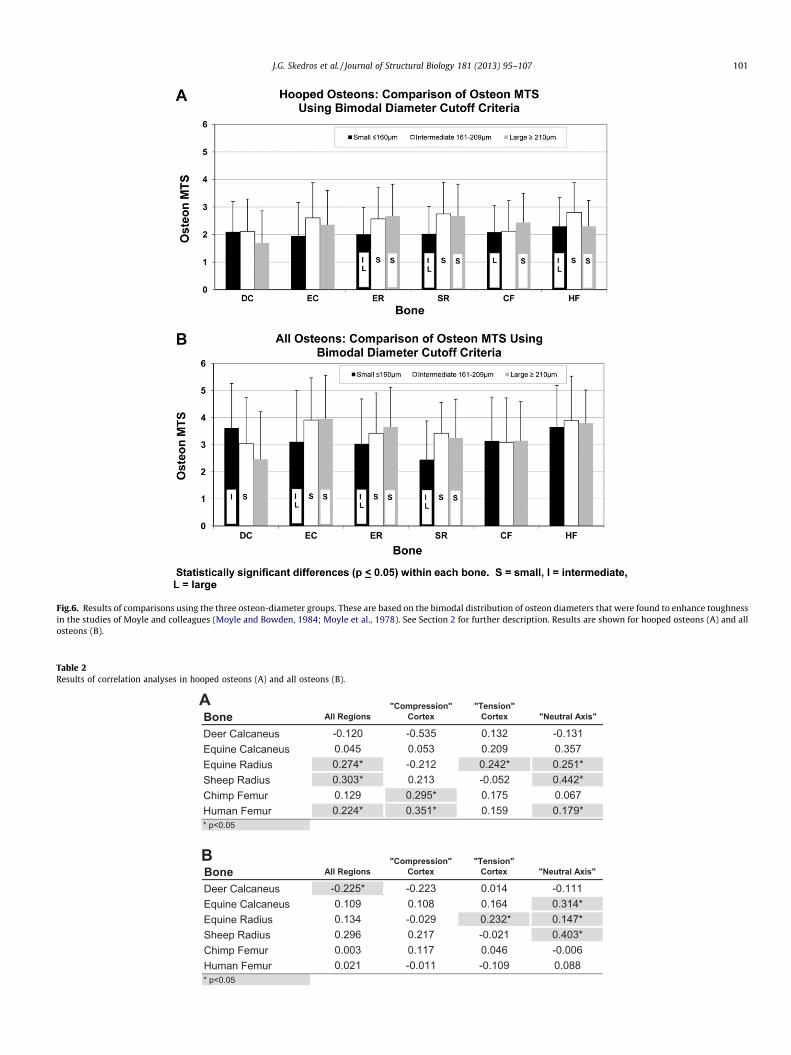
Fig.6. Results of comparisons using the three osteon-diameter groups. These are based on the bimodal distribution of osteon diameters that were found to enhance toughnessin the studies of Moyle and colleagues (Moyle and Bowden, 1984; Moyle et al., 1978). See Section 2 for further description. Results are shown for hooped osteons (A) and allosteons (B).
Table 2Results of correlation analyses in hooped osteons (A) and all osteons (B).
Bone All Regions"Compression"
Cortex"Tension"
Cortex "Neutral Axis"
Deer Calcaneus -0.120 -0.535 0.132 -0.131Equine Calcaneus 0.045 0.053 0.209 0.357Equine Radius 0.274* -0.212 0.242* 0.251*Sheep Radius 0.303* 0.213 -0.052 0.442*Chimp Femur 0.129 0.295* 0.175 0.067Human Femur 0.224* 0.351* 0.159 0.179** p<0.05
Bone All Regions"Compression"
Cortex"Tension"
Cortex "Neutral Axis"
Deer Calcaneus -0.225* -0.223 0.014 -0.111Equine Calcaneus 0.109 0.108 0.164 0.314*Equine Radius 0.134 -0.029 0.232* 0.147*Sheep Radius 0.296 0.217 -0.021 0.403*Chimp Femur 0.003 0.117 0.046 -0.006Human Femur 0.021 -0.011 -0.109 0.088* p<0.05
A
B
J.G. Skedros et al. / Journal of Structural Biology 181 (2013) 95–107 101
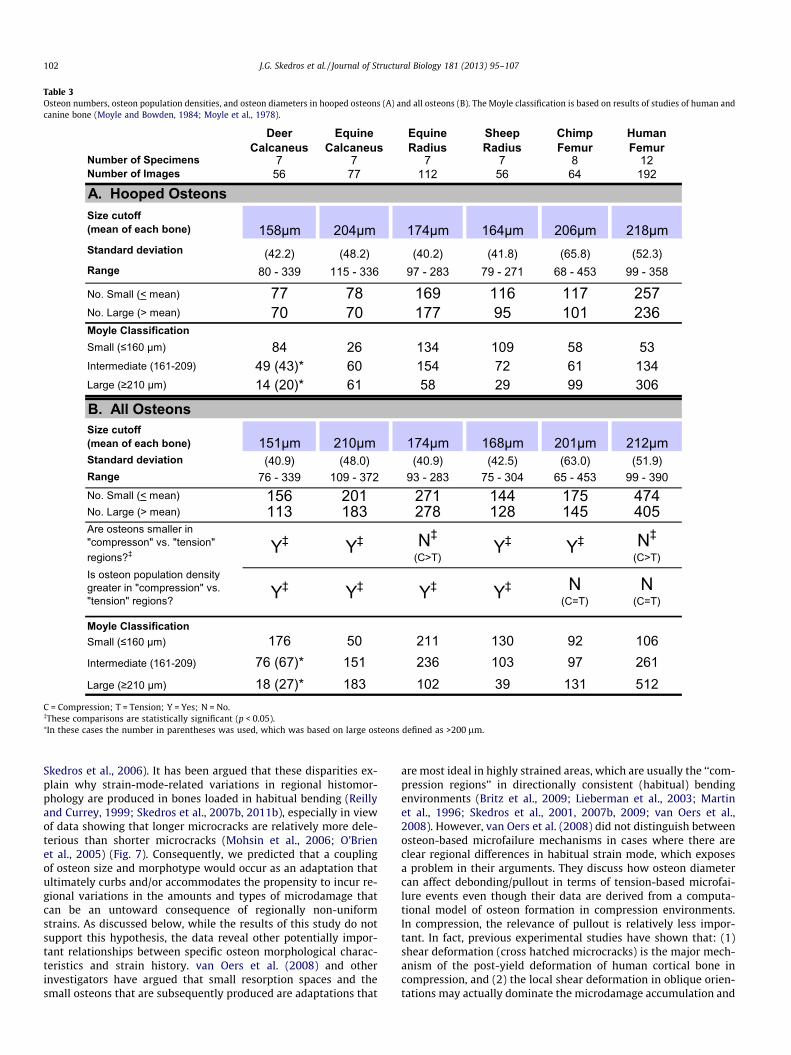
Table 3Osteon numbers, osteon population densities, and osteon diameters in hooped osteons (A) and all osteons (B). The Moyle classification is based on results of studies of human andcanine bone (Moyle and Bowden, 1984; Moyle et al., 1978).
Number of Specimens 7 7 7 7 8 12Number of Images 56 77 112 56 64 192
A. Hooped OsteonsSize cutoff (mean of each bone) 158µm 204µm 174µm 164µm 206µm 218µmStandard deviation (42.2) (48.2) (40.2) (41.8) (65.8) (52.3)Range 80 - 339 115 - 336 97 - 283 79 - 271 68 - 453 99 - 358
No. Small (< mean) 77 78 169 116 117 257No. Large (> mean) 70 70 177 95 101 236Moyle ClassificationSmall (≤160 µm) 84 26 134 109 58 53Intermediate (161-209) 49 (43)* 60 154 72 61 134Large (≥210 µm) 14 (20)* 61 58 29 99 306
B. All OsteonsSize cutoff (mean of each bone) 151µm 210µm 174µm 168µm 201µm 212µmStandard deviation (40.9) (48.0) (40.9) (42.5) (63.0) (51.9)Range 76 - 339 109 - 372 93 - 283 75 - 304 65 - 453 99 - 390No. Small (< mean) 156 201 271 144 175 474No. Large (> mean) 113 183 278 128 145 405Are osteons smaller in "compresson" vs. "tension" regions?‡ Y‡ Y‡ N‡
(C>T)Y‡ Y‡ N‡
(C>T)Is osteon population density greater in "compression" vs. "tension" regions? Y‡ Y‡ Y‡ Y‡ N
(C=T)N
(C=T)
Moyle ClassificationSmall (≤160 µm) 176 50 211 130 92 106Intermediate (161-209) 76 (67)* 151 236 103 97 261Large (≥210 µm) 18 (27)* 183 102 39 131 512
Chimp Femur
Human Femur
Deer Calcaneus
Equine Calcaneus
Equine Radius
Sheep Radius
C = Compression; T = Tension; Y = Yes; N = No.�These comparisons are statistically significant (p < 0.05).⁄In these cases the number in parentheses was used, which was based on large osteons defined as >200 lm.
102 J.G. Skedros et al. / Journal of Structural Biology 181 (2013) 95–107
Skedros et al., 2006). It has been argued that these disparities ex-plain why strain-mode-related variations in regional histomor-phology are produced in bones loaded in habitual bending (Reillyand Currey, 1999; Skedros et al., 2007b, 2011b), especially in viewof data showing that longer microcracks are relatively more dele-terious than shorter microcracks (Mohsin et al., 2006; O’Brienet al., 2005) (Fig. 7). Consequently, we predicted that a couplingof osteon size and morphotype would occur as an adaptation thatultimately curbs and/or accommodates the propensity to incur re-gional variations in the amounts and types of microdamage thatcan be an untoward consequence of regionally non-uniformstrains. As discussed below, while the results of this study do notsupport this hypothesis, the data reveal other potentially impor-tant relationships between specific osteon morphological charac-teristics and strain history. van Oers et al. (2008) and otherinvestigators have argued that small resorption spaces and thesmall osteons that are subsequently produced are adaptations that
are most ideal in highly strained areas, which are usually the ‘‘com-pression regions’’ in directionally consistent (habitual) bendingenvironments (Britz et al., 2009; Lieberman et al., 2003; Martinet al., 1996; Skedros et al., 2001, 2007b, 2009; van Oers et al.,2008). However, van Oers et al. (2008) did not distinguish betweenosteon-based microfailure mechanisms in cases where there areclear regional differences in habitual strain mode, which exposesa problem in their arguments. They discuss how osteon diametercan affect debonding/pullout in terms of tension-based microfai-lure events even though their data are derived from a computa-tional model of osteon formation in compression environments.In compression, the relevance of pullout is relatively less impor-tant. In fact, previous experimental studies have shown that: (1)shear deformation (cross hatched microcracks) is the major mech-anism of the post-yield deformation of human cortical bone incompression, and (2) the local shear deformation in oblique orien-tations may actually dominate the microdamage accumulation and
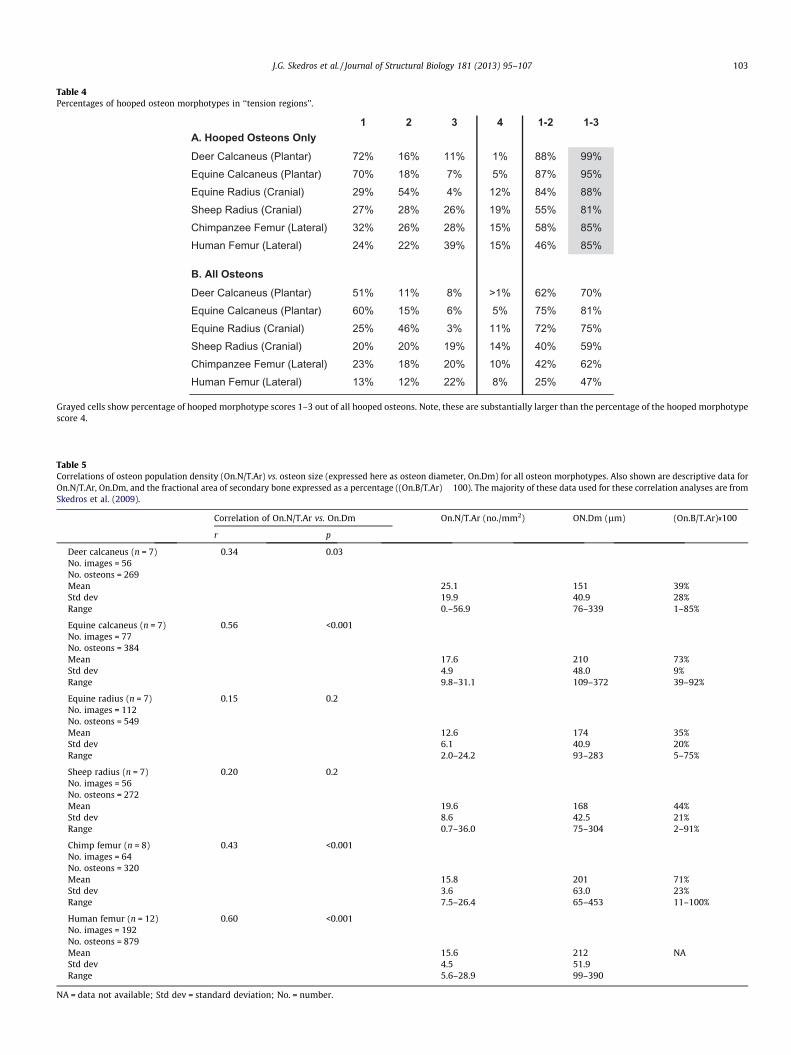
Table 4Percentages of hooped osteon morphotypes in ‘‘tension regions’’.
1 2 3 4 1-2 1-3A. Hooped Osteons OnlyDeer Calcaneus (Plantar) 72% 16% 11% 1% 88% 99%Equine Calcaneus (Plantar) 70% 18% 7% 5% 87% 95%Equine Radius (Cranial) 29% 54% 4% 12% 84% 88%Sheep Radius (Cranial) 27% 28% 26% 19% 55% 81%Chimpanzee Femur (Lateral) 32% 26% 28% 15% 58% 85%Human Femur (Lateral) 24% 22% 39% 15% 46% 85%
B. All OsteonsDeer Calcaneus (Plantar) 51% 11% 8% >1% 62% 70%Equine Calcaneus (Plantar) 60% 15% 6% 5% 75% 81%Equine Radius (Cranial) 25% 46% 3% 11% 72% 75%Sheep Radius (Cranial) 20% 20% 19% 14% 40% 59%Chimpanzee Femur (Lateral) 23% 18% 20% 10% 42% 62%Human Femur (Lateral) 13% 12% 22% 8% 25% 47%
Grayed cells show percentage of hooped morphotype scores 1–3 out of all hooped osteons. Note, these are substantially larger than the percentage of the hooped morphotypescore 4.
Table 5Correlations of osteon population density (On.N/T.Ar) vs. osteon size (expressed here as osteon diameter, On.Dm) for all osteon morphotypes. Also shown are descriptive data forOn.N/T.Ar, On.Dm, and the fractional area of secondary bone expressed as a percentage ((On.B/T.Ar) � 100). The majority of these data used for these correlation analyses are fromSkedros et al. (2009).
Correlation of On.N/T.Ar vs. On.Dm On.N/T.Ar (no./mm2) ON.Dm (lm) (On.B/T.Ar)«100
r p
Deer calcaneus (n = 7) �0.34 0.03No. images = 56No. osteons = 269Mean 25.1 151 39%Std dev 19.9 40.9 28%Range 0.–56.9 76–339 1–85%
Equine calcaneus (n = 7) �0.56 <0.001No. images = 77No. osteons = 384Mean 17.6 210 73%Std dev 4.9 48.0 9%Range 9.8–31.1 109–372 39–92%
Equine radius (n = 7) �0.15 0.2No. images = 112No. osteons = 549Mean 12.6 174 35%Std dev 6.1 40.9 20%Range 2.0–24.2 93–283 5–75%
Sheep radius (n = 7) �0.20 0.2No. images = 56No. osteons = 272Mean 19.6 168 44%Std dev 8.6 42.5 21%Range 0.7–36.0 75–304 2–91%
Chimp femur (n = 8) �0.43 <0.001No. images = 64No. osteons = 320Mean 15.8 201 71%Std dev 3.6 63.0 23%Range 7.5–26.4 65–453 11–100%
Human femur (n = 12) �0.60 <0.001No. images = 192No. osteons = 879Mean 15.6 212 NAStd dev 4.5 51.9Range 5.6–28.9 99–390
NA = data not available; Std dev = standard deviation; No. = number.
J.G. Skedros et al. / Journal of Structural Biology 181 (2013) 95–107 103
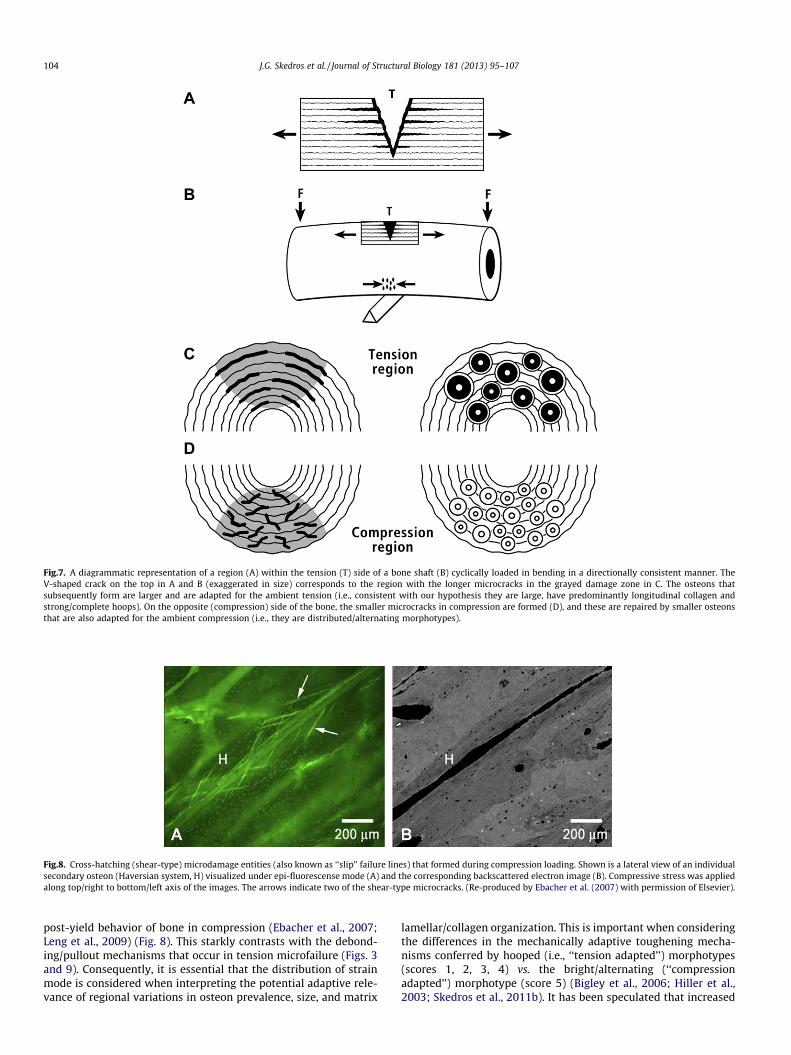
Fig.7. A diagrammatic representation of a region (A) within the tension (T) side of a bone shaft (B) cyclically loaded in bending in a directionally consistent manner. TheV-shaped crack on the top in A and B (exaggerated in size) corresponds to the region with the longer microcracks in the grayed damage zone in C. The osteons thatsubsequently form are larger and are adapted for the ambient tension (i.e., consistent with our hypothesis they are large, have predominantly longitudinal collagen andstrong/complete hoops). On the opposite (compression) side of the bone, the smaller microcracks in compression are formed (D), and these are repaired by smaller osteonsthat are also adapted for the ambient compression (i.e., they are distributed/alternating morphotypes).
Fig.8. Cross-hatching (shear-type) microdamage entities (also known as ‘‘slip’’ failure lines) that formed during compression loading. Shown is a lateral view of an individualsecondary osteon (Haversian system, H) visualized under epi-fluorescense mode (A) and the corresponding backscattered electron image (B). Compressive stress was appliedalong top/right to bottom/left axis of the images. The arrows indicate two of the shear-type microcracks. (Re-produced by Ebacher et al. (2007) with permission of Elsevier).
104 J.G. Skedros et al. / Journal of Structural Biology 181 (2013) 95–107
post-yield behavior of bone in compression (Ebacher et al., 2007;Leng et al., 2009) (Fig. 8). This starkly contrasts with the debond-ing/pullout mechanisms that occur in tension microfailure (Figs. 3and 9). Consequently, it is essential that the distribution of strainmode is considered when interpreting the potential adaptive rele-vance of regional variations in osteon prevalence, size, and matrix
lamellar/collagen organization. This is important when consideringthe differences in the mechanically adaptive toughening mecha-nisms conferred by hooped (i.e., ‘‘tension adapted’’) morphotypes(scores 1, 2, 3, 4) vs. the bright/alternating (‘‘compressionadapted’’) morphotype (score 5) (Bigley et al., 2006; Hiller et al.,2003; Skedros et al., 2011b). It has been speculated that increased
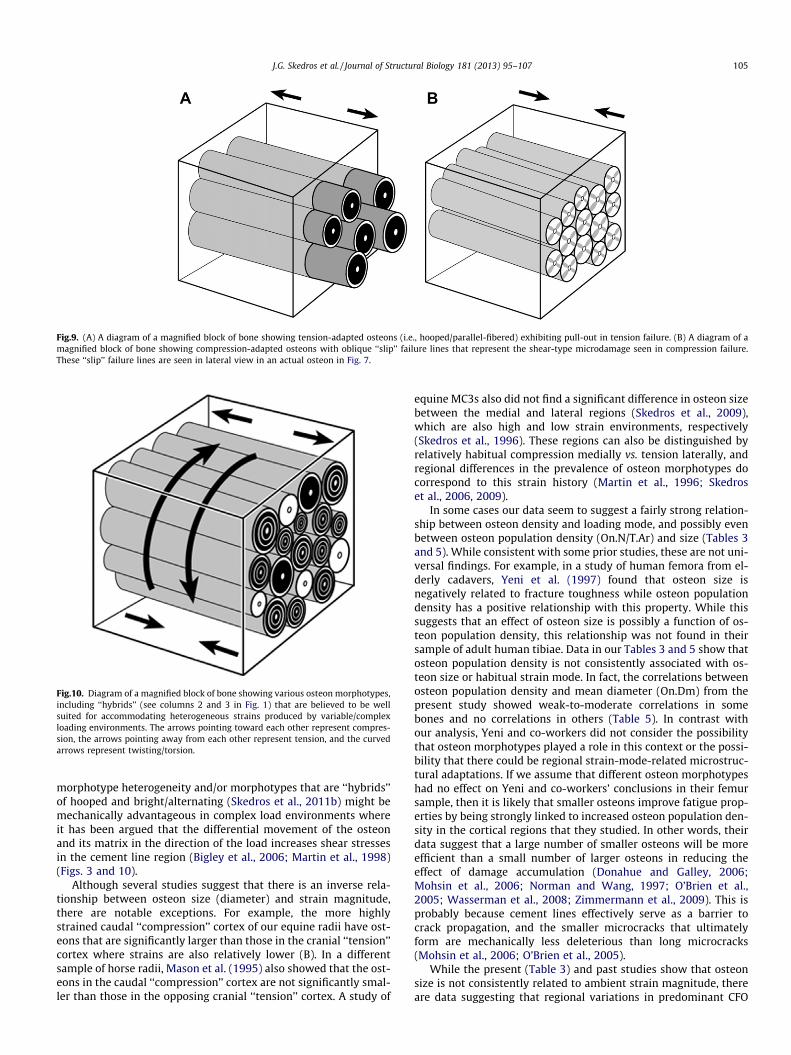
Fig.9. (A) A diagram of a magnified block of bone showing tension-adapted osteons (i.e., hooped/parallel-fibered) exhibiting pull-out in tension failure. (B) A diagram of amagnified block of bone showing compression-adapted osteons with oblique ‘‘slip’’ failure lines that represent the shear-type microdamage seen in compression failure.These ‘‘slip’’ failure lines are seen in lateral view in an actual osteon in Fig. 7.
Fig.10. Diagram of a magnified block of bone showing various osteon morphotypes,including ‘‘hybrids’’ (see columns 2 and 3 in Fig. 1) that are believed to be wellsuited for accommodating heterogeneous strains produced by variable/complexloading environments. The arrows pointing toward each other represent compres-sion, the arrows pointing away from each other represent tension, and the curvedarrows represent twisting/torsion.
J.G. Skedros et al. / Journal of Structural Biology 181 (2013) 95–107 105
morphotype heterogeneity and/or morphotypes that are ‘‘hybrids’’of hooped and bright/alternating (Skedros et al., 2011b) might bemechanically advantageous in complex load environments whereit has been argued that the differential movement of the osteonand its matrix in the direction of the load increases shear stressesin the cement line region (Bigley et al., 2006; Martin et al., 1998)(Figs. 3 and 10).
Although several studies suggest that there is an inverse rela-tionship between osteon size (diameter) and strain magnitude,there are notable exceptions. For example, the more highlystrained caudal ‘‘compression’’ cortex of our equine radii have ost-eons that are significantly larger than those in the cranial ‘‘tension’’cortex where strains are also relatively lower (B). In a differentsample of horse radii, Mason et al. (1995) also showed that the ost-eons in the caudal ‘‘compression’’ cortex are not significantly smal-ler than those in the opposing cranial ‘‘tension’’ cortex. A study of
equine MC3s also did not find a significant difference in osteon sizebetween the medial and lateral regions (Skedros et al., 2009),which are also high and low strain environments, respectively(Skedros et al., 1996). These regions can also be distinguished byrelatively habitual compression medially vs. tension laterally, andregional differences in the prevalence of osteon morphotypes docorrespond to this strain history (Martin et al., 1996; Skedroset al., 2006, 2009).
In some cases our data seem to suggest a fairly strong relation-ship between osteon density and loading mode, and possibly evenbetween osteon population density (On.N/T.Ar) and size (Tables 3and 5). While consistent with some prior studies, these are not uni-versal findings. For example, in a study of human femora from el-derly cadavers, Yeni et al. (1997) found that osteon size isnegatively related to fracture toughness while osteon populationdensity has a positive relationship with this property. While thissuggests that an effect of osteon size is possibly a function of os-teon population density, this relationship was not found in theirsample of adult human tibiae. Data in our Tables 3 and 5 show thatosteon population density is not consistently associated with os-teon size or habitual strain mode. In fact, the correlations betweenosteon population density and mean diameter (On.Dm) from thepresent study showed weak-to-moderate correlations in somebones and no correlations in others (Table 5). In contrast withour analysis, Yeni and co-workers did not consider the possibilitythat osteon morphotypes played a role in this context or the possi-bility that there could be regional strain-mode-related microstruc-tural adaptations. If we assume that different osteon morphotypeshad no effect on Yeni and co-workers’ conclusions in their femursample, then it is likely that smaller osteons improve fatigue prop-erties by being strongly linked to increased osteon population den-sity in the cortical regions that they studied. In other words, theirdata suggest that a large number of smaller osteons will be moreefficient than a small number of larger osteons in reducing theeffect of damage accumulation (Donahue and Galley, 2006;Mohsin et al., 2006; Norman and Wang, 1997; O’Brien et al.,2005; Wasserman et al., 2008; Zimmermann et al., 2009). This isprobably because cement lines effectively serve as a barrier tocrack propagation, and the smaller microcracks that ultimatelyform are mechanically less deleterious than long microcracks(Mohsin et al., 2006; O’Brien et al., 2005).
While the present (Table 3) and past studies show that osteonsize is not consistently related to ambient strain magnitude, thereare data suggesting that regional variations in predominant CFO
106 J.G. Skedros et al. / Journal of Structural Biology 181 (2013) 95–107
(often produced by osteon morphotypes) are more strongly corre-lated with strain mode (Mason et al., 1995; Riggs et al., 1993a;Skedros et al., 2009, 2011b). In fact, the association of regionalvariations in predominant CFO and/or osteon morphotypes withthe distribution of net tension and compression strains of habitualbending has been shown to be much more consistent than eitherosteon size or population density (Skedros, 2012; Skedros et al.,2009). When considering evidence that predominant CFO is caus-ally related to strain mode and not strain magnitude (Takanoet al., 1999), and the fact that our results do not support ourhypothesis that osteon diameter is coupled with osteon morpho-type, it is clear that further research is needed to address someof the additional hypotheses raised by our study. For example, itis not known if the higher prevalence of osteon morphotypes 1,2, and 3 than morphotype 4 (Table 4) is mechanically adaptive insome load environments. In other words, it is not known if the de-gree of ‘‘hoopedness’’ plays a mechanically important role. Addi-tional research should determine if osteon size and MTS aremediated by different stimuli.
Limitations of our study include the designation of habitualstrain-mode regions in some bones where this distinction is lessclear than in others because of their differences in loading variabil-ity/complexity. This is the case in the proximal shaft locations ofthe primate bones when compared to the mid-shaft locations ofnon-primate bones used in this study (Skedros, 2012). Neverthe-less, as reported in previous studies, the predominant CFO patternsin all bones examined in the present study show significant differ-ences that are consistent with habitual bending (i.e., more oblique-to-transverse CFO in ‘‘compression regions’’ and more longitudinalCFO in ‘‘tension’’ regions) (Boyde and Riggs, 1990; Riggs et al.,1993a; Skedros et al., 1999, 2009, 2011b). Additionally, thehypothesis that osteon size and hoopedness are coupled was stillrejected even in the more simply loaded calcanei and radii. An-other limitation of this study is that it cannot determine causalrelationships between osteon morphological characteristics; itcan only address associations.
In summary, the results of this study show that osteon size andmorphotype are not coupled in the bones and regions that weexamined. But some of the results of the present and prior studiessuggest that these osteon characteristics have the potential forindependent adaptations for locally prevalent/predominant strainmode or magnitude. However, among the various bone types stud-ied, the associations of osteon size with strain magnitude and os-teon population density are inconsistent. This contrasts with themore consistent association of osteon morphotypes with a region-ally prevalent/predominant strain mode. Consequently, osteonMTSs and the predominant CFO variations that they produce arecomparatively stronger correlates of spatially non-uniformstrain-mode histories produced by habitual bending, which is acommon load history in many limb bones. It is also clear that oste-onal adaptations for microfailure mechanisms cannot be generic innon-uniform load environments because marked differenceswould be expected for the locally prevalent/predominant strainmodes that are produced.
Acknowledgments
The authors thank Erick Anderson, Kyle Gubler, Jaxon Hoopes,Scott Sorenson, Adam Beckstrom, Anna Adondakis, and Chase Jar-dine for their assistance in completing this study. We are indebtedto Pat Campbell and Harlan Amstutz for the use of their laboratoryfacilities at the Joint Replacement Institute of Orthopaedic Hospitalin Los Angeles, California. This research is supported by USADepartment of Veterans Affairs medical research funds, and theDoctor’s Education Research Fund (DERF) of Orthopaedic Hospital,Los Angeles, California, USA.
References
Bertram, J.E., Biewener, A.A., 1988. Bone curvature: sacrificing strength for loadpredictability? J. Theor. Biol. 131, 75–92.
Bigley, R.F., Griffin, L.V., Christensen, L., Vandenbosch, R., 2006. Osteonal interfacialstrength and histomorphometry of equine cortical bone. J. Biomech. 39, 1629–1640.
Boyce, T.M., Fyhrie, D.P., Glotkowski, M.C., Radin, E.L., Schaffler, M.B., 1998. Damagetype and strain mode associations in human compact bone bending fatigue. J.Orthop. Res. 16, 322–329.
Boyde, A., Riggs, C.M., 1990. The quantitative study of the orientation of collagen incompact bone slices. Bone 11, 35–39.
Britz, H.M., Thomas, C.D., Clement, J.G., Cooper, D.M., 2009. The relation of femoralosteon geometry to age, sex, height and weight. Bone 45, 77–83.
Bromage, T.G., Goldman, H.M., McFarlin, S.C., Warshaw, J., Boyde, A., et al., 2003.Circularly polarized light standards for investigations of collagen fiberorientation in bone. Anat. Rec. 274B, 157–168.
Crescimanno, A., Stout, S.D., 2012. Differentiating fragmented human andnonhuman long bone using osteon circularity. J. Forensic Sci. 57, 287–294.
Currey, J.D., 2002. Bones: Structure and Mechanics. Princeton University Press,Princeton, NJ.
Diab, T., Vashishth, D., 2007. Morphology, localization and accumulation of in vivomicrodamage in human cortical bone. Bone 40, 612–618.
Doblaré, M., García Aznar, J.M., Gómez, M.J., 2004. Modelling bone tissue fractureand healing: a review. Eng. Fract. Mech. 71, 1809–1840.
Donahue, S.W., Galley, S.A., 2006. Microdamage in bone: implications for fracture,repair, remodeling, and adaptation. Crit. Rev. Biomed. Eng. 34, 215–271.
Ebacher, V., Tang, C., McKay, H., Oxland, T.R., Guy, P., et al., 2007. Strainredistribution and cracking behavior of human bone during bending. Bone 40,1265–1275.
Hiller, L.P., Stover, S.M., Gibson, V.A., Gibeling, J.C., Prater, C.S., et al., 2003. Osteonpullout in the equine third metacarpal bone: effects of ex vivo fatigue. J. Orthop.Res. 21, 481–488.
Hogan, H.A., 1992. Micromechanics modeling of Haversian cortical bone properties.J. Biomech. 25, 549–556.
Keenan, K., Knight, A., Tingey, S., Kiser, C., Thomas, S., et al., 2010. Drifting osteonsoccur in higher concentrations in habitual tension environments: amicrostructural toughening mechanism? Am. J. Phys. Anthropol. Suppl. 50, 140.
Kerschnitzki, M., Wagermaier, W., Roschger, P., Seto, J., Shahar, R., et al., 2011. Theorganization of the osteocyte network mirrors the extracellular matrixorientation in bone. J. Struct. Biol. 173, 303–311.
Launey, M.E., Buehler, M.J., Ritchie, R.O., 2010a. On the mechanistic origins oftoughness in bone. Annu. Rev. Mater. Res. 40, 25–53.
Launey, M.E., Chen, P.Y., McKittrick, J., Ritchie, R.O., 2010b. Mechanistic aspects ofthe fracture toughness of elk antler bone. Acta Biomater. 6, 1505–1514.
Leng, H., Dong, X.N., Wang, X., 2009. Progressive post-yield behavior of humancortical bone in compression for middle-aged and elderly groups. J. Biomech.42, 491–497.
Lieberman, D.E., Pearson, O.M., Polk, J.D., Demes, B., Crompton, A.W., 2003.Optimization of bone growth and remodeling in response to loading intapered mammalian limbs. J. Exp. Biol. 206, 3125–3138.
Marotti, G., 1996. The structure of bone tissues and the cellular control of theirdeposition. Ital. J. Anat. Embryol. 101, 25–79.
Martin, R.B., Gibson, V.A., Stover, S.M., Gibeling, J.C., Griffin, L.V., 1996. Osteonalstructure in the equine third metacarpus. Bone 19, 165–171.
Martin, R.B., Burr, D.B., Sharkey, N.A., 1998. Skeletal Tissue Mechanics. Springer-Verlag, New York, NY.
Mason, M.W., Skedros, J.G., Bloebaum, R.D., 1995. Evidence of strain-mode-relatedcortical adaptation in the diaphysis of the horse radius. Bone 17, 229–237.
Mohsin, S., O’Brien, F.J., Lee, T.C., 2006. Osteonal crack barriers in ovine compactbone. J. Anat. 208, 81–89.
Moyle, D.D., Bowden, R.W., 1984. Fracture of human femoral bone. J. Biomech. 17,203–213.
Moyle, D.D., Welborn 3rd, J.W., Cooke, F.W., 1978. Work to fracture of caninefemoral bone. J. Biomech. 11, 435–440.
Najafi, A., Arshi, A., Saffar, K., Eslami, M., Fariborz, S., et al., 2009. A fiber-ceramicmatrix composite material model for osteonal cortical bone fracturemicromechanics: solutions of arbitrary microcracks interaction. J. Mech.Behav. Biomed. Mater. 2, 217–223.
Nalla, R.K., Stolken, J.S., Kinney, J.H., Ritchie, R.O., 2005a. Fracture in human corticalbone: local fracture criteria and toughening mechanisms. J. Biomech. 38, 1517–1525.
Nalla, R.K., Kruzic, J.J., Kinney, J.H., Ritchie, R.O., 2005b. Mechanistic aspects of frac-ture and R-curve behavior in human cortical bone. Biomaterials 26, 217–231.
Norman, T.L., Wang, Z., 1997. Microdamage of human cortical bone: incidence andmorphology in long bones. Bone 20, 375–379.
O’Brien, F., Taylor, D., Lee, T.C., 2005. The effect of bone microstructure on theinitiation and growth of microcracks. J. Orthop. Res. 23, 475–480.
Parfitt, A.M., 1983. The physiologic and clinical significance of bone histomor-phometric data. In: Recker, R.R. (Ed.), Bone Histomorphometry: Techniques andInterpretation. CRC Press, Inc., Boca Raton, pp. 143–224 (Chapter 9).
Pazzaglia, U.E., Congiu, T., Zarattini, G., Marchese, M., Quacci, D., 2011. The fibrillarorganisation of the osteon and cellular aspects of its development : amorphological study using the SEM fractured cortex technique. Anat. Sci. Int.86, 128–134.
J.G. Skedros et al. / Journal of Structural Biology 181 (2013) 95–107 107
Pope, M.H., Murphy, M.C., 1974. Fracture energy of bone in a shear mode. Med. Biol.Eng. 12, 763–767.
Rasband, W., 1997–2009. ImageJ, 1.43 ed. U.S. National Institutes of Health,Bethesda, Maryland.
Reilly, G.C., Currey, J.D., 1999. The development of microcracking and failure inbone depends on the loading mode to which it is adapted. J. Exp. Biol. 202, 543–552.
Reilly, G.C., Currey, J.D., Goodship, A., 1997. Exercise of young thoroughbred horsesincreases impact strength of the third metacarpal bone. J. Orthop. Res. 15, 862–868.
Riggs, C.M., Lanyon, L.E., Boyde, A., 1993a. Functional associations between collagenfibre orientation and locomotor strain direction in cortical bone of the equineradius. Anat. Embryol. 187, 231–238.
Riggs, C.M., Vaughan, L.E., Boyde, A., Lanyon, L.E., 1993b. Mechanical implications ofcollagen fibre orientation in cortical bone of the equine radius. Anat. Embryol.187, 239–248.
Robling, A.G., 2012. The interaction of biological factors with mechanical signals inbone adaptation: recent developments. Curr. Osteoporos Rep. 10, 126–131.
Robling, A.G., Stout, S.D., 1999. Morphology of the drifting osteon. Cells TissuesOrgans 164, 192–204.
Skedros, J.G., 2012. Interpreting load history in limb–bone diaphyses: importantconsiderations and their biomechanical foundations. In: Crowder, C., Stout, S.(Eds.), Bone Histology: An Anthropological Perspective. CRC Press, Boca Raton,Florida, pp. 153–220.
Skedros, J.G., Baucom, S.L., 2007. Mathematical analysis of trabecular ‘trajectories’ inapparent trajectorial structures: the unfortunate historical emphasis on thehuman proximal femur. J. Theor. Biol. 244, 15–45.
Skedros, J.G., Mason, M.W., Nelson, M.C., Bloebaum, R.D., 1996. Evidence ofstructural and material adaptation to specific strain features in cortical bone.Anat. Rec. 246, 47–63.
Skedros, J.G., Hughes, P.E., Nelson, K., Winet, H., 1999. Collagen fiber orientation inthe proximal femur: challenging Wolff’s tension/compression interpretation. J.Bone Miner. Res. 14, S441.
Skedros, J.G., Mason, M.W., Bloebaum, R.D., 2001. Modeling and remodeling in adeveloping artiodactyl calcaneus: a model for evaluating Frost’s mechanostathypothesis and its corollaries. Anat. Rec. 263, 167–185.
Skedros, J.G., Holmes, J.L., Vajda, E.G., Bloebaum, R.D., 2005. Cement lines ofsecondary osteons in human bone are not mineral-deficient: new data in ahistorical perspective. Anat. Rec. A Discov. Mol. Cell. Evol. Biol. 286, 781–803.
Skedros, J.G., Dayton, M.R., Sybrowsky, C.L., Bloebaum, R.D., Bachus, K., 2006. Theinfluence of collagen fiber orientation and other histocompositionalcharacteristics on the mechanical properties of equine cortical bone. J. Exp.Biol. 209, 3025–3042.
Skedros, J.G., Sorenson, S.M., Jenson, N.H., 2007a. Are distributions of secondaryosteon variants useful for interpreting load history in mammalian bones? CellsTissues Organs 185, 285–307.
Skedros, J.G., Sorenson, S.M., Hunt, K.J., Holyoak, J.D., 2007b. Ontogenetic structuraland material variations in ovine calcanei: a model for interpreting boneadaptation. Anat. Rec. 290, 284–300.
Skedros, J.G., Mendenhall, S.D., Kiser, C.J., Winet, H., 2009. Interpreting cortical boneadaptation and load history by quantifying osteon morphotypes in circularlypolarized light images. Bone 44, 392–403.
Skedros, J.G., Kiser, C.J., Mendenhall, S.D., 2011a. A weighted osteon morphotypescore out-performs regional osteon percent prevalence calculations forinterpreting cortical bone adaptation. Am. J. Phys. Anthropol. 144, 41–50.
Skedros, J.G., Kiser, C.J., Keenan, K.E., Thomas, S.C., 2011b. Analysis of osteonmorphotype scoring schemes for interpreting load history: evaluation in thechimpanzee femur. J. Anat. 218, 480–499.
Skedros, J.G., Keenan, K.E., Halley, J.A., Knight, A.N., Bloebaum, R.D., 2012. Osteonmorphotypes and predominant collagen fiber orientation are adaptations forhabitual medial-lateral bending in the human proximal diaphysis: implicationsfor understanding the etiology of atypical fractures. 58th Annual Meeting of theOrthopaedic Research Society, vol. 37, p. 1512.
Takano, Y., Turner, C.H., Owan, I., Martin, R.B., Lau, S.T., et al., 1999. Elasticanisotropy and collagen orientation of osteonal bone are dependent on themechanical strain distribution. J. Orthop. Res. 17, 59–66.
Turner, C.H., Burr, D.B., 1993. Basic biomechanical measurements of bone: atutorial. Bone 14, 595–608.
van Oers, R.F., Ruimerman, R., van Rietbergen, B., Hilbers, P.A., Huiskes, R., 2008.Relating osteon diameter to strain. Bone 43, 476–482.
Vashishth, D., 2004. Rising crack-growth-resistance behavior in cortical bone:implications for toughness measurements. J. Biomech. 37, 943–946.
Wasserman, N., Brydges, B., Searles, S., Akkus, O., 2008. In vivo linear microcracks ofhuman femoral cortical bone remain parallel to osteons during aging. Bone 43,856–861.
Woodward, M., 2012. Epidemiology: Study Design and Data Analysis, second ed.Chapman and Hall/CRC, New York.
Yeni, Y.N., Brown, C.U., Wang, Z., Norman, T.L., 1997. The influence of bone mor-phology on fracture toughness of the human femur and tibia. Bone 21, 453–459.
Zimmermann, E.A., Launey, M.E., Barth, H.D., Ritchie, R.O., 2009. Mixed-modefracture of human cortical bone. Biomaterials 30, 5877–5884.
Zimmermann, E.A., Schaible, E., Bale, H., Barth, H.D., Tang, S.Y., et al., 2011. Age-related changes in the plasticity and toughness of human cortical bone atmultiple length scales. Proc. Natl. Acad. Sci. USA 108, 14416–14421.
Zioupos, P., Currey, J.D., 1998. Changes in the stiffness, strength, and toughness ofhuman cortical bone with age. Bone 22, 57–66.