What Drives Amyloid Molecules To Assemble into Oligomers and Fibrils
Upload
charite-deCategory
view
1download
0
Acta Biomaterialia xxx (2013) xxx–xxx
Contents lists available at SciVerse ScienceDirect
Acta Biomaterialia
journal homepage: www.elsevier .com/locate /actabiomat
Investigation of the three-dimensional orientation of mineralizedcollagen fibrils in human lamellar bone using synchrotron X-ray phasenano-tomography
1742-7061/$ - see front matter � 2013 Acta Materialia Inc. Published by Elsevier Ltd. All rights reserved.http://dx.doi.org/10.1016/j.actbio.2013.05.015
⇑ Corresponding author. Tel.: +49 30 450 539534; fax: +49 30 450 539952.E-mail address: [email protected] (P. Varga).
Please cite this article in press as: Varga P et al. Investigation of the three-dimensional orientation of mineralized collagen fibrils in human lamellusing synchrotron X-ray phase nano-tomography. Acta Biomater (2013), http://dx.doi.org/10.1016/j.actbio.2013.05.015
Peter Varga a,⇑, Alexandra Pacureanu b,c,d, Max Langer b,c, Heikki Suhonen c, Bernhard Hesse a,c,Quentin Grimal e, Peter Cloetens c, Kay Raum a, Françoise Peyrin b,c
a Julius Wolff Institute and Berlin-Brandenburg School for Regenerative Therapies, Charité Universitätsmedizin, Berlin, Germanyb Creatis, Université de Lyon, CNRS UMR5220, Inserm U1044, INSA-Lyon, Universite Lyon 1, 69621 Villeurbanne Cedex, Francec European Synchrotron Radiation Facility, 38043 Grenoble Cedex 9, Franced Centre for Image Analysis and Science for Life Laboratory, Uppsala University, Swedene LIP, UPMC Université Pierre et Marie Curie Paris 6, CNRS UMR7623, Paris, France
a r t i c l e i n f o
Article history:Received 23 January 2013Received in revised form 18 April 2013Accepted 14 May 2013Available online xxxx
Keywords:Lamellar boneOsteonMineralized collagen fibrilPlywood arrangementX-ray phase nano-tomography
a b s t r a c t
We investigate the three-dimensional (3-D) organization of mineralized collagen fibrils in human corticalbone based on synchrotron X-ray phase nano-tomography images. In lamellar bone the collagen fibrilsare assumed to have a plywood-like arrangement, but due to experimental limitations the 3-D fibrilstructure has only been deduced from section surfaces so far and the findings have been controversial.Breakthroughs in synchrotron tomographic imaging have given access to direct 3-D information on thebone structure at the nanoscale level. Using an autocorrelation-based orientation measure we confirmthat the fibrils are unidirectional in quasi-planes of sub-lamellae and find two specific dominant patterns,oscillating and twisted plywoods coexisting in a single osteon. Both patterns exhibit smooth orientationchanges between adjacent quasi-planes. Moreover, we find that the periodic changes in collagen fibrilorientation are independent of fluctuations in local mass density. These data improve our understandingof the lamellar arrangement in bone and allow more detailed investigations of structure–function rela-tionships at this scale, providing templates for bio-inspired materials. The presented methodology canbe applied to non-destructive 3-D characterization of the sub-micron scale structure of other naturaland artificial mineralized biomaterials.
� 2013 Acta Materialia Inc. Published by Elsevier Ltd. All rights reserved.
1. Introduction
Bone is a natural example of a highly optimized composite mate-rial with outstanding mechanical properties, achieved by assem-bling a mineral-reinforced collagen compound into a highlyorganized hierarchical structure [1,2]. Lamellar bone is the mostabundant type in the cortex of human bones, composed of osteonaltissue. Osteons are cylindrical shaped structural, functional andremodelling units of cortical bone with diameters of approximately200 lm and a central Haversian canal of about 50 lm hosting bloodvessels. Osteons have a concentric lamellar structure with a thick-ness of one lamellar unit of 3–7 lm [3]. Osteonal lamellae are laiddown consecutively by groups of osteoblasts synthesizing andsecreting collagen fibrils in the form of osteoids [4], which are thenprogressively mineralized [5]. The self-assembly of collagen [6] isbelieved to be influenced by the cells, which, through mechanosen-
sation, are able to fine tune the extracellular matrix to match the lo-cal mechanical environment [7]. The resulting fibril arrangement istherefore mechanically highly optimized, incorporating anisotropicstiffness [8–10] and toughness [11]. The design concepts of lamellarbone are therefore of great interest.
Although the micro-architecture of osteons has been an exten-sively researched topic for more than a century [12], our currentknowledge of the complex interplay of composition, structure,material properties and resulting functional consequences is stilllimited. Early investigations using polarized light microscopy[6,13] revealed different lamellar motifs in osteons based on theircharacteristic appearance, and these arrangements were proposedto be related to distinct mechanical requirements [13,14]. Marotti[15] suggested that the lamellar appearance results from collagen-rich and collagen-poor layers. Other models describe the bonelamella as a staggered array of unidirectional mineralized collagenfibril layers (referred to as ‘‘fibrils’’ below) in which each layer hasa distinct fibril orientation (h). Such arrangements result inperiodic plywood-like structures [16,17]. In addition to changes
ar bone

2 P. Varga et al. / Acta Biomaterialia xxx (2013) xxx–xxx
in mineral content and number and type of collagen cross-links,the fine structure of the sub-lamellar layers has to date beenwidely accepted to be a major determinant of the mechanical tis-sue properties at the higher levels of hierarchy. While other naturalcollagen-based mineralized biomaterials, e.g. mineralized tendon[18], or chitin-based composites, e.g. the cuticle of crustaceans[19], have well-defined microstructural arrangements of the basicconstruction units (i.e. collagen or chitin fibrils), lamellar boneappears to possess more complex and non-uniform fibril arrange-ments within single lamellae. Understanding these details mayhelp to better interpret the structure–function relationship andmay provide important details to advance the design of bone-mimicking materials [20].
Several experimental studies aimed at determining whether thetransition between the sub-lamellae is continuous or discrete and tofind idealized patterns providing representative descriptions of theperiodic lamellar unit have been conducted. Previously proposedlamellar unit models include: (i) an orthogonal plywood arrange-ment [12] with sudden, close to 90� changes in h; (ii) a twistedplywood arrangement with a continuous change in h [6,21]; (iii)an asymmetrical rotated plywood arrangement [17,22,23], in whichh shows specific patterns for different sub-lamellar thicknesses, acharacteristic ‘‘back-flip’’ phenomenon and different azimuthalrotations of the mineral platelets. Wagermaier et al. proposed ahelicoidal plywood structure, exhibiting a spiral fibril orientation,thus allowing for the spring-like behaviour of osteons [2,24]. Recentinvestigations revealed that neither the orthogonal nor the twistedplywood models are feasible from a micro-mechanical point of view[25] and that models similar to the rotated and helicoidal plywoodarrangements better explain the experimentally observed variationin mechanical properties [9,25].
The arsenal of previously applied methods of investigation in-cludes polarized light [13,26] and confocal [27,28] microscopy,transmission and backscattered scanning electron microscopy[15,17,29–31], contact microradiography [32], scanning nanoinden-tation [10,33], Raman microscopy [34], scanning acoustic micros-copy [9,23], small angle and wide angle X-ray scattering [35,36],wide angle X-ray diffraction [24], time of flight secondary ion massspectrometry [37], or combinations thereof [9,33,38], which haveprovided insights into the lamellar composition, size and orientationof collagen molecules and mineral platelets, as well as the aniso-tropic elastic properties of the mineralized fibrils. However, mostof these techniques either probe the tissue surface in reflectionmode or the bulk material in transmission mode. Extraction of thethree-dimensional (3-D) arrangement from two-dimensional(2-D) data is a challenging task and may lead to incorrect interpreta-tions [29]. Besides the missing third dimension, sample preparation(fixation, dehydration, embedding or demineralization) and surfacepreparation (polishing, microtome sectioning and fracturing) canalter the structural details and may result in artefacts. Moreover,there is very little experimental data providing large-scale informa-tion at sub-lamellar level resolution. Recently Reznikov et al. [39]performed a serial section analysis of lamellar bone of demineral-ized rat tibia samples using a dual beam electron microscopyapproach, providing a 10 nm isotropic voxel size in 10 lm sub-volumes stacked from the 2-D slices. Using this technique theindividual collagen fibrils could be visualized and their orientationwas analysed by means of a 2-D Fourier transform-based method.Studies using this approach for the first time shed light on the 3-Dfibril arrangement in murine [39] and equine [40] bone and con-firmed that several of the aforementioned motifs coexist. However,the dual beam microscopic approach is a destructive method andhas to be performed on demineralized samples. Moreover, thistechnique has not so far been used for the investigation of human tis-sue. 3-D imaging technologies with nanometer resolution, suitablecontrast and minimal destructiveness are of key importance in
Please cite this article in press as: Varga P et al. Investigation of the three-dimeusing synchrotron X-ray phase nano-tomography. Acta Biomater (2013), http:
unravelling the structure–function relationships of lamellar boneat this length scale. The recently introduced synchrotron X-rayphase nano-tomography (SR-PNT) approach meets these criteriaand can be utilized to investigate samples in close to the native state,and thus may overcome the common experimental artefacts caused,for example, by tissue preparation, sample alignment, limited fieldof view or the lack of a third dimension. Moreover, this techniquehas been shown to reveal information about the arrangement ofmineralized collagen fibrils [41].
The goal of this study was to quantify the 3-D fibril orientationpatterns from SR-PNT data of human cortical bone samples. Weanticipated that this analysis could improve experimental evidencefor the sub-lamellar fine structure of bone tissue and may highlightnovel details about the design principles of lamellar bone.
2. Materials and methods
2.1. Sample preparation
As described previously [41], three human femoral bone sam-ples from female donors (age 98, 85 and 92 years for samples I, IIand III, respectively) were obtained from a multi-organ collection.Ethical approval was granted by the Human Ethics Committee ofthe Centre du don des Corps, University Rene Descartes (Paris,France). The tissue donors or their legal guardians provided in-formed written consent to donate their tissue for investigation,in accord with legal clauses in the French Code of Public Health.Bone samples underwent preparation, including delipidation, med-ullary protein elimination and sterilization. Parallelepiped samples0.4 � 0.4 � 5 mm were cut from the femoral mid-diaphysis with adiamond-coated band saw. Based on anatomical indicators thelong side of the blocks was aligned with the femoral long axisand transverse cuts were made perpendicular to it (Fig. 1a–c).
2.2. Imaging
SR-PNT was performed at nanoimaging station ID22-NI of theEuropean Synchrotron Radiation Facility (ESRF, Grenoble, France).The imaging details have been previously described [41]. Briefly,series of tomographic scans were recorded at four distinct dis-tances between the sample and the focal spot. The phase of theX-rays was then retrieved from the corresponding projections ofthe four distances. The resulting phase projections were finallyused to reconstruct, by means of filtered back-projection, the spa-tial distribution of the refractive index with a 60 nm isotropic voxelsize within a 90 lm field of view. Although the individual fibrilswere not resolved, SR-PNT provided sufficient spatial resolutionand exceptional sensitivity to mass density fluctuations to observethe characteristic fibrillar pattern (Fig. 2a and b). This was the basisfor the reconstruction of the 3-D sub-lamellar fibril orientationpattern in osteons and interstitial tissues from the volumetricSR-PNT data. For the evaluation of density fluctuations themeasured refractive indices were converted to mass densitiesusing the formulae presented in Langer et al. [41].
2.3. Volumes of interest
In a first step the lamellar plane had to be aligned with theorthogonal coordinate system of the computed tomography data.Rectangular cuboid volumes of interest (VOIs) were selected fromosteonal and interstitial tissue zones in which the curvature of thelamellae was small, i.e. the lamellae were locally quasi-parallel andplane-like (Fig. 1e). The orientations of the local lamellar planeswere identified visually by slicing through the image volumes intwo perpendicular planes. The images were then rotated in twosteps to align the local x and z axes of the VOI with the lamellar
nsional orientation of mineralized collagen fibrils in human lamellar bone//dx.doi.org/10.1016/j.actbio.2013.05.015

Fig. 1. From the whole bone to the volume of interest (VOI). (a) Schematic drawing of the proximal femur showing the location of the cut diaphyseal region. (b) Cortical bonesection, the box shows the extracted sample. L, bone long axis; T, traverse plane perpendicular to L. (c) The parallelepiped shaped specimen resulting from samplepreparation, with the red rectangle indicating the slice illustrated in (d), showing the osteonal lamellae and the cement lines as thin and thick lines, respectively. The greencircle indicates the location of the sub-volume shown in (e), scanned using the phase retrieval principle (corresponding to Sample I in Fig. 2). The rectangular volumeindicated by dashed lines in (e) illustrates one exemplary VOI, which was selected for analysis. Note that the VOI is rotated to match the local lamellar plane. (f) The selectedVOI with its local orthogonal coordinate system. x and z are the axes within the lamellar quasi-plane, with z being the inverse of the projection of L into this plane,representing the approximated osteon axis. y is the axis perpendicular to the lamellar plane. L is within the yz plane. The fibrillar structure is illustrated as sets of paralleloblique thin lines shown in different lamellar planes, i.e. xz slices of the volume, with the angle h being the local angle between the main direction of the fibrils and the z axis.
Fig. 2. Synchrotron X-ray phase nano-tomography image of sample I with the definitions of the investigated VOIs. (a) Cross-sectional and (b) transverse slices of the 3-Dimage, with cut planes indicated by the white lines. The coloured boxes (red, purple, green and blue) indicate the four partially overlapping VOIs (A–D, respectively) with thedefinitions of the respective local coordinate systems (x, y and z). The location of a micro-fracture is denoted by �. (c) Schematic drawing of (a), showing the tissue regionswith the approximate lamellar structure. It, interstitial tissue; On, osteonal tissue; Cm, cement line. The location of this region within the sample is illustrated in Fig. 1d.
P. Varga et al. / Acta Biomaterialia xxx (2013) xxx–xxx 3
plane, such that the z axis was parallel to the projection of the longbone axis onto the xz plane, i.e. closely parallel with the osteonlong axis, and the y axis was perpendicular to the lamellar plane(Fig. 1e and f). In the following the expressions lamellar planeand osteon axis will refer to the approximate local xz plane and zaxis, respectively. The largest possible region not containing oste-ocyte lacunae was then cropped and taken as the VOI (Fig. 2aand b). The lacunae had to be avoided as these voids would havecaused artefacts during the orientation analysis. For the same rea-son canaliculi were segmented and filled with the average massdensity value of the image. These steps were performed in the im-age visualization and processing software ZibAmira [42]. The list ofall selected VOIs is shown in Table 1.
2.4. Autocorrelation function (ACF) analysis
The ACF was used to quantify the orientational dependence ofperiodicity in the SR-PNT images. Taking advantage of the Wie-ner–Khintchine theorem (http://mathworld.wolfram.com/Wie-ner-KhinchinTheorem.html) the ACF [43,44] was computed in theFourier domain:
ACF ¼ jF�1d ðFdðIÞconjðFdðIÞÞÞj ð1Þ
with Fd() and Fd�1() being the discrete Fourier and discrete inverse
Fourier transforms of the image I, respectively. ACF was computed
Please cite this article in press as: Varga P et al. Investigation of the three-dimeusing synchrotron X-ray phase nano-tomography. Acta Biomater (2013), http:
in several regions (analysis kernels) centralized at grid points with-in the given VOI (Fig. 3a and b). The analysis was performed in both2-D and 3-D for the following reasons. In order to resolve the com-plete details of the orientation change across the lamellae the sizeof the analysis kernel in the y direction had to be as small as possi-ble, i.e. one voxel, yielding a slice-wise 2-D ACF analysis in adjacentindependent xz planes (2-D ACF, Fig. 3a). This, however, assumesthat the xz plane of the VOI was parallel to the local lamellar planes.In order to verify this assumption 3-D ACF analysis was utilized,which provided the spatial fibril orientation, but with a lower reso-lution along the y direction. For the 3-D ACF analysis the out-of-plane size of the analysis kernel, i.e. thickness along the y direction,was 1.86 lm, selected to be as thin as possible to include a minimalnumber of sub-lamellae possibly having different fibril orientationsthat would be averaged by the spatial analysis, but thick enough tobe able to characterize the spatial signal. The in-plane size of theanalysis kernel, 8.46 � 8.46 lm for both the 2-D and the 3-D anal-yses, was optimized in a sub-study to be large enough to providea robust measure but small enough to avoid excessive averaging.An in-plane grid size of 3 lm was used, resulting in an up to�65% overlap between the neighbouring analysis kernels within agiven plane (Fig. 3b). The steps involved in quantifying the ACF-based fibril orientation are shown in Fig. 3c–f for the 2-D case. Priorto the ACF analysis the characteristic ring artefacts in the tomo-grams, appearing on the xz slices of the VOIs as high frequency
nsional orientation of mineralized collagen fibrils in human lamellar bone//dx.doi.org/10.1016/j.actbio.2013.05.015
Table 1Details of all analysed VOIs with the rate of twist values measured in twisted plywood (TP) regions and parameters of the sinusoidal fits of oscillating plywood (OsP) regions.
VOI i.d. Tissue type Plywood type Linear fit of TP Sinusoidal fit parameters of OsP
Rate of twist (lm per degree) Adjusted R2 Amplitude (�) H0 (�) ½ period (lm) Adjusted R2
I-A⁄ It TP 1 �22.5 0.98TP 2 �21.1 0.98TP 3 21.9 0.99OsP 29.4 �20.1 7.7 0.89
I-B⁄ It TP 1 �27.0 0.97TP 2 �26.8 0.99TP 3 21.62 0.99
I-C⁄ It TP 1 21.72 0.99TP 2 �21.45 0.99
I-D⁄ It TP 1 20.86 0.98TP 2 �24.62 0.94
II-A It OsP 19.7 �3 6.4 0.73II-B On TP 1 24.3 0.98
TP 2 24.1 0.94OsP 32.5 9.1 5.5 0.95
II-C On TP 1 �25.2 0.93TP 2 �30.7 0.95OsP 15.1 0.1 5.2 0.92
III-A On OsP 1 22.1 2.4 4.2 0.89OsP 2 20.7 9.6 6.1 0.96TP 23.2 0.98
III-B It OsP 30.2 2.2 4.6 0.97Absolute magnitudes TP 24.2 ± 2.6
OsP 24.2 ± 6.5 6.6 ± 6.9 5.7 ± 1.2
It, interstitial tissue; On, osteonal tissue; �, partially overlapping regions, which have been taken into account when computing the mean and SD.
Fig. 3. Details of the 2-D autocorrelation function analysis shown for one analysis kernel in slice 270 from VOI C of sample I. (a) Bounding box of the VOI with dimensions andthe selected xz plane (slice no. 270) shown. (b) A grey scale image of the slice. Black dashed lines, the analysis grid, i.e. the centres of the kernels (n = 20); white dashed box,one analysis kernel with the centre shown as a white circle. (c) The unfiltered image in the kernel. (d) The filtered image in the kernel. (e) The normalized magnitude of thediscrete ACF signal. (f) The segmented autocorrelation function signal providing the orientation distribution function and the derived in-plane fibril angle h, illustrated in red.(g) The resulting main orientations in the selected and all other analysis kernels of this slice are represented as white lines. This sub-figure is one frame of the video providedas Supplementary material, showing the evolution of the in-plane orientations in all analysis kernels of all slices for this VOI.
4 P. Varga et al. / Acta Biomaterialia xxx (2013) xxx–xxx
vertical line pattern noise, were suppressed using an anisotropicsecond order Butterworth band-reject filter (Fig. 3c and d). Thedetails of the filtering process, including an explanatory figure(Fig. S1), can be found in the Supplementary material. Followingfiltering the autocorrelation of each grey scale image region wascomputed using Eq. (1) (Fig. 3e). As the signal was not perfectlyperiodic the first minimum in the ACF was not found in alldirections. Instead, we used a simplified full width at half maximumapproach by normalizing the ACF signal to the [0,1] range andsegmenting at a threshold value of 0.5 (Fig. 3f). The resulting orien-tation distribution function of periodicity was fitted to an ellipseand an ellipsoid for the 2-D and 3-D ACFs, respectively. The orien-tation of the major semi-axis of the 2-D ACF ellipse, i.e. the directionwith the least periodicity of the grey scale signal, was taken as thedominant in-plane direction of the fibrils (h, Fig. 1f) in the analysiskernel (Fig. 3g). In the case of the 3-D ACF the xz in-plane compo-nent of the major semi-axis was used. Possible ±p shifts of h werecorrected based on the orientation of the preceding plane, assuming
Please cite this article in press as: Varga P et al. Investigation of the three-dimeusing synchrotron X-ray phase nano-tomography. Acta Biomater (2013), http:
that no jumps close to p occur in consecutive planes. The degree ofanisotropy of the 2-D ACF was defined as the ratio of the minor andthe major semi-axis lengths and was used to describe the fidelity ofthe orientation estimation. Results with a low degree of anisotropy(<1.5) were excluded, as the meaning of the major and minordirections is lost in the close to isotropic case. For the 3-D ACFthe ratio of the major to the middle semi-axis length was used. As3-D ACF may have been averaged over a region containing severaldifferent in-plane angles the fidelity threshold for the degree ofanisotropy in the case of the 3-D analysis was set to 1.2. Thevolumetric analysis provided a spatial vector corresponding to thelargest ACF eigenvalue, from which the allowed out-of-plane xzcomponent to quantify the angle (U, see Fig. S3) between the lamel-lar quasi-plane and the xz plane of the VOI was determined, toverify if these planes were approximately parallel. The means andstandard deviations (SDs) of the ACF-based orientation and degreeof anisotropy were computed from all analysis kernels within thexz planes (Fig. 3g). The Supplementary material contains a video
nsional orientation of mineralized collagen fibrils in human lamellar bone//dx.doi.org/10.1016/j.actbio.2013.05.015

P. Varga et al. / Acta Biomaterialia xxx (2013) xxx–xxx 5
illustrating the results for the total VOI by scrolling through itslice-wise and showing the 2-D ACF-based fibril orientation in allanalysis kernels as lines.
Mean and SD tissue mass densities were quantified in the xz VOIplanes by excluding the canalicular pores. The latter were seg-mented from the mineralized tissue matrix using a histogram-based threshold.
3. Results
All structural details, e.g. osteocyte lacunae, cananliculi, cementlines and the lamellar pattern, could be clearly seen in the SR-PNTimages (Fig. 2). Osteonal and interstitial tissues were identified asregions in which the bone lamellae were oriented approximatelyparallel to and cut by the cement line, respectively (Fig. 2c). Inmore than 93% of the analysed slices a robust estimation of the fi-bril orientation was obtained from the 2-D ACF.
3.1. In-plane fibril orientation from the 2-D ACF
Progression of the in-plane fibril orientation across the bonelamellae in an interstitial tissue region, compiled from four par-tially overlapping VOIs of sample I, is shown in Fig. 4a and b. Ex-cept for two small regions (indicated by � and # in Fig. 4) the 2-D ACF produced high fidelity orientation estimates with in-planeSD of approximately 5� (Fig. 4a). Moreover, the in-plane resultsfor the overlapping VOIs were consistent and could therefore beaveraged in these regions (Fig. 4c). The profile analysis revealeddifferent regions in which the fibril orientation changed in eithera smooth oscillatory pattern closely around the z axis (i) or witha continuous twist (ii) In some regions the pattern of orientationchange was less regular (iii, e.g. less than half an oscillation periodor 180� twist, Fig. 4c). Hereafter we refer to these regions as: (i)oscillating plywood; (ii) twisted plywood; (iii) irregular oscillatingplywood. The histogram of the mean in-plane orientations re-mapped in the range �90� to +90� and the probability density dis-tribution computed using a non-parametric kernel smoothingdensity estimation are shown in Fig. S12. The average orientationwas +4.0�, with 0� referring to the orientation parallel to the z axis,i.e. the approximate orientation of the osteon long axis. The fitshowed two pronounced peaks +8� and �35�, as well as a plateauat approximately +50�. The mass density (Fig. 4d) exhibited anaverage in-plane SD of 4.5%, but only marginal fluctuations acrossthe bone lamellae, which were not related to the fibril orientation.
The results for an osteonal region from sample II (VOI B) aresummarized in Fig. 5. The left boundary (y = 0) of this VOI wasset as close as possible to the cement line. In this and all otherevaluated osteonal tissue regions the outermost lamellae exhibiteda twisted plywood arrangement, which was followed by atransition towards an oscillating plywood pattern. Similar to theinterstitial tissue (Fig. 4), no lamellar variations in mass densitywere observed (Fig. 5f). The results for further VOIs are shown inSupplementary material Figs. S4–S9.
3.2. 3-D ACF results
The 3-D ACF analysis was used to verify that the plane orienta-tion used for the 2-D ACF analysis were parallel with the tissuesub-lamellae (Figs. 5c and S5–S9c). Despite the reduced accuracydue to averaging across the thickness of the analysis kernel thein-plane angle of the major 3-D ACF direction was close to thatmeasured by the 2-D method (R2 = 0.961–0.999, slope 0.82–1.01,intercept �6.9� to 3.4�). Out of lamellar plane angles were foundto be in general smaller than 5� (Figs. 5d and S5–S9d).
Please cite this article in press as: Varga P et al. Investigation of the three-dimeusing synchrotron X-ray phase nano-tomography. Acta Biomater (2013), http:
3.3. Plywood pattern parameters
In all VOIs the evolution of fibril orientation across the lamellaeexhibited oscillating, twisted or irregular oscillating plywood pat-terns. Moreover, rapid, quasi-discrete orientation changes couldbe observed in regions with a locally decreased degree of anisot-ropy of the ACF (e.g. Fig. 4a, region #). Further regions with alow degree of anisotropy, unrelated to special localized orientationchanges, were found (e.g. Fig. 5, around y = 10 lm).
In twisted plywood zones the slope of the curves defined therate of orientation change across the lamellae (Table 1 andFig. S11). Both clockwise and counter-clockwise twist directionswith absolute values of 24.6 ± 2.6� per lm were observed.
The orientation pattern in oscillating plywood regions could bereasonably well approximated with sinusoidal fits, providing theamplitude, period and base angle of the fluctuations (Table 1 andFig. S10). The base angle was typically close to 0�, i.e. parallel tothe z axis. The amplitude and half period of the orientation oscilla-tion varied from ±15� to ±33� and from 4.2 to 7.7 lm, respectively.Note that the sinusoidal fits were only descriptive approximationsand did not capture the exact details, e.g. asymmetry (e.g.Fig. S10b), of the oscillating plywood arrangements. The irregularoscillating plywood zones exhibited strongly asymmetric, consecu-tive clockwise and the counter-clockwise rotations at variablerates and amplitudes. In some cases the irregular oscillating ply-wood pattern had a very small oscillation amplitude and resem-bled an almost unidirectional motif (Fig. 4c, y = 42–52 lm).
For a selected VOI (sample I VOI C) the mean in-plane orienta-tion results were implemented in a virtual lamellar unit model,which showed good agreement with the fibril pattern visually ob-served in the raw SR-PNT images (Fig. 6). In particular, in the obli-que cut plane the arc pattern characteristic of twisted plywoodarrangements [29] could be demonstrated.
4. Discussion
In this study the spatial orientation of mineralized collagen fi-brils was quantified based on X-ray phase nano-tomography datafor a small set of human femoral cortical bone samples. This novelmodality provided, for the first time, true 3-D information aboutthe fibril arrangement from bulk tissue blocks in a close to nativestate. The results obtained corroborated some earlier findingsand provided novel details of the plywood arrangement in bothosteonal and interstitial bone tissues.
In the merged volume of the four interstitial VOIs of sample I,i.e. an approximately 25 � 70 lm cross-sectional area over a closeto 20 lm distance across the lamellae, the slice-wise SD of fibrilorientation was found to be close to 5�. Similar results in all VOIsof all samples allowed us to conclude that in the investigated spec-imens the bone lamellae were indeed quasi-plane-like, corroborat-ing the previous suggestion that fibrils could be considered to beunidirectionally aligned within the lamellar planes [17,29,39] andverified our assumption that the alignment of the VOIs was appro-priate, i.e. the xz plane-wise 2-D ACF analysis had indeed been per-formed within the lamellar planes.
In both the interstitial and osteonal regions the in-plane orien-tation of fibrils exhibited both oscillating plywood and twisted ply-wood-like arrangements across the lamellae. The coexistence ofdifferent patterns had been observed earlier [29,39]. We, however,demonstrated that the oscillating and twisted plywood arrange-ments coexist in a consecutive manner.
In the oscillating plywood arrangement we found the orienta-tion change between consecutive fibril arrays in general did not oc-cur in discrete steps, as proposed previously for the orthogonal androtated plywood models [17,29], but rather as a smooth transition,
nsional orientation of mineralized collagen fibrils in human lamellar bone//dx.doi.org/10.1016/j.actbio.2013.05.015
Fig. 4. In-plane fibril orientation and tissue mass density of the four VOIs of sample I shown in Fig. 2a and b. (a) Slice-wise mean and standard deviation (SD) of the in-planefibril orientations (h). The origin of the y coordinate axis is at the origin of region A. Only well-defined orientations (with a degree of anisotropy of ACF of >1.5) are shown. Inthe in-plane number of analysis kernels in the VOIs were 16, 20, 20 and 16 for A, B, C and D, respectively. (b) 3-D illustration of the fibril orientation for VOIs A (white) and C(blue). One rod represents a 300 nm thick region (5 image slices). (c) Mean in-plane fibril orientation, averaged over the overlapping parts of VOIs A–D. The thick linesrepresent a possible, idealized separation of the different plywood patterns: oscillating plywood (OsP), irregular oscillating plywood (iOsP) and twisted plywood (TP). (d) In-plane mean and SD of tissue mass density. Locations of a fracture and a quick orientation change are denoted by � and #, respectively.
6 P. Varga et al. / Acta Biomaterialia xxx (2013) xxx–xxx
in line with more recent findings [24,39]. Also in line with the re-sults of Wagermaier et al. [24], the average oscillation range, taken
Please cite this article in press as: Varga P et al. Investigation of the three-dimeusing synchrotron X-ray phase nano-tomography. Acta Biomater (2013), http:
as twice the amplitude of the sinusoidal fit, was found to be be-tween approximately 30� and 65�. This oscillation was found to oc-
nsional orientation of mineralized collagen fibrils in human lamellar bone//dx.doi.org/10.1016/j.actbio.2013.05.015
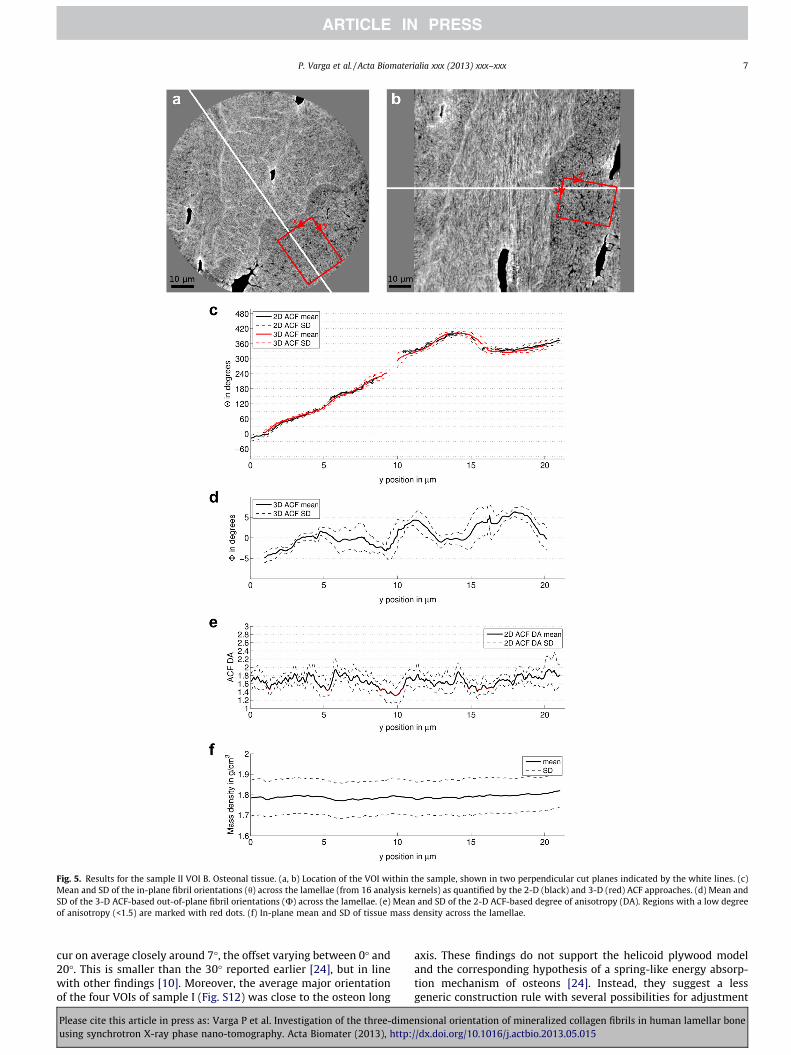
Fig. 5. Results for the sample II VOI B. Osteonal tissue. (a, b) Location of the VOI within the sample, shown in two perpendicular cut planes indicated by the white lines. (c)Mean and SD of the in-plane fibril orientations (h) across the lamellae (from 16 analysis kernels) as quantified by the 2-D (black) and 3-D (red) ACF approaches. (d) Mean andSD of the 3-D ACF-based out-of-plane fibril orientations (U) across the lamellae. (e) Mean and SD of the 2-D ACF-based degree of anisotropy (DA). Regions with a low degreeof anisotropy (<1.5) are marked with red dots. (f) In-plane mean and SD of tissue mass density across the lamellae.
P. Varga et al. / Acta Biomaterialia xxx (2013) xxx–xxx 7
cur on average closely around 7�, the offset varying between 0� and20�. This is smaller than the 30� reported earlier [24], but in linewith other findings [10]. Moreover, the average major orientationof the four VOIs of sample I (Fig. S12) was close to the osteon long
Please cite this article in press as: Varga P et al. Investigation of the three-dimeusing synchrotron X-ray phase nano-tomography. Acta Biomater (2013), http:
axis. These findings do not support the helicoid plywood modeland the corresponding hypothesis of a spring-like energy absorp-tion mechanism of osteons [24]. Instead, they suggest a lessgeneric construction rule with several possibilities for adjustment
nsional orientation of mineralized collagen fibrils in human lamellar bone//dx.doi.org/10.1016/j.actbio.2013.05.015

Fig. 6. Comparison of the raw SR-PNT image data and the derived fibril orientation. (a) VOI D from sample I, cropped with an oblique plane. The grey scale was inverted toenhance the visualization of collagen. Note the arc pattern in the cut plane. (b) The corresponding mineralized collagen fibril orientations illustrated as cylinders. Each linerepresents a 600 nm thick region. The orientation-based definition of thick (or dark, with �45� 6 h 6 45�) and thin (or bright, with �45 > h > �180� or 45 < h < 180�) lamellaeare shown as dark and light grey regions, respectively. The black scale bar represents 10 lm. (c) Virtual lamellar bone model showing fibrils idealized as cylinders (in blue)embedded in extrafibrillar matrix (white). Note the similarity to (a).
8 P. Varga et al. / Acta Biomaterialia xxx (2013) xxx–xxx
of the sub-lamellar structure. However, the predominant occur-rence of fibrils in parallel or close to parallel directions relativeto the osteonal long axis confirms that such a motif is optimizedto provide maximal resistance along the long bone axis.
We quantified the rate of orientation change across the lamellaefor the twisted plywood arrangement and found it to be within therange 20–30� per lm, which may be related to cholesteric self-assembly of the fibrils [6]. Furthermore, both clockwise and coun-ter-clockwise twist directions of the twisted plywood arrangementwere observed in two neighbouring lamellae. Wagermaier et al.[24] reported the existence of ‘‘backwards’’ (negative) twist angles,although only in the outermost lamella of a single osteon. Further,Reznikov et al. [39] also found that both twist directions existed intwisted plywood-like regions, which they called ‘‘fanning’’ lamel-lae. In contrast, progressive rotation of fibrils in consecutive layershas been the basis of previous twisted plywood models [17,29].The twisted plywood arrangement was found in the majority ofthe cases to start and stop more or less parallel to the osteon longaxis, i.e. a twist of multiples of p. Twisted plywood regions werefollowed by either oscillating plywood or twisted plywoodarrangements twisted in the reverse direction. Recently lack of atwisted plywood pattern has been reported in equine osteonal tis-sue [40]. We observed twisted plywood arrangements in almost allVOIs, however, our samples were of human origin and the numberof regions analysed was low.
Bone lamellar thickness has been reported to range between 5and 8 lm [3,24]. Bone lamellae can be defined as repeated orienta-tion patterns. In this respect, for the oscillating plywood arrange-ment the half period of oscillation can be considered to be thelamellar thickness, which was here found to range betweenapproximately 4 and 8 lm. For the twisted plywood arrangement,as twist angles of 0� and 180� describe essentially the same fibrilorientation, one repetition cycle is defined by a twist of 180�. Forthe identified twist rates (ranging from approximately 20 to 30�per lm) the corresponding lamellar thickness ranges from 6 to9 lm, which fits well with previously reported values.
Thin and thick lamellae have been observed in transverse sec-tions, e.g. by scanning electron [30] atomic force [45] and scanningacoustic microscopy [9]. While it is important to note that eachmethod has a different mechanism for creating contrast with re-spect to fibril orientation, the fibril patterns observed in this studycan be linked to the observations of thin and thick lamellae. For theoscillating plywood pattern the major group of fibrils are orientedapproximately parallel to the osteon axis and may appear as rela-
Please cite this article in press as: Varga P et al. Investigation of the three-dimeusing synchrotron X-ray phase nano-tomography. Acta Biomater (2013), http:
tively homogeneous thick lamellae. For the twisted plywoodarrangement that part between h = �45� and h = 45� may contrib-ute to the thick layer of the neighbouring plywood pattern andthose parts defined by the approximately transverse fibrils(h = 90� ± 45�) may define the thin lamella (Fig. 6b). These corre-spond with the reported differences in thickness ranges and inmechanical properties between these two lamellar types [9]. Fur-ther, this orientation-based distinction of lamellae is in line withpolarized microscopy-based observations of dark and bright lamel-lae, which were reported to include fibrils with predominantly par-allel (span angle less than ±45�) and perpendicular (span angleequal to ±45�) to the osteon axis, respectively [27]. However, theorientation distribution was proposed to be largely homogeneousin dark lamellae and more heterogeneous in bright lamellae, witha preferred oblique direction corresponding to ±45� in the latter[27]. These could not be observed in our data.
In some VOIs, next to the oscillating, irregular oscillating, andtwisted plywood arrangements, we observed rapid orientationchanges of approximately 60� (Figs. S5c and S9c) and 90� (Fig. 4c,#), which can be interpreted as what were earlier referred to asdiscrete steps, ‘‘back-flips’’ or ‘‘jumps’’ [17,24,40]. These abruptchanges, however, were rare and, most notably, the locations ofthese ‘‘jumps’’ were related to regions with low anisotropy of theACF measure, which is in line with the findings of Faingold et al.[40]. Low degree of anisotropy values may be explained by the lackof a preferred orientation. Thus we believe that this effect is not anartefact but is due to specific regions with less regularly organizedfibrils. This is in line with the findings of Reznikov et al. [39], cor-roborating the existence of disordered lamellae with loose fibrilpacking. Moreover, so-called ‘‘unidirectional’’ lamellae could befound in the form of irregular oscillating plywood arrangementswith small oscillation amplitudes (Fig. 4c, y = 42–52 lm) with hfor these sub-lamellae being close to parallel to the osteonal axis.Such patterns have also occasionally been found in murine tibia[39] and more frequently in equine metacarpal bones [40].
In all three analysed osteonal VOIs the domains close to the ce-ment sheath were found to exhibit a twisted plywood arrange-ment, followed by an oscillating plywood arrangement towardsthe Haversian canal. The outermost and first deposited osteonal la-mella has already been observed to have a distinct structure [24].The modulated structure of osteons has been proposed to be anefficient natural crack stopping mechanism which can protectblood vessels situated in the central Haversian canals from damage[2]. Microcracks arise in the older, more mineralized and stiffer
nsional orientation of mineralized collagen fibrils in human lamellar bone//dx.doi.org/10.1016/j.actbio.2013.05.015
P. Varga et al. / Acta Biomaterialia xxx (2013) xxx–xxx 9
interstitial tissue [46]. As the twisted plywood arrangement incor-porates fibrils rotated in all possible in-plane directions it can beseen as the most efficient of the observed motifs in stopping orredirecting cracks [47,48]. We therefore hypothesize that the out-ermost lamella of osteons has a generic twisted plywood pattern,which acts as a special transition zone between the old and stiffinterstitial tissue and the young and softer osteonal tissue and sup-ports inhibition of crack propagation from adjacent tissue regionstowards the Haversian canal. Depositions of other arrangementslocated further away from the boundary may be influenced byadditional mechanical factors, such as fluid flow in the Haversiancanal or deformation of the extracellular matrix. This, as well asother findings of the present study, have to be confirmed on a lar-ger sample.
Tissue mass density in the lamellar planes was not related to fi-bril orientation, which supports the hypothesis that the character-istic alterations in lamellar mechanical properties within the sameosteon, as observed by nanoindentation [33] and scanning acousticmicroscopy [9], may predominantly be due to variations in the fi-bril orientation [38]. While relatively homogeneous intralamellarmineral density distributions have also previously been observedby synchrotron radiation X-ray phase nanotomography [41] andcomplementary techniques, e.g. Raman spectroscopy [9,34], qBEI[49] and time of flight secondary ion mass spectrometry [37],lamellar fluctuations were observed by means of backscatteredelectron microscopy using special detector systems [33,39]. Inaddition to potential surface preparation artefacts, one possibleexplanation for the contradictory findings may be the presence ofcanalicular porosity, which, in the present study, could be entirelyexcluded from the investigated volumes, providing tissuedensities.
Our findings are limited by the age range of the donors, thesmall sample size and the restricted physical size of the VOIs.The latter was in all cases smaller than the radius of an osteon,with the latter being 100–200 lm on average. Therefore we cannotstate that the above findings hold generally for a larger population.All samples originated from femoral cortical bone tissue of elderlywomen. Specimens from other sites, ages, gender, or species mayexhibit different properties.
The osteonal region of sample I could not be analysed as thecurvature of the lamellae was large, due to the relative small os-teon diameter, and therefore did not fulfil the requirements ofthe applied methodology, discussed in Section 2.3.
Although only gentle sample preparation steps were needed forthis evaluation, sterilization using c-irradiation, required for theinvestigation at ESRF, and the repetitive application of synchrotronradiation required for the phase reconstruction may have had adeleterious effect on the mechanical properties of the tissue [50].While no apparent signs of radiation damage were observed inthe acquired images, these treatments may have influenced the re-sults of our study.
Despite these limitations, the potential of the presented SR-PNTimage-based approach for the quantitative description of mineral-ized collagen fibril orientation could be demonstrated. The advan-tages of SR-PNT, i.e. fast data acquisition at high spatial resolution,high sensitivity to density variations and simple sample prepara-tion requirements, in combination with the proposed quantitativeanalysis of fibril orientation patterns, are expected to be relevantfor the evaluation of not only natural [2,16,51] but also tissue engi-neered mineralized biomaterials. As an example, the 3-D details ofthe self-assembly of collagen–apatite composites mimickinglamellar bone [20] could be efficiently analysed by means of thepresented approach. Future studies targeting these aims may ben-efit from combining this method with other complementary stateof the art technologies, like dual beam electron microscopy [39]or small angle X-ray scattering computed tomography [52].
Please cite this article in press as: Varga P et al. Investigation of the three-dimeusing synchrotron X-ray phase nano-tomography. Acta Biomater (2013), http:
X-ray phase imaging has been shown to be advantageous whenstudying bone tissue formation in scaffolds [53,54]. The presentedimaging method could therefore be utilized for high resolution 3-Danalysis of the ingrowth of bone into biomaterials during the earlystages and, combined with the presented image processing ap-proach, to investigate collagen orientation in the newly formedbone tissue.
5. Conclusions
This study has provided a detailed evaluation of mineralizedcollagen fibril orientation derived from 3-D SR-PNT images withan isotropic voxel size of 60 nm. Besides justifying some earlierfindings, our results provide novel details about the spatialarrangement of mineralized collagen fibrils in human osteonalbone. Most importantly, we demonstrated that: (i) the fibrils wereunidirectional in the quasi-planes of lamellae; (ii) the in-plane ori-entation changed predominantly in a smooth manner across thelamellae, and either oscillated fairly regularly closely around theosteon axis with amplitudes ranging between approximately 30�and 65� (oscillating plywood), exhibited a less regular, asymmetri-cal oscillatory pattern (irregular oscillating plywood), or performedan n � 180� twist continuously at a well-defined rate (20–30� perlm) in either a clockwise or counter-clockwise direction (twistedplywood); (iii) the oscillating, irregular oscillating and twisted ply-wood arrangements coexisted in a consecutive manner and, in par-ticular, the outermost lamella of osteons was twisted, followed byoscillatory ones, which may have implications for the toughness;(iv) fibril orientation was not related to the local mass density.
These findings are expected to contribute to a deeper under-standing of the principles of the construction and structural adap-tation of lamellar bone tissue, and enhance our understanding ofthe principles of cellular construction during bone remodelling.The quantified fibril orientations provide accurate and direct inputfor homogenization methods to compute mechanical properties atcoarser length scales and may serve as templates for bio-inspiredmaterials with the aim of achieving optimal mechanical compe-tence [20]. To provide a more complete understanding of the fibril-lar pattern the proposed method should be applied to a largerpopulation of samples to investigate the influences of, for example,species, age, anatomical location, mechanical boundary conditions(e.g. load-bearing vs. non-load-bearing bones), and pathology. Thepresented approach has the potential to be used for 3-D character-ization of the structure of natural and artificial mineralized bioma-terials at the sub-micron scale.
Acknowledgements
The authors acknowledge the European Synchrotron radiationFacility for the beam time allocated in the long-term projectMD431 to acquire the SR PNT images used in this study. This workhas been conducted within the European Associated Laboratory‘‘Ultrasound Based Assessment of Bone’’ and was supported bythe Deutsche Forschungsgemeinschaft (SPP1420, grants Ra1380/7and Ge1894/3). We thank Cécile Olivier (Creatis, Lyon) for her helpin sample preparation. This work was partially supported by theLabEX PRIMES (‘‘Physics Radiobiology Medical Imaging and Simu-lation’’) of the Université de Lyon and funded by the French AgenceNationale de la Recherche.
Appendix A. Figures with essential colour discrimination
All figures in this article are difficult to interpret in black andwhite. The full colour images can be found in the on-line versionat http://dx.doi.org/10.1016/j.actbio.2013.05.015.
nsional orientation of mineralized collagen fibrils in human lamellar bone//dx.doi.org/10.1016/j.actbio.2013.05.015

10 P. Varga et al. / Acta Biomaterialia xxx (2013) xxx–xxx
Appendix B. Supplementary data
Supplementary data associated with this article can be found,in the online version, at http://dx.doi.org/10.1016/j.actbio.2013.05.015.
References
[1] Weiner S, Wagner HD. The material bone: structure–mechanical functionrelations. Annu Rev Mater Sci 1998;28:271–98.
[2] Fratzl P, Weinkamer R. Nature’s hierarchical materials. Prog Mater Sci2007;52:1263–334.
[3] Rho JY, Kuhn-Spearing L, Zioupos P. Mechanical properties and the hierarchicalstructure of bone. Med Eng Phys 1998;20(2):92–102.
[4] Robling AG, Castillo AB, Turner CH. Biomechanical and molecular regulation ofbone remodeling. Annu Rev Biomed Eng 2006;8:455–98.
[5] Ruffoni D, Fratzl P, Roschger P, Klaushofer K, Weinkamer R. The bonemineralization density distribution as a fingerprint of the mineralizationprocess. Bone 2007;40(5):1308–19.
[6] Giraud-Guille M-M, Besseau L, Martin R. Liquid crystalline assemblies ofcollagen in bone and in vitro systems. J Biomech 2003;36(10):1571–9.
[7] Rohrbach D, Lakshmanan S, Peyrin F, Langer M, Gerisch A, Grimal Q, et al.Spatial distribution of tissue level properties in a human femoral cortical bone.J Biomech 2012;45(13):2264–70.
[8] Wagner HD, Weiner S. On the relationship between the microstructure of boneand its mechanical stiffness. J Biomech 1992;25(11):1311–20.
[9] Hofmann T, Heyroth F, Meinhard H, Fränzel W, Raum K. Assessment ofcomposition and anisotropic elastic properties of secondary osteon lamellae. JBiomech 2006;39(12):2282–94.
[10] Reisinger AG, Pahr DH, Zysset PK. Principal stiffness orientation and degree ofanisotropy of human osteons based on nanoindentation in three distinctplanes. J Mech Behav Biomed Mater 2011;4(8):2113–27.
[11] Koester KJ, Ager JW, Ritchie RO. The true toughness of human cortical bonemeasured with realistically short cracks. Nat Mater 2008;7(8):672–7.
[12] Gebhardt W. Ueber funktionell wichtige Anordnungsweisen der groberen undfeineren Bauelemente des Wirbeltierknochens. Arch Entw Mech 1906;20:187–322.
[13] Ascenzi A, Bonucci E. The compressive properties of single osteons. Anat Rec1968;161(3):377–91.
[14] Goldman HM, Bromage TG, Thomas CDL, Clement JG. Preferred collagen fiberorientation in the human mid-shaft femur. Anat Rec A Discov Mol Cell EvolBiol 2003;272(1):434–45.
[15] Marotti G. A new theory of bone lamellation. Calcif Tissue Int 1993;53(Suppl.1):S47–56.
[16] Giraud-Guille MM. Liquid crystalline order of biopolymers in cuticles andbones. Microsc Res Tech 1994;27(5):420–8.
[17] Weiner S, Arad T, Sabanay I, Traub W. Rotated plywood structure of primarylamellar bone in the rat: orientations of the collagen fibril arrays. Bone1997;20(6):509–14.
[18] Spiesz EM, Roschger P, Zysset PK. Influence of mineralization andmicroporosity on tissue elasticity: experimental and numerical investigationon mineralized turkey leg tendons. Calcif Tissue Int 2012;90(4):319–29.
[19] Fabritius H-O, Sachs C, Triguero PR, Raabe D. Influence of structural principleson the mechanics of a biological fiber-based composite material withhierarchical organization: the exoskeleton of the lobster Homarusamericanus. Adv Mater 2009;21(4):391–400.
[20] Wang Y, Azaïs T, Robin M, Vallée A, Catania C, Legriel P, et al. The predominantrole of collagen in the nucleation, growth, structure and orientation of boneapatite. Nat Mater 2012;11(8):724–33.
[21] Bouligand Y. Twisted fibrous arrangements in biological materials andcholesteric mesophases. Tissue Cell 1972;4(2):189–217.
[22] Weiner S, Traub W, Wagner HD. Lamellar bone: structure–function relations. JStruct Biol 1999;126(3):241–55.
[23] Raum K, Grimal Q, Laugier P, Gerisch A. Multiscale structure–functionalmodeling of lamellar bone. Proc Meet Acoust 2011;9:1–15.
[24] Wagermaier W, Gupta HS, Gourrier A, Burghammer M, Roschger P, Fratzl P.Spiral twisting of fiber orientation inside bone lamellae. Biointerphases2006;1(1):1.
[25] Reisinger AG, Pahr DH, Zysset PK. Elastic anisotropy of bone lamellae as afunction of fibril orientation pattern. Biomech Model Mechanobiol2011;10(1):67–77.
[26] Spiesz EM, Kaminsky W, Zysset PK. A quantitative collagen fibers orientationassessment using birefringence measurements: calibration and application tohuman osteons. J Struct Biol 2011;176(3):302–6.
[27] Ascenzi MG, Ascenzi A, Benvenuti A, Burghammer M, Panzavolta S, Bigi A.Structural differences between ‘‘dark’’ and ‘‘bright’’ isolated human osteoniclamellae. J Struct Biol 2003;141(1):22–33.
Please cite this article in press as: Varga P et al. Investigation of the three-dimeusing synchrotron X-ray phase nano-tomography. Acta Biomater (2013), http:
[28] Ascenzi M-G, Lomovtsev A. Collagen orientation patterns in human secondaryosteons, quantified in the radial direction by confocal microscopy. J Struct Biol2006;153(1):14–30.
[29] Giraud-Guille MM. Twisted plywood architecture of collagen fibrils in humancompact bone osteons. Calcif Tissue Int 1988;42(3):167–80.
[30] Weiner S, Arad T, Traub W. Crystal organization in rat bone lamellae. FEBS Lett1991;285(1):49–54.
[31] Utku FS, Klein E, Saybasili H, Yucesoy CA, Weiner S. Probing the role of water inlamellar bone by dehydration in the environmental scanning electronmicroscope. J Struct Biol 2008;162(3):361–7.
[32] Boivin G, Meunier PJ. The degree of mineralization of bone tissue measured bycomputerized quantitative contact microradiography. Calcif Tissue Int2002;70(6):503–11.
[33] Gupta HS, Stachewicz U, Wagermaier W, Roschger P, Wagner HD, Fratzl P.Mechanical modulation at the lamellar level in osteonal bone. J Mater Res2006;21:1913–21.
[34] Kazanci M, Wagner HD, Manjubala NI, Gupta HS, Paschalis E, Roschger P, et al.Raman imaging of two orthogonal planes within cortical bone. Bone2007;41(3):456–61.
[35] Gourrier A, Wagermaier W, Burghammer M, Lammie D, Gupta HS, Fratzl P,et al. Scanning X-ray imaging with small-angle scattering contrast. J ApplCrystallogr 2007;40(s1):s78–82.
[36] Seidel R, Gourrier A, Kerschnitzki M, Burghammer M, Fratzl P, Gupta HS, et al.Synchrotron 3-D SAXS analysis of bone nanostructure. Bioinspired BiomimeticNanobiomater 2011;1:123–31.
[37] Faingold A, Cohen SR, Wagner HD. Nanoindentation of osteonal bone lamellae.J Mech Behav Biomed Mater 2012;9:198–206.
[38] Granke M, Gourrier A, Rupin F, Raum K, Peyrin F, Burghammer M, et al.Microfibril orientation dominates the microelastic properties of human bonetissue at the lamellar length scale. PLoS One 2013;8(3):e58043.
[39] Reznikov N, Almany-magal R, Shahar R, Weiner S. Three-dimensional imagingof collagen fibril organization in rat circumferential lamellar bone using a dualbeam electron microscope reveals ordered and disordered sub-lamellarstructures. Bone 2013;52(2):676–83.
[40] Faingold A, Cohen SR, Reznikov N, Wagner HD. Osteonal lamellae elementaryunits: lamellar microstructure, curvature and mechanical properties. ActaBiomater 2013;9(4):5956–62.
[41] Langer M, Pacureanu A, Suhonen H, Grimal Q, Cloetens P, Peyrin F. X-ray phasenanotomography resolves the 3D human bone ultrastructure. PLoS One2012;7:e35691.
[42] Stalling D, Westerhoff M, Hege H-C. Amira: a highly interactive system forvisual data analysis. In: Hansen CD, editor. The visualization handbook,Oxford, UK:Elsevier, 2005. p. 749–67.
[43] Wald MJ, Vasilic B, Saha PK, Wehrli FW. Study of trabecular bone microstructureusing spatial autocorrelation analysis. Proc SPIE 2005;5746:291–302.
[44] Varga P, Zysset PK. Assessment of volume fraction and fabric in the distalradius using HR-pQCT. Bone 2009;45(5):909–17.
[45] Hengsberger S, Kulik A, Zysset P. Nanoindentation discriminates the elasticproperties of individual human bone lamellae under dry and physiologicalconditions. Bone 2002;30(1):178–84.
[46] Gupta HS, Zioupos P. Fracture of bone tissue: the ‘‘hows’’ and the ‘‘whys’’. MedEng Phys 2008;30(10):1209–26.
[47] Peterlik H, Roschger P, Klaushofer K, Fratzl P. From brittle to ductile fracture ofbone. Nat Mater 2006;5(1):52–5.
[48] Ritchie RO. The conflicts between strength and toughness. Nat Mater2011;10(11):817–22.
[49] Fratzl-Zelman N, Roschger P, Misof BM, Pfeffer S, Glorieux FH, Klaushofer K,et al. Normative data on mineralization density distribution in iliac bonebiopsies of children, adolescents and young adults. Bone 2009;44(6):1043–8.
[50] Barth HD, Zimmermann EA, Schaible E, Tang SY, Alliston T, Ritchie RO.Characterization of the effects of X-ray irradiation on the hierarchical structureand mechanical properties of human cortical bone. Biomaterials 2011;32(34):8892–904.
[51] Nikolov S, Petrov M, Lymperakis L, Friák M, Sachs C, Fabritius H-O, et al.Revealing the design principles of high-performance biological compositesusing ab initio and multiscale simulations: the example of lobster cuticle. AdvMater 2010;22(4):519–26.
[52] Jensen TH, Bech M, Bunk O, Menzel A, Bouchet A, Le Duc G, et al. Molecular X-raycomputed tomography of myelin in a rat brain. Neuroimage 2011;57(1):124–9.
[53] Langer M, Liu Y, Tortelli F, Cloetens P, Cancedda R, Peyrin F. Regularized phasetomography enables study of mineralized and unmineralized tissue in porousbone scaffold. J Microsc 2010;238(3):230–9.
[54] Giuliani A, Manescu A, Langer M, Rustichelli F, Desiderio V, Paino F, et al. Threeyears after transplants in human mandibles, histological and in-lineholotomography revealed that stem cells regenerated a compact rather thana spongy bone: biological and clinical implications. Stem Cells Transl Med2013;2(4):316–24.
nsional orientation of mineralized collagen fibrils in human lamellar bone//dx.doi.org/10.1016/j.actbio.2013.05.015
Copyright © 2022 FDOKUMEN