Temperature dependence of electron magnetic resonance spectra of iron oxide nanoparticles...
10
Temperature dependence of electron magnetic resonance spectra of iron oxide nanoparticles mineralized in Listeria innocua protein cages Robert J. Usselman, Stephen E. Russek, Michael T. Klem, Mark A. Allen, Trevor Douglas et al. Citation: J. Appl. Phys. 112, 084701 (2012); doi: 10.1063/1.4757964 View online: http://dx.doi.org/10.1063/1.4757964 View Table of Contents: http://jap.aip.org/resource/1/JAPIAU/v112/i8 Published by the American Institute of Physics. Related Articles Magnetic and electrical properties of In doped cobalt ferrite nanoparticles J. Appl. Phys. 112, 084321 (2012) Effective magnetic anisotropy of annealed FePt nanoparticles Appl. Phys. Lett. 101, 172402 (2012) Perpendicular magnetic anisotropy in Nd-Co alloy films nanostructured by di-block copolymer templates J. Appl. Phys. 112, 083914 (2012) Size and polydispersity effect on the magnetization of densely packed magnetic nanoparticles J. Appl. Phys. 112, 073926 (2012) Modified Faraday rotation in a three-dimensional magnetophotonic opal crystal consisting of maghemite/silica composite spheres Appl. Phys. Lett. 101, 151121 (2012) Additional information on J. Appl. Phys. Journal Homepage: http://jap.aip.org/ Journal Information: http://jap.aip.org/about/about_the_journal Top downloads: http://jap.aip.org/features/most_downloaded Information for Authors: http://jap.aip.org/authors Downloaded 23 Oct 2012 to 132.163.52.20. Redistribution subject to AIP license or copyright; see http://jap.aip.org/about/rights_and_permissions
Transcript of Temperature dependence of electron magnetic resonance spectra of iron oxide nanoparticles...

Temperature dependence of electron magnetic resonance spectra of ironoxide nanoparticles mineralized in Listeria innocua protein cagesRobert J. Usselman, Stephen E. Russek, Michael T. Klem, Mark A. Allen, Trevor Douglas et al. Citation: J. Appl. Phys. 112, 084701 (2012); doi: 10.1063/1.4757964 View online: http://dx.doi.org/10.1063/1.4757964 View Table of Contents: http://jap.aip.org/resource/1/JAPIAU/v112/i8 Published by the American Institute of Physics. Related ArticlesMagnetic and electrical properties of In doped cobalt ferrite nanoparticles J. Appl. Phys. 112, 084321 (2012) Effective magnetic anisotropy of annealed FePt nanoparticles Appl. Phys. Lett. 101, 172402 (2012) Perpendicular magnetic anisotropy in Nd-Co alloy films nanostructured by di-block copolymer templates J. Appl. Phys. 112, 083914 (2012) Size and polydispersity effect on the magnetization of densely packed magnetic nanoparticles J. Appl. Phys. 112, 073926 (2012) Modified Faraday rotation in a three-dimensional magnetophotonic opal crystal consisting of maghemite/silicacomposite spheres Appl. Phys. Lett. 101, 151121 (2012) Additional information on J. Appl. Phys.Journal Homepage: http://jap.aip.org/ Journal Information: http://jap.aip.org/about/about_the_journal Top downloads: http://jap.aip.org/features/most_downloaded Information for Authors: http://jap.aip.org/authors
Downloaded 23 Oct 2012 to 132.163.52.20. Redistribution subject to AIP license or copyright; see http://jap.aip.org/about/rights_and_permissions

Temperature dependence of electron magnetic resonance spectra of ironoxide nanoparticles mineralized in Listeria innocua protein cages
Robert J. Usselman,1,a) Stephen E. Russek,1 Michael T. Klem,3,4 Mark A. Allen,5
Trevor Douglas,2,6 Mark Young,6,7 Yves U. Idzerda,5,8 and David J. Singel2,6
1National Institute of Standards and Technology, Boulder, Colorado 80305, USA2Department of Chemistry and Biochemistry, Montana State University, Bozeman, Montana 59717, USA3Department of Chemistry and Geochemistry, Montana Tech of the University of Montana, Butte, Montana59701, USA4Center for Advanced Supramolecular and Nanoscale Systems, Montana Tech of the University of Montana,Butte, Montana 59701, USA5Department of Material Science and Engineering, Massachusetts Institute of Technology, Cambridge,Massachusetts 02139, USA6Center for Bio-Inspired Nanomaterials, Montana State University, Bozeman, Montana 59717, USA7Department of Plant Sciences and Plant Pathology, Montana State University, Bozeman,Montana 59717, USA8Department of Physics, Montana State University, Bozeman, Montana 59717, USA
(Received 6 March 2012; accepted 12 September 2012; published online 16 October 2012)
Electron magnetic resonance (EMR) spectroscopy was used to determine the magnetic properties of
maghemite (c-Fe2O3) nanoparticles formed within size-constraining Listeria innocua (LDps)-
(DNA-binding protein from starved cells) protein cages that have an inner diameter of 5 nm.
Variable-temperature X-band EMR spectra exhibited broad asymmetric resonances with a
superimposed narrow peak at a gyromagnetic factor of g� 2. The resonance structure, which
depends on both superparamagnetic fluctuations and inhomogeneous broadening, changes
dramatically as a function of temperature, and the overall linewidth becomes narrower with
increasing temperature. Here, we compare two different models to simulate temperature-dependent
lineshape trends. The temperature dependence for both models is derived from a Langevin behavior
of the linewidth resulting from “anisotropy melting.” The first uses either a truncated log-normal
distribution of particle sizes or a bi-modal distribution and then a Landau-Liftshitz lineshape to
describe the nanoparticle resonances. The essential feature of this model is that small particles have
narrow linewidths and account for the g� 2 feature with a constant resonance field, whereas larger
particles have broad linewidths and undergo a shift in resonance field. The second model assumes
uniform particles with a diameter around 4 nm and a random distribution of uniaxial anisotropy
axes. This model uses a more precise calculation of the linewidth due to superparamagnetic
fluctuations and a random distribution of anisotropies. Sharp features in the spectrum near g� 2 are
qualitatively predicted at high temperatures. Both models can account for many features of the
observed spectra, although each has deficiencies. The first model leads to a nonphysical increase in
magnetic moment as the temperature is increased if a log normal distribution of particles sizes is
used. Introducing a bi-modal distribution of particle sizes resolves the unphysical increase in
moment with temperature. The second model predicts low-temperature spectra that differ
significantly from the observed spectra. The anisotropy energy density K1, determined by fitting the
temperature-dependent linewidths, was �50 kJ/m3, which is considerably larger than that of bulk
maghemite. The work presented here indicates that the magnetic properties of these size-constrained
nanoparticles and more generally metal oxide nanoparticles with diameters d< 5 nm are complex
and that currently existing models are not sufficient for determining their magnetic resonance
signatures. VC 2012 American Institute of Physics. [http://dx.doi.org/10.1063/1.4757964]
I. INTRODUCTION
Magnetic nanoparticles have attracted substantial inter-
est in nanoscience with applications in technologies such as
biological and chemical sensing,1 molecular magnetic reso-
nance imaging,2 remote-controlled drug delivery,3 and cellu-
lar targeting.4 Magnetic properties of nanostructures are
highly dependent on their size, shape, composition, and
topology. The controlled synthesis of nanostructures with a
particular size, shape, and morphology thus remains a central
goal. Bio-mimetic mineralization within protein cages is an
attractive approach for nanoparticle synthesis, because par-
ticles are limited to the cage inner diameter.5,6 Bio-mimetic
mineralization has facilitated much interest in material syn-
thesis based on molecular interactions between organic
super-molecular assemblies and inorganic minerals.7 Protein
cages provide a scaffold for preparing different metal
a)Author to whom correspondence should be addressed. Electronic mail:
[email protected]. Tel.: 303-497-4975. Fax: 303-497-5316.
0021-8979/2012/112(8)/084701/9/$30.00 VC 2012 American Institute of Physics112, 084701-1
JOURNAL OF APPLIED PHYSICS 112, 084701 (2012)
Downloaded 23 Oct 2012 to 132.163.52.20. Redistribution subject to AIP license or copyright; see http://jap.aip.org/about/rights_and_permissions

compositions having unique magnetic characteristics.8–10
Moreover, the protein shell surrounding the nanoparticles
presents a uniform spatial array of amino-acid side-chains
for genetic modification,4,11 further synthetic processing
such as covalently attaching relevant functional groups,12,13
or a combination thereof.14 Characterization of metal oxides
mineralized within protein cages is essential to understand,
design, and fabricate tailored magnetic properties for utiliza-
tion in bio-nanotechnologies.
Transition-metal oxide nanoparticles exhibit properties,
including superparamagnetic relaxation and a large fraction
of surface spins, different from bulk magnetism and molecu-
lar paramagnetism. Superparamagnetic properties are meas-
ured by use of established methods such as AC susceptibility,
M€ossbauer spectroscopy, magnetometry, neutron scattering,
and electron magnetic resonance (EMR) spectroscopy.15–17
The term EMR is used instead of electron paramagnetic reso-
nance or ferromagnetic resonance to emphasize that superpar-
amagnetic particles fall between these two well-understood
regimes. Previous efforts have been recently reviewed to pro-
vide a unified view of the magnetic properties of nanopar-
ticles by EMR spectroscopy with quantum and classical
approaches.18 The interface between the quantum and classi-
cal regimes remains a fruitful area of research to understand
the magnetic properties of molecular nanomagnets and mag-
netic nanoparticles and to observe the possible coexistence of
classical and quantum phenomena.19
An increasing number of investigations use EMR spec-
troscopy to determine magnetic moment distributions and
anisotropic energies of nanoparticles. Several routes have
emerged to address lineshape trends in EMR spectra: in par-
ticular, lineshape analysis to determine magnetic moment dis-
tributions20–22 and resonant field shifts to describe the
anisotropy energies23,24 and surface quantum effects.19,25,26
Often, bulk values for the magnetization and magnetocrystal-
line anisotropy are used as fixed parameters to assess EMR
temperature-dependent magnetic-moment distributions.21
There has long been speculation as to whether the bulk mag-
netization values are appropriate to describe nanoparticle
magnetic properties.27 For example, as the particle size
decreases, reduced bonding leads to a loss in spin exchange
sufficient to induce surface spin disorder, resulting in surface
anisotropy that contributes significantly to the bulk volumet-
ric magnetocrystalline anisotropy.28 Current evidence sup-
ports the need for a comprehensive model to describe the
magnetic properties in this size regime.18
This investigation presents variable-temperature EMR
spectra of size-constrained c-Fe2O3 iron oxide nanoparticles.
The spectra were simulated by use of existing models in an
attempt to characterize the nature of the magnetic anisotropy,
calculate the magnitude of the anisotropy energy K1, deter-
mine the particle magnetization as a function of temperature,
and estimate the particle size distribution. Listeria innocua(LDps)-(DNA-binding protein from starved cells), which is a
spherical protein with an inner diameter of 5 nm, was used as
a size-constraining template to synthesize iron-oxide nano-
particles. Nanoparticles formed within protein cages provide
an opportunity to place a size limit on the largest nanopar-
ticles. The cage-limited maximum particle size was used as a
fixed parameter in spectral simulations. The concept of size-
limited nanoparticles is in contrast to most nanoparticle sys-
tems where controlling the upper size without a template
presents a difficult synthesis challenge.
Previous magnetometry measurements of these particles
indicate that the particles are not simple superparamagnetic
particles, but rather the magnetic system seems to be com-
posed of superparamagnetic cores and a roughly comparable
moment contained in non-saturated paramagnetic species.29
Zero-field cooled (ZFC)/field-cooled (FC) magnetization
data further show a sharp bifurcation of the ZFC/FC curves,
confirming that there is an abrupt cut-off in the particle size.
The blocking temperature of the superparamagnetic cores,
determined from the ZFC/FC data, is �4 K, which yielded
an anisotropy energy of K1¼ 40 kJ/m3. Since the measured
anisotropy energy is much larger than the cubic bulk anisot-
ropy for c-Fe2O3, we will assume in this paper that the ani-
sotropy is uniaxial, due to surface magnetic properties.30 The
low blocking temperature and the sharp bifurcation indicate
that this nanoparticle system is among the smallest and most
uniform of all nanostructures studied, with the exception of
molecular nanomagnets.
Theoretical interpretation of EMR variable-temperature
spectra in small metal-oxide nanoparticles remains an intrac-
table problem that requires an emendation of the current lead-
ing models. We compare and contrast two theories (static and
kinetic) to simulate the variable-temperature EMR data of
iron oxide nanoparticles in a size-constraining vessel. Both
models describe the temperature dependence as derived from
a Langevin behavior of the saturated linewidth ensuing from
“anisotropy melting.” The first is a formalism developed by
Berger et al. with an added constraint that imposes a volume
limit.15 This model uses a distribution of particle sizes and a
Landau-Liftshitz lineshape to describe the individual nanopar-
ticle resonances. The essential feature of this model is that
small particles have narrow linewidths and a constant resonant
field at g� 2. Large particles have a broad linewidth and shift
in resonant frequency as a function of temperature. The sec-
ond model, developed by Raikher and Stepanov, uses a
Fokker-Planck formalism to average over both thermal fluctu-
ations and the particle distribution of anisotropy axes.31 For
this model, we assume uniform particles with a diameter
around 4 nm and a random uniaxial anisotropy. A sharp fea-
ture near g� 2 is predicted at higher temperatures, but there
are significant deviations from the experimental data.
Prominent two-component lineshapes are often observed
in typical EMR spectra of metal oxide nanoparticles with
diameters d< 15 nm.20–22,25,32,33 Both models investigated
here can account for a number of observed spectral features,
but each has deficiencies. The first model leads to a nonphys-
ical increase in lp as the temperature is increased if a stand-
ard log-normal distribution of particle sizes is assumed. Prior
multi-frequency EMR experiments showed that the particle
magnetization values, obtained with the Berger formalism,
were larger than bulk magnetization values for 5 nm LDps
particles.15 The second model, which more accurately
accounts for the particle fluctuations and ensemble broaden-
ing, predicts low-temperature spectra that are quite different
from the observed lineshape trends. Our work indicates that
084701-2 Usselman et al. J. Appl. Phys. 112, 084701 (2012)
Downloaded 23 Oct 2012 to 132.163.52.20. Redistribution subject to AIP license or copyright; see http://jap.aip.org/about/rights_and_permissions

these size-constrained nanoparticle systems and, more gener-
ally, metal oxide nanoparticles with diameters d< 5 nm have
complex magnetic properties and that previous theoretical
efforts have difficulty modeling metal oxide magnetic reso-
nance signatures across a wide temperature range.
II. EXPERIMENTAL
Iron-oxide nanoparticles were synthesized by use of
LDps spherical protein cages as a mineralization nano-
template with a nominal inner diameter of 5 nm. Transmission
electron microscopy (TEM) confirmed the encapsulation of
the iron oxide nanoparticles within the protein cages that have
an average diameter of 4.1 6 1.1 nm.34 Details of the minerali-
zation and characterization have been described elsewhere for
iron oxide nanoparticles mineralized within LDps.34 X-band
(�9.2 GHz) continuous-wave EMR spectra were recorded on
a commercial spectrometer for linearly polarized microwave
excitation and field modulation; hence, the EMR spectra I(Ba)
are proportional to the derivative of the imaginary part of the
magnetic susceptibility IðBaÞ / ddBaðv00þþv00�
2Þ; where v00þ and v00�
are, respectively, the imaginary parts of the magnetic suscep-
tibility for right- and left-circularly polarized excitations.
Temperature was controlled by means of a commercial cryo-
stat. The particles were in a frozen water solution with a con-
centration of approximately 0.3 mg/ml or 1.3 lM of protein
cages. The samples were cooled in zero magnetic field, and
the spectra were recorded with 10 mW power and 1 mT mod-
ulation amplitude at a frequency of 100 kHz. The tempera-
tures did not exceed the melting point of the water solution,
which if present would add additional motional effects to the
spectra.
III. EMR THEORY FOR NANOPARTICLES
Yulikov et al. describe the two main approaches for
calculating superparamagnetic spectra: the kinetic and static
methods.35 The static model, formulated by Berger
et al.,20,22 is more phenomenological and generally describes
the lineshape trends as a function of temperature21,36 and fre-
quency.15 The kinetic method, as discussed by Raikher and
Stepanov,37 calculates the moment-distribution function in
the presence of both superparamagnetic fluctuations and en-
semble broadening due to a distribution in anisotropy
axes.31,37 Other models include an improved static model to
describe the decrease in the magnetic anisotropy as tempera-
ture increases35 and a theory for surface quantum effects.25
Here, we first use the Berger formalism to describe the EMR
lineshape trends and magnetic properties of iron oxide nano-
particles. While quality fits to the data can be made, there
are concerns about the physical interpretation of the parame-
ters resulting from the fits. Next, we simulate the data by
means of the Raikher-Stepanov model and obtain qualitative
agreement with the experimental data at 225 K but substan-
tial deviation at lower temperatures.
A. Berger model
This model assumes an ensemble of non-interacting sin-
gle-domain particles of moment lp, volume V, with (for the
case considered here) randomly oriented anisotropy axes.
For each nanoparticle, the magnetization dynamics are
described by the Landau-Lifshitz (LL) equation of motion22
d
dt~M ¼ c � ~M � ~Beff �
acMs� ~M � ð~M � ~BeffÞ; (1)
where ~M ¼ lp!=V is the particle magnetization, Beff is the
effective field, which is the sum of the applied static, micro-
wave, and anisotropy fields, c is the gyromagnetic ratio, a is
the damping parameter, and Ms is the saturation magnetiza-
tion. Reference 21 includes a discussion of several other
phenomenological equations of motion; however, we will
focus only on the LL equation, because it provided the best
description of a single magnetic nanoparticle. If the applied
static field is sufficient to saturate the magnetization,
Eq. (1) leads to the normalized absorption lineshape, which
is proportional to the imaginary part of the magnetic
susceptibility22
v00LL6ðB;B0;DBÞ ¼1
pB2
0DB
ðB7B0Þ2B20 þ B2D2
B
; (2)
where 6 refers to right- and left-circular polarization, B0 is
the resonant field, and a linewidth parameter DB is the half-
width at half-amplitude of the resonance. For a single parti-cle obeying LL dynamics this homogenoues linewidth is
related to the damping parameter by DB¼ aB0. For a low
damping rate and hence narrow linewidth, B0�DB, the line-
shape simplifies to a Lorentzian lineshape with no shift in
resonant frequency, whereas the resonant field shifts slightly
to lower field values for broad resonance linewidths. This is
in contradistinction to the Landau-Lifshitz-Gilbert formalism
which has an explicit coupling of the resonance frequency to
the damping causing a large decrease in resonance frequency
for large damping values (a> 0.5). Given the large inhomo-
geneous broadening, the details of the individual line shape
are not of importance.
The absorption intensity I in an applied magnetic field
Ba is the sum of all particle resonances weighted by the parti-
cle volume amplitude22
IðBaÞ ¼Xvmax
i
Fi½Ba;B0;DBðVÞ� � fv; (3)
where Fi is the angle-dependent individual lineshape for the
ith nanoparticle with a volume Vi, B0 is the ensemble reso-
nant field, fv is the volume distribution function, and DBi is
the individual linewidth. The main assumption in this model
is that the resonance lineshape averaged over all particles
with a volume Vi are given by the LL susceptibility. This
assumption is not in general true, as discussed in the Sec. III B,
if the inhomogeneous broadening is much greater that the
homogenous broadening. The absorption intensity is then
given by
IðBaÞ ¼d
dBa
ðV
v00LL � fv � dV; (4)
084701-3 Usselman et al. J. Appl. Phys. 112, 084701 (2012)
Downloaded 23 Oct 2012 to 132.163.52.20. Redistribution subject to AIP license or copyright; see http://jap.aip.org/about/rights_and_permissions

where v00LL is related to the imaginary part of the susceptibility.
A decrease in the linewidth DB is assumed for decreas-
ing particle size due to more effective thermal averaging of
the anisotropy in small particles. Spectral narrowing can be
taken into account by introducing a size- and temperature-
dependent linewidth by the expression21
DB ¼ D0 � GðyÞ � L1ðnÞ;
LðnÞ ¼ coth n� 1
n;
GðyÞ ¼ 1� 3y�1cothyþ 3y�2
coth y - y�1; (5)
where n ¼ MsVBa
kBT ; y ¼ K1Vs
kBT . In Eq. (5), LðnÞ is the Langevin
function and G(y) is called the superparamagnetic averaging
factor for uniaxial anisotropy,30,38 D0 is the saturation line-
width at 0 K, and Vs is a reference volume taken as the great-
est volume in the statistical ensemble. Figure 1 is a plot of
the predicted linewidth versus particle diameter for two dif-
ferent temperatures, 10 K and 225 K. The correctness of this
functional form is debated in the literature, although all mod-
els qualitatively agree on the linewidth narrowing due to
thermal fluctuations averaging the anisotropy over phase
space.
The distribution of particle sizes and their accompany-
ing magnetic properties lead to characteristic features in their
EMR spectra. In characterizing the response of an ensemble
of particles, we first assume a truncated log-normal volume
distribution fv of the magnetic moments lp. The distribution
is modeled by the volume mode Vmode, logarithmic variance
r, a minimum volume Vmin, and maximum volume Vmax
value, which is limited to the inner diameter of the protein
cage. A bi-modal volume distribution function was also used
to describe the EMR spectra, and we highlight the advan-
tages when a two-component distribution function is used in
the nanoparticle EMR lineshape simulations.
B. Raikher-Stepanov model
The Raikher-Stepanov (RS) model also assumes single-
domain particles whose dynamics obey the LL equation of
motion. The model is based on solutions to the Fokker-
Planck equation and calculates the orientational distribution
function in the presence of both thermal fluctuations and a
distribution of easy axes. The dynamic susceptibility is then
calculated from the equation of motion of the average none-
qulibrium magnetization. For the case of particles with uni-
axial anisotropy with a uniform distribution of anisotropy
axes, analytic expressions for the complex susceptibility
(Eq. (6) and coefficients are derived from Ref. 31) are
obtained
v¼n lolp
2
VkbT
B
Dþ 2A�B
2C�D� B
D
� �arctg½3D=ð2C�DÞ�1=2
½3D=ð2C�DÞ�1=2
( );
(6)
where the complex coefficients are given by
A ¼ 1� 1
nþ i
a
� �L1;
B ¼ 2K1V
3kbT
3
n2� 1
nþ i
a
� �dL2
dn
� �;
C ¼ 2ixsþ nL1
� 1
� �� i
an;
D ¼ 2K1V
3kbT
1
L21
3� nd
dn� 3
i
aL1
� �L2:
Here, n¼lpBa/kBT, the characteristic orientational diffusion
period of the magnetic moment is given by s ¼ l=2acekBT,
and L1 and L2 are defined as averages of the first and second
Legendre polynomials over the unit sphere
L1ðnÞ ¼ hcoshi ¼ d
dn
�ln�
Z0ðnÞ��;
L2ðnÞ ¼D cosh2 � 1
2
E¼ 3
2
1
Z0ðnÞd2
dn2Z0ðnÞ
� �� 1
2;
where the partition function Z0 is
Z0ðnÞ ¼2pnðen � e�nÞ:
As shown in Ref. 31, these equations predict, for the imagi-
nary part of the susceptibility, a broad asymmetric “powder
pattern” at low temperatures, due to the distribution of ani-
sotropy axes (an example powder pattern is shown in Figure
6(a)). There are more particles with easy axes perpendicular
to the field and moment direction, which for positive K1,
have lower resonant frequencies. For this case, there is more
spectral weight at high field values (low frequencies). When
K1 is negative, the resonant frequencies of particles with
easy axes perpendicular to the field direction have higher res-
onant frequencies, hence there is more spectral weight at lowFIG. 1. EMR linewidth as a function of volume, which compares the Berger
and RS models at 10 K and 225 K.
084701-4 Usselman et al. J. Appl. Phys. 112, 084701 (2012)
Downloaded 23 Oct 2012 to 132.163.52.20. Redistribution subject to AIP license or copyright; see http://jap.aip.org/about/rights_and_permissions
fields. Thus, the resonant field shift is determined by the sign
of the anisotropy constant.
For small particles or at higher temperatures, as dis-
cussed above, thermal fluctuations induce a melting of the
anisotropy that leads to the narrowing of the linewidths as
temperature increases. The RS calculation indicates that
there is a thermal-fluctuation-induced reduction of the ani-
sotropy constant such that K1eff ¼ K1L2ðnÞ=L1ðnÞÞ and a
concomitant reduction in the inhomogeneous linewidth given
approximately by dBu ¼ 3K1eff ðn0Þ=Ms, where n0¼MsVx/
ckBT represents n evaluated at the resonance field and
x¼ 2pt. The decrease in linewidth due to anisotropy melt-
ing is qualitatively similar to, but quantitatively different
from, the Berger model. The RS model further predicts that
as n decreases below �1, the reduction of the inhomogene-
ous linewidth gives way to an increase in linewidth, due to
fluctuation broadening. In this limit, the particle’s moment
rapidly fluctuates from one orbit to another, and these rapid
fluctuations dominate the linewidth. This competition results
in a minimum linewidth for n ffi 1 (see Figure 1). The Berger
model does not account for fluctuation broadening and
assumes a monotonic reduction of the linewidth as ndecreases.
IV. RESULTS
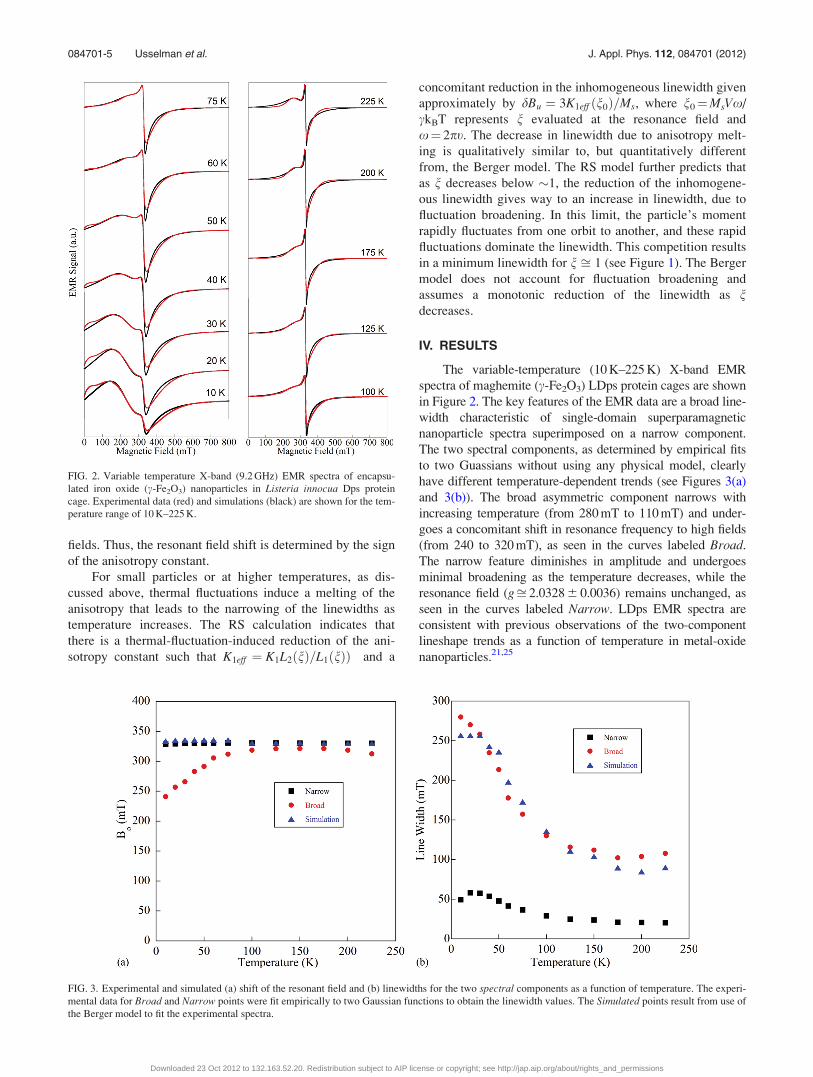
The variable-temperature (10 K–225 K) X-band EMR
spectra of maghemite (c-Fe2O3) LDps protein cages are shown
in Figure 2. The key features of the EMR data are a broad line-
width characteristic of single-domain superparamagnetic
nanoparticle spectra superimposed on a narrow component.
The two spectral components, as determined by empirical fits
to two Guassians without using any physical model, clearly
have different temperature-dependent trends (see Figures 3(a)
and 3(b)). The broad asymmetric component narrows with
increasing temperature (from 280 mT to 110 mT) and under-
goes a concomitant shift in resonance frequency to high fields
(from 240 to 320 mT), as seen in the curves labeled Broad.
The narrow feature diminishes in amplitude and undergoes
minimal broadening as the temperature decreases, while the
resonance field (gffi 2.0328 6 0.0036) remains unchanged, as
seen in the curves labeled Narrow. LDps EMR spectra are
consistent with previous observations of the two-component
lineshape trends as a function of temperature in metal-oxide
nanoparticles.21,25
FIG. 2. Variable temperature X-band (9.2 GHz) EMR spectra of encapsu-
lated iron oxide (c-Fe2O3) nanoparticles in Listeria innocua Dps protein
cage. Experimental data (red) and simulations (black) are shown for the tem-
perature range of 10 K–225 K.
FIG. 3. Experimental and simulated (a) shift of the resonant field and (b) linewidths for the two spectral components as a function of temperature. The experi-
mental data for Broad and Narrow points were fit empirically to two Gaussian functions to obtain the linewidth values. The Simulated points result from use of
the Berger model to fit the experimental spectra.
084701-5 Usselman et al. J. Appl. Phys. 112, 084701 (2012)
Downloaded 23 Oct 2012 to 132.163.52.20. Redistribution subject to AIP license or copyright; see http://jap.aip.org/about/rights_and_permissions

The Berger model (Eqs. (1)–(5)) was used to calculate
the variable-temperature EMR spectra and can describe the
lineshape trends for both spectral components of LDps iron
oxide nanoparticles.22 The linewidths and resonant field
shifts for both broad and narrow components are well-
described with an ensemble of Landau-Liftshitz lineshape
functions (Eq. (4)). The apparent resonant field shifts to
lower fields for large linewidths at low temperatures but
remains constant for linewidths much smaller than the reso-
nant field (B0 �DB). The fitting parameters for a truncated
log-normal distribution, derived from minimizing the sum of
squares, were Vmode¼ 65.45 nm3 (d¼ 5 nm), with a volume
distribution of r¼ 0.6 6 0.1 and a minimum volume of
0.37 nm3 (d¼ 0.89 nm). The adjustable parameters for each
temperature were Ms and DT, while the maximum diameter
was constant at the inner dimensions of the cage.
The spectral parameters and constraints that are used to
fit the experimental data determine the overall simulated Lan-
gevin function temperature trend (see Figure 4(a)). The mag-
netization Ms and temperature T parameters change the
curvature of the simulated Langevin functions, which describe
the evolution of the line broadening in the EMR variable-
temperature spectra. The saturating linewidth decreases as
temperature increases, consistent with anisotropy melting.
The experimental linewidth trends are modeled by assuming a
volume-dependent Langevin function; however, the physical
correctness of this functional form is questionable.33 Large
particles at the asymptote of the Langevin function, n> 1,
have the same saturated linewidth and, therefore, are spec-
trally insensitive to size variations. Small particles or narrow
linewidths are more sensitive to the linear region of the Lan-
gevin function, n< 1, and are more diagnostic of the smaller
volume ensemble distribution.15
The temperature dependence of the magnetization Ms pa-
rameter results from imposing a size constraint (protein cage)
(see Figure 5(a)). The values are similar to bulk magnetism
(370 kA/m) from 10 K to 60 K and increase drastically above
60 K to an unrealistic value of �9100 kA/m at 225 K. A mag-
netic moment that increases to such high values as a function
of temperature is a nonphysical result. The nonphysical result
of an increasing magnetic moment can be rectified by aban-
doning a log-normal distribution function and making use of a
two-component distribution function (see Figure 4(b)). The
two-component function is essentially two discrete volumes
(linewidths) instead of a continuous distribution of particle
sizes. Figure 4(b) inset shows a spectral fit at 50 K with a two-
component distribution function. The fitting quality is similar
to the log-normal distribution data across the entire tempera-
ture range. Assuming bulk magnetization, the spectra were fit
to a diameter d¼ 4.0 nm with a weight of 88% 6 4%. The
narrow component fit resulted in a diameter d¼ 1.9 6 0.3 nm
with 12% 6 4% weighting. With the present data, we cannot
determine whether the narrow spectrum is due to a small
superparamagnetic magnetic moment (d< 2 nm) or is from
surface spins on a superparamagnetic core. We caution
against the assertion that the compared integrated areas imply
a small population of the narrow component, because we do
not know the origin of the line broadening for the narrow
component.
The mechanism that leads to a decrease in the saturating
linewidths (DT) as a function of temperature has been de-
scribed by the superparamagnetic averaging factor (Eq. (5))
for uniaxial anisotropy.30,38 Here, we neglected the tempera-
ture dependence of K1, and the saturating linewidth DT was
fit to the equation DT¼D0G(K1Vs/kbT) with Vs¼ 65.4 nm3
(see Figure 5(b)). The saturation linewidth varied from
240 mT to 90 mT in the corresponding temperature range of
10 K–225 K. The anisotropy energy K1 was 52 kJ/m3, which
is considerably higher than the cubic anisotropy energy of
�4.7 kJ/m3, and suggests that other anisotropic effects are
present, such as surface anisotropy. Surface anisotropy may
contribute to the volumetric magnetocrystalline anisotropies,
FIG. 4. (a) Simulated Langevin functions used to generate the X-band EMR lineshape fits of Listeria innocua Dps iron oxide nanoparticles. (b) An illustration
of the log-normal (r¼ 0.6 6 0.1) and two-component weighted distribution functions. The inset is simulated (black) and experimental (red) spectra at 50 K
based on a two-component distribution function.
084701-6 Usselman et al. J. Appl. Phys. 112, 084701 (2012)
Downloaded 23 Oct 2012 to 132.163.52.20. Redistribution subject to AIP license or copyright; see http://jap.aip.org/about/rights_and_permissions

which become more pronounced in samples with relatively
small nanoparticles (d< 10 nm).17
RS Model linewidth simulations for the temperature
range are shown in Figure 5(b), and the predicted absorption
spectra at three temperatures are shown in Fig. 6(a). The
parameters used in the calculations were lp¼ 1200lB,
Ms¼ 330 kA/m, d¼ 4.0 nm, a¼ 0.01, K1¼ 40 kJ/m3,
t¼ 9.37 GHz. The resonance absorption linewidth is given by
dB ffi 3K1
MsBrat low temperatures. The derivative of the suscep-
tibility, which corresponds to the measured EMR spectra, is
shown in Figs. 6(b) and 6(c). The derivative highlights the
onset of resonance at low field and a second peak occurring
near g� 2. The calculated spectra at 225 K qualitatively repli-
cate the measured spectra in that there is a sharp feature at
g� 2 and spectral weight extending to low fields. However,
the low-temperature spectra show considerable deviation
without accurately describing the variable-temperature line-
shape trends of the two-component experimental spectra.
Including a second small component into the RS model will
provide a g¼ 2 feature at lower temperatures; however, the
detailed lineshape cannot be explained without allowing for a
distribution in particle sizes or anisotropy energies.
V. DISCUSSION
The EMR frequency and temperature spectral analysis
remains under considerable debate for determining nanopar-
ticle size distributions and magnetic properties.18 In particular,
the theoretical treatment needs improvement to accurately
describe the spectral trends for the two-component lineshape
structure of the EMR spectra in metal oxide nanoparticles.15
We have previously reported the multi-frequency spectral
evolution of three different-sized protein cages and suggested
that the narrow component in the spectra is most likely due to
small nanoparticles, in accordance with the Berger model.
The Landau-Liftshitz lineshape function follows the correct
shift in the resonant field as a function of linewidth, with
larger linewidth peaks being shifted to lower fields. However,
the use of the Landau-Liftshitz lineshape, which gives homo-
geneous broadening, to predict shifts in the resonance field is
questionable since the broadening is due to inhomogeneous
effects. The correlation between the observed line width and
resonant frequency is most likely due to the temperature de-
pendence of the anisotropy energy.
The physical constraint of volume limits can be consid-
ered a special treatment of the Berger model. Koseoglu et al.evaluated trends in Ms and K1 as a function of nanoparticle
size, assuming bulk magnetization values.36 In non-
constraining simulations, the “largest” particles are an
important modeling parameter that result in the entire nano-
particle ensemble being modeled as having bulk magnetiza-
tion properties.21,36 Here, the size distribution and magnetic
properties were modeled by limiting the largest particle size
to the inner diameter of the protein cage. We fixed the largest
particles to the inner diameter of the protein cage and
FIG. 5. (a) Temperature dependence of the magnetization of a 5 nm encapsulated nanoparticle determined from fits to the Berger model. With a truncated log-
normal volume distribution, departure from bulk magnetization values occurs around 60 K with the moment continuing to nonphysical values at 225 K. A two-
component distribution function showed no departure from bulk magnetization values. (b). Temperature dependence of the saturating linewidth parameter (DT)
and the theoretical fit using the superparamagnetic averaging factor (Eq. (5)). The magnetocrystalline energy, with a reference volume of 65.4 nm3, is approxi-
mately 52 kJ/m3. RS simulation by use of parameters described in the text with a¼ 0.01.
FIG. 6. The temperature dependence of the susceptibility predicted for the
RS model (top). Comparison of the derivative of the susceptibility for RS
and experimental data at 225 K (middle) and 30 K (bottom).
084701-7 Usselman et al. J. Appl. Phys. 112, 084701 (2012)
Downloaded 23 Oct 2012 to 132.163.52.20. Redistribution subject to AIP license or copyright; see http://jap.aip.org/about/rights_and_permissions

parametrically adjusted Ms and DT to simulate the experi-
mental data. The truncation of particle size provides insight
into a specific case of the static model and treatment of the
magnetic resonance data for nanoparticles of d< 5 nm. The
maximum volume dependence is intrinsic to the Berger for-
malism and underscores the importance of “size limits” to
understand EMR spectral results in metal-oxide nanoparticle
systems. A nonphysical increase in the magnetic moment
with increasing temperature was observed by applying size
constraints with a log-normal distribution of particles in the
Berger model (see Figure 5(a)).
A nonphysical temperature-dependent magnetic moment
lp has been notably observed in nanoparticles by use of
magnetometry,39 where moments increase with increasing
temperature. We previously have shown that the
temperature-dependent magnetic moment in magnetometry
may be rectified by abandoning a particle log-normal distri-
bution of sizes and model the particles with a core moment
and surface spins.29 The analogous ad hoc assumption can
also be applied to the EMR spectra, where the data were
modeled with a two-component distribution function. A bi-
modal volume distribution gives similar fitting results as the
lognormal distribution of particle volumes (see Figure 4(b)),
without the nonphysical increase in magnetic moment across
the entire temperature range (see Figure 5(a)). However, the
physical interpretation of the narrow component is yet debat-
able, because it clearly follows temperature trends different
from the broad component or paramagnetic iron spectra. As
a result, the true origin for the narrow component is
unknown; i.e., either a small population of nanoparticles
at� 2 nm or collectively from surface spins.
The narrow component has been attributed to smaller
nanoparticles32,40 or is perhaps due to surface spins in which
the smallest particles of <100 nm3 have a high surface-to-
volume ratio.25,26 Nanoparticles consisting of a few unit
cells may require the spin Hamiltonian formalism to give an
accurate description of the EMR lineshapes, similar to the
theoretical treatment molecular nanomagnets.18 Such nano-
particle structures would most likely have a resonant field
that is invariant with respect to the angular dependence of
the applied magnetic field, with minimal resonant influence
from a weak magnetic core. Li et al. performed EMR on
LDps iron oxide nanoparticles and showed no angle-
dependence on the resonance position for the narrow compo-
nent. The results suggested that the narrow component is due
to a population of paramagnetic ion nucleation clusters.30
For the broad component, Li et al. found evidence of uniax-
ial anisotropy by measuring the angle dependence and cal-
culated an anisotropy value of K1¼ 42.7 kJ/m3 at 76 K.30
They showed that anisotropy energy density increases with
decreasing particle size, supporting the importance of sur-
face anisotropy. Our results on the same system are compa-
rable from variable temperature EMR spectra with
K1¼ 52 kJ/m3 and magnetometry with K1¼ 40 kJ/m3. There-
fore, small nanoparticles may have considerable surface
effects that contribute to the increase in anisotropy energy.
The model of Raikher and Stepanov uses a more precise
calculation of the linewidth that includes a spectral competi-
tion between superparamagnetic fluctuations (homogeneous
broadening) and a random distribution of anisotropies as a
function of temperature (inhomogeneous broadening). As
temperature rises, the RS model predicts that the orienta-
tional fluctuations weaken the inhomogeneous broadening
arising from a distribution of anisotropy axes and strengthen
the homogenous-superparamagnetic broadening. A powder-
pattern spectrum is calculated at low temperatures with the
asymmetry determined by the sign of the anisotropy energy
(see Figure 6). As temperature increases, the spectrum shows
qualitative agreement with the two-component spectra and
eventually collapses into a single Lorentzian lineshape.
However, a single Gaussian lineshape is experimentally
observed for large nanoparticles and at high magnetic
fields.15,33 The Landau-Liftshitz lineshape function also pre-
dicts a Lorentzian lineshape at higher temperatures and
larger particles.
In contrast to paramagnetic broadening as temperature
increases, superparamagnetic anisotropies undergo motional
averaging due to thermal fluctuations of magnetic moments.21
Motional averaging requires the thermal fluctuation period to
be faster than the resonant period, which is not the case in
this temperature range, based on integration of the stochastic
Langevin equation.41 Therefore, we prefer the analogy of
“anisotropy melting” presented by Raikher and Stepanov for
describing spectral narrowing in superparamagnetic particles
EMR spectra.31 The spectral behavior of the narrow compo-
nent displays temperature-dependent trends that are charac-
teristic of neither paramagnetic iron, iron-sulfur clusters,42
nor superparamagnetic nanoparticles.43 The narrow compo-
nent may require a quantum- mechanical approach to fully
clarify the line-broadening mechanisms and temperature
trend. If the underlying physics between the narrow and
broad components are different, nanoparticle systems at the
quantum and classical interface may need a combination of
theories to account for lineshape trends in nanoparticle EMR
spectra.18,19,25 Therefore, the use of other methods, such as
the quantum approach suggested by Noginova et al., can be
used for modeling the two-component lineshape EMR spectra
of small metal oxide nanoparticles.25 Moreover, our results
also show a small but discernable signal at half the resonant
position (Bo/2), which has been attributed to both quantum19
and classical44 effects in nanoparticle systems. A giant-spin
model may offer a more fundamental analysis and compre-
hension of the complex lineshape behavior of superparamag-
netism in magnetic nanoparticles.25
VI. CONCLUSION
Magnetic properties of iron oxide nanoparticles formed
within Listeria innocua protein cages have been investigated
by variable-temperature X-band EMR spectroscopy. These
nanoparticles present an ideal case study to test existing theo-
retical models given their small size <5 nm and existence of
an upper size constraint. Static models, such as the Berger
model, can fit the EMR temperature spectra; however, the in-
formation obtained from the simulations must be carefully
evaluated, and other measurement techniques are needed to
restrict the variability in the parameters when the experimen-
tal data are fitted. In the Berger model, the magnetization Ms
084701-8 Usselman et al. J. Appl. Phys. 112, 084701 (2012)
Downloaded 23 Oct 2012 to 132.163.52.20. Redistribution subject to AIP license or copyright; see http://jap.aip.org/about/rights_and_permissions

increased with increasing temperature with a log-normal dis-
tribution of particles and with size limits imposed by the pro-
tein cage. A two-component analysis resolves the problem of
a nonphysical increasing magnetic moment, yet the origin of
the narrow component remains uncertain. The temperature
dependence of the saturating linewidth was used to determine
the anisotropy energy. The RS model predicts the tempera-
ture dependence of the line width of the large superpara-
magnetic component; however, the predicted complex
asymmetric line shape is not observed. We believe a compre-
hensive model is needed to describe simultaneously EMR
spectral trends and magnetometry data that conform to con-
sistent magnetic properties for both methodologies. To this
end, accurately modeling the magnetic properties of nanopar-
ticle systems with EMR may be used for quality control to
develop finely tuned nanoparticles for multiple applications.
ACKNOWLEDGMENTS
R.J.U. gratefully acknowledges support from the NSF-
IGERT graduate fellowship and NRC postdoctoral fellow-
ship. This research was supported in part by grants from the
National Institutes of Health (Grant R21EB005364) and the
Office of Naval Research (Grant 19-00-R006).
1S. X. Wang, S. Y. Bae, G. X. Li, S. H. Sun, R. L. White, J. T. Kemp, and
C. D. Webb, J. Magn. Magn. Mater. 293(1), 731–736 (2005).2D. E. Sosnovik and R. Weissleder, Curr. Opin. Biotechnol. 18(1), 4–10
(2007).3A. M. Derfus, G. von Maltzahn, T. J. Harris, T. Duza, K. S. Vecchio, E.
Ruoslahti, and S. N. Bhatia, Adv. Mater. 19(22), 3932–3936 (2007).4M. Uchida, M. L. Flenniken, M. Allen, D. A. Willits, B. E. Crowley, S.
Brumfield, A. F. Willis, L. Jackiw, M. Jutila, M. J. Young, and T. Douglas,
J. Am. Chem. Soc. 128(51), 16626–16633 (2006).5M. Uchida, M. T. Klem, M. Allen, P. Suci, M. Flenniken, E. Gillitzer, Z.
Varpness, L. O. Liepold, M. Young, and T. Douglas, Adv. Mater. 19(8),
1025–1042 (2007).6A. Lewin, G. R. Moore, and N. E. Le Brun, Dalton Trans. 2005(22),
3597–3610.7T. Douglas and M. Young, Science 312(5775), 873–875 (2006).8M. T. Klem, D. A. Resnick, K. Gilmore, M. Young, Y. U. Idzerda, and T.
Douglas, J. Am. Chem. Soc. 129(1), 197–201 (2007).9M. T. Klem, J. Mosolf, M. Young, and T. Douglas, Inorg. Chem. 47(7),
2237–2239 (2008).10M. Allen, D. Willits, M. Young, and T. Douglas, Inorg. Chem. 42(20),
6300–6305 (2003).11M. T. Klem, D. Willits, D. J. Solis, A. M. Belcher, M. Young, and T.
Douglas, Adv. Funct. Mater. 15(9), 1489–1494 (2005).12E. Gillitzer, D. Willits, M. Young, and T. Douglas, Chem. Commun.
2002(20), 2390–2391.13M. Allen, J. W. M. Bulte, L. Liepold, G. Basu, H. A. Zywicke, J. A. Frank,
M. Young, and T. Douglas, Magn. Reson. Med. 54(4), 807–812 (2005).
14R. J. Usselman, E. D. Walter, D. Willits, T. Douglas, M. Young, and D. J.
Singel, J. Am. Chem. Soc. 133(12), 4156–4159 (2011).15R. J. Usselman, M. Klem, M. Allen, E. D. Walter, K. Gilmore, T. Douglas,
M. Young, Y. Idzerda, and D. J. Singel, J. Appl. Phys. 97(10), 10M523
(2005).16J. L. Dormann, D. Fiorani, and E. Tronc, “Magnetic Relaxation in Fine-
Particle Systems,” in Advances in Chemical Physics, Vol. 98, edited by I.
Prigogine and S. A. Rice (Wiley, Hoboken, NJ, 2007), pp. 283–494.17K. Gilmore, Y. Idzerda, M. Klem, M. Allen, T. Douglas, and M. Young,
J. Appl. Phys. 97(10), 10B301 (2005).18M. Fittipaldi, L. Sorace, A. L. Barra, C. Sangregorio, R. Sessoli, and D.
Gatteschi, Phys. Chem. Chem. Phys. 11, 6555–6568 (2009).19M. Fittipaldi, C. Innocenti, P. Ceci, C. Sangregorio, L. Castelli, L. Sorace,
and D. Gatteschi, Phys. Rev. B 83, 104409 (2011).20R. Berger, J. Kliava, J. C. Bissey, and V. Baietto, J. Appl. Phys. 87(10),
7389–7396 (2000).21R. Berger, J. C. Bissey, J. Kliava, H. Daubric, and C. Estournes, J. Magn.
Magn. Mater. 234(3), 535–544 (2001).22R. Berger, J. C. Bissey, and J. Kliava, J. Phys.: Condens. Matter 12(44),
9347–9360 (2000).23F. Gazeau, V. Shilov, J. C. Bacri, E. Dubois, F. Gendron, R. Perzynski, Y.
L. Raikher, and V. I. Stepanov, J. Magn. Magn. Mater. 202(2–3), 535–546
(1999).24F. Gazeau, J. C. Bacri, F. Gendron, R. Perzynski, Y. L. Raikher, V. I. Ste-
panov, and E. Dubois, J. Magn. Magn. Mater. 186(1–2), 175–187 (1998).25N. Noginova, F. Chen, T. Weaver, E. P. Giannelis, A. B. Bourlinos, and V.
A. Atsarkin, J. Phys.: Condens. Matter 19(24), 246208 (2007).26M. M. Noginov, N. Noginova, O. Amponsah, R. Bah, R. Rakhimov, and
V. A. Atsarkin, J. Magn. Magn. Mater. 320(18), 2228–2232 (2008).27C. P. Bean and J. D. Livingston, J. Appl. Phys. S:30(4), 120S–129S
(1959).28R. H. Kodama, A. E. Berkowitz, E. J. McNiff, and S. Foner, Phys. Rev.
Lett. 77(2), 394–397 (1996).29R. J. Usselman, M. T. Klem, S. E. Russek, M. Young, T. Douglas, and R.
B. Goldfarb, J. Appl. Phys. 107(11), 114703 (2010).30H. Li, M. T. Klem, K. B. Sebby, D. J. Singel, M. Young, T. Douglas, and
Y. Idzerda, J. Magn. Magn. Mater. 321(3), 175–180 (2009).31Y. L. Raikher and V. I. Stepanov, Zhurnal Eksperimentalnoi I Teoretiche-
skoi Fiziki 102(4), 1409–1423 (1992).32M. P. Weir, T. J. Peters, and J. F. Gibson, Biochim. Biophys. Acta 828(3),
298–305 (1985).33J. Dubowik and J. Baszynski, J. Magn. Magn. Mater. 59(1–2), 161–168
(1986).34M. Allen, D. Willits, J. Mosolf, M. Young, and T. Douglas, Adv. Mater.
14(21), 1562–1565 (2002).35M. M. Yulikov and P. A. Purtov, Appl. Magn. Reson. 29(2), 231–249
(2005).36Y. Koseoglu and H. Kavas, J. Nanosci. Nanotechnol. 8(2), 584–590
(2008).37Y. L. Raikher and V. I. Stepanov, Phys. Rev. B 50(9), 6250–6259 (1994).38R. S. Debiasi and T. C. Devezas, J. Appl. Phys. 49(4), 2466–2469 (1978).39S. Morup and C. Frandsen, Phys. Rev. Lett. 92(21), 217201 (2004).40V. K. Sharma and F. Waldner, J. Appl. Phys. 48(10), 4298–4302 (1977).41W. F. Brown, Phys. Rev. 130(5), 1677–1686 (1963).42R. J. Usselman, A. J. Fielding, F. E. Frerman, N. J. Watmough, G. R.
Eaton, and S. S. Eaton, Biochemistry 47(1), 92–100 (2008).43L. Castelli, M. Fittipaldi, A. K. Powell, D. Gatteschi, and L. Sorace, Dal-
ton Trans. 40, 8145–8155 (2011).44M. Sparks, Ferromagnetic-Relaxation Theory (McGraw-Hill, 1964).
084701-9 Usselman et al. J. Appl. Phys. 112, 084701 (2012)
Downloaded 23 Oct 2012 to 132.163.52.20. Redistribution subject to AIP license or copyright; see http://jap.aip.org/about/rights_and_permissions