
Rectilinear Field Systems and Dispersed Settlement in South Somerset and Dorset
Upload
independentCategory
view
0download
0
INSTITUTE OF PHYSICS PUBLISHING NANOTECHNOLOGY
Nanotechnology 17 (2006) 4456–4463 doi:10.1088/0957-4484/17/17/029
Supramolecular capping-ligand effect oflamellar silica mesostructures for theone-pot synthesis of highly dispersedZnO nanoparticlesLorenzo Fernandez, Nuria Garro, Jose Manuel Morales,Pedro Burguete, Julio Latorre, Carmen Guillem, Aurelio Beltran,Daniel Beltran and Pedro Amoros1
Institut de Ciencia dels Materials de la Universitat de Valencia (ICMUV), PO Box 2085,46071-Valencia, Spain
E-mail: [email protected]
Received 16 June 2006, in final form 27 July 2006Published 21 August 2006Online at stacks.iop.org/Nano/17/4456
AbstractZnO–SiO2 lamellar nanocomposites with high zinc content (5 � Si/Zn � 50)have been synthesized through a one-pot surfactant-assisted procedure fromaqueous solution and starting from molecular atrane complexes of Zn and Sias inorganic hydrolytic precursors. This approach allows optimization of thedispersion of the ZnO nanodomains in the silica sheets. The nature of thelayered silica materials has been confirmed by x-ray diffraction.Spectroscopic (ultraviolet–visible and photoluminescence) study of theselayered silica materials shows that, regardless of the Si/Zn ratio, Zn atomsare organized in well-dispersed, uniform ZnO nanodomains (about 1.2 nm)partially embedded within the silica sheets. Quantum confinement effectshave been observed in the optical response of the ZnO nanoparticles includedin these nanocomposites.
1. Introduction
Zinc oxide (ZnO) has revealed a great potential as thematerial support for optoelectronic devices operating in theblue and ultraviolet spectral regions, thanks to its widedirect band-gap (3.25 eV) and large exciton binding energy(60 meV) [1]. The latter ensures efficient excitonic emissioneven at room temperature. An additional advantage ofZnO is that both bulk and nanostructured samples can beprepared by a variety of procedures, including chemical andphysical methods (CVD [2], cathodic electrodeposition [3]and plasma pyrolysis [4]). In particular, ZnO nanoparticleshave been synthesized through chemical methods by solutionprocesses [5–8] or by solid-state pyrolytic reactions [9],achieving particle diameters down to 1 nm. When theparticle size is comparable to the exciton Bohr radius of ZnO(∼2 nm), quantum confinement effects become apparent and
1 Author to whom any correspondence should be addressed.
an enlargement of the band-gap with decreasing particle size isobserved [5]. Hence, ZnO nanoparticles could be used to bringZnO-based electro-optic devices to even shorter wavelengths.However, with the increase in the surface/volume ratio, thecontribution from surface defect states, which produce abroad emission band in the visible range, also increases [10].Furthermore, the nanostructural properties can be lost ifseveral nanoparticles merge and form a large aggregate witha subsequent effect on the emission spectrum [11].
In order to avoid such effects, in addition to the strategiesthat include the use of molecular capping ligands [12], severalorganic (polymeric) and inorganic hosts have been utilized todisperse and/or encapsulate ZnO particles. Then, among theinert inorganic matrices, silica gels [13, 14], zeolites [15] and,more recently, mesoporous silicas [16–25] have usually beenused as supports. These strategies are very interesting onthinking about catalytic applications. In fact, ZnO-containingmesoporous silicas have been proved to be effective catalystsfor methanol production [26]. However, concerning other
0957-4484/06/174456+08$30.00 © 2006 IOP Publishing Ltd Printed in the UK 4456

ZnO–SiO2 nanocomposites from silica–surfactant mesostructures
Table 1. Compositional data and physical parameters of ZnO–SiO2 nanocomposites.
Sample Si/Zn ratio (solution) Si/Zn ratio (solid)a Eg (eV) R (nm)b Eb (eV) R (nm)c
1 50 32 ± 2 5.36 ± 0.16 1.16 ± 0.05 0.7 ± 0.2 1.2 ± 0.32 25 15 ± 1 5.16 ± 0.05 1.12 ± 0.02 0.5 ± 0.2 0.9 ± 0.33 10 9.0 ± 0.8 5.29 ± 0.11 1.18 ± 0.04 0.6 ± 0.2 1.1 ± 0.34 5 4.0 ± 0.5 5.10 ± 0.20 1.24 ± 0.07 0.4 ± 0.2 0.8 ± 0.3
a Values averaged from EPMA of about 50 different particles. Spot area of 1 μm.b Values obtained from equation (2).c Values obtained from equation (3).
applications, the high reactivity that is typical of nanoparticlesand the favourable interaction between ZnO particles andthe pore environment (due to the partial protection providedby the host) could lead to a certain surface degradationand subsequent loss of luminescent properties. In order toovercome this problem, but maintaining a reasonable particledispersion, lamellar silica hosts could also be employed,as reported in recent studies [27, 28], where natural clayminerals (kaolinite and montmorillonite) have been used asinorganic matrices. However, these approaches imply multi-step preparations including mineral cleaning and delaminationprior to the ZnO particle growth and intercalation among theinorganic layers, which results in very large total reactiontimes (one week). Moreover, in some cases, bimodal ZnOparticle size distributions are obtained [27] due to the growthof two types of ZnO species in the interlayer space and in themesopores formed by the house-of-cards stacking of exfoliatedclay crystallites.
In this work, we report on a new quick direct andreproducible one-pot surfactant-assisted procedure to prepareZnO nanoparticles embedded within the wall planes ofsynthetic lamellar silica. This strategy is based on theblocking effect of a layered silica–surfactant mesophase inthe growth process of ZnO nanoparticles and leads to highlydispersed mesostructured nanocomposites. Moreover, aftermesostructure calcination, good protection (like core–shellmaterials) of the ZnO nanoparticles by silica layers is achieved.
2. Experimental details
2.1. Chemicals
All reagents (dodecylamine, tetraethyl orthosilicate (TEOS),ZnCl2, and triethanolamine (TEAH3)) were used as receivedfrom Aldrich.
2.2. Preparative procedure
In a typical synthesis leading to the Si/Zn = 10 material,0.41 g of ZnCl2 was dissolved at room temperature in ahydroalcoholic mixture containing water (5 ml) and TEAH3
(10 ml). This solution was heated at 140 ◦C until waterevaporation was completed to give Zn–atrane complexes(complexes containing TEAH3 derived species as ligands).Then, 6 ml of TEOS was added at 140 ◦C in order to form therespective silatrane complexes, resulting in an homogeneousmixture of Zn and Si atrane complexes. After coolingthe previous solution to 80 ◦C, 2.09 g of the surfactant(dodecylamine) was added. The solution containing the atrane
complexes and the template was cooled down to 70 ◦C andmixed with water (25 ml). After a few seconds, a whitepowder appeared. The resulting suspension was allowed toage at room temperature for 24 h. The final (mesostructurednanocomposite) powder was filtered off, washed with water tofavour the evolution of the surfactant excess, and air-dried. Toobtain the final collapsed material, the as-synthesized solid wascalcined (to thermally remove the surfactant) at 550 ◦C for 5 hunder a static air atmosphere.
In all cases, the molar ratio of the reagents inthe mother liquor was adjusted to x Zn:2Si:7TEAH3:0.75dodecylamine:90H2O (where x = 0.04, 0.08, 0.20, and 0.40).The main synthesis variables and physical data concerningthe ZnO–SiO2 nanocomposites prepared in this way aresummarized in table 1.
2.3. Characterization
All solids were analysed for Zn and Si by electron probemicroanalysis (EPMA) in order to verify the chemicalhomogeneity of the resulting synthetic lamellar materials.EPMA analyses were carried out in a Philips SEM-515instrument.
X-ray powder diffraction (XRD) data were recorded on aSeifert 3003 TT-diffractometer using Cu Kα radiation. Patternswere collected in steps of 0.03◦ (2θ ) over the angular range0.73◦–80◦ (2θ ) for 5 s per step.
Thermogravimetric analysis (TG) and differential thermalanalysis (DTA) were performed using a SETARAM analyser,model SETSYS 16/18, in an oxygen atmosphere flowing at25 ml min−1. All samples were heated from room temperatureuntil 1100 ◦C with a heating rate of 5 ◦C min−1.
Transmission electron microscopy (TEM) was performedwith a JEOL JEM-1010 electron microscope operating at100 kV with a digital camera MegaView III and ‘Analysis’software.
29Si MAS NMR spectra were recorded on a Varian Unity300 spectrometer operating at 79.5 MHz and using a magic-angle spinning speed of 4.5 kHz. Spectra were obtained byperforming one-pulse experiments with a 90◦ pulse and arecycle delay of 60 s. Chemical shifts were referenced totetramethylsilane at 0 ppm. Deconvolution of spectra wasperformed by using Gaussian lines.
Diffuse reflectance (DRUV) spectra were measuredat room temperature using a Shimadzu UV–vis 2501PCinstrument equipped with an integrating sphere, using BaSO4
as a white reflectance standard. The slit was adapted to thestep to avoid over-sampling. The computer processing of thespectra consisted of the following steps: (1) subtraction of
4457

L Fernandez et al
the baseline; (2) calculation of the Kubelka–Munk functionF(R∞) from the reflectance measurements; (3) subtraction ofthe spectrum by using the parent silica support without zincand having a similar chemical history.
Photoluminescence (PL) measurements have also beencarried out. In these experiments, the samples were excitedwith the 244 nm (5.1 eV) second harmonic generation of the488 nm Ar+ laser line at power densities in the range of 103–104 W cm−2. The emitted light was analysed by a Jobin YvonT64000 triple monochromator and detected by a nitrogen-cooled charge-coupled device. All the optical measurementswere performed at room temperature.
3. Results and discussion
3.1. Synthesis strategy
Highly dispersed ZnO–SiO2 nanocomposites have beensynthesized through a one-pot approach using dodecylamineas surfactant in a TEAH3–water medium. Our synthesisstrategy is based on the use of complexes containing TEAH3
ligands as hydrolytic inorganic precursors. Under basicconditions, and working in an excess of TEAH3, thismethod unifies the precursor nature (by forming inert metal-atranes), favouring the preparation (through co-hydrolysis)of mixed oxides displaying a high chemical homogeneity.In any case, we should not forget that the replacement ofsilicon atoms by divalent metal cations in a silica matrixis a thermodynamically unfavourable process, and phasesegregation must be expected a priori [29]. Together with itscomplexing ability, the presence of the polyalcohol (TEAH3)is key, because it maintains, together with the dodecylamine,the buffered reaction medium (pH about 10) [30], favouringthe precipitation of Zn species as Zn(OH)2 (this species isthe predominant one in the 9–11 pH range) [31], which canbe considered as the precursor of the ZnO nanoparticles [32].Thus, the preparative technique is designed to optimize thedispersion of the ZnO nanoparticles.
This protocol is a modification of the so-called ‘atraneroute’ [33], which is a simple preparative technique that hasallowed us to successfully prepare a diversity of mesoporousoxides by using cationic surfactants as templates [33–36]. Inthis case, we have adapted the atrane route to alkylamine-like surfactants to favour the interaction between the ZnOsurface and the template through the amine groups. Then, thisinteraction must favour the dispersion of ZnO nanoparticlesand also provide a certain protective effect, in a similar wayto the capping-ligands. The amount of dodecylamine has beenoptimized to form a layered mesostructure [37].
In short, the designed procedure allows us to makethe nucleation and growth of ZnO nanoparticles and theformation of a silica–surfactant mesophase compatible. Thehomogeneity in size, nature and dispersion of the ZnOnanoparticles could be understood by taking into account thatthe growth process of the nucleated ZnO species is blockedby the relatively slow condensation of the mesostructuredsilica network. Thus, the time consumed for the nucleationand growth of the ZnO particles is constant and limited bythe silica polymerization and mesophase formation processes.As this time is independent of the initial Zn content in the
Figure 1. Scheme of the preparative strategy.
mother solution, a similar nanoparticle size is expected in allsamples. In some way, the silica–dodecylamine mesostructurecan be viewed as a supramolecular capping-ligand able toblock and capture a variable and large number of identical ZnOnanoparticles.
Finally, the thermal surfactant evolution leads to themesophase collapse and the subsequent encapsulation of theZnO nanoparticles. This approach can be considered asadvantageous with respect to the usual molecular capping-ligand strategy due to the higher thermal and chemical stabilityof the final composites together with its comparative low cost.A scheme of this general protocol is shown in figure 1.
3.2. Composition and structural characterization
We have used EPMA to check the chemical homogeneity of theresulting solids. Table 1 summarizes the data of the chemicalcomposition (Si/Zn molar ratio values) of the samples, whichhave been averaged in each case from data of about 50different particles. As can be noted, the low values of thecalculated standard deviations allows us to state reasonably thatall samples are chemically homogeneous at a micrometric level(a spot size of about 1 μm).
The Zn content in the final solids is significantly higherthan that present in the starting solutions. This fact couldbe attributed to the different solubility of ZnO and SiO2
phases at the working pH (about 9–10). While the Zn speciesreaches an insolubility maximum at pH = 10 (in the formof Zn(OH)2 [31]), under this basic conditions a significantsolubility of silica is expected (a Si(OH)4/(HO)3SiO− ratioof about 2/10 at pH = 10 [38]), leading to a loss of Si in thefinal solid and a consequent enrichment in ZnO. This effect ismore pronounced in the case of samples 1 and 2, isolated atthe highest pH values (9.5–9.8). As the Zn content increases(samples 3 and 4), the final pH slightly decreases (8.8–9.2)as a consequence of the hydrolysis of Zn species, and thispH shift favours the insolubility of SiO2 and leads to finalnanocomposites with Si/Zn molar ratio values close to thestarting nominal composition.
The XRD patterns of the intermediate mesostructuredcomposites are typical of layered compounds with therespective (00l) harmonics (figure 2). In all samples, weobserve the coexistence of two layered mesophases, with therespective (001) reflections centred at about 2.07◦ and 2.40◦(2θ ). As the ZnO content increases, the mesophase with
4458

ZnO–SiO2 nanocomposites from silica–surfactant mesostructures
0 1 2 3 4 52θ (degrees)
Inte
nsi
ty (A
.U.)
θ6 7 8 9 10
a
b
c
d
Figure 2. XRD patterns of the intermediate mesostructured materialscontaining dodecylamine. In the inset are showed the respectiveXRD patterns of the final calcined materials: (a) sample 1,(b) sample 2, (c) sample 3, and (d) sample 4.
large dimensions increases. The observation of two closemesostructures could probably be due to small changes in thesurfactant layers’ conformation. In any case, the coexistenceof two mesophases does not imply any problem, as thefinal nanocomposites result after surfactant evolution throughcalcination. The loss of the long-range order for calcinedsamples is evident due to the absence of XRD peaks in thelow-angle domain. Then, calcination leads to the collapseof the mesostructure. Moreover, the absence of XRD peaks(characteristics of zinc oxides) at high 2θ values (inset offigure 2) confirms that no extra mesostrucure phase segregationoccurs, and it is consistent with the presence of very smallnanocrystalline domains.
The calcination process does not affect the basic structureconstructed from silica layers and the ZnO nanoparticles. Themesostructure collapse is due to the evolution of the surfactantmolecules, organized in non-interdigitalized bi-layers betweenthe silica-based sheets (according to the basal spacing fromXRD, and in a similar way as occurs in natural lamellarsilicates as magadiite [39, 40]). A part of the dodecylaminemolecules must be protonated. This partial protonation isneeded in order to optimize the charge matching with theanionic silica layers (at the working pH value). Then, themesostructure cohesion is maintained through the cooperativeeffect of ionic interactions between dodecylammonium cations[CH3(CH2)11NH+
3 ] and the anionic silica surface and the weakhydrogen bonds between the amine and the surface silanolgroups. The existence of two dodecylamine-derived speciesis confirmed by TGA and DTA (figure 3). The DTA curveshows two intense peaks at about 210 and 305 ◦C associatedwith two weight losses in the respective TGA curves. The firstpeak can be assigned to the loss of dodecylamine moleculesand the second peak, at higher temperature, to the degradationof alkylammonium entities whose ionic interaction with thesilica layers must be significantly stronger [39]. Surprisingly,the proportion of charged amine/amine (about 1.15 ± 0.1)seems to be independent of the Zn content. This constancy
Figure 3. DTA and TG curves of the intermediate (as-synthesized)layered materials containing dodecylamine: (a) sample 1, (b) sample2, (c) sample 3, and (d) sample 4.
could be explained by taking into account two opposite effectsassociated with the presence of ZnO particles and the differentcharge at the silica surface due to the pH changes. Althoughthe pH modification induced by the hydrolysis of Zn species istoo small (about 1 pH unity) to alter the amine/charged amineequilibrium significantly, a clear effect on the silica surfaceis expected. In fact, the charge (due to SiO− groups) of ahydoxylated silica surface decrease in a gradual way as thepH decreases in the 6 < pH < 10 range. Then, a certaindecrease in the charged dodecylamine at the silica–surfactantinter-phase is expected as the ZnO content increases. On thecontrary, a relative increase of neutral dodecylamine moleculesat the ZnO–surfactant inter-phase is expected. The result is thepreviously mentioned constancy between charged and neutraltemplate molecules. On the other hand, the decrease of thetotal surfactant molecules as the Zn content increases mustbe associated with the distortions on the bi-layer paraffin-likeorganization of surfactants by the ZnO nanoparticles, leadingto a lowering in the molecule packing.
The characteristic architecture of these ZnO–SiO2
nanocomposites only can be appreciated by means of electron
4459
L Fernandez et al
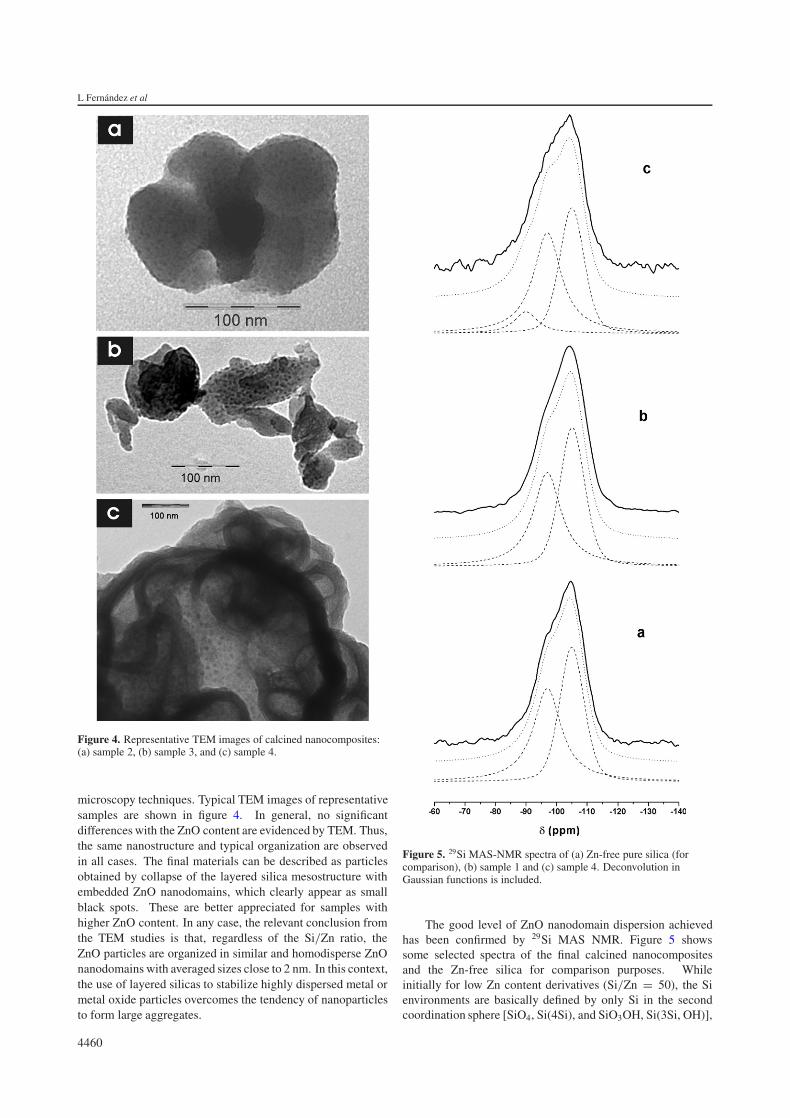
Figure 4. Representative TEM images of calcined nanocomposites:(a) sample 2, (b) sample 3, and (c) sample 4.
microscopy techniques. Typical TEM images of representativesamples are shown in figure 4. In general, no significantdifferences with the ZnO content are evidenced by TEM. Thus,the same nanostructure and typical organization are observedin all cases. The final materials can be described as particlesobtained by collapse of the layered silica mesostructure withembedded ZnO nanodomains, which clearly appear as smallblack spots. These are better appreciated for samples withhigher ZnO content. In any case, the relevant conclusion fromthe TEM studies is that, regardless of the Si/Zn ratio, theZnO particles are organized in similar and homodisperse ZnOnanodomains with averaged sizes close to 2 nm. In this context,the use of layered silicas to stabilize highly dispersed metal ormetal oxide particles overcomes the tendency of nanoparticlesto form large aggregates.
Figure 5. 29Si MAS-NMR spectra of (a) Zn-free pure silica (forcomparison), (b) sample 1 and (c) sample 4. Deconvolution inGaussian functions is included.
The good level of ZnO nanodomain dispersion achievedhas been confirmed by 29Si MAS NMR. Figure 5 showssome selected spectra of the final calcined nanocompositesand the Zn-free silica for comparison purposes. Whileinitially for low Zn content derivatives (Si/Zn = 50), the Sienvironments are basically defined by only Si in the secondcoordination sphere [SiO4, Si(4Si), and SiO3OH, Si(3Si, OH)],
4460

ZnO–SiO2 nanocomposites from silica–surfactant mesostructures
the progressive incorporation of ZnO nanodomains must leadto the formation of new Si environments [Si(4-nSi, nZn) andSi(3-nSi, OH, nZn)]. Indeed, the 29Si NMR spectra of thepure silica and the sample with Si/Zn = 50 display only twointense signals in the Q4 [Si(4Si)] region (δ = −105 ppm,relative intensity = 50%), and in the Q3 [Si(3Si, OH)] region(δ = −97 ppm, 50%), the latter indicating the presence ofa significant amount of silanol groups and the absence ofQ2 [Si(2Si, 2OH)] centres. Then, as the Zn incorporationincreases, a number of different signals can appear at lowchemical shifts (between −80 and −100 ppm) according to therelevant literature on tectozincosilicates [41]. The spectrumof the Si/Zn = 5 solid displays two intense signals at −105(42%) and −97 ppm (49%), and an additional small signalat −90 ppm (9%). At first glance, this spectrum mightbe wrongly interpreted by incorrectly attributing these threesignals to Q4 [Si(4Si)], Q3 [Si(3Si, OH)] and Q2 [Si(2Si,2OH)] silicon environments, respectively. However, a detailedcomparison with the spectrum of the sample exempt from Znclearly shows that the new signal must be associated withthe Zn incorporation. Although a precise assignment of allthe observed peaks is complicated due to the fact that it isnecessary to consider the simultaneous presence of Zn and OHgroups in the second coordination sphere of Si atoms, it ispossible to impute the relative growth of the signal at −97 ppm(when compared to the Q4) and the new signal at −90 ppm tothe presence of Si(3Si, 1Zn) and Si(2Si, 1OH, 1Zn) sites asdominant environments and, in a lower extension to a certainamount of Si(2Si, 2Zn) centres (taking into account that theexistence of Q2 [Si(2Si, 2OH)] environments is very unlikelyin solids calcined at 550 ◦C).
3.3. Optical characterization
The optical properties of our ZnO–SiO2 nanocomposites havebeen evaluated from UV–visible diffuse reflectance spec-troscopy and photoluminescence measurements. Moreover,this spectroscopic data can be used to confirm the average sizesof the ZnO nanodomains.
DRUV spectra (transformed Kubelka–Munk function[F(R∞)]2) of the calcined lamellar materials are shown infgure 6. A steep linear rise in [F(R∞)]2 above 6 eVis observed for all four samples. For nanocrystals [42],similarly to amorphous homogeneous semiconductors, theenergy dependence of the absorption coefficient in the regionof the absorption edge is proportional to
α ∝ (E − Eg)2
E. (1)
Thus, the absorption edge energy, Eg, can be calculated byextrapolating [F(R∞)]2 to zero in the linear region. Then,similar Eg values in the 6.6–7.0 eV range are obtained inall samples, 3 eV above the optical band gap of bulk ZnO.This pronounced blue shift in the absorption edge revealsquantum confinement effects and confirms the presence ofZnO nanoparticles. Moreover, an additional peak attributedto absorption from the exciton ground state can be resolvedbelow the absorption edge energy (see inset in figure 6). Thisexcitonic peak appears at energy Eg − Eb, where Eb is theexciton binding energy. The wide line-width of the excitonic
E / eV
[F(R
∞)]
2
Figure 6. Transformed Kubelka–Munk function of the DRUVspectra versus energy. The inset represents a zoom in order toappreciate the excitonic band. (a) Sample 1, (b) sample 2, (c) sample3, and (d) sample 4.
absorption peaks can be attributed to inhomogeneities in thenanoparticle size and is usually referred to as inhomogeneousbroadening. The observation of excitonic peaks is again aprobe of the existence of ZnO nanoparticles. Wood et al [6]collated their experimental results and the literature data for theexciton band positions of ZnO domains as a function of particlesize. From their experimental results, an exciton transitionwas visible at 265–270 nm (4.60–4.68 eV), correspondingto a particle diameter around 1 nm in ZnO colloids. Asthe additional peak that was detected in our nanocompositesand assigned to the adsorption from the exciton ground stateappears in this energy range, similar nanoparticle dimensionsmust be expected (see below). Table 1 summarizes theabsorption edge energy and the exciton binding energyobtained from the DRUV spectra of the different samplesstudied in this work. These energies do not change the Si/Znratio of the starting solutions and supports that the nanoparticlesize is independent from the constituent ratio, as observed inthe TEM pictures.
Let us first focus on the quantum confinement effectsobserved in the absorption edge of the nanoparticles. Aspointed out by Brus [43, 44], this corresponds to the ionizationenergy, which leaves a positively charged nanocrystal and afree electron in vacuum, and can be written in terms of thenanoparticle radius, R, as
Eg = E0 + h2π2
2R2
[1
me+ 1
mh
]+ e2
2RP (2)
where E0 is ZnO bulk band-gap energy, me and mh are theelectron and hole effective masses, respectively, and P is afunction of the dielectric constants of the nanoparticle, ε2, andthe surrounding matrix, ε1. The second term in equation (2)is the quantum confinement energy of electrons and holeslocalized in a spherical nanoparticle. The final term inequation (2) corresponds to the contribution of the polarizationcharge at the nanocrystallite surfaces. For a nanoparticle radius
4461

L Fernandez et al
of the order of the exciton Bohr radius, the polarization termonly adds a small correction to Eg and the main contributionto the measured blue-shift comes from the carrier confinementterms. The validity of this model, usually applied for verysmall semiconductor clusters [43], has recently been supportedby sophisticated theoretical studies [45].
The average particle radius has been estimated fromequation (2), and the values obtained for different Si/Zn ratiosare collected in table 1. All the required parameters have beenextracted from [43]. The calculated values of R are close to1.2 nm for all the investigated samples. This is in agreementwith the average particle sizes obtained by TEM (radius ofabout 1 nm).
An independent particle size evaluation can be establishedfrom the energy of the excitonic peak. In an earlier study,Wood et al [6] observed exciton resonances in ZnO colloidswith particle diameters ranging from 10 to 60 A. Assumingthe existence of spherical nanoparticles, Eb was calculated byBrus [43], and its dependence on the particle radius is given bythe following equation:
Eb = −1.8e2
ε2 R. (3)
Then, it is possible to calculate the ZnO nanoparticleradius from the experimental Eb energy values (table 1).Very similar values close to about 1 nm are estimated for allsamples. Although the particle radius predicted from the Eb
energy only can be considered as approximate values (due tothe inhomogeneous broadening of the DRUV peaks), thereis a reasonable good correlation with the more accurate Rvalues obtained from the absorption edge Eg (equation (2)).Hence, both TEM images and spectroscopy data confirms theexistence of ZnO nanoparticles with sizes in the 2.25–2.50 nmrange.
Finally, we turn the attention to the emission of theZnO nanoparticles. The energy (5.1) eV of the excitationsource in our experimental setup is on the high-energy side ofthe excitonic absorption spectrum and allows resonant photo-generation of excitons into the nanoparticles. A representativePL spectrum of the title ZnO–SiO2 calcined nanocompositesis displayed in figure 7. Since the SiO2 matrix does notemit in the ultraviolet region, the observed complex emissionband centred at 3.35 eV can be attributed unambiguously tothe embedded ZnO nanoparticles. A significant blue-shift isobserved when compared to the emission band (3.25 eV) ofa bulk ZnO sample (dashed line in figure 7). All samplespresent a second emission peak centred at higher energies,3.9 eV, of considerably weaker intensity, as can be appreciatedin the logarithmic scale of the inset of figure 7. The blueenergy shift of the nanoparticle emission peaks is a sign ofthe exciton confinement in the synthesized samples. However,the blue-shift of the PL is not as pronounced as that observedin the absorption spectra of figure 6. The reason for such adiscrepancy is the large energy red-shift (Stokes shift) of theemission maximum with respect to the excitonic absorptionpeak (a common feature of low-dimensional semiconductors).Then, Stokes shifts of the order of 0.7 eV are observed inthe emission of ZnS nanoparticles embedded in mesoporoushosts, and are attributed to the dominant contribution of coresulfur vacancy states [19]. ZnO nanoparticles also show large
No
rmal
ized
Inte
nsi
tyFigure 7. PL spectra of sample 2 (solid line) and bulk ZnO (dashedline) measured at room temperature. The inset contains a detail of thePL spectra of all calcined nanocomposites. (a) Sample 1, (b) sample2, (c) sample 3 and (d) sample 4.
Stokes shifts, but their origin is still not well understood [28].Therefore, the average nanoparticle radius cannot be estimatedfrom the maximum of the PL but rather from the energy band-gap Eg of the absorption spectrum.
Another striking difference between ZnO bulk andnanoparticles PL spectra displayed in figure 7 is the respectivebroadening of the peaks. The full width at half maximum ofthe bulk emission is 130 meV, and for the nanoparticle PLexceeds 500 meV. As discussed before, this is referred to asan inhomogeneous broadening due to certain dispersion in thenanoparticle radius.
Besides the excitonic emission, a broad emission bandcentred in the visible (at about 2.4 eV) was also observed,although it is not displayed in figure 7. Oxygen vacanciesoriginate a green emission band, which is also present in thePL spectrum of bulk ZnO materials [46]. In addition to thesevacancies [13, 14], surface defetcts also contribute to the greenemission of ZnO nanoparticles [28].
4. Conclusions
In conclusion, we present a simple low-cost and fast one-pot chemical strategy for obtaining ZnO–SiO2 nanocompositeswith high Zn content and well-dispersed uniform ZnOnanoparticles encapsulated among inorganic silica layers. Thekey aspect in our approach is based on the use of a lamellarsilica mesostructure as capping ligand to block the growthprocess of the ZnO nanoparticles. This control from themesostructure blocking effect warrants the homogeneity insize, nature and dispersion of the ZnO nanoparticles. Laterthe typical collapse of a lamellar mesophase after calcinationleads to the surfactant evolution and the subsequent ZnOnanoparticle encapsulation. Very likely, the synthesis strategypresented here might be extended to the preparation ofa diversity of materials based on dispersed nanoparticles.
4462

ZnO–SiO2 nanocomposites from silica–surfactant mesostructures
Moreover, our approach presents a clear advantage with respectto the use of other preformed natural or synthetic layeredinorganic solids: short preparative times, due to the one-potcharacter, and the absence of tedious pre-treatments of thematrix.
Acknowledgments
This research was supported by the Ministerio de Cienciay Tecnologıa and the Generalitat Valenciana under grantsMAT2003-08568-C03-01 and GV2004-B-745, respectively.LF and NG were supported by the Ramon y Cajal programof the Ministry of Science and Technology from Spain.
References
[1] Pearton S J, Norton D P, Ip K, Heo Y W and Steiner T 2004Superlatt. Microstruct. 34 3
[2] Marayama T and Shionoya J 1992 J. Mater. Sci. Lett. 11 170[3] Peulon S and Lincot D 1996 Adv. Mater. 8 166[4] Lin Y, Tang Z and Zhang Z 2000 J. Am. Ceram. Soc. 83 2869[5] Koch U, Fojtik A, Weller H and Henglein A 1985 Chem. Phys.
Lett. 122 507[6] Wood A, Giersig M, Hilgendorff M, Vilas-Campos A,
Liz-Marzan L M and Mulvaney P 2003 Aust. J. Chem.56 1051
[7] Ahmad T, Vaidya S, Sarkar N, Ghosh S and Ganguli A K 2006Nanotechnology 17 1236
[8] Marathe S K, Koinkar P M, Ashtaputre S S, More M A,Gosavi S W, Joag D S and Kulkarni S K 2006Nanotechnology 17 1932
[9] Wang Z, Zhang H, Zhang L, Yuan J, Yan S and Wang C 2003Nanotechnology 11 15
[10] Norberg N S and Gamelin D R 2005 J. Phys. Chem. B109 20810
[11] Jin X N and Gao L 2001 J. Inorg. Mater. 16 200[12] Guo L, Yang S, Yang C, Yu P, Wang J, Ge W and
Wong G K L 2000 Appl. Phys. Lett. 76 2901[13] Chakrabarti S, Ganguli D and Chaudhuri S 2003 J. Phys. D:
Appl. Phys. 36 146[14] Mikrajuddin, Iskandar F, Okuyama K and Shi F G 2001
J. Appl. Phys. 89 6431[15] Chen J, Feng Z C, Ying P L and Li C 2004 J. Phys. Chem. B
108 12669[16] Xiong Y, Zhang L Z, Tang G Q, Zhang G L and
Chen W J 2004 J. Lumin. 110 17[17] Dapurkar S E, Badamali S K and Selvam P 2001 Catal. Today
68 63[18] Zhang W H, Shi J L, Wang L Z and Yan D S 2000 Chem.
Mater. 12 1408[19] Chen H G, Shi J L, Chen H R, Yan J N, Li Y S, Hua Z L,
Yang Y and Yan D S 2004 Opt. Mater. 25 79
[20] Cheng Y H, Teh L K, Tay Y Y, Park H S, Wong C C andLi S 2006 Thin Solid Films 504 41
[21] Gies H, Grawoski S, Bandyopadhyay M, Grunert W,Tkachenko O P, Klementiev K V and Birkner A 2003Micropor. Mesopor. Mater. 60 31
[22] Zeng W, Wang Z, Qian X F, Yin J and Zhu Z K 2006 Mater.Res. Bull. 41 1155
[23] Burova L I, Petukhov D I, Eliseev A A, Lukashin A V andTretyakov Y D 2006 Superlatt. Microstruct. 39 257
[24] Tang G Q, Xiong Y, Zhang L Z and Zhang G L 2004 Chem.Phys. Lett. 395 97
[25] Cannas C, Mainas M, Musini A and Piccaluga G 2003 Comput.Sci. Technol. 63 1187
[26] Polarz S, Neues F, van den Berg M W E, Grunert W andKhodeir L 2006 J. Am. Chem. Soc. 127 12028
[27] Hur S G, Kim T W, Hwang S J, Hwang S H, Yang J H andChoy J H 2006 J. Phys. Chem. B 110 1599
[28] Nemeth J, Rodriguez-Gattorno G, Diaz D,Vazquez-Olmos A R and Dekany I 2004 Langmuir 20 2855
[29] El Haskouri J, Cabrera S, Guillem C, Latorre J, Beltran A,Marcos M D, Gomez-Garcıa C J, Beltran D andAmoros P 2004 Eur. J. Inorg. Chem. 1799
[30] Huerta L, Guillem C, Latorre J, Beltran A, Martınez-Manez R,Marcos M D, Beltran D and Amoros P 2006 Solid State Sci.8 940
[31] Baes C F and Mesmer R E 1976 The Hydrolysis of Cations(New York: Wiley)
[32] Greenwood N N and Earnshaw A 1984 Chemistry of theElements (New York: Pergamon)
[33] Cabrera S, El Haskouri J, Guillem C, Latorre J, Beltran A,Beltran D, Marcos M D and Amoros P 2000 Solid State Sci.2 405
[34] El Haskouri J, Cabrera S, Guillem C, Latorre J, Beltran A,Beltran D, Marcos M D and Amoros P 2002 Chem. Mater.15 5015
[35] El Haskouri J, Cabrera S, Gomez-Garcıa C J, Guillem C,Latorre J, Beltran A, Beltran D, Marcos M D andAmoros P 2004 Chem. Mater. 16 2805
[36] El Haskouri J et al 2002 Chem. Commun. 330[37] Laughlin R G 1994 The Aqueous Phase Behavior of
Surfactants (San Diego, CA: Academic)[38] Iler R K 1979 The Chemistry of Silica. Solubility,
Polymerization, Colloid and Surface Properties, andBiochemistry (New York: Wiley)
[39] Dailey J S and Pinnavaia T J 1992 Chem. Mater. 4 855[40] Lagaly G, Beneke K and Weiss A 1975 Am. Mineral. 60 650[41] Camblor M A and Davis M E 1994 J. Phys. Chem. 98 13151[42] Barton D G, Shtein M, Wilson R D, Soled S L and
Iglesia E 1999 J. Phys. Chem. B 103 630[43] Brus L 1984 J. Chem. Phys. 80 4403[44] Brus L 1986 J. Phys. Chem. 90 2555[45] Fonoberov V A and Balandin A A 2004 Phys. Rev. B
70 195410[46] Vanheusden K, Warren W L, Seager C H, Tallant D R,
Voigt J A and Gnade B E 1996 J. Appl. Phys. 79 7983
4463
Copyright © 2022 FDOKUMEN