Refractive index investigations of nanoparticles dispersed in water
6
This content has been downloaded from IOPscience. Please scroll down to see the full text. Download details: IP Address: 194.141.103.250 This content was downloaded on 22/01/2015 at 16:32 Please note that terms and conditions apply. Refractive index investigations of nanoparticles dispersed in water View the table of contents for this issue, or go to the journal homepage for more 2014 J. Phys.: Conf. Ser. 558 012062 (http://iopscience.iop.org/1742-6596/558/1/012062) Home Search Collections Journals About Contact us My IOPscience
-
Upload
uni-plovdiv -
Category
Documents
-
view
2 -
download
0
Transcript of Refractive index investigations of nanoparticles dispersed in water

This content has been downloaded from IOPscience. Please scroll down to see the full text.
Download details:
IP Address: 194.141.103.250
This content was downloaded on 22/01/2015 at 16:32
Please note that terms and conditions apply.
Refractive index investigations of nanoparticles dispersed in water
View the table of contents for this issue, or go to the journal homepage for more
2014 J. Phys.: Conf. Ser. 558 012062
(http://iopscience.iop.org/1742-6596/558/1/012062)
Home Search Collections Journals About Contact us My IOPscience

Refractive index investigations of nanoparticles dispersed in water
I Bodurov1, T Yovcheva1 and S Sainov2 1Department of Experimental Physics, Plovdiv University “Paisii Hilendarski”, 24 Tzar Assen str., 4000 Plovdiv, Bulgaria 2”HOLOBUL” Ltd., Acad. Georgi Bonchev str., block 109, 1113 Sofia, Bulgaria
E-mail: [email protected]
Abstract. The refractive index of nanoparticles dispersed in water is measured, using the total internal reflection method. The critical angle is determined by the disappearance of diffraction orders from a metal grating. The investigated nanoparticles are titanium dioxide (anatase phase), (35 nm diameter), zinc oxide, (<50 nm diameter), zirconium dioxide, (<100 nm diameter). The refractive index is measured with the experimental uncertainty of 1%. The Lorentz-Lorenz, Maxwell Garnett and Bruggeman relations are applied in the nanoparticle’s refractive indices calculations.
1. Introduction More than 120 years ago LeBlanc [1] has proposed a critical angle method for refractive index (RI) measurement of powders. In fact, that is an immersion technique, where critical angle is fixed when particle’s RI is equal to the RI of the immersion liquid. In this case the light scattering is minimized. The Abbe refractometer ensures satisfactory measurement precision. However, the LeBlanc’s method is time consuming; limited to the short list of high RI immersions; and high RI particles are measured with inflammable and toxic immersion liquids. In 1991 one of the authors [2] has proposed RI measuring method based on the critical angle determination by the disappearance of the diffraction pattern, created by a metal grating, placed in contact with the liquid or solid sample with a thickness varying from 250 nm to several µm. Applying this method, RI of turbid samples, cow butter for example, could be measured [3].The maximum experimental uncertainty is ±0.001 [4].
In the present paper the RI of high RI nanoparticles are measured. The samples are water dispersions of ZnO, TiO2 and ZrO2 nanoparticles with filling factors ( )f 0.15, 0.012 and 0.02, respectively. The thickness of the liquid layer’s is 6 µm. After RI determination of water dispersion’s RI, RI of the nanoparticles are calculated using well-known Lorentz-Lorenz [5], Maxwell Garnett [6] and Bruggeman [7] mixing models. He-Ne laser (632.8nm) and semiconductor laser (532nm) are utilized as light sources in the present RI measurements.
The RI data at these two laser wavelengths is used for one oscillator Sellmeier dispersion relation.
2. Theoretical background Our considerations are based on the most popular mixing theories. According Lorentz-Lorenz [5], in the optical spectral range we have:
18th International School on Condensed Matter Physics IOP PublishingJournal of Physics: Conference Series 558 (2014) 012062 doi:10.1088/1742-6596/558/1/012062
Content from this work may be used under the terms of the Creative Commons Attribution 3.0 licence. Any further distributionof this work must maintain attribution to the author(s) and the title of the work, journal citation and DOI.
Published under licence by IOP Publishing Ltd 1

( )2 2 2
2 2 2
1 1 112 2 2
e i m
e i m
n n nf fn n n
− − −= + −
+ + +, (1)
where en is experimentally obtained effective RI; in is RI of inclusions; mn is RI of matrix. Filling factor f is defined as ratio between the total particles’ volume and full volume:
i
m i
VfV V
=+
. (1a)
Using the effective dielectric function, Maxwell Garnett [6] obtained:
( ) ( )( ) ( )
2 2 2 22 2
2 2 2 2
2 2
2i m i m
e mi m i m
n n f n nn n
n n f n n
+ + −=
+ − −. (2)
In 1935, Bruggeman [7, 8] proposed another mixing relation:
( )( ) ( ) ( )
( )2 2 2 2
2 2 2 21 0
2 2i e m e
i e m e
n n n nf f
n n n n
− −+ − =
+ +. (3)
Solving the equation (1), (2) and (3), for RI of embedded nanoparticles we have:
( ) ( )( ) ( )
12 2 2 2 2
2 2 2
2 2
2e m m eL L
im e e
n n fn nn
n n f n−
− + + =
− + + , (4)
( ) ( )( ) ( )
12 2 2 2 2
2 2 2 2
2 2
2e m e mMG
i me m e m
n n f n nn n
f n n n n
− + + =
+ − − , (5)
( )( )
12 2 2 2
2 2 2
3 2
3m m eBr
i ee m e
fn n nn n
fn n n
− − =
+ − , (6)
where L Lin − , MG
in and Brin are the RI of nanoparticles, embedded into liquid or solid matrix and
calculated using different mixing rules.
3. Experimental
3.1. Samples All investigated samples are in the form of nanoparticles dispersed in water. The ZnO nanoparticles with diameter less than 50 nm, product of “Sigma-Aldrich”, are 50 wt.% dispersion concentration in water. Titanium dioxide nanoparticles with diameter 35 nm are in anatase form and 5 wt.% dispersion concentration in water. The ZrO2 nanoparticles with diameter less than 100 nm are also product of “Sigma-Aldrich” and 10 wt.% dispersion concentration in water. The 5 µl of the liquid sample is spread over 800 mm2 of the grating and its thickness of is calculated to be 6 µm.
3.2. Refractive index measurements The refractive index of the liquid sample is measured with a two-wavelength laser micro-refractometer at 632.8 nm and 532 nm. A 1 mW “Spectra Physics” He-Ne laser and second harmonic 20 mW semiconductor laser are used in the present investigations as light sources.
The laboratory device is illustrated in figure 1. As described [9], the critical angle cϕ is determined by the observed diffraction pattern
disappearing on the screen (10).
18th International School on Condensed Matter Physics IOP PublishingJournal of Physics: Conference Series 558 (2014) 012062 doi:10.1088/1742-6596/558/1/012062
2

Figure 1. Two-wavelengths laser micro-refractometer: 1 – He-Ne laser (632.8 nm); 2 – 532 nm semiconductor laser; 3 and 4 – choppers; 5 – beam splitter; 6 – rotary stage with vernier; 7 – sample;
8 – glass prism; 9 – metal diffraction grating; 10 – screen.
The refractive index is calculated by the following equation:
sinsin arcsin crn N A
Nϕ = ±
. (7)
The sign (+) and (-) corresponds to the clockwise and the counter-clockwise determination of crϕ , respectively. In our case the sign is (-). In equation (7) 65A = ° is the reflecting angle of the prism, N is the refractive index of the prism and has the values 1.7347 and 1.7480 for the used wavelength of 632.8 nm and 532 nm, respectively.
The optical properties of the materials are usually presented by their dispersion dependences. The most appropriate dispersion relation in dielectric and non-magnetic materials far from the fundamental absorption band is the Sellmeier relation:
2
22 21
s
sn λλ λ
− =−
. (8)
In the one-oscillator Sellmeier’s model the dependence of refractive index as a function of
wavelength λ is expressed by two constants, s and sλ , which are called Sellmeier’s coefficients.
4. Results and discussion The obtained experimental results calculated by equations (4), (5) and (6) are listed in table 1. The RI of water mn is measured by the laser micro-refractometer (see part 3.2) with the experimental uncertainty 0.01%. The nanoparticle concentration uncertainty is 0.05%. The nanoparticles RI uncertainty is 0.02n∆ = ± and mainly depended from effective RI measurements.
Table 1. Refractive index of investigated nanoparticles.
Sample TiO2 ZrO2 ZnO λ , nm 532 632.8 532 632.8 532 632.8
MGn , 0.02n∆ = ± 2.52 2.46 2.19 2.14 2.06 2.02
Brn , 0.02n∆ = ± 2.54 2.49 2.20 2.16 2.04 2.01
L Ln − , 0.02n∆ = ± 3.79 2.81 3.94 2.76 2.37 2.13
18th International School on Condensed Matter Physics IOP PublishingJournal of Physics: Conference Series 558 (2014) 012062 doi:10.1088/1742-6596/558/1/012062
3
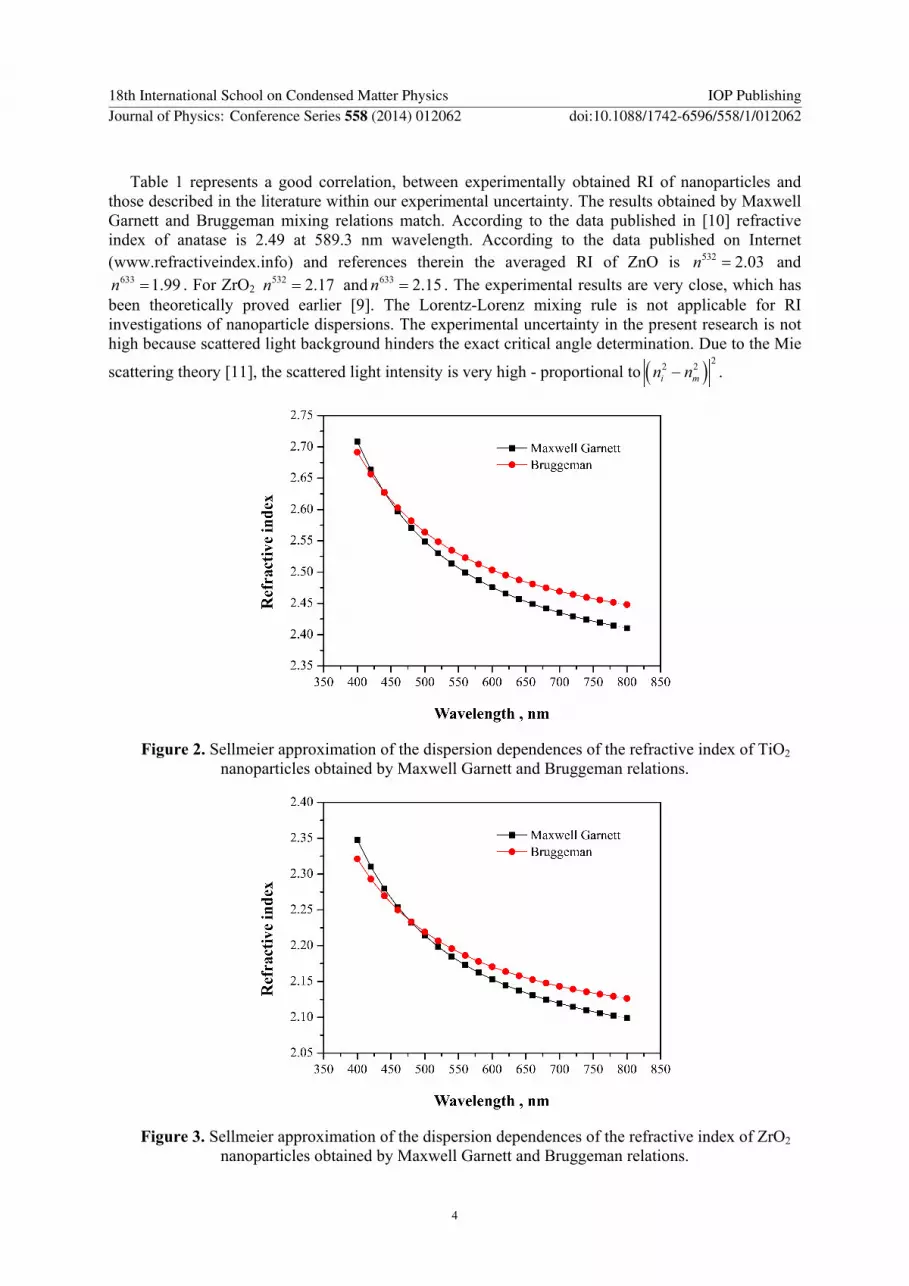
Table 1 represents a good correlation, between experimentally obtained RI of nanoparticles and those described in the literature within our experimental uncertainty. The results obtained by Maxwell Garnett and Bruggeman mixing relations match. According to the data published in [10] refractive index of anatase is 2.49 at 589.3 nm wavelength. According to the data published on Internet (www.refractiveindex.info) and references therein the averaged RI of ZnO is 532 2.03n = and
633 1.99n = . For ZrO2 532 2.17n = and 633 2.15n = . The experimental results are very close, which has been theoretically proved earlier [9]. The Lorentz-Lorenz mixing rule is not applicable for RI investigations of nanoparticle dispersions. The experimental uncertainty in the present research is not high because scattered light background hinders the exact critical angle determination. Due to the Mie
scattering theory [11], the scattered light intensity is very high - proportional to ( ) 22 2i mn n− .
Figure 2. Sellmeier approximation of the dispersion dependences of the refractive index of TiO2 nanoparticles obtained by Maxwell Garnett and Bruggeman relations.
Figure 3. Sellmeier approximation of the dispersion dependences of the refractive index of ZrO2 nanoparticles obtained by Maxwell Garnett and Bruggeman relations.
18th International School on Condensed Matter Physics IOP PublishingJournal of Physics: Conference Series 558 (2014) 012062 doi:10.1088/1742-6596/558/1/012062
4

In order to attain an experimental uncertainty better than ±0.001 it is necessary to increase signal-to-noise ratio in diffraction pattern detection. It could be achieved by CCD camera detection followed by computer processing for scattered light background suppression. The simultaneous sample’s thickness diminishing in the range 0.5 µm – 1.0 µm will also increase signal-to-noise ratio.
The refractive index dispersion dependencies of the investigated nanoparticles are obtained by fitting using equation (8) and listed below.
Figure 4. Sellmeier approximation of the dispersion dependences of the refractive index of ZnO nanoparticles obtained by Maxwell Garnett and Bruggeman relations.
5. Conclusion The refractometric method of the disappearing diffraction pattern is applicable for RI investigation of nanoparticles. In the present work high RI nanoparticles are dispersed in water - i.e. the case with the biggest RI difference and consequently, very high light scattering background.
Acknowledgements S. Sainov is grateful for the financial support under the contracts BG161PO003-1. 1.005-0085 –C0001 and COST Action MP 1102, contract DCOST 01/7-13.20.2012 with National Science Fund.
References [1] LeBlanc M 1892 Z. Phys. Chem. 10 433 [2] Sainov S 1991 Rev. Sci. Instr.62 3106 [3] Nikolova K, Panchev I and Sainov S 2007 Eur. Food Res. Technol. 225 139 [4] Nikolova K, Panchev I and Sainov S 2009 CR Acad. Bulg. des Sci. 62 559 [5] Ioffe B 1983 Refractometric methods in chemistry (Leningrad: Khimiya) (in Russian) [6] Maxwell Garnett J C 1904 Philos Trans. R. Soc. 203 385 [7] Bruggeman D A G 1935 Ann. Phys. 24 636 [8] Petroff Yu 1982 Physics of small particles (Moscow: Nauka Publishers) (in Russian) [9] Sainov S, Vlaeva I, Yovcheva T, Dragostinova V and Stavrev S 2010 J. Phys. Conf. Ser. 253
012067 [10] Hanaor D A H and Sorrell Ch C 2011 J. Mater. Sci. 46 855 [11] Mie G 1909 Ann. Phys. 25 377
18th International School on Condensed Matter Physics IOP PublishingJournal of Physics: Conference Series 558 (2014) 012062 doi:10.1088/1742-6596/558/1/012062
5