Identification of Cytoplasmic Capping Targets Reveals a Role for Cap Homeostasis in Translation and...
11
Cell Reports Resource Identification of Cytoplasmic Capping Targets Reveals a Role for Cap Homeostasis in Translation and mRNA Stability Chandrama Mukherjee, 1,2,5 Deepak P. Patil, 1,2,5 Brian A. Kennedy, 1,2,6 Baskar Bakthavachalu, 1,2 Ralf Bundschuh, 1,3,4 and Daniel R. Schoenberg 1,2, * 1 Center for RNA Biology 2 Department of Molecular and Cellular Biochemistry 3 Department of Physics 4 Department of Biochemistry Ohio State University, Columbus, OH 43210, USA 5 These authors contributed equally to this work 6 Present address: Ion Torrent, Inc., 7000 Shoreline Court, Suite 201, South San Francisco, CA 94080, USA *Correspondence: [email protected] http://dx.doi.org/10.1016/j.celrep.2012.07.011 SUMMARY The notion that decapping leads irreversibly to messenger RNA (mRNA) decay was contradicted by the identification of capped transcripts missing portions of their 5 0 ends and a cytoplasmic complex that can restore the cap on uncapped mRNAs. In this study, we used accumulation of uncapped tran- scripts in cells inhibited for cytoplasmic capping to identify the targets of this pathway. Inhibition of cyto- plasmic capping results in the destabilization of some transcripts and the redistribution of others from polysomes to nontranslating messenger ribo- nucleoproteins, where they accumulate in an uncap- ped state. Only a portion of the mRNA transcriptome is affected by cytoplasmic capping, and its targets encode proteins involved in nucleotide binding, RNA and protein localization, and the mitotic cell cycle. The 3 0 untranslated regions of recapping targets are enriched for AU-rich elements and micro- RNA binding sites, both of which function in cap- dependent mRNA silencing. These findings identify a cyclical process of decapping and recapping that we term cap homeostasis. INTRODUCTION The 5 0 end of all eukaryotic messenger RNAs (mRNAs) is modi- fied by the addition of an inverted methylguanosine cap. The cap is added cotranscriptionally through the action of capping enzyme and cap methyltransferase, both of which are positioned at the 5 0 end of newly transcribed pre-mRNA by the C-terminal domain of RNA polymerase II (Gu and Lima, 2005), and the quality of cap methylation is monitored by the Rat1/Rai1 complex and pre-mRNAs with improperly methylated caps that are degraded before they can be exported to the cytoplasm (Jiao et al., 2010). In the nucleus, the cap is bound by a hetero- dimer of CBP80-CBP20, and its interaction with other proteins coordinates many of the subsequent steps in pre-mRNA pro- cessing and mRNA surveillance (Schoenberg and Maquat, 2012). mRNAs are exported to the cytoplasm cap-end first, where the CBP80-CBP20 heterodimer is replaced by eIF4E, leading to translation initiation through the eIF4F complex. Translation and mRNA decay are interconnected processes. A simplified view of mRNA decay starts with shortening of the poly(A) tail to a point where it can no longer function to support translation, followed by decapping and degradation of the mRNA with 5 0 -3 0 polarity by the Xrn1 exonuclease (Schoenberg and Maquat, 2012). In reality, mRNA decay is much more compli- cated and can involve decapping while ribosomes are engaged in translation (Hu et al., 2009), bidirectional decay (Murray and Schoenberg, 2007; Mullen and Marzluff, 2008), and endonu- clease cleavage (Schoenberg, 2011). Loss of the cap, either by hydrolysis by Dcp2 or Nud16, or by endonuclease cleavage within the body of the transcript is common to all of these processes. Until recently, this was thought to be irreversible, with Xrn1 rapidly degrading decapped mRNAs. This notion has begun to change, starting first with work done in Arabidopsis and more recently in human cells (reviewed in Schoenberg and Maquat, 2009). In most of these studies, the 5 0 -monophosphate on uncapped mRNAs was tagged by ligation to a primer for subsequent physical recovery and analysis on microarrays (Jiao et al., 2008) or for identification of 5 0 ends by deep sequencing (Gregory et al., 2008; Karginov et al., 2010; Mercer et al., 2010; Ni et al., 2010). These studies identified an uncapped transcriptome that contained a significant representa- tion of protein-coding transcripts. In addition to finding tran- scripts with nearly intact 5 0 ends, work in mammalian cells also produced widespread evidence for endonuclease cleavage that was independent of Drosha, Dicer, and RISC (Karginov et al., 2010). It remains to be determined whether these uncap- ped transcripts represent intermediates in the decay process, intermediates in (or products of) the generation of regulatory RNAs, or new forms of mRNAs that are capable of encoding 674 Cell Reports 2, 674–684, September 27, 2012 ª2012 The Authors
Transcript of Identification of Cytoplasmic Capping Targets Reveals a Role for Cap Homeostasis in Translation and...
Cell Reports
Resource
Identification of Cytoplasmic Capping TargetsReveals a Role for Cap Homeostasisin Translation and mRNA StabilityChandrama Mukherjee,1,2,5 Deepak P. Patil,1,2,5 Brian A. Kennedy,1,2,6 Baskar Bakthavachalu,1,2 Ralf Bundschuh,1,3,4
and Daniel R. Schoenberg1,2,*1Center for RNA Biology2Department of Molecular and Cellular Biochemistry3Department of Physics4Department of BiochemistryOhio State University, Columbus, OH 43210, USA5These authors contributed equally to this work6Present address: Ion Torrent, Inc., 7000 Shoreline Court, Suite 201, South San Francisco, CA 94080, USA*Correspondence: [email protected]
http://dx.doi.org/10.1016/j.celrep.2012.07.011
SUMMARY
The notion that decapping leads irreversibly tomessenger RNA (mRNA) decay was contradictedby the identification of capped transcripts missingportions of their 50 ends and a cytoplasmic complexthat can restore the cap on uncapped mRNAs. Inthis study, we used accumulation of uncapped tran-scripts in cells inhibited for cytoplasmic capping toidentify the targets of this pathway. Inhibition of cyto-plasmic capping results in the destabilization ofsome transcripts and the redistribution of othersfrom polysomes to nontranslating messenger ribo-nucleoproteins, where they accumulate in an uncap-ped state. Only a portion of the mRNA transcriptomeis affected by cytoplasmic capping, and its targetsencode proteins involved in nucleotide binding,RNA and protein localization, and the mitotic cellcycle. The 30 untranslated regions of recappingtargets are enriched for AU-rich elements and micro-RNA binding sites, both of which function in cap-dependent mRNA silencing. These findings identifya cyclical process of decapping and recapping thatwe term cap homeostasis.
INTRODUCTION
The 50 end of all eukaryotic messenger RNAs (mRNAs) is modi-
fied by the addition of an inverted methylguanosine cap. The
cap is added cotranscriptionally through the action of capping
enzyme and capmethyltransferase, both of which are positioned
at the 50 end of newly transcribed pre-mRNA by the C-terminal
domain of RNA polymerase II (Gu and Lima, 2005), and the
quality of cap methylation is monitored by the Rat1/Rai1
complex and pre-mRNAs with improperly methylated caps that
are degraded before they can be exported to the cytoplasm
674 Cell Reports 2, 674–684, September 27, 2012 ª2012 The Author
(Jiao et al., 2010). In the nucleus, the cap is bound by a hetero-
dimer of CBP80-CBP20, and its interaction with other proteins
coordinates many of the subsequent steps in pre-mRNA pro-
cessing and mRNA surveillance (Schoenberg and Maquat,
2012). mRNAs are exported to the cytoplasm cap-end first,
where the CBP80-CBP20 heterodimer is replaced by eIF4E,
leading to translation initiation through the eIF4F complex.
Translation andmRNA decay are interconnected processes. A
simplified view of mRNA decay starts with shortening of the
poly(A) tail to a point where it can no longer function to support
translation, followed by decapping and degradation of the
mRNA with 50-30 polarity by the Xrn1 exonuclease (Schoenberg
andMaquat, 2012). In reality, mRNAdecay ismuchmore compli-
cated and can involve decapping while ribosomes are engaged
in translation (Hu et al., 2009), bidirectional decay (Murray and
Schoenberg, 2007; Mullen and Marzluff, 2008), and endonu-
clease cleavage (Schoenberg, 2011). Loss of the cap, either by
hydrolysis by Dcp2 or Nud16, or by endonuclease cleavage
within the body of the transcript is common to all of these
processes. Until recently, this was thought to be irreversible,
with Xrn1 rapidly degrading decapped mRNAs.
This notion has begun to change, starting first with work done
in Arabidopsis and more recently in human cells (reviewed in
Schoenberg and Maquat, 2009). In most of these studies, the
50-monophosphate on uncappedmRNAs was tagged by ligation
to a primer for subsequent physical recovery and analysis on
microarrays (Jiao et al., 2008) or for identification of 50 ends by
deep sequencing (Gregory et al., 2008; Karginov et al., 2010;
Mercer et al., 2010; Ni et al., 2010). These studies identified an
uncapped transcriptome that contained a significant representa-
tion of protein-coding transcripts. In addition to finding tran-
scripts with nearly intact 50 ends, work in mammalian cells also
produced widespread evidence for endonuclease cleavage
that was independent of Drosha, Dicer, and RISC (Karginov
et al., 2010). It remains to be determined whether these uncap-
ped transcripts represent intermediates in the decay process,
intermediates in (or products of) the generation of regulatory
RNAs, or new forms of mRNAs that are capable of encoding
s
N-terminally truncated proteins. Support for the latter comes
from work using antisense oligonucleotides (Thoma et al.,
2001), in which stable transcripts that accumulated downstream
of antisense oligonucleotide cleavage were translated into new
protein products. This finding was a mystery, however, because
the targets lacked an internal ribosome entry site and there was
no precedent for restoring a cap on decapped or endonucleolyti-
cally cleaved RNAs.
In erythroid cells, the decay of nonsense-containing b-globin
mRNA is accompanied by the appearance of stable truncated
transcripts that retain their poly(A) tail but are missing sequences
from the 50 end (Lim et al., 1992). These transcripts are generated
by endonuclease cleavage (Bremer et al., 2003; Stevens et al.,
2002), and were reported to be modified with a 50 cap or cap-
like structure (Lim and Maquat, 1992), a finding that we
confirmed (Otsuka et al., 2009). This finding also raised the ques-
tion of how cap addition might occur in the cytoplasm, since
capping enzyme was thought to only be present in the nucleus,
and if there were a cytoplasmic pool, one would still be faced
with the problem of converting the 50-monophosphate ends
generated by endonuclease cleavage to a diphosphate capping
substrate. These questions were resolved by our identification of
an �140 kDa complex containing capping enzyme complex and
the requisite kinase (Otsuka et al., 2009).
Capping enzyme cannot be knocked down without cell death
(Chu and Shatkin, 2008). To circumvent issues associated with
altering nuclear capping, we developed forms of capping
enzyme that are restricted to the cytoplasm, one of which is inac-
tive as a consequence of changing the GMP-binding site at K294
to alanine (K294A). We previously showed that this form of
capping enzyme is incorporated into the cytoplasmic capping
enzyme complex, and its overexpression reduced the ability of
cells to recover from arsenite stress (Otsuka et al., 2009).
Because recovery from stress depends on the restoration of
cap-dependent translation (Anderson and Kedersha, 2002),
this suggested that the overexpressed K294A form of capping
enzyme may have blocked the recapping of uncapped tran-
scripts that could have accumulated under those conditions.
In the study presented here, we used the accumulation of
uncapped transcripts in cells overexpressing K294A to identify
cytoplasmic capping targets. In the process, we found that cyto-
plasmic capping affects the stability of some mRNAs and the
translation of others, particularly mRNAs that encode proteins
associated with the mitotic cell cycle.
RESULTS
Identification of Recapping SubstratesWe previously described lines of tetracycline-inducible cells ex-
pressing wild-type (CE DNLS+NES) and inactive (K294A
DNLS+NES, hereafter referred to as K294A) forms of capping
enzyme that were modified to restrict their distribution to the
cytoplasm (Otsuka et al., 2009). As noted above, K294A is incor-
porated into the cytoplasmic capping enzyme complex, and its
overexpression reduced the ability of cells to recover from arse-
nite stress. We interpreted this as evidence of inhibition of cyto-
plasmic capping, and the data suggested that cell death might
result from reduced reactivation of translationally silenced
Cel
mRNAs. On the basis of this logic, we used the K294A cell line
as an isogenic system to identify mRNA targets of cytoplasmic
capping.
We identified the targets of cytoplasmic capping using Affy-
metrix Human Exon 1.0 ST microarrays, and mapped the result-
ing hits to the Ensembl GRCh37 release 60 reference assembly.
To limit this analysis to validated transcripts, only those with an
annotation status of ‘‘known’’ were considered, and any probes
within a probeset that did not map completely and uniquely to
the target transcript were removed from consideration, resulting
in a working data set of 55,662 transcripts. Analysis of the mean
signal intensity of each probeset as a function of its location rela-
tive to the 50 ends of mapped transcripts showed aminimal over-
all impact of K294A expression (Figure S1A), and the slightly
lower regression line suggests that some transcripts may be
reduced in these cells.
In our previous study (Otsuka et al., 2009), the in vitro suscep-
tibility to a 50-30 exonuclease proved to be an effective method
for discriminating between capped and uncapped RNAs. There-
fore, in this work we used a similar approach on a global scale to
identify uncapped RNAs and changes in cap status (Figure 1A).
Triplicate cultures were maintained for 24 hr in medium ± doxy-
cycline, where K294A is maximally induced, and cytoplasmic
RNA from each culture was depleted of ribosomal RNA before
half of each preparation was treated with Xrn1. The RNA recov-
ered from each treatment group was then applied to separate
microarrays. As expected, the majority of the mRNA transcripts
present in control and induced cells were capped and hence
resistant to Xrn1. Typical results for such RNAs are shown in
Figure S1B.
Under these conditions, most uncapped transcripts were
partially degraded, and only with rare exceptionswere uncapped
RNAs degraded completely. An independent t test was used to
assess differences between the 50 and 30 ends, and Benjamini-
Hochberg family-wise error correction was used to limit hits to
transcripts whose difference between treatment groups had
a p value of <0.05 (see Extended Experimental Procedures).
This identified 2,666 transcripts from control cells with some
degree of susceptibility to degradation by Xrn1 (Figure 1B). We
refer to these transcripts as the ‘‘uninduced’’ set, and based
on their similarity to products identified in Mercer et al. (2010)
and Karginov et al. (2010), they represent natively uncapped
transcripts. We identified another 675 transcripts that are unique
to K294A-expressing cells and refer to them as the ‘‘capping-in-
hibited’’ set. Lastly, 835 transcripts were identified that had
some degree of Xrn1 susceptibility in control cells, and increased
Xrn1 susceptibility in K294A-expressing cells. These are referred
to as the ‘‘common’’ set. A graphical representation of microar-
ray data for one of these transcripts is provided in Figure S1C.
The differential Xrn1 susceptibility of each set of transcripts is
shown by the heat map in Figures 1C–1E. The 2,666 transcripts
of the uninduced set are shown in Figure 1C, with individual tran-
scripts arrayed down the y axis and differences in probe intensity
for the first 1,500 nucleotides arrayed across the x axis. Although
the decreased intensity of the 50 probe sets following Xrn1 diges-
tion is consistent with the presence of uncapped forms of each of
these mRNAs, more compelling results are obtained by com-
paring the Xrn1 susceptibility of the 835 common transcripts
l Reports 2, 674–684, September 27, 2012 ª2012 The Authors 675
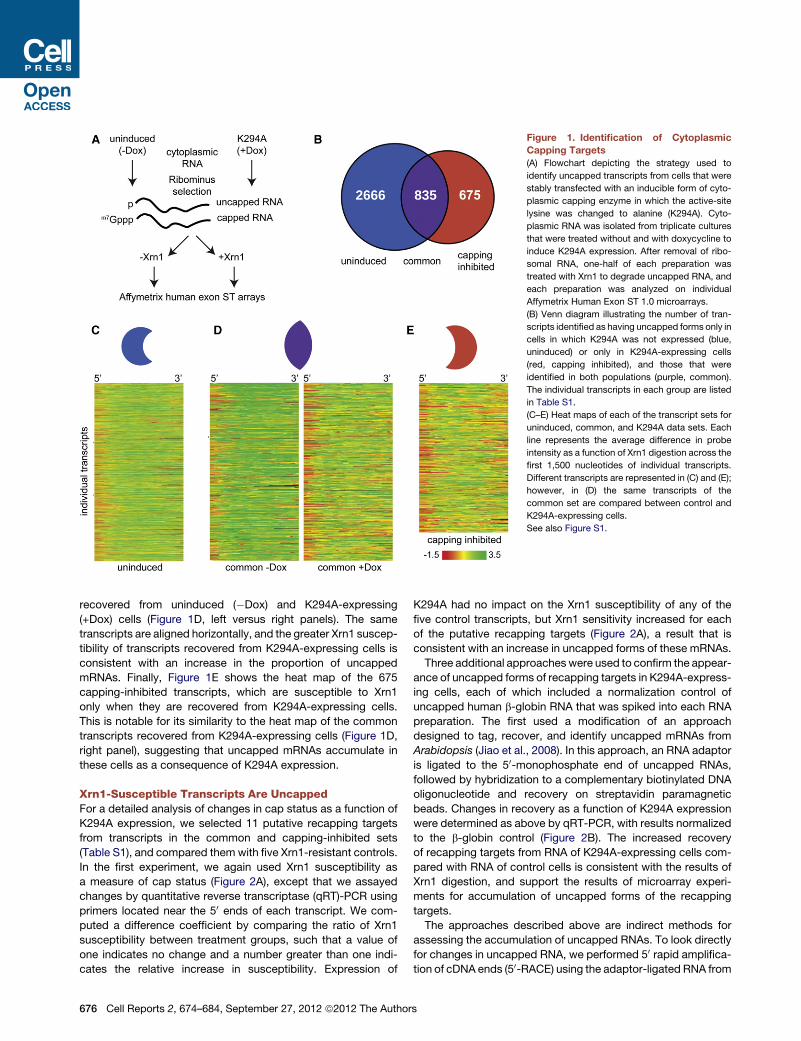
Figure 1. Identification of Cytoplasmic
Capping Targets
(A) Flowchart depicting the strategy used to
identify uncapped transcripts from cells that were
stably transfected with an inducible form of cyto-
plasmic capping enzyme in which the active-site
lysine was changed to alanine (K294A). Cyto-
plasmic RNA was isolated from triplicate cultures
that were treated without and with doxycycline to
induce K294A expression. After removal of ribo-
somal RNA, one-half of each preparation was
treated with Xrn1 to degrade uncapped RNA, and
each preparation was analyzed on individual
Affymetrix Human Exon ST 1.0 microarrays.
(B) Venn diagram illustrating the number of tran-
scripts identified as having uncapped forms only in
cells in which K294A was not expressed (blue,
uninduced) or only in K294A-expressing cells
(red, capping inhibited), and those that were
identified in both populations (purple, common).
The individual transcripts in each group are listed
in Table S1.
(C–E) Heat maps of each of the transcript sets for
uninduced, common, and K294A data sets. Each
line represents the average difference in probe
intensity as a function of Xrn1 digestion across the
first 1,500 nucleotides of individual transcripts.
Different transcripts are represented in (C) and (E);
however, in (D) the same transcripts of the
common set are compared between control and
K294A-expressing cells.
See also Figure S1.
recovered from uninduced (�Dox) and K294A-expressing
(+Dox) cells (Figure 1D, left versus right panels). The same
transcripts are aligned horizontally, and the greater Xrn1 suscep-
tibility of transcripts recovered from K294A-expressing cells is
consistent with an increase in the proportion of uncapped
mRNAs. Finally, Figure 1E shows the heat map of the 675
capping-inhibited transcripts, which are susceptible to Xrn1
only when they are recovered from K294A-expressing cells.
This is notable for its similarity to the heat map of the common
transcripts recovered from K294A-expressing cells (Figure 1D,
right panel), suggesting that uncapped mRNAs accumulate in
these cells as a consequence of K294A expression.
Xrn1-Susceptible Transcripts Are UncappedFor a detailed analysis of changes in cap status as a function of
K294A expression, we selected 11 putative recapping targets
from transcripts in the common and capping-inhibited sets
(Table S1), and compared them with five Xrn1-resistant controls.
In the first experiment, we again used Xrn1 susceptibility as
a measure of cap status (Figure 2A), except that we assayed
changes by quantitative reverse transcriptase (qRT)-PCR using
primers located near the 50 ends of each transcript. We com-
puted a difference coefficient by comparing the ratio of Xrn1
susceptibility between treatment groups, such that a value of
one indicates no change and a number greater than one indi-
cates the relative increase in susceptibility. Expression of
676 Cell Reports 2, 674–684, September 27, 2012 ª2012 The Author
K294A had no impact on the Xrn1 susceptibility of any of the
five control transcripts, but Xrn1 sensitivity increased for each
of the putative recapping targets (Figure 2A), a result that is
consistent with an increase in uncapped forms of these mRNAs.
Three additional approacheswere used to confirm the appear-
ance of uncapped forms of recapping targets in K294A-express-
ing cells, each of which included a normalization control of
uncapped human b-globin RNA that was spiked into each RNA
preparation. The first used a modification of an approach
designed to tag, recover, and identify uncapped mRNAs from
Arabidopsis (Jiao et al., 2008). In this approach, an RNA adaptor
is ligated to the 50-monophosphate end of uncapped RNAs,
followed by hybridization to a complementary biotinylated DNA
oligonucleotide and recovery on streptavidin paramagnetic
beads. Changes in recovery as a function of K294A expression
were determined as above by qRT-PCR, with results normalized
to the b-globin control (Figure 2B). The increased recovery
of recapping targets from RNA of K294A-expressing cells com-
pared with RNA of control cells is consistent with the results of
Xrn1 digestion, and support the results of microarray experi-
ments for accumulation of uncapped forms of the recapping
targets.
The approaches described above are indirect methods for
assessing the accumulation of uncapped RNAs. To look directly
for changes in uncapped RNA, we performed 50 rapid amplifica-
tion of cDNA ends (50-RACE) using the adaptor-ligated RNA from
s
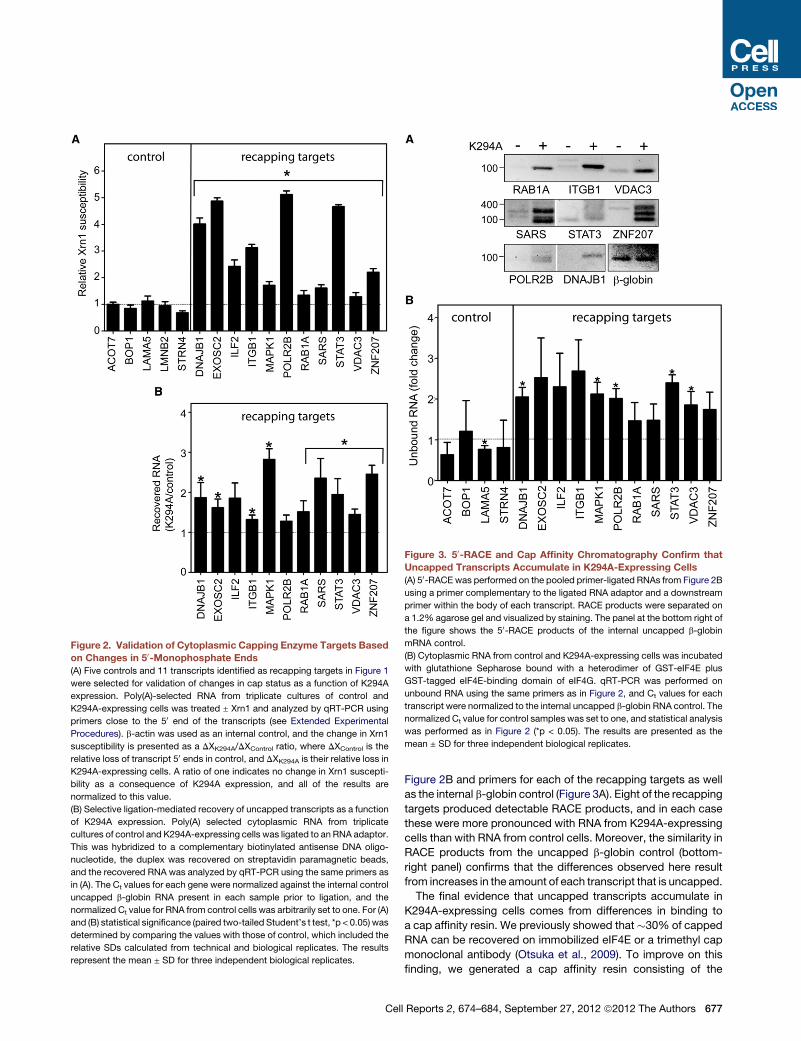
Figure 2. Validation of Cytoplasmic Capping Enzyme Targets Based
on Changes in 50-Monophosphate Ends
(A) Five controls and 11 transcripts identified as recapping targets in Figure 1
were selected for validation of changes in cap status as a function of K294A
expression. Poly(A)-selected RNA from triplicate cultures of control and
K294A-expressing cells was treated ± Xrn1 and analyzed by qRT-PCR using
primers close to the 50 end of the transcripts (see Extended Experimental
Procedures). b-actin was used as an internal control, and the change in Xrn1
susceptibility is presented as a DXK294A/DXControl ratio, where DXControl is the
relative loss of transcript 50 ends in control, and DXK294A is their relative loss in
K294A-expressing cells. A ratio of one indicates no change in Xrn1 suscepti-
bility as a consequence of K294A expression, and all of the results are
normalized to this value.
(B) Selective ligation-mediated recovery of uncapped transcripts as a function
of K294A expression. Poly(A) selected cytoplasmic RNA from triplicate
cultures of control and K294A-expressing cells was ligated to an RNA adaptor.
This was hybridized to a complementary biotinylated antisense DNA oligo-
nucleotide, the duplex was recovered on streptavidin paramagnetic beads,
and the recovered RNA was analyzed by qRT-PCR using the same primers as
in (A). The Ct values for each gene were normalized against the internal control
uncapped b-globin RNA present in each sample prior to ligation, and the
normalized Ct value for RNA from control cells was arbitrarily set to one. For (A)
and (B) statistical significance (paired two-tailed Student’s t test, *p < 0.05) was
determined by comparing the values with those of control, which included the
relative SDs calculated from technical and biological replicates. The results
represent the mean ± SD for three independent biological replicates.
Figure 3. 50-RACE and Cap Affinity Chromatography Confirm that
Uncapped Transcripts Accumulate in K294A-Expressing Cells
(A) 50-RACE was performed on the pooled primer-ligated RNAs from Figure 2B
using a primer complementary to the ligated RNA adaptor and a downstream
primer within the body of each transcript. RACE products were separated on
a 1.2% agarose gel and visualized by staining. The panel at the bottom right of
the figure shows the 50-RACE products of the internal uncapped b-globin
mRNA control.
(B) Cytoplasmic RNA from control and K294A-expressing cells was incubated
with glutathione Sepharose bound with a heterodimer of GST-eIF4E plus
GST-tagged eIF4E-binding domain of eIF4G. qRT-PCR was performed on
unbound RNA using the same primers as in Figure 2, and Ct values for each
transcript were normalized to the internal uncapped b-globin RNA control. The
normalized Ct value for control samples was set to one, and statistical analysis
was performed as in Figure 2 (*p < 0.05). The results are presented as the
mean ± SD for three independent biological replicates.
Cel
Figure 2B and primers for each of the recapping targets as well
as the internal b-globin control (Figure 3A). Eight of the recapping
targets produced detectable RACE products, and in each case
these were more pronounced with RNA from K294A-expressing
cells than with RNA from control cells. Moreover, the similarity in
RACE products from the uncapped b-globin control (bottom-
right panel) confirms that the differences observed here result
from increases in the amount of each transcript that is uncapped.
The final evidence that uncapped transcripts accumulate in
K294A-expressing cells comes from differences in binding to
a cap affinity resin. We previously showed that�30% of capped
RNA can be recovered on immobilized eIF4E or a trimethyl cap
monoclonal antibody (Otsuka et al., 2009). To improve on this
finding, we generated a cap affinity resin consisting of the
l Reports 2, 674–684, September 27, 2012 ª2012 The Authors 677
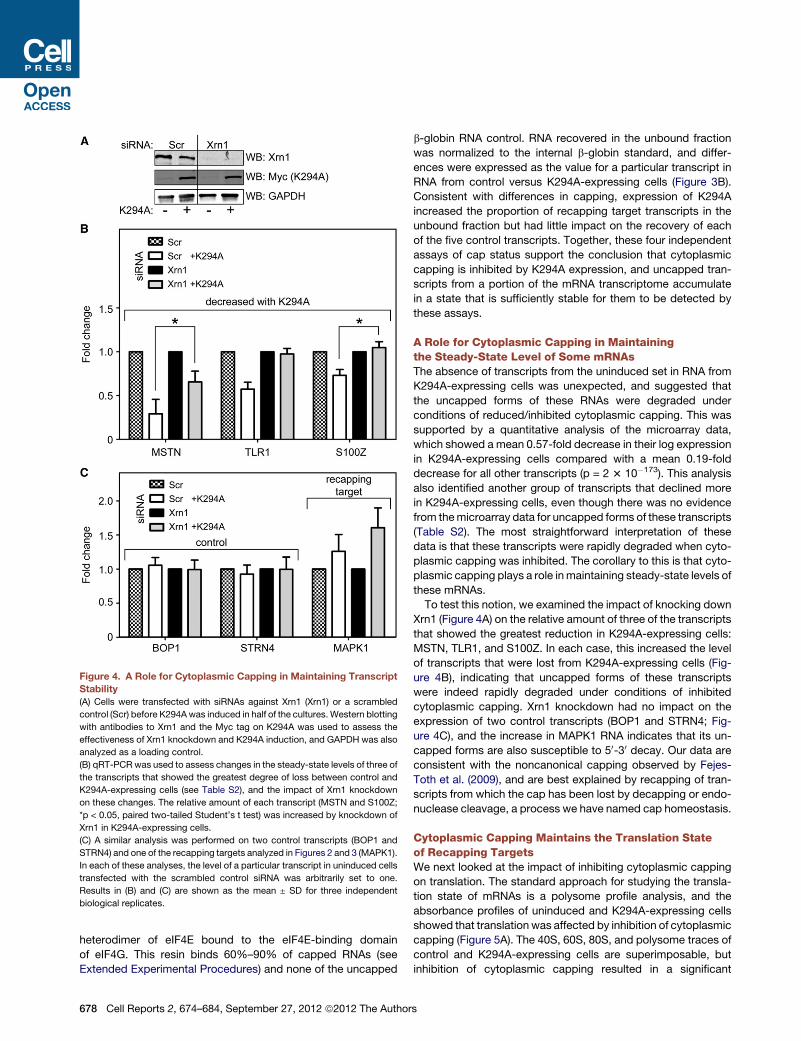
Figure 4. A Role for Cytoplasmic Capping in Maintaining Transcript
Stability
(A) Cells were transfected with siRNAs against Xrn1 (Xrn1) or a scrambled
control (Scr) before K294Awas induced in half of the cultures.Western blotting
with antibodies to Xrn1 and the Myc tag on K294A was used to assess the
effectiveness of Xrn1 knockdown and K294A induction, and GAPDH was also
analyzed as a loading control.
(B) qRT-PCR was used to assess changes in the steady-state levels of three of
the transcripts that showed the greatest degree of loss between control and
K294A-expressing cells (see Table S2), and the impact of Xrn1 knockdown
on these changes. The relative amount of each transcript (MSTN and S100Z;
*p < 0.05, paired two-tailed Student’s t test) was increased by knockdown of
Xrn1 in K294A-expressing cells.
(C) A similar analysis was performed on two control transcripts (BOP1 and
STRN4) and one of the recapping targets analyzed in Figures 2 and 3 (MAPK1).
In each of these analyses, the level of a particular transcript in uninduced cells
transfected with the scrambled control siRNA was arbitrarily set to one.
Results in (B) and (C) are shown as the mean ± SD for three independent
biological replicates.
heterodimer of eIF4E bound to the eIF4E-binding domain
of eIF4G. This resin binds 60%–90% of capped RNAs (see
Extended Experimental Procedures) and none of the uncapped
678 Cell Reports 2, 674–684, September 27, 2012 ª2012 The Author
b-globin RNA control. RNA recovered in the unbound fraction
was normalized to the internal b-globin standard, and differ-
ences were expressed as the value for a particular transcript in
RNA from control versus K294A-expressing cells (Figure 3B).
Consistent with differences in capping, expression of K294A
increased the proportion of recapping target transcripts in the
unbound fraction but had little impact on the recovery of each
of the five control transcripts. Together, these four independent
assays of cap status support the conclusion that cytoplasmic
capping is inhibited by K294A expression, and uncapped tran-
scripts from a portion of the mRNA transcriptome accumulate
in a state that is sufficiently stable for them to be detected by
these assays.
A Role for Cytoplasmic Capping in Maintainingthe Steady-State Level of Some mRNAsThe absence of transcripts from the uninduced set in RNA from
K294A-expressing cells was unexpected, and suggested that
the uncapped forms of these RNAs were degraded under
conditions of reduced/inhibited cytoplasmic capping. This was
supported by a quantitative analysis of the microarray data,
which showed a mean 0.57-fold decrease in their log expression
in K294A-expressing cells compared with a mean 0.19-fold
decrease for all other transcripts (p = 2 3 10�173). This analysis
also identified another group of transcripts that declined more
in K294A-expressing cells, even though there was no evidence
from themicroarray data for uncapped forms of these transcripts
(Table S2). The most straightforward interpretation of these
data is that these transcripts were rapidly degraded when cyto-
plasmic capping was inhibited. The corollary to this is that cyto-
plasmic capping plays a role inmaintaining steady-state levels of
these mRNAs.
To test this notion, we examined the impact of knocking down
Xrn1 (Figure 4A) on the relative amount of three of the transcripts
that showed the greatest reduction in K294A-expressing cells:
MSTN, TLR1, and S100Z. In each case, this increased the level
of transcripts that were lost from K294A-expressing cells (Fig-
ure 4B), indicating that uncapped forms of these transcripts
were indeed rapidly degraded under conditions of inhibited
cytoplasmic capping. Xrn1 knockdown had no impact on the
expression of two control transcripts (BOP1 and STRN4; Fig-
ure 4C), and the increase in MAPK1 RNA indicates that its un-
capped forms are also susceptible to 50-30 decay. Our data are
consistent with the noncanonical capping observed by Fejes-
Toth et al. (2009), and are best explained by recapping of tran-
scripts from which the cap has been lost by decapping or endo-
nuclease cleavage, a process we have named cap homeostasis.
Cytoplasmic Capping Maintains the Translation Stateof Recapping TargetsWe next looked at the impact of inhibiting cytoplasmic capping
on translation. The standard approach for studying the transla-
tion state of mRNAs is a polysome profile analysis, and the
absorbance profiles of uninduced and K294A-expressing cells
showed that translation was affected by inhibition of cytoplasmic
capping (Figure 5A). The 40S, 60S, 80S, and polysome traces of
control and K294A-expressing cells are superimposable, but
inhibition of cytoplasmic capping resulted in a significant
s
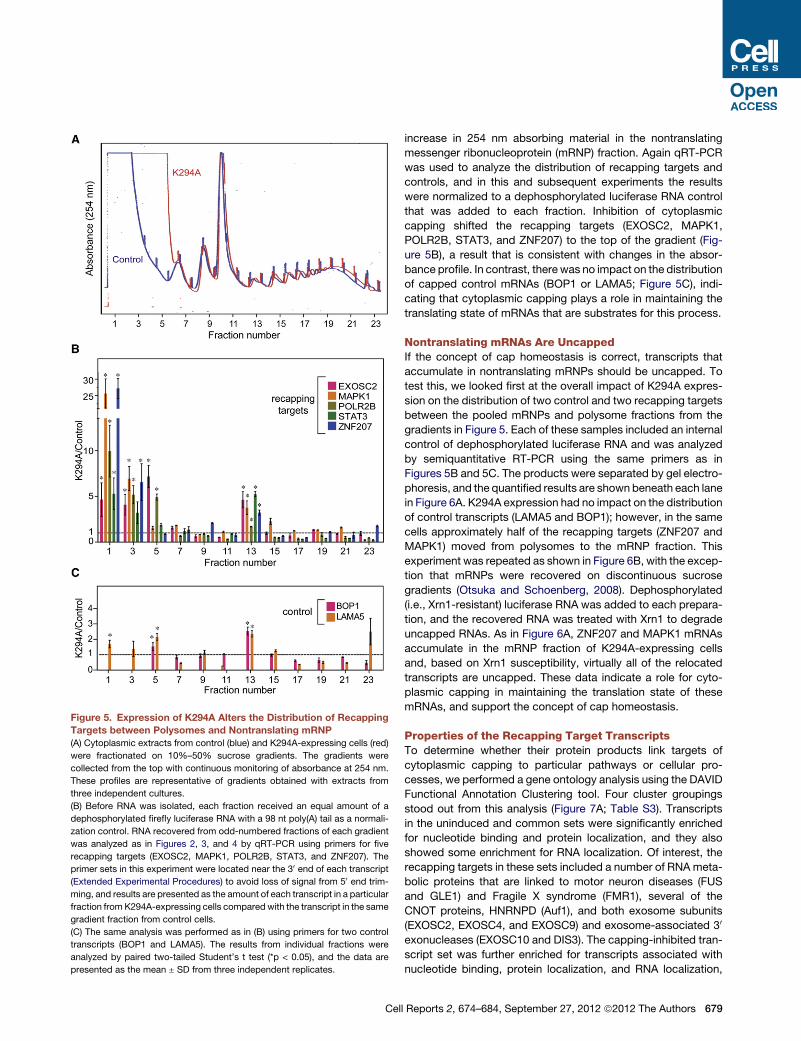
Figure 5. Expression of K294A Alters the Distribution of Recapping
Targets between Polysomes and Nontranslating mRNP
(A) Cytoplasmic extracts from control (blue) and K294A-expressing cells (red)
were fractionated on 10%–50% sucrose gradients. The gradients were
collected from the top with continuous monitoring of absorbance at 254 nm.
These profiles are representative of gradients obtained with extracts from
three independent cultures.
(B) Before RNA was isolated, each fraction received an equal amount of a
dephosphorylated firefly luciferase RNA with a 98 nt poly(A) tail as a normali-
zation control. RNA recovered from odd-numbered fractions of each gradient
was analyzed as in Figures 2, 3, and 4 by qRT-PCR using primers for five
recapping targets (EXOSC2, MAPK1, POLR2B, STAT3, and ZNF207). The
primer sets in this experiment were located near the 30 end of each transcript
(Extended Experimental Procedures) to avoid loss of signal from 50 end trim-
ming, and results are presented as the amount of each transcript in a particular
fraction from K294A-expressing cells compared with the transcript in the same
gradient fraction from control cells.
(C) The same analysis was performed as in (B) using primers for two control
transcripts (BOP1 and LAMA5). The results from individual fractions were
analyzed by paired two-tailed Student’s t test (*p < 0.05), and the data are
presented as the mean ± SD from three independent replicates.
Cel
increase in 254 nm absorbing material in the nontranslating
messenger ribonucleoprotein (mRNP) fraction. Again qRT-PCR
was used to analyze the distribution of recapping targets and
controls, and in this and subsequent experiments the results
were normalized to a dephosphorylated luciferase RNA control
that was added to each fraction. Inhibition of cytoplasmic
capping shifted the recapping targets (EXOSC2, MAPK1,
POLR2B, STAT3, and ZNF207) to the top of the gradient (Fig-
ure 5B), a result that is consistent with changes in the absor-
bance profile. In contrast, therewas no impact on the distribution
of capped control mRNAs (BOP1 or LAMA5; Figure 5C), indi-
cating that cytoplasmic capping plays a role in maintaining the
translating state of mRNAs that are substrates for this process.
Nontranslating mRNAs Are UncappedIf the concept of cap homeostasis is correct, transcripts that
accumulate in nontranslating mRNPs should be uncapped. To
test this, we looked first at the overall impact of K294A expres-
sion on the distribution of two control and two recapping targets
between the pooled mRNPs and polysome fractions from the
gradients in Figure 5. Each of these samples included an internal
control of dephosphorylated luciferase RNA and was analyzed
by semiquantitative RT-PCR using the same primers as in
Figures 5B and 5C. The products were separated by gel electro-
phoresis, and the quantified results are shown beneath each lane
in Figure 6A. K294A expression had no impact on the distribution
of control transcripts (LAMA5 and BOP1); however, in the same
cells approximately half of the recapping targets (ZNF207 and
MAPK1) moved from polysomes to the mRNP fraction. This
experiment was repeated as shown in Figure 6B, with the excep-
tion that mRNPs were recovered on discontinuous sucrose
gradients (Otsuka and Schoenberg, 2008). Dephosphorylated
(i.e., Xrn1-resistant) luciferase RNA was added to each prepara-
tion, and the recovered RNA was treated with Xrn1 to degrade
uncapped RNAs. As in Figure 6A, ZNF207 and MAPK1 mRNAs
accumulate in the mRNP fraction of K294A-expressing cells
and, based on Xrn1 susceptibility, virtually all of the relocated
transcripts are uncapped. These data indicate a role for cyto-
plasmic capping in maintaining the translation state of these
mRNAs, and support the concept of cap homeostasis.
Properties of the Recapping Target TranscriptsTo determine whether their protein products link targets of
cytoplasmic capping to particular pathways or cellular pro-
cesses, we performed a gene ontology analysis using the DAVID
Functional Annotation Clustering tool. Four cluster groupings
stood out from this analysis (Figure 7A; Table S3). Transcripts
in the uninduced and common sets were significantly enriched
for nucleotide binding and protein localization, and they also
showed some enrichment for RNA localization. Of interest, the
recapping targets in these sets included a number of RNA meta-
bolic proteins that are linked to motor neuron diseases (FUS
and GLE1) and Fragile X syndrome (FMR1), several of the
CNOT proteins, HNRNPD (Auf1), and both exosome subunits
(EXOSC2, EXOSC4, and EXOSC9) and exosome-associated 30
exonucleases (EXOSC10 and DIS3). The capping-inhibited tran-
script set was further enriched for transcripts associated with
nucleotide binding, protein localization, and RNA localization,
l Reports 2, 674–684, September 27, 2012 ª2012 The Authors 679
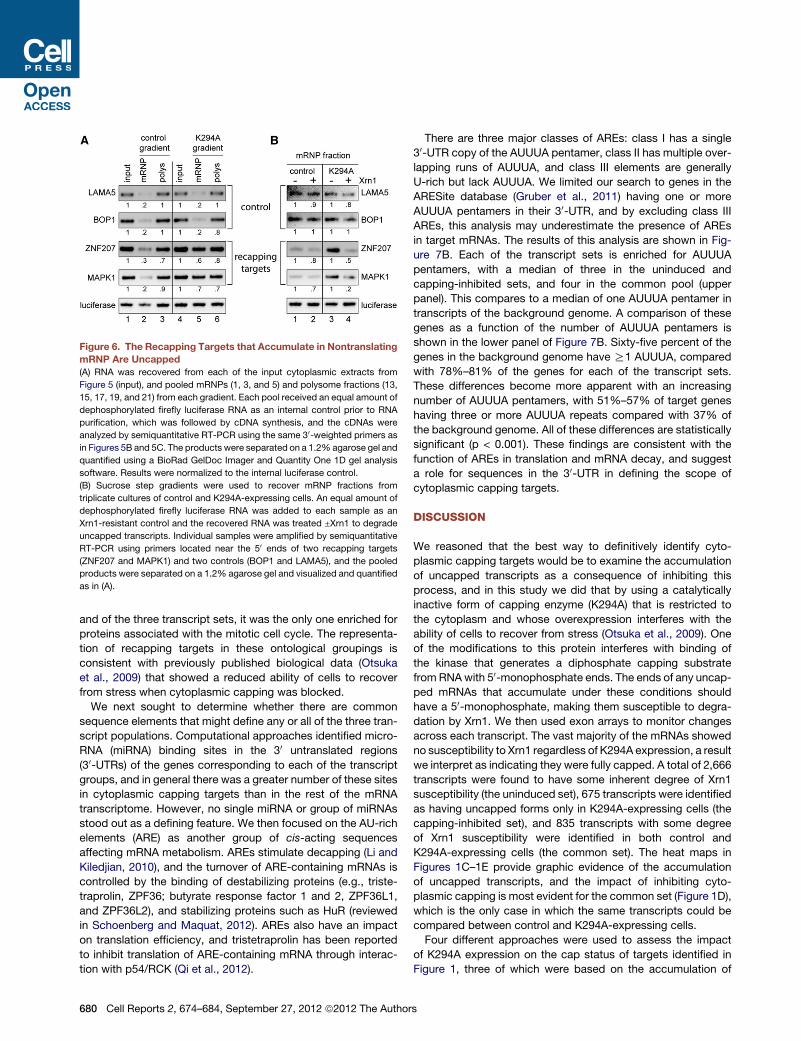
Figure 6. The Recapping Targets that Accumulate in Nontranslating
mRNP Are Uncapped
(A) RNA was recovered from each of the input cytoplasmic extracts from
Figure 5 (input), and pooled mRNPs (1, 3, and 5) and polysome fractions (13,
15, 17, 19, and 21) from each gradient. Each pool received an equal amount of
dephosphorylated firefly luciferase RNA as an internal control prior to RNA
purification, which was followed by cDNA synthesis, and the cDNAs were
analyzed by semiquantitative RT-PCR using the same 30-weighted primers as
in Figures 5B and 5C. The products were separated on a 1.2% agarose gel and
quantified using a BioRad GelDoc Imager and Quantity One 1D gel analysis
software. Results were normalized to the internal luciferase control.
(B) Sucrose step gradients were used to recover mRNP fractions from
triplicate cultures of control and K294A-expressing cells. An equal amount of
dephosphorylated firefly luciferase RNA was added to each sample as an
Xrn1-resistant control and the recovered RNA was treated ±Xrn1 to degrade
uncapped transcripts. Individual samples were amplified by semiquantitative
RT-PCR using primers located near the 50 ends of two recapping targets
(ZNF207 and MAPK1) and two controls (BOP1 and LAMA5), and the pooled
products were separated on a 1.2% agarose gel and visualized and quantified
as in (A).
and of the three transcript sets, it was the only one enriched for
proteins associated with the mitotic cell cycle. The representa-
tion of recapping targets in these ontological groupings is
consistent with previously published biological data (Otsuka
et al., 2009) that showed a reduced ability of cells to recover
from stress when cytoplasmic capping was blocked.
We next sought to determine whether there are common
sequence elements that might define any or all of the three tran-
script populations. Computational approaches identified micro-
RNA (miRNA) binding sites in the 30 untranslated regions
(30-UTRs) of the genes corresponding to each of the transcript
groups, and in general there was a greater number of these sites
in cytoplasmic capping targets than in the rest of the mRNA
transcriptome. However, no single miRNA or group of miRNAs
stood out as a defining feature. We then focused on the AU-rich
elements (ARE) as another group of cis-acting sequences
affecting mRNA metabolism. AREs stimulate decapping (Li and
Kiledjian, 2010), and the turnover of ARE-containing mRNAs is
controlled by the binding of destabilizing proteins (e.g., triste-
traprolin, ZPF36; butyrate response factor 1 and 2, ZPF36L1,
and ZPF36L2), and stabilizing proteins such as HuR (reviewed
in Schoenberg and Maquat, 2012). AREs also have an impact
on translation efficiency, and tristetraprolin has been reported
to inhibit translation of ARE-containing mRNA through interac-
tion with p54/RCK (Qi et al., 2012).
680 Cell Reports 2, 674–684, September 27, 2012 ª2012 The Author
There are three major classes of AREs: class I has a single
30-UTR copy of the AUUUA pentamer, class II has multiple over-
lapping runs of AUUUA, and class III elements are generally
U-rich but lack AUUUA. We limited our search to genes in the
ARESite database (Gruber et al., 2011) having one or more
AUUUA pentamers in their 30-UTR, and by excluding class III
AREs, this analysis may underestimate the presence of AREs
in target mRNAs. The results of this analysis are shown in Fig-
ure 7B. Each of the transcript sets is enriched for AUUUA
pentamers, with a median of three in the uninduced and
capping-inhibited sets, and four in the common pool (upper
panel). This compares to a median of one AUUUA pentamer in
transcripts of the background genome. A comparison of these
genes as a function of the number of AUUUA pentamers is
shown in the lower panel of Figure 7B. Sixty-five percent of the
genes in the background genome have R1 AUUUA, compared
with 78%–81% of the genes for each of the transcript sets.
These differences become more apparent with an increasing
number of AUUUA pentamers, with 51%–57% of target genes
having three or more AUUUA repeats compared with 37% of
the background genome. All of these differences are statistically
significant (p < 0.001). These findings are consistent with the
function of AREs in translation and mRNA decay, and suggest
a role for sequences in the 30-UTR in defining the scope of
cytoplasmic capping targets.
DISCUSSION
We reasoned that the best way to definitively identify cyto-
plasmic capping targets would be to examine the accumulation
of uncapped transcripts as a consequence of inhibiting this
process, and in this study we did that by using a catalytically
inactive form of capping enzyme (K294A) that is restricted to
the cytoplasm and whose overexpression interferes with the
ability of cells to recover from stress (Otsuka et al., 2009). One
of the modifications to this protein interferes with binding of
the kinase that generates a diphosphate capping substrate
from RNAwith 50-monophosphate ends. The ends of any uncap-
ped mRNAs that accumulate under these conditions should
have a 50-monophosphate, making them susceptible to degra-
dation by Xrn1. We then used exon arrays to monitor changes
across each transcript. The vast majority of the mRNAs showed
no susceptibility to Xrn1 regardless of K294A expression, a result
we interpret as indicating they were fully capped. A total of 2,666
transcripts were found to have some inherent degree of Xrn1
susceptibility (the uninduced set), 675 transcripts were identified
as having uncapped forms only in K294A-expressing cells (the
capping-inhibited set), and 835 transcripts with some degree
of Xrn1 susceptibility were identified in both control and
K294A-expressing cells (the common set). The heat maps in
Figures 1C–1E provide graphic evidence of the accumulation
of uncapped transcripts, and the impact of inhibiting cyto-
plasmic capping is most evident for the common set (Figure 1D),
which is the only case in which the same transcripts could be
compared between control and K294A-expressing cells.
Four different approaches were used to assess the impact
of K294A expression on the cap status of targets identified in
Figure 1, three of which were based on the accumulation of
s
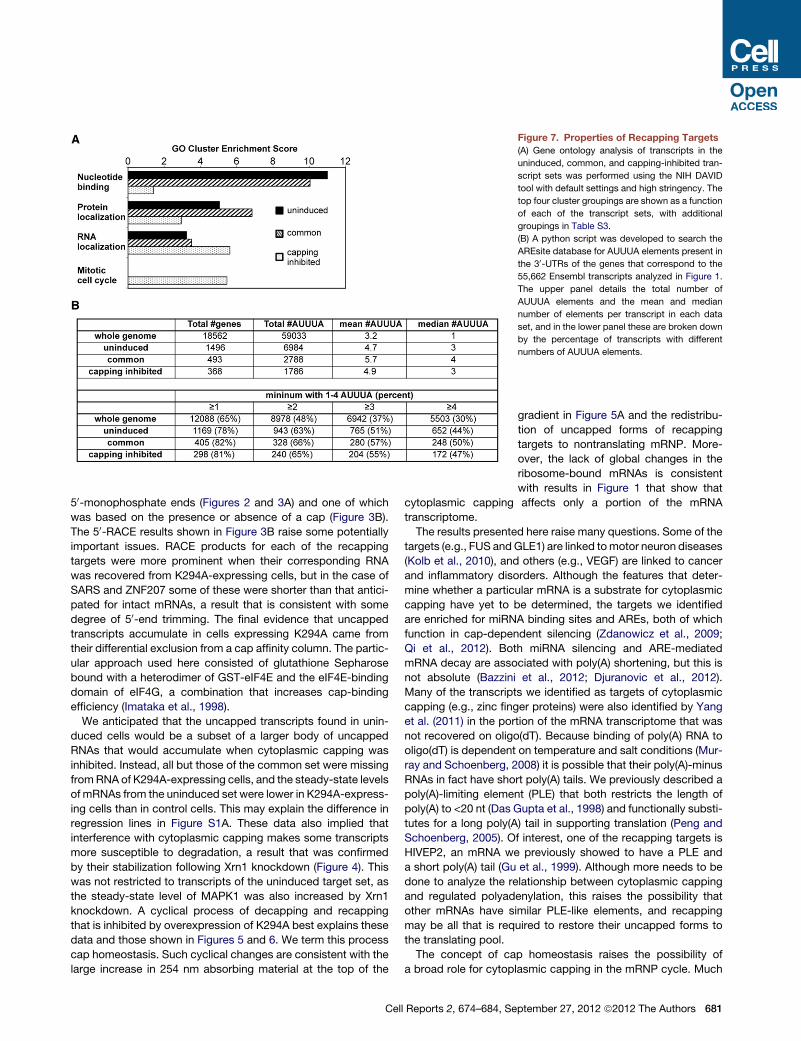
Figure 7. Properties of Recapping Targets
(A) Gene ontology analysis of transcripts in the
uninduced, common, and capping-inhibited tran-
script sets was performed using the NIH DAVID
tool with default settings and high stringency. The
top four cluster groupings are shown as a function
of each of the transcript sets, with additional
groupings in Table S3.
(B) A python script was developed to search the
AREsite database for AUUUA elements present in
the 30-UTRs of the genes that correspond to the
55,662 Ensembl transcripts analyzed in Figure 1.
The upper panel details the total number of
AUUUA elements and the mean and median
number of elements per transcript in each data
set, and in the lower panel these are broken down
by the percentage of transcripts with different
numbers of AUUUA elements.
50-monophosphate ends (Figures 2 and 3A) and one of which
was based on the presence or absence of a cap (Figure 3B).
The 50-RACE results shown in Figure 3B raise some potentially
important issues. RACE products for each of the recapping
targets were more prominent when their corresponding RNA
was recovered from K294A-expressing cells, but in the case of
SARS and ZNF207 some of these were shorter than that antici-
pated for intact mRNAs, a result that is consistent with some
degree of 50-end trimming. The final evidence that uncapped
transcripts accumulate in cells expressing K294A came from
their differential exclusion from a cap affinity column. The partic-
ular approach used here consisted of glutathione Sepharose
bound with a heterodimer of GST-eIF4E and the eIF4E-binding
domain of eIF4G, a combination that increases cap-binding
efficiency (Imataka et al., 1998).
We anticipated that the uncapped transcripts found in unin-
duced cells would be a subset of a larger body of uncapped
RNAs that would accumulate when cytoplasmic capping was
inhibited. Instead, all but those of the common set were missing
fromRNA of K294A-expressing cells, and the steady-state levels
of mRNAs from the uninduced set were lower in K294A-express-
ing cells than in control cells. This may explain the difference in
regression lines in Figure S1A. These data also implied that
interference with cytoplasmic capping makes some transcripts
more susceptible to degradation, a result that was confirmed
by their stabilization following Xrn1 knockdown (Figure 4). This
was not restricted to transcripts of the uninduced target set, as
the steady-state level of MAPK1 was also increased by Xrn1
knockdown. A cyclical process of decapping and recapping
that is inhibited by overexpression of K294A best explains these
data and those shown in Figures 5 and 6. We term this process
cap homeostasis. Such cyclical changes are consistent with the
large increase in 254 nm absorbing material at the top of the
Cell Reports 2, 674–684, Se
gradient in Figure 5A and the redistribu-
tion of uncapped forms of recapping
targets to nontranslating mRNP. More-
over, the lack of global changes in the
ribosome-bound mRNAs is consistent
with results in Figure 1 that show that
cytoplasmic capping affects only a portion of the mRNA
transcriptome.
The results presented here raise many questions. Some of the
targets (e.g., FUS andGLE1) are linked tomotor neuron diseases
(Kolb et al., 2010), and others (e.g., VEGF) are linked to cancer
and inflammatory disorders. Although the features that deter-
mine whether a particular mRNA is a substrate for cytoplasmic
capping have yet to be determined, the targets we identified
are enriched for miRNA binding sites and AREs, both of which
function in cap-dependent silencing (Zdanowicz et al., 2009;
Qi et al., 2012). Both miRNA silencing and ARE-mediated
mRNA decay are associated with poly(A) shortening, but this is
not absolute (Bazzini et al., 2012; Djuranovic et al., 2012).
Many of the transcripts we identified as targets of cytoplasmic
capping (e.g., zinc finger proteins) were also identified by Yang
et al. (2011) in the portion of the mRNA transcriptome that was
not recovered on oligo(dT). Because binding of poly(A) RNA to
oligo(dT) is dependent on temperature and salt conditions (Mur-
ray and Schoenberg, 2008) it is possible that their poly(A)-minus
RNAs in fact have short poly(A) tails. We previously described a
poly(A)-limiting element (PLE) that both restricts the length of
poly(A) to <20 nt (Das Gupta et al., 1998) and functionally substi-
tutes for a long poly(A) tail in supporting translation (Peng and
Schoenberg, 2005). Of interest, one of the recapping targets is
HIVEP2, an mRNA we previously showed to have a PLE and
a short poly(A) tail (Gu et al., 1999). Although more needs to be
done to analyze the relationship between cytoplasmic capping
and regulated polyadenylation, this raises the possibility that
other mRNAs have similar PLE-like elements, and recapping
may be all that is required to restore their uncapped forms to
the translating pool.
The concept of cap homeostasis raises the possibility of
a broad role for cytoplasmic capping in the mRNP cycle. Much
ptember 27, 2012 ª2012 The Authors 681
has been written about the cycling of mRNAs between active
(i.e., translating) and inactive states, and the function of visible
and submicroscopic RNP complexes in this process. P bodies,
neuronal granules, chromatoid bodies, and maternal RNA gran-
ules all contain decapping enzymes, p54/RCK, and mRNAs
that can be returned to the translating pool under the appropriate
stimuli. Although the cap and cap-binding proteins are key
factors in the silencing process, nothing is known about the cap
status of silencedor storedmRNAs.Our results provide evidence
that nontranslating mRNAs can accumulate in an uncapped
state, and they raise the possibility that decapping without
degradation may be used to maintain some transcripts in deep
hibernation, fromwhich theymay be reawakenedby cytoplasmic
capping. Such a mechanism might be particularly useful for
maintaining the nontranslating state of maternal mRNAs and
neuronal mRNAs as they move from the cell body to dendrites.
Although the gene ontology analysis shown in Figure 7A
suggests that cytoplasmic capping plays a role in a number of
cellular processes, much remains to be done to determine the
full scope of its role in gene expression. Transcripts with GO
terms linked to the mitotic cell cycle are only seen in the
capping-inhibited set, and although it is premature to interpret
functionality, these are also the transcripts that appear to be
most stable in an uncapped state and to accumulate uncapped
in nontranslatingmRNP.We previously showed that overexpres-
sion of K294A inhibits the ability of cells to recover from arsenite
stress (Otsuka et al., 2009), and future work will determine
whether some of these transcripts are stored uncapped (e.g.,
in P bodies or stress granules) and require cytoplasmic capping
to reactivate their translation. It will be equally important to deter-
mine where in the transcript the cap is added, and work is in
progress to apply deep sequencing to the identification of these
sites. We also have yet to determine whether there are cis-acting
elements or features other than the ones that were identified here
that function in identifying substrates for cytoplasmic capping.
Finally, Thoma et al. (2001) provided evidence for translation of
proteins from sequences downstream of antisense-targeted
cleavage sites. The mechanism responsible for this was not
determined, but the results presented here raise the possibility
that the 50 ends of cleaved RNAs were recapped, and cyto-
plasmic capping may have a broader role in facilitating the
synthesis of N-terminally truncated forms of some proteins.
EXPERIMENTAL PROCEDURES
Cell Culture
The establishment, growth, and properties of tetracycline-inducible U2OS
cells stably transfected with pcDNA4/TO/myc-K294DNLS+NES-Flag (referred
to here as K294A) are described in Otsuka et al. (2009). These cells express
a nonfunctional form of murine capping enzyme in which the active-site lysine
is changed to alanine. Its expression is restricted to the cytoplasm by deleting
the four-amino-acid nuclear localization signal and adding the HIV Rev nuclear
export signal. In all of the experiments reported here, expression was induced
by culturing cells for 24 hr inmedium containing 1 mg/ml of doxycycline, except
for polysome fractionation experiments, in which cells were induced for 48 hr.
All of the experiments were carried out in triplicate cultures.
Preparation of Cytoplasmic RNA and poly(A) Selection
Cells were washed twice in chilled phosphate-buffered saline (PBS), recov-
ered by centrifugation at 100 3 g and resuspended in three volumes of RSB
682 Cell Reports 2, 674–684, September 27, 2012 ª2012 The Author
buffer (10 mM Tris-HCl, pH 8.0, 10 mM NaCl, 2 mM EDTA, 0.5% NP-40,
with the addition of 1 mM dithiothreitol and 800 U/ml of RNaseOUT
[Invitrogen]). These cells were incubated on ice for 10 min with intermittent re-
suspension, and then centrifuged at 1,0003 g at 4�C for 10 min. Cytoplasmic
RNA was recovered from the supernatant using Trizol (Invitrogen) as directed
by the manufacturer. Then 5 mg total cytoplasmic RNA was treated with 1 unit
of DNase I (Invitrogen), and when necessary, poly(A) RNA was selected using
a Dynabeads mRNA DIRECT Kit (Invitrogen) according to the manufacturer’s
instructions. For RNA denaturation, samples were heated at 65�C for 5 min,
followed by snap chilling on ice.
Microarrays
Cytoplasmic RNA (10 mg) from individual cultures was treated with 1 unit of
DNase I, and ribosomal RNA was removed by two rounds of RiboMinus
(Invitrogen) selection. Then 0.6 mg of selected RNA was heat denatured
and either analyzed directly or treated for 2 hr at 37�C with 5 units of Xrn1
(New England Biolabs) to partially degrade uncapped RNA. The reaction
was terminated by heating at 70�C for 10min, and fluorescently labeled cDNAs
from biological triplicate samples were hybridized to individual Affymetrix
Human Exon 1.0 ST microarrays. The exon array data were normalized with
the standard RMA algorithm from the Oligo package for R from the Bio-
conductor suite and recorded as log2 expression.
Validation of Uncapped Transcripts
Uncapped transcripts identified by microarrays were validated by 50-RACE,susceptibility to degradation in vitro by Xrn1, ligation-mediated isolation
(Jiao et al., 2008), and cap-based separation, details of which are presented
in Extended Experimental Procedures. To determine the fold change due to
K294A overexpression, transcript levels were normalized to those of unin-
duced samples. The data represent three independent culture replicates. A
paired two-tailed Student’s t test (*p < 0.05) was used for statistical
comparison.
Xrn1 Knockdown
Control and K294A cells were transfected with 20 nM Xrn1 siRNA (Origene)
using Lipofectamine RNAiMAX transfection reagent (Invitrogen). Forty-eight
hours later, doxycycline (1 mg/ml) was added to half of the cultures to induce
K294A expression, and cells were harvested 24 hr later. The efficiency of
Xrn1 knockdown was monitored by western blotting with rabbit anti-Xrn1
antibody (Santa Cruz). Cytoplasmic RNA was recovered and assayed for
target gene expression by real-time PCR using primers listed in Extended
Experimental Procedures.
Polysome Fractionation, RNA Quantitation, and Xrn1 Susceptibility
of mRNPs
Cells were lysed in buffer containing 15 mM Tris-HCl pH 7.5, 10 mM MgCl2,
150 mM KCl, 500 mg/ml cycloheximide, 0.5% Triton X-100, protease inhibitor
cocktail (1:100 dilution from Sigma), phosphatase inhibitor cocktails 2 and 3
(1:100 dilution fromSigma), 2mM sodium orthovanadate, 1mMphenylmethyl-
sulfonyl fluoride and 1 U/ml of RNasin (Promega). Cytoplasmic extract (300 ml)
was layered onto 10%–50% linear gradients prepared in buffer containing
15mM Tris-HCl (pH 7.5), 10mMMgCl2, 150mMKCl, and 100 mg/ml cyclohex-
imide. These were centrifuged at 210,000 3 g in a Sorvall TH641 rotor for 3 hr
at 4�C. Then 0.5 ml fractions were collected from the top with continuous
monitoring of the absorbance at 254 nm, and 0.5 ng of an Xrn1-resistant
form of polyadenylated (A98) firefly luciferase RNA was added as a normaliza-
tion control to 200 ml of each fraction. The luciferase transcript wasmade resis-
tant to Xrn1 by removing 50 phosphates with shrimp alkaline phosphatase.
RNA recovered with Trizol reagent was stored in diethylpyrocarbonate
(DEPC)-treated water. cDNA was prepared from each fraction using the
Superscript III cDNA Synthesis kit (Invitrogen) with random hexamer priming,
and transcripts were quantified by SYBR green-based qRT-PCR using primers
located near the 30 end of each of the transcripts (see the primer table in
Extended Experimental Procedures). Alternatively, to demonstrate the accu-
mulation of target transcripts in mRNPs, the linear gradient fractions 1, 3,
and 5were pooled asmRNPs, and fractions 13, 15, 17, 19, and 21 were pooled
to form polysomal fractions. These pools were used for cDNA synthesis and
s
semiquantitative PCR using 30-end primers. The products were analyzed on
2% agarose gel in 1X TBE using Quantity One 1D gel imaging software
(Biorad). The cap status of transcripts in the mRNP fraction was determined
by treating RNA from the mRNP pool with Xrn1, followed by semiquantitative
RT-PCR using primers located near the 50 ends of the target transcripts. The
products of these reactions were analyzed on 2% agarose gel in 1X TBE.
ACCESSION NUMBERS
Microarray data have been submitted to GEO under accession number
GSE36729.
SUPPLEMENTAL INFORMATION
Supplemental Information includes Extended Experimental Procedures, one
figure, and four tables and can be found with this article online at http://dx.
doi.org/10.1016/j.celrep.2012.07.011.
LICENSING INFORMATION
This is an open-access article distributed under the terms of the Creative
Commons Attribution-Noncommercial-No Derivative Works 3.0 Unported
License (CC-BY-NC-ND; http://creativecommons.org/licenses/by-nc-nd/3.0/
legalcode).
ACKNOWLEDGMENTS
We thank Nahum Sonenberg and Jerry Pelletier (McGill University, Canada) for
plasmids, Juan Gutierrez (Ohio State Mathematical Biosciences Institute) for
help with bioinformatics, and Daniel L. Kiss and other members of the Schoen-
berg lab for helpful comments and discussion. We also acknowledge the
support of the Microarray Shared Resource of the Ohio State Comprehensive
Cancer Center. Research reported in this publication was supported by the
National Institute of General Medical Sciences of the National Institutes of
Health under award numbers R01GM084177 and R01GM038277. The content
is solely the responsibility of the authors and does not necessarily represent
the official views of the National Institutes of Health.
Received: May 11, 2012
Revised: June 20, 2012
Accepted: July 26, 2012
Published online: August 23, 2012
REFERENCES
Anderson, P., and Kedersha, N. (2002). Stressful initiations. J. Cell Sci. 115,
3227–3234.
Bazzini, A.A., Lee, M.T., and Giraldez, A.J. (2012). Ribosome profiling shows
that miR-430 reduces translation before causing mRNA decay in zebrafish.
Science 336, 233–237.
Bremer, K.A., Stevens, A., and Schoenberg, D.R. (2003). An endonuclease
activity similar to Xenopus PMR1 catalyzes the degradation of normal and
nonsense-containing human beta-globin mRNA in erythroid cells. RNA 9,
1157–1167.
Chu, C., and Shatkin, A.J. (2008). Apoptosis and autophagy induction in
mammalian cells by small interfering RNA knockdown of mRNA capping
enzymes. Mol. Cell. Biol. 28, 5829–5836.
Das Gupta, J., Gu, H., Chernokalskaya, E., Gao, X., and Schoenberg, D.R.
(1998). Identification of two cis-acting elements that independently regulate
the length of poly(A) on Xenopus albumin pre-mRNA. RNA 4, 766–776.
Djuranovic, S., Nahvi, A., and Green, R. (2012). miRNA-mediated gene
silencing by translational repression followed by mRNA deadenylation and
decay. Science 336, 237–240.
Fejes-Toth, K., Sotirova, V., Sachidanandam, R., Assaf, G., Hannon, G.J.,
Kapranov, P., Foissac, S., Willingham, A.T., Duttagupta, R., Dumais, E., and
Cel
Gingeras, T.R.Affymetrix ENCODE Transcriptome Project; Cold Spring Harbor
Laboratory ENCODE Transcriptome Project. (2009). Post-transcriptional pro-
cessing generates a diversity of 50-modified long and short RNAs. Nature 457,
1028–1032.
Gregory, B.D., O’Malley, R.C., Lister, R., Urich, M.A., Tonti-Filippini, J., Chen,
H., Millar, A.H., and Ecker, J.R. (2008). A link between RNA metabolism and
silencing affecting Arabidopsis development. Dev. Cell 14, 854–866.
Gruber, A.R., Fallmann, J., Kratochvill, F., Kovarik, P., and Hofacker, I.L.
(2011). AREsite: a database for the comprehensive investigation of AU-rich
elements. Nucleic Acids Res. 39(Database issue), D66–D69.
Gu, H., Das Gupta, J., and Schoenberg, D.R. (1999). The poly(A)-limiting
element is a conserved cis-acting sequence that regulates poly(A) tail length
on nuclear pre-mRNAs. Proc. Natl. Acad. Sci. USA 96, 8943–8948.
Gu,M., and Lima, C.D. (2005). Processing themessage: structural insights into
capping and decapping mRNA. Curr. Opin. Struct. Biol. 15, 99–106.
Hu, W., Sweet, T.J., Chamnongpol, S., Baker, K.E., and Coller, J. (2009).
Co-translational mRNA decay in Saccharomyces cerevisiae. Nature 461,
225–229.
Imataka, H., Gradi, A., and Sonenberg, N. (1998). A newly identified N-terminal
amino acid sequence of human eIF4G binds poly(A)-binding protein and
functions in poly(A)-dependent translation. EMBO J. 17, 7480–7489.
Jiao, X., Xiang, S., Oh, C., Martin, C.E., Tong, L., and Kiledjian, M. (2010).
Identification of a quality-control mechanism formRNA 50-end capping. Nature
467, 608–611.
Jiao, Y., Riechmann, J.L., and Meyerowitz, E.M. (2008). Transcriptome-wide
analysis of uncapped mRNAs in Arabidopsis reveals regulation of mRNA
degradation. Plant Cell 20, 2571–2585.
Karginov, F.V., Cheloufi, S., Chong, M.M.W., Stark, A., Smith, A.D., and
Hannon, G.J. (2010). Diverse endonucleolytic cleavage sites in the mammalian
transcriptome depend upon microRNAs, Drosha, and additional nucleases.
Mol. Cell 38, 781–788.
Kolb, S.J., Sutton, S., and Schoenberg, D.R. (2010). RNA processing defects
associated with diseases of the motor neuron. Muscle Nerve 41, 5–17.
Li, Y., and Kiledjian, M. (2010). Regulation of mRNA decapping. Wiley Interdis-
cip. Rev. RNA 1, 253–265.
Lim, S.K., and Maquat, L.E. (1992). Human beta-globin mRNAs that harbor
a nonsense codon are degraded in murine erythroid tissues to intermediates
lacking regions of exon I or exons I and II that have a cap-like structure at
the 50 termini. EMBO J. 11, 3271–3278.
Lim, S.K., Sigmund, C.D., Gross, K.W., and Maquat, L.E. (1992). Nonsense
codons in human beta-globin mRNA result in the production of mRNA degra-
dation products. Mol. Cell. Biol. 12, 1149–1161.
Mercer, T.R., Dinger, M.E., Bracken, C.P., Kolle, G., Szubert, J.M., Korbie,
D.J., Askarian-Amiri, M.E., Gardiner, B.B., Goodall, G.J., Grimmond, S.M.,
and Mattick, J.S. (2010). Regulated post-transcriptional RNA cleavage diver-
sifies the eukaryotic transcriptome. Genome Res. 20, 1639–1650.
Mullen, T.E., and Marzluff, W.F. (2008). Degradation of histone mRNA requires
oligouridylation followed by decapping and simultaneous degradation of the
mRNA both 50 to 30 and 30 to 50. Genes Dev. 22, 50–65.
Murray, E.L., and Schoenberg, D.R. (2007). A+U-rich instability elements
differentially activate 50-30 and 30-50 mRNA decay. Mol. Cell. Biol. 27, 2791–
2799.
Murray, E.L., and Schoenberg, D.R. (2008). Assays for determining poly(A) tail
length and the polarity of mRNA decay in mammalian cells. Methods Enzymol.
448, 483–504.
Ni, T., Corcoran, D.L., Rach, E.A., Song, S., Spana, E.P., Gao, Y., Ohler, U.,
and Zhu, J. (2010). A paired-end sequencing strategy to map the complex
landscape of transcription initiation. Nat. Methods 7, 521–527.
Otsuka, Y., and Schoenberg, D.R. (2008). Approaches for studying PMR1
endonuclease-mediated mRNA decay. Methods Enzymol. 448, 241–263.
l Reports 2, 674–684, September 27, 2012 ª2012 The Authors 683
Otsuka, Y., Kedersha, N.L., and Schoenberg, D.R. (2009). Identification of
a cytoplasmic complex that adds a cap onto 50-monophosphate RNA. Mol.
Cell. Biol. 29, 2155–2167.
Peng, J., and Schoenberg, D.R. (2005). mRNA with a <20-nt poly(A) tail
imparted by the poly(A)-limiting element is translated as efficiently in vivo as
long poly(A) mRNA. RNA 11, 1131–1140.
Qi, M.Y., Wang, Z.Z., Zhang, Z., Shao, Q., Zeng, A., Li, X.Q., Li, W.Q.,
Wang, C., Tian, F.J., Li, Q., et al. (2012). AU-rich-element-dependent transla-
tion repression requires the cooperation of tristetraprolin and RCK/P54. Mol.
Cell. Biol. 32, 913–928.
Schoenberg, D.R. (2011). Mechanisms of endonuclease-mediated mRNA
decay. Wiley Interdiscip. Rev. RNA 2, 582–600.
Schoenberg, D.R., and Maquat, L.E. (2009). Re-capping the message. Trends
Biochem. Sci. 34, 435–442.
Schoenberg, D.R., and Maquat, L.E. (2012). Regulation of cytoplasmic mRNA
decay. Nat. Rev. Genet. 13, 246–259.
684 Cell Reports 2, 674–684, September 27, 2012 ª2012 The Author
Stevens, A., Wang, Y., Bremer, K., Zhang, J., Hoepfner, R., Antoniou, M.,
Schoenberg, D.R., and Maquat, L.E. (2002). Beta-globin mRNA decay in
erythroid cells: UG site-preferred endonucleolytic cleavage that is augmented
by a premature termination codon. Proc. Natl. Acad. Sci. USA 99, 12741–
12746.
Thoma, C., Hasselblatt, P., Kock, J., Chang, S.F., Hockenjos, B., Will, H., Hen-
tze, M.W., Blum, H.E., von Weizsacker, F., and Offensperger, W.B. (2001).
Generation of stable mRNA fragments and translation of N-truncated proteins
induced by antisense oligodeoxynucleotides. Mol. Cell 8, 865–872.
Yang, L., Duff, M.O., Graveley, B.R., Carmichael, G.G., and Chen, L.L. (2011).
Genomewide characterization of non-polyadenylated RNAs. Genome Biol.
12, R16.
Zdanowicz, A., Thermann, R., Kowalska, J., Jemielity, J., Duncan, K., Preiss,
T., Darzynkiewicz, E., and Hentze, M.W. (2009). Drosophila miR2 primarily
targets the m7GpppN cap structure for translational repression. Mol. Cell
35, 881–888.
s