Glucose Homeostasis in Mice Is Transglutaminase 2 Independent Editor
11
Glucose Homeostasis in Mice Is Transglutaminase 2 Independent Siiri E. Iismaa 1,3 *, Mark Aplin 1 , Sara Holman 1 , Ting W. Yiu 1,3 , Kristy Jackson 1 , James G. Burchfield 2 , Christopher J. Mitchell 2 , Liam O’Reilly 2 , Aimee Davenport 2 , James Cantley 2 , Carsten Schmitz-Peiffer 2 , Trevor J. Biden 2 , Gregory J. Cooney 2 , Robert M. Graham 1,3 * 1 Molecular Cardiology and Biophysics Division, Victor Chang Cardiac Research Institute, Sydney, New South Wales, Australia, 2 Diabetes and Obesity Division, Garvan Institute of Medical Research, Sydney, New South Wales, Australia, 3 University of New South Wales, Sydney, New South Wales, Australia Abstract Transglutaminase type 2 (TG2) has been reported to be a candidate gene for maturity onset diabetes of the young (MODY) because three different mutations that impair TG2 transamidase activity have been found in 3 families with MODY. TG2 null (TG2 2/2 ) mice have been reported to be glucose intolerant and have impaired glucose-stimulated insulin secretion (GSIS). Here we rigorously evaluated the role of TG2 in glucose metabolism using independently generated murine models of genetic TG2 disruption, which show no compensatory enhanced expression of other TGs in pancreatic islets or other tissues. First, we subjected chow- or fat-fed congenic SV129 or C57BL/6 wild type (WT) and TG2 2/2 littermates, to oral glucose gavage. Blood glucose and serum insulin levels were similar for both genotypes. Pancreatic islets isolated from these animals and analysed in vitro for GSIS and cholinergic potentiation of GSIS, showed no significant difference between genotypes. Results from intraperitoneal glucose tolerance tests (GTTs) and insulin tolerance tests (ITTs) were similar for both genotypes. Second, we directly investigated the role of TG2 transamidase activity in insulin secretion using a coisogenic model that expresses a mutant form of TG2 (TG2 R579A ), which is constitutively active for transamidase activity. Intraperitoneal GTTs and ITTs revealed no significant differences between WT and TG2 R579A/R579A mice. Given that neither deletion nor constitutive activation of TG2 transamidase activity altered basal responses, or responses to a glucose or insulin challenge, our data indicate that glucose homeostasis in mice is TG2 independent, and question a link between TG2 and diabetes. Citation: Iismaa SE, Aplin M, Holman S, Yiu TW, Jackson K, et al. (2013) Glucose Homeostasis in Mice Is Transglutaminase 2 Independent. PLoS ONE 8(5): e63346. doi:10.1371/journal.pone.0063346 Editor: Frances M. Sladek, Univeristy of California Riverside, United States of America Received January 16, 2013; Accepted March 29, 2013; Published May 22, 2013 Copyright: ß 2013 Iismaa et al. This is an open-access article distributed under the terms of the Creative Commons Attribution License, which permits unrestricted use, distribution, and reproduction in any medium, provided the original author and source are credited. Funding: This study was supported by the National Health and Medical Research Council of Australia (http://www.nhmrc.gov.au/grants) grants 142000 (SEI, RMG), 459406 (RMG, SEI) and the Victor Chang Cardiac Research Institute’s (http://www.victorchang.org.au/home/study-careers/research/prince-christian- fellowship/) Prince Christian Fellowship (MA). The funders had no role in study design, data collection and analysis, decision to publish, or preparation of the manuscript. Competing Interests: The authors have declared that no competing interests exist. * E-mail: [email protected] (SEI); [email protected] (RMG) Introduction Type 2 diabetes mellitus (T2DM) is characterised by defects in both end-organ responsiveness to insulin (insulin resistance) and the regulation of insulin release by pancreatic b cells. A variant is maturity-onset diabetes of the young (MODY), a monogenic form of the disease responsible for 1–2% of T2DM [1,2]. Although causal mutations in several genes (e.g. HIF-1a, HNF-4a) have been identified, others remain unknown. Transglutaminase type 2 (TG2) has been reported to be a candidate gene for MODY, with three types of missense mutations found in the TG2-encoding gene (TGM2) in 3 families with early-onset Type 2 diabetes [3,4]. TG2, also known as tissue transglutaminase or G h (high molecular weight GTP-binding protein), is a multifunctional protein. Two independently-generated TG2 null mouse models [5,6] have demonstrated TG2 involvement in diverse intra- and extracellular pathophysiological processes, including cataract development, gluten sensitivity diseases, neurodegeneration, and tissue remodelling/repair associated with heart, liver, and kidney disease, cancer and bone development [7]. TG2 has three major biological activities: first, as a calcium-activated protein-cross- linking enzyme, it has transamidase activity, which results in linkage between intrachain glutamine and lysine residues to form an Ne-(c-glutamyl) isopeptide bond, incorporation of an amine onto a glutamine residue, or acylation of a lysine residue [8]; second, TG2 binds and hydrolyses GTP [9,10]. GTP binding inhibits transamidase activity, enabling TG2 to function as an intracellular G-protein that mediates signalling by various G- protein coupled receptors (GPCRs), including a 1B and a 1D - adrenergic [11–13], thromboxane A2 [14,15] and oxytocin [16] receptors, to activate phospholipase C (PLC); third, TG2 functions as an extracellular adaptor protein that facilitates interaction between the matrix and b1/b3-integrins to promote fibroblast adhesion and spreading [17]. The transamidase activity of TG2 has been suggested to modulate the exocytosis step of glucose- stimulated insulin secretion (GSIS) that accompanies calcium influx into pancreatic b cells [18–20]. Consistent with TG2 involvement in insulin release, pancreatic islets from TG2 null mice [5] have been reported to secrete less insulin, relative to wild- type (WT) islets, in response to a high glucose challenge [3,21]. This was reflected in lower blood insulin and higher blood glucose PLOS ONE | www.plosone.org 1 May 2013 | Volume 8 | Issue 5 | e63346
Transcript of Glucose Homeostasis in Mice Is Transglutaminase 2 Independent Editor

Glucose Homeostasis in Mice Is Transglutaminase 2IndependentSiiri E. Iismaa1,3*, Mark Aplin1, Sara Holman1, Ting W. Yiu1,3, Kristy Jackson1, James G. Burchfield2,
Christopher J. Mitchell2, Liam O’Reilly2, Aimee Davenport2, James Cantley2, Carsten Schmitz-Peiffer2,
Trevor J. Biden2, Gregory J. Cooney2, Robert M. Graham1,3*
1 Molecular Cardiology and Biophysics Division, Victor Chang Cardiac Research Institute, Sydney, New South Wales, Australia, 2 Diabetes and Obesity Division, Garvan
Institute of Medical Research, Sydney, New South Wales, Australia, 3 University of New South Wales, Sydney, New South Wales, Australia
Abstract
Transglutaminase type 2 (TG2) has been reported to be a candidate gene for maturity onset diabetes of the young (MODY)because three different mutations that impair TG2 transamidase activity have been found in 3 families with MODY. TG2 null(TG22/2) mice have been reported to be glucose intolerant and have impaired glucose-stimulated insulin secretion (GSIS).Here we rigorously evaluated the role of TG2 in glucose metabolism using independently generated murine models ofgenetic TG2 disruption, which show no compensatory enhanced expression of other TGs in pancreatic islets or other tissues.First, we subjected chow- or fat-fed congenic SV129 or C57BL/6 wild type (WT) and TG22/2 littermates, to oral glucosegavage. Blood glucose and serum insulin levels were similar for both genotypes. Pancreatic islets isolated from theseanimals and analysed in vitro for GSIS and cholinergic potentiation of GSIS, showed no significant difference betweengenotypes. Results from intraperitoneal glucose tolerance tests (GTTs) and insulin tolerance tests (ITTs) were similar for bothgenotypes. Second, we directly investigated the role of TG2 transamidase activity in insulin secretion using a coisogenicmodel that expresses a mutant form of TG2 (TG2R579A), which is constitutively active for transamidase activity.Intraperitoneal GTTs and ITTs revealed no significant differences between WT and TG2R579A/R579A mice. Given that neitherdeletion nor constitutive activation of TG2 transamidase activity altered basal responses, or responses to a glucose or insulinchallenge, our data indicate that glucose homeostasis in mice is TG2 independent, and question a link between TG2 anddiabetes.
Citation: Iismaa SE, Aplin M, Holman S, Yiu TW, Jackson K, et al. (2013) Glucose Homeostasis in Mice Is Transglutaminase 2 Independent. PLoS ONE 8(5): e63346.doi:10.1371/journal.pone.0063346
Editor: Frances M. Sladek, Univeristy of California Riverside, United States of America
Received January 16, 2013; Accepted March 29, 2013; Published May 22, 2013
Copyright: � 2013 Iismaa et al. This is an open-access article distributed under the terms of the Creative Commons Attribution License, which permitsunrestricted use, distribution, and reproduction in any medium, provided the original author and source are credited.
Funding: This study was supported by the National Health and Medical Research Council of Australia (http://www.nhmrc.gov.au/grants) grants 142000 (SEI,RMG), 459406 (RMG, SEI) and the Victor Chang Cardiac Research Institute’s (http://www.victorchang.org.au/home/study-careers/research/prince-christian-fellowship/) Prince Christian Fellowship (MA). The funders had no role in study design, data collection and analysis, decision to publish, or preparation of themanuscript.
Competing Interests: The authors have declared that no competing interests exist.
* E-mail: [email protected] (SEI); [email protected] (RMG)
Introduction
Type 2 diabetes mellitus (T2DM) is characterised by defects in
both end-organ responsiveness to insulin (insulin resistance) and
the regulation of insulin release by pancreatic b cells. A variant is
maturity-onset diabetes of the young (MODY), a monogenic form
of the disease responsible for 1–2% of T2DM [1,2]. Although
causal mutations in several genes (e.g. HIF-1a, HNF-4a) have
been identified, others remain unknown. Transglutaminase type 2
(TG2) has been reported to be a candidate gene for MODY, with
three types of missense mutations found in the TG2-encoding gene
(TGM2) in 3 families with early-onset Type 2 diabetes [3,4].
TG2, also known as tissue transglutaminase or Gh (high
molecular weight GTP-binding protein), is a multifunctional
protein. Two independently-generated TG2 null mouse models
[5,6] have demonstrated TG2 involvement in diverse intra- and
extracellular pathophysiological processes, including cataract
development, gluten sensitivity diseases, neurodegeneration, and
tissue remodelling/repair associated with heart, liver, and kidney
disease, cancer and bone development [7]. TG2 has three major
biological activities: first, as a calcium-activated protein-cross-
linking enzyme, it has transamidase activity, which results in
linkage between intrachain glutamine and lysine residues to form
an Ne-(c-glutamyl) isopeptide bond, incorporation of an amine
onto a glutamine residue, or acylation of a lysine residue [8];
second, TG2 binds and hydrolyses GTP [9,10]. GTP binding
inhibits transamidase activity, enabling TG2 to function as an
intracellular G-protein that mediates signalling by various G-
protein coupled receptors (GPCRs), including a1B and a1D-
adrenergic [11–13], thromboxane A2 [14,15] and oxytocin [16]
receptors, to activate phospholipase C (PLC); third, TG2 functions
as an extracellular adaptor protein that facilitates interaction
between the matrix and b1/b3-integrins to promote fibroblast
adhesion and spreading [17]. The transamidase activity of TG2
has been suggested to modulate the exocytosis step of glucose-
stimulated insulin secretion (GSIS) that accompanies calcium
influx into pancreatic b cells [18–20]. Consistent with TG2
involvement in insulin release, pancreatic islets from TG2 null
mice [5] have been reported to secrete less insulin, relative to wild-
type (WT) islets, in response to a high glucose challenge [3,21].
This was reflected in lower blood insulin and higher blood glucose
PLOS ONE | www.plosone.org 1 May 2013 | Volume 8 | Issue 5 | e63346

levels in TG22/2 mice following intraperitoneal glucose loading
[3].
Regulation of insulin secretion from pancreatic b cells is
complex, involving direct responses to nutrients as well as
amplification of these signals by gut-derived peptides and neural
mechanisms; the latter involving acetylcholine released from vagal
efferents acting on b cell muscarinic GPCRs of the M1 and M3
subtype [22–24]. Muscarinic receptors are G-protein-coupled:
M1, M3, and M5 subtypes activate PLC/protein kinase C (PKC)
signalling pathways via Gq and/or G11, and M2 and M4 subtypes
inhibit adenylyl cyclase via Gi. Given that TG2, like Gq/G11, can
function as a G-protein for signalling by a number of GPCRs that
activate PLC, we investigated the role of TG2 in mediating
muscarinic modulation of insulin release and glucose homeostasis.
Our results, using two different congenic TG2 null mouse lines
(generated in this work from mixed strain TG22/2 mice reported
by us [6]) as well as a coisogenic mouse line constitutively active for
TG2 transamidating activity (generated in this work), indicate no
role for TG2 in either glucose homeostasis or muscarinic
modulation of glucose homeostasis. This suggests, therefore, that
glucose homeostasis is TG2 independent and questions a role for
TG2 in the pathophysiology of T2DM.
Materials and Methods
Ethics StatementAll experimental procedures were approved by the Garvan
Institute/St. Vincent’s Hospital Animal Experimentation Ethics
Committee (No. 04/08, 07/12, 09/30) and were performed in
strict accordance with the National Health and Medical Research
Council (NHMRC) of Australia Guidelines on Animal Experi-
mentation. All efforts were made to minimize suffering.
MiceHeterozygous TG2+/2 mice (Tgm2tm1.1Rmgr) originally on a
mixed C57BL/6J–129S1/SvImsJ strain (designated B6;129)
background [6], were backcrossed to either C57BL/6J or
129T2/SvImsJ mice for twelve generations to generate congenic
heterozygous TG2+/2 mice with 99.95% C57BL/6J (B6.129-
Tgm2 tm1.1Rmgr; designated B6 WT or TG22/2) or 129T2/
SvImsJ (129.Cg-Tgm2tm1.1Rmgr; designated 129 WT or TG22/2)
genomic homogeneity, respectively. B6 or 129 TG2 null lines were
routinely maintained as heterozygous breeding pairs and back-
crossed after every second or third generation. Heterozygotes were
crossed to generate congenic TG2+/+ (WT) and TG22/2
littermates. PCR genotyping of DNA from ear clippings involved
two separate reactions: one using primers KOFP1 (59-GGAGCA-
CACAGGCCTTATGAGCTGAAG-39; complementary to an
intronic region between exons 5 and 6) and RP3 (59-GCCCCA-
CAAAGGAGCAAGTGTTACTATGTC-39; reverse comple-
ment of an intronic region 39 of the remnant loxP site that is
located between exons 8 and 9) to yield a 300 bp product from the
knock-out allele and the other using primers WTFP2 (59-
CAGATAGGGATACAAGAAGCATTGAAG-39; complementa-
ry to an intronic region 59 of the loxP site that is located between
exons 5 and 6) and RP3 to yield a 100 bp product from the WT
allele.
A TG2R579A knock-out/knock-in mouse that has Ala substituted
for Arg at position 579 of TG2 was generated by OzGene
(Australia) on a C57BL/6J background (B6-Tgm2tm2Rmgr; desig-
nated B6 WT or TG2R579A/R579A). The construct used for
homologous recombination into C57BL/6J (Bruce4) embryonic
stem cells (ES) encompassed exons 10–13 of Tgm2 (with ,6kb of
DNA homology on either side of codon 579). The Arg579 codon in
No Role for TG2 in Glucose Homeostasis
PLOS ONE | www.plosone.org 2 May 2013 | Volume 8 | Issue 5 | e63346

exon 11 (AGA) was mutated to Ala (GCC) thereby removing a
BglII restriction enzyme site. A new restriction enzyme site (NheI)
was introduced by silent mutation of Leu575 (CTG to CTA) and a
loxP-flanked phosphoglycerate kinase (PGK) promoter–neomycin
resistance–polyA cassette was inserted between exons 11 and 12.
Neomycin-resistant homologously-recombined Bruce4 ES cells
were identified by Southern analysis and injected into Balb/c
blastocysts. High-percentage chimeras were crossed with C57BL/
6J mice to generate germline WT/TG2R579A+Neo offspring.
These mice were crossed with a C57BL/6J homozygous Oz-Cre
deleter strain to remove the PGK–neomycin selection cassette and
generate WT/TG2R579ADNeo/Cre offspring. These mice were
crossed with C57BL/6J to generate heterozygous WT/
TG2R579ADNeo/DCre offspring. This line was routinely main-
tained as heterozygous breeding pairs and backcrossed after every
second or third generation. Heterozygotes were crossed to
generate co-isogenic TG2+/+ (WT) and TG2R579A/R579A litter-
mates. Genomic DNA sequencing confirmed the TG2R579A
mutation in the first homozygotes generated. PCR genotyping of
DNA from ear clippings used primers KIFP1 (59-TACGAGAAG-
TACAGCGGGTGCCTGACA-39; complementary to an exon 11
region upstream of codon 579) and KIRP2 (59-AATGCTTTC-
CACAAGGACCCAGAGAC-39; reverse complement of an in-
tronic region 39 of the remnant loxP site) to yield a 250 bp BglII-
cleavable product from the WT allele and a 320 bp NheI-cleavable
product from the knock-in allele. Detailed analysis of the
phenotype of this line will be presented elsewhere.
DietsMice were housed at an ambient temperature of 19–23uC,
(mean temp 22uC) under a 12 h dark/12 h light cycle in sterilized
cages with PuraChip Coarse Dust free Aspen bedding (Able
Scientific) and fed a standard (chow) diet (Rat and Mouse
Premium Breeder Diet: 23% protein, 6% fat, 5% fibre; irradiated
(25 kgy), Gordon’s Specialty Stockfeeds, Australia) with ad libitum
water. For dietary studies, 3 month-old male mice were randomly
divided into two diet groups and maintained for 3 months on a
chow or high-fat diet [25] as indicated. The high fat diet consisted
of 23% w/w casein (acid casein, MPD Dairy), 20.2% w/w sucrose
(Cat. No. GRAD25B, JL Stewart), 17% w/w starch (Cat. No.
CFLR2M, JL Stewart), 4.5% w/w homemade mineral mix
(0.0014% w/w NaSeO4, Cat. No. S0882 Sigma; 0.001% w/w
KIO3, Cat. No. 207977 Sigma; 0.055% w/w CrK(SO4)2.12H2O,
Cat. No. 243361 Sigma; 0.063% w/w MnCO3, Cat. No. 306
Ajax; 0.498% w/w FeSO4.7H2O, Cat. No. F7002 Sigma; 0.16%
w/w ZnCO3.2ZnO.3H2O, Cat No. 1518 Ajax; 0.03% w/w
CuCO3.Cu(OH)2, Cat No. 207896 Sigma; 13.488% w/w starch,
Cat. No. CFLR2M, JL Stewart; 35.671% w/w CaCO3, Cat.
No. 102059 Merck Millipore; 40.209% KH2PO4, Cat.
No. 104873 Merck Millipore; 7.4% w/w NaCl, Cat. No. S9625
Sigma; 2.4% MgO, heavy, Cat. No. 835, Ajax), 1.3% w/w trace
minerals (0296026401, MP Biomedicals), 5% w/w bran (BRA-
NIOUF, JL Stewart), 0.3% w/w methionine (M9500, Sigma), 2%
w/w gelatine (GELA2, JL Stewart), 0.4% w/w choline bitartate
(C1629, Sigma) stored as a dry powder with 3% w/w safflower oil
(311964001790, Proteco Gold), 22% w/w copha (Fonterra), and
1.3% w/w AIN76A vitamins (960098, MP Biomedicals) added on
the day.
Glucose Tolerance TestsFor intraperitoneal or oral glucose tolerance tests, mice were
fasted 6 h or overnight (16 h) before glucose (2 g/kg body weight)
administration by intraperitoneal injection or gavage, respectively.
Tail vein blood glucose was measured (Accu-ChekH Performa
glucometer) at 0, 15, 30, 45, 60, 90, and 120 min after injection.
Whole blood (50 ml) was collected at 0 and 15 mins, and serum
was stored at 280uC for later analysis of insulin levels using a
radioimmunoassay specific for rodent insulin (Linco Research
Immunoassay, USA).
Insulin Tolerance TestsFor insulin tolerance tests, mice were fasted for 5–6 hours, then
injected intraperitoneally with insulin (0.75 U/kg body weight) at
12:00–14:00 h and tail vein blood glucose was measured as above
at 0, 15, 30, 45 and 60 min after injection.
Figure 1. Neither Tgm2 deletion nor substitution with Tgm2R579A
enhances expression of other TGs. Brain, heart, kidney, liver, lung,skin, spleen, embryonic fibroblasts and islet mRNA from 3 month-old B6WT and TG22/2, 129 WT and TG22/2 or B6 WT and TG2R579A/R579A micewas subjected to RT-qPCR analysis of Tgm1-7 and F13a1 mRNAexpression relative to HPRT mRNA. Data are presented as means 6SEM (n = 3). Statistical significance was calculated using 2-way ANOVAwith the Bonferroni post hoc test.doi:10.1371/journal.pone.0063346.g001
Table 1. Fasting body weights (g), blood glucose (mM), serum insulin (ng/ml) and total insulin content per islet (ng/islet) in 6-month old mice fed a normal chow diet (Chow diet) or fed a normal chow diet for 3 months followed by a high-fat diet for 3months (High-fat diet).
Chow diet High-fat diet
Geneticbackground Genotype
Bodyweight
Bloodglucose
Seruminsulin
Islet insulincontent
Bodyweight
Bloodglucose
Seruminsulin
Islet insulincontent
B6 WT 27.961.0 8.660.3 0.3160.04 55.361.4 41.261.4* 10.760.8 1.6060.26* 37.264.7
TG22/2 27.260.3 8.260.2 0.4160.07 56.263.1 46.361.0*# 9.360.4 1.6660.20* 34.864.0x
129 WT 21.461.0` 4.760.2` 0.1460.02` 45.061.8 24.160.6` 4.560.1` 0.1960.03` 57.066.1{
TG22/2 20.561.0` 4.560.4` 0.1160.03` 46.862.9 23.760.7` 5.160.5` 0.1460.02` 53.565.3
Values are presented as means 6 SEM (n = 7).xP,0.05 vs chow diet;*P,0.001 vs chow diet;#P,0.001 vs WT;{P,0.05 vs corresponding B6 genotype;`P,0.001 vs corresponding B6 genotype.doi:10.1371/journal.pone.0063346.t001
No Role for TG2 in Glucose Homeostasis
PLOS ONE | www.plosone.org 3 May 2013 | Volume 8 | Issue 5 | e63346
Islet Isolation and Insulin Secretion AssaysMice were euthanized by cervical dislocation following anaes-
thesia with 5% isoflurane and the common bile duct was
cannulated and its duodenal end occluded by clamping. Two ml
of Liberase (Roche, Basel, Switzerland) solution (0.25 mg/ml in
M199) were injected into the duct to distend the pancreas [26].
The pancreas was excised, incubated at 37uC for 17 min, and
mechanically disrupted in 10 ml M199. Cellular components were
collected by density centrifugation (130 g for 2 min), washed and
re-suspended in 10 ml RPMI1640/10% FCS. Islets were hand-
picked under a microscope, washed once in Krebs-Ringer
bicarbonate (KRB) buffer pH 7.4 and cultured overnight in
RPMI1640/10% FCS with 11 mM glucose.
For insulin secretion studies of batch incubations, islets were
pre-incubated for 1 h in 1 ml KRB buffer (supplemented with
0.25% BSA and 10 mM HEPES) containing 2.8 mM glucose and
insulin release was assessed after a static 1 h incubation at 37uC/
5% CO2 of groups of five islets, size-matched by handpicking, in
KRB buffer containing 2.8 mM glucose, 16.8 mM glucose, or
16.8 mM glucose plus 0.1 mM carbachol. Islets for perifusion
studies were perifused as described [27] at 37uC at 0.5 ml/min
with 2.8 mM glucose in KRB buffer for 20 min before experi-
mental additions. Secreted insulin from batch supernatants and
perifusates was assayed by radioimmunoassay with rat insulin
standard (Linco Research, USA). Total cellular insulin islet
content was extracted with acid-ethanol (1.5% HCl in 75%
ethanol) and assayed by RIA.
Reverse-Transcription Quantitative Real-Time PCR (RT-qPCR) Analysis
RNA was isolated from tissues of TG2+/+, TG22/2 or
TG2R579A/R579A mice (n = 3) using the miRNeasy RNA extraction
kit (Qiagen, Germany). RNA integrity was measured by RNA
6000 Nano Chip using Agilent Bioanalyzer 2100 (Agilent
Technologies, USA) and reverse transcription performed using
Superscript III reverse transcriptase (Invitrogen, Australia). RT-
qPCR was performed in triplicate using the Taqman Gene
Expression Assay 384 well format (Applied Biosystems, Australia).
Expression levels of Tgm1 (assay ID: Mm00498375_m1*, ampli-
con length 83 bp spanning exons 9–10, Taqman probe sequence:
59-GACCAGCAGTGGCATCTTCTGCTGT-39 with anchor
nucleotide location at 1512 of NM_001161714.1), Tgm2
(Mm00436987_m1*, amplicon length 72 bp spanning exons 10–
11, Taqman probe sequence: 59-CCTGGATCCCTACTCTGA-
GAACAGC-39 with anchor nucleotide location at 1700 of
NM_009373.3), Tgm3 (Mm00436999_m1*, amplicon length
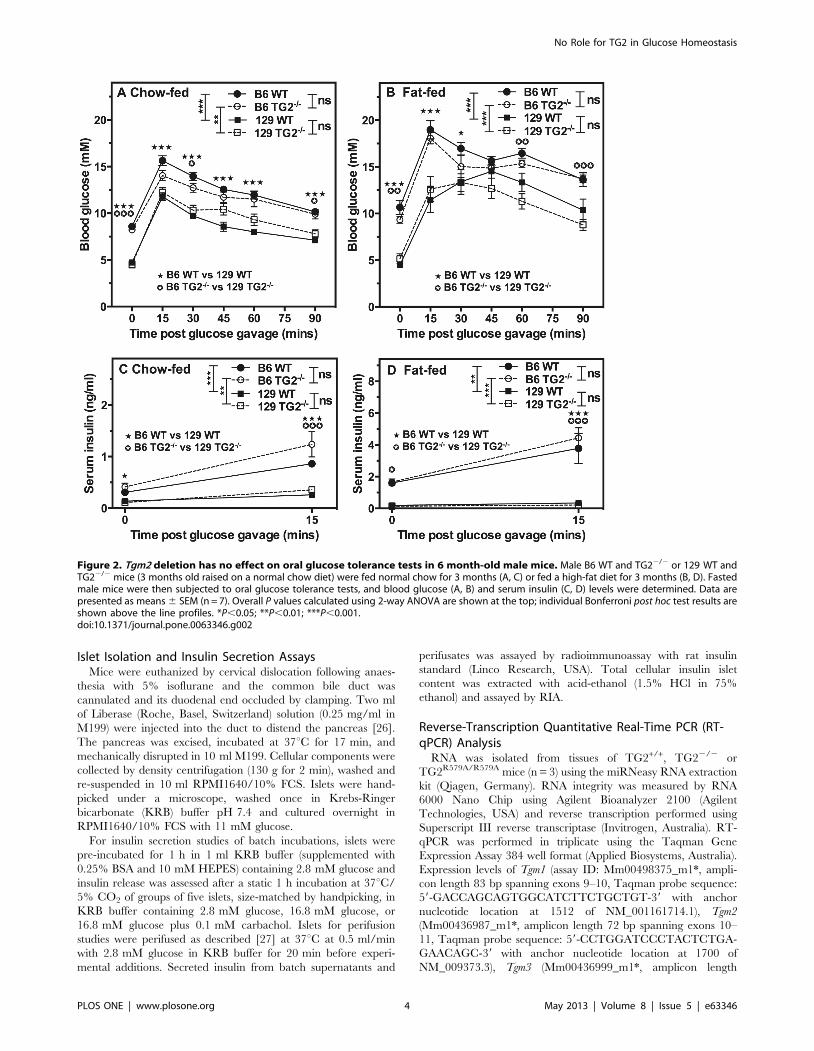
Figure 2. Tgm2 deletion has no effect on oral glucose tolerance tests in 6 month-old male mice. Male B6 WT and TG22/2 or 129 WT andTG22/2 mice (3 months old raised on a normal chow diet) were fed normal chow for 3 months (A, C) or fed a high-fat diet for 3 months (B, D). Fastedmale mice were then subjected to oral glucose tolerance tests, and blood glucose (A, B) and serum insulin (C, D) levels were determined. Data arepresented as means 6 SEM (n = 7). Overall P values calculated using 2-way ANOVA are shown at the top; individual Bonferroni post hoc test results areshown above the line profiles. *P,0.05; **P,0.01; ***P,0.001.doi:10.1371/journal.pone.0063346.g002
No Role for TG2 in Glucose Homeostasis
PLOS ONE | www.plosone.org 4 May 2013 | Volume 8 | Issue 5 | e63346

61 bp spanning exons 11–12, Taqman probe sequence: 59-
CCTGCTTTGACCCTGGAGGTGCTGG-39 with anchor nu-
cleotide location at 1824 of NM_009374.2), Tgm4
(Mm00626039_m1*, amplicon length 71 bp spanning exons 10–
11, Taqman probe sequence: 59-AGTTCCCAGAAGGCAGCC-
CAGAGGA-39 with anchor nucleotide location at 1358 of
NM_177911.4), Tgm5 (Mm00551335_m1*, amplicon length
59 bp spanning exons 11–12, Taqman probe sequence: 59-
TGATTAATGTTCTAGGAGCTGCCTT-39 with anchor nu-
cleotide location at 1980 of NM_028799.2), Tgm6
(Mm00624922_m1*, amplicon length 63 bp spanning exons 5–
6, Taqman probe sequence: 59-TCATCAGTGCCATGGTGAA-
CAGCAA-39 with anchor nucleotide location at 748 of
NM_177726.3), Tgm7 (Mm03990491_m1*, amplicon length
61 bp spanning exons 5–6, Taqman probe sequence: 59-
CTGTTATGTGCACGGTAATGAGATG-39 with anchor nu-
cleotide location at 863 of NM_001160424.1) and F13a1
(Mm00472334_m1*, amplicon length 62 bp spanning exons 14–
15, Taqman probe sequence: 59-AGAAAGGTGTTCCGT-
GAAATCCGGC-39 with anchor nucleotide location at 2112 of
NM_001166391.1) were quantitated against Hprt
(Mm00446968_m1*, amplicon length 65 bp spanning exons 6–
7, Taqman probe sequence: 59-GTTAAGGTTG-
CAAGCTTGCTGGTGA-39 with anchor nucleotide location at
630 of NM_013556.2) as the most suitable reference gene. A
standard curve using TG2+/+ cDNA diluted to 1, 1:10, 1:100, and
1:1,000 was constructed and a cDNA negative reaction were
included for each gene examined. Results were only accepted if
the crossing point was between 20–30 cycles and if the standard
deviation within one triplicate was less than 0.5.
Figure 3. Tgm2 deletion has no effect on insulin secretion by islets. Islets were isolated (A) from 6 month-old male B6 WT and TG22/2 (i) or129 WT and TG22/2 (ii) mice fed a normal chow diet (chow) or fed a normal chow diet for 3 months followed by a high-fat diet for 3 months (fat) or(B) from 3 month old male 129 WT and TG22/2 mice fed a normal chow diet. (A) Isolated islets, 5 per group (n = 7), were incubated in Krebs-Ringerbicarbonate (KRB) buffer containing 2.8 mM glucose or 16.8 mM glucose or 16.8 mM glucose plus 0.1 mM carbachol, 37uC, 1 h. (B) Groups of 70 islets(n = 3 for WT and n = 2 for TG22/2) were perifused in KRB containing 2.8 mM glucose for 10 min before a stimulatory period of 60 min with KRBcontaining 16.8 mM glucose. The perifusate was switched back to 2.8 mM glucose for 30 min to allow insulin secretion to return to basal levelsbefore exposure to 16.8 mM glucose and 100 mM carbachol for 30 min. The perifusate was switched back to 2.8 mM glucose for 10 min before non-metabolic depolarisation with 24 mM KCl to activate voltage-gated Ca2+ channel-triggered insulin secretion. One min fractions of the perifusate werecollected for the first 10 min, then 2 min fractions were collected at a flow rate of 0.5 ml/min. Insulin content of supernatant and of islets wasdetermined by radioimmunoassay. Data are presented as means 6 SEM. Overall P values calculated using 2-way ANOVA are shown at the top;individual Bonferroni post hoc test results are shown above the columns.**P,0.01; ***P,0.001.doi:10.1371/journal.pone.0063346.g003
No Role for TG2 in Glucose Homeostasis
PLOS ONE | www.plosone.org 5 May 2013 | Volume 8 | Issue 5 | e63346

ImmunoblottingTG2 expression levels were evaluated in various tissues by
Western blotting using anti-mouse TG2 rat monoclonal antibody
(a gift from Gail V. W. Johnson, University of Rochester, NY,
USA; 1:16,000 dilution in Tris-buffered saline for 1 h at room
temperature) and quantitated against either GAPDH (Santa Cruz,
USA) or b-tubulin (Sigma, USA) as a loading control.
Transamidase AssaysIn vitro calcium-activated transamidase activity [28] of liver
lysates (100 mg) and intracellular transamidase activity [29] of
murine embryonic fibroblasts were assayed. The relative insensi-
tivity of the intracellular transamidase assay coupled with non-
homogeneous diffusion of 5-(biotinamido)pentylamine into islets
precluded measurement of intracellular islet transamidase activity.
Statistical AnalysesData are expressed as means 6 SEM. Blood glucose and serum
insulin levels in congenic or co-isogenic strains, qPCR and
intracellular transamidase activity were compared using 2-way
ANOVA with the Bonferroni post hoc test; body weights of
congenic or co-isogenic strains and in vitro transamidase activity of
lysates were compared using 1-way ANOVA with the Bonferroni
post hoc test (GraphPad Prism). The level of statistical significance
was set at P,0.05.
Results
No Compensation by Other TGs in Congenic TG2 NullLines
Using RT-qPCR analysis of mRNA from brain, heart, kidney,
liver, lung, skin, spleen, embryonic fibroblasts and islets (Fig. 1)
from B6 or 129 WT and TG22/2 littermates, we found an
absence of Tgm2 mRNA in TG22/2 samples, as expected, and no
increase, relative to WT, of Tgm1, Tgm3-7 or F13a1 mRNA
expression in response to TG2 ablation. This indicates that, in the
tissues examined, neither congenic TG2 null line compensates for
the lack of TG2 by enhancing the expression of other TGs.
Strikingly, the only TG expressed in significant quantities by islets
is TG2 (Fig. 1). This indicates that any phenotype observed in
these mice reflects the role of the deleted Tgm2 gene.
Oral Glucose Tolerance Tests in WT and TG22/2 MiceTo investigate the role of TG2 in mediating muscarinic
modulation of glucose homeostasis, we first undertook oral glucose
tolerance tests. To amplify metabolic defects associated with
T2DM, such as impaired insulin secretion [30] or development of
insulin resistance [31], 3 month-old congenic male B6 or 129 WT
and TG22/2 littermates were fed a high-fat diet for 3 months.
The impact of TG2 deletion on glucose metabolism was assessed
in these fat-fed animals relative to 6 month-old congenic male B6
or 129 WT and TG22/2 littermates fed a standard chow diet.
Within each dietary group, fasting body weight, blood glucose and
serum insulin levels of 129 mice were significantly lower (p,0.001)
than those of B6 mice (Table 1). Consistent with previous studies
[31], B6 mice gained weight on the high-fat diet (mean increase:
+16 g) but 129 mice did not (Table 1). Although the average
fasting body weights of fat-fed B6 TG22/2 mice was significantly
greater (p,0.001) than that of fat-fed B6 WT mice, there was no
significant difference in the average fasting body weights between
Figure 4. Tgm2 deletion has no effect on intraperitonealglucose tolerance tests in 3 month-old male or female mice.Fasted male or female 129 WT and TG22/2 or B6 WT and TG22/2 micewere subjected to intraperitoneal (i.p.) glucose tolerance tests andblood glucose levels were determined. Data are presented as means 6SEM (n = 6–10). Overall P values calculated using 2-way ANOVA are
shown at the top; individual Bonferroni post hoc test results are shownabove the line profiles.*P,0.05; **P,0.01; ***P,0.001.doi:10.1371/journal.pone.0063346.g004
No Role for TG2 in Glucose Homeostasis
PLOS ONE | www.plosone.org 6 May 2013 | Volume 8 | Issue 5 | e63346

WT and TG22/2 mice on the same congenic background in the
other dietary groups (Table 1). Fasting blood glucose and serum
insulin levels were also no different between WT and TG22/2
mice on the same congenic background and in the same dietary
group (Table 1).
To determine whether TG2 might play a more selective role in
cephalic phase insulin secretion (including vagal mechanisms)
glucose homeostasis was assessed following oral glucose loading.
Consistent with previous studies [32], blood glucose levels were
significantly higher in male B6 than in male 129 mice following
glucose loading (p,0.01 or p,0.001; Fig. 2A&B) and, as expected
[31], significantly higher in fat-fed than in chow-fed mice
(p,0.001; compare congenic strains in Fig. 2A&B). Similarly,
following glucose loading, serum insulin levels were significantly
higher in male B6 than in male 129 mice (p,0.01 or p,0.001;
Fig. 2C&D) and only in male B6 mice were serum insulin levels
significantly higher with fat-feeding than with chow-feeding
(p,0.001; compare congenic strains in Fig. 2C&D – note the
scale differences in the ordinates of Fig. 2C vs Fig. 2D). Following
glucose loading, however, neither blood glucose (Fig. 2A&B) nor
serum insulin levels (Fig. 2C&D) were significantly different
between WT and TG22/2 mice on the same congenic
background and in the same dietary group, indicating no effect
of TG2 deletion on muscarinic potentiation of GSIS or insulin
action.
Cholinergic Potentiation of GSIS by WT and TG22/2 bCells
To further evaluate a role for TG2 in GSIS or in muscarinic
potentiation of GSIS, we isolated islets from 6 month-old congenic
male B6 or 129 WT and TG22/2 littermates fed normal chow for
6 months or fed normal chow for 3 months followed by a high-fat
diet for 3 months. Islets were analysed for GSIS and cholinergic
potentiation of insulin secretion. We found no difference in total
insulin content per islet between B6 WT and TG22/2 or 129 WT
and TG22/2 mice (Table 1). The fraction of islet insulin content
secreted after 1 h incubation with 2.8 mM glucose, 16.8 mM
glucose or 16.8 mM glucose plus 0.1 mM carbachol was no
different between islets from B6 WT and TG22/2 mice or
between 129 WT and TG22/2 mice fed the standard chow diet
(Fig. 3A). Consistent with the weight gain (Table 1) and elevated
serum insulin levels (Fig. 2) observed in fat-fed B6 mice, but not in
129 mice, relative to their chow-fed controls, B6 WT and TG22/
2, but not 129 WT and TG22/2 islets isolated from fat-fed mice
released a higher fraction of their insulin content than those
isolated from chow-fed mice when incubated with 16.8 mM
glucose or 16.8 mM glucose plus 0.1 mM carbachol (Fig. 3A). As
expected from WT islets isolated from mice in either dietary
group, the fraction of islet insulin content secreted in response to
incubation with 16.8 mM glucose was increased significantly
relative to incubation with 2.8 mM glucose, and GSIS was
potentiated in the presence of carbachol (Fig. 3A). Surprisingly,
there was no significant difference between WT and TG22/2
islets isolated from mice of the same congenic background and in
the same dietary group with respect to the fraction of insulin
content secreted in response to 2.8 mM glucose or 16.8 mM
glucose or 16.8 mM glucose plus 0.1 mM carbachol (Fig. 3A).
These data thus demonstrate that 6 month-old male B6 mice are
significantly more responsive than similarly-aged 129 mice in
glucose homeostasis and dietary effects on this homeostasis, but
reveals no significant difference in GSIS or muscarinic potentia-
tion of GSIS between congenic WT and TG22/2 mice.
Lack of TG2 involvement in GSIS was further confirmed by
more sensitive perifusion analysis, which showed that GSIS and
carbachol potentiation of GSIS were completely unaltered in
TG22/2 relative to WT mice (Fig. 3B).
Intraperitoneal Glucose Tolerance Tests in WT and TG22/
2 MiceSince TG2 had originally been implicated in glucose tolerance
[3] as a result of intraperitoneal glucose tolerance testing, which
does not involve vagal amplification of insulin secretion, we also
attempted to confirm this phenotype in our congenic lines by
investigating the responses of 3 month-old B6 or 129 WT and
TG22/2 littermates to intraperitoneal delivery of a glucose bolus.
At this age, unlike at 6 months of age, average fasting body weights
were not markedly different between male B6 and 129 mice,
whereas female 129 mice had significantly lower average fasting
body weights (p,0.001) than their B6 counterparts (Table 2).
Fasting blood glucose levels were not markedly different between
B6 WT and TG22/2 and 129 WT and TG22/2 mice, except for
those of female 129 WT mice, which were significantly lower
(p,0.001) than those of female B6 WT mice (Table 2). In response
to intraperitoneal glucose delivery, there was no difference in
blood glucose levels between male congenic B6 and 129 WT and
TG22/2 mice (Fig. 4A), or between female congenic B6 (Fig. 4B)
or 129 (Fig. 4C) WT and TG22/2 mice. There was, however, a
striking difference in intraperitoneal glucose tolerance between
congenic B6 (Fig. 4B) or 129 (Fig. 4C) males and females, with
males being less glucose tolerant than females, as indicated by their
Table 2. Fasting body weights (g), blood glucose (mM) and serum insulin (ng/ml) concentrations in 3–4 month-old mice.
Male Female
Genetic background Genotype Body weight Blood glucose Serum insulin Body weight Blood glucose Serum insulin
B6 WT 22.060.4 6.260.3 0.2960.05 24.160.4 7.960.5 0.2160.01
TG22/2 24.760.3 7.360.3 0.2860.03 23.960.8 6.660.3 0.2160.04
129 WT 21.160.4 5.060.3 ND 16.760.7` 2.560.2` ND
TG22/2 20.961.1 5.660.2 ND 15.660.3` 3.160.1 ND
B6 WT 26.061.0 8.260.5 0.3060.04 24.160.3 7.960.5 0.1760.01
TG2R579A/R579A 28.361.2 9.860.5 0.2760.03 20.860.2* 7.360.4 0.2060.02
Values are presented as means 6 SEM (n = 6–11).*P,0.001 vs male;`P,0.001 vs corresponding B6 genotype.doi:10.1371/journal.pone.0063346.t002
No Role for TG2 in Glucose Homeostasis
PLOS ONE | www.plosone.org 7 May 2013 | Volume 8 | Issue 5 | e63346

Figure 5. Generation of coisogenic B6 Tgm2R579A knock-in mice constitutively active for transamidating activity. A. Gene targetingstrategy. i. Original locus showing location of Arg579 and BglII site (red line) in exon 11 (black box) of Tgm2. PCR primers, FP1 & RP2, yield a 250 bpBglII-cleavable fragment. ii. Targetted locus showing Tgm2R579A mutation, introduced NheI site, and insertion of a LoxP-flanked PGK–neomycinresistance selection cassette between exons 11 & 12. iii. Cre-deleted locus showing Tgm2R579A mutation, introduced NheI site, and remnant loxP site.PCR primers, FP1 & RP2, yield a 320 bp NheI-cleavable fragment. B. PCR primers, FP1 and RP2, distinguish the 250 bp wild-type Tgm2 allele from the320 bp Tgm2R579A knock-in allele. C. Homogenized tissues from WT or TG2R579A/R579A mice (n = 3) were size-fractionated and TG2 levels detected byWestern blot were normalized for loading using anti-GAPDH for heart, liver, MEF or tubulin for islets. D. GTPcS inhibition of in vitro calcium-activatedtransamidase activity was assayed in WT or TG2R579A/R579A liver lysates (n = 3) as described in ‘‘Materials and Methods’’. Transamidase activity wasmaximal (100%) with addition of 2mM CaCl2. P values were calculated using 1-way ANOVA. E. Intracellular transamidase activity was assayed in intactWT or TG2R579A/R579A murine embryonic fibroblasts (n = 6) as described in ‘‘Materials and Methods’’. P values were calculated using 2-way ANOVA withthe Bonferroni post hoc test. Data are presented as means 6 SEM. **P,0.01; ***P,0.001.doi:10.1371/journal.pone.0063346.g005
No Role for TG2 in Glucose Homeostasis
PLOS ONE | www.plosone.org 8 May 2013 | Volume 8 | Issue 5 | e63346

higher and more prolonged increases in blood glucose (Fig. 4B, C).
Thus, our results, using two different congenic TG2 knock-out
lines, indicate that glucose homeostasis is unaltered by TG2
deletion.
Generation and Characterisation of TG2R579A/R579A Micewith Constitutively Active Transamidase Activity
Gene knock-out experiments analyse the effect of the missing
gene product rather than the effect of the gene product directly.
To directly study the role of the transamidase activity of TG2 in
insulin secretion, we generated a mouse (Fig. 5) that expresses a
mutant form of TG2 (TG2R579A), which displays constitutively
active transamidase activity [29]. Given the concurrence of our
results with the established literature that B6 is a more suitable
genetic background than 129 for phenotypic analyses of diabeto-
genic diseases, the TG2R579A/R579A line was established on the B6
background (Fig. 5A, B). qRT-PCR (Fig. 1) and Western blot
(Fig. 5C) analyses indicated that TG2R579A mRNA and protein
levels in a range of TG2R579A/R579A tissues and primary cells were
equivalent to those of their WT littermates, with no change in
expression of other TGs. We have shown previously that calcium
activates TG2 transamidase activity and that GTP binding inhibits
transamidase activity at calcium concentrations submaximal for
transamidase activation [28]. We have also shown that Arg579 is
important for GTP binding by TG2 and that loss of GTP binding
by TG2R579A abolishes GTP regulation of transamidase activity in
intact cells, resulting in disinhibition, or constitutive activation, of
intracellular transamidase activity [29]. Consistent with our
previous work, in vitro calcium-activated transamidase activity of
TG2R579A, but not WT TG2, was insensitive to GTPcS inhibition
(Fig. 5D), and basal intracellular transamidase activity of
TG2R579A in intact cells was elevated relative to WT TG2
(Fig. 5E). Stimulation with the calcium ionophore ionomycin
increased WT TG2 transamidase activity to that of TG2R579A, but
did not further stimulate TG2R579A activity, indicating maximal
and constitutive activation of TG2R579A in the unstimulated state.
Transamidase activity of both WT TG2 and TG2R579A was
inhibited by calcium chelation with BAPTA, confirming calcium
dependence of the transamidase activity.
Average body weights, fasting and non-fasting blood glucose
levels, and fasting serum insulin levels of TG2R579A/R579A mice
were equivalent to those of WT littermates (Tables 2, 3).
Intraperitoneal glucose tolerance tests revealed no difference in
blood glucose (Fig. 6A) or serum insulin (Fig. 6B) levels between
male or female WT and TG2R579A/R579A mice. However, as
observed previously, male mice were less glucose tolerant than
female mice. Insulin tolerance tests (Fig. 6C, D) also revealed no
significant differences between male or female WT, TG22/2 and
TG2R579A/R579A mice.
Taken together then, our data indicate that glucose homeostasis
is not affected by either TG2 deletion or constitutive activation of
TG2 transamidase activity.
Figure 6. Neither Tgm2 deletion nor substitution with Tgm2R579A
affects glucose homeostasis in 3 month-old B6 mice. (A, B)Fasted B6 WT and TG2R579A/R579A mice were subjected to intraperitonealglucose tolerance tests or (C, D) fed B6 WT and TG22/2 or B6 WT andTG2R579A/R579A mice were subjected to intraperitoneal insulin tolerancetests, and blood glucose (A, C, D) or serum insulin levels (B) weredetermined. Data are presented as means 6 SEM (n = 9–11). Overall Pvalues calculated using 2-way ANOVA are shown at the top; individualBonferroni post hoc test results are shown above the line profiles.**P,0.01; ***P,0.001.doi:10.1371/journal.pone.0063346.g006
No Role for TG2 in Glucose Homeostasis
PLOS ONE | www.plosone.org 9 May 2013 | Volume 8 | Issue 5 | e63346

Discussion
The phenotype of glucose intolerance and impaired insulin
secretion reported for the TG22/2 mouse [3] was from a lineage
derived from an undefined mix of both 129/SvJ and C57BL/6J
(B6;129) parental genomes. It is well recognized by mouse
geneticists that different inbred strains harbour different suscep-
tibilities for Type 1 and Type 2 diabetes, and that components of
parental backgrounds can contribute to metabolic dysfunction in
undefined ways when a particular targeted gene mutation is on a
segregating mixed background [33]. The 129 genome, for
example, harbours latent, undefined diabetes susceptibility quan-
titative trait loci (QTL) capable of enhancing insulin resistance
[33]. The influence of strain background on a phenotype is
therefore of such potential significance that confirming a
phenotype in two unrelated strains is highly desirable [34,35].
Thus, to separate the specific metabolic contribution of TG2
deletion to diabetogenesis from undefined strain background
contributions, our B6;129 TG2+/2 mice [6] were backcrossed to
the B6 or 129 parental background to generate congenic (B6 or
129) heterozygous TG2+/2 mouse lines that are genetically
identical to the parental strain background except for the
genetically-modified allele and the chromosomal region immedi-
ately neighbouring it.
Using these two distinct congenic TG2 knock-out lines and a
coisogenic knock-out/knock-in line, our results indicate that TG2
does not have a role in glucose homeostasis or in mediating
muscarinic modulation of glucose homeostasis. The lack of a
significant difference in glucose homeostasis between the 129 or
B6 WT and TG22/2 mice and the B6 WT and TG2R579A/R579A
mice described here is in itself reassuring because it indicates that
the targeted embryonic stem cells (which were injected into
blastocysts to generate the original TG2 knock-out or TG2 knock-
out/knock-in founder mice) did not have an accumulation of
culture-induced chromosomal aberrations upstream or down-
stream of the disrupted allele that might generate phenodeviants
independent of the targeted mutation. Moreover, RT-qPCR
analyses indicated a lack of compensatory enhanced expression of
other TGs in these mice.
Our data, however, are contrary to prior reports implicating a
role for TG2 in insulin secretion [3,18–21]. One of these studies
[3] used mixed-strain TG22/2 mice generated independently by
another group [5]. As shown by us here and reported elsewhere,
both the B6 and 129 parental strains show normal insulin
sensitivity. However, the phenomenon of unanticipated insulin
resistance being generated when two unrelated genomes are
combined, is well known [33]. Thus, it is possible that unexpected
contributions from the 129 genome that interact deleteriously with
the B6 genome might explain the glucose tolerance and impaired
insulin secretion reported by Bernassola et al., (2002) using their
mixed-strain TG22/2 mice. Another study [21] recently reported
impaired insulin secretion by islets isolated from that same
TG22/2 mouse line, now reported to be on a B6 background,
although the number of generations of backcrossing and, thus, the
genomic homogeneity of the line was not stated. Other studies
implicating transamidase activity in insulin secretion [18–20] have
used small molecule inhibitors such as methylamine, cystamine
and dansylcadaverine, which, in addition to being alternate
substrates that competitively inhibit transglutaminases [36], are
well-known to have many biological effects, including antioxidant
activity, inhibition of a range of cysteine proteases, as well as
inhibition of endocytosis [37–39]. Their mode of action, therefore,
cannot be considered to be so restricted as to interfere with
transglutaminases exclusively [36].
Three different missense mutations (M330R, I331N, N333S)
that impair transamidase activity have been found in TGM2 in 3
families with early-onset Type 2 diabetes [3,4]. A single
heterozygous missense mutation (c.998A.G, p.N333S) was
identified in an Italian individual with MODY and in his diabetic
father [3]; a second heterozygous missense mutation (c.989T.G,
p.M330R) was identified in a Danish patient but not in his
dizygotic twin or mother, and a third heterozygous missense
mutation (c.992T.A, p.I331N) was identified in two diabetic
siblings and two siblings with intermittent impaired fasting glucose,
but not in another sibling with diabetic neuropathy [4]. Thus,
although these mutations have not been found in 600 normogly-
caemic controls, the heterozygous TGM2 mutations are not fully
penetrant and do not appear to be the only cause of diabetes in
these families [4]. Given that, in the mice generated in this study,
neither deletion nor constitutive activation of TG2 transamidase
activity altered basal responses or responses upon glucose or
insulin challenge, our results call into question the link between
TG2 and diabetes reported in some human studies, although we
cannot exclude a possible species difference.
Acknowledgments
We would like to thank Eric Schmied and Rebecca Stokes for expert help
with pancreas perfusions, and Prof Laszlo Lorand for critical reading of the
manuscript.
Author Contributions
Conceived and designed the experiments: SEI GJC. Performed the
experiments: SEI MA SH TWY KJ JGB CJM LO’R AD JC CS-P GJC.
Analyzed the data: SEI MA SH TWY KJ JGB CJM CS-P TJB GJC RMG.
Contributed reagents/materials/analysis tools: SEI TJB GJC RGM. Wrote
the paper: SEI MA SH CS-P TJB GJC RGM.
Table 3. Randomly fed body weights (g) and blood glucose (mM) concentrations in 3–4 month-old mice.
Male Female
Genetic background Genotype Body weight Blood glucose Body weight Blood glucose
B6 WT 29.160.8 9.360.3 20.760.4* 8.160.3
TG22/2 27.860.5 10.460.2 20.260.4* 8.560.3
B6 WT 27.960.5 10.760.5 21.060.3* 10.160.5
TG2R579A/R579A 26.460.4 10.860.4 20.060.3* 9.160.2
Values are presented as means 6 SEM (n = 9–11).*P,0.001 vs male.doi:10.1371/journal.pone.0063346.t003
No Role for TG2 in Glucose Homeostasis
PLOS ONE | www.plosone.org 10 May 2013 | Volume 8 | Issue 5 | e63346

References
1. Ledermann HM (1995) Maturity-onset diabetes of the young (MODY) at least
ten times more commin in Europe than previously assumed? Diabetologia 38:1482.
2. Shields BM, Hicks S, Shepherd MH, Colclough K, Hattersley AT, et al. (2010)Maturity-onset diabetes of the young (MODY): how many cases are we missing?
Diabetologia 53: 2504–2508.
3. Bernassola F, Federici M, Corazzari M, Terrinoni A, Hribal ML, et al. (2002)Role of transglutaminase 2 in glucose tolerance: knockout mice studies and
putative mutation in a MODY patient. FASEB J 16: 1371–1378.4. Porzio O, Massa O, Cunsolo V, Colombo C, Malaponti M, et al. (2007)
Missense mutations in the TGM2 gene encoding Transglutaminase 2 are found
in patients with early-onset Type 2 diabetes. Hum Mutat 28: 1150.5. De Laurenzi V, Melino G (2001) Gene disruption of tissue transglutaminase.
Mol Cell Biol 21: 148–155.6. Nanda N, Iismaa SE, Owens WA, Husain A, Mackay F, et al. (2001) Targeted
inactivation of Gh/tissue transglutaminase II. J Biol Chem 276: 20673–20678.7. Iismaa SE, Mearns BM, Lorand L, Graham RM (2009) Transglutaminases and
disease: Lessons from genetically-engineered mosue models and inherited
disorders. Physiol Rev 89: 991–1023.8. Lorand L, Graham RM (2003) Transglutaminases: Crosslinking enzymes with
pleiotropic functions. Nat Rev Mol Cell Biol 4: 140–157.9. Achyuthan KE, Greenberg CS (1987) Identification of a guanosine triphos-
phate-binding site on guinea pig liver transglutaminase. Role of GTP and
calcium ions in modulating activity. J Biol Chem 262: 1901–1906.10. Im M-J, Riek RP, Graham RM (1990) A novel guanine nucleotide-binding
protein coupled to the a1-adrenergic receptor. II. Purification, characterization,and reconstitution. J Biol Chem 265: 18952–18960.
11. Nakaoka H, Perez DM, Baek KJ, Das T, Husain A, et al. (1994) Gh: a GTP-binding protein with transglutaminase activity and receptor signaling function.
Science 264: 1593–1596.
12. Chen SH, Lin F, Iismaa S, Lee KN, Birckbichler PJ, et al. (1996) a1-adrenergicreceptor signaling via Gh is subtype specific and independent of its
transglutaminase activity. J Biol Chem 271: 32385–32391.13. Dupuis M, Levy A, Mhaouty-Kodja S (2004) Functional coupling of rat
myometrial alpha 1-adrenergic receptors to Gh alpha/tissue transglutaminase 2
during pregnancy. J Biol Chem 279: 19257–19263.14. Vezza R, Habib A, FitzGerald GA (1999) Differential signaling by the
thromboxane receptor isoforms via the novel GTP-binding protein, Gh. J BiolChem 274: 12774–12779.
15. Zhang Z, Vezza R, Plappert T, McNamara P, Lawson JA, et al. (2003) COX-2dependent cardiac failure in Gh/tTG transgenic mice. Circ Res 92: 1153–1161.
16. Park ES, Won JH, Han KJ, Suh PG, Ryu SH, et al. (1998) Phospholipase C-
delta1 and oxytocin receptor signalling: evidence of its role as an effector.Biochem J 331: 283–289.
17. Akimov SS, Krylov D, Fleischmann LF, Belkin AM (2000) Tissue transgluta-minase is an integrin-binding adhesion coreceptor for fibronectin. J Cell Biol
148: 825–838.
18. Bungay PJ, Potter JM, Griffin M (1984) The inhibition of glucose-stimulatedinsulin secretion by primary amines. A role for transglutaminase in the secretory
mechanism. Biochem J 219: 819–827.19. Paulmann N, Grohmann M, Voigt J-P, Bert B, Vowinckel J, et al. (2009)
Intracellular serotonin modulates insulin secretion from pancreatic b-cells byprotein serotonylation. PLoS Biol 7: e1000229.
20. Gomis R, Sener A, Malaisse-Lagae F, Malaisse WJ (1983) Transglutaminase
activity in pancreatic islets. Biochim Biophys Acta 760: 384–388.
21. Salter NW, Ande SR, Nyguyen HK, Nyomba BLG, Mishra S (2012) Functional
characterization of naturally occurring transglutaminase 2 mutants implicated in
early-onset type 2 diabetes. Journal of Molecular Endocrinology 48: 203–216.
22. Iismaa TP, Kerr EA, Wilson JR, Carpenter L, Sims N, et al. (2000) Quantitative
and functional characterization of muscarinic receptor subtypes in insulin-
secreting cell lines and rat pancreatic islets. Diabetes 49: 392–398.
23. Gilon P, Henquin J-C (2001) Mechanisms and physiological significance of the
cholinergic control of pancreatic b-cell function. Endocr Rev 22: 565–604.
24. Duttaroy A, Zimliki CL, Gautam D, Cui Y, Mears D, et al. (2004) Muscarinic
stimulation of pancreatic insulin and glucagon release is abolished in M3
muscarinic acetylcholine receptor-deficient mice. Diabetes 53: 1714–1720.
25. Schmitz-Peiffer C, Laybutt DR, Burchfield JG, Gurisik E, Narasimhan S, et al.
(2007) Inhibition of PKCe improves glucose-stimulated insulin secretion and
reduces insulin clearance. Cell Metab 6: 320–328.
26. Cantley J, Boslem E, Laybutt DR, Cordery DV, Pearson G, et al. (2011)
Deletion of protein kinase Cd in mice modulates stability of inflammatory genes
and protects against cytokine-stimulated beta cell death in vitro and in vivo.
Diabetologia 54: 380–389.
27. Carpenter L, Mitchell CJ, Xu ZZ, Poronnik P, Both GW, et al. (2004) PKCa is
activated but not required during glucose-induced insulin secretion from rat
pancreatic islets. Diabetes 53: 53–60.
28. Iismaa SE, Wu M-J, Nanda N, Church WB, Graham RM (2000) GTP-binding
and signalling by Gh/transglutaminase II involves distinct residues in a unique
GTP-binding pocket. J Biol Chem 275: 18259–18265.
29. Begg GE, Holman SR, Stokes PH, Matthews JM, Graham RM, et al. (2006)
Mutation of a critical GTP-binding arginine in transglutaminase 2 disinhibits
intracellular crosslinking activity. J Biol Chem 281: 12603–12609.
30. Lee SK, Opara EC, Surwit RS, Feinglos MN, Akwari OE (1995) Defective
glucose-stimulated insulin release from perifused islets of C57BL/6J mice.
Pancreas 11: 206–211.
31. Andrikopoulos S, Massa CM, Aston-Mourney KA, Funkat A, Fam BC, et al.
(2005) Differential effect of inbred mouse strain (C57BL/6, DBA/2, 129T2) on
insulin secretory function in response to a high fat diet. J Endocrinol 187: 45–53.
32. Goren HJ, Kulkarni RN, Kahn CR (2004) Glucose homeostasis and tissue
transcript content of insulin signaling intermediates in four inbred strins of mice:
C57BL/6, C57BLKS/6, DBA/2 and 129X1. Endocrinology 145: 3307–3323.
33. Leiter EH (2002) Mice with targeted gene disruptions or gene insertions for
diabetes research: problems, pitfalls, and potential solutions. Diabetologia 45:
296–308.
34. Brennan K (2011) Colony Management. In: Pease S, Saunders TL, editors.
Advanced protocols for animal transgenesis An ISTT manual. 1st ed. Berlin:
Springer-Verlag. 535–576.
35. Wong GT (2002) Speed congenics: Applications for transgenic and knock-out
mouse strains. Neuropeptides 36: 230–236.
36. Lorand L, Conrad SM (1984) Transglutaminases. Mol Cell Biochem 58: 9–35.
37. Calkins MJ, Townsend JA, Johnson DA, Johnson JA (2010) Cystamine protects
form 3-nitropropionic acid lesioning via induction of nf-e2 related factor 2
mediated transcription. Experimental Neurology 224: 307–317.
38. Ruan Q, Johnson GVW (2007) Transglutaminase 2 in neurodegenerative
disorders. Front Biosci 12: 891–904.
39. Davies PJA, Cornwell MM, Johnson JD, Reggianni A, Myers M, et al. (1984)
Studies on the effects of dansylcadaverine and related compounds on receptor-
mediated endocytosis in cultured cells. Diabetes Care 7 (Suppl 1): 35–41.
No Role for TG2 in Glucose Homeostasis
PLOS ONE | www.plosone.org 11 May 2013 | Volume 8 | Issue 5 | e63346