Cytoplasmic condensation induced by membrane damage is ...
40
ARTICLE Cytoplasmic condensation induced by membrane damage is associated with antibiotic lethality Felix Wong 1,2 , Jonathan M. Stokes 1,2 , Bernardo Cervantes 1,2,3 , Sider Penkov 4 , Jens Friedrichs 5 , Lars D. Renner 5 ✉ & James J. Collins 1,2,6 ✉ Bactericidal antibiotics kill bacteria by perturbing various cellular targets and processes. Disruption of the primary antibiotic-binding partner induces a cascade of molecular events, leading to overproduction of reactive metabolic by-products. It remains unclear, however, how these molecular events contribute to bacterial cell death. Here, we take a single-cell physical biology approach to probe antibiotic function. We show that aminoglycosides and fluoroquinolones induce cytoplasmic condensation through membrane damage and sub- sequent outflow of cytoplasmic contents as part of their lethality. A quantitative model of membrane damage and cytoplasmic leakage indicates that a small number of nanometer- scale membrane defects in a single bacterium can give rise to the cellular-scale phenotype of cytoplasmic condensation. Furthermore, cytoplasmic condensation is associated with the accumulation of reactive metabolic by-products and lipid peroxidation, and pretreatment of cells with the antioxidant glutathione attenuates cytoplasmic condensation and cell death. Our work expands our understanding of the downstream molecular events that are asso- ciated with antibiotic lethality, revealing cytoplasmic condensation as a phenotypic feature of antibiotic-induced bacterial cell death. https://doi.org/10.1038/s41467-021-22485-6 OPEN 1 Institute for Medical Engineering & Science and Department of Biological Engineering, Massachusetts Institute of Technology, Cambridge, MA, USA. 2 Infectious Disease and Microbiome Program, Broad Institute of MIT and Harvard, Cambridge, MA, USA. 3 Microbiology Graduate Program, Massachusetts Institute of Technology, Cambridge, MA, USA. 4 Institute for Clinical Chemistry and Laboratory Medicine at the University Clinic and Medical Faculty of TU Dresden, Dresden, Germany. 5 Leibniz Institute of Polymer Research and the Max Bergmann Center of Biomaterials, Dresden, Germany. 6 Wyss Institute for Biologically Inspired Engineering, Harvard University, Boston, MA, USA. ✉ email: [email protected]; [email protected] NATURE COMMUNICATIONS | (2021)12:2321 | https://doi.org/10.1038/s41467-021-22485-6 | www.nature.com/naturecommunications 1 1234567890():,;
-
Upload
khangminh22 -
Category
Documents
-
view
1 -
download
0
Transcript of Cytoplasmic condensation induced by membrane damage is ...

ARTICLE
Cytoplasmic condensation induced by membranedamage is associated with antibiotic lethalityFelix Wong 12 Jonathan M Stokes12 Bernardo Cervantes123 Sider Penkov4 Jens Friedrichs5
Lars D Renner 5 amp James J Collins 126
Bactericidal antibiotics kill bacteria by perturbing various cellular targets and processes
Disruption of the primary antibiotic-binding partner induces a cascade of molecular events
leading to overproduction of reactive metabolic by-products It remains unclear however
how these molecular events contribute to bacterial cell death Here we take a single-cell
physical biology approach to probe antibiotic function We show that aminoglycosides and
fluoroquinolones induce cytoplasmic condensation through membrane damage and sub-
sequent outflow of cytoplasmic contents as part of their lethality A quantitative model of
membrane damage and cytoplasmic leakage indicates that a small number of nanometer-
scale membrane defects in a single bacterium can give rise to the cellular-scale phenotype of
cytoplasmic condensation Furthermore cytoplasmic condensation is associated with the
accumulation of reactive metabolic by-products and lipid peroxidation and pretreatment of
cells with the antioxidant glutathione attenuates cytoplasmic condensation and cell death
Our work expands our understanding of the downstream molecular events that are asso-
ciated with antibiotic lethality revealing cytoplasmic condensation as a phenotypic feature of
antibiotic-induced bacterial cell death
httpsdoiorg101038s41467-021-22485-6 OPEN
1 Institute for Medical Engineering amp Science and Department of Biological Engineering Massachusetts Institute of Technology Cambridge MA USA2 Infectious Disease and Microbiome Program Broad Institute of MIT and Harvard Cambridge MA USA 3Microbiology Graduate Program MassachusettsInstitute of Technology Cambridge MA USA 4 Institute for Clinical Chemistry and Laboratory Medicine at the University Clinic and Medical Faculty of TUDresden Dresden Germany 5 Leibniz Institute of Polymer Research and the Max Bergmann Center of Biomaterials Dresden Germany 6Wyss Institute forBiologically Inspired Engineering Harvard University Boston MA USA email renneripfddde jimjcmitedu
NATURE COMMUNICATIONS | (2021) 122321 | httpsdoiorg101038s41467-021-22485-6 |wwwnaturecomnaturecommunications 1
1234
5678
90()
Understanding the detailed mechanisms of action of anti-biotics remains a central focus in microbiology1 Whilethe primary binding partners of antibiotics have been
largely classified we still lack a holistic understanding of howbactericidal antibiotics lead to cell death2 Such an understandingwould better inform the use and misuse of antibiotics in additionto approaches for addressing antibiotic resistance
Previous work has shown that the intracellular accumulation ofpromiscuously reactive metabolic by-products induces wide-spread cellular dysfunction and contributes to antibioticlethality2ndash13 However the mechanisms underlying how reactivemetabolic by-products and the accompanying phenotypicchanges contribute to cell death have remained unclear Incontrast to conventional approaches that study bacterialresponses to antibiotics in bulk culture we reasoned that analysesof single cells through a physical biology approach14ndash16 couldallow for a more nuanced understanding of how cell death occursdownstream of the primary drugndashtarget interaction To this endwe investigated in Escherichia coli the single-cell response to threemain classes of bactericidal antibiotics aminoglycosides whichcorrupt mRNA proofreading by the 30S ribosomal subunitfluoroquinolones which perturb DNA replication and β-lactamswhich disrupt peptidoglycan cell wall biosynthesis through per-turbation of penicillin-binding proteins Here we show that incontrast to the lytic mode of action of β-lactams aminoglycosidesand fluoroquinolones induce a phenotype of cytoplasmic con-densation through membrane damage This phenotype is asso-ciated with the accumulation of reactive metabolic by-productslipid peroxidation and cell death thus indicating a sequence ofcellular events through which reactive metabolic products canlead to antibiotic-induced cell death
ResultsAminoglycosides and fluoroquinolones induce membranedamage and cytoplasmic condensation in E coli To probe howaminoglycoside fluoroquinolone and β-lactam antibiotics killmetabolically active bacterial cells we treated log-phase E coliwith the aminoglycoside kanamycin the fluoroquinolone cipro-floxacin and the β-lactam ampicillin at various concentrationsranging from 1times to 100times the minimum inhibitory concentration(MIC Supplementary Table 1) Using long-term microfluidicimaging across these conditions we observed variability in themorphological dynamics of cells which aside from filamentationcould be characterized by three modes cytoplasmic condensationmembrane bulging and lysis (Fig 1a and SupplementaryMovies 1ndash3) Interestingly some cells treated with kanamycinand most cells treated with ciprofloxacin but no cells treated withampicillin exhibited cytoplasmic condensation a phenotype inwhich the cytoplasm fragments and grows denser as manifestedby the appearance of discrete phase-light regions between phase-dark regions that grow darker (Supplementary Figs 1 and 2 andSupplementary Note 1) Since previous work has explored how β-lactam-mediated perturbation of peptidoglycan biosynthesis leadsto membrane bulging and lysis17 we ventured to explore furtherin this work the condensation phenotype induced by aminogly-cosides and fluoroquinolones
In cells that have exhibited cytoplasmic condensation whichcomprised ~30 of cells treated with kanamycin and ~90 ofcells treated with ciprofloxacin as distinguished visually fromlong-term timelapses (Fig 1d) discrete portions of cells typicallybecame phase-light over a timescale of ~1 min This phenotypecharacteristically appeared after tens of minutes or hours afterantibiotic exposure (Fig 1d) with larger antibiotic concentrationstypically resulting in earlier condensation (SupplementaryMovies 2 and 3) Subsequent imaging with fluorescent tags
labeling the inner membrane outer membrane cytoplasm andperiplasm revealed that the cytoplasm of these cells wasplasmolyzed the inner membrane was retracted from the outermembrane and the periplasmic space corresponding to phase-light regions was increased (Fig 1b c) similar to osmoticallyshocked cells18 Supporting the notion that the cytoplasmiccontents of these cells are compactified fluorescence microscopymeasurements with a strain exhibiting cytoplasmic fluorescenceindicated increased fluorescence intensities in condensed phase-dark regions (Supplementary Fig 2) Minutes to hours after theoccurrence of condensation most condensed cells (~90)eventually lysed (Fig 1d) as determined by the cytoplasmbecoming entirely phase-light Emphasizing the generality ofthese phenotypes we found that cytoplasmic condensation andlysis were shared among different aminoglycosides and fluor-oquinolones (Supplementary Fig 3) and across differentantibiotic concentrations (Supplementary Fig 4) as well as inthe Gram-positive bacterium Bacillus subtilis during antibiotictreatment for which we observed that the cytoplasm appeared toretract from the cell wall (Supplementary Fig 3)
Cytoplasmic condensation and lysis typically require loss ofcellular turgor or membrane integrity17 which are distinct fromthe primary mechanisms of action of aminoglycosides andfluoroquinolones Indeed under standard laboratory conditionsE coli maintains a turgor pressure of ~1 atm which presses itsinner membrane against the cell wall19 raising the question ofhow condensation of the cytoplasm could physically occur Wehypothesized that the observed condensation and lysis werecaused by loss of turgor To test this hypothesis we indepen-dently (i) osmotically shocked the cells using flow of hyper-osmotic media (Fig 1e and Supplementary Fig 5) and (ii) probedthe concentration of potassium an intracellular solute using amembrane-permeable potassium-sensitive dye ION PotassiumGreen (IPG Supplementary Fig 6) Quantifying the cellularresponse to a 500 mM hyperosmotic shockmdashcorresponding toapproximately ten times E colirsquos estimated turgor pressure19mdashrevealed that condensed and lysed cells exhibited smaller lengthcontractions compared to turgid ones (Fig 1e and SupplementaryFig 5) As the cell envelopes of cells with larger turgor pressuresare more stretched17 this observation indicates that the turgor ofcondensed and lysed cells was significantly diminished comparedto turgid cells and that cytoplasmic condensation could occurthrough loss of cellular turgor (Supplementary Note 1) Theseobservations are consistent with measurements of IPG fluores-cence which we found to be decreased in condensed cells(Supplementary Fig 6) suggesting that the loss of cellular turgoris associated with the depletion of intracellular solutes includingpotassium ions
To better understand how the mechanical properties of cellschange during condensation we next quantified the effectiveelastic moduli of cells using atomic force microscopy (AFMFig 1f and Supplementary Fig 7) AFM experiments on con-densed antibiotic-treated cells revealed that in ciprofloxacin-treated cells the phase-dark regions of condensed cells exhibitsignificantly larger elastic moduli than corresponding regions inturgid cells which in turn exhibit similar elastic moduli tophase-light regions (Fig 1f and Supplementary Fig 7) As E colirsquosturgor pressure has been estimated to be ~1 atm19 consistentwith inferred values based on our AFM measurements (seeMethods for details) these observations suggest that decreases ineffective stiffness arising from the loss of turgor pressure duringcytoplasmic condensation may be offset by the intracellularcompactification of macromolecules suggested by phase-contrastand fluorescence microscopy measurements (SupplementaryFig 2) Intriguingly we observed similar but less pronouncedvariations in cell stiffness in kanamycin-treated cells whose cell-
ARTICLE NATURE COMMUNICATIONS | httpsdoiorg101038s41467-021-22485-6
2 NATURE COMMUNICATIONS | (2021) 122321 | httpsdoiorg101038s41467-021-22485-6 | wwwnaturecomnaturecommunications
averaged elastic moduli are not significantly changed relative tothose of untreated cells (Supplementary Fig 7) It is possible thatthis difference between condensed ciprofloxacin- and kanamycin-treated cells could arise from additional membrane damagethrough ribosome-independent ionic interactions of aminoglyco-sides with the outer membrane which contributes to destabilizingthe cellular envelope20 Another possibility suggested by ourfluorescence intensity measurements (Supplementary Fig 2) isthat while cellular turgor is decreased in condensed cells treatedwith either antibiotic less intracellular compactification ofmacromolecules occurs in kanamycin-treated cells Thus these
AFM experiments suggest that cytoplasmic condensation affectsthe effective elastic moduli of antibiotic-treated cells to varyingdegrees
We next investigated whether the observed loss of turgor arosespecifically from membrane damage resulting in the outflow ofcytoplasmic contents Addition of SYTOX Blue a DNAintercalating dye that only penetrates cells with compromisedmembranes to drug-treated cells indicated loss of membraneintegrity in condensed and lysed cells with kanamycin-treatedcells exhibiting significant increases in fluorescence at lysis andciprofloxacin-treated cells exhibiting significant increases in
Phase AFM height
145 microm
0 microm
Cytoplasm(mCherry)
Innermembrane(mCherry)
Outermembrane
(GFP)
Periplasm(GFP)
Phase
Overlay
Fluorescent
a
b
e
g
Per
cent
age
leng
th
cont
ract
ion
afte
r sh
ock
Untreated Turgid Condensed
h
Rel
ativ
e D
iBA
C
inte
nsity
4
+CIP+KAN
Before treatment
Rel
ativ
e S
YTO
Xin
tens
ity
+CIP+KAN
+CIP
i
020
45e-912e-11
+KAN
d
0 10 200
05
10+CIP
+CIP
14e-946e-11
099
0 5 10
+KAN
0
05
10
Pop
ulat
ion
fract
ion
Time (h) Time (h)
Condensed
Lysed
+CIP+KAN
Membrane damage Membrane depolarization
0 min 20 min 30 min 0 min 10 min 20 min
+AMP
(3)
f
1
2
Outer membraneCell wallInner membranecytoplasm
Turgid
~1 min
Condensed
Lysed
c
~1 myseLyLL
~1+ h of ABX
Total condensed
No condensation
Untreated Untreated Untreated
Untreated
00510
0 5 10
Treated condensed
Turg
id (24
)
Conde
nsed
(27)
Lyse
d (20
)
Untrea
ted (3
0)
Treated
005
66e-6
12e-5
00867e-318e-8
61e-3
066
29e-4005
10e-5
32e-5
011
12e-11
016
22e-3
12e-885e-10
Pop
ulat
ion
fract
ion
Ela
stic
mod
ulus
(kP
a)
Untrea
ted (2
8)
Phase
light
1 (3
3) Phase
dark
2 (3
2)
008
47e-773e-9
049
85e-11 55e-11
36e-820e-838e-4
33e-12 83e-12
65e-16
11e-6087
59e-7
400
800
1200
1600
0
2
4
6
8
10
0
2
4
6
Turg
id (36
)
Conde
nsed
(34)
Lyse
d (34
)
Untrea
ted (3
0)
Treated
01020304050
0
10
20
30
Turg
id (41
)
Conde
nsed
(26)
Lyse
d (20
)
Untrea
ted (3
0)
Treated
Turg
id (30
)
Conde
nsed
(25)
Lyse
d (23
)
Untrea
ted (3
0)
Treated
-5
0
5
10
-5
0
5
10
15
Turg
id (21
)
Conde
nsed
(23)
Lyse
d (20
)
Untrea
ted (2
5)
Treated
Turg
id (61
)
Conde
nsed
(52)
Lyse
d (31
)
Untrea
ted (2
5)
Treated
NATURE COMMUNICATIONS | httpsdoiorg101038s41467-021-22485-6 ARTICLE
NATURE COMMUNICATIONS | (2021) 122321 | httpsdoiorg101038s41467-021-22485-6 |wwwnaturecomnaturecommunications 3
fluorescence during condensation (Fig 1g i and SupplementaryFig 8) we speculate that this difference may arise from varyinglevels of membrane damage as well as earlier lysis aftercondensation in kanamycin-treated cells (Supplementary Fig 9)which might allow for limited intercalation of dyes in these cellsbefore lysis Application of the membrane potential-sensitive dyeDiBAC4(3) similarly indicated membrane depolarization con-comitant with membrane damage (Fig 1h i and SupplementaryFig 8) Consistently as a control fluorescence of SYTOX Blueand DiBAC4(3) did not occur for plasmolyzed cells that weresubjected to a 500 mM hyperosmotic shock for which no cellslysed (Supplementary Fig 8) Taken together these results revealthat aminoglycosides and fluoroquinolones can induce cytoplas-mic condensation and lysis through membrane damage and assuggested by SYTOX Blue this membrane damage coincides withloss of cell viability As detailed below further time-kill assaysconfirm that the observed membrane damage accompanies loss ofcell viability
A biophysical model of cell envelope mechanics and soluteoutflow predicts the dynamics of cytoplasmic condensationHaving determined that cytoplasmic condensation occursthrough antibiotic-induced membrane damage we sought tobetter understand the extent of membrane damage and thephysiology of condensed cells using biophysical modeling To thisend building on previous work172122 we developed a model ofcell envelope mechanics that predicts (i) smaller turgor andcytoplasmic condensation to arise from the elastic relaxation toan equilibrium state one which is governed by the outward flowof cytoplasmic solutes through nanometer-sized membranedefects and (ii) the number of such defects consistent with theempirically observed ~1min timescale and magnitude of cyto-plasmic condensation (Fig 2andashc Supplementary Note 1 Sup-plementary Table 2 and Supplementary Fig 10)
The model assumes for simplicity that a constant number ofnanometer-scale defects are introduced into both the inner andouter membranes of a bacterium These defects need not overlapacross the cell envelope layers and similar defects need not beintroduced into the peptidoglycan cell wall because the cell wall isporous with characteristic pore areas of ~10 nm2 23 While similarmembrane defects may be generated and quickly alleviatedduring processes including electroporation the SYTOX Blue(Fig 1g) and osmotic shock experiments (Fig 1e) described abovesuggest that the membrane defects we consider are sustainedacross time so that appreciable outflow of intracellular solutesand intercalation of fluorescent dyes occur Based on a linear-elastic description of the cellular envelope and a simple model offluid transport through Poiseuille flow the model predicts thatthe hydrodynamic flow of solutes from the cytoplasm to theexternal milieu is laminar and results in a gradual loss of turgor(Fig 2d e) This loss of turgor decreases the mechanical strains inthe cell envelope In turn solute outflow is attenuated becauseboth the cellular turgor and the sizes of typical membrane nano-defects are decreased Cytoplasmic condensation occurs as cellvolume is lost (Fig 2f and Supplementary Fig 9) and the modelpredicts that condensation corresponds to a steady state of thisdynamical system Surprisingly the model predicts that only 10nanometer-scale defects corresponding to loss of approximately1 in 106 of all membrane phospholipids can quantitativelyexplain both the timescale and magnitude of cytoplasmiccondensation (Fig 2f) Thus building on our empiricalmeasurements the model reveals that subtle changes tomembrane integrity can provoke the cellular-scale phenotype ofcytoplasmic condensation
Cytoplasmic condensation is associated with cell death Tobetter understand the significance of membrane damage andaccompanying cytoplasmic condensation in a more conventionalexperimental system we performed single-cell analyses and
Fig 1 Aminoglycoside and fluoroquinolone antibiotics induce cytoplasmic condensation in E coli a Cytoplasmic condensation andor lysis (yellow andred markers respectively) induced by kanamycin (KAN) ciprofloxacin (CIP) and ampicillin (AMP) after 1ndash6 h of treatment (KAN 3 h CIP 6 h AMP 1 h)in a population of wild-type log-phase Escherichia coli cells imaged in phase contrast Times were chosen to reflect timescales of phenotypic change Hereand below all antibiotic concentrations used were 10times MIC while control cells were untreated working MICs were 5 μgmL for kanamycin 01 μgmL forciprofloxacin and 10 μgmL for ampicillin Ampicillin-treated cells exhibited membrane bulging and lysis in contrast to cytoplasmic condensation and lysisobserved in kanamycin- and ciprofloxacin-treated cells (Supplementary Fig 1) Ciprofloxacin-treated cells also displayed filamentation Cytoplasmiccondensation and lysis were general across cells in a population antibiotic concentrations ranging at least from 1times to 100times MIC different aminoglycosideand fluoroquinolone antibiotics and in Bacillus subtilis (Supplementary Figs 3 and 4) Results are representative of three biological replicates in eachcondition Scale bar 10 μm b E coli cells with fluorescent genetic outer membrane (green fluorescent protein GFP) inner membrane (mCherry)periplasmic (GFP) and cytoplasmic (mCherry) markers under ciprofloxacin treatment imaged in phase contrast and epifluorescence For similar cellstreated with kanamycin see Supplementary Fig 3 Results are representative of three biological replicates for each marker and yellow markers highlightcondensed cells Scale bars here and below 3 μm c Schematic of cytoplasmic condensation and lysis in E coli treated with kanamycin and ciprofloxacind Fractions of all cells that are condensed or lysed Error bars indicate one standard deviation and data are presented as mean plusmn SEM Data are derivedfrom two different fields of view with at least 100 cells each (kanamycin 133 and 149 cells ciprofloxacin 255 and 140 cells) and representative of twobiological replicates Note that cells may condense and lyse within the same hour such cells are reflected only in lysed cell counts The total condensedfraction counts all cells that are or have previously been condensed e Hyperosmotic shock measurements in control and antibiotic-treated E coli of whichthree characteristic phase-contrast microscopy images are shown (top) here ciprofloxacin-treated cells are shown The percentage length contraction anindicator of cellular turgor is the percentage change in cell length immediately after hyperosmotic shock Red dashed lines represent visual guides Thenumber of cells in each group are indicated in parentheses Here and below a box plot indicating the median (center) 25th and 75th percentile (bounds ofbox) and extreme data points not considered outliers (bounds of whiskers) is shown and red crosses indicate outliers including the minimum andmaximum values p-values for two-sample Kolmogorov-Smirnov tests are shown next to corresponding brackets f Atomic force microscopy (AFM) ofcells (Left) Phase-contrast and AFM topography image of a condensed ciprofloxacin-treated cell (Right) Inferred elastic moduli corresponding to thecellular regions shown to the left as indicated by different colors as well as along the cellular body of an untreated control cell The number of cells in eachgroup are indicated in parentheses Box plot features and statistical tests refer to those of panel (e) For measurements for kanamycin-treated cells seeSupplementary Fig 7 g h Fluorescence intensities of control and antibiotic-treated E coli in the presence of SYTOX Blue (g) and DiBAC4(3) (h) Thenumber of cells in each group are indicated in parentheses Box plot features and statistical tests refer to those of panel (e) i Representative timelapses ofciprofloxacin-treated E coli stained by SYTOX Blue and DiBAC4(3) imaged in phase contrast and epifluorescence Times show duration after the firstimage and results are representative of three biological replicates
ARTICLE NATURE COMMUNICATIONS | httpsdoiorg101038s41467-021-22485-6
4 NATURE COMMUNICATIONS | (2021) 122321 | httpsdoiorg101038s41467-021-22485-6 | wwwnaturecomnaturecommunications
concurrent bulk time-kill assays These revealed that condensa-tion and lysis events occur in time concomitant with gt1 log ofkilling in culture (Fig 3a) as determined after plating andovernight incubation by colony-forming unit (CFU) quantifica-tion We note here that decreases in CFUs were observed as soonas ~1 h after antibiotic treatment (Fig 3a) however this obser-vation does not imply that cell death occurs before cytoplasmiccondensation since cell death may occur after plating in corre-sponding time-kill assays Consistent with this hypothesis recentwork from the Zhao and Drlica labs has indicated that antibiotic-induced cell death occurs after plating on drug-free agar due inpart to the post-stress accumulation of reactive oxygen species(ROS)11 so that cell death may occur significantly after plating
To further probe the notion that cells die on timescales longerthan ~1 h of antibiotic treatment we performed bacterial growthmeasurements at the single-cell level These measurementsshowed that in cells treated with ciprofloxacin condensationrepresented an irreversible step at which cells failed to elongateand filament with cessation of filamentation occurring at thetime of condensation (Fig 3b c) Interestingly kanamycin-treated cells exhibited increased growth variability beforecondensation and oscillatory cell length dynamics (Fig 3d e)consistent with repeated membrane swellndashburst cycles20 and
suggestive of more heterogeneous membrane damage comparedto ciprofloxacin-treated cells This observation is also consistentwith earlier work showing that aminoglycosides induce outermembrane damage by ribosome-independent ionic interactionswhich along with subsequent membrane fusion lead to repeatedmembrane swellndashburst cycles20 For both antibiotics subsequentwashout with drug-free growth media revealed that condensedand lysed cells do not recover from antibiotic treatment whilefilamentous or dividing cells recover from antibiotic treatmentand appear to proliferate (Fig 3f g and Supplementary Movies 4and 5) These results indicate that the cessation of filamentationseen in condensed cells is associated with killing (Fig 3b c)Furthermore these observations collectively suggest that cyto-plasmic condensation is an irreversible phenotype distinguishingantibiotic susceptibility from tolerance although we note herethat because antibiotic treatment leads to gt1 log of killing but lessthan 90 of cells observed may be condensed not all susceptiblecells are condensed (Figs 1d and 3a)
Unsurprisingly experiments in which drug-tolerant stationary-phase cells were treated with kanamycin and ciprofloxacinrevealed less killing in culture and less cytoplasmic condensationand lysis in single cells (Supplementary Fig 11) This is expectedbecause recent work has shown that the lethality of different
Fig 2 Cytoplasmic condensation emerges from subtle nanometer-scale membrane defects a Model of condensation due to membrane nano-defectformation and subsequent solute leakage Membrane nano-defects are modeled as circular channels that extrude through both the inner and outermembranes with a typical radius of rd and a typical length of Ld Cytoplasmic condensation occurs as the cellular turgor (p) decreases For details of themodel see Supplementary Note 1 b Empirically observed distributions of condensation times in kanamycin-treated and ciprofloxacin-treated cells at 10timesMIC The cell numbers (N) population means and standard deviations (STD) are indicated c Same as panel (b) but for distributions of cell length changesas illustrated in phase contrast for a typical ciprofloxacin-treated cell (10times MIC) in the inset (left scale bar 3 μm) dndashf Model predictions for solute number(d) turgor pressure (e) and cell volume (f) against time after membrane nano-defect formation for the characteristic parameter values summarized inSupplementary Table 2 (Insets) Plots for short times The empirically observed decreases in cellular volume as functions of time for the kanamycin-treatedand ciprofloxacin-treated (10times MIC) cells represented in part by panels (b) and (c) are indicated by red and blue curves respectively Shaded regionsindicate one standard deviation
NATURE COMMUNICATIONS | httpsdoiorg101038s41467-021-22485-6 ARTICLE
NATURE COMMUNICATIONS | (2021) 122321 | httpsdoiorg101038s41467-021-22485-6 |wwwnaturecomnaturecommunications 5
Fig 3 Cytoplasmic condensation is an irreversible cell death phenotype a Survival of log-phase bulk cultures of E coli treated with kanamycin andciprofloxacin at 10times MIC and corresponding fractions of condensed and lysed cells after treatment for 24 h Each timepoint represents two biologicalreplicates and for population fractions two different fields of view with at least 100 cells each (untreated 109 and 100 cells kanamycin 113 and 102 cellsciprofloxacin 175 and 120 cells) For population fractions a population of cells was treated with antibiotics for the indicated treatment times inside amicrofluidic chamber cells were washed with drug-free medium and the number of condensed and lysed cells after 20 h were counted Error bars indicateone standard deviation and data are presented as mean plusmn SEM b E coli cell length (L) traces of 20 cells treated continuously with ciprofloxacin at 10timesMIC inside a microfluidic chamber c Average normalized single-cell elongation rates (dL(Ldt)) of cells corresponding to panel (b) with pre-condensation(pre-) and post-condensation (post-) values shown Here and below box plots indicating the median (center) 25th and 75th percentile (bounds of box)and extreme data points not considered outliers (bounds of whiskers) are shown and red crosses indicate outliers including the minimum and maximumvalues p-values for two-sample Kolmogorov-Smirnov tests are shown next to corresponding brackets dndashe Same as (b c) but for treatment withkanamycin at 10times MIC for which cells exhibited cell length oscillations approximately described by a typical period of ф= 20min (inset) Box plot featuresrefer to those of panel (c) f g Same as (b c) but for transient antibiotic treatment and subsequent washout showing that recovering turgid cells surviveand continue to elongate Here time is defined as time since condensation for condensed cells and time since start of measurement for recovering cellsCell length represents cumulative cell length of a cell and if the cell divides all its progeny The length is normalized to its value at condensation forcondensed cells and to its starting length for recovering cells All cells were treated for 30min with kanamycin or ciprofloxacin at 10times MIC inside amicrofluidic chamber Box plot features refer to those of panel c
ARTICLE NATURE COMMUNICATIONS | httpsdoiorg101038s41467-021-22485-6
6 NATURE COMMUNICATIONS | (2021) 122321 | httpsdoiorg101038s41467-021-22485-6 | wwwnaturecomnaturecommunications
antibiotics including aminoglycosides and fluoroquinolones isassociated with cellular metabolism2425 As cellular metabolism isdecreased in stationary-phase cells (Supplementary Fig 12) thedecreased frequencies of condensation and lysismdashin addition todecreased killingmdashobserved in these cells are consistent with thefinding that these cells are less susceptible to antibiotics
Cytoplasmic condensation is associated with ROS accumula-tion lipid peroxidation and changes in lipid compositionAlthough membrane damage and cytoplasmic condensationoccur rapidly after antibiotic exposure inhibition of DNA repli-cation and protein translation by themselves are not known tolead to membrane damage prompting our inquiry into theunderlying mechanism of these phenotypes While aminoglyco-sides have been shown to perturb membranes through non-specific ionic bonds and misfolded proteins26ndash28 another possi-bility that may explain our observations with both aminoglyco-sides and fluoroquinolones is that promiscuously reactivemetabolic by-products damage membrane phospholipids throughprocesses involving for example free-radical reactions231329Previous work has shown that antibiotic-treated cells experienceincreased flux through metabolic pathways that lead to reactivemetabolic by-products irrespective of the primary antibiotic-binding target and these reactive metabolic by-products havebeen evidenced to contribute to antibiotic lethality2ndash1329 Indeedconsistent with this notion we observed that condensed andorlysed antibiotic-treated cells exhibited significantly elevated levelsof reactive oxygen species (ROS) and reactive nitrogen species(RNS) as measured by the dyes carboxy-H2DCFDA and DAF-FM (Fig 4a b)
As such we wondered whether cytoplasmic condensationspecifically correlated with lipid peroxidation a process in whichfree radicals and other reactive molecules react with fatty acidsand may ultimately rupture the membrane30 To test thishypothesis we assayed lipid peroxidation both in single cellsand bulk culture using the lipophilic dye C11-BODIPY Thefluorescence of this dye shifts from red to green when oxidized byoxy-radicals and peroxynitrite31 and measurements of greenfluorescence intensity over time offer a quantitative measure oflipid peroxidation dynamics Consistent with the hypothesis thatcytoplasmic condensation correlates with lipid peroxidation weobserved that condensed and lysed cells exhibited largerintensities than turgid cells (Fig 4c) Moreover cells exhibitedsharp increases in fluorescence coincident in time with con-densation and lysis (Fig 4d) Flow cytometry measurements usingbulk cultures also confirmed an increase in fluorescence implyingincreases in ROS and RNS consistent with single-cell measure-ments (Fig 4endashg)
As the foregoing results indicate changes in membranecomposition we next characterized the lipid contents ofantibiotic-treated cells (Fig 5) We found that bulk culturestreated with kanamycin and ciprofloxacin in addition to bulkcultures treated with ampicillin and 10 mM H2O2 considered herefor comparison exhibited detectable increases in free fatty acids(FFA) relative to untreated cells (Fig 5a) In particular averagedmeasurements of peak area intensities suggest that FFA levels areincreased by as much as ~1-fold in kanamycin and ciprofloxacin-treated cells and by as much as ~7-fold in ampicillin-treated cellswith the size of the increase varying with treatment time (Fig 5b)While the latter may be expected based on the lytic mode ofaction of ampicillin the observation of increased FFA levels inkanamycin- and ciprofloxacin-treated cells contrasts with theprimary modes of action of aminoglycosides and fluoroquino-lones and is consistent with the membrane damage characterizedabove using SYTOX Blue (Fig 1g) We also observed salient shifts
in cardiolipin (CL)phosphatidylethanolamine (PE) ratios (Fig 5ac) which have previously been shown to be associated withchanges in cell envelope ultrastructure similar to that found forcytoplasmic condensation here32 Indeed we found that CLPEratios could be ~2 to ~3-fold higher in kanamycin- andciprofloxacin-treated cells suggesting that antibiotic treatmentand subsequent cytoplasmic condensation may be generallyassociated with changes in the CLPE ratio and lipid compositionIn sum these results are consistent with our observations ofmembrane damage and together our experiments demonstratethat antibiotic-induced cytoplasmic condensation is associatedwith the accumulation of promiscuously reactive metabolic by-products (Fig 4) lipid peroxidation (Fig 4) and changes in lipidcomposition (Fig 5)
Finally as previous work has shown that excess lipopolysac-charide (LPS) can lead to cell death in a mla strain of E coli33we asked as well whether changes in LPS levels are associated withthe cell death phenotype characterized here Measuring LPSconcentrations in antibiotic-treated bulk cultures with a limulusamebocyte lysate (LAL) assay we found intriguingly thatkanamycin- and ciprofloxacin-treated cultures exhibited signifi-cantly lower LPS concentrations than did untreated cultures(Supplementary Fig 13) This observation suggests that increasedLPS levels may not be associated with cell death in cells treatedwith kanamycin and ciprofloxacin
Cytoplasmic condensation and antibiotic-induced cell deathare mitigated by glutathione a scavenger of reactive metabolicby-products We next sought to determine whether the reactivemetabolic by-products that are associated with cytoplasmic con-densation also contribute to antibiotic lethality as measured atthe single-cell level by the frequency of condensation and lysis aswell as in bulk culture by time-kill assays To this end we pre-treated growing cultures of E coli with glutathione an anti-oxidant and scavenger of reactive metabolic by-products that isalso known to attenuate antibiotic killing of bulk cultures1324 Weobserved significantly decreased killing by both kanamycin andciprofloxacin in glutathione-pretreated cultures (Fig 6a b) Spe-cifically exogenous supplementation of glutathione (10 mM)decreased kanamycin killing by as much as ~7 logs and cipro-floxacin killing by as much as ~4 logs for cell cultures treated atthe previously determined MICs As glutathione also increases theMICs of kanamycin and ciprofloxacin (Supplementary Table 1)we performed further time-kill assays relative to these increasedMICs (Fig 6a b) These assays revealed increased survival relativeto cases of no glutathione with kanamycin treatment in the rangeof 1times MIC and ciprofloxacin treatment at various treatment timesin the range of 01times to 10times MIC (Fig 6a b) suggesting that theglutathione protection observed in bulk cultures may arise fromboth decreasing growth inhibition and decreasing killing ofindividual cells At the single-cell level antibiotic treatment ofglutathione-pretreated cells was accompanied by cell proliferationin kanamycin-treated cells and notable suppression of con-densation and lysis in ciprofloxacin-treated cells (Fig 6c h andSupplementary Movies 6 and 7) suggesting a reactive metabolicby-product-based origin for the membrane damage anddecreased survival observed in the absence of glutathione Fur-thermore while antibiotic lethality correlates with cellularmetabolism242529 we note here that the observed protectionfrom antibiotic killing by glutathione did not arise from differ-ences in intracellular ATP levels as indicated by bulk-culturemeasurements of ATP abundance (Supplementary Fig 12)Indeed since glutathione is involved not only in ROS and RNSscavenging but also cellular detoxification of additional reactivemetabolic by-products such as methylglyoxal34 these results
NATURE COMMUNICATIONS | httpsdoiorg101038s41467-021-22485-6 ARTICLE
NATURE COMMUNICATIONS | (2021) 122321 | httpsdoiorg101038s41467-021-22485-6 |wwwnaturecomnaturecommunications 7
suggest that reactive metabolic by-productsmdashwhich may includebut are not limited to ROS and RNSmdashcontribute to antibiotic-induced cell death and that glutathione-mediated detoxificationof these molecules contributes to protection from antibioticlethality
Next we performed time-kill experiments on Δgor and ΔgshAstrains of E coli which respectively lack genes encoding forglutathione reductase (Gor) and a glutamate-cysteine ligase(GshA) contributing to glutathione synthesis3536 We found thatantibiotic lethality remained largely unchanged from wild-typecontrols suggesting that the modifications to intracellularglutathione pools arising from these genetic deletions havelimited effects on aminoglycoside and fluoroquinolone killing(Supplementary Fig 14) As endogenous pools of glutathionehave been estimated to be ~10 mM in E coli37 it is possible thatthese genetic perturbations induce smaller variations in glu-tathione concentration than are needed to protect against
antibiotic lethality resulting from the production of reactivemetabolic by-products
As a positive control for a scavenging reaction involvingglutathione we repeated our time-kill experiments with treatmentby exogenous peroxynitrite38 with and without pretreatment byglutathione (10 mM) To explore the effects of differentantioxidants we also considered the antioxidants dithiothreitoland mercaptoethanol (10 mM) Intriguingly treating exponen-tially growing bulk cultures with peroxynitrite resulted in severallogs of killing which was accompanied at the single-cell level bycytoplasmic condensation and lysis (Fig 6dndashf) Yet whilepretreatment with any of the three antioxidants consideredrescued cells from peroxynitrite killing and appeared to suppressperoxynitrite-induced cytoplasmic condensation and lysis (Fig 6ef h) we found that cells pretreated with dithiothreitol andmercaptoethanol were not substantially rescued from kanamycinand ciprofloxacin-induced cell death and cytoplasmic
Fig 4 Cytoplasmic condensation is associated with the accumulation of reactive metabolic by-products a Fluorescence intensities of antibiotic-treatedE coli in the presence of the ROS-sensitive dye carboxy-H2DCFDA A representative view of ciprofloxacin-treated cells imaged in phase contrast andepifluorescence is shown Here and below the kanamycin and ciprofloxacin concentrations used were 10times MIC error bars represent one standarddeviation and scale bars indicate 3 μm The number of cells in each group are indicated in parentheses Box plots indicating the median (center) 25th and75th percentile (bounds of box) and extreme data points not considered outliers (bounds of whiskers) are shown and red crosses indicate outliersincluding the minimum and maximum values p-values for two-sample Kolmogorov-Smirnov tests are shown next to corresponding brackets b c Same as(a) but for DAF-FM a dye sensitive to nitric oxide (b) and C11-BODIPY a lipid peroxidation-sensitive dye (c) d A representative timelapse of aciprofloxacin-treated E coli cell in the presence of C11-BODIPY Times show duration after the first image and results are representative of three biologicalreplicates endashg Histograms of fluorescence intensities of populations of control and antibiotic-treated E coli as assayed by flow cytometry using the FITCfluorochrome Dyes and antibiotic concentrations were the same as in (andashc) and cells were assayed after 3 h (untreated and kanamycin-treated cells) and6 h (untreated and ciprofloxacin-treated cells) of treatment Cells were analyzed after longer times for ciprofloxacin treatment because a majority ofcondensation events occurred later in time (Fig 1d) Data are representative of four biological replicates and 20000 scattering events for each distribution
ARTICLE NATURE COMMUNICATIONS | httpsdoiorg101038s41467-021-22485-6
8 NATURE COMMUNICATIONS | (2021) 122321 | httpsdoiorg101038s41467-021-22485-6 | wwwnaturecomnaturecommunications
condensation (Fig 6g h) Consistent with these observationskanamycin and ciprofloxacin MICs were unchanged in thepresence of dithiothreitol and mercaptoethanol (SupplementaryTable 1) These differences which could arise from variedscavenging potentials toward different reactive metabolic by-products suggests that aminoglycoside and fluoroquinolone-induced cytoplasmic condensation lysis and cell death may notbe explained by the accumulation of peroxynitrite alone
Finally in order to test whether certain compounds mightattenuate lipid peroxidation and cell death in antibiotic-treatedcells we performed microscopy and time-kill experimentsinvolving the exogenous supplementation of α-tocopherol alipophilic antioxidant which has been shown to mitigate lipidperoxidation in eukaryotes39 We found that pretreating with α-tocopherol (50 mM) did not significantly alleviate antibioticlethality (Fig 6g) or alter kanamycin and ciprofloxacin MICs(Supplementary Table 1) Consistent with our characterization ofcytoplasmic condensation as a cell death phenotype cytoplasmiccondensation and fluorescence of C11-BODIPY also occurredsimilarly to cells without α-tocopherol pretreatment (Fig 6g hand Supplementary Fig 15) We speculate that α-tocopherol maybe less potent in E coli than in eukaryotes due to potentiallylimited scavenging potential and uptake Intriguingly a recentstudy developed a lipophilic antioxidant different from α-tocopherol and showed that it prevented lipid peroxidation andfluoroquinolone-induced cell death in E coli40 together with ourresults this observation suggests a varied landscape of chemicalcompounds that could attenuate lipid peroxidation and in doingso mitigate antibiotic lethality
Cytoplasmic condensation and antibiotic-induced cell deathare robust to changes in oxygen availability and externalosmolarity As the foregoing results suggest that cytoplasmiccondensation and antibiotic-induced cell death are associatedwith membrane damage induced by reactive metabolic by-pro-ducts we asked how cytoplasmic condensation and antibiotic
lethality could be affected by perturbations including (1) theabsence of environmental oxygen and (2) osmotic shifts thatmight physically restore cellular turgor and reverse the condensedphenotype To address this question we performed microscopyand time-kill experiments
We first considered the effects of oxygen availability on ourfindings We performed microscopy and time-kill experiments inan anaerobic chamber similarly to previous work from ourgroup13 Intriguingly when cells were cultured treated andimaged under strictly anaerobic conditions we found thattreatment by kanamycin and ciprofloxacin still induced cyto-plasmic condensation and fluorescence of C11-BODIPY (Fig 7a)Surprisingly however we found that glutathione also conferredprotection in anaerobic time-kill assays (Fig 7b) suggesting thatglutathione may be involved in cellular detoxification in theabsence of environmental oxygen Survival of glutathione-pretreated bulk cultures under kanamycin treatment wasincreased similarly to aerobic conditions by ~3 logs at 10times thebaseline aerobic MIC while survival under ciprofloxacin treat-ment was increased by ~1 to 2 logs at 1times and 10times MIC (Fig 7b)Together these findings indicate that reactive metabolic by-products in addition to ROS including RNS13 may contribute tocytoplasmic condensation and antibiotic-induced cell death underanaerobic conditions
We next performed microfluidic and time-kill experiments inwhich antibiotic-treated cells were hypoosmotically shocked inorder to produce increases in cellular turgor In microfluidicexperiments cells were grown in LB with 250 mM sorbitolbefore and during ~3 h of treatment with kanamycin orciprofloxacin (at 10times MIC) At the onset of cytoplasmiccondensation cells were hypoosmotically shocked with a flowof sorbitol-free drug-containing LB In untreated controls thishypoosmotic shock results in the transient enlargement of cellsdue to increased turgor with typical cytoplasmic volumeincreases of less than ~541 as confirmed here (SupplementaryMovie 8) In most antibiotic-treated cells we found that this
Fig 5 Antibiotic treatment is associated with changes in lipid composition a Representative thin-layer chromatography image for lysates of control andantibiotic-treated cell cultures Cells were harvested after various treatment times as shown and antibiotic concentrations used were 10times MIC Forcomparison results for cells treated with 10 mM hydrogen peroxide and 10times MIC ampicillin are shown Results are representative of two biologicalreplicates Abbreviations CL cardiolipin PG phosphatidylglycerol PE phosphatidylethanolamine FFA free fatty acids DAG diacylglycerol OA oleic acidb c Relative FFA levels (b) and CLPE ratios (c) across treatment conditions relative to values for untreated cells at each treatment time Data are fromtwo biological replicates (black points) and bars indicate averages
NATURE COMMUNICATIONS | httpsdoiorg101038s41467-021-22485-6 ARTICLE
NATURE COMMUNICATIONS | (2021) 122321 | httpsdoiorg101038s41467-021-22485-6 |wwwnaturecomnaturecommunications 9
hypoosmotic shock did not change the condensed phenotypeNevertheless we found that a small fraction (~10) ofcondensed ciprofloxacin-treated cells briefly became turgidas indicated in phase-contrast by phase-light regions becomingphase-dark and increases in cell size so that hypoosmotic shockappeared to transiently reverse cytoplasmic condensation inthese cells (Fig 7c and Supplementary Movie 9) Yet afterseveral minutesmdasha timescale consistent with the timescale ofsolute outflow predicted by our modelmdashthese cells reverted tothe condensed phenotype and failed to elongate upon
continued observation In contrast to ciprofloxacin-treatedcells we observed typical kanamycin-treated cells to lyseimmediately after hypoosmotic shock (SupplementaryMovie 10) as would be consistent with a scenario in whichkanamycin-induced membrane damage is more widespreadmdashpotentially due to ribosome-independent ionic interactionswith the outer membrane2026mdashand results in a lower resistanceof the membranes to stretching Importantly for bothantibiotics application of hypoosmotic shock failed to rescuecells by resulting in continued cell growth
ARTICLE NATURE COMMUNICATIONS | httpsdoiorg101038s41467-021-22485-6
10 NATURE COMMUNICATIONS | (2021) 122321 | httpsdoiorg101038s41467-021-22485-6 | wwwnaturecomnaturecommunications
In corresponding time-kill experiments bulk cultures weretreated with kanamycin or ciprofloxacin (10times MIC) in LB with250 mM sorbitol Cells were then hypoosmotically shocked byserial dilution in LB before plating on drug- and sorbitol-free LBagar Consistent with our microscopy observations subsequentCFU quantitation showed that cellular survival was notsignificantly changed in these cultures relative to the case of noosmotic shift at the time of plating (Fig 7d) Together theseresults suggest that physical changes in turgor pressure do notmitigate kanamycin- and ciprofloxacin-induced cell death andmembrane damage These findings are also consistent with thehypothesis that reactive metabolic by-product-mediated mem-brane damage lies upstream of cytoplasmic condensation andcell death
DiscussionIn summary our results which include both single-cell biophy-sical and conventional bulk-culture approaches suggest the fol-lowing physical biology-based model of bacterial cell death Uponthe primary antibioticndashtarget interaction cells generate reactivemolecules from increased flux through metabolic pathwaysincluding glycolysis and the tricarboxylic acid cycle as previouslyreported3 These reactive metabolic by-products lead to cellulardamage by promiscuously reacting with nucleic acids proteinsand membrane lipids Reactions with the membrane in processesincluding lipid peroxidation induce loss of membrane integritywhich results in cytoplasmic condensation through the leakage ofcytoplasmic contents and coincides with the loss of viability incells Intriguingly because cytoplasmic condensation is not seen
Fig 6 Cytoplasmic condensation and antibiotic killing vary with the supplementation of glutathione an antioxidant but not dithiothreitolmercaptoethanol or α-tocopherol a b Survival curves of E coli under kanamycin and ciprofloxacin treatment with and without exogenoussupplementation of glutathione (10mM) as determined by CFU plating and counting Each point represents two biological replicates error bars indicateone standard deviation and data are presented as mean plusmn SEM Positive survival values indicate increases in CFUmL Measurements at 1times and 10times MIC(a) and endpoint measurements (b) across a range of antibiotic concentrations are shown Arrows highlight protection All MICs used were with respect totheir baseline values with the exception of increased concentration values adjusted for growth inhibition effects (ldquonormalizedrdquo) as summarized inSupplementary Table 1 c Phase-contrast microscopy images of control and antibiotic-treated E coli (10times MIC) with and without exogenoussupplementation of glutathione (10mM) taken ~10 h after continual antibiotic treatment The starting densities of cells are similar across all images andresults are representative of two biological replicates Scale bar 3 μm d Same as (c) but for treatment with peroxynitrite a reactive metabolic by-productCells were imaged 3 h after treatment with peroxynitrite Results are representative of two biological replicates e f Same as (a b) but for peroxynitritetreatment and exogenous supplementation of glutathione (10mM) dithiothreitol (10 mM) and mercaptoethanol (10 mM) g Same as (a) but forkanamycin and ciprofloxacin treatment and exogenous supplementation of dithiothreitol (10 mM) mercaptoethanol (10mM) and α-tocopherol (50mM)h Fractions of all cells that are condensed or lysed 6 h after antibiotic treatment (10times MIC) or peroxynitrite treatment (1 mM) and antioxidant pretreatment(glutathione dithiothreitol mercaptoethanol 10 mM α-tocopherol 50mM) Data from two different fields of view from two biological replicates individualdata points from fields of view are shown The number of cells in each field of view in each group are indicated in parentheses and p-values for two-samplet-tests for differences in mean value compared to cases with no antioxidant are shown next to cell numbers
Fig 7 Cytoplasmic condensation and antibiotic killing are robust to changes in oxygen availability and external osmolarity a Phase-contrast andfluorescence microscopy images of control and antibiotic-treated E coli (10times MIC) taken 3 h after treatment Cells were grown treated and imaged underanaerobic conditions in LB medium Scale bar 3 μm b Survival curves of E coli under anaerobic kanamycin and ciprofloxacin treatment as determined byCFU plating and counting Each point represents two biological replicates error bars indicate one standard deviation and data are presented as mean plusmnSEM Positive values indicate increases in CFUmL Arrows highlight protection All MICs used were with respect to their baseline values under aerobicconditions (Supplementary Table 1) c d Same as (a b) but for aerobic cell cultures that are hypoosmotically shocked by downshifting from 250mMsorbitol after ~3 h of antibiotic treatment (c) and at plating (d) Yellow and red markers highlight condensed and lysed cells respectively
NATURE COMMUNICATIONS | httpsdoiorg101038s41467-021-22485-6 ARTICLE
NATURE COMMUNICATIONS | (2021) 122321 | httpsdoiorg101038s41467-021-22485-6 |wwwnaturecomnaturecommunications 11
in all dead cells our results suggest that alternative cell deathpathwaysmdashwhich may involve cellular damage to nucleic acidsand proteins resulting from both the primary drugndashtarget inter-action and subsequent generation of reactive metabolic by-pro-ductsmdashalso contribute to antibiotic-induced cell death
The phenotype of cytoplasmic condensation described in thiswork may offer a way of diagnosing bacterial cell death inaddition to suggesting possible molecular pathways that con-tribute to antibiotic lethality Our observation that condensedcells no longer accumulate biomass at the time of condensationsuggests consistent with recent work from the Zhao and Drlicagroups11 that antibiotic-treated cells can die substantially afterantibiotic treatment and that this cell death is not revealed bytraditional time-kill experiments in which cells are assumed tohave died at the time of plating As our observations indicate thatcondensed cells are effectively dead screening for cytoplasmiccondensation may inform a phenotype-based approach to anti-biotic susceptibility testing which typically involves cell culturingand genetic sequencing or intensive time-kill assays
Finally we observed that treatment by aminoglycoside andfluoroquinolone antibiotics in contrast to their primary modes ofaction is associated with membrane damage lipid peroxidationand changes in lipid composition The observation that cyto-plasmic condensation and lipid peroxidation can occur underdifferent oxygen conditions and are variably influenced by theapplication of different antioxidants suggests that a complexlandscape of reactive metabolic by-products may contribute toantibiotic lethality Further work is needed to characterize thesereactive metabolic by-products and the different cell deathpathways in which they participate The present study addressesthis issue in part by showing a sequence of cellular events thatcan lead to antibiotic-induced cell death underscoring cyto-plasmic condensation as a terminal cell death phenotype inantibiotic-treated cells Intriguingly comparable cell death phe-notypes have been observed in modes of killing as diverse ascarbon starvation42 and copper alloy treatment43 suggesting thatcytoplasmic condensation may be a common phenotype accom-panying bacterial cell death
MethodsBacterial strains The wild-type strain of E coli used in this study unless otherspecified is MG1655 we verified similar results in W3110 and BW25113 Strainswith fluorescently tagged cytoplasmic and cell envelope components used in thisstudy comprise those tagged as follows cytoplasmic mCherry (DH5α(λpir)pTD47) ZipA-mCherry (inner membrane-tagged TB28 attHKNP5)44 LpoB-GFP(MG1655 attHKCB28 outer membrane-tagged)44 and ssDsbA-LpoB-GFP (TB28attHKCB41 periplasm-tagged)45 these strains were a gift from the Bernhardtgroup and cultured in the absence of antibiotics The ΔgshA (JW2663-1) and Δgor(JW3467-1) strains were from the Keio collection of non-essential singleknockouts46 For B subtilis strain 168 (ATCC 23857) was used
Antibiotics and other reagents Kanamycin sulfate (product 60615 Milli-poreSigma St Louis MO) gentamicin sulfate (MilliporeSigma G1914) mecillinam(MilliporeSigma 33447) and ampicillin sodium salt (MilliporeSigma A9518) weredissolved in ultrapure MilliQ-water Ciprofloxacin powder (MilliporeSigma 17850)was dissolved in dilute acid (01 M HCl) Norfloxacin (MilliporeSigma N9890) wasdissolved in dimethyl sulfoxide (DMSO MilliporeSigma D5879) All antibioticswere freshly prepared before each experiment
L-glutathione (reduced MilliporeSigma G4251) and sorbitol were dissolved inultrapure Milli-Q water Solutions of DL-dithiothreitol (MilliporeSigma D0632)and 2-mercaptoethanol (MilliporeSigma M6250) were also prepared with ultrapureMilli-Q water (+-)-α-tocopherol (MilliporeSigma T3251) was dissolved inethanol Peroxynitrite (MilliporeSigma 516620) was used as supplied All of thesereagents were freshly prepared before each experiment
Bacterial culture and growth Cells were grown in liquid LB medium (product244620 Becton Dickinson Franklin Lakes NJ) LB media containing 15 Difcoagar (Becton Dickinson 244520) was used to grow individual colonies Cells weregrown from single colonies at 37 degC either in tubes in an incubation chambershaking at 300 rpm or for determining MICs in 96-well plates (product 9018Corning Corning NY) sealed with breathable membranes (MilliporeSigma
Z763624) with shaking at 900 rpm For Supplementary Fig 12 LB medium wasdiluted in phosphate-buffered saline (PBS Corning 21-040)
Determination of MICs We determined MICs for all antibiotics considered in thiswork by diluting both 1100 and 110000 from an overnight culture into both 96-well plates and 14-mL Falcon tubes with varying antibiotic concentrations TheMIC was determined as the minimum concentration at which no visible growthoccurred overnight (12ndash18 h OD600 lt 01) OD600 values were measured in 14 mLFalcon tubes with a Biowave cell density meter CO8000 (Biochrom Holliston MA)and in 96-well plates using 200 μL working volumes with a SpectraMax M3 platereader (Molecular Devices San Jose CA) A summary of all MIC values thusdetermined and their working values for different bacterial strains are provided inSupplementary Table 1 and we note here that we found quantitatively similar MICvalues between 1100 and 110000 dilutions which lie within the tabulated rangesshown in Supplementary Table 1
Microscopy Microscopy experiments were performed with cells sandwichedbetween agarose pads and glass coverslips or slides unless otherwise stated Cellswere concentrated by centrifugation at 850g for 5 min and resuspended in a smallervolume of supernatant We placed 2 μL of the resuspended bacterial culturebetween either 3Prime times 1Prime times 1Prime microscope slides (product 125444 Fisher ScientificHampton NH) or number 15 coverslips (VWR Radnor PA) and 1 mm thickagarose (15) pads made from growth media (agarose type IX-A MilliporeSigmaA2576) following conventional procedures for immobilizing cells47 Cells wereimaged immediately afterward We used a Nikon Ti inverted microscope (NikonTokyo Japan) equipped with a 65 μm-pixel Hamamatsu CMOS camera (Hama-matsu Hamamatsu City Japan) a Nikon 100times NA 145 objective TIRF illumi-nation and an enclosing custom-made incubation chamber and a Zeiss Axiovert200 inverted microscope equipped with a Zeiss Axiocam 503 camera a 40timesobjective (EC Plan-neofluar NA 075) a 63times objective (EC Plan-neofluar NA125) and an enclosing custom-made incubation chamber for microfluidicexperiments and fluorescence microscopy experiments AFM experiments wereperformed with a Zeiss AxioObserver D1 (Zeiss Jena Germany) as mentionedbelow For all other experiments and replicate fluorescence microscopy experi-ments we used a Zeiss Axioscope A1 upright microscope equipped with a ZeissAxiocam 503 camera a Zeiss 100times NA 13 Plan-neofluar objective (Zeiss JenaGermany) and an X-Cite 120Q Iris FL light source (Excelitas Technologies SalemMA) For timelapse measurements cells were imaged at 37 degC inside incubationchambers Images were recorded using Zen Lite Blue (Zeiss) NIS-Elements(Nikon) and AxioVision (v48 Zeiss) software We used ImageJ (NIH BethesdaMD) for processing and analyzing timelapses and the StackReg plugin48 whichrecursively aligns images in a sequence with geometric transformations to correctfor microscope drift as necessary Epifluorescence exposure times were limited to amaximum of 300 ms to avoid photobleaching All microscopy experiments werereplicated at least twice and we verified that the absolute values of all fluorescenceintensities were comparable across experiments performed using the samemicroscopy setup
Microfluidics and osmotic shock experiments We used the CellASIC ONIXplatform (MilliporeSigma Burlington MA) and the associated bacterial micro-fluidic plate (B04A-03) Cells were grown in culture to early log phase opticaldensity (OD600) between 01 and 02 or stationary phase OD600 approximately 2as described below as measured in 14 mL Falcon tubes with a Biowave cell densitymeter CO8000 Cells were then loaded into the microfluidic chamber according tothe manufacturerrsquos instructions at a flow rate corresponding to 20 kPa (~10 μLh)For antibiotic treatment LB containing antibiotics was flowed in from two inlets ata flow rate corresponding to 20 kPa (~10 μLh) under these settings we verifiedthat the solution saturated the device in approximately 5 min by adding yellow-green fluorescent beads (002 μm diameter FluoSpheres F8760 Thermo-FisherWaltham MA) to the solution as a proxy for its concentration Cells were subjectedto the same flow continuously unless otherwise noted For wash-out experimentsfresh LB without antibiotics was flowed in from two inlets at a flow rate corre-sponding to 20 kPa (~10 μLh) after cells were treated for specified durations byflow of antibiotic-containing LB For the osmotic shock experiments shown inFig 1e the protocol outlined above was followed with the following modificationsFirst cells were cultured in the presence of antibiotic when applicable before beingloaded into the microfluidic device Second after cell loading and equilibration theflow was replaced by LB+ antibiotic+ sorbitol (500 mM D-sorbitol Milli-poreSigma S1876) flowed in from two inlets at a flow rate corresponding to 20 kPa(~10 μLh) For the osmotic shock experiments shown in Fig 7c d E coliW3110 was cultured in LB+ sorbitol (250 mM) Cells were then loaded into themicrofluidic device and treated with constant flow of LB+ sorbitol (250 mM)+antibiotic (when applicable) for 2ndash5 h until the onset of condensation Forwashout experiments the flow was then replaced by LB+ antibiotic (whenapplicable) flowed in from two inlets at a flow rate corresponding to 10ndash20 kPa(~5 to 10 μLh)
Atomic force microscopy measurements A colony of E coli MG1655 or W3110was grown in LB media overnight at 30 degC with shaking at 220 rpm A new culture
ARTICLE NATURE COMMUNICATIONS | httpsdoiorg101038s41467-021-22485-6
12 NATURE COMMUNICATIONS | (2021) 122321 | httpsdoiorg101038s41467-021-22485-6 | wwwnaturecomnaturecommunications
was then started from the overnight culture with a 11000 dilution in fresh LBmedia and grown at 37 degC with shaking at 220 rpm At an OD600 between 01 and02 ciprofloxacin or kanamycin was added to the shaking culture to a final con-centration of 10times MIC After 3-4 h 100 μL of bacterial solution was aliquoted on aglass-bottom petri dish (FluoroDish WPI Sarasota FL) coated for 1 h in a 10 mMtris buffer solution (pH 85) containing 4 mgmL dopamine hydrochloride (99MilliporeSigma H8502) and incubated at room temperature for 30 min The bac-terial cell solution was then carefully removed and the petri dish was rinsed twicewith PBS to remove unbound cells PBS was then added to the petri dish for AFMmeasurements in liquid AFM measurements were conducted using a NanowizardIV (JPK BioAFM ndash Bruker Nano GmbH Berlin Germany) mounted on aninverted light microscope (AxioObserver D1 Zeiss) Commercial AFM tips with anominal spring constant of 01 Nm (qp-BioAC CB2 Nanosensors) were usedImages of immobilized bacteria were acquired using the Quantitative Imaging(QITM) mode of the instrument a force-distance curve-based imaging mode whichallowed us to simultaneously acquire several sample parameters (including topo-graphy and mechanical properties) The imaging parameter used were 2 nN set-point 7 ms pixel time 400 nm z-length The manufacturerrsquos (JPK BioAFM ndashBruker Nano GmbH) data processing software was used to determine the elasticmodulus from approach force-distance curves using the Hertz model modified fora paraboloid indenter49
F frac14 E1 ν2
4ffiffiffiffiffiffi
RC
p
3δ3=2
Here F is the applied force E is the elastic modulus v is the Poissonrsquos ratio RC isthe radius of the tip and δ is the indentation (vertical tip position) The cantileverwas calibrated using routines within the AFM software based on the Sadermethod50 Representative force-distance curves elastic modulus heatmaps and celldimension measurements are provided in Supplementary Fig 7
Inference of the cellular turgor pressure from atomic force microscopymeasurements Following seminal work by Arnoldi et al51 it is possible to esti-mate the turgor pressure of untreated turgid cells from our AFM measurementsAs shown in Supplementary Fig 7 typical force-indentation curves on such cellsindicate the effective spring constant of the AFM tip and the cell envelope as keff ~003 Nm For an AFM tip with spring constant 01 Nm and assuming that theeffective spring constant arises from two linear springs in series51 the cell envelopespring constant is ~004 Nm The following equation based on modeling theindentation of a pressurized shell then relates the cell envelope spring constant tothe cellular turgor pressure
ks frac143π2pRφethρ=dTHORN eth1THORN
Here ks is the cell envelope spring constant p is the cellular turgor pressure R isthe cell radius and φethρ=dTHORN is a geometric factor φethρ=dTHORN frac14 ρK1ethρ=dTHORN=frac12dK0ethρ=dTHORNwhere K0 and K1 are modified Bessel functions ρ is the radius of the contour of thecontact of the cantilever tip with the bacterial envelope and d is a characteristicannealing length of the cell envelope deformation51 For typical values of R= 04μm and φethρ=dTHORN 02 relevant to our experiments Eq (1) indicates p ~ 100 kPa anestimate quantitatively consistent with previous osmolarity-based studies of turgorpressure in E coli19 and approximately 3-fold larger than turgor pressure estimatesderived from AFM experiments performed on bulging cells for which cellularprotrusions without the peptidoglycan cell wall were indented52
Membrane permeability and depolarization assays SYTOX Blue Nucleic AcidStain (product S11348 Invitrogen Carlsbad CA) a DNA intercalating dye wasadded to incubating liquid cultures and agarose melt to a final concentration of 5μM to stain cells with and without compromised membranes DiBAC4(3) (Invi-trogen B438) a fluorescent reporter of membrane potential was dissolved inDMSO and added to incubating liquid cultures and agarose melt to a final con-centration of 10 μgmL to stain cells with and without depolarized membranesION Potassium Green-2 AM (IPG product ab142806 Abcam Cambridge UK) amembrane-permeable dye sensitive to potassium ions was added to incubatingliquid cultures and agarose melt to a final concentration of 40 μM to stain potas-sium ions in cells
ROS and RNS detection with fluorescent dyes For general detection of oxi-dative stress and ROS (H2O2 ROOmiddot and ONOOminus) we used the cell-permeant dyecarboxy-H2DCFDA (Invitrogen C400) which was dissolved in DMSO and addedto incubating liquid cultures and agarose melt to a final concentration of 10 μMFor general detection of RNS and in particular nitric oxide (NO) we used DAF-FM diacetate (Invitrogen D23844) dissolved in DMSO at a final concentrationof 10 μM
Membrane peroxidation detection with a fluorescent dye C11-BODIPY 581591 (Invitrogen D3861) a fluorescent dye-based lipid peroxidation sensor whosefluorescence emission peak shifts from red to green upon lipid peroxidation31 wasdissolved in DMSO and added to incubating liquid cultures or agarose melt to afinal concentration of 10 μM to stain membranes undergoing lipid peroxidation
Image analysis Cells were either counted manually or annotated semi-automatically using the MicrobeJ plugin53 in ImageJ (below) to determine featuressuch as condensation and lysis and cellular dimensions Fluorescence was quan-titatively analyzed with ImageJ (National Institutes of Health Bethesda MD)Briefly closed cell contours were delineated based on phase-contrast images usingMicrobeJ and ImageJ was used to measure the mean fluorescence pixel intensitywithin a given contour The average background fluorescence intensity was sub-tracted from all measured values and the relative intensity was calculated bydividing the difference with the average background fluorescence value Overlayimages were generated with Adobe Photoshop (Adobe San Jose CA) We were notblinded to allocation in the analysis
Condensed cells were delineated based on phase-contrast images or acombination of phase-contrast and fluorescence microscopy images according tothe features described in the main text and shown in Fig 1a b The cell volumesshown in Fig 2f were calculated excluding cellular poles by fitting 2D images ofcells to bent rods with constant radii along midlines Variations in cell length andradii across time were recorded using both phase-contrast timelapses andfluorescence timelapses from the cytoplasmic mCherry strain see SupplementaryFig 9 for representative traces We further note that the reported frequencies ofcytoplasmic condensation and lysis in Fig 1d were determined by counting at pre-defined time intervals up to the end of imaging It is possible that more cells arecondensed or lysed than reportedmdashthis could occur if cells either becamecondensed or lysed after imaging or in the case of condensation if cells condensedand lysed faster than the time resolution (~1 minframe) of our imaging
Single-cell traces Cell lengths were automatically measured in 20 min intervalsfor Fig 3b f and 10 min intervals for Fig 3d (2 min intervals for the inset) usingthe MicrobeJ plugin in ImageJ These measurements were repeated manually as aconsistency check we found that the results were in good quantitative agreementCell lengths were determined as the arclengths of cellular midlines a constructionwhich takes into account cell bending and movement across different frames of atimelapse22 A three-point moving average (four for the inset) was taken to smooththe curves in Fig 3d using MATLAB (Mathworks Natick MA) Normalizedgrowth rates were calculated by taking discrete finite differences of cell lengths
Sample preparation for thin-layer chromatography experiments A singlecolony of E coli W3110 was grown overnight at 30 degC with shaking at 220 rpmThe next morning a 1200 dilution of the overnight culture in 100 mL of fresh LBwas grown in Erlenmeyer flasks to an OD600 of 022 at 37 degC with shaking at 220rpm At this OD600 freshly prepared solutions of ampicillin (final concentration100 microgmL 10times MIC) ciprofloxacin (final concentration 1 microgmL 10times MIC)kanamycin (final concentration 50 microgmL 10times MIC) and hydrogen peroxide (finalconcentration 10 mM 4times the working MIC of 25 mM) were added to the culturesA control (LB only) culture was examined in parallel The cultures were incubatedfor 1 3 and 6 h At each timepoint 20 mL samples from each culture were ali-quoted centrifuged at 3770g and 4 degC and pelleted in a 50 mL Falcon tube Thesupernatant was discarded and the pellet was resuspended in 1 mL of fresh LB thenadded to a cryovial The resuspended pellets were centrifuged again at 3770g and 4degC the supernatant was again discarded and the pellet was flash-frozen in liquidnitrogen The flash-frozen samples were then stored at minus80 degC until furtherprocessing
Thin-layer chromatography of lipid content Frozen cell pellets were resus-pended in 300 μL of ultrapure MilliQ-water and lipids were extracted in two stepswith (i) 600 μL of chloroform-methanol (101 vv) and (ii) 600 μL of chloroform-methanol (21 vv) The lipid-containing organic phases were pooled and con-centrated Samples were volume-corrected so that each sample had identicalamounts of phospholipid content which approximated the membrane lipid frac-tion Samples were applied to 10 times 20 cm silica gel 60 HPTLC plates (MerckDarmstadt Germany) and chromatographically migrated using (i) chloroform-methanol-glacial acetic acid (652510 vvv) over 50 of the running distance (35cm) and (ii) n-hexane-diethylether-glacial acetic acid (70301 vvv) over 100 ofthe running distance (7 cm) The lipids were stained with solutions of copper (II)sulfate-orthophosphoric acid or primuline Peak area intensity measurements wereperformed on TLC images using ImageJ The assay was repeated twice
Time-kill assays and CFU measurements For all time-kill assays in bulk culturecells were diluted 1100 from an overnight culture into 14 mL Falcon tubes con-taining 2 mL of growth media and incubated either to early log phase (OD600 asymp01) to early stationary phase (OD600= 10ndash15) or to late stationary phase (OD600
gt 20) in the conditions described above (with shaking at 300 rpm at 37 degC) OD600
measurements were taken in 14 mL Falcon tubes with a Biowave cell density meterCO8000 and in 96-well plates using 300 μL working volumes with a SpectraMaxM3 plate reader For antioxidant pretreatment antioxidants were added to growthmedia 10 min before the addition of antibiotics when relevant Antibiotics wereadded to the final concentrations indicated and cultures were re-incubated withshaking at 300 rpm at 37 degC At the indicated times cells were removed fromincubation aliquoted and serially diluted in LB and spotted or spread on LB agarWe performed serial dilutions in LB instead of other media like PBS in order to
NATURE COMMUNICATIONS | httpsdoiorg101038s41467-021-22485-6 ARTICLE
NATURE COMMUNICATIONS | (2021) 122321 | httpsdoiorg101038s41467-021-22485-6 |wwwnaturecomnaturecommunications 13
better control for osmolarity and nutrient shifts For antibiotic concentrations at10times MIC cells were also centrifuged at 2350g for 1 min 90 of the supernatantwas removed and cells were resuspended in a smaller volume before being seriallydiluted so as to aid in the removal of antibiotics Petri dishes were allowed to dry atroom temperature before incubation at 37 degC overnight (16ndash24 h) CFUs were thendetermined by manual counting and all measurements are based on counts con-taining at least 10 colonies Survival was determined by normalizing all CFUmLmeasurements to that immediately before antibiotic treatment at time 0 h
Flow cytometry Cells were grown and treated with antibiotics as described aboveAt the indicated times cells grown in the presence of fluorescent dyes wereremoved from incubation aliquoted into 96-well plates and processed with aCytoFLEX S flow cytometer (Beckman Coulter Brea CA) Cells were flowed at alow flow rate (10 μLmin) and 20000 events were recorded for each sample Cellswere filtered by calibration of forward- and side-scattering measurements based onthose of the cytoplasmic mCherry strain which differs from MG1655 in that its redfluorescence can be used as a ground truth for separating cells from debris (Sup-plementary Fig 16) All samples were analyzed at least in biological duplicateFlowJo software (v10 Becton Dickinson) was used for data post-processing andfluorescence intensities correspond to those derived from pulse areas
ATP abundance assay Intracellular ATP (Supplementary Fig 12) was quantifiedusing the BacTiter-Glo Microbial Cell Viability Assay (product G8230 PromegaMadison WI) according to the manufacturerrsquos instructions Luminescence andabsorbance of samples were measured using 200 μL working volumes with aSpectraMax M3 plate reader
Anaerobic chamber The experiments shown in Fig 7a b were performed in ananaerobic chamber (Type B Vinyl Coy Labs Grass Lake MI) equipped with twinpalladium catalysts and a Coy OxygenHydrogen Analyzer (Coy Labs) andmaintained at 37 degC A 5 hydrogen in nitrogen gas mix (product NI HY5300AirGas Radnor PA) was used to maintain the steady-state anaerobic environmentat less than 5 ppm oxygen Additionally a BD BBL GasPak anaerobic indicator(Becton Dickinson) and growth media containing 1 mgL resorufin (resazurinMilliporeSigma R7017) as an anaerobic indicator54 were used to ensure strictlyanaerobic conditions All starting cultures were taken from cultures grown over-night inside the anaerobic chamber and MICs were based on their aerobic values
For time-kill assays cells were serially diluted plated and grown overnightinside the anaerobic chamber Cell cultures were treated in early log phase OD600 asymp002 OD600 measurements were taken in 96-well plates using 300 μL workingvolumes with a SpectraMax M3 plate reader For microscopy experiments cellswere plated and imaged with a Zeiss Axioscope A1 upright microscope as detailedabove this microscope was used because it could fit inside the anaerobic chamberPlating and microscopy were performed strictly inside the anaerobic chamber Toensure strictly anaerobic conditions cells were not immobilized with LB agarosepads when imaging in the anaerobic chamber as compared to imaging underaerobic conditions
To allow for deoxygenation all materials used in our experiments were broughtinto the anaerobic chamber at least 24 h before the start of each experiment withthe exception of antibiotics C11-BODIPY dye and glutathione To ensurefreshness of these reagents these reagents were prepared immediately before eachexperiment brought into the anaerobic chamber and equilibrated in open-cap 15mL or 5 mL centrifuge tubes for 1 to 2 h before usage After the addition of thesereagents to growing cultures we observed that resorufin in the growth mediaremained strictly colorless indicating that these reagents did not introducesignificant sources of environmental oxygen to our experiments
Protein concentration and LPS level assays The LPS levels shown in Supple-mentary Fig 13 were assayed as follows Here 50 mL of log-phase bulk cultures ofE coli MG1655 grown in LB were treated with kanamycin ciprofloxacin andampicillin at 10times MIC for 3 h in 250-mL flasks Cells were then centrifuged at3720g for 10 min Next the supernatant in all samples was discarded Each cellpellet was washed with 500 μL PBS resuspended and centrifuged again as abovethen the supernatant was discarded from each sample Next 500 μL B-PER II(product 78260 Thermo Fisher Scientific Waltham MA) containing 100 μgmLlysozyme (MilliporeSigma L6876) and 5 UmL DNase I (Thermo Fisher 90083) wasadded to cell pellets for harvesting and all samples were vortexed and incubated at37 degC for an additional 15 min All samples were then centrifuged at 1500g for 10min and the supernatant was aliquoted from each sample for analysis Serial 1101100 110000 and 1100000 dilutions of each cell lysate sample in PBS andendotoxin-free water were generated and used for each of the assays below toensure that protein and LPS levels were in the range of the standard curves
To measure the total protein concentration of cell lysates we used a Pierce BCAprotein assay kit (Thermo Fisher 23227) following the manufacturerrsquos instructionsBriefly the assay reagent was prepared by mixing the assay kit componentsaccording to the manufacturerrsquos instructions and for each sample 25 μL of the celllysate was pipetted directly into a larger volume (200 μL) of reagent in a 96-wellplate All samples were then incubated for 30 min at 37 degC according to themanufacturerrsquos instructions and the optical density at 562 nm was measured with a
SpectraMax M3 plate reader Standard curves were generated from control sampleswith bovine serum albumin (BSA) concentrations of 2000 1500 1000 750 500250 125 25 and 0 μgmL according to the manufacturerrsquos instructions Todetermine the component of protein concentration originating from bacterial cellsthe protein concentration of the B-PER II medium with 100 μgmL lysozyme and 5UmL DNase I (measured to be ~140 μgmL) was subtracted from the calculatedprotein concentrations in each lysate sample
To measure the LPS levels of cell lysates we used a Pierce ChromogenicEndotoxin Quant Kit (Thermo Fisher A39553) following the manufacturerrsquosinstructions Briefly the assay reagent based on the LAL was reconstituted andapplied to 50 μL of samples and LPS standards in a 96-well plate After mixing andincubation chromogenic substrate was added Following a final incubation stepand addition of 25 acetic acid to each well the optical density at 405 nm wasmeasured with a SpectraMax M3 plate reader Standard curves were generatedfrom control samples with LPS concentrations of 10 05 025 01 and 0 endotoxinunits per mL according to the manufacturerrsquos instructions
Statistical testing Two-sample Kolmogorov-Smirnov tests and one-sample andtwo-sample t-tests were performed at the standard 5 significance level and p-values are indicated when applicable
Reporting summary Further information on research design is available in the NatureResearch Reporting Summary linked to this article
Data availabilityAdditional data that support the findings of this study are available from thecorresponding authors upon reasonable request Source data are provided withthis paper
Received 8 September 2020 Accepted 15 March 2021
References1 Kohanski M A Dwyer D J amp Collins J J How antibiotics kill bacteria
from targets to networks Nat Rev Microbiol 8 423ndash435 (2010)2 Belenky P et al Bactericidal antibiotics induce toxic metabolic perturbations
that lead to cellular damage Cell Rep 13 968ndash980 (2015)3 Kohanski M A Dwyer D J Hayete B Lawrence C A amp Collins J J A
common mechanism of cellular death induced by bactericidal antibiotics Cell130 797ndash810 (2007)
4 Dwyer D J Kohanski M A Hayete B amp Collins J J Gyrase inhibitorsinduce an oxidative damage cellular death pathway in Escherichia coli MolSyst Biol 3 91 (2007)
5 Foti J J Devadoss B Winkler J A Collins J J amp Walker G C Oxidationof the guanine nucleotide pool underlies cell death by bactericidal antibioticsScience 336 315ndash319 (2012)
6 Dwyer D J Camacho D M Kohanski M A Callura J M amp Collins J JAntibiotic-induced bacterial cell death exhibits physiological and biochemicalhallmarks of apoptosis Mol Cell 46 561ndash572 (2012)
7 Davies B W et al Hydroxyurea induces hydroxyl radical-mediated cell deathin Escherichia coli Mol Cell 36 845ndash860 (2009)
8 Brynildsen M P Winkler J A Spina C S MacDonald I C amp Collins J JPotentiating antibacterial activity by predictably enhancing endogenousmicrobial ROS production Nat Biotechnol 31 160ndash165 (2013)
9 Grant S S Kaufmann B B Chand N S Haseley N amp Hung D TEradication of bacterial persisters with antibiotic-generated hydroxyl radicalsProc Natl Acad Sci USA 109 12147ndash12152 (2012)
10 Morones-Ramirez J R Winkler J A Spina C S amp Collins J J Silverenhances antibiotic activity against Gram-negative bacteria Sci Transl Med5 190ra81 (2013)
11 Hong Y Zeng J Wang X Drlica K amp Zhao X Post-stress bacterial celldeath mediated by reactive oxygen species Proc Natl Acad Sci USA 11610064ndash10071 (2019)
12 Gusarov I Shatalin K Starodubtseva M amp Nudler E Endogenous nitricoxide protects bacteria against a wide spectrum of antibiotics Science 3251380ndash1384 (2009)
13 Dwyer D J et al Antibiotics induce redox-related physiologicalalterations as part of their lethality Proc Natl Acad Sci USA 111E2100ndashE2109 (2014)
14 Balaban N Q Merrin J Chait R Kowalik L amp Leibler S Bacterialpersistence as a phenotypic switch Science 305 1622ndash1625 (2004)
15 Pribis J P et al Gamblers an antibiotic-induced evolvable cell subpopulationdifferentiated by reactive-oxygen-induced general stress response Mol Cell74 785ndash800 (2019)
ARTICLE NATURE COMMUNICATIONS | httpsdoiorg101038s41467-021-22485-6
14 NATURE COMMUNICATIONS | (2021) 122321 | httpsdoiorg101038s41467-021-22485-6 | wwwnaturecomnaturecommunications
16 Bos J et al Emergence of antibiotic resistance from multinucleated bacterialfilaments Proc Natl Acad Sci USA 112 178ndash183 (2015)
17 Wong F amp Amir A Mechanics and dynamics of bacterial cell lysis BiophysJ 116 2378ndash2389 (2019)
18 Pilizota T amp Shaevitz J W Fast multiphase volume adaptation tohyperosmotic shock by Escherichia coli PLoS ONE 7 e35205 (2012)
19 Cayley D S Guttman H J amp Record M T Biophysical characterization ofchanges in amounts and activity of Escherichia coli cell and compartmentwater and turgor pressure in response to osmotic stress Biophys J 781748ndash1764 (2000)
20 Martin N L amp Beveridge T J Gentamicin interaction with Pseudomonasaeruginosa cell envelope Antimicrob Agents Chemother 29 1079ndash1087 (1986)
21 Wong F Garner E C amp Amir A Mechanics and dynamics of translocatingMreB filaments on curved membranes eLife 8 e40472 (2019)
22 Wong F et al Mechanical strain sensing implicated in cell shape recovery inEscherichia coli Nat Microbiol 2 17115 (2017)
23 Turner R D Mesnage S Hobbs J K amp Foster S J Molecular imaging ofglycan chains couples cell-wall polysaccharide architecture to bacterial cellmorphology Nat Commun 9 1263 (2018)
24 Lopatkin A J et al Bacterial metabolic state more accurately predictsantibiotic lethality than growth rate Nat Microbiol 4 2109ndash2117 (2019)
25 Lobritz M A et al Antibiotic efficacy is linked to bacterial cellularrespiration Proc Natl Acad Sci USA 112 8173ndash8180 (2015)
26 Kadurugamuwa J L Clarke A J amp Beveridge T J Surface action ofgentamicin on Pseudomonas aeruginosa J Bacteriol 175 5798ndash5805 (1993)
27 Davis B D Chen L L amp Tai P C Misread protein creates membranechannels an essential step in the bactericidal action of aminoglycosides ProcNatl Acad Sci USA 83 6164ndash6168 (1986)
28 Kohanski M A Dwyer D J Wierzbowski J Cottarel G amp Collins J JMistranslation of membrane proteins and two-component system activationtrigger antibiotic-mediated cell death Cell 135 679ndash690 (2008)
29 Stokes J M Lopatkin A J Lobritz M A amp Collins J J Bacterialmetabolism and antibiotic efficacy Cell Metab 30 30312ndash2 (2019)
30 Cabiscol E Tamarit J amp Ros J Oxidative stress in bacteria and proteindamage by reactive oxygen species Int Microbiol 3 3ndash8 (2000)
31 Drummen G P van Liebergen L C Op den Kamp J A amp Post J A C11-BODIPY(581591) an oxidation-sensitive fluorescent lipid peroxidationprobe (micro)spectroscopic characterization and validation of methodologyFree Radic Biol Med 33 473ndash490 (2002)
32 Rowlett V W et al Impact of membrane phospholipid alterations inEscherichia coli on cellular function and bacterial stress adaptation JBacteriol 199 e00849ndash16 (2017)
33 Sutterlin H A et al Disruption of lipid homeostasis in the Gram-negative cellenvelope activates a novel cell death pathway Proc Natl Acad Sci USA 113E1565ndashE1574 (2016)
34 Ferguson G P Toumltemeyer S MacLean M J amp Booth I R Methylglyoxalproduction in bacteria suicide or survival Arch Microbiol 170 209ndash218(1998)
35 Bessette P H Åslund F Beckwith J amp Georgiou G Efficient folding ofproteins with multiple disulfide bonds in the Escherichia coli cytoplasm ProcNatl Acad Sci USA 96 13703ndash13708 (1999)
36 Fahey R C Glutathione analogs in prokaryotes Biochim Biophys Acta 18303182ndash3198 (2013)
37 Fahey R C Brown W C Adams W B amp Worsham M B Occurrence ofglutathione in bacteria J Bacteriol 133 1126ndash1129 (1978)
38 Brunelli L Crow J P amp Beckman J S The comparative toxicity of nitricoxide and peroxynitrite to Escherichia coli Arch Biochem Biophys 316327ndash334 (1995)
39 Traber M G amp Atkinson J Vitamin E antioxidant and nothing more FreeRadic Biol Med 43 4ndash15 (2007)
40 Martinez S R Duratini A M Becerra M C amp Cosa G Real-time single-cellimaging reveals accelerating lipid peroxyl radical formation in Escherichia colitriggered by a fluoroquinolone antibiotic ACS Inf Dis 6 2468ndash2477 (2020)
41 Buda R et al Dynamics of Escherichia colirsquos passive response to a suddendecrease in external osmolarity Proc Natl Acad Sci USA 113 E5838ndashE5846(2016)
42 Basta D W Angeles-Albores D Spero M A Ciemniecki J A amp NewmanD K Heat-shock proteases promote survival of Pseudomonas aeruginosaduring growth arrest Proc Natl Acad Sci USA 117 4358ndash4367 (2020)
43 Hong R Kang T Y Michels C A amp Gadura N Membrane lipidperoxidation in copper alloy mediated contact killing of Escherichia coli ApplEnviron Microbiol 78 1776ndash1784 (2012)
44 Yao Z Kahne D amp Kishony R Distinct single-cell morphological dynamicsunder beta-lactam antibiotics Mol Cell 48 705ndash712 (2012)
45 Paradis-Bleau C et al Lipoprotein cofactors located in the outer membraneactivate bacterial cell wall polymerases Cell 143 1110ndash1120 (2010)
46 Baba T et al Construction of Escherichia coli K-12 in-frame single-geneknockout mutants the Keio collection Mol Syst Biol 2006 0008 (2006)
47 Hussain S et al MreB filaments align along greatest principal membranecurvature to orient cell wall synthesis eLife 7 e32471 (2018)
48 Theacutevenaz P Ruttimann U amp Unser M A pyramid approach to subpixelregistration based on intensity IEEE Trans Image Process 7 27ndash41 (1998)
49 Hertz H Uumlber die Beruumlhrung fester elastischer Koumlrper J Reine Angew Math92 156ndash171 (1881)
50 Sader J E Larson I Mulvaney P amp White L R Method for the calibrationof atomic force microscope cantilevers Rev Sci Instrum 66 3789ndash3798(1995)
51 Arnoldi M et al Bacterial turgor pressure can be measured by atomic forcemicroscopy Phys Rev E 62 1034ndash1044 (2000)
52 Deng Y Sun M amp Shaevitz J W Direct measurement of cell wall stressstiffening and turgor pressure in live bacterial cells Phys Rev Lett 107158101 (2011)
53 Ducret A Quardokus E M amp Brun Y V MicrobeJ a tool for highthroughput bacterial cell detection and quantitative analysis Nat Microbiol 116077 (2016)
54 Reddy C A et al (eds) Methods for General and Molecular Microbiology(ASM Press 2007)
AcknowledgementsWe thank Tom Bernhardt and Anastasiya Yakhnina for assorted E coli strains UumlnalCoskun and Michal Grzybek for assistance with lipid analyses and Allison J LopatkinIan W Andrews Emma J Chory Erica J Zheng and members of the Collins lab forhelpful discussions and comments FW was supported by the James S McDonnellFoundation JMS was supported by the Banting Fellowships Program (393360) LDRwas supported by the Volkswagen Foundation JJC was supported by the DefenseThreat Reduction Agency (grant number HDTRA1-15-1-0051) the National Institutesof Health (grant number R01-AI146194) and the Broad Institute of MIT and Harvard
Author contributionsFW conceived research performed experiments and analysis developed the modelwrote the paper and supervised research JMS provided assistance with data inter-pretation and manuscript editing BC provided assistance with experiments SP per-formed experiments JF and LDR conceived research and performed experiments andanalysis JJC conceived and supervised research
Competing interestsJJC is scientific co-founder and scientific advisory board chair of EnBiotix an antibioticdrug discovery company The remaining authors declare no competing interests
Additional informationSupplementary information The online version contains supplementary materialavailable at httpsdoiorg101038s41467-021-22485-6
Correspondence and requests for materials should be addressed to LDR or JJC
Peer review information Nature Communications thanks David Alsteens MatthiasKoch and the other anonymous reviewers for their contribution to the peer review ofthis work Peer reviewer reports are available
Reprints and permission information is available at httpwwwnaturecomreprints
Publisherrsquos note Springer Nature remains neutral with regard to jurisdictional claims inpublished maps and institutional affiliations
Open Access This article is licensed under a Creative CommonsAttribution 40 International License which permits use sharing
adaptation distribution and reproduction in any medium or format as long as you giveappropriate credit to the original author(s) and the source provide a link to the CreativeCommons license and indicate if changes were made The images or other third partymaterial in this article are included in the articlersquos Creative Commons license unlessindicated otherwise in a credit line to the material If material is not included in thearticlersquos Creative Commons license and your intended use is not permitted by statutoryregulation or exceeds the permitted use you will need to obtain permission directly fromthe copyright holder To view a copy of this license visit httpcreativecommonsorglicensesby40
copy The Author(s) 2021
NATURE COMMUNICATIONS | httpsdoiorg101038s41467-021-22485-6 ARTICLE
NATURE COMMUNICATIONS | (2021) 122321 | httpsdoiorg101038s41467-021-22485-6 |wwwnaturecomnaturecommunications 15
Supplementary Information Cytoplasmic condensation induced bymembrane damage is associated with antibiotic lethalityFelix Wong12 Jonathan M Stokes12 Bernardo Cervantes123 Sider Penkov4 Jens Friedrichs5 Lars DRenner5lowast and James J Collins126lowast
1Institute forMedical Engineeringamp Science andDepartment of Biological EngineeringMassachusetts Institute of Tech-nology Cambridge MA 02139 USA2Infectious Disease and Microbiome Program Broad Institute of MIT and Harvard Cambridge MA 02142 USA3Microbiology Graduate Program Massachusetts Institute of Technology Cambridge MA 02139 USA4Institute for Clinical Chemistry and Laboratory Medicine at the University Clinic and Medical Faculty of TU Dresden01307 Dresden Germany5Leibniz Institute of Polymer Research and the Max Bergmann Center of Biomaterials 01069 Dresden Germany6Wyss Institute for Biologically Inspired Engineering Harvard University Boston MA 02115 USAlowastCorresponding authors James J Collins (jimjcmitedu) and Lars D Renner (renneripfddde)
1
Supplementary Note 111 Generality of observed phenotypesHere we discuss the generality of results presented in the main text In brief we find evidence for the accu-mulation of reactive metabolic byproducts but did not observe cytoplasmic condensation in cells treatedby β-lactams (Supplementary Fig 1) Furthermore we observed cytoplasmic condensation across differentaminoglycosides and quinolones and in a different Gram-positive species B subtilis (Supplementary Fig3)
111 β-lactam antibiotics
InE coli cells treated by ampicillin we observed increased fluorescence of carboxy-H2DCFDADAF-FM andC11-BODIPY relative to untreated controls (Supplementary Fig 1c-e) However we did not find significantcytoplasmic condensation in cells treated with either ampicillin or less lytic antibiotics such as mecillinam(Supplementary Fig 1ab) suggesting that typical cells likely undergo a different cell death pathway in-volving membrane bulging as previous work has shown [1] In contrast to kanamycin and ciprofloxacinwe found that ampicillin killing was less susceptible to glutathione protection (Supplementary Fig 1f) Aprevious study [2] has shown that higher levels (50mM) of glutathione pretreatment than those used in thiswork can better attenuate ampicillin killing by as much as sim3 logs together with our results these obser-vations suggest glutathione protection in β-lactams to be largely concentration- and antibiotic-dependent
112 Cytoplasmic condensation across different aminoglycoside and quinolone antibiotics and also inBacillus subtilis
In addition to kanamycin (Supplementary Fig 3a) and ciprofloxacin (Fig 1b of the main text) we ob-served similar cytoplasmic condensation in gentamicin- (an aminoglycoside) andnorfloxacin- (a quinolone)treated E coli (Supplementary Fig 3b) The evolutionarily distant Gram-positive rod B subtilis also exhib-ited similar condensation and lysis and increased levels of lipid peroxidation as assayed by C11-BODIPYwhen treated with kanamycin and ciprofloxacin (Supplementary Fig 3c) Intriguingly the incidence of cy-toplasmic condensation inB subtiliswasdecreased relative toE coli under both kanamycin and ciprofloxacintreatment Furthermore we observed significantmembrane bulging inB subtilis cells treated by ciprofloxacin(Supplementary Fig 3c) reminiscent of bulging E coli cells treated by β-lactams [1 3] The occurrence ofmembrane bulging in B subtilis is surprising since its turgor pressure is estimated to besim10-fold larger thanthat of E coli [4] while the yield areal strains of bacterial membranes are anticipated to be similar [1 5]Thus if the mechanical stresses in a membrane bulge were pR2 where p is the turgor pressure and R isthe radius of the bulge [1] then we would anticipate B subtilis cells to lyse immediately after bulge forma-tion due to membrane yielding The occurrence of bulging in B subtilis therefore suggests that like E coli(below) B subtilis cells may also lose a significant amount of cellular turgor due to membrane damage as aresult of ciprofloxacin treatment
113 Relation to previous work
As a historical remark we note that aspects of cytoplasmic condensation have been observed in previouswork revealing the leakage of [3H]-uracil-labeled cellular contents [6 7] and formation of vacuoles [8] inquinolone-treated E coli However to our knowledge a physiological characterization of the condensedstate in addition to the relationship between condensation and turgor loss cell death reactive metabolicbyproducts and glutathione protection has not until now been studied
12 Biophysical model of cytoplasmic condensationTo better understand the physiology of the condensed state we developed a biophysical model of cell en-velope mechanics which predicts (1) smaller turgor and cytoplasmic condensation to arise from elasticrelaxation to an equilibrium state which is governed by flow of solutes outside the cell and induced bynanometer-scale membrane defects and (2) the number of such defects consistent with the empirically
2
observed timescale and magnitude of condensation Building on previous work [1] we model the Gram-negative bacterial cell envelope as the combination of an elastic shell (the cell wall) sandwiched between twofluid membranes (the inner and outer membranes) The free energy of the cell envelope and its enclosedvolume includes both the elastic strain energies of all three layers and the entropy of mixing primarily ofsolutes contained within
F = Ewstrain + Eistrain + Eostrain minus TS (S1)
Here the superscripts w i and o denote cell wall inner membrane and outer membrane quantities respec-tively Estrain is the elastic strain energy T is the temperature and S is the entropy of mixing water andsolute molecules For simplicity we assume that there are only water molecules outside the cell S can thenbe expressed as S = minusk(ns lnxs + nw lnxw) where k is Boltzmannrsquos constant xs and xw are the numberfractions of solute and water molecules respectively and ns and nw are the numbers of solute and watermolecules respectively We point out the following details regarding the model
bull The turgor pressure is defined as p = kTC where C is the solute concentration Note that the originof turgor pressure is entropic and it will therefore decrease continuously with flow of solutes outsidethe cell and flow of water into the cell (below)
bull Throughout we will neglect the hemispherical poles of the cell for simplicity and consider only thecylindrical bulk
bull We assume that the contributions of any disjoint but potentially load-bearing cytoskeletal elementssuch as MreB [9] are coarse-grained by the continuum description of the cell envelope layers abovethe elastic moduli should therefore be viewed as effective ones
bull For simplicity we will focus on modeling the cellular periplasm as effectively a rigid permeableand gel-like body that supports the inner membrane [10 11 12] but is not isosmotic with the cyto-plasm [13] A previous study combining diffusionmeasurements in the cytoplasm and periplasm andhyperosmotic shocks suggested that the periplasm is iso-osmotic with the cytoplasm with the mainturgor pressure drop occurring across the cell wall and outer membrane However as indicated by asubsequent study [11] in this case the bending energy of the inner membrane would be minimal forrod-like cells when the inner membrane assumes the shape of a cylinder with the largest radius possi-ble Equilibration of the inner membrane would therefore result in the inner membrane squeezing outthe periplasm Amodel in which the periplasm and cytoplasm are isosmotic with no force exerted onthe inner membrane by the periplasm is therefore inconsistent with the existence of a periplasm Theperiplasm may exist upon the inclusion of a membrane pinning potential [11 12] however as notedbefore [11] for previously considered parameter values [12] the membrane pinning potential is largeenough so that the periplasm is effectively a rigid body
bull Additionally we assume that the periplasm does not hinder the transport of solutes and water outof the cytoplasm and can be viewed independently of each cell envelope component We thereforeneglect the periplasm in what follows
bull Finally we note that althoughmolecules such as Braunrsquos lipoprotein anchor the outermembrane to thecell wall the estimated number of such outermembrane-wall anchors (sim106) are few in comparison tothe estimated numbers (sim107) of phospholipids [1 14 15] Hence free phospholipids couldmodulatethe reference membrane states and allow for membrane reorganization That the cell envelope layerscan slide with respect to each other will be relevant to the calculations in sect122 below
121 Change in cellular turgor and volume due to membrane defects
We hypothesize that membrane damage is well described by the appearance of nanoscale gaps in the mem-brane (Fig 2a of the main text) Accordingly we model membrane defects as holes with characteristicradius rd asymp 1 nm which is much smaller than the combined thickness of the inner and outer membranessim20 nm Assuming it to be laminar the hydrodynamic flow of cytoplasmic contents from inside to outside
3
the cell is well described by Poiseuille flow with a volumetric flow rate of
Q =∆PA2
8πmicroLd (S2)
Here ∆P is the pressure drop inside and outside the cell A = πr2d is the defect area Ld is the defect lengthand micro is the viscosity of the medium Note that due to the entropic origin of turgor p decreases with flow ofsolutes outside the cell and flow of water into the cell through the semi-permeable cell membranes In turnthe membrane defect radius will decrease with the turgor due to there being less mechanical strain in thecell membranes Nonetheless for characteristic parameter values as summarized in Supplementary Table2 we note that at the start of flow Q asymp 10minus21 m3s and the Reynolds number is Re = 2Qrdρ(microA) asymp 10minus6where ρ is the density of water This suggests self-consistently the flow to indeed be laminar Furthermoreassuming this flow rate to be constant in time a simple but surprising estimate shows that only ten suchpores corresponding to removal of only sim 00001 of all phospholipids in a membrane layer are sufficientto predict a flow comparable to the entire cellular volume out of the cell within one minute
We now undertake a more detailed analysis taking into account the decrease of turgor and defect radiuswith flow of solutes outside the cell A characteristic value of the diffusion constant of ions in water isD asymp 10minus9 m2s [16] so that a typical root-mean-square distance traveled by an ion per second is 10 micromAccordingly we assume solutes to be significantly diluted once outside the cell so that ∆P = p the turgorpressure of the cell Viewing ns p rd Q and the cell volume V as time-dependent quantities that changewith flow of solutes out of the cell we therefore write
Q(t) =πp(t)rd(t)
4
8microLd p(t) =
kTns(t)
V (t)
dns(t)
dt= minusNQ(t)ns(t)
V (t) (S3)
where N is the number of such membrane defects It remains to determine V (t) and rd(t) this becomes aproblem of elasticity
122 Elastic determination of the cellular volume
Due to the possibility of water flow into the membrane as the number of solutes are modulated we hypoth-esize that the cellular volume is determined by the equilibration of the elastic strain energies in Eq (S1) Inparticular given the turgor pressure p(t) the cell envelope is free to change its dimensions to minimize thefree energy The bulk flow of water through the cell membranes is described by
dVwater
dt= LpAcellp (S4)
where Lp is the hydraulic conductivity of the membranes and Acell is the total membrane surface area [17]For characteristic values of these parameters as summarized in Supplementary Table 2 we find that a typi-cal sim40 change in cellular volume occurs within sim1 s Hence for the timescale of interest (sim1 s) here wefind that water flow indeed occurs fast enough for the cell to be in equilibrium
We therefore determine V (t) and rd(t) by finding the elastic stresses in the equilibrium conformation Forthis we resort to a linear theory and assume a linear-elastic cell wall with reference radius and lengths rw0and Lw0 respectively and (two-dimensional) Youngrsquos modulus and Poissonrsquos ratio Y w and νw respectivelyMoreover we view the two membranes as materially identical and fluid in-plane so that their stretchingis governed by their area-stretch modulus K = Ki = Ko and excess reference surface area ratio γ =Ai0A
w0 minus 1 = Ao0A
w0 minus 1 where Aw0 is the reference cell wall surface area and Ai0 and Ao0 are the inner and
outer membrane reference surface areas respectively [1] Ignoring bending terms which are anticipated tobe dominated by the stretching terms [1] the free energy of Eq (S1) can then be expressed as
F =1
2Y w
int[(σwxx)2 + (σwyy)2 minus 2νwσwxxσ
wyy]dAw + 2K
int(ui)2dAi + 2K
int(uo)2dAo minus TS (S5)
4
where the integrals are over the deformed surface areas σwxx and σwyy are cell wall stresses and ui and uo areinner and outer membrane strains respectively Note that the form of Eistrain and Eostrain in Eq (S5) arisesfrom the fluid in-plane nature of the membranes it follows from this that the membrane strains and stressesare isotropic and spatially homogeneous [1] As the cell wall is cylindrical its strains and stresses will alsobe spatially homogeneous but not necessarily isotropic
Depending on the values of γK and p we note that the deformed membrane dimensions may be differentfrom each other and those of the cell wall in the limit of smallminus1 lt γ 0 and p`K 1 for a characteristicmembrane length ` for instance the free energy is minimal when the inner membrane forms a sphericalvesicle inside the cell and the cell wall and outer membrane bear no load However we may anticipate aparameter regime in which each envelope layer bears some load (below) Then by symmetry of the innerand outer membranes u = ui = uo and the membrane stresses σ = σi = σo moreover these quantities willall be nonzero In general the mechanical stresses will be related to the strains by the following constitutiverelations [1]
σwxx =Y w
1minus (νw)2(uwxx + νwuwyy) σwyy =
Y w
1minus (νw)2(uwyy + νwuwxx) σ = 2Ku (S6)
Here the cell wall strains uwxx and uwyy correspond to the stresses σwxx and σwyy Furthermore the linear strain-displacement relations are
uwxx =r minus rw0rw0
uwyy =Lminus Lw0Lw0
u =Ai minusAi0
2Ai0=Ao minusAo0
2Ao0 (S7)
where r and L are the deformed cell wall radius and length respectively Assuming that the membranesshare the same deformed radius and length (below) we substitute Eqs (S6) and (S7) as well as the re-lation nw = πr2Lmw where mw is the volume occupied per water molecule into Eq (S5) From thiswe find that F can be rewritten as a function of two unknowns r and L and several parameters includingthe elastic constants γ and ns Hence we will minimize F over r and L from we determine all associatedelastic quantities
As mentioned above we anticipate that for typical cells the membrane reference areas will be similar tothat of the cell wall so that |γ| 1 [1] Furthermore we anticipate all cell envelope layers to be load-bearingand in contact in the deformed state so that we may suppose a common value of the deformed cell lengthand radius among all envelope layers these may be expressed as L = Lw0 + δL and r = rw0 + δr where δLand δr are viewed as small relative to Lw0 and rw0 Next we make the following small-variable assumptionsnsnw 1 and δrr δLL = O(ε) where ε 1 consistent with the linear theory In particular we willexpand F to first order in γ first order in ns and second order in ε Doing so and analytically solving forthe values of δL and δrwhich minimizeF upon substitution of the solution into Eqs (S6) and (S7) we find
σwxx =γKY w
Y w + 2K(1minus νw)+
kTns[K(1minus νw) + 2Y w]
2πrw0 Lw0 [2K(1minus νw) + Y w]
(S8)
+O(ε2) +O
[(nsnw
)2]
+O(γ2) +O(γε) +O
(γnsnw
)+O
(εnsnw
)
Accurate to the same order we have
σwyy =γKY w
Y w + 2K(1minus νw)+
kTns[K(1minus (νw)2) + Y w]
2πrw0 Lw0 [2K(1minus νw) + Y w]
σ =K[3kTns(1minus νw)minus 2πrw0 L
w0 γY
w]
4πrw0 Lw0 [2K(1minus νw) + Y w]
(S9)
It is straightforward to verify that σwxx + 2σ = kTns
πr0L0and σwyy + 2σ = kTns
2πr0L0 so that Laplacersquos law [1] is satis-
fied Furthermore whenK = 0 themembrane stress σ = 0 andwe recover the cylinder stresses σwxx = kTns
πr0L0
and σwyy = kTns
2πr0L0in the cell wall
5
Finally by viewing the stresses in Eqs (S8) and (S9) as functions of time through their dependence onns = ns(t) and finding the corresponding time-dependent strains through the linear constitutive relationsof Eq (S6) we can write closed-form expressions for the following
V (t) = π(rw0 )2Lw0 [1 + 2uwxx(t) + uwyy(t)] rd(t) = r0d(1 + u(t)) (S10)
Here r0d denotes the reference (unstretched) radius of the membrane defect and henceforth all equalitieswill be accurate to the orders shown in Eq (S8)
123 The final dynamical equation
Iteratively substituting Eqs (S6)-(S10) into Eq (S3) we find that a single equation governs the dynamicsof solute flow which in turn determines all other quantities
dns(t)
dt= minusNkTns(t)
2(Y w)2[2πrw0 Lw0 r
0d(8K(1minus νw) + (4minus γ)Y w) + 3kTr0d(1minus νw)ns(t)]
4
Φ(t) (S11)
whereΦ(t) = 8192π3microLd(rw0 )6(Lw0 )4[2K(1minusνw)+Y w]2[2πrw0 L
w0 Y
w(K(2+3γ)(1minusνw)+Y w)+kTns(t)(K(1minus(νw)2)+(5minus4νw)Y w)]2 andns(t = 0) = n0s the initial number of solutes inside the cell This is a complicatedordinary differential equation involving a degree-six rational function that is difficult to solve analytically orapproximately for the parameter values of interest We therefore turn to numerical solutions of this equationfor these parameter values (Supplementary Table 2)
124 The equilibrium state timescales of equilibration and cellular morphology
Solving the dynamical Eq (S11) numerically for the parameter values summarized in Supplementary Ta-ble 2 we find that the model predicts a cellular volume shrinkage of sim20 over the empirically observedminute-timescale of condensation consistent with experimental observations (Fig 2b-f of the main text)For this to occur the model shows that the turgor pressure is essentially abolished on the minute timescale(Fig 2e of the main text) consistent with our osmotic shock experiments (Fig 1e of the main text andSupplementary Fig 5) Furthermore the model predicts that the condensed state is not only a state ofmechanical equilibrium but also a steady state (t rarr infin) maintained by increasingly small solute leakageand cellular volume shrinkage (Fig 2df of the main text) Indeed the model predicts that there remainscytoplasmic material in condensed cells This is consistent with fluorescence microscopy (Fig 1b of themain text) and AFMmeasurements which show the elastic moduli of a typical condensed cytoplasm to belarger than that of the shrunken region (Fig 1f of the main text and Supplementary Fig 7) We note herethat these model predictions are general across a range of different membrane defect sizes and for differentdefect sizes predict different numbers of membrane defects to form (Supplementary Fig 10)
For γ lt 0 and vanishingly small turgor pressures corresponding to large t (Fig 2e of the main text) wenote that the inner membrane may form invaginations and retract from the cell wall consistent with Fig 1bof the main text In this case the assumption that all envelope layers are load-bearing no longer holds Theaccuracy of the model at long times therefore depends on γ nonetheless for γ asymp 0 as may be expected forE coli [1] we expect the model to be accurate and robust at the onset of condensation at which point allenvelope layers are in contact and load-bearing
Finally we note that in Eq (S5) the mixing of solutes and water inside the cell is assumed to be homo-geneous and the free energy depends on the cell wall stresses the cell wall area the cell membrane areasand the cellular volume Consistent with ignoring bending terms in this expression it is possible that thecell membranes may assume different shapes provided that the remaining quantities are conserved Ac-cordingly the model does not discriminate between condensed phenotypes wherein the phase-light regionappears mid-cell or at the poles and whether phase-dark regions of condensed cells may be connected Weanticipate future experimental studies to determine the factors that determine where along a cell conden-sation is initiated
6
Supplementary Tables
Antibiotic Empirical MIC Range (microgmL) Working MIC (microgmL)Kanamycin E coli MG1655 [50120] 50
E coli BW25113 [50625]Ciprofloxacin E coli MG1655 [0031250125] 01
E coli BW25113 [0031250125]E coli ∆gshA [0031250125]E coli ∆gor [0031250125]
Gentamicin E coli MG1655 [313625] 50E coli BW25113 [313625]E coli ∆gshA [313625]E coli ∆gor [313125]
Norfloxacin E coli MG1655 [01505] 05Ampicillin E coli MG1655 [313125] 100
E coli BW25113 [313125]E coli ∆gshA [313125]E coli ∆gor [313125]
Mecillinam E coli MG1655 [06320] 10With 10 mM glutathioneKanamycin E coli MG1655 [390780] 400Ciprofloxacin E coli MG1655 [015603125] 03With 10 mM dithiothreitolKanamycin E coli MG1655 [50125] 50Ciprofloxacin E coli MG1655 [00312501] 01With 10 mMmercaptoethanolKanamycin E coli MG1655 [50125] 50Ciprofloxacin E coli MG1655 [00312501] 01With 50 mM α-tocopherolKanamycin E coli MG1655 [50125] 50Ciprofloxacin E coli MG1655 [00312501] 01
Supplementary Table 1 Minimal inhibitory concentrations (MICs) of antibiotics used in this studyRangeswere determined from three replicates for each culture dilution (1100 and 110000) and each growthvessel (14-mL Falcon tubes and 96-well plates) see Methods for details Identical working MICs were usedacross all strains due to the similarity in observed empirical MIC ranges Similar empirical MICs were ob-served and the same working MICs for E coli MG1655 used for B subtilis 168
7
Variable Value ReferenceViscosity of water micro 89times 10minus4 Pa middot s ndashDensity of water ρ 997 kgm3 ndashVolume occupied per water moleculemw 3times 10minus29 m3 ndashTemperature T 300 K This workCharacteristic (reference) membrane defect radius r0d 1 nm This workCharacteristic membrane defect length Ld 20 nm This workCharacteristic number of membrane defects N 10 This workMembrane bilayer thickness 10 nm [18]Membrane hydraulic conductivity Lp 10minus12 m3N middot s [17 19]Characteristic E coli (reference) cell wall radius rw0 05 microm This workCharacteristic E coli (reference) cell wall length Lw0 2 microm This workE coli cell wall two-dimensional Youngrsquos modulus Y w 02 Nm [1 20 21 22]E coli cell wall Poissonrsquos ratio νw 02 [1 22]E coli membrane area-stretch modulusK 01 Nm [1 5]E coli membrane excess reference surface area ratio γ 0 This work estimate from [1]E coli (initial) turgor pressure p 105 Pa [1 20 23]E coli (initial) number of solutes n0s 38times 107 p = kTns[π(rw0 )2Lw0 ]
Supplementary Table 2 Biophysical model parameters
8
c
e
d
0 4 5 6 7
0 4 5 6 7
0 4 5 6 7
100
200
300
100
200
0200400
0
0
8001000
Carboxy-H DCFDA FITC2
DAF-FM FITC
C11-BODIPY FITC
Log green fluorescence intensity
Log green fluorescence intensity
Log green fluorescence intensity
Even
t cou
ntEv
ent c
ount
Even
t cou
nt
600
300
-6
-4
-2
0
2
Log
surv
ival
Time since treatment0 2 4
f
1x MIC 10x MIC
Glutathione+1x MIC Glutathione+10x MIC
a b
Frac
tion
TurgidCondensed
Lysed
+KAN+CIP+AMP+MEUntreated
+AMP +ME
Untreated (1h)+KAN (1h)+AMP (1h)Untreated (6h)+CIP (6h)
Untreated (1h)+KAN (1h)+AMP (1h)Untreated (6h)+CIP (6h)
Untreated (1h)+KAN (1h)+AMP (1h)Untreated (6h)+CIP (6h)
Glutathione+Untreated
Untreated
Untreated
0
02
04
06
08
1
Supplementary Figure 1 Generality of results to β-lactam antibioticsa Phase contrast microscopy images of E coli cells treated by the β-lactam antibiotics ampicillin (AMP left)and mecillinam (ME right) 1 h after treatment along with untreated control cells Here and below 10xMIC was used for all antibiotics and scale bars indicate 3 micromb Frequency of condensation and lysis observed under β-lactam treatment compared to kanamycinciprofloxacin and an untreated control after 6 h Data are from two different fields of view from two bi-ological replicates and individual datapoints corresponding to each field of view are shown Bars indicateaverages Number of cells in each field of view kanamycin 105 and 93 ciprofloxacin 241 and 198 ampi-cillin 21 32 and 35 mecillinam 91 and 98c-e Histograms of fluorescence intensities of populations of control and antibiotic-treated cells as assayedby flow cytometry using the fluorochromes indicated in the presence of carboxy-H2DCFDA DAF-FM andC11-BODIPY Antibiotic-treated cells were treated for 1 h (ampicillin kanamycin) or 6 h (ciprofloxacin)as in the main text a longer treatment time was chosen for ciprofloxacin due to a majority of condensationevents occurring later after treatment Data representative of four biological replicates and 20000 scatteringevents for each distributionf Survival curves under ampicillin treatment with and without exogenous supplementation of 10 mM glu-tathione as determined by CFU measurements at 1x and 10x MIC Control experiments are also shownEach point represents two biological replicates error bars indicate one standard deviation and data arepresented as mean values +- SEM
9
Aver
age
pixe
l inte
nsity
003 001
D = 020 D = 017
KAN 10x
Turgid
KAN 10x
Conde
nsed
CIP 10x
Turgid
CIP 10x
Conde
nsed
Untrea
ted
Treated
20
30
40
50
60
70
80a
-2
0
2
4
6
8
10
12
14
16
18
20
Relat
ive fl
uore
scen
ce in
tens
ity
KAN 10x
Turgid
KAN 10x
Conde
nsed
CIP 10x
Turgid
CIP 10x
Conde
nsed
Untrea
ted
Treated
b
005 37e-3
D = 055 D = 185
Supplementary Figure 2 Phase contrast measurements of condensation indicate increased cytoplasmicdensity in condensed cellsa Quantitative comparison of average pixel intensities before and after cytoplasmic condensation for E colicells treated by kanamycin (10x MIC) and ciprofloxacin (10x MIC) along with control cells Data are rep-resentative of three different fields of view with 20 cells in each group D denotes the population-averagerelative decrease in the average pixel intensity of a cell Here and below box plots indicating the median(center) 25th percentile and 75th percentile (bounds of box) and extreme data points not considered out-liers (bounds of whiskers) are shown and red crosses indicate outliers including the minimum and maxi-mum values p-values for one-sample t-tests for the decrease in the average pixel intensity are shown nextto corresponding bracketsb Same as a but for relative fluorescence intensities in the cytoplasmic mCherry strain
10
a
Outer membrane
+KAN
Inner membrane
b +NOR+GENT c+KAN
+CIP
B subtilis
C11-BODIPY
C11-BODIPY
E coli
Untreated
Untreated
Outer membrane
Inner membrane
CytoplasmUntreated
Phase
Phase
Phase Phase
Phase
CytoplasmPhase
Supplementary Figure 3 Generality of observed phenotypes to different antibiotics and bacterial speciesa E coli cells with fluorescent cytoplasmic (mCherry) outer membrane (GFP) and inner membrane(mCherry) markers as described in theMethods with and without kanamycin treatment for 2 h at 10x MICHere and below scale bars indicate 3 microm imaging was performed in phase contrast and epifluorescenceand results are representative of two biological replicates Yellow markers highlight condensed cellsb E coli cells treated with other antibiotics for 2 h at 10x MIC gentamicin (GENT) an aminoglycoside andnorfloxacin (NOR) a quinolone Results are representative of two biological replicates and yellowmarkershighlight condensed cells A phase contrast microscopy image of corresponding untreated control cells isshownc B subtilis cells treated with kanamycin (50 microgmL) and ciprofloxacin (10 microgmL) after 2 h with (right)and without (left) the dye C11-BODIPY Results are representative of two biological replicates and yellowmarkers highlight condensed bulged or lysed cells A phase contrast microscopy image of correspondinguntreated control cells is shown
11
100x MIC 10x MIC 1x MIC 01x MIC 001x MIC 0001x MIC No treatment
t = 0 h
t = 3 h
t = 20 h
No condensation No condensation No condensation
3 microm
100x MIC 10x MIC 1x MIC 01x MIC 001x MIC 0001x MIC No treatment
t = 0 h
t = 3 h
t = 20 h
3 microm
a
b
No condensationNo condensation No condensation No condensation
Supplementary Figure 4 Generality of the condensation phenotype across different antibiotic concen-trationsa Phase contrast microscopy images of E coli cells treated by various concentrations of kanamycin in cul-ture as indicated for various treatment times as indicated before imaging Here time 0 refers to immediatelybefore treatment Each image is representative of three biological replicates and yellow markers indicate asubset of condensed cellsb Same as panel a but for ciprofloxacin
12
0 5 10-05
0
05
1
15Untreated
0 5 10-05
0
05
1
15KAN Turgid
0 5 10-05
0
05
1
15KAN Condensed
0 5 10-05
0
05
1
15KAN Lysed
0 5 10-05
0
05
1
15CIP Turgid
0 5 10-05
0
05
1
15CIP Condensed
0 5 10-05
0
05
1
15CIP Lysed
L
ΔL
a
b
c
Leng
th c
ontra
ctio
n Δ
L
Cell length L
ε
Supplementary Figure 5 Osmotic shocks reveal collapse of cellular turgora Plot of pre-shock cell length against post-shock length contraction for the osmotic shock experimentssummarized in Fig 1e of the main text showing approximately linear relationships Control cells with noantibiotic treatment were used The average percentage length contraction or strain ε is the slope of thebest fit line (Right) Representative phase contrast microscopy images show the response of an untreatedcell Scale bar 3 micromb-c Same as panel a but for cells treated by kanamycin (10x MIC b) or ciprofloxacin (10x MIC c) andclassified by phenotype
13
Phase Fluorescence
IPG
a b
Untreated
+CIP
+KAN
0
1
2
3
4
5
1
2
3
4
5
00659e-973e-4
+KAN
Untrea
ted (3
0)
Turgid
(20)
Conde
nsed
(20)
Relat
ive IP
Gin
tens
ity
+CIP
Untrea
ted (3
0)
Turgid
(20)
Conde
nsed
(20)
Relat
ive IP
Gin
tens
ity
00649e-1142e-5
Supplementary Figure 6 Measurements of IPG fluorescencea Phase-contrast and fluorescence microscopy images of control and antibiotic-treated cells (10x MIC) inthe presence of IPG a membrane-permeable potassium-sensitive dye Cells were imaged at a time corre-sponding to 3 h of antibiotic treatment Results are representative of two biological replicates and yellowmarkers highlight condensed cells Scale bars 10 micromb Fluorescence intensities of control and antibiotic-treated cells in the presence of IPG Box plots indicatingthe median (center) 25th percentile and 75th percentile (bounds of box) and extreme data points not con-sidered outliers (bounds of whiskers) are shown and red crosses indicate outliers including the minimumand maximum values The numbers of cells in each group are indicated in parentheses and p-values fortwo-sample Kolmogorov-Smirnov tests are shown next to corresponding brackets
14
0 10 20 300
200
400
600
800
1000
distance (au)
elas
tic m
odul
us (k
Pa)
control_cell4
height
length
diameter
a b c
d e
f
Untreated(turgid)
(28)
+KAN(condensed)
(24)
+CIP(condensed)
(32)
400
600
800
1000
1200
Elas
tic m
odul
us (k
Pa)
02742e-8
600
700
800
900
1000
2000
3000
4000
5000
6000
400
600
800
1000
1200
1400
Hei
ght (
nm)
Leng
th (n
m)
Diam
eter
(nm
)
55e-347e-3020
30e-643e-5
009
42e-5014018
Untrea
ted (3
4)
10x C
IP (32)
100x
CIP (20)
10x K
AN (25)
0 10 20 300
500
1000
1500
distance (au)
elas
tic m
odul
us (k
Pa)
cell8
0 10 20 300
200
400
600
800
distance (au)
elas
tic m
odul
us (k
Pa)
Kanamycin_cell4
Supplementary Figure 7 Details of the AFM experimentsa-c Heatmaps of cell height (top) and plots of the elastic modulus (bottom) along the length of a cell (au)for a representative untreated cell (a) a kanamycin-treated cell (10x MIC b) and a ciprofloxacin-treatedcell (10x MIC c) Cells were assayed corresponding to a time sim3 h of antibiotic treatment Error bars indi-cate one standard deviation from at least two technical replicates for the same cell and data are presentedas mean values +- SEM Colored boxes highlight cellular regionsd Comparison of cell-averaged elastic moduli across different treatment conditions (10x MIC) Here andbelow box plots indicating themedian (center) 25th percentile and 75th percentile (bounds of box) and ex-treme data points not considered outliers (bounds of whiskers) are shown and red crosses indicate outliersincluding the minimum and maximum values The numbers of cells in each group are indicated in paren-theses and p-values for two-sample Kolmogorov-Smirnov tests are shown next to corresponding bracketse (Left) Similar to d but for inferred cellular dimensions across different treatment conditions (10x MIC)(Right) Schematic of the different cellular dimensions measuredf Sample force-distance curves from untreated control cells
15
a
b
0 4 5 6 7
0 4 5 6 7
0
SYTOX Blue Pb450
DiBAC (3) FITC
Log green fluorescence intensity
Log blue fluorescence intensity
Even
t cou
ntEv
ent c
ount
4
200400
8001000
600
0
200
400
800
600
Untreated (3h)+KAN (3h)Untreated (6h)+CIP (6h)
Untreated (3h)+KAN (3h)Untreated (6h)+CIP (6h)
-01
0
01
02
03
0
02
04
06
08
1
Relat
ive D
iBAC
(3)
inte
nsity
Relat
ive S
YTO
X Bl
uein
tens
ity4
Not sh
ocke
d
Shock
ed
Not sh
ocke
d
Shock
ed
006
077
c
d
Supplementary Figure 8 Additional DiBAC4(3) and SYTOX Blue measurementsa-b Histograms of fluorescence intensities of populations of control and antibiotic-treated cells in the pres-ence of DiBAC4(3) (a) and SYTOX Blue (b) 3 h after treatment (kanamycin) and 6 h after treatment(ciprofloxacin) as in the main text a longer treatment time was chosen for ciprofloxacin due to a majorityof condensation events occurring later after treatment Concentrations used were 10x MIC for both antibi-otics Data representative of four biological replicates and 20000 scattering events for each distribution Thefluorochromes used (FITC and Pb450) are indicatedc-d Fluorescence intensities of hyperosmotically shocked (500 mM sorbitol) cells in the presence of SYTOXBlue (c) and DiBAC4(3) (d) Fluorescence images were taken immediately after shock Data are from 20cells in each group Box plots indicating themedian (center) 25th percentile and 75th percentile (bounds ofbox) and extreme data points not considered outliers (bounds ofwhiskers) are shown and red crosses indi-cate outliers including the minimum and maximum values p-values for two-sample Kolmogorov-Smirnovtests are shown next to corresponding brackets
16
0
200
400
600
800
1000
10x K
AN
10x C
IP
36e-8
Tim
e fro
m c
onde
nsat
ion
to ly
sis (m
in)
0 200 400 60005
06
07
08
09
1
0 200 400 60005
06
07
08
09
1
0 200 400 60005
06
07
08
09
1ab
10x
KAN
10x
CIP
Relative cell length Relative cell radius Relative cell volume
Time after start of condensation (s)
0 200 400 60005
06
07
08
09
1
0 200 400 60005
06
07
08
09
1
0 200 400 60005
06
07
08
09
1
Supplementary Figure 9 Times from condensation to lysis in antibiotic-treated cells and cellular dimen-sions of condensed cellsa Times from condensation to lysis in kanamycin and ciprofloxacin-treated cells (10x MIC) Data are from20 cells in each group Box plots indicating themedian (center) 25th percentile and 75th percentile (boundsof box) and extreme data points not considered outliers (bounds of whiskers) are shown and red crossesindicate outliers including the minimum and maximum values The p-value for a two-sample Kolmogorov-Smirnov test is shown next to the corresponding bracketb Changes in relative cell length cell radius and cell volume across time from the beginning of conden-sation events in kanamycin and ciprofloxacin-treated cells (10x MIC) corresponding to Fig 2f in the maintext Data are from 20 cells in each group (colored curves) and population-averaged traces (thick redcurves) are shown Note that fluctuations in individual traces arise due to variations in semi-automatedimage processing see Methods for details of the image analysis
17
a
0 100 200 3000
02
04
06
08
10
Time after nanodefect formation (s)
Solute number
0 100 200 3000
02
04
06
08
10Turgor pressure
0 100 200 3000
02
04
06
08
10Cellular volume
b c
Frac
tion
of in
itial s
olut
es re
main
ing
Frac
tion
of in
itial t
urgo
r rem
ainin
g
Frac
tion
of in
itial c
ell v
olum
e re
main
ing
Time after nanodefect formation (s) Time after nanodefect formation (s)
Hole radius = 05 nm 100 holesHole radius = 1 nm 10 holesHole radius = 5 nm 1 hole
Supplementary Figure 10 Sensitivity analysis of the model of solute outflowa Model predictions for the solute number as a function of time across different membrane defect radii(different colors) Depending on the size of typical membrane defect (05 nm 1 nm 5 nm radius) themodelsuggests that different numbers of membrane defects form (100 10 and 1 respectively) as to be consistentwith the minute-timescale of condensation In all cases the model predicts cells to condense after outflowof solutes from a cell as detailed in Supplementary Note 1b-c Same as panel a but for the predicted cellular turgor pressure (b) and volume (c)
18
a
b c
+CIP
Frac
tion
+CIP exp
onen
tial
+CIP ea
rly sta
tiona
ry
+KAN exp
onen
tial
+KAN earl
y stat
ionary
Log
surv
ival
No trea
tmen
t exp
onen
tial
+CIP late
statio
nary
+KAN late
statio
nary
00102030405060708091
-6
-5
-4
-3
-2
-1
0
1
2
No trea
tmen
t earl
y stat
ionary
No trea
tmen
t late
statio
nary
+CIP exp
onen
tial
+CIP ea
rly sta
tiona
ry
+KAN exp
onen
tial
+KAN earl
y stat
ionary
No trea
tmen
t exp
onen
tial
+CIP late
statio
nary
+KAN late
statio
nary
No trea
tmen
t earl
y stat
ionary
No trea
tmen
t late
statio
nary
Supplementary Figure 11 Experiments on stationary-phase cellsa Microscopy images of early stationary-phase (OD600 asymp 15) E coli cells treated by ciprofloxacin (10xMIC)at times 0 h (left) and 6 h (right) Results are representative of two biological replicates and yellowmarkersindicate condensed or lysed cells Scale bar 3 micromb Fractions of all cells that are condensed or lysed corresponding to the experiments in panel a from twodifferent fields of view of two biological replicates with at least 20 cells each in addition to cells from earlyexponential phase (OD600 asymp 01) and late stationary phase (OD600 gt 20) as described in the MethodsAll antibiotics refer to 10x MIC and ldquono treatmentrdquo cells were not treated by antibiotics Individual pointscorresponding to each field of view are shown The numbers of cells in each of two fields of view accordingto the order of treatment shown along the horizontal axis was as follows 24 and 30 56 and 76 101 and 94195 and 206 20 and 20 20 and 20 95 and 107 20 and 20 20 and 30c Survival of E coli cells treated by kanamycin and ciprofloxacin (10x MIC) 6 h after treatment as deter-mined by CFU counting corresponding to panel b Positive values of the log survival indicate an increasein CFUmL Results are from two biological replicates (individual points) and bars indicate averages
19
0
1
2
Relat
ive A
TPO
D
rat
io60
0
LB
LB+glu
tathio
ne
1100
0 LB in
PBS
Supplementary Figure 12 Bulk culture measurements of ATP abundance in cell cultures with and with-out glutathione pretreatment (10 mM) Cells were assayed in early log phase (OD600 asymp 01) For compari-son measurements for cells grown in LB diluted 11000 in PBS are shown Error bars indicate one standarddeviation bars indicate averages and data are presented asmean values+- SEM Individualmeasurementsfrom biological replicates are shown as black points Number of biological replicates in each condition LB8 glutathione 6 11000 LB in PBS 10
20
Untrea
ted
KAN 10x
CIP 10x
AMP 10x
0
200
400
600
800
1000
LPS
(end
otox
in u
nitμ
g pr
otei
n)
Supplementary Figure 13 Measurements of lipopolysaccharide levels Shown are measurements oflipopolysaccharide (LPS) levels of bulk cultures of cells treated by antibiotics (10x MIC) as measured byan LAL assay For comparison data from treatment with 10x MIC ampicillin are included Data from twobiological replicates (black points) and bars indicate averages
21
Parent strain (BW25113) Genetic deletion
+GENT +CIP
ΔgshA
Δgor
-6
-4
-2
0
2
Log
surv
ival
-6
-4
-2
0
2
Log
surv
ival
-6
-4
-2
0
2
Log
surv
ival
-6
-4
-2
0
2
Log
surv
ival
Untrea
ted
1x M
IC
10x M
IC
Untrea
ted
1x M
IC
10x M
IC
Untrea
ted
1x M
IC
10x M
IC
Untrea
ted
1x M
IC
10x M
IC
Supplementary Figure 14 Effects of genetic deletions on antibiotic killing Shown are log survival valuesof E coli under gentamicin and ciprofloxacin treatment as determined by CFU plating and counting after4 h of treatment ∆gshA and ∆gor strains from the Keio collection as well as the parent strain (BW25113)were used Data from two biological replicates (black points) and bars indicate averages Positive valuesindicate increases in CFUmL
22
Relat
ive
C11-
BODI
PY in
tens
ity
+KAN +CIP
42e-5
84e-655e-10
013
47e-9
26e-3
Turgid
Conde
nsed
Lysed
Untrea
ted
Treated
Turgid
Conde
nsed
Lysed
Untrea
ted
Treated
0
5
10
15
20
0
5
10
15
20
55e-1036e-8
47e-9
006
42e-10
55e-10
Supplementary Figure 15 Measurements of C11-BODIPY fluorescence in the presence of α-tocopherolShown are fluorescence intensities of antibiotic-treated E coli pretreated by the lipophilic antioxidantα-tocopherol (50 mM) and in the presence of the lipid peroxidation-sensitive dye C11-BODIPY Thekanamycin and ciprofloxacin concentrations used were 10x MIC Data are from 20 cells in each group Boxplots indicating the median (center) 25th percentile and 75th percentile (bounds of box) and extreme datapoints not considered outliers (bounds of whiskers) are shown and red crosses indicate outliers includingthe minimum and maximum values p-values for two-sample Kolmogorov-Smirnov tests are shown next tocorresponding brackets
23
APC-A
Cytoplasmic mCherry
SSC-A
FSC
-A
Supplementary Figure 16 Gating strategy for flow cytometry E coli cells containing cytoplasmic mCherrywere filtered by calibration of forward- and side-scattering area measurements (FSC-A and SSC-A) usingthe APC-A (red) fluorochrome 20000 scattering events are shown and results are representative of fourbiological replicates with 20000 scattering events each The gating strategy was used for the flow cytometrymeasurements shown in Fig 4 of the main text and Supplementary Figs 1 and 8
24
Supplementary References1 Wong F amp Amir A Mechanics and dynamics of bacterial cell lysis Biophys J 116 2378ndash2389 (2019)
2 Dwyer D J et al Antibiotics induce redox-related physiological alterations as part of their lethalityProc Natl Acad Sci USA 111 E2100ndashE2109 (2014)
3 Yao Z Kahne D amp Kishony R Distinct single-cell morphological dynamics under beta-lactam antibi-otics Mol Cell 48 705ndash712 (2012)
4 Whatmore A M amp Reed R H Determination of turgor pressure in Bacillus subtilis a possible role forK+ in turgor regulation J Gen Microbiol 136 2521ndash2526 (1990)
5 Sun Y Sun T-L ampHuang HW Physical properties ofEscherichia coli spheroplastmembranes BiophysJ 107 2082ndash2090 (2014)
6 Dougherty T J amp Saukkonen J J Membrane permeability changes associated with DNA gyrase in-hibitors in Escherichia coli Antimicrob Agents Chemother 28 200ndash206 (1985)
7 Diver J M amp Wise R Morphological and biochemical changes in Escherichia coli after exposure tociprofloxacin J Antimicrob Chemother 18 31ndash41 (1986)
8 Elliott T S Shelton A amp Greenwood D The response of Escherichia coli to ciprofloxacin and nor-floxacin J Med Microbiol 23 83ndash88 (1987)
9 Wang S Arellano-Santoyo H Combs P A amp Shaevitz J W Actin-like cytoskeleton filaments con-tribute to cell mechanics in bacteria Proc Natl Acad Sci USA 107 9182ndash9185 (2010)
10 Koch A L Bacterial growth and form (Springer Science amp Business Media 2001)
11 Hussain S et al MreB filaments create rod shape by aligning along principal membrane curvature eLife7 e32471 (2018)
12 Wang S ampWingreen N S Cell shape canmediate the spatial organization of the bacterial cytoskeletonBiophys J 541ndash552 (2013)
13 et al K A S Protein diffusion in the periplasm of e coli under osmotic stress Biophys J 22ndash31 (2011)
14 Silhavy T J Kahne D amp Walker S The bacterial cell envelope Cold Spring Harb Perspect Biol 2a000414 (2010)
15 Movva N R Nakamura K amp Inouye M Regulatory region of the gene for the ompA protein a majorouter membrane protein of Escherichia coli Proc Natl Acad Sci USA 77 3845ndash3849 (1980)
16 Cussler E L Diffusion Mass Transfer in Fluid Systems (Cambridge University Press 1997)
17 Sperelakis N Cell Physiology Source Book Essentials of Membrane Biophysics (Academic Press 1995)
18 Phillips R Kondev J Theriot J amp Garcia H Physical Biology of the Cell (Taylor and Francis 2012)
19 Ccediletiner U et al Tension-activated channels in the mechanism of osmotic fitness in Pseudomonas aerugi-nosa J Gen Physiol 149 595ndash609 (2017)
20 Deng Y Sun M amp Shaevitz J W Direct measurement of cell wall stress stiffening and turgor pressurein live bacterial cells Phys Rev Lett 107 158101 (2011)
21 Amir A Babaeipour F McIntosh D B Nelson D R amp Jun S Bending forces plastically deformgrowing bacterial cell walls Proc Natl Acad Sci USA 111 5778ndash5783 (2014)
22 Yao X Jericho M Pink D amp Beveridge T Thickness and elasticity of Gram-negative murein sacculimeasured by atomic force microscopy J Bacteriol 181 6865ndash6875 (1999)
23 Cayley D S Guttman H J amp Record M T Biophysical characterization of changes in amounts andactivity of Escherichia coli cell and compartment water and turgor pressure in response to osmotic stressBiophys J 78 1748ndash1764 (2000)
25
- Cytoplasmic condensation induced by membrane damage is associated with antibiotic lethality
-
- Results
-
- Aminoglycosides and fluoroquinolones induce membrane damage and cytoplasmic condensation in E coli
- A biophysical model of cell envelope mechanics and solute outflow predicts the dynamics of cytoplasmic condensation
- Cytoplasmic condensation is associated with cell death
- Cytoplasmic condensation is associated with ROS accumulation lipid peroxidation and changes in lipid composition
- Cytoplasmic condensation and antibiotic-induced cell death are mitigated by glutathione a scavenger of reactive metabolic by-products
- Cytoplasmic condensation and antibiotic-induced cell death are robust to changes in oxygen availability and external osmolarity
-
- Discussion
- Methods
-
- Bacterial strains
- Antibiotics and other reagents
- Bacterial culture and growth
- Determination of MICs
- Microscopy
- Microfluidics and osmotic shock experiments
- Atomic force microscopy measurements
- Inference of the cellular turgor pressure from atomic force microscopy measurements
- Membrane permeability and depolarization assays
- ROS and RNS detection with fluorescent dyes
- Membrane peroxidation detection with a fluorescent dye
- Image analysis
- Single-cell traces
- Sample preparation for thin-layer chromatography experiments
- Thin-layer chromatography of lipid content
- Time-kill assays and CFU measurements
- Flow cytometry
- ATP abundance assay
- Anaerobic chamber
- Protein concentration and LPS level assays
- Statistical testing
-
- Reporting summary
- Data availability
- References
- Acknowledgements
- Author contributions
- Competing interests
- Additional information
-
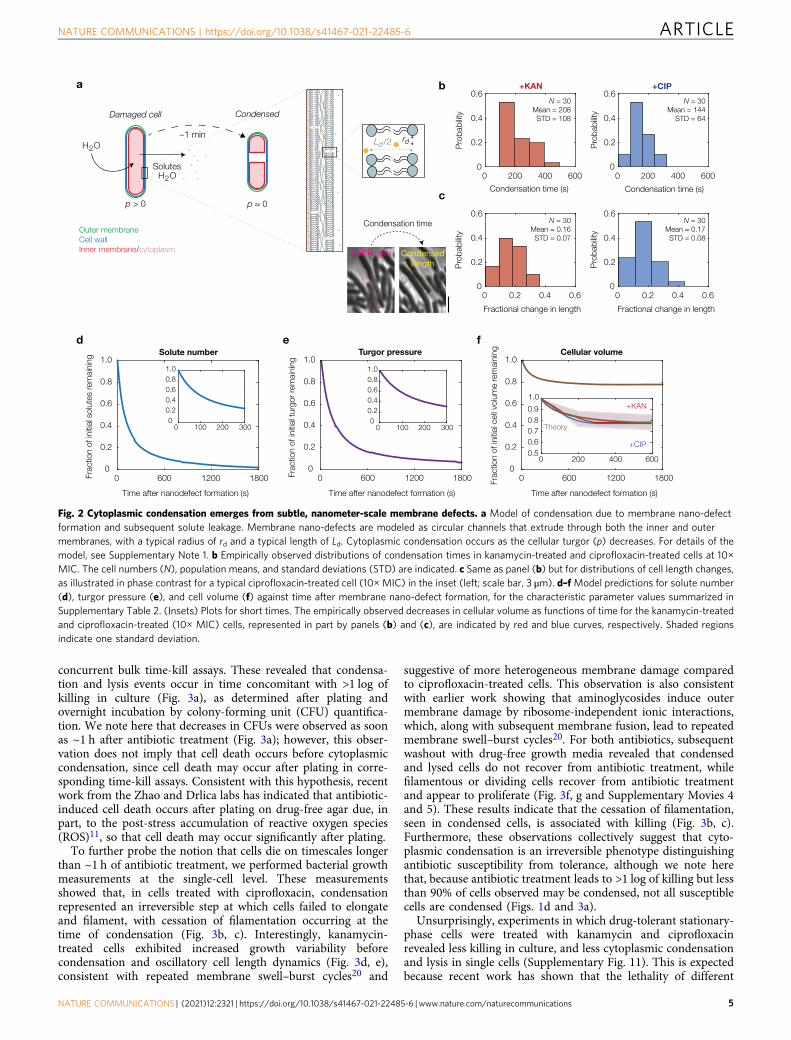
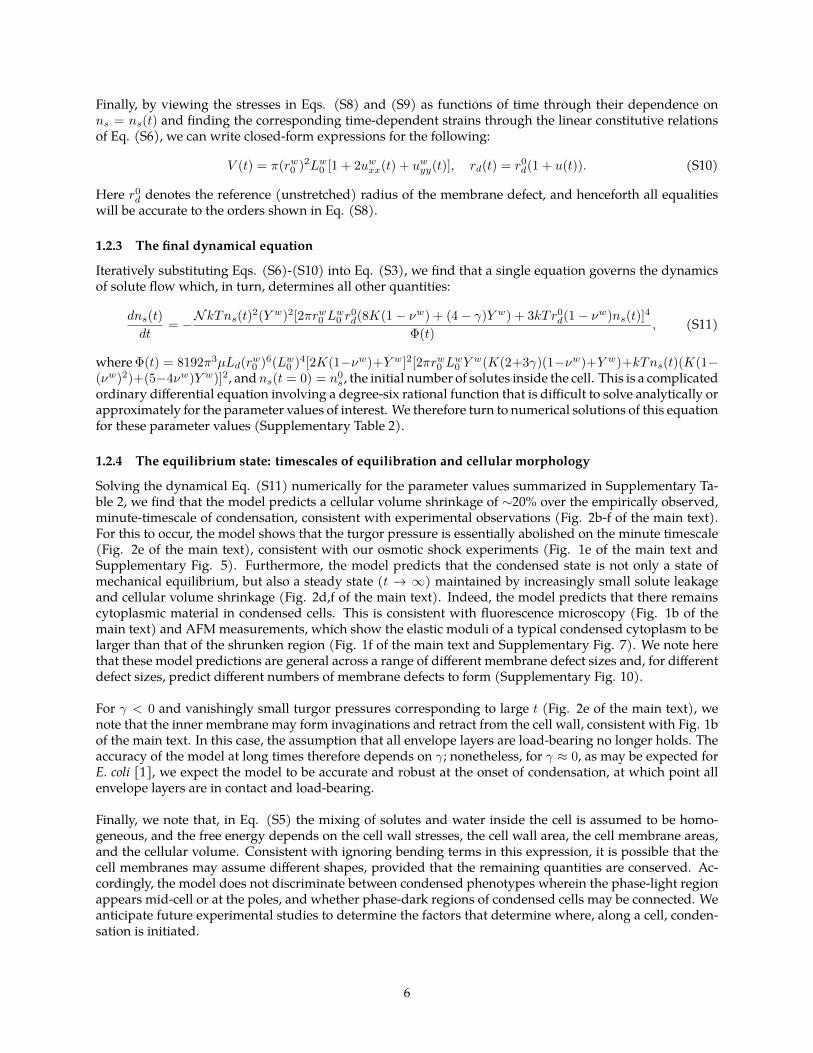
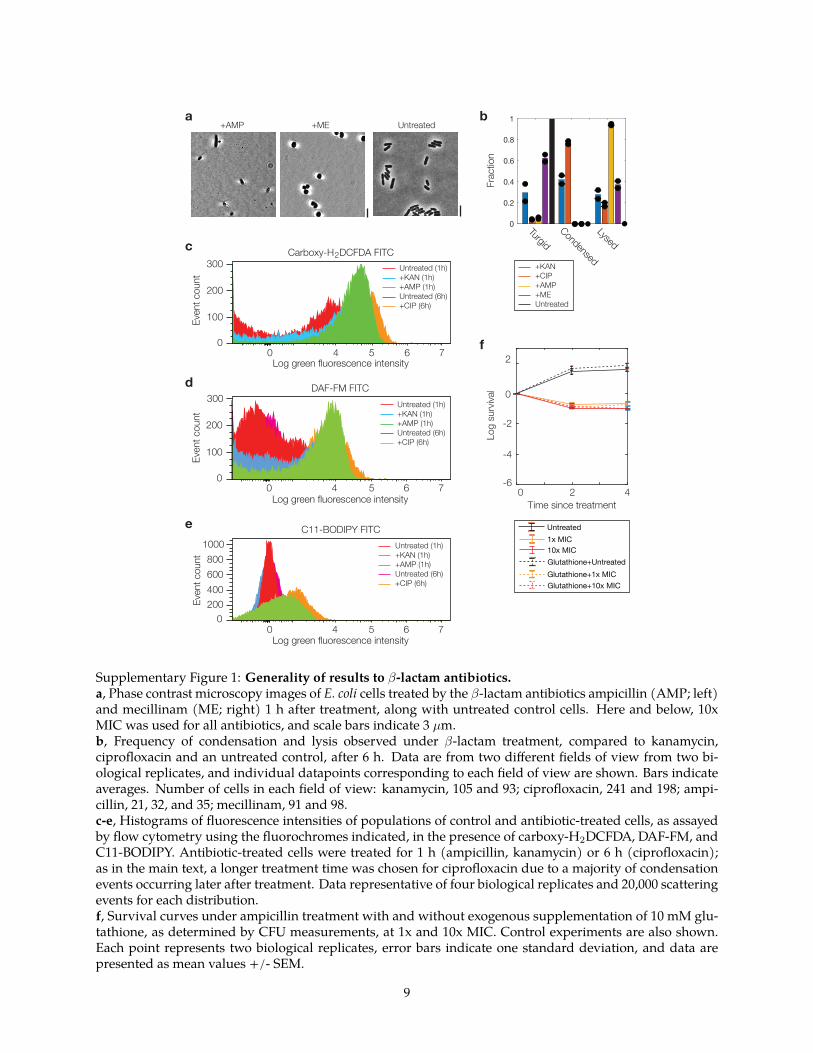
c
e
d
0 4 5 6 7
0 4 5 6 7
0 4 5 6 7
100
200
300
100
200
0200400
0
0
8001000
Carboxy-H DCFDA FITC2
DAF-FM FITC
C11-BODIPY FITC
Log green fluorescence intensity
Log green fluorescence intensity
Log green fluorescence intensity
Even
t cou
ntEv
ent c
ount
Even
t cou
nt
600
300
-6
-4
-2
0
2
Log
surv
ival
Time since treatment0 2 4
f
1x MIC 10x MIC
Glutathione+1x MIC Glutathione+10x MIC
a b
Frac
tion
TurgidCondensed
Lysed
+KAN+CIP+AMP+MEUntreated
+AMP +ME
Untreated (1h)+KAN (1h)+AMP (1h)Untreated (6h)+CIP (6h)
Untreated (1h)+KAN (1h)+AMP (1h)Untreated (6h)+CIP (6h)
Untreated (1h)+KAN (1h)+AMP (1h)Untreated (6h)+CIP (6h)
Glutathione+Untreated
Untreated
Untreated
0
02
04
06
08
1
Supplementary Figure 1 Generality of results to β-lactam antibioticsa Phase contrast microscopy images of E coli cells treated by the β-lactam antibiotics ampicillin (AMP left)and mecillinam (ME right) 1 h after treatment along with untreated control cells Here and below 10xMIC was used for all antibiotics and scale bars indicate 3 micromb Frequency of condensation and lysis observed under β-lactam treatment compared to kanamycinciprofloxacin and an untreated control after 6 h Data are from two different fields of view from two bi-ological replicates and individual datapoints corresponding to each field of view are shown Bars indicateaverages Number of cells in each field of view kanamycin 105 and 93 ciprofloxacin 241 and 198 ampi-cillin 21 32 and 35 mecillinam 91 and 98c-e Histograms of fluorescence intensities of populations of control and antibiotic-treated cells as assayedby flow cytometry using the fluorochromes indicated in the presence of carboxy-H2DCFDA DAF-FM andC11-BODIPY Antibiotic-treated cells were treated for 1 h (ampicillin kanamycin) or 6 h (ciprofloxacin)as in the main text a longer treatment time was chosen for ciprofloxacin due to a majority of condensationevents occurring later after treatment Data representative of four biological replicates and 20000 scatteringevents for each distributionf Survival curves under ampicillin treatment with and without exogenous supplementation of 10 mM glu-tathione as determined by CFU measurements at 1x and 10x MIC Control experiments are also shownEach point represents two biological replicates error bars indicate one standard deviation and data arepresented as mean values +- SEM
9
Aver
age
pixe
l inte
nsity
003 001
D = 020 D = 017
KAN 10x
Turgid
KAN 10x
Conde
nsed
CIP 10x
Turgid
CIP 10x
Conde
nsed
Untrea
ted
Treated
20
30
40
50
60
70
80a
-2
0
2
4
6
8
10
12
14
16
18
20
Relat
ive fl
uore
scen
ce in
tens
ity
KAN 10x
Turgid
KAN 10x
Conde
nsed
CIP 10x
Turgid
CIP 10x
Conde
nsed
Untrea
ted
Treated
b
005 37e-3
D = 055 D = 185
Supplementary Figure 2 Phase contrast measurements of condensation indicate increased cytoplasmicdensity in condensed cellsa Quantitative comparison of average pixel intensities before and after cytoplasmic condensation for E colicells treated by kanamycin (10x MIC) and ciprofloxacin (10x MIC) along with control cells Data are rep-resentative of three different fields of view with 20 cells in each group D denotes the population-averagerelative decrease in the average pixel intensity of a cell Here and below box plots indicating the median(center) 25th percentile and 75th percentile (bounds of box) and extreme data points not considered out-liers (bounds of whiskers) are shown and red crosses indicate outliers including the minimum and maxi-mum values p-values for one-sample t-tests for the decrease in the average pixel intensity are shown nextto corresponding bracketsb Same as a but for relative fluorescence intensities in the cytoplasmic mCherry strain
10
a
Outer membrane
+KAN
Inner membrane
b +NOR+GENT c+KAN
+CIP
B subtilis
C11-BODIPY
C11-BODIPY
E coli
Untreated
Untreated
Outer membrane
Inner membrane
CytoplasmUntreated
Phase
Phase
Phase Phase
Phase
CytoplasmPhase
Supplementary Figure 3 Generality of observed phenotypes to different antibiotics and bacterial speciesa E coli cells with fluorescent cytoplasmic (mCherry) outer membrane (GFP) and inner membrane(mCherry) markers as described in theMethods with and without kanamycin treatment for 2 h at 10x MICHere and below scale bars indicate 3 microm imaging was performed in phase contrast and epifluorescenceand results are representative of two biological replicates Yellow markers highlight condensed cellsb E coli cells treated with other antibiotics for 2 h at 10x MIC gentamicin (GENT) an aminoglycoside andnorfloxacin (NOR) a quinolone Results are representative of two biological replicates and yellowmarkershighlight condensed cells A phase contrast microscopy image of corresponding untreated control cells isshownc B subtilis cells treated with kanamycin (50 microgmL) and ciprofloxacin (10 microgmL) after 2 h with (right)and without (left) the dye C11-BODIPY Results are representative of two biological replicates and yellowmarkers highlight condensed bulged or lysed cells A phase contrast microscopy image of correspondinguntreated control cells is shown
11
100x MIC 10x MIC 1x MIC 01x MIC 001x MIC 0001x MIC No treatment
t = 0 h
t = 3 h
t = 20 h
No condensation No condensation No condensation
3 microm
100x MIC 10x MIC 1x MIC 01x MIC 001x MIC 0001x MIC No treatment
t = 0 h
t = 3 h
t = 20 h
3 microm
a
b
No condensationNo condensation No condensation No condensation
Supplementary Figure 4 Generality of the condensation phenotype across different antibiotic concen-trationsa Phase contrast microscopy images of E coli cells treated by various concentrations of kanamycin in cul-ture as indicated for various treatment times as indicated before imaging Here time 0 refers to immediatelybefore treatment Each image is representative of three biological replicates and yellow markers indicate asubset of condensed cellsb Same as panel a but for ciprofloxacin
12
0 5 10-05
0
05
1
15Untreated
0 5 10-05
0
05
1
15KAN Turgid
0 5 10-05
0
05
1
15KAN Condensed
0 5 10-05
0
05
1
15KAN Lysed
0 5 10-05
0
05
1
15CIP Turgid
0 5 10-05
0
05
1
15CIP Condensed
0 5 10-05
0
05
1
15CIP Lysed
L
ΔL
a
b
c
Leng
th c
ontra
ctio
n Δ
L
Cell length L
ε
Supplementary Figure 5 Osmotic shocks reveal collapse of cellular turgora Plot of pre-shock cell length against post-shock length contraction for the osmotic shock experimentssummarized in Fig 1e of the main text showing approximately linear relationships Control cells with noantibiotic treatment were used The average percentage length contraction or strain ε is the slope of thebest fit line (Right) Representative phase contrast microscopy images show the response of an untreatedcell Scale bar 3 micromb-c Same as panel a but for cells treated by kanamycin (10x MIC b) or ciprofloxacin (10x MIC c) andclassified by phenotype
13
Phase Fluorescence
IPG
a b
Untreated
+CIP
+KAN
0
1
2
3
4
5
1
2
3
4
5
00659e-973e-4
+KAN
Untrea
ted (3
0)
Turgid
(20)
Conde
nsed
(20)
Relat
ive IP
Gin
tens
ity
+CIP
Untrea
ted (3
0)
Turgid
(20)
Conde
nsed
(20)
Relat
ive IP
Gin
tens
ity
00649e-1142e-5
Supplementary Figure 6 Measurements of IPG fluorescencea Phase-contrast and fluorescence microscopy images of control and antibiotic-treated cells (10x MIC) inthe presence of IPG a membrane-permeable potassium-sensitive dye Cells were imaged at a time corre-sponding to 3 h of antibiotic treatment Results are representative of two biological replicates and yellowmarkers highlight condensed cells Scale bars 10 micromb Fluorescence intensities of control and antibiotic-treated cells in the presence of IPG Box plots indicatingthe median (center) 25th percentile and 75th percentile (bounds of box) and extreme data points not con-sidered outliers (bounds of whiskers) are shown and red crosses indicate outliers including the minimumand maximum values The numbers of cells in each group are indicated in parentheses and p-values fortwo-sample Kolmogorov-Smirnov tests are shown next to corresponding brackets
14
0 10 20 300
200
400
600
800
1000
distance (au)
elas
tic m
odul
us (k
Pa)
control_cell4
height
length
diameter
a b c
d e
f
Untreated(turgid)
(28)
+KAN(condensed)
(24)
+CIP(condensed)
(32)
400
600
800
1000
1200
Elas
tic m
odul
us (k
Pa)
02742e-8
600
700
800
900
1000
2000
3000
4000
5000
6000
400
600
800
1000
1200
1400
Hei
ght (
nm)
Leng
th (n
m)
Diam
eter
(nm
)
55e-347e-3020
30e-643e-5
009
42e-5014018
Untrea
ted (3
4)
10x C
IP (32)
100x
CIP (20)
10x K
AN (25)
0 10 20 300
500
1000
1500
distance (au)
elas
tic m
odul
us (k
Pa)
cell8
0 10 20 300
200
400
600
800
distance (au)
elas
tic m
odul
us (k
Pa)
Kanamycin_cell4
Supplementary Figure 7 Details of the AFM experimentsa-c Heatmaps of cell height (top) and plots of the elastic modulus (bottom) along the length of a cell (au)for a representative untreated cell (a) a kanamycin-treated cell (10x MIC b) and a ciprofloxacin-treatedcell (10x MIC c) Cells were assayed corresponding to a time sim3 h of antibiotic treatment Error bars indi-cate one standard deviation from at least two technical replicates for the same cell and data are presentedas mean values +- SEM Colored boxes highlight cellular regionsd Comparison of cell-averaged elastic moduli across different treatment conditions (10x MIC) Here andbelow box plots indicating themedian (center) 25th percentile and 75th percentile (bounds of box) and ex-treme data points not considered outliers (bounds of whiskers) are shown and red crosses indicate outliersincluding the minimum and maximum values The numbers of cells in each group are indicated in paren-theses and p-values for two-sample Kolmogorov-Smirnov tests are shown next to corresponding bracketse (Left) Similar to d but for inferred cellular dimensions across different treatment conditions (10x MIC)(Right) Schematic of the different cellular dimensions measuredf Sample force-distance curves from untreated control cells
15
a
b
0 4 5 6 7
0 4 5 6 7
0
SYTOX Blue Pb450
DiBAC (3) FITC
Log green fluorescence intensity
Log blue fluorescence intensity
Even
t cou
ntEv
ent c
ount
4
200400
8001000
600
0
200
400
800
600
Untreated (3h)+KAN (3h)Untreated (6h)+CIP (6h)
Untreated (3h)+KAN (3h)Untreated (6h)+CIP (6h)
-01
0
01
02
03
0
02
04
06
08
1
Relat
ive D
iBAC
(3)
inte
nsity
Relat
ive S
YTO
X Bl
uein
tens
ity4
Not sh
ocke
d
Shock
ed
Not sh
ocke
d
Shock
ed
006
077
c
d
Supplementary Figure 8 Additional DiBAC4(3) and SYTOX Blue measurementsa-b Histograms of fluorescence intensities of populations of control and antibiotic-treated cells in the pres-ence of DiBAC4(3) (a) and SYTOX Blue (b) 3 h after treatment (kanamycin) and 6 h after treatment(ciprofloxacin) as in the main text a longer treatment time was chosen for ciprofloxacin due to a majorityof condensation events occurring later after treatment Concentrations used were 10x MIC for both antibi-otics Data representative of four biological replicates and 20000 scattering events for each distribution Thefluorochromes used (FITC and Pb450) are indicatedc-d Fluorescence intensities of hyperosmotically shocked (500 mM sorbitol) cells in the presence of SYTOXBlue (c) and DiBAC4(3) (d) Fluorescence images were taken immediately after shock Data are from 20cells in each group Box plots indicating themedian (center) 25th percentile and 75th percentile (bounds ofbox) and extreme data points not considered outliers (bounds ofwhiskers) are shown and red crosses indi-cate outliers including the minimum and maximum values p-values for two-sample Kolmogorov-Smirnovtests are shown next to corresponding brackets
16
0
200
400
600
800
1000
10x K
AN
10x C
IP
36e-8
Tim
e fro
m c
onde
nsat
ion
to ly
sis (m
in)
0 200 400 60005
06
07
08
09
1
0 200 400 60005
06
07
08
09
1
0 200 400 60005
06
07
08
09
1ab
10x
KAN
10x
CIP
Relative cell length Relative cell radius Relative cell volume
Time after start of condensation (s)
0 200 400 60005
06
07
08
09
1
0 200 400 60005
06
07
08
09
1
0 200 400 60005
06
07
08
09
1
Supplementary Figure 9 Times from condensation to lysis in antibiotic-treated cells and cellular dimen-sions of condensed cellsa Times from condensation to lysis in kanamycin and ciprofloxacin-treated cells (10x MIC) Data are from20 cells in each group Box plots indicating themedian (center) 25th percentile and 75th percentile (boundsof box) and extreme data points not considered outliers (bounds of whiskers) are shown and red crossesindicate outliers including the minimum and maximum values The p-value for a two-sample Kolmogorov-Smirnov test is shown next to the corresponding bracketb Changes in relative cell length cell radius and cell volume across time from the beginning of conden-sation events in kanamycin and ciprofloxacin-treated cells (10x MIC) corresponding to Fig 2f in the maintext Data are from 20 cells in each group (colored curves) and population-averaged traces (thick redcurves) are shown Note that fluctuations in individual traces arise due to variations in semi-automatedimage processing see Methods for details of the image analysis
17
a
0 100 200 3000
02
04
06
08
10
Time after nanodefect formation (s)
Solute number
0 100 200 3000
02
04
06
08
10Turgor pressure
0 100 200 3000
02
04
06
08
10Cellular volume
b c
Frac
tion
of in
itial s
olut
es re
main
ing
Frac
tion
of in
itial t
urgo
r rem
ainin
g
Frac
tion
of in
itial c
ell v
olum
e re
main
ing
Time after nanodefect formation (s) Time after nanodefect formation (s)
Hole radius = 05 nm 100 holesHole radius = 1 nm 10 holesHole radius = 5 nm 1 hole
Supplementary Figure 10 Sensitivity analysis of the model of solute outflowa Model predictions for the solute number as a function of time across different membrane defect radii(different colors) Depending on the size of typical membrane defect (05 nm 1 nm 5 nm radius) themodelsuggests that different numbers of membrane defects form (100 10 and 1 respectively) as to be consistentwith the minute-timescale of condensation In all cases the model predicts cells to condense after outflowof solutes from a cell as detailed in Supplementary Note 1b-c Same as panel a but for the predicted cellular turgor pressure (b) and volume (c)
18
a
b c
+CIP
Frac
tion
+CIP exp
onen
tial
+CIP ea
rly sta
tiona
ry
+KAN exp
onen
tial
+KAN earl
y stat
ionary
Log
surv
ival
No trea
tmen
t exp
onen
tial
+CIP late
statio
nary
+KAN late
statio
nary
00102030405060708091
-6
-5
-4
-3
-2
-1
0
1
2
No trea
tmen
t earl
y stat
ionary
No trea
tmen
t late
statio
nary
+CIP exp
onen
tial
+CIP ea
rly sta
tiona
ry
+KAN exp
onen
tial
+KAN earl
y stat
ionary
No trea
tmen
t exp
onen
tial
+CIP late
statio
nary
+KAN late
statio
nary
No trea
tmen
t earl
y stat
ionary
No trea
tmen
t late
statio
nary
Supplementary Figure 11 Experiments on stationary-phase cellsa Microscopy images of early stationary-phase (OD600 asymp 15) E coli cells treated by ciprofloxacin (10xMIC)at times 0 h (left) and 6 h (right) Results are representative of two biological replicates and yellowmarkersindicate condensed or lysed cells Scale bar 3 micromb Fractions of all cells that are condensed or lysed corresponding to the experiments in panel a from twodifferent fields of view of two biological replicates with at least 20 cells each in addition to cells from earlyexponential phase (OD600 asymp 01) and late stationary phase (OD600 gt 20) as described in the MethodsAll antibiotics refer to 10x MIC and ldquono treatmentrdquo cells were not treated by antibiotics Individual pointscorresponding to each field of view are shown The numbers of cells in each of two fields of view accordingto the order of treatment shown along the horizontal axis was as follows 24 and 30 56 and 76 101 and 94195 and 206 20 and 20 20 and 20 95 and 107 20 and 20 20 and 30c Survival of E coli cells treated by kanamycin and ciprofloxacin (10x MIC) 6 h after treatment as deter-mined by CFU counting corresponding to panel b Positive values of the log survival indicate an increasein CFUmL Results are from two biological replicates (individual points) and bars indicate averages
19
0
1
2
Relat
ive A
TPO
D
rat
io60
0
LB
LB+glu
tathio
ne
1100
0 LB in
PBS
Supplementary Figure 12 Bulk culture measurements of ATP abundance in cell cultures with and with-out glutathione pretreatment (10 mM) Cells were assayed in early log phase (OD600 asymp 01) For compari-son measurements for cells grown in LB diluted 11000 in PBS are shown Error bars indicate one standarddeviation bars indicate averages and data are presented asmean values+- SEM Individualmeasurementsfrom biological replicates are shown as black points Number of biological replicates in each condition LB8 glutathione 6 11000 LB in PBS 10
20
Untrea
ted
KAN 10x
CIP 10x
AMP 10x
0
200
400
600
800
1000
LPS
(end
otox
in u
nitμ
g pr
otei
n)
Supplementary Figure 13 Measurements of lipopolysaccharide levels Shown are measurements oflipopolysaccharide (LPS) levels of bulk cultures of cells treated by antibiotics (10x MIC) as measured byan LAL assay For comparison data from treatment with 10x MIC ampicillin are included Data from twobiological replicates (black points) and bars indicate averages
21
Parent strain (BW25113) Genetic deletion
+GENT +CIP
ΔgshA
Δgor
-6
-4
-2
0
2
Log
surv
ival
-6
-4
-2
0
2
Log
surv
ival
-6
-4
-2
0
2
Log
surv
ival
-6
-4
-2
0
2
Log
surv
ival
Untrea
ted
1x M
IC
10x M
IC
Untrea
ted
1x M
IC
10x M
IC
Untrea
ted
1x M
IC
10x M
IC
Untrea
ted
1x M
IC
10x M
IC
Supplementary Figure 14 Effects of genetic deletions on antibiotic killing Shown are log survival valuesof E coli under gentamicin and ciprofloxacin treatment as determined by CFU plating and counting after4 h of treatment ∆gshA and ∆gor strains from the Keio collection as well as the parent strain (BW25113)were used Data from two biological replicates (black points) and bars indicate averages Positive valuesindicate increases in CFUmL
22
Relat
ive
C11-
BODI
PY in
tens
ity
+KAN +CIP
42e-5
84e-655e-10
013
47e-9
26e-3
Turgid
Conde
nsed
Lysed
Untrea
ted
Treated
Turgid
Conde
nsed
Lysed
Untrea
ted
Treated
0
5
10
15
20
0
5
10
15
20
55e-1036e-8
47e-9
006
42e-10
55e-10
Supplementary Figure 15 Measurements of C11-BODIPY fluorescence in the presence of α-tocopherolShown are fluorescence intensities of antibiotic-treated E coli pretreated by the lipophilic antioxidantα-tocopherol (50 mM) and in the presence of the lipid peroxidation-sensitive dye C11-BODIPY Thekanamycin and ciprofloxacin concentrations used were 10x MIC Data are from 20 cells in each group Boxplots indicating the median (center) 25th percentile and 75th percentile (bounds of box) and extreme datapoints not considered outliers (bounds of whiskers) are shown and red crosses indicate outliers includingthe minimum and maximum values p-values for two-sample Kolmogorov-Smirnov tests are shown next tocorresponding brackets
23
APC-A
Cytoplasmic mCherry
SSC-A
FSC
-A
Supplementary Figure 16 Gating strategy for flow cytometry E coli cells containing cytoplasmic mCherrywere filtered by calibration of forward- and side-scattering area measurements (FSC-A and SSC-A) usingthe APC-A (red) fluorochrome 20000 scattering events are shown and results are representative of fourbiological replicates with 20000 scattering events each The gating strategy was used for the flow cytometrymeasurements shown in Fig 4 of the main text and Supplementary Figs 1 and 8
24
Supplementary References1 Wong F amp Amir A Mechanics and dynamics of bacterial cell lysis Biophys J 116 2378ndash2389 (2019)
2 Dwyer D J et al Antibiotics induce redox-related physiological alterations as part of their lethalityProc Natl Acad Sci USA 111 E2100ndashE2109 (2014)
3 Yao Z Kahne D amp Kishony R Distinct single-cell morphological dynamics under beta-lactam antibi-otics Mol Cell 48 705ndash712 (2012)
4 Whatmore A M amp Reed R H Determination of turgor pressure in Bacillus subtilis a possible role forK+ in turgor regulation J Gen Microbiol 136 2521ndash2526 (1990)
5 Sun Y Sun T-L ampHuang HW Physical properties ofEscherichia coli spheroplastmembranes BiophysJ 107 2082ndash2090 (2014)
6 Dougherty T J amp Saukkonen J J Membrane permeability changes associated with DNA gyrase in-hibitors in Escherichia coli Antimicrob Agents Chemother 28 200ndash206 (1985)
7 Diver J M amp Wise R Morphological and biochemical changes in Escherichia coli after exposure tociprofloxacin J Antimicrob Chemother 18 31ndash41 (1986)
8 Elliott T S Shelton A amp Greenwood D The response of Escherichia coli to ciprofloxacin and nor-floxacin J Med Microbiol 23 83ndash88 (1987)
9 Wang S Arellano-Santoyo H Combs P A amp Shaevitz J W Actin-like cytoskeleton filaments con-tribute to cell mechanics in bacteria Proc Natl Acad Sci USA 107 9182ndash9185 (2010)
10 Koch A L Bacterial growth and form (Springer Science amp Business Media 2001)
11 Hussain S et al MreB filaments create rod shape by aligning along principal membrane curvature eLife7 e32471 (2018)
12 Wang S ampWingreen N S Cell shape canmediate the spatial organization of the bacterial cytoskeletonBiophys J 541ndash552 (2013)
13 et al K A S Protein diffusion in the periplasm of e coli under osmotic stress Biophys J 22ndash31 (2011)
14 Silhavy T J Kahne D amp Walker S The bacterial cell envelope Cold Spring Harb Perspect Biol 2a000414 (2010)
15 Movva N R Nakamura K amp Inouye M Regulatory region of the gene for the ompA protein a majorouter membrane protein of Escherichia coli Proc Natl Acad Sci USA 77 3845ndash3849 (1980)
16 Cussler E L Diffusion Mass Transfer in Fluid Systems (Cambridge University Press 1997)
17 Sperelakis N Cell Physiology Source Book Essentials of Membrane Biophysics (Academic Press 1995)
18 Phillips R Kondev J Theriot J amp Garcia H Physical Biology of the Cell (Taylor and Francis 2012)
19 Ccediletiner U et al Tension-activated channels in the mechanism of osmotic fitness in Pseudomonas aerugi-nosa J Gen Physiol 149 595ndash609 (2017)
20 Deng Y Sun M amp Shaevitz J W Direct measurement of cell wall stress stiffening and turgor pressurein live bacterial cells Phys Rev Lett 107 158101 (2011)
21 Amir A Babaeipour F McIntosh D B Nelson D R amp Jun S Bending forces plastically deformgrowing bacterial cell walls Proc Natl Acad Sci USA 111 5778ndash5783 (2014)
22 Yao X Jericho M Pink D amp Beveridge T Thickness and elasticity of Gram-negative murein sacculimeasured by atomic force microscopy J Bacteriol 181 6865ndash6875 (1999)
23 Cayley D S Guttman H J amp Record M T Biophysical characterization of changes in amounts andactivity of Escherichia coli cell and compartment water and turgor pressure in response to osmotic stressBiophys J 78 1748ndash1764 (2000)
25
- Cytoplasmic condensation induced by membrane damage is associated with antibiotic lethality
-
- Results
-
- Aminoglycosides and fluoroquinolones induce membrane damage and cytoplasmic condensation in E coli
- A biophysical model of cell envelope mechanics and solute outflow predicts the dynamics of cytoplasmic condensation
- Cytoplasmic condensation is associated with cell death
- Cytoplasmic condensation is associated with ROS accumulation lipid peroxidation and changes in lipid composition
- Cytoplasmic condensation and antibiotic-induced cell death are mitigated by glutathione a scavenger of reactive metabolic by-products
- Cytoplasmic condensation and antibiotic-induced cell death are robust to changes in oxygen availability and external osmolarity
-
- Discussion
- Methods
-
- Bacterial strains
- Antibiotics and other reagents
- Bacterial culture and growth
- Determination of MICs
- Microscopy
- Microfluidics and osmotic shock experiments
- Atomic force microscopy measurements
- Inference of the cellular turgor pressure from atomic force microscopy measurements
- Membrane permeability and depolarization assays
- ROS and RNS detection with fluorescent dyes
- Membrane peroxidation detection with a fluorescent dye
- Image analysis
- Single-cell traces
- Sample preparation for thin-layer chromatography experiments
- Thin-layer chromatography of lipid content
- Time-kill assays and CFU measurements
- Flow cytometry
- ATP abundance assay
- Anaerobic chamber
- Protein concentration and LPS level assays
- Statistical testing
-
- Reporting summary
- Data availability
- References
- Acknowledgements
- Author contributions
- Competing interests
- Additional information
-

a
Outer membrane
+KAN
Inner membrane
b +NOR+GENT c+KAN
+CIP
B subtilis
C11-BODIPY
C11-BODIPY
E coli
Untreated
Untreated
Outer membrane
Inner membrane
CytoplasmUntreated
Phase
Phase
Phase Phase
Phase
CytoplasmPhase
Supplementary Figure 3 Generality of observed phenotypes to different antibiotics and bacterial speciesa E coli cells with fluorescent cytoplasmic (mCherry) outer membrane (GFP) and inner membrane(mCherry) markers as described in theMethods with and without kanamycin treatment for 2 h at 10x MICHere and below scale bars indicate 3 microm imaging was performed in phase contrast and epifluorescenceand results are representative of two biological replicates Yellow markers highlight condensed cellsb E coli cells treated with other antibiotics for 2 h at 10x MIC gentamicin (GENT) an aminoglycoside andnorfloxacin (NOR) a quinolone Results are representative of two biological replicates and yellowmarkershighlight condensed cells A phase contrast microscopy image of corresponding untreated control cells isshownc B subtilis cells treated with kanamycin (50 microgmL) and ciprofloxacin (10 microgmL) after 2 h with (right)and without (left) the dye C11-BODIPY Results are representative of two biological replicates and yellowmarkers highlight condensed bulged or lysed cells A phase contrast microscopy image of correspondinguntreated control cells is shown
11
100x MIC 10x MIC 1x MIC 01x MIC 001x MIC 0001x MIC No treatment
t = 0 h
t = 3 h
t = 20 h
No condensation No condensation No condensation
3 microm
100x MIC 10x MIC 1x MIC 01x MIC 001x MIC 0001x MIC No treatment
t = 0 h
t = 3 h
t = 20 h
3 microm
a
b
No condensationNo condensation No condensation No condensation
Supplementary Figure 4 Generality of the condensation phenotype across different antibiotic concen-trationsa Phase contrast microscopy images of E coli cells treated by various concentrations of kanamycin in cul-ture as indicated for various treatment times as indicated before imaging Here time 0 refers to immediatelybefore treatment Each image is representative of three biological replicates and yellow markers indicate asubset of condensed cellsb Same as panel a but for ciprofloxacin
12
0 5 10-05
0
05
1
15Untreated
0 5 10-05
0
05
1
15KAN Turgid
0 5 10-05
0
05
1
15KAN Condensed
0 5 10-05
0
05
1
15KAN Lysed
0 5 10-05
0
05
1
15CIP Turgid
0 5 10-05
0
05
1
15CIP Condensed
0 5 10-05
0
05
1
15CIP Lysed
L
ΔL
a
b
c
Leng
th c
ontra
ctio
n Δ
L
Cell length L
ε
Supplementary Figure 5 Osmotic shocks reveal collapse of cellular turgora Plot of pre-shock cell length against post-shock length contraction for the osmotic shock experimentssummarized in Fig 1e of the main text showing approximately linear relationships Control cells with noantibiotic treatment were used The average percentage length contraction or strain ε is the slope of thebest fit line (Right) Representative phase contrast microscopy images show the response of an untreatedcell Scale bar 3 micromb-c Same as panel a but for cells treated by kanamycin (10x MIC b) or ciprofloxacin (10x MIC c) andclassified by phenotype
13
Phase Fluorescence
IPG
a b
Untreated
+CIP
+KAN
0
1
2
3
4
5
1
2
3
4
5
00659e-973e-4
+KAN
Untrea
ted (3
0)
Turgid
(20)
Conde
nsed
(20)
Relat
ive IP
Gin
tens
ity
+CIP
Untrea
ted (3
0)
Turgid
(20)
Conde
nsed
(20)
Relat
ive IP
Gin
tens
ity
00649e-1142e-5
Supplementary Figure 6 Measurements of IPG fluorescencea Phase-contrast and fluorescence microscopy images of control and antibiotic-treated cells (10x MIC) inthe presence of IPG a membrane-permeable potassium-sensitive dye Cells were imaged at a time corre-sponding to 3 h of antibiotic treatment Results are representative of two biological replicates and yellowmarkers highlight condensed cells Scale bars 10 micromb Fluorescence intensities of control and antibiotic-treated cells in the presence of IPG Box plots indicatingthe median (center) 25th percentile and 75th percentile (bounds of box) and extreme data points not con-sidered outliers (bounds of whiskers) are shown and red crosses indicate outliers including the minimumand maximum values The numbers of cells in each group are indicated in parentheses and p-values fortwo-sample Kolmogorov-Smirnov tests are shown next to corresponding brackets
14
0 10 20 300
200
400
600
800
1000
distance (au)
elas
tic m
odul
us (k
Pa)
control_cell4
height
length
diameter
a b c
d e
f
Untreated(turgid)
(28)
+KAN(condensed)
(24)
+CIP(condensed)
(32)
400
600
800
1000
1200
Elas
tic m
odul
us (k
Pa)
02742e-8
600
700
800
900
1000
2000
3000
4000
5000
6000
400
600
800
1000
1200
1400
Hei
ght (
nm)
Leng
th (n
m)
Diam
eter
(nm
)
55e-347e-3020
30e-643e-5
009
42e-5014018
Untrea
ted (3
4)
10x C
IP (32)
100x
CIP (20)
10x K
AN (25)
0 10 20 300
500
1000
1500
distance (au)
elas
tic m
odul
us (k
Pa)
cell8
0 10 20 300
200
400
600
800
distance (au)
elas
tic m
odul
us (k
Pa)
Kanamycin_cell4
Supplementary Figure 7 Details of the AFM experimentsa-c Heatmaps of cell height (top) and plots of the elastic modulus (bottom) along the length of a cell (au)for a representative untreated cell (a) a kanamycin-treated cell (10x MIC b) and a ciprofloxacin-treatedcell (10x MIC c) Cells were assayed corresponding to a time sim3 h of antibiotic treatment Error bars indi-cate one standard deviation from at least two technical replicates for the same cell and data are presentedas mean values +- SEM Colored boxes highlight cellular regionsd Comparison of cell-averaged elastic moduli across different treatment conditions (10x MIC) Here andbelow box plots indicating themedian (center) 25th percentile and 75th percentile (bounds of box) and ex-treme data points not considered outliers (bounds of whiskers) are shown and red crosses indicate outliersincluding the minimum and maximum values The numbers of cells in each group are indicated in paren-theses and p-values for two-sample Kolmogorov-Smirnov tests are shown next to corresponding bracketse (Left) Similar to d but for inferred cellular dimensions across different treatment conditions (10x MIC)(Right) Schematic of the different cellular dimensions measuredf Sample force-distance curves from untreated control cells
15
a
b
0 4 5 6 7
0 4 5 6 7
0
SYTOX Blue Pb450
DiBAC (3) FITC
Log green fluorescence intensity
Log blue fluorescence intensity
Even
t cou
ntEv
ent c
ount
4
200400
8001000
600
0
200
400
800
600
Untreated (3h)+KAN (3h)Untreated (6h)+CIP (6h)
Untreated (3h)+KAN (3h)Untreated (6h)+CIP (6h)
-01
0
01
02
03
0
02
04
06
08
1
Relat
ive D
iBAC
(3)
inte
nsity
Relat
ive S
YTO
X Bl
uein
tens
ity4
Not sh
ocke
d
Shock
ed
Not sh
ocke
d
Shock
ed
006
077
c
d
Supplementary Figure 8 Additional DiBAC4(3) and SYTOX Blue measurementsa-b Histograms of fluorescence intensities of populations of control and antibiotic-treated cells in the pres-ence of DiBAC4(3) (a) and SYTOX Blue (b) 3 h after treatment (kanamycin) and 6 h after treatment(ciprofloxacin) as in the main text a longer treatment time was chosen for ciprofloxacin due to a majorityof condensation events occurring later after treatment Concentrations used were 10x MIC for both antibi-otics Data representative of four biological replicates and 20000 scattering events for each distribution Thefluorochromes used (FITC and Pb450) are indicatedc-d Fluorescence intensities of hyperosmotically shocked (500 mM sorbitol) cells in the presence of SYTOXBlue (c) and DiBAC4(3) (d) Fluorescence images were taken immediately after shock Data are from 20cells in each group Box plots indicating themedian (center) 25th percentile and 75th percentile (bounds ofbox) and extreme data points not considered outliers (bounds ofwhiskers) are shown and red crosses indi-cate outliers including the minimum and maximum values p-values for two-sample Kolmogorov-Smirnovtests are shown next to corresponding brackets
16
0
200
400
600
800
1000
10x K
AN
10x C
IP
36e-8
Tim
e fro
m c
onde
nsat
ion
to ly
sis (m
in)
0 200 400 60005
06
07
08
09
1
0 200 400 60005
06
07
08
09
1
0 200 400 60005
06
07
08
09
1ab
10x
KAN
10x
CIP
Relative cell length Relative cell radius Relative cell volume
Time after start of condensation (s)
0 200 400 60005
06
07
08
09
1
0 200 400 60005
06
07
08
09
1
0 200 400 60005
06
07
08
09
1
Supplementary Figure 9 Times from condensation to lysis in antibiotic-treated cells and cellular dimen-sions of condensed cellsa Times from condensation to lysis in kanamycin and ciprofloxacin-treated cells (10x MIC) Data are from20 cells in each group Box plots indicating themedian (center) 25th percentile and 75th percentile (boundsof box) and extreme data points not considered outliers (bounds of whiskers) are shown and red crossesindicate outliers including the minimum and maximum values The p-value for a two-sample Kolmogorov-Smirnov test is shown next to the corresponding bracketb Changes in relative cell length cell radius and cell volume across time from the beginning of conden-sation events in kanamycin and ciprofloxacin-treated cells (10x MIC) corresponding to Fig 2f in the maintext Data are from 20 cells in each group (colored curves) and population-averaged traces (thick redcurves) are shown Note that fluctuations in individual traces arise due to variations in semi-automatedimage processing see Methods for details of the image analysis
17
a
0 100 200 3000
02
04
06
08
10
Time after nanodefect formation (s)
Solute number
0 100 200 3000
02
04
06
08
10Turgor pressure
0 100 200 3000
02
04
06
08
10Cellular volume
b c
Frac
tion
of in
itial s
olut
es re
main
ing
Frac
tion
of in
itial t
urgo
r rem
ainin
g
Frac
tion
of in
itial c
ell v
olum
e re
main
ing
Time after nanodefect formation (s) Time after nanodefect formation (s)
Hole radius = 05 nm 100 holesHole radius = 1 nm 10 holesHole radius = 5 nm 1 hole
Supplementary Figure 10 Sensitivity analysis of the model of solute outflowa Model predictions for the solute number as a function of time across different membrane defect radii(different colors) Depending on the size of typical membrane defect (05 nm 1 nm 5 nm radius) themodelsuggests that different numbers of membrane defects form (100 10 and 1 respectively) as to be consistentwith the minute-timescale of condensation In all cases the model predicts cells to condense after outflowof solutes from a cell as detailed in Supplementary Note 1b-c Same as panel a but for the predicted cellular turgor pressure (b) and volume (c)
18
a
b c
+CIP
Frac
tion
+CIP exp
onen
tial
+CIP ea
rly sta
tiona
ry
+KAN exp
onen
tial
+KAN earl
y stat
ionary
Log
surv
ival
No trea
tmen
t exp
onen
tial
+CIP late
statio
nary
+KAN late
statio
nary
00102030405060708091
-6
-5
-4
-3
-2
-1
0
1
2
No trea
tmen
t earl
y stat
ionary
No trea
tmen
t late
statio
nary
+CIP exp
onen
tial
+CIP ea
rly sta
tiona
ry
+KAN exp
onen
tial
+KAN earl
y stat
ionary
No trea
tmen
t exp
onen
tial
+CIP late
statio
nary
+KAN late
statio
nary
No trea
tmen
t earl
y stat
ionary
No trea
tmen
t late
statio
nary
Supplementary Figure 11 Experiments on stationary-phase cellsa Microscopy images of early stationary-phase (OD600 asymp 15) E coli cells treated by ciprofloxacin (10xMIC)at times 0 h (left) and 6 h (right) Results are representative of two biological replicates and yellowmarkersindicate condensed or lysed cells Scale bar 3 micromb Fractions of all cells that are condensed or lysed corresponding to the experiments in panel a from twodifferent fields of view of two biological replicates with at least 20 cells each in addition to cells from earlyexponential phase (OD600 asymp 01) and late stationary phase (OD600 gt 20) as described in the MethodsAll antibiotics refer to 10x MIC and ldquono treatmentrdquo cells were not treated by antibiotics Individual pointscorresponding to each field of view are shown The numbers of cells in each of two fields of view accordingto the order of treatment shown along the horizontal axis was as follows 24 and 30 56 and 76 101 and 94195 and 206 20 and 20 20 and 20 95 and 107 20 and 20 20 and 30c Survival of E coli cells treated by kanamycin and ciprofloxacin (10x MIC) 6 h after treatment as deter-mined by CFU counting corresponding to panel b Positive values of the log survival indicate an increasein CFUmL Results are from two biological replicates (individual points) and bars indicate averages
19
0
1
2
Relat
ive A
TPO
D
rat
io60
0
LB
LB+glu
tathio
ne
1100
0 LB in
PBS
Supplementary Figure 12 Bulk culture measurements of ATP abundance in cell cultures with and with-out glutathione pretreatment (10 mM) Cells were assayed in early log phase (OD600 asymp 01) For compari-son measurements for cells grown in LB diluted 11000 in PBS are shown Error bars indicate one standarddeviation bars indicate averages and data are presented asmean values+- SEM Individualmeasurementsfrom biological replicates are shown as black points Number of biological replicates in each condition LB8 glutathione 6 11000 LB in PBS 10
20
Untrea
ted
KAN 10x
CIP 10x
AMP 10x
0
200
400
600
800
1000
LPS
(end
otox
in u
nitμ
g pr
otei
n)
Supplementary Figure 13 Measurements of lipopolysaccharide levels Shown are measurements oflipopolysaccharide (LPS) levels of bulk cultures of cells treated by antibiotics (10x MIC) as measured byan LAL assay For comparison data from treatment with 10x MIC ampicillin are included Data from twobiological replicates (black points) and bars indicate averages
21
Parent strain (BW25113) Genetic deletion
+GENT +CIP
ΔgshA
Δgor
-6
-4
-2
0
2
Log
surv
ival
-6
-4
-2
0
2
Log
surv
ival
-6
-4
-2
0
2
Log
surv
ival
-6
-4
-2
0
2
Log
surv
ival
Untrea
ted
1x M
IC
10x M
IC
Untrea
ted
1x M
IC
10x M
IC
Untrea
ted
1x M
IC
10x M
IC
Untrea
ted
1x M
IC
10x M
IC
Supplementary Figure 14 Effects of genetic deletions on antibiotic killing Shown are log survival valuesof E coli under gentamicin and ciprofloxacin treatment as determined by CFU plating and counting after4 h of treatment ∆gshA and ∆gor strains from the Keio collection as well as the parent strain (BW25113)were used Data from two biological replicates (black points) and bars indicate averages Positive valuesindicate increases in CFUmL
22
Relat
ive
C11-
BODI
PY in
tens
ity
+KAN +CIP
42e-5
84e-655e-10
013
47e-9
26e-3
Turgid
Conde
nsed
Lysed
Untrea
ted
Treated
Turgid
Conde
nsed
Lysed
Untrea
ted
Treated
0
5
10
15
20
0
5
10
15
20
55e-1036e-8
47e-9
006
42e-10
55e-10
Supplementary Figure 15 Measurements of C11-BODIPY fluorescence in the presence of α-tocopherolShown are fluorescence intensities of antibiotic-treated E coli pretreated by the lipophilic antioxidantα-tocopherol (50 mM) and in the presence of the lipid peroxidation-sensitive dye C11-BODIPY Thekanamycin and ciprofloxacin concentrations used were 10x MIC Data are from 20 cells in each group Boxplots indicating the median (center) 25th percentile and 75th percentile (bounds of box) and extreme datapoints not considered outliers (bounds of whiskers) are shown and red crosses indicate outliers includingthe minimum and maximum values p-values for two-sample Kolmogorov-Smirnov tests are shown next tocorresponding brackets
23
APC-A
Cytoplasmic mCherry
SSC-A
FSC
-A
Supplementary Figure 16 Gating strategy for flow cytometry E coli cells containing cytoplasmic mCherrywere filtered by calibration of forward- and side-scattering area measurements (FSC-A and SSC-A) usingthe APC-A (red) fluorochrome 20000 scattering events are shown and results are representative of fourbiological replicates with 20000 scattering events each The gating strategy was used for the flow cytometrymeasurements shown in Fig 4 of the main text and Supplementary Figs 1 and 8
24
Supplementary References1 Wong F amp Amir A Mechanics and dynamics of bacterial cell lysis Biophys J 116 2378ndash2389 (2019)
2 Dwyer D J et al Antibiotics induce redox-related physiological alterations as part of their lethalityProc Natl Acad Sci USA 111 E2100ndashE2109 (2014)
3 Yao Z Kahne D amp Kishony R Distinct single-cell morphological dynamics under beta-lactam antibi-otics Mol Cell 48 705ndash712 (2012)
4 Whatmore A M amp Reed R H Determination of turgor pressure in Bacillus subtilis a possible role forK+ in turgor regulation J Gen Microbiol 136 2521ndash2526 (1990)
5 Sun Y Sun T-L ampHuang HW Physical properties ofEscherichia coli spheroplastmembranes BiophysJ 107 2082ndash2090 (2014)
6 Dougherty T J amp Saukkonen J J Membrane permeability changes associated with DNA gyrase in-hibitors in Escherichia coli Antimicrob Agents Chemother 28 200ndash206 (1985)
7 Diver J M amp Wise R Morphological and biochemical changes in Escherichia coli after exposure tociprofloxacin J Antimicrob Chemother 18 31ndash41 (1986)
8 Elliott T S Shelton A amp Greenwood D The response of Escherichia coli to ciprofloxacin and nor-floxacin J Med Microbiol 23 83ndash88 (1987)
9 Wang S Arellano-Santoyo H Combs P A amp Shaevitz J W Actin-like cytoskeleton filaments con-tribute to cell mechanics in bacteria Proc Natl Acad Sci USA 107 9182ndash9185 (2010)
10 Koch A L Bacterial growth and form (Springer Science amp Business Media 2001)
11 Hussain S et al MreB filaments create rod shape by aligning along principal membrane curvature eLife7 e32471 (2018)
12 Wang S ampWingreen N S Cell shape canmediate the spatial organization of the bacterial cytoskeletonBiophys J 541ndash552 (2013)
13 et al K A S Protein diffusion in the periplasm of e coli under osmotic stress Biophys J 22ndash31 (2011)
14 Silhavy T J Kahne D amp Walker S The bacterial cell envelope Cold Spring Harb Perspect Biol 2a000414 (2010)
15 Movva N R Nakamura K amp Inouye M Regulatory region of the gene for the ompA protein a majorouter membrane protein of Escherichia coli Proc Natl Acad Sci USA 77 3845ndash3849 (1980)
16 Cussler E L Diffusion Mass Transfer in Fluid Systems (Cambridge University Press 1997)
17 Sperelakis N Cell Physiology Source Book Essentials of Membrane Biophysics (Academic Press 1995)
18 Phillips R Kondev J Theriot J amp Garcia H Physical Biology of the Cell (Taylor and Francis 2012)
19 Ccediletiner U et al Tension-activated channels in the mechanism of osmotic fitness in Pseudomonas aerugi-nosa J Gen Physiol 149 595ndash609 (2017)
20 Deng Y Sun M amp Shaevitz J W Direct measurement of cell wall stress stiffening and turgor pressurein live bacterial cells Phys Rev Lett 107 158101 (2011)
21 Amir A Babaeipour F McIntosh D B Nelson D R amp Jun S Bending forces plastically deformgrowing bacterial cell walls Proc Natl Acad Sci USA 111 5778ndash5783 (2014)
22 Yao X Jericho M Pink D amp Beveridge T Thickness and elasticity of Gram-negative murein sacculimeasured by atomic force microscopy J Bacteriol 181 6865ndash6875 (1999)
23 Cayley D S Guttman H J amp Record M T Biophysical characterization of changes in amounts andactivity of Escherichia coli cell and compartment water and turgor pressure in response to osmotic stressBiophys J 78 1748ndash1764 (2000)
25
- Cytoplasmic condensation induced by membrane damage is associated with antibiotic lethality
-
- Results
-
- Aminoglycosides and fluoroquinolones induce membrane damage and cytoplasmic condensation in E coli
- A biophysical model of cell envelope mechanics and solute outflow predicts the dynamics of cytoplasmic condensation
- Cytoplasmic condensation is associated with cell death
- Cytoplasmic condensation is associated with ROS accumulation lipid peroxidation and changes in lipid composition
- Cytoplasmic condensation and antibiotic-induced cell death are mitigated by glutathione a scavenger of reactive metabolic by-products
- Cytoplasmic condensation and antibiotic-induced cell death are robust to changes in oxygen availability and external osmolarity
-
- Discussion
- Methods
-
- Bacterial strains
- Antibiotics and other reagents
- Bacterial culture and growth
- Determination of MICs
- Microscopy
- Microfluidics and osmotic shock experiments
- Atomic force microscopy measurements
- Inference of the cellular turgor pressure from atomic force microscopy measurements
- Membrane permeability and depolarization assays
- ROS and RNS detection with fluorescent dyes
- Membrane peroxidation detection with a fluorescent dye
- Image analysis
- Single-cell traces
- Sample preparation for thin-layer chromatography experiments
- Thin-layer chromatography of lipid content
- Time-kill assays and CFU measurements
- Flow cytometry
- ATP abundance assay
- Anaerobic chamber
- Protein concentration and LPS level assays
- Statistical testing
-
- Reporting summary
- Data availability
- References
- Acknowledgements
- Author contributions
- Competing interests
- Additional information
-

100x MIC 10x MIC 1x MIC 01x MIC 001x MIC 0001x MIC No treatment
t = 0 h
t = 3 h
t = 20 h
No condensation No condensation No condensation
3 microm
100x MIC 10x MIC 1x MIC 01x MIC 001x MIC 0001x MIC No treatment
t = 0 h
t = 3 h
t = 20 h
3 microm
a
b
No condensationNo condensation No condensation No condensation
Supplementary Figure 4 Generality of the condensation phenotype across different antibiotic concen-trationsa Phase contrast microscopy images of E coli cells treated by various concentrations of kanamycin in cul-ture as indicated for various treatment times as indicated before imaging Here time 0 refers to immediatelybefore treatment Each image is representative of three biological replicates and yellow markers indicate asubset of condensed cellsb Same as panel a but for ciprofloxacin
12
0 5 10-05
0
05
1
15Untreated
0 5 10-05
0
05
1
15KAN Turgid
0 5 10-05
0
05
1
15KAN Condensed
0 5 10-05
0
05
1
15KAN Lysed
0 5 10-05
0
05
1
15CIP Turgid
0 5 10-05
0
05
1
15CIP Condensed
0 5 10-05
0
05
1
15CIP Lysed
L
ΔL
a
b
c
Leng
th c
ontra
ctio
n Δ
L
Cell length L
ε
Supplementary Figure 5 Osmotic shocks reveal collapse of cellular turgora Plot of pre-shock cell length against post-shock length contraction for the osmotic shock experimentssummarized in Fig 1e of the main text showing approximately linear relationships Control cells with noantibiotic treatment were used The average percentage length contraction or strain ε is the slope of thebest fit line (Right) Representative phase contrast microscopy images show the response of an untreatedcell Scale bar 3 micromb-c Same as panel a but for cells treated by kanamycin (10x MIC b) or ciprofloxacin (10x MIC c) andclassified by phenotype
13
Phase Fluorescence
IPG
a b
Untreated
+CIP
+KAN
0
1
2
3
4
5
1
2
3
4
5
00659e-973e-4
+KAN
Untrea
ted (3
0)
Turgid
(20)
Conde
nsed
(20)
Relat
ive IP
Gin
tens
ity
+CIP
Untrea
ted (3
0)
Turgid
(20)
Conde
nsed
(20)
Relat
ive IP
Gin
tens
ity
00649e-1142e-5
Supplementary Figure 6 Measurements of IPG fluorescencea Phase-contrast and fluorescence microscopy images of control and antibiotic-treated cells (10x MIC) inthe presence of IPG a membrane-permeable potassium-sensitive dye Cells were imaged at a time corre-sponding to 3 h of antibiotic treatment Results are representative of two biological replicates and yellowmarkers highlight condensed cells Scale bars 10 micromb Fluorescence intensities of control and antibiotic-treated cells in the presence of IPG Box plots indicatingthe median (center) 25th percentile and 75th percentile (bounds of box) and extreme data points not con-sidered outliers (bounds of whiskers) are shown and red crosses indicate outliers including the minimumand maximum values The numbers of cells in each group are indicated in parentheses and p-values fortwo-sample Kolmogorov-Smirnov tests are shown next to corresponding brackets
14
0 10 20 300
200
400
600
800
1000
distance (au)
elas
tic m
odul
us (k
Pa)
control_cell4
height
length
diameter
a b c
d e
f
Untreated(turgid)
(28)
+KAN(condensed)
(24)
+CIP(condensed)
(32)
400
600
800
1000
1200
Elas
tic m
odul
us (k
Pa)
02742e-8
600
700
800
900
1000
2000
3000
4000
5000
6000
400
600
800
1000
1200
1400
Hei
ght (
nm)
Leng
th (n
m)
Diam
eter
(nm
)
55e-347e-3020
30e-643e-5
009
42e-5014018
Untrea
ted (3
4)
10x C
IP (32)
100x
CIP (20)
10x K
AN (25)
0 10 20 300
500
1000
1500
distance (au)
elas
tic m
odul
us (k
Pa)
cell8
0 10 20 300
200
400
600
800
distance (au)
elas
tic m
odul
us (k
Pa)
Kanamycin_cell4
Supplementary Figure 7 Details of the AFM experimentsa-c Heatmaps of cell height (top) and plots of the elastic modulus (bottom) along the length of a cell (au)for a representative untreated cell (a) a kanamycin-treated cell (10x MIC b) and a ciprofloxacin-treatedcell (10x MIC c) Cells were assayed corresponding to a time sim3 h of antibiotic treatment Error bars indi-cate one standard deviation from at least two technical replicates for the same cell and data are presentedas mean values +- SEM Colored boxes highlight cellular regionsd Comparison of cell-averaged elastic moduli across different treatment conditions (10x MIC) Here andbelow box plots indicating themedian (center) 25th percentile and 75th percentile (bounds of box) and ex-treme data points not considered outliers (bounds of whiskers) are shown and red crosses indicate outliersincluding the minimum and maximum values The numbers of cells in each group are indicated in paren-theses and p-values for two-sample Kolmogorov-Smirnov tests are shown next to corresponding bracketse (Left) Similar to d but for inferred cellular dimensions across different treatment conditions (10x MIC)(Right) Schematic of the different cellular dimensions measuredf Sample force-distance curves from untreated control cells
15
a
b
0 4 5 6 7
0 4 5 6 7
0
SYTOX Blue Pb450
DiBAC (3) FITC
Log green fluorescence intensity
Log blue fluorescence intensity
Even
t cou
ntEv
ent c
ount
4
200400
8001000
600
0
200
400
800
600
Untreated (3h)+KAN (3h)Untreated (6h)+CIP (6h)
Untreated (3h)+KAN (3h)Untreated (6h)+CIP (6h)
-01
0
01
02
03
0
02
04
06
08
1
Relat
ive D
iBAC
(3)
inte
nsity
Relat
ive S
YTO
X Bl
uein
tens
ity4
Not sh
ocke
d
Shock
ed
Not sh
ocke
d
Shock
ed
006
077
c
d
Supplementary Figure 8 Additional DiBAC4(3) and SYTOX Blue measurementsa-b Histograms of fluorescence intensities of populations of control and antibiotic-treated cells in the pres-ence of DiBAC4(3) (a) and SYTOX Blue (b) 3 h after treatment (kanamycin) and 6 h after treatment(ciprofloxacin) as in the main text a longer treatment time was chosen for ciprofloxacin due to a majorityof condensation events occurring later after treatment Concentrations used were 10x MIC for both antibi-otics Data representative of four biological replicates and 20000 scattering events for each distribution Thefluorochromes used (FITC and Pb450) are indicatedc-d Fluorescence intensities of hyperosmotically shocked (500 mM sorbitol) cells in the presence of SYTOXBlue (c) and DiBAC4(3) (d) Fluorescence images were taken immediately after shock Data are from 20cells in each group Box plots indicating themedian (center) 25th percentile and 75th percentile (bounds ofbox) and extreme data points not considered outliers (bounds ofwhiskers) are shown and red crosses indi-cate outliers including the minimum and maximum values p-values for two-sample Kolmogorov-Smirnovtests are shown next to corresponding brackets
16
0
200
400
600
800
1000
10x K
AN
10x C
IP
36e-8
Tim
e fro
m c
onde
nsat
ion
to ly
sis (m
in)
0 200 400 60005
06
07
08
09
1
0 200 400 60005
06
07
08
09
1
0 200 400 60005
06
07
08
09
1ab
10x
KAN
10x
CIP
Relative cell length Relative cell radius Relative cell volume
Time after start of condensation (s)
0 200 400 60005
06
07
08
09
1
0 200 400 60005
06
07
08
09
1
0 200 400 60005
06
07
08
09
1
Supplementary Figure 9 Times from condensation to lysis in antibiotic-treated cells and cellular dimen-sions of condensed cellsa Times from condensation to lysis in kanamycin and ciprofloxacin-treated cells (10x MIC) Data are from20 cells in each group Box plots indicating themedian (center) 25th percentile and 75th percentile (boundsof box) and extreme data points not considered outliers (bounds of whiskers) are shown and red crossesindicate outliers including the minimum and maximum values The p-value for a two-sample Kolmogorov-Smirnov test is shown next to the corresponding bracketb Changes in relative cell length cell radius and cell volume across time from the beginning of conden-sation events in kanamycin and ciprofloxacin-treated cells (10x MIC) corresponding to Fig 2f in the maintext Data are from 20 cells in each group (colored curves) and population-averaged traces (thick redcurves) are shown Note that fluctuations in individual traces arise due to variations in semi-automatedimage processing see Methods for details of the image analysis
17
a
0 100 200 3000
02
04
06
08
10
Time after nanodefect formation (s)
Solute number
0 100 200 3000
02
04
06
08
10Turgor pressure
0 100 200 3000
02
04
06
08
10Cellular volume
b c
Frac
tion
of in
itial s
olut
es re
main
ing
Frac
tion
of in
itial t
urgo
r rem
ainin
g
Frac
tion
of in
itial c
ell v
olum
e re
main
ing
Time after nanodefect formation (s) Time after nanodefect formation (s)
Hole radius = 05 nm 100 holesHole radius = 1 nm 10 holesHole radius = 5 nm 1 hole
Supplementary Figure 10 Sensitivity analysis of the model of solute outflowa Model predictions for the solute number as a function of time across different membrane defect radii(different colors) Depending on the size of typical membrane defect (05 nm 1 nm 5 nm radius) themodelsuggests that different numbers of membrane defects form (100 10 and 1 respectively) as to be consistentwith the minute-timescale of condensation In all cases the model predicts cells to condense after outflowof solutes from a cell as detailed in Supplementary Note 1b-c Same as panel a but for the predicted cellular turgor pressure (b) and volume (c)
18
a
b c
+CIP
Frac
tion
+CIP exp
onen
tial
+CIP ea
rly sta
tiona
ry
+KAN exp
onen
tial
+KAN earl
y stat
ionary
Log
surv
ival
No trea
tmen
t exp
onen
tial
+CIP late
statio
nary
+KAN late
statio
nary
00102030405060708091
-6
-5
-4
-3
-2
-1
0
1
2
No trea
tmen
t earl
y stat
ionary
No trea
tmen
t late
statio
nary
+CIP exp
onen
tial
+CIP ea
rly sta
tiona
ry
+KAN exp
onen
tial
+KAN earl
y stat
ionary
No trea
tmen
t exp
onen
tial
+CIP late
statio
nary
+KAN late
statio
nary
No trea
tmen
t earl
y stat
ionary
No trea
tmen
t late
statio
nary
Supplementary Figure 11 Experiments on stationary-phase cellsa Microscopy images of early stationary-phase (OD600 asymp 15) E coli cells treated by ciprofloxacin (10xMIC)at times 0 h (left) and 6 h (right) Results are representative of two biological replicates and yellowmarkersindicate condensed or lysed cells Scale bar 3 micromb Fractions of all cells that are condensed or lysed corresponding to the experiments in panel a from twodifferent fields of view of two biological replicates with at least 20 cells each in addition to cells from earlyexponential phase (OD600 asymp 01) and late stationary phase (OD600 gt 20) as described in the MethodsAll antibiotics refer to 10x MIC and ldquono treatmentrdquo cells were not treated by antibiotics Individual pointscorresponding to each field of view are shown The numbers of cells in each of two fields of view accordingto the order of treatment shown along the horizontal axis was as follows 24 and 30 56 and 76 101 and 94195 and 206 20 and 20 20 and 20 95 and 107 20 and 20 20 and 30c Survival of E coli cells treated by kanamycin and ciprofloxacin (10x MIC) 6 h after treatment as deter-mined by CFU counting corresponding to panel b Positive values of the log survival indicate an increasein CFUmL Results are from two biological replicates (individual points) and bars indicate averages
19
0
1
2
Relat
ive A
TPO
D
rat
io60
0
LB
LB+glu
tathio
ne
1100
0 LB in
PBS
Supplementary Figure 12 Bulk culture measurements of ATP abundance in cell cultures with and with-out glutathione pretreatment (10 mM) Cells were assayed in early log phase (OD600 asymp 01) For compari-son measurements for cells grown in LB diluted 11000 in PBS are shown Error bars indicate one standarddeviation bars indicate averages and data are presented asmean values+- SEM Individualmeasurementsfrom biological replicates are shown as black points Number of biological replicates in each condition LB8 glutathione 6 11000 LB in PBS 10
20
Untrea
ted
KAN 10x
CIP 10x
AMP 10x
0
200
400
600
800
1000
LPS
(end
otox
in u
nitμ
g pr
otei
n)
Supplementary Figure 13 Measurements of lipopolysaccharide levels Shown are measurements oflipopolysaccharide (LPS) levels of bulk cultures of cells treated by antibiotics (10x MIC) as measured byan LAL assay For comparison data from treatment with 10x MIC ampicillin are included Data from twobiological replicates (black points) and bars indicate averages
21
Parent strain (BW25113) Genetic deletion
+GENT +CIP
ΔgshA
Δgor
-6
-4
-2
0
2
Log
surv
ival
-6
-4
-2
0
2
Log
surv
ival
-6
-4
-2
0
2
Log
surv
ival
-6
-4
-2
0
2
Log
surv
ival
Untrea
ted
1x M
IC
10x M
IC
Untrea
ted
1x M
IC
10x M
IC
Untrea
ted
1x M
IC
10x M
IC
Untrea
ted
1x M
IC
10x M
IC
Supplementary Figure 14 Effects of genetic deletions on antibiotic killing Shown are log survival valuesof E coli under gentamicin and ciprofloxacin treatment as determined by CFU plating and counting after4 h of treatment ∆gshA and ∆gor strains from the Keio collection as well as the parent strain (BW25113)were used Data from two biological replicates (black points) and bars indicate averages Positive valuesindicate increases in CFUmL
22
Relat
ive
C11-
BODI
PY in
tens
ity
+KAN +CIP
42e-5
84e-655e-10
013
47e-9
26e-3
Turgid
Conde
nsed
Lysed
Untrea
ted
Treated
Turgid
Conde
nsed
Lysed
Untrea
ted
Treated
0
5
10
15
20
0
5
10
15
20
55e-1036e-8
47e-9
006
42e-10
55e-10
Supplementary Figure 15 Measurements of C11-BODIPY fluorescence in the presence of α-tocopherolShown are fluorescence intensities of antibiotic-treated E coli pretreated by the lipophilic antioxidantα-tocopherol (50 mM) and in the presence of the lipid peroxidation-sensitive dye C11-BODIPY Thekanamycin and ciprofloxacin concentrations used were 10x MIC Data are from 20 cells in each group Boxplots indicating the median (center) 25th percentile and 75th percentile (bounds of box) and extreme datapoints not considered outliers (bounds of whiskers) are shown and red crosses indicate outliers includingthe minimum and maximum values p-values for two-sample Kolmogorov-Smirnov tests are shown next tocorresponding brackets
23
APC-A
Cytoplasmic mCherry
SSC-A
FSC
-A
Supplementary Figure 16 Gating strategy for flow cytometry E coli cells containing cytoplasmic mCherrywere filtered by calibration of forward- and side-scattering area measurements (FSC-A and SSC-A) usingthe APC-A (red) fluorochrome 20000 scattering events are shown and results are representative of fourbiological replicates with 20000 scattering events each The gating strategy was used for the flow cytometrymeasurements shown in Fig 4 of the main text and Supplementary Figs 1 and 8
24
Supplementary References1 Wong F amp Amir A Mechanics and dynamics of bacterial cell lysis Biophys J 116 2378ndash2389 (2019)
2 Dwyer D J et al Antibiotics induce redox-related physiological alterations as part of their lethalityProc Natl Acad Sci USA 111 E2100ndashE2109 (2014)
3 Yao Z Kahne D amp Kishony R Distinct single-cell morphological dynamics under beta-lactam antibi-otics Mol Cell 48 705ndash712 (2012)
4 Whatmore A M amp Reed R H Determination of turgor pressure in Bacillus subtilis a possible role forK+ in turgor regulation J Gen Microbiol 136 2521ndash2526 (1990)
5 Sun Y Sun T-L ampHuang HW Physical properties ofEscherichia coli spheroplastmembranes BiophysJ 107 2082ndash2090 (2014)
6 Dougherty T J amp Saukkonen J J Membrane permeability changes associated with DNA gyrase in-hibitors in Escherichia coli Antimicrob Agents Chemother 28 200ndash206 (1985)
7 Diver J M amp Wise R Morphological and biochemical changes in Escherichia coli after exposure tociprofloxacin J Antimicrob Chemother 18 31ndash41 (1986)
8 Elliott T S Shelton A amp Greenwood D The response of Escherichia coli to ciprofloxacin and nor-floxacin J Med Microbiol 23 83ndash88 (1987)
9 Wang S Arellano-Santoyo H Combs P A amp Shaevitz J W Actin-like cytoskeleton filaments con-tribute to cell mechanics in bacteria Proc Natl Acad Sci USA 107 9182ndash9185 (2010)
10 Koch A L Bacterial growth and form (Springer Science amp Business Media 2001)
11 Hussain S et al MreB filaments create rod shape by aligning along principal membrane curvature eLife7 e32471 (2018)
12 Wang S ampWingreen N S Cell shape canmediate the spatial organization of the bacterial cytoskeletonBiophys J 541ndash552 (2013)
13 et al K A S Protein diffusion in the periplasm of e coli under osmotic stress Biophys J 22ndash31 (2011)
14 Silhavy T J Kahne D amp Walker S The bacterial cell envelope Cold Spring Harb Perspect Biol 2a000414 (2010)
15 Movva N R Nakamura K amp Inouye M Regulatory region of the gene for the ompA protein a majorouter membrane protein of Escherichia coli Proc Natl Acad Sci USA 77 3845ndash3849 (1980)
16 Cussler E L Diffusion Mass Transfer in Fluid Systems (Cambridge University Press 1997)
17 Sperelakis N Cell Physiology Source Book Essentials of Membrane Biophysics (Academic Press 1995)
18 Phillips R Kondev J Theriot J amp Garcia H Physical Biology of the Cell (Taylor and Francis 2012)
19 Ccediletiner U et al Tension-activated channels in the mechanism of osmotic fitness in Pseudomonas aerugi-nosa J Gen Physiol 149 595ndash609 (2017)
20 Deng Y Sun M amp Shaevitz J W Direct measurement of cell wall stress stiffening and turgor pressurein live bacterial cells Phys Rev Lett 107 158101 (2011)
21 Amir A Babaeipour F McIntosh D B Nelson D R amp Jun S Bending forces plastically deformgrowing bacterial cell walls Proc Natl Acad Sci USA 111 5778ndash5783 (2014)
22 Yao X Jericho M Pink D amp Beveridge T Thickness and elasticity of Gram-negative murein sacculimeasured by atomic force microscopy J Bacteriol 181 6865ndash6875 (1999)
23 Cayley D S Guttman H J amp Record M T Biophysical characterization of changes in amounts andactivity of Escherichia coli cell and compartment water and turgor pressure in response to osmotic stressBiophys J 78 1748ndash1764 (2000)
25
- Cytoplasmic condensation induced by membrane damage is associated with antibiotic lethality
-
- Results
-
- Aminoglycosides and fluoroquinolones induce membrane damage and cytoplasmic condensation in E coli
- A biophysical model of cell envelope mechanics and solute outflow predicts the dynamics of cytoplasmic condensation
- Cytoplasmic condensation is associated with cell death
- Cytoplasmic condensation is associated with ROS accumulation lipid peroxidation and changes in lipid composition
- Cytoplasmic condensation and antibiotic-induced cell death are mitigated by glutathione a scavenger of reactive metabolic by-products
- Cytoplasmic condensation and antibiotic-induced cell death are robust to changes in oxygen availability and external osmolarity
-
- Discussion
- Methods
-
- Bacterial strains
- Antibiotics and other reagents
- Bacterial culture and growth
- Determination of MICs
- Microscopy
- Microfluidics and osmotic shock experiments
- Atomic force microscopy measurements
- Inference of the cellular turgor pressure from atomic force microscopy measurements
- Membrane permeability and depolarization assays
- ROS and RNS detection with fluorescent dyes
- Membrane peroxidation detection with a fluorescent dye
- Image analysis
- Single-cell traces
- Sample preparation for thin-layer chromatography experiments
- Thin-layer chromatography of lipid content
- Time-kill assays and CFU measurements
- Flow cytometry
- ATP abundance assay
- Anaerobic chamber
- Protein concentration and LPS level assays
- Statistical testing
-
- Reporting summary
- Data availability
- References
- Acknowledgements
- Author contributions
- Competing interests
- Additional information
-

0 5 10-05
0
05
1
15Untreated
0 5 10-05
0
05
1
15KAN Turgid
0 5 10-05
0
05
1
15KAN Condensed
0 5 10-05
0
05
1
15KAN Lysed
0 5 10-05
0
05
1
15CIP Turgid
0 5 10-05
0
05
1
15CIP Condensed
0 5 10-05
0
05
1
15CIP Lysed
L
ΔL
a
b
c
Leng
th c
ontra
ctio
n Δ
L
Cell length L
ε
Supplementary Figure 5 Osmotic shocks reveal collapse of cellular turgora Plot of pre-shock cell length against post-shock length contraction for the osmotic shock experimentssummarized in Fig 1e of the main text showing approximately linear relationships Control cells with noantibiotic treatment were used The average percentage length contraction or strain ε is the slope of thebest fit line (Right) Representative phase contrast microscopy images show the response of an untreatedcell Scale bar 3 micromb-c Same as panel a but for cells treated by kanamycin (10x MIC b) or ciprofloxacin (10x MIC c) andclassified by phenotype
13
Phase Fluorescence
IPG
a b
Untreated
+CIP
+KAN
0
1
2
3
4
5
1
2
3
4
5
00659e-973e-4
+KAN
Untrea
ted (3
0)
Turgid
(20)
Conde
nsed
(20)
Relat
ive IP
Gin
tens
ity
+CIP
Untrea
ted (3
0)
Turgid
(20)
Conde
nsed
(20)
Relat
ive IP
Gin
tens
ity
00649e-1142e-5
Supplementary Figure 6 Measurements of IPG fluorescencea Phase-contrast and fluorescence microscopy images of control and antibiotic-treated cells (10x MIC) inthe presence of IPG a membrane-permeable potassium-sensitive dye Cells were imaged at a time corre-sponding to 3 h of antibiotic treatment Results are representative of two biological replicates and yellowmarkers highlight condensed cells Scale bars 10 micromb Fluorescence intensities of control and antibiotic-treated cells in the presence of IPG Box plots indicatingthe median (center) 25th percentile and 75th percentile (bounds of box) and extreme data points not con-sidered outliers (bounds of whiskers) are shown and red crosses indicate outliers including the minimumand maximum values The numbers of cells in each group are indicated in parentheses and p-values fortwo-sample Kolmogorov-Smirnov tests are shown next to corresponding brackets
14
0 10 20 300
200
400
600
800
1000
distance (au)
elas
tic m
odul
us (k
Pa)
control_cell4
height
length
diameter
a b c
d e
f
Untreated(turgid)
(28)
+KAN(condensed)
(24)
+CIP(condensed)
(32)
400
600
800
1000
1200
Elas
tic m
odul
us (k
Pa)
02742e-8
600
700
800
900
1000
2000
3000
4000
5000
6000
400
600
800
1000
1200
1400
Hei
ght (
nm)
Leng
th (n
m)
Diam
eter
(nm
)
55e-347e-3020
30e-643e-5
009
42e-5014018
Untrea
ted (3
4)
10x C
IP (32)
100x
CIP (20)
10x K
AN (25)
0 10 20 300
500
1000
1500
distance (au)
elas
tic m
odul
us (k
Pa)
cell8
0 10 20 300
200
400
600
800
distance (au)
elas
tic m
odul
us (k
Pa)
Kanamycin_cell4
Supplementary Figure 7 Details of the AFM experimentsa-c Heatmaps of cell height (top) and plots of the elastic modulus (bottom) along the length of a cell (au)for a representative untreated cell (a) a kanamycin-treated cell (10x MIC b) and a ciprofloxacin-treatedcell (10x MIC c) Cells were assayed corresponding to a time sim3 h of antibiotic treatment Error bars indi-cate one standard deviation from at least two technical replicates for the same cell and data are presentedas mean values +- SEM Colored boxes highlight cellular regionsd Comparison of cell-averaged elastic moduli across different treatment conditions (10x MIC) Here andbelow box plots indicating themedian (center) 25th percentile and 75th percentile (bounds of box) and ex-treme data points not considered outliers (bounds of whiskers) are shown and red crosses indicate outliersincluding the minimum and maximum values The numbers of cells in each group are indicated in paren-theses and p-values for two-sample Kolmogorov-Smirnov tests are shown next to corresponding bracketse (Left) Similar to d but for inferred cellular dimensions across different treatment conditions (10x MIC)(Right) Schematic of the different cellular dimensions measuredf Sample force-distance curves from untreated control cells
15
a
b
0 4 5 6 7
0 4 5 6 7
0
SYTOX Blue Pb450
DiBAC (3) FITC
Log green fluorescence intensity
Log blue fluorescence intensity
Even
t cou
ntEv
ent c
ount
4
200400
8001000
600
0
200
400
800
600
Untreated (3h)+KAN (3h)Untreated (6h)+CIP (6h)
Untreated (3h)+KAN (3h)Untreated (6h)+CIP (6h)
-01
0
01
02
03
0
02
04
06
08
1
Relat
ive D
iBAC
(3)
inte
nsity
Relat
ive S
YTO
X Bl
uein
tens
ity4
Not sh
ocke
d
Shock
ed
Not sh
ocke
d
Shock
ed
006
077
c
d
Supplementary Figure 8 Additional DiBAC4(3) and SYTOX Blue measurementsa-b Histograms of fluorescence intensities of populations of control and antibiotic-treated cells in the pres-ence of DiBAC4(3) (a) and SYTOX Blue (b) 3 h after treatment (kanamycin) and 6 h after treatment(ciprofloxacin) as in the main text a longer treatment time was chosen for ciprofloxacin due to a majorityof condensation events occurring later after treatment Concentrations used were 10x MIC for both antibi-otics Data representative of four biological replicates and 20000 scattering events for each distribution Thefluorochromes used (FITC and Pb450) are indicatedc-d Fluorescence intensities of hyperosmotically shocked (500 mM sorbitol) cells in the presence of SYTOXBlue (c) and DiBAC4(3) (d) Fluorescence images were taken immediately after shock Data are from 20cells in each group Box plots indicating themedian (center) 25th percentile and 75th percentile (bounds ofbox) and extreme data points not considered outliers (bounds ofwhiskers) are shown and red crosses indi-cate outliers including the minimum and maximum values p-values for two-sample Kolmogorov-Smirnovtests are shown next to corresponding brackets
16
0
200
400
600
800
1000
10x K
AN
10x C
IP
36e-8
Tim
e fro
m c
onde
nsat
ion
to ly
sis (m
in)
0 200 400 60005
06
07
08
09
1
0 200 400 60005
06
07
08
09
1
0 200 400 60005
06
07
08
09
1ab
10x
KAN
10x
CIP
Relative cell length Relative cell radius Relative cell volume
Time after start of condensation (s)
0 200 400 60005
06
07
08
09
1
0 200 400 60005
06
07
08
09
1
0 200 400 60005
06
07
08
09
1
Supplementary Figure 9 Times from condensation to lysis in antibiotic-treated cells and cellular dimen-sions of condensed cellsa Times from condensation to lysis in kanamycin and ciprofloxacin-treated cells (10x MIC) Data are from20 cells in each group Box plots indicating themedian (center) 25th percentile and 75th percentile (boundsof box) and extreme data points not considered outliers (bounds of whiskers) are shown and red crossesindicate outliers including the minimum and maximum values The p-value for a two-sample Kolmogorov-Smirnov test is shown next to the corresponding bracketb Changes in relative cell length cell radius and cell volume across time from the beginning of conden-sation events in kanamycin and ciprofloxacin-treated cells (10x MIC) corresponding to Fig 2f in the maintext Data are from 20 cells in each group (colored curves) and population-averaged traces (thick redcurves) are shown Note that fluctuations in individual traces arise due to variations in semi-automatedimage processing see Methods for details of the image analysis
17
a
0 100 200 3000
02
04
06
08
10
Time after nanodefect formation (s)
Solute number
0 100 200 3000
02
04
06
08
10Turgor pressure
0 100 200 3000
02
04
06
08
10Cellular volume
b c
Frac
tion
of in
itial s
olut
es re
main
ing
Frac
tion
of in
itial t
urgo
r rem
ainin
g
Frac
tion
of in
itial c
ell v
olum
e re
main
ing
Time after nanodefect formation (s) Time after nanodefect formation (s)
Hole radius = 05 nm 100 holesHole radius = 1 nm 10 holesHole radius = 5 nm 1 hole
Supplementary Figure 10 Sensitivity analysis of the model of solute outflowa Model predictions for the solute number as a function of time across different membrane defect radii(different colors) Depending on the size of typical membrane defect (05 nm 1 nm 5 nm radius) themodelsuggests that different numbers of membrane defects form (100 10 and 1 respectively) as to be consistentwith the minute-timescale of condensation In all cases the model predicts cells to condense after outflowof solutes from a cell as detailed in Supplementary Note 1b-c Same as panel a but for the predicted cellular turgor pressure (b) and volume (c)
18
a
b c
+CIP
Frac
tion
+CIP exp
onen
tial
+CIP ea
rly sta
tiona
ry
+KAN exp
onen
tial
+KAN earl
y stat
ionary
Log
surv
ival
No trea
tmen
t exp
onen
tial
+CIP late
statio
nary
+KAN late
statio
nary
00102030405060708091
-6
-5
-4
-3
-2
-1
0
1
2
No trea
tmen
t earl
y stat
ionary
No trea
tmen
t late
statio
nary
+CIP exp
onen
tial
+CIP ea
rly sta
tiona
ry
+KAN exp
onen
tial
+KAN earl
y stat
ionary
No trea
tmen
t exp
onen
tial
+CIP late
statio
nary
+KAN late
statio
nary
No trea
tmen
t earl
y stat
ionary
No trea
tmen
t late
statio
nary
Supplementary Figure 11 Experiments on stationary-phase cellsa Microscopy images of early stationary-phase (OD600 asymp 15) E coli cells treated by ciprofloxacin (10xMIC)at times 0 h (left) and 6 h (right) Results are representative of two biological replicates and yellowmarkersindicate condensed or lysed cells Scale bar 3 micromb Fractions of all cells that are condensed or lysed corresponding to the experiments in panel a from twodifferent fields of view of two biological replicates with at least 20 cells each in addition to cells from earlyexponential phase (OD600 asymp 01) and late stationary phase (OD600 gt 20) as described in the MethodsAll antibiotics refer to 10x MIC and ldquono treatmentrdquo cells were not treated by antibiotics Individual pointscorresponding to each field of view are shown The numbers of cells in each of two fields of view accordingto the order of treatment shown along the horizontal axis was as follows 24 and 30 56 and 76 101 and 94195 and 206 20 and 20 20 and 20 95 and 107 20 and 20 20 and 30c Survival of E coli cells treated by kanamycin and ciprofloxacin (10x MIC) 6 h after treatment as deter-mined by CFU counting corresponding to panel b Positive values of the log survival indicate an increasein CFUmL Results are from two biological replicates (individual points) and bars indicate averages
19
0
1
2
Relat
ive A
TPO
D
rat
io60
0
LB
LB+glu
tathio
ne
1100
0 LB in
PBS
Supplementary Figure 12 Bulk culture measurements of ATP abundance in cell cultures with and with-out glutathione pretreatment (10 mM) Cells were assayed in early log phase (OD600 asymp 01) For compari-son measurements for cells grown in LB diluted 11000 in PBS are shown Error bars indicate one standarddeviation bars indicate averages and data are presented asmean values+- SEM Individualmeasurementsfrom biological replicates are shown as black points Number of biological replicates in each condition LB8 glutathione 6 11000 LB in PBS 10
20
Untrea
ted
KAN 10x
CIP 10x
AMP 10x
0
200
400
600
800
1000
LPS
(end
otox
in u
nitμ
g pr
otei
n)
Supplementary Figure 13 Measurements of lipopolysaccharide levels Shown are measurements oflipopolysaccharide (LPS) levels of bulk cultures of cells treated by antibiotics (10x MIC) as measured byan LAL assay For comparison data from treatment with 10x MIC ampicillin are included Data from twobiological replicates (black points) and bars indicate averages
21
Parent strain (BW25113) Genetic deletion
+GENT +CIP
ΔgshA
Δgor
-6
-4
-2
0
2
Log
surv
ival
-6
-4
-2
0
2
Log
surv
ival
-6
-4
-2
0
2
Log
surv
ival
-6
-4
-2
0
2
Log
surv
ival
Untrea
ted
1x M
IC
10x M
IC
Untrea
ted
1x M
IC
10x M
IC
Untrea
ted
1x M
IC
10x M
IC
Untrea
ted
1x M
IC
10x M
IC
Supplementary Figure 14 Effects of genetic deletions on antibiotic killing Shown are log survival valuesof E coli under gentamicin and ciprofloxacin treatment as determined by CFU plating and counting after4 h of treatment ∆gshA and ∆gor strains from the Keio collection as well as the parent strain (BW25113)were used Data from two biological replicates (black points) and bars indicate averages Positive valuesindicate increases in CFUmL
22
Relat
ive
C11-
BODI
PY in
tens
ity
+KAN +CIP
42e-5
84e-655e-10
013
47e-9
26e-3
Turgid
Conde
nsed
Lysed
Untrea
ted
Treated
Turgid
Conde
nsed
Lysed
Untrea
ted
Treated
0
5
10
15
20
0
5
10
15
20
55e-1036e-8
47e-9
006
42e-10
55e-10
Supplementary Figure 15 Measurements of C11-BODIPY fluorescence in the presence of α-tocopherolShown are fluorescence intensities of antibiotic-treated E coli pretreated by the lipophilic antioxidantα-tocopherol (50 mM) and in the presence of the lipid peroxidation-sensitive dye C11-BODIPY Thekanamycin and ciprofloxacin concentrations used were 10x MIC Data are from 20 cells in each group Boxplots indicating the median (center) 25th percentile and 75th percentile (bounds of box) and extreme datapoints not considered outliers (bounds of whiskers) are shown and red crosses indicate outliers includingthe minimum and maximum values p-values for two-sample Kolmogorov-Smirnov tests are shown next tocorresponding brackets
23
APC-A
Cytoplasmic mCherry
SSC-A
FSC
-A
Supplementary Figure 16 Gating strategy for flow cytometry E coli cells containing cytoplasmic mCherrywere filtered by calibration of forward- and side-scattering area measurements (FSC-A and SSC-A) usingthe APC-A (red) fluorochrome 20000 scattering events are shown and results are representative of fourbiological replicates with 20000 scattering events each The gating strategy was used for the flow cytometrymeasurements shown in Fig 4 of the main text and Supplementary Figs 1 and 8
24
Supplementary References1 Wong F amp Amir A Mechanics and dynamics of bacterial cell lysis Biophys J 116 2378ndash2389 (2019)
2 Dwyer D J et al Antibiotics induce redox-related physiological alterations as part of their lethalityProc Natl Acad Sci USA 111 E2100ndashE2109 (2014)
3 Yao Z Kahne D amp Kishony R Distinct single-cell morphological dynamics under beta-lactam antibi-otics Mol Cell 48 705ndash712 (2012)
4 Whatmore A M amp Reed R H Determination of turgor pressure in Bacillus subtilis a possible role forK+ in turgor regulation J Gen Microbiol 136 2521ndash2526 (1990)
5 Sun Y Sun T-L ampHuang HW Physical properties ofEscherichia coli spheroplastmembranes BiophysJ 107 2082ndash2090 (2014)
6 Dougherty T J amp Saukkonen J J Membrane permeability changes associated with DNA gyrase in-hibitors in Escherichia coli Antimicrob Agents Chemother 28 200ndash206 (1985)
7 Diver J M amp Wise R Morphological and biochemical changes in Escherichia coli after exposure tociprofloxacin J Antimicrob Chemother 18 31ndash41 (1986)
8 Elliott T S Shelton A amp Greenwood D The response of Escherichia coli to ciprofloxacin and nor-floxacin J Med Microbiol 23 83ndash88 (1987)
9 Wang S Arellano-Santoyo H Combs P A amp Shaevitz J W Actin-like cytoskeleton filaments con-tribute to cell mechanics in bacteria Proc Natl Acad Sci USA 107 9182ndash9185 (2010)
10 Koch A L Bacterial growth and form (Springer Science amp Business Media 2001)
11 Hussain S et al MreB filaments create rod shape by aligning along principal membrane curvature eLife7 e32471 (2018)
12 Wang S ampWingreen N S Cell shape canmediate the spatial organization of the bacterial cytoskeletonBiophys J 541ndash552 (2013)
13 et al K A S Protein diffusion in the periplasm of e coli under osmotic stress Biophys J 22ndash31 (2011)
14 Silhavy T J Kahne D amp Walker S The bacterial cell envelope Cold Spring Harb Perspect Biol 2a000414 (2010)
15 Movva N R Nakamura K amp Inouye M Regulatory region of the gene for the ompA protein a majorouter membrane protein of Escherichia coli Proc Natl Acad Sci USA 77 3845ndash3849 (1980)
16 Cussler E L Diffusion Mass Transfer in Fluid Systems (Cambridge University Press 1997)
17 Sperelakis N Cell Physiology Source Book Essentials of Membrane Biophysics (Academic Press 1995)
18 Phillips R Kondev J Theriot J amp Garcia H Physical Biology of the Cell (Taylor and Francis 2012)
19 Ccediletiner U et al Tension-activated channels in the mechanism of osmotic fitness in Pseudomonas aerugi-nosa J Gen Physiol 149 595ndash609 (2017)
20 Deng Y Sun M amp Shaevitz J W Direct measurement of cell wall stress stiffening and turgor pressurein live bacterial cells Phys Rev Lett 107 158101 (2011)
21 Amir A Babaeipour F McIntosh D B Nelson D R amp Jun S Bending forces plastically deformgrowing bacterial cell walls Proc Natl Acad Sci USA 111 5778ndash5783 (2014)
22 Yao X Jericho M Pink D amp Beveridge T Thickness and elasticity of Gram-negative murein sacculimeasured by atomic force microscopy J Bacteriol 181 6865ndash6875 (1999)
23 Cayley D S Guttman H J amp Record M T Biophysical characterization of changes in amounts andactivity of Escherichia coli cell and compartment water and turgor pressure in response to osmotic stressBiophys J 78 1748ndash1764 (2000)
25
- Cytoplasmic condensation induced by membrane damage is associated with antibiotic lethality
-
- Results
-
- Aminoglycosides and fluoroquinolones induce membrane damage and cytoplasmic condensation in E coli
- A biophysical model of cell envelope mechanics and solute outflow predicts the dynamics of cytoplasmic condensation
- Cytoplasmic condensation is associated with cell death
- Cytoplasmic condensation is associated with ROS accumulation lipid peroxidation and changes in lipid composition
- Cytoplasmic condensation and antibiotic-induced cell death are mitigated by glutathione a scavenger of reactive metabolic by-products
- Cytoplasmic condensation and antibiotic-induced cell death are robust to changes in oxygen availability and external osmolarity
-
- Discussion
- Methods
-
- Bacterial strains
- Antibiotics and other reagents
- Bacterial culture and growth
- Determination of MICs
- Microscopy
- Microfluidics and osmotic shock experiments
- Atomic force microscopy measurements
- Inference of the cellular turgor pressure from atomic force microscopy measurements
- Membrane permeability and depolarization assays
- ROS and RNS detection with fluorescent dyes
- Membrane peroxidation detection with a fluorescent dye
- Image analysis
- Single-cell traces
- Sample preparation for thin-layer chromatography experiments
- Thin-layer chromatography of lipid content
- Time-kill assays and CFU measurements
- Flow cytometry
- ATP abundance assay
- Anaerobic chamber
- Protein concentration and LPS level assays
- Statistical testing
-
- Reporting summary
- Data availability
- References
- Acknowledgements
- Author contributions
- Competing interests
- Additional information
-

0 10 20 300
200
400
600
800
1000
distance (au)
elas
tic m
odul
us (k
Pa)
control_cell4
height
length
diameter
a b c
d e
f
Untreated(turgid)
(28)
+KAN(condensed)
(24)
+CIP(condensed)
(32)
400
600
800
1000
1200
Elas
tic m
odul
us (k
Pa)
02742e-8
600
700
800
900
1000
2000
3000
4000
5000
6000
400
600
800
1000
1200
1400
Hei
ght (
nm)
Leng
th (n
m)
Diam
eter
(nm
)
55e-347e-3020
30e-643e-5
009
42e-5014018
Untrea
ted (3
4)
10x C
IP (32)
100x
CIP (20)
10x K
AN (25)
0 10 20 300
500
1000
1500
distance (au)
elas
tic m
odul
us (k
Pa)
cell8
0 10 20 300
200
400
600
800
distance (au)
elas
tic m
odul
us (k
Pa)
Kanamycin_cell4
Supplementary Figure 7 Details of the AFM experimentsa-c Heatmaps of cell height (top) and plots of the elastic modulus (bottom) along the length of a cell (au)for a representative untreated cell (a) a kanamycin-treated cell (10x MIC b) and a ciprofloxacin-treatedcell (10x MIC c) Cells were assayed corresponding to a time sim3 h of antibiotic treatment Error bars indi-cate one standard deviation from at least two technical replicates for the same cell and data are presentedas mean values +- SEM Colored boxes highlight cellular regionsd Comparison of cell-averaged elastic moduli across different treatment conditions (10x MIC) Here andbelow box plots indicating themedian (center) 25th percentile and 75th percentile (bounds of box) and ex-treme data points not considered outliers (bounds of whiskers) are shown and red crosses indicate outliersincluding the minimum and maximum values The numbers of cells in each group are indicated in paren-theses and p-values for two-sample Kolmogorov-Smirnov tests are shown next to corresponding bracketse (Left) Similar to d but for inferred cellular dimensions across different treatment conditions (10x MIC)(Right) Schematic of the different cellular dimensions measuredf Sample force-distance curves from untreated control cells
15
a
b
0 4 5 6 7
0 4 5 6 7
0
SYTOX Blue Pb450
DiBAC (3) FITC
Log green fluorescence intensity
Log blue fluorescence intensity
Even
t cou
ntEv
ent c
ount
4
200400
8001000
600
0
200
400
800
600
Untreated (3h)+KAN (3h)Untreated (6h)+CIP (6h)
Untreated (3h)+KAN (3h)Untreated (6h)+CIP (6h)
-01
0
01
02
03
0
02
04
06
08
1
Relat
ive D
iBAC
(3)
inte
nsity
Relat
ive S
YTO
X Bl
uein
tens
ity4
Not sh
ocke
d
Shock
ed
Not sh
ocke
d
Shock
ed
006
077
c
d
Supplementary Figure 8 Additional DiBAC4(3) and SYTOX Blue measurementsa-b Histograms of fluorescence intensities of populations of control and antibiotic-treated cells in the pres-ence of DiBAC4(3) (a) and SYTOX Blue (b) 3 h after treatment (kanamycin) and 6 h after treatment(ciprofloxacin) as in the main text a longer treatment time was chosen for ciprofloxacin due to a majorityof condensation events occurring later after treatment Concentrations used were 10x MIC for both antibi-otics Data representative of four biological replicates and 20000 scattering events for each distribution Thefluorochromes used (FITC and Pb450) are indicatedc-d Fluorescence intensities of hyperosmotically shocked (500 mM sorbitol) cells in the presence of SYTOXBlue (c) and DiBAC4(3) (d) Fluorescence images were taken immediately after shock Data are from 20cells in each group Box plots indicating themedian (center) 25th percentile and 75th percentile (bounds ofbox) and extreme data points not considered outliers (bounds ofwhiskers) are shown and red crosses indi-cate outliers including the minimum and maximum values p-values for two-sample Kolmogorov-Smirnovtests are shown next to corresponding brackets
16
0
200
400
600
800
1000
10x K
AN
10x C
IP
36e-8
Tim
e fro
m c
onde
nsat
ion
to ly
sis (m
in)
0 200 400 60005
06
07
08
09
1
0 200 400 60005
06
07
08
09
1
0 200 400 60005
06
07
08
09
1ab
10x
KAN
10x
CIP
Relative cell length Relative cell radius Relative cell volume
Time after start of condensation (s)
0 200 400 60005
06
07
08
09
1
0 200 400 60005
06
07
08
09
1
0 200 400 60005
06
07
08
09
1
Supplementary Figure 9 Times from condensation to lysis in antibiotic-treated cells and cellular dimen-sions of condensed cellsa Times from condensation to lysis in kanamycin and ciprofloxacin-treated cells (10x MIC) Data are from20 cells in each group Box plots indicating themedian (center) 25th percentile and 75th percentile (boundsof box) and extreme data points not considered outliers (bounds of whiskers) are shown and red crossesindicate outliers including the minimum and maximum values The p-value for a two-sample Kolmogorov-Smirnov test is shown next to the corresponding bracketb Changes in relative cell length cell radius and cell volume across time from the beginning of conden-sation events in kanamycin and ciprofloxacin-treated cells (10x MIC) corresponding to Fig 2f in the maintext Data are from 20 cells in each group (colored curves) and population-averaged traces (thick redcurves) are shown Note that fluctuations in individual traces arise due to variations in semi-automatedimage processing see Methods for details of the image analysis
17
a
0 100 200 3000
02
04
06
08
10
Time after nanodefect formation (s)
Solute number
0 100 200 3000
02
04
06
08
10Turgor pressure
0 100 200 3000
02
04
06
08
10Cellular volume
b c
Frac
tion
of in
itial s
olut
es re
main
ing
Frac
tion
of in
itial t
urgo
r rem
ainin
g
Frac
tion
of in
itial c
ell v
olum
e re
main
ing
Time after nanodefect formation (s) Time after nanodefect formation (s)
Hole radius = 05 nm 100 holesHole radius = 1 nm 10 holesHole radius = 5 nm 1 hole
Supplementary Figure 10 Sensitivity analysis of the model of solute outflowa Model predictions for the solute number as a function of time across different membrane defect radii(different colors) Depending on the size of typical membrane defect (05 nm 1 nm 5 nm radius) themodelsuggests that different numbers of membrane defects form (100 10 and 1 respectively) as to be consistentwith the minute-timescale of condensation In all cases the model predicts cells to condense after outflowof solutes from a cell as detailed in Supplementary Note 1b-c Same as panel a but for the predicted cellular turgor pressure (b) and volume (c)
18
a
b c
+CIP
Frac
tion
+CIP exp
onen
tial
+CIP ea
rly sta
tiona
ry
+KAN exp
onen
tial
+KAN earl
y stat
ionary
Log
surv
ival
No trea
tmen
t exp
onen
tial
+CIP late
statio
nary
+KAN late
statio
nary
00102030405060708091
-6
-5
-4
-3
-2
-1
0
1
2
No trea
tmen
t earl
y stat
ionary
No trea
tmen
t late
statio
nary
+CIP exp
onen
tial
+CIP ea
rly sta
tiona
ry
+KAN exp
onen
tial
+KAN earl
y stat
ionary
No trea
tmen
t exp
onen
tial
+CIP late
statio
nary
+KAN late
statio
nary
No trea
tmen
t earl
y stat
ionary
No trea
tmen
t late
statio
nary
Supplementary Figure 11 Experiments on stationary-phase cellsa Microscopy images of early stationary-phase (OD600 asymp 15) E coli cells treated by ciprofloxacin (10xMIC)at times 0 h (left) and 6 h (right) Results are representative of two biological replicates and yellowmarkersindicate condensed or lysed cells Scale bar 3 micromb Fractions of all cells that are condensed or lysed corresponding to the experiments in panel a from twodifferent fields of view of two biological replicates with at least 20 cells each in addition to cells from earlyexponential phase (OD600 asymp 01) and late stationary phase (OD600 gt 20) as described in the MethodsAll antibiotics refer to 10x MIC and ldquono treatmentrdquo cells were not treated by antibiotics Individual pointscorresponding to each field of view are shown The numbers of cells in each of two fields of view accordingto the order of treatment shown along the horizontal axis was as follows 24 and 30 56 and 76 101 and 94195 and 206 20 and 20 20 and 20 95 and 107 20 and 20 20 and 30c Survival of E coli cells treated by kanamycin and ciprofloxacin (10x MIC) 6 h after treatment as deter-mined by CFU counting corresponding to panel b Positive values of the log survival indicate an increasein CFUmL Results are from two biological replicates (individual points) and bars indicate averages
19
0
1
2
Relat
ive A
TPO
D
rat
io60
0
LB
LB+glu
tathio
ne
1100
0 LB in
PBS
Supplementary Figure 12 Bulk culture measurements of ATP abundance in cell cultures with and with-out glutathione pretreatment (10 mM) Cells were assayed in early log phase (OD600 asymp 01) For compari-son measurements for cells grown in LB diluted 11000 in PBS are shown Error bars indicate one standarddeviation bars indicate averages and data are presented asmean values+- SEM Individualmeasurementsfrom biological replicates are shown as black points Number of biological replicates in each condition LB8 glutathione 6 11000 LB in PBS 10
20
Untrea
ted
KAN 10x
CIP 10x
AMP 10x
0
200
400
600
800
1000
LPS
(end
otox
in u
nitμ
g pr
otei
n)
Supplementary Figure 13 Measurements of lipopolysaccharide levels Shown are measurements oflipopolysaccharide (LPS) levels of bulk cultures of cells treated by antibiotics (10x MIC) as measured byan LAL assay For comparison data from treatment with 10x MIC ampicillin are included Data from twobiological replicates (black points) and bars indicate averages
21
Parent strain (BW25113) Genetic deletion
+GENT +CIP
ΔgshA
Δgor
-6
-4
-2
0
2
Log
surv
ival
-6
-4
-2
0
2
Log
surv
ival
-6
-4
-2
0
2
Log
surv
ival
-6
-4
-2
0
2
Log
surv
ival
Untrea
ted
1x M
IC
10x M
IC
Untrea
ted
1x M
IC
10x M
IC
Untrea
ted
1x M
IC
10x M
IC
Untrea
ted
1x M
IC
10x M
IC
Supplementary Figure 14 Effects of genetic deletions on antibiotic killing Shown are log survival valuesof E coli under gentamicin and ciprofloxacin treatment as determined by CFU plating and counting after4 h of treatment ∆gshA and ∆gor strains from the Keio collection as well as the parent strain (BW25113)were used Data from two biological replicates (black points) and bars indicate averages Positive valuesindicate increases in CFUmL
22
Relat
ive
C11-
BODI
PY in
tens
ity
+KAN +CIP
42e-5
84e-655e-10
013
47e-9
26e-3
Turgid
Conde
nsed
Lysed
Untrea
ted
Treated
Turgid
Conde
nsed
Lysed
Untrea
ted
Treated
0
5
10
15
20
0
5
10
15
20
55e-1036e-8
47e-9
006
42e-10
55e-10
Supplementary Figure 15 Measurements of C11-BODIPY fluorescence in the presence of α-tocopherolShown are fluorescence intensities of antibiotic-treated E coli pretreated by the lipophilic antioxidantα-tocopherol (50 mM) and in the presence of the lipid peroxidation-sensitive dye C11-BODIPY Thekanamycin and ciprofloxacin concentrations used were 10x MIC Data are from 20 cells in each group Boxplots indicating the median (center) 25th percentile and 75th percentile (bounds of box) and extreme datapoints not considered outliers (bounds of whiskers) are shown and red crosses indicate outliers includingthe minimum and maximum values p-values for two-sample Kolmogorov-Smirnov tests are shown next tocorresponding brackets
23
APC-A
Cytoplasmic mCherry
SSC-A
FSC
-A
Supplementary Figure 16 Gating strategy for flow cytometry E coli cells containing cytoplasmic mCherrywere filtered by calibration of forward- and side-scattering area measurements (FSC-A and SSC-A) usingthe APC-A (red) fluorochrome 20000 scattering events are shown and results are representative of fourbiological replicates with 20000 scattering events each The gating strategy was used for the flow cytometrymeasurements shown in Fig 4 of the main text and Supplementary Figs 1 and 8
24
Supplementary References1 Wong F amp Amir A Mechanics and dynamics of bacterial cell lysis Biophys J 116 2378ndash2389 (2019)
2 Dwyer D J et al Antibiotics induce redox-related physiological alterations as part of their lethalityProc Natl Acad Sci USA 111 E2100ndashE2109 (2014)
3 Yao Z Kahne D amp Kishony R Distinct single-cell morphological dynamics under beta-lactam antibi-otics Mol Cell 48 705ndash712 (2012)
4 Whatmore A M amp Reed R H Determination of turgor pressure in Bacillus subtilis a possible role forK+ in turgor regulation J Gen Microbiol 136 2521ndash2526 (1990)
5 Sun Y Sun T-L ampHuang HW Physical properties ofEscherichia coli spheroplastmembranes BiophysJ 107 2082ndash2090 (2014)
6 Dougherty T J amp Saukkonen J J Membrane permeability changes associated with DNA gyrase in-hibitors in Escherichia coli Antimicrob Agents Chemother 28 200ndash206 (1985)
7 Diver J M amp Wise R Morphological and biochemical changes in Escherichia coli after exposure tociprofloxacin J Antimicrob Chemother 18 31ndash41 (1986)
8 Elliott T S Shelton A amp Greenwood D The response of Escherichia coli to ciprofloxacin and nor-floxacin J Med Microbiol 23 83ndash88 (1987)
9 Wang S Arellano-Santoyo H Combs P A amp Shaevitz J W Actin-like cytoskeleton filaments con-tribute to cell mechanics in bacteria Proc Natl Acad Sci USA 107 9182ndash9185 (2010)
10 Koch A L Bacterial growth and form (Springer Science amp Business Media 2001)
11 Hussain S et al MreB filaments create rod shape by aligning along principal membrane curvature eLife7 e32471 (2018)
12 Wang S ampWingreen N S Cell shape canmediate the spatial organization of the bacterial cytoskeletonBiophys J 541ndash552 (2013)
13 et al K A S Protein diffusion in the periplasm of e coli under osmotic stress Biophys J 22ndash31 (2011)
14 Silhavy T J Kahne D amp Walker S The bacterial cell envelope Cold Spring Harb Perspect Biol 2a000414 (2010)
15 Movva N R Nakamura K amp Inouye M Regulatory region of the gene for the ompA protein a majorouter membrane protein of Escherichia coli Proc Natl Acad Sci USA 77 3845ndash3849 (1980)
16 Cussler E L Diffusion Mass Transfer in Fluid Systems (Cambridge University Press 1997)
17 Sperelakis N Cell Physiology Source Book Essentials of Membrane Biophysics (Academic Press 1995)
18 Phillips R Kondev J Theriot J amp Garcia H Physical Biology of the Cell (Taylor and Francis 2012)
19 Ccediletiner U et al Tension-activated channels in the mechanism of osmotic fitness in Pseudomonas aerugi-nosa J Gen Physiol 149 595ndash609 (2017)
20 Deng Y Sun M amp Shaevitz J W Direct measurement of cell wall stress stiffening and turgor pressurein live bacterial cells Phys Rev Lett 107 158101 (2011)
21 Amir A Babaeipour F McIntosh D B Nelson D R amp Jun S Bending forces plastically deformgrowing bacterial cell walls Proc Natl Acad Sci USA 111 5778ndash5783 (2014)
22 Yao X Jericho M Pink D amp Beveridge T Thickness and elasticity of Gram-negative murein sacculimeasured by atomic force microscopy J Bacteriol 181 6865ndash6875 (1999)
23 Cayley D S Guttman H J amp Record M T Biophysical characterization of changes in amounts andactivity of Escherichia coli cell and compartment water and turgor pressure in response to osmotic stressBiophys J 78 1748ndash1764 (2000)
25
- Cytoplasmic condensation induced by membrane damage is associated with antibiotic lethality
-
- Results
-
- Aminoglycosides and fluoroquinolones induce membrane damage and cytoplasmic condensation in E coli
- A biophysical model of cell envelope mechanics and solute outflow predicts the dynamics of cytoplasmic condensation
- Cytoplasmic condensation is associated with cell death
- Cytoplasmic condensation is associated with ROS accumulation lipid peroxidation and changes in lipid composition
- Cytoplasmic condensation and antibiotic-induced cell death are mitigated by glutathione a scavenger of reactive metabolic by-products
- Cytoplasmic condensation and antibiotic-induced cell death are robust to changes in oxygen availability and external osmolarity
-
- Discussion
- Methods
-
- Bacterial strains
- Antibiotics and other reagents
- Bacterial culture and growth
- Determination of MICs
- Microscopy
- Microfluidics and osmotic shock experiments
- Atomic force microscopy measurements
- Inference of the cellular turgor pressure from atomic force microscopy measurements
- Membrane permeability and depolarization assays
- ROS and RNS detection with fluorescent dyes
- Membrane peroxidation detection with a fluorescent dye
- Image analysis
- Single-cell traces
- Sample preparation for thin-layer chromatography experiments
- Thin-layer chromatography of lipid content
- Time-kill assays and CFU measurements
- Flow cytometry
- ATP abundance assay
- Anaerobic chamber
- Protein concentration and LPS level assays
- Statistical testing
-
- Reporting summary
- Data availability
- References
- Acknowledgements
- Author contributions
- Competing interests
- Additional information
-

a
b
0 4 5 6 7
0 4 5 6 7
0
SYTOX Blue Pb450
DiBAC (3) FITC
Log green fluorescence intensity
Log blue fluorescence intensity
Even
t cou
ntEv
ent c
ount
4
200400
8001000
600
0
200
400
800
600
Untreated (3h)+KAN (3h)Untreated (6h)+CIP (6h)
Untreated (3h)+KAN (3h)Untreated (6h)+CIP (6h)
-01
0
01
02
03
0
02
04
06
08
1
Relat
ive D
iBAC
(3)
inte
nsity
Relat
ive S
YTO
X Bl
uein
tens
ity4
Not sh
ocke
d
Shock
ed
Not sh
ocke
d
Shock
ed
006
077
c
d
Supplementary Figure 8 Additional DiBAC4(3) and SYTOX Blue measurementsa-b Histograms of fluorescence intensities of populations of control and antibiotic-treated cells in the pres-ence of DiBAC4(3) (a) and SYTOX Blue (b) 3 h after treatment (kanamycin) and 6 h after treatment(ciprofloxacin) as in the main text a longer treatment time was chosen for ciprofloxacin due to a majorityof condensation events occurring later after treatment Concentrations used were 10x MIC for both antibi-otics Data representative of four biological replicates and 20000 scattering events for each distribution Thefluorochromes used (FITC and Pb450) are indicatedc-d Fluorescence intensities of hyperosmotically shocked (500 mM sorbitol) cells in the presence of SYTOXBlue (c) and DiBAC4(3) (d) Fluorescence images were taken immediately after shock Data are from 20cells in each group Box plots indicating themedian (center) 25th percentile and 75th percentile (bounds ofbox) and extreme data points not considered outliers (bounds ofwhiskers) are shown and red crosses indi-cate outliers including the minimum and maximum values p-values for two-sample Kolmogorov-Smirnovtests are shown next to corresponding brackets
16
0
200
400
600
800
1000
10x K
AN
10x C
IP
36e-8
Tim
e fro
m c
onde
nsat
ion
to ly
sis (m
in)
0 200 400 60005
06
07
08
09
1
0 200 400 60005
06
07
08
09
1
0 200 400 60005
06
07
08
09
1ab
10x
KAN
10x
CIP
Relative cell length Relative cell radius Relative cell volume
Time after start of condensation (s)
0 200 400 60005
06
07
08
09
1
0 200 400 60005
06
07
08
09
1
0 200 400 60005
06
07
08
09
1
Supplementary Figure 9 Times from condensation to lysis in antibiotic-treated cells and cellular dimen-sions of condensed cellsa Times from condensation to lysis in kanamycin and ciprofloxacin-treated cells (10x MIC) Data are from20 cells in each group Box plots indicating themedian (center) 25th percentile and 75th percentile (boundsof box) and extreme data points not considered outliers (bounds of whiskers) are shown and red crossesindicate outliers including the minimum and maximum values The p-value for a two-sample Kolmogorov-Smirnov test is shown next to the corresponding bracketb Changes in relative cell length cell radius and cell volume across time from the beginning of conden-sation events in kanamycin and ciprofloxacin-treated cells (10x MIC) corresponding to Fig 2f in the maintext Data are from 20 cells in each group (colored curves) and population-averaged traces (thick redcurves) are shown Note that fluctuations in individual traces arise due to variations in semi-automatedimage processing see Methods for details of the image analysis
17
a
0 100 200 3000
02
04
06
08
10
Time after nanodefect formation (s)
Solute number
0 100 200 3000
02
04
06
08
10Turgor pressure
0 100 200 3000
02
04
06
08
10Cellular volume
b c
Frac
tion
of in
itial s
olut
es re
main
ing
Frac
tion
of in
itial t
urgo
r rem
ainin
g
Frac
tion
of in
itial c
ell v
olum
e re
main
ing
Time after nanodefect formation (s) Time after nanodefect formation (s)
Hole radius = 05 nm 100 holesHole radius = 1 nm 10 holesHole radius = 5 nm 1 hole
Supplementary Figure 10 Sensitivity analysis of the model of solute outflowa Model predictions for the solute number as a function of time across different membrane defect radii(different colors) Depending on the size of typical membrane defect (05 nm 1 nm 5 nm radius) themodelsuggests that different numbers of membrane defects form (100 10 and 1 respectively) as to be consistentwith the minute-timescale of condensation In all cases the model predicts cells to condense after outflowof solutes from a cell as detailed in Supplementary Note 1b-c Same as panel a but for the predicted cellular turgor pressure (b) and volume (c)
18
a
b c
+CIP
Frac
tion
+CIP exp
onen
tial
+CIP ea
rly sta
tiona
ry
+KAN exp
onen
tial
+KAN earl
y stat
ionary
Log
surv
ival
No trea
tmen
t exp
onen
tial
+CIP late
statio
nary
+KAN late
statio
nary
00102030405060708091
-6
-5
-4
-3
-2
-1
0
1
2
No trea
tmen
t earl
y stat
ionary
No trea
tmen
t late
statio
nary
+CIP exp
onen
tial
+CIP ea
rly sta
tiona
ry
+KAN exp
onen
tial
+KAN earl
y stat
ionary
No trea
tmen
t exp
onen
tial
+CIP late
statio
nary
+KAN late
statio
nary
No trea
tmen
t earl
y stat
ionary
No trea
tmen
t late
statio
nary
Supplementary Figure 11 Experiments on stationary-phase cellsa Microscopy images of early stationary-phase (OD600 asymp 15) E coli cells treated by ciprofloxacin (10xMIC)at times 0 h (left) and 6 h (right) Results are representative of two biological replicates and yellowmarkersindicate condensed or lysed cells Scale bar 3 micromb Fractions of all cells that are condensed or lysed corresponding to the experiments in panel a from twodifferent fields of view of two biological replicates with at least 20 cells each in addition to cells from earlyexponential phase (OD600 asymp 01) and late stationary phase (OD600 gt 20) as described in the MethodsAll antibiotics refer to 10x MIC and ldquono treatmentrdquo cells were not treated by antibiotics Individual pointscorresponding to each field of view are shown The numbers of cells in each of two fields of view accordingto the order of treatment shown along the horizontal axis was as follows 24 and 30 56 and 76 101 and 94195 and 206 20 and 20 20 and 20 95 and 107 20 and 20 20 and 30c Survival of E coli cells treated by kanamycin and ciprofloxacin (10x MIC) 6 h after treatment as deter-mined by CFU counting corresponding to panel b Positive values of the log survival indicate an increasein CFUmL Results are from two biological replicates (individual points) and bars indicate averages
19
0
1
2
Relat
ive A
TPO
D
rat
io60
0
LB
LB+glu
tathio
ne
1100
0 LB in
PBS
Supplementary Figure 12 Bulk culture measurements of ATP abundance in cell cultures with and with-out glutathione pretreatment (10 mM) Cells were assayed in early log phase (OD600 asymp 01) For compari-son measurements for cells grown in LB diluted 11000 in PBS are shown Error bars indicate one standarddeviation bars indicate averages and data are presented asmean values+- SEM Individualmeasurementsfrom biological replicates are shown as black points Number of biological replicates in each condition LB8 glutathione 6 11000 LB in PBS 10
20
Untrea
ted
KAN 10x
CIP 10x
AMP 10x
0
200
400
600
800
1000
LPS
(end
otox
in u
nitμ
g pr
otei
n)
Supplementary Figure 13 Measurements of lipopolysaccharide levels Shown are measurements oflipopolysaccharide (LPS) levels of bulk cultures of cells treated by antibiotics (10x MIC) as measured byan LAL assay For comparison data from treatment with 10x MIC ampicillin are included Data from twobiological replicates (black points) and bars indicate averages
21
Parent strain (BW25113) Genetic deletion
+GENT +CIP
ΔgshA
Δgor
-6
-4
-2
0
2
Log
surv
ival
-6
-4
-2
0
2
Log
surv
ival
-6
-4
-2
0
2
Log
surv
ival
-6
-4
-2
0
2
Log
surv
ival
Untrea
ted
1x M
IC
10x M
IC
Untrea
ted
1x M
IC
10x M
IC
Untrea
ted
1x M
IC
10x M
IC
Untrea
ted
1x M
IC
10x M
IC
Supplementary Figure 14 Effects of genetic deletions on antibiotic killing Shown are log survival valuesof E coli under gentamicin and ciprofloxacin treatment as determined by CFU plating and counting after4 h of treatment ∆gshA and ∆gor strains from the Keio collection as well as the parent strain (BW25113)were used Data from two biological replicates (black points) and bars indicate averages Positive valuesindicate increases in CFUmL
22
Relat
ive
C11-
BODI
PY in
tens
ity
+KAN +CIP
42e-5
84e-655e-10
013
47e-9
26e-3
Turgid
Conde
nsed
Lysed
Untrea
ted
Treated
Turgid
Conde
nsed
Lysed
Untrea
ted
Treated
0
5
10
15
20
0
5
10
15
20
55e-1036e-8
47e-9
006
42e-10
55e-10
Supplementary Figure 15 Measurements of C11-BODIPY fluorescence in the presence of α-tocopherolShown are fluorescence intensities of antibiotic-treated E coli pretreated by the lipophilic antioxidantα-tocopherol (50 mM) and in the presence of the lipid peroxidation-sensitive dye C11-BODIPY Thekanamycin and ciprofloxacin concentrations used were 10x MIC Data are from 20 cells in each group Boxplots indicating the median (center) 25th percentile and 75th percentile (bounds of box) and extreme datapoints not considered outliers (bounds of whiskers) are shown and red crosses indicate outliers includingthe minimum and maximum values p-values for two-sample Kolmogorov-Smirnov tests are shown next tocorresponding brackets
23
APC-A
Cytoplasmic mCherry
SSC-A
FSC
-A
Supplementary Figure 16 Gating strategy for flow cytometry E coli cells containing cytoplasmic mCherrywere filtered by calibration of forward- and side-scattering area measurements (FSC-A and SSC-A) usingthe APC-A (red) fluorochrome 20000 scattering events are shown and results are representative of fourbiological replicates with 20000 scattering events each The gating strategy was used for the flow cytometrymeasurements shown in Fig 4 of the main text and Supplementary Figs 1 and 8
24
Supplementary References1 Wong F amp Amir A Mechanics and dynamics of bacterial cell lysis Biophys J 116 2378ndash2389 (2019)
2 Dwyer D J et al Antibiotics induce redox-related physiological alterations as part of their lethalityProc Natl Acad Sci USA 111 E2100ndashE2109 (2014)
3 Yao Z Kahne D amp Kishony R Distinct single-cell morphological dynamics under beta-lactam antibi-otics Mol Cell 48 705ndash712 (2012)
4 Whatmore A M amp Reed R H Determination of turgor pressure in Bacillus subtilis a possible role forK+ in turgor regulation J Gen Microbiol 136 2521ndash2526 (1990)
5 Sun Y Sun T-L ampHuang HW Physical properties ofEscherichia coli spheroplastmembranes BiophysJ 107 2082ndash2090 (2014)
6 Dougherty T J amp Saukkonen J J Membrane permeability changes associated with DNA gyrase in-hibitors in Escherichia coli Antimicrob Agents Chemother 28 200ndash206 (1985)
7 Diver J M amp Wise R Morphological and biochemical changes in Escherichia coli after exposure tociprofloxacin J Antimicrob Chemother 18 31ndash41 (1986)
8 Elliott T S Shelton A amp Greenwood D The response of Escherichia coli to ciprofloxacin and nor-floxacin J Med Microbiol 23 83ndash88 (1987)
9 Wang S Arellano-Santoyo H Combs P A amp Shaevitz J W Actin-like cytoskeleton filaments con-tribute to cell mechanics in bacteria Proc Natl Acad Sci USA 107 9182ndash9185 (2010)
10 Koch A L Bacterial growth and form (Springer Science amp Business Media 2001)
11 Hussain S et al MreB filaments create rod shape by aligning along principal membrane curvature eLife7 e32471 (2018)
12 Wang S ampWingreen N S Cell shape canmediate the spatial organization of the bacterial cytoskeletonBiophys J 541ndash552 (2013)
13 et al K A S Protein diffusion in the periplasm of e coli under osmotic stress Biophys J 22ndash31 (2011)
14 Silhavy T J Kahne D amp Walker S The bacterial cell envelope Cold Spring Harb Perspect Biol 2a000414 (2010)
15 Movva N R Nakamura K amp Inouye M Regulatory region of the gene for the ompA protein a majorouter membrane protein of Escherichia coli Proc Natl Acad Sci USA 77 3845ndash3849 (1980)
16 Cussler E L Diffusion Mass Transfer in Fluid Systems (Cambridge University Press 1997)
17 Sperelakis N Cell Physiology Source Book Essentials of Membrane Biophysics (Academic Press 1995)
18 Phillips R Kondev J Theriot J amp Garcia H Physical Biology of the Cell (Taylor and Francis 2012)
19 Ccediletiner U et al Tension-activated channels in the mechanism of osmotic fitness in Pseudomonas aerugi-nosa J Gen Physiol 149 595ndash609 (2017)
20 Deng Y Sun M amp Shaevitz J W Direct measurement of cell wall stress stiffening and turgor pressurein live bacterial cells Phys Rev Lett 107 158101 (2011)
21 Amir A Babaeipour F McIntosh D B Nelson D R amp Jun S Bending forces plastically deformgrowing bacterial cell walls Proc Natl Acad Sci USA 111 5778ndash5783 (2014)
22 Yao X Jericho M Pink D amp Beveridge T Thickness and elasticity of Gram-negative murein sacculimeasured by atomic force microscopy J Bacteriol 181 6865ndash6875 (1999)
23 Cayley D S Guttman H J amp Record M T Biophysical characterization of changes in amounts andactivity of Escherichia coli cell and compartment water and turgor pressure in response to osmotic stressBiophys J 78 1748ndash1764 (2000)
25
- Cytoplasmic condensation induced by membrane damage is associated with antibiotic lethality
-
- Results
-
- Aminoglycosides and fluoroquinolones induce membrane damage and cytoplasmic condensation in E coli
- A biophysical model of cell envelope mechanics and solute outflow predicts the dynamics of cytoplasmic condensation
- Cytoplasmic condensation is associated with cell death
- Cytoplasmic condensation is associated with ROS accumulation lipid peroxidation and changes in lipid composition
- Cytoplasmic condensation and antibiotic-induced cell death are mitigated by glutathione a scavenger of reactive metabolic by-products
- Cytoplasmic condensation and antibiotic-induced cell death are robust to changes in oxygen availability and external osmolarity
-
- Discussion
- Methods
-
- Bacterial strains
- Antibiotics and other reagents
- Bacterial culture and growth
- Determination of MICs
- Microscopy
- Microfluidics and osmotic shock experiments
- Atomic force microscopy measurements
- Inference of the cellular turgor pressure from atomic force microscopy measurements
- Membrane permeability and depolarization assays
- ROS and RNS detection with fluorescent dyes
- Membrane peroxidation detection with a fluorescent dye
- Image analysis
- Single-cell traces
- Sample preparation for thin-layer chromatography experiments
- Thin-layer chromatography of lipid content
- Time-kill assays and CFU measurements
- Flow cytometry
- ATP abundance assay
- Anaerobic chamber
- Protein concentration and LPS level assays
- Statistical testing
-
- Reporting summary
- Data availability
- References
- Acknowledgements
- Author contributions
- Competing interests
- Additional information
-

0
200
400
600
800
1000
10x K
AN
10x C
IP
36e-8
Tim
e fro
m c
onde
nsat
ion
to ly
sis (m
in)
0 200 400 60005
06
07
08
09
1
0 200 400 60005
06
07
08
09
1
0 200 400 60005
06
07
08
09
1ab
10x
KAN
10x
CIP
Relative cell length Relative cell radius Relative cell volume
Time after start of condensation (s)
0 200 400 60005
06
07
08
09
1
0 200 400 60005
06
07
08
09
1
0 200 400 60005
06
07
08
09
1
Supplementary Figure 9 Times from condensation to lysis in antibiotic-treated cells and cellular dimen-sions of condensed cellsa Times from condensation to lysis in kanamycin and ciprofloxacin-treated cells (10x MIC) Data are from20 cells in each group Box plots indicating themedian (center) 25th percentile and 75th percentile (boundsof box) and extreme data points not considered outliers (bounds of whiskers) are shown and red crossesindicate outliers including the minimum and maximum values The p-value for a two-sample Kolmogorov-Smirnov test is shown next to the corresponding bracketb Changes in relative cell length cell radius and cell volume across time from the beginning of conden-sation events in kanamycin and ciprofloxacin-treated cells (10x MIC) corresponding to Fig 2f in the maintext Data are from 20 cells in each group (colored curves) and population-averaged traces (thick redcurves) are shown Note that fluctuations in individual traces arise due to variations in semi-automatedimage processing see Methods for details of the image analysis
17
a
0 100 200 3000
02
04
06
08
10
Time after nanodefect formation (s)
Solute number
0 100 200 3000
02
04
06
08
10Turgor pressure
0 100 200 3000
02
04
06
08
10Cellular volume
b c
Frac
tion
of in
itial s
olut
es re
main
ing
Frac
tion
of in
itial t
urgo
r rem
ainin
g
Frac
tion
of in
itial c
ell v
olum
e re
main
ing
Time after nanodefect formation (s) Time after nanodefect formation (s)
Hole radius = 05 nm 100 holesHole radius = 1 nm 10 holesHole radius = 5 nm 1 hole
Supplementary Figure 10 Sensitivity analysis of the model of solute outflowa Model predictions for the solute number as a function of time across different membrane defect radii(different colors) Depending on the size of typical membrane defect (05 nm 1 nm 5 nm radius) themodelsuggests that different numbers of membrane defects form (100 10 and 1 respectively) as to be consistentwith the minute-timescale of condensation In all cases the model predicts cells to condense after outflowof solutes from a cell as detailed in Supplementary Note 1b-c Same as panel a but for the predicted cellular turgor pressure (b) and volume (c)
18
a
b c
+CIP
Frac
tion
+CIP exp
onen
tial
+CIP ea
rly sta
tiona
ry
+KAN exp
onen
tial
+KAN earl
y stat
ionary
Log
surv
ival
No trea
tmen
t exp
onen
tial
+CIP late
statio
nary
+KAN late
statio
nary
00102030405060708091
-6
-5
-4
-3
-2
-1
0
1
2
No trea
tmen
t earl
y stat
ionary
No trea
tmen
t late
statio
nary
+CIP exp
onen
tial
+CIP ea
rly sta
tiona
ry
+KAN exp
onen
tial
+KAN earl
y stat
ionary
No trea
tmen
t exp
onen
tial
+CIP late
statio
nary
+KAN late
statio
nary
No trea
tmen
t earl
y stat
ionary
No trea
tmen
t late
statio
nary
Supplementary Figure 11 Experiments on stationary-phase cellsa Microscopy images of early stationary-phase (OD600 asymp 15) E coli cells treated by ciprofloxacin (10xMIC)at times 0 h (left) and 6 h (right) Results are representative of two biological replicates and yellowmarkersindicate condensed or lysed cells Scale bar 3 micromb Fractions of all cells that are condensed or lysed corresponding to the experiments in panel a from twodifferent fields of view of two biological replicates with at least 20 cells each in addition to cells from earlyexponential phase (OD600 asymp 01) and late stationary phase (OD600 gt 20) as described in the MethodsAll antibiotics refer to 10x MIC and ldquono treatmentrdquo cells were not treated by antibiotics Individual pointscorresponding to each field of view are shown The numbers of cells in each of two fields of view accordingto the order of treatment shown along the horizontal axis was as follows 24 and 30 56 and 76 101 and 94195 and 206 20 and 20 20 and 20 95 and 107 20 and 20 20 and 30c Survival of E coli cells treated by kanamycin and ciprofloxacin (10x MIC) 6 h after treatment as deter-mined by CFU counting corresponding to panel b Positive values of the log survival indicate an increasein CFUmL Results are from two biological replicates (individual points) and bars indicate averages
19
0
1
2
Relat
ive A
TPO
D
rat
io60
0
LB
LB+glu
tathio
ne
1100
0 LB in
PBS
Supplementary Figure 12 Bulk culture measurements of ATP abundance in cell cultures with and with-out glutathione pretreatment (10 mM) Cells were assayed in early log phase (OD600 asymp 01) For compari-son measurements for cells grown in LB diluted 11000 in PBS are shown Error bars indicate one standarddeviation bars indicate averages and data are presented asmean values+- SEM Individualmeasurementsfrom biological replicates are shown as black points Number of biological replicates in each condition LB8 glutathione 6 11000 LB in PBS 10
20
Untrea
ted
KAN 10x
CIP 10x
AMP 10x
0
200
400
600
800
1000
LPS
(end
otox
in u
nitμ
g pr
otei
n)
Supplementary Figure 13 Measurements of lipopolysaccharide levels Shown are measurements oflipopolysaccharide (LPS) levels of bulk cultures of cells treated by antibiotics (10x MIC) as measured byan LAL assay For comparison data from treatment with 10x MIC ampicillin are included Data from twobiological replicates (black points) and bars indicate averages
21
Parent strain (BW25113) Genetic deletion
+GENT +CIP
ΔgshA
Δgor
-6
-4
-2
0
2
Log
surv
ival
-6
-4
-2
0
2
Log
surv
ival
-6
-4
-2
0
2
Log
surv
ival
-6
-4
-2
0
2
Log
surv
ival
Untrea
ted
1x M
IC
10x M
IC
Untrea
ted
1x M
IC
10x M
IC
Untrea
ted
1x M
IC
10x M
IC
Untrea
ted
1x M
IC
10x M
IC
Supplementary Figure 14 Effects of genetic deletions on antibiotic killing Shown are log survival valuesof E coli under gentamicin and ciprofloxacin treatment as determined by CFU plating and counting after4 h of treatment ∆gshA and ∆gor strains from the Keio collection as well as the parent strain (BW25113)were used Data from two biological replicates (black points) and bars indicate averages Positive valuesindicate increases in CFUmL
22
Relat
ive
C11-
BODI
PY in
tens
ity
+KAN +CIP
42e-5
84e-655e-10
013
47e-9
26e-3
Turgid
Conde
nsed
Lysed
Untrea
ted
Treated
Turgid
Conde
nsed
Lysed
Untrea
ted
Treated
0
5
10
15
20
0
5
10
15
20
55e-1036e-8
47e-9
006
42e-10
55e-10
Supplementary Figure 15 Measurements of C11-BODIPY fluorescence in the presence of α-tocopherolShown are fluorescence intensities of antibiotic-treated E coli pretreated by the lipophilic antioxidantα-tocopherol (50 mM) and in the presence of the lipid peroxidation-sensitive dye C11-BODIPY Thekanamycin and ciprofloxacin concentrations used were 10x MIC Data are from 20 cells in each group Boxplots indicating the median (center) 25th percentile and 75th percentile (bounds of box) and extreme datapoints not considered outliers (bounds of whiskers) are shown and red crosses indicate outliers includingthe minimum and maximum values p-values for two-sample Kolmogorov-Smirnov tests are shown next tocorresponding brackets
23
APC-A
Cytoplasmic mCherry
SSC-A
FSC
-A
Supplementary Figure 16 Gating strategy for flow cytometry E coli cells containing cytoplasmic mCherrywere filtered by calibration of forward- and side-scattering area measurements (FSC-A and SSC-A) usingthe APC-A (red) fluorochrome 20000 scattering events are shown and results are representative of fourbiological replicates with 20000 scattering events each The gating strategy was used for the flow cytometrymeasurements shown in Fig 4 of the main text and Supplementary Figs 1 and 8
24
Supplementary References1 Wong F amp Amir A Mechanics and dynamics of bacterial cell lysis Biophys J 116 2378ndash2389 (2019)
2 Dwyer D J et al Antibiotics induce redox-related physiological alterations as part of their lethalityProc Natl Acad Sci USA 111 E2100ndashE2109 (2014)
3 Yao Z Kahne D amp Kishony R Distinct single-cell morphological dynamics under beta-lactam antibi-otics Mol Cell 48 705ndash712 (2012)
4 Whatmore A M amp Reed R H Determination of turgor pressure in Bacillus subtilis a possible role forK+ in turgor regulation J Gen Microbiol 136 2521ndash2526 (1990)
5 Sun Y Sun T-L ampHuang HW Physical properties ofEscherichia coli spheroplastmembranes BiophysJ 107 2082ndash2090 (2014)
6 Dougherty T J amp Saukkonen J J Membrane permeability changes associated with DNA gyrase in-hibitors in Escherichia coli Antimicrob Agents Chemother 28 200ndash206 (1985)
7 Diver J M amp Wise R Morphological and biochemical changes in Escherichia coli after exposure tociprofloxacin J Antimicrob Chemother 18 31ndash41 (1986)
8 Elliott T S Shelton A amp Greenwood D The response of Escherichia coli to ciprofloxacin and nor-floxacin J Med Microbiol 23 83ndash88 (1987)
9 Wang S Arellano-Santoyo H Combs P A amp Shaevitz J W Actin-like cytoskeleton filaments con-tribute to cell mechanics in bacteria Proc Natl Acad Sci USA 107 9182ndash9185 (2010)
10 Koch A L Bacterial growth and form (Springer Science amp Business Media 2001)
11 Hussain S et al MreB filaments create rod shape by aligning along principal membrane curvature eLife7 e32471 (2018)
12 Wang S ampWingreen N S Cell shape canmediate the spatial organization of the bacterial cytoskeletonBiophys J 541ndash552 (2013)
13 et al K A S Protein diffusion in the periplasm of e coli under osmotic stress Biophys J 22ndash31 (2011)
14 Silhavy T J Kahne D amp Walker S The bacterial cell envelope Cold Spring Harb Perspect Biol 2a000414 (2010)
15 Movva N R Nakamura K amp Inouye M Regulatory region of the gene for the ompA protein a majorouter membrane protein of Escherichia coli Proc Natl Acad Sci USA 77 3845ndash3849 (1980)
16 Cussler E L Diffusion Mass Transfer in Fluid Systems (Cambridge University Press 1997)
17 Sperelakis N Cell Physiology Source Book Essentials of Membrane Biophysics (Academic Press 1995)
18 Phillips R Kondev J Theriot J amp Garcia H Physical Biology of the Cell (Taylor and Francis 2012)
19 Ccediletiner U et al Tension-activated channels in the mechanism of osmotic fitness in Pseudomonas aerugi-nosa J Gen Physiol 149 595ndash609 (2017)
20 Deng Y Sun M amp Shaevitz J W Direct measurement of cell wall stress stiffening and turgor pressurein live bacterial cells Phys Rev Lett 107 158101 (2011)
21 Amir A Babaeipour F McIntosh D B Nelson D R amp Jun S Bending forces plastically deformgrowing bacterial cell walls Proc Natl Acad Sci USA 111 5778ndash5783 (2014)
22 Yao X Jericho M Pink D amp Beveridge T Thickness and elasticity of Gram-negative murein sacculimeasured by atomic force microscopy J Bacteriol 181 6865ndash6875 (1999)
23 Cayley D S Guttman H J amp Record M T Biophysical characterization of changes in amounts andactivity of Escherichia coli cell and compartment water and turgor pressure in response to osmotic stressBiophys J 78 1748ndash1764 (2000)
25
- Cytoplasmic condensation induced by membrane damage is associated with antibiotic lethality
-
- Results
-
- Aminoglycosides and fluoroquinolones induce membrane damage and cytoplasmic condensation in E coli
- A biophysical model of cell envelope mechanics and solute outflow predicts the dynamics of cytoplasmic condensation
- Cytoplasmic condensation is associated with cell death
- Cytoplasmic condensation is associated with ROS accumulation lipid peroxidation and changes in lipid composition
- Cytoplasmic condensation and antibiotic-induced cell death are mitigated by glutathione a scavenger of reactive metabolic by-products
- Cytoplasmic condensation and antibiotic-induced cell death are robust to changes in oxygen availability and external osmolarity
-
- Discussion
- Methods
-
- Bacterial strains
- Antibiotics and other reagents
- Bacterial culture and growth
- Determination of MICs
- Microscopy
- Microfluidics and osmotic shock experiments
- Atomic force microscopy measurements
- Inference of the cellular turgor pressure from atomic force microscopy measurements
- Membrane permeability and depolarization assays
- ROS and RNS detection with fluorescent dyes
- Membrane peroxidation detection with a fluorescent dye
- Image analysis
- Single-cell traces
- Sample preparation for thin-layer chromatography experiments
- Thin-layer chromatography of lipid content
- Time-kill assays and CFU measurements
- Flow cytometry
- ATP abundance assay
- Anaerobic chamber
- Protein concentration and LPS level assays
- Statistical testing
-
- Reporting summary
- Data availability
- References
- Acknowledgements
- Author contributions
- Competing interests
- Additional information
-

a
0 100 200 3000
02
04
06
08
10
Time after nanodefect formation (s)
Solute number
0 100 200 3000
02
04
06
08
10Turgor pressure
0 100 200 3000
02
04
06
08
10Cellular volume
b c
Frac
tion
of in
itial s
olut
es re
main
ing
Frac
tion
of in
itial t
urgo
r rem
ainin
g
Frac
tion
of in
itial c
ell v
olum
e re
main
ing
Time after nanodefect formation (s) Time after nanodefect formation (s)
Hole radius = 05 nm 100 holesHole radius = 1 nm 10 holesHole radius = 5 nm 1 hole
Supplementary Figure 10 Sensitivity analysis of the model of solute outflowa Model predictions for the solute number as a function of time across different membrane defect radii(different colors) Depending on the size of typical membrane defect (05 nm 1 nm 5 nm radius) themodelsuggests that different numbers of membrane defects form (100 10 and 1 respectively) as to be consistentwith the minute-timescale of condensation In all cases the model predicts cells to condense after outflowof solutes from a cell as detailed in Supplementary Note 1b-c Same as panel a but for the predicted cellular turgor pressure (b) and volume (c)
18
a
b c
+CIP
Frac
tion
+CIP exp
onen
tial
+CIP ea
rly sta
tiona
ry
+KAN exp
onen
tial
+KAN earl
y stat
ionary
Log
surv
ival
No trea
tmen
t exp
onen
tial
+CIP late
statio
nary
+KAN late
statio
nary
00102030405060708091
-6
-5
-4
-3
-2
-1
0
1
2
No trea
tmen
t earl
y stat
ionary
No trea
tmen
t late
statio
nary
+CIP exp
onen
tial
+CIP ea
rly sta
tiona
ry
+KAN exp
onen
tial
+KAN earl
y stat
ionary
No trea
tmen
t exp
onen
tial
+CIP late
statio
nary
+KAN late
statio
nary
No trea
tmen
t earl
y stat
ionary
No trea
tmen
t late
statio
nary
Supplementary Figure 11 Experiments on stationary-phase cellsa Microscopy images of early stationary-phase (OD600 asymp 15) E coli cells treated by ciprofloxacin (10xMIC)at times 0 h (left) and 6 h (right) Results are representative of two biological replicates and yellowmarkersindicate condensed or lysed cells Scale bar 3 micromb Fractions of all cells that are condensed or lysed corresponding to the experiments in panel a from twodifferent fields of view of two biological replicates with at least 20 cells each in addition to cells from earlyexponential phase (OD600 asymp 01) and late stationary phase (OD600 gt 20) as described in the MethodsAll antibiotics refer to 10x MIC and ldquono treatmentrdquo cells were not treated by antibiotics Individual pointscorresponding to each field of view are shown The numbers of cells in each of two fields of view accordingto the order of treatment shown along the horizontal axis was as follows 24 and 30 56 and 76 101 and 94195 and 206 20 and 20 20 and 20 95 and 107 20 and 20 20 and 30c Survival of E coli cells treated by kanamycin and ciprofloxacin (10x MIC) 6 h after treatment as deter-mined by CFU counting corresponding to panel b Positive values of the log survival indicate an increasein CFUmL Results are from two biological replicates (individual points) and bars indicate averages
19
0
1
2
Relat
ive A
TPO
D
rat
io60
0
LB
LB+glu
tathio
ne
1100
0 LB in
PBS
Supplementary Figure 12 Bulk culture measurements of ATP abundance in cell cultures with and with-out glutathione pretreatment (10 mM) Cells were assayed in early log phase (OD600 asymp 01) For compari-son measurements for cells grown in LB diluted 11000 in PBS are shown Error bars indicate one standarddeviation bars indicate averages and data are presented asmean values+- SEM Individualmeasurementsfrom biological replicates are shown as black points Number of biological replicates in each condition LB8 glutathione 6 11000 LB in PBS 10
20
Untrea
ted
KAN 10x
CIP 10x
AMP 10x
0
200
400
600
800
1000
LPS
(end
otox
in u
nitμ
g pr
otei
n)
Supplementary Figure 13 Measurements of lipopolysaccharide levels Shown are measurements oflipopolysaccharide (LPS) levels of bulk cultures of cells treated by antibiotics (10x MIC) as measured byan LAL assay For comparison data from treatment with 10x MIC ampicillin are included Data from twobiological replicates (black points) and bars indicate averages
21
Parent strain (BW25113) Genetic deletion
+GENT +CIP
ΔgshA
Δgor
-6
-4
-2
0
2
Log
surv
ival
-6
-4
-2
0
2
Log
surv
ival
-6
-4
-2
0
2
Log
surv
ival
-6
-4
-2
0
2
Log
surv
ival
Untrea
ted
1x M
IC
10x M
IC
Untrea
ted
1x M
IC
10x M
IC
Untrea
ted
1x M
IC
10x M
IC
Untrea
ted
1x M
IC
10x M
IC
Supplementary Figure 14 Effects of genetic deletions on antibiotic killing Shown are log survival valuesof E coli under gentamicin and ciprofloxacin treatment as determined by CFU plating and counting after4 h of treatment ∆gshA and ∆gor strains from the Keio collection as well as the parent strain (BW25113)were used Data from two biological replicates (black points) and bars indicate averages Positive valuesindicate increases in CFUmL
22
Relat
ive
C11-
BODI
PY in
tens
ity
+KAN +CIP
42e-5
84e-655e-10
013
47e-9
26e-3
Turgid
Conde
nsed
Lysed
Untrea
ted
Treated
Turgid
Conde
nsed
Lysed
Untrea
ted
Treated
0
5
10
15
20
0
5
10
15
20
55e-1036e-8
47e-9
006
42e-10
55e-10
Supplementary Figure 15 Measurements of C11-BODIPY fluorescence in the presence of α-tocopherolShown are fluorescence intensities of antibiotic-treated E coli pretreated by the lipophilic antioxidantα-tocopherol (50 mM) and in the presence of the lipid peroxidation-sensitive dye C11-BODIPY Thekanamycin and ciprofloxacin concentrations used were 10x MIC Data are from 20 cells in each group Boxplots indicating the median (center) 25th percentile and 75th percentile (bounds of box) and extreme datapoints not considered outliers (bounds of whiskers) are shown and red crosses indicate outliers includingthe minimum and maximum values p-values for two-sample Kolmogorov-Smirnov tests are shown next tocorresponding brackets
23
APC-A
Cytoplasmic mCherry
SSC-A
FSC
-A
Supplementary Figure 16 Gating strategy for flow cytometry E coli cells containing cytoplasmic mCherrywere filtered by calibration of forward- and side-scattering area measurements (FSC-A and SSC-A) usingthe APC-A (red) fluorochrome 20000 scattering events are shown and results are representative of fourbiological replicates with 20000 scattering events each The gating strategy was used for the flow cytometrymeasurements shown in Fig 4 of the main text and Supplementary Figs 1 and 8
24
Supplementary References1 Wong F amp Amir A Mechanics and dynamics of bacterial cell lysis Biophys J 116 2378ndash2389 (2019)
2 Dwyer D J et al Antibiotics induce redox-related physiological alterations as part of their lethalityProc Natl Acad Sci USA 111 E2100ndashE2109 (2014)
3 Yao Z Kahne D amp Kishony R Distinct single-cell morphological dynamics under beta-lactam antibi-otics Mol Cell 48 705ndash712 (2012)
4 Whatmore A M amp Reed R H Determination of turgor pressure in Bacillus subtilis a possible role forK+ in turgor regulation J Gen Microbiol 136 2521ndash2526 (1990)
5 Sun Y Sun T-L ampHuang HW Physical properties ofEscherichia coli spheroplastmembranes BiophysJ 107 2082ndash2090 (2014)
6 Dougherty T J amp Saukkonen J J Membrane permeability changes associated with DNA gyrase in-hibitors in Escherichia coli Antimicrob Agents Chemother 28 200ndash206 (1985)
7 Diver J M amp Wise R Morphological and biochemical changes in Escherichia coli after exposure tociprofloxacin J Antimicrob Chemother 18 31ndash41 (1986)
8 Elliott T S Shelton A amp Greenwood D The response of Escherichia coli to ciprofloxacin and nor-floxacin J Med Microbiol 23 83ndash88 (1987)
9 Wang S Arellano-Santoyo H Combs P A amp Shaevitz J W Actin-like cytoskeleton filaments con-tribute to cell mechanics in bacteria Proc Natl Acad Sci USA 107 9182ndash9185 (2010)
10 Koch A L Bacterial growth and form (Springer Science amp Business Media 2001)
11 Hussain S et al MreB filaments create rod shape by aligning along principal membrane curvature eLife7 e32471 (2018)
12 Wang S ampWingreen N S Cell shape canmediate the spatial organization of the bacterial cytoskeletonBiophys J 541ndash552 (2013)
13 et al K A S Protein diffusion in the periplasm of e coli under osmotic stress Biophys J 22ndash31 (2011)
14 Silhavy T J Kahne D amp Walker S The bacterial cell envelope Cold Spring Harb Perspect Biol 2a000414 (2010)
15 Movva N R Nakamura K amp Inouye M Regulatory region of the gene for the ompA protein a majorouter membrane protein of Escherichia coli Proc Natl Acad Sci USA 77 3845ndash3849 (1980)
16 Cussler E L Diffusion Mass Transfer in Fluid Systems (Cambridge University Press 1997)
17 Sperelakis N Cell Physiology Source Book Essentials of Membrane Biophysics (Academic Press 1995)
18 Phillips R Kondev J Theriot J amp Garcia H Physical Biology of the Cell (Taylor and Francis 2012)
19 Ccediletiner U et al Tension-activated channels in the mechanism of osmotic fitness in Pseudomonas aerugi-nosa J Gen Physiol 149 595ndash609 (2017)
20 Deng Y Sun M amp Shaevitz J W Direct measurement of cell wall stress stiffening and turgor pressurein live bacterial cells Phys Rev Lett 107 158101 (2011)
21 Amir A Babaeipour F McIntosh D B Nelson D R amp Jun S Bending forces plastically deformgrowing bacterial cell walls Proc Natl Acad Sci USA 111 5778ndash5783 (2014)
22 Yao X Jericho M Pink D amp Beveridge T Thickness and elasticity of Gram-negative murein sacculimeasured by atomic force microscopy J Bacteriol 181 6865ndash6875 (1999)
23 Cayley D S Guttman H J amp Record M T Biophysical characterization of changes in amounts andactivity of Escherichia coli cell and compartment water and turgor pressure in response to osmotic stressBiophys J 78 1748ndash1764 (2000)
25
- Cytoplasmic condensation induced by membrane damage is associated with antibiotic lethality
-
- Results
-
- Aminoglycosides and fluoroquinolones induce membrane damage and cytoplasmic condensation in E coli
- A biophysical model of cell envelope mechanics and solute outflow predicts the dynamics of cytoplasmic condensation
- Cytoplasmic condensation is associated with cell death
- Cytoplasmic condensation is associated with ROS accumulation lipid peroxidation and changes in lipid composition
- Cytoplasmic condensation and antibiotic-induced cell death are mitigated by glutathione a scavenger of reactive metabolic by-products
- Cytoplasmic condensation and antibiotic-induced cell death are robust to changes in oxygen availability and external osmolarity
-
- Discussion
- Methods
-
- Bacterial strains
- Antibiotics and other reagents
- Bacterial culture and growth
- Determination of MICs
- Microscopy
- Microfluidics and osmotic shock experiments
- Atomic force microscopy measurements
- Inference of the cellular turgor pressure from atomic force microscopy measurements
- Membrane permeability and depolarization assays
- ROS and RNS detection with fluorescent dyes
- Membrane peroxidation detection with a fluorescent dye
- Image analysis
- Single-cell traces
- Sample preparation for thin-layer chromatography experiments
- Thin-layer chromatography of lipid content
- Time-kill assays and CFU measurements
- Flow cytometry
- ATP abundance assay
- Anaerobic chamber
- Protein concentration and LPS level assays
- Statistical testing
-
- Reporting summary
- Data availability
- References
- Acknowledgements
- Author contributions
- Competing interests
- Additional information
-

a
b c
+CIP
Frac
tion
+CIP exp
onen
tial
+CIP ea
rly sta
tiona
ry
+KAN exp
onen
tial
+KAN earl
y stat
ionary
Log
surv
ival
No trea
tmen
t exp
onen
tial
+CIP late
statio
nary
+KAN late
statio
nary
00102030405060708091
-6
-5
-4
-3
-2
-1
0
1
2
No trea
tmen
t earl
y stat
ionary
No trea
tmen
t late
statio
nary
+CIP exp
onen
tial
+CIP ea
rly sta
tiona
ry
+KAN exp
onen
tial
+KAN earl
y stat
ionary
No trea
tmen
t exp
onen
tial
+CIP late
statio
nary
+KAN late
statio
nary
No trea
tmen
t earl
y stat
ionary
No trea
tmen
t late
statio
nary
Supplementary Figure 11 Experiments on stationary-phase cellsa Microscopy images of early stationary-phase (OD600 asymp 15) E coli cells treated by ciprofloxacin (10xMIC)at times 0 h (left) and 6 h (right) Results are representative of two biological replicates and yellowmarkersindicate condensed or lysed cells Scale bar 3 micromb Fractions of all cells that are condensed or lysed corresponding to the experiments in panel a from twodifferent fields of view of two biological replicates with at least 20 cells each in addition to cells from earlyexponential phase (OD600 asymp 01) and late stationary phase (OD600 gt 20) as described in the MethodsAll antibiotics refer to 10x MIC and ldquono treatmentrdquo cells were not treated by antibiotics Individual pointscorresponding to each field of view are shown The numbers of cells in each of two fields of view accordingto the order of treatment shown along the horizontal axis was as follows 24 and 30 56 and 76 101 and 94195 and 206 20 and 20 20 and 20 95 and 107 20 and 20 20 and 30c Survival of E coli cells treated by kanamycin and ciprofloxacin (10x MIC) 6 h after treatment as deter-mined by CFU counting corresponding to panel b Positive values of the log survival indicate an increasein CFUmL Results are from two biological replicates (individual points) and bars indicate averages
19
0
1
2
Relat
ive A
TPO
D
rat
io60
0
LB
LB+glu
tathio
ne
1100
0 LB in
PBS
Supplementary Figure 12 Bulk culture measurements of ATP abundance in cell cultures with and with-out glutathione pretreatment (10 mM) Cells were assayed in early log phase (OD600 asymp 01) For compari-son measurements for cells grown in LB diluted 11000 in PBS are shown Error bars indicate one standarddeviation bars indicate averages and data are presented asmean values+- SEM Individualmeasurementsfrom biological replicates are shown as black points Number of biological replicates in each condition LB8 glutathione 6 11000 LB in PBS 10
20
Untrea
ted
KAN 10x
CIP 10x
AMP 10x
0
200
400
600
800
1000
LPS
(end
otox
in u
nitμ
g pr
otei
n)
Supplementary Figure 13 Measurements of lipopolysaccharide levels Shown are measurements oflipopolysaccharide (LPS) levels of bulk cultures of cells treated by antibiotics (10x MIC) as measured byan LAL assay For comparison data from treatment with 10x MIC ampicillin are included Data from twobiological replicates (black points) and bars indicate averages
21
Parent strain (BW25113) Genetic deletion
+GENT +CIP
ΔgshA
Δgor
-6
-4
-2
0
2
Log
surv
ival
-6
-4
-2
0
2
Log
surv
ival
-6
-4
-2
0
2
Log
surv
ival
-6
-4
-2
0
2
Log
surv
ival
Untrea
ted
1x M
IC
10x M
IC
Untrea
ted
1x M
IC
10x M
IC
Untrea
ted
1x M
IC
10x M
IC
Untrea
ted
1x M
IC
10x M
IC
Supplementary Figure 14 Effects of genetic deletions on antibiotic killing Shown are log survival valuesof E coli under gentamicin and ciprofloxacin treatment as determined by CFU plating and counting after4 h of treatment ∆gshA and ∆gor strains from the Keio collection as well as the parent strain (BW25113)were used Data from two biological replicates (black points) and bars indicate averages Positive valuesindicate increases in CFUmL
22
Relat
ive
C11-
BODI
PY in
tens
ity
+KAN +CIP
42e-5
84e-655e-10
013
47e-9
26e-3
Turgid
Conde
nsed
Lysed
Untrea
ted
Treated
Turgid
Conde
nsed
Lysed
Untrea
ted
Treated
0
5
10
15
20
0
5
10
15
20
55e-1036e-8
47e-9
006
42e-10
55e-10
Supplementary Figure 15 Measurements of C11-BODIPY fluorescence in the presence of α-tocopherolShown are fluorescence intensities of antibiotic-treated E coli pretreated by the lipophilic antioxidantα-tocopherol (50 mM) and in the presence of the lipid peroxidation-sensitive dye C11-BODIPY Thekanamycin and ciprofloxacin concentrations used were 10x MIC Data are from 20 cells in each group Boxplots indicating the median (center) 25th percentile and 75th percentile (bounds of box) and extreme datapoints not considered outliers (bounds of whiskers) are shown and red crosses indicate outliers includingthe minimum and maximum values p-values for two-sample Kolmogorov-Smirnov tests are shown next tocorresponding brackets
23
APC-A
Cytoplasmic mCherry
SSC-A
FSC
-A
Supplementary Figure 16 Gating strategy for flow cytometry E coli cells containing cytoplasmic mCherrywere filtered by calibration of forward- and side-scattering area measurements (FSC-A and SSC-A) usingthe APC-A (red) fluorochrome 20000 scattering events are shown and results are representative of fourbiological replicates with 20000 scattering events each The gating strategy was used for the flow cytometrymeasurements shown in Fig 4 of the main text and Supplementary Figs 1 and 8
24
Supplementary References1 Wong F amp Amir A Mechanics and dynamics of bacterial cell lysis Biophys J 116 2378ndash2389 (2019)
2 Dwyer D J et al Antibiotics induce redox-related physiological alterations as part of their lethalityProc Natl Acad Sci USA 111 E2100ndashE2109 (2014)
3 Yao Z Kahne D amp Kishony R Distinct single-cell morphological dynamics under beta-lactam antibi-otics Mol Cell 48 705ndash712 (2012)
4 Whatmore A M amp Reed R H Determination of turgor pressure in Bacillus subtilis a possible role forK+ in turgor regulation J Gen Microbiol 136 2521ndash2526 (1990)
5 Sun Y Sun T-L ampHuang HW Physical properties ofEscherichia coli spheroplastmembranes BiophysJ 107 2082ndash2090 (2014)
6 Dougherty T J amp Saukkonen J J Membrane permeability changes associated with DNA gyrase in-hibitors in Escherichia coli Antimicrob Agents Chemother 28 200ndash206 (1985)
7 Diver J M amp Wise R Morphological and biochemical changes in Escherichia coli after exposure tociprofloxacin J Antimicrob Chemother 18 31ndash41 (1986)
8 Elliott T S Shelton A amp Greenwood D The response of Escherichia coli to ciprofloxacin and nor-floxacin J Med Microbiol 23 83ndash88 (1987)
9 Wang S Arellano-Santoyo H Combs P A amp Shaevitz J W Actin-like cytoskeleton filaments con-tribute to cell mechanics in bacteria Proc Natl Acad Sci USA 107 9182ndash9185 (2010)
10 Koch A L Bacterial growth and form (Springer Science amp Business Media 2001)
11 Hussain S et al MreB filaments create rod shape by aligning along principal membrane curvature eLife7 e32471 (2018)
12 Wang S ampWingreen N S Cell shape canmediate the spatial organization of the bacterial cytoskeletonBiophys J 541ndash552 (2013)
13 et al K A S Protein diffusion in the periplasm of e coli under osmotic stress Biophys J 22ndash31 (2011)
14 Silhavy T J Kahne D amp Walker S The bacterial cell envelope Cold Spring Harb Perspect Biol 2a000414 (2010)
15 Movva N R Nakamura K amp Inouye M Regulatory region of the gene for the ompA protein a majorouter membrane protein of Escherichia coli Proc Natl Acad Sci USA 77 3845ndash3849 (1980)
16 Cussler E L Diffusion Mass Transfer in Fluid Systems (Cambridge University Press 1997)
17 Sperelakis N Cell Physiology Source Book Essentials of Membrane Biophysics (Academic Press 1995)
18 Phillips R Kondev J Theriot J amp Garcia H Physical Biology of the Cell (Taylor and Francis 2012)
19 Ccediletiner U et al Tension-activated channels in the mechanism of osmotic fitness in Pseudomonas aerugi-nosa J Gen Physiol 149 595ndash609 (2017)
20 Deng Y Sun M amp Shaevitz J W Direct measurement of cell wall stress stiffening and turgor pressurein live bacterial cells Phys Rev Lett 107 158101 (2011)
21 Amir A Babaeipour F McIntosh D B Nelson D R amp Jun S Bending forces plastically deformgrowing bacterial cell walls Proc Natl Acad Sci USA 111 5778ndash5783 (2014)
22 Yao X Jericho M Pink D amp Beveridge T Thickness and elasticity of Gram-negative murein sacculimeasured by atomic force microscopy J Bacteriol 181 6865ndash6875 (1999)
23 Cayley D S Guttman H J amp Record M T Biophysical characterization of changes in amounts andactivity of Escherichia coli cell and compartment water and turgor pressure in response to osmotic stressBiophys J 78 1748ndash1764 (2000)
25
- Cytoplasmic condensation induced by membrane damage is associated with antibiotic lethality
-
- Results
-
- Aminoglycosides and fluoroquinolones induce membrane damage and cytoplasmic condensation in E coli
- A biophysical model of cell envelope mechanics and solute outflow predicts the dynamics of cytoplasmic condensation
- Cytoplasmic condensation is associated with cell death
- Cytoplasmic condensation is associated with ROS accumulation lipid peroxidation and changes in lipid composition
- Cytoplasmic condensation and antibiotic-induced cell death are mitigated by glutathione a scavenger of reactive metabolic by-products
- Cytoplasmic condensation and antibiotic-induced cell death are robust to changes in oxygen availability and external osmolarity
-
- Discussion
- Methods
-
- Bacterial strains
- Antibiotics and other reagents
- Bacterial culture and growth
- Determination of MICs
- Microscopy
- Microfluidics and osmotic shock experiments
- Atomic force microscopy measurements
- Inference of the cellular turgor pressure from atomic force microscopy measurements
- Membrane permeability and depolarization assays
- ROS and RNS detection with fluorescent dyes
- Membrane peroxidation detection with a fluorescent dye
- Image analysis
- Single-cell traces
- Sample preparation for thin-layer chromatography experiments
- Thin-layer chromatography of lipid content
- Time-kill assays and CFU measurements
- Flow cytometry
- ATP abundance assay
- Anaerobic chamber
- Protein concentration and LPS level assays
- Statistical testing
-
- Reporting summary
- Data availability
- References
- Acknowledgements
- Author contributions
- Competing interests
- Additional information
-
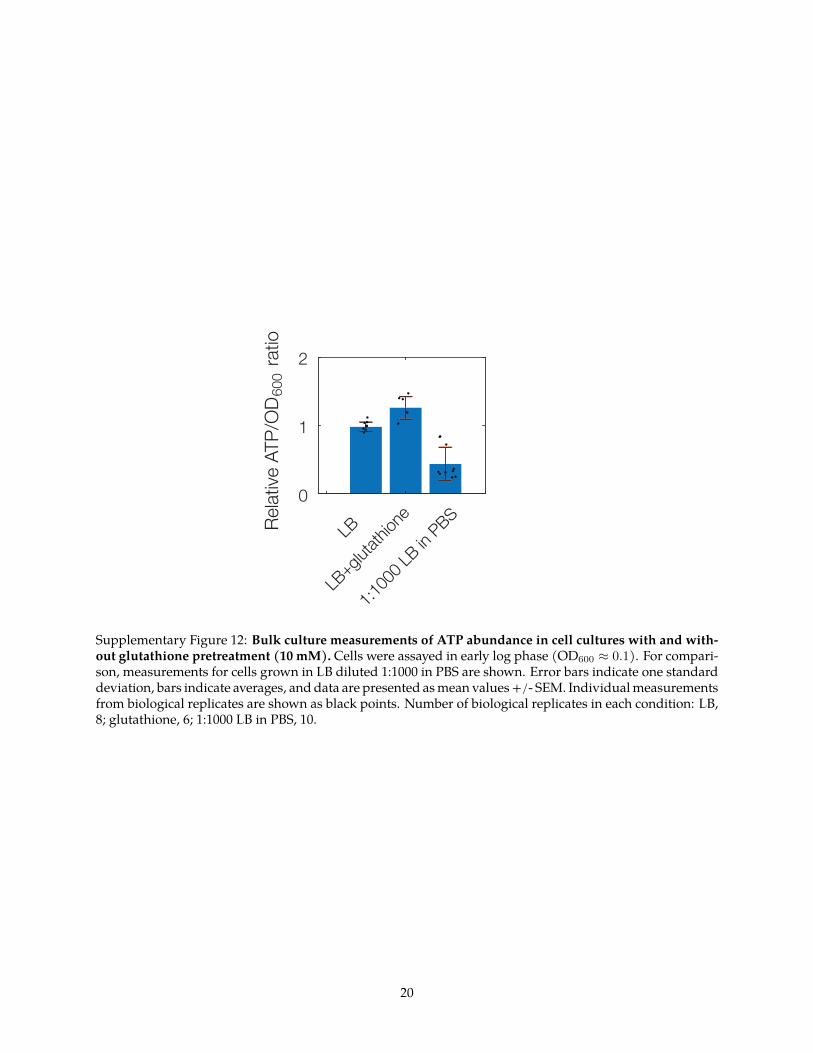
0
1
2
Relat
ive A
TPO
D
rat
io60
0
LB
LB+glu
tathio
ne
1100
0 LB in
PBS
Supplementary Figure 12 Bulk culture measurements of ATP abundance in cell cultures with and with-out glutathione pretreatment (10 mM) Cells were assayed in early log phase (OD600 asymp 01) For compari-son measurements for cells grown in LB diluted 11000 in PBS are shown Error bars indicate one standarddeviation bars indicate averages and data are presented asmean values+- SEM Individualmeasurementsfrom biological replicates are shown as black points Number of biological replicates in each condition LB8 glutathione 6 11000 LB in PBS 10
20
Untrea
ted
KAN 10x
CIP 10x
AMP 10x
0
200
400
600
800
1000
LPS
(end
otox
in u
nitμ
g pr
otei
n)
Supplementary Figure 13 Measurements of lipopolysaccharide levels Shown are measurements oflipopolysaccharide (LPS) levels of bulk cultures of cells treated by antibiotics (10x MIC) as measured byan LAL assay For comparison data from treatment with 10x MIC ampicillin are included Data from twobiological replicates (black points) and bars indicate averages
21
Parent strain (BW25113) Genetic deletion
+GENT +CIP
ΔgshA
Δgor
-6
-4
-2
0
2
Log
surv
ival
-6
-4
-2
0
2
Log
surv
ival
-6
-4
-2
0
2
Log
surv
ival
-6
-4
-2
0
2
Log
surv
ival
Untrea
ted
1x M
IC
10x M
IC
Untrea
ted
1x M
IC
10x M
IC
Untrea
ted
1x M
IC
10x M
IC
Untrea
ted
1x M
IC
10x M
IC
Supplementary Figure 14 Effects of genetic deletions on antibiotic killing Shown are log survival valuesof E coli under gentamicin and ciprofloxacin treatment as determined by CFU plating and counting after4 h of treatment ∆gshA and ∆gor strains from the Keio collection as well as the parent strain (BW25113)were used Data from two biological replicates (black points) and bars indicate averages Positive valuesindicate increases in CFUmL
22
Relat
ive
C11-
BODI
PY in
tens
ity
+KAN +CIP
42e-5
84e-655e-10
013
47e-9
26e-3
Turgid
Conde
nsed
Lysed
Untrea
ted
Treated
Turgid
Conde
nsed
Lysed
Untrea
ted
Treated
0
5
10
15
20
0
5
10
15
20
55e-1036e-8
47e-9
006
42e-10
55e-10
Supplementary Figure 15 Measurements of C11-BODIPY fluorescence in the presence of α-tocopherolShown are fluorescence intensities of antibiotic-treated E coli pretreated by the lipophilic antioxidantα-tocopherol (50 mM) and in the presence of the lipid peroxidation-sensitive dye C11-BODIPY Thekanamycin and ciprofloxacin concentrations used were 10x MIC Data are from 20 cells in each group Boxplots indicating the median (center) 25th percentile and 75th percentile (bounds of box) and extreme datapoints not considered outliers (bounds of whiskers) are shown and red crosses indicate outliers includingthe minimum and maximum values p-values for two-sample Kolmogorov-Smirnov tests are shown next tocorresponding brackets
23
APC-A
Cytoplasmic mCherry
SSC-A
FSC
-A
Supplementary Figure 16 Gating strategy for flow cytometry E coli cells containing cytoplasmic mCherrywere filtered by calibration of forward- and side-scattering area measurements (FSC-A and SSC-A) usingthe APC-A (red) fluorochrome 20000 scattering events are shown and results are representative of fourbiological replicates with 20000 scattering events each The gating strategy was used for the flow cytometrymeasurements shown in Fig 4 of the main text and Supplementary Figs 1 and 8
24
Supplementary References1 Wong F amp Amir A Mechanics and dynamics of bacterial cell lysis Biophys J 116 2378ndash2389 (2019)
2 Dwyer D J et al Antibiotics induce redox-related physiological alterations as part of their lethalityProc Natl Acad Sci USA 111 E2100ndashE2109 (2014)
3 Yao Z Kahne D amp Kishony R Distinct single-cell morphological dynamics under beta-lactam antibi-otics Mol Cell 48 705ndash712 (2012)
4 Whatmore A M amp Reed R H Determination of turgor pressure in Bacillus subtilis a possible role forK+ in turgor regulation J Gen Microbiol 136 2521ndash2526 (1990)
5 Sun Y Sun T-L ampHuang HW Physical properties ofEscherichia coli spheroplastmembranes BiophysJ 107 2082ndash2090 (2014)
6 Dougherty T J amp Saukkonen J J Membrane permeability changes associated with DNA gyrase in-hibitors in Escherichia coli Antimicrob Agents Chemother 28 200ndash206 (1985)
7 Diver J M amp Wise R Morphological and biochemical changes in Escherichia coli after exposure tociprofloxacin J Antimicrob Chemother 18 31ndash41 (1986)
8 Elliott T S Shelton A amp Greenwood D The response of Escherichia coli to ciprofloxacin and nor-floxacin J Med Microbiol 23 83ndash88 (1987)
9 Wang S Arellano-Santoyo H Combs P A amp Shaevitz J W Actin-like cytoskeleton filaments con-tribute to cell mechanics in bacteria Proc Natl Acad Sci USA 107 9182ndash9185 (2010)
10 Koch A L Bacterial growth and form (Springer Science amp Business Media 2001)
11 Hussain S et al MreB filaments create rod shape by aligning along principal membrane curvature eLife7 e32471 (2018)
12 Wang S ampWingreen N S Cell shape canmediate the spatial organization of the bacterial cytoskeletonBiophys J 541ndash552 (2013)
13 et al K A S Protein diffusion in the periplasm of e coli under osmotic stress Biophys J 22ndash31 (2011)
14 Silhavy T J Kahne D amp Walker S The bacterial cell envelope Cold Spring Harb Perspect Biol 2a000414 (2010)
15 Movva N R Nakamura K amp Inouye M Regulatory region of the gene for the ompA protein a majorouter membrane protein of Escherichia coli Proc Natl Acad Sci USA 77 3845ndash3849 (1980)
16 Cussler E L Diffusion Mass Transfer in Fluid Systems (Cambridge University Press 1997)
17 Sperelakis N Cell Physiology Source Book Essentials of Membrane Biophysics (Academic Press 1995)
18 Phillips R Kondev J Theriot J amp Garcia H Physical Biology of the Cell (Taylor and Francis 2012)
19 Ccediletiner U et al Tension-activated channels in the mechanism of osmotic fitness in Pseudomonas aerugi-nosa J Gen Physiol 149 595ndash609 (2017)
20 Deng Y Sun M amp Shaevitz J W Direct measurement of cell wall stress stiffening and turgor pressurein live bacterial cells Phys Rev Lett 107 158101 (2011)
21 Amir A Babaeipour F McIntosh D B Nelson D R amp Jun S Bending forces plastically deformgrowing bacterial cell walls Proc Natl Acad Sci USA 111 5778ndash5783 (2014)
22 Yao X Jericho M Pink D amp Beveridge T Thickness and elasticity of Gram-negative murein sacculimeasured by atomic force microscopy J Bacteriol 181 6865ndash6875 (1999)
23 Cayley D S Guttman H J amp Record M T Biophysical characterization of changes in amounts andactivity of Escherichia coli cell and compartment water and turgor pressure in response to osmotic stressBiophys J 78 1748ndash1764 (2000)
25
- Cytoplasmic condensation induced by membrane damage is associated with antibiotic lethality
-
- Results
-
- Aminoglycosides and fluoroquinolones induce membrane damage and cytoplasmic condensation in E coli
- A biophysical model of cell envelope mechanics and solute outflow predicts the dynamics of cytoplasmic condensation
- Cytoplasmic condensation is associated with cell death
- Cytoplasmic condensation is associated with ROS accumulation lipid peroxidation and changes in lipid composition
- Cytoplasmic condensation and antibiotic-induced cell death are mitigated by glutathione a scavenger of reactive metabolic by-products
- Cytoplasmic condensation and antibiotic-induced cell death are robust to changes in oxygen availability and external osmolarity
-
- Discussion
- Methods
-
- Bacterial strains
- Antibiotics and other reagents
- Bacterial culture and growth
- Determination of MICs
- Microscopy
- Microfluidics and osmotic shock experiments
- Atomic force microscopy measurements
- Inference of the cellular turgor pressure from atomic force microscopy measurements
- Membrane permeability and depolarization assays
- ROS and RNS detection with fluorescent dyes
- Membrane peroxidation detection with a fluorescent dye
- Image analysis
- Single-cell traces
- Sample preparation for thin-layer chromatography experiments
- Thin-layer chromatography of lipid content
- Time-kill assays and CFU measurements
- Flow cytometry
- ATP abundance assay
- Anaerobic chamber
- Protein concentration and LPS level assays
- Statistical testing
-
- Reporting summary
- Data availability
- References
- Acknowledgements
- Author contributions
- Competing interests
- Additional information
-

Untrea
ted
KAN 10x
CIP 10x
AMP 10x
0
200
400
600
800
1000
LPS
(end
otox
in u
nitμ
g pr
otei
n)
Supplementary Figure 13 Measurements of lipopolysaccharide levels Shown are measurements oflipopolysaccharide (LPS) levels of bulk cultures of cells treated by antibiotics (10x MIC) as measured byan LAL assay For comparison data from treatment with 10x MIC ampicillin are included Data from twobiological replicates (black points) and bars indicate averages
21
Parent strain (BW25113) Genetic deletion
+GENT +CIP
ΔgshA
Δgor
-6
-4
-2
0
2
Log
surv
ival
-6
-4
-2
0
2
Log
surv
ival
-6
-4
-2
0
2
Log
surv
ival
-6
-4
-2
0
2
Log
surv
ival
Untrea
ted
1x M
IC
10x M
IC
Untrea
ted
1x M
IC
10x M
IC
Untrea
ted
1x M
IC
10x M
IC
Untrea
ted
1x M
IC
10x M
IC
Supplementary Figure 14 Effects of genetic deletions on antibiotic killing Shown are log survival valuesof E coli under gentamicin and ciprofloxacin treatment as determined by CFU plating and counting after4 h of treatment ∆gshA and ∆gor strains from the Keio collection as well as the parent strain (BW25113)were used Data from two biological replicates (black points) and bars indicate averages Positive valuesindicate increases in CFUmL
22
Relat
ive
C11-
BODI
PY in
tens
ity
+KAN +CIP
42e-5
84e-655e-10
013
47e-9
26e-3
Turgid
Conde
nsed
Lysed
Untrea
ted
Treated
Turgid
Conde
nsed
Lysed
Untrea
ted
Treated
0
5
10
15
20
0
5
10
15
20
55e-1036e-8
47e-9
006
42e-10
55e-10
Supplementary Figure 15 Measurements of C11-BODIPY fluorescence in the presence of α-tocopherolShown are fluorescence intensities of antibiotic-treated E coli pretreated by the lipophilic antioxidantα-tocopherol (50 mM) and in the presence of the lipid peroxidation-sensitive dye C11-BODIPY Thekanamycin and ciprofloxacin concentrations used were 10x MIC Data are from 20 cells in each group Boxplots indicating the median (center) 25th percentile and 75th percentile (bounds of box) and extreme datapoints not considered outliers (bounds of whiskers) are shown and red crosses indicate outliers includingthe minimum and maximum values p-values for two-sample Kolmogorov-Smirnov tests are shown next tocorresponding brackets
23
APC-A
Cytoplasmic mCherry
SSC-A
FSC
-A
Supplementary Figure 16 Gating strategy for flow cytometry E coli cells containing cytoplasmic mCherrywere filtered by calibration of forward- and side-scattering area measurements (FSC-A and SSC-A) usingthe APC-A (red) fluorochrome 20000 scattering events are shown and results are representative of fourbiological replicates with 20000 scattering events each The gating strategy was used for the flow cytometrymeasurements shown in Fig 4 of the main text and Supplementary Figs 1 and 8
24
Supplementary References1 Wong F amp Amir A Mechanics and dynamics of bacterial cell lysis Biophys J 116 2378ndash2389 (2019)
2 Dwyer D J et al Antibiotics induce redox-related physiological alterations as part of their lethalityProc Natl Acad Sci USA 111 E2100ndashE2109 (2014)
3 Yao Z Kahne D amp Kishony R Distinct single-cell morphological dynamics under beta-lactam antibi-otics Mol Cell 48 705ndash712 (2012)
4 Whatmore A M amp Reed R H Determination of turgor pressure in Bacillus subtilis a possible role forK+ in turgor regulation J Gen Microbiol 136 2521ndash2526 (1990)
5 Sun Y Sun T-L ampHuang HW Physical properties ofEscherichia coli spheroplastmembranes BiophysJ 107 2082ndash2090 (2014)
6 Dougherty T J amp Saukkonen J J Membrane permeability changes associated with DNA gyrase in-hibitors in Escherichia coli Antimicrob Agents Chemother 28 200ndash206 (1985)
7 Diver J M amp Wise R Morphological and biochemical changes in Escherichia coli after exposure tociprofloxacin J Antimicrob Chemother 18 31ndash41 (1986)
8 Elliott T S Shelton A amp Greenwood D The response of Escherichia coli to ciprofloxacin and nor-floxacin J Med Microbiol 23 83ndash88 (1987)
9 Wang S Arellano-Santoyo H Combs P A amp Shaevitz J W Actin-like cytoskeleton filaments con-tribute to cell mechanics in bacteria Proc Natl Acad Sci USA 107 9182ndash9185 (2010)
10 Koch A L Bacterial growth and form (Springer Science amp Business Media 2001)
11 Hussain S et al MreB filaments create rod shape by aligning along principal membrane curvature eLife7 e32471 (2018)
12 Wang S ampWingreen N S Cell shape canmediate the spatial organization of the bacterial cytoskeletonBiophys J 541ndash552 (2013)
13 et al K A S Protein diffusion in the periplasm of e coli under osmotic stress Biophys J 22ndash31 (2011)
14 Silhavy T J Kahne D amp Walker S The bacterial cell envelope Cold Spring Harb Perspect Biol 2a000414 (2010)
15 Movva N R Nakamura K amp Inouye M Regulatory region of the gene for the ompA protein a majorouter membrane protein of Escherichia coli Proc Natl Acad Sci USA 77 3845ndash3849 (1980)
16 Cussler E L Diffusion Mass Transfer in Fluid Systems (Cambridge University Press 1997)
17 Sperelakis N Cell Physiology Source Book Essentials of Membrane Biophysics (Academic Press 1995)
18 Phillips R Kondev J Theriot J amp Garcia H Physical Biology of the Cell (Taylor and Francis 2012)
19 Ccediletiner U et al Tension-activated channels in the mechanism of osmotic fitness in Pseudomonas aerugi-nosa J Gen Physiol 149 595ndash609 (2017)
20 Deng Y Sun M amp Shaevitz J W Direct measurement of cell wall stress stiffening and turgor pressurein live bacterial cells Phys Rev Lett 107 158101 (2011)
21 Amir A Babaeipour F McIntosh D B Nelson D R amp Jun S Bending forces plastically deformgrowing bacterial cell walls Proc Natl Acad Sci USA 111 5778ndash5783 (2014)
22 Yao X Jericho M Pink D amp Beveridge T Thickness and elasticity of Gram-negative murein sacculimeasured by atomic force microscopy J Bacteriol 181 6865ndash6875 (1999)
23 Cayley D S Guttman H J amp Record M T Biophysical characterization of changes in amounts andactivity of Escherichia coli cell and compartment water and turgor pressure in response to osmotic stressBiophys J 78 1748ndash1764 (2000)
25
- Cytoplasmic condensation induced by membrane damage is associated with antibiotic lethality
-
- Results
-
- Aminoglycosides and fluoroquinolones induce membrane damage and cytoplasmic condensation in E coli
- A biophysical model of cell envelope mechanics and solute outflow predicts the dynamics of cytoplasmic condensation
- Cytoplasmic condensation is associated with cell death
- Cytoplasmic condensation is associated with ROS accumulation lipid peroxidation and changes in lipid composition
- Cytoplasmic condensation and antibiotic-induced cell death are mitigated by glutathione a scavenger of reactive metabolic by-products
- Cytoplasmic condensation and antibiotic-induced cell death are robust to changes in oxygen availability and external osmolarity
-
- Discussion
- Methods
-
- Bacterial strains
- Antibiotics and other reagents
- Bacterial culture and growth
- Determination of MICs
- Microscopy
- Microfluidics and osmotic shock experiments
- Atomic force microscopy measurements
- Inference of the cellular turgor pressure from atomic force microscopy measurements
- Membrane permeability and depolarization assays
- ROS and RNS detection with fluorescent dyes
- Membrane peroxidation detection with a fluorescent dye
- Image analysis
- Single-cell traces
- Sample preparation for thin-layer chromatography experiments
- Thin-layer chromatography of lipid content
- Time-kill assays and CFU measurements
- Flow cytometry
- ATP abundance assay
- Anaerobic chamber
- Protein concentration and LPS level assays
- Statistical testing
-
- Reporting summary
- Data availability
- References
- Acknowledgements
- Author contributions
- Competing interests
- Additional information
-