Screening out the Early Matured 'Boro Rice' Genotype for ...
16
_____________________________________________________________________________________________________ *Corresponding author: E-mail: [email protected], [email protected]; Annual Research & Review in Biology 37(2): 47-62, 2022; Article no.ARRB.83584 ISSN: 2347-565X, NLM ID: 101632869 Screening out the Early Matured ‘Boro Rice’ Genotype for Bangladesh Condition Based on their Physico-chemical Characteristics and Yields Eshath Tahmina a , Md. Shahidur Rashid Bhuiyan b , Zhumara Khatun c and Jasim Uddain c* a Institute of Seed Technology, Sher-e-Bangla Agricultural University, Dhaka, Bangladesh. b Department of Genetics & Plant Breeding, Sher-e-Bangla Agricultural University, Dhaka, Bangladesh. c Department of Horticulture, Sher-e-Bangla Agricultural University, Dhaka, Bangladesh. Authors’ contributions This work was carried out in collaboration among all authors. The final version of the manuscript was carefully read and accepted by all authors. Author ET Data curation; Writing-original draft; Author MSRB. Conceptualization; Investigation; Supervision. Author ZK Data curation; JU Formal analysis; Project administration; Writing-review & editing. All authors read and approved the final manuscript. Article Information DOI: 10.9734/ARRB/2022/v37i230487 Open Peer Review History: This journal follows the Advanced Open Peer Review policy. Identity of the Reviewers, Editor(s) and additional Reviewers, peer review comments, different versions of the manuscript, comments of the editors, etc are available here: https://www.sdiarticle5.com/review-history/83584 Received 07 December 2021 Accepted 14 February 2022 Published 25 February 2022 ABSTRACT In Bangladesh conditions, the end of the Boro season begins floods and natural calamities and loses more rice in farmer's fields. If we can select early maturity genotypes for the Boro season, we can harvest our rice from the farmer's field before flooding or any other natural calamities. The study attempted to determine the short duration and high yielding rice genotype for Boro season in Bangladesh amongst the 13 Boro rice F6 lines by contrast with two (2) test varieties. Keeping in view this idea, the output of the genotypes studied, the relationship between different morpho- physio-chemical and yield-contributing characteristics between all the genotypes were investigated there under field and laboratory conditions. Among these 15 lines, G11 line showed better in the most y ield contributing parameters. It is therefore concluded that the G11 genotype will be considered an appropriate line for the Boro season in Bangladesh. Original Research Article
-
Upload
khangminh22 -
Category
Documents
-
view
1 -
download
0
Transcript of Screening out the Early Matured 'Boro Rice' Genotype for ...

_____________________________________________________________________________________________________ *Corresponding author: E-mail: [email protected], [email protected];
Annual Research & Review in Biology 37(2): 47-62, 2022; Article no.ARRB.83584 ISSN: 2347-565X, NLM ID: 101632869
Screening out the Early Matured ‘Boro Rice’ Genotype for Bangladesh Condition Based on their
Physico-chemical Characteristics and Yields
Eshath Tahmina a, Md. Shahidur Rashid Bhuiyan b, Zhumara Khatun c and Jasim Uddain c*
a Institute of Seed Technology, Sher-e-Bangla Agricultural University, Dhaka, Bangladesh. b Department of Genetics & Plant Breeding, Sher-e-Bangla Agricultural University, Dhaka,
Bangladesh. c Department of Horticulture, Sher-e-Bangla Agricultural University, Dhaka, Bangladesh.
Authors’ contributions
This work was carried out in collaboration among all authors. The final version of the manuscript was
carefully read and accepted by all authors. Author ET Data curation; Writing-original draft; Author MSRB. Conceptualization; Investigation; Supervision. Author ZK Data curation; JU Formal analysis; Project administration; Writing-review & editing. All authors read and approved the final manuscript.
Article Information
DOI: 10.9734/ARRB/2022/v37i230487
Open Peer Review History:
This journal follows the Advanced Open Peer Review policy. Identity of the Reviewers, Editor(s) and additional Reviewers, peer review comments, different versions of the manuscript, comments of the editors, etc are available here:
https://www.sdiarticle5.com/review-history/83584
Received 07 December 2021 Accepted 14 February 2022 Published 25 February 2022
ABSTRACT
In Bangladesh conditions, the end of the Boro season begins floods and natural calamities and loses more rice in farmer's fields. If we can select early maturity genotypes for the Boro season, we can harvest our rice from the farmer's field before flooding or any other natural calamities. The study attempted to determine the short duration and high yielding rice genotype for Boro season in Bangladesh amongst the 13 Boro rice F6 lines by contrast with two (2) test varieties. Keeping in view this idea, the output of the genotypes studied, the relationship between different morpho-physio-chemical and yield-contributing characteristics between all the genotypes were investigated there under field and laboratory conditions. Among these 15 lines, G11 line showed better in the most yield contributing parameters. It is therefore concluded that the G11 genotype will be considered an appropriate line for the Boro season in Bangladesh.
Original Research Article

Tahmina et al.; ARRB, 37(2): 47-62, 2022; Article no.ARRB.83584
48
Keywords: Screening; physio-chemical properties; yield; genotype; rice.
1. INTRODUCTION Rice is one of the world's most important food crops, serving as a staple food for more than one-third of the world's population [1]. There are two different types of rice cultivated, viz. Asian (Oryza sativa) and African (Oryza glaberrima) rice. The 'Oryza' genus is divided into four species such as Oryza sativa, Oryza ofcinalis, Oryza ridelyi, and Oryza granulata. All members of the genus Oryza have n = 12 chromosomes. Rice ranks second to wheat amongst the most cultivated cereals throughout the world [2]. In Bangladesh, rice contributes to approximately 74% of the total cropped area [3]. Due to rice cultivation and total production, Bangladesh ranks fourth, after China, India and Indonesia [4]. The population of Bangladesh continues to grow by two million a year and may keep increasing by another 30 million within the next 20 years. Bangladesh will therefore require over 27.26 million tonnes of rice for 2020 but the average yield of rice is poor (4.34t ha
-1) in Bangladesh [5].
On the other hand, the rice production area is declining day by day due to high population pressures. Rice occupies a unique position in many nations due to its importance in traditional diets and the main source of income for many people in the world. It is the basis of food security and is closely linked to Bangladesh's traditional culture and customs. The wide diversity of the environment in Bangladesh, mainly due to the significant variations in topographic and seasonal components, is reflected in the range of rice groups cultivated, i.e., Aus, transplanted (T.) Aman, broadcast (B.) Aman and Boro, including in the distribution of wild and weed races [6]. The Aus season is from March-April to July-August, T. Aaman from June-July to November-December and the Boro season from October-November to April-May. Boro rice has contributed a large part of the total production of rice in Bangladesh. During the Boro season, one-fourth of the total rice area is covered by Boro rice and one-third of total rice production [1]. In view of the above information, boro rice has a vast potential in Bangladesh. The end of the Boro season begins with floods and natural calamities and the loss of more rice in the farmers' fields. If we can select early maturation
genotypes for the Boro season, we can harvest our rice from the farmer's field before flooding or any other natural calamity. It is therefore important to develop rice cultivars that are ideally suited to various boro rice-growing situations. Interval crosses and generation evaluations must be carried out to generate high yielding boro rice cultivars and to select early maturity and high yielding materials. The present study was therefore undertaken to identify the appropriate genotype based on their growth parameters, yield-contributing characteristics of selected boro rice genotypes.
2. MATERIALS AND METHODS
2.1 Experimental Site The research study carried at the central farm, Sher-e-Bangla Agricultural University (SAU), Dhaka, Bangladesh, from December 2015 to May 2016. The experimental field was located at 90 ° 22 'E longitude and 23 ° 41' N latitude at an altitude of 8.2 above sea level. It was under the Agro-Ecological Zone of Madhupur tract (AEZ No. 28) and its topsoil is clay loam in texture and common fine to medium distinct dark yellowish-brown mottles. The soil pH was 6.10; organic matter (0.84%); total N (0.46 %); exchangeable K (0.41meq/100g soil); available P (18.65µg g
-1); S
(20.92µg g-1
); Fe (225µg g-1
); Zn, (4.55µg g-1
) and Mg (0.81µg g
-1).
2.2 Planting Materials There are 15 (Fifteen) rice genotypes used in this experiment. Among the fifteen rice genotypes, thirteen genotypes were F5 materials and two were controlled materials. Physically healthy seeds of these genotypes have been obtained from the Department of Genetics and Plant Breeding (SAU), Dhaka. The name and origin of these genotypes are shown in Table 1.
2.3 Germination of Seed, Seedbed Preparation, Seedling Raising, and Transplanting
The collected seeds of all genotypes were soaked separately in a clothing bag for twenty-four (24) hours. Soaked seeds were taken out of the water and covered with straw and a gunny bag to raise the temperature to help the

Tahmina et al.; ARRB, 37(2): 47-62, 2022; Article no.ARRB.83584
49
germination. After 72 hours, the seeds were properly germinated. Germinated seeds have been seeded in selected seed beds, and seedlings have been raised by maintaining regular intervals of irrigation and protection from birds and insects. Recommended fertilisers were used in the main field before final soil preparation and thirty (30) days old seedlings were planted in the main field followed by 25 cm × 20 cm plant spacing.
2.4 Data Collection All morphological, physiological and biochemical data were collected following the standard method and data was recorded from the following parameters: 2.4.1 Morphological Days to flowering, days to maturity, total tillers/plant, number of effective tiller per plant, Panicle length (cm), Filled grains number per panicle, Unfilled grains number per panicle, Number of unfilled grains per panicle, Total number of spikelet per panicle, Yield/plant and 1000 seeds weight (gm). 2.4.2 Physiological 2.4.2.1 Milling and grain appearance Hulling (%), Milling outturn (%), Head rice recovery (%), Length/Breadth ratio of rough rice and Length/Breadth ratio of milled rice. 2.4.2.2.Cooking characteristics Kernel Length/ Breadth ratio of cooked rice, Kernel elongation ratio, Kernel elongation index, Water absorption (uptake) percentage, Volume expansion (%). 2.4.3 Biochemical Protein (%), Amylose (%).
2.5 Experimental Designs and Data Analysis
The experiments were designed in a complete block design (RCBD). The data were calculated and the mean value was analyzed using a one-way variance analysis (ANOVA) using the Statistical Package for Social Sciences (SPSS) Software Version 20.0 (SPSS Inc., Chicago, IL, USA). Mean and standard error comparisons
were determined by Duncan's multiple range tests at p≤ 0.05 significance level.
3. RESULTS
3.1 Evaluation of the Growth and Yield Performance of Different f6 Lines of Boro Rice
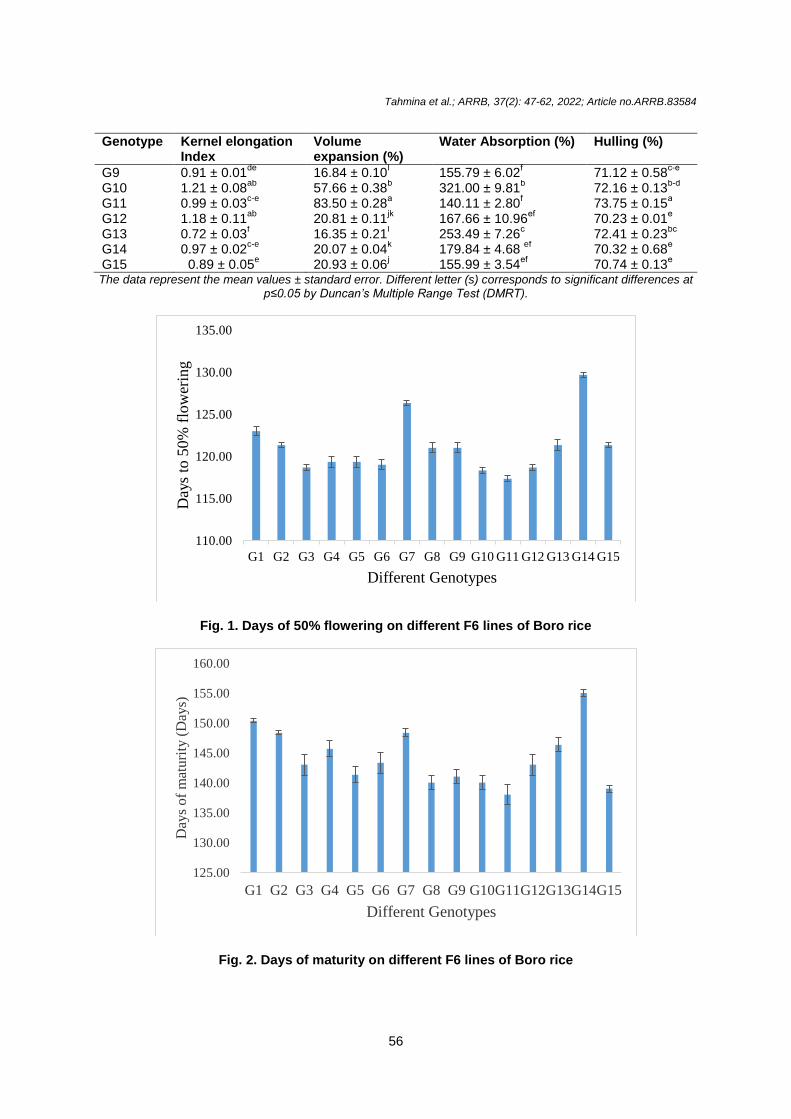
3.1.1 Days to 50 percent flowering
Days to 50 percent of the flowering of different F6 lines of rice differentiated significantly (Figure 1). The maximum days for 50 per cent of flowering (129.66 days) were recorded from G14 (BRRI dhan 29) which was the control variety and the other control variety was BRRI dhan 28(121.33), while the minimum days (117.33 days) were recorded from G11 (28 x 29 F6S2P4P3).
3.1.2 Days to maturity
Days to maturity of different F6 lines of Boro rice varied significantly (Figure 2). Among genotypes, the days to maturity ranged from 155 days to 138 days with a mean value of 144.17 days. Maximum days to maturity were found in genotype G14 (BRRI dhan 29). The G11 genotype (BRRI dhan 28 x BRRI dhan 29 F6 S2 P4 P3) had the shortest maturation period of 138 days, which is lower than the check variety BRRI dhan 29.
3.1.3 Plant height (cm)
In this study, the highest plant height (142.20 cm) was recorded from G4 (BR 21 x BRRI dhan28 F6S5P3P4) which was longer than their controls, such as BRRI dhan 29 (93.54 cm) and BRRI dhan 28 (100.52 cm) respectively. The minimum height of the plant was recorded from G14, which was checked. The rest of the population showed different plant heights (Table 2).
3.1.4 Total tillers per plant
Total tillers per plant of a different line of rice varied marginally (Table 2). The highest number of tiller per plant (17.83) was documented as G11 (BRRI dhan 28 X BRRI dhan 29 F6 S2 P4 P3), which was similar to G12 (17.40) and G15 (17.67). The minimum number (12.53) was observed in G4 (BR 21 x BRRI dhan 28 F6S5P3P4).
3.1.5 Effective tillers per plant
The comparative performance of F6 lines and the test variety for effective tillers per plant are

Tahmina et al.; ARRB, 37(2): 47-62, 2022; Article no.ARRB.83584
50
shown in Table 2. Effective tillers per plant of different F6 lines of boro rice differentiated significantly (Table 2). The highest number of effective tillers per plant (17.20) was documented from G11 (BRRI dhan 28 X BRRI dhan 29 F6 S2 P4 P3) which was statistically similar to G12, G15. The lowest number (12.07) of effective tiller was found in G4 (BR 21 x BRRI dhan 28 F6 S5 P3 P4). The rest of the population had shown different effective tillers per plant.
3.1.6 Panicle length (cm)
The length of the panicle was significantly varied across the different F6 lines of Boro rice (Table 2). The maximum panicle length (27.90 cm) was recorded from G11 (BRRI dhan 28 X BRRI dhan 29 F6 S2 P4 P3), which was higher than BRRI dhan 28 (24.07 cm) & BRRI dhan 29 (23.17 cm) and the minimum panicle length (20.91 cm) was recorded from G6 (BR 21 x BRRI dhan 29 F6S6P2P3).
3.1.7 Primary branches per panicle
From the mean tabulated value, the maximum primary branches for each panicle was performed besides G11 (14.26) while the minimum primary branches per panicle was documented for G2 (9.26) (Table 3). The rest lines had different primary branches for each panicle.
3.1.8 Secondary branches per panicle
Among the 15 genotypes, the maximum secondary branches per panicle was reported to G11 (40.10), while the minimum secondary branches per panicle was demonstrated in G2 (26.50) which was quite similar to G1 (26.76) (Table 3) and their checks were BRRI dhan 29 (32.20) and BRRI dhan 28 (30.23).
3.1.9 Spikelet per panicle
Spikelet per panicle of different F6 lines of rice differed significantly (Figure 3). The maximum spikelet per panicle (214.66) was documented in G7, while the minimum (152.93) was reported in G1. Genotypes G4, G7, G10, G11, G12 were shown to have a higher number of spikelet per plant than controls G14 (176.56) and G15 (187.93).
3.1.10 Filled grains per panicle
The maximum filled grains were recorded in G11 (195.96) which was higher than their checks in
G14 (176.56) and G15 (187.93) respectively (Figure 4). The remainder of the population displayed a different number of grains filled per panicle. 3.1.11 Unfilled grains per panicle The highest unfilled grains were recorded from G1 (90.06) while the lowest unfilled grains were documented in G11 (12.76). The rest of genotypes exhibited different unfilled grains number in each panicle (Table 3). 3.1.12 Yield per plant (g) The highest amount of yield (54.86 g) was documented from genotype G11 which was higher than their checks BRRI dhan 29 and BRRI dhan 28 had a 40.06g and 46.26g yield per plant respectively whereas the minimum (20.53 g) was recorded from G1 (Figure 5). Rest of the population showed different yield per plant. 3.1.13 1000 Seed weight (g) The maximum weight of 1000 seeds (26.41) was recorded from G11, while the minimum weight of 1000 seeds (21.25) was reported from G7 and had been statistically similar to G1 (21.90), G2 (21.63), G10 (21.99) and G14 (21.40) (Table 3).
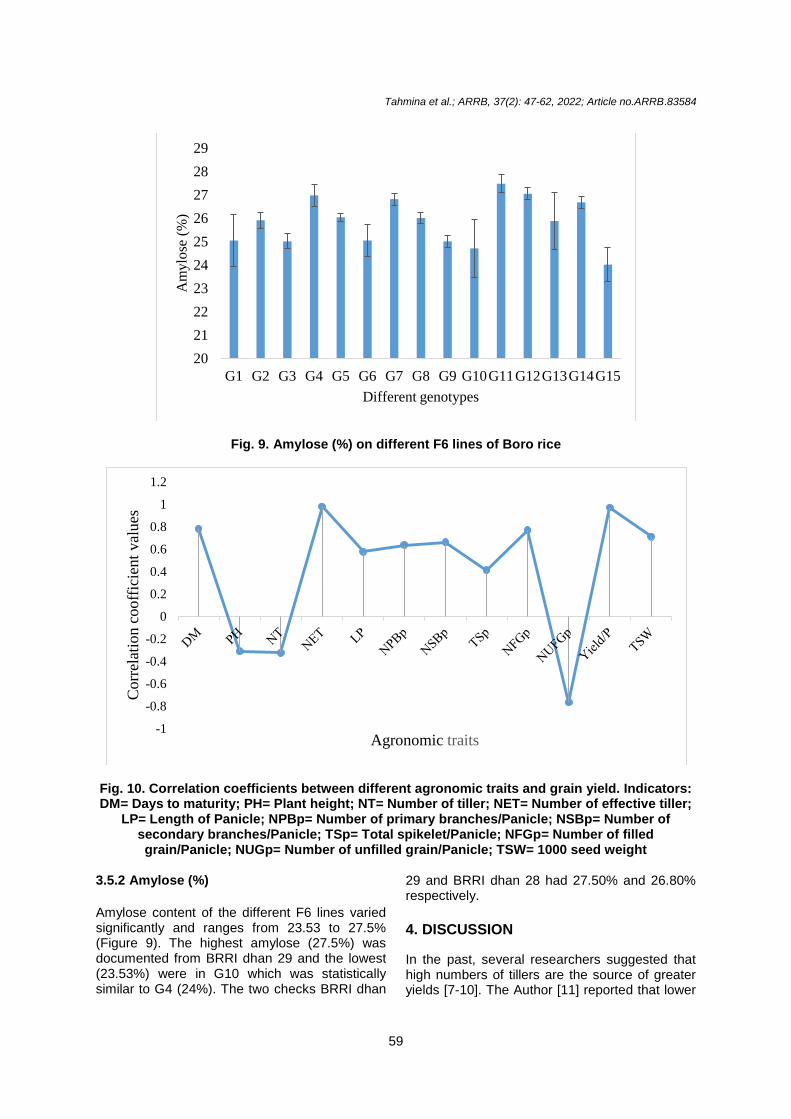
3.2 Correlations Analysis For indirect selection purposes the correlation analysis of agronomic traits can be used as a selection tool. Correlation studies can easily explain the plant breeder's yield components during the selection process. Table 4 displays most of the variables, including the days to maturity (R
2 = 0.778), number of effective tiller
(R2
= 0.978), length of panicle (R2
= 0.573), primary branches/panicle (R
2 = 0.635),
secondary branches/panicle (R2
= 0.659), spikelet per panicle (R
2 = 0.409), filled grains per
panicle (0.768), yield per plant (R2
= 0.968) and 1000 seed weight (0.709) showed a strong correlation to the key characteristics of the yield. A negative correlation was documented on plant height (R2 = -0.311), a number of the tiller (R2 = -0.328) and unfilled grains per panicle (R2 = -0.776).
3.3 Milling and Grain Appearance/Quality Characters of f6 Line of Boro Rice
The word paddy or rough rice is the same for paddy, or rice that retains its husk after threshing,
Tahmina et al.; ARRB, 37(2): 47-62, 2022; Article no.ARRB.83584
51
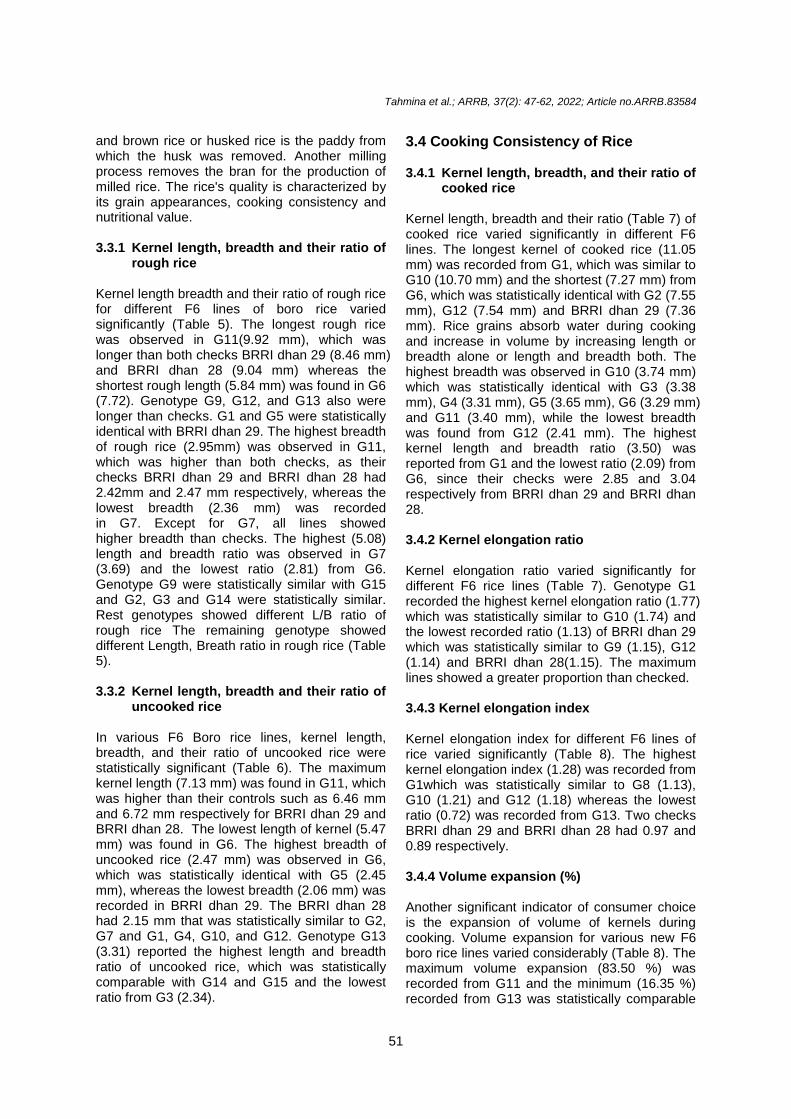
and brown rice or husked rice is the paddy from which the husk was removed. Another milling process removes the bran for the production of milled rice. The rice's quality is characterized by its grain appearances, cooking consistency and nutritional value. 3.3.1 Kernel length, breadth and their ratio of
rough rice Kernel length breadth and their ratio of rough rice for different F6 lines of boro rice varied significantly (Table 5). The longest rough rice was observed in G11(9.92 mm), which was longer than both checks BRRI dhan 29 (8.46 mm) and BRRI dhan 28 (9.04 mm) whereas the shortest rough length (5.84 mm) was found in G6 (7.72). Genotype G9, G12, and G13 also were longer than checks. G1 and G5 were statistically identical with BRRI dhan 29. The highest breadth of rough rice (2.95mm) was observed in G11, which was higher than both checks, as their checks BRRI dhan 29 and BRRI dhan 28 had 2.42mm and 2.47 mm respectively, whereas the lowest breadth (2.36 mm) was recorded in G7. Except for G7, all lines showed higher breadth than checks. The highest (5.08) length and breadth ratio was observed in G7 (3.69) and the lowest ratio (2.81) from G6. Genotype G9 were statistically similar with G15 and G2, G3 and G14 were statistically similar. Rest genotypes showed different L/B ratio of rough rice The remaining genotype showed different Length, Breath ratio in rough rice (Table 5). 3.3.2 Kernel length, breadth and their ratio of
uncooked rice In various F6 Boro rice lines, kernel length, breadth, and their ratio of uncooked rice were statistically significant (Table 6). The maximum kernel length (7.13 mm) was found in G11, which was higher than their controls such as 6.46 mm and 6.72 mm respectively for BRRI dhan 29 and BRRI dhan 28. The lowest length of kernel (5.47 mm) was found in G6. The highest breadth of uncooked rice (2.47 mm) was observed in G6, which was statistically identical with G5 (2.45 mm), whereas the lowest breadth (2.06 mm) was recorded in BRRI dhan 29. The BRRI dhan 28 had 2.15 mm that was statistically similar to G2, G7 and G1, G4, G10, and G12. Genotype G13 (3.31) reported the highest length and breadth ratio of uncooked rice, which was statistically comparable with G14 and G15 and the lowest ratio from G3 (2.34).
3.4 Cooking Consistency of Rice 3.4.1 Kernel length, breadth, and their ratio of
cooked rice Kernel length, breadth and their ratio (Table 7) of cooked rice varied significantly in different F6 lines. The longest kernel of cooked rice (11.05 mm) was recorded from G1, which was similar to G10 (10.70 mm) and the shortest (7.27 mm) from G6, which was statistically identical with G2 (7.55 mm), G12 (7.54 mm) and BRRI dhan 29 (7.36 mm). Rice grains absorb water during cooking and increase in volume by increasing length or breadth alone or length and breadth both. The highest breadth was observed in G10 (3.74 mm) which was statistically identical with G3 (3.38 mm), G4 (3.31 mm), G5 (3.65 mm), G6 (3.29 mm) and G11 (3.40 mm), while the lowest breadth was found from G12 (2.41 mm). The highest kernel length and breadth ratio (3.50) was reported from G1 and the lowest ratio (2.09) from G6, since their checks were 2.85 and 3.04 respectively from BRRI dhan 29 and BRRI dhan 28. 3.4.2 Kernel elongation ratio Kernel elongation ratio varied significantly for different F6 rice lines (Table 7). Genotype G1 recorded the highest kernel elongation ratio (1.77) which was statistically similar to G10 (1.74) and the lowest recorded ratio (1.13) of BRRI dhan 29 which was statistically similar to G9 (1.15), G12 (1.14) and BRRI dhan 28(1.15). The maximum lines showed a greater proportion than checked. 3.4.3 Kernel elongation index Kernel elongation index for different F6 lines of rice varied significantly (Table 8). The highest kernel elongation index (1.28) was recorded from G1which was statistically similar to G8 (1.13), G10 (1.21) and G12 (1.18) whereas the lowest ratio (0.72) was recorded from G13. Two checks BRRI dhan 29 and BRRI dhan 28 had 0.97 and 0.89 respectively. 3.4.4 Volume expansion (%) Another significant indicator of consumer choice is the expansion of volume of kernels during cooking. Volume expansion for various new F6 boro rice lines varied considerably (Table 8). The maximum volume expansion (83.50 %) was recorded from G11 and the minimum (16.35 %) recorded from G13 was statistically comparable

Tahmina et al.; ARRB, 37(2): 47-62, 2022; Article no.ARRB.83584
52
to G9 and controls were 20.07 % from BRRI dhan 29 and 20.93 % from BRRI dhan 28. 3.4.5 Water absorption (%) Water absorption for different F6 lines of rice varied significantly (Table 8). The highest water absorption (470.33 %) was documented from G7 and the lowest (140.11 %) was observed in G11. The two checks BRRI dhan 29 and BRRI dhan 28 had 179.84% and 155.99%. Genotype G4, G9, G12 were similar to BRRI dhan 28. Rest of the populations showed different water absorption (%). 3.4.6 Hulling (%) Rice hulling percentage differed significantly for different boro rice lines of F6 (Table 8). The G11 reported maximum (73.75) hulling (%), and G2 recorded minimum (68.37) hulling (%), which was statistically similar to G8. The resemblance between G1 and G5 has been established. The remainder of the genotype displayed hulling (%) differently.
3.4.7 Milling outturn (%)
The milling outturn represents the actual output of the consumable product. Strong milling efficiency requires a fast recovery of the whole kernel and less rice breakage. Although milling recovery as a whole depends primarily on the quality of the hull varying from 18 to 26 per cent and the nature of the aleurone area. Rice milling
output for different F6 rice line was varied significantly (Figure 6). Genotype G3 recorded the maximum milling outtturn (65.84 %), which was statistically identical to G6, G11, and G13, whereas G8 recorded the lowest (61.05 %). 3.4.8 Head rice recovery (%) The Head rice recovery (HRR) differed significantly for various F6 boro rice lines (Figure 7). The maximum head rice recovery in G9 was reported (61.63%), which was statistically the same as G11, G12, G13 and G14, while G3 (44.63%) was shown as the lowest.
3.5 Biochemical Properties 3.5.1 Protein (%) From a nutritional point of view, protein content is a key factor in rice. The protein content of the different genotypes ranges from 7.03 to 9.53 %. The protein content of different F6 lines of rice varied significantly (Figure 8). The highest protein (9.63 %) was from G4, which was statistically identical to G1 (9.53 %) and the lowest (7.03 %) from BRRI dhan 29, which was statistically related to G6 (7.13 %) and G9 (7.20 %). The two checks BRRI dhan 29 had 7.03% and BRRI dhan 28 had 8.50 % which was statistically close to G2 (8.60 percent). Genotype G5 and G8 also had higher protein percentage and moderate protein was present in G3, G7, G10, G11.
Table 1. List of the genotypes used in the experiment with their source
Sl. No. Designation Genotypes Source
1 (G1) BR 21 x BR 26 F6 S6 P7 P7 GEPB, SAU
2 (G2) BR 21 X BR 26 F6 S6 P3 P5 3 (G3) BR 21 X BRRI dhan 28 F6 S5 P1 P2 4 (G4) BR 21 X BRRI dhan 28 F6 S5 P3 P4 5 (G5) BR 21 X BRRI dhan 29 F6 S6 P6 P1 6 (G6) BR 21 X BRRI dhan 29 F6 S6 P2 P3 7 (G7) BR 24 X BR 26 F6 S6 P4 P8 8 (G8) BR 24 X BRRI dhan 28 F6 S10 P6 P10 9 (G9) BR 26 X BRRI dhan 28 F6 S1 P9 P5 10 (G10) BR 26 X BRRI dhan 29 F6 S6 P3 P3 11 (G11) BRRI dhan 28 X BRRI dhan 29 F6 S2 P4 P3 12 (G12) BRRI dhan 28 X BRRI dhan 36 F6 S7 P8 P5 13 (G13) BRRI dhan 29 X BRRI dhan 36 F6 S5 P10 14 (G14) BRRI dhan 29 BRRI, Gazipur 15 (G15) BRRI dhan 28 Note: GPB= Department of Genetics and Plant Breeding, SAU= Sher-e-Bangla Agricultural University, BRRI=
Bangladesh Rice Research Institute

Tahmina et al.; ARRB, 37(2): 47-62, 2022; Article no.ARRB.83584
53
Table 2. Performance of growth and yield contributing characters of different F6 lines of Boro rice
Genotype Plant height (cm)
Number of total tillers/Plant
Number of effective tillers/Plant
Panicle length (cm)
G1 108.57 ± 0.40de
16.60 ± 0.84abc
16.16 ± 0.74ab
23.17 ± 0.74d-f
G2 111.54 ± 0.43c-e
16.13 ±0.19 a-d 15.66 ±0.27 a-c 22.48 ± 0.14f
G3 124.88 ± 3.25b 14.57 ± 0.12
de 13.80 ± 0.39
c-e 24.77 ± 0.38
b
G4 142.20 ± 1.52a 12.53 ± 0.03
f 12.07 ± 0.08
e 24.35 ± 0.09
bc
G5 113.44 ± 1.37cd
15.23 ± 0.41cd
14.40 ± 0.78b-d
22.99 ± 0.04ef
G6 105.45 ± 2.50e-g
12.97 ± 0.58ef 12.63 ± 0.46
de 20.91 ± 0.39
g
G7 115.44 ± 5.07c 15.13 ± 0.26
cd 14.76 ± 0.27
bc 24.06 ± 0.15
b-d
G8 107.02 ± 1.48d-f
12.97 ± 0.52ef 12.63 ± 0.61
de 23.22 ± 0.57
d-f
G9 100.18 ± 0.58g 16.80 ± 0.46
a-c 16.26 ± 0.54
ab 23.57 ± 0.22
c-e
G10 116.70 ± 1.27c 16.80 ± 1.08
a-c 16.16 ± 1.24
ab 22.54 ± 0.07
f
G11 100.84 ± 0.62fg 17.83 ± 0.28
a 16.86 ± 0.82
a 27.90 ± 0.08
a
G12 107.29 ± 3.92d-f
17.40 ± 0.68ab
17.20 ± 0.17a 24.32 ± 0.37
bc
G13 99.95 ± 0.39g 15.90 ± 0.87
b-d 15.73 ± 0.81
a-c 23.36 ± 0.39
d-f
G14 93.54 ± 0.68h 14.47 ± 0.48
de 13.86 ± 0.51
c-e 23.17 ± 0.17
d-f
G15 100.52 ± 0.57fg 17.67 ± 0.37
a 16.93 ± 0.28
a 24.07 ± 0.05
b-d
The data represent the mean values ± standard error. Different letter (s) corresponds to significant differences at p≤0.05 by Duncan’s Multiple Range Test (DMRT).
Table 3. Performance of yield contributing characters and yield of F6 lines of Boro rice
Genotype Number of primary Branches/
Panicle
Number of secondary Branches/ Panicle
Number of unfilled grains/
Panicle
1000 seeds weight (gm)
G1 9.60 ± 0.11fg 26.76 ± 0.82
g 90.06 ±4.89
a 21.90 ± 0.44
f
G2 9.26 ± 0.12 g 26.50± 0.36
g 25.03 ± 2.35
cd 21.63 ± 0.22
f
G3 11.33 ± 0.35bc
30.76 ± 1.17d-f
48.76 ± 0.21b 25.03 ± 0.27
bc
G4 11.40 ± 0.12bc
37.46 ± 0.49ab
41.86 ± 2.33b 23.90 ± 0.29
cd
G5 12.06 ± 0.48b 30.96 ± 1.12
d-f 22.83 ± 5.80
d 24.14 ± 0.35
cd
G6 10.00 ± 0.17e-g
34.66 ± 1.49b-d
16.03 ± 0.19de
23.60 ± 0.48de
G7 9.43 ± 0.18fg 33.60 ± 1.94
c-e 18.90 ± 2.51
de 21.25 ± 0.12
f
G8 10.43 ± 0.15de
30.93 ± 0.21d-f
22.83 ± 0.44d 22.44 ± 0.09
ef
G9 9.50 ± 0.32fg 29.60 ± 1.18
fg 16.26 ± 1.50
de 23.86 ± 0.73
cd
G10 10.86 ± 0.28cd
28.56 ± 1.62fg 16.73 ± 0.58
de 21.99 ± 0.21
f
G11 14.26 ± 0.23a 40.10 ± 2.16
a 12.76 ± 0.27
e 26.41 ± 0.69
a
G12 11.6 ± 0.12b 36.10 ± 0.44
bc 33.06 ± 5.04
c 24.30 ± 0.02
b-d
G13 10.03 ± 0.29e-g
30.86 ± 0.19d-f
15.13 ± 4.29de
25.47 ± 0.57ab
G14 10.16 ± 0.18d-f
32.20 ± 0.49d-f
17.06 ± 2.57de
21.40 ± 0.50f
G15 9.46 ± 0.09fg 30.23 ± 1.65
e-g 21.66 ± 2.11
de 22.52 ± 0.16
ef
The data represent the mean values ± standard error. Different letter (s) corresponds to significant differences at p≤0.05 by Duncan’s Multiple Range Test (DMRT)

Tahmina et al.; ARRB, 37(2): 47-62, 2022; Article no.ARRB.83584
54
Table 4. Correlation coefficients among the agronomic traits using genotypes means
Characters DM PH NT NET LP NPBp NSBP TSp NFGp NUFGp Yield/P TSW
DM .778*
*
-.009 -.057 -.065 -.094 -.450** -.133 -.090 -.028 -.044 -.164 -
.553**
PH -.311
*
-.064 -.078 -.010 -.204 -.105 -.218 -.326* .283 -.329
* -.310
*
NT -.328
*
-.356* -.145 .627
** .237 .315
* -.017 .336
* -.134 .359
*
NET .978** -.142 -.393
** -.429
** -.076 -.031 -.029 .236 -.225
LP .573** -.389
** -.415
** -.092 -.051 -.014 .216 -.195
NPBp .635** .267 .361
* .095 .209 .065 .507
**
NSBp .659** .364
* .141 .141 .260 .622
**
TSp .409** .385
** -.187 .538
** .414
**
NFGp .768** -.192 .470
** -.033
NUFGp -.776** .700
** -.047
Yield/P .968** .199
TSW .709**
**. Correlation is significant at the 0.01 level; *. Correlation is significant at the 0.05 level. Indicators: DM= Days to maturity; PH= Plant height; NT= Number of tiller; NET= Number of effective tiller; LP=
Length of Panicle; NPBp= Number of primary branches/Panicle; NSBp= Number of secondary branches/Panicle; TSp= Total spikelet/Panicle; NFGp= Number of filled grain/Panicle; NUGp= Number of unfilled grain/Panicle;
TSW= 1000 seed weight
Table 5. Performance of Milling and Grain quality of F6 lines of Boro rice
Genotype Kernel length of rough rice
Kernel breadth of rough rice Kernel Length, breadth ratio of rough rice
G1 8.48 ± 0.04d-f
2.61 ± 0.05b-e
3.25 ± 0.05d
G2 8.29 ± 0.09e-g
2.53 ± 0.07c-g
3.27 ± 0.04cd
G3 8.97 ± 0.14bc
2.70 ± 0.04bc
3.32 ± 0.02cd
G4 8.74 ± 0.26cd
2.68 ± 0.05b-d
3.26 ± 0.05cd
G5 8.37 ± 0.12d-f
2.59 ± 0.03b-f
3.23 ± 0.04de
G6 7.72 ± 0.11h 2.75 ± 0.17
b 2.81 ± 0.06
f
G7 8.72 ± 0.11c-e
2.36 ± 0.01g 3.69 ± 0.10
a
G8 7.91 ± 0.13gh
2.56 ± 0.02c-f
3.08 ± 0.23e
G9 9.13 ± 0.09bc
2.51 ± 0.03d-g
3.64 ± 0.08ab
G10 8.28 ± 0.04fg 2.72 ± 0.02
bc 3.05 ± 0.02
ef
G11 9.92 ± 0.29a 2.95 ± 0.06
a 3.36 ± 0.06
c
G12 9.05 ± 0.08bc
2.60 ± 0.02b-f
3.48 ± 0.06bc
G13 9.28 ± 0.05b 2.51 ± 0.05
d-g 3.50 ± 0.16
b
G14 8.46 ± 0.04d-f
2.42 ± 0.04fg 3.50 ± 0.03
b
G15 9.04 ± 0.11bc
2.47 ± 0.11e-g
3.66 ± 0.02ab
The data represent the mean values ± standard error. Different letter (s) corresponds to significant differences at
p≤0.05 by Duncan’s Multiple Range Test (DMRT).

Tahmina et al.; ARRB, 37(2): 47-62, 2022; Article no.ARRB.83584
55
Table 6. Performance of Milling and Grain quality of F6 lines of Boro rice
Genotype Kernel length of uncooked rice
Kernel breadth of uncooked rice
Kernel Length, breadth ratio of uncooked rice
G1 6.22 ± 0.01de
2.25 ± 0.01a-d
2.76 ± 0.06 c
G2 6.22 ± 0.10de
2.10 ± 0.16b-d
2.96 ± 0.04bc
G3 6.48 ± 0.04
cd 2.34 ± 0.02
a-c 2.34 ± 0.04
d
G4 6.41 ± 0.24cd
2.22 ± 0.02a-d
2.88 ± 0.05bc
G5 6.02 ± 0.14
ef 2.45 ± 0.06
a 2.45 ± 0.01
cd
G6 5.47 ± 0.02g 2.47 ± 0.02
a 2.21 ± 0.03
de
G7 6.47 ± 0.01cd
2.13 ± 0.06b-d
3.04 ± 0.08bc
G8 5.79 ± 0.01
fg 2.37 ± 0.01
ab 2.44 ± 0.02
cd
G9 6.63 ± 0.03bc
2.15 ± 0.02b-d
3.08 ± 0.03b
G10 6.19 ± 0.01de
2.26 ± 0.01a-d
2.74 ± 0.17c
G11 7.13 ± 0.15a 2.33 ± 0.03
a-c 3.06 ± 0.05
bc
G12 6.61 ± 0.13bc
2.25 ± 0.01a-d
2.92 ± 0.07bc
G13 6.89 ± 0.12
ab 2.08 ± 0.02
cd 3.31 ± 0.09
a
G14 6.46 ± 0.16cd
2.06 ± 0.23d 3.13± 0.05
ab
G15 6.72 ± 0.12bc
2.15 ± 0.02b-d
3.13 ± 0.23ab
The data represent the mean values ± standard error. Different letter (s) corresponds to significant differences at
p≤0.05 by Duncan’s Multiple Range Test (DMRT).
Table 7. Performance of Grain quality of F6 lines of Boro rice
Genotype Kernel length of cooked rice
Kernel breadth of cooked rice
Kernel Length, breadth ratio of cooked rice
Kernel elongation ratio
G1 11.05 ± 0.02a 3.18 ± 0.03bc
3.50 ± 0.03a 1.77 ± 0.01
a
G2 7.55 ± 0.01f 3.23 ± 0.07bc
2.35 ± 0.05ef
1.21 ± 0.02fg
G3 9.07 ± 0.03b-d 3.38 ± 0.09a-c
2.67 ± 0.07de
1.40 ± 0.01c-e
G4 9.53 ± 0.01bc 3.31 ± 0.08
a-c 2.94 ± 0.07
b-d 1.33 ± 0.02
c-f
G5 9.74 ± 0.10b 3.65 ± 0.11ab
2.68 ± 0.04de
1.62 ± 0.05b
G6 7.27 ± 0.06f 3.29 ± 0.04a-c
2.09 ± 0.17f 1.32 ± 0.01
d-f
G7 8.75 ± 0.09cd 3.18 ± 0.03bc
2.75 ± 0.01cd
1.35 ± 0.01c-e
G8 8.54 ± 0.68de 3.12 ± 0.12
c 2.78 ± 0.32
cd 1.47 ± 0.11
c
G9 7.65 ± 0.02ef 2.65 ± 0.02d 2.89 ± 0.03
b-d 1.15 ± 0.01
g
G10 10.70 ± 0.17a 3.74 ± 0.3a 2.89 ± 0.02
b-d 1.74 ± 0.01
a
G11 9.24 ± 0.93b-d 3.40 ± 0.18a-c
2.72 ± 0.13cd
1.43 ± 0.09cd
G12 7.54 ± 0.03f 2.41 ± 0.01
d 3.14 ± 0.02
b 1.14 ± 0.01
g
G13 8.75 ± 0.05cd 3.21 ± 0.52bc
2.36 ± 0.02ef
1.26 ± 0.01e-g
G14 7.36 ± 0.04f 2.57 ± 0.02
d 2.85 ± 0.01
b-d 1.13 ± 0.02
g
G15 7.77 ± 0.02ef 2.56 ± 0.01d 3.04 ± 0.02
bc 1.15 ± 0.02
g
The data represent the mean values ± standard error. Different letter (s) corresponds to significant differences at p≤0.05 by Duncan’s Multiple Range Test (DMRT).
Table 8. Performance of Grain quality of F6 lines of Boro rice
Genotype Kernel elongation Index
Volume expansion (%)
Water Absorption (%) Hulling (%)
G1 1.28 ±0.02 a 40.54 ± 0.57
e 315.81 ± 34.02
b 70.95 ± 0.25
de
G2 0.85 ± 0.03ef 29.62 ± 0.25
h 230.87 ± 3.25
cd 68.37 ± 0.79
f
G3 0.96 ± 0.01c-e
28.31 ± 0.21i 243.33 ± 19.15
c 71.36 ± 0.38
b-e
G4 0.91 ± 0.03de
34.68 ± 0.05f 171.33 ± 3.55
ef 70.73 ± 0.30
e
G5 1.09 ± 0.02b-d
54.01 ± 0.08d 353.75 ± 0.91
b 71.04 ± 0.70
de
G6 0.94 ± 0.08c-e
55.63 ± 0.32c 223.50 ± 1.45
cd 72.53 ± 0.37
b
G7 0.90 ± 0.03de
20.91 ± 0.05j 470.33 ± 32.13
a 71.59 ± 0.32
b-e
G8 1.13 ± 0.12a-c
33.78 ± 0.51g 188.68 ± 2.40
de 67.97 ± 0.16
f
Tahmina et al.; ARRB, 37(2): 47-62, 2022; Article no.ARRB.83584
56
Genotype Kernel elongation Index
Volume expansion (%)
Water Absorption (%) Hulling (%)
G9 0.91 ± 0.01de
16.84 ± 0.10l 155.79 ± 6.02
f 71.12 ± 0.58
c-e
G10 1.21 ± 0.08ab
57.66 ± 0.38b 321.00 ± 9.81
b 72.16 ± 0.13
b-d
G11 0.99 ± 0.03c-e
83.50 ± 0.28a 140.11 ± 2.80
f 73.75 ± 0.15
a
G12 1.18 ± 0.11ab
20.81 ± 0.11jk 167.66 ± 10.96
ef 70.23 ± 0.01
e
G13 0.72 ± 0.03f 16.35 ± 0.21
l 253.49 ± 7.26
c 72.41 ± 0.23
bc
G14 0.97 ± 0.02c-e
20.07 ± 0.04k 179.84 ± 4.68
ef 70.32 ± 0.68
e
G15 0.89 ± 0.05e 20.93 ± 0.06
j 155.99 ± 3.54
ef 70.74 ± 0.13
e
The data represent the mean values ± standard error. Different letter (s) corresponds to significant differences at p≤0.05 by Duncan’s Multiple Range Test (DMRT).
Fig. 1. Days of 50% flowering on different F6 lines of Boro rice
Fig. 2. Days of maturity on different F6 lines of Boro rice
110.00
115.00
120.00
125.00
130.00
135.00
G1 G2 G3 G4 G5 G6 G7 G8 G9 G10 G11 G12 G13 G14 G15
Day
s to
50%
flo
wer
ing
Different Genotypes
125.00
130.00
135.00
140.00
145.00
150.00
155.00
160.00
G1 G2 G3 G4 G5 G6 G7 G8 G9 G10 G11 G12 G13 G14 G15
Day
s o
f m
aturi
ty (
Day
s)
Different Genotypes

Tahmina et al.; ARRB, 37(2): 47-62, 2022; Article no.ARRB.83584
57
Fig. 3. Total Spikelet/Plant on different F6 lines of Boro rice
Fig. 4. Number of filled grain/Plant on different F6 line of Boro rice
Fig. 5. Yield per plant on different F6 line of Boro rice
0
50
100
150
200
250
G1 G3 G5 G7 G9 G11 G13 G15
To
tal S
pik
elet
s/P
lan
t
Different Genotypes
0
50
100
150
200
250
G1 G3 G5 G7 G9 G11 G13 G15
Num
ber
of
fill
ed g
rain
/Pla
nt
Different genotypes
0
10
20
30
40
50
60
70
80
G1 G3 G5 G7 G9 G11 G13 G15
Yie
ld/P
lant (g
)
Different genotypes

Tahmina et al.; ARRB, 37(2): 47-62, 2022; Article no.ARRB.83584
58
Fig. 6. Milling outturn on different F6 lines of Boro rice
Fig. 7. Head Rice Recovery on different F6 lines of Boro rice
Fig. 8. Protein (%) of different F6 lines of Boro rice
56
58
60
62
64
66
68
G1 G3 G5 G7 G9 G11 G13 G15
Mil
lin
g o
utt
urn
Different genotypes
0
10
20
30
40
50
60
70
G1 G3 G5 G7 G9 G11 G13 G15
Hea
d R
ice
Rec
over
y
Different genotypes
0
2
4
6
8
10
12
G1 G3 G5 G7 G9 G11 G13 G15
Pro
tein
(%
)
Different genotypes
Tahmina et al.; ARRB, 37(2): 47-62, 2022; Article no.ARRB.83584
59
Fig. 9. Amylose (%) on different F6 lines of Boro rice
Fig. 10. Correlation coefficients between different agronomic traits and grain yield. Indicators: DM= Days to maturity; PH= Plant height; NT= Number of tiller; NET= Number of effective tiller;
LP= Length of Panicle; NPBp= Number of primary branches/Panicle; NSBp= Number of secondary branches/Panicle; TSp= Total spikelet/Panicle; NFGp= Number of filled grain/Panicle; NUGp= Number of unfilled grain/Panicle; TSW= 1000 seed weight
3.5.2 Amylose (%)
Amylose content of the different F6 lines varied significantly and ranges from 23.53 to 27.5% (Figure 9). The highest amylose (27.5%) was documented from BRRI dhan 29 and the lowest (23.53%) were in G10 which was statistically similar to G4 (24%). The two checks BRRI dhan
29 and BRRI dhan 28 had 27.50% and 26.80% respectively.
4. DISCUSSION
In the past, several researchers suggested that high numbers of tillers are the source of greater yields [7-10]. The Author [11] reported that lower
20
21
22
23
24
25
26
27
28
29
G1 G2 G3 G4 G5 G6 G7 G8 G9 G10 G11 G12 G13 G14 G15
Am
ylo
se (
%)
Different genotypes
-1
-0.8
-0.6
-0.4
-0.2
0
0.2
0.4
0.6
0.8
1
1.2
Corr
elat
ion c
ooff
icie
nt
val
ues
Agronomic traits

Tahmina et al.; ARRB, 37(2): 47-62, 2022; Article no.ARRB.83584
60
tillering habit (6-10 tillers / plant) would yield more than modern varieties of 20-25 tillers. The author also noted that only 14-15 of these tillers trigger small panicles and remain unproductive. Less tillering promotes flora and maturity and more unusual panicle size. The Author [12] notes that a smaller number of tillers also indicated that more heavy grain was low. Many researchers have recorded the positive relation between grain number of panicle and grain yield [13-15]. No major association between plant height and yield. This is in contrast [16] which had shown that plant height was associated positively and substantially with yield. In general, it is required to provide a low-grade high production of rice [17]. However, the number of effective tillers (NFT), the length of the panicle (PL), the number of primary branches, the number of secondary branches, the total spikelet, the number of grains filled and the weight of 1000 seeds showed a positive correlation with the yield. Grain unfilled showed a negative correlation. A negative association between productive tillers per plant and the percentage of fertility was found by [18]. The Authors [19] also investigated the positive relationship of grain yield with effective tillers / plant. Even the total spikelet per panicle exhibited a positive effect and coefficient of correlation with yield of grain per plant. The Authors [20] reported that total grain contributes positively to grain yield which supports the present finding. Figure 10 showed correlation coefficients between different agronomic traits and grain yield. The elongation ratio (L1 / L0) is a measure of the length of kernel after cooking, which is due to the swelling by water absorption of starch granules [21]. The Author [22] suggested that the elongation ratio be the best quality index as opposed to the elongation index and the proportionate increase. The Authors [23] reported significant association of L / B ratio with kernel elongation. The Authors [24] observed a strong positive association between the elongation and the length of the cooked kernel. Kernel elongation was affected primarily by form and size of the kernel. Consequently, the elongation ratio (L1 / Lo), indicating length elongation, is a better indicator of cooking efficiency than the elongation index indicating both length and width. The greater percentage of milling may not lead to an increased head rice recovery, because it also depends on the size of the grain. The size and shape of the grain, the hardness, the irregular presence or absence of white rice, the quality of the humidity, the precision of harvest, storage, processing and
milling conditions have a direct effect upon rice head recovery [25]. In general, rice yields are less high in varieties with long bold grains and white Varieties with medium slender, long slender and translucent grains provide high yields of head rice. Even less breaking is experienced by varieties with high protein content. Sun cracking due to alternative drying and wetting of grain due to delays also increases the grain disruption [26]. Grain disruption increased. The reverse relation between HRR percent and the grain L / B ratios was reported by the Authors [27, 28]. However, water absorption is essentially the expansion of the volume, subject to the effect of the texture of the kernel [29]. He also stated that the varieties expected to have a significant volume increase are sticky and pasty when cooked. All pasty cooking types were invariably associated with increased water absorption. He concluded that pasty cooking was closely associated with high absorption of water. Hybrids are also more attractive with low water absorption and high-volume expansion. In order to be commercially successful, the rice variety must have a high total milled rice and a whole grain (HRR) turnout. Various factors like variety, environment and cultural may affect the grain's protein content [30]. The amylose content of rice determines the durability and bondage of cooked rice. The amylose content of non-sticky, soft or cooked rice is greater than 25 per cent. Rice with 20–25% amylose produces rice that is soft and relatively sticky [31]. Most of the Bangladeshi citizens prefer high amylose rice.
5. CONCLUSIONS Several 'Boro' genotypes of rice were performed in this research. The variance analysis has shown that the 15 F6 lines for all of the characters significant variance. The presence of significant improvements in materials means that the performance potentials can be increased. The experiment has shown a wide range of mean values for various characters. G11 was the highest efficient tiller, primary and secondary category, higher grain filling, greater yields of each plant, higher hulling percentage, higher milling outturn, higher HRR, lower absorption of water, protein and high amylose content among these 15 F6 lines. Accumulated information might be useful as potential breeding materials in future 'Boro' rice research in Bangladesh as well as other countries and G11 (BRRI dhan 28 ×

Tahmina et al.; ARRB, 37(2): 47-62, 2022; Article no.ARRB.83584
61
BRRI dhan 29 F6 S2 P4 P3) genotypes may be used as potential breeding materials.
FUNDING This project was funded by the Ministry of Science & Technology, Bangladesh, and research facilities were provided by Sher-e-Bangla Agricultural University, Dhaka, Bangladesh.
DATA AVAILABILITY STATEMENT All data are provided within this paper.
COMPETING INTERESTS Authors have declared that no competing interests exist.
REFERENCES 1. Bhuiyan MSH, Zahan A, Khatun H, Iqbal M,
Alam F, Manir MR. Yield performance of newly developed test crossed hybrid rice variety. Int. J. Agron. Agricul. Res. 2014;5:48-54.
2. Abodolereza A, Racionzer P. Food Outlook: Global market analysis. 2009:23-27.
3. BBS. The year book of agricultural statistics of Bangladesh. Statistics Division, Ministry of Planning, Government Peoples Republic of Bangladesh. Dhaka. 2016:123-127.
4. FAO. Production year book’ Food and Agricultural Organization of the United Nations, Rome, Italy. 2008:57.
5. BRRI. Adhunik Dhaner Chash (in Bengali)’ Bangladesh Rice Research Institute, Joydebpur, Gazipur. 2011:5.
6. Nayak AR, Chaudhury D, Reddy JN. Inter-relationship among quality characters in scented rice. Indian J. Agric. Res. 2003;37:124-127.
7. Reddy YS, Kumar PVR. Studies on genetic variability, correlation and path analysis in rice. New Botanist, 1996;23:129-133.
8. Pandey MP, Singh JP, Singh H. Heterosis breeding for grain yield and other bagronomic characters in rice (Oryza saliva L.)’ Indian J. Gen.,1995;55:438-445.
9. Padmavathi N, Mahadevappa M, Reddy OUK. Association of various yield components in rice (Oryza sativa L.)’ University of Agricultural Sciences GKVK. Bangalore Karnataka 560 065. Crop Research Hisar. 1996;12:353-357.
10. Bocevska M, Aldabas I, Andreevska D, Ilieva V. Gelatinization behavior of grains and flour in relation to physiochemical properties of milled rice (Oryza Sativa L.). J. Food Quality 2009;32:108–124.
11. Khush GS. New plant type of rice for increasing the genetic yield potential. lo: Rice breeding and Genetics-Research priorities and challenges’ Jata, S. Nanda (etd), Oxford & IBH Publishing Co. Pvt. Ltd. New Delhi, India. 1999:100- 108.
12. Cai Y, Liu C, Wang W, Cai K. Differences in physicochemical properties of kernels of two rice cultivars during grain formation. J. Sci. Food Agril. 2011;91:1977 –1983.
13. Chauhan, J.S. Variability for high density grain index and hull weight ratio and their interrelationships with other rain traits in rice (Oryza sativa L). Indian J.Pl. Physiol. 2000;5(1):7-12.
14. Janagle RD, Ugle SD, Dumbre AD. A study of cause-and-effect relationship among quantitative traits in upland paddy. J. Maharastra Agric. Univ.1987;12(1): 31-34.
15. Kalaimani S, Kadambavansundaram M. Heterosis in rice. Madras Agric. J. 1988;74(8-9):369-372.
16. Bai NR, Devika R, Regina A, Joseph C. Correlation of yield and yield components in medium duration rice cultivars. Environ. Ecol. 1992;10:469-470.
17. Singh RK, Singh US, Khush GS, Rashmi R. Genetics and biotechnology of quality traits in aromatic rice. In Aromatic Rices. New Delhi: Oxford & IBH Publishing Co. Pvt. Ltd., 2000:47-71.
18. Golam F, Yin YH, Masitah A, Afnierna N, Majid NA, Khalid N, Osman M. Analysis of aroma and yield components of aromatic rice in Malaysian tropical environment. Australian J. Crop Sci. 2011;5(11): 1318-1325.
19. Meenakshi T, Ratinam AAD, Backiyarani S. Correlation and path analysis of yield and some physiological characters in rain fed rice’ Oryza. 1999;6:154-156.
20. Kim CH, Rutger JN. Heterosis in rice. In: Hybrid Rice. International Rice Research Institute, Manila, Philippines. 1988:39-54.
21. Juliano BO. The chemical basis of rice quality’ The ‘workshop on Chemical Aspects of Rice Grain Quality. IRRI, Manilla, Philippines. 1979:69-90.

Tahmina et al.; ARRB, 37(2): 47-62, 2022; Article no.ARRB.83584
62
22. Pilaiyar, P. Quality characteristics of Tamil Nadu Rices. Madras Agricul. J. 1988, 75, 307-317.
23. Deosarker BD, Nerkar YS. Correlation and path analysis for grain quality characters in indica rice. J. Maharashtra Agric. Uni. 1994;19:175-177.
24. Chauhan JS, Chauhan VS, Lodh SB. Cooking quality components and their interrelationships with some physico-chemical characters of rainfed and upland rice grain. Oryza, 1995;32: 79-82.
25. Bhattacharya KR. Breakage of rice during milling: a review. Tropical Sci. 1980;22:255-278.
26. Shobha Rani N. Quality considerations in developing rice hybrids. In: Winter school on advances in hybrid rice technology. Org. DRR, Hyderabad, India. 2003: 145-159.
27. Viraktamath BC. Heterosis and combining ability studies in rice with respect to yield, yield components and some quality characteristics. Ph. D. Thesis. 1987, IARI, New Delhi.
28. Yadav TP, Singh VP. Milling characteristics of aromatic rice. IRRN. 1989;14:7-8.
29. Zaman FU. Genetic studies of some of the cooking and nutritive qualities of cultivated rice (Oryza sativa L.) Ph.D. Thesis. University of Bihar. BuzalTarpur. India; 1981.
30. Gomez A. Effect of environment on protein and amylose content of rice.In proc. The workshop on chemical aspect of rice grain quality.Int. Rice Res. Inst.Phillippines.1979:59-68.
31. Anonymous. Annual Report for 1997’ Bangladesh Rice Research Institute, Gazipur. 1997:24-25.
_________________________________________________________________________________ © 2022 Tahmina et al.; This is an Open Access article distributed under the terms of the Creative Commons Attribution License (http://creativecommons.org/licenses/by/4.0), which permits unrestricted use, distribution, and reproduction in any medium, provided the original work is properly cited.
Peer-review history: The peer review history for this paper can be accessed here:
https://www.sdiarticle5.com/review-history/83584