Cellular Oxidative Stress Response Controls the Antiviral and ...
Upload
khangminh22Category
view
0download
0
Canadian Agency forDrugs and Technologies
in Health
Agence canadienne des médicaments et des technologies de la santé
Supporting Informed Decisions
CADTH Therapeutic ReviewDirect-Acting Antiviral Agents for Chronic Hepatitis C Genotype 1
October 2014Volume 2, Issue 2B

This report is prepared by the Canadian Agency for Drugs and Technologies in Health (CADTH). The report contains a comprehensive review of the existing public literature, studies, materials, and other information and documentation (collectively the “source documentation”) available to CADTH at the time of report preparation. The information in this report, when finalized, is intended to help Canadian health care decision-makers, health care professionals, health systems leaders, and policy-makers make well-informed decisions and thereby improve the quality of health care services. The information in this report should not be used as a substitute for the application of clinical judgment in respect of the care of a particular patient or other professional judgment in any decision-making process, nor is it intended to replace professional medical advice. While CADTH has taken care in the preparation of this document to ensure that its contents are accurate, complete, and up to date as of the date of publication, CADTH does not make any guarantee to that effect. CADTH is not responsible for the quality, currency, propriety, accuracy, or reasonableness of any statements, information, or conclusions contained in the source documentation. CADTH is not responsible for any errors or omissions or injury, loss, or damage arising from or relating to the use (or misuse) of any information, statements, or conclusions contained in or implied by the information in this document or in any of the source documentation. This document and the information provided are prepared and intended for use in the context of the Canadian health care system. Other health care systems are different; the issues and information related to the subject matter of this document may be different in other jurisdictions and, if used outside of Canada, it is at the user’s risk. This disclaimer and any questions or matters of any nature arising from or relating to the content or use (or misuse) of this document will be governed by and interpreted in accordance with the laws of the Province of Ontario and the laws of Canada applicable therein, and all proceedings shall be subject to the exclusive jurisdiction of the courts of the Province of Ontario, Canada. CADTH takes sole responsibility for the final form and content of this document, subject to the limitations noted above. The statements and conclusions in this document are those of CADTH and not of its advisory committees and reviewers. The statements, conclusions, and views expressed herein do not necessarily represent the views of Health Canada or any Canadian provincial or territorial government. Production of this document is made possible by financial contributions from Health Canada and the governments of Alberta, British Columbia, Manitoba, New Brunswick, Newfoundland and Labrador, Northwest Territories, Nova Scotia, Nunavut, Prince Edward Island, Saskatchewan, and Yukon. This report is shared for feedback and comments and should not be used for any purposes other than for consultation. The report may change following this consultation. Please contact CADTH’s Vice-President of Corporate Services at [email protected] with any inquiries about this notice or other legal matters relating to CADTH’s services. Cite as: Canadian Agency for Drugs and Technologies in Health. CADTH therapeutic review. Direct-acting antiviral agents for chronic hepatitis C genotype 1 [Internet]. Ottawa: The Agency; 2014 Oct. (CADTH Therapeutic Review vol.2, no.2b). [cited yyyy mmm dd]. Available from: http://www.cadth.ca/en/products/therapeutic-reviews/chronic-hep-c/reports ISSN: 1929-7440

Note regarding changes to the report following stakeholder feedback: Following feedback received in response to the previous draft of this report, several modifications were made to the text and data tables. These modifications were minor changes and did not alter the results of the main analyses or the conclusions of the report. The most notable changes to the report include: addition of supplementary adverse event data for QUEST1 and QUEST2, change in utility values for patients with compensated cirrhosis while receiving treatment and following viral clearance, and additional exploratory and sensitivity analyses using utility values obtained using the Health Utilities Index Mark 3 (HUI3) instrument instead of HUI Mark 2 (HUI2), using response-guided therapy criteria based on the Canadian label rather than on clinical trials for simeprevir, using a 3% discount rate (instead of 5%), and assessing the impact of age on the analysis stratified by fibrosis stage.

Canadian Agency for Drugs and Technologies in Health
Direct-Acting Antiviral Agents for Chronic Hepatitis C Genotype 1
Gaetanne Murphy1 Bechara Farah1 William Wong3 Murray Krahn3 George Wells2
Li Chen2 Shannon Kelly2 David Kaunelis1
Julie Blouin1 Karen Lee1
Anita Carrie1
October 2014
1 Canadian Agency for Drugs and Technologies in Health (CADTH), Ottawa, Ontario. 2 University of Ottawa Heart Institute, Ottawa, Ontario. 3 Toronto Health Economics and Technology Assessment (THETA) Collaborative, Toronto, Ontario.

Direct-Acting Antiviral Agents for Chronic Hepatitis C Genotype 1 i
Authorship
Gaetanne Murphy led the project protocol development; selected studies; extracted, tabulated, and analyzed data; wrote the clinical section of the report; and revised the report based on reviewers’ comments. Bechara Farah selected studies; extracted, tabulated, and analyzed data; wrote the clinical section of the report; and revised the report based on reviewers’ comments. William Wong contributed to the conception and design of the economic model, acquired data for the model, developed the economic model, performed cost-effective analyses and interpretation of results, and drafted the pharma economic section of the report. Murray Krahn contributed to the design of the economic model and provided step-by-step supervision of economic analysis. George Wells contributed to the design of the network meta-analysis, provided supervision of the analysis, and revised the report based on reviewers’ comments. Li Chen contributed to the analysis and interpretation of results related to the network meta-analysis, and drafted the statistical methods section. Shannon Kelly contributed to the conception and design of the network meta-analysis, to the analysis and interpretation of results, and the drafting and revision of relevant sections of the report. David Kaunelis designed and executed the literature search strategies; wrote the literature search section; and managed report referencing. Julie Blouin provided guidance on the design and methods of the economic analysis, conducted technical validation and check of methods, assisted in the interpretation of results, and assisted in writing and editing economic sections of the report. Anita Carrie contributed to the conception of scope and protocol for the clinical review, provided guidance regarding the choice of methods for the analysis of clinical data, reviewed and revised the clinical sections of the report, and assisted in the interpretation of clinical data. Karen Lee contributed to the early model development of the project before initation of the therapeutic review, provided feedback on the econommic model and methods during the therapeutic review, and reviewed drafts of the report. All authors approved the final draft report.

Direct-Acting Antiviral Agents for Chronic Hepatitis C Genotype 1 ii
Contributors
The authors would like to acknowledge the following individuals for their contributions: Dr. Sam Lee, Dr. Jordan Feld, and Dr. Curtis Cooper for providing content expertise and reviewing drafts of the report. Hong-Anh Tu for literature review and data analysis; Petros Pechlivanoglou for advice on the network meta-analysis component, and Aysegul Erman for support with the manuscript; all in relation to the economic sections of the report. Algomir Hossain for statistical analysis and interpretation of data related to the network meta-analysis.
CADTH staff for their contributions: Hongbo Yuan for advise on the protocol design, data analysis, and review of reports; Wendy Prichett-Pejic for checking data extraction; Elizabeth Pitre for study selection and data verification; Srabani Banerjee for data extraction and feedback; Elaine MacPhail for feedback support and advice related to patient input; Sarah Jennings for feedback on project scope and final report, support for patient groups and patient input summaries, and advice on knowledge translation; Chander Sehgal, Kristen Chelak, and Kobina Quansah for input on project scope; and Kim Ghosh for project management support.

Direct-Acting Antiviral Agents for Chronic Hepatitis C Genotype 1 iii
TABLE OF CONTENTS
ABBREVIATIONS .......................................................................................................................................................... XV EXECUTIVE SUMMARY ............................................................................................................................................... XVI 1. CONTEXT AND POLICY ISSUES .................................................................................................................................. 1
1.1 Objectives of the Report ................................................................................................................................. 1 2. RESEARCH QUESTIONS ............................................................................................................................................. 6 3. METHODS ................................................................................................................................................................. 6
3.1 Systematic Review ........................................................................................................................................... 6 3.1.1 Literature Search Strategy .................................................................................................................. 6 3.1.2 Selection Criteria and Methods .......................................................................................................... 7 3.1.3 Data Extraction Strategy and Critical Appraisal of Included Studies .................................................. 7 3.1.4 Data Analysis Methods ....................................................................................................................... 8
3.2 Pharmacoeconomic Analysis ......................................................................................................................... 11 3.2.1 Type of Economic Evaluation ............................................................................................................ 11 3.2.2 Target Population ............................................................................................................................. 11 3.2.3 Treatments........................................................................................................................................ 12 3.2.4 Perspective ....................................................................................................................................... 13 3.2.5 Time Horizon ..................................................................................................................................... 13 3.2.6 Model Structure ................................................................................................................................ 13 3.2.7 Data Inputs........................................................................................................................................ 15 3.2.8 Assumptions Within the Economic Model........................................................................................ 26 3.2.9 Exploratory Analyses for Sofosbuvir ................................................................................................. 26 3.2.10 Exploratory Analysis Based on Health Canada Dosing and RGT Criteria .......................................... 26 3.2.11 Exploratory Analysis for Simeprevir in Partial Response Group ....................................................... 27 3.2.12 Sensitivity Analyses ........................................................................................................................... 27 3.2.13 Model Validation .............................................................................................................................. 28
4. RESULTS ............................................................................................................................................................... 29
4.1 Selection of Primary Studies.......................................................................................................................... 29 4.2 Study and Patient Characteristics.................................................................................................................. 30
4.2.1 Treatment-Naive Patients ................................................................................................................. 30 4.2.2 Treatment-Experienced Patients ...................................................................................................... 38 4.2.3 HIV Co-infection ................................................................................................................................ 43
4.4 Critical Appraisal of Included Studies ............................................................................................................ 45 4.4.1 Treatment-Naive Patients ................................................................................................................. 45 4.4.2 Treatment-Experienced Patients ...................................................................................................... 46 4.4.3 HIV Co-infection ................................................................................................................................ 47
4.5 Data Synthesis ............................................................................................................................................... 47 4.5.1 Treatment-Naive Patients ................................................................................................................. 49 4.5.2 Treatment-Experienced Patients ...................................................................................................... 66 4.5.3 HIV Co-infection ................................................................................................................................ 95
4.6 Pharmacoeconomic Evaluation ..................................................................................................................... 97 4.6.1 Base-Case Analysis ............................................................................................................................ 97 4.6.2 Exploratory Analyses....................................................................................................................... 103 4.6.3 Deterministic Sensitivity Analysis ................................................................................................... 108 4.6.4 Probabilistic Sensitivity Analysis ..................................................................................................... 114

Direct-Acting Antiviral Agents for Chronic Hepatitis C Genotype 1 iv
5. DISCUSSION .......................................................................................................................................................... 116 5.1 Summary of Evidence .................................................................................................................................. 116 5.2 Interpretation of the Results ....................................................................................................................... 117
5.2.1 Efficacy — Sustained Virologic Response ....................................................................................... 117 5.2.2 Other Efficacy Outcomes ................................................................................................................ 119 5.2.3 Harms .............................................................................................................................................. 119 5.2.4 Secondary Analyses ........................................................................................................................ 120 5.2.5 Populations of Special Interest ....................................................................................................... 120
5.3 Pharmacoeconomic Considerations ............................................................................................................ 120 5.4 Strengths and Limitations of the Systematic Review .................................................................................. 121
5.4.1 Strengths ......................................................................................................................................... 121 5.4.2 Key Limitations ................................................................................................................................ 122 5.4.3 Other Considerations ...................................................................................................................... 125
6. CONCLUSIONS AND IMPLICATIONS FOR DECISION- OR POLICY-MAKING .......................................................... 126 7. REFERENCES ......................................................................................................................................................... 128 APPENDIX 1 : PATIENT INPUT SUMMARY .................................................................................................................. 142 APPENDIX 2 : LITERATURE SEARCH STRATEGY .......................................................................................................... 145 APPENDIX 3 : CRITERIA FOR INCLUSION IN SYSTEMATIC REVIEW BASED ON EMPLOYED DOSAGE REGIMENS ....... 148 APPENDIX 4 : WINBUGS CODE ................................................................................................................................... 150 APPENDIX 5 : SELECTION OF INCLUDED STUDIES ...................................................................................................... 152 APPENDIX 6 : INCLUDED STUDY LIST ......................................................................................................................... 153 APPENDIX 7 : EXCLUDED STUDY LIST ......................................................................................................................... 161 APPENDIX 8 : EFFICACY AND ADVERSE EVENTS DATA INPUTS USED FOR THE EXPLORATORY ECONOMIC ANALYSIS INCLUDING SOFOSBUVIR ................................................................................. 171 APPENDIX 9 : CRITICAL APPRAISAL OF INCLUDED STUDIES ....................................................................................... 175 APPENDIX 10 : CHARACTERISTICS OF INCLUDED STUDIES ........................................................................................ 177 APPENDIX 11 : PATIENT CHARACTERISTICS OF INCLUDED STUDIES .......................................................................... 179 APPENDIX 12 : SUMMARY OF RESULTS OF TREATMENT-NAIVE STUDIES ................................................................. 184 APPENDIX 13 : SUMMARY OF RESULTS OF TREATMENT-EXPERIENCED STUDIES ..................................................... 195 APPENDIX 14 : SUMMARY OF RESULTS OF HIV CO-INFECTION STUDIES .................................................................. 203 APPENDIX 15 : DIRECT PAIRWISE META-ANALYSIS ................................................................................................... 205 APPENDIX 16 : SUPPLEMENTARY DATA FOR QUEST1 AND QUEST2 ......................................................................... 221 APPENDIX 17 : DETAILED RESULTS FROM THE INDIRECT TREATMENT COMPARISON .............................................. 224 APPENDIX 18 : ADDITIONAL NMA ANALYSES IN TREATMENT-NAIVE PATIENTS ....................................................... 235 APPENDIX 19 : NMA SUBGROUP ANALYSES BY FIBROSIS SEVERITY .......................................................................... 239 APPENDIX 20 : NMA SUBGROUP ANALYSES BY GENOTYPE SUBTYPE ....................................................................... 246 APPENDIX 21 : ASSESSMENT OF INCONSISTENCY ..................................................................................................... 255 APPENDIX 22 : NMA SECONDARY ANALYSES STRATIFIED BY PEGINTERFERON-2A OR -2B ....................................... 266 APPENDIX 23 : NMA SECONDARY ANALYSIS RESTRICTED TO HEALTH CANADA DOSAGE REGIMENS ...................... 309 APPENDIX 24 : NMA META-REGRESSION ADJUSTED FOR PROPORTION WITH CIRRHOSIS ....................................... 326 APPENDIX 25 : OVERVIEW OF PEGINTERFERON RANDOMIZED CONTROLLED TRIALS .............................................. 336 APPENDIX 26 : BASE-CASE ANALYSIS ADDITIONAL RESULTS ..................................................................................... 345 APPENDIX 27 : UNIVARIATE SENSITIVITY ANALYSES ................................................................................................. 347

Direct-Acting Antiviral Agents for Chronic Hepatitis C Genotype 1 v
Tables Table 1: Health Canada–Approved Pharmaceutical Therapies for the Treatment of Chronic Hepatitis C .................... 2 Table 2: Health Canada–Approved Direct-Acting Antiviral Dosing Regimens for Genotype 1 Chronic Hepatitis C ...... 4 Table 3: Treatment Regimen Nomenclature ................................................................................................................. 5 Table 4: Inclusion and Exclusion Criteria for Primary Studies........................................................................................ 7 Table 5: Fibrosis Distribution ....................................................................................................................................... 12 Table 6: Available Treatments Included in Primary Analysis ....................................................................................... 12 Table 7: Description of Health States .......................................................................................................................... 13 Table 8: Natural History Parameters ........................................................................................................................... 15 Table 9: Treatment Efficacy (Sustained Virologic Response) ....................................................................................... 16 Table 10: Adverse Events ............................................................................................................................................. 17 Table 11: Discontinuation Rate.................................................................................................................................... 18 Table 12: Proportion of Cohort That Qualified for Short-Duration Response-Guided Therapy .................................. 20 Table 13: Chronic Hepatitis C–Related Mortality ........................................................................................................ 21 Table 14: Chronic Hepatitis C–Related Cost ................................................................................................................ 21 Table 15: Therapy Cost ................................................................................................................................................ 22 Table 16: Cost of Adverse Events Associated with Chronic Hepatitis C Therapies ...................................................... 24 Table 17: Chronic Hepatitis C–Related Utilities ........................................................................................................... 25 Table 18: Assumptions Within the Economic Model ................................................................................................... 26 Table 19: Parameters Varied in the Deterministic Sensitivity Analyses ...................................................................... 27 Table 20: Validation Results — Probability of Cirrhosis .............................................................................................. 28 Table 21: Validation Results — Probability of Liver Death .......................................................................................... 28 Table 22: Summary of Interventions Evaluated .......................................................................................................... 30 Table 23: Summary of Dosage Regimens in Studies of Treatment-Naive Patients ..................................................... 31 Table 24: Summary of Randomized Controlled Trials Included in the Network Meta-analysis —
Treatment-Naive Patients ........................................................................................................................... 33 Table 25: Summary of Studies Not Included in the Network Meta-analysis — Treatment-Naive Patients ................ 37 Table 26: Summary of Patient Populations and Dosage Regimens in Studies in Treatment-Experienced Patients ... 39 Table 27: Summary of Randomized Controlled Trials Included in the Network Meta-analysis —
Treatment-Experienced Patients ................................................................................................................. 40 Table 28: Summary of Studies Not Included in the Network Meta-analysis — Treatment-Experienced Patients...... 42 Table 29: Summary of Included Randomized Controlled Trials — Patients With HIV Co-infection ............................ 44 Table 30: Summary of Data Available for the Network Meta-analysis
a ...................................................................... 48
Table 31: NMA Results for SVR in Treatment-Naive Patients: Relative Risk (Lower Segment) and Risk Difference % (Upper Segment) for Random Effects Model......................................................................... 52
Table 32: NMA Results for SVR in Treatment-Naive Patients With Fibrosis Score F0 to F2: Relative Risk (Lower Segment) and Risk Difference % (Upper Segment) for Random Effects Model .............................. 54
Table 33: NMA Results for SVR in Treatment-Naive Patients With Fibrosis Score F3 to F4: Relative Risk (Lower Segment) and Risk Difference % (Upper Segment) for Random Effects Model .............................. 54
Table 34: NMA Results for SVR by Genotype in Treatment-Naive Patients: Relative Risk (Lower Segment) and Risk Difference % (Upper Segment) for Random Effects Model .......................................................... 56
Table 35: Treatment–Naive Patients — Direct Pairwise Comparison for Relapse ...................................................... 57 Table 36: Treatment-Naive Patients — Direct Pairwise Comparison for Treatment Discontinuation ........................ 58 Table 37: Treatment-Naive Patients — Mortality ....................................................................................................... 60 Table 38: Treatment-Naive Patients — Direct Pairwise Comparison for Serious Adverse Events .............................. 61 Table 39: NMA Results for Anemia in Treatment-Naive Patients: Relative Risk (Lower Segment) and Risk
Difference % (Upper Segment) for Random Effects Model ......................................................................... 63 Table 40: NMA Results for Rash in Treatment-Naive Patients: Relative Risk (Lower Segment) and Risk
Difference % (Upper Segment) for Random Effects Model......................................................................... 64 Table 41: NMA Results for Depression in Treatment-Naive Patients: Relative Risk (Lower Segment) and Risk
Difference % (Upper Segment) for Random Effects Model ......................................................................... 66
Direct-Acting Antiviral Agents for Chronic Hepatitis C Genotype 1 vi
Table 42: NMA Results for SVR in All Treatment-Experienced Patients: Relative Risk (Lower Segment) and Risk Difference % (Upper Segment) for Random Effects Model ................................................................. 70
Table 43: NMA Results for SVR in All Treatment-Experienced Patients with Fibrosis Score F0 to F2: Relative Risk (Lower Segment) and Risk Difference % (Upper Segment) for Random Effects Model ....................... 72
Table 44: NMA Results for SVR in All Treatment-Experienced Patients with Fibrosis Score F3 to F4: Relative Risk (Lower Segment) and Risk Difference % (Upper Segment) for Random Effects Model ......... 72
Table 45: NMA Results for SVR by Genotype in All Treatment-Experienced Patients: Relative Risk (Lower Segment) and Risk Difference % (Upper Segment) for Random Effects Model .............................. 74
Table 46: NMA Results for SVR in Patients With Prior Relapse: Relative Risk (Lower Segment) and Risk Difference % (Upper Segment) for Random Effects Model ................................................................. 76
Table 47: NMA Results for SVR in Patients With a Prior Relapse with Fibrosis Score F0 to F2: Relative Risk (Lower Segment) and Risk Difference % (Upper Segment) for Random Effects Model .............................. 77
Table 48: NMA Results for SVR in Patients With a Prior Relapse With Fibrosis Score F3 to F4: Relative Risk (Lower Segment) and Risk Difference % (Upper Segment) for Random Effects Model .............................. 78
Table 49: NMA Results for SVR by Genotype in Patients With Prior Relapse: Relative Risk (Lower Segment) and Risk Difference % (Upper Segment) for Random Effects Model .......................................................... 79
Table 50: NMA Results for SVR in Patients with Prior Partial Response: Relative Risk (Lower Segment) and Risk Difference % (Upper Segment) for Random Effects Model ......................................................................... 80
Table 51: NMA Results for SVR in Patients With Prior Partial Respondse With Fibrosis Score F0 to F2: Relative Risk (Lower Segment) and Risk Difference % (Upper Segment) for Random Effects Model ......... 82
Table 52: NMA Results for SVR in Patients With Prior Partial Response with Fibrosis Score F3 to F4: Relative Risk (Lower Segment) and Risk Difference % (Upper Segment) for Random Effects Model ......... 82
Table 53: NMA Results for SVR in Patients With Prior Null Response: Relative Risk (Lower Segment) and Risk Difference % (Upper Segment) for Random Effects Model ................................................................. 83
Table 54: Treatment-Experienced Patients — Direct Pairwise Comparison for Relapse ............................................ 85 Table 55: Treatment-Experienced Patients — Direct Pairwise Comparison for Treatment Discontinuation ............. 86 Table 56: Treatment-Experienced Patients — Mortality ............................................................................................. 87 Table 57: Treatment-Experienced Patients — Direct Pairwise Comparison for Serious Adverse Events ................... 88 Table 58: NMA Results for Anemia in All Treatment-Experienced Patients: Relative Risk (Lower Segment)
and Risk Difference % (Upper Segment) for Random Effects Model .......................................................... 90 Table 59: NMA Results for Rash in All Treatment-Experienced Patients: Relative Risk (Lower Segment) and
Risk Difference % (Upper Segment) for Random Effects Model ................................................................. 91 Table 60: NMA Results for Depression in All Treatment-Experienced Patients: Relative Risk (Lower Segment)
and Risk Difference % (Upper Segment) for Random Effects Model .......................................................... 92 Table 61: HIV Co-infection — Indirect Treatment Comparison (Bucher Method) ...................................................... 97 Table 62: Total Costs (Treatment-Naive Patients) Generated by the Model for Each of the Treatment Regimens ... 97 Table 63: Results of Base-Case Deterministic Analysis (Treatment-Naive Patients) With Pegylated Interferon
Plus Ribavirin as a Reference ....................................................................................................................... 98 Table 64: Results of Base-Case Deterministic Analysis (Treatment-Naive Patients) by Fibrosis Stages ...................... 98 Table 65: Total Costs (Treatment-Experienced Patients: Prior Relapse) Generated by the Model for Each
of the Treatment Regimens ......................................................................................................................... 99 Table 66: Results of Base-Case Deterministic Analysis (Treatment-Experienced Patients: Prior Relapse)
With Pegylated Interferon Plus Ribavirin as Reference ............................................................................. 100 Table 67: Results of Base-Case Deterministic Analysis (Treatment-Experienced Patients: Prior Relapse)
by Fibrosis Stages ...................................................................................................................................... 101 Table 68: Total Costs (Treatment-Experienced Patients: Partial Response) Generated by the Model for
Each of the Treatment Regimens .............................................................................................................. 102 Table 69: Results of Base-Case Deterministic Analysis (Treatment-Experienced Patients: Partial Response)
With Pegylated Interferon Plus Ribavirin as Reference ............................................................................. 102 Table 70: Results of Base-Case Deterministic Analysis (Treatment-Experienced Patients: Partial Response)
by Fibrosis Stages ...................................................................................................................................... 103 Table 71: Results of Exploratory Analysis (Treatment-Naive Patients) With Sofosbuvir, Mainly Based on
Network Meta-analysis (PROTON Randomized Controlled Trial) .............................................................. 104

Direct-Acting Antiviral Agents for Chronic Hepatitis C Genotype 1 vii
Table 72: Results of Exploratory Analysis (Treatment-Naive Patients) with Sofosbuvir Based on the NEUTRINO Randomized Controlled Trial ................................................................................................... 105
Table 73: Results of Exploratory Analysis (Treatment-Naive Patients) Using Health Canada–Recommended Dose for Boceprevir ................................................................................................................................... 106
Table 74: Results of Exploratory Analysis (Treatment-Experienced Patients: Prior Relapse) using Health Canada–Recommended RGT Criteria for Telaprevir ................................................................................. 106
Table 75: Results of Exploratory Analysis using Health Canada–Recommended RGT Criteria for Simeprevir .......... 107 Table 76: Results of Exploratory Analysis (Treatment-Experienced Patients: Partial Response) for
Simeprevir, Assuming Same Efficacy as Telaprevir .................................................................................... 108 Table 77: Results of Exploratory Analysis (Treatment-Experienced Patients: Partial Response) for Simeprevir,
Assuming Same Efficacy as Boceprevir ...................................................................................................... 108 Table 78: Results of Sensitivity Analysis on-Treatment Efficacy ................................................................................ 112 Table 79: Results of Sensitivity Analysis on Cost of Antiviral Therapy ....................................................................... 112 Table 80: Results of Sensitivity Analysis on Baseline Age .......................................................................................... 113 Table 81: Dosing Inclusion Criteria ............................................................................................................................ 149 Table 82: Treatment Efficacy Including Sofosbuvir ................................................................................................... 171 Table 83: Adverse Events Rate for Sofosbuvir, Based Mainly on NMA ..................................................................... 172 Table 84: Treatment Efficacy Including Sofosbuvir Using NEUTRINO RCT ................................................................ 173 Table 85: Adverse Events Rate for Sofosbuvir Using NEUTRINO RCT ........................................................................ 174 Table 86: Treatment-Naive Patients — Assessment of Risk of Bias .......................................................................... 175 Table 87: Treatment-Experienced Patients — Assessment of Risk of Bias ................................................................ 176 Table 88: HIV Co-infection — Assessment of Risk of Bias ......................................................................................... 176 Table 89: Treatment-Naive Patients — Disposition .................................................................................................. 177 Table 90: Treatment-Experienced — Disposition ...................................................................................................... 178 Table 91: Patient Characteristics — Treatment-Naive Patients ................................................................................ 179 Table 92: Patient Characteristics — Studies of Treatment-Experienced Patients Included in the NMA ................... 181 Table 93: Patient Characteristics — Studies of Treatment-Experienced Patients Not Included in the NMA ............ 182 Table 94: Patient Characteristics — HIV Co-infection Studies ................................................................................... 183 Table 95: Antiretroviral Therapies — HIV Co-infection Studies................................................................................. 183 Table 96: Treatment-Naive Patients — Proportion of Patients With SVR ................................................................. 184 Table 97: Treatment-Naive Patients — SVR by Fibrosis Severity .............................................................................. 185 Table 98: Treatment-Naive Patients — SVR by Genotype Subtype ........................................................................... 186 Table 99: Treatment-Naive Patients — Relapse and Mortality ................................................................................. 187 Table 100: Treatment-Naive — Qualified for Short-Duration RGT ............................................................................ 188 Table 101: Treatment-Naive — All-Cause Treatment Discontinuation ..................................................................... 189 Table 102: Treatment-Naive — HRQoL ..................................................................................................................... 190 Table 103: Treatment-Naive Patients — Key Adverse Events ................................................................................... 191 Table 104: Treatment-Naive Patients — Other Adverse Events ............................................................................... 193 Table 105: Treatment-Experienced Patients — SVR12/24
d ....................................................................................... 195
Table 106: Treatment-Experienced Patients — SVR by Fibrosis Severity .................................................................. 196 Table 107: Treatment-Experienced Patients — SVR by Genotype Subtype .............................................................. 197 Table 108: Treatment-Experienced Patients — Relapse and Mortality .................................................................... 199 Table 109: Treatment-Experienced — Discontinued Treatment (All-Cause) ............................................................ 200 Table 110: Treatment-Experienced Patients — Qualified for Short-Duration RGT ................................................... 200 Table 111: Treatment-Experienced Patients — Key Adverse Events ........................................................................ 201 Table 112: Treatment-Experienced Patients — Other Adverse Events ..................................................................... 202 Table 113: HIV Co-infection — Efficacy Outcomes .................................................................................................... 203 Table 114: HIV Co-infection — Adverse Events ......................................................................................................... 204 Table 115: Treatment-Naive Patients — Direct Pairwise Comparison for SVR ......................................................... 205 Table 116: Treatment-Naive Patients — Direct Pairwise Comparison of SVR by Fibrosis Severity ........................... 205 Table 117: Treatment-Naive Patients — Direct Pairwise Comparison of SVR by Genotype Subtype ....................... 206 Table 118: Treatment-Naive Patients — Direct Pairwise Comparison of Treatment Discontinuation
Due to Adverse Events ............................................................................................................................. 207

Direct-Acting Antiviral Agents for Chronic Hepatitis C Genotype 1 viii
Table 119: Treatment-Naive Patients — Direct Pairwise Comparison of Fatigue ..................................................... 207 Table 120: Treatment-Naive Patients — Direct Pairwise Comparison of Influenza-Like Symptoms ......................... 208 Table 121: Treatment-Naive Patients — Direct Pairwise Comparison of Neutropenia ............................................ 209 Table 122: Treatment-Naive Patients — Direct Pairwise Comparison of Pruritus .................................................... 209 Table 123: Treatment-Naive Patients — Direct Pairwise Comparison of Anorectal Discomfort .............................. 210 Table 124: Treatment-Naive Patients — Direct Pairwise Comparison of Anemia..................................................... 210 Table 125: Treatment-Naive Patients — Direct Pairwise Comparison of Rash ......................................................... 211 Table 126: Treatment-Naive Patients — Direct Pairwise Comparison of Depression ............................................... 211 Table 127: Treatment-Experienced Patients — Direct Pairwise Comparison of SVR ................................................ 212 Table 128: Treatment-Experienced Patients — Direct Pairwise Comparison of SVR by Fibrosis Severity ................ 214 Table 129: Treatment-Experienced Patients — Direct Pairwise Comparison of SVR by Genotype Subtype ............ 215 Table 130: Treatment-Experienced Patients — Direct Pairwise Comparison for Treatment Discontinuation
Due to Adverse Events ............................................................................................................................. 216 Table 131: Treatment-Experienced Patients — Direct Pairwise Comparison for Fatigue ......................................... 216 Table 132: Treatment-Experienced Patients — Direct Pairwise Comparison for Influenza-Like Symptoms ............ 217 Table 133: Treatment-Experienced Patients — Direct Pairwise Comparison of Neutropenia .................................. 217 Table 134: Treatment-Experienced Patients — Direct Pairwise Comparison of Pruritus ......................................... 218 Table 135: Treatment-Experienced Patients — Direct Pairwise Comparison of Anorectal Discomfort .................... 218 Table 136: Treatment-Experienced Patients — Direct Pairwise Comparison of Anemia .......................................... 219 Table 137: Treatment-Experienced Patients — Direct Pairwise Comparison of Rash .............................................. 219 Table 138: Treatment-Experienced Patients — Direct Pairwise Comparison of Depression .................................... 220 Table 139: Virologic Response According to Response-Guided Therapy Criteria Among Patients Who
Received Simeprevir ................................................................................................................................ 221 Table 140: Treatment-Naive Patients – Key Adverse Events Reported Over the Entire Treatment Period
in QUEST1 and QUEST2 ........................................................................................................................... 222 Table 141: Treatment-naive Patients – Other Adverse Events Reported over the Entire Treatment Period in
QUEST1 and QUEST2 ............................................................................................................................... 222 Table 142: Treatment-Naive Patients – Direct Pairwise Comparison of Adverse Event Outcomes for
Simeprevir (Revised Data Based on Adverse Events Occurring Over Entire Treatment Period) ............. 223 Table 143: SVR Treatment Comparisons in Treatment-Naive Patients: Odds Ratios, Relative Risks, and Risk
Difference for Random Effects Model ..................................................................................................... 224 Table 144: Anemia in Treatment-Naive Patients: Odds Ratios, Relative Risks, and Risk Difference for Random
Effects Model ........................................................................................................................................... 225 Table 145: Depression — Treatment-Naive Patients: Odds Ratios, Relative Risks and Risk Difference for All
Treatment Comparisons and Random Effects Model.............................................................................. 226 Table 146: Rash in Treatment-Naive Patients: Odds Ratios, Relative Risks and Risk Difference for All Treatment
Comparisons and Random Effects Model ............................................................................................... 227 Table 147: SVR — All Treatment-Experienced Patients: Odds Ratios, Relative Risks, and Risk Difference for All
Treatment Comparisons and Random Effects Model.............................................................................. 229 Table 148: SVR Treatment-Experienced Patients With Prior Relapse: Odds Ratios, Relative Risks, and Risk
Difference for All Treatment Comparisons and Random Effects Model ................................................. 230 Table 149: SVR Treatment-Experienced Patients With Prior Partial Response: Odds Ratios, Relative Risks,
and Risk Difference for All Treatment Comparisons and Random Effects Model ................................... 231 Table 150: SVR Treatment-Experienced Patients With Prior Null Response: Odds Ratios, Relative Risks,
and Risk Difference for All Treatment Comparisons and Random Effects Model ................................... 231 Table 151: Anemia in All Treatment-Experienced Patients: Odds Ratios, Relative Risks, and Risk Difference
for All Treatment Comparisons and Random Effects Model ................................................................... 232 Table 152: Depression — All Treatment-Experienced Patients: Odds Ratios, Relative Risks, and Risk Difference
for All Treatment Comparisons and Random Effects Model ................................................................... 233 Table 153: Rash — All Treatment-Experienced Patients: Odds Ratios, Relative Risks, and Risk Difference
for All Treatment Comparisons and Random Effects Model ................................................................... 234

Direct-Acting Antiviral Agents for Chronic Hepatitis C Genotype 1 ix
Table 154: SVR for Fibrosis Score F0-F2-Treatment-Naive Patients: Relative Risk (Lower Segment), Risk Difference % (Upper Segment) for Head-to-Head Comparisons of All Treatments / Random Effects Model (PROTON Added) ....................................................................................................................................................... 235
Table 155: SVR for Fibrosis Score F0-F2-Treatment-Naive Patients: Odds Ratios, Relative Risks, and Risk Difference for All Treatment Comparisons and Random Effects Model ..................................................................... 236
Table 156: SVR for Fibrosis Score F3-F4 —Treatment-Naive: Relative Risk (Lower Segment), Risk Difference % (Upper Segment) for Head-to-Head Comparisons of All Treatments / Random Effects Model (B44 PR48 Group Included) ......................................................................................................................................... 237
Table 157: SVR for Fibrosis Score F3-F4 —Treatment-Naive: Odds Ratios, Relative Risks, and Risk Difference for All Treatment Comparisons and Random Effects Model (B44 PR48 Group Included) ................................... 238
Table 158: SVR for Fibrosis Score F0-F2-Treatment-Naive Patients: Odds Ratios, Relative Risks, and Risk Difference for All Treatment Comparisons and Random Effects Model ..................................................................... 239
Table 159: SVR for Fibrosis Score F3-F4 — Treatment-Naive Patients: Odds Ratios, Relative Risks, and Risk Difference for All Treatment Comparisons and Random Effects Model ................................................... 240
Table 160: SVR for Fibrosis Score F0-F2 — All Treatment-Experienced Patients: Odds Ratios, Relative Risks, and Risk Difference for All Treatment Comparisons and Random Effects Model ................................................... 241
Table 161: SVR for Fibrosis Score F3-F4 — All Treatment- Experienced Patients: Odds Ratios, Relative Risks and Risk Difference for All Treatment Comparisons and Random Effects Models.................................................. 242
Table 162: SVR for Fibrosis Score F0-F2 —Treatment-Experienced Patients With Prior Relapse: Odds Ratios, Relative Risks, and Risk Difference for All Treatment Comparisons and Random Effects Model ............. 243
Table 163: SVR for Fibrosis Score F3-F4 — Treatment-Experienced Patients With Prior Relapse: Odds Ratios, Relative Risks and Risk Difference for All Treatment Comparisons and Random Effects Model .............. 244
Table 164: SVR for Fibrosis Score F0-F2 — Treatment-Experienced Patients With Partial Response: Odds Ratios, Relative Risks, and Risk Difference for All Treatment Comparisons and Random Effects Model ............. 244
Table 165: SVR for Fibrosis Score F3-F4 — Treatment-Experienced Patients With Prior Partial Response: Odds Ratios, Relative Risks, and Risk Difference for All Treatment Comparisons and Random Effects Model . 245
Table 166: SVR by Genotypes — Treatment-Naive Patients: Odds Ratios, Relative Risks, and Risk Difference for All Treatment Comparisons and Random Effects Model ............................................................................... 247
Table 167: SVR by Genotypes — All Treatment-Experienced Patients: Odds Ratios, Relative Risks, and Risk Difference for All Treatment Comparisons and Random Effects Model ................................................... 251
Table 168: SVR by Genotypes — Treatment-Experienced Patients With Prior Relapse: Odds Ratios, Relative Risks, and Risk Difference for All Treatment Comparisons and Random Effects Model ..................................... 254
Table 169: SVR by Genotypes — Treatment-Experienced Patients With Prior Relapse: Plot of Posterior Mean Deviance of the Individual Data Points in the Inconsistency Model Against Their Posterior Mean Deviance in the Consistency Model .......................................................................................................................... 263
Table 170: SVR — Treatment-Naive Patients: Odds Ratios, Relative Risks, and Risk Difference for All Treatment Comparisons and Random Effects Model (PR48 2a/b Separated, All Doses) ............................................ 266
Table 171: SVR — Treatment-Naive Patients: Odds Ratios, Relative Risks, and Risk Difference for All Treatment Comparisons and Random Effects Model (PR48 2a/b Separated, Health Canada Doses Only) ................ 271
Table 172: SVR for Fibrosis Score F0-F2 — Treatment-Naive Patients: Odds Ratios, Relative Risks, and Risk Difference for All Treatment Comparisons and Random Effects Model (PR48 2a/b Separated, Health Canada Doses) ........................................................................................................................................... 274
Table 173: SVR for Fibrosis Score F3-F4 — –Treatment-Naive Patients: Odds Ratios, Relative Risks, and Risk Difference for All Treatment Comparisons and Random Effects Model (PR48 2a/b Separated, Health Canada Doses) ........................................................................................................................................... 275
Table 174: SVR by Genotypes — Treatment-Naive Patients: Odds Ratios, Relative Risks, and Risk Difference for All Treatment Comparisons and Random Effects Model (PR48 2a/b Separated, All Doses) .......................... 276
Table 175: SVR by Genotypes — Treatment-Naive Patients: Odds Ratios, Relative Risks, and Risk Difference for All Treatment Comparisons and Random Effects Model (PR48 2a/b Separated, Health Canada Doses Only) ................................................................................................................................................................... 281
Table 176: Rash — Treatment-Naive Patients: Odds Ratios, Relative Risks, and Risk Difference for All Treatment Comparisons-Random Effects Model (PR48 2a/b Separated, All Doses) .................................................. 286

Direct-Acting Antiviral Agents for Chronic Hepatitis C Genotype 1 x
Table 177: Rash — Treatment-Naive Patients: Odds Ratios, Relative Risks, and Risk Difference for All Treatment Comparisons and Random Effects Model (PR48 2a/b Separated, Health Canada Doses Only) ................ 290
Table 178: Anemia — Treatment-Naive Patients: Odds Ratios, Relative Risks, and Risk Difference for All Treatment Comparisons and Random Effects Model (PR48 2a/b Separated, All Doses) ............................................ 292
Table 179: Anemia — Treatment-Naive Patients: Odds Ratios, Relative Risks, and Risk Difference for All Treatment Comparisons and Random Effects Model (PR48 2a/b Separated, Health Canada Doses Only) ................ 296
Table 180: Depression — Treatment-Naive Patients: Odds Ratios, Relative Risks and Risk Difference for All Treatment Comparisons-Random Effects Model (PR48 2a/b Separated, All Doses) ................................ 298
Table 181: Depression — Treatment-Naive Patients: Odds Ratios, Relative Risks, and Risk Difference for All Treatment Comparisons and Random Effects Model (PR48 2a/b Separated, Health Canada Doses Only) ................................................................................................................................................................... 301
Table 182: SVR — All Treatment-Experienced Patients: Odds Ratios, Relative Risks, and Risk Difference for All Treatment Comparisons and Random Effects Model (PR48 2a/b Separated, All Doses) .......................... 302
Table 183: SVR — All Treatment-Experienced Patients: Odds Ratios, Relative Risks, and Risk Difference for All Treatment Comparisons and Random Effects Model (PR48 2a/b Separated, Health Canada Doses Only)....................... 305
Table 184: Anemia — All Treatment-Experienced Patients: Odds Ratios, Relative Risks, and Risk Difference for All Treatment Comparisons and Random Effects Model (PR48 2a/b Separated, All Doses) .......................... 306
Table 185: Anemia — All Treatment-Experienced Patients: Odds Ratios, Relative Risks, and Risk Difference for All Treatment Comparisons and Random Effects Model (PR48 2a/b Separated, Health Canada Doses Only) ................................................................................................................................................................... 308
Table 186: SVR — Treatment-Naive Patients: Odds Ratios, Relative Risks, and Risk Difference for All Treatment Comparisons and Random Effects Model (Health Canada Doses Only) .................................................... 309
Table 187: Rash — Treatment-Naive Patients: Odds Ratios, Relative Risks, and Risk Difference for All Treatment Comparisons and Random Effects Model (Health Canada Doses Only) .................................................... 310
Table 188: Anemia —Treatment-Naive Patients: Odds Ratios, Relative Risks, and Risk Difference for All Treatment Comparisons and Random Effects Model (Health Canada Doses Only) .................................................... 310
Table 189: Depression — Treatment-Naive Patients: Odds Ratios, Relative Risks, and Risk Difference for All Treatment Comparisons-Random Effects Model (Health Canada Doses Only) ........................................ 311
Table 190: SVR by Genotypes — Treatment-Naive Patients: Odds Ratios, Relative Risks, and Risk Difference for All Treatment Comparisons / Random Effects Model (Health Canada Doses Only) ...................................... 312
Table 191: SVR — All Treatment-Experienced Patients: Odds Ratios, Relative Risks, and Risk Difference for All Treatment Comparisons-Random Effects Model (Health Canada Doses Only) ........................................ 316
Table 192: Rash — All Treatment-Experienced Patients: Odds Ratios, Relative Risks, and Risk Difference for All Treatment Comparisons and Random Effects Model (Health Canada Doses Only) .................................. 316
Table 193: Anemia — All Treatment-Experienced Patients: Odds Ratios, Relative Risks, and Risk Difference for All Treatment Comparisons and Random Effects Model (Health Canada Doses Only) .................................. 317
Table 194: Depression — All Treatment-Experienced Patients: Odds Ratios, Relative Risks, and Risk Difference for All Treatment Comparisons and Random Effects Model (Health Canada Doses Only) ............................. 317
Table 195: SVR for Fibrosis Score F0-F2 — All Treatment-Experienced Patients: Odds Ratios, Relative Risks, and Risk Difference for All Treatment Comparisons and Random Effects Model (Health Canada Doses Only) ..... 318
Table 196: SVR for Fibrosis Score F3-F4 — All Treatment-Experienced Patients: Odds Ratios, Relative Risks, and Risk Difference for All Treatment Comparisons and Random Effects Model (Health Canada Doses Only) ..... 318
Table 197: SVR by Genotypes — All Treatment-Experienced Patients: Odds Ratios, Relative Risks, and Risk Difference for All Treatment Comparisons and Random Effects Model (Health Canada Doses Only) ..... 319
Table 198: SVR — Treatment-Experienced Patients With Prior Relapse: Odds Ratios, Relative Risks, and Risk Difference for All Treatment Comparisons and Random Effects Model (Health Canada Doses Only) ..... 321
Table 199: SVR for Fibrosis Score F3-F4 —Treatment-Experienced Patients With Prior Relapse: Odds Ratios, Relative Risks, and Risk Difference for All Treatment Comparisons and Random Effects Model (Health Canada Doses Only) ................................................................................................................................... 322
Table 200: SVR by Genotypes — Treatment-Experienced Patients With Prior Relapse: Odds Ratios, Relative Risks, and Risk Difference for All Treatment Comparisons and Random Effects Model (Health Canada Doses Only) .......................................................................................................................................................... 322

Direct-Acting Antiviral Agents for Chronic Hepatitis C Genotype 1 xi
Table 201: SVR — Treatment-Experienced Patients With Prior Partial Response: Odds Ratios, Relative Risks, and Risk Difference for All Treatment Comparisons and Random Effects Model (Health Canada Doses Only) .................................................................................................................... 324
Table 202: SVR for Fibrosis Score F0-F2 — Treatment-Experienced Patients With Prior Partial Response: Odds Ratios, Relative Risks, and Risk Difference for All Treatment Comparisons and Random Effects Model (Health Canada Doses Only) ............................................................................................. 324
Table 203: SVR for Fibrosis Score F3-F4 —Treatment-Experienced Patients With Prior Partial Response: Odds Ratios, Relative Risks, and Risk Difference for All Treatment Comparisons and Random Effects Model (Health Canada Doses Only) ............................................................................................. 325
Table 204: SVR — Treatment-Experienced Patients With Prior Null Response: Odds Ratios, Relative Risks, and Risk Difference for All Treatment Comparisons and Random Effects Model (Health Canada Doses Only) .............................................................................................................................................. 325
Table 205: SVR — Treatment-Naive Patients: Odds Ratios, Relative Risks, and Risk Difference for All Treatment Comparisons and Random Effects Model .............................................................................. 326
Table 206: Anemia — Treatment-Naive Patients: Odds Ratios, Relative Risks, and Risk Difference for All Treatment Comparisons and Random Effects Model ......................................................................... 328
Table 207: Rash — Treatment-Naive Patients: Odds Ratios, Relative Risks, and Risk Difference for All Treatment Comparisons and Random Effects Model ......................................................................... 330
Table 208: SVR — All Treatment-Experienced Patients: Odds Ratios, Relative Risks, and Risk Difference for All Treatment Comparisons and Random Effects Model ................................................................... 332
Table 209: Anemia — All Treatment-Experienced Patients: Odds Ratios, Relative Risks, and Risk Difference for All Treatment Comparisons and Random Effects Model ................................................................... 333
Table 210: Rash — All Treatment-Experienced Patients: Odds Ratios, Relative Risks, and Risk Difference for All Treatment Comparisons and Random Effects Model ................................................................... 334
Table 211: Depression — All Treatment-Experienced Patients: Odds Ratios, Relative Risks, and Risk Difference for All Treatment Comparisons and Random Effects Model ................................................................... 335
Table 212: Inclusion Criteria for Peginterferon RCTs ................................................................................................. 336 Table 213: Study Characteristics for Peginterferon Studies ...................................................................................... 339 Table 214: Patient Characteristics for Peginterferon Studies .................................................................................... 341 Table 215: Risk of Bias for Peginterferon Studies ...................................................................................................... 342 Table 216: Peginterferon Studies — Efficacy Outcomes ........................................................................................... 342 Table 217: Peginterferon Studies — SVR24 by Fibrosis Severity ............................................................................... 343 Table 218: Peginterferon Studies — Key Adverse Events.......................................................................................... 343 Table 219: Peginterferon Studies — Other Adverse Events ...................................................................................... 344 Table 220: Results of Base-Case Deterministic Analysis (Treatment-Naive Patients) With Boceprevir as
Reference ................................................................................................................................................. 345 Table 221: Results of Base-Case Deterministic Analysis (Treatment-Naive Patients) With Simeprevir
as Reference ............................................................................................................................................ 345 Table 222: Results of Base-Case Deterministic Analysis (Treatment-Experienced Patients: Prior Relapse)
With Simeprevir as Reference ................................................................................................................. 345 Table 223: Results of Base-Case Deterministic Analysis (Treatment-Experienced Patients: Prior Relapse)
With Boceprevir as Reference ................................................................................................................. 346 Table 224: Results of Base-Case Deterministic Analysis (Treatment-Experienced Patients: Partial Response)
With Boceprevir as Reference ................................................................................................................. 346 Table 225: Results of Sensitivity Analysis on Fibrosis Distribution ............................................................................ 347 Table 226: Results of Sensitivity Analysis (Treatment-Naive) by Fibrosis Stages ...................................................... 348 Table 227: Results of Sensitivity Analysis (Treatment-Experienced Patients: Prior Relapse) by Fibrosis Stages ...... 349 Table 228: Results of Sensitivity Analysis (Treatment-Experienced Patients: Partial Response) by Fibrosis Stages . 350 Table 229: Results of Sensitivity Analysis on CHC-Related Costs ............................................................................... 351 Table 230: CHC-Related Utilities Used in Sensitivity Analysis .................................................................................... 352 Table 231: Results of Sensitivity Analysis on CHC-Related Utilities ........................................................................... 352 Table 232: CHC-Related Utilities Used in Sensitivity Analysis (HUI3) ........................................................................ 353 Table 233: Results of Sensitivity Analysis on CHC-Related Utilities (HUI 3) ............................................................... 353

Direct-Acting Antiviral Agents for Chronic Hepatitis C Genotype 1 xii
Table 234: Results of Sensitivity Analysis on CHC-Related Mortality ........................................................................ 354 Table 235: Results of Sensitivity Analysis on CHC Progression Rate.......................................................................... 355 Table 236: Results of Sensitivity Analysis on-Treatment Efficacy (Telaprevir Dose) ................................................. 356 Table 237: Results of Sensitivity Analysis on-Treatment Efficacy (Boceprevir Dose) ................................................ 357 Table 238: Results of Sensitivity Analysis on Percentage Meeting RGT Criteria for Short Therapy .......................... 358 Table 239: Results of Sensitivity Analysis on Cost of Adverse Events........................................................................ 359 Table 240: Results of Sensitivity Analysis on the Cost of EPO Used (Utilization = 0%) .............................................. 360 Table 241: Results of Sensitivity Analysis on Disutility for Adverse Events ............................................................... 361 Table 242: Results of Sensitivity Analysis on Adverse Event Rate ............................................................................. 362 Figures Figure 1: State-Transition Model of Hepatitis C Virus Infection and Progression ....................................................... 14 Figure 2: Risk of Bias for Studies in Treatment-Naive Patients Included in Network Meta-analysis ........................... 46 Figure 3: Risk of Bias for Studies in Treatment-Experienced Patients Included in Network Meta-analysis ............... 47 Figure 4: Staircase Diagram “Legend” for Interpretation of Relative Risk and Risk Difference................................... 49 Figure 5: Proportion of Treatment-Naive Patients With Sustained Virologic Response ............................................. 50 Figure 6: Treatment-Naive Patients — Evidence Network for Sustained Virologic Response .................................... 51 Figure 7: Treatment-Naive Patient Subgroups with Fibrosis Score F0 to F2 or F3 to F4 — Evidence Network
for Sustained Virologic Response ................................................................................................................ 53 Figure 8: Proportion of Treatment-Naive Patients Who Met Response-Guided Therapy Criteria for
Short-Duration Therapy ............................................................................................................................... 59 Figure 9: Treatment-Naive Patients — Evidence Network for Anemia, Rash ............................................................ 62 Figure 10: Treatment-Naive — Evidence Network for Depression ............................................................................. 65 Figure 11: Proportion of Treatment-Experienced Patients with Sustained Virologic Response ................................. 68 Figure 12: Treatment-Experienced (All Patients): Evidence Network for Sustained Virologic Response .................... 69 Figure 13: All Treatment-Experienced Subgroup With Fibrosis Score F0 to F2 and F3 to F4 —
Evidence Network for Sustained Virologic Response ................................................................................. 71 Figure 14: Treatment-Experienced — Relapse: Evidence Network for Sustained Virologic Response ....................... 75 Figure 15: Patients With Prior Relapse and Fibrosis Score F0 to F2 or F3 to F4 — Evidence Network for
Sustained Virologic Response..................................................................................................................... 77 Figure 16: Treatment-Experienced Patients With Prior Partial Response: Evidence Network for
Sustained Virologic Response..................................................................................................................... 80 Figure 17: Patients With a Prior Partial Response With Fibrosis Score F0 to F2 or F3 to F4 —
Evidence Network for Sustained Virologic Response ................................................................................. 81 Figure 18: Treatment-Experienced Patients With a Prior Null Response: Evidence Network for
Sustained Virologic Response..................................................................................................................... 83 Figure 19: Treatment-Experienced Patients: Evidence Network for Anemia and Rash .............................................. 89 Figure 20: Treatment-Experienced Patients — Evidence Network for Depression .................................................... 92 Figure 21: HIV Co-infection — Proportion of Patients With Virologic Outcomes ....................................................... 96 Figure 22: Tornado Diagram: Simeprevir Versus PR for Treatment-Naive Patients (ICUR $32,230/QALY) .............. 109 Figure 23: Tornado Diagram: Telaprevir Versus Pegylated Interferon for Patients With Prior Relapse (ICUR
$19,808/QALY) ......................................................................................................................................... 110 Figure 24: Tornado Diagram: Boceprevir Versus Pegylated Interferon for Patients With Prior Partial
Response (ICUR $23,131/QALY) ............................................................................................................... 111 Figure 25: Cost-Effectiveness Acceptability Curve for Treatment-Naive Patients .................................................... 114 Figure 26: Cost-Effectiveness Acceptability Curve for Patients With Prior Relapse .................................................. 115 Figure 27: Cost-Effectiveness Acceptability Curve for Patients With Prior Partial Response ................................... 115 Figure 28: PRISMA Flow Diagram for Inclusion and Exclusion of Studies ................................................................. 152 Figure 29: SVR for Fibrosis Score F0-F2 in Treatment-Naive Patients: Evidence Network
(PROTON Study Included) ........................................................................................................................ 235 Figure 30: SVR for Fibrosis Score F3-F4 — Treatment-Naive Patients: Evidence Network ...................................... 237 Figure 31: SVR by Genotypes — Treatment-Naive Patients: Evidence Network ...................................................... 246

Direct-Acting Antiviral Agents for Chronic Hepatitis C Genotype 1 xiii
Figure 32: SVR by Genotypes — All Treatment-Experienced Patients: Evidence Network ....................................... 250 Figure 33: SVR by Genotypes — Treatment-Experienced Patients With Prior Relapse: Evidence Network ............. 253 Figure 34: SVR Inconsistency Assessment — Treatment-Naive Patients: Plot of Posterior Mean Deviance of the
Individual Data Points in the Inconsistency Model Against Their Posterior Mean Deviance in the Consistency Model ................................................................................................................................... 255
Figure 35: SVR by Genotypes —Treatment-Naive Patients: Plot of Posterior Mean Deviance of the Individual Data Points in the Inconsistency Model Against Their Posterior Mean Deviance in the Consistency Model ................................................................................................................................... 256
Figure 36: Rash — Treatment-Naive Patients: Plot of Posterior Mean Deviance of the Individual Data Points in the Inconsistency Model Against Their Posterior Mean Deviance in the Consistency Model ............. 256
Figure 37: Anemia —Treatment-Naive Patients: Plot of Posterior Mean Deviance of the Individual Data Points in the Inconsistency Model Against Their Posterior Mean Deviance in the Consistency Model .. 257
Figure 38: Depression — Treatment-Naive Patients: Plot of Posterior Mean Deviance of the Individual Data Points in the Inconsistency Model Against Their Posterior Mean Deviance in the Consistency Model ................................................................................................................................... 257
Figure 39: SVR — All Treatment-Experienced Patients: Plot of Posterior Mean Deviance of the Individual Data Points in the Inconsistency Model Against Their Posterior Mean Deviance in the Consistency Model .. 258
Figure 40: SVR for Fibrosis Score F0-F2 — All Treatment-Experienced Patients: Plot of Posterior Mean Deviance of the Individual Data Points in the Inconsistency Model Against Their Posterior Mean Deviance in the Consistency Model ............................................................................................................................. 258
Figure 41: SVR for Fibrosis Score F3-F4 — All Treatment-Experienced Patients: Plot of Posterior Mean Deviance of the Individual Data Points in the Inconsistency Model Against Their Posterior Mean Deviance in the Consistency Model ......................................................................................................................... 259
Figure 42: SVR for Fibrosis Score F3-F4 — All Treatment-Experienced Patients: Plot of Posterior Mean Deviance of the Individual Data Points in the Inconsistency Model Against Their Posterior Mean Deviance in the Consistency Model ............................................................................................................................. 259
Figure 43: SVR by Genotypes — All Treatment-Experienced Patients: Plot of Posterior Mean Deviance of the Individual Data Points in the Inconsistency Model Against Their Posterior Mean Deviance in the Consistency Model ................................................................................................................................... 260
Figure 44: Rash — All Treatment-Experienced Patients: Plot of Posterior Mean Deviance of the Individual Data Points in the Inconsistency Model against Their Posterior Mean Deviance in the Consistency Model ... 260
Figure 45: Anemia — All Treatment-Experienced Patients: Plot of Posterior Mean Deviance of the Individual Data Points in the Inconsistency Model Against Their Posterior Mean Deviance in the Consistency Model ................................................................................................................................... 261
Figure 46: Depression — All Treatment-Experienced Patients: Plot of Posterior Mean Deviance of the Individual Data Points in the Inconsistency Model Against Their Posterior Mean Deviance in the Consistency Model ................................................................................................................................... 261
Figure 47: SVR — Treatment-Experienced Relapsed: Plot of Posterior Mean Deviance of the Individual Data Points in the Inconsistency Model Against Their Posterior Mean Deviance in the Consistency Model ................................................................................................................................... 262
Figure 48: SVR for Fibrosis Score F0-F2 — Treatment-Experienced Patients With Prior Relapse: Plot of Posterior Mean Deviance of the Individual Data Points in the Inconsistency Model Against Their Posterior Mean Deviance in the Consistency Model ............................................................................................... 262
Figure 49: SVR for Fibrosis Score F3-F4 — Treatment-Experienced Patients With Prior Relapse: Plot of Posterior Mean Deviance of the Individual Data Points in the Inconsistency Model Against Their Posterior Mean Deviance in the Consistency Model ............................................................................... 263
Figure 50: SVR Treatment-Experienced Patients With Prior Partial Response: Plot of Posterior Mean Deviance of the Individual Data Points in the Inconsistency Model Against Their Posterior Mean Deviance in the Consistency Model ............................................................................................................................. 264
Figure 51: SVR for Fibrosis Score F0-F2 — Treatment-Experienced Patients With Prior Partial Response: Plot of Posterior Mean Deviance of the Individual Data Points in the Inconsistency Model Against Their Posterior Mean Deviance in the Consistency Model ......................................................... 264

Direct-Acting Antiviral Agents for Chronic Hepatitis C Genotype 1 xiv
Figure 52: SVR for Fibrosis Score F3-F4 — Treatment-Experienced Patients With Prior Partial Response: Plot of Posterior Mean Deviance of the Individual Data Points in the Inconsistency Model Against Their Posterior Mean Deviance in the Consistency Model ...................................................................... 265
Figure 53: SVR — Treatment-Naive Patients: Plot of Posterior Mean Deviance of the Individual Data Points in the Inconsistency Model Against Their Posterior Mean Deviance in the Consistency Model (PR48 2a/b Separated, All Doses) ............................................................................................................. 270
Figure 54: SVR — Treatment-Naive Patients: Plot of Posterior Mean Deviance of the Individual Data Points in the Inconsistency Model Against Their Posterior Mean Deviance in the Consistency Model (PR48 2a/b Separated, Health Canada Doses Only) ................................................................................. 273
Figure 55: SVR by Genotypes — Treatment-Naive Patients: Plot of Posterior Mean Deviance of the Individual Data Points in the Inconsistency Model Against Their Posterior Mean Deviance in the Consistency Model (PR48 2a/b Separated, All Doses) ............................................................................. 280
Figure 56: SVR by Genotypes — Treatment-Naive Patients: Plot of Posterior Mean Deviance of the Individual Data Points in the Inconsistency Model Against Their Posterior Mean Deviance in the Consistency Model (PR48 2a/b Separated, Health Canada Doses Only) ...................................................................... 285
Figure 57: Rash — Treatment-Naive Patients: Plot of Posterior Mean Deviance of the Individual Data Points in the Inconsistency Model Against Their Posterior Mean Deviance in the Consistency Model (PR48 2a/b Separated, All Doses) ............................................................................................................. 289
Figure 58: Rash — Treatment-Naive Patients: Plot of Posterior Mean Deviance of the Individual Data Points in the Inconsistency Model Against Their Posterior Mean Deviance in the Consistency Model (PR48 2a/b Separated, Health Canada Doses Only) ................................................................................. 291
Figure 59: Anemia — Treatment-Naive Patients: Plot of Posterior Mean Deviance of the Individual Data Points in the Inconsistency Model Against Their Posterior Mean Deviance in the Consistency Model (PR48 2a/b Separated, All Doses) ................................................................................................. 295
Figure 60: Anemia — Treatment-Naive Patients: Plot of Posterior Mean Deviance of the Individual Data Points in the Inconsistency Model against Their Posterior Mean Deviance in the Consistency Model (PR48 2a/b Separated, Health Canada Doses Only) ...................................................................... 297
Figure 61: Depression — Treatment-Naive Patients: Plot of Posterior Mean Deviance of the Individual Data Points in the Inconsistency Model Against Their Posterior Mean Deviance in the Consistency Model (PR48 2a/b Separated, All Doses) ................................................................................................. 300
Figure 62: SVR — All Treatment-Experienced Patients: Plot of Posterior Mean Deviance of the Individual Data Points in the Inconsistency Model Against Their Posterior Mean Deviance in the Consistency Model (PR48 2a/b Separated, All Doses) ............................................................................................................. 304
Figure 63: Anemia — All Treatment-Experienced Patients: Plot of Posterior Mean Deviance of the Individual Data Points in the Inconsistency Model Against Their Posterior Mean Deviance in the Consistency Model (PR48 2a/b Separated, All Doses) ............................................................................. 307
Figure 64: SVR by Genotypes — Treatment-Naive Patients: Plot of Posterior Mean Deviance of the Individual Data Points in the Inconsistency Model Against Their Posterior Mean Deviance in the Consistency Model (Health Canada Doses Only) ......................................................................................................... 315
Figure 65: SVR by Genotypes — All Treatment-Experienced Patients: Plot of Posterior Mean Deviance of the Individual Data Points in the Inconsistency Model Against Their Posterior Mean Deviance in the Consistency Model (Health Canada Doses Only) ..................................................................................... 321
Figure 66: SVR by Genotypes — Treatment-Experienced Patients With Prior Relapse: Plot of Posterior Mean Deviance of the Individual Data Points in the Inconsistency Model Against Their Posterior Mean Deviance in the Consistency Model (Health Canada Doses Only) ............................................................ 323
Figure 67: Pooled SVR for Peginterferon RCTs .......................................................................................................... 337

Direct-Acting Antiviral Agents for Chronic Hepatitis C Genotype 1 xv
ABBREVIATIONS
CHC chronic hepatitis C
CI confidence interval
CrI credible interval
DAA direct-acting antiviral
DIC deviance information criterion
EQ-5D EuroQol Five-Dimensions
HCV hepatitis C virus
HUI
ICUR
Health Utilities Index
incremental cost-utility ratio
Metavir fibrosis score:
F0 no fibrosis
F1 portal fibrosis without septa
F2 portal fibrosis with rare septa
F3 numerous septa without cirrhosis
F4 cirrhosis
NMA network meta-analysis
QALY quality-adjusted life-years
OR odds ratio
PR pegylated interferon plus ribavirin
PSA probabilistic sensitivity analysis
RCT randomized controlled trial
RGT response-guided therapy
RNA ribonucleic acid
SF-36 Short-Form 36
SVR sustained virologic response

Direct-Acting Antiviral Agents for Chronic Hepatitis C Genotype 1 xvi
EXECUTIVE SUMMARY
Context and Policy Issues An estimated 250,000 Canadians have chronic hepatitis C virus (HCV) infection; however, the exact number affected is not known, as 30% to 70% of patients are unaware that they have been infected and limited population level surveillance has been carried out in Canada to document prevalent cases.1,2 While the incidence of HCV infection in the US and Canada appears to be stable or declining, liver-related morbidity and mortality are expected to increase over the coming decades, as those who are already infected age and develop progressive liver disease.1-5 Since the early 2000s, pegylated interferon plus ribavirin (PR) has been the standard therapy for chronic hepatitis C (CHC). When effective, treatment leads to viral eradication or sustained virologic response (SVR), which is a virologic cure of infection, associated with improved long-term clinical outcomes.6,7 In patients with advanced fibrosis or cirrhosis at baseline, SVR is associated with reduced liver-related and all-cause mortality as well as a reduced incidence of liver failure and liver cancer.6 Although treatment with PR results in SVR in a proportion of patients, the treatment is less than ideal because of its long duration, numerous associated side effects, and relatively low efficacy. In 2011, the first two direct-acting antiviral (DAA) agents, boceprevir and telaprevir, were approved for use in combination with PR for patients with genotype 1 CHC. Recently, two new DAA agents (simeprevir and sofosbuvir) have been approved by Health Canada for use in patients with genotype 1 CHC, in combination with PR therapy. Given the market entry of two new DAA agents, there is a need to determine the relative effectiveness, safety, and cost-effectiveness of approved treatments for genotype 1 CHC. Genotype 1 CHC is the most prevalent form of CHC infection in Canada, and it is also the least responsive to PR treatment. Despite the availability of boceprevir and telaprevir, a substantial unmet need remains. The treatment burden is high for regimens that require 48 weeks of therapy, and for treatment regimens that include PR. Patients have expressed the need for new treatments that have higher cure rates, better side effect profiles and reduced treatment burden, yet remain affordable and accessible. The introduction of the new DAA agents (simeprevir and sofosbuvir) may address some unmet needs through potentially higher cure rates, more favourable adverse event profiles, shorter treatment durations, or combinations of these. However, treatment costs remain a concern. This review was undertaken to address policy questions put forward by the public drug plans in Canada (excluding Quebec), as described in the Therapeutic Review protocol.8 Specifically, this review is meant to inform formulary listing decisions for the four DAA therapies for the treatment of CHC genotype 1 by identifying the most cost-effective strategies, based on patient characteristics and prior treatment history. Key patient characteristics examined include liver fibrosis severity, genotype subtype, and HCV Q80K polymorphism (an amino acid substitution associated with resistance to simeprevir and possibly other protease inhibitors).9-11

Direct-Acting Antiviral Agents for Chronic Hepatitis C Genotype 1 xvii
Objectives The objective of this Therapeutic Review is to evaluate the comparable benefits, harms, and cost-effectiveness of the DAA regimens approved for use in Canada for genotype 1 CHC, based on the following research questions: 1. What is the comparative efficacy and safety of DAA and PR combination treatments for CHC
genotype 1 patients who are treatment-naive? 2. What is the comparative cost-effectiveness of DAA and PR combination treatments for CHC
genotype 1 patients who are treatment-naive? 3. What is the comparative efficacy and safety of DAA and PR combination treatments for CHC
genotype 1 patients who have relapsed or had a partial or null response to prior PR therapy? 4. What is the comparative cost-effectiveness of DAA and PR combination treatments for CHC
genotype 1 patients who have relapsed or had a partial or null response to prior PR therapy? 5. For questions 1 to 4, how do the comparative efficacy, safety, and cost-effectiveness vary across
population subgroups based on fibrosis level (Metavir score F0, F1, F2, F3, or F4), genotype subtype (1a or 1b), and Q80K polymorphism (present or absent)?
6. What is the comparative efficacy and safety of DAA and PR combination treatments for CHC genotype 1 patients who are co-infected with HIV?
7. What is the comparative efficacy and safety of DAA and PR combination treatments for CHC genotype 1 patients who have had a liver transplant?
8. What are the comparative efficacy, safety, and cost-effectiveness of DAA and PR combination treatments for CHC genotype 1 patients who have had an inadequate response (due to virologic failure or intolerance) to prior DAA plus PR therapy?
Methods We conducted a systematic review of the Health Canada–approved DAAs for CHC genotype 1 infection: boceprevir, telaprevir, simeprevir, and sofosbuvir in combination with PR. A comprehensive literature search was conducted of electronic databases, grey literature, and through stakeholder consultation to identify published, randomized or non-randomized, controlled or uncontrolled, prospective interventional studies that met the inclusion criteria: adults with genotype 1 CHC treated with boceprevir, telaprevir, simeprevir, or sofosbuvir in combination with PR. Two researchers independently screened and selected articles, extracted data, and assessed the quality, including the risk of bias of the selected studies. Outcomes of interest included SVR, relapse, treatment completion, quality of life, histological changes, liver failure, hepatocellular carcinoma, liver transplants, and mortality. Adverse events of interest included serious adverse events, discontinuation due to adverse events, rash, fatigue, anemia, pruritus, anorectal discomfort, neutropenia, depression, suicidal ideation, and influenza-like symptoms. Direct pairwise meta-analyses were conducted for comparisons of DAA regimens versus PR alone for all outcomes using Review Manager 5.2 software. Indirect comparisons between DAAs in combination with PR using Bayesian network meta-analyses (NMAs) (using WinBUGS 1.4.3 software) were performed in treatment-naive and treatment-experienced populations, where sufficient data were available to form stable networks for the outcomes of SVR and of adverse events anemia, rash, and depression. The choice of these outcomes for NMA was based on their importance to patients and impact on health care resources. Meta-regression, subgroup, and sensitivity analyses were conducted to explore potential sources of heterogeneity. For the HIV co-infected population, indirect treatment comparisons were conducted using the Bucher method.

Direct-Acting Antiviral Agents for Chronic Hepatitis C Genotype 1 xviii
An economic model was developed in the form of a cost-utility analysis. The primary outcome was the number of quality-adjusted life-years (QALYs), with treatments compared in terms of the incremental cost per QALY (incremental cost-utility ratio [ICUR]). Treatments included in the base-case analysis were DAAs currently approved in Canada used in combination with PR (boceprevir, telaprevir, and simeprevir) and PR standard therapy. Sofosbuvir in combination with PR was included in an exploratory analysis. Cohorts were defined by age, treatment status (naive versus experienced), and fibrosis stage (F0 to F4). The treatment-experienced cohort was further categorized by type of prior response with respect to PR therapy (patients with prior relapse or prior partial response). No analysis was performed on patients with prior null response because there were insufficient data to perform an NMA stratified by fibrosis stage in that population. Treatment effect estimates on SVR and relative risk of adverse events (anemia, depression, and rash) were obtained from the NMAs. Other inputs for the economic model were derived from published sources and validated by clinical experts. Drug costs were obtained from the Ontario Drug Benefit Formulary, the Saskatchewan Drug Formulary, or directly from manufacturers. Extensive sensitivity analyses were conducted to test the effect of changes in underlying parameter values (parameter uncertainty) and assumptions within the models (structural uncertainty). This report was peer-reviewed by methodologists, clinical experts, and health economists.
Summary of Findings A total of 26 trials in adults with genotype 1 CHC met the inclusion criteria for this systematic review. Of these, 15 studies were in patients who were treatment-naive,12-26 nine studies were in patients who were treatment-experienced,27-35 and two studies were in treatment-naive patients with HIV co-infection.36,37 Fifteen were double-blind randomized controlled trials (RCTs), seven were open-label or partially blinded RCTs, and four were uncontrolled studies. No published trials directly comparing the DAA regimens of interest were identified in the literature search. Key Clinical Findings Sustained Virologic Response Treatment-Naïve: In the treatment-naive population, 10 of the included RCTs compared PR plus one of boceprevir (two studies),12,19 telaprevir (four studies),13,14,23,26 simeprevir (three studies),15,17,18 or sofosbuvir (one study),16 with 48 weeks of PR therapy. Two RCTs compared telaprevir 750 mg every eight hours plus PR with telaprevir 1,125 mg every 12 hours plus PR.21,22 One telaprevir RCT compared different response-guided therapy (RGT) regimens.20 There was one uncontrolled, single-group clinical trial for sofosbuvir (NEUTRINO),24 and another RCT that compared different sofosbuvir regimens.25 In treatment-naive patients (N = 4,160), direct pairwise comparisons and indirect NMA results suggest that simeprevir, telaprevir, and boceprevir, at Health Canada–recommended dosages and in combination with PR RGT, are more effective in achieving SVR than 48 weeks of PR alone. Sofosbuvir plus PR RGT appeared to be more effective in achieving SVR than PR alone in both direct pairwise and indirect comparisons. Of note, this finding was based on the PROTON study, which employed a longer PR treatment than recommended by Health Canada. Based on the NMA, there were no statistically significant differences between any of the DAA plus PR regimens for SVR. We could not assess the comparative effectiveness of sofosbuvir at the Health Canada–recommended dosage regimen due to the lack of any RCT employing this regimen. Treatment-Experienced: Among treatment-experienced patients, six RCTs compared PR plus boceprevir (two studies),27,28 telaprevir (two studies),29,30 or simeprevir (two studies)31,32 with 48 weeks of
Direct-Acting Antiviral Agents for Chronic Hepatitis C Genotype 1 xix
PR therapy. In addition, there were two uncontrolled studies for telaprevir34,35 and one uncontrolled study for boceprevir.33 There were no trials of sofosbuvir plus PR in treatment-experienced patients therefore sofosbuvir could not be included in the NMA. Among all treatment-experienced patients (N = 2,020), simeprevir, boceprevir, and telaprevir were more effective than PR alone in achieving SVR, based on both direct pairwise and indirect comparisons. Based on NMAs, no statistically significant differences between DAA plus PR regimens were demonstrated. The results for the treatment-experienced population were examined separately based on response to prior PR therapy. Among patients with a prior relapse (N = 1,287), direct pairwise and indirect comparisons suggest that simeprevir, boceprevir, and telaprevir were all more effective than PR alone in achieving SVR. The indirect comparisons suggest there is no difference between the DAAs, except for boceprevir 32 weeks RGT, which was less effective in achieving SVR than telaprevir 12 weeks plus PR 48 weeks. Of note, this telaprevir dosing regimen was not consistent with the Health Canada–recommended regimen of RGT for patients with a prior relapse. Simeprevir, boceprevir, and telaprevir, at Health Canada–recommended doses, appear to be more effective than PR alone in achieving SVR in patients with prior partial response, based on direct pairwise and indirect comparisons (N = 370). No between-DAA indirect comparisons showed statistically significant differences. In patients with prior null response, limited data were available for boceprevir (one uncontrolled study); thus, it is not possible to determine its comparative efficacy. The direct pairwise and indirect comparisons suggest that telaprevir was more effective than PR alone among patients with prior null response (N = 184). The differences between simeprevir and PR alone were not statistically significant; however, this analysis was likely underpowered to detect differences, as data on simeprevir were limited to 33 patients. Fibrosis Severity Subgroup analyses for SVR were conducted with data stratified by fibrosis severity (less severe fibrosis: Metavir score F0 to F2; more severe fibrosis: Metavir score F3 to F4). In general, the results of these subgroup analyses were consistent with the base-case analyses, which showed DAA regimens were more effective than PR alone but showed no statistically significant differences between DAA regimens. Exceptions to these findings are noted below. In treatment-naive patients, the efficacy of sofosbuvir by fibrosis severity could not be assessed due to lack of data. Among treatment-naive patients with more severe fibrosis, simeprevir and telaprevir, but not boceprevir, were more effective than PR alone, based on both direct pairwise and indirect analyses. Neither dosage regimens for boceprevir, boceprevir 24 weeks RGT, nor boceprevir 44 weeks plus PR 48 weeks (the Health Canada dose for patients with cirrhosis) showed statistically significant differences in SVR outcomes relative to PR alone. However, the boceprevir data were based on a single RCT (SPRINT-2) and a limited number of patients with more severe fibrosis. Fewer data were available for patients with prior partial response and prior null response, limiting our ability to conduct some subgroup analyses. In the all treatment-experienced population, and among patients with prior relapse or partial response and more severe fibrosis, boceprevir 32 weeks RGT was not statistically significantly different from PR alone. Patients with prior relapse who received boceprevir 32 weeks RGT were statistically significantly less likely to achieve SVR than those who received

Direct-Acting Antiviral Agents for Chronic Hepatitis C Genotype 1 xx
boceprevir 44 weeks plus PR 48 weeks. Data for boceprevir 32 weeks RGT, however, were from a single RCT (RESPOND2) with a limited number of patients with more severe fibrosis. In patients with prior partial response, the efficacy of simeprevir by fibrosis severity could not be assessed due to lack of data. In the subgroup with more severe fibrosis (F3 to F4), only telaprevir and boceprevir 44 weeks plus PR 48 weeks were statistically significantly better than PR alone; however, significance was not consistently achieved in both direct pairwise and indirect analyses and for analyses based on risk difference and relative risk. The confidence and credible intervals were wide, reflecting the uncertainty in these results, which were based on data from two RCTs and 88 patients with severe fibrosis. In patients with prior null response, data were available for telaprevir only. Patients who received telaprevir were more likely to achieve SVR than those who received PR alone, regardless of fibrosis severity, based on direct comparisons. Genotype Subtype Subgroup analyses for SVR were conducted with data stratified by HCV genotype subtype 1a or 1b. In addition, patients who received simeprevir were stratified according to the presence of Q80K polymorphism at baseline. The findings of these subgroup analyses were consistent with the base-case analyses, except for simeprevir. These analyses suggested that for patients with genotype 1a and Q80K polymorphism, simeprevir was not statistically significantly different from PR alone (in treatment-naive and all treatment-experienced patients, and in patients with relapse), and was less effective than telaprevir (in treatment-naive patients and in patients with a relapse). None of the other DAA studies reported SVR rates for patients with Q80K polymorphism. In patients with prior partial or null response, data were available for telaprevir only. Based on direct evidence, patients with genotype 1a and 1b who received telaprevir were more likely to achieve SVR than those who received PR alone. Other Outcomes None of the included studies reported data on histological changes, liver failure, hepatocellular carcinoma, or need for liver transplant. Relapse: Treatment-naive and treatment-experienced patients who received boceprevir, telaprevir, or simeprevir were less likely to experience a virologic relapse than those who received PR alone. For sofosbuvir, no estimates were available for comparison with PR alone. Treatment Completion: Patients who received a DAA plus PR regimen were more likely to complete the course of therapy than those who received PR alone. A portion of the excess discontinuation in the PR groups was due to early virologic failure. Health-Related Quality of Life: Health-related quality of life was reported in only two studies, and these data were limited by missing data and potential bias due to incomplete blinding. Death: Death occurred rarely (less than 0.5% of patients) during the trials, which were 16 to 72 weeks in duration. The follow-up periods in the included trials were too short to assess the impact of SVR on mortality and liver disease progression.

Direct-Acting Antiviral Agents for Chronic Hepatitis C Genotype 1 xxi
Harms We identified three key adverse events — anemia, depression, and rash — based on their impact on patients’ quality of life and health care resource utilization, and these events were analyzed using NMA methods. The findings for treatment-naive and treatment-experienced patients were similar; comparative data for sofosbuvir were available only for treatment-naive patients. The risk of anemia was statistically significantly higher for patients who received boceprevir or telaprevir compared with PR alone, but not for simeprevir or sofosbuvir versus PR alone, based on both direct pairwise and indirect comparisons. The absolute risk of anemia was higher for telaprevir or boceprevir versus simeprevir, but the differences did not consistently reach statistical significance. No statistically significant differences were detected between boceprevir, telaprevir, simeprevir, or PR alone regarding the risk of depression for both treatment-naive and treatment-experienced patients, in both direct and indirect analyses. No comparative data were available for sofosbuvir. Among treatment-naive patients, telaprevir was associated with a statistically significant increased risk of rash versus PR alone based on direct pairwise comparisons; however, these differences were no longer statistically significant in the NMA. No other direct or indirect treatment comparisons showed statistically significant differences for rash in treatment-naive patients. Among treatment-experienced patients, there was a statistically significant increased risk of rash for patients who received boceprevir or telaprevir compared with PR alone, based on direct and indirect evidence. Some comparisons between the different dosage regimens of boceprevir or telaprevir versus simeprevir showed a lower risk of rash for those receiving simeprevir; however, the differences were not consistently statistically significant. No clear increased risk of serious adverse events, influenza-like symptoms, or neutropenia were observed among patients who received DAA plus PR, compared with PR dual therapy. Pruritus and anorectal discomfort were reported more frequently among patients who received telaprevir than PR alone. Suicidal ideation was infrequently reported, and no conclusions can be drawn for this adverse event. Populations of Special Interest In patients with CHC and HIV co-infection, we identified two RCTs comparing boceprevir or telaprevir with PR alone. Both boceprevir and telaprevir were more effective in achieving SVR than PR alone, based on direct comparisons. The indirect treatment comparison (Bucher method) found no statistically significant difference between the two DAA regimens for SVR, relapse, anemia, depression, and rash. No studies evaluating simeprevir or sofosbuvir in the HIV co-infected population met the inclusion criteria; thus, we were not able to assess their effectiveness in this patient population. No trials meeting the inclusion criteria were identified in patients with liver transplant, or in patients re-treated after an unsuccessful treatment course with a DAA. Key Economic Findings The pharmacoeconomic analysis suggests that for all populations assessed (treatment-naive patients and those with prior relapse or prior partial response), at least one of the new DAA-based therapies appears to be economically attractive compared with PR therapy alone. The drug that is the most cost-effective varies by population, but was generally consistent across fibrosis stages. This can be explained

Direct-Acting Antiviral Agents for Chronic Hepatitis C Genotype 1 xxii
by the fact that, although the NMA for SVR stratified by fibrosis stage showed that there were generally no statistically significant differences between DAA regimens, the magnitude of effect for each DAA regimen compared with PR alone, and the agent with the greatest effect versus PR alone, varied across populations. It is also important to note that simeprevir was not included in the analysis of patients with prior partial response because of insufficient reporting of SVR stratified by fibrosis stage in that subgroup in the clinical trials. For treating genotype 1 CHC treatment-naive patients, the pharmacoeconomic analysis suggests that simeprevir is likely to be the most cost-effective option, at $32,230 per QALY gained compared with PR therapy. The incremental cost per QALY for telaprevir versus PR was $36,661, and the incremental cost per QALY for boceprevir versus PR was $73,429. Treating patients with genotype 1 and prior relapse with telaprevir is likely to be the most cost-effective option, at $19,808 per QALY gained compared with PR therapy alone. However, the differences in ICURs between simeprevir and telaprevir as compared with PR therapy alone were modest: the incremental cost per QALY for simeprevir versus PR alone was $22,608. The incremental cost per QALY for boceprevir versus PR alone was $31,341. For patients with genotype 1 and prior partial response, treatment with boceprevir is likely to be the most cost-effective option, at $23,131 per QALY gained compared with PR therapy. The incremental cost per QALY for telaprevir versus PR alone was $37,803 (simeprevir not included in the analysis). In the analyses stratified by fibrosis stage, ICURs of DAA-based therapies compared with PR alone tended to be lower in patients with advanced fibrosis (F3 to F4) compared with patients with no or mild fibrosis (F0 to F2), meaning that therapy appears to be more cost-effective in patients with more advanced disease. In treatment-naive patients, simeprevir was the most cost-effective treatment option, compared with PR alone, across all fibrosis stages. In patients with prior relapse and no or mild fibrosis (F0 to F2), both simeprevir and telaprevir were economically attractive, while boceprevir was ruled out due to extended dominance by PR and simeprevir. In patients with F3 and F4, telaprevir was the most cost-effective treatment option compared with PR alone. In patients with partial response and no or mild fibrosis, both boceprevir and telaprevir were economically attractive (simeprevir was not included in the analysis). In patients with F3 and F4, boceprevir was the most cost-effective treatment option compared with PR alone, while telaprevir was dominated or extendedly dominated by PR alone and boceprevir. Apart from treatment efficacy and fibrosis stage, the main factors affecting the cost-effectiveness of DAA regimens versus PR alone were baseline age and cost of antiviral therapy. The sensitivity analyses also suggest that the cost-effectiveness results are highly sensitive to drug acquisition costs. The pharmacoeconomic analyses do not account for any confidential prices that have been negotiated for CHC therapies. Results of both the multiple one-way sensitivity analyses and probabilistic sensitivity analysis (PSA) suggest that simeprevir is likely to remain cost-effective for treatment-naive patients. Telaprevir is likely to remain cost-effective for treatment-experienced patients with prior relapse. However, due to the large credible intervals for the efficacy data derived from the NMA for patients with prior partial response, there is significant uncertainty associated with the ICURs for this population.

Direct-Acting Antiviral Agents for Chronic Hepatitis C Genotype 1 xxiii
Strengths and Limitations Strengths of the current review include its systematic approach to collecting evidence, performing data extraction, quality assessment, and analysis. Patient-relevant outcomes such as viral clearance and adverse events were included in the review. The available data were analyzed and presented using both direct pairwise meta-analysis and an NMA (for key outcomes). The sensitivity analyses conducted based on the type of pegylated interferon used and proportion of patients with cirrhosis demonstrated the robustness of the base-case analysis. The design and reporting of the included trials allowed us to examine treatment efficacy based on prior treatment history and liver disease severity. Other potential sources of heterogeneity, such as genotype subtype and Q80K polymorphism, were explored through subgroup analyses. A comprehensive economic evaluation was conducted using available cost data, published literature, and the results of the NMAs. Extensive sensitivity analyses were conducted to test the effect of changes in underlying parameter values. Our evaluation of the comparative efficacy, safety, and cost-effectiveness of DAA regimens was limited by important gaps in the available evidence, including the lack of RCTs that compared different DAA regimens head to head, examined sofosbuvir at the Health Canada–recommended dosage regimen or in treatment-experienced patients, and investigated DAAs in the populations of special interest. Furthermore, limited data were available for several DAAs at the Health Canada–recommended dose, or for specific subgroups, such as those with severe fibrosis, Q80K polymorphism, or prior partial or null response. As a result, some NMAs were either missing approved treatments, or were conducted using few studies and a limited number of patients, producing results with considerable uncertainty. Of particular concern is the limited comparative data for sofosbuvir. The short, 12-week sofosbuvir regimen is highly appealing to patients who must endure the adverse events and substantive treatment burden associated with existing therapies. Unfortunately, the lack of RCTs employing the Health Canada–recommended regimen for sofosbuvir severely limited our NMAs. Consequently, sofosbuvir was assessed in an exploratory economic analysis, and ICURs generated from these analyses, although informative, are uncertain. We were unable to assess the impact of DAA therapy on longer-term safety, liver disease progression, and mortality because of the short duration of the trials (up to 72 weeks). The review is limited by the quality of the included studies. All but one of the studies had one or more methodological domains with an unclear or high risk of bias. Fifteen studies had potential sources of selection bias, 21 had potential for bias related to incomplete blinding, and four trials were rated as high risk of bias related to selective outcome reporting.
Conclusions and Implications for Decision- or Policy-Making Results from the systematic review and indirect treatment comparison suggest that DAAs in combination with PR are more effective in achieving an SVR than 48 weeks of PR in adults with genotype 1 CHC infection. Specifically, in patients who are treatment-naive, simeprevir, boceprevir, and telaprevir at Health Canada–recommended dosages are more effective in achieving SVR than PR alone. Sofosbuvir at a non-approved dosage regimen (24- or 48-week RGT) is also more effective than PR alone. In all treatment-experienced patients, and including those with prior relapse or prior partial response, simeprevir, telaprevir, and boceprevir were more effective than PR alone in achieving an SVR.

Direct-Acting Antiviral Agents for Chronic Hepatitis C Genotype 1 xxiv
No conclusions can be drawn regarding the comparative efficacy of sofosbuvir plus PR at the Health Canada–approved dosage regimen for treatment-naive patients or at any dose for treatment-experienced patients, due to the lack of RCTs. No DAA was found to be more effective than another in achieving SVR among treatment-naive or the overall treatment-experienced population, based on indirect comparisons. Subgroup analyses suggest that boceprevir RGT may be less effective than telaprevir in patients with prior relapse, and may be less effective than boceprevir 48-week regimens in patients with prior relapse and severe fibrosis. The findings of the subgroup analyses, however, must be interpreted with caution, given the limited number of patients and the uncertainty in the findings. Among patients with genotype 1a and Q80K polymorphism, simeprevir showed no significant benefit compared with PR alone. In terms of safety, boceprevir, and telaprevir showed an increased risk of anemia relative to PR alone in treatment-naive and treatment-experienced patients, and an increased risk of rash versus PR alone in treatment-experienced patients. The indirect comparisons between DAA regimens did not consistently show an increased risk of anemia for boceprevir or telaprevir versus simeprevir. Similarly, in treatment-experienced patients, no consistent increased risk of rash was found between boceprevir or telaprevir and simeprevir. Comparative safety data for sofosbuvir were limited. Among the populations of special interest, no conclusions can be drawn regarding the efficacy and safety of DAAs in patients who have undergone a liver transplant or who were re-treated after failing to achieve an SVR with DAA therapy, due to the absence of clinical trials. Boceprevir and telaprevir were more effective than PR alone in patients with HIV co-infection, with no clear difference between DAA regimens based on indirect comparisons. Several evidence gaps were identified in the systematic review, particularly for sofosbuvir. The lack of RCTs employing the Health Canada–recommended regimen for sofosbuvir limited the feasibility of assessing its comparative efficacy and safety across populations. Consequently, sofosbuvir was not included in the primary economic analysis, and was assessed in exploratory analyses. ICURs generated from these analyses, although informative, are uncertain. Furthermore, all comparisons between DAAs were based on indirect evidence due to the absence of head-to-head RCTs. Data were also limited for some subgroups; thus, the findings from these analyses were incomplete (i.e., missing DAA regimens), or were uncertain, as reflected by the wide credible intervals. The pharmacoeconomic analysis suggests that, for all populations assessed (treatment-naive and those with prior relapse or prior partial response), at least one of the new DAA-based therapies appears to be economically attractive compared with PR alone. The drug that is the most cost-effective varies by population, but was generally consistent across fibrosis stages. For treating genotype 1 CHC treatment-naive patients, the pharmacoeconomic analysis suggests that simeprevir is likely to be the most cost-effective option, at $32,230 per QALY gained, compared with PR therapy. Results of the PSA suggest that simeprevir is likely to remain cost-effective for treatment-naive patients. In the analysis stratified by fibrosis stage, simeprevir therapy was the most cost-effective treatment option, compared with PR alone, across all fibrosis stages.

Direct-Acting Antiviral Agents for Chronic Hepatitis C Genotype 1 xxv
For treating patients with genotype 1 CHC and prior relapse, telaprevir is likely to be the most cost-effective option, at $19,808 per QALY gained, compared with PR therapy. Results of the PSA suggest that telaprevir is likely to remain cost-effective for treatment-experienced patients with prior relapse. However, the three DAA-based therapies included in the base-case analysis had ICURs below $35,000 per QALY compared with PR alone. In the analysis stratified by fibrosis stage, in patients with no or mild fibrosis (F0 to F2), both simeprevir and telaprevir were economically attractive, while boceprevir was ruled out due to extended dominance by PR alone and simeprevir. In patients with F3 and F4, telaprevir was the most cost-effective treatment option, compared with PR alone. Due to the large degree of uncertainty around the efficacy data derived from the NMA on prior partial response, there is significant uncertainty associated with the ICURs for this population. Patient group input clearly indicated that lengthy treatment durations, the need for frequent injections, and treatment-associated adverse events contribute to a significant treatment burden for many of the Health Canada–approved regimens for CHC. Patients specifically expressed a desire for short-duration, all-oral, interferon-free treatment regimens. There are a number of novel DAA regimens (many of which do not include interferon or ribavirin) that are currently under investigation and may be approved by Health Canada in the near future. Examples of all-oral, interferon-free regimens that have been submitted for regulatory approval in Europe, Canada, or the US include sofosbuvir plus simeprevir or ledipasvir; ABT-450 with ritonavir plus ombitasvir and dasabuvir; and daclatasvir plus asunaprevir. Given the rapid pace of development of treatments for CHC, it is apparent that updates to this Therapeutic Review will be necessary as new evidence emerges. At present, sofosbuvir is the only DAA with Health Canada approval for use in CHC genotypes 2, 3, and 4; however, research on other pangenotypic DAA regimens is in progress. Future therapeutic reviews will need a broader scope to include these new regimens and other CHC genotypes and will require innovative methods to conduct meta-analyses for disconnected evidence networks.

Direct-Acting Antiviral Agents for Chronic Hepatitis C Genotype 1 1
1. CONTEXT AND POLICY ISSUES
1.1 Objectives of the Report
Hepatitis C infection is caused by an enveloped, single-stranded linear ribonucleic acid (RNA) virus of the Flaviviridae family. It is estimated that 250,000 Canadians have chronic hepatitis C virus (HCV) infection; however, the exact number affected is not known, as 30% to 70% of patients are unaware that they have been infected and limited population level surveillance has been carried out in Canada to document prevalent cases.1,2 In 2009, 11,357 cases of HCV were reported through the Canadian Notifiable Disease Surveillance System, with most cases resulting from injection drug use.4 There are six major HCV genotypes, which show a similar natural history and no clear correlation between the infecting genotype and disease severity. Genotype, however, strongly correlates with treatment response. Genotype 1 infections are the least responsive to interferon-based treatment and account for most HCV infections in Canadians (55% to 65%).12,38,39 Of those infected, approximately 25% clear the infection spontaneously (ranging from 15% to 45%) and the remainder develop chronic infection.40-42 Of those with chronic infection, the available evidence suggests that 15% to 20% will develop end-stage liver disease over 20 years of infection.43 Given the long duration of infection in many individuals, it is possible that a higher proportion of patients will develop progressive liver disease during their lifetimes; however, long-term follow-up data beyond 20 to 30 years of infection are limited. A Metavir score may be used to grade the severity of liver disease in terms of liver fibrosis. Scores range from F0 to F4, where F0 means there is no visible liver scarring; F1 indicates portal fibrosis without septa; F2, portal fibrosis with rare septa; F3, numerous septa without cirrhosis (i.e., advanced fibrosis); and F4 means there is advanced liver scarring (i.e., cirrhosis). Fibrosis does not necessarily progress linearly over time, and a number of individual patient characteristics have been shown to affect progression rates.43 Male gender, ethanol use, HIV co-infection, obesity, and increasing age are associated with an increased risk of liver disease progression.43,44 While the incidence of HCV infection in the US and Canada appears to be stable or declining, it is expected that liver-related morbidity and mortality will increase over the coming decades, as those who are already infected age and develop progressive liver disease.1-5 Since the early 2000s, pegylated interferon (peginterferon) plus ribavirin (PR) has been the standard therapy to treat chronic hepatitis C (CHC) infection. The goal of treatment is viral eradication, termed a sustained virologic response (SVR), and is associated with improved long-term clinical outcomes.6,7 In patients with advanced fibrosis or cirrhosis at baseline, achievement of SVR has been shown to reduce the rate of liver failure, liver cancer, and liver-related and all-cause mortality.6 Approximately half of patients with genotype 1 CHC could expect to achieve response SVR with PR therapy. Greater understanding of the hepatitis C viral replication cycle has resulted in the development of direct-acting antiviral (DAA) agents that target several types of non-structural proteins essential to viral replication. The market entry of protease inhibitors (boceprevir and telaprevir) in 2011 changed the landscape of CHC therapy. For patients with an inadequate response to PR therapy, re-treatment with a protease inhibitor added to PR can triple the likelihood of treatment success.27,29 Recently, two new DAA agents have been approved by Health Canada (simeprevir and sofosbuvir) (Table 1).

Direct-Acting Antiviral Agents for Chronic Hepatitis C Genotype 1 2
TABLE 1: HEALTH CANADA–APPROVED PHARMACEUTICAL THERAPIES FOR THE TREATMENT OF CHRONIC
HEPATITIS C
Product, Manufacturer Health Canada Indication Mechanism of Action
Pegylated interferon-containing products
Peginterferon alfa-2a (Pegasys), Peginterferon alfa-2a plus ribavirin (Pegasys RBV)
For the treatment of CHC in adult patients without cirrhosis or with compensated cirrhosis, including HCV/HIV co-infection patients with stable HIV disease with or without antiretroviral therapy
Interferons bind to specific receptors on the cell surface, initiating a complex intracellular signalling pathway and rapid activation of gene transcription. Interferon-stimulated genes modulate many biological effects, including the inhibition of viral replication in infected cells, inhibition of cell proliferation, and immunomodulation. The mechanism of action of ribavirin is not known
Peginterferon alfa-2b plus ribavirin (PEGETRON)
Treatment of adult patients (18 years or older) with CHC who have compensated liver disease and are positive for HCV RNA, including patients who have not received previous treatment or who failed prior treatment with interferon alfa (pegylated or non-pegylated) and ribavirin combination therapy
Protease inhibitors
Boceprevir (VICTRELIS) (VICTRELIS TRIPLE)
Treatment of CHC genotype 1 infection, in combination with peginterferon alfa and ribavirin, in adult patients (18 years or older) with compensated liver disease, including cirrhosis, who are previously untreated or who have failed previous therapy
DAA against HCV that is a specific inhibitor of the HCV NS3/4A protease, covalently, yet reversibly binds to the NS3/4A protease active site serine (Ser139) through an α-ketoamide functional group to inhibit viral replication in HCV-infected host cells
Telaprevir (INCIVEK)a Treatment of CHC genotype 1 infection, in combination with peginterferon alfa and ribavirin, in adult patients with compensated liver disease, including cirrhosis, who are treatment-naive or who have previously been treated with interferon-based treatment, including those with prior null response, partial response, and relapse
DAA against HCV that is a specific inhibitor of the HCV NS3/4A protease, which is essential for viral replication
Simeprevir (GALEXOS) Treatment of CHC genotype 1 infection, in combination with peginterferon alfa and ribavirin in adults with compensated liver disease, including cirrhosis, who are treatment-naive or who have failed previous interferon therapy (pegylated or non-pegylated) with ribavirin
DAA against HCV that is a specific inhibitor of the HCV NS3/4A protease through a non-covalent, induced-fit binding into the active site of the NS3 protease
Nucleotide polymerase inhibitor
Sofosbuvir (Sovaldi) Treatment of CHC infection in adult patients with compensated liver disease, including cirrhosis, as follows:
for the treatment of genotype 1 and genotype 4 CHC infection in combination with pegylated interferon and ribavirin
for the treatment of genotype 2 and genotype 3 CHC infection in combination with ribavirin
DAA against HCV that is mediated by a membrane-associated multiprotein replication complex. The HCV polymerase (NS5B protein) is an RNA-dependent RNA polymerase, the essential initiating and catalytic subunit of this replication complex and critical for the viral replication cycle
CHC = chronic hepatitis C; DAA = direct-acting antiviral; HCV = hepatitis C virus; NS = non-structural; RNA = ribonucleic acid. aVertex Pharmaceuticals Incorporated will be discontinuing the sale and distribution of INCIVEK® (telaprevir) in the United States by October 2014.45

Direct-Acting Antiviral Agents for Chronic Hepatitis C Genotype 1 3
Three of the DAA agents included in this review belong to the protease inhibitor class of agents: boceprevir, telaprevir, and simeprevir. The fourth agent, sofosbuvir, is the first of the nucleotide polymerase inhibitors to reach the market. The Health Canada–approved dosing regimens for patients with genotype 1 CHC vary depending on the patients’ previous exposure to PR therapy and the presence of cirrhosis (Table 2). The total treatment duration for regimens employing any of the protease inhibitors depends upon prior treatment history and response to triple therapy. Patients treated with boceprevir start with a four-week lead-in therapy with PR, then boceprevir is added for 24 to 44 weeks, and additional PR dual therapy may follow, based on response. Telaprevir and simeprevir are administered with PR for the first 12 weeks, followed by PR for an additional 12 or 36 weeks based on response. Response-guided therapy (RGT) for protease inhibitors is recommended for patients who are treatment-naive or who relapsed after PR therapy. With RGT, patients who show a rapid clearance of HCV during the first few weeks of therapy are eligible for a shortened 24- or 28-week course. For patients receiving boceprevir, telaprevir, and simeprevir who are less likely to respond to treatment, such as those with cirrhosis or null response to prior PR treatment, the total treatment course is 48 weeks, regardless of early viral response. For patients with prior partial response to PR therapy, RGT is the recommended regimen for boceprevir, whereas a 48-week standard-duration therapy course is suggested for simeprevir and telaprevir. Sofosbuvir (a nucleotide polymerase inhibitor) offers the shortest total treatment course of the Health Canada–approved DAAs for patients with genotype 1 CHC who are treatment-naive: sofosbuvir in combination with PR for total treatment duration of 12 weeks. The dose of peginterferon and ribavirin used in combination with the DAAs is as follows: peginterferon alfa-2a 180 mcg subcutaneously once per week plus ribavirin 1,000 mg orally (body mass < 75 kg) or 1,200 mg (body mass ≥ 75 kg), divided into two doses per day; peginterferon alfa-2b 1.5 mcg/kg subcutaneously once per week plus weight-based ribavirin (800 mg to 1,400 mg orally per day). Simeprevir and sofosbuvir are both administered orally once daily, and boceprevir is administered orally three times daily. When first approved in Canada, telaprevir orally three times daily was the recommended dose, but the dose has recently been changed to a twice-daily oral regimen. Patients have expressed the need for new treatments with higher cure rates, better side effect profiles, and reduced treatment burden. There is also a need to identify optimal treatment strategies for patients who have had an inadequate response to first-line treatments. In addition, treatments must be accessible and affordable for patients (Appendix 1). The objective of this Therapeutic Review is to evaluate the comparable benefits, harms, and cost-effectiveness of the DAAs and regimens approved for use in Canada for genotype 1 CHC. Nomenclature used throughout this report to denote the various regimens is described in Table 3.

Direct-Acting Antiviral Agents for Chronic Hepatitis C Genotype 1 4
TABLE 2: HEALTH CANADA–APPROVED DIRECT-ACTING ANTIVIRAL DOSING REGIMENS FOR GENOTYPE 1 CHRONIC HEPATITIS C
Drug, Subgroup
Boceprevir46
Telaprevir47,48
Simeprevir49
Sofosbuvir50
Dose (oral)
DAA 800 mg three times daily 750 mg three times daily, or 1,125 mg twice daily
b
150 mg daily 400 mg daily
Duration
Treatment-naive
RGT: PR wks 1 to 4, then (a) BOC + PR wks 5 to 28 if HCV RNA undetected at wk 8, 12, and 24; or (b) BOC + PR wks 5 to 28, then PR wks 29 to 48 if HCV RNA detectable at wk 8, < 100 IU/mL wk 12 and undetectable at wk 24
RGT: TEL + PR wks 1 to 12, then (a) PR wks 13 to 24 if HCV RNA undetected at wk 4 and 12; or (b) PR wks 13 to 48 if HCV RNA detectable (≤ 1,000 IU/mL) at wk 4 or 12
RGT: SIM + PR wks 1 to 12, then (a) PR wks 13 to 24 if HCV RNA undetectable at wk 4; or (b) PR wks 13 to 48 if HCV RNA < 25 IU/mL detectable at wk 4
SDT: SOF + PR wks 1 to 12
Prior relapse RGT: PR wks 1 to 4, then (a) BOC + PR wks 5 to 36 if HCV RNA undetectable at wk 8, 12, and 24; or (b) BOC + PR wks 5 to 36, then PR wks 37 to 48 if HCV RNA detectable at wk 8, < 100 IU/mL wk 12 and undetectable at wk 24
RGT: same as naive RGT: same as naive NA
Prior partial response
RGT: same as prior relapse SDT: TEL + PR wks 1 to 12, then PR wks 13 to 48
SDT: SIM + PR wks 1 to 12, then PR wks 13 to 48
NA
Prior null response
SDT: PR wks 1 to 4, then BOC + PR wks 5 to 48
SDT: TEL + PR wks 1 to 12, then PR wks 13 to 48
SDT: SIM + PR wks 1 to 12, then PR wks 13 to 48
NA
Cirrhosis SDT: wks PR 1 to 4, then BOC + PR wks 5 to 48
a
SDT: TEL + PR wks 1 to 12, then PR wks 13 to 48
Same duration as patients without cirrhosis
NR
Stopping rules Stop all drugs if HCV RNA ≥ 100 IU/mL at wk 12 or confirmed detectable at wk 24
Stop all drugs if HCV RNA ≥ 1,000 IU/mL at wk 4 or 12, or confirmed detectable at wk 24
Stop all drugs if HCV RNA ≥ 25 IU/mL at wk 4. Stop PR therapy if HCV RNA detectable at wk 12 or 24
None
BOC = boceprevir; DAA = direct-acting antiviral; HCV RNA = hepatitis C virus ribonucleic acid; NA = not applicable; NR = not reported; PR = peginterferon + ribavirin; RGT = response-guided therapy; SDT = standard (or fixed) duration therapy; SIM = simeprevir; SOF = sofosbuvir; TEL = telaprevir; wk = week. aAlso applies to treatment-naive patients without cirrhosis but with a poor interferon response (< 1 log10 decline in HCV RNA at week 4). bCurrent Health Canada–recommended dose is 1,125 mg every 12 hours.

Direct-Acting Antiviral Agents for Chronic Hepatitis C Genotype 1 5
TABLE 3: TREATMENT REGIMEN NOMENCLATURE
Abbreviation Description
B24 PR28/48 RGT Boceprevir for 24 wks and PR used as RGT for a total of 28 or 48 wks (initial 4-wk lead-in therapy with PR)
B24 PR28 Boceprevir for 24 wks and PR used for a total of 28 wks (initial 4-wk lead-in therapy with PR)
B32 PR36/48 Boceprevir for 32 wks and PR used as RGT for a total of 36 or 48 wks (initial 4-wk lead-in therapy with PR)
B44 PR48 Boceprevir for 44 wks and PR used for a total of 48 wks (initial 4-wk lead-in therapy with PR)
Si12 PR24/48 RGT Simeprevir for 12 wks and PR used as RGT for a total of 24 or 48 wks
Si12 PR48 Simeprevir for 12 wks and PR for a total of 48 wks
So12 PR24/48 RGT Sofosbuvir for 12 wks and PR used as RGT for a total of 24 or 48 wks
So12 PR12 Sofosbuvir and PR for 12 wks
T12 PR24/48 RGT Telaprevir for 12 wks and PR used as RGT for a total of 24 or 48 wks
T12 PR24 Telaprevir for 12 wks and PR used for a total of 24 wks
T12 PR48 Telaprevir for 12 wks and PR used for a total of 48 wks
T12 PR48 LI Telaprevir for 12 wks and PR used for a total of 48 wks (initial 4-wk lead-in therapy with PR)
q8 or q12 Refers to the dosing frequency for telaprevir, as there are two regimens that have been evaluated: telaprevir 750 mg every 8 h, or telaprevir 1,125 mg every 12 h
PR48 Pegylated interferon (peginterferon) plus ribavirin for 48 wks
PR 2a/2b Type of peginterferon used in combination with ribavirin: peginterferon alfa-2a or peginterferon alfa-2b
RGT Treatment regimens that apply virologic response criteria to determine the length of therapy; patients who meet these extended rapid virologic response criteria (e.g., undetectable HCV RNA at wks 4 to 12) qualify for a shorter course of treatment
eRVR Patients met extended rapid viral response criteria, showing favourable treatment response
no eRVR Patients did not meet extended rapid viral response criteria, indicating less favourable early treatment response
* An asterix placed prior to a DAA regimen abbreviation (e.g., *T12 PR24) was used to denote dosing regimens that were not consistent with Health Canada recommendations for a given patient population
PR = peginterferon + ribavirin; h = hour; HCV RNA = hepatitis C virus ribonucleic acid; RGT = response-guided therapy; wk = week.

Direct-Acting Antiviral Agents for Chronic Hepatitis C Genotype 1 6
2. RESEARCH QUESTIONS
1. What is the comparative efficacy and safety of DAA and PR combination treatments for CHC genotype 1 patients who are treatment-naive?
2. What is the comparative cost-effectiveness of DAA and PR combination treatments for CHC genotype 1 patients who are treatment-naive?
3. What is the comparative efficacy and safety of DAA and PR combination treatments for CHC genotype 1 patients who have relapsed or had a partial or null response to prior PR therapy?
4. What is the comparative cost-effectiveness of DAA and PR combination treatments for CHC genotype 1 patients who have relapsed or had a partial or null response to prior PR therapy?
5. For questions 1 to 4, how do the comparative efficacy, safety, and cost-effectiveness vary across population subgroups based on fibrosis level (Metavir score F0, F1, F2, F3, or F4), genotype subtype (1a or 1b), and Q80K polymorphism (present or absent)?
6. What is the comparative efficacy and safety of DAA and PR combination treatments for CHC genotype 1 patients who are co-infected with HIV?
7. What is the comparative efficacy and safety of DAA and PR combination treatments for CHC genotype 1 patients who have had a liver transplant?
8. What are the comparative efficacy, safety, and cost-effectiveness of DAA and PR combination treatments for CHC genotype 1 patients who have had an inadequate response (due to virologic failure or intolerance) to prior DAA plus PR therapy?
3. METHODS
3.1 Systematic Review
3.1.1 Literature Search Strategy The literature search was performed by an information specialist using a peer-reviewed search strategy (Appendix 2). Published literature was identified by searching the following bibliographic databases: MEDLINE (1946–) with In-Process records and daily updates through Ovid; Embase (1974–) through Ovid; the Cochrane Central Register of Controlled Trials through Ovid; and PubMed. The search strategy consisted of both controlled vocabulary, such as the National Library of Medicine’s MeSH (Medical Subject Headings), and keywords. The main search concepts were telaprevir, boceprevir, sofosbuvir, simeprevir, Incivek, Incivo, Victrelis, Sovaldi, Galexos, and Olysio.
No filters were applied to limit the retrieval by study type. Where possible, retrieval was limited to the human population. Retrieval was not limited by publication date but was restricted to English-language results. Conference abstracts were excluded. Regular alerts were established to update the search until recommendations by the Canadian Drug Expert Committee (CDEC), based on this review, were finalized. Regular search updates were performed on databases that do not provide alert services.
Grey literature (literature that is not commercially published) was identified by searching relevant websites from the following sections of the Grey Matters: A Practical Search Tool for Evidence-Based Medicine checklist (http://www.cadth.ca/resources/grey-matters): health technology assessment agencies, health economics, clinical practice guidelines, drug and device regulatory approvals, advisories and warnings, drug class reviews, and databases (free). Google and other Internet search engines were

Direct-Acting Antiviral Agents for Chronic Hepatitis C Genotype 1 7
used to search for additional web-based materials. These searches were supplemented by reviewing the bibliographies of key papers, contacting appropriate experts, and by eliciting stakeholder feedback. 3.1.2 Selection Criteria and Methods Studies were selected for inclusion in the systematic review based on the selection criteria presented in Table 4. In keeping with Canadian clinical practice, this review focused on Health Canada–recommended treatment regimens. Specifically, boceprevir 800 mg three times daily, telaprevir 750 mg three times daily or 1,125 mg twice daily, simeprevir 150 mg daily or sofosbuvir 400 mg daily, orally, combined with peginterferon alfa-2a or -2b plus ribavirin were included. Additional details regarding the dosing inclusion criteria are listed in Appendix 3. Two clinical reviewers independently selected studies for inclusion in the review based on titles and abstracts, according to the predetermined protocol. Full-text articles of all citations considered potentially relevant by at least one reviewer were acquired. Reviewers independently made the final selection of studies to be included in the review, and differences were resolved through discussion. The study selection process is presented in a Preferred Reporting Items for Systematic Reviews and Meta-Analyses (PRISMA) flowchart (Appendix 5).
TABLE 4: INCLUSION AND EXCLUSION CRITERIA FOR PRIMARY STUDIES
Inclusion Criteria
Population Patients with CHC genotype 1 infection (adult populations)
Interventions Telaprevir in combination with PR
Boceprevir in combination with PR
Simeprevir in combination with PR
Sofosbuvir in combination with PR
Comparators Comparisons between dual therapy (PR) and triple therapy (PR + DAA)
Comparisons between DAA triple-therapy options
Outcomes SVR, treatment completion, histological changes, relapse, quality of life, liver failure, hepatocellular carcinoma, liver transplants, and mortality (all-cause and liver-related) Serious adverse events, adverse events, withdrawals due to adverse events, rash, fatigue, anemia, pruritus, anorectal discomfort, neutropenia, depression, suicidal ideation, and influenza-like symptoms
Study design Published, randomized or non-randomized, controlled or uncontrolled, prospective interventional studies
Exclusion Criteria
Studies were excluded if they were in languages other than English; did not meet the aforementioned selection criteria; provided results of a qualitative study; or were follow-up, extension, or observational studies. Duplicate publications, narrative reviews, and editorials were also excluded. Abstracts were excluded unless they presented supplementary data for an RCT that had another full-text publication that might be used to assess the risk of bias.
CHC = chronic hepatitis C; DAA = direct-acting antiviral; PR = peginterferon + ribavirin; RCT = randomized controlled trial; SVR = sustained virologic response. 3.1.3 Data Extraction Strategy and Critical Appraisal of Included Studies One reviewer performed the data extraction for each article, using a data extraction form developed a priori and covering the following items:
baseline characteristics, demographics, and treatment history of trial participants

Direct-Acting Antiviral Agents for Chronic Hepatitis C Genotype 1 8
interventions evaluated, including dose, duration, and relevant concomitant medication
efficacy and safety results for specified outcomes
type of analysis (intention-to-treat or per-protocol)
withdrawals.
All extracted data were checked for accuracy by a second reviewer, and any disagreements were resolved through discussion until consensus was reached.
Quality assessment of the included studies was performed independently by two reviewers using the Cochrane Risk of Bias tool.51 3.1.4 Data Analysis Methods Heterogeneity across trials in terms of patient characteristics, trial methodologies, and treatment protocols was described and assessed narratively. Comparative data from RCTs, where available, were included in indirect treatment comparisons and pairwise meta-analyses. Data not suitable for meta-analysis or indirect treatment comparisons were summarized narratively. No pooling was done for uncontrolled studies. Separate analyses were conducted for treatment-naive and treatment-experienced patients. In addition, patients with liver transplant, HIV co-infection, and patients with an inadequate response to DAA therapy were analyzed as separate populations due to the complexity of care for these specialized groups and anticipated differences in treatment efficacy and safety. a) Direct Pairwise Comparison Data that were homogenous in terms of study and patient characteristics were pooled using standard meta-analysis methods with Review Manager 5.2 software.52 Random effects models were used if I2 values exceeded 50% or if statistical heterogeneity was present. b) Bayesian Network Meta-analysis As there were no head-to-head RCTs comparing the DAA regimens, we undertook indirect treatment comparisons to address the research questions on the comparative efficacy and safety of DAA treatments for CHC. Bayesian NMAs were conducted for SVR and specific adverse events (i.e., rash, anemia, and depression) in treatment-naive and treatment-experienced patients. The choice of these outcomes for NMA was based on their importance to patients and the sufficiency of the data available to derive robust and consistent network models. Treatment-experienced patients were further analyzed based on their response to prior PR treatment; specifically, whether they experienced relapse, partial response, or null response. NMAs were conducted for a number of subgroups within the main treatment-naive and treatment-experienced populations. The base case for the analysis was all DAA plus PR dosage regimens included in the systematic review, compared with 48 weeks of PR therapy, and assuming peginterferon alfa-2a and -2b provided comparable efficacy. WinBUGS software version 1.4.3 (MRC Biostatistics Unit, Cambridge, UK53-55) was used to conduct Bayesian NMA using a binomial likelihood model, which allows for the use of multi-group trials. Pegylated interferon alfa-2a or -2b plus ribavirin administered for 48 weeks (PR48) was chosen as the

Direct-Acting Antiviral Agents for Chronic Hepatitis C Genotype 1 9
reference group in the model. NMAs were conducted using both fixed effects and random effects models, and these models were compared for fit using deviance information criterion (DIC) and residual deviance. For all analyses, the DICs for the random effects model and fixed effect model were within three to five points of each other. The residual deviance for both models was also close to each other and was approximately equal to the number of unconstrained data points. Hence, both random effects model and fixed effect models showed good fit. We selected to report the random effects model as the primary results, as this model takes into consideration between-study variation, whereas fixed effect models assume all the trials are estimating the same treatment effect.55,56 Point estimates and 95% credible intervals for odds ratios (OR) were derived using Markov chain Monte Carlo methods. Relative risk and absolute risk for an outcome of interest were estimated based on the ORs and the mean proportion of patients who experience the outcome in the reference group among included studies. The standard conversion of OR to relative risk is used (i.e., relative risk = OR/[1+Ic (OR-1)]) where Ic is the incidence of the event in the control group. Ideally, Ic is the “real” population event rate. Often this event rate is difficult to determine and, indeed, our clinical experts were directly asked this question and could not provide this estimate. The next best choice is to base this estimate on the “control event rate” that is determined as part of the estimation process of the NMA. The estimate and its credible intervals were discussed with the clinical experts in order to assess their face validity. Vague priors, N(0, 1002), were assigned for basic parameters of the treatment effects in the model.55 For the random effects model, informative priors for the variance parameter were considered.57 Informative priors were deemed appropriate given that the networks had an insufficient number of studies to produce robust estimates of between-study variance and, thus, estimates would be dominated by a null prior. To ensure convergence was reached, trace plots and the Brooks–Gelman–Rubin statistic were assessed.53 Three chains were fitted in WinBUGS for each analysis, with at least 20,000 iterations, and a burn-in of at least 20,000 iterations.53,58 A sample of the WinBUGS code is provided in Appendix 4. Heterogeneity
To investigate potential sources of clinical heterogeneity, subgroup analyses and meta-regression analyses59,60 were considered, although limited data precluded many analyses considered (e.g., stratifying network by Metavir fibrosis scores of F4). To determine whether a subgroup effect interacts with the treatment effect, two approaches were considered. First, a separate analysis was considered for each level of the subgroup. Although easy to perform, the disadvantage of this approach, in a random effects framework, is that each analysis depends on different estimates of between-trial variation. Another disadvantage is that this approach does not provide a test of interaction to test the null hypothesis that there are no differences in the treatment effect for each subgroup. The second approach to investigating subgroup effects was to perform a meta-regression analysis that contains a common between-trial heterogeneity estimate and an interaction term beta with the treatment effect. Heterogeneity was examined for the proportion with cirrhosis (Metavir fibrosis score F4), based primarily on the opinions of our clinical experts and on the availability of data. In this analysis we adjusted by the overall percentage of patients with cirrhosis from each study. We used the random effects model with a shared between-trial heterogeneity parameter and an interaction term between the treatments and the overall percentage of patients with cirrhosis. A direct test of interaction between treatments and cirrhosis was conducted by determining whether the credible interval of beta for the interaction term includes 0. In doing so, we evaluated whether treatment effects were significantly affected by different proportions of patients with cirrhosis. The model with and without the covariate of

Direct-Acting Antiviral Agents for Chronic Hepatitis C Genotype 1 10
cirrhosis was also compared by the differences of DIC statistics. The posterior medians of standard deviation between trials were also compared for models with and without covariate cirrhosis, to assess whether the heterogeneity was considerably reduced in the model with the covariate. The interactions between the treatments and the percentage of patients with cirrhosis were tested to evaluate whether the effects of treatments were equal for different proportions of patients with cirrhosis. Subgroup analyses were conducted to examine treatment efficacy (SVR) based on fibrosis severity, HCV genotype subtype (1a or 1b), and HCV Q80K polymorphism. The Q80K substitution on the HCV non-structural protein 3 (NS3) has displayed low-level resistance to the NS3/4 protease inhibitor simeprevir.9,49 Given the high prevalence of this amino acid substitution among North American patients with genotype 1a CHC (up to 50%), it was examined as a potential effect modifier.10,49 Secondary analyses were conducted with treatment stratified by peginterferon alfa-2a or -2b, which allowed treatment effects to vary according to the type of peginterferon used in the intervention and control groups. Further analyses were conducted restricted to Health Canada–approved dosage regimens, which were most relevant to the policy questions. In all analyses, DAA regimens with different total treatment durations (i.e., RGT, standard 24-, or 48-week durations) were analyzed separately. We pooled data from telaprevir dosing regimens that included a four-week PR lead-in therapy prior to 12 weeks of triple therapy, with the standard telaprevir 12 weeks plus PR 48-week regimen in the REALIZE trial.29 We considered undetectable HCV RNA levels 12 weeks after the end of therapy (SVR12) an acceptable surrogate for undetectable HCV RNA levels 24 weeks after the end of treatment (SVR24).61 If both SVR12 and SVR24 were reported, SVR24 was used in the analyses. There were discrepancies in the reporting of adverse events among the treatment-naive RCTs. In some studies, the adverse events were reported for the full treatment period, and, for other studies, events were reported for only part of this period (first 12 weeks). We explored the impact of these reporting differences through regression analysis and determined that there was no significant interaction between duration and adverse events. Thus, the adverse event NMA analyses included data from all studies, regardless of the reporting period. Consistency
NMA relies on the fundamental assumption of consistency of treatments effects across the different direct comparisons in the network. To ensure that the consistency assumption is valid, it is important to assess whether there are systematic differences in study and patient characteristics that are modifiers of the relative treatment effects across the different direct comparisons. Violations can be partly identified by comparing the study (including study-level bias) and patient characteristics that are potential effect modifiers across the different types of direct comparisons in the network. However, it is important to acknowledge that there is always the risk of imbalances in unknown or unreported effect modifiers. Accordingly, formal statistical methods have been developed to assess inconsistency. When an evidence network contains a closed loop of interventions, there are both direct and indirect evidence for the treatment comparisons of the interventions that are part of that loop. If there is obvious inconsistency, violations will show as inconsistency between direct and indirect estimates for a particular treatment contrast. Inconsistency was formally assessed by comparing the deviance and DIC statistics of the consistency and inconsistency models.59,62 To help identify the loops in which inconsistency was present, the posterior mean deviance of the individual data points in the inconsistency model was plotted against their

Direct-Acting Antiviral Agents for Chronic Hepatitis C Genotype 1 11
posterior mean deviance in the consistency model.62 Using the plots, loops in which inconsistency is present could be identified. The inconsistency model can be considered for evidence networks including both two-group and multi-group studies. When multi-group trials are included in the evidence, the inconsistency model can have different parameterizations, depending on which of the multiple contrasts defined by a multi-group trial are chosen. However, because inconsistency degrees of freedom corresponds to the number of independent loops, if a loop is formed from a multi-group trial alone, it is not counted as an independent loop and must therefore be discounted from the total inconsistency degrees of freedom. Therefore, a limitation of the consistency evaluation is that some of closed loops were from multi-group trials. Model Diagnostics
Model diagnostics, including trace plots and the Brooks–Gelman–Rubin statistic, were used to assess model convergence.53,55 Convergence occurs when the inferences do not depend on the initial starting values and the Gibbs sampler has reached a stationary distribution. In order to properly assess convergence, at least three chains were run, and the starting values for each chain were substantially different from the starting values for the other chains. The Brooks–Gelman–Rubin statistic was computed through Markov chain Monte Carlos simulations using multiple chains. In calculating this statistic, the variances between chains are compared with variances within chains. If there is a large discrepancy between these two variances, then this is indication that there is non-convergence. The Gelman–Rubin convergence statistic R compares the ratio of the pooled chain variance to the within variance. Once convergence is reached, R = 1. Trace plots and Brooks–Gelman–Rubin statistic always indicated convergence of the model. c) Bucher Indirect Treatment Comparison An indirect treatment comparison using the Bucher method was completed to compare DAA regimens in patients with CHC and HIV co-infection. Considering the limited data available in this population, it was decided that the less complex Bucher indirect treatment comparison was an appropriate analytical method. The indirect treatment comparison was conducted as per the CADTH guidelines using CADTH’s indirect treatment calculator software.63,64
3.2 Pharmacoeconomic Analysis
3.2.1 Type of Economic Evaluation The analysis was in the form of a cost-utility analysis. The primary outcome was the number of quality-adjusted life-years (QALYs), with treatments compared by incremental cost per QALY (incremental cost-utility ratio [ICUR]). 3.2.2 Target Population In the pharmacoeconomic analysis, the target population was Canadians infected with genotype 1 CHC. According to Statistics Canada, the prevalence of CHC is higher for age group 50 to 79.65 Thus, for the baseline analysis, 50-year-old individuals infected with genotype 1 CHC were considered. A broader age range (40 to 60 years) was considered in the sensitivity analyses. Patients’ weight was assumed to be 80 kg, which was consistent with previous health technology assessment reviews and Canadian studies.66-70 Due to limited availability of published data, the analysis avoided placing implicit proportion assumptions on the treatment population where possible. In the analysis, cohorts were defined by age,

Direct-Acting Antiviral Agents for Chronic Hepatitis C Genotype 1 12
treatment status (naive versus experienced), and fibrosis stages (F0 to F4). The treatment-experienced cohort was further categorized by type of prior response with respect to PR therapy (prior relapse and partial response). No analysis was performed in patients with a null response, because there were insufficient data to perform an NMA stratified by fibrosis stage in that population. For some analyses, distribution of fibrosis of the target population was needed. In the absence of estimates in the general CHC population, the distribution of fibrosis stages among patients with CHC was estimated using Canadian data from clinical practice settings (Table 5).69,70 Sensitivity analyses in which the proportions were varied by ± 25% were applied to determine whether these distribution estimates had a significant impact on the results.
TABLE 5: FIBROSIS DISTRIBUTION
Treatment Status and Fibrosis Stage
Base Estimate
Lower Limit (–25%)
Upper Limit
(+25%) Probability Distribution
Treatment-naive69
F0 0.08 0.06 0.1 Beta (58.8,676.2)
F1 0.20 0.15 0.25 Beta (51,204)
F2 0.35 0.2625 0.4375 Beta (41.25,76.61)
F3 0.21 0.1575 0.2625 Beta (50.35,189.41)
F4 0.17 0.1275 0.2125 Beta (52.95,258.52)
Treatment-experienced70
F0 0.04a
0.03 0.05 Beta (61.4,1473.6)
F1 0.13a 0.0975 0.1625 Beta (55.55,371.76)
F2 0.38a 0.285 0.475 Beta (39.3,64.12)
F3 0.23 0.1725 0.2875 Beta (49.05,164.21)
F4 0.26 0.195 0.325 Beta (47.1,134.05)
F0 = no fibrosis; F1 = portal fibrosis without septa; F2 = portal fibrosis with rare septa; F3 = numerous septa without cirrhosis; F4 = cirrhosis. aThe original publication provided only an aggregate estimate for F0 to F2 (55%). Individual rates were extrapolated and validated by clinical experts.
3.2.3 Treatments All treatments that are approved and currently available in Canada for the treatment of patients with genotype 1 CHC were included in the primary analysis, except sofosbuvir (Table 6).
TABLE 6: AVAILABLE TREATMENTS INCLUDED IN PRIMARY ANALYSIS
Treatment Comparators
Description
PR2a Peginterferon alfa-2a plus ribavirin 180 mcg/200 mg (Pegasys RBV)
PR2b Peginterferon alfa-2b plus ribavirin 120 mcg/200 mg (PEGETRON)
BOC Boceprevir 200 mg (VICTRELIS)
TEL Telaprevir 375 mg (INCIVEK)
SIM Simeprevir 150 mg (GALEXOS)
PR = peginterferon plus ribavirin; BOC = boceprevir; TEL = telaprevir; SIM = simeprevir.
Because the pivotal trial supporting the Health Canada dosing recommendation for sofosbuvir could not be included in the NMA, and considering the number of assumptions required, sofosbuvir (Sovaldi) was not included in the primary baseline analysis, but its cost-effectiveness was assessed in an exploratory analysis (see 3.2.9).

Direct-Acting Antiviral Agents for Chronic Hepatitis C Genotype 1 13
3.2.4 Perspective This analysis was conducted from the perspective of a provincial Ministry of Health in Canada. 3.2.5 Time Horizon The analysis adopted a lifetime horizon with a weekly cycle length. According to the modelling good research practices developed by the International Society for Pharmacoeconomics and Outcomes Research (ISPOR) in collaboration with the Society for Medical Decision Making (SMDM), the cycle length should be short enough to represent the frequency of clinical events and interventions.71 In the case of hepatitis C, clinical events such as adverse events, duration of treatment, and SVR occur in a weekly manner; thus, a weekly cycle was used in the economic model. 3.2.6 Model Structure In the analysis, a state-transition model was implemented using TreeAge Pro 2013 software.72 The model was divided into a treatment module and a natural history module. The treatment module could easily be modified to reflect different treatment algorithms, whereas the natural history module was a robust model that reflected the natural history of CHC and was validated against other models in the literature. In the model, health states related to treatment and adverse events, fibrosis stages (F0 to F4), and clinical states (e.g., cirrhosis, hepatocellular carcinoma) were used to reflect the natural history of CHC (Table 7).
TABLE 7: DESCRIPTION OF HEALTH STATES
Health States Description
F0 No fibrosis; currently on treatment
F1 Portal fibrosis without septa; currently on treatment
F2 Portal fibrosis with rare septa; currently on treatment
F3 Numerous septa without cirrhosis; currently on treatment
F4 Cirrhosis; currently on treatment
F0 non-SVR No fibrosis; failure to achieve SVR after treatment
F1 non-SVR Portal fibrosis without septa; failure to achieve SVR after treatment
F2 non-SVR Portal fibrosis with rare septa; failure to achieve SVR after treatment
F3 non-SVR Numerous septa without cirrhosis; failure to achieve SVR after treatment
F4 non-SVR Cirrhosis; failure to achieve SVR after treatment
F0 SVR No fibrosis; achieved SVR after treatment
F1 SVR Portal fibrosis without septa; achieved SVR after treatment
F2 SVR Portal fibrosis with rare septa; achieved SVR after treatment
F3 SVR Numerous septa without cirrhosis; achieved SVR after treatment
F4 SVR Cirrhosis; achieved SVR after treatment
Decompensated Cirrhosis Decompensated cirrhosis
HCC Hepatocellular carcinoma
Liver transplant First year after liver transplant
Post-transplant After first year of liver transplant
Liver-related death Liver-related death related to decompensated cirrhosis, HCC, or liver transplant
All-cause death All causes of death
HCC = hepatocellular carcinoma; SVR = sustained virologic response.
During simulation, cohort members move between pre-defined health states in weekly cycles until all members have died. Health states and allowed transitions among health states are shown in Figure 1.
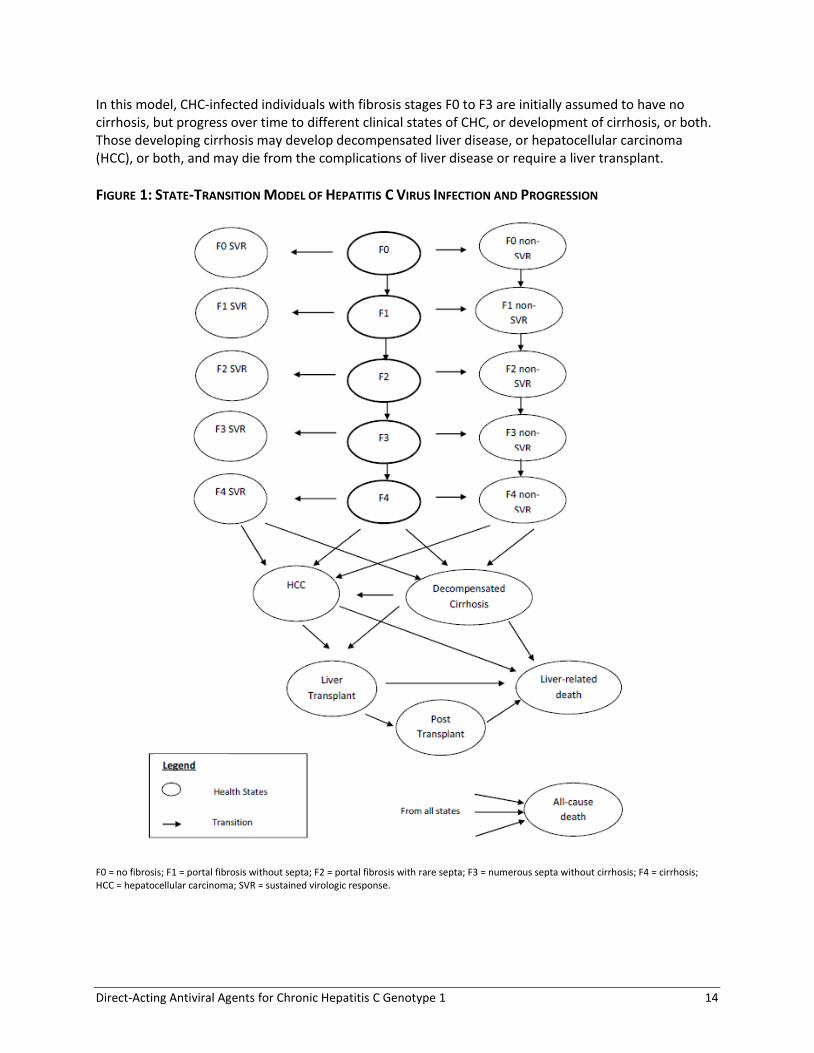
Direct-Acting Antiviral Agents for Chronic Hepatitis C Genotype 1 14
In this model, CHC-infected individuals with fibrosis stages F0 to F3 are initially assumed to have no cirrhosis, but progress over time to different clinical states of CHC, or development of cirrhosis, or both. Those developing cirrhosis may develop decompensated liver disease, or hepatocellular carcinoma (HCC), or both, and may die from the complications of liver disease or require a liver transplant.
FIGURE 1: STATE-TRANSITION MODEL OF HEPATITIS C VIRUS INFECTION AND PROGRESSION
F0 = no fibrosis; F1 = portal fibrosis without septa; F2 = portal fibrosis with rare septa; F3 = numerous septa without cirrhosis; F4 = cirrhosis; HCC = hepatocellular carcinoma; SVR = sustained virologic response.

Direct-Acting Antiviral Agents for Chronic Hepatitis C Genotype 1 15
3.2.7 Data Inputs Data inputs are subject to uncertainty regarding their true value, known as parameter uncertainty.73
Parameter uncertainty can be assessed by implementing an informal Bayesian approach to cost-effectiveness analysis by specifying relevant parameters as probability distributions rather than point estimates. This technique allows for the estimation of the likelihood of various output values based on a wide number of sets of input parameters generated by sampling from their probability density functions and was implemented in the probabilistic sensitivity analysis. a) Natural History of the Disease Fibrosis progression parameters were obtained from a systematic review conducted by Thein et al. in 2008,43 which estimated the annual transition probabilities between fibrosis stages from 111 prognostic studies with 33,121 patients.43 The progression parameters were derived from all published literature around the world from 1990 to 2007, the majority of which assessed liver clinic populations (84%). Although there is likely some uncertainty regarding the true transition rates, these rates are the most robust currently available in the literature and were acceptable to the clinical experts. Transition probabilities to advanced liver disease were obtained from a published study that provided separate estimates for both SVR and non-SVR CHC patients.6 Annual probabilities for fibrosis progression and advanced disease progression are provided in Table 8.
TABLE 8: NATURAL HISTORY PARAMETERS
Description Base Estimate
Lower Limit
(95% CI)
Upper Limit
(95% CI)
Probability Distribution
Annual probability for fibrosis progression
F0 F143
0.117 0.104 0.13 Beta (285.9,2158.3)
F1 F243
0.085 0.075 0.096 Beta (218.5,2351.6)
F2 F343
0.12 0.109 0.133 Beta (299.8,2198.6)
F3 F443
0.116 0.104 0.129 Beta (281.4,2144.7)
Annual probability for cirrhosis progression
F4 decompensated (non-SVR)6 0.035 0.027 0.043 Beta (73.8,2036.1)
F4 decompensated (SVR)6 0.002 0.0001 0.005 Beta (1.77,884.3)
F4 HCC (non-SVR)6 0.024 0.018 0.031 Beta (45.9,1865.3)
F4 HCC (SVR)6 0.005 0.001 0.009 Beta (6.21,1236.5)
CI = confidence interval; F0 = no fibrosis; F1 = portal fibrosis without septa; F2 = portal fibrosis with rare septa; F3 = numerous septa without cirrhosis; F4 = cirrhosis; HCC = hepatocellular carcinoma; SVR = sustained virologic response.
b) Treatment Efficacy and Safety Efficacy
Table 9 summarizes the treatment efficacy data for PR, boceprevir, telaprevir, and simeprevir. The baseline probability of achieving SVR in the PR48 group (see Table 3 for treatment regimen nomenclature) was generated directly from the NMA model. The baseline probability was calculated by using the mean log odds of the SVR rate in the PR48 group averaged over all trials included in the NMA in which PR48 was used.74 The probability of achieving SVR in the DAA plus PR treatment groups was obtained by multiplying the relative risk obtained from the NMA for each treatment by the baseline probability of achieving SVR in the PR48 group. Please refer to Section 3.1.4 for a description of the NMA methods.

Direct-Acting Antiviral Agents for Chronic Hepatitis C Genotype 1 16
Because fibrosis stage is a well-known predictor of response to treatment, the pharmacoeconomic model used the efficacy data from the NMA stratified by fibrosis stage (F0 to F2 and F3 to F4).75
TABLE 9: TREATMENT EFFICACY (SUSTAINED VIROLOGIC RESPONSE)
Description Baselinea /
RR Lower Limit
(95% CrI) Upper Limit
(95% CrI) Probability Distribution
Treatment-Naive
F0 to F2
Reference baseline (PR 48 2a/2b) 0.4867a 0.4457
a 0.5277
a Based on NMA
Si12 PR24/48 2a/b RGT 1.641 1.373 1.884 Based on NMA
T12 PR24/48 2a RGT q8 1.63 1.29 1.879 Based on NMA
B24 PR28/48 2b RGT 1.561 1.206 1.827 Based on NMA
F3 to F4
Reference baseline (PR 48 2a/2b) 0.3554a 0.2788
a 0.4368
a Based on NMA
Si12 PR24/48 2a/b RGT 1.91 1.294 2.619 Based on NMA
T12 PR24/48 2a RGT q8 1.811 1.049 2.553 Based on NMA
B24 PR28/48 2b RGT 1.101 0.3895 2.173 Based on NMA
B44 PR48 2b 1.417 0.5888 2.446 Based on NMA
Treatment-Experienced (Relapse)
F0 to F2
Reference baseline (PR 48 2a/2b) 0.3422a 0.2655
a 0.4249
a Based on NMA
Si12 PR24/48 2a RGT 2.256 1.553 2.964 Based on NMA
B32 PR36/48 2b RGT 2.24 1.402 3.113 Based on NMA
T12 PR48 2a q8 2.552 1.858 3.39 Based on NMA
F3 to F4
Reference baseline (PR 48 2a/2b) 0.1717a 0.08398
a 0.2868
a Based on NMA
Si12 PR24/48 2a RGT 3.764 1.961 7.178 Based on NMA
B32 PR36/48 2b RGT 2.797 0.7143 8.549 Based on NMA
T12 PR48 2a q8 5.099 2.969 10.26 Based on NMA
B44 PR48 2b 4.731 2.052 10.78 Based on NMA
Treatment-Experienced (Partial Response)
F0 to F2
Reference baseline (PR 48 2a/2b) 0.1101a 0.03388
a 0.233
a Based on NMA
T12 PR48 2a q8 5.49 2.053 17.01 Based on NMA
B32 PR36/48 2b RGT 5.06 1.683 20.75 Based on NMA
F3 to F4
Reference baseline (PR 48 2a/2b) 0.03717a 0.0004238
a 0.2266
a Based on NMA
T12 PR48 2a q8 6.22 1.039 121.3 Based on NMA
B32 PR36/48 2b RGT 10.82 0.5955 2170 Based on NMA
B44 PR48 2b 14.97 1.104 2243 Based on NMA
2a/2b = peginterferon alfa-2a or peginterferon alfa-2b; B24 PR28/48 RGT = boceprevir for 24 weeks and PR used as RGT for 28 or 48 weeks; B24 PR28 = boceprevir for 24 weeks and PR used for 28 weeks; B32 PR36/48 = boceprevir for 32 weeks and PR used as RGT for 36 or 48 weeks; B44 PR48 = boceprevir for 44 weeks and PR used for 48 weeks; CrI = credible interval; F0 = no fibrosis; F1 = portal fibrosis without septa; F2 = portal fibrosis with rare septa; F3 = numerous septa without cirrhosis; F4 = cirrhosis; NMA = network meta-analysis; PR48 = pegylated interferon + ribavirin for 48 weeks; q8 = telaprevir 750 mg every 8 h; RGT = response-guided therapy; RR = relative risk; Si12 PR24/48 RGT = simeprevir for 12 weeks and PR used as RGT for 24 or 48 weeks; T12 PR24/48 RGT = telaprevir for 12 weeks and PR used as RGT for 24 or 48 weeks; T12 PR24 = telaprevir for 12 weeks and PR used for 24 weeks; T12 PR48 = telaprevir for 12 weeks and PR used for 48 weeks. aBaseline probability.

Direct-Acting Antiviral Agents for Chronic Hepatitis C Genotype 1 17
Safety
In the economic model, three different types of adverse events were considered: anemia, depression, and rash. Clinical experts suggested including these three adverse events as they are relatively common and associated with significant costs. The adverse events occurrence rates were obtained from the NMA (Table 10). The baseline probability of experiencing the adverse event of interest in the PR48 group was generated directly from the NMA model. The baseline probability was calculated by using the mean log odds of the rate of each adverse event in the PR48 group averaged over all trials included in the NMA in which PR48 was used.74 The probability of experiencing the adverse event in the DAA plus PR treatment groups was obtained by multiplying the relative risk obtained from the NMA for each treatment by the probability in the PR48 group.
TABLE 10: ADVERSE EVENTS
Description Baselinea/ RR Lower Limit
(95% CrI) Upper Limit
(95% CrI) Probability Distribution
Treatment-Naive
Depression
Reference baseline (PR48 2a/2b) 0.2035a 0.1733
a 0.2354
a Based on NMA
Si12 PR24/48 2a/b RGT 0.6376 0.219 1.561 Based on NMA
T12 PR24/48 2a RGT q8 0.8285 0.4166 1.508 Based on NMA
B24 PR28/48 2b RGT 1.039 0.534 1.808 Based on NMA
Anemia
Reference baseline (PR48 2a/2b) 0.2456a 0.2136
a 0.2787
a Based on NMA
Si12 PR24/48 2a/b RGT 1.091 0.7683 1.518 Based on NMA
T12 PR24/48 2a RGT q8 1.81 1.271 2.419 Based on NMA
B24 PR28/48 2b RGT 1.76 1.243 2.349 Based on NMA
Rash
Reference baseline (PR48 2a/2b) 0.2095a 0.1788
a 0.2409
a Based on NMA
Si12 PR24/48 2a/2b RGT 1.275 0.8968 1.753 Based on NMA
T12 PR24/48 2a RGT q8 1.544 0.9782 2.264 Based on NMA
B24 PR28/48 2b RGT 1.108 0.6641 1.727 Based on NMA
Treatment-Experienced
Depression
Reference baseline (PR48 2a/2b) 0.1223a 0.09216
a 0.1562
a Based on NMA
Si12 PR24/48 2a RGT 1.649 0.53 4.258 Based on NMA
T12 PR48 2a q8 0.7695 0.3384 1.697 Based on NMA
B32 PR36/48 2b RGT 0.9018 0.3745 2.055 Based on NMA
B44 PR48 2b 1.303 0.6731 2.494 Based on NMA
B32 PR36/48 2b RGT
Anemia
Reference baseline (PR48 2a/2b) 0.1777a 0.1468
a 0.2121
a Based on NMA
Si12 PR24/48 2a RGT 0.8361 0.3694 1.687 Based on NMA
T12 PR48 2a q8 2.102 1.109 3.432 Based on NMA
B32 PR36/48 2b RGT 2.013 1.095 3.312 Based on NMA
B44 PR48 2b 2.052 1.273 3.072 Based on NMA

Direct-Acting Antiviral Agents for Chronic Hepatitis C Genotype 1 18
Description Baselinea/ RR Lower Limit
(95% CrI) Upper Limit
(95% CrI) Probability Distribution
Rash
Reference baseline (PR48 2a/2b) 0.1337a 0.1019
a 0.1674
a Based on NMA
Si12 PR24/48 2a RGT 1.033 0.4718 2.107 Based on NMA
T12 PR48 2a q8 2.08 1.058 3.631 Based on NMA
B32 PR36/48 2b RGT 2.96 1.36 5.604 Based on NMA
B44 PR48 2b 2.579 1.35 4.761 Based on NMA
2a/2b = peginterferon alfa-2a or peginterferon alfa-2b; B24 PR28/48 RGT = boceprevir for 24 weeks and PR used as RGT for 28 or 48 weeks; B24 PR28 = boceprevir for 24 weeks and PR used for 28 weeks; B32 PR36/48 = boceprevir for 32 weeks and PR used as RGT for 36 or 48 weeks; B44 PR48 = boceprevir for 44 weeks and PR used for 48 weeks; CrI = credible interval; NMA = network meta-analysis; PR48 = pegylated interferon + ribavirin for 48 weeks; q8 = telaprevir 750 mg every 8 h; RGT = response-guided therapy; RR = relative risk; Si12 PR24/48 RGT = simeprevir for 12 weeks and PR used as RGT for 24 or 48 weeks; T12 PR24/48 RGT = telaprevir for 12 weeks and PR used as RGT for 24 or 48 weeks; T12 PR24 = telaprevir for 12 weeks and PR used for 24 weeks; T12 PR48 = telaprevir for 12 weeks and PR used for 48 weeks. aBaseline probability.
All-Cause Treatment Discontinuation
In the economic model, all-cause treatment discontinuations were also considered (Table 11), and their rates from the studies included in the NMA were used to populate the model (Table 101 and Table 109). Where possible, pooled estimates and 95% confidence intervals (CIs) were calculated using a random effects model. Detailed data on timing of treatment discontinuation were often not reported in published clinical data. Therefore, the model assumed that the discontinuation occurred in the middle of the scheduled therapy.
TABLE 11: DISCONTINUATION RATE
Description Base Estimate Lower Limit (95% CI)
Upper Limit (95% CI)
Probability Distribution
Treatment-Naive
PR48 2a/2b 0.401 0.317 0.492 Beta (46.12,68.90)
Si12 PR24/48 2a/2b RGT 0.156 0.091 0.255 Beta (8.23,44.51)
T12 PR24/48 2a RGT q8 0.225 0.162 0.302 Beta (26.24,90.40)
B24 PR28/48 2b RGT 0.378 0.33 0.428 Beta (141.82,233.37)
Treatment-Experienced
PR48 2a/2b 0.552 0.38 0.713 Beta (17.90,14.53)
Si12 PR24/48 2a RGT 0.065 0.041 0.103 Beta (10.88,156.47)
T12 PR48 2a q8 0.168 0.126 0.22 Beta (34.57,171.2)
B32 PR36/48 2b RGT 0.358 0.288 0.435 Beta (55.15,98.91)
B44 PR48 2b 0.377 0.318 0.44 Beta (88.86,146.84)
2a/2b = peginterferon alfa-2a or peginterferon alfa-2b; B24 PR28/48 RGT = boceprevir for 24 weeks and PR used as RGT for 28 or 48 weeks; B32 PR36/48 = boceprevir for 32 weeks and PR used as RGT for 36 or 48 weeks; B44 PR48 = boceprevir for 44 weeks and PR used for 48 weeks; CI = confidence interval; PR48 = pegylated interferon + ribavirin for 48 weeks; q8 = telaprevir 750 mg every 8 h; RGT = response-guided therapy; Si12 PR24/48 RGT = simeprevir for 12 weeks and PR used as RGT for 24 or 48 weeks; T12 PR24/48 RGT = telaprevir for 12 weeks and PR used as RGT for 24 or 48 weeks; T12 PR24/48 = telaprevir for 12 weeks and PR used for 24 or 48 weeks; T12 PR48 = telaprevir for 12 weeks and PR used for 48 weeks.
Patients Eligible for Short-Duration Response-Guided Therapy
The proportion of the cohort eligible to receive shorter PR therapy based on RGT criteria was also considered in the analysis (Table 12), and was obtained from the clinical trials included in the NMA (Table 100 and Table 110). Where possible, pooled estimates and 95% CI were calculated using a random effects model.

Direct-Acting Antiviral Agents for Chronic Hepatitis C Genotype 1 19
In the treatment-naive cohort, for patients with a fibrosis stage of F0 to F2, RGT was used for simeprevir, telaprevir, and boceprevir regimens. For patients with a fibrosis stage of F3 to F4, RGT was used for simeprevir and telaprevir; however, no RGT was used for boceprevir in the base-case analysis. For F3 treatment-naive patients, the NMA results using the recommended RGT regimen (B24 PR28/48 2b RGT, relative risk = 1.10) are largely affected by the response of F4 patients (47% of patients in SPRINT-2 were F4). Applying a lower response for F3 versus F4 in that population does not reflect what was shown in SPRINT-2. This is why, following discussion with clinical experts, the B44PR48 group results from the NMA were applied for F3 and F4. The impact of this assumption was further assessed in sensitivity analyses. In the prior relapse group, no RGT was assumed for telaprevir based on NMA results (RGT was not used in REALIZE). This may not reflect the clinical practice in Canada. In sensitivity analyses, it was assumed that patients with extended rapid virologic response in REALIZE would receive RGT with telaprevir. RGT was used for boceprevir (F0 to F3) and simeprevir. In the partial response group, no RGT was assumed for telaprevir, but RGT was used for boceprevir for F0 to F3. Further, it should be noted that, as presented in Table 139, the proportion of patients who met the RGT criteria to stop therapyearly in the simeprevir trials may overestimate the proportion in clinical practice in Canada due to differences in the RGT criteria between the trials and Health Canada recommendations. An exploratory analysis was performed in which a lower proportion of patients qualifying for RGT with simeprevir was assumed (see Simeprevir: Percentage Meeting RGT Criteria For Short Therapy, page 107).

Direct-Acting Antiviral Agents for Chronic Hepatitis C Genotype 1 20
TABLE 12: PROPORTION OF COHORT THAT QUALIFIED FOR SHORT-DURATION RESPONSE-GUIDED THERAPY
Description Base Estimate Lower Limit (95% CI)
Upper Limit (95% CI)
Probability Distribution
Treatment-Naive
F0 to F2
Si12 PR24/48 2a/2b RGT 0.859 0.777 0.913 Beta (61.03,10.01 )
T12 PR24/48 2a RGT q8 0.647 0.598 0.693 Beta (245.53, 133.96)
B24 PR28/48 2b RGT 0.44 0.39 0.491 Beta (166.29, 211.64)
F3 to F4
Si12 PR24/48 2a/2b RGT 0.859 0.777 0.913 Beta (61.03,10.01 )
T12 PR24/48 2a RGT q8 0.647 0.598 0.693 Beta (245.53, 133.96)
B44 PR48 2b - - - -
Treatment-Experienced (Relapse)
F0 to F2
Si12 PR24/48 2a RGT 0.927 0.888 0.953 Beta (164.05, 12.92)
B32 PR36/48 2b RGT 0.457 0.382 0.534 Beta (76.05, 90.36)
T12 PR48 2a q8 - - -
F3 to F4
Si12 PR24/48 2a RGT 0.927 0.888 0.953 Beta (164.05, 12.92)
B32 PR36/48 2b RGT (F3) 0.457 0.382 0.534 Beta (76.05, 90.36)
B44 PR48 2b (F4) - - - -
T12 PR48 2a q8 - - - -
Treatment-Experienced (Partial Response)
F0 to F2
B32 PR36/48 2b RGT 0.457 0.382 0.534 Beta (76.05, 90.36)
T12 PR48 2a q8 - - - -
F3 to F4
B32 PR36/48 2b RGT (F3) 0.457 0.382 0.534 Beta (76.05, 90.36)
B44 PR48 2b (F4) - - - -
T12 PR48 2a q8 - - - -
2a/2b = peginterferon alfa-2a or peginterferon alfa-2b; B24 PR28/48 RGT = boceprevir for 24 weeks and PR used as RGT for 28 or 48 weeks; B24 PR28 = boceprevir for 24 weeks and PR used for 28 weeks; B32 PR36/48 = boceprevir for 32 weeks and PR used as RGT for 36 or 48 weeks; B44 PR48 = boceprevir for 44 weeks and PR used for 48 weeks; CI = confidence interval; F0 = no fibrosis; F1 = portal fibrosis without septa; F2 = portal fibrosis with rare septa; F3 = numerous septa without cirrhosis; F4 = cirrhosis; PR48 = pegylated interferon + ribavirin for 48 weeks; q8 = telaprevir 750 mg every 8 h; RGT = response-guided therapy; Si12 PR24/48 RGT = simeprevir for 12 weeks and PR used as RGT for 24 or 48 weeks; T12 PR24/48 RGT = telaprevir for 12 weeks and PR used as RGT for 24 or 48 weeks; T12 PR24 = telaprevir for 12 weeks and PR used for 24 weeks; T12 PR48 = telaprevir for 12 weeks and PR used for 48 weeks.
c) Mortality In the absence of good Canadian sources that would distinguish death from HCC and decompensated cirrhosis, data were obtained from sources estimated to be sufficiently generalizable to the Canadian population given the study’s size and quality. More specifically, the annual mortality risk associated with advanced liver diseases were obtained from a US study based on cancer registries,76 and a systematic review77 (Table 13). All-cause mortality was obtained from Statistics Canada.78
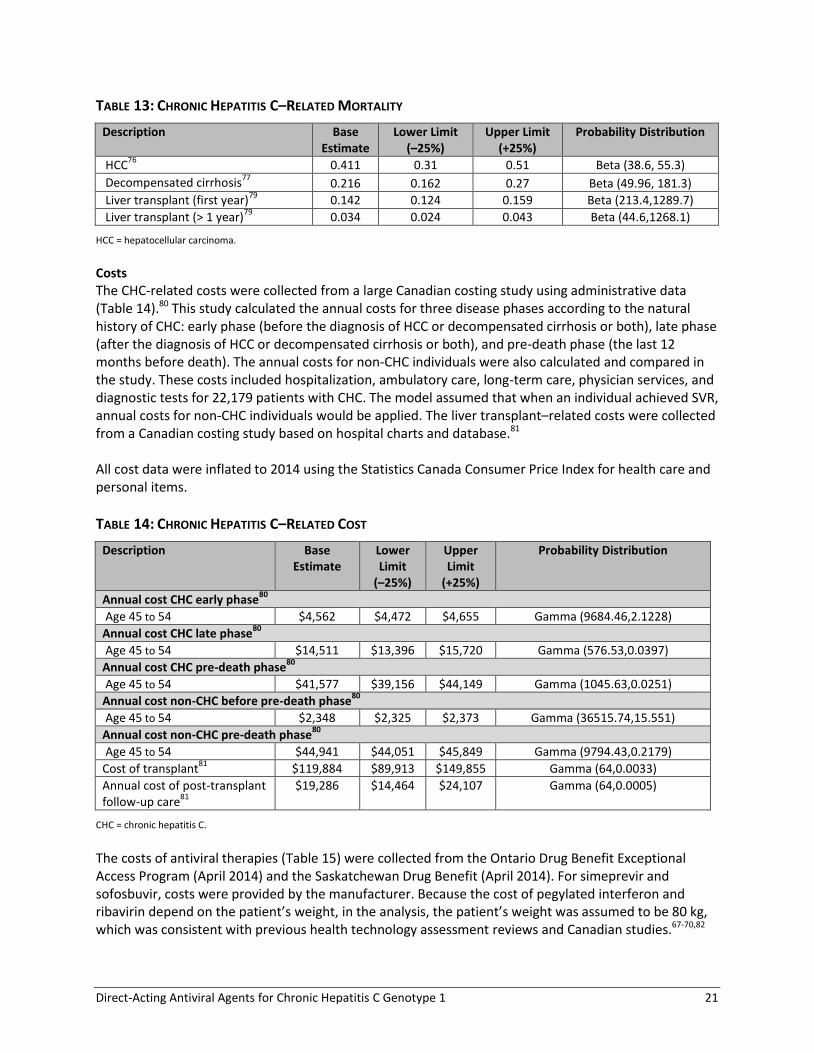
Direct-Acting Antiviral Agents for Chronic Hepatitis C Genotype 1 21
TABLE 13: CHRONIC HEPATITIS C–RELATED MORTALITY
Description Base Estimate
Lower Limit (–25%)
Upper Limit (+25%)
Probability Distribution
HCC76
0.411 0.31 0.51 Beta (38.6, 55.3)
Decompensated cirrhosis77
0.216 0.162 0.27 Beta (49.96, 181.3)
Liver transplant (first year)79
0.142 0.124 0.159 Beta (213.4,1289.7)
Liver transplant (> 1 year)79
0.034 0.024 0.043 Beta (44.6,1268.1)
HCC = hepatocellular carcinoma.
Costs
The CHC-related costs were collected from a large Canadian costing study using administrative data (Table 14).80 This study calculated the annual costs for three disease phases according to the natural history of CHC: early phase (before the diagnosis of HCC or decompensated cirrhosis or both), late phase (after the diagnosis of HCC or decompensated cirrhosis or both), and pre-death phase (the last 12 months before death). The annual costs for non-CHC individuals were also calculated and compared in the study. These costs included hospitalization, ambulatory care, long-term care, physician services, and diagnostic tests for 22,179 patients with CHC. The model assumed that when an individual achieved SVR, annual costs for non-CHC individuals would be applied. The liver transplant–related costs were collected from a Canadian costing study based on hospital charts and database.81 All cost data were inflated to 2014 using the Statistics Canada Consumer Price Index for health care and personal items.
TABLE 14: CHRONIC HEPATITIS C–RELATED COST
Description Base Estimate
Lower Limit
(–25%)
Upper Limit
(+25%)
Probability Distribution
Annual cost CHC early phase80
Age 45 to 54 $4,562 $4,472 $4,655 Gamma (9684.46,2.1228)
Annual cost CHC late phase80
Age 45 to 54 $14,511 $13,396 $15,720 Gamma (576.53,0.0397)
Annual cost CHC pre-death phase80
Age 45 to 54 $41,577 $39,156 $44,149 Gamma (1045.63,0.0251)
Annual cost non-CHC before pre-death phase80
Age 45 to 54 $2,348 $2,325 $2,373 Gamma (36515.74,15.551)
Annual cost non-CHC pre-death phase80
Age 45 to 54 $44,941 $44,051 $45,849 Gamma (9794.43,0.2179)
Cost of transplant81
$119,884 $89,913 $149,855 Gamma (64,0.0033)
Annual cost of post-transplant follow-up care
81
$19,286 $14,464 $24,107 Gamma (64,0.0005)
CHC = chronic hepatitis C.
The costs of antiviral therapies (Table 15) were collected from the Ontario Drug Benefit Exceptional Access Program (April 2014) and the Saskatchewan Drug Benefit (April 2014). For simeprevir and sofosbuvir, costs were provided by the manufacturer. Because the cost of pegylated interferon and ribavirin depend on the patient’s weight, in the analysis, the patient’s weight was assumed to be 80 kg, which was consistent with previous health technology assessment reviews and Canadian studies.67-70,82

Direct-Acting Antiviral Agents for Chronic Hepatitis C Genotype 1 22
TABLE 15: THERAPY COST
Drug/ Comparator
Strength Dosage Form Price ($) Recommended Dose Duration Cost for One Course of
Therapy ($)
HCV Protease Inhibitor
Boceprevir (VICTRELIS) 200 mg Cap 12.5000 4 × 200 mg 3 times daily 24 to 44 wks 25,200 to 46,200
d
Simeprevir (GALEXOS) 150 mg Cap 434.55a 150 mg once daily 12 wks 36,502
e
Telaprevir (INCIVEK) 375 mg Tab 69.3810 3 × 375 mg 2 times daily 12 wks 34,968e
Nucleotide Polymerase Inhibitor
Sofosbuvir (Sovaldi) 400 mg Tab 654.76a 400 mg once daily 12 wks 55,000
f
Combination Peginterferon alfa + Ribavirin Therapy
Peginterferon alfa-2a + RBV (Pegasys RBV)
180 mcg/200 mg Vial or syringe/ 28, 35, or 42
tabs
Per wk 395.8400
c
Peginterferon 180 mcg/wk; RBV 800 to
1,200 mg/dayb
24 to 48 wks 9,500 to 19,000
Peginterferon alfa-2b + RBV (PEGETRON)
50 mcg/200 mg 2 vials + 56 caps
774.7700c Peginterferon 1.5
mcg/kg/wk; RBV 800 to 1,400 mg/day
b
24 to 48 wks 9,297 to 18,594
150 mcg/200 mg 2 vials + 84 or 98 caps
856.1200c 10,273 to 20,547
80 mcg/200 mg
100 mcg/200 mg 120 mcg/200 mg 150 mcg/200 mg
2 pens / 56 to 98 caps
Per 2 wks 774.7700
c
774.7700c
856.1200c
856.1200c
9,297 to 20,547
Cap = capsule; HCV = hepatitis C virus; RBV = ribavirin; tab = tablet; wk = week. Source: Ontario Drug Benefit Exceptional Access Program (April 2014) prices, unless otherwise stated. aList price confirmed by manufacturer. bDosing varies by weight CSaskatchewan Drug Benefit (April 2014). dTotal cost of treatment regimen will also include 28 to 48 weeks of PR and will vary depending on treatment status (naive versus experienced) and fibrosis stage e Total cost of treatment regimen will also include 24 to 48 weeks of PR fTotal cost of treatment regimen will also include 12 weeks of PR

Direct-Acting Antiviral Agents for Chronic Hepatitis C Genotype 1 23
The cost of adverse events was based on the resource utilization from Gao et al.83 and the associated Canadian costs from the literature. Canadian costs were obtained from the Ontario Drug Benefit Formulary, the Schedule of Benefits for Laboratory Services in Ontario, and the Schedule of Benefits for Physician Services, Ontario. The cost of transfusion was based on a previous CADTH report, and inflated to 2014 using the health care component of the Consumer Price Index.84,85 The calculated average per-event costs for anemia was $2,048.29, for depression was $975.34, and $254.39 for rash based on 48 weeks of treatment. The average per-event costs were adjusted by the corresponding treatment duration and applied to the economic model based on the rate of adverse event occurrence per treatment option. d) Utilities Health states utility data were obtained from the most recent and valid Canadian utility study available, conducted by Hsu et al. in 2012, using Health Utilities Index Mark 2 (HUI2).86 The study included 700 patients across different CHC health states. However, because the study did not include patients with decompensated cirrhosis, utility for these patients was determined by adjusting the CHC utility score from a disutility value published in a systematic review (Table 17).87 The on-treatment utility and the viral clearance utility for CHC patients who had compensated cirrhosis was determined by adjusting the compensated cirrhosis utility score with a disutility value (-0.02) and a utility gain value (+0.07), both generated by the patients without cirrhosis. The utilities of CHC patients who had late-stage liver disease (decompensated cirrhosis or HCC) were obtained from a relatively small sample size and may not cover the full spectrum of the severity of the disease. A separate set of utility data was used in a sensitivity analysis (Chong et al.88). In the economic model, on-treatment utility was applied during the treatment period. Disutility associated with anemia, depression, and rash was also applied for the patients experiencing the adverse event. In the absence of disutility data associated with adverse events in CHC patients, these disutilities were estimated using scores measured either in the general population or in patients with treatment-induced anemia.89,90 Similar to cost of adverse events, the duration of disutility was based on Gao et al.83 and was adjusted by the corresponding treatment duration. Alternative source of CHC utilities and uncertainty surrounding disutility values was tested in sensitivity analyses.

Direct-Acting Antiviral Agents for Chronic Hepatitis C Genotype 1 24
TABLE 16: COST OF ADVERSE EVENTS ASSOCIATED WITH CHRONIC HEPATITIS C THERAPIES
Event
Resource Utilized Utilization (%)
Frequency in Weeks (number used for the
HE model)
Cost/Unit Total Cost During Therapy
a
Total Cost Per Patient
Anemia Epoetin alfa 40,000 IU pre-filled syringe (Eprex)
b
22 16 $432.67 $1,523.00 $2,048.29
Blood count — WBC differential (L393; 16 LSM units × $0.517)
c
100 3 $8.27 $24.82
Bilirubin — total (L030; 5 LSM units
$0.517)
c
100 3 to 7 (3) $2.59 $7.76
Uric acid (L252; 5 LSM units × $0.517)
c
100 3 to 7 (3) $2.59 $7.76
Reticulocytes (L398; 13 LSM unitsa
× $0.517)c
100 3 to 7 (3) $6.72 $20.16
Red blood cell transfusion 22 1 to 2 (1) $334.27 $73.54
Clinic visit and injection (G373)d 22 16 $6.75 $23.76
Hematology consultation (A615)d 100 1 to 5 (1) $157.00 $157.00
Repeat hematology consultation (A616)
d
100 2 to 12 (2) $105.25 $210.50
Depression 210 mg citalopram/weekb 7 48 $3.50 $11.74 $975.34
Individual outpatient psychotherapy (K197)
d
100 12 $80.30 $963.60
Rash Hydrocortisone cream 1% (45 g)b 100 12 to 24 (12) $7.73 $92.77 $254.39
Simple clinic visit (A005)d 100 2 to 4 (2) $77.20 $154.40
Dermatology consultation (A025)d 5 2 to 4 (2) $72.15 $7.22
IU = international units; LSM = labour, materials, supervision units. Each unit is worth $0.517 WBC = white blood cells. aTotal cost = cost/unit × frequency × utilization. bOntario Drug Benefit Formulary (March 2014). cSchedule of Benefits for Laboratory Services, Ontario (April 1, 1999). dSchedule of Benefits for Physician Services, Ontario (October 1, 2013).

Direct-Acting Antiviral Agents for Chronic Hepatitis C Genotype 1 25
TABLE 17: CHRONIC HEPATITIS C–RELATED UTILITIES
Description Base Estimate
Lower Limit (–25%)
Upper Limit (+25%)
Probability Distribution
Canadian population average61,91
Age 45 to 54 0.86 0.83 0.88 Beta (459.34,74.78)
Utility for CHC–related health states86,87
Non-cirrhosis 0.73 0.69 0.77 Beta (358.98,132.77)
Compensated cirrhosis 0.69 0.65 0.73 Beta (368.29,165.46)
HCC 0.72 0.68 0.75 Beta (362.16,140.84)
Decompensated cirrhosis 0.65 0.61 0.69 Beta (369.04,198.71)
Post-transplant 0.75 0.70 0.79 Beta (224.25,74.75)
Non-cirrhosis on-treatment 0.71 0.67 0.75 Beta (364.76,148.99)
Non-cirrhosis viral clearance 0.80 0.76 0.84 Beta (319.2,79.8)
Compensated cirrhosis on-treatment 0.67 0.63 0.71 Beta (369.67,182.08)
Compensated cirrhosis viral clearance 0.76 0.72 0.80 Beta (345.8,109.2)
Disutility associated with adverse event89,90
Anemia –0.03 –0.0375 –0.0225 –Beta (62.05,2006.28)
Depression –0.0625 –0.0781 –0.0468 –Beta (59.94,899.06)
Rash –0.0213 –0.0267 –0.0159 –Beta (62.62,2006.28)
CHC = chronic hepatitis C; HCC = hepatocellular carcinoma.

Direct-Acting Antiviral Agents for Chronic Hepatitis C Genotype 1 26
3.2.8 Assumptions Within the Economic Model The following assumptions were made for the economic model (Table 18).
TABLE 18: ASSUMPTIONS WITHIN THE ECONOMIC MODEL
Description
Future costs and health benefits were discounted at 5% annually
All cost data were inflated to 2014 using the Statistics Canada Consumer Price Index for health care and personal items
HCC and decompensated cirrhosis were assumed to occur only at F4
No switching on treatment was assumed
Patient populations in natural history studies were assumed to sufficiently reflect the Canadian population
AEs were assumed to be transient in nature and did not reflect compliance
Model assumed no other pre-existing conditions; e.g., HIV
Model assumed no spontaneous remission
Patients who discontinued treatment were assumed not to achieve SVR
Patients who discontinued treatment did so in the middle of their scheduled therapy
Base case uses dosing and treatment duration based on the NMA results
Incidence of AEs is not affected by fibrosis stage and type of prior response
AE = adverse event; F4 = cirrhosis; HCC = hepatocellular carcinoma; NMA = network meta-analysis; SVR = sustained virologic response.
3.2.9 Exploratory Analyses for Sofosbuvir For sofosbuvir, the pivotal trial (NEUTRINO)24 had no control group, so it could not be included in the NMA. Only one sofosbuvir trial (PROTON)16 was included in the NMA. However, there were a number of issues associated with the PROTON trial: PROTON trial was a phase 2 trial with a different dosing regimen from the dosing recommended by Health Canada for genotype 1 treatment-naive patients; the PROTON trial did not include patients with cirrhosis (F4); and the clinical experts were concerned by the high incidence of rash reported in PROTON, which was not consistent with the low incidence observed in clinical practice. Because of these data limitations, sofosbuvir was not included in the base-case analysis, but will be presented as an exploratory analysis. Two scenarios were explored: one scenario in which sofosbuvir efficacy and treatment regimen was based on NMA results (PROTON) and one scenario in which the Health Canada–recommended dose (sofosbuvir and PR for 12 weeks only) was used in the analysis with treatment efficacy for sofosbuvir based on NEUTRINO24 results and on the NMA for other comparators and PR. Adverse event rates for sofosbuvir were based on NEUTRINO for the sofosbuvir group, and the NMA for other comparators and PR. Efficacy and adverse event inputs used for these scenarios are presented in Appendix 8. 3.2.10 Exploratory Analysis Based on Health Canada Dosing and RGT Criteria The doses and proportion of patients eligible to receive shorter duration of treatment based on RGT criteria used in the base-case analysis were based on the clinical trials included in the NMA (best evidence available), which sometimes differed from the Health Canada–recommended dosing, especially in terms of RGT. Some of the trials included in the NMA did not allow for shorter duration of PR therapy, or, in the case of boceprevir, used 44 weeks of treatment for all fibrosis stages, a duration that is recommended only for patients with fibrosis stage F4. This may not reflect the clinical practice in

Direct-Acting Antiviral Agents for Chronic Hepatitis C Genotype 1 27
Canada. Furthermore, the proportion of patients who met the RGT criteria to stop therapy early in the simeprevir trials may overestimate the proportion in clinical practice in Canada due to differences in the RGT criteria between the trials and Health Canada recommendations. Additional analyses were performed using the Health Canada–recommended dose, with the assumptions that the efficacy of agents using the Health Canada–recommended duration of treatment will be the same as in the NMA results. 3.2.11 Exploratory Analysis for Simeprevir in Partial Response Group Due to lack of data, simeprevir was not included in the partial response group base-case analysis. In this exploratory analysis, for simeprevir, costs were based on simeprevir dosing (Si12 PR24/48), and efficacy was based on either telaprevir (T12 PR48) or boceprevir (B32 PR36/48 RGT for F0 to F3 and B44 PR48 for F4). 3.2.12 Sensitivity Analyses a) One-Way Deterministic Sensitivity Analyses Full deterministic one-way sensitivity analyses were performed on all model parameters to test the effect of changes in underlying parameter values and assumptions for treatment-naive and treatment-experienced patients. The parameters that were varied in the deterministic sensitivity analyses, as well as the range, are presented in Table 19.
TABLE 19: PARAMETERS VARIED IN THE DETERMINISTIC SENSITIVITY ANALYSES
Parameter Range/Alternate Source
CHC-related parameters
CHC-related cost ± 25% reference value
CHC-related utilities ± 25% reference value, alternate source (Chong et al.
88), and alternate instrument (HUI3 instead
of HUI2 from Hsu et al. 2012)
CHC-related mortality ± 25% reference value
CHC progression rate (natural history) ± 95% CI limits
Treatment-related parameters
Cost of antiviral therapy ± 25% reference value
Cost of adverse events ± 25% reference value Proportion of patients receiving EPO reduced to 0%
Disutility for adverse events Assuming no disutility
Proportion of patients that qualified for short-duration RGT ± 95% CI limits
Comparative efficacy (NMA results for SVR rates) ± 95% CrI limits
Comparative incidence of adverse events (NMA results for anemia, depression, rash)
± 95% CrI limits
Heterogeneity parameters
Fibrosis distribution ± 25% reference value
Baseline age 40 to 60 years
Discount rate 3% (instead of 5% in base case)
CHC = chronic hepatitis C; CI = confidence interval; CrI = credible interval; EPO = epoetin alfa; HUI2 and HUI3 = Health Utilities Index Mark 2 and 3; NMA = network meta-analysis; RGT = response-guided therapy; SVR = sustained virologic response.

Direct-Acting Antiviral Agents for Chronic Hepatitis C Genotype 1 28
b) Probabilistic Sensitivity Analysis For probabilistic sensitivity analysis (PSA), Monte Carlo simulations were used to explore all model strategies by running 5,000 iterations. All probabilistic parameters and utilities used in the model were represented by beta distributions formed by the corresponding ranges, as indicated in previous subsection; all the cost parameters were represented by gamma distributions formed by the corresponding ranges, as indicated in Table 13 and Table 14. Treatment efficacy and adverse event parameters were represented by the prior distribution generated from the NMA (binomial distribution). 3.2.13 Model Validation For validation purposes, the predictions of the current model, based on the baseline parameter values, were compared with external studies.92-94 More specifically, outcomes compared included the probability of progression to cirrhosis and the probability of liver death (Table 20 and Table 21). The current model’s predictions closely matched those from a previous Canadian model developed by Krahn et al.92 to assess the prognosis of hepatitis C patients infected by transfusion, with the probability of cirrhosis over 20 years (from the time of infection) being 15.0% and 13.9% in the current model and Krahn’s model, respectively; the probability of liver-related death over 20 years (from the time of infection) is 2.6% and 2.5% in the current model and Krahn’s model, respectively. Moreover, the results were also similar to a calibrated model by Salomon et al.,93 using data from the US, where the probability of cirrhosis over 30 years (from the time of infection) was estimated as 35.5% and 30.0% in the current model and Salomon’s model, respectively.
TABLE 20: VALIDATION RESULTS — PROBABILITY OF CIRRHOSIS
Studies 20 years 30 years
Current model (age 50 years) 15.0% 35.5%
Salomon et al. (age 40 years)93
Not reported 30.0%
Krahn et al. (mean age 67 years)92
13.9% Not reported
Wong et al. (age 40 years)94
Not reported 41%
TABLE 21: VALIDATION RESULTS — PROBABILITY OF LIVER DEATH
Studies 20 years
Current model (age 50 years) 2.6%
Salomon et al. (age 40 years)93
Not reported
Krahn et al. (mean age 67 years)92
2.5%
Wong et al. (age 40 years)94
Not reported

Direct-Acting Antiviral Agents for Chronic Hepatitis C Genotype 1 29
4. RESULTS
4.1 Selection of Primary Studies
A total of 1,078 studies were identified from the original literature, and, upon screening the titles and abstracts, 133 potentially relevant publications were retrieved for further scrutiny, as well as 37 additional references identified through other sources. Of the 168 potentially relevant reports, a total of 60 reports,12-37,95-128 describing 26 unique studies, were selected for inclusion. Twenty-four studies were in mono-infected patients (15 in treatment-naive, nine in treatment-experienced), and two studies were in HIV co-infected patients. Of these studies, 18 RCTs were included in the NMA: 12 unique studies of patients who were treatment-naive,12-19,21-23,26 and six RCTs in patients who had previously been treated with PR therapy and had failed to achieve an SVR (Table 22).27-32 Of the studies not included in the NMA, two RCTs enrolled treatment-naive patients who were co-infected with HIV,36,37 four were uncontrolled trials,24,33-35 one was an RCT in which only one treatment group used a dosage that met criteria to be included in the systematic review,25 and one was an RCT that evaluated different RGT options for telaprevir and lacked a common treatment group that could be connected to the network.20 Information from published articles was supplemented with data obtained from the US Food and Drug Administration (FDA),116-123 European Medicines Agency,124-126 clinicaltrials.gov,96-111 abstracts,17,18,115 and supplementary online materials to 1412,13,15,16,20-22,24,27-29,33,36,37 of the published articles. Two pivotal studies for simeprevir (QUEST 1 and QUEST2) had not been published in full by the deadline specified in the protocol for inclusion of data in the NMA. Thus, the data for QUEST1 and QUEST2 used in the analyses were extracted from publicly available sources.17,18,115-117 Full-text publications became available in June 2014,127,128 and additional data (including adverse events for the full treatment period) are provided in an appendix; however, no revisions to the NMA of adverse events were conducted. No studies of patients who had undergone liver transplantation or who had an inadequate response to prior DAA therapy met the inclusion criteria for the systematic review. The trial selection process appears in a PRISMA flowchart in Appendix 5. Included studies are presented in Appendix 6 and excluded studies (with reasons) are presented in Appendix 7.

Direct-Acting Antiviral Agents for Chronic Hepatitis C Genotype 1 30
TABLE 22: SUMMARY OF INTERVENTIONS EVALUATED
Interventions Publications (n)
a
Individual Trials
(n)
DB RCT (n)
Patients (n)
b
Publication Years
Included in the NMA
Treatment-Naive Patients
Boceprevir 800 mg every 8 hours 3 2 1 1,617 2010–2011
Telaprevir 750 mg every 8 hours or 1,125 mg every 12 hours
12 6 3 2,762 2009–2013
Simeprevir 150 mg daily 3c 3
c 3 1,171 2013
Sofosbuvir 400 mg daily 1 1 1 121 2013
Treatment-Experienced Patients
Boceprevir 800 mg every 8 hours 5 2 2 604 2011–2013
Telaprevir 750 mg every 8 hours 4 2 2 1,115 2010–2011
Simeprevir 150 mg daily 4 2 2 855 2014
Not included in the NMA
Treatment-Naive Patients
Telaprevir 750 mg every 8 hours 1 1 0 540 2011
Sofosbuvir 400 mg daily 4 2 0 643 2013
Treatment-Experienced
Boceprevir 800 mg every 8 hours 2 1 0 168 2013
Telaprevir 750 mg every 8 hours 3 2 0 1,704d 2011–2013
Patients With HIV Co-infection
Boceprevir 800 mg every 8 hours 2 1 1 99 2013
Telaprevir 750 mg every 8 hours or 1,125 mg every 8 hours
2 1 1 60 2013
TOTAL 46a 26 16 11,459
DB = double-blind; NMA = network meta-analysis; RCT = randomized controlled trial. aTotal number of publications does not include the US Food and Drug Administration or European Medicines Agency reports (three on boceprevir, three on telaprevir, three on simeprevir, and three on sofosbuvir).
bIncludes all patients enrolled in the studies. Not all patients may have been included in the NMA and clinical summary if one or more treatment groups were not receiving a dosage regimen of interest. cIncludes the QUEST1 and QUEST2 studies, which were available as abstracts. dColombo et al. 201334 included 321 (20%) patients who were treatment-naive.
1.2 Study and Patient Characteristics
4.2.1 Treatment-Naive Patients Of the 15 studies in patients who were treatment-naive, seven were double-blind RCTs,12-18 and eight were partially blinded or open-label studies (Table 24).19-26 Two trials were non-inferiority studies.20,21 No published trials directly comparing the DAA regimens of interest were identified in the literature search. Of the 15 trials included in the systematic review, 12 were included in the NMA. Ten included studies compared PR plus one of boceprevir,12,19 telaprevir,13,14,23,26 simeprevir,15,17,18 or sofosbuvir16 with 48 weeks of PR therapy alone (with or without placebo) (Table 23). Two RCTs compared telaprevir 750 mg every eight hours plus PR versus telaprevir 1,125 mg every 12 hours plus PR.21,22 Two sofosbuvir trials24,25 and one telaprevir trial20 could not be connected to the network because they lacked a comparable treatment group (Table 25). One of these studies (NEUTRINO) was a single-group trial,24 and the other study (ATOMIC) included only one treatment group that met the dose-related inclusion criteria.25 The telaprevir study (ILLUMINATE20) randomized patients based on their early viral

Direct-Acting Antiviral Agents for Chronic Hepatitis C Genotype 1 31
response to treatment. In ILLUMINATE, all patients received 12 weeks of telaprevir plus PR therapy, and then PR dual therapy until week 20, when patients who met the extended rapid viral response criteria were randomized to continue PR therapy until week 24 or 48. Those not meeting extended rapid viral response criteria all received a total of 48 weeks of treatment.20 Eight RCTs in the NMA included a dosage group consistent with the Health Canada–recommended dosing regimen.12,13,15,17,18,20-22 The two studies of sofosbuvir that were not included in the NMA also included the Health Canada–recommended dosage regimen.24,25
TABLE 23: SUMMARY OF DOSAGE REGIMENS IN STUDIES OF TREATMENT-NAIVE PATIENTS
Study/Treatmenta
PR
48
B2
4 P
R2
8/4
8 R
GT
*B2
4 P
R2
8
T12
PR
24
/48
RG
T q
8
T12
PR
24
/48
RG
T q
12
T12
PR
24
RG
T e
RV
R q
8
*T1
2 P
R4
8 R
GT
eRV
R q
8
T12
PR
48
RG
T n
o e
RV
R q
8
*T1
2 P
R2
4 q
8
*T1
2 P
R4
8 q
8
Si1
2 P
R2
4/4
8 R
GT
So1
2 P
R1
2
*So
12
PR
24
/48
RG
T
Included in the NMA
SPRINT-212
x x
SPRINT-119
x x
ADVANCE13
x x
OPTIMIZE21
x x
Marcellin22
x x
PROVE226
x x
PROVE114
x x x
Kumada23
x x
QUEST117
x x
QUEST218
x x
PILLAR15
x x
PROTON16
x x
Not Included in the NMA
ILLUMINATE20
x x x
NEUTRINO24
x
ATOMIC25
x
B24 PR28/48 RGT = boceprevir for 24 weeks and PR used as RGT for 28 or 48 weeks; B24 PR28 = boceprevir for 24 weeks and PR used for 28 weeks; DAA = direct-acting antiviral; eRVR = patients met extended rapid viral response criteria showing favourable treatment response; NMA = network meta-analysis; no eRVR = patients did not meet extended rapid viral response criteria indicating less favourable early treatment response; PR48 = pegylated interferon plus ribavirin for 48 weeks; q8 = every 8 hours (pertains to dosing of DAA); q12 = every 12 hours (pertains to dosing of DAA); RGT = response-guided therapy; Si12 PR24/48 RGT = simeprevir for 12 weeks and PR used as RGT for 24 or 48 weeks; So12 PR12 = sofosbuvir for 12 weeks and PR for 12 weeks; So12 PR24/48 RGT = sofosbuvir for 12 weeks and PR used as RGT for 24 or 48 weeks; T12 PR24/48 RGT = telaprevir for 12 weeks and PR used as RGT for 24 or 48 weeks; T12 PR24 = telaprevir for 12 weeks and PR used for 24 weeks; T12 PR48 = telaprevir for 12 weeks and PR used for 48 weeks. aHealth Canada–recommended dosage regimens in bold. *Not a Health Canada–recommended dosage regimen.

Direct-Acting Antiviral Agents for Chronic Hepatitis C Genotype 1 32
All trials, except five,14,16,23-25 were multinational studies. The study duration ranged from 24 weeks to 72 weeks, and the sample size ranged from 121 to 1,097 participants (median 386). Of the patients enrolled, 1,415 received PR for 48 weeks and 2,889 received a DAA plus PR dosage regimen as per Health Canada recommendations (boceprevir: 368; telaprevir: 1,544; simeprevir: 598; sofosbuvir: 379 patients). The patients enrolled were adults with genotype 1 CHC, excluding those with decompensated liver disease, HIV co-infection, and other causes of liver disease. Seven studies excluded patients with cirrhosis.14-16,22,23,25,26 Among the treatment groups that met the inclusion criteria for this review, the median age of patients enrolled ranged from 40 to 55 years, and 45% to 73% of patients were male (Table 91). The proportion of patients with cirrhosis ranged from 0% to 17%. The management of anemia varied across the included studies. In five studies, the use of erythropoietin was prohibited,13,15,20,24,25 and in three studies,17,18,23 it was not clear whether the use of erythropoietin was allowed. In all other studies, the criteria for use of erythropoiesis-stimulating agents varied. In three studies, erythropoietin was allowed only after the first 12 weeks of therapy.14,16,26 In four studies, erythropoietin use was allowed at the physician’s discretion for hemoglobin levels < 10 g/dL, or according to local treatment guidelines.12,19,21,22 The outcomes reported included SVR12 or SVR24, virologic relapse, treatment completion, mortality, health-related quality of life (HRQoL), and adverse events. None of the studies reported histological changes, liver failure, hepatocellular carcinoma, or need for liver transplant.

Direct-Acting Antiviral Agents for Chronic Hepatitis C Genotype 1 33
TABLE 24: SUMMARY OF RANDOMIZED CONTROLLED TRIALS INCLUDED IN THE NETWORK META-ANALYSIS — TREATMENT-NAIVE PATIENTS
DAA, Author, Year, Study Name, Design
N Population Active Comparatora Placebo/ Control Group
a Country Outcomes,
Study Follow-up
Boceprevir
Poordad et al. 201112
SPRINT-2 RCT, DB Phase 3
1,097 Treatment-naive Genotype 1 CHC Age > 18 years
Peg2b-R SVR24 4 wks, then
Boceprevir 800 mg q8h + Peg2b-R × 24 wks, then stop therapy or Peg2b-R + placebo × 20 wks (RGT)
Boceprevir 800 mg q8h + Peg2b-R × 44 wks
Peg2b-R × 4 wks, then Peg2b-R + placebo × 44 wks
N. America, Europe, Latin America
SVR24, relapse, treatment completion, harms 72 wks
Kwo et al. 201019
SPRINT-1 RCT, OL
b
Phase 2
520 Treatment-naive Genotype 1 CHC Age 18 to 60 years
Peg2b-R × 4 wks, then boceprevir 800 mg q8h + Peg2b-R × 24
Peg2b-R × 4 wks, then boceprevir 800 mg q8h + Peg2b-R × 44 wks
Boceprevir 800 mg q8h + Peg2b-R × 28 wks
Boceprevir 800 mg q8h + Peg2b-R × 48 wks
Peg2b-R × 48 wks US, Canada, Europe SVR24, relapse, treatment completion, harms 52 to 72 wks
Telaprevir
Jacobson et al. 201113
ADVANCE RCT, DB Phase 3
1,088 Treatment-naive Genotype 1 CHC Age 18 to 70 years
Telaprevir 750 mg q8h + Peg2a-R × 12 wks
Telaprevir 750 mg q8h + Peg2a-R × 8 wks, then Peg2a-R + placebo × 4 wks
Then Peg2a-R × 12–36 wks (RGT)
Peg2a-R + placebo × 12 wks then Peg2a-R × 36 wks
N. America, Europe, Argentina, Australia, Israel
SVR12/24, relapse, treatment completion, HRQoL, harms 72 wks
Buti et al. 201321
OPTIMIZE RCT, OL, NI Phase 3
740 Treatment-naive Genotype 1 CHC Age 18 to 70 years
Telaprevir 750 mg q8h + Peg2a-R × 12 wks
Telaprevir 1,125 mg q12h with Peg2a-R × 12 wks
Then 12 to 36 wks Peg2a-R (RGT)
— Europe, N. America SVR12/24, relapse, harms Up to 72 wks

Direct-Acting Antiviral Agents for Chronic Hepatitis C Genotype 1 34
DAA, Author, Year, Study Name, Design
N Population Active Comparatora Placebo/ Control Group
a Country Outcomes,
Study Follow-up
Marcellin et al. 201122
C208 RCT, OL Phase 2
161 Treatment-naive Genotype 1 CHC Non-cirrhotic Age 18 to 65 years
Telaprevir 750 mg q8h + Peg2a-R × 12 wks
Telaprevir 750 mg q8h + Peg2b-R × 12 wks
Telaprevir 1,125 mg q12h with Peg2a-R × 12 wks
Telaprevir 1,125 mg q12h with Peg2b-R × 12 wks
Then 12-36 wks Peg2a/b-R (RGT)
— Austria, Belgium, France, Germany, Italy, Spain, Netherlands
SVR24, relapse, treatment completion, harms Up to 72 wks
Hezode et al. 200926
PROVE-2 RCT, partially blinded Phase 2
334 Treatment-naive Genotype 1 CHC Non-cirrhotic Age 18 to 65 years
Telaprevir 750 mg q8h + Peg2a-R × 12 wks, then Peg2a-R × 12 wks
Telaprevir 750 mg q8h + Peg2a-R × 12 wks
Telaprevir 750 mg q8h + Peg2a (no ribavirin) × 12 wks
Peg2a-R + placebo × 12 wks, then Peg2a-R × 36 wks
France, Germany, UK, Austria
SVR12/24, relapse, treatment completion, harms Up to 72 wks
McHutchison et al. 2009
14
PROVE-1 RCT, DB Phase 2
250 Treatment-naive Genotype 1 CHC Non-cirrhotic Age 18 to 65 years
Telaprevir 750 mg q8h + Peg2a-R × 12 wks
Telaprevir 750 mg q8h + Peg2a-R × 12 wks, then Peg2a-R × 12 wks
Telaprevir 750 mg q8h + Peg2a-R × 12 wks, then Peg2a-R × 36 wks
Peg2a-R + placebo × 12 wks, then Peg2a-R × 36 wks
US SVR12/24, relapse, treatment completion, harms Up to 72 wks

Direct-Acting Antiviral Agents for Chronic Hepatitis C Genotype 1 35
DAA, Author, Year, Study Name, Design
N Population Active Comparatora Placebo/ Control Group
a Country Outcomes,
Study Follow-up
Kumada et al. 201223
RCT, OL
189 Treatment-naive Genotype 1 CHC Age 20 to 65 years
Telaprevir 750 mg q8h + Peg2b-R × 12 wks
Then Peg2b-R × 12 wks
Peg2b-R × 48 wks Japan SVR24, relapse, treatment completion, harms 48 to 72 wks
Simeprevir
QUEST-1116,117
(STUDY 208) RCT, DB Phase 3
394 Treatment-naive Genotype 1 CHC Age ≥ 18 years
Simeprevir 150 mg daily + Peg2a-R × 12 wks then Peg2a-R × 12-36 wks (RGT)
Peg2a-R + placebo × 12 wks, then Peg2a-R × 36 wks
N. America, Europe, Asia-Pacific
SVR12 Relapse Harms (12 wks) 72 wks planned (60-wk data available)
QUEST-2116,117
(STUDY 216) RCT, DB Phase 3
391 Treatment-naive Genotype 1 CHC Age ≥ 18 years
Simeprevir 150 mg daily + Peg2a-R or Peg2b-R × 12 wks then Peg2a-R or Peg2b-R × 12 to 36 wks (RGT) (European patients were randomized to either Peg2a or Peg2b; patients from other countries received Peg2a)
Peg2a-R + placebo × 12 wks then Peg2a-R × 36 wks
Europe, US, S. America
SVR12 Relapse Harms (12 wks) 72 wks planned (60-wk data available)
Fried et al. 201315
PILLAR (STUDY C205) RCT, DB Phase 2
386 Treatment-naive Genotype 1 CHC Non-cirrhotic Adult
Simeprevir 150 mg daily + Peg2a-R × 12 wks, then placebo + Peg2a-R × 12 wks
Simeprevir 75 mg daily + Peg2a-R × 12 wks, then placebo + Peg2a-R × 12 wks
Simeprevir 150 mg daily + Peg2a-R × 24 wks
Simeprevir 75 mg daily + Peg2a-R × 24 wks
then stop therapy or Peg2a-R × 24 wks (RGT)
Peg2a-R + placebo × 24 wks, then Peg2a-R × 24 wks
N. America, Europe, Asia-Pacific
SVR12/24, relapse, treatment completion, harms 72 wks

Direct-Acting Antiviral Agents for Chronic Hepatitis C Genotype 1 36
DAA, Author, Year, Study Name, Design
N Population Active Comparatora Placebo/ Control Group
a Country Outcomes,
Study Follow-up
Sofosbuvir
Lawitz et al. 201316
PROTON RCT, DB
b
Phase 2
121 Treatment-naive Genotype 1 CHC Non-cirrhotic Age 18 to 70 years
Sofosbuvir 200 mg daily + Peg2a-R × 12 wks
Sofosbuvir 400 mg daily + Peg2a-R × 12 wks
Then Peg2a-R × 12 to 36 wks (RGT)
Peg2a-R + placebo × 12 wks, then Peg2a-R × 36 wks
US SVR12/24, relapse, treatment completion, harms (12 wks) 48 to 72 wks
CHC = chronic hepatitis C; DAA = direct-acting antiviral; DB = double blind; HRQoL = health-related quality of life; NI = non-inferiority study; OL = open label; Peg2a/b-R = peginterferon 2a or 2b plus ribavirin; q8h = every 8 hours; q12h = every 12 hours; RCT = randomized controlled trial; RGT = response-guided therapy; SVR12/24 = sustained virologic response 12 or 24 wks after the end of treatment; wk = week. aPatients received the standard dose of peg-R (peginterferon 2a 180 mcg per week + ribavirin 1,000 mg if < 75 kg, or 1,200 mg if ≥ 75 kg, divided into two doses per day; peginterferon 2b 1.5 mcg/kg per week with weight-based ribavirin [800 mg to 1,400 mg]) except for Poordad et al.12 (ribavirin 600 mg to 1,400 mg/day); Kumada et al.23 (ribavirin 600 mg to 1,000 mg/day). bThe study included a second cohort that was allocated to treatment and analyzed separately. The cohort did not meet the inclusion criteria for the systematic review and thus has not been summarized.
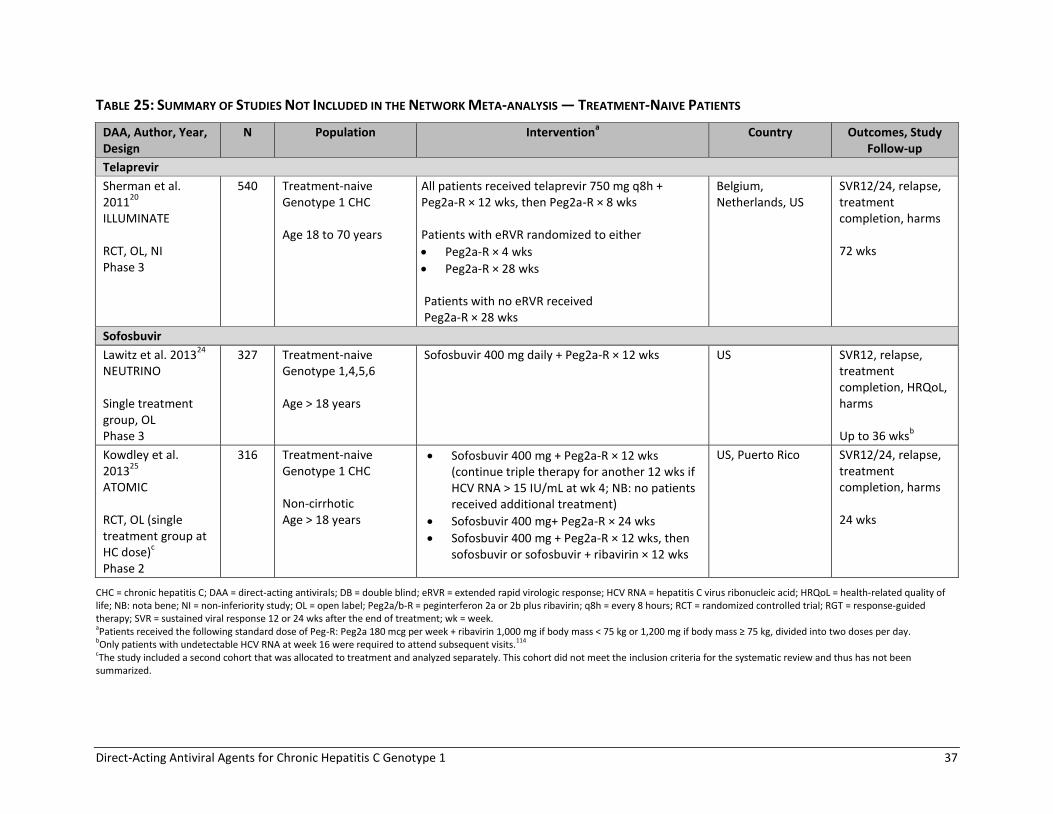
Direct-Acting Antiviral Agents for Chronic Hepatitis C Genotype 1 37
TABLE 25: SUMMARY OF STUDIES NOT INCLUDED IN THE NETWORK META-ANALYSIS — TREATMENT-NAIVE PATIENTS
DAA, Author, Year, Design
N Population Interventiona Country Outcomes, Study
Follow-up
Telaprevir
Sherman et al. 2011
20
ILLUMINATE RCT, OL, NI Phase 3
540 Treatment-naive Genotype 1 CHC Age 18 to 70 years
All patients received telaprevir 750 mg q8h + Peg2a-R × 12 wks, then Peg2a-R × 8 wks Patients with eRVR randomized to either
Peg2a-R × 4 wks
Peg2a-R × 28 wks Patients with no eRVR received Peg2a-R × 28 wks
Belgium, Netherlands, US
SVR12/24, relapse, treatment completion, harms 72 wks
Sofosbuvir
Lawitz et al. 201324
NEUTRINO Single treatment group, OL Phase 3
327 Treatment-naive Genotype 1,4,5,6 Age > 18 years
Sofosbuvir 400 mg daily + Peg2a-R × 12 wks US SVR12, relapse, treatment completion, HRQoL, harms Up to 36 wks
b
Kowdley et al. 2013
25
ATOMIC RCT, OL (single treatment group at HC dose)
c
Phase 2
316 Treatment-naive Genotype 1 CHC Non-cirrhotic Age > 18 years
Sofosbuvir 400 mg + Peg2a-R × 12 wks (continue triple therapy for another 12 wks if HCV RNA > 15 IU/mL at wk 4; NB: no patients received additional treatment)
Sofosbuvir 400 mg+ Peg2a-R × 24 wks
Sofosbuvir 400 mg + Peg2a-R × 12 wks, then sofosbuvir or sofosbuvir + ribavirin × 12 wks
US, Puerto Rico SVR12/24, relapse, treatment completion, harms 24 wks
CHC = chronic hepatitis C; DAA = direct-acting antivirals; DB = double blind; eRVR = extended rapid virologic response; HCV RNA = hepatitis C virus ribonucleic acid; HRQoL = health-related quality of life; NB: nota bene; NI = non-inferiority study; OL = open label; Peg2a/b-R = peginterferon 2a or 2b plus ribavirin; q8h = every 8 hours; RCT = randomized controlled trial; RGT = response-guided therapy; SVR = sustained viral response 12 or 24 wks after the end of treatment; wk = week. aPatients received the following standard dose of Peg-R: Peg2a 180 mcg per week + ribavirin 1,000 mg if body mass < 75 kg or 1,200 mg if body mass ≥ 75 kg, divided into two doses per day. bOnly patients with undetectable HCV RNA at week 16 were required to attend subsequent visits.114 cThe study included a second cohort that was allocated to treatment and analyzed separately. This cohort did not meet the inclusion criteria for the systematic review and thus has not been summarized.
Direct-Acting Antiviral Agents for Chronic Hepatitis C Genotype 1 38
4.2.2 Treatment-Experienced Patients A total of nine studies enrolled patients with genotype 1 CHC who had failed to achieve an SVR with PR therapy (Table 26).27-35 Of these, six were double-blind RCTs, which were included in the NMA (Table 27).27-32 The other three studies were non-randomized, uncontrolled, open-label trials that could not be connected to the network (Table 28).33-35 All studies included patients with relapse after PR therapy, eight studies included those with a partial response,27-30,32-35 and six studies29,30,32-35 included patients with a null response to prior PR therapy. In the Colombo et al. 201334 study, adults with bridging fibrosis or cirrhosis were enrolled, including treatment-naive (20%) and treatment-experienced patients (80%).
The study conducted by Muir et al.35 enrolled 117 patients who participated in the PROVE1, PROVE2, or PROVE3 phase 2 studies. All patients had received PR therapy in the parent study and did not achieve an SVR. Of these patients, 82 (70%) were enrolled in the PROVE3 trial of treatment-experienced patients and thus had received at least two courses of treatment prior to enrolling in the study by Muir et al.35 The PROVIDE study33 enrolled 168 patients who participated in the SPRINT-1, SPRINT-2, RESPOND2, or P05685 clinical trials. All patients had received PR therapy in the parent study and did not achieve an SVR. Of these patients, 81 (48%) were enrolled in the RESPOND2 or P05685 trials of treatment-experienced patients and thus had received at least two courses of treatment prior to enrolling in PROVIDE. Six RCTs compared PR plus boceprevir,27,28 telaprevir,29,30 or simeprevir with 48 weeks of PR therapy (with placebo) (Table 26).31,32 All but one RCT30 included a treatment group that was consistent with a Health Canada–recommended dosage regimen; however, not all subpopulations (with relapse, partial, or null PR response) were studied at the Health Canada dose. No sofosbuvir studies or DAA head-to-head RCTs were identified. In addition, no RCTs evaluating the telaprevir 1,125 mg every 12 hour dosing regimen were found in treatment-experienced patients.
All trials were multinational studies with a follow-up duration ranging from 16 to 72 weeks.27-35 The sample size ranged from 117 to 1,587, with a median of 403 participants. Among the treatment groups of interest in this review, the average age ranged from 48 to 53.5 years, 59% to 72% were male, and 9% to 53% of patients had cirrhosis (Table 92 and Table 93). All trials excluded patients with decompensated liver disease, HIV co-infection, and other causes of liver disease. The studies used similar criteria to define patients with relapse,27-33,35 or partial27-29,32,33,35 or null response29,32,33,35 to PR therapy, except for the PROVE3 study.30 In PROVE3, non-responders were defined as patients who never achieved undetectable HCV RNA levels with PR therapy, whereas other studies used more specific criteria and defined partial responders as those with ≥ 2 log10 reduction in HCV RNA levels by week 12, but detectable levels during therapy, and null responders as those with < 2 log10 reduction in HCV RNA levels by week 12. The study by Colombo et al.34 did not provide definitions for patients’ previous treatment response. For the management of anemia, erythropoietin use was allowed in the three studies,27,28,35 unreported in one study,33 and not allowed in all the other trials.29-
32,34 The outcomes reported included SVR12 or SVR24, virologic relapse, treatment completion, mortality, and adverse events. None of the studies reported HRQoL, histological changes, liver failure, hepatocellular carcinoma, or liver transplant incidence.

Direct-Acting Antiviral Agents for Chronic Hepatitis C Genotype 1 39
TABLE 26: SUMMARY OF PATIENT POPULATIONS AND DOSAGE REGIMENS IN STUDIES IN TREATMENT-EXPERIENCED PATIENTS
Study
Prior PR Treatment Treatmenta
Tre
atm
en
t-n
aive
Re
lap
se
Par
tial
re
spo
nse
Nu
ll re
spo
nse
PR
48
B3
2 P
R3
6/4
8 R
GT
B4
4 P
R4
8
T12
PR
12
/48
RG
T q
8
T12
PR
48
q8
*T1
2 P
R4
8 L
I q8
*T1
2 P
R2
4 q
8
Si1
2 P
R2
4/4
8 R
GT
Si1
2 P
R4
8
Included in the NMA
RESPOND227
x x x x x
P0568528
x x x x
REALIZE29
x x x x x x
PROVE330
x x x x x
PROMISE31
x x x
ASPIRE32
x x x x x
Not included in the NMA
PROVIDE33
x x x x
Colombo 201334
x x x x x x
Muir 201135
x x x x x x
B32 PR36/48 = boceprevir for 32 weeks and PR used as RGT for 36 or 48 weeks; B44 PR48 = boceprevir for 44 weeks and PR used for 48 weeks; NMA = network meta-analysis; PR48 = pegylated interferon 2a or 2b plus ribavirin for 48 weeks; q8 = every 8 hours (refers to dosing of DAA); RGT = response-guided therapy; Si12 PR24/48 RGT = simeprevir for 12 weeks and PR used as RGT for 24 or 48 weeks; Si12 PR48 = simeprevir for 12 weeks and PR for 12 weeks; T12 PR24/48 RGT = telaprevir for 12 weeks and PR used as RGT for 24 or 48 weeks; T12 PR24 = telaprevir for 12 weeks and PR used for 24 weeks; T12 PR48 = telaprevir for 12 weeks and PR used for 48 weeks; T12 PR48 LI = telaprevir for 12 weeks and PR used for 48 weeks (initial 4-week lead-in therapy with PR). aHealth Canada–recommended dosage regimens in bold.
*Not a Health Canada–recommended dosage regimen.

Direct-Acting Antiviral Agents for Chronic Hepatitis C Genotype 1 40
TABLE 27: SUMMARY OF RANDOMIZED CONTROLLED TRIALS INCLUDED IN THE NETWORK META-ANALYSIS — TREATMENT-EXPERIENCED PATIENTS
DAA, Author, Year, Study name, Design
N Populationa Active Comparator
b Placebo/Control Group
b Country Outcomes,
Follow-up
Boceprevir
Bacon et al., 201127
RESPOND2 DB, RCT Phase 3
403 Prior non-response or relapse, genotype 1 CHC Age ≥ 18 years
Peg2b-R × 4 wks, then
Boceprevir 800 mg q8h + Peg2b-R × 32 wks, then Peg2b-R + placebo up to 12 wks (RGT), or
Boceprevir 800 mg q8h + Peg2b-R × 44 wks
Peg2b-R × 4 wks, then Peg2b-R + placebo × 44 wks
N. America, Europe
SVR24, relapse, treatment completion, harms 72 wks
Flamm et al., 2013
28
P05685 DB, RCT Phase 3
201 Prior non-response or relapse, genotype 1 CHC Age ≥ 18 years
Peg2a-R × 4 wks, then boceprevir 800 mg q8h + Peg2a-R × 44 wks
Peg2a-R × 4 wks, then Peg2a-R + placebo × 44 wks
N. America, Europe
SVR24, relapse, treatment completion, harms 72 wks
Telaprevir
Zeuzem et al., 2011
29
REALIZE DB, RCT Phase 3
662 No or partial response to previous therapy, genotype 1 CHC 18 to 70 years
Telaprevir 750 mg q8h + Peg2a-R × 12 wks, then Peg2a-R × 36 wks
c
Peg2a-R × 4 wks, then telaprevir 750 mg q8h + Peg2a-R × 12 wks, then Peg2a-R × 32 wks†
Peg2a-R + placebo × 16 wks, then Peg2a-R × 32 wks
Europe, S. America, N. America
SVR12/24, relapse, treatment completion, harms 72 wks
McHutchison et al., 2010
30
PROVE3 DB, RCT Phase 2
453 Prior non-response or relapse, genotype 1 CHC 18 to 70 years
Telaprevir 750 mg q8h + Peg2a-R × 12 wks, then Peg2a-R × 12 wks
c
Telaprevir 750 mg q8h + Peg2a-R × 24 wks, then Peg2a-R × 24 wks
Telaprevir 750 mg q8h + Peg2a-R × 24 wks
Peg2a-R + placebo × 24 wks, then Peg2a-R × 24 wks
US, Canada, Netherlands, Germany
SVR24, relapse, treatment completion, harms Up to 72 wks

Direct-Acting Antiviral Agents for Chronic Hepatitis C Genotype 1 41
DAA, Author, Year, Study name, Design
N Populationa Active Comparator
b Placebo/Control Group
b Country Outcomes,
Follow-up
Simeprevir
Forns et al., 201431
PROMISE DB, RCT Phase 3
393 Relapsed, genotype 1 CHC Age ≥ 18 years
Simeprevir 150 mg daily + Peg2a-R × 12 wks, then Peg2a-R × 12 to 36 wks (RGT)
Peg2a-R + placebo × 12 wks, then Peg2a-R × 36 wks
N. America, Europe, Asia-Pacific
SVR12, relapse, harms (12 wks) 72 wks planned (60-wk data available)
Zeuzem et al., 2014
32
ASPIRE DB, RCT Phase 2b
462 Null or partial response, or relapse, after Peg-R; genotype 1 CHC 18 to 70 years
7 treatment groupsc
Simeprevir 100 mg or 150 mg daily for 12, 24, or 48 wks in combination with Peg2a-R × 48 wks
Peg2a-R + placebo × 48 wks
Europe, N. America, Australia, New Zealand
SVR12/24, relapse, treatment completion, harms 72 wks
CHC = chronic hepatitis C; DAA = direct-acting antiviral; DB = double blind; N. = North; Peg2a/b-R = peginterferon 2a or 2b plus ribavirin; q8h = every 8 hours; RCT = randomized controlled trial; RGT = response-guided therapy; SVR12/24 = sustained viral response 12 or 24 weeks after the end of treatment; wk = week. aEnrolled patients who did not achieve an SVR with peginterferon with ribavirin therapy for a minimum of 12 weeks in RESPOND2, P05685, PROVE3, ASPIRE; 24 weeks in PROMISE; or 80% of intended dose in REALIZE. bPatients received the following standard dose of peginterferon plus ribavirin: peg2a 180 mcg per week + ribavirin 1,000 mg if body mass < 75 kg, or 1,200 mg if body mass ≥ 75 kg, divided into two doses per day; peg2b 1.5 mcg/kg per week with weight-based ribavirin (800 mg to 1,400 mg), except for RESPOND2 (ribavirin 600 mg to 1,400 mg). cPatients received placebo when not on DAA during the first 16, 24, or 48 weeks of treatment in the REALIZE, PROVE3, and ASPIRE trials, respectively.

Direct-Acting Antiviral Agents for Chronic Hepatitis C Genotype 1 42
TABLE 28: SUMMARY OF STUDIES NOT INCLUDED IN THE NETWORK META-ANALYSIS — TREATMENT-EXPERIENCED PATIENTS
DAA, Author, Year, Study name, Design
N Population Interventiona Country Outcomes,
Study follow-up
Boceprevir
Vierling et al., 2013
33
PROVIDE Single-arm, OL, rollover study
168 Treatment-experienced genotype 1 CHC patients from SPRINT-1 or -2, RESPOND 2 or Study 05685 (Flamm et al. 2013) RCTs who completed at least 12 wks of PR therapy and did not achieve SVR Adults
Peg2b-R × 4 wks, then boceprevir 800 mg q8h + Peg2b-R × 44 wks PR lead-in therapy was waived if patients had enrolled within two wks of EOT in parent study
US, Italy, Germany Spain, France, Canada, Puerto Rico, Argentina
SVR24, relapse, treatment completion, harms Up to 72 wks
Telaprevir
Colombo et al., 2013
34
Single-arm, OL, expanded access program
1,587 Treatment-naive or treatment-experienced genotype 1 CHC with bridging fibrosis or cirrhosis Age 18 to 70 years
Telaprevir 750 mg q8h + Peg2a/2b-R × 12 wks, then:
Peg2a/b-R × 12 or 36 wks (RGT) for treatment-naive patients or patients with prior relapse, or
Peg2a/b-R × 36 wks for patients with prior partial or null response, and all patients with cirrhosis
Europe, S. America, Australasia
Harms Interim data or patients who reached 16 wks therapy
Muir et al., 2011
35
Single-arm, OL, rollover study
117 Treatment-experienced genotype 1 CHC from PROVE1, 2 or 3 RCTs who failed PR therapy Adults
Telaprevir 750 mg q8h + Peg2a-R × 12 wks, then:
Peg2a-R × 12 or 36 wks (RGT) for patients with prior relapse, partial response or viral breakthrough
Peg2a/b-R × 36 wks for null responders Note: These dosing regimens were initiated after a protocol amendment. Initial patients all received 12 wks of triple therapy followed by 12 wks Peg-R (N = 28)
US, Puerto Rico, Canada, France, Germany, Austria, UK
SVR24, relapse, treatment completion, harms Up to 72 wks
CHC = chronic hepatitis C; DAA = direct-acting antiviral; OL = open label; EOT = end of treatment; Peg2a/b-R = peginterferon 2a or 2b plus ribavirin; q8h = every 8 hours; RGT = response-guided therapy; S. = South; SVR24 = sustained viral response 24 wks after the end of treatment; wk = week. aPatients received the following standard dose of peginterferon plus ribavirin: Peg2a 180 mcg per week + ribavirin 1,000 mg if body mass < 75 kg, or 1,200 mg if body mass ≥ 75 kg, divided into two doses per day; Peg2b 1.5 mcg/kg per week with weight-based ribavirin (800 mg to 1,400 mg), except for PROVIDE (ribavirin 600 mg to 1,400 mg) and Colombo et al., 2013 (dose of peg-R not reported).

Direct-Acting Antiviral Agents for Chronic Hepatitis C Genotype 1 43
4.2.3 HIV Co-infection Two double-blind RCTs evaluated DAAs for the treatment of patients with genotype 1 CHC and stable HIV disease (Table 29).36,37 The studies compared boceprevir or telaprevir plus PR with placebo plus PR, in adults with no prior treatment of CHC. Both trials were multinational RCTs that were 72 weeks in duration. The outcomes reported included SVR12 and SVR24, relapse, treatment completion, and harms.36,37 In the boceprevir study, 98 patients were randomized to receive either placebo plus PR for 48 weeks or PR lead-in for four weeks, then PR plus boceprevir 800 mg every eight hours for 44 weeks.36 This study excluded patients taking didanosine, zidovudine, efavirenz, or other non-nucleoside reverse transcriptase inhibitors. The mean age per treatment group ranged from 43 to 45 years, 65% to 72% of participants were male, and 3% had cirrhosis (Table 94, Appendix 11). Most patients were taking a ritonavir-boosted HIV protease inhibitor with two nucleoside reverse transcriptase inhibitors (Table 95, Appendix 11). Patients in the control group who failed treatment by week 24 had the option of crossing over to boceprevir therapy.36 In the telaprevir RCT,37 enrolment was restricted to patients who were receiving no antiretrovirals, or who were treated with one of two antiretroviral regimens including efavirenz, or ritonavir-boosted atazanavir (Table 29). Patients receiving or not receiving antiretrovirals were randomized separately to telaprevir or placebo. The dose of telaprevir was 12 weeks of 1,125 mg every eight hours in patients receiving efavirenz-based antiretroviral therapy or 750 mg every eight hours for all other patients. All patients also received PR therapy for a total of 48 weeks. A total of 60 patients were randomized, of whom 22% were not receiving antiretrovirals. The median age per treatment group ranged from 44 to 46 years, 82% to 92% were male, and 0% to 5% had cirrhosis (Table 94, Appendix 11).

Direct-Acting Antiviral Agents for Chronic Hepatitis C Genotype 1 44
TABLE 29: SUMMARY OF INCLUDED RANDOMIZED CONTROLLED TRIALS — PATIENTS WITH HIV CO-INFECTION
DAA, Author, Year, Design, Phase
N Population, Key Inclusion Criteria Intervention Placebo/Control Group
Country Outcomes,
Study Follow-up
Boceprevir
Sulkowski et al., 2013
36
RCT, DB Phase 2
98 Treatment-naive genotype 1 CHC and HIV patients (stable HIV disease >6 mo duration) Age 18 to 65 years; ≥ 200 CD4
cells/µL; HIV RNA < 50 copies/mL Excluded patients taking didanosine, zidovudine, efavirenz, or other NNRTI
Peg2b-R × 4 wks, then boceprevir 800 mg q8h + Peg2b-R × 44 wks
a
Peg2b-R × 4 wks then Peg2b-R + placebo × 44 wks
a
Europe, S. America, US, Canada
SVR12/24, relapse, harms 72 wks
Telaprevir
Sulkowski et al., 2013
37
RCT, DB Phase 2
60 Treatment-naive genotype 1 CHC and stable HIV patients Age 18 to 65 years Part A: no antiretroviral therapy, ≥ 500 CD4 cells/µL and ≤ 100,000 HIV RNA copies/mL; Part B: ≥ 300 CD4 cells/µL, HIV RNA < 50 copies/mL and > 12 wks of either (1) efavirenz, tenofovir, and emtricitabine or (2) ritonavir-boosted atazanavir, tenofovir, and either emtricitabine or lamivudine antiretroviral therapy
Telaprevir + Peg2a-R × 12 wks, then Peg2a-R × 36 wks
b
Efavirenz-based regimens: Telaprevir 1,125 mg q8h All other patients: Telaprevir 750 mg q8h
Placebo + Peg2a-R × 12 wks, then Peg2a-R × 36 wks
b
US, Spain, Germany, France
SVR12/24, relapse, harms 72 wks
CHC = chronic hepatitis C; DAA = direct-acting antiviral; DB = double blind; mo = month; NNRTI = non-nucleoside reverse transcriptase inhibitors; Peg2a/b-R = peginterferon 2a or 2b plus ribavirin; q8h = every 8 hours; q12h = every 12 hours; RCT = randomized controlled trial; RNA = ribonucleic acid; S. = South; SVR12/24 = sustained viral response 12 or 24 weeks after the end of treatment; wk = week. aPeginterferon 2b 1.5 mcg/kg per week by subcutaneous injection plus ribavirin 600 mg to 1,400 mg per day (weight-based). bPeginterferon 2a 180 mcg per week by subcutaneous injection plus ribavirin 800 mg per day, except in France and Germany, where patients received 1,000 mg to 1,200 mg ribavirin per day, based on weight.

Direct-Acting Antiviral Agents for Chronic Hepatitis C Genotype 1 45
4.4 Critical Appraisal of Included Studies
All studies were assessed for the risk of bias related to randomization, allocation concealment (selection bias), blinding (performance and detection bias), incomplete outcome measures (attrition bias), selective outcome reporting (reporting bias), and other sources of bias according to the Cochrane Handbook.129 4.4.1 Treatment-Naive Patients All but one study12 had one or more domains with an unclear or high risk of bias (Table 86, Appendix 9). Fourteen of 15 studies were industry-funded; the funding source was not reported in Kumada et al.23 The risk of bias for the 12 RCTs included in the NMA is summarized in Figure 2. Randomization and allocation concealment methods were adequate in eight trials; allocation concealment was unclear in four RCTs.14,22,23,26 Four studies were open-label trials.19,21-23 Eight studies were described as double-blind; however, not all treatment groups were blinded in one study.26 In 10 studies, it was not clear whether patients and investigators were blinded to the HCV RNA level results or whether blinding of HCV RNA results were maintained for only a portion of the treatment period.12-14,16,21-23,26,127,128 There is potential for bias if knowledge of treatment allocation or virologic response influenced patients’ decisions to complete the course of therapy, especially for patients in the PR group who may have had the option of escape treatment with a DAA. More patients stopped therapy early in the PR than the DAA treatment groups in nine trials,12-14,16,19,23,26,127,128 but a portion of the excess discontinuation in the PR groups was due to patients meeting early virologic stopping rules. The risk of bias related to incomplete outcome measures was rated as low for all but three studies,14,23,26 which had an unclear risk of bias. The proportion of patients who withdrew from the studies was less than 20% and was similar between treatment groups within studies in eight trials (range 4% to 17%).13,15,19,21-23,127,128 In two RCTs, there were substantially more withdrawals in the PR than the DAA treatment groups (SPRINT-212 35% versus 21%; PROTON16 46% versus 11%, respectively) (Table 89, Appendix 1). In all trials, the intention-to-treat analysis included all patients who received at least one dose of study medication. The non-inferiority trial failed to report the results of the per-protocol analysis and was rated as high risk of bias due to selective outcome reporting.21 The baseline patient characteristics were similar within and across studies; however, five phase 2 trials14-
16,22,26 excluded patients with cirrhosis, who are less likely to respond to antiviral therapy. Two studies (QUEST1 and QUEST2)127,128 reported interim data based on 60 of 72 weeks of follow-up; thus, data on SVR24 and relapse after 24 weeks of follow-up were not available. At the time the analyses were conducted, these trials, as well as PROTON,16 reported adverse event data for the first 12 weeks of treatment, not the entire treatment period, which makes it difficult to compare the incidence of adverse events across all DAA studies.

Direct-Acting Antiviral Agents for Chronic Hepatitis C Genotype 1 46
FIGURE 2: RISK OF BIAS FOR STUDIES IN TREATMENT-NAIVE PATIENTS INCLUDED IN NETWORK META-ANALYSIS
Two sofosbuvir trials and one telaprevir trial could not be included in the NMA due to the lack of a linking treatment group: NEUTRINO,24 ATOMIC,25 and ILLUMINATE20 (Table 86, Appendix 9). NEUTRINO was an open-label uncontrolled study of 12 weeks of sofosbuvir plus PR therapy and was rated as an unclear risk of bias related to selection, performance, or detection bias.24 Although the inclusion criteria and patient characteristics of those enrolled appear similar to those in other DAA trials, without a randomized comparator group, the possibility of selection bias cannot be determined. The NEUTRINO study reported SVR12 but not SVR24 results (a secondary outcome specified in the protocol) and thus was rated as high risk of bias due to selective outcome reporting. The potential for late relapse (after 12 weeks of follow-up) is an outcome of key interest, given that this is the first treatment with a short (12-week total) treatment course to reach the market. The ATOMIC study25 was rated as low risk of bias related to randomization, incomplete outcome measures, and other sources of bias. The risk of bias was unclear for allocation concealment, blinding, and selective outcome reporting. The ILLUMINATE RCT was rated as low risk of bias for all domains except two.20 This non-inferiority trial failed to report the results of the per-protocol analysis and was rated as high risk of bias due to selective outcome reporting. There was unclear risk of bias related to blinding. 4.4.2 Treatment-Experienced Patients All of the studies in treatment-experienced patients had one or more domains with an unclear or high risk of bias (Table 87, Appendix 9,). All nine studies were industry-funded. Among the six RCTs included in the NMA, three had an unclear risk of bias related to randomization28,30,31 and one study28 had unclear allocation concealment (Figure 3). There was an unclear or high risk of bias related to blinding27,28,30-32 and selective outcome reporting,28-32 each in five studies. The risk of bias was rated as low in all other domains. For the three non-randomized, open-label, uncontrolled studies not included in the NMA (PROVIDE, Muir et al., and Colombo et al.), the risk of bias related to selection, performance, or detection bias was rated as unclear.33-35 The risk of bias related to incomplete outcome reporting was rated as low and for
0 2 4 6 8 10 12
Other biases
Selective outcome reporting
Incomplete outcome measures
Blinding
Allocation concealment
Randomization
Number of studies
low unclear high

Direct-Acting Antiviral Agents for Chronic Hepatitis C Genotype 1 47
other domains was rated as unclear in the PROVIDE study.33 The other two trials were rated as unclear risk of bias for incomplete outcome measure, selective outcome reporting, and other sources of bias.34,35
FIGURE 3: RISK OF BIAS FOR STUDIES IN TREATMENT-EXPERIENCED PATIENTS INCLUDED IN NETWORK META-ANALYSIS
4.4.3 HIV Co-infection Two RCTs in patients with CHC and HIV co-infection were included.36,37 The risk of bias was low for all domains except selective outcome reporting (rated as unclear) in the telaprevir study (Table 88, Appendix 9).37 In this trial, 18% to 23% of patients did not complete the study. The boceprevir study36 had an unclear risk of bias related to incomplete outcome measures and selective outcome reporting; all other domains were rated as a low risk of bias. Of patients in the boceprevir group, 13% did not complete the follow-up, compared with 21% in the PR group.36 Both studies were industry-funded.
4.5 Data Synthesis
The data extracted from studies in treatment-naive, treatment-experienced, and HIV co-infected patients are listed in Appendix 12, Appendix 13, and Appendix 14, respectively. A summary of the direct evidence is listed in Appendix 15. Indirect evidence from the NMA is included in Appendix 17 to Appendix 24. The results of the NMA random effects model for key analyses are presented below, with each treatment compared with PR48, and additional results are provided in Appendix 17, with subgroup analyses by fibrosis severity and genotype subtype in Appendix 19 and Appendix 20. Consistency plots, where closed-loop evidence networks allowed for assessment, are provided in Appendix 21. A detailed summary of the indirect comparisons conducted for the secondary analyses stratified by peginterferon 2a or 2b (peginterferon 2a plus ribavirin for 48 weeks as the reference treatment), and the analyses of Health Canada doses only, are available in Appendix 22 and Appendix 23, respectively. Consistency plots for the secondary analyses are provided alongside indirect comparison result tables. Evidence network diagrams were generated for each outcome. ORs based on the NMA, as well as relative risks (RRs) and absolute risk differences (RD) estimated using these ORs and the mean proportion of patients who experienced the outcome in the PR48 group, are provided for each outcome, comparing each treatment with PR48. Results for comparisons between treatments are also presented.
0 1 2 3 4 5 6
Other biases
Selective outcome reporting
Incomplete outcome measures
Blinding
Allocation concealment
Randomization
Number of studies
low unclear high

Direct-Acting Antiviral Agents for Chronic Hepatitis C Genotype 1 48
The NMA results presented include the point estimate (RD, RR, or OR) as well as the 95% credible intervals (CrI). Crls that exclude the null value (i.e., OR, RR null = 1, RD null = 0) were interpreted to be statistically significant. A summary of the data available for the base-case, all-doses analyses, is presented in Table 30. Figure 4 provides a legend for interpreting the staircase diagrams used to summarize NMA results.
TABLE 30: SUMMARY OF DATA AVAILABLE FOR THE NETWORK META-ANALYSISa
Population/Outcome No. of Treatment Strategies
No. of Patients No. of RCTs
Treatment-Naive
SVR 9 4,160 12
SVR by Metavir fibrosis score F0 to F2 5 2,324 5
SVR by Metavir fibrosis score F3 to F4 5 616 5
SVR by genotype subtype 6 3,038 6
Anemia 9 4,160 12
Depression 8 2,373 7
Rash 9 4,160 12
All Treatment-Experienced
SVR 7 2,020 6
SVR by Metavir fibrosis score F0 to F2 6 1,189 5
SVR by Metavir fibrosis score F3 to F4 6 647 5
SVR by genotype subtype 5 1,350 3
Anemia 7 2,020 6
Depression 6 1,627 5
Rash 7 2,020 6
Prior Relapse
SVR 7 1,287 6
SVR by Metavir fibrosis score F0 to F2 5 664 3
SVR by Metavir fibrosis score F3 to F4 5 316 3
SVR by genotype subtype 3 752 2
Prior Partial Response
SVR 4 370 4
SVR by Metavir fibrosis score F0 to F2 4 167 2
SVR by Metavir fibrosis score F3 to F4 4 88 2
Prior Null Response
SVR 3 217 2
F0 = no fibrosis; F1 = portal fibrosis without septa; F2 = portal fibrosis with rare septa; F3 = numerous septa without cirrhosis; F4 = cirrhosis; RCT = randomized controlled trial; SVR = sustained viral response. aBase-case, all-doses analyses.

Direct-Acting Antiviral Agents for Chronic Hepatitis C Genotype 1 49
FIGURE 4: STAIRCASE DIAGRAM “LEGEND” FOR INTERPRETATION OF RELATIVE RISK AND RISK DIFFERENCE
Treatment 1
Absolute risk difference of treatment 2 compared
with treatment 1
Absolute risk difference of treatment 3 compared
with treatment 1
Absolute risk difference of treatment 4 compared
with treatment 1
Relative risk of treatment 2 compared
with treatment 1
Treatment 2
Absolute risk difference of treatment 3 compared
with treatment 2
Absolute risk difference of treatment 4 compared
with treatment 2
Relative risk of treatment 3 compared
with treatment 1
Relative risk of treatment 3 compared with
treatment 2
Treatment 3
Absolute risk difference of treatment 4 compared
with treatment 3
Relative risk of treatment 4 compared
with treatment 1
Relative risk of treatment 4 compared with
treatment 2
Relative risk of treatment 4 compared with
treatment 3 Treatment 4
Relative risk = RR (95% CrI), Absolute risk difference = RD (95% CrI)
4.5.1 Treatment-Naive Patients a) Sustained Virologic Response SVR is defined as the absence of detectable HCV RNA, 12 weeks (SVR12) to 24 weeks (SVR24) following the end of treatment. Four studies reported SVR24,12,19,22,23 three studies reported SVR12,17,18,24 and eight studies reported both.13-16,20,21,25,26 The differences between SVR24 and SVR12 were 3% or less, except in PROVE1.14 SVR24 was used in the analyses if available; otherwise, SVR12 was used. The proportion of patients with SVR12 or SVR24 is presented in Figure 5, and the direct pairwise comparisons for DAA regimens versus PR alone are given in Table 115, Appendix 15. Based on direct pairwise comparisons, boceprevir (RD 19% and 26%), telaprevir (RD 22% to 31%), simeprevir (RD 27%), and sofosbuvir (RD 32%) were more effective than PR alone.

Direct-Acting Antiviral Agents for Chronic Hepatitis C Genotype 1 50
FIGURE 5: PROPORTION OF TREATMENT-NAIVE PATIENTS WITH SUSTAINED VIROLOGIC RESPONSE
B24 PR28/48 RGT = boceprevir for 24 weeks and PR used as RGT for 28 or 48 weeks; B24 PR28 = boceprevir for 24 weeks and PR used for 28 weeks; eRVR = patients met extended rapid viral response criteria showing favourable treatment response; no eRVR = patients did not meet extended rapid viral response criteria indicating less favourable early treatment response; PR48 2a or 2b = pegylated interferon 2a or 2b plus ribavirin for 48 weeks; q8 = every 8 hours (pertains to dosing of DAA); q12 = every 12 hours (pertains to dosing of DAA); PR = peginterferon + ribavirin; RGT = response-guided therapy; Si12 PR24/48 RGT = simeprevir for 12 weeks and PR used as RGT for 24 or 48 weeks; So12 PR12 = sofosbuvir for 12 weeks and PR for 12 weeks; So12 PR24/48 RGT = sofosbuvir for 12 weeks and PR used as RGT for 24 or 48 weeks; T12 PR24/48 RGT = telaprevir for 12 weeks and PR used as RGT for 24 or 48 weeks; T12 PR24 = telaprevir for 12 weeks and PR used for 24 weeks; T12 PR48 = telaprevir for 12 weeks and PR used for 48 weeks. *Not a Health Canada–recommended dosage regimen.
38
63
38
56
44
75
73
75
85
81
83
82
92
88
64
46
69
41
61
67
49
73
50
80
50
81
65
81
58
89
89
88
0 10 20 30 40 50 60 70 80 90 100
PR48 2b
B24 PR28/48 2b RGT
PR48 2b
*B24 PR28 2b
PR48 2a
T12 PR24/48 2a RGT q8
T12 PR24/48 2a RGT q8
T12 PR24/48 2a RGT q12
T12 PR24/48 2a RGT q8
T12 PR24/48 2b RGT q8
T12 PR24/48 2a RGT q12
T12 PR24/48 2b RGT q12
T12 PR24 2a RGT eRVR q8
*T12 PR48 2a RGT eRVR q8
T12 PR48 2a RGT no eRVR q8
PR48 2a
*T12 PR24 2a q8
PR48 2a
*T12 PR24 2a q8
*T12 PR48 2a q8
PR48 2b
*T12 PR24 2b q8
PR48 2a
Si12 PR24/48 2a RGT
PR48 2a/b
Si12 PR24/48 2a/b RGT
PR48 2a
Si12 PR24/48 2a RGT
PR48 2a
*So12 PR24/48 2a RGT
So12 PR12 2a
So12 PR12 2a
SP
RIN
T2
SP
RIN
T1
AD
VA
NC
EO
PT
IMI
ZE
Mar
celli
nIL
LUM
INA
TE
PR
OV
E2
PR
OV
E1
Kum
ada
QU
ES
T1
QU
ES
T2
PIL
LAR
PR
OT
ON
NE
UT
RIN O
AT
OM IC
% SVR12/24

Direct-Acting Antiviral Agents for Chronic Hepatitis C Genotype 1 51
Twelve studies involving a total of 4,160 treatment-naive patients were included in the NMA. Overall, nine different treatment strategies were considered, providing for 14 comparisons. Data for Health Canada–recommended dosage regimens were available for boceprevir, simeprevir, and telaprevir, but not sofosbuvir. All studies were two-group RCTs with the exception of one study that had three treatment groups. The evidence network for this outcome is displayed in Figure 6, with the available number of RCTs indicated for each direct comparison. The results of the NMA between different treatment strategies are provided in Table 31. Compared with PR48 dual therapy, all eight DAAs plus PR triple therapy treatment strategies significantly improved SVR in treatment-naive patients (RR ranging from 1.39 to 1.79 and RD ranging from 19% to 38%). There was no statistically significant difference between DAA triple therapy treatment strategies. Additional results of the NMAs that include the OR are provided in Table 143, Appendix 17, and the consistency plot is shown in Figure 34, Appendix 21.
FIGURE 6: TREATMENT-NAIVE PATIENTS — EVIDENCE NETWORK FOR SUSTAINED VIROLOGIC RESPONSE
2a/b = pegylated interferon 2a or 2b; B24 PR28-48 RGT = boceprevir for 24 weeks and PR used as RGT for 28 or 48 weeks; B24 PR28 = boceprevir for 24 weeks and PR used for 28 weeks; q8 = every 8 hours (pertains to dosing of DAA); q12 = every 12 hours (pertains to dosing of DAA); PR = peginterferon + ribavirin; RCT = randomized controlled trial; RGT = response-guided therapy; Si12 PR24/48 RGT = simeprevir for 12 weeks and PR used as RGT for 24 or 48 weeks; So12 PR24-48 RGT = sofosbuvir for 12 weeks and PR used as RGT for 24 or 48 weeks; T12 PR24-48 RGT = telaprevir for 12 weeks and PR used as RGT for 24 or 48 weeks; T12 PR24 = telaprevir for 12 weeks and PR used for 24 weeks; T12 PR48 = telaprevir for 12 weeks and PR used for 48 weeks. *Not a Health Canada–recommended dosage regimen.

Direct-Acting Antiviral Agents for Chronic Hepatitis C Genotype 1 52
TABLE 31: NMA RESULTS FOR SVR IN TREATMENT-NAIVE PATIENTS: RELATIVE RISK (LOWER SEGMENT) AND
RISK DIFFERENCE % (UPPER SEGMENT) FOR RANDOM EFFECTS MODEL
PR48 2a/b 29.48 (21.75
to 35.71) 29.85 (20.15
to 37.24) 31.24 (17.93
to 39.92) 24.54 (13.95
to 33.20) 37.76 (15.04
to 49.64) 22.28 (12.59
to 30.83) 26.36 (11.46
to 38.14)
18.75 (3.02 to 32.06)
1.62 (1.44 to 1.78)
Si12 PR24/48 2a/b RGT
0.39 (–10.69 to
10.67)
1.73 (–12.51 to
13.08)
–4.98 (–16.74 to
6.39)
8.31 (–14.38 to
22.04)
–7.17 (–18.05 to
3.90)
–3.15 (–18.84 to
10.89)
–10.64 (–27.50 to
4.45)
1.63 (1.42 to 1.81)
1.01 (0.87 to 1.15)
T12 PR24/48 2a/b RGT q8
1.31 (–6.71 to
7.56)
–5.32 (–18.02 to
7.36)
7.78 (–15.28 to
22.88)
–7.57 (–19.30 to
4.91)
–3.54 (–19.77 to
11.36)
–11.08 (–28.10 to
5.01)
1.65 (1.37 to 1.86)
1.02 (0.84 to 1.18)
1.02 (0.91 to 1.10)
T12 PR24/48 2a/b RGT
q12
–6.60 (–20.17 to
8.83)
6.45 (–17.08 to
24.08)
–8.90 (–21.53 to
6.27)
–4.82 (–21.58 to
12.35)
–12.34 (–30.19 to
6.16)
1.51 (1.29 to 1.71)
0.94 (0.79 to 1.09)
0.93 (0.78 to 1.11)
0.92 (0.76 to 1.13)
B24 PR28/48 2b
RGT
13.12 (–10.29 to
28.87)
–2.25 (–15.00 to
11.03)
1.83 (–15.02 to
17.41)
–5.66 (–23.39 to
10.82)
1.79 (1.31 to 2.09)
1.11 (0.82 to 1.31)
1.10 (0.81 to 1.33)
1.08 (0.79 to 1.36)
1.18 (0.86 to 1.45)
*So12
PR24/48 2a RGT
–15.29 (–30.27 to
7.98)
–11.05 (–30.02 to
13.10)
–18.68 (–38.57 to
6.45)
1.47 (1.26 to 1.67)
0.91 (0.78 to 1.05)
0.90 (0.77 to 1.07)
0.89 (0.75 to 1.09)
0.97 (0.81 to 1.17)
0.82 (0.68 to 1.12)
*T12 PR24 2a/b q8
4.08 (–10.18 to
16.50)
–3.48 (–21.28 to
12.57)
1.55 (1.24 to 1.83)
0.96 (0.76 to 1.15)
0.95 (0.75 to 1.16)
0.94 (0.74 to 1.18)
1.03 (0.80 to 1.27)
0.87 (0.67 to 1.20)
1.06 (0.86 to 1.25)
*T12 PR48 2a q8
–7.52 (–27.00 to
12.13)
1.39 (1.06 to 1.69)
0.86 (0.65 to 1.06)
0.86 (0.65 to 1.07)
0.84 (0.63 to 1.09)
0.92 (0.69 to 1.16)
0.78 (0.58 to 1.10)
0.95 (0.71 to 1.20)
0.90 (0.66 to 1.19)
*B24 PR28 2b
2a/b = pegylated interferon 2a or 2b; B24 PR28/48 RGT = boceprevir for 24 weeks and PR used as RGT for 28 or 48 weeks; B24 PR28 = boceprevir for 24 weeks and PR used for 28 weeks; NMA = network meta-analysis; PR48 2a or 2b = pegylated interferon 2a or 2b plus ribavirin for 48 weeks; q8 = every 8 hours (pertains to dosing of DAA); q12 = every 12 hours (pertains to dosing of DAA); PR48 = peginterferon + ribavirin for 48 weeks; RGT = response-guided therapy; Si12 PR24/48 RGT = simeprevir for 12 weeks and PR used as RGT for 24 or 48 weeks; So12 PR24/48 RGT = sofosbuvir for 12 weeks and PR used as RGT for 24 or 48 weeks; SVR = sustained virologic response; T12 PR24/48 RGT = telaprevir for 12 weeks and PR used as RGT for 24 or 48 weeks; T12 PR24 = telaprevir for 12 weeks and PR used for 24 weeks; T12 PR48 = telaprevir for 12 weeks and PR used for 48 weeks.
*Not a Health Canada–recommended dosage regimen.
Note: Bolded numbers indicate statistical significance.
Subgroup Analysis of Sustained Virologic Response by Fibrosis Severity in Treatment-Naive Patients
SVR data by fibrosis severity was available from seven RCTs12,13,17-21 and one uncontrolled study24 (Table 97, Appendix 12), but data from only five RCTs could be used in the analysis. Two trials could not be linked to the network,20,24 and one RCT reported data aggregated by Metavir fibrosis scores F0 to F3, and F4, and thus could not be combined with other trial data.19 The analysis of SVR was stratified by fibrosis severity, with separate analyses conducted for patients with Metavir fibrosis scores F0 to F2, and F3 to F4. Patients with less severe fibrosis (Metavir F0 to F2) generally had higher SVR rates than those with more severe fibrosis (Metavir F3 or F4). Based on direct pairwise comparisons, boceprevir (RD 29%), telaprevir (RD 31%), and simeprevir (RD 28%) were more

Direct-Acting Antiviral Agents for Chronic Hepatitis C Genotype 1 53
effective than PR alone in patients with Metavir fibrosis scores F0 to F2, as were telaprevir (RD 29%) and simeprevir (RD 32%) in patients with Metavir fibrosis scores F3 or F4 (Table 116, Appendix 15). In the NMA, five RCTs provided data for five treatment comparisons involving 2,324 treatment-naive patients with Metavir score F0 to F2, and 616 patients with Metavir score F3 or F4 (Figure 7). No assessment of consistency was possible, as there were no closed loops and no data were available for sofosbuvir.
FIGURE 7: TREATMENT-NAIVE PATIENT SUBGROUPS WITH FIBROSIS SCORE F0 TO F2 OR F3 TO F4 — EVIDENCE
NETWORK FOR SUSTAINED VIROLOGIC RESPONSE
B24 PR28-48 RGT = boceprevir for 24 weeks and PR used as RGT for 28 or 48 weeks; PR48 2a/b = pegylated interferon 2a or 2b plus ribavirin for 48 weeks; q8 = every 8 hours (pertains to dosing of DAA); q12 = every 12 hours (pertains to dosing of DAA); PR = peginterferon + ribavirin; RCT = randomized controlled trial; RGT = response-guided therapy; Si12 PR24-48 RGT = simeprevir for 12 weeks and PR used as RGT for 24 or 48 weeks; T12 PR24-48 RGT = telaprevir for 12 weeks and PR used as RGT for 24 or 48 weeks.
Patients with less fibrosis (Metavir fibrosis scores F0 to F2) who received simeprevir, telaprevir, or boceprevir were all statistically significantly more likely to achieve an SVR than those who received PR alone (Table 32). No statistically significant differences were detected between DAA regimens. A secondary analysis was conducted including data for sofosbuvir from the PROTON study in the network (Table 154). Although PROTON did not report SVR by fibrosis severity, 95% of patients enrolled had fibrosis scores F0 to F2, and thus the overall study population was used as a proxy for the subgroup with fibrosis scores F0 to F2. Sofosbuvir for 12 weeks combined with PR for 24 or 48 weeks RGT was associated with a RR of 1.72 (95% CrI, 1.22, 2.05) compared with PR alone (RD 36.4%; 95 % CrI, 11.6, 48.7) (Table 154). No significant differences were detected between sofosbuvir and other DAA regimens, and between-DAA comparisons were similar to those in the network without the PROTON study (Table 32).
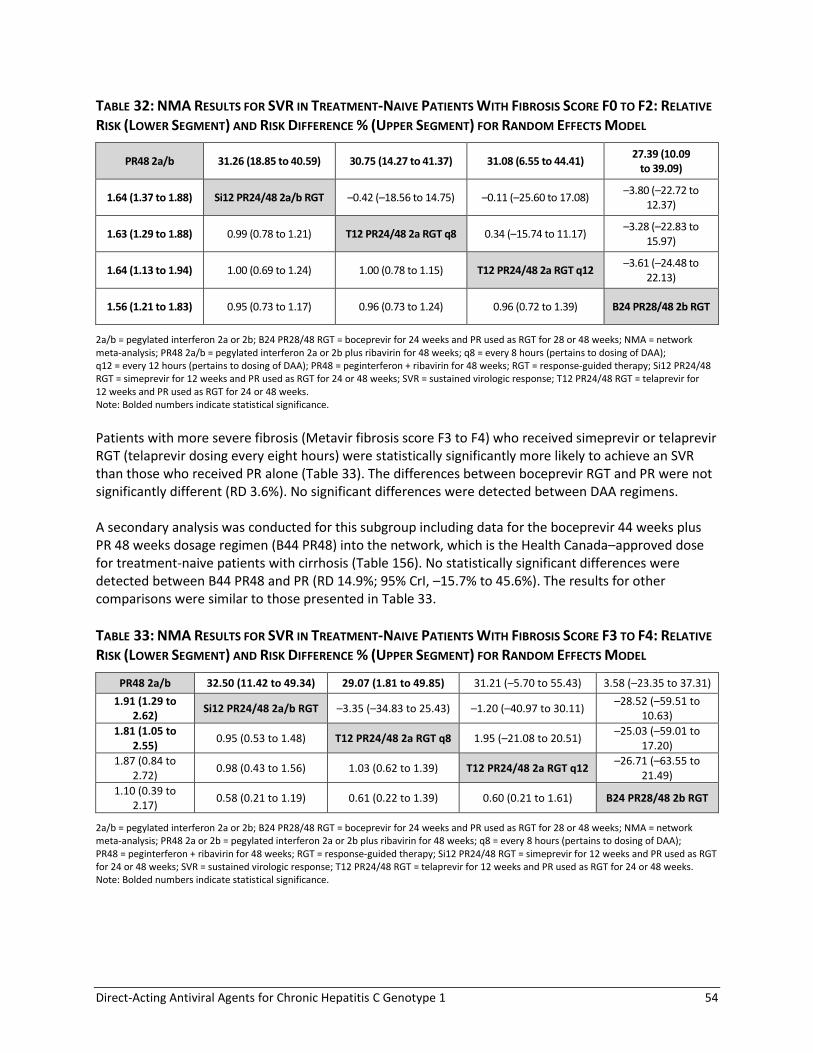
Direct-Acting Antiviral Agents for Chronic Hepatitis C Genotype 1 54
TABLE 32: NMA RESULTS FOR SVR IN TREATMENT-NAIVE PATIENTS WITH FIBROSIS SCORE F0 TO F2: RELATIVE
RISK (LOWER SEGMENT) AND RISK DIFFERENCE % (UPPER SEGMENT) FOR RANDOM EFFECTS MODEL
PR48 2a/b 31.26 (18.85 to 40.59) 30.75 (14.27 to 41.37) 31.08 (6.55 to 44.41) 27.39 (10.09
to 39.09)
1.64 (1.37 to 1.88) Si12 PR24/48 2a/b RGT –0.42 (–18.56 to 14.75) –0.11 (–25.60 to 17.08) –3.80 (–22.72 to
12.37)
1.63 (1.29 to 1.88) 0.99 (0.78 to 1.21) T12 PR24/48 2a RGT q8 0.34 (–15.74 to 11.17) –3.28 (–22.83 to
15.97)
1.64 (1.13 to 1.94) 1.00 (0.69 to 1.24) 1.00 (0.78 to 1.15) T12 PR24/48 2a RGT q12 –3.61 (–24.48 to
22.13)
1.56 (1.21 to 1.83) 0.95 (0.73 to 1.17) 0.96 (0.73 to 1.24) 0.96 (0.72 to 1.39) B24 PR28/48 2b RGT
2a/b = pegylated interferon 2a or 2b; B24 PR28/48 RGT = boceprevir for 24 weeks and PR used as RGT for 28 or 48 weeks; NMA = network meta-analysis; PR48 2a/b = pegylated interferon 2a or 2b plus ribavirin for 48 weeks; q8 = every 8 hours (pertains to dosing of DAA); q12 = every 12 hours (pertains to dosing of DAA); PR48 = peginterferon + ribavirin for 48 weeks; RGT = response-guided therapy; Si12 PR24/48 RGT = simeprevir for 12 weeks and PR used as RGT for 24 or 48 weeks; SVR = sustained virologic response; T12 PR24/48 RGT = telaprevir for 12 weeks and PR used as RGT for 24 or 48 weeks. Note: Bolded numbers indicate statistical significance.
Patients with more severe fibrosis (Metavir fibrosis score F3 to F4) who received simeprevir or telaprevir RGT (telaprevir dosing every eight hours) were statistically significantly more likely to achieve an SVR than those who received PR alone (Table 33). The differences between boceprevir RGT and PR were not significantly different (RD 3.6%). No significant differences were detected between DAA regimens. A secondary analysis was conducted for this subgroup including data for the boceprevir 44 weeks plus PR 48 weeks dosage regimen (B44 PR48) into the network, which is the Health Canada–approved dose for treatment-naive patients with cirrhosis (Table 156). No statistically significant differences were detected between B44 PR48 and PR (RD 14.9%; 95% CrI, –15.7% to 45.6%). The results for other comparisons were similar to those presented in Table 33.
TABLE 33: NMA RESULTS FOR SVR IN TREATMENT-NAIVE PATIENTS WITH FIBROSIS SCORE F3 TO F4: RELATIVE
RISK (LOWER SEGMENT) AND RISK DIFFERENCE % (UPPER SEGMENT) FOR RANDOM EFFECTS MODEL
PR48 2a/b 32.50 (11.42 to 49.34) 29.07 (1.81 to 49.85) 31.21 (–5.70 to 55.43) 3.58 (–23.35 to 37.31)
1.91 (1.29 to 2.62)
Si12 PR24/48 2a/b RGT –3.35 (–34.83 to 25.43) –1.20 (–40.97 to 30.11) –28.52 (–59.51 to
10.63)
1.81 (1.05 to 2.55)
0.95 (0.53 to 1.48) T12 PR24/48 2a RGT q8 1.95 (–21.08 to 20.51) –25.03 (–59.01 to
17.20)
1.87 (0.84 to 2.72)
0.98 (0.43 to 1.56) 1.03 (0.62 to 1.39) T12 PR24/48 2a RGT q12 –26.71 (–63.55 to
21.49)
1.10 (0.39 to 2.17)
0.58 (0.21 to 1.19) 0.61 (0.22 to 1.39) 0.60 (0.21 to 1.61) B24 PR28/48 2b RGT
2a/b = pegylated interferon 2a or 2b; B24 PR28/48 RGT = boceprevir for 24 weeks and PR used as RGT for 28 or 48 weeks; NMA = network meta-analysis; PR48 2a or 2b = pegylated interferon 2a or 2b plus ribavirin for 48 weeks; q8 = every 8 hours (pertains to dosing of DAA); PR48 = peginterferon + ribavirin for 48 weeks; RGT = response-guided therapy; Si12 PR24/48 RGT = simeprevir for 12 weeks and PR used as RGT for 24 or 48 weeks; SVR = sustained virologic response; T12 PR24/48 RGT = telaprevir for 12 weeks and PR used as RGT for 24 or 48 weeks. Note: Bolded numbers indicate statistical significance.

Direct-Acting Antiviral Agents for Chronic Hepatitis C Genotype 1 55
Subgroup Analysis of Sustained Virologic Response by Hepatitis C Virus Genotype Subtype
In this analysis, data were stratified by HCV genotype subtype 1a or 1b. In addition, patients who received simeprevir were stratified according to the presence of Q80K polymorphism at baseline. SVR data by genotype subtype were available in seven RCTs12,13,17-21 and one uncontrolled study (Table 98, Appendix 12).24 Based on direct pairwise comparisons, boceprevir (RD 19% to 26%), telaprevir (RD 30% and 31%), and simeprevir (RD 28% and 33%) were more effective than PR alone in both patients with genotype 1a and 1b (Table 117, Appendix 15). The response rate for patients receiving simeprevir with genotype 1a and Q80K polymorphism was not statistically significantly different from PR alone (RD 15%; 95% CI, –11% to 41%; N = 215). None of the telaprevir, sofosbuvir, or boceprevir studies provided data for patients with Q80K polymorphism at baseline. The NMA included six RCTs of 3,038 patients divided into 13 genotype plus treatment combinations (Appendix 20). No data were available for sofosbuvir. Boceprevir, telaprevir, and simeprevir regimens were statistically significantly more effective than PR therapy except for simeprevir RGT in patients with genotype 1a and Q80K polymorphism (Table 34). Patients treated with simeprevir who had genotype 1a HCV with a Q80K polymorphism were statistically significantly less likely to achieve SVR than simeprevir-treated patients with genotype 1b HCV or genotype 1a without Q80K (RD 28% and 30%, respectively). The proportion of patients receiving simeprevir with genotype 1a and Q80K who achieved SVR was also lower than those who received telaprevir (RD 18% to 29%).

Direct-Acting Antiviral Agents for Chronic Hepatitis C Genotype 1 56
TABLE 34: NMA RESULTS FOR SVR BY GENOTYPE IN TREATMENT-NAIVE PATIENTS: RELATIVE RISK (LOWER SEGMENT) AND RISK DIFFERENCE % (UPPER SEGMENT) FOR RANDOM EFFECTS MODEL
PR48 2a/b genotype 1a
6.79 (–0.62 to
14.31)
11.98 (–1.69 to 26.35)
39.83 (29.63 to 48.58) 42.15 (33.28 to
49.80) 30.52 (20.17 to
39.64) 38.27 (28.52 to
46.22) 30.76 (15.92 to
42.55) 41.26 (28.50 to
50.54) 24.76 (12.48 to
35.68) 31.48 (19.30 to
41.78) 19.89 (0.88 to
36.34) 27.90 (7.55
to 44.04)
1.17 (0.99 to 1.38)
PR48 2a/b genotype 1b
5.27 (–8.69 to 19.57)
33.02 (22.53 to 42.21) 35.31 (26.16 to
43.67) 23.71 (12.96 to
33.31) 31.41 (21.26 to
40.23) 23.98 (8.84 to
36.32) 34.44 (21.26 to
44.46) 17.94 (5.48 to
29.37) 24.63 (12.19 to
35.55) 13.04
(–6.14 to 29.90) 21.13 (0.57
to 37.58)
1.30 (0.96 to 1.70)
1.11 (0.82 to 1.45)
Si12 PR24/48 2a/b RGT
genotype 1a with Q80K
27.68 (13.18 to 41.20) 29.93 (16.31 to
43.06) 18.40 (1.37 to
34.18) 26.12 (9.54 to
41.19) 18.65
(–1.47, 36.34) 29.01 (10.59 to
44.97) 12.72
(–5.62 to 29.39) 19.42 (1.28 to
35.60) 7.74 (–15.80 to
29.09)
15.58 (–8.52 to
36.81)
2.00 (1.70 to 2.32)
1.71 (1.45 to 2.01)
1.53 (1.21 to 2.03)
Si12 PR24/48 2a/b RGT genotype 1a without
Q80K
2.32 (–6.78 to 11.93)
–9.29 (–22.01 to 3.09)
–1.57 (–13.59 to 9.98)
–8.95 (–25.63 to 5.51)
1.46 (–13.32 to 13.79)
–14.99 (–29.25 to –1.13)
–8.26 (–22.49 to 4.95)
–19.91 (–40.17 to –
1.07)
–11.89 (–33.23 to
6.51)
2.06 (1.78 to 2.36)
1.76 (1.51 to 2.05)
1.58 (1.26 to 2.08)
1.03 (0.92 to 1.17) Si12 PR24/48 2a/b RGT genotype 1b
–11.54 (–23.58 to
–0.21)
–3.90 (–15.07 to 6.58)
–11.29 (–27.45 to 2.28)
–0.83 (–15.01 to 10.47)
–17.31 (–30.86 to
–4.42)
–10.60 (–24.33 to 1.55)
–22.17 (–42.12 to
–4.35)
–14.22 (–35.02 to
3.12)
1.76 (1.49 to 2.05)
1.51 (1.26 to 1.78)
1.35 (1.02 to 1.85)
0.88 (0.74 to 1.04) 0.86 (0.72 to 1.00) T12 PR24/48 2a
RGT q8 genotype 1a
7.67 (–0.25 to 15.73)
0.27 (–11.26 to 10.16)
10.62 (0.40 to 19.70)
–5.77 (–20.22 to 8.66)
0.99 (–13.40 to
14.83)
–10.61 (–31.04 to 8.69)
–2.67 (–24.37 to
16.07)
1.96 (1.68 to 2.24)
1.67 (1.42 to 1.95)
1.50 (1.15 to 2.03)
0.98 (0.84 to 1.14) 0.95 (0.82 to 1.09) 1.11 (1.00 to 1.25) T12 PR24/48 2a
RGT q8 genotype 1b
–7.37 (–19.22 to 2.47)
2.95 (–7.33 to 11.81)
–13.44 (–27.38 to 0.47)
–6.73 (–20.48 to 6.52)
–18.26 (–38.17 to 0.17)
–10.33 (–31.58 to
7.60)
1.77 (1.39 to 2.12)
1.51 (1.18 to 1.84)
1.36 (0.98 to 1.88)
0.89 (0.69 to 1.08) 0.86 (0.67 to 1.03) 1.00 (0.84 to 1.15) 0.91 (0.75 to 1.03) T12 PR24/48 2a
RGT q12 genotype 1a
10.26 (–0.43 to 21.90)
–6.01 (–22.48 to 11.81)
0.71 (–15.61 to
18.06)
–10.73 (–32.86 to
10.82)
–2.85 (–25.81 to
18.61)
2.03 (1.69 to 2.36)
1.73 (1.43 to 2.05)
1.56 (1.17 to 2.12)
1.02 (0.84 to 1.19) 0.99 (0.82 to 1.14) 1.15 (1.01 to 1.31) 1.04 (0.91 to 1.16) 1.15 (0.99 to 1.37) T12 PR24/48 2a
RGT q12 genotype 1b
–16.42 (–30.95 to –0.39)
–9.69 (–24.30 to 6.03)
–21.13 (–41.68 to
–1.11)
–13.17 (–34.84 to
6.74)
1.62 (1.30 to 1.94)
1.38 (1.11 to 1.68)
1.25 (0.91 to 1.72)
0.81 (0.65 to 0.98) 0.79 (0.63 to 0.94) 0.92 (0.73 to 1.14) 0.83 (0.66 to 1.01) 0.92 (0.71 to 1.20) 0.80 (0.64 to
0.99) B24 PR28/48 2b RGT genotype 1a
6.63 (–5.98 to 19.22)
–4.88 (–26.14 to
15.29)
3.05 (–19.12 to
22.87)
1.79 (1.47 to 2.11)
1.53 (1.25 to 1.83)
1.37 (1.02 to 1.88)
0.90 (0.73 to 1.07) 0.87 (0.71 to 1.02) 1.01 (0.82 to 1.24) 0.91 (0.75 to 1.09) 1.01 (0.80 to 1.31) 0.88 (0.72 to 1.08) 1.10 (0.91 to
1.34)
B24 PR28/48 2b RGT
genotype 1b
–11.50 (–32.38 to 8.29)
–3.62 (–25.59 to
15.97)
1.50 (1.02 to 1.96)
1.28 (0.87 to 1.69)
1.15 (0.74 to 1.69)
0.75 (0.51 to 0.99) 0.73 (0.50 to 0.94) 0.85 (0.58 to 1.14) 0.77 (0.53 to 1.00) 0.85 (0.57 to 1.18) 0.74 (0.51 to
0.98) 0.92 (0.62 to
1.27) 0.84 (0.57 to
1.13) *B24 PR28 2b genotype 1a
7.96 (–13.12 to
28.04)
1.70 (1.18 to 2.16)
1.45 (1.01 to 1.87)
1.30 (0.86 to 1.88)
0.85 (0.60 to 1.09) 0.83 (0.58 to 1.04) 0.96 (0.67 to 1.25) 0.87 (0.61 to 1.11) 0.96 (0.66 to 1.31) 0.84 (0.59 to 1.09) 1.05 (0.72 to
1.41) 0.95 (0.66 to
1.25) 1.13 (0.80 to
1.61)
*B24 PR28 2b
genotype 1b
2a/b = pegylated interferon 2a or 2b; B24 PR28/48 RGT = boceprevir for 24 weeks and PR used as RGT for 28 or 48 weeks; B24 PR28 = boceprevir for 24 weeks and PR used for 28 weeks; PR48 2a/b = pegylated interferon 2a or 2b plus ribavirin for 48 weeks; q8 = every 8 hours (pertains to dosing of DAA); q12 = every 12 hours (pertains to dosing of DAA); PR = peginterferon + ribavirin; RGT = response-guided therapy; Si12 PR24/48 RGT = simeprevir for 12 weeks and PR used as RGT for 24 or 48 weeks; So12 PR12 = sofosbuvir for 12 weeks and PR for 12 weeks; T12 PR24/48 RGT = telaprevir for 12 weeks and PR used as RGT for 24 or 48 weeks.
*Not a Health Canada–recommended dosage regimen.
Note: Bolded numbers indicate statistical significance.

Direct-Acting Antiviral Agents for Chronic Hepatitis C Genotype 1 57
b) Relapse Virologic relapse is defined as detectable plasma HCV RNA levels during follow-up among patients who had undetectable levels at the end of treatment. Relapse was reported in all 15 studies (Table 99, Appendix 12). Direct pairwise comparisons for DAA plus PR therapy versus PR alone were conducted, where possible, using a random effects model (Table 35). Boceprevir, telaprevir, and simeprevir administered as RGT were associated with statistically significant fewer relapses compared with PR alone (RD –10% to –19%). Five studies did not include a PR treatment group and were not included in Table 35.20-22,24,25 The proportion of patients who experienced relapse ranged from 3% to 11% across treatment groups in three RCTs that compared different dosing regimens for telaprevir.20-22 In the ATOMIC and NEUTRINO studies, 4% and 9% of patients who received sofosbuvir 400 mg daily plus PR for 12 weeks experienced relapse during the first 12 weeks of follow-up.24,25
TABLE 35: TREATMENT–NAIVE PATIENTS — DIRECT PAIRWISE COMPARISON FOR RELAPSE
DAA Versus PR48 N trials RD (95% CI)a P value, I
2 RR (95% CI) P value, I
2
Boceprevir
B24 PR28/48 RGT Trials: 1 N = 433
–13% (–20% to –6%)
< 0.001 0.42 (0.26 to 0.67) < 0.001
*B24 PR28 Trials: 1 N = 127
0% (–15% to 15%) 0.98 1.01 (0.53 to 1.91) 0.98
Telaprevir
T12 PR24/48 RGT Trials: 1 N = 543
–19% (–26% to –13%)
< 0.001
0.31 (0.20 to 0.47) < 0.001
*T12 PR24 Trials: 2 N = 178
–14% (–27% to –2%)
0.02 I2 = 25%
0.33 (0.06 to 1.89) 0.21 I2 = 63%
*T12 PR48 Trials: 1 N = 86
–17% (–32% to –2%)
0.03 0.26 (0.07 to 0.90) 0.03
Simeprevir
Si12 PR24/48 RGT Trials: 3 N = 771
–10% (–16% to –4%)
< 0.001 I2 = 0%
0.52 (0.37 to 0.74) < 0.001 I2 = 0%
Sofosbuvir
*So12 PR24/48 RGT Trials: 1 N = 63
Not estimable (0 events in PR group)
Not estimable (0 events in PR group)
B24 PR28/48 RGT = boceprevir for 24 weeks and PR used as RGT for 28 or 48 weeks; B24 PR28 = boceprevir for 24 weeks and PR used for 28 weeks; CI = confidence interval; DAA = direct-acting antiviral; PR48 = pegylated interferon plus ribavirin for 48 weeks; PR = peginterferon + ribavirin; RD = risk difference; RGT = response-guided therapy; RR = relative risk; Si12 PR24/48 RGT = simeprevir for 12 weeks and PR used as RGT for 24 or 48 weeks; So12 PR24/48 RGT = sofosbuvir for 12 weeks and PR used as RGT for 24 or 48 weeks; T12 PR24/48 RGT = telaprevir for 12 weeks and PR used as RGT for 24 or 48 weeks; T12 PR24 = telaprevir for 12 weeks and PR used for 24 weeks; T12 PR48 = telaprevir for 12 weeks and PR used for 48 weeks. aNegative numbers indicate the fewer patients who received DAA + PR experienced a relapse, relative to PR for 48 weeks.
*Not a Health Canada–recommended dosage regimen.
Note: Calculated by CADTH using Review Manager random effects model.
c) Treatment Discontinuation Proportion Who Did Not Complete Treatment Course
The proportion of patients who discontinued DAA plus PR treatment early ranged from 26% to 38% in boceprevir studies,12,19 from 15% to 41% in telaprevir studies,13,14,20,22,23,26 and from 2% to 11% in sofosbuvir studies16,24,25 (Table 101). In the simeprevir studies,15,25 4% to 16% of patients in the

Direct-Acting Antiviral Agents for Chronic Hepatitis C Genotype 1 58
simeprevir plus PR treatment group stopped one or more of the therapies. Across studies, 27% to 56% randomized to the control group discontinued PR. Patients who received DAA plus PR were less likely to discontinue treatment early than those who received PR. The proportion of patients who discontinued therapy for any reason was statistically significantly lower than PR for all DAA regimens (Table 36), except for one simeprevir analysis based on the PILLAR trial.15
TABLE 36: TREATMENT-NAIVE PATIENTS — DIRECT PAIRWISE COMPARISON FOR TREATMENT DISCONTINUATION
DAA Versus PR48 N trials RD (95% CI)a P value, I
2 RR (95% CI) P value, I
2
Boceprevir
B24 PR28/48 RGT Trials: 1 N = 731
–18% (–26% to –11%)
< 0.001 0.67 (0.57 to 0.79) < 0.001
*B24 PR28 Trials: 1 N = 207
–24% (–37% to –11%)
< 0.001 0.52 (0.36 to 0.76) < 0.001
Telaprevir
T12 PR24/48 RGT Trials: 1 N = 724
–18% (–25% to –11%)
< 0.001 0.59 (0.48 to 0.73) < 0.001
*T12 PR24 Trials: 3 N = 506
–9% (–18% to –1%) 0.02 0%
0.76 (0.59 to 0.97) 0.03 0%
*T12 PR48 Trials: 1 N = 154
–18% (–33% to –2%)
0.02 0.64 (0.43 to 0.95) 0.03
Simeprevir
Si12 PR24/48 RGT All drugs
Trials: 1 N = 154
3% (–8% to 14%) 0.64 1.20 (0.55 to 2.61) 0.65
Placebo/simeprevir Trials: 2 N = 785
–56% (–62% to –49%)
< 0.001 0%
0.11 (0.04 to 0.35) < 0.001 90%
Peginterferon –29% (–35% to –23%)
< 0.001 0%
0.27 (0.17 to 0.42) < 0.001 57%
Ribavirin –29% (–35% to –22%)
< 0.001 0%
0.27 (0.15 to 0.47) < 0.001 71%
Sofosbuvir
*So12 PR24/48 RGT Trials: 1 N = 73
–32% (–53% to –11%)
0.003 0.25 (0.10 to 0.65) 0.004
CI = confidence interval; DAA = direct-acting antiviral; B24 PR28/48 RGT = boceprevir for 24 weeks and PR used as RGT for 28 or 48 weeks; B24 PR28 = boceprevir for 24 weeks and PR used for 28 weeks; PR = peginterferon + ribavirin; RD = risk difference; RGT = response-guided therapy; RR = relative risk; Si12 PR24/48 RGT = simeprevir for 12 weeks and PR used as RGT for 24 or 48 weeks; So12 PR24/48 RGT = sofosbuvir for 12 weeks and PR used as RGT for 24 or 48 weeks; T12 PR24/48 RGT = telaprevir for 12 weeks and PR used as RGT for 24 or 48 weeks; T12 PR24 = telaprevir for 12 weeks and PR used for 24 weeks; T12 PR48 = telaprevir for 12 weeks and PR used for 48 weeks. aNegative numbers indicate that fewer patients who received DAA + PR discontinued therapy, relative to PR.
*Not a Health Canada–recommended dosage regimen.
Note: Calculated by CADTH using Review Manager random effects model.
Short-Course Treatment Via Response-Guided Therapy
Eight RCTs applied RGT regimens for patients who were treatment-naive.12,13,15,17,18,20-22 The proportion of patients who met the early viral response criteria and thus were eligible for short-duration therapy (24 or 28 weeks) was lowest for boceprevir (44%)12 and highest for simeprevir (79% to 91%).15,17,18 For telaprevir, 56% to 75% of patients met eligibility criteria for short-duration therapy.13,20-22

Direct-Acting Antiviral Agents for Chronic Hepatitis C Genotype 1 59
Of note, the RGT criteria applied in QUEST1 and QUEST2 simeprevir trials were less stringent than those recommended by Health Canada. In the Canadian product monograph,49 patients with undetectable HCV RNA at week 4 are eligible for a 24-week treatment course, whereas in the clinical trials, patients with HCV RNA < 25 IU/mL detectable or with undetectable HCV RNA at week 4 were eligible. The proportion of simeprevir-treated patients who met Health Canada’s criteria for RGT were 73% and 76% in QUEST1 and QUEST2, respectively (Appendix 16).127,128
FIGURE 8: PROPORTION OF TREATMENT-NAIVE PATIENTS WHO MET RESPONSE-GUIDED THERAPY CRITERIA FOR
SHORT-DURATION THERAPY
BOC 2b = boceprevir plus peginterferon 2b and ribavirin RGT; SIM 2a/2b = simeprevir plus peginterferon 2a or 2b and ribavirin RGT; TEL 2a/2b q8 = telaprevir every eight hour dosing plus peginterferon 2a or 2b and ribavirin RGT; TEL 2a/2b q12 = telaprevir every 12 hour dosing plus peginterferon 2a or 2b and ribavirin RGT.
d) Health-Related Quality of Life HRQoL was reported in two studies, ADVANCE and NEUTRINO (Table 102, Appendix 12).112-114 In the ADVANCE study, a post hoc analysis of HRQoL data was reported for a subgroup (n = 722) of patients who received either PR for 48 weeks or telaprevir for 12 weeks plus PR for 24 or 48 weeks (RGT).112 EuroQol Five-Dimension (EQ-5D) health states were converted to a summary index by applying US-specific valuation weights to each level in each of the five dimensions (mobility, self-care, usual activities, pain or discomfort, and anxiety or depression). The EQ-5D index ranges from 0 (equivalent to death) to 1 (full health). The analyses were conducted using the observed data with no imputation for missing data. Missing data ranged from 4% to 25% across treatment groups and visits and were 5% higher in among telaprevir groups than in the PR group in ADVANCE.112 The EQ-5D index values were similar between telaprevir and PR groups at baseline, declined after 12 weeks of treatment, and were consistent with baseline values at week 72.112 The shorter 24-week treatment regimen was associated with an earlier return to baseline values. The authors did not report whether the differences between groups were statistically significant.112 In the NEUTRINO study, HRQoL data employing the Short-Form 36 (SF-36) Health Survey questionnaire were reported for patients who received sofosbuvir plus PR therapy for 12 weeks.113,114 The SF-36 questionnaire features eight scores including physical functioning, role–physical, bodily pain, general
44%
58%
67% 69% 75%
67% 73%
56%
65%
79% 84%
91%
0%
10%
20%
30%
40%
50%
60%
70%
80%
90%
100%
BO
C 2
b
TE
L 2a
q8
TE
L 2a
q8
TE
L 2a
q12
TE
L 2a
q8
TE
L 2b
q8
TE
L 2a
q12
TE
L 2b
q12
TE
L 2a
q8
SIM
2a
SIM
2a
SIM
2a/
b
SPRINT2 ADVANCE OPTIMIZE Marcellin ILLUMINATE PILLAR QUEST1 QUEST2

Direct-Acting Antiviral Agents for Chronic Hepatitis C Genotype 1 60
health, vitality, social functioning, role–emotional, and mental health, which may be summarized into physical and mental health components. The physical and mental summary scales showed a statistically significant decline from baseline during treatment. The summary values were similar to baseline 12 weeks after the end of treatment for the subgroup of patients who had undetectable levels after treatment and thus returned for a follow-up visit at week 24.113 In the NEUTRINO study, patients with detectable HCV RNA at week four post-treatment were not asked to come for subsequent visits; thus, 24-week data are available for the patients who had a favourable treatment response. The trends reported for the CHC-specific Chronic Liver Disease Questionnaire-Hepatitis C Virus quality of life measure were similar to SF-36 for the subset of patients who did and did not achieve an SVR.114 e) Mortality Data on deaths were reported for all studies except Kumada et al. 2012 (Table 99, Appendix 12).23 Death occurred infrequently (< 0.3%) during the studies, with a total of 14 deaths reported among the 4,890 patients treated (Table 37). No deaths were reported during the three sofosbuvir studies, but it should be noted that the follow-up time in two of these trials24,25 was 24 to 36 weeks compared with 48 to 72 weeks in the other DAA RCTs.
TABLE 37: TREATMENT-NAIVE PATIENTS — MORTALITY
Boceprevir Telaprevir Simeprevir Sofosbuvir PR
Deaths 3 4 2 0 5
Total N treated 471 2,043 598 426 1,352
% mortality 0.6% 0.2% 0.3% 0% 0.4%
PR = peginterferon + ribavirin.
f) Adverse Events
A summary of adverse events reported in the included studies are given in Table 103 and Table 104, Appendix 12. In addition, direct pairwise comparisons for DAA plus PR versus PR alone are summarized in to Table 126, Appendix 15). The results of the NMA for anemia, rash, and depression are reported in Appendix 17. The incidence of adverse events was high, with 95% to 100% of patients reporting at least one adverse event during the studies. In general, the proportions of patients who experienced a serious adverse event or who discontinued treatment due to an adverse event were similar between the PR and DAA treatment groups. Serious adverse events were reported by 2% to 13% of patients who received PR, 8% to 11% on boceprevir, 2% to 22% on telaprevir, 2% to 5% on simeprevir, and 1% to 4% on sofosbuvir (Table 38). Discontinuation due to adverse events was reported by 5% to 22% on PR therapy, 12% to 15% on boceprevir, 8% to 23% on telaprevir, 2% to 5% on simeprevir, and 2% to 6% on sofosbuvir (Table 118, Appendix 15 and Table 103, Appendix 12).

Direct-Acting Antiviral Agents for Chronic Hepatitis C Genotype 1 61
TABLE 38: TREATMENT-NAIVE PATIENTS — DIRECT PAIRWISE COMPARISON FOR SERIOUS ADVERSE EVENTS
DAA Versus PR48 N Trials
N Patients
% Patients with SAE SAE
PR DAA RD (95% CI), I2 RR (95% CI), I
2
Boceprevir
B24 PR28/48 RGT 1 731 9% 11% 3% (–1% to 7%) 1.34 (0.86 to 2.08)
*B24 PR28 1 207 8% 8% 0% (–7% to 7%) 1.01 (0.39 to 2.59)
Telaprevira
T12 PR24/48 RGT 1 724 7% 9% 2% (–1% to 6%) 1.37 (0.83 to 2.27)
*T12 PR24 3 506 5% to 10% 12% to 20% 6% (1% to 12%), I2 = 0%
1.78 (1.05 to 3.00), I2 = 0%
*T12 PR48 1 154 5% 6% 1% (–6% to 8%) 1.19 (0.33 to 4.25)
Simeprevir
Si12 PR24/48 RGTb 3 939 2% to 13% 2% to 5% –1% (–5% to 3%),
I2 = 58%
0.65 (0.32 to 1.32), I2 = 0%
Sofosbuvirc
*So12 PR24/48 RGT 1 73 Uncleard Unclear
d NR NR
B24 PR28/48 RGT = boceprevir for 24 weeks and PR used as RGT for 28 or 48 weeks; B24 PR28 = boceprevir for 24 weeks and PR used for 28 weeks; CI = confidence interval; DAA = direct-acting antiviral; PR = peginterferon plus ribavirin; PR48 = peginterferon plus ribavirin for 48 weeks; PR48 2a or 2b = pegylated interferon 2a or 2b plus ribavirin for 48 weeks; RD = risk difference; RGT = response-guided therapy; RR = relative risk; SAE = serious adverse events; Si12 PR24/48 RGT = simeprevir for 12 weeks and PR used as RGT for 24 or 48 weeks; So12 PR24/48 RGT = sofosbuvir for 12 weeks and PR used as RGT for 24 or 48 weeks; T12 PR24/48 RGT = telaprevir for 12 weeks and PR used as RGT for 24 or 48 weeks; T12 PR24 = telaprevir for 12 weeks and PR used for 24 weeks; T12 PR48 = telaprevir for 12 weeks and PR used for 48 weeks. *Not a Health Canada–recommended dosage regimen. aIn the OPTIMIZE, Marcellin 2011, and ILLUMINATE trials, SAE ranged from 2% to 22% among patients who received different telaprevir RGT dosage regimens. bIn the QUEST1 and QUEST2 study, SAEs were reported for the first 12 weeks of treatment (not the full 24- to 48-week treatment period), thus may underestimate the overall incidence of adverse events. cIn the NEUTRINO and ATOMIC studies, 1% and 4% of patients reported an SAE during 12 weeks of sofosbuvir + PR therapy. dOne patient in each group was reported to have an SAE; however, reporting was unclear, and thus may not have included all patients who experienced SAEs during the study. Note: Calculated by CADTH using Review Manager random effects model.
Fatigue was commonly reported for patients who received PR, or DAA plus PR (Table 119, Appendix 15). The incidence of fatigue ranged from 37% to 76% for those randomized to PR therapy, 53% to 68% for boceprevir, 26% to 73% for telaprevir, 35% to 42% for simeprevir, and 48% to 68% for sofosbuvir treatment (Table 104, Appendix 12). Influenza-like illness was reported by 24% to 52% of patients who received PR therapy. The incidence in the PR-treated patients was similar to those who received DAA plus PR therapy (boceprevir: 20% and 25%; telaprevir: 18% to 51%; simeprevir: 23% and 26%; sofosbuvir: 16%) (Table 120, Appendix 15). Similar findings were reported for neutropenia: 11% to 24% of those on PR therapy reported treatment-emergent neutropenia. The incidence among those who received DAA plus PR therapy ranged from 17% to 25% for boceprevir, 0% to 26% for telaprevir, 19% to 25% for simeprevir, and 17% to 30% for sofosbuvir (Table 121, Appendix 15 and Table 104, Appendix 12). The proportion of patients with pruritus ranged from 11% to 46% among those who received PR treatment. The incidence of pruritus was higher among those receiving telaprevir (18% to 64%). Among those who received boceprevir, the incidence ranged from 18% to 24% and was from 19% to 39% for those who received simeprevir, and 17% for those on sofosbuvir (Appendix 15, Table 122).

Direct-Acting Antiviral Agents for Chronic Hepatitis C Genotype 1 62
Anorectal discomfort was reported in one sofosbuvir and one boceprevir trial, with an incidence of 1% or less (for DAA or PR). Among the telaprevir trials, 3% to 32% of patients who received telaprevir reported anorectal discomfort, compared with 2% to 4% of those who received PR alone (Table 123). None of the included studies reported data on the incidence of suicidal ideation. Anemia
Anemia was reported in 11% to 73% of patients who received PR alone compared with 49% and 53% on boceprevir, 27% to 91% on telaprevir, 14% to 22% on simeprevir, and 14% to 21% on sofosbuvir. In direct pairwise comparisons, boceprevir and telaprevir were associated with increased risk of anemia compared with PR alone (Table 124, Appendix 15). One Japanese RCT23 reported a higher incidence of anemia than all other studies (telaprevir 91%, PR 73%), but the reasons for these differences are unclear, as the thresholds used to define anemia were infrequently reported. The NMA for anemia included 12 RCTs, 4,160 patients, and nine treatments (Figure 9).
FIGURE 9: TREATMENT-NAIVE PATIENTS — EVIDENCE NETWORK FOR ANEMIA, RASH
2a/b = pegylated interferon 2a or 2b; B24 PR28-48 RGT = boceprevir for 24 weeks and PR used as RGT for 28 or 48 weeks; B24 PR28 = boceprevir for 24 weeks and PR used for 28 weeks; PR48 2a or 2b = pegylated interferon 2a or 2b plus ribavirin for 48 weeks; PR = peginterferon + ribavirin; RCT = randomized controlled trial; RGT = response-guided therapy; Si12 PR24-48 RGT = simeprevir for 12 weeks and PR used as RGT for 24 or 48 weeks; So12 PR24-48 RGT = sofosbuvir for 12 weeks and PR used as RGT for 24 or 48 weeks; T12 PR24-48 RGT = telaprevir for 12 weeks and PR used as RGT for 24 or 48 weeks; T12 PR24 = telaprevir for 12 weeks and PR used for 24 weeks; T12 PR48 = telaprevir for 12 weeks and PR used for 48 weeks. *Not a Health Canada–recommended dosage regimen. Patients who received telaprevir or boceprevir were statistically significantly more likely to develop anemia than those who received PR (Table 39) The risk of anemia was not significantly different between simeprevir RGT or sofosbuvir RGT and PR alone. The incidence of anemia was statistically significantly higher among those treated with boceprevir RGT (RD 16%) or telaprevir RGT (RD 18% and 22%) compared with simeprevir RGT.

Direct-Acting Antiviral Agents for Chronic Hepatitis C Genotype 1 63
TABLE 39: NMA RESULTS FOR ANEMIA IN TREATMENT-NAIVE PATIENTS: RELATIVE RISK (LOWER SEGMENT) AND
RISK DIFFERENCE % (UPPER SEGMENT) FOR RANDOM EFFECTS MODEL
PR48 2a/2b
2.22 (–5.91 to
12.11)
19.93 (6.68 to
34.19)
24.19 (7.67 to
42.01)
18.65 (5.98 to
32.74)
–2.66 (–18.67 to
28.08)
16.88 (5.37 to
29.20)
5.89 (–8.08 to
23.91)
17.79 (1.75 to 35.57)
1.09 (0.77 to 1.52)
Si12 PR24/48 2a/b RGT
17.63 (1.00 to
34.14)
21.84 (2.47 to
41.56)
16.37 (0.18 to
32.71)
–4.81 (–24.01 to
26.79)
14.59 (–0.76 to
29.61)
3.72 (–13.56 to
23.46)
15.49 (–3.65 to
35.18)
1.81 (1.27 to 2.42)
1.66 (1.03 to 2.59)
T12 PR24/48 2a/b RGT
q8
4.18 (–5.90 to
15.19)
–1.27 (–20.24 to
18.05)
–22.16 (–44.39 to
10.94)
–3.00 (–21.32 to
15.06)
–13.78 (–34.27 to
8.06)
–2.10 (–23.66
to 20.17)
1.98 (1.31 to 2.75)
1.82 (1.08 to 2.90)
1.09 (0.86 to 1.37)
T12 PR24/48 2a/b RGT
q12
–5.45 (–27.34 to
16.01)
–26.23 (–51.16 to
7.89)
–7.19 (–28.60 to
13.41)
–17.94 (–41.16 to
5.80)
–6.38 (–30.35
to 17.93)
1.76 (1.24 to 2.35)
1.61 (1.01 to 2.52)
0.97 (0.62 to 1.53)
0.89 (0.56 to 1.46)
B24 PR28/48 2b RGT
–20.87 (–43.08 to
11.67)
–1.83 (–19.84 to
15.95)
–12.68 (–32.64 to
9.06)
–0.88 (–22.09
to 20.98)
0.89 (0.28 to 2.22)
0.82 (0.25 to 2.17)
0.49 (0.15 to 1.29)
0.45 (0.14 to 1.20)
0.51 (0.16 to 1.32)
*So12 PR24/48 2a RGT
19.17 (–13.49 to
40.63)
8.25 (–25.50 to
33.21)
19.93 (–14.42
to 45.07)
1.69 (1.21 to 2.25)
1.55 (0.98 to 2.42)
0.93 (0.61 to 1.45)
0.85 (0.54 to 1.39)
0.96 (0.63 to 1.49)
1.88 (0.73 to 6.20)
*T12 PR24 2a/b q8
–10.73 (–26.32 to
6.25)
0.91 (–19.75
to 22.32)
1.24 (0.68 to 2.01)
1.14 (0.57 to 2.06)
0.69 (0.36 to 1.23)
0.63 (0.32 to 1.16)
0.70 (0.37 to 1.26)
1.38 (0.46 to 4.89)
0.74 (0.42 to 1.17)
*T12 PR48 2a q8
11.67 (–12.52
to 34.88)
1.72 (1.07 to 2.49)
1.58 (0.88 to 2.59)
0.95 (0.55 to 1.58)
0.87 (0.49 to 1.50)
0.98 (0.57 to 1.62)
1.92 (0.69 to 6.36)
1.02 (0.59 to 1.65)
1.39 (0.71 to 2.81)
*B24 PR28 2b
2a/b = pegylated interferon 2a or 2b; B24 PR28/48 RGT = boceprevir for 24 weeks and PR used as RGT for 28 or 48 weeks; B24 PR28 = boceprevir for 24 weeks and PR used for 28 weeks; NMA = network meta-analysis; PR48 2a/b = pegylated interferon 2a or 2b plus ribavirin for 48 weeks; q8 = every 8 hours (pertains to dosing of DAA); q12 = every 12 hours (pertains to dosing of DAA); PR = peginterferon + ribavirin; RGT = response-guided therapy; Si12 PR24/48 RGT = simeprevir for 12 weeks and PR used as RGT for 24 or 48 weeks; So12 PR24/48 RGT = sofosbuvir for 12 weeks and PR used as RGT for 24 or 48 weeks; T12 PR24/48 RGT = telaprevir for 12 weeks and PR used as RGT for 24 or 48 weeks; T12 PR24 = telaprevir for 12 weeks and PR used for 24 weeks; T12 PR48 = telaprevir for 12 weeks and PR used for 48 weeks.
*Not a Health Canada–recommended dosage regimen.
Rash
Rash was reported in 6% to 41% of patients on PR, 6% and 25% on boceprevir, 33% to 73% on telaprevir, 21% to 27% on simeprevir, and 14% to 26% on sofosbuvir. Based on direct pairwise comparisons, telaprevir was the only DAA associated with an increased risk of rash versus PR (Appendix 15, Table 125). The NMA for rash included 12 RCTs, 4,160 patients, and nine treatments (Figure 9). No statistically significant differences in the incidence of rash were found, except for one comparison. Patients who received telaprevir 12 weeks plus PR 24 weeks were more likely to report rash than those who received PR (RD 11.3%; 95% CrI, 2.0 to 22.3) (Table 40).

Direct-Acting Antiviral Agents for Chronic Hepatitis C Genotype 1 64
TABLE 40: NMA RESULTS FOR RASH IN TREATMENT-NAIVE PATIENTS: RELATIVE RISK (LOWER SEGMENT) AND
RISK DIFFERENCE % (UPPER SEGMENT) FOR RANDOM EFFECTS MODEL
PR48 2a/b 5.74
(–2.23 to 15.14)
11.38 (–0.45 to
26.20)
9.54 (–4.80 to
27.50)
2.26 (–7.10 to
15.10)
13.58 (–9.13 to
48.62)
11.32 (2.01 to 22.29)
14.14 (–0.53 to
32.32)
0.42 (–14.81 to
28.38)
1.28 (0.90 to 1.75)
Si12 PR24/48 2a/b RGT
5.60 (–9.54 to
22.76)
3.76 (–13.34 to
23.39)
–3.46 (–16.66 to
11.70)
7.86 (–17.16 to
44.01)
5.57 (–7.87 to
19.37)
8.34 (–9.09 to
28.51)
–5.28 (–23.63 to
23.75)
1.54 (0.98 to 2.26)
1.21 (0.70 to 2.03)
T12 PR24/48 2a/b RGT q8
–1.80 (–11.53 to
8.39)
–8.98 (–26.46 to
8.22)
2.20 (–25.49 to
39.47)
–0.04 (–17.60 to
16.17)
2.75 (–17.91 to
24.42)
–10.76 (–32.37 to
19.23)
1.46 (0.77 to 2.32)
1.14 (0.56 to 2.03)
0.94 (0.64 to 1.26)
T12 PR24/48 2a/b RGT
q12
–7.18 (–27.15 to
11.87)
4.04 (–25.42 to
41.88)
1.80 (–18.36 to
19.83)
4.54 (–18.39 to
27.98)
–8.83 (–32.79 to
21.96)
1.11 (0.66 to 1.73)
0.87 (0.48 to 1.53)
0.72 (0.38 to 1.36)
0.76 (0.38 to 1.64)
B24 PR28/48 2b
RGT
11.21 (–14.86 to
47.08)
8.98 (–6.81 to
23.31)
11.72 (–7.67 to
32.22)
–1.87 (–21.93 to
27.31)
1.65 (0.59 to 3.52)
1.30 (0.45 to 2.97)
1.07 (0.36 to 2.58)
1.13 (0.37 to 3.01)
1.49 (0.49 to 3.70)
*So12
PR24/48 2a RGT
–2.13 (–39.15 to
23.68)
0.51 (–37.40 to
30.59)
–12.76 (–51.04 to
23.05)
1.54 (1.09 to 2.11)
1.21 (0.76 to 1.92)
1.00 (0.60 to 1.73)
1.06 (0.60 to 2.14)
1.39 (0.80 to 2.52)
0.94 (0.41 to 2.71)
*T12 PR24
2a/b q8
2.78 (–12.64 to
20.56)
–10.81 (–30.07 to
18.87)
1.68 (0.98 to 2.59)
1.31 (0.71 to 2.29)
1.09 (0.57 to 2.03)
1.15 (0.57 to 2.47)
1.51 (0.75 to 2.96)
1.02 (0.41 to 3.08)
1.09 (0.64 to 1.72)
*T12 PR48
2a q8
–13.24 (–38.12 to
17.63)
1.02 (0.32 to 2.43)
0.80 (0.24 to 2.03)
0.66 (0.20 to 1.74)
0.71 (0.20 to 2.02)
0.92 (0.27 to 2.52)
0.62 (0.16 to 2.36)
0.66 (0.20 to 1.68)
0.61 (0.18 to 1.67)
*B24 PR28 2b
B24 PR28/48 RGT = boceprevir for 24 weeks and PR used as RGT for 28 or 48 weeks; B24 PR28 = boceprevir for 24 weeks and PR used for 28 weeks; PR48 2a/b = pegylated interferon 2a or 2b plus ribavirin for 48 weeks; q8 = every 8 hours (pertains to dosing of DAA); PR = peginterferon + ribavirin; RGT = response-guided therapy; Si12 PR24/48 RGT = simeprevir for 12 weeks and PR used as RGT for 24 or 48 weeks; So12 PR24/48 RGT = sofosbuvir for 12 weeks and PR used as RGT for 24 or 48 weeks; T12 PR24/48 RGT = telaprevir for 12 weeks and PR used as RGT for 24 or 48 weeks; T12 PR24 = telaprevir for 12 weeks and PR used for 24 weeks; T12 PR48 = telaprevir for 12 weeks and PR used for 48 weeks.
*Not a Health Canada–recommended dosage regimen.
Depression
Depression was reported in 10 of 15 studies.12-15,19,20,22,24-26 Across studies, 17% to 23% of patients on PR, 19% and 23% on boceprevir, 10% to 24% on telaprevir, 12% on simeprevir, and 8% to 9% on sofosbuvir reported depression. Based on direct pairwise comparisons, the incidence of depression was similar for boceprevir, telaprevir, and simeprevir compared with PR alone (Appendix 15, Table 126). No data were available comparing sofosbuvir with PR. The NMA for depression included seven RCTs, 2,373 patients, and eight treatments (Figure 10). No statistically significant differences between PR, simeprevir, telaprevir, and boceprevir were found for depression (Table 41). No data were available for sofosbuvir.

Direct-Acting Antiviral Agents for Chronic Hepatitis C Genotype 1 65
FIGURE 10: TREATMENT-NAIVE — EVIDENCE NETWORK FOR DEPRESSION
2a/b = pegylated interferon 2a or 2b; B24 PR28-48 RGT = boceprevir for 24 weeks and PR used as RGT for 28 or 48 weeks; B24 PR28 = boceprevir for 24 weeks and PR used for 28 weeks; PR48 2a or 2b = pegylated interferon 2a or 2b plus ribavirin for 48 weeks; q8 = every 8 hours (pertains to dosing of DAA); q12 = every 12 hours (pertains to dosing of DAA); PR = peginterferon + ribavirin; RCT = randomized controlled trial; RGT = response-guided therapy; Si12 PR24-48 RGT = simeprevir for 12 weeks and PR used as RGT for 24 or 48 weeks; T12 PR24-48 RGT = telaprevir for 12 weeks and PR used as RGT for 24 or 48 weeks; T12 PR24 = telaprevir for 12 weeks and PR used for 24 weeks; T12 PR48 = telaprevir for 12 weeks and PR used for 48 weeks. *Not a Health Canada–recommended dosage regimen.

Direct-Acting Antiviral Agents for Chronic Hepatitis C Genotype 1 66
TABLE 41: NMA RESULTS FOR DEPRESSION IN TREATMENT-NAIVE PATIENTS: RELATIVE RISK (LOWER SEGMENT)
AND RISK DIFFERENCE % (UPPER SEGMENT) FOR RANDOM EFFECTS MODEL
PR48 2a/b –7.36
(–16.70 to 10.88)
–3.48 (–12.03 to
10.30)
–6.22 (–16.43 to
17.58)
0.79 (–9.56 to
16.24)
0.24 (–9.62 to
14.31)
–0.44 (–12.39 to
19.43)
–1.72 (–12.70 to
16.63)
0.64 (0.22 to 1.56)
Si12 PR24/48 2a
RGT
3.80 (–15.35 to
19.94)
1.10 (–18.94 to
25.88)
7.95 (–12.23 to
25.75)
7.47 (–12.54 to
23.95)
6.67 (–14.23 to
28.27)
5.50 (–15.04 to
25.80)
0.83 (0.42 to 1.51)
1.30 (0.43 to 4.36)
T12 PR24/48 2a/b RGT q8
–2.58 (–13.24 to
15.36)
4.21 (–12.54 to
21.40)
3.66 (–12.68 to
19.57)
2.98 (–14.76 to
23.91)
1.79 (–15.54 to
21.29)
0.69 (0.21 to 1.87)
1.09 (0.24 to 4.62)
0.84 (0.32 to 1.88)
T12 PR24/48 2a/b RGT
q12
6.83 (–18.11 to
24.86)
6.30 (–18.84 to
23.29)
5.54 (–20.20 to
27.39)
4.40 (–21.20 to
24.72)
1.04 (0.53 to 1.81)
1.63 (0.54 to 5.31)
1.25 (0.51 to 2.99)
1.50 (0.46 to 5.55)
B24 PR28/48 2b RGT
–0.54 (–18.50 to
16.54)
–1.21 (–20.27 to
20.61)
–2.42 (–21.09 to
18.08)
1.01 (0.55 to 1.74)
1.59 (0.54 to 5.23)
1.22 (0.53 to 2.94)
1.46 (0.46 to 5.52)
0.97 (0.44 to 2.29)
*T12 PR24 2a q8
–0.63 (–14.98 to
16.99)
–1.86 (–19.41 to
18.49)
0.98 (0.42 to 2.00)
1.53 (0.45 to 5.55)
1.18 (0.42 to 3.17)
1.41 (0.39 to 5.72)
0.94 (0.35 to 2.48)
0.97 (0.43 to 2.00)
*T12 PR48 2a q8
–1.18 (–23.66 to
20.36)
0.92 (0.40 to 1.85)
1.44 (0.42 to 5.13)
1.11 (0.40 to 2.91)
1.33 (0.36 to 5.27)
0.88 (0.33 to 2.30)
0.91 (0.34 to 2.25)
0.94 (0.31 to 2.82)
*B24 PR28 2b
B24 PR28/48 RGT = boceprevir for 24 weeks and PR used as RGT for 28 or 48 weeks; B24 PR28 = boceprevir for 24 weeks and PR used for 28 weeks; NMA = network meta-analysis; PR48 2a/b = pegylated interferon 2a or 2b plus ribavirin for 48 weeks; q8 = every 8 hours (pertains to dosing of DAA); q12 = every 12 hours (pertains to dosing of DAA); PR = peginterferon + ribavirin; RGT = response-guided therapy; Si12 PR24/48 RGT = simeprevir for 12 weeks and PR used as RGT for 24 or 48 weeks; T12 PR24/48 RGT = telaprevir for 12 weeks and PR used as RGT for 24 or 48 weeks; T12 PR24 = telaprevir for 12 weeks and PR used for 24 weeks; T12 PR48 = telaprevir for 12 weeks and PR used for 48 weeks.
*Not a Health Canada–recommended dosage regimen.
There was inconsistency in reporting of adverse events across the studies. At the time the NMA were conducted, the data available for QUEST1 and QUEST2 studies (simeprevir) and the PROTON study (sofosbuvir) reported adverse events after the first 12 weeks of treatment (i.e., the end of DAA therapy), whereas all other studies reported adverse events for the entire treatment period. In June 2014, harms data for the entire treatment period were published for QUEST1 and QUEST2.127,128 These data are summarized in Appendix 16 and they show a higher incidence of anemia, rash, pruritus, and neutropenia over the entire treatment period, compared with the first 12 weeks of therapy. Direct pairwise comparisons between simeprevir RGT and PR were calculated using these new data and the findings were generally similar to the data reported previously (based on events in the first 12 weeks of treatment). 4.5.2 Treatment-Experienced Patients Data were analyzed for the total treatment-experienced population, as well as for subgroups based on response to prior PR treatment (relapsed, partial, or null responders), where data were available. a) Sustained Virologic Response SVR24 was reported in five studies,27,28,30,33,35 SVR12 was reported in one study,31 and both were reported in two studies, Table 105, Appendix 13).29,32 Colombo et al.34 reported interim results after 16 weeks of treatment and thus did not report any efficacy outcomes.

Direct-Acting Antiviral Agents for Chronic Hepatitis C Genotype 1 67
The proportion of patients who achieved an SVR according to prior treatment experience is illustrated in Figure 11. In all studies, the proportion of patients achieving SVR with a DAA plus PR was highest in patients with relapse, followed by those with partial response, then by those with null response. Two studies (PROVIDE,33 Muir 201135) could not be connected to the NMA and thus are summarized narratively. In PROVIDE,33 63% achieved SVR after receiving boceprevir for 44 weeks and PR for 48 weeks. According to prior treatment history, 93% of the patients with relapse, 67% of those with partial and 38% of those with null response achieved SVR. In Muir et al.,35 97% of the patients with prior relapse and 59% of those with prior partial response achieved SVR with telaprevir RGT. SVR was achieved by 56% of patients with null response who received telaprevir 12 weeks plus PR 48 weeks, and by 17% of those given 12 weeks of telaprevir plus 24 weeks PR. The 24-week treatment regimen was abandoned partway through the study owing to poor efficacy in those with prior null response.

Direct-Acting Antiviral Agents for Chronic Hepatitis C Genotype 1 68
FIGURE 11: PROPORTION OF TREATMENT-EXPERIENCED PATIENTS WITH SUSTAINED VIROLOGIC RESPONSE
B32 PR36-48 = boceprevir for 32 weeks and PR used as RGT for 36 or 48 weeks; B44 PR48 = boceprevir for 44 weeks and PR used for 48 weeks; PR48 2a/2b = peginterferon 2a or 2b plus ribavirin for 48 weeks; q8 = every 8 hours (pertains to DAA); RGT = response-guided therapy; Si12 PR24-48 RGT = simeprevir for 12 weeks and PR used as RGT for 24 or 48 weeks; Si12 PR48 = simeprevir for 12 weeks and PR for 12 weeks; T12 PR24-48 RGT = telaprevir for 12 weeks and PR used as RGT for 24 or 48 weeks; T12 PR24 = telaprevir for 12 weeks and PR used for 24 weeks; T12 PR48 = telaprevir for 12 weeks and PR used for 48 weeks; T12 PR48 LI = telaprevir for 12 weeks and PR used for 48 weeks (initial 4-week lead-in therapy with PR). *Not a Health Canada–recommended dosage regimen.
All Treatment-Experienced Patients
Based on direct pairwise comparisons, patients who received boceprevir (RD 37% and 44%), telaprevir (37% and 49%), or simeprevir (42% and 44%) were statistically significantly more likely to achieve an SVR than those who received PR alone (Table 127, Appendix 15).
29
69
75
28
70
93
24
83
88
20
69
97
37
79
37
77
7
40
52
5
47
67
15
59
54
59
9
65
38
5
29
33
17
56
19
53
0 10 20 30 40 50 60 70 80 90 100
PR48 2b
B32 PR36-48 2b RGT
*B44 PR48 2b
PR48 2a
*B44 PR48 2a
B44 PR48
PR48 2a
T12 PR48 2a q8
*T12 PR48 2a LI q8
PR48 2a
*T12 PR24 2a q8
*T12 PR24
T12 PR48
T12 PR24-48 RGT
PR48 2a
Si12 PR24-48 2a RGT
PR48 2a
Si12 PR48 2a
RES
PO
ND
2P
05
68
5P
RO
VID
ER
EALI
IZE
PR
OV
E3M
uir
PR
OM
ISE
ASP
IRE
% SVR12/24
Relpse Partial Null

Direct-Acting Antiviral Agents for Chronic Hepatitis C Genotype 1 69
The NMA of SVR for all treatment-experienced patients included six RCTs, 2,020 patients, and seven treatments (Figure 12). Comparisons between simeprevir, telaprevir, or boceprevir and PR were all statistically significantly different in favour of the DAA regimens (RD 37% to 51%; Table 42). Comparisons between DAA regimens were not statistically significantly different.
FIGURE 12: TREATMENT-EXPERIENCED (ALL PATIENTS): EVIDENCE NETWORK FOR SUSTAINED VIROLOGIC
RESPONSE
2a/b = pegylated interferon 2a or 2b; B32 PR36-48 RGT = boceprevir for 32 weeks and PR used as RGT for 36 or 48 weeks; B44 PR28 = boceprevir for 44 weeks and PR used for 28 weeks; q8 = every 8 hours (pertains to dosing of DAA); PR = peginterferon + ribavirin; RCT = randomized controlled trial; RGT = response-guided therapy; Si12 PR48 = simeprevir for 12 weeks and PR for 48 weeks; T12 PR48 = telaprevir for 12 weeks and PR for 48 weeks; T12 PR24 = telaprevir for 12 weeks and PR used for 24 weeks.

Direct-Acting Antiviral Agents for Chronic Hepatitis C Genotype 1 70
TABLE 42: NMA RESULTS FOR SVR IN ALL TREATMENT-EXPERIENCED PATIENTS: RELATIVE RISK (LOWER
SEGMENT) AND RISK DIFFERENCE % (UPPER SEGMENT) FOR RANDOM EFFECTS MODEL
PR48 2a/b 42.62 (23.79 to
58.27) 44.05 (20.34 to
62.55) 50.73 (32.93 to
63.98) 37.08 (18.27 to
54.43) 44.65 (30.30 to
57.56) 42.70 (21.16
to 60.50)
3.02 (2.11 to 3.93)
Si12 PR24/48 2a RGT
1.40 (–26.90 to
27.84)
7.97 (–15.47 to
31.21)
–5.48 (–30.12 to
20.27)
1.96 (–19.34 to
25.03)
0.10 (–26.53 to
25.88)
3.09 (1.93 to 4.24)
1.02 (0.62 to 1.57)
Si12 PR48 2a 6.63
(–18.98 to 33.86)
–6.92 (–33.41 to
22.62)
0.55 (–23.21 to
27.84)
–1.34 (–29.88 to
28.45)
3.40 (2.50 to 4.31)
1.13 (0.79 to 1.66)
1.10 (0.75 to 1.77)
T12 PR48 2a q8 –13.55
(–36.51 to 11.16)
–6.09 (–25.51 to
15.88)
–7.96 (–33.19 to
16.86)
2.76 (1.83 to 3.79)
0.91 (0.59 to 1.42)
0.89 (0.56 to 1.51)
0.81 (0.54 to 1.19)
B32 PR36/48 2b RGT
7.49 (–8.73 to
24.36)
5.60 (–22.36 to
31.60)
3.12 (2.34 to 4.02)
1.03 (0.74 to 1.54)
1.01 (0.71 to 1.64)
0.92 (0.68 to 1.28)
1.13 (0.87 to 1.57)
*B44 PR48 2a/b
–1.87 (–27.47 to
21.15)
3.02 (1.97 to 4.11)
1.00 (0.63 to 1.53)
0.98 (0.61 to 1.63)
0.89 (0.57 to 1.29)
1.10 (0.67 to 1.74)
0.97 (0.62 to 1.38)
*T12 PR24 2a q8
B32 PR36/48 RGT = boceprevir for 24 weeks and PR used as RGT for 36 or 48 weeks; NMA = network meta-analysis; PR48 2a/b = pegylated interferon 2a or 2b plus ribavirin for 48 weeks; q8 = every 8 hours (pertains to dosing of DAA); PR = peginterferon + ribavirin; RGT = response-guided therapy; Si12 PR48 = simeprevir for 12 weeks and PR for 48 weeks; SVR = sustained virologic response; T12 PR48 = telaprevir for 12 weeks and PR for 48 weeks; T12 PR24 = telaprevir for 12 weeks and PR used for 24 weeks.
*Not a Health Canada–recommended dosage regimen.
All Treatment-Experienced Subgroup Analysis of Sustained Virologic Response by Fibrosis Severity
The analysis of SVR was stratified by fibrosis severity, with separate analyses conducted for patients with Metavir scores F0 to F2, and F3 to F4. All studies provided data by Metavir fibrosis score except for ASPIRE (Table 106, Appendix 13).32 Patients with less fibrosis (Metavir F0 to F2) generally had higher SVR rates than those with more severe fibrosis (Metavir F3 to F4). Based on direct pairwise comparisons, boceprevir, telaprevir, and simeprevir were more effective than PR alone in all treatment-experienced patients with less severe fibrosis (F0 to F2: RD 40% to 53%) and more severe fibrosis (F3 to F4: RD 30% to 50%) (Table 128, Appendix 15).
For the NMA, five RCTs provided data for six treatment comparisons involving 1,189 treatment-experienced patients with Metavir fibrosis scores F0 to F2, and 647 patients with Metavir fibrosis scores F3 or F4 (Figure 13).

Direct-Acting Antiviral Agents for Chronic Hepatitis C Genotype 1 71
FIGURE 13: ALL TREATMENT-EXPERIENCED SUBGROUP WITH FIBROSIS SCORE F0 TO F2 AND F3 TO F4 —
EVIDENCE NETWORK FOR SUSTAINED VIROLOGIC RESPONSE
B32 PR36-48 RGT = boceprevir for 32 weeks and PR used as RGT for 36 or 48 weeks; B44 PR28 = boceprevir for 44 weeks and PR used for 28 weeks; q8 = every 8 hours (pertains to dosing of DAA); PR = peginterferon + ribavirin; RCT = randomized controlled trial; RGT = response-guided therapy; Si12 PR24-48 RGT = simeprevir for 12 weeks and PR used as RGT for 24 or 48 weeks; T12 PR24 = telaprevir for 12 weeks and PR used for 24 weeks; T12 PR48 = telaprevir for 12 weeks and PR used for 48 weeks. Patients with less severe fibrosis (F0 to F2) who received simeprevir, telaprevir, or boceprevir were statistically significantly more likely to achieve an SVR than those who received PR alone (Table 43). No statistically significant differences were detected between DAA regimens.

Direct-Acting Antiviral Agents for Chronic Hepatitis C Genotype 1 72
TABLE 43: NMA RESULTS FOR SVR IN ALL TREATMENT-EXPERIENCED PATIENTS WITH FIBROSIS SCORE F0 TO F2:
RELATIVE RISK (LOWER SEGMENT) AND RISK DIFFERENCE % (UPPER SEGMENT) FOR RANDOM EFFECTS MODEL
PR48 2a/b 43.66 (23.17 to
59.60) 53.79 (35.70 to
66.68) 44.95 (24.54 to
60.85) 47.90 (32.46 to
60.53) 44.53 (20.43 to
63.02)
2.86 (1.96 to 3.81)
Si12 PR24/48 2a RGT
9.97 (–13.83 to 34.40)
1.33 (–24.70 to 27.29)
4.13 (–17.78 to 28.45)
0.92 (–27.94 to 28.63)
3.29 (2.42 to 4.28)
1.15 (0.82 to 1.71)
T12 PR48 2a q8 –8.79 (–32.61 to
15.09) –5.89 (–25.73 to
16.30) –9.09 (–36.58 to
16.97)
2.92 (1.98 to 3.96)
1.02 (0.68 to 1.56)
0.89 (0.61 to 1.24)
B32 PR36/48 2b RGT 2.84 (–12.62 to
20.72) –0.49 (–29.36 to
27.53)
3.05 (2.26 to 4.01)
1.06 (0.77 to 1.59)
0.92 (0.70 to 1.27)
1.04 (0.84 to 1.40) *B44 PR48 2a/b –3.30 (–30.86 to
20.95)
2.90 (1.82 to 4.06)
1.01 (0.63 to 1.58)
0.88 (0.56 to 1.27)
0.99 (0.61 to 1.53) 0.95 (0.60 to 1.35) *T12 PR24 2a q8
2a/b = pegylated interferon 2a or 2b; B32 PR36/48 RGT = boceprevir for 32 weeks and PR used as RGT for 36 or 48 weeks; B44 PR48 = boceprevir for 44 weeks and PR used for 48 weeks; NMA = network meta-analysis; PR48 2a/b = pegylated interferon 2a or 2b plus ribavirin for 48 weeks; q8 = every 8 hours (pertains to dosing of DAA); Si12 PR24/48 RGT = simeprevir for 12 weeks and PR used as RGT for 24 or 48 weeks; T12 PR48 = telaprevir for 12 weeks and PR used for 48 weeks; PR = peginterferon + ribavirin; RGT = response-guided therapy; SVR = sustained virologic response.
*Not a Health Canada–recommended dosage regimen.
Patients with more severe fibrosis (F3 to F4) who received simeprevir, telaprevir, or boceprevir, except boceprevir 32 weeks RGT, were statistically significantly more likely to achieve an SVR than those who received PR alone (Table 44). No significant differences were detected between DAA regimens.
TABLE 44: NMA RESULTS FOR SVR IN ALL TREATMENT-EXPERIENCED PATIENTS WITH FIBROSIS SCORE F3 TO F4:
RELATIVE RISK (LOWER SEGMENT) AND RISK DIFFERENCE % (UPPER SEGMENT) FOR RANDOM EFFECTS MODEL
PR48 2a/b 44.53 (16.50 to
69.10) 50.68 (23.31 to
72.67) 25.61 (–0.21 to
61.77) 48.15 (21.27 to
73.99) 36.36 (8.17 to
67.23)
4.45 (2.24 to 7.99)
Si12 PR24/48 2a RGT
6.01 (–31.47 to 42.93)
–18.40 (–57.27 to 31.27)
3.56 (–35.33 to 46.96)
–7.74 (–47.23 to 34.60)
4.91 (2.71 to 8.78)
1.10 (0.56 to 2.36)
T12 PR48 2a q8 –24.71 (–60.73 to
23.76) –2.75 (–39.01 to
39.06) –13.86 (–51.55 to
28.39)
2.99 (0.99 to 8.14)
0.68 (0.23 to 1.98)
0.61 (0.21 to 1.59)
B32 PR36/48 2b RGT 21.59 (–7.10 to
47.20) 10.83 (–38.56 to
53.67)
4.74 (2.27 to 10.36)
1.06 (0.53 to 2.58)
0.96 (0.50 to 2.04)
1.56 (0.88 to 3.63) *B44 PR48 2a/b –11.31 (–54.26 to
31.77)
3.81 (1.62 to 7.81)
0.86 (0.33 to 2.02)
0.78 (0.31 to 1.68)
1.28 (0.38 to 4.05) 0.81 (0.29 to 1.77) *T12 PR24 2a q8
2a/b = pegylated interferon 2a or 2b; B32 PR36/48 RGT = boceprevir for 32 weeks and PR used as RGT for 36 or 48 weeks; B44 PR48 = boceprevir for 44 weeks and PR used for 48 weeks; NMA = network meta-analysis; PR48 2a/b = pegylated interferon 2a or 2b plus ribavirin for 48 weeks; q8 = every 8 hours (pertains to dosing of DAA); Si12 PR24/48 RGT = simeprevir for 12 weeks and PR used as RGT for 24 or 48 weeks; T12 PR24 = telaprevir for 12 weeks and PR used for 24 weeks; T12 PR48 = telaprevir for 12 weeks and PR used for 48 weeks; PR = peginterferon + ribavirin; RGT = response-guided therapy; SVR = sustained virologic response.
*Not a Health Canada–recommended dosage regimen.
All Treatment-Experienced Subgroup Analysis of Sustained Virologic Response by Hepatitis C Genotype Subtype
In this analysis, data were stratified by HCV genotype subtype 1a or 1b. In addition, patients who received simeprevir were also stratified according to the presence of Q80K polymorphism at baseline. SVR data by genotype subtype were available in three RCTs27,29,31 and two uncontrolled studies (Table 107, Appendix 13).33,35

Direct-Acting Antiviral Agents for Chronic Hepatitis C Genotype 1 73
Based on direct pairwise comparisons, boceprevir (RD 26% to 51%), telaprevir (36% and 61%), and simeprevir (42% and 43%) were more effective than PR alone in patients with genotype 1a and 1b (Appendix 15, Table 129). The response rate for simeprevir in patients with genotype 1a and Q80K polymorphism was not statistically significantly different from that for PR alone (RD 19%; 95% CI, –3% to 40%; N = 84). None of the telaprevir or boceprevir studies provided data for patients with Q80K polymorphism at baseline. The NMA included three RCTs of 1,350 patients divided into 11 genotype plus treatment combinations (Appendix 20). Boceprevir, telaprevir, and simeprevir regimens were statistically significantly more effective than PR therapy, except for simeprevir RGT in patients with genotype 1a and Q80K polymorphism (Table 45). Among simeprevir-treated patients, patients who had genotype 1a HCV with Q80K polymorphism present were statistically significantly less likely to achieve an SVR than those with genotype 1b HCV (RD 43%) or with genotype 1a without Q80K (RD 33%). Within-treatment comparisons between genotype 1a and 1b were not significantly different for PR, boceprevir, and telaprevir.

Direct-Acting Antiviral Agents for Chronic Hepatitis C Genotype 1 74
TABLE 45: NMA RESULTS FOR SVR BY GENOTYPE IN ALL TREATMENT-EXPERIENCED PATIENTS: RELATIVE RISK (LOWER SEGMENT) AND RISK DIFFERENCE %
(UPPER SEGMENT) FOR RANDOM EFFECTS MODEL
PR48 2a/b genotype 1a
0.42 (–13.27 to
15.14)
9.12 (–12.71 to
38.95)
43.58 (16.15 to 63.21)
53.57 (29.35 to 68.13)
44.67 (19.34 to 63.25)
56.06 (34.18 to 69.55)
28.57 (0.48 to 53.81)
43.48 (14.93 to 63.71)
39.38 (10.75 to 61.11)
50.99 (23.56 to 68.03)
1.02 (0.52 to 1.72)
PR48 2a/b genotype 1b
8.62 (–12.71 to
37.54)
42.75 (17.05 to 63.07)
52.67 (29.73 to 68.89)
43.87 (19.11 to 63.48)
55.22 (33.53 to 70.86)
27.82 (1.45 to 53.02)
42.75 (15.29 to 63.71)
38.63 (11.19 to 60.64)
50.25 (23.82 to 68.66)
1.38 (0.51 to 2.74)
1.35 (0.54 to 2.92)
Si12 PR24/48 2a RGT
genotype 1a with Q80K
33.36 (2.38 to 58.33)
43.35 (13.06 to 65.56)
34.85 (–1.26 to
62.81)
46.21 (11.53 to 70.89)
18.86 (–19.41 to
50.88)
33.60 (–5.14 to
62.43)
29.49 (–9.45 to
59.65)
40.89 (3.19 to 68.24)
2.78 (1.60 to 4.07)
2.71 (1.58 to 4.88)
2.00 (1.05 to 4.76)
Si12 PR24/48 2a RGT
genotype 1a without Q80K
9.58 (–13.36 to
33.66)
1.13 (–28.72 to
32.03)
12.24 (–14.55 to
40.79)
–14.61 (–47.31 to
19.64)
–0.12 (–32.57 to
31.51)
–3.96 (–37.29 to
28.45)
7.17 (–24.14 to
37.46)
3.18 (2.08 to 4.46)
3.12 (1.92 to 5.49)
2.30 (1.23 to 5.50)
1.14 (0.82 to 1.75)
Si12 PR24/48 2a RGT
genotype 1b
–8.62 (–35.64 to
19.19)
2.44 (–21.06 to
27.59)
–24.47 (–54.42 to 7.42)
–9.76 (–39.62 to
18.86)
–13.78 (–43.95 to
15.71)
–2.40 (–31.14 to
24.39)
2.83 (1.72 to 4.11)
2.76 (1.62 to 5.02)
2.04 (0.98 to 5.33)
1.02 (0.63 to 1.71)
0.89 (0.57 to 1.33)
T12 PR48 2a q8 genotype 1a
11.08 (–8.49 to 31.88)
–15.91 (–47.63 to
17.35)
–1.15 (–33.05 to
29.01)
–5.24 (–37.56 to
25.89)
6.18 (–24.64 to
34.32)
3.29 (2.23 to 4.61)
3.22 (2.00 to 5.78)
2.38 (1.20 to 6.12)
1.18 (0.82 to 1.95)
1.03 (0.75 to 1.48)
1.16 (0.89 to 1.67)
T12 PR48 2a q8 genotype 1b
–27.17 (–56.21 to 3.95)
–12.33 (–41.66 to
15.00)
–16.41 (–46.00 to
11.81)
–4.96 (–33.00 to
20.23)
2.17 (1.02 to 3.57)
2.12 (1.05 to 4.07)
1.56 (0.63 to 4.29)
0.78 (0.38 to 1.42)
0.69 (0.34 to 1.12)
0.77 (0.38 to 1.34)
0.66 (0.33 to 1.06)
B32 PR36/48 2b RGT
genotype 1a
14.44 (–12.58 to
40.19)
10.51 (–16.46 to
36.18)
21.67 (–4.29 to
46.34)
2.77 (1.55 to 4.17)
2.71 (1.51 to 4.97)
2.00 (0.91 to 5.27)
1.00 (0.58 to 1.70)
0.88 (0.52 to 1.32)
0.98 (0.57 to 1.60)
0.85 (0.51 to 1.23)
1.27 (0.80 to 2.30)
B32 PR36/48 2b RGT
genotype 1b
–3.93 (–29.72 to
21.51)
7.19 (–17.02 to
31.68)
2.61 (1.40 to 4.00)
2.55 (1.38 to 4.70)
1.88 (0.83 to 4.97)
0.94 (0.52 to 1.62)
0.82 (0.47 to 1.26)
0.92 (0.51 to 1.53)
0.80 (0.45 to 1.18)
1.20 (0.73 to 2.15)
0.94 (0.59 to 1.45)
*B44 PR48 2b genotype 1a
11.11 (–13.41 to
36.18)
3.08 (1.86 to 4.47)
3.01 (1.75 to 5.45)
2.22 (1.06 to 5.76)
1.11 (0.69 to 1.85)
0.97 (0.63 to 1.42)
1.09 (0.68 to 1.73)
0.94 (0.61 to 1.32)
1.41 (0.93 to 2.55)
1.11 (0.77 to 1.70)
1.17 (0.81 to 1.89)
*B44 PR48 2b genotype 1b
2a/b = pegylated interferon 2a or 2b; B32 PR44 RGT = boceprevir for 32 weeks and PR used as RGT for 44 weeks; B44 PR48 = boceprevir for 44 weeks and PR used for 48 weeks; NMA = network meta-analysis; PR48 2a or 2b = pegylated interferon 2a or 2b plus ribavirin for 48 weeks; q8 = every 8 hours (pertains to dosing of DAA); PR = peginterferon + ribavirin; RGT = response-guided therapy; Si12 PR24/48 RGT = simeprevir for 12 weeks and PR used as RGT for 24 or 48 weeks; SVR = sustained virologic response; T12 PR24/48 RGT = telaprevir for 12 weeks and PR used as RGT for 24 or 48 weeks; T12 PR48 = telaprevir for 12 weeks and PR used for 48 weeks. *Not a Health Canada–recommended dosage regimen.

Direct-Acting Antiviral Agents for Chronic Hepatitis C Genotype 1 75
Treatment-Experienced — Relapse
A subgroup analysis was conducted including all patients who had experienced relapse after PR therapy. SVR data were available for six RCTs and two uncontrolled studies (Appendix 13, Table 105).27-33,35 Based on direct pairwise comparisons, patients who received boceprevir, telaprevir, or simeprevir were statistically significantly more likely to achieve an SVR than those who received PR alone (Table 127, Appendix 15). The NMA included data for 1,287 patients from six RCTs including seven treatments (Figure 14). Simeprevir RGT and boceprevir RGT dosing regimens included in the analysis were consistent with Health Canada dosing recommendations for patients with prior relapse. All DAA regimens were more effective than PR alone for the outcome of SVR, with RD ranging from 38% to 60% (Table 46). No significant differences were detected between DAA regimens, except that telaprevir 12 weeks plus PR 48 weeks was more effective than boceprevir 32 weeks RGT (RD 21.6%; 95% CrI, 1.2 to 43.8).
FIGURE 14: TREATMENT-EXPERIENCED — RELAPSE: EVIDENCE NETWORK FOR SUSTAINED VIROLOGIC RESPONSE
2a/b = pegylated interferon 2a or 2b; B32 PR36-48 RGT = boceprevir for 32 weeks and PR used as RGT for 36 to 48 weeks; B44 PR48 = boceprevir for 44 weeks and PR used for 48 weeks; q8 = every 8 hours (pertains to dosing of DAA); PR = peginterferon + ribavirin; RGT = response-guided therapy; Si12 PR24-48 RGT = simeprevir for 12 weeks and PR used as RGT for 24 or 48 weeks; T12 PR24 = telaprevir for 12 weeks and PR used for 24 weeks; T12 PR48 = telaprevir for 12 weeks and PR used for 48 weeks. *Not a Health Canada–recommended dosage regimen.

Direct-Acting Antiviral Agents for Chronic Hepatitis C Genotype 1 76
TABLE 46: NMA RESULTS FOR SVR IN PATIENTS WITH PRIOR RELAPSE: RELATIVE RISK (LOWER SEGMENT) AND
RISK DIFFERENCE % (UPPER SEGMENT) FOR RANDOM EFFECTS MODEL
PR48 2a/b 43.77 (25.58 to
57.34) 38.40 (17.40 to
55.22) 41.98 (10.46 to
63.80) 51.04 (25.97 to
66.40) 60.29 (47.15 to
68.71) 44.47 (28.84 to
56.93)
2.55 (1.88 to 3.23)
Si12 PR24/48 2a RGT
–5.43 (–30.11 to
19.53)
–1.71 (–35.46 to
26.62)
7.11 (–21.09 to
30.80)
16.30 (–1.81 to
36.09)
0.57 (–19.62 to
22.68)
2.36 (1.58 to 3.18)
0.93 (0.62 to 1.34)
B32 PR36/48 2b RGT
3.49 (–31.76 to
34.56)
12.43 (–17.14 to
38.18)
21.64 (1.20 to 43.84)
5.91 (–10.67 to
24.71)
2.48 (1.35 to 3.54)
0.98 (0.54 to 1.46)
1.05 (0.57 to 1.70)
*Si12 PR48 2a 8.64
(–23.62 to 43.43)
18.05 (–6.52 to
49.68)
2.37 (–24.52 to
36.26)
2.80 (1.86 to 3.73)
1.10 (0.73 to 1.55)
1.19 (0.77 to 1.79)
1.12 (0.72 to 2.05)
*T12 PR24 2a q8
8.97 (–9.58 to
34.49)
–6.59 (–28.08 to
21.31)
3.13 (2.51 to 3.88)
1.23 (0.98 to 1.67)
1.32 (1.02 to 1.94)
1.26 (0.93 to 2.24)
1.11 (0.89 to 1.62)
*T12 PR48 2a q8
–15.67 (–32.52 to
1.38)
2.58 (1.94 to 3.30)
1.01 (0.76 to 1.41)
1.09 (0.86 to 1.51)
1.03 (0.72 to 1.88)
0.92 (0.68 to 1.38)
0.82 (0.64 to 1.02)
*B44 PR48 2a/b
2a/b = pegylated interferon 2a or 2b; B32 PR36/48 RGT = boceprevir for 32 weeks and PR used as RGT for 36 to 48 weeks; B44 PR48 = boceprevir for 44 weeks and PR used for 48 weeks; q8 = every 8 hours (pertains to dosing of DAA); PR = peginterferon + ribavirin; RGT = response-guided therapy; Si12 PR24/48 RGT = simeprevir for 12 weeks and PR used as RGT for 24 or 48 weeks; T12 PR24 = telaprevir for 12 weeks and PR used for 24 weeks; T12 PR48 = telaprevir for 12 weeks and PR used for 48 weeks.
*Not a Health Canada–recommended dosage regimen.
Relapse — Subgroup Analysis of SVR by Fibrosis Severity
Subgroup analyses of patients with prior relapse were conducted based on fibrosis severity. Data were available from three RCTs27,29,31 and two uncontrolled studies.33,35 Based on direct pairwise comparisons, patients with a prior relapse treated with boceprevir, telaprevir, or simeprevir were statistically significantly more likely to achieve SVR than those treated with PR alone, both among those with less severe fibrosis (Metavir fibrosis score F0 to F2) and with more severe fibrosis (F3 or F4), except in regard to one regimen. In patients with more severe fibrosis, boceprevir 32 weeks RGT was not statistically significantly different from PR alone (RD 30%; 95% CI, –2% to 62%) (Table 128, Appendix 15). SVR data from three RCTs (five treatments) were included in the NMA for patients with prior relapse stratified by fibrosis severity (Figure 15). Of the dosing regimens analyzed, simeprevir RGT and boceprevir RGT were consistent with Health Canada recommendations. A total of 664 patients with Metavir fibrosis scores F0 to F2 and 316 patients with scores F3 or F4 were included in these NMA analyses.

Direct-Acting Antiviral Agents for Chronic Hepatitis C Genotype 1 77
FIGURE 15: PATIENTS WITH PRIOR RELAPSE AND FIBROSIS SCORE F0 TO F2 OR F3 TO F4 — EVIDENCE NETWORK
FOR SUSTAINED VIROLOGIC RESPONSE
2a/b = pegylated interferon 2a or 2b; B32 PR36-48 RGT = boceprevir for 32 weeks and PR used as RGT for 36 to 48 weeks; B44 PR48 = boceprevir for 44 weeks and PR used for 48 weeks; q8 = every 8 hours (pertains to dosing of DAA); PR = peginterferon + ribavirin; RCT = randomized controlled trial; RGT = response-guided therapy; Si12 PR24-48 RGT = simeprevir for 12 weeks and PR used as RGT for 24 or 48 weeks; T12 PR48 = telaprevir for 12 weeks and PR used for 48 weeks. *Not a Health Canada–recommended dosage regimen. Boceprevir, telaprevir, and simeprevir all significantly improved the likelihood of SVR as compared with PR alone (RD 43% to 53%) among patients with Metavir fibrosis scores F0 to F2 (Table 47). For patients with Metavir fibrosis score F3 or F4, similar results were found for DAA regimens versus PR alone, except for boceprevir 32 weeks RGT versus PR, which failed to reach statistical significance (RD 31.3%; 95% CrI, –6.5 to 73.7%) (Table 48). The comparisons between DAA regimens were not statistically significantly different, except for boceprevir 44 weeks plus PR 48 weeks, which was significantly better than boceprevir 32 weeks RGT (RD 31.0%; 95% CrI, 0.4% to 63.9%) for the fibrosis score F3 or F4 subgroup.
TABLE 47: NMA RESULTS FOR SVR IN PATIENTS WITH A PRIOR RELAPSE WITH FIBROSIS SCORE F0 TO F2:
RELATIVE RISK (LOWER SEGMENT) AND RISK DIFFERENCE % (UPPER SEGMENT) FOR RANDOM EFFECTS MODEL
PR48 2a/b 43.21 (19.94 to 57.76) 42.80 (15.21 to 60.24) 53.48 (33.56 to 65.48) 43.46 (16.49 to 60.59)
2.26 (1.55 to 2.96) Si12 PR24/48 2a RGT –0.41 (–29.56 to
27.05) 10.02 (–12.20 to
34.23) 0.16 (–28.31 to 27.56)
2.24 (1.40 to 3.11) 0.99 (0.64 to 1.47) B32 PR36/48 2b RGT 10.39 (–13.35 to
38.29) 0.64 (–19.29 to 21.01)
2.55 (1.86 to 3.39) 1.13 (0.86 to 1.61) 1.13 (0.85 to 1.74) *T12 PR48 2a q8 –9.79 (–36.86 to
13.86)
2.26 (1.44 to 3.14) 1.00 (0.66 to 1.48) 1.01 (0.75 to 1.37) 0.89 (0.59 to 1.19) *B44 PR48 2b
2a/b = pegylated interferon 2a or 2b; B32 PR36/48 RGT = boceprevir for 32 weeks and PR used as RGT for 36 to 48 weeks; B44 PR48 = boceprevir for 44 weeks and PR used for 48 weeks; NMA = network meta-analysis; q8 = every 8 hours (pertains to dosing of DAA); PR48 = peginterferon + ribavirin used for 48 weeks; RGT = response-guided therapy; Si12 PR24/48 RGT = simeprevir for 12 weeks and PR used as RGT for 24 or 48 weeks; SVR = sustained virologic response; T12 PR48 = telaprevir for 12 weeks and PR used for 48 weeks.
*Not a Health Canada–recommended dosage regimen.

Direct-Acting Antiviral Agents for Chronic Hepatitis C Genotype 1 78
TABLE 48: NMA RESULTS FOR SVR IN PATIENTS WITH A PRIOR RELAPSE WITH FIBROSIS SCORE F3 TO F4:
RELATIVE RISK (LOWER SEGMENT) AND RISK DIFFERENCE % (UPPER SEGMENT) FOR RANDOM EFFECTS MODEL
PR48 2a/b 48.17 (18.47 to 70.52) 31.33 (–6.45 to 73.71) 70.95 (50.10 to 83.98) 66.12 (24.56 to 86.45)
3.76 (1.96 to 7.18) Si12 PR24/48 2a RGT –16.52 (–62.24 to
39.63) 22.08 (–7.68 to 55.90)
16.69 (–29.96 to 57.29)
2.80 (0.71 to 8.55) 0.75 (0.21 to 2.04) B32 PR36/48 2b RGT 39.23 (–8.58 to 77.65) 31.01 (0.36 to 63.87)
5.10 (2.97 to 10.26) 1.33 (0.91 to 2.61) 1.80 (0.90 to 5.97) *T12 PR48 2a q8 –4.56 (–46.23 to
24.22)
4.73 (2.05 to 10.78) 1.25 (0.62 to 2.64) 1.64 (1.01 to 4.46) 0.95(0.50 to 1.35) *B44 PR48 2b
2a/b = pegylated interferon 2a or 2b; B32 PR36/48 RGT = boceprevir for 32 weeks and PR used as RGT for 36 to 48 weeks; B44 PR48 = boceprevir for 44 weeks and PR used for 48 weeks; NMA = network meta-analysis; q8 = every 8 hours (pertains to dosing of DAA); PR48 = peginterferon + ribavirin used for 48 weeks; RGT = response-guided therapy; Si12 PR24/48 RGT = simeprevir for 12 weeks and PR used as RGT for 24 or 48 weeks; SVR = sustained virologic response; T12 PR48 = telaprevir for 12 weeks and PR used for 48 weeks.
*Not a Health Canada–recommended dosage regimen.
Relapse — Subgroup Analysis of SVR by Genotype Subtype
In this subgroup analysis, patients with prior relapse were stratified by HCV genotype subtype 1a or 1b; in addition, patients who received simeprevir were stratified according to the presence of Q80K polymorphism at baseline. Stratified data were reported for telaprevir and simeprevir in two RCTs,29,31 and for boceprevir and telaprevir in two uncontrolled studies (Appendix 13, Table 107).33,35 Based on direct pairwise comparisons, telaprevir (54% and 69%) and simeprevir (42% and 43%) were more effective than PR alone in patients with genotype 1a and 1b (Appendix 15, Table 129). The response rate for patients receiving simeprevir with genotype 1a and Q80K polymorphism was not statistically significantly different from that for PR alone (RD 19%; 95% CI, –3% to 40%; N = 84). The telaprevir or boceprevir studies did not provide data for patients with Q80K polymorphism at baseline. The NMA included two RCTs of 752 patients with prior relapse divided into seven genotype plus treatment combinations (Figure 33). Of the dosing regimens analyzed, only simeprevir RGT was consistent with Health Canada recommendations. No data were available for boceprevir (Appendix 20). All simeprevir and telaprevir regimens were statistically significantly more effective than PR therapy, except for simeprevir RGT in patients with genotype 1a Q80K (Table 49).
Patients with genotype 1a HCV and Q80K polymorphism who received simeprevir were statistically significantly less likely to achieve SVR than patients with genotype 1b (RD 42%) or genotype 1a without Q80K (RD 33%) who received simeprevir. Simeprevir patients with genotype 1a and Q80K were also less likely to achieve SVR than patients who received telaprevir (RD 47% and 50%).

Direct-Acting Antiviral Agents for Chronic Hepatitis C Genotype 1 79
TABLE 49: NMA RESULTS FOR SVR BY GENOTYPE IN PATIENTS WITH PRIOR RELAPSE: RELATIVE RISK (LOWER
SEGMENT) AND RISK DIFFERENCE % (UPPER SEGMENT) FOR RANDOM EFFECTS MODEL
PR48 2a/b genotype 1a
5.25 (–13.93 to 24.23)
12.69 (–12.90 to 41.69)
46.15 (19.22 to 63.80)
54.82 (32.28 to 68.43)
59.86 (39.55 to 72.51)
62.45 (44.38 to 74.10)
1.19 (0.55 to 2.08)
PR48 2a/b genotype 1b
7.33 (–16.71 to
35.83)
40.49 (15.39 to 60.60)
49.17 (26.83 to 66.35)
54.39 (32.05 to 71.30)
56.96 (35.89 to 73.51)
1.47 (0.58 to 2.75)
1.23 (0.55 to 2.56)
Si12 PR24/48 2a RGT genotype 1a
with Q80K
32.68 (2.81 to 57.49)
41.51 (12.35 to 64.12)
46.84 (13.45 to 72.05)
49.52 (17.13 to 73.92)
2.69 (1.62 to 4.07)
2.25 (1.38 to 4.21)
1.83 (1.05 to 4.07)
Si12 PR24/48 2a RGT genotype 1a
without Q80K
8.41 (–11.15 to 30.20)
13.41 (–9.16 to
39.55)
16.01 (–5.02 to 42.03)
3.00 (1.99 to 4.46)
2.52 (1.60 to 4.73)
2.05 (1.19 to 4.59)
1.11 (0.86 to 1.59)
Si12 PR24/48 2a RGT genotype 1b
4.91 (–14.68 to
26.47)
7.46 (–10.14 to 28.44)
3.19 (2.16 to 4.81)
2.68 (1.68 to 5.18)
2.18 (1.20 to 5.24)
1.18 (0.89 to 1.81)
1.06 (0.83 to 1.42)
T12 PR48 2a q8 genotype 1a
2.46 (–9.80 to 16.68)
3.29 (2.26 to 4.93)
2.76 (1.75 to 5.38)
2.24 (1.26 to 5.40)
1.22 (0.94 to 1.86)
1.09 (0.88 to 1.46)
1.03 (0.89 to 1.23)
T12 PR48 2a q8 genotype 1b
PR48 2a/b = pegylated interferon 2a or 2b plus ribavirin for 48 weeks; q8 = every 8 hours (pertains to dosing of DAA); PR48 = peginterferon + ribavirin used for 48 weeks; RGT = response-guided therapy; Si12 PR24/48 RGT = simeprevir for 12 weeks and PR used as RGT for 24 or 48 weeks; T12 PR24/48 RGT = telaprevir for 12 weeks and PR used as RGT for 24 or 48 weeks; T12 PR48 = telaprevir for 12 weeks and PR used for 48 weeks. Treatment-Experienced — Partial Response
This subgroup analysis was conducted including all patients who had a prior partial response to PR therapy. Four RCTs27-29,32 and two uncontrolled studies33,35 provided data on SVR for those with a prior partial response (Table 105, Appendix 13). Based on direct pairwise comparisons, patients who received boceprevir, telaprevir, or simeprevir were statistically significantly more likely to achieve an SVR than those who received PR alone (Table 127, Appendix 15).
The NMA included data from four RCTs, 370 patients, and five treatments: the boceprevir RGT, simeprevir, and telaprevir dosing regimens were consistent with Health Canada recommendations for patients with a prior partial response (Figure 16). Patients with prior partial response who received boceprevir, telaprevir, or simeprevir were statistically significantly more likely to achieve SVR than those who received PR alone (Table 50). None of the comparisons between DAA regimens were significantly different.

Direct-Acting Antiviral Agents for Chronic Hepatitis C Genotype 1 80
FIGURE 16: TREATMENT-EXPERIENCED PATIENTS WITH PRIOR PARTIAL RESPONSE: EVIDENCE NETWORK FOR
SUSTAINED VIROLOGIC RESPONSE
2a/b = pegylated interferon 2a or 2b; B32 PR36-48 RGT = boceprevir for 32 weeks and PR used as RGT for 36 to 48 weeks; B44 PR48 = boceprevir for 44 weeks and PR used for 48 weeks; q8 = every 8 hours (pertains to dosing of DAA); PR = peginterferon + ribavirin; RGT = response-guided therapy; Si12 PR48 RGT = simeprevir for 12 weeks and PR used as RGT for 48 weeks; T12 PR48 = telaprevir for 12 weeks and PR used for 48 weeks. *Not a Health Canada–recommended dosage regimen.
TABLE 50: NMA RESULTS FOR SVR IN PATIENTS WITH PRIOR PARTIAL RESPONSE: RELATIVE RISK (LOWER
SEGMENT) AND RISK DIFFERENCE % (UPPER SEGMENT) FOR RANDOM EFFECTS MODEL
PR48 2a/b 57.14 (17.61 to 87.00) 31.12 (6.91 to 65.00) 38.91 (11.94 to 70.16) 50.57 (25.07 to 75.06)
8.67 (3.11 to 23.50) Si12 PR48 2a –24.16 (–69.73 to
28.99) –17.58 (–64.62 to
39.29) –6.32 (–52.75 to 47.29)
5.33 (1.94 to 13.40) 0.62 (0.18 to 1.97) T12 PR48 2a q8 7.41 (–40.42 to 52.09) 18.97 (–27.86 to 59.01)
6.35 (2.25 to 18.74) 0.73 (0.25 to 2.44) 1.19 (0.38 to 4.37) B32 PR36/48 2b RGT 11.11 (–12.58 to 34.29)
7.97 (3.41 to 21.80) 0.90 (0.40 to 2.83) 1.49 (0.58 to 5.08) 1.24 (0.79 to 2.35) *B44 PR48 2a/b
2a/b = pegylated interferon 2a or 2b; B32 PR36/48 RGT = boceprevir for 32 weeks and PR used as RGT for 36 to 48 weeks; B44 PR48 = boceprevir for 44 weeks and PR used for 48 weeks; NMA = network meta-analysis; q8 = every 8 hours (pertains to dosing of DAA); PR48 = peginterferon + ribavirin used for 48 weeks; RGT = response-guided therapy; Si12 PR48 RGT = simeprevir for 12 weeks and PR used as RGT for 48 weeks; SVR = sustained virologic response; T12 PR48 = telaprevir for 12 weeks and PR used for 48 weeks. *Not a Health Canada–recommended dosage regimen.
Partial Response — Subgroup Analysis of SVR by Fibrosis Severity
Subgroup analyses of patients with prior partial response were conducted based on fibrosis severity. Data were available for boceprevir and telaprevir from two RCTs27,29 and two uncontrolled studies.33,35 No SVR data stratified by fibrosis severity were available for simeprevir. Based on direct pairwise comparisons, patients with a prior partial response treated with boceprevir or telaprevir were statistically significantly more likely to achieve SVR than those receiving PR alone among those with less severe fibrosis (Metavir fibrosis score F0 to F2). Among patients with more severe fibrosis (F3 or F4), boceprevir 44 weeks plus PR 48 weeks and telaprevir 12 weeks plus PR 48 weeks were

Direct-Acting Antiviral Agents for Chronic Hepatitis C Genotype 1 81
statistically significantly more likely to achieve SVR than PR alone in the analyses based on RD but not RR (Appendix 15, Table 128). The NMA for patients with less severe fibrosis (Metavir score F0 to F2) included 167 patients, and the NMA for patients with more severe fibrosis (F3 to F4) included 88 patients from two RCTs (Figure 17). Data for four treatment regimens were available, including PR, as well as boceprevir and telaprevir. SVR data stratified by fibrosis severity were not available for simeprevir. The boceprevir RGT and telaprevir dosing regimens were consistent with Health Canada recommendations for patients with a prior partial response.
FIGURE 17: PATIENTS WITH A PRIOR PARTIAL RESPONSE WITH FIBROSIS SCORE F0 TO F2 OR F3 TO F4 —
EVIDENCE NETWORK FOR SUSTAINED VIROLOGIC RESPONSE
2a/b = pegylated interferon 2a or 2b; B32 PR36-48 RGT = boceprevir for 32 weeks and PR used as RGT for 36 to 48 weeks; B44 PR48 = boceprevir for 44 weeks and PR used for 48 weeks; q8 = every 8 hours (pertains to dosing of DAA); PR = peginterferon + ribavirin; RCT = randomized controlled trial; RGT = response-guided therapy; T12 PR48 = telaprevir for 12 weeks and PR used for 48 weeks. *Not a Health Canada–recommended dosage regimen. Among patients with less severe fibrosis, boceprevir and telaprevir were more effective than PR alone in achieving SVR. The differences between DAA regimens, however, were not statistically significantly different (Table 51). For patients with Metavir fibrosis score F3 or F4, boceprevir 44 weeks plus
PR 48 weeks and telaprevir 12 weeks plus PR 48 weeks were more effective than PR therapy (Table 52). The differences between boceprevir RGT and PR and the comparisons between DAA regimens were not statistically significantly different. It should be noted that these subgroup analyses, especially that for the F3 and F4 subgroup, were based on a limited number of patients from two RCTs, and there is substantial uncertainty in these results, as reflected by the large CrIs.

Direct-Acting Antiviral Agents for Chronic Hepatitis C Genotype 1 82
TABLE 51: NMA RESULTS FOR SVR IN PATIENTS WITH PRIOR PARTIAL RESPONDSE WITH FIBROSIS SCORE F0 TO
F2: RELATIVE RISK (LOWER SEGMENT) AND RISK DIFFERENCE % (UPPER SEGMENT) FOR RANDOM EFFECTS
MODEL
PR48 2a/b 50.39 (15.06 to 78.57) 46.43 (10.75 to 80.13) 53.18 (17.47 to 83.39)
5.49 (2.05 to 17.01) T12 PR48 2a q8 –3.99 (–56.44 to 53.96) 2.48 (–49.44 to 58.08)
5.06 (1.68 to 20.75) 0.94 (0.31 to 3.00) B32 PR36/48 2b RGT 6.29 (–19.96 to 32.71)
5.68 (2.05 to 22.21) 1.04 (0.40 to 3.17) 1.11 (0.68 to 2.05) *B44 PR48 2b
2a/b = pegylated interferon 2a or 2b; B32 PR36/48 RGT = boceprevir for 32 weeks and PR used as RGT for 36 to 48 weeks; B44 PR48 = boceprevir for 44 weeks and PR used for 48 weeks; NMA = network meta-analysis; q8 = every 8 hours (pertains to dosing of DAA); PR48 = peginterferon + ribavirin used for 48 weeks; RGT = response-guided therapy; SVR = sustained virologic response; T12 PR48 = telaprevir for 12 weeks and PR used for 48 weeks.
*Not a Health Canada–recommended dosage regimen.
TABLE 52: NMA RESULTS FOR SVR IN PATIENTS WITH PRIOR PARTIAL RESPONSE WITH FIBROSIS SCORE F3 TO
F4: RELATIVE RISK (LOWER SEGMENT) AND RISK DIFFERENCE % (UPPER SEGMENT) FOR RANDOM EFFECTS
MODEL
PR48 2a/b 21.09 (0.00 to 77.35) 41.40 (–5.28 to 98.63) 57.95 (1.28 to 99.20)
6.22 (1.04 to 121.30) T12 PR48 2a q8 17.70 (–72.33 to 98.07) 33.98 (–65.81 to 98.66)
10.82 (0.60 to 2170.00) 1.62 (0.07 to 205.80) B32 PR36/48 2b RGT 9.88 (–22.76 to 50.45)
14.97 (1.10 to 2243.00) 2.19 (0.15 to 209.10) 1.21 (0.54 to 5.20) *B44 PR48 2b
2a/b = pegylated interferon 2a or 2b; B32 PR36/48 RGT = boceprevir for 32 weeks and PR used as RGT for 36 to 48 weeks; B44 PR48 = boceprevir for 44 weeks and PR used for 48 weeks; NMA = network meta-analysis; q8 = every 8 hours (pertains to dosing of DAA); PR48 = peginterferon + ribavirin used for 48 weeks; RGT = response-guided therapy; SVR = sustained virologic response; T12 PR48 = telaprevir for 12 weeks and PR used for 48 weeks.
*Not a Health Canada–recommended dosage regimen.
Partial Response — Subgroup Analysis of SVR by Genotype Subtype It was not possible to conduct an NMA on SVR rate by genotype subtype because data from only one RCT were available.29 Based on direct pairwise analyses, compared with PR, patients who received telaprevir 12 weeks plus PR 48 weeks were more likely to achieve SVR, both in the genotype 1a subgroup (RD 29%; 95% CI, 7% to 52%) and the genotype 1b subgroup (RD 60%; 95% CI, 35% to 84%). The differences between telaprevir and PR were not statistically significant when pairwise comparisons were based on RR (Table 129, Appendix 15). Treatment-Experienced Patients — Null Response
This subgroup analysis was conducted including all patients who had a prior null response to PR therapy. Two RCTs32,33 and two uncontrolled studies33,35 provided data on SVR for those with a null response (Table 105, Appendix 13). None of the boceprevir RCTs enrolled patients with prior null response.
Based on direct pairwise comparisons, patients who received telaprevir or simeprevir were statistically significantly more likely to achieve an SVR than those who received PR alone (Table 127, Appendix 15). The simeprevir comparison was based on a limited number of patients (N = 33) and reached statistical significance for the analysis based on RD but not on RR. The NMA for the subgroup of patients with prior null response included 217 patients from two studies and three treatments (PR, simeprevir and telaprevir) (Figure 18). Patients who received telaprevir 12 weeks plus PR 48 weeks were statistically significantly more likely to achieve SVR than those who

Direct-Acting Antiviral Agents for Chronic Hepatitis C Genotype 1 83
received PR alone (Table 53). All other treatment comparisons were not statistically significantly different. This analysis was based on a limited number of patients and studies, resulting in relatively large CrIs.
TABLE 53: NMA RESULTS FOR SVR IN PATIENTS WITH PRIOR NULL RESPONSE: RELATIVE RISK (LOWER
SEGMENT) AND RISK DIFFERENCE % (UPPER SEGMENT) FOR RANDOM EFFECTS MODEL
PR48 2a/b 24.79 (–1.24 to 65.47) 38.86 (9.26 to 74.85)
3.78 (0.89 to 14.23) Si12 PR48 2a 13.80 (–43.55 to 65.47)
5.23 (1.71 to 21.12) 1.40 (0.34 to 7.82) T12 PR48 2a q8
2a/b = pegylated interferon 2a or 2b; NMA = network meta-analysis; q8 = every 8 hours (pertains to dosing of DAA); PR48 = peginterferon + ribavirin used for 48 weeks; Si12 PR48 RGT = simeprevir for 12 weeks and PR used as RGT for 48 weeks; SVR = sustained virologic response; T12 PR48 = telaprevir for 12 weeks and PR used for 48 weeks.
FIGURE 18: TREATMENT-EXPERIENCED PATIENTS WITH A PRIOR NULL RESPONSE: EVIDENCE NETWORK FOR
SUSTAINED VIROLOGIC RESPONSE
2a/b = pegylated interferon 2a or 2b; Si12 PR48 RGT = simeprevir for 12 weeks and PR used as RGT for 48 weeks; q8 = every 8 hours (pertains to dosing of DAA); PR48 = peginterferon + ribavirin used for 48 weeks; RCT = randomized controlled trial; T12 PR48 = telaprevir for 12 weeks and PR used for 48 weeks. The only data available for boceprevir among patients with prior null response are from an uncontrolled study (PROVIDE).33 In PROVIDE, 38% of patients who received boceprevir 44 weeks plus PR 48 weeks achieved SVR. For telaprevir, the uncontrolled study by Muir et al.35 reported that 56% of patients with prior null response who received telaprevir 12 weeks plus PR 48 weeks achieved an SVR. The proportion with SVR in Muir et al. is almost double the proportion reported for telaprevir in the REALIZE RCT (29% and 33%).33 Both PROVIDE and Muir et al. were rollover studies that enrolled patients who had previously participated in an industry-sponsored RCT and failed to achieve SVR on the control therapy (placebo plus PR).33,35 Null Response — Subgroup Analysis of SVR by Fibrosis Severity or Genotype Subtype
Among patients with a prior null response, it was not possible to do an NMA on SVR by fibrosis stage or by genotype subtype, because only one study was available for each of these subgroups.29 Based on direct pairwise analyses, patients who received telaprevir 12 weeks plus PR 48 weeks were more likely to achieve SVR than patients who received PR among subgroups with Metavir fibrosis scores F0 to F2 (RD 34%; 95% CI, 17% to 51%) or scores F3 to F4 (RD 21%; 95% CI, 6% to 35%) (Table 128, Appendix 15). Similarly, more patients on telaprevir than on PR alone achieved SVR in patients with genotype 1a (RD 22%; 95% CI, 7% to 38%) and genotype 1b (RD 33%; 95% CI, 17% to 49%) (Appendix 15,

Direct-Acting Antiviral Agents for Chronic Hepatitis C Genotype 1 84
Table 129). Direct pairwise comparisons based on RR were statistically significant for patients with fibrosis score F0 to F2 and genotype 1b only. b) Relapse Virologic relapse was reported in all but one study (Table 108, Appendix 13).34 Based on direct pairwise analyses of the treatment-experienced population, patients who received boceprevir, telaprevir, or simeprevir were significantly less likely to experience a relapse than those who received PR therapy (Table 54). For patients with prior relapse after PR therapy, those who received telaprevir or simeprevir were statistically significantly less likely to experience a subsequent relapse than those who received PR alone (Table 54). The differences between telaprevir or simeprevir and PR were not statistically significantly different for the subgroups of patients with prior partial or prior null response; however, these analyses were based on limited numbers of patients (< 75 patients). No relapse data were available for patients with prior relapse or partial response in the boceprevir RCTs,27,28 and no boceprevir RCTs included patients with prior null response. However, in the uncontrolled PROVIDE study, 0%, 15%, and 13% of patients with prior relapse and with partial and null response, respectively, experienced a relapse after receiving boceprevir plus PR.33 In the uncontrolled telaprevir study (Muir et al.35), 3%, 21%, and 21% of patients with prior relapse and with partial and null response, respectively, experienced a relapse after receiving telaprevir plus PR.

Direct-Acting Antiviral Agents for Chronic Hepatitis C Genotype 1 85
TABLE 54: TREATMENT-EXPERIENCED PATIENTS — DIRECT PAIRWISE COMPARISON FOR RELAPSE
DAA versus PR48 Number of trials,
N patients
RD (95% CI)a P value, I
2 RR (95% CI)
b P value, I
2
All Patients with Prior Treatment Experience
Boceprevir
B32 PR36/48 RGT Trials: 1 N = 136
–17% (–36 to 3) 0.09 0.48 (0.23 to 0.98) 0.04
*B44 PR48 Trials: 2 N = 262
–21% (–35 to –7) 0.004 I2 = 0%
0.36 (0.20 to 0.62) 0.003 I2 = 0%
Telaprevir
*T12 PR24 Trials: 1 N = 121
–23% (–42 to –4) 0.02 0.56 (0.36 to 0.89) 0.01
T12 PR48 Trials: 1 N = 354
–35% (–47 to –22) < 0.001 0.16 (0.10 to 0.27) < 0.001
Simeprevir
Si12 PR24/48 RGT Trials: 1 N = 342
–30% (–41 to –19) < 0.001 0.38 (0.27 to 0.53) < 0.001
Si12 PR48 Trials: 1 N = 78
–33% (–53 to –12) 0.002 0.26 (0.11 to 0.63) 0.003
Patients with Prior Relapse
Telaprevir
*T12 PR48 Trials: 1 N = 319
–58% (–72 to –44) < 0.001 0.11 (0.07 to 0.17) < 0.001
Simeprevir
Si12 PR24/48 RGT Trials: 1 N = 342
–30% (–41 to –19) < 0.001 0.38 (0.27 to 0.53) < 0.001
*Si12 PR48 Trials: 1 N = 42
–34% (–61 to –8) 0.01 0.28 (0.09 to 0.88) 0.03
Patients with Prior Partial Response
Telaprevir
T12 PR48 Trials: 1 N = 75
Not estimable (0 relapse in PR group)
Not estimable (0 relapse in PR group)
Simeprevir
Si12 PR48 Trials: 1 N = 21
–44% (–94 to 6) 0.09 0.12 (0.01 to 1.00) 0.05
Patients with Prior Null Response
Telaprevir
T12 PR48 Trials: 1 N = 71
–34% (–78 to 9) 0.12 0.43 (0.19 to 0.98) 0.05
Simeprevir
Si12 PR48 Trials: 1 N = 15
–7% (–55 to 41) 0.78 0.73 (0.09 to 6.00) 0.77
CI = confidence interval; DAA = direct-acting antiviral; PR48 = peginterferon plus ribavirin for 48 weeks; RD = risk difference; RR = relative risk. aNegative numbers indicate that fewer patients who received DAA + PR experienced a relapse, relative to PR for 48 weeks. bAn RR of 1.00 means no difference between comparators, while an RR < 1 indicates that fewer patients who received DAA + PR experienced a relapse, relative to PR for 48 weeks; an RR > 1 means the difference is in favour of PR. *Not a Health Canada–recommended dosage regimen. Note: Calculated by CADTH using Review Manager random effects model.

Direct-Acting Antiviral Agents for Chronic Hepatitis C Genotype 1 86
c) Treatment Discontinuation Proportion Who Did Not Complete Treatment Course
The proportion of patients who discontinued DAA plus PR treatment early ranged from 35% to 41% in boceprevir studies,27,28,33 from 14% to 32% in telaprevir studies,29,30,35 and from 7% to 24% in simeprevir studies31,32 (Table 109, Appendix 13). Among the patients randomized to PR therapy, the proportion who discontinued treatment prematurely ranged from 28% to 71%.27-32 Patients who received boceprevir, telaprevir, or simeprevir were statistically significantly less likely to stop therapy early compared with patients who received PR therapy, based on direct pairwise analyses (Table 55). The proportion of patients who met the futility criteria and therefore stopped treatment early because of treatment failure ranged from 36% to 64% for PR, 16% to 30% for boceprevir, 13% to 16% for telaprevir, and 17% for simeprevir.27-30,32
TABLE 55: TREATMENT-EXPERIENCED PATIENTS — DIRECT PAIRWISE COMPARISON FOR TREATMENT
DISCONTINUATION
DAA versus PR48 Number of trials, N Patients
RD (95% CI)a P value, I
2 RR (95% CI)
b P value, I
2
All Patients with Prior Treatment Experience
Boceprevir
B32 PR36/48 RGT Trials: 1 N = 242
–35% (–48 to –23) < 0.001 0.50 (0.39 to 0.64) < 0.001
*B44 PR48 Trials: 2 N = 442
–33% (–42 to –24) < 0.001 I2 = 0%
0.53 (0.45 to 0.64) < 0.001 I2 = 0%
Telaprevir
*T12 PR24 Trials: 1 N = 229
–43% (–55 to –32) < 0.001 0.37 (0.26 to 0.52) < 0.001
T12 PR48 Trials: 1 N = 662
–17% (–25 to –8) < 0.001 0.50 (0.37 to 0.68) < 0.001
Simeprevir
Si12 PR24/48 RGT Trials: 1 N = 393
–21% (–29 to –13) < 0.001 0.24 (0.14 to 0.40) < 0.001
Si12 PR48 Trials: 1 N = 132
–36% (–52 to –21) < 0.001 0.40 (0.25 to 0.64) < 0.001
Patients with Prior Relapse
Simeprevir
Si12 PR24/48 RGT Trials: 1 N = 393
–21% (–29 to –13) < 0.001 0.24 (0.14 to 0.40) < 0.001
CI = confidence interval; DAA = direct-acting antiviral; PR48 = peginterferon plus ribavirin for 48 weeks; RD = risk difference; RR = relative risk. aNegative numbers indicate that fewer patients who received DAA + PR discontinued treatment, relative to PR for 48 weeks. bAn RR of 1.00 means no difference between comparators, while an RR < 1 indicates that fewer patients who received DAA + PR discontinued treatment, relative to PR for 48 weeks; an RR > 1 means the difference is in favour of PR.
*Not a Health Canada–recommended dosage regimen.
Note: Calculated by CADTH using Review Manager random effects model.

Direct-Acting Antiviral Agents for Chronic Hepatitis C Genotype 1 87
Short-Course Treatment Via Response-Guided Therapy
Two studies randomized patients to an RGT treatment group with a DAA plus PR (Table 110, Appendix 13).27,31 In the RESPOND2 trial, 46% of patients with prior relapse and partial response met the RGT criteria for a shortened course of boceprevir plus PR therapy. In the PROMISE study, 93% of patients with prior relapse treated with simeprevir plus PR met the criteria for a short 24-week treatment course.31 Of note, the RGT criteria applied in PROMISE were less stringent than those recommended by Health Canada. Data on the proportion that met Health Canada’s RGT criteria were not reported. d) Mortality Data on deaths were reported in five studies (Table 108, Appendix 13).28,31-34 A total of 12 deaths (0.5%) occurred among the 2,479 patients who were followed for 16 to 72 weeks (Table 56).
TABLE 56: TREATMENT-EXPERIENCED PATIENTS — MORTALITY
Boceprevir Telaprevir Simeprevir PR
Deaths 2 7 2 1
Total N treated 300 1,587 326 266
% mortality 0.7% 0.4% 0.6% 0.4%
PR = peginterferon + ribavirin.
e) Adverse Events A summary of adverse events for all treatment-experienced patients in the included studies is given in Table 111 and Table 112, Appendix 13. In addition, direct pairwise comparisons for DAA plus PR versus PR are summarized in Table 130 to Table 138, Appendix 15. The results of the NMA for anemia, rash, and depression are reported in Appendix 17. The incidence of adverse events was high across studies, with 94% to 100% of patients reporting one or more adverse events, except in the uncontrolled study by Colombo et al.,34 in which 60% to 67% of patients experienced a grade 2 to 4 adverse event, based on an interim analysis of the first 16 weeks of therapy. Serious adverse events were reported in 5% to 10% of patients who received PR alone, 10% to 14% who received boceprevir,27,28,33 5% to 17% of patients who received telaprevir,29,30,34,35 and 5% to 11% of patients who received simeprevir31,32 (Table 57).

Direct-Acting Antiviral Agents for Chronic Hepatitis C Genotype 1 88
TABLE 57: TREATMENT-EXPERIENCED PATIENTS — DIRECT PAIRWISE COMPARISON FOR SERIOUS ADVERSE
EVENTS
DAA versus PR48 N Trials
N Patients
% SAE in PR Groups
% SAE in DAA Groups
SAE
RD (95% CI)a, I
2 RR (95% CI)
b, I
2
Boceprevirc
B32 PR36/48 RGT 1 242 5% 10% 5% (–2% to 12%) 1.98 (0.68 to 5.72)
*B44 PR48 2 442 5% and 10% 13% and 14%
7% (1% to 13%) I2=11%
1.80 (0.83 to 3.94), I2=31%
Telaprevird
*T12 PR24 1 229 8% 5% –3% (–9% to 4%) 0.66 (0.24 to 1.80)
T12 PR48 1 662 5% 12% 7% (2% to 12%) 2.29 (1.07 to 4.87)
Simeprevir
Si12 PR24/48 RGT 1 393 8% 5% –2% (–7% to 3%) 0.72 (0.33 to 1.57)
Si12 PR48 1 132 6% 11% 5% (–5% to 14%) 1.75 (0.54 to 5.70)
CI = confidence interval; DAA = direct-acting antiviral; PR48 = peginterferon plus ribavirin for 48 weeks; RD = risk difference; RR = relative risk; SAE = serious adverse event. aPositive numbers indicate that more patients who received DAA + PR experienced a SAE, relative to PR for 48 weeks. bAn RR of 1.00 means no difference between comparators, while an RR > 1 indicates that more patients who received DAA + PR experienced SAE, relative to PR for 48 weeks; an RR < 1 means the difference is in favour of DAA + PR. c11% reported SAE in the PROVIDE study. d10% and 13% in Colombo 2013, and 17% in Muir 2011 reported SAE. *Not a Health Canada–recommended dosage regimen. Note: Calculated by CADTH using Review Manager random effects model
Among patients who received PR alone, 0% to 5% stopped treatment due to adverse events compared with 8% to 17% who received boceprevir, 4% to 14% who received telaprevir, and 0.4% to 5% who received simeprevir (Table 111, Appendix 13). Similar to the treatment-naive population, the incidence of fatigue was high in treatment-experienced patients, with 40% to 56% of patients on PR alone reporting fatigue. The incidence reported was 48% to 57% for boceprevir, 44% to 67% for telaprevir, and 32% to 39% for simeprevir (Table 112, Appendix 13). The incidence of influenza-like symptoms and neutropenia was similar between the PR and DAA regimens (Table 132 to Table 133, Appendix 15). Influenza-like symptoms were reported as follows: PR alone 20% to 32%; boceprevir 21% to 25%; telaprevir 24% to 36%; simeprevir 24% to 30%. Neutropenia was reported in 6% to 22% of patients in the PR groups, 14% to 31% for boceprevir, 7% to 14% for telaprevir, and 18% to 27% for simeprevir (Table 112, Appendix 13). Pruritus was reported by 12% to 28% of patients on PR alone, 13% to 15% for boceprevir, 5% to 52% for telaprevir, and 28% to 30% for simeprevir (Table 112, Appendix 13). In the two telaprevir trials,29,30 the incidence of pruritus was statistically significantly higher for telaprevir compared with PR alone (RD 19% and 24%) (Table 134, Appendix 15). Suicidal ideation was reported in two boceprevir RCTs27,28 and one telaprevir RCT.30 Three patients who received boceprevir and no patients on PR alone or telaprevir reported suicidal ideation. Anorectal discomfort was reported in the four telaprevir studies only.29,30,34,35 No patients on PR reported anorectal discomfort, whereas 3% to 9% on telaprevir reported this adverse event (Table 135, Appendix 15 and Table 112, Appendix 13).

Direct-Acting Antiviral Agents for Chronic Hepatitis C Genotype 1 89
The incidence of any adverse event, rash, and pruritus was lower in Colombo et al.’s study34 than in other studies, due to differences in the reporting of events. Colombo et al. reported patients with grade 2 to 4 drug-related adverse events over the first 16 weeks of telaprevir therapy, whereas other studies reported all patients with adverse events during the overall treatment period. Anemia
Anemia was reported by 8% to 33% of patients who received PR alone, 43% to 50% for boceprevir, 25% to 62% for telaprevir, and 15% to 17% for simeprevir (Table 111, Appendix 13). Based on direct pairwise comparisons, boceprevir and telaprevir, but not simeprevir, were associated with increased risk of anemia (Table 136, Appendix 15).
The NMA for anemia in all treatment-experienced patients included 2,020 patients from six RCTs and seven treatments (Figure 19). The incidence of anemia was statistically significantly higher among patients who received boceprevir (RD 18% to 19%) and telaprevir (RD 20% to 30%) compared with PR alone (Table 58). No significant differences were found between simeprevir and PR alone. The incidence of anemia was higher for patients on telaprevir or boceprevir than on simeprevir (RD 21% to 34%), but the differences were statistically significant for only two regimens (boceprevir 44 weeks plus PR48 weeks and telaprevir 12 weeks plus PR 24 weeks). No significant differences were found between telaprevir and boceprevir.
FIGURE 19: TREATMENT-EXPERIENCED PATIENTS: EVIDENCE NETWORK FOR ANEMIA AND RASH
2a/b = pegylated interferon 2a or 2b; B32 PR36-48 RGT = boceprevir for 32 weeks and PR used as RGT for 36 or 48 weeks; B44 PR48 = boceprevir for 44 weeks and PR used for 48 weeks; PR48 2a/b = pegylated interferon 2a or 2b plus ribavirin for 48 weeks; q8 = every 8 hours (pertains to dosing of DAA); RCT = randomized controlled trial; Si12 PR48 RGT = simeprevir for 12 weeks and PR used as RGT for 48 weeks; T12 PR48 = telaprevir for 12 weeks and PR used for 48 weeks; PR = peginterferon + ribavirin; RGT = response-guided therapy. *Not a Health Canada–recommended dosage regimen.

Direct-Acting Antiviral Agents for Chronic Hepatitis C Genotype 1 90
TABLE 58: NMA RESULTS FOR ANEMIA IN ALL TREATMENT-EXPERIENCED PATIENTS: RELATIVE RISK (LOWER
SEGMENT) AND RISK DIFFERENCE % (UPPER SEGMENT) FOR RANDOM EFFECTS MODEL
PR48 2a/b –2.90
(–11.61 to 11.94)
–4.13 (–14.01 to
15.54)
19.56 (1.99 to 41.50)
17.96 (1.75 to 39.28)
18.68 (5.12 to 34.78)
30.35 (6.69 to 55.70)
0.84 (0.37 to 1.69)
Si12 PR24/48 2a RGT
–1.23 (–18.55 to
19.48)
22.15 (–0.45 to
45.39)
20.59 (–0.98 to 43.38)
21.35 (1.54 to 39.53)
32.82 (5.17 to 59.38)
0.77 (0.26 to 1.91)
0.91 (0.25 to 3.07)
Si12 PR48 2a 23.25
(–2.26 to 47.02)
21.70 (–3.07 to 45.26)
22.54 (–1.14 to
41.50)
33.80 (3.72 to 61.33)
2.10 (1.11 to 3.43)
2.50 (0.98 to 6.43)
2.73 (0.92 to 8.90)
T12 PR48 2a q8
–1.57 (–28.52 to 25.96)
–0.86 (–26.48 to
23.22)
10.63 (–21.87 to
41.84)
2.01 (1.10 to 3.31)
2.39 (0.96 to 6.14)
2.62 (0.89 to 8.59)
0.96 (0.45 to 2.10)
B32 PR36/48 2b RGT
0.70 (–18.13 to
17.06)
12.22 (–19.75 to
43.00)
2.05 (1.27 to 3.07)
2.45 (1.06 to 6.01)
2.68 (0.96 to 8.48)
0.98 (0.51 to 2.04)
1.02 (0.63 to 1.72) *B44 PR48
2a/b
11.53 (–17.66 to
40.95)
2.70 (1.36 to 4.40)
3.20 (1.23 to 8.18)
3.50 (1.14 to 11.33)
1.28 (0.57 to 2.78)
1.34 (0.59 to 2.83) 1.32 (0.61 to
2.52) *T12 PR24 2a
q8
2a/b = pegylated interferon 2a or 2b; B32 PR36/48 = boceprevir for 32 weeks and PR used as RGT for 36 or 48 weeks; B44 PR48 = boceprevir for 44 weeks and PR used for 48 weeks; NMA = network meta-analysis; PR48 = pegylated interferon 2a or 2b plus ribavirin for 48 weeks; q8 = every 8 hours (refers to dosing of DAA); RGT = response-guided therapy; Si12 PR24/48 RGT = simeprevir for 12 weeks and PR used as RGT for 24 or 48 weeks; Si12 PR48 = simeprevir for 12 weeks and PR for 48 weeks; T12 PR24 = telaprevir for 12 weeks and PR used for 24 weeks; T12 PR48 = telaprevir for 12 weeks and PR used for 48 weeks. *Not a Health Canada–recommended dosage regimen.
Rash
Rash was reported by 5% to 23% of patients on PR alone, 14% to 22% on boceprevir, 12% to 50% on telaprevir, and 23% to 26% on simeprevir (Table 111, Appendix 13). Based on direct pairwise comparisons, boceprevir and telaprevir, but not simeprevir, were associated with increased risk of rash (Table 137, Appendix 15). The NMA for rash in all treatment-experienced patients included 2,020 patients from six RCTs and seven treatments (Figure 19). Patients who received boceprevir (RD 21% and 26%) or telaprevir (14% and 25%) were significantly more likely to report rash than those who received PR alone (Table 59). The incidence of rash was not statistically significant different between simeprevir and PR alone. Rash occurred more frequently among those who received boceprevir (RD 20% and 26%) or telaprevir (RD 14% and 24%) than simeprevir RGT, but the differences were statistically significant for only boceprevir RGT, and telaprevir 12 weeks plus PR 24 weeks. The differences between simeprevir 12 weeks plus PR 48 weeks versus boceprevir or telaprevir, and for boceprevir versus telaprevir were not significantly different.

Direct-Acting Antiviral Agents for Chronic Hepatitis C Genotype 1 91
TABLE 59: NMA RESULTS FOR RASH IN ALL TREATMENT-EXPERIENCED PATIENTS: RELATIVE RISK (LOWER
SEGMENT) AND RISK DIFFERENCE % (UPPER SEGMENT) FOR RANDOM EFFECTS MODEL
PR48 2a/b 0.43
(–7.30 to 14.30)
6.11 (–6.08 to
28.41)
14.36 (0.80 to 34.12)
26.34 (5.38 to 52.06)
21.15 (5.35 to 41.76)
25.21 (6.78 to 47.67)
1.03 (0.47 to 2.11)
Si12 PR24/48 2a RGT
5.58 (–12.59 to
28.75)
13.75 (–5.30 to
34.64)
25.61 (0.73 to 52.29)
20.45 (–0.26 to
42.23)
24.45 (1.73 to 47.93)
1.46 (0.57 to 3.25)
1.41 (0.44 to 4.30)
Si12 PR48 2a 8.08
(–17.64 to 31.25)
19.87 (–11.04 to
49.14)
14.86 (–12.98 to
39.41)
18.66 (–10.06 to
44.62)
2.08 (1.06 to 3.63)
2.02 (0.76 to 5.20)
1.42 (0.51 to 4.17)
T12 PR48 2a q8 11.76
(–17.95 to 41.36)
6.67 (–19.65 to
32.01)
10.61 (–16.36 to
36.73)
2.96 (1.36 to 5.60)
2.86 (1.03 to 7.64)
2.03 (0.68 to 6.18)
1.43 (0.56 to 3.46)
B32 PR36/48 2b RGT
–5.07 (–25.62 to
14.48)
–1.09 (–33.84 to
30.46)
2.58 (1.35 to 4.76)
2.49 (0.99 to 6.59)
1.77 (0.65 to 5.35)
1.24 (0.54 to 2.98)
0.87 (0.52 to 1.59)
*B44 PR48 2a/b
4.00 (–24.80 to
32.50)
2.89 (1.50 to 4.77)
2.79 (1.08 to 6.91)
1.97 (0.71 to 5.63)
1.38 (0.59 to 3.13)
0.97 (0.41 to 2.32)
1.12 (0.48 to 2.39)
*T12 PR24 2a q8
2a/b = pegylated interferon 2a or 2b; B32 PR36/48 RGT = boceprevir for 32 weeks and PR used as RGT for 36 to 48 weeks; B44 PR48 = boceprevir for 44 weeks and PR used for 48 weeks; NMA = network meta-analysis; q8 = every 8 hours (pertains to dosing of DAA); PR48 = peginterferon + ribavirin used for 48 weeks; RGT = response-guided therapy; Si12 PR24/48 RGT = simeprevir for 12 weeks and PR used as RGT for 24 to 48 weeks; Si12 PR48 = simeprevir for 12 weeks and PR for 48 weeks; T12 PR48 = telaprevir for 12 weeks and PR used for 48 weeks; T12 PR24 = telaprevir for 12 weeks and PR used for 24 weeks.
*Not a Health Canada–recommended dosage regimen.
Depression
Depression was reported by 9% to 17% of those on PR alone, 12% to 17% on boceprevir, 9% to 13% on telaprevir, and 15% on simeprevir (Table 111, Appendix 13). Based on direct pairwise comparisons, the incidence of depression was not statistically significantly different between boceprevir, telaprevir, or simeprevir and PR alone in treatment-experienced patients (Table 138, Appendix 15).
The NMA for depression included data from five RCTs, 1,627 patients, and six treatments (Figure 20). No statistically significant differences were found between PR, boceprevir, simeprevir, and telaprevir for the incidence of depression (Table 60).

Direct-Acting Antiviral Agents for Chronic Hepatitis C Genotype 1 92
FIGURE 20: TREATMENT-EXPERIENCED PATIENTS — EVIDENCE NETWORK FOR DEPRESSION
2a/b = pegylated interferon 2a or 2b; B32 PR36-48 RGT = boceprevir for 32 weeks and PR used as RGT for 36 to 48 weeks; B44 PR48 = boceprevir for 44 weeks and PR used for 48 weeks; q8 = every 8 hours (pertains to dosing of DAA); PR48 = peginterferon + ribavirin used for 48 weeks; RGT = response-guided therapy; Si12 PR48 = simeprevir for 12 weeks and PR for 48 weeks; T12 PR48 = telaprevir for 12 weeks and PR used for 48 weeks. *Not a Health Canada–recommended dosage regimen.
TABLE 60: NMA RESULTS FOR DEPRESSION IN ALL TREATMENT-EXPERIENCED PATIENTS: RELATIVE RISK (LOWER
SEGMENT) AND RISK DIFFERENCE % (UPPER SEGMENT) FOR RANDOM EFFECTS MODEL
PR48 2a/b 7.94 (–6.24 to
35.41) –2.79 (–8.62 to
8.11) –1.19 (–8.39 to
11.77) 3.68 (–4.45 to
16.24) –4.17 (–9.99 to
7.18)
1.65 (0.53 to 4.26)
Si12 PR48 2a –10.49 (–38.12 to
7.05) –8.96 (–37.15 to
10.31) –4.19 (–33.08 to
15.24) –11.84 (–39.35 to
5.85)
0.77 (0.34 to 1.70)
0.47 (0.13 to 1.84)
T12 PR48 2a q8 1.56 (–11.02 to
15.18) 6.35 (–6.86 to
19.81) –1.37 (–13.17 to
10.89)
0.90 (0.37 to 2.06)
0.55 (0.15 to 2.20)
1.17 (0.36 to 3.73) B32 PR36/48 2b
RGT 4.71 (–5.92 to
15.14) –2.95 (–16.64 to
10.11)
1.30 (0.67 to 2.49)
0.79 (0.25 to 2.91)
1.69 (0.61 to 4.86) 1.44 (0.69 to 3.26) *B44 PR48 2a/b –7.73 (–21.25 to
5.86)
0.66 (0.24 to 1.61)
0.40 (0.10 to 1.68)
0.85 (0.24 to 2.87) 0.72 (0.20 to 2.55) 0.50 (0.15 to
1.54) *T12 PR24 2a q8
2a/b = pegylated interferon 2a or 2b; B32 PR36/48 RGT = boceprevir for 32 weeks and PR used as RGT for 36 to 48 weeks; B44 PR48 = boceprevir for 44 weeks and PR used for 48 weeks; NMA = network meta-analysis; q8 = every 8 hours (pertains to dosing of DAA); PR48 = peginterferon + ribavirin used for 48 weeks; RGT = response-guided therapy; Si12 PR48 = simeprevir for 12 weeks and PR for 48 weeks; T12 PR48 = telaprevir for 12 weeks and PR used for 48 weeks. *Not a Health Canada–recommended dosage regimen.
f) Network Meta-Analysis Secondary Analyses Stratified by Peginterferon 2a or 2b
Secondary analyses were conducted in order to investigate whether the type of peginterferon used (2a or 2b) had an impact on the effect estimates. In these analyses, patients who received peginterferon 2a and those who received peginterferon 2b were stratified into separate nodes and analyzed separately.

Direct-Acting Antiviral Agents for Chronic Hepatitis C Genotype 1 93
A supplementary literature search was conducted to identify RCTs comparing peginterferon 2a plus ribavirin with peginterferon 2b plus ribavirin in patients with genotype 1 CHC. A total of six peginterferon studies met the inclusion criteria, and these have been summarized in Appendix 25. Detailed data on all analyses stratified by peginterferon 2a or 2b are listed in Appendix 22. Treatment-Naive Patients Sustained Virologic Response: A total of 17 studies with 14 treatment strategies were included in the NMA for SVR in treatment-naive patients (N = 6,919). Although peginterferon 2b plus ribavirin was found to be inferior to peginterferon 2a plus ribavirin (RD –7.2%; 95% CrI, –15.2 to –1.3), no statistically significant differences were found when comparing peginterferon 2a with 2b when combined with a DAA. In general, the effect estimates from this secondary analysis were consistent with the base-case analysis.
Two additional subgroup analyses were conducted, stratified by fibrosis severity and by genotype subtype 1a or 1b. In both analyses, no statistically significant differences were found when comparing peginterferon 2a with 2b. Overall, in both analyses the effect estimates for DAAs plus PR were consistent with the base-case subgroup analyses. Anemia, Depression, and Rash: No statistically significant differences were found when comparing peginterferon 2a versus 2b for the occurrence of anemia, depression, or rash. The direction of results for comparisons between DAA regimens against PR alone or DAA regimens against each other was, in general, similar to the base-case analysis for all adverse events investigated. All Treatment-Experienced Patients
Sustained Virologic Response: A total of seven studies with 10 treatment strategies were included in the NMA for SVR in all treatment-experienced patients (N = 2,112). No statistically significant differences were found when comparing peginterferon 2a with 2b and when comparing the DAAs with each other. In general, the effect estimates from the secondary analysis were consistent with the base-case analysis. It was not possible to conduct analysis by Metavir score or by genotype subtype due to lack of data. Anemia: No statistically significant differences were found when comparing peginterferon 2a versus 2b for the occurrence of anemia. The direction of effects for comparisons between DAA regimens versus PR or for DAA regimens versus each other was, in general, similar to the base-case analysis for anemia. It was not possible to do secondary analyses for rash and depression due to lack of data. Health Canada Dosage Regimens Only
Secondary analyses were conducted to investigate whether restricting the analyses to Health Canada–recommended doses would have an impact on the findings. For detailed data on all analyses when only Health Canada–recommended dosage regimens were included in the NMA, see Appendix 23. Treatment-Naive Patients
Sustained Virologic Response: A total of seven studies with nine treatment strategies were included in the NMA for SVR in treatment-naive patients (N = 3,295).The effect estimates were consistent with the base-case analysis. Similarly, in the subgroup analysis stratified by genotype subtype 1a or 1b, results for SVR were consistent with the base-case subgroup analysis.

Direct-Acting Antiviral Agents for Chronic Hepatitis C Genotype 1 94
Anemia, Depression, and Rash: Results from the analysis of using only Health Canada–recommended doses for the occurrence of anemia, depression, and rash were consistent with the base-case results for these adverse events. All Treatment-Experienced Patients
Sustained Virologic Response: A total of four studies with five treatment strategies were included in the NMA for SVR in all treatment-experienced patients (N = 1,165). The effect estimates were consistent with the base-case analysis. Similarly, in the subgroup analysis, when SVR rates were stratified by Metavir scores or genotype subtype 1a or 1b, results were consistent with the base-case results of these subgroup analyses. Anemia: Results from the analysis of using only Health Canada–recommended doses for the occurrence of anemia, depression, and rash were consistent with the base-case results for these adverse events. Treatment-Experienced Patients — Relapse
A total of two studies with three treatment strategies were included in the NMA for SVR in patients who had a relapse after PR therapy (N = 549). The effect estimates were consistent with the base-case analysis for SVR in this patient population. Similarly, in the subgroup analysis, when SVR rates were stratified by Metavir scores or genotype subtype 1a or 1b, results were consistent with the base-case subgroup analyses. Treatment-Experienced Patients — Partial Response A total of three studies with four treatment strategies were included in the NMA for SVR in patients who had a partial response to prior PR therapy (N = 208). The effect estimates were consistent with the base-case analysis for partial response. Similarly, in the subgroup analysis, when data were stratified by Metavir scores, results were consistent with the base-case subgroup results. Treatment-Experienced Patients — Null Response
A total of two studies with three treatment strategies were included in the NMA for SVR in patients with prior null response (N = 549). The effect estimates were consistent with the base-case analysis for SVR in this patient population. Meta-Regression
To further investigate heterogeneity, meta-regression analyses were conducted by adjusting the network using the overall percentage of patients with cirrhosis in each study as covariate. This analysis was done for SVR, anemia, and rash in treatment-naive and treatment-experienced patients. In general, the effect estimates were consistent with the base-case analyses; in some cases, the RR changed from being less than 1 in the base case to greater than 1 in the meta-regression analysis, but in both analyses the results were not statistically significant. This indicates that adjusting for the percentage of patients with Metavir fibrosis score of F4 did not significantly affect the results. Detailed data on all meta-regression analyses are listed in Appendix 24. Comparison With Direct Pairwise Meta-analysis
A comparison between the results generated from the NMA for the DAAs plus PR versus PR alone, and results generated from direct pairwise comparisons using conventional meta-analysis, was done for the following outcomes: SVR, SVR by Metavir fibrosis score, SVR by genotype subtype, anemia, rash, and depression. In both treatment-naive and treatment-experienced patients, results were consistent

Direct-Acting Antiviral Agents for Chronic Hepatitis C Genotype 1 95
between the two analyses: RR and RD were in the same direction. For some comparisons, the results did not include the null value in one analysis, but did include the null in the other. Consistency
Of the 62 NMA models considered, 37 had closed loops, of which 14 had independent loops. For the closed loops, the consistency and inconsistency models were considered. The deviance and DIC statistics in fitted consistency and inconsistency models were considered, and the posterior mean deviance of the individual data points in the inconsistency model were plotted against their posterior mean deviance in the consistency model to identify any loops in which inconsistency was present. For all analyses, the data fell on or around the line of equality, indicating that inconsistency was not present in the networks. The figures of assessment of inconsistency are listed in Appendix 21, Appendix 22, and Appendix 23. 4.5.3 HIV Co-infection Two RCTs in patients with CHC and HIV co-infection met the inclusion criteria for the systematic review.36,37 These trials compared boceprevir 44 weeks plus PR 48 weeks36 or telaprevir 12 weeks plus PR 48 weeks37 with 48 weeks of PR in patients who had never received treatment of CHC. Patients with CHC and HIV co-infection who received treatment with boceprevir or telaprevir were statistically significantly more likely to achieve an SVR than patients who received PR alone (Figure 21), based on direct pairwise comparisons. The proportion of patients achieving an SVR24 was 33% higher (95% CI, 14% to 52%) and 28% higher (95% CI, 3% to 53%) than for PR alone for those in the boceprevir and telaprevir groups, respectively (Table 113, Appendix 14).36,37
In the subgroups based on genotype subtype (1a or 1b) and fibrosis level (Metavir fibrosis score F0 to F2), the differences between boceprevir and PR were similar to the overall study population.36 None of the eight patients with more severe fibrosis (Metavir fibrosis score F3 to F4) achieved an SVR.36 In the telaprevir study, patients with genotype 1a were more likely to achieve an SVR with telaprevir than with PR alone (74% versus 29%, n = 41), but those with genotype 1b showed no difference between treatments (64% versus 66%, n = 17).37 The risk of relapse was lower in the DAA groups than in PR groups; however, the differences were not statistically significantly different (boceprevir: RD –5%; 95% CI, –25% to 14%; telaprevir: –12%; 95% CI, –33% to 8%).36,37 The proportion of patients who did not complete the 48-week treatment regimen was similar for the telaprevir and PR groups (42% versus 41%),37 but lower for boceprevir versus PR (34% versus 53%), although the differences were not statistically significant.36 No data were reported for the other efficacy outcomes of interest in this review.

Direct-Acting Antiviral Agents for Chronic Hepatitis C Genotype 1 96
FIGURE 21: HIV CO-INFECTION — PROPORTION OF PATIENTS WITH VIROLOGIC OUTCOMES
A) SVR24a B) Relapse
DAA = direct-acting antiviral; PR = peginterferon + ribavirin; SVR24 = sustained virologic response 24 weeks after the end of treatment. aP < 0.05 for boceprevir and telaprevir versus PR alone.
The incidence of adverse events was high, with 97% to 100% of patients reporting at least one adverse event during the studies (Table 114, Appendix 14). No deaths were reported in either 72-week study.36,37 Serious adverse events were reported by 18% and 9% of patients in the telaprevir and PR groups,37 and in 17% and 21% in the boceprevir and PR groups,36 respectively. More patients who received a DAA plus PR stopped therapy due to adverse events than PR alone (boceprevir: 20% versus 9%; telaprevir: 8% versus 0%). Of the specific adverse events of interest in this review, fatigue (42%), pruritus (39%), and rash (34%) were the most frequently reported events among patients who received telaprevir.37 Anemia (41%), fatigue (38%), and influenza-like illness (25%) were the most common adverse events among those who received boceprevir.36 When boceprevir and telaprevir were compared using indirect treatment comparison methods, no statistically significant differences were detected between treatments for key efficacy and harms outcomes.
29%
45%
63%
74%
0%
10%
20%
30%
40%
50%
60%
70%
80%
boceprevir telaprevir
PR DAA
10%
15%
5%
3%
0%
2%
4%
6%
8%
10%
12%
14%
16%
18%
boceprevir telaprevir
PR DAA

Direct-Acting Antiviral Agents for Chronic Hepatitis C Genotype 1 97
TABLE 61: HIV CO-INFECTION — INDIRECT TREATMENT COMPARISON (BUCHER METHOD)
Outcome Boceprevir versus Telaprevir
RD (95% CI) RR (95% CI)
SVR24 5% (–26% to 36%) 1.32 (0.63 to 2.76)
Relapse 7% (–21% to 35%) 2.40 (0.09 to 61.72)
Treatment discontinuation –20% (–53% to 13%) 0.63 (0.29 to 1.37)
Adverse events
Anemia 8% (–21% to 37%) 1.25 (0.36 to 4.37)
Depression –7% (–30% to 15%) 0.63 (0.10 to 3.83)
Rash –3% (–28% to 22%) 3.92 (0.20 to 78.45)
CI = confidence interval; RD = absolute risk difference; RR = relative risk; SVR24 = sustained virologic response 24 weeks after the end of treatment.
4.6 Pharmacoeconomic Evaluation
4.6.1 Base-Case Analysis a) Treatment-Naive: Overall Population Total costs per patient over lifetime for each of the treatment regimens are presented in Table 62. Drug costs represented 29% to 31% of total costs for DAA plus PR regimens and 13% of total costs for PR therapy alone.
TABLE 62: TOTAL COSTS (TREATMENT-NAIVE PATIENTS) GENERATED BY THE MODEL FOR EACH OF THE
TREATMENT REGIMENS
PR Boceprevir Simeprevir Telaprevir
Total cost $113,347 $136,537 $137,183 $137,454
HCV drugs $14,789 $39,521 $43,203 $42,607
Adverse events $725 $1,109 $723 $1,119
CHC-related costsa $97,833 $95,907 $93,257 $93,728
CHC = chronic hepatitis C; HCV = hepatitis C virus; PR = pegylated interferon plus ribavirin. aIncludes hospitalization, ambulatory care, long-term care, physician services, diagnostic tests, and liver transplant–related
costs.
Table 63 summarizes the outcomes associated with the base-case analysis for a cohort of 50-year-old, genotype 1, treatment-naive patients, when the baseline fibrosis distribution is applied. The DAAs used in combination with PR are more costly but more effective than PR. Among the DAAs, telaprevir was the most expensive treatment ($137,454), followed by simeprevir ($137,183), then boceprevir ($136,537). Simeprevir was associated with an increase in health (0.74 QALY) and cost ($23,836), resulting in an ICUR of $32,230 per QALY compared with PR therapy. Boceprevir was extendedly dominated by PR and simeprevir. Telaprevir was dominated by simeprevir (as telaprevir was more expensive, but resulted in less QALY gains than simeprevir).
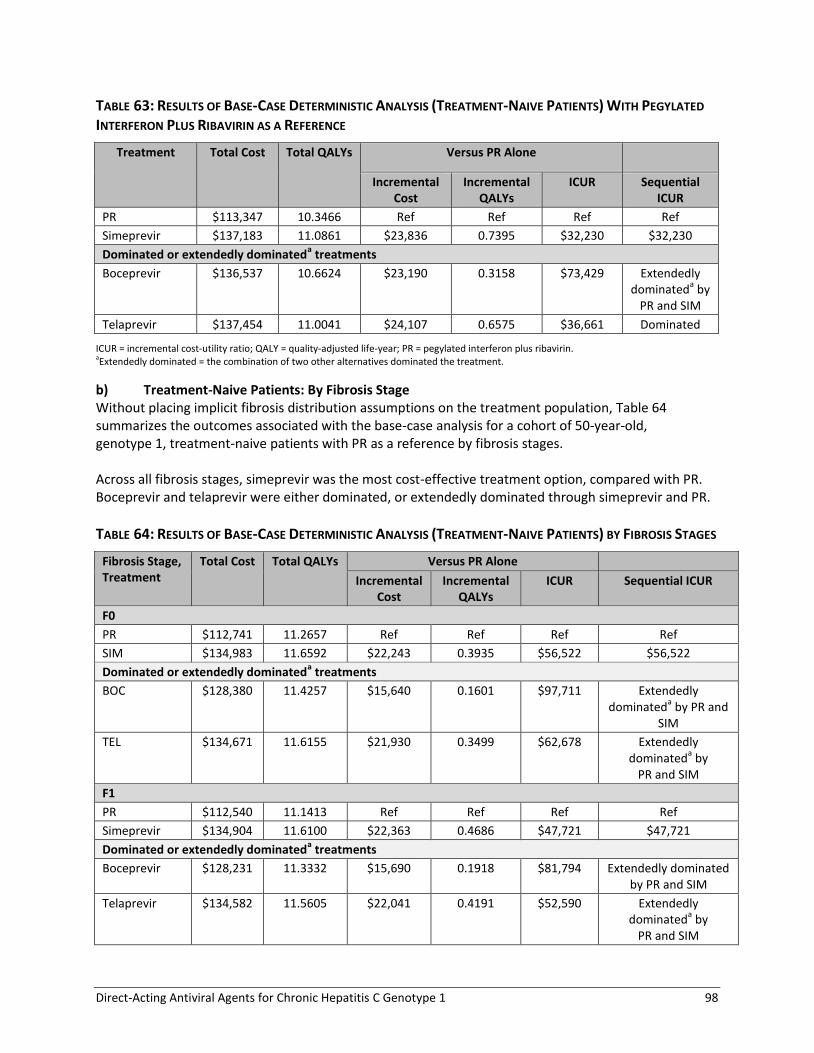
Direct-Acting Antiviral Agents for Chronic Hepatitis C Genotype 1 98
TABLE 63: RESULTS OF BASE-CASE DETERMINISTIC ANALYSIS (TREATMENT-NAIVE PATIENTS) WITH PEGYLATED
INTERFERON PLUS RIBAVIRIN AS A REFERENCE
Treatment Total Cost Total QALYs Versus PR Alone
Incremental Cost
Incremental QALYs
ICUR Sequential ICUR
PR $113,347 10.3466 Ref Ref Ref Ref
Simeprevir $137,183 11.0861 $23,836 0.7395 $32,230 $32,230
Dominated or extendedly dominateda treatments
Boceprevir $136,537 10.6624 $23,190 0.3158 $73,429 Extendedly dominated
a by
PR and SIM
Telaprevir $137,454 11.0041 $24,107 0.6575 $36,661 Dominated
ICUR = incremental cost-utility ratio; QALY = quality-adjusted life-year; PR = pegylated interferon plus ribavirin. aExtendedly dominated = the combination of two other alternatives dominated the treatment.
b) Treatment-Naive Patients: By Fibrosis Stage Without placing implicit fibrosis distribution assumptions on the treatment population, Table 64 summarizes the outcomes associated with the base-case analysis for a cohort of 50-year-old, genotype 1, treatment-naive patients with PR as a reference by fibrosis stages. Across all fibrosis stages, simeprevir was the most cost-effective treatment option, compared with PR. Boceprevir and telaprevir were either dominated, or extendedly dominated through simeprevir and PR.
TABLE 64: RESULTS OF BASE-CASE DETERMINISTIC ANALYSIS (TREATMENT-NAIVE PATIENTS) BY FIBROSIS STAGES
Fibrosis Stage, Treatment
Total Cost Total QALYs Versus PR Alone
Incremental Cost
Incremental QALYs
ICUR Sequential ICUR
F0
PR $112,741 11.2657 Ref Ref Ref Ref
SIM $134,983 11.6592 $22,243 0.3935 $56,522 $56,522
Dominated or extendedly dominateda treatments
BOC $128,380 11.4257 $15,640 0.1601 $97,711 Extendedly dominated
a by PR and
SIM
TEL $134,671 11.6155 $21,930 0.3499 $62,678 Extendedly dominated
a by
PR and SIM
F1
PR $112,540 11.1413 Ref Ref Ref Ref
Simeprevir $134,904 11.6100 $22,363 0.4686 $47,721 $47,721
Dominated or extendedly dominateda treatments
Boceprevir $128,231 11.3332 $15,690 0.1918 $81,794 Extendedly dominated by PR and SIM
Telaprevir $134,582 11.5605 $22,041 0.4191 $52,590 Extendedly dominated
a by
PR and SIM

Direct-Acting Antiviral Agents for Chronic Hepatitis C Genotype 1 99
Fibrosis Stage, Treatment
Total Cost Total QALYs Versus PR Alone
Incremental Cost
Incremental QALYs
ICUR Sequential ICUR
F2
PR $111,949 10.8130 Ref Ref Ref Ref
Simeprevir $134,673 11.4796 $22,724 0.6666 $34,088 $34,088
Dominated or extendedly dominateda treatments
Boceprevir $127,838 11.0889 $15,889 0.2759 $57,590 Extendedly dominated
a
by PR and SIM
Telaprevir $134,323 11.4146 $22,374 0.6016 $37,191 Extendedly dominated
a
by PR and SIM
F3
PR $113,130 9.9591 Ref Ref Ref Ref
Simeprevir $136,244 10.9330 $23,114 0.9740 $23,732 $23,732
Dominated or extendedly dominateda treatments
Telaprevir $136,036 10.8126 $22,905 0.8535 $26,837 Extendedly dominated
a
by PR and SIM
Boceprevir $147,393 10.3849 $34,262 0.4258 $80,463 Dominated
F4
PR $117,711 8.5019 Ref Ref Ref Ref
Simeprevir $147,183 9.5837 $29,472 1.0818 $27,244 $27,244
Dominated or extendedly dominateda treatments
Telaprevir $150,284 9.4579 $32,572 0.9560 $34,071 Dominated
Boceprevir $154,648 8.9832 $36,937 0.4813 $76,741 Dominated
F0 = No fibrosis; F1 = portal fibrosis without septa; F2 = portal fibrosis with rare septa; F3 = numerous septa without cirrhosis; F4 = cirrhosis; ICUR=incremental cost-utility ratio; PR = pegylated interferon plus ribavirin; QALY = quality-adjusted life-year. aExtendedly dominated = the combination of two other alternatives dominated the treatment.
c) Treatment-Experienced Patients (Prior Relapse): Overall Population Total costs per patient over lifetime for each of the treatment regimens are presented in Table 65. Drug costs represented 31% to 33% of total costs for DAA plus PR regimens and 12% of total costs for PR.
TABLE 65: TOTAL COSTS (TREATMENT-EXPERIENCED PATIENTS: PRIOR RELAPSE) GENERATED BY THE MODEL FOR
EACH OF THE TREATMENT REGIMENS
PR Simeprevir Boceprevir Telaprevir
Total cost $113,835 $139,152 $139,955 $141,955
HCV drugs $13,433 $44,408 $42,705 $47,442
Adverse events $500 $522 $916 $887
CHC-related costsa $99,902 $94,222 $96,334 $93,626
CHC = chronic hepatitis C; HCV = hepatitis C virus; PR = pegylated interferon plus ribavirin. aIncludes hospitalization, ambulatory care, long-term care, physician services, diagnostic tests, and liver transplant–related costs.

Direct-Acting Antiviral Agents for Chronic Hepatitis C Genotype 1 100
Table 66 summarizes the outcomes associated with the base-case analysis for a cohort of 50-year-old, genotype 1, treatment-experienced patients with prior relapse, when the baseline fibrosis distribution is applied. DAAs are more costly but more effective than PR. Among the DAAs, telaprevir was the most expensive treatment ($141,955), followed by boceprevir ($139,955), then simeprevir ($139,152). For patients with a prior relapse, simeprevir was associated with an increase in health (1.12 QALYs) and cost ($25,317), resulting in an ICUR of $22,608 per QALY compared with PR therapy. Boceprevir was associated with an increase in health (0.83 QALY) and cost ($26,120), resulting in an ICUR of $31,341 per QALY compared with PR therapy. Telaprevir was associated with an increase in health (1.42 QALYs) and cost ($28,120), resulting in an ICUR of $19,808 per QALY compared with PR therapy.
TABLE 66: RESULTS OF BASE-CASE DETERMINISTIC ANALYSIS (TREATMENT-EXPERIENCED PATIENTS: PRIOR
RELAPSE) WITH PEGYLATED INTERFERON PLUS RIBAVIRIN AS REFERENCE
Treatment Total Cost Total QALYs
Versus PR Alone
Incremental Cost
Incremental QALYs
ICUR Sequential ICUR
PR $113,835 9.7694 Ref Ref Ref Ref
Telaprevir $141,955 11.1891 $28,120 1.4197 $19,808 $19,808
Dominated or extendedly dominateda treatments
Simeprevir $139,152 10.8892 $25,317 1.1198 $22,608 Extendedly dominated
a by
PR and TEL
Boceprevir $139,955 10.6029 $26,120 0.8334 $31,341 Dominated
ICUR = incremental cost-utility ratio; PR = pegylated interferon plus ribavirin; QALY = quality-adjusted life-year. aExtendedly dominated = the combination of two other alternatives dominated the treatment.
TREATMENT-EXPERIENCED PATIENTS: (PRIOR RELAPSE) BY FIBROSIS STAGE Table 67 summarizes the outcomes associated with the base-case analysis for a cohort of 50-year-old, genotype 1, treatment-experienced patients with prior relapse using PR as a reference by fibrosis stages. In patients with F0, simeprevir was the most cost-effective treatment option, compared with PR. In patients with F1 or F2, both simeprevir and telaprevir were economically attractive, while boceprevir was ruled out through extended dominance through PR and simeprevir. In patients with F3 and F4, telaprevir was the most cost-effective treatment option, compared with PR.

Direct-Acting Antiviral Agents for Chronic Hepatitis C Genotype 1 101
TABLE 67: RESULTS OF BASE-CASE DETERMINISTIC ANALYSIS (TREATMENT-EXPERIENCED PATIENTS: PRIOR
RELAPSE) BY FIBROSIS STAGES
Fibrosis Stage, Treatment
Total Cost Total QALYs
Versus PR Alone
Incremental Cost
Incremental QALYs
ICUR Sequential ICUR
F0
PR $113,753 11.1053 Ref Ref Ref Ref
Simeprevir $136,444 11.6310 $22,691 0.5257 $43,162 $43,162
Telaprevir $139,363 11.6698 $25,610 0.5645 $45,370 $75,327
Dominated or extendedly dominateda treatments
Boceprevir $135,619 11.4507 $21,866 0.3454 $63,298 Extendedly dominateda
by PR and SIM
F1
PR $113,496 10.9455 Ref Ref Ref Ref
Simeprevir $136,354 11.5753 $22,859 0.6298 $36,294 $36,294
Telaprevir $139,297 11.6286 $25,801 0.6831 $37,770 $55,210
Dominated or extendedly dominateda treatments
Boceprevir $135,477 11.3631 $21,982 0.4176 $52,643 Extendedly dominateda
by PR and SIM
F2
PR $112,736 10.5237 Ref Ref Ref Ref
Simeprevir $136,093 11.4279 $23,357 0.9042 $25,830 $25,830
Telaprevir $139,100 11.5205 $26,364 0.9968 $26,449 $32,503
Dominated or extendedly dominateda treatments
Boceprevir $135,064 11.1314 $22,328 0.6077 $36,741 Extendedly dominateda
by PR and SIM
F3
PR $114,274 9.4220 Ref Ref Ref Ref
Telaprevir $138,874 11.3622 $24,600 1.9401 $12,679 $12,679
Dominated or extendedly dominateda treatments
Boceprevir $136,996 10.3256 $22,723 0.9036 $25,146 Extendedly dominateda
by PR and TEL
Simeprevir $137,727 10.8366 $23,453 1.4146 $16,579 Extendedly dominateda
by PR and TEL
F4
PR $115,489 7.8920 Ref Ref Ref Ref
Telaprevir $152,148 10.0887 $36,659 2.1967 $16,689 $16,689
Dominated or extendedly dominateda treatments
Simeprevir $148,071 9.4735 $32,582 1.5815 $20,602 Extendedly dominateda
by PR and TEL
Boceprevir $154,932 9.3763 $39,443 1.4843 $26,573 Dominated
F0 = No fibrosis; F1 = portal fibrosis without septa; F2 = portal fibrosis with rare septa; F3 = numerous septa without cirrhosis; F4 = cirrhosis; ICUR = incremental cost-utility ratio; PR = pegylated interferon plus ribavirin; QALY = quality-adjusted life-year. aExtendedly dominated = the combination of two other alternatives dominated the treatment.

Direct-Acting Antiviral Agents for Chronic Hepatitis C Genotype 1 102
d) Treatment-Experienced Patients: Partial Response — Overall Population Total costs per patient over lifetime for each of the treatment regimens are presented in Table 65. Drug costs represented 31% to 33% of total costs for DAA plus PR regimens and 12% of total costs for PR.
TABLE 68: TOTAL COSTS (TREATMENT-EXPERIENCED PATIENTS: PARTIAL RESPONSE) GENERATED BY THE MODEL
FOR EACH OF THE TREATMENT REGIMENS
PR Alone Boceprevir Telaprevir
Total cost $116,345 $141,971 $145,679
HCV drugs $13,433 $43,706 $47,442
Adverse events $499 $1,917 $887
CHC-related costsa $102,413 $96,348 $97,350
CHC = chronic hepatitis C; HCV = hepatitis C virus; PR = pegylated interferon plus ribavirin. aIncludes hospitalization, ambulatory care, long-term care, physician services, diagnostic tests, and liver transplant–related costs.
Table 69 summarizes the outcomes associated with the base-case analysis for a cohort of 50-year-old, genotype 1, treatment-experienced patients with partial response. At the baseline estimate, the DAAs are more costly but more effective than PR alone. Among the DAAs, telaprevir was the most expensive treatment ($145,679), followed by boceprevir ($141,971). For patients with prior partial response, boceprevir was associated with an increase in health (1.06 QALYs) and cost ($24,626), resulting in an ICUR of $23,131 per QALY compared with PR therapy. Telaprevir was dominated by boceprevir.
TABLE 69: RESULTS OF BASE-CASE DETERMINISTIC ANALYSIS (TREATMENT-EXPERIENCED PATIENTS: PARTIAL
RESPONSE) WITH PEGYLATED INTERFERON PLUS RIBAVIRIN AS REFERENCE
Treatment Total Cost Total QALYs
Versus PR Alone
Incremental Cost
Incremental QALYs
ICUR Sequential ICUR
PR $116,345 9.3527 Ref Ref Ref Ref
Boceprevir $141,971 10.4173 $24,626 1.0646 $23,131 $23,131
Dominated or extendedly dominated treatments
Telaprevir $145,679 10.1287 $29,334 0.7760 $37,803 Dominated
ICUR = incremental cost-utility ratio; PR = pegylated interferon plus ribavirin; QALY = quality-adjusted life-year.
e) Treatment-Experienced Patients (Partial Response): By Fibrosis Stage Without placing implicit fibrosis distribution assumptions on the treatment population, Table 70 summarizes the outcomes associated with our base-case analysis for a cohort of 50-year-old, genotype 1, treatment-experienced patients with partial responder using PR as a reference by fibrosis stages. In stages of fibrosis F0, F1, and F2, both boceprevir and telaprevir were economically attractive (simeprevir was not included in the analysis). In patients with F3 and F4, boceprevir was the most cost-effective treatment option compared with PR alone. Telaprevir was dominated or extendedly dominated by PR and boceprevir.

Direct-Acting Antiviral Agents for Chronic Hepatitis C Genotype 1 103
TABLE 70: RESULTS OF BASE-CASE DETERMINISTIC ANALYSIS (TREATMENT-EXPERIENCED PATIENTS: PARTIAL
RESPONSE) BY FIBROSIS STAGES
Fibrosis Stage, Treatment
Total Cost Total QALYs
Versus PR Alone
Incremental Cost
Incremental QALYs
ICUR Sequential ICUR
F0
PR $117,925 10.8355 Ref Ref Ref Ref
Boceprevir $137,160 11.3512 $19,236 0.5157 $37,298 $37,298
Telaprevir $143,453 11.4052 $25,529 0.5698 $44,805 $116,456
F1
PR $117,581 10.6217 Ref Ref Ref Ref
Boceprevir $136,987 11.2435 $19,405 0.6219 $31,205 $31,205
Telaprevir $143,303 11.3111 $25,721 0.6895 $37,306 $93,446
F2
PR $116,556 10.0575 Ref Ref Ref Ref
Boceprevir $136,477 10.9591 $19,920 0.9015 $22,096 $22,096
Telaprevir $142,863 11.0601 $26,306 1.0026 $26,239 $63,206
F3
PR $116,280 9.0315 Ref Ref Ref Ref
Boceprevir $138,173 10.0970 $21,893 1.0655 $20,547 $20,547
Dominated or extendedly dominateda treatments
Telaprevir $147,834 9.6182 $31,554 0.5867 $53,783 Dominated
F4
PR $115,030 7.4518 Ref Ref Ref Ref
Boceprevir $154,704 9.1585 $39,675 1.7067 $23,246 $23,246
Dominated or extendedly dominateda treatments
Telaprevir $150,098 8.1228 $35,068 0.6710 $52,261 Extendedly dominated
a by
PR and BOC
F0 = no fibrosis; F1 = portal fibrosis without septa; F2 = portal fibrosis with rare septa; F3 = numerous septa without cirrhosis; F4 =cirrhosis; ICUR = incremental cost-utility ratio; PR = pegylated interferon plus ribavirin; QALY = quality-adjusted life-year. aExtendedly dominated = the combination of two other alternatives dominated the treatment.
4.6.2 Exploratory Analyses a) Exploratory Analysis Including Sofosbuvir Scenario A — Analysis Based on NMA (PROTON Randomized Controlled Trial)
In this section, sofosbuvir was included in the exploratory analysis with the following assumptions: 1. The PROTON RCT16 included mostly F0 to F2 patients (8% F3, 0% F4); thus, efficacy generated from
the NMA was assumed to reflect the efficacy in F0 to F2 patients. Efficacy data for F3–F4 patients were obtained from the NEUTRINO RCT24 (sofosbuvir SVR rate = 80%), and the PR SVR rate obtained from the NMA was used as reference (SVR rate = 35.54%).
2. Adverse events rates for sofosbuvir were based on the NMA results for anemia and rash. Depression rates were from the NEUTRINO RCT (9%) event rate.
3. The therapy cost was based on the treatment regimen used in PROTON,16 with 98% of patients eligible for 24 weeks of PR therapy, and 2% of patients undergoing 48 weeks of PR therapy.
Detailed data inputs are presented in Appendix 8.

Direct-Acting Antiviral Agents for Chronic Hepatitis C Genotype 1 104
Table 71 summarizes the outcomes associated with the exploratory analysis for a cohort of 50-year-old, genotype 1, treatment-naive patients. Sofosbuvir was the most costly but also the most effective treatment. Simeprevir was associated with an increase in health (0.73 QALY) and cost ($23,909), resulting in an ICUR of $32,655 per QALY compared with PR therapy. Sofosbuvir was associated with an increase in health (0.95 QALY) and cost ($39,907), resulting in an ICUR of $42,178 per QALY compared with PR therapy. Telaprevir was dominated. Boceprevir was extendedly dominated by PR and SIM.
TABLE 71: RESULTS OF EXPLORATORY ANALYSIS (TREATMENT-NAIVE PATIENTS) WITH SOFOSBUVIR, MAINLY
BASED ON NETWORK META-ANALYSIS (PROTON RANDOMIZED CONTROLLED TRIAL)
Treatment Total Cost Total QALYs Versus PR Alone
Incremental Cost
Incremental QALYs
ICUR Sequential ICUR
PR $113,151 10.3662 Ref Ref Ref Ref
Simeprevir $137,060 11.0984 $23,909 0.7322 $32,655 $32,655
Sofosbuvir $153,058 11.3124 $39,907 0.9462 $42,178 $74,762
Dominated or extendedly dominateda treatments
Boceprevir $136,537 10.6624 $23,386 0.2961 $78,970 Extendedly dominated
a by
PR and SIM
Telaprevir $137,454 11.0041 $24,303 0.6379 $38,100 Dominated
ICUR = incremental cost-utility ratio; PR = pegylated interferon plus ribavirin; QALY = quality-adjusted life-year. aExtendedly dominated = the combination of two other alternatives dominated the treatment.
Scenario B: Analysis Based on NEUTRINO Randomized Controlled Trial
In this scenario analysis, the Health Canada–recommended dose (sofosbuvir and PR for 12 weeks only) was used in the analysis, with the following assumptions: 1. Treatment efficacy for sofosbuvir was based on the NEUTRINO24 RCT (Table 84) and the NMA for
other comparators and PR. 2. Adverse events rates for sofosbuvir were based on the NEUTRINO24 RCT (Table 85) for the sofosbuvir
group, and the NMA for other comparators and PR. Table 72 summarizes the outcomes associated with the exploratory analysis for a cohort of 50-year-old, genotype 1, treatment-naive patients. Sofosbuvir was the most costly but also the most effective treatment. With the baseline fibrosis distribution, simeprevir was associated with an increase in health (0.74 QALYs) and cost ($23,835), resulting in an ICUR of $32,230 per QALY compared with PR therapy. Sofosbuvir was associated with an increase in health (1.01 QALYs) and cost ($34,602), resulting in an ICUR of $34,265 per QALY compared with PR therapy.

Direct-Acting Antiviral Agents for Chronic Hepatitis C Genotype 1 105
TABLE 72: RESULTS OF EXPLORATORY ANALYSIS (TREATMENT-NAIVE PATIENTS) WITH SOFOSBUVIR BASED ON
THE NEUTRINO RANDOMIZED CONTROLLED TRIAL
Treatment Total Cost Total QALYs Versus PR Alone
Incremental Cost
Incremental QALYs
ICUR Sequential ICUR
PR $113,347 10.3466 Ref Ref Ref Ref
Simeprevir $137,183 11.0861 $23,835 0.7395 $32,230 $32,230
Sofosbuvir $147,949 11.3564 $34,602 1.0098 $34,265 $39,835
Dominated or extendedly dominateda treatments
Boceprevir $136,537 10.6624 $23,190 0.3158 $73,429 Extendedly dominated
a by
PR and SIM
Telaprevir $137,454 11.0041 $24,107 0.6575 $36,661 Dominated
ICUR = incremental cost-utility ratio; PR = pegylated interferon plus ribavirin; QALY = quality-adjusted life-year. aExtendedly dominated = the combination of two other alternatives dominated the treatment.
Exploratory Analysis Using Health Canada–Recommended Dose
The dose used in the base-case analyses were based on those used in the trials included in the NMA (best evidence available), which may differ from the Health Canada–recommended dosing. This may not reflect the clinical practice in Canada. In this section, additional analyses were performed using the Health Canada–recommended dose, with the assumptions that the efficacy of the dose will be the same as in the NMA results. Treatment-Naive Patients: Boceprevir Dose in Patients With Fibrosis Stage F3
In the base-case analysis, for the treatment-naive group, both cost and efficacy for patients with fibrosis stage F3 were based on non-RGT dosing (B44 PR48 group). However, the product monograph recommends RGT dosing (boceprevir for 24 weeks and PR for 28 or 48 weeks) for patients with F3. In this analysis, for boceprevir, cost and efficacy for patients with F3 were based on this RGT dosing, while cost and efficacy for patients with F4 were based on non-RGT dosing (boceprevir for 44 weeks and PR for a total of 48 weeks). Table 73 summarizes the outcomes associated with the exploratory analysis. With the baseline fibrosis distribution, boceprevir was associated with an increase in health (0.25 QALYs versus 0.32 in the base case) and cost ($19,730 versus $23,190 in the base case), compared with PR.
Note that the main conclusion did not change: boceprevir was extendedly dominated by PR and simeprevir.

Direct-Acting Antiviral Agents for Chronic Hepatitis C Genotype 1 106
TABLE 73: RESULTS OF EXPLORATORY ANALYSIS (TREATMENT-NAIVE PATIENTS) USING HEALTH CANADA–RECOMMENDED DOSE FOR BOCEPREVIR
Treatment Total Cost Total QALYs Versus PR Alone
Incremental Cost
Incremental QALYs
ICUR Sequential ICUR
PR $113,347 10.3466 Ref Ref Ref Ref
Simeprevir $137,183 11.0861 $23,835 0.7395 $32,230 $32,230
Dominated or extendedly dominateda treatments
Boceprevir $133,077 10.5957 $19,730 0.2491 $79,210 Extendedly dominated
a by
PR and SIM
Telaprevir $137,454 11.0041 $24,107 0.6575 $36,661 Dominated
ICUR = incremental cost-utility ratio; PR = pegylated interferon plus ribavirin; QALY = quality-adjusted life-year. aExtendedly dominated = the combination of two other alternatives dominated the treatment.
Treatment-Experienced Patients (Prior Relapse): Telaprevir Dose
In the base-case analysis, for patients with prior relapse, both cost and efficacy for patients with fibrosis stages F0 to F4 were based on fixed dosing (telaprevir for 12 weeks and PR for a total of 48 weeks). However, the product monograph recommends RGT dosing (telaprevir for 12 weeks and RGT for a total of 24 or 48 weeks) for patients with F0 to F3. In this analysis, for telaprevir, cost and efficacy for patients with F0 to F3 were based on the RGT dosing; the percentage meeting RGT criteria for short therapy was assumed to be 65.5%, based on the proportion of patients with prior relapse receiving telaprevir plus PR in the immediate-start group of REALIZE who experienced extended rapid virologic response.29 The cost and efficacy for patients with F4 were based on the non-RGT dosing, as RGT is not recommended for patients with F4.
Table 74 summarizes the outcomes associated with the exploratory analysis. With the baseline fibrosis distribution, telaprevir was associated with an increase in health (1.44 QALYs versus 1.42 QALYs in the base case) and cost ($24,306 versus $28,120 in the base case), resulting in an ICUR of $16,921 per QALY compared with PR therapy (versus $19,808 in the base case). Note that the main conclusion did not change.
TABLE 74: RESULTS OF EXPLORATORY ANALYSIS (TREATMENT-EXPERIENCED PATIENTS: PRIOR RELAPSE) USING
HEALTH CANADA–RECOMMENDED RGT CRITERIA FOR TELAPREVIR
Treatment Total Cost Total QALYs Versus PR Alone
Incremental Cost
Incremental QALYs
ICUR Sequential ICUR
PR $113,835 9.7694 Ref Ref Ref Ref
Telaprevir $138,141 11.2059 $24,306 1.4365 $16,921 $16,921
Dominated or extendedly dominateda treatments
Simeprevir $139,152 10.8892 $25,317 1.1198 $22,608 Dominated
Boceprevir $139,955 10.6029 $26,120 0.8334 $31,341 Dominated
ICUR = incremental cost-utility ratio; PR = pegylated interferon plus ribavirin; RGT = response-guided therapy; QALY = quality-adjusted life-year. aExtendedly dominated = the combination of two other alternatives dominated the treatment.

Direct-Acting Antiviral Agents for Chronic Hepatitis C Genotype 1 107
Simeprevir: Percentage Meeting Response-Guided Therapy Criteria for Short Therapy
In the base-case analysis, for the treatment-naive group, the proportion of patients who were deemed eligible for short therapy for simeprevir was 0.859 (0.927 for those with prior relapse). However, the proportion of patients who met the RGT criteria to stop therapy early in the simeprevir trials may overestimate the proportion in clinical practice in Canada due to differences in the RGT criteria between the trials and Health Canada recommendations. In the QUEST2 trial, when the Health Canada–recommended RGT dosing criteria was considered, the proportion of patients eligible was reduced by 15% (Table 139).128 Table 75 summarizes the outcomes associated with the exploratory analysis. The proportion of patients who were deemed eligible for short therapy for simeprevir was assumed to be reduced by 15% compared to what was used in the base-case analysis (0.709 for treatment-naive patients and 0.777 for those with prior relapse). Note that the main conclusion did not change.
TABLE 75: RESULTS OF EXPLORATORY ANALYSIS USING HEALTH CANADA–RECOMMENDED RGT CRITERIA FOR
SIMEPREVIR
Treatment Total Cost Total QALYs Versus PR Alone
Incremental Cost
Incremental QALYs
ICUR Sequential ICUR
Treatment-Naive
PR $113,347 10.3466 Ref Ref Ref Ref
Simeprevir $138,292 11.0831 $24,944 0.7365 $33,868 $33,868
Dominated or extendedly dominateda treatments
Boceprevir $136,537 10.6624 $23,190 0.3158 $73,429 Extendedly dominated
a by
PR and simeprevir
Telaprevir $137,454 11.0041 $24,107 0.6575 $36,661 Extendedly dominated
a by
PR and simeprevir
Treatment-Experienced: Prior Relapse
PR $113,835 9.7694 Ref Ref Ref Ref
Telaprevir $141,955 11.1891 $28,120 1.4197 $19,808 $19,808
Dominated or extendedly dominateda treatments
Boceprevir $139,955 10.6029 $26,120 0.8334 $31,341 Extendedly dominated
a by
PR and telaprevir
Simeprevir $140,366 10.8879 $26,531 1.1184 $23,721 Extendedly dominated
a by
PR and telaprevir
ICUR = incremental cost-utility ratio; PR = pegylated interferon plus ribavirin; QALY = quality-adjusted life-year. aExtendedly dominated = the combination of two other alternatives dominated the treatment.
b) Exploratory Analysis for Simeprevir in Patients with Partial Response Due to lack of data, simeprevir was not included in the analysis of patients with partial response. In this analysis, for simeprevir, costs were based on simeprevir dosing (simeprevir for 12 weeks and PR for a total of 24 or 48 weeks), and efficacy was based on either telaprevir (telaprevir for 12 weeks and PR for
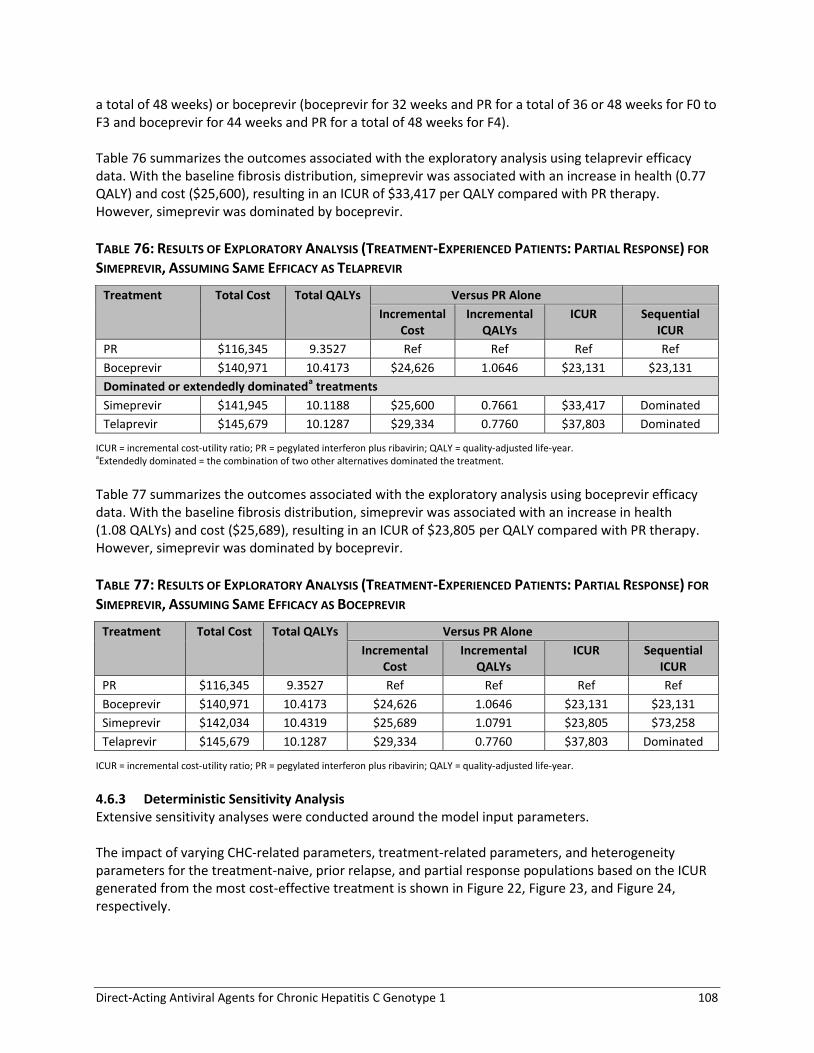
Direct-Acting Antiviral Agents for Chronic Hepatitis C Genotype 1 108
a total of 48 weeks) or boceprevir (boceprevir for 32 weeks and PR for a total of 36 or 48 weeks for F0 to F3 and boceprevir for 44 weeks and PR for a total of 48 weeks for F4). Table 76 summarizes the outcomes associated with the exploratory analysis using telaprevir efficacy data. With the baseline fibrosis distribution, simeprevir was associated with an increase in health (0.77 QALY) and cost ($25,600), resulting in an ICUR of $33,417 per QALY compared with PR therapy. However, simeprevir was dominated by boceprevir.
TABLE 76: RESULTS OF EXPLORATORY ANALYSIS (TREATMENT-EXPERIENCED PATIENTS: PARTIAL RESPONSE) FOR
SIMEPREVIR, ASSUMING SAME EFFICACY AS TELAPREVIR
Treatment Total Cost Total QALYs Versus PR Alone
Incremental Cost
Incremental QALYs
ICUR Sequential ICUR
PR $116,345 9.3527 Ref Ref Ref Ref
Boceprevir $140,971 10.4173 $24,626 1.0646 $23,131 $23,131
Dominated or extendedly dominateda treatments
Simeprevir $141,945 10.1188 $25,600 0.7661 $33,417 Dominated
Telaprevir $145,679 10.1287 $29,334 0.7760 $37,803 Dominated
ICUR = incremental cost-utility ratio; PR = pegylated interferon plus ribavirin; QALY = quality-adjusted life-year. aExtendedly dominated = the combination of two other alternatives dominated the treatment.
Table 77 summarizes the outcomes associated with the exploratory analysis using boceprevir efficacy data. With the baseline fibrosis distribution, simeprevir was associated with an increase in health (1.08 QALYs) and cost ($25,689), resulting in an ICUR of $23,805 per QALY compared with PR therapy. However, simeprevir was dominated by boceprevir.
TABLE 77: RESULTS OF EXPLORATORY ANALYSIS (TREATMENT-EXPERIENCED PATIENTS: PARTIAL RESPONSE) FOR
SIMEPREVIR, ASSUMING SAME EFFICACY AS BOCEPREVIR
Treatment Total Cost Total QALYs Versus PR Alone
Incremental Cost
Incremental QALYs
ICUR Sequential ICUR
PR $116,345 9.3527 Ref Ref Ref Ref
Boceprevir $140,971 10.4173 $24,626 1.0646 $23,131 $23,131
Simeprevir $142,034 10.4319 $25,689 1.0791 $23,805 $73,258
Telaprevir $145,679 10.1287 $29,334 0.7760 $37,803 Dominated
ICUR = incremental cost-utility ratio; PR = pegylated interferon plus ribavirin; QALY = quality-adjusted life-year.
4.6.3 Deterministic Sensitivity Analysis Extensive sensitivity analyses were conducted around the model input parameters. The impact of varying CHC-related parameters, treatment-related parameters, and heterogeneity parameters for the treatment-naive, prior relapse, and partial response populations based on the ICUR generated from the most cost-effective treatment is shown in Figure 22, Figure 23, and Figure 24, respectively.

Direct-Acting Antiviral Agents for Chronic Hepatitis C Genotype 1 109
FIGURE 22: TORNADO DIAGRAM: SIMEPREVIR VERSUS PR FOR TREATMENT-NAIVE PATIENTS
(ICUR $32,230/QALY)
CHC = chronic hepatitis C; ICUR = incremental cost-utility ratio; QALY = quality-adjusted life-year.
15,000 20,000 25,000 30,000 35,000 40,000 45,000 50,000 55,000
Baseline age
Treatment efficacy
Cost of antiviral therapy
Discount rate
CHC-related utilities
Fibrosis stage distribution
Proportion of short therapy
CHC progression rate
CHC-related mortality
CHC-related cost (non-therapy)
Adverse events rate
Disutilities for adverse events
Cost of adverse events
ICUR ($/QALY)

Direct-Acting Antiviral Agents for Chronic Hepatitis C Genotype 1 110
FIGURE 23: TORNADO DIAGRAM: TELAPREVIR VERSUS PEGYLATED INTERFERON FOR PATIENTS WITH PRIOR
RELAPSE (ICUR $19,808/QALY)
CHC = chronic hepatitis C; ICUR = incremental cost-utility ratio; QALY = quality-adjusted life-year.
10,000 15,000 20,000 25,000 30,000 35,000
Baseline age
Cost of antiviral therapy
Treatment efficacy
Discount rate
CHC-related utilities
Fibrosis stage distribution
CHC progression rate
Adverse events rate
CHC-related cost (non-therapy)
Cost of adverse events
Disutilities for adverse events
CHC-related mortality
Proportion of short therapy
ICUR ($/QALY)
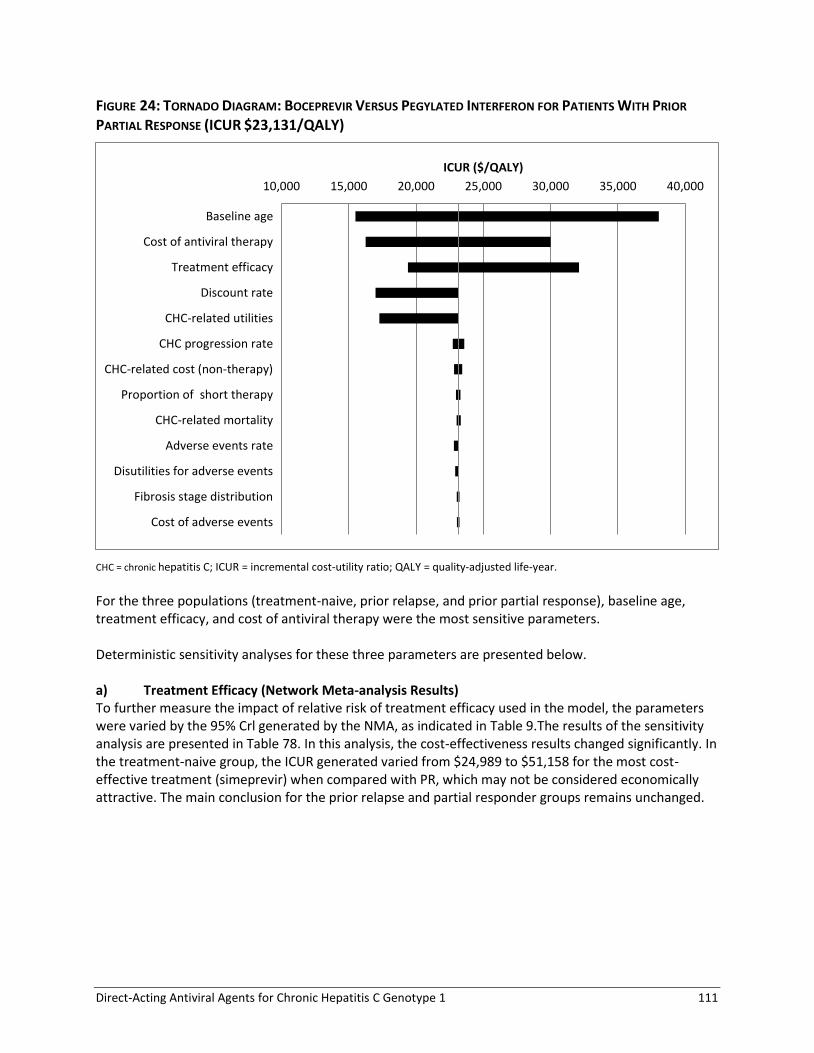
Direct-Acting Antiviral Agents for Chronic Hepatitis C Genotype 1 111
FIGURE 24: TORNADO DIAGRAM: BOCEPREVIR VERSUS PEGYLATED INTERFERON FOR PATIENTS WITH PRIOR
PARTIAL RESPONSE (ICUR $23,131/QALY)
CHC = chronic hepatitis C; ICUR = incremental cost-utility ratio; QALY = quality-adjusted life-year. For the three populations (treatment-naive, prior relapse, and prior partial response), baseline age, treatment efficacy, and cost of antiviral therapy were the most sensitive parameters. Deterministic sensitivity analyses for these three parameters are presented below. a) Treatment Efficacy (Network Meta-analysis Results) To further measure the impact of relative risk of treatment efficacy used in the model, the parameters were varied by the 95% Crl generated by the NMA, as indicated in Table 9.The results of the sensitivity analysis are presented in Table 78. In this analysis, the cost-effectiveness results changed significantly. In the treatment-naive group, the ICUR generated varied from $24,989 to $51,158 for the most cost-effective treatment (simeprevir) when compared with PR, which may not be considered economically attractive. The main conclusion for the prior relapse and partial responder groups remains unchanged.
10,000 15,000 20,000 25,000 30,000 35,000 40,000
Baseline age
Cost of antiviral therapy
Treatment efficacy
Discount rate
CHC-related utilities
CHC progression rate
CHC-related cost (non-therapy)
Proportion of short therapy
CHC-related mortality
Adverse events rate
Disutilities for adverse events
Fibrosis stage distribution
Cost of adverse events
ICUR ($/QALY)

Direct-Acting Antiviral Agents for Chronic Hepatitis C Genotype 1 112
TABLE 78: RESULTS OF SENSITIVITY ANALYSIS ON-TREATMENT EFFICACY
Treatment Total Cost Total QALYs Sequential ICUR
Treatment-naive
PR $113,347 10.347 Ref
Boceprevir $136,239 to $137,459 10.240 to 10.799 $50,583 — Dominated
Simeprevir $136,747 to $137,763 10.824 to 11.283 $24,989 to $51,158
Telaprevir $137,109 to $138,162 10.687 to 11.158 Dominated
Treatment-experienced: Prior Relapse
PR $113,835 9.769 Ref
Simeprevir $138,333 to $140,030 10.443 to 11.305 $15,950 — Dominated
Boceprevir $139,392 to $141,200 10.362 to 10.712 Dominated
Telaprevir $141,955 to $142,823 10.741 to 11.189 $19,807 to $29,831
Treatment-experienced: Partial Response
PR $116,345 9.353 Ref
Boceprevir $140,135 to $142,295 10.161 to 10.579 $19,398 to $32,109
Telaprevir $144,060 to $146,197 9.861 to 10.964 Dominated
ICUR = incremental cost-utility ratio; PR = pegylated interferon plus ribavirin; QALY = quality-adjusted life-year.
b) Cost of Antiviral Therapy To measure the impact of the cost of antiviral therapies used in the model, these parameters were varied by ± 25%, as indicated in Table 15. Table 79 summarizes the results of the sensitivity analysis. Although the cost-effectiveness results changed significantly in this analysis, the main conclusion did not change.
TABLE 79: RESULTS OF SENSITIVITY ANALYSIS ON COST OF ANTIVIRAL THERAPY
Treatment Total Cost Total QALYs Sequential ICUR
Treatment-Naive
PR $109,650 to $117,044 10.347 Ref
Boceprevir $126,657 to $146,418
10.662 $53,852 to $93,007a
Simeprevir $126,382 to $147,984 11.086 $22,624 to $41,835
Telaprevir $126,802 to $148,106 11.004 Dominated
Treatment-Experienced: Prior Relapse
PR $110,476 to $117,193
9.769 Ref
Simeprevir $128,050 to $150,254 10.889 $15,693 to $29,524a
Boceprevir $129,279 to $150,632 10.603 Dominated
Telaprevir $130,094 to $153,815
11.189 $13,819 to $25,796
Treatment-experienced: Partial Response
PR $112,987 to $119,703 9.353 Ref
Boceprevir $130,294 to $151,647 10.417 $16,257 to $30,005
Telaprevir $133,818 to $157,539 10.129 Dominated
ICUR = incremental cost-utility ratio; PR = pegylated interferon plus ribavirin; QALY = quality-adjusted life-year. aExtendedly dominated.

Direct-Acting Antiviral Agents for Chronic Hepatitis C Genotype 1 113
c) Baseline Age To measure the impact of age in the model, instead of the baseline values, a broader range of age (40 to 60) was evaluated in this sensitivity analysis. Table 80 summarizes the results. The cost-effectiveness results changed significantly. In the treatment-naive group, the ICUR generated varied from $21,149 to $51,666 for the most cost-effective treatment (simeprevir) when compared with PR, which may not be considered economically attractive. The main conclusion for the prior relapse group and partial response group remains unchanged.
TABLE 80: RESULTS OF SENSITIVITY ANALYSIS ON BASELINE AGE
Treatment Total Cost Total QALYs Sequential ICUR
Treatment-Naive
PR $103,385 to $118,113 8.647 to 1.602 Ref
Simeprevir $125,073 to $143,670 9.142 to 12.581 $22,149 to $51,666
Telaprevir $125,549 to $143,746 9.082 to 12.477 Dominated
Boceprevir $125,662 to $141,973 8.854 to 12.024 Dominated
Treatment-Experienced: Prior Relapse
PR $105,143 to $117,706 8.268 to 10.843 Ref
Simeprevir $127,603 to $145,206 9.010 to 12.326 $15,144 to $37,062a
Boceprevir $129,342 to $145,178 8.815 to 11.948 Dominated
Telaprevir $129,847 to $148,249 9.199 to 12.728 $13,104 to $32,773
Treatment-Experienced: Partial Response
PR $108,923 to $119,219 7.995 to 10.284 Ref
Boceprevir $130,882 to $145,789 8.693 to 11.700 $15,499 to $38,039
Telaprevir $135,790 to $150,416 8.501 to 11.328 Dominated
ICUR = incremental cost-utility ratio; PR = pegylated interferon plus ribavirin; QALY = quality-adjusted life-year. aExtendedly dominated.
The impact of age was also assessed in the analyses stratified by fibrosis stages and is presented in Appendix 27. This analysis showed that, for patients with F0 or F1 and older age, DAAs were generally not economically attractive. d) Other Parameters Several other parameters were addressed in deterministic sensitivity analysis, including:
Fibrosis stage distribution
CHC-related costs, utilities, mortality, CHC progression
Telaprevir dosing schedule (every 8 hours versus every 12 hours)
Boceprevir dose (RGT versus fixed duration in advanced stages of fibrosis)
Proportion of patients eligible for short treatment duration based on RGT
Adverse events (costs, % of patients receiving erythropoietin, disutility associated with adverse events, relative risk from the NMA).
Varying the above parameters did not significantly change the base-case analysis results. Results of these sensitivity analyses are presented in Appendix 27.

Direct-Acting Antiviral Agents for Chronic Hepatitis C Genotype 1 114
4.6.4 Probabilistic Sensitivity Analysis For treatment-naive patients, simeprevir had a 69% probability of being the most cost-effective agent, using a $50,000 per QALY threshold, followed by 27.2% probability for telaprevir, 3.4% probability for PR alone, and 0.4% probability for boceprevir. Figure 25 summarizes the results in a cost-effectiveness acceptability curve.
FIGURE 25: COST-EFFECTIVENESS ACCEPTABILITY CURVE FOR TREATMENT-NAIVE PATIENTS
For treatment-experienced patients with prior relapse, telaprevir had a 74.1% probability of being the most cost-effective agent, using a $50,000 per QALY threshold, followed by 25.6% probability for simeprevir, 0.3% probability for boceprevir, and 0% chance for PR alone. Figure 26 summarizes the results in a cost-effectiveness acceptability curve.
0
0.1
0.2
0.3
0.4
0.5
0.6
0.7
0.8
0.9
1
% C
ost
-Eff
ect
ive
willingness to pay ($)
Boceprevir
PR
Telaprevir
Simeprevir

Direct-Acting Antiviral Agents for Chronic Hepatitis C Genotype 1 115
FIGURE 26: COST-EFFECTIVENESS ACCEPTABILITY CURVE FOR PATIENTS WITH PRIOR RELAPSE
For treatment-experienced patients with prior partial response, boceprevir had a 35.7% probability of being the most cost-effective agent, using a $50,000 per QALY threshold, followed by 33.8% probability for PR alone, and 30.5% probability for telaprevir. Figure 27 summarizes the results in a cost-effectiveness acceptability curve. Due to the wide CrIs around the efficacy data derived from the NMA of patients with prior partial response, the results in that population are uncertain.
FIGURE 27: COST-EFFECTIVENESS ACCEPTABILITY CURVE FOR PATIENTS WITH PRIOR PARTIAL RESPONSE
0
0.1
0.2
0.3
0.4
0.5
0.6
0.7
0.8
0.9
1
% C
ost
-Eff
ect
ive
willingness to pay ($)
Boceprevir
PR
Telaprevir
Simeprevir
0
0.1
0.2
0.3
0.4
0.5
0.6
0.7
0.8
0.9
1
% C
ost
-Eff
ect
ive
willingness to pay ($)
Boceprevir
PR
Telaprevir

Direct-Acting Antiviral Agents for Chronic Hepatitis C Genotype 1 116
5. DISCUSSION
Genotype 1 CHC is the most prevalent form of CHC infection in Canada, and it is also the most difficult to eradicate with PR-based therapy. Despite the availability of the DAAs boceprevir and telaprevir, a substantial unmet need remains. The treatment burden is high for regimens that require 48 weeks of treatment and must be used in combination with PR. The introduction of new DAAs that offer high cure rates, often with shorter durations that reduce the burden of treatment, may address some unmet needs, but the high cost and lack of information regarding the comparative benefit of the new DAA-based regimens needs to be evaluated. The objective of this Therapeutic Review is to evaluate the comparable benefits, harms, and cost-effectiveness of the DAA regimens approved for use in Canada for genotype 1 CHC. It was undertaken to help inform formulary listing decisions for the four DAA therapies for treatment of CHC genotype 1, by identifying the most cost-effective strategies based on patient characteristics and prior treatment history. Patients have expressed the need for new treatments that have higher cure rates, better side effect profiles, and reduced treatment burden, and that are accessible and affordable.
5.1 Summary of Evidence
A total of 26 trials in adults with genotype 1 CHC met the inclusion criteria for this systematic review. Of these, 15 were in patients who were treatment-naive,12-16,19-26,127,128 nine studies were in patients who were treatment-experienced,27-35 and two studies were in treatment-naive patients with HIV co-infection.36,37 No other trials in the populations of special interest, in patients with liver transplant, or in patients who had failed treatment with a DAA plus PR regimen met the inclusion criteria. Separate analyses were conducted for populations based on prior treatment history due to anticipated differences in treatment efficacy and safety, and due to the complexity of care for the populations of special interest. The treatments evaluated included boceprevir, telaprevir, simeprevir, and sofosbuvir, in combination with PR. No published trials directly comparing the DAA regimens of interest were identified in the literature search. In the treatment-naive population, 10 RCTs compared PR plus one of boceprevir,12,19 telaprevir,13,14,23,26 simeprevir15,127,128 or sofosbuvir16 with 48 weeks of PR therapy. Two RCTs compared telaprevir 750 mg every eight hours plus PR versus telaprevir 1,125 mg every 12 hours plus PR.21,22 One telaprevir RCT compared different RGT regimens.20 There was one uncontrolled clinical trial for sofosbuvir,24 and one RCT that compared different sofosbuvir regimens.25 Among treatment-experienced patients, six RCTs compared PR plus boceprevir,27,28 telaprevir,29,30 or simeprevir31,32 with 48 weeks of PR therapy. In addition, there were two uncontrolled trials of telaprevir34,35 and one uncontrolled trial of boceprevir.33 There were no trials of sofosbuvir in treatment-experienced patients. All data were analyzed using direct pairwise meta-analysis comparing DAA regimens with PR. Given the lack of RCTs directly comparing the new DAA regimens, we conducted an indirect treatment comparison using Bayesian NMA methods for the outcomes of SVR, anemia, rash, and depression. Twelve RCTs12-
19,21-23,26 (N = 4,160) in treatment-naive, and six RCTs27-32 (N = 2020) in treatment-experienced patients

Direct-Acting Antiviral Agents for Chronic Hepatitis C Genotype 1 117
were included in the indirect treatment comparisons, although the data available varied for each analysis.
5.2 Interpretation of the Results
5.2.1 Efficacy — Sustained Virologic Response a) Treatment-Naive Patients In treatment-naive patients, direct and indirect evidence suggest that simeprevir, telaprevir, and boceprevir, at Health Canada–recommended dosages and in combination with RGT PR, are more effective in achieving SVR than 48 weeks of PR. In addition, sofosbuvir plus PR (RGT, based on the PROTON study, which employed a longer PR treatment than recommended by Health Canada) demonstrated superior efficacy in terms of SVR, compared with PR in both direct and indirect comparisons. Based on the NMA, there were no statistically significant differences between DAA regimens for SVR. We could not assess the comparative efficacy of sofosbuvir at the Health Canada–recommended dosage regimen due to the lack of any RCT employing the recommended regimen. The efficacy findings in the overall treatment-naive population were generally consistent with those observed within subgroups based on fibrosis severity and genotype subtype, with a few notable exceptions. First, there were no subgroup data available for sofosbuvir from the PROTON study; thus, differences of effect across subgroups could not be assessed. Second, among patients with more severe fibrosis (Metavir score F3 to F4), simeprevir and telaprevir, but not boceprevir, were more effective than PR alone, based on both direct and indirect analyses. Neither dosage regimens for boceprevir RGT nor boceprevir for 44 weeks plus PR for 48 weeks (the Health Canada–recommended dose for patients with cirrhosis) showed improved SVR outcomes relative to PR alone. However, the boceprevir data were based on a single RCT (SPRINT-2)12 and a limited sample size (PR: 24; boceprevir RGT: 34; boceprevir 44 weeks plus PR 48 weeks: 42 patients with fibrosis score F3 or F4). The third difference noted was that patients with genotype 1a and Q80K polymorphism who received simeprevir were less likely to achieve an SVR than simeprevir-treated patients with genotype 1b or genotype 1a without Q80K, and than genotype 1a or 1b patients who received telaprevir. The differences between PR alone and simeprevir in patients with genotype 1a and Q80K were not statistically significantly different. None of the boceprevir, telaprevir, or sofosbuvir studies reported results for patients with the Q80K polymorphism. b) Treatment-Experienced Patients Among all treatment-experienced patients, simeprevir, boceprevir, and telaprevir were more effective than PR alone in achieving SVR, based on both direct and indirect evidence. Based on indirect evidence, no statistically significant differences between DAA regimens were found. These findings were similar in the subgroup analysis based on fibrosis severity, with one exception. The difference in SVR between boceprevir RGT and PR alone did not reach statistical significance in patients with Metavir fibrosis score F3 or F4. This comparison, however, was based on a limited sample size. Because prior response to PR treatment is an important predictor of effectiveness with DAAs, we analyzed SVR according to subgroups of patients with prior relapse, and partial and null response. In the analyses of all patients with prior relapse (N = 1,287) and patients with relapse and less severe fibrosis (N = 664), direct and indirect evidence revealed that simeprevir, boceprevir, and telaprevir were all more effective than PR alone. Indirect evidence suggests that boceprevir for 32 weeks plus response-guided PR therapy was less effective in achieving SVR than telaprevir for 12 weeks plus PR for 48 weeks. Of note, this telaprevir dosing regimen is not consistent with the Health Canada–recommended regimen

Direct-Acting Antiviral Agents for Chronic Hepatitis C Genotype 1 118
of RGT for this patient population (those with prior relapse). Boceprevir for 32 weeks RGT was also found to be less effective than boceprevir for 44 weeks plus PR for 48 weeks, and was not statistically significantly different from PR alone in patients with a prior relapse and more severe fibrosis. Fewer data were available for patients with prior partial response (N = 370) and prior null response (N = 217), which limited our ability to conduct some subgroup analyses. Simeprevir, boceprevir, and telaprevir, at Health Canada–recommended doses, were more effective than PR alone in patients with prior partial response, based on direct and indirect evidence. No between-DAA indirect comparisons showed statistically significant differences. In the subgroup analysis by fibrosis severity, there were no data available for patients with prior partial response treated with simeprevir. Telaprevir and boceprevir were more effective than PR alone in the subgroup of patients with less severe fibrosis (Metavir fibrosis score F0 to F2), based on direct and indirect evidence. In the subgroup with more severe fibrosis (F3 to F4), only telaprevir and boceprevir for 44 weeks plus PR for 48 weeks were statistically significantly better than PR alone; however, significance was not consistently achieved in both direct and indirect analyses, and for analyses based on RD and RR. The CIs and CrIs were wide, reflecting the uncertainty in these results, which were based on data from two RCTs and 88 patients with severe fibrosis. In patients with prior null response, limited data were available for boceprevir (one uncontrolled study), and it is therefore not possible to determine its comparative effectiveness. The direct and indirect evidence suggests that telaprevir was more effective than PR alone among patients with prior null response. The differences between simeprevir and PR were not significant, but this analysis was likely underpowered to detect differences, as data on simeprevir were limited to 33 patients. Subgroup analysis in patients with genotype 1a and Q80K polymorphism suggested that simeprevir was not statistically significantly different from PR alone (in all treatment-experienced patients and patients with relapse), and was less effective than telaprevir (in patients with relapse). However, none of the other included studies reported SVR rates for patients with this amino acid substitution. The only other efficacy data for subgroups with the Q80K substitution come from interim reports for the ATTAIN study.130 This head-to-head RCT was ongoing at the time of our review and has not been published. It compared simeprevir plus PR with telaprevir plus PR in patients with prior partial or null response.131 Lower response rates were reported for patients with genotype 1a and Q80K polymorphism for both treatment groups.130 In this study, 27% and 26% of simeprevir- and telaprevir-treated patients with genotype 1a and the Q80K substitution achieved SVR at 12 weeks after the end of treatment, compared with 54% and 55% of the overall study population.130 These results are surprising, as in vitro studies have found no substantial decreased susceptibility to boceprevir or telaprevir among genotype 1a isolates with Q80K polymorphism.9-11 Moreover, the telaprevir product monograph reports that baseline polymorphisms at non-structural protein 3 position Q80 (Q80K, Q80L, Q80R), were not associated with reduced efficacy for telaprevir based on post hoc analyses of ADVANCE, ILLUMINATE and REALIZE trials.48 Further scrutiny of the subgroup data are warranted once the full data from ATTAIN and other protease inhibitor studies are published. Of note, the product monograph for simeprevir indicates that testing for Q80K polymorphism in patients with HCV genotype 1a could be considered when accessible; no such statement is included in the product monographs of the other three DAAs. Sofosbuvir targets the HCV polymerase (non-structural protein 5B) and thus is not affected by non-structural protein 3 Q80 polymorphism.

Direct-Acting Antiviral Agents for Chronic Hepatitis C Genotype 1 119
5.2.2 Other Efficacy Outcomes The outcomes not included in the NMA were analyzed using direct pairwise meta-analysis. Treatment-naive and treatment-experienced patients who received boceprevir, telaprevir, or simeprevir were less likely to experience a virologic relapse than those who received PR alone. No estimates compared with PR were estimable for sofosbuvir; 2% to 9% of patients treated with sofosbuvir experienced a relapse. Patients who received a DAA plus PR were more likely to complete treatment than those who received PR alone. The proportion of patients who discontinued therapy for any reason was statistically significantly lower than PR for all DAA regimens in treatment-naive and treatment-experienced patients. A portion of the excess discontinuation in the PR groups was due to early virologic failure. HRQoL was reported in only two studies in treatment-naive patients, both of which showed that quality of life decreased during sofosbuvir or telaprevir treatment, with a return to baseline levels after the end of therapy. These data, however, were limited by missing data and potential bias due to incomplete blinding. Death occurred rarely (less than 0.5% of patients) during the trials, which were 16 to 72 weeks in duration. The follow-up periods in the included trials were too short to assess the impact of SVR on mortality and liver disease progression. 5.2.3 Harms We identified three key adverse events — anemia, rash and depression — based on their impact on patients’ quality of life and health care resources, and these events were analyzed using NMA methods. Although treatment-naive and treatment-experienced patients were analyzed separately, the findings in both populations were similar. The risk of anemia was statistically significantly higher for patients who received boceprevir or telaprevir compared with PR alone, but not for simeprevir or sofosbuvir versus PR alone, based on both direct and indirect evidence. The absolute risk of anemia was higher for telaprevir or boceprevir versus simeprevir, but the differences did not consistently reach statistical significance. No statistically significant differences were detected between boceprevir, telaprevir, simeprevir, or PR regarding the risk of depression for both treatment-naive and treatment-experienced patients, in both direct and indirect analyses. No comparative data were available for sofosbuvir. Among treatment-naive patients, telaprevir was associated with a statistically significant increased risk of rash versus PR alone (RD 12% to 19%) based on direct pairwise comparisons; however, these differences were no longer statistically significant in the NMA. No other direct or indirect treatment comparisons showed statistically significant differences for rash in treatment-naive patients. Among treatment-experienced patients, several notable differences between treatments were found. There was a statistically significant increased risk of rash for patients who received boceprevir or telaprevir compared with PR alone, based on direct (boceprevir RD 12%, telaprevir 18% and 30%) and indirect evidence. Some comparisons between boceprevir or telaprevir and simeprevir showed a lower risk of rash for those receiving simeprevir; however, the differences were not consistently statistically significant. No clear increased risk of serious adverse events, influenza-like symptoms, or neutropenia were observed among patients who received DAA plus PR compared with PR dual therapy. Pruritus and

Direct-Acting Antiviral Agents for Chronic Hepatitis C Genotype 1 120
anorectal discomfort were reported more frequently among patients who received telaprevir. Suicidal ideation was infrequently reported and no conclusions can be drawn for this adverse event. 5.2.4 Secondary Analyses We conducted several additional analyses to explore potential sources of heterogeneity. These included NMAs stratified by the type of peginterferon (2a or 2b) and restricted to Health Canada–approved dosing regimens, as well as meta-regression including the proportion of patients with cirrhosis as a covariate. The results of these analyses were consistent with the primary analyses. 5.2.5 Populations of Special Interest In patients with CHC and HIV co-infection, we identified two RCTs comparing boceprevir or telaprevir plus PR to PR alone. Both boceprevir and telaprevir were more effective in achieving SVR than PR alone. The indirect treatment comparison (Bucher method) found no statistically significant difference between treatments for SVR, relapse, anemia, depression, and rash. No studies evaluating simeprevir or sofosbuvir in the HIV co-infected population met the inclusion criteria; thus, we were not able to assess their effectiveness. Also, no studies were found for patients with liver transplant, or for patients re-treated after an unsuccessful treatment course with a DAA. We conducted supplementary literature searches to look for emerging evidence in conference abstracts in the populations of special interest, and no emerging evidence was found.132,133
5.3 Pharmacoeconomic Considerations
The results of the base-case analysis suggest that for each population (treatment-naive patients and those with prior relapse or prior partial response), at least one of the new DAA-based therapies appears to be economically attractive compared with PR alone. The drug that is the most cost-effective varies by population, but was generally consistent across fibrosis stages. This can be explained by the fact that, although the NMA for SVR, stratified by fibrosis stage, showed that there were generally no statistically significant differences between DAA regimens, the magnitude of effect for each DAA regimen compared with PR alone and the agent with the greatest effect versus PR alone varied across populations. Furthermore, it must be noted that simeprevir was not included in the analysis of patients with prior partial response. For genotype 1 CHC treatment-naive patients, the base-case analysis suggests that simeprevir is likely to be the most cost-effective option, at $32,230 per QALY gained compared with PR therapy. The incremental cost per QALY for telaprevir versus PR alone was $36,661, and the incremental cost per QALY for boceprevir versus PR alone was $73,429. The analysis also suggests that treating patients with genotype 1 and prior relapse with telaprevir is likely to be the most cost-effective option, at $19,808 per QALY gained compared with PR therapy. The incremental cost per QALY for simeprevir versus PR alone was $22,608, and the incremental cost per QALY for boceprevir versus PR alone was $31,341. For patients with genotype 1 and prior partial response, treatment with boceprevir is likely to be the most cost-effective option, at $23,131 per QALY gained compared with PR therapy. The incremental cost per QALY for telaprevir versus PR alone was $37,803 (simeprevir was excluded from this analysis due to insufficient reporting in clinical trials).

Direct-Acting Antiviral Agents for Chronic Hepatitis C Genotype 1 121
In the analyses that were stratified by fibrosis stage, ICURs for DAA regimens compared with PR alone tended to be lower (more cost-effective) in patients with advanced fibrosis (F3 to F4) compared with patients with no or mild fibrosis (F0 to F2). In patients with prior relapse, in patients with no or mild fibrosis (F0 to F2), both simeprevir and telaprevir were economically attractive, while boceprevir was ruled out due to extended dominance by PR alone and simeprevir. In patients with F3 and F4, the telaprevir was the most cost-effective treatment option, compared with PR alone. In patients with partial response and no or mild fibrosis, both boceprevir and telaprevir were economically attractive (simeprevir was not included in the analysis). In patients with F3 and F4, boceprevir was the most cost-effective treatment option compared with PR alone. Telaprevir was dominated or extendedly dominated by PR and boceprevir. In treatment-naive patients, the sofosbuvir pivotal trial (NEUTRINO)24 had no control group, so it could not be included in the NMA. Two exploratory analyses were performed, one in which sofosbuvir data came mainly from PROTON (scenario A), and another one in which sofosbuvir data were based on NEUTRINO (scenario B). Both analyses provided similar results. In both scenarios, sofosbuvir was shown to be more attractive than telaprevir and boceprevir. In scenario A, the ICUR of sofosbuvir compared with PR alone was greater than that of simeprevir. In scenario B, simeprevir and sofosbuvir had similar ICURs compared with PR alone. It is, however, difficult to draw definitive conclusions on the comparative cost-effectiveness of sofosbuvir, due to the design of clinical trials and exclusion of NEUTRINO from the NMA. Further analyses including patient-level data would be required to fully appraise the comparative cost-effectiveness of sofosbuvir with that of other DAAs. Extensive sensitivity analyses were conducted around the model input parameters, and the structural uncertainty was tested. Besides treatment efficacy and fibrosis stage, the main factors affecting the cost-effectiveness of DAA regimens versus PR alone were baseline age and the cost of antiviral therapies. The analyses showed that ICURs of DAA-based therapies compared with PR tended to be lower (i.e., DAAs are more cost-effective) in younger patients. Additionally, the sensitivity analyses also showed that the cost-effectiveness results are highly sensitive to drug acquisition costs. Results of both the multiple one-way sensitivity analyses and PSA provide evidence that simeprevir is likely to remain cost-effective despite the uncertainty of the model’s parameters for treatment-naive patients. Telaprevir is likely to remain cost-effective despite the uncertainty of the model’s parameters for treatment-experienced patients with prior relapse. However, due to the wide CrIs in the efficacy data for patients with prior partial response, the conclusions are uncertain. The impact of the Q80K polymorphism on SVR rates after treatment with simeprevir in combination with PR, as well as costs and resources required for the test, were not assessed in the economic analysis.
5.4 Strengths and Limitations of the Systematic Review
5.4.1 Strengths This systematic review was conducted according to a pre-specified protocol, using standard approaches for collecting evidence and performing data extraction, quality assessment, and analysis. Heterogeneity across trials in terms of patient characteristics, trial methodologies, and treatment protocols was carefully assessed. Meta-regression, subgroup, and sensitivity analyses were conducted, where data allowed, to explore and control for potential sources of heterogeneity. These included the type of peginterferon, proportion of patients with cirrhosis, prior treatment experience, genotype subtype, Q80K polymorphism, fibrosis severity, and DAA dosage regimens.

Direct-Acting Antiviral Agents for Chronic Hepatitis C Genotype 1 122
The pharmacoeconomic model used best available utility data as well as costing data, which were also grounded on Canadian data. Several sensitivity analyses showed that the results remained consistent when other utility sources or instruments were used. The model also used the best available fibrosis progression data from the literature, and it was validated against other existing models. Furthermore, the model used efficacy data stratified by fibrosis stage and type of prior response to PR treatment, two predictors of response to treatment, which allowed for assessment of the cost-effectiveness of DAAs in these specific populations and subgroups. 5.4.2 Key Limitations The systematic review was limited by quality of the included studies. Of the 26 studies included in the systematic review, all but one had one or more methodological domains with an unclear or high risk of bias. Moreover, data for some DAAs in specific populations were limited to open-label, uncontrolled studies, thus limiting our ability to assess comparative efficacy and safety. The systematic review included information available in the public domain only. At the time of this review, the reports for the two pivotal simeprevir studies in treatment-naive patients, QUEST1 and QUEST2, had not yet been published. We extracted data for these RCTs using the publicly available data, but were unable to incorporate updated harms data into the NMA given the timing of publication of the additional harms data (June 2014).127,128 NMAs were not conducted for all outcomes of interest in the systematic review. The outcomes analyzed were selected based on their clinical importance to the research questions and the economic model. The adverse events analyzed were limited to those specific events deemed to have the greatest impact on patients’ quality of life or ability to complete treatment regimens, or those that required additional interventions or incurred substantial costs to manage. In the NMAs, the estimate generated for the assessment of outcomes is OR, and the calculation of relative risk was based on the ORs and the “control” event rate (i.e., PR event rate) as a representative of the “real” population event rate. The number of trials that contributed to some of the NMAs was limited, which may have yielded less precise estimates than if we had more robust evidence networks. This was especially an issue in the analysis of prior partial and prior null response, which included few studies and a limited number of patients; thus, the results showed wide CrIs. We performed regression analyses to determine whether the percentage of patients with cirrhosis in the trials had an impact on our findings. In general, the effect estimates were consistent with the base-case analyses. However, the analyses based on meta-regression should be interpreted with caution due to the small number of studies, especially for treatment-experienced patients. Consistency was assessed whenever a closed loop was available by comparing consistency and inconsistency models. However, in most of the analyses, there was no closed loop available. Where there was a closed loop, it was through one study that included a PR group and two different dosage groups for the same DAA. We were unable to compare direct and indirect evidence between DAAs due to the absence of head-to-head trials. Hence, our ability to assess consistency was limited. In the base-case analysis, similar treatment effects were assumed for peginterferon 2a and 2b, but there is evidence that patients who receive peginterferon 2a as part of their treatment regimen show better efficacy than those who receive peginterferon 2b. We conducted a sensitivity analysis in which peginterferon 2a and 2b regimens were considered to have different efficacy and safety. In treatment-experienced patients, there was only one small study available comparing peginterferon 2a plus ribavirin

Direct-Acting Antiviral Agents for Chronic Hepatitis C Genotype 1 123
with peginterferon 2b plus ribavirin (which was needed to create a connected network). This trial did not provide subgroup data by previous treatment response, or any data on the incidence of rash or depression. As a result, there is some uncertainty regarding the secondary analyses results for peginterferon 2a and 2b in treatment-experienced patients. We conducted direct pairwise comparisons for outcomes not included in the NMA and indicated the results were statistically significant if they did not include the null value. The studies were not designed to detect statistically significant results for these outcomes, and non-significant findings may be due to lack of power. From this systematic review, we identified several evidence gaps. No head-to-head studies met the inclusion criteria; thus, all comparisons between DAAs plus PR were based on indirect evidence. There is one ongoing head-to-head RCT comparing simeprevir with telaprevir, each in combination with PR, in treatment-experienced patients (ATTAIN, NCT01485991).131 This study has not yet been published and so could not be included in this review. Interim data suggest that simeprevir was non-inferior to telaprevir.130 No RCTs meeting the inclusion criteria for our systematic review assessed the following treatments or populations:
Any DAA in patients with liver transplant
Re-treatment of patients who had an inadequate response to DAA plus PR therapy
Simeprevir or sofosbuvir in patients with HIV co-infection
Sofosbuvir in treatment-experienced patients
Sofosbuvir at the Health Canada–recommended dosage regimen in treatment-naive patients
Boceprevir in patients with prior null response to PR therapy
Telaprevir RGT (the Health Canada–recommended dosage regimen) in patients with prior relapse
Telaprevir 1,125 mg every 12 hours in treatment-experienced patients Furthermore, some treatments or subgroups were studied in a limited number of patients, which hindered our ability to assess efficacy and safety for important populations. Comparative RCT data for sofosbuvir were limited to a single phase 2 study (PROTON), which reported no information on the subgroups of interest. As a result, sofosbuvir could not be included in the base-case economic analysis. The pivotal phase 3 trial for sofosbuvir (NEUTRINO) was an uncontrolled, single-group, open-label study. Although sofosbuvir showed efficacy, the lack of control group limits our ability to draw conclusions with regard to its comparative efficacy using NMA. Methods to incorporate single-group data into an NMA include high-dimensional propensity scoring, but this requires access to individual patient data. Few patients with prior null response were enrolled in the telaprevir or simeprevir RCTs. Moreover, none of the boceprevir studies enrolled patients with a prior null response. As a result, the NMA for SVR was sparse, and we had insufficient data to conduct subgroup analyses by fibrosis severity or genotype subtype in null responders. Data were also limited for subgroups of patients with more severe fibrosis (Metavir fibrosis score F3 and F4). Eight studies did not report SVR results according to fibrosis severity, or data were aggregated in a way that could not be combined with other trials in the NMA. Six studies excluded patients with
Direct-Acting Antiviral Agents for Chronic Hepatitis C Genotype 1 124
cirrhosis. Due to the sparse data, we had to group patients with cirrhosis with those with bridging fibrosis (Metavir F3) when conducting the analysis. Patients with cirrhosis achieve lower rates of SVR with PR and are at higher risk of treatment-related complications. Pooling data for Metavir F3 and F4 subgroups may inflate the treatment effects for those with cirrhosis. In addition, due to sparse data, our subgroup analyses for patients with more severe fibrosis may lack power, and the uncertainty in the findings are reflected in the wide CrIs. HRQoL was reported in only two studies (concerning sofosbuvir and telaprevir), and the findings were potentially biased by incomplete blinding and missing data. Moreover, the authors noted that patients enrolled in these studies are likely healthier than the CHC population in general. In fact, the pooled baseline EQ-5D index value (0.91; 95% CI, 0.90 to 0.92) was higher than the US population norm (0.87, standard error 0.01) for adults of a similar age in ADVANCE. We were unable to analyze adverse events according to their severity, as data on severity were not consistently reported. In addition, different definitions of adverse events may have been used across studies, but due to the lack of detailed descriptions and study protocols, we were unable to assess potential differences. None of the included studies reported data on liver disease progression, such as change in fibrosis severity, development of HCC, or need for liver transplant. Among the studies, the longest follow-up was 72 weeks, which is insufficient to assess the impact of treatment on mortality or disease progression outcomes. We noted some limitations related to generalizability. Most of the patients included in the studies were Caucasians, which might limit the generalizability to other ethnic groups, some of which are less responsive to treatment. There were differences between studies on the management of anemia and this may have had an impact on anemia-related treatment discontinuation and SVR. However, a recent study suggested that SVR rates were comparable between patients whose anemia was managed through ribavirin dose reduction versus erythropoietin therapy.134 Due to limited data, no economic analysis could be performed in prior null responders, and no subgroup analysis by genotype subtype 1a with Q80K polymorphism was possible. As with all economic models, a number of assumptions were made in this economic evaluation. First, comparative efficacy was based on findings for fibrosis subgroups from the NMA. Ideally, the NMA should have been stratified by individual fibrosis stages. Patients with a fibrosis stage F3 should have been analyzed separately from F4. This was not possible because the sample sizes were very small, and sometimes studies reported only data grouped by F3 and F4. This was not optimal in the case of boceprevir, given that the recommended dosing regimen differs for patients with F3 and F4. There was considerable uncertainty in some of the populations, especially in patients with prior partial response. Because no NMA stratified by fibrosis stage could be performed due to insufficient reporting in the clinical trials, the assumption was made that the incidence of adverse events is not affected by fibrosis stage and type of prior response. Although this assumption seems reasonable for rash and depression, cirrhosis is a risk factor for anemia. Furthermore, there were very few data available in the literature on the disutility associated with adverse events. Adverse events were not shown to have a big impact on the results. Sensitivity analyses in which no disutility was applied did not affect the results. Costs

Direct-Acting Antiviral Agents for Chronic Hepatitis C Genotype 1 125
associated with adverse events contributed to less than 1% of total costs, for all treatments and populations. The pharmacoeconomic analyses were based on the dosing that was used in the NMA (best evidence available), which may differ from the Health Canada–recommended dosing, and thus may not reflect the true clinical practice in Canada. The CHC progression parameters used by the model were derived from all published literature around the world. Hence, these parameters may not reflect the Canadian population; however, they are probably close to Canadian parameters. Although there is likely some uncertainty regarding the true transition rates, these rates are the most robust currently available in the literature and were acceptable to the clinical experts. The CHC-related costs used were not fibrosis-specific; they may overestimate the cost of mild/no fibrosis and underestimate the cost of severe fibrosis. The utilities of CHC patients who have late-stage liver disease (decompensated cirrhosis and HCC) used in the model were based on very small sample sizes and may not cover the full spectrum of the severity of the disease. The pharmacoeconomic analyses do not account for any confidential prices that have been negotiated for CHC therapies. 5.4.3 Other Considerations We are aware of one other technology assessment that assessed the comparative efficacy of all four DAAs in combination with PR. The report by the California Technology Assessment Forum (CTAF) compared the new DAAs, simeprevir and sofosbuvir, to boceprevir, telaprevir and PR alone in patients with genotype 1 CHC.135 CTAF reported that, in terms of SVR, both simeprevir and sofosbuvir regimens had similar efficacy, and both were more effective than boceprevir or telaprevir. Moreover, all DAAs were more effective than PR alone. CTAF’s conclusions on the superiority of simeprevir and sofosbuvir versus the other DAAs are not in line with the results of our analyses, which did not find statistically significant differences between the DAAs. These discrepancies may be explained by differences in the methods used to conduct the indirect comparisons. The CTAF analysis included single-group data for sofosbuvir and made assumptions for the control group (PR). In addition, the CTAF analysis excluded subjects with Q80K polymorphism from simeprevir studies. Recently updated clinical guidelines have recommended therapies with sofosbuvir and simeprevir over those with boceprevir and telaprevir. The 2014 European Association for the Study of the Liver (EASL) guidelines list sofosbuvir plus PR (option 1) or simeprevir plus PR (option 2) for genotype 1 patients.136 Similarly, the 2014 American Association for the Study of Liver Diseases (AASLD) guidelines recommend sofosbuvir plus PR for treatment-naive genotype 1 patients, and simeprevir plus PR as an alternate therapy for those with genotype 1b or 1a without Q80K polymorphism.137 Both guidelines also endorse sofosbuvir plus simeprevir combination therapy as a potential option, although it is listed as option 5 with a B1 recommendation (moderate quality of evidence) by EASL, and limited to treatment-naive patients who are not eligible for interferon by AASLD.136,137 The AASLD recommends simeprevir plus sofosbuvir, or sofosbuvir plus PR for treatment-experienced patients. The AASLD guidelines do not recommend boceprevir or telaprevir triple therapy, or PR dual therapy in patients with genotype 1 CHC, whereas the EASL guidelines state that if no other options are available, then telaprevir and boceprevir treatment remains acceptable.136,137 Data to support combined simeprevir and sofosbuvir are based on the COSMOS phase 2 study, which tested sofosbuvir plus simeprevir regimens (with or without ribavirin) in either patients with previous

Direct-Acting Antiviral Agents for Chronic Hepatitis C Genotype 1 126
null response and mild fibrosis, or treatment-naive patients or those with null response with advanced fibrosis or cirrhosis.138 Health Canada has yet to approve sofosbuvir-simeprevir combination therapy. Patient group input clearly indicated that lengthy treatment durations, need for frequent injections, and treatment-associated adverse events contribute to a significant treatment burden for many of the Health Canada–approved regimens for CHC. Patients specifically expressed a desire for short-duration, all-oral, interferon-free treatment regimens. There are a number of novel DAA regimens (many of which do not include interferon or ribavirin) currently under investigation, which may be approved by Health Canada in the near future. Examples of all-oral, interferon-free regimens that have been submitted for regulatory approval in Europe, Canada, or the US include sofosbuvir plus simeprevir or ledipasvir; ABT-450/ritonavir plus ombitasvir and dasabuvir; and daclatasvir plus asunaprevir. Given the rapid pace of development of treatments for CHC, it is apparent that updates to this Therapeutic Review will be necessary as new evidence emerges. At present, sofosbuvir is the only DAA with Health Canada approval for use in CHC genotypes 2, 3, and 4; however, research on other pangenotypic DAA regimens is in progress. Future therapeutic reviews will need a broader scope to include these new regimens and other CHC genotypes and will require innovative methods to conduct meta-analyses for disconnected evidence networks.
6. CONCLUSIONS AND IMPLICATIONS FOR DECISION- OR POLICY-MAKING
Results from the systematic review and indirect treatment comparison suggest that DAAs in combination with PR are more effective in achieving an SVR than 48 weeks of PR in adults with genotype 1 CHC infection. Specifically, in patients who are treatment-naive, simeprevir, boceprevir, and telaprevir at Health Canada–recommended dosages are more effective in achieving SVR than PR alone. Sofosbuvir at a non-approved dosage regimen (24- or 48-week RGT) is also more effective than PR alone. In all treatment-experienced patients, including those with prior relapse or prior partial response, simeprevir, telaprevir, and boceprevir were more effective than PR alone in achieving an SVR. No conclusions can be drawn regarding the comparative efficacy of sofosbuvir plus PR, at the Health Canada–approved dosage regimen for treatment-naive patients, or at any dose for treatment-experienced patients, due to the lack of RCTs. No DAA was found to be more effective than another DAA in achieving SVR among treatment-naive or the overall treatment-experienced populations, based on indirect evidence. Subgroup analyses suggest that boceprevir RGT may be less effective than telaprevir in patients with prior relapse, and may be less effective than boceprevir 48-week regimens in patients with prior relapse and severe fibrosis. However, the findings of subgroup analyses must be interpreted with caution, given the limited number of patients and the uncertainty in the findings. Among patients with genotype 1a and Q80K polymorphism, simeprevir showed no significant benefit over PR alone. In terms of safety, boceprevir and telaprevir showed an increased risk of anemia relative to PR in treatment-naive and treatment-experienced patients, and an increased risk of rash versus PR in

Direct-Acting Antiviral Agents for Chronic Hepatitis C Genotype 1 127
treatment-experienced patients. The indirect comparisons between DAA regimens did not consistently show an increased risk of anemia for boceprevir or telaprevir versus simeprevir. Similarly, in treatment-experienced patients, no consistent increased risk of rash was found between boceprevir or telaprevir and simeprevir. Comparative safety data for sofosbuvir were limited. Among the populations of special interest, no conclusions can be drawn regarding the efficacy and safety of DAAs in patients who have undergone a liver transplant or who were re-treated after failing to achieve an SVR with DAA therapy, due to the absence of clinical trials. Boceprevir and telaprevir were more effective than PR alone in patients with HIV co-infection, with no clear difference between DAA regimens based on indirect comparisons. Several evidence gaps were identified in the systematic review, particularly for sofosbuvir, which limited our ability to incorporate this DAA into the economic model and to fully examine its comparative efficacy and safety across populations. Furthermore, all comparisons between DAAs were based on indirect evidence because of the absence of head-to-head RCTs. Data were also limited for some subgroups, and the findings from these analyses were therefore either incomplete because there were no data for the specified regimen, or were uncertain, as reflected by the wide CrIs. The pharmacoeconomic analysis suggests that, for all populations assessed (treatment-naive and those with prior relapse or prior partial response), at least one of the new DAA-based therapies appears to be economically attractive compared with PR alone. The drug that is the most cost-effective varies by population, but was generally consistent across fibrosis stages. For treating genotype 1 CHC treatment-naive patients, the pharmacoeconomic analysis suggests that simeprevir is likely to be the most cost-effective option, at $32,230 per QALY gained, compared with PR therapy. Results of the PSA suggest that simeprevir is likely to remain cost-effective for treatment-naive patients. In the analysis stratified by fibrosis stage, simeprevir therapy was the most cost-effective treatment option, compared with PR alone, across all fibrosis stages. For treating patients with genotype 1 CHC and prior relapse, telaprevir is likely to be the most cost-effective option, at $19,808 per QALY gained, compared with PR therapy. Results of the PSA suggest that telaprevir is likely to remain cost-effective for treatment-experienced patients with prior relapse. However, the three DAA-based therapies included in the base-case analysis had ICURs below $35,000 per QALY compared with PR alone. In the analysis stratified by fibrosis stage, in patients with no or mild fibrosis (F0 to F2), both simeprevir and telaprevir were economically attractive, while boceprevir was ruled out due to extended dominance by PR alone and simeprevir. In patients with F3 and F4, telaprevir was the most cost-effective treatment option, compared with PR alone. Due to the large degree of uncertainty around the efficacy data derived from the NMA on prior partial response, there is significant uncertainty associated with the ICURs for this population. Considering the rapid pace of development of treatments for CHC, updated and expanded therapeutic reviews will be necessary. There are all-oral, interferon-free regimens in development that may be approved by Health Canada in the near future. Early evidence suggests that these treatments may offer many of the advances demanded by patients — higher cure rates, better side effect profiles, and reduced treatment burden — but may offer additional challenges in terms of costs and affordability.

Direct-Acting Antiviral Agents for Chronic Hepatitis C Genotype 1 128
7. REFERENCES
1. Myers RP, Krajden M, Bilodeau M, Kaita K, Marotta P, Peltekian K, et al. Burden of disease and cost of chronic hepatitis C virus infection in Canada. Can J Gastroenterol Hepatol. 2014 May;28(5):243-50.
2. Remis RS. Modelling the incidence and prevalence of hepatitis C infection and its sequelae in Canada, 2007: final report [Internet]. Ottawa: Public Health Agency of Canada; 2009. [cited 2014 Jan 27]. Available from: http://www.phac-aspc.gc.ca/sti-its-surv-epi/model/pdf/model07-eng.pdf
3. Davis GL, Alter MJ, El-Serag H, Poynard T, Jennings LW. Aging of hepatitis C virus (HCV)-infected persons in the United States: a multiple cohort model of HCV prevalence and disease progression. Gastroenterology. 2010 Feb;138(2):513-21, 521.e1-6.
4. Centre for Communicable Diseases and Infection Control, Infectious Disease Prevention and Control Branch. Hepatitis C in Canada: 2005-2010 surveillance report [Internet]. Ottawa: Public Health Agency of Canada; 2011. [cited 2014 Aug 27]. Available from: http://publications.gc.ca/collections/collection_2012/aspc-phac/HP40-70-2012-eng.pdf
5. CDC [Internet]. Atlanta (GA): Centers for Disease Control and Prevention. Surveillance for viral hepatitis - United States, 2011; 2013 Aug 19 [cited 2014 Aug 27]. Available from: http://www.cdc.gov/hepatitis/Statistics/2011Surveillance/Commentary.htm
6. van der Meer AJ, Veldt BJ, Feld JJ, Wedemeyer H, Dufour JF, Lammert F, et al. Association between sustained virological response and all-cause mortality among patients with chronic hepatitis C and advanced hepatic fibrosis. JAMA. 2012 Dec 26;308(24):2584-93.
7. Morgan RL, Baack B, Smith BD, Yartel A, Pitasi M, Falck-Ytter Y. Eradication of hepatitis C virus infection and the development of hepatocellular carcinoma: a meta-analysis of observational studies. Ann Intern Med. 2013 Mar 5;158(5 pt 1):329-37.
8. Canadian Agency for Drugs and Technologies in Health. Direct-acting antivirals for chronic hepatitis C genotype 1: project protocol [Internet]. Ottawa: The Agency; 2014 Feb. (Therapeutic review report; vol 2 no. 2a). [cited 2014 May 16]. Available from: http://www.cadth.ca/media/pdf/TR0007_HepC_Protocol_e.pdf
9. Lenz O, Verbinnen T, Lin TI, Vijgen L, Cummings MD, Lindberg J, et al. In vitro resistance profile of the hepatitis C virus NS3/4A protease inhibitor TMC435. Antimicrob Agents Chemother [Internet]. 2010 May [cited 2014 May 27];54(5):1878-87. Available from: http://www.ncbi.nlm.nih.gov/pmc/articles/PMC2863659
10. Berger KL, Triki I, Cartier M, Marquis M, Massariol MJ, Bocher WO, et al. Baseline hepatitis C virus (HCV) NS3 polymorphisms and their impact on treatment response in clinical studies of the HCV NS3 protease inhibitor faldaprevir. Antimicrob Agents Chemother [Internet]. 2014 Feb [cited 2014 May 27];58(2):698-705. Available from: http://www.ncbi.nlm.nih.gov/pmc/articles/PMC3910880
Direct-Acting Antiviral Agents for Chronic Hepatitis C Genotype 1 129
11. McPhee F, Friborg J, Levine S, Chen C, Falk P, Yu F, et al. Resistance analysis of the hepatitis C virus NS3 protease inhibitor asunaprevir. Antimicrob Agents Chemother [Internet]. 2012 Jul [cited 2014 May 27];56(7):3670-81. Available from: http://www.ncbi.nlm.nih.gov/pmc/articles/PMC3393445
12. Poordad F, McCone J, Bacon BR, Bruno S, Manns MP, Sulkowski MS, et al. Boceprevir for untreated chronic HCV genotype 1 infection. N Engl J Med. 2011 Mar 31;364(13):1195-206.
13. Jacobson IM, McHutchison JG, Dusheiko G, Di Bisceglie AM, Reddy KR, Bzowej NH, et al. Telaprevir for previously untreated chronic hepatitis C virus infection. N Engl J Med [Internet]. 2011 Jun 23 [cited 2014 Jan 16];364(25):2405-16. Available from: http://www.nejm.org/doi/pdf/10.1056/NEJMoa1012912
14. McHutchison JG, Everson GT, Gordon SC, Jacobson IM, Sulkowski M, Kauffman R, et al. Telaprevir with peginterferon and ribavirin for chronic HCV genotype 1 infection. N Engl J Med [Internet]. 2009 Apr 30 [cited 2014 Jan 17];360(18):1827-38. Available from: http://www.nejm.org/doi/pdf/10.1056/NEJMoa0806104
15. Fried MW, Buti M, Dore GJ, Flisiak R, Ferenci P, Jacobson I, et al. Once-daily simeprevir (TMC435) with pegylated interferon and ribavirin in treatment-naïve genotype 1 hepatitis C: the randomized PILLAR study. Hepatology. 2013;58(6):1918-29.
16. Lawitz E, Lalezari JP, Hassanein T, Kowdley KV, Poordad FF, Sheikh AM, et al. Sofosbuvir in combination with peginterferon alfa-2a and ribavirin for non-cirrhotic, treatment-naive patients with genotypes 1, 2, and 3 hepatitis C infection: a randomised, double-blind, phase 2 trial. Lancet Infect Dis. 2013 May;13(5):401-8.
17. Levin J. Simeprevir (TMC435) with peginterferon/ribavirin for chronic HCV genotype 1 infection in treatment-naïve patients: results from QUEST-1, a phase III trial [conference report on the Internet]. New York: National AIDS Treatment Advocacy Project; 2013 Apr. [cited 2014 Mar 11]. Available from: http://www.natap.org/2013/EASL/EASL_10.htm
18. Levin J. Simeprevir (TMC435) with peginterferon-a2a or -a2b and ribavirin in treatment-naïve HCV genotype 1 patients: QUEST-2, a randomised phase III trial [conference report on the Internet]. New York: National AIDS Treatment Advocacy Project; 2013 Apr. [cited 2014 Mar 11]. Available from: http://www.natap.org/2013/EASL/EASL_18.htm
19. Kwo PY, Lawitz EJ, McCone J, Schiff ER, Vierling JM, Pound D, et al. Efficacy of boceprevir, an NS3 protease inhibitor, in combination with peginterferon alfa-2b and ribavirin in treatment-naive patients with genotype 1 hepatitis C infection (SPRINT-1): an open-label, randomised, multicentre phase 2 trial. Lancet. 2010 Aug 28;376(9742):705-16.
20. Sherman KE, Flamm SL, Afdhal NH, Nelson DR, Sulkowski MS, Everson GT, et al. Response-guided telaprevir combination treatment for hepatitis C virus infection. N Engl J Med. 2011 Sep 15;365(11):1014-24.
21. Buti M, Agarwal K, Horsmans Y, Sievert W, Janczewska E, Zeuzem S, et al. Telaprevir twice daily Is noninferior to telaprevir every 8 hours for patients with chronic hepatitis C. Gastroenterology. 2014;146(3):744-53.

Direct-Acting Antiviral Agents for Chronic Hepatitis C Genotype 1 130
22. Marcellin P, Forns X, Goeser T, Ferenci P, Nevens F, Carosi G, et al. Telaprevir is effective given every 8 or 12 hours with ribavirin and peginterferon alfa-2a or -2b to patients with chronic hepatitis C. Gastroenterology. 2011 Feb;140(2):459-68.
23. Kumada H, Toyota J, Okanoue T, Chayama K, Tsubouchi H, Hayashi N. Telaprevir with peginterferon and ribavirin for treatment-naive patients chronically infected with HCV of genotype 1 in Japan. J Hepatol. 2012 Jan;56(1):78-84.
24. Lawitz E, Mangia A, Wyles D, Rodriguez-Torres M, Hassanein T, Gordon SC, et al. Sofosbuvir for previously untreated chronic hepatitis C infection. N Engl J Med. 2013 May 16;368(20):1878-87.
25. Kowdley KV, Lawitz E, Crespo I, Hassanein T, Davis MN, DeMicco M, et al. Sofosbuvir with pegylated interferon alfa-2a and ribavirin for treatment-naive patients with hepatitis C genotype-1 infection (ATOMIC): an open-label, randomised, multicentre phase 2 trial. Lancet. 2013 Jun 15;381(9883):2100-7.
26. Hézode C, Forestier N, Dusheiko G, Ferenci P, Pol S, Goeser T, et al. Telaprevir and peginterferon with or without ribavirin for chronic HCV infection. N Engl J Med [Internet]. 2009 Apr 30 [cited 2014 Jan 17];360(18):1839-50. Available from: http://www.nejm.org/doi/pdf/10.1056/NEJMoa0807650
27. Bacon BR, Gordon SC, Lawitz E, Marcellin P, Vierling JM, Zeuzem S, et al. Boceprevir for previously treated chronic HCV genotype 1 infection. N Engl J Med. 2011 Mar 31;364(13):1207-17.
28. Flamm SL, Lawitz E, Jacobson I, Bourliere M, Hezode C, Vierling JM, et al. Boceprevir with peginterferon alfa-2a-ribavirin is effective for previously treated chronic hepatitis C genotype 1 infection. Clin Gastroenterol Hepatol. 2013 Jan;11(1):81-7.
29. Zeuzem S, Andreone P, Pol S, Lawitz E, Diago M, Roberts S, et al. Telaprevir for retreatment of HCV infection. N Engl J Med. 2011 Jun 23;364(25):2417-28.
30. McHutchison JG, Manns MP, Muir AJ, Terrault NA, Jacobson IM, Afdhal NH, et al. Telaprevir for previously treated chronic HCV infection. N Engl J Med [Internet]. 2010 Apr 8 [cited 2014 Jan 17];362(14):1292-303. Available from: http://www.nejm.org/doi/pdf/10.1056/NEJMoa0908014
31. Forns X, Lawitz E, Zeuzem S, Gane E, Bronowicki JP, Andreone P, et al. Simeprevir with peginterferon and ribavirin leads to high rates of SVR in patients with HCV genotype 1 who relapsed after previous therapy: a phase 3 trial. Gastroenterology. 2014;146(7):1669-79.
32. Zeuzem S, Berg T, Gane E, Ferenci P, Foster GR, Fried MW, et al. Simeprevir increases rate of sustained virologic response among treatment-experienced patients with HCV genotype-1 infection: a phase IIb trial. Gastroenterology. 2014 Feb;146(2):430-41.
33. Vierling JM, Davis M, Flamm S, Gordon SC, Lawitz E, Yoshida EM, et al. Boceprevir for chronic HCV genotype 1 infection in patients with prior treatment failure to peginterferon/ribavirin, including prior null response. J Hepatol. 2014;60(4):748-56.

Direct-Acting Antiviral Agents for Chronic Hepatitis C Genotype 1 131
34. Colombo M, Fernandez I, Abdurakhmanov D, Ferreira PA, Strasser SI, Urbanek P, et al. Safety and on-treatment efficacy of telaprevir: the early access programme for patients with advanced hepatitis C. Gut [Internet]. 2014 Jul [cited 2014 Jul 31];63(7):1150-8. Available from: http://gut.bmj.com/content/63/7/1150.full.pdf+html
35. Muir AJ, Poordad FF, McHutchison JG, Shiffman ML, Berg T, Ferenci P, et al. Retreatment with telaprevir combination therapy in hepatitis C patients with well-characterized prior treatment response. Hepatology. 2011 Nov;54(5):1538-46.
36. Sulkowski M, Pol S, Mallolas J, Fainboim H, Cooper C, Slim J, et al. Boceprevir versus placebo with pegylated interferon alfa-2b and ribavirin for treatment of hepatitis C virus genotype 1 in patients with HIV: a randomised, double-blind, controlled phase 2 trial. Lancet Infect Dis. 2013 Jul;13(7):597-605.
37. Sulkowski MS, Sherman KE, Dieterich DT, Bsharat M, Mahnke L, Rockstroh JK, et al. Combination therapy with telaprevir for chronic hepatitis C virus genotype 1 infection in patients with HIV: a randomized trial. Ann Intern Med. 2013 Jul 16;159(2):86-96.
38. Manns MP, McHutchison JG, Gordon SC, Rustgi VK, Shiffman M, Reindollar R, et al. Peginterferon alfa-2b plus ribavirin compared with interferon alfa-2b plus ribavirin for initial treatment of chronic hepatitis C: a randomised trial. Lancet. 2001 Sep 22;358(9286):958-65.
39. Fried MW, Shiffman ML, Reddy KR, Smith C, Marinos G, Goncales FL, et al. Peginterferon alfa-2a plus ribavirin for chronic hepatitis C virus infection. N Engl J Med. 2002 Sep 26;347(13):975-82.
40. Kamal SM. Acute hepatitis C: a systematic review. Am J Gastroenterol. 2008 May;103(5):1283-97.
41. Maheshwari A, Ray S, Thuluvath PJ. Acute hepatitis C. Lancet. 2008 Jul 26;372(9635):321-32.
42. Maheshwari A, Thuluvath PJ. Management of acute hepatitis C. Clin Liver Dis. 2010 Feb;14(1):169-76.
43. Thein HH, Yi Q, Dore GJ, Krahn MD. Estimation of stage-specific fibrosis progression rates in chronic hepatitis C virus infection: a meta-analysis and meta-regression. Hepatology. 2008 Aug;48(2):418-31.
44. Ghany MG, Strader DB, Thomas DL, Seeff LB, American Association for the Study of Liver Diseases. Diagnosis, management, and treatment of hepatitis C: an update. Hepatology. 2009 Apr;49(4):1335-74.
45. Vertex to discontinue sale of telaprevir (Incivek) for hepatitis C. HIVandHepatitis.com [Internet]. 2014 Aug 22 [cited 2014 Oct 28]. Available from: http://www.hivandhepatitis.com/hcv-treatment/approved-hcv-drugs/4808-vertex-to-discontinue-sale-of-telaprevir-incivek-for-hepatitis-c
46. PrVictrelis™ (boceprevir): 200 mg capsule [product monograph]. Merck Canada Inc.: Kirkland (QC); 2013 May 13.

Direct-Acting Antiviral Agents for Chronic Hepatitis C Genotype 1 132
47. PrIncivek™ telaprevir tablets: 375 mg [product monograph]. Laval (QC): Vertex Pharmaceuticals (Canada) Incorporated; 2013 Aug 19.
48. PrIncivek® telaprevir tablets: 375 mg [product monograph]. Laval (QC): Vertex Pharmaceuticals (Canada) Incorporated; 2013 Dec 17.
49. PrGalexos™ (simeprevir capsules): 150 mg simeprevir (as simeprevir sodium) [product monograph]. Toronto: Janssen Inc.; 2013 Nov 18.
50. PrSovaldi™ (sofosbuvir) tablets: 400 mg sofosbuvir [product monograph]. Foster City (CA) and Mississauga (ON): Gilead Sciences Inc. and Gilead Sciences Canada Inc.; 2013 Dec 12.
51. Higgins JPT, Altman DG, Sterne JAC, editors. Chapter 8.5: The Cochrane Collaboration's tool for assessing risk of bias [Internet]. In: Higgins JT, Green S, editors. Cochrane handbook for systematic reviews of interventions. Version 5.1.0. London: The Cochrane Collaboration; 2011 [cited 2014 Jan 15]. Available from: http://www.cochrane-handbook.org/.
52. Review manager (RevMan). Version 5.1 for Windows. Copenhagen: The Nordic Cochrane Centre, The Cochrane Collaboration; 2011.
53. Spiegelhalter D, Thomas A, Best N, Lunn D. WinBUGS user manual [Internet]. Version 1.4. Cambridge, UK: MRC Biostatistics Unit, Institute of Public Health; 2003. [cited 2014 Apr 21]. Available from: http://www.mrc-bsu.cam.ac.uk/wp-content/uploads/manual14.pdf
54. Dias S, Welton NJ, Sutton AJ, Ades AE. NICE DSU technical support document 1: introduction to evidence synthesis for decision making [Internet]. Sheffield, UK: National Institute for Health and Clinical Excellence, Decision Support Unit; 2011 Apr. [cited 2014 Apr 22]. Available from: http://www.nicedsu.org.uk/TSD1%20Introduction.final.08.05.12.pdf
55. Dias S, Welton NJ, Sutton AJ, Ades AE. NICE DSU technical support document 2: a generalised linear modelling framework for pairwise and network meta-anlysis of randomised controlled trials [Internet]. Sheffield, UK: National Institute for Health and Clinical Excellence Decision Support Unit; 2011 Aug. [cited 2014 Apr 22]. Available from: http://www.nicedsu.org.uk/TSD2%20General%20meta%20analysis%20corrected%2015April2014.pdf
56. Cooper NJ, Sutton AJ, Morris D, Ades AE, Welton NJ. Addressing between-study heterogeneity and inconsistency in mixed treatment comparisons: application to stroke prevention treatments in individuals with non-rheumatic atrial fibrillation. Stat Med. 2009 Jun 30;28(14):1861-81.
57. Turner RM, Thompson SG, Spiegelhalter DJ. Prior distributions for the intracluster correlation coefficient, based on multiple previous estimates, and their application in cluster randomized trials. Clin Trials. 2005;2(2):108-18.
58. Ades AE, Welton NJ, Caldwell D, Price M, Goubar A, Lu G. Multiparameter evidence synthesis in epidemiology and medical decision-making. J Health Serv Res Policy. 2008 Oct;13 Suppl 3:12-22.
59. Dias S, Welton NJ, Sutton AJ, Caldwell DM, Lu G, Ades AE. NICE DSU technical support document 4: inconsistency in networks of evidence based on randomised controlled trials [Internet].

Direct-Acting Antiviral Agents for Chronic Hepatitis C Genotype 1 133
Sheffield, UK: National Institute for Health and Clinical Excellence, Decision Support Unit; 2011 May. [cited 2014 Apr 22]. Available from: http://www.nicedsu.org.uk/TSD4%20Inconsistency.final.15April2014.pdf
60. Dias S, Sutton AJ, Welton NJ, Ades AE. NICE DSU technical support document 3: heterogeneity: subgroups, meta-regression, bias and bias-adjustment [Internet]. Sheffield, UK: National Institute for Health and Clinical Excellence, Decision Support Unit; 2011 Sep. [cited 2014 Apr 22]. Available from: http://www.nicedsu.org.uk/TSD3%20Heterogeneity.final%20report.08.05.12.pdf
61. Chen J, Florian J, Carter W, Fleischer RD, Hammerstrom TS, Jadhav PR, et al. Earlier sustained virologic response end points for regulatory approval and dose selection of hepatitis C therapies. Gastroenterology. 2013 Jun;144(7):1450-5.
62. Dias S, Welton NJ, Caldwell DM, Ades AE. Checking consistency in mixed treatment comparison meta-analysis. Stat Med. 2010 Mar 30;29(7-8):932-44.
63. Wells GA, Sultan SA, Chen L, Khan M, Coyle D. Indirect evidence: indirect treatment comparisons in meta-analysis [Internet]. Ottawa: Canadian Agency for Drugs and Technologies in Health; 2009 Mar. [cited 2014 Apr 28]. Available from: http://www.cadth.ca/media/pdf/H0462_itc_tr_e.pdf
64. Wells GA, Sultan SA, Chen L, Khan M, Coyle D. Indirect treatment comparison [computer program on the Internet]. Version 1.0. Ottawa: Canadian Agency for Drugs and Technologies in Health; 2009. [cited 2014 Apr 28]. Available from: http://www.cadth.ca/en/publication/884
65. Rotermann M, Langlois K, Andonov A, Trubnikov M. Seroprevalence of hepatitis B and C virus infections: results from the 2007 to 2009 and 2009 to 2011 Canadian Health Measures Survey. Health Rep [Internet]. 2013 Nov 20 [cited 2014 Jan 20];24(11):3-13. Available from: http://www.statcan.gc.ca/pub/82-003-x/2013011/article/11876-eng.pdf
66. Hartwell D, Shepherd J. Pegylated and non-pegylated interferon-alfa and ribavirin for the treatment of mild chronic hepatitis C: a systematic review and meta-analysis. Int J Technol Assess Health Care. 2009 Jan;25(1):56-62.
67. Brady B, Siebert U, Sroczynski G, Murphy G, Husereau D, Sherman M, et al. Pegylated interferon combined with ribavirin for chronic hepatitis C virus infection: an economic evaluation [Internet]. Ottawa: Canadian Agency for Drugs and Technologies in Health; 2007 Mar. [cited 2014 Feb 3]. (Technology report no 82). Available from: http://www.cadth.ca/media/pdf/232_HepC_tr_e.pdf
68. Brady B, Siebert U, Sroczynski G, Murphy G, Husereau D, Sherman M, et al. Pegylated interferon combined with ribavirin for chronic hepatitis C virus infection: an economic evaluation. Appendices 1-4 [Internet]. Ottawa: Canadian Agency for Drugs and Technologies in Health; 2007 Mar. [cited 2014 Feb 3]. (Technology report no 82). Available from: http://cadth.ca/media/pdf/232_Hep-C_tr_appendices_e.pdf

Direct-Acting Antiviral Agents for Chronic Hepatitis C Genotype 1 134
69. Lee SS, Bain VG, Peltekian K, Krajden M, Yoshida EM, Deschenes M, et al. Treating chronic hepatitis C with pegylated interferon alfa-2a (40 KD) and ribavirin in clinical practice. Aliment Pharmacol Ther. 2006 Feb 1;23(3):397-408.
70. Sherman M, Yoshida EM, Deschenes M, Krajden M, Bain VG, Peltekian K, et al. Peginterferon alfa-2a (40KD) plus ribavirin in chronic hepatitis C patients who failed previous interferon therapy. Gut [Internet]. 2006 Nov [cited 2014 May 15];55(11):1631-8. Available from: http://www.ncbi.nlm.nih.gov/pmc/articles/PMC1860092
71. Siebert U, Alagoz O, Bayoumi AM, Jahn B, Owens DK, Cohen DJ, et al. State-transition modeling: a report of the ISPOR-SMDM Modeling Good Research Practices Task Force--3. Value Health. 2012 Sep;15(6):812-20.
72. TreeAge Pro 2013 [Internet]. Williamstown (MA): TreeAge Software, Inc. 2014 [cited 2014 Apr 22]. Available from: http://www.treeage.com/news/treeage-pro-2013-r2-0-released/
73. Briggs A, Claxton K, Sculpher M. Decision modelling for health economic evaluation. Oxford, United Kingdom: Oxford University Press; 2006. (Handbooks in health economic evaluation).
74. Caldwell DM, Ades AE, Higgins JP. Simultaneous comparison of multiple treatments: combining direct and indirect evidence. BMJ. 2005 Oct 15;331(7521):897-900.
75. Ridruejo E. Predictors of response to chronic hepatitis C treatment. Future Virology. 2012;7(11):1089-101.
76. Altekruse SF, McGlynn KA, Reichman ME. Hepatocellular carcinoma incidence, mortality, and survival trends in the United States from 1975 to 2005. J Clin Oncol [Internet]. 2009 Mar 20 [cited 2014 Jan 27];27(9):1485-91. Available from: http://www.ncbi.nlm.nih.gov/pmc/articles/PMC2668555
77. D'Amico G, Garcia-Tsao G, Pagliaro L. Natural history and prognostic indicators of survival in cirrhosis: a systematic review of 118 studies. J Hepatol. 2006 Jan;44(1):217-31.
78. Life tables, Canada, provinces and territories: 2009 to 2011 [Internet]. Ottawa: Statistics Canada; 2014 Apr 25. [cited 2014 May 15]. Available from: http://www.statcan.gc.ca/pub/84-537-x/84-537-x2013005-eng.htm
79. Charlton M, Seaberg E, Wiesner R, Everhart J, Zetterman R, Lake J, et al. Predictors of patient and graft survival following liver transplantation for hepatitis C. Hepatology. 1998 Sep;28(3):823-30.
80. Krajden M, Kuo M, Zagorski B, Alvarez M, Yu A, Krahn M. Health care costs associated with hepatitis C: a longitudinal cohort study. Can J Gastroenterol [Internet]. 2010 Dec [cited 2014 Jan 17];24(12):717-26. Available from: http://www.ncbi.nlm.nih.gov/pmc/articles/PMC3004444/pdf/cjg24717.pdf
81. Taylor MC, Greig PD, Detsky AS, McLeod RS, Abdoh A, Krahn MD. Factors associated with the high cost of liver transplantation in adults. Can J Surg [Internet]. 2002 Dec [cited 2014 May 15];45(6):425-34. Available from: http://www.ncbi.nlm.nih.gov/pmc/articles/PMC3684657

Direct-Acting Antiviral Agents for Chronic Hepatitis C Genotype 1 135
82. Hartwell D, Jones J, Baxter L, Shepherd J. Peginterferon alfa and ribavirin for chronic hepatitis C in patients eligible for shortened treatment, re-treatment or in HCV/HIV co-infection: a systematic review and economic evaluation. Health Technol Assess [Internet]. 2011 Apr [cited 2014 Feb 3];15(17):i-210. Available from: http://www.journalslibrary.nihr.ac.uk/__data/assets/pdf_file/0017/65312/FullReport-hta15170.pdf
83. Gao X, Stephens JM, Carter JA, Haider S, Rustgi VK. Impact of adverse events on costs and quality of life in protease inhibitor-based combination therapy for hepatitis C. Expert Rev Pharmacoecon Outcomes Res. 2012 Jun;12(3):335-43.
84. Canadian Agency for Drugs and Technologies in Health. Recombinant activated factor VII in treatment of hemorrhage unrelated to hemophilia: a systematic review and economic evaluation [Internet]. Ottawa: The Agency; 2009 Apr. (Technology report no 118). [cited 2014 May 9]. Available from: http://www.cadth.ca/media/pdf/H0457A_Recombinant_Activated_Factor_VII_Hemorrhage_Hemophilia_tr_e.pdf
85. Amin M, Fergusson D, Wilson K, Tinmouth A, Aziz A, Coyle D, et al. The societal unit cost of allogenic red blood cells and red blood cell transfusion in Canada. Transfusion. 2004 Oct;44(10):1479-86.
86. Hsu PC, Federico CA, Krajden M, Yoshida EM, Bremner KE, Anderson FH, et al. Health utilities and psychometric quality of life in patients with early- and late-stage hepatitis C virus infection. J Gastroenterol Hepatol. 2012;27(1):149-57.
87. McLernon DJ, Dillon J, Donnan PT. Health-state utilities in liver disease: a systematic review. Med Decis Making. 2008 Jul;28(4):582-92.
88. Chong CA, Gulamhussein A, Heathcote EJ, Lilly L, Sherman M, Naglie G, et al. Health-state utilities and quality of life in hepatitis C patients. Am J Gastroenterol. 2003 Mar;98(3):630-8.
89. Sullivan PW, Ghushchyan V. Preference-based EQ-5D index scores for chronic conditions in the United States. Med Decis Making [Internet]. 2006 Jul [cited 2014 May 15];26(4):410-20. Available from: http://www.ncbi.nlm.nih.gov/pmc/articles/PMC2634296/pdf/nihms-81406.pdf
90. Del Rio RA, Post AB, Singer ME. Cost-effectiveness of hematologic growth factors for anemia occurring during hepatitis C combination therapy. Hepatology. 2006 Dec;44(6):1598-606.
91. Maddigan SL, Feeny DH, Johnson JA. Health-related quality of life deficits associated with diabetes and comorbidities in a Canadian National Population Health Survey. Qual Life Res. 2005 Jun;14(5):1311-20.
92. Krahn M, Wong JB, Heathcote J, Scully L, Seeff L. Estimating the prognosis of hepatitis C patients infected by transfusion in Canada between 1986 and 1990. Med Decis Making. 2004 Jan;24(1):20-9.
93. Salomon JA, Weinstein MC, Hammitt JK, Goldie SJ. Cost-effectiveness of treatment for chronic hepatitis C infection in an evolving patient population. JAMA. 2003 Jul 9;290(2):228-37.

Direct-Acting Antiviral Agents for Chronic Hepatitis C Genotype 1 136
94. Wong JB, Bennett WG, Koff RS, Pauker SG. Pretreatment evaluation of chronic hepatitis C: risks, benefits, and costs. JAMA. 1998 Dec 23;280(24):2088-93.
95. Bruno S, Vierling JM, Esteban R, Nyberg LM, Tanno H, Goodman Z, et al. Efficacy and safety of boceprevir plus peginterferon-ribavirin in patients with HCV G1 infection and advanced fibrosis/cirrhosis. J Hepatol. 2013 Mar;58(3):479-87.
96. Clinicaltrials.gov [Internet]. Bethesda (MD): U.S. National Institutes of Health; 2000 Feb 29 -. Identifier NCT00959699, A phase 2b, safety and efficacy study of boceprevir in patients coinfected with HIV and hepatitis C (P05411 AM4); 2013 Jul 26 [cited 2014 Feb 14]. Available from: http://clinicaltrials.gov/show/NCT00959699
97. Clinicaltrials.gov [Internet]. Bethesda (MD): U.S. National Institutes of Health; 2000 Feb 29 -. Identifier NCT00708500, Boceprevir in subjects with chronic hepatitis C genotype 1 who failed prior treatment with peginterferon/ribavirin (Study P05101AM3); 2013 Aug 30 [cited 2014 Feb 14]. Available from: http://clinicaltrials.gov/show/NCT00708500
98. Clinicaltrials.gov [Internet]. Bethesda (MD): U.S. National Institutes of Health; 2000 Feb 29 -. Identifier NCT00423670, Safety and efficacy of SCH 503034 in previously untreated subjects with chronic hepatitis C infected with genotype 1 (Study P03523); 2013 Mar 15 [cited 2014 Feb 14]. Available from: http://clinicaltrials.gov/show/NCT00423670
99. Clinicaltrials.gov [Internet]. Bethesda (MD): U.S. National Institutes of Health; 2000 Feb 29 -. Identifier NCT00845065, Boceprevir in combination with peginterferon alfa-2a and ribavirin in participants with chronic hepatitis C genotype 1 who failed prior treatment with peginterferon/ribavirin (Study P05685AM2); 2013 Oct 22 [cited 2014 Feb 14]. Available from: http://clinicaltrials.gov/show/NCT00845065
100. Clinicaltrials.gov [Internet]. Bethesda (MD): U.S. National Institutes of Health; 2000 Feb 29 -. Identifier NCT00910624, Boceprevir treatment in participants with chronic hepatitis C genotype 1 deemed nonresponders to peginterferon/ribavirin (P05514) (PROVIDE); 2013 Sep 18 [cited 2014 Feb 14]. Available from: http://clinicaltrials.gov/show/NCT00910624
101. Clinicaltrials.gov [Internet]. Bethesda (MD): U.S. National Institutes of Health; 2000 Feb 29 -. Identifier NCT00528528, An open-label study of telaprevir administered every 12 or 8 hours in combination with one of two pegylated interferons and ribavirin in treatment-naive genotype 1 chronic hepatitis C participants; 2013 Jun 7 [cited 2014 Feb 14]. Available from: http://clinicaltrials.gov/show/NCT00528528
102. Clinicaltrials.gov [Internet]. Bethesda (MD): U.S. National Institutes of Health; 2000 Feb 29 -. Identifier NCT00372385, Phase 2 study of VX-950, Pegasys® with and without Copegus® in hepatitis C; 2011 Jun 22 [cited 2014 Feb 14]. Available from: http://clinicaltrials.gov/show/NCT00372385
103. Clinicaltrials.gov [Internet]. Bethesda (MD): U.S. National Institutes of Health; 2000 Feb 29 -. Identifier NCT00336479, Phase 2 study of VX-950, Pegasys®, and Copegus® in hepatitis C; 2011 Jun 22 [cited 2014 Feb 14]. Available from: http://clinicaltrials.gov/show/NCT00336479
Direct-Acting Antiviral Agents for Chronic Hepatitis C Genotype 1 137
104. Clinicaltrials.gov [Internet]. Bethesda (MD): U.S. National Institutes of Health; 2000 Feb 29 -. Identifier NCT00420784, A study of telaprevir (VX-950), Pegasys and Copegus in hepatitis C; 2011 Jun 22 [cited 2014 Feb 14]. Available from: http://clinicaltrials.gov/show/NCT00420784
105. Clinicaltrials.gov [Internet]. Bethesda (MD): U.S. National Institutes of Health; 2000 Feb 29 -. Identifier NCT00627926, A phase 3 study of telaprevir in combination with Pegasys® and Copegus® in treatment-naive subjects with genotype 1 HCV; 2011 Jun 22 [cited 2014 Feb 14]. Available from: http://clinicaltrials.gov/show/NCT00627926
106. Clinicaltrials.gov [Internet]. Bethesda (MD): U.S. National Institutes of Health; 2000 Feb 29 -. Identifier NCT00535847, A rollover study for subjects participating in the control arm of Study VX06-950-106, VX05-950-104 and VX05-950-104EU whose plasma HCV RNA levels did not respond to therapy; 2011 Jun 22 [cited 2014 Feb 14]. Available from: http://clinicaltrials.gov/show/NCT00535847
107. Clinicaltrials.gov [Internet]. Bethesda (MD): U.S. National Institutes of Health; 2000 Feb 29 -. Identifier NCT00758043, A study evaluating 24-week and 48-week telaprevir-based regimen in treatment naïve subjects with genotype 1 chronic hepatitis C who achieve an extended rapid viral response; 2013 Sep 30 [cited 2014 Feb 14]. Available from: http://clinicaltrials.gov/show/NCT00758043
108. Clinicaltrials.gov [Internet]. Bethesda (MD): U.S. National Institutes of Health; 2000 Feb 29 -. Identifier NCT00983853, Safety and efficacy of telaprevir in combination with peginterferon alfa-2a and ribavirin in subjects co-infected with hepatitis C virus (HCV) and HIV; 2013 Aug 2 [cited 2014 Feb 14]. Available from: http://clinicaltrials.gov/show/NCT00983853
109. Clinicaltrials.gov [Internet]. Bethesda (MD): U.S. National Institutes of Health; 2000 Feb 29 -. Identifier NCT00703118, A safety and effectiveness study of telaprevir in chronic, genotype 1, hepatitis C patients that failed previous standard treatment; 2013 Dec 5 [cited 2014 Feb 14]. Available from: http://clinicaltrials.gov/show/NCT00703118
110. Clinicaltrials.gov [Internet]. Bethesda (MD): U.S. National Institutes of Health; 2000 Feb 29 -. Identifier NCT00980330, A safety and effectiveness study of TMC435 in chronic, genotype 1, hepatitis C patients who failed to previous standard treatment (ASPIRE); 2013 Dec 18 [cited 2014 Feb 14]. Available from: http://clinicaltrials.gov/show/NCT00980330
111. Clinicaltrials.gov [Internet]. Bethesda (MD): U.S. National Institutes of Health; 2000 Feb 29 -. Identifier NCT01281839, An efficacy, safety and tolerability study of TMC435 in genotype 1 hepatitis C-infected patients who relapsed after previous therapy (PROMISE); 2013 Feb 26 [cited 2014 Mar 18]. Available from: http://clinicaltrials.gov/show/NCT01281839
112. Vera-Llonch M, Martin M, Aggarwal J, Donepudi M, Bayliss M, Goss T, et al. Health-related quality of life in genotype 1 treatment-naïve chronic hepatitis C patients receiving telaprevir combination treatment in the ADVANCE study. Aliment Pharmacol Ther. 2013 Jul;38(2):124-33.
113. Younossi ZM, Stepanova M, Henry L, Gane E, Jacobson IM, Lawitz E, et al. Minimal impact of sofosbuvir and ribavirin on health related quality of life in chronic hepatitis C (CH-C). J Hepatol. 2014;60(4):741-7.

Direct-Acting Antiviral Agents for Chronic Hepatitis C Genotype 1 138
114. Younossi ZM, Stepanova M, Henry L, Gane E, Jacobson IM, Lawitz E, et al. Effects of sofosbuvir-based treatment, with and without interferon, on outcome and productivity of patients with chronic hepatitis C. Clin Gastroenterol Hepatol. 2013 Dec 5. Epub ahead of print.
115. Janssen Inc. Antiviral Drugs Advisory Committee Meeting. Briefing document: simeprevir (TMC435). Treatment of patients with chronic hepatitis C [Internet]. Silver Spring (MD): U.S. Food and Drug Administration; 2013 Oct 24. [cited 2014 Mar 11]. Available from: http://www.fda.gov/downloads/advisorycommittees/committeesmeetingmaterials/drugs/antiviraldrugsadvisorycommittee/ucm371624.pdf
116. Center for Drug Evaluation and Research, U.S. Food and Drug Administration. Medical review(s) [Internet]. In: Olysio (simeprevir) 150 mg capsules. Company: Janssen Research & Development, LLC. Application no.: 205123. Approval date: 11/22/2013. Rockville (MD): The Center; 2013 [cited 2014 Jan 17]. (FDA drug approval package). Available from: http://www.accessdata.fda.gov/drugsatfda_docs/nda/2013/205123Orig1s000TOC.cfm.
117. Center for Drug Evaluation and Research, U.S. Food and Drug Administration. Statistical review(s) [Internet]. In: Olysio (simeprevir) 150 mg capsules. Company: Janssen Research & Development, LLC. Application no.: 205123. Approval date: 11/22/2013. Rockville (MD): The Center; 2013 [cited 2014 Jan 17]. (FDA drug approval package). Available from: http://www.accessdata.fda.gov/drugsatfda_docs/nda/2013/205123Orig1s000TOC.cfm.
118. Center for Drug Evaluation and Research, U.S. Food and Drug Administration. Medical review(s) [Internet]. In: Sovaldi (sofosbuvir) tablets. Company: Gilead Sciences, Inc. Application no.: 204671. Approval date: 12/06/2013. Rockville (MD): The Center; 2013 [cited 2014 Feb 18]. (FDA drug approval package). Available from: http://www.accessdata.fda.gov/drugsatfda_docs/nda/2013/204671Orig1s000TOC.cfm.
119. Center for Drug Evaluation and Research, U.S. Food and Drug Administration. Statistical review(s) [Internet]. In: Sovaldi (sofosbuvir) tablets. Company: Gilead Sciences, Inc. Application no.: 204671. Approval date: 12/06/2013. Rockville (MD): The Center; 2013 [cited 2014 Feb 18]. (FDA drug approval package). Available from: http://www.accessdata.fda.gov/drugsatfda_docs/nda/2013/204671Orig1s000TOC.cfm.
120. Center for Drug Evaluation and Research, U.S. Food and Drug Administration. Medical review(s) [Internet]. In: Victrelis (boceprevir) capsules. Company: Schering Corporation. Application no.: 202258. Approval date: 05/13/2011. Rockville (MD): The Center; 2011 [cited 2014 Jan 30]. (FDA drug approval package). Available from: http://www.accessdata.fda.gov/drugsatfda_docs/nda/2011/202258Orig1s000TOC.cfm.
121. Center for Drug Evaluation and Research, U.S. Food and Drug Administration. Statistical review(s) [Internet]. In: Victrelis (boceprevir) capsules. Company: Schering Corporation. Application no.: 202258. Approval date: 05/13/2011. Rockville (MD): The Center; 2011 [cited 2014 Jan 30]. (FDA drug approval package). Available from: http://www.accessdata.fda.gov/drugsatfda_docs/nda/2011/202258Orig1s000TOC.cfm.
122. Center for Drug Evaluation and Research, U.S. Food and Drug Administration. Medical review(s) [Internet]. In: Incivek (telaprevir) film-coated tablets. Company: Vertex Pharmaceuticals, Incorporated. Application no.: 201917. Approval date: 05/23/2011. Rockville (MD): The Center;

Direct-Acting Antiviral Agents for Chronic Hepatitis C Genotype 1 139
2011 [cited 2014 Feb 3]. (FDA drug approval package). Available from: http://www.accessdata.fda.gov/drugsatfda_docs/nda/2011/201917Orig1s000TOC.cfm.
123. Center for Drug Evaluation and Research, U.S. Food and Drug Administration. Statistical review(s) [Internet]. In: Incivek (telaprevir) film-coated tablets. Company: Vertex Pharmaceuticals, Incorporated. Application no.: 201917. Approval date: 05/23/2011. Rockville (MD): The Center; 2011 [cited 2014 Feb 3]. (FDA drug approval package). Available from: http://www.accessdata.fda.gov/drugsatfda_docs/nda/2011/201917Orig1s000TOC.cfm.
124. European public assessment report (EPAR): Victrelis (boceprevir) [Internet]. London: European Medicines Agency; 2011. [cited 2014 Jan 30]. Available from: http://www.ema.europa.eu/docs/en_GB/document_library/EPAR_-_Public_assessment_report/human/002332/WC500109789.pdf
125. European public assessment report (EPAR): Incivo (telaprevir) [Internet]. London: European Medicines Agency; 2011. [cited 2014 Jan 30]. Available from: http://www.ema.europa.eu/docs/en_GB/document_library/EPAR_-_Public_assessment_report/human/002313/WC500115532.pdf
126. European public assessment report (EPAR): Sovaldi. International non-proprietary name: sofosbuvir [Internet]. London: European Medicines Agency; 2013 Nov 21. [cited 2014 Mar 11]. Available from: http://www.ema.europa.eu/docs/en_GB/document_library/EPAR_-_Public_assessment_report/human/002798/WC500160600.pdf
127. Jacobson IM, Dore GJ, Foster GR, Fried MW, Radu M, Rafalsky VV, et al. Simeprevir with pegylated interferon alfa 2a plus ribavirin in treatment-naive patients with chronic hepatitis C virus genotype 1 infection (QUEST-1): a phase 3, randomised, double-blind, placebo-controlled trial. Lancet. 2014 Jun 4. Epub ahead of print.
128. Manns M, Marcellin P, Poordad F, de Araujo ES, Buti M, Horsmans Y, et al. Simeprevir with pegylated interferon alfa 2a or 2b plus ribavirin in treatment-naive patients with chronic hepatitis C virus genotype 1 infection (QUEST-2): a randomised, double-blind, placebo-controlled phase 3 trial. Lancet. 2014 Jun 4. Epub ahead of print.
129. Higgins JPT, Green S, editors. Cochrane handbook for systematic reviews of interventions [Internet]. Version 5.1.0. [Oxford, United Kingdom]: The Cochrane Collaboration; 2011 Mar. [cited 2014 Apr 28]. Available from: http://www.cochrane-handbook.org
130. Medivir [Internet]. Stockholm, Sweden: Medivir AB; 2014. Press release, New phase III data from once-daily simeprevir presented at the Conference of the Asian Pacific Association for the Study of the Liver (APASL); 2014 Mar 17 [cited 2014 Apr 23]. Available from: http://www.medivir.se/v5/en/uptodate/pressrelease.cfm?releaseid=38CAB19B5909B757&year=2014
131. Clinicaltrials.gov [Internet]. Bethesda (MD): U.S. National Institutes of Health; 2000 Feb 29 -. Identifier NCT01485991, TMC435HPC3001 - an efficacy, safety and tolerability study for TMC435 vs telaprevir in combination with PegINFa-2a and ribavirin in chronic hepatitis C patients who were null or partial responders to prior PegINFa-2a and ribavirin therapy (ATTAIN); 2014 Mar 17 [cited 2014 Apr 23]. Available from: http://clinicaltrials.gov/show/NCT01485991

Direct-Acting Antiviral Agents for Chronic Hepatitis C Genotype 1 140
132. Canadian Agency for Drugs and Technologies in Health. Direct acting antivirals for chronic hepatitis C genotype 1 in select populations: emerging evidence of clinical effectiveness and safety [Internet]. Ottawa: The Agency; 2014 Apr 28. (Rapid response report: summary of abstracts). [cited 2014 May 5]. Available from: http://www.cadth.ca/media/pdf/htis/may-2014/RB0673%20DAAs%20for%20select%20populations%20Final.pdf
133. Canadian Agency for Drugs and Technologies in Health. Re-treatment with direct acting antivirals for chronic hepatitis C genotype 1: emerging evidence of clinical effectiveness and safety [Internet]. Ottawa: The Agency; 2014 Apr 24. (Rapid response report: summary of abstracts). [cited 2014 May 6]. Available from: http://www.cadth.ca/media/pdf/htis/may-2014/RB0672%20DAA%20treatment%20failure%20Final.pdf
134. Poordad F, Lawitz E, Reddy KR, Afdhal NH, Hezode C, Zeuzem S, et al. Effects of ribavirin dose reduction vs erythropoietin for boceprevir-related anemia in patients with chronic hepatitis C virus genotype 1 infection--a randomized trial. Gastroenterology. 2013 Nov;145(5):1035-44.
135. Tice JA, Ollendorf DA, Pearson SD. The comparative clinical effectiveness and value of simeprevir and sofosbuvir in the treatment of chronic hepatitis C infection: a technology assessment. Final report [Internet]. Boston: Institute for Clinical and Economic Review; 2014 Apr 15. [cited 2014 May 7]. Available from: http://ctaf.org/sites/default/files/assessments/CTAF_Hep_C_Apr14_final.pdf . Jointly published by California Technology Assessment Forum (CTAF).
136. EASL recommendations on treatment of hepatitis C: 2014 [Internet]. Geneva, Switzerland: European Association for the Study of the Liver; 2014 Apr. [cited 2014 Apr 29]. Available from: http://files.easl.eu/easl-recommendations-on-treatment-of-hepatitis-C/
137. American Association for the Study of Liver Diseases, Infectious Diseases Society of America, International Antiviral Society-USA. Recommendations for testing, managing, and treating hepatitis C [Internet]. San Francisco (CA): HCVguidelines.org. 2014 Mar 21 [cited 2014 Apr 29]. Available from: http://hcvguidelines.org/full-report-view
138. Press release, Final data from the phase 2 COSMOS study of Janssen's once-daily simeprevir in combination with sofosbuvir presented at The International Liver Congress™ 2014 of the European Association for the Study of the Liver (EASL) [Internet]. London: Janssen Pharmaceutical Companies of Johnson & Johnson; 2014 Apr 12. [cited 2014 Apr 28]. Available from: http://www.janssen-emea.com/sites/default/files/PressReleases/FINAL%20EMEA%20EASL%20Press%20release.pdf
139. Awad T, Thorlund K, Hauser G, Stimac D, Mabrouk M, Gluud C. Peginterferon alpha-2a is associated with higher sustained virological response than peginterferon alfa-2b in chronic hepatitis C: systematic review of randomized trials. Hepatology. 2010 Apr;51(4):1176-84.
140. Druyts E, Mills EJ, Nachega J, O'Regan C, Cooper CL. Differences in clinical outcomes among hepatitis C genotype 1-infected patients treated with peginterferon alpha-2a or peginterferon alpha-2b plus ribavirin: a meta-analysis. Clin Exp Gastroenterol [Internet]. 2012 [cited 2014 Jan 16];5:11-21. Available from: http://www.ncbi.nlm.nih.gov/pmc/articles/PMC3304330/pdf/ceg-5-011.pdf

Direct-Acting Antiviral Agents for Chronic Hepatitis C Genotype 1 141
141. McHutchison JG, Lawitz EJ, Shiffman ML, Muir AJ, Galler GW, McCone J, et al. Peginterferon alfa-2b or alfa-2a with ribavirin for treatment of hepatitis C infection. N Engl J Med [Internet]. 2009 Aug 6 [cited 2014 May 6];361(6):580-93. Available from: http://www.nejm.org/doi/pdf/10.1056/NEJMoa0808010
142. Ascione A, De Luca M, Tartaglione MT, Lampasi F, Di Costanzo GG, Lanza AG, et al. Peginterferon alfa-2a plus ribavirin is more effective than peginterferon alfa-2b plus ribavirin for treating chronic hepatitis C virus infection. Gastroenterology. 2010 Jan;138(1):116-22.
143. Rumi MG, Aghemo A, Prati GM, D'Ambrosio R, Donato MF, Soffredini R, et al. Randomized study of peginterferon-alpha2a plus ribavirin vs peginterferon-alpha2b plus ribavirin in chronic hepatitis C. Gastroenterology. 2010 Jan;138(1):108-15.
144. Mach TH, Ciesla A, Warunek W, Janas-Skulina U, Cibor D, Owczarek D, et al. Efficacy of pegylated interferon alfa-2a or alfa-2b in combination with ribavirin in the treatment of chronic hepatitis caused by hepatitis C virus genotype 1b. Pol Arch Med Wewn. 2011 Dec;121(12):434-9.
145. Yenice N, Mehtap O, Gumrah M, Arican N. The efficacy of pegylated interferon alpha 2a or 2b plus ribavirin in chronic hepatitis C patients. Turk J Gastroenterol. 2006 Jun;17(2):94-8.
146. Scotto G, Fazio V, Fornabaio C, Tartaglia A, Di Tullio R, Saracino A, et al. Peg-interferon alpha-2a versus Peg-interferon alpha-2b in nonresponders with HCV active chronic hepatitis: a pilot study. J Interferon Cytokine Res. 2008 Oct;28(10):623-9.

Direct-Acting Antiviral Agents for Chronic Hepatitis C Genotype 1 142
APPENDIX 1: PATIENT INPUT SUMMARY
This section was summarized by CADTH staff based on the input provided by patient groups. It has not been systematically reviewed. It has been reviewed by the submitting patient groups. 1. Brief Description of Patient Group(s) Supplying Input Five patient groups representing people with the hepatitis C virus (HCV) provided input. The Canadian Liver Foundation (CLF) is a national organization committed to reducing the incidence and impact of liver disease for Canadians living with or at risk of liver disease, through research, public and professional education programs, patient support programs, and other fundraising and outreach efforts. The CLF has received unrestricted educational grants or has worked on joint initiatives with AbbVie, Astellas, Boehringer Ingelheim, Gilead, Janssen, Merck, Novartis, and Hoffman-La Roche. The Chairman of CLF has received honoraria from AbbVie, Boehringer Ingelheim, Merck, Janssen, Hoffman-La Roche, and Bristol Myers Squibb. Canadian Treatment Action Council (CTAC) is a national non-governmental organization run by and for people living with HIV/AIDS, including those who are co-infected. CTAC addresses policy and program issues related to access to treatment, care and support for people living with HIV or HCV. Full membership is limited to persons living with HIV/AIDs or organizations with a substantial HIV/AIDS mandate. CTAC has received unrestricted organizational and educational grants from Abbott/AbbVie, Boehringer Ingelheim, Gilead, Janssen, MAC AIDS Foundation, and ViiV. Hepatitis C Education and Prevention Society (HepCBC) is a non-profit organization run by and for people affected by HCV in Western Canada. HepCBC focuses on providing peer support groups, anti-stigma activities, prevention education, and encouraging testing among at-risk groups. HepCBC has received funding from Merck, Hoffman-La Roche, Vertex, Gilead, Janssen, Bristol Myers Squibb, Boehringer Ingelheim, and AbbVie. The author of HepCBC’s patient input submission received funding to attend conferences. The Pacific Hepatitis C Network’s mission is to strengthen the capacity of individuals and organizations throughout British Columbia to prevent HCV infections and improve the health and treatment outcomes of people with HCV. Its members include individuals at risk, exposed to, or concerned about HCV. The Pacific Hepatitis C Network has received a project grant from Janssen. Positive Living BC is a non-profit organization run by and for persons living with HIV/AIDS in Western Canada and provides a comprehensive suite of programs and services. Services include health education, health promotion, advocacy, peer navigation, peer support groups, and workshops. Positive Living BC has received funding from unions, health authorities, AbbVie, Janssen, Gilead, Pfizer, Bristol Myers Squibb, Merck, and ViiV. 2. Condition and Current Therapy-Related Information This information was collected through online surveys, interviews and discussions with Canadian patients, caregivers, and health care professionals, expert opinion, and printed sources. Also, content from previous patient input submissions to CADTH was used.

Direct-Acting Antiviral Agents for Chronic Hepatitis C Genotype 1 143
HCV is a serious and potentially life-threatening liver disease that is contracted through blood-to-blood contact with an infected person. The virus attacks the liver, leading to fibrosis, cirrhosis, liver cancer, liver failure and even death. Patients may live with HCV for years with few symptoms, but must cope with the stigma associated with HCV and are often reluctant to disclose their HCV status for fear of rejection or ostracism. They may face discrimination even from health professionals. The social stigma, fear of spreading the infection, and the uncertainty in their future health exact a high emotional toll on patients that may lead to depression, anxiety, and social isolation. Debilitating physical symptoms may develop, such as chronic fatigue (highlighted in the submissions), mental confusion, memory loss and mood swings that can result in job loss and relying on disability benefits or social assistance. Other debilitating symptoms include insomnia, muscle or joint pain, nausea, headaches, abdominal discomfort, itchy skin, hair loss and food sensitivities. Patients with advanced disease develop severe symptoms and complications such as retaining fluid in their abdomens and legs, confusion due to build-up of toxins, and life-threatening bleeding from esophageal varices. For some, the physical and financial impact of HCV may increase their vulnerability to living in poor/unstable housing with few social supports. The symptoms of hepatitis C also affect personal relationships, resulting in increasing isolation and depression. Patients are often too tired to complete basic household tasks, and cannot participate in family and community activities. Spouses and loved ones who care for patients with HCV are faced with a substantial burden, as the symptoms of HCV and side effects of treatment can leave the patient completely dependent and unable to contribute financially, physically, psychologically or emotionally to the household, the relationship, or the care of children. Caregivers must endure their loved one’s mood swings, dietary problems, lack of energy and concentration while shouldering the responsibility for managing doctor’s appointments, drug regimens and household responsibilities. As the patient’s symptoms and behaviour become more difficult to manage, families and marriages can break apart due to stress, financial difficulties and social isolation. Current therapy is 24 to 48 weeks of peginterferon plus ribavirin, with or without boceprevir or telaprevir (genotype 1 HCV). Dual therapy involves weekly injections of peginterferon plus 6-8 ribavirin pills per day. Adverse effects can be severe and debilitating, affecting patients’ work, families and mental health. Side effects include anemia, susceptibility to infection, sleep loss, depression, mood swings, flu-like illness, rashes, taste disturbances, hair loss, headaches, weakness, nausea, severe fatigue, and weight loss. The addition of boceprevir and telaprevir has increased the cure rates to ~75% for some patient groups; however, rates are lower for patients who failed previous therapy. Their addition increases the risk of adverse events, particularly rash and anemia, and increases the pill burden by 6 to 12 pills per day. There are specific dietary requirements with telaprevir and drug interactions to consider with both agents. Among Canadians living with hepatitis C, uptake of currently available treatment is limited. Many patients cannot tolerate treatment and are either never treated or stop therapy early. Those who fail therapy have few treatment options. Access to treatment is a major roadblock: many patients who do not meet eligibility criteria are denied treatment through provincial drug plans, or must wait for treatment until they show serious liver damage. If a patient is denied treatment for hepatitis C because he or she cannot afford it, the increased health problems from the disease are not just a burden on the patient and his or her family (physical, family, or social burden), but also an economic burden on the

Direct-Acting Antiviral Agents for Chronic Hepatitis C Genotype 1 144
health care system itself, as patients require additional treatments — e.g., liver transplants or other ongoing expensive treatments. 3. Related Information About the Drugs Being Reviewed Expectations for an ideal new treatment regimen include higher cure rate, better side effect profile, reduced treatment duration, all-oral regimen with lowered pill burden, interferon-free, fewer drug interactions, ability to re-treat prior null responders and relapsers, accessibility and affordability. Higher cure rate and better side effect profile were often cited as the most important aspects, and all submissions highlighted the need for interferon-sparing and ribavirin-sparing regimens that would avoid the debilitating side effects associated with these agents. Simeprevir, sofosbuvir, and faldaprevir were generally viewed favourably as there is potential that these agents may be interferon-sparing in the future. With the interferon-containing regimens that are currently in use, simeprevir, sofosbuvir, and faldaprevir are believed to be preferable to boceprevir or telaprevir due to increased efficacy, lack of significant additional side effects, and shorter treatment duration. Shorter treatment duration means less time off work and less time being dependent on others. A more tolerable side effect profile means more patients will be willing to undergo treatment and to be compliant with therapy. Patients believe there is a role for all three new agents, as sofosbuvir is potentially the most effective treatment with the shortest duration for treatment-naive patients, simeprevir is largely effective across treatment-experienced populations, and faldeprevir has been studied in the HIV co-infected population and showed high sustained virologic response rates. 4. Additional Information About 4% of people living with hepatitis C in Canada are also co-infected with HIV. HIV co-infection appears to speed up hepatitis C disease progression and patient groups expressed the urgent need for more treatment options for this group. There are concerns that access delays may occur for people living with HIV/HCV co-infection due to the lack of completed phase III clinical trials in this population. Limiting treatment to patients with more advanced liver disease delays access to therapy, decreases the likelihood of a successful response to treatment, and increases the risk of liver cancer or the need for liver transplant. Treatment should be initiated as early as possible and there should be no restrictions on access except those dictated by a patient’s medical condition. Current pricing decisions should take into account the future availability of interferon-free and ribavirin-free regimens, and ensure that eventual best combinations will be accessible.

Direct-Acting Antiviral Agents for Chronic Hepatitis C Genotype 1 145
APPENDIX 2: LITERATURE SEARCH STRATEGY
Database Search
OVERVIEW
Interface: Ovid
Databases: Embase 1974 to present MEDLINE Daily and MEDLINE 1946 to present MEDLINE In-Process & Other Non-Indexed Citations EBM Reviews - Cochrane Central Register of Controlled Trials December 2013 Note: Subject headings have been customized for each database. Duplicates between databases were removed in Ovid.
Date of Search: January 9, 2014
Alerts: Weekly search updates until project completion
Study Types: No study design filters used
Limits: Date limit: None Language limit: English Conference abstracts: excluded
SYNTAX GUIDE
/ At the end of a phrase, searches the phrase as a subject heading
.sh At the end of a phrase, searches the phrase as a subject heading
exp Explode a subject heading
* Before a word, indicates that the marked subject heading is a primary topic; or, after a word, a truncation symbol (wildcard) to retrieve plurals or varying endings
adj Requires words are adjacent to each other (in any order)
.ti Title
.ab Abstract
.hw Heading Word; usually includes subject headings and controlled vocabulary
.nm Name of Substance Word
.ot Original title
.pt Publication type
.rn CAS registry number
pmez Ovid database code; MEDLINE In-Process & Other Non-Indexed Citations, MEDLINE Daily and Ovid MEDLINE 1946 to Present
oemezd Ovid database code; Embase 1974 to present, updated daily
cctr Ovid database code; Cochrane Central Register of Controlled Trials
# Searches
1 (incivek* or incivo or telaprevir* or telapravir* or telepravir* or teleprevir* or VX-950 or VX950 or LY-570310 or LY570310 or MP-424 or MP424 or VRT-111950 or VRT111950).ti,ab,ot,sh,hw,rn,nm.
2 (402957-28-2 or 569364-34-7).rn,nm.
3 (boceprevir* or bocepravir* or victrelis* or sch 503034 or sch503034 or ebp 520 or

Direct-Acting Antiviral Agents for Chronic Hepatitis C Genotype 1 146
# Searches
ebp520).ti,ab,ot,sh,hw,rn,nm.
4 394730-60-0.rn,nm.
5 (sofosbuvir* or GS 7977 or GS7977 or PSI 7977 or PSI7977 or PSI 7851 or PSI7851 or PSI 7976 or PSI7976 or Sovaldi or Virunon).ti,ab,ot,sh,hw,rn,nm.
6 1190307-88-0.rn,nm.
7 (simeprevir* or TMC435 or TMC 435 or TMC435350 or TMC 435350 or Galexos or Olysio or Sovriad).ti,ab,ot,sh,hw,rn,nm.
8 923604-59-5.rn,nm.
9 or/1-8
10 9 use pmez,cctr
11 (incivek* or incivo or telaprevir* or telapravir* or telepravir* or teleprevir* or VX-950 or VX950 or LY-570310 or LY570310 or MP-424 or MP424 or VRT-111950 or VRT111950).ti,ab.
12 *telaprevir/
13 (boceprevir* or bocepravir* or victrelis* or sch 503034 or sch503034 or ebp 520 or ebp520).ti,ab.
14 *boceprevir/
15 (sofosbuvir* or GS 7977 or GS7977 or PSI 7977 or PSI7977 or PSI 7851 or PSI7851 or PSI 7976 or PSI7976 or Sovaldi or Virunon).ti,ab.
16 *sofosbuvir/
17 (simeprevir* or TMC435 or TMC 435 or TMC435350 or TMC 435350 or Galexos or Olysio or Sovriad).ti,ab.
18 *simeprevir/
19 or/11-18
20 19 use oemezd
21 10 or 20
22 exp animals/
23 exp animal experimentation/ or exp animal experiment/
24 exp models animal/
25 nonhuman/
26 exp vertebrate/ or exp vertebrates/
27 or/22-26
28 exp humans/
29 exp human experimentation/ or exp human experiment/
30 or/28-29
31 27 not 30
32 21 not 31
33 limit 32 to English language [limit not valid in CCTR; records were retained]
34 remove duplicates from 33
35 34 not conference abstract.pt.
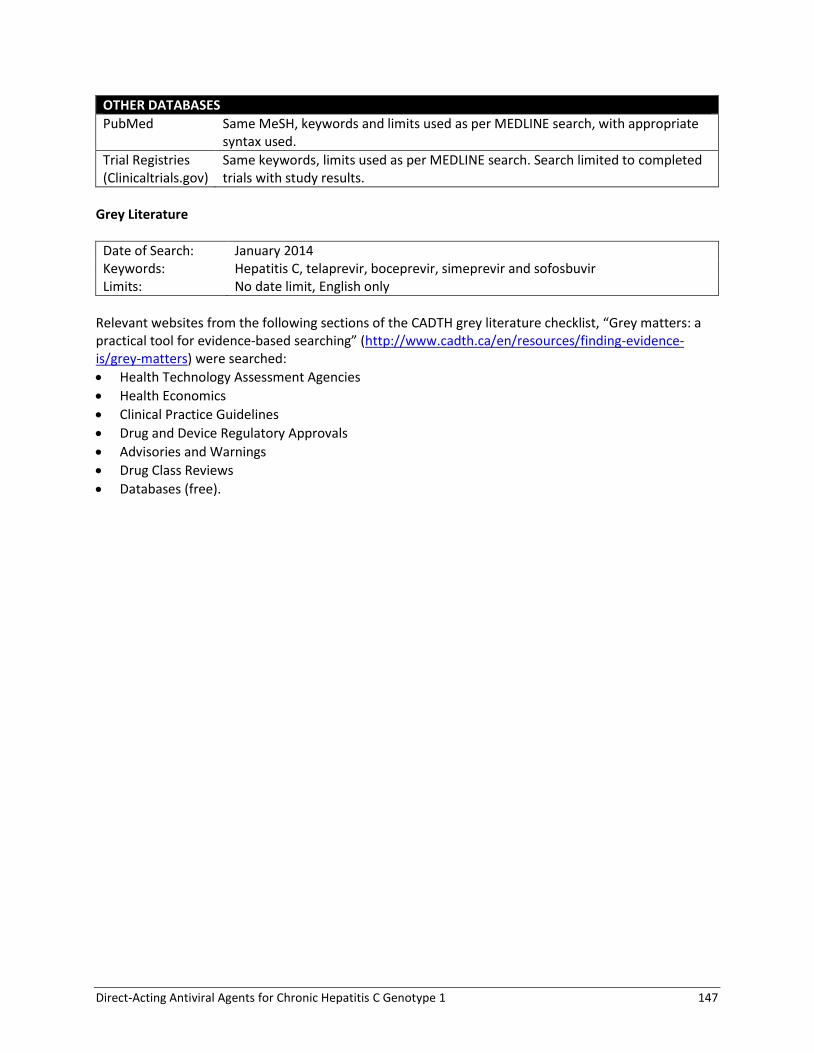
Direct-Acting Antiviral Agents for Chronic Hepatitis C Genotype 1 147
OTHER DATABASES
PubMed Same MeSH, keywords and limits used as per MEDLINE search, with appropriate syntax used.
Trial Registries (Clinicaltrials.gov)
Same keywords, limits used as per MEDLINE search. Search limited to completed trials with study results.
Grey Literature
Date of Search: January 2014 Keywords: Hepatitis C, telaprevir, boceprevir, simeprevir and sofosbuvir Limits: No date limit, English only
Relevant websites from the following sections of the CADTH grey literature checklist, “Grey matters: a practical tool for evidence-based searching” (http://www.cadth.ca/en/resources/finding-evidence-is/grey-matters) were searched:
Health Technology Assessment Agencies
Health Economics
Clinical Practice Guidelines
Drug and Device Regulatory Approvals
Advisories and Warnings
Drug Class Reviews
Databases (free).

Direct-Acting Antiviral Agents for Chronic Hepatitis C Genotype 1 148
APPENDIX 3: CRITERIA FOR INCLUSION IN SYSTEMATIC REVIEW BASED ON EMPLOYED DOSAGE REGIMENS
All studies must include a Health Canada–approved dosage regimen for the population enrolled (Table 81), which includes: DAA agent (daily dose, dosing interval, and duration of therapy must all meet Health Canada–
approved regimens; e.g., telaprevir 750 mg every eight hours or 1,125 mg every 12 hours for 12 weeks would both be eligible for inclusion)
Peginterferon 2a or 2b (weekly dose) Ribavirin (weight-based dosing, with a total daily dose of 600 mg to 1,400 mg).
RCTs and non-randomized studies in which the duration of PR therapy is consistent with the Health Canada–recommended duration for the population (or a subpopulation) enrolled will be eligible for inclusion.
RCTs that employ alternate durations of PR therapy may be included in the systematic review if they meet the following criteria: If Health Canada recommends response-guided therapy (RGT), then standard-duration therapy
(SDT) will be eligible for inclusion if the PR therapy duration is the same as RGT treatment options (e.g., if the RGT regimen is 24 or 48 weeks of PR treatment, then SDT for 24 weeks or 48 weeks would be eligible for inclusion).
If Health Canada recommends SDT, then studies employing response-guided PR therapy for up to 48 weeks would be eligible for inclusion.
Regimens with a lead-in period may be accepted if the total duration of the DAA and PR therapy fall within the ranges specified.
For patients with HIV co-infection or those who are treated following liver transplantation, dosing regimens other that those described previously may be eligible for inclusion given that potential drug interactions between antiretroviral and immunosuppressant agents may require dosage adjustments of HCV medications.

Direct-Acting Antiviral Agents for Chronic Hepatitis C Genotype 1 149
TABLE 81: DOSING INCLUSION CRITERIA
DAA dose Boceprevir Telaprevir Simeprevir Sofosbuvir
800 mg three times daily
750 mg q8h or 1125 mg q12h
150 mg daily 400 mg daily
DAA duration
Treatment-naive 24 wks starting after 4 wk PR lead-in
12 weeks 12 weeks 12 weeks
Relapser 32 wks starting after 4 wk PR lead-in
12 weeks 12 weeks NA
Partial response 32 wks starting after 4 wk PR lead-in
12 weeks 12 weeks NA
Null response 44 wks starting after 4 wk PR lead-in
12 weeks 12 weeks NA
PR duration (total treatment duration)
Treatment-naive
HC RGT 28 or 48 wks RGT 24 or 48 wks RGT 24 or 48 wks SDT 12 wks
Othera SDT 28 or 48 wks SDT 24 or 48 wks SDT 24 or 48 wks RGT up to 48 wks
Relapsed
HC RGT 36 or 48 wks RGT 24 or 48 wks RGT 24 or 48 wks NA
Othera SDT 36 or 48 wks SDT 24 or 48 wks SDT 24 or 48 wks
Prior partial
HC RGT 36 or 48 wks SDT 48 wks SDT 48 wks NA
Othera SDT 36 or 48 wks RGT up to 48 wks RGT up to 48 wks
Prior null
HC SDT 48 wks SDT 48 wks SDT 48 wks NA
Othera RGT up to 48 wks RGT up to 48 wks RGT up to 48 wks
DAA = direct-acting antiviral; HC = Health Canada; q8h = every 8 hours; q12h = every 12 hours; PR = peginterferon + ribavirin; RGT = response-guided therapy; SDT = standard (or fixed) duration therapy; wks = weeks. aRegimens with a lead-in period were accepted if the total duration of the DAA and PR therapy fell within the ranges specified.

Direct-Acting Antiviral Agents for Chronic Hepatitis C Genotype 1 150
APPENDIX 4: WINBUGS CODE
Fixed effects model model{ for(i in 1:NS){ delta[i,1]<-0 mu[i] ~ dnorm(0,.0001) # vague priors for 24 trial baselines for (k in 1:na[i]) { r[i,k] ~ dbin(p[i,k],n[i,k]) # binomial likelihood logit(p[i,k])<-mu[i] + delta[i,k] # model r0[i,k]<-r[i,k]+0.01*equals(r[i,k],0) -0.01*equals(r[i,k],n[i,k]) p0[i,k]<- max(p[i,k],.001) r.hat[i,k]<- p0[i,k]*n[i,k] #Deviance calculation for binomial data dev[i,k]<- 2*(r0[i,k]*log(r0[i,k]/r.hat[i,k]) + (n[i,k] - r0[i,k])*log((n[i,k] - r0[i,k])/(n[i,k] - r.hat[i,k]))) } for (k in 2:na[i]) { delta[i,k] <- d[t[i,k]] - d[t[i,1]] } sdev[i]<-sum(dev[i,1:na[i]]) } resdev<-sum(sdev[]) d[1]<-0 for (k in 2:NT){d[k] ~ dnorm(0,.0001) } # vague priors for basic parameters # Absolute risk, based on average of NP trials including it. for (i in 1:NS) { mu1[i] <- mu[i] * equals(t[i,1],1) } for (k in 1:NT) { logit(T[k])<- (sum(mu1[])/NP) +d[k] } # pairwise ORs, RD, NNT, RR for (c in 1:(NT-1)) { for (k in (c+1):NT) { or[c,k] <- exp(d[k] - d[c]) RD[c,k]<-T[k]-T[c] RR[c,k]<-T[k]/T[c] lor[c,k]<-d[k]-d[c] } } } # *** PROGRAM ENDS #Initial Values list(d=c(NA,0,0,0,0,0,0,0,0),mu=c(0,0,0,0,0,0,0,0,0,0,0,0)) list(d=c(NA,-1,-1,-1,-1,-1,-1,-1,-1),mu=c(-3,-3,-3,-3,-3,-3,-3,-3,-3,-3,-3,-3)) list(d=c(NA,-0.5,-0.5,-0.5,-0.5,-0.5,-0.5,-0.5,-0.5),mu=c(-3,-3,-3,-3,-3,-3,-3,-3,-3,-3,-3,-3))

Direct-Acting Antiviral Agents for Chronic Hepatitis C Genotype 1 151
Random effects model model{ for(i in 1:NS){ w[i,1] <-0 delta[i,1]<-0 mu[i] ~ dnorm(0,.001) # vague priors for baselines for (k in 1:na[i]) { r[i,k] ~ dbin(p[i,k],n[i,k]) # binomial likelihood logit(p[i,k])<-mu[i] + delta[i,k] # model r0[i,k]<-r[i,k]+0.01*equals(r[i,k],0) -0.01*equals(r[i,k],n[i,k]) p0[i,k]<- max(p[i,k],.001) r.hat[i,k]<- p0[i,k]*n[i,k] #Deviance calculation for binomial data dev[i,k]<- 2*(r0[i,k]*log(r0[i,k]/r.hat[i,k]) + (n[i,k] - r0[i,k])*log((n[i,k] - r0[i,k])/(n[i,k] - r.hat[i,k]))) } for (k in 2:na[i]) { delta[i,k] ~ dnorm(md[i,k],taud[i,k]) # trial-specific LOR distributions md[i,k] <- d[t[i,k]] - d[t[i,1]] + sw[i,k] # mean of LOR distributions taud[i,k] <- tau *2*(k-1)/k # precision of LOR distributions w[i,k] <- (delta[i,k] - d[t[i,k]] + d[t[i,1]]) # adjustment, multi-group RCTs sw[i,k] <-sum(w[i,1:k-1])/(k-1) # cumulative adjustment for multi-group trials } sdev[i]<-sum(dev[i,1:na[i]]) } resdev<-sum(sdev[]) d[1]<-0 for (k in 2:NT){d[k] ~ dnorm(0,.001) } # vague priors for basic parameters var ~ dlnorm(-3.02,0.292) # Informative log-normal prior with mean -3.02, precision 0.292=1/(1.85^2) for heterogeneity variance parameter tau - Turner 2012 tau<-1/var # between-trial precision (1/between-trial variance) sd <- pow(tau,-0.5) # Absolute risk, based on average of NP trials including it. for (i in 1:NS) { mu1[i] <- mu[i] * equals(t[i,1],1) } for (k in 1:NT) { logit(T[k])<- (sum(mu1[])/NP) +d[k] } # pairwise ORs, RD, NNT, RR for (c in 1:(NT-1)) { for (k in (c+1):NT) { or[c,k] <- exp(d[k] - d[c]) RD[c,k]<-T[k]-T[c] RR[c,k]<-T[k]/T[c] lor[c,k]<-d[k]-d[c] } } } # *** PROGRAM ENDS #Initial Values list(d=c(NA,0,0,0,0,0,0,0,0),var=1,mu=c(0,0,0,0,0,0,0,0,0,0,0,0)) list(d=c(NA,-1,-1,-1,-1,-1,-1,-1,-1),var=0.2,mu=c(-3,-3,-3,-3,-3,-3,-3,-3,-3,-3,-3,-3))
list(d=c(NA,-0.5,-0.5,-0.5,-0.5,-0.5,-0.5,-0.5,-0.5),var=0.1,mu=c(-3,-3,-3,-3,-3,-3,-3,-3,-3,-3,-3,-3))

Direct-Acting Antiviral Agents for Chronic Hepatitis C Genotype 1 152
APPENDIX 5: SELECTION OF INCLUDED STUDIES
FIGURE 28: PRISMA FLOW DIAGRAM FOR INCLUSION AND EXCLUSION OF STUDIES
60 Reports included
Presenting data from 26 unique studies (15 treatment-naive, 9 treatment- experienced, 2 HIV co-infection)
1,078 Citations identified in literature
search
133 Potentially relevant reports
identified and screened
170
Total potentially relevant reports identified and screened
110 Reports excluded
37 Potentially relevant reports
from other sources

Direct-Acting Antiviral Agents for Chronic Hepatitis C Genotype 1 153
APPENDIX 6: INCLUDED STUDY LIST
Boceprevir PROVIDE (2013) Vierling JM, Davis M, Flamm S, Gordon SC, Lawitz E, Yoshida EM, et al. Boceprevir for chronic HCV genotype 1 infection in patients with prior treatment failure to peginterferon/ribavirin, including prior null response. J Hepatol. 2014;60(4):748-56.
Related references: Clinicaltrials.gov [Internet]. Bethesda (MD): U.S. National Institutes of Health; 2000 Feb 29 -. Identifier NCT00910624, Boceprevir treatment in participants with chronic hepatitis C genotype 1 deemed nonresponders to peginterferon/ribavirin (P05514) (PROVIDE); 2013 Sep 18 [cited 2014 Feb 14]. Available from: http://clinicaltrials.gov/show/NCT00910624
Flamm et al. (2013) Flamm SL, Lawitz E, Jacobson I, Bourliere M, Hezode C, Vierling JM, et al. Boceprevir with peginterferon alfa-2a-ribavirin is effective for previously treated chronic hepatitis C genotype 1 infection. Clin Gastroenterol Hepatol. 2013 Jan;11(1):81-7.
Related references: Clinicaltrials.gov [Internet]. Bethesda (MD): U.S. National Institutes of Health; 2000 Feb 29 -. Identifier NCT00845065, Boceprevir in combination with peginterferon alfa-2a and ribavirin in participants with chronic hepatitis C genotype 1 who failed prior treatment with peginterferon/ribavirin (Study P05685AM2); 2013 Oct 22 [cited 2014 Feb 14]. Available from: http://clinicaltrials.gov/show/NCT00845065
Sulkowski et al. (2013) Sulkowski M, Pol S, Mallolas J, Fainboim H, Cooper C, Slim J, et al. Boceprevir versus placebo with pegylated interferon alfa-2b and ribavirin for treatment of hepatitis C virus genotype 1 in patients with HIV: a randomised, double-blind, controlled phase 2 trial. Lancet Infect Dis. 2013 Jul;13(7):597-605.
Related references: Clinicaltrials.gov [Internet]. Bethesda (MD): U.S. National Institutes of Health; 2000 Feb 29 -. Identifier NCT00959699, A phase 2b, safety and efficacy study of boceprevir in patients coinfected with HIV and hepatitis C (P05411 AM4); 2013 Jul 26 [cited 2014 Feb 14]. Available from: http://clinicaltrials.gov/show/NCT00959699
SPRINT-2 (2011) Poordad F, McCone J, Bacon BR, Bruno S, Manns MP, Sulkowski MS, et al. Boceprevir for untreated chronic HCV genotype 1 infection. N Engl J Med. 2011 Mar 31;364(13):1195-206. RESPOND-2 (2011) Bacon BR, Gordon SC, Lawitz E, Marcellin P, Vierling JM, Zeuzem S, et al. Boceprevir for previously treated chronic HCV genotype 1 infection. N Engl J Med. 2011 Mar 31;364(13):1207-17.

Direct-Acting Antiviral Agents for Chronic Hepatitis C Genotype 1 154
Related references: Bruno S, Vierling JM, Esteban R, Nyberg LM, Tanno H, Goodman Z, et al. Efficacy and safety of boceprevir plus peginterferon-ribavirin in patients with HCV G1 infection and advanced fibrosis/cirrhosis. J Hepatol. 2013 Mar;58(3):479-87.
Clinicaltrials.gov [Internet]. Bethesda (MD): U.S. National Institutes of Health; 2000 Feb 29 -. Identifier NCT00708500, Boceprevir in subjects with chronic hepatitis C genotype 1 who failed prior treatment with peginterferon/ribavirin (Study P05101AM3); 2013 Aug 30 [cited 2014 Feb 14]. Available from: http://clinicaltrials.gov/show/NCT00708500
SPRINT-1 (2010) Kwo PY, Lawitz EJ, McCone J, Schiff ER, Vierling JM, Pound D, et al. Efficacy of boceprevir, an NS3 protease inhibitor, in combination with peginterferon alfa-2b and ribavirin in treatment-naive patients with genotype 1 hepatitis C infection (SPRINT-1): an open-label, randomised, multicentre phase 2 trial. Lancet. 2010 Aug 28;376(9742):705-16.
Related references: Clinicaltrials.gov [Internet]. Bethesda (MD): U.S. National Institutes of Health; 2000 Feb 29 -. Identifier NCT00423670, Safety and efficacy of SCH 503034 in previously untreated subjects with chronic hepatitis C-infected with genotype 1 (Study P03523); 2013 Mar 15 [cited 2014 Feb 14]. Available from: http://clinicaltrials.gov/show/NCT00423670
Telaprevir OPTIMIZE (2013) Buti M, Agarwal K, Horsmans Y, Sievert W, Janczewska E, Zeuzem S, et al. Telaprevir twice daily Is noninferior to telaprevir every 8 hours for patients with chronic hepatitis C. Gastroenterology. 2014;146(3):744-53. Colombo (2013) Colombo M, Fernandez I, Abdurakhmanov D, Ferreira PA, Strasser SI, Urbanek P, et al. Safety and on-treatment efficacy of telaprevir: the early access programme for patients with advanced hepatitis C. Gut [Internet]. 2013 Nov 7 [cited 2014 Jan 17]. Available from: http://gut.bmj.com/content/early/2013/11/07/gutjnl-2013-305667.full.pdf+html Sulkowski (2013) Sulkowski MS, Sherman KE, Dieterich DT, Bsharat M, Mahnke L, Rockstroh JK, et al. Combination therapy with telaprevir for chronic hepatitis C virus genotype 1 infection in patients with HIV: a randomized trial. Ann Intern Med. 2013 Jul 16;159(2):86-96.
Related references: Clinicaltrials.gov [Internet]. Bethesda (MD): U.S. National Institutes of Health; 2000 Feb 29 -. Identifier NCT00983853, Safety and efficacy of telaprevir in combination with peginterferon alfa-2a and ribavirin in subjects co-infected with hepatitis C virus (HCV) and HIV; 2013 Aug 2 [cited 2014 Feb 14]. Available from: http://clinicaltrials.gov/show/NCT00983853

Direct-Acting Antiviral Agents for Chronic Hepatitis C Genotype 1 155
Kumada (2012) Kumada H, Toyota J, Okanoue T, Chayama K, Tsubouchi H, Hayashi N. Telaprevir with peginterferon and ribavirin for treatment-naive patients chronically infected with HCV of genotype 1 in Japan. J Hepatol. 2012 Jan;56(1):78-84. REALIZE (2011) Zeuzem S, Andreone P, Pol S, Lawitz E, Diago M, Roberts S, et al. Telaprevir for retreatment of HCV infection. N Engl J Med. 2011 Jun 23;364(25):2417-28.
Related references: Clinicaltrials.gov [Internet]. Bethesda (MD): U.S. National Institutes of Health; 2000 Feb 29 -. Identifier NCT00703118, A safety and effectiveness study of telaprevir in chronic, genotype 1, hepatitis C patients that failed previous standard treatment; 2013 Dec 5 [cited 2014 Feb 14]. Available from: http://clinicaltrials.gov/show/NCT00703118
Marcellin (2011) Marcellin P, Forns X, Goeser T, Ferenci P, Nevens F, Carosi G, et al. Telaprevir is effective given every 8 or 12 hours with ribavirin and peginterferon alfa-2a or -2b to patients with chronic hepatitis C. Gastroenterology. 2011 Feb;140(2):459-68.
Related references: Clinicaltrials.gov [Internet]. Bethesda (MD): U.S. National Institutes of Health; 2000 Feb 29 -. Identifier NCT00528528, An open-label study of telaprevir administered every 12 or 8 hours in combination with one of two pegylated interferons and ribavirin in treatment-naive genotype 1 chronic hepatitis C participants; 2013 Jun 7 [cited 2014 Feb 14]. Available from: http://clinicaltrials.gov/show/NCT00528528
Muir (2011) Muir AJ, Poordad FF, McHutchison JG, Shiffman ML, Berg T, Ferenci P, et al. Retreatment with telaprevir combination therapy in hepatitis C patients with well-characterized prior treatment response. Hepatology. 2011 Nov;54(5):1538-46.
Related references: Clinicaltrials.gov [Internet]. Bethesda (MD): U.S. National Institutes of Health; 2000 Feb 29 -. Identifier NCT00535847, A rollover study for subjects participating in the control group of Study VX06-950-106, VX05-950-104 and VX05-950-104EU whose plasma HCV RNA levels did not respond to therapy; 2011 Jun 22 [cited 2014 Feb 14]. Available from: http://clinicaltrials.gov/show/NCT00535847
ILLUMINATE (2011) Sherman KE, Flamm SL, Afdhal NH, Nelson DR, Sulkowski MS, Everson GT, et al. Response-guided telaprevir combination treatment for hepatitis C virus infection. N Engl J Med. 2011 Sep 15;365(11):1014-24.
Related references: Clinicaltrials.gov [Internet]. Bethesda (MD): U.S. National Institutes of Health; 2000 Feb 29 -. Identifier NCT00758043, A study evaluating 24-week and 48-week telaprevir-based regimen in

Direct-Acting Antiviral Agents for Chronic Hepatitis C Genotype 1 156
treatment-naive subjects with genotype 1 chronic hepatitis C who achieve an extended rapid viral response; 2013 Sep 30 [cited 2014 Feb 14]. Available from: http://clinicaltrials.gov/show/NCT00758043
ADVANCE (2011) Jacobson IM, McHutchison JG, Dusheiko G, Di Bisceglie AM, Reddy KR, Bzowej NH, et al. Telaprevir for previously untreated chronic hepatitis C virus infection. N Engl J Med [Internet]. 2011 Jun 23 [cited 2014 Jan 16];364(25):2405-16. Available from: http://www.nejm.org/doi/pdf/10.1056/NEJMoa1012912
Related references: Vera-Llonch M, Martin M, Aggarwal J, Donepudi M, Bayliss M, Goss T, et al. Health-related quality of life in genotype 1 treatment-naive chronic hepatitis C patients receiving telaprevir combination treatment in the ADVANCE study. Aliment Pharmacol Ther. 2013 Jul;38(2):124-33. Clinicaltrials.gov [Internet]. Bethesda (MD): U.S. National Institutes of Health; 2000 Feb 29 -. Identifier NCT00627926, A phase 3 study of telaprevir in combination with Pegasys® and Copegus® in treatment-naive subjects with genotype 1 HCV; 2011 Jun 22 [cited 2014 Feb 14]. Available from: http://clinicaltrials.gov/show/NCT00627926
PROVE-3 (2010) McHutchison JG, Manns MP, Muir AJ, Terrault NA, Jacobson IM, Afdhal NH, et al. Telaprevir for previously treated chronic HCV infection. N Engl J Med [Internet]. 2010 Apr 8 [cited 2014 Jan 17];362(14):1292-303. Available from: http://www.nejm.org/doi/pdf/10.1056/NEJMoa0908014
Related references: Clinicaltrials.gov [Internet]. Bethesda (MD): U.S. National Institutes of Health; 2000 Feb 29 -. Identifier NCT00420784, A study of telaprevir (VX-950), Pegasys and Copegus in hepatitis C; 2011 Jun 22 [cited 2014 Feb 14]. Available from: http://clinicaltrials.gov/show/NCT00420784
PROVE-1 (2009) McHutchison JG, Everson GT, Gordon SC, Jacobson IM, Sulkowski M, Kauffman R, et al. Telaprevir with peginterferon and ribavirin for chronic HCV genotype 1 infection. N Engl J Med [Internet]. 2009 Apr 30 [cited 2014 Jan 17];360(18):1827-38. Available from: http://www.nejm.org/doi/pdf/10.1056/NEJMoa0806104
Related references: Clinicaltrials.gov [Internet]. Bethesda (MD): U.S. National Institutes of Health; 2000 Feb 29 -. Identifier NCT00336479, Phase 2 study of VX-950, Pegasys®, and Copegus® in hepatitis C; 2011 Jun 22 [cited 2014 Feb 14]. Available from: http://clinicaltrials.gov/show/NCT00336479
PROVE-2 (2009) Hézode C, Forestier N, Dusheiko G, Ferenci P, Pol S, Goeser T, et al. Telaprevir and peginterferon with or without ribavirin for chronic HCV infection. N Engl J Med [Internet]. 2009 Apr 30 [cited 2014 Jan 17];360(18):1839-50. Available from: http://www.nejm.org/doi/pdf/10.1056/NEJMoa0807650
Related references: Clinicaltrials.gov [Internet]. Bethesda (MD): U.S. National Institutes of Health; 2000 Feb 29 -. Identifier NCT00372385, Phase 2 study of VX-950, Pegasys® with and without Copegus® in
Direct-Acting Antiviral Agents for Chronic Hepatitis C Genotype 1 157
hepatitis C; 2011 Jun 22 [cited 2014 Feb 14]. Available from: http://clinicaltrials.gov/show/NCT00372385
Sofosbuvir ATOMIC (2013) Kowdley KV, Lawitz E, Crespo I, Hassanein T, Davis MN, DeMicco M, et al. Sofosbuvir with pegylated interferon alfa-2a and ribavirin for treatment-naive patients with hepatitis C genotype-1 infection (ATOMIC): an open-label, randomised, multicentre phase 2 trial. Lancet. 2013 Jun 15;381(9883):2100-7. NEUTRINO (2013) Lawitz E, Mangia A, Wyles D, Rodriguez-Torres M, Hassanein T, Gordon SC, et al. Sofosbuvir for previously untreated chronic hepatitis C infection. N Engl J Med. 2013 May 16;368(20):1878-87.
Related references: Younossi ZM, Stepanova M, Henry L, Gane E, Jacobson IM, Lawitz E, et al. Minimal impact of sofosbuvir and ribavirin on health-related quality of life in chronic hepatitis C (CH-C). J Hepatol. 2014;60(4):741-7. Younossi ZM, Stepanova M, Henry L, Gane E, Jacobson IM, Lawitz E, et al. Effects of sofosbuvir-based treatment, with and without interferon, on outcome and productivity of patients with chronic hepatitis C. Clin Gastroenterol Hepatol. 2013 Dec 5. Epub ahead of print.
PROTON (2013) Lawitz E, Lalezari JP, Hassanein T, Kowdley KV, Poordad FF, Sheikh AM, et al. Sofosbuvir in combination with peginterferon alfa-2a and ribavirin for non-cirrhotic, treatment-naive patients with genotypes 1, 2, and 3 hepatitis C infection: a randomised, double-blind, phase 2 trial. Lancet Infect Dis. 2013 May;13(5):401-8. Simeprevir ASPIRE (2014) Zeuzem S, Berg T, Gane E, Ferenci P, Foster GR, Fried MW, et al. Simeprevir increases rate of sustained virologic response among treatment-experienced patients with HCV genotype-1 infection: a phase IIb trial. Gastroenterology. 2014 Feb;146(2):430-41.
Related references: Clinicaltrials.gov [Internet]. Bethesda (MD): U.S. National Institutes of Health; 2000 Feb 29 -. Identifier NCT00980330, A safety and effectiveness study of TMC435 in chronic, genotype 1, hepatitis C patients who failed to previous standard treatment (ASPIRE); 2013 Dec 18 [cited 2014 Feb 14]. Available from: http://clinicaltrials.gov/show/NCT00980330
PILLAR (2013) Fried MW, Buti M, Dore GJ, Flisiak R, Ferenci P, Jacobson I, et al. Once-daily simeprevir (TMC435) with pegylated interferon and ribavirin in treatment-naive genotype 1 hepatitis C: the randomized PILLAR study. Hepatology. 2013;58(6):1918-29.

Direct-Acting Antiviral Agents for Chronic Hepatitis C Genotype 1 158
PROMISE (2014) Forns X, Lawitz E, Zeuzem S, Gane E, Bronowicki JP, Andreone P, et al. Simeprevir with peginterferon and ribavirin leads to high rates of SVR in patients with HCV genotype 1 who relapsed after previous therapy: a phase 3 trial. Gastroenterology. 2014 Mar 3. Epub ahead of print.
Related references: Clinicaltrials.gov [Internet]. Bethesda (MD): U.S. National Institutes of Health; 2000 Feb 29 -. Identifier NCT01281839, An efficacy, safety and tolerability study of TMC435 in genotype 1 hepatitis C-infected patients who relapsed after previous therapy (PROMISE); 2013 Feb 26 [cited 2014 Mar 18]. Available from: http://clinicaltrials.gov/show/NCT01281839
QUEST-1 Jacobson IM, Dore GJ, Foster GR, Fried MW, Radu M, Rafalsky VV, et al. Simeprevir with pegylated interferon alfa-2a plus ribavirin in treatment-naive patients with chronic hepatitis C virus genotype 1 infection (QUEST-1): a phase 3, randomised, double-blind, placebo-controlled trial. Lancet. 2014 Jun 4;early online publication.
Related references: Levin J. Simeprevir (TMC435) with peginterferon/ribavirin for chronic HCV genotype 1 infection in treatment-naive patients: results from QUEST-1, a phase III trial [conference report on the Internet]. New York: National AIDS Treatment Advocacy Project; 2013 Apr. [cited 2014 Mar 11]. Available from: http://www.natap.org/2013/EASL/EASL_10.htm
QUEST-2 Manns M, Marcellin P, Poordad F, de Araujo ESA, Buti M, Horsmans Y, et al. Simeprevir with pegylated interferon alfa-2a or -2b plus ribavirin in treatment-naive patients with chronic hepatitis C virus genotype 1 infection (QUEST-2): a randomised, double-blind, placebo-controlled phase 3 trial. Lancet. 2014 Jun 4.
Related references: Levin J. Simeprevir (TMC435) with peginterferon-a2a or -a2b and ribavirin in treatment-naive HCV genotype 1 patients: QUEST-2, a randomised phase III trial [conference report on the Internet]. New York: National AIDS Treatment Advocacy Project; 2013 Apr. [cited 2014 Mar 11]. Available from: http://www.natap.org/2013/EASL/EASL_18.htm
Other Related References Center for Drug Evaluation and Research, U.S. Food and Drug Administration. Medical review(s) [Internet]. In: Incivek (telaprevir) film-coated tablets. Company: Vertex Pharmaceuticals, Incorporated. Application no.: 201917. Approval date: 05/23/2011. Rockville (MD): The Center; 2011 [cited 2014 Feb 3]. (FDA drug approval package). Available from: http://www.accessdata.fda.gov/drugsatfda_docs/nda/2011/201917Orig1s000TOC.cfm Center for Drug Evaluation and Research, U.S. Food and Drug Administration. Statistical review(s) [Internet]. In: Incivek (telaprevir) film-coated tablets. Company: Vertex Pharmaceuticals, Incorporated. Application no.: 201917. Approval date: 05/23/2011. Rockville (MD): The Center; 2011 [cited 2014 Feb 3]. (FDA drug approval package). Available from: http://www.accessdata.fda.gov/drugsatfda_docs/nda/2011/201917Orig1s000TOC.cfm

Direct-Acting Antiviral Agents for Chronic Hepatitis C Genotype 1 159
European public assessment report (EPAR): Incivo (telaprevir) [Internet]. London: European Medicines Agency; 2011; updated 2012 May 15. [cited 2014 Jan 30]. Available from: http://www.ema.europa.eu/docs/en_GB/document_library/EPAR_-_Public_assessment_report/human/002313/WC500115532.pdf Center for Drug Evaluation and Research, U.S. Food and Drug Administration. Medical review(s) [Internet]. In: Victrelis (boceprevir) capsules. Company: Schering Corporation. Application no.: 202258. Approval date: 05/13/2011. Rockville (MD): The Center; 2011 [cited 2014 Jan 30]. (FDA drug approval package). Available from: http://www.accessdata.fda.gov/drugsatfda_docs/nda/2011/202258Orig1s000TOC.cfm. Center for Drug Evaluation and Research, U.S. Food and Drug Administration. Statistical review(s) [Internet]. In: Victrelis (boceprevir) capsules. Company: Schering Corporation. Application no.: 202258. Approval date: 05/13/2011. Rockville (MD): The Center; 2011 [cited 2014 Jan 30]. (FDA drug approval package). Available from: http://www.accessdata.fda.gov/drugsatfda_docs/nda/2011/202258Orig1s000TOC.cfm. European public assessment report (EPAR): Victrelis (boceprevir) [Internet]. London: European Medicines Agency; 2011. [cited 2014 Jan 30]. Available from: http://www.ema.europa.eu/docs/en_GB/document_library/EPAR_-_Public_assessment_report/human/002332/WC500109789.pdf Center for Drug Evaluation and Research, U.S. Food and Drug Administration. Medical review(s) [Internet]. In: Sovaldi (sofosbuvir) tablets. Company: Gilead Sciences, Inc. Application no.: 204671. Approval date: 12/06/2013. Rockville (MD): The Center; 2013 [cited 2014 Jan 31]. (FDA drug approval package). Available from: http://www.accessdata.fda.gov/drugsatfda_docs/nda/2013/204671Orig1s000TOC.cfm. Center for Drug Evaluation and Research, U.S. Food and Drug Administration. Statistical review(s) [Internet]. In: Sovaldi (sofosbuvir) tablets. Company: Gilead Sciences, Inc. Application no.: 204671. Approval date: 12/06/2013. Rockville (MD): The Center; 2013 [cited 2014 Jan 31]. (FDA drug approval package). Available from: http://www.accessdata.fda.gov/drugsatfda_docs/nda/2013/204671Orig1s000TOC.cfm. European public assessment report (EPAR): Sovaldi. International non-proprietary name: sofosbuvir [Internet]. London: European Medicines Agency; 2013 Nov 21. [cited 2014 Mar 11]. Available from: http://www.ema.europa.eu/docs/en_GB/document_library/EPAR_-_Public_assessment_report/human/002798/WC500160600.pdf
Center for Drug Evaluation and Research, U.S. Food and Drug Administration. Medical review(s) [Internet]. In: Olysio (simeprevir) 150 mg capsules. Company: Janssen Research & Development, LLC. Application no.: 205123. Approval date: 11/22/2013. Rockville (MD): The Center; 2013 [cited 2014 Jan 17]. (FDA drug approval package). Available from: http://www.accessdata.fda.gov/drugsatfda_docs/nda/2013/205123Orig1s000TOC.cfm Center for Drug Evaluation and Research, U.S. Food and Drug Administration. Statistical review(s) [Internet]. In: Olysio (simeprevir) 150 mg capsules. Company: Janssen Research & Development, LLC. Application no.: 205123. Approval date: 11/22/2013. Rockville (MD): The Center; 2013 [cited 2014 Jan

Direct-Acting Antiviral Agents for Chronic Hepatitis C Genotype 1 160
17]. (FDA drug approval package). Available from: http://www.accessdata.fda.gov/drugsatfda_docs/nda/2013/205123Orig1s000TOC.cfm Janssen Inc. Antiviral Drugs Advisory Committee Meeting. Briefing document: simeprevir (TMC435). Treatment of patients with chronic hepatitis C [Internet]. Silver Spring (MD): U.S. Food and Drug Administration; 2013 Oct 24. [cited 2014 Mar 11]. Available from: http://www.fda.gov/downloads/advisorycommittees/committeesmeetingmaterials/drugs/antiviraldrugsadvisorycommittee/ucm371624.pdf

Direct-Acting Antiviral Agents for Chronic Hepatitis C Genotype 1 161
APPENDIX 7: EXCLUDED STUDY LIST
Study Design Not of Interest Martel-Laferriere V, Brinkley S, Bichoupan K, Posner S, Stivala A, Perumalswami P, et al. Virological response rates for telaprevir-based hepatitis C triple therapy in patients with and without HIV coinfection. HIV Med. 2014 Feb;15(2):108-15. Werner CR, Egetemeyr DP, Lauer UM, Nadalin S, Konigsrainer A, Malek NP, et al. Feasibility of telaprevir-based triple therapy in liver transplant patients with hepatitis C virus: SVR 24 results. PLoS ONE [Internet]. 2013 [cited 2014 Jan 17];8(11):e80528. Available from: http://www.ncbi.nlm.nih.gov/pmc/articles/PMC3827217/pdf/pone.0080528.pdf Hepatitis: sustained virologic response in treatment-experienced patients with HCV genotype 1 is increased by simeprevir. Nat Rev Gastroenterol Hepatol. 2014 Jan;11(1):2. Asselah T. Sofosbuvir-based interferon-free therapy for patients with HCV infection. J Hepatol. 2013 Dec;59(6):1342-5. Mauss S, Hueppe D, Alshuth U. Renal impairment is frequent in chronic hepatitis C patients under triple therapy with telaprevir or boceprevir. Hepatology. 2014 Jan;59(1):46-8. Ogawa E, Furusyo N, Nakamuta M, Kajiwara E, Nomura H, Dohmen K, et al. Telaprevir-based triple therapy for chronic hepatitis C patients with advanced fibrosis: a prospective clinical study. Aliment Pharmacol Ther. 2013 Nov;38(9):1076-85. Coilly A, Roche B, Dumortier J, Leroy V, Botta-Fridlund D, Radenne S, et al. Safety and efficacy of protease inhibitors to treat hepatitis C after liver transplantation: a multicenter experience. J Hepatol. 2014 Jan;60(1):78-86. Bichoupan K, Schwartz JM, Martel-Laferriere V, Giannattasio ER, Marfo K, Odin JA, et al. Effect of fibrosis on adverse events in patients with hepatitis C treated with telaprevir. Aliment Pharmacol Ther. 2014 Jan;39(2):209-16. Backus LI, Belperio PS, Shahoumian TA, Cheung R, Mole LA. Comparative effectiveness of the hepatitis C virus protease inhibitors boceprevir and telaprevir in a large U.S. cohort. Aliment Pharmacol Ther. 2014 Jan;39(1):93-103. Trimoulet P, Pinson P, Papuchon J, Foucher J, Vergniol J, Chermak F, et al. Dynamic and rapid changes in viral quasispecies by UDPS in chronic hepatitis C patients receiving telaprevir-based therapy. Antivir Ther. 2013;18(5):723-7. Benito JM, Sanchez-Parra C, Maida I, Aguilera A, Rallon NI, Rick F, et al. Triple combination therapy for hepatitis C with telaprevir exhibits greater early antiviral activity than with boceprevir. Antivir Ther. 2013;18(5):709-15.
Direct-Acting Antiviral Agents for Chronic Hepatitis C Genotype 1 162
D'Ambrosio R, Colombo M. Safety of direct antiviral agents in real life. Dig Liver Dis. 2013 Sep 30;45 Suppl 5:363-6. Hezode C, Fontaine H, Dorival C, Larrey D, Zoulim F, Canva V, et al. Triple therapy in treatment-experienced patients with HCV-cirrhosis in a multicentre cohort of the French early access programme (ANRS CO20-CUPIC) - NCT01514890. J Hepatol. 2013 Sep;59(3):434-41. Belperio PS, Hwang EW, Thomas IC, Mole LA, Cheung RC, Backus LI. Early virologic responses and hematologic safety of direct-acting antiviral therapies in veterans with chronic hepatitis C. Clin Gastroenterol Hepatol. 2013 Aug;11(8):1021-7. Furusyo N, Ogawa E, Nakamuta M, Kajiwara E, Nomura H, Dohmen K, et al. Telaprevir can be successfully and safely used to treat older patients with genotype 1b chronic hepatitis C. J Hepatol. 2013 Aug;59(2):205-12. Pungpapong S, Aqel BA, Koning L, Murphy JL, Henry TM, Ryland KL, et al. Multicenter experience using telaprevir or boceprevir with peginterferon and ribavirin to treat hepatitis C genotype 1 after liver transplantation. Liver Transpl. 2013 Jul;19(7):690-700. Asselah T. A sprint to increase response to HCV treatment: expectancies but caution. J Hepatol. 2011;55(5):1154-8. Lacombe K, Valin N, Stitou H, Gozlan J, Thibault V, Boyd A, et al. Efficacy and tolerance of telaprevir in HIV-hepatitis C virus genotype 1-coinfected patients failing previous antihepatitis C virus therapy: 24-week results. AIDS. 2013 May 15;27(8):1356-9. Hynicka LM, Heil EL. Anemia management in patients with chronic viral hepatitis C. Ann Pharmacother. 2013 Feb;47(2):228-36. Maasoumy B, Port K, Markova AA, Serrano BC, Rogalska-Taranta M, Sollik L, et al. Eligibility and safety of triple therapy for hepatitis C: lessons learned from the first experience in a real world setting. PLoS ONE [Internet]. 2013 [cited 2014 Jan 20];8(2):e55285. Available from: http://www.ncbi.nlm.nih.gov/pmc/articles/PMC3562338/pdf/pone.0055285.pdf Werner CR, Egetemeyr DP, Lauer UM, Nadalin S, Konigsrainer A, Malek NP, et al. Telaprevir-based triple therapy in liver transplant patients with hepatitis C virus: a 12-week pilot study providing safety and efficacy data. Liver Transpl. 2012 Dec;18(12):1464-70. Sulkowski MS, Poordad F, Manns MP, Bronowicki JP, Rajender RK, Harrison SA, et al. Anemia during treatment with peginterferon Alfa-2b/ribavirin and boceprevir: analysis from the serine protease inhibitor therapy 2 (SPRINT-2) trial. Hepatology. 2013 Mar;57(3):974-84. Coilly A, Furlan V, Roche B, Barau C, Noel C, Bonhomme-Faivre L, et al. Practical management of boceprevir and immunosuppressive therapy in liver transplant recipients with hepatitis C virus recurrence. Antimicrob Agents Chemother. 2012 Nov;56(11):5728-34. Roujeau JC, Mockenhaupt M, Tahan SR, Henshaw J, Martin EC, Harding M, et al. Telaprevir-related dermatitis. JAMA Dermatol. 2013 Feb;149(2):152-8.

Direct-Acting Antiviral Agents for Chronic Hepatitis C Genotype 1 163
Lenz O, de Bruijne MC, Vijgen L, Verbinnen T, Weegink C, van Marck H, et al. Efficacy of re-treatment with TMC435 as combination therapy in hepatitis C virus-infected patients following TMC435 monotherapy. Gastroenterology. 2012 Nov;143(5):1176-8. Poordad F, Bronowicki JP, Gordon SC, Zeuzem S, Jacobson IM, Sulkowski MS, et al. Factors that predict response of patients with hepatitis C virus infection to boceprevir. Gastroenterology. 2012 Sep;143(3):608-18. Manns MP, Markova AA, Calle SB, Cornberg M. Phase III results of boceprevir in treatment-naive patients with chronic hepatitis C genotype 1. Liver Int. 2012 Feb;32 Suppl 1:27-31. Suzuki F, Suzuki Y, Akuta N, Sezaki H, Hirakawa M, Kawamura Y, et al. Influence of ITPA polymorphisms on decreases of hemoglobin during treatment with pegylated interferon, ribavirin, and telaprevir. Hepatology. 2011 Feb;53(2):415-21. Bronowicki JP. Boceprevir plus peginterferon/ribavirin for the treatment of HCV/HIV co-infected patients: end-of-treatment (week 48) interim results - commentary. Gastroenterol Hepatol. 2012;8(6 Suppl 3):18-9. Boceprevir plus peginterferon/ribavirin for the treatment of HCV/HIV co-infected patients: end-of-treatment (week 48) interim results. Gastroenterol Hepatol. 2012;8(6 Suppl 3):15-7. Sustained virologic response (SVR) in prior peginterferon/ribavirin (PR) treatment failures after re-treatment with boceprevir (BOC) + PR: the PROVIDE study interim results. Gastroenterol Hepatol. 2012;8(6 Suppl 3):10. Safety of telaprevir or boceprevir in combination with peginterferon alpha/ribavirin in cirrhotic nonresponders. First results of the French early access program (ANRS CO20-CUPIC). Gastroenterol Hepatol. 2012;8(6 Suppl 3):8-9. Charlton M. Boceprevir (Victrelis) for HCV: V is for victory and very complex. Hepatology. 2011;54(5):1882-6. Bathgate A. Boceprevir for previously treated chronic hepatitis C virus genotype 1 infection. J R Coll Physicians Edinb. 2011 Jun;41(2):122-3. Fujino H, Imamura M, Nagaoki Y, Kawakami Y, Abe H, Hayes CN, et al. Predictive value of the IFNL4 polymorphism on outcome of telaprevir, peginterferon, and ribavirin therapy for older patients with genotype 1b chronic hepatitis C. J Gastroenterol. 2013 Dec 21. Epub ahead of print. Ioannou GN, Beste LA, Green PK. Similar effectiveness of boceprevir and telaprevir treatment regimens for hepatitis C virus infection, based on a nationwide study of veterans. Clin Gastroenterol Hepatol. 2013 Dec 17. Epub ahead of print. Shimada N, Toyoda H, Tsubota A, Ide T, Takaguchi K, Kato K, et al. Baseline factors and very early viral response (week 1) for predicting sustained virological response in telaprevir-based triple combination therapy for Japanese genotype 1b chronic hepatitis C patients: a multicenter study. J Gastroenterol. 2013 Nov 28. Epub ahead of print.

Direct-Acting Antiviral Agents for Chronic Hepatitis C Genotype 1 164
Shimada N, Tsubota A, Atsukawa M, Abe H, Ika M, Kato K, et al. alpha-Fetoprotein is a surrogate marker for predicting treatment failure in telaprevir-based triple combination therapy for genotype 1b chronic hepatitis C Japanese patients with the IL28B minor genotype. J Med Virol. 2013 Oct 28. Epub ahead of print. Manns MP, McCone J Jr, Davis MN, Rossaro L, Schiff E, Shiffman ML, et al. Overall safety profile of boceprevir plus peginterferon alfa-2b and ribavirin in patients with chronic hepatitis C genotype 1: a combined analysis of 3 phase 2/3 clinical trials. Liver Int. 2013 Aug 2. Epub ahead of print. Zhou K, Ferguson J, Bau S, Saab S. Viral breakthrough is associated with resistance using direct acting agents in patients treated for chronic hepatitis C infection. J Clin Gastroenterol. 2013 Sep 16. Epub ahead of print. Saadoun D, Resche RM, Thibault V, Longuet M, Pol S, Blanc F, et al. Peg-IFNalpha/ribavirin/protease inhibitor combination in hepatitis C virus associated mixed cryoglobulinemia vasculitis: results at week 24. Ann Rheum Dis. 2013 Apr 20. Epub ahead of print. Singh G, Issa D, Sedki E, Hanouneh I, Lopez R, Zein N, et al. Anemia in patients with chronic hepatitis C infection during triple therapy with telaprevir or boceprevir - a controlled study. Journal of Antivirals & Antiretrovirals. 2013 Dec 8;5(7):173-77. Intervention Not of Interest Pearlman BL, Ehleben C. Hepatitis C genotype 1 virus with low viral load and rapid virologic response to peginterferon/ribavirin obviates a protease inhibitor. Hepatology. 2014 Jan;59(1):71-7. Akuta N, Suzuki F, Fukushima T, Kawamura Y, Sezaki H, Suzuki Y, et al. Utility of detection of telaprevir-resistant variants for prediction of efficacy of treatment of hepatitis C virus genotype 1 infection. J Clin Microbiol. 2014 Jan;52(1):193-200. Tsubota A, Shimada N, Atsukawa M, Abe H, Kato K, Ika M, et al. Impact of IL28B polymorphisms on 24-week telaprevir-based combination therapy for Asian chronic hepatitis C patients with hepatitis C virus genotype 1b. J Gastroenterol Hepatol. 2014 Jan;29(1):144-50. Nishiguchi S, Sakai Y, Kuboki M, Tsunematsu S, Urano Y, Sakamoto W, et al. Safety and efficacy of faldaprevir with pegylated interferon alfa-2a and ribavirin in Japanese patients with chronic genotype-1 hepatitis C infection. Liver Int. 2014 Jan;34(1):78-88. Poordad F, Lawitz E, Reddy KR, Afdhal NH, Hezode C, Zeuzem S, et al. Effects of ribavirin dose reduction vs erythropoietin for boceprevir-related anemia in patients with chronic hepatitis C virus genotype 1 infection--a randomized trial. Gastroenterology. 2013 Nov;145(5):1035-44. Ogawa E, Furusyo N, Nakamuta M, Kajiwara E, Nomura H, Dohmen K, et al. Clinical milestones for the prediction of severe anemia by chronic hepatitis C patients receiving telaprevir-based triple therapy. J Hepatol. 2013 Oct;59(4):667-74.

Direct-Acting Antiviral Agents for Chronic Hepatitis C Genotype 1 165
Berger KL, Lagace L, Triki I, Cartier M, Marquis M, Lawetz C, et al. Viral resistance in hepatitis C virus genotype 1-infected patients receiving the NS3 protease inhibitor faldaprevir (BI 201335) in a phase 1b multiple-rising-dose study. Antimicrob Agents Chemother. 2013 Oct;57(10):4928-36. Lawitz EJ, Rodriguez-Torres M, Denning J, Mathias A, Mo H, Gao B, et al. All-oral therapy with nucleotide inhibitors sofosbuvir and GS-0938 for 14 days in treatment-naive genotype 1 hepatitis C (nuclear). J Viral Hepat. 2013 Oct;20(10):699-707. Akuta N, Suzuki F, Fukushima T, Kawamura Y, Sezaki H, Suzuki Y, et al. Prediction of treatment efficacy and telaprevir-resistant variants after triple therapy in patients infected with hepatitis C virus genotype 1. J Clin Microbiol. 2013 Sep;51(9):2862-8. Hara T, Akuta N, Suzuki F, Sezaki H, Suzuki Y, Hosaka T, et al. A pilot study of triple therapy with telaprevir, peginterferon and ribavirin for elderly patients with genotype 1 chronic hepatitis C. J Med Virol. 2013 Oct;85(10):1746-53. Rodriguez-Torres M, Lawitz E, Kowdley KV, Nelson DR, DeJesus E, McHutchison JG, et al. Sofosbuvir (GS-7977) plus peginterferon/ribavirin in treatment-naive patients with HCV genotype 1: a randomized, 28-day, dose-ranging trial. J Hepatol. 2013 Apr;58(4):663-8. Hoffmann L, Ramos JA, Souza EV, Araujo Ramos AL, Villela-Nogueira CA, Urmenyi TP, et al. Dynamics of resistance mutations to NS3 protease inhibitors in a cohort of Brazilian patients chronically infected with hepatitis C virus (genotype 1) treated with pegylated interferon and ribavirin: a prospective longitudinal study. Virol J. 2013;10:57. Manns M, Reesink H, Berg T, Dusheiko G, Flisiak R, Marcellin P, et al. Rapid viral response of once-daily TMC435 plus pegylated interferon/ribavirin in hepatitis C genotype-1 patients: a randomized trial. Antivir Ther. 2011;16(7):1021-33. Suzuki F, Suzuki Y, Sezaki H, Akuta N, Seko Y, Kawamura Y, et al. Exploratory study on telaprevir given every 8h at 500mg or 750mg with peginterferon-alpha-2b and ribavirin in hepatitis C patients. Hepatol Res. 2013 Jul;43(7):691-701. Suzuki F, Akuta N, Suzuki Y, Sezaki H, Yatsuji H, Kawamura Y, et al. Rapid loss of hepatitis C virus genotype 1b from serum in patients receiving a triple treatment with telaprevir (MP-424), pegylated interferon and ribavirin for 12 weeks. Hepatol Res. 2009 Nov;39(11):1056-63. Akuta N, Suzuki F, Seko Y, Kawamura Y, Sezaki H, Suzuki Y, et al. Emergence of telaprevir-resistant variants detected by ultra-deep sequencing after triple therapy in patients infected with HCV genotype 1. J Med Virol. 2013 Jun;85(6):1028-36. Osinusi A, Meissner EG, Lee YJ, Bon D, Heytens L, Nelson A, et al. Sofosbuvir and ribavirin for hepatitis C genotype 1 in patients with unfavorable treatment characteristics: a randomized clinical trial. JAMA. 2013 Aug 28;310(8):804-11. Zeuzem S, Soriano V, Asselah T, Bronowicki JP, Lohse AW, Mullhaupt B, et al. Faldaprevir and deleobuvir for HCV genotype 1 infection. N Engl J Med. 2013 Aug 15;369(7):630-9.

Direct-Acting Antiviral Agents for Chronic Hepatitis C Genotype 1 166
Sulkowski MS, Bourliere M, Bronowicki JP, Asselah T, Pawlotsky JM, Shafran SD, et al. Faldaprevir combined with peginterferon alfa-2a and ribavirin in chronic hepatitis C virus genotype-1 patients with prior nonresponse: SILEN-C2 trial. Hepatology. 2013 Jun;57(6):2155-63. Sulkowski MS, Asselah T, Lalezari J, Ferenci P, Fainboim H, Leggett B, et al. Faldaprevir combined with pegylated interferon alfa-2a and ribavirin in treatment-naive patients with chronic genotype 1 HCV: SILEN-C1 trial. Hepatology. 2013 Jun;57(6):2143-54. Toyota J, Ozeki I, Karino Y, Asahina Y, Izumi N, Takahashi S, et al. Virological response and safety of 24-week telaprevir alone in Japanese patients infected with hepatitis C virus subtype 1b. J Viral Hepat. 2013 Mar;20(3):167-73. Vispo E, Rallon NI, Labarga P, Barreiro P, Benito JM, Soriano V. Different impact of IL28B polymorphisms on response to peginterferon- plus ribavirin in HIV-positive patients infected with HCV subtypes 1a or 1b. J Clin Virol. 2012 Sep;55(1):58-61. Akuta N, Suzuki F, Seko Y, Kawamura Y, Sezaki H, Suzuki Y, et al. Determinants of response to triple therapy of telaprevir, peginterferon, and ribavirin in previous non-responders infected with HCV genotype 1. J Med Virol. 2012 Jul;84(7):1097-105. Hayashi N, Okanoue T, Tsubouchi H, Toyota J, Chayama K, Kumada H. Efficacy and safety of telaprevir, a new protease inhibitor, for difficult-to-treat patients with genotype 1 chronic hepatitis C. J Viral Hepat. 2012 Feb;19(2):e134-e142. Yamada I, Suzuki F, Kamiya N, Aoki K, Sakurai Y, Kano M, et al. Safety, pharmacokinetics and resistant variants of telaprevir alone for 12 weeks in hepatitis C virus genotype 1b infection. J Viral Hepat. 2012 Feb;19(2):e112-e119. Vermehren J, Susser S, Lange CM, Forestier N, Karey U, Hughes E, et al. Mutations selected in the hepatitis C virus NS3 protease domain during sequential treatment with boceprevir with and without pegylated interferon alfa-2b. J Viral Hepat. 2012 Feb;19(2):120-7. Zeuzem S, Asselah T, Angus P, Zarski JP, Larrey D, Mullhaupt B, et al. Efficacy of the protease inhibitor BI 201335, polymerase inhibitor BI 207127, and ribavirin in patients with chronic HCV infection. Gastroenterology. 2011;141(6):2047-55. Ozeki I, Akaike J, Karino Y, Arakawa T, Kuwata Y, Ohmura T, et al. Antiviral effects of peginterferon alpha-2b and ribavirin following 24-week monotherapy of telaprevir in Japanese hepatitis C patients. J Gastroenterol. 2011 Jul;46(7):929-37. Chayama K, Hayes CN, Abe H, Miki D, Ochi H, Karino Y, et al. IL28B but not ITPA polymorphism is predictive of response to pegylated interferon, ribavirin, and telaprevir triple therapy in patients with genotype 1 hepatitis C. J Infect Dis. 2011 Jul 1;204(1):84-93. Manns MP, Bourliere M, Benhamou Y, Pol S, Bonacini M, Trepo C, et al. Potency, safety, and pharmacokinetics of the NS3/4A protease inhibitor BI201335 in patients with chronic HCV genotype-1 infection. J Hepatol. 2011 Jun;54(6):1114-22.

Direct-Acting Antiviral Agents for Chronic Hepatitis C Genotype 1 167
Akuta N, Suzuki F, Hirakawa M, Kawamura Y, Yatsuji H, Sezaki H, et al. Amino acid substitution in hepatitis C virus core region and genetic variation near the interleukin 28B gene predict viral response to telaprevir with peginterferon and ribavirin. Hepatology. 2010 Aug;52(2):421-9. Akuta N, Suzuki F, Hirakawa M, Kawamura Y, Yatsuji H, Sezaki H, et al. Amino acid substitutions in the hepatitis C virus core region of genotype 1b affect very early viral dynamics during treatment with telaprevir, peginterferon, and ribavirin. J Med Virol. 2010 Apr;82(4):575-82. Forestier N, Reesink HW, Weegink CJ, McNair L, Kieffer TL, Chu HM, et al. Antiviral activity of telaprevir (VX-950) and peginterferon alfa-2a in patients with hepatitis C. Hepatology. 2007 Sep;46(3):640-8. Lawitz E, Rodriguez-Torres M, Muir AJ, Kieffer TL, McNair L, Khunvichai A, et al. Antiviral effects and safety of telaprevir, peginterferon alfa-2a, and ribavirin for 28 days in hepatitis C patients. J Hepatol. 2008 Aug;49(2):163-9. Reesink HW, Zeuzem S, Weegink CJ, Forestier N, van Vliet A, van de Wetering de Rooij, et al. Rapid decline of viral RNA in hepatitis C patients treated with VX-950: a phase Ib, placebo-controlled, randomized study. Gastroenterology. 2006 Oct;131(4):997-1002. Matsuura K, Watanabe T, Iijima S, Murakami S, Fujiwara K, Orito E, et al. Serum IP-10 concentrations and IL28B genotype associated with responses to pegylated interferon plus ribavirin with and without telaprevir for chronic hepatitis C. Hepatol Res. 2013 Dec 23. Epub ahead of print. Gane EJ, Stedman CA, Hyland RH, Ding X, Svarovskaia E, Subramanian GM, et al. Efficacy of nucleotide polymerase inhibitor sofosbuvir plus the NS5A inhibitor ledipasvir or the NS5B non-nucleoside inhibitor GS-9669 against HCV genotype 1 infection. Gastroenterology. 2013 Nov 18. Epub ahead of print. Berger KL, Triki I, Cartier M, Marquis M, Massariol MJ, Bocher WO, et al. Baseline HCV NS3 polymorphisms and their impact on treatment response in clinical studies of the HCV NS3 protease inhibitor faldaprevir. Antimicrob Agents Chemother. 2013 Nov 11. Epub ahead of print. Lawitz E, Poordad FF, Pang PS, Hyland RH, Ding X, Mo H, et al. Sofosbuvir and ledipasvir fixed-dose combination with and without ribavirin in treatment-naive and previously treated patients with genotype 1 hepatitis C virus infection (LONESTAR): an open-label, randomised, phase 2 trial. Lancet. 2014 Feb 8;383(9916):515-23. Kawakami Y, Suzuki F, Karino Y, Toyota J, Kumada H, Chayama K. Telaprevir is effective given every 12 hours at 750 mg with peginterferon-alfa-2b and ribavirin to Japanese patients with HCV-1b IL28B rs8099917 TT. Antivir Ther. 2013 Nov 5. Epub ahead of print. Everson GT, Sims KD, Rodriguez-Torres M, Hezode C, Lawitz E, Bourliere M, et al. Efficacy of an interferon- and ribavirin-free regimen of daclatasvir, asunaprevir, and BMS-791325 in treatment-naive patients with HCV genotype 1 infection. Gastroenterology. 2014;146(2):420-9. Furusyo N, Ogawa E, Murata M, Toyoda K, Ohnishi H, Eiraku K, et al. Therapeutic drug monitoring of telaprevir in chronic hepatitis C patients receiving telaprevir-based triple therapy is useful for predicting virological response. J Antimicrob Chemother. 2013 Oct 3;69:483-90.

Direct-Acting Antiviral Agents for Chronic Hepatitis C Genotype 1 168
Hayashi N, Seto C, Kato M, Komada Y, Goto S. Once-daily simeprevir (TMC435) with peginterferon/ribavirin for treatment-naive hepatitis C genotype 1-infected patients in Japan: the DRAGON study. J Gastroenterol. 2013 Sep 5. Epub ahead of print. Karino Y, Ozeki I, Hige S, Kimura M, Arakawa T, Nakajima T, et al. Telaprevir impairs renal function and increases blood ribavirin concentration during telaprevir/pegylated interferon/ribavirin therapy for chronic hepatitis C. J Viral Hepat. 2013 Aug 25. Epub ahead of print. Ishida H, Sakane S, Toyama T, Fukutomi K, Kimura K, Sugimoto A, et al. Administration of low-dose epoetin-alpha facilitates adherence to ribavirin in triple therapy with pegylated interferon-alpha-2b and telaprevir. Hepatol Res. 2013 Aug 19. Epub ahead of print. Zeuzem S, Asselah T, Angus P, Zarski JP, Larrey D, Mullhaupt B, et al. Faldaprevir (BI 201335), deleobuvir (BI 207127) and ribavirin oral therapy for treatment-naive HCV genotype 1: SOUND-C1 final results. Antivir Ther. 2013 Apr 4. Epub ahead of print. Non-English/French Shimada N, Atsukawa M, Tsubota A, Yoshizawa K, Abe H, Kato K, et al. Factors contributing to rapid virological response to triple therapy with peginterferon alfa-2b, ribavarin and telaprevir in chronic hepatitis c patients infected with genotype 1b: multicenter trial. Acta Hepatologica Japonica. 2012;53(10):627-32. In Japanese. Hara T, Akuta N, Fukushima T, Seko Y, Kawamura Y, Sezaki H, et al. A pilot study of triple therapy with telaprevir 1500 mg, peginterferon and ribavirin for elderly HCV patients. Acta Hepatologica Japonica. 2012;53(10):624-6. In Japanese. Ozeki I, Kimura M, Arakawa T, Nakajima T, Kuwata Y, Ohmura T, et al. Renal dysfunction with telaprevir in combination with peginterferon alfa-2b and ribavirin therapy. Acta Hepatologica Japonica. 2012;53(7):425-8. In Japanese. Ozeki I, Karino Y, Toyota J, Takahashi S, Kawakami Y, Chayama K, et al. Telaprevir in combination with peginterferon alfa-2b and ribavirin therapy for genotype 1 Japanese chronic HCV patients: impact on adherence and antiviral effects. Acta Hepatologica Japonica. 2012;53(2):69-77. In Japanese. Outcome Not of Interest Torii H, Sueki H, Kumada H, Sakurai Y, Aoki K, Yamada I, et al. Dermatological side-effects of telaprevir-based triple therapy for chronic hepatitis C in phase III trials in Japan. J Dermatol. 2013 Aug;40(8):587-95. Younossi Z, Negro F, Serfaty L, Pol S, Diago M, Zeuzem S, et al. Homeostasis model assessment of insulin resistance does not seem to predict response to telaprevir in chronic hepatitis C in the REALIZE trial. Hepatology. 2013 Dec;58(6):1897-906. Jiang M, Mani N, Lin C, Ardzinski A, Nelson M, Reagan D, et al. In vitro phenotypic characterization of hepatitis C virus NS3 protease variants observed in clinical studies of telaprevir. Antimicrob Agents Chemother. 2013 Dec;57(12):6236-45.

Direct-Acting Antiviral Agents for Chronic Hepatitis C Genotype 1 169
Sullivan JC, De Meyer S, Bartels DJ, Dierynck I, Zhang EZ, Spanks J, et al. Evolution of treatment-emergent resistant variants in telaprevir phase 3 clinical trials. Clin Infect Dis. 2013 Jul;57(2):221-9. Pol S, Aerssens J, Zeuzem S, Andreone P, Lawitz EJ, Roberts S, et al. Limited impact of IL28B genotype on response rates in telaprevir-treated patients with prior treatment failure. J Hepatol. 2013 May;58(5):883-9. Barnard RJ, Howe JA, Ogert RA, Zeuzem S, Poordad F, Gordon SC, et al. Analysis of boceprevir resistance associated amino acid variants (RAVs) in two phase 3 boceprevir clinical studies. Virology. 2013 Sep;444(1-2):329-36. Ogert RA, Howe JA, Vierling JM, Kwo PY, Lawitz EJ, McCone J, et al. Resistance-associated amino acid variants associated with boceprevir plus pegylated interferon-alpha2b and ribavirin in patients with chronic hepatitis C in the SPRINT-1 trial. Antivir Ther. 2013;18(3):387-97. Foster GR, Zeuzem S, Andreone P, Pol S, Lawitz EJ, Diago M, et al. Sustained virologic response rates with telaprevir by response after 4 weeks of lead-in therapy in patients with prior treatment failure. J Hepatol. 2013 Mar;58(3):488-94. Bartels DJ, Sullivan JC, Zhang EZ, Tigges AM, Dorrian JL, De Meyer S, et al. Hepatitis C virus variants with decreased sensitivity to direct-acting antivirals (DAAs) were rarely observed in DAA-naive patients prior to treatment. J Virol. 2013 Feb;87(3):1544-53. De Meyer S, Dierynck I, Ghys A, Beumont M, Daems B, Van Baelen B, et al. Characterization of telaprevir treatment outcomes and resistance in patients with prior treatment failure: results from the REALIZE trial. Hepatology. 2012 Dec;56(6):2106-15. Kieffer TL, De Meyer S, Bartels DJ, Sullivan JC, Zhang EZ, Tigges A, et al. Hepatitis C viral evolution in genotype 1 treatment-naive and treatment-experienced patients receiving telaprevir-based therapy in clinical trials. PLoS ONE [Internet]. 2012 [cited 2014 Jan 20];7(4):e34372. Available from: http://www.ncbi.nlm.nih.gov/pmc/articles/PMC3325239/pdf/pone.0034372.pdf Serfaty L, Forns X, Goeser T, Ferenci P, Nevens F, Carosi G, et al. Insulin resistance and response to telaprevir plus peginterferon and ribavirin in treatment-naive patients infected with HCV genotype 1. Gut. 2012 Oct;61(10):1473-80. Fukuda K, Imai Y, Hiramatsu N, Irishio K, Igura T, Sawai Y, et al. Renal impairment during the treatment of telaprevir with peginterferon and ribavirin in patients with chronic hepatitis C. Hepatol Res. 2013 Sep 5. Epub ahead of print. Population Not of Interest Jacobson IM, Gordon SC, Kowdley KV, Yoshida EM, Rodriguez-Torres M, Sulkowski MS, et al. Sofosbuvir for hepatitis C genotype 2 or 3 in patients without treatment options. N Engl J Med. 2013 May 16;368(20):1867-77. Fierer DS, Dieterich DT, Mullen MP, Branch AD, Uriel AJ, Carriero DC, et al. Telaprevir in the treatment of acute hepatitis C virus infection in HIV-infected men. Clin Infect Dis. 2014 Jan 2. Epub ahead of print.

Direct-Acting Antiviral Agents for Chronic Hepatitis C Genotype 1 170
Abstract/no full publication Schilsky M, Sam T, Tichy E, Caldwell C, Jakab S, Emre S. Boceprevir, peginterferon and ribavirin (PEGIFN/RIB) as triple antiviral therapy for severe recurrent hepatitis C post liver transplant: an early single center experience [abstract]. Am J Transplant. 2012;12:433. (Presented at 2012 American Transplant Congress; Boston; June 2-6, 2012). Clinicaltrials.gov [Internet]. Bethesda (MD): U.S. National Institutes of Health; 2000 Feb 29 -. Identifier: NCT01054573, VX-950-TiDP24-C219: a roll over trial for patients in the control group of the C216 study who received telaprevir placebo; 2013 May 6 [cited 2014 May 5]. Available from: http://clinicaltrials.gov/show/NCT01054573 Poordad F, Vierling J, Flamm S, Gordon S, Lawitz E, Bronowicki JP, et al. Sustained virologic response (SVR) in prior null responders to peginterferon/ ribavirin (PR) after retreatment with boceprevir/PR (B/PR): the PROVIDE study [abstract]. Hepatol Int. 2012 Jan;6(1):166. (Presented at 22nd Conference of the Asian Pacific Association for the Study of the Liver; Taipei, Taiwan; Feb 16-19, 2012).

Direct-Acting Antiviral Agents for Chronic Hepatitis C Genotype 1 171
APPENDIX 8: EFFICACY AND ADVERSE EVENTS DATA INPUTS USED FOR THE EXPLORATORY ECONOMIC ANALYSIS INCLUDING SOFOSBUVIR
Scenario A: Based on NMA Results TABLE 82: TREATMENT EFFICACY INCLUDING SOFOSBUVIR
Description Baselinea/
RR Lower Limit Upper Limit Probability Distribution
Treatment-Naive
F0-F2
Reference baseline (PR48 2a/2b) 0.5052a 0.454
a 0.558
a Based on NMA
Si12 PR24/48 2a/b RGT 1.603 1.354 1.838 Based on NMA
T12 PR24/48 2a RGT q8 1.592 1.282 1.834 Based on NMA
B24 PR28/48 2b RGT 1.53 1.195 1.783 Based on NMA
So12 PR24/48 2a RGT 1.718 1.218 2.047 Based on NMA
F3-F4
Reference baseline (PR 2a/2b) 0.3555a 0.2797
a 0.4364
a Based on NMA
Si12 PR24/48 2a/b RGT 1.911 1.294 2.616 Based on NMA
T12 PR24/48 2a RGT q8 1.81 1.049 2.555 Based on NMA
B24 PR28/48 2b RGT 1.106 0.3843 2.16 Based on NMA
B44 PR48 2b 1.417 0.5888 2.446 Based on NMA
So12 PR24/48 2a RGT 0.8b - - NEUTRINO
24
F0 = no fibrosis; F1 = portal fibrosis without septa; F2 = portal fibrosis with rare septa; F3 = numerous septa without cirrhosis; F4 = cirrhosis; NMA = network meta-analysis; RR = relative risk. aBaseline probability.
bSustained virological response in F4 patients in NEUTRINO.
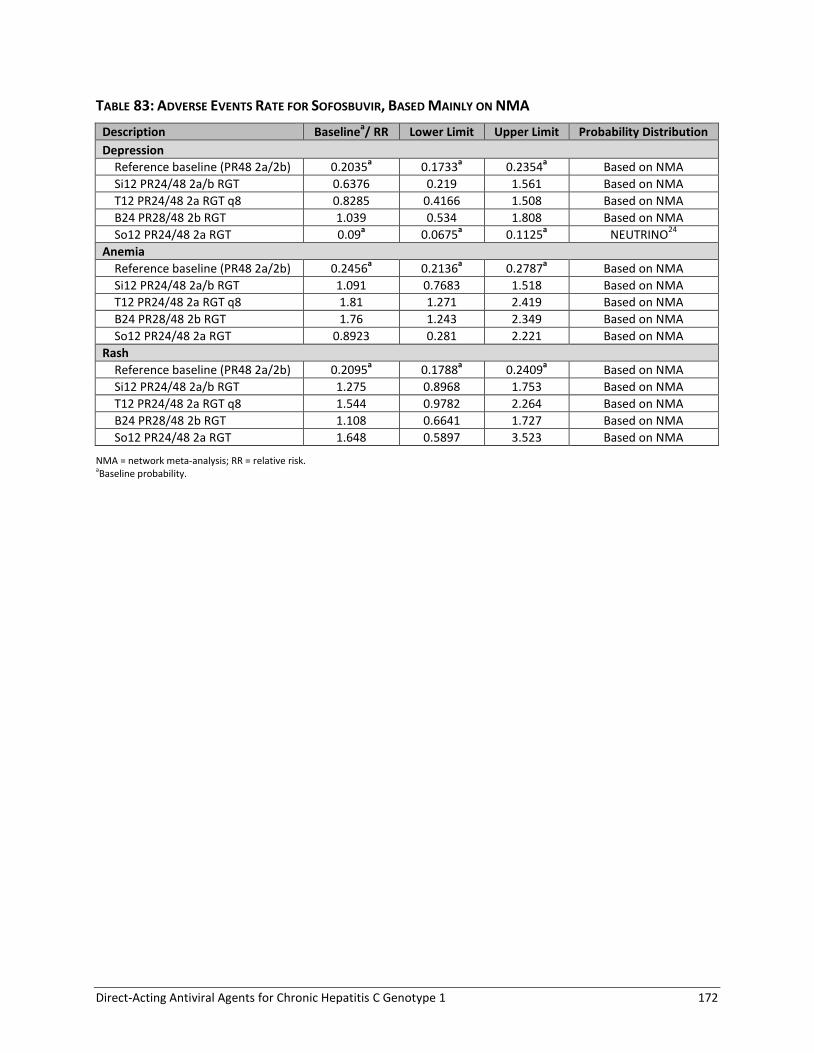
Direct-Acting Antiviral Agents for Chronic Hepatitis C Genotype 1 172
TABLE 83: ADVERSE EVENTS RATE FOR SOFOSBUVIR, BASED MAINLY ON NMA
Description Baselinea/ RR Lower Limit Upper Limit Probability Distribution
Depression
Reference baseline (PR48 2a/2b) 0.2035a 0.1733
a 0.2354
a Based on NMA
Si12 PR24/48 2a/b RGT 0.6376 0.219 1.561 Based on NMA
T12 PR24/48 2a RGT q8 0.8285 0.4166 1.508 Based on NMA
B24 PR28/48 2b RGT 1.039 0.534 1.808 Based on NMA
So12 PR24/48 2a RGT 0.09a 0.0675
a 0.1125
a NEUTRINO
24
Anemia
Reference baseline (PR48 2a/2b) 0.2456a 0.2136
a 0.2787
a Based on NMA
Si12 PR24/48 2a/b RGT 1.091 0.7683 1.518 Based on NMA
T12 PR24/48 2a RGT q8 1.81 1.271 2.419 Based on NMA
B24 PR28/48 2b RGT 1.76 1.243 2.349 Based on NMA
So12 PR24/48 2a RGT 0.8923 0.281 2.221 Based on NMA
Rash
Reference baseline (PR48 2a/2b) 0.2095a 0.1788
a 0.2409
a Based on NMA
Si12 PR24/48 2a/b RGT 1.275 0.8968 1.753 Based on NMA
T12 PR24/48 2a RGT q8 1.544 0.9782 2.264 Based on NMA
B24 PR28/48 2b RGT 1.108 0.6641 1.727 Based on NMA
So12 PR24/48 2a RGT 1.648 0.5897 3.523 Based on NMA
NMA = network meta-analysis; RR = relative risk. aBaseline probability.
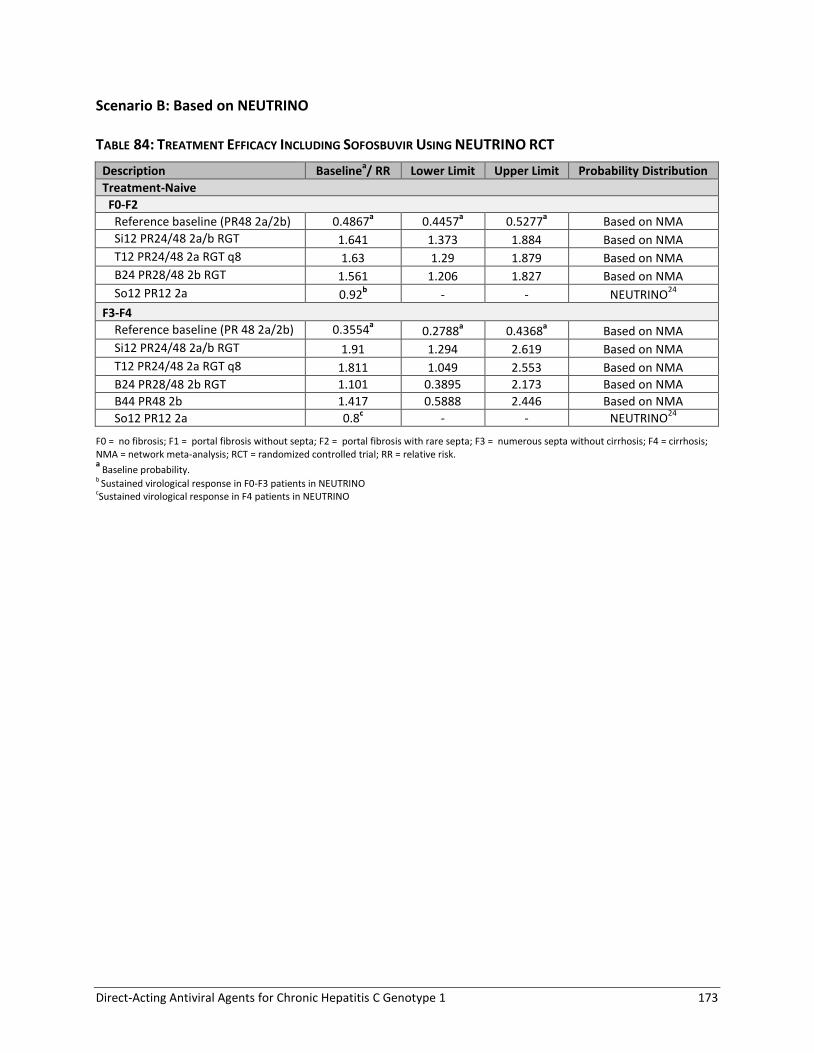
Direct-Acting Antiviral Agents for Chronic Hepatitis C Genotype 1 173
Scenario B: Based on NEUTRINO TABLE 84: TREATMENT EFFICACY INCLUDING SOFOSBUVIR USING NEUTRINO RCT
Description Baselinea/ RR Lower Limit Upper Limit Probability Distribution
Treatment-Naive
F0-F2
Reference baseline (PR48 2a/2b) 0.4867a 0.4457
a 0.5277
a Based on NMA
Si12 PR24/48 2a/b RGT 1.641 1.373 1.884 Based on NMA
T12 PR24/48 2a RGT q8 1.63 1.29 1.879 Based on NMA
B24 PR28/48 2b RGT 1.561 1.206 1.827 Based on NMA
So12 PR12 2a 0.92b - - NEUTRINO
24
F3-F4
Reference baseline (PR 48 2a/2b) 0.3554a 0.2788
a 0.4368
a Based on NMA
Si12 PR24/48 2a/b RGT 1.91 1.294 2.619 Based on NMA
T12 PR24/48 2a RGT q8 1.811 1.049 2.553 Based on NMA
B24 PR28/48 2b RGT 1.101 0.3895 2.173 Based on NMA
B44 PR48 2b 1.417 0.5888 2.446 Based on NMA
So12 PR12 2a 0.8c - - NEUTRINO
24
F0 = no fibrosis; F1 = portal fibrosis without septa; F2 = portal fibrosis with rare septa; F3 = numerous septa without cirrhosis; F4 = cirrhosis; NMA = network meta-analysis; RCT = randomized controlled trial; RR = relative risk. a
Baseline probability. b Sustained virological response in F0-F3 patients in NEUTRINO cSustained virological response in F4 patients in NEUTRINO

Direct-Acting Antiviral Agents for Chronic Hepatitis C Genotype 1 174
TABLE 85: ADVERSE EVENTS RATE FOR SOFOSBUVIR USING NEUTRINO RCT
Description Baseline/ RR Lower Limit Upper Limit Probability Distribution
Depression
Reference baseline (PR48 2a/2b) 0.2035a 0.1733 0.2354 Based on NMA
Si12 PR24/48 2a/b RGT 0.6376 0.219 1.561 Based on NMA
T12 PR24/48 2a RGT q8 0.8285 0.4166 1.508 Based on NMA
B24 PR28/48 2b RGT 1.039 0.534 1.808 Based on NMA
So12 PR12 2a 0.09b 0.0675
a 0.1125
a NEUTRINO
24
Anemia
Reference baseline (PR48 2a/2b) 0.2456a 0.2136 0.2787 Based on NMA
Si12 PR24/48 2a/b RGT 1.091 0.7683 1.518 Based on NMA
T12 PR24/48 2a RGT q8 1.81 1.271 2.419 Based on NMA
B24 PR28/48 2b RGT 1.76 1.243 2.349 Based on NMA
So12 PR12 2a 0.21b 0.16
a 0.26
a NEUTRINO
24
Rash
Reference baseline (PR48 2a/2b) 0.2095a 0.1788 0.2409 Based on NMA
Si12 PR24/48 2a/b RGT 1.275 0.8968 1.753 Based on NMA
T12 PR24/48 2a RGT q8 1.544 0.9782 2.264 Based on NMA
B24 PR28/48 2b RGT 1.108 0.6641 1.727 Based on NMA
So12 PR12 2a 0.18b 0.14
a 0.23
a NEUTRINO
24
NMA = network meta-analysis; RCT = randomized controlled trial; RR = relative risk. a Baseline probability b.Reported incidence in NEUTRINO

Direct-Acting Antiviral Agents for Chronic Hepatitis C Genotype 1 175
APPENDIX 9: CRITICAL APPRAISAL OF INCLUDED STUDIES
TABLE 86: TREATMENT-NAIVE PATIENTS — ASSESSMENT OF RISK OF BIAS
Study Name, Author, Year
Ran
do
miz
atio
n
Allo
cati
on
Co
nce
alm
en
t
Blin
din
g
Inco
mp
lete
Ou
tco
me
Me
asu
res
Sele
ctiv
e
Ou
tco
me
Re
po
rtin
g
Oth
er
Sou
rce
s o
f
Bia
s
Studies included in the NMA
Boceprevir
SPRINT2 Poordad et al., 201112
Low Low Low Low Low Low
SPRINT1 Kwo et al., 201019
Low Low High Low Unclear Low
Telaprevir
ADVANCE Jacobson et al., 201113
Unclear Low Low Low Low Low
OPTIMIZE Buti et al., 201421
Low Low Unclear Low High Low
Marcellin et al., 201122
Low Unclear Unclear Low Unclear Low
PROVE2 Hézode et al., 200926
Low Unclear High Unclear Unclear Low
PROVE1 McHutchison et al., 200914
Unclear Unclear Low Unclear Unclear Low
Kumada et al., 201223
Unclear Unclear High Unclear Unclear Low
Simeprevir
QUEST1127
Low Low Unclear Low Unclear Low
QUEST2128
Low Low Unclear Low Unclear Low
PILLAR Fried et al., 201315
Unclear Low Low Low Unclear Low
Sofosbuvir
PROTON Lawitz et al., 201316
Low Low High Low Unclear Unclear
Studies not included in the NMA
Telaprevir
ILLUMINATE Sherman et al., 201120
Low Low Unclear Low High Low
Sofosbuvir
ATOMIC Kowdley et al., 201325
Low Unclear Unclear Low Unclear Low
NEUTRINO Lawitz et al., 201324
Unclear Unclear Unclear Low High Unclear
NMA = network meta-analysis.

Direct-Acting Antiviral Agents for Chronic Hepatitis C Genotype 1 176
TABLE 87: TREATMENT-EXPERIENCED PATIENTS — ASSESSMENT OF RISK OF BIAS
Study Name, Author, Year
Ran
do
miz
atio
n
Allo
cati
on
Co
nce
alm
en
t
Blin
din
g
Inco
mp
lete
Ou
tco
me
Me
asu
res
Sele
ctiv
e
Ou
tco
me
Re
po
rtin
g
Oth
er
Sou
rce
s o
f
Bia
s
Studies included in the NMA
Boceprevir
RESPOND2 Bacon et al., 201127
Low Low Unclear Low Low Low
Flamm et al., 201328
Unclear Low Unclear Low Unclear Low
Telaprevir
REALIZE Zeuzem et al., 201129
Low Low Low Low High Low
PROVE3 McHutchison et al., 201030
Unclear Unclear Unclear Low Unclear Low
Simeprevir
PROMISE Forns et al., 201431
Unclear Low Unclear Low Unclear Low
ASPIRE Zeuzem et al., 201432
Low Low Unclear Low Unclear Low
Studies not included in the NMA
Boceprevir
PROVIDE Vierling et al., 201433
Unclear Unclear Unclear Low Unclear Unclear
Telaprevir
Colombo et al., 201334
Unclear Unclear Unclear Unclear Unclear Unclear
Muir et al., 201135
Unclear Unclear Unclear Unclear Unclear Unclear
NMA = network meta-analysis.
TABLE 88: HIV CO-INFECTION — ASSESSMENT OF RISK OF BIAS
Author, Year
Ran
do
miz
atio
n
Allo
cati
on
Co
nce
alm
en
t
Blin
din
g
Inco
mp
lete
Ou
tco
me
Me
asu
res
Sele
ctiv
e
Ou
tco
me
Re
po
rtin
g
Oth
er
Sou
rce
s o
f
Bia
s Boceprevir
Sulkowski et al., 2013b36
Low Low Low Unclear Unclear Low
Telaprevir
Sulkowski et al., 2013a37
Low Low Low Low Unclear Low

Direct-Acting Antiviral Agents for Chronic Hepatitis C Genotype 1 177
APPENDIX 10: CHARACTERISTICS OF INCLUDED STUDIES
TABLE 89: TREATMENT-NAIVE PATIENTS — DISPOSITION
Study Name, Author, Year Treatment Proportion of Patients Who Did Not Complete Study Follow-Up
n N %
Boceprevir
SPRINT2 Poordad et al., 201112
PR48 2b 128 363 35%
B24 PR28/48 2b RGT 78 368 21%
SPRINT1 Kwo et al., 201019
PR48 2b 10 104 10% *B24 PR28 2b 18 103 17%
Telaprevir
ADVANCE Jacobson et al., 2011
13
PR48 2a 36 361 10%
T12 PR24/48 2a RGT q8 35 363 10%
OPTIMIZE Buti et al., 201421
T12 PR24/48 2a RGT q8 34 371 9%
T12 PR24/48 2a RGT q12 40 369 11%
Marcellin et al., 201122
T12 PR24/48 2a RGT q8 3 40 8%
T12 PR24/48 2b RGT q8 3 42 7%
T12 PR24/48 2a RGT q12 3 40 8%
T12 PR24/48 2b RGT q12 3 39 8% aILLUMINATE Sherman et al.,
201120
T12 PR24 2a RGT eRVR q8 7 162 4% *T12 PR48 2a RGT eRVR q8 13 160 8%
T12 PR48 2a RGT no eRVR q8 15 118 13% *Discontinued prior to wk20 40 100 40%
Kumada et al., 201223
PR48 2b 9 63 14% *T12 PR24 2b q8 12 126 10%
Simeprevir bQUEST1
C208117
PR48 2a 10 130 8%
Si12 PR24/48 2a RGT 21 264 8% cQUEST2
C216117
PR48 2a/b 17 134 13%
Si12 PR24/48 2a/b RGT 12 257 5%
PILLAR Fried et al., 201315
PR48 2a 6 77 8%
Si12 PR24/48 2a RGT 7 77 9%
Sofosbuvir
PROTON Lawitz et al., 201316
PR48 2a 12 26 46% *So12 PR24/48 2a RGT 5 47 11%
aNEUTRINO Lawitz et al.,
201324
So12 PR12 2a 29 327 9%
aATOMIC Kowdley et al., 2013
25 So12 PR12 2a 4 52 8%
*Not a Health Canada–recommended dosage regimen. aStudy not included in the network meta-analysis.
bQUEST1 data incomplete: 69% to 71% of patients ongoing at cut-off date for interim data lock (60 of 72 weeks follow-up)
cQUEST2 data incomplete: 49% to 52% of patients ongoing at cut-off date for interim data lock (60 of 72 weeks follow-up).

Direct-Acting Antiviral Agents for Chronic Hepatitis C Genotype 1 178
TABLE 90: TREATMENT-EXPERIENCED — DISPOSITION
Study Name, Author, Year Treatment Proportion of Patients Who Did Not Complete Study Follow-Up
n N %
Boceprevir
RESPOND2 Bacon 2011 et al.,27
PR48 2b 5 80 6%
B32 PR36/48 2b RGT 16 162 10%
B44 PR48 2b 10 161 6%
PROVIDE aVierling et al., 2014
33 B44 PR48 23 168 14%
Telaprevir
REALIZE Zeuzem et al., 201129
PR48 2a 22 132 17%
T12 PR48 2a q8 21 266 8%
*T12 PR48 2a LI q8 16 264 6%
Simeprevir
PROMISE Forns et al., 201431
PR48 2a 14 133 11%
Si12 PR24/48 2a RGT 10 260 4%
ASPIRE Zeuzem et al., 201432
PR48 2a 7 66 11%
Si12 PR48 2a 5 66 8%
*Not a Health Canada–recommended dosage regimen.
aStudy not included in the network meta-analysis
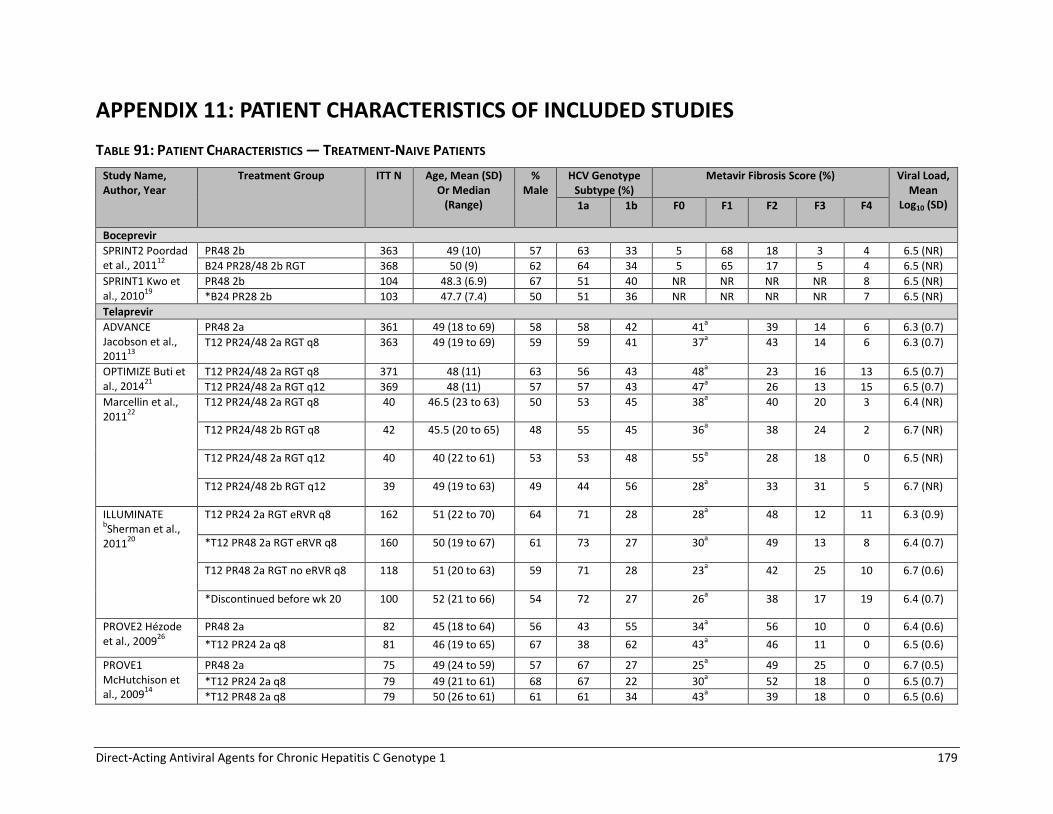
Direct-Acting Antiviral Agents for Chronic Hepatitis C Genotype 1 179
APPENDIX 11: PATIENT CHARACTERISTICS OF INCLUDED STUDIES
TABLE 91: PATIENT CHARACTERISTICS — TREATMENT-NAIVE PATIENTS
Study Name, Author, Year
Treatment Group ITT N Age, Mean (SD) Or Median
(Range)
% Male
HCV Genotype Subtype (%)
Metavir Fibrosis Score (%) Viral Load, Mean
Log10 (SD) 1a 1b F0 F1 F2 F3 F4
Boceprevir
SPRINT2 Poordad et al., 2011
12
PR48 2b 363 49 (10) 57 63 33 5 68 18 3 4 6.5 (NR)
B24 PR28/48 2b RGT 368 50 (9) 62 64 34 5 65 17 5 4 6.5 (NR)
SPRINT1 Kwo et al., 2010
19
PR48 2b 104 48.3 (6.9) 67 51 40 NR NR NR NR 8 6.5 (NR)
*B24 PR28 2b 103 47.7 (7.4) 50 51 36 NR NR NR NR 7 6.5 (NR)
Telaprevir
ADVANCE Jacobson et al., 2011
13
PR48 2a 361 49 (18 to 69) 58 58 42 41a 39 14 6 6.3 (0.7)
T12 PR24/48 2a RGT q8 363 49 (19 to 69) 59 59 41 37a 43 14 6 6.3 (0.7)
OPTIMIZE Buti et al., 2014
21
T12 PR24/48 2a RGT q8 371 48 (11) 63 56 43 48a 23 16 13 6.5 (0.7)
T12 PR24/48 2a RGT q12 369 48 (11) 57 57 43 47a 26 13 15 6.5 (0.7)
Marcellin et al., 2011
22
T12 PR24/48 2a RGT q8 40 46.5 (23 to 63) 50 53 45 38a 40 20 3 6.4 (NR)
T12 PR24/48 2b RGT q8 42 45.5 (20 to 65) 48 55 45 36a 38 24 2 6.7 (NR)
T12 PR24/48 2a RGT q12 40 40 (22 to 61) 53 53 48 55a 28 18 0 6.5 (NR)
T12 PR24/48 2b RGT q12 39 49 (19 to 63) 49 44 56 28a 33 31 5 6.7 (NR)
ILLUMINATE bSherman et al.,
201120
T12 PR24 2a RGT eRVR q8 162 51 (22 to 70) 64 71 28 28a 48 12 11 6.3 (0.9)
*T12 PR48 2a RGT eRVR q8 160 50 (19 to 67) 61 73 27 30a 49 13 8 6.4 (0.7)
T12 PR48 2a RGT no eRVR q8 118 51 (20 to 63) 59 71 28 23a 42 25 10 6.7 (0.6)
*Discontinued before wk 20 100 52 (21 to 66) 54 72 27 26a 38 17 19 6.4 (0.7)
PROVE2 Hézode et al., 2009
26
PR48 2a 82 45 (18 to 64) 56 43 55 34a 56 10 0 6.4 (0.6)
*T12 PR24 2a q8 81 46 (19 to 65) 67 38 62 43a 46 11 0 6.5 (0.6)
PROVE1 McHutchison et al., 2009
14
PR48 2a 75 49 (24 to 59) 57 67 27 25a 49 25 0 6.7 (0.5)
*T12 PR24 2a q8 79 49 (21 to 61) 68 67 22 30a 52 18 0 6.5 (0.7)
*T12 PR48 2a q8 79 50 (26 to 61) 61 61 34 43a 39 18 0 6.5 (0.6)

Direct-Acting Antiviral Agents for Chronic Hepatitis C Genotype 1 180
Study Name, Author, Year
Treatment Group ITT N Age, Mean (SD) Or Median
(Range)
% Male
HCV Genotype Subtype (%)
Metavir Fibrosis Score (%) Viral Load, Mean
Log10 (SD) 1a 1b F0 F1 F2 F3 F4
Kumada et al., 2012
23
PR48 2b 63 55 (20 to 65) 52 0 100 NR 6.9 (NR)
*T12 PR24 2b q8 126 53 (20 to 65) 52 2 98 NR 6.7 (NR)
Simeprevir
QUEST1 (C208)
116,117
PR48 2a 130 48 (20 to 66) 57 57 43 38a 31 18 13 6.3 (0.8)
Si12 PR24/48 2a RGT 264 48 (19 to 68) 56 56 44 45a 25 18 12 6.4 (0.6)
QUEST2 (C216)
116,117
PR48 2a/b 134 47 (18 to 73) 57 40 57 45a 31 13 11 6.4 (0.7)
Si12 PR24/48 2a/b RGT 257 46 (18 to 73) 54 41 58 52a 26 15 7 6.4 (0.7)
PILLAR, Fried et al., 2013
15
PR48 2a 77 45 (21 to 67) 51 38 NR 12 46 34 9 0 6.4 (0.6)
Si12 PR24/48 2a RGT 77 47 (18 to 69) 56 49 NR 16 42 34 9 0 6.5 (0.5)
Sofosbuvir
PROTON, Lawitz et al., 2013
16
PR48 2a 26 48.6 (9.4) 73 77 23 12a 81 8 0 6.5 (0.8)
*So12 PR24/48 2a RGT 47 51.4 (9.4) 45 74 26 15a 81 4 0 6.4 (0.8)
NEUTRINO, bLawitz et al.,
201324
So12 PR12 2a 327 52 (19 to 70) 64% 69%c 20%
c NR NR NR 17% 6.4 (0.7)
ATOMIC, bKowdley et al.,
201325
So12 PR12 2a 52 51 (10) 67 77 23 17a 69 14 0 6.5 (0.7)
F0 = no fibrosis; F1 = portal fibrosis without septa; F2 = portal fibrosis with rare septa; F3 = numerous septa without cirrhosis; F4 = cirrhosis; HCV = hepatitis C virus; ITT = intention to treat; NR = not reported; SD = standard deviation. *Not a Health Canada–recommended dosage regimen. aProportion of patients with Metavir F0 or F1; bStudy not included in the network meta-analysis. cNEUTRINO includes 35 patients (11%) with genotype 4,5,6 chronic hepatitis C.

Direct-Acting Antiviral Agents for Chronic Hepatitis C Genotype 1 181
TABLE 92: PATIENT CHARACTERISTICS — STUDIES OF TREATMENT-EXPERIENCED PATIENTS INCLUDED IN THE NMA
Study Name, Author, Year
Treatment Group ITT N Age, Mean (SD) or Median (Range)
% Male
Treatment History With PR (%)
HCV Genotype
Subtype (%)
Metavir Fibrosis Score (%) Viral Load, Mean Log10
(SD)/ Median (Range) Relapse Partial Null 1a 1b F0 F1 F2 F3 F4
Boceprevir
RESPOND2 Bacon et al., 2011
27
PR48 2b 80 52.9 (8.0) 72 64 36 0 58 42 6 54 16 6 13 6.5 (0.7)
B32 PR36/48 2b RGT 162 52.9 (7.4) 60 65 35 0 58 41 5 49 19 9 10 6.6 (0.5)
B44 PR48 2b 161 52.3 (7.7) 70 64 36 0 60 38 3 48 22 6 14 6.7 (0.6)
Flamm et al., 2013
28
PR48 2a 67 53.5 (6.8) 64 70 30 0 57 40 70a 9 13
B44 PR48 2a 134 52.0 (7.2) 72 73 27 0 56 41 69a 6 18
Telaprevir
REALIIZE Zeuzem et al., 2011
29
PR48 2a 132 49.9 (9.74) 67 52 20 28 45 45 27b 29 22 23 6.6 (SE 0.05)
T12 PR48 2a q8 266 50.7 (8.51) 69 55 18 27 44 45 19 b
31 23 27 6.6 (SE 0.03)
*T12 PR48 2a LI q8 264 51 (8.24) 72 53 18 28 46 44 26 b
27 22 25 6.6 (SE 0.04)
PROVE3 McHutchison et al., 2010
30
PR48 2a 114 50 (18 to 65) 67 36 60 62 30 29 b
32 27 11 6.6 (0.5)
*T12 PR24 2a q8 115 51 (22 to 65) 68 37 57 60 29 23 b
38 23 17 6.7 (0.5)
Simeprevir
ASPIRE Zeuzem et al., 2014
32
PR48 2a 66 50.5 (22 to 66)
64 41 35 24 41 59 11 28 25 20 16 6.6 (5.2 to 7.6)
Si12 PR48 2a 66 48 (20 to 63) 68 39 35 26 46 55 8 29 27 17 20 6.6 (3.5 to 7.5)
PROMISE Forns et al., 2014
31
PR48 2a 133 50.3 (10.76) 59 100 0 0 41 59 36 b
39 11 14 6.5 (0.6)
Si12 PR24/48 2a RGT
260 49.7 (10.27) 69 100 0 0 42 57 35 b
32 18 16 6.4 (0.6)
F0 = no fibrosis; F1 = portal fibrosis without septa; F2 = portal fibrosis with rare septa; F3 = numerous septa without cirrhosis; F4 = cirrhosis; HCV = hepatitis C virus; ITT = intention to treat; NMA = network meta-analysis; NR = not reported; PR = pegylated interferon 2a or 2b plus ribavirin; SD = standard deviation. *Not a Health Canada–recommended dosage regimen.
aProportion of patients with Metavir F0, F1 or F2. bProportion of patients with Metavir F0 or F1.

Direct-Acting Antiviral Agents for Chronic Hepatitis C Genotype 1 182
TABLE 93: PATIENT CHARACTERISTICS — STUDIES OF TREATMENT-EXPERIENCED PATIENTS NOT INCLUDED IN THE NMA
Study Name, Author, Year
Treatment ITT N Age, Mean (SD) or Median (Range)
% Male
Treatment History with PR (%) HCV Genotype
Subtype (%)
Metavir Fibrosis Score (%) Viral Load, Mean Log10
(SD)
Naive Relapse Partial Null 1a 1b F0 F1 F2 F3 F4
Boceprevir
PROVIDE Vierling et al., 2014
33
B44 PR48 168 52 (8) 67 0 17 51 31 62 38 3 53 24 6 10 6.3 (NR)
Telaprevir
Colombo et al., 2013
34
T12 PR24/48
RGT or T12 PR48
1587 53 (19 to 75)
64 20 33 13 27 22 74 0* 0 47 53 6.1 (0.7)
Muir et al., 2011
35
T12 PR24/48
RGT, T12PR24 or
T12PR48
117 50 (19 to 63)
69 0 25 32 44 59 32 25a 38 29 9 NR
F0 = no fibrosis; F1 = portal fibrosis without septa; F2 = portal fibrosis with rare septa; F3 = numerous septa without cirrhosis; F4 = cirrhosis; HCV = hepatitis C virus; ITT = intention to treat; NMA = network meta-analysis; NR = not reported; PR = pegylated interferon 2a or 2b plus ribavirin; SD = standard deviation. aProportion of patients with Metavir score F0 or F1.

Direct-Acting Antiviral Agents for Chronic Hepatitis C Genotype 1 183
TABLE 94: PATIENT CHARACTERISTICS — HIV CO-INFECTION STUDIES
Study Name, Author, Year
Treatment Group
ITT N Age, Mean (SD) or Median
(Range)
% Male HCV Genotype Subtype (%)
Metavir Fibrosis Score (%) Viral Load, Mean Log10 (SD)/Median
(Range) 1a 1b F0/F1 F2 F3 F4
Boceprevir
Sulkowski et al., 2013
36
PR 34 45 (10) 65% 74% 26% 85% 3% 3% 6.8 (6.2 to 7.1)
Boceprevir + PR
64 43 (8) 72% 80% 19% 84% 6% 3% 6.6 (6.2 to 7.0)
Telaprevir
Sulkowski et al., 2013
37
PR 22 44 (26 to 65) 82% 64% 27% 50% 41% 9% 0% 6.4 (0.6)
Telaprevir + PR
38 46 (31 to 59) 92% 71% 29% 26% 61% 8% 5% 6.5 (0.7)
F0 = no fibrosis; F1 = portal fibrosis without septa; F2 = portal fibrosis with rare septa; F3 = numerous septa without cirrhosis; F4 = cirrhosis; HCV = hepatitis C virus; ITT = intention to treat; PR = peginterferon plus ribavirin; SD = standard deviation.
TABLE 95: ANTIRETROVIRAL THERAPIES — HIV CO-INFECTION STUDIES
Study Name, Author, Year
Treatment Treatment with Antiretrovirals
NRTI Protease Inhibitors Raltegravir or Other
Boceprevir
Sulkowski et al., 201336
PR 97% 91% 15%
Boceprevir + PR 92% 86% 20%
No Treatment Efavirenz-Based Regimen Ritonavir-Boosted Regimen
Telaprevir
Sulkowski et al., 201337
PR 27% 36% 36%
Telaprevir + PR 18% 42% 39%
NRTI = nucleoside reverse transcriptase inhibitors; PR = peginterferon plus ribavirin.

Direct-Acting Antiviral Agents for Chronic Hepatitis C Genotype 1 184
APPENDIX 12: SUMMARY OF RESULTS OF TREATMENT-NAIVE STUDIES
TABLE 96: TREATMENT-NAIVE PATIENTS — PROPORTION OF PATIENTS WITH SVR
Study Name, Author, Year
Treatment N SVR24 SVR12
n % n %
Boceprevir
SPRINT2 Poordad et al., 2011
12
PR48 2b 363 137 38 NR
B24 PR28/48 2b RGT 368 233 63 NR
SPRINT1 Kwo et al., 2010
19
PR48 2b 104 39 38 NR
*B24 PR28 2b 103 58 56 NR
Telaprevir
ADVANCE Jacobson et al., 2011
13
PR48 2a 361 158 44 161 45
T12 PR24/48 2a RGT q8 363 271 75 275 76
OPTIMIZE Buti et al., 2014
21
T12 PR24/48 2a RGT q8 371 270 73 270 73
T12 PR24/48 2a RGT q12 369 276 75 274 74
Marcellin et al., 2011
22
T12 PR24/48 2a RGT q8 40 34 85 NR
T12 PR24/48 2b RGT q8 42 34 81 NR
T12 PR24/48 2a RGT q12 40 33 83 NR
T12 PR24/48 2b RGT q12 39 32 82 NR
ILLUMINATE aSherman et al.,
201120
T12 PR24 2a RGT eRVR q8 162 149 92 151 93
*T12 PR48 2a RGT eRVR q8 160 140 88 144 90
T12 PR48 2a RGT no eRVR q8 118 76 64 79 67
*Discontinued prior to wk 20 100 23 23 28 28
PROVE2 Hérzode et al., 2009
26
PR48 2a 82 38 46 39 48
*T12 PR24 2a q8 81 56 69 56 69
PROVE1 McHutchison et al., 2009
14
PR48 2a 75 31 41 27 36
*T12 PR24 2a q8 79 48 61 42 53
*T12 PR48 2a q8 79 53 67 46 58
Kumada et al., 201323
PR48 2b 63 31 49 NR
*T12 PR24 2b q8 126 92 73 NR
Simeprevir
QUEST1 C208
117
PR48 2a 130 NR 65 50
Si12 PR24/48 2a RGT 264 NR 210 80
QUEST2 C216
117
PR48 2a/b 134 NR 67 50
Si12 PR24/48 2a/b RGT 257 NR 209 81
PILLAR Fried et al., 2013
15
PR48 2a 77 50 65 51 66
Si12 PR24/48 2a RGT 77 62 81 62 81
Sofosbuvir
PROTON Lawitz et al., 2013
16
PR48 2a 26 15 58 15 58
*So12 PR24/48 2a RGT 47 42 89 43 91
NEUTRINO a,b
Lawitz et al., 2013
24
So12 PR12 2a 292 NR 261 89
ATOMIC aKowdley
et al., 201325
So12 PR12 2a 52 46 88 47 90
NR = not reported; SVR12/24 = sustained viral response 12 or 24 weeks after the end of treatment; wk = week. *Not a Health Canada–recommended dosage regimen aStudy not included in the network meta-analysis.
bSubgroup with genotype 1 (SVR12 for all patients 295/327, 90%).

Direct-Acting Antiviral Agents for Chronic Hepatitis C Genotype 1 185
TABLE 97: TREATMENT-NAIVE PATIENTS — SVR BY FIBROSIS SEVERITY
Study Name Treatment SVR12/24
Metavir F0-F2 Metavir F3-F4
n N % n N %
Boceprevir
SPRINT2 Poordad et al., 2011
12
PR48 2b 123 328 38 9 24 38
B24 PR28/48 2b RGT 213 319 67 14 34 41
*B44 PR48 211 313 67 22 42 52
SPRINT1 cKwo et al.,
201019
PR48 2b 37
a 96
a 39
a 2
b 8
b 25
b
*B24 PR28 2b 54a 96
a 56
a 4
b 7
b 57
b
*B44 PR48 74a 97
a 76
a 3
b 6
b 50
b
Telaprevir
ADVANCE Jacobson et al., 2011
13
PR48 2a 134 288 47 24 73 33
T12 PR24/48 2a RGT q8 226 290 78 45 73 62
OPTIMIZE Buti et al., 2014
21
T12 PR24/48 2a RGT q8 208 262 79 62 108 57
T12 PR24/48 2a RGT q12 213 267 80 61 102 60
ILLUMINATE cSherman et al.,
201120
T12 PR24 2a RGT eRVR q8 118 124 95 31 38 82
*T12 PR48 2a RGT eRVR q8 111 127 87 29 33 88
T12 PR48 2a RGT no eRVR q8 53 76 70 23 42 55
*Discontinued prior to wk 20 12 64 19 11 36 31
Simeprevir
QUEST1 C208
17
PR48 2a 54 90 60 11 40 28
Si12 PR24/48 2a RGT 152 183 83 54 77 70
QUEST2 C216
18
PR48 2a/b 52 102 51 15 32 47
Si12 PR24/48 2a/b RGT 165 195 85 35 53 66
Sofosbuvir
NEUTRINO c, d
Lawitz et al., 2013
24
So12 PR12 2a 252a 273
a 92
a 43
b 54
b 80
b
F0 = no fibrosis; F1 = portal fibrosis without septa; F2 = portal fibrosis with rare septa; F3 = numerous septa without cirrhosis; F4 = cirrhosis; SVR = sustained viralogic response; SVR12/24 = sustained viralogic response 12 or 24 weeks after the end of treatment. *Not a Health Canada–recommended dosage regimen aData for Metavir score F0 to F3. bData Metavir score F4/cirrhosis.
cStudy not included in the network meta-analysis.
dIncludes 35 patients with genotype 4,5,6.

Direct-Acting Antiviral Agents for Chronic Hepatitis C Genotype 1 186
TABLE 98: TREATMENT-NAIVE PATIENTS — SVR BY GENOTYPE SUBTYPE
Study Name, Author, Year
Treatment Subgroup Genotype 1a Genotype 1b
n N % n N %
Boceprevir
SPRINT2 Poordad et al., 2011
12
PR48 2b 62 177 35 51 126 40
B24 PR28/48 2b RGT 106 179 59 89 134 66
SPRINT1 et al.,Kwo 2010
19
PR48 2b 16 53 30 17 42 41
*B24 PR28 2b 27 53 51 22 37 60
Telaprevir
ADVANCE Jacobson et al., 2011
13
PR48 2a 85 208 41 73 151 48
T12 PR24/48 2a RGT q8 152 213 71 118 149 79
OPTIMIZE Buti et al., 2014
21
T12 PR24/48 2a RGT q8 145 209 69 123 160 77
T12 PR24/48 2a RGT q12 146 210 70 126 157 80
ILLUMINATE aSherman et al.,
201120
T12 PR24 2a RGT eRVR q8 103 115 90 45 46 98
*T12 PR48 2a RGT eRVR q8 103 117 88 37 43 86
T12 PR48 2a RGT no eRVR q8 49 84 58 26 33 79
*Discontinued prior to wk 20 18 72 25 4 27 15
Simeprevir
QUEST1 C208
17,115
PR48 2a 36 74 49 29 56 52
Si12 PR24/48 2a RGT All patients 105 147 71 105 117 90
Si12 PR24/48 2a RGT With Q80K 31 60 52 NR
Si12 PR24/48 2a RGT Without Q80K
73 86 85 NR
QUEST2 C216
18,115
PR48 2a/b 26 57 46 41 77 53
Si12 PR24/48 2a/b RGT All patients 86 107 80 123 150 82
Si12 PR24/48 2a/b RGT With Q80K 18 24 75 NR
Si12 PR24/48 2a/b RGT Without Q80K
65 79 82 NR
PILLAR aFried et
al., 201315
PR48 2a 19 29 67 31 48 64
Si12 PR24/48 2a RGT NR NR
Sofosbuvir
NEUTRINO Lawitz et al.,
a,b 2013
24
So12 PR12 2a 206 225 92 54 66 82
NR = not reported; SVR = sustained viral response 12 or 24 weeks after the end of treatment. *Not a Health Canada–recommended dosage regimen. aStudy not included in the network meta-analysis. bIncludes 35 patients with genotype 4, 5 or 6.

Direct-Acting Antiviral Agents for Chronic Hepatitis C Genotype 1 187
TABLE 99: TREATMENT-NAIVE PATIENTS — RELAPSE AND MORTALITY
Study Name, Author, Year Treatment Group Relapse Mortality
n N % n N %
Boceprevir
SPRINT2 Poordad et al., 201112
PR48 2b 39 176 22% 4 363 1%
B24 PR28/48 2b RGT 24 257 9% 2 368 0.5%
SPRINT1 Kwo et al., 201019
PR48 2b 12 51 24% 0 104 0%
*B24 PR28 2b 18 76 24% 1 103 1%
Telaprevir
ADVANCE Jacobson et al., 2011
13
PR48 2a 64 229 28% 1 361 0.3%
T12 PR24/48 2a RGT q8 27 314 9% 2 363 0.6%
OPTIMIZE Buti et al., 201421
T12 PR24/48 2a RGT q8 NR NR 7% 1 371 0.3%
T12 PR24/48 2b RGT q12 NR NR 8% 0 369 0%
Marcellin et al., 201122
T12 PR24/48 2a RGT q8 3 37 8% 0 40 0%
T12 PR24/48 2b RGT q8 2 37 5% 0 42 0%
T12 PR24/48 2a RGT q12 3 37 8% 0 40 0%
T12 PR24/48 2b RGT q12 1 34 3% 0 39 0%
ILLUMINATE Sherman et al., 2011
20
T12 PR24 2a RGT eRVR q8 9 159 6% 1 162 0.6%
*T12 PR48 2a RGT eRVR q8 4 154 3% 0 160 0%
T12 PR48 2a RGT no eRVR q8 11 97 11% 0 118 0%
*Discontinued prior wk20 13 59 22% 0 100 0%
PROVE2 Hézode et al., 200926
PR48 2a 10 45 22% 0 82 0%
*T12 PR24 2a q8 8 57 14% 0 81 0%
PROVE1 McHutchison et al., 2009
14
PR48 2a 8 35 23% 0 75 0% a*T12 PR24 2a q8 1 41 2% 0 79 0%
*T12 PR48 2a q8 3 51 6% 0 79 0%
Kumada et al., 201223
PR48 2b NR NR 22 NR 63 NR
*T12 PR24 2b q8 NR NR 17% NR 126 NR
Simeprevir
QUEST1 C208
117
PR48 2a 17 83 21% 0 130 0%
Si12 PR24/48 2a RGT 24 233 10% 0 264 0%
QUEST2 C216
117
PR48 2a/b 21 88 24% 0 134 0%
Si12 PR24/48 2a/b RGT 31 236 13% 2 257 0.8%
PILLAR Fried et al., 201315
PR48 2a 11 62 18% 0 77 0%
Si12 PR24/48 2a RGT 6 69 9% 0 77 0%
Sofosbuvir
PROTON Lawitz et al., 201316
PR48 2a 0 16 0% 0 26 0%
*So12 PR24/48 2a RGT 1 47 2% 0 47 0%
Studies not included in the NMA
NEUTRINO Lawitz et al., b2013
24 So12 PR12 2a 28 326 9 0 327 0%
ATOMIC Kowdley et al., 201325
So12 PR12 2a 2 NR 4 0 52 0%
NR = not reported; wk = week.
*Not a Heath Canada-recommended dose. aRelapse was measured in patients who had rapid viral response at week 4, undetectable HCV RNA levels through to week 20 and completed therapy: excluded those who escaped to PR 48 weeks due to inadequate early viral response. bIncludes 35 patients with genotype 4, 5, or 6.

Direct-Acting Antiviral Agents for Chronic Hepatitis C Genotype 1 188
TABLE 100: TREATMENT-NAIVE — QUALIFIED FOR SHORT-DURATION RGT
Study Name, First Author, Year Treatment Group Qualified for 24/28 Week RGT Treatment Duration
n N %
Boceprevir
SPRINT2 Poordad et al., 201112
B24 PR28/48 2b RGT 162 368 44%
Telaprevir
ADVANCE Jacobson et al., 201113
T12 PR24/48 2a RGT q8 210 363 58%
OPTIMIZE Buti et al., 201421
T12 PR24/48 2a RGT q8 250 371 67%
T12 PR24/48 2b RGT q12 256 369 69%
Marcellin et al., 201122
T12 PR24/48 2a RGT q8 30 40 75%
T12 PR24/48 2b RGT q8 28 42 67%
T12 PR24/48 2a RGT q12 29 40 73%
T12 PR24/48 2b RGT q12 22 39 56%
ILLUMINATE Sherman et al., 201120
Overall population T12 PR24/48 2a RGT q8
352 540 65%
Simeprevir
QUEST1 C208
117
Si12 PR24/48 2a RGT 222 264 84%
QUEST2 C216
117
Si12 PR24/48 2a/b RGT 235 257 91%
PILLAR Fried et al., 201315
Si12 PR24/48 2a RGT 61 77 79%
Sofosbuvir
PROTON Lawitz et al., 201316
*So12 PR24/48 2a RGT NR
NR = not reported; RGT = response-guided therapy.
*Not a Heath Canada-recommended dose.

Direct-Acting Antiviral Agents for Chronic Hepatitis C Genotype 1 189
TABLE 101: TREATMENT-NAIVE — ALL-CAUSE TREATMENT DISCONTINUATION
Study Name, Author, Year Outcome Treatment N N %
Boceprevir
SPRINT2 Poordad et al., 2011
12
Stopped treatment during overall treatment period
PR48 2b 204 363 56%
B24 PR28/48 2b RGT 139 368 38%
SPRINT1 Kwo et al., 201019
Stopped treatment PR48 2b 52 104 50%
*B24 PR28 2b 27 103 26%
Telaprevir
ADVANCE Jacobson et al., 2011
13
Stopped treatment PR48 2a 159 361 44
T12 PR24/48 2a RGT q8 95 363 26
Marcellin et al., 201122
Stopped treatment during overall study period
T12 PR24/48 2a RGT q8 6 40 15%
T12 PR24/48 2b RGT q8 8 42 19%
T12 PR24/48 2a RGT q12 8 40 20%
T12 PR24/48 2b RGT q12 11 39 28%
ILLUMINATE Sherman et al., 2011
20
Discontinued treatment
T12 PR24 2a RGT eRVR q8 1 162 1
*T12 PR48 2a RGT eRVR q8 41 160 26
T12 PR48 2a RGT no eRVR q8 39 118 33
*Discontinued prior to randomization (week 20)
100 100 100
PROVE2 Hérzode et al.,,2009
26
Discontinued study drug
PR48 2a 32 82 39%
*T12 PR24 2a q8 20 81 25%
PROVE1 McHutchison et al., 2009
14
Stopped all treatment
PR48 2a 37 75 49%
*T12 PR24 2a q8 32 79 41%
*T12 PR48 2a q8 25 79 32%
Kumada et al., 201323
Discontinued all drugs
PR48 2b 17 63 27%
*T12 PR24 2b q8 27 126 21%
Simeprevir
QUEST1 C208
117
Discontinued simeprevir/placebo
PR48 2a 85 130 65
Si12 PR24/48 2a RGT 33 264 13
Discontinued peginterferon
PR48 2a 51 130 39
Si12 PR24/48 2a RGT 34 264 13
Discontinued ribavirin
PR48 2a 51 130 39
Si12 PR24/48 2a RGT 36 264 14
QUEST2 C216
117
Discontinued simeprevir/placebo
PR48 2a/b 83 134 62
Si12 PR24/48 2a/b RGT 10 257 4
Discontinued peginterferon
PR48 2a/b 53 134 40
Si12 PR24/48 2a/b RGT 21 257 8
Discontinued ribavirin
PR48 2a/b 53 134 40
Si12 PR24/48 2a/b RGT 20 257 8
PILLAR Fried et al., 201315
Discontinued all Drugs
PR48 2a 10 77 13
Si12 PR24/48 2a RGT 12 77 16
Sofosbuvir
PROTON Lawitz et al., 201316
Discontinued treatment
PR48 2a 11 26 42%
*So12 PR24/48 2a RGT 5 47 11%
Studies not included in the NMA
NEUTRINO Lawitz et al., 2013
24
Discontinued study treatment
So12 PR12 2a 7 327 2
ATOMIC Kowdley et al., 2013
25
Discontinued treatment
So12 PR12 2a 5 52 10
NMA = network meta-analysis; RGT = response-guided therapy.
*Not a Health Canada–recommended dosage regimen.
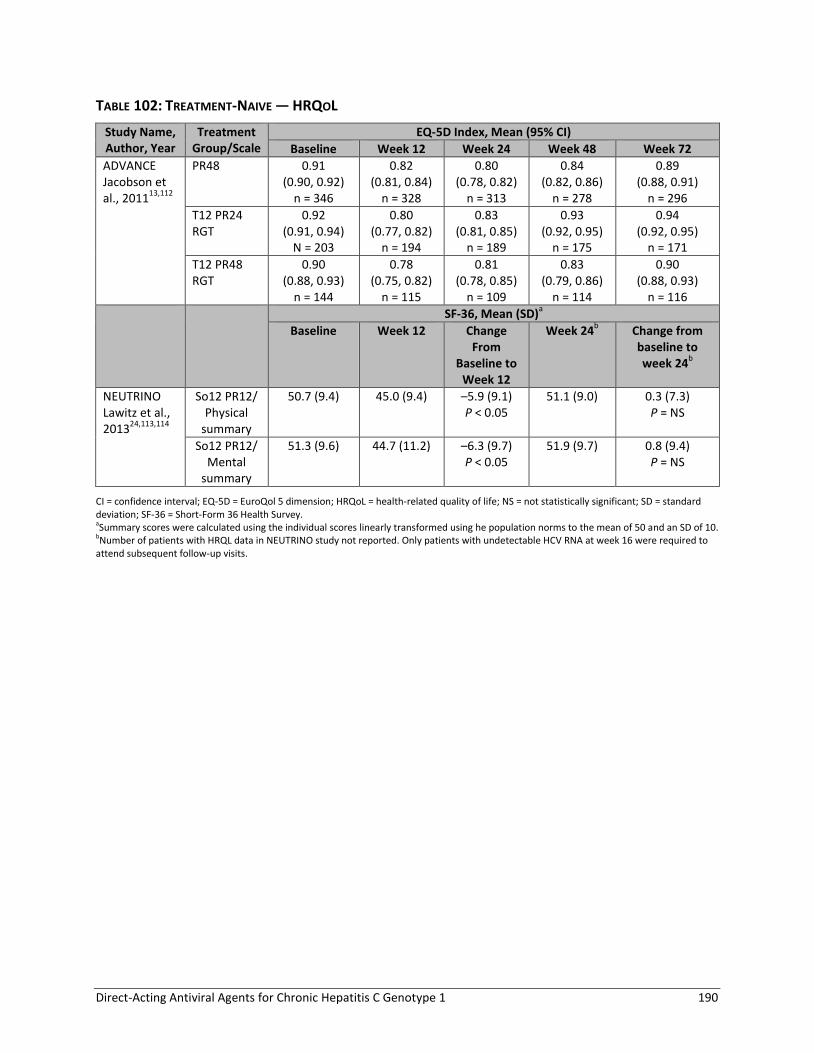
Direct-Acting Antiviral Agents for Chronic Hepatitis C Genotype 1 190
TABLE 102: TREATMENT-NAIVE — HRQOL
Study Name, Author, Year
Treatment Group/Scale
EQ-5D Index, Mean (95% CI)
Baseline Week 12 Week 24 Week 48 Week 72
ADVANCE Jacobson et al., 2011
13,112
PR48 0.91 (0.90, 0.92)
n = 346
0.82 (0.81, 0.84)
n = 328
0.80 (0.78, 0.82)
n = 313
0.84 (0.82, 0.86)
n = 278
0.89 (0.88, 0.91)
n = 296
T12 PR24 RGT
0.92 (0.91, 0.94)
N = 203
0.80 (0.77, 0.82)
n = 194
0.83 (0.81, 0.85)
n = 189
0.93 (0.92, 0.95)
n = 175
0.94 (0.92, 0.95)
n = 171
T12 PR48 RGT
0.90 (0.88, 0.93)
n = 144
0.78 (0.75, 0.82)
n = 115
0.81 (0.78, 0.85)
n = 109
0.83 (0.79, 0.86)
n = 114
0.90 (0.88, 0.93)
n = 116
SF-36, Mean (SD)a
Baseline Week 12 Change From
Baseline to Week 12
Week 24b Change from
baseline to week 24
b
NEUTRINO Lawitz et al., 2013
24,113,114
So12 PR12/ Physical
summary
50.7 (9.4) 45.0 (9.4) –5.9 (9.1) P < 0.05
51.1 (9.0) 0.3 (7.3) P = NS
So12 PR12/ Mental
summary
51.3 (9.6) 44.7 (11.2) –6.3 (9.7) P < 0.05
51.9 (9.7) 0.8 (9.4) P = NS
CI = confidence interval; EQ-5D = EuroQol 5 dimension; HRQoL = health-related quality of life; NS = not statistically significant; SD = standard deviation; SF-36 = Short-Form 36 Health Survey. aSummary scores were calculated using the individual scores linearly transformed using he population norms to the mean of 50 and an SD of 10. bNumber of patients with HRQL data in NEUTRINO study not reported. Only patients with undetectable HCV RNA at week 16 were required to attend subsequent follow-up visits.

Direct-Acting Antiviral Agents for Chronic Hepatitis C Genotype 1 191
TABLE 103: TREATMENT-NAIVE PATIENTS — KEY ADVERSE EVENTS
Study Name, Author, Year
Treatment N Any AE Discontinued Treatment Due to AE
SAE Anemia Depression Rash
n % n % n % n % n % n %
Boceprevir
SPRINT2 Poordad et al., 201112
PR48 2b 363 356 98 57 16 31 9 107 29 79 22 83 23
B24 PR28/48 2b RGT 368 365 99 45 12 42 11 182 49 83 23 93 25
SPRINT1 Kwo et al., 201019
PR48 2b 104 102 98 8 8 8 8 35 34 22 21 6 6
*B24 PR28 2b 103 102 99 15 15 8 8 55 53 20 19 6 6
Telaprevir
ADVANCE Jacobson et al., 201113
PR48 2a 361 354 98 26 7 24 7 70 19 79 22 88 24
T12 PR24/48 2a RGT q8 363 361 99 36 10 33 9 135 37 66 18 133 37
OPTIMIZE Buti et al., 201421
T12 PR24/48 2a RGT q8 371 368 99 70a 19a 48 13 166 45 NR NR 139 38
T12 PR24/48 2a RGT q12 369 361 98 57a 15a 42 11 174 47 NR NR 139 38
Marcellin et al., 201122
T12 PR24/48 2a RGT q8 40 40 100 3 8 5 13 18 45 7 18 29 73
T12 PR24/48 2b RGT q8 42 41 98 2 5 1 2 14 33 9 21 24 57
T12 PR24/48 2a RGT q12 40 40 100 4 10 4 10 18 45 4 10 23 58
T12 PR24/48 2b RGT q12 39 39 100 4 10 1 3 20 51 9 23 22 56
ILLUMINATE Sherman et al., b201120
T12 PR24 2a RGT eRVR q8 162 161 99 1 1 4 2 68 42 22 14 60 37
*T12 PR48 2a RGT eRVR q8 160 160 100 20 12 16 10 66 41 35 22 62 39
T12 PR48 2a RGT no eRVR q8 118 117 99 12 10 7 6 38 32 28 24 47 40
*Discontinued prior to wk 20 100 99 99 62 62 22 22 40 40 22 22 33 33
PROVE2 Hérzode et al., 200926
PR48 2a 82 81 99 6 7 8 10 14 17 19 23 29 35
*T12 PR24 2a q8 81 80 99 11 14 16 20 22 27 16 20 40 49
PROVE1 McHutchison et al., 200914
PR48 2a 75 75 100 8 11 4 5 20 27 13 17 31 41
*T12 PR24 2a q8 79 79 100 18 23 10 13 29 37 17 22 47 60
*T12 PR48 2a q8 79 79 100 11 14 5 6 23 29 15 19 48 61
Kumada et al., 201323
PR48 2b 63 63 100 14 22 6 10 46 73 NR 18 29
*T12 PR24 2b q8 126 126 100 21 17 15 12 115 91 NR 48 38
Simeprevir
QUEST1 C20817
PR48 2a 130 NR 4a 3a 5 4 14 11 NR NR 33 25
Si12 PR24/48 2a RGT 264 NR 7a 3a 7 3 42 16 NR NR 72 27

Direct-Acting Antiviral Agents for Chronic Hepatitis C Genotype 1 192
Study Name, Author, Year
Treatment N Any AE Discontinued Treatment Due to AE
SAE Anemia Depression Rash
n % n % n % n % n % n %
Interim data (12 weeks)
QUEST2 C21618 Interim data (12 weeks)
PR48 2a/b 134 NR 1 1 2 2 21 16 NR NR 15 11
Si12 PR24/48 2a/b RGT 257 NR 4 2 6 2 35 14 NR NR 61 24
PILLAR Fried et al., 201315
PR48 2a 77 75 97 4 5 10 13 16 21 14 18 18 23
Si12 PR24/48 2a RGT 77 76 99 4 5 4 5 17 22 9 12 16 21
Sofosbuvir
PROTON Lawitz et al., 201316 Interim data (12 weeks)
PR48 2a 26 NR 3 12 1c Unclear 5 19 NR NR 4 15
*So12 PR24/48 2a RGT 47 NR 3 6 1c Unclear 8 17 NR NR 12 26
NEUTRINO bLawitz et al., 201324
So12 PR12 2a 327 310 95 5 2 4 1 68 21 31 9 59 18
ATOMIC bKowdley et al., 201325
So12 PR12 2a 52 NR NR 3 6 2 4 7 14 4 8 7 14
AE = adverse event; NR = not reported; SAE = serious adverse event. *Not a Health Canada–recommended dosage regimen. aPermanent discontinuation of DAA: no data on discontinuation of PR. bStudy not included in the NMA . cOne patient in each group was reported to have an SAE; however, reporting was unclear, and thus may not be all patients who experienced SAE during the study.

Direct-Acting Antiviral Agents for Chronic Hepatitis C Genotype 1 193
TABLE 104: TREATMENT-NAIVE PATIENTS — OTHER ADVERSE EVENTS
Study Name, Author, Year
Treatment N Anorectal Discomfort
Fatigue Influenza-Like Symptoms
Neutropenia Pruritus
n % n % n % n % n %
Boceprevir
SPRINT2 Poordad et al., 201112
PR48 2b 363 NR 217 60 93 26% 77 21% 98 27
B24 PR28/48 2b RGT 368 196 53 91 25% 92 25% 87 24
SPRINT1 Kwo et al., 201019
PR48 2b 104 0 0% 57 55 25 24% 12 12% 16 15
*B24 PR28 2b 103 1 1% 70 68 21 20% 17 17% 19 18
Telaprevir
ADVANCE Jacobson et al., 201113
PR48 2a 361 13 4% 206 57 101 28% 68 19% 131 36
T12 PR24/48 2a RGT q8 363 46 13% 207 57 102 28% 51 14% 181 50
OPTIMIZE Buti et al., 201421
T12 PR24/48 2a RGT q8 371 119 32% 181 49 NR NR 170 46
T12 PR24/48 2a RGT q12 369 106 29% 185 50 172 47
Marcellin et al., 201122
T12 PR24/48 2a RGT q8 40 3 8% 15 38 16 40% 2 5% 19 48
T12 PR24/48 2b RGT q8 42 3 7% 15 36 19 45% 2 5% 23 55
T12 PR24/48 2a RGT q12 40 1 3% 16 40 11 28% 0 0% 20 50
T12 PR24/48 2b RGT q12 39 3 8% 15 39 20 51% 1 3% 25 64
ILLUMINATE Sherman et al., 201120
T12 PR24 2a RGT eRVR q8 162 35 22% 110 68 47 29% 23 14% 95 59
*T12 PR48 2a RGT eRVR q8 160 25 16% 111 69 40 25% 36 23% 83 52
T12 PR48 2a RGT no eRVR q8 118 18 15% 81 69 33 28% 31 26% 55 47
*Discontinued prior to wk20 100 8 8% 67 67 21 21% 13 13% 40 40
PROVE2 Hérzode 200926
PR48 2a 82 2 2% 30 37 43 52% 14 17% 29 35
*T12 PR24 2a q8 81 4 5% 21 26 32 40% 3 4% 41 51
PROVE1 McHutchison et al., 200914
PR48 2a 75 2 3% 57 76 32 43% 18 24% 17 23
*T12 PR24 2a q8 79 6 8% 55 70 39 49% 11 14% 38 48
*T12 PR48 2a q8 79 3 4% 58 73 30 38% 19 24% 32 40
Kumada et al., 201323
PR48 2b 63 NR NR 16 25% NR 13 21
*T12 PR24 2b q8 126 22 18% 23 18
Simeprevir
QUEST1 C20817 Interim data (12 weeks)
PR48 2a 130 NR 49 38 NR 14 11% 14 11
Si12 PR24/48 2a RGT 264 106 40 49 19% 56 21

Direct-Acting Antiviral Agents for Chronic Hepatitis C Genotype 1 194
Study Name, Author, Year
Treatment N Anorectal Discomfort
Fatigue Influenza-Like Symptoms
Neutropenia Pruritus
n % n % n % n % n %
QUEST2 C21618 Interim data (12 weeks)
PR48 2a/b 134 NR 52 39 34 25% NR 20 15
Si12 PR24/48 2a/b RGT 257 89 35 66 26% 48 19
PILLAR Fried et al., 201315
PR48 2a 77 NR 37 48 29 38% 16 21% 35 46
Si12 PR24/48 2a RGT 77 32 42 18 23% 19 25% 30 39
Sofosbuvir
PROTON Lawitz et al., 201316 Interim data (12 weeks)
PR48 2a 26 NR 14 54 NR 5 19% NR
*So12 PR24/48 2a RGT 47 32 68 14 30%
NEUTRINO Lawitz et al., 201324
So12 PR12 2a 327 2 < 1 192 59 51 16 54 17 54 17
ATOMIC Kowdley et al., 201325
So12 PR12 2a 52 NR 25 48 NR 12 23 NR
NR = not reported. *Not a Health Canada–recommended dosage regimen.

Direct-Acting Antiviral Agents for Chronic Hepatitis C Genotype 1 195
APPENDIX 13: SUMMARY OF RESULTS OF TREATMENT-EXPERIENCED STUDIES
TABLE 105: TREATMENT-EXPERIENCED PATIENTS — SVR12/24D
Study Name, Author, Year
Treatment All Patients Relapsed Partial Null
n N % n N % n N % n N %
Boceprevir
RESPOND2 Bacon et al., 201127
PR48 2b 17 80 21 15 51 29 2 29 7
B32 PR36/48 2b RGT
95 162 59 72 105 69 23 57 40
B44 PR48 2b 107 161 66 77 103 75 30 58 52
P05685 Flamm et al., 201328
PR48 2a 14 67 21 13 47 28 1 20 5
B44 PR48 2a 86 134 64 69 98 70 17 36 47
PROVIDE aVierling et al., 201433
B44 PR48 104 166 63 27 29 93 57 85 67 20 52 38
Telaprevir
REALIZE Zeuzem et al., 201129
PR48 2a 22 132 17b 16 68 24 4 27 15 2 37 5
T12 PR48 2a q8 171 266 64b 121 145 83 29 49 59 21 72 29
*T12 PR48 2a LI q8 175 264 66b 124 141 88 26 48 54 25 75 33
PROVE3 McHutchison et al., 201030
PR48 2a 16 114 14 8 41 20
*T12 PR24 2a q8 59 115 51 29 42 69
aMuir et al., 201135
*T12 PR24 4 24 17 4 24 17
T12 PR48 15 27 56 15 27 56
T12 PR24/48 RGT 50 66 76 28 29 97 22c 37c 59
Simeprevir
PROMISE Forns et al., 201431
PR48 2a 49 133 37 49 133 37
Si12 PR24/48 2a RGT
206 260 79 206 260 79
ASPIRE Zeuzem et al., 201432
PR48 2a 15 66 23b 10 27 37 2 23 9 3 16 19
Si12 PR48 2a 44 66 67b 20 26 77 15 23 65 9 17 53
SVR12/24 = sustained viral response 12 or 24 weeks after the end of treatment. *Not a Health Canada–recommended dosage regimen. aStudy not included in the network meta-analysis.
bData for SVR12 were identical except for REALIZE T12 PR48 group where 175/266 (66%) achieved SVR12.
cIncludes 8 patients with prior viral breakthrough, of which, 6 achieved SVR. dSVR12 reported in PROMISE; all other studies SVR24.

Direct-Acting Antiviral Agents for Chronic Hepatitis C Genotype 1 196
TABLE 106: TREATMENT-EXPERIENCED PATIENTS — SVR BY FIBROSIS SEVERITY
Study Name, Author, Year
Treatment SVR12/24 by Metavir Fibrosis Score
F0-F2 F3-F4
n N % n N %
All Patients
Boceprevir
RESPOND2 Bacon et al., 2011
27
PR48 2b 14 61 23 2 15 13
B32 PR36/48 2b RGT 77 117 66 14 32 44
B44 PR48 2b 81 119 68 21 31 68
P05685 Flamm et al., 2013
28
PR48 2a 10 47 21 2 15 13
B44 PR48 2a 66 93 71 16 32 50
PROVIDE a,b
Vierling et al.,
2014
33
B44 PR48 82 129 64 a
20 27 74 a
Telaprevir
REALIZE Zeuzem et al., 2011
29
PR48 2a 16 74 22 6 59 10
T12 PR48 2a q8 96 134 72 78 132 59
*T12 PR48 2a LI q8 109 139 78 67 125 54
PROVE3 McHutchison et al., 2010
30
PR48 2a 11 70 16 5 44 11
*T12 PR24 2a q8 39 70 56 20 45 44 bMuir et al., 2011
35 *T12 PR24 4 13 31 0 11 0
T12 PR48 8 16 50 7 11 64
T12 PR24/48 RGT 36 44c 82 14 22
c 64
Simeprevir
PROMISE Forns et al., 2014
31
PR48 2a 40 98 41 8 34 24
Si12 PR24/48 2a RGT 137 167 82 61 83 73
Relapsed
Boceprevir
RESPOND2 Bacon et al., 2011
27
PR48 2b 12 38 32 2 10 20
B32 PR36/48 2b RGT 59 79 75 11 22 50
*B44 PR48 2b 58 77 75 15 18 83
PROVIDE a,b
Vierling et al., 2014
33
*B44 PR48 23 23 100 a
3 3 100 a
Telaprevir
REALIZE Zeuzem et al., 2011
29
PR48 2a 12 38 32 4 30 13
*T12 PR48 2a q8 67 81 83 54 64 84
*T12 PR48 2a LI q8 77 86 90 47 55 85 bMuir et al., 2011
35 *T12 PR24/48 RGT 22 23 96 6 6 100
Simeprevir
PROMISE Forns et al., 2014
31
PR48 2a 40 98 41 8 34 24
Si12 PR24/48 2a RGT 137 167 82 61 83 73
Partial
Boceprevir
RESPOND2 Bacon et al., 2011
27
PR48 2b 2 23 9 0 5 0
B32 PR36/48 2b RGT 18 38 47 3 10 30
*B44 PR48 2b 23 42 55 6 13 46
PROVIDE a,b
Vierling et al., 2014
33
*B44 PR48 41 63 65 a
15 19 79 a
Telaprevir
REALIZE Zeuzem et al., PR48 2a 3 17 18 1 10 10

Direct-Acting Antiviral Agents for Chronic Hepatitis C Genotype 1 197
Study Name, Author, Year
Treatment SVR12/24 by Metavir Fibrosis Score
F0-F2 F3-F4
n N % n N %
201129
T12 PR48 2a q8 18 24 75 11 25 44
*T12 PR48 2a LI q8 16 23 70 10 25 40 bMuir et al., 2011
35 *T12 PR24/48 RGT 14 21
c 67 8 16
c 50
Null
Boceprevir
PROVIDE a,b
Vierling et al.,
2014
33
B44 PR48 18 43 42 a
2 5 40 a
Telaprevir
REALIZE bZeuzem et al.,
201129
PR48 2a 1 18 6 1 19 5
T12 PR48 2a q8 9 29 31 12 43 28
*T12 PR48 2a LI q8 15 30 50 10 45 22 bMuir et al., 2011
35 *T12 PR24 4 13 31 0 11 0
T12 PR48 8 16 50 7 11 64
F0 = no fibrosis; F1 = portal fibrosis without septa; F2 = portal fibrosis with rare septa; F3 = numerous septa without cirrhosis; F4 = cirrhosis; SVR = sustained viralogic response; SVR = sustained virologic response.. *Not a Health Canada–recommended dosage regimen.
aModified ITT analysis (all patients who received at least one dose of boceprevir) excludes patients who discontinued therapy during the 4 week
PR lead-in period.
bStudy not included in the network meta-analysis.
cIncludes four patients with prior viral breakthrough of which three achieved SVR.
TABLE 107: TREATMENT-EXPERIENCED PATIENTS — SVR BY GENOTYPE SUBTYPE
Study Name, Author, Year
DAA Treatment Subgroup SVR12/24 by Genotype Subtype
Genotype 1a Genotype 1b
n N % n N %
All Patients
RESPOND2 Bacon et al., 2011
27
BOC PR48 2b 9 38 24 8 36 22
B32 PR36/48 2b RGT 37 74 50 49 75 65
B44 PR48 2b 47 77 61 49 67 73
PROVIDE a,b
Vierling et al., 2014
33
BOC B44 PR48 68 100 a
68 37 63 a
59
REALIZE Zeuzem et al., 2011
29
TEL PR48 2a 14 59 24 7 59 12
T12 PR48 2a q8 67 118 57 89 121 74
*T12 PR48 2a LI q8 74 120 62 83 115 72 bMuir et al.,
201135
TEL T12 PR24/48 RGT 30 39
d 77 15 20
d 75
*T12 PR24 2 14 14 1 8 12
T12 PR48 9 16 56 6 10 60
PROMISE Forns et al., 2014
31
SIM PR48 2a 15 54 28 34 79 43
Si12 PR24/48 2a RGT All patients 78 111 70 128 149 86
Si12 PR24/48 2a RGT With Q80K 14 30 47 --
Si12 PR24/48 2a RGT Without Q80K
62 79 78 --
Relapsed
PROVIDE a,b
Vierling et al., 2014
33
BOC *B44 PR48 18 19 95 a
9 9 100 a

Direct-Acting Antiviral Agents for Chronic Hepatitis C Genotype 1 198
Study Name, Author, Year
DAA Treatment Subgroup SVR12/24 by Genotype Subtype
Genotype 1a Genotype 1b
n N % n N %
REALIZE Zeuzem et al., 2011
29
TEL PR48 2a 10 34 29 6 31 19
*T12 PR48 2a q8 52 65 80 67 77 87
*T12 PR48 2a LI q8 67 77 87 56 63 89 bMuir et al.,
201135
TEL T12 PR24/48 RGT 17 17 100 9 10 90
PROMISE Forns et al., 2014
31
SIM PR48 2a 15 54 28 34 79 43
Si12 PR24/48 2a RGT 78 111 70 128 149 86
Si12 PR24/48 2a RGT With Q80K 14 30 47 --
Si12 PR24/48 2a RGT Without Q80K
62 79 78 --
Partial
PROVIDE a,b
Vierling et al., 2014
33
BOC *B44 PR48 34 48 71 a
22 36 61 a
REALIZE Zeuzem 2011
29
TEL PR48 2a 3 16 19 1 10 10
T12 PR48 2a q8 13 26 50 15 22 68
*T12 PR48 2a LI q8 13 29 45 12 18 67 bMuir et al.,
201135
TEL *T12 PR24/48 RGT 13 22
c 59 6 10
c 60
Null
PROVIDE a,b
Vierling et al., 2014
33
BOC B44 PR48 14 31 45 a
6 18 33 a
REALIZE Zeuzem et al., 2011
29
TEL PR48 2a 1 17 6 1 20 5
T12 PR48 2a q8 11 45 24 10 27 37
*T12 PR48 2a LI q8 13 43 30 12 32 38 bMuir et al.,
201135
TEL *T12 PR24 2 14 14 1 8 12
T12 PR48 9 16 56 6 10 60
BOC = boceprevir; DAA = direct-acting antiviral; SIM = simeprevir; SVR12/24 = sustained viral response 12 or 24 weeks after the end of treatment; TEL = telaprevir. *Not a Health Canada–recommended dosage regimen. aModified ITT analysis (all patients who received at least one dose of boceprevir) excludes patients who discontinued therapy during the 4 week PR lead-in period. bStudy not included in the Nnetwork meta-analysis. cIncludes 8 patients with prior viral breakthrough of which 5/5 with genotype 1a and 1/3 with genotype 1b achieved SVR.

Direct-Acting Antiviral Agents for Chronic Hepatitis C Genotype 1 199
TABLE 108: TREATMENT-EXPERIENCED PATIENTS — RELAPSE AND MORTALITY
Study Name, Author, Year
Population Treatment Relapse Mortality
n N % n N %
Boceprevir
RESPOND2 Bacon et al., 201127
Relapse/partial PR48 2b 8 25 32% NR
B32 PR36/48 2b RGT 17 111 15%
B44 PR48 2b 14 121 12%
P05685 Flamm et al., 201328
Relapse/partial PR48 2a 7 21 33% 0 67 0.0%
B44 PR48 2a 11 95 12% 2 134 1.5%
PROVIDE Vierling et al., 201333
Relapse *B44 PR48 0 29 0% 0 29 0
Partial *B44 PR48 10 67 15% 0 85 0
Null B44 PR48 3 23 13% 0 52 0
Telaprevir
REALIZE Zeuzem et al., 201129
Relapse/partial/null PR48 2b 28 68 41% NR
T12 PR48 2a q8 10 145 7%
*T12 PR48 2a LI q8 9 141 6%
PROVE3 McHutchison et al., 201030
Relapse/partial/null PR48 2a 18 34 53% NR
*T12 PR24 2a q8 26 87 30%
Colombo et al., 201334 Interim data (16 weeks)
Treatment-naive/experienced Bridging fibrosis
T12 PR24/48 RGT or T12 PR48
NR 1 752 0.1%
Treatment-naive/experienced cirrhosis
T12 PR48 NR 6 835 0.7%
Muir et al., 201135 Relapse T12 PR24/48 RGT 1 29 3 NR
Partial *T12 PR24/48 RGTa 6 29 21 NR
Null T12 PR48 4 19 21 NR
Null *T12 PR24 2 6 33 NR
Simeprevir
PROMISE Forns et al., 201431
Relapse PR48 2a 45 93 48% 1 133 0.8%
Si12 PR24/48 2a RGT 46 249 18% 1 260 0.4%
ASPIRE Zeuzem et al., 201432
Relapse/partial/null PR48 2a 12 27 44% 0 66 0.0%
Si12 PR48 2a 6 51 12% 1 66 1.5%
NR = not reported. *Not a Health Canada–recommended dosage regimen. aIncludes six patients with prior viral breakthrough, none of which experienced a relapse after telaprevir therapy.

Direct-Acting Antiviral Agents for Chronic Hepatitis C Genotype 1 200
TABLE 109: TREATMENT-EXPERIENCED — DISCONTINUED TREATMENT (ALL-CAUSE)
Study Name, Author, Year Treatment % Discontinued Treatment
n N %
Boceprevir
RESPOND2 Bacon et al., 201127
PR48 2b 57 80 71%
B32 PR36/48 2b RGT 58 162 36%
B44 PR48 2b 56 161 35%
P05685 Flamm et al., 201328
PR48 2a 47 67 70%
B44 PR48 2a 55 134 41%
PROVIDE Vierling et al., 201433
B44 PR48 60 168 36%
Telaprevir
REALIZE Zeuzem et al., 201129
PR48 2a 44 132 33%
T12 PR48 2a q8 51 266 19%
*T12 PR48 2a LI q8 38 264 14%
PROVE3 McHutchison et al., 201030
PR48 2a 78 114 68%
*T12 PR24 2a q8 29 115 25%
Muir et al., 201135
T12 PR24/48 RGT, *T12 PR24 or T12 PR48 38 117 32%
Simeprevir
PROMISE Forns et al., 201431
PR48 2a 37 133 28%
Si12 PR24/48 RGT 2a 17 260 7%
ASPIRE Zeuzem et al., 201432
PR48 2a 40 66 61%
Si12 PR48 2a 16 66 24%
*Not a Health Canada–recommended dosage regimen.
TABLE 110: TREATMENT-EXPERIENCED PATIENTS — QUALIFIED FOR SHORT-DURATION RGT
Study Name, Author, Year Population Treatment Quality for Short-Duration RGT
n N %
RESPOND2 Bacon et al., 201127
relapse/partial B32 PR36/48 2b RGT 74 162 46%
PROMISE Forns et al., 201431
relapse Si12 PR24/48 2a RGT 241 260 93%
RGT = response-guided therapy.
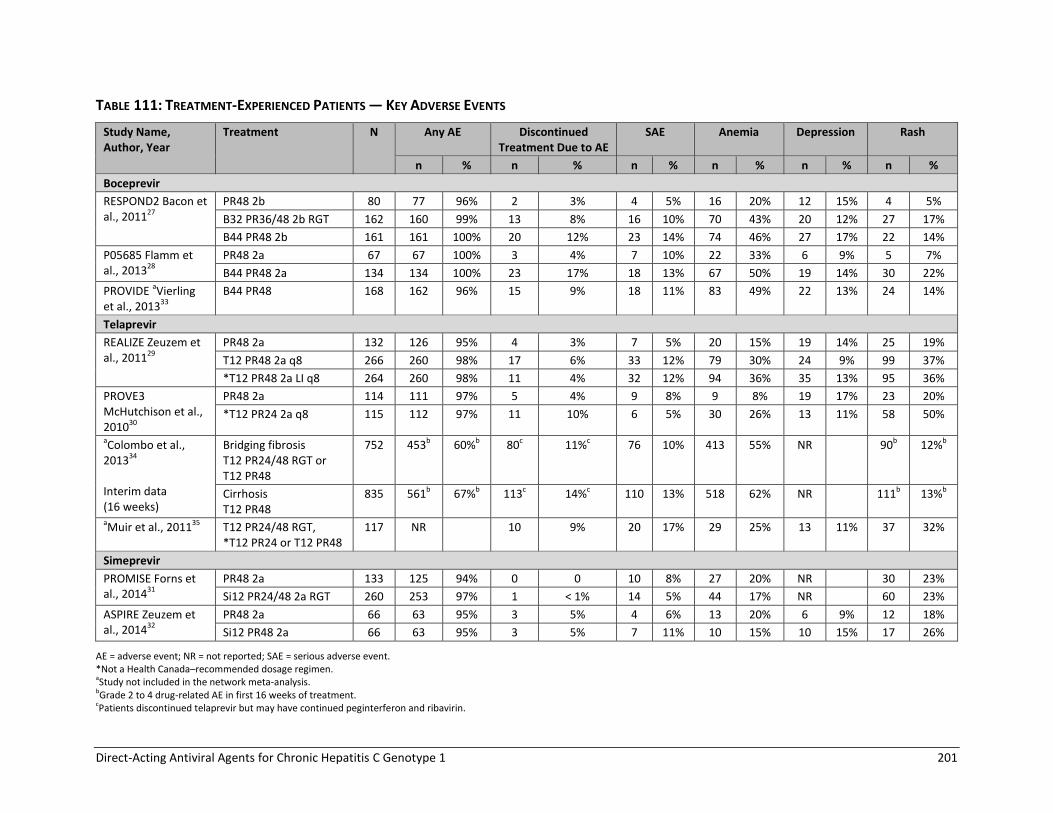
Direct-Acting Antiviral Agents for Chronic Hepatitis C Genotype 1 201
TABLE 111: TREATMENT-EXPERIENCED PATIENTS — KEY ADVERSE EVENTS
Study Name, Author, Year
Treatment N Any AE Discontinued Treatment Due to AE
SAE Anemia Depression Rash
n % n % n % n % n % n %
Boceprevir
RESPOND2 Bacon et al., 201127
PR48 2b 80 77 96% 2 3% 4 5% 16 20% 12 15% 4 5%
B32 PR36/48 2b RGT 162 160 99% 13 8% 16 10% 70 43% 20 12% 27 17%
B44 PR48 2b 161 161 100% 20 12% 23 14% 74 46% 27 17% 22 14%
P05685 Flamm et al., 201328
PR48 2a 67 67 100% 3 4% 7 10% 22 33% 6 9% 5 7%
B44 PR48 2a 134 134 100% 23 17% 18 13% 67 50% 19 14% 30 22%
PROVIDE aVierling et al., 201333
B44 PR48 168 162 96% 15 9% 18 11% 83 49% 22 13% 24 14%
Telaprevir
REALIZE Zeuzem et al., 201129
PR48 2a 132 126 95% 4 3% 7 5% 20 15% 19 14% 25 19%
T12 PR48 2a q8 266 260 98% 17 6% 33 12% 79 30% 24 9% 99 37%
*T12 PR48 2a LI q8 264 260 98% 11 4% 32 12% 94 36% 35 13% 95 36%
PROVE3 McHutchison et al., 201030
PR48 2a 114 111 97% 5 4% 9 8% 9 8% 19 17% 23 20%
*T12 PR24 2a q8 115 112 97% 11 10% 6 5% 30 26% 13 11% 58 50%
aColombo et al., 201334 Interim data (16 weeks)
Bridging fibrosis T12 PR24/48 RGT or T12 PR48
752 453b 60%b 80c 11%c 76 10% 413 55% NR 90b 12%b
Cirrhosis T12 PR48
835 561b 67%b 113c 14%c 110 13% 518 62% NR 111b 13%b
aMuir et al., 201135 T12 PR24/48 RGT, *T12 PR24 or T12 PR48
117 NR 10 9% 20 17% 29 25% 13 11% 37 32%
Simeprevir
PROMISE Forns et al., 201431
PR48 2a 133 125 94% 0 0 10 8% 27 20% NR 30 23%
Si12 PR24/48 2a RGT 260 253 97% 1 < 1% 14 5% 44 17% NR 60 23%
ASPIRE Zeuzem et al., 201432
PR48 2a 66 63 95% 3 5% 4 6% 13 20% 6 9% 12 18%
Si12 PR48 2a 66 63 95% 3 5% 7 11% 10 15% 10 15% 17 26%
AE = adverse event; NR = not reported; SAE = serious adverse event.
*Not a Health Canada–recommended dosage regimen. aStudy not included in the network meta-analysis. bGrade 2 to 4 drug-related AE in first 16 weeks of treatment. cPatients discontinued telaprevir but may have continued peginterferon and ribavirin.

Direct-Acting Antiviral Agents for Chronic Hepatitis C Genotype 1 202
TABLE 112: TREATMENT-EXPERIENCED PATIENTS — OTHER ADVERSE EVENTS
Study Name, Author, Year Treatment Group N
Anorectal Discomfort
Fatigue Influenza-Like Symptoms
Neutropenia Pruritus Suicidal Ideation
n % n % n % n % n % n %
Boceprevir
RESPOND2 Bacon et al., 201127 PR48 2b 80 NR 40 50% 20 25% 8 10% NR 0 0%
B32 PR36/48 2b RGT 162 87 54% 38 23% 23 14% 2 1%
B44 PR48 2b 161 92 57% 37 23% 23 14% 0 0%
P05685 Flamm et al., 201328 PR48 2a 67 NR 36 54% 18 27% 12 18% 8 12% 0 0%
B44 PR48 2a 134 66 49% 34 25% 42 31% 18 13% 1 1%
PROVIDE Vierling et al., 201333 B44 PR48 168 NR 81 48 35 21 38 23 25 15 NR
Telaprevir
REALIZE Zeuzem et al., 201129 PR48 2a 132 0 0% 53 40% 33 25% 14 11% 36 27% NR
T12 PR48 2a q8 266 21 8% 145 55% 85 32% 38 14% 138 52% NR
*T12 PR48 2a LI q8 264 11 4% 131 50% 94 36% 35 13% 132 50% NR
PROVE3 McHutchison et al., 201030 PR48 2a 114 0 0% 64 56% 36 32% 7 6% 17 15% 0 0%
*T12 PR24 2a q8 115 8 7% 77 67% 29 25% 12 10% 39 34% 0 0%
Colombo 201334 Interim data (16 wks)
Bridging fibrosis T12 PR24/48 RGT or T12 PR48
752 26a 3%a NR NR NR 37a 5%a NR
Cirrhosis T12 PR48
835 35 a 4%a NR NR NR 58a 7%a NR
Muir et al., 201135 T12 PR24/48 RGT, *T12 PR24 or T12 PR48
117 10 9% 52 44% 28 24% 8 7% 45 38% NR
Simeprevir
PROMISE Forns et al., 201431 PR48 2a 133 NR 58 44% 27 20% 29 22% 37 28% NR
Si12 PR24/48 2a RGT 260 84 32% 77 30% 46 18% 72 28% NR
ASPIRE Zeuzem et al., 201432 PR48 2a 66 NR 29 44% 13 20% 11 17% 11 17% NR
Si12 PR48 2a 66 26 39% 16 24% 18 27% 20 30% NR
NR = not reported; RGT = response-guided therapy. *Not a Health Canada–recommended dosage regimen. aGrade 2 to 4 drug-related adverse event in first 16 weeks of treatment.
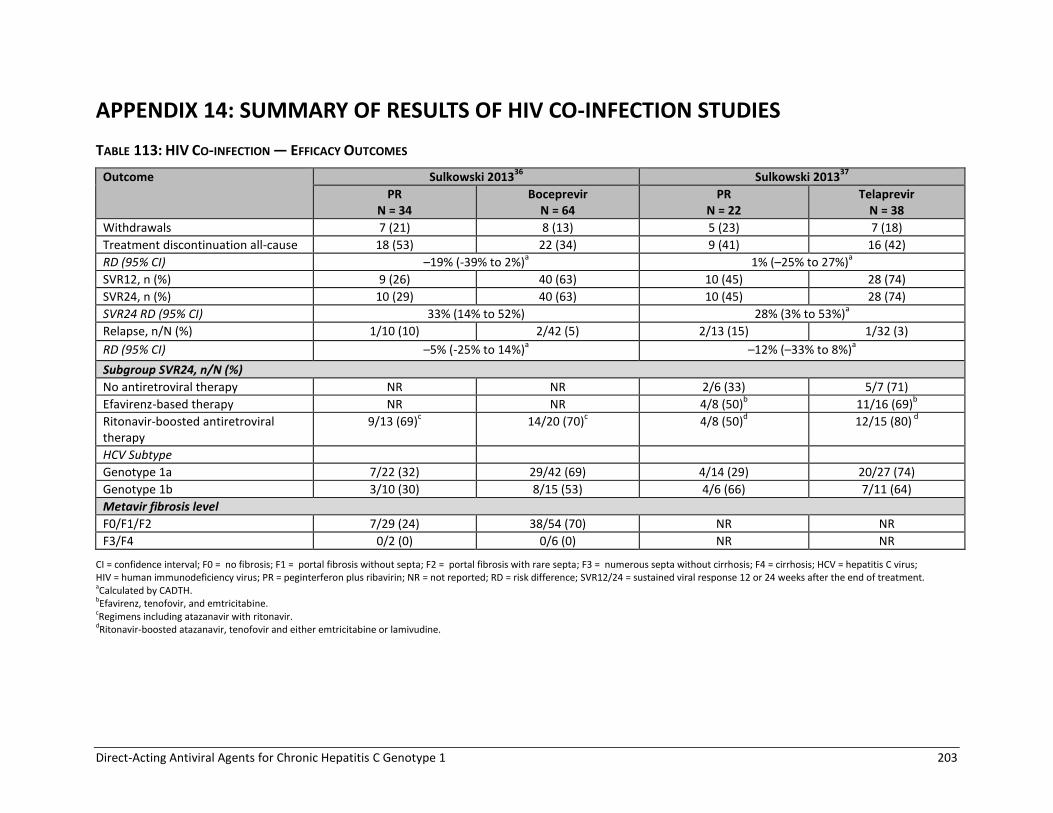
Direct-Acting Antiviral Agents for Chronic Hepatitis C Genotype 1 203
APPENDIX 14: SUMMARY OF RESULTS OF HIV CO-INFECTION STUDIES
TABLE 113: HIV CO-INFECTION — EFFICACY OUTCOMES
Outcome Sulkowski 201336
Sulkowski 201337
PR N = 34
Boceprevir N = 64
PR N = 22
Telaprevir N = 38
Withdrawals 7 (21) 8 (13) 5 (23) 7 (18)
Treatment discontinuation all-cause 18 (53) 22 (34) 9 (41) 16 (42)
RD (95% CI) –19% (-39% to 2%)a 1% (–25% to 27%)
a
SVR12, n (%) 9 (26) 40 (63) 10 (45) 28 (74)
SVR24, n (%) 10 (29) 40 (63) 10 (45) 28 (74)
SVR24 RD (95% CI) 33% (14% to 52%) 28% (3% to 53%)a
Relapse, n/N (%) 1/10 (10) 2/42 (5) 2/13 (15) 1/32 (3)
RD (95% CI) –5% (-25% to 14%)a –12% (–33% to 8%)
a
Subgroup SVR24, n/N (%)
No antiretroviral therapy NR NR 2/6 (33) 5/7 (71)
Efavirenz-based therapy NR NR 4/8 (50)b 11/16 (69)
b
Ritonavir-boosted antiretroviral therapy
9/13 (69)c 14/20 (70)
c 4/8 (50)
d 12/15 (80)
d
HCV Subtype
Genotype 1a 7/22 (32) 29/42 (69) 4/14 (29) 20/27 (74)
Genotype 1b 3/10 (30) 8/15 (53) 4/6 (66) 7/11 (64)
Metavir fibrosis level
F0/F1/F2 7/29 (24) 38/54 (70) NR NR
F3/F4 0/2 (0) 0/6 (0) NR NR
CI = confidence interval; F0 = no fibrosis; F1 = portal fibrosis without septa; F2 = portal fibrosis with rare septa; F3 = numerous septa without cirrhosis; F4 = cirrhosis; HCV = hepatitis C virus; HIV = human immunodeficiency virus; PR = peginterferon plus ribavirin; NR = not reported; RD = risk difference; SVR12/24 = sustained viral response 12 or 24 weeks after the end of treatment. aCalculated by CADTH. bEfavirenz, tenofovir, and emtricitabine. cRegimens including atazanavir with ritonavir. dRitonavir-boosted atazanavir, tenofovir and either emtricitabine or lamivudine.

Direct-Acting Antiviral Agents for Chronic Hepatitis C Genotype 1 204
TABLE 114: HIV CO-INFECTION — ADVERSE EVENTS
Outcome Sulkowski 201336
Sulkowski 201337
PR N = 34
Boceprevir N = 64
PR N = 22
Telaprevir N = 38
Any AE, n (%)a 33 (97) 62 (97) 22 (100) 38 (100)
SAE 7 (21) 11 (17) 2 (9) 7 (18)
Death 0 0 0 0
Treatment discontinuation due to AE 3 (9) 13 (20) 0 3 (8)
Anemia 11 (32) 26 (41) 4 (18) 7 (18)
Rash 0 5 (8) 5 (23) 13 (34)
Prurits 3 (9) 12 (19) 2 (9) 15 (39)
Depression 4 (12) 11 (17) 2 (9) 8 (21)
Suicide ideation NR NR 0 1 (3)
Neutropenia 2 (6) 12 (19) 5 (23) 9 (24)
Fatigue 12 (35) 24 (38) 9 (41) 16 (42)
Influenza-like illness 13 (38) 16 (25) 3 (14) 5 (13)
Anorectal discomfort NR NR 2 (9) 5 (13)
AE = adverse event; PR = peginterferon plus ribavirin; SAE = serious adverse event; NR = not reported. aNumber of patients with adverse events.

Direct-Acting Antiviral Agents for Chronic Hepatitis C Genotype 1 205
APPENDIX 15: DIRECT PAIRWISE META-ANALYSIS
Treatment-Naive TABLE 115: TREATMENT-NAIVE PATIENTS — DIRECT PAIRWISE COMPARISON FOR SVR
DAA Versus PR48 N Trials N Patients SVR
RD% (95% CI), I2 RR (95% CI), I
2
Boceprevir
B24 PR28/48 RGT 1 731 26% (19 to 33) 1.68 (1.44 to 1.96)
*B24 PR28 1 207 19% (5 to 32) 1.50 (1.11 to 2.03)
Telaprevir
T12 PR24/48 RGT 1 724 31% (24 to 38) 1.71 (1.50 to 1.95)
*T12 PR24 3 588 22% (13 to 31), I2 = 0% 1.48 (1.26 to 1.75), I
2 = 0%
*T12 PR48 1 154 26% (11 to 41%) 1.62 (1.19 to 2.21)
Simeprevir
Si12 PR24/48 RGT 3 939 27% (18 to 35) I2 = 45% 1.48 (1.25 to 1.75) I
2 = 59%
Sofosbuvir
*So12 PR24/48 RGT 1 73 32% (11 to 53) 1.55 (1.10 to 2.18)
CI = confidence interval; DAA = direct-acting antiviral; HIV = human immunodeficiency virus; PR48 = peginterferon 2a or 2b plus ribavirin for 48 weeks; RD = risk difference; RR = relative risk; SVR = sustained viral response. *Not a Health Canada–recommended dosage regimen. Note: Calculated by CADTH using Review Manager software, random effects model.
TABLE 116: TREATMENT-NAIVE PATIENTS — DIRECT PAIRWISE COMPARISON OF SVR BY FIBROSIS SEVERITY
DAA Versus PR48 Metavir Score
N Trials N Patients
SVR
RD% (95% CI), I2 RR (95% CI), I
2
Boceprevir
B24 PR28/48 RGT F0-F2 1 647 29% (22 to 37) 1.78 (1.52 to 2.09)
F3-F4 58 4% (-22 to 29) 1.10 (0.57 to 2.11)
B44 PR48 F3-F4 1 66 15% (-10 to 39) 1.40 (0.77 to 2.52)
Telaprevir
T12 PR24/48 RGT F0-F2 1 578 31% (24 to 39) 1.67 (1.46 to 1.92)
F3-F4 146 29% (13 to 44) 1.88 (1.29 to 2.73)
Simeprevir
Si12 PR24/48 RGT F0-F2 2 570 28% (18 to 39), I2 = 41%
1.51 (1.26 to 1.80), I2 = 43%
F3-F4 202 32% (9 to 55), I2 = 64% 1.86 (1.02 to 3.38),
I2 = 69%
CI = confidence interval; F0 = no fibrosis; F1 = portal fibrosis without septa; F2 = portal fibrosis with rare septa; F3 = numerous septa without cirrhosis; F4 = cirrhosis; DAA = direct-acting antiviral; PR48 = peginterferon 2a or 2b plus ribavirin for 48 weeks; RD = risk difference; RR = relative risk; SVR = sustained viral response. Note: Calculated by CADTH using Review Manager software, random effects model.

Direct-Acting Antiviral Agents for Chronic Hepatitis C Genotype 1 206
TABLE 117: TREATMENT-NAIVE PATIENTS — DIRECT PAIRWISE COMPARISON OF SVR BY GENOTYPE SUBTYPE
DAA Versus PR48 Genotype N Trials
N Patients
SVR
RD% (95% CI), I2 RR (95% CI), I
2
Boceprevir
B24 PR28/48 RGT 1a 1 356a 24% (14 to 34) 1.69 (1.34 to 2.14)
1b 260a 26% (14 to 38) 1.64 (1.29 to 2.09)
*B24 PR28 1a 1 106 21% (2 to 39) 1.69 (1.04 to 2.75)
1b 79 19% (–3 to 41) 1.47 (0.93 to 2.31)
Telaprevir
T12 PR24/48 RGT 1a 1 421 30% (21 to 40) 1.75 (1.45 to 2.10)
1b 300 31% (21 to 41) 1.64 (1.36 to 1.97)
Simeprevir
Si12 PR24/48 RGT 1a 2 385 28% (17 to 40), I2 = 26%
1.59 (1.31 to 1.93), I2 = 0%
1a + Q80Kb 215 15% (–11 to 41),
I2 = 72%
1.31 (0.85 to 2.03), I2 = 67%
1a no Q80Kb 296 36% (26 to 47), I
2 = 0% 1.77 (1.46 to 2.14),
I2 = 0%
1b 400 33% (23 to 42), I2 = 0% 1.62 (1.37 to 1.92),
I2 = 0%
CI = confidence interval; DAA = direct-acting antiviral; PR48 = peginterferon 2a or 2b plus ribavirin for 48 weeks; RD = risk difference; RR = relative risk; SVR = sustained viral response. *Not a Heath Canada-recommended dosage regimen.
a115 (17%) of patients could not be classified as either genotype 1a or 1b and therefore were excluded from the analysis.
bControl group includes all patients randomized to PR with genotype 1a chronic hepatitis C (i.e., with and without Q80K polymorphism at
baseline). Note: Calculated by CADTH using Review Manager software, random effects model.

Direct-Acting Antiviral Agents for Chronic Hepatitis C Genotype 1 207
TABLE 118: TREATMENT-NAIVE PATIENTS — DIRECT PAIRWISE COMPARISON OF TREATMENT DISCONTINUATION
DUE TO ADVERSE EVENTS
DAA Versus PR48 N Trials
N Patients
% Patients Who Discontinued Due to AE
Discontinued Treatment Due to AE
PR DAA RD% (95% CI), I2 RR (95% CI), I
2
Boceprevir
B24 PR28/48 RGT 1 731 16% 12% –3% (–8 to 2) 0.78 (0.54 to 1.12)
*B24 PR28 1 207 8% 15% 7% (–2 to 15) 1.89 (0.84 to 4.27)
Telaprevir
T12 PR24/48 RGT 1 724 7% 10%a 3% (–1 to 7) 1.38 (0.85 to 2.23)
*T12 PR24 3 506 7% to 22% 14% to 23% 5% (–5 to 14); I2 = 55%
1.37 (0.67 to 2.80), I2 = 62%
*T12 PR48 1 154 11% 14% 3% (–7 to 14) 1.31 (0.56 to 3.07)
Simeprevir
Si12 PR24/48 RGTb 3 939 1% to 5% 2% to 5% 0% (–1 to 2),
I2 = 0%
1.04 (0.45 to 2.39), I2 = 0%
Sofosbuvirc
*So12 PR24/48 RGTb 1 73 12% 6% –5% (–19 to 9) 0.55 (0.12 to 2.55)
AE = adverse event; CI = confidence interval; DAA = direct-acting antiviral; PR48 = peginterferon 2a or 2b plus ribavirin for 48 weeks; RD = risk difference; RR = relative risk. *Not a Health Canada–recommended dosage regimen. aThe proportion of patients who discontinued all treatment ranged from 8% to 19% in OPTIMIZE, Marcellin 2011, and ILLUMINATE trials which
compared different telaprevir RGT dosage regimens. bIn the QUEST1, QUEST2 and PROTON studies, discontinuations due to AE were reported for the first 12 weeks of treatment (not the full 24 to
48 week treatment period), thus may underestimate the overall incidence. cIn NEUTRINO and ATOMIC studies, 2% and 6% of patients who received sofosbuvir + PR for 12 weeks, discontinued treatment due to AE.
Note: Calculated by CADTH using Review Manager software, random effects model.
TABLE 119: TREATMENT-NAIVE PATIENTS — DIRECT PAIRWISE COMPARISON OF FATIGUE
DAA Versus PR48 N Trials N Patients
% Patients With Fatigue Fatigue
PR DAA RD% (95% CI), I2 RR (95% CI), I
2
Boceprevir
B24 PR28/48 RGT 1 731 60% 53% –7% (–14 to 1%) 0.89 (0.78 to 1.01)
*B24 PR28 1 207 55% 68% 13% (0 to 26) 1.24 (1.00 to 1.54)
Telaprevir
T12 PR24/48 RGT 1 724 57% 57%a 0% (–7 to 7) 1.00 (0.88 to 1.13)
*T12 PR24 2 317 37% to 76% 26% to 70% –9 % (–19 to 1), I2 = 0%
0.85 (0.70 to 1.03)
*T12 PR48 1 154 76% 73% –3% (–16 to 11) 0.97 (0.80 to 1.16)
Simeprevir
Si12 PR24/48 RGTb 3 939 38% to 48% 35% to 42% –2% (–8 to 5%),
I2 = 0%
0.95 (0.81 to 1.13)
Sofosbuvirc
*So12 PR24/48 RGT
b
1 73 54% 68% 14% (–9 to 38) 1.26 (0.84 to 1.90)
CI = confidence interval; DAA = direct-acting antiviral; PR48 = peginterferon 2a or 2b plus ribavirin for 48 weeks; RD = risk difference; RR = relative risk. *Not a Health Canada–recommended dosage regimen. aIncidence of fatigue ranged from 36% to 69% in OPTIMIZE, Marcellin 2011 and ILLUMINATE trials that compared different telaprevir RGT
dosage regimens. bIn the QUEST1, QUEST2 and PROTON studies, AE were reported for the first 12 weeks of treatment (not the full 24 to 48 week treatment
period), thus may underestimate the overall incidence. cIn NEUTRINO and ATOMIC studies, 59% and 48% of patients reported fatigue during 12 weeks of sofosbuvir + PR therapy.
Note: Calculated by CADTH using Review Manager software, fixed effects model.

Direct-Acting Antiviral Agents for Chronic Hepatitis C Genotype 1 208
TABLE 120: TREATMENT-NAIVE PATIENTS — DIRECT PAIRWISE COMPARISON OF INFLUENZA-LIKE SYMPTOMS
DAA Versus PR48 N Trials N Patients
% Patients With Influenza-Like Symptoms
Influenza-Like Symptoms
PR DAA RD% (95% CI), I2 RR (95% CI), I
2
Boceprevir
B24 PR28/48 RGT 1 731 26% 25% –1% (–7 to 5) 0.97 (0.75 to 1.24)
*B24 PR28 1 207 24% 20% –4% (–15 to 8) 0.85 (0.51 to 1.42)
Telaprevir
T12 PR24/48 RGT 1 724 28% 28%a 0% (–6 to 7) 1.00 (0.80 to 1.27)
*T12 PR24 3 506 25% to 52% 18% to 49% –5% (–16 to 6), I2 = 41%
0.87 (0.63 to 1.21), I2 = 50%
*T12 PR48 1 154 43% 38% –5% (–20 to 11) 0.89 (0.61 to 1.31)
Simeprevir
Si12 PR24/48 RGTb 2 545 25% to 38% 23% to 26% –6% (-20 to 8),
I2 = 65%
0.82 (0.51 to 1.32), I2 = 59%
Sofosbuvirc
*So12 PR24/48 RGT 1 73 NR NR NR NR
CI = confidence interval; DAA = direct-acting antiviral; NR = not reported; PR48 = peginterferon 2a or 2b plus ribavirin for 48 weeks; RD = risk difference; RR = relative risk. *Not a Health Canada–recommended dosage regimen. aIncidence of influenza-like symptoms ranged from 21% to 51% in the Marcellin 2011 and ILLUMINATE trials that compared different telaprevir
RGT dosage regimens. bIn the QUEST2 study, AE were reported for the first 12 weeks of treatment (not the full 24 to 48 week treatment period), thus may
underestimate the overall incidence. cIn NEUTRINO study, 16% of patients who received sofosbuvir + PR for 12 weeks, reported influenza-like symptoms.
Note: Calculated by CADTH using Review Manager software, random effects model.

Direct-Acting Antiviral Agents for Chronic Hepatitis C Genotype 1 209
TABLE 121: TREATMENT-NAIVE PATIENTS — DIRECT PAIRWISE COMPARISON OF NEUTROPENIA
DAA Versus PR48 N Trials
N Patients
% Patients With Neutropenia Neutropenia
PR DAA RD% (95% CI), I2 RR (95% CI), I
2
Boceprevir
B24 PR28/48 RGT 1 731 21% 25% 4% (–2 to 10) 1.18 (0.90 to 1.54)
*B24 PR28 1 207 12% 17% 5% (–4 to 14) 1.43 (0.72 to 2.84)
Telaprevir
T12 PR24/48 RGT 1 724 19% 14%a –5% (–10 to 1) 0.75 (0.53 to 1.04)
*T12 PR24 2 396 17% to 24% 4% to 14% –12% (-20 to -5), I2 = 0%
0.40 (0.16 to 1.04), I
2 = 50%
*T12 PR48 1 154 24% 24% 0% (–13 to 14) 1.00 (0.57 to 1.76)
Simeprevir
Si12 PR24/48 RGTb 2 548 11% to 21% 19% to 25% 7% (1 to 13), I
2 = 0% 1.44 (0.97 to
2.16), I2 = 0%
Sofosbuvirc
*So12 PR24/48 RGTb 1 73 19% 30% 11% (–9 to 31) 1.55 (0.63 to 3.82)
CI = confidence interval; DAA = direct-acting antiviral; PR48 = peginterferon 2a or 2b plus ribavirin for 48 weeks; RD = risk difference; RR = relative risk. *Not a Health Canada–recommended dosage regimen. aIncidence of neutropenia ranged from 0% to 26% in Marcellin 2011 and ILLUMINATE trials that compared different telaprevir RGT dosage
regimens. bIn the QUEST1, QUEST2 and PROTON studies, AE were reported for the first 12 weeks of treatment (not the full 24 to 48 week treatment
period), thus may underestimate the overall incidence. cIn NEUTRINO and ATOMIC studies, 17% and 23% of patients who received sofosbuvir + PR for 12 weeks, reported neutropenia.
Note: Calculated by CADTH using Review Manager software, random effects model.
TABLE 122: TREATMENT-NAIVE PATIENTS — DIRECT PAIRWISE COMPARISON OF PRURITUS
DAA Versus PR48 N Trials
N Patients
% Patients With Pruritus Pruritus
PR DAA RD% (95% CI), I2 RR (95% CI), I
2
Boceprevir
B24 PR28/48 RGT 1 731 27% 24% –3% (–10 to 3) 0.88 (0.68 to 1.12)
*B24 PR28 1 207 15% 18% 3% (–7 to 13) 1.20 (0.65 to 2.20)
Telaprevir
T12 PR24/48 RGT 1 724 36% 50%a 14% (6 to 21) 1.37 (1.16 to 1.63)
*T12 PR24 3 506 21% to 35% 18% to 51% 12% (–5 to 29), I2 = 78%
1.44 (0.93 to 2.21), I2 = 60%
*T12 PR48 1 154 23% 40% 18% (3 to 32) 1.79 (1.09 to 2.94)
Simeprevirb
Si12 PR24/48 RGTc 3 939 11% to 46% 19% to 39% 5% (–3 to 13),
I2 = 55%
1.24 (0.77 to 2.02), I2 = 70%
Sofosbuvirb
*So12 PR24/48 RGT 1 73 NR NR NR NR
CI = confidence interval; DAA = direct-acting antiviral; PR = peginterferon 2a or 2b plus ribavirin for 48 weeks; RD = risk difference; RR = relative risk. *Not a Health Canada–recommended dosage regimen. aIncidence of pruritus ranged from 40% to 64% in OPTIMIZE, Marcellin 2011 and ILLUMINATE trials that compared different telaprevir RGT
dosage regimens. bIn NEUTRINO study, 17% of patients who received sofosbuvir + PR for 12 weeks, reported pruritus.
cIn the QUEST1, QUEST2 and PROTON studies, AE were reported for the first 12 weeks of treatment (not the full 24 to 48 week treatment
period), thus may underestimate the overall incidence. Note: Calculated by CADTH using Review Manager software, random effects model.

Direct-Acting Antiviral Agents for Chronic Hepatitis C Genotype 1 210
TABLE 123: TREATMENT-NAIVE PATIENTS — DIRECT PAIRWISE COMPARISON OF ANORECTAL DISCOMFORT
DAA Versus PR48 N Trials N Patients
% Patients With Anorectal Discomfort
Anorectal Discomfort
PR DAA RD% (95% CI), I2 RR (95% CI), I
2
Boceprevir
*B24 PR28 1 207 0% 1% Not estimable Not estimable
Telaprevir
T12 PR24/48 RGT 1 724 4% 13%a 9% (5 to 13) 3.52 (1.93 to 6.40)
*T12 PR24 2 396 2% to 3% 5% to 8% 4% (–1 to 8), I2 = 0% 2.44 (0.78 to 7.64),
I2 = 0%
*T12 PR48 1 154 3% 4% 1% (–4 to 7) 1.42 (0.24 to 8.29)
Sofosbuvirb
*So12 PR24/48 RGT 1 73 NR NR NR NR
CI = confidence interval; DAA = direct-acting antiviral; NR = not reported; PR = peginterferon 2a or 2b plus ribavirin for 48 weeks; RD = risk difference; RR = relative risk. *Not a Health Canada–recommended dosage regimen. aIncidence of anorectal discomfort ranged from 3% to 32% in OPTIMIZE, Marcellin 2011 and ILLUMINATE trials that compared different
telaprevir RGT dosage regimens. bIn NEUTRINO study, < 1% of patients who received sofosbuvir + PR for 12 weeks, reported anorectal discomfort.
Note: Calculated by CADTH using Review Manager software, fixed effects model.
TABLE 124: TREATMENT-NAIVE PATIENTS — DIRECT PAIRWISE COMPARISON OF ANEMIA
DAA Versus PR48 N Trials N Patients Anemia
RD% (95% CI), I2 RR (95% CI), I
2
Boceprevir
B24 PR28/48 RGT 1 731 20% (13 to 27) 1.68 (1.39 to 2.03)
*B24 PR28 1 207 20% (7 to 33) 1.59 (1.15 to 2.20)
Telaprevir
T12 PR24/48 RGT 1 724 18% (11 to 24%) 1.92 (1.49 to 2.46)
*T12 PR24 3 506 13% (5 to 20), I2 = 0% 1.33 (1.12 to 1.58), I
2 = 0%
*T12 PR48 1 154 2 (–12 to 17) 1.09 (0.66 to 1.82)
Simeprevir
Si12 PR24/48 RGTa 3 939 1% (–3 to 6), I2 = 0% 1.10 (0.80 to 1.51), I
2 = 0%
Sofosbuvir
*So12 PR24/48 RGTa 1 73 –2% (–21 to 16) 0.89 (0.32 to 2.43)
CI = confidence interval; DAA = direct-acting antiviral; PR48 = peginterferon plus ribivirn; RD = risk difference; RR = relative risk. *Not a Health Canada–recommended dosage regimen.
aIn the QUEST1, QUEST2, and PROTON studies, anemia was reported for the first 12 weeks of treatment (not the full 24 to 48 week treatment period), thus may underestimate the overall incidence. Note: Calculated by CADTH using Review Manager software, fixed effects model.

Direct-Acting Antiviral Agents for Chronic Hepatitis C Genotype 1 211
TABLE 125: TREATMENT-NAIVE PATIENTS — DIRECT PAIRWISE COMPARISON OF RASH
DAA Versus PR48 N Trials N Patients
% Rash DAA Group
Rash
RD% (95% CI), I2 RR (95% CI), I
2
Boceprevir
B24 PR28/48 RGT 1 731 25% 2% (–4 to 9) 1.11 (0.85 to 1.43)
*B24 PR28 1 207 6% 0% (–6 to 6) 1.01 (0.34 to 3.03)
Telaprevir
T12 PR24/48 RGT 1 724 37%a 12% (6 to 19) 1.50 (1.20 to 1.89)
*T12 PR24 3 506 38% to 60% 14% (5 to 22), I2 = 0% 1.40 (1.13 to 1.73),
I2 = 0%
*T12 PR48 1 154 61% 19% (4 to 35) 1.47 (1.06 to 2.03)
Simeprevir
Si12 PR24/48 RGTb 3 939 21% to 27% 5% (–4 to 14),
I2 = 64%
1.26 (0.78 to 2.05), I2 = 66%
Sofosbuvir
*So12 PR24/48 RGTb 1 73 26% 10% (–9 to 29) 1.66 (0.60 to 4.63)
CI = confidence interval; DAA = direct-acting antiviral; PR48 = pegylated interferon 2a or 2b plus ribavirin for 48 weeks; RD = risk difference; RR = relative risk. *Not a Health Canada–recommended dosage regimen.
aIncidence of rash ranged from 33% to 73% in OPTIMIZE, Marcellin 2011 and ILLUMINATE trials that compared different telaprevir RGT dosage
regimens. bIn the QUEST1, QUEST2, and PROTON studies, adverse events were reported for the first 12 weeks of treatment (not the full 24 to 48 week
treatment period), thus may underestimate the overall incidence. Note: Calculated by CADTH using Review Manager software, random effects model.
TABLE 126: TREATMENT-NAIVE PATIENTS — DIRECT PAIRWISE COMPARISON OF DEPRESSION
DAA Versus PR48 N Trials N Patients Depression
RD% (95% CI), I2 RR (95% CI), I
2
Boceprevir
B24 PR28/48 RGT 1 731 1% (–5 to 7%) 1.04 (0.79 to 1.36)
*B24 PR28 1 207 –2% (–13 to 9) 0.92 (0.53 to 1.58)
Telaprevir
T12 PR24/48 RGT 1 724 –4% (–10 to 2) 0.83 (0.62 to 1.11)
*T12 PR24 2 317 0% (–9 to 9), I2 = 0% 1.01 (0.66 to 1.57), I
2 = 0%
*T12 PR48 1 154 2% (–11 to 14%) 1.10 (0.56 to 2.15)
Simeprevir
Si12 PR24/48 RGT 1 154 –6% (–18 to 5) 0.64 (0.30 to 1.40)
CI = confidence interval; DAA = direct-acting antiviral; PR48 = pegylated interferon 2a or 2b plus ribavirin for 48 weeks; RD = risk difference; RR = relative risk. *Not a Health Canada–recommended dosage regimen.
Note: Calculated by CADTH using Review Manager software, fixed effects model.

Direct-Acting Antiviral Agents for Chronic Hepatitis C Genotype 1 212
Treatment-Experienced TABLE 127: TREATMENT-EXPERIENCED PATIENTS — DIRECT PAIRWISE COMPARISON OF SVR
DAA Versus PR48 N Trials, Patients
RD% (95% CI)a P Value, I
2 RR
b (95% CI) P Value,
I2
All Treatment-Experienced
Boceprevir
B32 PR36/48 RGT Trials: 1 N = 242
37% (26 to 49) < 0.001 2.76 (1.78 to 4.29) < 0.001
B44 PR48 Trials: 2 N = 442
44% (36 to 53) < 0.001 I2 = 0%
3.10 (2.24 to 4.29) < 0.001 I2 = 0%
Telaprevir
*T12 PR24 Trials: 1 N = 229
37% (26 to 48) < 0.001 3.66 (2.24 to 5.95) < 0.001
T12 PR48 Trials: 1 N = 662
49% (41 to 56) < 0.001 3.92 (2.66 to 5.76) < 0.001
Simeprevir
Si12 PR24/48 RGT Trials: 1 N = 393
42% (33 to 52) < 0.001 2.15 (1.71 to 2.71) < 0.001
Si12 PR48 Trials: 1 N = 132
44% (29 to 59) < 0.001 2.93 (1.82 to 4.72) < 0.001
Patients With Prior Relapse
Boceprevir
B32 PR36/48 RGT Trials: 1 N = 156
39% (24 to 54) < 0.001 2.33 (1.49 to 3.64) < 0.001
*B44 PR48 Trials: 2 N = 299
44% (33 to 55) < 0.001 I2 = 0%
2.54 (1.84 to 3.52) < 0.001 I2 = 0%
Telaprevir
*T12 PR24 Trials: 1 N = 83
50% (31 to 68) < 0.001 3.54 (1.84 to 6.80) < 0.001
*T12 PR48 Trials: 1 N = 354
62% (51 to 73) < 0.001 3.64 (2.37 to 5.60) < 0.001
Simeprevir
Si12 PR24/48 RGT Trials: 1 N = 393
42% (33 to 52) < 0.001 2.15 (1.71 to 2.71) < 0.001
*Si12 PR48 Trials: 1 N = 53
40% (16 to 64) < 0.001 2.08 (1.22 to 3.55) 0.007
Patients With Prior Partial Response
Boceprevir
B32 PR36/48 RGT Trials: 1 N = 86
33% (18 to 49) < 0.001 5.85 (1.48 to 23.12) 0.01
*B44 PR48 Trials: 2 N = 143
44% (32 to 56) < 0.001 I2 = 0%
8.09 (2.66 to 24.65) < 0.001 I2 = 0%
Telaprevir
T12 PR48 Trials: 1 N = 124
42% (25 to 58) < 0.001 3.82 (1.52 to 9.59) 0.004

Direct-Acting Antiviral Agents for Chronic Hepatitis C Genotype 1 213
DAA Versus PR48 N Trials, Patients
RD% (95% CI)a P Value, I
2 RR
b (95% CI) P Value,
I2
Simeprevir
Si12 PR48 Trials: 1 N = 46
57% (34 to 79) < 0.001 7.50 (1.93 to 29.15) 0.004
Patients With Prior Null Response
Telaprevir
T12 PR48 Trials: 1 N = 184
26% (15 to 36) < 0.001 5.77 (1.47 to 22.68) 0.01
Simeprevir
Si12 PR48 Trials: 1 N = 33
34% (4 to 65) 0.03 2.82 (0.93 to 8.60) 0.07
CI = confidence interval; DAA = direct-acting antiviral; PR48 = pegylated interferon 2a or 2b plus ribavirin for 48 weeks; RD = risk difference; RR = relative risk; SVR = sustained viral response. *Not a Health Canada–recommended dosage regimen. aPositive numbers indicate that more patients who received DAA + PR achieved SVR, relative to PR for 48 weeks. bAn RR of 1.00 means no difference between comparators, while a RR > 1 indicates that more patients who received DAA + PR achieved SVR, relative to PR for 48 weeks: a RR < 1 means the difference is in favour of PR. Note: Calculated by CADTH using Review Manager software, random effects model.

Direct-Acting Antiviral Agents for Chronic Hepatitis C Genotype 1 214
TABLE 128: TREATMENT-EXPERIENCED PATIENTS — DIRECT PAIRWISE COMPARISON OF SVR BY FIBROSIS
SEVERITY
DAA Versus PR48 Metavir Score
N Trials N Patients
SVR
RD% (95% CI)a, I2 RR (95% CI)b, I2
All Treatment-Experienced
Boceprevir
B32 PR36/48 RGT F0-F2 1
178 43% (29 to 56) 2.87 (1.78 to 4.62)
F3-F4 47 30% (6 to 55) 3.28 (0.85 to 12.64)
B44 PR48 F0-F2
2
320 47% (37 to 57),
I2 = 0% 3.11 (2.16 to 4.48),
I2 = 0%
F3-F4 93
46% (28 to 63), I2 = 4%
4.38 (1.72 to 11.16), I2 = 0%
Telaprevir
*T12 PR24 F0-F2 1
140 40% (26 to 54) 3.55 (1.98 to 6.34)
F3-F4 89 33% (16 to 50) 3.91 (1.61 to 9.50)
T12 PR48 F0-F2 1
347 53% (43 to 64) 3.47 (2.23 to 5.38)
F3-F4 316 46% (36 to 56) 5.53 (2.57 to 11.90)
Simeprevir
Si12 PR24/48 RGT F0-F2 1
265 41% (30 to 53) 2.01 (1.57 to 2.58)
F3-F4 117 50% (33 to 67) 3.12 (1.68 to 5.80)
Patients With Prior Relapse
Boceprevir
B32 PR36/48 RGT F0-F2 1
117 43% (25 to 61) 2.36 (1.46 to 3.84)
F3-F4 32 30% (-2 to 62) 2.50 (0.68 to 9.25)
*B44 PR48 F0-F2 1
115 44% (26 to 61) 2.39 (1.47 to 3.87)
F3-F4 28 63% (33 to 94) 4.17 (1.19 to 14.64)
Telaprevir
*T12 PR48 F0-F2 1
205 55% (39 to 70) 2.73 (1.70 to 4.37)
F3-F4 149 72% (58 to 85) 6.37 (2.55 to 15.91)
Simeprevir
Si12 PR24/48 RGT F0-F2 1
265 41% (30 to 53) 2.01 (1.57 to 2.58)
F3-F4 117 50% (33 to 67) 3.12 (1.68 to 5.80)
Patients With Prior Partial Response
Boceprevir
B32 PR36/48 RGT F0-F2 1
61 39% (19 to 58) 5.45 (1.39 to 21.35)
F3-F4 15 30% (-5 to 65) 3.82 (0.23 to 62.24)
*B44 PR48 F0-F2 1
65 46% (27 to 65) 6.30 (1.63 to 24.35)
F3-F4 18 46% (12 to 80) 5.57 (0.37 to 83.97)
Telaprevir
T12 PR48 F0-F2 1
64 56% (34 to 78) 3.84 (1.36 to 10.83)
F3-F4 60 34% (11 to 58) 2.81 (0.63 to 12.62)
Patients With Prior Null Response
Telaprevir
T12 PR48 F0-F2 1
77 34% (17 to 51) 5.02 (1.06 to 23.73)
F3-F4 107 21% (6 to 35) 3.28 (0.68 to 15.84)
CI = confidence interval; DAA = direct-acting antiviral; PR48 = pegylated interferon 2a or 2b plus ribavirin for 48 weeks; RD = risk difference; RR = relative risk; SVR = sustained viral response. *Not a Heath Canada-recommended dosage regimen. aPositive numbers indicate that more patients who received DAA + PR achieved SVR, relative to PR for 48 weeks. bAn RR of 1.00 means no difference between comparators, while a RR > 1 indicates that more patients who received DAA + PR achieved SVR, relative to PR for 48 weeks: a RR < 1 means the difference is in favour of PR. Note: Calculated by CADTH using Review Manager software, random effects model.

Direct-Acting Antiviral Agents for Chronic Hepatitis C Genotype 1 215
TABLE 129: TREATMENT-EXPERIENCED PATIENTS — DIRECT PAIRWISE COMPARISON OF SVR BY GENOTYPE
SUBTYPE
DAA Versus PR48 Genotype N Trials
N Patients
SVR
RD% (95% CI) a
RR (95% CI)b
All Treatment-Experienced
Boceprevir
B32 PR36/48 RGT 1a 1
112c 26% (9 to 44) 2.11 (1.14 to 3.90)
1b 111c 43% (26 to 60) 2.94 (1.56 to 5.54)
B44 PR48 1a 1
115 c 37% (20 to 55) 2.58 (1.42 to 4.69)
1b 103c 51% (34 to 68) 3.29 (1.76 to 6.17)
Telaprevir
T12 PR48 1a 1
297d 36% (23 to 48) 2.49 (1.56 to 3.99)
1b 295d 61% (51 to 71) 6.07 (3.02 to 12.22)
Simeprevir
Si12 PR24/48 RGTe 1a
1
165 42% (28 to 57) 2.53 (1.62 to 3.95)
1a + Q80Kf 84 19% (–3 to 40) 1.68 (0.94 to 2.99)
1a no Q80Kf 133 51% (36 to 66) 2.83 (1.81 to 4.41)
1b 228 43% (31 to 55) 2.00 (1.54 to 2.59)
Patients With Prior Relapse
Telaprevir
*T12 PR48 1a 1
176g 54% (38 to 71) 2.84 (1.68, 4.80)
1b 171g 69% (54 to 84) 4.54 (2.21, 9.34)
Si12 PR24/48 RGTe 1a
1
165 42% (28 to 57) 2.53 (1.62 to 3.95)
1a + Q80Kf 84 19% (–3 to 40) 1.68 (0.94 to 2.99)
1a no Q80Kf 133 51% (36 to 66) 2.83 (1.81 to 4.41)
1b 228 43% (31 to 55) 2.00 (1.54 to 2.59)
Patients With Prior Partial Response
Telaprevir
T12 PR48 1a 1
71h 29% (7 to 52) 2.40 (0.84 to 6.83)
1b 50h 60% (35 to 84) 4.41 (1.00 to 19.36)
Patients With Prior Null Response
Telaprevir
T12 PR48 1a 1
105 22% (7 to 38) 3.20 (0.67 to 15.30) 1b 79 33% (17 to 49) 4.85 (1.01 to 23.31)
CI = confidence interval; DAA = direct-acting antiviral; PR48 = pegylated interferon 2a or 2b plus ribavirin for 48 weeks; RD = risk difference; RR = relative risk; SVR = sustained viral response. *Not a Heath Canada-recommended dosage regimen. aPositive numbers indicate that more patients who received DAA + PR achieved SVR, relative to PR for 48 weeks. b An RR of 1.00 means no difference between comparators, while a RR > 1 indicates that more patients who received DAA + PR achieved SVR, relative to PR for 48 weeks: a RR < 1 indicates the difference is in favour of PR. c36 (9%) of patients in RESPOND2 study could not be classified as either genotype 1a or 1b and therefore were excluded from the analysis. d70 (11%) of patients in REALIZE study could not be classified as either genotype 1a or 1b and therefore were excluded from the analysis. eAll patients included in this study were prior relapse. fControl group includes all patients randomized to PR with genotype 1a CHC (i.e., with and without Q80K polymorphism at baseline). g7 (2%) of prior relapse patients in REALIZE study could not be classified as either genotype 1a or 1b and therefore were excluded from the analysis. h3 (2%) of prior partial response patients in REALIZE study could not be classified as either genotype 1a or 1b and therefore were excluded from the analysis Note: Calculated by CADTH using Review Manager software, random effects model. For T12 PR48, data used for the analysis of all treatment experience were extracted from the US Food and Drug Administration medical review report for telaprevir;122 while data for the analysis of patients with prior relapse, or prior partial response, or prior null response were extracted from the European public assessment report for telaprevir.125 The number of patients with prior relapse or prior partial response or prior null response is larger than the number of patients with all treatment experience. This could be due to the different methods used in each agency for identifying the sub genotype subtype. This difference in the number of patients should not have an impact on the overall results.

Direct-Acting Antiviral Agents for Chronic Hepatitis C Genotype 1 216
TABLE 130: TREATMENT-EXPERIENCED PATIENTS — DIRECT PAIRWISE COMPARISON FOR TREATMENT
DISCONTINUATION DUE TO ADVERSE EVENTS
DAA Versus PR48 N Trials
N Patients
% d/c in PR Group
% d/c in DAA Group
Discontinued Treatment Due to AE
RD% (95% CI) a, I2 RR (95% CI) b, I2
Boceprevirc
B32 PR36/48 RGT 1 242 3% 8% 6% (0 to 11) 3.21 (0.74 to 13.88)
*B44 PR48 2 442 3% to 4% 12% to 17% 11% (6 to 16), I2 = 0%
4.25 (1.72 to 10.50) I2 = 0%
Telaprevird
*T12 PR24 1 229 4% 10% 5% (–1 to 12) 2.18 (0.78 to 6.08)
T12 PR48 1 662 3% 4% to 6%e 2% (–1 to 6) 1.71 (0.61 to 4.81)
Simeprevir
Si12 PR24/48 RGTf 1 393 0% 0.4% 0% (–1 to 2) 1.54 (0.06 to 37.55)
Si12 PR48 1 132 5% 5% 0% (–7 to 7) 1.00 (0.21 to 4.78)
AE = adverse event; CI = confidence interval; d/c = discontinued treatment; DAA = direct-acting antiviral; PR48 = pegylated interferon 2a or 2b plus ribavirin for 48 weeks; RD = risk difference; RR = relative risk. *Not a Health Canada–recommended dosage regimen. aPositive numbers indicate that more patients who received DAA + PR discontinued the study due to AE, relative to PR for 48 weeks. bAn RR of 1.00 means no difference between comparators, while a RR > 1 indicates that more patients who received DAA + PR discontinued the study due to AE, relative to PR for 48 weeks: a RR < 1 means the difference is in favour of DAA + PR. c9% discontinued due to AE in the PROVIDE study.
d11% and 14% in Colombo 2013 and 9% in Muir 2011 discontinued due to AE.
e discontinuation due to adverse events ranged from 4% to 6% in REALIZE study.
fAll patients included in this study were prior relapse. Note: Calculated by CADTH using Review Manager random effects model.
TABLE 131: TREATMENT-EXPERIENCED PATIENTS — DIRECT PAIRWISE COMPARISON FOR FATIGUE
DAA Versus PR48 N Trials N Patients Fatigue
RD% (95% CI)a, I
2 RR (95% CI)
b, I
2
Boceprevir
B32 PR36/48 RGT 1 242 4% [–10, 17] 1.07 [0.83, 1.40] B44 PR48 2 442 2% [–8, 12], I
2 = 24% 1.04 [0.86, 1.25], I
2 = 23%
Telaprevir
*T12 PR24 1 229 11% [–2, 23] 1.19 [0.97, 1.47] T12 PR48 1 662 12% [3, 21] 1.30 [1.04, 1.62] Simeprevir
Si12 PR24/48 RGT 1 393 –11% [–21, –1] 0.74 [0.57, 0.96] Si12 PR48 1 132 –5% [–21, 12] 0.90 [0.60, 1.34]
CI = confidence interval; DAA = direct-acting antiviral; PR48 = pegylated interferon 2a or 2b plus ribavirin for 48 weeks; RD = risk difference; RR = relative risk. *Not a Health Canada–recommended dosage regimen. aPositive numbers indicate that more patients who received DAA + PR experienced fatigue, relative to PR for 48 weeks. bAn RR of 1.00 means no difference between comparators, while a RR > 1 indicates that more patients who received DAA + PR experienced
fatigue, relative to PR for 48 weeks: a RR < 1 means the difference is in favour DAA + PR. Note: Calculated by CADTH using Review Manager software, fixed effects model.

Direct-Acting Antiviral Agents for Chronic Hepatitis C Genotype 1 217
TABLE 132: TREATMENT-EXPERIENCED PATIENTS — DIRECT PAIRWISE COMPARISON FOR INFLUENZA-LIKE
SYMPTOMS
DAA Versus PR48 N Trials N Patients Influenza-Like Symptoms
RD% (95% CI)a, I
2 RR (95% CI)
b, I
2
Boceprevir
B32 PR36/48 RGT 1 242 –2% [–13, 10] 0.94 [0.59, 1.50] B44 PR48 2 442 –2% [–10, 7], I
2 = 0% 0.93 [0.66, 1.31], I
2 = 0%
Telaprevir
*T12 PR24 1 229 –6% [–18, 5] 0.80 [0.53, 1.21] T12 PR48 1 662 9% [0, 17] 1.35 [0.98, 1.86] Simeprevir
Si12 PR24/48 RGT 1 393 10% [1, 19] 1.48 [1.01, 2.17] Si12 PR48 1 132 5% [–10, 19] 1.23 [0.64, 2.35]
CI = confidence interval; DAA = direct-acting antiviral; PR48 = pegylated interferon 2a or 2b plus ribavirin for 48 weeks; RD = risk difference; RR = relative risk. *Not a Health Canada–recommended dosage regimen. aPositive numbers indicate that more patients who received DAA + PR experienced influenza-like symptoms, relative to PR for 48 weeks. bAn RR of 1.00 means no difference between comparators, while a RR > 1 indicates that more patients who received DAA + PR experienced
influenza-like symptoms, relative to PR for 48 weeks: a RR < 1 means the difference is in favour DAA + PR. Note: Calculated by CADTH using Review Manager software, fixed effects model.
TABLE 133: TREATMENT-EXPERIENCED PATIENTS — DIRECT PAIRWISE COMPARISON OF NEUTROPENIA
DAA Versus PR48 N Trials N Patients Neutropenia
RD% (95% CI)a, I
2 RR (95% CI)
b, I
2
Boceprevir
B32 PR36/48 RGT 1 242 4% [–4 to 13] 1.42 [0.66 to 3.03] B44 PR48 2 442 8% [1 to 16], I
2 = 36% 1.62 [1.03 to 2.56], I
2 = 0%
Telaprevir
*T12 PR24 1 229 4% [–3 to 11] 1.70 [0.69 to 4.16] T12 PR48 1 662 3% [–3 to 9] 1.30 [0.76 to 2.23] Simeprevir
Si12 PR24/48 RGT 1 393 –4% [–13 to 4] 0.81 [0.54 to 1.23] Si12 PR48 1 132 –2% [–14 to 11] 0.91 [0.41 to 1.99]
CI = confidence interval; DAA = direct-acting antiviral; PR48 = pegylated interferon 2a or 2b plus ribavirin for 48 weeks; RD = risk difference; RR = relative risk. *Not a Health Canada–recommended dosage regimen.
aPositive numbers indicate that more patients who received DAA + PR experienced neutropenia relative to PR for 48 weeks. bAn RR of 1.00 means no difference between comparators, while a RR > 1 indicates that more patients who received DAA + PR experienced
neutropenia, relative to PR for 48 weeks, a RR < 1 means the difference is in favour of DAA + PR. Note: Calculated by CADTH using Review Manager software, fixed effects model.

Direct-Acting Antiviral Agents for Chronic Hepatitis C Genotype 1 218
TABLE 134: TREATMENT-EXPERIENCED PATIENTS — DIRECT PAIRWISE COMPARISON OF PRURITUS
DAA Versus PR48 N Trials N Patients Pruritus
RD% (95% CI)a, I
2 RR (95% CI)
b, I
2
Boceprevir
B44 PR48 1 201 1% [–8, 11] 1.13 [0.52, 2.45] Telaprevir
*T12 PR24 1 229 19% [8, 30] 2.27 [1.37, 3.78] T12 PR48 1 662 24% [15, 32] 1.87 [1.40, 2.50] Simeprevir
Si12 PR24/48 RGT 1 393 0% [–9, 9] 1.00 [0.71, 1.39] Si12 PR48 1 132 14% [–1, 28] 1.82 [0.95, 3.49]
CI = confidence interval; DAA = direct-acting antiviral; PR48 = pegylated interferon 2a or 2b plus ribavirin for 48 weeks; RD = risk difference; RR = relative risk. *Not a Health Canada–recommended dosage regimen.
aPositive numbers indicate that more patients who received DAA + PR- experienced pruritus, relative to PR for 48 weeks.
bAnRR of 1.00 means no difference between comparators, while a RR > 1 indicates that more patients who received DAA + PR-experienced
pruritus, relative to PR for 48 weeks, a RR < 1 means the difference is in favour DAA + PR. Note” Calculated by CADTH using Review Manager software, fixed effects model
TABLE 135: TREATMENT-EXPERIENCED PATIENTS — DIRECT PAIRWISE COMPARISON OF ANORECTAL
DISCOMFORT
DAA Versus PR48 N Trials N Patients Anorectal Discomfort
RD% (95% CI)a, I
2 RR (95% CI)
b, I
2
Telaprevir
*T12 PR24 1 229 7% [2, 12] 16.85 [0.98, 288.60] T12 PR48 1 662 6% [3, 9] 8.30 [1.15, 60.19]
CI = confidence interval; DAA = direct-acting antiviral; PR48 = pegylated interferon 2a or 2b plus ribavirin for 48 weeks; RD = risk difference; RR = relative risk. *Not a Health Canada–recommended dosage regimen.
aPositive numbers indicate that more patients who received DAA + PR experienced anorectal discomfort, relative to PR for 48 weeks.
b An RR pf 1.00 means no difference between comparators, while a RR > 1 indicates that more patients who received DAA + PR experienced anorectal discomfort, relative to PR for 48 weeks, a RR < 1 means the difference is in favour of DAA + PR. Note: Calculated by CADTH using Review Manager software, fixed effects model.

Direct-Acting Antiviral Agents for Chronic Hepatitis C Genotype 1 219
TABLE 136: TREATMENT-EXPERIENCED PATIENTS — DIRECT PAIRWISE COMPARISON OF ANEMIA
DAA Versus PR48 N Trials N Patients Anemia
RD% (95% CI)a, I
2 RR (95% CI)
b, I
2
Boceprevir
B32 PR36/48 RGT 1 242 23% (12 to 35) 2.16 (1.35 to 3.47) B44 PR48 2 442 22% (13 to 31), I
2 = 0% 1.85 (1.37 to 2.49), I
2 = 45%
Telaprevir
*T12 PR24 1 229 18% (9 to 28) 3.30 (1.64 to 6.64) T12 PR48 1 662 17% (10 to 25) 2.15 (1.41 to 3.29) Simeprevir
Si12 PR24/48 RGT 1 393 -3% (-12 to 5) 0.83 (0.54 to 1.28) Si12 PR48 1 132 -5% (-17 to 8) 0.77 (0.36 to 1.63)
CI = confidence interval; DAA = direct-acting antiviral; PR48 = pegylated interferon 2a or 2b plus ribavirin for 48 weeks; RD = risk difference; RR = relative risk. *Not a Health Canada–recommended dosage regimen.
aPositive numbers indicate that more patients who received DAA + PR- experienced anemia, relative to PR for 48 weeks. bAn RR of 1.00 means no difference between comparators, while a RR > 1 indicates that more patients who received DAA + PR-experienced anemia, relative to PR for 48 weeks: a RR < 1 means the difference is in favour of DAA + PR. Note: Calculated by CADTH using Review Manager software, fixed effects model.
TABLE 137: TREATMENT-EXPERIENCED PATIENTS — DIRECT PAIRWISE COMPARISON OF RASH
DAA Versus PR48
N Trials N Patients Rash
RD% (95% CI)a, I
2 RR (95% CI)
b, I
2
Boceprevir
B32 PR36/48 RGT 1 242 12% [4, 19] 3.33 [1.21, 9.20] B44 PR48 2 442 12% [6, 17], I
2 = 10% 2.88 [1.46, 5.68], I
2 = 0%
Telaprevir
*T12 PR24 1 229 30% [19, 42] 2.50 [1.66, 3.76] T12 PR48 1 662 18% [10, 26] 1.93 [1.33, 2.80] Simeprevir
Si12 PR24/48 RGT 1 393 1% [–8, 9] 1.02 [0.70, 1.50] Si12 PR48 1 132 8% [–6, 22] 1.42 [0.74, 2.73]
CI = confidence interval; DAA = direct-acting antiviral; PR48 = pegylated interferon 2a or 2b plus ribavirin for 48 weeks; RD = risk difference; RR = relative risk. *Not a Health Canada–recommended dosage regimen.
aPositive numbers indicate that more patients who received DAA + PR- experienced rash, relative to PR for 48 weeks. bAn RR of 1.00 means no difference between comparators, while a RR > 1 indicates that more patients who received DAA + PR-experienced rash, relative to PR for 48 weeks, a RR < 1 means the difference is in favour DAA + PR. Note: Calculated by CADTH using Review Manager software, fixed effects model.

Direct-Acting Antiviral Agents for Chronic Hepatitis C Genotype 1 220
TABLE 138: TREATMENT-EXPERIENCED PATIENTS — DIRECT PAIRWISE COMPARISON OF DEPRESSION
DAA Versus PR48 N Trials N Patients Depression
RD% (95% CI)a, I
2 RR (95% CI) b,
I2
Boceprevir
B32 PR36/48 RGT 1 242 –3% [–12, 7] 0.82 [0.42, 1.60] B44 PR48 2 442 3% [–3, 10], I
2 = 0% 1.27 [0.77, 2.11], I
2 = 0%
Telaprevir
*T12 PR24 1 229 –5% [–14, 4] 0.68 [0.35, 1.31] T12 PR48 1 662 –3% [–10, 3] 0.77 [0.48, 1.25] Simeprevir
Si12 PR48 1 132 6% [–5, 17] 1.67 [0.64, 4.32]
CI = confidence interval; DAA = direct-acting antiviral; PR48 = pegylated interferon 2a or 2b plus ribavirin for 48 weeks; RD = risk difference; RR = relative risk. *Not a Health Canada–recommended dosage regimen.
aPositive numbers indicate that more patients who received DAA + PR- experienced depression, relative to PR for 48 weeks. bAn RR of 1.00 means no difference between comparators, while a RR > 1 indicates that more patients who received DAA + PR-experienced depression, relative to PR for 48 weeks: a RR < 1 means the difference is in favour DAA + PR. Note: Calculated by CADTH using Review Manager software, fixed effects model.

Direct-Acting Antiviral Agents for Chronic Hepatitis C Genotype 1 221
APPENDIX 16: SUPPLEMENTARY DATA FOR QUEST1 AND QUEST2
On June 4, 1014, the full-text publications for QUEST1 and QUEST2 became available.127,128 From these published reports, new or revised data were available on study methodology and some outcomes. Based on these data, the risk of bias related to randomization and allocation concealment were changed from unclear to low risk for QUEST1 and QUEST2. The number of patients with relapse (PR: 18/84, 21%; simeprevir: 21/234, 9%) and the proportion who qualified for short-course RGT (224/264, 85%) as reported in the published paper for QUEST1127 were different than the data from the FDA117 reported in the main body of this report. Based on the published report for QUEST2, 30/236 (13%) of simeprevir-treated patients relapsed after the end of treatment: FDA sources reported that 31 patients relapsed.117 These differences were judged to be minor. In QUEST1 and QUEST2, the proportion of patients who met the RGT criteria to stop therapyearly may overestimate the proportion in clinical practice in Canada due to differences in the RGT criteria between the trials and Health Canada recommendations. In the Canadian product monograph,49 patients with undetectable HCV RNA at week 4 are eligible for a 24 week treatment course, whereas in the clinical trials, less stringent criteria were applied and patients with HCV RNA < 25 IU/mL detectable or undetectable at week 4 were eligible (Table 139).
TABLE 139: VIROLOGIC RESPONSE ACCORDING TO RESPONSE-GUIDED THERAPY CRITERIA AMONG PATIENTS
WHO RECEIVED SIMEPREVIR
RGT criteria QUEST1127
QUEST2128
Proportion that met virologic criteria,
n/N (%)
SVR12, n/N (%)
a
Proportion that met virologic criteria,
n/N (%)
SVR12, n/N (%)
a
Clinical trial criteria: HCV RNA < 25 IU/mL detectable or undetectable at week 4 and undetectable at week 12
224/264 (85) b 203/224 (91) 235/257 (91)
b 202/235 (86)
Health Canada criteria: HCV RNA < 25 IU/mL undetectable at week 4 and undetectable at week 12
194/264 (73) 179/194 (92) 195/257 (76) 178/195 (91)
HCV RNA = hepatitis C virus ribonucleic acid; RGT = response-guided therapy a Denominator includes the patients who met RGT criteria. b Twelve and six patients in QUEST1 and QUEST2, respectively, could not be classified in accordance with the RGT criteria and discontinued
treatment before assessment of eligibility.
In the published papers for QUEST1 and QUEST2 data on adverse events were reported for the first 12 weeks of treatment and for the overall treatment period.127,128 The proportion of patients with adverse events over the entire treatment period were extracted and reported in Table 140 and Table 141.

Direct-Acting Antiviral Agents for Chronic Hepatitis C Genotype 1 222
TABLE 140: TREATMENT-NAIVE PATIENTS – KEY ADVERSE EVENTS REPORTED OVER THE ENTIRE TREATMENT PERIOD IN QUEST1 AND QUEST2
Study name, author, year
Treatment N Any AE Discontinued treatment due
to AE
SAE Anemia Depression Rash
n % n % n % n % n % n %
Simeprevir
QUEST1 C208
127
PR48 2a 130 125 96 3 2 8 6 27 21 NR 42 32
Si12 PR24/48 2a RGT 264 255 97 7 3 10 4 53 20 89 34
QUEST2 C216
128
PR48 2a/b 134 132 99 0 0 10 7 37 28 NR 27 20
Si12 PR24/48 2a/b RGT 257 249 97 2 < 1 16 6 53 21 69 27
TABLE 141: TREATMENT-NAIVE PATIENTS – OTHER ADVERSE EVENTS REPORTED OVER THE ENTIRE TREATMENT PERIOD IN QUEST1 AND QUEST2
Study name, author, year
Treatment N Anorectal discomfort
Fatigue Influenza-like symptoms
Neutropenia Pruritus
n % n % n % n % n %
Simeprevir
QUEST1 C208
127
PR48 2a 130 NR 53 41 NR 23 18 26 20
Si12 PR24/48 2a RGT 264 110 42 64 24 79 30
QUEST2 C216
128
PR48 2a/b 134 NR 56 42 35 26 36 27 36 27
Si12 PR24/48 2a/b RGT
257 94 37 66 26 54 21 66 26
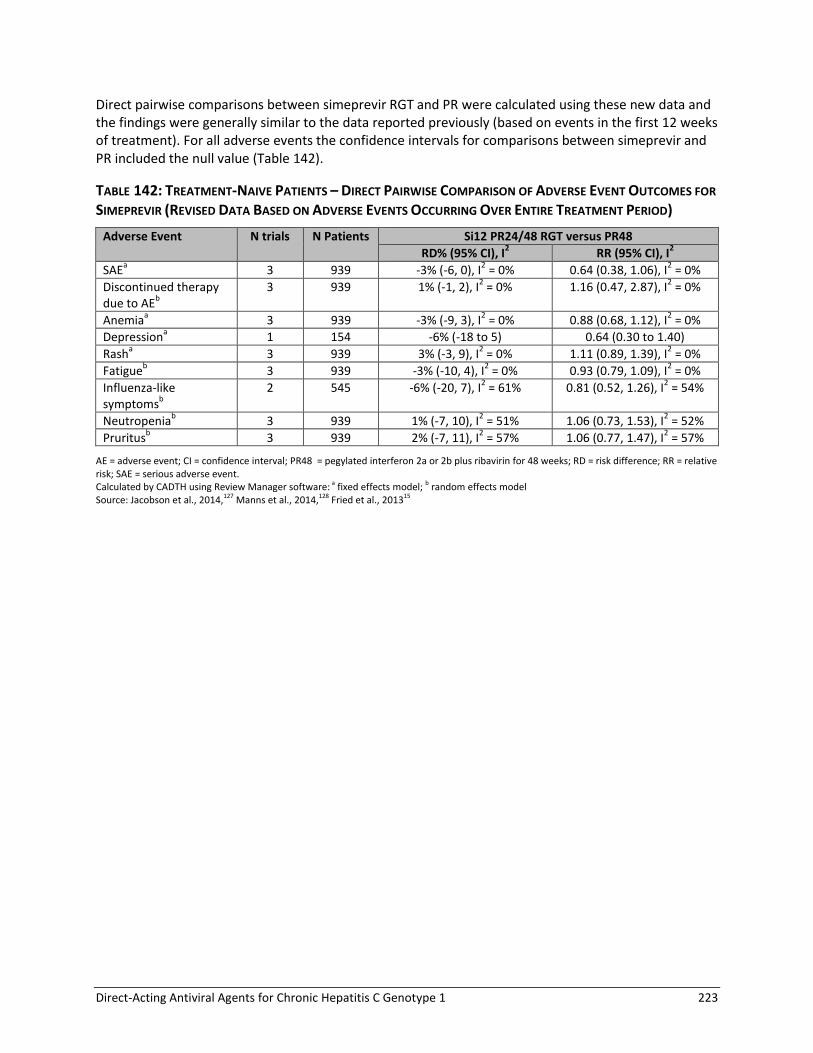
Direct-Acting Antiviral Agents for Chronic Hepatitis C Genotype 1 223
Direct pairwise comparisons between simeprevir RGT and PR were calculated using these new data and the findings were generally similar to the data reported previously (based on events in the first 12 weeks of treatment). For all adverse events the confidence intervals for comparisons between simeprevir and PR included the null value (Table 142).
TABLE 142: TREATMENT-NAIVE PATIENTS – DIRECT PAIRWISE COMPARISON OF ADVERSE EVENT OUTCOMES FOR
SIMEPREVIR (REVISED DATA BASED ON ADVERSE EVENTS OCCURRING OVER ENTIRE TREATMENT PERIOD)
Adverse Event N trials N Patients Si12 PR24/48 RGT versus PR48
RD% (95% CI), I2 RR (95% CI), I
2
SAEa 3 939 -3% (-6, 0), I
2 = 0% 0.64 (0.38, 1.06), I
2 = 0%
Discontinued therapy due to AE
b
3 939 1% (-1, 2), I2 = 0% 1.16 (0.47, 2.87), I
2 = 0%
Anemiaa 3 939 -3% (-9, 3), I
2 = 0% 0.88 (0.68, 1.12), I
2 = 0%
Depressiona 1 154 -6% (-18 to 5) 0.64 (0.30 to 1.40)
Rasha 3 939 3% (-3, 9), I
2 = 0% 1.11 (0.89, 1.39), I
2 = 0%
Fatigueb 3 939 -3% (-10, 4), I
2 = 0% 0.93 (0.79, 1.09), I
2 = 0%
Influenza-like symptoms
b
2 545 -6% (-20, 7), I2 = 61% 0.81 (0.52, 1.26), I
2 = 54%
Neutropeniab 3 939 1% (-7, 10), I
2 = 51% 1.06 (0.73, 1.53), I
2 = 52%
Pruritusb 3 939 2% (-7, 11), I
2 = 57% 1.06 (0.77, 1.47), I
2 = 57%
AE = adverse event; CI = confidence interval; PR48 = pegylated interferon 2a or 2b plus ribavirin for 48 weeks; RD = risk difference; RR = relative risk; SAE = serious adverse event. Calculated by CADTH using Review Manager software: a fixed effects model; b random effects model Source: Jacobson et al., 2014,127 Manns et al., 2014,128 Fried et al., 201315

Direct-Acting Antiviral Agents for Chronic Hepatitis C Genotype 1 224
APPENDIX 17: DETAILED RESULTS FROM THE INDIRECT TREATMENT COMPARISON
Treatment-Naive TABLE 143: SVR TREATMENT COMPARISONS IN TREATMENT-NAIVE PATIENTS: ODDS RATIOS, RELATIVE RISKS, AND RISK DIFFERENCE FOR RANDOM EFFECTS MODEL
Treatment Reference Network Meta-analysis
OR (95% CrI) RR (95% CrI) RD% (95% CrI)
Si12 PR24-48 2a/b RGT PR48 2a/b 3.72 (2.51,5.31) 1.62 (1.44,1.78) 29.48 (21.75,35.71)
T12 PR24-48 2a/b RGT q8 3.80 (2.32,6.09) 1.63 (1.42,1.81) 29.85 (20.15,37.24)
T12 PR24-48 2a/b RGT q12 4.12 (2.10,7.63) 1.65 (1.37,1.86) 31.24 (17.93,39.92)
B24 PR28-48 2b RGT 2.86 (1.76,4.61) 1.51 (1.29,1.71) 24.54 (13.95,33.20)
*So12 PR24-48 2a RGT 6.46 (1.86,26.44) 1.79 (1.31,2.09) 37.76 (15.04,49.64)
*T12 PR24 2a/b q8 2.56 (1.67,3.91) 1.47 (1.26,1.67) 22.28 (12.59,30.83)
*T12 PR48 2a q8 3.13 (1.59,6.39) 1.55 (1.24,1.83) 26.36 (11.46,38.14)
*B24 PR28 2b 2.17 (1.13,4.27) 1.39 (1.06,1.69) 18.75 (3.02,32.06)
T12 PR24-48 2a/b RGT q8 Si12 PR24-48 2a/b RGT 1.02 (0.56,1.90) 1.01 (0.87,1.15) 0.39 (–10.69,10.67)
T12 PR24-48 2a/b RGT q12 1.11 (0.52,2.33) 1.02 (0.84,1.18) 1.73 (–12.51,13.08)
B24 PR28-48 2b RGT 0.77 (0.43,1.42) 0.94 (0.79,1.09) –4.98 (–16.74,6.39)
*So12 PR24-48 2a RGT 1.75 (0.48,7.59) 1.11 (0.82,1.31) 8.31 (–14.38,22.04)
*T12 PR24 2a/b q8 0.69 (0.40,1.22) 0.91 (0.78,1.05) –7.17 (–18.05,3.90)
*T12 PR48 2a q8 0.84 (0.39,1.94) 0.96 (0.76,1.15) –3.15 (–18.84,10.89)
*B24 PR28 2b 0.59 (0.28,1.28) 0.86 (0.65,1.06) –10.64 (–27.50,4.45)
T12 PR24-48 2a/b RGT q12 T12 PR24-48 2a/b RGT q8 1.08 (0.70,1.63) 1.02 (0.91,1.10) 1.31 (–6.71,7.56)
B24 PR28-48 2b RGT 0.75 (0.38,1.49) 0.93 (0.78,1.11) –5.32 (–18.02,7.36)
*So12 PR24-48 2a RGT 1.71 (0.45,7.76) 1.10 (0.81,1.33) 7.78 (–15.28,22.88)
*T12 PR24 2a/b q8 0.67 (0.36,1.28) 0.90 (0.77,1.07) –7.57 (–19.30,4.91)
*T12 PR48 2a q8 0.82 (0.36,1.96) 0.95 (0.75,1.16) –3.54 (–19.77,11.36)
*B24 PR28 2b 0.57 (0.26,1.31) 0.86 (0.65,1.07) –11.08 (–28.10,5.01)
B24 PR28-48 2b RGT T12 PR24-48 2a/b RGT q12 0.70 (0.32,1.57) 0.92 (0.76,1.13) –6.60 (–20.17,8.83)
*So12 PR24-48 2a RGT 1.57 (0.39,7.61) 1.08 (0.79,1.36) 6.45 (–17.08,24.08)
*T12 PR24 2a/b q8 0.62 (0.29,1.36) 0.89 (0.75,1.09) –8.90 (–21.53,6.27)
*T12 PR48 2a q8 0.76 (0.31,2.00) 0.94 (0.74,1.18) –4.82 (–21.58,12.35)
*B24 PR28 2b 0.53 (0.22,1.37) 0.84 (0.63,1.09) –12.34 (–30.19,6.16)
*So12 PR24-48 2a RGT B24 PR28-48 2b RGT 2.27 (0.60,10.11) 1.18 (0.86,1.45) 13.12 (–10.29,28.87)
*T12 PR24 2a/b q8 0.90 (0.47,1.69) 0.97 (0.81,1.17) –2.25 (–15.00,11.03)
*T12 PR48 2a q8 1.10 (0.48,2.59) 1.03 (0.80,1.27) 1.83 (–15.02,17.41)
*B24 PR28 2b 0.76 (0.34,1.72) 0.92 (0.69,1.16) –5.66 (–23.39,10.82)
*T12 PR24 2a/b q8 *So12 PR24-48 2a RGT 0.40 (0.09,1.47) 0.82 (0.68,1.12) –15.29 (–30.27,7.98)
*T12 PR48 2a q8 0.49 (0.10,1.99) 0.87 (0.67,1.20) –11.05 (-30.02,13.10)
*B24 PR28 2b 0.33 (0.07,1.37) 0.78 (0.58,1.10) –18.68 (–38.57,6.45)

Direct-Acting Antiviral Agents for Chronic Hepatitis C Genotype 1 225
Treatment Reference Network Meta-analysis
OR (95% CrI) RR (95% CrI) RD% (95% CrI)
*T12 PR48 2a q8 *T12 PR24 2a/b q8 1.23 (0.62,2.46) 1.06 (0.86,1.25) 4.08 (–10.18,16.50)
*B24 PR28 2b 0.85 (0.39,1.88) 0.95 (0.71,1.20) –3.48 (–21.28,12.57)
*B24 PR28 2b *T12 PR48 2a q8 0.69 (0.27,1.80) 0.90 (0.66,1.19) –7.52 (–27.00,12.13)
Random Effects Model
Residual Deviance 22.98 vs. 25 data points
Deviance Information Criteria
171.329
Fixed Effects Model
Residual Deviance 22.98 vs. 25 data points
Deviance Information Criteria
171.329
CrI = credible interval; OR = odds ratio; RD = risk difference; RR = relative risk; SVR = sustained viral response; vs. = versus. *Not a Health Canada–recommended dosage regimen.
TABLE 144: ANEMIA IN TREATMENT-NAIVE PATIENTS: ODDS RATIOS, RELATIVE RISKS, AND RISK DIFFERENCE
FOR RANDOM EFFECTS MODEL
Treatment Reference Network Meta-analysis
OR (95% CrI) RR (95% CrI) RD% (95% CrI)
Si12 PR24-48 2a/b RGT PR48 2a/2b 1.12 (0.71,1.80) 1.09 (0.77,1.52) 2.22 (–5.91,12.11)
T12 PR24-48 2a/b RGT q8 2.46 (1.40,4.39) 1.81 (1.27,2.42) 19.93 (6.68,34.19)
T12 PR24-48 2a/b RGT q12 2.93 (1.46,6.13) 1.98 (1.31,2.75) 24.19 (7.67,42.01)
B24 PR28-48 2b RGT 2.34 (1.35,4.13) 1.76 (1.24,2.35) 18.65 (5.98,32.74)
*So12 PR24-48 2a RGT 0.86 (0.23,3.50) 0.89 (0.28,2.22) –2.66 (–18.67,28.08)
*T12 PR24 2a/b q8 2.18 (1.31,3.63) 1.69 (1.21,2.25) 16.88 (5.37,29.20)
*T12 PR48 2a q8 1.35 (0.61,2.92) 1.24 (0.68,2.01) 5.89 (–8.08,23.91)
*B24 PR28 2b 2.26 (1.10,4.68) 1.72 (1.07,2.49) 17.79 (1.75,35.57)
T12 PR24-48 2a/b RGT q8 Si12 PR24-48 2a/b RGT 2.19 (1.05,4.56) 1.66 (1.03,2.59) 17.63 (1.00,34.14)
T12 PR24-48 2a/b RGT q12 2.60 (1.12,6.21) 1.82 (1.08,2.90) 21.84 (2.47,41.56)
B24 PR28-48 2b RGT 2.09 (1.01,4.30) 1.61 (1.01,2.52) 16.37 (0.18,32.71)
*So12 PR24-48 2a RGT 0.77 (0.18,3.35) 0.82 (0.25,2.17) –4.81 (–24.01,26.79)
*T12 PR24 2a/b q8 1.94 (0.97,3.86) 1.55 (0.98,2.42) 14.59 (–0.76,29.61)
*T12 PR48 2a q8 1.20 (0.48,2.94) 1.14 (0.57,2.06) 3.72 (–13.56,23.46)
*B24 PR28 2b 2.01 (0.84,4.73) 1.58 (0.88,2.59) 15.49 (–3.65,35.18)
T12 PR24-48 2a/b RGT q12 T12 PR24-48 2a/b RGT q8 1.19 (0.78,1.89) 1.09 (0.86,1.37) 4.18 (–5.90,15.19)
B24 PR28-48 2b RGT 0.95 (0.43,2.13) 0.97 (0.62,1.53) –1.27 (–20.24,18.05)
*So12 PR24-48 2a RGT 0.35 (0.08,1.58) 0.49 (0.15,1.29) –22.16 (–44.39,10.94)
*T12 PR24 2a/b q8 0.88 (0.41,1.89) 0.93 (0.61,1.45) –3.00 (–21.32,15.06)
*T12 PR48 2a q8 0.55 (0.21,1.41) 0.69 (0.36,1.23) –13.78 (–34.27,8.06)
*B24 PR28 2b 0.92 (0.36,2.31) 0.95 (0.55,1.58) –2.10 (–23.66,20.17)
B24 PR28-48 2b RGT T12 PR24-48 2a/b RGT q12 0.80 (0.32,1.95) 0.89 (0.56,1.46) –5.45 (–27.34,16.01)
*So12 PR24-48 2a RGT 0.29 (0.06,1.39) 0.45 (0.14,1.20) –26.23 (–51.16,7.89)
*T12 PR24 2a/b q8 0.75 (0.30,1.76) 0.85 (0.54,1.39) –7.19 (–28.60,13.41)
*T12 PR48 2a q8 0.46 (0.16,1.28) 0.63 (0.32,1.16) –17.94 (–41.16,5.80)
*B24 PR28 2b 0.77 (0.28,2.12) 0.87 (0.49,1.50) –6.38 (–30.35,17.93)

Direct-Acting Antiviral Agents for Chronic Hepatitis C Genotype 1 226
Treatment Reference Network Meta-analysis
OR (95% CrI) RR (95% CrI) RD% (95% CrI)
*So12 PR24-48 2a RGT B24 PR28-48 2b RGT 0.37 (0.08,1.63) 0.51 (0.16,1.32) –20.87 (–43.08,11.67)
*T12 PR24 2a/b q8 0.93 (0.44,1.96) 0.96 (0.63,1.49) –1.83 (–19.84,15.95)
*T12 PR48 2a q8 0.57 (0.22,1.47) 0.70 (0.37,1.26) –12.68 (–32.64,9.06)
*B24 PR28 2b 0.96 (0.39,2.40) 0.98 (0.57,1.62) –0.88 (–22.09,20.98)
*T12 PR24 2a/b q8 *So12 PR24-48 2a RGT 2.51 (0.57,10.86) 1.88 (0.73,6.20) 19.17 (–13.49,40.63)
*T12 PR48 2a q8 1.56 (0.31,7.52) 1.38 (0.46,4.89) 8.25 (–25.50,33.21)
*B24 PR28 2b 2.63 (0.54,12.08) 1.92 (0.69,6.36) 19.93 (–14.42,45.07)
*T12 PR48 2a q8 *T12 PR24 2a/b q8 0.62 (0.28,1.30) 0.74 (0.42,1.17) –10.73 (–26.32,6.25)
*B24 PR28 2b 1.04 (0.42,2.51) 1.02 (0.59,1.65) 0.91 (–19.75,22.32)
*B24 PR28 2b *T12 PR48 2a q8 1.68 (0.58,4.92) 1.39 (0.71,2.81) 11.67 (–12.52,34.88)
Random Effects Model
Residual Deviance 24.78 vs. 25 data points
Deviance Information Criteria 170.346
Fixed Effects Model
Residual Deviance 25.5 vs. 25 data points
Deviance Information Criteria 169.595
CrI = credible interval; OR = odds ratio; RD = risk difference; RR = relative risk; vs. = versus. *Not a Health Canada–recommended dosage regimen.
TABLE 145: DEPRESSION — TREATMENT-NAIVE PATIENTS: ODDS RATIOS, RELATIVE RISKS AND RISK DIFFERENCE
FOR ALL TREATMENT COMPARISONS AND RANDOM EFFECTS MODEL
Treatment Reference Network Meta-analysis
OR (95% CrI) RR (95% CrI) RD% (95 CrI)
Si12 PR24-48 2a RGT PR48 2a/b 0.58 (0.18,1.81) 0.64 (0.22,1.56) –7.36 (–16.70,10.88)
T12 PR24-48 2a/b RGT q8 0.79 (0.36,1.73) 0.83 (0.42,1.51) –3.48 (–12.03,10.30)
T12 PR24-48 2a/b RGT q12 0.64 (0.17,2.40) 0.69 (0.21,1.87) –6.22 (–16.43,17.58)
B24 PR28-48 2b RGT 1.05 (0.48,2.27) 1.04 (0.53,1.81) 0.79 (–9.56,16.24)
*T12 PR24 2a q8 1.02 (0.49,2.12) 1.01 (0.55,1.74) 0.24 (–9.62,14.31)
*T12 PR48 2a q8 0.97 (0.36,2.64) 0.98 (0.42,2.00) –0.44 (–12.39,19.43)
*B24 PR28 2b 0.90 (0.34,2.33) 0.92 (0.40,1.85) –1.72 (–12.70,16.63)
T12 PR24-48 2a/b RGT q8 Si12 PR24-48 2a RGT 1.36 (0.35,5.48) 1.30 (0.43,4.36) 3.80 (–15.35,19.94)
T12 PR24-48 2a/b RGT q12 1.10 (0.19,6.41) 1.09 (0.24,4.62) 1.10 (–18.94,25.88)
B24 PR28-48 2b RGT 1.80 (0.46,7.23) 1.63 (0.54,5.31) 7.95 (–12.23,25.75)
*T12 PR24 2a q8 1.74 (0.46,6.89) 1.59 (0.54,5.23) 7.47 (–12.54,23.95)
*T12 PR48 2a q8 1.67 (0.37,7.74) 1.53 (0.45,5.55) 6.67 (–14.23,28.27)
*B24 PR28 2b 1.54 (0.35,6.98) 1.44 (0.42,5.13) 5.50 (–15.04,25.80)
T12 PR24-48 2a/b RGT q12 T12 PR24-48 2a/b RGT q8 0.81 (0.28,2.34) 0.84 (0.32,1.88) –2.58 (–13.24,15.36)
B24 PR28-48 2b RGT 1.32 (0.43,3.94) 1.25 (0.51,2.99) 4.21 (–12.54,21.40)
*T12 PR24 2a q8 1.28 (0.45,3.75) 1.22 (0.53,2.94) 3.66 (–12.68,19.57)
*T12 PR48 2a q8 1.23 (0.35,4.34) 1.18 (0.42,3.17) 2.98 (–14.76,23.91)
*B24 PR28 2b 1.13 (0.32,3.85) 1.11 (0.40,2.91) 1.79 (–15.54,21.29)
B24 PR28-48 2b RGT T12 PR24-48 2a/b RGT q12 1.64 (0.36,7.41) 1.50 (0.46,5.55) 6.83 (–18.11,24.86)

Direct-Acting Antiviral Agents for Chronic Hepatitis C Genotype 1 227
Treatment Reference Network Meta-analysis
OR (95% CrI) RR (95% CrI) RD% (95 CrI)
*T12 PR24 2a q8 1.58 (0.35,7.19) 1.46 (0.46,5.52) 6.30 (–18.84,23.29)
*T12 PR48 2a q8 1.52 (0.29,7.96) 1.41 (0.39,5.72) 5.54 (–20.20,27.39)
*B24 PR28 2b 1.41 (0.27,7.05) 1.33 (0.36,5.27) 4.40 (–21.20,24.72)
*T12 PR24 2a q8 B24 PR28-48 2b RGT 0.97 (0.34,2.84) 0.97 (0.44,2.29) –0.54 (–18.50,16.54)
*T12 PR48 2a q8 0.93 (0.27,3.28) 0.94 (0.35,2.48) –1.21 (–20.27,20.61)
*B24 PR28 2b 0.86 (0.25,2.96) 0.88 (0.33,2.30) –2.42 (–21.09,18.08)
*T12 PR48 2a q8 *T12 PR24 2a q8 0.96 (0.35,2.54) 0.97 (0.43,2.00) –0.63 (–14.98,16.99)
*B24 PR28 2b 0.89 (0.26,2.88) 0.91 (0.34,2.25) –1.86 (–19.41,18.49)
*B24 PR28 2b *T12 PR48 2a q8 0.93 (0.23,3.67) 0.94 (0.31,2.82) –1.18 (–23.66,20.36)
Random Effects Model
Residual Deviance 14.83 vs. 15 data points
Deviance Information Criteria 101.079
Fixed Effects Model
Residual Deviance 14.82 vs. 15 data points
Deviance Information Criteria 100.722
CrI = credible interval; OR = odds ratio; RD = risk difference; RR = relative risk; vs. = versus. *Not a Health Canada–recommended dosage regimen.
TABLE 146: RASH IN TREATMENT-NAIVE PATIENTS: ODDS RATIOS, RELATIVE RISKS AND RISK DIFFERENCE FOR
ALL TREATMENT COMPARISONS AND RANDOM EFFECTS MODEL
Treatment Reference Network Meta-analysis
OR (95% CrI) RR (95% CrI) RD% (95% CrI)
Si12 PR24-48 2a/b RGT PR48 2a/b 1.38 (0.87,2.16) 1.28 (0.90,1.75) 5.74 (–2.23,15.14)
T12 PR24-48 2a/b RGT q8 1.81 (0.97,3.37) 1.54 (0.98,2.26) 11.38 (–0.45,26.20)
T12 PR24-48 2a/b RGT q12 1.66 (0.73,3.55) 1.46 (0.77,2.32) 9.54 (–4.80,27.50)
B24 PR28-48 2b RGT 1.14 (0.61,2.14) 1.11 (0.66,1.73) 2.26 (–7.10,15.10)
*So12 PR24-48 2a RGT 1.99 (0.53,8.87) 1.65 (0.59,3.52) 13.58 (–9.13,48.62)
*T12 PR24 2a/b q8 1.80 (1.12,2.92) 1.54 (1.09,2.11) 11.32 (2.01,22.29)
*T12 PR48 2a q8 2.05 (0.97,4.35) 1.68 (0.98,2.59) 14.14 (–0.53,32.32)
*B24 PR28 2b 1.03 (0.27,3.76) 1.02 (0.32,2.43) 0.42 (–14.81,28.38)
T12 PR24-48 2a/b RGT q8 Si12 PR24-48 2a/b RGT 1.31 (0.61,2.87) 1.21 (0.70,2.03) 5.60 (–9.54,22.76)
T12 PR24-48 2a/b RGT q12 1.21 (0.47,2.92) 1.14 (0.56,2.03) 3.76 (–13.34,23.39)
B24 PR28-48 2b RGT 0.83 (0.38,1.81) 0.87 (0.48,1.53) –3.46 (–16.66,11.70)
*So12 PR24-48 2a RGT 1.46 (0.36,6.89) 1.30 (0.45,2.97) 7.86 (–17.16,44.01)
*T12 PR24 2a/b q8 1.31 (0.68,2.54) 1.21 (0.76,1.92) 5.57 (–7.87,19.37)
*T12 PR48 2a q8 1.49 (0.63,3.61) 1.31 (0.71,2.29) 8.34 (–9.09,28.51)
*B24 PR28 2b 0.75 (0.18,2.95) 0.80 (0.24,2.03) –5.28 (–23.63,23.75)
T12 PR24-48 2a/b RGT q12 T12 PR24-48 2a/b RGT q8 0.92 (0.55,1.45) 0.94 (0.64,1.26) –1.80 (–11.53,8.39)
B24 PR28-48 2b RGT 0.63 (0.26,1.53) 0.72 (0.38,1.36) –8.98 (–26.46,8.22)
*So12 PR24-48 2a RGT 1.11 (0.25,5.58) 1.07 (0.36,2.58) 2.20 (–25.49,39.47)
*T12 PR24 2a/b q8 1.00 (0.46,2.20) 1.00 (0.60,1.73) –0.04 (–17.60,16.17)
*T12 PR48 2a q8 1.13 (0.43,3.00) 1.09 (0.57,2.03) 2.75 (–17.91,24.42)

Direct-Acting Antiviral Agents for Chronic Hepatitis C Genotype 1 228
Treatment Reference Network Meta-analysis
OR (95% CrI) RR (95% CrI) RD% (95% CrI)
*B24 PR28 2b 0.57 (0.13,2.38) 0.66 (0.20,1.74) –10.76 (–32.37,19.23)
B24 PR28-48 2b RGT T12 PR24-48 2a/b RGT q12 0.69 (0.26,1.94) 0.76 (0.38,1.64) –7.18 (–27.15,11.87)
*So12 PR24-48 2a RGT 1.21 (0.26,6.59) 1.13 (0.37,3.01) 4.04 (–25.42,41.88)
*T12 PR24 2a/b q8 1.09 (0.44,2.82) 1.06 (0.60,2.14) 1.80 (–18.36,19.83)
*T12 PR48 2a q8 1.23 (0.43,3.79) 1.15 (0.57,2.47) 4.54 (–18.39,27.98)
*B24 PR28 2b 0.62 (0.13,2.85) 0.71 (0.20,2.02) –8.83 (–32.79,21.96)
*So12 PR24-48 2a RGT B24 PR28-48 2b RGT 1.75 (0.41,8.65) 1.49 (0.49,3.70) 11.21 (–14.86,47.08)
*T12 PR24 2a/b q8 1.58 (0.72,3.46) 1.39 (0.80,2.52) 8.98 (–6.81,23.31)
*T12 PR48 2a q8 1.79 (0.68,4.79) 1.51 (0.75,2.96) 11.72 (–7.67,32.22)
*B24 PR28 2b 0.90 (0.21,3.79) 0.92 (0.27,2.52) –1.87 (–21.93,27.31)
*T12 PR24 2a/b q8 *So12 PR24-48 2a RGT 0.91 (0.19,3.73) 0.94 (0.41,2.71) –2.13 (–39.15,23.68)
*T12 PR48 2a q8 1.02 (0.20,4.76) 1.02 (0.41,3.08) 0.51 (–37.40,30.59)
*B24 PR28 2b 0.51 (0.07,3.29) 0.62 (0.16,2.36) –12.76 (–51.04,23.05)
*T12 PR48 2a q8 *T12 PR24 2a/b q8 1.13 (0.54,2.42) 1.09 (0.64,1.72) 2.78 (–12.64,20.56)
*B24 PR28 2b 0.57 (0.14,2.28) 0.66 (0.20,1.68) –10.81 (–30.07,18.87)
*B24 PR28 2b *T12 PR48 2a q8 0.51 (0.11,2.21) 0.61 (0.18,1.67) –13.24 (–38.12,17.63)
Random Effects Model
Residual Deviance 25.54 vs. 25 data points
Deviance Information Criteria 171.785
Fixed Effects Model
Residual Deviance 27.51 vs. 25 data points
Deviance Information Criteria 171.822
CrI = credible interval; OR = odds ratio; RD = risk difference; RR = relative risk; vs. = versus. *Not a Health Canada–recommended dosage regimen.

Direct-Acting Antiviral Agents for Chronic Hepatitis C Genotype 1 229
Treatment-Experienced TABLE 147: SVR — ALL TREATMENT-EXPERIENCED PATIENTS: ODDS RATIOS, RELATIVE RISKS, AND RISK
DIFFERENCE FOR ALL TREATMENT COMPARISONS AND RANDOM EFFECTS MODEL
Treatment Reference Network Meta-analysis
OR (95% CrI) RR (95% CrI) RD% (95% CrI)
Si12 PR24-48 2a RGT PR48 2a/b 6.60 (3.04,14.47) 3.02 (2.11,3.93) 42.62 (23.79,58.27)
Si12 PR48 2a 7.02 (2.61,19.07) 3.09 (1.93,4.24) 44.05 (20.34,62.55)
T12 PR48 2a q8 9.58 (4.37,21.21) 3.40 (2.50,4.31) 50.73 (32.93,63.98)
B32 PR36-48 2b RGT 5.23 (2.40,11.69) 2.76 (1.83,3.79) 37.08 (18.27,54.43)
*B44 PR48 2a/b 7.21 (3.88,13.93) 3.12 (2.34,4.02) 44.65 (30.30,57.56)
*T12 PR24 2a q8 6.62 (2.71,16.65) 3.02 (1.97,4.11) 42.70 (21.16,60.50)
Si12 PR48 2a Si12 PR24-48 2a RGT 1.06 (0.30,3.73) 1.02 (0.62,1.57) 1.40 (–26.90,27.84)
T12 PR48 2a q8 1.45 (0.48,4.44) 1.13 (0.79,1.66) 7.97 (–15.47,31.21)
B32 PR36-48 2b RGT 0.79 (0.26,2.43) 0.91 (0.59,1.42) –5.48 (–30.12,20.27)
*B44 PR48 2a/b 1.09 (0.40,3.02) 1.03 (0.74,1.54) 1.96 (–19.34,25.03)
*T12 PR24 2a q8 1.01 (0.30,3.32) 1.00 (0.63,1.53) 0.10 (–26.53,25.88)
T12 PR48 2a q8 Si12 PR48 2a 1.37 (0.38,4.87) 1.10 (0.75,1.77) 6.63 (–18.98,33.86)
B32 PR36-48 2b RGT 0.74 (0.21,2.66) 0.89 (0.56,1.51) –6.92 (–33.41,22.62)
*B44 PR48 2a/b 1.03 (0.32,3.37) 1.01 (0.71,1.64) 0.55 (–23.21,27.84)
*T12 PR24 2a q8 0.94 (0.25,3.65) 0.98 (0.61,1.63) –1.34 (–29.88,28.45)
B32 PR36-48 2b RGT T12 PR48 2a q8 0.54 (0.18,1.68) 0.81 (0.54,1.19) –13.55 (–36.51,11.16)
*B44 PR48 2a/b 0.75 (0.28,2.09) 0.92 (0.68,1.28) –6.09 (–25.51,15.88)
*T12 PR24 2a q8 0.69 (0.21,2.28) 0.89 (0.57,1.29) –7.96 (–33.19,16.86)
*B44 PR48 2a/b B32 PR36-48 2b RGT 1.38 (0.67,2.87) 1.13 (0.87,1.57) 7.49 (–8.73,24.36)
*T12 PR24 2a q8 1.27 (0.38,4.18) 1.10 (0.67,1.74) 5.60 (–22.36,31.60)
*T12 PR24 2a q8 *B44 PR48 2a/b 0.92 (0.30,2.77) 0.97 (0.62,1.38) –1.87 (–27.47,21.15)
Random Effects Model
Residual Deviance 12.35 vs. 13 data points
Deviance Information Criteria 90.309
Fixed Effects Model
Residual Deviance 12.08 vs. 13 data points
Deviance Information Criteria 89.748
CrI = credible interval; OR = odds ratio; RD = risk difference; RR = relative risk; SVR = sustained viral response; vs. = versus. *Not a Health Canada–recommended dosage regimen.

Direct-Acting Antiviral Agents for Chronic Hepatitis C Genotype 1 230
TABLE 148: SVR TREATMENT-EXPERIENCED PATIENTS WITH PRIOR RELAPSE: ODDS RATIOS, RELATIVE RISKS, AND RISK DIFFERENCE FOR ALL TREATMENT COMPARISONS AND RANDOM EFFECTS MODEL
Treatment Reference Network Meta-analysis
OR (95% CrI) RR (95% CrI) RD% (95% CrI)
Si12 PR24-48 2a RGT PR48 2a/b 6.59 (2.96,14.96) 2.55 (1.88,3.23) 43.77 (25.58,57.34)
B32 PR36-48 2b RGT 5.11 (2.12,12.55) 2.36 (1.58,3.18) 38.40 (17.40,55.22)
*Si12 PR48 2a 6.03 (1.59,25.97) 2.48 (1.35,3.54) 41.98 (10.46,63.80)
*T12 PR24 2a q8 9.83 (2.98,34.85) 2.80 (1.86,3.73) 51.04 (25.97,66.40)
*T12 PR48 2a q8 20.02 (7.94,51.33) 3.13 (2.51,3.88) 60.29 (47.15,68.71)
*B44 PR48 2a/b 6.81 (3.35,14.03) 2.58 (1.94,3.30) 44.47 (28.84,56.93)
B32 PR36-48 2b RGT Si12 PR24-48 2a RGT 0.77 (0.23,2.62) 0.93 (0.62,1.34) –5.43 (–30.11,19.53)
*Si12 PR48 2a 0.92 (0.19,4.85) 0.98 (0.54,1.46) –1.71 (–35.46,26.62)
*T12 PR24 2a q8 1.49 (0.34,6.56) 1.10 (0.73,1.55) 7.11 (–21.09,30.80)
*T12 PR48 2a q8 3.04 (0.88,10.41) 1.23 (0.98,1.67) 16.30 (–1.81,36.09)
*B44 PR48 2a/b 1.03 (0.35,3.03) 1.01 (0.76,1.41) 0.57 (–19.62,22.68)
*Si12 PR48 2a B32 PR36-48 2b RGT 1.18 (0.24,6.66) 1.05 (0.57,1.70) 3.49 (–31.76,34.56)
*T12 PR24 2a q8 1.93 (0.43,8.86) 1.19 (0.77,1.79) 12.43 (–17.14,38.18)
*T12 PR48 2a q8 3.92 (1.08,14.23) 1.32 (1.02,1.94) 21.64 (1.20,43.84)
*B44 PR48 2a/b 1.33 (0.57,3.13) 1.09 (0.86,1.51) 5.91 (–10.67,24.71)
*T12 PR24 2a q8 *Si12 PR48 2a 1.62 (0.25,10.22) 1.12 (0.72,2.05) 8.64 (–23.62,43.43)
*T12 PR48 2a q8 3.33 (0.58,16.67) 1.26 (0.93,2.24) 18.05 (–6.52,49.68)
*B44 PR48 2a/b 1.13 (0.22,5.15) 1.03 (0.72,1.88) 2.37 (–24.52,36.26)
*T12 PR48 2a q8 *T12 PR24 2a q8 2.02 (0.43,9.24) 1.11 (0.89,1.62) 8.97 (–9.58,34.49)
*B44 PR48 2a/b 0.69 (0.17,2.82) 0.92 (0.68,1.38) –6.59 (–28.08,21.31)
*B44 PR48 2a/b *T12 PR48 2a q8 0.34 (0.10,1.10) 0.82 (0.64,1.02) –15.67 (–32.52,1.38)
Random Effects Model
Residual Deviance 12.44 vs. 13 data points
Deviance Information Criteria 83.211
Fixed Effects Model
Residual Deviance 12.44 vs. 13 data points
Deviance Information Criteria 83.211
CrI = credible interval; OR = odds ratio; RD = risk difference; RR = relative risk; SVR = sustained viral response vs. = versus. *Not a Health Canada–recommended dosage regimen.

Direct-Acting Antiviral Agents for Chronic Hepatitis C Genotype 1 231
TABLE 149: SVR TREATMENT-EXPERIENCED PATIENTS WITH PRIOR PARTIAL RESPONSE: ODDS RATIOS, RELATIVE
RISKS, AND RISK DIFFERENCE FOR ALL TREATMENT COMPARISONS AND RANDOM EFFECTS MODEL
Treatment Reference Network Meta-analysis
OR (95% CrI) RR (95% CrI) RD% (95% CrI)
Si12 PR48 2a PR48 2a/b 23.74 (4.07,235.70) 8.67 (3.11,23.50) 57.14 (17.61,87.00)
T12 PR48 2a q8 8.26 (2.15,38.24) 5.33 (1.94,13.40) 31.12 (6.91,65.00)
B32 PR36-48 2b RGT 11.23 (2.67,62.56) 6.35 (2.25,18.74) 38.91 (11.94,70.16)
*B44 PR48 2a/b 17.80 (5.07,88.71) 7.97 (3.41,21.80) 50.57 (25.07,75.06)
T12 PR48 2a q8 Si12 PR48 2a 0.35 (0.02,3.64) 0.62 (0.18,1.97) –24.16
(–69.73,28.99)
B32 PR36-48 2b RGT 0.47 (0.03,5.78) 0.73 (0.25,2.44) –17.58
(–64.62,39.29)
*B44 PR48 2a/b 0.76 (0.06,8.43) 0.90 (0.40,2.83) –6.32
(–52.75,47.29)
B32 PR36-48 2b RGT T12 PR48 2a q8 1.37 (0.17,11.88) 1.19 (0.38,4.37) 7.41 (–40.42,52.09)
*B44 PR48 2a/b 2.21 (0.30,17.20) 1.49 (0.58,5.08) 18.97
(–27.86,59.01)
*B44 PR48 2a/b B32 PR36-48 2b RGT 1.61 (0.57,4.61) 1.24 (0.79,2.35) 11.11
(–12.58,34.29)
Random-Effects Model
Residual Deviance 8.377 vs. 9 data points
Deviance Information Criteria 48.107
Fixed Effects Model
Residual Deviance 8.377 vs. 9 data points
Deviance Information Criteria 48.107
CrI = credible interval; OR = odds ratio; RD = risk difference; RR = relative risk; SVR = sustained viral response; vs. = versus. *Not a Health Canada–recommended dosage regimen.
TABLE 150: SVR TREATMENT-EXPERIENCED PATIENTS WITH PRIOR NULL RESPONSE: ODDS RATIOS, RELATIVE
RISKS, AND RISK DIFFERENCE FOR ALL TREATMENT COMPARISONS AND RANDOM EFFECTS MODEL
Treatment Reference Network Meta-analysis
OR (95% CrI) RR (95% CrI) RD% (95% CrI)
Si12 PR48 2a PR48 2a/b 5.39 (0.88,41.18) 3.78 (0.89,14.23) 24.79 (–1.24,65.47)
T12 PR48 2a q8 9.44 (1.97,88.18) 5.23 (1.71,21.12) 38.86 (9.26,74.85)
T12 PR48 2a q8 Si12 PR48 2a 1.81 (0.14,29.94) 1.40 (0.34,7.82) 13.80 (–43.55,65.47)
Random Effects Model
Residual Deviance 4.141 vs. 4 data points
Deviance Information Criteria 22.078
Fixed Effect Model
Residual Deviance 4.184 vs. 4 data points
Deviance Information Criteria 21.401
CrI = credible interval; OR = odds ratio; RD = risk difference; RR = relative risk; SVR = sustained viral response; vs. = versus.

Direct-Acting Antiviral Agents for Chronic Hepatitis C Genotype 1 232
TABLE 151: ANEMIA IN ALL TREATMENT-EXPERIENCED PATIENTS: ODDS RATIOS, RELATIVE RISKS, AND RISK
DIFFERENCE FOR ALL TREATMENT COMPARISONS AND RANDOM EFFECTS MODEL
Treatment Reference Network Meta-analysis
OR (95% CrI) RR (95% CrI) RD% (95% CrI)
Si12 PR24-48 2a RGT PR48 2a/b 0.81 (0.32,1.98) 0.84 (0.37,1.69) –2.90 (–11.61,11.94)
Si12 PR48 2a 0.73 (0.22,2.36) 0.77 (0.26,1.91) –4.13 (–14.01,15.54)
T12 PR48 2a q8 2.76 (1.14,6.86) 2.10 (1.11,3.43) 19.56 (1.99,41.50)
B32 PR36-48 2b RGT 2.58 (1.12,6.27) 2.01 (1.10,3.31) 17.96 (1.75,39.28)
*B44 PR48 2a/b 2.66 (1.36,5.25) 2.05 (1.27,3.07) 18.68 (5.12,34.78)
*T12 PR24 2a q8 4.30
(1.48,13.16) 2.70 (1.36,4.40) 30.35 (6.69,55.70)
Si12 PR48 2a Si12 PR24-48 2a RGT 0.90 (0.20,3.92) 0.91 (0.25,3.07) –1.23 (–18.55,19.48)
T12 PR48 2a q8 3.42 (0.97,12.37) 2.50 (0.98,6.43) 22.15 (–0.45,45.39)
B32 PR36-48 2b RGT 3.20 (0.94,11.39) 2.39 (0.96,6.14) 20.59 (–0.98,43.38)
*B44 PR48 2a/b 3.30
(1.08,10.27) 2.45 (1.06,6.01) 21.35 (1.54,39.53)
*T12 PR24 2a q8 5.33
(1.33,22.27) 3.20 (1.23,8.18) 32.82 (5.17,59.38)
T12 PR48 2a q8 Si12 PR48 2a 3.80 (0.88,16.87) 2.73 (0.92,8.90) 23.25 (–2.26,47.02)
B32 PR36-48 2b RGT 3.56 (0.85,15.74) 2.62 (0.89,8.59) 21.70 (–3.07,45.26)
*B44 PR48 2a/b 3.68 (0.95,14.47) 2.68 (0.96,8.48) 22.54 (–1.14,41.50)
*T12 PR24 2a q8 5.94
(1.22,29.86) 3.50 (1.14,11.33) 33.80 (3.72,61.33)
B32 PR36-48 2b RGT T12 PR48 2a q8 0.93 (0.28,3.28) 0.96 (0.45,2.10) –1.57 (–28.52,25.96)
*B44 PR48 2a/b 0.96 (0.31,2.96) 0.98 (0.51,2.04) –0.86 (–26.48,23.22)
*T12 PR24 2a q8 1.56 (0.38,6.42) 1.28 (0.57,2.78) 10.63 (–21.87,41.84)
*B44 PR48 2a/b B32 PR36-48 2b RGT 1.03 (0.45,2.25) 1.02 (0.63,1.72) 0.70 (–18.13,17.06)
*T12 PR24 2a q8 1.67 (0.42,6.74) 1.34 (0.59,2.83) 12.22 (-19.75,43.00)
*T12 PR24 2a q8 *B44 PR48 2a/b 1.62 (0.45,5.96) 1.32 (0.61,2.52) 11.53 (–17.66,40.95)
Random Effects Model
Residual Deviance
13.1 vs. 13 data points
Deviance Information Criteria
89.667
Fixed Effects Model Residual Deviance
13.35 vs. 13 data points
Deviance Information Criteria
89.415
CrI = credible interval; OR = odds ratio; RD = risk difference; RR = relative risk; vs. = versus. *Not a Health Canada–recommended dosage regimen.

Direct-Acting Antiviral Agents for Chronic Hepatitis C Genotype 1 233
TABLE 152: DEPRESSION — ALL TREATMENT-EXPERIENCED PATIENTS: ODDS RATIOS, RELATIVE RISKS, AND RISK
DIFFERENCE FOR ALL TREATMENT COMPARISONS AND RANDOM EFFECTS MODEL
Treatment Reference Network Meta-analysis
OR (95% CrI) RR (95% CrI) RD% (95% CrI)
Si12 PR48 2a PR48 2a/b 1.82 (0.49,7.04) 1.65 (0.53,4.26) 7.94 (–6.24,35.41)
T12 PR48 2a q8 0.75 (0.31,1.87) 0.77 (0.34,1.70) –2.79 (–8.62,8.11)
B32 PR36-48 2b RGT 0.89 (0.34,2.37) 0.90 (0.37,2.06) –1.19 (–8.39,11.77)
*B44 PR48 2a/b 1.36 (0.64,3.04) 1.30 (0.67,2.49) 3.68 (–4.45,16.24)
*T12 PR24 2a q8 0.62 (0.22,1.76) 0.66 (0.24,1.61) –4.17 (–9.99,7.18)
T12 PR48 2a q8 Si12 PR48 2a 0.41 (0.08,2.02) 0.47 (0.13,1.84) –10.49 (–38.12,7.05)
B32 PR36-48 2b RGT 0.49 (0.09,2.50) 0.55 (0.15,2.20) –8.96 (–37.15,10.31)
*B44 PR48 2a/b 0.75 (0.16,3.50) 0.79 (0.25,2.91) –4.19 (–33.08,15.24)
*T12 PR24 2a q8 0.34 (0.06,1.81) 0.40 (0.10,1.68) –11.84 (–39.35,5.85)
B32 PR36-48 2b RGT T12 PR48 2a q8 1.19 (0.32,4.46) 1.17 (0.36,3.73) 1.56 (–11.02,15.18)
*B44 PR48 2a/b 1.82 (0.56,6.08) 1.69 (0.61,4.86) 6.35 (–6.86,19.81)
*T12 PR24 2a q8 0.84 (0.21,3.25) 0.85 (0.24,2.87) –1.37 (–13.17,10.89)
*B44 PR48 2a/b B32 PR36-48 2b RGT 1.53 (0.64,3.86) 1.44 (0.69,3.26) 4.71 (–5.92,15.14)
*T12 PR24 2a q8 0.70 (0.16,2.87) 0.72 (0.20,2.55) –2.95 (–16.64,10.11)
*T12 PR24 2a q8 *B44 PR48 2a/b 0.46 (0.12,1.65) 0.50 (0.15,1.54) –7.73 (–21.25,5.86)
Random Effects Model
Residual Deviance 10.6 vs. 11 data points
Deviance Information Criteria 69.803
Fixed Effects Model
Residual Deviance 10.45 vs. 11 data points
Deviance Information Criteria 69.342
CrI = credible interval; OR = odds ratio; RD = risk difference; RR = relative risk; vs. = versus. *Not a Health Canada–recommended dosage regimen.

Direct-Acting Antiviral Agents for Chronic Hepatitis C Genotype 1 234
TABLE 153: RASH — ALL TREATMENT-EXPERIENCED PATIENTS: ODDS RATIOS, RELATIVE RISKS, AND RISK
DIFFERENCE FOR ALL TREATMENT COMPARISONS AND RANDOM EFFECTS MODEL
Treatment Reference Network Meta-analysis
OR (95% CrI) RR (95% CrI) RD% (95% CrI)
Si12 PR24-48 2a RGT PR48 2a/b 1.04 (0.44,2.51) 1.03 (0.47,2.11) 0.43 (–7.30,14.30)
Si12 PR48 2a 1.57 (0.53,4.81) 1.46 (0.57,3.25) 6.11 (–6.08,28.41)
T12 PR48 2a q8 2.50 (1.07,5.94) 2.08 (1.06,3.63) 14.36 (0.80,34.12)
B32 PR36-48 2b RGT 4.27 (1.45,13.44) 2.96 (1.36,5.60) 26.34 (5.38,52.06)
*B44 PR48 2a/b 3.42 (1.44,8.90) 2.58 (1.35,4.76) 21.15 (5.35,41.76)
*T12 PR24 2a q8 4.09 (1.63,10.36) 2.89 (1.50,4.77) 25.21 (6.78,47.67)
Si12 PR48 2a Si12 PR24-48 2a RGT 1.52 (0.38,6.23) 1.41 (0.44,4.30) 5.58 (–12.59,28.75)
T12 PR48 2a q8 2.42 (0.71,8.23) 2.02 (0.76,5.20) 13.75 (–5.30,34.64)
B32 PR36-48 2b RGT 4.13 (1.05,17.17) 2.86 (1.03,7.64) 25.61 (0.73,52.29)
*B44 PR48 2a/b 3.30 (0.98,11.74) 2.49 (0.99,6.59) 20.45 (–0.26,42.23)
*T12 PR24 2a q8 3.96 (1.11,13.87) 2.79 (1.08,6.91) 24.45 (1.73,47.93)
T12 PR48 2a q8 Si12 PR48 2a 1.59 (0.39,6.34) 1.42 (0.51,4.17) 8.08 (–17.64,31.25)
B32 PR36-48 2b RGT 2.75 (0.57,13.10) 2.03 (0.68,6.18) 19.87 (–11.04,49.14)
*B44 PR48 2a/b 2.19 (0.53,9.32) 1.77 (0.65,5.35) 14.86 (–12.98,39.41)
*T12 PR24 2a q8 2.61 (0.61,10.83) 1.97 (0.71,5.63) 18.66 (–10.06,44.62)
B32 PR36-48 2b RGT T12 PR48 2a q8 1.72 (0.42,7.00) 1.43 (0.56,3.46) 11.76 (–17.95,41.36)
*B44 PR48 2a/b 1.37 (0.40,4.87) 1.24 (0.54,2.98) 6.67 (–19.65,32.01)
*T12 PR24 2a q8 1.64 (0.45,5.73) 1.38 (0.59,3.13) 10.61 (–16.36,36.73)
*B44 PR48 2a/b B32 PR36-48 2b RGT 0.80 (0.33,2.00) 0.87 (0.52,1.59) –5.07 (–25.62,14.48)
*T12 PR24 2a q8 0.95 (0.22,3.95) 0.97 (0.41,2.32) –1.09 (–33.84,30.46)
*T12 PR24 2a q8 *B44 PR48 2a/b 1.19 (0.32,4.22) 1.12 (0.48,2.39) 4.00 (-24.80,32.50)
Random Effects Model
Residual Deviance 12.31 vs. 13 data points
Deviance Information Criteria 86.505
Fixed Effects Model
Residual Deviance 12.15 vs. 13 data points
Deviance Information Criteria 86.173
CrI = credible interval; OR = odds ratio; RD = risk difference; RR = relative risk; vs. = versus. *Not a Health Canada–recommended dosage regimen.

Direct-Acting Antiviral Agents for Chronic Hepatitis C Genotype 1 235
APPENDIX 18: ADDITIONAL NMA ANALYSES IN TREATMENT-NAIVE PATIENTS
Base Case Treatment-Naive SVR: Metavir Score F0-F2 (Addition of the PROTON Study)
PROTON did not report SVR stratified by fibrosis score. However, 94% of patients were F0-F2 at baseline. For the health economic model, we will consider that the response rate observed in PROTON is representative of the Metavir F0-F2 population.
Total Patients 2,397
Total Studies 6
2-group trials 6
FIGURE 29: SVR FOR FIBROSIS SCORE F0-F2 IN TREATMENT-NAIVE PATIENTS: EVIDENCE NETWORK (PROTON
STUDY INCLUDED)
TABLE 154: SVR FOR FIBROSIS SCORE F0-F2-TREATMENT-NAIVE PATIENTS: RELATIVE RISK (LOWER SEGMENT), RISK DIFFERENCE % (UPPER SEGMENT) FOR HEAD-TO-HEAD COMPARISONS OF ALL TREATMENTS / RANDOM
EFFECTS MODEL (PROTON ADDED)
PR48 2a/b 30.55
(18.62,39.62) 30.01
(14.46,40.26) 30.35 (6.61,43.06) 26.82 (9.93,38.19)
36.40 (11.61,48.67)
1.60 (1.35,1.84) Si12 PR24-48 2a/b
RGT –0.51
(–17.68,14.24) –0.15
(–24.69,16.23) –3.67
(–22.04,12.03) 5.78
(–18.94,21.48)
1.59 (1.28,1.83) 0.99 (0.79,1.20) T12 PR24-48 2a
RGT q8 0.35
(–15.36,10.54) –3.15
(–22.18,15.54) 6.17
(–18.52,24.86)
1.60 (1.13,1.89) 1.00 (0.70,1.22) 1.00 (0.79,1.14) T12 PR24-48 2a
RGT q12 –3.45
(–23.60,22.06) 5.71
(–19.86,31.39)
1.53 (1.20,1.78) 0.96 (0.74,1.16) 0.96 (0.74,1.23) 0.96 (0.73,1.37) B24 PR28-48 2b
RGT 9.31
(–15.97,29.18)
1.72 (1.22,2.05) 1.07 (0.78,1.30) 1.08 (0.78,1.37) 1.07 (0.77,1.54) 1.12 (0.81,1.47) *So12 PR24-48
2a RGT
*Not a Health Canada–recommended dosage regimen.

Direct-Acting Antiviral Agents for Chronic Hepatitis C Genotype 1 236
TABLE 155: SVR FOR FIBROSIS SCORE F0-F2-TREATMENT-NAIVE PATIENTS: ODDS RATIOS, RELATIVE RISKS, AND RISK DIFFERENCE FOR ALL TREATMENT COMPARISONS AND RANDOM EFFECTS MODEL
Treatment Reference OR (95% CrI) RR (95% CrI) RD% (95% CrI)
Si12 PR24-48 2a/b RGT PR48 2a/b 4.23 (2.23,7.99) 1.60 (1.35,1.84) 30.55 (18.62,39.62)
T12 PR24-48 2a RGT q8 4.09 (1.82,9.19) 1.59 (1.28,1.83) 30.01 (14.46,40.26)
T12 PR24-48 2a RGT q12 4.18 (1.31,13.32) 1.60 (1.13,1.89) 30.35 (6.61,43.06)
B24 PR28-48 2b RGT 3.36 (1.50,7.47) 1.53 (1.20,1.78) 26.82 (9.93,38.19)
*So12 PR24-48 2a RGT 6.58 (1.62,29.30) 1.72 (1.22,2.05) 36.40 (11.61,48.67)
T12 PR24-48 2a RGT q8 Si12 PR24-48 2a/b RGT 0.97 (0.35,2.71) 0.99 (0.79,1.20) –0.51 (–17.68,14.24)
T12 PR24-48 2a RGT q12 0.99 (0.27,3.73) 1.00 (0.70,1.22) –0.15 (–24.69,16.23)
B24 PR28-48 2b RGT 0.80 (0.29,2.25) 0.96 (0.74,1.16) –3.67 (–22.04,12.03)
*So12 PR24-48 2a RGT 1.56 (0.34,7.93) 1.07 (0.78,1.30) 5.78 (–18.94,21.48)
T12 PR24-48 2a RGT q12 T12 PR24-48 2a RGT q8 1.02 (0.44,2.35) 1.00 (0.79,1.14) 0.35 (–15.36,10.54)
B24 PR28-48 2b RGT 0.82 (0.26,2.58) 0.96 (0.74,1.23) –3.15 (–22.18,15.54)
*So12 PR24-48 2a RGT 1.61 (0.33,8.70) 1.08 (0.78,1.37) 6.17 (–18.52,24.86)
B24 PR28-48 2b RGT T12 PR24-48 2a RGT q12 0.81 (0.20,3.34) 0.96 (0.73,1.37) –3.45 (–23.60,22.06)
*So12 PR24-48 2a RGT 1.57 (0.26,10.35) 1.07 (0.77,1.54) 5.71 (–19.86,31.39)
*So12 PR24-48 2a RGT B24 PR28-48 2b RGT 1.96 (0.40,10.55) 1.12 (0.81,1.47) 9.31 (–15.97,29.18)
Random Effects Model Residual Deviance 12.16 vs. 12 data points
Deviance Information Criteria 86.298
Fixed Effects Model Residual Deviance 12.47 vs. 12 data points
Deviance Information Criteria 86.071
CrI = credible interval; OR = odds ratio; RD = risk difference; RR = relative risk; SVR = sustained viral response; vs. = versus. *Not a Health Canada–recommended dosage regimen.
Base Case Treatment-Naive SVR: Metavir Score F3-F4 — Addition of the B44 PR48 Treatment Arm
Total Patients 658
Total Studies 5
2-group 4
3-group 1
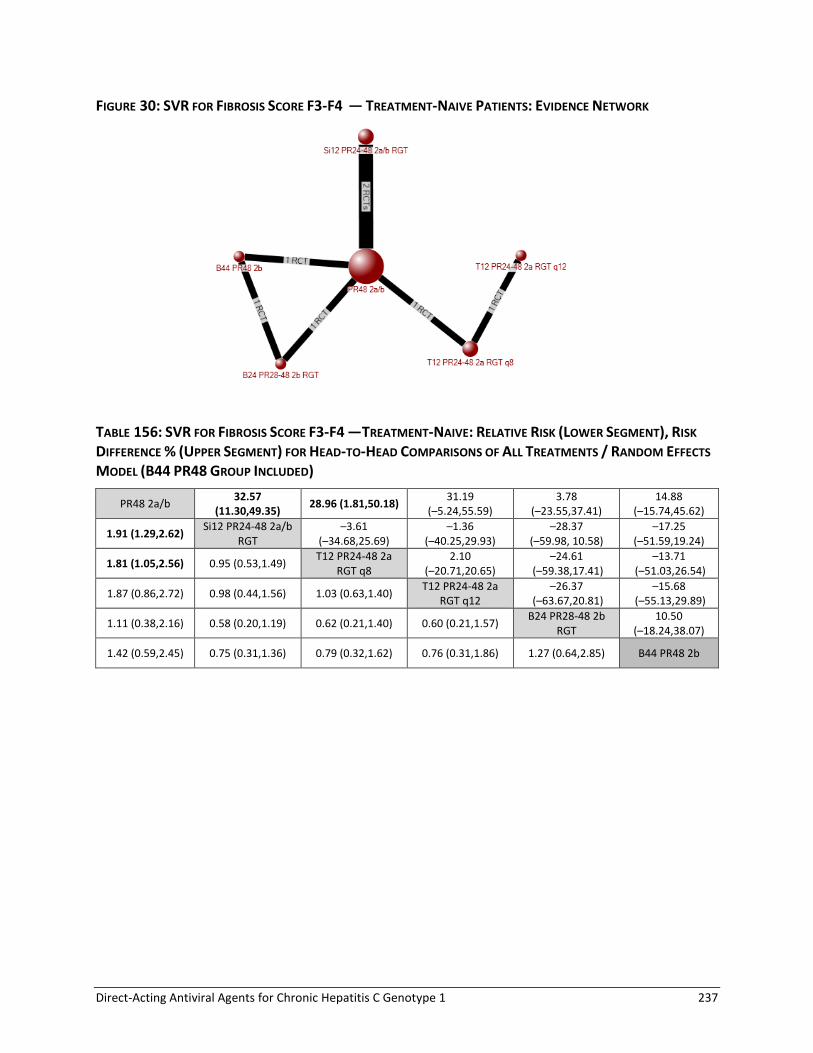
Direct-Acting Antiviral Agents for Chronic Hepatitis C Genotype 1 237
FIGURE 30: SVR FOR FIBROSIS SCORE F3-F4 — TREATMENT-NAIVE PATIENTS: EVIDENCE NETWORK
TABLE 156: SVR FOR FIBROSIS SCORE F3-F4 —TREATMENT-NAIVE: RELATIVE RISK (LOWER SEGMENT), RISK
DIFFERENCE % (UPPER SEGMENT) FOR HEAD-TO-HEAD COMPARISONS OF ALL TREATMENTS / RANDOM EFFECTS
MODEL (B44 PR48 GROUP INCLUDED)
PR48 2a/b 32.57
(11.30,49.35) 28.96 (1.81,50.18)
31.19 (–5.24,55.59)
3.78 (–23.55,37.41)
14.88 (–15.74,45.62)
1.91 (1.29,2.62) Si12 PR24-48 2a/b
RGT –3.61
(–34.68,25.69) –1.36
(–40.25,29.93) –28.37
(–59.98, 10.58) –17.25
(–51.59,19.24)
1.81 (1.05,2.56) 0.95 (0.53,1.49) T12 PR24-48 2a
RGT q8 2.10
(–20.71,20.65) –24.61
(–59.38,17.41) –13.71
(–51.03,26.54)
1.87 (0.86,2.72) 0.98 (0.44,1.56) 1.03 (0.63,1.40) T12 PR24-48 2a
RGT q12 –26.37
(–63.67,20.81) –15.68
(–55.13,29.89)
1.11 (0.38,2.16) 0.58 (0.20,1.19) 0.62 (0.21,1.40) 0.60 (0.21,1.57) B24 PR28-48 2b
RGT 10.50
(–18.24,38.07)
1.42 (0.59,2.45) 0.75 (0.31,1.36) 0.79 (0.32,1.62) 0.76 (0.31,1.86) 1.27 (0.64,2.85) B44 PR48 2b

Direct-Acting Antiviral Agents for Chronic Hepatitis C Genotype 1 238
TABLE 157: SVR FOR FIBROSIS SCORE F3-F4 —TREATMENT-NAIVE: ODDS RATIOS, RELATIVE RISKS, AND RISK
DIFFERENCE FOR ALL TREATMENT COMPARISONS AND RANDOM EFFECTS MODEL (B44 PR48 GROUP INCLUDED)
Treatment Reference OR (95% CrI) RR (95% CrI) RD% (95% CrI)
Si12 PR24-48 2a/b RGT PR48 2a/b 3.91 (1.59,9.50) 1.91 (1.29,2.62) 32.57 (11.30,49.35)
T12 PR24-48 2a RGT q8 3.32 (1.08,10.61) 1.81 (1.05,2.56) 28.96 (1.81,50.18)
T12 PR24-48 2a RGT q12 3.67 (0.79,18.01) 1.87 (0.86,2.72) 31.19 (–5.24,55.59)
B24 PR28-48 2b RGT 1.18 (0.28,4.88) 1.11 (0.38,2.16) 3.78 (–23.55,37.41)
B44 PR48 2b 1.85 (0.47,7.57) 1.42 (0.59,2.45) 14.88 (–15.74,45.62)
T12 PR24-48 2a RGT q8 Si12 PR24-48 2a/b RGT 0.85 (0.20,3.75) 0.95 (0.53,1.49) –3.61 (–34.68,25.69)
T12 PR24-48 2a RGT q12 0.94 (0.16,5.89) 0.98 (0.44,1.56) –1.36 (–40.25,29.93)
B24 PR28-48 2b RGT 0.30 (0.06,1.61) 0.58 (0.20,1.19) –28.37 (–59.98,10.58)
B44 PR48 2b 0.48 (0.09,2.51) 0.75 (0.31,1.36) –17.25 (–51.59,19.24)
T12 PR24-48 2a RGT q12 T12 PR24-48 2a RGT q8 1.11 (0.38,3.30) 1.03 (0.63,1.40) 2.10 (–20.71,20.65)
B24 PR28-48 2b RGT 0.35 (0.06,2.16) 0.62 (0.21,1.40) –24.61 (–59.38,17.41)
B44 PR48 2b 0.56 (0.09,3.36) 0.79 (0.32,1.62) –13.71 (–51.03,26.54)
B24 PR28-48 2b RGT T12 PR24-48 2a RGT q12 0.32 (0.04,2.56) 0.60 (0.21,1.57) –26.37 (–63.67,20.81)
B44 PR48 2b 0.50 (0.06,3.95) 0.76 (0.31,1.86) –15.68 (–55.13,29.89)
B44 PR48 2b B24 PR28-48 2b RGT 1.58 (0.44,5.89) 1.27 (0.64,2.85) 10.50 (–18.24,38.07)
Random Effects Model
Residual Deviance 11.85 vs. 11 data points
Deviance Information Criteria
70.445
Fixed Effects Model Residual Deviance 12.79 vs. 11 data points
Deviance Information Criteria
70.905
CrI = credible interval; OR = odds ratio; RD = risk difference; RR = relative risk; SVR = sustained viral response; vs. = versus.

Direct-Acting Antiviral Agents for Chronic Hepatitis C Genotype 1 239
APPENDIX 19: NMA SUBGROUP ANALYSES BY FIBROSIS SEVERITY
Treatment-Naive TABLE 158: SVR FOR FIBROSIS SCORE F0-F2-TREATMENT-NAIVE PATIENTS: ODDS RATIOS, RELATIVE RISKS, AND RISK DIFFERENCE FOR ALL TREATMENT COMPARISONS AND RANDOM EFFECTS MODEL
Treatment Reference Network Meta-analysis
OR (95% CrI) RR (95% CrI) RD% (95% CrI)
Si12 PR24-48 2a/b RGT PR48 2a/b 4.21 (2.22,7.93) 1.64 (1.37,1.88) 31.26 (18.85,40.59)
T12 PR24-48 2a RGT q8
4.09 (1.79,9.16) 1.63 (1.29,1.88) 30.75 (14.27,41.37)
T12 PR24-48 2a RGT q12
4.17 (1.30,13.49) 1.64 (1.13,1.94) 31.08 (6.55,44.41)
B24 PR28-48 2b RGT
3.37 (1.50,7.41) 1.56 (1.21,1.83) 27.39 (10.09,39.09)
T12 PR24-48 2a RGT q8 Si12 PR24-48 2a/b RGT 0.97 (0.34,2.71) 0.99 (0.78,1.21) –0.42 (–18.56,14.75)
T12 PR24-48 2a RGT q12
0.99 (0.26,3.78) 1.00 (0.69,1.24) –0.11 (–25.60,17.08)
B24 PR28-48 2b RGT
0.80 (0.29,2.21) 0.95 (0.73,1.17) –3.80 (–22.72,12.37)
T12 PR24-48 2a RGT q12 T12 PR24-48 2a RGT q8 1.02 (0.44,2.39) 1.00 (0.78,1.15) 0.34 (–15.74,11.17)
B24 PR28-48 2b RGT
0.82 (0.26,2.56) 0.96 (0.73,1.24) –3.28 (–22.83,15.97)
B24 PR28-48 2b RGT T12 PR24-48 2a RGT q12 0.81 (0.20,3.25) 0.96 (0.72,1.39) –3.61 (–24.48,22.13)
Random Effects Model
Residual Deviance 10.08 vs. 10 data points
Deviance Information Criteria
75.108
Fixed Effects Model
Residual Deviance 10.43 vs. 10 data points
Deviance Information Criteria
74.939
CrI = credible interval; OR = odds ratio; RD = risk difference; RR = relative risk; SVR = sustained viral response; versus.

Direct-Acting Antiviral Agents for Chronic Hepatitis C Genotype 1 240
TABLE 159: SVR FOR FIBROSIS SCORE F3-F4 — TREATMENT-NAIVE PATIENTS: ODDS RATIOS, RELATIVE RISKS, AND RISK DIFFERENCE FOR ALL TREATMENT COMPARISONS AND RANDOM EFFECTS MODEL
Treatment Reference Network Meta-analysis
OR (95% CrI) RR (95% CrI) RD% (95% CrI)
Si12 PR24-48 2a/b RGT PR48 2a/b 3.89 (1.60,9.45) 1.91 (1.29,2.62) 32.50 (11.42,49.34)
T12 PR24-48 2a RGT q8 3.34 (1.08,10.37) 1.81 (1.05,2.55) 29.07 (1.81,49.85)
T12 PR24-48 2a RGT q12 3.68 (0.77,17.45) 1.87 (0.84,2.72) 31.21 (–5.70,55.43)
B24 PR28-48 2b RGT 1.17 (0.28,4.86) 1.10 (0.39,2.17) 3.58 (–23.35,37.31)
T12 PR24-48 2a RGT q8 Si12 PR24-48 2a/b RGT 0.86 (0.20,3.61) 0.95 (0.53,1.48) –3.35 (–34.83,25.43)
T12 PR24-48 2a RGT q12 0.94 (0.16,5.74) 0.98 (0.43,1.56) –1.20 (–40.97,30.11)
B24 PR28-48 2b RGT 0.30 (0.06,1.61) 0.58 (0.21,1.19) –28.52 (–59.51,10.63)
T12 PR24-48 2a RGT q12 T12 PR24-48 2a RGT q8 1.10 (0.38,3.23) 1.03 (0.62,1.39) 1.95 (–21.08,20.51)
B24 PR28-48 2b RGT 0.35 (0.06,2.14) 0.61 (0.22,1.39) –25.03 (–59.01,17.20)
B24 PR28-48 2b RGT T12 PR24-48 2a RGT q12 0.32 (0.04,2.65) 0.60 (0.21,1.61) –26.71 (–63.55,21.49)
Random Effects Model
Residual Deviance 10.88 vs. 10 data points
Deviance Information Criteria
64.318
Fixed Effects Model
Residual Deviance 11.78 vs. 10 data points
Deviance Information Criteria
64.674
CrI = credible interval; OR = odds ratio; RD = risk difference; RR = relative risk; SVR = sustained viral response; vs. = versus.

Direct-Acting Antiviral Agents for Chronic Hepatitis C Genotype 1 241
Treatment-Experienced a) All Treatment-Experienced
TABLE 160: SVR FOR FIBROSIS SCORE F0-F2 — ALL TREATMENT-EXPERIENCED PATIENTS: ODDS RATIOS, RELATIVE RISKS, AND RISK DIFFERENCE FOR ALL TREATMENT COMPARISONS AND RANDOM EFFECTS MODEL
Treatment Reference Network Meta-analysis
OR (95% CrI) RR (95% CrI) RD% (95% CrI)
Si12 PR24-48 2a RGT PR48 2a/b 6.71 (2.85,15.99) 2.86 (1.96,3.81) 43.66 (23.17,59.60)
T12 PR48 2a q8 11.17 (4.70,28.05) 3.29 (2.42,4.28) 53.79 (35.70,66.68)
B32 PR36-48 2b RGT 7.11 (2.97,17.25) 2.92 (1.98,3.96) 44.95 (24.54,60.85)
*B44 PR48 2a/b 8.18 (4.06,16.83) 3.05 (2.26,4.01) 47.90 (32.46,60.53)
*T12 PR24 2a q8 6.98 (2.51,20.30) 2.90 (1.82,4.06) 44.53 (20.43,63.02)
T12 PR48 2a q8 Si12 PR24-48 2a RGT 1.67 (0.49,5.91) 1.15 (0.82,1.71) 9.97 (–13.83,34.40)
B32 PR36-48 2b RGT 1.06 (0.31,3.63) 1.02 (0.68,1.56) 1.33 (–24.70,27.29)
*B44 PR48 2a/b 1.22 (0.40,3.71) 1.06 (0.77,1.59) 4.13 (–17.78,28.45)
*T12 PR24 2a q8 1.04 (0.27,4.06) 1.01 (0.63,1.58) 0.92 (–27.94,28.63)
B32 PR36-48 2b RGT T12 PR48 2a q8 0.63 (0.18,2.19) 0.89 (0.61,1.24) –8.79
(–32.61,15.09)
*B44 PR48 2a/b 0.73 (0.23,2.27) 0.92 (0.70,1.27) –5.89
(–25.73,16.30)
*T12 PR24 2a q8 0.62 (0.16,2.50) 0.88 (0.56,1.27) –9.09 (–36.58,16.97)
*B44 PR48 2a/b B32 PR36-48 2b RGT 1.15 (0.52,2.60) 1.04 (0.84,1.40) 2.84 (–12.62,20.72)
*T12 PR24 2a q8 0.98 (0.26,3.93) 0.99 (0.61,1.53) –0.49
(–29.36,27.53)
*T12 PR24 2a q8 *B44 PR48 2a/b 0.85 (0.24,3.06) 0.95 (0.60,1.35) –3.30
(–30.86,20.95)
Random Effects Model
Residual Deviance 10.44 vs. 11 data points
Deviance Information Criteria 72.888
Fixed Effects Model Residual Deviance 10.21 vs. 11 data points
Deviance Information Criteria 72.348
CrI = credible interval; OR = odds ratio; RD = risk difference; RR = relative risk; SVR = sustained viral response; vs. = versus. *Not a Health Canada–recommended dosage regimen.
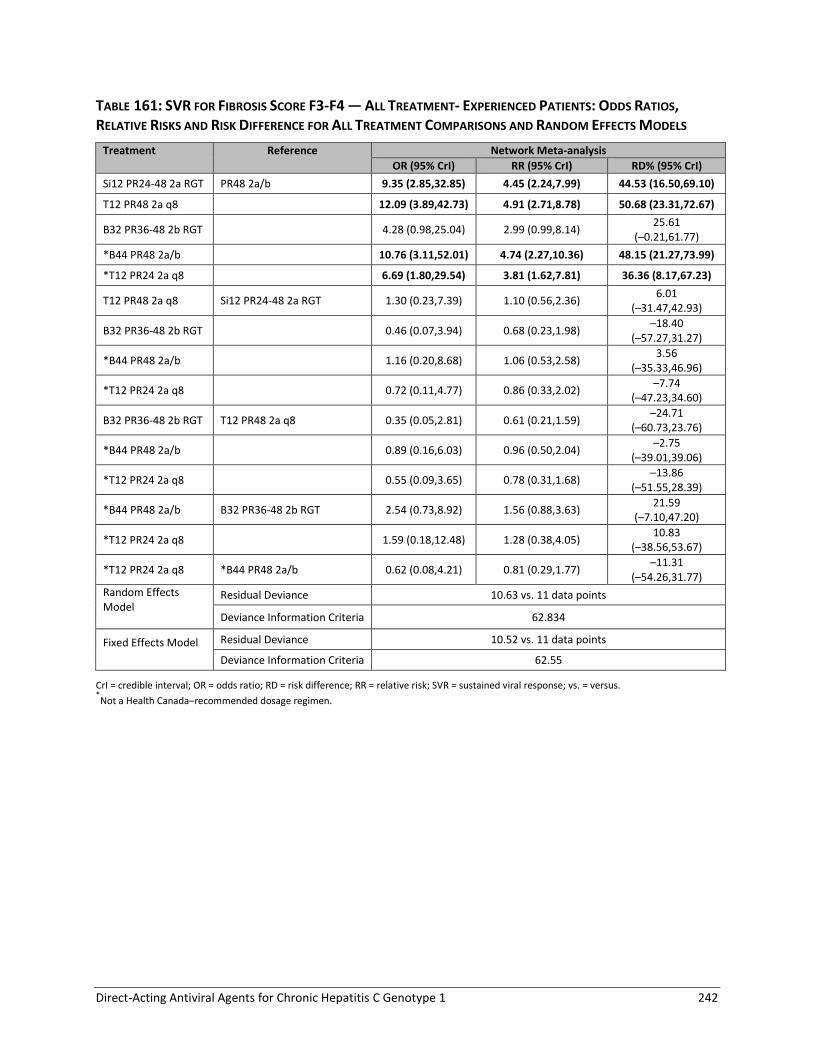
Direct-Acting Antiviral Agents for Chronic Hepatitis C Genotype 1 242
TABLE 161: SVR FOR FIBROSIS SCORE F3-F4 — ALL TREATMENT- EXPERIENCED PATIENTS: ODDS RATIOS, RELATIVE RISKS AND RISK DIFFERENCE FOR ALL TREATMENT COMPARISONS AND RANDOM EFFECTS MODELS
Treatment Reference Network Meta-analysis
OR (95% CrI) RR (95% CrI) RD% (95% CrI)
Si12 PR24-48 2a RGT PR48 2a/b 9.35 (2.85,32.85) 4.45 (2.24,7.99) 44.53 (16.50,69.10)
T12 PR48 2a q8 12.09 (3.89,42.73) 4.91 (2.71,8.78) 50.68 (23.31,72.67)
B32 PR36-48 2b RGT 4.28 (0.98,25.04) 2.99 (0.99,8.14) 25.61
(–0.21,61.77)
*B44 PR48 2a/b 10.76 (3.11,52.01) 4.74 (2.27,10.36) 48.15 (21.27,73.99)
*T12 PR24 2a q8 6.69 (1.80,29.54) 3.81 (1.62,7.81) 36.36 (8.17,67.23)
T12 PR48 2a q8 Si12 PR24-48 2a RGT 1.30 (0.23,7.39) 1.10 (0.56,2.36) 6.01
(–31.47,42.93)
B32 PR36-48 2b RGT 0.46 (0.07,3.94) 0.68 (0.23,1.98) –18.40
(–57.27,31.27)
*B44 PR48 2a/b 1.16 (0.20,8.68) 1.06 (0.53,2.58) 3.56
(–35.33,46.96)
*T12 PR24 2a q8 0.72 (0.11,4.77) 0.86 (0.33,2.02) –7.74
(–47.23,34.60)
B32 PR36-48 2b RGT T12 PR48 2a q8 0.35 (0.05,2.81) 0.61 (0.21,1.59) –24.71
(–60.73,23.76)
*B44 PR48 2a/b 0.89 (0.16,6.03) 0.96 (0.50,2.04) –2.75
(–39.01,39.06)
*T12 PR24 2a q8 0.55 (0.09,3.65) 0.78 (0.31,1.68) –13.86
(–51.55,28.39)
*B44 PR48 2a/b B32 PR36-48 2b RGT 2.54 (0.73,8.92) 1.56 (0.88,3.63) 21.59
(–7.10,47.20)
*T12 PR24 2a q8 1.59 (0.18,12.48) 1.28 (0.38,4.05) 10.83
(–38.56,53.67)
*T12 PR24 2a q8 *B44 PR48 2a/b 0.62 (0.08,4.21) 0.81 (0.29,1.77) –11.31
(–54.26,31.77)
Random Effects Model
Residual Deviance 10.63 vs. 11 data points
Deviance Information Criteria 62.834
Fixed Effects Model
Residual Deviance 10.52 vs. 11 data points
Deviance Information Criteria 62.55
CrI = credible interval; OR = odds ratio; RD = risk difference; RR = relative risk; SVR = sustained viral response; vs. = versus. *Not a Health Canada–recommended dosage regimen.

Direct-Acting Antiviral Agents for Chronic Hepatitis C Genotype 1 243
b) Relapsed
TABLE 162: SVR FOR FIBROSIS SCORE F0-F2 —TREATMENT-EXPERIENCED PATIENTS WITH PRIOR RELAPSE:
ODDS RATIOS, RELATIVE RISKS, AND RISK DIFFERENCE FOR ALL TREATMENT COMPARISONS AND RANDOM
EFFECTS MODEL
Treatment Reference Network Meta-analysis
OR (95% CrI) RR (95% CrI) RD% (95% CrI)
Si12 PR24-48 2a RGT PR48 2a/b 6.71 (2.28,20.14) 2.26 (1.55,2.96) 43.21 (19.94,57.76)
B32 PR36-48 2b RGT 6.54 (1.87,23.44) 2.24 (1.40,3.11) 42.80 (15.21,60.24)
*T12 PR48 2a q8 14.18 (4.14,49.47) 2.55 (1.86,3.39) 53.48 (33.56,65.48)
*B44 PR48 2b 6.80 (1.97,24.48) 2.26 (1.44,3.14) 43.46 (16.49,60.59)
B32 PR36-48 2b RGT Si12 PR24-48 2a RGT 0.98 (0.18,5.13) 0.99 (0.64,1.47) –0.41 (–29.56,27.05)
*T12 PR48 2a q8 2.11 (0.41,10.74) 1.13 (0.86,1.61) 10.02 (–12.20,34.23)
*B44 PR48 2b 1.01 (0.20,5.34) 1.00 (0.66,1.48) 0.16 (–28.31,27.56)
*T12 PR48 2a q8 B32 PR36-48 2b RGT 2.16 (0.37,12.71) 1.13 (0.85,1.74) 10.39 (–13.35,38.29)
*B44 PR48 2b 1.04 (0.32,3.43) 1.01 (0.75,1.37) 0.64 (–19.29,21.01)
*B44 PR48 2b *T12 PR48 2a q8 0.48 (0.08,2.85) 0.89 (0.59,1.19) –9.79 (–36.86,13.86)
Random Effects Model Residual Deviance 7.077 vs. 7 data points
Deviance Information Criteria 45.989
Fixed Effects Model Residual Deviance 7.052 vs. 7 data points
Deviance Information Criteria 45.94
CrI = credible interval; OR = odds ratio; RD = risk difference; RR = relative risk; SVR = sustained viral response; vs. = versus. *Not a Health Canada–recommended dosage regimen.

Direct-Acting Antiviral Agents for Chronic Hepatitis C Genotype 1 244
TABLE 163: SVR FOR FIBROSIS SCORE F3-F4 — TREATMENT-EXPERIENCED PATIENTS WITH PRIOR RELAPSE:
ODDS RATIOS, RELATIVE RISKS AND RISK DIFFERENCE FOR ALL TREATMENT COMPARISONS AND RANDOM
EFFECTS MODEL
Treatment Reference Network Meta-analysis
OR (95% CrI) RR (95% CrI) RD% (95% CrI)
Si12 PR24-48 2a RGT PR48 2a/b 9.46 (2.70,36.67) 3.76 (1.96,7.18) 48.17 (18.47,70.52)
B32 PR36-48 2b RGT 4.61 (0.66,48.02) 2.80 (0.71,8.55) 31.33 (–6.45,73.71)
*T12 PR48 2a q8 39.87 (9.93,203.70) 5.10 (2.97,10.26) 70.95 (50.10,83.98)
*B44 PR48 2b 25.59 (3.12,343.30) 4.73 (2.05,10.78) 66.12 (24.56,86.45)
B32 PR36-48 2b RGT Si12 PR24-48 2a RGT 0.49 (0.05,6.86) 0.75 (0.21,2.04) –16.52 (–62.24,39.63)
*T12 PR48 2a q8 4.23 (0.60,32.43) 1.33 (0.91,2.61) 22.08 (–7.68,55.90)
*B44 PR48 2b 2.71 (0.22,48.46) 1.25 (0.62,2.64) 16.69 (–29.96,57.29)
*T12 PR48 2a q8 B32 PR36-48 2b RGT 8.69 (0.58,108.90) 1.80 (0.90,5.97) 39.23 (–8.58,77.65)
*B44 PR48 2b 5.50 (1.02,38.84) 1.64 (1.01,4.46) 31.01 (0.36,63.87)
*B44 PR48 2b *T12 PR48 2a q8 0.65 (0.05,11.99) 0.95 (0.50,1.35) –4.56 (–46.23,24.22)
Random Effects Model Residual Deviance 7.237 vs. 7 data points
Deviance Information Criteria 39.089
Fixed Effects Model Residual Deviance 7.241 vs. 7 data points
Deviance Information Criteria 39.072
CrI = credible interval; OR = odds ratio; RD = risk difference; RR = relative risk; SVR = sustained viral response; vs. = versus. *Not a Health Canada–recommended dosage regimen.
c) Partial Response
TABLE 164: SVR FOR FIBROSIS SCORE F0-F2 — TREATMENT-EXPERIENCED PATIENTS WITH PARTIAL RESPONSE:
ODDS RATIOS, RELATIVE RISKS, AND RISK DIFFERENCE FOR ALL TREATMENT COMPARISONS AND RANDOM
EFFECTS MODEL
Treatment Reference Network Meta-analysis
OR (95% CrI) RR (95% CrI) RD% (95% CrI)
T12 PR48 2a q8 PR48 2a/b 13.55 (2.69,89.17) 5.49 (2.05,17.01) 50.39 (15.06,78.57)
B32 PR36-48 2b RGT 11.15 (1.99,119.80) 5.06 (1.68,20.75) 46.43 (10.75,80.13)
*B44 PR48 2b 14.98 (2.74,165.60) 5.68 (2.05,22.21) 53.18 (17.47,83.39)
B32 PR36-48 2b RGT T12 PR48 2a q8 0.84 (0.06,13.66) 0.94 (0.31,3.00) –3.99 (–56.44,53.96)
*B44 PR48 2b 1.12 (0.09,18.92) 1.04 (0.40,3.17) 2.48 (–49.44,58.08)
*B44 PR48 2b B32 PR36-48 2b RGT 1.36 (0.38,4.81) 1.11 (0.68,2.05) 6.29 (–19.96,32.71)
Random Effects Model Residual Deviance 5.19 vs. 5 data points
Deviance Information Criteria 27.941
Fixed Effects Model Residual Deviance 5.168 vs. 5 data points
Deviance Information Criteria 27.89
CrI = credible interval; OR = odds ratio; RD = risk difference; RR = relative risk; SVR = sustained viral response; vs. = versus. *Not a Health Canada–recommended dosage regimen.

Direct-Acting Antiviral Agents for Chronic Hepatitis C Genotype 1 245
TABLE 165: SVR FOR FIBROSIS SCORE F3-F4 — TREATMENT-EXPERIENCED PATIENTS WITH PRIOR PARTIAL
RESPONSE: ODDS RATIOS, RELATIVE RISKS, AND RISK DIFFERENCE FOR ALL TREATMENT COMPARISONS AND
RANDOM EFFECTS MODEL
Treatment Reference Network Meta-analysis
OR (95% CrI) RR (95% CrI) RD% (95% CrI)
T12 PR48 2a q8 PR48 2a/b 9.14 (1.04,340.40) 6.22 (1.04,121.30) 21.09 (0.00,77.35)
B32 PR36-48 2b RGT 21.17 (0.55,121500.00) 10.82 (0.60,2170.00) 41.40
(–5.28,98.63)
*B44 PR48 2b 43.06 (1.14,239600.00) 14.97 (1.10,2243.00) 57.95 (1.28,99.20)
B32 PR36-48 2b RGT T12 PR48 2a q8 2.25 (0.02,14690.00) 1.62 (0.07,205.80) 17.70
(–72.33,98.07)
*B44 PR48 2b 4.46 (0.04,27600.00) 2.19 (0.15,209.10) 33.98
(–65.81,98.66)
*B44 PR48 2b B32 PR36-48 2b RGT 2.01 (0.28,14.80) 1.21 (0.54,5.20) 9.88
(–22.76,50.45)
Random Effects Model
Residual Deviance 5.201 vs. 5 data points
Deviance Information Criteria
23.484
Fixed Effects Model
Residual Deviance 5.199 vs. 5 data points
Deviance Information Criteria
23.438
CrI = credible interval; OR = odds ratio; RD = risk difference; RR = relative risk; SVR = sustained viral response; vs. = versus. *Not a Health Canada–recommended dosage regimen.

Direct-Acting Antiviral Agents for Chronic Hepatitis C Genotype 1 246
APPENDIX 20: NMA SUBGROUP ANALYSES BY GENOTYPE SUBTYPE
Treatment-Naive Patients
Total Patients 3,038
Total Studies 6
4-group 4
5-group 2 Number of Treatments = 13
FIGURE 31: SVR BY GENOTYPES — TREATMENT-NAIVE PATIENTS: EVIDENCE NETWORK
*Not a Health Canada–recommended dosage regimen.

Direct-Acting Antiviral Agents for Chronic Hepatitis C Genotype 1 247
TABLE 166: SVR BY GENOTYPES — TREATMENT-NAIVE PATIENTS: ODDS RATIOS, RELATIVE RISKS, AND RISK DIFFERENCE FOR ALL TREATMENT
COMPARISONS AND RANDOM EFFECTS MODEL
Treatment Reference Network Meta-analysis
OR (95% CrI) RR (95% CrI) RD% (95% CrI)
PR48 2a/b genotype 1b PR48 2a/b genotype 1a 1.32 (0.97,1.79) 1.17 (0.99,1.38) 6.79 (–0.62,14.31)
Si12 PR24-48 2a/b RGT genotype 1a with Q80K 1.63 (0.93,2.95) 1.30 (0.96,1.70) 11.98 (–1.69,26.35)
Si12 PR24-48 2a/b RGT genotype 1a without Q80K 5.96 (3.49,10.52) 2.00 (1.70,2.32) 39.83 (29.63,48.58)
Si12 PR24-48 2a/b RGT genotype 1b 6.92 (4.22,11.62) 2.06 (1.78,2.36) 42.15 (33.28,49.80)
T12 PR24-48 2a RGT q8 genotype 1a 3.60 (2.27,5.74) 1.76 (1.49,2.05) 30.52 (20.17,39.64)
T12 PR24-48 2a RGT q8 genotype 1b 5.42 (3.30,8.90) 1.96 (1.68,2.24) 38.27 (28.52,46.22)
T12 PR24-48 2a RGT q12 genotype 1a 3.64 (1.90,6.93) 1.77 (1.39,2.12) 30.76 (15.92,42.55)
T12 PR24-48 2a RGT q12 genotype 1b 6.55 (3.28,13.14) 2.03 (1.69,2.36) 41.26 (28.50,50.54)
B24 PR28-48 2b RGT genotype 1a 2.76 (1.66,4.62) 1.62 (1.30,1.94) 24.76 (12.48,35.68)
B24 PR28-48 2b RGT genotype 1b 3.77 (2.19,6.57) 1.79 (1.47,2.11) 31.48 (19.30,41.78)
*B24 PR28 2b genotype 1a 2.24 (1.04,4.76) 1.50 (1.02,1.96) 19.89 (0.88,36.34)
*B24 PR28 2b genotype 1b 3.18 (1.36,7.56) 1.70 (1.18,2.16) 27.90 (7.55,44.04)
Si12 PR24-48 2a/b RGT genotype 1a with Q80K PR48 2a/b genotype 1b 1.24 (0.70,2.23) 1.11 (0.82,1.45) 5.27 (–8.69,19.57)
Si12 PR24-48 2a/b RGT genotype 1a without Q80K 4.52 (2.64,7.90) 1.71 (1.45,2.01) 33.02 (22.53,42.21)
Si12 PR24-48 2a/b RGT genotype 1b 5.24 (3.21,8.75) 1.76 (1.51,2.05) 35.31 (26.16,43.67)
T12 PR24-48 2a RGT q8 genotype 1a 2.73 (1.70,4.37) 1.51 (1.26,1.78) 23.71 (12.96,33.31)
T12 PR24-48 2a RGT q8 genotype 1b 4.10 (2.47,6.81) 1.67 (1.42,1.95) 31.41 (21.26,40.23)
T12 PR24-48 2a RGT q12 genotype 1a 2.77 (1.43,5.32) 1.51 (1.18,1.84) 23.98 (8.84,36.32)
T12 PR24-48 2a RGT q12 genotype 1b 4.96 (2.46,10.00) 1.73 (1.43,2.05) 34.44 (21.26,44.46)
B24 PR28-48 2b RGT genotype 1a 2.09 (1.25,3.54) 1.38 (1.11,1.68) 17.94 (5.48,29.37)
B24 PR28-48 2b RGT genotype 1b 2.85 (1.65,5.02) 1.53 (1.25,1.83) 24.63 (12.19,35.55)
*B24 PR28 2b genotype 1a 1.70 (0.78,3.65) 1.28 (0.87,1.69) 13.04 (–6.14,29.90)
*B24 PR28 2b genotype 1b 2.42 (1.02,5.75) 1.45 (1.01,1.87) 21.13 (0.57,37.58)
Si12 PR24-48 2a/b RGT genotype 1a without Q80K Si12 PR24-48 2a/b RGT genotype 1a with Q80K
3.67 (1.88,7.03) 1.53 (1.21,2.03) 27.68 (13.18,41.20)
Si12 PR24-48 2a/b RGT genotype 1b 4.25 (2.26,7.89) 1.58 (1.26,2.08) 29.93 (16.31,43.06)
T12 PR24-48 2a RGT q8 genotype 1a 2.21 (1.06,4.43) 1.35 (1.02,1.85) 18.40 (1.37,34.18)
T12 PR24-48 2a RGT q8 genotype 1b
3.34 (1.55,6.80) 1.50 (1.15,2.03) 26.12 (9.54,41.19)
T12 PR24-48 2a RGT q12 genotype 1a 2.24 (0.94,5.14) 1.36 (0.98,1.88) 18.65 (–1.47,36.34)
T12 PR24-48 2a RGT q12 genotype 1b 4.02 (1.62,9.54) 1.56 (1.17,2.12) 29.01 (10.59,44.97)
B24 PR28-48 2b RGT genotype 1a 1.70 (0.79,3.49) 1.25 (0.91,1.72) 12.72 (–5.62,29.39)
B24 PR28-48 2b RGT genotype 1b 2.32 (1.06,4.87) 1.37 (1.02,1.88) 19.42 (1.28,35.60)
*B24 PR28 2b genotype 1a 1.38 (0.52,3.48) 1.15 (0.74,1.69) 7.74 (–15.80,29.09)
*B24 PR28 2b genotype 1b 1.94 (0.70,5.43) 1.30 (0.86,1.88) 15.58 (–8.52,36.81)
Si12 PR24-48 2a/b RGT genotype 1b Si12 PR24-48 2a/b RGT genotype 1a 1.16 (0.63,2.11) 1.03 (0.92,1.17) 2.32 (–6.78,11.93)

Direct-Acting Antiviral Agents for Chronic Hepatitis C Genotype 1 248
Treatment Reference Network Meta-analysis
OR (95% CrI) RR (95% CrI) RD% (95% CrI)
without Q80K
T12 PR24-48 2a RGT q8 genotype 1a 0.60 (0.30,1.18) 0.88 (0.74,1.04) –9.29 (–22.01,3.09)
T12 PR24-48 2a RGT q8 genotype 1b 0.91 (0.44,1.81) 0.98 (0.84,1.14) –1.57 (–13.59,9.98)
T12 PR24-48 2a RGT q12 genotype 1a 0.61 (0.27,1.37) 0.89 (0.69,1.08) –8.95 (–25.63,5.51)
T12 PR24-48 2a RGT q12 genotype 1b 1.10 (0.45,2.54) 1.02 (0.84,1.19) 1.46 (–13.32,13.79)
B24 PR28-48 2b RGT genotype 1a 0.46 (0.22,0.94) 0.81 (0.65,0.98) –14.99 (–29.25, –1.13)
B24 PR28-48 2b RGT genotype 1b 0.63 (0.30,1.32) 0.90 (0.73,1.07) –8.26 (–22.49,4.95)
*B24 PR28 2b genotype 1a 0.37 (0.15,0.95) 0.75 (0.51,0.99) –19.91 (–40.17, –1.07)
*B24 PR28 2b genotype 1b 0.53 (0.20,1.47) 0.85 (0.60,1.09) –11.89 (–33.23,6.51)
T12 PR24-48 2a RGT q8 genotype 1a Si12 PR24-48 2a/b RGT genotype 1b 0.52 (0.27,0.99) 0.86 (0.72,1.00) –11.54 (–23.58, –0.21)
T12 PR24-48 2a RGT q8 genotype 1b 0.78 (0.40,1.52) 0.95 (0.82,1.09) –3.90 (–15.07,6.58)
T12 PR24-48 2a RGT q12 genotype 1a 0.53 (0.24,1.15) 0.86 (0.67,1.03) –11.29 (–27.45,2.28)
T12 PR24-48 2a RGT q12 genotype 1b 0.94 (0.41,2.15) 0.99 (0.82,1.14) –0.83 (–15.01,10.47)
B24 PR28-48 2b RGT genotype 1a 0.40 (0.20,0.79) 0.79 (0.63,0.94) –17.31 (–30.86, –4.42)
B24 PR28-48 2b RGT genotype 1b 0.54 (0.26,1.10) 0.87 (0.71,1.02) –10.60 (-24.33,1.55)
*B24 PR28 2b genotype 1a 0.32 (0.13,0.79) 0.73 (0.50,0.94) –22.17 (–42.12, –4.35)
*B24 PR28 2b genotype 1b 0.46 (0.18,1.22) 0.83 (0.58,1.04) -14.22 (–35.02,3.12)
T12 PR24-48 2a RGT q8 genotype 1b T12 PR24-48 2a RGT q8 genotype 1a 1.51 (0.99,2.30) 1.11 (1.00,1.25) 7.67 (–0.25,15.73)
T12 PR24-48 2a RGT q12 genotype 1a 1.01 (0.60,1.71) 1.00 (0.84,1.15) 0.27 (–11.26,10.16)
T12 PR24-48 2a RGT q12 genotype 1b 1.82 (1.02,3.27) 1.15 (1.01,1.31) 10.62 (0.40,19.70)
B24 PR28-48 2b RGT genotype 1a 0.77 (0.40,1.50) 0.92 (0.73,1.14) –5.77 (–20.22,8.66)
B24 PR28-48 2b RGT genotype 1b 1.05 (0.53,2.10) 1.01 (0.82,1.24) 0.99 (–13.40,14.83)
*B24 PR28 2b genotype 1a 0.62 (0.26,1.51) 0.85 (0.58,1.14) –10.61 (–31.04,8.69)
*B24 PR28 2b genotype 1b 0.88 (0.34,2.33) 0.96 (0.67,1.25) –2.67 (–24.37,16.07)
T12 PR24-48 2a RGT q12 genotype 1a T12 PR24-48 2a RGT q8 genotype 1b 0.67 (0.39,1.15) 0.91 (0.75,1.03) –7.37 (–19.22,2.47)
T12 PR24-48 2a RGT q12 genotype 1b 1.20 (0.66,2.22) 1.04 (0.91,1.16) 2.95 (–7.33,11.81)
B24 PR28-48 2b RGT genotype 1a 0.51 (0.26,1.02) 0.83 (0.66,1.01) –13.44 (–27.38,0.47)
B24 PR28-48 2b RGT genotype 1b 0.70 (0.34,1.43) 0.91 (0.75,1.09) –6.73 (–20.48,6.52)
*B24 PR28 2b genotype 1a 0.41 (0.17,1.01) 0.77 (0.53,1.00) –18.26 (–38.17,0.17)
*B24 PR28 2b genotype 1b 0.59 (0.22,1.56) 0.87 (0.61,1.11) -10.33 (–31.58,7.60)
T12 PR24-48 2a RGT q12 genotype 1b T12 PR24-48 2a RGT q12 genotype 1a 1.80 (0.98,3.31) 1.15 (0.99,1.37) 10.26 (–0.43,21.90)
B24 PR28-48 2b RGT genotype 1a 0.76 (0.34,1.70) 0.92 (0.71,1.20) –6.01 (–22.48,11.81)
B24 PR28-48 2b RGT genotype 1b 1.04 (0.46,2.36) 1.01 (0.80,1.31) 0.71 (–15.61,18.06)
*B24 PR28 2b genotype 1a 0.62 (0.23,1.64) 0.85 (0.57,1.18) –10.73 (–32.86,10.82)
*B24 PR28 2b genotype 1b 0.87 (0.31,2.53) 0.96 (0.66,1.31) –2.85 (–25.81,18.61)
B24 PR28-48 2b RGT genotype 1a T12 PR24-48 2a RGT q12 genotype 1b 0.42 (0.18,0.98) 0.80 (0.64,0.99) –16.42 (–30.95, –0.39)
B24 PR28-48 2b RGT genotype 1b 0.58 (0.24,1.38) 0.88 (0.72,1.08) –9.69 (–24.30,6.03)
*B24 PR28 2b genotype 1a 0.34 (0.12,0.94) 0.74 (0.51,0.98) –21.13 (–41.68, –1.11)

Direct-Acting Antiviral Agents for Chronic Hepatitis C Genotype 1 249
Treatment Reference Network Meta-analysis
OR (95% CrI) RR (95% CrI) RD% (95% CrI)
*B24 PR28 2b genotype 1b 0.49 (0.17,1.46) 0.84 (0.59,1.09) –13.17 (–34.84,6.74)
B24 PR28-48 2b RGT genotype 1b B24 PR28-48 2b RGT genotype 1a 1.36 (0.76,2.47) 1.10 (0.91,1.34) 6.63 (–5.98,19.22)
*B24 PR28 2b genotype 1a 0.81 (0.33,1.99) 0.92 (0.62,1.27) –4.88 (–26.14,15.29)
*B24 PR28 2b genotype 1b 1.15 (0.44,3.09) 1.05 (0.72,1.41) 3.05 (–19.12,22.87)
*B24 PR28 2b genotype 1a B24 PR28-48 2b RGT genotype 1b 0.59 (0.24,1.48) 0.84 (0.57,1.13) –11.50 (–32.38,8.29)
*B24 PR28 2b genotype 1b 0.84 (0.32,2.30) 0.95 (0.66,1.25) –3.62 (–25.59,15.97)
*B24 PR28 2b genotype 1b *B24 PR28 2b genotype 1a 1.43 (0.57,3.56) 1.13 (0.80,1.61) 7.96 (–13.12,28.04)
Random Effects Model Residual Deviance 25.58 vs. 26 data points
Deviance Information Criteria 171.331
Fixed Effects Model Residual Deviance 25.58 vs. 26 data points
Deviance Information Criteria 171.331
CrI = credible interval; OR = odds ratio; RD = risk difference; RR = relative risk; SVR = sustained viral response; vs. = versus. *Not a Health Canada–recommended dosage regimen.

Direct-Acting Antiviral Agents for Chronic Hepatitis C Genotype 1 250
Treatment-Experienced a) All Treatment-Experienced
FIGURE 32: SVR BY GENOTYPES — ALL TREATMENT-EXPERIENCED PATIENTS: EVIDENCE NETWORK
*Not a Health Canada–recommended dosage regimen.

Direct-Acting Antiviral Agents for Chronic Hepatitis C Genotype 1 251
TABLE 167: SVR BY GENOTYPES — ALL TREATMENT-EXPERIENCED PATIENTS: ODDS RATIOS, RELATIVE RISKS, AND RISK DIFFERENCE FOR ALL TREATMENT COMPARISONS AND RANDOM EFFECTS MODEL
Treatment Reference Network Meta-analysis
OR (95% CrI) RR (95% CrI) RD% (95% CrI)
PR48 2a/b genotype 1b PR48 2a/b genotype 1a
1.02 (0.44,2.13) 1.02 (0.52,1.72) 0.42 (–13.27,15.14)
Si12 PR24-48 2a RGT genotype 1a with Q80l
1.57 (0.44,5.51) 1.38 (0.51,2.74) 9.12 (–12.71,38.95)
Si12 PR24-48 2a RGT genotype 1a without Q80l
6.68 (2.08,21.55) 2.78 (1.60,4.07) 43.58 (16.15,63.21)
Si12 PR24-48 2a RGT genotype 1b
11.17 (3.55,34.51) 3.18 (2.08,4.46) 53.57 (29.35,68.13)
T12 PR48 2a q8 genotype 1a
7.01 (2.37,21.35) 2.83 (1.72,4.11) 44.67 (19.34,63.25)
T12 PR48 2a q8 genotype 1b
13.00 (4.33,39.93) 3.29 (2.23,4.61) 56.06 (34.18,69.55)
B32 PR36-48 2b RGT genotype 1a
3.52 (1.03,11.34) 2.17 (1.02,3.57) 28.57 (0.48,53.81)
B32 PR36-48 2b RGT genotype 1b
6.63 (1.96,21.96) 2.77 (1.55,4.17) 43.48 (14.93,63.71)
*B44 PR48 2b genotype 1a
5.52 (1.65,17.96) 2.61 (1.40,4.00) 39.38 (10.75,61.11)
*B44 PR48 2b genotype 1b
9.63 (2.80,32.81) 3.08 (1.86,4.47) 50.99 (23.56,68.03)
Si12 PR24-48 2a RGT genotype 1a with Q80l
PR48 2a/b genotype 1b
1.54 (0.46,5.58) 1.35 (0.54,2.92) 8.62 (–12.71,37.54)
Si12 PR24-48 2a RGT genotype 1a without Q80l
6.50 (2.20,22.08) 2.71 (1.58,4.88) 42.75 (17.05,63.07)
Si12 PR24-48 2a RGT genotype 1b
10.88 (3.77,35.67) 3.12 (1.92,5.49) 52.67 (29.73,68.89)
T12 PR48 2a q8 genotype 1a
6.83 (2.39,22.47) 2.76 (1.62,5.02) 43.87 (19.11,63.48)
T12 PR48 2a q8 genotype 1b
12.66 (4.42,42.07) 3.22 (2.00,5.78) 55.22 (33.53,70.86)
B32 PR36-48 2b RGT genotype 1a
3.43 (1.08,11.70) 2.12 (1.05,4.07) 27.82 (1.45,53.02)
B32 PR36-48 2b RGT genotype 1b
6.50 (2.01,22.59) 2.71 (1.51,4.97) 42.75 (15.29,63.71)
*B44 PR48 2b genotype 1a
5.39 (1.69,18.42) 2.55 (1.38,4.70) 38.63 (11.19,60.64)
*B44 PR48 2b genotype 1b
9.48 (2.88,33.83) 3.01 (1.75,5.45) 50.25 (23.82,68.66)
Si12 PR24-48 2a RGT genotype 1a without Q80l
Si12 PR24-48 2a RGT genotype 1a with Q80l
4.25 (1.12,16.76) 2.00 (1.05,4.76) 33.36 (2.38,58.33)
Si12 PR24-48 2a RGT genotype 1b
7.12 (1.88,27.30) 2.30 (1.23,5.50) 43.35 (13.06,65.56)
T12 PR48 2a q8 genotype 1a
4.47 (0.95,22.10) 2.04 (0.98,5.33) 34.85 (–1.26,62.81)
T12 PR48 2a q8 genotype 1b
8.28 (1.73,41.16) 2.38 (1.20,6.12) 46.21 (11.53,70.89)
B32 PR36-48 2b RGT genotype 1a
2.24 (0.43,11.18) 1.56 (0.63,4.29) 18.86 (–19.41,50.88)
B32 PR36-48 2b RGT genotype 1b
4.24 (0.80,21.50) 2.00 (0.91,5.27) 33.60 (–5.14,62.43)
*B44 PR48 2b genotype 1a
3.52 (0.66,17.96) 1.88 (0.83,4.97) 29.49 (–9.45,59.65)
*B44 PR48 2b genotype 1b
6.15 (1.15,32.91) 2.22 (1.06,5.76) 40.89 (3.19,68.24)

Direct-Acting Antiviral Agents for Chronic Hepatitis C Genotype 1 252
Treatment Reference Network Meta-analysis
OR (95% CrI) RR (95% CrI) RD% (95% CrI)
Si12 PR24-48 2a RGT genotype 1b
Si12 PR24-48 2a RGT genotype 1a without Q80l
1.67 (0.48,5.74) 1.14 (0.82,1.75) 9.58 (–13.36,33.66)
T12 PR48 2a q8 genotype 1a
1.06 (0.23,4.75) 1.02 (0.63,1.71) 1.13 (–28.72,32.03)
T12 PR48 2a q8 genotype 1b
1.96 (0.44,8.83) 1.18 (0.82,1.95) 12.24 (–14.55,40.79)
B32 PR36-48 2b RGT genotype 1a
0.53 (0.11,2.43) 0.78 (0.38,1.42) –14.61 (–47.31,19.64)
B32 PR36-48 2b RGT genotype 1b
0.99 (0.20,4.66) 1.00 (0.58,1.70) –0.12 (–32.57,31.51)
*B44 PR48 2b genotype 1a
0.83 (0.16,3.87) 0.94 (0.52,1.62) –3.96 (–37.29,28.45)
*B44 PR48 2b genotype 1b
1.45 (0.29,7.09) 1.11 (0.69,1.85) 7.17 (–24.14,37.46)
T12 PR48 2a q8 genotype 1a
Si12 PR24-48 2a RGT genotype 1b
0.63 (0.14,2.79) 0.89 (0.57,1.33) –8.62 (–35.64,19.19)
T12 PR48 2a q8 genotype 1b
1.17 (0.27,5.24) 1.03 (0.75,1.48) 2.44 (–21.06,27.59)
B32 PR36-48 2b RGT genotype 1a
0.32 (0.06,1.44) 0.69 (0.34,1.12) –24.47 (–54.42,7.42)
B32 PR36-48 2b RGT genotype 1b
0.60 (0.12,2.78) 0.88 (0.52,1.32) –9.76 (–39.62,18.86)
*B44 PR48 2b genotype 1a
0.50 (0.10,2.27) 0.82 (0.47,1.26) –13.78 (–43.95,15.71)
*B44 PR48 2b genotype 1b
0.87 (0.18,4.12) 0.97 (0.63,1.42) –2.40 (–31.14,24.39)
T12 PR48 2a q8 genotype 1b
T12 PR48 2a q8 genotype 1a
1.86 (0.61,5.71) 1.16 (0.89,1.67) 11.08 (–8.49,31.88)
B32 PR36-48 2b RGT genotype 1a
0.50 (0.11,2.22) 0.77 (0.38,1.34) –15.91 (–47.63,17.35)
B32 PR36-48 2b RGT genotype 1b
0.95 (0.20,4.32) 0.98 (0.57,1.60) –1.15 (–33.05,29.01)
*B44 PR48 2b genotype 1a
0.78 (0.17,3.52) 0.92 (0.51,1.53) –5.24 (–37.56,25.89)
*B44 PR48 2b genotype 1b
1.38 (0.29,6.39) 1.09 (0.68,1.73) 6.18 (–24.64,34.32)
B32 PR36-48 2b RGT genotype 1a
T12 PR48 2a q8 genotype 1b
0.27 (0.06,1.23) 0.66 (0.33,1.06) –27.17 (–56.21,3.95)
B32 PR36-48 2b RGT genotype 1b
0.51 (0.11,2.35) 0.85 (0.51,1.23) –12.33 (–41.66,15.00)
*B44 PR48 2b genotype 1a
0.42 (0.09,1.91) 0.80 (0.45,1.18) –16.41 (–46.00,11.81)
*B44 PR48 2b genotype 1b
0.74 (0.15,3.48) 0.94 (0.61,1.32) –4.96 (–33.00,20.23)
B32 PR36-48 2b RGT genotype 1b
B32 PR36-48 2b RGT genotype 1a
1.89 (0.56,6.54) 1.27 (0.80,2.30) 14.44 (–12.58,40.19)
*B44 PR48 2b genotype 1a
1.57 (0.47,5.26) 1.20 (0.73,2.15) 10.51 (–16.46,36.18)
*B44 PR48 2b genotype 1b
2.75 (0.81,9.64) 1.41 (0.93,2.55) 21.67 (–4.29,46.34)
*B44 PR48 2b genotype 1a B32 PR36-48 2b RGT genotype 1b
0.83 (0.24,2.80) 0.94 (0.59,1.45) –3.93 (–29.72,21.51)
*B44 PR48 2b genotype 1b
1.46 (0.41,5.12) 1.11 (0.77,1.70) 7.19 (–17.02,31.68)
*B44 PR48 2b genotype 1b *B44 PR48 2b genotype 1a
1.74 (0.51,6.21) 1.17 (0.81,1.89) 11.11 (–13.41,36.18)
Random Effects Model
Residual Deviance 16.6 vs. 15 data points
Deviance Information Criteria
98.501

Direct-Acting Antiviral Agents for Chronic Hepatitis C Genotype 1 253
Treatment Reference Network Meta-analysis
OR (95% CrI) RR (95% CrI) RD% (95% CrI)
Fixed Effects Model
Residual Deviance 16.6 vs. 15 data points
Deviance Information Criteria
98.501
CrI = credible interval; OR = odds ratio; RD = risk difference; RR = relative risk; SVR = sustained viral response; vs. = versus. *Not a Health Canada–recommended dosage regimen.
b) Relapsed
FIGURE 33: SVR BY GENOTYPES — TREATMENT-EXPERIENCED PATIENTS WITH PRIOR RELAPSE: EVIDENCE
NETWORK

Direct-Acting Antiviral Agents for Chronic Hepatitis C Genotype 1 254
TABLE 168: SVR BY GENOTYPES — TREATMENT-EXPERIENCED PATIENTS WITH PRIOR RELAPSE: ODDS RATIOS, RELATIVE RISKS, AND RISK DIFFERENCE FOR ALL TREATMENT COMPARISONS AND RANDOM EFFECTS MODEL
Treatment Reference Network Meta-analysis
OR (95% CrI) RR (95% CrI) RD% (95% CrI)
PR48 2a/b genotype 1b PR48 2a/b genotype 1a
1.29 (0.46,3.02) 1.19 (0.55,2.08) 5.25 (–13.93,24.23)
Si12 PR24-48 2a RGT genotype 1a with Q80l
1.79 (0.48,6.17) 1.47 (0.58,2.75) 12.69 (–12.90,41.69)
Si12 PR24-48 2a RGT genotype 1a without Q80l
7.53 (2.28,24.36) 2.69 (1.62,4.07) 46.15 (19.22,63.80)
Si12 PR24-48 2a RGT genotype 1b
12.60 (3.91,39.82) 3.00 (1.99,4.46) 54.82 (32.28,68.43)
T12 PR48 2a q8 genotype 1a
18.74 (5.48,62.17) 3.19 (2.16,4.81) 59.86 (39.55,72.51)
T12 PR48 2a q8 genotype 1b
24.26 (7.11,80.80) 3.29 (2.26,4.93) 62.45 (44.38,74.10)
Si12 PR24-48 2a RGT genotype 1a with Q80l
PR48 2a/b genotype 1b
1.39 (0.42,5.07) 1.23 (0.55,2.56) 7.33 (–16.71,35.83)
Si12 PR24-48 2a RGT genotype 1a without Q80l
5.86 (1.99,20.44) 2.25 (1.38,4.21) 40.49 (15.39,60.60)
Si12 PR24-48 2a RGT genotype 1b
9.81 (3.41,32.94) 2.52 (1.60,4.73) 49.17 (26.83,66.35)
T12 PR48 2a q8 genotype 1a
14.59 (4.55,53.06) 2.68 (1.68,5.18) 54.39 (32.05,71.30)
T12 PR48 2a q8 genotype 1b
18.90 (5.97,69.79) 2.76 (1.75,5.38) 56.96 (35.89,73.51)
Si12 PR24-48 2a RGT genotype 1a without Q80l
Si12 PR24-48 2a RGT genotype 1a with Q80l
4.22 (1.14,16.38) 1.83 (1.05,4.07) 32.68 (2.81,57.49)
Si12 PR24-48 2a RGT genotype 1b
7.08 (1.95,26.41) 2.05 (1.19,4.59) 41.51 (12.35,64.12)
T12 PR48 2a q8 genotype 1a
10.54 (2.09,53.55) 2.18 (1.20,5.24) 46.84 (13.45,72.05)
T12 PR48 2a q8 genotype 1b
13.68 (2.72,69.46) 2.24 (1.26,5.40) 49.52 (17.13,73.92)
Si12 PR24-48 2a RGT genotype 1b
Si12 PR24-48 2a RGT genotype 1a without Q80l
1.67 (0.49,5.67) 1.11 (0.86,1.59) 8.41 (–11.15,30.20)
T12 PR48 2a q8 genotype 1a
2.49 (0.52,11.77) 1.18 (0.89,1.81) 13.41 (–9.16,39.55)
T12 PR48 2a q8 genotype 1b
3.23 (0.67,15.55) 1.22 (0.94,1.86) 16.01 (–5.02,42.03)
T12 PR48 2a q8 genotype 1a
Si12 PR24-48 2a RGT genotype 1b
1.49 (0.32,6.80) 1.06 (0.83,1.42) 4.91 (–14.68,26.47)
T12 PR48 2a q8 genotype 1b
1.94 (0.41,8.86) 1.09 (0.88,1.46) 7.46 (–10.14,28.44)
T12 PR48 2a q8 genotype 1b
T12 PR48 2a q8 genotype 1a
1.30 (0.39,4.30) 1.03 (0.89,1.23) 2.46 (–9.80,16.68)
Random Effects Model Residual Deviance 10.09 vs. 9 data points
Deviance Information Criteria
57.473
Fixed Effects Model Residual Deviance 10.09 vs. 9 data points
Deviance Information Criteria
57.473
CrI = credible interval; OR = odds ratio; RD = risk difference; RR = relative risk; SVR = sustained viral response; vs. = versus.

Direct-Acting Antiviral Agents for Chronic Hepatitis C Genotype 1 255
APPENDIX 21: ASSESSMENT OF INCONSISTENCY
Treatment-Naive FIGURE 34: SVR INCONSISTENCY ASSESSMENT — TREATMENT-NAIVE PATIENTS: PLOT OF POSTERIOR MEAN
DEVIANCE OF THE INDIVIDUAL DATA POINTS IN THE INCONSISTENCY MODEL AGAINST THEIR POSTERIOR MEAN
DEVIANCE IN THE CONSISTENCY MODEL

Direct-Acting Antiviral Agents for Chronic Hepatitis C Genotype 1 256
FIGURE 35: SVR BY GENOTYPES —TREATMENT-NAIVE PATIENTS: PLOT OF POSTERIOR MEAN DEVIANCE OF THE
INDIVIDUAL DATA POINTS IN THE INCONSISTENCY MODEL AGAINST THEIR POSTERIOR MEAN DEVIANCE IN THE
CONSISTENCY MODEL
FIGURE 36: RASH — TREATMENT-NAIVE PATIENTS: PLOT OF POSTERIOR MEAN DEVIANCE OF THE INDIVIDUAL
DATA POINTS IN THE INCONSISTENCY MODEL AGAINST THEIR POSTERIOR MEAN DEVIANCE IN THE CONSISTENCY
MODEL

Direct-Acting Antiviral Agents for Chronic Hepatitis C Genotype 1 257
FIGURE 37: ANEMIA —TREATMENT-NAIVE PATIENTS: PLOT OF POSTERIOR MEAN DEVIANCE OF THE INDIVIDUAL
DATA POINTS IN THE INCONSISTENCY MODEL AGAINST THEIR POSTERIOR MEAN DEVIANCE IN THE CONSISTENCY
MODEL
FIGURE 38: DEPRESSION — TREATMENT-NAIVE PATIENTS: PLOT OF POSTERIOR MEAN DEVIANCE OF THE
INDIVIDUAL DATA POINTS IN THE INCONSISTENCY MODEL AGAINST THEIR POSTERIOR MEAN DEVIANCE IN THE
CONSISTENCY MODEL

Direct-Acting Antiviral Agents for Chronic Hepatitis C Genotype 1 258
Treatment-Experienced FIGURE 39: SVR — ALL TREATMENT-EXPERIENCED PATIENTS: PLOT OF POSTERIOR MEAN DEVIANCE OF THE
INDIVIDUAL DATA POINTS IN THE INCONSISTENCY MODEL AGAINST THEIR POSTERIOR MEAN DEVIANCE IN THE
CONSISTENCY MODEL
FIGURE 40: SVR FOR FIBROSIS SCORE F0-F2 — ALL TREATMENT-EXPERIENCED PATIENTS: PLOT OF POSTERIOR
MEAN DEVIANCE OF THE INDIVIDUAL DATA POINTS IN THE INCONSISTENCY MODEL AGAINST THEIR POSTERIOR
MEAN DEVIANCE IN THE CONSISTENCY MODEL

Direct-Acting Antiviral Agents for Chronic Hepatitis C Genotype 1 259
FIGURE 41: SVR FOR FIBROSIS SCORE F3-F4 — ALL TREATMENT-EXPERIENCED PATIENTS: PLOT OF POSTERIOR
MEAN DEVIANCE OF THE INDIVIDUAL DATA POINTS IN THE INCONSISTENCY MODEL AGAINST THEIR POSTERIOR
MEAN DEVIANCE IN THE CONSISTENCY MODEL
FIGURE 42: SVR FOR FIBROSIS SCORE F3-F4 — ALL TREATMENT-EXPERIENCED PATIENTS: PLOT OF POSTERIOR
MEAN DEVIANCE OF THE INDIVIDUAL DATA POINTS IN THE INCONSISTENCY MODEL AGAINST THEIR POSTERIOR
MEAN DEVIANCE IN THE CONSISTENCY MODEL

Direct-Acting Antiviral Agents for Chronic Hepatitis C Genotype 1 260
FIGURE 43: SVR BY GENOTYPES — ALL TREATMENT-EXPERIENCED PATIENTS: PLOT OF POSTERIOR MEAN
DEVIANCE OF THE INDIVIDUAL DATA POINTS IN THE INCONSISTENCY MODEL AGAINST THEIR POSTERIOR MEAN
DEVIANCE IN THE CONSISTENCY MODEL
FIGURE 44: RASH — ALL TREATMENT-EXPERIENCED PATIENTS: PLOT OF POSTERIOR MEAN DEVIANCE OF THE
INDIVIDUAL DATA POINTS IN THE INCONSISTENCY MODEL AGAINST THEIR POSTERIOR MEAN DEVIANCE IN THE
CONSISTENCY MODEL

Direct-Acting Antiviral Agents for Chronic Hepatitis C Genotype 1 261
FIGURE 45: ANEMIA — ALL TREATMENT-EXPERIENCED PATIENTS: PLOT OF POSTERIOR MEAN DEVIANCE OF THE
INDIVIDUAL DATA POINTS IN THE INCONSISTENCY MODEL AGAINST THEIR POSTERIOR MEAN DEVIANCE IN THE
CONSISTENCY MODEL
FIGURE 46: DEPRESSION — ALL TREATMENT-EXPERIENCED PATIENTS: PLOT OF POSTERIOR MEAN DEVIANCE OF
THE INDIVIDUAL DATA POINTS IN THE INCONSISTENCY MODEL AGAINST THEIR POSTERIOR MEAN DEVIANCE IN
THE CONSISTENCY MODEL

Direct-Acting Antiviral Agents for Chronic Hepatitis C Genotype 1 262
FIGURE 47: SVR — TREATMENT-EXPERIENCED RELAPSED: PLOT OF POSTERIOR MEAN DEVIANCE OF THE
INDIVIDUAL DATA POINTS IN THE INCONSISTENCY MODEL AGAINST THEIR POSTERIOR MEAN DEVIANCE IN THE
CONSISTENCY MODEL
FIGURE 48: SVR FOR FIBROSIS SCORE F0-F2 — TREATMENT-EXPERIENCED PATIENTS WITH PRIOR RELAPSE:
PLOT OF POSTERIOR MEAN DEVIANCE OF THE INDIVIDUAL DATA POINTS IN THE INCONSISTENCY MODEL AGAINST
THEIR POSTERIOR MEAN DEVIANCE IN THE CONSISTENCY MODEL

Direct-Acting Antiviral Agents for Chronic Hepatitis C Genotype 1 263
FIGURE 49: SVR FOR FIBROSIS SCORE F3-F4 — TREATMENT-EXPERIENCED PATIENTS WITH PRIOR RELAPSE:
PLOT OF POSTERIOR MEAN DEVIANCE OF THE INDIVIDUAL DATA POINTS IN THE INCONSISTENCY MODEL AGAINST
THEIR POSTERIOR MEAN DEVIANCE IN THE CONSISTENCY MODEL
TABLE 169: SVR BY GENOTYPES — TREATMENT-EXPERIENCED PATIENTS WITH PRIOR RELAPSE: PLOT OF
POSTERIOR MEAN DEVIANCE OF THE INDIVIDUAL DATA POINTS IN THE INCONSISTENCY MODEL AGAINST THEIR
POSTERIOR MEAN DEVIANCE IN THE CONSISTENCY MODEL
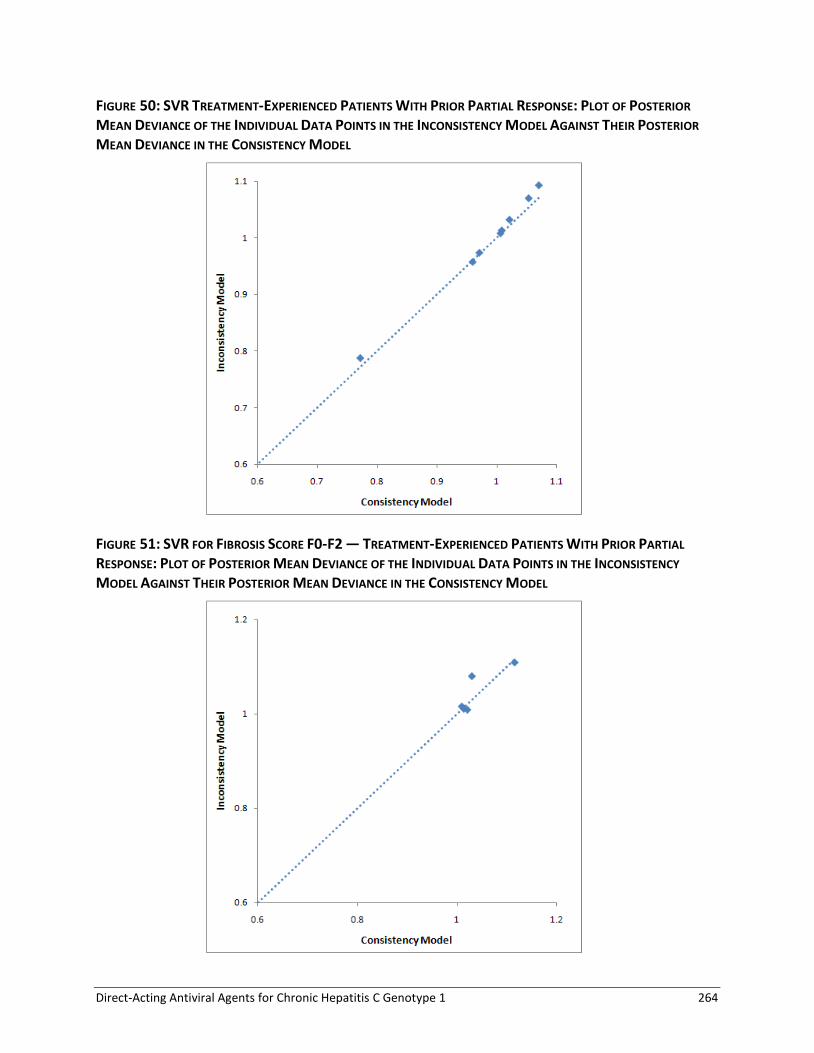
Direct-Acting Antiviral Agents for Chronic Hepatitis C Genotype 1 264
FIGURE 50: SVR TREATMENT-EXPERIENCED PATIENTS WITH PRIOR PARTIAL RESPONSE: PLOT OF POSTERIOR
MEAN DEVIANCE OF THE INDIVIDUAL DATA POINTS IN THE INCONSISTENCY MODEL AGAINST THEIR POSTERIOR
MEAN DEVIANCE IN THE CONSISTENCY MODEL
FIGURE 51: SVR FOR FIBROSIS SCORE F0-F2 — TREATMENT-EXPERIENCED PATIENTS WITH PRIOR PARTIAL
RESPONSE: PLOT OF POSTERIOR MEAN DEVIANCE OF THE INDIVIDUAL DATA POINTS IN THE INCONSISTENCY
MODEL AGAINST THEIR POSTERIOR MEAN DEVIANCE IN THE CONSISTENCY MODEL

Direct-Acting Antiviral Agents for Chronic Hepatitis C Genotype 1 265
FIGURE 52: SVR FOR FIBROSIS SCORE F3-F4 — TREATMENT-EXPERIENCED PATIENTS WITH PRIOR PARTIAL
RESPONSE: PLOT OF POSTERIOR MEAN DEVIANCE OF THE INDIVIDUAL DATA POINTS IN THE INCONSISTENCY
MODEL AGAINST THEIR POSTERIOR MEAN DEVIANCE IN THE CONSISTENCY MODEL

Direct-Acting Antiviral Agents for Chronic Hepatitis C Genotype 1 266
APPENDIX 22: NMA SECONDARY ANALYSES STRATIFIED BY PEGINTERFERON-2A OR -2B
Treatment-Naive TABLE 170: SVR — TREATMENT-NAIVE PATIENTS: ODDS RATIOS, RELATIVE RISKS, AND RISK DIFFERENCE FOR ALL TREATMENT COMPARISONS AND
RANDOM EFFECTS MODEL (PR48 2A/B SEPARATED, ALL DOSES)
Treatment Reference OR (95% CrI) RR (95% CrI) RD% (95% CrI)
PR48 2b PR48 2a 0.75 (0.54,0.95) 0.85 (0.70,0.97) –7.15 (–15.15,–1.28)
Si12 PR24-48 2a RGT 3.69 (2.47,5.45) 1.60 (1.42,1.76) 29.06 (21.11,35.48)
Si12 PR24-48 2b RGT 2.93 (1.46,6.03) 1.51 (1.19,1.77) 24.83 (9.38,36.64)
T12 PR24-48 2a RGT q8 3.80 (2.24,6.47) 1.61 (1.39,1.78) 29.52 (19.16,37.29)
T12 PR24-48 2b RGT q8 3.27 (0.99,10.95) 1.55 (0.99,1.89) 26.85 (–0.33,42.49)
T12 PR24-48 2a RGT q12 4.06 (1.95,8.31) 1.63 (1.33,1.84) 30.63 (16.16,40.06)
T12 PR24-48 2b RGT q12 3.55 (1.05,12.43) 1.58 (1.02,1.91) 28.38 (1.15,43.53)
B24 PR28-48 2b RGT 2.14 (1.12,3.69) 1.38 (1.06,1.61) 18.32 (2.85,29.11)
*So12 PR24-48 2a RGT 6.23 (1.88,24.05) 1.75 (1.31,2.03) 36.73 (15.29,48.14)
*T12 PR24 2a q8 2.39 (1.40,4.22) 1.42 (1.17,1.67) 20.71 (8.29,31.57)
*T12 PR24 2b q8 2.12 (0.92,4.66) 1.37 (0.96,1.69) 18.03 (–2.18,32.96)
T12 PR48 2a q8 3.04 (1.48,6.42) 1.52 (1.20,1.79) 25.47 (9.72,37.40)
*B24 PR28 2b 1.61 (0.73,3.36) 1.24 (0.84,1.57) 11.69 (–7.68,27.47)
Si12 PR24-48 2a RGT PR48 2b 4.96 (3.21,8.07) 1.87 (1.60,2.29) 36.24 (27.35,45.52)
Si12 PR24-48 2b RGT 3.96 (1.95,8.56) 1.77 (1.38,2.25) 32.12 (16.43,45.65)
T12 PR24-48 2a RGT q8 5.05 (2.94,9.86) 1.88 (1.57,2.35) 36.54 (25.65,47.94)
T12 PR24-48 2b RGT q8 4.41 (1.30,15.60) 1.82 (1.16,2.40) 34.12 (6.54,51.76)
T12 PR24-48 2a RGT q12 5.41 (2.61,12.36) 1.90 (1.53,2.40) 37.64 (23.20,50.34)
T12 PR24-48 2b RGT q12 4.75 (1.39,17.49) 1.85 (1.19,2.43) 35.40 (8.14,52.69)
B24 PR28-48 2b RGT 2.86 (1.70,4.86) 1.61 (1.32,1.95) 25.38 (13.09,36.17)
*So12 PR24-48 2a RGT 8.44 (2.50,33.73) 2.05 (1.50,2.62) 43.97 (22.14,57.62)
*T12 PR24 2a q8 3.22 (1.79,6.25) 1.67 (1.32,2.15) 27.97 (14.45,41.36)
*T12 PR24 2b q8 2.85 (1.33,6.09) 1.61 (1.17,2.03) 25.26 (7.06,39.76)

Direct-Acting Antiviral Agents for Chronic Hepatitis C Genotype 1 267
Treatment Reference OR (95% CrI) RR (95% CrI) RD% (95% CrI)
T12 PR48 2a q8 4.08 (1.94,9.38) 1.78 (1.37,2.30) 32.69 (16.32,47.16)
*B24 PR28 2b 2.16 (1.08,4.41) 1.46 (1.05,1.87) 18.95 (1.88,34.23)
Si12 PR24-48 2b RGT Si12 PR24-48 2a RGT 0.80 (0.39,1.68) 0.95 (0.76,1.11) –4.16 (–19.03,8.24)
T12 PR24-48 2a RGT q8 1.03 (0.54,2.02) 1.01 (0.86,1.16) 0.42 (–11.35,11.33)
T12 PR24-48 2b RGT q8 0.89 (0.25,3.18) 0.97 (0.62,1.21) –2.12 (–30.22,15.35)
T12 PR24-48 2a RGT q12 1.09 (0.48,2.53) 1.02 (0.83,1.19) 1.48 (–13.84,13.70)
T12 PR24-48 2b RGT q12 0.96 (0.27,3.59) 0.99 (0.64,1.22) –0.70 (–28.46,16.24)
B24 PR28-48 2b RGT 0.58 (0.28,1.13) 0.86 (0.66,1.03) –10.71 (–26.70,2.26)
*So12 PR24-48 2a RGT 1.69 (0.48,7.05) 1.10 (0.82,1.29) 7.67 (–13.99,21.12)
*T12 PR24 2a q8 0.65 (0.34,1.29) 0.89 (0.73,1.06) –8.24 (–21.90,4.65)
*T12 PR24 2b q8 0.57 (0.23,1.37) 0.86 (0.60,1.07) –11.01 (–31.68,5.45)
T12 PR48 2a q8 0.82 (0.36,1.96) 0.95 (0.75,1.15) –3.53 (–20.21,10.74)
*B24 PR28 2b 0.43 (0.18,1.00) 0.78 (0.53,1.00) –17.34 (–37.18,0.01)
T12 PR24-48 2a RGT q8 Si12 PR24-48 2b RGT 1.29 (0.53,3.12) 1.06 (0.87,1.37) 4.58 (–10.61,21.80)
T12 PR24-48 2b RGT q8 1.12 (0.28,4.56) 1.03 (0.64,1.39) 2.08 (–27.40,24.28)
T12 PR24-48 2a RGT q12 1.37 (0.50,3.75) 1.08 (0.85,1.39) 5.57 (–12.39,23.60)
T12 PR24-48 2b RGT q12 1.19 (0.30,5.13) 1.04 (0.67,1.41) 3.16 (–25.71,25.45)
B24 PR28-48 2b RGT 0.73 (0.28,1.73) 0.91 (0.68,1.19) –6.54 (–25.30,11.74)
*So12 PR24-48 2a RGT 2.15 (0.51,9.64) 1.16 (0.85,1.52) 11.77 (–12.31,31.12)
*T12 PR24 2a q8 0.82 (0.34,1.99) 0.94 (0.74,1.24) –4.08 (–20.79,14.34)
*T12 PR24 2b q8 0.72 (0.24,2.03) 0.91 (0.62,1.23) –6.81 (–29.74,14.10)
T12 PR48 2a q8 1.03 (0.38,2.87) 1.01 (0.77,1.33) 0.61 (–18.70,19.99)
*B24 PR28 2b 0.54 (0.20,1.48) 0.82 (0.55,1.13) –13.08 (–35.03,8.28)
T12 PR24-48 2b RGT q8 T12 PR24-48 2a RGT q8 0.86 (0.30,2.56) 0.97 (0.65,1.17) –2.63 (–26.62,12.46)
T12 PR24-48 2a RGT q12 1.07 (0.65,1.73) 1.01 (0.89,1.11) 1.12 (–8.28,8.02)
T12 PR24-48 2b RGT q12 0.93 (0.31,2.93) 0.98 (0.67,1.18) –1.25 (–25.33,13.49)
B24 PR28-48 2b RGT 0.57 (0.24,1.19) 0.86 (0.66,1.05) –11.05 (–28.21,3.34)
*So12 PR24-48 2a RGT 1.64 (0.45,7.02) 1.09 (0.82,1.32) 7.04 (–14.73,22.39)
*T12 PR24 2a q8 0.63 (0.30,1.37) 0.89 (0.72,1.08) –8.70 (–22.82,5.96)

Direct-Acting Antiviral Agents for Chronic Hepatitis C Genotype 1 268
Treatment Reference OR (95% CrI) RR (95% CrI) RD% (95% CrI)
*T12 PR24 2b q8 0.56 (0.21,1.44) 0.85 (0.59,1.09) –11.41 (–32.75,6.39)
T12 PR48 2a q8 0.80 (0.33,1.99) 0.95 (0.74,1.16) –4.00 (–21.20,11.50)
*B24 PR28 2b 0.42 (0.16,1.05) 0.77 (0.52,1.01) –17.66 (–38.49,0.92)
T12 PR24-48 2a RGT q12 T12 PR24-48 2b RGT q8 1.24 (0.41,3.62) 1.05 (0.85,1.54) 3.63 (–12.46,26.87)
T12 PR24-48 2b RGT q12 1.08 (0.32,3.72) 1.02 (0.73,1.43) 1.31 (–21.37,23.56)
B24 PR28-48 2b RGT 0.65 (0.17,2.41) 0.89 (0.64,1.41) –8.44 (–30.86,20.25)
*So12 PR24-48 2a RGT 1.91 (0.36,11.99) 1.12 (0.81,1.79) 9.44 (–15.95,39.55)
*T12 PR24 2a q8 0.73 (0.20,2.81) 0.92 (0.70,1.47) –6.07 (–26.20,23.20)
*T12 PR24 2b q8 0.64 (0.15,2.71) 0.89 (0.59,1.43) –8.69 (–34.77,21.83)
T12 PR48 2a q8 0.92 (0.23,3.84) 0.98 (0.73,1.56) –1.45 (–23.56,28.19)
*B24 PR28 2b 0.49 (0.12,1.99) 0.81 (0.52,1.31) –14.75 (–40.50,15.82)
T12 PR24-48 2b RGT q12 T12 PR24-48 2a RGT q12 0.87 (0.29,2.74) 0.97 (0.67,1.18) –2.23 (–25.75,13.33)
B24 PR28-48 2b RGT 0.53 (0.20,1.30) 0.85 (0.64,1.08) –12.11 (–30.10,5.14)
*So12 PR24-48 2a RGT 1.54 (0.38,7.33) 1.08 (0.80,1.37) 5.99 (–16.31,24.52)
*T12 PR24 2a q8 0.59 (0.24,1.50) 0.88 (0.70,1.12) –9.74 (–25.01,8.06)
*T12 PR24 2b q8 0.52 (0.17,1.50) 0.84 (0.58,1.11) –12.35 (–34.53,7.56)
T12 PR48 2a q8 0.75 (0.27,2.14) 0.94 (0.72,1.20) –5.06 (–23.24,13.29)
*B24 PR28 2b 0.40 (0.13,1.12) 0.76 (0.52,1.03) –18.62 (–40.14,2.18)
B24 PR28-48 2b RGT T12 PR24-48 2b RGT q12 0.60 (0.15,2.28) 0.87 (0.64,1.36) –9.88 (–31.69,18.74)
*So12 PR24-48 2a RGT 1.76 (0.32,11.35) 1.10 (0.80,1.74) 8.00 (–16.81,37.96)
*T12 PR24 2a q8 0.68 (0.18,2.64) 0.90 (0.70,1.43) –7.47 (–26.92,21.83)
*T12 PR24 2b q8 0.60 (0.13,2.55) 0.87 (0.58,1.39) –9.98 (–35.87,20.43)
T12 PR48 2a q8 0.86 (0.20,3.61) 0.97 (0.71,1.52) –2.70 (–25.18,26.82)
*B24 PR28 2b 0.45 (0.10,1.88) 0.79 (0.52,1.27) –16.05 (–41.55,14.33)
*So12 PR24-48 2a RGT B24 PR28-48 2b RGT 2.93 (0.77,13.06) 1.27 (0.93,1.69) 18.23 (–5.30,37.31)
*T12 PR24 2a q8 1.12 (0.52,2.65) 1.04 (0.81,1.39) 2.42 (–13.86,21.15)
*T12 PR24 2b q8 0.99 (0.40,2.49) 1.00 (0.70,1.33) –0.15 (–21.03,19.01)
T12 PR48 2a q8 1.42 (0.58,3.88) 1.11 (0.84,1.49) 7.19 (–11.64,26.69)
*B24 PR28 2b 0.76 (0.32,1.80) 0.91 (0.62,1.23) –6.38 (–26.64,12.88)

Direct-Acting Antiviral Agents for Chronic Hepatitis C Genotype 1 269
Treatment Reference OR (95% CrI) RR (95% CrI) RD% (95% CrI)
*T12 PR24 2a q8 *So12 PR24-48 2a RGT 0.38 (0.09,1.44) 0.82 (0.65,1.11) –15.78 (–32.72,7.46)
*T12 PR24 2b q8 0.34 (0.07,1.47) 0.79 (0.54,1.11) –18.25 (–42.30,7.44)
T12 PR48 2a q8 0.48 (0.11,2.00) 0.87 (0.67,1.19) –10.98 (–30.42,12.72)
*B24 PR28 2b 0.25 (0.05,1.07) 0.71 (0.47,1.02) –24.60 (–47.85,1.37)
*T12 PR24 2b q8 *T12 PR24 2a q8 0.88 (0.32,2.31) 0.96 (0.65,1.27) –2.73 (–25.61,16.57)
T12 PR48 2a q8 1.27 (0.61,2.67) 1.07 (0.86,1.30) 4.66 (–10.46,18.36)
*B24 PR28 2b 0.67 (0.26,1.65) 0.87 (0.58,1.17) –8.88 (–31.07,10.62)
T12 PR48 2a q8 *T12 PR24 2b q8 1.44 (0.49,4.50) 1.11 (0.82,1.64) 7.34 (–14.17,31.09)
*B24 PR28 2b 0.76 (0.27,2.14) 0.91 (0.61,1.34) –6.21 (–28.72,17.24)
*B24 PR28 2b T12 PR48 2a q8 0.53 (0.18,1.48) 0.82 (0.54,1.13) –13.53 (–36.67,8.29)
Random Effects Model Residual Deviance 37.12 vs. 39 data points
Deviance Information Criteria 264.234
Fixed Effects Model Residual Deviance 41.32 vs. 39 data points
Deviance Information Criteria 265.528
CrI = credible interval; OR = odds ratio; RD = risk difference; RR = relative risk; SVR = sustained viral response; vs. = versus. *Not a Health Canada–recommended dosage regimen.

Direct-Acting Antiviral Agents for Chronic Hepatitis C Genotype 1 270
FIGURE 53: SVR — TREATMENT-NAIVE PATIENTS: PLOT OF POSTERIOR MEAN DEVIANCE OF THE INDIVIDUAL
DATA POINTS IN THE INCONSISTENCY MODEL AGAINST THEIR POSTERIOR MEAN DEVIANCE IN THE CONSISTENCY
MODEL (PR48 2A/B SEPARATED, ALL DOSES)

Direct-Acting Antiviral Agents for Chronic Hepatitis C Genotype 1 271
TABLE 171: SVR — TREATMENT-NAIVE PATIENTS: ODDS RATIOS, RELATIVE RISKS, AND RISK DIFFERENCE FOR ALL TREATMENT COMPARISONS AND
RANDOM EFFECTS MODEL (PR48 2A/B SEPARATED, HEALTH CANADA DOSES ONLY)
Treatment Reference OR (95% CrI) RR (95% CrI) RD% (95% CrI)
PR48 2b PR48 2a 0.74 (0.53,0.95) 0.85 (0.69,0.97) –7.41 (-15.50,–1.25)
Si12 PR24-48 2a RGT 3.69 (2.43,5.53) 1.59 (1.41,1.76) 28.93 (20.74,35.66)
Si12 PR24-48 2b RGT 2.94 (1.45,6.13) 1.51 (1.18,1.77) 24.84 (9.16,36.71)
T12 PR24-48 2a RGT q8 3.79 (2.21,6.63) 1.60 (1.38,1.78) 29.44 (18.83,37.49)
T12 PR24-48 2b RGT q8 3.32 (0.97,10.91) 1.55 (0.98,1.88) 27.05 (–0.77,42.37)
T12 PR24-48 2a RGT q12 4.05 (1.90,8.53) 1.62 (1.31,1.84) 30.56 (15.51,40.18)
T12 PR24-48 2b RGT q12 3.51 (1.04,12.59) 1.57 (1.02,1.90) 28.07 (0.94,43.44)
B24 PR28-48 2b RGT 2.13 (1.08,3.75) 1.37 (1.04,1.61) 18.12 (1.87,29.39)
Si12 PR24-48 2a RGT PR48 2b 5.00 (3.20,8.24) 1.88 (1.60,2.29) 36.39 (27.25,45.90)
Si12 PR24-48 2b RGT 3.99 (1.96,8.73) 1.77 (1.38,2.24) 32.24 (16.61,45.85)
T12 PR24-48 2a RGT q8 5.11 (2.92,10.23) 1.88 (1.57,2.35) 36.72 (25.57,48.42)
T12 PR24-48 2b RGT q8 4.50 (1.31,15.75) 1.82 (1.16,2.41) 34.44 (6.57,51.93)
T12 PR24-48 2a RGT q12 5.47 (2.57,12.66) 1.91 (1.52,2.40) 37.82 (22.92,50.59)
T12 PR24-48 2b RGT q12 4.76 (1.38,18.30) 1.85 (1.19,2.43) 35.51 (7.95,52.93)
B24 PR28-48 2b RGT 2.86 (1.67,4.98) 1.61 (1.31,1.94) 25.39 (12.57,36.56)
Si12 PR24-48 2b RGT Si12 PR24-48 2a RGT 0.80 (0.39,1.69) 0.95 (0.76,1.11) –4.13 (–19.05,8.33)
T12 PR24-48 2a RGT q8 1.03 (0.53,2.09) 1.01 (0.86,1.16) 0.47 (–11.55,11.67)
T12 PR24-48 2b RGT q8 0.90 (0.24,3.17) 0.98 (0.62,1.20) –1.83 (–30.46,15.18)
T12 PR24-48 2a RGT q12 1.10 (0.47,2.58) 1.02 (0.82,1.19) 1.59 (–14.27,13.83)
T12 PR24-48 2b RGT q12 0.95 (0.26,3.66) 0.99 (0.64,1.22) –0.88 (–28.93,16.24)
B24 PR28-48 2b RGT 0.57 (0.27,1.15) 0.86 (0.66,1.03) –10.94 (–27.45,2.50)
T12 PR24-48 2a RGT q8 Si12 PR24-48 2b RGT 1.29 (0.52,3.22) 1.06 (0.87,1.37) 4.54 (–11.04,22.06)
T12 PR24-48 2b RGT q8 1.11 (0.27,4.50) 1.03 (0.64,1.39) 1.96 (–27.97,24.14)
T12 PR24-48 2a RGT q12 1.37 (0.48,3.82) 1.08 (0.84,1.39) 5.57 (–12.98,23.85)
T12 PR24-48 2b RGT q12 1.19 (0.29,5.15) 1.04 (0.66,1.41) 3.09 (–26.32,25.34)
B24 PR28-48 2b RGT 0.72 (0.27,1.73) 0.91 (0.68,1.19) –6.76 (–25.78,11.68)
T12 PR24-48 2b RGT q8 T12 PR24-48 2a RGT q8 0.87 (0.29,2.54) 0.97 (0.65,1.16) –2.38 (–26.93,12.14)

Direct-Acting Antiviral Agents for Chronic Hepatitis C Genotype 1 272
Treatment Reference OR (95% CrI) RR (95% CrI) RD% (95% CrI)
T12 PR24-48 2a RGT q12 1.07 (0.64,1.75) 1.01 (0.89,1.11) 1.06 (–8.57,8.16)
T12 PR24-48 2b RGT q12 0.92 (0.31,2.94) 0.98 (0.66,1.18) –1.44 (–25.62,13.57)
B24 PR28-48 2b RGT 0.56 (0.23,1.21) 0.86 (0.65,1.05) –11.24 (–29.17,3.60)
T12 PR24-48 2a RGT q12 T12 PR24-48 2b RGT q8 1.23 (0.42,3.63) 1.05 (0.86,1.54) 3.43 (–12.06,26.89)
T12 PR24-48 2b RGT q12 1.07 (0.32,3.71) 1.01 (0.73,1.43) 1.03 (–20.89,23.41)
B24 PR28-48 2b RGT 0.64 (0.16,2.49) 0.88 (0.64,1.41) –8.91 (–31.44,20.81)
T12 PR24-48 2b RGT q12 T12 PR24-48 2a RGT q12 0.86 (0.29,2.75) 0.97 (0.67,1.19) –2.37 (–25.86,13.50)
B24 PR28-48 2b RGT 0.52 (0.19,1.33) 0.85 (0.63,1.08) –12.31 (–30.82,5.73)
B24 PR28-48 2b RGT T12 PR24–48 2b RGT q12 0.60 (0.14,2.31) 0.87 (0.63,1.37) –9.81 (–32.44,19.10)
Random Effects Model Residual Deviance 26.64 vs. 28 data points
Deviance Information Criteria 193.057
Fixed Effects Model Residual Deviance 31.09 vs. 28 data points
Deviance Information Criteria 194.601
CrI = credible interval; HC = Health Canada; OR = odds ratio; RD = risk difference; RR = relative risk; SVR = sustained viral response; vs. = versus.

Direct-Acting Antiviral Agents for Chronic Hepatitis C Genotype 1 273
FIGURE 54: SVR — TREATMENT-NAIVE PATIENTS: PLOT OF POSTERIOR MEAN DEVIANCE OF THE INDIVIDUAL
DATA POINTS IN THE INCONSISTENCY MODEL AGAINST THEIR POSTERIOR MEAN DEVIANCE IN THE CONSISTENCY
MODEL (PR48 2A/B SEPARATED, HEALTH CANADA DOSES ONLY)

Direct-Acting Antiviral Agents for Chronic Hepatitis C Genotype 1 274
TABLE 172: SVR FOR FIBROSIS SCORE F0-F2 — TREATMENT-NAIVE PATIENTS: ODDS RATIOS, RELATIVE RISKS, AND RISK DIFFERENCE FOR ALL TREATMENT
COMPARISONS AND RANDOM EFFECTS MODEL (PR48 2A/B SEPARATED, HEALTH CANADA DOSES)
Treatment Reference OR (95% CrI) RR (95% CrI) RD% (95% CrI)
PR48 2b PR48 2a 0.94 (0.36,2.46) 0.97 (0.53,1.42) –1.51 (–23.69,21.02)
Si12 PR24-48 2a RGT 3.32 (1.14,9.64) 1.53 (1.07,1.86) 26.76 (3.29,41.41)
T12 PR24-48 2a RGT q8 4.09 (1.50,11.07) 1.60 (1.20,1.87) 30.22 (9.99,42.06)
T12 PR24-48 2a RGT q12 4.20 (1.01,17.37) 1.61 (1.01,1.92) 30.64 (0.34,44.84)
B24 PR28-48 2b RGT 3.16 (0.80,12.54) 1.52 (0.89,1.86) 25.89 (–5.67,42.62)
Si12 PR24-48 2a RGT PR48 2b 3.52 (0.85,14.81) 1.57 (0.95,2.89) 27.96 (–3.49,53.50)
T12 PR24-48 2a RGT q8 4.35 (1.10,17.51) 1.65 (1.03,2.99) 31.51 (1.68,55.74)
T12 PR24-48 2a RGT q12 4.46 (0.79,25.50) 1.65 (0.92,2.98) 31.67 (–4.79,57.22)
B24 PR28-48 2b RGT 3.36 (1.26,8.96) 1.55 (1.08,2.21) 26.74 (4.30,41.26)
T12 PR24-48 2a RGT q8 Si12 PR24-48 2a RGT 1.23 (0.29,5.30) 1.05 (0.76,1.50) 3.46 (–20.04,28.14)
T12 PR24-48 2a RGT q12 1.26 (0.21,7.52) 1.05 (0.65,1.51) 3.76 (–27.79,29.58)
B24 PR28-48 2b RGT 0.95 (0.17,5.39) 0.99 (0.58,1.45) –0.80 (–33.31,26.17)
T12 PR24-48 2a RGT q12 T12 PR24-48 2a RGT q8 1.03 (0.37,2.82) 1.01 (0.74,1.17) 0.37 (–18.82,12.15)
B24 PR28-48 2b RGT 0.77 (0.14,4.27) 0.95 (0.56,1.32) –4.29 (–36.04,20.53)
B24 PR28-48 2b RGT T12 PR24-48 2a RGT q12 0.75 (0.11,5.53) 0.94 (0.56,1.51) –4.59 (–36.99,27.73)
Random Effects Model Residual Deviance 10.04 vs. 10 data points
Deviance Information Criteria 79.803
Fixed Effects Model Residual Deviance 10.02 vs. 10 data points
Deviance Information Criteria 79.774
CrI = credible interval; HC = Health Canada; OR = odds ratio; RD = risk difference; RR = relative risk; SVR = sustained viral response; vs. = versus.
No consistency plot for this analysis.

Direct-Acting Antiviral Agents for Chronic Hepatitis C Genotype 1 275
TABLE 173: SVR FOR FIBROSIS SCORE F3-F4 — –TREATMENT-NAIVE PATIENTS: ODDS RATIOS, RELATIVE RISKS, AND RISK DIFFERENCE FOR ALL TREATMENT
COMPARISONS AND RANDOM EFFECTS MODEL (PR48 2A/B SEPARATED, HEALTH CANADA DOSES)
Treatment Reference OR (95% CrI) RR (95% CrI) RD% (95% CrI)
PR48 2b PR48 2a 0.83 (0.27,2.58) 0.87 (0.34,1.82) –3.43 (-18.92,21.61)
Si12 PR24-48 2a RGT 6.38 (1.86,23.41) 2.55 (1.47,3.73) 43.12 (14.32,63.50)
T12 PR24-48 2a RGT q8 3.33 (1.05,10.71) 2.02 (1.04,3.10) 28.21 (1.06,52.68)
T12 PR24-48 2a RGT q12 3.67 (0.75,17.79) 2.10 (0.81,3.36) 30.56 (–5.43,59.71)
B24 PR28-48 2b RGT 0.98 (0.16,5.93) 0.98 (0.21,2.55) –0.42 (–22.54,41.48)
Si12 PR24-48 2a RGT PR48 2b 7.65 (1.41,42.36) 2.89 (1.17,7.61) 45.83 (7.31,71.30)
T12 PR24-48 2a RGT q8 3.99 (0.78,19.97) 2.29 (0.87,6.15) 31.07 (–5.20,59.69)
T12 PR24-48 2a RGT q12 4.40 (0.61,30.32) 2.37 (0.73,6.44) 33.23 (–9.46,65.99)
B24 PR28-48 2b RGT 1.17 (0.28,4.94) 1.12 (0.34,2.59) 2.75 (–17.25,34.05)
T12 PR24-48 2a RGT q8 Si12 PR24-48 2a RGT 0.52 (0.09,2.80) 0.79 (0.39,1.45) –14.58 (–48.03,21.90)
T12 PR24-48 2a RGT q12 0.58 (0.08,4.17) 0.83 (0.32,1.55) –12.07 (–52.36,27.01)
B24 PR28-48 2b RGT 0.15 (0.02,1.36) 0.39 (0.08,1.12) –42.15 (–73.45,6.47)
T12 PR24-48 2a RGT q12 T12 PR24-48 2a RGT q8 1.10 (0.38,3.28) 1.04 (0.58,1.51) 2.20 (–20.26,22.63)
B24 PR28-48 2b RGT 0.29 (0.03,2.46) 0.49 (0.10,1.51) –27.77 (–61.48,19.68)
B24 PR28-48 2b RGT T12 PR24-48 2a RGT q12 0.26 (0.02,2.97) 0.48 (0.10,1.74) –29.64 (–67.93,22.48)
Random Effects Model Residual Deviance 10.12 vs. 10 data points
Deviance Information Criteria 65.378
Fixed Effects Model Residual Deviance 10.06 vs. 10 data points
Deviance Information Criteria 65.258
CrI = credible interval; HC = Health Canada; OR = odds ratio; RD = risk difference; RR = relative risk; SVR = sustained viral response; vs. = versus.
No consistency plot for this analysis.
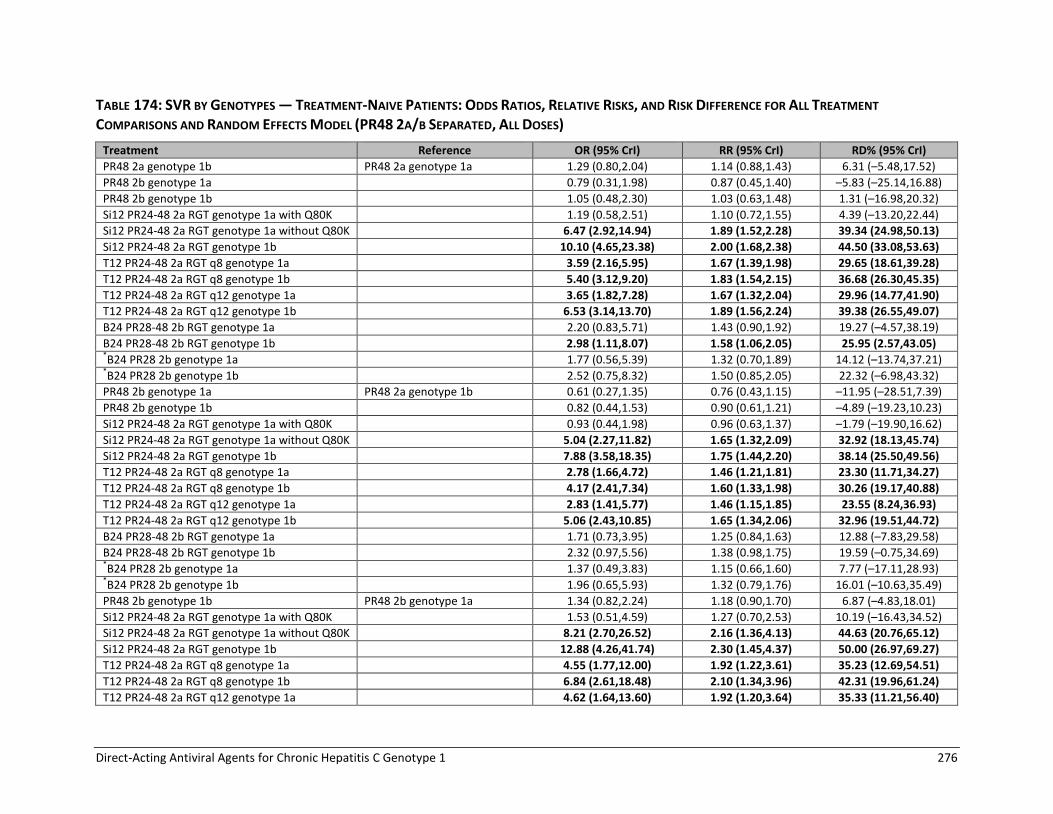
Direct-Acting Antiviral Agents for Chronic Hepatitis C Genotype 1 276
TABLE 174: SVR BY GENOTYPES — TREATMENT-NAIVE PATIENTS: ODDS RATIOS, RELATIVE RISKS, AND RISK DIFFERENCE FOR ALL TREATMENT
COMPARISONS AND RANDOM EFFECTS MODEL (PR48 2A/B SEPARATED, ALL DOSES)
Treatment Reference OR (95% CrI) RR (95% CrI) RD% (95% CrI)
PR48 2a genotype 1b PR48 2a genotype 1a 1.29 (0.80,2.04) 1.14 (0.88,1.43) 6.31 (–5.48,17.52)
PR48 2b genotype 1a 0.79 (0.31,1.98) 0.87 (0.45,1.40) –5.83 (–25.14,16.88)
PR48 2b genotype 1b 1.05 (0.48,2.30) 1.03 (0.63,1.48) 1.31 (–16.98,20.32)
Si12 PR24-48 2a RGT genotype 1a with Q80K 1.19 (0.58,2.51) 1.10 (0.72,1.55) 4.39 (–13.20,22.44)
Si12 PR24-48 2a RGT genotype 1a without Q80K 6.47 (2.92,14.94) 1.89 (1.52,2.28) 39.34 (24.98,50.13)
Si12 PR24-48 2a RGT genotype 1b 10.10 (4.65,23.38) 2.00 (1.68,2.38) 44.50 (33.08,53.63)
T12 PR24-48 2a RGT q8 genotype 1a 3.59 (2.16,5.95) 1.67 (1.39,1.98) 29.65 (18.61,39.28)
T12 PR24-48 2a RGT q8 genotype 1b 5.40 (3.12,9.20) 1.83 (1.54,2.15) 36.68 (26.30,45.35)
T12 PR24-48 2a RGT q12 genotype 1a 3.65 (1.82,7.28) 1.67 (1.32,2.04) 29.96 (14.77,41.90)
T12 PR24-48 2a RGT q12 genotype 1b 6.53 (3.14,13.70) 1.89 (1.56,2.24) 39.38 (26.55,49.07)
B24 PR28-48 2b RGT genotype 1a 2.20 (0.83,5.71) 1.43 (0.90,1.92) 19.27 (–4.57,38.19)
B24 PR28-48 2b RGT genotype 1b 2.98 (1.11,8.07) 1.58 (1.06,2.05) 25.95 (2.57,43.05) *B24 PR28 2b genotype 1a 1.77 (0.56,5.39) 1.32 (0.70,1.89) 14.12 (–13.74,37.21) *B24 PR28 2b genotype 1b 2.52 (0.75,8.32) 1.50 (0.85,2.05) 22.32 (–6.98,43.32)
PR48 2b genotype 1a PR48 2a genotype 1b 0.61 (0.27,1.35) 0.76 (0.43,1.15) –11.95 (–28.51,7.39)
PR48 2b genotype 1b 0.82 (0.44,1.53) 0.90 (0.61,1.21) –4.89 (–19.23,10.23)
Si12 PR24-48 2a RGT genotype 1a with Q80K 0.93 (0.44,1.98) 0.96 (0.63,1.37) –1.79 (–19.90,16.62)
Si12 PR24-48 2a RGT genotype 1a without Q80K 5.04 (2.27,11.82) 1.65 (1.32,2.09) 32.92 (18.13,45.74)
Si12 PR24-48 2a RGT genotype 1b 7.88 (3.58,18.35) 1.75 (1.44,2.20) 38.14 (25.50,49.56)
T12 PR24-48 2a RGT q8 genotype 1a 2.78 (1.66,4.72) 1.46 (1.21,1.81) 23.30 (11.71,34.27)
T12 PR24-48 2a RGT q8 genotype 1b 4.17 (2.41,7.34) 1.60 (1.33,1.98) 30.26 (19.17,40.88)
T12 PR24-48 2a RGT q12 genotype 1a 2.83 (1.41,5.77) 1.46 (1.15,1.85) 23.55 (8.24,36.93)
T12 PR24-48 2a RGT q12 genotype 1b 5.06 (2.43,10.85) 1.65 (1.34,2.06) 32.96 (19.51,44.72)
B24 PR28-48 2b RGT genotype 1a 1.71 (0.73,3.95) 1.25 (0.84,1.63) 12.88 (–7.83,29.58)
B24 PR28-48 2b RGT genotype 1b 2.32 (0.97,5.56) 1.38 (0.98,1.75) 19.59 (–0.75,34.69) *B24 PR28 2b genotype 1a 1.37 (0.49,3.83) 1.15 (0.66,1.60) 7.77 (–17.11,28.93) *B24 PR28 2b genotype 1b 1.96 (0.65,5.93) 1.32 (0.79,1.76) 16.01 (–10.63,35.49)
PR48 2b genotype 1b PR48 2b genotype 1a 1.34 (0.82,2.24) 1.18 (0.90,1.70) 6.87 (–4.83,18.01)
Si12 PR24-48 2a RGT genotype 1a with Q80K 1.53 (0.51,4.59) 1.27 (0.70,2.53) 10.19 (–16.43,34.52)
Si12 PR24-48 2a RGT genotype 1a without Q80K 8.21 (2.70,26.52) 2.16 (1.36,4.13) 44.63 (20.76,65.12)
Si12 PR24-48 2a RGT genotype 1b 12.88 (4.26,41.74) 2.30 (1.45,4.37) 50.00 (26.97,69.27)
T12 PR24-48 2a RGT q8 genotype 1a 4.55 (1.77,12.00) 1.92 (1.22,3.61) 35.23 (12.69,54.51)
T12 PR24-48 2a RGT q8 genotype 1b 6.84 (2.61,18.48) 2.10 (1.34,3.96) 42.31 (19.96,61.24)
T12 PR24-48 2a RGT q12 genotype 1a 4.62 (1.64,13.60) 1.92 (1.20,3.64) 35.33 (11.21,56.40)

Direct-Acting Antiviral Agents for Chronic Hepatitis C Genotype 1 277
Treatment Reference OR (95% CrI) RR (95% CrI) RD% (95% CrI)
T12 PR24-48 2a RGT q12 genotype 1b 8.31 (2.82,24.84) 2.17 (1.36,4.08) 44.86 (21.36,64.31)
B24 PR28-48 2b RGT genotype 1a 2.80 (1.60,4.87) 1.63 (1.22,2.38) 24.17 (10.72,36.28)
B24 PR28-48 2b RGT genotype 1b 3.80 (2.12,7.00) 1.81 (1.33,2.74) 30.73 (16.98,43.31)
*B24 PR28 2b genotype 1a 2.24 (0.99,5.05) 1.49 (1.00,2.31) 18.96 (–0.13,36.81)
*B24 PR28 2b genotype 1b 3.22 (1.30,7.97) 1.69 (1.14,2.72) 27.07 (6.06,45.28)
Si12 PR24-48 2a RGT genotype 1a with Q80K PR48 2b genotype 1b 1.14 (0.43,3.01) 1.07 (0.64,1.83) 3.11 (–20.71,26.23)
Si12 PR24-48 2a RGT genotype 1a without Q80K 6.14 (2.23,17.77) 1.83 (1.27,2.94) 37.70 (16.69,56.93)
Si12 PR24-48 2a RGT genotype 1b 9.60 (3.56,27.41) 1.94 (1.38,3.10) 42.93 (23.43,60.85)
T12 PR24-48 2a RGT q8 genotype 1a 3.40 (1.51,7.70) 1.62 (1.15,2.56) 28.19 (9.12,46.06)
T12 PR24-48 2a RGT q8 genotype 1b 5.11 (2.21,11.80) 1.77 (1.26,2.80) 35.23 (16.20,52.59)
T12 PR24-48 2a RGT q12 genotype 1a 3.46 (1.36,8.92) 1.62 (1.12,2.59) 28.38 (6.94,47.88)
T12 PR24-48 2a RGT q12 genotype 1b 6.20 (2.36,16.38) 1.83 (1.29,2.91) 37.82 (17.51,56.00)
B24 PR28-48 2b RGT genotype 1a 2.08 (1.16,3.71) 1.38 (1.07,1.81) 17.40 (3.43,29.69)
B24 PR28-48 2b RGT genotype 1b 2.84 (1.53,5.27) 1.52 (1.20,2.04) 23.98 (9.93,36.30)
*B24 PR28 2b genotype 1a 1.67 (0.73,3.79) 1.27 (0.83,1.78) 12.29 (–7.17,29.91)
*B24 PR28 2b genotype 1b 2.40 (0.96,5.99) 1.44 (0.98,2.04) 20.46 (–1.09,38.10)
Si12 PR24-48 2a RGT genotype 1a without Q80K Si12 PR24-48 2a RGT genotype 1a with Q80K
5.40 (2.27,13.57) 1.71 (1.27,2.50) 34.49 (16.90,51.27)
Si12 PR24-48 2a RGT genotype 1b 8.44 (3.62,21.06) 1.82 (1.37,2.66) 39.77 (23.52,55.58)
T12 PR24-48 2a RGT q8 genotype 1a 2.99 (1.29,6.99) 1.52 (1.09,2.29) 25.10 (5.76,43.58)
T12 PR24-48 2a RGT q8 genotype 1b 4.49 (1.91,10.67) 1.66 (1.21,2.49) 32.08 (13.44,49.91)
T12 PR24-48 2a RGT q12 genotype 1a 3.05 (1.16,8.06) 1.52 (1.06,2.32) 25.34 (3.31,45.31)
T12 PR24-48 2a RGT q12 genotype 1b 5.45 (2.02,14.91) 1.71 (1.24,2.57) 34.71 (14.73,53.01)
B24 PR28-48 2b RGT genotype 1a 1.85 (0.59,5.62) 1.30 (0.77,2.06) 14.68 (–12.98,38.63)
B24 PR28-48 2b RGT genotype 1b 2.50 (0.78,7.81) 1.43 (0.89,2.23) 21.22 (–6.12,43.83)
*B24 PR28 2b genotype 1a 1.47 (0.41,5.32) 1.19 (0.62,2.00) 9.35 (–21.17,37.34)
*B24 PR28 2b genotype 1b 2.12 (0.56,8.17) 1.36 (0.74,2.21) 17.67 (–14.17,44.08)
Si12 PR24-48 2a RGT genotype 1b Si12 PR24-48 2a RGT genotype 1a without Q80K
1.57 (0.61,4.04) 1.06 (0.94,1.24) 5.11 (–5.57,17.31)
T12 PR24-48 2a RGT q8 genotype 1a 0.55 (0.22,1.36) 0.89 (0.74,1.08) –9.65 (–22.99,5.48)
T12 PR24-48 2a RGT q8 genotype 1b 0.83 (0.32,2.07) 0.97 (0.83,1.16) –2.67 (–14.94,11.57)
T12 PR24-48 2a RGT q12 genotype 1a 0.56 (0.20,1.56) 0.89 (0.70,1.10) –9.29 (–26.27,7.34)
T12 PR24-48 2a RGT q12 genotype 1b 1.01 (0.35,2.89) 1.00 (0.84,1.20) 0.09 (–14.45,14.82)
B24 PR28-48 2b RGT genotype 1a 0.34 (0.10,1.07) 0.76 (0.48,1.01) –19.73 (–44.16,1.10)
B24 PR28-48 2b RGT genotype 1b 0.46 (0.14,1.50) 0.84 (0.57,1.08) –13.04 (–37.17,6.13)
*B24 PR28 2b genotype 1a 0.27 (0.07,1.01) 0.70 (0.38,1.00) –24.94 (–53.04,0.11)
*B24 PR28 2b genotype 1b 0.39 (0.10,1.51) 0.80 (0.46,1.08) –16.58 (–46.54,6.14)

Direct-Acting Antiviral Agents for Chronic Hepatitis C Genotype 1 278
Treatment Reference OR (95% CrI) RR (95% CrI) RD% (95% CrI)
T12 PR24-48 2a RGT q8 genotype 1a Si12 PR24-48 2a RGT genotype 1b
0.35 (0.14,0.85) 0.83 (0.71,0.97) –14.83 (–26.72,–2.43)
T12 PR24-48 2a RGT q8 genotype 1b 0.53 (0.21,1.31) 0.91 (0.80,1.05) –7.84 (–18.78,3.69)
T12 PR24-48 2a RGT q12 genotype 1a 0.36 (0.13,0.99) 0.84 (0.66,1.00) –14.45 (–30.50,–0.13)
T12 PR24-48 2a RGT q12 genotype 1b 0.64 (0.22,1.85) 0.94 (0.80,1.09) –5.05 (–18.48,7.04)
B24 PR28-48 2b RGT genotype 1a 0.22 (0.07,0.68) 0.72 (0.46,0.94) –25.00 (–48.66,–5.55)
B24 PR28-48 2b RGT genotype 1b 0.30 (0.09,0.95) 0.79 (0.54,0.99) –18.25 (–41.44,–0.61)
*B24 PR28 2b genotype 1a 0.17 (0.05,0.63) 0.66 (0.36,0.92) –30.17 (–57.38,–6.58)
*B24 PR28 2b genotype 1b 0.25 (0.06,0.97) 0.75 (0.43,1.00) –21.83 (–50.81,–0.33)
T12 PR24-48 2a RGT q8 genotype 1b T12 PR24-48 2a RGT q8 genotype 1a
1.50 (0.97,2.35) 1.09 (0.99,1.22) 6.94 (–0.61,14.85)
T12 PR24-48 2a RGT q12 genotype 1a 1.02 (0.59,1.75) 1.00 (0.85,1.14) 0.32 (–10.83,9.70)
T12 PR24-48 2a RGT q12 genotype 1b 1.82 (1.01,3.36) 1.13 (1.00,1.27) 9.62 (0.21,18.35)
B24 PR28-48 2b RGT genotype 1a 0.61 (0.22,1.63) 0.86 (0.55,1.13) –10.34 (–33.67,8.90)
B24 PR28-48 2b RGT genotype 1b 0.83 (0.30,2.29) 0.95 (0.65,1.20) –3.62 (–26.54,13.87)
*B24 PR28 2b genotype 1a 0.49 (0.15,1.54) 0.79 (0.43,1.11) –15.46 (–42.53,7.88)
*B24 PR28 2b genotype 1b 0.71 (0.21,2.39) 0.90 (0.52,1.21) –7.10 (–35.85,14.31)
T12 PR24-48 2a RGT q12 genotype 1a T12 PR24-48 2a RGT q8 genotype 1b
0.68 (0.38,1.20) 0.92 (0.77,1.04) –6.62 (–18.26,2.76)
T12 PR24-48 2a RGT q12 genotype 1b 1.21 (0.65,2.28) 1.03 (0.91,1.14) 2.75 (–6.99,10.88)
B24 PR28-48 2b RGT genotype 1a 0.41 (0.15,1.12) 0.79 (0.51,1.02) –17.27 (–40.40,1.78)
B24 PR28-48 2b RGT genotype 1b 0.55 (0.20,1.55) 0.87 (0.59,1.09) –10.58 (–33.25,6.58)
*B24 PR28 2b genotype 1a 0.33 (0.10,1.05) 0.72 (0.39,1.01) –22.44 (–49.55,0.81)
*B24 PR28 2b genotype 1b 0.47 (0.13,1.62) 0.83 (0.47,1.09) –14.15 (–43.03,7.01)
T12 PR24-48 2a RGT q12 genotype 1b T12 PR24-48 2a RGT q12 genotype 1a
1.79 (0.96,3.41) 1.12 (0.99,1.33) 9.24 (–0.72,20.63)
B24 PR28-48 2b RGT genotype 1a 0.60 (0.20,1.76) 0.86 (0.55,1.17) –10.55 (–35.16,10.89)
B24 PR28-48 2b RGT genotype 1b 0.82 (0.27,2.50) 0.95 (0.64,1.26) –3.87 (–27.95,16.43)
*B24 PR28 2b genotype 1a 0.48 (0.14,1.66) 0.79 (0.43,1.15) –15.64 (–44.15,9.71)
*B24 PR28 2b genotype 1b 0.69 (0.19,2.56) 0.90 (0.51,1.25) –7.37 (–37.14,16.27)
B24 PR28-48 2b RGT genotype 1a T12 PR24-48 2a RGT q12 genotype 1b
0.34 (0.11,1.02) 0.76 (0.49,1.00) –19.92 (–43.49,0.33)
B24 PR28-48 2b RGT genotype 1b 0.46 (0.15,1.43) 0.84 (0.57,1.07) –13.26 (–36.21,5.35)
*B24 PR28 2b genotype 1a 0.27 (0.07,0.95) 0.70 (0.38,0.99) –25.02 (–52.67,–0.91)
*B24 PR28 2b genotype 1b 0.39 (0.10,1.48) 0.80 (0.46,1.07) –16.74 (–45.76,5.63)
B24 PR28-48 2b RGT genotype 1b B24 PR28-48 2b RGT genotype 1a
1.36 (0.74,2.54) 1.10 (0.90,1.42) 6.49 (–6.34,19.93)

Direct-Acting Antiviral Agents for Chronic Hepatitis C Genotype 1 279
Treatment Reference OR (95% CrI) RR (95% CrI) RD% (95% CrI)
*B24 PR28 2b genotype 1a 0.80 (0.32,2.05) 0.92 (0.58,1.30) –4.97 (–26.45,15.56)
*B24 PR28 2b genotype 1b 1.16 (0.42,3.20) 1.05 (0.69,1.48) 3.08 (–19.83,23.75)
*B24 PR28 2b genotype 1a B24 PR28-48 2b RGT genotype 1b
0.59 (0.23,1.53) 0.84 (0.52,1.15) –11.40 (–33.29,8.79)
*B24 PR28 2b genotype 1b 0.85 (0.30,2.40) 0.95 (0.62,1.30) –3.37 (–26.44,16.99)
*B24 PR28 2b genotype 1b *B24 PR28 2b genotype 1a 1.44 (0.54,3.79) 1.14 (0.78,1.74) 7.96 (–13.81,28.96)
Random Effects Model Residual Deviance 21.05 vs. 23 data points
Deviance Information Criteria 156.661
Fixed Effects Model Residual Deviance 20.49 vs. 23 data points
Deviance Information Criteria 155.388
CrI = credible interval; OR = odds ratio; RD = risk difference; RR = relative risk; SVR = sustained viral response; vs. = versus. *Not a Health Canada–recommended dosage regimen.

Direct-Acting Antiviral Agents for Chronic Hepatitis C Genotype 1 280
FIGURE 55: SVR BY GENOTYPES — TREATMENT-NAIVE PATIENTS: PLOT OF POSTERIOR MEAN DEVIANCE OF THE
INDIVIDUAL DATA POINTS IN THE INCONSISTENCY MODEL AGAINST THEIR POSTERIOR MEAN DEVIANCE IN THE
CONSISTENCY MODEL (PR48 2A/B SEPARATED, ALL DOSES)

Direct-Acting Antiviral Agents for Chronic Hepatitis C Genotype 1 281
TABLE 175: SVR BY GENOTYPES — TREATMENT-NAIVE PATIENTS: ODDS RATIOS, RELATIVE RISKS, AND RISK DIFFERENCE FOR ALL TREATMENT
COMPARISONS AND RANDOM EFFECTS MODEL (PR48 2A/B SEPARATED, HEALTH CANADA DOSES ONLY)
Treatment Reference OR (95% CrI) RR (95% CrI) RD% (95% CrI)
PR48 2a genotype 1b PR48 2a genotype 1a 1.28 (0.78,2.08) 1.14 (0.87,1.44) 6.12 (–6.05,18.04)
PR48 2b genotype 1a 0.84 (0.29,2.33) 0.90 (0.43,1.48) –4.26 (–26.23,20.60)
PR48 2b genotype 1b 1.05 (0.46,2.33) 1.03 (0.61,1.49) 1.16 (–18.04,20.63)
Si12 PR24-48 2a RGT genotype 1a with Q80K
1.20 (0.57,2.57) 1.10 (0.71,1.56) 4.61 (–13.60,22.96)
Si12 PR24-48 2a RGT genotype 1a without Q80K
6.44 (2.89,14.93) 1.88 (1.52,2.28) 39.19 (24.77,50.17)
Si12 PR24-48 2a RGT genotype 1b 10.06 (4.50,24.18) 2.00 (1.67,2.38) 44.40 (32.57,53.72)
T12 PR24-48 2a RGT q8 genotype 1a
3.57 (2.07,6.11) 1.66 (1.37,1.99) 29.52 (17.68,39.58)
T12 PR24-48 2a RGT q8 genotype 1b
5.35 (3.02,9.45) 1.82 (1.53,2.15) 36.55 (25.70,45.46)
T12 PR24-48 2a RGT q12 genotype 1a
3.60 (1.73,7.49) 1.67 (1.29,2.04) 29.71 (13.48,42.27)
T12 PR24-48 2a RGT q12 genotype 1b
6.50 (2.99,14.29) 1.88 (1.54,2.24) 39.29 (25.64,49.24)
B24 PR28-48 2b RGT genotype 1a 2.26 (0.79,6.22) 1.45 (0.87,1.95) 19.91 (–5.82,39.50)
B24 PR28-48 2b RGT genotype 1b 3.10 (1.06,8.62) 1.60 (1.03,2.07) 26.69 (1.34,43.85)
PR48 2b genotype 1a PR48 2a genotype 1b 0.65 (0.26,1.63) 0.79 (0.41,1.23) –10.41 (–29.38,11.73)
PR48 2b genotype 1b 0.82 (0.42,1.58) 0.90 (0.59,1.23) –4.96 (–20.20,11.07)
Si12 PR24-48 2a RGT genotype 1a with Q80K
0.94 (0.44,2.04) 0.97 (0.64,1.39) –1.52 (–19.80,17.26)
Si12 PR24-48 2a RGT genotype 1a without Q80K
5.04 (2.21,11.81) 1.65 (1.31,2.11) 32.94 (17.54,45.90)
Si12 PR24-48 2a RGT genotype 1b 7.88 (3.48,19.10) 1.75 (1.42,2.23) 38.13 (24.88,50.04)
T12 PR24-48 2a RGT q8 genotype 1a
2.78 (1.60,4.90) 1.46 (1.19,1.83) 23.26 (10.83,34.96)
T12 PR24-48 2a RGT q8 genotype 1b
4.17 (2.34,7.58) 1.60 (1.32,2.00) 30.24 (18.43,41.34)
T12 PR24-48 2a RGT q12 genotype 1a
2.81 (1.35,6.04)
1.46 (1.13,1.88)
23.42 (7.14,37.59)

Direct-Acting Antiviral Agents for Chronic Hepatitis C Genotype 1 282
Treatment Reference OR (95% CrI) RR (95% CrI) RD% (95% CrI)
T12 PR24-48 2a RGT q12 genotype 1b
5.06 (2.33,11.43) 1.65 (1.33,2.09) 32.95 (18.61,45.41)
B24 PR28-48 2b RGT genotype 1a 1.77 (0.70,4.35) 1.27 (0.82,1.66) 13.63 (–8.74,31.03)
B24 PR28-48 2b RGT genotype 1b 2.41 (0.93,6.09) 1.40 (0.97,1.80) 20.32 (–1.73,36.19)
PR48 2b genotype 1b PR48 2b genotype 1a 1.25 (0.66,2.41) 1.13 (0.81,1.79) 5.25 (–9.92,19.21)
Si12 PR24-48 2a RGT genotype 1a with Q80K
1.45 (0.43,4.81) 1.23 (0.66,2.65) 8.99 (–19.91,34.98)
Si12 PR24-48 2a RGT genotype 1a without Q80K
7.68 (2.30,27.20) 2.08 (1.27,4.35) 43.03 (16.67,65.50)
Si12 PR24-48 2a RGT genotype 1b 12.03 (3.57,43.96) 2.21 (1.36,4.62) 48.33 (22.94,70.22)
T12 PR24-48 2a RGT q8 genotype 1a
4.24 (1.47,12.73) 1.84 (1.14,3.80) 33.52 (8.42,55.37)
T12 PR24-48 2a RGT q8 genotype 1b
6.37 (2.19,19.44) 2.01 (1.25,4.17) 40.58 (15.84,61.93)
T12 PR24-48 2a RGT q12 genotype 1a
4.30 (1.34,14.44) 1.84 (1.11,3.82) 33.62 (6.57,57.05)
T12 PR24-48 2a RGT q12 genotype 1b
7.75 (2.35,26.87) 2.08 (1.27,4.31) 43.20 (16.93,65.45)
B24 PR28-48 2b RGT genotype 1a 2.70 (1.46,5.04) 1.59 (1.16,2.45) 23.17 (8.25,36.55)
B24 PR28-48 2b RGT genotype 1b 3.69 (1.93,7.07) 1.75 (1.26,2.83) 29.74 (14.14,43.38)
Si12 PR24-48 2a RGT genotype 1a with Q80K
PR48 2b genotype 1b 1.16 (0.42,3.19) 1.08 (0.64,1.91) 3.53 (–20.68,27.34)
Si12 PR24-48 2a RGT genotype 1a without Q80K
6.19 (2.17,18.10) 1.83 (1.26,3.04) 37.80 (16.00,57.44)
Si12 PR24-48 2a RGT genotype 1b 9.63 (3.41,29.37) 1.95 (1.36,3.24) 43.03 (22.59,62.10)
T12 PR24-48 2a RGT q8 genotype 1a
3.41 (1.46,8.19) 1.62 (1.13,2.68) 28.22 (8.28,47.18)
T12 PR24-48 2a RGT q8 genotype 1b
5.11 (2.14,12.51) 1.78 (1.25,2.93) 35.28 (15.52,53.74)
T12 PR24-48 2a RGT q12 genotype 1a
3.45 (1.29,9.49) 1.62 (1.10,2.70) 28.32 (5.74,48.96)
T12 PR24-48 2a RGT q12 genotype 1b
6.22 (2.23,17.71) 1.83 (1.27,3.04) 37.87 (16.46,57.24)
B24 PR28-48 2b RGT genotype 1a 2.16 (1.14,4.09) 1.40 (1.06,1.87) 18.13 (2.89,31.35)
B24 PR28-48 2b RGT genotype 1b 2.95 (1.51,5.76) 1.54 (1.19,2.11) 24.68 (9.48,37.62)

Direct-Acting Antiviral Agents for Chronic Hepatitis C Genotype 1 283
Treatment Reference OR (95% CrI) RR (95% CrI) RD% (95% CrI)
Si12 PR24-48 2a RGT genotype 1a without Q80K
Si12 PR24-48 2a RGT genotype 1a with Q80K
5.35 (2.21,13.45) 1.70 (1.26,2.51) 34.24 (16.26,51.20)
Si12 PR24-48 2a RGT genotype 1b 8.37 (3.44,21.54) 1.81 (1.35,2.68) 39.51 (22.55,55.92)
T12 PR24-48 2a RGT q8 genotype 1a
2.95 (1.23,7.07) 1.51 (1.07,2.30) 24.73 (4.70,43.74)
T12 PR24-48 2a RGT q8 genotype 1b
4.44 (1.83,10.85) 1.65 (1.20,2.50) 31.79 (12.61,50.00)
T12 PR24-48 2a RGT q12 genotype 1a
2.99 (1.10,8.28) 1.51 (1.04,2.33) 24.90 (2.17,45.66)
T12 PR24-48 2a RGT q12 genotype 1b
5.37 (1.93,15.36) 1.70 (1.22,2.59) 34.37 (13.74,53.30)
B24 PR28-48 2b RGT genotype 1a 1.87 (0.57,6.15) 1.30 (0.76,2.10) 14.88 (–13.67,39.77)
B24 PR28-48 2b RGT genotype 1b 2.56 (0.75,8.54) 1.44 (0.88,2.26) 21.63 (–6.97,44.86)
Si12 PR24-48 2a RGT genotype 1b Si12 PR24-48 2a RGT genotype 1a without Q80K
1.57 (0.59,4.18) 1.06 (0.93,1.24) 5.12 (–6.10,17.71)
T12 PR24-48 2a RGT q8 genotype 1a
0.55 (0.21,1.38) 0.88 (0.73,1.08) –9.71 (-23.65,5.70)
T12 PR24-48 2a RGT q8 genotype 1b
0.83 (0.32,2.13) 0.97 (0.83,1.16) –2.73 (–15.48,11.94)
T12 PR24-48 2a RGT q12 genotype 1a
0.56 (0.19,1.60) 0.89 (0.69,1.10) –9.42 (–27.10,7.69)
T12 PR24-48 2a RGT q12 genotype 1b
1.01 (0.34,3.02) 1.00 (0.83,1.21) 0.06 (–15.31,15.34)
B24 PR28-48 2b RGT genotype 1a 0.35 (0.10,1.19) 0.77 (0.47,1.04) –19.13 (–44.95,2.72)
B24 PR28-48 2b RGT genotype 1b 0.48 (0.13,1.64) 0.85 (0.55,1.10) –-12.35 (–37.99,7.45)
T12 PR24-48 2a RGT q8 genotype 1a
Si12 PR24-48 2a RGT genotype 1b
0.35 (0.13,0.89) 0.83 (0.70,0.98) –14.84 (–27.58,–1.84)
T12 PR24-48 2a RGT q8 genotype 1b
0.53 (0.20,1.36) 0.91 (0.79,1.05) –7.84 (–19.27,4.11)
T12 PR24-48 2a RGT q12 genotype 1a
0.36 (0.12,1.02) 0.84 (0.66,1.00) –14.58 (–31.39,0.27)
T12 PR24-48 2a RGT q12 genotype 1b
0.64 (0.21,1.91) 0.94 (0.79,1.09) –5.08 (–19.30,7.59)
B24 PR28-48 2b RGT genotype 1a 0.22 (0.06,0.76) 0.73 (0.44,0.95) –24.28 (–49.94,–3.92)
B24 PR28-48 2b RGT genotype 1b 0.31 (0.08,1.04) 0.80 (0.52,1.01) –17.49 (–42.80,0.48)

Direct-Acting Antiviral Agents for Chronic Hepatitis C Genotype 1 284
Treatment Reference OR (95% CrI) RR (95% CrI) RD% (95% CrI)
T12 PR24-48 2a RGT q8 genotype 1b
T12 PR24-48 2a RGT q8 genotype 1a
1.50 (0.94,2.39) 1.09 (0.99,1.23) 7.00 (–1.01,15.31)
T12 PR24-48 2a RGT q12 genotype 1a
1.01 (0.57,1.81) 1.00 (0.84,1.15) 0.25 (–11.56,10.22)
T12 PR24-48 2a RGT q12 genotype 1b
1.82 (0.98,3.46) 1.13 (1.00,1.28) 9.66 (–0.32,18.74)
B24 PR28-48 2b RGT genotype 1a 0.64 (0.21,1.84) 0.87 (0.54,1.16) –9.45 (–34.82,10.76)
B24 PR28-48 2b RGT genotype 1b 0.87 (0.28,2.52) 0.96 (0.63,1.23) –2.68 (–27.78,15.40)
T12 PR24-48 2a RGT q12 genotype 1a
T12 PR24-48 2a RGT q8 genotype 1b
0.67 (0.37,1.23) 0.92 (0.76,1.04) –6.69 (–19.05,3.10)
T12 PR24-48 2a RGT q12 genotype 1b
1.21 (0.64,2.35) 1.03 (0.91,1.15) 2.75 (–7.47,11.21)
B24 PR28-48 2b RGT genotype 1a 0.42 (0.14,1.23) 0.80 (0.49,1.04) –16.46 (–41.63,3.29)
B24 PR28-48 2b RGT genotype 1b 0.58 (0.19,1.70) 0.88 (0.58,1.10) –9.71 (–34.45,7.73)
T12 PR24-48 2a RGT q12 genotype 1b
T12 PR24-48 2a RGT q12 genotype 1a
1.80 (0.93,3.52) 1.13 (0.99,1.35) 9.37 (–1.18,21.26)
B24 PR28-48 2b RGT genotype 1a 0.63 (0.19,2.02) 0.87 (0.53,1.21) –9.71 (–35.98,13.22)
B24 PR28-48 2b RGT genotype 1b 0.86 (0.25,2.76) 0.96 (0.62,1.28) –3.00 (–28.85,17.99)
B24 PR28-48 2b RGT genotype 1a T12 PR24-48 2a RGT q12 genotype 1b
0.35 (0.10,1.14) 0.77 (0.47,1.03) –19.07 (–44.73,2.11)
B24 PR28-48 2b RGT genotype 1b 0.48 (0.14,1.59) 0.85 (0.56,1.09) –12.33 (–37.54,7.01)
B24 PR28-48 2b RGT genotype 1b B24 PR28-48 2b RGT genotype 1a
1.37 (0.72,2.60) 1.10 (0.89,1.43) 6.42 (–6.99,20.28)
Random Effects Model Residual Deviance 17.78 vs. 19 data points
Deviance Information Criteria 133.368
Fixed Effects Model Residual Deviance 17.25 vs. 19 data points
Deviance Information Criteria 132.222
CrI = credible interval; HC = Health Canada; OR = odds ratio; RD = risk difference; RR = relative risk; SVR = sustained viral response; vs. = versus.

Direct-Acting Antiviral Agents for Chronic Hepatitis C Genotype 1 285
FIGURE 56: SVR BY GENOTYPES — TREATMENT-NAIVE PATIENTS: PLOT OF POSTERIOR MEAN DEVIANCE OF THE
INDIVIDUAL DATA POINTS IN THE INCONSISTENCY MODEL AGAINST THEIR POSTERIOR MEAN DEVIANCE IN THE
CONSISTENCY MODEL (PR48 2A/B SEPARATED, HEALTH CANADA DOSES ONLY)

Direct-Acting Antiviral Agents for Chronic Hepatitis C Genotype 1 286
TABLE 176: RASH — TREATMENT-NAIVE PATIENTS: ODDS RATIOS, RELATIVE RISKS, AND RISK DIFFERENCE FOR ALL TREATMENT COMPARISONS-RANDOM
EFFECTS MODEL (PR48 2A/B SEPARATED, ALL DOSES)
Treatment Reference OR (95% CrI) RR (95% CrI) RD% (95% CrI)
PR48 2b PR48 2a 0.73 (0.41,1.29) 0.78 (0.48,1.20) –5.69 (–13.80,5.20)
Si12 PR24-48 2a RGT 1.02 (0.58,1.77) 1.01 (0.66,1.48) 0.33 (–9.40,12.17)
T12 PR24-48 2a RGT q8 1.81 (0.98,3.34) 1.49 (0.99,2.08) 12.87 (–0.33,28.02)
T12 PR24-48 2b RGT q8 1.22 (0.40,3.67) 1.15 (0.47,2.16) 4.00 (–14.00,30.41)
T12 PR24-48 2a RGT q12 1.62 (0.68,3.39) 1.39 (0.75,2.09) 10.26 (–6.71,28.38)
T12 PR24-48 2b RGT q12 1.16 (0.38,3.60) 1.12 (0.45,2.14) 3.05 (–14.53,29.89)
B24 PR28-48 2b RGT 0.83 (0.36,1.92) 0.87 (0.43,1.54) –3.47 (–15.19,14.31)
*So12 PR24-48 2a RGT 2.04 (0.54,9.26) 1.60 (0.62,3.15) 15.90 (–10.83,50.42)
*T12 PR24 2a q8 1.93 (1.10,3.45) 1.55 (1.07,2.13) 14.44 (1.87,28.61)
*T12 PR24 2b q8 1.13 (0.41,3.07) 1.09 (0.49,1.99) 2.39 (–13.66,25.98)
*T12 PR48 2a q8 2.11 (1.00,4.58) 1.63 (1.00,2.40) 16.61 (–0.06,35.58)
*B24 PR28 2b 0.74 (0.17,3.09) 0.79 (0.22,1.99) –5.48 (–20.75,26.12)
Si12 PR24-48 2a RGT PR48 2b 1.40 (0.63,3.04) 1.29 (0.71,2.35) 6.04 (–8.29,19.72)
T12 PR24-48 2a RGT q8 2.48 (1.10,5.79) 1.89 (1.07,3.40) 18.41 (1.90,35.37)
T12 PR24-48 2b RGT q8 1.68 (0.48,5.74) 1.47 (0.56,3.20) 9.55 (–11.02,36.88)
T12 PR24-48 2a RGT q12 2.22 (0.79,5.56) 1.77 (0.84,3.26) 15.80 (–4.20,35.34)
T12 PR24-48 2b RGT q12 1.60 (0.46,5.58) 1.42 (0.53,3.16) 8.66 (–11.70,36.30)
B24 PR28-48 2b RGT 1.14 (0.61,2.12) 1.11 (0.67,1.71) 2.21 (–6.89,14.70)
*So12 PR24-48 2a RGT 2.80 (0.67,14.20) 2.02 (0.74,4.70) 21.30 (–6.79,56.27)
*T12 PR24 2a q8 2.65 (1.20,6.00) 1.97 (1.14,3.51) 20.00 (3.84,36.04)
*T12 PR24 2b q8 1.55 (0.67,3.60) 1.39 (0.72,2.36) 7.97 (–5.63,27.64)
*T12 PR48 2a q8 2.90 (1.15,7.56) 2.07 (1.10,3.82) 22.17 (2.78,42.47)
*B24 PR28 2b 1.01 (0.27,3.84) 1.01 (0.32,2.43) 0.21 (–14.77,29.07)
T12 PR24-48 2a RGT q8 Si12 PR24-48 2a RGT 1.77 (0.79,4.09) 1.46 (0.85,2.52) 12.41 (–4.92,30.65)
T12 PR24-48 2b RGT q8 1.20 (0.35,4.13) 1.13 (0.44,2.43) 3.59 (–17.78,31.54)
T12 PR24-48 2a RGT q12 1.58 (0.58,4.00) 1.37 (0.67,2.45) 9.78 (–10.61,30.45)

Direct-Acting Antiviral Agents for Chronic Hepatitis C Genotype 1 287
Treatment Reference OR (95% CrI) RR (95% CrI) RD% (95% CrI)
T12 PR24-48 2b RGT q12 1.15 (0.33,4.07) 1.10 (0.42,2.41) 2.75 (–18.31,31.36)
B24 PR28-48 2b RGT 0.81 (0.30,2.22) 0.86 (0.39,1.75) –3.79 (–19.79,16.17)
*So12 PR24-48 2a RGT 2.00 (0.47,10.03) 1.57 (0.57,3.53) 15.36 (–14.23,51.21)
*T12 PR24 2a q8 1.89 (0.86,4.26) 1.52 (0.91,2.61) 13.97 (–3.28,31.40)
*T12 PR24 2b q8 1.10 (0.36,3.54) 1.07 (0.45,2.27) 1.94 (–17.55,27.70)
*T12 PR48 2a q8 2.07 (0.82,5.41) 1.61 (0.87,2.85) 16.17 (–4.23,37.70)
*B24 PR28 2b 0.72 (0.16,3.36) 0.78 (0.21,2.17) –5.78 (–24.86,26.91)
T12 PR24-48 2b RGT q8 T12 PR24-48 2a RGT q8 0.68 (0.26,1.69) 0.78 (0.37,1.32) –8.62 (–25.27,12.56)
T12 PR24-48 2a RGT q12 0.90 (0.50,1.41) 0.93 (0.62,1.21) –2.54 (–14.55,8.20)
T12 PR24-48 2b RGT q12 0.65 (0.25,1.68) 0.75 (0.35,1.32) –9.54 (–25.93,12.49)
B24 PR28-48 2b RGT 0.46 (0.16,1.28) 0.59 (0.27,1.17) –16.07 (–35.16,5.28)
*So12 PR24-48 2a RGT 1.13 (0.26,5.77) 1.08 (0.40,2.34) 2.97 (–28.02,40.38)
*T12 PR24 2a q8 1.07 (0.46,2.47) 1.04 (0.64,1.73) 1.58 (–18.20,20.88)
*T12 PR24 2b q8 0.62 (0.19,1.99) 0.73 (0.31,1.50) –10.29 (–32.66,15.91)
*T12 PR48 2a q8 1.17 (0.44,3.13) 1.10 (0.61,1.91) 3.78 (–18.89,26.77)
*B24 PR28 2b 0.41 (0.08,1.89) 0.54 (0.14,1.45) –17.86 (–39.94,14.94)
T12 PR24-48 2a RGT q12 T12 PR24-48 2b RGT q8 1.32 (0.51,3.25) 1.20 (0.67,2.38) 5.86 (–15.47,22.96)
T12 PR24-48 2b RGT q12 0.95 (0.35,2.71) 0.97 (0.48,2.00) –0.93 (–21.82,20.47)
B24 PR28-48 2b RGT 0.68 (0.17,2.76) 0.76 (0.30,2.16) –7.29 (–35.78,17.65)
*So12 PR24-48 2a RGT 1.68 (0.29,11.33) 1.38 (0.45,4.33) 11.38 (–26.92,51.38)
*T12 PR24 2a q8 1.58 (0.46,5.64) 1.34 (0.65,3.46) 10.21 (–18.49,33.73)
*T12 PR24 2b q8 0.93 (0.21,4.10) 0.95 (0.34,2.74) –1.49 (-32.32,28.09)
*T12 PR48 2a q8 1.74 (0.46,6.78) 1.41 (0.64,3.72) 12.41 (–18.32,39.12)
*B24 PR28 2b 0.61 (0.10,3.65) 0.70 (0.17,2.44) –8.71 (–40.00,25.87)
T12 PR24-48 2b RGT q12 T12 PR24-48 2a RGT q12 0.73 (0.29,1.92) 0.81 (0.40,1.47) –6.74 (–23.86,14.97)
B24 PR28-48 2b RGT 0.51 (0.17,1.74) 0.63 (0.29,1.47) –13.53 (–34.91,10.89)
*So12 PR24-48 2a RGT 1.28 (0.27,7.21) 1.16 (0.42,2.86) 5.65 (–27.34,44.31)
*T12 PR24 2a q8 1.20 (0.47,3.39) 1.12 (0.65,2.23) 4.23 (–17.88,26.46)
*T12 PR24 2b q8 0.70 (0.20,2.62) 0.79 (0.33,1.85) –7.65 (–31.90,21.06)

Direct-Acting Antiviral Agents for Chronic Hepatitis C Genotype 1 288
Treatment Reference OR (95% CrI) RR (95% CrI) RD% (95% CrI)
*T12 PR48 2a q8 1.31 (0.46,4.22) 1.17 (0.63,2.44) 6.37 (–18.31,32.10)
*B24 PR28 2b 0.46 (0.09,2.40) 0.58 (0.15,1.72) –15.03 (–39.53,19.39)
B24 PR28-48 2b RGT T12 PR24-48 2b RGT q12 0.71 (0.18,2.88) 0.78 (0.30,2.25) –6.35 (–35.18,18.36)
*So12 PR24-48 2a RGT 1.77 (0.31,11.65) 1.43 (0.46,4.42) 12.47 (–25.48,51.80)
*T12 PR24 2a q8 1.65 (0.48,5.88) 1.38 (0.66,3.61) 11.16 (–17.79,34.28)
*T12 PR24 2b q8 0.97 (0.21,4.33) 0.98 (0.35,2.86) –0.67 (–31.98,28.62)
*T12 PR48 2a q8 1.80 (0.47,7.18) 1.45 (0.65,3.88) 13.16 (–17.59,39.72)
*B24 PR28 2b 0.64 (0.10,3.75) 0.72 (0.17,2.50) –7.83 (–39.61,26.48)
*So12 PR24-48 2a RGT B24 PR28-48 2b RGT 2.46 (0.52,13.88) 1.83 (0.62,4.85) 18.85 (–12.33,55.19)
*T12 PR24 2a q8 2.32 (0.85,6.47) 1.78 (0.90,3.85) 17.64 (–3.67,36.05)
*T12 PR24 2b q8 1.36 (0.48,3.85) 1.25 (0.58,2.59) 5.62 (–12.62,27.25)
*T12 PR48 2a q8 2.54 (0.84,7.93) 1.86 (0.90,4.15) 19.70 (–3.72,41.95)
*B24 PR28 2b 0.89 (0.21,3.80) 0.91 (0.26,2.48) –1.92 (–21.59,27.75)
*T12 PR24 2a q8 *So12 PR24-48 2a RGT 0.94 (0.19,4.05) 0.97 (0.45,2.56) –1.39 (–38.83,29.46)
*T12 PR24 2b q8 0.55 (0.09,2.89) 0.69 (0.24,2.05) –13.00 (–51.59,22.08)
*T12 PR48 2a q8 1.03 (0.19,4.87) 1.02 (0.44,2.77) 0.80 (–38.45,34.22)
*B24 PR28 2b 0.36 (0.04,2.55) 0.51 (0.12,1.84) –20.16 (–59.18,20.09)
*T12 PR24 2b q8 *T12 PR24 2a q8 0.59 (0.18,1.83) 0.71 (0.30,1.41) –11.84 (–33.61,14.34)
*T12 PR48 2a q8 1.09 (0.51,2.35) 1.05 (0.66,1.60) 2.15 (–15.51,20.60)
*B24 PR28 2b 0.38 (0.08,1.75) 0.52 (0.14,1.37) –19.42 (–41.06,13.39)
*T12 PR48 2a q8 *T12 PR24 2b q8 1.86 (0.54,6.73) 1.48 (0.69,3.65) 13.80 (–14.32,39.28)
*B24 PR28 2b 0.65 (0.14,3.15) 0.73 (0.20,2.17) –7.43 (–32.82,23.86)
*B24 PR28 2b *T12 PR48 2a q8 0.35 (0.07,1.77) 0.49 (0.13,1.39) –21.39 (–46.93,13.32)
Random Effects Model Residual Deviance 26.42 vs. 27 data points
Deviance Information Criteria 186.587
Fixed Effects Model Residual Deviance 26.42 vs. 27 data points
Deviance Information Criteria 185.595
CrI = credible interval; OR = odds ratio; RD = risk difference; RR = relative risk; vs. = versus. *Not a Health Canada–recommended dosage regimen.
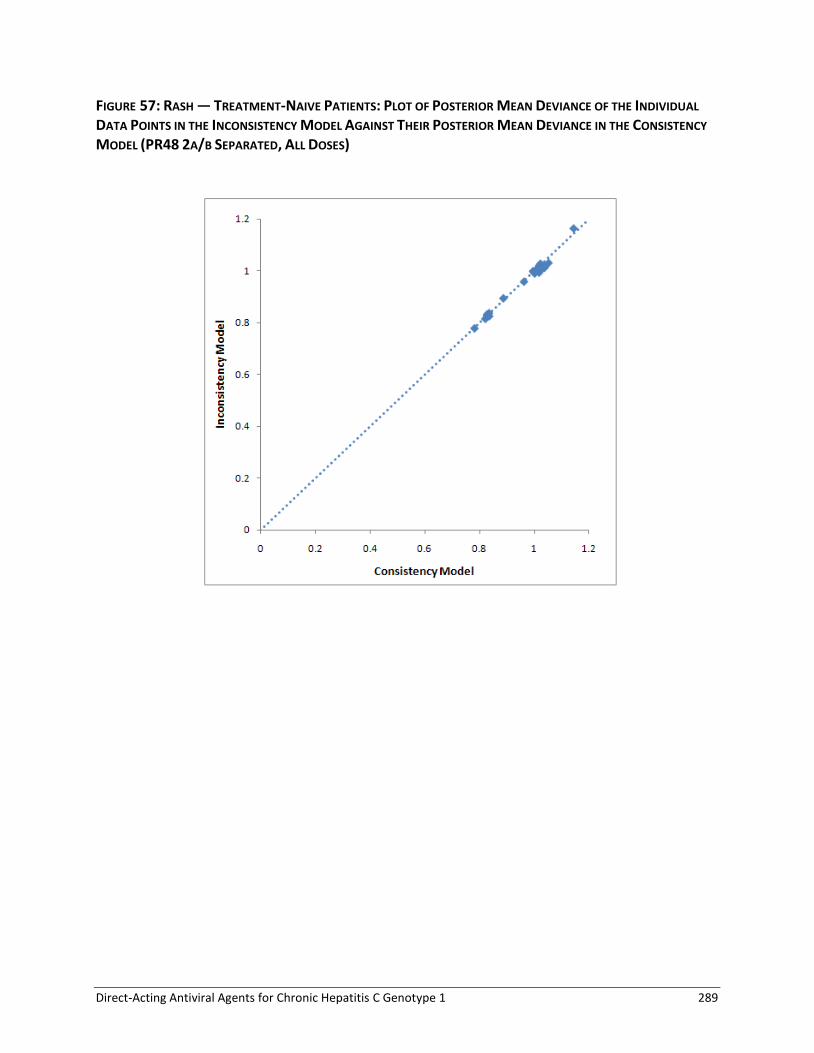
Direct-Acting Antiviral Agents for Chronic Hepatitis C Genotype 1 289
FIGURE 57: RASH — TREATMENT-NAIVE PATIENTS: PLOT OF POSTERIOR MEAN DEVIANCE OF THE INDIVIDUAL
DATA POINTS IN THE INCONSISTENCY MODEL AGAINST THEIR POSTERIOR MEAN DEVIANCE IN THE CONSISTENCY
MODEL (PR48 2A/B SEPARATED, ALL DOSES)

Direct-Acting Antiviral Agents for Chronic Hepatitis C Genotype 1 290
TABLE 177: RASH — TREATMENT-NAIVE PATIENTS: ODDS RATIOS, RELATIVE RISKS, AND RISK DIFFERENCE FOR ALL TREATMENT COMPARISONS AND
RANDOM EFFECTS MODEL (PR48 2A/B SEPARATED, HEALTH CANADA DOSES ONLY)
Treatment Reference OR (95% CrI) RR (95% CrI) RD% (95% CrI)
PR48 2b PR48 2a 0.73 (0.37,1.45) 0.78 (0.44,1.30) –5.43 (–14.14,7.48)
Si12 PR24-48 2a RGT 1.02 (0.55,1.86) 1.01 (0.62,1.55) 0.33 (–10.02,12.77)
T12 PR24-48 2a RGT q8 1.80 (0.88,3.65) 1.50 (0.91,2.21) 12.48 (–2.27,29.73)
T12 PR24-48 2b RGT q8 1.21 (0.34,3.84) 1.15 (0.41,2.26) 3.67 (–14.84,31.06)
T12 PR24-48 2a RGT q12 1.60 (0.58,3.67) 1.39 (0.65,2.21) 9.81 (–8.83,29.91)
T12 PR24-48 2b RGT q12 1.18 (0.34,3.82) 1.13 (0.40,2.25) 3.15 (–15.12,30.87)
B24 PR28-48 2b RGT 0.83 (0.31,2.24) 0.87 (0.38,1.71) –3.29 (–15.73,17.64)
Si12 PR24-48 2a RGT PR48 2b 1.40 (0.55,3.41) 1.30 (0.64,2.62) 5.74 (–10.82,20.29)
T12 PR24-48 2a RGT q8 2.47 (0.92,6.53) 1.91 (0.94,3.79) 17.78 (–1.55,36.83)
T12 PR24-48 2b RGT q8 1.65 (0.40,6.25) 1.46 (0.47,3.49) 8.96 (–13.18,37.28)
T12 PR24-48 2a RGT q12 2.20 (0.63,6.30) 1.78 (0.71,3.63) 15.11 (–7.59,36.51)
T12 PR24-48 2b RGT q12 1.61 (0.38,6.16) 1.44 (0.46,3.47) 8.42 (–13.57,37.05)
B24 PR28-48 2b RGT 1.14 (0.56,2.33) 1.11 (0.62,1.83) 2.09 (–7.59,16.55)
T12 PR24-48 2a RGT q8 Si12 PR24–48 2a RGT 1.77 (0.71,4.54) 1.48 (0.78,2.73) 12.06 (–6.98,32.29)
T12 PR24-48 2b RGT q8 1.18 (0.30,4.45) 1.13 (0.38,2.59) 3.26 (–18.72,32.71)
T12 PR24-48 2a RGT q12 1.57 (0.49,4.39) 1.37 (0.59,2.64) 9.32 (–12.72,31.81)
T12 PR24-48 2b RGT q12 1.15 (0.29,4.38) 1.11 (0.37,2.58) 2.68 (–18.99,32.31)
B24 PR28-48 2b RGT 0.82 (0.26,2.66) 0.86 (0.34,1.97) –3.59 (–20.65,19.64)
T12 PR24-48 2b RGT q8 T12 PR24-48 2a RGT q8 0.67 (0.24,1.73) 0.77 (0.33,1.35) –8.62 (–25.57,12.93)
T12 PR24-48 2a RGT q12 0.89 (0.46,1.47) 0.93 (0.57,1.25) –2.65 (–15.55,8.98)
T12 PR24-48 2b RGT q12 0.65 (0.23,1.72) 0.75 (0.33,1.35) –9.22 (–25.96,12.76)
B24 PR28-48 2b RGT 0.46 (0.14,1.56) 0.58 (0.23,1.34) –15.57 (–36.52,9.45)
T12 PR24-48 2a RGT q12 T12 PR24-48 2b RGT q8 1.33 (0.49,3.53) 1.21 (0.65,2.58) 5.76 (–15.80,23.36)
T12 PR24-48 2b RGT q12 0.98 (0.33,2.87) 0.98 (0.46,2.11) –0.42 (–21.94,21.03)
B24 PR28-48 2b RGT 0.69 (0.15,3.43) 0.76 (0.27,2.55) –6.79 (–36.48,20.69)
T12 PR24-48 2b RGT q12 T12 PR24-48 2a RGT q12 0.73 (0.28,2.03) 0.81 (0.38,1.54) –6.25 (–23.69,15.82)
B24 PR28-48 2b RGT 0.52 (0.15,2.23) 0.63 (0.25,1.75) –12.86 (–35.84,15.34)

Direct-Acting Antiviral Agents for Chronic Hepatitis C Genotype 1 291
Treatment Reference OR (95% CrI) RR (95% CrI) RD% (95% CrI)
B24 PR28-48 2b RGT T12 PR24-48 2b RGT q12 0.71 (0.16,3.51) 0.78 (0.27,2.60) –6.18 (–36.15,20.99)
Random Effects Model Residual Deviance 15.89 vs. 16 data points
Deviance Information Criteria 117.953
Fixed Effects Model Residual Deviance 16.21 vs. 16 data points
Deviance Information Criteria 117.506
CrI = credible interval; HC = Health Canada; OR = odds ratio; RD = risk difference; RR = relative risk; vs. = versus.
FIGURE 58: RASH — TREATMENT-NAIVE PATIENTS: PLOT OF POSTERIOR MEAN DEVIANCE OF THE INDIVIDUAL DATA POINTS IN THE INCONSISTENCY MODEL
AGAINST THEIR POSTERIOR MEAN DEVIANCE IN THE CONSISTENCY MODEL (PR48 2A/B SEPARATED, HEALTH CANADA DOSES ONLY)

Direct-Acting Antiviral Agents for Chronic Hepatitis C Genotype 1 292
TABLE 178: ANEMIA — TREATMENT-NAIVE PATIENTS: ODDS RATIOS, RELATIVE RISKS, AND RISK DIFFERENCE FOR ALL TREATMENT COMPARISONS AND
RANDOM EFFECTS MODEL (PR48 2A/B SEPARATED, ALL DOSES)
Treatment Reference OR (95% CrI) RR (95% CrI) RD% (95% CrI)
PR48 2b PR48 2a 1.01 (0.61,1.69) 1.01 (0.66,1.49) 0.18 (–6.74,9.65)
Si12 PR24-48 2a RGT 1.35 (0.75,2.43) 1.26 (0.79,1.92) 5.23 (–4.34,17.20)
T12 PR24-48 2a RGT q8 2.48 (1.40,4.35) 1.91 (1.30,2.64) 18.21 (6.00,32.00)
T12 PR24-48 2b RGT q8 1.56 (0.53,4.51) 1.40 (0.58,2.68) 8.03 (–8.41,32.86)
T12 PR24-48 2a RGT q12 2.70 (1.27,5.54) 2.02 (1.21,2.95) 20.23 (4.12,37.90)
T12 PR24-48 2b RGT q12 3.35 (1.14,9.56) 2.28 (1.11,3.59) 25.51 (2.22,50.32)
B24 PR28-48 2b RGT 2.37 (1.14,5.00) 1.86 (1.11,2.80) 17.10 (2.11,35.55)
*So12 PR24-48 2a RGT 0.87 (0.24,3.50) 0.90 (0.28,2.41) –2.06 (–15.52,25.54)
*T12 PR24 2a q8 1.71 (0.93,3.18) 1.50 (0.94,2.26) 9.85 (–1.19,23.58)
*T12 PR24 2b q8 3.98 (1.37,12.04) 2.49 (1.28,3.82) 29.71 (5.48,54.96)
*T12 PR48 2a q8 1.18 (0.53,2.58) 1.14 (0.59,1.98) 2.70 (–8.62,18.73)
*B24 PR28 2b 2.32 (0.96,5.64) 1.83 (0.97,2.95) 16.57 (–0.65,38.38)
Si12 PR24-48 2a RGT PR48 2b 1.34 (0.62,2.84) 1.25 (0.69,2.23) 4.99 (–8.36,18.50)
T12 PR24-48 2a RGT q8 2.46 (1.14,5.16) 1.90 (1.10,3.18) 17.91 (2.47,33.09)
T12 PR24-48 2b RGT q8 1.55 (0.47,4.91) 1.39 (0.54,2.95) 7.79 (–10.96,33.07)
T12 PR24-48 2a RGT q12 2.68 (1.07,6.38) 2.00 (1.05,3.48) 19.93 (1.30,38.89)
T12 PR24-48 2b RGT q12 3.32 (1.02,10.55) 2.25 (1.01,4.14) 25.17 (0.30,50.74)
B24 PR28-48 2b RGT 2.34 (1.36,4.05) 1.84 (1.26,2.56) 16.81 (5.00,30.43)
*So12 PR24-48 2a RGT 0.87 (0.21,3.74) 0.89 (0.26,2.59) –2.14 (–18.80,25.84)
*T12 PR24 2a q8 1.68 (0.77,3.71) 1.48 (0.82,2.64) 9.56 (–4.75,24.81)
*T12 PR24 2b q8 3.93 (1.52,10.46) 2.44 (1.37,3.83) 29.30 (7.27,51.72)
*T12 PR48 2a q8 1.16 (0.45,2.91) 1.13 (0.52,2.24) 2.51 (–12.22,19.63)
*B24 PR28 2b 2.29 (1.11,4.74) 1.81 (1.09,2.75) 16.22 (1.65,34.21)
T12 PR24-48 2a RGT q8 Si12 PR24-48 2a RGT 1.84 (0.81,4.14) 1.52 (0.86,2.63) 12.96 (–4.44,30.07)
T12 PR24-48 2b RGT q8 1.15 (0.34,3.94) 1.11 (0.42,2.46) 2.70 (–17.58,29.79)
T12 PR24-48 2a RGT q12 2.00 (0.78,5.04) 1.59 (0.84,2.86) 14.89 (–5.12,35.38)
T12 PR24-48 2b RGT q12 2.48 (0.73,8.39) 1.79 (0.79,3.44) 19.98 (–6.20,47.34)

Direct-Acting Antiviral Agents for Chronic Hepatitis C Genotype 1 293
Treatment Reference OR (95% CrI) RR (95% CrI) RD% (95% CrI)
B24 PR28-48 2b RGT 1.75 (0.70,4.53) 1.47 (0.77,2.68) 11.74 (–7.09,32.66)
*So12 PR24-48 2a RGT 0.65 (0.16,2.98) 0.71 (0.21,2.14) –7.21 (–25.37,22.37)
*T12 PR24 2a q8 1.26 (0.54,2.99) 1.18 (0.64,2.20) 4.60 (–11.88,21.74)
*T12 PR24 2b q8 2.94 (0.87,10.37) 1.96 (0.90,3.65) 24.24 (–2.88,51.70)
*T12 PR48 2a q8 0.87 (0.32,2.31) 0.90 (0.41,1.85) –2.49 (–19.18,16.14)
*B24 PR28 2b 1.71 (0.61,4.95) 1.45 (0.69,2.78) 11.24 (–9.39,35.25)
T12 PR24-48 2b RGT q8 T12 PR24-48 2a RGT q8 0.63 (0.25,1.56) 0.74 (0.35,1.28) –9.95 (–25.46,10.49)
T12 PR24-48 2a RGT q12 1.09 (0.68,1.72) 1.05 (0.77,1.35) 1.98 (–8.38,12.91)
T12 PR24-48 2b RGT q12 1.36 (0.55,3.31) 1.19 (0.66,1.79) 7.24 (–12.74,28.22)
B24 PR28-48 2b RGT 0.95 (0.38,2.46) 0.97 (0.54,1.70) –1.10 (–21.23,20.81)
*So12 PR24-48 2a RGT 0.35 (0.09,1.57) 0.47 (0.14,1.34) –19.91 (–40.19,10.20)
*T12 PR24 2a q8 0.69 (0.30,1.59) 0.78 (0.45,1.36) –8.21 (–26.29,10.25)
*T12 PR24 2b q8 1.61 (0.48,5.61) 1.30 (0.63,2.31) 11.41 (–16.23,39.65)
*T12 PR48 2a q8 0.47 (0.18,1.24) 0.60 (0.29,1.16) –15.31 (–33.58,4.67)
*B24 PR28 2b 0.93 (0.33,2.67) 0.96 (0.48,1.75) –1.60 (–23.25,22.92)
T12 PR24-48 2a RGT q12 T12 PR24-48 2b RGT q8 1.73 (0.70,4.32) 1.43 (0.81,2.93) 11.69 (–8.33,28.65)
T12 PR24-48 2b RGT q12 2.14 (0.78,5.99) 1.59 (0.86,3.30) 16.43 (–5.27,38.59)
B24 PR28-48 2b RGT 1.52 (0.42,5.68) 1.32 (0.59,3.46) 8.82 (–19.29,33.73)
*So12 PR24-48 2a RGT 0.57 (0.10,3.29) 0.65 (0.17,2.43) –9.45 (–39.00,21.86)
*T12 PR24 2a q8 1.09 (0.32,3.86) 1.06 (0.49,2.82) 1.75 (–25.33,23.63)
*T12 PR24 2b q8 2.55 (0.56,11.97) 1.75 (0.70,4.66) 20.97 (–12.78,52.25)
*T12 PR48 2a q8 0.75 (0.20,2.92) 0.81 (0.32,2.30) –5.22 (–32.83,17.95)
*B24 PR28 2b 1.48 (0.38,6.01) 1.30 (0.53,3.51) 8.22 (–21.26,35.93)
T12 PR24-48 2b RGT q12 T12 PR24-48 2a RGT q12 1.24 (0.51,3.05) 1.13 (0.64,1.78) 5.14 (–14.74,26.23)
B24 PR28-48 2b RGT 0.87 (0.32,2.54) 0.92 (0.49,1.77) –3.12 (–26.06,21.21)
*So12 PR24-48 2a RGT 0.32 (0.07,1.57) 0.45 (0.14,1.34) –21.69 (–45.10,9.90)
*T12 PR24 2a q8 0.63 (0.25,1.66) 0.74 (0.42,1.41) –10.22 (–31.35,10.84)
*T12 PR24 2b q8 1.48 (0.41,5.59) 1.23 (0.58,2.38) 9.37 (–20.46,39.45)
*T12 PR48 2a q8 0.44 (0.15,1.29) 0.57 (0.26,1.19) –17.27 (–38.90,5.24)

Direct-Acting Antiviral Agents for Chronic Hepatitis C Genotype 1 294
Treatment Reference OR (95% CrI) RR (95% CrI) RD% (95% CrI)
*B24 PR28 2b 0.86 (0.28,2.71) 0.91 (0.44,1.80) –3.52 (–28.20,22.99)
B24 PR28-48 2b RGT T12 PR24-48 2b RGT q12 0.71 (0.20,2.60) 0.82 (0.42,1.84) –8.26 (–37.14,20.85)
*So12 PR24-48 2a RGT 0.26 (0.05,1.53) 0.40 (0.12,1.32) –26.59 (–56.46,8.90)
*T12 PR24 2a q8 0.51 (0.15,1.76) 0.66 (0.35,1.48) –15.39 (–42.96,11.64)
*T12 PR24 2b q8 1.19 (0.27,5.53) 1.09 (0.49,2.47) 4.15 (–30.49,38.89)
*T12 PR48 2a q8 0.35 (0.09,1.33) 0.50 (0.23,1.22) –22.36 (–50.32,5.59)
*B24 PR28 2b 0.69 (0.18,2.75) 0.81 (0.37,1.87) –8.53 (–39.13,22.53)
*So12 PR24-48 2a RGT B24 PR28-48 2b RGT 0.37 (0.08,1.77) 0.49 (0.14,1.46) –18.64 (–42.41,12.33)
*T12 PR24 2a q8 0.72 (0.28,1.87) 0.81 (0.44,1.54) –7.18 (–28.80,13.07)
*T12 PR24 2b q8 1.68 (0.56,5.13) 1.33 (0.70,2.32) 12.37 (–12.71,37.29)
*T12 PR48 2a q8 0.50 (0.17,1.46) 0.61 (0.28,1.30) –14.26 (–36.01,7.67)
*B24 PR28 2b 0.98 (0.40,2.41) 0.99 (0.54,1.69) –0.55 (–19.77,20.14)
*T12 PR24 2a q8 *So12 PR24-48 2a RGT 1.94 (0.43,8.44) 1.66 (0.56,5.69) 11.63 (–18.24,31.63)
*T12 PR24 2b q8 4.54 (0.80,25.09) 2.73 (0.87,9.16) 30.64 (–4.97,61.04)
*T12 PR48 2a q8 1.33 (0.27,6.24) 1.25 (0.38,4.60) 4.45 (–24.92,26.01)
*B24 PR28 2b 2.63 (0.52,12.97) 2.01 (0.65,7.00) 17.93 (–13.57,44.79)
*T12 PR24 2b q8 *T12 PR24 2a q8 2.34 (0.68,8.22) 1.66 (0.77,3.06) 19.70 (–8.11,47.53)
*T12 PR48 2a q8 0.69 (0.32,1.47) 0.76 (0.41,1.31) –7.01 (–20.78,7.76)
*B24 PR28 2b 1.36 (0.46,3.97) 1.23 (0.58,2.34) 6.68 (–15.38,31.15)
*T12 PR48 2a q8 *T12 PR24 2b q8 0.30 (0.07,1.11) 0.46 (0.21,1.07) –26.52 (–55.14,2.07)
*B24 PR28 2b 0.58 (0.17,1.92) 0.74 (0.38,1.49) –12.67 (–40.12,14.69)
*B24 PR28 2b *T12 PR48 2a q8 1.98 (0.61,6.46) 1.61 (0.70,3.59) 13.74 (–9.60,38.47)
Random Effects Model Residual Deviance 25.28 vs. 27 data points
Deviance Information Criteria 185.578
Fixed Effects Model Residual Deviance 24.78 vs. 27 data points
Deviance Information Criteria 184.311
CrI = credible interval; OR = odds ratio; RD = risk difference; RR = relative risk; vs. = versus. *Not a Health Canada–recommended dosage regimen.

Direct-Acting Antiviral Agents for Chronic Hepatitis C Genotype 1 295
FIGURE 59: ANEMIA — TREATMENT-NAIVE PATIENTS: PLOT OF POSTERIOR MEAN DEVIANCE OF THE INDIVIDUAL
DATA POINTS IN THE INCONSISTENCY MODEL AGAINST THEIR POSTERIOR MEAN DEVIANCE IN THE CONSISTENCY
MODEL (PR48 2A/B SEPARATED, ALL DOSES)

Direct-Acting Antiviral Agents for Chronic Hepatitis C Genotype 1 296
TABLE 179: ANEMIA — TREATMENT-NAIVE PATIENTS: ODDS RATIOS, RELATIVE RISKS, AND RISK DIFFERENCE FOR ALL TREATMENT COMPARISONS AND
RANDOM EFFECTS MODEL (PR48 2A/B SEPARATED, HEALTH CANADA DOSES ONLY)
Treatment Reference OR (95% CrI) RR (95% CrI) RD% (95% CrI)
PR48 2b PR48 2a 1.01 (0.57,1.79) 1.01 (0.62,1.55) 0.12 –7.47,10.80)
Si12 PR24-48 2a RGT 1.35 (0.73,2.54) 1.26 (0.78,1.99) 5.16 –4.85,17.62)
T12 PR24-48 2a RGT q8 2.48 (1.33,4.69) 1.92 (1.25,2.75) 18.09 (4.93,33.60)
T12 PR24-48 2b RGT q8 1.55 (0.49,4.81) 1.39 (0.54,2.76) 7.78 (-9.15,34.26)
T12 PR24-48 2a RGT q12 2.70 (1.20,6.04) 2.02 (1.16,3.07) 20.09 (3.05,39.78)
T12 PR24-48 2b RGT q12 3.37 (1.10,10.37) 2.29 (1.08,3.71) 25.54 (1.53,51.93)
B24 PR28-48 2b RGT 2.37 (1.02,5.46) 1.86 (1.02,2.92) 17.00 (0.30,37.52)
Si12 PR24-48 2a RGT PR48 2b 1.34 (0.58,3.08) 1.26 (0.66,2.39) 5.04 –9.60,19.25)
T12 PR24-48 2a RGT q8 2.46 (1.06,5.75) 1.90 (1.04,3.44) 17.87 (1.18,34.86)
T12 PR24-48 2b RGT q8 1.54 (0.43,5.42) 1.39 (0.50,3.17) 7.59 –12.02,34.70)
T12 PR24-48 2a RGT q12 2.68 (1.00,7.12) 2.00 (1.00,3.74) 19.85 –0.09,40.68)
T12 PR24-48 2b RGT q12 3.35 (0.96,11.58) 2.27 (0.97,4.41) 25.20 –0.70,52.43)
B24 PR28-48 2b RGT 2.35 (1.28,4.34) 1.84 (1.20,2.65) 16.74 (3.79,31.79)
T12 PR24-48 2a RGT q8 Si12 PR24-48 2a RGT 1.84 (0.76,4.44) 1.52 (0.83,2.70) 12.97 –5.65,31.82)
T12 PR24-48 2b RGT q8 1.15 (0.31,4.21) 1.11 (0.39,2.54) 2.70 –18.23,31.36)
T12 PR24-48 2a RGT q12 2.00 (0.72,5.44) 1.60 (0.79,2.94) 14.86 –6.54,37.16)
T12 PR24-48 2b RGT q12 2.50 (0.69,8.92) 1.81 (0.76,3.49) 20.26 –7.16,48.68)
B24 PR28-48 2b RGT 1.75 (0.62,4.98) 1.47 (0.71,2.81) 11.78 –8.93,34.85)
T12 PR24-48 2b RGT q8 T12 PR24-48 2a RGT q8 0.63 (0.24,1.60) 0.73 (0.34,1.30) -9.98 –25.80,11.17)
T12 PR24-48 2a RGT q12 1.09 (0.65,1.79) 1.05 (0.75,1.38) 1.95 –9.25,13.79)
T12 PR24-48 2b RGT q12 1.36 (0.53,3.47) 1.19 (0.65,1.83) 7.24 –13.15,29.23)
B24 PR28-48 2b RGT 0.95 (0.34,2.68) 0.97 (0.49,1.78) -1.10 –23.38,22.69)
T12 PR24-48 2a RGT q12 T12 PR24-48 2b RGT q8 1.73 (0.67,4.54) 1.43 (0.80,3.04) 11.67 –9.19,29.28)
T12 PR24-48 2b RGT q12 2.16 (0.77,6.26) 1.60 (0.85,3.38) 16.57 –5.58,39.33)
B24 PR28-48 2b RGT 1.53 (0.38,6.24) 1.33 (0.55,3.69) 8.94 –21.29,35.09)
T12 PR24-48 2b RGT q12 T12 PR24-48 2a RGT q12 1.25 (0.49,3.22) 1.13 (0.63,1.82) 5.21 –15.49,27.30)
B24 PR28-48 2b RGT 0.88 (0.28,2.79) 0.92 (0.45,1.85) -3.03 –28.17,23.14)
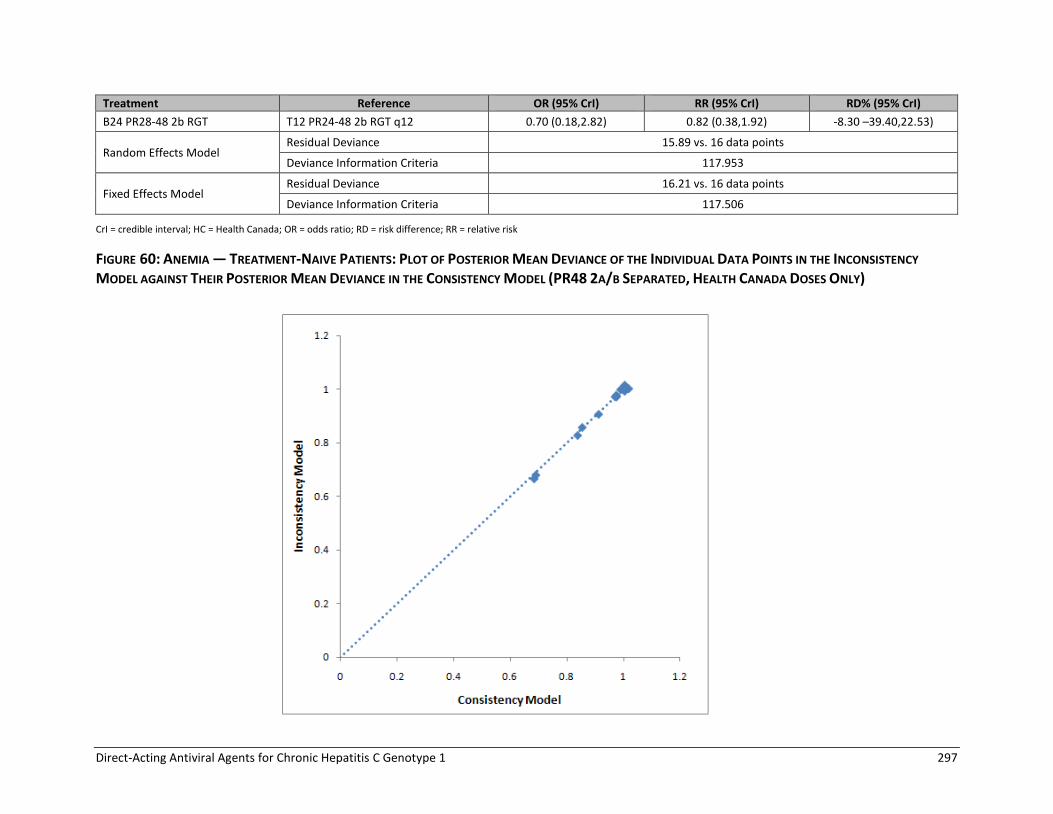
Direct-Acting Antiviral Agents for Chronic Hepatitis C Genotype 1 297
Treatment Reference OR (95% CrI) RR (95% CrI) RD% (95% CrI)
B24 PR28-48 2b RGT T12 PR24-48 2b RGT q12 0.70 (0.18,2.82) 0.82 (0.38,1.92) -8.30 –39.40,22.53)
Random Effects Model Residual Deviance 15.89 vs. 16 data points
Deviance Information Criteria 117.953
Fixed Effects Model Residual Deviance 16.21 vs. 16 data points
Deviance Information Criteria 117.506
CrI = credible interval; HC = Health Canada; OR = odds ratio; RD = risk difference; RR = relative risk
FIGURE 60: ANEMIA — TREATMENT-NAIVE PATIENTS: PLOT OF POSTERIOR MEAN DEVIANCE OF THE INDIVIDUAL DATA POINTS IN THE INCONSISTENCY
MODEL AGAINST THEIR POSTERIOR MEAN DEVIANCE IN THE CONSISTENCY MODEL (PR48 2A/B SEPARATED, HEALTH CANADA DOSES ONLY)

Direct-Acting Antiviral Agents for Chronic Hepatitis C Genotype 1 298
TABLE 180: DEPRESSION — TREATMENT-NAIVE PATIENTS: ODDS RATIOS, RELATIVE RISKS AND RISK DIFFERENCE FOR ALL TREATMENT COMPARISONS-RANDOM EFFECTS MODEL (PR48 2A/B SEPARATED, ALL DOSES)
Treatment Reference OR (95% CrI) RR (95% CrI) RD% (95% CrI)
PR48 2b PR48 2a 1.17 (0.70,1.74) 1.14 (0.73,1.57) 2.07 –4.10,8.18)
Si12 PR24-48 2a RGT 0.59 (0.20,1.71) 0.63 (0.23,1.56) –5.41 –12.06,7.85)
T12 PR24-48 2a RGT q8 or q8/q12 0.79 (0.40,1.54) 0.82 (0.44,1.43) –2.71 –8.45,6.27)
T12 PR24-48 2b RGT q8/q12 1.44 (0.44,4.80) 1.35 (0.48,3.09) 5.12 –7.79,30.57)
B24 PR28-48 2b RGT 1.22 (0.52,2.56) 1.18 (0.56,2.09) 2.66 –6.63,15.79)
*T12 PR24 2a q8 1.03 (0.53,2.02) 1.02 (0.57,1.77) 0.33 –6.72,10.67)
*T12 PR48 2a q8 0.98 (0.39,2.45) 0.98 (0.43,2.03) –0.26 –8.83,14.58)
*B24 PR28 2b 1.04 (0.38,2.70) 1.03 (0.42,2.16) 0.43 –8.86,16.92)
Si12 PR24-48 2a RGT PR48 2b 0.51 (0.16,1.66) 0.56 (0.19,1.52) –7.30 –16.48,7.16)
T12 PR24-48 2a RGT q8 or q8/q12 0.68 (0.32,1.61) 0.72 (0.37,1.49) –4.71 –12.87,6.40)
T12 PR24-48 2b RGT q8/q12 1.24 (0.36,4.69) 1.19 (0.41,3.06) 3.13 –10.96,29.63)
B24 PR28-48 2b RGT 1.04 (0.54,2.03) 1.04 (0.58,1.73) 0.59 –6.81,11.92)
*T12 PR24 2a q8 0.88 (0.41,2.07) 0.90 (0.47,1.82) –1.64 (–10.96,10.55)
*T12 PR48 2a q8 0.84 (0.31,2.41) 0.87 (0.36,2.02) –2.21 (–12.68,13.91)
*B24 PR28 2b 0.89 (0.38,2.16) 0.91 (0.42,1.81) –1.50 (–9.90,13.39)
T12 PR24-48 2a RGT q8 or q8/q12 Si12 PR24-48 2a RGT 1.33 (0.39,4.78) 1.29 (0.44,4.13) 2.60 (–11.28,13.66)
T12 PR24-48 2b RGT q8/q12 2.43 (0.50,12.29) 2.13 (0.55,7.89) 10.19 (–7.49,36.57)
B24 PR28-48 2b RGT 2.05 (0.53,7.74) 1.86 (0.58,6.05) 7.81 (–7.91,22.72)
*T12 PR24 2a q8 1.74 (0.49,6.29) 1.62 (0.55,5.21) 5.65 (–9.17,17.82)
*T12 PR48 2a q8 1.66 (0.41,6.93) 1.56 (0.46,5.51) 5.01 (–10.43,21.29)
*B24 PR28 2b 1.75 (0.40,7.71) 1.63 (0.45,5.89) 5.65 (–10.05,23.93)
T12 PR24-48 2b RGT q8/q12 T12 PR24-48 2a RGT q8 or q8/q12 1.82 (0.67,5.09) 1.65 (0.70,3.42) 7.63 (–3.54,29.61)
B24 PR28-48 2b RGT 1.54 (0.52,4.16) 1.45 (0.57,3.30) 5.29 (–7.64,19.37)
*T12 PR24 2a q8 1.30 (0.51,3.36) 1.25 (0.56,2.84) 2.99 (–8.14,14.51)
*T12 PR48 2a q8 1.24 (0.40,3.87) 1.20 (0.45,3.11) 2.41 (–9.63,17.98)
*B24 PR28 2b 1.32 (0.39,4.16) 1.27 (0.44,3.25) 3.13 (–9.80,20.17)

Direct-Acting Antiviral Agents for Chronic Hepatitis C Genotype 1 299
Treatment Reference OR (95% CrI) RR (95% CrI) RD% (95% CrI)
B24 PR28-48 2b RGT T12 PR24-48 2b RGT q8/q12 0.84 (0.19,3.37) 0.87 (0.29,2.79) –2.51 (–29.54,15.70)
*T12 PR24 2a q8 0.71 (0.18,2.82) 0.76 (0.28,2.45) –4.72 (–30.91,11.80)
*T12 PR48 2a q8 0.68 (0.15,3.13) 0.73 (0.23,2.63) –5.25 (–31.76,14.35)
*B24 PR28 2b 0.72 (0.15,3.25) 0.77 (0.22,2.67) –4.51 (–31.57,15.84)
*T12 PR24 2a q8 B24 PR28-48 2b RGT 0.85 (0.31,2.51) 0.87 (0.39,2.18) –2.21 (–17.15,11.68)
*T12 PR48 2a q8 0.81 (0.25,2.81) 0.84 (0.31,2.35) –2.79 (–18.36,14.52)
*B24 PR28 2b 0.86 (0.29,2.55) 0.88 (0.35,2.13) –2.04 (–16.07,14.16)
*T12 PR48 2a q8 *T12 PR24 2a q8 0.96 (0.39,2.34) 0.96 (0.44,2.01) –0.55 (–10.89,12.69)
*B24 PR28 2b 1.01 (0.30,3.19) 1.01 (0.35,2.56) 0.09 (–13.86,17.82)
*B24 PR28 2b *T12 PR48 2a q8 1.06 (0.26,3.94) 1.05 (0.32,3.14) 0.73 (–16.86,19.07)
Random Effects Model Residual Deviance 20.36 vs. 21 data points
Deviance Information Criteria 141.376
Fixed Effects Model Residual Deviance 20.97 vs. 21 data points
Deviance Information Criteria 141.08
CrI = credible interval; OR = odds ratio; RD = risk difference; RR = relative risk; vs. = versus. *Not a Health Canada–recommended dosage regimen.

Direct-Acting Antiviral Agents for Chronic Hepatitis C Genotype 1 300
FIGURE 61: DEPRESSION — TREATMENT-NAIVE PATIENTS: PLOT OF POSTERIOR MEAN DEVIANCE OF THE
INDIVIDUAL DATA POINTS IN THE INCONSISTENCY MODEL AGAINST THEIR POSTERIOR MEAN DEVIANCE IN THE
CONSISTENCY MODEL (PR48 2A/B SEPARATED, ALL DOSES)

Direct-Acting Antiviral Agents for Chronic Hepatitis C Genotype 1 301
TABLE 181: DEPRESSION — TREATMENT-NAIVE PATIENTS: ODDS RATIOS, RELATIVE RISKS, AND RISK DIFFERENCE FOR ALL TREATMENT COMPARISONS AND
RANDOM EFFECTS MODEL (PR48 2A/B SEPARATED, HEALTH CANADA DOSES ONLY)
Treatment Reference OR (95% CrI) RR (95% CrI) RD% (95 CrI)
PR48 2b PR48 2a 1.17 (0.67,1.77) 1.14 (0.70,1.62) 1.82 –.14,7.65)
Si12 PR24-48 2a RGT 0.58 (0.19,1.75) 0.62 (0.22,1.60) –4.95 (–11.05,7.31)
T12 PR24-48 2a RGT q8 or q8/q12 0.79 (0.38,1.61) 0.82 (0.41,1.49) –2.38 (–7.90,6.37)
T12 PR24-48 2b RGT q8/q12 1.45 (0.41,5.07) 1.37 (0.44,3.32) 4.78 (–7.36,30.20)
B24 PR28-48 2b RGT 1.22 (0.47,2.70) 1.19 (0.51,2.21) 2.39 (–6.65,15.53)
Si12 PR24-48 2a RGT PR48 2b 0.51 (0.16,1.74) 0.55 (0.18,1.60) –6.58
(–14.94,6.96)
T12 PR24-48 2a RGT q8 or q8/q12 0.68 (0.30,1.72) 0.72 (0.34,1.59) –4.15
(–11.94,6.67)
T12 PR24-48 2b RGT q8/q12 1.25 (0.34,5.01) 1.21 (0.38,3.31) 3.00
(–10.16,29.34)
B24 PR28-48 2b RGT 1.05 (0.51,2.13) 1.04 (0.55,1.83) 0.59 (–6.51,11.92)
T12 PR24-48 2a RGT q8 or q8/q12 Si12 PR24-48 2a RGT 1.36 (0.37,5.07) 1.32 (0.41,4.43) 2.49
(–10.43,12.98)
T12 PR24-48 2b RGT q8/q12 2.49 (0.47,13.53) 2.21 (0.51,8.89) 9.36 (–7.33,35.80)
B24 PR28-48 2b RGT 2.07 (0.50,8.03) 1.90 (0.55,6.35) 7.07 (–7.65,21.47)
T12 PR24-48 2b RGT q8/q12 T12 PR24-48 2a RGT q8 or q8/q12 1.83 (0.65,5.29) 1.68 (0.68,3.62) 7.00 (–3.37,28.89)
B24 PR28-48 2b RGT 1.54 (0.47,4.44) 1.45 (0.52,3.55) 4.71 (–7.85,18.52)
B24 PR28-48 2b RGT T12 PR24-48 2b RGT q8/q12 0.84 (0.18,3.59) 0.86 (0.26,3.02) –2.39
(–29.16,15.12)
Random Effects Model Residual Deviance 13.64 vs. 14 data points
Deviance Information Criteria 97.197
Fixed Effects Model Residual Deviance 14.23 vs. 14 data points
Deviance Information Criteria 97.08
CrI = credible interval; HC = Health Canada; OR = odds ratio; RD = risk difference; RR = relative risk; vs. = versus.
No consistency plot for this analysis.

Direct-Acting Antiviral Agents for Chronic Hepatitis C Genotype 1 302
Treatment-Experienced TABLE 182: SVR — ALL TREATMENT-EXPERIENCED PATIENTS: ODDS RATIOS, RELATIVE RISKS, AND RISK DIFFERENCE FOR ALL TREATMENT COMPARISONS
AND RANDOM EFFECTS MODEL (PR48 2A/B SEPARATED, ALL DOSES)
Treatment Reference OR (95% CrI) RR (95% CrI) RD% (95% CrI)
PR48 2b PR48 2a 0.69 (0.14,3.10) 0.75 (0.19,2.03) –6.63 (–22.44,25.79)
Si12 PR24-48 2a RGT 6.62 (2.32,19.12) 2.66 (1.71,3.39) 43.90 (19.04,60.86)
Si12 PR48 2a 7.01 (2.14,23.75) 2.70 (1.64,3.54) 45.07 (17.17,63.46)
T12 PR48 2a q8 9.57 (3.33,28.23) 2.92 (2.04,3.60) 50.96 (28.06,64.85)
B32 PR36-48 2b RGT 3.70 (0.54,24.35) 2.16 (0.61,3.54) 30.63 (–10.49,63.78)
*B44 PR48 2a 6.97 (2.20,22.28) 2.70 (1.66,3.53) 44.96 (17.79,62.83)
*B44 PR48 2b 5.23 (0.76,33.51) 2.46 (0.81,3.66) 38.76 (–5.18,66.49)
*T12 PR24 2a q8 6.60 (2.15,20.88) 2.66 (1.64,3.48) 43.83 (17.20,62.00)
Si12 PR24-48 2a RGT PR48 2b 9.72 (1.58,63.87) 3.51 (1.23,13.91) 49.64 (10.08,73.58)
Si12 PR48 2a 10.33 (1.51,74.91) 3.56 (1.21,14.24) 50.47 (9.23,76.26)
T12 PR48 2a q8 14.06 (2.28,89.63) 3.87 (1.39,15.14) 56.72 (17.85,78.30)
B32 PR36-48 2b RGT 5.38 (1.74,16.83) 2.74 (1.35,5.79) 34.98 (6.43,56.32)
*B44 PR48 2a 10.16 (1.56,72.10) 3.55 (1.22,14.18) 50.32 (9.62,75.59)
*B44 PR48 2b 7.56 (2.48,23.61) 3.14 (1.52,6.90) 42.59 (11.47,61.68)
*T12 PR24 2a q8 9.69 (1.50,67.50) 3.50 (1.20,14.04) 49.38 (8.99,74.79)
Si12 PR48 2a Si12 PR24-48 2a RGT 1.06 (0.22,5.11) 1.02 (0.61,1.62) 1.11 (–30.28,30.65)
T12 PR48 2a q8 1.45 (0.32,6.48) 1.10 (0.74,1.72) 6.96 (–20.32,34.34)
B32 PR36-48 2b RGT 0.56 (0.06,4.74) 0.82 (0.24,1.50) –12.83 (–57.01,27.00)
*B44 PR48 2a 1.06 (0.22,4.95) 1.02 (0.62,1.62) 1.12 (–29.80,30.23)
*B44 PR48 2b 0.79 (0.09,6.59) 0.93 (0.31,1.59) –4.97 (–50.96,31.05)
*T12 PR24 2a q8 1.00 (0.21,4.69) 1.00 (0.61,1.60) 0.02 (–30.53,29.48)
T12 PR48 2a q8 Si12 PR48 2a 1.37 (0.27,6.73) 1.08 (0.73,1.78) 5.82 (–22.23,35.82)
B32 PR36-48 2b RGT 0.52 (0.05,4.83) 0.80 (0.23,1.55) –13.96 (–58.89,28.12)
*B44 PR48 2a 1.00 (0.18,5.19) 1.00 (0.60,1.68) –0.05 (–32.10,32.07)
*B44 PR48 2b 0.73 (0.08,6.72) 0.91 (0.31,1.65) –6.27 (–52.99,32.60)
*T12 PR24 2a q8 0.94 (0.18,4.90) 0.98 (0.59,1.66) –1.20 (–32.26,31.08)
B32 PR36-48 2b RGT T12 PR48 2a q8 0.38 (0.04,3.30) 0.74 (0.22,1.29) –19.93 (–62.34,18.58)
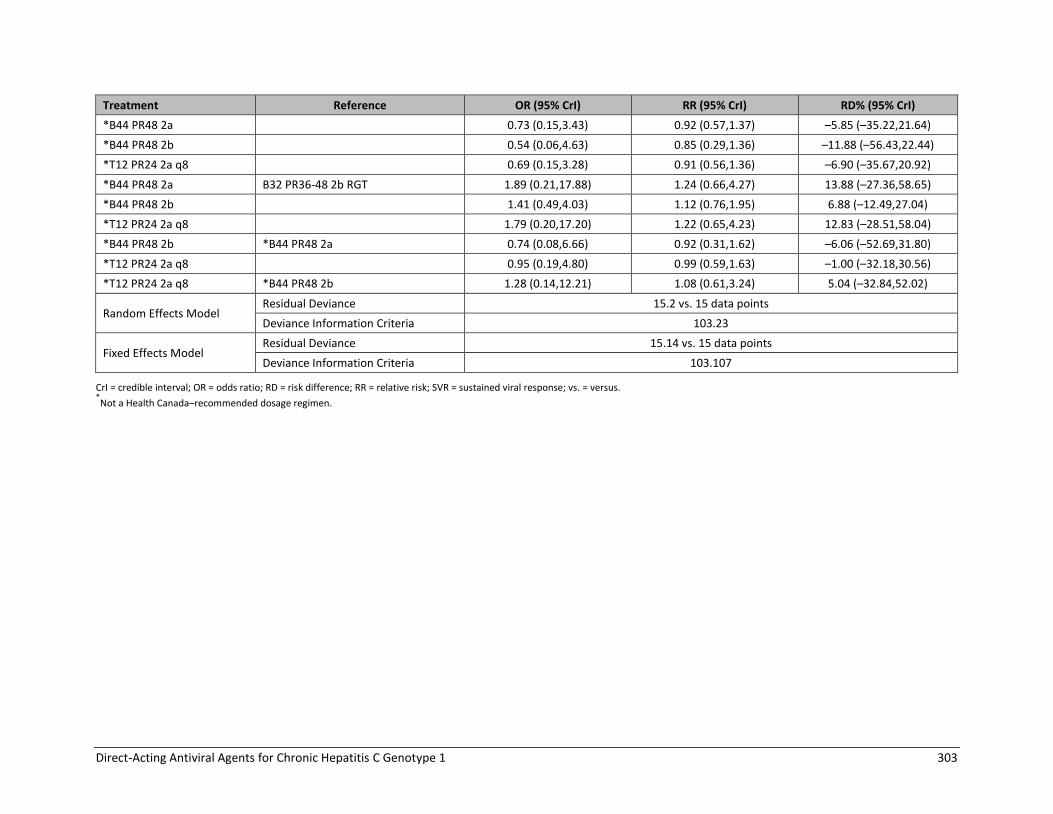
Direct-Acting Antiviral Agents for Chronic Hepatitis C Genotype 1 303
Treatment Reference OR (95% CrI) RR (95% CrI) RD% (95% CrI)
*B44 PR48 2a 0.73 (0.15,3.43) 0.92 (0.57,1.37) –5.85 (–35.22,21.64)
*B44 PR48 2b 0.54 (0.06,4.63) 0.85 (0.29,1.36) –11.88 (–56.43,22.44)
*T12 PR24 2a q8 0.69 (0.15,3.28) 0.91 (0.56,1.36) –6.90 (–35.67,20.92)
*B44 PR48 2a B32 PR36-48 2b RGT 1.89 (0.21,17.88) 1.24 (0.66,4.27) 13.88 (–27.36,58.65)
*B44 PR48 2b 1.41 (0.49,4.03) 1.12 (0.76,1.95) 6.88 (–12.49,27.04)
*T12 PR24 2a q8 1.79 (0.20,17.20) 1.22 (0.65,4.23) 12.83 (–28.51,58.04)
*B44 PR48 2b *B44 PR48 2a 0.74 (0.08,6.66) 0.92 (0.31,1.62) –6.06 (–52.69,31.80)
*T12 PR24 2a q8 0.95 (0.19,4.80) 0.99 (0.59,1.63) –1.00 (–32.18,30.56)
*T12 PR24 2a q8 *B44 PR48 2b 1.28 (0.14,12.21) 1.08 (0.61,3.24) 5.04 (–32.84,52.02)
Random Effects Model Residual Deviance 15.2 vs. 15 data points
Deviance Information Criteria 103.23
Fixed Effects Model Residual Deviance 15.14 vs. 15 data points
Deviance Information Criteria 103.107
CrI = credible interval; OR = odds ratio; RD = risk difference; RR = relative risk; SVR = sustained viral response; vs. = versus. *Not a Health Canada–recommended dosage regimen.

Direct-Acting Antiviral Agents for Chronic Hepatitis C Genotype 1 304
FIGURE 62: SVR — ALL TREATMENT-EXPERIENCED PATIENTS: PLOT OF POSTERIOR MEAN DEVIANCE OF THE
INDIVIDUAL DATA POINTS IN THE INCONSISTENCY MODEL AGAINST THEIR POSTERIOR MEAN DEVIANCE IN THE
CONSISTENCY MODEL (PR48 2A/B SEPARATED, ALL DOSES)

Direct-Acting Antiviral Agents for Chronic Hepatitis C Genotype 1 305
TABLE 183: SVR — ALL TREATMENT-EXPERIENCED PATIENTS: ODDS RATIOS, RELATIVE RISKS, AND RISK DIFFERENCE
FOR ALL TREATMENT COMPARISONS AND RANDOM EFFECTS MODEL (PR48 2A/B SEPARATED, HEALTH CANADA
DOSES ONLY)
Treatment Reference OR (95% CrI) RR (95% CrI) RD% (95% CrI)
PR48 2b PR48 2a 0.66 (0.15,2.88) 0.72 (0.19,2.08) –6.32 (–19.80,22.08)
Si12 PR24-48 2a RGT 6.60 (2.39,18.35) 2.92 (1.81,3.99) 43.02 (18.44,61.66)
Si12 PR48 2a 6.92 (2.19,22.84) 2.96 (1.71,4.25) 44.06 (16.64,64.66)
T12 PR48 2a q8 9.18 (3.29,26.27) 3.23 (2.14,4.32) 50.02 (26.34,66.02)
B32 PR36-48 2b RGT 3.55 (0.58,22.69) 2.25 (0.64,4.19) 28.12 (–8.47,64.50)
Si12 PR24-48 2a RGT PR48 2b 9.98 (1.70,59.53) 4.02 (1.32,15.26) 48.45 (11.39,71.78)
Si12 PR48 2a 10.54 (1.61,69.30) 4.08 (1.29,15.51) 49.44 (10.41,74.62)
T12 PR48 2a q8 13.76 (2.32,83.62) 4.44 (1.49,16.76) 55.39 (18.54,76.58)
B32 PR36-48 2b RGT 5.34 (1.83,16.38) 2.99 (1.44,6.16) 32.99 (6.61,55.95)
Si12 PR48 2a Si12 PR24-48 2a RGT 1.05 (0.23,5.02) 1.02 (0.58,1.73) 0.97 (–31.08,32.29)
T12 PR48 2a q8 1.39 (0.33,5.99) 1.10 (0.71,1.81) 6.80 (–22.17,35.43)
B32 PR36-48 2b RGT 0.54 (0.07,4.44) 0.78 (0.23,1.59) –14.48 (–55.51,28.81)
T12 PR48 2a q8 Si12 PR48 2a 1.32 (0.27,6.16) 1.09 (0.68,1.88) 5.76 (–24.78,36.72)
B32 PR36-48 2b RGT 0.51 (0.06,4.52) 0.77 (0.22,1.63) –15.50 (–58.15,29.50)
B32 PR36-48 2b RGT T12 PR48 2a q8 0.39 (0.05,3.18) 0.70 (0.21,1.37) –21.32 (–61.62,20.85)
Random Effects Model
Residual Deviance 10.09 vs. 10 data points
Deviance Information Criteria
67.744
Fixed Effects Model
Residual Deviance 10.05 vs. 10 data points
Deviance Information Criteria
67.654
CrI = credible interval; HC = Health Canada; OR = odds ratio; RD = risk difference; RR = relative risk; SVR = sustained viral response; vs. = versus.
No consistency plot for this analysis.

Direct-Acting Antiviral Agents for Chronic Hepatitis C Genotype 1 306
TABLE 184: ANEMIA — ALL TREATMENT-EXPERIENCED PATIENTS: ODDS RATIOS, RELATIVE RISKS, AND RISK
DIFFERENCE FOR ALL TREATMENT COMPARISONS AND RANDOM EFFECTS MODEL (PR48 2A/B SEPARATED, ALL
DOSES)
Treatment Reference OR (95% Crl) RR (95% Crl) RD% (95% Crl)
PR48 2b PR48 2a 1.14 (0.30,4.34) 1.12 (0.34,2.86) 1.93 (–11.37,28.66)
Si12 PR24-48 2a RGT 0.80 (0.28,2.30) 0.83 (0.32,1.90) –2.77 (–11.50,14.49)
Si12 PR48 2a 0.72 (0.20,2.54) 0.76 (0.23,2.05) –3.99 (–13.41,16.41)
T12 PR48 2a q8 2.77 (1.01,7.93) 2.15 (1.01,3.76) 18.78 (0.08,44.14)
B32 PR36-48 2b RGT 3.59 (0.65,19.75) 2.52 (0.70,5.03) 24.84 (–5.20,62.81)
*B44 PR48 2a 2.05 (0.71,6.04) 1.75 (0.75,3.36) 12.26 (–4.24,37.54)
*B44 PR48 2b 3.99 (0.72,21.64) 2.67 (0.76,5.15) 27.41 (–4.12,64.35)
*T12 PR24 2a q8 4.25 (1.32,14.75) 2.77 (1.25,4.79) 29.01 (4.27,57.39)
Si12 PR24-48 2a RGT PR48 2b 0.70 (0.13,3.77) 0.75 (0.20,3.05) –4.53 (–31.94,16.32)
Si12 PR48 2a 0.63 (0.10,3.98) 0.68 (0.15,3.15) –5.68 (–33.37,17.75)
T12 PR48 2a q8 2.43 (0.46,13.22) 1.91 (0.59,6.93) 16.45 (–14.93,44.67)
B32 PR36-48 2b RGT 3.12 (1.07,9.30) 2.16 (1.05,4.27) 21.76 (0.72,46.11)
*B44 PR48 2a 1.80 (0.33,10.12) 1.56 (0.45,5.91) 10.04 (–20.59,38.48)
*B44 PR48 2b 3.47 (1.19,10.42) 2.29 (1.12,4.55) 24.38 (1.84,48.19)
*T12 PR24 2a q8 3.76 (0.64,22.55) 2.46 (0.74,8.65) 26.43 (–8.99,58.19)
Si12 PR48 2a Si12 PR24-48 2a RGT 0.90 (0.17,4.47) 0.91 (0.22,3.48) –1.15 (–20.02,19.72)
T12 PR48 2a q8 3.46 (0.81,15.19) 2.58 (0.86,7.55) 21.18 (–3.39,46.94)
B32 PR36-48 2b RGT 4.46 (0.61,32.63) 2.97 (0.67,9.49) 26.98 (–6.44,65.31)
*B44 PR48 2a 2.55 (0.58,11.46) 2.10 (0.66,6.50) 14.74 (–8.03,40.54)
*B44 PR48 2b 4.98 (0.67,36.25) 3.16 (0.74,9.83) 29.70 (–5.17,67.02)
*T12 PR24 2a q8 5.30 (1.12,26.80) 3.30 (1.08,9.60) 31.25 (1.87,60.43)
T12 PR48 2a q8 Si12 PR48 2a 3.86 (0.79,20.21) 2.82 (0.84,10.44) 22.27 (–4.02,48.63)
B32 PR36-48 2b RGT 5.00 (0.59,42.11) 3.25 (0.66,12.86) 28.00 (–7.08,66.65)
*B44 PR48 2a 2.86 (0.55,15.35) 2.30 (0.64,8.89) 15.87 (–9.21,42.05)
*B44 PR48 2b 5.62 (0.66,46.31) 3.47 (0.73,13.34) 30.67 (–5.70,68.41)
*T12 PR24 2a q8 5.90 (1.07,34.99) 3.61 (1.04,13.26) 32.22 (1.05,61.92)
B32 PR36-48 2b RGT T12 PR48 2a q8 1.29 (0.17,9.19) 1.16 (0.30,3.15) 5.75 (–32.99,47.43)
*B44 PR48 2a 0.74 (0.17,3.28) 0.82 (0.30,2.17) –6.35 (–35.75,23.99)
*B44 PR48 2b 1.44 (0.19,10.10) 1.24 (0.32,3.26) 8.40 (–31.46,49.14)
*T12 PR24 2a q8 1.54 (0.32,7.55) 1.29 (0.51,3.14) 10.04 (–24.66,43.63)
*B44 PR48 2a B32 PR36-48 2b RGT 0.58 (0.08,4.33) 0.71 (0.24,2.84) –11.89 (–53.26,26.37)
*B44 PR48 2b 1.12 (0.41,2.98) 1.06 (0.60,1.90) 2.30 (–17.25,21.49)
*T12 PR24 2a q8 1.20 (0.15,9.82) 1.10 (0.40,4.30) 4.26 (–40.81,45.95)
*B44 PR48 2b *B44 PR48 2a 1.94 (0.25,14.53) 1.51 (0.38,4.31) 14.57 (–24.95,55.30)
*T12 PR24 2a q8 2.09 (0.43,10.50) 1.58 (0.59,4.20) 16.43 (–18.09,49.03)
*T12 PR24 2a q8 *B44 PR48 2b 1.08 (0.14,8.72) 1.04 (0.39,3.91) 1.79 (–42.91,44.30)
Random Effects Model Residual Deviance 15.15 vs. 14 data points
Deviance Information Criteria
102.193
Fixed Effects Model
Residual Deviance 15.14 vs. 14 data points
Deviance Information Criteria
102.168
CrI = credible interval; OR = odds ratio; RD = risk difference; RR = relative risk; vs. = versus. *Not a Health Canada–recommended dosage regimen.

Direct-Acting Antiviral Agents for Chronic Hepatitis C Genotype 1 307
FIGURE 63: ANEMIA — ALL TREATMENT-EXPERIENCED PATIENTS: PLOT OF POSTERIOR MEAN DEVIANCE OF THE
INDIVIDUAL DATA POINTS IN THE INCONSISTENCY MODEL AGAINST THEIR POSTERIOR MEAN DEVIANCE IN THE
CONSISTENCY MODEL (PR48 2A/B SEPARATED, ALL DOSES)

Direct-Acting Antiviral Agents for Chronic Hepatitis C Genotype 1 308
TABLE 185: ANEMIA — ALL TREATMENT-EXPERIENCED PATIENTS: ODDS RATIOS, RELATIVE RISKS, AND RISK
DIFFERENCE FOR ALL TREATMENT COMPARISONS AND RANDOM EFFECTS MODEL (PR48 2A/B SEPARATED, HEALTH CANADA DOSES ONLY)
Treatment Reference OR (95% CrI) RR (95% CrI) RD% (95% CrI)
PR48 2b PR48 2a 1.11 (0.30,4.11) 1.09 (0.35,2.81) 1.49 (–11.55,27.02)
Si12 PR24-48 2a RGT 0.80 (0.29,2.28) 0.83 (0.33,1.89) –2.83 (–11.51,14.11)
Si12 PR48 2a 0.72 (0.20,2.54) 0.76 (0.23,2.05) –3.97 (–13.58,16.13)
T12 PR48 2a q8 2.40 (0.85,6.82) 1.95 (0.87,3.58) 15.55 (–2.13,40.37)
B32 PR36-48 2b RGT 3.46 (0.64,18.67) 2.46 (0.68,5.11) 23.94 (–5.51,61.73)
Si12 PR24-48 2a RGT PR48 2b 0.72 (0.14,3.82) 0.76 (0.20,3.07) –4.17 (–30.34,16.43)
Si12 PR48 2a 0.65 (0.10,3.92) 0.70 (0.15,3.13) –5.20 (–31.94,17.62)
T12 PR48 2a q8 2.18 (0.41,11.41) 1.79 (0.53,6.36) 13.76 (–16.66,41.38)
B32 PR36-48 2b RGT 3.10 (1.07,9.13) 2.17 (1.05,4.20) 21.42 (0.67,45.86)
Si12 PR48 2a Si12 PR24-48 2a RGT 0.90 (0.17,4.47) 0.92 (0.22,3.47) –1.09 (–19.81,19.57)
T12 PR48 2a q8 3.01 (0.69,12.78) 2.35 (0.75,6.94) 18.11 (–5.66,43.42)
B32 PR36-48 2b RGT 4.31 (0.59,31.10) 2.92 (0.66,9.37) 26.15 (–6.77,64.35)
T12 PR48 2a q8 Si12 PR48 2a 3.35 (0.65,17.07) 2.57 (0.73,9.28) 19.10 (–6.81,45.10)
B32 PR36-48 2b RGT 4.79 (0.59,39.51) 3.17 (0.66,12.64) 27.12 (–6.97,65.88)
B32 PR36-48 2b RGT T12 PR48 2a q8 1.44 (0.20,10.26) 1.25 (0.32,3.55) 8.03 (–29.94,49.49)
Random Effects Model
Residual Deviance 10.06 vs. 10 data points
Deviance Information Criteria 66.976
Fixed Effects Model Residual Deviance 10.05 vs. 10 data points
Deviance Information Criteria 66.956
CrI = credible interval; HC = Health Canada; OR = odds ratio; RD = risk difference; RR = relative risk; vs. = versus.
No consistency plot for this analysis.

Direct-Acting Antiviral Agents for Chronic Hepatitis C Genotype 1 309
APPENDIX 23: NMA SECONDARY ANALYSIS RESTRICTED TO HEALTH CANADA DOSAGE REGIMENS
Treatment-Naive TABLE 186: SVR — TREATMENT-NAIVE PATIENTS: ODDS RATIOS, RELATIVE RISKS, AND RISK DIFFERENCE FOR
ALL TREATMENT COMPARISONS AND RANDOM EFFECTS MODEL (HEALTH CANADA DOSES ONLY)
Treatment Reference OR (95% CrI) RR (95% CrI) RD% (95% CrI)
Si12 PR24-48 2a/b RGT PR48 2a/b 3.67 (2.38,5.40) 1.59 (1.40,1.77) 28.85 (20.29,35.62)
T12 PR24-48 2a/b RGT q8 3.80 (2.13,6.74) 1.60 (1.36,1.80) 29.43 (18.06,37.91)
T12 PR24-48 2a/b RGT q12 4.10 (1.89,8.48) 1.62 (1.31,1.85) 30.68 (15.41,40.36)
B24 PR28-48 2b RGT 2.85 (1.62,5.03) 1.49 (1.24,1.71) 24.22 (11.81,33.98)
T12 PR24-48 2a/b RGT q8 Si12 PR24-48 2a/b RGT 1.03 (0.52,2.14) 1.01 (0.85,1.17) 0.56 (–12.02,12.04)
T12 PR24-48 2a/b RGT q12 1.12 (0.47,2.63) 1.02 (0.82,1.19) 1.84 (–14.32,14.18)
B24 PR28-48 2b RGT 0.78 (0.39,1.60) 0.94 (0.77,1.11) –4.60 (–18.32,8.09)
T12 PR24-48 2a/b RGT q12 T12 PR24-48 2a/b RGT q8 1.08 (0.65,1.72) 1.02 (0.89,1.11) 1.19 (–8.09,8.02)
B24 PR28-48 2b RGT 0.75 (0.34,1.69) 0.93 (0.76,1.14) –5.19 (–19.76,9.49)
B24 PR28-48 2b RGT T12 PR24-48 2a/b RGT q12 0.70 (0.28,1.84) 0.92 (0.75,1.17) –6.39 (–
21.54,11.44)
Random Effects Model
Residual Deviance 13.39 vs. 14 data points
Deviance Information Criteria
101.956
Fixed Effects Model Residual Deviance 13.44 vs. 14 data points
Deviance Information Criteria
101.072
CrI = credible interval; HC = Health Canada; OR = odds ratio; RD = risk difference; RR = relative risk; SVR = sustained viral response; vs = versus.
No consistency plot for this analysis.

Direct-Acting Antiviral Agents for Chronic Hepatitis C Genotype 1 310
TABLE 187: RASH — TREATMENT-NAIVE PATIENTS: ODDS RATIOS, RELATIVE RISKS, AND RISK DIFFERENCE FOR
ALL TREATMENT COMPARISONS AND RANDOM EFFECTS MODEL (HEALTH CANADA DOSES ONLY)
Treatment Reference OR (95% CrI) RR (95% CrI) RD% (95% CrI)
Si12 PR24-48 2a/b RGT PR48 2a/b 1.38 (0.81,2.31) 1.28 (0.85,1.84) 5.71 (–3.39,16.30)
T12 PR24-48 2a/b RGT q8 1.80 (0.82,3.89) 1.54 (0.85,2.45) 11.24 (–3.13,29.52)
T12 PR24-48 2a/b RGT q12 1.64 (0.59,4.18) 1.45 (0.65,2.53) 9.33 (–7.38,31.29)
B24 PR28-48 2b RGT 1.14 (0.52,2.51) 1.11 (0.58,1.91) 2.26 (–8.83,18.82)
T12 PR24-48 2a/b RGT q8 Si12 PR24-48 2a/b RGT 1.31 (0.51,3.36) 1.21 (0.61,2.23) 5.51 (–12.37,26.21)
T12 PR24-48 2a/b RGT q12 1.19 (0.38,3.52) 1.14 (0.47,2.25) 3.56 (–16.24,27.52)
B24 PR28-48 2b RGT 0.83 (0.33,2.17) 0.87 (0.42,1.73) –3.41 (–18.49,15.60)
T12 PR24-48 2a/b RGT q12 T12 PR24-48 2a/b RGT q8 0.91 (0.49,1.59) 0.94 (0.59,1.33) –1.87 (–13.23,10.29)
B24 PR28-48 2b RGT 0.64 (0.21,1.95) 0.72 (0.32,1.61) –8.83 (–30.17,12.84)
B24 PR28-48 2b RGT T12 PR24-48 2a/b RGT q12 0.69 (0.21,2.53) 0.77 (0.33,2.01) –6.94 (–31.22,16.34)
Random Effects Model
Residual Deviance 15.21 vs. 14 data points
Deviance Information Criteria
104.299
Fixed Effects Model
Residual Deviance 17.97 vs. 14 data points
Deviance Information Criteria
105.371
CrI = credible interval; HC = Health Canada; OR = odds ratio; RD = risk difference; RR = relative risk; vs. = versus.
No consistency plot for this analysis.
TABLE 188: ANEMIA —TREATMENT-NAIVE PATIENTS: ODDS RATIOS, RELATIVE RISKS, AND RISK DIFFERENCE
FOR ALL TREATMENT COMPARISONS AND RANDOM EFFECTS MODEL (HEALTH CANADA DOSES ONLY)
Treatment Reference OR (95% CrI) RR (95% CrI) RD% (95% CrI)
Si12 PR24-48 2a/b RGT PR48 2a/2b 1.13 (0.71,1.80) 1.10 (0.75,1.59) 1.87 (–5.01,9.87)
T12 PR24-48 2a/b RGT q8 2.46 (1.37,4.41) 1.94 (1.28,2.74) 17.26 (5.23,31.31)
T12 PR24-48 2a/b RGT q12 2.91 (1.43,6.26) 2.15 (1.32,3.21) 21.16 (5.92,40.01)
B24 PR28-48 2b RGT 2.34 (1.32,4.18) 1.88 (1.25,2.66) 16.13 (4.58,30.02)
T12 PR24-48 2a/b RGT q8 Si12 PR24-48 2a/b RGT 2.18 (1.03,4.60) 1.76 (1.02,2.88) 15.36 (0.52,31.24)
T12 PR24-48 2a/b RGT q12 2.58 (1.10,6.34) 1.95 (1.07,3.32) 19.26 (1.70,39.58)
B24 PR28-48 2b RGT 2.08 (1.00,4.37) 1.70 (1.00,2.80) 14.22 (–0.09,30.05)
T12 PR24-48 2a/b RGT q12 T12 PR24-48 2a/b RGT q8 1.18 (0.77,1.92) 1.11 (0.84,1.45) 3.83 (–5.48,15.36)
B24 PR28-48 2b RGT 0.95 (0.42,2.17) 0.97 (0.57,1.65) –1.13 (–19.41,17.22)
B24 PR28-48 2b RGT T12 PR24-48 2a/b RGT q12 0.81 (0.31,2.01) 0.87 (0.49,1.57) –4.98 (–27.26,15.28)
Random Effects Model Residual Deviance 13.28 vs. 14 data points
Deviance Information Criteria
100.803
Fixed Effects Model
Residual Deviance 13.55 vs. 14 data points
Deviance Information Criteria
100.147
CrI = credible interval; HC = Health Canada; OR = odds ratio; RD = risk difference; RR = relative risk; vs. = versus.
No consistency plot for this analysis.

Direct-Acting Antiviral Agents for Chronic Hepatitis C Genotype 1 311
TABLE 189: DEPRESSION — TREATMENT-NAIVE PATIENTS: ODDS RATIOS, RELATIVE RISKS, AND RISK
DIFFERENCE FOR ALL TREATMENT COMPARISONS-RANDOM EFFECTS MODEL (HEALTH CANADA DOSES ONLY)
Treatment Reference OR (95% CI) RR (95% CI) RD% (95 CI)
Si12 PR24-48 2a RGT PR48 2a/b 0.59 (0.23,1.44) 0.64 (0.27,1.33) –7.32 (–16.31,6.04)
T12 PR24-48 2a/b RGT q8 0.79 (0.55,1.14) 0.83 (0.61,1.11) –3.50 (–8.51,2.15)
T12 PR24-48 2a/b RGT q12 0.64 (0.26,1.55) 0.69 (0.31,1.40) –6.25 (–14.69,7.87)
B24 PR28-48 2b RGT 1.05 (0.74,1.49) 1.04 (0.78,1.36) 0.76 (–4.66,6.97)
T12 PR24-48 2a/b RGT q8 Si12 PR24-48 2a RGT 1.35 (0.51,3.74) 1.29 (0.58,3.19) 3.80 (–10.02,14.12)
T12 PR24-48 2a/b RGT q12 1.10 (0.31,3.98) 1.08 (0.36,3.24) 1.05 (–13.91,17.56)
B24 PR28-48 2b RGT 1.79 (0.68,4.89) 1.62 (0.74,3.93) 8.06 (–6.28,19.02)
T12 PR24-48 2a/b RGT q12 T12 PR24-48 2a/b RGT q8 0.81 (0.35,1.82) 0.84 (0.40,1.59) –2.70 (–10.71,10.04)
B24 PR28-48 2b RGT 1.32 (0.80,2.20) 1.25 (0.83,1.89) 4.24 (–3.51,12.10)
B24 PR28-48 2b RGT T12 PR24-48 2a/b RGT q12 1.63 (0.63,4.31) 1.50 (0.71,3.54) 6.94 (–8.01,17.40)
Random Effects Model Residual Deviance 8.064 vs. 8 data points
Deviance Information Criteria 56.695
Fixed Effects Model Residual Deviance 8.064 vs. 8 data points
Deviance Information Criteria 56.695
CrI = credible interval; HC = Health Canada; OR = odds ratio; RD = risk difference; RR = relative risk; vs. = versus.
No consistency plot for this analysis.

Direct-Acting Antiviral Agents for Chronic Hepatitis C Genotype 1 312
TABLE 190: SVR BY GENOTYPES — TREATMENT-NAIVE PATIENTS: ODDS RATIOS, RELATIVE RISKS, AND RISK
DIFFERENCE FOR ALL TREATMENT COMPARISONS / RANDOM EFFECTS MODEL (HEALTH CANADA DOSES ONLY)
Treatment Reference OR (95% CrI) RR (95% CrI) RD% (95% CrI)
PR48 2a/b genotype 1b PR48 2a/b genotype 1a
1.29 (0.92,1.79) 1.15 (0.96,1.36) 6.20 (–2.01,14.40)
Si12 PR24-48 2a/b RGT genotype 1a with Q80K
1.61 (0.91,2.95) 1.28 (0.95,1.65) 11.73 (–2.22,26.21)
Si12 PR24-48 2a/b RGT genotype 1a without Q80K
5.91 (3.40,10.30) 1.92 (1.63,2.22) 38.86 (28.54,47.29)
Si12 PR24-48 2a/b RGT genotype 1b
6.80 (4.19,11.39) 1.96 (1.71,2.26) 40.89 (32.38,48.53)
T12 PR24-48 2a RGT q8 genotype 1a
3.57 (2.20,5.74) 1.71 (1.44,1.98) 29.96 (19.36,38.94)
T12 PR24-48 2a RGT q8 genotype 1b
5.36 (3.24,8.94) 1.88 (1.62,2.15) 37.27 (27.78,45.27)
T12 PR24-48 2a RGT q12 genotype 1a
3.63 (1.88,7.08) 1.71 (1.36,2.05) 30.29 (15.63,41.99)
T12 PR24-48 2a RGT q12 genotype 1b
6.51 (3.21,13.24) 1.95 (1.63,2.25) 40.21 (27.70,49.17)
B24 PR28-48 2b RGT genotype 1a
2.72 (1.61,4.60) 1.57 (1.27,1.88) 24.26 (11.74,35.17)
B24 PR28-48 2b RGT genotype 1b
3.73 (2.13,6.56) 1.73 (1.42,2.03) 30.81 (18.57,41.03)
Si12 PR24-48 2a/b RGT genotype 1a with Q80K
PR48 2a/b genotype 1b
1.25 (0.71,2.29) 1.11 (0.84,1.44) 5.48 (–8.40,20.05)
Si12 PR24-48 2a/b RGT genotype 1a without Q80K
4.60 (2.66,8.02) 1.67 (1.42,1.97) 32.56 (22.16,41.84)
Si12 PR24-48 2a/b RGT genotype 1b
5.30 (3.25,8.86) 1.71 (1.48,2.01) 34.62 (25.50,43.21)
T12 PR24-48 2a RGT q8 genotype 1a
2.78 (1.70,4.53) 1.49 (1.25,1.76) 23.71 (12.81,33.49)
T12 PR24-48 2a RGT q8 genotype 1b
4.17 (2.47,7.07) 1.64 (1.39,1.93) 31.05 (20.72,40.05)
T12 PR24-48 2a RGT q12 genotype 1a
2.83 (1.44,5.57) 1.49 (1.18,1.82) 24.08 (9.01,36.38)
T12 PR24-48 2a RGT q12 genotype 1b
5.07 (2.46,10.48) 1.70 (1.40,2.02) 33.93 (20.81,44.16)
B24 PR28-48 2b RGT genotype 1a
2.12 (1.25,3.61) 1.37 (1.11,1.66) 18.02 (5.49,29.40)
B24 PR28-48 2b RGT genotype 1b
2.90 (1.64,5.18) 1.50 (1.23,1.80) 24.54 (11.98,35.47)
Si12 PR24-48 2a/b RGT genotype 1a without Q80K
Si12 PR24-48 2a/b RGT genotype 1a with Q80K
3.69 (1.87,7.12) 1.50 (1.19,1.95) 26.99 (12.64,40.43)
Si12 PR24-48 2a/b RGT genotype 1b
4.24 (2.25,7.93) 1.54 (1.24,2.00) 29.04 (15.57,42.18)
T12 PR24-48 2a RGT q8 genotype 1a
2.23 (1.06,4.43) 1.34 (1.02,1.79) 18.18 (1.22,33.55)
T12 PR24-48 2a RGT q8 genotype 1b
3.36 (1.55,6.84) 1.47 (1.14,1.95) 25.56 (9.15,40.20)
T12 PR24-48 2a RGT q12 genotype 1a
2.27 (0.94,5.16) 1.34 (0.98,1.82) 18.51 (–1.45,35.48)
T12 PR24-48 2a RGT q12 genotype 1b
4.08 (1.62,9.83) 1.52 (1.16,2.03) 28.33 (10.12,43.89)
B24 PR28-48 2b RGT genotype 1a
1.69 (0.79,3.53) 1.23 (0.91,1.68) 12.43 (–5.59,29.23)

Direct-Acting Antiviral Agents for Chronic Hepatitis C Genotype 1 313
Treatment Reference OR (95% CrI) RR (95% CrI) RD% (95% CrI)
B24 PR28-48 2b RGT genotype 1b
2.32 (1.06,4.98) 1.35 (1.02,1.82) 18.92 (1.35,35.27)
Si12 PR24-48 2a/b RGT genotype 1b
Si12 PR24-48 2a/b RGT genotype 1a without Q80K
1.15 (0.63,2.11) 1.03 (0.92,1.15) 2.02 (–6.40,11.27)
T12 PR24-48 2a RGT q8 genotype 1a
0.60 (0.30,1.20)
0.89 (0.75,1.04)
–8.82 (–21.15,3.27)
T12 PR24-48 2a RGT q8 genotype 1b
0.91 (0.44,1.85) 0.98 (0.85,1.13) –1.50 (–12.94,9.66)
T12 PR24-48 2a RGT q12 genotype 1a
0.61 (0.26,1.41) 0.90 (0.71,1.08) –8.46 (–24.65,5.67)
T12 PR24-48 2a RGT q12 genotype 1b
1.10 (0.46,2.64) 1.02 (0.85,1.18) 1.39 (–12.67,13.42)
B24 PR28-48 2b RGT genotype 1a
0.46 (0.22,0.95) 0.82 (0.66,0.99) –14.52 (–28.43,–0.96)
B24 PR28-48 2b RGT genotype 1b
0.63 (0.30,1.35) 0.90 (0.74,1.07) –8.01 (–21.65,5.12)
T12 PR24-48 2a RGT q8 genotype 1a
Si12 PR24-48 2a/b RGT genotype 1b
0.52 (0.27,0.99) 0.87 (0.74,1.00) –10.85 (–22.63,–0.18)
T12 PR24-48 2a RGT q8 genotype 1b
0.79 (0.39,1.52) 0.96 (0.83,1.08) –3.56 (–14.48,6.16)
T12 PR24-48 2a RGT q12 genotype 1a
0.53 (0.24,1.17) 0.87 (0.69,1.03) –10.49 (–26.51,2.37)
T12 PR24-48 2a RGT q12 genotype 1b
0.96 (0.41,2.20) 0.99 (0.83,1.13) –0.58 (–14.29,9.97)
B24 PR28-48 2b RGT genotype 1a
0.40 (0.20,0.79) 0.80 (0.65,0.95) –16.59 (–30.00,–4.08)
B24 PR28-48 2b RGT genotype 1b
0.55 (0.26,1.11) 0.88 (0.73,1.02) –10.01 (–23.30,1.62)
T12 PR24-48 2a RGT q8 genotype 1b
T12 PR24-48 2a RGT q8 genotype 1a
1.50 (0.98,2.33) 1.10 (0.99,1.24) 7.24 (–0.41,15.40)
T12 PR24-48 2a RGT q12 genotype 1a
1.02 (0.60,1.74) 1.01 (0.85,1.15) 0.34 (–10.86,10.09)
T12 PR24-48 2a RGT q12 genotype 1b
1.82 (1.02,3.31) 1.14 (1.01,1.29) 10.11 (0.34,18.99)
B24 PR28-48 2b RGT genotype 1a
0.76 (0.39,1.51) 0.92 (0.74,1.13) –5.67 (–20.13,8.51)
B24 PR28-48 2b RGT genotype 1b
1.04 (0.51,2.13) 1.01 (0.82,1.22) 0.83 (–13.45,14.55)
T12 PR24-48 2a RGT q12 genotype 1a
T12 PR24-48 2a RGT q8 genotype 1b
0.68 (0.39,1.18) 0.91 (0.76,1.04) –6.90 (–18.57,2.70)
T12 PR24-48 2a RGT q12 genotype 1b
1.21 (0.66,2.26) 1.04 (0.91,1.15) 2.87 (–6.99,11.34)
B24 PR28-48 2b RGT genotype 1a
0.51 (0.25,1.02) 0.84 (0.68,1.01) –12.94 (–26.81,0.34)
B24 PR28-48 2b RGT genotype 1b
0.69 (0.34,1.44) 0.92 (0.76,1.09) –6.46 (–19.98,6.34)
T12 PR24-48 2a RGT q12 genotype 1b
T12 PR24-48 2a RGT q12 genotype 1a
1.79 (0.97,3.34) 1.13 (0.99,1.34) 9.68 (–0.56,21.09)
B24 PR28-48 2b RGT genotype 1a
0.75 (0.33,1.70) 0.92 (0.72,1.19) –6.05 (–22.15,11.47)
B24 PR28-48 2b RGT genotype 1b
1.02 (0.44,2.39) 1.01 (0.81,1.29) 0.47 (–15.51,17.49)
B24 PR28-48 2b RGT genotype 1a
T12 PR24-48 2a RGT q12 genotype 1b
0.42 (0.18,0.98) 0.81 (0.65,1.00) –15.83 (–30.28,–0.31)

Direct-Acting Antiviral Agents for Chronic Hepatitis C Genotype 1 314
Treatment Reference OR (95% CrI) RR (95% CrI) RD% (95% CrI)
B24 PR28-48 2b RGT genotype 1b
0.57 (0.23,1.38) 0.89 (0.73,1.08) –9.30 (–23.74,5.76)
B24 PR28-48 2b RGT genotype 1b
B24 PR28-48 2b RGT genotype 1a
1.37 (0.75,2.51) 1.10 (0.92,1.33) 6.47 (-5.94,18.84)
Random Effects Model
Residual Deviance 22.19 vs. 22 data points
Deviance Information Criteria
147.948
Fixed Effects Model Residual Deviance 22.5 vs. 22 data points
Deviance Information Criteria
146.717
CrI = credible interval; HC = Health Canada; OR = odds ratio; RD = risk difference; RR = relative risk; SVR = sustained viral response; vs. = versus.

Direct-Acting Antiviral Agents for Chronic Hepatitis C Genotype 1 315
FIGURE 64: SVR BY GENOTYPES — TREATMENT-NAIVE PATIENTS: PLOT OF POSTERIOR MEAN DEVIANCE OF THE
INDIVIDUAL DATA POINTS IN THE INCONSISTENCY MODEL AGAINST THEIR POSTERIOR MEAN DEVIANCE IN THE
CONSISTENCY MODEL (HEALTH CANADA DOSES ONLY)

Direct-Acting Antiviral Agents for Chronic Hepatitis C Genotype 1 316
Treatment-Experienced a) All Treatment-Experienced
TABLE 191: SVR — ALL TREATMENT-EXPERIENCED PATIENTS: ODDS RATIOS, RELATIVE RISKS, AND RISK
DIFFERENCE FOR ALL TREATMENT COMPARISONS-RANDOM EFFECTS MODEL (HEALTH CANADA DOSES ONLY)
Treatment Reference OR (95% CrI) RR (95% CrI) RD% (95% CrI)
Si12 PR24-48 2a RGT PR48 2a/b 6.62 (2.43,18.46) 2.85 (1.81,3.80) 43.40 (19.12,61.49)
Si12 PR48 2a 6.95 (2.23,22.70) 2.89 (1.71,4.04) 44.50 (17.37,64.30)
T12 PR48 2a q8 9.13 (3.26,25.81) 3.13 (2.09,4.08) 50.10 (26.59,65.51)
B32 PR36-48 2b RGT 5.33 (1.84,15.97) 2.63 (1.52,3.76) 38.48 (12.73,59.59)
Si12 PR48 2a Si12 PR24-48 2a RGT 1.05 (0.23,4.92) 1.02 (0.60,1.68) 1.08 (–30.37,31.44)
T12 PR48 2a q8 1.38 (0.32,5.89) 1.10 (0.71,1.76) 6.55 (–21.87,34.35)
B32 PR36-48 2b RGT 0.81 (0.18,3.60) 0.93 (0.53,1.57) –4.78 (–35.53,26.48)
T12 PR48 2a q8 Si12 PR48 2a 1.31 (0.28,6.11) 1.08 (0.70,1.81) 5.39 (–24.01,35.56)
B32 PR36-48 2b RGT 0.77 (0.16,3.70) 0.91 (0.51,1.61) –5.90 (–38.24,27.83)
B32 PR36-48 2b RGT T12 PR48 2a q8 0.58 (0.13,2.63) 0.85 (0.49,1.35) –11.38 (–40.91,19.15)
Random Effects Model
Residual Deviance 8.041 vs. 8 data points
Deviance Information Criteria 56.429
Fixed Effects Model Residual Deviance 8.049 vs. 8 data points
Deviance Information Criteria 56.436
CrI = credible interval; HC = Health Canada; OR = odds ratio; RD = risk difference; RR = relative risk; SVR = sustained viral response; vs. = versus.
No consistency plot for this analysis.
TABLE 192: RASH — ALL TREATMENT-EXPERIENCED PATIENTS: ODDS RATIOS, RELATIVE RISKS, AND RISK
DIFFERENCE FOR ALL TREATMENT COMPARISONS AND RANDOM EFFECTS MODEL (HEALTH CANADA DOSES ONLY)
Treatment Reference OR (95% CrI) RR (95% CrI) RD% (95% CrI)
Si12 PR24-48 2a RGT PR48 2a/b 1.04 (0.37,2.91) 1.03 (0.40,2.31) 0.44 (–8.61,17.74)
Si12 PR48 2a 1.59 (0.47,5.45) 1.47 (0.51,3.47) 6.43 (–7.34,31.92)
T12 PR48 2a q8 2.56 (0.92,7.33) 2.10 (0.93,3.98) 15.28 (–0.97,39.97)
B32 PR36-48 2b RGT 4.03 (1.06,19.60) 2.82 (1.05,6.33) 25.55 (0.80,59.96)
Si12 PR48 2a Si12 PR24-48 2a RGT 1.53 (0.32,7.56) 1.42 (0.39,4.89) 5.86 (–15.37,32.01)
T12 PR48 2a q8 2.47 (0.58,10.76) 2.03 (0.66,6.12) 14.51 (–8.22,39.91)
B32 PR36-48 2b RGT 3.91 (0.73,25.54) 2.72 (0.80,9.21) 24.68 (–4.98,59.80)
T12 PR48 2a q8 Si12 PR48 2a 1.62 (0.33,8.01) 1.43 (0.46,4.74) 8.61 (–20.66,36.38)
B32 PR36-48 2b RGT 2.55 (0.41,18.79) 1.92 (0.54,7.09) 18.50 (–16.86,56.66)
B32 PR36-48 2b RGT T12 PR48 2a q8 1.58 (0.29,10.47) 1.34 (0.44,4.08) 9.90 (–25.11,49.36)
Random Effects Model
Residual Deviance 8.09 vs. 8 data points
Deviance Information Criteria 54.286
Fixed Effects Model Residual Deviance 8.06 vs. 8 data points
Deviance Information Criteria 54.22
CrI = credible interval; HC = Health Canada; OR = odds ratio; RD = risk difference; RR = relative risk; vs. = versus.
No consistency plot for this analysis.

Direct-Acting Antiviral Agents for Chronic Hepatitis C Genotype 1 317
TABLE 193: ANEMIA — ALL TREATMENT-EXPERIENCED PATIENTS: ODDS RATIOS, RELATIVE RISKS, AND RISK
DIFFERENCE FOR ALL TREATMENT COMPARISONS AND RANDOM EFFECTS MODEL (HEALTH CANADA DOSES ONLY)
Treatment Reference OR (95% CrI) RR (95% CrI) RD% (95% CrI)
Si12 PR24-48 2a RGT PR48 2a/b 0.81 (0.27,2.37) 0.84 (0.32,1.90) –3.01 (–13.03,16.10)
Si12 PR48 2a 0.73 (0.20,2.65) 0.76 (0.23,2.06) –4.32 (–15.09,18.26)
T12 PR48 2a q8 2.41 (0.82,7.25) 1.91 (0.85,3.46) 16.70 (–2.88,43.19)
B32 PR36-48 2b RGT 3.11 (1.01,9.63) 2.24 (1.01,3.88) 22.70 (0.22,49.60)
Si12 PR48 2a Si12 PR24-48 2a RGT 0.90 (0.17,4.94) 0.92 (0.22,3.65) –1.23 (–22.26,22.50)
T12 PR48 2a q8 2.99 (0.65,13.80) 2.28 (0.73,6.78) 19.35 (–7.00,46.53)
B32 PR36-48 2b RGT 3.86 (0.82,18.50) 2.66 (0.87,7.89) 25.27 (–3.34,53.27)
T12 PR48 2a q8 Si12 PR48 2a 3.32 (0.63,17.88) 2.48 (0.72,9.09) 20.50 (–8.05,48.21)
B32 PR36-48 2b RGT 4.30 (0.77,23.77) 2.91 (0.84,10.50) 26.44 (–4.58,55.02)
B32 PR36-48 2b RGT T12 PR48 2a q8 1.29 (0.27,6.13) 1.17 (0.46,2.99) 5.83 (–27.92,38.46)
Random Effects Model
Residual Deviance 8.074 vs. 8 data points
Deviance Information Criteria 55.102
Fixed Effects Model Residual Deviance 8.064 vs. 8 data points
Deviance Information Criteria 55.087
CrI = credible interval; HC = Health Canada; OR = odds ratio; RD = risk difference; RR = relative risk; vs. = versus.
No consistency plot for this analysis.
TABLE 194: DEPRESSION — ALL TREATMENT-EXPERIENCED PATIENTS: ODDS RATIOS, RELATIVE RISKS, AND RISK
DIFFERENCE FOR ALL TREATMENT COMPARISONS AND RANDOM EFFECTS MODEL (HEALTH CANADA DOSES ONLY)
Treatment Reference OR (95% CrI) RR (95% CrI) RD% (95% CrI)
Si12 PR48 2a PR48 2a/b 1.83 (0.45,8.09) 1.66 (0.49,4.74) 8.05 (–7.14,37.70)
T12 PR48 2a q8 0.59 (0.20,1.83) 0.62 (0.22,1.67) –4.47 (–10.68,7.77)
B32 PR36-48 2b RGT 0.80 (0.25,2.67) 0.82 (0.28,2.25) –2.16 (–10.01,13.81)
T12 PR48 2a q8 Si12 PR48 2a 0.32 (0.05,1.95) 0.38 (0.09,1.78) –12.31 (–41.41,6.33)
B32 PR36-48 2b RGT 0.43 (0.07,2.81) 0.49 (0.11,2.39) –9.95 (–39.73,11.73)
B32 PR36-48 2b RGT T12 PR48 2a q8 1.34 (0.26,6.93) 1.31 (0.31,5.52) 2.25 (–11.29,18.43)
Random Effects Model
Residual Deviance 6.132 vs. 6 data points
Deviance Information Criteria 38.182
Fixed Effects Model Residual Deviance 6.079 vs. 6 data points
Deviance Information Criteria 38.08
CrI = credible interval; HC = Health Canada; OR = odds ratio; RD = risk difference; RR = relative risk; vs. = versus.
No consistency plot for this analysis.

Direct-Acting Antiviral Agents for Chronic Hepatitis C Genotype 1 318
TABLE 195: SVR FOR FIBROSIS SCORE F0-F2 — ALL TREATMENT-EXPERIENCED PATIENTS: ODDS RATIOS, RELATIVE RISKS, AND RISK DIFFERENCE FOR ALL TREATMENT COMPARISONS AND RANDOM EFFECTS MODEL
(HEALTH CANADA DOSES ONLY)
Treatment Reference OR (95% CrI) RR (95% CrI) RD% (95% CrI)
Si12 PR24-48 2a RGT PR48 2a/b 6.70 (2.34,19.64) 2.60 (1.68,3.49) 44.07 (19.58,60.89)
T12 PR48 2a q8 9.45 (3.12,28.87) 2.83 (1.91,3.80) 50.50 (26.97,65.20)
B32 PR36-48 2b RGT 6.64 (2.17,21.16) 2.59 (1.61,3.63) 43.92 (17.89,62.21)
T12 PR48 2a q8 Si12 PR24-48 2a RGT 1.41 (0.30,6.58) 1.09 (0.73,1.69) 6.22 (–21.44,34.06)
B32 PR36-48 2b RGT 0.99 (0.21,4.71) 1.00 (0.62,1.59) –0.14 (–30.22,29.39)
B32 PR36-48 2b RGT T12 PR48 2a q8 0.71 (0.14,3.45) 0.92 (0.58,1.38) –6.36 (–35.57,22.16)
Random Effects Model
Residual Deviance 6.058 vs. 6 data points
Deviance Information Criteria 41.013
Fixed Effects Model Residual Deviance 6.043 vs. 6 data points
Deviance Information Criteria 40.986
CrI=credible interval; HC = Health Canada; OR = odds ratio; RD = risk difference; RR = relative risk; SVR = sustained viral response; vs. = versus.
No consistency plot for this analysis.
TABLE 196: SVR FOR FIBROSIS SCORE F3-F4 — ALL TREATMENT-EXPERIENCED PATIENTS: ODDS RATIOS, RELATIVE RISKS, AND RISK DIFFERENCE FOR ALL TREATMENT COMPARISONS AND RANDOM EFFECTS MODEL
(HEALTH CANADA DOSES ONLY)
Treatment Reference OR (95% CrI) RR (95% CrI) RD% (95% CrI)
Si12 PR24-48 2a RGT PR48 2a/b 9.44 (2.64,36.56) 4.27 (2.06,8.16) 45.77 (15.90,70.52)
T12 PR48 2a q8 13.48 (3.89,52.89) 4.83 (2.55,9.19) 53.84 (24.81,75.01)
B32 PR36-48 2b RGT 5.78 (0.96,56.28) 3.42 (0.97,10.49) 34.12 (–0.61,74.66)
T12 PR48 2a q8 Si12 PR24-48 2a RGT 1.43 (0.23,9.18) 1.13 (0.58,2.44) 7.85 (–30.68,45.56)
B32 PR36-48 2b RGT 0.62 (0.07,8.39) 0.81 (0.25,2.40) –11.55 (–56.75,44.58)
B32 PR36-48 2b RGT T12 PR48 2a q8 0.43 (0.04,5.61) 0.71 (0.22,1.85) –19.36 (–62.75,35.59)
Random Effects Model
Residual Deviance 6.072 vs. 6 data points
Deviance Information Criteria 35.58
Fixed Effects Model Residual Deviance 6.143 vs. 6 data points
Deviance Information Criteria 35.715
CrI = credible interval; HC = Health Canada; OR = odds ratio; RD = risk difference; RR = relative risk; SVR = sustained viral response; vs. = versus.
No consistency plot for this analysis.

Direct-Acting Antiviral Agents for Chronic Hepatitis C Genotype 1 319
TABLE 197: SVR BY GENOTYPES — ALL TREATMENT-EXPERIENCED PATIENTS: ODDS RATIOS, RELATIVE RISKS, AND RISK DIFFERENCE FOR ALL TREATMENT COMPARISONS AND RANDOM EFFECTS MODEL (HEALTH CANADA
DOSES ONLY)
Treatment Reference OR (95% CrI) RR (95% CrI) RD% (95% CrI)
PR48 2a/b genotype 1b PR48 2a/b genotype 1a 1.01 (0.44,2.14) 1.01 (0.52,1.73) 0.20 (–13.19,15.25)
Si12 PR24-48 2a RGT genotype 1a with Q80l
1.55 (0.44,5.55) 1.36 (0.51,2.74) 8.86 (–12.75,39.20)
Si12 PR24-48 2a RGT genotype 1a without Q80l
6.63 (2.11,22.19) 2.77 (1.62,4.10) 43.50 (16.44,63.65)
Si12 PR24-48 2a RGT genotype 1b
11.05 (3.58,34.78) 3.16 (2.09,4.46) 53.40 (29.45,68.16)
T12 PR48 2a q8 genotype 1a
6.32 (2.07,19.99) 2.72 (1.60,4.05) 42.47 (15.94,62.45)
T12 PR48 2a q8 genotype 1b
13.48 (4.26,43.25) 3.29 (2.22,4.64) 56.58 (33.83,70.13)
B32 PR36-48 2b RGT genotype 1a
3.45 (1.02,11.25) 2.15 (1.02,3.55) 28.12 (0.38,53.67)
B32 PR36-48 2b RGT genotype 1b
6.56 (1.94,21.36) 2.76 (1.55,4.14) 43.29 (14.57,63.36)
Si12 PR24-48 2a RGT genotype 1a with Q80l
PR48 2a/b genotype 1b 1.53 (0.46,5.65) 1.35 (0.54,2.94) 8.55 (–12.72,37.71)
Si12 PR24-48 2a RGT genotype 1a without Q80l
6.56 (2.21,22.44) 2.72 (1.58,4.93) 42.95 (17.20,63.30)
Si12 PR24-48 2a RGT genotype 1b
10.94 (3.78,35.49) 3.12 (1.93,5.54) 52.79 (29.89,68.95)
T12 PR48 2a q8 genotype 1a
6.24 (2.10,20.99) 2.68 (1.53,4.91) 41.89 (16.15,62.58)
T12 PR48 2a q8 genotype 1b
13.31 (4.37,45.06) 3.25 (2.00,5.81) 55.92 (33.25,71.38)
B32 PR36-48 2b RGT genotype 1a
3.39 (1.06,11.73) 2.11 (1.04,4.09) 27.51 (1.23,53.01)
B32 PR36-48 2b RGT genotype 1b
6.46 (2.00,22.43) 2.71 (1.50,4.98) 42.65 (15.14,63.62)
Si12 PR24-48 2a RGT genotype 1a without Q80l
Si12 PR24-48 2a RGT genotype 1a with Q80l
4.30 (1.12,16.99) 2.01 (1.05,4.79) 33.57 (2.41,58.50)
Si12 PR24-48 2a RGT genotype 1b
7.16 (1.88,27.06) 2.31 (1.23,5.55) 43.51 (13.08,65.48)
T12 PR48 2a q8 genotype 1a
4.08 (0.82,20.48) 1.98 (0.92,5.24) 32.86 (–4.60,61.58)
T12 PR48 2a q8 genotype 1b
8.70 (1.73,43.37) 2.41 (1.19,6.24) 46.95 (11.46,71.53)
B32 PR36-48 2b RGT genotype 1a
2.22 (0.42,11.58) 1.56 (0.62,4.32) 18.60 (–19.65,51.52)
B32 PR36-48 2b RGT genotype 1b
4.22 (0.80,21.97) 2.00 (0.91,5.30) 33.49 (–5.15,62.64)
Si12 PR24-48 2a RGT genotype 1b
Si12 PR24-48 2a RGT genotype 1a without Q80l
1.67 (0.48,5.78) 1.14 (0.83,1.74) 9.54 (–13.30,33.69)
T12 PR48 2a q8 genotype 1a
0.95 (0.20,4.38) 0.98 (0.58,1.67) –1.15 (–32.38,30.64)
T12 PR48 2a q8 genotype 1b
2.03 (0.42,9.26) 1.19 (0.81,1.95) 12.66 (–14.93,40.94)

Direct-Acting Antiviral Agents for Chronic Hepatitis C Genotype 1 320
Treatment Reference OR (95% CrI) RR (95% CrI) RD% (95% CrI)
B32 PR36-48 2b RGT genotype 1a
0.52 (0.10,2.43) 0.78 (0.38,1.41) –15.15 (–
47.79,19.45)
B32 PR36-48 2b RGT genotype 1b
0.98 (0.20,4.59) 0.99 (0.57,1.69) –0.40 (–32.89,31.26)
T12 PR48 2a q8 genotype 1a
Si12 PR24-48 2a RGT genotype 1b
0.57 (0.12,2.61) 0.86 (0.53,1.30) –10.82 (–
39.42,17.90)
T12 PR48 2a q8 genotype 1b
1.21 (0.26,5.55) 1.04 (0.74,1.49) 2.97 (–21.64,28.15)
B32 PR36-48 2b RGT genotype 1a
0.31 (0.06,1.44) 0.68 (0.34,1.12) –24.97 (–54.63,7.34)
B32 PR36-48 2b RGT genotype 1b
0.59 (0.12,2.76) 0.87 (0.51,1.32) –10.03 (–
40.05,18.82)
T12 PR48 2a q8 genotype 1b
T12 PR48 2a q8 genotype 1a
2.13 (0.66,6.84) 1.20 (0.91,1.81) 13.65 (–7.10,35.86)
B32 PR36-48 2b RGT genotype 1a
0.54 (0.11,2.50) 0.79 (0.38,1.43) –14.15 (–
46.97,20.30)
B32 PR36-48 2b RGT genotype 1b
1.03 (0.21,4.87) 1.01 (0.58,1.72) 0.70 (–32.16,32.27)
B32 PR36-48 2b RGT genotype 1a
T12 PR48 2a q8 genotype 1b
0.26 (0.05,1.21) 0.65 (0.33,1.06) –28.05 (–57.19,3.71)
B32 PR36-48 2b RGT genotype 1b
0.48 (0.10,2.32) 0.84 (0.50,1.23) –13.03 (–
42.46,14.81)
B32 PR36-48 2b RGT genotype 1b
B32 PR36-48 2b RGT genotype 1a
1.90 (0.56,6.59) 1.28 (0.80,2.30) 14.56 (–12.49,40.37)
Random Effects Model Residual Deviance 14.52 vs. 13 data points
Deviance Information Criteria
83.845
Fixed Effects Model Residual Deviance 17.16 vs. 13 data points
Deviance Information Criteria
85.309
CrI = credible interval; HC = Health Canada; OR = odds ratio; RD = risk difference; RR = relative risk; SVR = sustained viral response; vs.-versus.

Direct-Acting Antiviral Agents for Chronic Hepatitis C Genotype 1 321
FIGURE 65: SVR BY GENOTYPES — ALL TREATMENT-EXPERIENCED PATIENTS: PLOT OF POSTERIOR MEAN
DEVIANCE OF THE INDIVIDUAL DATA POINTS IN THE INCONSISTENCY MODEL AGAINST THEIR POSTERIOR MEAN
DEVIANCE IN THE CONSISTENCY MODEL (HEALTH CANADA DOSES ONLY)
b) Relapsed
TABLE 198: SVR — TREATMENT-EXPERIENCED PATIENTS WITH PRIOR RELAPSE: ODDS RATIOS, RELATIVE RISKS, AND RISK DIFFERENCE FOR ALL TREATMENT COMPARISONS AND RANDOM EFFECTS MODEL (HEALTH CANADA
DOSES ONLY)
Treatment Reference OR (95% CrI) RR (95% CrI) RD% (95% CrI)
Si12 PR24-48 2a RGT PR48 2a/b 6.60 (2.37,18.75) 2.31 (1.61,3.05) 43.22 (20.71,57.89)
B32 PR36-48 2b RGT 5.30 (1.69,17.09) 2.18 (1.35,3.12) 39.13 (12.58,58.01)
B32 PR36-48 2b RGT Si12 PR24-48 2a RGT 0.80 (0.17,3.77) 0.95 (0.61,1.42) –4.06 (–32.53,24.05)
Random Effects Model Residual Deviance 4.031 vs. 4 data points
Deviance Information Criteria 28.101
Fixed Effects Model Residual Deviance 4.023 vs. 4 data points
Deviance Information Criteria 28.08
CrI = credible interval; HC = Health Canada; OR = odds ratio; RD = risk difference; RR = relative risk; SVR = sustained viral response; vs. = versus.
No consistency plot for this analysis.

Direct-Acting Antiviral Agents for Chronic Hepatitis C Genotype 1 322
TABLE 199: SVR FOR FIBROSIS SCORE F3-F4 —TREATMENT-EXPERIENCED PATIENTS WITH PRIOR RELAPSE:
ODDS RATIOS, RELATIVE RISKS, AND RISK DIFFERENCE FOR ALL TREATMENT COMPARISONS AND RANDOM
EFFECTS MODEL (HEALTH CANADA DOSES ONLY)
Treatment Reference OR (95% CrI) RR (95% CrI) RD% (95% CrI)
Si12 PR24-48 2a RGT PR48 2a/b 9.34 (2.67,36.32) 3.40 (1.79,7.24) 48.38 (19.28,69.64)
B32 PR36-48 2b RGT 4.80 (0.68,47.70) 2.67 (0.76,9.10) 33.99 (–7.39,72.87)
B32 PR36-48 2b RGT Si12 PR24-48 2a RGT 0.51 (0.05,6.93) 0.79 (0.26,2.07) –14.95 (–61.20,40.45)
Random Effects Model Residual Deviance 4.133 vs. 4 data points
Deviance Information Criteria 22.439
Fixed Effects Model Residual Deviance 4.152 vs. 4 data points
Deviance Information Criteria 22.475
CrI = credible interval; HC = Health Canada; OR = odds ratio; RD = risk difference; RR = relative risk; SVR = sustained viral response; vs. = versus.
No consistency plot for this analysis.
TABLE 200: SVR BY GENOTYPES — TREATMENT-EXPERIENCED PATIENTS WITH PRIOR RELAPSE: ODDS RATIOS, RELATIVE RISKS, AND RISK DIFFERENCE FOR ALL TREATMENT COMPARISONS AND RANDOM EFFECTS MODEL
(HEALTH CANADA DOSES ONLY)
Treatment Reference OR (95% CrI) RR (95% CrI) RD% (95% CrI)
PR48 2a/b genotype 1b PR48 2a/b genotype 1a
1.29 (0.45,3.07) 1.19 (0.55,2.09) 5.16 (–14.06,24.57)
Si12 PR24-48 2a RGT genotype 1a with Q80l
1.77 (0.48,6.28) 1.46 (0.57,2.80) 12.46 (–13.05,42.16)
Si12 PR24-48 2a RGT genotype 1a without Q80l
7.61 (2.26,24.92) 2.69 (1.61,4.09) 46.34 (18.89,64.03)
Si12 PR24-48 2a RGT genotype 1b 12.60 (3.85,39.86) 3.00 (1.96,4.47) 54.82 (31.86,68.52)
T12 PR48 2a q8 genotype 1a 14.57 (4.03,52.14) 3.08 (1.98,4.67) 56.83 (33.02,71.11)
T12 PR48 2a q8 genotype 1b 24.67 (6.64,91.58) 3.29 (2.23,4.93) 62.52 (43.14,74.43)
Si12 PR24-48 2a RGT genotype 1a with Q80l
PR48 2a/b genotype 1b
1.38 (0.42,5.00) 1.23 (0.54,2.56) 7.20 (–17.10,35.69)
Si12 PR24-48 2a RGT genotype 1a without Q80l
5.92 (2.02,20.38) 2.25 (1.38,4.22) 40.67 (15.66,60.58)
Si12 PR24-48 2a RGT genotype 1b 9.79 (3.43,32.80) 2.52 (1.60,4.73) 49.15 (26.77,66.34)
T12 PR48 2a q8 genotype 1a 11.37 (3.34,44.28) 2.58 (1.58,4.99) 51.24 (26.49,69.56)
T12 PR48 2a q8 genotype 1b 19.15 (5.55,77.24) 2.76 (1.74,5.35) 56.98 (35.05,73.59)
Si12 PR24-48 2a RGT genotype 1a without Q80l
Si12 PR24-48 2a RGT genotype 1a with Q80l
4.29 (1.14,16.50) 1.84 (1.05,4.09) 32.98 (2.77,57.70)
Si12 PR24-48 2a RGT genotype 1b 7.12 (1.95,27.02) 2.06 (1.19,4.63) 41.65 (12.40,64.32)
T12 PR48 2a q8 genotype 1a 8.28 (1.56,44.90) 2.11 (1.14,5.08) 43.85 (8.76,70.39)
T12 PR48 2a q8 genotype 1b 14.00 (2.61,75.95) 2.25 (1.25,5.43) 49.67 (16.64,74.34)
Si12 PR24-48 2a RGT genotype 1b Si12 PR24-48 2a RGT genotype 1a without Q80l
1.66 (0.49,5.65) 1.11 (0.86,1.59) 8.27 (–11.30,30.05)
T12 PR48 2a q8 genotype 1a 1.91 (0.39,9.72) 1.14 (0.82,1.75) 10.17 (–15.03,37.48)
T12 PR48 2a q8 genotype 1b 3.23 (0.64,16.47) 1.21 (0.93,1.86) 15.77 (–5.93,41.75)

Direct-Acting Antiviral Agents for Chronic Hepatitis C Genotype 1 323
Treatment Reference OR (95% CrI) RR (95% CrI) RD% (95% CrI)
T12 PR48 2a q8 genotype 1a Si12 PR24-48 2a RGT genotype 1b
1.15 (0.24,5.81) 1.02 (0.76,1.39) 1.88 (–20.88,24.76)
T12 PR48 2a q8 genotype 1b 1.95 (0.39,9.85) 1.09 (0.87,1.46) 7.44 (–11.18,28.83)
T12 PR48 2a q8 genotype 1b T12 PR48 2a q8 genotype 1a
1.68 (0.44,6.50) 1.06 (0.90,1.36) 5.39 (–9.21,23.37)
Random Effects Model
Residual Deviance 10.1 vs. 9 data points
Deviance Information Criteria
56.23
Fixed Effects Model
Residual Deviance 11.21 vs. 9 data points
Deviance Information Criteria
56.774
CrI = credible interval; HC = Health Canada; OR = odds ratio; RD = risk difference; RR = relative risk; SVR = sustained viral response; vs. = versus.
FIGURE 66: SVR BY GENOTYPES — TREATMENT-EXPERIENCED PATIENTS WITH PRIOR RELAPSE: PLOT OF
POSTERIOR MEAN DEVIANCE OF THE INDIVIDUAL DATA POINTS IN THE INCONSISTENCY MODEL AGAINST THEIR
POSTERIOR MEAN DEVIANCE IN THE CONSISTENCY MODEL (HEALTH CANADA DOSES ONLY)

Direct-Acting Antiviral Agents for Chronic Hepatitis C Genotype 1 324
c) Partial Responder
TABLE 201: SVR — TREATMENT-EXPERIENCED PATIENTS WITH PRIOR PARTIAL RESPONSE: ODDS RATIOS, RELATIVE RISKS, AND RISK DIFFERENCE FOR ALL TREATMENT COMPARISONS AND RANDOM EFFECTS MODEL
(HEALTH CANADA DOSES ONLY)
Treatment Reference OR (95% CrI) RR (95% CrI) RD% (95% CrI)
Si12 PR48 2a PR48 2a/b 22.87 (3.77,253.10) 7.78 (2.82,21.88) 58.79 (18.81,87.45)
T12 PR48 2a q8 9.16 (2.12,45.49) 5.31 (1.88,13.08) 36.69 (7.93,69.81)
B32 PR36-48 2b RGT 10.87 (2.08,94.72) 5.79 (1.83,18.08) 41.04 (8.74,78.47)
T12 PR48 2a q8 Si12 PR48 2a 0.40 (0.02,4.58) 0.69 (0.20,2.07) –20.86 (–69.32,33.96)
B32 PR36-48 2b RGT 0.47 (0.03,7.62) 0.75 (0.22,2.38) –16.88 (–67.50,42.97)
B32 PR36-48 2b RGT T12 PR48 2a q8 1.20 (0.12,15.81) 1.09 (0.32,4.07) 4.21 (–45.86,57.02)
Random Effects Model Residual Deviance 6.165 vs. 6 data points
Deviance Information Criteria 32.586
Fixed Effects Model Residual Deviance 6.244 vs. 6 data points
Deviance Information Criteria 32.714
CrI = credible interval; HC = Health Canada; OR = odds ratio; RD = risk difference; RR = relative risk; SVR = sustained viral response; vs. = versus.
No consistency plot for this analysis.
TABLE 202: SVR FOR FIBROSIS SCORE F0-F2 — TREATMENT-EXPERIENCED PATIENTS WITH PRIOR PARTIAL
RESPONSE: ODDS RATIOS, RELATIVE RISKS, AND RISK DIFFERENCE FOR ALL TREATMENT COMPARISONS AND
RANDOM EFFECTS MODEL (HEALTH CANADA DOSES ONLY)
Treatment Reference OR (95% CrI) RR (95% CrI) RD% (95% CrI)
T12 PR48 2a q8 PR48 2a/b 16.31 (2.90,126.70) 5.85 (2.15,18.79) 54.42 (16.43,82.08)
B32 PR36-48 2b RGT 11.45 (2.01,109.80) 5.17 (1.69,19.58) 46.65 (11.03,79.74)
B32 PR36-48 2b RGT T12 PR48 2a q8 0.71 (0.05,12.16) 0.89 (0.30,2.82) –7.71 (-59.01,51.89)
Random Effects Model Residual Deviance 4.182 vs. 4 data points
Deviance Information Criteria 20.988
Fixed Effects Model Residual Deviance 4.182 vs. 4 data points
Deviance Information Criteria 20.988
CrI = credible interval; HC = Health Canada; OR = odds ratio; RD = risk difference; RR = relative risk; SVR = sustained viral response; vs. = versus.
No consistency plot for this analysis.

Direct-Acting Antiviral Agents for Chronic Hepatitis C Genotype 1 325
TABLE 203: SVR FOR FIBROSIS SCORE F3-F4 —TREATMENT-EXPERIENCED PATIENTS WITH PRIOR PARTIAL RESPONSE: ODDS RATIOS, RELATIVE RISKS, AND
RISK DIFFERENCE FOR ALL TREATMENT COMPARISONS AND RANDOM EFFECTS MODEL (HEALTH CANADA DOSES ONLY)
Treatment Reference OR (95% CrI) RR (95% CrI) RD% (95% CrI)
T12 PR48 2a q8 PR48 2a/b 10.02 (1.05,416.40) 6.75 (1.04,124.10) 21.40 (0.00,81.33)
B32 PR36-48 2b RGT 24.90 (0.58,578200.00) 12.14 (0.62,4208.00) 44.17 (–4.48,99.38)
B32 PR36-48 2b RGT T12 PR48 2a q8 2.51 (0.01,62310.00) 1.71 (0.07,416.20) 20.17
(–76.21,99.06)
Random Effects Model Residual Deviance 4.229 vs. 4 data points
Deviance Information Criteria 17.824
Fixed Effects Model Residual Deviance 4.179 vs. 4 data points
Deviance Information Criteria 17.662
CrI = credible interval; HC = Health Canada; OR = odds ratio; RD = risk difference; RR = relative risk; SVR = sustained viral response; vs. = versus.
No consistency plot for this analysis. d) Null Responder
TABLE 204: SVR — TREATMENT-EXPERIENCED PATIENTS WITH PRIOR NULL RESPONSE: ODDS RATIOS, RELATIVE RISKS, AND RISK DIFFERENCE FOR ALL
TREATMENT COMPARISONS AND RANDOM EFFECTS MODEL (HEALTH CANADA DOSES ONLY)
Treatment Reference OR (95% CrI) RR (95% CrI) RD% (95% CrI)
Si12 PR48 2a PR48 2a 5.41 (0.90,38.03) 3.77 (0.91,13.62) 25.00 (–1.04,64.66)
T12 PR48 2a q8 8.38 (1.61,82.70) 4.88 (1.47,20.95) 36.05 (6.14,73.56)
T12 PR48 2a q8 Si12 PR48 2a 1.58 (0.12,26.98) 1.31 (0.30,7.47) 10.52 (–46.38,64.04)
Random Effects Model Residual Deviance 4.146 vs. 4 data points
Deviance Information Criteria 21.35
Fixed Effects Model Residual Deviance 4.184 vs. 4 data points
Deviance Information Criteria 21.401
CrI = credible interval; HC = Health Canada; OR = odds ratio; RD = risk difference; RR = relative risk; SVR = sustained viral response; vs. = versus.
No consistency plot for this analysis.

Direct-Acting Antiviral Agents for Chronic Hepatitis C Genotype 1 326
APPENDIX 24: NMA META-REGRESSION ADJUSTED FOR PROPORTION WITH CIRRHOSIS
Treatment-Naive TABLE 205: SVR — TREATMENT-NAIVE PATIENTS: ODDS RATIOS, RELATIVE RISKS, AND RISK DIFFERENCE FOR ALL TREATMENT COMPARISONS AND
RANDOM EFFECTS MODEL
Treatment Reference OR (95% CrI) RR (95% CrI) RD% (95% CrI)
Si12 PR24-48 2a/b RGT PR48 2a/b 3.08 (1.84,5.13) 1.54 (1.31,1.76) 25.97 (14.93,35.04)
T12 PR24-48 2a/b RGT q8 3.47 (2.03,5.89) 1.59 (1.36,1.79) 28.21 (17.16,36.77)
T12 PR24-48 2a/b RGT q12 3.74 (1.85,7.42) 1.62 (1.31,1.85) 29.56 (15.04,39.62)
B24 PR28-48 2b RGT 2.86 (1.74,4.72) 1.51 (1.28,1.72) 24.51 (13.62,33.56)
*So12 PR24-48 2a RGT 7.90 (2.16,32.89) 1.83 (1.38,2.11) 40.01 (18.47,50.25)
*T12 PR24 2a/b q8 3.05 (1.74,5.38) 1.54 (1.28,1.77) 25.77 (13.61,35.70)
*T12 PR48 2a q8 3.77 (1.73,8.34) 1.62 (1.28,1.89) 29.72 (13.43,41.17)
*B24 PR28 2b 1.89 (0.91,3.93) 1.32 (0.95,1.66) 15.52 (–2.30,30.62)
T12 PR24-48 2a/b RGT q8 Si12 PR24-48 2a/b RGT 1.13 (0.59,2.16) 1.03 (0.87,1.22) 2.19 (–10.05,14.22)
T12 PR24-48 2a/b RGT q12 1.21 (0.55,2.66) 1.05 (0.85,1.26) 3.49 (–11.74,16.87)
B24 PR28-48 2b RGT 0.93 (0.46,1.92) 0.98 (0.81,1.20) –1.49 (–15.06,12.71)
*So12 PR24-48 2a RGT 2.59 (0.58,12.65) 1.19 (0.87,1.46) 13.87 (–10.44,29.72)
*T12 PR24 2a/b q8 0.99 (0.40,2.44) 1.00 (0.78,1.27) –0.18 (–17.73,16.98)
*T12 PR48 2a q8 1.23 (0.42,3.52) 1.05 (0.79,1.33) 3.72 (–17.01,21.38)
*B24 PR28 2b 0.61 (0.28,1.36) 0.86 (0.63,1.09) –10.44 (–28.00,6.09)
T12 PR24-48 2a/b RGT q12 T12 PR24-48 2a/b RGT q8 1.08 (0.69,1.67) 1.02 (0.90,1.11) 1.34 (–7.40,8.21)
B24 PR28-48 2b RGT 0.83 (0.40,1.72) 0.95 (0.78,1.15) –3.61 (–17.36,10.40)
*So12 PR24-48 2a RGT 2.29 (0.54,10.91) 1.15 (0.86,1.41) 11.64 (–11.51,27.14)
*T12 PR24 2a/b q8 0.88 (0.37,2.06) 0.97 (0.78,1.20) –2.41 (–18.44,13.50)
*T12 PR48 2a q8 1.09 (0.40,3.01) 1.02 (0.78,1.27) 1.48 (–17.68,18.20)
*B24 PR28 2b 0.54 (0.23,1.29) 0.83 (0.60,1.07) –12.55 (–31.16,4.93)
B24 PR28-48 2b RGT T12 PR24-48 2a/b RGT q12 0.77 (0.33,1.82) 0.94 (0.77,1.18) –4.95 (–19.55,11.95)
*So12 PR24-48 2a RGT 2.14 (0.47,10.69) 1.13 (0.84,1.44) 10.26 (–13.03,28.26)
*T12 PR24 2a/b q8 0.81 (0.31,2.14) 0.95 (0.76,1.22) –3.77 (–20.20,14.52)

Direct-Acting Antiviral Agents for Chronic Hepatitis C Genotype 1 327
Treatment Reference OR (95% CrI) RR (95% CrI) RD% (95% CrI)
*T12 PR48 2a q8 1.01 (0.33,3.05) 1.00 (0.76,1.29) 0.11 (–19.72,19.11)
*B24 PR28 2b 0.51 (0.20,1.33) 0.82 (0.59,1.08) –13.77 (–33.25,5.68)
*So12 PR24-48 2a RGT B24 PR28-48 2b RGT 2.77 (0.69,12.73) 1.21 (0.91,1.48) 15.29 (–7.06,30.22)
*T12 PR24 2a/b q8 1.06 (0.51,2.26) 1.02 (0.83,1.25) 1.20 (–13.44,15.80)
*T12 PR48 2a q8 1.32 (0.52,3.37) 1.07 (0.83,1.33) 5.16 (–13.26,20.76)
*B24 PR28 2b 0.66 (0.27,1.59) 0.88 (0.62,1.14) –8.94 (–28.60,9.37)
*T12 PR24 2a/b q8 *So12 PR24-48 2a RGT 0.39 (0.09,1.45) 0.84 (0.69,1.10) –13.84 (–28.86,7.13)
*T12 PR48 2a q8 0.48 (0.10,2.02) 0.89 (0.69,1.17) –9.76 (–28.31,11.73)
*B24 PR28 2b 0.24 (0.05,1.14) 0.73 (0.51,1.04) –23.96 (–45.47,2.56)
*T12 PR48 2a q8 *T12 PR24 2a/b q8 1.24 (0.61,2.55) 1.05 (0.87,1.23) 3.90 (–9.87,15.68)
*B24 PR28 2b 0.62 (0.22,1.70) 0.86 (0.59,1.17) –10.07 (–32.51,10.90)
*B24 PR28 2b *T12 PR48 2a q8 0.50 (0.16,1.56) 0.82 (0.56,1.14) –14.11 (–36.60,9.24)
Random Effects Model Residual Deviance 22.91 vs. 25 data points
Deviance Information Criteria 172.246
CrI = credible interval; HC = Health Canada; OR = odds ratio; RD = risk difference; RR = relative risk; SVR = sustained viral response; vs. = versus. *Not a Health Canada–recommended dosage regimen.

Direct-Acting Antiviral Agents for Chronic Hepatitis C Genotype 1 328
TABLE 206: ANEMIA — TREATMENT-NAIVE PATIENTS: ODDS RATIOS, RELATIVE RISKS, AND RISK DIFFERENCE FOR ALL TREATMENT COMPARISONS AND
RANDOM EFFECTS MODEL
Treatment Reference OR (95% CrI) RR (95% CrI) RD% (95% CrI)
Si12 PR24-48 2a/b RGT PR48 2a/2b 1.02 (0.57,1.87) 1.02 (0.64,1.55) 0.44 (–9.19,12.95)
T12 PR24-48 2a/b RGT q8 2.32 (1.21,4.51) 1.75 (1.15,2.44) 18.46 (3.68,34.82)
T12 PR24-48 2a/b RGT q12 2.77 (1.25,6.37) 1.93 (1.18,2.78) 22.76 (4.34,42.82)
B24 PR28-48 2b RGT 2.35 (1.28,4.32) 1.77 (1.20,2.40) 18.80 (4.74,33.78)
*So12 PR24-48 2a RGT 1.00 (0.23,4.41) 1.00 (0.29,2.48) 0.00 (–18.23,33.69)
*T12 PR24 2a/b q8 2.43 (1.26,4.81) 1.80 (1.18,2.55) 19.62 (4.58,36.12)
*T12 PR48 2a q8 1.50 (0.61,3.77) 1.33 (0.68,2.28) 8.17 (–8.10,30.30)
*B24 PR28 2b 2.07 (0.93,4.78) 1.64 (0.94,2.51) 15.66 (–1.40,36.11)
T12 PR24-48 2a/b RGT q8 Si12 PR24-48 2a/b RGT 2.28 (1.01,5.02) 1.72 (1.01,2.86) 17.88 (0.17,35.25)
T12 PR24-48 2a/b RGT q12 2.71 (1.08,6.99) 1.89 (1.05,3.25) 22.08 (1.60,43.32)
B24 PR28-48 2b RGT 2.30 (0.98,5.29) 1.73 (0.98,2.98) 18.23 (–0.52,36.01)
*So12 PR24-48 2a RGT 0.98 (0.18,5.20) 0.98 (0.25,2.87) –0.39 (–24.48,36.02)
*T12 PR24 2a/b q8 2.38 (0.84,6.72) 1.77 (0.89,3.42) 19.15 (–3.84,41.03)
*T12 PR48 2a q8 1.46 (0.43,4.96) 1.31 (0.54,2.92) 7.69 (–15.41,34.14)
*B24 PR28 2b 2.03 (0.81,5.00) 1.61 (0.86,2.79) 15.14 (–4.13,35.71)
T12 PR24-48 2a/b RGT q12 T12 PR24-48 2a/b RGT q8 1.19 (0.75,1.96) 1.10 (0.84,1.40) 4.21 (–6.48,15.85)
B24 PR28-48 2b RGT 1.01 (0.41,2.48) 1.01 (0.61,1.68) 0.31 (–21.01,21.35)
*So12 PR24-48 2a RGT 0.43 (0.08,2.23) 0.57 (0.16,1.57) –18.01 (–44.75,19.13)
*T12 PR24 2a/b q8 1.05 (0.38,2.95) 1.03 (0.58,1.84) 1.11 (–23.13,25.58)
*T12 PR48 2a q8 0.64 (0.19,2.16) 0.76 (0.34,1.56) –10.17 (–35.19,18.05)
*B24 PR28 2b 0.89 (0.33,2.43) 0.94 (0.51,1.63) –2.66 (-25.27,20.90)
B24 PR28-48 2b RGT T12 PR24-48 2a/b RGT q12 0.85 (0.30,2.28) 0.92 (0.54,1.61) –3.95 (–28.36,19.25)
*So12 PR24-48 2a RGT 0.36 (0.06,2.00) 0.52 (0.14,1.46) –22.13 (–51.27,16.34)
*T12 PR24 2a/b q8 0.88 (0.28,2.69) 0.93 (0.52,1.74) –3.18 (-29.96,23.47)
*T12 PR48 2a q8 0.54 (0.15,1.95) 0.69 (0.31,1.47) –14.44 (–41.99,15.55)
*B24 PR28 2b 0.75 (0.24,2.23) 0.85 (0.45,1.56) –6.91 (–32.46,18.71)
*So12 PR24-48 2a RGT B24 PR28-48 2b RGT 0.43 (0.09,2.09) 0.57 (0.16,1.49) –18.37 (–42.99,17.61)
*T12 PR24 2a/b q8 1.04 (0.42,2.57) 1.02 (0.61,1.70) 0.86 (–20.51,22.42)
*T12 PR48 2a q8 0.64 (0.21,1.91) 0.76 (0.36,1.44) –10.41 (–32.96,15.42)

Direct-Acting Antiviral Agents for Chronic Hepatitis C Genotype 1 329
Treatment Reference OR (95% CrI) RR (95% CrI) RD% (95% CrI)
*B24 PR28 2b 0.88 (0.32,2.46) 0.93 (0.50,1.64) –3.05 (–25.63,21.42)
*T12 PR24 2a/b q8 *So12 PR24-48 2a RGT 2.47 (0.55,10.58) 1.80 (0.72,5.93) 19.35 (–14.58,42.29)
*T12 PR48 2a q8 1.53 (0.29,7.29) 1.35 (0.46,4.64) 8.18 (–27.08,34.79)
*B24 PR28 2b 2.06 (0.37,12.01) 1.62 (0.55,6.25) 15.18 (–23.38,45.22)
*T12 PR48 2a q8 *T12 PR24 2a/b q8 0.62 (0.28,1.33) 0.75 (0.42,1.17) –11.07 (–27.56,6.80)
*B24 PR28 2b 0.85 (0.27,2.77) 0.91 (0.45,1.75) –3.96 (–30.35,24.23)
*B24 PR28 2b *T12 PR48 2a q8 1.38 (0.37,5.19) 1.23 (0.54,2.87) 7.31 (–22.72,35.85)
Random Effects Model
Residual Deviance 25.25 vs. 25 data points
Deviance Information Criteria 171.679
CrI = credible interval; HC = Health Canada; OR = odds ratio; RD = risk difference; RR = relative risk; vs. = versus. *Not a Health Canada–recommended dosage regimen.

Direct-Acting Antiviral Agents for Chronic Hepatitis C Genotype 1 330
TABLE 207: RASH — TREATMENT-NAIVE PATIENTS: ODDS RATIOS, RELATIVE RISKS, AND RISK DIFFERENCE FOR ALL TREATMENT COMPARISONS AND
RANDOM EFFECTS MODEL
Treatment Reference OR (95% CrI) RR (95% CrI) RD% (95% CrI)
Si12 PR24-48 2a/b RGT PR48 2a/b 1.27 (0.69,2.28) 1.21 (0.74,1.81) 4.27 (–5.57,16.37)
T12 PR24-48 2a/b RGT q8 1.72 (0.84,3.43) 1.49 (0.87,2.29) 10.33 (–2.69,26.57)
T12 PR24-48 2a/b RGT q12 1.58 (0.63,3.64) 1.41 (0.68,2.36) 8.56 (–6.65,27.97)
B24 PR28-48 2b RGT 1.14 (0.57,2.27) 1.11 (0.63,1.79) 2.27 (–7.80,16.51)
*So12 PR24-48 2a RGT 2.26 (0.53,10.63) 1.78 (0.59,3.72) 16.43 (–9.09,52.51)
*T12 PR24 2a/b q8 1.97 (1.07,3.81) 1.64 (1.05,2.42) 13.30 (1.13,29.09)
*T12 PR48 2a q8 2.24 (0.94,5.51) 1.78 (0.95,2.86) 16.27 (–0.98,38.32)
*B24 PR28 2b 0.94 (0.24,3.64) 0.95 (0.29,2.39) –0.99 (–15.53,27.57)
T12 PR24-48 2a/b RGT q8 Si12 PR24-48 2a/b RGT 1.35 (0.59,3.11) 1.24 (0.68,2.20) 5.96 (–9.92,23.65)
T12 PR24-48 2a/b RGT q12 1.24 (0.45,3.22) 1.17 (0.54,2.22) 4.19 (–13.73,24.86)
B24 PR28-48 2b RGT 0.90 (0.37,2.26) 0.92 (0.46,1.82) –1.98 (–17.42,15.47)
*So12 PR24-48 2a RGT 1.78 (0.35,10.13) 1.48 (0.44,3.77) 12.08 (–17.61,51.03)
*T12 PR24 2a/b q8 1.55 (0.58,4.47) 1.36 (0.68,2.82) 8.98 (–11.23,30.89)
*T12 PR48 2a q8 1.76 (0.55,6.01) 1.48 (0.65,3.17) 11.94 (–11.63,38.78)
*B24 PR28 2b 0.74 (0.18,3.11) 0.80 (0.24,2.15) –5.02 (–23.25,24.09)
T12 PR24-48 2a/b RGT q12 T12 PR24-48 2a/b RGT q8 0.92 (0.53,1.51) 0.94 (0.62,1.30) –1.74 (–11.87,9.07)
B24 PR28-48 2b RGT 0.66 (0.25,1.80) 0.74 (0.37,1.54) –7.98 (–26.86,11.38)
*So12 PR24-48 2a RGT 1.31 (0.26,7.62) 1.19 (0.37,3.03) 5.94 (–25.22,45.59)
*T12 PR24 2a/b q8 1.14 (0.43,3.33) 1.09 (0.57,2.25) 2.95 (–18.39,25.33)
*T12 PR48 2a q8 1.30 (0.41,4.42) 1.19 (0.54,2.54) 5.85 (–18.93,33.01)
*B24 PR28 2b 0.55 (0.13,2.40) 0.64 (0.19,1.77) –10.93 (–32.39,18.89)
B24 PR28-48 2b RGT T12 PR24-48 2a/b RGT q12 0.72 (0.25,2.30) 0.79 (0.37,1.88) –6.24 (–27.79,14.92)
*So12 PR24-48 2a RGT 1.43 (0.26,8.93) 1.26 (0.38,3.63) 7.66 (–25.27,47.93)

Direct-Acting Antiviral Agents for Chronic Hepatitis C Genotype 1 331
Treatment Reference OR (95% CrI) RR (95% CrI) RD% (95% CrI)
*T12 PR24 2a/b q8 1.25 (0.43,4.19) 1.16 (0.58,2.79) 4.76 (–19.10,28.38)
*T12 PR48 2a q8 1.42 (0.41,5.45) 1.26 (0.55,3.10) 7.54 (–19.11,35.72)
*B24 PR28 2b 0.60 (0.13,2.89) 0.68 (0.20,2.08) –9.05 (–33.34,21.76)
*So12 PR24-48 2a RGT B24 PR28-48 2b RGT 1.98 (0.40,10.71) 1.61 (0.49,4.04) 13.95 (–15.02,51.50)
*T12 PR24 2a/b q8 1.72 (0.70,4.52) 1.47 (0.78,2.95) 10.81 (–7.34,29.79)
*T12 PR48 2a q8 1.97 (0.65,6.08) 1.60 (0.73,3.34) 13.87 (–8.38,37.85)
*B24 PR28 2b 0.83 (0.18,3.76) 0.86 (0.24,2.52) –3.11 (–23.86,26.73)
*T12 PR24 2a/b q8 *So12 PR24-48 2a RGT 0.88 (0.18,3.87) 0.92 (0.42,2.72) –2.94 (–39.57,25.53)
*T12 PR48 2a q8 0.99 (0.18,4.95) 1.00 (0.40,3.06) –0.12 (–38.79,32.23)
*B24 PR28 2b 0.41 (0.05,3.20) 0.54 (0.12,2.31) –16.78 (–57.96,22.41)
*T12 PR48 2a q8 *T12 PR24 2a/b q8 1.14 (0.52,2.50) 1.09 (0.63,1.71) 2.91 (–13.78,21.44)
*B24 PR28 2b 0.48 (0.10,2.32) 0.58 (0.16,1.73) –14.02 (–37.43,18.63)
*B24 PR28 2b *T12 PR48 2a q8 0.42 (0.08,2.31) 0.54 (0.14,1.73) –16.77 (-45.43,18.19)
Random Effects Model Residual Deviance 25.94 vs. 25 data points
Deviance Information Criteria 173.144
CrI = credible interval; HC = Health Canada; OR = odds ratio; RD = risk difference; RR = relative risk; vs. = versus. *Not a Health Canada–recommended dosage regimen.

Direct-Acting Antiviral Agents for Chronic Hepatitis C Genotype 1 332
Treatment-Experienced TABLE 208: SVR — ALL TREATMENT-EXPERIENCED PATIENTS: ODDS RATIOS, RELATIVE RISKS, AND RISK DIFFERENCE FOR ALL TREATMENT COMPARISONS
AND RANDOM EFFECTS MODEL
Treatment Reference OR (95% CrI) RR (95% CrI) RD% (95% CrI)
Si12 PR24-48 2a RGT PR48 2a/b 6.39 (2.16,17.36) 2.99 (1.73,4.06) 41.87 (15.72,61.09)
Si12 PR48 2a 7.19 (2.32,23.15) 3.12 (1.80,4.34) 44.59 (17.37,65.08)
T12 PR48 2a q8 11.22 (0.97,211.40) 3.53 (0.97,5.02) 53.81 (–0.59,77.51)
B32 PR36-48 2b RGT 4.97 (1.17,18.02) 2.70 (1.13,4.14) 35.84 (2.77,61.67)
*B44 PR48 2a/b 6.88 (2.22,19.66) 3.06 (1.76,4.29) 43.58 (16.30,62.99)
*T12 PR24 2a q8 6.34 (1.67,21.60) 2.98 (1.46,4.27) 41.66 (9.80,64.18)
Si12 PR48 2a Si12 PR24-48 2a RGT 1.12 (0.22,6.40) 1.04 (0.56,1.97) 2.49 (–32.48,38.59)
T12 PR48 2a q8 1.77 (0.09,62.07) 1.18 (0.28,2.45) 11.61 (–52.64,55.72)
B32 PR36-48 2b RGT 0.79 (0.19,2.91) 0.91 (0.43,1.48) –5.50 (–36.65,22.28)
*B44 PR48 2a/b 1.09 (0.32,3.50) 1.03 (0.65,1.63) 1.95 (–24.37,26.96)
*T12 PR24 2a q8 0.99 (0.25,3.84) 1.00 (0.54,1.63) –0.31 (–30.85,27.60)
T12 PR48 2a q8 Si12 PR48 2a 1.59 (0.14,23.68) 1.13 (0.34,1.92) 8.65 (–42.50,41.82)
B32 PR36-48 2b RGT 0.70 (0.08,4.50) 0.88 (0.33,1.77) –8.09 (–53.02,32.54)
*B44 PR48 2a/b 0.97 (0.15,5.21) 0.99 (0.50,1.86) –0.67 (–40.48,35.66)
*T12 PR24 2a q8 0.89 (0.12,5.34) 0.96 (0.42,1.85) –2.64 (–45.20,35.21)
B32 PR36-48 2b RGT T12 PR48 2a q8 0.44 (0.01,14.57) 0.76 (0.26,3.77) –17.81 (–71.57,57.36)
*B44 PR48 2a/b 0.60 (0.01,15.88) 0.86 (0.40,3.91) –10.35 (–58.57,59.11)
*T12 PR24 2a q8 0.56 (0.01,15.13) 0.84 (0.34,3.79) –11.81 (–63.48,57.56)
*B44 PR48 2a/b B32 PR36-48 2b RGT 1.39 (0.59,3.49) 1.13 (0.85,1.93) 7.31 (–10.34,27.46)
*T12 PR24 2a q8 1.26 (0.34,5.05) 1.09 (0.64,2.13) 5.19 (–23.78,34.77)
*T12 PR24 2a q8 *B44 PR48 2a/b 0.91 (0.27,3.17) 0.97 (0.56,1.50) –2.18 (–28.68,23.44)
Random Effects Model Residual Deviance 13.02 vs. 13 data points
Deviance Information Criteria 91.637
CrI = credible interval; HC = Health Canada; OR = odds ratio; RD = risk difference; RR = relative risk; SVR = sustained viral response; vs. = versus. *Not a Health Canada–recommended dosage regimen.

Direct-Acting Antiviral Agents for Chronic Hepatitis C Genotype 1 333
TABLE 209: ANEMIA — ALL TREATMENT-EXPERIENCED PATIENTS: ODDS RATIOS, RELATIVE RISKS, AND RISK DIFFERENCE FOR ALL TREATMENT
COMPARISONS AND RANDOM EFFECTS MODEL
Treatment Reference OR (95% CrI) RR (95% CrI) RD% (95% CrI)
Si12 PR24-48 2a RGT PR48 2a/b 0.62 (0.20,1.83) 0.67 (0.23,1.61) –5.83 (–14.07,10.39)
Si12 PR48 2a 0.87 (0.24,3.17) 0.89 (0.28,2.32) –1.88 (–13.41,22.29)
T12 PR48 2a q8 9.69 (0.75,179.00) 3.80 (0.78,5.90) 49.79 (–3.90,79.70)
B32 PR36-48 2b RGT 1.60 (0.35,6.04) 1.44 (0.40,3.24) 7.83 (–10.82,38.41)
*B44 PR48 2a/b 1.80 (0.57,5.05) 1.58 (0.62,2.99) 10.15 (–6.89,34.05)
*T12 PR24 2a q8 2.89 (0.69,11.43) 2.16 (0.74,4.18) 20.62 (–4.87,52.77)
Si12 PR48 2a Si12 PR24-48 2a RGT 1.40 (0.23,8.97) 1.33 (0.28,6.08) 3.78 (–16.85,29.84)
T12 PR48 2a q8 15.36 (0.65,585.10) 5.47 (0.72,20.46) 54.76 (–6.02,90.41)
B32 PR36-48 2b RGT 2.57 (0.55,10.68) 2.13 (0.61,6.14) 13.21 (–6.42,40.92)
*B44 PR48 2a/b 2.88 (0.79,10.06) 2.33 (0.83,6.36) 15.47 (–3.25,37.51)
*T12 PR24 2a q8 4.64 (1.00,21.21) 3.16 (1.00,9.11) 25.75 (0.02,55.94)
T12 PR48 2a q8 Si12 PR48 2a 11.04 (0.92,171.00) 3.83 (0.94,11.93) 49.38 (–1.16,81.67)
B32 PR36-48 2b RGT 1.82 (0.20,14.58) 1.60 (0.27,7.66) 9.29 (–24.48,44.71)
*B44 PR48 2a/b 2.06 (0.30,12.89) 1.76 (0.40,7.41) 11.62 (–20.76,41.27)
*T12 PR24 2a q8 3.31 (0.40,25.95) 2.39 (0.51,9.97) 21.82 (–15.96,58.31)
B32 PR36-48 2b RGT T12 PR48 2a q8 0.16 (0.00,6.12) 0.39 (0.08,3.41) –41.32 (–87.92,35.95)
*B44 PR48 2a/b 0.19 (0.00,5.51) 0.42 (0.12,3.31) –39.12 (–83.69,32.93)
*T12 PR24 2a q8 0.30 (0.01,9.98) 0.58 (0.15,4.13) –28.26 (–79.19,47.39)
*B44 PR48 2a/b B32 PR36-48 2b RGT 1.13 (0.47,2.85) 1.09 (0.62,2.30) 2.13 (–15.71,16.58)
*T12 PR24 2a q8 1.81 (0.42,8.43) 1.47 (0.56,4.47) 11.85 (–17.36,41.51)
*T12 PR24 2a q8 *B44 PR48 2a/b 1.60 (0.43,6.39) 1.36 (0.55,3.20) 9.82 (–15.98,39.31)
Random Effects Model Residual Deviance 13.08 vs. 13 data points
Deviance Information Criteria 90.127
CrI = credible interval; HC = Health Canada; OR = odds ratio; RD = risk difference; RR = relative risk; vs. = versus. *Not a Health Canada–recommended dosage regimen.
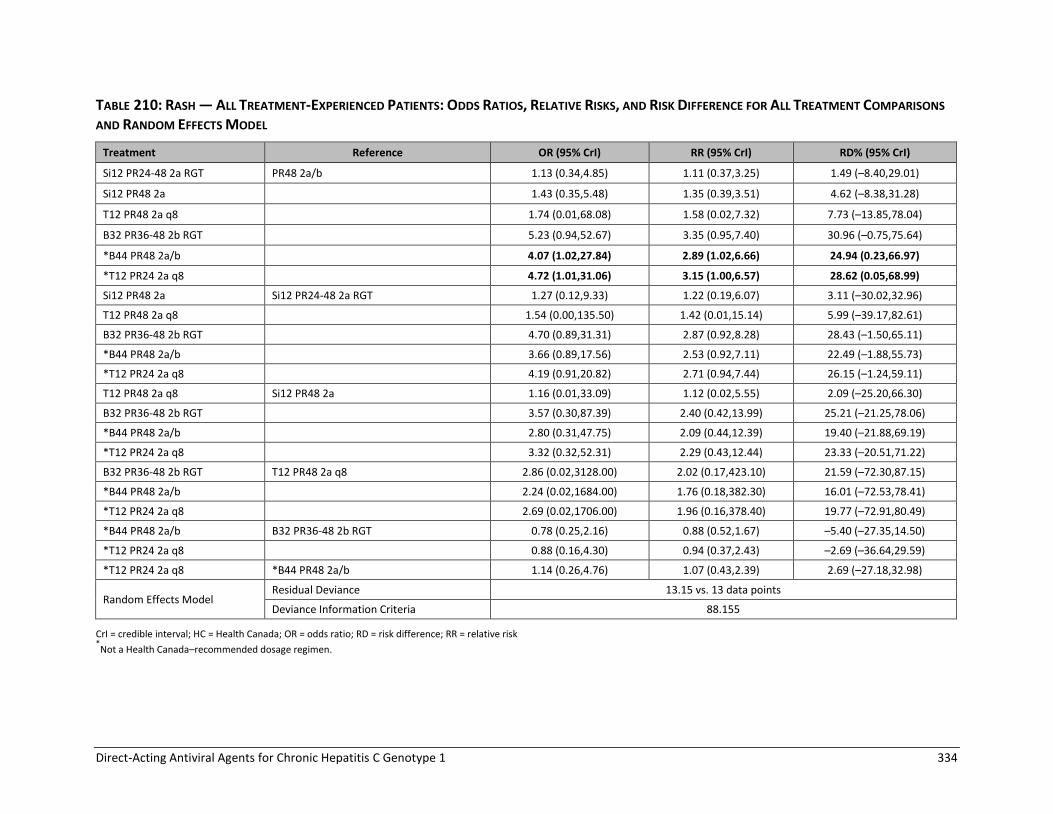
Direct-Acting Antiviral Agents for Chronic Hepatitis C Genotype 1 334
TABLE 210: RASH — ALL TREATMENT-EXPERIENCED PATIENTS: ODDS RATIOS, RELATIVE RISKS, AND RISK DIFFERENCE FOR ALL TREATMENT COMPARISONS
AND RANDOM EFFECTS MODEL
Treatment Reference OR (95% CrI) RR (95% CrI) RD% (95% CrI)
Si12 PR24-48 2a RGT PR48 2a/b 1.13 (0.34,4.85) 1.11 (0.37,3.25) 1.49 (–8.40,29.01)
Si12 PR48 2a 1.43 (0.35,5.48) 1.35 (0.39,3.51) 4.62 (–8.38,31.28)
T12 PR48 2a q8 1.74 (0.01,68.08) 1.58 (0.02,7.32) 7.73 (–13.85,78.04)
B32 PR36-48 2b RGT 5.23 (0.94,52.67) 3.35 (0.95,7.40) 30.96 (–0.75,75.64)
*B44 PR48 2a/b 4.07 (1.02,27.84) 2.89 (1.02,6.66) 24.94 (0.23,66.97)
*T12 PR24 2a q8 4.72 (1.01,31.06) 3.15 (1.00,6.57) 28.62 (0.05,68.99)
Si12 PR48 2a Si12 PR24-48 2a RGT 1.27 (0.12,9.33) 1.22 (0.19,6.07) 3.11 (–30.02,32.96)
T12 PR48 2a q8 1.54 (0.00,135.50) 1.42 (0.01,15.14) 5.99 (–39.17,82.61)
B32 PR36-48 2b RGT 4.70 (0.89,31.31) 2.87 (0.92,8.28) 28.43 (–1.50,65.11)
*B44 PR48 2a/b 3.66 (0.89,17.56) 2.53 (0.92,7.11) 22.49 (–1.88,55.73)
*T12 PR24 2a q8 4.19 (0.91,20.82) 2.71 (0.94,7.44) 26.15 (–1.24,59.11)
T12 PR48 2a q8 Si12 PR48 2a 1.16 (0.01,33.09) 1.12 (0.02,5.55) 2.09 (–25.20,66.30)
B32 PR36-48 2b RGT 3.57 (0.30,87.39) 2.40 (0.42,13.99) 25.21 (–21.25,78.06)
*B44 PR48 2a/b 2.80 (0.31,47.75) 2.09 (0.44,12.39) 19.40 (–21.88,69.19)
*T12 PR24 2a q8 3.32 (0.32,52.31) 2.29 (0.43,12.44) 23.33 (–20.51,71.22)
B32 PR36-48 2b RGT T12 PR48 2a q8 2.86 (0.02,3128.00) 2.02 (0.17,423.10) 21.59 (–72.30,87.15)
*B44 PR48 2a/b 2.24 (0.02,1684.00) 1.76 (0.18,382.30) 16.01 (–72.53,78.41)
*T12 PR24 2a q8 2.69 (0.02,1706.00) 1.96 (0.16,378.40) 19.77 (–72.91,80.49)
*B44 PR48 2a/b B32 PR36-48 2b RGT 0.78 (0.25,2.16) 0.88 (0.52,1.67) –5.40 (–27.35,14.50)
*T12 PR24 2a q8 0.88 (0.16,4.30) 0.94 (0.37,2.43) –2.69 (–36.64,29.59)
*T12 PR24 2a q8 *B44 PR48 2a/b 1.14 (0.26,4.76) 1.07 (0.43,2.39) 2.69 (–27.18,32.98)
Random Effects Model Residual Deviance 13.15 vs. 13 data points
Deviance Information Criteria 88.155
CrI = credible interval; HC = Health Canada; OR = odds ratio; RD = risk difference; RR = relative risk *Not a Health Canada–recommended dosage regimen.

Direct-Acting Antiviral Agents for Chronic Hepatitis C Genotype 1 335
TABLE 211: DEPRESSION — ALL TREATMENT-EXPERIENCED PATIENTS: ODDS RATIOS, RELATIVE RISKS, AND RISK DIFFERENCE FOR ALL TREATMENT
COMPARISONS AND RANDOM EFFECTS MODEL
Treatment Reference OR (95% CrI) RR (95% CrI) RD% (95% CrI)
Si12 PR48 2a PR48 2a/b 1.65 (0.41,6.99) 1.53 (0.44,4.25) 6.35 (–7.23,35.40)
T12 PR48 2a q8 0.35 (0.01,7.86) 0.38 (0.01,4.27) –7.31 (–13.18,39.64)
B32 PR36-48 2b RGT 1.30 (0.22,9.73) 1.26 (0.25,4.97) 3.06 (–9.75,43.63)
*B44 PR48 2a/b 1.91 (0.45,10.16) 1.72 (0.49,5.10) 8.60 (–6.63,44.23)
*T12 PR24 2a q8 0.84 (0.17,4.44) 0.85 (0.19,3.20) –1.75 (–10.46,24.93)
T12 PR48 2a q8 Si12 PR48 2a 0.20 (0.01,4.47) 0.25 (0.01,2.78) –11.55 (–38.55,28.70)
B32 PR36-48 2b RGT 0.77 (0.06,12.03) 0.81 (0.10,6.40) –3.36 (–37.68,42.47)
*B44 PR48 2a/b 1.13 (0.12,12.95) 1.10 (0.19,6.90) 1.83 (–34.15,43.44)
*T12 PR24 2a q8 0.50 (0.05,5.62) 0.55 (0.08,4.11) –7.80 (–39.64,24.34)
B32 PR36-48 2b RGT T12 PR48 2a q8 3.68 (0.04,793.80) 3.26 (0.07,371.20) 10.03 (–46.74,54.45)
*B44 PR48 2a/b 5.40 (0.07,808.50) 4.45 (0.14,377.10) 15.64 (–43.65,54.90)
*T12 PR24 2a q8 2.34 (0.03,327.10) 2.19 (0.06,215.30) 5.18 (–47.33,35.52)
*B44 PR48 2a/b B32 PR36-48 2b RGT 1.45 (0.53,4.01) 1.34 (0.65,3.35) 4.66 (–11.99,19.50)
*T12 PR24 2a q8 0.62 (0.13,3.04) 0.67 (0.19,2.62) –4.48 (–32.52,11.83)
*T12 PR24 2a q8 *B44 PR48 2a/b 0.43 (0.11,1.76) 0.50 (0.15,1.56) –9.54 (–34.70,7.59)
Random Effects Model Residual Deviance 11.09 vs. 11 data points
Deviance Information Criteria 70.974
CrI = credible interval; HC = Health Canada; OR = odds ratio; RD = risk difference; RR = relative risk; vs. = versus. *Not a Health Canada–recommended dosage regimen.

Direct-Acting Antiviral Agents for Chronic Hepatitis C Genotype 1 336
APPENDIX 25: OVERVIEW OF PEGINTERFERON RANDOMIZED CONTROLLED TRIALS
Objective To review randomized controlled trials (RCTs) which compare the efficacy and safety of 48 weeks of peginterferon-2a plus ribavirin versus peginterferon-2b plus ribavirin in adults with genotype 1 chronic hepatitis C (CHC). These data will be used in the network meta-analysis (NMA) to conduct sensitivity analyses based on the type of peginterferon used in combination with direct-acting antiviral (DAA) agents. Methods We identified potentially relevant articles from two published systematic reviews139,140 and performed a literature search update to these reports. Two researcher independently selected articles based on pre-defined inclusion and exclusion criteria (Table 212). Data were extracted by one researcher and verified by a second researcher. The studies were assessed for the risk of bias independently by two researchers. The studies were assessed for homogeneity, and data were pooled using standard meta-analysis methods, if appropriate. A fixed-effect model was used unless heterogeneity was high (I2 > 75%).
TABLE 212: INCLUSION CRITERIA FOR PEGINTERFERON RCTS
Populations Patients with chronic hepatitis C genotype 1 (adult populations)
Interventions Peginterferon alfa-2a + ribavirin
Comparators Peginterferon alfa-2b + ribavirin
Outcomes Sustained virological response (SVR) rates (SVR12 or SVR24) Serious adverse events, adverse events, withdrawals due to adverse events, treatment discontinuation, rash, fatigue, anemia, pruritus, neutropenia, depression
Study design Published RCTs
Exclusions Studies were excluded if they: were in languages other than English, did not meet the selection criteria abovementioned, provided results of a qualitative study, were follow-up or extension studies or were published in abstract form only. Duplicate publications, narrative reviews, and editorials were also excluded. Studies were limited to Health Canada–approved dosing regimens: Peginterferon alfa-2a 180 mcg/week subcutaneous injection (SC), or peginterferon alfa-2b 1.5 mcg/kg/week SC + weight-based ribavirin (600 mg to 1,400 mg total daily oral dose) for 48 weeks. Studies enrolling a mixed population of patients with CHC genotypes 1 to 6 were included if ≥ 80% of patients were genotype 1, or if the outcome data were reported for genotype 1 patients separately.
Results The literature search identified 182 potentially relevant citations. Thirteen articles from the literature search and 11 articles from the systematic reviews were identified for full-text review. Of these, six RCTs met the inclusion criteria: five RCTs in treatment-naive patients141-145 and one RCT146 in patients previously treated with interferon and ribavirin (Table 213).

Direct-Acting Antiviral Agents for Chronic Hepatitis C Genotype 1 337
The studies enrolled adults with CHC genotype 1 to 4,142,143,146 genotype 1,141,145 or genotype 1b.144 All studies excluded patients with hepatitis B or HIV co-infections, or decompensated liver disease. The RCT by Scotto et al.146 enrolled patients who were non-responsive to prior interferon plus ribavirin therapy of at least three months in duration. The IDEAL study was a large (N = 3070), multi-centre, partially blinded RCT.141 All other trials were single centre, open-label RCTs with a sample size ranging from 80 to 431 patients. The patients enrolled received either peginterferon-2a 180 mcg/week or peginterferon-2b (1.5 mcg/kg/week) with weight-based ribavirin (dosage range from 800 mg to 1400 mg per day) for 48 weeks.141-146 The IDEAL study included a third treatment group with low-dose peginterferon-2b 1.0 mcg/kg/week plus ribavirin.141 In all studies, the patients were followed for 72 weeks. The mean age of patients ranged from 44.2 to 54.8 years per treatment group and 27% to 60% of
participants were malE (TABLE 214). Between 11% and 35% of patients enrolled had bridging fibrosis or cirrhosis.141-144,146
In treatment-naive patients, the proportion of patients who achieved a sustained virologic response (SVR) 24 weeks after the end of treatment ranged from 41% to 55% for peginterferon- 2a and 32% to 44% for peginterferon-2b (pooled RD 4%; 95% CI, 0% to 7%; P = 0.05, I2 = 48%).141-145 In treatment-experienced patients, 18% and 13% achieved an SVR 24 in the peginterferon-2a and -2b groups, respectively (RD 5%; 95% CI, –10% to 20%; P = 0.50).146
FIGURE 67: POOLED SVR FOR PEGINTERFERON RCTS
CI = confidence interval; RCT = randomized controlled trials; SVR = sustained virologic response.
Study or Subgroup
4.1.1 Treatment naive
Ascione 2010
IDEAL McHutchinson 2009
Mach 2011
MIST Rumi 2010
Yenice 2006
Subtotal (95% CI)
Total events
Heterogeneity: Chi² = 7.65, df = 4 (P = 0.11); I² = 48%
Test for overall effect: Z = 1.96 (P = 0.05)
4.1.2 Treatment experienced
Scotto 2008
Subtotal (95% CI)
Total events
Heterogeneity: Not applicable
Test for overall effect: Z = 0.67 (P = 0.50)
Test for subgroup differences: Chi² = 0.03, df = 1 (P = 0.86), I² = 0%
Events
51
423
68
44
18
604
8
8
Total
93
1035
138
91
40
1397
45
45
Events
37
406
54
28
13
538
6
6
Total
93
1019
122
87
40
1361
47
47
Weight
6.7%
74.5%
9.4%
6.5%
2.9%
100.0%
100.0%
100.0%
M-H, Fixed, 95% CI
0.15 [0.01, 0.29]
0.01 [-0.03, 0.05]
0.05 [-0.07, 0.17]
0.16 [0.02, 0.30]
0.13 [-0.09, 0.34]
0.04 [-0.00, 0.07]
0.05 [-0.10, 0.20]
0.05 [-0.10, 0.20]
Peg 2a-R Peg 2b-R Risk Difference Risk Difference
M-H, Fixed, 95% CI
-0.5 -0.25 0 0.25 0.5
Favours Peg 2b-R Favours Peg 2a-R

Direct-Acting Antiviral Agents for Chronic Hepatitis C Genotype 1 338
Among the treatment-naive studies, fewer patients on peginterferon-2a stopped treatment for any reason than those on peginterferon-2b (3 trials; RD -7%; 95% CI, -11% to -3%; P < 0.001, I2 = 0%); however, no difference was found in treatment discontinuation due to adverse events (4 trials; RD 0%; 95% CI, –2% to 2%; P = 0.93, I2 = 0%). In the treatment-experienced RCT,146 no statistically significant differences were found for discontinuation for any reason, or discontinuation due to adverse events. The proportion of patients reporting adverse events are reported in Table 218 and Table 219. In general, the incidence of adverse events was similar between groups within the RCTs but varied across the trials, with the IDEAL study,141 in most cases, reporting the highest incidence. Serious adverse events were reported in 0% to 12% of patients,141-143 and anemia was reported in 13%146 and 34% of participants.141 The incidence of fatigue and influenza-like illness was high and exceeded 50% in studies reporting these adverse events.141-143,146 The Mach et al. study144 did not report data for any adverse event.
Risk of Bias All studies had one or more domain with unclear or high risk of bias (Table 215). Two trials had randomization sequence generation142,143 or allocation concealment141,142 at low risk of bias. One study146 had high risk of bias related to allocation concealment, and all others had an unclear risk of bias in allocation concealment and sequence generation. The risk of bias related to blinding was unclear in all trials. Two trials144,146 had a high or unclear risk of bias related to outcomes measures; all others had a low risk of bias. Two studies had potential conflicts of interest related to funding.141,142 Summary Six RCTs in genotype 1 CHC compared peginterferon-2a plus ribavirin to peginterferon-2b plus ribavirin at doses consistent with Health Canada recommendations.141-146 All but one RCT (Scotto et al.146) included patients with no previous treatment for CHC. The proportion of patients who achieved an SVR 24 weeks after the end of treatment was higher for peginterferon-2a than peginterferon-2b in all studies; however, pooled results were not statistically significantly different for either treatment-naive (P = 0.05) or treatment-experienced (P = 0.50) patients. Treatment-naive patients who received peginterferon-2a were less likely to discontinue therapy for any reason compared with those who received peginterferon-2b. The incidence of adverse events was generally similar between treatment groups within studies but varied across trials. All studies had one or more methodological domains with an unclear or high risk of bias and only one of the six RCTs (Ascione et al.142) had a low risk of bias related to sequence generation and allocation concealment. Reporting of adverse event data was limited, and the studies were likely underpowered to detect differences between groups in the less common adverse events. Data for patients who were treatment-experienced were limited to one RCT that enrolled 143 patients, of which 92 (64%) had genotype 1 CHC.146 These patients may not be directly comparable to treatment-experienced patients in direct-acting antivirals (DAA) trials, since those in the Scotto et.al. study were non-responders to standard interferon plus ribavirin, not peginterferon plus ribavirin.146 The characteristics of treatment-naive patients enrolled in the peginterferon studies appear to be generally similar to those in the DAA RCTs except for a higher proportion of patients with more severe fibrosis among some peginterferon RCTs.142-144

Direct-Acting Antiviral Agents for Chronic Hepatitis C Genotype 1 339
TABLE 213: STUDY CHARACTERISTICS FOR PEGINTERFERON STUDIES
Author, Year, Study Name, Design
N Population Interventions Country Outcomes, Study Follow-up
Treatment-Naive
Ascione et al., 2010142
RCT, OL, single centre
320 Treatment-naive genotype 1 to 4 CHC
Peg-2a 180 mcg/week SC + ribavirin 1,000 mg to 1,200 mg per day (weight-based) Peg-2b 1.5 mcg/kg/week SC + ribavirin 1,000 mg to 1,200 mg per day (weight-based)
Italy SVR24, treatment completion, harms 72 weeks
MIST, Rumi et al., 2010143
RCT, OL, single centre
431 (G1 N = 178)
Treatment-naive genotype 1 to 4 CHC Age 18 to 70 years
Peg-2a 180 mcg/week SC + ribavirin 1,000 mg to 1200 mg per day (weight-based) Peg-2b 1.5 mcg/kg/week SC + ribavirin 800 mg to 1,200 mg per day (weight-based)
Italy SVR24, harms 72 weeks
IDEAL, McHutchison et al., 2009
141
RCT, DB with respect to Peg2b dose, multi-centre
3070 Treatment-naive genotype 1 CHC Age ≥ 18 years
Peg-2a 180 mcg/week SC + ribavirin 1,000 mg to 1200 mg per day (weight-based) Peg-2b 1.5 mcg/kg/week SC + ribavirin 800 mg to 1,400 mg per day (weight-based) Peg-2b 1.0 mcg/kg/week SC + ribavirin 800 mg to 1,400 mg per day (weight-based)
US SVR24, treatment completion, harms 72 weeks
Yenice et al., 2006145
RCT, OL, single centre
80 Treatment-naive genotype 1 CHC
Peg-2a 180 mcg/week SC + ribavirin 800 mg to 1,200 mg per day (weight-based) Peg-2b 1.5 mcg/kg/week SC + ribavirin 800 mg to 1,200 mg per day (weight-based)
Turkey SVR24, treatment completion 72 weeks
Mach at al., 2011144
RCT, OL, single centre
260 Treatment-naive genotype 1b CHC
Peg-2a 180 mcg/week SC + ribavirin 1,000 mg to 1200 mg per day (weight-based) Peg-2b 1.5 mcg/kg/week SC + ribavirin 1,000 mg to 1,200 mg per day (weight-based)
Poland SVR24 72 weeks

Direct-Acting Antiviral Agents for Chronic Hepatitis C Genotype 1 340
Author, Year, Study Name, Design
N Population Interventions Country Outcomes, Study Follow-up
Treatment-Experienced
Scotto et al., 2008146
RCT, OL, single centre
143 Genotype 1 to 4 CHC who were non-responders to previous interferon + ribavirin treatment (did not clear serum HCV RNA or had a reduction of < 2 log10 HCV RNA levels after at least 3 months of standard interferon 6 MU three times/week + ribavirin 10.6 mg/kg/day)
Peg-2a 180 mcg/week SC + ribavirin 15 mg/kg/day Peg-2b 1.5 mcg/kg/week SC + ribavirin 15 mg/kg/day
Italy SVR24, treatment completion, harms 72 weeks
CHC = chronic hepatitis C; DB = double-blind; G = genotype; OL = open-label; Peg-2a = peginterferon 2a; Peg-2b = peginterferon 2b; RCT = randomized controlled trial; SC = subcutaneous; SVR24 = sustained virologic response 24 weeks after the end of treatment.

Direct-Acting Antiviral Agents for Chronic Hepatitis C Genotype 1 341
TABLE 214: PATIENT CHARACTERISTICS FOR PEGINTERFERON STUDIES
Study Name, Author, Year
Treatment Group
ITT N Age, Mean/Median
Years (SD)
% Male
Hepatitis C Genotype/Subtype (%) Metavir Fibrosis Score (%) Viral Load (log10 IU/mL, Mean (SD)/
Median (Range))
1 1a 1b other F0 F1 F2 F3 F4/ Cirrhosis
Treatment-Naive
Ascione et al., 2010
142
PR48 2a 160 (G1&4 N = 93, 66%)
51.3 (10.3) 51% 56% NR NR G2:31% G3: 11% G4: 3%
NR 26% (G 1&4) 5.7 (2.6 to 6.93 (G1&4)
PR48 2b 160 (G1&4 N = 93, 66%)
48.9 (11.3) 59% 58% NR NR G2: 31% G3: 11% G4: 1%
NR 12% (G 1&4) 5.8 (2.9 to 7.0) (G1&4)
MIST, Rumi et al., 2010
143
PR48 2a 91 54.8 (10.8) 55% 100% NR NR a
NR 24% (Ishak score 5,6)
NR
PR48 2b 87 53.9 (12.6) 49% 100% NR NR a NR 21% (Ishak
score 5,6) NR
IDEAL, McHutchison et al., 2009
141
PR48 2a 1035 47.6 (8.2) 59% -- 61% 36% -- NR 11%b 6.3 (0.6)
PR48 2b 1019 47.5 (7.8) 60% -- 64% 35% -- NR 11%b 6.3 (0.7)
Yenice et al., 2006
145
PR48 2a 40 (data for 37)
50 35% -- 19% 76% G1c: 5% NR NR
PR48 2b 40 (data for 37)
50.8 27% -- 5% 95% -- NR NR
Mach et al., 2011
144
PR48 2a 138 45.2 (10.5) 58% -- -- 100% -- 73%c 27%
b 6.6 (6.3)
PR48 2b 122 44.2 (13.6) 60% -- -- 100% -- 65%c 35%
b 6.5 (6.0)
Treatment-Experienced
Scotto et al., 2008
146
PR48 2a 71 45.9 (9.3) 59% 63% NR NR G2: 9% G3:11% G4: 17%
NR 18% 6.4 (6.7)
PR48 2b 72 47.8 (9.6) 56% 65% NR NR G2: 7% G3: 13% G4: 15%
NR 18% 6.3 (6.5)
G = genotype; ITT = intention to treat; NR = not reported; PR48 2a = peginterferon 2a + ribavirin × 48 weeks; PR48 2b = peginterferon 2b + ribavirin × 48 weeks; SD = standard deviation.
aMIST study also included in genotype 2,3,4; patient characteristics and outcomes data for patients with genotype1 were reported separately and have been included in this table.
bCombined Metavir fibrosis score F3 & F4.
cCombined Metavir fibrosis score F0 to F2.

Direct-Acting Antiviral Agents for Chronic Hepatitis C Genotype 1 342
TABLE 215: RISK OF BIAS FOR PEGINTERFERON STUDIES
Study Name, Author, Year
Randomization Allocation Concealment
Blinding Incomplete Outcome Measures
Selective Outcome Reporting
Other Sources of Bias
Treatment-Naive aAscione et al.,
2010142
Low Low Unclear Low Low Low
MIST, Rumi et al., 2010
143
Low Unclear Unclear Low Low Low
IDEAL, McHutchison et al., 2009
141
Unclear Low Unclear Low Low Low
Yenice et al., 2006
145
Unclear Unclear Unclear Low Low Low
Mach et al., 2011
144
Unclear Unclear Unclear High High Low
Treatment-experienced
Scotto et al., 2008
146
Unclear High Unclear High Unclear Low
aIncludes online supplementary data
TABLE 216: PEGINTERFERON STUDIES — EFFICACY OUTCOMES
Study Name, Author, Year, Population
Treatment Discontinued Therapy SVR24
n N % n N %
Treatment-Naive
Ascione et al., 2010142
PR48 2a 3 93a 3 51 93* 55
PR48 2b 13 93a 14 37 93* 40
IDEAL, McHutchison et al., 2009
141
PR48 2a 414 1035 40 423 1035 41
PR48 2b 479 1019 47 406 1019 40
MIST, Rumi et al., 2010143
PR48 2a NR 44 91† 48
PR48 2b NR 28 87† 32
Yenice et al., 2006145
PR48 2a 3 40 8 18 40 45
PR48 2b 3 40 8 13 40 33
Mach et al., 2011144
PR48 2a NR 68 138b 49
PR48 2b NR 54 122b 44
Treatment-experienced
Scotto et al., 2008146
PR48 2a 17 71c 24 8 45 18
PR48 2b 12 72c 17 6 47 13
NR = not reported; PR482a = peginterferon-2a + ribavirin × 48 weeks; PR48-2b = peginterferon-2b + ribavirin × 48 weeks; SVR24 = sustained virologic response 24 weeks after end of treatment. aPatients with genotype 1 and 4 chronic hepatitis C (CHC).
bPatients with genotype 1b CHC.
cPatients with genotype 1 to 4 CHC.

Direct-Acting Antiviral Agents for Chronic Hepatitis C Genotype 1 343
TABLE 217: PEGINTERFERON STUDIES — SVR24 BY FIBROSIS SEVERITY
Study Name, Author, Year, Population Treatment SVR24 Metavir F0-F2 SVR Metavir F3-F4
n N % n N %
IDEAL, McHutchison et al., 2009141
PR48 2a 376 862 44 26 110 24
PR48 2b 366 869 42 23 111 21
PR482a = peginterferon-2a + ribavirin × 48 weeks; PR482b = peginterferon 2b + ribavirin × 48 weeks; SVR 24 = sustained virologic response 24 weeks after end of treatment.
TABLE 218: PEGINTERFERON STUDIES — KEY ADVERSE EVENTS
Study Name, Author, Year
Treatment N Any AE Discontinued Treatment Due to AE
SAE Anemia Depression Rash
n % n % n % n % n % n %
Treatment-Naive aAscione et al.,
2010142
PR48 2a 93 84 90 3 3 0 0 NR 5 5 NR
PR48 2b 93 86 93 8 9 0 0 NR 6 6 NR
IDEAL, McHutchison et al., 2009
141
PR48 2a 1035 NR 135 13 121 12 348 34 217 21 290 28
PR48 2b 1019 NR 129 13 88 9 345 34 260 26 225 22 bMIST, Rumi et al.,
2010143
PR48 2a 212 NR 16 7 2 1 NR 19 9 NR
PR48 2b 219 NR 17 8 1 1 NR 15 7 NR
Yenice et al., 2006145
PR48 2a 40 NR 3 8 NR NR NR NR
PR48 2b 40 NR 3 8 NR NR NR NR
Treatment-Experienced bScotto et al., 2008
146 PR48 2a 71 NR 10 14 NR 9 13 NR NR
PR48 2b 72 NR 8 11 NR 10 14 NR NR
AE = adverse events; G = genotype; NR = not reported; PR482a = peginterferon-2a + ribavirin × 48 weeks; PR482b = peginterferon-2b + ribavirin × 48 weeks; SAE = serious adverse events. aPatients with genotype 1 and 4 chronic hepatitis C.
bPatients with genotype 1 to 4 chronic hepatitis C.

Direct-Acting Antiviral Agents for Chronic Hepatitis C Genotype 1 344
TABLE 219: PEGINTERFERON STUDIES — OTHER ADVERSE EVENTS
Study Name, Author, Year Treatment N Fatigue Influenza-Like Illness Neutropenia Pruritus
n % n % n % n %
Treatment-Naive aAscione et al., 2010
142 PR48 2a 93 54 58 NR NR 15 16
PR48 2b 93 55 59 NR NR 16 17
IDEAL, McHutchison et al., 2009141
PR48 2a 1035 656 63 NR 326 31 NR
PR48 2b 1019 672 66 NR 263 26 NR
MIST, bRumi et al., 2010
143 PR48 2a 212 NR 134 63 NR NR
PR48 2b 219 NR 136 62 NR NR
Treatment-Experienced bScotto et al., 2008
146 PR48 2a 71 NR 42 59 0 0 NR
PR48 2b 72 NR 44 61 0 0 NR
NR = not reported; PR482a = peginterferon-2a + ribavirin × 48 weeks; PR482b = peginterferon-2b + ribavirin × 48 weeks. aPatients with genotype 1 and 4 chronic hepatitis C (CHC).
bPatients with genotype 1 to 4 CHC.

Direct-Acting Antiviral Agents for Chronic Hepatitis C Genotype 1 345
APPENDIX 26: BASE-CASE ANALYSIS ADDITIONAL RESULTS
Table 220 summarizes the outcomes associated with our base-case analysis for a cohort of 50- year-old, genotype 1, treatment-naive patients with boceprevir as a reference.
TABLE 220: RESULTS OF BASE-CASE DETERMINISTIC ANALYSIS (TREATMENT-NAIVE PATIENTS) WITH BOCEPREVIR
AS REFERENCE
Treatment Total Cost Total QALYs Versus boceprevir
Incremental Cost
Incremental QALYs
ICUR Sequential ICUR
BOC $136,537 10.662 Ref Ref Ref Ref
SIM $137,183 11.086 $645 0.424 $1,523 $1,523
Dominated or extendedly dominated treatments
TEL $137,454 11.004 $916 0.342 $2,682 Dominated
BOC = boceprevir; ICUR = incremental cost-utility ratio; QALY = quality-adjusted life-year; Ref = reference; SIM = simeprevir; TEL = telaprevir.
Table 221 summarizes the outcomes associated with our base-case analysis for a cohort of 50- year-old, genotype 1, treatment-naive patients with simeprevir as a reference.
TABLE 221: RESULTS OF BASE-CASE DETERMINISTIC ANALYSIS (TREATMENT-NAIVE PATIENTS) WITH SIMEPREVIR
AS REFERENCE
Treatment Total Cost Total QALYs Versus Simeprevir
Incremental Cost
Incremental QALYs
ICUR Sequential ICUR
SIM $137,183 11.086 Ref Ref Ref Ref
TEL $137,454 11.004 $271 -0.082 Dominated Dominated
ICUR = incremental cost-utility ratio; QALY = quality-adjusted life-year; Ref = reference; SIM = simeprevir; TEL = telaprevir.
Table 222 summarizes the outcomes associated with our base-case analysis for a cohort of 50- year-old, genotype 1, treatment-experienced patients with prior relapse using simeprevir as a reference.
TABLE 222: RESULTS OF BASE-CASE DETERMINISTIC ANALYSIS (TREATMENT-EXPERIENCED PATIENTS: PRIOR
RELAPSE) WITH SIMEPREVIR AS REFERENCE
Treatment Total Cost Total QALYs Versus Simeprevir
Incremental Cost
Incremental QALYs
ICUR Sequential ICUR
SIM $139,152 10.889 Ref Ref Ref Ref
TEL $141,955 11.189 $2,803 0.300 $9,347 $9,347
Dominated or extendedly dominated treatments
BOC $139,955 10.603 $803 -0.286 Dominated Dominated
BOC = boceprevir; ICUR = incremental cost-utility ratio; QALY = quality-adjusted life-year; Ref = reference; SIM = simeprevir; TEL = telaprevir.

Direct-Acting Antiviral Agents for Chronic Hepatitis C Genotype 1 346
Table 223 summarizes the outcomes associated with our base-case analysis for a cohort of 50- year-old, genotype 1, treatment-experienced patients with prior relapse using boceprevir as a reference.
TABLE 223: RESULTS OF BASE-CASE DETERMINISTIC ANALYSIS (TREATMENT-EXPERIENCED PATIENTS: PRIOR
RELAPSE) WITH BOCEPREVIR AS REFERENCE
Treatment Total Cost Total QALYs Versus Telaprevir
Incremental Cost
Incremental QALYs
ICUR Sequential ICUR
BOC $139,955 10.603 Ref Ref Ref Ref
TEL $141,955 11.189 $1,999 0.586 $3,411 $3,411
BOC = boceprevir; ICUR = incremental cost-utility ratio; QALY = quality-adjusted life-year; Ref = reference; TEL = telaprevir.
Table 224 summarizes the outcomes associated with the base-case analysis for a cohort of 50- year-old, genotype 1, treatment-experienced patients with prior partial respond using boceprevir as a reference.
TABLE 224: RESULTS OF BASE-CASE DETERMINISTIC ANALYSIS (TREATMENT-EXPERIENCED PATIENTS: PARTIAL
RESPONSE) WITH BOCEPREVIR AS REFERENCE
Treatment Total Cost Total QALYs Versus Telaprevir
Incremental Cost
Incremental QALYs
ICUR Sequential ICUR
BOC $140,971 10.417 Ref Ref Ref Ref
TEL $145,679 10.129 $4,708 -0.289 Dominated Dominated
BOC = boceprevir; ICUR = incremental cost-utility ratio; QALY = quality-adjusted life-year; Ref = reference; TEL = telaprevir.
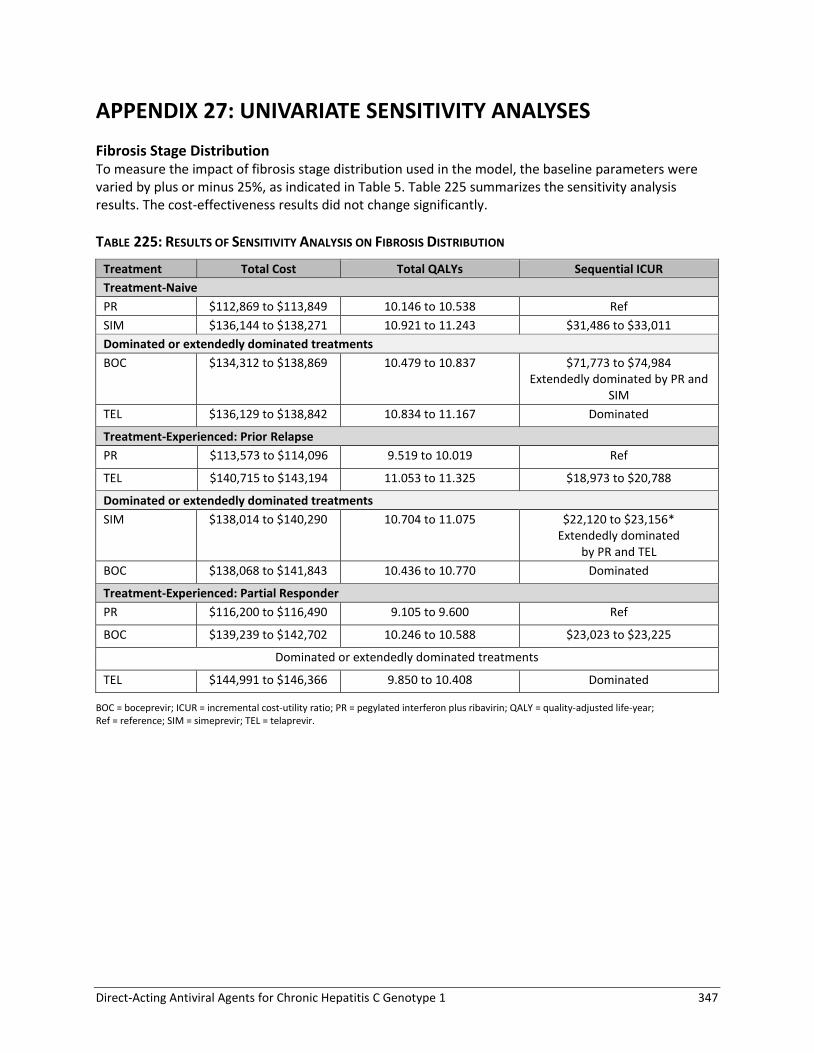
Direct-Acting Antiviral Agents for Chronic Hepatitis C Genotype 1 347
APPENDIX 27: UNIVARIATE SENSITIVITY ANALYSES
Fibrosis Stage Distribution To measure the impact of fibrosis stage distribution used in the model, the baseline parameters were varied by plus or minus 25%, as indicated in Table 5. Table 225 summarizes the sensitivity analysis results. The cost-effectiveness results did not change significantly.
TABLE 225: RESULTS OF SENSITIVITY ANALYSIS ON FIBROSIS DISTRIBUTION
Treatment Total Cost Total QALYs Sequential ICUR
Treatment-Naive
PR $112,869 to $113,849 10.146 to 10.538 Ref
SIM $136,144 to $138,271 10.921 to 11.243 $31,486 to $33,011
Dominated or extendedly dominated treatments
BOC $134,312 to $138,869 10.479 to 10.837 $71,773 to $74,984 Extendedly dominated by PR and
SIM
TEL $136,129 to $138,842 10.834 to 11.167 Dominated
Treatment-Experienced: Prior Relapse
PR $113,573 to $114,096 9.519 to 10.019 Ref
TEL $140,715 to $143,194 11.053 to 11.325 $18,973 to $20,788
Dominated or extendedly dominated treatments
SIM $138,014 to $140,290 10.704 to 11.075 $22,120 to $23,156* Extendedly dominated
by PR and TEL
BOC $138,068 to $141,843 10.436 to 10.770 Dominated
Treatment-Experienced: Partial Responder
PR $116,200 to $116,490 9.105 to 9.600 Ref
BOC $139,239 to $142,702 10.246 to 10.588 $23,023 to $23,225
Dominated or extendedly dominated treatments
TEL $144,991 to $146,366 9.850 to 10.408 Dominated
BOC = boceprevir; ICUR = incremental cost-utility ratio; PR = pegylated interferon plus ribavirin; QALY = quality-adjusted life-year; Ref = reference; SIM = simeprevir; TEL = telaprevir.

Direct-Acting Antiviral Agents for Chronic Hepatitis C Genotype 1 348
a) Impact of Age: Analyses Stratified By Fibrosis Stage To further measure the impact of age in the model, instead of the baseline values, a broader range of age (40 to 60) was evaluated in this sensitivity analysis. Table 226, Table 227, and Table 228 summarize the results by fibrosis stage for treatment-naive, prior relapsers and partial responder respectively.
TABLE 226: RESULTS OF SENSITIVITY ANALYSIS (TREATMENT-NAIVE) BY FIBROSIS STAGES
Treatment Total Cost Total QALYs Sequential ICUR
F0
PR $101,769 to $117,793 9.229 to 12.821 Ref
SIM $121,488 to $142,446 9.518 to 13.332 $38,634 to $85,377
Dominated or extendedly dominated treatments
BOC $116,330 to $134,434 9.344 to 13.031 $69,285 to $144,441 Extendedly dominated by PR and SIM-
Dominated TEL $121,387 to $141,902 9.482 to 13.279 $20,434 to $54,048
Extendedly dominated by PR and SIM- Dominated
F1
PR $101,477 to $117,808 9.171 to 12.626 Ref
SIM $121,373 to $142,451 9.494 to 13.254 $31,661 to $76,066
Dominated or extendedly dominated treatments
BOC $116,114 to $134,443 9.300 to 12.886 $56,218 to $128,006 Extendedly dominated by PR and SIM-
Dominated TEL $121,258 to $141,908 9.456 to 13.193 $16,805 to $47,893
Extendedly dominated by PR and SIM-Dominated
F2
PR $100,902 to $117,610 8.987 to 12.166 Ref
SIM $121,151 to $142,373 9.422 to 13.072 $22,348 to $57,045
Dominated or extendedly dominated treatments
BOC $115,736 to $134,338 9.164 to 12.545 $39,160 to $94,874 Extendedly dominated by PR and SIM-
Dominated TEL $121,010 to $141,820 9.375 to 12.989 $11,886 to $35,475
Extendedly dominated by PR and SIM-Dominated
F3
PR $103,430 to $118,150 8.425 to 11.066 Ref
SIM $123,834 to $143,252 9.062 to 12.361 $15,765 to $39,421
Dominated or extendedly dominated treatments
TEL $123,944 to $142,779 8.979 to 12.204 $44,467 Extendedly dominated by PR and SIM-
Dominated BOC $136,522 to $153,142 8.698 to 11.638
Dominated F4
PR $111,419 to $119,608 7.333 to 9.330 Ref
SIM $140,650 to $148,847 8.075 to 10.704 $21,275 to $39,437
Dominated or extendedly dominated treatments
TEL $143,807 to $151,903 7.983 to 10.549 Dominated
BOC $148,288 to $156,317 7.658 to 9.946 Dominated
BOC = boceprevir; F0 = No fibrosis; F1 = portal fibrosis without septa; F2 = portal fibrosis with rare septa; F3 = numerous septa without cirrhosis; F4 = cirrhosis; ICUR = incremental cost-utility ratio; PR = pegylated interferon plus ribavirin; QALY = quality-adjusted life-year; SIM = simeprevir; TEL = telaprevir. aExtendedly dominated = the combination of two other alternatives dominated the treatment.

Direct-Acting Antiviral Agents for Chronic Hepatitis C Genotype 1 349
TABLE 227: RESULTS OF SENSITIVITY ANALYSIS (TREATMENT-EXPERIENCED PATIENTS: PRIOR RELAPSE) BY
FIBROSIS STAGES
Treatment Total Cost Total QALYs Sequential ICUR
F0
PR $103,924 to $117,745
9.117 to 12.607 Ref
SIM $123,156 to $143,719
9.498 to 13.293 $27,999 to $68,105
TEL $125,703 to $146,831
9.518 to 13.354 $42,229 to $157,083
Dominated or extendedly dominated treatments
BOC $123,431 to $141,768
9.363 to 13.064 Extendedly dominated by PR and SIM- Dominated
F1
PR $103,550 to $117,763
9.042 to 12.356 Ref
SIM $123,026 to $143,725
9.472 to 13.206 $22,908 to $60,332
TEL $125,607 to $146,835
9.499 to 13.289 $31,048 to $116,704
Dominated or extendedly dominated treatments
BOC $123,226 to $141,776
9.321 to 12.927 Extendedly dominated by PR and SIM- Dominated
F2
PR $102,812 to $117,508
8.806 to 11.766 Ref
SIM $122,774 to $143,637
9.390 to 13.000 $16,169 to $44,797
TEL $125,416 to $146,767
9.438 to 13.138 $19,141 to $64,409
Dominated or extendedly dominated treatments
BOC $122,828 to $141,636
9.192 to 12.603 Extendedly dominated by PR and SIM-Dominated
F3
PR $106,090 to $118,211
8.081 to 10.346 Ref
TEL $125,291 to $146,570
9.332 to 12.941 $7,401 to $22,670
Dominated or extendedly dominated treatments
SIM $125,589 to $144,545
9.001 to 12.231 Extendedly dominated by PR and TEL-Dominated
BOC $126,288 to $142,686
8.663 to 11.556 Extendedly dominated by PR and TEL-Dominated
F4
PR $109,341 to $117,479
6.920 to 8.552 Ref

Direct-Acting Antiviral Agents for Chronic Hepatitis C Genotype 1 350
Treatment Total Cost Total QALYs Sequential ICUR
TEL $145,523 to $153,658
8.414 to 11.351 $12,929 to $24,216
Dominated or extendedly dominated treatments
SIM $141,564 to $149,753
8.000 to 10.563 $16,020 to $29,875 Extendedly dominated by PR and TEL
BOC $148,476 to $156,533
7.926 to 10.447 Dominated
BOC = boceprevir; F0 = No fibrosis; F1 = portal fibrosis without septa; F2 = portal fibrosis with rare septa; F3 = numerous septa without cirrhosis; F4 = cirrhosis; ICUR = incremental cost-utility ratio; PR = pegylated interferon plus ribavirin; QALY = quality-adjusted life-year; SIM = simeprevir; TEL = telaprevir. aExtendedly dominated = the combination of two other alternatives dominated the treatment.
TABLE 228: RESULTS OF SENSITIVITY ANALYSIS (TREATMENT-EXPERIENCED PATIENTS: PARTIAL RESPONSE) BY
FIBROSIS STAGES
Treatment Total Cost Total QALYs Sequential ICUR
F0
PR $109,940 to $120,191 8.923 to 12.252 Ref
BOC $125,648 to $142,674 9.291 to 12.933 $23,057 to $61,138
TEL $131,601 to $149,229 9.328 to 13.006 $81,697 to $176,008
F1
PR $109,437 to $120,218 8.823 to 11.915 Ref
BOC $125,396 to $142,686 9.240 to 12.764 $18,808 to $53,846
TEL $131,378 to $149,242 9.284 to 12.857 $64,060 to $149,037
F2
PR $108,432 to $119,881 8.510 to 11.124 Ref
BOC $124,902 to $142,515 9.082 to 12.366 $13,263 to $39,568
TEL $130,952 to $149,104 9.145 to -12.505 $43,553 to $103,740
F3
PR $109,204 to $119,423 7.829 to 9.824 Ref
BOC $128,111 to $143,398 8.515 to 11.250 $13,253 to $34,973
Dominated or extendedly dominated treatments
TEL $126,288 to $142,686 8.663 to 11.556 Dominated
F4
PR $108,990 to $117,097 6.621 to 7.990 Ref
BOC $148,302 to $156,344 7.778 to 10.169 $18,046 to $33,927
Dominated or extendedly dominated treatments
TEL $143,952 to $151,952 7.080 to 8.842 $41,064 to $75,935
Extendedly dominated by PR and BOC
BOC = boceprevir; F0 = No fibrosis; F1 = portal fibrosis without septa; F2 = portal fibrosis with rare septa; F3 = numerous septa without cirrhosis; F4 = cirrhosis; ICUR = incremental cost-utility ratio; PR = pegylated interferon plus ribavirin; QALY = quality-adjusted life-year; SIM = simeprevir; TEL = telaprevir. aExtendedly dominated = the combination of two other alternatives dominated the treatment.
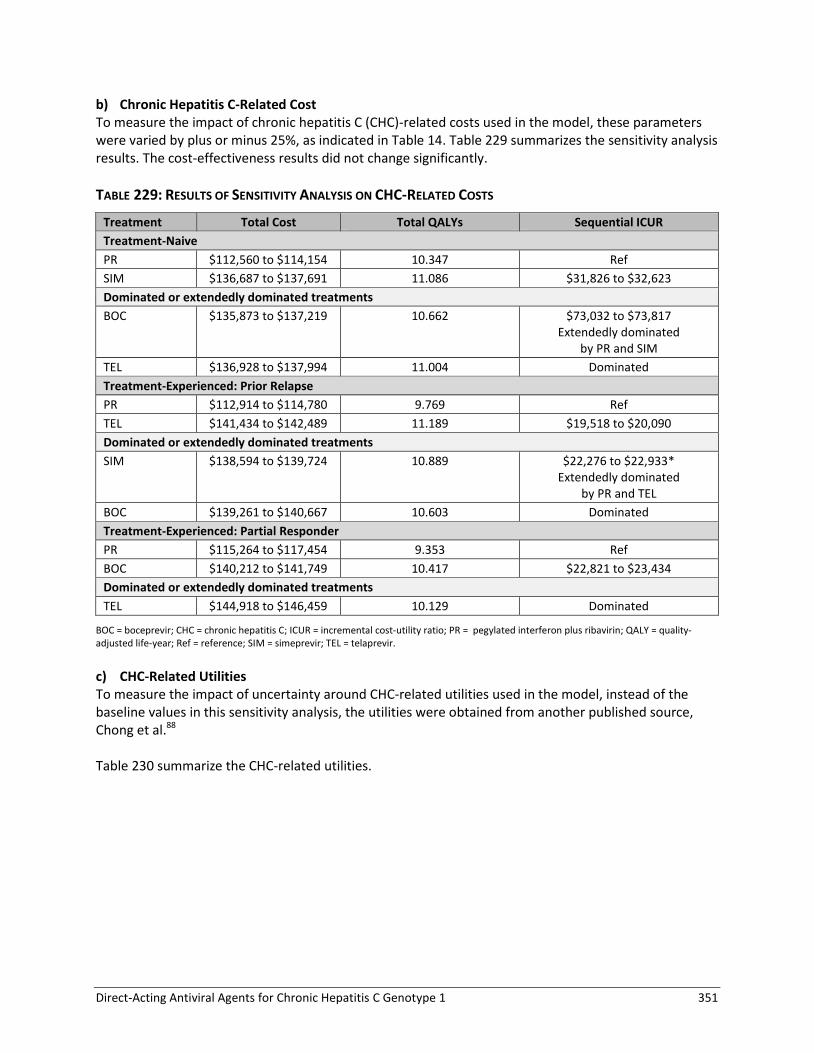
Direct-Acting Antiviral Agents for Chronic Hepatitis C Genotype 1 351
b) Chronic Hepatitis C-Related Cost To measure the impact of chronic hepatitis C (CHC)-related costs used in the model, these parameters were varied by plus or minus 25%, as indicated in Table 14. Table 229 summarizes the sensitivity analysis results. The cost-effectiveness results did not change significantly.
TABLE 229: RESULTS OF SENSITIVITY ANALYSIS ON CHC-RELATED COSTS
Treatment Total Cost Total QALYs Sequential ICUR
Treatment-Naive
PR $112,560 to $114,154 10.347 Ref
SIM $136,687 to $137,691 11.086 $31,826 to $32,623
Dominated or extendedly dominated treatments
BOC $135,873 to $137,219 10.662 $73,032 to $73,817 Extendedly dominated
by PR and SIM
TEL $136,928 to $137,994 11.004 Dominated
Treatment-Experienced: Prior Relapse
PR $112,914 to $114,780 9.769 Ref
TEL $141,434 to $142,489 11.189 $19,518 to $20,090
Dominated or extendedly dominated treatments
SIM $138,594 to $139,724 10.889 $22,276 to $22,933* Extendedly dominated
by PR and TEL
BOC $139,261 to $140,667 10.603 Dominated
Treatment-Experienced: Partial Responder
PR $115,264 to $117,454 9.353 Ref
BOC $140,212 to $141,749 10.417 $22,821 to $23,434
Dominated or extendedly dominated treatments
TEL $144,918 to $146,459 10.129 Dominated
BOC = boceprevir; CHC = chronic hepatitis C; ICUR = incremental cost-utility ratio; PR = pegylated interferon plus ribavirin; QALY = quality- adjusted life-year; Ref = reference; SIM = simeprevir; TEL = telaprevir.
c) CHC-Related Utilities To measure the impact of uncertainty around CHC-related utilities used in the model, instead of the baseline values in this sensitivity analysis, the utilities were obtained from another published source, Chong et al.88 Table 230 summarize the CHC-related utilities.

Direct-Acting Antiviral Agents for Chronic Hepatitis C Genotype 1 352
TABLE 230: CHC-RELATED UTILITIES USED IN SENSITIVITY ANALYSIS
Description Base Estimate
Utility for CHC-related health states
Non-cirrhosis 0.79
Compensated cirrhosis 0.80
HCC 0.75
Decompensated cirrhosis 0.60
Post-transplant 0.73
Non-cirrhosis on treatment 0.77
Non-cirrhosis viral clearance 0.86
Compensated cirrhosis on treatment 0.78
Compensated cirrhosis viral clearance 0.87
CHC = chronic hepatitis C; HCC = Hepatocellular carcinoma
Table 231 summarizes the sensitivity analysis results using the specified utilities. The cost-effectiveness results did not change significantly.
TABLE 231: RESULTS OF SENSITIVITY ANALYSIS ON CHC-RELATED UTILITIES
Treatment Total Cost Total QALYs Sequential ICUR
Treatment-Naive
PR $113,347 11.232 Ref
SIM $137,183 11.931 $34,088
Dominated or extendedly dominated treatments
BOC $136,537 11.531 Extendedly dominated by PR and SIM
TEL $137,454 11.857 Dominated
Treatment-Experienced: Prior Relapse
PR $113,835 10.686 Ref
TEL $141,955 12.070 $20,323
Dominated or extendedly dominated treatments
SIM $139,152 11.774 Extendedly dominated by PR and TEL
BOC $139,955 11.495 Dominated
Treatment-Experienced: Partial Responder
PR $116,345 10.197 Ref
BOC $140,971 11.273 $22,899
TEL $145,679 10.987 Dominated
BOC = boceprevir; CHC = chronic hepatitis C; ICUR = incremental cost-utility ratio; PR = pegylated interferon plus ribavirin; QALY = quality- adjusted life-year; Ref = reference; SIM = simeprevir; TEL = telaprevir.
To further measure the impact of uncertainty around CHC-related utilities instruments used in the model, instead of the baseline values (HUI2), in this sensitivity analysis, the utilities were obtained HUI3 from the same source; Table 232 summarizes the CHC-related utilities.

Direct-Acting Antiviral Agents for Chronic Hepatitis C Genotype 1 353
TABLE 232: CHC-RELATED UTILITIES USED IN SENSITIVITY ANALYSIS (HUI3)
Description Base Estimate
Utility for CHC-related health states
Non-cirrhosis 0.57
Compensated cirrhosis 0.51
Hepatocellular carcinoma (HCC) 0.56
Decompensated cirrhosis 0.49
Post-transplant 0.64
Non-cirrhosis on-treatment 0.52
Non-cirrhosis viral clearance 0.70
Compensated cirrhosis on treatment 0.46
Compensated cirrhosis viral clearance 0.64
Table 233 summarizes the sensitivity analysis results using the specified utilities. The cost-effectiveness results did not change significantly.
TABLE 233: RESULTS OF SENSITIVITY ANALYSIS ON CHC-RELATED UTILITIES (HUI 3)
Treatment Total Cost Total QALYs Sequential ICUR
Treatment-Naive
PR $113,347 8.400 Ref
SIM $137,183 9.342 $25,297
Dominated or extendedly dominated treatments
BOC $136,537 8.800 Extendedly dominated by PR and SIM
TEL $137,454 9.235 Dominated
Treatment-Experienced: Prior Relapse
PR $113,835 7.767 Ref
TEL $141,955 9.503 $16,198
Dominated or extendedly dominated treatments
SIM $139,152 9.173 Extendedly dominated by PR and TEL
BOC $139,955 8.792 Dominated
Treatment-Experienced: Partial Responder
PR $116,345 7.029 Ref
BOC $140,971 8.454 $17,272
TEL $145,679 8.094 Dominated
PR = Pegylated interferon plus ribavirin; BOC = boceprevir; SIM = simeprevir; TEL = telaprevir; QALY = quality-adjusted life-year; ICUR = incremental cost-utility ratio
a) CHC-Related Mortality To measure the impact of CHC-related mortality used in the model, the parameters were varied by plus or minus 25%, as indicated in Table 13. Table 234 summarize the results of the sensitivity analysis. The cost-effectiveness results did not change significantly in the analysis.

Direct-Acting Antiviral Agents for Chronic Hepatitis C Genotype 1 354
TABLE 234: RESULTS OF SENSITIVITY ANALYSIS ON CHC-RELATED MORTALITY
Treatment Total Cost Total QALYs Sequential ICUR
Treatment-Naive
PR $112,517 to $114,558 10.303 to 10.409 Ref
SIM $136,773-$137,780 11.065 to 11.117 $31,857 to $32,821
Dominated or extendedly dominated treatments
BOC $135,894 to $137,475 10.629 to 10.711 $71,812 to $75,989 Extendedly dominated
by PR and SIM
TEL $137,005 to $138,109 10.981 to 11.038 Dominated
Treatment-Experienced: Prior Relapse
PR $112,636 to $115,583 9.707 to 9.860 Ref
TEL $141,646-$142,404 11.173 to 11.212 $19,792 to $19,836
Dominated or extendedly dominated treatments
SIM $138,630 to $139,912 10.862 to 10.929 $22,507 to $22,772 Extendedly dominated
by PR and TEL
BOC $139,286 to $140,931 10.568 to 10.653 Dominated
Treatment-Experienced: Partial Responder
PR $114,902 to $118,450 9.278 to 9.462 Ref
BOC $140,190 to $142,109 10.377 to 10.477 $23,011 to $23,326
Dominated or extendedly dominated treatments
TEL $144,687 to $147,124 10.077 to 10.204 Dominated
BOC = boceprevir; CHC = chronic hepatitis C; ICUR = incremental cost-utility ratio; PR = pegylated interferon plus ribavirin; QALY = quality- adjusted life-year; Ref = reference; SIM = simeprevir; TEL = telaprevir.
b) CHC Progression Rate To measure the impact of CHC progression rate used in the model, the parameters were varied by the 95% confidence interval, as indicated in Table 8. Table 235 summarizes the results of the sensitivity analysis. The cost-effectiveness results did not change significantly.

Direct-Acting Antiviral Agents for Chronic Hepatitis C Genotype 1 355
TABLE 235: RESULTS OF SENSITIVITY ANALYSIS ON CHC PROGRESSION RATE
Treatment Total Cost Total QALYs Sequential ICUR
Treatment-Naive
PR $113,299 to $113,399 10.318 to 10.377 Ref
SIM $137,162 to $137,205 11.073 to 11.100 $31,607 to $32,933
Dominated or extendedly dominated treatments
BOC $136,501 to $136,577 10.641 to 10.685 $71,928 to $75,126 Extendedly dominated by PR and
SIM
TEL $137,431 to $137,479 10.990 to 11.019 Dominated
Treatment-Experienced: Prior Relapse
PR $113,769 to $113,906 9.732 to 9.810 Ref
TEL $141,940 to $141,970 11.180 to 11.199 $19,445 to $20,217
Dominated or extendedly dominated treatments
SIM $139,127 to $139,179 10.874 to 10.905 $22,190 to $23,080 Extendedly dominated by PR and
TEL
BOC $139,918 to $139,996 10.581 to 10.627 Dominated
Treatment-Experienced: Partial Responder
PR $116,263 to $116,434 9.306 to 9.404 Ref
BOC $140,926 to $141,019 10.391 to 10.446 $22,727 to $23,587
Dominated or extendedly dominated treatments
TEL $145,629 to $145,733 10.100 to 10.160 Dominated
BOC = boceprevir; CHC = chronic hepatitis C; ICUR = incremental cost-utility ratio; PR = pegylated interferon plus ribavirin; QALY = quality- adjusted life-year; Ref = reference; SIM = simeprevir; TEL = telaprevir.
c) Telaprevir Dose Two different dosing regimens for telaprevir efficacy were identified from the network meta-analysis (NMA) for treatment-naive patients (dosing every eight or 12 hours). The base case used the every eight hours dosing because it had the most robust data. In this sensitivity analysis, we used the alternative dose rather than the baseline dose for telaprevir. Table 236 summarizes the result of the sensitivity analysis for this parameter. The cost-effectiveness results did not change significantly in the analysis.

Direct-Acting Antiviral Agents for Chronic Hepatitis C Genotype 1 356
TABLE 236: RESULTS OF SENSITIVITY ANALYSIS ON-TREATMENT EFFICACY (TELAPREVIR DOSE)
Treatment Total Cost Total QALYs Sequential ICUR
Treatment-Naive
PR $113,347 10.347 Ref
SIM $137,183 11.086 $32,230
Dominated or extendedly dominated treatments
BOC $136,537 10.662 $73,429 Extendedly dominated
by PR and SIM
TEL $137,452 11.030 Dominated
BOC = boceprevir; ICUR = incremental cost-utility ratio; PR = pegylated interferon plus ribavirin; QALY = quality-adjusted life-year; SIM = simeprevir; TEL = telaprevir.
d) Boceprevir Dose Two different dosing regimens for boceprevir efficacy were identified from the NMA for both treatment-naive patients (B24 PR28-48 RGT and BOC44 PR48) and treatment-experienced patients (B32 PR36/48 RGT and B44 PR48). In treatment-naive group, the base case used RGT dosing for F0-F2 and non-RGT for F3-F4, while in the treatment-experienced group the base case used RGT dosing for F0-F3 and non-RGT for F4 because it had the most robust data. In this sensitivity analysis, we used the alternative dose rather than the baseline dose for boceprevir. Table 237 summarizes the result of the sensitivity analysis for the boceprevir dose. The main conclusion in all groups remains unchanged.

Direct-Acting Antiviral Agents for Chronic Hepatitis C Genotype 1 357
TABLE 237: RESULTS OF SENSITIVITY ANALYSIS ON-TREATMENT EFFICACY (BOCEPREVIR DOSE)
Treatment Total Cost Total QALYs Sequential ICUR
Treatment-Naive
PR $113,347 10.347 Ref
SIM $137,183 11.086 $32,230
Dominated or extendedly dominated treatments
BOC $130,077 to $136,537 10.596 to 10.662 $73,429 to $79,210 Extendedly dominated
by PR and SIM
TEL $137,454 11.004 Dominated
Treatment-Experienced: Prior Relapse
PR $113,835 9.769 Ref
TEL $141,955 11.189 $19,808
Dominated or extendedly dominated treatments
SIM $139,152 10.889 $22,608 Extendedly dominated by
PR and TEL
BOC $139,848 to $141,974 10.500 to 10.711 Dominated
Treatment-Experienced: Partial Responder
PR $116,345 9.353 Ref
BOC $140,855 to $143,013 10.306 to 10.521 $22,834 to $25,711
Dominated or extendedly dominated treatments
TEL $145,679 10.129 Dominated
BOC = boceprevir; CHC = chronic hepatitis C; ICUR = incremental cost-utility ratio; PR = pegylated interferon plus ribavirin; QALY = quality- adjusted life-year; Ref = reference; SIM = simeprevir; TEL = telaprevir.
e) Percentage Meeting RGT Criteria for Short Therapy To measure the impact of the proportion of patients who were deemed eligible for short therapy according to the RCT source used in the model, these parameters were varied by the 95% confidence interval, as indicated in Table 12. Table 240 summarizes the sensitivity analysis results. The cost-effectiveness results did not change significantly.

Direct-Acting Antiviral Agents for Chronic Hepatitis C Genotype 1 358
TABLE 238: RESULTS OF SENSITIVITY ANALYSIS ON PERCENTAGE MEETING RGT CRITERIA FOR SHORT THERAPY
Treatment Total Cost Total QALYs Sequential ICUR
Treatment-Naive
PR $113,347 10.347 Ref
SIM $136,784 to $137,789 11.084 to 11.087 $31,644 to $33,124
Dominated or extendedly dominated treatments
BOC $136,390 to $136,685 10.662 to 10.663 $72,815 to $74,047 Extendedly dominated
by PR and SIM
TEL $136,901 to $137,730 11.003 to 11.006 Dominated
Treatment-Experienced: Prior Relapse
PR $113,835 9.769 Ref
TEL $141,955 11.189 $19,807
Dominated or extendedly dominated treatments
SIM $138,941 to $139,468 10.889 to 10.889 $22,416 to $22,898 Extendedly dominated
by PR and TEL
BOC $139,785 to $140,121 10.602 to 10.603 Dominated
Treatment-Experienced: Partial Responder
PR $116,345 9.352 Ref
BOC $140,802 to $141,135 10.418 to 10.417 $22,965 to $23,293
Dominated or extendedly dominated treatments
TEL $145,679 10.129 Dominated
BOC = boceprevir; CHC = chronic hepatitis C; ICUR = incremental cost-utility ratio; PR = pegylated interferon plus ribavirin; QALY = quality- adjusted life-year; Ref = reference; SIM = simeprevir; TEL = telaprevir.
f) Cost of Adverse Events To measure the impact of the costs of adverse events used in the model, the parameters were varied by plus or minus 25%, as indicated in Table 16. Table 239 summarizes the results of the sensitivity analysis. The cost-effectiveness results did not change significantly in the analysis.

Direct-Acting Antiviral Agents for Chronic Hepatitis C Genotype 1 359
TABLE 239: RESULTS OF SENSITIVITY ANALYSIS ON COST OF ADVERSE EVENTS
Treatment Total Cost Total QALYs Sequential ICUR
Treatment-Naive
PR $113,166 to $113,529 10.347 Ref
SIM $137,002 to $137,363 11.086 $32,229 to $32,231
Dominated or extendedly dominated treatments
BOC $136,260 to $136,814 10.662 $73,126 to $73,733 Extendedly dominated
by PR and SIM
TEL $137,174 to $137,734 11.004 Dominated
Treatment-Experienced: Prior Relapse
PR $113,710 to $113,960 9.769 Ref
TEL $141,733 to $142,176 11.189 $19,739 to $19,876
Dominated or extendedly dominated treatments
SIM $139,021 to $139,282 10.889 $22,603 to $22,614 Extendedly dominated
by PR and TEL
BOC $139,726 to $140,184 10.603 Dominated
Treatment-Experienced: Partial Responder
PR $116,220 to $116,470 9.353 Ref
BOC $140,742 to $141,200 10.417 $23,033 to $23,229
Dominated or extendedly dominated treatments
TEL $145,457 to $145,900 10.129 Dominated
BOC = boceprevir; CHC = chronic hepatitis C; ICUR = incremental cost-utility ratio; PR = pegylated interferon plus ribavirin; QALY = quality- adjusted life-year; Ref = reference; SIM = simeprevir; TEL = telaprevir.
g) Sensitivity Analysis on Cost of Anemia (Epoetin Alfa Use) The use of epoetin alfa (EPO) for the treatment of anemia secondary to hepatitis C therapy is not reimbursed by all Canadian public drug plans. Further, for many patients, a reduction of the dose of ribavirin is sufficient to manage treatment-induced anemia. Therefore, a sensitivity analysis assuming a 0% utilization of EPO was performed. Table 240 summarizes the results of the sensitivity analysis based on 0% utilization on EPO.

Direct-Acting Antiviral Agents for Chronic Hepatitis C Genotype 1 360
TABLE 240: RESULTS OF SENSITIVITY ANALYSIS ON THE COST OF EPO USED (UTILIZATION = 0%)
Treatment Total Cost Total QALYs Sequential ICUR
Treatment-Naive
PR $112,982 to $113,347 10.347 Ref
SIM $136,780 to $137,183 11.086 $32,179 to $32,230
Dominated or extendedly dominated treatments
BOC $135,893 to $136,537 10.662 $72,545 to $73,429 Extendedly dominated
by PR and SIM
TEL $136,789 to $137,454 11.004 Dominated
Treatment-Experienced: Prior Relapse
PR $113,570 to $113,835 9.769 Ref
TEL $141,402 to $141,955 11.189 $19,605 to $19,807
Dominated or extendedly dominated treatments
SIM $138,928 to $139,152 10.889 $22,608 to $22,645 Extendedly dominated
by PR and TEL
BOC $139,420 to $139,955 10.603 Dominated
Treatment-Experienced: Partial Responder
PR $116,080 to $116,345 9.353 Ref
BOC $140,436 to $140,971 10.417 $22,878 to $23,131
Dominated or extendedly dominated treatments
TEL $145,126 to $145,679 10.129 Dominated
BOC = boceprevir; CHC = chronic hepatitis C; EPO = epoetin alfa; ICUR = incremental cost-utility ratio; PR = pegylated interferon plus ribavirin; QALY = quality-adjusted life-year; Ref = reference; SIM = simeprevir; TEL = telaprevir.
h) Disutility for Adverse Events To measure the impact of the disutility associated with adverse events used in the model, this sensitivity analysis assumed that there was no disutility associated with any adverse event and, instead, the disutility associated with adverse events was reflected by the overall on-treatment disutility. Table 241 summarizes the results of the sensitivity analysis. The cost-effectiveness results did not change significantly.

Direct-Acting Antiviral Agents for Chronic Hepatitis C Genotype 1 361
TABLE 241: RESULTS OF SENSITIVITY ANALYSIS ON DISUTILITY FOR ADVERSE EVENTS
Treatment Total Cost Total QALYs Sequential ICUR
Treatment-Naive
PR $113,347 10.347 to 10.370 Ref
SIM $137,183 11.086 to 11.107 $32,230 to $32,333
Dominated or extendedly dominated treatments
BOC $136,537 10.662 to 10.692 $71,969 to $73,429 Extendedly dominated
by PR and SIM
TEL $137,454 11.004 to 11.034 Dominated
Treatment-Experienced: Prior Relapse
PR $113,835 9.769 to 9.785 Ref
TEL $141,955 11.189 to 11.211 $19,714 to $19,808
Dominated or extendedly dominated treatments
SIM $139,152 10.889 to 10.909 $22,524 to $22,608 Extendedly dominated
by PR and TEL
BOC $139,955 10.603 to 10.628 Dominated
Treatment-Experienced: Partial Responder
PR $116,345 9.353 to 9.368 Ref
BOC $140,971 10.417 to 10.443 $22,910 to $23,131
Dominated or extendedly dominated treatments
TEL $145,679 10.129 to 10.151 Dominated
BOC = boceprevir; CHC = chronic hepatitis C; ICUR = incremental cost-utility ratio; PR = pegylated interferon plus ribavirin; QALY = quality- adjusted life-year; Ref = reference; SIM = simeprevir; TEL = telaprevir.
i) Relative Risk of Adverse Events (Network Meta-analysis Results) To measure the impact of relative risks of adverse events used in the model, the parameters were varied by the 95% credible intervals that were generated by the NMA, as indicated in Table 10. Table 242 summarizes the results of the sensitivity analysis. The cost-effectiveness results did not change significantly.

Direct-Acting Antiviral Agents for Chronic Hepatitis C Genotype 1 362
TABLE 242: RESULTS OF SENSITIVITY ANALYSIS ON ADVERSE EVENT RATE
Treatment Total Cost Total QALYs Sequential ICUR
Treatment-Naive
PR $113,347 10.347 Ref
SIM $137,025 to $137,392 11.083 to 11.088 $31,917 to $32,648
Dominated or extendedly dominated treatments
BOC $136,287 to $136,823 10.658 to 10.666 $71,801 to $75,332 Extendedly dominated
by PR and SIM
TEL $137,192 to $137,750 11.000 to 11.008 Dominated
Treatment-Experienced: Prior Relapse
PR $113,835 9.769 Ref
TEL $141,609 to $142,417 11.182 to 11.194 $19,495 to $20,230
Dominated or extendedly dominated treatments
SIM $138,987 to $139,453 10.884 to 10.891 $22,412 to $22,968 Extendedly dominated
by PR and TEL
BOC $139,704 to $140,310 10.598 to 10.607 Dominated
Treatment-Experienced: Partial Responder
PR $116,345 9.353 Ref
BOC $140,720 to $141,326 10.412 to 10.421 $22,817 to $23,131
Dominated or extendedly dominated treatments
TEL $145,333 to $146,141 10.122 to 10.134 Dominated
BOC = boceprevir; CHC = chronic hepatitis C; EPO = epoetin alfa; ICUR = incremental cost-utility ratio; PR = pegylated interferon plus ribavirin; QALY = quality- adjusted life-year; Ref = reference; SIM = simeprevir; TEL = telaprevir.
Copyright © 2022 FDOKUMEN