
Cellular Oxidative Stress Response Controls the Antiviral and ...
18
Cellular Oxidative Stress Response Controls the Antiviral and Apoptotic Programs in Dengue Virus-Infected Dendritic Cells David Olagnier 1¤ *, Suraj Peri 2 , Courtney Steel 1 , Nadine van Montfoort 1 , Cindy Chiang 1 , Vladimir Beljanski 1 , Michael Slifker 2 , Zhong He 1 , Carmen N. Nichols 1 , Rongtuan Lin 3 , Siddharth Balachandran 2 , John Hiscott 1 * 1 Vaccine & Gene Therapy Institute of Florida, Port St. Lucie, Florida, United States of America, 2 Fox Chase Cancer Center, Philadelphia, Pennsylvania, United States of America, 3 Lady Davis Institute, Jewish General Hospital, McGill University, Montreal, Quebec, Canada Abstract Dengue virus (DENV) is a re-emerging arthropod borne flavivirus that infects more than 300 million people worldwide, leading to 50,000 deaths annually. Because dendritic cells (DC) in the skin and blood are the first target cells for DENV, we sought to investigate the early molecular events involved in the host response to the virus in primary human monocyte- derived dendritic cells (Mo-DC). Using a genome-wide transcriptome analysis of DENV2-infected human Mo-DC, three major responses were identified within hours of infection - the activation of IRF3/7/STAT1 and NF-kB-driven antiviral and inflammatory networks, as well as the stimulation of an oxidative stress response that included the stimulation of an Nrf2- dependent antioxidant gene transcriptional program. DENV2 infection resulted in the intracellular accumulation of reactive oxygen species (ROS) that was dependent on NADPH-oxidase (NOX). A decrease in ROS levels through chemical or genetic inhibition of the NOX-complex dampened the innate immune responses to DENV infection and facilitated DENV replication; ROS were also essential in driving mitochondrial apoptosis in infected Mo-DC. In addition to stimulating innate immune responses to DENV, increased ROS led to the activation of bystander Mo-DC which up-regulated maturation/activation markers and were less susceptible to viral replication. We have identified a critical role for the transcription factor Nrf2 in limiting both antiviral and cell death responses to the virus by feedback modulation of oxidative stress. Silencing of Nrf2 by RNA interference increased DENV-associated immune and apoptotic responses. Taken together, these data demonstrate that the level of oxidative stress is critical to the control of both antiviral and apoptotic programs in DENV-infected human Mo-DC and highlight the importance of redox homeostasis in the outcome of DENV infection. Citation: Olagnier D, Peri S, Steel C, van Montfoort N, Chiang C, et al. (2014) Cellular Oxidative Stress Response Controls the Antiviral and Apoptotic Programs in Dengue Virus-Infected Dendritic Cells. PLoS Pathog 10(12): e1004566. doi:10.1371/journal.ppat.1004566 Editor: Glenn Randall, The University of Chicago, United States of America Received July 14, 2014; Accepted November 10, 2014; Published December 18, 2014 Copyright: ß 2014 Olagnier et al. This is an open-access article distributed under the terms of the Creative Commons Attribution License, which permits unrestricted use, distribution, and reproduction in any medium, provided the original author and source are credited. Data Availability: The authors confirm that all data underlying the findings are fully available without restriction. All relevant data are within the paper and its Supporting Information files except for the array data which is available in the NCBI Gene Expression Omnibus (GEO Series accession number GSE58278). Funding: This project was supported by funding from VGTI Florida and the Canadian Institute of Health and Research. The funders had no role in study design, data collection and analysis, decision to publish, or preparation of the manuscript. Competing Interests: The authors have declared that no competing interests exist. * Email: [email protected] (DO); [email protected] (JH) ¤ Current address: Lady Davis Institute, Jewish General Hospital, McGill University, Montreal, Quebec, Canada Introduction Dengue virus (DENV) is the leading arthropod-borne viral infection in the world, and represents a major global human health concern. DENV is endemic in more than 100 countries with up to 3 billion people in tropical regions of the world at risk of infection [1–3]. Recently, DENV has expanded its global range, with long- term outbreaks in South America and reintroduction into North America through Florida and Texas, with each of these outbreaks accompanied by increased disease severity. Of the estimated 50– 100 million annual cases, the majority of infected individuals develop a self-limiting febrile illness, but approximately 500,000 clinical cases result in more severe manifestations, such as DENV- induced hemorrhagic fever and shock syndrome [1], leading to 25–50,000 deaths per year [4]. The pathogenesis of dengue is incompletely understood and the factors that determine whether infection manifests as self-limiting dengue fever or progresses to life-threatening illness remains unanswered. Dengue is an RNA virus of the Flaviviridae family with 4 closely related serotypes that exhibit inter- and intra-serotypic genetic diversity [5–9]. Innate recognition of DENV involves a spectrum of pattern recognition receptors (PRR) that sense conserved molecular components termed pathogen associated molecular patterns (PAMP), and together orchestrate antiviral responses to the viral infection. The cytoplasmic helicases RIG-I and MDA-5 have a central role in the host response to DENV by contributing to DENV protection in hepatocytes [10]. Addition- ally, TLR3 and TLR7 recognize DENV RNA and mount a rapid protective immune response in human monocytic cells and plasmacytoid dendritic cells, respectively [11,12]. Signaling through these different cellular sensors leads to the activation of the interferon pathway that restricts viral proliferation and PLOS Pathogens | www.plospathogens.org 1 December 2014 | Volume 10 | Issue 12 | e1004566
-
Upload
khangminh22 -
Category
Documents
-
view
0 -
download
0
Transcript of Cellular Oxidative Stress Response Controls the Antiviral and ...
Cellular Oxidative Stress Response Controls the Antiviraland Apoptotic Programs in Dengue Virus-InfectedDendritic CellsDavid Olagnier1¤*, Suraj Peri2, Courtney Steel1, Nadine van Montfoort1, Cindy Chiang1,
Vladimir Beljanski1, Michael Slifker2, Zhong He1, Carmen N. Nichols1, Rongtuan Lin3,
Siddharth Balachandran2, John Hiscott1*
1 Vaccine & Gene Therapy Institute of Florida, Port St. Lucie, Florida, United States of America, 2 Fox Chase Cancer Center, Philadelphia, Pennsylvania, United States of
America, 3 Lady Davis Institute, Jewish General Hospital, McGill University, Montreal, Quebec, Canada
Abstract
Dengue virus (DENV) is a re-emerging arthropod borne flavivirus that infects more than 300 million people worldwide,leading to 50,000 deaths annually. Because dendritic cells (DC) in the skin and blood are the first target cells for DENV, wesought to investigate the early molecular events involved in the host response to the virus in primary human monocyte-derived dendritic cells (Mo-DC). Using a genome-wide transcriptome analysis of DENV2-infected human Mo-DC, three majorresponses were identified within hours of infection - the activation of IRF3/7/STAT1 and NF-kB-driven antiviral andinflammatory networks, as well as the stimulation of an oxidative stress response that included the stimulation of an Nrf2-dependent antioxidant gene transcriptional program. DENV2 infection resulted in the intracellular accumulation of reactiveoxygen species (ROS) that was dependent on NADPH-oxidase (NOX). A decrease in ROS levels through chemical or geneticinhibition of the NOX-complex dampened the innate immune responses to DENV infection and facilitated DENV replication;ROS were also essential in driving mitochondrial apoptosis in infected Mo-DC. In addition to stimulating innate immuneresponses to DENV, increased ROS led to the activation of bystander Mo-DC which up-regulated maturation/activationmarkers and were less susceptible to viral replication. We have identified a critical role for the transcription factor Nrf2 inlimiting both antiviral and cell death responses to the virus by feedback modulation of oxidative stress. Silencing of Nrf2 byRNA interference increased DENV-associated immune and apoptotic responses. Taken together, these data demonstratethat the level of oxidative stress is critical to the control of both antiviral and apoptotic programs in DENV-infected humanMo-DC and highlight the importance of redox homeostasis in the outcome of DENV infection.
Citation: Olagnier D, Peri S, Steel C, van Montfoort N, Chiang C, et al. (2014) Cellular Oxidative Stress Response Controls the Antiviral and Apoptotic Programs inDengue Virus-Infected Dendritic Cells. PLoS Pathog 10(12): e1004566. doi:10.1371/journal.ppat.1004566
Editor: Glenn Randall, The University of Chicago, United States of America
Received July 14, 2014; Accepted November 10, 2014; Published December 18, 2014
Copyright: � 2014 Olagnier et al. This is an open-access article distributed under the terms of the Creative Commons Attribution License, which permitsunrestricted use, distribution, and reproduction in any medium, provided the original author and source are credited.
Data Availability: The authors confirm that all data underlying the findings are fully available without restriction. All relevant data are within the paper and itsSupporting Information files except for the array data which is available in the NCBI Gene Expression Omnibus (GEO Series accession number GSE58278).
Funding: This project was supported by funding from VGTI Florida and the Canadian Institute of Health and Research. The funders had no role in study design,data collection and analysis, decision to publish, or preparation of the manuscript.
Competing Interests: The authors have declared that no competing interests exist.
* Email: [email protected] (DO); [email protected] (JH)
¤ Current address: Lady Davis Institute, Jewish General Hospital, McGill University, Montreal, Quebec, Canada
Introduction
Dengue virus (DENV) is the leading arthropod-borne viral
infection in the world, and represents a major global human health
concern. DENV is endemic in more than 100 countries with up to
3 billion people in tropical regions of the world at risk of infection
[1–3]. Recently, DENV has expanded its global range, with long-
term outbreaks in South America and reintroduction into North
America through Florida and Texas, with each of these outbreaks
accompanied by increased disease severity. Of the estimated 50–
100 million annual cases, the majority of infected individuals
develop a self-limiting febrile illness, but approximately 500,000
clinical cases result in more severe manifestations, such as DENV-
induced hemorrhagic fever and shock syndrome [1], leading to
25–50,000 deaths per year [4]. The pathogenesis of dengue is
incompletely understood and the factors that determine whether
infection manifests as self-limiting dengue fever or progresses to
life-threatening illness remains unanswered.
Dengue is an RNA virus of the Flaviviridae family with 4
closely related serotypes that exhibit inter- and intra-serotypic
genetic diversity [5–9]. Innate recognition of DENV involves a
spectrum of pattern recognition receptors (PRR) that sense
conserved molecular components termed pathogen associated
molecular patterns (PAMP), and together orchestrate antiviral
responses to the viral infection. The cytoplasmic helicases RIG-I
and MDA-5 have a central role in the host response to DENV by
contributing to DENV protection in hepatocytes [10]. Addition-
ally, TLR3 and TLR7 recognize DENV RNA and mount a rapid
protective immune response in human monocytic cells and
plasmacytoid dendritic cells, respectively [11,12]. Signaling
through these different cellular sensors leads to the activation of
the interferon pathway that restricts viral proliferation and
PLOS Pathogens | www.plospathogens.org 1 December 2014 | Volume 10 | Issue 12 | e1004566
contributes to the establishment of adaptive immune responses viaNF-kB-mediated cytokine and chemokine release [13–16]. Inter-
estingly, the host immune response, activated in response to
DENV infection, not only mediates protection against disease, but
also contributes to disease severity [1]. For example, high levels of
circulating pro-inflammatory cytokines such as IL-1b or TNF-a in
DENV-infected patients correlates with severe dengue fever,
compared to patients suffering with mild dengue fever [17].
Reactive oxygen species (ROS) production, generated as a
consequence of microbial invasion, has long been known to exert
an antimicrobial effect in phagocytes [18]. The activation of the
antiviral and inflammatory signaling pathways has also been
linked with the production of ROS [19–23], which include oxygen
ions and peroxides that are produced as byproducts of aerobic
metabolism. Because of the high chemical reactivity of ROS, cells
possess scavenger antioxidant mechanisms that maintain redox
homeostasis [24–26]. Signaling pathways downstream of ROS
detection activate the transcription factor nuclear factor-erythroid
2-related factor 2 (Nrf2) [24–26], which binds antioxidant
response elements (ARE) within the promoters of genes encoding
antioxidant and detoxifying enzymes. Nrf2-dependent antioxidant
genes act synergistically to reduce oxidative stress by quenching
ROS [24–26].
Increased generation of ROS and changes in redox homeostasis
have been described in the context of many viral infections
[23,27–33] and the failure to maintain an appropriate redox
balance contributes to viral pathogenesis through alterations of
biological structures and the massive induction of cell death [34–
36]. In the flavivirus family, hepatitis C virus (HCV) has been
shown to promote oxidative stress and manipulate antioxidant
systems, leading to chronic disease [31,37,38]. As well, DENV was
shown to stimulate oxidative stress in hepatocytes leading to
production of the chemokine CCL5 and to activation of the
transcriptional regulator C/EBP beta [39]. Furthermore, HepG2
xenografted SCID mice presented alterations in oxidative stress
status and increased inflammatory cytokines following DENV
infection [40]. More recently, oxidative stress-induced damage
and alterations in redox status have been associated with increased
disease severity in DENV-infected patients, suggesting a possible
role for oxidative stress in DENV-induced pathogenesis [41–44].
Interestingly, circulating monocytes from glucose-6-phosphate
dehydrogenase (G6PD)-deficient patients, displayed an increased
susceptibility to DENV infection and replication [45]. The G6PD
deletion affects ROS production, thus linking cellular oxidative
state and susceptibility to DENV infection. Altogether, these
observations underline the importance of the redox homeostasis in
DENV infection and suggest an important interplay between the
generation of oxidative stress and the immunopathology of dengue
disease.
Initial contact between DENV and innate immune cells plays
an essential role in the outcome of the infection. Indeed, DENV
infection pushes monocytes towards a CD16+ inflammatory
phenotype that facilitates plasmablast differentiation and induction
of anti-DENV antibody responses [46]. Given the importance of
DC in bridging the innate and adaptive immune response, and
since DC in the skin and peripheral blood are the first target cells
for DENV after transmission via a mosquito bite [47–49],
evaluation of the early molecular events in DC is crucial to the
understanding of DENV pathogenesis. In the present study, we
generated in-depth transcriptome analysis, coupled with biochem-
ical and functional analyses of the early host response to DENV
infection in primary Mo-DC. DENV infection triggered an
NADPH-oxidase (NOX)-dependent oxidative stress response that
was required for the activation of IRF3/7/STAT1 and NF-kB-
mediated antiviral responses and for mitochondrial-dependent
apoptosis. Furthermore, we have identified a critical role for the
transcription factor Nrf2 in regulating both antiviral and
inflammatory gene response to the virus by feedback modulation
of oxidative stress. Overall, these studies highlight the importance
of redox homeostasis in the outcome of DENV infection.
Results
DENV2 highly infects Mo-DC and generates a broadantiviral response
An in vitro model of de novo DENV infection was established
using primary human monocytes differentiated in vitro with Mo-
DC-differentiation medium containing GM-CSF and IL-4.
Primary CD14+ CD1a2 monocytes were less permissive to
DENV2 infection, whereas infectivity increased progressively as
the cells differentiated toward the Mo-DC (CD142 CD1a+)
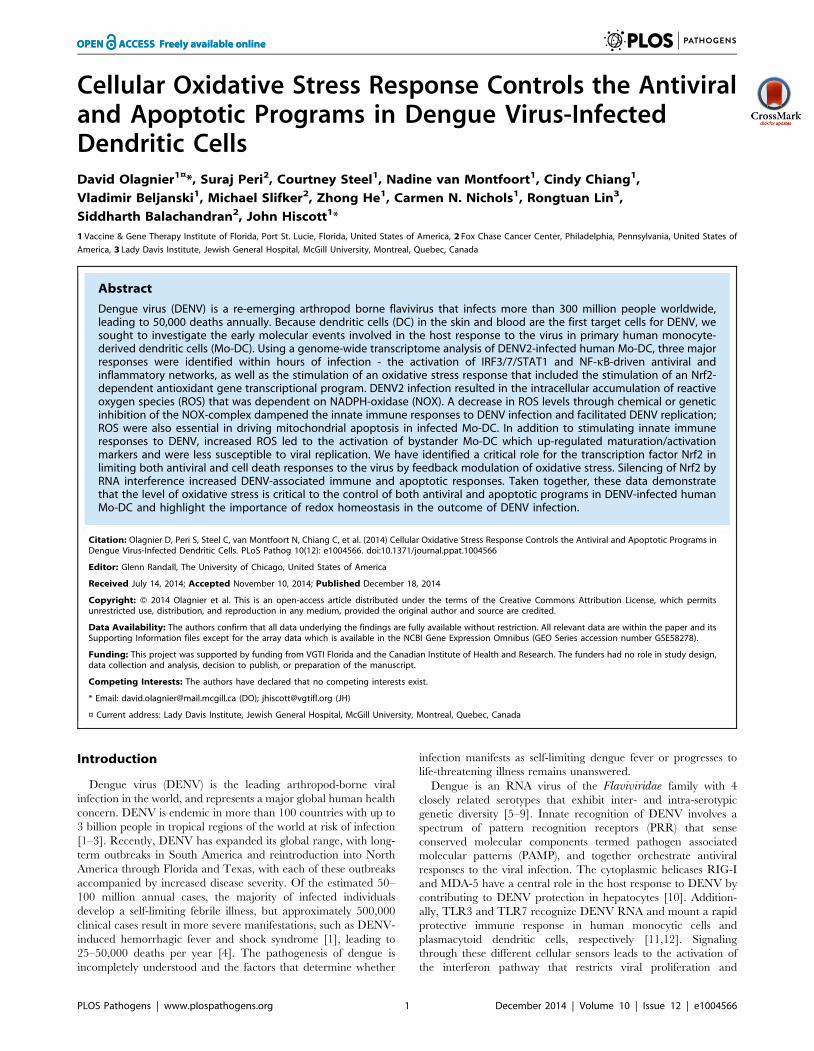
phenotype (4.6660.45% of DENV+ cells in monocytes at day 0 vs79.660.47% in Mo-DC at day 7) (Fig. 1A). A strong statistical
correlation between a CD142CD1a+ phenotype and DENV
infection was confirmed by the nonparametric Spearman test
(r = 0.9829; p,0.0001; n = 15). DENV2 viral RNA accumulation
was detected after a lag period of 6 h and increased exponentially
thereafter (Fig. 1B), which corroborates a previous report demon-
strating release of infectious particles [50]. Prior to the onset of
detectable DENV replication, an antiviral response was mounted
by the infected Mo-DC population, as demonstrated by the
increase in IFN-b, IFIT1 and CCL5 gene expression (Fig. 1B).
DENV infected Mo-DC in a dose dependent manner to a
maximum of ,80% infectivity at a MOI of 20 (Fig. 1C). As a
consequence of early virus sensing, a broad antiviral and
inflammatory response was generated as shown by the phosphor-
ylation of IRF3 and STAT1 (Fig. 1D) and significant release of
IFN-a, TNF-a and IL-6 (Fig. 1E) by the infected cells. Previous
studies reported cleavage of the endoplasmic reticulum adaptor
STING upon DENV infection in Mo-DC [51]. However, in our
experimental model and with the viral strain used, a modest 20%
decrease in STING expression was observed at 48 h after infection
Author Summary
Dengue virus (DENV), the leading arthropod-borne viralinfection in the world, represents a major human healthconcern with a global at risk population of over 3 billionpeople. Currently, there are no antivirals or vaccinesavailable to treat patients with dengue fever, nor is itpossible to predict which patients will progress to life-threatening severe dengue fever. Markers associated withoxidative stress responses have been reported in patientswith severe DENV infection, suggesting a relationshipbetween oxidative stress and viral pathogenesis. In orderto uncover biological processes that determine theoutcome of disease in patients, we utilized humandendritic cells, the primary target of DENV infection, inan in vitro model. Transcriptional analysis of pathwaysactivated upon de novo DENV infection revealed a majorrole for cellular oxidative stress in the induction of antiviral,inflammatory, and cell death responses. We also demon-strated that antioxidant mechanisms play a critical role incontrolling antiviral and cell death responses to the virus,acting as feedback regulators of the oxidative stressresponse. This report highlights the importance of oxida-tive stress responses in the outcome of DENV infection,and identifies this pathway as a potential new entry-pointfor treating dengue-associated diseases.
Redox Regulation of the Host Response to DENV
PLOS Pathogens | www.plospathogens.org 2 December 2014 | Volume 10 | Issue 12 | e1004566
(Fig. 1D). Altogether these data demonstrate that DENV-infected
Mo-DC generate a broad host response and secrete an array of
antiviral and inflammatory cytokines in response to the virus.
Transcriptome kinetics of the host response to DENV2infection
To characterize signaling pathways involved in the host intrinsic
response to DENV2 infection, a transcriptome analysis of DENV-
infected Mo-DC was performed; Fig. 2A represents a waterfall
plot of differentially expressed genes (DEG; selected based on fold
change .61.3, p value ,0.05) after DENV2 infection. Most
changes in gene expression appeared early, with over 7000 genes
either up- or down-regulated by 6 h after infection (Fig. 2A).
Pathway analysis identified multiple canonical networks coordi-
nately regulated at all times after infection; the expected IFN/IRF
antiviral pathways as well as the NF-kB-dependent pro-inflam-
matory pathways were all highly enriched after de novo DENV2
infection (Fig. 2B). We also noticed an enrichment of networks
associated with the generation of a pro- and anti-oxidant stress
response (Fig. 2B). Further gene analysis represents the top 50
DEG over time following DENV infection (Fig. 2C); among the
top up-regulated genes, two subclasses predominated – interferon-
stimulated genes (ISGs) such as ISG15, IFIT1, IFIT2, IFIT3,
OASL, OAS2, CCL5, HES4 (presented in black) and more
surprisingly a large set of antioxidant genes belonging to the
metallothionein family including MT1A, MT2A, MT1E, MT1X,
MT1G, MT1H, and MT1F (presented in red) (Fig. 2C). Based on
the regulation of gene networks activated or repressed after
DENV2 infection, Fig. 2D illustrates a word cloud map of possibly
activated (red) or inhibited (green) transcription factors controlling
Fig. 1. Mo-DC are highly susceptible to DENV infection and generate a broad antiviral and inflammatory response. (A) The correlationbetween the percentage of infected cells determined by intracellular staining of DENV E protein expression and the percentage of CD142 CD1a+ Mo-DC was calculated during the course of Mo-DC differentiation (n = 15; Spearman test). The FACS panels on the left hand side represent theprogression of Mo-DC differentiation at days 0, 3 and 7. (B) DENV RNA levels as well as IFN-b, IFIT1, and CCL5 gene expression levels were determinedby qPCR at various times of DENV2 infection (MOI 10). P values were determined based on the comparison with cells at time 3 h after infection. Dataare from one experiment performed on three individual donors. (C) Mo-DC were infected with increasing amounts of virus (MOI 0.04-MOI 20) for 24 h.Percentage of DENV2-infected cells was determined by intracellular staining (ICS) of DENV E protein expression using flow cytometry. Data are themeans 6 SEM from one experiment performed on three different donors. (D) Mo-DC were challenged with DENV2 (MOI 20) and antiviral andinflammatory responses were examined by immunoblotting. Data are from one representative experiment. (E) Cytokine release was evaluated bycytokine bead array (CBA) 24 h after DENV2 challenge (MOI 10) in the supernatants of infected cells. P values were determined based on thecomparison with uninfected cells. Data are the means 6 SEM from one experiment performed on three different donors.doi:10.1371/journal.ppat.1004566.g001
Redox Regulation of the Host Response to DENV
PLOS Pathogens | www.plospathogens.org 3 December 2014 | Volume 10 | Issue 12 | e1004566

Fig. 2. Transcriptome analysis of the host response to DENV2 infection in Mo-DC. Mo-DC were infected with DENV2 (MOI 20) fordesignated periods of time. Samples were analyzed by Illumina gene expression array and differentially expressed genes (DEGs) that satisfied a pvalue (,0.05) with $1.3 fold change (up or down) were selected. (A) Waterfall plot representing the total number of up-regulated and down-regulated genes at each time point. (B) Heat map shows statistically significant canonical pathways (Ingenuity Pathway Analysis Software) commonlyregulated at 6 h, 12 h, 18 h and 24 h when compared to baseline. Genes that had adjusted p-value ,0.05 at each time point and fold change .1.3 or,21.3 and associated with a canonical pathway in Ingenuity’s Knowledge Base were used for pathway analysis. Heat map colors represent the ratioof regulated genes/pathway genes after dengue infection (red and blue correspond to over- and under-represented, respectively). The over-representation test was performed using Fisher Exact Test. Statistical significance achieved at p,0.05. The data are representative of one experimentperformed on three different donors. (C) Gene expression heatmap of the top 50 differentially expressed genes induced by dengue infection in Mo-DC at various times when compared to baseline. Genes are selected as differentially expressed in at least one comparison following ANOVA F test asimplemented in the LIMMA package. The scale shows the level of gene expression where red and blue correspond to up- and down-regulationrespectively. A panel of antiviral (black) and antioxidant (red) DEG is represented on the right hand side of the heatmap. (D) Word clouds representingpotentially activated (red)/inhibited (green) transcription factors at 6 h and 24 h after DENV2 challenge. IPA Upstream Regulator Analysis was used toidentify molecules upstream of the genes in the data set that could explain the detected expression changes. The p-value of overlap, which measuresthe enrichment of network-regulated genes in the data set, is represented by the size of the word. The activation z-score which predicts likelyregulating molecules was used to color the predicted activation state.doi:10.1371/journal.ppat.1004566.g002
Redox Regulation of the Host Response to DENV
PLOS Pathogens | www.plospathogens.org 4 December 2014 | Volume 10 | Issue 12 | e1004566

Redox Regulation of the Host Response to DENV
PLOS Pathogens | www.plospathogens.org 5 December 2014 | Volume 10 | Issue 12 | e1004566

gene networks at 6 h and 24 h after DENV2 challenge (Fig. 2D).
At 6 h after infection, two subclasses of transcription factors
predominated: 1) transcription factors associated with cellular
stress-responses including TP53 (p53), EPAS1, HIF1A and
NFE2L2 (Nrf2); and 2) transcriptional regulators associated with
the antiviral program including IRF1/3/7, STAT1/ISGF3 and
NF-kB complex (Fig. 2D). By 24 h post-infection, the activity of
stress-related transcription factors decreased, with the exception of
TP53, while transcription factors driving the antiviral response -
predominantly IRF7 and NF-kB - were highly active (Fig. 2D).
A Fluidigm BioMark high throughput qPCR assay encompass-
ing a cross-section of genes identified in the genomic analysis (S1
Table) was used to validate the transcriptome data; the pattern of
gene expression at various times after DENV2 infection was
similar for three different donors (S1A Figure). Computational
analysis identified different kinetics of IFN induction, as well as
sustained up-regulation of chemokines, Th1 cytokines, ISGs and
antiviral transcription factors (S1B Figure). A strong statistical
correlation between the log fold change for the microarray values
and the log fold change for the BioMark values was confirmed by a
Spearman correlation test (S1C Figure) (r = 0.8399194;
p = 4.576e-14; n = 49). In order to gain systems-wide insight into
DENV-modulated transcriptome, a functional clustering (node
analysis) (Fig. 3), as well as gene-pathway checkerboard analysis
(S2 Figure) of DENV-induced DEGs was performed. This
functional clustering identified at 6 h (Fig. 3A and S2A Figure)
and 24 h (Fig. 3B and S2B Figure) a variety of transcriptional sub-
networks and biological processes regulated by DENV. The Nrf2-
mediated oxidative stress response pathway, the top differentially
regulated pathway in DENV-infected Mo-DC at 6 h (S2A Figure),
was triggered prior to the onset of viral replication and intersected
with other pathways such as NF-kB, IRF and STAT signaling
(Fig. 3A and S2A Figure). At the same time, hypoxia pathway
controlled by the transcription factor HIF1-a was predominantly
down regulated (Fig. 3A and S2A Figure). By 24 h the activity of
the Nrf2-driven pathway decreased, whereas the expansion and
increased interaction among the antiviral, inflammatory and death
response networks predominated (Fig. 3B and S2B Figure).
Concomitantly, genes related to mitochondrial function were all
significantly down regulated and presumably associated with an
increase in the apoptotic response (Fig. 3B and S2B Figure).
DENV-induced NOX-derived ROS accumulation isessential for induction of innate immune responses
The role of reactive oxygen species (ROS) as specific second
messengers in signaling cascades involved in cell proliferation,
differentiation and immune activation has been well documented
[52]. In light of the array data and to evaluate if ROS are involved
in the recognition of DENV, Mo-DC were infected and ROS
formation was monitored by flow cytometry using the oxidant-
sensitive fluorescent detection probe CM-H2DCFDA. ROS
production was induced in DENV-infected Mo-DC, as reflected
in the 2-fold increase in DCF fluorescence detected by FACS at
18 h after infection (p = 0.0405) (Fig. 4A). Also, DENV infection
increased intracellular ROS accumulation in a dose dependent
manner (Fig. 4B). A strong statistical correlation between DENV
infection and the accumulation of ROS was confirmed by the
nonparametric Spearman test (r = 0.7635; p,0.0001; n = 15)
(Fig. 4C). Although ROS are generated intracellularly, the
primary sources of ROS are plasma membrane oxidases,
particularly NADPH oxidases. ROS were detected as early as
3 h after infection, and ROS production was suppressed by pre-
treatment with the antioxidant diphenyleneidonium chloride
(DPI), an NADPH-oxidase (NOX) inhibitor (Fig. 4D). ROS
production was independently confirmed in Mo-DC by the use
of pyocyanin (N-methyl-1-hydroxyphenazine), an oxidative stress
inducer, as denoted by the 1.8 fold increase in ROS generation at
3 h after stimulation (Fig. 4D). The involvement of NOX in
DENV-induced ROS accumulation was further confirmed by the
increased phosphorylation of the p47 subunit of the NADPH-
oxidase (p = 0.0404) (Fig. 4E). Interference with NADPH-oxidase
activity using siRNA-mediated silencing of the catalytic gp91phox
subunit limited ROS accumulation in response to de novo DENV
infection (p = 0.0328) (Fig. 4F). To examine whether cellular
oxidative stress impacted the immediate host response to DENV,
we evaluated the effect of exogenous ROS addition on expression
of DENV-induced antiviral genes. Treatment with increasing
concentrations of hydrogen peroxide (H2O2) did not stimulate
immune responses in Mo-DC; however addition of H2O2
moderately potentiated the elevation of DENV-induced antiviral
gene expression (Fig. 4G).
Next, the role of ROS in triggering the early host response to
DENV2 was evaluated by treating infected Mo-DC with
increasing concentrations of DPI, an NADPH-oxidase inhibitor.
Strikingly, phosphorylation of IRF3, STAT1 and IkBa, as well as
the induction of ISGs such as RIG-I and IFIT1 – all markers of
the antiviral response – were inhibited in a dose-dependent
manner by DPI (Fig. 5A). The observation that NOX-inhibitor
blocked DENV-induced immune response was further confirmed
by quantitative intracellular measurement of STAT1 phosphory-
lation. Indeed, DPI prevented the increase in STAT1 phosphor-
ylation detected by PhosFlow following DENV infection. Impor-
tantly, IFNb-induced STAT1 phosphorylation was not affected by
the DPI treatment (Fig. 5B). Using a customized BioMark chip,
antiviral and inflammatory genes such as type I IFNs (IFNA2,
IFNB1), pro-inflammatory cytokines and chemokines (IL1b,
CCL5) and ISGs (MX1, IFITM1/2/3, OASL, IDO1, OAS3,DDX58) were inhibited by DPI in a dose dependent manner in
DENV-infected cells (Fig. 5C, upper right box). Cytokine release
(IFN-a, TNF-a and IL-6) was also impaired in the presence of the
antioxidant molecule (Fig. 5D). The use of antioxidant molecules
with different modes of action (S3A Figure) recapitulated the effect
observed with DPI and impaired the induction of antiviral and
inflammatory gene expression (Fig. 5E). Importantly, all antiox-
idant molecules tested in this panel did not affect cell survival, as
shown in S3B Figure and S3C Figure. Inhibition of NADPH-
oxidase activity using transient knock-down of the catalytic
gp91phox subunit also decreased IFIT1 protein expression
following de novo DENV infection (Fig. 5F). No increase in
DENV RNA accumulation was detected in the presence of the
NOX-inhibitor (3 mM) after 24 h of infection (S4 Figure).
However, pre-treatment of cells with a higher concentration of
DPI (30 mM) led to an increase in DENV viral RNA accumulation
in the same conditions (S4 Figure). Importantly, DPI treatment
resulted in increased DENV infectivity and replication at 48 h
post-infection, as demonstrated by the increased number of
Fig. 3. Functional characterization of genes differentially expressed by DENV2 infection. Differentially expressed genes were subjected toIngenuity Pathway Analysis for both 6 h (A) and 24 h (B) time points based on p-values (,0.001) and fold change $61 (log2). Red represent genesinduced by DENV, and green indicated genes downregulated by the virus; the intensity of the color is representative of the fold change. Larger circlesindicate transcription factors. Genes enriched for a pathway are represented as a cloud.doi:10.1371/journal.ppat.1004566.g003
Redox Regulation of the Host Response to DENV
PLOS Pathogens | www.plospathogens.org 6 December 2014 | Volume 10 | Issue 12 | e1004566
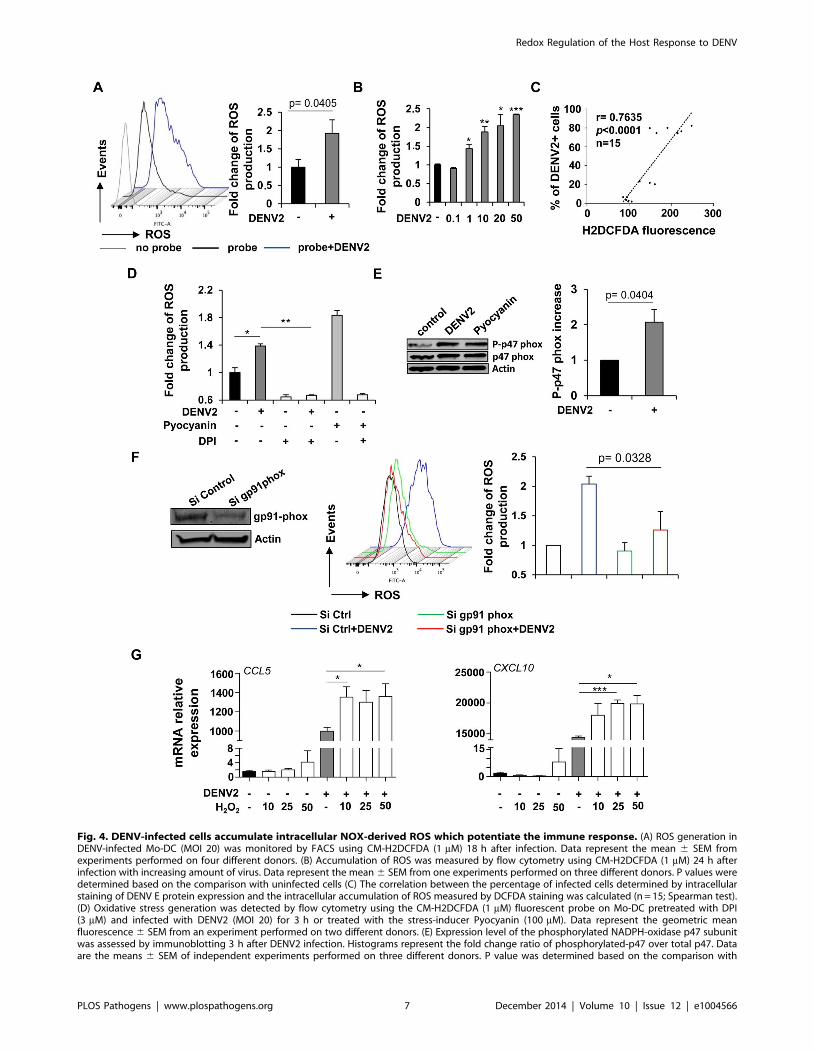
Fig. 4. DENV-infected cells accumulate intracellular NOX-derived ROS which potentiate the immune response. (A) ROS generation inDENV-infected Mo-DC (MOI 20) was monitored by FACS using CM-H2DCFDA (1 mM) 18 h after infection. Data represent the mean 6 SEM fromexperiments performed on four different donors. (B) Accumulation of ROS was measured by flow cytometry using CM-H2DCFDA (1 mM) 24 h afterinfection with increasing amount of virus. Data represent the mean 6 SEM from one experiments performed on three different donors. P values weredetermined based on the comparison with uninfected cells (C) The correlation between the percentage of infected cells determined by intracellularstaining of DENV E protein expression and the intracellular accumulation of ROS measured by DCFDA staining was calculated (n = 15; Spearman test).(D) Oxidative stress generation was detected by flow cytometry using the CM-H2DCFDA (1 mM) fluorescent probe on Mo-DC pretreated with DPI(3 mM) and infected with DENV2 (MOI 20) for 3 h or treated with the stress-inducer Pyocyanin (100 mM). Data represent the geometric meanfluorescence 6 SEM from an experiment performed on two different donors. (E) Expression level of the phosphorylated NADPH-oxidase p47 subunitwas assessed by immunoblotting 3 h after DENV2 infection. Histograms represent the fold change ratio of phosphorylated-p47 over total p47. Dataare the means 6 SEM of independent experiments performed on three different donors. P value was determined based on the comparison with
Redox Regulation of the Host Response to DENV
PLOS Pathogens | www.plospathogens.org 7 December 2014 | Volume 10 | Issue 12 | e1004566
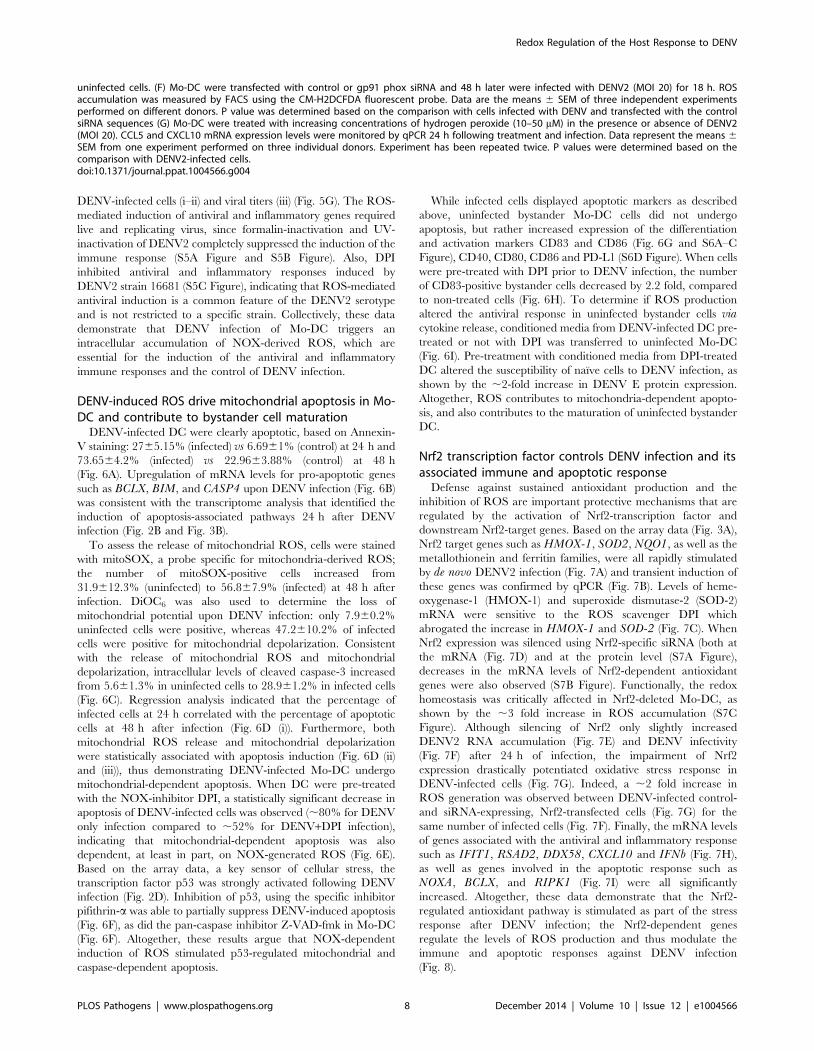
DENV-infected cells (i–ii) and viral titers (iii) (Fig. 5G). The ROS-
mediated induction of antiviral and inflammatory genes required
live and replicating virus, since formalin-inactivation and UV-
inactivation of DENV2 completely suppressed the induction of the
immune response (S5A Figure and S5B Figure). Also, DPI
inhibited antiviral and inflammatory responses induced by
DENV2 strain 16681 (S5C Figure), indicating that ROS-mediated
antiviral induction is a common feature of the DENV2 serotype
and is not restricted to a specific strain. Collectively, these data
demonstrate that DENV infection of Mo-DC triggers an
intracellular accumulation of NOX-derived ROS, which are
essential for the induction of the antiviral and inflammatory
immune responses and the control of DENV infection.
DENV-induced ROS drive mitochondrial apoptosis in Mo-DC and contribute to bystander cell maturation
DENV-infected DC were clearly apoptotic, based on Annexin-
V staining: 2765.15% (infected) vs 6.6961% (control) at 24 h and
73.6564.2% (infected) vs 22.9663.88% (control) at 48 h
(Fig. 6A). Upregulation of mRNA levels for pro-apoptotic genes
such as BCLX, BIM, and CASP4 upon DENV infection (Fig. 6B)
was consistent with the transcriptome analysis that identified the
induction of apoptosis-associated pathways 24 h after DENV
infection (Fig. 2B and Fig. 3B).
To assess the release of mitochondrial ROS, cells were stained
with mitoSOX, a probe specific for mitochondria-derived ROS;
the number of mitoSOX-positive cells increased from
31.9612.3% (uninfected) to 56.867.9% (infected) at 48 h after
infection. DiOC6 was also used to determine the loss of
mitochondrial potential upon DENV infection: only 7.960.2%
uninfected cells were positive, whereas 47.2610.2% of infected
cells were positive for mitochondrial depolarization. Consistent
with the release of mitochondrial ROS and mitochondrial
depolarization, intracellular levels of cleaved caspase-3 increased
from 5.661.3% in uninfected cells to 28.961.2% in infected cells
(Fig. 6C). Regression analysis indicated that the percentage of
infected cells at 24 h correlated with the percentage of apoptotic
cells at 48 h after infection (Fig. 6D (i)). Furthermore, both
mitochondrial ROS release and mitochondrial depolarization
were statistically associated with apoptosis induction (Fig. 6D (ii)
and (iii)), thus demonstrating DENV-infected Mo-DC undergo
mitochondrial-dependent apoptosis. When DC were pre-treated
with the NOX-inhibitor DPI, a statistically significant decrease in
apoptosis of DENV-infected cells was observed (,80% for DENV
only infection compared to ,52% for DENV+DPI infection),
indicating that mitochondrial-dependent apoptosis was also
dependent, at least in part, on NOX-generated ROS (Fig. 6E).
Based on the array data, a key sensor of cellular stress, the
transcription factor p53 was strongly activated following DENV
infection (Fig. 2D). Inhibition of p53, using the specific inhibitor
pifithrin-a was able to partially suppress DENV-induced apoptosis
(Fig. 6F), as did the pan-caspase inhibitor Z-VAD-fmk in Mo-DC
(Fig. 6F). Altogether, these results argue that NOX-dependent
induction of ROS stimulated p53-regulated mitochondrial and
caspase-dependent apoptosis.
While infected cells displayed apoptotic markers as described
above, uninfected bystander Mo-DC cells did not undergo
apoptosis, but rather increased expression of the differentiation
and activation markers CD83 and CD86 (Fig. 6G and S6A–C
Figure), CD40, CD80, CD86 and PD-L1 (S6D Figure). When cells
were pre-treated with DPI prior to DENV infection, the number
of CD83-positive bystander cells decreased by 2.2 fold, compared
to non-treated cells (Fig. 6H). To determine if ROS production
altered the antiviral response in uninfected bystander cells viacytokine release, conditioned media from DENV-infected DC pre-
treated or not with DPI was transferred to uninfected Mo-DC
(Fig. 6I). Pre-treatment with conditioned media from DPI-treated
DC altered the susceptibility of naı̈ve cells to DENV infection, as
shown by the ,2-fold increase in DENV E protein expression.
Altogether, ROS contributes to mitochondria-dependent apopto-
sis, and also contributes to the maturation of uninfected bystander
DC.
Nrf2 transcription factor controls DENV infection and itsassociated immune and apoptotic response
Defense against sustained antioxidant production and the
inhibition of ROS are important protective mechanisms that are
regulated by the activation of Nrf2-transcription factor and
downstream Nrf2-target genes. Based on the array data (Fig. 3A),
Nrf2 target genes such as HMOX-1, SOD2, NQO1, as well as the
metallothionein and ferritin families, were all rapidly stimulated
by de novo DENV2 infection (Fig. 7A) and transient induction of
these genes was confirmed by qPCR (Fig. 7B). Levels of heme-
oxygenase-1 (HMOX-1) and superoxide dismutase-2 (SOD-2)
mRNA were sensitive to the ROS scavenger DPI which
abrogated the increase in HMOX-1 and SOD-2 (Fig. 7C). When
Nrf2 expression was silenced using Nrf2-specific siRNA (both at
the mRNA (Fig. 7D) and at the protein level (S7A Figure),
decreases in the mRNA levels of Nrf2-dependent antioxidant
genes were also observed (S7B Figure). Functionally, the redox
homeostasis was critically affected in Nrf2-deleted Mo-DC, as
shown by the ,3 fold increase in ROS accumulation (S7C
Figure). Although silencing of Nrf2 only slightly increased
DENV2 RNA accumulation (Fig. 7E) and DENV infectivity
(Fig. 7F) after 24 h of infection, the impairment of Nrf2
expression drastically potentiated oxidative stress response in
DENV-infected cells (Fig. 7G). Indeed, a ,2 fold increase in
ROS generation was observed between DENV-infected control-
and siRNA-expressing, Nrf2-transfected cells (Fig. 7G) for the
same number of infected cells (Fig. 7F). Finally, the mRNA levels
of genes associated with the antiviral and inflammatory response
such as IFIT1, RSAD2, DDX58, CXCL10 and IFNb (Fig. 7H),
as well as genes involved in the apoptotic response such as
NOXA, BCLX, and RIPK1 (Fig. 7I) were all significantly
increased. Altogether, these data demonstrate that the Nrf2-
regulated antioxidant pathway is stimulated as part of the stress
response after DENV infection; the Nrf2-dependent genes
regulate the levels of ROS production and thus modulate the
immune and apoptotic responses against DENV infection
(Fig. 8).
uninfected cells. (F) Mo-DC were transfected with control or gp91 phox siRNA and 48 h later were infected with DENV2 (MOI 20) for 18 h. ROSaccumulation was measured by FACS using the CM-H2DCFDA fluorescent probe. Data are the means 6 SEM of three independent experimentsperformed on different donors. P value was determined based on the comparison with cells infected with DENV and transfected with the controlsiRNA sequences (G) Mo-DC were treated with increasing concentrations of hydrogen peroxide (10–50 mM) in the presence or absence of DENV2(MOI 20). CCL5 and CXCL10 mRNA expression levels were monitored by qPCR 24 h following treatment and infection. Data represent the means 6SEM from one experiment performed on three individual donors. Experiment has been repeated twice. P values were determined based on thecomparison with DENV2-infected cells.doi:10.1371/journal.ppat.1004566.g004
Redox Regulation of the Host Response to DENV
PLOS Pathogens | www.plospathogens.org 8 December 2014 | Volume 10 | Issue 12 | e1004566
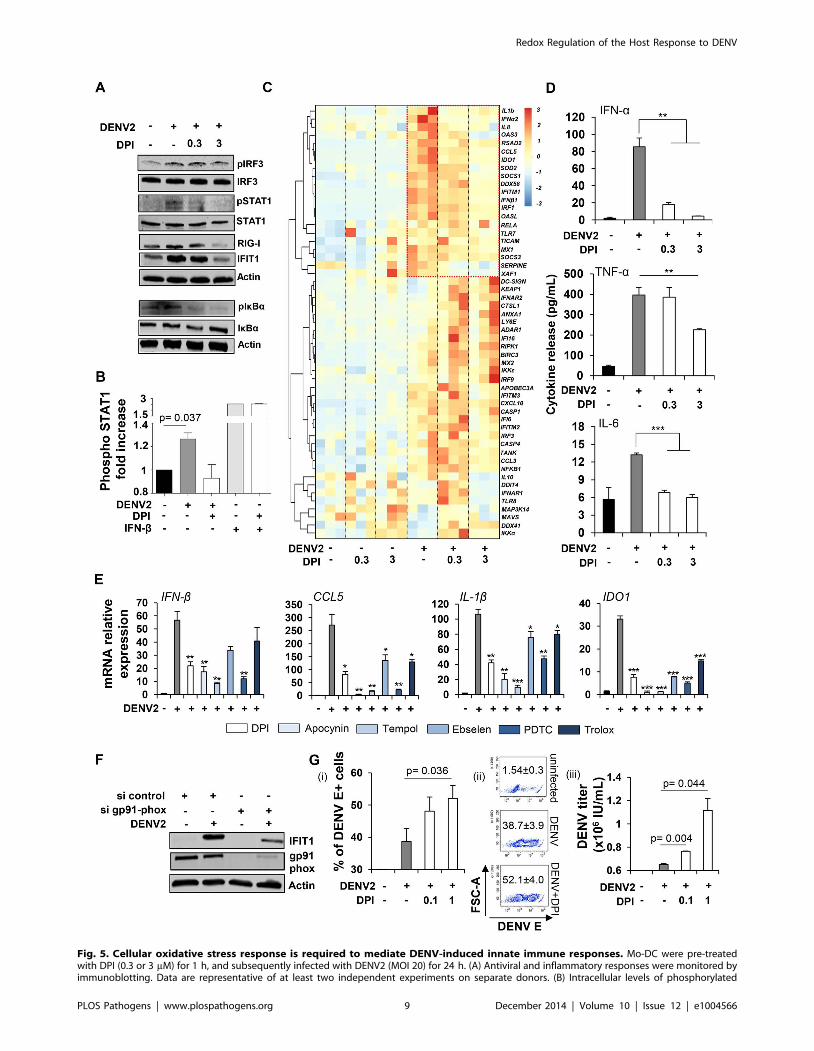
Fig. 5. Cellular oxidative stress response is required to mediate DENV-induced innate immune responses. Mo-DC were pre-treatedwith DPI (0.3 or 3 mM) for 1 h, and subsequently infected with DENV2 (MOI 20) for 24 h. (A) Antiviral and inflammatory responses were monitored byimmunoblotting. Data are representative of at least two independent experiments on separate donors. (B) Intracellular levels of phosphorylated
Redox Regulation of the Host Response to DENV
PLOS Pathogens | www.plospathogens.org 9 December 2014 | Volume 10 | Issue 12 | e1004566

Discussion
Evaluation of the early host immune response to DENV
infection is essential for a complete understanding of the complex
immunopathogenesis associated with the development of mild or
severe dengue fever in patients. Previous studies have demonstrat-
ed that DENV can trigger an innate immune response that
includes the release of antiviral and inflammatory cytokines
[50,53,54], while other studies demonstrate the ability of DENV
to antagonize the induction of innate responses via cleavage of the
endoplasmic reticulum adaptor STING [51,55]. To uncover novel
regulatory pathways involved in DENV infection of Mo-DC, we
have for the first time used a transcriptome-wide expression
analysis, coupled with biochemical dissection, to investigate the
early host response to DENV infection in primary human
dendritic cells - an important pool of cells infected early in vivoafter the bite of the mosquito Aedes aegypti. Here, we demonstrate
that: 1) DENV preferentially infected myeloid cells as they
differentiated in vitro to mature Mo-DC; 2) DENV2 infection
triggered antiviral, inflammatory, and oxidative stress pathways
with distinct kinetics; 3) DENV2 infection generated a NOX-
dependent intracellular accumulation of ROS; 4) ROS production
mediated activation of the IRF3/STAT1- and NF-kB-mediated
innate immune responses; 5) ROS production mediated p53
mitochondrial-dependent apoptosis and contributed to bystander
Mo-DC maturation/activation; and 6) Nrf2-regulated target genes
limited the oxidative stress response, and ultimately modulated
ROS-induced immune and apoptotic responses. These results
highlight a requirement for the oxidative stress response in the
generation of the host innate immune response to DENV
infection.
Activation of the NADPH-oxidase (NOX) complex and
generation of reactive oxygen species (ROS) has been described
for several viral infections, including hepatitis C virus (HCV),
Rhinovirus, and HIV [56–58]. We demonstrate that DENV
infection also activates NOX-dependent ROS production in Mo-
DC. In some infection models, viral proteins such as Nef and Tat
for HIV and NS3 for HCV were shown to specifically stimulate
the NOX complex [59–61]. NOX activity was also regulated by
spleen tyrosine kinase (Syk)-mediated phosphorylation of the
NOX p47phox subunit [62]; Syk kinase is downstream of the
surface receptor CLEC5A, which was shown to promote
inflammasome activation and inflammatory cytokine release in
DENV infection [63,64]. Importantly, TLR3, a receptor critically
involved in RNA sensing, was recently shown to stimulate NOX-
dependent ROS production that was required for NF-kB, IRF3
and STAT1 activation in murine macrophages in response to the
synthetic dsRNA Poly (I:C) [65]. Furthermore, exogenous addition
of oxidative stress potentiated the TLR3 response to dsRNA in
airway epithelial cells [66]. Finally, the specific TLR7 agonist
imiquimod also elevated basal superoxide production through
enhanced NOX2 activity in macrophages [67]. Further studies are
now required to determine the exact mechanism(s) involved in
DENV-induced NOX-dependent ROS production in human Mo-
DC.
ROS were long considered as toxic, microbe-induced by-
products involved in the killing of pathogens [18]; however, their
function as second messengers that regulate immune signaling
suggests a much broader role in host defense against viruses [19–
23]. ROS production was in fact required to trigger the antiviral
and inflammatory responses to DENV infection in DC, and was
confirmed by both chemical and genetic inhibition of the NOX
complex. Blockade of NOX activation or ROS production
inhibited antiviral and inflammatory responses, including the
IRF3/STAT1 antiviral axis and the NF-kB inflammatory
pathway (Fig. 4). The IRF3 pathway has previously been
demonstrated to be regulated by oxidative stress variations.
Indeed, the expression level of the non-canonical IKK-like kinase,
IKKe, is itsef NOX-regulated and participated in the immune
response induced by the respiratory syncytial virus (RSV) [68].
NOX-derived ROS were also shown to activate the RIG-I/
MAVS/IRF3 antiviral axis in epithelial cells, and were required to
maintain the constitutive level of MAVS expression [22]. In
contrast, statistical changes in MAVS or IKKe expression
following NOX inhibition in primary DENV-infected DC were
not observed in this study (S8A–C Figure), suggesting that DENV-
induced ROS may regulate host response via post-translational
modification of proteins involved in antiviral signaling, as was
described previously for S-glutathionylation of TRAF3 and
TRAF6 [19]. Other non-infectious biological processes such as
impairment of autophagy also support the idea that oxidative
stress modulates the sensitivity to antiviral signaling. Indeed,
blocking of autophagy allows for oxidative stress accumulation
through defective mitochondria and leads to the amplification of
RLR signaling [69]. Altogether, these studies cumulatively
highlight the complexity of ROS involvement in the stimulation
of antiviral responses and argues that the innate immune response
integrates both viral RNA sensing and detection of homeostatic
perturbations to coordinate an appropriate host response.
The Nrf2-mediated antioxidant response was one of the top
differentially regulated pathways early after DENV infection,
resulting in the expression of many cytoprotective enzymes such as
HMOX-1, SOD2, NQO1, GCLC and GCLM, that function
together to maintain an appropriate redox status, and thus protect
STAT1 were detected by PhosFlow in Mo-DC infected for 24 h by DENV2 (MOI 20) or stimulated for 30 min with IFN-b (1000 IU/mL) and pre-treatedor not with DPI (1 mM). Data represent the means 6 SEM from two experiments performed on separate donors. (C) High throughput analysis of geneexpression evaluated by qPCR BioMark analysis. Gene expression levels were calculated using the DDCt method and gene-wise standardizedexpression (z-score) were generated for each gene. The scale represents z-score values where red shows an up-regulation and blue a down-regulation in gene expression. Data are representative of one experiment performed on three individual donors. Each box of the heatmap representsone donor. (D) Cytokine release was evaluated by cytokine bead array (CBA) on the supernatants of DENV infected cells pre-treated or not with DPI(0.3–3 mM). Data represent the means 6 SEM from three individual donors. P values were determined based on the comparison with DENV2-infectedcells. (E) Mo-DC were pre-treated with DPI (3 mM), Apocynin (3 mM), TEMPOL (3 mM), Ebselen (10 mM), PDTC (40 mM) and Trolox (5 mM) for 1 h, andsubsequently infected with DENV2 (MOI 20) for 24 h. Antiviral and inflammatory gene expression was determined by qPCR. Data represent the means6 SEM from one experiment performed on three individual donors. P values were determined based on the comparison with DENV2-infected cells.(F) Mo-DC were transfected with control or gp91 phox siRNA and 48 h later were infected with DENV2 (MOI 20). IFIT1 and gp91 phox proteinexpression levels were measured by immunoblot analysis. Result is representative of one experiment. (G) Mo-DC were pre-treated with DPI (0.1–1 mM) for 1 h, and subsequently infected with DENV2 (MOI 1) for 48 h. Percentage of infected cells was determined by intracellular staining of DENV Eprotein (i–ii). DENV titers were determined by transferring supernatants from Mo-DC-infected cells on A549 cells and staining for DENV E protein (iii).DENV titers were expressed as the number of infectious units/mL. Data represent the means 6 SEM of experiments performed on four (i–ii) and twodifferent donors (iii).doi:10.1371/journal.ppat.1004566.g005
Redox Regulation of the Host Response to DENV
PLOS Pathogens | www.plospathogens.org 10 December 2014 | Volume 10 | Issue 12 | e1004566
Fig. 6. NOX-dependent ROS production triggers mitochondrial-dependent apoptosis in DENV-infected cells and activatesbystander cells. (A) The percentage of apoptotic cells was assessed by Annexin-V staining at 6–48 h post-infection. Data are the means 6 SEM fromindependent experiments performed in triplicate on five individual donors. P values were determined based on the comparison with uninfected cellsat the appropriate time (B) mRNA relative expression of apoptosis-associated genes was detected by qPCR at various times post DENV2 infection.Values are representative of one donor. Experiment has been repeated on three individual donors. (C) Levels of mitoSOX red, DiOC6(3), cleavedcaspase 3 (CLcaspase3), Annexin-V and DENV E protein expression were evaluated by flow cytometry 48 h post-DENV infection. Values represent the
Redox Regulation of the Host Response to DENV
PLOS Pathogens | www.plospathogens.org 11 December 2014 | Volume 10 | Issue 12 | e1004566
cells from ROS-induced damage [24–26]. The importance of Nrf2
activity during viral pathogenesis was demonstrated recently in a
study showing that Marburg virus (MARV) hijacked the Nrf2
pathway leading to a persistent activation of Nrf2-dependent
antioxidant and cytoprotective genes, temporarily blocking cell
death of MARV-infected cells, and thus facilitating viral prolifer-
ation [70,71]. Another study involving Nrf2 knockout mice
demonstrated that mice challenged with Respiratory Syncytial
Virus (RSV) or influenza had both higher viral replication and
increased inflammatory responses and injury in their lungs
[34,72,73]. Consistent with these observations, genetic silencing
of Nrf2 in primary Mo-DC deregulated intracellular redox
homeostasis and led to increased inflammatory and apoptotic
responses. The importance of Nrf2 in DENV pathogenesis was
more recently illustrated in a study of DENV-infected HepG2
xenografted SCID mice treated with the tripeptide glutathione
(GSH), an anti-oxidant whose intracellular levels are also regulated
by Nrf2. GSH prevented DENV-induced oxidative stress and liver
injury by inhibiting pro-inflammatory cytokine production [40].
The same observation was made in vitro where treatment of
DENV-infected HepG2 cells with GSH prevented the increase in
ROS accumulation. Administration of antioxidant molecules such
as GSH or other Nrf2 activators may be a novel strategy to treat
and limit symptoms associated with DENV disease.
DC are potent antigen presenting cells that, after sensing of
pathogens, migrate from peripheral tissues to the lymph nodes and
drive CD4+ and CD8+ T cell responses [74]. Here, we
demonstrate that DENV-infected Mo-DC undergo mitochon-
dria-dependent apoptosis, driven by an increase in ROS and
facilitated by p53 transcription factor. Uninfected bystander DC,
on the other hand, are not killed but rather mature to DC
expressing maturation and activation markers, as previously
reported [50]. ROS exposure and the immune response generated
in infected cells, rendered the bystander uninfected DC less
susceptible to DENV replication, most probably as a consequence
of released soluble factors from infected cells. Meanwhile
inhibition of ROS with DPI decreased expression of maturation
markers and increased susceptibility to DENV infection. Thus,
ROS production may not only impact infected cells but also affect
DC maturation indirectly, by altering the cytokine milieu of
uninfected bystander DC; in turn DC maturation in context of
DENV infection may alter priming of the T cell response.
There are no diagnostic markers presently available that will
determine whether a DENV-infected patient will develop a mild
illness or progress to a more severe dengue fever, associated with
DENV-induced hemorrhagic fever or shock syndrome. However,
markers of oxidative stress have been reported in patients with
severe DENV infection, suggesting a relationship between
oxidative stress and viral pathogenesis in patients [41,43,44].
Soundravally et al demonstrated an association between the
induction of proinflammatory cytokines and the levels of lipid
peroxidation in patients [43]. Earlier studies also demonstrated
that DENV-infected Mo-DC overproduce matrix metalloprotei-
nase-9 (MMP-9), a result also suggested by our array analysis
(Fig. 2B). The induction of MMP-9 by DENV-infected Mo-DC
enhanced endothelial permeability in vitro and was proposed as a
marker for disease severity [75]. Interestingly, increased oxidative
species through NADPH-oxidase activation or upon TLR3
ligation were also shown to regulate MMP-9 expression
[30,76,77]. Furthermore, mice lacking the p47 NADPH-oxidase
subunit displayed a reduction in hemorrhage development and
disease severity after DENV infection [78]. Altogether, these
findings highlight a key role for NADPH-oxidase in the oxidative
stress-related pathology of DENV, and suggest that both NADPH-
oxidase activity, ROS levels or associated ROS-induced molecules
may be useful biomarkers to predict disease severity.
In conclusion, DENV infection of DC induces intracellular
ROS levels that regulate the magnitude of the activation of innate
antiviral immune responses and stimulate apoptosis. Parallel
activation of antioxidant pathways regulated by Nrf2 also
contributes to the regulatory control of antiviral and apoptotic
responses by maintaining redox homeostasis. ROS were identified
as an essential component of the host response to DENV infection;
a further understanding of the molecular details underlying the
biological targets of ROS during DENV infection may facilitate
identification of novel treatment strategies for dengue-associated
diseases.
Materials and Methods
Ethics statementHuman peripheral blood mononuclear cells (PBMC) were
isolated from buffy coats of healthy, seronegative volunteers in a
study approved by the IRB and by the VGTI-FL Institutional
Biosafety Committee (2011-6-JH1). Written informed consent
approved by the VGTI-FL Inc. ethics review board (FWA#161)
was provided to study participants. Research conformed to ethical
guidelines established by the ethics committee of the OHSU
VGTI and Martin Health System.
Monocyte isolation and differentiation into Mo-DCBriefly, PBMC were isolated from freshly collected blood using
the Ficoll-Paque PLUS medium (GE Healthcare Bio) as per
manufacturer’s instructions. CD14+ monocytes were isolated by
positive selection using CD14 microbeads and a magnetic cells
separator as per kit instructions (Miltenyi Biotech). Purified CD14+
monocytes were cultured for 7 days either in six-well plates
(1.56106 cells) or 100 mm dishes (156106 cells) in 2 mL (6-well
plate) or 10 mL (100 mm dish), respectively of complete Mo-DC
differentiation medium (Miltenyi Biotech.). On day 3, the medium
means 6 SEM from at least three individual donors. (D) The correlation between (i) the percentage of DENV2+ cells at 24 h and the percentage ofapoptotic cells at 48 h; (ii) the percentage of apoptotic cells and the percentage of mitoSOX+ cells at 48 h, and (iii) the percentage of apoptotic cellsand the percentage of DiOC6(3)low cells at 48 h was calculated in Mo-DC using a Spearman test. (E) Percentage of apoptotic cells in DENV-infectedMo-DC was detected 48 h post-infection in the presence or absence of DPI (0.3 mM). Histograms represent the means 6 SEM of three experimentsperformed in duplicate on three independent donors. (F) Percentage of apoptotic cells in DENV-infected Mo-DC was detected 48 h post-infection inthe presence or absence of the p53 inhibitor pifithrin-a (10 mM) or the pan-caspase inhibitor Z-VAD-fmk (20 mM). Histograms represent the means 6SEM of one representative experiment performed in triplicate. P values were determined based on the comparison with DENV2-infected cells. (G)CD83 expression level was evaluated on Annexin-V+ (red) and Annexin-V2 (blue) DENV-infected cell population (MOI 1) (H) Mo-DC were pre-treatedwith increasing concentrations of DPI (0.3–3 mM) before DENV challenge (MOI 0.5). Percent of CD83+ Annexin-V2 cells was detected by flowcytometry 48 h after infection. P values were determined based on the comparison with DENV2-infected cells. Data are the means 6 SEM of twoexperiments performed in triplicate. (I) Mo-DC pre-treated or not with increasing concentrations of DPI were cultured in the presence of DENV2 (MOI20). After 24 h of infection, supernatants were collected and transferred for 8 h on naı̈ve Mo-DC and cells were subsequently infected by DENV2 (MOI20). DENV infection was assessed 24 h later by flow cytometry. The values are means 6 SEM from one experiment performed in triplicate. P valueswere determined based on the comparison with DENV2 infected cells.doi:10.1371/journal.ppat.1004566.g006
Redox Regulation of the Host Response to DENV
PLOS Pathogens | www.plospathogens.org 12 December 2014 | Volume 10 | Issue 12 | e1004566
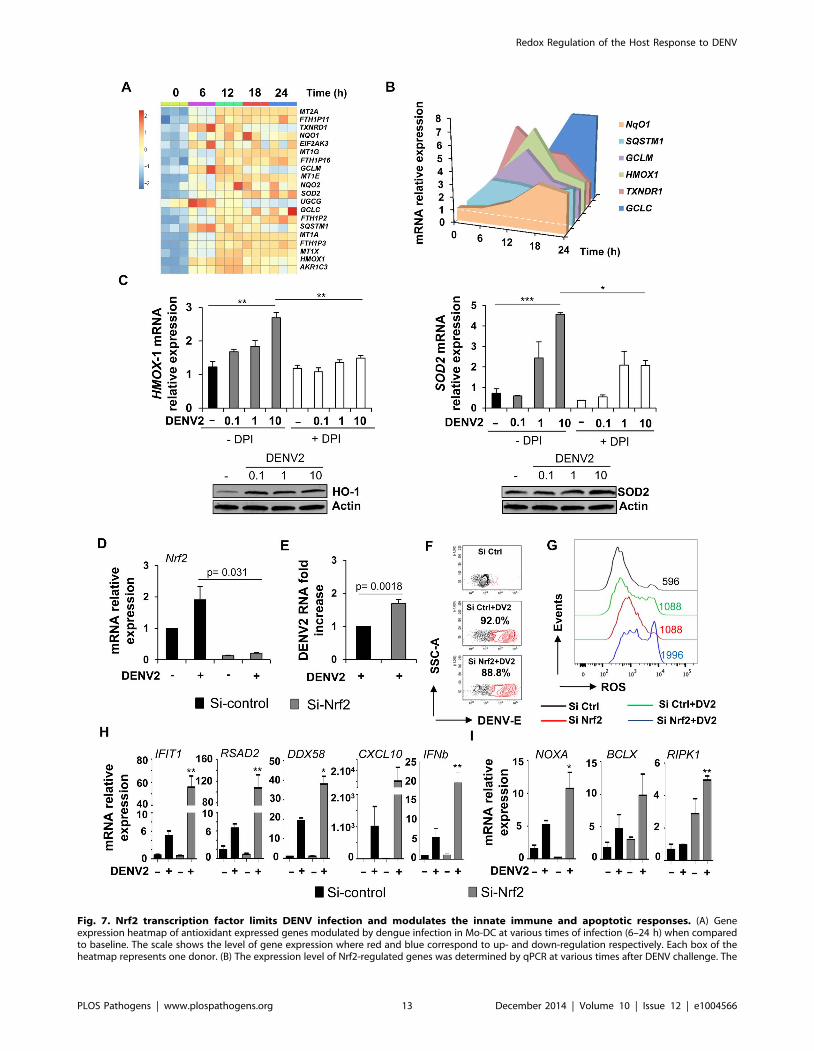
Fig. 7. Nrf2 transcription factor limits DENV infection and modulates the innate immune and apoptotic responses. (A) Geneexpression heatmap of antioxidant expressed genes modulated by dengue infection in Mo-DC at various times of infection (6–24 h) when comparedto baseline. The scale shows the level of gene expression where red and blue correspond to up- and down-regulation respectively. Each box of theheatmap represents one donor. (B) The expression level of Nrf2-regulated genes was determined by qPCR at various times after DENV challenge. The
Redox Regulation of the Host Response to DENV
PLOS Pathogens | www.plospathogens.org 13 December 2014 | Volume 10 | Issue 12 | e1004566

was replenished with fresh medium. Purity of CD142 CD1a+ DC-
SIGN high moDC was typically .80%.
Virus production, quantification and Mo-DC infectionDENV serotype 2 (DENV2) strain New Guinea C (DENV
NGC) or DENV2 strain 16681 were produced on C6/36 cells and
quantified on Vero cells as previously reported [79]. In control
experiments, virus was inactivated using formalin 0.05% in PBS at
22uC or UV-inactivated for 1 h on ice. For infection, except where
indicated, immature Mo-DC were infected at a multiplicity of
infection of 20 in a small volume of medium without FBS for
3 hours at 37uC. Following adsorption, cells were washed twice in
serum-free medium and incubated with complete medium
containing cytokines prior to analysis. Mock-infected Mo-DC
were treated according to the same procedure. All procedures with
live DENV2 were performed in a Biosafety level 2+ facility at the
Vaccine and Gene Therapy Institute of Florida.
Microarray analysisThe DENV2 kinetics microarray experiment was performed as
a single experiment on Mo-DC derived from 3 independent
healthy donors. Mo-DC were infected at an MOI of 20 as
described above and cells were collected at various times and lysed
using RLT lysis buffer (Qiagen) for RNA extraction. Briefly, RNA
were extracted using RNeasy Micro Kits (Qiagen). The quantity
and the quality of the RNA were validated using a NanoDrop
2000c (Thermo Fisher). Samples were then amplified using
Illumina TotalPrep RNA amplification kits (Ambion). The
microarray analysis was conducted using 750 ng of biotinylated
complementary RNA hybridized to HumanHT-12_V4 Bead-
Chips (Illumina) at 58uC for 20 hours. The data were collected
with Illumina GenomeStudio software. First, arrays displaying
unusually low median intensity, low variability, or low correlation
relative to the bulk of the arrays were discarded from the rest of
the analysis. Quantile normalization, followed by a log2 transfor-
mation using the Bioconductor package LIMMA was applied to
process microarrays. Missing values were imputed with the R
package (http://cran.r-project.org/web/packages/impute/index.
html). In order to identify differentially expressed genes between
uninfected and infected samples, the LIMMA package from
Bioconductor was used. For data mining and functional analyses,
genes that satisfied a p value (,0.05) with $1.3 fold change (up or
down) were selected. Probes that do not map to annotated RefSeq
genes and control probes were removed. The expected propor-
tions of false positives (FDR) were estimated from the unadjusted pvalue using the Benjamini and Hochberg method.
All network analysis was done with Ingenuity Pathway Analysis
(IPA: Ingenuity systems). The differentially expressed genes
selected based on above criteria were mapped to the ingenuity
pathway knowledge base with different colors. The significance of
the association between the dataset and the canonical pathway was
measured in two ways: (1) A ratio of the number of genes from the
dataset that map to the pathway divided by the total number of
genes that map to the canonical pathway was displayed; (2) by
over-representation analysis Fisher’s exact test was used to
calculate a p-value determining the probability that the association
between the genes in the dataset and the canonical pathway is
explained by chance alone. The pathways were ranked with 2log
p-values. The pathway enrichment and network analyses were
done using Ingenuity Pathway Analysis (IPA: Ingenuity systems).
The differentially expressed genes were further selected based on
p-value (0.001) and subsequently were mapped to the Ingenuity
Pathway knowledgebase. The significance of the association
between the dataset and the canonical pathway was measured in
two ways: (1) A ratio of the number of genes from the dataset that
map to the pathway divided by the total number of genes that map
to the canonical pathway was displayed; (2) by overrepresentation
analysis: Fisher’s exact test was used to calculate a p-value
determining the probability that the association between the genes
in the dataset and the canonical pathway is explained by chance
alone. The top ranking pathways were selected by ranking 2log p-
values. The selected pathways were then represented as networks
by grouping genes involved in a pathway as a cloud by retaining
the relationships represented as edges. Manual curation was
further employed to annotate selected pathways by adding genes
and their relationships to other genes in networks that are not
depicted by Ingenuity. Subsequently, genes were color-coded
based on the fold-changes (green – downregulated; red –
upregulated). Heatmaps of these genes were generated to display
both fold-changes and membership of genes in one or more
pathways; these heatmaps were created using the R statistical
computing environment. The data have been deposited in the
NCBI Gene Expression Omnibus (GEO Series accession number
GSE58278).
Quantitative real-time PCRTotal RNA was isolated from cells using RNeasy Kit (Qiagen)
as per manufacturer’s instructions. RNA was reverse transcribed
using the SuperScript VILO cDNA synthesis kit according to
manufacturer’s instructions (Invitrogen). PCR primers were
designed using Roche’s Universal Probe Library Assay Design
Center (www.universalprobelibrary.com). Quantitative RT-PCR
was performed on a LightCycler 480 system using LightCycler 480
Probes Master (Roche). The N-fold differential expression of
mRNA gene expression was expressed as 22DDCt.
Fluidigm BioMark assayThe DENV2 kinetics BioMark experiment was performed with
Mo-DC derived from 3 independent healthy donors. Total RNA
and cDNA were prepared as described above. Intron-spanning
PCR primers were designed using Roche’s Universal Probe
Library Assay Design Center (www.universalprobelibrary.com)
and obtained from the Integrated DNA Technology company
(USA) (S1 Table). cDNA along with the entire pool of primers
were pre-amplified for 14 cycles using TaqMan PreAmp Master
Mix as per manufacturer’s protocol (Applied Biosystems). cDNA
was treated with Exonuclease I (New England Biolabs). cDNA
samples were prepared with 2X FastStart TaqMan Probe Master
data are representative of three donors. (C) Mo-DC were pre-treated with DPI (3 mM) and subsequently challenged with increasing amounts of DENV(MOI 0.1–10). The gene and protein expression levels of HMOX-1 and SOD2 were evaluated by qPCR and immunoblot, respectively. Data are themeans 6 SEM of one experiment performed on three individual donors. Immunoblots are representative of the results from one donor. (D–E) Mo-DCwere transfected with control or Nrf2 siRNA and 48 h later were infected with DENV (MOI 1). Nrf2 mRNA expression level (D) and DENV viral RNA (E)were assessed by qPCR. (F–G) Mo-DC were transfected with Control or Nrf2 siRNA and 48 h later were infected with DENV (MOI 20). Percentage ofDENV-infected cells and ROS accumulation was determined in the same samples at 18 h after infection. (H–I) mRNA expression levels of antiviral (H)and apoptotic genes (I) were measured by qPCR in Nrf2-depleted cells that were infected with DENV (MOI 1). Data are the mean 6 SEM of twoindependent experiments performed in duplicate on two donors. P values were determined based on the comparison with DENV2-infected si-control-transfected cells.doi:10.1371/journal.ppat.1004566.g007
Redox Regulation of the Host Response to DENV
PLOS Pathogens | www.plospathogens.org 14 December 2014 | Volume 10 | Issue 12 | e1004566

(Roche), GE sample loading buffer (Fluidigm) and Taq Polymer-
ase (Invitrogen). Assays were prepared with 2X assay loading
reagent (Fluidigm), primers (IDT) and probes (Roche). Samples
and assays were loaded in their appropriate inlets on a 48.48
BioMark chip. The chip was run on the BioMark HD System
(Fluidigm), which enabled quantitative measurement of up to 48
Fig. 8. Schematic of DENV induces NOX-dependent ROS production required for antiviral and apoptotic responses. DENV2 infectiongenerates intracellular NOX-derived ROS accumulation in Mo-DC (A). DENV2-induced ROS formation is essential for the activation of the NF-kBinflammatory response (B) and for the IRF3-mediated antiviral response (C). ROS accumulation leads to p53 stimulation which generates amitochondrial and caspase-dependent apoptosis (D). Finally, oxidative stress generation also stimulates the cytoprotective transcription factor Nrf2(E) which tightly regulates ROS levels (f) as well as innate immune and apoptotic responses to DENV infection.doi:10.1371/journal.ppat.1004566.g008
Redox Regulation of the Host Response to DENV
PLOS Pathogens | www.plospathogens.org 15 December 2014 | Volume 10 | Issue 12 | e1004566
different mRNAs in 48 samples under identical reaction condi-
tions. Runs were 40 cycles. Raw Ct values were calculated by the
real time PCR analysis software (Fluidigm) and software-designat-
ed failed reactions were discarded from analysis. All data are
presented as a relative quantification with efficiency correction
based on the relative expression of target gene versus the geomean
of (GAPDH+Actin+b2 microglobulin) as the invariant control.
The N-fold differential expression of mRNA gene samples was
expressed as 22DDCt. The heatmaps were produced with the
following package; pheatmap: Pretty Heatmaps. R package
version 0.7.7 http://CRAN.R-project.org/package=pheatmap.
Gene level expression is shown as 2DDCt or gene-wise
standardized expression (Z score). The sequences of primers used
as well as their complementary probes are listed in the S1 Table.
Flow cytometry analysesSurface staining. Before staining, FccR were blocked using
the Human TruStain FcX Solution (BioLegend) for 10 min at
room temperature in PBS 2% FBS. Cells were then stained for
15 min at 4uC in PBS 2% FBS with one or more of the following
Ab: anti- CD14-AF700 (BioLegend), anti-DC-SIGN-AF647
(BioLegend), anti-CD1a-AF488 (BioLegend), anti-CD83-PE (Bio-
Legend), anti-CD86-Pacific Blue (BioLegend), anti-CD40 PE
(BioLegend), anti-CD80 Pacific Blue (BD Biosciences), anti-PD-
L1 APC (BioLegend), anti HLA-DR A700 (BioLegend).
DENV E staining. The percentage of cells infected with
DENV was determined by intracellular staining using a mouse
IgG2a mAb, specific for DENV E protein (clone 4G2) as
previously described [79].
ROS production. Total ROS production using the CM-
H2DCFDA probe (Life Technologies) (1 mM) or was evaluated by
flow cytometry. Following DENV infection, cells were washed in
PBS before incubation with the probes for 30 min at 37uC. After
incubation, cells were washed twice in PBS before FACS analysis.
PhosFlow. PhosFlow stainings were all performed in a 96-
well plate format. Cells were resuspended in 100 mL of PBS and
fixed with the same volume of pre-warmed Fix Buffer I (BD
Biosciences) for 10 min at 37uC. Cells were pelleted down by
centrifugation and resuspended in 200 mL ice-cold PERM
BUFFER III (BD Biosciences) for 20 min at 4uC. Cells were then
washed three times with 200 mL of PBS containing 5% FBS and
then incubated for 30 min on ice in PBS 2% FBS. Cells were
pelleted down by centrifugation and stained in 50 mL PBS 2%FBS
with the P-STAT1 Y701 Pacific Blue antibody (BD Biosciences)
for 30 min at room temperature. Cells were finally washed twice
in staining buffer and analyzed by flow cytometry. In all the
proposed flow cytometry experiments, cells were analyzed on a
LSRII flow cytometer (Becton Dickinson, New Jersey, USA).
Calculations, compensations as well as population analyses were
done using FACS Diva software and overlay representations were
done using FlowJo.
Protein extraction and immunoblot analysisProtein lysates (20 to 40 mg) from Mo-DC were subjected to
western blot analysis. Membranes were probed with primary
antibodies: anti-pIRF3 at Ser 396 (EMD Millipore), anti-IRF3
(IBL, Japan), anti-IRF7 (EMD Millipore), anti-RIG-I (EMD
Millipore), anti-IFIT1 (Thermo Fisher Scientic), anti pSTAT1 at
Tyr701 (Cell Signaling), anti-STAT1 (Cell Signaling), anti–pIkBaat Ser32 (Cell Signaling), anti-IkBa (Cell Signaling), anti-p47phox
at Ser359 (AssayBioTech), anti-p47phox (Sigma Aldrich), anti-
STING (Cell Signaling), anti-gp91phox (Santacruz Biotechnolo-
gy), anti-Nrf2 (Cell Signaling), anti-b-actin (Odyssey, USA).
Antibody signals were detected by immunofluorescence using the
IRDye 800CW and IRDye 680RD secondary antibodies (Odys-
sey, USA) and the LI-COR imager (Odyssey, USA). Protein
expression levels were determined and normalized to b-actin using
the ImageJ software (National Institutes of Health, Bethesda,
USA).
Cytometric bead arrayCytokine production was evaluated in the supernatants of
DENV2-infected Mo-DC using a BD CBA flex set (IFN-a, TNF-
a, IL-6, IL-1b, IL-10, IL-12p70) as per manufacturer’s recom-
mendations. The BD FACS Array Bioanalyzer was used to process
the samples and perform the analysis.
Small interfering RNA assaysTwo different methods were used for siRNA transfection of Mo-
DC. A total of 36106 Mo-DC were transfected in a cuvette in the
presence of 100 pmol of control (sc-37007), Nrf2 (sc-37030) or
gp91-phox (sc-35503) human siRNA (Santa Cruz Biotechonlogy,
USA) using the Amaxa 4D-Nucleofector Technology for 48 h.
The Amaxa P3 Primary Cell 4D Nucleofector X Kit was used with
the electroporation program EA-100. Another method based on a
transfection reagent was alternatively used to transfect lower
amount of cells. A total of 46105 Mo-DC was transfected in 24-
well plates in the presence of 40 pmol of control (sc-37007), Nrf2
(sc-37030), gp91-phox (sc-35503) human siRNA (Santa Cruz
Biotechonlogy, USA) using 6 mL of HiPerfect Transfection
Reagent (Qiagen) for 48 h.
Statistical analysisValues were expressed as the mean 6 SEM and statistical
analysis, except where indicated, was performed with Microsoft
Excel or Graph Pad Prism, using an unpaired, two-tailed Student’s
t test to determine significance. P values of less than 0.05 were
considered statistically significant, ***, p,0.001; **, p,0.01, and
*, p,0.05.
Supporting Information
S1 Figure High throughput analysis of DENV2-associ-ated host response in Mo-DC. Mo-DC from 3 individual
donors were infected with DENV2 (MOI 20) and sampled at 0–
24 h post-infection. (A) Heatmap of the three donor gene profiles
after DENV2 infection, evaluated by high throughput qPCR.
Gene expression levels are represented by 2DDCt values where
red corresponds to an up- regulation and blue to a down-
regulation of gene expression. (B) Kinetics of selected genes from
one donor grouped by function. (C) Correlation between the Log
FC values of gene expression from the microarray and from the
high throughput qPCR experiment was calculated (n = 49;
Spearman test).
(TIF)
S2 Figure Genes and pathways from cloud map analysisdisplayed in a heatmap. Log (base2) fold-changes are
represented by intensity of red and green (for up- and down-
regulated genes, respectively). Genes are ranked by fold-change in
each row, unless included in earlier rows. A neutral color indicates
that a gene does not belong to a given pathway. (A) 6 h and (B)
24 h.
(TIF)
S3 Figure Cytotoxic effect of antioxidant molecules onMo-DC. (A) Summary table of the working concentrations as well
as the mode of action of the antioxidant molecules used in the
study. (B–C) Mo-DC were treated for 24 h with the different
Redox Regulation of the Host Response to DENV
PLOS Pathogens | www.plospathogens.org 16 December 2014 | Volume 10 | Issue 12 | e1004566
antioxidant molecules cited in (A). Cell viability was assessed by
flow cytometry using an Annexin-V and 7AAD staining cocktail.
(TIF)
S4 Figure NOX-inhibitor increases DENV RNA accu-mulation. Mo-DC were pretreated with the NOX inhibitor DPI
(0.3–3–30 mM) for 1 h and subsequently infected with DENV2
(MOI 20). DENV RNA accumulation was detected by qPCR.
Data are the means 6 SEM of one experiment performed on
three individual donors.
(TIF)
S5 Figure DENV-induced immune responses require areplicating dengue virus. (A–B) Formalin-inactivated (A) or
UV-inactivated (B) DENV was used to challenge Mo-DC for 24 h
(MOI 20). (i) viral RNA (qPCR), (ii) percentage of DENV-infected
cells (FACS) and (iii) gene expression level (PCR) was detected
24 h after inactive-DENV2 challenge. The data are the means of
one experiment performed in triplicate. P values were determined
based on the comparison with live DENV2-infected cells. (C) Gene
expression level of various antiviral genes was detected in Mo-DC
pre-treated with the NADPH-oxidase inhibitor DPI (1 mM) for 1 h
and challenged with DENV2 (strain NGC) (MOI 20) or DENV2
(strain 16681). Data are for one representative experiment
performed in triplicate. P values were determined based on the
comparison with the appropriate DENV2-infected control.
(TIF)
S6 Figure DENV infection activates uninfected bystand-er cells. (A–C) Mo-DC were infected with DENV (MOI 1 or 20)
or treated with LPS (1 mg/mL) for 48 h. CD83 and CD86 protein
expression levels were evaluated by FACS among the infected
Annexin-V+ cells or uninfected Annxexin-V2 cells. (D) Pheno-
typic profile of the Annexin-V2 cell population (so-called
bystander cell population), 48 h after DENV challenge at MOI 1.
(TIF)
S7 Figure Efficiency of Nrf2 silencing in Mo-DC. Mo-DC
were transfected with control or Nrf2 siRNA for 48 h. (A) Nrf2
protein level was determined by immunoblot. (B) Nrf2 and
antioxidant/detoxifying enzymes gene levels were determined by
qPCR. (C) ROS levels were determined by FACS using the
H2DCFDA fluorescent probe. Results from two independent
donors are represented.
(TIF)
S8 Figure Chemical blocking of NOX affects neitherMAVS nor IKKe expression. Mo-DC were pre-treated with
the NOX inhibitor DPI (0.3–3 mM) for 1 h and subsequently
infected with DENV2 (MOI 20). IKKe mRNA (A), MAVS
mRNA (B) and MAVS protein (C) expression levels were detected
by qPCR or immunoblotting, respectively. For panels (A) and (B),
the data are the means 6 SEM of one experiment performed in
triplicate on three individual donors. For panel (C), the experiment
has been performed on one donor.
(TIF)
S1 Table Primer sequences and probes used for thehigh throughput qPCR analysis.
(DOCX)
Acknowledgments
We thank Dr. Greg Kirchenbaum for his precious help with the use of
FlowJo and Dr. Rafael Cubas for sharing his extensive knowledge of flow
cytometry. We also thank Kevin Yin for his critical reading of the
manuscript.
Author Contributions
Conceived and designed the experiments: DO JH. Performed the
experiments: DO NvM CC ZH CNN. Analyzed the data: DO SP CS
MS SB. Wrote the paper: DO JH. Edited manuscript and figures: VB RL.
References
1. Rothman AL (2011) Immunity to dengue virus: a tale of original antigenic sin
and tropical cytokine storms. Nature reviews Immunology 11: 532–543.
2. Halstead SB (2008) Dengue virus-mosquito interactions. Annu Rev Entomol 53:
273–291.
3. Wilder-Smith A, Ooi EE, Vasudevan SG, Gubler DJ (2010) Update on dengue:
epidemiology, virus evolution, antiviral drugs, and vaccine development. Curr
Infect Dis Rep 12: 157–164.
4. Bhatt S, Gething PW, Brady OJ, Messina JP, Farlow AW, et al. (2013) The
global distribution and burden of dengue. Nature 496: 504–507.
5. Roche C, Cassar O, Laille M, Murgue B (2007) Dengue-3 virus genomic
differences that correlate with in vitro phenotype on a human cell line but not
with disease severity. Microbes Infect 9: 63–69.
6. Silva RL, de Silva AM, Harris E, MacDonald GH (2008) Genetic analysis of
Dengue 3 virus subtype III 59 and 39 non-coding regions. Virus Res 135: 320–325.
7. Vasilakis N, Fokam EB, Hanson CT, Weinberg E, Sall AA, et al. (2008) Genetic
and phenotypic characterization of sylvatic dengue virus type 2 strains. Virology
377: 296–307.
8. Zhou Y, Mammen MP, Jr., Klungthong C, Chinnawirotpisan P, Vaughn DW,
et al. (2006) Comparative analysis reveals no consistent association between the
secondary structure of the 39-untranslated region of dengue viruses and disease
syndrome. J Gen Virol 87: 2595–2603.
9. Shurtleff AC, Beasley DW, Chen JJ, Ni H, Suderman MT, et al. (2001) Genetic
variation in the 39 non-coding region of dengue viruses. Virology 281: 75–87.
10. Nasirudeen AM, Wong HH, Thien P, Xu S, Lam KP, et al. (2011) RIG-I,
MDA5 and TLR3 synergistically play an important role in restriction of dengue
virus infection. PLoS Negl Trop Dis 5: e926.
11. Sun P, Fernandez S, Marovich MA, Palmer DR, Celluzzi CM, et al. (2009)
Functional characterization of ex vivo blood myeloid and plasmacytoid dendritic
cells after infection with dengue virus. Virology 383: 207–215.
12. Tsai YT, Chang SY, Lee CN, Kao CL (2009) Human TLR3 recognizes dengue
virus and modulates viral replication in vitro. Cell Microbiol 11: 604–615.
13. Goubau D, Deddouche S, Reis e Sousa C (2013) Cytosolic sensing of viruses.
Immunity 38: 855–869.
14. Takeuchi O, Akira S (2009) Innate immunity to virus infection. Immunol Rev
227: 75–86.
15. Takeuchi O, Akira S (2010) Pattern recognition receptors and inflammation.
Cell 140: 805–820.
16. Wilkins C, Gale M, Jr. (2010) Recognition of viruses by cytoplasmic sensors.
Curr Opin Immunol 22: 41–47.
17. Jaiyen Y, Masrinoul P, Kalayanarooj S, Pulmanausahakul R, Ubol S (2009)
Characteristics of dengue virus-infected peripheral blood mononuclear cell death
that correlates with the severity of illness. Microbiol Immunol 53: 442–450.
18. Rada B, Leto TL (2008) Oxidative innate immune defenses by Nox/Duox
family NADPH oxidases. Contrib Microbiol 15: 164–187.
19. Gonzalez-Dosal R, Horan KA, Rahbek SH, Ichijo H, Chen ZJ, et al. (2011)
HSV infection induces production of ROS, which potentiate signaling from
pattern recognition receptors: role for S-glutathionylation of TRAF3 and 6.
PLoS Pathog 7: e1002250.
20. Kim HJ, Kim CH, Ryu JH, Kim MJ, Park CY, et al. (2013) Reactive oxygen
species induce antiviral innate immune response through IFN-lambda regulation
in human nasal epithelial cells. Am J Respir Cell Mol Biol 49: 855–865.
21. Narayanan A, Amaya M, Voss K, Chung M, Benedict A, et al. (2014) Reactive
oxygen species activate NFkappaB (p65) and p53 and induce apoptosis in RVFV
infected liver cells. Virology 449: 270–286.
22. Soucy-Faulkner A, Mukawera E, Fink K, Martel A, Jouan L, et al. (2010)
Requirement of NOX2 and reactive oxygen species for efficient RIG-I-mediated
antiviral response through regulation of MAVS expression. PLoS Pathog 6:
e1000930.
23. Strengert M, Jennings R, Davanture S, Hayes P, Gabriel G, et al. (2013)
Mucosal Reactive Oxygen Species Are Required for Antiviral Response: Role of
Duox in Influenza A Virus Infection. Antioxid Redox Signal.
24. Bryan HK, Olayanju A, Goldring CE, Park BK (2013) The Nrf2 cell defence
pathway: Keap1-dependent and -independent mechanisms of regulation.
Biochem Pharmacol 85: 705–717.
25. Ma Q (2013) Role of nrf2 in oxidative stress and toxicity. Annu Rev Pharmacol
Toxicol 53: 401–426.
26. Ma Q, He X (2012) Molecular basis of electrophilic and oxidative defense:
promises and perils of Nrf2. Pharmacol Rev 64: 1055–1081.
27. Ibeh BO, Emeka-Nwabunnia IK (2012) Increased oxidative stress condition
found in different stages of HIV disease in patients undergoing antiretroviral
Redox Regulation of the Host Response to DENV
PLOS Pathogens | www.plospathogens.org 17 December 2014 | Volume 10 | Issue 12 | e1004566
therapy in Umuahia (Nigeria). Immunopharmacol Immunotoxicol 34: 1060–
1066.
28. Isaguliants M, Smirnova O, Ivanov AV, Kilpelainen A, Kuzmenko Y, et al.(2013) Oxidative stress induced by HIV-1 reverse transcriptase modulates the
enzyme’s performance in gene immunization. Hum Vaccin Immunother 9:2111–2119.
29. Kalinowska M, Bazdar DA, Lederman MM, Funderburg N, Sieg SF (2013)
Decreased IL-7 responsiveness is related to oxidative stress in HIV disease. PLoSOne 8: e58764.
30. Lee YH, Lai CL, Hsieh SH, Shieh CC, Huang LM, et al. (2013) Influenza A
virus induction of oxidative stress and MMP-9 is associated with severe lungpathology in a mouse model. Virus Res 178: 411–422.
31. Paracha UZ, Fatima K, Alqahtani M, Chaudhary A, Abuzenadah A, et al.
(2013) Oxidative stress and hepatitis C virus. Virol J 10: 251.
32. Reddy PV, Agudelo M, Atluri VS, Nair MP (2012) Inhibition of nuclear factor
erythroid 2-related factor 2 exacerbates HIV-1 gp120-induced oxidative and
inflammatory response: role in HIV associated neurocognitive disorder.Neurochem Res 37: 1697–1706.
33. Reddy PV, Gandhi N, Samikkannu T, Saiyed Z, Agudelo M, et al. (2012) HIV-1
gp120 induces antioxidant response element-mediated expression in primaryastrocytes: role in HIV associated neurocognitive disorder. Neurochem Int 61:
807–814.
34. Cho HY, Imani F, Miller-DeGraff L, Walters D, Melendi GA, et al. (2009)Antiviral activity of Nrf2 in a murine model of respiratory syncytial virus disease.
Am J Respir Crit Care Med 179: 138–150.
35. Garofalo RP, Kolli D, Casola A (2013) Respiratory syncytial virus infection:
mechanisms of redox control and novel therapeutic opportunities. Antioxid
Redox Signal 18: 186–217.
36. Imai Y, Kuba K, Neely GG, Yaghubian-Malhami R, Perkmann T, et al. (2008)
Identification of oxidative stress and Toll-like receptor 4 signaling as a key
pathway of acute lung injury. Cell 133: 235–249.
37. Ivanov AV, Bartosch B, Smirnova OA, Isaguliants MG, Kochetkov SN (2013)
HCV and oxidative stress in the liver. Viruses 5: 439–469.
38. Ke PY, Chen SS (2012) Hepatitis C virus and cellular stress response:implications to molecular pathogenesis of liver diseases. Viruses 4: 2251–2290.
39. Lin YL, Liu CC, Chuang JI, Lei HY, Yeh TM, et al. (2000) Involvement of
oxidative stress, NF-IL-6, and RANTES expression in dengue-2-virus-infectedhuman liver cells. Virology 276: 114–126.
40. Wang J, Chen Y, Gao N, Wang Y, Tian Y, et al. (2013) Inhibitory effect of
glutathione on oxidative liver injury induced by dengue virus serotype 2infections in mice. PLoS One 8: e55407.
41. Gil L, Martinez G, Tapanes R, Castro O, Gonzalez D, et al. (2004) Oxidative
stress in adult dengue patients. Am J Trop Med Hyg 71: 652–657.
42. Seet RC, Lee CY, Lim EC, Quek AM, Yeo LL, et al. (2009) Oxidative damage
in dengue fever. Free Radic Biol Med 47: 375–380.
43. Soundravally R, Hoti SL, Patil SA, Cleetus CC, Zachariah B, et al. (2014)Association between proinflammatory cytokines and lipid peroxidation in
patients with severe dengue disease around defervescence. Int J Infect Dis 18:
68–72.
44. Soundravally R, Sankar P, Hoti SL, Selvaraj N, Bobby Z, et al. (2008) Oxidative
stress induced changes in plasma protein can be a predictor of imminent severedengue infection. Acta Trop 106: 156–161.
45. Al-Alimi AA, Ali SA, Al-Hassan FM, Idris FM, Teow SY, et al. (2014) Dengue
virus type 2 (DENV2)-induced oxidative responses in monocytes from glucose-6-phosphate dehydrogenase (G6PD)-deficient and G6PD normal subjects. PLoS
Negl Trop Dis 8: e2711.
46. Kwissa M, Nakaya HI, Onlamoon N, Wrammert J, Villinger F, et al. (2014)Dengue Virus Infection Induces Expansion of a CD14CD16 Monocyte
Population that Stimulates Plasmablast Differentiation. Cell Host Microbe.
47. Green S, Rothman A (2006) Immunopathological mechanisms in dengue anddengue hemorrhagic fever. Curr Opin Infect Dis 19: 429–436.
48. Palucka AK (2000) Dengue virus and dendritic cells. Nat Med 6: 748–749.
49. Wu SJ, Grouard-Vogel G, Sun W, Mascola JR, Brachtel E, et al. (2000) Human
skin Langerhans cells are targets of dengue virus infection. Nat Med 6: 816–820.
50. Nightingale ZD, Patkar C, Rothman AL (2008) Viral replication and paracrine
effects result in distinct, functional responses of dendritic cells following infectionwith dengue 2 virus. J Leukoc Biol 84: 1028–1038.
51. Aguirre S, Maestre AM, Pagni S, Patel JR, Savage T, et al. (2012) DENV
inhibits type I IFN production in infected cells by cleaving human STING. PLoSPathog 8: e1002934.
52. Yang Y, Bazhin AV, Werner J, Karakhanova S (2013) Reactive oxygen species
in the immune system. Int Rev Immunol 32: 249–270.
53. Ho LJ, Wang JJ, Shaio MF, Kao CL, Chang DM, et al. (2001) Infection ofhuman dendritic cells by dengue virus causes cell maturation and cytokine
production. J Immunol 166: 1499–1506.
54. Libraty DH, Pichyangkul S, Ajariyakhajorn C, Endy TP, Ennis FA (2001)Human dendritic cells are activated by dengue virus infection: enhancement by
gamma interferon and implications for disease pathogenesis. J Virol 75: 3501–3508.
55. Rodriguez-Madoz JR, Bernal-Rubio D, Kaminski D, Boyd K, Fernandez-Sesma
A (2010) Dengue virus inhibits the production of type I interferon in primaryhuman dendritic cells. Journal of virology 84: 4845–4850.
56. Boudreau HE, Emerson SU, Korzeniowska A, Jendrysik MA, Leto TL (2009)
Hepatitis C virus (HCV) proteins induce NADPH oxidase 4 expression in atransforming growth factor beta-dependent manner: a new contributor to HCV-
induced oxidative stress. J Virol 83: 12934–12946.57. Comstock AT, Ganesan S, Chattoraj A, Faris AN, Margolis BL, et al. (2011)
Rhinovirus-induced barrier dysfunction in polarized airway epithelial cells is
mediated by NADPH oxidase 1. J Virol 85: 6795–6808.58. Song HY, Ju SM, Seo WY, Goh AR, Lee JK, et al. (2011) Nox2-based NADPH
oxidase mediates HIV-1 Tat-induced up-regulation of VCAM-1/ICAM-1 andsubsequent monocyte adhesion in human astrocytes. Free Radic Biol Med 50:
576–584.59. Vilhardt F, Plastre O, Sawada M, Suzuki K, Wiznerowicz M, et al. (2002) The
HIV-1 Nef protein and phagocyte NADPH oxidase activation. J Biol Chem 277:
42136–42143.60. Wu RF, Ma Z, Myers DP, Terada LS (2007) HIV-1 Tat activates dual Nox
pathways leading to independent activation of ERK and JNK MAP kinases.J Biol Chem 282: 37412–37419.
61. Bureau C, Bernad J, Chaouche N, Orfila C, Beraud M, et al. (2001)
Nonstructural 3 protein of hepatitis C virus triggers an oxidative burst inhuman monocytes via activation of NADPH oxidase. J Biol Chem 276: 23077–
23083.62. Lefevre L, Lugo-Villarino G, Meunier E, Valentin A, Olagnier D, et al. (2013)
The C-type lectin receptors dectin-1, MR, and SIGNR3 contribute bothpositively and negatively to the macrophage response to Leishmania infantum.
Immunity 38: 1038–1049.
63. Chen ST, Lin YL, Huang MT, Wu MF, Cheng SC, et al. (2008) CLEC5A iscritical for dengue-virus-induced lethal disease. Nature 453: 672–676.
64. Wu MF, Chen ST, Yang AH, Lin WW, Lin YL, et al. (2013) CLEC5A is criticalfor dengue virus-induced inflammasome activation in human macrophages.
Blood 121: 95–106.
65. Yang CS, Kim JJ, Lee SJ, Hwang JH, Lee CH, et al. (2013) TLR3-triggeredreactive oxygen species contribute to inflammatory responses by activating signal
transducer and activator of transcription-1. J Immunol 190: 6368–6377.66. Koarai A, Sugiura H, Yanagisawa S, Ichikawa T, Minakata Y, et al. (2010)
Oxidative stress enhances toll-like receptor 3 response to double-stranded RNAin airway epithelial cells. Am J Respir Cell Mol Biol 42: 651–660.
67. To EE, Broughton BR, Hendricks KS, Vlahos R, Selemidis S (2014) Influenza A
virus and TLR7 activation potentiate NOX2 oxidase-dependent ROSproduction in macrophages. Free Radic Res 48: 940–947.
68. Indukuri H, Castro SM, Liao SM, Feeney LA, Dorsch M, et al. (2006) Ikkepsilonregulates viral-induced interferon regulatory factor-3 activation via a redox-
sensitive pathway. Virology 353: 155–165.
69. Tal MC, Sasai M, Lee HK, Yordy B, Shadel GS, et al. (2009) Absence ofautophagy results in reactive oxygen species-dependent amplification of RLR
signaling. Proc Natl Acad Sci U S A 106: 2770–2775.70. Edwards MR, Johnson B, Mire CE, Xu W, Shabman RS, et al. (2014) The
Marburg virus VP24 protein interacts with Keap1 to activate the cytoprotectiveantioxidant response pathway. Cell Rep 6: 1017–1025.
71. Page A, Volchkova VA, Reid SP, Mateo M, Bagnaud-Baule A, et al. (2014)
Marburgvirus hijacks nrf2-dependent pathway by targeting nrf2-negativeregulator keap1. Cell Rep 6: 1026–1036.
72. Kosmider B, Messier EM, Janssen WJ, Nahreini P, Wang J, et al. (2012) Nrf2protects human alveolar epithelial cells against injury induced by influenza A
virus. Respir Res 13: 43.
73. Yageta Y, Ishii Y, Morishima Y, Masuko H, Ano S, et al. (2011) Role of Nrf2 inhost defense against influenza virus in cigarette smoke-exposed mice. J Virol 85:
4679–4690.74. Banchereau J, Steinman RM (1998) Dendritic cells and the control of immunity.
Nature 392: 245–252.
75. Luplertlop N, Misse D, Bray D, Deleuze V, Gonzalez JP, et al. (2006) Dengue-virus-infected dendritic cells trigger vascular leakage through metalloproteinase
overproduction. EMBO Rep 7: 1176–1181.76. Yang CM, Lee IT, Hsu RC, Chi PL, Hsiao LD (2013) NADPH oxidase/ROS-
dependent PYK2 activation is involved in TNF-alpha-induced matrixmetalloproteinase-9 expression in rat heart-derived H9c2 cells. Toxicol Appl
Pharmacol 272: 431–442.
77. Yu F, Kamada H, Niizuma K, Endo H, Chan PH (2008) Induction of mmp-9expression and endothelial injury by oxidative stress after spinal cord injury.
J Neurotrauma 25: 184–195.78. Yen YT, Chen HC, Lin YD, Shieh CC, Wu-Hsieh BA (2008) Enhancement by
tumor necrosis factor alpha of dengue virus-induced endothelial cell production
of reactive nitrogen and oxygen species is key to hemorrhage development.J Virol 82: 12312–12324.
79. Olagnier D, Scholte FE, Chiang C, Albulescu IC, Nichols C, et al. (2014)Inhibition of dengue and chikungunya virus infections by RIG-I-mediated type I
interferon-independent stimulation of the innate antiviral response. J Virol 88:4180–4194.
Redox Regulation of the Host Response to DENV
PLOS Pathogens | www.plospathogens.org 18 December 2014 | Volume 10 | Issue 12 | e1004566