genotype by environment interaction for oil quality in - CiteSeerX
283
GENOTYPE BY ENVIRONMENT INTERACTION FOR OIL QUALITY IN HIGH OLEIC ACID SUNFLOWER LINES By ROUXLÉNE VAN DER MERWE Submitted in fulfilment of the requirements of the degree PHILOSOPHIAE DOCTOR Faculty of Natural and Agricultural Sciences Department of Plant Sciences (Plant Breeding) University of the Free State Bloemfontein South Africa November 2010 Supervisor: Prof. M.T. Labuschagne Co-supervisor: Prof. L. Herselman Co-supervisor: Prof. A. Hugo
-
Upload
khangminh22 -
Category
Documents
-
view
1 -
download
0
Transcript of genotype by environment interaction for oil quality in - CiteSeerX

GENOTYPE BY ENVIRONMENT INTERACTION FOR OIL QUALITY IN
HIGH OLEIC ACID SUNFLOWER LINES
By
ROUXLÉNE VAN DER MERWE
Submitted in fulfilment of the requirements of the degree
PHILOSOPHIAE DOCTOR
Faculty of Natural and Agricultural Sciences
Department of Plant Sciences (Plant Breeding)
University of the Free State
Bloemfontein
South Africa
November 2010
Supervisor: Prof. M.T. Labuschagne
Co-supervisor: Prof. L. Herselman
Co-supervisor: Prof. A. Hugo

ii
DECLARATION
“I declare that the thesis hereby submitted by me for the degree of Doctor of Philosophy
in Agriculture at the University of the Free State is my own independent work, except
where otherwise stated. I certify that this work has not been previously submitted by me
for any degree at another University/Faculty.
I furthermore concede copyright of the thesis in favour of the University of the Free
State”.
____________________ ________________
Rouxléne van der Merwe Date

iii
“The greatest thing in this world is not so much where we are, but in what
direction we are moving.” - Oliver Wendell Holmes

iv
This work is dedicated to my husband, Werner,
my mother Martie Coetzee and my father, Nick Coetzee

v
ACKNOWLEDGEMENTS
The execution and completion of this study would not have been possible without the
support of the following people and organisations and I would like to thank them all for
their contributions towards the success of this study:
• Our Father in Heaven for giving me the opportunity, wisdom and strength to fulfil my
dreams.
• Prof. Maryke Labuschagne, Prof. Liezel Herselman and Prof. Arno Hugo for their
valuable supervision, theoretical and practical input, advice and motivation. Thank you
for all your support and the time you have put in for the completion of this study.
• The National Research Foundation and Oilseeds Advisory Committee for financial
support.
• PANNAR (Pty) Ltd. for the opportunity, resources and execution of field trials.
• Johan Potgieter, Danie Leeuwner, Ruaan Lochner and Elna Kuhn for their assistance
and input.
• Sadie Geldenhuys for administrating financial affairs, for moral support and
encouragement.
• Prof. Charl van Deventer for his valuable advice, encouragement and vital input.
• My colleagues Eileen Roodt, Adré Minnaar-Ontong and Scott Sydenham for training
and assisting in the laboratory as well as their valuable friendship.
• Wilhelm Hoffmann and Stephan Steyn for assisting in obtaining weather data.
• The University of the Free State and the Department of Plant Sciences for the
opportunity, resources and for providing facilities and financial support.
• My husband and parents, for their love, support, patience and understanding.
• My friends for their encouragement and continuous friendship.

vi
TABLE OF CONTENT
Page
Declaration
Quote
Dedication
Acknowledgements
ii
iii
iv
v
List of abbreviations
List of SI units
List of tables
List of figures
xi
xv
xvii
xxii
CHAPTER 1: GENERAL INTRODUCTION 1
CHAPTER 2: LITERATURE REVIEW 7
2.1 Brief history of sunflower 7
2.2 Economic importance of sunflower 8
2.3 Botanical description 9
2.4 Chemical composition of sunflower seed and oil 10
2.4.1 Seed oil content 10
2.4.2 Triacylglycerol structure 11
2.4.3 Fatty acid compositions of the three types of sunflower 11
2.4.4 Non-acylglycerol components 13
2.4.5 Oil quality parameters 14
2.4.6 Oil oxidative stability 15
2.5 Lipid biosynthesis 19
2.6 Genotypic and environmental factors influencing seed oil content and
composition
24
2.6.1 Genotypic factors 24
2.6.2 Environmental factors 24
2.6.3 Temperature effect on oleoyl phosphatidyl-choline desturase activity 27
2.6.4 Temperature effect on high oleic sunflower 27
2.7 Genotype by environment interaction 28
2.7.1 Genotype by environment interaction in sunflower 29

vii
2.7.2 Analysis of variance 30
2.7.3 Additive main effects and multiplicative interaction analysis 32
2.8 Breeding of sunflower to change or improve oil composition 33
2.9 Inheritance of the high oleic acid trait 37
2.10 Advanced breeding for oil crop modification: DNA marker-assisted
selection
41
2.10.1 Amplified fragment length polymorphism 42
2.10.2 Genetic markers and linkage map construction in sunflower 43
2.11 References 47
CHAPTER 3: GENOTYPE BY ENVIRONMENT ANALYSIS IN HIGH
AND MID OLEIC SUNFLOWER HYBRIDS
68
3.1 Introduction 68
3.2 Materials and methods 70
3.2.1 Plant material 70
3.2.2 Field trials 70
3.2.3 Oil extraction and fractionation 73
3.2.4 Fatty acid analysis 74
3.2.5 Statistical analysis 74
3.3 Results 75
3.3.1 Separate analysis of variance for six locations: Season of 2004/2005 76
3.3.2 Combined analysis of variance across six locations for 2004/2005 86
3.3.3 Separate analysis of variance for two locations: Season of 2005/2006 91
3.3.4 Combined analysis of variance across two locations for 2005/2006 99
3.3.5 Separate analyses of variance for Kroonstad: Season of 2006/2007 101
3.3.6 Combined analysis of variance for Kroonstad across three years
(2004-2007)
104
3.3.7 Stability analysis for genotype performance 107
3.3.7.1 Additive main effects and multiplicative interaction analysis for
one year over six locations (season of 2004/2005)
107
3.3.7.2 Additive main effects and multiplicative interaction analysis over
three years for Kroonstad (seasons of 2004 to 2007)
117
3.4 Discussion 126

viii
3.5 References 131
CHAPTER 4:
GENETIC ANALYSIS OF SEED OIL QUALITY AND
RELATED TRAITS IN SUNFLOWER EXPOSED TO
HEAT STRESS DURING SEED-FILLING
135
4.1 Introduction 135
4.2 Materials and methods 136
4.2.1 Plant material 136
4.2.2 Glasshouse trial 136
4.2.3 Temperature treatment 137
4.2.4 Sunflower head and seed traits 137
4.2.5 Seed oil extraction and fatty acid analysis 138
4.2.6 Statistical analysis and genetic parameters 138
4.3 Results 139
4.3.1 Analysis of variance for sunflower head and seed traits 140
4.3.2 Analysis of variance for sunflower oil and major fatty acid content 142
4.3.3 Mean values for sunflower head and seed traits 143
4.3.4 Mean values for sunflower oil and major fatty acid content 149
4.3.5 General and specific combining ability means of F1 sunflower hybrids
for sunflower head and seed traits
157
4.3.6 General and specific combining ability means of F1 sunflower hybrids
for sunflower seed oil composition
159
4.3.7 Estimates of variance components and broad sense heritability for
sunflower head and seed traits
163
4.3.8 Estimates of variance components and broad sense heritability for
sunflower seed oil and major fatty acid content
165
4.4 Correlations 167
4.4.1 Correlations between agronomic traits 167
4.4.2 Correlations between seed oil traits 169
4.4.3 Correlations between agronomic and seed oil traits 169
4.5 Discussion 170
4.6 References 178

ix
CHAPTER 5: IDENTIFICATION OF MOLECULAR MARKERS
LINKED TO THE HIGH OLEIC ACID TRAIT IN
SUNFLOWER
183
5.1 Introduction 183
5.2 Materials and methods 186
5.2.1 Plant material and glasshouse trial 186
5.2.2 Seed oil extraction and fatty acid analysis 186
5.2.3 Deoxyribonucleic acid (DNA) isolation 187
5.2.4 Bulk segregant analysis 189
5.2.5 Amplified fragment length polymorphism analysis 190
5.2.6 Simple sequence repeat analysis 193
5.2.7 Polyacrylamide gel electrophoresis 193
5.2.8 Silver staining of polyacrylamide gels 195
5.2.9 Identification of polymorphisms 195
5.2.10 Statistical analysis 196
5.3 Results 196
5.3.1 Phenotypic analysis of the F2 population (F3 seed) for oleic acid
content
196
5.3.2 Amplified fragment length polymorphism analysis 198
5.3.3 Simple sequence repeat analysis 198
5.3.4 Linkage analyses of putative markers related to the high oleic acid
trait
198
5.3.5 Identification of putative quantitative trait loci for high oleic acid
genes
201
5.4 Discussion 201
5.5 References 206
CHAPTER 6: PHYSICOCHEMICAL AND OXIDATIVE STABILITY
CHARACTERISITCS OF HIGH AND MID OLEIC
SUNFLOWER SEED OIL
212
6.1 Introduction 212
6.2 Materials and methods 213
6.2.1 Seed material 213

x
6.2.2 Seed oil extraction and fatty acid analysis 214
6.2.3 Physicochemical properties 214
6.2.4 Determination of oxidative stability 215
6.2.5 Statistical analyses 217
6.3 Results 217
6.3.1 Oil and fatty acid content 217
6.3.2 Physicochemical properties 222
6.3.3 Determination of oil oxidative stability and prediction of oil shelf life 224
6.4 Discussion 225
6.5 Oxidative stability of commercial vegetable oils 231
6.5.1 Introduction 231
6.5.2 Materials and methods 231
6.5.3 Results 232
6.5.4 Discussion 238
6.6 References 242
CHAPTER 7: GENERAL CONCLUSIONS AND RECOMMEN-
DATIONS
248
SUMMARY
OPSOMMING
257
259

xi
LIST OF ABBREVIATIONS
ACP Acyl carrier protein
A.D. Anno Domini
AFLP Amplified fragment length polymorphism
AMMI Additive main effects and multiplicative interaction
ANOVA Analysis of variance
AOAC Association of Official Analytical Chemists
AOCS American Oil Chemists’ Society
AOM Active oxygen method
ATP Adenosine 5’-triphosphate
AV (p-AV) Anisidine value
B.C. Before Christ
BSA Bulk segregant analysis
Ca Calcium
CDP Cytidine 5’-diphosphate
CH2 Methylene group
CoA Coenzyme A
CTAB Hexadecyltrimethylammonium bromide
CV Coefficient of variation
DAA Days after anthesis
DAF Days after the initiation of flowering
DAG Diacylglycerol
DALP Direct amplification of length polymorphism
DNA Deoxyribonucleic acid
dNTP 2’Deoxynucleoside 5’triphosphate
DTT Dithiotreitol
E Environment
EDTA Ethylene-diaminetetra-acetate
ER Endoplasmic reticulum
EST Expressed sequence tag
F1 First filial generation
F2 Second filial generation
F3 Third filial generation
xii
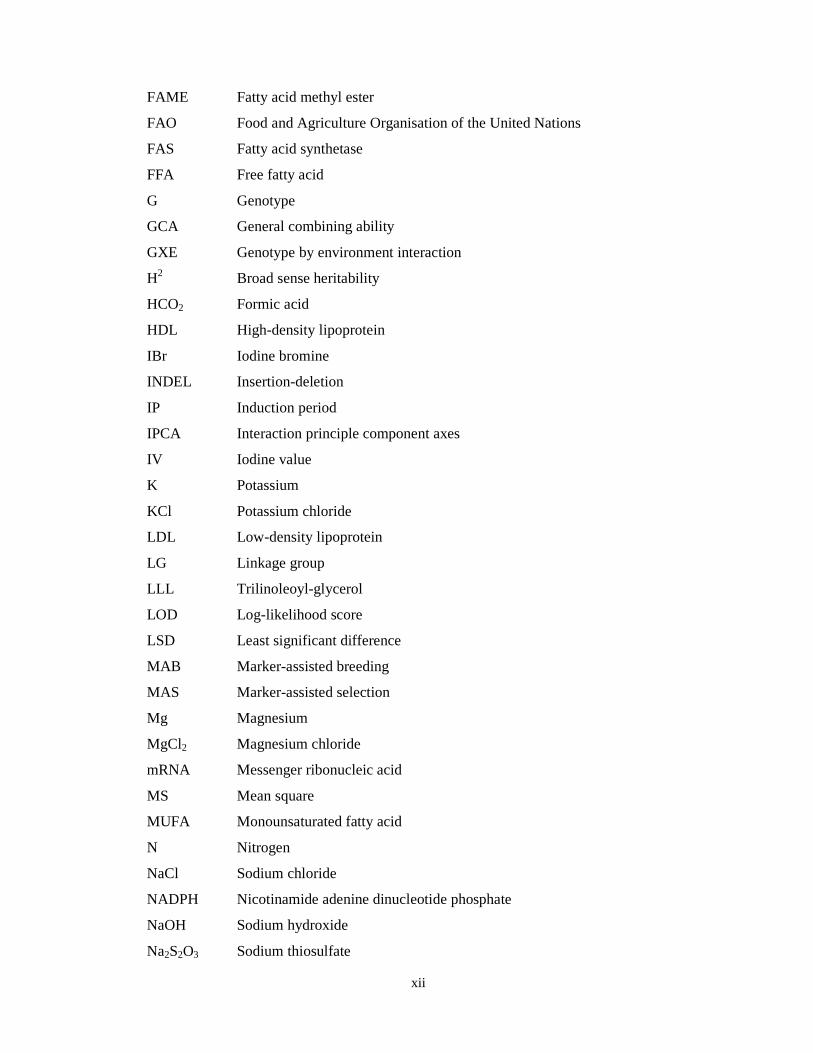
FAME Fatty acid methyl ester
FAO Food and Agriculture Organisation of the United Nations
FAS Fatty acid synthetase
FFA Free fatty acid
G Genotype
GCA General combining ability
GXE Genotype by environment interaction
H2 Broad sense heritability
HCO2 Formic acid
HDL High-density lipoprotein
IBr Iodine bromine
INDEL Insertion-deletion
IP Induction period
IPCA Interaction principle component axes
IV Iodine value
K Potassium
KCl Potassium chloride
LDL Low-density lipoprotein
LG Linkage group
LLL Trilinoleoyl-glycerol
LOD Log-likelihood score
LSD Least significant difference
MAB Marker-assisted breeding
MAS Marker-assisted selection
Mg Magnesium
MgCl2 Magnesium chloride
mRNA Messenger ribonucleic acid
MS Mean square
MUFA Monounsaturated fatty acid
N Nitrogen
NaCl Sodium chloride
NADPH Nicotinamide adenine dinucleotide phosphate
NaOH Sodium hydroxide
Na2S2O3 Sodium thiosulfate

xiii
ND Not detected
ND Refractive index measurement value at 589.3 nm (the D Fraunhofer line).
ODS Oleoyl-phosphatidylcholine desaturase
OLL Monooleoyl-dilinoleoyl-glycerol
OOL Dioleoyl-monolinoleoyl-glycerol
OSI Oxidative stability index
P Phosphorus
PA Phosphatidic acid
PAGE Polyacrylamide gel electrophoresis
PC Phosphatidylcholine
PCA Principle component analysis
PCR Polymerase chain reaction
PUFA Polyunsaturated fatty acid
PV Peroxide value
QTL Quantitative trait loci
R Replicates
RAPD Random amplified polymorphic DNA
REP Replication
RFLP Restriction fragment length polymorphism
RH Fatty acid group
RI Refractivity index
RIL Recombinant inbred line
RNA Ribonucleic acid
ROOH Hydroperoxide
S Sulphur
SAD Stearoyl-acyl carrier protein desaturase
SCA Specific combining ability
SCAR Sequence characterised amplified region
SFA Saturated fatty acid
SNP Single nucleotide polymorphism
SSR Simple sequence repeat
STS Sequence tagged site
TAG Triacylglycerol
Taq Thermus aquaticus

xiv
TBE Tris-Boric acid-EDTA buffer
TE Tris-EDTA buffer
TEMED N’N’N’N’ -tetramethylene-diamine
Tris-Cl Trishydroxymethyl-aminomethane
U Unit(s)
USA United States of America
USDA United States Department of Agriculture
UV Ultraviolet
Zn Zink
σ2e Environmental variance component
σ2g Genetic variance component
σ2p Phenotypic variance component

xv
LIST OF SI UNITS
Ab Absorbance
α Alpha
β Beta
ºC Degrees Celsius
cm Centimetre(s)
cM CentiMorgans
g Relative centrifugal force
g Gram(s)
h Hour(s)
ha Hectare(s)
kg Kilogram(s)
l Litre(s)
m Metre(s)
µg Microgram(s)
µl Microlitre(s)
µm Micrometre(s)
µM Micromolar
meq Milli-equivalents
mg Milligram(s)
min Minute(s)
ml Millilitre(s)
mm Millimetre(s)
mM Millimolar
mmol Millimole(s)
M Molar
N Normality
ng Nanogram(s)
nm Nanometre
pmol Picomole(s)
psi Pounds per square inch
pH Power of hydrogen
r/s Revolutions per second

xvi
s Second(s)
t Tonne(s)
V Volt(s)
v/v Volume per volume
W Watt(s)
w/v Weight per volume
w/w Weight per weight

xvii
LIST OF TABLES
Page
Table 2.1 World total sunflower seed production (in 1000 metric tons) 8
Table 2.2 Proximate composition of sunflower seeds 10
Table 2.3 Typical fatty acid composition (%) of traditional, high oleic and
mid oleic sunflower oil
12
Table 2.4 Sunflower mutants or lines with altered fatty acid composition
developed through mutagenesis or germplasm evaluation
35
Table 2.5 Theoretical genotypic and phenotypic classes for oleic acid (C18:1)
levels in crosses segregating for this fatty acid
39
Table 3.1 Areas planted and sunflower seed yield for the production seasons
2006/2007, 2007/2008 and 2008/2009
68
Table 3.2 The 16 sunflower hybrids used to determine the effect of location,
year and genotype on oil content and composition
70
Table 3.3 Mean seed and oil yield, rainfall and temperature data for growing
seasons 2004/2005, 2005/2006 and 2006/2007
71
Table 3.4 Summary of the regional orientation, coordinates and climatic
region for eight locations planted from seasons 2004/2005 to
2006/2007
72
Table 3.5 Mean squares of oil content for six locations in 2004/2005 77
Table 3.6 Mean values and rankings of oil content for six locations in
2004/2005
78
Table 3.7 Mean squares of linoleic acid content for six locations in 2004/2005 79
Table 3.8 Mean values and rankings of linoleic acid content for six locations
in 2004/2005
80
Table 3.9 Mean squares of oleic acid content for six locations in 2004/2005 82
Table 3.10 Mean values and rankings of oleic acid content for six locations in
2004/2005
83
Table 3.11 Mean squares of palmitic acid content for six locations in
2004/2005
84
Table 3.12 Mean values and rankings of palmitic acid content for six locations
in 2004/2005
85
Table 3.13 Mean squares of stearic acid content for six locations in 2004/2005 87

xviii
Table 3.14 Mean values and rankings of stearic acid content for six locations in
2004/2005
88
Table 3.15 Mean squares of oil and fatty acid contents over environment for
six locations in 2004/2005
89
Table 3.16 Mean values and rankings of oil and fatty acid contents for six
locations in 2004/2005
90
Table 3.17 Mean squares of oil content for two locations in 2005/2006 91
Table 3.18 Mean values and rankings of oil content for two locations in
2005/2006
92
Table 3.19 Mean squares of linoleic acid content for two locations in
2005/2006
93
Table 3.20 Mean values and rankings of linoleic acid content for two locations
in 2005/2006
93
Table 3.21 Mean squares of oleic acid content for two locations in 2005/2006 95
Table 3.22 Mean values and rankings of oleic acid content for two locations in
2005/2006
95
Table 3.23 Mean squares of palmitic acid content for two locations in
2005/2006
97
Table 3.24 Mean values and rankings of palmitic acid content for two locations
in 2005/2006
97
Table 3.25 Mean squares of stearic acid content for two locations in 2005/2006 98
Table 3.26 Mean values and rankings of stearic acid content for two locations
in 2005/2006
98
Table 3.27 Mean squares of oil and fatty acid contents over environments for
two locations in 2005/2006
99
Table 3.28 Mean values and rankings of oil and fatty acid contents for two
locations in 2005/2006
100
Table 3.29 Mean squares of oil and fatty acid contents for Kroonstad in
2006/2007
102
Table 3.30 Mean values and rankings of oil and fatty acid contents for
Kroonstad in 2006/2007
103
Table 3.31 Mean squares of fatty acid contents for Kroonstad across three
years
105

xix
Table 3.32 Mean values and rankings of fatty acid contents for Kroonstad
across three years
106
Table 3.33 Contribution of IPCA 1 and IPCA 2 to the total variation for GXE
interaction for one year (2004/2005) over six locations
108
Table 3.34 Mean squares of oil and fatty acid contents for the AMMIs for six
locations for season 2004/2005
108
Table 3.35 Contribution of IPCA 1 and IPCA 2 to the total variation for GXE
interaction for three years (2004/2005) and one location
117
Table 3.36 Mean squares of fatty acid contents for the AMMIs for Kroonstad
for three seasons
118
Table 4.1 Hierarchical cross of male parents A, B, C and D with 12 different
females
137
Table 4.2 Oleic acid types of the F1 offspring from the hierarchal cross
between the male and female inbred lines
139
Table 4.3 Mean squares of sunflower head traits, seed traits and major fatty
acid composition for 12 sunflower F1 hybrids analysed at two
temperature treatments
141
Table 4.4 Mean values and rankings of 12 sunflower F1 hybrids for head
diameter analysed at two temperature treatments
144
Table 4.5 Mean values and differences between 12 sunflower F1 hybrids and
treatments for head diameter
144
Table 4.6 Mean values and rankings of 12 sunflower F1 hybrids for total
number of filled seeds per head analysed at two temperature
treatments
145
Table 4.7 Mean values and differences between 12 sunflower F1 hybrids and
treatments for total number of filled seeds per sunflower head
145
Table 4.8 Mean values and rankings of 12 sunflower F1 hybrids for twenty-
five seed weight analysed at two temperature treatments
147
Table 4.9 Mean values and differences between 12 sunflower F1 hybrids and
treatments for twenty-five seed weight
147
Table 4.10 Mean values and rankings of 12 sunflower F1 hybrids for head
sterile centre diameter analysed at two temperature treatments
148

xx
Table 4.11 Mean values and differences between 12 sunflower F1 hybrids and
treatments for head sterile centre diameter
148
Table 4.12
Mean values and rankings of 12 sunflower F1 hybrids for oil
content analysed at two temperature treatments
150
Table 4.13 Mean values and differences between 12 sunflower F1 hybrids and
treatments for oil content
150
Table 4.14 Mean values and rankings of 12 sunflower F1 hybrids for palmitic
acid content analysed at two temperature treatments
151
Table 4.15 Mean values and differences between 12 sunflower F1 hybrids and
treatments for palmitic acid content
151
Table 4.16 Mean values and rankings of 12 sunflower F1 hybrids for stearic
acid content analysed at two temperature treatments
153
Table 4.17 Mean values and differences between 12 sunflower F1 hybrids and
treatments for stearic acid content
153
Table 4.18 Mean values and rankings of 12 sunflower F1 hybrids for oleic acid
content analysed at two temperature treatments
154
Table 4.19 Mean values and differences between 12 sunflower F1 hybrids and
treatments for oleic acid content
154
Table 4.20 Mean values and rankings of 12 sunflower F1 hybrids for linoleic
acid content analysed at two temperature treatments
156
Table 4.21 Mean values and differences between 12 sunflower F1 hybrids and
treatments for linoleic acid content
156
Table 4.22 General and specific combining ability means of 12 sunflower F1
hybrids for agronomic traits analysed at two temperature treatments
158
Table 4.23 General and specific combining ability means of 12 F1 sunflower
hybrids for seed oil composition at two temperature treatments
160
Table 4.24 Variance components and broad sense heritability for head and seed
traits of 12 sunflower F1 hybrids analysed at two temperature
treatments
164
Table 4.25 Variance components and broad sense heritability for oil and major
fatty acid contents of 12 sunflower F1 hybrids analysed at two
temperature treatments
166

xxi
Table 4.26 Correlation matrix obtained for sunflower head and seed traits and
oil composition from 12 F1 sunflower hybrids of the control
treatment
168
Table 4.27 Correlation matrix obtained for sunflower head and seed traits and
oil composition from 12 F1 sunflower hybrids of the heat treatment
168
Table 5.1 Mean and range for oleic and linoleic acid contents of sunflower
seed oil of the homozygous F2 bulk individuals (based on values of
F3 seeds) from a cross between high and low oleic parents
188
Table 5.2 Adapters and primers used for AFLP analysis to identify and map
markers linked to the high oleic acid trait in a F2 segregating
population of sunflower
191
Table 5.3 Primers used for SSR analysis to identify and map markers linked
to the high oleic acid trait in a F2 segregating population of
sunflower
194
Table 5.4 Mean oleic and linoleic acid contents of sunflower seed oil of the
high oleic acid and low oleic acid parents and F2 individuals (based
on values of F3 seeds) from a cross between the two parents
197
Table 5.5 AFLP analysis data obtained using EcoRI/MseI primer
combinations
199
Table 6.1 Mean oil and major fatty acid contents of traditional, high oleic and
mid oleic sunflower oil types
218
Table 6.2 Significant correlations between oil content, fatty acids and
physicochemical properties
220
Table 6.3 Mean values for physical and chemical tests of traditional, high
oleic and mid oleic sunflower oil types
223
Table 6.4 Mean oxidative stability index and shelf life values for traditional,
mid oleic and high oleic sunflower oils
225
Table 6.5 Initial fatty acid composition (as percentage of total fatty acids) and
oil analysis results of four commercial vegetable oils before oil
oxidation as well as the number of days for the oils to show the first
phase of oxidation
233

xxii
LIST OF FIGURES
Page
Figure 2.1 General structure of triacylglycerol. 12
Figure 2.2 Typical unsaturated triglyceride molecule with double-bond linkage
and α-methylenic carbon (oxidation site).
17
Figure 2.3 Simplified schematic showing the two spatially separate pathways
involved in lipid biosynthesis in vegetable oil production.
20
Figure 2.4 The biosynthetic pathway of TAG in developing sunflower seeds. 23
Figure 3.1 AMMI biplot-1 for the 2004/2005 season for oil content showing
means of genotypes (1-16) and environments plotted against their
respective scores of the first interaction principle component
(IPCA-1).
109
Figure 3.2 AMMI biplot-1 for the 2004/2005 season for linoleic acid content
showing means of genotypes (1-16) and environments plotted
against their respective scores of the first interaction principle
component (IPCA-1).
111
Figure 3.3 AMMI biplot-1 for the 2004/2005 season for oleic acid content
showing means of genotypes (1-16) and environments plotted
against their respective scores of the first interaction principle
component (IPCA-1).
113
Figure 3.4 AMMI biplot-1 for the 2004/2005 season for palmitic acid content
showing means of genotypes (1-16) and environments plotted
against their respective scores of the first interaction principle
component (IPCA-1).
114
Figure 3.5 AMMI biplot-1 for the 2004/2005 season for stearic acid content
showing means of genotypes (1-16) and environments plotted
against their respective scores of the first interaction principle
component (IPCA-1).
116
Figure 3.6
AMMI biplot-1 for seasons 2004 to 2007 for oil content showing
means of genotypes (1-16, without 8 and 13) and environments
plotted against their respective scores of the first interaction
principle component (IPCA-1).
119

xxiii
Figure 3.7 AMMI biplot-1 for seasons 2004 to 2007 for linoleic acid content
showing means of genotypes (1-16, without 8 and 13) and
environments plotted against their respective scores of the first
interaction principle component (IPCA-1).
120
Figure 3.8 AMMI biplot-1 for seasons 2004 to 2007 for oleic acid content
showing means of genotypes (1-16, without 8 and 13) and
environments plotted against their respective scores of the first
interaction principle component (IPCA-1).
122
Figure 3.9 AMMI biplot-1 for seasons 2004 to 2007 for palmitic acid content
showing means of genotypes (1-16, without 8 and 13) and
environments plotted against their respective scores of the first
interaction principle component (IPCA-1).
123
Figure 3.10 AMMI biplot-1 for seasons 2004 to 2007 for stearic acid content
showing means of genotypes (1-16, without 8 and 13) and
environments plotted against their respective scores of the first
interaction principle component (IPCA-1).
125
Figure 5.1 AFLP and SSR marker order of putative linkage group 14 of
sunflower based on a segregating F2 population. Names of markers
are shown on the right and their map position (cM) on the left.
200
Figure 5.2 Linkage map of linkage group 14 indicating the chromosomal
regions containing the quantitative trait loci (QTL) associated with
the high oleic trait and the relative distances of the markers from the
QTL.
202
Figure 6.1 Graph indicating number of days for peroxide value to reach
maximum of 100 meq peroxide/1000 g oil for traditional sunflower,
high oleic sunflower, canola and palm oil.
236
Figure 6.2 Graph indicating number of days for refractive index to reach a
value difference of 0.001 for traditional sunflower, high oleic
sunflower, canola and palm oil.
236
Figure 6.3 Graph indicating gradual increase in p-anisidine value measured for
traditional sunflower, high oleic sunflower, canola and palm oil.
237

1
CHAPTER 1
GENERAL INTRODUCTION
Sunflower (Helianthus annuus L.) is the fourth most important vegetable oil crop after
soybean, palm and edible rapeseed (canola) in world trade. It accounts for approximately
13% of the world’s total edible oil production (Paniego et al., 2007). In South Africa
sunflower is the largest source of vegetable oil. It contributes about 80% to the total oil
produced and is followed by soybeans and canola that make up the balance (20%). The
sunflower oil market has shown a steady increase of approximately three percent per year
in the last few years. About 540 million litre oil is annually consumed and sunflower oil
provides half of this quantity.
There are three types of sunflower. These include oilseed sunflower, non-oilseed (or
confectionary) sunflower and ornamental sunflower. However, the production of
sunflower is mainly devoted to oil extraction (Dorrell and Vick, 1997). The whole seed
contains approximately 40% oil and up to 25% protein. The meal left after oil removal is
usually used as livestock feed (Paniego et al., 2007).
Oilseed sunflower has many potential applications in both the non-food and food industry.
Because of its relatively high iodine value of 133 (O’Brien, 2004), traditional sunflower
oil is considered a semi-drying oil that can be used in the formulation of paints and for
other industrial uses. Sunflower oil is traditionally used for cooking, frying, making salad
dressing and margarine production. However, standard sunflower oil is not optimally
suited to some potential applications that require a high oxidative stability, for example
manufacturing of shelf-stable fried foods. In order to be able to use sunflower oil for
industrial frying applications, the oil must be partially hydrogenated (Gupta, 2002).
Hydrogenation involves the chemical addition of hydrogen to unsaturated fatty acids by
mixing heated oil and hydrogen gas in the presence of a catalyst (O’Brien, 2004). During
this chemical treatment, not only are unsaturated fatty acids converted to saturated ones,
but many positional and “trans” isomers not normally found in nature, are also produced.
There is evidence that the intake of these artificial (trans) fatty acids is casually related to
the risk of developing heart disease (Stender and Dyerberg, 2004). Consequently, there is

2
an increasing interest within the food industry to produce oil crops with higher amounts of
saturated and mono-unsaturated fatty acids in their oils.
Traditional sunflower oil has been a popular vegetable oil for many years. However, it is
polyunsaturated with a high linoleic acid and low saturated fatty acid content and the fatty
acid composition of traditional sunflower oil is far from being appropriate for specific
uses that require high saturation levels in the oil. Fortunately plant breeders have been
successful in overcoming limitations of the traditional oil by developing a wide range of
novel and healthier oil types (Fernández-Martínez et al., 2004). Recent research has lead
to the development of high oleic acid sunflower varieties with oil that approach or exceed
89% oleic acid content (Dorrell and Vick, 1997). The high and mid oleic acid sunflower
variants were developed through conventional breeding in the 1980s and 1990s and are
speciality oils especially useful in food products such as spray oils (snacks and crackers),
frying oils and for other products that require an oil with high oxidative stability (O’Brien,
2004). Due to their natural stability, these oils do not need to be hydrogenated in order to
be used for these applications (Paniego et al., 2007). Additionally, high and mid oleic
sunflower oils are considered healthier oils, because they contain no trans fatty acids.
The development of healthier sunflower oil types was encouraged by South African
breeding companies after breeders rights in America expired. Breeding for high oleic acid
sunflower started around 1983 in South Africa (R. Lochner, PANNAR®, personal
communication, 2010). High oleic hybrids have been released and seed is commercially
available. However, high oleic sunflower oil production started in 2003 and is still in the
foundation stage. Only a few farmers are being contracted to plant high oleic acid hybrids.
Sunflower is commercially planted in South Africa in the Free State, North West,
Limpopo, Mpumalanga, Gauteng, Western Cape, Eastern Cape and Northern Cape
provinces with a total area of 635 800 ha planted during the 2008/2009 season (Dredge,
2010). The Free State and North West provinces are the major sunflower producing areas
and constitute 88% of the total area planted in South Africa. These areas of sunflower
production vary for climate, weather (rainfall and temperature) and other environmental
factors such as intercepted solar radiation, altitude, latitude and soil type. Sunflower
growth and development are greatly influenced by the weather and the environment it is
grown in. Temperature and the amount of moisture in the soil are the major factors

3
influencing sunflower seed oil composition and especially oleic acid content (Baldini et
al., 2002). Fatty acid composition of sunflower is also affected by the genotype and its
interaction with the environment. Genotype by environment interaction (GXE) has been
reported for sunflower oil fatty acid composition (Lajara et al., 1990). As a result, the
study of GXE interaction for South African sunflower hybrids is necessary in order to
select stable and widely adapted hybrids in South African production areas.
Additionally, unusually high temperatures occurring during the seed-filling period have a
huge influence on the fatty acid composition of traditional sunflower oil (Rondanini et al.,
2003). It has been reported that high temperatures lead to an increase in oleic acid and
decrease in linoleic acid content and vice versa (Harris et al., 1978; Chunfang et al.,
1996). However, in high oleic acid sunflower, controversy exists regarding the effect of
high temperature on oil composition. Differences in reports may be a consequence of
different genetic backgrounds used (Salera and Baldini, 1998). Current trends toward
increased global temperature (Easterling et al., 1997) may increase the probability of
occurrence of high temperatures in many regions of the world (Conroy et al., 1994).
These might also increase the frequency of episodes of high temperatures in warmer
climates (Wheeler et al., 2000). This change in weather may cause unusually high
temperatures during the critical stage of seed maturation which will have an influence on
sunflower oil quality. Therefore the effect of temperature during the seed-filling period on
oil content and composition in traditional, mid oleic and high oleic sunflower hybrids
within South African genetic backgrounds is necessary. This would facilitate breeding
strategies focussing on developing stable and widely adapted high oleic and mid oleic
hybrids that are less sensitive to large temperature differences.
Since oleic acid content is largely affected by the environment and high oleic acid genes
show unstable expression for oleic acid content in different genetic backgrounds,
phenotypic selection for the high oleic acid trait may be difficult across different
environments and seasons (Demurin and Škorić, 1996). DNA markers are not influenced
by the environment and therefore selection for markers linked to the high oleic acid trait
will further advance selection for this trait. Identifying molecular markers linked to the
high oleic acid trait that can be further developed for use in marker-assisted breeding
(MAB) would greatly assist breeding programmes in developing stable mid and high oleic
acid breeding lines.

4
High oleic acid hybrids with comparable yield to that of traditional sunflower oil have
recently been developed by South African breeding companies. As a result, local farmers
can produce sunflower that has high yield potential as well as the benefits of healthier and
more stable oil. Breeding high oleic hybrids with high seed yield, disease tolerance and
shorter growth periods are some of the main focal points of sunflower breeding
companies. In addition, much research is still needed to improve the stability of oil fatty
acid composition.
The aims of this study were to::
• Investigate the effects of genotype, environment and their interaction on the fatty acid
composition of traditional, high oleic and mid oleic sunflower hybrids and to make
recommendations on the most stable and adaptable hybrids for the sunflower
production areas under study.
• Study the effects of a short period of high temperature stress during the seed-filling
stage on some yield traits as well as fatty acid composition. Genetic parameters
including general and specific combining ability, variance components and heritability
were investigated for yield traits and fatty acids.
• Identify putative DNA markers linked to the high oleic acid trait in South African lines
that may in future be implemented in high oleic sunflower breeding programmes.
• Investigate a few physical and chemical properties of high oleic, mid oleic and
traditional sunflower hybrids and to compare the three oil variants with regard to
quality and oxidative stability.
References
Baldini, M., Giovanardi, R., Tahmasebi-Enferadi, S. and Vannozzi, G.P. 2002. Effects of
water regime on fatty acid accumulation and final fatty acid composition in the oil of
standard and high oleic sunflower hybrids. Italian Journal of Agronomy 6: 119-126.
Chunfang, G., Jian, Z. and Qiu, L. 1996. The influence of climatic factors on the
composition of lipid acids in sunflower oil. In: Proceedings of the 14th International
Sunflower Conference, Beijing, China, Volume 1. pp. 559-564.
Conroy, J., Seneweera, S., Basra, A., Rogers, G. and Nissen-Wooller, B. 1994. Influence
of rising atmospheric CO2 concentrations and temperature on growth, yield and grain
quality of cereal crops. Australian Journal of Plant Physiology 21: 741-758.

5
Demurin, Y. and Škorić, D. 1996. Unstable expression of Ol gene for high oleic acid
content in sunflower seeds. In: Proceedings of the 14th International Sunflower
Conference, Beijing, China. International Sunflower Association, Paris. pp. 145-150.
Dorrell, D.G. and Vick, B.A. 1997. Properties and processing of oilseed sunflower. In:
Sunflower technology and production, Agronomy Monograph no 35. Schneiter, A.A.
(Ed.). American Society of Agronomy Inc., Crop Science Society of America Inc.,
Soil Science Society of America Inc., Wisconsin, USA. pp. 709-745.
Dredge, R.D. 2010. Crop estimates committee, Private bag X246, Pretoria, South Africa.
http://www.sagis.org.za (22 July 2010).
Easterling, D., Horton, B., Jones, P., Peterson, T., Karl, T., Parker, D., Salinger, M.,
Razuvayev, V., Plummer, N., Jamason, P. and Folland, C. 1997. Maximum and
minimum temperature trends for the globe. Science 277: 364-367.
Fernández-Martínez, J.M., Velasco, L. and Pérez-Vich, B. 2004. Progress in the genetic
modification of sunflower oil quality. In: Proceedings of the 16th International
Sunflower Conference, Fargo, ND USA. pp. 1-14.
Gupta, M.K. 2002. Sunflower oil. In: Vegetable oils in food technology: Composition,
properties and uses. Gunstone, F.D. (Ed.). Blackwell Publishing Ltd. CRC Press LLC,
USA, Canada. pp. 128-156.
Harris, H.C., Mcwilliam, J.R. and Mason, W.K. 1978. Influence of temperature on oil
content and composition of sunflower seed. Australian Journal of Agricultural
Research 29: 1203-1212.
Lajara, J., Diaz, U. and Quidiello, R. 1990. Definite influence of location and climatic
conditions on the fatty acid composition on sunflower seed oil. Journal of the
American Oil Chemist’s Society 67: 618-623.
O’Brien, R.D. 2004. Fats and oils: formulating and processing for applications, 2nd
edition. CRC Press, Taylor and Francis Group, LLC, 592 pp.
Paniego, N., Heinz, R., Fernandez, P., Talia, P., Nishinakamasu, V. and Hopp, H.E. 2007.
Sunflower. In: Genome mapping and molecular breeding in plants, Volume 2.
Oilseeds. Kole, C. (Ed.). Springer-Verlag, Berlin, Heidelberg. pp. 153-177.
Rondanini, D., Savin, R. and Hall, A.J. 2003. Dynamics of fruit growth and oil quality of
sunflower (Helianthus annuus L.) exposed to brief intervals of high temperature
during grain filling. Field Crops Research 83: 79-90.
Salera, E. and Baldini, M. 1998. Performance of high and low oleic acid hybrids of
sunflower under different environmental conditions. Note II. Helia 21: 55-68.

6
Stender, S. and Dyerberg, J. 2004. Influence of trans fatty acids on health. Annals of
Nutrition and Metabolism 48: 61-66.
Wheeler, T.R., Craufurd, P.Q., Ellis, R.H., Porter, J.R. and Vara Prasad, P.V. 2000.
Temperature variability and the yield of annual crops. Agriculture, Ecosystems and
Environment 82: 159-167.

7
CHAPTER 2
LITERATURE REVIEW
2.1 Brief history of sunflower
Sunflower originated in northern Mexico and south-western USA and domestication
occurred about 3000 B.C. by the Native American Indians (Heiser, 1954). It was of
substantial importance to the indigenous population of that region who used the seed for
food and medicine (Putt, 1997). Flower petals and oil were used for ceremonial body
painting, while dried stalks were used as building material. At the beginning of the 1500s
A.D. the arrival of Spanish explorers introduced sunflower to Europe. Nicolás Bautista
Monardes (1508-1588) did the first scientific review of American plants and it was the
first time that sunflower was mentioned (Grompone, 2005; Paniego et al., 2007). It was
popular as an ornamental plant and was later established as an oilseed crop in Eastern
Europe (Putt, 1997). In the 18th century, sunflower cultivation spread to Russia and Peter
the Great was accredited for this introduction (Semelczi-Kovacks, 1975). Sunflower oil
became the main source of vegetable oil in Russia. The first commercial production of
sunflower oil occurred in 1830 and since then the crop has steadily grown in importance.
The introduction of Russian varieties such as Peredovic, Mennonite and Sunrise that were
suitable for mechanical harvesting opened doors for the commercial development of
sunflower. The discovery of cytoplasmic male sterility (Leclercq, 1969) and fertility
restoration (Kinman, 1970) allowed efficient production of high oil content hybrid seed in
the late 1970s that replaced the older varieties (Weiss, 2000). The crop was reintroduced
into America in the late 18th century by Ukrainian immigrants. The first commercial use
of sunflower was for poultry feed and processing of oil started in 1926. The first official
sunflower-breeding programmes in America started during the 1930s using seeds
introduced by European immigrants (Putt, 1997). In Argentina, a short-cycle and high oil
content variety (Klein) was bred in 1938. Commercial production of oil seed-type
sunflower started with the Peredovic variety and other cultivars and since 1966 several
research programmes in the USA have sought to improve sunflower hybrids (Grompone,
2005). From then sunflower cultivation steadily increased in both North and South
America leading to it being ranked first in the world for sunflower production (Paniego et
al., 2007).

8
Soldatov (1976) identified genotypes with oleic acid contents as high as 80-90% (Fick
and Miller, 1997). Pervenets was the first high oleic acid variety developed through
conventional breeding. Several breeding programmes included Pervenets in their crosses
as the high oleic acid content parent. High oleic oil gained market acceptance, especially
for food and industrial purposes where a high level of oxidative stability was required.
High oleic sunflower oil became commercially available in Russia in the late 1970s and in
the USA in 1985. The development of high oleic sunflower varieties was encouraged by
South African breeding companies after breeders’ rights in America expired. Breeding for
high oleic acid sunflower started around 1983 in South Africa (R. Lochner, PANNAR®,
personal communication, 2010).
2.2 Economic importance of sunflower
Sunflower oil production is determined by the production of seed. Total world production
of sunflower seed was on average 31 million metric tons during the last few years (Table
2.1). Russia and Ukraine rank first in the world for sunflower production. The European
countries account for about 50% of the world production of sunflower. In 2007, South
Africa ranked 15th in the world with a seed production of 300000 metric tons (FAO,
2010). High oleic sunflower is commercially produced mainly in the United States and
France. High oleic oil contributes less than 5% of the total sunflower production globally
with about 300000 metric tons of high oleic oil produced annually.
Table 2.1 World sunflower seed production (in 1000 metric tons)
Area 2006/2007 2007/2008 2008/2009
Russia/Ukraine European Union Argentina China India United States Turkey Rest of Europe South Africa Other Total
11900 6407 3120 1850 1450 997 820 385 300
2863 30092
10380 4944 4600 1800 1460 1309 670 295 872
2929 29259
14320 6848 3130 1850 1150 1553 850 454 801
3595 34551
(Dredge, 2010; National Sunflower Association, 2010).

9
2.3 Botanical description
Sunflower belongs to the subtribe Helianthinae, the subfamily Asteroideae and family
Compositae (Seiler and Rieseberg, 1997). The genus name of sunflower is derived from
two Greek words: helios meaning sun and anthos, meaning flower (Salunkhe et al., 1992;
Paniego et al., 2007). The genus has a basic chromosome number of n=17 and contains
diploid (2n=2x=34), tertaploid (2n=4x=68) and hexaploid (2n=6x=102) species. It
includes 12 annual and 36 perennial species (Jan, 1997). The Jerusalem artichoke
(Helianthus tuberosus L.) is related to sunflower. Sunflower that is commercially
cultivated for seed purposes is grouped under H. annuus variety macrocarpus (Maiti et
al., 1988). The commercial crop is a predominantly cross-pollinating annual upright plant
with a long stem of 1-3 m. It has a terminal flower head (also called a capitulum) that is
commonly about 30 cm in diameter. The characteristic of turning its head towards the sun
additionally accounts for sunflower’s common and botanical name (Seiler, 1997; Paniego
et al., 2007).
In oilseed cultivars, the sunflower head consists of 700-3000 flowers. The sunflower
inflorescence consists of two types of flowers. The outer whorl of flowers, called the ray
florets, is sterile and has a display role. The remainder of the flowers, the hermaphroditic
disk florets, are arranged in arcs radiating from the centre of the head and these produce
the seed. During anthesis the outer whorl of disk flowers opens first and then progresses
to the centre of the head at one to four rows per day. Opening of all florets on the head is
usually completed within 10-15 days, but individual florets can remain receptive for up to
two weeks. Sunflower is generally an open-pollinator and bees are beneficial in
transferring pollen from plant to plant that result in cross-pollination. Varieties differ in
their dependence on insect pollinators. The older open-pollinated varieties have a seed set
of only 15-20% without pollinators, while recent autogamous sunflower hybrids have a
seed set of 85-100% without pollinators (Knowles, 1978; Weiss, 2000; Putnam et al.,
2009).
The sunflower seed (or achene) consists of a kernel and adhering pericarp (or hull). The
hull comprises about 21-30% of the final achene weight (Dorrell and Vick, 1997). All
achenes develop hulls, even if they are not fertilised. The kernel consists of two
cotyledons and an embryo. The embryo contains the oil-rich, large aleurone particles and
protein crystals (Knowles, 1978; Salunkhe et al., 1992; Seiler, 1997). Accumulation of

10
reserve lipids in the embryo begins several days after the rapid growth of the embryo.
Little oil is deposited during the first third of the seed-filling period, but increases to a
fairly stable rate that is maintained until close to physiological maturity (Harris et al.,
1978; Villalobos et al., 1996; Connor and Hall, 1997; Rondanini et al., 2003; Mantese et
al., 2006; Dong et al., 2007). Physiological maturity of the seed is reached when seed oil
percentage and dry weight are at their maximum about 35 days after the initiation of
flowering (DAF) (Robertson et al., 1978).
2.4 Chemical composition of sunflower seed and oil
The chemical composition of sunflower seed varies widely due to genetic and
environmental factors. Proximate chemical compositions of open-pollinated cultivars and
hybrid sunflowers are presented in Table 2.2. Data were obtained from a United States
Department of Agriculture (USDA) study in 1994 (Gupta, 2002).
Table 2.2 Proximate composition of sunflower seeds
Constituent Percentage (%)
Hull 20-25
Oil 44-51
Protein 15-25
Fibre residue 15-20
Ash 0.41-0.45
(Weiss, 2000; Gupta, 2002; Paniego et al., 2007).
2.4.1 Seed oil content
Oil content in sunflower seed ranges between 25-48%, but can reach 65% depending on
the genotype and environmental factors (Salunkhe et al., 1992; Weiss, 2000). The kernel
(dehulled seed) contains more oil than the whole seed. The kernel contains the highest
percentage of oil (87%) followed by the embryo (7.4%).
The oil percentage of whole sunflower achenes depends on both the percentage of oil in
the kernel and the proportion of hull (Weiss, 2000). The hull contains a low percentage of
oil and is reported to be between 0.4-5.2% by several authors (Salunkhe et al., 1992).

11
2.4.2 Triacylglycerol structure
Sunflower oil mainly contains triacylglycerol (TAG) molecules that represent more than
95% of the total oil weight (Fernández-Martínez et al., 2009). The storage lipid structure
fits the general hypothesis for distribution of the fatty acid on the triacylglycerol
molecule. Three fatty acids are esterified to the hydroxyl groups of a glycerol backbone
(Figure 2.1).
A stereochemical numbering system is used to identify the three positions on the glycerol
derivative as sn-1, sn-2 and sn-3 from the top to the bottom with the secondary hydroxyl
to the left of the central carbon. Several seed oil analyses have indicated that saturated
fatty acids tend to occupy the sn-1 position, whereas unsaturated fatty acids are found at
the sn-2 position. The sn-3 position is occupied with variable molecular fatty acid species
(Weselake, 2002). In sunflower oil, the TAG molecule has unsaturated fatty acids at all
three positions of the glycerol molecule. However, linoleic acid preferentially esterifies
the sn-2 position.
The predominant form (39%) is monooleoyl-dilinoleoyl-glycerol (OLL) with one
molecule of oleic acid and two molecules of linoleic acid esterified to one molecule of
glycerol. Dioleoyl-monolinoleoyl-glycerol (OOL) and trilinoleoyl-glycerol (LLL) forms
occur in lesser amounts (Dorrell and Vick, 1997).
2.4.3 Fatty acid compositions of the three types of sunflower
Fatty acid contents vary slightly between different reports for traditional, high oleic and
mid oleic sunflower oil. This can be attributed to differences in genetic backgrounds used
and growing conditions of sunflower plants. However, typical fatty acid compositions of
the three types of sunflower are accepted according to the report of Gupta (2002) (Table
2.3). Traditional sunflower oil is characterised by a high concentration of linoleic acid
(66-72%), a moderate level of oleic acid (16-20%) and low level of linolenic acid (less
than 1%). The saturated fatty acids (SFA), palmitic (C16:0) and stearic (C18:0) acids,
account for less than 15% of the fatty acids. Lauric, arachidic, behenic, lignoceric and
eicosenoic acids occur in minor percentages (Seiler and Brothers, 1999).

12
H O H C O C R O R C O C H O H C O C R H
Figure 2.1 General structure of triacylglycerol. R is the fatty acyl chain without the
carboxyl group (Weselake, 2002).
Table 2.3 Typical fatty acid composition (%) of traditional, high oleic and mid
oleic sunflower oil
Fatty acid Traditional (%) High oleic (%) Mid oleic (%)
Total SFAs 11-13 9-10 <10
Oleic acid 20-30 80-90 55-75
Linoleic acid 60-70 5-9 15-35
Linolenic acid <1 <1 <1
SFA: Saturated fatty acid.
Sunflower cultivars with high oleic acid content were introduced during the 1980s. High
oleic sunflower oil differs from traditional sunflower oil by a significantly increased oleic
acid content to more than 80% (Dorrell and Vick, 1997), a low concentration of linoleic
acid (2-9%) and generally less than 10% SFAs. The high level of monounsaturation
makes the high oleic oil less susceptible to oxidative degradation than the traditional
sunflower oil and therefore the high oleic oil shows potential for applications requiring a
high oxidative stability (Seiler and Brothers, 1999).
sn-1
sn-3
sn-2

13
In early 1995, the initial idea to redesign traditional sunflower oil to contain an oleic acid
content of approximately 60% was suggested by the snack food and oil processing
industry in the USA. NuSun sunflower oil was developed by F. Miller and B. Vick in
Fargo, North Dakota through conventional hybrid breeding. It is referred to as mid oleic
oil because it contains higher oleic acid content than traditional sunflower oil but lower
oleic acid content than the high oleic variety. The mid oleic oil has a lower SFA content
than traditional sunflower oil, but the same SFA content as high oleic oil. NuSun’s oil
fatty acid profile leads to highly stable oil that does not need to be hydrogenated for
commercial use (Gupta, 2002).
2.4.4 Non-acylglycerol components
In addition to oil and protein, sunflower seed contain micro-constituents that include
phospholipids, sterols, waxes and tocopherols among others. Phospholipids, also known
as phosphadites, are naturally present in all oilseeds and are oil-soluble. These lipids are
composed of glycerol esterified with fatty acids and phosphoric acid and comprise about
1% of the lipids. A low phospholipid content is desirable for refined sunflower oil. This is
accomplished by chemical or refining processing of the oil. Sterols and sterol esters are
essential components of cell membranes. They are natural antioxidants that showed
benefits in human nutrition by lowering total and low-density lipoprotein (LDL)
cholesterol (Fernández-Martínez et al., 2009). Wax and wax like material are mainly
present in the seed hull (83% of the total) and are usually less than 1% of the total lipids
in the seed. Its content in the crude oil is minimised by de-hulling of seeds before
crushing. Waxes are undesirable for salad oils as they give the oil a cloudy appearance
when refrigerated. The process of dewaxing is used to reduce the wax content of the oil.
Tocopherols are natural fat-soluble compounds that exert an antioxidant action both in
vivo (vitamin E activity) and in vitro. Tocopherols exist in four forms, including, alpha,
beta, gamma and delta and each form differs in antioxidant activity. Alpha-tocopherol is
the most efficient antioxidant in vivo, while gamma-tocopherol is the most powerful
antioxidant in vitro (Kalmal-Eldin and Appelqvist, 1996). Beta- and delta-tocopherols
have intermediate properties (Pongracz et al., 1995). Sunflower oil contains a high
concentration of alpha-tocopherol (95% of the total tocopherol) that has the highest in
vivo activity, but the lowest in vitro activity, of the four antioxidants (Dorrell and Vick
1997; Gupta, 2002).

14
2.4.5 Oil quality parameters
Traditionally oil quality was measured primarily based on oil content and fatty acid
composition and the ideal fatty acid composition depended on the end-use of the oil
(Knowles, 1983; Rondanini et al., 2003). However, more recently other components of
vegetable oils that influence their nutritional and technological properties are being
emphasised by oil chemists and nutritionists (Fernández-Martínez et al., 2007). The main
parameters defining the quality of oil are 1) fatty acid composition, 2) the distribution of
fatty acids within the triacylglycerol molecule and 3) the total content and composition of
natural antioxidants, tocopherols and sterols (Fernández-Martínez et al., 2004; 2007).
From a nutritional viewpoint, SFAs are regarded as undesirable for human health. Intake
of especially lauric, myristic and palmitic acid has a detrimental atherogenic effect by
raising both total serum and LDL cholesterol levels (Katan et al., 1995). However,
individual fatty acids within this group have different effects. Although lauric acid greatly
increases total cholesterol, its effect is mostly on HDL cholesterol. Oils rich in lauric acid
decrease the ratio of total to HDL cholesterol, while myristic and palmitic acids show
little effect on the ratio. Stearic acid reduces the ratio (Mensink et al., 2003). Conversely,
monounsaturated (oleic) and polyunsaturated (linoleic) fatty acids are
hypocholesterolemic (Mensink and Katan, 1989; Kris-Etherton and Yu, 1997). Although
linoleic acid is an essential fatty acid, it is more susceptible to oxidation than oleic acid.
Therefore, oil rich in oleic acid is preferred as it combines the hypocholestrolemic effect
and a greater oxidative stability (Yodice, 1990). From a technological point of view,
manufacturing of certain food products, such as margarine, requires solid or semi-solid
fats. Since traditional sunflower oil is a liquid at room temperature, the oil needs
preceding chemical hardening to change it to a semi-solid state. This is usually obtained
by hydrogenation or trans-esterification of the oil that produces harmful trans fatty acids
(O’Brien, 2004). For these applications, sunflower oil with a high concentration of SFAs
is necessary (Pérez-Vich et al., 2000).
The stereochemical position of the three fatty acids in the TAG molecule is another
important parameter in the nutritional value of oils. The absorption rate of fatty acids is
higher when they occupy the central sn-2 TAG position than when they are at the external
sn-1 and sn-3 positions (Bracco, 1994). As a result, oils that have undesirable fatty acids
at the sn-2 position are more atherogenic than those that have similar total fatty acid

15
contents, but distributed at the external sn-1 and sn-3 positions (Alvarez-Ortega et al.,
1997).
Tocopherols are important compounds that have antioxidant activity in sunflower seeds.
The antioxidant properties of oil depend on both the total tocopherol content and its
composition (Shintani and DellaPenna, 1998). In sunflower, large variation for tocopherol
content has been reported (Marquard, 1990; Demurin, 1993). Tocopherol content of
sunflower seed is affected by both the genotype and environment (Dolde et al., 1999;
Velasco et al., 2002).
Sunflower seed oil quality has been modified by the development of oil with enhanced
nutritional and functional properties as well as oil that requires less or no processing for
specific end-use markets. Oil quality modifications include breeding for increased linoleic
acid content (Miller and Vick, 2001) for special margarine markets, reducing palmitic and
stearic acids (Miller and Vick, 1999; Seiler, 2004) for improved nutritional value and
increased levels of palmitic acid (Fernández-Martínez et al., 1997) to prevent
crystallisation in manufacturing and storage of margarine (Fick and Miller, 1997).
Breeding efforts to improve oil oxidative stability also led to the development and
characterisation of several sources of modified tocopherol profiles in sunflower (Demurin,
1993; Demurin et al., 1996; Velasco et al., 2004a).
2.4.6 Oil oxidative stability
Lipid oxidation is a major factor for quality deterioration in edible oils and fatty acid
foods since it alters their chemical, sensory and nutritional properties (Frankel, 1998).
Autoxidation is a major cause of quality losses in crude and refined oils during storage.
The rate of oxidation depends on storage conditions, such as temperature and the presence
of light, as well as on the availability of soluble and reactive oxygen in the oil’s mass
(Márquez-Ruiz et al., 2003). Oil oxidative stability and deterioration depend on the initial
oil composition, concentration of compounds with antioxidant or pro-oxidant
characteristics and degree of processing (Crapiste et al., 1999; Kanavouras et al., 2005).
Oxidation of oils occurs at sites of unsaturation (Labuza and Dugan, 1971) and as a result,
the rate of oxidation of fatty compounds depends on the number of double bonds and their
position (Frankel, 1998). Autoxidation of unsaturated lipids is a series of free radical
reactions, initiated and propagated by free radicals reacting with methylene (-CH2-)

16
groups that are adjacent to double bonds (Figure 2.2). A free radical is an unpaired
electron, indicated as a heavy dot in chemical formulas and is a highly reactive species.
Autoxidation can be described in terms of initiation, propagation and termination
(Stauffer, 1996; Crapiste et al., 1999; Choe and Min, 2006).
Initiation starts when a hydrogen atom departs from the α-methylenic carbon, adjacent to
a double bond in a fatty acid (RH) group of the lipid molecule. This reaction may be
catalysed by light, heat or metal ions to form a free radical (R•) (reaction 1).
Initiation: RH initiator R• + H•
The resultant alkyl free radical is highly susceptible to attack by atmospheric oxygen and
the dissolved oxygen adds to this site and an unstable peroxide free radical is formed
(ROO•) (reaction 2). The peroxide free radical abstracts a hydrogen from another
methylene group and reacts with the hydrogen to form a hydroperoxide (ROOH) and a
new alkyl free radical (reaction 3).
Propagation: R• + O2 → ROO•
ROO• + RH → ROOH + R•
These free radicals serve as strong catalysts of further oxidation reactions, hence oxidative
degradation of oils become an autocatalytic process. The chain reaction (or propagation)
may be terminated by the formation of non-radical products that result from the
combination of two radical species (reactions 4-6). In the final stage of oxidation, the
hydroperoxides are readily decomposed into aromatic organic compounds, mainly
aldehydes, ketones, alcohols and acids. These compounds cause the rancidity condition
that ultimately destroys acceptability and usefulness of oils (Sherwin, 1978; Shahidi and
Wanasundara, 1996; Stauffer, 1996; Choe and Min, 2006).
Termination: R• + R• → RR
R• + ROO → ROOR
ROO • + ROO • → ROOR + O2

17
H O H H H H C O C(CH2)6 C C C (CH2)7CH3
O H Oxidation site H C O C R O
H C O C R H Figure 2.2 Typical unsaturated triglyceride molecule with double-bond linkage and
α-methylenic carbon (oxidation site). R: Fatty acid group (Sherwin, 1978).
The progress of oxidation can be studied by the quantification (or measurement) of
oxidised TAG monomers, dimers and polymers (Márquez-Ruiz et al., 1996). Martín-
Polvillo et al. (2004) studied the evolution of oxidation in sunflower oils during long-term
storage at room temperature and distinguished two oxidation stages: 1) An induction
period which is characterised by slow progress of oxidation and 2) an accelerated
(advanced) oxidation stage. During the induction period a significant increase in the
monomeric oxidation compounds occur and the oxidised monomers are mainly composed
of hydroperoxides during the early oxidation stage (Márquez-Ruiz et al., 1996; Martín-
Polvillo et al., 2004). The end of the induction period is defined as the point when a
notable shift in the oxidation rate is observed and is clearly characterised by a sharp
increase in levels of total oxidation compounds, exhaustion of antioxidants (α-tocopherol)
and significant formation of polymerisation products. The length of the induction period
depends on the degree of unsaturation. The higher the degree of oil unsaturation, the
shorter the induction period and the higher the amount of primary oxidation products
accumulated at the end of the induction period (Martín-Polvillo et al., 2004). During the
advanced oxidation stage, secondary products are formed. As a consequence, TAG
containing oxygenated functions other than the hydroperoxide (epoxy, keto, hydroxy, etc.)
starts contributing to the amount of oxygenated TAG monomers. Hydroperoxide
functions are therefore not only present in primary oxidation compounds but are also
involved in dimeric linkages of polymerisation compounds (Martín-Polvillo et al., 2004).

18
Various methods are available to measure lipid oxidation and may be divided into two
groups. The first group measures primary changes and the second group secondary
changes. Primary changes are generally measured by monitoring loss of unsaturated fatty
acids, oxygen uptake by weight gain, hydroperoxide values and conjugated diene value.
During the early stages of lipid oxidation, edible oils increase in weight as fatty acids
combine with oxygen during hydroperoxide formation. Therefore, the increase in weight
in a heated sample during storage can be used to determine the induction time of the oil
(Shahidi and Zhong, 2005). Secondary changes are followed by quantitation of carbonyl
compounds, malonaldehyde and other aldehydes and fluorescence products. The method
chosen depends on the nature of the oxidised sample, type of information required, time
available and test conditions. Rapid methods have been developed to test the resistance of
edible oils to oxidation. The active oxygen method (AOM) is based on the principle that
rancidification of fat is greatly accelerated by aeration in a tube held at constant
temperature. The Metrohm Rancimat, which assesses the oxidative stability index (OSI),
is a rapid automated method and is frequently used due to its ease of use and
reproducibility. The OSI and Rancimat tests measure the changes in conductivity of water
in which volatile organic acids (mainly formic acid) are trapped, while in AOM, peroxide
values are measured. The OSI determines the induction period precisely and is based on
analysis of stable secondary products. The AOM, however, does not determine the
induction period (is merely related to it) and relies on the analysis of unstable primary
reaction products (Shahidi and Wanasundara, 1996; Pike, 2001).
The above mentioned oxidative quality indices have been used in combinations to study
lipid oxidation in various vegetable oils. For instance, peroxide value (PV), anisidine
value (AV), free fatty acids (FFAs), polar compounds and weight gain (Shahidi and
Zhong, 2005) were used to study the oxidative deterioration of crude sunflower oils
obtained by either pressing or solvent extraction (Crapiste et al., 1999). The oil was stored
at different temperatures and varying oxygen concentrations (Crapiste et al., 1999). These
authors found a positive correlation between polar compound content and PV. In another
study Martín-Polvillo et al. (2004) investigated the oxidative stability of sunflower oils
that differed in their unsaturation degrees during long-term storage at room temperature
(25ºC). FFA, PV, ultraviolet (UV) absorbance at K270 nm (measures secondary oxidation
products such as ethylenic diketones, conjugate ketodienes and dienals) and
unsaponifiable matter content was determined in order to evaluate the initial oil quality of

19
the three sunflower oil types. The Rancimat apparatus was used to determine OSI values.
Induction periods obtained for the three oils were compared and a significant correlation
was found between the length of the induction period and the degree of oil unsaturation.
High oleic sunflower oil proved to be twice as stable as traditional sunflower oil during
long-term storage.
Smith et al. (2007) also compared the oxidative stability of high oleic sunflower oil with
those of traditional sunflower, soybean, maize and groundnut oils during storage at 55ºC.
Oxidative stability was evaluated by measuring oxygen depletion, head space volatile
compound formation and peroxide value. They found that the high oleic sunflower oil had
a higher oxidative stability than regular sunflower and soybean oil, but it was similar to
those of maize and groundnut oil. Oil stability index and PV have been used to determine
oil quality and stability of conventional and high oleic varieties of commercial vegetable
oils with and without added antioxidants (Merrill et al., 2008). OSI values obtained in
hours at 110ºC for the conventional oils were 5.2 h (sunflower), 7.6 h (soybean), 8.4 h
(canola), 9.8 h (maize), 10.9 h (partially hydrogenated soybean) and 14.3 h (oleic
safflower oil). OSI values of high oleic variants were 12.9 h (high oleic canola), 16.5 h
(high oleic sunflower) and 18.5 h (very high oleic canola), respectively. Additionally,
these authors found that the added antioxidants increased the OSI value and the most
stable oils were high oleic canola, very high oleic canola, oleic safflower and high oleic
sunflower with OSI values of 40.9 h, 48.5 h, 48.8 h and 55.7 h, respectively. Oil stability
during use and storage can effectively be improved by the natural antioxidants contained
in sunflower oil. Food applications demanding high nutritional values require an
improvement of the alpha-tocopherol content and a reduction in the SFAs of the oil (Fick
and Miller, 1997; Fernández-Martínez et al., 2007).
2.5 Lipid biosynthesis
In oilseeds fatty acids are synthesised at high rates over a short period and used
preferentially for TAG synthesis. Vegetable oil synthesis is divided into two distinct,
spatially separated reactions, namely fatty acid biosynthesis in the plastids and lipid
biosynthesis in the cytosol (Figure 2.3). More than 20 separate biochemical steps are
involved, starting with the first step of fatty acid biosynthesis and ending with TAG
production (Schultz and Ohlrogge, 2002).

20
1
2
3 4
5
6
ATP + HCO2
Malonyl-ACP + 2 NADPH
Triacylglycerol biosynthesis in the cytosol
TAG DAG PA lyso-PA glycerol-3-phosphate
acyl-CoA acyl-CoA acyl-CoA
18:1-CoA
Saturated-CoA
Fatty acid biosynthesis in the plastid
acetyl-CoA
malonyl-CoA 18:1-ACP
malony-ACP 18:0-ACP
4:0-ACP 16:0-ACP
Figure 2.3 Simplified schematic showing the two spatially separate pathways
involved in lipid biosynthesis in vegetable oil production.
PA: Phosphatidic acid, DAG: Diacylglycerol, TAG: Triacylglycerol, Enzymes for numbered
reactions: (1) Acetyl-coenzyme A (CoA) carboxylase, (2) Malonyl-CoA:acyl carrier protein
(ACP) transacylase, (3) β-ketoacyl-acyl carrier protein synthase (KAS III), β-ketoacyl-ACP
reductase, β-hydroaxyacyl-ACP dehydrase, Enoyl-ACP reductase, (4) β-ketoacyl-acyl
carrier protein synthase (KAS I) β-ketoacyl-ACP reductase, β-hydroaxyacyl-ACP
dehydrase, Enoyl-ACP reductase, (5) β-ketoacyl-acyl carrier protein synthase (KAS II) β-
ketoacyl-ACP reductase, β-hydroaxyacyl-ACP dehydrase, Enoyl-ACP reductase, (6) ∆9
steroyl-ACP desaturase, (7) Thioesterase (Fat A), (8) Thioesterase (Fat B), (9) Acyl-CoA
synthetase; (10) Cytosolic G-3-P acyltransferase, (11) Lyso-phosphatidic acid acyl
transferase, (12) Phosphatidic acid phosphatase, (13) Diacylglycerol acyl transferase, ATP:
Adenosine 5’-triphosphate, HCO2: Formic acid, NADPH: Nicotinamide adenine
dinucleotide phosphate (Schultz and Ohlrogge, 2002).
7
8
9
Acetyl-CoA + 2 NADPH
10 11 12 13
4

21
Fatty acid biosynthesis in oilseed is initiated with acetyl-coenzyme A (CoA) as substrate
and is catalysed by the actions of acetyl-CoA carboxylase and the dissociable fatty acid
synthetase (FAS) enzyme complex type III (Harwood, 1996). The sequential actions of
FAS III and FAS I produce mainly palmitoyl-acyl carrier protein (palmitoyl-ACP), which
is then elongated by two carbon atoms to produce stearoyl-ACP by the FAS II complex.
In turn, the stearoyl-ACP is desaturated by the stearoyl-ACP desaturase (SAD) enzyme,
which introduces the first double bond in the carbon chain (between carbon atoms 9 and
10) to produce oleoyl-ACP. The acyl-ACPs, palmitoyl-ACP, stearoyl-ACP and oleoyl-
ACP are hydrolysed to free fatty acids that can be exported to the cytosol. These are
activated to the corresponding acyl-CoAs, by the action of the acyl-ACP thioesterases
(Rolletschek et al., 2007). Two types of thioesterases have been identified: Fat A and Fat
B (Martínez-Force et al., 2000). Fat A preferentially acts on long chain fatty acids and has
a high specificity for 18:1-ACP. In contrast, Fat B exhibits a higher affinity for the
saturated 16:0-ACP and 18:0-ACP (Pleite et al., 2006). Although these thioesterases
influence the final composition of seed oils (Davies, 1993), fatty acid biosynthesis is also
influenced by the interaction of thioesterases with key enzymes such as FAS II and SAD
(Martínez-Force and Garcés, 2002).
Once acyl-ACPs are hydrolysed, acyl-CoA synthase incorporates acyl molecules to the
pool of acyl-CoA. Oleic acid, once incorporated into phosphatidyl-choline, can be
desaturated to linoleic acid and then into α-linolenic acid by the actions of oleoyl-
phosphatidylcholine desaturase (ODS) and linoleoyl-phosphatidylcholine desaturase
respectively. Both enzymes are membrane-bound and located in the endoplasmic
reticulum (ER) (Gray and Kekwick, 1996).
TAG biosynthesis has been proposed to take place by the Kennedy pathway in some
species. Fatty acids are sequentially transferred from CoA to positions sn-1 and sn-2 of
glycerol-3-phosphate, resulting in the formation of phosphatidic acid (PA), a central
metabolite. Diacyglycerol (DAG) is released by the defosforilation of PA. A third fatty
acid is transferred to position sn-3 of DAG to form TAG, catalysed by diacylglycerol-
acyltransferase.

22
Most of the fatty acids produced in the plastid are not immediately available for TAG
biosynthesis. Instead, in most oilseeds the major flux of acyl chains enter into
phosphatidylcholine (PC) pools where further desaturation and hydroxylation occur. The
fatty acids from PC may then become available for TAG synthesis by one of two
mechanisms (Figure 2.4) (Ohlrogge and Browse, 1995; Thelen and Ohlrogge, 2002):
1) Fatty acids attached to CoA and those on PC may essentially trade places. This acyl
exchange probably occurs by the combined reverse and forward reactions of an acyl-
CoA:PC acyltransferase (Stymne and Stobart, 1987). The resulting acyl-CoA may
then be used as an acyl donor in TAG synthesis.
2) PC can donate its entire DAG portion for TAG synthesis. In many plants, the
synthesis of PC from DAG and cytidine 5’-diphosphate (CDP)-choline appears to be
rapidly reversible as catalysed by the choline-DAG phosphotransferase. The
reversibility of this reaction allows the DAG moiety of PC to become available for
TAG synthesis.
The flux of acyl chains in the ER eventually leads to esterification on all three positions of
the glycerol to form TAG (Thelen and Ohlrogge, 2002).
Mutations leading to modification of enzymatic activities could occur at several levels
(desaturase gene deletion or duplication, transcription levels of these genes or
accumulation of desaturase gene transcripts) and therefore several mechanisms may
explain the oleic acid accumulation in high-oleic seeds (Lacombe and Bervillé, 2000).
Several studies indicated that in high oleic acid content sunflower, ODS activity was
drastically reduced during the critical stages of reserve lipid synthesis, explaining the low
linoleic and high oleic acid content in high oleic acid mutants of sunflower (Garcés et al.,
1989; Garcés and Mancha, 1991).

23
4
OH
OH
vvv vvv P
vvv vvv OH
vvv vvv vvv
G-3-P PA DAG TAG
Figure 2.4 The biosynthetic pathway of TAG in developing sunflower seeds.
G-3-P: Glycerol-3-phosphate, PA: Phosphatidic acid, PC: Phosphatidyl-choline, DAG:
Diacylglycerol, TAG: Triacylglycerol, CDPchol: Cytidine diphosphocholine, CMP:
Cytidine monophosphate, vvv: Fatty acid. Enzymes for numbered reactions: (1) G-3-P and
lyso PA-acyltransferases, (2) Phosphatidate-phosphatase, (3) DAG-acyltransferase, (4) CDP
choline:DAG-phosphotransferase, (5) Oleoyl PC-desaturase, (6) Lyso PC-acyltransferase,
Pi: Phosphatidylinositol, Pchol: Phosphocholine, CoA: Coenzyme A (Triki et al., 1999).
Martínez-Rivas et al. (2001) reported that the seed specific microsomal ODS encoded by
the FAD2-1 gene was completely active, however, the level of gene expression was
drastically reduced. They suggested that the high oleic mutation in sunflower obstructs the
regulation of the transcription of the seed-specific FAD2-1 gene. Other studies revealed
that the high oleic phenotype was correlated to a strong reduction in the level of ODS
transcript accumulation in the high oleic sunflower embryos during the critical stages of
storage lipid biosynthesis (Hongtrakul et al., 1998; Lacombe and Bervillé, 2000). The
lack in ODS transcript accumulation could be due to a non-expression of the FAD2-1
gene (Lagravere et al., 2000).
acyl-CoA Pool
vvv 5 vvv 18:1 18:2 Pchol Pchol
PC
6
1 2 3
Pi
+ CMP
+ CDPchol.
OH OH
P

24
2.6 Genotypic and environmental factors influencing seed oil content and
composition
2.6.1 Genotypic factors
Sunflower seed oil content and fatty acid composition are significantly influenced by
genetic factors. Seed oil content depends on the proportion of hull in the seed. A negative
correlation between oil content and hull thickness has been reported by several
researchers (Anand and Chandra, 1979; Lajara et al., 1990; Denis et al., 1994; Weiss,
2000). Cultivars with low hull content contain more oil than those with a high hull
content. Therefore, breeding and selection for lower hull percentage resulted in an
increase in seed oil percentage (Fick and Miller, 1997). Head size and shape are additional
factors that have an influence on these traits (Weiss, 2000). Afzalpurkar and
Lakshminarayana (1980) reported that seed from smaller sized heads contained more oil
than those from larger heads. Oil content and fatty acid composition also vary with the
position of seed within the head. Munshi et al. (2003) found that oil content was higher in
seed from the peripheral whorls than in those from the middle and central whorls. For
fatty acid composition, the linoleic acid and palmitic acid contents increase, while the
oleic acid content decreases in seed from the perimeter towards the centre of the head
(Fick and Zimmerman, 1973; Zimmerman and Fick, 1973).
2.6.2 Environmental factors
Sunflower oil content and composition is not only influenced by genetic factors, but also
by environmental and agronomical factors including planting location, climate,
temperature, water regime, planting date and fertiliser and irrigation applications
(Salunkhe et al., 1992; Seiler and Brothers, 1999; Flagella et al., 2002; Izquierdo et al.,
2002; O’Brien, 2004; Qadir et al., 2006).
Robertson et al. (1978) found that latitude and average temperature had no significant
effect on the oil content of sunflower seed in a study including several locations and years
in North America. However, Chunfang et al. (1996) reported that both latitude and
altitude had an influence on oil content and fatty acid composition and that the higher the
latitude, the higher the oil content. They also found that in the same latitudes, sunflower
grown in areas of high altitude contained more oil and that the influence of altitude was
stronger than that of latitude. These differences may vary with temperature.

25
The fatty acid composition of sunflower seed varies with planting location and climatic
conditions during the growing season (Kinman and Earle, 1964; Cummins et al., 1967;
Chunfang et al., 1996; Qadir et al., 2006). In general there exists a correlation between
latitude and fatty acid composition. Sunflower seed grown in the northern hemisphere had
higher linoleic acid content than seed grown in the southern hemisphere. However, this
correlation was only because of the influence of latitude on the climatic conditions (Lajara
et al., 1990). Temperature is mostly the direct consequence of location and therefore
microclimatic conditions may determine acute differences within the same latitude
(Chunfang et al., 1996).
According to Flagella et al. (2002), different planting dates and water regimes cause
different environmental conditions during seed-filling and oil synthesis of sunflower seed
and therefore a possible alteration in oil content and fatty acid composition of the seed.
Different planting dates may cause flowering and seed development to occur during
periods of widely different temperatures, radiation, day length and soil water availability.
Both oleic and linoleic acid concentrations of the oil of cultivated sunflower were
significantly related to total solar radiation and day length (Seiler, 1983).
Sunflower seeds grown under non-irrigated (rainfed) or limited irrigation conditions
contained less oil than those grown under fully irrigated conditions (Göksoy et al., 2004).
In addition, exposure of sunflower to brief periods of water stress during the seed-filling
period reduced oil content, however, this was associated with an increase in the
proportion of hull (Hall et al., 1989). Furthermore, when water stress conditions occurred
during the seed-filling period, an increase in the oleic to linoleic ratio was observed. This
could be due to the effect of unfavourable cell water status on the activity of the ODS
enzyme. However, Baldini et al. (2002) hypothesised that water stress caused accelerated
and earlier embryo development and lipid accumulation. This therefore caused a shorter
duration of all enzymatic activities, including those of ODS and this could reflect on the
final fatty acid composition. Flagella et al. (2002) claimed that upon irrigation, the plant
tissue temperature is lowered that may cause higher activity of ODS and therefore a lower
oleic to linoleic ratio.
Temperature was shown to affect both oil content and composition of sunflower seed
during the period of seed development and maturation (Seiler, 1983; Seiler and Brothers,

26
1999; Rondanini et al., 2003; 2006; Qadir et al., 2006). High temperature (above 35⁰C)
during seed development resulted in a reduction in total oil content (Rondanini et al.,
2003). However, the effect of temperature on oil content was variable. Canvin (1965)
found that sunflower grown at a constant temperature of 21°C had a higher oil content
than those grown at both higher and lower temperatures. According to Harris et al.
(1978), oil content decreased as temperature increased. The cause of the reduction in oil
content may lie in the greater proportion of the pericarp, due to the shortening of the seed-
filling period at high temperatures (Connor and Hall, 1997). This was explained by the
fact that oil content decreased with an increase in the proportion of the pericarp (Anand
and Chandra, 1979). Unger and Thompson (1982) reported that oil content of seed
maturing late in the season (at lower temperatures) was lower compared to seed from
sunflower planted earlier that matured during warmer weather. According to Connor and
Hall (1997), this supposedly positive effect of temperature on oil content might possibly
be associated with small or light seed that could be due to problems with pollination or
subsequent seed growth.
The relative proportions of the major unsaturated fatty acids (oleic and linoleic acid) are
strongly influenced by the environmental temperature during sunflower seed development
(Harris et al., 1978). There is an inverse relationship between temperature and the degree
of unsaturation of the oil (Qadir et al., 2006). Several studies have been conducted in
order to clarify how temperature affects the fatty acid composition of plant lipids (Garcés
et al., 1992; Rondanini et al., 2003; 2006; Qadir et al., 2006). In controlled environment
studies, high temperatures during seed development (especially night temperature) have
been found to cause a decrease in the amount of linoleic acid and a corresponding
increase in the amount of oleic acid in the oil (Izquierdo et al., 2002). Seed maturation
during periods of low temperature gave opposite results. The mechanism involved
appeared to be the direct effect of temperature on the activity of the desaturase enzymes
that are responsible for the conversion of oleic to linoleic acid (Canvin, 1965; Harris et
al., 1978; Silver et al., 1984; Garcés and Mancha, 1991). Therefore, both temperature and
genetic effects are mediated by changes in the activity of the microsomal ODS. According
to Izquierdo et al. (2002) variations in oil fatty acid composition were related to night
temperature and maximum temperature during the light period. They suggested that the
effect of temperature during the dark period on fatty acid composition was an indication
that light or a metabolite associated with the day/night cycle could affect the activity of

27
the ODS enzymes. Environmental factors (that may cause any type of stress) influence the
proportions of fatty acids by altering the enzyme activity as well as transport between
organelles (Steer and Seiler, 1990) and therefore a thorough understanding of the
environmental factors influencing seed development and oil quality is necessary.
2.6.3 Temperature effect on oleoyl phoshatidylcholine desaturase activity
The ODS enzyme is highly regulated by temperature in sunflower seed and according to
García-Díaz et al. (2002), different mechanisms might be involved in the control of the
microsomal ODS activity. These mechanisms include: 1) de novo enzyme synthesis or
activation of ODS that is stimulated by low temperatures, 2) the rapid and reversible
partial inhibition of the pre-existing enzyme at high temperatures and 3) the exchange of
oleate and linoleate between TAGs and PC (Canvin, 1965; Garcés et al., 1992; Sarmiento
et al., 1998).
In addition, Martínez-Rivas et al. (2001) proposed two separate and independent
mechanisms that could be involved in the temperature regulation of ODS activity in
developing sunflower seeds: 1) The long-term direct effect of temperature, mostly related
to the low thermal stability of the ODS enzyme and 2) the short-term indirect effect of
temperature on the availability of oxygen. Higher solubility of oxygen in water at low
temperatures may increase the total desaturase activity by increasing the availability of
oxygen that acts as co-substrate for oleate desaturation. Both regulation mechanisms are
of particular relevance as they act during field growth conditions of sunflower plants.
However, temperature does not only regulate ODS activity, but also the amount of oleate
(synthesised de novo and mobilised from preformed TAG) available as substrate for the
enzyme (García-Díaz et al., 2002).
2.6.4 Temperature effect on high oleic sunflower
It is reported that in high oleic sunflower seed, fatty acid composition was not affected by
climatic conditions (Salunkhe et al., 1992). Several researchers reported that oleic acid
content showed a great stability in different environments in high oleic genotypes, even if
genetic differences were present (Salera and Baldini, 1998). Additionally, in high oleic
mutants the oleic and linoleic acid contents were less influenced by temperature than
standard genotypes (Flagella et al., 2000). However, Champolivier and Merrien (1996)
suggested that temperature had an effect on oleic acid content in high oleic sunflower

28
hybrids. Tatini (1995) showed that an increase in temperature from 10-20⁰C during seed-
filling produced an increment from 45-80% of oleic acid content in a high oleic genotype.
In contrast, Lagravere et al. (2000) found that the high oleic hybrids they studied were
insensitive to temperature conditions. The differences between these reports could be
related to differences in hybrids studied as well as their genetic backgrounds. Oleic
hybrids can be characterised as high or low oleic acid potential hybrids and the largest
part of total variation in oleic acid percentage could be due to differences in potential acid
percentages of the hybrids (Izquierdo et al., 2002). Lagravere et al. (2000) suggested that
hybrids with low oleic acid potentials could be more sensitive to environmental conditions
such as temperature, while hybrids with a higher oleic acid content genetic potential were
insensitive to temperature conditions.
2.7 Genotype by environment interaction
Cultivars grown under a wide range of conditions are exposed to different soil types and
fertility levels, rainfall and soil moisture conditions, temperatures and agricultural
practices. These variables can all be described collectively as the environment. When
comparing cultivars in different environments, their performance relative to each other
may differ. These differential responses of cultivars across different environments are
referred to as GXE interaction (Fehr, 1987; De la Vega and Chapman, 2000). GXE
interactions are of interest for both the plant breeder as well as the agronomist for several
reasons. When developing cultivars for specific purposes or for specific geographical
areas, it is necessary to understand the interaction of the genotypes with predictable
environments. The resources for testing genotypes across locations and years can be
effectively allocated upon the relative importance of genotype x location, genotype x year
and genotype x location x year interactions. The stability of performance of genotypes to
various productivity levels among environments can be determined. Environmental
stability of genotypes help to determine their suitability for fluctuations in growing
conditions that are likely to be encountered (Fehr, 1987). High yield stability refers to the
ability of a genotype to perform consistently (whether at high or low yield levels) across a
wide range of environments (Annicchiarico, 2002).
A number of statistical procedures can be applied to determine GXE interaction and its
relationship to phenotypic stability. The regression technique (Finlay and Wilkinson,
1963; Eberhart and Russell, 1966) has been widely used due to its simplicity and because

29
its information on adaptive response is easily applicable to locations (Annicchiarico,
1997). The principle component analysis (PCA) method that shows the mean squares of
the principle components axis has also been used (Gauch and Furnas, 1991). Methods that
have been widely used to asses stability include the regression coefficient (Finlay and
Wilkenson, 1963), the environmental variance (Lin et al., 1986), Shukla’s stability
variance (Shukla, 1972), Wricke’s ecovalence (Wricke, 1962) and univariate and
multivariate methods (Akçura et al., 2005).
2.7.1 Genotype by environment interaction in sunflower
Sunflower yield and oil quality traits are both dependant on the genotype (cultivar) and its
interaction with the environment (Connor and Sadras, 1992; Pereyra-Irujo and
Aguirrezábal, 2007). For traditional cultivated sunflower genotypes, yield and oil quality
depend largely on the environment that is highly variable among locations (Seiler, 1983;
Lajara et al., 1990; De la Vega and Chapman, 2000; Radić et al., 2008), years (Laureti
and Del Gatto, 2000; Mijić et al., 2007) and sowing dates within a single year (Unger and
Thompson, 1982; Göksoy et al., 1998; Radić et al., 2008).
GXE interaction was reported for SFA contents after evaluating high palmitic and high
stearic acid sunflower mutants under different temperature regimes (Martínez-Force et al.,
1998). High palmitc and mid stearic acid mutants proved to be more sensitive to
temperature differences during seed development than the high stearic acid mutant CAS-
3. On the other hand, Fernández-Moya et al. (2002) indicated that the stearic acid levels
of the high stearic acid mutant CAS-14 were highly dependent on temperature during
seed-filling.
Genotype and temperature exert a major effect on the proportions of linoleic and oleic
fatty acids during seed-filling and oil deposition (Seiler, 1986; Flagella et al., 2002).
However, not all genotypes are equally affected by temperature and show strong GXE
interactions (Salera and Baldini, 1998). It has been shown that the oleic to linoleic ratio
was more stable across environments in high oleic acid content mutants than in traditional
sunflower types, high linoleic acid lines or some wild species across environments
(Fernández-Martínez et al., 1986; Garcés et al., 1989; Simpson et al., 1989; Seiler, 1992).
Some high oleic acid sunflower inbred lines have shown stability in the field over years,
whereas the oleic acid percentages varied according to year for others. The instability of

30
mutants may be caused by the presence of modifier (instability) genes that could be the
same as those that cause instability in the traditional high linoleic hybrids. During the
course of a breeding programme for high oleic acid hybrids, it is necessary to do analyses
over several generations in order to select for the most stable genotypes. However, if an
unstable line has good agronomic characteristics, a number of hybrids should be made
from these genotypes and tested for stability of oleic and linoleic acid contents (Triboï-
Blondel et al., 2000). By combining the genetic variability in the response of the fatty acid
composition to temperature and the climatic diversity under which sunflower is cultivated,
it is possible to obtain sunflower oils with different qualities (Izquierdo and Aguirrezábal,
2008).
2.7.2 Analysis of variance
Phenotypic performances of genotypes in multi-environments can be used to calculate the
amount of variation attributed to genotypic effects, environmental effects, GXE effects
and experimental error (Basford and Cooper, 1998). In a conventional variety assessment
trial where the yield of genotypes (G) is measured in environments (E) over replicates
(R), the classic model to analyse the total yield variation contained in GER observations,
is the analysis of variance (ANOVA). After removing the replicate effects when
combining the data, GXE observations are partitioned into two sources: 1) additive main
affects for genotypes and environments and 2) non-additive effects due to GXE (Pillay,
2000). The ANOVA of the combined data expresses the observed (Yij) mean yield of the
ith genotype at the jth environment as:
Y ij = µ +Gi + Ej +GEij + εij
Where µ is the overall mean, Gi, Ej and GEij represent the effect of the genotype,
environment and genotype x environment interaction, respectively, and εij is the average
of random errors. The non-additive interaction GEij implies that an expected value of Yij
depends not only on the separate levels of G and E, but also on their combination (Crossa,
1990; Purchase, 1997). Estimation of the interaction is important to estimate the genotypic
effects and optimal allocation of resources. The variance components can be calculated by
the estimated mean squares from the observed mean squares in the ANOVA (Pillay,
2000).

31
The ANOVA has been used in several studies to analyse data obtained for several
agronomic and oil quality traits from trials planted in different localities (or environments)
and across several growing seasons (Khan et al., 2008). For example, Alza and
Fernández-Martínez (1997) evaluated six sunflower hybrids in eight environments. The
experimental area consisted of two adjacent trials, the first under irrigation and the second
under rainfed conditions. Statistical analysis was carried out in two steps. First a separate
analysis was done for each environment and secondly, a combined analysis over
environments. In the separate analysis highly significant differences were observed for
yield (kg/ha), no of seeds per head, seed weight and head diameter between hybrids
planted under rainfed and irrigated conditions. According to the combined ANOVA,
genotypes showed significant effects for all traits, while GXE interactions were also
highly significant for all traits. In another study Denis et al. (1994) studied the genetic
control of hullability in 36 sunflower hybrids that were produced by a factorial cross of
six male sterile and six restorer lines. Hybrids were evaluated in two locations in Spain
(one rainfed and one irrigated) and one location (irrigated) in France. The ANOVA of
hullability indicated significant genotypic and environmental effects, while the GXE
effect was also highly significant. The trial under rainfed conditions in Spain gave a mean
hullability of 83% and it was double the value obtained in France (41.5%). The irrigated
trial in Spain gave an intermediate value of 60.4%.
Velasco et al. (2002) investigated the genetic and environmental variation of tocopherol
content and composition in sunflower. A total of 36 hybrids were grown at 13 locations in
southern Spain. They reported that both genotypic and environmental effects were highly
significant for tocopherol content and composition. The effect of genotype was larger than
that of environment for alpha-, beta- and total tocopherol content whereas the effect of
environment was greater on gamma-tocopherol content. GXE interaction was significant
for alpha-, gamma- and total tocopherol content.
Zobel et al. (1988) compared the traditional statistical analysis with additive main effects
and multiplicative interaction (AMMI) analysis and showed that these analyses were not
always effective in analysing the multi-environment trial data structure. The ANOVA, an
additive model, describes main effects effectively and determines if GXE interaction is a
significant source of variation. However, it does not provide insight into genotype or
environment patterns that give rise to interaction. The multiplicative model of PCA

32
contains no sources of variation for additive genotypic or environmental main effects and
also does not analyse interactions effectively. The linear regression method uses
environmental means, which are sometimes a poor estimate of environments, such that the
fitted lines in most cases account for a small fraction of the total GXE and could be
deceptive (Byth et al., 1976; Zobel et al. 1988; Ariyo, 1999).
2.7.3 Additive main effects and multiplicative interaction analysis
AMMI analysis has been reported to be suitable for depicting adaptive responses and is
useful in understanding complex GXE interactions (Gauch and Zobel, 1989). The AMMI
model separates the additive variance from the multiplicative (interaction) variance and
applies PCA to the interaction portion from the ANOVA analysis to extract a new set of
coordinate axes (interaction principle component axes) that account more effectively for
the interaction patterns (Shaffi et al., 1992). In clarification of GXE interactions, AMMI
summarises patterns and relationships of genotypes and environments (Crossa, 1990). The
plant breeder is interested in both adaptability (average performance across localities) and
stability (consistent performance across environments). The variance across environments
can be used for traits such as quality. Cultivar influence is a limitation of stability
analysis, because large deviations from the regression do not necessarily imply instability,
but it might be that a specific genotype only reacts differently from the rest of the
genotypes (Pillay, 2000).
AMMI results are graphed in a highly informative biplot that shows the main and
interaction effects for both genotypes and environments on the same scatter plot. Also, the
data are partitioned into a pattern rich model, while the noise rich residual is discarded to
gain accuracy (Gauch and Zobel, 1996). AMMI combines ANOVA and PCA into a single
model with additive and multiplicative parameters. The equation of the AMMI model is:
Yger = µ + αg + βe + Σλnγgnηen + ρge + εger
Where Yger is the yield of genotype g in environment e for replicate r, µ is the overall
mean, αg is genotype mean deviation (mean minus grand mean), βe is the environment
devations, n is the number of PCA axes retained in the model, λn is the singular value of
PCA axis n, γgn is the genotype eigenvector values for PCA axis n, ηen is the environment

33
eigenvector values for PCA axis n, ρge is the AMMI residuals and εger is the residual error
(Gauch and Zobel, 1996).
Studies on GXE interaction, stability and adaptability analyses have been previously
performed in sunflower for various traits across different environments and for
consecutive years (De la Vega and Chapman, 2000; Laureti and Del Gatto, 2000; Lúquez
et al., 2002). These authors assessed stability using Fisher’s protected least significant
difference (LSD) test (Steel and Torrie, 1993), relative yield (Yau and Hamblin, 1994),
Shukla’s stability variance statistic (Shukla, 1972), Kang’s yield stability statistic (Kang,
1993), Piepho’s method of multiple comparison (Piepho, 1995) and PCA (De la Vega and
Chapman, 2000). However, the AMMI model was shown to overcome some of the
problems with linear regression and proved to be a valuable tool for depicting adaptive
responses (Gauch and Zobel, 1989; Gauch, 1993; Annicchiarico, 1997; Ariyo, 1999),
improving the probability of successful selection and for analysing GXE interaction with
greater precision (Schoeman, 2003).
Leeuwner (2005) used the AMMI model to evaluate the effects of GXE interaction in
sunflower and their adaptation at 32 South African locations. The AMMI identified
considerable GXE interaction. The first two interaction principle components axes (IPCA)
were highly significant (P<0.001), but factors responsible for GXE could not be
identified. The two IPCAs contributed 34% and 22.5% of the interaction sums of squares
respectively. By plotting scores of IPCA1 against that of IPCA2, genotypes and
environments grouped together according to the length of their growing season. But,
because genotypes and environments could not be described according to the factors
responsible for the observed GXE interaction, genotypes could not be recommended for
adaptability to specific environments. However, widely adapted cultivars for South
African environments were selected.
2.8 Breeding of sunflower to change or improve oil composition
In some cases standard sunflower oil needs additional processing and chemical additives
to meet its many potential applications in both the food and non-food industry. The result
of this processing is a final product that might have detrimental implications for human
health. For common uses such as deep frying or margarine production, sunflower oil
needs to be hydrogenated (hardened off) in order to obtain solid or semi-solid fats.

34
However, this process induces cis-trans isomerisation of fatty acids, resulting in the
production of trans-fatty acids that might be related to heart disease (Willet et al., 1993).
In addition, sunflower oil is not suited for uses that require a high oxidative stability
(Fernández-Martínez et al., 2004). Breeding of novel and healthier sunflower oil types
with improved oil quality for specific applications has received great attention by plant
breeders. Improvement in oil quality has been achieved mainly by modifying the fatty
acid composition of the oil (Knowles, 1983; Ivanov et al., 1988; Osorio et al., 1995;
Fernández-Martínez et al., 1997; Salas et al., 2004; Seiler, 2004 Fernández-Moya et al.,
2005). Genetic variation of fatty acid composition in sunflower oil has been achieved
through conventional breeding and mutagenesis (Fernández-Martínez et al., 2007).
Sunflower mutants with altered fatty acid compositions that have been developed are
summarised in Table 2.4.
Because sunflower fatty acid composition varies with different temperatures during seed
development, there has been interest in developing both high linoleic and high oleic types
that are temperature insensitive (Knowles, 1983; Miller and Vick, 2001). High oleic lines
derived from Pervenets have been shown to be stable under different temperature regimes
(Fernández-Martínez et al., 1986). Increased concentrations of SFAs are necessary for
applications in the food industry that requires plastic fats (for production of margarines
and shortenings) without the need of hydrogenation. Oils with higher SFA contents would
be naturally more stable than oil from traditional sunflower. A high level of stearic acid is
preferred over other SFAs due to its neutral effect on serum lipoprotein cholesterol
(Pearson, 1994). Mutagenesis was effective in developing mutants with increased levels
of SFAs at the sn-1 and sn-3 TAG positions where the absorption rate of the fatty acid is
lower than at the sn-2 position (Bracco, 1994; Alvarez-Ortega et al., 1997).
Using mutagenesis of dry seeds through X-ray radiation, Ivanov et al. (1988) and Osorio
et al. (1995) developed single mutants with high palmitic acid contents above 25% (Table
2.4). The double mutant, CAS-12 was developed by mutagenising a high oleic acid line
isogenic to the original low oleic acid line used to obtain CAS-5 (Fernández-Martínez et
al., 1997).

35
Table 2.4 Sunflower mutants or lines with altered fatty acid composition
developed through mutagenesis or germplasm evaluation
Trait Mutant or line Reference
High oleic acid
High palmitic acid
High palmitic acid and increased
oleic acid content
High palmitic and medium content of
palmitoleic acid
Medium to high stearic acid
Very high stearic acid content
Low stearic acid content
Low palmitic acid content
Low total saturated fatty acids*
High stearic acid on high oleic
background*
High linoleic acid content*
1) Pervenets
1) 275 HP
2) CAS-5
1) CAS-12
1) CAS-37
1) CAS-8
2) CAS-4
3) CAS-3
1) CAS-14
1) LS-1
2) LS-2
1) LP-1
1) RS1
2) RS2
3) NMS 2229
1) CAS-15
1) 2698-L
Soldatov, 1976
Ivanov et al., 1988
Osorio et al., 1995
Fernández-Martínez et al., 1997
Salas et al., 2004
Osorio et al., 1995
Fernández-Moya et al., 2002
Miller and Vick, 1999
Miller and Vick, 1999
Vick et al., 2002
Vick et al., 2002
Seiler, 2004
Fernández-Moya et al., 2005
Miller and Vick, 2001
*Lines developed with variation in fatty acid compositions through germplasm evaluation and recombination (Fernández-Martínez et al., 2007).

36
CAS-12 showed a high palmitic acid content of above 30% and an increased oleic acid
content of about 56%. The high palmitic acid mutants were found to exhibit palmitoleic
acid (C16:1) in their seed oil, a fatty acid that is absent in standard sunflower oil. Salas et
al. (2004) reported on a mutant, CAS-37, with high levels of palmitic acid and presence of
palmitolinoleic (C16:2) and asclepic acid (C18:1∆11). Three mutants with increased
stearic acid contents CAS-3, (>25%), CAS-4 (>13%) and CAS-8 (>10%) were isolated
after chemical mutagenesis with ethyl methanesulfonate and sodium azide (Osorio et al.,
1995). Fernández-Moya et al. (2002) isolated a very high stearic acid mutant CAS-14
with stearic acid levels above 35% using mutagenesis with sodium azide. Later two more
lines, CAS-19 and CAS-20, with medium stearic acid levels were further developed by
Pérez-Vich et al. (2004) from crossing CAS-3 and a standard sunflower line.
During the last decade, consumers have become concerned about the consumption of
SFAs in their diets due to the fact that high levels of saturated fat may contribute to
increased blood serum cholesterol. This increases the risk for coronary heart disease
(Mensink et al., 1994; Willett, 1994). The reduction of total SFA content is an important
objective for specific dietary uses. Lowered SFA contents have been developed by using
both germplasm evaluation and mutagenesis. Miller and Vick (1999) obtained the LP-1
mutant with lowered palmitic acid content, as well as two low stearic acid mutants, LS-1
and LS-2, using chemical mutagenesis. Similarly Vick et al. (2002) selected two
germplasm lines, RS1 and RS2, with reduced total SFA from a cultivated sunflower line.
For these lines, the decrease in total SFAs was principally obtained by reduction of the
stearic acid content. Seiler (2004) also identified low SFA levels in a population of wild
H. annuus.
Further improvement of oil quality was achieved by recombining several seed oil quality
traits in a single phenotype. However, to facilitate this process, traits to be recombined
should be inherited independently. Pérez-Vich et al. (2002a) studied the relationship
between the high palmitic and high stearic acid traits in crosses between the mutant lines
CAS-5 and CAS-3. Three genes are involved in the control of high levels of palmitic acid
namely P1, P2 and P3, as well as high stearic acid content, namely Es1, Es2 and Es3. One
or two genes are, however, involved in the control of low levels of these fatty acids. They
reported that complete recombination of these traits was not possible because of an
epistatic effect of loci controlling high palmitic acid content on the loci responsible for

37
high stearic acid content. Similarly, these authors investigated the genetic relationships of
high stearic and high oleic acid contents involving the high stearic line CAS-3 and the
high-oleic acid line HAOL-9. They found that the genetic linkage between the stearic acid
locus Es2 and the oleic acid gene Ol hindered complete recombination of the high stearic
and high oleic acid levels of the parents (Pérez-Vich et al. 2002b). However, Pérez-Vich
et al. (2002a) also reported that the high palmitic acid and high oleic acid traits were
independently inherited.
High temperature processes (e.g. the frying oil industry) need sunflower oil that is highly
resistant to thermoxidation, with a low concentration of linoleic acid and a high
concentration of in vitro oxidants (mainly gamma- and delta-tocopherol). Variation for
increased levels of beta- and gamma-tocopherol has been found in collections of
cultivated germplasm (Demurin, 1993; Velasco et al., 2004b). Demurin et al. (1996)
found that genes controlling fatty acid levels were independently inherited from those
controlling the tocopherol profile. This allowed the combination of different fatty acid and
tocopherol profiles (Fernández-Martínez et al., 2004). Novel fatty acid and tocopherol
traits are usually under embryonic control by a low number of genes that facilitate their
management in breeding programmes (Fernández-Martínez et al., 2004).
2.9 Inheritance of the high oleic acid trait
In general, genetic modifications that alter the fatty acid profile have been found to be
qualitative rather than quantitative. This means that they are controlled by a low number
of genes and are less affected by the environment than quantitative traits such as oil
content. They are mostly determined by the genotype of the developing embryo with little
or no maternal influence. This could be crucial in breeding programmes, since low
maternal inheritance allows selection to be carried out at a single seed level (Fernández-
Martínez et al., 2004).
The study of oleic acid inheritance in sunflower is complex and no general agreement on
how oleic acid is inherited has been reached. Several studies have been carried out to
explain the inheritance of the high oleic acid content in germplasm derived from the
Pervenets variety. Miller and Zimmerman (1983) detected lack of dominance and
maternal influence after crossing high oleic plants with a low oleic parent. The first
genetic analysis done on the high oleic sunflower mutant, obtained by Soldatov (1976),

38
concluded that the high oleic acid trait was controlled by a dominant or partially dominant
single gene that was designated Ol (Fick, 1984; Urie, 1984). In a further study Urie (1985)
detected the presence of modifiers as well as a reversal of the dominance of the Ol gene
that could not be explained. A second gene modifying the high oleic acid content was
identified by Miller et al. (1987) and was designated Ml. The authors proposed a model
that stated that the high oleic acid trait was expressed in genotypes having one dominant
allele of the Ol gene combined with the recessive allele ml in a homozygous condition
(Ol_mlml).
Fernández-Martínez et al. (1989) and Pérez-Vich et al. (2002a) observed three different
F2 segregation patterns (1:3, 7:9 and 37:27) for high oleic and low-intermediate classes.
These authors hypothesised that the high oleic character is controlled by three dominant
complementary genes, Ol1, Ol2 and Ol3 and according to this model, the high oleic acid
trait was only expressed when all three dominant genes were present. However, although
the segregation 3 high : 1 low + intermediate (indicating a single dominant gene) was
observed by several studies (Fernández-Martínez et al., 1989; Schmidt et al., 1989; Pérez-
Vich et al., 2002a) (Table 2.5), further studies demonstrated that the genetic control of the
high oleic acid trait was more complex. However, Demurin and Škoric (1996) could not
confirm the previous hypothesis and concluded that the Ol locus exhibited genetically
unstable expression. Fernández et al. (1999) postulated a two gene model and suggested
that the high oleic content was produced by the recessive allele ol and the dominant allele
Ml, both in a homozygous condition. They also suggested that Ml might be a gene
complex rather than a single gene.
All the above genetic studies were carried out under non-controlled environments despite
of the well-known influence of temperature on the phenotypic expression of oleic acid
content. In the first controlled environment study done, Alonso (1988) used growth
chambers at three temperatures (10°C, 20°C and 30°C) and detected a large effect of
temperature on oleic acid content in different generations. It was concluded that oleic acid
content was controlled by the single Ol gene that acted either as dominant or partially
dominant depending on the temperature (Velasco et al., 2000).

39
Table 2.5 Theoretical genotypic and phenotypic classes for oleic acid (C18:1) levels in crosses segregating for this fatty acid
Line Genetic model Expected F2 genotypes Frequency 18:1 Phenotype References Pervenets selection Pervenets selection Pervenets selection R 978 HAOL-9 HAOL-9 HAOL-9 HAOL-9 LG-27 HAOL-9
One partially dominant gene One dominant gene Single dominant gene and recessive modifier Single recessive gene and recessive modifier One dominant gene Two dominant genes Three dominant genes One recessive gene One recessive gene Five genes
Olol Ol_ Olol Ol_ Olol_ _ Ol_Ml_ Ol_mlml Ol_Ml_, Ol_mlml, olol_Ml_ olol mlml ol1ol1OL2OL2OL3OL3
OL1_ OL2OL2OL3OL3 ol1ol1_ _ OL3OL3 or Ol1_OL2_ OL3OL3 OL1_ OL2OL3OL3 ol1ol1_ _ _ _ or _ _ ol2ol2_ _ or _ _ _ _ ol3ol3 OL1_ OL2_ OL3 OL1_OL2OL2OL3OL3 ol1ol1OL2OL2OL3OL3 OL_ ol1ol1
1/4 3/4 1/4 3/4 4/16 9/16 3/16 15/16 1/16 1/4 3/4 7/16 9/16 37/64 27/64 3/4 1/4 3/4 1/4
Low High + intermediate Low-intermediate High Low Intermediate High Low + Intermediate High Low-intermediate High Low-intermediate High Low-intermediate High Low-intermediate High Low Mid
Fick, 1984 Urie, 1985 Schmidt et al., 1989 Miller et al., 1987 Fernández et al. 1999 Fernández-Martínez et al., 1989 Pérez-Vich et al., 2002a Fernández-Martínez et al., 1989 Pérez-Vich et al., 2002a Fernández-Martínez et al., 1989 Pérez-Vich et al., 2002a Fernández-Martínez et al., 1989 Pérez-Vich et al., 2002a Demurin et al., 2000 Velasco et al., 2000
(Fernández-Martínez et al., 2004).

40
In a second controlled environment study, Velasco et al. (2000) observed a number of
different segregation patterns in the F1, F2 and BC1F1 generations produced by a cross
between a standard inbred sunflower line and a near-isogenic high oleic line. They
proposed a genetic model consisting of five genes that explained the segregation patterns.
Genes controlling the oleic acid content were designated Ol1, Ol2, Ol3, Ol4 and Ol5. They
found that genotypes Ol1Ol1, Ol1ol1Ol2Ol2 and Ol1ol1Ol2ol2 were high in oleic acid,
whereas the genotype ol1ol1 had a low oleic phenotype. Conversely, depending on the Ol3,
Ol4 and Ol5 genes, the genotype Ol1ol1ol2ol2 could exhibit low, medium or high oleic acid
content.
Lacombe et al. (2001) reported that the high oleic acid content was directed by two
independent loci, a locus carrying the oleHOS allele (that is exclusively correlated to the
high oleic acid content status of the genotype) and another locus that carries a suppressor
allele (supHOAC) that also directs the high oleic acid trait. The supHOAC allele
suppresses the effect of the high oleic acid content allele. Therefore, depending on the
supHOAC allele in the segregating population, the high oleic acid trait is controlled by
one or two loci. The suppressor allele could disturb the conventional segregating pattern
for high oleic to linoleic acid and therefore other observations that reject the dominance of
the high oleic acid trait might be due to segregation at this locus.
In short, there is general agreement on the presence of a principle Ol gene controlling the
high oleic acid content character, but this trait is complex and involves a number of
modifying genes whose number and function still need to be determined. Studies by
Fernández-Martínez et al. (1989), Demurin and Škoric (1996), Velasco et al. (2000) and
Pérez-Vich et al. (2002a) confirmed the reversal of dominance that was mentioned by
Urie (1985). Furthermore, interpretative differences in these studies may be due to
background genes in the parental lines used, environments utilised to test the segregating
generations and the number of modified genes present in the breeding material (Miller,
1992; Miller and Fick, 1997; Triboï-Blondel et al., 2000). Finally, the molecular and
genetic nature of the high oleic acid trait is still not well understood and this lack of
understanding causes difficulties in directing the conversion of traditional linoleic lines
into high oleic lines during breeding programmes.

41
2.10 Advanced breeding for oil crop modification: DNA marker-assisted selection
Conventional plant breeding has always relied on the phenotypic selection of
agronomically important traits from the diverse gene pool that is present within a crop
species. Traits like height and flower colour are visible and can be easily identified.
However, for some traits phenotypic selection has made little progress due to challenges
in measuring phenotypes. Traits like seed oil quality can only be measured by
sophisticated analytical methods and in addition, the expression of this trait depends on
variable environmental conditions and developmental stage. Formerly it was necessary for
breeders to develop and analyse each generation before they could measure the specific
trait or phenotype and select the best plants. With the introduction of marker-assisted
selection (MAS), this has changed and breeders can now select plants that are likely to
express the required traits from thousands of progeny even before the plants have matured
(Murphy, 2006; Moose and Mumm, 2008).
A prerequisite for MAS is the development of molecular tags. Molecular markers such as
restriction fragment length polymorphism (RFLP), random amplified polymorphic DNA
(RAPD), amplified fragment length polymorphism (AFLP) and microsatellite or simple
sequence repeat (SSR) among others, have been developed for many oil crops. These
markers are assembled into genetic maps that are useful in research and commercial
breeding programmes. Markers that are tightly linked to the trait of interest can be used to
trace the presence of that specific trait in large segregating populations and at young plant
stage as part of a crop-breeding programme. In addition, molecular markers might
increase the probability of identifying superior genotypes, by focussing on genotypes with
the greatest potential, by decreasing the number of progeny that need to be screened
phenotypically and by allowing simultaneous improvement of traits that are negatively
correlated (Mohan et al., 1997; Murphy, 2006; Moose and Mumm, 2008).
Quality traits are quantitative traits (also called polygenic traits) and are controlled by
several genes. Regions within a plant genome that contain genes associated with a
particular quantitative trait are called quantitative trait loci (QTL). DNA markers are used
to construct linkage maps which are used to identify chromosomal regions that contain
genes and/or QTL associated with traits of interest. This is called QTL analysis and these
maps are then referred to as QTL maps. The principle of QTL mapping is based on genes
and markers that segregate via chromosome recombination during meiosis, therefore

42
allowing their analysis in the progeny. Genes and markers that are close together (tightly
linked) will be transmitted together from parent to progeny (Collard et al., 2005).
The construction of linkage maps and QTL analysis takes a considerable amount of time
and may be expensive. Subsequently, there are alternative methods that can save time and
money, especially if resources are limited. One method that can be used to identify
markers and tag major QTL is bulk segregant analysis (BSA). The BSA approach,
developed by Michelmore et al. (1991), is frequently used in gene tagging and is based on
the principle of near-isogenic lines. In BSA, two parents that differ in their expression of
the targeted trait are crossed to develop a segregating population that are subsequently
phenotyped for the targeted trait. Two “bulks” of DNA samples differing for the trait of
interest are constructed. Theoretically, the genetic constitution of the two bulks are
similar, but for the genomic region associated with the trait. DNA markers are then
screened across the two parents and the two bulks. A marker showing a linked
polymorphism between parents as well as the bulks is considered putatively linked to the
targeted trait or QTL of interest. Afterwards, all individuals of the entire segregating
population are genotyped with these polymorphic markers and a localised linkage map
can be constructed. QTL analysis can then be performed and the position of the QTL
determined. BSA generally prefers high-throughput marker techniques such as RAPD and
AFLP that can generate multiple markers from a single DNA preparation (Collard et al.,
2005). This method has been applied in several molecular analysis studies for sunflower
to map genes related to agronomically important traits such as disease resistance (Lawson
et al., 1996; Lu et al., 2000; Tang et al., 2003a), nuclear male-sterility (Chen et al., 2006),
gamma-tocopherol content (García-Moreno et al., 2006), chlorophyll deficiency (Yue et
al., 2009) and fatty acid composition (Dehmer and Friedt, 1998a; Pérez-Vich et al., 2006).
2.10.1 Amplified fragment length polymorphism
AFLP is defined as the selective amplification of restriction fragments from total genomic
DNA digests using the polymerase chain reaction (PCR). This technique represents a
combination of RFLP and PCR, however, in contrast to the RFLP technique, AFLPs will
display the presence or absence of restriction fragments rather than length polymorphisms
(Vos et al., 1995).

43
The AFLP technique can be used for DNA samples of any origin with no prior sequence
information. Small sequence variations can be detected using only small quantities of
genomic DNA. The AFLP technique is extremely efficient because numerous fragments
can be analysed simultaneously on a gel. AFLP has the capacity to inspect a great number
of loci for polymorphism and the number of polymorphisms detected per reaction is
especially high. Markers obtained are reliable and reproducible within and between
laboratories and are relatively easy to generate. AFLP can generate a virtually unlimited
number of markers by simply varying the restriction enzymes and the number and nature
of the selective nucleotides. AFLP has applications for DNA fingerprinting, MAB, the
construction of high density molecular maps and the positional cloning of target genes
(Blears et al., 1998). Although the AFLP technique is powerful and reliable in identifying
markers closely linked to genes of interest, it has some disadvantages. AFLP markers are
dominant and therefore homozygotes and heterozygotes cannot be distinguished. The
technique is technically demanding and due to the number of steps involved it is too
laborious to be used in high-throughput screening.
The AFLP technique involves the following basic steps: Genomic DNA is first digested
simultaneously using rare and frequent cutting restriction endonucleases that results in
fragments with overhanging ends. Double-stranded oligonucleotide adapters, homologous
to the 5’-sticky end of the corresponding restriction site, are ligated to the DNA fragments
to generate template DNA for amplification. The ligated fragments are amplified by PCR
using primers complementary to the adapter and restriction site sequence with additional
selective nucleotides at their 3’-end. From the vast number of fragments generated by
restriction, only a subset of the template fragments with complementary nucleotides
extending beyond the restriction site will be amplified under strict annealing conditions.
Genetic polymorphisms are revealed by analysis of amplified fragments on denaturing
polyacrylamide gels and comparison of patterns generated for each sample (Vos et al.,
1995; Blears et al., 1998; Agarwal et al., 2008).
2.10.2 Genetic markers and linkage map construction in sunflower
The first DNA markers developed in sunflower were RFLPs. Genetic linkage maps based
on RFLP markers were reported by several research groups (Jan et al., 1993; 1998;
Gentzbittel et al., 1994; 1995; Berry et al., 1995). These included maps based on data of
individual F2 populations as well as composite maps based on data of different mapping

44
populations (Gentzbittel et al., 1995; 1999; Berry et al., 1996). Maps consisted of 17 or
more linkage groups (LG) that presumably corresponded to the 17 haploid chromosomes
of sunflower. Genetic distances covered by these maps (1650 cM) were close to the
estimated length of the sunflower genome (Gentzbittel et al., 1995). Additionally, RFLP
maps have been used as tools for mapping agronomic traits and QTL (Leon et al., 1995;
1996; 2000; 2001; 2003; Lu et al., 1999; Bert et al., 2001; Pérez-Vich et al., 2002c;
Rachid Al-Charaani et al., 2002). However, the extensive use of RFLPs and linkage maps
in sunflower has been restricted by a lack of public RFLP probes, consequent lack of a
dense public RFLP map and the low-throughput nature of RFLP markers (Yu et al.,
2003).
RAPD markers were used in early genetic studies in sunflower. Several reports indicated
high levels of variation with the proportion of polymorphic loci averaging more than 50%
for most lines (Lawson et al., 1994; Teulat et al., 1994). RAPDs have been used for
tagging phenotypic loci such as rust (Puccinina helianthi Schwein.) and boomrape
(Orobanche cumana Wallr.) resistance genes (Lawson et al., 1998; Lu et al., 2000) as
well as the development of markers for the high oleic acid trait in sunflower (Dehmer and
Friedt, 1998a). RAPD maps have been developed for wild H. annuus and H. petiolaris
Nutt. (Rieseberg et al., 1995), based on 212 and 400 RAPD loci respectively. They
reported 17 LGs for both species covering 1084 cM and 1761 cM for H. annuus and H.
petiolaris, respectively.
AFLP markers were rapidly adopted in sunflower because of their high multiplex ratio
and high reproducibility (Vos et al., 1995). They have been previously used to fingerprint
elite inbred sunflower lines (Hongtrakul et al., 1997), to construct new genetic maps
(Flores-Berrios et al., 2000) and to increase the density of already existing genetic maps
(Gedil et al., 2001; Al-Charaani et al. 2002). Langar et al. (2003) constructed a genetic
map with a distance of 2169 cM by combining AFLP and direct amplification of length
polymorphism (DALP) markers. However, RAPD and AFLP markers are inadequate for
establishing a genome-wide framework for DNA markers for anchoring and cross
referencing of genetic maps. Microsatellite markers that are preferred for such purposes
have only been recently developed in sunflower. These include SSR and expressed
sequence tag (EST) derived single nucleotide polymorphism (SNP) markers (Paniego et
al., 2007). Several research groups have described the development and characterisation

45
of SSR markers and these added to a total of 2040 markers (Dehmer and Friedt, 1998b;
Paniego et al., 2002; Tang et al., 2002; Yu et al., 2002).
The first genetic linkage map based on SSR markers for sunflower was developed by
Tang et al. (2002). This public reference SSR map was constructed using F7 recombinant
inbred lines (RILs) and 408 polymorphic SSR markers. Yu et al. (2003) constructed the
first cross-referenced maps by adding 701 new SSR and 89 RFLP or insertion-deletion
(INDEL) marker loci onto three populations. Two of these populations were previously
used by Gedil et al. (2001) and Tang et al. (2002). From these maps, Tang et al. (2003b)
published a composite linkage map of sunflower that integrated 657 loci, covering a
distance of 1423 cM.
The AFLP map constructed by Al-Charaani et al. (2002) was improved by increasing the
number of AFLP markers and integrating 38 SSR markers (Al-Charaani et al., 2004). In
the new map, 367 AFLP and SSR marker loci were placed in 21 linkage groups that
covered 2916 cM. Paniego et al. (2007) reported an improvement of this map. They
integrated 161 new SSR markers from different sources and this map was cross-
referenced to the public SSR map of Tang et al. (2002). The use of molecular markers
linked to target traits together with MAB will contribute to breeding efficiency for
sunflower fatty acid profiles (Fernández-Martínez et al., 2007). In addition, since DNA
markers are not affected by the environment in which the sunflower plants are grown in,
they could be especially vital in breeding programmes for high oleic sunflower.
The molecular basis of modified fatty acid content in the sunflower seed oil has been
studied through a QTL and a candidate gene approach. A number of sunflower genes,
coding for enzymes involved in the biosynthetic pathway of fatty acids in seeds, have
been cloned and their polymorphism studied in cultivated sunflower (Fernández-Martínez
et al., 2004). The first DNA markers linked to the high oleic acid content in sunflower
were identified by Dehmer and Friedt (1998a). These were two RAPD markers linked to
the Ol1 gene. Subsequent studies showed that the Ol1 gene cosegregated with FAD2-1, a
seed-specific ODS gene. The FAD2-1 gene showed strong expression in the normal
sunflower type, but weak expression in high oleic acid lines (Hongtrakul et al., 1998;
Lacombe and Bervillé, 2001; Martínez-Rivas et al., 2001). Pérez-Vich et al., 2002c
reported that the Ol1-FAD2-1 locus mapped to LG 14 of the public sunflower genetic

46
map. This locus was found to underlie a major oleic acid QTL that explained 56% of the
phenotypic variance for the high oleic acid trait. The physical structure of the FAD2-1
locus was determined and sequence tagged site (STS) DNA markers diagnostic for the Ol1
mutation were developed by Schuppert et al. (2006a). It was also indicated that FAD2-1
was silenced by RNA interference and this mechanism underlie the Ol1 mutation
(Schuppert et al. (2005). Modifying genes that affect oleic acid content have also been
characterised. A minor QTL on LG 8 that showed an epistatic interaction with the major
QTL for oleic acid at the FAD2-1 locus on LG 14 has been identified (Pérez-Vich et al.,
2002c). In other studies, Lacombe et al. (2001; 2002) identified a locus that suppressed
the effect of FAD2-1. This was probably through a mechanism of gene silencing. In
addition, Schuppert et al. (2003. 2006b) identified another ODS gene (FAD2-2) on LG 1
that showed an epistatic interaction with the Ol1-FAD2-1 locus on LG 14.
Although molecular markers have been identified for some of the fatty acids in
preliminary studies (Dehmer and Friedt, 1998a; Hongtrakul et al., 1998; Pérez-Vich et al.,
2000; 2002c), these might not be suitable for MAS. Generally, markers should be
validated by testing their effectiveness in determining the target phenotype in independent
populations and different genetic backgrounds (Collard et al., 2005).
The optimal quality of sunflower oil depends on the end-use of the oil. In general
characteristics that are required for salad and cooking oils may be undesirable for other
applications such as margarine and shortening that requires semi-solid fats. For the latter a
high SFA content is desirable because the semi-solid consistency reduces the need for
hydrogenation or transesterification that generates trans isomers that are related to heart
disease (Willett and Ascherio, 1994). On the other hand, SFA are regarded as detrimental
to human health because of their contribution to raising cholesterol levels (Mensink et al.,
1994). Accordingly, breeding objectives were aimed at producing healthy oil for direct
consumption (salad and cooking oils) by lowering total SFA content. However, at the
moment oleic acid is the preferred fatty acid for edible purposes as it combines a
hypocholsterolemic effect (Mensink and Katan, 1989) with a much greater oxidative
stability than PUFAs. Therefore, selection for mid and high oleic acid content has been a
priority in sunflower breeding programmes. Nevertheless, the genetic control of high oleic
acid content is not well understood. High oleic acid content was initially identified as a
monogenic trait produced by dominant alleles Ol (Urie, 1984), but afterwards several

47
modifying genes were identified that affect the Ol gene and produce reversal of the
expected dominance. This has complicated the practical management of the trait in
breeding programmes. Additionally, oleic acid content is largely influenced by the
environment and the occurrence of GXE interaction may complicate selection of hybrids
that are stable and widely adapted for this trait. However, the development of molecular
markers for this trait will contribute to improving breeding efficiency for high oleic
sunflower.
2.11 References
Afzalpurkar, A.B. and Lakshminarayana, G. 1980. Variation in oil content and fatty acid
composition with sunflower head size and shape. Journal of the American Oil
Chemists’ Society 57: 105-106.
Agarwal, M., Shrivastava, N. and Padh, H. 2008. Advances in molecular marker
techniques and their applications in plant sciences. Plant Cell Reports 27: 617-631.
Akçura, M., Kaya, Y. and Taner, S. 2005. Genotype-environment interaction and
phenotypic stability analysis for grain yield of durum wheat in the Central Anatolian
region. Turkish Journal of Agriculture and Forestry 29: 369-375.
Al-Charaani, G.R., Gentzbittel, L., Huang, X. and Sarrafi, A. 2004. Genotypic variation
and identification of QTLs for agronomic traits using AFLP and SSR in recombinant
inbred lines of sunflower (Helianthus annuus L.). Theoretical and Applied Genetics
109: 1353-1360.
Al-Charaani, G.R., Roustaee, A., Gentzbittel, L., Mokrani, L., Barrault, G., Dechamp-
Guillaume, G. and Sarrafi, A. 2002. A QTL analysis of sunflower partial resistance to
downy mildew (Plasmopara halstedii) and black stem (Phoma macdonaldii) by the
use of recombinant inbred lines (RILs). Theoretical and Applied Genetics 104: 490-
496.
Alonso, L.C. 1988. Estudio genético del carácter alto oleico en el girasol (Helianthus
annuus L.) y su comportamiento a distintas temperaturas. In: Proceedings of the 12th
International Sunflower Conference, Novi Sad, Yugoslavia. pp. 454-462.
Alvarez-Ortega, R., Cantisán, S., Martinez-Force, E. and Garcés, R. 1997.
Characterization of polar and non polar seed lipid classes from highly saturated fatty
acid sunflower mutants. Lipids 32: 833-837.

48
Alza, J.O. and Fernández-Martínez, J.M. 1997. Genetic analysis of yield and related traits
in sunflower (Helianthus annuus L.) in dryland and irrigated environments. Euphytica
95: 243-251.
Anand, I.J. and Chandra, S. 1979. Genetic diversity and inter-relationships of oil yielding
trials in sunflower. Sunflower Newsletter 1: 5-8.
Annicchiarico, P. 1997. Joint regression vs. AMMI analysis of genotype-environment
interactions for cereals in Italy. Euphytica 94: 53-62.
Annicchiarico, P. 2002. Genotype x environment interaction: Challenges and
opportunities for plan breeding and cultivar recommendations. Food and Agriculture
Organisation of the United Nations, Rome. 121 pp.
Ariyo, O.J. 1999. Use of additive main effects and multiplicative interaction model to
analyse multilocation soybean trials. Journal of Genetics and Breeding 53: 129-134.
Baldini, M., Giovanardi, R., Tahmasebi-Enferdi, S. and Vanozzi, G.P. 2002. Effects of
water regime on fatty acid composition and final fatty acid composition in the oil of
standard and high oleic sunflower hybrids. Italian Journal of Agronomy 6: 119-126.
Basford, K.E. and Cooper, M. 1998. Genotype x environment interactions and some
considerations of their implications for wheat breeding in Australia. Australian
Journal of Agricultural Research 49: 154-174.
Berry, S.T., Leon, A.J., Challis, P., Livini, C., Jones, R., Hanfrey, C.C., Griffiths, S. and
Roberts, A. 1996. Construction of a high density, composite RFLP linkage map for
cultivated sunflower (Helianthus annuus L.). In: Proceedings of the 14th International
Sunflower Conference, Beijing, China, Volume 2. pp. 1155-1160.
Berry, S.T., Leon, A.J., Hanfrey, C.C., Challis, P., Burkholz, A., Barnes, S.R., Rufener,
G.K., Lee, M. and Caligari, P.D.S. 1995. Molecular marker analysis of Helianthus
annuus L. 2. Construction of an RFLP linkage map for cultivated sunflower.
Theoretical and Applied Genetics 91: 195-199.
Bert, P.F., Tourvieille de Labrouche, D., Philippon, J., Mouzeyar, S., Jouan, I., Nicolas, P.
and Vear, F. 2001. Identification of a second linkage group carrying genes controlling
resistance to downy mildew (Plasmopara halstedii) in sunflower (Helianthus annuus
L.). Theoretical and Applied Genetics 103: 992-997.
Blears, M.J., De Grandis, S.A., Lee, H. and Trevors, J.T. 1998. Amplified fragment length
polymorphism (AFLP): a review of the procedure and its applications. Journal of
Industrial Microbiology and Biotechnology 21: 99-114.

49
Bracco, U. 1994. Effect of triglyceride structure on fat absorption. American Journal of
Clinical Nutrition 60: 1002S-1009S.
Byth, D.E., Eiseman, R.L. and De Lacy, I.H. 1976. Two-way pattern analysis of a large
data set to evaluate genotype adaptation. Heredity 37: 215-230.
Canvin, D.T. 1965. The effect of temperature on the oil content and fatty acid
composition of oils from several oil seed crops. Canadian Journal of Botany 43: 63-
69.
Champolivier, L. and Merrien, A. 1996. Evolution de la teneur en huile et de la
composition en acides gras chez deux variétés de tournesol (oléique ou non) sous
l’effet de temperatures different pendant la maturation des grains. Oléagineux Crops
Gras Lipides 3: 140-144.
Chen, J., Hu, J., Vick, B.A. and Jan, C.C. 2006. Molecular mapping of a nuclear male
sterility gene in sunflower (Helianthus annuus L.) using TRAP and SSR markers.
Theoretical and Applied Genetics 113: 122-127.
Choe, E. and Min, D.B. 2006. Mechanisms and factors for edible oil oxidation.
Comprehensive Reviews in Food Science and Food Safety 5: 169-186.
Chunfang, G., Jian, Z. and Qiu, L. 1996. The influence of climatic factors on the
composition of lipid acids in sunflower. In: Proceedings of the 14th International
Sunflower Conference, Beijing, China. International Sunflower Association, Paris. pp.
559-564.
Collard, B.C.Y., Jahufer, M.Z.Z., Brouwer, J.B. and Pang, E.C.K. 2005. An introduction
to markers, quantitative trait loci (QTL) mapping and marker-assited selection for
crop improvement: The basic concepts. Euphytica 142: 169-196.
Connor, D.J. and Hall, A.J. 1997. Sunflower physiology. In: Sunflower technology and
production, Agronomy Monograph no 35. Schneiter, A.A. (Ed.). American Society of
Agronomy Inc., Crop Science Society of America Inc., Soil Science Society of
America Inc., Wisconsin, USA. pp. 113-182.
Connor, D.J. and Sadras, V.O. 1992. Physiology of yield expression in sunflower. Field
Crops Research 30: 333-389.
Crapiste, G.H., Brevedan, M.I.V. and Carelli, A.A. 1999. Oxidation of sunflower oil
during storage. Journal of the American Oil Chemists’ Society 76: 1437-1443.
Crossa, J. 1990. Statistical analysis of mulitlocation trials. Advances in Agronomy 44: 55-
86.

50
Cummins, D.G., Marion, J.E., Craigmiles, J.P. and Burns, R.E. 1967. Oil content, fatty
acid composition, and other agronomic characteristics of sunflower introductions.
Journal of the American Oil Chemists’ Society 44: 581-582.
Davies, H.M. 1993. Medium chain acyl-ACP hydrolysis activities of developing oilseeds.
Phytochemistry 33: 1353-1356.
Dehmer, K.J. and Friedt, W. 1998a. Development of molecular markers for high oleic
acid content in sunflower (Helianthus annuus L.). Industrial Crops and Products 7:
311-315.
Dehmer, K.J. and Friedt, W. 1998b. Evaluation of different microsatellite motifs for
analysing genetic relationships in cultivated sunflower (Helianthus annuus L.). Plant
Breeding 117: 45-48.
De la Vega, A.J. and Chapman, S.C. 2000. Environmental attributes underlying
environmental main-effects and genotype by environment interactions in sunflower.
In: Proceedings of the 15th International Sunflower Conference, Toulouse, France. pp.
D112-D116.
Demurin, Y. 1993. Genetic variability of tocopherol composition in sunflower seeds.
Helia 16: 59-62.
Demurin, Y. and Škorić, D. 1996. Unstable expression of Ol gene for high oleic acid
content in sunflower seeds. In: Proceedings of the 14th International Sunflower
Conference, Beijing, China. International Sunflower Association, Paris. pp. 145-150.
Demurin, Y., Škorić, D. and Karlovic, D. 1996. Genetic variability of tocopherol
composition in sunflower seeds as a basis of breeding for improved oil quality. Plant
Breeding 115: 33-36.
Demurin, Y., Škorić, D., Veresbaranji, I. and Jocic, S. 2000. Inheritance of increased oleic
acid content in sunflower seed oil. Helia 23: 87-92.
Denis, L., Dominguez, J., Baldini, M. and Vear, F. 1994. Genetical studies of hullability
in comparison with other sunflower seed characteristics. Euphytica 79: 29-38.
Dolde, D., Vlahakis, C. and Hazebroek, J. 1999. Tocopherols in breeding lines and effects
of planting location, fatty acid composition and temperature during development.
Journal of the American Oil Chemists’ Society 76: 349-355.
Dong, G., Liu, X., Chen, Z., Pan, W., Li, H. and Liu, G. 2007. The dynamics of
tocopherol and the effect of high temperature in developing sunflower (Helianthus
annuus L.) embryo. Food Chemistry 102: 138-145.

51
Dorrell, D.G. and Vick, B.A. 1997. Properties and processing of oilseed sunflower. In:
Sunflower technology and production, Agronomy Monograph no 35. Schneiter, A.A.
(Ed.). American Society of Agronomy Inc., Crop Science Society of America Inc.,
Soil Science Society of America Inc., Wisconsin, USA. pp. 709-745.
Dredge, R.D. 2010. Crop estimates committee, Private bag X246, Pretoria, South Africa.
http://www.sagis.org.za (22 July 2010).
Eberhart, S.A. and Russell, W.A. 1966. Stability parameters for comparing varieties. Crop
Science 6: 36-40.
Fehr, W.R. 1987. Principles of cultivar development: Theory and technique, Volume 1,
Macmillan Publishing Company, A Division of Macmillan, Inc., New York. 536 pp.
Fernández, H., Baldini, M. and Olivieri, A.M. 1999. Inheritance of high oleic acid content
in sunflower oil. Journal of Genetics and Breeding 53: 99-103.
Fernández-Martínez, J., Jiménez-Ramírez, A., Domínquez-Giménez, J. and Alcántara, M.
1986. Temperature effect on the oleic and linoleic acids of three genotypes in
sunflower. Grasas y Aceites 37: 236-331.
Fernández-Martínez, J.M., Jimenez, A., Dominquez, J., Garcia, J.M., Garcés, R. and
Mancha, M. 1989. Genetic analysis of the high oleic acid content in cultivated
sunflower. Euphytica 41: 39-51.
Fernández-Martínez, J.M., Mancha, M., Osorio, J. and Garcés, R. 1997. Sunflower mutant
containing high levels of palmitic acid in high oleic acid background. Euphytica 97:
113-116.
Fernández-Martínez, J.M., Pérez-Vich, B. and Velasco, L. 2009. Sunflower. In:
Handbook of plant breeding, Volume 4: Oil crops. Vollmann, J. and Rajcan, I. (Eds.).
Springer, New York. pp. 155-232.
Fernández-Martínez, J.M., Pérez-Vich, B., Velasco, L. and Domínguez, J. 2007. Breeding
for speciality oils types in sunflower. Helia 30: 75-84.
Fernández-Martínez, J.M., Velasco, L. and Pérez-Vich, B. 2004. Progress in the genetic
modification of sunflower oil quality. In: Proceedings of the 16th International
Sunflower Conference, Fargo, ND, USA. pp. 1-14.
Fernández-Moya, V., Martínez-Force, E. and Garcés, R. 2002. Temperature effect on a
high stearic acid sunflower mutant. Phytochemistry 59: 33-37.
Fernández-Moya, V., Martínez-Force, E. and Garcés, R. 2005. Oils from improved high
stearic acid sunflower seeds. Journal of Agricultural and Food Chemistry 53: 5326-
5330.

52
Fick, G.N. 1984. Inheritance of high oleic acid in the seed oil of sunflower. In: National
Sunflower Association. Proceedings of the Sunflower Research Workshop, Bismark,
USA. pp. 9.
Fick, G.N. and Miller, J.F. 1997. Sunflower breeding. In: Sunflower technology and
production, Agronomy Monograph no 35. Schneiter, A.A. (Ed.). American Society of
Agronomy Inc., Crop Science Society of America Inc., Soil Science Society of
America Inc., Wisconsin, USA. pp. 395-439.
Fick, G.N. and Zimmerman, D.C. 1973. Variability in oil content among heads and seeds
within heads of sunflowers (Helianthus annuus L). Journal of the American Oil
Chemists’ Society 50: 529-531.
Finlay, K.W. and Wilkinson, G.N. 1963. Adaptation in a plant breeding programme.
Australian Journal of Agricultural Research 14: 742-754.
Flagella, Z., Rotunno, T., Di Caterina, R., De Simone, G., Ciciretti, L. and De Caro, A.
2000. Effect of supplementary irrigation on seed yield and oil quality of sunflower
(Helianthus annuus L.) grown in a sub-arid environment. In: Proceedings of the 15th
International Sunflower Conference, Toulouse, France. Volume 1. pp. C139-C144.
Flagella, Z., Rotunno, T., Tarantino, E., Di Caterina, R. and De Caro, A. 2002. Changes in
seed yield and oil fatty acid composition of high oleic sunflower (Helianthus annuus
L.) hybrids in relation to the sowing date and the water regime. European Journal of
Agronomy 17: 221-230.
Flores-Berrios, E., Gentzbittel, L., Kayyal, H., Alibert, G. and Sarrafi, A. 2000. AFLP
mapping of QTLs for in vitro organogenesis traits using recombinant inbred lines in
sunflower (Helianthus annuus L.). Theoretical and Applied Genetics 101: 1299-1306.
Food and Agriculture Organisation of the United Nations (FAO). 2010. FAOSTAT,
http://faostat.fao.org/site/339/default.aspx (3 August 2010).
Frankel, E.N. 1998. Lipid oxidation. The Oily Press, Dundee, Scotland. 303 pp.
Garcés, R. and Mancha, M. 1991. In vitro oleate desaturase in developing sunflower
seeds. Phytochemistry 30: 2127-2130.
Garcés, R., Garcia, J.M. and Mancha, M. 1989. Lipid characterization in seeds of a high
oleic acid sunflower mutant. Phytochemistry 28: 2597-2600.
Garcés, R., Sarmiento, C. and Mancha, M. 1992. Temperature regulation of oleate
desaturase in sunflower (Helianthus annuus L.) seeds. Planta 186: 461-465.

53
García-Díaz, M.T., Martínez-Rivas, J.M. and Mancha, M. 2002. Temperature and oxygen
regulation of oleate desaturation in developing sunflower (Helianthus annuus) seeds.
Physiologia Plantarum 114: 13-20.
García-Moreno, M.J., Vera-Ruiz, E.M., Fernández-Martínez, J.M., Velasco, L. and
Pérez-Vich, B. 2006. Genetic and molecular analysis of high gamma-tocopherol
content in sunflower. Crop Science 46: 2015-2021.
Gauch, H.G. 1993. MATMODEL version 2.0. AMMI and related analyses for two-way
data matrices. Microcomputer power, Ithaca, New York, USA.
Gauch, H.G. and Furnas, R.E. 1991. Statistical analysis of yield trials with MATMODEL.
Agronomy Journal 83: 916-920.
Gauch H.G. and Zobel, R.W. 1989. Accuracy and selection success in yield trial analysis.
Theoretical and Applied Genetics 77: 443-481.
Gauch, H.G. and Zobel, R.W. 1996. AMMI analysis of yield trials. In: Genotype-by-
environment interaction. Kang, M.S. and Gauch, H.G. (Eds.). CRC Press, Boca Raton,
Florida. pp. 85-122.
Gedil, M.A., Wye, C., Berry, S., Segers, B., Peleman, J., Jones, R., Leon, A., Slabaugh,
M.B. and Knapp, S.J. 2001. An integrated restriction fragment length polymorphism-
amplified fragment length polymorphism linkage map for cultivated sunflower.
Genome 44: 213-221.
Gentzbittel, L., Mestries, E., Mouzeyar, S., Mazyrat, F., Badaoul, S. Vear, F., Tourvieille
de Labrouche, D. and Nicolas, P. 1999. A composite map of expressed sequences and
phenotypic traits of sunflower (Helianthus annuus L.) genome. Theoretical and
Applied Genetics 99: 218-234.
Gentzbittel, L., Vear, F., Zhang, Y.-X., Bervillé, A. and Nicolas, P. 1995. Development of
a consensus linakge RFLP map of cultivated sunflower (Helianthus annuus L.).
Theoretical and Applied Genetics 90: 1079-1086.
Gentzbittel, L., Zhang, Y.-X., Vear, F., Griveau, B. and Nicolas, P. 1994. RFLP studies of
genetic relationships among inbred lines of cultivated sunflower, Helianthus annuus
L.: Evidence for distinct restorer and maintainer germplasm pools. Theoretical and
Applied Genetics 89: 419-425.
Göksoy, A.T., Demir, A.O., Turan, Z.M. and Dağüstü, N. 2004. Responses of sunflower
(Helianthus annuus L.) to full and limited irrigation at different growth stages. Field
Crops Research 87: 167-178.

54
Göksoy, A.T., Turan, Z.M. and Açikgöz, E. 1998. Effect of planting date and plant
population on seed and oil yield and plant characteristics in sunflower (Helianthus
annuus L.). Helia 21: 107-116.
Gray, D.A. and Kekwick, R.G.O. 1996. Intracellular location of oleate desaturase and
associated constituents in developing sunflower (Helianthus annuus) seeds. Plant
Science 119: 11-21.
Grompone, M.A. 2005. Sunflower oil. In: Bailey’s industrial oil and fat products, 6th
edition. Shahidi, F. (Ed.). John Wiley and Sons Inc. pp. 655-730.
Gupta, M.K. 2002. Sunflower oil. In: Vegetable oils in food technology: Composition,
properties and uses. Gunstone, F.D. (Ed.). Blackwell Publishing Ltd. CRC Press LLC,
USA, Canada. pp. 128-156.
Hall, A.J., Connor, D.J. and Whitfield, D.M. 1989. Contribution of pre-anthesis
assimilates to grain filling in irrigated and water-stressed sunflower crops. I. Estimates
using labelled carbon. Field Crops Research 20: 95-112.
Harris, H.C., McWilliam, J.R. and Mason, W.K. 1978. Influence of temperature on oil
content and composition of sunflower seed. Australian Journal of Agricultural
Research 29: 1203-1212.
Harwood, J.L. 1996. Recent advances in the biosynthesis of plant fatty acids: A review.
Biochimica et Biophysica Acta 1301: 7-56.
Heiser, C.B. 1954. Variation and subspeciation in the common sunflower, Helianthus
annuus. American Midland Naturalist 51: 287-305.
Hongtrakul, V., Huestis, G.M. and Knapp, S.J. 1997. Amplified fragment length
polymorphisms as a tool for DNA fingerprinting sunflower germplasm: genetic
diversity among oilseed inbred lines. Theoretical and Applied Genetics 95: 400-407.
Hongtrakul, V., Slabaugh, M.B. and Knapp, S.J. 1998. A seed specific ∆-12 oleate
desaturase gene is duplicated, rearranged, and weakly expressed in high oleic acid
sunflower lines. Crop Science 38: 1245-1249.
Ivanov, P., Petakov, D., Nikolova, V. and Petchev, E. 1988. Sunflower breeding for high
palmitic acid content in the oil. In: Proceedings of the 12th International Sunflower
Conference, Novi Sad, Yugoslavia. International Sunflower Association, Toowoomba,
Australia. pp. 463-465.
Izquierdo, N. and Aguirrezábal, L.A.N. 2008. Genetic variability in the response of fatty
acid composition to minimum temperature during grain filling in sunflower. Field
Crops Research 106: 116-125.

55
Izquierdo, N., Aguirrezábal, L., Andrade, F. and Pereyra, V. 2002. Night temperature
affects fatty acid composition in sunflower oil depending on the hybrid and the
phenological stage. Field Crops Research 77: 115-126.
Jan, C.C. 1997. Cytology and interspecific hybridisation. In: Sunflower technology and
production, Agronomy Monograph no 35. Schneiter, A.A. (Ed.). American Society of
Agronomy Inc., Crop Science Society of America Inc., Soil Science Society of
America Inc., Wisconsin, USA. pp. 497-558.
Jan, C.C., Vick, B.A., Miller, J.F., Kahler, A.L. and Butler, E.T. 1993. Progress in the
development of genomic RFLP map of cultivated sunflower (Helianthus annuus). In:
Proceedings of the 15th Sunflower Research Workshop. National Sunflower
Association, Bismarck, N.D. pp. 125-128.
Jan, C.C., Vick, B.A., Miller, J.F., Kahler, A.L. and Butler, E.T. 1998. Construction of an
RFLP linkage map for cultivated sunflower. Theoretical and Applied Genetics 96: 15-
22.
Kalmal-Eldin, A. and Appelqvist, L.Å. 1996. The chemistry and antioxidant properties of
tocopherols and tocotrienols. Lipids 31: 671-701.
Kanavouras, A., Cert, A. and Hernandez, R.J. 2005. Oxidation of olive oil under still air.
Food Science and Technology International 11: 183-189.
Kang, M.S. 1993. Simultaneous selection for yield and stability in crop performance
trials: consequences for growers. Agronomy Journal 85: 754-757.
Katan, M.B., Zock, P.L. and Mensink, R.P. 1995. Dietary oils, serum lipoproteins and
coronary heart disease. American Journal of Clinical Nutrition 61: 1368S-1373S.
Khan, H., Hidayat-Ur-Rahman., Ahmad, H., Ali, H., Inamullah and Alam, M. 2008.
Magnitude of heterosis and heritability in sunflower over environments. Pakistan
Journal of Botany 40: 301-308.
Kinman, M.L. 1970. New developments in the USDA and state experiment breeding
programme. In: Proceedings of the 4th International Sunflower Association, Paris,
France. pp. 181-183.
Kinman, M.L. and Earle, F.R. 1964. Agronomic performance and chemical composition
of the seed of sunflower hybrids and introduced varieties. Crop Science 4: 417-420.
Knowles, P.F. 1978. Morphology and anatomy. In: Sunflower science and technology.
Carter, J.F. (Ed.). American Society of Agronomy, Inc., Wisconsin, USA. pp. 55-87.
Knowles, P.F. 1983. Genetics and breeding of oilseed crops. Economic Botany 37: 423-
433.

56
Kris-Etherton, P.M. and Yu, S. 1997. Individual fatty acid effects on plasma lipids and
lipoproteins: human studies. American Journal of Clinical Nutrition 65: 1628S-1644S.
Labuza, T.P. and Dugan, L.R. (Jr.). 1971. Kinetics of lipid oxidation in foods: A review.
CRC Critical Reviews in Food Technology 2: 355-405.
Lacombe, S. and Bervillé, A. 2000. Analysis of desaturase transcript accumulation in
normal and in high oleic oil sunflower development seeds. In: Proceedings of the 15th
International Sunflower Conference, Toulouse, France. pp. A1-A6.
Lacombe, S. and Bervillé, A. 2001. A dominant mutation for high oleic acid content in
sunflower (Helianthus annuus L.) seed oil is genetically linked to a single oleate-
desaturase RFLP locus. Molecular Breeding 8: 129-137.
Lacombe, S., Kaan, F., Léger, S. and Bervillé, A. 2001. An oleate desaturase and a
suppressor loci direct high oleic acid content of sunflower (Helianthus annuus L.) oil
in the Pervenets mutant. Life Sciences 324: 839-845.
Lacombe, S., Leger, S., Kaan, F. and Bervillé, A. 2002. Genetic, molecular and
expression features of the Pervenets mutant leading to high oleic acid content of seed
oil in sunflower. Oléagineux, Corps Gras, Lipides 9: 17-23.
Lagravere, T., Lacombe, S., Oliver, S., Kleiber, D., Berville, A. and Dayde, J. 2000. Oil
composition and accumulation of fatty acids in new oleic sunflower (Helianthus
annuus L.) hybrids. In: Proceedings of the 15th International Sunflower Conference,
Toulouse, France. pp. A25-A30.
Lajara, J.R., Díaz, U. and Díaz-Quidiello, R. 1990. Definite influence of location and
climatic conditions on the fatty acid composition of sunflower seed oil. Journal of the
American Oil Chemists’ Society 67: 618-623.
Langar, K., Lorieux, M., Desmarais, E., Griveau, Y., Gentzbittel, L. and Bervillé, A.
2003. Combined mapping of DALP and AFLP markers in cultivated sunflower using
F9 recombinant inbred lines. Theoretical and Applied Genetics 106: 1068-1074.
Laureti, D. and Del Gatto, A. 2000. Genotype x environment interaction in new sunflower
(Helianthus annuus L.) hybrids. In: Proceedings of the 15th International Sunflower
Conference, Toulouse, France. E IT 14.
Lawson, W.R., Goulter, K.C., Henry, R.J., Kong, G.A. and Kochman, J.H. 1994. Genetic
diversity in sunflower (Helianthus annuus L.) as revealed by random amplified
polymorphic DNA analysis. Australian Journal of Agricultural Research 45: 1319-
1327.

57
Lawson, W.R., Goulter, K.C., Henry, R.J., Kong, G.A. and Kochman, J.K. 1996. RAPD
markers for a sunflower rust resistance gene. Australian Journal of Agricultural
Research 47: 395-401.
Lawson, W.R., Goulter, K.C., Henry, R.J., Kong, G.A. and Kochman, J.K. 1998. Marker-
assisted selection for two rust resistance genes in sunflower. Molecular Breeding 4:
227-234.
Leclercq, P. 1969. Une stérilité male cytoplasmique chezle tournesol. Annales
Amelioration des Plantes 19: 99-106.
Leeuwner, D.V. 2005. Genotype x environment interaction for sunflower hybrids in South
Africa. M.Sc. Dissertation, University of Pretoria, Pretoria, South Africa. 54 pp.
Leon, A.J., Andrade, F.H. and Lee, M. 2000. Genetic mapping of factors affecting
quantitative variation for flowering in sunflower (Helianthus annuus L.). Crop
Science 40: 404-407.
Leon, A.J., Andrade, F.H. and Lee, M. 2003. Genetic analysis of seed oil concentration
across generations and environments in sunflower (Helianthus annuus L.). Crop
Science 43: 135-150.
Leon, A.J., Lee, M. and Andrade, F.H. 2001. Quantitative trait loci for growing degree
days to flowering and photoperiod response in sunflower (Helianthus annuus L.).
Theoretical and Applied Genetics 102: 497-503.
Leon, A.J., Lee, M., Rufener, G.K., Berry, S.T. and Mowers, R.P. 1995. Use of RFLP
markers for genetic linkage analysis of oil percentage in sunflower seed. Crop Science
35: 558-564.
Leon, A.J., Lee, M., Rufener, G.K., Berry, S.T. and Mowers, R.P. 1996. Genetic mapping
of a locus (hyp) affecting seed hypodermis colour in sunflower. Crop Science 36:
1666-1668.
Lin, C.S., Binns, M.R. and Lefkovitch, L.P. 1986. Stability analysis: where do we stand?
Crop Science 26: 894-900.
Lu, Y.H., Gagne, B., Grezes-Besset, B. and Blanchard, P. 1999. Integration of a
molecular linkage group containing boomrape resistance gene Or5 into an RFLP map
in sunflower. Genome 42: 453-456.
Lu, Y.H., Melero-Vara, J.M., García-Tejada, J.A. and Blanchard, P. 2000. Development
of SCAR markers linked to the gene OR5 conferring resistance to boomrape
(Orobanche cumana Wallr.) in sunflower. Theoretical and Applied Genetics 100: 625-
632.

58
Lúquez, J.E., Aguirrezábal, L.A.N., Agüero, M.E. and Pereyra, V.R. 2002. Stability and
adaptability of cultivars in non-balanced yield trials. Comparison of methods for
selecting “high oleic” sunflower hybrids for grain yield and quality. Journal of
Agronomy and Crop Science 188: 225-234.
Maiti, S., Hegde, M.R. and Chattopadhyay, S.B. 1988. Handbook of annual oilseed crops,
New Delhi, Oxford and IBH. 325 pp.
Mantese, A.I., Medan, D. and Hall, A.J. 2006. Achene structure, development and lipid
accumulation in sunflower cultivars differing in oil content at maturity. Annals of
Botany 97: 999-1010.
Marquard, R. 1990. Untersuchungen őber dem einfluss von sorte und standort auf den
tocopherolgehalt verschiedener pflanzenöle. Fat Science and Technology 92: 452-455.
Márquez-Ruiz, G., Martín-Polvillo, M. and Dobarganes, M.C. 1996. Quantitation of
oxidised triglyceride monomers and dimers as a useful measurement for early and
advanced stages of oxidation. Grasas Aceites 47: 48-53.
Márquez-Ruiz, G., Martín-Polvillo, M. and Dobarganes, M.C. 2003. Effect of temperature
and addition of α-tocopherol on the oxidation of trilinolein model systems. Lipids 338:
233-240.
Martínez-Force, E. and Garcés, R. 2002. Dynamic channelling during de novo fatty acid
biosynthesis in Helianthus annuus seeds. Plant Physiology and Biochemistry 40: 383-
391.
Martínez-Force, E., Alvarez-Ortega, R., Cantisán, S. and Garcés, R. 1998. Fatty acid
composition in developing high saturated sunflower (Helianthus annuus) seeds:
Maturation changes and temperature effect. Journal of Agricultural and Food
Chemistry 46: 3577-3582.
Martínez-Force, E., Cantisán, S., Serrano-Vega, M.J. and Garcés, R. 2000. Acyl-acyl
carrier protein thioesterase activity from sunflower (Helianthus annuus L.) seeds.
Planta 211: 673-678.
Martínez-Rivas, J.M., Sperling, P., Lühs, W. and Heinz, E. 2001. Spatial and temporal
regulation of three different microsomal oleate desaturase genes (FAD2) from normal-
type and high-oleic varieties of sunflower (Helianthus annuus L.). Molecular
Breeding 8: 159-168.
Martín-Polvillo, M., Márquez-Ruiz, G. and Dobarganes, M.C. 2004. Oxidative stability of
sunflower oils differing in unsaturation degree during long-term storage at room
temperature. Journal of the American Oil Chemists' Society 81: 577-583.

59
Mensink, R.P. and Katan, M.B. 1989. Effect of a diet enriched with monounsaturated or
polyunsaturated fatty acids on levels of low-density and high-density lipoprotein
cholesterol in healthy women and men. National English Journal of Medicine 321:
436-441.
Mensink, R.P., Temple, E.H.M. and Hornstra, G. 1994. Dietary saturated and trans fatty
acids and lipoprotein metabolism. Annals of Medicine 26: 461-464.
Mensink, R.P., Zock, P.L., Kester, A.D.M. and Katan, M.B. 2003. Effects of dietary fatty
acids and carbohydrates on the ratio of serum total to HDL cholesterol and on serum
lipids and apolipoproteins: a meta-analysis of 60 controlled trials. American Journal
of Clinical Nutrition 77: 1146-1155.
Merrill, L.I., Pike, O.A., Ogden, L.V. and Dunn, M.L. 2008. Oxidative stability of
conventional and high oleic vegetable oils with added antioxidants. Journal of the
American Oil Chemists’ Society 85: 771-776.
Michelmore, R., Paran, I. and Kesseli, R. 1991. Identification of markers linked to
disease-resistance genes by bulked segregant analysis: A rapid method to detect
markers in specific genomic regions by using segregating populations. Proceedings of
the National Academy of Sciences of the United States of America 88: 9828-9832.
Miji ć A., Krizmanić, M., Liović, I., Zdunić, A. and Marić, S. 2007. Response of
sunflower to growing in different environments. Cereal Research Communications
35: 781-784.
Miller, J.F. 1992. Update on the inheritance of sunflower characteristics. In: Proceedings
of the 13th International Sunflower Conference, Pisa, Italy. pp. 905-945.
Miller, J.F. and Fick, G.N. 1997. The genetics of sunflower. In: Sunflower technology and
production, Agronomy Monograph no 35. Schneiter, A.A. (Ed.). American Society of
Agronomy Inc., Crop Science Society of America Inc., Soil Science Society of
America Inc., Wisconsin, USA. pp. 441-495.
Miller, J.F. and Vick, B.A. 1999. Inheritance of reduced stearic and palmitic acid content
in sunflower seed oil. Crop Science 39: 364-367.
Miller, J.F. and Vick, B.A. 2001. Registration of four high linoleic sunflower
germplasms. Crop Science 41: 602.
Miller. J.F. and Zimmerman, D.C. 1983. Inheritance of high oleic fatty acid content in
sunflower. In: Proceedings of the Sunflower Research Workshop, Fargo, N.D.
National Sunflower Association, Bismark, N.D. pp. 10.

60
Miller, J.F., Zimmerman, D.C. and Vick, B.A. 1987. Genetic control of high oleic acid
content in sunflower oil. Crop Science 27: 923-926.
Mohan, M., Nair, S., Bhagwat, A., Krishna, T.G., Yano, M., Bhatia, C.R. and Sasaki, T.
1997. Genome mapping, molecular markers and marker-assisted selection in crop
plants. Molecular Breeding 3: 87-103.
Moose, S.P. and Mumm, R.H. 2008. Molecular plant breeding as the foundation for the
21st century crop improvement. Plant Physiology 147: 969-977.
Munshi, S.K., Kaushal, B. and Bajaj, R.K. 2003. Compositional changes in seeds
influenced by their positions in different whorls of mature sunflower head. Journal of
the Science of Food and Agriculture 83: 1622-1626.
Murphy, D.J. 2006. Molecular breeding strategies for the modification of lipid
composition. In Vitro Cellular and Developmental Biology – Plant 42: 89-99.
National Sunflower Association, Mandan, ND. 2010. Sunflower statistics,
http://www.sunflowernsa.com (13 July 2010).
O’Brien, R.D. 2004. Fats and Oils: Formulating and processing for applications, second
edition. CRC Press, LLC, Florida. 592 pp.
Ohlrogge, J. and Browse, J. 1995. Lipid biosynthesis. The Plant Cell 7: 957-970.
Osorio, J., Fernández-Martínez, J.M., Mancha, M. and Garcés, R. 1995. Mutant sunflower
with high concentration in saturated fatty acid in the oil. Crop Science 35: 739-742.
Paniego, N., Echaide, M., Muñoz, M., Fernández, L., Torales, S., Faccio, P., Fuxan, I.,
Carrera, M., Zandomeni, R., Suárez, I. and Hopp, E.H. 2002. Microsatellite isolation
and characterisation in sunflower (Helianthus annuus L.). Genome 45: 34-43.
Paniego, N., Heinz, R., Fernandez, P., Talia, P., Nishinakamasu, V. and Hopp, H.E. 2007.
Sunflower. In: Genome mapping and molecular breeding in plants, Volume 2.
Oilseeds. Kole, C. (Ed.). Springer-Verlag, Berlin, Heidelberg. pp. 153-177.
Pearson, T.A. 1994. Stearic acid and cardiovascular disease-answers and questions.
American Journal of Clinical Nutrition 60: 1017-1072.
Pereyra-Irujo, G.A. and Aguirrezábal, L.A.N. 2007. Sunflower yield and oil quality
interactions and variability: Analysis through a simple simulation model. Agricultural
and Forest Meteorology 143: 252-265.
Pérez-Vich, B., Fernández-Martínez, J.M., Grondona, S.J., Knapp, S.J. and Berry, S.T.
2002c. Stearoyl-ACP and oleoyl-PC destaurase genes cosegregate with quantitative
trait loci underlying stearic and oleic acid mutant phenotypes in sunflower.
Theoretical and Applied Genetics 104: 338-349.

61
Pérez-Vich, B., Fernández-Martínez, J.M., Knapp, S.J. and Berry, S.T. 2000. Molecular
markers associated with sunflower oleic acid and stearic acid concentrations in a high
stearic x high oleic cross. In: Proceedings of the 15th International Sunflower
Conference, Toulouse, France. pp. A55-A66.
Pérez-Vich, B., Garcés, R. and Fernández-Martínez, J.M. 2002a. Inheritance of high
palmitic acid and its relationship with high oleic acid content in the sunflower mutant
CAS-12. Plant Breeding 121: 49-56.
Pérez-Vich, B., Garcés, R. and Fernández-Martínez, J.M. 2002b. Inheritance of medium
stearic acid content in the seed oil of sunflower mutant CAS-4. Crop Science 42:
1806-1811.
Pérez-Vich, B., Leon, A.J., Grondona, M., Velasco, L. and Fernández-Martínez, J.M.
2006. Molecular analysis of the high stearic acid content in sunflower mutant CAS-14.
Theoretical and Applied Genetics 112: 867-875.
Pérez-Vich, B., Munoz-Ruz, J. and Fernández-Martínez, J.M. 2004. Developing mid-
stearic acid sunflower lines from a high stearic acid mutant. Crop Science 44: 70-75.
Piepho, H.P. 1995. Assessing cultivar adaptability by multiple comparison with the best.
Agronomy Journal 87: 1225-1227.
Pike, O.A. 2001. Assessment of oxidative stability for lipids. Current Protocols in Food
Analytical Chemistry D2.3.1.-D2.3.5.
Pillay, K.N. 2000. Estimation of genotype x environment interaction for yield in green
beans (Phaseolus vulgaris). M.Sc. Dissertation, University of the Free State,
Bloemfontein, South Africa. 102 pp.
Pleite, R., Martínez-Force, E. and Garcés, R. 2006. Inhibitors of fatty acid biosynthesis in
sunflower seeds. Journal of Plant Physiology 163: 885-894.
Pongracz, G., Weiser, H. and Matzinger, D. 1995. Tocopherole. Antioxidanten der Natur.
Fat Science and Technology 97: 90-104.
Purchase, J.L. 1997. Parametric analysis to describe GXE interaction and yield stability in
winter wheat. Ph.D. Thesis, University of the Free State, Bloemfontein, South Africa.
83 pp.
Putnam, D.H., Oplinger, E.S., Hicks, D.R., Durgan, B.R., Noetzel, D.M., Meronuck,
R.A., Doll, J.D. and Schulte, E.E. 2009. Sunflower. Alternative Field Crops Manual,
University of Wisconsin-Extension, Cooperative Extension, Department of
Agronomy, Madison. http://www.hort.purdue.edu/newcrop/afcm/sunflower.html (29
September 2009).

62
Putt, E.D. 1997. Early history of sunflower. In: Sunflower technology and production,
Agronomy Monograph no 35. Schneiter, A.A. (Ed.). American Society of Agronomy
Inc., Crop Science Society of America Inc., Soil Science Society of America Inc.,
Wisconsin, USA. pp. 1-19.
Qadir, G., Ahmad, S., Ul-Hassan, F. and Cheema, M.A. 2006. Oil and fatty acid
accumulation in sunflower as influenced by temperature variation. Pakistan Journal of
Botany 38: 1137-1147.
Radić, V., Jocić, S. and Mrda, J. 2008. Effect of environment on the chemical
composition and some other parameters of sunflower seed quality. In: Proceedings of
the 17th International Sunflower Conference, Córdoba, Spain. pp. 747-750.
Rieseberg, L.H., Van Fossen, C. and Desrochers, A. 1995. Hybrid speciation
accompanied by genomic reorganisation in wild sunflower. Nature 375: 313-316.
Robertson, J.A., Chapman, G.W. (Jr.) and Wilson, R.L. (Jr.). 1978. Relation of days after
flowering to chemical composition and physiological maturity of sunflower seed.
Journal of the American Oil Chemists’ Society 55: 266-269.
Rolletschek, H., Borisjuk, L., Sánchez-García, A., Gotor, C., Romero, L.C., Martínez-
Rivas, J.M. and Mancha, M. 2007. Temperature-dependant endogenous oxygen
concentration regulates microsomal oleate desaturase in developing sunflower seeds.
Journal of Experimental Botany 58: 3171-3181.
Rondanini, D., Mantese, A., Savin, R. and Hall, A.J. 2006. Response of sunflower yield
and grain quality to alternating day/night high temperature regimes during grain
filling: Effects of timing, duration and intensity of exposure to stress. Field Crops
Research 96: 48-62.
Rondanini, D., Savin, R. and Hall, A.J. 2003. Dynamics of fruit growth and oil quality of
sunflower (Helianthus annuus L.) exposed to brief intervals of high temperature
during grain filling. Field Crops Research 83: 79-90.
Salas, J.J., Martínez-Force, E. and Garcés, R. 2004. Biochemical characterization of a
high palmitoleic acid Helianthus annuus mutant. Plant Physiology and Biochemistry
42: 373-381.
Salera, E. and Baldini, M. 1998. Performance of high and low oleic acid hybrids of
sunflower under different environmental conditions. Note II. Helia 21: 55-68.
Salunkhe, D.K., Chavon, J.K., Adsule, R.N. and Kadam, S.S. 1992. World oilseeds:
Chemistry, technology, and utilization. Van Nostrand, Reinhold, New York. 554 pp.

63
Sarmiento, C., Garcés, R. and Mancha, M. 1998. Oleate desaturation and acyl turnover in
sunflower (Helianthus annuus L.) seed lipids during rapid temperature adaptation.
Planta 205: 595-600.
Schmidt, L., Marquard, R. and Friedt, W. 1989. Status and prospects of breeding high
oleic sunflowers for central Europe. Fat Science Technology 91: 346-349.
Schoeman, L.J. 2003. Genotype x environment analysis in sunflower (Helianthus annuus)
in South Africa. M.Sc. Dissertation, University of the Free State, Bloemfontein, South
Africa. 78 pp.
Schultz, D.J. and Ohlrogge, J.B. 2002. Metabolic engineering of fatty acid biosynthesis.
In: Lipid Biotechnology. Kuo, T.M. and Gardner, H.W. (Eds.). Marcel Dekker Inc.,
USA. pp. 1-26.
Schuppert, G.F., Bushman, B.S., Kasschau, K.D., Slabaugh, M.B., Carrington, J.C. and
Knapp, S.J. 2005. The FAD2-1 gene is tandemly duplicated and silences by RNA
interference in high oleic acid sunflower. In: 13th Plant and Animal Genome
Conference, San Diego, CA, USA.
http://www.intl-pag.org/13/abstracts/PAG13_W072.html (17 August 2007).
Schuppert, G.F., Heesacker, A., Slabaugh, M.B., Cole, G. and Knapp, S.J. 2003. The high
oleic acid phenotype in sunflower is caused by epistatic interactions between oleate
desaturase genes. In: 11th Plant and Animal Genome Conference, San Diego, CA,
USA.
http://www.intl-pag.org/11/abstracts/W15_W101_XI.html (17 August 2007).
Schuppert, G.F., Tang, S., Cole, G., Heesacker, A., Slabaugh, M.B., Bushman, B.S.,
Bridges, W.C. and Knapp, S.J. 2006b. Silencing of an oleoyl-phosphatidyl choline
desaturase triggers genetic interactions among synthase, thioesterase, and desaturase
loci necessary for oleic and linoleic acid synthesis in developing sunflower seed. In:
Proceedings of the 7th European Conference on Sunflower Biotechnology,
Gengenbach, Germany. pp. 53.
Schuppert, G.F., Tang, S., Slabaugh, M.B. and Knapp, S.J. 2006a. The sunflower high-
oleic mutant Ol carries variable tandem repeats of FAD2-1, a seed specific oleoyl-
phosphatidyl choline desaturase. Molecular Breeding 17: 214-256.
Seiler, G.J. 1983. Effect of genotype, flowering date, and environment on oil content and
oil quality of wild sunflower seed. Crop Science 23: 1063-1068.
Seiler, G.J. 1986. Analysis of the relationships of environmental factors with seed oil and
fatty acid concentrations of wild annual sunflower. Field Crops Research 15: 57-72.

64
Seiler, G.J. 1992. Utilisation of wild sunflower species for the improvement of cultivated
sunflower. Field Crops Research 30: 195-230.
Seiler, G.J. 1997. Anatomy and morphology of sunflower. In: Sunflower technology and
production, Agronomy Monograph no 35. Schneiter, A.A. (Ed.). American Society of
Agronomy Inc., Crop Science Society of America Inc., Soil Science Society of
America Inc., Wisconsin, USA. pp. 67-111.
Seiler, G.J. 2004. Wild Helianthus annuus, a potential source of reduced palmitic and
stearic fatty acids in sunflower oil. Helia 27: 55-62.
Seiler, G.J. and Brothers, M.E. 1999. Oil concentration and fatty acid composition of
achenes of Helianthus species (Asteraceae) from Canada. Economic Botany 53: 273-
280.
Seiler, G.J. and Rieseberg, L.H. 1997. Systematics, origin, and germplasm resources of
the wild and domesticated sunflower. In: Sunflower technology and production,
Agronomy Monograph no 35. Schneiter, A.A. (Ed.). American Society of Agronomy
Inc., Crop Science Society of America Inc., Soil Science Society of America Inc.,
Wisconsin, USA. pp. 21-65.
Semelczi-Kovacks, A. 1975. Acclimatisation and dissemination of the sunflower in
Europe. Acta Ethnographica Academiae Scientiarum Hungaricae 24: 47-88.
Shaffi, B., Mahler, K.A., Price, W.J. and Auld, D.L. 1992. Genotype x environment
interaction effects on winter rapeseed yield and oil content. Crop Science 32: 922-927.
Shahidi, F. and Wanasundara, U.N. 1996. Methods for evaluation of oxidative stability of
lipid-containing foods: A review. Food Science Technology International 2: 73-81.
Shahidi, F. and Zhong, Y. 2005. Lipid oxidation: measurement methods. In: Bailey’s
industrial oil and fat products, 6th edition. Shahidi, F. (Ed.). John Wiley and Sons Inc.
pp. 357-385.
Sherwin, E.R. 1978. Oxidation and antioxidants in fat and oil processing. Journal of the
American Oil Chemists’ Society 55: 809-814.
Shintani, D. and DellaPenna, D. 1998. Elevating the vitamin E content of plants through
metabolic engineering. Science 282: 2098-2100.
Shukla, G.K. 1972. Some statistical aspects of partitioning genotype-environmental
components of variability. Heredity 29: 237-245.
Silver, J.G., Rochester, C.P., Bishop, D.G. and Harris, H.C. 1984. Unsaturated fatty acid
synthesis during the development of isolated sunflower (Helianthus annuus L.) seeds.
Journal of Experimental Botany 35: 1507-1514.

65
Simpson, B.W., McLeod, C.M. and George, D.L. 1989. Selection for high linoleic acid
content in sunflower (Helianthus annuus L.). Australian Journal of Experimental
Agriculture 29: 233-239.
Smith, S.A., King, R.E. and Min, D.B. 2007. Oxidative and thermal stabilities of
genetically modified high oleic sunflower oil. Food Chemistry 102: 1208-1213.
Soldatov, K.I. 1976. Chemical mutagenesis in sunflower breeding. In: Proceedings of the
7th International Sunflower Conference, Krasnodar, USSR. International Sunflower
Association, Vlaardingen, The Netherlands. pp. 352-357.
Stauffer, C.E. 1996. Fats and oils. Eagan Press Handbook Series, American Association
of Cereal Chemists, Inc., USA. 149 pp.
Steel, R. and Torrie, J. 1993. Comparaciones multiples. En Biostadística. Principios y
Procedimientos, 2nd edition, McGraw-Hill, Mexico. 622 pp.
Steer, B.T. and Seiler, G.J. 1990. Changes in fatty acid composition of sunflower
(Helianthus annuus L.) seeds in response to time of nitrogen application, supply rates
and defoliation. Journal of the Science of Food and Agriculture 51: 11-26.
Stymne, S. and Stobart, A.K. 1987. Triacylglycerol biosynthesis. In: The biochemistry of
plants, Volume 9. Lipids: Structure and function. Stumpf, P.K. and Conn, E.E. (Eds.).
Academic Press Orlando, F.L. pp. 175-211.
Tang, S., Heesacker, A., Kishore, V.K., Fernandez, A., Sadik, E.S., Cole, G. and Knapp,
S.J. 2003a. Genetic mapping of the Or5 gene for resistance to Orobanche race E in
sunflower. Crop Science 43: 1021-1028.
Tang, S., Kishore, V.K. and Knapp, S.J. 2003b. PCR-multiplexes for a genome-wide
framework of simple sequence repeat marker loci in cultivated sunflower. Theoretical
and Applied Genetics 107: 6-19.
Tang, S., Yu, J.-K., Slabaugh, M.B., Shintani, D.K. and Knapp, S.J. 2002. Simple
sequence repeat map of the sunflower genome. Theoretical and Applied Genetics 105:
1124-1136.
Tatini, W. 1995. High oleic sunflower. Influence of genotype and temperature upon oleic
acid content. Sementi Elette 41: 31-32.
Teulat, B., Zhang, Y.-X. and Nicolas, N. 1994. Characteristics of random amplified DNA
markers discriminating Helianthus annuus inbred lines. Agronomie 14: 497-502.
Thelen, J.J. and Ohlrogge, J.B. 2002. Metabolic engineering of fatty acid biosynthesis in
plants. Metabolic engineering 4: 12-21.

66
Triboï-Blondel, A.-M., Bonnemoy, B., Falcimagne, R., Martingnac, M. and Messaoud, J.
2000. The effect of temperature from flowering to maturity on seed composition of
high oleic sunflower inbreds and mid oleic hybrids. In: Proceedings of the 15th
International Sunflower Conference, Toulouse, France. pp. A67-A72.
Triki, S., Demandre, C. and Mazliak, P. 1999. Biosynthesis of triacylglycerols by
developing sunflower seed microsomes. Phytochemistry 52: 55-62.
Unger, P.W. and Thompson, T.E. 1982. Planting date effects on sunflower head and seed
development. Agronomy Journal 74: 389-395.
Urie, A.L. 1984. Inheritance of very high oleic acid content in sunflower. In: Proceedings
of the Sunflower Research Workshop, Bismarck, USA. National Sunflower
Association. pp. 9-10.
Urie, A.L. 1985. Inheritance of high oleic acid in sunflower. Crop Science 25: 986-989.
Velasco, L., Domínquez, J. and Fernández-Martínez, J.M. 2004a. Registration of T589
and T2100 sunflower germplasms with modified tocopherol profiles. Crop Science
44: 361-362.
Velasco, L., Fernández-Martínez, J.M., García-Ruíz, R. and Domínquez, J. 2002. Genetic
and environmental variation for tocopherol content and composition in sunflower
commercial hybrids. Journal of Agricultural Science 139: 425-429.
Velasco, L., Pérez-Vich, B. and Fernández-Martínez, J.M. 2000. Inheritance of oleic acid
content under controlled environment. In: Proceedings of the 15th International
Sunflower Conference, Toulouse, France. International Sunflower Association, Paris,
France. Vol. I, pp. A31-A36.
Velasco, L., Pérez-Vich, B. and Fernández-Martínez, J.M. 2004b. Novel variation for
tocopherol profile in sunflower created by mutagenesis and recombination. Plant
Breeding 123: 490-492.
Vick, B.A., Jan, C.C. and Miller, J. 2002. Inheritance of reduced saturated fatty acid
content in sunflower oil. Helia 25: 113-122.
Villalobos, F., Hall, A., Ritchie, J. and Orgaz, F. 1996. OILCROP-SUN: a development,
growth and yield model of the sunflower crop. Agronomy Journal 88: 1202-1210.
Vos, P., Hogers, R., Bleeker, M., Reijans, M., Van de Lee, T., Hornes, M., Frijters, A.,
Pot, J., Peleman, J., Kuiper, M. and Zabeau, M. 1995. AFLP: a new technique for
DNA fingerprinting. Nucleic Acids Research 23: 4407-4414.
Weiss, E.A. 2000. Oilseed Crops, 2nd edition. Blackwell Science Ltd. 364 pp.

67
Weselake, R.J. 2002. Biochemistry and biotechnology of triacylglycerol accumulation in
plants. In: Lipid Biotechnology. Kuo, T.M. and Gardner, H.W. (Eds.). Marcel Dekker
Inc., USA. pp. 27-56.
Willett, W.C. 1994. Diet and health: What should we eat? Science 264: 532-537.
Willett, W.C. and Ascherio, A. 1994. Trans fatty acids: are the effects only marginal?
American Journal of Public Health 84: 722-724.
Willett, W.C., Stampfer, M.J., Manson, J.E., Colditz, G.A., Speizer, F.E., Rosner, B.A.,
Hennekens, C.H. and Sampson, L.A. 1993. Intake of trans fatty acids and risk of
coronary heart disease among women. The Lancet 341: 581-585.
Wricke, G. 1962. Őber eine methode zur erfassung der ökologischen streubreite in
feldversuchen. Zeitschrift Fur Pflanzenzuchtung 47: 92-96.
Yau, S.K. and Hamblin, J. 1994. Relative yield as a measure of entry performance in
variable environments. Crop Science 34: 813-817.
Yodice, R. 1990. Nutritional and stability characteristics of high oleic sunflower seed oil.
Fat Science and Technology 92: 121-126.
Yu, J.K., Mangor, J., Thompson, L., Edwards, K.J., Slabaugh, M.B. and Knapp, S.J.
2002. Allelic diversity of simple sequence repeat markers among elite inbred lines in
cultivated sunflower. Genome 45: 652-660.
Yu, J.-K., Tang, S., Slabaugh, M.B., Heesacker, A., Cole, G., Herring, M., Soper, J., Han,
F., Chu, W.-C., Webb, D.M., Thompson, L., Edwards, K.J., Berry, S., Leon, A.J.,
Grondona, M., Olungu, C., Maes, N. and Knapp, S.J. 2003. Towards a saturated
molecular genetic linkage map for cultivated sunflower. Crop Science 43: 367-387.
Yue, B., Cai, X., Vick, B. and Hu, J. 2009. Genetic characterization and molecular
mapping of a chlorophyll deficiency gene is sunflower (Helianthus annuus). Journal
of Plant Physiology 166: 644-651.
Zimmerman, D.C. and Fick, G.N. 1973. Fatty acid composition of sunflower (Helianthus
annuus L.) oil as influenced by seed position. Journal of the American Oil Chemists’
Society 50: 273-275.
Zobel, R.W., Wright, M.J. and Gauch, H.G. 1988. Statistical analysis of yield data.
Agronomy Journal 80: 388-393.

68
CHAPTER 3
GENOTYPE BY ENVIRONMENT ANALYSIS IN HIGH AND MID OL EIC
SUNFLOWER HYBRIDS
3.1 Introduction
Sunflower is the most important oilseed crop in South Africa. The most important
cropping areas include the Free State, North West, Limpopo, Mpumalanga and Gauteng
provinces (Table 3.1) (Dredge, 2010). These areas of sunflower cultivation vary
considerably in soil type, climate and elevation. Together with these environmental
factors, water regime and planting date also have a marked influence on the performance
of sunflower (Alza and Fernández-Martínez, 1997; Qadir et al., 2006).
Table 3.1 Areas planted and sunflower seed yield for the production seasons
2006/2007, 2007/2008 and 2008/2009
2006/2007 2007/2008 2008/2009
Province Area
planted (ha)
Final yield (ton)
Area planted
(ha)
Final yield (ton)
Area planted
(ha)
Final yield (ton)
Free State 135000 155000 270000 459000 280000 363000 North West 130000 110000 200000 300000 230000 298000 Limpopo 30000 13500 70000 77000 90000 90000 Mpumalanga 13000 13000 17000 25500 27000 37700 Gauteng 7000 7700 6000 8700 7000 9820 Western Cape 500 300 600 540 700 700 Eastern Cape 150 180 300 360 600 780 Northern Cape Total
700 316350
1320 300000
400 564300
900 872000
500 635800
1000 801000
(Dredge, 2010).
Cultivars and hybrids grown in multi-environment trials react differently to environmental
variations. Plant breeders aim to develop genotypes that are widely adapted over a broad
range of environmental conditions. Stable and more adaptive genotypes that show a low
degree of fluctuation when grown over a range of environments are selected. The
difference in response of genotypes to variable environmental conditions is attributed to
GXE interaction (De la Vega and Chapman, 2000). Assessment of GXE interaction is
advantageous for the identification of stable genotypes, to increase the efficiency of the
breeding programme and to select the best genotypes.

69
Several studies investigated GXE interaction in sunflower (Schoeman, 2003; Dijanovic et
al., 2004; Ghafoor et al., 2005; Leeuwner, 2005) and other oil crops like sesame (John et
al., 2001; Boshim et al., 2003), linseed (Adugna and Labuschagne, 2002) and Ethiopian
mustard (Kassa, 2002). These authors reported that the mean squares for genotypes,
environments and GXE were highly significant. This was an indication of a broad range
of variation between genotypes, between seasons and genotypes over seasons. The effects
of genotype and environment on sunflower seed oil content and composition have been
studied by several researchers (Qadir et al., 2006; Radić et al., 2008). It was reported that
oil content and fatty acid composition are significantly influenced by environmental
conditions. Piva et al. (2000) indicated that especially temperature had a profound effect
on the oleic/linoleic acid ratio. In addition, genotypes exhibited different sensitivity to
environmental conditions. The high oleic genotypes seemed to be more stable than
traditional sunflower cultivars regarding fatty acid composition (Lagravere et al., 2000;
Laureti and Del Gatto et al., 2000; Piva et al., 2000). However, some differences may
occur in high oleic genotypes due to different genetic backgrounds (Salera and Baldini,
1998; Radić et al., 2008).
Since genotype and environment have a large influence on oil content and composition, it
is necessary for plant breeders to analyse hybrid lines over several growing locations and
seasons in order to test for the occurrence of GXE interaction. This will give an indication
of the most stable and widely adapted cultivars or hybrids for these locations regarding oil
quality traits.
The aim of this study was to compare oil and fatty acid content of high and mid oleic acid
sunflower hybrids against two commonly produced linoleic sunflower hybrids in different
environments and seasons and to determine to what extent oil content and fatty acid
profiles are influenced by the environment.

70
3.2 Materials and methods
3.2.1 Plant material
Sunflower seed material was obtained from the PANNAR® sunflower breeding
programme and included two standard linoleic, eight high oleic and six mid oleic hybrids
(Table 3.2). The oleic type of each hybrid was defined according to its pedigree. Due to
confidentiality reasons, the names of hybrids as well as their pedigrees may not be
revealed. These high and mid oleic hybrids are not commercialised yet and are still being
evaluated across years and localities for agronomic performance, oil quality and disease
resistance.
Table 3.2 The 16 sunflower hybrids used to determine the effect of location, year
and genotype on oil content and composition
Hybrid number Oleic type 1 Standard linoleic 2 Standard linoleic 3 High oleic 4 High oleic 5 High oleic 6 High oleic 7 High oleic 8 High oleic 9 High oleic 10 Mid oleic 11 Mid oleic 12 Mid oleic 13 Mid oleic 14 High oleic 15 Mid oleic 16 Mid oleic
3.2.2 Field trials
Three sets of trials were planted over three consecutive seasons. A lattice design (4x4)
with three replications was used. A different randomisation was used at each location.
Plots consisted of two 6 m rows with a 0.91 m between row spacing. The plant population
was 36000 plants per hectare. Normal cultural practices were followed. The 16 hybrids
were evaluated in eight different locations from the 2004/2005 to the 2006/2007 season
(Table 3.3). A summary of the regional orientation, coordinates and climatic region for
each location is listed in Table 3.4. Not all locations and genotypes were planted each
season due to unforeseen weather conditions and insufficient seed.

71
Table 3.3 Mean seed and oil yield, rainfall and temperature data for growing seasons 2004/2005, 2005/2006 and 2006/2007
Season of 2004/2005
Location
Planting
date
Harvest
date
Mean yield
(t/ha)
Mean oil
yield (t/ha)
Rain during
growing season (mm)*
Average daily temperature (ºC)#
Maximum Minimum Nov Dec Jan Feb Mar Apr Nov Dec Jan Feb Mar Apr
Kroonstad 15-12-2004 10-05-2005 3.29 1.31 359.8 31.0 29.9 30.0 28.3 25.4 22.4 14.5 15.7 16.8 15.6 13.5 9.6 Delmas 03-12-2004 04-04-2005 2.49 1.08 382.8 29.5 27.9 29.0 29.3 27.1 25.1 16.8 18.0 18.7 17.8 15.4 11.6 Standerton 16-11-2004 10-04-2005 3.46 1.61 470.6 27.4 25.1 25.7 26.0 23.5 20.7 12.2 12.8 14.1 12.5 10.4 7.3 Klerksdorp 26-01-2005 13-06-2005 2.34 0.86 542.0 30.6 28.4 27.8 27.3 24.8 21.4 13.6 14.5 15.2 14.4 11.5 8.5 Lichtenburg 14-12-2004 20-04-2005 2.13 0.93 638.4 32.0 29.8 29.8 29.0 26.8 23.0 15.5 16.4 17.2 16.4 13.8 10.7 Settlers 25-01-2005 03-06-2005 1.13 0.49
Season of 2005/2006
Location
Planting date
Harvest
date
Mean yield
(t/ha)
Mean oil
yield (t/ha)
Rain during
growing season (mm) *
Average daily temperature (ºC) #
Maximum Minimum Nov Dec Jan Feb Mar Apr Nov Dec Jan Feb Mar Apr
Kroonstad
08-12-2005
02-05-2006
2.17
0.83
203.7
29.2
29.6
26.8
23.4
20.8
20.0
14.1
14.9
16.1
13.3
10.3
7.4
Bloemfontein 25-01-2006 26-06-2006 1.88 0.72 612.3 28.7 30.8 29.0 26.7 25.0 22.7 10.3 14.6 18.0 17.4 12.8 10.0
Season of 2006/2007
Location Planting date
Harvest date
Mean yield (t/ha)
Mean oil yield (t/ha)
Rain during growing
season (mm) *
Average daily temperature (ºC) #
Maximum Minimum
Nov Dec Jan Feb Mar Apr Nov Dec Jan Feb Mar Apr
Kroonstad 23-11-2006 20-04-2007 2.31 0.91 228.1 30.0 31.3 32.7 31.4 29.0 25.2 16.0 18.5 16.9 14.6 11.9 10.2 Bloemfontein 13-11-2006 03-04-2007 1.84 0.77 310.0 27.7 30.7 31.6 32.0 28.3 24.2 13.2 15.4 16.3 15.7 13.1 10.9 Koster 05-01-2007 22-05-2007 1.42 0.56
*: Total rain for growing season October to May, #: Average daily temperature for growing season November to April. Weather data was not available for Settlers and Koster (University of the Free State weather station, 2010; South African Weather Services, 2010).

72
Table 3.4 Summary of the regional orientation, coordinates and climatic region for
eight locations planted from seasons 2004/2005 to 2006/2007
Location Coordinates Regional orientation Climatic region Bloemfontein 29º06’S
26º12’E West Dry
Highveld Grassland
Delmas 26º08’S 28º41’E
East Moist Highveld Grassland
Klerksdorp 26º51’S 26º39’E
West Dry Highveld Grassland
Kroonstad 27º39’S 27º14’E
West Dry Highveld Grassland
Lichtenburg 26º08’S 26º09’E
West Dry Highveld Grassland
Settlers 24º57’S 28º32’E
North Central Bushveld
Standerton Koster
26º55’S 29º14’E 25⁰52’S 26⁰54’E
East West
Moist Highveld Grassland Dry Highveld Grassland
(Leeuwner, 2005).
The western region locations are situated in the dry highveld grassland climatic region
that is characterised by a precipitation range of about 450 mm in the west to 700 mm at its
northern border. The rainy season reaches its maximum during December and January in
the north, but during February and March in the west and the south. Locations in the
eastern region are located in the moist highveld grassland climatic region that is similar to
the dry highveld grassland region, but cooler and wetter due to higher elevation and
position relative to rain bearing systems. Precipitation ranges from 600-800 mm per year
and the rainy season reaches it maximum during December and January in the east, but
during February in the south. Settlers is located in the northern region that occurs in the
central bushveld climatic region. This region is characterised by a rather erratic

73
precipitation that ranges from 500-750 mm pear year. The rainy season lasts from
approximately November to March, with peak rainfall in January.
During the 2004/2005 growing season trials were planted at six different locations namely
Delmas, Standerton, Lichtenburg, Settlers, Klerksdorp and Kroonstad. During the
2005/2006 season, these trials were repeated using the same 16 hybrids and six locations.
However, Bloemfontein (Bainsvlei) was included as an additional locality. Because of the
high rainfall during the 2005/2006 season (above 600 mm over three months: January,
February and March), trials in four of the locations were lost due to the high occurrence of
Sclerotinia head and stem rot and therefore only seed material harvested at Bloemfontein
and Kroonstad was obtained from PANNAR®. To obtain representative data for statistical
analyses, more data was needed and another year’s trial was planted. The same hybrids
were planted, except for two hybrids (8 and 13) that were substituted because of a lack of
seed. These were planted in Bloemfontein, Delmas, Kroonstad and another new locality,
Koster, during the 2006/2007 season. The other localities were either not planted or trials
failed due to drought. Seed material obtained from PANNAR® included two replications
from Kroonstad and one replication each from Bloemfontein and Koster. Since at least
two replications' data are needed for statistical analyses, seed material obtained from
Bloemfontein and Koster could not be used. During harvest, seed from each plot were
bulked. A representative seed sample from each plot was obtained from PANNAR® and a
random sample of 100 g seed was dehulled and prepared for oil extraction and grounded
with a coffee mill.
3.2.3 Oil extraction and fractionation
Total lipid was quantitatively extracted from a ground seed sample (±1 g) from each
hybrid according to Folch et al. (1957). Chloroform and methanol in a ratio of 2:1 was
used. Butylated hydroxy toluene was added to the mixture at a concentration of 0.001%
(v/v) which served as an antioxidant. Samples were left overnight in a refrigerator at 4ºC.
Each sample was filtered into a separating funnel, distilled water added and the funnel
was shaken thoroughly. Samples were left 1 hour for separation of the phases to occur.
The lower phase was drained into a flask and the upper phase discarded. The extracted
samples were dried under vacuum in a rotary evaporator and further dried in a vacuum
oven at 50ºC with anhydrous phosphorus pentoxide as moisture absorbent. The
extractable fat content was determined by weighing and expressed as percentage fat (w/w)

74
per 100 g seed material. From the extracted lipid, ±10 mg was weighed for each sample
and transferred to new glass vials for methylation. These were stored under a blanket of
nitrogen at -20ºC until analysed.
3.2.4 Fatty acid analysis
An amount of ±10 mg of the extracted fat was methylated by using methanol-BF3 (Slover
and Lanza, 1979) to prepare fatty acid methyl esters (FAME) for gas chromatographic
analysis. These were quantified using a Varian GX 3400 flame ionisation gas
chromatograph, with a fused silica capillary column, Chrompack CPSIL 88 (100 m
length, 0.25 mm internal diameter, 0.2 µm thickness). The column temperature was 40-
230ºC (hold 2 minutes 3ºC/min; hold 10 minutes). The FAME in hexane (1 µl) were
injected into the column by use of a Varian 8200 CX Autosampler with a split ratio of
100:1. Both the injection port and detector were maintained at 250ºC. Hydrogen was used
as the carrier gas at 45 psi, while the make-up gas was nitrogen. The chromatograms were
recorded using the Varian Star Chromatography Software. Sample FAME identification
was made by comparing the relative retention times of FAME peaks from samples with
those of standards obtained from SIGMA (189-19). Fatty acids were expressed as the
relative percentage of each individual fatty acid of the total of all fatty acids present in the
sample.
3.2.5 Statistical analysis
ANOVA was done on individual trials followed by a combined analysis across localities
and years (Agrobase, 2005). This gave an indication of significant differences between
measured characteristics for the high oleic, mid oleic and traditional linoleic acid
germplasm as well as GXE interactions. The relative contribution of sources of variation
was calculated by using the sums of squares. Where significant GXE was detected, further
multivariate analysis (AMMI) was done. This gave an indication of the stability of the
varieties for oil and fatty acid content across locations and years (Zobel et al., 1998). The
AMMI analysis provides a biplot of main effects and the first principle component scores
of the interactions (IPCA 1) of both genotypes and environments. The IPCA 1 score is on
the vertical axis and the mean yield on the horizontal. Genotypes or environments that
appear almost on a perpendicular line of the graph have similar means, while those that
fall almost on a horizontal line have similar interaction patterns (Crossa, 1990). High PCA
scores (either negative or positive as it is a relative value) indicate the specific adaption of

75
a genotype to certain environments. The more the IPCA score approximates zero, the
more stable the genotype is over all respective environments. Genotypes or environments
on the right side of the midpoint of the perpendicular line have higher yields than those on
the left side. By using IPCA 1 scores of individual environments in conjunction with
IPCA scores of the genotype, the adaptability of a genotype is determined by
characterisation of environments. Environments can be classified into low or high
potential environments (Crossa, 1990).
3.3 Results
With reference to mean seed yield and mean oil yield per hectare, differences were
observed among locations and seasons (Table 3.3). During the first season (2004/2005)
Standerton and Kroonstad showed the highest mean seed yields of 3.46 and 3.29 t/ha
respectively of the six locations planted. In addition, these two locations also showed the
highest mean oil yields (1.61 and 1.31 t/ha respectively). Delmas and Klerksdorp showed
more or less the same mean yields (2.49 and 2.34 t/ha respectively), but Delmas yielded
slightly more oil (1.08 t/ha) than Klerksdorp (0.86 t/ha). Lichtenburg and Settlers showed
the lowest mean seed yields (2.13 and 1.13 t/ha respectively) and oil yields (0.93 and 0.49
t/ha) of the six locations planted. In the second season (2005/2006) Kroonstad yielded
2.17 t/ha seed and that was more than 1 t/ha less than what was observed the previous
season. Additionally, the mean oil yield (0.83 t/ha) was lower than for the previous
season. Bloemfontein showed lower mean seed yield (1.88 t/ha) and mean oil content
(0.72 t/ha) than Kroonstad. In the third season (2006/2007) Kroonstad showed more or
less the same mean seed yield (2.31 t/ha) and mean oil yield (0.91 t/ha) than the second
season. Bloemfontein also showed similar mean seed (1.84 t/ha) and mean oil (0.77 t/ha)
yields than observed in the second season. The differences observed in mean seed and oil
yields across locations and years showed an association with the amount of rain the
different locations received during the growing season.
Representative seed samples for each hybrid, obtained after harvesting trials at the
different locations and over the three seasons, were analysed for oil content and fatty acid
composition. From the fatty acid analyses, a total of 11 different fatty acids were
identified, but not all hybrids contained all 11. The predominant fatty acids were oleic
(C18:1), linoleic (C18:2), stearic (C18:0) and palmitic (C16:0) acid. Behenic, arachidic,
linolenic, lignoceric and eicosasienoic acid occurred in trace amounts.

76
3.3.1 Separate analyses of variance for six locations: Season of 2004/2005
Oil content
ANOVA for oil content (Table 3.5) indicated significant mean squares (P≤0.05) for
replication at Kroonstad and Klerksdorp. Genotype mean squares were highly significant
at Kroonstad, Delmas and Standerton. Between 59.99-62.48% of the total sum of squares
was accounted for by genotypes at these locations. Large variation was observed among
rankings of genotypes in the different environments, due to the fluctuation of the
genotypes in response to the different environments (Table 3.6). Where significant
genotypic variation occurs, genotypes can be genetically improved for the trait of interest.
Highly significant differences were observed among some of the genotypes, mostly at
Kroonstad, Delmas and Standerton. In general, genotypes did not differ significantly at
Lichtenburg and Settlers. Standerton yielded on average the highest oil content (55.86%),
while Klerksdorp yielded the lowest oil content (45.91%).
Linoleic acid
In the ANOVA for linoleic acid content (Table 3.7), mean squares for genotype were
highly significant at all six locations and 95.81-97.97% of the total variance was
accounted for by genotypes at all six locations. Less variation was observed in the
rankings of genotypes across six locations than observed for oil content (Table 3.8). The
standard linoleic genotypes 1 and 2 ranked first and second respectively across all six
locations with mean linoleic acid contents of 65.31% and 60.27% respectively. Values
measured for these two genotypes were expected for traditional sunflower genotypes. Of
the eight high oleic genotypes, genotype 3, 5, 6, 8 and 14 had low linoleic acid contents as
expected for high oleic sunflower. However, high oleic genotypes 4, 7 and 9 had mid-
level linoleic acid contents (between 20.64-40.74%) that compared well with the mid
oleic genotypes. The mid oleic genotypes had mid-level linoleic acid contents that ranged
between 24.94-39.65%. The lowest average linoleic acid content was observed at
Kroonstad (26.15%) while Klerksdorp displayed the highest average linoleic acid content
(31.18%). Additionally, most hybrids showed higher linoleic acid contents at Kroonstad
compared to the other locations.

77
Table 3.5 Mean squares of oil content for six locations in 2004/2005
Source Kroonstad Delmas Lichtenburg Standerton Klerksdorp Settlers
MS % Variation
MS % Variation
MS % Variation
MS % Variation
MS % Variation
MS % Variation
Rep 16.60* 8.79 0.535 0.21 20.99 9.04 1.70 1.53 21.94* 14.53 0.84 0.82
Genotype 15.11** 59.99 20.76** 62.48 9.23 29.82 9.17** 61.89 4.12 20.49 5.44 40.07
Error 3.93 31.22 6.20 37.30 9.46 61.13 2.71 36.59 6.54 64.98 4.02 59.11
Mean
LSD (Entry)
CV (%)
50.12
3.31
3.96
50.18
4.15
4.96
48.67
5.13
6.32
55.86
2.75
2.95
45.91
4.26
5.57
52.97
3.34
3.78
*P≤0.05, **P≤0.01. MS: Mean squares, Rep: Replication, LSD: Least significant difference, CV: Coefficient of variation.

78
Table 3.6 Mean values and rankings of oil content for six locations in 2004/2005
Genotype Kroonstad Delmas Lichtenburg Standerton Klerksdorp Settlers Mean Rank Mean Rank Mean Rank Mean Rank Mean Rank Mean Rank
1 50.19 10 50.72 6 48.36 11 56.63 5 45.61 11 52.23 12 2 53.98 1 52.98 3 48.42 10 56.26 8 45.25 13 50.88 15 3 51.86 3 45.93 15 50.92 1 56.80 3 44.30 15 52.90 10 4 48.71 13 51.00 5 49.36 7 60.25 1 45.90 9 53.39 7 5 45.11 16 48.66 14 50.04 4 53.43 15 43.40 16 52.82 11 6 49.13 12 50.60 7 47.63 13 54.48 14 45.55 12 53.36 8 7 51.02 7 53.63 2 49.81 6 56.64 4 46.89 3 53.89 5 8 49.65 11 49.23 10 49.95 5 55.22 12 45.05 14 50.38 16 9 47.28 14 49.15 11 45.07 16 55.16 13 45.80 10 53.51 6 10 50.35 9 52.51 4 49.30 8 55.25 11 46.14 6 51.00 14 11 50.83 8 55.68 1 50.21 3 56.20 9 45.91 8 54.26 3 12 51.84 4 45.63 16 50.72 2 55.55 10 47.90 2 54.90 1 13 51.40 6 48.81 12 45.25 15 56.35 6 46.54 4 54.56 2 14 47.05 14 50.00 8 47.29 14 52.21 16 45.99 7 53.15 9 15 52.16 2 49.65 9 47.64 12 56.35 7 46.27 5 52.09 13 16 51.40 5 48.75 13 48.68 9 56.96 2 48.10 1 54.19 4
Average LSD (0.05)
50.12 3.31
50.18 4.15
48.67 5.13
55.86 2.75
45.91 4.26
52.97 3.34
LSD: Least significant difference.

79
Table 3.7 Mean squares of linoleic acid content for six locations in 2004/2005
Source Kroonstad Delmas Lichtenburg Standerton Klerksdorp Settlers
MS % Variation
MS % Variation
MS % Variation
MS % Variation
MS % Variation
MS % Variation
Rep 2.97 0.05 3.19 0.05 6.27 0.08 8.74 0.16 20.15 0.31 2.32 0.04
Genotype 764.45** 96.92 863.03** 95.81 989.37** 97.97 713.11** 97.60 853.58** 97.57 804.92** 97.10
Error 11.96 3.03 18.62 4.13 9.80 1.94 8.20 2.24 9.28 0.02 11.88 2.87
Mean
LSD (Entry)
CV (%)
26.15
5.77
13.23
29.09
7.19
14.84
28.42
5.22
11.02
26.56
4.77
10.78
31.18
5.08
9.77
28.89
5.75
11.93
**P≤0.01. MS: Mean squares, Rep: Replication, LSD: Least significant difference, CV: Coefficient of variation.

80
Table 3.8 Mean values and rankings of linoleic acid content for six locations in 2004/2005
Genotype Kroonstad Delmas Lichtenburg Standerton Klerksdorp Settlers Mean Rank Mean Rank Mean Rank Mean Rank Mean Rank Mean Rank
1 62.45 1 65.34 1 68.31 1 62.26 1 67.34 1 66.18 1 2 56.53 2 58.85 2 65.37 2 52.90 2 65.77 2 62.22 2 3 12.16 13 11.99 13 11.05 13 13.43 12 17.39 13 20.26 12 4 26.99 4 36.68 4 34.34 4 31.89 5 32.29 8 29.00 7 5 14.85 12 10.47 14 16.86 12 13.35 13 20.97 12 15.65 13 6 7.28 15 8.18 15 6.95 15 6.83 16 9.27 16 10.36 15 7 26.42 9 40.74 3 28.38 8 21.71 11 34.58 6 26.79 10 8 6.03 16 14.82 12 5.42 16 6.99 15 10.40 15 6.27 16 9 20.64 11 22.15 11 27.20 10 23.59 10 26.46 11 26.14 11 10 27.51 6 25.34 10 29.64 7 25.77 9 32.77 7 30.25 6 11 24.94 10 31.40 9 26.42 11 28.28 8 28.47 10 28.00 8 12 27.14 7 32.42 6 35.00 3 33.00 4 31.81 9 33.43 5 13 31.03 5 35.91 5 32.68 5 34.31 3 39.65 3 33.67 4 14 7.81 14 6.78 16 7.33 14 9.80 14 11.03 14 11.32 14 15 33.94 3 32.35 7 32.34 6 31.31 6 35.57 4 35.76 3 16 32.60 4 31.99 8 27.42 9 29.59 7 35.05 5 26.95 9
Average LSD (0.05)
26.15 5.77
29.09 7.19
28.42 5.22
26.56 4.77
31.18 5.08
28.89 5.75
LSD: Least significant difference.

81
Oleic acid
Highly significant mean squares (P≤0.01) were observed for replication at Klerksdorp
(Table 3.9). Genotype mean squares were highly significant at all six locations and 95.62-
97.81% of the variance was contributed by genotypes at all six locations. Small variation
was observed in rankings of genotypes across six locations (Table 3.10). The standard
linoleic genotypes 1 and 2 ranked sixteenth and fifteenth for oleic acid and this was
expected from the negative correlation between oleic and linoleic acid content. The high
oleic genotypes (except for genotypes 4 and 7) ranked the highest at all six locations for
oleic acid content. The high oleic genotypes (3, 5. 6, 8 and 14) had significantly higher
oleic acid percentages than the mid oleic and linoleic acid genotypes. The oleic acid
contents of the high oleic genotypes 4, 7 and 9 compared well with mid oleic hybrids with
oleic acid contents between 55-75%. However, genotype 7 ranked first in Settlers with an
oleic acid content of 82.58%. The mid oleic genotypes ranged between 51.26-63.93%.
Generally, genotypes had lower oleic acid contents in Klerksdorp compared to the other
five localities. Klerksdorp, as a result, yielded the lowest mean oleic acid content
(55.83%), while Kroonstad yielded the highest average oleic acid content (62.58%).
Palmitic acid
Highly significant replication mean squares were evident at Klerksdorp (Table 3.11).
Genotype mean squares were highly significant at all six locations and 57.22-93.97% of
the total variance was accounted for by genotypes at all locations. Large variation was
observed among rankings of genotypes across the six locations for palmitic acid content
(Table 3.12). The standard linoleic genotypes 1 and 2 ranked in the top three places for
palmitic acid content across all six locations with contents between 4.72-6.46%. The high
oleic genotypes, with the exception of genotypes 4, 7 and 9 had the lowest rankings for
palmitic acid content. The high oleic genotypes contained on average less than 4%
palmitic acid. The mid oleic genotypes showed mid-level palmitic acid contents since
these contained less palmitic acid than the traditional linoleic genotypes and more
palmitic acid than the high oleic genotypes. The palmitic acid contents of the mid oleic
genotypes ranged between 3.74-4.63%. Kroonstad yielded the lowest average palmitic
acid content (3.81%), while Standerton yielded the highest (4.47%).

82
Table 3.9 Mean squares of oleic acid content for six locations in 2004/2005
Source Kroonstad Delmas Lichtenburg Standerton Klerksdorp Settlers
MS % Variation
MS % Variation
MS % Variation
MS % Variation
MS % Variation
MS % Variation
Rep 2.42 0.04 4.03 0.06 3.77 0.05 8.01 0.13 65.623** 0.90 3.08 0.05
Genotype 798.04** 96.72 892.38** 95.62 1059.40** 97.81 773.44** 97.41 935.86** 96.70 869.84** 96.92
Error 13.39 3.24 20.19 4.33 11.60 2.15 9.76 2.46 11.61 2.40 13.63 3.04
Mean 62.58 60.17 60.35 62.13 55.83 59.19
LSD (Entry) 6.10 7.49 5.68 5.21 5.68 6.16
CV (%) 5.85 7.47 5.64 5.03 6.10 6.24
**P≤0.01, MS: Mean squares, Rep: Replication, LSD: Least significant difference, CV: Coefficient of variation.

83
Table 3.10 Mean values and rankings of oleic acid content for six locations in 2004/2005
Genotype Kroonstad Delmas Lichtenburg Standerton Klerksdorp Settlers Mean Rank Mean Rank Mean Rank Mean Rank Mean Rank Mean Rank
1 25.72 16 23.55 16 19.20 16 25.00 16 18.22 16 20.61 16 2 32.29 15 29.48 15 21.73 15 33.20 15 20.15 15 24.27 15 3 76.34 4 76.49 4 77.63 4 74.70 5 70.46 4 67.32 5 4 61.22 11 52.15 13 54.64 13 57.48 11 52.44 10 59.55 10 5 75.25 5 80.04 3 72.68 5 76.31 4 67.57 5 74.35 4 6 81.44 3 81.27 2 82.49 3 82.39 1 77.82 2 75.83 3 7 61.54 10 48.05 14 59.71 9 66.68 6 51.22 13 82.58 1 8 82.84 1 74.45 5 84.02 1 81.92 2 77.74 3 61.33 7 9 68.12 6 66.37 6 60.80 8 64.84 7 59.91 6 62.29 6 10 61.78 8 63.66 7 59.45 10 62.92 8 54.33 9 57.61 11 11 63.93 7 57.86 9 62.26 6 60.66 9 57.97 7 60.11 9 12 61.68 9 57.46 10 54.22 14 56.43 13 56.12 8 54.54 13 13 58.21 12 53.47 12 56.15 12 54.69 14 47.62 14 55.12 12 14 81.67 2 83.31 1 82.72 2 80.01 3 78.56 1 79.16 2 15 53.56 14 57.25 11 56.32 11 57.14 12 51.60 11 51.26 14 16 56.66 13 57.92 8 61.57 7 59.77 10 51.57 12 61.04 8
Average LSD (0.05)
62.58 6.10
60.17 7.49
60.35 5.68
62.13 5.21
55.83 5.68
59.19 6.16
LSD: Least significant difference.

84
Table 3.11 Mean squares of palmitic acid content for six locations in 2004/2005
Source Kroonstad Delmas Lichtenburg Standerton Klerksdorp Settlers
MS % Variation
MS % Variation
MS % Variation
MS % Variation
MS % Variation
MS % Variation
Rep 0.01 2.46 0.00 0.04 0.05 0.35 0.28 1.94 1.88** 17.45 0.06 0.55
Genotype 0.74** 91.13 1.10** 92.25 1.67** 93.97 1.39** 73.06 0.82** 57.22 1.40** 93.02
Error 0.03 8.41 0.05 7.71 0.05 5.68 0.24 25.00 0.18 25.33 0.05 6.43
Mean
LSD (Entry)
CV (%)
3.81
0.31
4.85
4.03
0.36
5.31
4.26
0.38
5.28
4.46
0.81
10.93
3.98
0.71
10.72
4.19
0.37
5.25
**P≤0.01, MS: Mean squares, Rep: Replication, LSD: Least significant difference, CV: Coefficient of variation.

85
Table 3.12 Mean values and rankings of palmitic acid content for six locations in 2004/2005
Genotype Kroonstad Delmas Lichtenburg Standerton Klerksdorp Settlers Mean Rank Mean Rank Mean Rank Mean Rank Mean Rank Mean Rank
1 4.95 1 5.41 1 5.77 2 6.46 1 4.97 1 5.73 1 2 4.73 2 4.87 2 5.85 1 5.32 2 4.72 3 5.40 2 3 3.31 14 3.28 16 3.52 14 4.70 4 3.46 14 3.80 12 4 3.88 6 4.42 4 4.62 3 4.27 10 4.79 2 4.34 5 5 3.34 13 3.31 15 3.83 12 3.75 15 3.87 10 3.64 13 6 3.29 15 3.38 14 3.59 13 3.66 16 3.46 13 3.46 14 7 3.99 4 4.56 3 4.18 9 4.15 12 4.15 5 3.96 10 8 3.09 16 3.44 12 3.11 16 3.81 14 3.37 15 3.15 16 9 3.81 10 3.93 9 4.60 4 4.55 6 4.03 8 4.17 9 10 3.91 5 3.89 11 4.41 6 4.41 9 4.19 4 4.28 7 11 3.74 11 4.34 5 4.17 10 4.51 7 3.88 9 4.25 8 12 3.83 9 4.01 8 4.57 5 4.46 8 4.05 7 4.52 4 13 3.87 7 4.20 7 4.27 7 4.73 3 4.07 6 4.63 3 14 3.37 12 3.39 13 3.46 15 3.89 13 3.08 16 3.43 15 15 4.05 3 3.89 10 4.21 8 4.56 5 3.81 11 4.33 6 16 3.84 8 4.23 6 4.06 11 4.22 11 3.77 12 3.94 11
Average LSD
3.81 0.31
4.03 0.36
4.26 0.38
4.47 0.81
3.98 0.71
4.19 0.37
LSD: Least significant difference.

86
Stearic acid
Highly significant replication mean squares were indicated at Klerksdorp (Table 3.13).
Genotype mean squares were highly significant at all six locations. Between 60.71-
88.31% of the total variance was accounted for by genotypes at all six locations. Large
variation was observed among rankings of genotypes across the six locations (Table 3.14).
The high oleic genotypes 4 and 7 ranked in the first two places for stearic acid content in
Kroonstad and Klerksdorp. However, genotype 7 ranked second in both Lichtenburg and
Standerton. Klerksdorp yielded the highest average stearic acid content (6.89%), while
Delmas yielded the lowest (4.66%).
3.3.2 Combined analysis of variance across six locations for 2004/2005
The mean squares for environment, genotype and GXE interaction were highly significant
for all five sets of data (Table 3.15). Oil content varied from 48.91% (genotype 5) to
52.18% (genotype 11), with a mean of 50.62% (Table 3.16). Significant differences
occurred between genotypes for oleic and linoleic acid contents. Genotypes 1 and 2 are
standard linoleic genotypes with low oleic (22.05% and 26.69% respectively) and high
linoleic (65.32% and 60.27% respectively) acid contents (Table 3.14). The high oleic
genotypes 6, 8 and 14 yielded oleic acid contents above 80% and linoleic acid contents of
less than 10%. These high oleic genotypes are regarded as high potential oleic acid
genotypes with oleic acid contents above the minimum limit of 75% that is recommended
for high oleic sunflower. The high oleic genotypes 3, 4, 5, 7 and 9 were considered low
potential oleic acid genotypes, since their oleic acid contents were less than the minimum
of 75% accepted for high oleic genotypes. The mid oleic genotypes contained oleic acid
contents of between 54.21-60.46%. The oleic and linoleic acid contents of the mid oleic
genotypes were within the ranges recommended for mid oleic genotypes. With regard to
palmitic acid content, the traditional linoleic genotypes ranked first, while the high oleic
genotypes with the exception of genotypes 4 and 7 ranked last. A negative association
between palmitic and oleic acid content was observed. High oleic genotypes with high
oleic acid potentials had the lowest palmitic acid contents. No specific pattern for stearic
acid was observed concerning the different oleic types.

87
Table 3.13 Mean squares of stearic acid content for six locations in 2004/2005
Source Kroonstad Delmas Lichtenburg Standerton Klerksdorp Settlers
MS % Variation
MS % Variation
MS % Variation
MS % Variation
MS % Variation
MS % Variation
Rep 0.12 2.27 0.01 0.29 0.07 0.10 0.09 2.08 5.98** 20.62 0.13 1.10
Genotype 0.47** 67.48 0.45** 82.20 0.77** 82.84 0.52** 88.31 2.35** 60.71 1.29** 82.40
Error 0.11 30.27 0.05 17.51 0.08 16.15 0.03 9.60 0.36 18.66 0.13 16.50
Mean 5.16 4.66 5.03 4.80 6.89 5.43
LSD (Entry) 0.54 0.36 0.46 0.28 1.00 0.60
CV (%) 6.30 4.68 5.46 3.49 8.72 6.62
**P≤0.01, MS: Mean squares, Rep: Replication, LSD: Least significant difference, CV: Coefficient of variation.

88
Table 3.14 Mean values and rankings of stearic acid content for six locations in 2004/2005
Genotype Kroonstad Delmas Lichtenburg Standerton Klerksdorp Settlers 1
Mean Rank Mean Rank Mean Rank Mean Rank Mean Rank Mean Rank 5.05 11 4.16 15 4.91 10 4.42 12 7.38 5 5.58 7
2 5.28 5 4.80 8 5.54 3 4.88 7 7.38 4 6.37 1 3 5.71 3 5.24 1 5.79 1 5.71 1 6.34 12 6.30 3 4 5.74 2 5.04 3 4.83 12 4.58 10 8.53 1 5.27 11 5 4.45 16 4.12 16 4.23 15 4.40 13 5.66 15 4.13 16 6 5.27 7 4.85 7 4.85 11 4.93 6 7.10 8 4.92 14 7 5.75 1 5.02 4 5.76 2 5.32 2 8.05 2 5.87 4 8 5.27 6 4.91 5 5.22 7 5.31 3 6.27 13 5.43 9 9 5.46 4 5.21 2 5.40 4 5.11 4 7.32 7 5.36 10 10 4.84 14 4.88 6 4.60 13 4.79 9 6.71 10 5.70 5 11 5.17 9 4.48 11 5.09 9 4.57 11 7.47 3 5.59 6 12 4.87 13 4.21 14 4.45 14 4.29 16 6.06 14 5.25 12 13 4.93 12 4.49 10 5.14 8 4.98 5 6.51 11 5.10 13 14 4.47 15 4.25 12 4.08 16 4.31 15 5.05 16 4.19 15 15 5.18 8 4.72 9 5.26 6 4.87 8 7.03 9 5.45 8 16 5.13 10 4.23 13 5.37 5 4.40 14 7.33 6 6.35 2
Average 5.16 4.66 5.03 4.80 6.89 5.43 LSD (0.05) 0.54 0.36 0.46 0.28 1.00 0.60
LSD: Least significant difference.

89
Table 3.15 Mean squares of oil and fatty acid contents over environment for six locations in 2004/2005
Source Mean squares
Oil content Linoleic acid Oleic acid Palmitic acid Stearic acid
Environment 570.10** 162.06** 282.04** 2.53** 31.42**
Rep in Environment 10.43* 7.28 14.49 0.38** 1.07**
Genotype 16.04** 4857.49** 5191.75** 6.33** 3.47**
GXE 9.56** 26.19** 27.44** 0.18** 0.48**
Residual 5.48 11.62 13.36 0.10 0.12
CV (%) 4.62 12.01 6.09 7.72 6.62
*P≤0.05, **P≤0.01, MS: Mean squares, Rep: Replication, LSD: Least significant difference, GXE: Genotype by environment interaction, CV: Coefficient of variation.

90
Table 3.16 Mean values and rankings of oil and fatty acid contents for six locations in 2004/2005
Genotype Oil content Linoleic acid Oleic acid Palmitic acid Stearic acid
1 Mean Rank Mean Rank Mean Rank Mean Rank Mean Rank 50.62 9 65.32 1 22.05 16 5.55 1 5.25 12
2 51.30 5 60.27 2 26.69 15 5.19 2 5.71 3 3 50.45 11 14.38 13 73.82 5 3.68 12 5.85 2 4 51.44 3 31.87 6 56.25 12 4.39 3 5.67 4 5 48.91 16 15.36 12 74.37 4 3.62 13 4.50 15 6 50.13 12 8.15 16 80.21 3 3.47 14 5.32 10 7 51.98 2 29.77 8 58.09 10 4.17 8 5.96 1 8 49.91 13 8.32 15 80.59 2 3.33 16 5.40 8 9 49.33 14 24.36 11 63.72 6 4.18 7 5.64 5 10 50.76 7 28.55 9 59.96 8 4.18 6 5.25 11 11 52.18 1 27.92 10 60.46 7 4.15 9 5.40 9 12 51.09 6 32.13 5 56.74 11 4.24 5 4.86 14 13 50.48 10 34.54 3 54.21 14 4.30 4 5.19 13 14 49.28 15 9.01 14 80.91 1 3.44 15 4.39 16 15 50.69 8 33.54 4 54.52 13 4.14 10 5.42 7 16 51.35 4 30.60 7 58.09 9 4.01 11 5.47 6
Average LSD (0.05)
50.62 1.54
28.38 2.24
60.04 2.40
4.13 0.17
5.33 0.23
LSD: Least significant difference.

91
3.3.3 Separate analyses of variance for two locations: Season of 2005/2006
During this season, the same localities were planted than for the previous season except
for Bloemfontein that was a new location. However, due to the high rainfall during this
season, trials planted at Delmas, Standerton and Klerksdorp failed due to the occurrence
of Sclerotinia head and stem rot. Seed obtained from Lichtenburg included only one
replication and could therefore not be included in the analyses.
Oil content
Replication and genotypic mean squares were significant at Kroonstad and 45.12% of the
total variance was accounted for by genotype (Table 3.17). Large variation was observed
among rankings of genotypes in the two environments (Table 3.18). The standard linoleic
genotypes 1 and 2 ranked second and third at Kroonstad, while at Bloemfontein these
hybrids ranked in the eight and sixth places respectively. The mid oleic genotype 12
ranked first at Kroonstad, but at Bloemfontein it ranked fifth. In Bloemfontein genotype 4
ranked first for oil content, but in Kroonstad it ranked thirteenth. Significant differences
were observed among genotypes at Kroonstad, however, at Bloemfontein, only genotypes
6 and 14 differed significantly from genotype 1. Kroonstad yielded an average oil content
of 49.02%, while that of Bloemfontein was 42.73%.
Table 3.17 Mean squares of oil content for two locations in 2005/2006
Source
Kroonstad Bloemfontein
MS % Variation MS % Variation Rep 17.76* 11.35 4.81 2.01 Genotype 9.42* 45.12 11.45 35.80 Error 4.54 43.53 9.94 62.18 Mean 49.01 42.73 LSD (Entry) 3.55 5.26 CV (%) 4.35 7.38
*P≤0.05, MS: Mean squares, Rep: Replication, LSD: Least significant difference, CV: Coefficient of variation.

92
Table 3.18 Mean values and rankings of oil content for two locations in 2005/2006
Genotype Kroonstad Bloemfontein Mean Rank Mean Rank
1 51.08 2 42.91 8 2 50.94 3 43.25 6 3 48.54 11 44.31 4 4 47.38 13 46.09 1 5 46.35 15 42.61 9 6 49.42 7 39.82 15 7 50.01 5 41.89 13 8 48.93 9 41.90 12 9 47.09 14 41.98 11 10 45.83 16 39.33 16 11 49.39 8 45.45 2 12 52.28 1 43.93 5 13 50.29 4 44.97 3 14 48.17 12 40.08 14 15 49.93 6 42.96 7 16 48.62 10 42.21 10
Average LSD (0.05)
49.02 3.55
42.73 5.258
LSD: Least significant difference.
Linoleic acid
Genotype mean squares were highly significant for both Kroonstad and Bloemfontein.
Genotypes contributed 80.30-93.18% of the total variance at both locations (Table 3.19).
Slight variation was observed between rankings of genotypes 5-16 across the two
locations (Table 3.20). The standard linoleic genotypes 1 and 2 ranked first and second
respectively at both Kroonstad and Bloemfontein for linoleic acid content. However, the
linoleic acid contents of these two genotypes were 10.2% and 13.61% higher at
Bloemfontein than at Kroonstad. The high oleic genotypes (except for genotype 4 at both
locations and genotypes 7 and 9 at Bloemfontein) had linoleic acid contents of less than
25.0%. The mid oleic genotypes (except for genotypes 12 and 13 at Bloemfontein) had
mid-level linoleic acid contents of between 26.0-38.49%. Genotypes 12 and 13 had
slightly higher linoleic acid contents (42.19% and 48.53% respectively) at Bloemfontein.
Most genotypes yielded higher linoleic acid contents at Bloemfontein when compared to
Kroonstad. As a result, Bloemfontein yielded the highest linoleic acid content (33.97%),
while Kroonstad yielded the lowest (27.5%).

93
Table 3.19 Mean squares of linoleic acid content for two locations in 2005/2006
Source
Kroonstad Bloemfontein
MS % Variation MS % Variation Rep 148.07 2.46 10.83 0.11 Genotype 643.98** 80.30 1194.35** 93.18 Error 69.12 17.24 43.01 6.71 Mean 27.50 33.97 LSD (Entry) 13.86 10.94 CV (%) 30.23 19.30
**P≤0.01, MS: Mean squares, Rep: Replication, LSD: Least significant difference, CV: Coefficient of variation.
Table 3.20 Mean values and rankings of linoleic acid content for two locations in
2005/2006
Genotype Kroonstad Bloemfontein Mean Rank Mean Rank
1 61.67 1 71.87 1 2 57.61 2 71.22 2 3 14.08 14 11.90 14 4 32.66 3 49.71 3 5 15.08 13 21.72 12 6 8.17 16 6.68 15 7 22.44 12 31.13 10 8 25.00 10 5.99 16 9 22.94 11 34.14 8 10 27.89 7 33.52 9 11 26.00 9 37.37 7 12 32.21 4 42.19 5 13 28.34 6 48.58 4 14 9.36 15 14.33 13 15 27.12 8 38.49 6 16 29.40 5 27.70 11
Average LSD (0.05)
27.50 13.86
33.97 10.94
LSD: Least significant difference.

94
Oleic acid
Highly significant genotype mean squares were seen at both Kroonstad and Bloemfontein
and 79.78-93.02% of the variance was contributed by genotype at both locations (Table
3.21). Slight variation was observed in rankings of some genotypes across the two
locations (Table 3.22). Only genotypes 1, 2, 4 and 6 did not differ in their rankings across
both locations. The standard linoleic genotypes 1 and 2 had the lowest oleic acid contents
as expected and ranked sixteenth and fifteenth respectively at both locations. However,
the oleic acid contents of these two genotypes were higher at Kroonstad than at
Bloemfontein.
The oleic acid contents of genotypes 1 and 2 were 13.36% and 17.04% higher at
Kroonstad than at Bloemfontein. The high oleic genotypes had the highest oleic acid
contents as expected and genotypes 3, 6 and 14 had oleic acid contents above 75% at both
locations. However, the high oleic genotype 5 had an oleic acid content of 75.67% at
Kroonstad, but 67.26% at Bloemfontein. An oleic acid content of above 75% is
recommended for genotypes to be regarded as high oleic genotypes. Also, the high oleic
genotype 8 had an oleic acid content of 81.22% at Bloemfontein, while at Kroonstad it
was 63.90% (less than 75%). This indicates that high oleic genotypes have different oleic
acid potentials in different environments. Genotype 4 had an oleic acid content of 55.78%
at Kroonstad, while at Bloemfontein it was 35.08%. This genotype is considered a low
oleic potential genotype with oleic and linoleic acid contents that compare well with those
of mid oleic genotypes. The high oleic genotypes 7 and 9 also had oleic acid contents
(between 52.94-66.83%) that compared to the mid oleic genotypes at both locations. The
mid oleic genotypes had mid-level oleic acid contents of between 36.92-63.08%. In
general, all genotypes (except genotype 8) had higher oleic acid contents at Kroonstad
than at Bloemfontein. The average oleic acid content was the lowest at Bloemfontein
(52.57%) and the highest at Kroonstad (61.88%). It was observed that Kroonstad
promoted higher oleic acid contents, while Bloemfontein promoted higher linoleic acid
contents.

95
Table 3.21 Mean squares of oleic acid content for two locations in 2005/2006
Source
Kroonstad Bloemfontein
MS % Variation MS % Variation Rep 148.72 2.33 12.43 0.12 Genotype 678.18** 79.78 1291.11** 93.02 Error 76.03 17.89 47.63 6.86 Mean 61.88 52.57 LSD (Entry) 14.54 11.51 CV (%) 14.09 13.13
**P≤0.01, MS: Mean squares, Rep: Replication, LSD: Least significant difference, CV: Coefficient of variation.
Table 3.22 Mean values and rankings of oleic acid content for two locations in
2005/2006
Genotype Kroonstad Bloemfontein Mean Rank Mean Rank
1 26.87 16 13.51 16 2 31.40 15 14.36 15 3 75.14 4 74.75 3 4 55.78 14 35.08 14 5 75.67 3 67.26 5 6 81.31 2 80.08 2 7 66.26 6 54.91 7 8 63.90 7 81.22 1 9 66.83 5 52.94 8 10 61.64 10 52.72 9 11 63.08 8 52.11 10 12 56.91 13 44.02 12 13 61.27 11 36.92 13 14 81.35 1 74.64 4 15 62.03 9 47.46 11 16 60.55 12 59.05 6
Average LSD (0.05)
61.88 14.54
52.57 11.51
LSD: Least significant difference.

96
Palmitic acid
Highly significant genotype mean squares were observed at Kroonstad and Bloemfontein
(Table 3.23). Variance due to genotype contributed 59.46-77.22% of the total variance.
Large variation was observed among rankings of some genotypes (4, 6, 8 and 13) across
both locations (Table 3.24). Only genotypes 1, 11 and 14 did not differ in their rankings
across both locations. The standard linoleic genotypes 1 and 2 ranked in the top three
positions for palmitic acid with contents of between 4.99-6.52% at both locations.
However, both genotypes contained more palmitic acid at Bloemfontein than at
Kroonstad. The high oleic genotypes did not differ significantly from the mid oleic
genotypes for palmitic acid content at Kroonstad. However, at Bloemfontein significant
differences were observed among the high and mid oleic genotypes for palmitic acid
content. The high oleic genotypes contained on average less palmitic acid than the
traditional and mid oleic genotypes at both locations. In general, genotypes at Kroonstad
contained less palmitic acid than those at Bloemfontein with the exception of genotypes 6
and 8. The average palmitic acid content observed for Kroonstad was 4.51% and 5.23%
for Bloemfontein.
Stearic acid
Highly significant replication mean squares were evident at Kroonstad. Genotype mean
squares were highly significant at both Kroonstad and Bloemfontein and 83.75-88.85% of
the total variance was accounted for by genotypes at both locations (Table 3.25). Large
variation was observed among rankings of genotypes in the two locations (Table 3.26).
However, only genotypes 4, 11, 15 and 16 did not differ in their rankings at both
locations. The standard linoleic acid genotypes 1 and 2 had higher stearic acid contents at
Bloemfontein than at Kroonstad. Genotype 1 and 2 contained 2.32% and 1.98% more
stearic acid respectively at Bloemfontein than at Kroonstad. These genotypes contained
on average less stearic acid than the high oleic genotypes, but more than the mid oleic
genotypes. The high oleic genotypes had on average the highest stearic acid contents that
ranged between 3.97-8.06% at both locations. The high oleic genotype 4 ranked first in
both locations for stearic acid with contents of 5.58% and 8.06% at Kroonstad and
Bloemfontein respectively. The mid oleic genotypes had on average the lowest stearic
acid contents and ranged between 3.78-7.21% at both locations. In general, all genotypes
contained more stearic acid at Bloemfontein than at Kroonstad. The average stearic acid
content for Kroonstad was 4.52% and 6.55% at Bloemfontein.

97
Table 3.23 Mean squares of palmitic acid content for two locations in 2005/2006
Source
Kroonstad Bloemfontein
MS % Variation MS % Variation Rep 0.22 2.08 0.02 0.01 Genotype 0.83** 59.46 1.59** 77.22 Error 0.27 38.46 0.23 22.77 Mean 4.51 5.23 LSD (Entry) 0.86 0.81 CV (%) 11.49 9.25
**P≤0.01, MS: Mean squares, Rep: Replication, LSD: Least significant difference, CV: Coefficient of variation.
Table 3.24 Mean values and rankings of palmitic acid content for two locations in
2005/2006
Genotype Kroonstad Bloemfontein Mean Rank Mean Rank
1 5.75 1 6.52 1 2 4.99 3 6.26 2 3 3.89 15 4.29 14 4 4.34 9 5.73 5 5 3.97 14 4.75 12 6 4.45 8 4.21 15 7 4.70 5 5.20 8 8 4.77 4 4.54 13 9 4.26 13 5.06 9 10 4.58 7 5.65 6 11 4.27 11 5.01 11 12 5.37 2 5.78 4 13 4.33 10 5.84 3 14 3.72 16 4.12 16 15 4.59 6 5.61 7 16 4.27 12 5.05 10
Average LSD (0.05)
4.51 0.86
5.23 0.81
LSD: Least significant difference.

98
Table 3.25 Mean squares of stearic acid content for two locations in 2005/2006
Source Kroonstad Bloemfontein
MS % Variation MS % Variation Rep 0.28** 5.01 0.12 0.55 Genotype 0.63** 83.75 2.29** 88.85 Error 0.04 11.23 0.14 10.53 Mean 4.52 6.55 LSD (Entry) 0.34 0.61 CV (%) 4.54 5.63
**P≤0.01, MS: Mean squares, Rep: Replication, LSD: Least significant difference, CV: Coefficient of variation.
Table 3.26 Mean values and rankings of stearic acid content for two locations in
2005/2006
Genotype Kroonstad Bloemfontein Mean Rank Mean Rank
1 4.18 13 6.50 10 2 4.78 3 6.76 7 3 5.22 2 6.93 5 4 5.58 1 8.06 1 5 3.97 15 4.47 16 6 4.24 12 6.84 6 7 4.77 5 7.41 2 8 4.62 7 6.53 9 9 4.63 6 6.44 12 10 4.42 10 6.38 13 11 4.78 4 7.01 4 12 3.78 16 6.21 14 13 4.47 9 7.21 3 14 4.04 14 4.82 15 15 4.49 8 6.72 8 16 4.40 11 6.49 11
Average LSD (0.05)
4.52 0.34
6.55 0.61
LSD: Least significant difference.

99
3.3.4 Combined analysis of variance across two locations for 2005/2006
The mean squares for environment were highly significant for all five data sets (Table
3.27). All four major fatty acids showed highly significant variance for genotype. GXE
was significant for linoleic and oleic acid content and highly significant for stearic acid
content. Oil content varied between 42.58% (genotype 10) and 48.10% (genotype 12)
with a mean of 45.87% (Table 3.28). The standard linoleic genotypes 1 and 2 ranked fifth
and fouth respectively for oil content. These genotypes yielded the highest linoleic acid
contents (66.77% and 64.42% respectively) as well as the highest palmitic acid contents
(6.13% and 5.63% respectively). The high oleic genotypes 3, 6 and 14 can be considered
high potential oleic genotypes with high oleic acid contents of 74.95%, 80.70% and
78.00% respectively and linoleic acid contents of less than 13%. The remaining high oleic
genotypes 4, 5, 7, 8 and 9 were considered low potential oleic genotypes since their oleic
acid contents were less than the recommended 75% for high oleic sunflower. Genotype 4
with its low oleic acid content (45.43%) and relatively high linoleic acid content (41.18%)
should be regarded a mid oleic genotype than a high oleic genotype. In addition, this
hybrid had the highest stearic acid content (6.82%) of all genotypes.
Table 3.27 Mean squares of oil and fatty acid contents over environments for two
locations in 2005/2006
Source Mean squares
Oil content Linoleic acid Oleic acid
Palmitic acid Stearic acid
Environment 948.53** 1005.44** 2079.85** 12.18** 98.31** Rep in Environment 11.29 79.45 80.57 0.11 0.20 Genotype 13.67* 1709.24** 1827.01** 2.042** 2.34** GXE 7.19 129.09* 142.27* 0.34 0.58** Residual 7.24 56.06 61.83 0.25 0.09 CV (%) 5.87 24.36 13.74 10.30 5.39
*P≤0.05, **P≤0.01, Rep: Replication, GXE: Genotype by environment interaction, CV: Coefficient of variation.

100
Table 3.28 Mean values and rankings of oil and fatty acid contents for two locations in 2005/2006
Genotype Oil content Linoleic acid Oleic acid Palmitic acid Stearic acid Mean Rank Mean Rank Mean Rank Mean Rank Mean Rank
1 47.00 5 66.77 1 20.19 16 6.13 1 5.34 13 2 47.09 4 64.42 2 22.88 15 5.63 2 5.77 6 3 46.42 8 12.99 14 74.95 3 4.09 15 6.08 3 4 46.73 6 41.18 3 45.43 14 5.04 7 6.82 1 5 44.48 14 18.40 12 71.47 5 4.36 13 4.22 16 6 44.62 12 7.43 16 80.70 1 4.33 14 5.54 9 7 45.95 9 26.79 11 60.59 6 4.95 8 6.09 2 8 45.42 10 15.50 13 72.56 4 4.65 11 5.58 8 9 44.53 13 28.54 10 59.89 7 4.66 9 5.54 10 10 42.58 16 30.70 7 57.18 10 5.12 4 5.40 12 11 47.42 3 30.19 8 57.60 9 4.64 12 5.89 4 12 48.10 1 37.20 5 50.46 12 5.58 3 5.00 14 13 47.63 2 38.46 4 49.10 13 5.08 6 5.84 5 14 44.13 15 11.84 15 78.00 2 3.92 16 4.43 15 15 46.44 7 32.80 6 54.75 11 5.10 5 5.61 7 16 45.42 11 28.55 9 59.80 8 4.66 10 5.45 11
Average LSD (0.05)
45.87 3.11
30.73 8.65
57.22 9.08
4.87 0.58
5.54 0.34
LSD: Least significant difference.

101
3.3.5 Separate analyses of variance for Kroonstad: Season of 2006/2007
Kroonstad was the only environment analysed the third season. Data obtained for
Bloemfontein and Koster included only one replication each and could therefore not be
included for statistical analysis. This trial included only 14 entries. Genotypes 8 and 13
from the previous trials were excluded from this trial because of a shortage of seed during
planting of trials.
Genotype mean squares were highly significant for linoleic, oleic, palmitic and stearic
acid with genotype contributing 59.68-76.72% to the total variance (Table 3.29). Oil
content varied between 47.39% (genotype 11) and 38.63% (genotype 5) (Table 3.30).
Apart from genotype 11 that was significantly better than genotypes 5 and 9, no
significant differences were observed among genotypes for oil content. The standard
linoleic genotypes 1 and 2 ranked second and third for oil content (47.33% and 46.49%
respectively). In addition, these genotypes ranked second and first respectively for linoleic
acid with contents of 47.24% and 50.81% respectively. The high oleic genotypes 3 and 14
had low linoleic acid contents of less than 15% and they had the highest oleic acid
contents (80.26% and 77.71% respectively). These two genotypes were regarded as high
oleic potential genotypes. The rest of the high oleic genotypes had higher linoleic acid
contents of between 20.46-22.19%. The high oleic genotype 4 contained 27.29% linoleic
acid and 61.02% oleic acid content. High oleic genotypes 4, 5, 6, 7 and 9 were regarded as
low oleic potential genotypes since their oleic acid contents were less than the
recommended 75% for high oleic sunflower. Their oleic acid contents (between 61.02-
69.33%) were within the range recommended for mid oleic genotypes. The mid oleic
genotypes 10, 11, 12, 15 and 16 had mid-level oleic acid contents of between 53.17-
65.60%.
The traditional genotypes 1 and 2 yielded the highest palmitic acid contents (5.24% and
5.02% respectively). With the exception of the mid oleic genotype 12 that differed
significantly from the high oleic genotypes 3 and 5, no significant differences were
observed among high and mid oleic genotypes for palmitic acid content. The high oleic
genotype 4 ranked first for stearic acid content (5.64%) and was followed by genotype 3
(5.61%). Some of the genotypes showed significant differences for stearic acid content.
On average, the high oleic genotypes contained more stearic acid than the traditional and
mid oleic genotypes.

102
Table 3.29 Mean squares of oil and fatty acid contents for Kroonstad in 2006/2007
Source Oil content Linoleic acid Oleic acid Palmitic acid Stearic acid
MS % Variation
MS % Variation
MS % Variation
MS % Variation
MS % Variation
Rep 1.41 0.50 66.77 1.79 78.29 2.09 0.20 4.64 0.11 1.58 Genotype 19.18 44.06 422.77** 73.86 429.95** 73.39 0.39** 59.68 0.83** 76.72 Error 12.99 55.50 69.66 24.34 71.83 24.55 0.12 35.69 0.12 21.70 Mean 44.06 27.30 61.83 4.62 4.93 LSD (Entry) 5.83 14.01 14.22 0.58 0.58 CV (%) 7.90 30.57 13.71 7.42 6.96
**P≤0.01, MS: Mean squares, Rep: Replication, LSD: Least significant difference, CV: Coefficient of variation.

103
Table 3.30 Mean values and rankings of oil and fatty acid contents for Kroonstad in 2006/2007
Genotype Oil content Linoleic acid Oleic acid Palmitic acid Stearic acid Mean Rank Mean Rank Mean Rank Mean Rank Mean Rank
1 47.33 2 47.24 2 41.82 13 5.24 1 4.57 9 2 46.49 3 50.81 1 37.73 14 5.02 2 5.18 6 3 44.82 5 8.78 14 80.26 1 4.05 16 5.61 2 4 43.19 11 27.29 6 61.02 10 4.58 9 5.64 1 5 38.63 14 20.46 12 69.33 3 4.14 14 4.43 13 6 44.34 7 21.51 11 67.51 4 4.44 13 5.19 5 7 44.23 8 22.04 10 66.55 5 4.70 6 5.59 4 9 40.14 13 22.19 9 66.18 6 4.64 7 5.60 3 10 45.78 4 23.56 8 65.60 7 4.57 9 4.92 7 11 47.39 1 26.29 7 63.40 8 4.75 5 4.45 12 12 44.11 9 35.89 4 53.72 11 5.00 3 4.13 14 14 41.65 12 12.04 13 77.71 2 4.09 13 4.48 11 15 43.98 10 27.66 5 61.58 9 4.56 10 4.79 8 16 44.72 6 36.43 3 53.17 12 4.96 4 4.53 10
Average LSD (0.05)
44.06 5.84
27.30 14.01
61.83 14.22
4.62 0.58
4.93 0.58
LSD: Least significant difference.

104
3.3.6 Combined analysis of variance for Kroonstad across three years (2004-2007)
Kroonstad was the only locality that had enough data for analysis across three consecutive
years. Trials planted at the rest of the localities either failed due to the occurrence of
Sclerotia disease, or localities were not planted due to unforeseen circumstances. The
mean squares for environment were highly significant for oil content as well as palmitic
and stearic acid contents, with environment contributing 20.45-41.19% to the total
variance. The mean squares for genotype were highly significant for all five data sets. For
the two major fatty acids, linoleic and oleic acid, genotype contributed 85.63% and
85.40% respectively to the total variance, while genotype contributed only 44.64% and
52.46% to the total variance for palmitic and stearic acid. Only 22.35% of the total
variance was accounted for by genotype for oil content. The mean squares for GXE
interaction were significant for linoleic and oleic acid contents (Table 3.31).
The standard conventional genotypes 1 and 2 yielded the highest oil contents (49.54% and
50.47% respectively). However, genotype 2 was not significantly better than six of the
other genotypes (Table 3.32). The two standard linoleic genotypes yielded the highest
linoleic acid contents (57.12% and 54.98% respectively) and these were significantly
better than the rest of the genotypes. These also yielded the lowest oleic acid contents
(31.47% and 33.4% respectively) of all genotypes as expected for traditional sunflower
genotypes. High oleic genotypes 3, 6 and 14 ranked in the top three positions for oleic
acid content. These genotypes were considered high oleic potential genotypes with oleic
acid contents of 77.25%, 76.75% and 80.24% respectively and low linoleic acid contents
of less than 13%. The rest of the high oleic genotypes (4, 5, 7 and 9) were considered low
oleic potential genotypes with oleic acid contents that ranged between 59.34-73.42%. The
linoleic acid contents of these genotypes ranged between 16.80-28.98%.
The standard linoleic genotypes 1 and 2 ranked first and second and yielded palmitic acid
contents of 5.31% and 4.91% respectively. The high oleic genotypes contained on average
the lowest palmitic acid contents, while the standard linoleic genotypes contained on
average the highest palmitic acid content. Significant differences were observed among
some of the genotypes for palmitic and stearic acid content. Genotype 4 ranked first for
stearic acid content (5.65%) and was followed by genotype 3 (5.51%). On average, the
high oleic genotypes had the highest stearic acid contents and were followed by the
standard linoleic and mid oleic genotypes.

105
Table 3.31 Mean squares of fatty acid contents for Kroonstad across three years
Source Oil content Linoleic acid Oleic acid Palmitic acid Stearic acid MS %
Variation MS %
Variation MS %
Variation MS %
Variation MS %
Variation Environment 427.93** 41.19 1.76 0.01 1.82 0.01 7.12** 27.66 4.53** 20.45 Rep in Environment 11.68 3.37 28.88 0.62 31.78 0.66 0.21 2.43 0.16 2.22 Genotype 35.72** 22.35 1832.24** 85.63 1909.17** 85.40 1.77** 44.64 1.79** 52.64 GXE 5.46 6.84 55.66* 5.20 59.63* 5.33 0.15 7.43 0.14 8.47 Residual 6.99 26.25 30.42 8.53 32.03 8.60 0.12 17.85 0.09 16.20 CV (%) 5.55 20.14 9.18 7.93 6.23
*P≤0.05, **P≤0.01, MS: Mean squares, Rep: Replication, GXE: Genotype by environment interaction, CV: Coefficient of variation.

106
Table 3.32 Mean values and rankings of fatty acid contents for Kroonstad across three years
Genotype Oil Content Linoleic acid Oleic acid Palmitic acid Stearic acid Mean Rank Mean Rank Mean Rank Mean Rank Mean Rank
1 49.54 2 57.12 1 31.47 14 5.31 1 4.60 11 2 50.47 1 54.98 2 33.47 13 4.91 2 5.08 5 3 48.41 7 11.67 13 77.25 2 3.75 13 5.51 2 4 46.43 11 28.98 6 59.34 9 4.27 8 5.65 1 5 43.36 14 16.80 11 73.42 4 3.81 12 4.28 13 6 47.63 9 12.32 12 76.75 3 4.06 11 4.90 6 7 48.42 6 23.63 9 64.78 6 4.46 4 5.37 3 9 44.84 13 21.93 10 67.04 5 4.23 10 5.23 4 10 47.32 10 26.32 7 63.01 8 4.35 7 4.73 9 11 49.20 4 25.74 8 63.47 7 4.25 9 4.80 8 12 49.41 3 31.74 4 57.44 11 4.73 3 4.26 14 14 45.62 12 9.74 14 80.24 1 3.73 14 4.33 12 15 48.69 5 29.57 5 59.06 10 4.40 5 4.82 7 16 48.25 8 32.81 3 56.79 12 4.35 6 4.69 10
Average LSD (0.05)
47.68 2.48
27.38 5.18
61.68 5.31
4.33 0.32
4.87 0.28
LSD: Least significant difference.

107
3.3.7 Stability analyses for genotype performance
3.3.7.1 Additive main effects and multiplicative interaction analysis for one year over
six locations (season of 2004/2005)
Oil content
The AMMI analysis of oil content revealed that the IPCA axis 1 and IPCA axis 2
explained 40.52% and 24.37% of the GXE interaction respectively (Table 3.33).
Environments and GXE interaction showed highly significant variation for oil content
(Table 3.34). The standard linoleic genotypes 1 and 2 as well as the high oleic genotypes
4, 5, 8 and 9 were the most stable and widely adapted genotypes for oil content across all
six locations (Figure 3.1). Genotypes are stable when their IPCA 1 scores are close to
zero. However, the high oleic genotypes 6 and 14 as well as the mid oleic genotypes 13
and 15 were relatively stable across environments. From the stable genotypes, only the
standard genotype 1, the high oleic genotype 4 and the mid oleic genotype 15 had average
or above average oil content. Genotype 11 had the highest oil content in the combined
ANOVA (Table 3.16), but was not significantly better than genotypes 2, 4, 7, 10, 12, 15
and 16.
Settlers, Lichtenburg and Klerksdorp showed similar interactions and were the most stable
environments for oil content. However, only Settlers and Standerton occurred in the high
potential area of the biplot. Kroonstad and Standerton showed similar interactions but
were less stable locations. Delmas was an average potential location, but was a highly
unstable for oil content. As a result, Delmas may have a high probability for GXE
interaction. Klerksdorp, Lichtenburg and Kroonstad occurred in the low potential area of
the biplot and were less favourable environments for oil content.

108
Table 3.33 Contribution of IPCA 1 and IPCA 2 to the total variation for GXE
interaction for one year (2004/2005) over six locations
Trait
% GXE explained Cumulative %
IPCA 1 IPCA 2
Oil content 40.52 24.37 64.89 Linoleic acid 48.90 22.18 71.07 Oleic acid 49.45 22.87 72.32 Palmitic acid 46.63 25.58 72.21 Stearic acid 62.97 28.53 91.50
IPCA: Interactive principle component analysis, GXE: Genotype by environment interaction.
Table 3.34 Mean squares of oil and fatty acid contents for the AMMIs for six
locations for season 2004/2005
Source Mean squares
Oil content Linoleic acid Oleic acid Palmitic acid Stearic acid Environments 570.07** 162.03** 282.08** 2.53** 31.41** Reps in environments
10.43
7.28
14.49
0.38
1.07
Genotype 16.03 4857.48** 5191.68** 6.33** 3.46** GXE 9.56** 25.19** 27.44** 0.18** 0.48** IPCA 1 15.29** 50.55** 53.57** 0.32** 1.19** Residual 5.47 11.62 13.36 0.10 0.12 CV (%) 4.62 12.01 6.09 7.72 6.62
**P≤0.01, AMMI: Additive main effects and multiplicative interaction, Reps: Replications, GXE: Genotype by environment interaction, IPCA: Interactive principle component analysis, CV: Coefficient of variation.

109
Figure 3.1 AMMI biplot-1 for the 2004/2005 season for oil content showing means of
genotypes (1-16) and environments plotted against their respective scores
of the first interaction principle component (IPCA-1). A: Delmas, B:
Klerksdorp, C: Kroonstad, D: Lichtenburg, E: Standerton, F: Settlers.
1
2
3
45
7
89
10
6
11
12
13
14
15
16
A
B
C
D
E
F
-1.9
-1.4
-0.9
-0.4
0.1
0.6
1.1
1.6
2.1
2.6
45 47.5 50 52.5 55
IPC
A 1
sco
re
Oil content (%)
45.91 50.62 55.86

110
Linoleic acid
The IPCA axis 1 and IPCA axis 2 explained 48.90% and 22.18% of the GXE interaction
respectively (Table 3.33). Genotypes and environments showed highly significant
variation for linoleic acid content (Table 3.34). Additionally, highly significant GXE
interaction was observed. The standard linoleic genotypes 1 and 2 were close in relation
to each other, indicating similar genetic backgrounds (Figure 3.2). They had the highest
linoleic acid percentages, significantly higher than the remaining 14 genotypes (Table
3.16) as expected for the traditional sunflower genotypes. However, genotype 1 was more
stable and widely adapted than genotype 2 across all six environments. The high oleic
genotype 6 and the mid oleic genotypes 12 and 13 were relatively stable genotypes for
linoleic acid content. From these, genotype 6 had a low linoleic acid (as expected for the
high oleic genotypes) whereas the mid oleic genotypes had above average linoleic acid
contents. The rest of the genotypes showed variation for linoleic acid and were unstable
across environments.
Klerksdorp was the most stable location and was a favourable environment for linoleic
acid content. Delmas and Standerton were average potential locations, but unstable
environments for linoleic acid percentage. Kroonstad was relatively stable, but
unfavourable. Lichtenburg and Settlers showed similar interactions, but was relatively
unstable locations. Genotype 7 was specifically adapted to Delmas.

111
Figure 3.2 AMMI biplot-1 for the 2004/2005 season for linoleic acid content showing
means of genotypes (1-16) and environments plotted against their
respective scores of the first interaction principle component (IPCA-1).
A: Delmas, B: Klerksdorp, C: Kroonstad, D: Lichtenburg, E: Standerton, F:
Settlers.
1
2
3
4
5
7
8
910
6
11
12
13
14
15
16
A
B
C
D
E
F
-1.9
-1.4
-0.9
-0.4
0.1
0.6
1.1
1.6
2.1
2.6
3.1
3.6
7.5 12.5 17.5 22.5 27.5 32.5 37.5 42.5 47.5 52.5 57.5 62.5
IPC
A 1
sco
re
Linoleic acid (%)8.14 28.38 65.31

112
Oleic acid
The IPCA axis 1 and IPCA axis 2 explained 49.45% and 22.87% of the GXE interaction
respectively (Table 3.33). Genotypes and environments showed highly significant
variation for oleic acid content (Table 3.34). Additionally, highly significant GXE
interaction was observed. The standard linoleic genotypes 1 and 2 were closely grouped
as expected for these two genotypes. They contained the lowest oleic acid contents
because of the negative correlation between oleic and linoleic content. From these,
genotype 1 was more stable than genotype 2 for oleic acid content and showed good
adaptability across the six environments (Figure 3.3). As observed for linoleic acid
content, the high oleic genotype 6 and the mid oleic genotypes 12 and 13 have shown
relatively good stability for oleic acid content. The rest of the genotypes showed variation
for oleic acid content and were unstable across the six environments.
Klerksdorp and Kroonstad were the most stable environments relating to oleic acid
content, however, only Kroonstad occurred in the high potential area of the biplot and this
would be the location to select from. Delmas, Lichtenburg and Standerton were unstable
locations for oleic acid content but, they showed average potentials for oleic acid content.
Settlers was a more favourable environment, but was an unstable location for oleic acid
content.
Palmitic acid
The IPCA axis 1 and IPCA axis 2 explained 46.63% and 22.58% of the GXE interaction
respectively (Table 3.33). Genotypes and environments showed highly significant
variation for palmitic acid content (Table 3.35). Highly significant GXE interaction was
also observed. The standard linoleic genotypes 1 and 2 grouped in the high potential area
of the biplot (Figure 3.4). These two genotypes had above average palmitic acid contents.
Genotype 2 was stable and widely adapted across all six locations for palmitic acid
content, but genotype 1 was unstable. The high oleic genotypes 8 and 9 were the most
stable and widely adapted, followed by genotypes 5, 6 and 14. The rest of the high oleic
genotypes (3, 4 and 7) were unstable. Except for genotype 4, all high oleic genotypes had
below average palmitic acid contents. The mid oleic genotypes grouped together and
showed more or less average palmitic acid contents. From these, genotypes 10, 11 and 12
were the most stable mid oleic genotypes for palmitic acid content.

113
Figure 3.3 AMMI biplot-1 for the 2004/2005 season for oleic acid content showing
means of genotypes (1-16) and environments plotted against their
respective scores of the first interaction principle component (IPCA-1).
A: Delmas, B: Klerksdorp, C: Kroonstad, D: Lichtenburg, E: Standerton, F:
Settlers.
12
3
4
5
7
8
9
10
6
11
12
13
1415
16
A
B
C
D
E
F
-3.7
-3.2
-2.7
-2.2
-1.7
-1.2
-0.7
-0.2
0.3
0.8
1.3
1.8
2.3
2.8
21 31.5 42 52.5 63 73.5
IPC
A 1
sco
re
Oleic acid (%)
22.05 60.04 80.90

114
Figure 3.4 AMMI biplot-1 for the 2004/2005 season for palmitic acid content
showing means of genotypes (1-16) and environments plotted against
their respective scores of the first interaction principle component
(IPCA-1). A: Delmas, B: Klerksdorp, C: Kroonstad, D: Lichtenburg, E:
Standerton, F: Settlers.
1
2
3
4
5
7
8
9
106
11 12
1314
15
16
A
B
C D
E
F
-1
-0.8
-0.6
-0.4
-0.2
0
0.2
0.4
0.6
0.8
3.2 3.7 4.2 4.7 5.2 5.7
IPC
A 1
sco
re
Palmitic acid (%)
3.32 4.13 5.55

115
Klerksdorp and Settlers were the most unstable environments for palmitic acid content.
However, from these Settlers was a more favourable environment for palmitic acid
content. Kroonstad and Lichtenburg showed similar interaction and these two locations
were the most stable. However, Lichtenburg was a more favourable environment for
palmitic acid content, while Kroonstad was a less favourable environment.
Stearic acid
The IPCA axis 1 and IPCA axis 2 explained 62.97% and 28.53% of the GXE interaction
respectively (Table 3.33). Genotypes and environments showed highly significant
variation for stearic acid content (Table 3.34). Additionally, highly significant GXE
interaction was observed. The high oleic genotypes 6 and 9 as well as the mid oleic
genotypes 10 and 15 were the most stable and widely adapted genotypes for stearic acid
content across all six environments analysed (Figure 3.5). However, from these only
genotypes 9 and 15 had above average stearic acid contents. The rest of the genotypes
were unstable for stearic acid content.
Kroonstad and Standerton were the most stable locations for stearic acid content.
However, Kroonstad was a less favourable environment for stearic acid content.
Klerksdorp was the most favourable location for stearic acid content, but it was highly
unstable. Lichtenburg was a relatively stable location, but a less favourable environment
for stearic acid content. Delmas and Settlers occurred in the low potential are of the biplot
and were unstable locations for stearic acid content.

116
Figure 3.5 AMMI biplot-1 for the 2004/2005 season for stearic acid content showing
means of genotypes (1-16) and environments plotted against their
respective scores of the first interaction principle component (IPCA-1).
A: Delmas, B: Klerksdorp, C: Kroonstad, D: Lichtenburg, E: Standerton, F:
Settlers.
1
2
3
4
5
7
8
9
10
6
11
12
13
14
15
16
A
B
C
D
E
F
-1.45
-0.95
-0.45
0.05
0.55
4 4.5 5 5.5 6 6.5 7
IPC
A 1
sco
re
Stearic acid (%)
4.39 5.33 6.89

117
3.3.7.2 Additive main effects and multiplicative interaction analysis over three
years for Kroonstad (seasons of 2004 to 2007)
Oil content
IPCA axis 1 explained 68.33% of the GXE interaction and IPCA axis 2 31.67% (Table
3.35). Genotype and environment indicated highly significant variation for oil content
(Table 3.36). However, GXE interaction was non-significant for oil content across the
three seasons. The standard linoleic genotypes 1 and 2, the high oleic genotypes 4, 6 and 7
and the mid oleic genotype 15 were the most stable and widely adapted genotypes for oil
content across the three seasons at Kroonstad (Figure 3.6). The standard genotypes 1 and
2 had the highest oil contents across the three seasons; however, genotype 2 was not
significantly better than the high oleic genotypes 3 and 7, and the mid oleic genotypes 11,
12, 15 and 16 (Table 3.32). The high oleic genotypes 5, 9 and 14 showed below average
oil contents and were unstable genotypes. The high oleic genotype 10 had an average oil
content, but was highly unstable.
The year effect was not consistent for Kroonstad. During the first season (2004/2005)
Kroonstad was a stable and high potential location. However, during the second season
(2005/2006) it was a high potential but unstable location. In the third season (2006/2007)
it was a low potential and unstable location and selection of adapted genotypes for
Kroonstad during that season would be inefficient. In an unstable environment, more
interaction occurs among genotypes and the environment and therefore it would be
difficult to select adapted genotypes.
Table 3.35 Contribution of IPCA 1 and IPCA 2 to the total variation for GXE
interaction for three years (2004/2005) and one location
Trait
% GXE explained Cumulative %
IPCA 1 IPCA 2
Oil content 68.33 31.67 100.00 Linoleic acid 85.54 14.46 100.00 Oleic acid 84.45 15.55 100.00 Palmitic acid 59.92 40.08 100.00 Stearic acid 62.52 37.48 100.00
IPCA: Interactive principle component analysis, GXE: Genotype by environment interaction.

118
Table 3.36 Mean squares of fatty acid contents for the AMMIs for Kroonstad for
three seasons
Source Mean squares
Oil content Linoleic acid Oleic acid Palmitic
acid Stearic acid
Environments 427.93** 1.76 1.82 7.12** 4.53** Reps within environments
11.68
28.88
31.78
0.21
0.16
Genotype 35.72** 1832.24** 1909.20** 1.77** 1.79** GXE 5.46 55.66* 59.62* 1.25 0.14 IPCA 1 6.93 88.43** 93.50** 0.16 0.17* IPCA 2 3.75 17.44 20.09 0.13 0.12 Residual 6.99 30.42 32.03 0.12 0.09 CV (%) 5.55 20.14 9.18 7.93 6.23
*P ≤0.05, **P≤0.01, AMMI: Additive main effects and multiplicative interaction, Reps: Replications, GXE: Genotype by environment interaction, IPCA: Interactive principle component analysis, CV: Coefficient of variation.
Linoleic acid
IPCA axis 1 explained 85.54% of the GXE interaction (Table 3.35). Highly significant
variation occurred among genotypes for linoleic acid content across the three years (Table
3.36). In addition, significant GXE interaction was also observed. The standard linoleic
genotypes 1 and 2 showed the highest linoleic acid contents as expected. However, these
genotypes were highly unstable for linoleic acid content across the three seasons analysed
at Kroonstad (Figure 3.7). The high oleic genotypes 4, 7 and 9 as well as the mid oleic
genotype 11 were the most stable and widely adapted genotypes for linoleic acid content.
The high oleic genotypes occurred in the low potential area of the biplot as expected for
high oleic genotypes with low linoleic acid contents. The mid oleic genotypes 10, 12, 15
and 16 showed average to above average linoleic acid contents. However, these were
unstable genotypes for linoleic acid content. Kroonstad was an average potential and
unstable location for linoleic acid across all three seasons.

119
Figure 3.6 AMMI biplot-1 for seasons 2004 to 2007 for oil content showing means of
genotypes (1-16, without 8 and 13) and environments plotted against their
respective scores of the first interaction principle component (IPCA-1).
KSTD 1: Kroonstad season 1, KSTD 2: Kroonstad season 2, KSTD 3:
Kroonstad season 3.
12
3
4
5
7
9
10
11
6
12
14
15
16KSTD 1
KSTD 2
KSTD 3
-1.95
-1.45
-0.95
-0.45
0.05
0.55
1.05
1.55
43 44.5 46 47.5 49 50.5
IPC
A 1
sco
re
Oil content (%)
43.36 47.68 50.47

120
Figure 3.7 AMMI biplot-1 for seasons 2004 to 2007 for linoleic acid content showing
means of genotypes (1-16, without 8 and 13) and environments plotted
against their respective scores of the first interaction principle component
(IPCA-1). KSTD 1: Kroonstad season 1, KSTD 2: Kroonstad season 2,
KSTD 3: Kroonstad season 3.
1
2
3
4
5
7
9
10
11
6
12
14
15
16
KSTD 1
KSTD 2
KSTD 3
-2.8
-2.3
-1.8
-1.3
-0.8
-0.3
0.2
0.7
1.2
1.7
2.2
2.7
3.2
3.7
9 14.5 20 25.5 31 36.5 42 47.5 53
IPC
A 1
sco
re
Linoleic acid (%)
9.74 27.38 57.12

121
Oleic acid
IPCA axis 1 explained 84.45% of the GXE interaction (Table 3.35). Highly significant
variation was observed between genotypes for oleic acid content and GXE interaction was
also significant (Table 3.36). The standard linoleic genotypes 1 and 2 occurred in the low
potential area of the biplot for oleic acid content (Figure 3.8). This was the result of the
negative correlation between oleic and linoleic acid content. Genotype 2 showed better
stability for oleic acid then genotype 1, nonetheless, both were unstable for oleic acid
content. These two genotypes showed the same instability for oleic acid content as
observed for linoleic acid content. The high oleic genotypes 4, 7, and 9 as well as the mid
oleic genotype 11 were the most stable and adapted genotypes for oleic acid content
across the three seasons at Kroonstad. This observation was in correlation with that
observed for linoleic acid content. The high oleic genotypes 3, 5, 6 and 14 occurred in the
high potential area of the biplot as expected for high oleic genotypes. However, these
genotypes were unstable for oleic acid content. The mid oleic genotypes 10, 12, 15 and 16
had more or less average oleic acid contents. These were also unstable for oleic acid
content. This observation was in correlation with that observed for linoleic acid content.
Kroonstad was an average potential and unstable location for oleic acid percentage across
the three seasons.
Palmitic acid
IPCA axis 1 explained 59.92% of the GXE interaction and IPCA axis 2 40.08% (Table
3.35). Genotype and environment showed highly significant variation for palmitic acid
content (Table 3.36). However, GXE interaction was non-significant. The standard
linoleic genotypes 1 and 2 occurred in the high potential area of the biplot and had the
highest palmitic acid contents across all three seasons at Kroonstad (Figure 3.9).
However, these genotypes were unstable for palmitic acid content. The high oleic
genotypes 3, 5 and 7 as well as the mid oleic genotypes 10 and 15 were the most stable
and widely adapted genotypes for palmitic acid content. From these, genotypes 7, 10 and
15 had above average palmitic acid percentages. Except for genotype 7, all high oleic
genotypes had below average palmitic acid contents. The mid oleic genotypes 9, 11 and
16 had more or less average palmitic acid contents and these, together with genotype 12
that occurred in high potential area of the biplot, were unstable genotypes for palmitic
acid content.

122
Figure 3.8 AMMI biplot-1 for seasons 2004 to 2007 for oleic acid content showing
means of genotypes (1-16, without 8 and 13) and environments plotted
against their respective scores of the first interaction principle component
(IPCA-1). KSTD 1: Kroonstad season 1, KSTD 2: Kroonstad season 2,
KSTD 3: Kroonstad season 3.
1
2
3
4
5
7
9
10
11
6
12
14
15
16
KSTD 1
KSTD 2
KSTD 3
-2.65
-2.15
-1.65
-1.15
-0.65
-0.15
0.35
0.85
1.35
1.85
2.35
2.85
3.35
3.85
30 35.5 41 46.5 52 57.5 63 68.5 74 79.5
IPC
A 1
sco
re
Oleic acid (%)
31.47 61.68 80.24

123
Figure 3.9 AMMI biplot-1 for seasons 2004 to 2007 for palmitic acid content
showing means of genotypes (1-16, without 8 and 13) and environments
plotted against their respective scores of the first interaction principle
component (IPCA-1). KSTD 1: Kroonstad season 1, KSTD 2: Kroonstad
season 2, KSTD 3: Kroonstad season 3.
1
2
3
4
5
7
9
10
11
6
12
14
15
16
KSTD 1
KSTD 2
KSTD 3
-0.5
-0.3
-0.1
0.1
0.3
0.5
0.7
3.6 3.8 4 4.2 4.4 4.6 4.8 5 5.2 5.4
IPC
A 1
sco
re
Palmitic acid (%)
3.72 4.33 5.31

124
During the first season (2004/2005), Kroonstad was a less favourable environment for
palmitic acid content. But, in both the second (2005/2006) and third (2006/2007) seasons,
Kroonstad was more favourable for palmitic acid content. In general Kroonstad was an
unstable location for palmitic acid content across all three seasons.
Stearic acid
IPCA axis 1 explained 62.52% of the GXE interaction and IPCA axis 2 37.48% (Table
3.35). Genotype and environment showed highly significant variation for stearic acid
content (Table 3.36). However, GXE interaction was non-significant. The standard
linoleic genotypes 1 and 2 showed good stability and adaptability across the three seasons
at Kroonstad (Figure 3.10). However, genotype 1 had below average stearic acid content,
while genotype 2 had above average stearic acid content. The high oleic genotypes 3, 5
and 14 were stable genotypes across the three seasons. However, from these only
genotype 3 had above average stearic acid content. The high oleic genotypes 4, 6, 7 and 9
had above average stearic acid contents, but were unstable genotypes. Genotype 4 had the
highest stearic acid content of all genotypes. The mid oleic genotypes 10, 12 and 15 were
relatively stable, but genotypes 9, 11 and 16 were unstable. From all mid oleic genotypes,
only genotype 9 had above average stearic acid content.
In the first season (2004/2005) Kroonstad was a highly favourable environment for stearic
acid content and was a relatively stable location. However, in the second season
(2005/2006) Kroonstad was a less favourable environment and a highly unstable location
for stearic acid content. In the third season (2006/2007) Kroonstad was again a more
favourable environment for stearic acid content, but was a highly unstable location.

125
Figure 3.10 AMMI biplot-1 for seasons 2004 to 2007 for stearic acid content
showing means of genotypes (1-16, without 8 and 13) and environments
plotted against their respective scores of the first interaction principle
component (IPCA-1). KSTD 1: Kroonstad season 1, KSTD 2: Kroonstad
season 2, KSTD 3: Kroonstad season 3.
1
2 3
4
14
7
9
10
11
6
12
5
15
16
KSTD 1
KSTD 2
KSTD 3
-0.65
-0.55
-0.45
-0.35
-0.25
-0.15
-0.05
0.05
0.15
0.25
0.35
0.45
0.55
0.65
0.75
4.1 4.3 4.5 4.7 4.9 5.1 5.3 5.5 5.7
IPC
A 1
sco
re
Stearic acid (%)
4.26 4.87 5.65

126
3.4 Discussion
High and mid oleic acid sunflower hybrids, together with two traditional sunflower
hybrids, were planted in field trials and these were analysed for variance across locations
and years. Significant differences were observed between measured traits for the high and
mid oleic, and traditional sunflower genotypes. Additionally, genotypes responded
differently between locations and years and environmental conditions had a large
influence on the performance of genotypes. Significant GXE interactions were observed
and consequently further multivariate analysis was done in order to determine the stability
and adaptability of genotypes across locations and years for oil and fatty acid content.
An almost linear association between sunflower seed yield and rainfall was observed.
Generally, sunflower seed and oil yield decreased in locations and years with lower
rainfall. This was in agreement with findings in literature (Göksoy et al., 2004; Weiss
2000). In the first season, Standerton, Delmas and Kroonstad received fairly high rainfalls
that resulted in the high mean seed and oil yields observed for these locations. However,
Klerksdorp and Lichtenburg received much more rain than Kroonstad, Delmas and
Standerton, but showed lower seed and oil yields than these three locations. This
observation may be explained by the fact that in locations with high rainfall, low radiation
(because of the cloudy weather) and/or waterlogging conditions might have occurred.
Waterlogging has a direct effect on a range of physiological processes such as respiration
and photosynthesis. Under waterlogging conditions the plant shuts down its stomata in
order to reduce transpiration as a survival mechanism. Consequently, plant growth and
seed development are restricted that may result in lower seed set and as result in lower
seed and oil yields. Grassini et al. (2007) reported that higher than normal rainfall during
seed-filling resulted in reductions of sunflower grain yield. Therefore, in Klerksdorp and
Lichtenburg, high rainfall might have caused restriction in growth and flower
development and consequently lower seed set. This might have caused lower seed and oil
yields.
In the second and third seasons, the lower seed and oil yield observed for Kroonstad,
compared to the first season, was because of the lower rainfall Kroonstad received during
these seasons. However, this association could not be applied to Bloemfontein. Although
Bloemfontein received almost 300 mm rain less during the third season compared to the

127
second season, the mean seed and oil yields remained more or less the same for the two
seasons.
Genotypes used in this study were characterised as standard linoleic, mid oleic and high
oleic acid genotypes according to their pedigrees and genetic backgrounds. The standard
linoleic genotypes 1 and 2 performed as expected for traditional sunflower with regard to
linoleic and oleic acid content. However, the high oleic genotypes showed differences in
their response to oleic and linoleic acid contents among different trials. It has been
previously reported that high oleic genotypes are less variable for oleic acid content than
traditional sunflower genotypes (Lagravere et al., 2000; Laureti and Del Gatto, 2000; Piva
et al. 2000). However, the high oleic acid genotypes have shown large variation for
linoleic and oleic acid content among genotypes and across environments. The low
linoleic acid contents observed for the high oleic genotypes was a result of the negative
correlation between oleic and linoleic acid content. Linoleic and oleic acid contents are
complementary and the increase in one results in a more or less similar decrease of the
other (Lajara et al., 1990). From the eight high oleic genotypes analysed genotype 6 was
the most stable genotype for oleic and linoleic acid content across locations. The other
high oleic genotypes (3, 4, 5, 7 and 14) were highly unstable and showed large variation
across locations for oleic and linoleic acid content. Radíc et al. (2008) also reported
significant differences in oleic acid contents of high oleic acid hybrids among different
locations (Serbia and Argentina). Salera and Baldini (1998) reported unstable oleic acid
contents of high oleic acid hybrids across different environments. From the analysis at
Kroonstad, across years, the high oleic genotype 9 showed good stability for oleic and
linoleic acid content.
According to literature, the high oleic mutation is partially dominant and oleic acid
content is under the control of the allelic pair OL/ol (Tatini, 1995). Whatever the allelic
combinations might be (OL/OL, OL/ol or ol/ol), the expression of the trait is influenced
by the environment (especially temperature) during seed maturation. Variations in the
oleic acid content may either be a function of the allelic combination or temperature.
However, Fernández-Matínez et al. (1993) and Triboï-Blondel et al. (2000) reported the
presence of modifier factors (or genes) that may cause unstable expression of the Ol gene
(Demurin and Skoric, 1996). These modifier factors come from the linoleic parent used to
produce high oleic acid hybrids and cause a reduction of high oleic acid content to

128
intermediate levels in high oleic hybrids. Lagravere et al. (2000) have reported that high
oleic genotypes may have different oleic acid potentials and that genotypes with high
oleic acid potentials are more stable than those with low oleic acid potentials. It is
therefore possible that the unstable high oleic genotypes (3, 4, 5, 7 and 14), that perform
as high oleic genotypes in some environments but as mid oleic genotypes in others, or
over different seasons, may contain these modifier genes that are influenced by the
environment genotypes are grown in.
The most important environmental effects that had an influence on the performance of
genotypes for oil content and fatty acid composition were rainfall, temperature and
planting date. The drier environments (less rain received) as well as the warmer
environments had higher oleic acid contents than those that received more rain or that had
cooler weather during the growing season. For example, Kroonstad received 203.7 mm
rain during the growing season compared to the 612.3 mm rain Bloemfontein received.
Therefore Kroonstad was a much drier location than Bloemfontein and this could explain
the higher oleic acid content observed at Kroonstad and the higher linoleic acid content
observed at Bloemfontein. Baldini et al. (2000; 2002) also observed an increase in oleic
acid content when water stress occurred during seed-filling, while Flagella et al. (2002)
observed a decrease in oleic acid content when irrigation was applied. However, in
another report it was indicated that a severe water deficit during the seed-filling period
caused a reduction in oleic acid content of 10-16% in traditional hybrids and a
concomitant increase of linoleic acid content (Roche et al., 2006).
In addition, different planting dates resulted in trials maturing at different temperatures
that had a large influence on the fatty acid composition of genotypes. It is well known that
when high temperatures occur during sunflower maturation, the seed may contain less oil
and the oleic/linoleic acid ratio is higher (Piva et al., 2000). Trials planted in the
beginning of the season (beginning of November-middle of December) resulted in
maturation of the sunflower plants during February-March when high temperatures
occurred. However, later planting dates (end of January) resulted in maturation of plants
when mean daily temperatures were lower. For example, in the first season, locations
planted in the beginning of the season showed the highest average oleic acid content
(above 60%) per locality, while locations planted later in the season (Klerksdorp and
Settlers) showed the lowest average oleic acid contents (less than 60%). In addition, the

129
high oleic genotypes generally showed higher oleic acid contents in localities planted
earlier. A similar response was observed for linoleic acid content. The traditional and
some of the high and mid oleic genotypes had higher linoleic acid contents in locations
planted later in the season (Klerksdorp and Settlers) than in locations planted earlier
(Kroonstad and Delmas). Lichtenburg was an exception. This location was planted early,
but some of the traditional, high and mid oleic genotypes had higher linoleic acid contents
than in Klerksdorp and Settlers. This might have been the result of the higher rainfall at
Lichtenburg (638.4 mm) that was the highest rainfall of all locations. The high rainfall
might have contributed to the higher linoleic acid contents observed at Lichtenburg.
Also, in the second season, Kroonstad (planted at the beginning of December) was
planted earlier than Bloemfontein (end of January) and as result, genotypes planted at
Kroonstad generally had higher oleic acid contents (average of 61.88%) compared to
those planted at Bloemfontein (52.57%). This effect of planting date on fatty acid
composition was in agreement with the findings of Unger and Thompson (1982), Flagella
et al. (2002) and Qadir et al. (2006). According to these authors, early (or spring)
plantings accumulated higher oleic acid content in comparison with later (autumn)
plantings that accumulated higher linoleic acid contents.
It can therefore be accepted that the unstable high oleic acid genotypes that showed high
oleic acid contents in some locations (but lower oleic acid content in others) may be a
consequence of high temperatures occurring during maturation or less rainfall received at
locations. In addition, these genotypes may contain modifying factors (genes) that make
them more susceptible to environmental influences.
It was difficult to characterise specific genotypes as stable for all oil traits measured and
therefore genotypes that have shown good yield and stability are discussed separately for
each trait. Genotypes that have shown stability across most of the locations and seasons
for oil content and that had average to above average oil contents included the standard
linoleic genotype 1, the high oleic genotypes 6 and 8, and the mid oleic genotype 15. The
linoleic genotype 1 has shown stability across most locations and seasons for linoleic acid
content and had a high linoleic acid content. The high oleic genotypes that have shown
stability across most locations and seasons for oleic acid content and had high oleic acid

130
potentials (oleic acid contents of above 75%) included the high oleic genotypes 6, 8 and
14.
The high oleic genotypes 5 and 9 have shown stability across most locations and seasons
for palmitic acid content and had average to low palmitic acid contents. A negative
association between oleic and palmitic acid content was observed and this indicated that
the higher the oleic acid content, the lower the palmitic acid content. This association
appeared to be genetic and not related to environmental influences. This negative
correlation in high oleic genotypes is generally observed in literature (Martín-Polvillo et
al., 2004; Márquez-Ruiz et al., 2008; Merrill et al., 2008; Codex Alimentarius
Commission, 2009).
Stearic acid showed no consistent association with any of the other fatty acids. This was
not in agreement with the report of Lajara et al. (1990). These authors observed an inverse
correlation between oleic and stearic acid content in traditional sunflower. Genotypes that
have shown stability across most of the locations and seasons for stearic acid content and
that had average to above average stearic acid contents included the high oleic genotype 9
and the mid oleic genotype 10.
Across locations in the first season, all locations were unstable for oil content and only
Standerton and Settlers were favourable environments for oil content. Kroonstad has
shown stability for all fatty acid traits measured. However, Kroonstad was a more
favourable environment for oleic acid content and a less favourable environment for
linoleic, palmitic and stearic acid content. Klerksdorp has shown stability for oleic and
linoleic acid content with average potential for linoleic acid and low potential for oleic
acid content. Lichtenburg was only stable for palmitic acid content. The rest of the
environments were unstable for all oil traits measured. At Klerksdorp, replication showed
significant variation for oil content, palmitic and stearic acid content. This might have
resulted from the position of replications in the field trial. It may happen that some
replications are planted at the border of a trial that is exposed to different environmental
influences for example more wind, sunlight radiation and warmer temperatures. This
resulted in a different response of these replications compared to others planted in the
middle of the field trial.

131
Sunflower oil quality is dependent on the genotype and its interaction with the
environment. For traditional sunflower genotypes, oil quality depends largely on the
environment, which is highly variable among years, locations and sowing dates within a
single year. For stable high oleic sunflower, the genotype can be the main determinant of
oil composition (Flagella et al., 2002). Analyses of the high oleic genotypes over several
generations will permit selection of the most stable genotypes (Triboï-Blondel et al.,
2000). It is recommended that the unstable high oleic genotypes be selected against in the
breeding programme.
3.5 References
Adugna, W. and Labuschagne, M.T. 2002. Genotype-environment interactions and
phenotypic stability analysis of linseed in Ethiopia. Plant Breeding 121: 66-71.
Agrobase, 2005. AGROBASE Generation II User's Manual. Version 11, revised edition.
www.agronomix.com. Agronomix Software Winnipeg, M.B., Canada.
Alza, J.O. and Fernández-Martínez, J.M. 1997. Genetic analysis of yield and related traits
in sunflower (Helianthus annuus L.) in dryland and irrigated environments. Euphytica
95: 243-251.
Baldini, M., Giovanardi, R. and Vannozzi, G.P. 2000. Effects of different water
availability on fatty acid composition of the oil in standard and high oleic sunflower
hybrids. In: Proceedings of the 15th International Sunflower Conference, Toulouse,
France. pp. A79-A82.
Baldini, M., Giovanardi, R., Tahmasebi-Enferadi, S. and Vannozzi, G.P. 2002. Effects of
water regime on fatty acid accumulation and final fatty acid composition in the oil of
standard and high oleic sunflower hybrids. Italian Journal of Agronomy 6: 119-126.
Boshim, K., Churl-Whan, K., Dong-Hee, K. and Jang-Whan, P. 2003. Interpretation of
genotype x environment interaction effects on yield in sesame (Sesamum indicum L.).
In: Sesame and Safflower Newsletter, No. 18, Fernández-Martínez, J. (Ed.). Institute
of Sustainable Agriculture, Spain. pp. 20-24.
Codex Alimentarius Commission. 2009. Codex standard for named vegetable oils.
CODEX STAN 210-1999. www.codexalimentarius.net (13 May 2009).
Crossa, J. 1990. Statistical analysis of mulitlocation trials. Advances in Agronomy 44: 55-
86.

132
De La Vega, A.J. and Chapman, S.C. 2000. Environmental attributes underlying
environmental main-effects and genotype by environment interactions in sunflower.
In: Proceedings of the 15th International Sunflower Conference, Toulouse, France. pp.
D112-D116.
Demurin, Y. and Škorić, D. 1996. Unstable expression of Ol gene for high oleic acid
content in sunflower seeds. In: Proceedings of the 14th International Sunflower
Conference, Beijing, China. International Sunflower Association, Paris. pp. 145-150.
Dijanovic, D., Kraljevic-Balalic, M., Stankovic, V. and Mihajlovic, I. 2004. Stability
parameters of oil and protein content in protein sunflower lines. In: Proceedings of the
16th International Sunflower Conference, Fargo, North Dakota, USA. pp. 573-579.
Dredge, R.D. 2010. Crop estimates committee, Private bag X246, Pretoria, 0001.
Fernández-Martínez, J., Muñoz, J. and Gómez-Arnau, G. 1993. Performance of near-
isogenic high and low oleic acid hybrids of sunflower. Crop Science 33: 1158-1163.
Flagella, Z., Rotunno, T., Tarantino, E., Di Caterina, R. and De Caro, A. 2002. Changes in
seed yield and oil fatty acid composition of high oleic sunflower (Helianthus annuus
L.) hybrids in relation to the sowing date and water regime. European Journal of
Agronomy 17: 221-230.
Folch, J., Lees, M. and Sloone-Stanley, G.M. 1957. A simple method for the isolation and
purification of total lipids from animal tissue. Journal of Biological Chemistry 226:
497-509.
Ghafoor, A., Arshad, I.A. and Muhammad, F. 2005. Stability and adaptability analysis in
sunflower from eight locations in Pakistan. Journal of Applied Science 5: 118-121.
Göksoy, A.T., Demir, A.O., Turan, Z.M. and Dağüstü, N. 2004. Responses of sunflower
(Helianthus annuus L.) to full and limited irrigation at different growth stages. Field
Crops Research 87: 167-178.
Grassini, P., Indaco, G.V., Pereira, M.L., Hall, A. and Trápani, N. 2007. Responses to
short-term waterlogging during grain filling in sunflower. Field Crops Research 101:
352-363.
John, A., Subbaraman, N. and Jebbaraj, S. 2001. Genotype by environment interaction in
sesame (Sesamum indicum L.). In: Sesame and Safflower Newsletter, No. 16,
Fernández-Martínez, J. (Ed.). Institute of Sustainable Agriculture, Spain. pp. 13-15.
Kassa, T.G. 2002. Genetic diversity analysis and genotype x environment interaction in
Ethiopian mustard (Brassica carinata A. Braun). Ph.D. Thesis, University of the Free
State, Bloemfontein, South Africa. 173 pp.

133
Lagravere, T., Champolivier, L., Lacombe, S., Kleiber, D, Bervillé, A. and Dayde, J.
2000. Effects of temperature variations on fatty acid composition in sunflower oil
(Helianthus annuus L.) hybrids. In: Proceedings of the 15th International Sunflower
Conference, Toulouse, France. pp. A73-A78.
Lajara, R., Diaz, U. and Quidiello, R.D. 1990. Definite influence of location and climatic
conditions on the fatty acid composition of sunflower seed oil. Journal of the
American Oil Chemists’ Society 67: 618-623.
Laureti, D. and Del Gatto, A. 2000. Genotype x environment interaction in new sunflower
(Helianthus annuus L.) hybrids. In: Proceedings of the 15th International Sunflower
Conference, Toulouse, France. E IT 14.
Leeuwner, D.V. 2005. Genotype x environment interaction for sunflower hybrids in South
Africa. M.Sc. Dissertation, University of the Free State, Bloemfontein, South Africa.
54 pp.
Márquez-Ruiz, G., Martín-Polvillo, M., Velasco, J. and Dobarganes, C. 2008. Formation
of oxidation compounds in sunflower and olive oils under oxidative stability index
conditions. European Journal of Lipid Science and Technology 110: 465-471.
Martín-Polvillo, M., Márquez-Ruiz, G. and Dobarganes, M.C. 2004. Oxidative stability of
sunflower oils differing in unsaturation degree during long-term storage at room
temperature. Journal of the American Oil Chemists’ Society 81: 577-583.
Merrill, L.I., Pike, O.A., Ogden, L.V. and Dunn, M.L. 2008. Oxidative stability of
conventional and high-oleic vegetable oils with added antioxidants. Journal of the
American Oil Chemists’ Society 85: 771-776.
Piva, G., Bouniols, A. and Mondiès, M. 2000. Effect of cultural conditions on yield, oil
content and fatty acid composition of sunflower kernel. In: Proceedings of the 15th
International Sunflower Conference, Toulouse, France. pp. A61-A66.
Qadir, G., Ahmad, S., Ul-Hassan, F. and Cheema, M.A. 2006. Oil and fatty acid
accumulation in sunflower as influenced by temperature variation. Pakistan Journal of
Botany 38: 1137-1147.
Radić, V., Jocić, S. and Mrda, J. 2008. Effect of environment on the chemical
composition and some other parameters of sunflower seed quality. In: Proceedings of
the 17th International Sunflower Conference, Córdoba, Spain. pp. 747-750.
Roche, J., Bouniols, A., Mouloungui, Z., Barranco, T. and Cerny, M. 2006. Management
of environmental crop conditions to produce useful sunflower oil components.
European Journal of Lipid Science and Technology 108: 287-297.

134
Salera, E. and Baldini, M. 1998. Performance of high and low oleic acid hybrids of
sunflower under different environmental conditions. Note II. Helia 21: 55-68.
Schoeman, L.J. 2003. Genotype x environment analysis in sunflower (Helianthus annuus)
in South Africa. M.Sc. Dissertation, University of the Free State, Bloemfontein, South
Africa. 78 pp.
Slover, H.T. and Lanza, E. 1979. Quantitative analysis of food fatty acids by capillary gas
chromatography. Journal of the Oil Chemists’ Society 56: 933-943.
South African Weather Services (SAWS). 2010. Private bag X097, Pretoria, 0001.
Tatini, W. 1995. High oleic sunflower. Influence of genotype and temperature upon oleic
acid content (In Italian). Sementi Elette 41: 31-32.
Triboï-Blondel, A.-M., Bonnemoy, B., Falcimagne, R., Martignac, M. and Messaoud, J.
2000. The effect of temperature from flowering to maturity on seed composition of
high oleic sunflower inbreds and mid oleic hybrids. In: Proceedings of the 15th
International Sunflower Conference, Toulouse, France. pp. A67-A72.
Unger, P.W. and Thompson, T.E. 1982. Planting date effects on sunflower head and seed
development. Agronomy Journal 74: 389-395.
University of the Free State weather station. 2010. Department of Soil, Crop and Climate
Sciences, Faculty of Natural and Agricultural Sciences, University of the Free State,
Bloemfontein, South Africa.
Weiss, E.A. 2000. Oilseed Crops, 2nd edition. Blackwell Science Ltd. 364 pp.
Zobel, R.W., Wright, M.J. and Gauch, H.G. 1988. Statistical analysis of a yield trial.
Agronomy Journal 80: 388-393.

135
CHAPTER 4
GENETIC ANALYSIS OF SEED OIL QUALITY AND RELATED TR AITS IN
SUNFLOWER EXPOSED TO HEAT STRESS DURING SEED-FILLING
4.1 Introduction
Sunflower has an optimum temperature range for normal growth and development. This
specific temperature is dependent on both the genotype and growth and developmental
stage of the specific genotype. When temperatures exceed the optimal range, temperature
stress is caused, which interferes with the plants’ performance (Škorić, 2009). High
temperature stress occurring during growth and development of plants causes major yield
losses in crops (Burkhanova et al., 2001). Heat stress induces reduction in the duration of
plant growth and development that consequently leads to fewer and smaller plant organs.
Reduced light perception and a shortened life cycle, in turn, influence processes like
transpiration and may lead to a reduction in yield (Amutha et al., 2007). Additionally,
high temperatures during reproductive development often negatively impact fertilisation,
seed-filling and seed composition (Rondanini et al., 2003; Hall, 2004).
Constant high temperatures or brief periods of very high temperatures have different
effects on sunflower seed growth and oil quality. Sunflower oil quality is related to seed
oil content and fatty acid composition and defines the oil’s value for industry (Rondanini
et al., 2003). Constant high temperatures during grain growth modify oil content and fatty
acid composition (Harris et al., 1978; Rawson et al., 1984; Lajara et al., 1990). High
temperatures during the entire growing season or applied from anthesis to maturity can
increase oleic acid content and decrease linoleic acid in standard sunflower cultivars
(Canvin, 1965; Chunfang et al., 1996; Triboï-Blondel et al., 2000). This increase in the
oleic/linoleic acid ratio (unsaturation ratio) may be caused in part by inhibition of the
ODS enzyme, involved in the synthesis of linoleic acid from oleic acid during seed
development. High temperatures strongly inhibit ODS enzyme activity and oleic acid
accumulates (Garcés and Mancha, 1991; Garcés et al., 1992; Sarmiento et al., 1998).
Brief periods of heat stress during the seed-filling period in sunflower produced seed with
lower oil content and altered fatty acid composition, thus lower commercial quality.
According to Rondanini et al. (2003) the period from 12-19 days after anthesis (DAA)
showed the greatest sensitivity to heat stress regarding grain weight responses, while the

136
period from 19-26 DAA showed the greatest sensitivity to oil quality. The threshold
temperature for seed growth responses is 35°C. With current trends toward increased
global temperatures, sunflower breeders may be challenged with defining a suitable
breeding strategy in environments where heat stress may occur. To achieve this, reliable
information on heritability and gene effects on oil quality and related traits under brief
periods of heat stress during the critical seed-filling period is necessary.
The aim of this study was to estimate genetic parameters using 12 F1 high and mid oleic
hybrids from a hierarchal cross (presented by Comstock and Robinson, 1952 as
Experiment 1) of four male and 12 different female lines. These hybrids were evaluated
under heat stress conditions for grain oil quality and related traits.
4.2 Materials and methods
4.2.1 Plant material
Seed material from 12 F1 hybrids were obtained from the PANNAR® breeding station in
Delmas, South Africa. These included mid and high oleic hybrids (Table 4.1) and were
generated by a hierarchical cross of four male inbred lines with 12 different female inbred
lines. Due to confidentiality reasons, names of hybrids and their pedigrees may not be
revealed.
4.2.2 Glasshouse trial
The heat stress and control trials were planted in the glasshouse at the University of the
Free State (Bloemfontein). The F1 seed were sown on 19 February 2007 in polystyrene
seedling trays with Hygrotech seedling mix. This method was used to promote optimal
germination. Seedlings were transplanted 15 days later in 9 l black nursery planting bags.
The bags were filled with Bainsvlei type red soil with fertilizer N:P:K [3:2:1 (25) + 0.5%
Zn] and Curaterr® (2 ml per plant). Two trials were compiled: the first one was a control
and the second the temperature treatment trial. The two trials were planted next to each
other and a randomised complete block design with three replications and eight plants per
replication was used for each trial.

137
Table 4.1 Hierarchical cross of male parents A, B, C and D with 12 different females
Male parent Oleic type Female parent Oleic type Hybrid
A High oleic a High oleic 1 A High oleic b Low oleic 2 A High oleic c Low oleic 3 B High oleic d High oleic 4 B High oleic e High oleic 5 B High oleic f Low oleic 6 C Low oleic g High oleic 7 C Low oleic h High oleic 8 C Low oleic i High oleic 9 D Low oleic j High oleic 10 D Low oleic k High oleic 11 D Low oleic l High oleic 12
Plants were irrigated using computerised drip irrigation pipe lines. Each plant received
350 ml water daily. The minimum and maximum temperature of the glasshouse was set at
18°C and 25°C respectively. Day length was set at 14 hours daylight.
4.2.3 Temperature treatment
All plants reached 50% anthesis between 22 April 2007 and 9 May 2007. Each plant was
labelled at 50% anthesis. Heat treatment for each plant started at 15 DAA (when
flowering of the entire sunflower head was at 50%) and plants were treated in heat
cabinets for 10 consecutive days. Treatment temperatures were set at 24°C (minimum)
and 36°C (maximum). The humidity was 60% and the light intensity 100%. Daylight was
set at 14 hours. All plants in the cabinets were watered daily by hand. After treatment,
plants were returned to the glasshouse to complete their growth cycles. All seed were
harvested on 29 June 2007.
4.2.4 Sunflower head and seed traits
For the total of 576 (288 heat treated and 288 control) plants harvested, the following
traits were measured for each plant:
1. Head diameter was measured in centimetre over the length of the head with a
measuring tape.

138
2. The total number of filled (non-sterile) seeds per head was hand counted for each
head.
3. Twenty-five seed weight was determined in gram on a laboratory scale on 25 non-
sterile seeds, randomly selected from each head.
4. The sterile area of the head was measured in centimetre over the sterile area of the
head with a measuring tape.
4.2.5 Seed oil extraction and fatty acid analysis
Twenty seeds were randomly selected from the outer ring of each sunflower head. The 20
seeds for each of the eight plants per entry per replication were bulked. Lipid extraction
and fatty acid analyses were done for each of the bulked seed samples according to the
methods described in Chapter 3.
4.2.6 Statistical analysis and genetic parameters
ANOVA was performed for the sunflower head and seed traits as well as for the four
major fatty acids using Agrobase (2005). Male and female interaction effects as well as
estimates of variance components for each trait and for each temperature trial were based
on the ANOVA presented in Singh and Chaudhary (1979). The following formulae were
used for estimation of genetic (σ2g), environmental (σ2e) and phenotypic (σ2p) variances:
σ2g = (MS2-MS1)/r
σ2e = MS1
σ2p = σ2g + σ2e
Where MS2 and MS1 are estimates of hybrid mean square and error mean square
respectively and r is the number of replicates.
Estimates of broad sense heritability based on F1 mean basis were calculated for each trait
in both temperature treatments. It is the ratio of genotypic to phenotypic variance:
H2 = σ2g/σ2p

139
4.3 Results
The oleic status of seed from the F1 offspring was determined based on the fatty acid
analysis (Table 4.2). Hybrids that contained more than 70% oleic acid were considered
high oleic hybrids, while the mid oleic hybrids contained between 50%-70% oleic acid.
Hybrids that contained less than 50% oleic acid were regarded as low oleic (linoleic)
hybrids. In the first cross, where the high oleic male parent A was crossed with the high
oleic female parent a, the F1 offspring (hybrid 1) contained an intermediate level of oleic
acid and was regarded a mid oleic hybrid (Tables 4.1 and 4.2). However, when this male
was crossed with low oleic females b and c, the resulting hybrids (2 and 3) contained mid
and low oleic acid levels respectively. When the high oleic male parent B was crossed
with the high oleic female parent d, the resulting hybrid 4 contained a high oleic acid level
and was therefore regarded a high oleic hybrid. Male B crossed with high oleic females e
and f produced hybrids 5 and 6 with intermediate levels of oleic acid. Crosses made
between the low oleic male parent C with three different high oleic acid females (g, h and
i) all resulted in hybrids (7, 8 and 9) containing low levels of oleic acid. In crosses where
the low oleic male parent D was crossed with three different high oleic females (j, k and
l), one hybrid (11) with an intermediate oleic acid level and two hybrids (10 and 12) with
low oleic acid levels resulted.
Table 4.2 Oleic acid types of the F1 offspring from the hierarchal cross between the
male and female inbred lines
Entry Oleic type 1 Mid oleic 2 Mid oleic 3 Low oleic 4 High oleic 5 Mid oleic 6 Mid oleic 7 Low oleic 8 Low oleic 9 Low oleic 10 Low oleic 11 Mid oleic 12 Low oleic

140
4.3.1 Analysis of variance for sunflower head and seed traits
Head diameter
Highly significant differences were observed between replications and treatments for head
diameter (Table 4.3). No significant differences were observed between hybrids.
Significant differences were observed between treatments and the heat treatment caused a
significant average increase in head diameter. The interaction between hybrids and
treatments were not significant and this indicated that all hybrids responded similarly to
the heat stress treatment.
Total number of filled seeds per sunflower head
Significant differences were observed between replications for number of filled seeds per
head. Additionally, highly significant differences were observed between hybrids. This
indicated that selection can be made for improved number of filled seeds per head. No
significant differences were observed between treatments, however, significant
differences were observed for interactions of hybrids with treatments. This indicated that
some hybrids were more sensitive to the heat stress treatment (Table 4.3).
Twenty-five seed weight
Significant differences were observed between hybrids for twenty-five seed weight
indicating genetic variability for this trait. Highly significant differences were observed
for treatments and the heat treatment caused a significant decrease in twenty-five seed
weight. No significant differences were observed for the interaction between hybrids and
treatments for twenty-five seed weight, indicating that all hybrids responded similarly to
the heat stress treatment (Table 4.3).
Head sterile centre diameter
Highly significant differences were observed between hybrids for head sterile area
indicating genetic variability for this trait. Highly significant differences were observed
for treatments with heat treatment causing a significant increase in sterile centre diameter.
This led to a smaller, non-sterile area of the head and as a result, less filled seeds.

141
Table 4.3 Mean squares of sunflower head traits, seed traits and major fatty acid composition for 12 sunflower F1 hybrids analysed at
two temperature treatments
Source
Head and seed traits Oil major fatty acids
Head diameter
Number of seeds
25-seed weight
Head sterile centre diameter
Oil content C16:0 C18:0 C18:1 C18:2
Replications 7.25** 22614.23* 0.10 0.78** 25.04 0.05 0.33 63.90 65.80
Hybrids 2.87 34325.01** 0.09* 0.77** 21.23* 2.60** 4.95** 1203.03** 1196.48**
Treatments 26.22** 8236.28 0.34** 5.94** 667.83** 16.87** 42.72** 2355.03** 3738.26**
Hybrids x
treatments
2.74 12910.76* 0.07 0.18 14.67 0.54 0.28 101.29** 94.88**
Residual 1.37 4974.98 0.03 0.12 9.43 0.29 0.29 22.79 22.95
*P≤0.05, **P≤0.01.

142
No significant differences were observed for the interaction between hybrids and
treatments for twenty-five seed weight indicating that all hybrids responded similarly to
the heat stress treatment (Table 4.3). The sterile centres of sunflower heads could be a
result of low self-fertility, since insect pollination did not occur in the glasshouse.
4.3.2 Analysis of variance for sunflower oil and major fatty acid content
Oil content
Variation among hybrids was significant for oil content (Table 4.3). Additionally, highly
significant differences were observed between treatments. No significant differences were
observed for the interaction between hybrids and treatments for oil content and this
indicated that hybrids responded similarly to heat stress.
Palmitic (C16:0) and stearic (C18:0) acid
Highly significant differences were observed between hybrids for both palmitic and
stearic acid percentage, indicating genetic variability for these fatty acids (Table 4.3).
Highly significant differences occurred between treatments for both palmitic and stearic
acid percentage. No significant differences were observed for the interaction between
hybrids and treatments for palmitic and stearic acid content. This indicated that hybrids
responded similarly to the heat stress treatment.
Oleic acid (C18:1) and linoleic acid (C18:2)
Highly significant differences were observed between hybrids and treatments for both
oleic and linoleic acid percentage (Table 4.3). This is due to the negative correlation
between oleic and linoleic acid. Significant interactions between hybrids and treatments
indicated that both fatty acids in hybrids were highly sensitive to the heat stress treatment.

143
4.3.3 Mean values for sunflower head and seed traits
Head diameter
Within the control, significant differences were observed between some of the hybrids for
head diameter (Table 4.4). Hybrids 1, 2 and 10 ranked in the first three positions for head
diameter, but these were not significantly different from each other and from hybrids 3, 7,
8, 11 and 12. Hybrids 4, 5, 6 and 9 had significantly smaller head sizes than hybrids 1, 2,
and 10. No significant differences were observed between hybrids for head diameter in
the heat treatment. The average of the heat treatment was significantly higher than that of
the control value. The heat treated plants showed an average increase of 1.21 cm in head
diameter (Table 4.5). All hybrids except for hybrids 1 and 10 showed an increase in head
diameter after heat treatment. From these, the high oleic hybrid 4, the mid oleic hybrid 6
and the low oleic hybrid 9 showed significant increases in head diameter after heat
treatment (Table 4.5).
Total number of filled seeds per head
Within the control, significant differences occurred between some of the hybrids (Table
4.6). Hybrid 10 ranked first, but it was not significantly different from hybrids 2, 7 and 8.
The remaining hybrids had significantly smaller numbers of filled seed per head than
hybrid 10. Significant differences were also observed between individual hybrids within
the heat treatment. Hybrids 9 and 10 ranked first and second, but these were not
significantly different from each other and from hybrid 8. The remaining hybrids had
significantly smaller numbers of filled seeds per head than hybrids 9 and 10. The change
in rankings of hybrids indicated that the hybrids responded differently to the heat stress
treatment and interaction occurred between hybrids and treatments. The total number of
filled seeds per head varied between 108 and 465 for hybrids for both the control and the
heat treatment. In general, hybrids showed an average decrease of 21.39 seeds after heat
treatment; however this decrease was non-significant (Table 4.7). All hybrids showed a
decrease in filled seeds per head after heat treatment, except for hybrids 4, 8 and 9 that
showed an increase. Hybrid 9 showed a significant increase in filled seeds after heat
treatment (Table 4.7).

144
Table 4.4 Mean values and rankings of 12 sunflower F1 hybrids for head diameter
analysed at two temperature treatments
Control Heat treatment Rank Hybrid Average* Rank Hybrid Average*
1 1 8.80a 1 6 9.26a 2 10 8.78a 2 3 9.16a 3 2 8.58a 3 8 9.14a 4 8 8.06ab 4 2 9.05a 5 3 8.04ab 5 9 8.96a 6 12 7.84ab 6 12 8.83a 7 7 7.84ab 7 4 8.56a 8 11 7.26ab 8 11 8.36a 9 9 6.43b 9 7 5.20a 10 5 6.35b 10 10 8.17a 11 4 5.53b 11 1 8.04a 12 6 5.51b 12 5 7.78a
LSD (0.05) = 1.92
*Averages followed by the same letter in the same column did not differ significantly at P≤0.05. LSD: Least significant difference.
Table 4.5 Mean values and differences between 12 sunflower F1 hybrids and
treatments for head diameter
Hybrid Control Heat treatment Difference and
significance level 1 8.80 8.04 0.76 2 8.58 9.05 0.46 3 8.04 9.16 1.11 4 5.53 8.56 3.03* 5 6.35 7.78 1.43 6 5.51 9.26 3.75* 7 7.84 8.20 0.36 8 8.06 9.14 1.08 9 6.43 8.96 2.53* 10 8.78 8.18 0.60 11 7.26 8.36 1.10 12 7.84 8.83 0.99
Average 7.42 8.630 1.21*
*P≤0.05.

145
Table 4.6 Mean values and rankings of 12 sunflower F1 hybrids for total number of
filled seeds per head analysed at two temperature treatments
Control Heat treatment Rank Hybrid Average* Rank Hybrid Average*
1 10 465.16a 1 9 413.01a 2 2 324.87ab 2 10 372.70a 3 7 311.53ab 3 8 332.54ab 4 8 304.77ab 4 12 251.88b 5 11 291.94b 5 2 236.79b 6 12 287.81b
262.23b 6 4 235.50b
7 3 7 7 229.97b 8 1 248.39bc 8 11 220.72bc 9 5 242.42bc 9 3 206.36bc 10 9 208.05bcd 10 5 179.15bc 11 6 138.74cd 11 1 163.80bc 12 4 121.97d 12 6 108.79c
LSD (0.05) = 115.92
*Averages followed by the same letter in the same column did not differ significantly at P≤0.05. LSD: Least significant difference.
Table 4.7 Mean values and differences between 12 sunflower F1 hybrids and
treatments for total number of filled seeds per sunflower head
Hybrid Control Heat treatment Difference and
significance level 1 248.39 163.80 84.59 2 324.87 236.79 88.08 3 262.23 206.36 55.87 4 121.97 235.50 113.53 5 242.42 179.15 63.27 6 138.74 108.79 29.95 7 311.53 229.97 81.56 8 304.77 332.54 27.77 9 208.05 413.01 204.96* 10 465.16 372.70 92.70 11 291.94 220.72 71.22 12 287.81 251.88 35.93
Average 267.32 245.93 21.39
*P≤0.05.

146
Twenty-five seed weight
Significant differences were observed between some hybrids within the control (Table
4.8). Hybrid 1 ranked first for twenty-five seed weight; however, this hybrid did not differ
significantly from hybrids 2 and 3. The remaining hybrids had significantly lower twenty-
five seed weights than hybrid 1. No significant differences were observed between
individual hybrids of the heat treatment. The average twenty-five seed weight varied
between 0.65 g to 1.39 g between hybrids for both the control and the treatment. The
average of the heat treatment was significantly lower than the control. The heat treatment
resulted in an average decrease of 0.13 g for twenty-five seed weight (Table 4.9). Except
for hybrids 4, 6 and 9 which showed a non-significant increase in twenty-five seed
weight, most of the hybrids showed a decrease. From these, hybrids 1 and 3 showed a
significant reduction in twenty-five seed weight after the heat treatment.
Head sterile centre diameter
Significant differences were observed between individual hybrids of both the control and
the heat treatment for head sterile centre diameter (Table 4.10). In the control treatment,
hybrids 2, 8, 9 and 10 had relatively large sterile centre diameters and these did not differ
significantly from each other. Hybrid 11 had the smallest sterile centre diameter, but it
was not significantly different from seven other hybrids. In the heat treatment, hybrid 8
had the largest sterile centre diameter and it was not significantly different from hybrids 3,
6 and 9. In both treatments, hybrids 1, 4 and 11 had relatively small head sterile centre
diameters. Large variation was observed between hybrids for head sterile centre diameter.
The average sterile centre diameter varied between 1.46 cm and 2.66 cm for hybrids of
the control and between 1.73 cm and 3.27 cm for the heat treatment. The heat treatment
showed an average significant increase of 0.58 cm in sterile centre diameter compared to
the control. All 12 hybrids showed an increase for this trait after heat treatment and from
these seven were significant (Table 4.11). Hybrid 1 showed a small and insignificant
increase, while hybrid 5 showed the largest increase in sterile centre diameter.

147
Table 4.8 Mean values and rankings of 12 sunflower F1 hybrids for twenty-five seed
weight analysed at two temperature treatments
Control Heat treatment Rank Hybrid Average* Rank Hybrid Average*
1 1 1.39a 1 4 0.93a 2 3 1.18ab 2 2 0.93a 3 2 1.13ab 3 6 0.85a 4 7 0.99b 4 1 0.83a 5 11 0.93bc 5 11 0.79a 6 5 0.84bc 6 12 0.79a 7 10 0.83bc 7 3 0.76a 8 6 0.82bc 8 5 0.74a 9 12 0.81bc 9 7 0.72a 10 8 0.80bc 10 9 0.70a 11 4 0.70bc 11 8 0.70a 12 9 0.65c 12 10 0.69a
LSD (0.05) = 0.30
*Averages followed by the same letter in the same column did not differ significantly at P≤0.05. LSD: Least significant difference.
Table 4.9 Mean values and differences between 12 sunflower F1 hybrids and
treatments for twenty-five seed weight
Hybrid Control Heat treatment Difference and
significance level 1 1.39 0.83 0.56* 2 1.13 0.92 0.20 3 1.18 0.76 0.42* 4 0.70 0.93 0.23 5 0.84 0.74 0.10 6 0.82 0.85 0.03 7 0.99 0.72 0.27 8 0.80 0.70 0.10 9 0.65 0.70 0.05 10 0.83 0.69 0.14 11 0.93 0.79 0.14 12 0.81 0.79 0.02
Average 0.92 0.79 0.13*
*P≤0.05.

148
Table 4.10 Mean values and rankings of 12 sunflower F1 hybrids for head sterile
centre diameter analysed at two temperature treatments
Control Heat treatment Rank Hybrid Average* Rank Hybrid Average*
1 8 2.66a 1 8 3.27a 2 2 2.36ab 2 9 2.87ab 3 10 2.19abc 3 6 2.79ab 4 9 2.16abc 4 3 2.66ab 5 6 1.86bcd 5 5 2.61bc 6 7 1.83bcd 6 10 2.53bc 7 12 1.75cd 7 7 2.51bc 8 3 1.72cd 8 2 2.47bc 9 1 1.69cd 9 4 2.19cd 10 4 1.63cd 10 11 2.17cd 11 5 1.50d 11 12 1.88cd 12 11 1.46d 12 1 1.73d
LSD (0.05) = 0.58
*Averages followed by the same letter in the same column did not differ significantly at P≤0.05, LSD: Least significant difference.
Table 4.11 Mean values and differences between 12 sunflower F1 hybrids and
treatments for head sterile centre diameter
Hybrid Control Heat treatment Difference and significance level
1 1.69 1.73 0.05 2 2.37 2.47 0.11 3 1.72 2.66 0.95* 4 1.63 2.19 0.57 5 1.50 2.61 1.11* 6 1.87 2.79 0.93* 7 1.83 2.51 0.68* 8 2.66 3.27 0.62* 9 2.16 2.87 0.71* 10 2.19 2.53 0.35 11 1.46 2.18 0.72* 12 1.75 1.88 0.13
Average 1.90 2.48 0.58*
* P≤0.05.

149
4.3.4 Mean values for sunflower oil and major fatty acid content
Oil content
Within the control and heat treatments respectively, significant differences were observed
between some individual hybrids for oil content that would allow selection for this trait
under normal and heat stress conditions (Table 4.12). In the control treatment, hybrid 4
ranked first, but it was not significantly different from hybrids 1, 3, 5 and 9. The
remaining hybrids did not differ significantly from each other. In the heat treatment
hybrids 1, 4, 3 and 5 ranked in positions 7-10. Hybrid 9 ranked in the second position but
it was only significantly different from hybrids 11 and 12 that ranked in the last two
positions for oil content. Additionally, hybrid 8 that ranked first in the heat treatment was
only significantly different from hybrids 5, 11 and 12. However, in the control, hybrid 8
ranked seventh and was only significantly different from the top two hybrids (3 and 4).
The average oil content of the control was 28.19%, while that of the heat treatment was
22.10%. The heat stress treatment resulted in a significant decrease of 6.09% in oil
content (Table 4.13). All 12 hybrids showed a reduction in oil content after heat
treatment, but only seven hybrids showed a significant decrease in oil content. These
included hybrids 1, 3, 4, 5, 6, 11 and 12. Of these, hybrid 4 showed the highest decrease
in oil content (11.80%). Hybrids 8 and 10 showed a slight decrease in oil content.
Palmitic acid (C16:0)
Within the control and heat treatments respectively, significant differences occurred
between individual hybrids for palmitic acid content (Table 4.14). In the control
treatment, the low oleic hybrids 3, 7, 8, 9, 10 and 12 ranked in the first six positions and
these did not differ significantly for palmitic acid content. The high and mid oleic hybrids
had significantly lower palmitic acid contents than the low oleic hybrids with the
exception of hybrid 3 that did not differ from mid oleic hybrids 2 and 6. The high and mid
oleic hybrids contained less than 4% palmitic acid, while the low oleic acid hybrids
contained more or less 5% palmitic acid. A similar tendency was observed in the heat
treatment. Low oleic hybrids 3, 7, 8 and 12 ranked in the first four positions and did not
differ significantly from each other. These contained more than 5% palmitic acid. The
high and mid oleic acid hybrids, with the exception of hybrid 1, ranked in the last five
positions with oleic acid contents of 5% and less (Table 4.15). The average of the heat
treatment was significantly higher than the control. The heat treatment showed an average
increase of 0.97% in palmitic acid.

150
Table 4.12 Mean values and rankings of 12 sunflower F1 hybrids for oil content
analysed at two temperature treatments
Control Heat treatment Rank Hybrid Average* Rank Hybrid Average*
1 4 33.95a 1 8 26.05a 2 3 30.46ab 2 9 24.77ab 3 1 29.54abc 3 10 23.17abc 4 5 29.19abc 4 2 22.75abc 5 9 29.06abc 5 6 22.71abc 6 6 27.99bc 6 7 22.69abc 7 8 27.50c 7 3 22.65abc 8 2 27.31c 8 4 22.15abc 9 11 26.70c 9 1 21.52abc 10 7 26.31c 10 5 20.46bcd 11 12 25.43c 11 11 19.69cd 12 10 24.89c 12 12 16.62d
LSD (0.05) = 5.05
*Averages followed by the same letter in the same column did not differ significantly at P≤0.05, LSD: Least significant difference.
Table 4.13 Mean values and differences between 12 sunflower F1 hybrids and
treatments for oil content
Hybrid Control Heat treatment Difference and significance level
1 29.54 21.52 8.02* 2 27.13 22.75 4.56 3 30.46 22.65 7.80* 4 33.95 22.15 11.80* 5 29.19 20.46 8.73* 6 27.99 22.71 5.28* 7 26.31 22.69 3.62 8 27.50 26.05 1.45 9 29.06 24.77 4.29 10 24.89 23.17 1.72 11 26.70 19.69 7.01* 12 25.43 16.62 8.81*
Average 28.19 22.10 6.09*
*P≤0.05.

151
Table 4.14 Mean values and rankings of 12 sunflower F1 hybrids for palmitic acid
content analysed at two temperature treatments
Control Heat treatment Rank Hybrid Average* Rank Hybrid Average*
1 9 5.34a 1 12 6.26a 2 8 5.19a 2 3 5.77ab 3 10 5.02a 3 8 5.71ab 4 12 4.97a 4 7 5.46ab 5 7 4.78ab 5 1 5.33b 6 3 3.99bc 6 10 5.21bc 7 2 3.91bc 7 9 5.10bc 8 6 3.63c 8 2 5.00bc 9 1 3.52c 9 6 4.84bcd 10 5 3.42c 10 5 4.66bcd 11 4 3.23c 11 4 4.37cd 12 11 3.16c 12 11 4.07d
LSD (0.05) = 0.8926
*Averages followed by the same letter in the same column did not differ significantly at P≤0.05, LSD: Least significant difference.
Table 4.15 Mean values and differences between 12 sunflower F1 hybrids and
treatments for palmitic acid content
Hybrid Control Heat treatment Difference and
significance level 1 3.52 5.33 1.81* 2 3.91 5.00 1.09* 3 3.99 5.77 1.78* 4 3.23 4.38 1.14* 5 3.45 4.66 1.21* 6 3.63 4.84 1.22* 7 4.78 5.46 0.68 8 5.19 5.71 0.52 9 5.34 5.10 0.23 10 5.02 5.21 0.19 11 3.16 4.07 0.91* 12 4.97 6.26 1.29*
Average 4.18 5.15 0.97*
*P≤0.05.

152
Eight of the 12 hybrids showed a significant increase in palmitic acid after heat treatment.
Low oleic acid hybrids 7, 8, 9 and 10 showed small and insignificant changes in palmitic
acid content after heat treatment.
Stearic acid (C18:0)
Significant differences were observed between hybrids for stearic acid content in both
treatments (Table 4.16). In both treatments hybrids 1, 3, 4 and 5 ranked in the first four
positions for stearic acid content. The mid oleic hybrid 1 ranked first and was not
significantly different from the low oleic hybrid 3 in the control and the mid oleic hybrid
5 in the heat treatment. Hybrids 2, 7, 10, 11 and 12 ranked in positions 5-9 in both
treatments and did not differ significantly from each other. Hybrids 9, 6 and 8 ranked in
positions 10, 11 and 12 respectively in both treatments. No significant differences were
observed between these hybrids except for hybrid 9 that differed significantly from hybrid
8 in the heat treatment. The average of the heat treatment was significantly higher than the
control (Table 4.17). The heat treatment caused an average increase of 1.56% in stearic
acid. All 12 hybrids showed a significant increase in stearic acid after heat treatment.
Hybrid 5 showed the largest increase (2.53%) in stearic acid content.
Oleic acid (C18:1)
Significant differences were observed between individual hybrids for both treatments
(Table 4.18). The high oleic acid hybrid 4 ranked first in both the control and heat
treatments and had a significantly higher oleic acid content than all 12 hybrids in the
control treatment. In the heat treatment, the value of hybrid 4 was not significantly higher
than mid oleic acid hybrids 1, 5 and 11. Mid oleic acid hybrids 1, 5 and 11 ranked in the
second, third and fourth positions in both treatments. Some of the mid oleic acid hybrids
showed significant differences for oleic acid content. The low oleic acid hybrids ranked in
the last six positions for oleic acid content, however, significant differences were
observed among some of these. The change in rankings of the low oleic hybrids indicated
that these responded differently to the heat stress treatment and an interaction occurred
between hybrids and treatments. The average oleic acid percentage varied between
25.10% and 74.18% for all hybrids for both the control and heat treatment (Table 4.19).
The average of the heat treatment was significantly higher than the control. The heat
treatment caused an average increase of 11.44% in oleic acid. Of the 12 hybrids, seven
showed a significant increase in oleic acid percentage after heat treatment.

153
Table 4.16 Mean values and rankings of 12 sunflower F1 hybrids for stearic acid
content analysed at two temperature treatments
Control Heat treatment Rank Hybrid Average* Rank Hybrid Average*
1 1 7.37a 1 1 8.95a 2 3 6.75ab 2 5 8.33ab 3 4 5.93bc 3 3 7.98bc 4 5 5.80bc 4 4 7.18cd 5 12 5.49cd 5 7 7.07d 6 10 5.47cde 6 10 7.04d 7 11 5.40cde 7 11 6.80de 8 2 5.29cde 8 12 6.77de 9 7 5.10cdef 9 2 6.65de 10 9 4.80def 10 9 6.57de 11 6 4.59ef 11 6 5.94ef 12 8 4.24f 12 8 5.44f
LSD (0.05) = 0.88
*Averages followed by the same letter in the same column did not differ significantly at P≤0.05, LSD: Least significant difference.
Table 4.17 Mean values and differences between 12 sunflower F1 hybrids and
treatments for stearic acid content
Hybrid Control Heat treatment Difference and
significance level 1 7.37 8.95 1.58* 2 5.29 6.65 1.36* 3 6.75 7.98 1.24* 4 5.93 7.18 1.25* 5 5.81 8.33 2.53* 6 4.59 5.94 1.35* 7 5.10 7.07 1.98* 8 4.24 5.44 1.21* 9 4.80 6.57 1.76* 10 5.45 7.04 1.58* 11 5.40 6.80 1.40* 12 5.50 6.77 1.27*
Average 5.52 7.06 1.56*
*P≤0.05.

154
Table 4.18 Mean values and rankings of 12 sunflower F1 hybrids for oleic acid
content analysed at two temperature treatments
Control Heat treatment Rank Hybrid Average* Rank Hybrid Average*
1 4 74.18a 1 4 73.57a 2 11 66.06b 2 1 69.71ab 3 5 63.92bc 3 5 69.43ab 4 1 60.79bc 4 11 66.72abc 5 6 56.64cd 5 6 64.24bc 6 2 50.40d 6 2 60.74c 7 3 36.57e 7 10 52.24d 8 8 34.84e 8 9 49.45de 9 9 29.52ef 9 8 47.84de 10 10 28.74ef 10 12 46.94de 11 12 26.53f 11 7 46.52de 12 7 25.10f 12 3 43.13e
LSD (0.05) = 7.85
*Averages followed by the same letter in the same column did not differ significantly at P≤0.05. LSD: Least significant difference.
Table 4.19 Mean values and differences between 12 sunflower F1 hybrids and
treatments for oleic acid content
Hybrid Control Heat treatment Difference and
significance level 1 60.79 69.71 8.92* 2 50.40 60.74 10.34* 3 36.57 43.13 6.56 4 74.18 73.57 0.61 5 63.92 69.43 5.51 6 56.64 64.24 7.60 7 25.10 46.52 24.42* 8 34.84 47.84 13.00* 9 29.52 49.45 19.93* 10 28.74 52.24 23.50* 11 66.06 66.72 0.66 12 26.53 46.94 20.41*
Average 46.11 57.55 11.44*
*P≤0.05.

155
All hybrids, except for the high oleic hybrid 4, showed an increase in oleic acid after heat
treatment. Additionally, the mid oleic acid hybrid 11 showed only a slight increase in
oleic acid content. For these hybrids the heat treatment did not have a major influence on
the oleic acid content.
Linoleic acid (C18:2)
Significant differences were observed between individual hybrids for both treatments
(Table 4.20). The low oleic acid hybrids ranked in the first six positions in both the
control and the heat treatment. In the control treatment, significant differences were
observed between hybrid 7 and 3 and between hybrid 7 and 8. However, in the heat
treatment, no significant differences were observed among all linoleic acid hybrids. The
change in rankings of the low oleic hybrids indicated that these responded differently to
the heat stress treatment. The mid oleic hybrids 2 and 6 ranked in the seventh and eighth
positions in both treatments and did not differ significantly from each other. Significant
differences were observed between some of the remaining mid oleic acid hybrids in both
treatments. The high oleic acid hybrid 4 ranked in the last position with the lowest linoleic
acid content in both treatments (less than 15%).
The average linoleic acid content varied between 14.21% and 63.12% in the control
treatment, while in the heat treatment the linoleic acid averages were lower and varied
between 12.46% and 40.93% for all 12 hybrids (Table 4.21). The average of the heat
treatment was significantly lower than the control. The heat treatment caused an average
decrease of 14.41% in linoleic acid compared to the control. Of the 12 hybrids, 10 showed
a significant decrease in linoleic acid after heat treatment. Hybrids 4 and 11 showed only
slight decreases in linoleic acid content after heat treatment. For these hybrids,
temperature stress did not have a major influence on the linoleic acid content.
The heat treatment had a significant influence on the oleic and linoleic acid contents of
most hybrids. It resulted in a significant increase in oleic acid and simultaneously a
significant reduction in the linoleic acid contents of most hybrids (Tables 4.19 and 4.21).
Hybrid 10 showed the second highest increase in oleic acid (23.50%) and at the same time
the highest decrease in linoleic acid (25.66%).

156
Table 4.20 Mean values and rankings of 12 sunflower F1 hybrids for linoleic acid
content analysed at two temperature treatments
Control Heat treatment Rank Hybrid Average* Rank Hybrid Average*
1 7 63.12a 1 3 40.93a 2 12 61.48ab 2 8 39.17a 3 10 59.55ab 3 7 39.13a 4 9 59.38ab 4 12 38.14a 5 8 54.57bc 5 9 37.00a 6 3 50.86c 6 10 33.88a 7 2 38.54d 7 2 25.46b 8 6 33.71de 8 6 23.03bc 9 1 26.49ef 9 11 19.74bcd 10 5 25.21f 10 5 15.47cd 11 11 23.49f 11 1 13.27d 12 4 14.21g 12 4 12.46d
LSD (0.05) = 7.87
*Averages followed by the same letter in the same column did not differ significantly at P≤0.05, LSD: Least significant difference.
Table 4.21 Mean values and differences between 12 sunflower F1 hybrids and
treatments for linoleic acid content
Hybrid Control Heat treatment Difference and
significance level 1 26.49 13.26 13.23* 2 38.54 25.46 13.08* 3 50.86 40.93 9.94* 4 14.21 12.46 1.75 5 25.20 15.47 9.73* 6 33.71 23.03 10.68* 7 63.12 39.13 23.99* 8 54.57 39.17 15.40* 9 59.38 37.00 22.38* 10 59.55 33.88 25.66* 11 23.49 19.74 3.74 12 61.48 38.13 23.34*
Average 42.55 28.14 14.41*
*P≤0.05.

157
4.3.5 General and specific combining ability means of F1 sunflower hybrids for
sunflower head and seed traits
The means of F1 hybrids within the crossing pairs were used to determine the general
(GCA) and specific combining ability (SCA) of the parents for the traits studied.
Head diameter
Male A showed the best GCA of all males in the control treatment, however, it was not
significantly better than males C and D (Table 4.22). Male B showed the lowest GCA in
the control treatment and was significantly lower than males A and D. Therefore, when
selecting parents for head diameter under normal temperature conditions, all crosses made
with males A, C and D can be considered. For heat treatment, the four males performed
the same with regards to GCA and male B did not differ significantly from the other
males. As a result, when selecting parents to produce F1 hybrids that will perform good
for this trait under high temperature conditions, male B could be considered even though
it had a poor GCA under normal temperature conditions.
Number of filled seeds per head
Male D showed the best GCA of the males in the control treatment, however, it was not
significantly better than males A and C (Table 4.22). Male B showed the lowest GCA and
was significantly lower than male D. Female j was significantly higher than all females
with regard to SCA for this trait and crosses of male D with female j produced F1 hybrids
with significantly increased number of filled seeds per sunflower head in the control
treatment. In the heat treatment the rankings changed and male C showed the best GCA,
but it was only significantly better than male B. Female i showed the best SCA in a cross
with male C and was significantly better than most of the other females with regard to this
trait. Under high temperature conditions, male C crossed with females h and i would give
the best results. However, when selecting parents to produce F1 hybrids that will perform
well for this trait, male D x female j would be the best choice for normal and high
temperature conditions.

158
Table 4.22 General and specific combining ability means of 12 sunflower F1 hybrids for agronomic traits analysed at two temperature
treatments
Sunflower head and seed traits
Head diameter
Number of filled seeds per head Twenty-five seed weight Sterile centre diameter
Males X Females Control Heat Control Heat Control Heat Control Heat a 8.80 8.04 248.39 163.80 1.39 0.82 3.10 3.24
A b 8.58 9.05 324.87 236.69 1.36 0.92 5.02 5.71 c 8.04 9.16 262.23 206.36 1.18 0.76 3.03 5.75 Mean 8.48 8.75 278.50 202.28 1.31 0.84 3.71 4.90 d 5.53 8.56 121.96 235.50 0.70 0.93 2.33 4.16 B e 6.35 7.78 242.42 179.15 0.84 0.74 2.27 5.66 f 5.51 9.26 138.74 108.79 0.82 0.85 3.06 6.41 Mean 5.80 8.53 167.70 174.48 0.79 0.84 2.56 5.41 g 7.84 8.20 311.53 229.97 0.99 0.72 3.06 5.65 C h 8.06 9.13 304.76 332.54 0.79 0.70 6.15 8.71 i 6.43 8.96 208.06 413.01 0.65 0.70 4.24 7.11 Mean 7.44 8.76 274.78 325.17 0.81 0.71 4.48 7.16 j 8.78 8.17 465.17 372.70 0.83 0.69 3.93 5.34 D k 7.26 8.36 291.94 220.72 0.93 0.79 2.03 3.94 l 7.84 8.83 287.81 235.21 0.80 0.79 2.92 2.99 Mean 7.96 8.45 348.31 276.21 0.86 0.76 2.96 4.09
LSD (0.05) 2.08 1.87 112.66 111.50 0.37 0.27 1.63 2.06
LSD: Least significant difference.

159
Twenty-five seed weight
Male A showed the best GCA in the control treatment and was significantly better than
the other three males for this trait (Table 4.22). Female a showed the best SCA in a cross
with male A and was significantly better than the other females in crosses with their
respective males. However, in the heat treatment, the male parents did not differ
significantly from each other with regard to GCA for this trait. In addition, no significant
differences for SCA were observed between all females in all crosses for twenty-five seed
weight. Under normal temperature conditions, male A x female a and b would be the
choice, while for high temperature conditions, any of the parent crosses can be chosen.
However, when selecting for F1 hybrids that would perform well for this trait under
normal and high temperature conditions, male A x female b would be the choice.
Head sterile centre diameter
Crosses made with male B produced F1 hybrids that showed the lowest average sterile
centre diameters under control treatment conditions (Table 4.22). Male B was the best
male parent with regards to this trait and showed the lowest GCA. However, male B was
only significantly better than male C for this trait. Crosses made between male A x female
b, and male C x females h and i produced F1 hybrids that had significantly larger head
sterile centres than the rest and these crosses should not be considered if the breeder aims
to decrease this trait under normal temperature conditions. The heat treatment previously
caused a significant mean increase in head sterile centre diameter (Table 4.9). Male D was
the best male parent with regards to this trait and showed the weakest GCA. Male D was
also significantly better than male C. When selecting parents to produce F1 hybrids with
decreased head sterile centre under heat treatment conditions, the best crosses would be
male A x female a, and male D x females k and l.
4.3.6 General and specific combining ability means of F1 sunflower hybrids for
sunflower seed oil composition
Oil content
Male B showed the best GCA in the control treatment for oil content, but it was not
significantly different from the other males for this trait (Table 4.23). Female d in a cross
with male B showed significantly better SCA than females g, j, k and l in their respective
crosses.

160
Table 4.23 General and specific combining ability means of 12 F1 sunflower hybrids for seed oil composition at two temperature
treatments
Sunflower seed oil composition
Oil content C16:0 C18:0 C18:1 C18:2
Males X Females Control Heat Control Heat Control Heat Control Heat Control Heat
a 29.54 21.52 3.52 5.33 7.37 8.95 60.79 69.71 26.49 13.26 A b 27.31 22.75 3.91 5.00 5.30 6.65 50.40 60.74 38.54 25.46 c 30.46 22.65 3.99 5.77 6.78 7.98 36.57 43.13 50.86 40.93 Mean 29.10 22.31 3.80 5.37 6.48 7.86 49.25 57.86 38.63 26.55 d 33.95 22.15 3.27 4.37 6.09 7.18 74.18 73.57 14.21 12.46 B e 29.19 20.46 3.45 4.66 5.80 8.33 63.92 69.43 25.20 15.47 f 27.99 22.71 3.62 4.84 4.59 5.94 56.64 64.24 33.71 23.03 Mean 30.38 21.77 3.45 4.63 5.49 7.15 64.91 69.08 27.38 16.99 g 26.31 22.69 4.78 5.46 5.10 7.07 25.10 46.51 63.12 39.13 C h 27.50 26.05 5.19 5.70 4.24 5.44 34.84 47.84 54.57 39.17 i 29.06 24.77 5.33 5.10 4.80 6.56 29.52 49.45 59.38 37.00 Mean 27.62 24.50 5.10 5.42 4.71 6.36 29.82 47.94 59.02 38.43 j 24.89 23.17 5.02 5.21 5.46 7.04 28.74 52.24 59.55 33.88 D k 26.70 19.69 3.16 4.07 5.40 6.80 66.06 66.72 23.49 19.74 l 25.43 16.62 4.97 6.26 5.49 6.77 26.53 46.94 61.48 38.13 Mean 25.67 19.83 4.38 5.18 5.45 6.87 40.44 55.30 48.17 30.59
LSD (0.05) 6.76 2.88 0.70 1.12 0.86 0.90 9.88 5.56 9.65 6.31
LSD: Least significant difference.

161
Therefore when the breeder selects parents to produce F1 hybrids with high oil content
under normal temperature conditions, the choice of parents would be male B crossed with
females d and e, male A crossed with females a and c and male C crossed with female i.
Under heat stress conditions, male C showed the best GCA for oil content. However, male
C was only significantly better than male D. Female h in a cross with male C showed the
best SCA and it was significantly better than the rest of the females (except for female i)
in their respective crosses. As a result, when selecting parents to produce F1 hybrids with
high oil contents under heat stress conditions, the best choices would be male C with
females h and i. In both the control and the heat treatment male D showed the lowest
CGA as well as low SCA used in crosses with some of the females.
Palmitic acid (C16:0)
Male C showed the best GCA in the control treatment and was significantly better than
the other three males for palmitic acid content (Table 4.23). Females g, h and i showed
significantly better SCA in crosses made with male C compared to the crosses made with
males A and B. Therefore, when the breeder aims to increase palmitic acid content under
normal temperature conditions, the choice of parents would be male C crossed with
females g, h and i, and male D crossed with females j and l. Under heat treatment
conditions, the male parents did not differ significantly for GCA with regard to this trait.
However, the cross between male D x female l produced F1 hybrids that showed a
significantly increased palmitic acid content on average when compared to crosses made
between male B x females d, e and f.
Stearic acid (C18:0)
Male A showed the best GCA in the control treatment and was significantly better than
the other three males for stearic acid content (Table 4.23). Variation occurred between the
females with regard to SCA, however, females a and c crossed with male A showed the
best SCA, significantly better than for most of the crosses. Therefore, when the breeder
aims to increase stearic acid content under normal temperature conditions, the choice of
parents would be male A with females a and c. Under heat treatment conditions, male A
also showed the best GCA and was significantly better than males C and D for stearic acid
content. Female a in a cross with male A showed the best SCA and was significantly
better than the rest of the females (except for female e x male B) in their respective

162
crosses. When selecting parents to produce F1 hybrids with higher stearic acid contents
under heat treatment conditions, the best crosses would be male A x female a.
Oleic acid (C18:1)
Male B showed the best GCA in the control treatment and was significantly better than
the other three males for oleic acid content (Table 4.23). Significant variation occurred
between females with regards to SCA, however, female d in a cross with male B had the
highest SCA and was significantly better than most of the females (except for female k x
male D) in their respective crosses. Therefore, the parents of choice when selecting for
high oleic acid content under normal temperature conditions would be male B x female d.
Under high temperature conditions, male B also showed the best GCA and was
significantly better than the other three males for oleic acid content. Significant variation
occurred between females with regard to SCA. However, female d in a cross with male B
again had the highest SCA but was not significantly better than females a, e and k in their
respective crosses. When selecting parents to produce F1 hybrids with high oleic acid
content under heat treatment conditions, the best crosses would be male A x female a,
male B x females d and e and male D x female k.
Linoleic acid (C18:2)
Male C showed the best GCA in the control treatment and was significantly better than
the other three males for linoleic acid content (Table 4.23). Females g, h and i showed
significantly better SCA in crosses made with male C compared to the crosses made with
females and males A and B. Also, females j and l in crosses with male D showed
significantly better SCA compared to crosses made with females and males A and B.
When selecting parents to produce F1 hybrids with high linoleic acid contents under
normal temperature conditions, male C with female g would be the choice. Although the
average linoleic acid contents of the F1 hybrids were less under high temperature
treatment conditions, male C also showed the best GCA and was significantly better than
the other three males for linoleic acid content. Female c in a cross with male A showed
the best combining ability of the females in their respective crosses. However, the
combining ability for this female was not significantly better than females g, h and i in
crosses with male C, and female l in a cross with male D. When selecting parents to
produce F1 hybrids with high linoleic acid content under heat treatment conditions, the

163
best crosses would be male A x female c, male C x females g, h and i and male D x
female k.
4.3.7 Estimates of variance components and broad sense heritability for sunflower
head and seed traits
Head diameter
The environmental variance (σ2e) proportion contributed most to the phenotypic (total)
variation in both the control and the heat treatments, indicating high impact of the
environment on head diameter (Table 4.24). A low heritability estimate of 38% was
observed for head diameter in the control treatment. A negative heritability estimate
(-0.14) was observed for head diameter in the heat treatment. The negative heritability
estimate was a result of the negative genotypic variance. Head diameter was highly
sensitive to high temperature. The high temperature treatment resulted in large, but even-
sized heads for all hybrids and therefore a low estimate of genetic variance was observed
for this trait. In addition, the significant differences between replications might have
contributed to the low genetic variance component.
Number of filled seeds per head
The genotypic variance proportion contributed most to the phenotypic variation in both
the control and the heat treatments for number of filled seeds per head (Table 4.24).
Although environmental variance contributed less to the total variance, the environment
had some impact on this trait. Intermediate levels of heritability were observed for number
of filled seeds per head in the control (60%) and heat treatment (59%).
Twenty-five seed weight
The environmental variance proportion contributed slightly more to the total variation in
both the control and the heat treatments, indicating impact of the environment on twenty-
five seed weight (Table 4.24). A low heritability estimate of 47% was observed for
twenty-five seed weight in the control treatment. A negative heritability estimate (-0.07)
was observed for twenty-five seed weight in the heat treatment. Seed weight was highly
sensitive to high temperatures. The high temperature treatment caused a reduction in seed
weight to an extent where no genetic variability was observed between hybrids. This
might have contributed to the low genetic variance component estimate observed for
twenty-five seed weight.

164
Table 4.24 Variance components and broad sense heritability for head and seed traits of 12 sunflower F1 hybrids analysed at two
temperature treatments
Head diameter Number of filled seeds per head Twenty-five seed weight Head sterile centre diameter
Control Heat Control Heat Control Heat Control Heat
σ2g 0.92 -0.15 6625.79 6221.42 0.043 -0.00 1.16 2.18
σ2e 1.51 1.21 4400.45 4310.77 0.048 0.02 0.93 1.47
σ2p 2.423 1.06 11026.24 10532.20 0.09 0.02 2.08 3.65
H2 0.38 -0.14 0.60 0.59 0.47 -0.07 0.56 0.60
σ2g: Genotypic variance component, σ2p: Phenotypic variance component, σ2e: Environmental variance component, H2: Broad sense heritability.

165
Head sterile centre diameter
The genotypic variance proportion contributed mostly to the total variation in both the
control and the heat treatments for head sterile centre diameter (Table 4.24). However,
although environmental variance contributed less to the total variance, the environment
had some impact on this trait. Intermediate levels of heritability were observed for head
sterile centre diameter in the control (56%) and heat treatment (60%) respectively.
4.3.8 Estimates of variance components and broad sense heritability for sunflower
seed oil and major fatty acid content
Oil content
The environmental variance proportion contributed predominantly to the phenotypic
variation in the control treatment, indicating high impact of the environment on oil
content (Table 4.25). Under heat stress conditions the environmental variance proportion
was much lower and the genotypic variance component contributed predominantly to the
phenotypic variation in the heat treatment. As a result, under heat stress conditions the
environment had a smaller effect on oil content than under normal temperature conditions.
The high impact of environment under normal temperature conditions resulted in the low
broad sense heritability estimate (5%) observed for oil content under these conditions.
However, under heat stress conditions an intermediate level of heritability (63%) was
observed for oil content.
Palmitic acid (C16:0)
The genotypic variance proportion contributed mostly to the phenotypic variation in
palmitic acid content (Table 4.25). However, under heat stress, the environmental
variance component contributed most to the total variance and palmitic acid was sensitive
to the high temperature environment. In addition, the low genotypic variance estimate
indicated there was small genetic variability for palmitic acid in the heat treatment. The
reason for this is that the heat treatment caused an increase in palmitic acid content to an
extent where hybrids might have reached their maximum potential for this fatty acid.
Relatively high broad sense heritability was observed for palmitic acid content in the
control (78%) while in the heat treatment, the estimate was low (35%).

166
Table 4.25 Variance components and broad sense heritability for oil and major fatty acid contents of 12 sunflower F1 hybrids analysed
at two temperature treatments
Oil content C16:0 C18:0 C18:1 C18:2
Control Heat Control Heat Control Heat Control Heat Control Heat
σ2g 0.85 4.88 0.61 0.23 0.71 0.86 303.95 115.97 297.08 117.99
σ2e 15.85 2.88 0.17 0.43 0.25 0.28 33.82 10.79 32.31 13.82
σ2p 16.70 7.75 0.77 0.67 0.96 1.14 337.77 126.74 329.40 131.81
H2 0.05 0.63 0.78 0.35 0.74 0.75 0.90 0.91 0.90 0.90
σ2g: Genotypic variance component, σ2p: Phenotypic variance component, σ2e: Environmental variance component, H2: Heritability.

167
Stearic acid (C18:0)
The genotypic variance proportion contributed most to the phenotypic variation in both
the control and the heat treatments for stearic acid content (Table 4.25). Relatively high
levels of heritability were observed for stearic acid content in the control (74%) and heat
treatment (75%) respectively.
Oleic acid (C18:1)
Estimates of genetic variance were much larger than estimates of environmental variances
for oleic acid content in both temperature treatments (Table 4.25). This indicated that
genotypic variance contributed largely to the phenotypic variance and that the
environment had almost no effect on the trait within each treatment. High levels of
heritability were observed for oleic acid content in both the control (90%) and heat
treatment (91%).
Linoleic acid (C18:2)
The genotypic variance proportion contributed most to the phenotypic variation in both
the control and the heat treatments for linoleic acid content (Table 4.25). Within each
treatment, the environment had almost no effect on linoleic acid content and the trait
exhibited a large amount of genetic variability. High levels of heritability were observed
for linoleic acid content in both the control (90%) and heat treatment (90%).
4.4 Correlations
4.4.1 Correlations between agronomic traits
In the control treatment strong positive and significant correlations were observed
between head diameter and number of filled seeds per head as well as between head
diameter and twenty-five seed weight (Table 4.26). In the heat treatment, the same
positive correlations were observed, however, the correlation between head diameter and
number of filled seeds per head was weaker. (Table 4.27) The reason for this could be
because the heat treatment resulted in an average decrease in the number of seeds per
head and simultaneously a significant increase in the average head diameter (Tables 4.5
and 4.7). Head sterile centre diameter did not show any strong correlations with the other
agronomical traits in both treatments.

168
Table 4.26 Correlation matrix obtained for sunflower head and seed traits and oil composition from 12 F1 sunflower hybrids of the
control treatment
NFSH HD 25-SW HSCD Oil content C16:0 C18:0 C18:1 HD 0.83** 25-SW 0.29 0.66** HSCD 0.28 0.29 -0.18 Oil content -0.16 0.03 0.14 -0.15 C16:0 0.25 0.09 -0.34* 0.43* -0.40* C18:0 -0.12* 0.19 0.63** -0.45** 0.16 -0.40* C18:1 -0.43* -0.30 0.12 -0.32 0.34* -0.89** 0.28 C18:2 0.43 0.29 -0.14 0.34* -0.34* 0.89** -0.32 -0.99**
*P≤0.05, **P≤0.01, HD: Head diameter, NFSH: Number of filled seeds per head, 25-SW: Twenty-five seed weight, HSCD: Head sterile centre diameter.
Table 4.27 Correlation matrix obtained for sunflower head and seed traits and oil composition from 12 F1 sunflower hybrids of the heat
treatment
NFSH HD 25-SW HSCD Oil content C16:0 C18:0 C18:1 HD 0.47* 25-SW 0.28 0.70** HSCD 0.32 0.31 -0.11 Oil content 0.52** 0.32 0.22 0.62** C16:0 0.05 0.03 -0.26 0.09 -0.14 C18:0 -0.37* -0.28 -0.15 -0.48* -0.43* 0.00 C18:1 -0.48** -0.29 0.13 -0.33 -0.27 -0.60** 0.34* C18:2 0.52* 0.31 -0.10 0.39* 0.31 0.55** -0.45** -0.99**
*P≤0.05, **P≤0.01, HD: Head diameter, NFSH: Number of filled seeds per head, 25-SW: Twenty-five seed weight, HSCD: Head sterile centre diameter.

169
4.4.2 Correlations between seed oil traits
In the control treatment, significant and negative correlations were observed between oil
content and palmitic acid as well as between oil content and linoleic acid (Table 4.26).
However, these correlations were relatively weak. Oil content was significantly and
positively correlated with oleic acid content. In the heat treatment a significant and
negative correlation was observed between oil content and stearic acid content. This
correlation was, however, positive and non-significant in the control treatment (Table
4.27). The reason for this difference might be due to the significant decrease in oil content
(Table 4.13) and simultaneous significant increase in stearic acid content (Table 4.17) in
the heat treatment. Oil content was negatively correlated with palmitic and oleic acid
content, but these correlations were non-significant.
Strong negative and significant correlations were observed between palmitic and oleic
acid, as well as between oleic and linoleic acid in the control treatment. The strong
positive and significant correlation between palmitic and linoleic acid may be a result of
the strong negative correlation between oleic and linoleic acid. In the heat treatment, the
same correlations were observed; however, some were weaker than in the control
treatment. The weaker negative correlation between palmitic and oleic acid may be
because the heat treatment resulted in significant average increases in both palmitic (Table
4.15) and oleic (Table 4.19) acids. Similarly, the weaker positive correlation between
palmitic and linoleic acid was because of the increase in palmitic acid, but significant
average decrease in linoleic acid (Table 4.21) in the heat treatment.
4.4.3 Correlations between agronomic and seed oil traits
In the heat treatment, relatively strong and highly significant positive correlations were
observed between oil content and number of filled seeds per head as well as between oil
content and head sterile centre diameter. However, in the control treatment these
correlations were negative, weak and non-significant. A relatively strong and significantly
positive correlation was observed between stearic acid and twenty-five seed weight in the
control treatment. However, this correlation was weak, non-significant and negative in the
heat treatment. The reason for this difference might be due to the significant average
increase in stearic acid (Table 4.17) and simultaneous significant decrease in twenty-five
seed weight (Table 4.9) in the heat treatment. Significant and negative correlations were
observed between number of filled seeds per head and oleic acid content in both the

170
control and heat treatment. The significant and negative correlation between number of
filled seeds per head and oleic acid content may be a result of the negative correlation
between oleic and linoleic acid, since linoleic acid was positively correlated with number
of filled seeds per head. The last correlation was significant in the heat treatment.
Significant and negative correlations were observed between number of filled seeds per
head and stearic acid content in both treatments. However, these correlations were
relatively weak. The reason for the negative correlation between number of filled seeds
per head and stearic acid content may result from the significant negative correlation
between stearic acid and linoleic acid, since linoleic acid was positively correlated with
number of filled seeds per head. Significant and negative correlations were observed
between head sterile centre diameter and stearic acid content in both treatments. The
reason for the significant and negative correlation between head sterile centre diameter
and stearic acid content may result from the negative correlation between stearic and
linoleic acid, since linoleic acid was significantly and positively correlated with head
sterile centre diameter.
4.5 Discussion
Brief periods of temperatures higher than 35ºC have a direct and sometimes unfavourable
effect on oil quality in sunflower. The most sensitive period for modification in oil quality
is from 19-26 DAA, the period of rapid TAG accumulation (Rondanini et al., 2003).
Applying a heat stress period of 10 consecutive days at temperatures of 24ºC minimum
and 36ºC maximum during the period of 15-25 days after 50% anthesis in sunflower was
done to examine the responses of hybrids with regard to some head and seed
characteristics as well as oil quality.
Significant genetic variability was observed between hybrids for most traits and this
indicated that hybrids can be genetically improved for the specific trait. Where significant
interactions occurred between hybrids and treatments, hybrids differed in their sensitivity
to the environment and this complicates breeding for the specific trait.
Heat treatment resulted in a significant increase in the average head diameter. However,
all hybrids responded the same in the two treatments since no significant interaction
occurred between hybrids and treatments for this trait. This increase in head diameter with
higher temperature was contradictory to reports on the effect of drought stress on head

171
diameter. Rauf (2008) reported that drought stress during the vegetative phase of
sunflower resulted in a reduction in head diameter. Jaleel et al. (2009) also pointed out
that water stress reduced head diameter. The reason why head diameter was not reduced
by heat stress might be that hybrids were more tolerant to high temperatures for this trait.
Genetic variability was low in the control treatment, while no genetic variability was seen
in the heat treatment. The low broad sense heritability estimate (38%) observed for head
diameter in the control treatment was in agreement with low broad sense heritability
estimates reported. Çamaş and Esendal (2006) reported that in safflower, head diameter
had a low broad sense heritability of 21%. According to Miller and Fick (1997) broad
sense heritability estimates of 22% and 44% were reported by Kloczowski (1975) and
Pathak (1974) for sunflower. The low genetic variation, together with the low heritability
estimates indicate that no progress from selection will be made for head diameter.
Selection for this trait is not advised in breeding programmes to improve yield under both
normal and high temperature environments.
Heat treatment resulted in a decrease in the number of filled seeds per head, however, it
was non-significant. Although genetic variability was seen in both temperature treatments,
the significant interaction between hybrids and treatments, as well as the intermediate
level of heritability (±60%) will make selection for this trait under both temperature
environments difficult. Ayub (2001) reported a low broad sense heritability of -6% for
number of seed per head. Seed number per head has the largest direct influence on seed
yield and is determined, among others, by self-compatibility and environmental factors at
flowering and pollination (Škorić et al., 2007).
The average twenty-five seed weight was significantly reduced by the heat treatment.
Seed weight is sensitive to short, but severe heat stress. Rondanini et al. (2003) reported
that temperatures above 35°C significantly reduced final seed weight. This decrease
observed in seed weight might be due to a reduction of the duration of seed growth under
temperature stressed conditions. No interaction between hybrids and treatments was
observed and this indicated that hybrids performed similarly to heat stress. Although some
genetic variability was seen between hybrids in the control treatment, no significant
genetic variation was seen between hybrids in the heat treatment. A low broad sense
heritability estimate of 47% was observed for twenty-five seed weight in the control
treatment and was in the range reported. According to Miller and Fick (1997) broad sense

172
heritability estimates of between 30-66% were reported for seed weight (Pathak, 1974;
Shabana, 1974; Kloczowski, 1975; Zhao-Cheng et al., 1988). The low heritability
estimates also indicated that this trait was sensitive to the environment and therefore
selection for twenty-five seed weight is not advised in breeding programmes to improve
yield under both normal and high temperature environments.
Heat treatment resulted in a significant increase in the average head sterile centre diameter
and no significant interaction was seen between hybrids and treatments. Significant
genetic variation was seen between hybrids in both treatments, however, heritability
estimates was of intermediate level for both treatments. Selection for reduced head sterile
centres in both normal and high temperature environments will not be effective.
Cytoplasmic male sterility or self-incompatibility may play an important role in hybrids
for the sterile area of the head. Fernández-Martínez et al. (1992) reported that the high
oleic mutant alleles may be associated with self-compatibility and found that the high
oleic acid hybrids had a consistently lower self-compatibility. Since self-compatibility is
an important objective in sunflower breeding, the association of Ol alleles with lower
levels of self-compatibility is obstructive in the development of high oleic hybrids.
However, since the level of self-compatibility vary with genetic background, it is possible
to breed for high oleic self-compatible hybrids with the use of favourable genetic
backgrounds.
Results obtained from this study showed that the broad sense heritability estimates for
head diameter, number of filled seeds per head and twenty-five seed weight were higher
for normal conditions than for heat-stressed conditions. Alza and Fernández-Martínez
(1997) also reported that estimates of narrow sense heritability were generally higher in
non-stressed conditions than in water-stressed conditions for the same yield-related traits.
Additionally, heritability estimates are unique and belong to the specific plant population
in a specific experiment.
Oil content and major fatty acid composition was significantly modified after exposure to
heat stress. Heat treatment resulted in a significant decrease in oil content. This decrease
in oil content with an increase in temperature was in accordance with other reports (Harris
et al., 1978; Silver et al., 1984; Salunkhe et al., 1992; Jasso de Rodriquez et al., 2002;
Rondanini et al., 2003). It was reported that high temperature during seed development

173
can reduce oil content with up to 16% (Weiss, 2000). Temperatures higher than 35ºC
during the early seed-filling stage changes the embryo growth pattern that results in
higher pericarp:embryo ratios (Rondanini et al., 2003). This may contribute to reductions
in seed oil content, since hull percentage is negatively correlated with oil content (Lajara
et al., 1990; Weiss, 2000). However, the effect of temperature on oil content is variable
and higher oil content at higher temperatures has been reported (Ahmad and Hassan,
2000; Qadir et al., 2006).
All hybrids responded similarly to both treatments for oil content. Significant variation
was observed between hybrids in both temperature treatments indicating the potential for
genetic improvement for oil content. The low heritability estimate (5%) observed in the
control treatment indicated that no progress from selection will be made for oil content.
However, the heritability estimate observed in the heat treatment was intermediate (63%)
and selection for oil content in high temperature conditions might be more effective than
in normal temperature conditions. Heritability estimates vary considerably for oil content
in sunflower. This variation is probably due to different genetic backgrounds,
environmental effects and methods of estimation (Miller and Fick, 1997). Broad sense
heritability ranging from 62-68% has been reported for sunflower (Abd-Elkreem et al.,
1983). A high broad sense heritability of 96% has been reported by Ayub (2001).
Heat treatment resulted in a significant increase in palmitic acid content. This observation
was in agreement with the report of Rondanini et al. (2003) who observed an increase in
palmitic acid content after exposure to temperatures above 35ºC during the early seed-
filling period. However, all hybrids responded the same to both treatments for this fatty
acid. Highly significant genetic variation was observed between hybrids in both
temperature treatments. The relatively high heritability estimate (78%) seen in the control
treatment, indicated that selection for palmitic acid will be effective under normal
temperature conditions. However, it is not advised in high temperature environments,
since palmitic acid content was sensitive to heat.
The average stearic acid content was significantly increased by the heat treatment. This
was in agreement with the findings of Rondanini et al. (2003) who reported an increase in
stearic acid content after exposure to temperatures above 35ºC during 19-26 DAA.
Conversely, Martínez-Force et al. (1998) reported that stearic acid content progressively

174
decreased with an increase in temperature in sunflower. Significant variation was seen
between hybrids in both temperature treatments. Also, the relatively high heritability in
both temperature conditions makes selection for stearic acid effective in both normal and
high temperature environments. From a nutritional point of view, a reduction in SFA
(palmitic and stearic acid) content of traditional sunflower oil might result in healthier
edible oil by lowering the risk of cardiovascular disease (Kris-Etherton and Yu, 1997;
Seiler, 2004). However, from a technological point of view an increase in SFA content is
necessary for many industrial uses, for example production of shortenings and margarine
(Fernández-Martínez et al., 2004).
The heat treatment resulted in a significant increase in the oleic acid content of most
hybrids. On average, increases between 8.92% and 24.42% were observed.
Simultaneously, linoleic acid content was significantly reduced by the heat treatment.
Some hybrids showed a reduction of up to 25% in linoleic acid. Hybrids responded
differently to the two temperature treatments for both fatty acids. Some hybrids were
more sensitive to temperature treatment than others. However, the high oleic acid hybrid
showed less sensitivity to the high temperature conditions. High heritability estimates
were observed for both oleic and linoleic fatty acids in both temperature treatments.
Therefore, selection for oleic or linoleic acid content would be effective in breeding
programmes. In addition, the largest part of the total variation in oleic acid percentage
observed in the control and heat treatments respectively was due to differences in
potential oleic acid percentage between the 12 hybrids. Therefore, hybrid selection for a
specific temperature environment is important to obtain a specified oil quality.
A negative correlation was observed between oleic and linoleic acid profiles for both
temperature treatments. For most hybrids, as oleic acid increased, a simultaneous
reduction in linoleic acid was observed. Previous reports indicated that during seed
maturation high temperatures (and especially high night temperatures) modify the
oleic/linoleic ratio in standard sunflower cultivars by increasing the oleic acid content
and/or reducing the linoleic acid content (Harris et al., 1978; Triboï-Blondel et al., 2000;
Izquierdo et al., 2002; Rondanini et al., 2003).
However, it was reported that in high oleic acid mutants, the oleic and linoleic acid
contents were less influenced by temperature than for standard genotypes (Garcés et al.,

175
1989; Lagravère et al., 2000; Izquierdo et al., 2002). Results obtained for the high oleic
hybrid (hybrid 4) was in accordance with these reports. The heat treatment had no
significant influence on both oleic and linoleic fatty acid percentages for the high oleic
acid hybrid. The reason for this could be due to a different influence of temperature on the
ODS activity or the high oleic Ol alleles could be associated with genes at other loci for
adaptation to high temperature conditions (Fernández-Martínez et al., 1992).
The different temperature treatments had an influence on the combining ability of the
males and females especially for agronomical traits. Selecting for larger head diameter
may result in higher seed yield because head diameter, among other characters, is
positively correlated with yield (Fick and Miller, 1997). However, it was previously
reported that smaller sunflower heads (less than 20 cm in diameter) carry seeds with up to
40% more oil than seed from larger heads (30 cm in diameter) (Afzalpurkar and
Lakshminarayana, 1980). Therefore, when selecting for yield, larger heads should be
considered, but when selecting for oil content, smaller head diameters should be selected.
Number of filled seeds per head is positively correlated with seed yield (Fick and Miller,
1997). Therefore, selecting parents for increased number of filled seeds per head would
result in an indirect selection for increased seed yield. Seed weight is also reported to be
positively correlated with seed yield (Fick and Miller, 1997). Therefore, selecting parents
for increased twenty-five seed weight would result in an indirect selection for increased
seed yield. As a result, parents should be carefully selected to produce hybrids that will
perform the best for specific agronomical traits and/or oil fatty acid contents in areas
where high temperatures may occur during the growing season and especially heat stress
periods during the early seed-filling period.
Characteristics like head diameter, filled seed number per plant and seed weight are
generally correlated with sunflower yield (Fick and Miller, 1997). Consequently, when
selecting parents to produce hybrids with increased yield components like number of
filled seeds per head, there is a good chance for increasing yield at the same time.
Although significant correlations were observed between the agronomical and oil quality
traits, these were not strong. Therefore, when selecting traits for increased yield, the fatty
acid composition will not be influenced to a large extend. Also, when selecting for oleic,
linoleic or palmitic acid content, the agronomical traits will not be largely influenced.

176
Relationships between oil and fatty acid contents were in agreement with other reports. A
negative correlation between oil content and palmitic acid has been reported by Velasco et
al. (2007) in sunflower and by Möllers and Schierholt (2002) in rapeseed. This negative
correlation suggests that selection for higher oil content would automatically lead to a
reduction in palmitic acid content. The correlation between oil content and oleic acid
content was inconsistent at different temperatures. A significant positive correlation was
observed in the control, but it was negative and weak in the heat treatment. A positive
correlation between oil content and oleic acid content has been reported by Fernández-
Martínez et al. (1993) and by Velasco et al. (2007) in sunflower. Selection for higher oil
content would result in an increase in oleic acid content under normal temperature
conditions. However, under heat stress conditions, selection for higher oil content would
result in a reduction in oleic acid content. The relationship between oil content and stearic
acid content was inconsistent at different temperatures. Under normal temperatures, this
correlation was positive and non-significant. Conversely, under heat stress conditions it
was negative and significant. As result, selection for both traits is feasible under normal
temperatures, but under heat stress conditions selection for higher oil content would result
in a reduction in stearic acid content. This observation was in accordance with Velasco et
al. (2007) who reported an inconsistent correlation between oil content and stearic acid
content. The strong and highly significant correlations observed between palmitic and
oleic acid content in both temperature treatments were in agreement with reports by
Ebrahimi et al. (2008) for sunflower and by Möllers and Schierholt (2002) for rapeseed.
Selection for increased oleic acid content would lead to a reduction in palmitic acid
content. Significant negative correlations between oleic and linoleic acid content were in
accordance with other reports for sunflower (Lagravère et al., 2004; Qadir et al., 2006;
Ebrahimi et al. 2008) and for rapeseed (Möllers and Schierholt, 2002).
Correlations between some traits were weaker in the heat treatment than in the control
treatment. These were explained by the different responses of the particular traits to
temperature treatment. The correlations between traits should be taken into account when
parents are selected for a specific trait.
Variation between hybrids in response to high temperature can be used to select
temperature stable hybrids for specific traits. The most stable hybrids (less sensitive to
heat stress) that have shown small differences between the two temperature treatments for

177
head diameter include the low oleic hybrids 7 and 10 and the mid oleic hybrid 2. The high
oleic hybrid 4 was highly sensitive to heat stress for head diameter and showed a
significant increase (3.03 cm) in head diameter. For number of filled seeds per head, the
mid oleic hybrid 6 and the low oleic hybrids 8 and 12 were the most stable hybrids.
However, the low oleic hybrid 9 was the most sensitive hybrid and showed a significant
increase (204.96) in number of filled seeds per head. The low oleic hybrids 9 and 12 as
well as the mid oleic hybrid 6 were the most stable hybrids for twenty-five seed weight.
Conversely, the mid oleic hybrid 1 and the low oleic hybrid 3 were the most sensitive
hybrids that showed significant reductions in twenty-five seed weight after heat stress. For
head sterile centre diameter, mid oleic hybrids 1 and 2 as well as the low oleic hybrid 12
were the most stable hybrids. In addition, the high oleic hybrid 4 and the low oleic hybrid
10 were relatively stable across the two treatments for this trait. The mid oleic hybrid 5
was the most sensitive hybrid for heat stress and showed a large and significant increase
(1.11 cm) in head sterile centre diameter.
With regard to oil quality characteristics, low oleic hybrids 8 and 10 were the most stable
hybrids for oil content. The rest of the hybrids were sensitive and showed large reductions
in oil content under heat stress. The high oleic hybrid 4 showed the largest decrease in oil
content (11.80%) and was highly unstable for oil content. Low oleic hybrids 7, 8, 9 and 10
were the most stable hybrids for palmitic acid content. The rest of the hybrids (mostly the
mid and high oleic hybrid) were sensitive to the heat stress and showed significant
increases in palmitic acid content. All hybrids showed more or less the same sensitivity to
heat stress. However, the mid oleic hybrid 5 was the most sensitive of all to heat stress
and showed a large and significant increase (2.53%) in stearic acid content. For oleic acid
content, the high oleic hybrid 4 and mid oleic hybrid 11 were the most stable hybrids
between the two temperature treatments. Mid oleic hybrids 1 and 2 as well as the low
oleic hybrids 7, 8, 9, 10 and 12 were the most unstable hybrids and showed large and
significant increases in oleic acid content. With regard to linoleic acid, the high oleic
hybrid 4 and mid oleic hybrid 11 were again the most stable hybrids. The rest of the
hybrids showed significant decreases in linoleic acid content. The low oleic hybrids 10
and 12 were the most unstable hybrids with large reductions in linoleic acid content
(25.66% and 23.34% respectively).

178
Although the high oleic hybrid 4 showed stability for oleic acid content under heat stress
conditions, this hybrid did not perform well with regard to agronomical traits. This hybrid
showed a significant increase in head diameter that indirectly resulted in the significant
decrease in oil content observed for this hybrid. It was previously reported that larger
heads resulted in increased hull content (Pustovoit, 1966) and since hull content is
negatively correlated with seed oil content (Dennis et al., 1994), the larger head size
resulted in lower oil content.
This knowledge on how sunflower hybrids respond to heat stress with regard to head and
seed characteristics and oil quality may assist breeders in determining the correct breeding
methods and selection criteria for environments where high temperatures may occur
during critical growth stages and seed-filling periods.
4.6 References
Abd-Elkreem, S., Elah-Mar, B.A., Galal, H. and Abou Gazala, M. 1983. Inheritance of oil
percent in sunflower seeds. Helia 6: 13-16.
Afzalpurkar, A.B. and Lakshminarayana, G. 1980. Variation in oil content and fatty acid
composition with sunflower head size and shape. Journal of the American Oil
Chemists’ Society 57: 105-106.
Agrobase, 2005. AGROBASE Generation II User's Manual. Version 11, revised edition.
www.agronomix.com. Agronomix Software Winnipeg, M.B., Canada.
Ahmad, S. and Hassan, F.U. 2000. Oil yield and fatty acid composition of spring
sunflower. Pakistan Journal of Biological Sciences 3: 2063-2064.
Alza, J.O. and Fernández-Martínez, J.M. 1997. Genetic analysis of yield and related traits
in sunflower (Helianthus annuus L.) in dryland and irrigated environments. Euphytica
95: 243-251.
Amutha, R., Muthulaksmi, S., Baby Rani, W., Indira, K. and Mareeswari, P. 2007.
Alleviation of high temperature stress in sunflower (Helianthus annuus L.) by plant
growth regulators and chemicals. Research Journal of Agriculture and Biological
Sciences 3: 1658-1662.
Ayub, K. 2001. Yield performance, heritability and interrelationship in some quantitative
traits in sunflower. Helia 24: 35-40.

179
Burkhanova, E.A., Mikulovich, T.P., Kudryakova, N.V., Kuhna, I.M., Smith, A.R., Hall,
M.A. and Kulaeva, O.N. 2001. Heat shock pre-treatment enhances the response of
Arabidopsis thaliana leaves and Cucurbita pepo cotyledons to benzyladenine. Plant
Growth Regulation 33: 195-198.
Çamaş, N. and Esendal, E. 2006. Estimates of broad sense heritability for yield and yield
components of safflower (Carthamus tinctorius L.). Hereditas 143: 5-57.
Canvin, D. 1965. The effect of temperature on the oil content and fatty acid composition
of the oils of several oil seed crops. Canadian Journal of Experimental Botany 43: 63-
69.
Chunfang, G., Jian, Z. and Qiu, L. 1996. The influence of climatic factors on the
composition of lipid acids in sunflower oil. In: Proceedings of the 14th International
Sunflower Conference, Beijing, China. Volume 1. pp. 559-564.
Comstock, R.E. and Robinson, H.F. 1952. Estimation of average dominance of genes. In:
Heterosis. Gowen, J.W. (Ed.). Iowa State Colledge Press, Ames, Iowa. pp. 494-518.
Dennis, L., Dominguez, J., Baldini, M. and Vear, F. 1994. Genetical studies of hullability
in comparison with other sunflower seed characteristics. Euphytica 79: 29-38.
Ebrahimi, A., Maury, P., Berger, M., Kiani, P., Nabipour, A., Shariati, F., Grieu, P. and
Sarrafi, A. 2008. QTL mapping of seed-quality traits in sunflower recombinant inbred
lines under different water regimes. Genome 51: 599-615.
Fernández-Martínez, J., Muñoz, J. and Gómez-Arnau, J. 1993. Performance of near-
isogenic high and low oleic acid hybrids of sunflower. Crop Science 33: 1158-1163.
Fernández-Martínez, J., Muñoz-Ruz, J. and Gómez-Arnau, J. 1992. Influence of genes for
high oleic acid on agronomic characters of sunflower. In: Proceedings of the 13th
International Sunflower Conference, Pise. Italy. Volume 2. pp. 1037-1042.
Fernández-Martínez, J.M., Velasco, L. and Pérez-Vich, B. 2004. Progress in the genetic
modification of sunflower oil quality. In: Proceedings of the 16th International
Sunflower Conference, Fargo, ND USA. pp. 1-14.
Fick, G.N. and Miller, J.F. 1997. Sunflower breeding. In: Sunflower technology and
production, Agronomy Monograph no 35. Schneiter, A.A. (Ed.). American Society of
Agronomy Inc., Crop Science Society of America Inc., Soil Science Society of
America Inc., Wisconsin, USA. pp. 395-439.
Garcés, R. and Mancha, M. 1991. In vitro oleate desaturase in developing sunflower
seeds. Phytochemistry 30: 2127-2130.

180
Garcés, R., Garcia, J.M. and Mancha, M. 1989. Lipid characterization in seeds of high
oleic acid sunflower mutant. Phytochemistry 28: 2597-2600.
Garcés, R., Sarmiento, C. and Mancha, M. 1992. Temperature regulation of oleate
desaturase in sunflower seeds. Planta 186: 461-465.
Hall, A.E. 2004. Breeding for adaptation to drought and heat in cowpea. European
Journal of Agronomy 21: 447-454.
Harris, H., McWilliam, J. and Mason, W. 1978. Influence of temperature on oil content
and composition of sunflower seeds. Australian Journal of Agricultural Research 29:
1203-1212.
Izquierdo, N., Aguirrezábal, L., Andrade, F. and Pereyra, V. 2002. Night temperature
effects on fatty acid composition in sunflower oil depending on the hybrid and the
phenological stage. Field Crops Research 77: 115-126.
Jaleel, C.A., Manivannan, P., Wahid, A., Farooq, M., Al-Juburi, H.J., Somasundaram, R.
and Panneerselvam, R. 2009. Drought stress in plants: A review on morphological
characteristics and pigments composition. International Journal of Agriculture and
Biology 11: 100-105.
Jasso de Rodriquez, D., Phillips, B.S., Rodriquez-García, R. and Angulo-Sánchez, J.L.
2002. Grain yield and fatty acid composition of sunflower seed for cultivars
developed under dry land conditions. In: Trends in new crops and new uses. Janick, J.
and Whipkey, A. (Eds.). ASHS Press, Alexandria, VA. pp. 139-142.
Kloczowski, Z. 1975. Studies on some features of oil sunflower and their significance in
breeding that plant in Poland. Hodowla Roślin, Aklimatyzacja i Nasiennictwo 19: 89-
131.
Kris-Etherton P.M. and Yu, S. 1997. Individual fatty acid effects on plasma lipids and
lipoproteins: human studies. American Journal of Clinical Nutrition 65: 1628S-1644S.
Lagravère, T., Champolivier, L., Lacombe, S., Kleiber, D., Berville, A. and Dayde, J.
2000. Effects of temperature variations on fatty acid composition in oleic sunflower
oil (Helianthus annuus L.) hybrids. In: Proceedings of the 15th International Sunflower
Conference, Toulouse. pp. A73-A78.
Lagravère, T., Kleiber, D., Surel, O., Calmon, A., Berville, A. and Daydé, J. 2004.
Comparison of fatty acid metabolism of two oleic and one conventional sunflower
hybrids: a new hypothesis. Journal of Agronomy and Crop Science 190: 223-229.

181
Lajara, J., Diaz, U. and Quidiello, R. 1990. Definite influence of location and climatic
conditions on the fatty acid composition on sunflower seed oil. Journal of the
American Oil Chemists’ Society 67: 618-623.
Martínez-Force, E., Álvarez-Ortega, R., Cantisán, S. and Garcés, R. 1998. Fatty acid
composition in developing high saturated sunflower (Helianthus annuus) seeds:
maturation changes and temperature effect. Journal of Agricultural and Food
Chemistry 46: 3577-3582.
Miller, J.F. and Fick, G.N. 1997. The genetics of sunflower. In: Sunflower technology and
production, Agronomy Monograph no 35. Schneiter, A.A. (Ed.). American Society of
Agronomy Inc., Crop Science Society of America Inc., Soil Science Society of
America Inc., Wisconsin, USA. pp. 441-495.
Möllers, C. and Schierholt, A. 2002. Genetic variation of palmitate and oil content in a
winter oilseed rape doubled haploid population segregating for oleate content. Crop
Science 42: 379-384.
Pathak, R.S. 1974. Yield components in sunflower. In: Proceedings of the 6th International
Sunflower Conference, Bucharest, Romania. International Sunflower Association,
Paris, France. Volume 2. pp. 271-281.
Pustovoit, V.S. 1966. Selected Works. Kolos, Moscow. pp. 368.
Qadir, G., Ahmad, S., Ul-Hassan, F. and Cheema, M.A. 2006. Oil and fatty acid
accumulation in sunflower as influenced by temperature variation. Pakistan Journal of
Botany 38: 1137-1147.
Rauf, S. 2008. Breeding sunflower (Helianthus annuus L.) for drought tolerance.
Communications in Biometry and Crop Science 3: 29-44.
Rawson, H., Constable, G. and Howe, G. 1984. Canopy development, light interception
and seed production in sunflower as influenced by temperature and radiation.
Australian Journal of Plant Physiology 11: 255-265.
Rondanini, D., Savin, R. and Hall, A.J. 2003. Dynamics of fruit growth and oil quality of
sunflower (Helianthus annuus L.) exposed to brief intervals of high temperature
during grain filling. Field Crops Research 83: 79-90.
Salunkhe, D.K., Chavon, J.K., Adsule, R.N. and Kadam, S.S. 1992. World oilseeds:
Chemistry, technology, and utilization. Van Nostrand, Reinhold, New York. 554 pp.
Sarmiento, C., Garcés, R. and Mancha, M. 1998. Oleate desaturation and acyl turnover in
sunflower (Helianthus annuus L.) seed lipids during rapid temperature adaptation.
Planta 205: 595-600.

182
Seiler, G.J. 2004. Wild Helianthus annuus, a potential source of reduced palmitic and
stearic fatty acids in sunflower oil. Helia 27: 55-62.
Shabana, R. 1974. Genetic variability of sunflower varieties and inbred lines. In:
Proceedings of the 6th International Sunflower Conference, Bucharest, Romania.
International Sunflower Association, Paris, France. Vol. 2. pp. 263-269.
Silver, J.G., Rochester, C.P., Bishop, D.G. and Harris, H.C. 1984. Unsaturated fatty acid
synthesis during the development of isolated sunflower (Helianthus annuus L.) seeds.
Journal of Experimental Botany 35: 1507-1514.
Singh, R.K. and Chaudhary, B.D. 1979. Biometrical methods in quantitative genetic
analysis. Kalyani Publishers, New Delhi, Ludhiana. 304 pp.
Škorić, D. 2009. Sunflower breeding for resistance to abiotic stresses. Helia 32: 1-16.
Škorić, D., Jocić, S., Hladni, H. and Vannozzi, G.P. 2007. Analysis of heterotic potential
for agronomically important traits in sunflower (Helianthus annuus L.). Helia 30: 55-
74.
Triboï-Blondel, A.-M., Bonnemoy, B., Falcimagne, R., Martingnac, M. and Messaoud, J.
2000. The effect of temperature from flowering to maturity on seed composition of
high oleic sunflower inbred and mid oleic hybrids. In: Proceedings of the 15th
International Sunflower Conference, Toulouse, France. pp. A67-A72.
Velasco, L., Pérez-Vich, B. and Fernández-Martínez, J.M. 2007. Relationships between
oil content and fatty acid composition in high stearic acid sunflower. Plant Breeding
126: 503-508.
Weiss, E.A. 2000. Oilseed Crops, 2nd edition. Blackwell Science Ltd. 364 pp.
Zhao-Cheng, X., Duo, L., Gui-Zhi, W. and Jie, Q. 1988. Applied theory of relative
heritability to calculate heterosis of sunflower. In: Proceedings of the 12th
International Sunflower Conference, Novi Sad, Yugoslavia. International Sunflower
Association, Paris, France. Volume 2. pp. 484-488.

183
CHAPTER 5
IDENTIFICATION OF MOLECULAR MARKERS LINKED TO THE H IGH
OLEIC ACID TRAIT IN SUNFLOWER
5.1 Introduction
Traditional sunflower oil is economically important because it is used in the food, feed
and chemical industries. Sunflower oil is characterised by a high content of
polyunsaturated fatty acids and most common varieties contain about 65-70% linoleic,
20% monounsaturated (oleic) and 10-14% saturated (palmitic and stearic) fatty acids.
Breeding efforts in sunflower have focussed on modifying the proportions of fatty acid in
the seed oil in order to increase its suitability for potential applications such as deep
frying. Soldatov (1976) developed the first stable high oleic acid variety ‘Pervenets”
through chemical mutagenesis and further selections for high oleic acid in several
generations. High oleic acid lines have been derived from Pervenets. High oleic varieties
typically contain 80-90% oleic acid and low linoleic acid contents of between 5-9%
(Gupta, 2002).
Many studies have been conducted to explain oleic acid accumulation in high oleic
sunflower (Lacombe and Bervillé, 2000a; Lacombe et al., 2001; 2009). Oleic acid is
produced from stearic acid by stearoyl-acyl carrier protein desaturase and subsequently
desaturated into linoleic acid by ODS. In high oleic acid sunflower ODS activity is
drastically reduced (Shanklin and Cahoon, 1998) that results in an increased oleic acid
content of sunflower seeds. Further studies revealed a correlation between the high oleic
acid phenotype and a strong reduction of ODS transcript accumulation in high oleic acid
seeds during the critical stages of storage lipid synthesis (Kabbaj et al., 1996; Hongtrakul
et al., 1998a. Lacombe and Bervillé, 2000a). It was suggested that the mutation that has
occurred in Pervenets affected the structure of the high oleic specific ODS region. In a
later study, Lacombe et al. (2009) demonstrated that the ODS allele is organised in two
sections. The first is present in both high and low oleic acid genotypes and carries a
normal ODS gene. However, the second section is specific to the high oleic acid genotype
and carries duplications of the ODS gene. By studying messenger ribonucleic acid
(mRNA) accumulation in high and low oleic acid seeds these authors revealed that the
Pervenets mutation was dominant and induced ODS mRNA down-regulation. In addition,

184
they found that ODS small interfering RNA (that is characteristic of gene silencing)
accumulated only in high oleic acid seeds. Therefore it was concluded that the mutation
was associated with ODS duplications that led to gene silencing of the ODS gene. As a
result silencing of the ODS gene resulted in accumulation of oleic acid in high oleic seed
(Lacombe et al. 2009).
On the other hand, many studies also have been conducted to study the genetics of the
high oleic acid trait in sunflower. However, inheritance of the high oleic acid trait is
complex and is not well understood. Contradictory results were obtained that are
concerned with 1) the high oleic acid trait that behaved as dominant, recessive or
intermediate, 2) the different number of genes and modifiers involved deduced from these
studies and 3) the presence of some maternal effects. In addition, oil composition is
largely influenced by the environment the plants are grown in as well as the genetic
background of genotypes used. These factors may explain differences observed in
previous genetic studies (Lacombe and Bervillé, 2000b).
Several studies demonstrated the importance of molecular markers in the genetic analysis
of sunflower. The development of molecular markers has largely contributed to the
establishment of saturated molecular maps. A number of linkage maps using various
molecular markers, including RFLP, RAPD, AFLP and SSR markers have been published
for sunflower (Berry et al., 1995; Gentzbittel et al., 1995; Gedil et al., 2001; Tang et al.,
2002; Yu et al., 2003; Rachid Al-Chaarani et al., 2004). In general, most of these maps
had 17 or more linkage groups that presumably corresponded to the haploid chromosome
number (2n=2x=34) of cultivated sunflower. A unified consensus molecular genetic map,
integrating independently developed linkage maps, has recently been published for
cultivated sunflower (Paniego et al., 2007). This framework covered 96% of the full
sunflower genome. Molecular genetic linkage maps provide molecular breeders with a
dense genome-wide framework of DNA markers that allow the mapping of qualitative
traits and the localisation of factors underlying quantitative traits (Lu et al., 2007).
The application of DNA markers to sunflower breeding has been mainly focussed on the
development of markers for some agronomic traits and disease resistance. RFLP, AFLP
and SSR analyses have been applied in several studies to map QTL related to seed oil
content (Leon et al., 1995; Mokrani et al., 2002; Bert et al., 2003; Rachid Al-Chaarani et

185
al., 2004), seed weight (Mestries et al., 1998; Mokrani et al., 2002; Bert et al., 2003),
days to flowering and photoperiod response (Leon et al., 2001; Mokrani et al., 2002;
Rachid Al-Chaarani et al., 2004) and plant height, stem and head diameter (Rachid Al-
Chaarani et al., 2004). QTL have been identified that showed association with Sclerotinia
sclerotiorum (Lib) de Bary (Mestries et al., 1998; Rönicke et al., 2005), Diaporthe
helianthi Munt-Cvet et al. (Bert et al., 2002), Plasmopara halstedii (Farl.) Berl. et de
Toni. (Rachid Al-Chaarani et al., 2001; Kusterer et al., 2004) and Phoma macdonaldii
Boerema (Rachid Al-Chaarani et al., 2001). In addition, the BSA approach (Michelmore
et al., 1991.) has been applied in several molecular analysis studies to map genes related
to disease resistance (Lawson et al., 1996; Lu et al., 2000; Kusterer et al., 2002; Tang et
al., 2003), chlorophyll deficiency (Yue et al., 2009a), nuclear male sterility (Chen et al.,
2006), fertility restoration (Kusterer et al., 2002; 2004) and gamma-tocopherol content
(García-Moreno et al., 2006).
On the other hand, only a few molecular studies related to sunflower seed oil composition
have been published. The molecular basis of modified fatty acid composition in sunflower
seed oil has been studied through both QTL analysis and a candidate gene approach.
Several genes coding for enzymes in the fatty acid biosynthetic pathway of seed oil have
been cloned and their polymorphism studied (Hongtrakul et al., 1998a; 1998b; Lacombe
and Bervillé, 2000a; Pérez-Vich et al., 2002). Genes encoding ODS are logical candidates
for the Ol mutation. Marker studies related to high oleic acid content in sunflower began
with the identification of two RAPD markers linked to the Ol1 gene (Dehmer and Friedt,
1998). Later studies demonstrated that the Ol1 gene cosegregated with the ODS gene,
FAD2-1, that is strongly expressed in low oleic and weakly expressed in high oleic lines
(Hongtrakul et al., 1998a). The Ol1-FAD2-1 locus mapped to LG 14 of the public
sunflower genetic map and was found to underlie a major oleic acid QTL explaining 56%
of the phenotypic variance for oleic acid (Pérez-Vich et al., 2002; Schuppert et al., 2006).
In breeding programmes for high oleic acid sunflower, oleic acid contents of seeds are
usually determined using gas chromatography. Since environmental effects strongly
influence seed oil composition (Harwood, 1996) it is difficult to differentiate between
several high oleic acid alleles in high oleic acid genotypes or between homozygous or
heterozygous plants for the high oleic acid trait. As a result, genotypic selection using
linked molecular markers would be independent from the environment and is therefore a

186
more reliable method (Pérez-Vich et al., 2000). The aim of this study was to identify
molecular markers linked to the high oleic acid trait, using the BSA method in
conjunction with AFLP and SSR analysis.
5.2 Materials and methods
5.2.1 Plant material and glasshouse trial
A F1 hybrid was developed from a cross between a high oleic line and traditional linoleic
line from the PANNAR® breeding programme. Due to confidentiality reasons the names
of the breeding lines may not be revealed. The F1 hybrids were planted in a field trial at
the Delmas breeding station and the F2 seed were collected during harvest. The F2 plant
population was grown in the glasshouse at the University of the Free State in
Bloemfontein from September 2006 to January 2007. The F2 seed were initially sown in
polystyrene seedling trays with Hygromix seedling growth medium (Hygrotech). This
method was used to promote an optimal germination percentage. Seedlings were
transplanted in 8 l planting pots. Pots were filled with Bainsvlei type red soil with N:P:K
fertiliser [3:2:1 (25) + 0.5% Zn] and Curaterr® (2 ml per plant). A total of 80 F2 plants
were grown under normal conditions in the glasshouse. The minimum and maximum
temperature was set at 15°C and 26°C respectively. Plants were watered daily by hand.
Kompel Hydroponic fertiliser (6.5% N, 2.7% P, 13% K, 7% Ca, 2.2% Mg and 7.5% S)
was applied every second week at 5 ml/l water. Red spider mite infestation was controlled
by spraying plants every two weeks, alternatively with Red Spider Spray (Wonder) and
AbamecPlus (R.T. Chemicals). Young leaves were collected from single plants after each
plant formed 10 leaves. Leaves were rinsed with sterile distilled water and placed in
sterile tubes and freeze-dried in a VirTis AdVantage freeze-drier for approximately four
days. The freeze-dried samples were stored in a freezer at -80ºC for DNA isolation. Each
F2 sunflower plant’s head was covered with transparent pollination bags to prevent cross
pollination. After maturity, F3 seed from each F2 plant was harvested and seeds threshed
out separately.
5.2.2 Seed oil extraction and fatty acid analysis
In order to do phenotyping of the individual plants of the segregating mapping population,
five seeds from each parental plant and F3 seed harvested from the 78 individual self-
pollinated F2 plants were prepared for oil fatty acid analysis. Five seeds instead of the 10
seeds generally analysed per plant (Bilyeu et al., 2005; Yue et al., 2009b), were used due

187
to the high cost of fatty acid analysis. Nonetheless, five F3 seeds proved to be sufficient to
discriminate between three oleic acid groups: 1) the high oleic group that included
individuals with mean oleic acid contents of above 85%, 2) the low oleic group that
included individuals with mean oleic acid contents of less than 35% 3) the mid oleic
group that included individuals that showed segregation for oleic acid and with oleic acid
contents that ranged from 35-84% (Table 5.1).
Total lipids were quantitatively extracted from single ground seed samples by adding 5 ml
hexane as solvent to the sample. Samples were thoroughly shaken for 1 min and left
overnight at room temperature. Each sample was filtered into a 10 ml glass vial and the
hexane was evaporated under a stream of nitrogen. Oil samples were stored under a
blanket of nitrogen at -20ºC until analysed. Oil fatty acid analysis was done according to
the method described in Chapter 3. The oleic and linoleic acid contents of the five single
seeds of each plant were determined based on the fatty acid analyses. The phenotypes of
the two parents (high oleic and low oleic) were confirmed and the 78 F2 individuals were
classified into the three oleic acid groups (high oleic, low oleic and mid oleic) according
to the oleic and linoleic acid contents of their F3 progeny.
5.2.3 Deoxyribonucleic acid (DNA) isolation
The freeze-dried leaf material was homogenised using a Qiagen TissueLyser. A small
piece of leaf material together with two stainless steel ball bearings (5 mm diameter each)
were placed into a 2 ml Eppendorf tube and grinded to fine powder for 30 seconds at 30
r/s.
Total genomic DNA from the parental lines and F2 population was isolated from the
homogenised leaf material using the hexadecyltrimethylammonium bromide (CTAB)
method (Saghai-Maroof et al., 1984). CTAB DNA isolation buffer was prepared by
mixing together SABEX water, 100 mM Tris-Cl (trishydroxymethyl-aminomethane) at
pH 8.0, 20 mM EDTA (ethylene-diaminetetra-acetate) at pH 8.0, 1.4 M NaCl, 2% (w/v)
CTAB and 0.2% (v/v) β-mercaptho-ethanol. CTAB buffer (750 µl) was added to each
Eppendorf tube (containing ± 250 µl powdered leaf material) and incubated at 65°C in a
water bath for 1 h. Chloroform:isoamylalchohol (500 µl) at a ratio of 24:1 (v/v) was
added to each tube (containing the extraction suspension) and mixed.

188
Table 5.1 Mean and range for oleic and linoleic acid contents of sunflower seed oil
of the parental lines and F2 individuals used in the high and low oleic acid
bulks (based on values of five F3 seeds) from a cross between high and
low oleic parents
Mean and range of fatty acid content*
C18:1 C18:2
Parent or F2 individuals Mean Range Mean Range
Parents
High oleic 86.05 85.52-86.60 2.56 2.08-3.69
Low oleic 21.47 19.12-24.17 63.46 59.44-66.39
F2 individuals
High oleic group
1
2
3
4
5
6
7
8
9
10
85.52
89.57
89.52
87.91
90.58
89.24
89.02
87.42
87.91
90.72
82.90-86.64
89.19-90.81
88.16-90.59
84.42-89.83
90.29-91.15
88.10-89.60
86.71-90.56
84.33-90.06
86.08-89.39
88.25-92.87
2.74
1.60
1.32
2.85
0.99
1.01
0.75
0.99
0.55
0.68
1.76-4.54
0.98-2.51
0.87-2.23
1.28-6.86
0.55-1.71
0.81-1.32
0.63-0.89
0.70-1.25
0.38-0.81
0.50-0.88
Low oleic group
1
2
3
4
5
6
7
8
34.74
33.85
29.05
30.62
19.46
32.30
27.36
31.88
28.85-40.03
28.30-41.72
16.97-46.45
13.85-39.99
17.02-22.74
28.67-35.26
13.11-40.26
18.17-47.12
52.27
51.53
59.16
57.45
67.57
55.28
55.58
57.57
48.32-55.48
43.89-57.81
41.63-71.74
48.13-74.81
64.66-70.13
53.20-57.32
45.49-68.53
43.05-71.15
*Fatty acids were expressed as percentages of total fatty acids, C18:1: Oleic acid, C18:2: Linoleic acid.

189
Tubes were centrifuged for 5 min at 12000 g to separate the DNA from the cell debris,
proteins and chloroform:isoamylalchohol. DNA from the aqueous phase was precipitated
using isopropanol (500 µl) at room temperature and left to stand for 20 min at room
temperature. The sample tubes were centrifuged for 5 min at 12000 g. The supernatant
was discarded and the tubes drained. The precipitate was washed by adding 70% (v/v)
ice-cold ethanol (500 µl) and left to stand for 20 min at room temperature. Tubes were
again centrifuged for 5 min at 12000 g and the supernatant discarded. The DNA pellet
was left to air dry for ±1 h at room temperature. The air-dried pellets were resuspended in
200 µl TE (10 mM Tris-Cl at pH 8.0 and 1 mM EDTA at pH 8.0) buffer overnight at 4°C.
The following day, 100 µg/ml DNAse-free RNase A was added to each sample tube and
tubes were incubated at 37°C in a water bath for ±2 h. DNA was extracted with 0.75 M
ammonium acetate and 200 µl chloroform:isoamylalchohol at a ratio of 24:1 (v/v) and
centrifuged for 5 min at 12000 g. DNA from the aqueous phase was precipitated with
100% ice-cold ethanol (500 µl) and left overnight at 4°C. The following morning the
tubes were centrifuged for 15 min at 12000 g and the supernatant was discarded
afterwards. The DNA was washed twice with 70% (v/v) ice-cold ethanol (500 µl) by
centrifuging for 10 min each time and the supernatant discarded afterwards. The sample
tubes were left open at room temperature for the DNA pellets to dry. After ±2 h, the air-
dried samples were resuspended overnight at 4°C in TE buffer at pH 8.0.
The quantity and quality of the DNA were estimated with agarose gel electrophoresis. An
0.8% (w/v) agarose gel was prepared and electrophoresis of the DNA was done for 1 h at
80 V in 1x UNTAN buffer (40 mM Tris-Cl and 2 mM EDTA, adjusted to pH 7.4 with
acetic acid). DNA was visualised under UV light using ethidium bromide staining. DNA
concentrations of samples were determined using a Helios Spectronic Unicam
spectrophotometer. Absorbencies were measured at A260 nm and A280 nm and the ratio
A260/A280 gave an indication of DNA purity. The DNA concentration was determined
from the A260 nm reading and the genomic DNA from each sample was diluted to a
working solution of 200 ng/µl.
5.2.4 Bulk segregant analysis
For BSA, equal amounts of genomic DNA from 10 individuals of the high oleic acid
group and eight individuals of the low oleic acid group were respectively pooled to form
the high oleic- and low oleic-bulk samples. Selection of individual F2 plants for the bulks

190
was based on the seed oil analysis of their F3 progenies (Table 5.1). The DNA
concentration of each individual constituting the bulks were 20 ng/µl for the high oleic-
bulk and 25 ng/µl for the low oleic-bulk in order to create bulks with end-concentrations
of 200 ng/µl each. Both bulks, together with the parents were used to identify markers
showing linked polymorphisms between the four samples. These polymorphic markers
were further used to analyse individual F2 plants to determine linkages between AFLP
markers and the high oleic acid trait.
5.2.5 Amplified fragment length polymorphism analysis
AFLP analysis was performed according to Vos et al. (1995) with modifications
(Herselman, 2003). Adapters and primers used, together with their sequences, are given in
Table 5.2. These were synthesised by Integrated DNA Technologies Inc. (Coralville, IA,
USA). Primers were named “E” and “M” for EcoRI and MseI, respectively, followed by a
number representing a code for the three selective nucleotides, as indicated in Table 5.2.
Oligonucleotides used for adapters were purified using polyacrylamaide gel
electrophoresis (PAGE). Adapters were prepared by mixing equimolar amounts of both
strands. These were heated for 10 min in a water bath at 65ºC. After the 10 min, the water
bath was switched off and the adapters were left to cool down overnight to room
temperature in the water bath.
Restriction digestion and adapter ligation
Genomic DNA from the two parental lines, the two bulks, the 18 high and low oleic
individuals used to construct the bulks and 62 mid oleic F2 individuals were digested
using two restriction enzymes, MseI and EcoRI. For each sample, 10 µl DNA (±2 µg) was
digested using 4 U MseI (New England Biolabs) and 1x MseI-buffer [50 mM NaCl, 10
mM Tris-Cl, 10 mM MgCl2 and 1 mM dithiotreitol (DTT) at pH 7.9]. Samples were
placed in the water bath for 5 h at 37ºC. After the 5 h, 5 U EcoRI (Roche Diagnostics) and
NaCl (to a final concentration of 100 mM) were added to the samples and the DNA was
further digested overnight at 37ºC.

191
Table 5.2 Adapters and primers used for AFLP analysis to identify and map
markers linked to the high oleic acid trait in a F2 segregating population
of sunflower
Enzyme Adapter /
primer Sequence (5'-3')
EcoRI
Adapter-F
Adapter-R
CTCGTAGACTGCGTACC
AATTGGTACGCAGTCTAC
MseI
Adapter-F
Adapter-R
GACGATGAGTCCTGAG
TACTCAGGACTCAT
EcoRI Primer+0 GACTGCGTACCAATTC
MseI Primer+0 GATGAGTCCTGAGTAA
EcoRI
Primer+3
GACTGCGTACCAATTCANN
ANN = AAC (E32), AAG (E33), ACA (E35), ACC (E36),
ACG (E37), ACT (E38), AGC (E40), AGG (E41)
MseI Primer+3 GATGAGTCCTGAGTAANNN
NNN = AAC (M32), ACA (M35), ACG (M37), AGT (M42),
ATA (M43), CAA (M47), CAC (M48), CAG (M49), CAT
(M50), CCA (M51), CCC (M52), CCG (M53), CCT (M54),
CGA (M55), CGC (M56), CGG (M57), CGT (M58), CTA
(M59), CTC (M60), CTG (M61), CTT (M62), GAA (M63),
GAC (M64), GCA (M67), GCT (M70), GGA (M71), GGC
(M72), TCG (M85), TCT (M86), TGA (M87), TGC (M88),
TGT (M90)

192
Oligonucleotide adapters (Table 5.2) were ligated to the ends of the restriction fragments
by adding a 10 µl mixture containing MseI-adapter (50 pmol), EcoRI-adapter (5 pmol),
0.4 mM adenosine 5’-triphosphate (ATP), 1x T4 DNA Ligase buffer (66 mM Tris-Cl at
pH 7.6, 6.6 mM MgCl2, 10 mM DTT and 66 mM ATP) and 1 U T4 DNA Ligase (USB
Corporation). Samples were incubated overnight in a water bath at 16ºC.
Pre-selective and selective amplifications
All PCR amplification reactions were performed in a DYAD™ Peltier Thermal Cycler.
The pre-selective amplification step was included to reduce background smears (that
result from mismatched amplification) in the AFLP pattern. A mixture containing 1x
Promega DNA polymerase buffer (10 mM Tris-Cl at pH 9.0, 50 mM KCl and 0.1% (v/w)
Triton X-100), 2 mM MgCl2, 200 µM of each 2’deoxynucleoside 5’ triphosphate (dNTP),
30 ng MseI-primer+0, 30 ng EcoRI-primer+0 (Table 5.2) and 1 U GoTaq® Flexi DNA
polymerase (Promega) was prepared. A volume of 45 µl of the mixture was added to 5 µl
restriction/ligation solution. Pre-selective amplification started with a 5 min denaturation
step at 94ºC that was followed by 30 cycles of the following cycle profile: a 30 s DNA
denaturation step at 94ºC, a 1 min annealing step at 56ºC and a 1 min elongation step at
72ºC. A final elongation step at 72ºC for 10 min followed the last PCR cycle.
The pre-selective amplification fragments were separated on a 1.5% (w/v) agarose gel in
order to determine the purity and quantity of the amplified DNA. Gel electrophoresis was
performed at 80 V for 1 h using 1x UNTAN buffer. Ethidium bromide was added to the
gel solution in order to visualise the fragments under UV light. DNA fragment sizes were
determined by comparison with marker DNA fragments (an EcoRI/HindIII digest of
lambda DNA). The pre-selective DNA was diluted with 1x TE buffer according to the
observed quantity (1:15 to 1:30) and served as templates for the selective amplification
reaction.
For selective amplification, a mixture containing 1x Taq polymerase buffer, 2 mM MgCl2,
200 µM of each dNTP, 100 µg/ml Bovine serum albumin, 30 ng MseI-primer+3, 30 ng
EcoRI-primer+3 (Table 5.2) and 0.75 U GoTaq® Flexi DNA polymerase was prepared. A
volume of 15 µl of the mixture was added to 5 µl diluted pre-selective DNA. Selective
amplification started with a 5 min denaturation step at 94ºC, which was followed by 9
cycles of the following cycle profile: a 30 s DNA denaturation step at 94ºC, a 30 s

193
annealing step at 65ºC, and a 1 min elongation step at 72ºC. The annealing temperature
was subsequently reduced by 1ºC per cycle. The next cycle profile included: a 30 s
denaturation step at 94ºC, a 30 s annealing step at 56ºC and a 1 min elongation step at
72ºC. This profile was repeated for 25 cycles followed by a final elongation step for 2 min
at 72ºC.
5.2.6 Simple sequence repeat analysis
SSR analysis was conducted following the procedures of Tang et al. (2002). Primers used
together with their forward and reverse sequences are given in Table 5.3. Primer
sequences were supplied by PANNAR® (Biotechnology division in Greytown). SSR
primers were selected based on the published sunflower map of Paniego et al. (2007).
Since previous reports (Pérez-Vich et al., 2000; 2002) indicated that the high oleic acid
trait mapped to LG 14, 10 SSR markers, spread over the entire length of LG 14, were
selected for analysis. Genomic DNA from each sample (parental lines and entire F2
population) was diluted to a working solution of 50 ng/µl. PCR was performed using a 10
µl reaction mixture containing 4 µl genomic DNA (0.2 µg), 1x Taq polymerase buffer, 2
mM MgCl2, 200 µM of each dNTP, 30 ng of each forward and reverse primer (Table 5.3)
and 0.5 U GoTaq® Flexi DNA polymerase. Amplification started with a 3 min
denaturation step at 95ºC, followed by 1 cycle with the following profile: 30 s
denaturation at 94ºC, 30 s annealing at 64ºC and 30 s elongation at 72ºC. The annealing
temperature was decreased 1ºC per cycle in subsequent cycles until reaching either 58ºC
or 59ºC (Table 5.3) depending on the primer pair. The next cycle profile included: 30 s
denaturation at 94ºC, 30 s annealing at 58ºC and 30 s elongation at 72ºC. The profile was
repeated for 32 cycles with a final elongation for 10 min at 72ºC.
5.2.7 Polyacrylamide gel electrophoresis
In order to visualise the amplification products (either AFLP or SSR), fragments were
separated on 5% (w/v) denaturing polyacrylamide gels. The gel matrix consisted of 19:1
acrylamide:bis-acrylamide solution, 7 M urea, 1x TBE buffer (89 mM Tris-Cl, 89 mM
boric acid and 2 mM EDTA), N’N’N’N’ -tetramethylene-diamine (TEMED) and 0.22%
(w/v) ammonium persulfate. The gel solution was carefully stirred and cast between two
clean and treated glass plates. DNA products were mixed with equal volumes of
formamide loading dye [98% de-ionised formamide, 10 mM EDTA at pH 8.0, 0.05%
(w/v) bromophenol blue and 0.05% (w/v) xylene cyanol].

194
Table 5.3 Primers used for SSR analysis to identify and map markers linked to the
high oleic acid trait in a F2 segregating population of sunflower
Primer name Sequence (5’-3’) Annealing temperature ORS301-F CGTGACCTGTGAAACACCAA 58ºC
ORS301-R CGATAACCGTGTGAATCGTC 58ºC
ORS307-F CAGTTCCCTGAAACCAATTCA 58ºC
ORS307-R GCAGTAGAAGATGACGGGATG 58ºC
ORS391-F AGACTGGAGGGTATGGAGAGC 58ºC
ORS391-R GCTCGGTTAAGGAGGGAGAAA 58ºC
ORS398-F CACGTCCTAAATTAAGTAGGAACGA 58ºC
ORS398-R CCAAGACCTCCGTTGAGCTAT 58ºC
ORS578-F CTCTCAATCCCTAAAGTCCCT 58ºC
ORS578-R TGGTGGATGTGGTTGTTGAT 58ºC
ORS694-F CCTGGAACTGAACCGAGAAC 58ºC
ORS694-R GCCGTGAAACAGAGAGAGGA 58ºC
ORS782-F CCATGACGTGTTTGTGTGTGT 58ºC
ORS782-R GCCAAGCGTACATCAGACTTT 58ºC
ORS1079-F TACGACTGACGATTCCATTTCTC 59ºC
ORS1079-R AACTGGATTTCACAGGGAGTGTT 59ºC
ORS1086-F TTGTTTGTCGCACACTCAAGATT 59ºC
ORS1086-R ATTATCGGCACATCTTTCCATTT 59ºC
ORS1206-F GTTAAATCTGGTCATGTGCTTGC 59ºC
ORS1206-R ACAGAATCAGGAACCATCTTCCA 59ºC

195
A 100 base pair and 25 base pair DNA ladder (Promega) was used to compare AFLP and
SSR fragment sizes respectively. Prior to loading DNA products on the gel, these,
together with the ladder, were denatured for 5 min at 95ºC in the thermal cycler and
immediately put on ice afterwards. PAGE was performed at a constant power of 80 W for
approximately 2 h for AFLP and 1:10 h for SSR. The same 1x TBE buffer used in
preparing the gel matrix was used as running buffer.
5.2.8 Silver staining of polyacrylamide gels
The AFLP and SSR patterns in the polyacrylamide gel were visualised using the silver
staining procedure described in the Silver Sequence™ DNA Sequencing System manual
supplied by Promega. After staining, the gel on the glass plate was left to air-dry
overnight. Photographs of the gel were taken by placing photographic paper (Ilford,
Multigrade IV RC de lux) face to face with the gel and underneath the glass plate and
exposing it to dim white light for approximately 22 s.
5.2.9 Identification of polymorphisms
The BSA strategy was used to target genes/QTL linked to the high oleic acid trait by
establishing a linkage relationship between the phenotype and the polymorphic AFLP and
SSR markers. Screening of AFLP and SSR primer pair combinations for polymorphic
markers that show putative linkage to the high oleic acid trait was conducted with DNA
samples from the two parental lines (one showing high oleic acid content and one
showing low oleic acid content) and the two bulk samples (Table 5.1). A fragment
showing presence in the high oleic parent and high oleic bulk and absence in the low oleic
parent and low oleic bulk and vice versa was considered putatively linked to the high
oleic acid trait.
The high oleic and low oleic parents and high oleic and low oleic DNA bulks were
screened for linked polymorphism using 160 randomly selected EcoRI/MseI primer
combinations and 10 SSR primer pairs (Tables 5.2 and 5.3). Informative primer
combinations that generated informative polymorphisms either in coupling or repulsion
phase between the parents and the bulks and were used to screen the parents and the 18
high and low oleic individuals that were used to constitute the two bulks. Informative
primers identified after screening the parents and bulk individuals were tested on the
remaining 60 F2 individuals form the segregating population.

196
5.2.10 Statistical analysis
Linked DNA fragments in both coupling and repulsion phase with the high oleic acid trait
were identified and polymorphic fragments were dominantly scored for presence (1) or
absence (0). A binary matrix reflecting these fragments was generated for each genotype.
For phenotypic trait scoring, the average oleic acid content of the five seeds per individual
was used. Linkage analysis of the putative markers was conducted using the software
MAPMAKER/EXP version 3.0 (Lander et al., 1987). The Haldane mapping function was
used to determine the genetic distances between linked markers in centiMorgans (cM)
from the recombination fractions. Interval mapping was used to link putative markers. A
minimum log-likelihood score (LOD) of 3.0 with a maximum recombination frequency
(theta) of 0.5 was employed. A coding system where the high oleic parent was seen as the
homozygous parent and thus coded as B was used. QTL analysis was conducted using
MAPMAKER/QTL version 1.1 (Lander and Botstein, 1989). Maps were drawn using
Mapchart version 2.2 (Voorrips, 2002). The position of QTL was determined with interval
mapping and a minimum LOD score of 3.0 was used for determination of significance.
The percentage variation explained by the QTL was estimated at the maximum-likelihood
QTL position.
5.3 Results
5.3.1 Phenotypic analysis of the F2 population (F3 seed) for oleic acid content
The mean oleic and linoleic acid percentage in the parental lines (high oleic and low
oleic) and the F2 individuals of the mapping population obtained from a cross between the
two parents are shown in Table 5.4. The oleic acid contents of the F3 seeds were assigned
to three phenotypic classes: high oleic acid, low oleic acid and intermediate oleic acid.
The oleic acid content of the high oleic bulk individuals ranged between 85.52-90.72%,
while the oleic acid content of the low oleic bulk individuals ranged between 19.46-
34.74%. The oleic acid contents of the mid oleic F2 individuals ranged between 37.26-
84.39%.

197
Table 5.4 Mean oleic and linoleic acid contents of sunflower seed oil of the high oleic acid and low oleic acid parents and F2 individuals
(based on values of F3 seeds) from a cross between the two parents
Fatty acid content*
C18:1 C18:2
Parent or F2 individuals Number of individuals Mean Range Mean Range
Parents
High oleic 1 86.05 85.52-86.60 2.56 2.08-3.69
Low oleic 1 21.47 19.12-24.17 63.46 59.44-66.39
F2 individuals
High oleic bulk individuals 10 88.74 85.52-90.72 1.35 0.55-2.85
Low oleic bulk individuals 8 29.91 19.46-34.74 57.05 51.83-67.57
Mid-oleic individuals 60 60.79 37.26-84.39 26.97 5.56-48.78
*Fatty acids were expressed as percentages of total fatty acids, C18:1: Oleic acid, C18:2: Linoleic acid.

198
5.3.2 Amplified fragment length polymorphism analysis
Analysis of the high and low oleic parents and the two bulks with a total of 160
EcoRI/MseI primer combinations, identified a total of 9058 loci, of which 41 (0.45%)
were polymorphic between the two bulks (Table 5.5). A maximum of 104 and a minimum
of 24 loci, with an average of 56.61 loci, were detected by a single primer pair
combination. From the total of 160 primer combinations tested, 32 (20%) displayed
linked polymorphisms between the two parental lines and two bulk samples and from
these only 14 (8.75%) primers generated linked polymorphisms between parents and 18
individuals of the two bulks. A maximum of 21 polymorphisms per primer pair were
scored between the two parental lines, with an average of 8.67 polymorphisms per primer
pair. The 14 primer combinations that were informative between the two parents and
individuals from the bulks were tested on the rest of the mid oleic population to confirm
co-segregation of fragments with the high oleic acid trait.
5.3.3 Simple sequence repeat analysis
Analysis of the two parental lines and the two bulk samples with 10 primer pairs
identified a total of 12 loci. Of the 10 primer pairs tested, three (25%) generated
polymorphisms between the two parents, while two (16.6%) generated polymorphisms
between the two parents and two bulks. The two primer pairs that were informative
between the individuals from the bulks were then tested on the rest of the mid oleic
population to confirm co-segregation of the fragments with the high oleic acid trait.
5.3.4 Linkage analyses of putative markers related to the high oleic acid trait
Data obtained from 14 AFLP two SSR primer pairs that were informative between the
two parents and 18 high and low oleic individuals from the segregating population used to
construct the bulk samples (and that were screened on the entire population), were used to
order markers into a linkage group (Figure 5.1). The linkage group was constructed from
the information from 16 putative AFLP and four SSR markers using MAPMAKER/EXP.
Markers linked both in coupling and repulsion phase with the oleic acid trait were used
for linkage mapping. The putative AFLP markers were named using the universal code of
the primer combinations.

199
Table 5.5 AFLP analysis data obtained using EcoRI/MseI primer combinations
EcoRI/MseI reactions
Primers tested
Total number of fragments detected
Total polymorphisms
Informative primers between parents
Informative primers between bulks
Average fragments per primer pair
Maximum fragments per primer pair
Minimum fragments per primer pair
Maximum polymorphisms per primer pair
Polymorphic fragments in parents
Polymorphic fragments in bulks
Average polymorphisms per primer (parents)
Average polymorphisms per primer (bulks)
160
9058
1417
89%
20%
56.61
104
24
21
15.31%
0.45%
8.67
0.26
Of the total of 20 markers used, 19 markers (15 AFLP and 4 SSR) mapped to a single
linkage group (Table 5.1). Since all four tested SSR markers mapped to this linkage group
and since they mapped to LG 14 of sunflower during several previous studies (Pérez-Vich
et al., 2000; 2002; Paniego et al., 2007), it was assumed that the linkage group obtained in
this study was the same as LG 14 of these reports. One marker was unlinked. Putative LG
14 covered a distance of 147.2 cM. Distances between adjacent markers on putative LG
14 ranged from 2.6-29.0 cM. A clustering of SSR markers ORS1086.2, ORS307.1 and
ORS307.2 was observed on putative LG 14.

200
E36M58.20.0
E36M7229.0
E35M53.145.0
E32M57.159.5E36M8663.4
E35M8678.3E36M58.384.0E36M58.187.7E41M56.192.7E37M55.197.0
E35M37108.3ORS1086.1112.2E40M53.1114.8E38M3.1123.2ORS1086.2127.3ORS307.2129.9ORS307.1134.2E38M58.1141.1E35M52.1147.2
LG14
Figure 5.1 AFLP and SSR marker order of putative linkage group 14 of sunflower
based on a segregating F2 population. Names of markers are shown on
the right and their map position (cM) on the left. LG: Linkage group.
Codes used for marker names are given in Table 5.2.
Putative LG 14
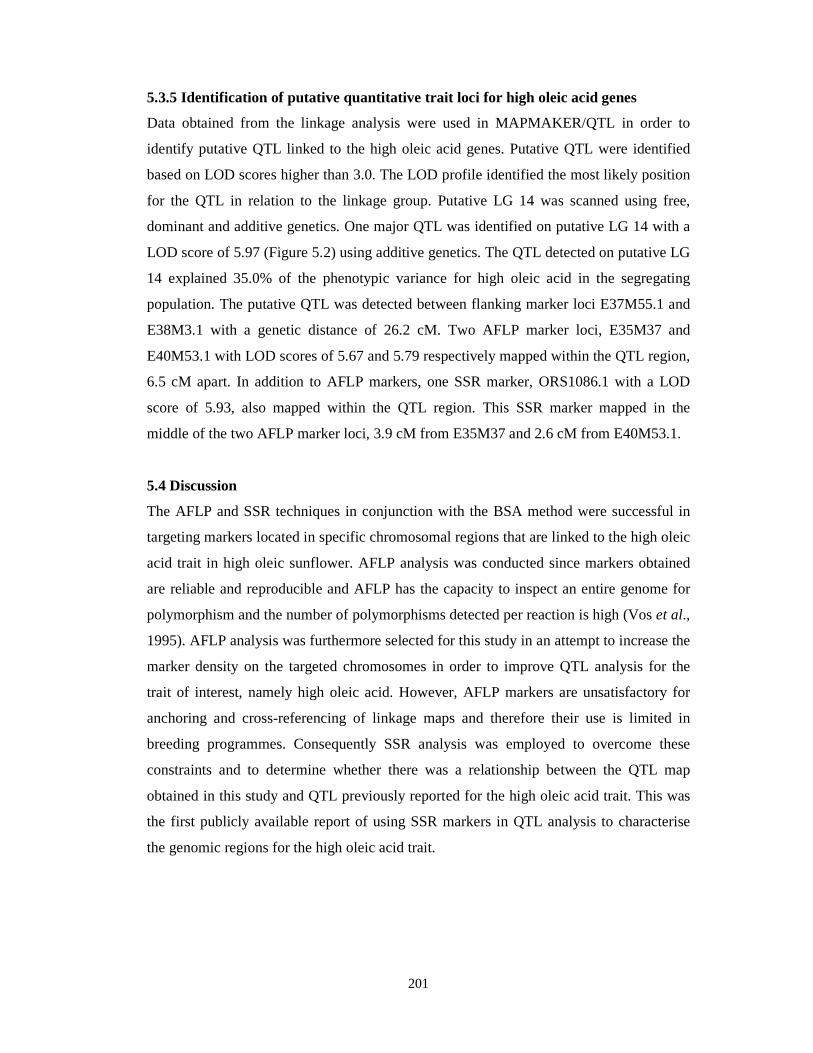
201
5.3.5 Identification of putative quantitative trait loci for high oleic acid genes
Data obtained from the linkage analysis were used in MAPMAKER/QTL in order to
identify putative QTL linked to the high oleic acid genes. Putative QTL were identified
based on LOD scores higher than 3.0. The LOD profile identified the most likely position
for the QTL in relation to the linkage group. Putative LG 14 was scanned using free,
dominant and additive genetics. One major QTL was identified on putative LG 14 with a
LOD score of 5.97 (Figure 5.2) using additive genetics. The QTL detected on putative LG
14 explained 35.0% of the phenotypic variance for high oleic acid in the segregating
population. The putative QTL was detected between flanking marker loci E37M55.1 and
E38M3.1 with a genetic distance of 26.2 cM. Two AFLP marker loci, E35M37 and
E40M53.1 with LOD scores of 5.67 and 5.79 respectively mapped within the QTL region,
6.5 cM apart. In addition to AFLP markers, one SSR marker, ORS1086.1 with a LOD
score of 5.93, also mapped within the QTL region. This SSR marker mapped in the
middle of the two AFLP marker loci, 3.9 cM from E35M37 and 2.6 cM from E40M53.1.
5.4 Discussion
The AFLP and SSR techniques in conjunction with the BSA method were successful in
targeting markers located in specific chromosomal regions that are linked to the high oleic
acid trait in high oleic sunflower. AFLP analysis was conducted since markers obtained
are reliable and reproducible and AFLP has the capacity to inspect an entire genome for
polymorphism and the number of polymorphisms detected per reaction is high (Vos et al.,
1995). AFLP analysis was furthermore selected for this study in an attempt to increase the
marker density on the targeted chromosomes in order to improve QTL analysis for the
trait of interest, namely high oleic acid. However, AFLP markers are unsatisfactory for
anchoring and cross-referencing of linkage maps and therefore their use is limited in
breeding programmes. Consequently SSR analysis was employed to overcome these
constraints and to determine whether there was a relationship between the QTL map
obtained in this study and QTL previously reported for the high oleic acid trait. This was
the first publicly available report of using SSR markers in QTL analysis to characterise
the genomic regions for the high oleic acid trait.

202
E36M58.20.0
E36M7229.0
E35M53.145.0
E32M57.159.5E36M8663.4
E35M8678.3E36M58.384.0E36M58.187.7E41M56.192.7E37M55.197.0
E35M37108.3ORS1086.1112.2E40M53.1114.8E38M3.1123.2ORS1086.2127.3ORS307.2129.9ORS307.1134.2E38M58.1141.1E35M52.1147.2
oleic_q
tl1 2 3 4 5 6 7
LG14
oleic_qtl
Figure 5.2 Linkage map of putative linkage group 14 indicating the chromosomal
regions containing the quantitative trait loci (QTL) associated with the
high oleic trait and the relative distances of the markers from the QTL.
LG: Linkage group. The linkage map of putative LG 14 is on the left.
Marker names and their genetic distances (cM) are indicated at the right and
left sides of the linkage map respectively. The QTL likelihood-profile for the
high oleic acid trait is given on the right. LOD scores and map distances are
indicated on the horizontal and vertical axes respectively. The bar graph in
the middle of the figure represents the standard 1 LOD (shaded region)
and/or 2 LOD support intervals for the oleic QTL region.
Putative LG 14

203
AFLP markers used in this study that were also used in a previous study are E32M57 and
E35M52 (Pérez-Vich et al., 2002). Although a number of SSR markers have been used in
previous studies to develop linkage maps in sunflower, none of these markers have
previously been linked to the high oleic acid trait in sunflower. Since major QTL for oleic
acid content in sunflower have previously been mapped to LG 14 (Pérez-Vich et al.,
2000; 2002), SSR markers used in this study were selected from LG 14 of genetic linkage
maps previously been constructed for sunflower (Tang et al., 2002; Yu et al., 2003;
Paniego et al., 2007).
Fatty acid analysis of F3 seeds of the F2 population from a cross between a high and a mid
oleic acid parent demonstrated the existence of three oleic acid groups: one with low oleic
acid content (19.46-34.74%), one with high oleic acid content (85.52-90.72%) and a third
(intermediate) group formed by individuals whose oleic acid content ranged from 37.26-
84.39%. According to these values, individual F2 plants were classified into three groups
namely the high oleic, low oleic and mid oleic groups. High oleic- and low oleic-DNA
bulks were formed by pooling equal amounts of genomic DNA from 10 high oleic and
eight low oleic individuals respectively. By making bulks, all loci were randomised
except for the region containing the high oleic acid trait. After screening the parents and
the two bulks with a total of 160 EcoRI/MseI primer combinations and 10 SSR primer
pairs, 20 markers putatively linked to the high oleic acid trait were identified.
A linkage group for the F2 population segregating for the high oleic acid trait was
constructed using information from 16 putative AFLP and four putative SSR markers.
Seven of these markers were linked in repulsion phase and 13 in coupling phase. From the
20 putative markers, 19 (15 AFLP and four SSR) mapped to a single linkage group and
covered a distance of 147.2 cM. Linkage analysis generated only a single linkage group
since BSA, being a gene targeting approach, generates only a few linkage groups on the
targeted regions with a limited number of markers. Distances between adjacent markers
ranged from 2.6-29.0 cM. Large distances were observed between E36M58.2 and
E36M72, between E36M72 and E35M53.1 as well as between E35M53.1 and E32M57.1.
The large distances observed between these markers might be due to lack of markers
within these regions and also probably because these markers were on the distal end of the
chromosome.

204
The use of SSR markers, that are highly polymorphic in mapping populations, made it
possible to determine whether there existed a relationship between the previously mapped
QTL and QTL found in the present study. Both SSR markers that showed linked
polymorphisms between the parental lines and individuals of the bulks, mapped with
AFLP markers to the same linkage group after being tested on the entire mapping
population. Since both these SSR markers previously mapped to LG 14 in sunflower
(Tang et al., 2002; Yu et al., 2003; Paniego et al., 2007), they could be used to anchor the
current linkage group to LG 14 of previous maps.
QTL analysis was performed to detect an association between the high oleic acid
phenotype and markers. A major QTL with a LOD score of 5.97 was identified on
putative LG 14 and explained 35.0% of the variation for this trait. The LOD score and
phenotypic variance explained by this QTL was low in comparison with previous reports
for high oleic acid trait in sunflower. Pérez-Vich et al. (2000) identified a major high oleic
acid QTL on LG 14 with a peak LOD score of 33.8 and this QTL explained 83.9% of the
variation. Additionally, they identified minor QTL on LG 8 with a peak LOD of 2.39 and
that explained 0.6% of the variation. In another study, Pérez-Vich et al. (2002)
constructed a linkage map with AFLP and RFLP markers and identified QTL affecting
oleic acid content on LGs 1, 8 and 14. These QTL together accounted for 58.4% of the
phenotypic variance. Individual QTL accounted for 24.5% (LG 1 with peak LOD 8.5),
9.6% (LG 8 with peak LOD 3.1) and 56.5% (LG 14 with peak LOD 19.7). In a later
study, Kusterer et al. (2004) identified two QTL (located at the same position) for both
linoleic and oleic acid content on linkage group A. The first QTL (LOD 3.19) explained
28.4% while the second QTL (LOD 3.79) accounted for 27.6% of the variation. These
two QTL together explained 56.0% of the phenotypic variation for oleic acid content.
Linkage group A of this map might correspond to LG 14 of Pérez-Vich et al. (2002),
however, it still needs to be proven.
Accordingly, there should be other major and/or minor QTL with smaller effects that
contribute to the high oleic acid trait, that were not detected in the present study. Reasons
for this are that with the BSA approach it is possible that some major and minor QTL with
smaller effects might not be detected and that the size of the segregating population was
too small. By increasing the population size and by using whole genome QTL analysis
instead of the BSA approach it is more likely to detect QTL with smaller effects (Haley

205
and Andersson, 1997). In addition, the profound influence of the environment (Collard et
al., 2005) on the expression of the high oleic acid trait as well as the fact that the
sunflower trial was planted in the glasshouse (one environment and for one year) may
have had an influence on the low number of QTL detected.
Selection for the high oleic acid trait based on the two markers flanking the oleic acid
QTL region (E37M55.1 and E38M3.1) would be more reliable than selection based on
one single marker detected within the QTL region. However, the genetic distance between
the two flanking markers is large (26.2 cM) and there is a chance for recombination to
occur within the QTL region. However, since the SSR marker ORS1086.1 mapped within
the QTL region, this marker should be more useful and reliable than the AFLP markers in
high throughput screening for the high oleic acid trait in a breeding programme.
Although the BSA technique has some limitations, this approach was successful in this
study since 19 out of 20 identified markers mapped to a single linkage group, putative LG
14, and the QTL related to the high oleic acid trait also mapped to this linkage group. In
addition, phenotyping of five F3 seeds instead of 10 or more seeds was effective to
accurately map the QTL.
In future research, additional markers should be tested for linkage with the high oleic acid
trait in the population used in this study in order to develop a more saturated linkage
group. In addition, SSR markers identified by Lacombe et al. (2009), that showed linkage
with the Pervenets mutation, should be screened on the parents and on the entire
population in order to detect polymorphisms between high and low oleic acid genotypes.
If linked polymorphisms are detected, these should be included in QTL analyses. If these
markers also map to putative LG 14 and within the high oleic acid QTL region, it is
possible that QTL identified in this study could be genetically linked to the Pervenets
mutation explained by Lacombe et al. (2009).
Additional major and/or minor QTL influencing the high oleic acid trait should also be
mapped. Furthermore, markers identified in this study should be validated by testing their
effectiveness in determining the target phenotype in different populations from different
genetic backgrounds and by testing in different environments and years since environment
has a profound influence on fatty acid composition in sunflower. For these purposes it

206
might be necessary to develop an “eternal” mapping population such as recombinant
inbred lines (RILs) or doubled haploid lines in order to conduct replicated trials across
different locations and years.
Although the AFLP marker technique was a reliable and stable and generated a high
number of markers in a short period of time, AFLP markers are dominant, multicopy and
unsatisfactory for anchoring and cross referencing linkage maps. In addition, AFLP
analysis is expensive, time-consuming and technologically demanding, and therefore the
use of AFLP markers for large scale screening in breeding programmes is limited. This
constraint may be overcome by converting AFLP markers into sequence characterised
amplified region (SCAR) or STS markers that are technically simpler, less expensive and
more efficient (Tang et al., 2003; Collard et al., 2005). Several studies reported the
successful conversion of AFLP markers to SCAR markers that were associated with
agronomic traits in B. juncea, cowpea and Ponkan mandarin (Negi et al., 2000; Boukar et
al., 2004; JinPing et al., 2009). As a result, the AFLP markers detected in this study may
need to be converted to single copy, co-dominant SCAR markers to facilitate their wider
use in MAS in sunflower breeding.
5.5 References
Berry, S.T., Leon, A.J., Hanfrey, C.C., Challis, P., Burkholz, A., Barnes, S.R., Rufener,
G.K., Lee, M. and Caligari, P.D.S. 1995. Molecular marker analysis of Helianthus
annuus L. II. Construction of an RFLP linkage map for cultivated sunflower.
Theoretical and Applied Genetics 91: 195-199.
Bert, P.-F., Jouan, I., Tourvieille de Labrouche, D., Serre, F., Nicolas, P. and Vear, F.
2002. Comparative genetic analysis of quantitative traits in sunflower (Helianthus
annuus L.). 1. QTL involved in resistance to Sclerotinia sclerotiorum and Diaporhte
helianthi. Theoretical and Applied Genetics 105: 985-993.
Bert, P.-F., Jouan, I., Tourvieille de Labrouche, D., Serre, F., Phillippon, J., Nicolas, P.
and Vear, F. 2003. Comparative genetic analysis of quantitative traits in sunflower
(Helianthus annuus L.). 2. Characterisation of QTL involved in developmental and
agronomic traits. Theoretical and Applied Genetics 107: 181-189.
Bilyeu, K., Palavalli, L., Sleper, D. and Beuselinck, P. 2005. Mutations in soybean
microsomal omega-3 fatty acid desaturase genes reduce linolenic acid concentration
in soybean seeds. Crop Science 45: 1830-1836.

207
Boukar, O., Kong, L., Sing, B.B., Murdock, L. and Ohm, H.W. 2004. AFLP and AFLP-
derived SCAR markers associated with Striga gesnerioides resistance in cowpea.
Crop Science 44: 1259-1264.
Chen, J., Hu, J., Vick, B.A. and Jan, C.C. 2006. Molecular mapping of a nuclear male
sterility gene in sunflower (Helianthus annuus L.) using TRAP and SSR markers.
Theoretical and Applied Genetics 113: 122-127.
Collard, B.C.Y., Jahufer, M.Z.Z., Brouwer, J.B. and Pang, E.C.K. 2005. An introduction
to markers, quantitative trait loci (QTL) mapping and marker-assisted selection for
crop improvement: The basic concepts. Euphytica 142: 169-196.
Dehmer, K.J. and Friedt, W. 1998. Development of molecular markers for high oleic acid
content in sunflower (Helianthus annuus L.). Industrial Crops and Products 7: 311-
315.
García-Moreno, M.J., Vera-Ruiz, E.M., Fernández-Martínez, J.M., Velasco, L. and
Pérez-Vich, B. 2006. Genetic and molecular analysis of high gamma-tocopherol
content in sunflower. Crop Science 46: 2015-2021.
Gedil, M.A., Wye, C., Berry, S.T., Segers, B., Peleman, J., Jones, R., Leon, A., Slabaugh,
M.B. and Knapp, S.J. 2001. An integrated restriction fragment length polymorphism-
amplified fragment length polymorphism linkage map for cultivated sunflower.
Genome 44: 213-221.
Gentzbittel, L., Vear, F., Zhang, Y.-X., Berville, A. and Nicolas, P. 1995. Development of
a consensus RFLP linkage map of cultivated sunflower (Helianthus annuus L.).
Theoretical and Applied Genetics 90: 1079-1086.
Gupta, M.K. 2002. Sunflower oil. In: Vegetable oils in food technology: Composition,
properties and uses. Gunstone, F.D. (Ed.). Blackwell Publishing Ltd. CRC Press LLC,
USA, Canada. pp. 128-156.
Haley, C. and Andersson, L. 1997. Linkage mapping of quantitative trait loci in plants and
animals. In: Genome mapping: a practical approach. Dear, P. (Ed.). Oxford University
Press, New York. pp. 49-72.
Harwood, J.L. 1996. Recent advances in the biosynthesis of plant fatty acids: A review.
Biochimica et Biophysica Acta 1301: 7-56.
Herselman, L. 2003. Genetic variation among Southern African cultivated peanut
(Arachis hypogaea L.) genotypes as revealed by AFLP analysis. Euphytica 133: 319-
327.

208
Hongtrakul, V., Slabaugh, M.B. and Knapp, S.J. 1998a. A seed specific �-12 oleate
desaturase gene is duplicated, rearranged, and weakly expressed in high oleic acid
sunflower lines. Crop Science 38: 1245-1249.
Hongtrakul, V., Slabaugh, M.B. and Knapp, S.J. 1998b. DFLP, SSCP, and SSR markers
for ∆9-stearoyl-acyl carrier protein desaturases strongly expressed in developing seeds
of sunflower: intron lengths are polymorphic among elite inbred lines. Molecular
Breeding 4: 195-203.
JinPing, X., LiGeng, C., Ming, X., HaiLin, L. and WeiOi, Y. 2009. Identification of
AFLP fragments linked to seedlessness in Ponkan mandarin (Citrus reticulata Blanco)
and conversion to SCAR markers. Scientia Horticulturae 121: 505-510.
Kabbaj, A., Vervoort, V., Abbott, A.G., Tersac, M. and Bervillé. A. 1996. Polymorphism
in Helianthus and expression of stearate, oleate and linoleate desaturase gene in
sunflower with normal and high oleic acid contents. Helia 19: 1-18.
Kusterer, B., Prüfe, M., Lazarescu, E., Özdemir, N., Friedt, W. and Horn, R. 2002.
Mapping of the restorer gene Rf1 in sunflower (Helianthus annuus L.). Helia 25: 41-
46.
Kusterer, B., Rozynek, B., Brahm, L., Prüfe, M., Tzigos, S., Horn, R. and Friedt, W.
2004. Construction of a genetic map and localization of major traits in sunflower
(Helianthus annuus L.). Helia 27: 15-24.
Lacombe, S. and Bervillé, A. 2000a. Analysis of desaturase transcript accumulation in
normal and high oleic oil sunflower development seeds. In: Proceedings of the 15th
International Sunflower Conference, Toulouse, France. pp. A1-A6.
Lacombe, S. and Bervillé, A. 2000b. Problems and goals in studying oil composition
variation in sunflower. In: Proceedings of the 15th International Sunflower
Conference, Toulouse, France. pp. D16-D25.
Lacombe, S., Guillot, H., Kaan, F., Millet, C. and Bervillé, A. 2000. Genetic and
molecular characterization of the high oleic content of sunflower oil in Pervenets. In:
Proceedings of the 15th International Sunflower Conference, Toulouse, France. pp.
A13-A18.
Lacombe, S., Kaan, F., Léger, S. and Bervillé, A. 2001. An oleate desaturase and a
suppressor loci direct high oleic acid content of sunflower (Helianthus annuus L.) oil
in the Pervenets mutant. Life Sciences 324: 839-845.

209
Lacombe, S., Souyris, I. and Bervillé, A. 2009. An insertion of oleate desaturase
homologous sequence silences via siRNA the functional gene leading to high oleic
acid content in sunflower seed oil. Molecular Genetics and Genomics 281: 43-54.
Lander, E.S. and Botstein, D. 1989. Mapping Mendelian factors underlying quantitative
traits using RFLP linkage maps. Genetics 121: 185-199.
Lander, E.S., Green, P., Abrahamson, J., Barlow, A., Daley, M., Lincoln, S. and
Newburg, L. 1987. MAPMAKER: an interactive computer package for constructing
primary genetic linkage maps of experimental and natural populations. Genomics 1:
174-181.
Lawson, W.R., Goulter, K.C., Henry, R.J., Kong, G.A. and Kochman, J.K. 1996. RAPD
markers for a sunflower rust gene. Australian Journal of Agricultural Research 47:
395-401.
Leon, A.J., Lee, M. and Andrade, F.H. 2001. Quantitative trait loci for growing degree
days to flowering and photoperiod response in sunflower (Helianthus annuus L.).
Theoretical and Applied Genetics 102: 497-503.
Leon, A.J., Lee, M., Rufener, G.K., Berry, S.T. and Mowers, R.P. 1995. Use of RFLP
markers for genetic linkage analysis of oil percentage in sunflower seed. Crop
Science 35: 558-564.
Lu, G., Hu, X. and Bidney, D.L. 2007. Sunflower. In: Biotechnology in Agriculture and
Forestry. Volume 61, Transgenic Crops VI. Pua, E.C. and Davey, M.R. (Eds.).
Springer-Verlag Berlin, Heidelberg. pp. 39-58.
Lu, Y.H., Melero-Vara, J.M., García-Tejada, J.A. and Blanchard, P. 2000. Development
of SCAR markers linked to the gene OR5 conferring resistance to boomrape
(Orobanche cumana Wallr.) in sunflower. Theoretical and Applied Genetics 100:
625-632.
Mestries, E., Gentzbittel, L., Tourvieille de Labrouche, D., Nicolas, P. and Vear, F. 1998.
Analyses of quantitative trait loci associated with resistance to Sclerotinia
sclerotiorum in sunflowers (Helianthus annuus L.) using molecular markers.
Molecular Breeding 4: 215-226.
Michelmore, R., Paran, I. and Kesseli, R. 1991. Identification of markers linked to
disease-resistance genes by bulked segregant analysis: A rapid method to detect
markers in specific genomic regions by using segregating populations. Proceedings of
the National Academy of Sciences of the United States of America 88: 9828-9832.

210
Mokrani, L., Gentzbittel, L., Azanza, F., Fitamant, L., Al-Chaarani, G. and Sarrafi, A.
2002. Mapping and analysis of quantitative trait loci for grain oil content and
agronomic traits using AFLP and SSR in sunflower (Helianthus annuus L.)
Theoretical and Applied Genetics 106: 149-156.
Negi, M.S., Devic, M., Delsney, M. and Lakshmikumaran, M. 2000. Identification of
AFLP fragments linked to seed coat colour in Brassica juncea and conversion to a
SCAR marker for rapid selection. Theoretical and Applied Genetics 101: 146-152.
Paniego, N., Heinz, R., Fernandez, P., Talia, P., Nishinakamasu, V. and Hopp, H.E. 2007.
Sunflower. In: Genome mapping and molecular breeding in plants, Volume 2.
Oilseeds. Kole, C. (Ed.). Springer-Verlag, Berlin, Heidelberg. pp. 153-177.
Pérez-Vich, B., Fernández-Martínez, J.M., Grondona, M., Knapp, S.J. and Berry, S.T.
2002. Stearoyl-ACP and oleoyl-PC desaturase genes cosegregate with quantitative
trait loci underlying high stearic and high oleic acid mutant phenotypes in sunflower.
Theoretical and Applied Genetics 104: 338-349.
Pérez-Vich, B., Fernández-Martínez, J.M., Knapp, S.J. and Berry, S.T. 2000. Molecular
markers associated with sunflower oleic acid concentrations in a high stearic x high
oleic cross. In: Proceedings of the 15th International Sunflower Conference, Toulouse,
France. pp. A55-A60.
Rachid Al-Charaani, G., Gentzbittel, L., Huang, X. and Sarrafi, A. 2004. Genotypic
variation and identification of QTLs for agronomic traits using AFLP and SSR
markers in RILs of sunflower (Helianthus annuus L.). Theoretical and Applied
Genetics 109: 1353-1360.
Rachid Al-Charaani, G., Roustaee, A., Gentzbittel, L., Mokrani, L., Barrault, G.,
Dechamp-Guillaume, G. and Sarrafi, A. 2001. A QTL analysis of sunflower partial
resistance to downy mildew (Plasmopara halstedii) and black stem (Phoma
macdonaldii) by the use of recombinant inbred lines (RILs). Theoretical and Applied
Genetics 104: 490-496.
Rönicke, S., Hahn, V., Vogler, A. and Friedt, W. 2005. Quantitative trait loci analysis of
resistance to Sclerotinia sclerotiorum in sunflower. Phytopathology 95: 834-839.
Saghai-Maroof, M.A., Soliman, K.M., Jorgensen, R.A. and Allard, R.W. 1984.
Ribosomal DNA spacer-length polymorphisms in barley: Mendelian inheritance,
chromosomal location, and population dynamics. Proceedings of the National
Academy of Science of the United States of America 81: 8014-8018.

211
Schuppert, G.F., Tang, S., Slabaugh, M.B. and Knapp, S.J. 2006. The sunflower high-
oleic mutant Ol carries variable tandem repeats of FAD2-1, a seed specific oleoyl-
phosphatidyl choline desaturase. Molecular Breeding 17: 214-256.
Shanklin, J. and Cahoon, E.B. 1998. Desaturation and related modifications of fatty acids.
Annual Review of Plant Physiology and Plant Molecular Biology 49: 611-641.
Soldatov, K.I. 1976. Chemical mutagenesis in sunflower breeding. In: Proceedings of the
7th International Sunflower Conference, Krasnodar, USSR. International Sunflower
Association, Vlaardingen, The Netherlands. pp. 352-357.
Tang, S., Heesacker, A., Kishore, V.K., Fernandez, A., Sadik, E.S., Cole, G. and Knapp,
S.J. 2003. Genetic mapping of the Or5 gene for resistance to Orobanche race E in
sunflower. Crop Science 43: 1021-1028.
Tang, S., Yu, J.-K., Slabaugh, M.B., Shintani, D.K. and Knapp, S.J. 2002. Simple
sequence repeat map of the sunflower genome. Theoretical and Applied Genetics 105:
1124-1136.
Voorrips, R.E. 2002. Software for the graphical presentation of linkage maps and QTLs.
Journal of Heredity 93: 77-78.
Vos, P., Hogers, R., Bleeker, M., Reijans, M., Van de Lee, T., Hornes, M., Frijters, A.,
Pot, J., Peleman, J., Kuiper, M. and Zabeau, M. 1995. AFLP: a new technique for
DNA fingerprinting. Nucleic Acids Research 23: 4407-4414.
Yu, J.-K., Tang, S., Slabaugh, M.B., Heesacker, A., Cole, G., Herring, M., Soper, J., Han,
F., Chu, W.-C., Webb, D.M., Thompson, L., Edwards, K.J., Berry, S., Leon, A.J.,
Grondona, M., Olungu, C., Maes, N. and Knapp, S.J. 2003. Towards a saturated
molecular genetic linkage map for cultivated sunflower. Crop Science 43: 367-387.
Yue, B., Cai, X., Vick, B.A. and Hu, J. 2009a. Genetic characterization and molecular
mapping of a chlorophyll deficiency gene is sunflower (Helianthus annuus). Journal
of Plant Physiology 166: 644-651.
Yue, B., Cai, X., Yuan, W., Vick, B.A. and Hu, J. 2009b. Mapping quantitative trait loci
(QTL) controlling seed morphology and disk diameter in sunflower (Helianthus
annuus L.). Helia 32: 17-36.

212
CHAPTER 6
PHYSICOCHEMICAL AND OXIDATIVE STABILITY CHARACTERIS TICS OF
HIGH AND MID OLEIC SUNFLOWER SEED OIL
6.1 Introduction
Sunflower oil is the major product of seed processing that contributes approximately 80%
to the total value of the crop. The oil is mostly used as a cooking medium, but is often
used in salad oil and to manufacture margarine, shortening and other products. Sunflower
oil has a desirable fatty acid composition for use as edible oil. It is a polyunsaturated oil
with a relatively low total saturated fatty acid content. However, because of its high
unsaturation level, sunflower oil is highly susceptible to oxidation (Salunkhe et al., 1992).
Oxidative stability refers to the resistance of oils to lipid oxidation during processing and
storage (Guillen and Cabo, 2002). Different types of oxidation occur and these include
autoxidation, photo-oxidation, thermal oxidation and hydrolytic oxidation (O’Brien,
2009). The consequences of lipid oxidation are the formation of off-flavours and odours,
associated with rancidity, as well as loss of functional and nutritional value (Nawar, 1996;
Stauffer, 1996; Grompone, 2005). Oxidative stability is therefore an important indicator
to determine oil quality and predict oil shelf-life (Pike, 2001; Martín-Polvillo et al., 2004;
Choe and Min, 2006).
Oil oxidative stability depends on various factors including oil composition, minor
antioxidant or pro-oxidant compound content and degree of processing. Oil storage
conditions and packaging also affect the rate of oxidation. Oil storage in light or dark
conditions, temperature and oxygen availability may influence the oil’s oxidative stability
(Crapiste et al., 1999; Abramovic and Abram, 2005). These factors interactively affect the
oxidation of oil and it is difficult to differentiate between their individual effects (Choe
and Min, 2006). Autoxidation can be retarded by storing oil in the dark, refrigeration or
freezing, vacuum packaging and packing under an inert gas to exclude oxygen. The
addition of antioxidants to oil is highly preferable to suppress oxidation (Merrill et al.,
2008) because the above storing conditions are not always applicable and only a small
amount of oxygen in the oil is necessary to initiate and maintain oxidative processes (Naz
et al., 2004).

213
The degree of unsaturation of fatty acids is one of the most important parameters that
influence oil oxidative stability (Holman and Elmer, 1947; Merrill et al., 2008). Much
research has focussed on improving oil stability and nutritional quality by altering the
fatty acid composition. This was achieved through conventional breeding, coupled with
mutagenesis in some cases. Oils that have been developed by decreasing the
polyunsaturated (linoleic and linolenic) fatty acids and increasing the monounsaturated
(oleic) acid content have improved oxidative stability compared to traditional oils (Liu
and White, 1992; Neff et al., 1994; Hu et al., 2006; Smith et al., 2007). These include
soybean (Patil et al., 2007), canola and rapeseed (Auld et al., 1992; Spasibionek, 2006),
safflower (Knowles et al., 1965) and sunflower oil (Soldatov, 1976).
Oxidative degradation is directly related to the polyunsaturated fatty acid content of the
oil (Neff et al., 1994). Oxidation essentially takes place at the double-bond (unsaturation)
sites in triglyceride molecules (Sherwin, 1978; Stauffer, 1996). Consequently the higher
the number of double bonds in the triglyceride structure (the higher the unsaturation level
of fatty acids), the more susceptible the oil is to oxidative degradation and the higher the
rate of oxidation (Gray, 1978; Sherwin, 1978; Kamal-Eldin, 2006). As a result,
polyunsaturated oil is more susceptible to oxidation than monounsaturated oil.
The high monounsaturation makes high oleic sunflower oil much less susceptible to
oxidative degradation than traditional sunflower oil with high polyunsaturation (Dorrell
and Vick, 1997). For that reason, sunflower oils with high oleic acid contents and low
linoleic acid levels should prove more resistant to oxidation than traditional sunflower oil.
The aim of this study was to evaluate and compare the physicochemical properties along
with the oxidative stability of traditional and high oleic sunflower hybrids developed and
grown in South Africa.
6.2 Materials and methods
6.2.1 Seed material
The seed analysed in this study were obtained from a PANNAR® breeding trial planted in
Lichtenburg in 2008. The trial layout was the same as trials described in Chapter 3. Seed
were harvested in May 2009. Seed material included three traditional (linoleic), three high
oleic and one mid oleic hybrid entry with three replications for each entry. Due to

214
confidentiality reasons the names of hybrids may not be revealed. Once received, seed
were vacuum-sealed and stored at 4ºC until needed for oil extraction.
6.2.2 Seed oil extraction and fatty acid analysis
Crude seed oil was extracted using a Soxhlet extraction procedure at a rate of six to eight
drops per minute with diethyl ether as solvent. Sunflower achenes were ground with a
coffee grinder and more or less 70 g of sample was weighed into each thimble. Thimbles
were placed in a vacuum oven at 50ºC and left overnight. Phosphorus pentoxide was used
as moisture absorbent. The following morning, thimbles were placed in the Soxhlet
apparatus and the oil extracted from the dried sample using diethyl ether as solvent. After
extraction, the diethyl ether was evaporated on a water bath and the oil weighed. Flasks
were left overnight in the refrigerator and the oil filtered the following morning to remove
waxes. The filtered oil was again placed in the vacuum oven for two hours at 50ºC. The
oil was cooled to room temperature and poured into individual dark bottles. Oil samples
were stored with nitrogen in the headspace. Fatty acid analysis was done according to the
methods described in Chapter 3.
6.2.3 Physicochemical properties
Refractivity index (RI) was determined according to the Association of Official
Analytical Chemists' (AOAC) Official Method 921.08 (2000) with an Abbé automatic
digital refractometer from ATAGO® (Model RX 5000α). Two droplets of the extracted
lipid were placed on the glass prism of the sample chamber. The RI-readings were done in
triplicate at a temperature of 40°C. After each reading, the prism was wiped with 100%
ethanol and dried with clean, dry, soft tissue paper. Distilled water was used as a blank
(with a known RI-value of 1.33061) and the blank was used to calibrate the refractometer
after every seventh sample.
Iodine value (IV) was determined according to AOAC Official Method 920.158 (2000). A
sample of 0.5 g lipid, from the Soxhlet extraction, was weighed into a 250 ml Erlenmeyer
flask. A volume of 10 ml chloroform was added and the flask shaken until the lipid
dissolved. Then 25 ml of the Hanus iodine bromine solution (0.1 M IBr in glacial acetic
acid) was added and allowed to stand for 30 min in the dark. After the 30 min, 10 ml of a
15% potassium iodide solution and 100 ml distilled water was added and the flask was
shaken. The sample was titrated with 0.1 N sodium thiosulfate. As the yellow colour

215
became faint, a few drops of starch indicator were added and when the blue colour
disappeared, the endpoint was reached. The IV was expressed as the number of gram
iodine absorbed by 100 g of lipid. IV is determined by the formula (Jacobs, 1958):
Iodine/100 g fat = [(difference of ml blank – ml of sample) x N of Na2S2O3) x 126.91]
Weight of sample x 10
FFA content was determined according to the method described by Pearson (1973). A
sample of 0.5 g lipid, from the Soxhlet extraction, was weighed into a 250 ml glass
beaker. A solvent was prepared by mixing 20 ml of ethanol [95% (v/v)] with 1 ml
phenolphthalein indicator [1% (v/v) in alcohol]. The mixture was neutralised by adding
0.1 N NaOH from a buret. The solvent was added to the oil sample and titrated with 0.1 N
NaOH, while constantly being stirred, until the sample’s colour turned pink and the pink
colour persisted for at least 15 s. FFA was calculated as free oleic acid on a percentage
basis: If titration = V ml of 0.1 N of NaOH and W = weight of the sample (g), then
FFA (as oleic acid %) = (V x 0.0282 x 100) /W
6.2.4 Determination of oxidative stability
PV of the extracted oils was determined according to the AOAC Official Method 965.33
(2000). A sample of 1.0 g oil was weighed into a 250 ml glass Erlenmeyer flask. A
solution of acetic acid and chloroform (3:2) was prepared and 30 ml of this solution was
added to the sample. Thereafter, 0.5 ml saturated potassium iodide solution was added to
the sample and stirred for precisely 1 min. After 1 min, 20 ml distilled water was added to
the sample to stop the reaction. A 1% (w/v) starch indicator was prepared and 0.5 ml of
the starch indicator was added to the sample. The sample was titrated with 0.01 N sodium
thiosulfate until a specific colour reaction was observed. The reading on the buret was
taken and the value was used in the formula to calculate the peroxide value. The peroxide
value is expressed in terms of milli-equivalents (meq) peroxide per 1000 g of sample:
PV = (S x N x 1000) / weight of sample

216
where S is the titration value of the sample and N is the normality of sodium thiosulfate
solution.
The p-anisidine value (p-AV) was determined according to the method described by
Hamilton and Hamilton (1992). A sample of 0.5 g oil was weighed into a 25 ml
volumetric flask. The oil was dissolved with isooctane and the solution was diluted to
volume with a disposable pasteur pipet. The spectrophotometer was calibrated at 350 nm
absorbency with isooctane as blank. The absorbance (Ab) of the fat solution was measured
at 350 nm with a Thermo Spectronic spectrophotometer (Genesys™ 10 series). The ρ-
anisidine was prepared by weighing 0.0625 g anisidine into a 25 ml volumetric flask and
adding 25 ml of glacial acetic acid to the flask. The solution was stirred to dissolve the
anisidine. Exactly 5 ml of the fat solution and 1 ml of the anisidine reagent was pipetted
into a glass test tube. The blank contained 5 ml isooctane solvent and 1 ml anisidine
reagent. Tubes were shaken and left for 10 min. Thereafter, the blank was used to
calibrate the spectrophotometer and the absorbance (As) of the fat solution with anisidine
was measured. The colour was quantitated and converted to AV. The p-AV is given by
the formula:
p-AV = [25 x (1.2As-Ab)] / m
where As is the absorbance of the lipid solution after reaction with the p-anisidine reagent,
Ab is the absorbance of the lipid solution and m is the mass (g) of the lipid.
The OSI measurements were done at Antioxidants Aromas and Fine Chemicals (PTY)
LTD in Richards Bay. The oxidative stability instrument from Omnion was used
according to the American Oil Chemists’ Society (AOCS) Official Method Cd 12b-92.
The oil sample was held in a thermostated bath and oxidation was carried out at 110ºC. A
stream of purified air was passed through the lipid at a rate of 2.5 ml/s. The effluent air
from the lipid sample was bubbled through a vessel containing deionised water. The
conductivity of the water was continuously measured as the effluent air contained volatile
organic acids (swept from the oxidising oil) which increased the conductivity of the water
as oxidation proceeded. The conductivity of the water was monitored by a computer. The
time it took for the oil sample to begin a rapid increase in conductivity determines the
induction period endpoint (Pike, 2001). The time-based end point was determined by a

217
computer that calculated the maximum of the second derivative of the conductivity with
respect to time.
6.2.5 Statistical analyses
ANOVA and LSD tests were conducted to identify differences among means using
Agrobase (2005).
6.3 Results
6.3.1 Oil and fatty acid content
The mean seed oil content varied between 35.65-36.56% among the traditional, high oleic
and mid oleic oil types (Table 6.1). On average, the three oil types did not differ
significantly for oil content even though the traditional oil contained 0.6% more oil than
the high oleic oil. The traditional hybrid 3 contained the highest percentage of oil
(38.08%) and this was significantly higher than the oil contents for the traditional hybrid 1
and the high oleic hybrid 6. The mid oleic hybrid 7 had, on average, a similar oil content
as the traditional hybrids, but was not significantly different from any other hybrid.
The predominant fatty acids detected were palmitic (C16:0), stearic (C18:0), oleic
(C18:1c9) and linoleic acid (C18:2c9,12). Palmitoleic (C16:1), α-linolenic
(C18:3c9,12,15), arachidic (C20:0), eicosenoic (C20:1c11), eicosadienoic (C20:2c11,14),
behenic (C22:0) and lignoceric (C24:0) acid were detected in minor percentages in all
oils, while vaccenic acid (C18:1c7) was only detected in the traditional and mid oleic oils.
Insignificant percentages of myristic acid (C14:0) were detected in a small number of oil
samples. Only major fatty acids palmitic, stearic, oleic and linoleic, occurring at levels
more than 0.5%, are presented and discussed (Table 6.1).
Averages for palmitic acid content ranged between 3.40-6.28% among the three oil types
(Table 6.1). Significant differences were observed between oil types for palmitic acid
content. The traditional oil contained on average 2.88% and 1.47% more palmitic acid
than the high oleic and mid oleic oils respectively. The palmitic acid content of traditional
hybrid 3 was significantly higher than all other hybrids. However, the individual high
oleic hybrids did not differ significantly for palmitic acid content.

218
Table 6.1 Mean oil and major fatty acid contents of traditional, high oleic and mid oleic sunflower oil types
LSD: Least significant difference, C16:0: Palmitic acid, C18:0: Stearic acid, C18:1: Oleic acid, C18:2: Linoleic acid, MUFA: Monounsaturated fatty acids, PUFA: Polyunsaturated fatty acids, SFA: Saturated fatty acids. Mean values followed by the same letter did not differ significantly at P≤0.05.
Oil type Hybrid Oil
content C16:0 C18:0 C18:1 C18:2 MUFA PUFA SFA PUFA/SFA
Traditional 1 34.46b 5.91b 3.81a 26.95b 61.96b 27.12b 62.02b 10.86b 5.71a
2 36.20ab 6.22b 3.83a 22.66c 65.97a 22.82c 66.04a 11.14b 5.93a
3 38.08a 6.70a 3.89a 19.12c 69.04a 19.26c 69.10a 11.64a 5.94a
Mean 36.25 6.28 3.84 22.91 65.66 23.07 65.72 11.21 5.86
High oleic 4 35.51ab 3.27c 4.07a 84.08a 6.61c 84.31a 6.71c 8.98de 0.76b
5 36.78ab 3.25c 3.62a 81.67a 9.45c 81.93a 9.55c 8.53e 1.12b
6 34.66b 3.68c 4.14a 81.94a 8.28c 82.18a 8.43c 9.39cd 0.90b
Mean 35.65 3.40 3.94 82.56 8.11 82.81 8.23 8.97 0.93
Mid oleic
7
36.56ab
4.81d
3.57a
53.77d
36.37d
53.95d
36.42d
9.63c
3.78c
LSD (0.05) 2.93 0.47 0.60 3.77 3.74 3.77 3.74 0.47 0.37

219
A highly significant and negative correlation was observed between palmitic and oleic
acid (Table 6.2). The higher the oleic acid, the lower the palmitic acid content. This
negative correlation was evident in the traditional and high oleic sunflower oil types. The
traditional oil contained more palmitic acid than the high oleic oil. The strong and highly
significant positive correlation between palmitic and linoleic acid can be attributed to the
strong negative correlation between oleic and linoleic acid. Although both palmitic and
stearic acid contributed to the SFA content, only palmitic acid showed a strong and
significantly positive correlation with SFA content.
Stearic acid content varied between 3.57-3.94% among the three oil types (Table 6.1). No
significant differences were observed between individual hybrids (and as result, between
the three oil types) for stearic acid content. A significant and negative correlation between
stearic acid and oil content was observed (Table 6.2). However, this correlation was only
observed for high oleic and mid oleic hybrids. As oil content increased, stearic acid
content decreased. Although significant variation occurred between the traditional hybrids
for oil content, their stearic acid contents were more or less the same and the correlation
appeared to be positive between stearic acid and oil content.
Oleic acid content varied between 19.12-26.95% among the traditional hybrids (Table
6.1). The traditional hybrid 1 showed significantly higher oleic acid content (26.95%)
than the other two traditional hybrids (22.66% and 19.12% respectively). The high oleic
oil types contained the highest oleic acid content (82.56%) which was significantly higher
than in the traditional (22.91%) and mid oleic (53.77%) oils. No significant differences
were observed among the high oleic hybrids for oleic acid content. The oleic acid content
of the mid oleic oil was significantly higher than that of the traditional oil. Linoleic acid
content varied between 61.96-69.04% among the traditional hybrids (Table 6.1). The
traditional hybrid 1 showed a significantly lower linoleic acid content than the other two
traditional hybrids. This observation together with the significantly higher oleic acid
content for this hybrid was a result of the highly negative correlation between oleic and
linoleic acid content (Table 6.2). The traditional oil contained on average significantly
higher linoleic acid content (65.66%) than the high oleic (8.11%) and mid oleic (36.37%)
oils. No significant differences were observed among the high oleic hybrids for linoleic
acid content. However, the average linoleic acid content of the mid oleic oil was
significantly different from that of the high oleic oil.

220
Table 6.2 Significant correlations between oil content, fatty acids and physicochemical properties
Oil
content C16:0 C18:0 C18:1 C18:2 SFA MUFA PUFA PUFA/SFA RI
C16:0
C18:0
0.29
-0.65*
-0.21
C18:1 -0.20 -0.98** 0.15
C18:2 0.21 0.98** -0.16 -1.00**
SFA 0.07 0.94** 0.15 -0.94** 0.93**
MUFA -0.20 -0.94** 0.15 1.00** -1.00** -0.94**
PUFA 0.21 0.98** -0.16 -1.00** 1.00** 0.93** -1.00**
PUFA/SFA 0.21 0.98** -0.21 -0.99** 0.99** 0.91** -0.99** 0.99**
RI 0.23 0.98** -0.19 -0.99** 0.99** 0.92** -0.99** 0.99** 0.99**
IV 0.20 0.91** -0.25 -0.94** 0.94** 0.82** -0.94** 0.94** 0.96** 0.94**
**P≤0.01,*P≤0.05, C16:0: Palmitic acid, C18:0: Stearic acid, C18:1: Oleic acid, C18:2: Linoleic acid, SFA: Saturated fatty acids, MUFA: Monounsaturated fatty acids, PUFA: Polyunsaturated fatty acids, RI: Refractive index, IV: Iodine value.

221
Fatty acids palmitoleic, oleic, eicosenoic and vaccenic contributed to the monounsaturated
fatty acid (MUFA) content of each hybrid. However, palmitoleic, eicosenoic and vaccenic
acids occurred in minor percentages (data not shown) and their contributions to the
MUFA content can be omitted. As a result, the MUFA averages of hybrids and three oil
types correlated well with their oleic acid contents (Table 6.1). MUFA content showed a
strong and significantly positive correlation with oleic acid and strong and significantly
negative correlation linoleic acid (Table 6.2). Additionally, the strong and significantly
negative correlation between MUFA and palmitic acid was a result of the significantly
negative correlation between palmitic and oleic acid content.
Fatty acids linoleic, eicosadienoic and linolenic contributed to the total polyunsaturated
fatty acid (PUFA) content of each hybrid. Since eicosadienoic and linolenic acids
occurred in minor percentages (data not shown) in each hybrid, their contributions to the
PUFA content can be ignored. As result PUFA contents of hybrids (and three oil types)
were related to their linoleic acid contents (Table 6.1). Therefore, PUFA was positively
correlated with linoleic acid and negatively correlated with oleic acid content (Table 6.2).
The strong and significantly negative correlation between MUFA and PUFA was a result
of the strong and significantly negative correlation between oleic and linoleic acid.
Additionally, the strong and significant correlation between PUFA and palmitic acid was
a result of the significantly positive correlation between palmitic and linoleic acid.
Myristic, palmitic, stearic, arachidic, behenic and lignoceric acids contributed to the total
SFA content of each hybrid. However, palmitic and stearic acids contributed the most to
the SFA content and the minor percentages of the other SFAs can be ignored. The three
oil types differed significantly for total SFA content. The traditional oil contained on
average 11.21% SFA, the high oleic oil 8.97% and the mid oleic oil 9.63% SFAs.
Significant differences were observed among some individual hybrids as well as between
the three oil types for SFA content. The traditional hybrid 3 contained a significantly
higher SFA content than the other two traditional hybrids. Also, significant differences
were observed between high oleic hybrids 5 and 6 for SFA. The significantly higher total
SFA content of the high oleic hybrid 6 may be attributed to slightly higher contents of
palmitic and stearic acids for this hybrid. The average SFA content of the traditional oil
(11.21%) was significantly higher than that of the high oleic (8.97%) and mid oleic
(9.63%) oils. This observation could be explained by the significantly higher palmitic acid

222
contents observed for the traditional hybrids since the stearic acid contents did not differ
significantly between all individual hybrids (Table 6.1). Additionally, SFA content
showed a strong and significantly negative correlation with MUFA (oleic acid) content
(Table 6.2). Therefore, as the oleic acid content increased, SFA content decreased. The
negative correlation was mainly attributed to the strong negative correlation between
palmitic and oleic acid. The strong and significantly positive correlation between SFA and
PUFA (linoleic acid) content was a result of the strong and significantly positive
correlation between palmitic acid and PUFA content.
The three oil types differed significantly in their ratios of polyunsaturated fatty acids to
saturated fatty acids (PUFA/SFA). The high average PUFA/SFA ratio of the traditional
oil (5.86) was attributed to the significantly higher PUFA (linoleic acid) content of the oil,
while the low PUFA/SFA ratio of the high oleic oil (0.93) was a result of both the
significantly lower PUFA content and SFA contents of the oil. The PUFA/SFA ratio for
the mid oleic oil (3.78) was significantly different from that of both the traditional and
high oleic oils. The reason for this is because of the significant differences between the
mid oleic oil and the other two oils with regard to linoleic acid content. The ratio of
PUFA/SFA showed strong and significantly positive correlations with PUFA (linoleic
acid) content, but it was negatively correlated with MUFA (oleic acid) content (Table
6.2). The strong and significantly positive correlation of PUFA/SFA with SFA content
was a result of the strong and significantly positive correlation of PUFA/SFA with
palmitic acid content.
6.3.2 Physicochemical properties
The three oil types differed significantly in their RI values. Traditional hybrids had the
highest RI values, followed by the mid oleic and high oleic hybrids (Table 6.3). Of the
traditional hybrids, hybrid 1 was significantly different from the other two, while for the
high oleic hybrids, hybrid 5 was significantly different from the other two. Similarly to
the RI values, the traditional oil had on average the highest IV (104.23), followed by the
mid oleic (101.33) and high oleic (85.31) oil (Table 6.3). The traditional and mid oleic oil
did not differ significantly, but both were significantly different from the high oleic oil.
No significant differences were observed between traditional hybrids and between high
oleic hybrids within each oil type.

223
Table 6.3 Mean values for physical and chemical tests of traditional, high oleic and mid oleic sunflower oil types
LSD: Least significant difference. Mean values followed by the same letter did not differ significantly at P≤0.05. ND: Refractive index measurement value at 589.3 nm (the D Fraunhofer line).
Oil type Hybrid no. Refractive index
(ND 40ºC) Iodine value
Free fatty acid
(% oleic acid)
Peroxide value
(meq/1000 g) p-Anisidine value
Traditional 1 1.467142b 105.64a 0.32a 10.33bc 4.55a
2 1.467563a 102.23a 0.37a 12.32b 2.15ab
3 1.467824a 104.81a 0.41ab 17.34a 2.22ab
Mean 1.467510 104.23 0.37 13.33 2.97
High oleic 4 1.462098d 83.86b 0.32a 3.17d 0.44b
5 1.462420c 86.78b 0.33a 4.10d 0.78b
6 1.462090d 85.29b 0.62b 3.19d 0.27b
Mean 1.462203 85.31 0.34 3.49 0.50
Mid oleic
7
1.464854e
101.33a
0.32a
8.18c
2.27ab
LSD (0.05) 0.0003 4.33 0.28 2.83 2.85

224
Highly significant and positive correlations were observed between RI and linoleic acid
(PUFA) content and between IV and linoleic (PUFA) content (Table 6.2). These
correlations were expected since both RI- and IV-values are indicative of the level of
unsaturation of an oil. The higher the unsaturation level, the higher the RI- and IV-values.
Additionally, the higher the MUFA (oleic acid) content, the lower the RI- and IV-values.
FFA content ranged between 0.32-0.62% (Table 6.3). These values were below the limit
of 2% and indicated that the oil of all seven hybrids was of good initial oil quality.
When considering the oxidation indexes, the three oil types differed significantly for
average PV (Table 6.3). The high oleic oil had on average a significantly lower PV than
the traditional and mid oleic oils. Between the traditional hybrids, hybrid 3 had a
significantly higher PV (17.34 meq/1000 g) than the other two hybrids (10.33 and 12.32
meq/1000 g). No significant differences were observed between the high oleic hybrids for
PV values. The PV of the mid oleic hybrid 7 (8.18 meq/1000 g) was not significantly
different from the PV of the traditional hybrid 1 (10.33 meq/1000 g). The PV of the mid
oleic oil was on average significantly lower than that of the traditional oil.
The traditional oil showed on average the highest p-AV of 2.97 and was followed by the
mid oleic oil with a p-AV of 2.27. The high oleic oil had the lowest average p-AV of
0.50. However, the three oil types did not differ significantly for p-AV. No significant
differences were observed between individual hybrids for p-AV apart from for the
traditional hybrid 1 that had a significantly higher p-AV than all three high oleic hybrids.
6.3.3 Determination of oil oxidative stability and prediction of oil shelf life
Only hybrids with PVs of 10 meq/1000 g and less (Table 6.3) were used for oxidative
stability analysis and therefore only hybrids 1, 4, 5, 6 and 7 were included for OSI
determination. A PV of less than 10 meq/1000 g indicates that oil oxidation has not
occurred yet and therefore that the oil is of good quality. Only the high oleic hybrids were
analysed for variation because there were three entries for this oil type.

225
Table 6.4 Mean oxidative stability index and shelf life values for traditional, mid
oleic and high oleic sunflower oils
Oil type Hybrid OSI at 110ºC
(hours) Shelf life (months)
Traditional 1 2.70 0.96 Mid oleic
7 4.10 1.45
High oleic 4 10.38a 3.69 5 9.02a 3.21 6 5.05a 1.79 Mean 8.15 2.90
LSD (0.05) 6.24 2.21
OSI: Oil oxidative stability index, LSD: Least significant difference.
The traditional and mid oleic oils contained only one entry each and could therefore not
be analysed for variation.
The traditional, mid oleic and high oleic oils differed in their OSI times and as a result in
their predicted shelf life times (Table 6.4). This observation was a result of the different
unsaturation levels of the oils. The traditional hybrid 1 showed the lowest OSI value (2.70
OSI/h) with a corresponding predicted shelf life of one month. The mid oleic hybrid 7 had
a slightly higher value (4.10 OSI/h) than hybrid 1 with a predicted shelf life of one and a
half months. The high oleic hybrids had the highest OSI values and together they had an
average predicted shelf life of three months. Among the three high oleic hybrids, hybrid 4
performed the best of all hybrids and showed the highest OSI value (10.38 OSI/h) with a
corresponding predicted shelf life of four months. Hybrid 5 was less stable than hybrid 4
with a predicted shelf life of three months while hybrid 6 had a predicted shelf life of two
months. Although the three high oleic hybrids differed in their OSI values and predicted
shelf lives, the differences were non-significant.
6.4 Discussion
The mean seed oil content varied between 35.65-36.56% for the three oil types and no
significant differences were observed among these for oil content. Therefore, the high and
mid oleic hybrids compared well to the traditional hybrids with regard to oil content.
Values obtained in this study are in accordance with oil contents reported by several

226
researchers (Rondanini et al., 2003; Radić et al., 2008). Reported oil contents in whole
sunflower seed varied between 34-52% (Salunkhe et al., 1992).
According to the fatty acid analysis, three oil groups could be distinguished from the
seven sunflower hybrids. They included the traditional (PUFA) oil with a high linoleic
acid content (65.66%) and low oleic acid content (22.91%), the high oleic (MUFA) oil
with a high oleic acid content (82.56%) and low linoleic acid content (8.11%) and the mid
oleic oil with 53.77% oleic and 36.37% linoleic acid. The extent of variation obtained
through traditional plant breeding for sunflower seed oil is evident when comparing fatty
acid composition of the three oil types.
The three oil types differed significantly for palmitic acid content with traditional oil
containing the highest percentage, followed by the mid oleic oil and the high oleic oil. It
was evident that as oleic acid content of the hybrids increased, the palmitic acid content
decreased and this observation was confirmed by the significantly negative correlation
between palmitic and oleic acid content. The high oleic oil contained on average 2.9%
less palmitic acid than the traditional sunflower oil. This tendency is generally observed
for high oleic acid sunflower oil (Martín-Polvillo et al., 2004; Márquez-Ruiz et al., 2008;
Merrill et al., 2008; Codex Alimentarius Commission, 2010). Stearic acid did not vary
significantly between the three oil types and was not correlated with oleic acid content as
was the case with palmitic acid. However, a negative correlation was observed between
stearic acid and oil content of the high oleic hybrids. Therefore, when selecting high oleic
hybrids with increased oil content, a reduction in stearic acid content would result. In
general, fatty acid contents of the high oleic and traditional oils used in this study were
consistent with data reported by other researchers (Martín-Polvillo et al., 2004; Márquez-
Ruiz et al., 2008; Merrill et al., 2008) for traditional and high oleic sunflower oil.
High intake of saturated fatty acids has proven to elevate total and low density lipoprotein
LDL cholesterol in the blood that increases the risk of heart disease. Several studies
showed that by substituting dietary SFAs with PUFAs, the LDL-cholesterol
concentrations are reduced in the blood plasma (Mensink and Katan, 1989; Kris-Etherton
and Yu, 1997; Kris-Etherton et al., 2004). Thus, by increasing the dietary PUFA/SFA
ratio by including linoleic oils in the diet may be advantageous in reducing total plasma
cholesterol (Jackson et al., 1984). However, both high density lipoprotein (HDL)

227
cholesterol and LDL-cholesterol is reduced. Increasing evidence is showing that MUFA
also reduce LDL-cholesterol and plasma TAG, but without adversely affecting the HDL-
cholesterol levels in the blood (Mattson and Grundy, 1985; Kris-Etherton et al., 1999;
Roche, 2001). Recommendations for a preference of MUFA over PUFA for replacing
SFA in the diet initially stemmed from a metabolic study by Mattson and Grundy (1985).
However, much controversy later evolved over the recommendation for restriction of
specific types of dietary fat in the prevention of coronary heart disease. Katan et al.
(1997) suggested that a diet in which the total fat content is held constant and that is
enriched with MUFA will offer better protection against coronary heart disease than a
low-fat diet. It was reported that high intakes of linoleic acid were associated with
increased susceptibility of LDL-cholesterol to oxidation. This could lead to increased
risks of cancer and accelerated ageing (Grundy, 1997). The high oleic oils may therefore
play an important role in decreasing the PUFA intake and may help in reducing these
health concerns.
From an oil quality perspective, the PUFA/SFA ratio is a measure of the extent of
polyunsaturation and is therefore taken as a measure of an oil’s tendency to experience
autoxidation (Farhoosh et al., 2008). Oils with the highest levels of unsaturation are most
likely to experience autoxidation. The significantly different RI and IV values between
the traditional and high oleic sunflower oils can be attributed to differences in their
unsaturation degrees. RI and IV increases with the number of double bonds present in the
fatty acid. As a result, the polyunsaturated oils had higher RI and IV values than the
monounsaturated oils. This was confirmed by the highly significant positive correlations
between linoleic acid (PUFA) content and RI and IV respectively. The significantly lower
RI value observed for the traditional hybrid 1 compared to traditional hybrids 2 and 3 was
attributed to the significantly lower linoleic acid (and total PUFA) content observed for
this hybrid. The observed RI and IV values fell within the range recommended by the
Codex standards (Codex Alimentarius Commission, 2010) for the three sunflower oil
types.
The FFA content of an oil is an important quality parameter in oil crops (Moschner and
Biskupek-Korell, 2006). FFA production is generated from lipid hydrolysis by chemical
or enzymatic action (Robertson et al., 1984; Frega et al., 1999). Improper handling of
seed that damages it and unsuitable storage conditions, such as high temperature and

228
humidity, may cause a considerable increase in the FFA content in the crude oil
(Moschner and Biskupek-Korell, 2006; O’Brien, 2009). Therefore, the significantly
higher FFA value observed for the high oleic hybrid 6 may be a result of the larger
amount of damaged seeds (from harvesting) present in the seed sample received.
However, results obtained in this study showed that FFA contents of all hybrids (and as
result, the three oil types) were less than the threshold maximum value of 2% FFA set for
crude sunflower seed oil. The three sunflower oils were therefore of good quality.
The oxidative status of the oil samples was evaluated considering both primary and
secondary oxidation. The progress of oxidation can be distinguished into two stages
(Martín-Polvillo et al., 2004). The first stage is characterised by a slow progress of
oxidation or the induction period (IP) and the second stage is an accelerated stage of
oxidation (secondary oxidation). PV measures the hydroperoxide content of an oil sample
and is a useful index for the early stage oxidation. PV reaches a maximum during the
progress of oxidation that is followed by a notable decrease in PV. During this stage
(secondary oxidation) the decomposition rate of hydroperoxides exceeds the rate of their
formation (Martín-Polvillo et al., 2004). The p-AV test assesses secondary oxidation by
estimating the amount of unsaturated aldehydes generated during the decomposition of
hydroperoxides (Shahidi and Zhong, 2005). The p-AV is a reliable indicator of oxidative
rancidity in oils (Van der Merwe et al., 2003).
The number of peroxides present in oil is an index of its primary oxidative level and
consequently of its tendency to go rancid. The higher PVs observed for the traditional oil
(>10 meq/1000 g) might be a consequence of peroxides or hydroperoxides formed during
seed storage before oil extraction and during oil extraction itself. Higher PVs observed for
traditional hybrids indicated that these were more sensitive to oxygen during storage and
extraction and were therefore less stable to oxidation than the high oleic oils. Since
PUFAs are more susceptible to oxidation than MUFAs and SFAs, the higher PVs
observed for the traditional hybrids was a consequence of their higher unsaturation levels.
Therefore, the significantly higher PV observed for the traditional hybrid 3, when
compared to traditional hybrid 1, may be attributed to the significantly higher linoleic acid
(and PUFA) content for this hybrid. The significantly lower PVs observed for the high
oleic hybrids (≤4.1 meq/1000 g) were attributed by their significantly lower PUFA/SFA
ratios. According to the Codex standard 210-1999 (Codex Alimentarius Commission,

229
2010) a maximum PV value of 10 meq/1000 g oil is acceptable for good oil quality. The
high oleic and mid oleic hybrids showed PVs lower than the recommended standard
(Codex Alimentarius Commission, 2010) and these were therefore considered to be of
good quality.
The high oleic oil had the lowest average p-AV (0.50) and was followed by the mid oleic
oil (2.27) and traditional oil (2.97). However, the three oil types did not differ
significantly for average p-AV. The reason for the higher p-AVs of the traditional and
mid oleic hybrids may be because of their higher unsaturation levels. According to White
(1995), an anisidine value of between 1-10 mmol/kg is acceptable for well-refined oils,
while this level might even be higher for fresh PUFA oils. Monounsaturated oil is
expected to have lower p-AVs than PUFA oils.
The moderately low PV- and p-AV-values observed for all three oil types indicated that
oxidation was in the induction stage that is characterised by a slow progress of oxidation.
Martín-Polvillo et al. (2004) observed that high oleic sunflower oil had longer IPs than
traditional sunflower oil. Hydroperoxide formation was slower in high oleic sunflower oil
than in the traditional oil. The reason for this is that the length of the induction period
depends on the unsaturation degree of an oil and the higher the level of unsaturation, the
shorter the induction period. Consequently secondary oxidation is likely to occur more
rapidly in traditional sunflower oil than in high oleic sunflower oil.
To estimate their oxidative stability, the three sunflower oil types were evaluated for OSI.
Since OSI measures the resistance of lipids to oxidation, OSI duration is positively
associated with oil stability (Guillen and Cabo, 2002). In addition, OSI is useful for
quality control of oils (Shahidi and Zhong, 2005). The high oleic sunflower oil proved to
be the most stable of the three oil types with an average OSI of 8.15 h, followed by the
mid oleic oil (4.10 h) and traditional sunflower oil (2.70 h). Variation in initial OSI values
between traditional and high oleic sunflower oil have been found in several studies
(Márquez-Ruiz et al., 2008; Merrill et al., 2008). According to their initial oil stability
analysis results, the traditional sunflower oil had significantly lower OSI values (7.4 h at
100ºC and 5.2 h at 110ºC) than the high oleic sunflower oil (20.1 h at 100ºC and 16.5 h at
110ºC). Dobarganes et al. (1993) also observed that induction time was positively
correlated with the unsaturation degree of oils and that the high oleic sunflower oil

230
(80.8% oleic and 6.5% linoleic aicd) showed significantly higher induction times
compared to the traditional sunflower oil (22.3% oleic and 65.0% linoleic acid). The
distinct OSI values observed for the three oil types can be attributed to differences in the
unsaturation degrees of the three oils.
OSI values were used to estimate predicted oil shelf lives. The predicted shelf life of the
high oleic sunflower was on average three months, while for traditional sunflower oil it
was one month. As a result, the monounsaturated high oleic oils were three times more
stable to oxidation than the traditional sunflower oil. Results obtained in this study
supported observations of Smith et al. (2007) who reported that high oleic sunflower oil
had greater oxidative stability than traditional sunflower and soybean oil with high PUFA
contents. Among the three high oleic hybrids, hybrid 4 performed the best of all hybrids
and showed the highest OSI value (10.38 OSI/h) with a corresponding predicted shelf life
of four months. The reason for this could be the high oleic acid content of 84.08% and the
low linoleic acid content (6.61%) observed for hybrid 4.
Other oils that are high in oleic acid content include olive oil (78%) and variants of
regular safflower (77%), canola (78%), peanut (76%) and soybean (79-68%) oil
(Gunstone, 2005). Despite their similar oleic acid contents, some of these oils showed
variation in their OSI values in a study by Merrill et al. (2008). The high oleic canola oil
(71.3% oleic acid), with a lower oleic acid content than safflower oil (72.8%) was more
stable (OSI of 18.5 h) than the safflower oil (OSI of 14.3 h). In addition, the high oleic
sunflower oil (76.2% oleic acid) was less stable (OSI of 16.5 h) than the high oleic canola
oil. These differences can be explained by the tocopherol profiles and levels present in the
oils. Oils of similar fatty acid composition, those having higher amounts of tocopherols,
have greater stability (Normand et al., 2006).
In conclusion, the oil of the high oleic sunflower hybrids proved to be of good quality
with low PVs and p-AVs. In addition, the high oleic oils had considerably better oxidative
stabilities than the traditional sunflower oil. Among the high oleic hybrids, hybrid 4 had
the highest oleic and lowest linoleic acid content. This resulted in the low RI and IV
values observed for this hybrid. In addition it had the lowest FFA content and PV that
indicated good oil quality and oxidative stability. Hybrid 4 indicated the best resistance to
oxidation (highest OSI) with the longest predicted shelf life (four months) of the three

231
high oleic acid hybrids. As a result, this hybrid should be considered in high oleic acid
sunflower breeding programmes for developing high oleic acid sunflower lines with high
quality oil that will show better resistance to autoxidation.
6.5 Oxidative stability of commercial vegetable oils
6.5.1 Introduction
Vegetable oils, the most commonly used cooking media, are beneficial and popular due to
their cholesterol lowering effect. However, there are some important issues regarding
their well-judged use, that are largely ignored by consumers and the medical society (Naz
et al., 2004). In contrast to highly saturated and stable animal fats, unsaturated vegetable
oils are more readily reactive to oxygen. In addition, the fatty acid composition and
presence of antioxidants in oils also influence oil oxidation. Oil quality and nutritional
losses may arise from reaction with atmospheric oxygen (autoxidation) or by hydrolytic
reactions catalysed by lipases. The effects of hydrolytic reactions can be minimised by
cold storage and careful packaging. However, oxidation is an autocatalytic series of
reactions that needs low activation energy and cannot be stopped by lowering temperature
(Stauffer, 1996).
Cold pressed high oleic sunflower oil is available on the shelves of various local
supermarkets. In order to compete with other cooking oils (traditional sunflower, canola
and olive oil), the high nutritional value and oxidative stability of the oil is mostly used to
promote high oleic sunflower oil. In addition, the oil is less expensive than olive oil. The
fatty acid composition of high oleic oil compares well with olive oil and this, together
with the lower price, should make the high oleic sunflower oil more attractive to the
general consumer.
The aim of this study was to evaluate the oxidative stability of four commercially
produced cooking oils using a simple accelerated oxidation test, the Schaal oven test, and
to compare the “recently” produced high oleic sunflower oil with other standard cooking
oils commercially used in South Africa.
6.5.2 Materials and methods
Commercial cooking oils were taken from the shelf in a local supermarket and were
evaluated for oxidative stability. Oils selected for this study were traditional sunflower

232
oil, cold-pressed high oleic sunflower oil, canola oil and palm oil. Traditional sunflower
and canola oil were selected due to their common use as cooking oils and the high relative
reaction rates of their unsaturated fatty acids with oxygen. High oleic sunflower oil was
included to compare the oxidative stability of this oil with that of the commonly used
cooking oils. Palm oil was included due to its high resistance to oxidation, so that a
comparison could be made between reaction rates of oils with different inherent
stabilities.
A duplicate oil sample of 60 g of each type of cooking oil was weighed in 250 ml glass
beakers with free access to air (McGinley, 1991). Oil samples were placed in a heat
cabinet with the temperature set at 63ºC. On day zero, the oil was evaluated for initial
quality and stability. Fatty acid composition together with free fatty acid content, RI, IV,
PV and p-AV values were analysed according to methods described previously.
In order to follow the oxidation rate in each oil sample, these were periodically analysed
for PV, p-AV and RI. Measurements were taken daily for the first two weeks, after that
these were taken three times a week until all oil samples reached the required oxidation
point. A single reaction criterion was not enough to account for the oxidative changes at
various stages. The keeping quality from a PV point of view was determined as the
number of days needed for PV to reach a value of 100 meq/1000 g oil (Hertzman et al.,
1988). Keeping quality from a RI point of view was determined as the number of days for
RI to show an increase of 0.001 units from the initial value at day zero. Both methods
were used because the claim was made that the RI gives a more precise indication of the
end of induction period compared to the PV (McGinley, 1991).
6.5.3 Results
Fatty acid composition
The initial fatty acid analysis results of the four commercial oils before heat storage at
63⁰C are shown in Table 6.5. Traditional sunflower, high oleic sunflower and canola oil
contained between 3.78-5.80% palmitic acid. However, palm oil contained 40.62%
palmitic acid. Traditional sunflower, high oleic sunflower and palm oil contained between
3.99-5.47% stearic acid. Canola oil showed a slightly lower stearic acid content of 2.05%.
The different oils showed large variation for oleic and linoleic acid content.

233
Table 6.5 Initial fatty acid composition (as percentage of total fatty acids) and oil analysis results of four commercial vegetable oils
before oil oxidation as well as the number of days for the oils to show the first phase of oxidation
Measurement Traditional sunflower oil High oleic sunflower oil Canola oil Palm oil Fatty acid composition (%) C14:0 0.03 ND 0.06 0.95 C16:0 5.80 3.78 4.45 40.62 C16:1 ND 0.05 0.18 0.15 C18:0 5.47 5.20 2.05 3.99 C18:1 22.66 74.18 59.63 43.56 C18:2 64.60 15.28 21.76 10.08 C18:3 0.09 0.05 8.98 0.18 C20:0 0.31 ND 0.47 ND C20:1 0.11 0.15 1.39 0.13 C22:0 0.72 1.02 0.05 ND PUFA/SFA ratio 5.16 1.49 4.24 0.22 IV (g I2/100g oil) 104.75 89.26 100.39 56.13 FFA (% oleic acid) 0.31 0.71 0.21 0.19 PV0 (meq/1000 g oil) #Time (days)
3.01 9
9.36 21
3.47 9
0.98 58
p-AV 10.71 1.33 1.26 8.82 RI0 (40ºC) RI1 (40ºC) *Time (days)
1.46737 1.46874
17
1.46276 1.46394
29
1.46577 1.46682
14
1.45857 1.45981
66
C14:0: Myristic acid, C16:0: Palmitic acid, C16:1: Palmitoleic acid, C18:0: Stearic acid, C18:1 Oleic acid, C18:2: Linoleic acid, C18:3: Linolenic acid, C20:0: Arachidic acid, C20:1: Eicosenoic acid, C22:0: Behenic acid, PUFA: Polyunsaturated fatty acids, SFA: Saturated fatty acids, IV: Iodine value, FFA: Free fatty acids, PV0: Initial peroxide value at day zero, p-AV: ρ-Anisidine value, RI0: Initial refractive index at day zero, RI1: Refractive index with a difference of ≥ 0.001, ND: Not detected. #Time in days for PV to reach a maximum value of 100 meq/1000g, *Time in days for RI to differ with 0.001 units from RI0.

234
The traditional sunflower oil contained the highest percentage of linoleic acid (64.60%) of
all four oils and 22.66% oleic acid. High oleic sunflower oil had oleic and linoleic acid
contents of 74.18% and 15.28%. Canola oil contained 59.63% oleic and 21.76% linoleic
acid. Palm oil contained 43.65% oleic and 10.08% linoleic acid. With regard to minor
fatty acids, canola oil contained 8.98% linolenic acid and 1.39% eicosenoic acid, while
the other three oils contained minor amounts of these fatty acids that can be ignored.
Small amounts of behenic acid were detected in the high oleic sunflower oil (1.02%) and
traditional sunflower oil (0.72%). However, this fatty acid occurred in minor amounts for
canola and palm oil.
The traditional sunflower oil had the highest PUFA/SFA ratio of 5.16 and was followed
by canola oil with a ratio of 4.24 (Table 6.5). The relatively high PUFA/SFA ratio
observed for the traditional sunflower oil can be attributed to the high linoleic acid content
and relatively low total SFA content of this oil. However, for canola oil, both linoleic and
linolenic acids contributed to the PUFA and resulted in a high PUFA content. In addition,
canola oil contained less SFA and therefore it had a relatively high PUFA/SFA ratio
(4.24). The low PUFA/SFA ratio of high oleic sunflower oil (1.49) was a result of the low
PUFA (linoleic acid) content of the oil. Palm oil showed the lowest PUFA/SFA ratio
(0.22) of the four oil types. The high palmitic (SFA) content and low linoleic acid (PUFA)
content of this oil contributed to the low PUFA/SFA ratio.
Initial oil quality and influence of high temperature storage on oil quality and oxidative
stability
Before the oil samples were placed in the heat cabinet for heat storage at 63⁰C, they were
tested for initial oil quality. The IV differences observed between the four oil types were a
result of differences in their unsaturation levels. The traditional sunflower and canola oil
had the highest IVs (104.75 and 100.39 respectively) and were the result of their high
PUFA contents (Table 6.5). The high oleic sunflower oil had a lower PUFA content that
resulted in the lower IV (89.26) observed for this oil. Palm oil had the lowest IV (56.13)
since this oil had the lowest PUFA content. The high oleic sunflower oil had the highest
FFA value (0.71% oleic) and was followed by the traditional sunflower (0.31% oleic) and
canola (0.21% oleic) oils (Table 6.5). The palm oil had the lowest FFA value (0.19%
oleic).

235
The traditional sunflower and canola oils showed similar initial PVs (PV0) of 3.01 and
3.47 meq/1000 g oil respectively (Table 6.5). The high oleic sunflower oil had a relatively
high PV0 of 9.36 meq/1000 g oil, while the palm oil showed the lowest PV0 of 0.98
meq/1000 g oil. The initial p-AVs observed for canola and high sunflower oil were low
(1.26 and 1.33 respectively). However, the traditional sunflower and palm oil had
relatively high initial p-AVs of 10.71 and 8.82 respectively. The initial RI-values (RI0) for
the four oil types were in the ranges recommended by the Codex standards (Codex
Alimentarius Commission, 2010).
After placing the oil samples in the heat cabinet, PV, p-AV and RI-values were
periodically measured for all four oils until the oil reached a maximum PV of 100
meq/1000 g oil and the oil showed an RI-value increase of 0.001 units from the RI0 value.
The number of days it took for the different oils to reach 100 meq/1000 g oil differed with
their levels of unsaturation. Both the traditional sunflower and canola oil with the highest
PUFA/SFA ratio took only nine days to reach 100 meq/1000 g (Table 6.5 and Figure 6.1).
For both the traditional and canola oil, the PV showed a sharp increase from the second
day of heat storage. The high oleic sunflower oil with a lower PUFA/SFA ratio reached
100 meq/1000 g after 21 days of heat storage. This oil showed a gradual increase in PV
from the first day of heat storage. Palm oil with the lowest PUFA/SFA ratio took the
longest of the four oils and reached 100 meq/1000 g after 58 days of heat storage. Palm
oil showed constant PVs during the first two weeks of heat storage, however, from day 17
the PV showed a sharp increase.
With regard to the RI-values, canola oil was the fastest of the four oils and reached a RI
increase of 0.001 units after 14 days of heat storage (Table 6.5 and Figure 6.2). The
traditional sunflower oil took 17 days to reach the same unit increase. The high oleic
sunflower oil was much slower and took 29 days to show a RI increase of 0.001 units.
The palm oil was the slowest and took 66 days to reach the same RI unit increase.

236
Figure 6.1 Graph indicating number of days for peroxide value to reach maximum
of 100 meq peroxide/1000 g oil for traditional sunflower, high oleic
sunflower, canola and palm oil. SO: Traditional sunflower oil, HOSO: High
oleic sunflower oil.
Figure 6.2 Graph indicating number of days for refractive index to reach a value
difference of 0.001 for traditional sunflower, high oleic sunflower, canola
and palm oil. SO: Traditional sunflower oil, HOSO: High oleic sunflower oil.
0
25
50
75
100
0 2 4 6 8 11 17 24 32 44 54
Per
oxid
e va
lue
(meq
per
oxid
e/kg
oil)
Days
SO
HOSO
Canola
Palm
-0.00040
-0.00020
0.00000
0.00020
0.00040
0.00060
0.00080
0.00100
1 3 5 7 9 14 24 32 54 66
Diff
eren
ce in
ref
ract
ive
inde
x
Days
SO
HOSO
Canola
Palm

237
The p-AVs remained constant during the early stages of oxidation for all four oils (Figure
6.3). Measurements for p-AV were taken until the PV of an oil reached its maximum
value of 100 meq/1000 g. The p-AVs for the traditional sunflower oil remained more or
less constant with values ranging between 10-13. The high oleic sunflower oil also
showed stable p-AVs of between 0-1.7 but p-AV gradually increased from day nine to
reach a value of 3.5 at day 21. The p-AV of palm oil remained more or less stable during
the first three weeks with an average value of 9.0. However, palm oil showed a slow but
systematic increase in p-AV from 10.9 (day 24) to 17.4 (day 58). Only canola oil showed
a sharp increase in p-AV from day four (5.7) to day nine (27.3).
Figure 6.3 Graph indicating gradual increase in p-anisidine value measured for
traditional sunflower, high oleic sunflower, canola and palm oil. SO:
Traditional sunflower oil, HOSO: High oleic sunflower oil.
05
1015202530354045
1 3 5 7 9 14 21 29 37 51 58
p-A
V
Days
SO
HOSO
Canola
Palm

238
6.5.4 Discussion
Large variation was observed between the four oil types for fatty acid composition.
Traditional sunflower oil is generally characterised as a linoleic oil with linoleic acid
contents between 48.3-74.0% and low oleic acid content of less than 39.4% (Codex
Alimentarius Commission, 2010). The linoleic acid content of the traditional sunflower
oil used in this study was 64.60%, while the oleic acid content was 22.66%. Canola oil
had a higher oleic acid content (59.63%) than the traditional sunflower oil, but a lower
linoleic acid content (21.76%). However, the canola oil had the highest linolenic acid
content (8.98%) of all four oil types. The traditional sunflower, high oleic sunflower and
palm oil contained minor percentages of linolenic acid. The contents of major fatty acids
were in the ranges recommended for canola oil (Friedt and Snowdon, 2009; Codex
Alimentarius Commission, 2010). Although both traditional sunflower and canola oil are
widely used for cooking oil, salad oil and in making margarine, canola oil is preferred by
health-conscious consumers because it has the lowest saturated fatty acid content of all
major edible vegetable oils (Raymer, 2002).
High oleic sunflower oil is characterised by its high oleic acid content (74.18%) and low
linoleic acid content (15.28%). However, the oleic acid content showed a lower level than
the minimum limit required for high oleic sunflower oil. According to literature, high
oleic sunflower oil should not contain less than 75% oleic acid and the linoleic acid
content should preferably be less than 10% (Gupta, 2002; Codex Alimentarius
Commission, 2010). The lower oleic acid content measured for the high oleic sunflower
oil might be the result of the high oleic hybrid seed delivered at the oil press. If high oleic
acid hybrids are unstable for the oleic acid trait, they would vary in their oleic acid
contents across planting locations (environments) and years, since environment has a
large influence on oil fatty acid composition. This would result in seed batches that vary
for oleic acid content. As a result, high oleic seed delivered at the oil press might have had
lower oleic acid contents than the minimum required limit because of the environmental
influence on these hybrids.
Palm oil is the commodity oil richest in palmitic acid with an average content of 44-45%
(Lin, 2002). Eighty percent of the oil is mainly used in food (as cooking oil, margarine,
and shortenings), while the remaining 20% are used as oleochemicals to replace mineral
oils in various industries (pharmaceutical, cosmetics, detergents, lubricants and plastics)

239
(Soh et al., 2009). Palm oil used in this study contained 40.62% palmitic, 3.99% stearic,
43.56% oleic and 10.08% linoleic acid and these values were in the ranges recommended
by the Codex Alimentarius Commission (2010) for palm oil.
IV gives an indication of the number of double bonds in the oil and therefore quantifies
the degree of unsaturation in the fatty acids (Oderinde et al., 2009). The IV is thus a
reflection of the susceptibility of an oil to oxidation. The higher IVs observed for the
traditional sunflower and canola oil were attributed to the high unsaturation levels of these
oils and as a result these were expected to show the lowest oxidative stability. The high
oleic sunflower oil had a lower IV since it is a monounsaturated oil with a lower
unsaturation level. The saturated palm oil with the lowest IV was expected to show the
highest oxidative stability. The IVs of all four oils were in the ranges recommended by the
Codex standards (Codex Alimentarius Commission, 2010) for each oil respectively.
FFA and PV are the most frequently determined quality indices during oil production,
marketing and storage (Thomaidis and Georgiou, 1999). All four oils showed low FFA
values (less than 1.0%) and were below the limit of 2%. The low FFA values observed
indicated absence of hydrolytic alteration and that the oil was of good quality.
The traditional sunflower and canola oil showed low PV0 at the beginning of heat storage.
In spite of their low initial PVs, these oils were the most susceptible to oxidation and both
oils reached the maximum PV of 100.0 meq/1000 g after only nine days of heat storage.
The low oxidative stability of the traditional sunflower oil might be attributed to its high
PUFA/SFA ratio and high linoleic acid content. For canola oil, both linoleic and linolenic
acid contents contributed to the total PUFA content for this oil. This, together with the
low SFA content, resulted in the high PUFA/SFA ratio that contributed to the low
oxidative stability for canola oil. The relatively high initial PV0 of 9.36 meq/1000 g
observed for the high oleic sunflower oil may be because the high oleic oil was cold-
pressed and therefore may contain impurities that have an effect on the stability of the oil.
However, the PV0 was still below the recommended value. The high oleic oil reached a
maximum PV of 100 meq/1000 g after 21 days of heat storage. Regardless of the higher
initial PV of the high oleic sunflower oil, it was more than twice as stable as the
traditional sunflower and canola oil when PV is considered. This resistance to oxidation
may be attributed to the lower PUFA/SFA ratio as well as the high monounsaturated fatty

240
acid (mostly oleic acid) content of the high oleic sunflower oil. Palm oil had a low initial
PV0 of 0.98 meq/1000 g. The oil showed the highest resistance to oxidation of all four oils
and the maximum PV value of 100.0 meq/1000 g was reached after 58 days of heat
storage. The high oxidative stability of palm oil was expected due to the high total SFA
content, low PUFA/SFA ratio and hence, its inherent stability.
The p-AV, an indicator of secondary oxidation (aldehyde content) remained constant
during the early stages of oxidation for all four oils. However, as oxidation progressed
over time, the p-AV gradually increased from day eight on for the traditional sunflower,
high oleic sunflower and palm oil. On the other hand, canola oil showed a sharp increase
in p-AV from day four on. The reason for this sudden increase in p-AV for canola oil may
be explained by the fact that two oxidation stages can be distinguished. The first period is
characterised by a slow progression of oxidation, also named the IP and is followed by the
second stage of accelerated oxidation (Márquiz-Ruiz et al., 2003; Martín-Polvillo et al.,
2004). During the IP, the PV increases to a maximum point, while the AV remains
constant. However, when the secondary oxidation stage starts, the peroxides formed
during the IP are broken down to secondary oxidation products and as result, the PV
decreases while the p-AV increases. The reason for the stable p-AVs observed for
traditional sunflower, high oleic sunflower and palm oil may be because for these oils,
oxidation was still in the IP and oxidation did not reach the accelerated stage yet.
Alternatively, canola oil might have had a shorter IP and secondary oxidation may have
started at day four.
As oxidation of oil samples progressed over time, the RI values increased. Autoxidation is
a complex series of chemical reactions that causes a decrease in the total unsaturated
content of the oil due to abstraction of hydrogen adjacent to a double bond and the
formation of free radicals (Stauffer, 1996). Since RI-values are related to the degree of
unsaturation of oils, RI-values increase upon oxidation (Martín-Polvillo et al., 2004).
According to the RI1-values, canola oil showed the shortest IP with a RI-value difference
of 0.001 that was reached after two weeks. Canola oil was followed by the traditional
sunflower oil with the RI difference that was reached after 17 days. The high oleic
sunflower showed a notably longer IP with the RI difference that was reached after
approximately four weeks. The palm oil was the most stable oil with the longest IP of
more than nine weeks.
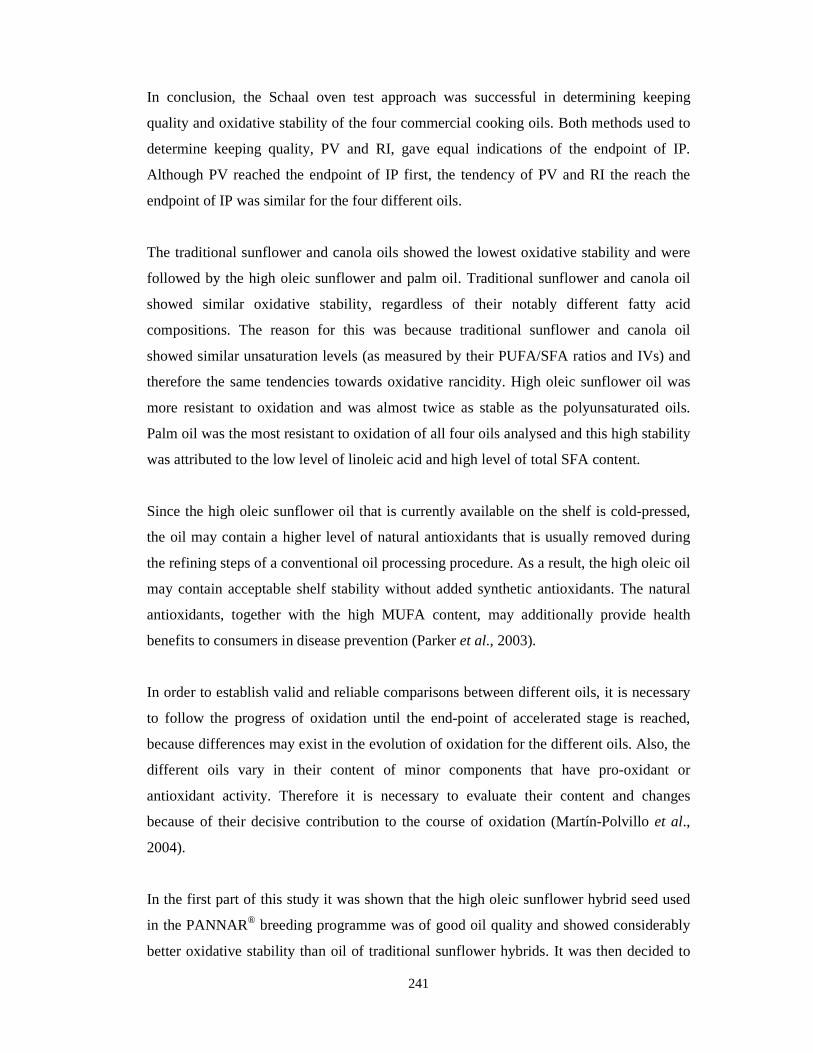
241
In conclusion, the Schaal oven test approach was successful in determining keeping
quality and oxidative stability of the four commercial cooking oils. Both methods used to
determine keeping quality, PV and RI, gave equal indications of the endpoint of IP.
Although PV reached the endpoint of IP first, the tendency of PV and RI the reach the
endpoint of IP was similar for the four different oils.
The traditional sunflower and canola oils showed the lowest oxidative stability and were
followed by the high oleic sunflower and palm oil. Traditional sunflower and canola oil
showed similar oxidative stability, regardless of their notably different fatty acid
compositions. The reason for this was because traditional sunflower and canola oil
showed similar unsaturation levels (as measured by their PUFA/SFA ratios and IVs) and
therefore the same tendencies towards oxidative rancidity. High oleic sunflower oil was
more resistant to oxidation and was almost twice as stable as the polyunsaturated oils.
Palm oil was the most resistant to oxidation of all four oils analysed and this high stability
was attributed to the low level of linoleic acid and high level of total SFA content.
Since the high oleic sunflower oil that is currently available on the shelf is cold-pressed,
the oil may contain a higher level of natural antioxidants that is usually removed during
the refining steps of a conventional oil processing procedure. As a result, the high oleic oil
may contain acceptable shelf stability without added synthetic antioxidants. The natural
antioxidants, together with the high MUFA content, may additionally provide health
benefits to consumers in disease prevention (Parker et al., 2003).
In order to establish valid and reliable comparisons between different oils, it is necessary
to follow the progress of oxidation until the end-point of accelerated stage is reached,
because differences may exist in the evolution of oxidation for the different oils. Also, the
different oils vary in their content of minor components that have pro-oxidant or
antioxidant activity. Therefore it is necessary to evaluate their content and changes
because of their decisive contribution to the course of oxidation (Martín-Polvillo et al.,
2004).
In the first part of this study it was shown that the high oleic sunflower hybrid seed used
in the PANNAR® breeding programme was of good oil quality and showed considerably
better oxidative stability than oil of traditional sunflower hybrids. It was then decided to

242
compare results obtained with commercial oils that are available on the shelf for the
consumer. The commercially available high oleic sunflower oil proved to be of good
quality with noticeably better oxidative stability. However, this high oleic sunflower oil
that was randomly taken from the shelf had an oleic acid content that was below the
minimum requirements for this oil type. It is not acceptable to label an oil “high oleic” if
the oleic acid content of the oil is below the expected requirements for this type. The
reason for this is that high oleic sunflower oil production and commercialisation is still in
the foundation stage and it is necessary to develop stringent quality control for high oleic
sunflower. Additionally, quick methods for testing the fatty acid content of seed batches
delivered at the oil press should be put in place (for example by use of near magnetic
resonance spectroscopy instruments). Finally, breeding of stable high oleic sunflower
hybrids that will produce seed with invariable and high oleic acid contents across seed
batches is necessary to produce oil that will comply with the standards set for high oleic
sunflower oil.
6.6 References
Abramovic, H. and Abram, V. 2005. Physiochemical properties, composition and
oxidative stability of Camelina sativa oil. Food Technology and Biotechnology 43:
63-70.
Agrobase, 2005. AGROBASE Generation II User's Manual. Version 11, revised edition.
www.agronomix.com. Agronomix Software Winnipeg, M.B., Canada.
Association of Official Analytical Chemists (AOAC). 2000. Official methods of analysis
of the American Oil Chemists’ Society, 17th edition. Volume 2, AOAC International.
Chapter 41: Oils and Fat. pp. 1-69.
Auld, A.D., Heikkinen, M.K., Erickson, D.A., Sernyk, J.L. and Romero, J.E. 1992.
Rapeseed mutant with reduced levels of polyunsaturated fatty acids and increased
levels of oleic acid. Crop Science 32: 657-662.
Choe, E. and Min, D.B. 2006. Mechanisms and factors for edible oil oxidation.
Comprehensive Reviews in Food Science and Technology 5: 169-186.
Codex Alimentarius Commission, 2010. Codex standard for named vegetable oils.
CODEX STAN 210-1999. www.codexalimentarius.net (2 February 2010).
Crapiste, G.H., Brevedan, M.I.V. and Carelli, A.A. 1999. Oxidation of sunflower oil
during storage. Journal of the American Oil Chemists’ Society 76: 1437-1443.

243
Dobarganes, M.C., Márquez-Ruiz, G. and Pérez-Camino, M.C. 1993. Thermal stability
and frying performance of genetically modified sunflower seed (Helianthus annuus
L.) oils. Journal of Agricultural and Food Chemistry 41: 678-681.
Dorrell, D.G. and Vick, B.A. 1997. Properties and processing of oilseed sunflower. In:
Sunflower technology and production. Carter, J.F. (Ed.). American Society of
Agronomy, Inc., Wisconsin, USA. pp. 709-745.
Farhoosh, R., Niazmand, R., Rezaei, M. and Sarabi, M. 2008. Kinetic parameter
determination of vegetable oil oxidation under Rancimat test conditions. European
Journal of Lipid Science and Technology 110: 587-592.
Frega, N., Mozzon, M. and Lercker, G. 1999. Effects of free fatty acids on oxidative
stability of vegetable oil. Journal of the American Oil Chemist's Society 76: 325-329.
Friedt, W. and Snowdon, R. 2009. Oilseed rape. In: Handbook of Plant Breeding: Oil
Crops, Volume 4. Vollmann, J. and Rajcan, I. (Eds.). Springer Science and Business
Media, LLC. pp. 91-126.
Gray, J.I. 1978. Measurement of lipid oxidation: A review. Journal of the American Oil
Chemists’ Society 55: 539-546.
Grompone, M.A. 2005. Sunflower oil. In: Bailey’s industrial oil and fat products, 6th
edition. Shahidi, F. (Ed.). John Wiley and Sons Inc. pp. 655-730.
Grundy, S.M. 1997. What is the desirable ratio of saturated, polyunsaturated, and
monounsaturated fatty acids in the diet? The American Journal of Clinical Nutrition
66: 988S-990S.
Guillen, M.D. and Cabo, N. 2002. Fourier transform infrared spectra data versus peroxide
and ansidine values to determine oxidative stability of edible oils. Food Chemistry 77:
503-510.
Gunstone, F.D. 2005. Vegetable oils. In: Bailey’s industrial oil and fat products, 6th ed.,
Vol. 1. Shahidi, F. (Ed.). John Wiley and Sons Inc. pp. 212-267.
Gupta, M.K. 2002. Sunflower oil. In: Vegetable oils in food technology: Composition,
properties and uses. Gunstone, F.D. (Ed.). Blackwell Publishing Ltd. CRC Press LLC,
USA, Canada. pp. 128-156.
Hamilton, R.J. and Hamilton, S. 1992. Lipid analysis: a practical approach. Oxford
University Press, 310 pp.
Hertzman, C., Göransson, L. and Rudérus, H. 1988. Influence of fishmeal, rape seed, and
rape seed meal in feed on the fatty acid composition and storage stability of porcine
body fat. Meat Science 23: 37-53.

244
Holman, T.H. and Elmer, O.C. 1947. The rates of oxidation of unsaturated fatty acids and
esters. Journal of the American Oil Chemist's Society 24: 127-129.
Hu, X.Y., Sullivan-Gilbert, M., Gupta, M. and Thompson, S.A. 2006. Mapping of loci
controlling oleic and linoleic acid contents and development of fad2 and fad3 allele-
specific markers in canola (Brassica napus L.). Theoretical and Applied Genetics 113:
497-507.
Jackson, R.L., Kashyap, M., Barnhart, R.L., Allen, C., Hogg, E. and Glueck, C.J. 1984.
Influence of polyunsaturated and saturated fats on plasma lipids and lipoproteins in
man. The American Journal of Clinical Nutrition 39: 589-597.
Jacobs, M.B. 1958. The chemical analysis of foods and food products, 3rd edition. D. Van
Nonstrand Co., Inc., Princetown, NJ., 970 pp.
Kamal-Eldin, A. 2006. Effect of fatty acids and tocopherols on the oxidative stability of
vegetable oils. European Journal of Lipid Science and Technology 58: 1051-1061.
Katan, M.B., Grundy, S.M. and Willet, W.C. 1997. Should a low-fat, high carbohydrate
diet be recommended for everyone? Beyond low-fat diets. New England Journal of
Medicine 337: 563-569.
Knowles, P.F., Bill, A.B. and Ruckman, J.E. 1965. High oleic acid content in new
safflower, UC-1. California Agriculture 19: 15.
Kris-Etherton P.M. and Yu, S. 1997. Individual fatty acid effects on plasma lipids and
lipoproteins: human studies. American Journal of Clinical Nutrition 65: 1628S-1644S.
Kris-Etherton P.M., Hecker, K.D. and Binkoski, A.E. 2004. Polyunsaturated fatty acids
and cardiovascular health. Nutrition Reviews 62: 141-426.
Kris-Etherton P.M., Pearson, T.A., Wan, Y., Hargrove, R.L., Moriarty, K., Fishell, V. and
Etherton, T.D. 1999. High-monounsaturated fatty acids diets lower both plasma
cholesterol and triacylglycerol concentrations. American Journal of Clinical Nutrition
70: 1009-1015.
Lin, S.W. 2002. Palm oil. In: Vegetable oils in food technology: composition, properties
and uses, Gunstone, F.D. (Ed.). Blackwell Publishing, Ltd. CRC Press, USA and
Canada. pp. 59-97.
Liu, H.-R. and White, P.J. 1992. Oxidative stability of soybean oils with altered fatty acid
compositions. Journal of the American Oil Chemists’ Society 69: 528-532.
Márquez-Ruiz, G., Martín-Polvillo, M. and Dobarganes, C. 2003. Effect of temperature
and addition of α-tocopherol on the oxidation of trilinoleinmodel systems. Lipids 38:
233-240.

245
Márquez-Ruiz, G., Martín-Polvillo, M., Velasco, J. and Dobarganes, C. 2008. Formation
of oxidation compounds in sunflower and olive oils under oxidative stability index
conditions. European Journal of Lipid Science and Technology 110: 465-471.
Martín-Polvillo, M., Márquez-Ruiz, G. and Dobarganes, M.C. 2004. Oxidative stability of
sunflower oils differing in unsaturation degree during long-term storage at room
temperature. Journal of the American Oil Chemists’ Society 81: 577-583.
Mattson, F.H. and Grundy, S.M. 1985. Comparison of effects of dietary saturated,
monounsaturated, and polyunsaturated fatty acids on plasma lipids and lipoproteins in
man. Journal of Lipid Research 26: 194-202.
McGinley, L. 1991. Analysis and quality control for processing and processed fats. In:
Analysis of oilseeds, fats and fatty foods. Rossell, J.B. and Pritchard, J.L.R. (Eds.).
Elsevier Applied Science, London, New York, pp. 465-466.
Mensink, R.P. and Katan, M.B. 1989. Effect of a diet enriched with monounsaturated or
polyunsaturated fatty acids on levels of low-density and high-density lipoprotein
cholesterol in healthy women and men. National English Journal of Medicine 321:
436-441.
Merrill, L.I., Pike, O.A., Ogden, L.V. and Dunn, M.L. 2008. Oxidative stability of
conventional and high-oleic vegetable oils with added antioxidants. Journal of the
American Oil Chemists’ Society 85: 771-776.
Moschner, C.R. and Biskupek-Korell, B. 2006. Estimating the content of free fatty acids
in high oleic sunflower seeds by near-infrared spectroscopy. European Journal of
Lipid Science and Technology 108: 606-613.
Nawar, W.W. 1996. Lipids. In: Food Chemistry. 3rd edition. Fennema, O.R. (Ed.). pp.
225-319.
Naz, S., Sheikh, H., Siddiqi, R. and Sayeed, S.A. 2004. Oxidative stability of olive, corn
and soybean oil under different conditions. Food Chemistry 88: 253-259.
Neff, W.E., Mounts, T.L., Rinsch, W.M., Konishi, H. and Agaimy, M.A. 1994. Oxidative
stability of purified canola oil triacylglycerols with altered fatty acid compositions as
affected by triacylglycerol composition and structure. Journal of the American Oil
Chemists’ Society 71: 1101-1109.
Normand, L., Eskin, N.A.M. and Przybylski, R. 2006. Comparison of the frying stability
of regular and high oleic acid sunflower oils. Journal of the American Oil Chemists’
Society 83: 331-334.

246
O’Brien, R.D. 2009. Fats and oils: formulating and processing for applications, 3rd
edition. CRC Press, Taylor and Francis Group, LLC, 592 pp.
Oderinde, R.A., Ajayi, I.A. and Adewuyi, A. 2009. Characterization of seed and seed oil
of Hura crepitans and the kinetics of degradation of the oil during heating. Electronic
Journal of Environmental, Agricultural and Food Chemistry 8: 201-208.
Parker, T.D., Adams, D.A., Zhou, K. and Yu, L. 2003. Fatty acid composition and
oxidative stability of cold-pressed edible seed oils. Journal of Food Science 68: 1240-
1243.
Patil, A., Taware, S.P., Oak, M.D., Tamhankar, S.A. and Rao, V.S. 2007. Improvement of
oil quality in soybean [Glycine max (L.) Merrill] by mutation breeding. Journal of the
American Oil Chemists’ Society 84: 1117-1124.
Pearson, D. 1973. Oil values and rancidity. In: Laboratory Techniques in Food Analysis.
Butterworths, London, 315 pp.
Pike, O.A. 2001. Assessment of oxidative stability for lipids. Current Protocols in Food
Analytical Chemistry: D2.3.1-D2.3.5.
Radić, V., Jocić, S. and Mrda, J. 2008. Effect of environment on the chemical
composition and some other parameters of sunflower seed quality. In: Proceedings of
the 15th International Sunflower Conference, Córdoba, Spain. pp. 747-750.
Raymer, P.L. 2002. Canola: an emerging oilseed crop. In: Trends in new crops and new
uses. Janick, J. and Whipkey, A. (Eds.). ASHS Press, Alexandria, VA. pp. 122-126.
Robertson, J.A., Chapman, G.W., Wilson, R.L. and Russell, R.R.B. 1984. Effect of
moisture content of oil type sunflower seed on fungal growth and seed quality during
storage. Journal of the American Oil Chemists’ Society 61: 768-775.
Roche, H.M. 2001. Olive oil, high-oleic sunflower oil and CHD. British Journal of
Nutrition 85: 3-4.
Rondanini, D., Savin, R. and Hall, A.J. 2003. Dynamics of fruit growth and oil quality of
sunflower (Helianthus annuus L.) exposed to brief intervals of high temperature
during grain filling. Field Crops Research 83: 79-90.
Salunkhe, D.K., Chavon, J.K., Adsule, R.N. and Kadam, S.S. 1992. World oilseeds:
Chemistry, technology and utilization. Van Nonstrand, Reinhold, New York, 554 pp.
Shahidi, F. and Zhong, Y. 2005. Lipid oxidation: Measurement methods. In: Bailey’s
industrial oil and fat products, 6th edition. Volume 1. Shahidi, F. (Ed.). John Wiley and
Sons Inc. pp. 357-385.

247
Sherwin, E.R. 1978. Oxidation and antioxidants in fat and oil processing. Journal of the
American Oil Chemists’ Society 55: 809-814.
Smith, S.A., King, R.E. and Min, D.B. 2007. Oxidative and thermal stabilities of
genetically modified high oleic sunflower oil. Food Chemistry 102: 1208-1213.
Soh, A.C., Wong, C.K., Ho, Y.W. and Choong, W.C. 2009. Oil Palm. In: Handbook of
Plant Breeding: Oil Crops, Volume 4. Vollmann, J. and Rajcan, I. (Eds.). Springer
Science and Business Media, LLC. pp. 333-367.
Soldatov, K.I. 1976. Chemical mutagenesis in sunflower breeding. In: Proceedings of the
7th International Sunflower Conference, Krasnodar, USSR. pp. 352-357.
Spasibionek, S. 2006. New mutants of winter rapeseed (Brassica napus L.) with changed
fatty acid composition. Plant Breeding 125: 259-267.
Stauffer, C.E. 1996. Fats and oils. Eagan Press Handbook Series, American Association
of Cereal Chemists, Inc., USA, 149 pp.
Thomaidis, N.S. and Georgiou, C.A. 1999. Edible oil analysis by flow injection.
Laboratory Automation and Information Management 34: 101-114.
Van der Merwe, G.H., Du Plessis, L.M. and Taylor, J.R.N. 2003. Changes in chemical
quality indices during long-term storage of palm-olein oil under heated storage and
transport-type conditions. Journal of the Science of Food and Agriculture 84: 52-58.
White, P.J. 1995. Conjugated diene, anisidine value and carbonyl value analyses. In:
Methods to assess quality and stability of oils and fat-containing foods, Warner, K.
and Eskin, N.A.M. (Eds.). American Oil Chemists’ Society Press, Campaign, IL. pp.
159-178.

248
CHAPTER 7
GENERAL CONCLUSIONS AND RECOMMENDATIONS
Sunflower oil has unique properties that are popular with consumers who use the oil for
cooking, frying and for salad dressing. High oleic sunflower oil is becoming more
attractive to health-conscious consumers as well as for restaurants. This oil type has all
the appeal of traditional sunflower oil, while at the same time it is more stable and does
not need to be hydrogenated for industrial frying applications. However, high oleic
sunflower oil production and commercialisation is still in the foundation stage and much
research is still needed to produce high oleic sunflower oil that complies with the
standards set for this oil type.
One of the aims of this study was to investigate the effects of genotype, environment and
their interaction on oil quality traits of traditional, high oleic and mid oleic acid sunflower
genotypes and to identify the most stable and widely adapted genotypes for these traits.
Sunflower seed oil content and fatty acid composition have shown significant differences
in relation to genotype, environment and year effect. Environmental factors that were
found to have a large influence on genotypic performance for these traits included rainfall,
temperature and planting date. In general, higher oil yields were observed in environments
that received more rain during the growing season. However, too much rain resulted in
lower oil yields that could be attributed to either the occurrence of low radiation, low
temperatures, diseases or waterlogging conditions. Rainfall also had a significant
influence on the fatty acid profiles and especially the oleic and linoleic acid contents.
Generally, genotypes grown in drier and warmer environments showed higher oleic and
lower linoleic acid contents than those grown in environments that received more rain and
had cooler temperatures during the growing season. Different planting dates caused
flowering and seed development to occur during periods of widely different temperatures,
radiation and day length. The highest oleic acid content was observed for early plantings
when seed maturation occurred during high mean daily temperatures. Later plantings
caused seed maturation to occur when the mean daily temperatures were lower. As a
result, genotypes showed higher linoleic acid contents in later plantings.

249
Analyses of variance indicated highly significant GXE interaction for all oil quality traits
over locations and seasons. As a result it was necessary to do stability analyses. In
general, the traditional linoleic genotypes (genotypes 1 and 2) had high linoleic and low
oleic acid contents and were relatively stable for these fatty acids over six locations during
the first season (2004/2005). However, both these genotypes were unstable for oleic and
linoleic acid content across years. The traditional genotype 1 was stable across locations
for oil content while both traditional genotypes showed stability across years at one
location (Kroonstad). The high oleic genotypes showed large variation for oleic and
linoleic acid content across locations and years. However, of the eight high oleic
genotypes analysed, genotypes 6, 8 and 14 were the most stable for oleic acid content
across locations and years and showed oleic acid contents of above 75%. The high oleic
genotypes 6 and 8 and the mid oleic genotype 15 were the most stable for oil content and
showed average to above average oil contents. The high oleic genotypes 5 and 9 were the
most stable for palmitic acid content, while the high oleic genotype 9 and the mid oleic
genotype 10 showed stable stearic acid contents over locations and years. Genotypes that
showed stability for the particular traits should be considered for commercial hybrid seed
production. High oleic genotypes 6 and 8 that showed stability for both oil content and
oleic acid content with average to above average contents of these traits are highly
recommended for commercialisation.
Sunflower hybrids have different oleic acid potentials in their oil. In high oleic sunflower,
the potential oleic acid content varies between 70-90%. High oleic hybrids with lower
oleic acid potentials could be more sensitive to environmental factors such as temperature
and soil water availability. The variability in oleic acid content observed for the high oleic
acid genotypes across locations and years can possibly be attributed to the presence of
modifying factors in their genetic backgrounds. These modifiers are inherited from either
one or both parental lines used in hybrid production and have an effect on the expression
of the high oleic acid genes. Modifiers may be alleles that suppress the effect of the Ol
allele on the high oleic acid trait. However, it is possible to breed for stable and widely
adapted high and mid oleic acid genotypes. High oleic acid inbred lines that are used in
hybrid crosses should be analysed across locations and generations for stability of the
high oleic acid trait. Lines that show stability for oleic acid content should then be used
for hybrid production. Hybrids obtained from crossing stable inbred lines should then be
analysed across locations and seasons for stable oleic and linoleic acid contents. It is

250
recommended that genotypes that show unstable expression for this trait be selected
against in the breeding programme.
Most parts of South Africa where sunflower is produced, is semi-arid and therefore erratic
weather conditions may occur during the cropping season that has a large effect on
agronomical and oil quality properties of sunflower. It is therefore necessary that hybrids
are produced that will perform well under heat and drought stress conditions and that
show stability for yield-related and oil quality traits. In order to assess the effect of heat
stress on these traits, plants of high oleic, mid oleic and traditional sunflower hybrids were
exposed to a maximum temperature of 36ºC for a brief period during the most critical
stage of storage lipid biosynthesis. Heat stress resulted in a significant increase in head
diameter and head sterile centre diameter, but number of filled seeds per head and twenty
five-seed weight was reduced. These traits are generally correlated with sunflower seed-
and oil yield and therefore heat stress would result in a reduction in oil yield. In general,
the most stable hybrids for head and seed traits were the low oleic hybrids 10 and 12 and
the mid oleic hybrid 2.
Unfortunately, the high oleic hybrid 4 did not perform well with regard to agronomical
traits. This hybrid was highly sensitive to the heat stress and showed a significant increase
in head diameter that resulted in the increases observed for number of filled seeds per
head and twenty five-seed weight. Although increases in these traits were observed, it was
not the ideal since it was previously reported that larger heads resulted in increased
percentage of hull that ultimately results in decrease of oil content, since oil content and
hull percentage is negatively correlated. This was proved by the significant reduction in
oil content observed for hybrid 4. The oil content of this hybrid was reduced with 11.8%,
the largest observed among all hybrids analysed. Also, the larger head size resulted in an
increase in the sterile centre of the head.
Heat stress significantly modified oil content and fatty acid composition in both
traditional and mid oleic hybrids. Oil content showed a significant reduction of 6.09% on
average. Palmitic, stearic and oleic acid contents were significantly increased by the heat
stress, however, linoleic acid content was significantly reduced. The low oleic hybrids 8
and 10 showed good stability for oil and palmitic acid content. The high oleic hybrid 4
and the mid oleic hybrid 11 were the most stable hybrids for oleic and linoleic acid

251
content. These should be considered for production in areas where high temperatures may
occur. Where significant differences were observed between hybrids for seed and oil
quality traits, it is possible to genetically improve these traits through selection. However,
heritability estimates of these traits also contribute to the effectiveness of selection for a
trait.
Estimates of broad sense heritability were higher under normal temperature conditions
than under heat stress conditions for head diameter, number of filled seeds per head and
twenty five-seed weight. However, these estimates were generally low to intermediate
under both normal temperatures and heat stress conditions and indicated that these traits
were sensitive to the environment. As a result, chances for improvement of these traits
through selection would be complicated. Oil content and palmitic acid showed
inconsistent heritability estimates between treatments and therefore it would be difficult to
improve upon these traits under heat stress conditions. However, stearic, oleic and linoleic
acid contents had high heritability estimates under both normal temperature and heat
stress conditions and indicated that it would be possible to improve upon these traits
through selection. For oil quality purposes, oleic and linoleic acids are the most important
fatty acids because these contribute almost 90% to the total fatty acid composition of
sunflower oil. Since these traits showed high heritability estimates, breeding to improve
these traits would be relatively simple under different temperature conditions. However,
the inconsistent heritability estimates observed for oil content under different
temperatures are challenging in producing hybrids with high oil contents.
Although significant correlations were observed between some agronomical and oil
quality traits, these were low. Therefore, when selecting for head and seed traits, the fatty
acid composition would not necessarily be affected and vice versa. Care should be taken
when selecting for traits that show inconsistent correlations at different temperature
conditions. The negative correlation between oil content and oleic acid content under heat
stress conditions is problematic for the production of high oil yielding high oleic acid
hybrids.
Unfortunately, during this trial only one potential high oleic acid hybrid was identified
and analysed and therefore no general conclusion on the effect of heat stress on the
stability of oleic acid content could be made. It is recommended that more high potential

252
oleic acid hybrids should be included in this type of study since different high oleic
hybrids have shown variation in stability across different environments and seasons. In
future research the inheritance of the high oleic acid trait in South African genetic
backgrounds needs to be investigated. Additionally, the number of genes involved as well
as the presence of modifier genes in the parental germplasm need be established.
Knowledge of the genetic control and inheritance of high oleic acid content can help
breeding programmes to focus on developing stable high oleic acid breeding lines that can
be used to develop superior F1 hybrids with stable oleic acid contents across different
environments and seasons.
Since the environment plays a major role on oil fatty acid composition, it is difficult using
conventional phenotypic evaluation, to differentiate between different high oleic acid
alleles in high oleic acid genotypes or between homozygous and heterozygous plants for
this trait. However, genotypic selection for the high oleic acid trait with the use of
molecular markers and MAS would be more reliable in breeding programmes, since these
markers are not influenced by the environment. Although molecular markers linked to the
high oleic acid trait have been identified in previous reports, the development of markers
targeting this trait in a South African genetic background was necessary. Furthermore,
these previously mapped markers are not suitable for high throughput and reliable
analysis in breeding programmes.
A F2 segregating population was developed from a cross between a high oleic and low
oleic acid parent. The F2 individuals and their two parents were screened for
polymorphism using AFLP and SSR markers and a linkage group was constructed based
on 19 putative markers. At first, AFLP makers were identified in order to ensure a high
density of markers in the targeted chromosome region(s). SSR markers were included to
correlate or anchor the linkage group obtained in this study with LG 14 of the public
sunflower map. One major QTL (LOD 5.97), controlling oleic acid content, was identified
on putative LG 14. This QTL explained 35.0% of the phenotypic variation for the high
oleic acid trait. In addition, results of the QTL analysis indicated that the QTL controlling
this trait was due to an additive effect. Since only one QTL, explaining 35% of the
variation, was detected, other major and/or minor QTL that contribute to the phenotypic
variation for this trait might exist that were not identified in this study. Reasons for this
are the small population size used and because only one trial was planted in one

253
environment. Also the BSA approach was used to target the gene of interest and whole
genome mapping was not done.
From the 19 putative markers that mapped to putative LG 14, five mapped within the high
oleic acid QTL region. The two AFLP markers flanking the oleic QTL region (E37M55.1
and E38M3.1) as well as the SSR marker, ORS1086.1, can be used for MAS. However,
these need to be validated for their reliability in predicting the phenotype. In order for the
AFLP markers to be useful in MAS, these need to be converted to SCAR markers that can
be used in high throughput screening for the high oleic acid trait. However, the SSR
marker ORS1086.1 should be reliable and useful in the breeding programme.
Furthermore, because of the large distance (26.2 cM) between the flanking markers, there
is a chance for recombination to occur within the QTL region and therefore it is necessary
to identify and map more markers on LG 14 that are linked to the high oleic acid trait.
It is recommended that the identified markers should be tested for their effectiveness in
determining the target phenotype in different populations and in different genetic
backgrounds. Additionally, these should also be tested in different locations and years
since uncontrolled environmental effects could create large phenotypic variation without
any genetic basis for the effects. In order to validate markers across locations and years, it
will be necessary to develop an immortal mapping population such as a RIL or doubled
haploid population. Future research should concentrate on marker saturation of the
targeted chromosome. In addition, the size of the mapping population should also be
increased to allow detection of additional major and minor QTL.
The last aim of this study focussed on oil quality and oxidative stability properties of the
seed oil of high oleic, mid oleic and traditional sunflower hybrids. Oil quality refers to the
nutritional and functional properties of oil; however, it is a relative concept that depends
on the end-use of the oil. The keeping quality of oil is the length of time that the oil resists
significant change of its acceptable properties. Oil content and fatty acid composition are
regarded as major oil quality parameters and fatty acid content and the level of
unsaturation play a key role in the keeping quality of oil.
The high and mid oleic sunflower hybrids had similar oil contents than the traditional
sunflower hybrids. Mean seed oil content varied between 35.65-36.56% for the three

254
hybrid types and was relatively low compared to oil contents observed for hybrids in
Chapter 3. Mean oil content varied between 45.9-52.97% for genotypes studied in
Chapter 3. Since oil content is largely influenced by the environment, the lower oil
contents observed may have resulted from unfavourable conditions like heat or drought
stress occurring during the field trial.
The high oleic, mid oleic and traditional sunflower hybrids differed significantly in their
fatty acid contents. High oleic hybrids contained on average 82.56% oleic acid (8.11%
linoleic acid), the mid oleic hybrid 53.77% oleic acid (36.37% linoleic acid) and
traditional hybrids 65.66% linoleic acid (22.91% oleic acid). High oleic hybrids contained
on average 3% less palmitic acid than the traditional sunflower oil. This correlation was
genetic and contributed to the lower SFA content of high oleic sunflower oil. The
PUFA/SFA ratio as well as RI and IV values were indicative of unsaturation levels and as
a result oils’ tendency to undergo autoxidation. Decreased levels of unsaturation (linoleic
acid) will result in increased levels of oxidative stability. Therefore the high and mid oleic
sunflower oils with their lower levels of unsaturation should be more resistant to
oxidation than the traditional sunflower oil. This conjecture was verified by determining
the oxidative quality and stability of the three oil types.
The initial oxidative status of the three oil types was evaluated by measuring PV and p-
AV values. The significantly lower PV and p-AV values observed for the high oleic
sunflower oil confirmed that this oil type was more stable than the traditional sunflower
oil. For the traditional oil, autoxidation already started during seed storage and was in the
induction period. Additionally, oxidative stability of the three oil types were assessed
under accelerated oxidation conditions, using the OSI test. The high oleic sunflower oil
was the most stable oil with the highest OSI value. Oil shelf life was estimated from the
OSI values. The high oleic sunflower oil showed the longest predicted shelf life of three
months, while the traditional sunflower oil had a predicted shelf life of one month. The
mid oleic oil showed better oxidative stability than the traditional sunflower oil with a
predicted shelf life of one and a half months. The considerably better oxidative stability of
the high oleic sunflower oil was attributed to its low level of unsaturation. Among the
three high oleic acid hybrids analysed, hybrid 4 showed the best initial oil oxidative status
and had the best resistance to oxidation. It had the longest predicted shelf life of four

255
months. This hybrid should be considered in breeding programmes for developing high
oleic acid hybrids with excellent oil oxidative stability.
Oil of the high oleic sunflower hybrids from PANNAR® showed good oil quality and
excellent oxidative stability compared to oil of traditional sunflower hybrids. It was
decided to investigate the keeping quality and oxidative stability of commercially
available high oleic sunflower oil and compare it with traditional sunflower, canola and
palm oil. The high oleic sunflower oil showed outstanding oxidative stability and was
more than twice as stable as the traditional sunflower and canola oils. This resistance to
oxidation was attributed to the low PUFA/SFA ratio and unsaturation level of the oil. The
traditional sunflower and canola oil showed similar oxidative stability due to their similar
levels of unsaturation. Palm oil was the most resistant to oxidation of all four oils tested
and this high oxidative stability was attributed to the high SFA content and low
PUFA/SFA ratio of the oil.
Vegetable oils obtained from the shelf of local supermarkets vary in their content of minor
components that have pro-oxidant or antioxidant activity since these oils were obtained
through different extraction and processing procedures. Therefore making a comparison
between these oils is not exactly valid. Therefore, for future research it is recommended
that the same test is repeated on the same oil samples, including olive oil. In order to
make more valid comparison between the different oil types, fresh crude oil samples
should be obtained that did not go through some sort of processing (degumming, refining,
dewaxing or hydrogenation). These processes alter oil composition and structure that will
ultimately contribute to differences in keeping quality and oxidative stability.
Although the cold-pressed high oleic sunflower oil, that is currently commercially
available, proved to be of high quality with good oxidative stability, its oleic acid content
of 74.18% is below the minimum level (75%) recommended for sunflower oil to be
regarded as high oleic acid oil. The precise reason for this is unclear, but the instability of
high oleic acid hybrids for oleic acid content might contribute to the low level observed.
However, high oleic acid sunflower hybrids with oleic acid contents that exceed 80%
have been identified in this study and are promising for the production and
commercialisation of high oleic sunflower oil that will conform to requirements for high
oleic sunflower oil.

256
This study made a valuable contribution towards high oleic acid sunflower breeding in
South Africa, since it was possible to identify high oleic acid hybrids that showed stability
and adaptability for the high oleic acid trait in different environments and under different
temperature conditions. High heritability estimates, observed from genetic analyses for
oleic and linoleic acid contents, will contribute to further development of high oleic
sunflower hybrids. Additionally, molecular markers linked to the high oleic acid trait have
been identified that may possibly be implemented in breeding programmes in order to
select more accurately for the high oleic acid trait. High oleic sunflower seed oil has
superior oil quality and oxidative stability properties to traditional sunflower oil and the
South African hybrids will meet the demands for more healthy and stable sunflower oil.

257
SUMMARY
High oleic acid sunflower hybrids have been available on the market for a few years, but
research on the stability of these genotypes for oil quality traits in South African
production areas is limited. General aims of this study were to compare oil quality traits of
high oleic sunflower against traditional sunflower genotypes in different environments,
over seasons and under heat stress conditions and to identify possible genetic markers
related to the oleic acid trait that would be useful in breeding programmes.
Combined ANOVAs of oil, linoleic, oleic, palmitic and stearic acid content of 16
genotypes tested in a total of nine trials over eight locations and three seasons showed
highly significant differences between genotype, environment and GXE. Significant GXE
suggested differential response of genotypes across testing locations and years and the
need for stability analyses. Stability analyses were performed for all oil traits using
AMMI. Stability analyses indicated that high oleic genotypes 6 and 8 could be considered
stable across environments and seasons for oil and oleic acid content and genotype 9 for
palmitic and stearic acid content.
Sunflower oil quality is affected by genotype and environmental conditions with
temperature as a major influence. The effect of heat stress on seed yield and oil quality
traits was investigated by applying a maximum temperature of 36ºC to plants during the
critical seed-filling stage. This information was needed to define a breeding strategy to
further improve seed oil quality in environments where heat stress may occur. All traits
measured were significantly influenced by heat stress. The low heritability estimates
observed for seed-related yield traits indicated that genetic improvement for these traits
would be difficult. Oil and linoleic acid contents were significantly reduced by heat, while
oleic acid content was significantly increased in traditional hybrids. The oleic acid content
of the high oleic acid hybrid was unaffected, but this hybrid showed the largest decrease
in oil content. High heritability estimates observed for oleic and linoleic acid content
indicated that it is possible to genetically improve these traits under different temperature
conditions.
Since oleic acid content is influenced by the environment, this trait showed instability
across environments. Genotypic selection for this trait using linked markers is

258
independent from the environment. A segregating population comprising 78 F2
individuals was obtained from a cross between a high oleic acid and traditional sunflower
line. AFLP and SSR markers were used to identify and map QTL, associated with the
high oleic acid trait, putatively to LG 14 of the sunflower consensus map. A major QTL
controlling the level of oleic acid was identified that explained 35% of the phenotypic
variance for this trait. Markers linked to this trait were identified that could be useful in
MAB.
Physicochemical properties and oxidative stability of seed oil of high (82.6% oleic) and
mid oleic acid (53.8% oleic) sunflower hybrids were compared with those of traditional
sunflower (65.7% linoleic and 22.9% oleic). Oxidative stability was evaluated by
measuring PV, p-AV and OSI values. High oleic acid oil had the best oxidative stability.
Since oxidative stability was related to the unsaturation level of oil, the high oleic oil with
significantly reduced linoleic acid content had the highest resistance to oxidation. Keeping
quality of commercially available vegetable oils, including high oleic sunflower oil was
evaluated using the Schaal oven test. Oil samples, placed in a heat cabinet at 63ºC were
periodically examined for keeping quality by determining PV, p-AV and RI values. High
oleic sunflower oil was twice as stable as traditional sunflower and canola oils.
Keywords: AMMI, ANOVA, broad sense heritability, high oleic acid, fatty acids,
molecular markers, Helianthus annuus L., oxidative stability, temperature
stress

259
OPSOMMING
Hoë-oleïensuur sonneblombasters is al vir ‘n geruime tyd kommersieel beskikbaar, maar
byna geen navorsing is gedoen om die stabiliteit van hierdie genotipes ten opsigte van
olie-kwaliteitseienskappe in Suid-Afrikaanse produksiegebiede te ondersoek nie. Die doel
van hierdie studie was om die olie-kwaliteitseienskappe van Suid-Afrikaanse hoë-
oleïensuur sonneblomgenotipes met dié van tradisionele sonneblomgenotipes te vergelyk
en om die effek van verskillende omgewings, seisoene en temperatuurstoestande op
hierdie genotipes te bepaal. ‘n Verdere doel was om moontlike molekulêre merkers, wat
aan die hoë-oleïeneienskap gekoppel is en in teelprogramme gebruik kan word, te
identifiseer.
Die gekombineerde variansie-analises vir palmitiensuur, steariensuur, oleïensuur,
linoliensuur en olie-inhoud het aangetoon dat vir ‘n totaal van 16 genotipes, wat in nege
proewe in agt lokaliteite oor ‘n tydperk van drie jaar ontleed is, daar hoogs betekenisvolle
verskille vir genotipe, omgewing en genotipe-omgewing interaksie was. Betekenisvolle
genotipe-omgewing interaksie het aangetoon dat genotipes verskillend in verskillende
omgewings en oor jare gereageer het en stabiliteitsontledings was dus nodig. Die
stabiliteit van al die olie-eienskappe is deur middel van additiewe hoofeffek en
multiplikatiewe en interaksie analise (AMMI) bepaal. Hierdie ontledings het aangetoon
dat die hoë-oleïensuur genotipes 6 en 8 hoogs stabiel oor omgewings en seisoene was vir
olie- en oleïensuurinhoud, terwyl genotipe 9 stabiel vir palmitiensuur- en
steariensuurinhoud was.
Sonneblomolie-kwaliteit word grootliks deur die omgewing beïnvloed en temperatuur
speel die belangrikste rol. Die effek van hittestremming op saadopbrengs- en olie-
kwaliteiteienskappe is bestudeer deur sonneblomplante aan ‘n maksimum temperatuur
van 36ºC gedurende die mees kritieke stadium van lipiedbiosintese bloot te stel.
Hittestremming het ‘n betekenisvolle invloed op al die eienskappe gehad. Lae
oorerflikhede van saadopbrengs-verwante eienskappe dui daarop dat genetiese vordering
vir hierdie eienskappe nie haalbaar is nie. Vir die tradisionele sonneblombasters is ‘n
betekenisvolle afname in linoliensuur waargeneem, terwyl oleïensuurinhoud betekenisvol
toegeneem het. Die oleïensuurinhoud van die hoë oleïenbaster was onveranderd, maar
hierdie baster het ‘n beduidende afname in olie-inhoud getoon. Die hoë oorerflikhede vir

260
oleïensuur en linoliensuur dui daarop dat dit wel moontlik sal wees om hierdie eienskappe
geneties onder verkillende temperatuurtoestande te verbeter.
Omdat oleïensuurinhoud grootliks deur omgewingstoestande beïnvloed word, is hierdie
eienskap onstabiel oor verskillende omgewings. Deur van genetiese merkers wat aan die
hoë-oleïeneienskap gekoppel is, gebruik te maak, kan seleksie op die genotipe gedoen
word en die omgewing speel dus nie ‘n rol nie. ‘n F2 segregerende populasie, bestaande
uit 78 plante, is verkry nadat ‘n hoë-oleïen ingeteelde lyn met ‘n tradisionele
sonneblomteellyn gekruis is. AFLP (geamplifiseerde fragment lengte polimorfisme)- en
SSR (eenvoudig herhalende volgorde) analises is gebruik om QTL (kwantitatiewe
eienskap lokusse), wat aan die hoë-oleïeneienskap gekoppel is, te identifiseer en
waarskynlik op LG 14 van die konsensus sonneblomkaart te karteer. ‘n Hoof QTL, wat
die hoë-oleïensuur inhoud reguleer, is geïdentifiseer en verklaar 35% van die fenotipiese
variasie vir hierdie eienskap. Die geïdentifiseerde merkers, wat aan die hoë-
oleïeneienskap gekoppel is, kan vir merker-ondersteunende teling gebruik word.
Die fisies-chemiese- en oksidatiewe stabiliteitseienskappe van die saadolie van hoë-
oleïensuur (82.6% oleïensuur) en mid-oleïensuur (53.8% oleïensuur) sonneblombasters is
met dié van tradisionele sonneblom (65.7% linoliensuur en 22.9% oleïensuur) vergelyk.
Oksidatiewe stabiliteit is bepaal deur peroksied-, p-ansidien- en olie stabiliteitsindeks
(OSI) waardes te meet. Olie van die hoë-oleïensuurbasters het die beste weerstand teen
oksidasie getoon. Omdat die vetsuur-onversadigingsvlak van olie ‘n aanduiding van
oksidatiewe stabiliteit is, het die hoë-oleïenolie, wat die laagste onversadigingsvlak gehad
het, die meeste weerstand teen oksidasie getoon. Die oksidatiewe stabiliteit van
kommersiële kookolies, insluitende dié van hoë-oleïen sonneblom olie, is deur middel van
die Schaal oondtoets geëvalueer. Olie monsters is in ‘n hittekabinet by 63ºC geplaas en
peroksied-, p-ansidien- en refraksie indekswaardes is gereeld geneem om te bepaal hoe
lank dit vir die olie neem om te oksideer. Die oksidatiewe stabiliteit van die hoë-oleïen
sonneblom olie was twee maal hoër as dié van tradisionele sonneblom- en kanola-olie.
Kernwoorde: AMMI, ANOVA, oorerflikheid in die breë begrip, hoë oleïensuur, vetsure,
molekulêre merkers, Helianthus annuus L., oksidatiewe stabiliteit,
temperatuurstremming