Genotype by Environment Interaction in Adolescents’ Cognitive Aptitude
20
Genotype by Environment Interaction in Adolescents’ Cognitive Aptitude K. Paige Harden, Department of Psychology, University of Virginia, P.O. Box 400400, Charlottesville, VA 22904, USA Eric Turkheimer, and Department of Psychology, University of Virginia, P.O. Box 400400, Charlottesville, VA 22904, USA John C. Loehlin University of Texas, Austin, TX, USA Behav Genet K. Paige Harden: [email protected] Abstract In a replication of Turkheimer, Haley, Waldron, D’Onofrio, Gottesman II (2003, Socioeconomic status modifies heritability of IQ in young children. Psychological Science, 14:623–628), we investigate genotype–environment (G × E) interaction in the cognitive aptitude of 839 twin pairs who completed the National Merit Scholastic Qualifying Test in 1962. Shared environmental influences were stronger for adolescents from poorer homes, while genetic influences were stronger for adolescents from more affluent homes. No significant differences were found between parental income and parental education interaction effects. Results suggest that environmental differences between middle- to upper-class families influence the expression of genetic potential for intelligence, as has previously been suggested by Bronfenbrenner and Ceci’s (1994, Nature-nurture reconceptualized in developmental perspective: a bioecological model Psychological Review, 101:568–586) bioecological model. Keywords Gene-environment interaction; Intelligence; Socioeconomic status; Cognitive aptitude Turkheimer et al. (2003) published a report of genotype–environment (G × E) interaction in the intelligence of young children. In a sample of 7-year old children from the National Perinatal Collaborative Project, the genetic and shared environmental influences on IQ, as measured by the Weschler Intelligence Scale for Children—Revised (WISC-R), were modified by the socioeconomic status (SES) of the children. For disadvantaged children, shared environmental influences accounted for nearly 60% of the variance in IQ, while genetic factors accounted for negligible variance. In advantaged children, the pattern was nearly the reverse. Although the above results are congruent with some previous research (for reviews see Rowe et al. 1999 or Turkheimer et al. 2003), researchers have not always found clear evidence for G × E interaction in cognitive ability (e.g., Scarr 1981, Van den Oord and Rowe 1997), leaving open the extent to which the results Turkheimer et al. present can be generalized beyond the NCPP sample. This paper presents results of a replication of Turkheimer et al.’s (2003) investigation; however, there are several key changes in the current study. First, the Correspondence to: K. Paige Harden, [email protected]. NIH Public Access Author Manuscript Behav Genet. Author manuscript; available in PMC 2010 July 14. Published in final edited form as: Behav Genet. 2007 March ; 37(2): 273–283. doi:10.1007/s10519-006-9113-4. NIH-PA Author Manuscript NIH-PA Author Manuscript NIH-PA Author Manuscript
Transcript of Genotype by Environment Interaction in Adolescents’ Cognitive Aptitude
Genotype by Environment Interaction in Adolescents’ CognitiveAptitude
K. Paige Harden,Department of Psychology, University of Virginia, P.O. Box 400400, Charlottesville, VA 22904, USA
Eric Turkheimer, andDepartment of Psychology, University of Virginia, P.O. Box 400400, Charlottesville, VA 22904, USA
John C. LoehlinUniversity of Texas, Austin, TX, USA Behav GenetK. Paige Harden: [email protected]
AbstractIn a replication of Turkheimer, Haley, Waldron, D’Onofrio, Gottesman II (2003, Socioeconomicstatus modifies heritability of IQ in young children. Psychological Science, 14:623–628), weinvestigate genotype–environment (G × E) interaction in the cognitive aptitude of 839 twin pairswho completed the National Merit Scholastic Qualifying Test in 1962. Shared environmentalinfluences were stronger for adolescents from poorer homes, while genetic influences were strongerfor adolescents from more affluent homes. No significant differences were found between parentalincome and parental education interaction effects. Results suggest that environmental differencesbetween middle- to upper-class families influence the expression of genetic potential for intelligence,as has previously been suggested by Bronfenbrenner and Ceci’s (1994, Nature-nurturereconceptualized in developmental perspective: a bioecological model Psychological Review,101:568–586) bioecological model.
KeywordsGene-environment interaction; Intelligence; Socioeconomic status; Cognitive aptitude
Turkheimer et al. (2003) published a report of genotype–environment (G × E) interaction inthe intelligence of young children. In a sample of 7-year old children from the NationalPerinatal Collaborative Project, the genetic and shared environmental influences on IQ, asmeasured by the Weschler Intelligence Scale for Children—Revised (WISC-R), were modifiedby the socioeconomic status (SES) of the children. For disadvantaged children, sharedenvironmental influences accounted for nearly 60% of the variance in IQ, while genetic factorsaccounted for negligible variance. In advantaged children, the pattern was nearly the reverse.
Although the above results are congruent with some previous research (for reviews see Roweet al. 1999 or Turkheimer et al. 2003), researchers have not always found clear evidence for G× E interaction in cognitive ability (e.g., Scarr 1981, Van den Oord and Rowe 1997), leavingopen the extent to which the results Turkheimer et al. present can be generalized beyond theNCPP sample. This paper presents results of a replication of Turkheimer et al.’s (2003)investigation; however, there are several key changes in the current study. First, the
Correspondence to: K. Paige Harden, [email protected].
NIH Public AccessAuthor ManuscriptBehav Genet. Author manuscript; available in PMC 2010 July 14.
Published in final edited form as:Behav Genet. 2007 March ; 37(2): 273–283. doi:10.1007/s10519-006-9113-4.
NIH
-PA Author Manuscript
NIH
-PA Author Manuscript
NIH
-PA Author Manuscript

demographic composition of the present sample, which includes middle to upper classadolescents, is different from the NCPP sample, which included a number of extremelydisadvantaged children. We are interested in whether the expression of genetic potential forintelligence interacts with environment over the entire range of environmental experience, orwhether such interactions are limited to environments of radically poor quality. Second, ratherthan combining indices of SES into a single measure, we examine potential differences in themagnitude of interactive effects between aspects of socioeconomic advantage, specificallybetween parental education and income.
In a sample of 839 adolescent twin pairs (Loehlin and Nichols 1976), we examine whether thegenetic and shared environmental influences of cognitive aptitude, as measured by the NationalMerit Scholarship Qualifying Test (NMSQT), are modified by SES. Of the home environmentmeasures available for the NMQST sample, mid-parent education and parental income wereused. (These were chosen to be similar to the measurement of SES in Turkheimer et al.(2003), a linear combination of parental education, income, and occupational status. Parentaloccupational status was not available for this sample.) Our expectation is that additive geneticinfluences will account for a substantial portion of the phenotypic variance in the cognitiveaptitude of adolescents from high income, highly educated families, while the sharedenvironment will be more influential in less advantaged families. It is possible, however, thatchanges in heritability with socioeconomic status will be less marked in the present sample,because our participants have higher socioeconomic status than nearly all of the participantsused by Turkheimer et al. (2003).
MethodParticipants
Participants were sampled from the nearly 600,000 nationwide adolescents who completed theNational Merit Scholarship Qualifying Test (NMSQT) in 1962. Virtually all adolescents werein the 11th grade at the time of the NMSQT, and most were 17 years old. Of these adolescents,1507 prospective pairs of same-sex twins were identified and 839 pairs of twins (509 MZ, 330DZ) ultimately participated in the study (a 56% response rate). Female twins composed 58.4%of the sample; male twins 41.6%. This sample represented approximately 5% of the live same-sex twin pairs born in the United States in 1945. Representation of the U.S. population wasbiased towards high-achieving adolescents. Students taking the NMQST ranked, on average,in the 79th percentile in their high schools. Zygosity was assigned by twins’ responses toquestionnaire items concerning their similarity in childhood and the frequency with which theywere confused by others (Nichols and Bilbro 1966). Questionnaire zygosity assignments werecross-validated with a subsample of 124 twin pairs (82 MZ, 42 DZ) and shown to be over 90%accurate. For a more detailed discussion of selection and data collection procedures see Loehlinand Nichols (1976).
MeasuresThe NMSQT is composed of five subtests: English Usage, Mathematics Usage, Social ScienceReading, Natural Science Reading, and Word Usage/Vocabulary (means and standarddeviations are shown in Table 1). The NMSQT is highly reliable, as indicated from the split-half reliability coefficients for this sample, which range from 0.83 for Natural Science to 0.96for Vocabulary (Loehlin and Nichols 1976), and subtest scores are highly correlated with oneanother (see Table 2). The variance of NMSQT total scores is roughly constant across the rangeof total scores. Test constructors describe the NMSQT as a measure of cognitive aptitude, i.e.,students’ readiness for future intellectual or educational pursuits (National Merit ScholarshipCorporation, 2005). It is not, therefore, synonymous with an IQ test of the sort used in theTurkheimer et al. (2003) study. However, general cognitive ability, or g, accounts for most
Harden et al. Page 2
Behav Genet. Author manuscript; available in PMC 2010 July 14.
NIH
-PA Author Manuscript
NIH
-PA Author Manuscript
NIH
-PA Author Manuscript

individual differences on various cognitive tests, regardless of the specific content of anyparticular test (Jensen 1998). Therefore, we can reasonably expect genotype–environmentinteractions for NMSQT aptitude scores to be similar to those found for IQ, althoughdifferences between cognitive ability and cognitive aptitude may have some implications forreplication.
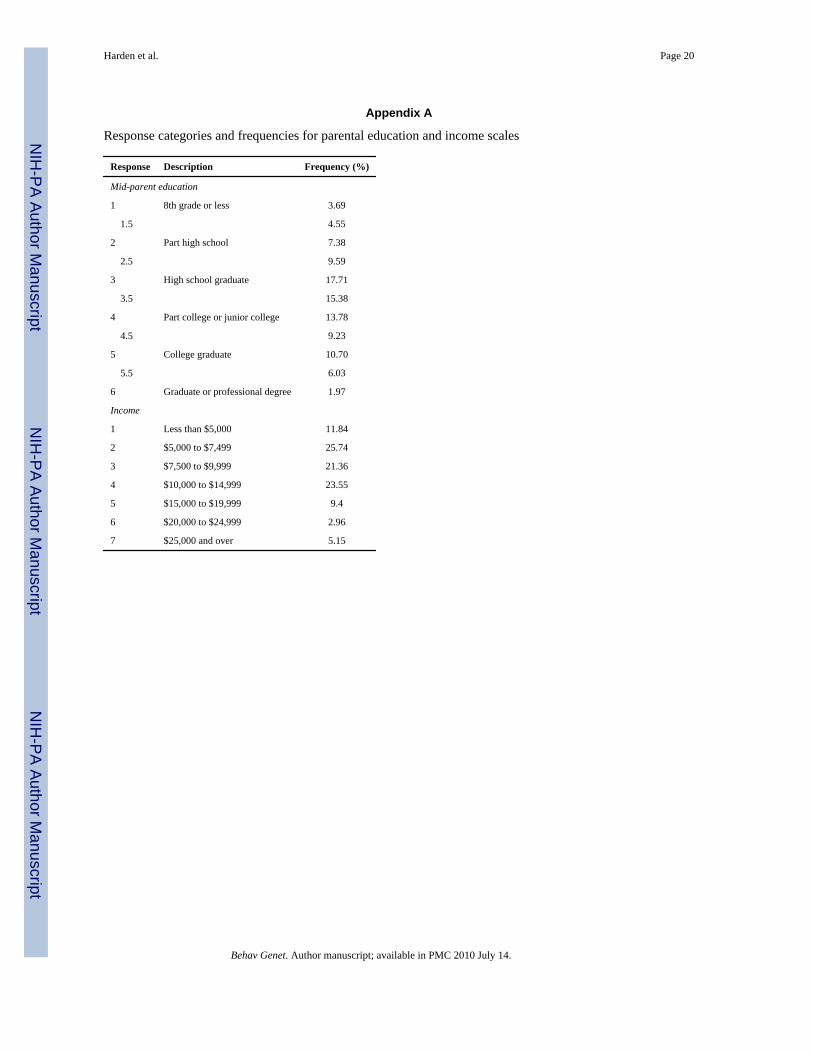
Mothers reported on both their own and the fathers’ level of education and the annual familyincome in a written questionnaire. Parental education was classified on a 6-point ordinal scale,from less than an 8th grade education to a graduate or professional degree. Mid-parenteducation was calculated as the average of maternal and paternal education (median = 3.5;variance = 1.44). Income was classified on a 7-point ordinal scale (median = 3; variance =2.37), from less than $5000 per year to over $25,000 per year (roughly equivalent to less than$31,250 to over $156,250 in 2004 dollars). Response categories and frequency counts for theincome and parental education scales are shown in Appendix A. The scaling used in thequestionnaire partially adjusted for the non-normality of income and education in thepopulation, although income did remain somewhat positively skewed and parental educationnegatively kurtotic. Furthermore, as might be anticipated given the bias towards high-achievingtwins, the distribution of parental income was not nationally representative: less than 12% ofthe NMSQT families reported annual incomes less than $5000, in comparison to 42% of theU.S. population in 1960 (U.S. Department of Commerce, Bureau of the Census 1960). Parentaleducation and income were correlated (r = 0.530). Parental education and income were equallycorrelated with adolescents’ total NSMQT scores (calculated separately for member of twinpair: rincome - NMSQT1 = 0.23; reducation - NMSQT1 = 0.21; rincome - NMQT2 = 0.26;reducation - NMSQT2 = 0.21). Of the 839 twin families, 777 reported income, 813 reported parentaleducation, and 768 reported both. The twin pair average NMSQT total score for twin pairswith missing parental income data (M = 95.74) was significantly less than the average scorefor twin pairs with parental income data (M = 102.92, t = 2.62, P < 0.01). Twin pair averagescores did not differ as a function of missing parental education data (t = 0.20, P = 0.845). Bothparental education and income were centered at the median prior to structural equationmodeling.
AnalysesWe first conducted an exploratory factor analysis on subtest scores. In order to prevent biasdue to non-independent observations, the EFA was restricted to one randomly selected twinper pair. EFA results clearly indicated a one factor model (eigenvalues = 3.84, 0.56, 0.39; rootmean square error of approximation = 0.046), as also suggested by the consistently largeintercorrelations among the subtests (see Table 2). For this reason, we chose to consider G ×E interactions for overall cognitive aptitude, modeled as a common factor of the NMSQTsubtests.
Using the cognitive aptitude factor, we fit two series of interaction models, one series for eachmeasured indicator of SES. Each interaction model decomposed the variance of cognitiveaptitude into four components: variance accounted for by the measured environment (incomeor education), variance due to other environmental influences shared by twins (C), variancedue to additive genetic influences (A), and variance unique to each twin (E; due toenvironmental influences not shared by twins and measurement error). Furthermore, the pathsfrom the additive genetic and shared environmental variance components were allowed to varyaccording to the measured environment. For example, for the income interaction models,aptitude scores were modeled as follows:
(1)
Harden et al. Page 3
Behav Genet. Author manuscript; available in PMC 2010 July 14.
NIH
-PA Author Manuscript
NIH
-PA Author Manuscript
NIH
-PA Author Manuscript
Similarly, for the parental education interaction models, aptitude scores were modeled asfollows:
(2)
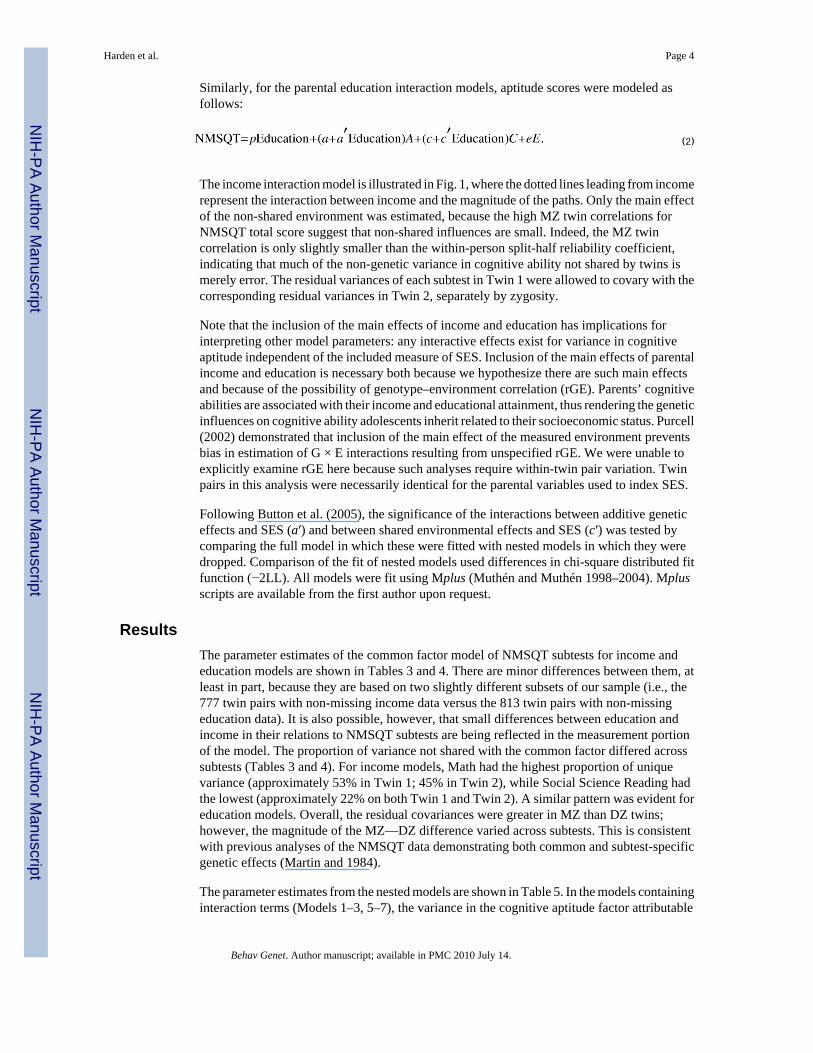
The income interaction model is illustrated in Fig. 1, where the dotted lines leading from incomerepresent the interaction between income and the magnitude of the paths. Only the main effectof the non-shared environment was estimated, because the high MZ twin correlations forNMSQT total score suggest that non-shared influences are small. Indeed, the MZ twincorrelation is only slightly smaller than the within-person split-half reliability coefficient,indicating that much of the non-genetic variance in cognitive ability not shared by twins ismerely error. The residual variances of each subtest in Twin 1 were allowed to covary with thecorresponding residual variances in Twin 2, separately by zygosity.
Note that the inclusion of the main effects of income and education has implications forinterpreting other model parameters: any interactive effects exist for variance in cognitiveaptitude independent of the included measure of SES. Inclusion of the main effects of parentalincome and education is necessary both because we hypothesize there are such main effectsand because of the possibility of genotype–environment correlation (rGE). Parents’ cognitiveabilities are associated with their income and educational attainment, thus rendering the geneticinfluences on cognitive ability adolescents inherit related to their socioeconomic status. Purcell(2002) demonstrated that inclusion of the main effect of the measured environment preventsbias in estimation of G × E interactions resulting from unspecified rGE. We were unable toexplicitly examine rGE here because such analyses require within-twin pair variation. Twinpairs in this analysis were necessarily identical for the parental variables used to index SES.
Following Button et al. (2005), the significance of the interactions between additive geneticeffects and SES (a′) and between shared environmental effects and SES (c′) was tested bycomparing the full model in which these were fitted with nested models in which they weredropped. Comparison of the fit of nested models used differences in chi-square distributed fitfunction (−2LL). All models were fit using Mplus (Muthén and Muthén 1998–2004). Mplusscripts are available from the first author upon request.
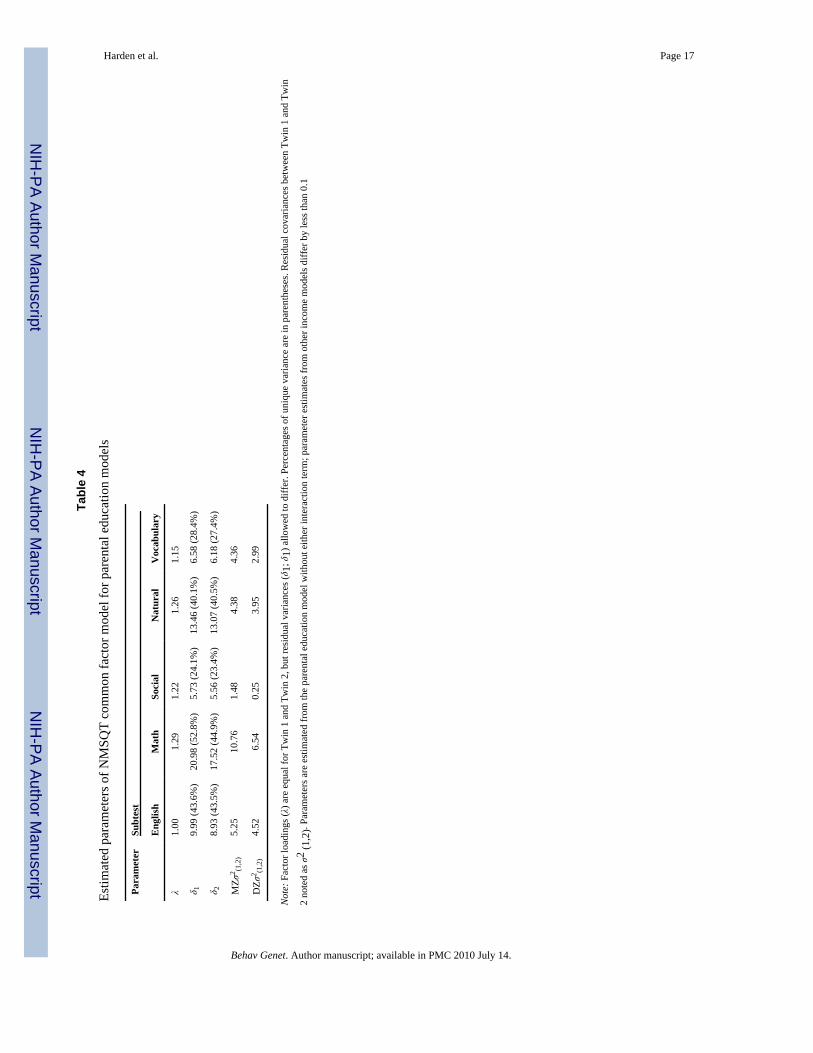
ResultsThe parameter estimates of the common factor model of NMSQT subtests for income andeducation models are shown in Tables 3 and 4. There are minor differences between them, atleast in part, because they are based on two slightly different subsets of our sample (i.e., the777 twin pairs with non-missing income data versus the 813 twin pairs with non-missingeducation data). It is also possible, however, that small differences between education andincome in their relations to NMSQT subtests are being reflected in the measurement portionof the model. The proportion of variance not shared with the common factor differed acrosssubtests (Tables 3 and 4). For income models, Math had the highest proportion of uniquevariance (approximately 53% in Twin 1; 45% in Twin 2), while Social Science Reading hadthe lowest (approximately 22% on both Twin 1 and Twin 2). A similar pattern was evident foreducation models. Overall, the residual covariances were greater in MZ than DZ twins;however, the magnitude of the MZ—DZ difference varied across subtests. This is consistentwith previous analyses of the NMSQT data demonstrating both common and subtest-specificgenetic effects (Martin and 1984).
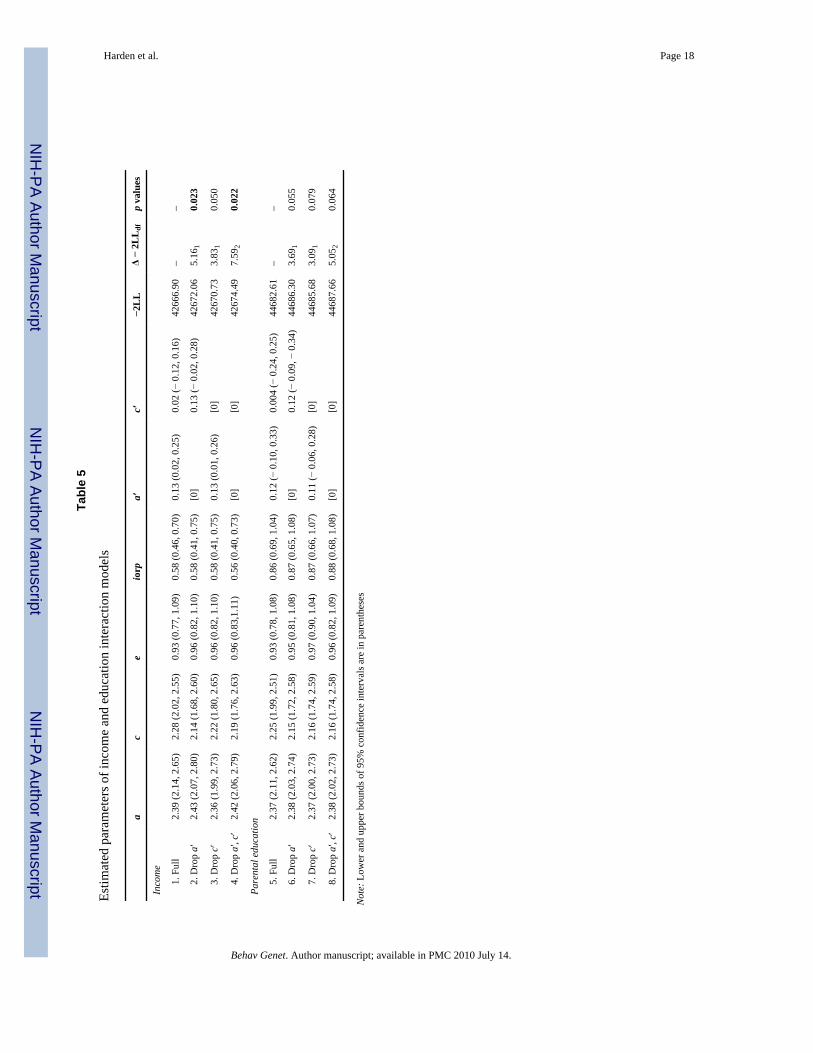
The parameter estimates from the nested models are shown in Table 5. In the models containinginteraction terms (Models 1–3, 5–7), the variance in the cognitive aptitude factor attributable
Harden et al. Page 4
Behav Genet. Author manuscript; available in PMC 2010 July 14.
NIH
-PA Author Manuscript
NIH
-PA Author Manuscript
NIH
-PA Author Manuscript
to additive genetic or shared environmental influences is a function of the measuredenvironment. (There is no interaction with the non-shared environmental component (e) or themain effects of income (i) or education (p), so e, i, and p are interpreted in the interactionmodels the same as in a classical twin model.) For example, additive genetic variance in Models1–3 is calculated as:
(3)
Because parental income and education were centered such that values of zero correspond tothe medians for each variable, the squared genetic (a) and shared environmental (c) main effectsparameters equal the genetic and shared environmental variance in the common aptitude factorat the median level of the measured environment. Similarly, the proportion of varianceattributable to a predictor in the interaction models also changes as a function of the measuredenvironment. For example, the proportion of genetic variance (i.e., the heritability) for Model1 is calculated as:
(4)
The squared a and c main effects divided by the total variance equals the heritability and sharedenvironmentality of NSMQT at the median environment. Using parameters from Model 1,additive genetic factors accounted for 45% of the variance in cognitive aptitude, sharedenvironment 41%, unique environment 7%, and income 6% at the median level of parentalincome ($7500 to $9999). Using parameters from Model 5, additive genetic factors accountedfor 44% of the variance in cognitive aptitude, shared environment 40%, unique environment7%, and parental education 9% at the median level of parental education (high school graduateor part college).
Whether the observed interactions can be attributed to sampling error can be gauged by theconfidence intervals around the individual interaction parameters, a′ and c′, and by differencesin fit function (− 2LL) between the full model and nested models that drop one or both of theinteraction parameters. In Model 1, the 95% confidence interval around a′ (0.02, 0.25) indicatesthat the change in genetic variance with income is significant. In contrast, the sharedenvironmental interaction is not significantly different from zero (95% CI = −0.20, 0.16). Thechange in − 2LL (5.16, Δdf = 1) from Model 1 to Model 2 is significant (P = 0.023), indicatingthat dropping the genetic interaction worsens the fit of the model. Model 3 assessed thecontribution of the shared environment interaction by fixing c′ to zero. The change in − 2LL(3.83, Δdf = 1) from Model 1 to Model 3 is not (quite) significant at the 0.05 level (P = 0.0503);i.e., dropping the shared environment interaction did not demonstrably worsen the fit of themodel. Finally, Model 4 assessed the simultaneous contribution of both a′ and c′ to model fit.The change in − 2LL from Model 1 to Model 4 is significant (7.59, Δdf = 2), further suggestingthat inclusion of some interaction parameter (presumably the genetic one) improves model fit.Model 3, then, represents the most parsimonious fit to the data.
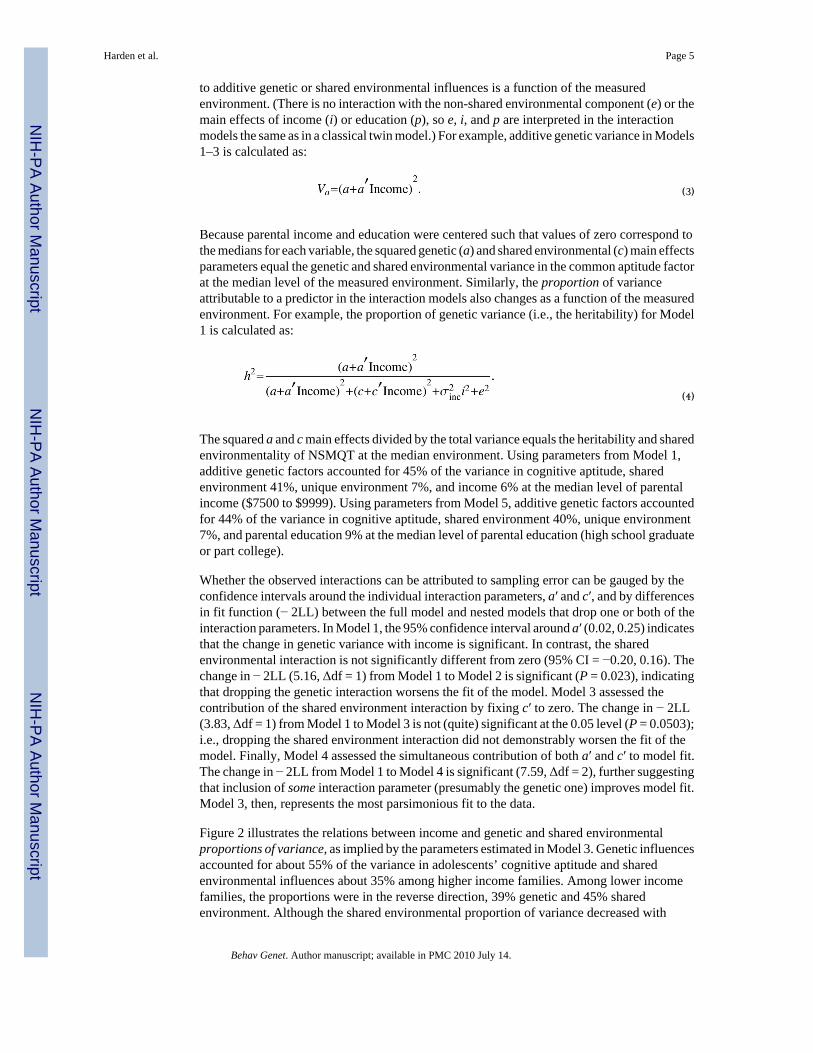
Figure 2 illustrates the relations between income and genetic and shared environmentalproportions of variance, as implied by the parameters estimated in Model 3. Genetic influencesaccounted for about 55% of the variance in adolescents’ cognitive aptitude and sharedenvironmental influences about 35% among higher income families. Among lower incomefamilies, the proportions were in the reverse direction, 39% genetic and 45% sharedenvironment. Although the shared environmental proportion of variance decreased with
Harden et al. Page 5
Behav Genet. Author manuscript; available in PMC 2010 July 14.
NIH
-PA Author Manuscript
NIH
-PA Author Manuscript
NIH
-PA Author Manuscript
income, shared environmental variance per se did not decrease. The interactive effect wasdriven entirely by the increase in genetic variance. Genetic variance in cognitive aptitude nearlydoubled from 4.41 in families earning less than $5000 annually to 8.29 in families earningmore than $25,000 annually.
A slightly different picture emerges for the parental education models. The wide 95% CIsaround both a′ and c′ in Model 5, and the non-significant worsening of fit when both are droppedin Model 8, suggest that interactions may not be necessary to explain the data. Moreover, thechange in − 2LL (3.69, Δdf =1) from Model 5 to Model 6 is not quite significant (P = 0.054),suggesting that the genetic interaction may be dropped. Model 7 also did not fit the datasignificantly worse than Model 5 (Δ − 2LL = 3.09, Δdf=1, P = 0.079), suggesting that theshared environment interaction may be dropped. Therefore, we may not conclude that parentaleducation interacts with genetic and shared environmental influences on cognitive aptitudebeyond what may be attributed to sampling error.
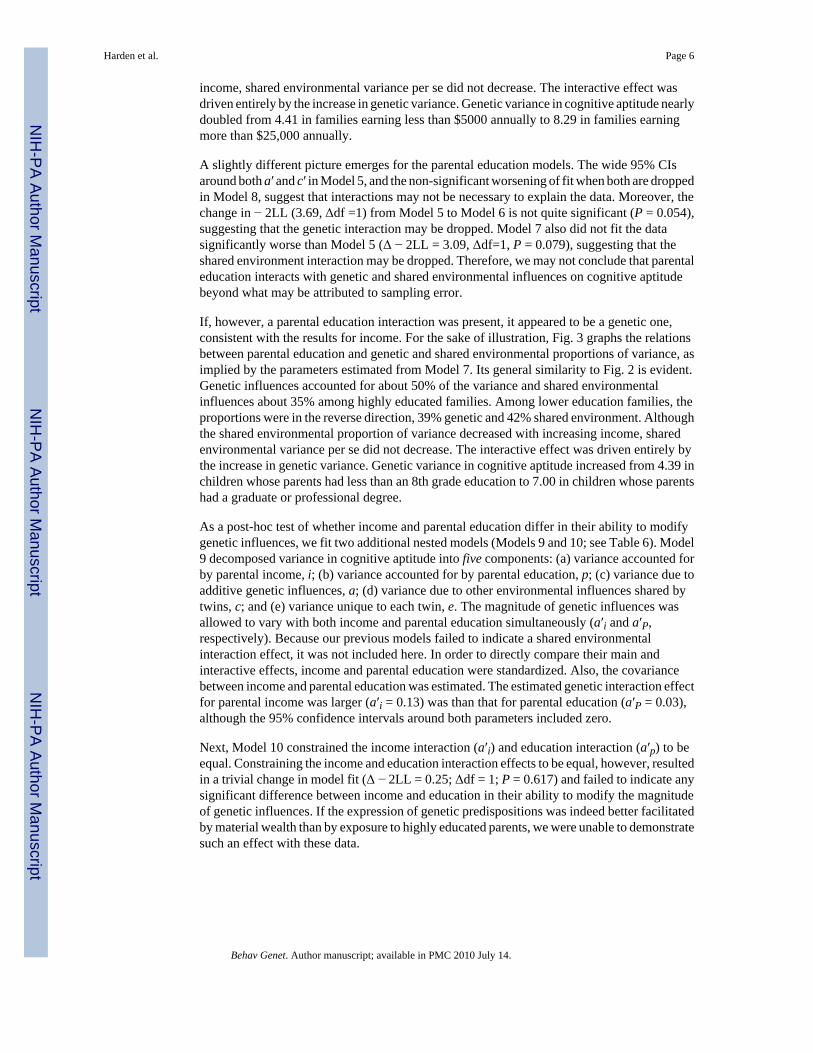
If, however, a parental education interaction was present, it appeared to be a genetic one,consistent with the results for income. For the sake of illustration, Fig. 3 graphs the relationsbetween parental education and genetic and shared environmental proportions of variance, asimplied by the parameters estimated from Model 7. Its general similarity to Fig. 2 is evident.Genetic influences accounted for about 50% of the variance and shared environmentalinfluences about 35% among highly educated families. Among lower education families, theproportions were in the reverse direction, 39% genetic and 42% shared environment. Althoughthe shared environmental proportion of variance decreased with increasing income, sharedenvironmental variance per se did not decrease. The interactive effect was driven entirely bythe increase in genetic variance. Genetic variance in cognitive aptitude increased from 4.39 inchildren whose parents had less than an 8th grade education to 7.00 in children whose parentshad a graduate or professional degree.
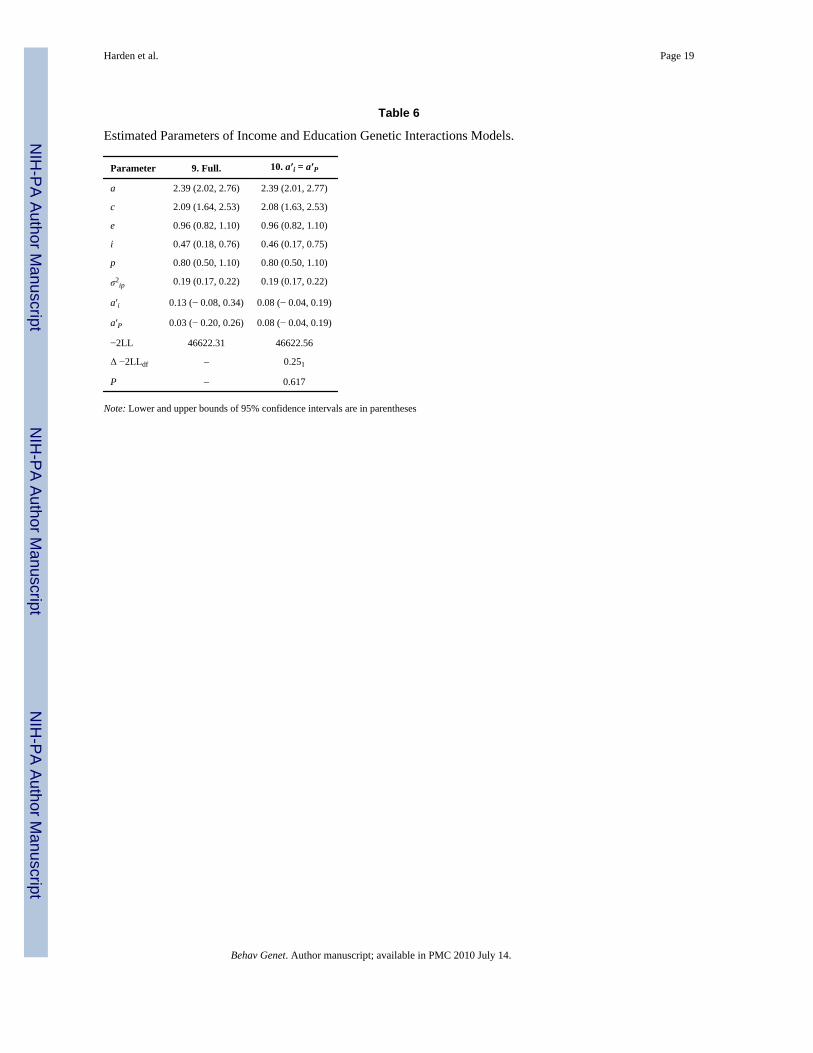
As a post-hoc test of whether income and parental education differ in their ability to modifygenetic influences, we fit two additional nested models (Models 9 and 10; see Table 6). Model9 decomposed variance in cognitive aptitude into five components: (a) variance accounted forby parental income, i; (b) variance accounted for by parental education, p; (c) variance due toadditive genetic influences, a; (d) variance due to other environmental influences shared bytwins, c; and (e) variance unique to each twin, e. The magnitude of genetic influences wasallowed to vary with both income and parental education simultaneously (a′i and a′P,respectively). Because our previous models failed to indicate a shared environmentalinteraction effect, it was not included here. In order to directly compare their main andinteractive effects, income and parental education were standardized. Also, the covariancebetween income and parental education was estimated. The estimated genetic interaction effectfor parental income was larger (a′i = 0.13) was than that for parental education (a′P = 0.03),although the 95% confidence intervals around both parameters included zero.
Next, Model 10 constrained the income interaction (a′i) and education interaction (a′p) to beequal. Constraining the income and education interaction effects to be equal, however, resultedin a trivial change in model fit (Δ − 2LL = 0.25; Δdf = 1; P = 0.617) and failed to indicate anysignificant difference between income and education in their ability to modify the magnitudeof genetic influences. If the expression of genetic predispositions was indeed better facilitatedby material wealth than by exposure to highly educated parents, we were unable to demonstratesuch an effect with these data.
Harden et al. Page 6
Behav Genet. Author manuscript; available in PMC 2010 July 14.
NIH
-PA Author Manuscript
NIH
-PA Author Manuscript
NIH
-PA Author Manuscript

DiscussionOur investigation supports our hypothesis that the magnitude of genetic influences on cognitiveaptitude varies with socioeconomic status. This partially replicates the results presented byTurkheimer et al. (2003); however, no shared environmental interaction effects weredemonstrable in the current study. Genetic influences accounted for about 55% of the variancein adolescents’ cognitive aptitude and shared environmental influences about 35% amonghigher income families. Among lower income families, the proportions were in the reversedirection, 39% genetic and 45% shared environment. This pattern is similar to the pattern seenin Turkheimer et al. (2003), although less marked.
Differences among aspects of SES in the facilitation of genetic potentialWe were unable to demonstrate directly that parental income and parental education differ intheir interaction with genetic influences on cognitive aptitude; however, income and educationmodels had different patterns of results, with a significant genetic interaction detected only forincome. It is, therefore, possible that not all aspects of high socioeconomic standing equallyfacilitate expression of genetic potential. Guo and Stearns (2002) drew similar conclusions intheir investigation of adolescent verbal intelligence, which demonstrated that the interactionbetween parental education and genetic influences on verbal intelligence disappeared if otherenvironmental indices—income, parental employment, absence of a biological father, and race—were included. Most previous research investigating interactions between genetic variancein cognitive aptitude and socioeconomic advantage have used single indices of SES, includingparental education (Rowe et al. 1999), parental occupational status (van den Oord and Rowe1997), census tract characteristics (Scarr 1981), and linear combinations of the above(Turkheimer et al. 2003). With the exception of Guo and Stearns (2002), differences amongindicators with regard to their ability to modify genetic expression have not been explored.Such differences may conceivably explain the inconsistency with which clear evidence for G× E interactions have been found: van den Oord and Rowe (1998) did not find evidence of adirect interaction with parental occupational status, nor did Scarr (1981) with census tractcharacteristics.
A difficulty with interpreting an interaction between genotype and socioeconomic status is thatSES presumably reflects genetic differences between parents, in addition to differences in thequality of the environment provided for children (Turkheimer et al. 2003). The observedincrease in heritability with parental income, therefore, may reflect an interaction with geneticdifferences between more and less affluent families (gene–gene interaction), rather than aninteraction with environmental quality. Income, however, is loaded with genetic variance to alesser extent than parental education or occupational status and is less closely related to parentalIQ. Rowe, Vesterdal, and Rodgers (1998), using a nationally representative sample of adultsaged 28–35 years, reported within-person correlations between education and IQ of 0.52–0.66,whereas within-person correlations between income and IQ were 0.26–0.38. Furthermore, theheritability of income was substantially lower than that of education (0.42 vs. 0.68), and themajority of the total genetic variance in education was shared with IQ (75%), while the majorityof the total genetic variance in income was not shared with either education or IQ (71%). Therelative independence of income from genetic influences on parental IQ raises our confidencesomewhat that the observed interaction is truly a genotype by environment interaction. Ideally,we would like some knowledge of the genetic correlation between adolescents’ cognitiveaptitude and parental SES. This is impossible to estimate in the current study, because twinchildren are not genetically informative about parental characteristics for which they arenecessarily identical.
Harden et al. Page 7
Behav Genet. Author manuscript; available in PMC 2010 July 14.
NIH
-PA Author Manuscript
NIH
-PA Author Manuscript
NIH
-PA Author Manuscript
The modification of heritability within the range of “normal” environmentsThese results partially replicate the work of Turkheimer et al. (2003) in a sample of radicallydifferent demographic composition. The National Collaborative Perinatal Project sample over-represented children from extremely disadvantaged environments, with 33% of families onpublic assistance and 25% of mothers having less than a 9th grade education. In contrast, theadolescents composing the NMSQT sample are relatively advantaged in terms of intellectualability (ranking, on average, in the 79th percentile in their high schools) and their parents’income. Less than 12% of the NMSQT families reported annual incomes less than $5000, incomparison to 42% of the U.S. population in 1960; over 60% of the NMSQT families reportedincomes over $7500, whereas only 34% of the U.S. population reported incomes over $7000in 1960 (U.S. Department of Commerce, Bureau of the Census 1960). The socioeconomicadvantage of the NMSQT adolescents may be due to two selection processes: (a) for this cohort,only adolescents with a certain level of academic achievement took the NMSQT; (b) of twinsidentified as potential participants, non-response may have been associated with environmentaldisadvantage. The modification of heritability within the NMSQT sample suggests thatgenotype–environment interactions in cognitive ability are not limited to severelydisadvantaged environments, as has been previously suggested (Turkheimer and Gottesman1991; Scarr 1992).
Turkheimer and Gottesman’s (1991) hypothetical reaction norm for intelligence illustrates thehypothesis that differences among “normal” environments are largely irrelevant for differencesamong children’s intelligence. Below a certain threshold of environmental quality, intelligenceincreases sharply with better environments (i.e., a steep slope across the environmental axis),and genetic differences among individuals are better expressed in better environments (i.e.,the slope along the genetic axis depends on the environment). The latter reflects a gene-environment interaction. In contrast, above a certain threshold of environmental quality, thereaction plane is essentially flat: for any given genotype, better environments do not predictan increase in intelligence (a flat slope across the environmental axis), and for any givenenvironment, genetic differences are equally well expressed (a constant linear slope along thegenetic axis). Thus any gene-environment interaction disappears above a threshold ofenvironmental quality. Scarr (1992) further elaborated on this idea, claiming that other thansevere abuse and neglect, such as being “trapped in crack houses of inner cities, locked inbasements and attics by vengeful crazy relatives” (p. 3), differences in family environmentshave no effect on children. In sum, differences among normal-range family environments havebeen thought to be largely irrelevant to the development of intelligence, both because sharedenvironmental variance components are low in advantaged environments and because onlyextremely disadvantaged environments can suppress the expression of genetic potential.
The alleged irrelevance of differences among normal- range family environments has beenchallenged by Bronfenbrenner and Ceci (1994), who “take issue with the prevailing conceptionof the reaction range simply as a curved plane, similar to a bent piece of chicken wire …” (p.571). Their bioecological model proposes that proximal processes, i.e., mechanisms by whichgenetic potential for effective or adaptive functioning are realized, differ among families inmagnitude, quality, and stability, and that these differences in proximal processes “can producesubstantial variation in heritability even in advantaged environments” (p. 571). Rowe et al.(1999) characterized this position as “paradoxical,” because the proportion of environmentalvariance must necessarily decrease as the proportion of genetic variance (i.e., heritability)increases. This characterization is inaccurate in two respects. First, although proportions ofvariance are constrained to sum to unity, unstandardized variance components are not. Second,by asserting that differences among normal-range family environments are relevant tochildren’s functioning, the bioecological model is not necessarily predicting substantial sharedenvironmental variance in adequate environments. Rather, the bioecological model is
Harden et al. Page 8
Behav Genet. Author manuscript; available in PMC 2010 July 14.
NIH
-PA Author Manuscript
NIH
-PA Author Manuscript
NIH
-PA Author Manuscript
predicting an increase in genetic variance even over the range of normal environments, aslightly different conception of what it means for environmental differences to be “relevant”for children’s functioning. Indeed, Bronfenbrenner and Ceci (1994) predict the identical patternas Turkheimer and Gottesman (1991): high heritability estimates and low sharedenvironmentality estimates as environmental advantage increases.
In the typology of genotype–environment interactions recently proposed by Shanahan andHofer (2005), the “bent piece of chicken wire” view of the reaction norm for intelligenceemphasizes “social context as social control”—extreme socioeconomic disadvantage enforcesstructural constraints on people and their choices. Beyond the constraints of poverty, thegenotype–environment interaction is thought to no longer operate. In contrast, the presentresearch, echoing Bronfenbrenner and Ceci’s (1994) formulation, emphasizes “social contextas enhancement” (Shanahan and Hofer 2005, p. 69)—high quality interactions with theenvironment increase adaptive functioning and increase heritability, even within normal rangeenvironments. Our results suggest that differences between middle class and affluent parentsaffect the expression of genetic potential.
Data from a sample spanning the entire range of socioeconomic advantage—from extremepoverty to extreme wealth—would be useful in further tests of the Turkheimer and Gottesman(1991) reaction norm and Bronfenbrenner and Ceci (1994) bioecological models. Bycomparing results from two roughly contemporaneous samples of overlapping socioeconomicstatus, we have attempted to “piece together” a representation of how genetic influences interactwith the home environment over a broad range of socioeconomic status. Although thiscomparison suggests support for the bioecological model, this approach is not withoutdifficulty. Specifically, the heritability estimates for IQ among the most advantaged NCPPparticipants (h2 ≈ 0.80; Turkheimer et al. 2003) are substantially higher than the heritabilityestimates for NMQST scores of participants with similar socioeconomic status (i.e., the lowend of the NMSQT sample). As mentioned previously, NMSQT aptitude scores are notsynonymous with IQ scores. The shared environment may be more influential for NMSQTscores because they also reflect, to some extent, academic achievement, rather than purecognitive ability. Regardless of why heritability estimates differ in the two samples, thesedifferences are indicative of the need for future research to construct a model of genotype–environment interactions from a single sample, rather than piecing together such a model fromvarious, partially overlapping, samples.
ConclusionsOverall, these results mirror findings in other areas of behavior genetic research demonstratingthat the magnitude of genetic variance is not a static characteristic of a trait but a populationstatistic that may be moderated by other predictors. For example, Johnson and Krueger(2005) have demonstrated that genetic variance in physical health decreases with increasingincome and increasing sense of psychological control. Similarly, Button et al. (2005) haveshown that genetic variance in childhood conduct problems drops dramatically with elevatedlevels of family dysfunction. The present research thus extends a relatively small body ofbehavior genetic research that has moved beyond the calculation of heritability coefficients foroverall psychological outcomes to investigations of the environmental contexts facilitating orsuppressing genetic expression.
ReferencesBrofenbrenner U, Ceci SJ. Nature-nurture reconceptualized in developmental perspective: a
bioecological model. Psychol Rev 1994;101:568–586. [PubMed: 7984707]Button TMM, Scourfield J, Martin N, Purcell S, McGuffin P. Family dysfunction interacts with genes in
the causation of antisocial symptoms. Behav Genet 2005;35:115–120. [PubMed: 15685425]
Harden et al. Page 9
Behav Genet. Author manuscript; available in PMC 2010 July 14.
NIH
-PA Author Manuscript
NIH
-PA Author Manuscript
NIH
-PA Author Manuscript

Guo G, Stearns E. The social influences on the realization of genetic potential for intellectualdevelopment. Social Forces 2002;80:881–910.
Jensen, AR. The g factor: the science of mental ability. Preager; Westport, CT: 1998.Johnson W, Krueger RF. Higher perceived life control decreases genetic variance in physical health:
evidence from a national twin study. J Pers Soc Psychol 2005;88:165–173. [PubMed: 15631582]Loehlin, JC.; Nichols, RC. Heredity, environment, and personality: a study of 850 sets of twins. University
of Texas Press; Austin, TX: 1976.Martin NG, Jardine R, Eaves LJ. Is there only one set of genes for different abilities? A reanalysis of the
National Merit Scholarship Qualifying Test (NMSQT) data. Behav Genet 1984;14:355–370.[PubMed: 6542358]
Muthén, LK.; Muthén, BO. Mplus user’s guide. 3. Muthén & Muthén; Los Angeles, CA: 1998–2004.Nichols RC, Bilbro WC. The diagnosis of twin zygosity. Acta Genetica et Statistica Medica 1966;16:265–
275. [PubMed: 4959152]Purcell S. Variance components models for gene-environment interaction in twin analysis. Twin Res
2002;5:554–771. [PubMed: 12573187]Rowe DC, Jacobson KE, van den Oord E. Genetic and environmental influences on vocabulary IQ:
parental education level as a moderator. Child Dev 1999;70:1151–1162. [PubMed: 10546338]Rowe DC, Vesterdal WJ, Rodgers JL. Herrnstein’s syllogism: genetic and shared environmental
influences on IQ, education, and income. Intelligence 1999;26:405–423.Scarr S. Developmental theories for the 1990s: development and individual differences. Child Dev
1992;63:1–19. [PubMed: 1343618]Scarr, S. Race, social class, and individual differences in IQ: new studies of old issues. Erlbaum; Hillsdale,
NJ: 1981.Shanahan MJ, Hofer SM. Social context in gene-environment interactions: retrospect and prospect. J
Gerentol: SERIES B 2005;60B:65–76.Turkheimer E, Haley A, Waldron M, D’Onofrio BM, Gottesman II. Socioeconomic status modifies
heritability of IQ in young children. Psychol Sci 2003;14:623–628. [PubMed: 14629696]Turkheimer E, Gottesman II. Individual differences and the canalization of human behavior. Dev Psychol
1991;27:18–22.U.S. Department of Commerce, Bureau of the Census. General population characteristics. U.S.
Government Printing Office; Washington, D.C: 1960.van den Oord E, Rowe DC. An examination of genotype–environment interactions for academic
achievement in an U.S. longitudinal survey. Intelligence 1997;25:205–219.
Harden et al. Page 10
Behav Genet. Author manuscript; available in PMC 2010 July 14.
NIH
-PA Author Manuscript
NIH
-PA Author Manuscript
NIH
-PA Author Manuscript

Fig. 1.Income interaction model
Harden et al. Page 11
Behav Genet. Author manuscript; available in PMC 2010 July 14.
NIH
-PA Author Manuscript
NIH
-PA Author Manuscript
NIH
-PA Author Manuscript

Fig. 2.Genetic and shared environmental proportions of variance by parental income, as implied byfitted interaction parameters.*Note: X-axis corresponds to response categories of parental education scale
Harden et al. Page 12
Behav Genet. Author manuscript; available in PMC 2010 July 14.
NIH
-PA Author Manuscript
NIH
-PA Author Manuscript
NIH
-PA Author Manuscript
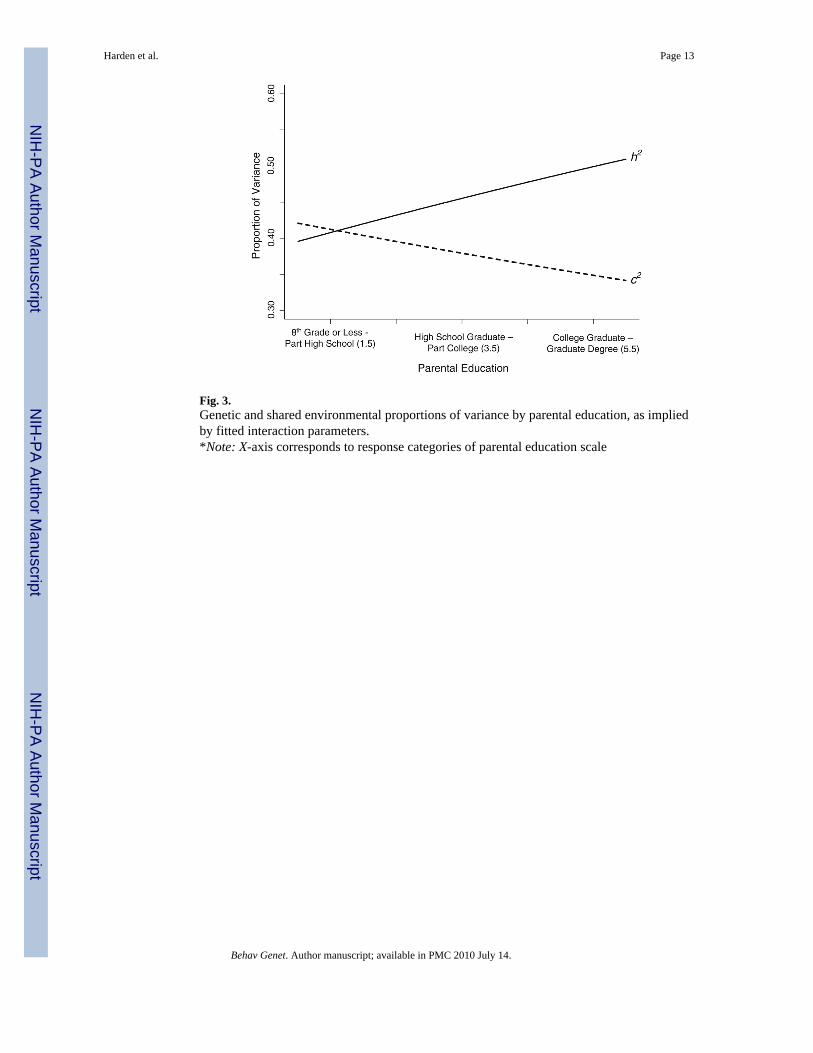
Fig. 3.Genetic and shared environmental proportions of variance by parental education, as impliedby fitted interaction parameters.*Note: X-axis corresponds to response categories of parental education scale
Harden et al. Page 13
Behav Genet. Author manuscript; available in PMC 2010 July 14.
NIH
-PA Author Manuscript
NIH
-PA Author Manuscript
NIH
-PA Author Manuscript

NIH
-PA Author Manuscript
NIH
-PA Author Manuscript
NIH
-PA Author Manuscript
Harden et al. Page 14
Tabl
e 1
NM
SQT
subt
est s
ampl
e st
atis
tics a
nd tw
in p
air c
orre
latio
ns b
y zy
gosi
ty
Subt
est
Tw
in 1
Tw
in 2
MZ
DZ
MSD
MSD
Engl
ish
19.2
24.
8819
.76
4.60
0.76
0.57
Mat
h20
.64
6.29
21.3
66.
190.
750.
49
Soci
al20
.34
4.87
20.8
54.
890.
770.
52
Nat
ural
19.4
55.
8820
.16
5.70
0.69
0.55
Voc
abul
ary
20.7
54.
9521
.09
4.88
0.86
0.64
Tota
l10
1.40
22.1
210
3.29
21.9
50.
880.
65
Behav Genet. Author manuscript; available in PMC 2010 July 14.

NIH
-PA Author Manuscript
NIH
-PA Author Manuscript
NIH
-PA Author Manuscript
Harden et al. Page 15
Tabl
e 2
Cor
rela
tions
bet
wee
n N
MSQ
T su
btes
ts b
y m
embe
r of t
win
pai
r
Subt
est
Eng
lish
Mat
hSo
cial
Nat
ural
Voc
abul
ary
Tot
al
Engl
ish
1.00
0.56
0.62
0.56
0.67
0.80
Mat
h0.
531.
000.
650.
670.
580.
84
Soci
al0.
640.
571.
000.
670.
770.
88
Nat
ural
0.59
0.64
0.66
1.00
0.60
0.85
Voc
abul
ary
0.67
0.54
0.77
0.60
1.00
0.84
Tota
l0.
810.
810.
860.
850.
841.
00
Not
e: T
win
1 c
orre
latio
ns a
re b
elow
the
diag
onal
; Tw
in 2
cor
rela
tions
are
abo
ve th
e di
agon
al
Behav Genet. Author manuscript; available in PMC 2010 July 14.

NIH
-PA Author Manuscript
NIH
-PA Author Manuscript
NIH
-PA Author Manuscript
Harden et al. Page 16
Tabl
e 3
Estim
ated
par
amet
ers o
f NM
SQT
com
mon
fact
or m
odel
for i
ncom
e m
odel
s
Para
met
erSu
btes
t
Eng
lish
Mat
hSo
cial
Nat
ural
Voc
abul
ary
λ1.
001.
301.
221.
231.
14
δ 110
.15
(44.
3%)
21.3
6 (5
3.7%
)5.
40 (2
2.7%
)13
.56
(40.
4%)
6.52
(28.
1%)
δ 28.
98 (4
3.7%
)17
.57
(45.
0%)
5.40
(22.
7%)
12.6
4 (3
9.1%
)6.
07 (2
6.9%
)
MZσ
2 (1,2
)5.
2610
.99
1.39
4.19
4.34
DZσ
2 (1,2
)4.
576.
440.
153.
862.
91
Not
e: F
acto
r loa
ding
s (λ)
are
equ
al fo
r Tw
in 1
and
Tw
in 2
, but
resi
dual
var
ianc
es (δ
1; δ
1) a
llow
ed to
diff
er. P
erce
ntag
es o
f uni
que
varia
nce
are
in p
aren
thes
es. R
esid
ual c
ovar
ianc
es b
etw
een
Twin
1 a
nd T
win
2 no
ted
as σ
2 (1
,2).
Para
met
ers a
re e
stim
ated
from
the
pare
ntal
inco
me
mod
el w
ithou
t eith
er in
tera
ctio
n te
rm; p
aram
eter
est
imat
es fr
om o
ther
inco
me
mod
els d
iffer
by
less
than
0.1
Behav Genet. Author manuscript; available in PMC 2010 July 14.
NIH
-PA Author Manuscript
NIH
-PA Author Manuscript
NIH
-PA Author Manuscript
Harden et al. Page 17
Tabl
e 4
Estim
ated
par
amet
ers o
f NM
SQT
com
mon
fact
or m
odel
for p
aren
tal e
duca
tion
mod
els
Para
met
erSu
btes
t
Eng
lish
Mat
hSo
cial
Nat
ural
Voc
abul
ary
λ1.
001.
291.
221.
261.
15
δ 19.
99 (4
3.6%
)20
.98
(52.
8%)
5.73
(24.
1%)
13.4
6 (4
0.1%
)6.
58 (2
8.4%
)
δ 28.
93 (4
3.5%
)17
.52
(44.
9%)
5.56
(23.
4%)
13.0
7 (4
0.5%
)6.
18 (2
7.4%
)
MZσ
2 (1,2
)5.
2510
.76
1.48
4.38
4.36
DZσ
2 (1,2
)4.
526.
540.
253.
952.
99
Not
e: F
acto
r loa
ding
s (λ)
are
equ
al fo
r Tw
in 1
and
Tw
in 2
, but
resi
dual
var
ianc
es (δ
1; δ
1) a
llow
ed to
diff
er. P
erce
ntag
es o
f uni
que
varia
nce
are
in p
aren
thes
es. R
esid
ual c
ovar
ianc
es b
etw
een
Twin
1 a
nd T
win
2 no
ted
as σ
2 (1
,2).
Para
met
ers a
re e
stim
ated
from
the
pare
ntal
edu
catio
n m
odel
with
out e
ither
inte
ract
ion
term
; par
amet
er e
stim
ates
from
oth
er in
com
e m
odel
s diff
er b
y le
ss th
an 0
.1
Behav Genet. Author manuscript; available in PMC 2010 July 14.
NIH
-PA Author Manuscript
NIH
-PA Author Manuscript
NIH
-PA Author Manuscript
Harden et al. Page 18
Tabl
e 5
Estim
ated
par
amet
ers o
f inc
ome
and
educ
atio
n in
tera
ctio
n m
odel
s
ac
eio
rpa′
c′−2
LL
Δ −
2LL
dfp
valu
es
Inco
me
1.
Ful
l2.
39 (2
.14,
2.6
5)2.
28 (2
.02,
2.5
5)0.
93 (0
.77,
1.0
9)0.
58 (0
.46,
0.7
0)0.
13 (0
.02,
0.2
5)0.
02 (−
0.1
2, 0
.16)
4266
6.90
––
2.
Dro
p a′
2.43
(2.0
7, 2
.80)
2.14
(1.6
8, 2
.60)
0.96
(0.8
2, 1
.10)
0.58
(0.4
1, 0
.75)
[0]
0.13
(− 0
.02,
0.2
8)42
672.
065.
161
0.02
3
3.
Dro
p c′
2.36
(1.9
9, 2
.73)
2.22
(1.8
0, 2
.65)
0.96
(0.8
2, 1
.10)
0.58
(0.4
1, 0
.75)
0.13
(0.0
1, 0
.26)
[0]
4267
0.73
3.83
10.
050
4.
Dro
p a′
, c′
2.42
(2.0
6, 2
.79)
2.19
(1.7
6, 2
.63)
0.96
(0.8
3,1.
11)
0.56
(0.4
0, 0
.73)
[0]
[0]
4267
4.49
7.59
20.
022
Pare
ntal
edu
catio
n
5.
Ful
l2.
37 (2
.11,
2.6
2)2.
25 (1
.99,
2.5
1)0.
93 (0
.78,
1.0
8)0.
86 (0
.69,
1.0
4)0.
12 (−
0.1
0, 0
.33)
0.00
4 (−
0.2
4, 0
.25)
4468
2.61
––
6.
Dro
p a′
2.38
(2.0
3, 2
.74)
2.15
(1.7
2, 2
.58)
0.95
(0.8
1, 1
.08)
0.87
(0.6
5, 1
.08)
[0]
0.12
(− 0
.09,
− 0
.34)
4468
6.30
3.69
10.
055
7.
Dro
p c′
2.37
(2.0
0, 2
.73)
2.16
(1.7
4, 2
.59)
0.97
(0.9
0, 1
.04)
0.87
(0.6
6, 1
.07)
0.11
(− 0
.06,
0.2
8)[0
]44
685.
683.
091
0.07
9
8.
Dro
p a′
, c′
2.38
(2.0
2, 2
.73)
2.16
(1.7
4, 2
.58)
0.96
(0.8
2, 1
.09)
0.88
(0.6
8, 1
.08)
[0]
[0]
4468
7.66
5.05
20.
064
Not
e: L
ower
and
upp
er b
ound
s of 9
5% c
onfid
ence
inte
rval
s are
in p
aren
thes
es
Behav Genet. Author manuscript; available in PMC 2010 July 14.
NIH
-PA Author Manuscript
NIH
-PA Author Manuscript
NIH
-PA Author Manuscript
Harden et al. Page 19
Table 6
Estimated Parameters of Income and Education Genetic Interactions Models.
Parameter 9. Full. 10. a′i = a′P
a 2.39 (2.02, 2.76) 2.39 (2.01, 2.77)
c 2.09 (1.64, 2.53) 2.08 (1.63, 2.53)
e 0.96 (0.82, 1.10) 0.96 (0.82, 1.10)
i 0.47 (0.18, 0.76) 0.46 (0.17, 0.75)
p 0.80 (0.50, 1.10) 0.80 (0.50, 1.10)
σ2ip 0.19 (0.17, 0.22) 0.19 (0.17, 0.22)
a′i 0.13 (− 0.08, 0.34) 0.08 (− 0.04, 0.19)
a′P 0.03 (− 0.20, 0.26) 0.08 (− 0.04, 0.19)
−2LL 46622.31 46622.56
Δ −2LLdf – 0.251
P – 0.617
Note: Lower and upper bounds of 95% confidence intervals are in parentheses
Behav Genet. Author manuscript; available in PMC 2010 July 14.
NIH
-PA Author Manuscript
NIH
-PA Author Manuscript
NIH
-PA Author Manuscript
Harden et al. Page 20
Appendix A
Response categories and frequencies for parental education and income scales
Response Description Frequency (%)
Mid-parent education
1 8th grade or less 3.69
1.5 4.55
2 Part high school 7.38
2.5 9.59
3 High school graduate 17.71
3.5 15.38
4 Part college or junior college 13.78
4.5 9.23
5 College graduate 10.70
5.5 6.03
6 Graduate or professional degree 1.97
Income
1 Less than $5,000 11.84
2 $5,000 to $7,499 25.74
3 $7,500 to $9,999 21.36
4 $10,000 to $14,999 23.55
5 $15,000 to $19,999 9.4
6 $20,000 to $24,999 2.96
7 $25,000 and over 5.15
Behav Genet. Author manuscript; available in PMC 2010 July 14.