Colonisation of poplar trees by gfp expressing bacterial endophytes
Upload
independentCategory
view
7download
0
PRIMARY RESEARCH PAPER
Salinity as a driver of aquatic invertebrate colonisationbehaviour and distribution in the wheatbelt of WesternAustralia
Scott Carver Æ Andrew Storey Æ Helen Spafford ÆJessica Lynas Æ Lisa Chandler Æ Philip Weinstein
Received: 15 January 2008 / Revised: 27 April 2008 / Accepted: 14 July 2008 / Published online: 1 August 2008
� Springer Science+Business Media B.V. 2008
Abstract To understand how environmental change
will modify community assembly and the distribution
of organisms it is valuable to understand mechanisms
that drive the occurrence of organisms across the
landscape. Salinisation of agricultural land in south-
west Western Australia, as a result of land clearing, is a
widespread environmental change, which threatens
numerous taxa, but provides an opportunity to eluci-
date such mechanisms. Although salinisation affects
terrestrial fauna and flora, the greatest impacts are seen
in wetlands and waterways. Many aquatic insect taxa
colonise ephemeral water bodies directly as adults or
by oviposition. Few empirical studies, however,
evaluate the influence of abiotic factors, such as water
body salinity, on the colonisation behaviour of aquatic
fauna. We conducted a manipulative experiment using
mesocosms to test whether colonising insect fauna
select aquatic habitats based upon salinity. We found
that halosensitive fauna selected less saline meso-
cosms for oviposition and colonisation, demonstrating
that behaviour can influence the distribution of aquatic
organisms. Additionally, we utilised field surveys of
insects from ephemeral water bodies across a broad
region of southwest Western Australia to determine if
mesocosm results reflected field observation. The
abundance of the same insect taxa and taxonomic
groups in the field were highly variable and, with the
exceptions of Culex australicus Dobrotworksy and
Drummond and Anopheles annulipes Giles (Diptera:
Culicidae), did not show similar patterns of distribu-
tion to those observed in the mesocosm experiment.
Both mesocosm and field assemblages exhibited
similar and significant trajectories associated with
the salinity gradient, even though there were differ-
ences in assemblage structure between the two. Our
findings give empirical support to the importance of
behaviour in the spatial distribution and assembly of
some aquatic insects.
Keywords Dryland salinity � Oviposition �Colonisation � Behaviour � Community assembly �Temporary pools
Introduction
Understanding mechanisms that generate the spatial
distributions of organisms in modified landscapes is
one of the major goals of ecology (Crain et al., 2004).
Handling editor: K. Martens
S. Carver (&) � A. Storey � H. Spafford �J. Lynas � L. Chandler
School of Animal Biology (M085), University of Western
Australia, 35 Stirling Highway, Crawley, WA 6009,
Australia
e-mail: [email protected]
S. Carver � P. Weinstein
School of Population Health (M431), University
of Western Australia, 35 Stirling Highway, Crawley,
WA 6009, Australia
123
Hydrobiologia (2009) 617:75–90
DOI 10.1007/s10750-008-9527-5
Anthropogenic (secondary) salinisation of arid and
Mediterranean lands occurs globally and influences
the distribution of aquatic assemblages across the
landscape (Roberts & Irving-Bell, 1997; Halse et al.,
2003; Hart & Lovvorn, 2005; Pinder et al., 2005;
Piscart et al., 2005b). General consensus exists that
increasing river and wetland salinity has potential to
cause local extinctions, alterations in ecosystem
function and extensive environmental damage (Halse
et al., 2003; Kefford et al., 2003; Jardine et al.,
2007). Halse et al. (2003) predicted that approxi-
mately one-third of aquatic invertebrate diversity in
the inland southwest of Western Australia (WA) will
disappear with the expansion of secondary salinisa-
tion, and Pinder et al. (2005) suggested that up to 100
species that are largely restricted to the inland
southwest are at risk of extinction. However, biotic
factors, such as behaviour, are also important drivers
of organism distribution, but considered less fre-
quently (Stoks & McPeek, 2003; Blaustein et al.,
2004). James et al. (2003) and Neilsen et al. (2003)
suggested that behavioural avoidance of saline water
bodies may assist the persistence of mobile halosen-
sitive aquatic fauna, but empirical support is needed.
Behavioural selection of habitat is a determinant of
animal distribution in terrestrial (Singleton, 1989;
Terpstra & Wilson, 1989) and aquatic systems
(Mokany & Shine, 2003; Blaustein et al., 2004;
Silberbush et al., 2005). Numerous studies have
documented biotic interactions, such as predation
and competition, influencing oviposition decisions by
mosquitoes (Diptera: Culicidae) (Stav et al. 1999;
Juliano & Gravel, 2002; Mokany & Shine, 2003;
Blaustein et al., 2004; Hagman & Shine, 2006), and
most likely colonisation by other insects with aquatic
life phases. Surprisingly, the influence of abiotic
conditions, such as water chemistry, is rarely docu-
mented with reference to colonisation behaviour
(whether by direct colonisation as an adult or
oviposition) (Trimble & Wellington, 1979; Bailey
et al., 1981; Pappas & Pappas, 1983; Roberts, 1996;
Silberbush et al., 2005).
Colonisation of aquatic habitats by insects in
secondary salinised landscapes is useful to evaluate
how an abiotic gradient influences selection of aquatic
habitat and organism distribution. Detection of salinity
by colonisers has consequences for survival and fitness
and is likely to influence colonisation behaviour,
population and assemblage structure. For example, in
saline habitats: survival of Cloeon sp. and Centropti-
lum sp. (Ephemeroptera: Baetidae) decreases (Hassell
et al., 2006); developmental rates and survival are
reduced for Chironomus sp. (Diptera: Chironomidae)
(Hassell et al., 2006), Aedes taeniorhynchus Wiede-
mann and Aedes aegypti L. (Diptera: Culicidae) (Clark
et al., 2004); and survival is reduced for Culex
australicus Dobrotworsky and Drummond and Aedes
camptorhynchus Thomson (Diptera: Culicidae) (van
Schie, unpublished data). This article examines the
influence of salinity on colonisation of water bodies by
insect taxa using a manipulative mesocosm experi-
ment in the field (Fig. 1). A field survey of ephemeral
water bodies, across a broad region of southwest WA
(Fig. 1), and encompassing saline and non-saline land,
is used to determine if mesocosm results reflect field
observations.
The inland southwest of WA (the Wheatbelt) is
substantially affected by secondary salinisation, as a
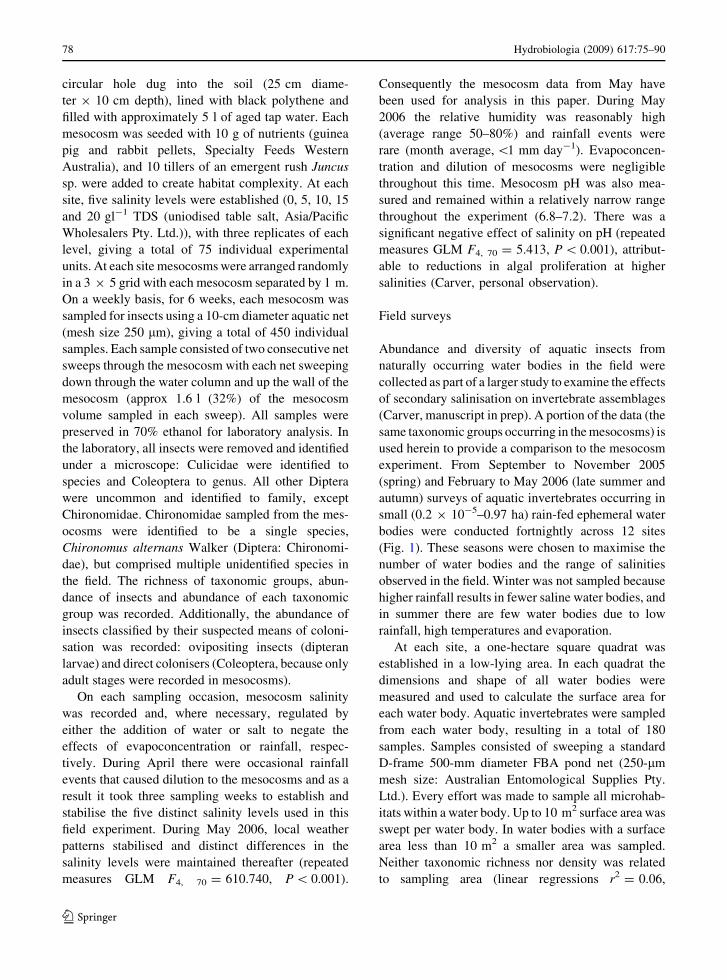
Fig. 1 Sites used for the mesocosm experiment (open circles)
and field surveys (open and closed circles) of aquatic
invertebrates in the Wheatbelt of southwest WA
76 Hydrobiologia (2009) 617:75–90
123
consequence of land clearing and rising groundwater
tables bringing stored salt to the surface (McKenzie
et al., 2003). Currently more than one million hectares
are affected and salinisation is expected to expand two-
to fourfold by 2050 (George et al., 2006; Jardine et al.,
2007). Ephemeral water bodies are characteristic of the
Wheatbelt, where they show a range of salinities,
especially in areas affected by secondary salinisation,
making them ideal to investigate how salinity affects
the colonisation and oviposition behaviour of insects.
Numerous studies have investigated how salinity
influences the distribution of aquatic organisms by
examining patterns in species occurrence (Halse, 1981;
Bunn & Davies, 1992; Kay et al., 2001; Williams,
2003; Halse et al., 2004; Marshall & Bailey, 2004;
Pinder et al., 2004; Piscart et al., 2005a) and salt
sensitivity (Roberts, 1996; Blasius & Merritt, 2002;
Kefford et al. 2003; Jeffery et al. 2005; Hassell et al.,
2006; Zalizniak et al., 2006). Studies have found a
range of invertebrate fauna, such as the disease vector
Ae. camptorhynchus, to be prevalent in saline areas
(Pinder et al., 2005; Jardine et al., 2007; Lindsay et al.,
2007). However, little attention has been given to the
significance of colonisation behaviour in distribution
(but see, Silberbush et al., 2005). Laboratory studies
demonstrate salinity influences oviposition prefer-
ences of mosquitoes (Trimble & Wellington, 1979;
Bailey et al., 1981; Pappas & Pappas, 1983; Roberts,
1996), but laboratory results do not always reflect field
distributions. For example, Sinha (1976) found Culex
quinquefasciatus Say (Diptera: Culicidae) has ovipo-
sitional preferences for freshwater, but observed
abundant larvae at salinities B 7.5 gl-1 total dissolved
solids (TDS) in the field. Inconsistencies between
laboratory and field results undoubtedly result from
additional biotic and abiotic inputs (such as predation,
competition, microhabitat structure, habitat availabil-
ity and stochastic encounters with water bodies). As
such, patterns in assemblages of colonisers across a
salinity gradient may be more holistically informative
of how salinity influences colonisation behaviour, in
the presence of other variables, than individual taxa
alone (Halse et al., 2004; Pinder et al., 2005). Addi-
tionally, analyses of assemblages enable the relative
contributions of fresh water and halophilic fauna to be
readily quantified.
This study examines the hypothesis that salinity
influences colonisation behaviour and the structure of
insect assemblages in the field. This unifying
hypothesis is evaluated through two supporting
hypotheses: (1) salinity in mesocosms will affect
colonisation by individual taxa and assemblages of
insects and (2) responses of fauna to salinity in
mesocosms will reflect responses of fauna observed
in field surveys. These supporting hypotheses link the
role of salinity, as an abiotic gradient, on colonisation
behaviour and the general importance of colonisation
behaviour as a determinant of field assemblage
structure. The mesocosm experiment is conducted
in areas of the Wheatbelt with minimal secondary
salinisation (water bodies 0–3 gl-1 TDS), but where
water tables are rising and future salinity is antici-
pated (Fig. 1). As such, it was expected that most
aquatic fauna of mesocosms would be freshwater
taxa. Dispersal of aquatic insects in the wheatbelt is
widespread, but locally heterogeneous, due to vari-
ation in habitat (Kay et al., 2001; Pinder et al., 2005).
It is anticipated that insects colonising mesocosms
vary in space and time.
Materials and methods
Study area
This study was undertaken in the Great Southern
meteorological district of the WA Wheatbelt (Fig. 1).
The study area has a Mediterranean climate with hot
dry summers and mild wet winters. Annual rainfall
declines from approximately 600 mm at the western
boundary of our study area to 350 mm in the east
(Australian Bureau of Meteorology). Approximately
80–90% of the region has been cleared for agriculture
(Halse et al., 2004). Sites were located in remnant
native vegetation and were chosen to correspond with
locations previously used by the WA Department of
Environment and Conservation to assess the impacts
of secondary salinisation (Keighery et al., 2004).
Mesocosm experiment
Mesocosms were constructed at five sites in April and
May 2006 (autumn) (Fig. 1). At this time of year there
were few water bodies, because negligible rainfall
occurs during summer and autumn, and the occurrence
of insect families in mesocosms would be the result of
opportunistic colonisation by highly mobile species
(Kay et al., 2001). Each mesocosm consisted of a
Hydrobiologia (2009) 617:75–90 77
123
circular hole dug into the soil (25 cm diame-
ter 9 10 cm depth), lined with black polythene and
filled with approximately 5 l of aged tap water. Each
mesocosm was seeded with 10 g of nutrients (guinea
pig and rabbit pellets, Specialty Feeds Western
Australia), and 10 tillers of an emergent rush Juncus
sp. were added to create habitat complexity. At each
site, five salinity levels were established (0, 5, 10, 15
and 20 gl-1 TDS (uniodised table salt, Asia/Pacific
Wholesalers Pty. Ltd.)), with three replicates of each
level, giving a total of 75 individual experimental
units. At each site mesocosms were arranged randomly
in a 3 9 5 grid with each mesocosm separated by 1 m.
On a weekly basis, for 6 weeks, each mesocosm was
sampled for insects using a 10-cm diameter aquatic net
(mesh size 250 lm), giving a total of 450 individual
samples. Each sample consisted of two consecutive net
sweeps through the mesocosm with each net sweeping
down through the water column and up the wall of the
mesocosm (approx 1.6 l (32%) of the mesocosm
volume sampled in each sweep). All samples were
preserved in 70% ethanol for laboratory analysis. In
the laboratory, all insects were removed and identified
under a microscope: Culicidae were identified to
species and Coleoptera to genus. All other Diptera
were uncommon and identified to family, except
Chironomidae. Chironomidae sampled from the mes-
ocosms were identified to be a single species,
Chironomus alternans Walker (Diptera: Chironomi-
dae), but comprised multiple unidentified species in
the field. The richness of taxonomic groups, abun-
dance of insects and abundance of each taxonomic
group was recorded. Additionally, the abundance of
insects classified by their suspected means of coloni-
sation was recorded: ovipositing insects (dipteran
larvae) and direct colonisers (Coleoptera, because only
adult stages were recorded in mesocosms).
On each sampling occasion, mesocosm salinity
was recorded and, where necessary, regulated by
either the addition of water or salt to negate the
effects of evapoconcentration or rainfall, respec-
tively. During April there were occasional rainfall
events that caused dilution to the mesocosms and as a
result it took three sampling weeks to establish and
stabilise the five distinct salinity levels used in this
field experiment. During May 2006, local weather
patterns stabilised and distinct differences in the
salinity levels were maintained thereafter (repeated
measures GLM F4, 70 = 610.740, P \ 0.001).
Consequently the mesocosm data from May have
been used for analysis in this paper. During May
2006 the relative humidity was reasonably high
(average range 50–80%) and rainfall events were
rare (month average, \1 mm day-1). Evapoconcen-
tration and dilution of mesocosms were negligible
throughout this time. Mesocosm pH was also mea-
sured and remained within a relatively narrow range
throughout the experiment (6.8–7.2). There was a
significant negative effect of salinity on pH (repeated
measures GLM F4, 70 = 5.413, P \ 0.001), attribut-
able to reductions in algal proliferation at higher
salinities (Carver, personal observation).
Field surveys
Abundance and diversity of aquatic insects from
naturally occurring water bodies in the field were
collected as part of a larger study to examine the effects
of secondary salinisation on invertebrate assemblages
(Carver, manuscript in prep). A portion of the data (the
same taxonomic groups occurring in the mesocosms) is
used herein to provide a comparison to the mesocosm
experiment. From September to November 2005
(spring) and February to May 2006 (late summer and
autumn) surveys of aquatic invertebrates occurring in
small (0.2 9 10-5–0.97 ha) rain-fed ephemeral water
bodies were conducted fortnightly across 12 sites
(Fig. 1). These seasons were chosen to maximise the
number of water bodies and the range of salinities
observed in the field. Winter was not sampled because
higher rainfall results in fewer saline water bodies, and
in summer there are few water bodies due to low
rainfall, high temperatures and evaporation.
At each site, a one-hectare square quadrat was
established in a low-lying area. In each quadrat the
dimensions and shape of all water bodies were
measured and used to calculate the surface area for
each water body. Aquatic invertebrates were sampled
from each water body, resulting in a total of 180
samples. Samples consisted of sweeping a standard
D-frame 500-mm diameter FBA pond net (250-lm
mesh size: Australian Entomological Supplies Pty.
Ltd.). Every effort was made to sample all microhab-
itats within a water body. Up to 10 m2 surface area was
swept per water body. In water bodies with a surface
area less than 10 m2 a smaller area was sampled.
Neither taxonomic richness nor density was related
to sampling area (linear regressions r2 = 0.06,
78 Hydrobiologia (2009) 617:75–90
123
F1, 178 = 1.057, P = 0.305 and r2 = 0.007, F1, 178 =
1.238, P = 0.267, respectively). The area sampled
from each water body was recorded. Salinity of every
water body within each site was measured on each
sampling occasion. All samples were preserved in
70% ethanol and returned to the laboratory, where all
insects were removed and identified (to the same
taxonomic levels as in the mesocosm) under a
microscope. Large samples were homogenised and
then split into half or quarters for sub-sampling. All
insect data were standardised to number of individuals
per m2 of water body surface area (number of insects/
sampling area).
To allow comparison between the results from the
salinity levels (0, 5, 10, 15 and 20 gl-1 TDS) used in
the mesocosm experiment, with results from the field
samples, the samples taken from the field were
divided into comparable salinity categories (0–5,
5–10, 10–15, 15–20 and 20+ gl-1 TDS).
Analyses
To test the effects of time, site and salinity on the
richness of taxa and abundance of taxonomic groups
sampled from the mesocosms, a three-factor General
Estimating Equation (GEE, in SPSS 15.0, SPSS Inc.
Chicago, US), with time as a repeated measure, was
used. GEE was used because taxa were heteroge-
neously distributed amongst mesocosms and between
sites, and data could not reliably be normalised by
transformation. An Omnibus test was used to specify
the optimal distribution and transformation of the taxa
(Poisson or negative binomial probability distribution
and identity or log-link function, respectively) for the
analysis. GEE were performed on an independent
correlation matrix. The main effects (time, site and
salinity) were examined, and interactions were added
to the analysis, using a forward selection process,
where they gave a more parsimonious model, based on
the corrected quasi-likelihood information criterion.
To examine the effect of salinity on the richness
and abundance of the taxa collected in the field
samples, a Generalized Linear Model (GZLM, in
SPSS 15.0, SPSS Inc. Chicago, US) was used. The
optimal distribution and transformation of taxa data
were specified using an Omnibus test, as described
for GEE. Tukey’s post hoc analyses were employed
to compare levels within treatments in the GEE and
GZLM analyses.
To determine if salinity, site and time had effects on
the assemblages of insects occurring in mesocosms, a
PERMANOVA (permutation based MANOVA) was
used (Anderson, 2005). The effect of salinity on field
assemblages was examined using a NPMANOVA
(non-parametric permutation-based MANOVA)
because this analysis allowed comparison of uneven
sample sizes (Anderson, 2004). In both cases the
assemblage data were square-root transformed to
down-weight the dominance of highly abundant spe-
cies on the analyses, and Bray-Curtis dissimilarity
matrices were calculated. Post hoc analyses pairwise
comparisons were used to determine significance
between the levels. Non-Metric Multidimensional
Scaling (NMDS, PRIMER v6, PRIMER-E Ltd: Plym-
outh, UK), based on square-root transformed data
and Bray-Curtis dissimilarity matrices, was used to
ordinate the data for visualisation.
Multivariate trends in assemblage changes,
between salinity levels, were calculated and com-
pared between the mesocosm and field data. To
calculate multivariate trends, the centroid for each
salinity level was calculated from the transformed
dissimilarity matrix, and the distance between cen-
troids for each salinity level calculated using a
Principle Coordinate analysis (PRIMER v6, PRI-
MER-E Ltd: Plymouth, UK), for mesocosm and field
assemblages individually. To compare mesocosm and
field multivariate trends, the centroid distance of the
lowest salinity level to the centroid of each increasing
salinity level, in the mesocosms (i.e. 0 and 5, 0 and
10, 0 and 15, and 0 and 20 gl-1 TDS), was plotted
against the centriod distances from 0 to 5 gl-1 TDS
to the centroid of each increasing salinity level, for
field assemblages. Multivariate trends were corre-
lated using a Pearson correlation (using SPSS 15.0,
SPSS Inc. Chicago, US).
Results
Insects from two orders, Diptera and Coleoptera,
colonised the mesocosms, with the former propor-
tionally more abundant (87.9%) than the latter
(12.1%). In field samples, Diptera comprised 99.5%
and Coleoptera 0.5% of total abundance. All Cole-
optera sampled in mesocosms were adults and, in the
absence of maturing larvae, presumably actively flew
in to colonise, whereas Diptera were larval, and thus
Hydrobiologia (2009) 617:75–90 79
123
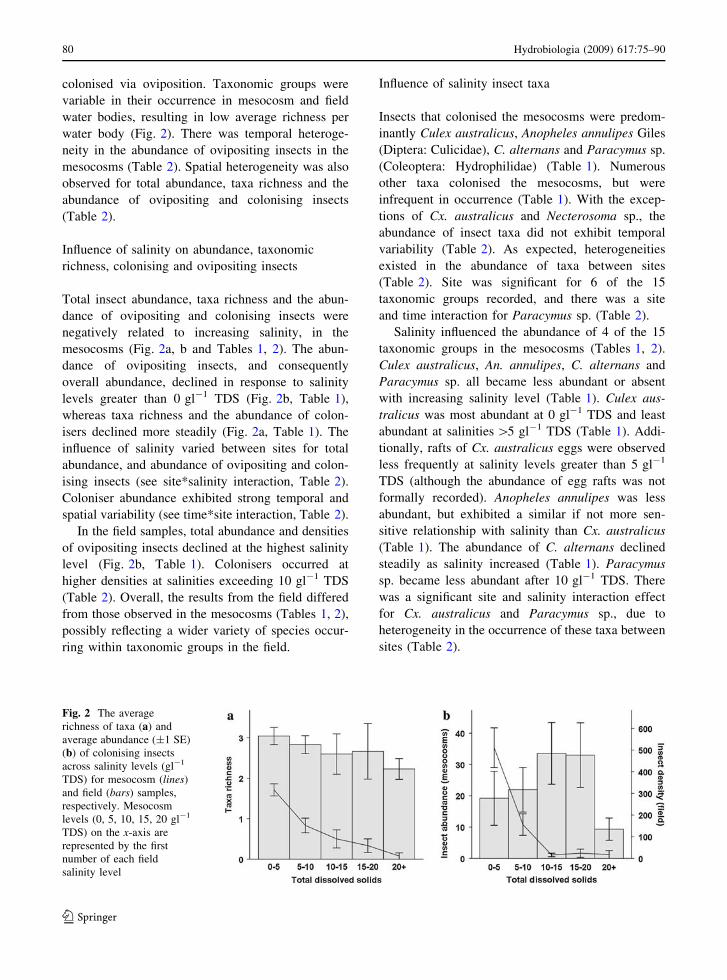
colonised via oviposition. Taxonomic groups were
variable in their occurrence in mesocosm and field
water bodies, resulting in low average richness per
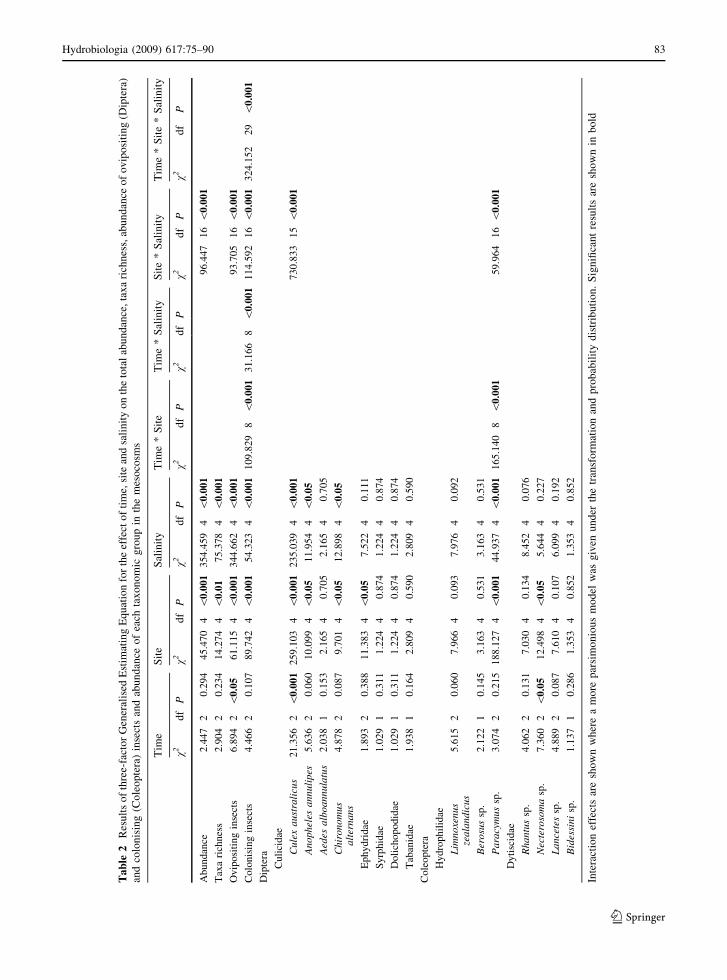
water body (Fig. 2). There was temporal heteroge-
neity in the abundance of ovipositing insects in the
mesocosms (Table 2). Spatial heterogeneity was also
observed for total abundance, taxa richness and the
abundance of ovipositing and colonising insects
(Table 2).
Influence of salinity on abundance, taxonomic
richness, colonising and ovipositing insects
Total insect abundance, taxa richness and the abun-
dance of ovipositing and colonising insects were
negatively related to increasing salinity, in the
mesocosms (Fig. 2a, b and Tables 1, 2). The abun-
dance of ovipositing insects, and consequently
overall abundance, declined in response to salinity
levels greater than 0 gl-1 TDS (Fig. 2b, Table 1),
whereas taxa richness and the abundance of colon-
isers declined more steadily (Fig. 2a, Table 1). The
influence of salinity varied between sites for total
abundance, and abundance of ovipositing and colon-
ising insects (see site*salinity interaction, Table 2).
Coloniser abundance exhibited strong temporal and
spatial variability (see time*site interaction, Table 2).
In the field samples, total abundance and densities
of ovipositing insects declined at the highest salinity
level (Fig. 2b, Table 1). Colonisers occurred at
higher densities at salinities exceeding 10 gl-1 TDS
(Table 2). Overall, the results from the field differed
from those observed in the mesocosms (Tables 1, 2),
possibly reflecting a wider variety of species occur-
ring within taxonomic groups in the field.
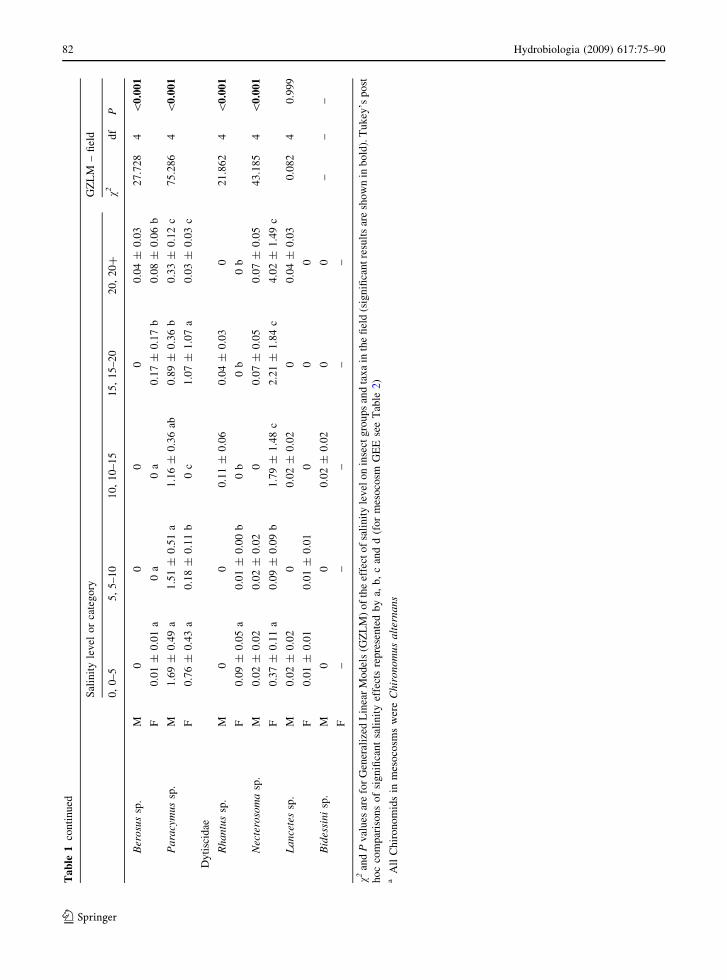
Influence of salinity insect taxa
Insects that colonised the mesocosms were predom-
inantly Culex australicus, Anopheles annulipes Giles
(Diptera: Culicidae), C. alternans and Paracymus sp.
(Coleoptera: Hydrophilidae) (Table 1). Numerous
other taxa colonised the mesocosms, but were
infrequent in occurrence (Table 1). With the excep-
tions of Cx. australicus and Necterosoma sp., the
abundance of insect taxa did not exhibit temporal
variability (Table 2). As expected, heterogeneities
existed in the abundance of taxa between sites
(Table 2). Site was significant for 6 of the 15
taxonomic groups recorded, and there was a site
and time interaction for Paracymus sp. (Table 2).
Salinity influenced the abundance of 4 of the 15
taxonomic groups in the mesocosms (Tables 1, 2).
Culex australicus, An. annulipes, C. alternans and
Paracymus sp. all became less abundant or absent
with increasing salinity level (Table 1). Culex aus-
tralicus was most abundant at 0 gl-1 TDS and least
abundant at salinities [5 gl-1 TDS (Table 1). Addi-
tionally, rafts of Cx. australicus eggs were observed
less frequently at salinity levels greater than 5 gl-1
TDS (although the abundance of egg rafts was not
formally recorded). Anopheles annulipes was less
abundant, but exhibited a similar if not more sen-
sitive relationship with salinity than Cx. australicus
(Table 1). The abundance of C. alternans declined
steadily as salinity increased (Table 1). Paracymus
sp. became less abundant after 10 gl-1 TDS. There
was a significant site and salinity interaction effect
for Cx. australicus and Paracymus sp., due to
heterogeneity in the occurrence of these taxa between
sites (Table 2).
Fig. 2 The average
richness of taxa (a) and
average abundance (±1 SE)
(b) of colonising insects
across salinity levels (gl-1
TDS) for mesocosm (lines)
and field (bars) samples,
respectively. Mesocosm
levels (0, 5, 10, 15, 20 gl-1
TDS) on the x-axis are
represented by the first
number of each field
salinity level
80 Hydrobiologia (2009) 617:75–90
123

Ta
ble
1T
he
aver
age
mes
oco
sm(M
)an
dfi
eld
(F)
abu
nd
ance
,ta
xa
rich
nes
s,ab
un
dan
ceo
fo
vip
osi
tin
g(D
ipte
ra)
and
colo
nis
ing
(Co
leo
pte
ra)
inse
cts
and
the
abu
nd
ance
of
each
tax
on
om
icg
rou
pfo
rea
chsa
lin
ity
lev
el(g
l-1
TD
S±
1S
E)
Sal
init
yle
vel
or
cate
go
ryG
ZL
M–
fiel
d
0,
0–
55
,5
–1
01
0,
10
–1
51
5,
15
–2
02
0,
20+
v2d
fP
Ab
un
dan
ceM
35
.40
±6
.34
a1
0.0
9±
2.4
7b
2.7
3±
0.7
8c
1.8
9±
0.6
8c
1.2
0±
0.4
2c
23
.13
14
\0
.00
1
F3
48
±7
9.5
7a
31
7.0
8±
10
3.2
6a
48
4.2
0±
14
2.4
6a
47
6.8
2±
14
9.3
7a
13
5.1
9±
51
.17
b
Tax
ari
chn
ess
M1
.71
±0
.15
a1
.02
±0
.15
b0
.78
±0
.13
bc
0.4
7±
0.0
9c
0.5
1±
0.1
2c
3.4
29
40
.48
9
F2
.59
±0
.12
2.8
3±
0.2
22
.6±
0.5
02
.67
±0
.69
2.2
3±
0.2
4
Ov
ipo
siti
ng
inse
cts
M3
3.6
2±
6.5
1a
8.4
9±
2.4
9b
1.4
2±
0.6
6c
0.8
9±
0.5
9c
0.7
1±
0.4
0c
24
.69
44
\0
.00
1
F3
47
.39
±7
9.4
0a
31
6.7
8±
10
3.2
6a
48
0.4
1±
14
1.5
5a
47
3.3
7±
15
0.0
0a
13
0.9
7±
51
.38
b
Co
lon
isin
gin
sect
sM
1.7
8±
0.5
0a
1.6
0±
0.5
2a
1.3
1±
0.4
0a
1.0
0±
0.3
6ab
0.4
9±
0.1
5b
11
76
.15
24
\0
.00
1
F1
.24
±0
.46
a0
.30
±0
.13
a3
.79
±2
.32
b3
.44
±2
.89
b4
.22
±1
.49
b
Dip
tera
Cu
lici
dae
Cu
lex
au
stra
licu
sM
28
.40
±6
.62
a6
.62
±2
.50
b1
.18
±0
.67
c0
.60
±0
.54
c0
.67
±0
.40
c1
53
.85
04
\0
.00
1
F1
6.4
8±
6.8
5a
20
.68
±1
6.0
9a
1.8
4±
1.4
5b
0c
0c
An
op
hel
esa
nn
uli
pes
M0
.40
±0
.20
a0
.20
±0
.11
ab0
.02
±0
.02
b0
b0
b1
26
.04
44
\0
.00
1
F1
.70
±0
.56
a1
3.2
3±
9.0
3b
0c
0.0
3±
0.0
3c
0c
Aed
esa
lbo
an
nu
latu
sM
0.1
3±
0.0
80
00
01
50
.14
64
\0
.00
1
F8
9.9
2±
51
.19
a2
.94
±1
.11
b4
3.9
1±
41
.58
c0
.17
±0
.12
d0
.21
±0
.21
d
Ch
iro
no
mid
aeM
a4
.49
±1
.35
a1
.53
±0
.76
b0
.11
±0
.07
bc
0.2
9±
0.2
7b
c0
cd1
2.7
62
4\
0.0
5
F2
37
.55
±6
0.4
0a
27
1.4
0±
92
.36
a4
31
.37
±1
31
.89
a4
69
.54
±1
49
.39
a1
30
.34
±5
1.5
0b
Ep
hy
dri
dae
M0
.11
±0
.08
0.1
3±
0.0
60
.11
±0
.07
00
.02
±0
.02
10
5.1
49
4\
0.0
01
F0
.81
±0
.37
a6
.09
±3
.76
b2
.80
±1
.98
c1
.34
±0
.71
ac0
.02
±0
.02
d
Sy
rph
idae
M0
.02
±0
.02
00
00
––
–
F–
––
––
Do
lich
op
od
idae
M0
00
00
.02
±0
.02
51
5.9
40
4\
0.0
01
F0
.93
±0
.59
a2
.44
±2
.17
b0
.48
±0
.40
c2
.26
±1
.49
b0
.42
±0
.31
c
Tab
anid
aeM
0.0
7±
0.0
50
00
00
.29
04
0.9
90
F0
00
0.0
3±
0.0
30
Co
leo
pte
ra
Hy
dro
ph
ilid
ae
Lim
no
xen
us
zea
lan
dic
us
M0
.04
±0
.03
0.0
7±
0.0
40
00
9.9
22
4\
0.0
5
F0
.01
±0
.01
a0
.01
±0
.01
a2
.00
±2
.00
b0
a0
.08
±0
.08
a
Hydrobiologia (2009) 617:75–90 81
123
Ta
ble
1co
nti
nu
ed
Sal
init
yle
vel
or
cate
go
ryG
ZL
M–
fiel
d
0,
0–
55
,5
–1
01
0,
10
–1
51
5,
15
–2
02
0,
20+
v2d
fP
Ber
osu
ssp
.M
00
00
0.0
4±
0.0
32
7.7
28
4\
0.0
01
F0
.01
±0
.01
a0
a0
a0
.17
±0
.17
b0
.08
±0
.06
b
Pa
racy
mu
ssp
.M
1.6
9±
0.4
9a
1.5
1±
0.5
1a
1.1
6±
0.3
6ab
0.8
9±
0.3
6b
0.3
3±
0.1
2c
75
.28
64
\0
.00
1
F0
.76
±0
.43
a0
.18
±0
.11
b0
c1
.07
±1
.07
a0
.03
±0
.03
c
Dy
tisc
idae
Rh
an
tus
sp.
M0
00
.11
±0
.06
0.0
4±
0.0
30
21
.86
24
\0
.00
1
F0
.09
±0
.05
a0
.01
±0
.00
b0
b0
b0
b
Nec
tero
som
asp
.M
0.0
2±
0.0
20
.02
±0
.02
00
.07
±0
.05
0.0
7±
0.0
54
3.1
85
4\
0.0
01
F0
.37
±0
.11
a0
.09
±0
.09
b1
.79
±1
.48
c2
.21
±1
.84
c4
.02
±1
.49
c
La
nce
tes
sp.
M0
.02
±0
.02
00
.02
±0
.02
00
.04
±0
.03
0.0
82
40
.99
9
F0
.01
±0
.01
0.0
1±
0.0
10
00
Bid
essi
ni
sp.
M0
00
.02
±0
.02
00
––
–
F–
––
––
v2an
dP
val
ues
are
for
Gen
eral
ized
Lin
ear
Mo
del
s(G
ZL
M)
of
the
effe
cto
fsa
lin
ity
lev
elo
nin
sect
gro
up
san
dta
xa
inth
efi
eld
(sig
nifi
can
tre
sult
sar
esh
ow
nin
bold
).T
uk
ey’s
po
st
ho
cco
mp
aris
on
so
fsi
gn
ifica
nt
sali
nit
yef
fect
sre
pre
sen
ted
by
a,b
,c
and
d(f
or
mes
oco
smG
EE
see
Tab
le2)
aA
llC
hir
on
om
ids
inm
eso
cosm
sw
ere
Ch
iro
no
mu
sa
lter
na
ns
82 Hydrobiologia (2009) 617:75–90
123
Ta
ble
2R
esu
lts
of
thre
e-fa
cto
rG
ener
alis
edE
stim
atin
gE
qu
atio
nfo
rth
eef
fect
of
tim
e,si
tean
dsa
lin
ity
on
the
tota
lab
un
dan
ce,
tax
ari
chn
ess,
abu
nd
ance
of
ov
ipo
siti
ng
(Dip
tera
)
and
colo
nis
ing
(Co
leo
pte
ra)
inse
cts
and
abu
nd
ance
of
each
tax
on
om
icg
rou
pin
the
mes
oco
sms
Tim
eS
ite
Sal
init
yT
ime
*S
ite
Tim
e*
Sal
init
yS
ite
*S
alin
ity
Tim
e*
Sit
e*
Sal
init
y
v2d
fP
v2d
fP
v2d
fP
v2d
fP
v2d
fP
v2d
fP
v2d
fP
Ab
un
dan
ce2
.44
72
0.2
94
45
.47
04
\0
.001
35
4.4
59
4\
0.0
019
6.4
47
16
\0
.001
Tax
ari
chn
ess
2.9
04
20
.23
41
4.2
74
4\
0.0
17
5.3
78
4\
0.0
01
Ov
ipo
siti
ng
inse
cts
6.8
94
2\
0.0
56
1.1
15
4\
0.0
013
44
.66
24
\0
.001
93
.70
51
6\
0.0
01
Colo
nis
ing
inse
cts
4.4
66
20
.10
78
9.7
42
4\
0.0
015
4.3
23
4\
0.0
011
09
.82
98
\0
.001
31
.16
68
\0
.001
11
4.5
92
16
\0
.001
32
4.1
52
29
\0
.001
Dip
tera
Cu
lici
dae
Cul
exa
ust
rali
cus
21
.35
62
\0
.00
12
59
.10
34
\0
.001
23
5.0
39
4\
0.0
017
30
.83
31
5\
0.0
01
An
oph
eles
an
nu
lip
es5
.63
62
0.0
60
10
.09
94
\0
.05
11
.95
44
\0
.05
Aed
esa
lbo
an
nu
latu
s2
.03
81
0.1
53
2.1
65
40
.705
2.1
65
40
.705
Chi
ron
om
us
alt
ern
ans
4.8
78
20
.08
79
.701
4\
0.0
51
2.8
98
4\
0.0
5
Ep
hy
dri
dae
1.8
93
20
.38
81
1.3
83
4\
0.0
57
.522
40
.111
Sy
rph
idae
1.0
29
10
.31
11
.224
40
.874
1.2
24
40
.874
Do
lich
opo
did
ae1
.02
91
0.3
11
1.2
24
40
.874
1.2
24
40
.874
Tab
anid
ae1
.93
81
0.1
64
2.8
09
40
.590
2.8
09
40
.590
Cole
op
tera
Hy
dro
ph
ilid
ae
Lim
no
xen
us
zea
lan
dic
us
5.6
15
20
.06
07
.966
40
.093
7.9
76
40
.092
Ber
osu
ssp
.2
.12
21
0.1
45
3.1
63
40
.531
3.1
63
40
.531
Pa
racy
mu
ssp
.3
.07
42
0.2
15
18
8.1
27
4\
0.0
014
4.9
37
4\
0.0
011
65
.14
08
\0
.001
59
.96
41
6\
0.0
01
Dyti
scid
ae
Rh
ant
us
sp.
4.0
62
20
.13
17
.030
40
.134
8.4
52
40
.076
Nec
tero
som
asp
.7
.36
02
\0
.05
12
.49
84
\0
.05
5.6
44
40
.227
La
nce
tes
sp.
4.8
89
20
.08
77
.610
40
.107
6.0
99
40
.192
Bid
essi
ni
sp.
1.1
37
10
.28
61
.353
40
.852
1.3
53
40
.852
Inte
ract
ion
effe
cts
are
sho
wn
wh
ere
am
ore
par
sim
on
iou
sm
od
elw
asg
iven
un
der
the
tran
sfo
rmat
ion
and
pro
bab
ilit
yd
istr
ibu
tio
n.
Sig
nifi
can
tre
sult
sar
esh
ow
nin
bo
ld
Hydrobiologia (2009) 617:75–90 83
123

With the exceptions of Ephydridae, Dolichopodi-
dae and Necterosoma sp., taxa that were sampled
infrequently in the mesocosms were also sampled
infrequently in the field samples (Table 1). The
density of numerous taxonomic groups was signifi-
cantly related to salinity (Table 1). Culex australicus
densities declined beyond 10 gl-1 TDS (Table 1).
Anopheles annulipes and Ephydridae densities were
greatest at 5–10 gl-1 TDS and were reduced there-
after (Table 1). The density of Aedes alboannulatus
Macquart (Diptera: Culicidae) was heterogeneous
between 0 and 15 gl-1 TDS, but remained low as
salinity exceeded 15 gl-1 TDS (Table 1). Densities
of Chironomidae were lower at the highest salinity
level (Table 1). Necterosoma sp. occurred at greater
densities at salinities exceeding 10 gl-1 TDS
(Table 1). The remaining taxonomic groups were
either seldom encountered or had heterogeneous
densities between salinity levels (Table 1).
It was difficult to determine clear cases where the
same taxonomic group was affected by salinity in
both mesocosms and field samples. In the meso-
cosms, the abundance of Cx. australicus and An.
annulipes declined significantly as salinity increased
and this pattern was similar in the field, although it is
noted that An. annulipes densities were lower at
0–5 gl-1 TDS than 5–10 gl-1 TDS in the field
(Table 1). Overall, the effect of salinity level on
individual taxonomic groups in the field differed from
those observed in the mesocosms (Tables 1, 2),
potentially due to a lack of species level identification
of non-culicid fauna.
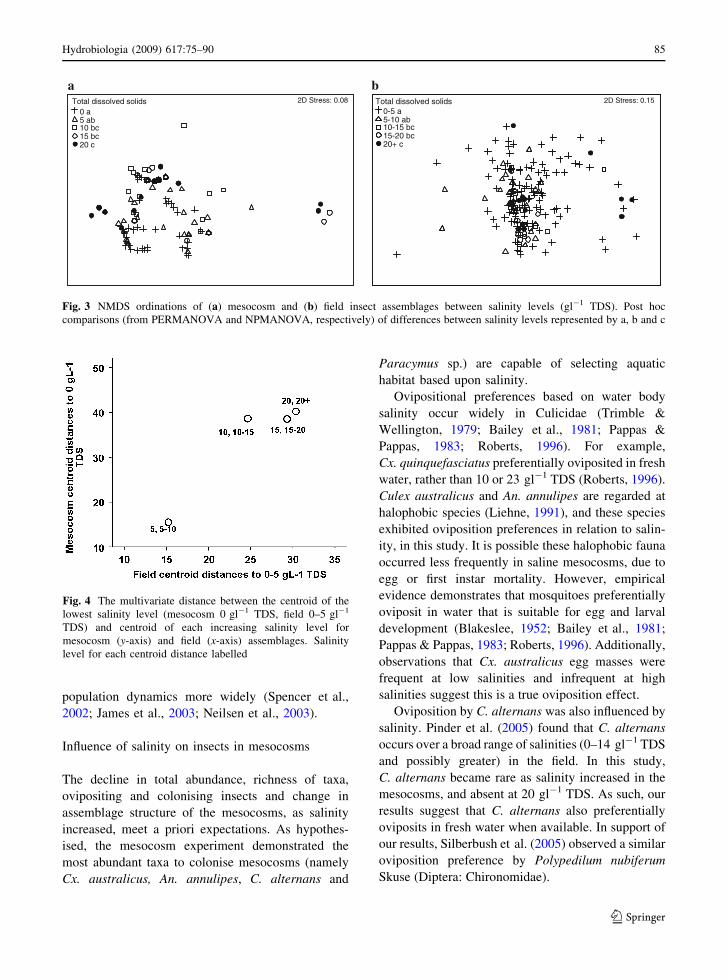
Influence of salinity on insect assemblages
Analysis of assemblages in mesocosms revealed that
assemblage structure changed significantly as salinity
increased (Table 3, Fig. 3a). Similar to univariate
results of abundance and richness (Table 1), the
overall pattern of assemblage composition demon-
strated a clear and consistent relationship to the
salinity gradient (Fig. 3a). Assemblage structure was
also spatially heterogeneous and there were interac-
tions between site and time, and site and salinity
(Table 3). Analysis of field data revealed that
assemblage structure also changed in relation to the
salinity gradient (NPMANOVA F4, 175 = 2.261,
P \ 0.001, Fig. 3b). Similar trajectories of assem-
blages across salinity levels were observed between
the field and mesocosms (Fig. 3). However, it should
be noted that insect assemblages from field surveys
were generally of a different composition to those
observed in mesocosms.
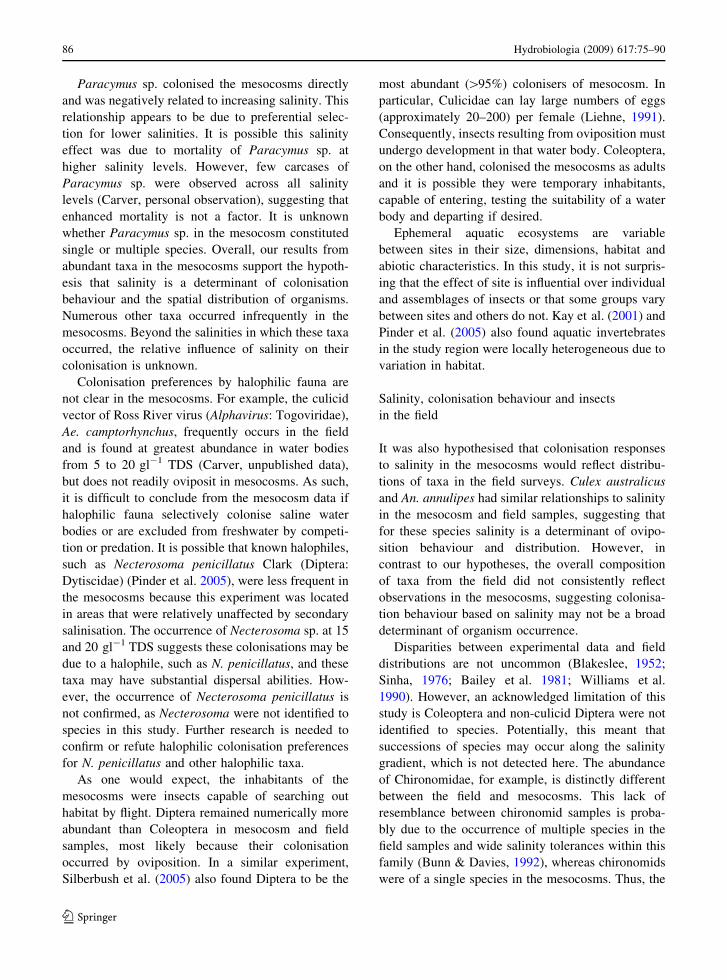
As salinity level increased in the mesocosms, the
centroid distances to the centroid at the lowest
salinity level (0 gl-1 TDS) increased (Fig. 4). The
centroid distances for 10, 15 and 20 gl-1 TDS were
similar (Fig. 4), suggesting assemblages at these
salinities were more uniform. Similar to the meso-
cosms, centroid distances to the lowest salinity level
(0–5 gl-1 TDS) in the field increased for each
increasing salinity level (Fig. 4). Centroid distances
for 15–20 and 20+ gl-1 TDS in the field were similar
(Fig. 4), again suggesting assemblages at these
salinities were more uniform. There was a similar
trend between mesocosm and field centroid distances
(Pearson correlation r = 0.945, P = 0.055), suggest-
ing a similar trajectory in multivariate assemblage
response to increasing salinity.
Discussion
The anthropogenic salinisation of land in southwest
WA leads to an abiotic gradient that has a substantial
influence upon aquatic organisms and potentially to
biodiversity as a whole (Halse et al. 2003, 2004). Yet,
adaptive behaviour, such as the avoidance of saline
water bodies, may assist the persistence of aquatic
invertebrates that are halosensitive and influence
Table 3 PERMANOVA of the effect of time, site, salinity and
interactions on the colonising assemblage of insects in the
mesocosms
PERMANOVA
df F P
Time 2 0.312 0.902
Site 4 10.752 \0.001
Salinity 4 5.038 \0.001
Time * Site 8 4.8 \0.001
Time * Salinity 8 1.102 0.348
Site * Salinity 16 2.317 \0.001
Time * Site * Salinity 32 1.136 0.189
Error df 150
Significant results are shown in bold
84 Hydrobiologia (2009) 617:75–90
123
population dynamics more widely (Spencer et al.,
2002; James et al., 2003; Neilsen et al., 2003).
Influence of salinity on insects in mesocosms
The decline in total abundance, richness of taxa,
ovipositing and colonising insects and change in
assemblage structure of the mesocosms, as salinity
increased, meet a priori expectations. As hypothes-
ised, the mesocosm experiment demonstrated the
most abundant taxa to colonise mesocosms (namely
Cx. australicus, An. annulipes, C. alternans and
Paracymus sp.) are capable of selecting aquatic
habitat based upon salinity.
Ovipositional preferences based on water body
salinity occur widely in Culicidae (Trimble &
Wellington, 1979; Bailey et al., 1981; Pappas &
Pappas, 1983; Roberts, 1996). For example,
Cx. quinquefasciatus preferentially oviposited in fresh
water, rather than 10 or 23 gl-1 TDS (Roberts, 1996).
Culex australicus and An. annulipes are regarded at
halophobic species (Liehne, 1991), and these species
exhibited oviposition preferences in relation to salin-
ity, in this study. It is possible these halophobic fauna
occurred less frequently in saline mesocosms, due to
egg or first instar mortality. However, empirical
evidence demonstrates that mosquitoes preferentially
oviposit in water that is suitable for egg and larval
development (Blakeslee, 1952; Bailey et al., 1981;
Pappas & Pappas, 1983; Roberts, 1996). Additionally,
observations that Cx. australicus egg masses were
frequent at low salinities and infrequent at high
salinities suggest this is a true oviposition effect.
Oviposition by C. alternans was also influenced by
salinity. Pinder et al. (2005) found that C. alternans
occurs over a broad range of salinities (0–14 gl-1 TDS
and possibly greater) in the field. In this study,
C. alternans became rare as salinity increased in the
mesocosms, and absent at 20 gl-1 TDS. As such, our
results suggest that C. alternans also preferentially
oviposits in fresh water when available. In support of
our results, Silberbush et al. (2005) observed a similar
oviposition preference by Polypedilum nubiferum
Skuse (Diptera: Chironomidae).
aTotal dissolved solids
0 a5 ab10 bc15 bc20 c
2D Stress: 0.08
bTotal dissolved solids
0-5 a5-10 ab10-15 bc15-20 bc20+ c
2D Stress: 0.15
Fig. 3 NMDS ordinations of (a) mesocosm and (b) field insect assemblages between salinity levels (gl-1 TDS). Post hoc
comparisons (from PERMANOVA and NPMANOVA, respectively) of differences between salinity levels represented by a, b and c
Fig. 4 The multivariate distance between the centroid of the
lowest salinity level (mesocosm 0 gl-1 TDS, field 0–5 gl-1
TDS) and centroid of each increasing salinity level for
mesocosm (y-axis) and field (x-axis) assemblages. Salinity
level for each centroid distance labelled
Hydrobiologia (2009) 617:75–90 85
123
Paracymus sp. colonised the mesocosms directly
and was negatively related to increasing salinity. This
relationship appears to be due to preferential selec-
tion for lower salinities. It is possible this salinity
effect was due to mortality of Paracymus sp. at
higher salinity levels. However, few carcases of
Paracymus sp. were observed across all salinity
levels (Carver, personal observation), suggesting that
enhanced mortality is not a factor. It is unknown
whether Paracymus sp. in the mesocosm constituted
single or multiple species. Overall, our results from
abundant taxa in the mesocosms support the hypoth-
esis that salinity is a determinant of colonisation
behaviour and the spatial distribution of organisms.
Numerous other taxa occurred infrequently in the
mesocosms. Beyond the salinities in which these taxa
occurred, the relative influence of salinity on their
colonisation is unknown.
Colonisation preferences by halophilic fauna are
not clear in the mesocosms. For example, the culicid
vector of Ross River virus (Alphavirus: Togoviridae),
Ae. camptorhynchus, frequently occurs in the field
and is found at greatest abundance in water bodies
from 5 to 20 gl-1 TDS (Carver, unpublished data),
but does not readily oviposit in mesocosms. As such,
it is difficult to conclude from the mesocosm data if
halophilic fauna selectively colonise saline water
bodies or are excluded from freshwater by competi-
tion or predation. It is possible that known halophiles,
such as Necterosoma penicillatus Clark (Diptera:
Dytiscidae) (Pinder et al. 2005), were less frequent in
the mesocosms because this experiment was located
in areas that were relatively unaffected by secondary
salinisation. The occurrence of Necterosoma sp. at 15
and 20 gl-1 TDS suggests these colonisations may be
due to a halophile, such as N. penicillatus, and these
taxa may have substantial dispersal abilities. How-
ever, the occurrence of Necterosoma penicillatus is
not confirmed, as Necterosoma were not identified to
species in this study. Further research is needed to
confirm or refute halophilic colonisation preferences
for N. penicillatus and other halophilic taxa.
As one would expect, the inhabitants of the
mesocosms were insects capable of searching out
habitat by flight. Diptera remained numerically more
abundant than Coleoptera in mesocosm and field
samples, most likely because their colonisation
occurred by oviposition. In a similar experiment,
Silberbush et al. (2005) also found Diptera to be the
most abundant ([95%) colonisers of mesocosm. In
particular, Culicidae can lay large numbers of eggs
(approximately 20–200) per female (Liehne, 1991).
Consequently, insects resulting from oviposition must
undergo development in that water body. Coleoptera,
on the other hand, colonised the mesocosms as adults
and it is possible they were temporary inhabitants,
capable of entering, testing the suitability of a water
body and departing if desired.
Ephemeral aquatic ecosystems are variable
between sites in their size, dimensions, habitat and
abiotic characteristics. In this study, it is not surpris-
ing that the effect of site is influential over individual
and assemblages of insects or that some groups vary
between sites and others do not. Kay et al. (2001) and
Pinder et al. (2005) also found aquatic invertebrates
in the study region were locally heterogeneous due to
variation in habitat.
Salinity, colonisation behaviour and insects
in the field
It was also hypothesised that colonisation responses
to salinity in the mesocosms would reflect distribu-
tions of taxa in the field surveys. Culex australicus
and An. annulipes had similar relationships to salinity
in the mesocosm and field samples, suggesting that
for these species salinity is a determinant of ovipo-
sition behaviour and distribution. However, in
contrast to our hypotheses, the overall composition
of taxa from the field did not consistently reflect
observations in the mesocosms, suggesting colonisa-
tion behaviour based on salinity may not be a broad
determinant of organism occurrence.
Disparities between experimental data and field
distributions are not uncommon (Blakeslee, 1952;
Sinha, 1976; Bailey et al. 1981; Williams et al.
1990). However, an acknowledged limitation of this
study is Coleoptera and non-culicid Diptera were not
identified to species. Potentially, this meant that
successions of species may occur along the salinity
gradient, which is not detected here. The abundance
of Chironomidae, for example, is distinctly different
between the field and mesocosms. This lack of
resemblance between chironomid samples is proba-
bly due to the occurrence of multiple species in the
field samples and wide salinity tolerances within this
family (Bunn & Davies, 1992), whereas chironomids
were of a single species in the mesocosms. Thus, the
86 Hydrobiologia (2009) 617:75–90
123

results and their subsequent interpretation would
most likely have benefited from species level iden-
tification of taxa. However, it should be noted that the
average abundance of insects in the field exhibited a
general decline at 20+ gl-1 TDS, bearing some
similarity to the mesocosm results.
Dipteran families in the WA Wheatbelt occur
within relatively wide salinity boundaries (Kay et al.,
2001; Pinder et al., 2005). For example, Chironom-
idae, Ephydridae and Dolichopodidae are observed
up to and exceeding salinities of 100 gl-1 TDS (Kay
et al., 2001; Pinder et al., 2005). However, Pinder
et al. (2005) observed that few species exceed
10 gl-1 TDS. With the exemption of Chironomidae,
this study found a general decline in the abundance of
Dipteran families, lumped together, in the field
(GZLM v2 = 160.046, df = 4, P \ 0.001) and mes-
ocosms (GEE v2 = 13.980, df = 4, P \ 0.01).
Numerous taxa, such as Ephydridae, L. zealandicus
and Necterosoma sp., were not abundant enough in
both field and mesocosms for direct individual
comparisons to be made.
Similar to the field samples in this study, Pinder
et al. (2005) found that species richness of water
bodies 3–20 gl-1 TDS was comparable to 3 gl-1 TDS
sites. However, Pinder et al. (2005) noted that
variability (around the regression line) in observations
contracted above 4.1 gl-1 TDS, suggesting species
structure became more uniform. In this study, a
contraction in the variability of taxa richness was not
observed at salinities [ 5 gl-1 TDS in the field, which
may reflect the level of taxonomic discrimination used.
In contrast, the richness of taxa in mesocosms was
clearly related to salinity and may reflect general
patterns in faunal preferences when a range of
salinities are locally available, or that local colonising
taxa are freshwater species. Many artificial fresh water
habitats remain ubiquitous across inland southwest
WA in the form of farm dams, with 50–72% of local
aquatic fauna known to occur within them (Halse
et al., 2003; Benier, 2005). In a similar way that the
salinity of our mesocosms influenced colonisation by
certain taxa and assemblage of insects, farm dams that
occur in proximity to salinity affected water bodies,
may provide refugia and influence the spatial distri-
bution, population dynamics and persistence of
halosensitive fauna across the WA landscape. Further
research is needed to examine the importance of farm
dams to aquatic fauna in saline areas.
Relationships have been found between salinity
and Coleoptera over salinity ranges of 0–8 gl-1 TDS
in other studies (Lancaster & Scudder, 1987). How-
ever, many Coleoptera in inland southwest WA
appear to be relatively salt tolerant, and the same
correlation was not found in this study (over 0–8 or
0–20 gl-1 TDS) or in other studies in the same region
(Kay et al., 2001; Bailey et al., 2002; Pinder et al.,
2004, 2005). It is also possible that salinity differ-
ences in abundances of Coleoptera, between
mesocosm and field samples, may partially be due
to some field Coleoptera having developed from eggs
within water bodies, whereas all Coleoptera colon-
ised mesocosms as adults. However, if salinity is a
determinant of colonisation for coleopteran taxa then
it would be expected that oviposition preferences
would also reflect colonisation behaviour.
Other biotic and abiotic variables (such as preda-
tion, competition, microhabitat structure and
stochastic encounters with water bodies) may be
more influential than salinity on our measures of
organism occurrence (Williams et al., 1990; Kay
et al., 2001), potentially explaining differences
between mesocosm and field results. Ovipositing
and colonising insects are known to choose habitat
that maximises survival and fitness (Spencer et al.,
2002; Blaustein et al., 2004). Bailey et al. (1981)
suggested that favourable habitat may be more
important than salinity to the oviposition behaviour
of some insects. In addition, the field sampling in this
study was undertaken over a more broad time scale
than the mesocosm experiment. It is acknowledged
that the abundance of many insects fluctuates over
time. Consequently, the abundance of some taxa may
fluctuate over the temporal sampling period in this
study. However, it is considered unlikely that
temporal fluctuations of abundance would affect the
relative difference in preference between salinity
levels, if salinity is a significant determinant of
colonisation behaviour.
Influence of salinity on insect assemblages
The influence of abiotic factors on colonisation
behaviour may strongly influence assemblage struc-
ture and population dynamics (James et al., 2003;
Silberbush et al., 2005). Analysis of assemblages
revealed that salinity is a determinant of assemblages
that colonise the mesocosms, broadly influencing
Hydrobiologia (2009) 617:75–90 87
123

selective behaviour. Assemblage structure of insects
in the field also changed along the salinity gradient,
which is consistent with other studies (Cale et al.,
2004; Halse et al., 2004). However, our taxonomic
investigations demonstrate abundance of individual
taxa between salinity levels in the mesocosms is
relatively dissimilar from abundance of individual
taxa between salinity levels in the field. Clearly this
study (and other examples, such as Sinha, 1976)
demonstrates that experimental results, of how salin-
ity influences colonisation behaviour, are not always
consistent, at least statistically, with observations
from the field (Blakeslee, 1952; Sinha, 1976; Trimble
& Wellington, 1979; Bailey et al., 1981; Pappas &
Pappas, 1983).
Using patterns of multiple taxa undoubtedly
incorporates indirect effects that may not be related
to salinity, such as cascading effects species have
upon the occurrence of each other, through bottom-up
or top-down controls. However, the use of multiple
taxa provides a more holistic picture of the salinity
relationship on insect assemblages. While the assem-
blage structure of insects was relatively dissimilar
between mesocosm and field samples, and colonisa-
tion behaviour was not a clear determinant of
taxonomic occurrence in the field, both exhibited a
similar gradient of change in multivariate space
associated with salinity. This suggested that salinity
is, broadly, a useful mechanism to examine how
abiotic factors influence the distribution of assem-
blages as a whole (Cale et al., 2004; Halse et al.,
2004; Piscart et al., 2005b; Silberbush et al., 2005).
Conclusions and environmental and management
implications
Understanding mechanisms that generate the spatial
distribution of species is a central theme in ecology
and crucial to the conservation and restoration of
threatened species. Approximately one-third of aqua-
tic invertebrate diversity in the inland southwest of
Western Australia is predicted to disappear with the
expansion of anthropogenic exacerbated land salini-
sation (Halse et al., 2003). Yet, little consideration
has been given to the role of behaviour in colonisa-
tion, or the availability of anthropogenic-created
freshwater habitats. Findings here give empirical
support to the importance of behavioural ecology in
the spatial distribution of aquatic invertebrates and
their assemblages across a landscape affected by
salinity (Spencer et al., 2002; Silberbush et al.,
2005). In particular, behaviour appears to be a
determinant of Cx. australicus and An. annulipies
distributions in the field. However, our interpretations
to other taxa in the field are restricted, probably due
to the level of taxonomic discrimination used. As
such, results here may be conservative of the
importance of behaviour to generating spatial distri-
bution. Colonisation behaviour is an important
consideration for ecosystem management and
restoration.
Acknowledgements This study was supported by Land and
Water Australia, through a Science and Innovation Award from
the Australian Government Bureau of Rural Sciences. This
study was also supported by the Australian and Jean Rogerson
Postgraduate awards. The Department of Environment and
Conservation granted authority to enter land (CE001070) and
provided licenses to collect aquatic fauna (SF005093). The
authors would like to acknowledge the contribution of several
volunteers that helped with all aspects of the fieldwork. Two
anonymous reviewers provided comments that greatly
improved this paper.
References
Anderson, M. J., 2004. NPMANOVA: A FORTRAN
Computer Program for Non-Parametric Permutational
Multivariate Analysis of Variance. Department of Statis-
tics. University of Auckland, Auckland, New Zealand.
Anderson, M. J., 2005. PERMANOVA: A FORTRAN Com-
puter Program for Permutational Multivariate Analysis
of Variance. Department of Statistics. University of
Auckland, Auckland, New Zealand.
Bailey, P., P. Boon & K. Morris, 2002. Australian Biodiversity:
Salt Sensitivity Database. Monash University and Victo-
rian University of Technology.
Bailey, D. L., P. E. Kaiser, D. A. Focks & R. E. Lowe, 1981.
Effects of salinity on Anopheles albimanus: ovipositional
behavior, immature development and population dynam-
ics. Mosquito News 41: 161–167.
Benier, J.-M., 2005. The Role of Farm Dams as Refugia for
Aquatic Invertebrates in a Salinised Landscape, South
Western Australia. Centre for Ecosystem Management.
Unpublished MSc thesis. Edith Cowan University, Wes-
tern Australia, Australia.
Blakeslee, D. L., 1952. Chloride ion tolerance of four mos-
quitoes of Okinawa. Mosquito News 12: 191–194.
Blasius, B. J. & R. W. Merritt, 2002. Field and laboratory
investigations on the effects of road salt (NaCl) on stream
macroinvertebrate communities. Environmental Pollution
120: 219–231.
Blaustein, L., M. Kiflawi, A. Eitam, M. Mangel & J. E. Cohen,
2004. Oviposition habitat selection in response to risk of
predation in temporary pools: mode of detection and
88 Hydrobiologia (2009) 617:75–90
123

consistency across experimental venue. Oecologia 138:
300–305.
Bunn, S. E. & P. M. Davies, 1992. Community structure of the
macroinvertebrate fauna and water quality of a saline river
system in south-western Australia. Hydrobiologia 248:
143–160.
Cale, D. J., S. A. Halse & C. D. Walker, 2004. Wetland
monitoring in the wheatbelt of south-west Western Aus-
tralia: site descriptions, waterbird, aquatic invertebrate
and groundwater data. Conservation Science of Western
Australia 5: 20–135.
Clark, T. M., B. J. Flis & S. K. Remold, 2004. Differences in
the effects of salinity on larval growth and developmental
programs of a freshwater and a euryhaline mosquito
species (Insecta: Diptera, Culicidae). Journal of Experi-
mental Biology 207: 2289–2295.
Crain, C. M., B. R. Silliman, S. L. Bertness & M. D. Bertness,
2004. Physical and biotic drivers of plant distribution
across estuarine salinity gradients. Ecology 85: 2539–
2549.
George, R., J. Clarke & P. English, 2006. Modern and palae-
ogeographic trends in the salinisation of the Western
Australian Wheatbelt. Proceedings of the Australian Earth
Sciences Convention 2006, Melbourne. http://www.earth
2006.org.au/papers/extendedpdf/George%20Richard%20-
%20Modern%20and%20palaeogeographic-extended.pdf
[accessed September 22, 2006].
Hagman, M. & R. Shine, 2006. Effects of invasive cane toads
on Australian mosquitoes: does the dark cloud have a
silver lining? Biological Invasions 9: 445–452.
Halse, S. A., 1981. Faunal assemblages of some saline lakes
near marchagee Western Australia. Australian Journal of
Marine & Freshwater Research 32: 133–142.
Halse, S. A., M. N. Lyons, A. M. Pinder & R. J. Shiel, 2004.
Biodiversity patterns and their conservation in the wetlands
of the Western Australia wheatbelt. Records of the Western
Australian Museum. Supplement No. 67: 337–364.
Halse, S. A., J. K. Ruprecht & A. M. Pinder, 2003. Salinisation
and prospects for biodiversity in rivers and wetlands of
south-west Western Australia. Australian Journal of
Botany 51: 673–688. doi:10.1071/BT02113.
Hart, E. A. & J. R. Lovvorn, 2005. Patterns of macroinverte-
brate abundance in inland saline wetlands: a trophic
analysis. Hydrobiologia 541: 45–54.
Hassell, K. L., B. J. Kefford & D. Nugegoda, 2006. Sub-lethal
and chronic salinity tolerances of three freshwater insects:
Cloeon sp. and Centroptilum sp. (Ephemeroptera: Baeti-
dae) and Chironomus sp. (Diptera: Chironomidae).
Journal of Experimental Biology 209: 4024–4032.
James, K. R., B. Cant & T. Ryan, 2003. Responses of fresh-
water biota to rising salinity levels and implications for
saline water management: a review. Australian Journal of
Botany 51: 703–713.
Jardine, A., P. Speldewinde, S. Carver & P. Weinstein, 2007.
Dryland salinity and ecosystem distress syndrome: human
health implications. EcoHealth 4: 10–17.
Jeffery, J. A. L., B. H. Kay & P. A. Ryan, 2005. Development
time and survival of Verrallina funerea (Theobald)
(Diptera: Culicidae) immatures and other brackish water
mosquito species in southeast Queensland, Australia.
Australian Journal of Entomology 44: 226–232.
Juliano, S. A. & M. E. Gravel, 2002. Predation and the evo-
lution of prey behavior: an experiment with tree hole
mosquitoes. Behavioral Ecology 13: 301–311.
Kay, W. R., S. A. Halse, M. D. Scanlon & M. J. Smith, 2001.
Distribution and environmental tolerances of aquatic
macroinvertebrate families in the agricultural zone of
southwestern Australia. Journal of the North American
Benthological Society 20: 182–199.
Kefford, B. J., T. Paradise, P. J. Papas, E. Fields & D. Nugegoda,
2003. Assessment of a system to predict the loss of aquatic
biodiversity from changes in salinity. Report to Land and
Water Australia, Project No: VCE 17, Perth, Western
Australia.
Keighery, G. J., S. A. Halse, N. L. McKenzie & M. S. Harvey
(eds) 2004. A biodiversity survey of the Western Aus-
tralian agricultural zone. Records of the Western
Australian Museum. Supplement; no. 67. Western
Australian Museum, Perth, Western Australia: 384pp.
Lancaster, J. & G. G. E. Scudder, 1987. Aquatic Coleoptera
and Hemiptera in some Canadian saline lakes: patterns in
community structure. Canadian Journal of Zoology 65:
1383–1390.
Liehne, P. F. S., 1991. An Atlas of the Mosquitoes of Western
Australia. Health Department of Western Australia, Perth.
Lindsay, M. D., A. Jardine, C. A. Johansen, A. E. Wright, S. A.
Harrington & P. Weinstein, 2007. Mosquito (Diptera:
Culicidae) fauna in inland areas of south west Western
Australia. Australian Journal of Entomology 46: 60–64.
Marshall, N. A. & P. C. E. Bailey, 2004. Impact of secondary
salinisation on freshwater ecosystems: effects of con-
trasting, experimental, short-term releases of saline
wastewater on macroinvertebrates in a lowland stream.
Marine and Freshwater Research 55: 509–523.
McKenzie, N. L., A. H. Burbidge & J. K. Rolfe, 2003. Effect of
salinity on small, ground-dwelling animals in the Western
Australian wheatbelt. Australian Journal of Botany 51:
725–740.
Mokany, A. & R. Shine, 2003. Oviposition site selection by
mosquitoes is affected by cues from conspecific larvae
and anuran tadpoles. Austral Ecology 28: 33–37.
Neilsen, D. L., M. Brock, G. Rees & D. Baldwin, 2003. Effects
of increasing salinity on freshwater ecosystems in Aus-
tralia. Australian Journal of Botany 51: 655–665.
Pappas, L. G. & C. D. Pappas, 1983. Laboratory studies on the
significance of sodium chloride as an oviposition deterrent
in Culiseta inornata. Mosquito News 43: 153–155.
Pinder, A. M., S. A. Halse, J. M. McRae & R. J. Shiel, 2004.
Aquatic invertebrate assemblages of wetlands and rivers
in the wheatbelt region of Western Australia. Records
of the Western Australian Museum. Supplement No.
67:7–37.
Pinder, A. M., S. A. Halse, J. M. McRae & R. J. Shiel, 2005.
Occurence of aquatic invertebrates of the wheatbelt region
of Western Australia in relation to salinity. Hydrobiologia
543: 1–24.
Piscart, C., A. Lecerf, P. Usseglio-Polatera, J. C. Moreteau &J. N. Beisel, 2005a. Biodiversity patterns along a salinity
gradient: the case of net-spinning caddisflies. Biodiversity
and Conservation 14: 2235–2249.
Piscart, C., J. C. Moreteau & J. N. Beisel, 2005b. Biodiversity
and structure of macroinvertebrate communities along a
Hydrobiologia (2009) 617:75–90 89
123
small permanent salinity gradient (Meurthe River,
France). Hydrobiologia 551: 227–236.
Roberts, D., 1996. Mosquitoes (Diptera: Culicidae) breeding in
brackish water: Female ovipositional preferences or larval
survival? Journal of Medical Entomology 33: 525–530.
Roberts, D. M. & R. J. Irving-Bell, 1997. Salinity and micro-
habitat preferences in mosquito larvae from southern
Oman. Journal of Arid Environments 37: 497–504.
Silberbush, A., L. Blaustein & Y. Margalith, 2005. Influence of
salinity concentration on aquatic insect community
structure: a mesocosm experiment in the Dead Sea Basin
Region. Hydrobiologia 548: 1–10.
Singleton, G., 1989. Population dynamics of an outbreak of
house mouse (Mus domesticus) in the Mallee wheatlands
of Australia—hypothesis of plague formation. Journal of
Zoology 219: 495–515.
Sinha, V. P., 1976. Further observations on the physiochemical
factors of the breeding places of Culex quinquesfasciatusSay = fatigans Wied. Mosquito News 36: 358–360.
Spencer, M., L. Blaustein & J. E. Cohen, 2002. Oviposition
habitat selection by mosquitoes (Culiseta longiareolata)
and consequences for population size. Ecology 83:
669–679.
Stav, G., L. Blaustein & J. Margalith, 1999. Experimental
evidence for predation risk sensitive oviposition by a
mosquito, Culiseta longiareolata. Ecological Entomology
24: 202–207.
Stoks, R. & M. A. McPeek, 2003. Antipredator behavior and
physiology determine Lestes species turnover along the
pond-permanence gradient. Ecology 84: 3327–3338.
Terpstra, J. W. & A. D. Wilson, 1989. Grazing distribution of
sheep and kangaroos in a semi-arid woodland. Applied
Animal Behaviour Science 24: 343–352.
Trimble, R. M. & W. G. Wellington, 1979. Effects of salinity
on site selection by ovipositing Aedes togoi Diptera
Culicidae. Canadian Journal of Zoology 57: 593–596.
Williams, D. D., 2003. The brackishwater hyporheic zone:
invertebrate community structure across a novel ecotone.
Hydrobiologia 510: 153–173.
Williams, W. D., A. J. Boulton & R. G. Taaffe, 1990. Salinity
as a determinant of salt lake Fauna—a question of scale.
Hydrobiologia 197: 257–266.
Zalizniak, L., B. J. Kefford & D. Nugegoda, 2006. Is all
salinity the same? I The effect of ionic compositions on
the salinity tolerance of five species of freshwater inver-
tebrates. Marine and Freshwater Research 57: 75–82.
90 Hydrobiologia (2009) 617:75–90
123
Copyright © 2022 FDOKUMEN