Non-commercial invertebrate discards in an experimental trammel net fishery
12
Non-commercial invertebrate discards in an experimental trammel net fishery J. M. S. GONC ¸ ALVES, L. BENTES, R. COELHO, P. MONTEIRO, J. RIBEIRO, C. CORREIA, P. G. LINO & K. ERZINI Centro de Cie ˆncias do Mar – CCMAR/CIMAR, Universidade do Algarve, Faro, Portugal Abstract Non-commercial invertebrate discards in an experimental trammel net fishery were studied in relation to selectivity of the gear, depth, soak time and season. Forty experimental fishing trials were carried out over a 1-year period with six combinations of small mesh (100, 120 and 140 mm) inner and large mesh (600 and 800 mm) outer panels. On average, 43.8 ± 12.2 (SD) (individuals 1000 m )1 of net) of non-commercial invertebrates were discarded, accounting for 48% and 65% of the total catch and total discards by numbers, respectively. Within non-commercial invertebrates discards, the six most abundant species by number were Phallusia mammillata (Cuvier) (27.5%), Cymbium olla (L.) (13.0%), Sphaerechinus granularis (Lamarck) (11.3%), Paracentrotus lividus (Lamarck) (10.9%), Astropartus mediterraneus (Risso) (8.2%) and Astropecten aranciacus (L.) (8.1%); Echino- derms (43.1%) particularly important. The highest and lowest discard ratios were found in autumn and winter, respectively. Discards generally decreased with depth, varied considerably in relation to soak time and were not related to mesh size combinations. Trammel nets seem to be the most important gear in terms of ecological impacts on benthic invertebrates compared with other coastal fishing gears and at the depths studied (15–60 m). KEYWORDS: biodiversity, by-catch, discards, fisheries, gear selectivity, invertebrates. Introduction The maintenance of marine biodiversity is an impor- tant priority for conservation, and fishing is one of the activities that most impacts on marine communities, removing rare and abundant species, changing species composition, modifying and even destroying habitats (e.g. Hall 1999). Discarding is a common practice in fisheries worldwide, accounting for an estimated 8% of the annual commercial fish catches or 7.3 million ton of fish returned to the sea (Kelleher 2005). As discarded organisms are often dead or in a poor state, their discarding represents a loss of diversity of marine communities (e.g. Hall 1996; Hall, Alverson & Metu- zals 2000). With the growing consciousness of the importance of ecosystem functioning for sustainability of fisheries resources (e.g. Gislason, Sinclair, Sainsbury & OÕBoyle 2000), a number of studies on the evaluation of the effects of fishing on the environment have been undertaken (e.g. Jennings & Kaiser 1998; Collie, Hall, Kaiser & Poiner 2000). As trammel nets are one of the most widely used gears in coastal waters worldwide, there have been some studies on discards (e.g. Purbayanto, Tsunoda, Akiyama, Arimoto & Tokai 2001; Coelho, Erzini, Bentes, Correia, Lino, Monteiro, Ribeiro & Gonc¸alves 2005; Gonc¸alves, Stergiou, Hernando, Puente, Mou- topoulos, Arregi, Soriguer, Vilas, Coelho & Erzini 2007) but, as with discard studies for most gears, the emphasis was on vertebrates or commercially valuable or protected species. In the Algarve (southern Portugal), 130 coastal fishing vessels were licensed to fish with trammel nets in 2002, accounting for 14.8% of all the licenses, with only longline licenses more important (DGPA 2007). Given that the coastal vessels are allowed to fish up to 9.0 km of trammel nets, the quantity of trammel nets used in Algarve waters (coastline of 160 km) could easily exceed 1000 km. Trammel netting takes place at depths from 10 to 90 m, mostly within 6 nautical miles of the shore. The target species of this fishery are demersal and benthic species, such as cuttlefish, sea breams, soles, red mullet, skates and spiny lobster and Correspondence: Jorge M. S. Gonc¸alves, Centro de Cieˆncias do Mar – CCMAR, Universidade do Algarve. FCMA Campus de Gambelas, 8005-139 Faro, Portugal (e-mail: [email protected]) Fisheries Management and Ecology, 2008, 15, 199–210 Ó 2008 The Authors. Journal compilation Ó 2008 Blackwell Publishing Ltd. doi: 10.1111/j.1365-2400.2008.00607.x Fisheries Management and Ecology
Transcript of Non-commercial invertebrate discards in an experimental trammel net fishery
Non-commercial invertebrate discardsin an experimental trammel net fishery
J . M . S . G O N C A L V E S, L . B E N T E S, R . C O E L H O, P . M O N T E I R O,
J . R I B E I R O, C . C O R R E I A , P . G . L I N O & K . E R Z I N I
Centro de Ciencias do Mar – CCMAR/CIMAR, Universidade do Algarve, Faro, Portugal
Abstract Non-commercial invertebrate discards in an experimental trammel net fishery were studied in relationto selectivity of the gear, depth, soak time and season. Forty experimental fishing trials were carried out over a1-year period with six combinations of small mesh (100, 120 and 140 mm) inner and large mesh (600 and 800 mm)outer panels. On average, 43.8 ± 12.2 (SD) (individuals 1000 m)1 of net) of non-commercial invertebrates werediscarded, accounting for 48% and 65% of the total catch and total discards by numbers, respectively. Withinnon-commercial invertebrates discards, the six most abundant species by number were Phallusia mammillata(Cuvier) (27.5%), Cymbium olla (L.) (13.0%), Sphaerechinus granularis (Lamarck) (11.3%), Paracentrotus lividus(Lamarck) (10.9%), Astropartus mediterraneus (Risso) (8.2%) and Astropecten aranciacus (L.) (8.1%); Echino-derms (43.1%) particularly important. The highest and lowest discard ratios were found in autumn and winter,respectively. Discards generally decreased with depth, varied considerably in relation to soak time and were notrelated to mesh size combinations. Trammel nets seem to be the most important gear in terms of ecological impactson benthic invertebrates compared with other coastal fishing gears and at the depths studied (15–60 m).
KEYWORDS : biodiversity, by-catch, discards, fisheries, gear selectivity, invertebrates.
Introduction
The maintenance of marine biodiversity is an impor-tant priority for conservation, and fishing is one of theactivities that most impacts on marine communities,removing rare and abundant species, changing speciescomposition, modifying and even destroying habitats(e.g. Hall 1999). Discarding is a common practice infisheries worldwide, accounting for an estimated 8% ofthe annual commercial fish catches or 7.3 million tonof fish returned to the sea (Kelleher 2005). Asdiscarded organisms are often dead or in a poor state,their discarding represents a loss of diversity of marinecommunities (e.g. Hall 1996; Hall, Alverson & Metu-zals 2000).With the growing consciousness of the importance
of ecosystem functioning for sustainability of fisheriesresources (e.g. Gislason, Sinclair, Sainsbury & O�Boyle2000), a number of studies on the evaluation of theeffects of fishing on the environment have beenundertaken (e.g. Jennings & Kaiser 1998; Collie, Hall,Kaiser & Poiner 2000).
As trammel nets are one of the most widely usedgears in coastal waters worldwide, there have beensome studies on discards (e.g. Purbayanto, Tsunoda,Akiyama, Arimoto & Tokai 2001; Coelho, Erzini,Bentes, Correia, Lino, Monteiro, Ribeiro & Goncalves2005; Goncalves, Stergiou, Hernando, Puente, Mou-topoulos, Arregi, Soriguer, Vilas, Coelho & Erzini2007) but, as with discard studies for most gears, theemphasis was on vertebrates or commercially valuableor protected species.
In the Algarve (southern Portugal), 130 coastalfishing vessels were licensed to fish with trammel netsin 2002, accounting for 14.8% of all the licenses, withonly longline licenses more important (DGPA 2007).Given that the coastal vessels are allowed to fish up to9.0 km of trammel nets, the quantity of trammel netsused in Algarve waters (coastline of 160 km) couldeasily exceed 1000 km. Trammel netting takes place atdepths from 10 to 90 m, mostly within 6 nautical milesof the shore. The target species of this fishery aredemersal and benthic species, such as cuttlefish, seabreams, soles, red mullet, skates and spiny lobster and
Correspondence: Jorge M. S. Goncalves, Centro de Ciencias do Mar – CCMAR, Universidade do Algarve. FCMA Campus de Gambelas,
8005-139 Faro, Portugal (e-mail: [email protected])
Fisheries Management and Ecology, 2008, 15, 199–210
� 2008 The Authors. Journal compilation � 2008 Blackwell Publishing Ltd. doi: 10.1111/j.1365-2400.2008.00607.x
Fisheries Managementand Ecology

fish discards, consist mainly of pelagic species like chubmackerel and sardine (Goncalves et al. 2007).
The main objectives of this study, part of a projecton selectivity of trammel nets in southern Europeanwaters, were to quantify the discards of non-commer-cial invertebrates of trammel nets in Algarve waters(Northeastern Atlantic), in relation to gear/selectivitycharacteristics, depth, soak time and season.
Materials and methods
Experimental design and data collection
The trammel net fishery studied uses coastal cate-gory boats (vessels between 9 and 33 m in length),monofilament nets and targets cuttlefish/sole andassorted demersal fin-fish (Borges, Erzini, Bentes,Costa, Goncalves, Lino, Pais & Ribeiro 2001; Erzini,Goncalves, Bentes, Moutopoulos, Hernando-Casal,Soriguer, Puente, Errazkin & Stergiou 2006).
The experimental nets consisted of six differentcombinations, all of green monofilament netting. Thus,each net was constructed with one of two sizes of largemesh outer panels (600 or 800 mm stretched mesh) andone of three smaller mesh inner panels (100, 120,140 mm stretched mesh). Each combination was com-posed of five nets with the same mesh size for eachpanel. Overall, five groups of these combinations wereused giving a total of 150 nets. The six distinctcombinations were joined together by a footrope,leaving a 2-m gap between them so that fish are not ledfrom one combination to the adjacent combination,thereby causing biased catch rates. A total of 8900 mof trammel net, composed of 2500, 3000, 3400 m ofeach inner mesh size (100, 120 and 140, respectively)were used. For these inner mesh sizes, the calculatedhanging ratios were 0.49, 0.49 and 0.48, respectively(Erzini et al. 2006).
Normal fishing practices were followed, with thesetting of the gear in the afternoon or evening beforesunset and hauling after sunrise in the next day orseveral days later. As hauling usually took all morningand part of the afternoon, setting of the nets oftenoccurred after all the nets had been hauled. The soaktime was calculated as the time in minutes elapsedbetween the time of setting the nets (average betweenthe beginning and the end of the operation) and thetime of hauling (average between the beginning and theend of the operation).
Catches were sorted according to the six trammel nettypes and information recorded on fishing grounds,depth, number of fleets, times of setting and hauling,method of capture and discarding practices. All
organisms were identified and all fish, crustaceansand molluscs were measured (total length, disc widthor mantle length) to the nearest millimetre. When indoubt, organisms were taken to the laboratory foridentification. Before sorting, the catches were classi-fied by the fishermen as commercial or discard.
Experimental fishing trials were carried out on aseasonal basis, with 10 fishing trials per season with25 nets of each of the six combinations of inner andouter panels. Fishing took place in the same generalarea in Algarve waters between 10 and 90 m andthe exact position of each set was recorded with aGPS.
Data analysis
Abundances of each species, species diversity, richnessand evenness, and dominance curves were used toanalyse discard species composition per inner/outerpanel mesh combination of trammel nets. Diversitywas calculated using the Shannon–Wiener diversityindex H�, species richness using Margalef�s D index,and evenness using Pielou�s J measure (Magurran1988).
Matrices comprising the numbers of each species(discard numbers per 1000 m of net) from each inner/outer mesh combination per each season (i.e., averageof all trials per season) were constructed to study gearand season overlap [i.e. (all species) · (six inner/outermesh combinations) · (four seasons)]. From thesematrices, triangular matrices of similarities betweenall pairs of inner/outer mesh combinations werecomputed using the Bray–Curtis coefficient. Prior tothis computation, data were transformed using thedouble square root transformation to reduce theweighting of abundant species. Non-parametric per-mutation tests (ANOSIM with two crossed factors) wereused to test for differences between regions, seasonsand mesh sizes (Clarke & Warwick 2001). The contri-bution of each species to the average Bray–Curtisdissimilarity between groups of combinations as wellas to similarity within a group of combinations wasidentified using Similarity of Percentages (SIMPER)analysis (Clarke & Warwick 2001). All the above-mentioned analyses were carried out using PRIMER 6(Clarke & Warwick 2001).
The discard/total catch ratio (D/T) in numbers wascalculated separately for each individual inner/outermesh size and season. Comparisons of mean diversityindices, numerical abundances and catch rates betweendifferent inner/outer panel mesh size combinations,seasons and geographic areas were carried out usingt-test or Mann–Whitney test and one-way analysis of
J. M. S. GONCALVES ET AL.200
� 2008 The Authors. Journal compilation � 2008 Blackwell Publishing Ltd.
variance (ANOVA) or Kruskal–Wallis ANOVA on ranks,according to the case (Zar 1999).
Results
The experimental fishing trials carried out betweenJanuary and December 2000 resulted in a total catch of29 844 individual organisms, with 8392 (28.1%) clas-sified as commercial, 13 220 (44.3%) as non-commer-cial invertebrate discards and 8232 (27.6%) as otherdiscards. These numbers illustrate the importance ofdiscards and in particular of invertebrates that accountfor the majority of trammel net catches. The averagetotal discard ratio of the trammel nets studied off theAlgarve coast was 0.74 ± 0.08 (SD). The overall meannumber of discarded invertebrates was 43.8 ± 12.2(SD) 1000 m)1, which corresponded to a mean D/T of0.48 ± 0.14 (SD), and accounted for almost 65% ofthe total discards in numbers.The commercial catch was dominated by Sepia
officinalis L. (cuttlefish) and Microchirus azevia (Cap-ello) (bastard sole), while Scomber japonicus Houttuyn(chub mackerel) and Sardina pilchardus (Walbaum)(sardine) were the most important discarded fishspecies. The most important discarded commercialinvertebrates were S. officinalis, Octopus vulgarisCuvier (common octopus), Loligo vulgaris Lamarck(common squid), Eledone cirrhosa (Lamarck) (hornedoctopus), Maja squinado (Herbst) (spiny spider crab)and Palinurus elephas (Fabricius) (spiny lobster).Individuals of these species were discarded largelybecause of poor condition and/or insufficient quanti-ties for sale in auction, and to a lesser extent for being
below the legal minimum landing size. For the lattertwo cases, the organisms are often taken by thefishermen for their own consumption, or returned tothe sea if very small and alive.
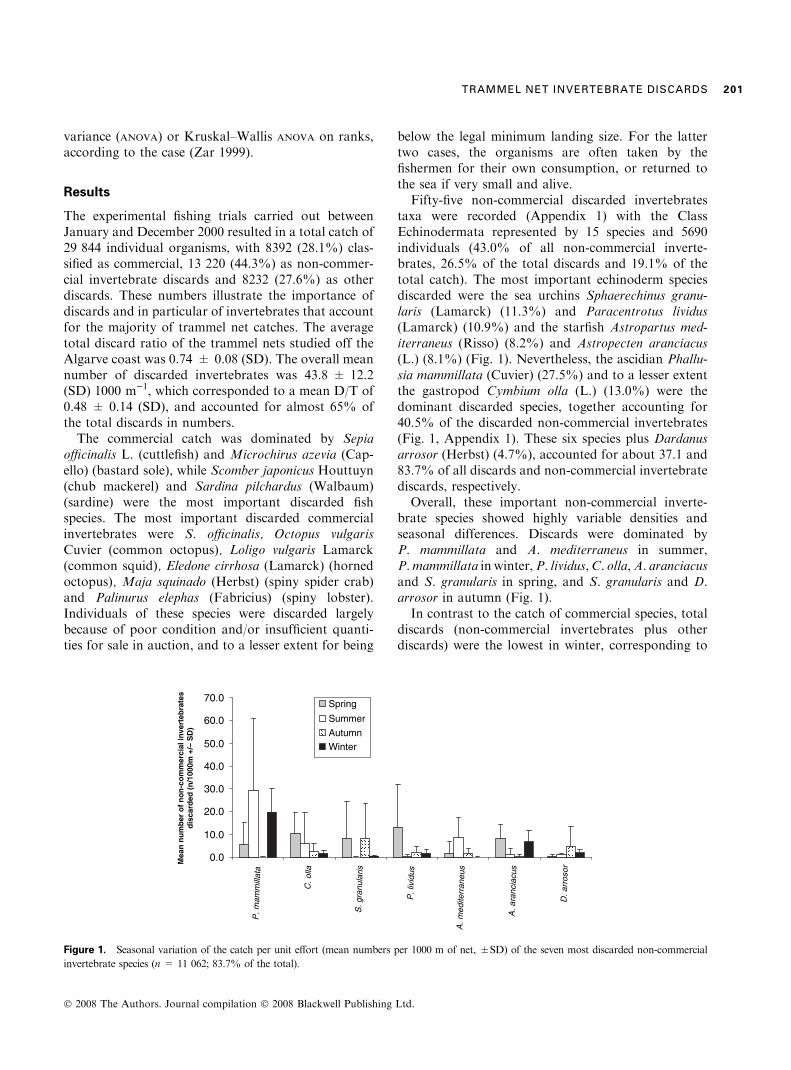
Fifty-five non-commercial discarded invertebratestaxa were recorded (Appendix 1) with the ClassEchinodermata represented by 15 species and 5690individuals (43.0% of all non-commercial inverte-brates, 26.5% of the total discards and 19.1% of thetotal catch). The most important echinoderm speciesdiscarded were the sea urchins Sphaerechinus granu-laris (Lamarck) (11.3%) and Paracentrotus lividus(Lamarck) (10.9%) and the starfish Astropartus med-iterraneus (Risso) (8.2%) and Astropecten aranciacus(L.) (8.1%) (Fig. 1). Nevertheless, the ascidian Phallu-sia mammillata (Cuvier) (27.5%) and to a lesser extentthe gastropod Cymbium olla (L.) (13.0%) were thedominant discarded species, together accounting for40.5% of the discarded non-commercial invertebrates(Fig. 1, Appendix 1). These six species plus Dardanusarrosor (Herbst) (4.7%), accounted for about 37.1 and83.7% of all discards and non-commercial invertebratediscards, respectively.
Overall, these important non-commercial inverte-brate species showed highly variable densities andseasonal differences. Discards were dominated byP. mammillata and A. mediterraneus in summer,P.mammillata in winter,P. lividus,C. olla,A. aranciacusand S. granularis in spring, and S. granularis and D.arrosor in autumn (Fig. 1).
In contrast to the catch of commercial species, totaldiscards (non-commercial invertebrates plus otherdiscards) were the lowest in winter, corresponding to
0.0
10.0
20.0
30.0
40.0
50.0
60.0
70.0
P. m
amm
illat
a
C. o
lla
S. g
ranu
laris
P. l
ivid
us
A. m
edite
rran
eus
A. a
ranc
iacu
s
D. a
rros
or
Mea
n n
um
ber
of
no
n-c
om
mer
cial
inve
rteb
rate
sd
isca
rded
(n
/100
0m +
/– S
D)
Spring
Summer
AutumnWinter
Figure 1. Seasonal variation of the catch per unit effort (mean numbers per 1000 m of net, ±SD) of the seven most discarded non-commercial
invertebrate species (n = 11 062; 83.7% of the total).
TRAMMEL NET INVERTEBRATE DISCARDS 201
� 2008 The Authors. Journal compilation � 2008 Blackwell Publishing Ltd.
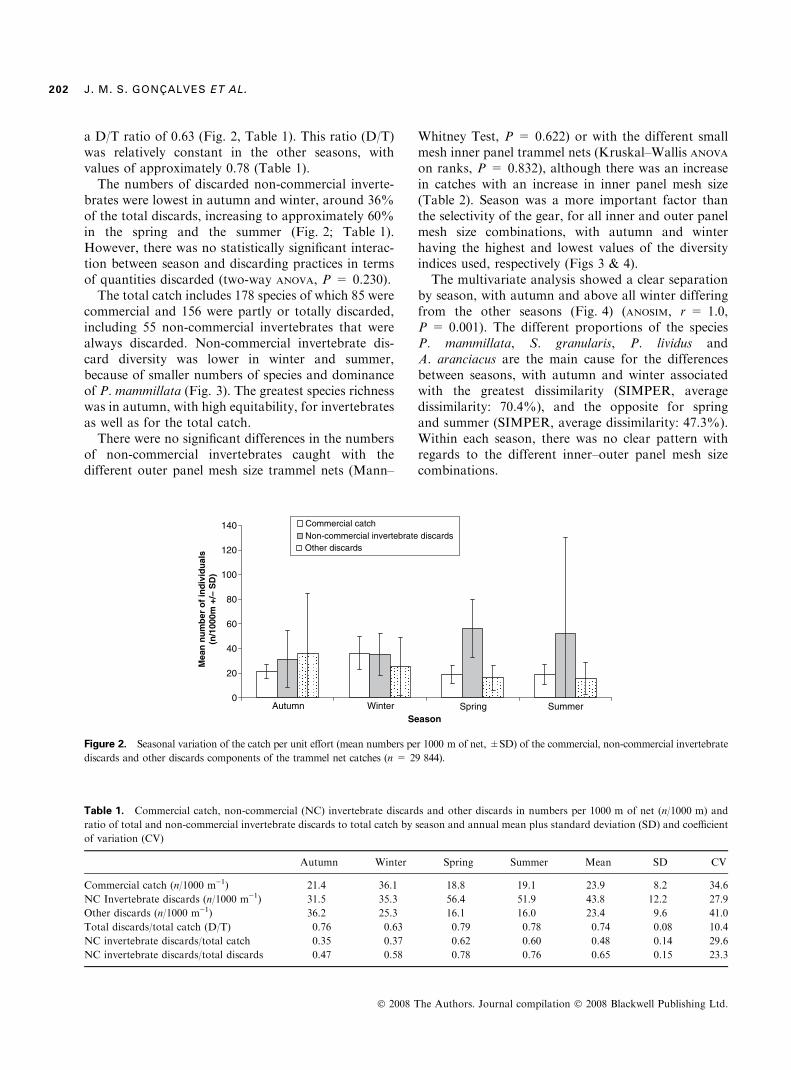
a D/T ratio of 0.63 (Fig. 2, Table 1). This ratio (D/T)was relatively constant in the other seasons, withvalues of approximately 0.78 (Table 1).
The numbers of discarded non-commercial inverte-brates were lowest in autumn and winter, around 36%of the total discards, increasing to approximately 60%in the spring and the summer (Fig. 2; Table 1).However, there was no statistically significant interac-tion between season and discarding practices in termsof quantities discarded (two-way ANOVA, P = 0.230).
The total catch includes 178 species of which 85 werecommercial and 156 were partly or totally discarded,including 55 non-commercial invertebrates that werealways discarded. Non-commercial invertebrate dis-card diversity was lower in winter and summer,because of smaller numbers of species and dominanceof P. mammillata (Fig. 3). The greatest species richnesswas in autumn, with high equitability, for invertebratesas well as for the total catch.
There were no significant differences in the numbersof non-commercial invertebrates caught with thedifferent outer panel mesh size trammel nets (Mann–
Whitney Test, P = 0.622) or with the different smallmesh inner panel trammel nets (Kruskal–Wallis ANOVA
on ranks, P = 0.832), although there was an increasein catches with an increase in inner panel mesh size(Table 2). Season was a more important factor thanthe selectivity of the gear, for all inner and outer panelmesh size combinations, with autumn and winterhaving the highest and lowest values of the diversityindices used, respectively (Figs 3 & 4).
The multivariate analysis showed a clear separationby season, with autumn and above all winter differingfrom the other seasons (Fig. 4) (ANOSIM, r = 1.0,P = 0.001). The different proportions of the speciesP. mammillata, S. granularis, P. lividus andA. aranciacus are the main cause for the differencesbetween seasons, with autumn and winter associatedwith the greatest dissimilarity (SIMPER, averagedissimilarity: 70.4%), and the opposite for springand summer (SIMPER, average dissimilarity: 47.3%).Within each season, there was no clear pattern withregards to the different inner–outer panel mesh sizecombinations.
0
20
40
60
80
100
120
140
SummerSeason
Mea
n n
um
ber
of
ind
ivid
ual
s(n
/100
0m +
/– S
D)
Commercial catchNon-commercial invertebrate discardsOther discards
Autumn Winter Spring
Figure 2. Seasonal variation of the catch per unit effort (mean numbers per 1000 m of net, ±SD) of the commercial, non-commercial invertebrate
discards and other discards components of the trammel net catches (n = 29 844).
Table 1. Commercial catch, non-commercial (NC) invertebrate discards and other discards in numbers per 1000 m of net (n/1000 m) and
ratio of total and non-commercial invertebrate discards to total catch by season and annual mean plus standard deviation (SD) and coefficient
of variation (CV)
Autumn Winter Spring Summer Mean SD CV
Commercial catch (n/1000 m)1) 21.4 36.1 18.8 19.1 23.9 8.2 34.6
NC Invertebrate discards (n/1000 m)1) 31.5 35.3 56.4 51.9 43.8 12.2 27.9
Other discards (n/1000 m)1) 36.2 25.3 16.1 16.0 23.4 9.6 41.0
Total discards/total catch (D/T) 0.76 0.63 0.79 0.78 0.74 0.08 10.4
NC invertebrate discards/total catch 0.35 0.37 0.62 0.60 0.48 0.14 29.6
NC invertebrate discards/total discards 0.47 0.58 0.78 0.76 0.65 0.15 23.3
J. M. S. GONCALVES ET AL.202
� 2008 The Authors. Journal compilation � 2008 Blackwell Publishing Ltd.

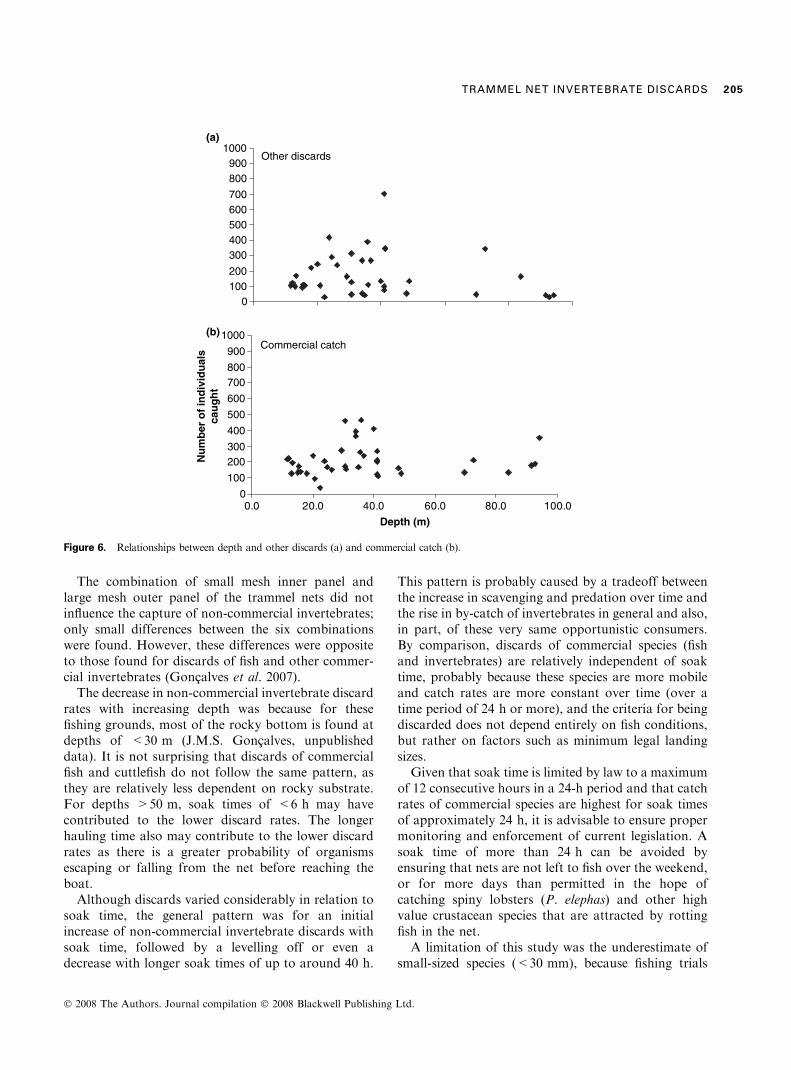
There was a decrease in non-commercialinvertebrate discards with an increase in depth(Fig. 5a), but not for other discards or for commer-cial catches (Figs 6a,b). For the latter, there were
large catches at depths between 30 and 40 m(Fig. 6b).
Although there was a slight increase in non-com-mercial invertebrate discards with increasing soak
0.0
1.0
2.0
3.0
4.0
5.0
6.0
001/006
021/006
041/006
001/008
021/008
041/008
001/006
021/006
041/006
001/008
021/0 08
041/008
001 /006
021/0 06
041 /006
001/00 8
021/00 8
041/008
001/0 06
021/006
041/006
001/ 00 8
021/008
041/008
A A A A WA A W W W W W Sp Sp Sp Sp Sp Sp Su Su Su Su Su Su
Margalef's richness indexShannon's diversity indexEvenness
Figure 3. Non-commercial invertebrate discards species diversity by season and mesh size combination (n = 13 220; s = 56). A = autumn;
W = winter; Sp = spring; Su = summer; 600 and 800 mm = outer panels mesh size; 100, 120 and 140 mm = inner panels mesh size.
Table 2. Total catch, total discards and non-commercial (NC) invertebrate discards in numbers per 1000m of net and relative importance of
non-commercial invertebrate discards to total catch and total discards by inner/outer panel mesh size combination
Outer mesh size (mm): 600 800
Grand totalInner mesh size (mm): 100 120 140 Total 100 120 140 Total
Total catch (n) 54.4 57.9 52.6 164.9 58.7 55.7 54.1 168.6 333.5
Total discards (n) 37.2 41.4 39.7 118.3 40.7 39.4 41.3 121.4 239.7
NC invertebrate discards (n) 21.4 24.6 28.6 74.6 20.6 24.3 28.3 73.1 147.7
NC invertebrate discards/total catch (%) 39.3 42.5 54.4 45.2 35.1 43.6 52.2 43.4 44.3
NC invertebrate discards/total discards (%) 57.4 59.5 72.1 63.0 50.6 61.6 68.4 60.2 61.6
Figure 4. Multivariate analyses based on the matrices that comprise the discard numbers of each non-commercial invertebrate species from each
inner/outer mesh combination per season: dendrogram (cluster analysis). A = autumn; W = winter; Sp = spring; Su = summer; 6 = 600 and
8 = 800 mm outer panels mesh size; 10 = 100, 12 = 120 and 14 = 140 mm inner panels mesh size.
TRAMMEL NET INVERTEBRATE DISCARDS 203
� 2008 The Authors. Journal compilation � 2008 Blackwell Publishing Ltd.
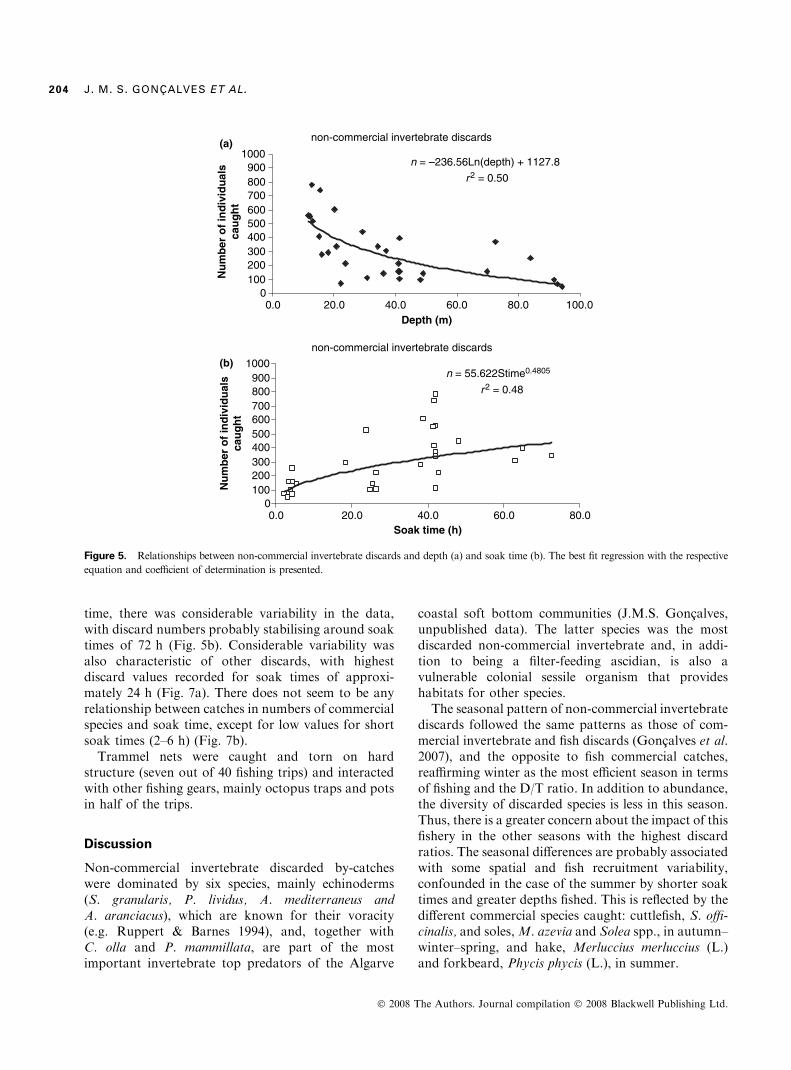
time, there was considerable variability in the data,with discard numbers probably stabilising around soaktimes of 72 h (Fig. 5b). Considerable variability wasalso characteristic of other discards, with highestdiscard values recorded for soak times of approxi-mately 24 h (Fig. 7a). There does not seem to be anyrelationship between catches in numbers of commercialspecies and soak time, except for low values for shortsoak times (2–6 h) (Fig. 7b).
Trammel nets were caught and torn on hardstructure (seven out of 40 fishing trips) and interactedwith other fishing gears, mainly octopus traps and potsin half of the trips.
Discussion
Non-commercial invertebrate discarded by-catcheswere dominated by six species, mainly echinoderms(S. granularis, P. lividus, A. mediterraneus andA. aranciacus), which are known for their voracity(e.g. Ruppert & Barnes 1994), and, together withC. olla and P. mammillata, are part of the mostimportant invertebrate top predators of the Algarve
coastal soft bottom communities (J.M.S. Goncalves,unpublished data). The latter species was the mostdiscarded non-commercial invertebrate and, in addi-tion to being a filter-feeding ascidian, is also avulnerable colonial sessile organism that provideshabitats for other species.
The seasonal pattern of non-commercial invertebratediscards followed the same patterns as those of com-mercial invertebrate and fish discards (Goncalves et al.2007), and the opposite to fish commercial catches,reaffirming winter as the most efficient season in termsof fishing and the D/T ratio. In addition to abundance,the diversity of discarded species is less in this season.Thus, there is a greater concern about the impact of thisfishery in the other seasons with the highest discardratios. The seasonal differences are probably associatedwith some spatial and fish recruitment variability,confounded in the case of the summer by shorter soaktimes and greater depths fished. This is reflected by thedifferent commercial species caught: cuttlefish, S. offi-cinalis, and soles,M. azevia and Solea spp., in autumn–winter–spring, and hake, Merluccius merluccius (L.)and forkbeard, Phycis phycis (L.), in summer.
non-commercial invertebrate discards
n = –236.56Ln(depth) + 1127.8
0100200300400500600700800900
1000(a)
(b)
100.0Depth (m)
Nu
mb
er o
f in
div
idu
als
cau
gh
t
r2 = 0.50
0.0 20.0 40.0 60.0 80.0
Nu
mb
er o
f in
div
idu
als
cau
gh
t
non-commercial invertebrate discards
n = 55.622Stime0.4805
r2 = 0.48
0100200300400500600700800900
1000
Soak time (h)0.0 20.0 40.0 60.0 80.0
Figure 5. Relationships between non-commercial invertebrate discards and depth (a) and soak time (b). The best fit regression with the respective
equation and coefficient of determination is presented.
J. M. S. GONCALVES ET AL.204
� 2008 The Authors. Journal compilation � 2008 Blackwell Publishing Ltd.
The combination of small mesh inner panel andlarge mesh outer panel of the trammel nets did notinfluence the capture of non-commercial invertebrates;only small differences between the six combinationswere found. However, these differences were oppositeto those found for discards of fish and other commer-cial invertebrates (Goncalves et al. 2007).The decrease in non-commercial invertebrate discard
rates with increasing depth was because for thesefishing grounds, most of the rocky bottom is found atdepths of <30 m (J.M.S. Goncalves, unpublisheddata). It is not surprising that discards of commercialfish and cuttlefish do not follow the same pattern, asthey are relatively less dependent on rocky substrate.For depths >50 m, soak times of <6 h may havecontributed to the lower discard rates. The longerhauling time also may contribute to the lower discardrates as there is a greater probability of organismsescaping or falling from the net before reaching theboat.Although discards varied considerably in relation to
soak time, the general pattern was for an initialincrease of non-commercial invertebrate discards withsoak time, followed by a levelling off or even adecrease with longer soak times of up to around 40 h.
This pattern is probably caused by a tradeoff betweenthe increase in scavenging and predation over time andthe rise in by-catch of invertebrates in general and also,in part, of these very same opportunistic consumers.By comparison, discards of commercial species (fishand invertebrates) are relatively independent of soaktime, probably because these species are more mobileand catch rates are more constant over time (over atime period of 24 h or more), and the criteria for beingdiscarded does not depend entirely on fish conditions,but rather on factors such as minimum legal landingsizes.
Given that soak time is limited by law to a maximumof 12 consecutive hours in a 24-h period and that catchrates of commercial species are highest for soak timesof approximately 24 h, it is advisable to ensure propermonitoring and enforcement of current legislation. Asoak time of more than 24 h can be avoided byensuring that nets are not left to fish over the weekend,or for more days than permitted in the hope ofcatching spiny lobsters (P. elephas) and other highvalue crustacean species that are attracted by rottingfish in the net.
A limitation of this study was the underestimate ofsmall-sized species (<30 mm), because fishing trials
Other discards
0100200
300400500600700
800900
1000(a)
(b)Commercial catch
0
100
200300
400
500
600
700800
900
1000
0.0 20.0 40.0 60.0 80.0 100.0
Depth (m)
Nu
mb
er o
f in
div
idu
als
cau
gh
t
Figure 6. Relationships between depth and other discards (a) and commercial catch (b).
TRAMMEL NET INVERTEBRATE DISCARDS 205
� 2008 The Authors. Journal compilation � 2008 Blackwell Publishing Ltd.

were carried out on a commercial fishing vessel whereconditions did not allow for adequate identification ofsuch species. However, megafauna are the best indica-tors of fishing effects because they are in general morevulnerable to fishing than smaller species and as slowergrowing organisms, they tend to take a longer time torecover from harvesting. Collie et al. (2000) concludedthat the removal of these species reduced the complex-ity and species diversity of the benthic community.
In the study area, coastal trammel nets are the maincause of by-catch and discarding of non-commercialinvertebrates at depths between 15 and 60 m. Atdepths <15 m, dredges for bivalves such as Donaxspp. and Spisula solida (L.), together with artisanaltrammel nets have a considerable impact (Borges et al.2001; Chicharo, Chicharo, Gaspar, Regala & Alves2002). With regards to other gears operating in thisarea, little is known of their impact on non-commercialinvertebrates. However, Erzini, Goncalves, Bentes,Lino & Cruz (1996) found that longlines fished atdepths between 10 and 50 m often caught starfish(A. aranciacus). At these depths, purse seines areresponsible for the discarding of relatively few inver-tebrate species, although at times in great quantities
(e.g. Polybius henslowi Leach), and at shallow depths(10–30 m) may scrape the bottom and have negativeimpacts on slow growing organisms such as gorgo-nians (Goncalves, Bentes, Monteiro, Coelho, Corado& Erzini 2008). Both gill netters and trawlers alsodiscard significant amounts of non-commercial inver-tebrates in these waters (Borges et al. 2001; Erzini,Costa, Bentes & Borges 2002; Erzini, Goncalves,Bentes, Lino, Ribeiro & Stergiou 2003). For example,for deep water crustacean trawls (300–700 m depth),non-commercial invertebrates accounted for 16.8%and 36.1% of the discards in weight and in number(Monteiro, Araujo, Erzini & Castro 2001). Garthe,Camphuysen & Furness (1996) reported that 19% ofthe total biomass of discards in the North Sea and NEAtlantic consisted of benthic invertebrates, while ahigher percentage was found for the southern NorthSea (40.3%).
As trammel nets are static gear, mortality ofinvertebrate megafauna is probably more associatedwith capture and subsequent discarding, rather thanthe impact of the gear on the bottom, although thisshould be incorporated in future research. By com-parison, only trawls could have a more direct physical
Other discards
0100
200300
400500600
700800
9001000
Commercial catch
0
100
200
300
400
500
600
700
800
900
1000
0.0 20.0 40.0 60.0 80.0Soak time (h)
Nu
mb
er o
f in
div
idu
als
cau
gh
t
(a)
(b)
Figure 7. Relationships between soak time and other discards (a) and commercial catch (b).
J. M. S. GONCALVES ET AL.206
� 2008 The Authors. Journal compilation � 2008 Blackwell Publishing Ltd.
impact on bottom invertebrates in addition to theircapture and discarding (e.g. Kaiser & Spencer 1996).Trammel nets are usually fished close to rocky
bottoms that typically have high diversity, as seen fromthe capture of fish species such as scorpaenids (rockfishes), and gorgonians, sponges and corals. The studyof variability of commercial to discard ratios as afunction of distance from rocky bottoms is importantas it could contribute to minimising discarding in thisfishery.With the exception of certain small, robust species
such as Scorpaena notata Rafinesque that are easilyuntangled from the trammel nets and discarded alive,the majority of discarded fish are either dead or in suchpoor condition that survival rates would be extremelylow. For non-commercial invertebrate discards, severaldifferent situations were identified: (1) asteroids andcrustacea: where loss of arms or appendages iscommon but survival is likely; (2) gastropod molluscsand echinoids: the shells of some species such as C. ollaand sea urchins like S. granularis and are often crushedby the fishermen in the process of removal from thenets, resulting in high mortality rates; and (3) ascidians– generally returned intact and likely to survive. Inaddition to the impact of the gear, the handling onboard and the condition and physical characteristics ofthe organism, survivorship after discarding is affectedby other factors such as, predation in the watercolumn, scavenging on the bottom, the resistance tochanges in pressure and the ability to re-colonise. Asdiscarding generally occurs while the fishing vessel isunderway and results in organisms being returned toareas, depths and habitats different from those wherethey were originally caught, the implications in termsof potential recolonisation are particularly importantfor organisms having poor mobility, such as molluscs(Malaquias, Bentes, Erzini & Borges 2006). However,an advantage of discarding taking place as the vessel isunderway is that there is no danger of concentration ofdiscards in a small area, which may have a negativeeffect on the equilibrium of benthic communities andlead to a loss in biodiversity. The quantification ofsurvivorship requires specific, carefully designed stud-ies that were beyond the scope of the present study.Of the discarded invertebrate species, none can be
considered threatened or had any kind of conservationstatus (IUCN 2007). However, this may be because fewspecies of invertebrates have such a status and alsobecause of the general lack of knowledge and studieson these species. Only one flag species, the red coral,Corallium rubrum (L.), an endemic species of valuableoctocoral from the Mediterranean and adjacent Atlan-tic rocky coasts that has been over-exploited for many
years (e.g. Santangelo, Maggi, Bramanti & Bongiorni2004), was discarded.
The highest non-commercial invertebrate discardrates observed were associated with greater fishingeffort on high complexity bottoms at low depths thatare rich in terms of biodiversity. Together with thepotentially disruptive removal of the most importantinvertebrate top predators of the coastal soft bottomcommunities, trammel netting on these types of bot-toms may have an impact in terms of reducing habitatcomplexity and consequently on the ecosystem as awhole.
Acknowledgments
We would like to thank all the people, institutions andorganizations who contributed directly or indirectly tothis study, with special thanks to Captain Julio Diogoand all the �Dois Alhinhos� crew for all of their supportand to our colleagues who took part in the laboratorysampling. Funds for this study were provided by theEuropean Commission, Directorate General of Fish-eries, DG XIV/C1 and the Portuguese NationalFoundation for Science and Technology (FCT) witha grant to J.M.S. Goncalves. We are also grateful totwo anonymous reviewers for the most valuablecomments.
References
Borges T.C., Erzini K., Bentes L., Costa M.E., Goncalves
J.M.S., Lino P.G., Pais C. & Ribeiro J. (2001) By-catch
and discarding practices in five Algarve (southern Portu-
gal) metiers. Journal of Applied Ichthyology 17, 104–114.
Chicharo L., Chicharo M., Gaspar M., Regala J. & Alves F.
(2002) Reburial time and indirect mortality of Spisula
solida clams caused by dredging. Fisheries Research 59,
247–257.
Clarke K.R. & Warwick R.M. (2001) Change in Marine
Communities: An Approach to Statistical Analysis and
Interpretation, 2nd edn. Plymouth: Natural Primer-E Ltd.
Plymouth Marine Laboratory, 172 pp.
Coelho R., Erzini K., Bentes L., Correia C., Lino P.G.,
Monteiro P., Ribeiro J. & Goncalves J.M.S. (2005) Semi-
pelagic longline and trammel net elasmobranch catches in
Southern Portugal: catch composition, catch rates and
discards. Journal of Northwest Atlantic Fishery Science 35,
531–537.
Collie J.S., Hall S.J., Kaiser M.J. & Poiner I.R. (2000) A
quantitative analysis of fishing impacts on shelf-sea ben-
thos. Journal of Animal Ecology 69, 785–799.
DGPA (2007) Recursos Pesca. http://www.dgpescas.pt/
(last accessed August 2007).
TRAMMEL NET INVERTEBRATE DISCARDS 207
� 2008 The Authors. Journal compilation � 2008 Blackwell Publishing Ltd.
Erzini K., Goncalves J.M.S., Bentes L., Lino P.G. & Cruz J.
(1996) Species and size selectivity in a multispecies Portu-
guese artisanal longline fishery. ICES Journal of Marine
Science 53, 811–819.
Erzini K., Costa M.E., Bentes L. & Borges T.C. (2002) A
comparative study of the species composition of discards
from five fisheries from the Algarve (southern Portugal).
Fisheries Management and Ecology 9, 31–40.
Erzini K., Goncalves J.M.S., Bentes L., Lino P.G., Ribeiro J.
& Stergiou K.I. (2003) Quantifying the roles of competing
static gears: comparative selectivity of longlines and
monofilament gill nets in a multi-species fishery of the
Algarve (southern Portugal). Scientia Marina 67, 341–352.
Erzini K., Goncalves J.M.S., Bentes L., Moutopoulos D.K.,
Hernando-Casal J.A., Soriguer M.C., Puente E., Errazkin
L.A. & Stergiou K.I. (2006) Size selectivity of trammel nets
in southern European small-scale fisheries. Fisheries
Research 79, 183–201.
Garthe S., Camphuysen K.C.J. & Furness R.W. (1996)
Amounts of discards by commercial fisheries and their
significance as food for seabirds in the North Sea. Marine
Ecology Progress Series 136, 1–11.
Gislason H., Sinclair M., Sainsbury K. & O�Boyle R. (2000)
Symposium overview: incorporating ecosystem objectives
within fisheries management. ICES Journal of Marine
Science 57, 468–475.
Goncalves J.M.S, Stergiou K.I., Hernando J.A., Puente E.,
Moutopoulos D.K., Arregi L., Soriguer M.C., Vilas C.,
Coelho R. & Erzini K. (2007) Discards of trammel nets in
southern European small-scale fisheries. Fisheries Research
8, 5–14.
Goncalves J.M.S., Bentes L., Monteiro P., Coelho R.,
Corado M. & Erzini K. (2008) Reducing discards in a
demersal purse-seine fishery. Aquatic Living Resources 21,
doi: 10.1051/alr:2008.
Hall M.A. (1996) On bycatches. Reviews in Fish Biology and
Fisheries 63, 319–352.
Hall S.J. (1999) The Effect of Fishing on Marine Ecosystems
and Communities. Oxford: Blackwell Science, 274 pp.
Hall M.A., Alverson D.L. & Metuzals K.I. (2000) By-catch:
problems and solutions. Marine Pollution Bulletin 41, 204–
219.
IUCN (2007) IUCN Red List of Threatened Species. http://
www.iucnredlist.org/ (last accessed August 2007).
Jennings S. & Kaiser M. (1998) The effects of fishing on
marine ecosystems. Advances in Marine Biology 34, 201–
352.
Kaiser M.J. & Spencer B.E. (1996) The effects of beam-trawl
disturbance on infaunal communities in different habitats.
Journal of Animal Ecology 65, 348–358.
Kelleher K. (2005) Discards in the world�s marine fisheries:
an update. FAO Fisheries Technical Paper 470, 131 pp.
Magurran A.E. (1988) Ecological Diversity and its Measure-
ment. London: Croom Helm, 179 pp.
Malaquias M.A.E., Bentes L., Erzini K. & Borges T.C.
(2006) Molluscan diversity caught by trawling fisheries: a
case study in southern Portugal. Fisheries Management and
Ecology 13, 39–45.
Monteiro P., Araujo A., Erzini K. & Castro M. (2001) Dis-
cards of the Algarve (Southern Portugal) crustacean trawl
fishery. Hydrobiologia 449, 267–277.
Purbayanto A., Tsunoda A., Akiyama S., Arimoto T. &
Tokai T. (2001) Survival of Japanese whiting Sillago
japonica and by-catch species captured by a sweeping
trammel net. Fisheries Science 671, 21–29.
Ruppert E.E. & Barnes R.B. (1994) Invertebrate Zoology,
6th edn. Philadelphia, PA: Saunders College Publishing,
1056 pp.
Santangelo G., Maggi E., Bramanti L. & Bongiorni L. (2004)
Demography of the over-exploited Mediterranean red
coral Corallium rubrum (L. 1758). Scientia Marina
68(Suppl. 1), 199–204.
Zar J.H. (1999) Biostatistical Analysis, 4th edn. Upper Saddle
River, NJ: Prentice-Hall, 663 pp.
J. M. S. GONCALVES ET AL.208
� 2008 The Authors. Journal compilation � 2008 Blackwell Publishing Ltd.
Appendix 1
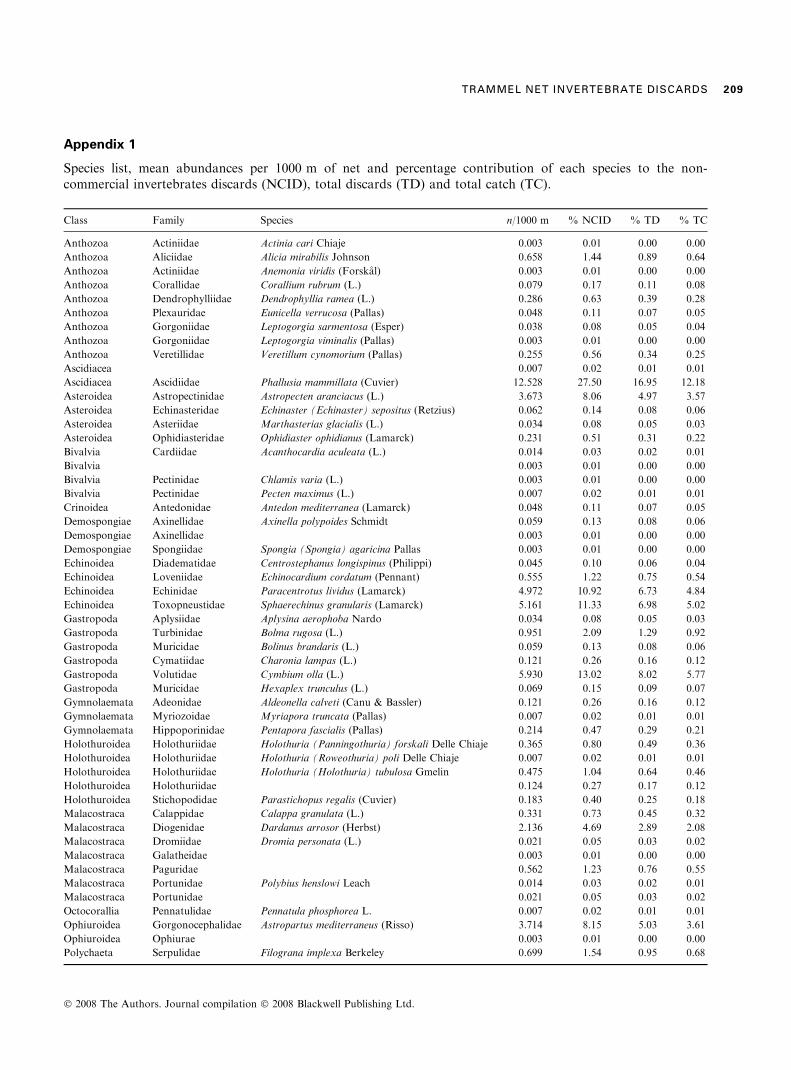
Species list, mean abundances per 1000 m of net and percentage contribution of each species to the non-commercial invertebrates discards (NCID), total discards (TD) and total catch (TC).
Class Family Species n/1000 m % NCID % TD % TC
Anthozoa Actiniidae Actinia cari Chiaje 0.003 0.01 0.00 0.00
Anthozoa Aliciidae Alicia mirabilis Johnson 0.658 1.44 0.89 0.64
Anthozoa Actiniidae Anemonia viridis (Forskal) 0.003 0.01 0.00 0.00
Anthozoa Corallidae Corallium rubrum (L.) 0.079 0.17 0.11 0.08
Anthozoa Dendrophylliidae Dendrophyllia ramea (L.) 0.286 0.63 0.39 0.28
Anthozoa Plexauridae Eunicella verrucosa (Pallas) 0.048 0.11 0.07 0.05
Anthozoa Gorgoniidae Leptogorgia sarmentosa (Esper) 0.038 0.08 0.05 0.04
Anthozoa Gorgoniidae Leptogorgia viminalis (Pallas) 0.003 0.01 0.00 0.00
Anthozoa Veretillidae Veretillum cynomorium (Pallas) 0.255 0.56 0.34 0.25
Ascidiacea 0.007 0.02 0.01 0.01
Ascidiacea Ascidiidae Phallusia mammillata (Cuvier) 12.528 27.50 16.95 12.18
Asteroidea Astropectinidae Astropecten aranciacus (L.) 3.673 8.06 4.97 3.57
Asteroidea Echinasteridae Echinaster (Echinaster) sepositus (Retzius) 0.062 0.14 0.08 0.06
Asteroidea Asteriidae Marthasterias glacialis (L.) 0.034 0.08 0.05 0.03
Asteroidea Ophidiasteridae Ophidiaster ophidianus (Lamarck) 0.231 0.51 0.31 0.22
Bivalvia Cardiidae Acanthocardia aculeata (L.) 0.014 0.03 0.02 0.01
Bivalvia 0.003 0.01 0.00 0.00
Bivalvia Pectinidae Chlamis varia (L.) 0.003 0.01 0.00 0.00
Bivalvia Pectinidae Pecten maximus (L.) 0.007 0.02 0.01 0.01
Crinoidea Antedonidae Antedon mediterranea (Lamarck) 0.048 0.11 0.07 0.05
Demospongiae Axinellidae Axinella polypoides Schmidt 0.059 0.13 0.08 0.06
Demospongiae Axinellidae 0.003 0.01 0.00 0.00
Demospongiae Spongiidae Spongia (Spongia) agaricina Pallas 0.003 0.01 0.00 0.00
Echinoidea Diadematidae Centrostephanus longispinus (Philippi) 0.045 0.10 0.06 0.04
Echinoidea Loveniidae Echinocardium cordatum (Pennant) 0.555 1.22 0.75 0.54
Echinoidea Echinidae Paracentrotus lividus (Lamarck) 4.972 10.92 6.73 4.84
Echinoidea Toxopneustidae Sphaerechinus granularis (Lamarck) 5.161 11.33 6.98 5.02
Gastropoda Aplysiidae Aplysina aerophoba Nardo 0.034 0.08 0.05 0.03
Gastropoda Turbinidae Bolma rugosa (L.) 0.951 2.09 1.29 0.92
Gastropoda Muricidae Bolinus brandaris (L.) 0.059 0.13 0.08 0.06
Gastropoda Cymatiidae Charonia lampas (L.) 0.121 0.26 0.16 0.12
Gastropoda Volutidae Cymbium olla (L.) 5.930 13.02 8.02 5.77
Gastropoda Muricidae Hexaplex trunculus (L.) 0.069 0.15 0.09 0.07
Gymnolaemata Adeonidae Aldeonella calveti (Canu & Bassler) 0.121 0.26 0.16 0.12
Gymnolaemata Myriozoidae Myriapora truncata (Pallas) 0.007 0.02 0.01 0.01
Gymnolaemata Hippoporinidae Pentapora fascialis (Pallas) 0.214 0.47 0.29 0.21
Holothuroidea Holothuriidae Holothuria (Panningothuria) forskali Delle Chiaje 0.365 0.80 0.49 0.36
Holothuroidea Holothuriidae Holothuria (Roweothuria) poli Delle Chiaje 0.007 0.02 0.01 0.01
Holothuroidea Holothuriidae Holothuria (Holothuria) tubulosa Gmelin 0.475 1.04 0.64 0.46
Holothuroidea Holothuriidae 0.124 0.27 0.17 0.12
Holothuroidea Stichopodidae Parastichopus regalis (Cuvier) 0.183 0.40 0.25 0.18
Malacostraca Calappidae Calappa granulata (L.) 0.331 0.73 0.45 0.32
Malacostraca Diogenidae Dardanus arrosor (Herbst) 2.136 4.69 2.89 2.08
Malacostraca Dromiidae Dromia personata (L.) 0.021 0.05 0.03 0.02
Malacostraca Galatheidae 0.003 0.01 0.00 0.00
Malacostraca Paguridae 0.562 1.23 0.76 0.55
Malacostraca Portunidae Polybius henslowi Leach 0.014 0.03 0.02 0.01
Malacostraca Portunidae 0.021 0.05 0.03 0.02
Octocorallia Pennatulidae Pennatula phosphorea L. 0.007 0.02 0.01 0.01
Ophiuroidea Gorgonocephalidae Astropartus mediterraneus (Risso) 3.714 8.15 5.03 3.61
Ophiuroidea Ophiurae 0.003 0.01 0.00 0.00
Polychaeta Serpulidae Filograna implexa Berkeley 0.699 1.54 0.95 0.68
TRAMMEL NET INVERTEBRATE DISCARDS 209
� 2008 The Authors. Journal compilation � 2008 Blackwell Publishing Ltd.
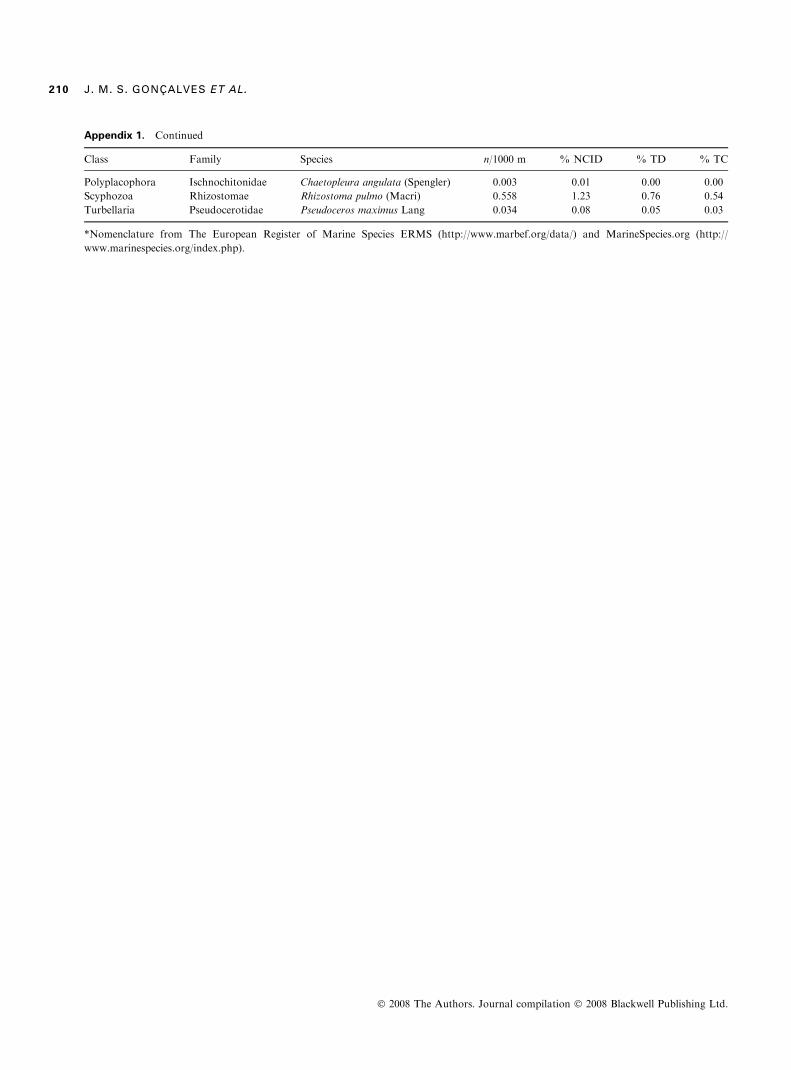
Appendix 1. Continued
Class Family Species n/1000 m % NCID % TD % TC
Polyplacophora Ischnochitonidae Chaetopleura angulata (Spengler) 0.003 0.01 0.00 0.00
Scyphozoa Rhizostomae Rhizostoma pulmo (Macri) 0.558 1.23 0.76 0.54
Turbellaria Pseudocerotidae Pseudoceros maximus Lang 0.034 0.08 0.05 0.03
*Nomenclature from The European Register of Marine Species ERMS (http://www.marbef.org/data/) and MarineSpecies.org (http://
www.marinespecies.org/index.php).
J. M. S. GONCALVES ET AL.210
� 2008 The Authors. Journal compilation � 2008 Blackwell Publishing Ltd.