Decarbonising Fishery Ports Through Smart Cluster Energy ...
264
Decarbonising Fishery Ports Through Smart Cluster Energy Systems Ateyah Ahmed Alzahrani A thesis presented for the degree of Doctor of Philosophy School of Engineering Cardiff University September 2021
-
Upload
khangminh22 -
Category
Documents
-
view
2 -
download
0
Transcript of Decarbonising Fishery Ports Through Smart Cluster Energy ...

Decarbonising Fishery Ports Through
Smart Cluster Energy Systems
Ateyah Ahmed Alzahrani
A thesis presented for the degree of Doctor of
Philosophy
School of Engineering
Cardiff University
September 2021

Abstract
The rising energy prices at seaports and fishing industries pose a major challenge
because the pace of work and high demand for fish products has increased dra‐
matically. This comes at a time of growing international pressure and global moti‐
vations to address climate change and reduce carbon emissions in many different
sectors of the economy.
In the literature review, a few research studies were found to highlight the op‐
timal use of power energy in ports, while some studies proposed certain measures
that contribute to some extent to reducing energy consumption and carbon emis‐
sions. However, there is an absence of a study that discusses the possibility of de‐
veloping a holistic energy analysis and management that can be scaled from a site
to a community level to achieve economically and environmentally viable benefits
to the community.
The research study that is described in this thesis aims to develop a compre‐
hensive integrated system for the optimal use of energy in seaports through the de‐
velopment of a smart grid system that is based on the renewable energy at Milford
Haven Port, whichwas developed and used as an applied case stud. It is hoped that
this study will contribute to reducing energy prices and that the port will achieve
economic benefits by sharing its surplus power with the national grid.
A five‐stage research methodology has been developed, starting with the pro‐
cess of collecting and analysing data on fishery buildings, known as and energy
audit. It then develops energy simulation models at the port using energy simula‐
tion software. The next stage aims to propose a smart grid model at multi‐levels,
namely a building, port and a community of 200 houses around a fishery port. The
next stage consists of the development of two smart decision‐making systems: the
first aimed at sharing surplus power with the neighbours of the port through a Peeri

to Peer (P2P) energy sharing approach; and the second aims to achieve financial in‐
comes for the port by selling surplus power to the national grid when energy prices
rise, a price‐based control strategy is used in this system
The model was developed and tested within 24 hours on randomly selected
days during the four seasons of the year. The simulation was characterised by the
fact that it was carried out instantaneously to get an accurate result, which resem‐
bles a real‐life system. In addition, the optimal number of energy storage systems
was determined at multi‐levels, which achieve the self‐sufficiency of the electric
power that is needed to meet the energy demand during the day.
Finally, a proposed roadmap has been developed to achieve nearly zero carbon
fishery ports that can be applied to different ports in different locations.
ii

Contents
Summary i
List of figures xi
List of tables xii
Acknowledgements xiii
List of Publication xiv
Acronyms xv
1 Introduction 1
Introduction 1
1.1 Background . . . . . . . . . . . . . . . . . . . . . . . . . . . . . 1
1.2 Key drivers for addressing climate agenda . . . . . . . . . . . . . 3
1.2.1 Global motivation toward decarbonisation . . . . . . . . 3
1.2.2 Introduction of distributed renewable energy sources . . 5
1.2.3 Energy decentralisation . . . . . . . . . . . . . . . . . . . 6
1.2.4 Energy market . . . . . . . . . . . . . . . . . . . . . . . 7
1.2.5 Industry 4.0 . . . . . . . . . . . . . . . . . . . . . . . . . 9
1.3 The case of seaports . . . . . . . . . . . . . . . . . . . . . . . . 10
1.4 Problem Statement . . . . . . . . . . . . . . . . . . . . . . . . . 12
1.5 Research Questions and Objectives . . . . . . . . . . . . . . . . . 12
1.6 Contributions . . . . . . . . . . . . . . . . . . . . . . . . . . . . 13
1.7 Thesis Outline . . . . . . . . . . . . . . . . . . . . . . . . . . . . 14iii

CONTENTS
2 Literature Review 17
Literature Review 17
2.1 Introduction . . . . . . . . . . . . . . . . . . . . . . . . . . . . . 17
2.2 Key findings of related research studies on decarbonising seaports 18
2.2.1 Carbon reduction . . . . . . . . . . . . . . . . . . . . . . 20
2.2.2 Renewable energy adoption . . . . . . . . . . . . . . . . 25
2.2.3 Cost optimisation . . . . . . . . . . . . . . . . . . . . . . 29
2.2.4 Adoption of smart control technologies . . . . . . . . . . 30
2.2.5 Regulatory landscape for greening seaports . . . . . . . . 33
2.2.6 Best practice guidelines for smart green ports . . . . . . . 34
2.3 Evolution of the seaport environmental regulatory landscape . . . 35
2.4 Previous projects that focused on decarbonising seaports and ter‐
minals . . . . . . . . . . . . . . . . . . . . . . . . . . . . . . . . 38
2.5 Smart port approach . . . . . . . . . . . . . . . . . . . . . . . . 40
2.6 The impact of energy systems in decarbonisation of seaports . . . 44
2.6.1 Centralised energy system . . . . . . . . . . . . . . . . . 44
2.6.2 Decentralised energy system (DES) . . . . . . . . . . . . . 47
2.6.3 Energy storage system . . . . . . . . . . . . . . . . . . . 50
2.6.4 Summary . . . . . . . . . . . . . . . . . . . . . . . . . . 55
2.7 The key components to greening seaports . . . . . . . . . . . . . 55
2.7.1 Background . . . . . . . . . . . . . . . . . . . . . . . . . 55
2.7.2 Smart grid . . . . . . . . . . . . . . . . . . . . . . . . . . 56
2.7.3 Microgrid . . . . . . . . . . . . . . . . . . . . . . . . . . 59
2.7.4 Virtual power plant . . . . . . . . . . . . . . . . . . . . . 62
2.7.5 Net zero energy building (NZEB) . . . . . . . . . . . . . . 63
2.7.6 Artificial intelligence . . . . . . . . . . . . . . . . . . . . 64
2.7.7 Information and communication technology . . . . . . . 65
2.7.8 Internet of Things . . . . . . . . . . . . . . . . . . . . . . 66
2.7.9 Summary . . . . . . . . . . . . . . . . . . . . . . . . . . 66
2.8 Energy analysis and simulation techniques . . . . . . . . . . . . . 67
2.8.1 Overview . . . . . . . . . . . . . . . . . . . . . . . . . . 67
2.8.2 Energy auditing . . . . . . . . . . . . . . . . . . . . . . . 68iv

CONTENTS
2.8.3 Modeling and simulation of an energy system . . . . . . . 70
2.8.4 Scheduling appliances technique . . . . . . . . . . . . . . 73
2.8.5 Applied Real decision‐making systems for Energy Manage‐
ment systems . . . . . . . . . . . . . . . . . . . . . . . 75
2.9 The current status of Energy use at fishery Ports . . . . . . . . . . 76
2.9.1 Energy cost . . . . . . . . . . . . . . . . . . . . . . . . . 77
2.9.2 The challenges of energy use for fish industries . . . . . . 78
2.10 Gap identification . . . . . . . . . . . . . . . . . . . . . . . . . . 79
2.10.1 The lack of total lifecycle approach to seaports decarboni‐
sation . . . . . . . . . . . . . . . . . . . . . . . . . . . . 80
2.10.2 The lack of semantic‐based modelling, forecasting and op‐
timisation of seaports energy systems . . . . . . . . . . . 81
2.10.3 The lack of secure and reliable seaport energy services . . 83
2.10.4 The lack of a transition towards prosumer‐driven seaport
energy communities . . . . . . . . . . . . . . . . . . . . 84
2.11 Summary . . . . . . . . . . . . . . . . . . . . . . . . . . . . . . 85
3 Methodology 88
Methodology 88
3.1 Introduction . . . . . . . . . . . . . . . . . . . . . . . . . . . . . 88
3.1.1 Research methodology approach . . . . . . . . . . . . . 88
3.1.2 Refined scope of the research . . . . . . . . . . . . . . . 90
3.2 Case study design and implementation . . . . . . . . . . . . . . . 91
3.2.1 Problem based industrial case . . . . . . . . . . . . . . . 91
3.3 Case study design and implementation . . . . . . . . . . . . . . . 95
3.3.1 Simulation‐based energy analysis at the district level . . . 95
3.3.2 Simulation‐based energy optimisation at district level . . . 96
3.4 Research structure . . . . . . . . . . . . . . . . . . . . . . . . . 100
3.4.1 Phase one . . . . . . . . . . . . . . . . . . . . . . . . . . 100
3.4.2 Phase two . . . . . . . . . . . . . . . . . . . . . . . . . . 101
3.4.3 Phase three . . . . . . . . . . . . . . . . . . . . . . . . . 102
3.5 Conclusion . . . . . . . . . . . . . . . . . . . . . . . . . . . . . . 102v

CONTENTS
4 Energy modeling and simulation of a Fishery Port 104
Energy modeling and simulation of a Fishery Port 104
4.1 Modelling approach . . . . . . . . . . . . . . . . . . . . . . . . . 104
4.2 Energy simulation programs . . . . . . . . . . . . . . . . . . . . 109
4.2.1 DesignBuilder . . . . . . . . . . . . . . . . . . . . . . . . 109
4.2.2 EnergyPlus . . . . . . . . . . . . . . . . . . . . . . . . . 110
4.2.3 Building Control Virtual Test Bed (BCVTB) . . . . . . . . . 111
4.3 Implementing the simulation model . . . . . . . . . . . . . . . . 112
4.3.1 Energy modeling for fish processing industries . . . . . . 112
4.3.2 Co‐Simulation of energy systems at fish processing indus‐
tries in MHPA . . . . . . . . . . . . . . . . . . . . . . . . 119
4.4 Initial insights . . . . . . . . . . . . . . . . . . . . . . . . . . . . 124
4.4.1 Simulation results . . . . . . . . . . . . . . . . . . . . . . 124
4.4.2 Integrating buildings with the solar farm using BCVTB . . . 125
4.4.3 Result of optimising schedules in Packaway . . . . . . . . 126
4.5 Discussion and Conclusion . . . . . . . . . . . . . . . . . . . . . 130
5 Developing a micro‐grid for a Fishery Port at multi‐level 135
Developing a micro‐grid for a Fishery Port at multi‐level 135
5.1 Introduction . . . . . . . . . . . . . . . . . . . . . . . . . . . . . 135
5.2 Methodological approach tomodelling and simulating amicro‐grid
in a fishery port . . . . . . . . . . . . . . . . . . . . . . . . . . . 136
5.3 Modeling and implementing amicro‐grid in the selected case study
(Building level) . . . . . . . . . . . . . . . . . . . . . . . . . . . 138
5.3.1 Load profile (building Level) . . . . . . . . . . . . . . . . 140
5.3.2 PV power supply . . . . . . . . . . . . . . . . . . . . . . 141
5.3.3 Grid connection . . . . . . . . . . . . . . . . . . . . . . . 143
5.3.4 Energy storage (battery system) . . . . . . . . . . . . . . 143
5.3.5 Charge/discharge control algorithm . . . . . . . . . . . . 145
5.3.6 Implementation of a micro‐grid in the selected case study 147
5.4 Scaling up the micro‐grid at a fishery port . . . . . . . . . . . . . 148
5.5 Scaling up a micro‐grid to promote energy community sharing . . 152vi

CONTENTS
5.6 Results and Discussion . . . . . . . . . . . . . . . . . . . . . . . 154
5.6.1 Micro‐grid at building level . . . . . . . . . . . . . . . . . 154
5.6.2 Scale‐up Micro‐grid at Fishery port level . . . . . . . . . . 159
5.6.3 Scale‐up Micro‐grid to promote energy community sharing 160
5.7 Conclusion . . . . . . . . . . . . . . . . . . . . . . . . . . . . . . 162
6 Optimal control strategies for Fishery ports micro‐grids 165
Optimal control strategies for Fishery ports micro‐grids 165
6.1 Energy community entities at fishery port . . . . . . . . . . . . . 165
6.2 Developing real‐time decision making to promote nearly zero car‐
bon fishery port . . . . . . . . . . . . . . . . . . . . . . . . . . . 167
6.2.1 Smart control based pricing . . . . . . . . . . . . . . . . 168
6.2.2 Smart control of P2P energy sharing . . . . . . . . . . . . 168
6.3 Results and discussion . . . . . . . . . . . . . . . . . . . . . . . 170
6.3.1 Optimise energy use by applying the price‐based control
strategy . . . . . . . . . . . . . . . . . . . . . . . . . . . 172
6.3.2 Optimise energy use by integrating the energy storage ca‐
pacity of electric boats . . . . . . . . . . . . . . . . . . . 173
6.3.3 Optimise energy use with P2P energy sharing control strategy174
6.4 Conclusions . . . . . . . . . . . . . . . . . . . . . . . . . . . . . 176
7 Conclusion and Future works 177
Conclusion and Future works 177
7.1 Research findings . . . . . . . . . . . . . . . . . . . . . . . . . . 177
7.1.1 Developing simulation capability at fishery port . . . . . . 178
7.1.2 Deploy and implement micro‐grid at fishery port . . . . . 179
7.1.3 Promote real‐time decision making toward decarbonizing
seaports . . . . . . . . . . . . . . . . . . . . . . . . . . . 180
7.1.4 Revisiting the Hypothesis . . . . . . . . . . . . . . . . . . 181
7.2 Contribution to the Body of Knowledge . . . . . . . . . . . . . . 182
7.3 Limitations and challenges . . . . . . . . . . . . . . . . . . . . . 183
7.4 Future work . . . . . . . . . . . . . . . . . . . . . . . . . . . . . 183vii

CONTENTS
7.4.1 Total life‐cycle approach to seaports decarbonisation . . . 184
7.4.2 Semantic‐basedmodelling, forecasting and optimization of
seaports energy systems . . . . . . . . . . . . . . . . . . 185
7.4.3 Secure and reliable seaports energy services . . . . . . . 186
7.4.4 Transition towards Prosumer‐driven seaport energy com‐
munities . . . . . . . . . . . . . . . . . . . . . . . . . . . 187
7.4.5 Propose roadmap for delivering a zero carbon fishery port
with an energy community . . . . . . . . . . . . . . . . . 188
7.4.6 Develop a smart decision making system to deliver a zero
carbon fishery port . . . . . . . . . . . . . . . . . . . . . 194
A Appendix 241
Appendix 241
viii

List of Figures
1.1 Global carbon emissions since 1970 to 2016 . . . . . . . . . . . . 2
1.2 The Total Global Primary Energy Supply between 1992‐2018 . . . 2
1.3 Global renewable energy capacity from 2001 to 2018 . . . . . . . 6
1.4 Energy market layout . . . . . . . . . . . . . . . . . . . . . . . . 8
2.1 The phases of the review process . . . . . . . . . . . . . . . . . . 20
2.2 Timeline of the main motivations for decarbonisation in the UK . . 36
2.3 A comparison between traditional seaports and smart ports . . . 43
2.4 Centralised power system paradigm . . . . . . . . . . . . . . . . 47
2.5 Main Distributed Generation Technologies . . . . . . . . . . . . . 49
2.6 The Fundamental Concept of Energy Storage . . . . . . . . . . . 51
2.7 Applicable power range and discharge power duration of different
energy storage type . . . . . . . . . . . . . . . . . . . . . . . . . 52
2.8 A comparison between cost and capacity between different energy
storage technologies . . . . . . . . . . . . . . . . . . . . . . . . 53
2.9 Battery storage system . . . . . . . . . . . . . . . . . . . . . . . 54
2.10 The seven domains of smart grid component based on NIST . . . 58
2.11 The interaction between smart grid technologies in a power system 59
2.12 The structure of a microgrid with DER . . . . . . . . . . . . . . . 61
2.13 The fundamentals of a NZEB design . . . . . . . . . . . . . . . . 64
2.14 The proposed seaport data space architecture . . . . . . . . . . . 67
2.15 Energy auditing phases . . . . . . . . . . . . . . . . . . . . . . . 69
2.16 HVAC scheduling types . . . . . . . . . . . . . . . . . . . . . . . 74
3.1 The Research Onion . . . . . . . . . . . . . . . . . . . . . . . . . 89
3.2 Milford Haven Port Authority . . . . . . . . . . . . . . . . . . . . 94ix

LIST OF FIGURES
3.3 The process of modeling and simulation using DesignBuilder and
EnergyPlus . . . . . . . . . . . . . . . . . . . . . . . . . . . . . . 96
3.4 Input Output variables for a smart grid model using simulink . . . 97
3.5 Input output variables for a smart grid model based on control price 99
3.6 Input output variables for a smart grid model based P2P power
sharing . . . . . . . . . . . . . . . . . . . . . . . . . . . . . . . . 99
3.7 The Main Methodology of Research for the Scope of this Thesis . 103
4.1 Modelling and simulation using DesignBuilder and EnergyPlus . . 105
4.2 Modelling and simulation using DesignBuilder and EnergyPlus . . 106
4.3 InputOutput data for simulation container using DesignBuilder and
EnergyPlus . . . . . . . . . . . . . . . . . . . . . . . . . . . . . . 107
4.4 Interface between energy models and power generation sources
using BCVTB . . . . . . . . . . . . . . . . . . . . . . . . . . . . . 108
4.5 The Process of simulation in DesignBuilder . . . . . . . . . . . . . 109
4.6 Energy simulation process of EnergyPlus software . . . . . . . . . 110
4.7 The process of integration multi software in BCVTB platform . . . 111
4.8 Packaway building model using DesignBuilder . . . . . . . . . . . 114
4.9 K Shed model . . . . . . . . . . . . . . . . . . . . . . . . . . . . 116
4.10 M Shed model . . . . . . . . . . . . . . . . . . . . . . . . . . . . 116
4.11 F Shed model . . . . . . . . . . . . . . . . . . . . . . . . . . . . 117
4.12 J Shed model . . . . . . . . . . . . . . . . . . . . . . . . . . . . 118
4.13 Solar Farm . . . . . . . . . . . . . . . . . . . . . . . . . . . . . . 119
4.14 The conceptual integration between power demand and supply
within the energy cluster . . . . . . . . . . . . . . . . . . . . . . 122
4.15 Integrating power supply and demand in BCVTB . . . . . . . . . . 123
4.16 Total power consumption of the buildings in the Milford Haven port 125
4.17 Simulation based optimisation BCVTB . . . . . . . . . . . . . . . 127
4.18 Result of integrating buildings with the solar farm in BCVTB . . . . 128
5.1 Grid component for the fishery industry . . . . . . . . . . . . . . 137
5.2 Input Output variables for a smart‐grid model using Simulink . . . 139
5.3 3D‐model of Packaway building in Milford Haven . . . . . . . . . 140x

LIST OF FIGURES
5.4 PV generation model in SIMULINK platform . . . . . . . . . . . . 143
5.5 Infinity grid model in SIMULINK platform . . . . . . . . . . . . . . 144
5.6 Battery model in the SIMULINK platform . . . . . . . . . . . . . . 145
5.7 Control charge algorithm using main storage system . . . . . . . . 146
5.8 Control charge algorithm using main storage system and backup
storage . . . . . . . . . . . . . . . . . . . . . . . . . . . . . . . 147
5.9 Simulation models of the buildings in the port of Milford Haven . 149
5.10 Control charge strategy for industries and the local community . . 151
5.11 Control charge algorithm using main storage system . . . . . . . . 153
5.12 Optimising energy use with the micro‐grid model . . . . . . . . . 155
5.13 Micro‐grid system . . . . . . . . . . . . . . . . . . . . . . . . . . 156
5.14 State of charge for four seasons [ a‐ winter, b‐spring, c‐summer,
d‐autumn] . . . . . . . . . . . . . . . . . . . . . . . . . . . . . . 158
5.15 The simulation results when integrating industries in the fishery
port with the solar farm . . . . . . . . . . . . . . . . . . . . . . . 160
5.16 Simulation results for the expandedenergy community aroundfish‐
ery port . . . . . . . . . . . . . . . . . . . . . . . . . . . . . . . 162
6.1 The grid energy community at fish industry . . . . . . . . . . . . 167
6.2 P2P energy sharing architecture and components . . . . . . . . . 170
6.3 Optimising energy cost using the price‐based control strategy . . . 173
6.4 Optimising energy use when using electric boat battery storage . 174
6.5 Optimising energy use based on a P2P energy sharing control strategy175
7.1 Roadmap for Delivering a Zero Carbon Fishery Port with Energy
Community . . . . . . . . . . . . . . . . . . . . . . . . . . . . . 190
xi

List of Tables
2.1 Carbon reduction studies in Seaports . . . . . . . . . . . . . . . . 21
2.2 Previous studies on greening seaports . . . . . . . . . . . . . . . 31
2.3 Previous studies on greening seaports . . . . . . . . . . . . . . . 32
2.4 List of projects investigating green seaports and port activities . . 41
2.5 The estimated energy usage and expenses at fish industries ‐ UK . 78
3.1 Related Studies . . . . . . . . . . . . . . . . . . . . . . . . . . . 92
4.1 The comparison between the actual and simulation result of Pack‐
away . . . . . . . . . . . . . . . . . . . . . . . . . . . . . . . . . 126
4.2 Impact of energy consumption per appliance . . . . . . . . . . . 128
4.3 The appliance usage list in the Packaway building . . . . . . . . . 129
4.4 Optimized appliances schedules for the Packaway Building . . . . 130
4.5 Comparisonbetweenmodel and actual data for the Packawaybuild‐
ing . . . . . . . . . . . . . . . . . . . . . . . . . . . . . . . . . . 132
5.1 List of the main appliances in Packaway building . . . . . . . . . . 141
5.2 Optimum battery size trials for smart energy community . . . . . 163
xii

Acknowledgements
First of all, I thank Allah Almighty for making it easy for me to study a PhD at Cardiff
University.
I extend my thanks and appreciation to all those who helped me in my studies,
foremost of whomwas his Excellency Professor Yacine Rezgui, who stood with me,
and who gave and refined my scientific research skills!
I also extend my heartfelt thanks to Dr.Ioan Petri and Dr.Ali Ghoroghi for their
help and guidance in my PhD journey.
I also wish to thank the piSCES Project team for providing access for data to
research and development in my PhD.
I also would like to thank my friends at BRE Centre for Sustainable Engineering
who support me during my study.
I would especially like to thank His ExcellencyMajor General Dr. Saud Al‐Shehri
for his continuous support in scientific research and various fields of knowledge.
I sincerely thankmy belovedmother, my brothers and sisters, andmy dearwife,
Najmah al‐Muslim, who stood with me during my PhD trip, and all my friends who
supported me and stood with me during my PhD Journey.
I also send this gift to my sons Ahmed, Ammar and Moaath. I ask Allah to see
them as distinguished, carrying the flag of knowledge and excellence, and looking
forward to a promising future full of excitement and challenges.
xiii

List of Publication
Conference papers
1. Alzahrani, A., Petri, I. and Rezgui, Y., 2020. Analysis and simulation of smart
energy clusters and energy value chain for fish processing industries. Energy
Reports, 6, pp.534‐540.
2. Alzahrani, A., Petri, I. and Rezgui, Y., 2019, June. Modelling and implement‐
ing smart micro‐grids for fish‐processing industry. In 2019 IEEE International
Conference on Engineering, Technology and Innovation (ICE/ITMC) (pp. 1‐8).
IEEE.
3. Alzahrani, A., Petri, I. and Rezgui, Y., 2021, June. Optimal Control Based Price
strategies for Smart Fishery ports Micro‐Grids. In 2021 IEEE International
Conference on Engineering, Technology and Innovation (ICE/ITMC) (pp. 1‐
8). IEEE. (paper accepted)
Journal papers
1. Alzahrani, A., Petri, I., Rezgui, Y. and Ghoroghi, A., 2020. Developing Smart
Energy Communities around Fishery Ports: Toward Zero‐Carbon Fishery Ports.
Energies, 13(11), p.2779.
2. Petri, I., Alzahrani, A., Reynolds, J. and Rezgui, Y., 2020. Federating Smart
Cluster Energy Grids for Peer‐to‐Peer Energy Sharing and Trading. IEEE Ac‐
cess, 8, pp.102419‐102435.
3. Alzahrani, A., Petri, I., Rezgui, Y. and Ghoroghi, A., 2021. Decarbonizing sea‐
port: current directions and future research. Energy Strategy Reviews. (un‐
der progress)
xiv

AcronymsCO2 Carbon Dioxide
COP21 Conference of the Parties
RES Renewable Energy Sources
EU European Union
RTG Rubber Tired Gantries
OPS Onshore Power Supply
AMS Automatic Mooring System
EMS Energy Management System
PV Photovoltaic
PCD Seaport Container Distribution
MAS Multi‐Agent System
IPCC Intergovernmental Panel on Climate Change
WPCI World Seaport Climate Initiative
GHG Greenhouse Gas emissions
PEEP seaport Energy Environmental Plan
Rewec3 Resonant Wave Energy Converter
ISWEC Inertial Sea Wave Energy Converter
IoT Internet of Things
UNFCCC United Nations Framework Convention on Climate Change
RO Renewable Obligation
NFFO Non‐Fossil Fuel Obligation
FIT Feed‐In Tariff
DER Distributed Energy Resources
DES Decentralized Energy System
DG Distributed Generation
ICT Information and Communication Technology
VPP Virtual Power Plantxv

LIST OF TABLES
DSO Distribution System Operator
AI Artificial Intelligence
ANN Artificial Neural Networks
GA Genetic Algorithm
FL Fuzzy Logic
ES Expert Systems
LCA Lifecycle Assessment
NIST National Institute of Standards and Technology
P2P Peer‐to‐Peer
BESS Battery Energy Storage System
xvi

CHAPTER1
Introduction
1.1 Background
In recent years, there has been a significant change in the earth’s climate as result of
globalwarming and an increase in the level of carbondioxide in the atmosphere [1].
The Intergovernmental Panel on Climate Change (IPCC) reported that there has
been a remarkable change in the atmosphere and ocean currents since 1950 [2].
One of the main reasons for climate change is the excessive use of primary energy
sources as result of the Industrial Revolution, which has caused a large amount of
carbon to be emitted into the atmosphere. Using primary fuel resources such as
fossil fuels has caused an increase in Ghg emissions into the atmosphere, which
is predicted to lead to global warming, climate change and ozone layer depletion.
Figure 1.1 illustrates the rise of global carbon emissions from 1970 to 2016.
The main source of carbon emissions is burning fossil fuels. Fossil fuels are
formed from ancient plants and animals that lived on the Earth millions of years
ago. Currently, fossil fuels are used to produce energy in cars, generators, trains,
planes. The fuel combustion process in engines produces exhaust gases that con‐
sist of air pollutants such as Sulphur Dioxide (SO2), particulate matter (soot), Nitro‐
gen Oxide (NOx) and a large amount of Carbon Dioxide(CO2) [4].
Energy use is the cornerstone of climate change. Therefore, the basic need to
use energy for different purposes in different sectors around the world needs to
be taken into consideration. The global demand for primary energy sources has
increased due to demographic growth. Meanwhile, the increase in the number of
electricity users and the Industrial Revolution in developing countries have con‐
tributed significantly to economic growth around the world since the last century .1

1.1. BACKGROUND
Figure 1.1: Global carbon emissions since 1970 to 2016 [3]
It is expected that the world’s need for energy will increase during the next decade
because of population growth and increased industrial activities. The industrial
sector is predicted to increase its energy consumption by 40 percent by 2040 [5].
Figure 1.2 illustrates the total global primary energy supply from 1990 to 2018.
Figure 1.2: The Total Global Primary Energy Supply between 1992‐2018 [6]
However, there is need to transition toward clean, affordable and resilient en‐
ergy sources that will mitigate carbon emissions and limit the effects of global
warming. Consequently, governments and countries should act and deal with cli‐
mate change to limit its impact on the earth and its people. The first steps for
international action in dealing with climate change began with the launch of in‐2

1.2. KEY DRIVERS FOR ADDRESSING CLIMATE AGENDA
tergovernmental panel on climate change in 1988 [7] . This was followed by the
United Nation’s Framework Convention of Climate Change (UNFCCC) in 1994 [8].
In 1997, the Tokyo Protocol was adopted by more than 192 participating coun‐
tries, which aims to activate and operate the UNFCCC. This led to a commitment
from themajor industrial and economic countries to reduce carbon emissions. The
Tokyo Protocol entered into force in 2005 [9].
Subsequently, 184 countries agreed a plan to combat climate change in Paris
in 2015. The majority of decision‐makers promised to start making practical steps
to eliminate global average temperature changes and reduce emissions, and to
increase the utility of renewable energy sources [10]. As a result of the global
agreement to tackling climate change, some countries have started to set the rules,
legislation and policies of renewable energy to reduce CO2 emissions and increase
the use of renewable energy sources. Annunziata et al. [10], Moya et al. [11] high‐
lighted the main three prospective that governments can use to limit CO2 emis‐
sions, which are the integration of energy efficiency and renewable energy require‐
ments, translate investment in energy savings into economic value, and a commit‐
ment towards the ‘’zero‐energy buildings’’ target. In 2016, Moya mentioned that
governments need to continuously focus on energy efficiency programs as a suc‐
cessful experience for developing countries to decrease Ghg emissions and save
energy [12]. In 1997, the European Union (EU) was one of the first coalitions in
the world set targets to reduce CO2 emissions and increase the use of renewable
energy resources [4]. The main objectives of the European Union to tackle climate
change are to decrease greenhouse gas emissions, ensure the security of supply
and improve EU competitiveness [13].
1.2 Key drivers for addressing climate agenda
1.2.1 Global motivation toward decarbonisation
Due to increased awareness about global warming and the importance of follow‐
ing a decarbonisation plan at the global level, many countries have started tomove
towards decarbonisation. In 1990, the US Pollution Prevention Law focused on re‐
ducing the amount of pollution using cost‐effective changes in a life‐cycle process.3

1.2. KEY DRIVERS FOR ADDRESSING CLIMATE AGENDA
This law was applied at government level, including the industrial sector. This law
focuses on different criteria to eliminate pollution, such as changing the use of
technologies, processes and implementing training to increase energy efficiency
and minimise pollution through different applications [14].
In 2011, the EuropeCommission published its low carbon roadmap for EUmem‐
ber state, which stated that by 2050 the EU should cut its greenhouse gas emissions
by 80‐95 percent. To achieve this target, the EU members must increase the level
of development and deployment of clean technology [15].
The United Kingdomwas one of the first countries to start to implement a long
term plan to reduce carbon emissions and increase the use of renewable energy
resources. In 1989, the UK aimed to replace fossil fuel by nuclear energy to pro‐
duce electricity under the Non‐Fossil Fuel Obligation (NFFO) [16]. This was fol‐
lowed by the global motivation programme, known as the Climate Change Pro‐
gramme, which aimed to reduce CO2 emission by 15‐18 percent below the 1990
level by 2010 and also reduce overall ghg emission [17].
In 2002, the UK government enacted the new Renewable Obligation (RO). This
obligation makes it mandatory for the supplier to secure a specific share of elec‐
tricity from renewable energy or they have to pay a penalty. Another of these poli‐
cies has been enacted in 2003 2003/87/EC, known as the Emission Trading Scheme
[ETS], which is one of the main tools to reduce ghg emissions in the EU [18]. This
scheme limits emissions from more than 11000 heavy energy–using emission in
more than 31 countries. The scheme works as a cap and trade mechanism. The
cap sets the total amount of ghg that can be emitted by the installation, while the
companies receive or trade the emission allowances that can be traded [19]. In
2008, a new act from the government has been introduced related to the danger‐
ous of climate change. This act requires to cut GHG emissions by about 34 percent
in 2020 and 80 percent by 2050. The government sets a budget in several periods
to achieve the target of decreasing carbon emissions to 2050 [20]. Another impor‐
tant policy that has been applied in Europe since 1980 is the Feed‐In‐Tariff [FIT],
which began to be applied in Denmark, Germany and Italy in 1990 [21].
The concept of [FIT] is ‘’policy pricing, guaranteeing renewable energy genera‐
tors a fixed price for the electricity they produce’’, which will attract considerable4

1.2. KEY DRIVERS FOR ADDRESSING CLIMATE AGENDA
capacity [22]. The FIT’s advantage is the guaranteed price, which will allow house‐
holders with solar panels to buy power through RE markets.The EU also set a new
directive 2001/77/EC to promote electricity production from renewable energy re‐
sources [23]. In addition, to increase the deployment and development of RES,
the EU in 2009 issued the renewable energy directive 28/2009/EC to promote the
use of renewable energy resources with 20 percent of total power production by
2020 [24].
In 2011, a new law was enacted by the EU Commission that required all mem‐
bers to apply the industrial emission directive. This law aims to increase the level
of protection of human health and the environment by decreasing the level of in‐
dustrial emissions in the EU. This law is based on five criteria, as follows: integrated
approach, best available techniques, flexibility, environment inspection and public
participation [25]. In 2012, the UK set up a new approach that was known as the
“Green Deal”, which aimed to help homeowners to improve their energy savings
and find the best option to pay for them. This was followed in 2014 by a gov‐
ernment announcement of a plan to deploy smart meters in homes from 2014 to
2019, which aimed to install more then 53 million smart meters for gas and elec‐
tricity [26].
1.2.2 Introduction of distributed renewable energy sources
The use of renewable energy sources has increased dramatically in different sec‐
tors around the world. However, there is a global trend to transition energy use
from fossil fuel to renewable energy sources [27], which is hoped to reduce global
emissions from burning fossil fuels. In 2016, around 14 percent of the total energy
primary supply came from renewable energy supply. However, approximately 70
percent of renewable primary energy supply comes from biomass energy, which
was followed by 20 percent from hydro‐power [28]. In contrast, the proportion of
primary energy supply from geothermal, solar and wind rose gradually from 3.23
percent to 11.66 percent between 1990 and 2016, respectively [29].
The global renewable energy capacity rose by 8.3 percent in 2017. By the end
of 2017, the total renewable energy generation capacity was about 2179 Gigawatt.
Furthermore, the total amount of renewable energy served off‐grid renewable5

1.2. KEY DRIVERS FOR ADDRESSING CLIMATE AGENDA
power to more than 146 million users [30]. Figure 1.3 demonstrates the global
growth of renewable energy generation from 2001 to 2018, by energy source [31].
Figure 1.3: Global renewable energy capacity from 2001 to 2018 [31]
1.2.3 Energy decentralisation
Originally, Direct Current [DC] power was supplied locally from small power gen‐
erator units; however, this system suffered from limited units of power voltage.
Later, Alternative Current [AC] based power grids were introduced that enabled
electricity to be carried over long distances from large power stations (e.g. Drax in
the UK), which is known as a centralised energy system [32].
The last decade has witnessed a significant transition of energy policy due to
issues such as the limited supply of fossil fuels and global warming, together with
an increase in the population growth rate. Consequently, some countries have
started to deploy small power generation units to increase the security of supply
and to meet power demand, which is known as a decentralised energy system or
Distributed Generation. The role of distributed generation is to provide flexibility
and reliability to the grid because it uses small sized plants and efficient genera‐
tion [33]. In addition, distribution energy generation is able to exploit local energy
generation resources and install energy storage at local sites [34]. The main en‐
ergy policies that have been enacted to deploy decentralised energy systems are
to deregulate the energymarket and tackle climate change. This will help to deploy6

1.2. KEY DRIVERS FOR ADDRESSING CLIMATE AGENDA
decentralised energy systems, as well as increase the competitiveness between en‐
tities [35]. Paliwal et al. [36] found that the transition from centralised power gen‐
eration to decentralised power generation is accelerating. Furthermore, RES inte‐
gration with a decentralised energy system decreases reliance on depleting fossil
fuel, increases security of power supply and reduces carbon emissions.
1.2.4 Energy market
The global transition from a regulated to deregulated power market started in the
last three decades. However, this transition needs a new system to organise the en‐
ergy market. Consequently the power exchange and power pool were established
to enable energy providers, energy traders and large consumers to participate in
energy market to buy or sell energy [37]. In 1989, the UK was the first country in
the European Union to privatise its electricity industry, although the action plan
to start privatisation electricity industry began in 1990 [38]. Wholesale electricity
competition was introduced in 1998 and the whole retail market was deregulated
by National Power, which means that all consumers have the freedom to choose
their power supply. At that time, the number of electricity customers was about
22million end‐users [39]. Thewholesalemarket is designed to bemuch like a com‐
modity market. Generators sell electricity to suppliers through bilateral contracts,
Over The Counter (OTC) trades and spot markets. In 2010, 91.5 percent of power
traded in the UK was OTC traded and about 9 percent was exchange traded. Cur‐
rently, there are three exchange providers in the UK’s electricity markets: the APX
GROUP, Nasdaq OMX N2EX and the intercontinental exchange. Figure 1.4 demon‐
strates the process of Energy market (ICE)) [40].
In 2010, half of the electricity consumed in the UK was produced by the largest
three companies. Seven companies had a market share increase of 5 percent.
Meanwhile, 68 percent of the retail supply is dominated by the major energy sup‐
pliers. Electricity trades every 30minutes blocks (settlement periods) in thewhole‐
sale market and it will continue to 60 minutes before settlement period, which is
called gate closure. After the closure gate (National Grid Electricity Transmission
and the system operator) are responsible for supply and demand on second‐by‐
second basis. National Grid Electricity Transmission [NGET] assesses the situation7

1.2. KEY DRIVERS FOR ADDRESSING CLIMATE AGENDA
Figure 1.4: Energy market layout [40]
of the system and takes balancing actions, mostly using the balancing mechanism
to correct any imbalance [41]. In 1990, the retail electricity supply market opened
to competition [42].
Today, six large vertical integrated energy suppliers dominate the retail markets
in the United Kingdom, which are Centrica plc, E.On UK, EDF Energy, RWE N Power,
Scottish and Southern Power [SSE] and Scottish Power [43]. The National Electric‐
ity Transmission System [NETS] is the responsible for transmitting electricity from
the generator to the consumers. NETS includes around 25 000 km of high‐voltage
overhead lines (275) kilo‐volts and above in England and Wales, and 132 kilo‐volts
and above in Scotland and offshore). Regulatory regional monopoly transmission
owned and maintained Transmission Onshore Assets [TOs). NGET is considered to
be a part of the national grid and in 1995 it was listed on the London Stock Ex‐
change with a multi‐ownership base. NGET has the responsibility for ensuring that
electricity supply and demand stay in balance and the system in stable with limited
technical and operating work [41, 44]. The regulator, Ofgem, was concerned about
the security of supply by 2009 and the Labour government reported the decarbon‐
isation of generation and development through the Committee of Climate Change
in 2010 [39], as follows:8

1.2. KEY DRIVERS FOR ADDRESSING CLIMATE AGENDA
• Security of supply,
• Low carbon emission from electricity,
• Affordable.
In 2012, the European Union introduced its plan for the future of the European
electricity market, including developing, implementation, target model coupling
by 2014, and a draft energy bill with policy overview. In the same year, the inter‐
connector between Ireland and Wales started [17].
The Labor government published an energy act in 2013, which focused on de‐
carbonisation of generation and reforms of the electricity market [17]. In 2014,
Ofgem proposed market investigation by the competition and market authority
[45]. Electricity market reform is a government policy to invest in secure, low‐
carbon electricity, improve the security of the United Kingdom’s electricity sup‐
ply, and improve affordability for consumers [39]. It will also help to bring forward
investment in low‐carbon technologies in an affordable, secure and sustainable
manner [46].
1.2.5 Industry 4.0
The last few years have witnessed radical transformation of the global industrial
landscape, due to fast growth of the new generation of technology with smart
features that can increase production, minimise the cost and optimise the work
environment via different approaches [47]. The Industry 4.0 is a high technology
initiative strategy that has been discussed in both research and technical fields af‐
ter an article published in 2020 by the German government [48]. Industry 4.0 can
emerge between the physical and digital worlds through the Cyber Physical System
(CPS), which will enhance productivity and efficiency among industries. The new
approach will combine among different kinds of new technologies, such as CPSs,
the Internet of Things (IoT), Internet of Services (IoS), Robotics, Big Data, Cloud
Manufacturing and Augmented Reality [AR] [49]. In addition, integration among
these technologies will make factories smarter [50]. The concept of a smart fac‐
tory refers to different developments in the new generation of the industrial sector
based on integration, digitalisation, flexible structures and smart solutions [51].9

1.3. THE CASE OF SEAPORTS
The combination of software, hardware and machines leads to an improvement
in productivity, and reduces waste, cost and unnecessary resources [52]. The IoT
will play a vital role in energy management in the industry sector via smart meters,
which collect data of energy use in different sectors of industry in real time. Thiswill
improve energy efficiency and reduce waste via EMS in smart industry [53, 54, 55].
1.3 The case of seaports
Seaports are important contributors to economic growthworldwide [56]. Seaports
have always played an important role in facilitating import and export movements
between countries, and they have directly contributed to the formation of inter‐
national trade and global supply chains [57].
As result of the congestion of commercial activities from ships and the opera‐
tions of lifting and unloading containers, as well as the local presence of fish indus‐
tries, modern seaports and their surrounding cities have become carbon intensive
and have substantial pollution levels [58].
The most polluted cities in the world are all coastal cities, which is exacerbated
by the fact that 70 percent of emissions from ships worldwide occur within 400
km from coastal areas [59]. Based on a health board study: (a) the emissions from
seaports and ships affects about 19,000 people with lung cancer, while (b) approx‐
imately 60,000 die annually from different conditions caused by pollutants [60].
Carbon emissions from ships have increased gradually over time, and are cur‐
rently estimated at circa 2.7 percent of total CO2 emissions [61] [62]. The United
Nations estimates the annual CO2 emissions frommaritime transport to about 1000
million tonnes [63]. The intensive use of energy from primary sources has led to an
increase in the level of carbon emissions. Consequently, there is a pressing need to
transition towards clean, affordable and resilient energy systems to help mitigate
carbon emissions and limit the effects of global warming [64].
Key milestones in this climate mitigation journey include the 2005 Kyoto proto‐
col [65, 66] and the 2015 COP21 agreement in Paris, where 184 countries agreed
to implement practical steps to limit and lower the global average temperature
by reducing emissions, as well as increasing reliance on renewable energy [67].10

1.3. THE CASE OF SEAPORTS
As a result of this global agreement, several countries began to establish regula‐
tions, legislation and policies to promote the uptake Renewable Energy Sources
(RES) [68]. The mitigation methods include: (a) integration of energy efficiency
and renewable energy, (b) investments in energy savings, and (c) moving towards
zero‐energy buildings [10, 11].
The EU has set ambitious objectives to address the climate agenda by: (a) de‐
creasing greenhouse gas emissions, (b) ensuring the security of supply chains, and
(c) improving the EU’s competitiveness [69].The fishing industry is one of the main
activities of seaports. Food and agriculture organisation studies have also reported
that the global human consumption of fish increased dramatically from 1950 to
2012. The proportion of fish processed world‐wide increased from 20 million tons
to more than 136 million tons, which adds pressure for fish processing industries
to use energy from different sources to meet the demand of fishing and for fish
processing operations [70, 71].
Several parameters can influence energy usage by the fishing industries, such
as: (i) seasonal variations can increase the fishing industry’s demand for energy; (ii)
the weather can have a significant effect on the total processed fish during a year;
and (iii) the number of fisheries and boats can also effect total energy use. Energy
use for fish processing industries can have two main operating modes: (i) direct
use, such as lighting system, heating and washing machines;and (ii) indirect use,
through converting the power to another form of energy, such as cooling cycle and
freezing equipment. However, increased energy demand from the fishing industry
increases the cost and CO2 emissions.
Consequently, the fishing industry should move towards more secure, clean
and sustainable energy solutions. In this thesis, it argue that the new smart energy
systems and techniques that have recently emerged are able to meet the require‐
ments of the fish processing industries and fishery ports through increased use of
renewable energy and smart energy management. Seaports are facing increased
pressures to reduce their carbon footprint, while increasing their energy efficiency
and global competitiveness [72, 73]. Moreover,energy consumption in seaports
must be continuously monitored to manage the increasing energy costs, which is
reflected in the increased fuel demand [74].11

1.4. PROBLEM STATEMENT
1.4 Problem Statement
Fishery buildings at ports use energy‐intensive equipment, such as refrigerators,
air conditioners and ice making machines. This leads to high energy costs and,
indirectly, to an increase of the carbon emissions. Because most fishery build‐
ings are old, there is an urgent requirement to make them more sustainable and
achieve economic competitiveness in the energymarket. In 2011, fishery buildings
consumed about 40 billion litres of fuel and produced 179 million tons of carbon
emissions [75]. The traditional design of energy systems at fishery buildings leads
to increased energy consumption and carbon emissions. because it lack to new
updated of energy efficiency standards that effectively contribute to less energy
consumption and produce minimum emissions. Furthermore, the percentage of
carbon emissions resulting from fishery buildings is estimated to be 4 percent of
the global greenhouse gas emission (GHGS) [10]. Meanwhile, the total human con‐
sumption of seafood has increased from 20 million tons in 1950 to more than 136
million tons in 2014 [12].This rapid growth in seafood consumption has increased
carbon emissions as result of intensive energy use by this industry. So, It is crucial
to find a smart, sustainable and affordable energy that will help to reduce energy
cost and limit carbon emission at fishery buildings.
1.5 Research Questions and Objectives
This study aims to reduce the costs and carbon footprint of fishery buildings by
developing and testing a new ‘smart grid’ electricity network. Consequently, this
thesis has three main research questions that aim to address this gap, as follows:
• Can a reliable simulation capability be developed that provides real‐time ac‐
counts of energy demand and use for fishery buildings?
• Can the concept of a smart grid be adopted and applied to energy systems
in fishery buildings at multi‐levels?
• Can the energy sharing and trading approachbe simulated to promotedecision‐
making that reflects the efficiency in fishery buildings?12

1.6. CONTRIBUTIONS
This thesis aims to reduce carbon emissions from energy networks in fishery
buildings by implementing smart energy system technologies.
The first research question is translated to the following objectives:
• Develop an energy model and simulation capability to provide real‐time ac‐
counts of energy flows in seaports.
• Investigate the potential of local power supplies tomeet total power demand
in the fish processing industry using a co‐simulation platform.
The second research question is translated to the following objective:
• Examine various scenarios for decarbonising seaports by leveraging renew‐
able energy sources, including solar energy and energy storage.
The third research question is translated to the following objective:
• Investigate the role of seaports to address the energy demand of their local
communities through energy sharing.
The following research hypothesis is posited: “The concept of Industry 4.0 has
the potential to deliver net zero carbon fishery ports by leveraging smart and clean
energy generation, use, and storage, while promoting the formation of energy
communities within the local ecosystem.” This thesis will apply three different case
studies, as follows: fish processing industry, fishery port site and warehouse refrig‐
eration.
1.6 Contributions
Themain contribution of this study is its focus onminimising the cost and emissions
related to energy use by the fishery industries using smart energy systems. The
contributions that have been derived from this study include:
1. A thorough and authoritative review of the state‐of‐the‐art research, includ‐
ing past and ongoing initiatives, with the objective to reduce the carbon
footprint of seaports. The literature review reveals that existing research
leverages recent advances in digital technologies, while focusing on one or
several of the following themes: carbon reduction, use of renewable en‐
ergy resources, cost performance optimisation, deployment of smart control13

1.7. THESIS OUTLINE
technologies, regulatory landscape for greening seaports, and implementing
green port practices guidelines. As such, this thesis provides a critical review
of existing technologies and concepts that promote and contribute to the
decarbonisation of seaports, including smart grids and virtual power plants.
2. A reliable simulation capability that provides real‐time accounts of energy
demand and use, as well as short to medium‐term energy projections to un‐
derstand the complex ecosystem around seaports, including energy systems
in use, fish processing activities, local stakeholders, including communities
by utilising tools such as DesignBuilder [76], EnergyPlus [77] and Building
Control Virtual Test Bed (BCVTB) [78].
3. A simulation model of integration of local solar farm energy in a local en‐
ergy cluster using a multi‐building energy coordination model developed in
EnergyPlus and simulate in BCVTB.
4. A smart grid model to explore various scenarios for decarbonising seaports
by leveraging renewable energy sources, including solar energy and energy
storage, through a smart monitoring control strategy.
5. A smart energy community model around seaports by integrating the smart
grid with local community energy storage via developing a simulation‐based
optimisation strategy.
6. Real‐time decision‐making strategies that lead seaports and communities
around seaports towards decarbonisation through energy sharing and trad‐
ing.
1.7 Thesis Outline
This thesis is structured as follows:
Chapter One discusses the main drivers of applying a smart energy system
for the industrial sector and it presents the main problem statement, hypothesis
and objectives for the research study.
Chapter Two reviews the previous studies and related works of the applica‐
tion of smart energy systems in fishery ports and fish processing industries. It will14

1.7. THESIS OUTLINE
highlight the current status of global energy use in the industrial sectors and it will
outline future energy use by industrial sector. This will be followed by a description
of the fourth generation of smart energy systems, including the history of energy
transition toward decentralisation, distributed generation (DG), renewable energy
resources and energy storage systems.
Chapter Three describes the methodology that is used in this thesis, which
involves case studies drawn from the EU INTERREG piSCES project (smart energy
cluster for the fish processing industry).
Chapter Fourdiscusses energymodeling and simulation at fishery ports. This
chapter is based on the first research question, which aims to develop simulation
capability at fishery processing industries. The first part will give a brief description
of the modeling and simulation of energy systems, focusing on energy modelling
for industrial applications. It will then present the follow‐up methodology that has
been used to answer the question. The next part will describe the simulation soft‐
ware that will be used to simulate fishery port sites. This chapter will then present
a simulation of a container implementation for three different pilot sites.
Chapter Fivewill highlight the implementation of a smart micro grid at build‐
ing level. A micro‐grid system for the fish processing industries with a validation
use‐case atMilford Haven Port in SouthWales, UK has been implemented. The sys‐
tem has beenmodelled using EnergyPlus andMATLAB with an infinite grid, renew‐
able energy resource,battery and charge/discharge controllers to optimise energy
consumption and production, and reduce carbon emissions. Also, this chapter will
conduct an energy analysis and modelling for the fishing industries by exploring
energy transition, from a building level to an energy community level. It aims to
find the optimum balance between the battery storage system and the number of
PVs that are required to meet the community’s power demands.
Chapter Six investigates the energy usage of a case study fishery port and
it evaluates a method to maximise the use of renewable energy sources in these
energy clusters via a smart‐grid approach, while applying price‐based control and
peer‐to‐peer (P2P) power sharing considering optimised trading of energy. It will
then develop a roadmap to achieve a nearly zero carbon emission fishery port.
Chapter Seven will re‐examine the main research questions and review the15

1.7. THESIS OUTLINE
extent towhich they are achieved, as well as discuss the contributionsmade by this
research the field of knowledge. It will also present the most important challenges
and obstacles that occurred during the research phase. The most important future
trends in reducing carbon emissions in seaports will also be presented, including
their impact on the global level.
16

CHAPTER2
Literature Review
This chapter provides a review of the previous studies and relatedworks for the ap‐
plication of smart energy systems in seaports and fish processing industries. It will
highlight the current status of global energy use in the industrial sectors and it will
outline future energy use by industrial sector. This will be followed by a description
of the fourth generation of smart energy systems, including the history of energy
transition toward decentralisation, distributed generation, renewable energy re‐
sources and energy storage system. The next section will focus on smart energy
management systems including Smart Grid, Micro‐Grid, Virtual power plants and
Net Zero Energy systems. The following section will review the optimisation tech‐
niques of energy in fishery ports and fish processing industries. The next section
will focus on energy auditing, modeling and simulation, scheduling appliances and
artificial intelligent techniques. The final section will summarise the review and
related works, and it will present the gap identification for this research.
2.1 Introduction
Seaports are important contributors to economic growth worldwide [56]. Since
before the beginning of the Industrial Revolution, seaports have played an impor‐
tant role in facilitating import and export movements between countries. This
has directly contributed to the formation of international trade and global sup‐
ply chains [57]. However, because of the congestion of commercial activities from
ships, and the operations of lifting and unloading containers, as well as the local
presence of fish industries, seaports and their surrounding cities have become car‐
bon intensive and have experienced substantial pollution levels [58].
The most polluted cities in the world are all coastal cities, which is exacerbated17

2.2. KEY FINDINGS OF RELATED RESEARCH STUDIES ON DECARBONISINGSEAPORTS
by the fact that 70 percent of emissions from ships worldwide occur within 400 km
from coastal areas [59]. Based on a recent health board study (a) the emissions
from seaports and ships lead to about 19,000 annual cases of lung cancer, while
(b) approximately 60,000 die every year from conditions caused by pollutants [60].
Carbon emissions from ships have increased gradually over time, and are currently
estimated at circa 2.7 percent of total CO2 emissions [61][62]. The United Nations
estimates the annual CO2 emissions frommaritime transport to be about 1000mil‐
lion tonnes [63]. The intensive use of energy from primary sources has led to an
increase in the level of carbon emissions. Consequently, there is a pressing need to
transition towards clean, affordable and resilient energy systems to help mitigate
carbon emissions and limit the effects of global warming [64].
Key milestones in this climate mitigation journey include the 2005 Kyoto proto‐
col [65, 66] and the 2015 COP21 Paris agreement [79], where 184 countries agreed
to implement practical steps to limit and lower the global average temperature by
reducing emissions, as well as increasing reliance on renewable energy [67]. As a
result of this global agreement, several countries have begun to establish regula‐
tions, legislation and policies to promote the uptake of Renewable Energy Sources
(RES) [68]. In order to alleviate some of the burden of decarbonisation from the
power sector and to reduce potential decarbonisation in end‐use sectors, some
mitigation methods can be implemented. Mitigation methods include: (a) inte‐
gration of energy efficiency and renewable energy, (b) investments in energy sav‐
ings, and (c) moving towards zero‐energy buildings These aim to increase renew‐
able energy use in buildings and industry, encourage shifts to low carbon tech‐
nologies and fuels, and reduce emissions by optimizing building volume, use, and
processes. [10, 11].
2.2 Key findings of related research studies on decar‐
bonising seaports
Many seaports are facing increasedpressure to reduce their carbon footprint, while
increasing their energy efficiency and global competitiveness [72, 73]. Moreover,
energy consumption in seaports must be continuously monitored to manage in‐18

2.2. KEY FINDINGS OF RELATED RESEARCH STUDIES ON DECARBONISINGSEAPORTS
creasing energy costs, as reflected by the increase in fuel demand [74]. This re‐
view aims to investigate the global efforts to decarbonise seaports, and it aims to
answer the following research questions:
• What are themain drivers for seaports to transition towards becoming green
seaports?
• What is the state of the art in delivering the vision of green seaports?
• What are the directions for future research in this seaport decarbonisation
journey?
This review relied on leading search engines like Science Direct, Web of Sci‐
ence, Scopus, IEEE and google scholar, to identify related research using a set of
keywords, while covering a period of several decades to factor in key evolutions in
the decarbonization journey of seaports. An initial list of keywords was selected
and then refined to provide a broad perspective to address the posited research
questions. The following keywords were eventually retained as providing a com‐
prehensive coverage of the related academic literature: “green seaport”, “marine
energy sources”, “fish industries”, “smart energy system”, and “smart seaport”. In
the context of this review paper, by “Smart” we refer to the capability of a system
to learn and adapt to changing boundary conditions using digital technologies to
address multi‐objective scenarios, i.e., the capacity of a seaport to factor in envi‐
ronmental, occupancy, and process conditions to reduce energy demand and its
carbon footprint.The research methodology involved five steps as illustrated in fig‐
ure 2.1.
The first step started with the identification of related keywords and then the
selection of authoritative research databases to direct the search for related re‐
search. This led to the identification of 428 research papers. Next, the authors
have filtered the results by excluding dissertations, duplicate articles, patents, and
non‐English articles. 54 articles were retained as a result of this process. These
themes are discussed in the next section.
These themes are discussed in the next section.
Based on the review analysis, six main themes have emerged from the analysis
of the selected papers, as listed below:
• Carbon reduction 19

2.2. KEY FINDINGS OF RELATED RESEARCH STUDIES ON DECARBONISINGSEAPORTS
Figure 2.1: The phases of the review process
• Renewable energy adoption
• Cost optimisation
• Adoption of smart control technologies
• Regulatory landscape for greening seaports
• Best practice guidelines for smart green seaports
2.2.1 Carbon reduction
The literature search found 35 studies that focused on a reduction of carbon emis‐
sions in seaports. These studies can be divided into three categories; the first cate‐
gory focuses on the application and implementation of systems that directly assist
in reducing carbon emissions in seaports, the second category focuses on the inves‐
tigation and analysis of the extent to which some systems can be applied to reduce
carbon emissions in seaports, and the third category proposes practices that may
help reduce carbon emissions in seaports. Table 2.1 summarized previous studies
based on three categories for carbon reduction factor.20

2.2. KEY FINDINGS OF RELATED RESEARCH STUDIES ON DECARBONISINGSEAPORTS
Table 2.1: Carbon reduction studies in SeaportsCategory Methodology
Case study Modeling and simulation Framework
Category 1Stoll et al. [80]
Wang et al. [81]
Aarsaether and Karl [82]
Yun et al. [83]
Wang et al. [84]
Molavi et al. [85]
Case study Analysis Approach Proposed Method
Category 2
Manolis et al. [73]
Alzahrani et al. [86, 87]
Lam et al. [88]
Heng et al. [89]
Zhu et al. [90]
Fahdi et al. [91]
Gutierrez‐Romer et al. [92]
Piris et al. [93]
Tovar and Wall [94]
Ramos et al. [95]
Haibo et al. [96]
Lazaroiu et al. [97]
Erdas et al. [98]
Green Practices
Category 3
Tsai et al. [99]
Twrdy et al. [100]
Villalba and Gemechu [101]
In terms of the first category, Stoll et al. [80] developed an architecture for
an active house for residential customers at the Stockholm Royal Seaport. This
house can interact with the smart grid at the seaport, and reduce carbon emis‐
sions and manage the energy consumption in buildings. The study by Aarsaether
[82] presented an initiative used in Norway to reduce carbon emissions by devel‐
oping battery‐based propulsion systems with electric power distribution for the
shore‐based power supplies of ships in seaports. Yun et al. [83] developed a car‐
bon emission quantification simulation model to eliminate the impact of mitiga‐
tion strategies on carbon emissions from seaport operations and shipping inside
container terminals. The experimental results showed that reducing ship speed in
waterway channels from 24 to 8 knots can reduce the carbon emissions of these
ships by up to 48.4 percent and by about 32.9 percent for the whole container.
Another important study by Wang et al. [84] proposed a two‐stage framework
for an optimal design of a hybrid renewable energy system for seaports. This frame‐
work can achieve significant reductions in carbon emissions and can be used as a
reference for green seaport container construction. The study by Molavi et al. [85]
explored the impact of applying a smart grid to a seaport using a two‐stage stochas‐
tic mixed integer programming model. The results showed that applying a smart21

2.2. KEY FINDINGS OF RELATED RESEARCH STUDIES ON DECARBONISINGSEAPORTS
grid at a seaport can have a significant impact by reducing energy consumption
and carbon emissions. Meanwhile, the study by Wang et al. [81] applied a green
seaport scheduling model for seaport construction to optimise economic and en‐
vironmental efficiency. The results showed that such a seaport can reduce the use
of coal by about 6527 tonnes, which will consequently reduce CO2 emissions by
about 40,875 tonnes.
The second category of research on carbon reduction focuses on the analysis
and investigation of systems that will help reduce carbon emissions at seaports.
Fahdi et al. [91] compared the performance of Rubber Tired Gantries (RTGs) and
Electric Rubber Tired Gantries (E‐RTGs). The results showed that using E‐RTGs
when applying green seaport policies can have a significant impact by reducing
carbon emissions by about 67.79 percent and saving about 86.6 percent of energy
usage. Gutierrez‐Romero et al. [92] investigated the impact of applying an On‐
shore Power Supply (OPS) for ships at berths. The results showed that applying
these technologies can save up to 10,000 tonnes of CO2. The study by Piris et al.
[93] investigated the use of an Automatic Mooring System (AMS), which can result
in a reduction of carbon emissions at seaport by about 76.78 percent.
The study by Lam et al. [88] investigated the feasibility of implementing an En‐
ergy Management System for seaports. This study used discrete event simulations
for its investigations. The results show that an EnMS can reduce carbon emissions
and provide greater benefits for seaport authorities. Meanwhile, Alzahrani et al.
[87, 86] proposed a smart microgrid for fishery seaports that was validated using a
case study of a local seaport. The result shows that the seaport authority and sur‐
rounding communities canmeet the local power demands using local Photovoltaic
(PV) power generation, which will reduce CO2 emissions considerably. Heng et al.
[89] proposed a twin seaport coordination optimisation model within the frame‐
work of vessel terminal coordination. The results showed that both time and fuel
consumption can beminimised, whichwill impact the total amount of carbon emis‐
sions. Haibo et al. [96] investigated energy consumption and carbon emissions at
seaports using consumption and emission inventories. This study proposed control
measures for reducing both energy consumption and carbon emissions. Lazaroiu
and Roscia [97] highlighted the concept of a zero emission seaport. This study22

2.2. KEY FINDINGS OF RELATED RESEARCH STUDIES ON DECARBONISINGSEAPORTS
proposed two scenarios for applying renewable energy resources at a seaport in
Naples to reduce dependency on fossil fuels and reduce carbon emissions. Mean‐
while, Zhu et al. [90] discussed the use of renewable energy resources to meet
power demands in a seaport of Ningbo, Belgium. The results of this study proved
that using clean energy in seaports can achieve energy savings and carbon reduc‐
tions at seaports. Wang et al. [102] analysed the carbon emissions in 30 seaports
in China. The authors proposedmethods for calculating the carbon emissions from
Seaport Container Distribution (PCD). The study by Erdas et al. [98] introduced a
strategy for the environmental management of seaports to reduce environmental
impacts. Furthermore, Tovar andWall [94] estimated the environmental efficiency
of 28 Spanish seaport authorities using an output directional distance frontier with
poor output and high carbon emissions. This study proved that if the seaport au‐
thorities provided sufficient environmental efficiency, then the carbon emissions
could be reduced by 63 percent .
Arena et al. [103] studied the feasibility of applying energy systems in seaports
that can produce electricity from sea waves and use electric vehicles for mobility.
The study by Johnson and Styhre [104] investigated the possibility of increasing
energy efficiency in shipping at seaports by reducing the time spent in seaport.
The results showed that an estimated 28 percent reduction in energy consump‐
tion can occur in seaports when the time is reduced. Meanwhile,Yang [105] inves‐
tigated CO2 emissions from two seaports using carbon footprint analysis and grey
relational analysis. The results showed that a green container should be designed
to harmonise container terminal operations with environmental impacts. Ramos
et al. [95] investigated the capability of implementing a tidal energy farm to meet
the power demands of the seaport of Ribadeo. The results showed that about
25 turbines are able to meet local power demands and reduce carbon emissions.
The study by Hua and Wu [61] used historical data on the energy consumption of
Taiwanese fishing vessels to analyse energy efficiency to find ways to reduce daily
emissions. The authors suggested that fisheries should be encouraged via subsi‐
dies to use clean energy for their vessels and use informed energy practices for
their appliances. Meanwhile, Acciaro et al. [72] urged seaport authorities to apply
smart Energy Management System (EMS) to limit environmental impacts by en‐23

2.2. KEY FINDINGS OF RELATED RESEARCH STUDIES ON DECARBONISINGSEAPORTS
hancing the energy efficiency of their systems. The author argued that increasing
the energy efficiency of seaport authorities would reduce both carbon emissions
and energy costs. This argument was supported through a comparison between
two seaport authorities that applied smart energy management strategies. The
study by Parise et al. [106] used statistical techno‐economic analysis to investigate
the impact of applying renewable energy and energy storage for boats to improve
the energy network that can exchange power with the grid. The authors argued
that applying a smartmicrogrid can have a significant impact on the energy used by
the seaport authority. Furthermore, Manolis et al. [73] discussed the importance
of a distributed demand response strategy using a Multi‐Agent System (MAS) to
improve voltage in the energy distribution networks at seaports. Misra et al. [62]
estimated the carbon emissions from the seaport of Chennai using guidelines from
the Intergovernmental Panel on Climate Change (IPCC) and the World Seaport Cli‐
mate Initiative (WPCI). The totalwas found to be about 280,558 tonnes of CO2/year.
The author suggested applying an AMS system and OPS to mitigate carbon emis‐
sions at the seaport site. In addition, Misra et al. [107] proposed that the sea‐
port authority should apply renewable energy technology to help mitigate carbon
emissions.The third category proposes some practices that might help reduce car‐
bon emissions in seaports. Tsai et al. [99] developed self‐management approaches
that have the potential to helpmanage and control the total carbon emissions from
seaport activities. This study proposed nine strategies and three actions that can
help to control carbon emissions in seaports. Meanwhile, Twrdy and Zanne [100]
investigated the sustainability of seaport logistics and the current status of the sea‐
port in Koper. The authors suggested developing the planning of the seaport site
and applying green activities to help reduce carbon emissions at the seaport. A
study by Villalba and Gemechu [101] proposed indicator measures of Greenhouse
Gas emissions (GHG) for seaport activities that will help monitor and control the
carbon emissions in seaports. The author also argued that indicators can help de‐
cision makers prevent and control carbon emissions from seaport authorities over
time.
24

2.2. KEY FINDINGS OF RELATED RESEARCH STUDIES ON DECARBONISINGSEAPORTS
2.2.2 Renewable energy adoption
The second most important finding in relevant studies was the increased role of
applying renewable energy resources at seaports. The main types of renewable
energy resources that are discussed in the literature are solar energy, wind energy
and marine energy.
2.2.2.1 Solar energy
Within the industrial sector, solar power has become an attractive source of energy
because it is free, clean and abundant with no pollution [108]. In 2016, the propor‐
tion of the renewable share in the form of final energy consumption was about 10
percent [109]. Two types of solar energy applications are used: solar thermal and
PV. Solar thermal industrial applications account for 10 percent of the total amount
of global high temperature industrial processes [110]. The most common types of
thermal applications are hot water, steam, drying and dehydration processes, pre‐
heating, concentration, pasteurisation, sterilisation, washing, cleaning, chemical
reactions, industrial space heating, food, plastics, buildings, the textile industry and
even business concerns [111]. PV refers to the process of “converting directly radi‐
ated light (solar or other) into electricity” [112]. In 2015, approximately 25 percent
of PV solar cells were made of pure monocrystalline silicon. Monocrystalline solar
cells are the most efficient of all PV panels, boasting efficiency rates of upwards
of 15 to 20 percent [113]. Many manufacturers offer 25 year warranties on these
types of PV systems. In general, solar PV cells involve a simple design component
with very competitive maintenance costs [114]. PV panels can work effectively in
different weather situations. It has also been suggested that the installation costs
will gradually decrease, due to the increased demand and production of PV pan‐
els [115]. PV systems are incredibly versatile and they can be installed at differ‐
ent sized sites for different projects. There are two main groups of PV systems:
stand‐alone and grid‐connected systems. A stand‐alone system is not connected
to the grid and the power production will be used locally to meet power demands.
This system needs a storage system to meet power demand at night. Meanwhile,
grid‐connected systems are connected to the national grid [116] to feed the sur‐
plus power production to the grid and meet demand when the power from the PV25

2.2. KEY FINDINGS OF RELATED RESEARCH STUDIES ON DECARBONISINGSEAPORTS
system is not adequate. Solar energy in the industrial sector is not only used for
heating, cooling and air conditioning but also to produce energy using PV systems.
A PV system can be used directly by storing energy in rechargeable battery systems,
which can then be used for different applications [117].
Only a few studies highlight the application of solar farms specifically at sea‐
ports. The study by Stoll et al. [80] discussed the application of an active house
for sustainability of the Stockholm Royal seaport. This study discussed integrat‐
ing solar PV systems with smart appliances and local energy storage to enable
demand response integration to build automation systems. Furthermore, Brenna
et al. [118] investigated the integration of a local PV system to charge electric ve‐
hicles for cities, airports and seaports. A study by Lam et al. [88] analysed the ap‐
plication of an EnMS for a seaport site to reduce costs and carbon emissions. This
study suggested that solar energy systems could be used to integrate andmeet the
power demands of the seaport authority. The study by Alzahrani et al. [87] inves‐
tigated the implementation of a smart microgrid for a fishery seaport site using
a rooftop PV system to meet the power demands of the seaport authority. The
same authors [35,66] investigated the integration of a local solar farm to meet the
local power demands and those of the surrounding community using modelling
and simulation analysis programs. In addition, a case study by Verma et al. [119]
discussed the implementation of a 3.3MWp PV system to help reduce instability in
power distribution at the seaport of Jurong. Zhu et al. [90] investigated the appli‐
cation of multiple renewable energy resources, such as solar, wind and geothermal
energy for Ningbo seaport Co. Ltd. Furthermore, Acciaro et al. [72] compared the
application of energy management systems for seaports between two seaports:
the Hamburg seaport and the seaport of Genoa. The seaport of Genoa applied the
seaport Energy Environmental Plan (PEEP), which aims to develop the activities of
energy production and consumption at the seaport. One of the main goals of the
PEEP plan is to install three stations of solar energy, which will help reduce overall
carbon emissions in the seaport by more than 20,000 tonnes/CO2 emission.
The study by Misra et al. [62] proposed a microgrid system to meet the power
demands of the port authority and applied different kinds of renewable energy
resources. The study found that applying a 5 MWp solar PV system with differ‐26

2.2. KEY FINDINGS OF RELATED RESEARCH STUDIES ON DECARBONISINGSEAPORTS
ent types of energy resources can help meet the power demands of the local port
authority. Another case study by Balbaa et al. [120] developed smart electrical in‐
terconnection management between multiple ports in Egypt. This study proposed
that applying a PV system can not only meet local power demands for the port site
but can also feed surplus power to other ports, whichwill help in greening seaports
and developing eco‐friendly port sites. The case study [121] proposed installing a
smart EnMS for a touristic harbour by applying renewable energy resources. This
study applied a PV system to meet the power demands of the harbours at ports.
2.2.2.2 Wind energy
Wind energy is considered to be the most promising renewable energy source be‐
cause it is clean, free and abundant. The concept of wind energy is based on the
large scale movement of air mass due to differences in atmospheric pressure along
with the rotation of the Earth [122]. There has been a large growth in installedwind
energy at a global level. In 2018, the total installed wind capacity was 599 GW. It
was projected that the installed wind energy would rise to 664.5 GW [123]. Wind
turbines consist of a tower, a wind turbine, a yawmechanism, a speed control unit,
a drive train system and an electrical generator [124].
There are many benefits to using wind as an energy source which is simple,
produces zero emissions and offers high efficiency. While wind is a popular energy
source, wind turbines require further development to minimise their noise gener‐
ation. Wind turbines are not considered to be aesthetically pleasing and they are
also considered to be very expensive to install compared to other renewable en‐
ergy sources [125]. While wind turbines can be installed both on and offshore, the
authors in [126] suggested that using offshore wind energy could bemore effective
and stable compared to onshore wind energy. With the UK looking to increase its
RES (Renewable Energy Systems) power generation by 35 percent by 2020, the UK
sees offshore power as a solution to achieve this target and it aims to generate 22
GW from offshore power supplies [127].
Studies on using wind energy for seaports remain very limited because not all
the seaport locations are suitable for the installation of either onshore or offshore
wind turbines. Wind farms are large in size, and there is often not enough space27

2.2. KEY FINDINGS OF RELATED RESEARCH STUDIES ON DECARBONISINGSEAPORTS
close to port sites to install them. The study by Acciaro et al. [72] noted that the
Hamburg port authority has invested in renewable energy since 1990 and has in‐
stalled 58 turbines with a capacity of 52.75 MW. Furthermore, Wang et al. [81]
proposed a framework to help find the optimumdesign capacity of a hybrid renew‐
able energy system for seaports. This model proposed installing wind energy as a
sub‐system to meet the power demands of the port site. Meanwhile, Gutierrez‐
Romero et al. [92] investigated the capability of renewable energy resources to
meet power demands for a port site. This study found that wind energy can be
efficiently applied to the site to meet the power demands for the port authority.
2.2.2.3 Marine energy
Three quarters of the Earth’s surface is occupiedwith oceans and seas, which offers
the potential for energy generation. Marine renewable energy power generation
occurs fromtidalmovement and ocean circulation. There aremany types ofmarine
renewable energy sources that can be utilise to generate electricity, includingwind,
tides and waves[128]. According to the World Offshore Renewable Energy Report
2002–2007, theworld’s potential tidal energy is estimated to be 3000 GW,with less
than 3 percent being located in areas suitable for power generation [129].
A total of 16.2 GW of offshore wind capacity is expected to be installed in Eu‐
rope, with the majority located in the North Sea. The United Kingdom alone is
expected to install 18 GW of offshore wind by 2020. Tidal currents are very pre‐
dictable, as high and low tides develop with well‐known cycles, making marine
renewable energy much easier to predict than renewable resources that rely on
wind and sun exposure. Compared to other types of renewable energy sources,
marine renewable energy is considered to be less complicated to connect to the
national grid. The biggest challenge associated with marine renewable energy is
its installation, which can be time consuming and expensive. Furthermore, Rourke
et al. [130] argued that the installation costs of marine energy are much higher
than those of any other renewable energy sources and marine renewable energy
sources require regular maintenance by highly skilled labourers.
Only a few studies[86, 107] highlight the application of solar farm, specifically
at seaports. Based on our search, only three studies mention the application of28

2.2. KEY FINDINGS OF RELATED RESEARCH STUDIES ON DECARBONISINGSEAPORTS
marine energy to meet the power demands of the port authority. First, the study
by Ramos et al. [95] investigated the implementation of tidal energy to meet the
power demands of the port authority and showed that about 25 turbines of tidal
energy can fulfil the total power demands. Second, Alvarez et al. [131] designed
a tidal energy turbine to investigate the capabilities of the proposed tidal turbine
to meet the local power demands of the port site. Finally, Lazaroiu and Roscia [97]
investigated the application of a sea wave energy converter to utilise power for
port applications. This study investigated the application of ResonantWave Energy
Converter (Rewec3) and Inertial Sea Wave Energy Converter (ISWEC) devices to
convert waves to energy, and showed that Rewec3 is the best system to apply from
a theoretical and experimental point of view.
2.2.3 Cost optimisation
This review has identified that most studies focus on minimising the cost of en‐
ergy used for seaport activities, while some research has discussed maximising the
profit from installing green energy resources to help meet power demands locally.
Based on the analysis of the studies in table 2.2, the cost optimisation is di‐
vided into two main categories: profit maximisation and cost minimisation. The
studies that optimise costs via profit maximisation focus on the ability to increase
the income from investing in energy systems and their applications in seaports. In
contrasts, studies that optimise costs via cost minimisation focus on the ability to
reduce the costs of energy use, lower the investments needed to apply smart sys‐
tems and reduce impact of carbon emission taxation on seaport authorities and
key workers.
The review shows that most existing literature discusses cost minimisation at
seaports, while only three studies highlighted cost optimisation throughprofitmax‐
imisation [88, 97, 119]. Studies that discuss the minimisation of costs are divided
into direct effect and indirect effect minimisation. “Direct effect” studies aim to re‐
duce costs directly at the seaport via different techniques and optimisation strate‐
gies [82, 84, 87, 86, 120, 132, 133]. “Indirect effect” studies focus on reducing the
costs of operations at seaports, such as energy costs and emission and operational
costs, indirectly by applying a smart system, increasing energy efficiency [81, 91,29

2.2. KEY FINDINGS OF RELATED RESEARCH STUDIES ON DECARBONISINGSEAPORTS
104, 105, 131, 134].
2.2.4 Adoption of smart control technologies
The search results show that studies on seaport energy applications are moving
toward deploying smart technologies that will increase the efficiency of the opera‐
tional system at port facilities. These studies discuss three main areas: introducing
smart grid approaches, proposing energy management systems for seaports and
using Internet Of Things (IoT) approaches for port activities.
For smart grid approaches for seaports, the Royal Port of Stockholm [80] de‐
veloped a project that aims to reduce carbon emissions and enhance the concept
of sustainability at the port district by developing smart house architecture that
will provide interactions between consumers and their utilities to improve the en‐
ergy usage in each house. The study by [87] developed a smart microgrid for a
fishery port site that aims to increase the use of renewable energy resources and
reduce both energy consumption and carbon emissions. Furthermore, Niglia [136]
discussed the role of securing critical infrastructure with smart grids for seaport
applications. This study argued that, due to the importance of applying smart grid
technologies at seaports, security is crucial for the smart grid system to protect
the port from disruptive cyber‐attacks. Meanwhile, Verma et al. [119] developed
a smart grid approach for the port site using renewable energy sources and an en‐
ergy storage system to meet local power demand for the port site and to sell the
surplus power to the grid. In addition, Molavi et al. [85] explored the benefits of
applying a microgrid at a port site. This study developed a multi‐stage stochastic
mixed integer programming model to investigate the effectiveness of applying a
microgrid to a port site based on different parameters. These authors argued that
applying a microgrid can have an impact on the overall activities of the port site.
Finally, Arena et al. [103] investigated the feasibility of producing energy from sea
waves and using it to charge electric vehicles for seaports.
In their study, Gutierrez‐Romero et al. [92] investigated the application of an
onshore power supply at the port to meet the power demands of ships at their
berths. This study argued that the proposed system will reduce carbon emissions
and increase energy efficiency at the port site. Meanwhile, Ramos et al. [95] inves‐30

2.2. KEY FINDINGS OF RELATED RESEARCH STUDIES ON DECARBONISINGSEAPORTS
Table 2.2: Previous studies on greening seaportsAuthor Port Decarbonization Indicators
CR RES CO ST LP GPP
Max Min SG EMS IOT
Fahdi et al. [91] ✓ ✓ ✓ ✓ ✓
Stoll et al. [80] ✓ ✓ ✓ ✓ ✓
Brenna et al. [118] ✓ ✓ ✓ ✓
Sarabia‐Jácome et al. [135] ✓ ✓ ✓
Aarsaether [82] ✓ ✓ ✓
Lam et al. [88] ✓ ✓ ✓ ✓
Alzahrani et al. [87] ✓ ✓ ✓ ✓ ✓
Heng et al. [89] ✓
Alvarez et al. [131] ✓ ✓ ✓
Niglia [136] ✓ ✓
Verma et al. [119] ✓ ✓ ✓
Haibo et al. [96] ✓ ✓
Lazaroiu and Roscia [97] ✓ ✓ ✓ ✓
Parise et al. [106] ✓
Zhu et al. [90] ✓ ✓ ✓
Li et al. [137] ✓ ✓
Yun et al. [83] ✓
Wang et al. [84] ✓ ✓ ✓ ✓ ✓
Azarkamand et al. [138] ✓ ✓
Wang et al. [102] ✓ ✓ ✓
Yang et al. [139] ✓ ✓
Boile et al. [140] ✓ ✓
Zughbi and Zulli [141] ✓
Gobbi et al. [142] ✓
Erdas et al. [98] ✓ ✓ ✓ ✓
Molavi et al. [85] ✓ ✓ ✓ ✓ ✓ ✓
Hua and Wu [61] ✓
Moya et al. [11] ✓ ✓
Villalba and Gemechu [101] ✓ ✓ ✓
Tovar and Wall [94] ✓
Arena et al. [103] ✓ ✓ ✓ ✓
*CR: Carbon Reduction, *CO: Cost Optimisation, *ST: Smart Technologies, *LP: Law & Policies,
*GPP: Green Port Practices, *RES: Renewable Energy Sources, *SG: Smart Grid,
*EMS: Energy Management System, *IOT: Internet of Things
31

2.2. KEY FINDINGS OF RELATED RESEARCH STUDIES ON DECARBONISINGSEAPORTS
Table 2.3: Previous studies on greening seaportsAuthor Port Decarbonization Indicators
CR RES CO ST LP GPP
Max Min SG EMS IOT
Lam et al. [88] ✓
Dulebenets [143] ✓
Trivyza et al. [132] ✓ ✓
Johnson and Styhre [104] ✓ ✓ ✓
Gutierrez‐Romero et al. [92] ✓ ✓ ✓ ✓
Twrdy and Zanne [100] ✓ ✓ ✓
Song et al. [133] ✓
Park and Kim [144] ✓
Yang [105] ✓ ✓
Piris et al. [93] ✓ ✓
Tsai et al. [99] ✓
Pavlic et al. [145] ✓
Ramos et al. [95] ✓ ✓ ✓ ✓
Acciaro et al. [72] ✓ ✓
Wang et al. [81] ✓ ✓ ✓ ✓
Misra et al. [107] ✓ ✓ ✓ ✓
Balbaa et al. [120] ✓ ✓ ✓ ✓
Misra et al. [62] ✓ ✓
Davarzani et al. [146] ✓
Lamberti et al. [134] ✓ ✓ ✓ ✓
Manolis et al. [73] ✓ ✓
*CR: Carbon Reduction, *CO: Cost Optimisation, *ST: Smart Technologies, *LP: Law & Policies,
*GPP: Green Port Practices, *RES: Renewable Energy Sources, *SG: Smart Grid,
*EMS: Energy Management System, *IOT: Internet of Things
32

2.2. KEY FINDINGS OF RELATED RESEARCH STUDIES ON DECARBONISINGSEAPORTS
tigated the implementation of a tidal farm to meet the power demands of a port
site. The result of the study showed that 25 tidal turbines are capable of meeting
the power demands of the port. Misra et al. [62] proposed a microgrid for a port
site using renewable energy resources tomeet power demands and reduce carbon
emissions for seaport activities.The second criteria for applying smart technologies
to seaports is the role of energy management systems for seaports in increasing
energy efficiency. For example, Lam et al. [88] investigated the impact of using
an EnMS for seaports. These authors argued that implementing a smart EnMS at
seaports can have an economic and environmental impact on the port site and
surrounding communities. Furthermore, Parise et al. [106] argued that an energy
master plan at the port site can improve the efficiency of the operational systems
at the port.
Applying a new smart EnMS will help to optimise the energy usage at seaports,
such as by using a smart grid, microgrid and/or shore‐to‐ship power supply.Acciaro
et al. [72] compared two port authorities applying Energymanagement systems for
seaports, and showed that applying an EnMS to ports will help reduce energy cost
and increase energy efficiency at the port site. Meanwhile, Lamberti et al. [134]
analysed the impact of using smart Energy management systems for seaports for
touristic harbours by utilising currently installed renewable energy generators and
energy storage. This study showed that selling local energy production to the grid is
the optimal solution to recoup the investment costs of the system.The third criteria
for applying smart technologies to a seaport is applying new advanced technology.
Sarabia‐Jácome et al. [135] developed a seaport data space that will help avoid the
interoperability of the stakeholder information system. These results show that
the seaport data space improves the decision‐making process between seaport
departments. Furthermore, Piris et al. [93] investigated the use of an Automatic
Mooring System [AMS] that allows vessels to bemooredwithout a robe, whichwas
found to reduce carbon emissions.
2.2.5 Regulatory landscape for greening seaports
With the increased global motivation to mitigate climate change, some countries
have implemented new rules, policies and legislation to help to reduce the impact33

2.2. KEY FINDINGS OF RELATED RESEARCH STUDIES ON DECARBONISINGSEAPORTS
of climate change. The seaport industry is a crucial element of economic growth for
cities and communities [147]. Some studies proposed variousmeasures and strate‐
gies to help reduce carbon emissions from seaports. An exploratory study by Li
et al. [137] on implementing low carbon port concepts at Chinese ports suggested
several strategies to help apply the low carbon port concept, including promoting
the awareness of green port activities, enacting rules and regulations of low carbon
port emission, applying clean and smart energy technology, and supporting the
implementation of low carbon ports through policy and financial aspects. Azarka‐
mand et al. [138] developed a standardised tool to calculate the emissions from
the seaports based on the WPCI and IPCC guidelines. Erdas et al. [98] introduced
a methodology to help rationalise the environmental management strategies for
seaports to minimise environmental impacts. Finally, Villalba and Gemechu [101]
proposed indicators of carbon emissions for port activities, which could be used to
develop practical policy measures based on the proportion of carbon emissions for
each activity at the port site.
2.2.6 Best practice guidelines for smart green ports
The idea of greening ports has emerged after several initiatives to reduce the amount
of emissions caused by seaport activities. The concept of a green port involves “the
integration of environmentally friendly methods of port activities, operation and
management” [148]. Several criteria can be used to define themeasures for imple‐
menting the green port concept, such as policies to help reduce carbon emissions
from the seaport. Likewise, the use of renewable energy for seaport operations
should be increased. Previous studies on green ports can be divided into twomain
categories: first, applications that will lead to green ports, and second themethods
and measures that will lead to greening ports.
Fahdi et al. [91] discussed the replacement of rubber tired gantries by an elec‐
tric type to help reduce carbon emissions and energy consumption.Stoll et al. [80]
demonstrated the application of active house architecture at a seaport, which will
help to save energy, reduce carbon emissions and increase the use of green en‐
ergy. Alzahrani et al. [87] developed a smart microgrid for fishery ports, which
helped reduce carbon emissions, reduce energy consumption and increase the use34

2.3. EVOLUTION OF THE SEAPORT ENVIRONMENTAL REGULATORY LANDSCAPE
of renewable energy resources. Further research by Haibo et al. [96] proposed an
inventory method for energy consumption at seaports, including some measures
to help reduce carbon emissions and apply the green port concept. Zhu et al. [39]
discussed the application of renewable energy technology that will lead to reduced
carbon emissions from seaports. In addition, Wang et al. [81] proposed a frame‐
work using hybrid renewable energy technology for seaports. Molvi et al. [28]
studied the impact of applying microgrids to seaports. Twrdy and Zanne [100] in‐
vestigated sustainability in port logistics and the current status in the port of Koper.
Misra et al. [107] developed a microgrid for a port authority in India, which led to
reduced carbon emissions through the increased use of renewable energy.
The second category of research on green port practices includes studies that
discuss the methodologies, measures and standards that will contribute to the ap‐
plication of green port concepts. Jian [149] developed practical guidelines for ap‐
plying low carbon ports in China.[138] developed standardisation tools to calculate
carbon emissions, which will help monitor and reduce carbon emissions from sea‐
ports. Meanwhile, Erdas et al. [98] proposed amethodology to analyse the ecolog‐
ical footprint based on the environmental objectives of ISO 14000.Hua et al. [150]
proposed a green port indicator and used fuzzy importance performance analysis
to assess the performance of green ports. In addition, Pavlic et al. [145] proposed
approaches for the practical application of green port concepts. Finally, Misra et al.
[62] demonstrated the role of smart technologies in helping reduce carbon emis‐
sions from port sites.
2.3 Evolution of the seaport environmental regulatory
landscape
Climate change has led to the introduction of global policies aimed at decarbonis‐
ing industries. According to an IPCC report, since 1950, the observations of atmo‐
sphere and ocean currents have gradually increased [151]. Climate is the term for
“the typical average weather of a region or city”, while climate change is a “change
in the Earth’s overall climate” [3]. In response to climate change, there is an in‐
ternational movement toward environmental sustainability and decarbonisation35

2.3. EVOLUTION OF THE SEAPORT ENVIRONMENTAL REGULATORY LANDSCAPE
away from fossil fuels [152].
These initiativeswere startedby the intergovernmental panel on climate change
in 1988 [153]. They were followed by the United Nations Framework Convention
on Climate Change (UNFCCC) in 1994 [65]. In 2005, the Kyoto protocol applied to
more than 192 parties [66]. On 12 December 2015, 195 countries agreed to com‐
bat climate change in Paris, and important policy makers vowed to initiate practical
steps to reduce the global average temperature and emissions by increasing the
utility of renewable energy. Environmental legislation and policies on renewable
energy at the international level aim to reduce CO2 emissions and increase the use
of renewable energy sources.
Annunziata et al. [10] highlighted the main three perspectives that govern‐
ments focus on to reduce CO2 emission, including the integration of energy effi‐
ciency and renewable energy, investments in energy savings, and the development
of zero‐energy buildings. Moya et al. [11] highlighted the importance for govern‐
ments to focus on energy efficiency programs for developing countries to decrease
GHG emissions and reduce energy consumption. In addition, the EU set targets
for reducing CO2 emissions and increasing the use of renewable energy resources
[154]. The main objectives of the EU established in 1997 were to decrease GHG
emissions, ensuring the security of the supply chain, and improving the EU’s com‐
petitiveness [69]. Due to the increasing awareness of global warming and the im‐
portance to focus on decarbonisation plans at a global level, many countries have
begun tomove toward decarbonisation. United Kingdomwas one of the first coun‐
tries to start implementing a long‐term plan to reduce its carbon emissions and
increase its use of RES, as shown in Figure 2.2
Figure 2.2: Timeline of the main motivations for decarbonisation in the UK
36

2.3. EVOLUTION OF THE SEAPORT ENVIRONMENTAL REGULATORY LANDSCAPE
The first initiative began in 1989, with the aim of replacing fossil fuels by nu‐
clear energy to produce electricity under theNon‐Fossil Fuel Obligation (NFFO) law.
This initiative was followed by a global motivation program, known as the Climate
Change Program, which aimed to reduce CO2 by 15‐18 percent in 2010. In 2002,
the government established the Renewable Obligation (RO) law. This act makes it
mandatory for the supplier to secure a specific share of electricity from renewable
energy, or they must pay a penalty. One of these policies was enacted in 2003
(2003/87/EC). This policy is known as the emission trading scheme, which is con‐
sidered to be the main tool for reducing GHG emissions in the EU
[18]. This scheme works via a cap and trade mechanism. The cap sets the total
amount of GHGs that can be emitted by the installation, while the relevant com‐
panies receive or trade their emission allowances.In 2008, a new act, known as
the Climate Change Act, was passed by the government. This act requires compa‐
nies to cut their GHG emissions by about 34 percent by 2020 and by 80 percent by
2050. The government also developed a budget across several periods to achieve
the target of decreasing its carbon emissions by 2050.
The Feed‐In Tariff (FIT) is an important policy that was applied in Europe in
1980. This tariff was applied in Denmark, Germany and Italy in 1990 [155]. The
concept of the FIT is “policy pricing, guaranteeing renewable energy generators a
fixed price for the electricity they produce” [22]. The advantages of FIT include a
guaranteed price, which will allow householders with solar panels to buy power
through renewable energy markets. In 2011, a new law was established by the
EU that requires all members to apply an industrial emissions directive. This law
aims to increase the level of protection over human health and the environment
by decreasing the level of industrial emissions in the EU. This law is based on five
criteria: an integrated approach, the best available techniques, flexibility, environ‐
mental inspection and public participation.
In 2012, the UK established a new approach known as the “Green Deal”, which
helps homeowners improve their energy savings and determine the best option to
pay for their energy. This was followed in 2014 when the government announced
a mega plan to install smart meters in homes between 2014 and 2019, with over
53 million smart meters for gas and electricity now being used. The EU established37

2.4. PREVIOUS PROJECTS THAT FOCUSED ON DECARBONISING SEAPORTS ANDTERMINALS
a new directive (2001/77/EC) to promote the use of electricity from renewable en‐
ergy resources [66, 156]. To increase the deployment and development of RES,
in 2009 the EU implemented a renewable energy directive (28/2009/EC) that pro‐
motes the use of renewable energy resources to provide 20 percent of the total
power production by 2020 [15]. In 2011, the Europe Commission published a low
carbon roadmap for EUmembers, aiming at reducing GHG emissions by 80–95 per‐
cent by 2050. To achieve this target, each EU member must increase its level of
development and deployment of clean technologies [15].
2.4 Previous projects that focusedondecarbonising sea‐
ports and terminals
In the last few decades, governments, global coalitions, and international organisa‐
tions have moved towards finding more sustainable solutions based on innovative
modern technologies to minimise carbon emissions in the industrial sectors. This
was primarily undertaken by announcing financial grants for to study, analyse and
implement projects to reduce carbon emissions. The seaport industries have en‐
tered into an digital transformation as part of this global warming agenda with the
key objective to reduce carbon emissions around the value chain.
Several projects have been implemented to improve operations at seaports and
terminals. These projects were developed to combat climate change by reducing
carbon emissions while reducing energy consumption. Some projects developed
and built smart energy technologies in an attempt to maximise the utilisation of
renewable energy resources and to reduce carbon emissions. However, several
projects have had different contributions ranging from rules design and implemen‐
tation towards definition of standards for the installation of sustainable strategies
for port activities [157, 158, 159]. One of the biggest projects attempting to ad‐
dress digital transformation of seaports is the Stockholm Royal seaport project.
which aims to implement and develop a fuel free seaport district with a budget of
around euro 2.2 billion[160]. This initiative also includes the development of the
largest urban area in Sweden, aiming to construct more than 12000 new houses
and more than 35000 workplaces.38

2.4. PREVIOUS PROJECTS THAT FOCUSED ON DECARBONISING SEAPORTS ANDTERMINALS
The Green EFFORTS means ”Green and Effective Operations at Terminals and
in Ports” [161] is a research project that is co‐funded by the European Commission
aiming to reduce energy consumption and improve clean energy in ports. This
project provides strategic planning instruments for ports and terminal to reduce
carbon emissions and deliver smarter energy management in seaports.
The APICE project [162] is financed by the European program and it aims to
establish a knowledge‐based approach for air pollution mitigation and sustainable
development of ports activities driven by spatial planning policies at local level,
which includes the territory around the seaports. This project aims to help policy
makers to integrate a port master plan and associated investments in seaports.
The Enerfish project [163] develops an integrated renewable energy solutions
for seafood processing stations using a new polygeneration application with re‐
newable energy sources for the fishery industry. The research project improves
energy use at fishery industry through developing optimisation, simulation, vali‐
dation and planning of pilot case studies. The research outcomes of this project
are based on developing a distributed energy system that uses the cleaning waste
of fish processing industries to produce bio‐diesel, which can be used to produce
energy for the fish processing industries.
Recently, the Smart Cluster Energy System (piSCES) project [164] has aimed to
reduce the costs and carbon footprint for the fish processing industry by develop‐
ing and testing a new ‘smart grid’ electricity network. The smart cluster energy
system aims to reduce the costs and carbon footprint of energy networks in the
fish processing value chain by implementing smart grid technologies throughmod‐
elling the usage profile of their energy networks, and optimising that against the
wholesale energy market and any available onsite generation.
In the selected group of projects that have been reviewed, different sustainabil‐
ity objectives have been addressed in relation with the life cycle of seaports, all in‐
volving different sets of variables and objectives for reducing energy consumption,
reducing carbon emissions and applying renewable energy systems. Table 2.4 pro‐
vides a comprehensive list of the previous projects that have focused on improving
the environmental quality in seaports and terminals.39

2.5. SMART PORT APPROACH
2.5 Smart port approach
The three features of the 2020 strategy for Europe are: Smart, sustainable and in‐
clusive [165]. One of these initiatives involves transforming ports into smart ports
. The smart port project will involve installing and deploying a new energy model
and value proposition based on smart and innovative technologies with low oper‐
ational and environmental impacts. Buiza et al. [74] summarised the holistic con‐
cept of a smart port as follows: “emphasizing particularly operational and energy
efficiency, competitiveness and the environmental impact aspect”.
The smart port approach can impact the overall ecosystem of the seaport by
continuously harvesting information on seaport activities using the IoT, andmaking
decisions using AI and big data technologies. This approach can provide a data
storage system that is resilient and which allows different entities to obtain access
to relevant data, based on an agreed governance model, that will help optimise
operational systems and increase efficiency.
Seaports play an important role in the increasing development of new tech‐
nologies that will increase their level of effectiveness given that seaports are amul‐
tidimensional system combining economic functions, infrastructure systems and
geographical space and trade [166]. The development of seaports from 1950 to
1990 followed the traditional paradigm of seaports, with some progress in logistics
operations and infrastructure but limited improvements to information and com‐
munication systems.
Advanced technology for port operations can also have a robust impact on both
the port authority and the surrounding communities, as well as increasing the level
of competitiveness between different port authorities. This could lead to the im‐
plementation of smart port activities using leading edge technology [85].
40

2.5.SM
ARTPORT
APPROACH
Table 2.4: List of projects investigating green seaports and port activitiesProject Date Aim Fund Coordinated by
The Stockholm Royal
Seaport [160]2010‐2030 To develop a fuel free seaport district 2.2 Bn The Stockholm City Council
GREEN EFFORTS [161] 2007‐2013 Reduce energy consumption and improve clean energy 3.1 M Jacobs University Bremen
Greencranes [167] 2012‐2014 Demonstrate the feasibility of new technologies and alternative fuels 3.6 M Ministero delle Infrastrutture e dei Trasporti (MIT)
PRISM [159] 2010‐2012Identify a set of relevant and feasible performance indicators for the
EU ports‐ European Sea Ports Organization (ESPO)
CLIMEPORT [168] 2009‐2012 Encourages Mediterranean Ports to reducing greenhouse emissions 1.6 M Port Authority of Valencia
ECOPORT [157] 2009‐2012 Improve the quality of ports 2.1 M Autoridad Portuaria de Valencia
piSCES [164] 2017‐2020Reduce the costs and carbon for fish industries by implementing
smart grid2.2 M Waterford Institute of Technology
APICE [162] 2007‐2013Develop a knowledge‐based approach for air pollution mitigation and
sustainable development of port activities2.2 M Regional Environmental Agency of Veneto
Enerfish [163] 2008‐2013 A new polygeneration application with renewable energy sources 5.4 M TEKNOLOGIAN TUTKIMUSKESKUS VTT
E‐harbour [169] 2010‐2013Create a more sustainable energy model in harbour regions on the
basis of innovative intelligent energy networks (smart grids)‐ Municipality of Zaanstad
EFICONT [158] 2009‐2011To incorporate a set of significant energy efficiency improvements
for seaprts‐ Ministry of Development
Greenberth [170] 2013‐2015Study in detail the improvement opportunities of energy efficiency in
six mediterranean ports1.6 M Port Authority of Valencia
41

2.5. SMART PORT APPROACH
From 2000 to present, seaports began to enhance their operational systems to
become smart ports using advanced technology systems [171]. The study by Siror
et al. [172] noted that smart ports are “a system of port transportation and op‐
eration based on modern information technology, that provide multifarious in‐
formation services for port participants based on the collection, processing, re‐
lease, exchange, analysis and usage of the relevant information”. Another defini‐
tion by [173] described a smart port as an integration of all elements of terminal
operations, warehousing, logistics, yards and port transportation through a special
network that provides different types of information for daily operations at the
port.
Another explanation of the smart port concept was provided by Ferretti et al.
[174], who described smart ports as a convergence between new smart technolo‐
gies, such as the IoT, Big Data, automation and environmentally friendly technol‐
ogy, which combine to form a smart infrastructure that connects wired and wire‐
less networks to surrounding objects, such as sensors, to allow the exchange of
data between entities. This will help to improve the logistics and transportation in‐
dustries. Buiza et al. [74] highlighted the concept of a smart port based on a project
known as the “action plan towards the smart port concept in the Mediterranean
area”. The definition of the smart port concept focuses on three main areas: op‐
eration, energy consumption and the environment [175].
The importance of the energy consumption at seaports relates to the high en‐
ergy demands of port operations. Using energy in an efficient way is a challenge
for port authorities because greater energy consumption means greater carbon
emission production. This will lead to an increase in the operational costs for such
energy [176]. Consequently, most port organisations urge the port authorities to
set port regulations that will reduce energy consumption and increase the use of
green energy resources. This will also help reduce carbon emissions and energy
costs for port operation systems. The second element of the smart port definition
is the environmental aspect. Initiatives such as ECOPORT, PRISM and GREEN Efforts
aim to define and set the environmental performance indicators of port authorities
to help them reduce and eliminate the impact of environmental effects from the
port authority.42

2.5. SMART PORT APPROACH
European seaport authorities consider air quality to be the most important of
the 10 environmental priorities for seaports because air quality effects both port
operations and shipping activities. Consequently, the environmental element is a
crucial area that needs to be considered to transform ports into smart ports [177].
The third area of the smart seaport concept is operations. The main operations at
sea are loading and unloading the cargo and containers from ships, boats and ves‐
sels into warehouses. In the supply chain of the operational systems at seaports,
there are several areas that could be optimised to increase the efficiency and ef‐
fectiveness of port operations, which will help to reduce cost, time, labour and
the lifespan of the machinery.Figure 2.3 presents comparison between traditional
and smart port. It can clearly seen how new smart technologies such as IoT, ICT,
Industry 4.0 and smart energy reflects on the new smart port approach.
Figure 2.3: A comparison between traditional seaports and smart ports
Molavi et al. [178] added another domain to the smart port index domains,
which is safety and security. Safety and security in seaports are part of the port’s
critical infrastructure. In the last few years, calls have been made to increase the
level of safety and security in seaports by increasing digitisation and automation [179].
However, seaport operations have recently experienced an increase in the level of
cyber attacks [180]. This issue increases the urgency to consider safety and security
at the seaport as one of four main domains of the smart port index.43

2.6. THE IMPACT OF ENERGY SYSTEMS IN DECARBONISATION OF SEAPORTS
2.6 The impact of energy systems in decarbonisation of
seaports
In 600 BC, Thales of Miletus noticed that amber has an attractive power when
rubbed with animal fur, which is the first observation of static electricity and mag‐
netism [181]. In the sixteenth century, William Gilbert was the first scientist to use
the terms “Electricity, electric force, magnetic pole and electric attraction” [182].
In 1663, Otto von Guericke built the first electricity generation machine. Dutch
scientist van Musschenbroek then discovered the first capacitor. In the late seven‐
teenth century, Italian physician Alessandro Volta invented the first battery [183].
In 1820, French physicist Andre‐Marie Ampere discovered electromagnetism and
the unit of current—the “Ampere”. Perhaps the greatest contribution to our under‐
standing anduse of electricitywasmadebyMichael Faraday in the early nineteenth
century. For example, he concluded that if magnetic force is generated circularly
and the current wire is suspended within an effective radius, then the wire will ro‐
tate in a constant circle at a constant rate around emitter of the force. This led to
the invention of the electric motor [184]. In 1878, Thomas Edison started the Edi‐
son electric light companywhen he bought some patents related to electric lighting
[185].
2.6.1 Centralised energy system
Electrification started at the end of the nineteenth century when distributed elec‐
trical power was introduced when Thomas Edison opened the first central power
station inManhattan’s city in 1882. This plantwas called the Pearl Street power sta‐
tion and its capacity was about 600kW, which was capable of powering 5000 lights.
However, Edison used a direct current (DC) power system [186]. The first high‐
voltage alternative current (AC) power station opened in London in 1890, which
was the beginning of AC central power stations after a period of long experimental
controversial debate between the benefits of DC and AC [187]. The United States
started to emerge as a leader of electric networks at the beginning of the 20th cen‐
tury to meet the fast growing demand of of its Industrial Revolution. One of the
main drivers of the market was the demand for power from technological systems.44

2.6. THE IMPACT OF ENERGY SYSTEMS IN DECARBONISATION OF SEAPORTS
The government regulated the electric network in the United States. The system
was built on a centralised model and was regulated between states. In contrast,
the electrical network system in Europe was built for different reasons, such as
political issues and legislation systems. However, the first and second world wars
affected the development of the electric network in Europe [188].
The progress of local, national electric grids was gradually increased due to the
availability and low prices of non‐renewable fuels. However, post‐war electrifica‐
tion at the global level reached 82 percent by 2010 [189]. In 1947, electricity was
placed under public ownership in the UK. This system consisted of four grids. Two
of the grids were in Scotland, one for Northern Ireland, and one for England and
Wales. There were about 560 generation plants. Following integration, the grid
was placed under 14 electricity boards: 12 for England and Wales, and two for
Southern Scotland [41].
In 1989, the government privatised the electricity industry in the United King‐
dom, which was the first country in Europe union to privatise electricity industry.
However, the action plan to start privatisation of the electricity industry began in
1990 [38]. Wholesale electricity competition was introduced in 1998 and the re‐
tail market was deregulated by National Power, which means that all consumers
have the freedom to choose their power supply. The number of electricity cus‐
tomers was about 22 million end‐users [39]. Privatising the power market led to
an open themarket for stakeholders and investors. This increased the competitive‐
ness between power providers, which will drop‐off the power prices. The dereg‐
ulated power market also increased innovation in the power technology system.
This helped the users to manage electricity consumption in general [190].
Fossil fuel is still one of themain sources of fuel for power plants in many coun‐
tries due to reliability and inexpensive, it is also able to produce electricity for large
scale areas. In contrast, countries have avoided producing energy from renewable
energy due to a lack of expertise in the field, and the high cost to install and op‐
erate such a system. Hydroelectricity is one of the most popular types of renew‐
able energy resource thanks to its reliability, controllability and dispatch to the grid
[189]. Nevertheless, the global attitude toward transition from traditional energy
resources to renewable energy resources has improved dramatically, due to global45

2.6. THE IMPACT OF ENERGY SYSTEMS IN DECARBONISATION OF SEAPORTS
warming and increased carbon emissions. This transition will reduce the use of
fossil fuels, encourage the use of green energy, and set new laws and regulations
for decarbonisation at the global level.
2.6.1.1 Traditional paradigm of a centralised energy system
At the beginning, power generator units supplied electricity only to the closest
neighbourhoods because they used a DC‐based power grid and power voltage was
limited. AC grids provided power electricity over long distances, which is known as
a centralised energy system[32]. The term “centralisation” refers to large scale gen‐
eration of electricity, usually located remotely from the end customers. The power
is transmitted through high voltage transmission lines to the end‐users [191]. A
huge amount of powerwill be transmitted through transmission lines through cities
to points, it will then pass tomedium capacity lines and is then distributed to neigh‐
bourhoods, small and medium enterprises(SME) and so on; as shown in figure 2.4
[192].
In contrast, there has long been controversy about the capability of the old
paradigm of a centralised energy system to meet the fast growth of industrialisa‐
tion, economics and population. For example, authors have mentioned some of
the drawbacks of traditional architecture of electric system [193]. The Interna‐
tional Energy Agency (IEA) has reported that a one direction power supply, trans‐
mission and distribution will be costly and have negative impacts. For example,
from a technical perspective, a one direction power system leads to increased
losses in transmission and distribution networks. In addition, the ability to in‐
crease reliability and flexibility of the power network will be less. Consequently,
rural areas might be affected by frequent power cuts [194]. Furthermore, power
producers do not consider consumers as active entities. However, activate elec‐
tricity users have great ambitions in increase energy efficiency and may become
prosumers of power energy [33]. However, population growth, the economic ma‐
turity of developed and developing countries, and increased the public awareness
toward clean and sustainable energy resources have led to amajor transition in the
design of electric energy systems. The transition focus of smart, green, controllable
and predictable electric system design. McDonald in 2008 mentioned stated that:46

2.6. THE IMPACT OF ENERGY SYSTEMS IN DECARBONISATION OF SEAPORTS
Figure 2.4: Centralised power system paradigm [192]
”Traditional electrical power system architectures reflect historical strategic policy
drivers for building large‐scale, centralised, thermal‐ (hydro‐carbon‐ and nuclear‐)
based power stations providing bulk energy supplies to load centres through inte‐
grated electricity transmission (high‐voltage: 400, 275 and 132 kV) and distribution
(medium‐, low‐voltage: 33 kV, 11 kV, 3.3 kV and 440V) three‐phase systems” [195].
2.6.2 Decentralised energy system (DES)
2.6.2.1 Background
The earliest days of power generator units supplied electricity only to the closest
neighbourhoods due to direct current‐based power grid and the limited units of
power voltage. A later update of power grid system appeared which give an ac‐
cessibility to provide power electricity to long distances between power units and
buildings using technical tools, such as the emergence of AC grids. This system is47

2.6. THE IMPACT OF ENERGY SYSTEMS IN DECARBONISATION OF SEAPORTS
known as centralised energy system [32]. However, the last decade has witnessed
a significant transition of energy policy because of global warming with an increase
in the population growth rate. Consequently, some countries have started to de‐
ploy small power generation units to increase the security of supply and meet the
power demand. This system is known as a decentralised energy system (DES) or
Distributed Generation [DG]. The role of DG is to provide the flexibility and reli‐
ability to the grid through small size plants and the efficient generation [33]. In
addition, distributed energy generation is able to exploit local energy generation
resources and install energy storage at local sites [34]. The main energy policies to
deploy DES are a deregulated energy market and tackling climate change. This will
deploy DESs and increase the competitiveness between entities [35].
Paliwal et al. [36] mentioned that there is a fast transition from centralised
power generation to decentralised power generation. Furthermore, RES integra‐
tion with DEC leads to a decreased reliance on depleting fossil fuel, increase secu‐
rity of power supply and reduced carbon emission. The concept of DG has many
definitions. The first definition of DG was published by [196], who referred the
meaning of DG to the location prospective. He defined DG as “electric power gen‐
eration within distribution networks or on the customer side of the meter”. Based
on the authors review, many different terms have been used for DG. In Anglo‐
American countries it is known as ‘’Embedded generation’’ and it called ‘’Dispersed
generation in Northern America. Meanwhile, the common term for DG in Europe
and Asia is ‘’decentralised generation’’. In addition, IEEE has defined DG based on
DG capacity which is “ the generation of electricity by facilities that are sufficiently
smaller than central generating plants so as to allow interconnection at nearly any
point in a power system” [197]. Mehigan et al. define DG according to three core
elements: a) connected to the distribution network (b) the customer side of the
meter and (c) isolated from the grid and local to the demand it supplies [198].
Many types of DG and main technologies have been used. Basically, a DG con‐
sists of traditional generation and non‐traditional generation. Traditional genera‐
tion can include micro‐turbines, while non‐traditional generation can include RES,
storage devices and electrochemical devices (fuel cell). The authors mentioned
several applications of DG, such as a standby to supply required power in peak48

2.6. THE IMPACT OF ENERGY SYSTEMS IN DECARBONISATION OF SEAPORTS
time or critical situation. It can also produce a combined heat and power supply
with high efficiency at the district level [199]. The following figure 2.5 presents the
DG technologies.
Figure 2.5: Main Distributed Generation Technologies [198]
Labis et al. [200] investigated and compared the cost of line losses, transmis‐
sion and distribution in the case of laying additional transmission lines, and the cost
of carbon emission in case of fossil fuel based on DG, and then calculated the cost
of using renewable DG in providing additional power to a small rural electric util‐
ity. The result showed that renewable DG is economic in the long term, taking in
account fuel and emission cost. Alanne and Saari [34] highlights the major barriers
of deploying DG, which is institutional, uncertainty and consumer attitude and so‐
cial acceptance. The institutional obstacles of applying DG can include grid access,
regulation, licensing and planning of system. and uncertainty refers to technology
performance and certainty of policy support. The limit of social acceptance refers
to inconvenience and the value of housing assets. A report by Ofgem and the UK
government lists four key barriers to installing and deploying DG:
1. DG is less attractive commercially due to high capital cost, long payback pe‐
riod and unfair price of export surplus electricity to the grid.
2. Potential users cannot easily find access to a DG data centre, and the incen‐
tives are misunderstood.49

2.6. THE IMPACT OF ENERGY SYSTEMS IN DECARBONISATION OF SEAPORTS
3. The traditional design of electricity industry structure in UK does not support
DG technology to connect and operate within it.
4. The current design of housing policy and planning may find it difficult to in‐
teract with DG system.
The cost of power generation from DG is more than cost of power generation
from centralised power generation considering the cost of transmission and distri‐
bution, and the cost of generation. However, Strbac et al. [201] analysed the cost of
power generation from DG and centralised energy system. the result showed that
cost of power generation from centralised energy cost 2‐3p/kWh, while the cost of
power generation from DG is from 4‐10p/kWh. An important role can be achieved
from DG to environment through CHP with DG technologies and the nature of re‐
newable energy resources. This will lead to a significant reduction of emission and
will help to find an optimal energy consumption for communities. Gulli [202] in‐
vestigated the social‐cost benefit of DG in the residential and services sectors. The
result shows that DG system is not competitive in the residential and service sector
applications. Cao et al. [203] evaluated the carbon emission and energy consump‐
tion of DG in a distributed grid in a local city at Chinese city life cycle assessment.
The carbon intensity of provincial power grid is evaluated using a grey prediction
model. The result showed that integration of DG to the power grid can significantly
reduce the carbon emission and carbon intensity, and the author suggested based
on this result to integrate DG to power grid wide area. He mentioned some factors
that can have an impact on the deployment of DG in future, which are: the loca‐
tion and the availability of natural resources based on the weather conditions; the
current infrastructure of power plants, and their reliability; electrification in heat
and transportation and storage; social acceptance and customer behaviour; rules,
legislation and policies; and high cost of DG technologies [198].
2.6.3 Energy storage system
Due to high exploitation of renewable energy sources and depletion on fossil fuel
resources, there demand to increase attention given to energy storage systems
(ESS). Power production from traditional centralised power generation needs to50

2.6. THE IMPACT OF ENERGY SYSTEMS IN DECARBONISATION OF SEAPORTS
consumed power instantaneously based on the load requirement. Otherwise, the
power production will be wasted, which will have negative effect from economi‐
cal and operation perspectives. In addition, the intermittent supply of renewable
energy sources such as solar, wind and hydro may affect the overall system. There‐
fore, contingency measures need to be in the system if there is no energy storage
system [204]. An energy storage system converts electrical energy from the power
network into a form that can be stored to be converted back to electrical energy
when needed. This system can reproduce electricity based on status at time of low
demand or high power price from the grid. It can also be used at a critical time of
peak load or contingency [205].The figure 2.6 that follows illustrates the concept
of an energy storage system.
Figure 2.6: The Fundamental Concept of Energy Storage [205]
An energy storage system will help to protect the environment and reduce car‐
bon emissions by reduce burning fuel to generate power and reproduce it from
storage system [206]. Therefore, it will conserve fossil fuel; increase the use of
different renewable sources; and maintain clean, efficient and affordable energy
[207]. There are several types of energy storage technologies and each type of stor‐
age technology depends on the purpose of the store. There are two main type of
energy stores: electrical energy storage and thermal energy storage. If the energy
is stored thermally and then reused in the same form of energy then it is classified51

2.6. THE IMPACT OF ENERGY SYSTEMS IN DECARBONISATION OF SEAPORTS
as thermal energy storage. However, when the energy is stored thermally and then
released in the formof electrical energy it is classified as electrical energy [208]. En‐
ergy can be stored in different forms based on the various types of energy storage
technology, such as chemical, electrochemical, mechanical and thermal systems
[209]. The use of energy storage is also based on the application type. However,
it is crucial for energy storage technology to become more energy efficient [210].
However, some types of energy storage is considered to be viable to apply, due to
increase DG and DESs. The main viable types for DG and DES are pumped hydro‐
electric, battery storage and superconducting magnetic energy storage systems.
Energy storage can play vital role in micro‐grid applications and it will help to deal
with the intermittent supply of renewable energy. It also has a smart impact when
interacting with the peak load and regulating the power system in the grid. There
are many factors that can help us to identify efficient choice of energy storage, in‐
cluding the practicality of the location from environmental perspectives, cost, reli‐
ability, Depth of Discharge [DOD], amount of energy required, life expectancy and
efficiency [205]. The figure 2.7 shows the applicable power range and discharge
power duration of different energy storage technologies.
Figure 2.7: Applicable power range and discharge power duration of different en‐
ergy storage type [205]
52

2.6. THE IMPACT OF ENERGY SYSTEMS IN DECARBONISATION OF SEAPORTS
Energy storage can maintain the energy system’s stability and it can play signif‐
icant role in energy system planning, operation, and frequency. In addition, it will
help to improve power quality and meet power demand and supply [211]. How‐
ever, it is important for micro‐grids to use energy storage systems because it gives
them a fast response, makes them more controllable and gives them geographi‐
cal independence. Battery energy storage systems (BESSs) can be integrated into
a microgrid. BESSs can not only increase the power quality from short term to
long term but can also enhance reliability and continuous power supply[212].The
cost of an energy storage system depends on the application of the system, based
on variables such as location, construction methods, and system size. Figure 2.8
shows a comparison between cost and capacity between different energy storage
technologies.
Figure 2.8: A comparison between cost and capacity between different energy stor‐
age technologies [212]
A BESS is an energy storage device that is designed to convert its stored chemi‐
cal energy into electrical energy, while during the charging process energy is stored
in the form of electrochemical energy [212]. A BESS consists of a set of cells and
it is connected either in parallel or in series to provide the amount of voltage and53

2.6. THE IMPACT OF ENERGY SYSTEMS IN DECARBONISATION OF SEAPORTS
capacity. The cell consists of two conductor electrodes and one electrolyte, which
are placed together in sealed container and connected to external sources or load.
The electrolyte enables the exchangeof ions between the twoelectrodes, while
the electrons flow through the external circuit. BESS is a solution based on low‐
voltage power battery modules connected in series or parallel to achieve the de‐
sired electrical characteristics. A BESS contains batteries, the Control and Power
Conditioning System (C‐PCS) and the rest of the plant, which provides good pro‐
tection for the entire system.
Figure 2.9: Battery storage system [213]
The figure 2.9 illustrates the main parts of battery storage [213]. BESSs are ma‐
ture storage devices with high energy densities and high voltages. The battery stor‐
age can include lithium ion (Li‐ion), sodium‐sulphur (NaS), nickel‐cadmium (NiCd),
lead acid (Pb‐acid), lead‐carbon batteries, as well as zebra batteries (Na‐NiCl2) and
flow batteries [214]. Lithium ions play a crucial role in electrical energy storage due
to their high specific energy (energy per unit weight) and energy density (energy
per unit volume). One of the greatest concerns of applying a Lithium ion battery
is that it can be a considerable safety hazard thanks to its large capacity [21]. The
principle operation of a Lithium ion battery is that positive Li ions migrate from the
negative plate to the positive plate during discharging and in reversed direction
during charging. The electrolyte permits ion circulation but not electron condi‐
tion. The electrolyte is either aprotic or nonaqueous, due to the high reactivity of
the lithium with water[215].54

2.7. THE KEY COMPONENTS TO GREENING SEAPORTS
2.6.4 Summary
This section highlights power systems and it focus on the centralised energy system
era. It has also outlined the revolution of electricity supply in the United Kingdom
since privatisation in 1986 until 2016. It then discussed the current paradigm of
centralised energy system, and examined the main advantages and disadvantages
of the system in light of new updates in energy policies. It then shed light on global
motivation toward decarbonisation, with a focus on the United Kingdom and its
approach to energy regulation and legislation.
2.7 The key components to greening seaports
2.7.1 Background
The new approach of introducing information and communication technology (ICT)
applications into homes and buildings via automation networks has increased the
feasibility of applying a smart energy system in residential and commercial build‐
ings to reduce the environmental impact of energy generation and its usage [216].
However, global energy demand is projected to increase in the next few decades
due to population growth and increased industrial activities. The industrial sec‐
tor is predicted to increase energy consumption by 40 percent by 2040 [118]. The
global energy demand forecast shows that there is an urgent need to take further
steps to manage energy use to minimise energy consumption and its environmen‐
tal impacts.
An energymanagement system (EMS) can help to optimise energy use in build‐
ings and industries [217]. Energy management began in 1970 as a result of in‐
creased energy prices and the lack of primary resources [218]. The main objec‐
tive of an energy management system is to reduce energy cost without affecting
production and quality, while minimising environmental impacts [71]. The new
approach of energy management systems is smart, efficient, secure and afford‐
able. The new smart energy management system comes under the umbrella of
distributed energy resources (DERs), which refers to electric power generation re‐
sources that are directly connected to medium voltage (MV) or low voltage (LV)55

2.7. THE KEY COMPONENTS TO GREENING SEAPORTS
distribution systems, rather than to the bulk power transmission systems [219].
The new approaches that manage energy use in a DER are a smart grid, microgrid
and VPP, which will be discussed in more detail in the following sections.
2.7.2 Smart grid
2.7.2.1 Background
The first power generator units only supplied electricity to the closest neighbour‐
hoods because they used DC‐based power grids and also because of the limited
units of power voltage. Later power grids were able to provide power electricity
over long distances using AC‐based grids, which is known as a centralised energy
system [46]. In addition, the predicted growth of power demand in the coming
decades needs a vast response. A smart grid is able to identify quality and cooper‐
ate generation and storage options. The objective of a smart grid is to enable the
participants and decision makers to find an operation environment that is suitable
for both utilities and power consumers. In addition, the residents can adopt amore
positive role by adding PV cells or through a storage system [220].
Population growth and the mature economies in developed and developing
countries, and increased public awareness toward clean and sustainable energy re‐
sources, have led to amajor transition in the design of electric energy systems. The
transition focuses on smart, green, controllable and predictable electric system de‐
sign [195]. Smart grid technologies can provide a solution for many power system
problems and will provide more sustainable, reliable, safe and quality electricity.
A smart grid defined as an electricity network that can efficiently integrate the be‐
haviour and actions of all users connected to it (suppliers, consumers and those
that do both) to ensure economic efficiency, and to provide sustainable power
systems with low losses and high levels of quality, security of supply and safety
[221].The benefit of using smart grids is that they allow renewable energy sources
to integrate with local energy sources to increase the reliability and quality of the
power supply across the system. Consumers play a vital role in smart grid technol‐
ogy because they can use energy systems to prevent energy waste or loss, reduce
power consumption during peak times, and improve energy efficiency. Cost oper‐56

2.7. THE KEY COMPONENTS TO GREENING SEAPORTS
ations can also be reduced through the smart use of energy in smart grid organi‐
sations [222].
The concept of the smart grid was developed in 2006 by the European Technol‐
ogy Platform, as follows: A Smart Grid is an electricity network that can intelligently
integrate the actions of all users connected to it—generators, consumers and those
that do both—in order to efficiently deliver sustainable, economic and secure elec‐
tricity supplies. According to The EuropeanRegulators Group for Electricity andGas
(ERGEG), developed based on the definition from the European Technology Plat‐
form Smart Grids (ETPS), a smart grid is an electricity network that can cost effi‐
ciently integrate the behaviour and actions of all users connected to it generators,
consumers and those that do both to ensure economically efficient, sustainable
power systemwith low losses, and high levels of quality and security of supply and
safety [221]. According to the US Department of Energy: ’’A smart grid uses digital
technology to improve reliability, security, and efficiency (both economic and en‐
ergy) of the electric system from large generation, through the delivery systems to
electricity consumers and a growing number of distributed‐generation and storage
resources’’[79].
And European technology platform defines a smart grid as ’’smart grid is an
electricity network that can intelligently integrate the actions of all users connected
to it generators, consumers and those that do both to efficiently deliver sustain‐
able, economic and secure electricity supplies’’[223]. The Department of Energy
and climate change in the UK defined a smart grid as ‘’a modernised electricity grid
that uses information and communications technology tomonitor and actively con‐
trol generation and demand in near real‐time, which provides a more reliable and
cost‐effective system for transporting electricity from generators to homes, busi‐
nesses and industry’’[224]. The Electric Power Research Institute defined a smart
grid as: “The overlaying of a unified communications and control system on the
existing power delivery infrastructure to provide the right information to the right
entity” [225].
The definition provided by the Energy Networks Association (ENA) states that
the Smart Grid is everything from generation through to home automation with
a smart meter being an important element, with every piece of network equip‐57

2.7. THE KEY COMPONENTS TO GREENING SEAPORTS
ment, communications technology and processes in between contributing to an
efficient and smart grid [226]. In addition, smart grid technology can include the
transmission of electricity from suppliers to consumers with the aid of computer
systems (through control automation, continuousmonitoring and optimisation of a
distribution system). This approach aims to save energy, reduce costs and increase
reliability [227].
2.7.2.2 Smart grid technologies
The National Institute of Standards and Technology divided a smart grid into seven
main domains, as shown in Figure 2.10, as follows:
1. Advanced metering infrastructure (AMI),
2. Customer side system (CSS),
3. Electric Vehicle Charging System (EV),
4. Transmission enhancement application (TEA),
5. Distributed energy resources (DER),
6. Information and communication technologies (ICT),
7. Wide‐area monitoring, measurement and control.
Figure 2.10: The seven domains of smart grid component based on NIST [228]
The figure that follows 2.11 illustrates the interaction between smart grid tech‐
nologies in the power system, from the generation stage to the consumer stage.58

2.7. THE KEY COMPONENTS TO GREENING SEAPORTS
Figure 2.11: The interaction between smart grid technologies in a power sys‐
tem [228]
2.7.3 Microgrid
To limit human made greenhouse gas emissions, new ways of using energy effi‐
ciently and generating electricity from clean resources must be found [229]. Mi‐
crogrids are a promising option for the energy transition era [230]. A microgrid
is basically a small‐scale localised energy network, which includes loads, network
control system and number of distributed energy resources (DER) such as gener‐
ators and energy storage systems. A microgrid can be integrated with smart el‐
ements that been adopted in smart grids to enable DERs and demand response
to interact in distribution systems [231]. Based on the US Department of Energy,
a microgrid is ”a group of interconnected loads and distributed energy resources
within clearly defined electrical boundaries that acts as a single controllable entity
with respect to the grid”. A microgrid can connect and disconnect from the grid to
enable it to operate in both grid‐connected or island mode [223].
Microgrids consist of distributed energy resources, power conversion equip‐
ment, communication system, controllers , energy management system to main‐
tains flexible energymanagement betweenentities and consumers [232, 233] There
are three different types of microgrid, as follows:
1. Urban (grid tied)microgrids, which has different types of loads anddistributed
energy resources, and is able to operate in islanded mode. An urban micro‐
grid needs to meet all of the requirements to be fully integrated with a large59

2.7. THE KEY COMPONENTS TO GREENING SEAPORTS
grid to rely on overall power quality. This type of microgrid is applicable for
campuses, compounds and mall centres [234, 235]
2. Remote microgrids, which are designed for off grid use. It relies on its own
systems and does not need to meet requirement to fit with other grids. It
requires remote control features to be applicable in different remote areas
and serve different communities. However, there is a lack of investment in
this type of microgrid due to economic, political and technological reasons
[236, 234].
3. Agile microgrids, which are developed to be a temporary solution to meet
specific operations in different sites based on the commission. Agile micro‐
grids could be used by the military in a field hospital or for disaster recovery
[237].
Amicrogrid can be combinedwith renewable energy resources, energy storage,
controllers, consumers, grid connected and multigeneration systems. The RES de‐
pends on the climate conditions and PV, wind and tidal are intermittent resources
[238]. A microgrid needs to be reliable, meet power demand and avoid contin‐
gency [239] However, energy storage systems can be used for microgrids to help
to solve the problem of intermittency of RES [212]. The operation, control and co‐
ordination inside a microgrid could have an impact of the overall performance of
the system. Several studies have used optimisation techniques to minimise faults
and waste, and maximise performance and profits for the system and users [143].
Furthermore, several researchers focused on minimisation the cost of microgrid
operation problems and they used differentmetaheuristic optimisation techniques
[240]. Figure 2.12 illustrates the structure of a microgrid with distributed energy
resources [241].
2.7.3.1 Review of micro‐grids setting in a fishery ports
In the previous chapter, the nature of the energy consumption in the seaport build‐
ings has been analysed , and the amount of energy generated by PV solar system
installed on the roof of the building was calculated, which at that time was work‐
ing in a primitive way by connecting the energy generated in the period of sun rise60

2.7. THE KEY COMPONENTS TO GREENING SEAPORTS
Figure 2.12: The structure of a microgrid with DER [231]
to meet the demand in the building and in case no power demand in the building
it is sold directly to the national grid without benefiting or storing it. However, it
was important to study the feasibility of implementing amicro‐grid proposal at the
seaport and to measure its impact at the level of one building.
The implementation and development of a micro‐grid in seaports is new and
modern, and studies and research in this topic are very few, and focus mostly on
the establishment and induction of renewable energy systems of all kinds, which
contribute significantly to reducing carbon emissions, as well as replacing the en‐
ergy used and reducing the prices of spent fuel[242]. The micro‐grid is a modern
technology that was described in the literature review in Chapter Two. It is cur‐
rently one of the most promising solutions for the future industries, in which mul‐
tiple types of renewable energy sources can be combined and implemented via a
smart energymanagement system through automated control systems andAI tools
to understand the nature of electricity consumption and generation, as well as to
predict the times of need and power generation, which will greatly help to achieve
a more efficient network performance and ensure that power is not interrupted
during a period of work time [233]. It will also contribute significantly to improving
the performance of electric power systems and reducing the waste of electricity in
the building, as well as reducing the reliance on electricity from the national grid.61

2.7. THE KEY COMPONENTS TO GREENING SEAPORTS
This will help to achieve the green port concept, which focuses heavily on the use
of clean energy tomeet the need for electricity and to reduce the cost of electricity
consumed.
Few studies have discussed the application of a micro‐grid for a seaport. The
study by Fang et al. [243] discussed the future of micro‐grid in seaports. This study
proved that a micro‐grid for a seaport could play vital role and can have economi‐
cal and environmental impacts. This study listed the future challenges that stand in
the way of deployment micro‐grid for a seaport, which are: adaptation of energy
management methods, the functionality of energy storage systems and distribu‐
tion control road map. Meanwhile, the study by [244] highlighted the strategies
and technologies that can be used to reduce emissions from ports activities and
they supported the deployment of micro‐grid as sustainable technology that can
help to reduce carbon emission and achieve future green ports. The same author
in [245] used HOMER simulation to analyse the feasibility of applying a micro‐grid
for a seaport, which show that about three quarters of the power can be met from
local renewable power sources.
2.7.4 Virtual power plant
Due to the increased penetration of DG units and their ability to exchange the
energy produced from conventional power plants, high technology is required to
meet power demand from the consumer considering economic and security per‐
spectives [246]. In addition, increased deployment of DGs with an absence of a
passive approach can reflect the total investment of running DGs in the long term.
However, there is a need to start assimilating an active approach, which will help
DGs to participate in energymarkets [247]. A VPP can be defined as ”a single power
plant that connects, control and envisions dispersed generators via an information
and communication technologies (ICT)” [248]. A VPP is able to manage and con‐
trol power flow between units [249]. It will also help to optimise energy use and
increase the performance of the system [250]. The three main functions of a VPP
are dispatch and optimisation, management and control, and integration of DGs
and renewable energy resources [251].
The functionality of VPP is to exchange energy with grid network, and control62

2.7. THE KEY COMPONENTS TO GREENING SEAPORTS
power supply and demand flow between entities [249]. There are two main types
of VPP: a technical virtual power plant (TVPP) and a commercial virtual power plant
(CVPP). The role of a TVPP is to help the distribution system operator (DSO) avoid
any problems from the local energy system. In addition, it monitors and controls
the units, loads, control strategy and battery energy storage in the DG [252]. The
role of a CVPP is to optimise and schedule power production based on the fore‐
casted power demand. It also integrates the energy market to maximise revenues
chances for the consumers and producers [253]. Therefore, the impact of aggre‐
gates TVPP and CVPP will reflect on the stakeholder, DSO, TSO and policy makers
in the long run, and it will help to mitigate carbon emission and reduce energy
consumption in the long term [254].
2.7.5 Net zero energy building (NZEB)
In the last few decades, population growth has increased the need for indoor com‐
fort, which has turned buildings into one of the main causes of global energy con‐
sumption and carbon emission [203]. Buildings account about 40 percent of to‐
tal primary energy consumption [255]. With increased risks of climate change and
global warming, there is a global motivation towards reducing energy consumption
and carbon emissions of commercial, residential and industrial sectors [9]. Conse‐
quently, new initiatives have been introduced to more efficiently use energy in
buildings, aiming to become net zero energy buildings. In addition, an increased
share of renewable energy sources which will help to limit the use of fossil fuels
in buildings through a decentralised approach[256]. The concept of a NZEB aims
to reduce dependency on fossil fuels in the building by implementing energy ef‐
ficient measures and producing clean energy to meet local energy demand [257].
The Energy Performance Building Directive (EPBD, 2010/31/EC) defined a NZEB as
“a building with very high energy performance where the nearly zero or very low
amount of energy required should be extensively covered by renewable sources
produced on‐site or nearby” [258].
There are four principles to design a NZEB [259]: first, reduce the energy de‐
mand for all new buildings, including internal heat, envelop loads and HVAC equip‐
ment energy consumption. Second, improve indoor environmental quality through63

2.7. THE KEY COMPONENTS TO GREENING SEAPORTS
set upminimum fresh air, accessing daylighting and set upmaximum capacity den‐
sity. Third, provide a renewable energy share by producing energy from renewable
sources on‐site and meeting power demand from renewable energy sources. Fi‐
nally, reduce energy consumption and carbon emission. Figure 2.12 presents the
fundamentals of a NZEB design.
Figure 2.13: The fundamentals of a NZEB design [259]
2.7.6 Artificial intelligence
AI applications for environmental modelling are increasingly being used due to
their ability to solve complex problems [260]. AI mimics human perception, learn‐
ing and reasoning to solve complicated problems [260]. An AI is defined as the
science and engineering of making intelligent machines, especially intelligent com‐
puter programs. Furthermore, AI techniques can be divided into four areas: expert
systems (ESs), fuzzy logic (FL), artificial neural networks (ANN) and the genetic al‐
gorithm (GA). ESs ,which are also known as knowledge‐based systems, can be de‐
fined as computer programs that incorporate knowledge from experts in specific
disciplines to analyse problems for users [261].
Yager and Zadeh [262] describes vagueness as a linguistic expression instead of
a mathematical description. Meanwhile, an ANN [263] is a mathematical simula‐
tion of human neural networks for processing information and consists of layers of
artificial neurons linked by weighted connections. The GA [264] is a search engine64

2.7. THE KEY COMPONENTS TO GREENING SEAPORTS
technique used to find the best or approximately best solutions for optimisation
problems [265]. AI techniques are applied for the prediction, optimisation, mod‐
elling, and simulation and control of complex systems such as adaptive control,
scheduling, optimisation and complex mapping [266]. AI has been used in many
disciplines, such as engineering, medicine, economics, military, and so on [267].
In the energy sector, AI plays a crucial role in every stage of the supply chain of
energy systems; frompower generation, to transmission, to distribution, to the end
user [268, 269, 270, 271]. AI can increase the energy efficiency of power systems
via intelligent energy management systems for seaports [272, 273, 274]. AI can
also increase the security of the power supply and help reduce the cost of power
[275].
2.7.7 Information and communication technology
Information and communication technology (ICT) is one of the basic elements in
modern society. ICT is also the core element of the industrial sector. UNESCO
defines ICT as the combination of informatics technology with other related tech‐
nologies, specifically communication technology [276]. The role of ICT in a smart
grid is to build highly flexible and reliable communication infrastructure that allow
protocols to enable real time interactions between producers and consumers in a
smart grid [277]. There are three types of communication technology in a smart
grid:
• Communication based on the electrical grid.
• Communication based on cable infrastructure and telephone lines.
• Wireless communication.
The most commonly used communication strategy is a combination of a smart
meter and a data concentrator, via a Power Line Communications (PLC). The second
strategy involves a combination of a data concentrator and a meter data manage‐
ment system; GPS‐GPRS is the most commonly used system [278]. In the power
grid, there are three layers of the power system: generation, transmission and dis‐
tribution. The current system for collecting data and exchanging it with the power
grid system consists of three ICT network layers:
• Wide Area Network (WAN).65

2.7. THE KEY COMPONENTS TO GREENING SEAPORTS
• Neighbourhood Area Network (NAN).
• Home Area Network (HAN).
TheWAN is responsible for collecting and routing the data for generation trans‐
mission and distribution. However, NAN and HAN are responsible for covering the
data in the second stage of distribution and delivering energy to customer’s homes
2.7.8 Internet of Things
The IoT is a new paradigm of information technology [279]. The Internet is a world‐
wide system that interconnects computer networks based on a standard Internet
protocol suite, which serves hundreds of millions of users worldwide. The Inter‐
net consists of millions of private, public, academic, business and government net‐
works connected by a broad array of electronic, wireless and optical networking
technologies [280].
The IoT aims to allow the trusted exchange of useful data between unseen,
embedded and uniquely identifiable devices through Radio Frequency Identifica‐
tion (RFID) and Wireless Sensor Networks (WSNs) using sensor devices and multi‐
ple processors for decision making to facilitate automation [281]. The use of IoT
for port activities was described by Sarabia‐Jácome et al. [135], who developed
a seaport data space that will help avoid the interoperability of the stakeholder
information system as shown in Figure 2.14. The results show that the seaport
data space improves the decision‐making process between seaport departments.
Another study investigated the use of an AutomaticMooring Systems(AMS) that al‐
lows vessels to be moored without a robe, showing that such a system can reduce
carbon emissions[93].
2.7.9 Summary
This section has discussed smart energy management approaches including smart
grid and its technologies, and an integration approach with a power system. It
has discussed a microgrid system, including the three main types of MG. This is
followed by VPP technology and its role in the new paradigm of energy system.
Furthermore, NZEBs have been described. There are some previous studies in the66
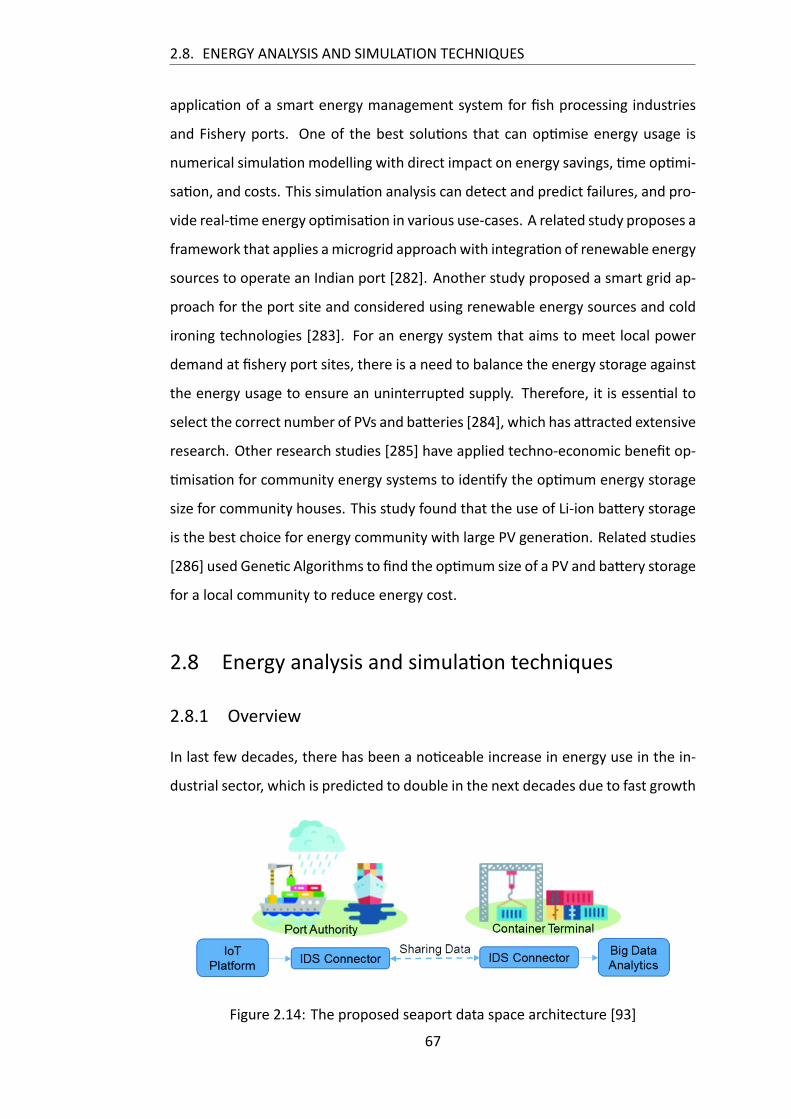
2.8. ENERGY ANALYSIS AND SIMULATION TECHNIQUES
application of a smart energy management system for fish processing industries
and Fishery ports. One of the best solutions that can optimise energy usage is
numerical simulation modelling with direct impact on energy savings, time optimi‐
sation, and costs. This simulation analysis can detect and predict failures, and pro‐
vide real‐time energy optimisation in various use‐cases. A related study proposes a
framework that applies amicrogrid approachwith integration of renewable energy
sources to operate an Indian port [282]. Another study proposed a smart grid ap‐
proach for the port site and considered using renewable energy sources and cold
ironing technologies [283]. For an energy system that aims to meet local power
demand at fishery port sites, there is a need to balance the energy storage against
the energy usage to ensure an uninterrupted supply. Therefore, it is essential to
select the correct number of PVs and batteries [284], which has attracted extensive
research. Other research studies [285] have applied techno‐economic benefit op‐
timisation for community energy systems to identify the optimum energy storage
size for community houses. This study found that the use of Li‐ion battery storage
is the best choice for energy community with large PV generation. Related studies
[286] used Genetic Algorithms to find the optimum size of a PV and battery storage
for a local community to reduce energy cost.
2.8 Energy analysis and simulation techniques
2.8.1 Overview
In last few decades, there has been a noticeable increase in energy use in the in‐
dustrial sector, which is predicted to double in the next decades due to fast growth
Figure 2.14: The proposed seaport data space architecture [93]
67

2.8. ENERGY ANALYSIS AND SIMULATION TECHNIQUES
of smart technologies, such as Industry 4.0 , IoT and cyber physical systems [287].
However, there is great motivation toward optimising energy use in the industrial
sector via techniques that can reduce energy consumption, and therefore reduce
cost of energy and decrease an intensive amount of carbon emission [288]. This
section will review the most recent smart techniques that will help to optimise en‐
ergy use in the industrial sector.
2.8.2 Energy auditing
One of the most effective techniques of optimising energy use in industrial is en‐
ergy auditing. Energy auditing is a comprehensive assessment of a building’s layout
and its appliances. This will identify the energy consumption requirements of the
building and provide an opportunity to exploreways to reduce energy consumption
without impacting negatively on energy bills or the occupants. Doty and Turner rec‐
ommend that a detailed report should be implemented to demonstrate the current
energy requirement and layout of the building [289]. Based on ASHRAE, energy au‐
diting can be defined as follows: “Preliminary Energy Use Analysis. This involves
analysis of historic utility use and cost and development of the energy utilisation
index (EUI) of the building. Compare the building’s EUI to similar buildings to de‐
termine if further engineering study and analysis are likely to produce significant
energy savings” [290]. The process of energy auditing can be divided into three
phases [291].
1. Pre‐audit phase, which covers awalk through visit of the site, and a question‐
naire and interview with energy related staff at the site. This stage will help
to understand the process of the site and the energy use, which will help to
identify sensitive areas of energy consumption that can be optimised.
2. Audit phases, which are the main core of the energy auditing process. This
starts by analysing interviewing and questionnaire from energy related staff
in the site and also analysing utility bills for 12 months. Moreover, data of
local energy appliances is collected, and the efficiency and operation time
of the appliances is investigated. The following step is to use energy simu‐
lation software to model the energy site and identify the opportunity areas68

2.8. ENERGY ANALYSIS AND SIMULATION TECHNIQUES
Figure 2.15: Energy auditing phases [291]
of optimisation energy use. The final step is to write an energy proposal
report about the site, which contains recommendations to reduce energy
consumption and energy efficiency.
3. Post‐audit phase, which refers to the practical steps at the site to install or
change the recommended appliances to improve energy efficiency.
An energy audit can be an effective tool where data is lacking at the site and
it can help to identify the optimum recommendations of energy use at the
site using energy auditing process [292]. However, an energy audit does not
directly reflect on energy savings but it will help to shed the light on the areas
of energy optimisation at the site [293]. Several studies have mentioned the
impact of an energy auditing on energy systems. Energy savings are themost
obvious result of an energy audit. And as result of energy saving, the cost of
energy usewill be reduced. In addition, carbon emissionswill be reduced be‐
causewaste of energy isminimised [291, 294, 295]. In addition, some studies
have shown that an energy audit could improve processes in organisations
[296] by reducing energy intensity and reducing carbon emissions, whichwill
reflect on the energy efficiency of the manufacturing process. The emission
trading scheme is one of the first major markets for trading greenhouse gas
emission at an international level. The directive has been enacted in 2010
under the number of 2010/75/EU. The ETS aims to minimise emissions from
the industrial sector by more than 11,500 installations. The energy auditing
process will help to increase energy efficiency in the industrial sector [297],
which will benefit the sites, and the community and environment.
69

2.8. ENERGY ANALYSIS AND SIMULATION TECHNIQUES
2.8.3 Modeling and simulation of an energy system
The role of energy simulation software is to minimise energy consumption, which
will reflect directly in the energy cost. It will also help to optimise energy use
by identifying the sensitive parameters that effect the overall energy use in the
properties[298]. In addition, energy simulation programs can be used to evaluate
the impact of new policies and regulations for energy systems, which will help de‐
cision makers to develop business strategies and evaluate business opportunities
based on the evolution of the energy system. A simulation of the energy system
helps to monitor and analyze the actual energy use in the property, and therefore
compare it with measured energy use to detect and diagnose faults in the system.
Furthermore, a simulation can be used to test and implement new products for
the property, such as new types of window (e.g. double glazing, smart cooling sys‐
tem, led lighting, fans etc.). It can also help to estimate the capital cost and energy
consumption [299].
2.8.3.1 Energy system: Definitions
Modernisation has harnessed different forms of energy to extend human capabil‐
ities and ingenuity. Energy plays a vital role in daily life and is fundamental for
modern life [300]. An energy system comprises energy supply sector and the end
use technology needed to provide energy services [301]. In addition, energy sys‐
tems are based on converted primary energy resources to energy carriers, such as
electricity that is used by end users for cooling, heating and lighting [302]. The
[IPPC] defined energy supply sector as follows: “ Comprises all energy extraction,
conversion, storage, transmission, and distribution processes with the exception
of those that use final energy to provide energy services in the end‐use sectors
(industry, transport, and building, as well as agriculture and forestry” [303].
2.8.3.2 Energy models
Modeling can be defined as “ the act of interpreting a set of physical phenomena
and of devising a reasonably complete, closed and comprehensive phenomeno‐
logical and mathematical formulation for its description” [304]. Energy models70

2.8. ENERGY ANALYSIS AND SIMULATION TECHNIQUES
aim to represent and simplify real systems to perform test and experiments, which
might be impractical and costly [305]. The modeling process through computer‐
isation can have a positive impact, due to the computational modellers’ assump‐
tions through logical consequences. It also able to interrelate many factors instan‐
taneously. There are six types of energy models, as follows: optimisation mod‐
els, decentralised energy models, energy supply/demand driven models, energy
and environmental planning models, resource energy planning models and energy
models based on neural networks [306]. decnterlization and optimimzation en‐
ergy model are between the most popular energy models. The decentralised en‐
ergy model seeks to meet energy demand from different resources. Its objective
is to minimise total annual energy cost, carbon emissions and maximise overall
system energy efficiency [307]. In addition, the decentralised energy model will
help to predict total energy supply/demand and estimate the overall cost of the
system before execution. It will also help to assess the attitude of social and tech‐
nical parameter, and their impact on real life. Consequently, it will to implement
the overall system and give a clear understanding of the system. an optimisation
model will is to find an input of function to minimise or maximise its value, which
could be subjected to constraint [308, 309].
2.8.3.3 Energy simulation
The Cambridge Dictionary defines simulation as “a situation or event that seems
real but is not real, used especially in order to help people deal with such situa‐
tions or events [310]. According to Schriber: “Simulation involves the modeling of
a process or system in such a way that themodel mimics the response of the actual
systems to events that take place over time” [311]. The simulation process occurs
by using energy simulation programs that are designed to calculate the amount of
energy use per unit considering several parameters. This allow simulation users
to identify the behaviour of energy system in the unit [312]. The role of energy
simulation software is to minimise energy consumption, which will reflect directly
on the energy cost. It will also help to optimise energy use in properties by iden‐
tifying the sensitive parameters that effect the overall energy use [298]. In addi‐
tion, energy simulation programs are used to evaluate the impact of new policies71

2.8. ENERGY ANALYSIS AND SIMULATION TECHNIQUES
and regulations of energy systems, which will help the decision makers to develop
business strategies and evaluate business opportunities based on the evolution in
energy systems [313]. The simulation of energy system helps to monitor and anal‐
yse the actual energy use in the property, and therefore compare it with measured
energy use to detect and diagnose faults in the system. Furthermore, simulations
can be used to test and implement new products for the property, such as new
types of window, smart cooling system, led lighting, fans and so on. This will help
to estimate the capital cost and energy consumption [299]. Furthermore, comput‐
erised based‐simulation can be categorised into discrete event simulation (DES)
and continuous event simulation (CES) [314]. The DES approach solves problems
with changing variables in discrete time by discrete steps. Meanwhile, CES can be
used for systems with continuously changing variables [315]. DES is more practi‐
cal to use for analyze the dynamics of production systems [316]. However, CES is
better to use for analyze energy flow of loads in production processes, due to the
continuous variation of loads through time periods [317].
2.8.3.4 Energy simulation tools
In the last few years, the number of energy simulation tools (i.e., commercial, open
source and academic) has increased and they have become available for differ‐
ent types of energy applications. The capability of new smart systems has helped
computer engineers to develop new dynamic simulation models that can show re‐
markable outcomes thanks to accurate results. The graphical user interface (GUI)
of energy simulation tools made by the operating system (i.e., MicrosoftWindows,
Mac, and Linux) has helped design engineers to get more accessibility to the sys‐
tem [318]. One study has shown that the most complete energy simulation soft‐
ware tools are the EnergyPlus, the ESP‐r (Energy Simulation Software tool), the
IDA ICE (Indoor ClimateEnergy), IES‐VE (Integrated Environmental Solutions ‐ Vir‐
tual Environment) and TRNSYS[189]. Furthermore, energy system simulation tools
can be formalised in equations based on block flow diagram tools, such as MAT‐
LAB/SIMULINK. “MATLAB is a high‐performance language for technical comput‐
ing. It integrates computation, visualisation, and programming in an easy‐to‐use
environment where problems and solutions are expressed in familiar mathemat‐72

2.8. ENERGY ANALYSIS AND SIMULATION TECHNIQUES
ical notation” [319]. SIMULINK “is a block diagram environment for multidomain
simulation and Model‐Based Design. It supports system‐level design, simulation,
automatic code generation, and continuous test and verification of embedded sys‐
tems. It provides a graphical editor, customisable block libraries, and solvers for
modeling and simulating dynamic systems. It is integrated with MATLAB, enabling
you to incorporate MATLAB algorithms into models and export simulation results
to MATLAB for further analysis” [320]. One of most efficient uses for modeling
techniques for energy systems is co‐simulation, which “is an emerging enabling
technique, where global simulation of a coupled system can be achieved by com‐
posing the simulations of its parts” [321] Building Control Virtual Test Bed (BCVTB)
is one of the most efficient platforms for co‐simulation between energy simulation
tools. It allows users to couple different simulation programs for co‐simulation,
and to couple simulation programs with actual hardware. For example, the BCVTB
allows us to simulate a building in EnergyPlus, and the HVAC and control system in
Modelica, while exchanging data between the software as they simulate [78].
2.8.4 Scheduling appliances technique
Due to high electrical energy consumption in buildings, and commercial and in‐
dustrial sectors, some countries have introduced a practical method to help to re‐
duce energy consumption. For example, Australia has applied energy conservation
measures to reduce energy consumption from electrical appliances (e.g., lighting,
heating, ventilation and air‐conditioning systems) [322]. However, ECM must not
effect the comfort of the occupant. The ECM can be divided into two basic meth‐
ods. The first method contains physical changes or adds to the exist system in the
building, such as replacement of lighting system or adding sensors to the lighting
system. This first method changes the process of operation of the system, such
as scheduling appliances [323]. A strategy of building energy management sys‐
tem proposed to control energy flows in the building and reduce the total cost
of energy. Framework consists of three modules which is prediction, long term
scheduling and real time control. Long term scheduling can tan take an optimal
decision based on some input variables such as (load consumption, available so‐
lar power and power price) [324]. Another study used an optimisation model to73

2.8. ENERGY ANALYSIS AND SIMULATION TECHNIQUES
reduce power cost for residential demand response through scheduling home ap‐
pliances. A mixed integer nonlinear optimisation model has been applied in this
study using time of use electricity tariff. The authors found that electricity cost can
be saved up to 25 percent [325]. Another study examined a new development of
home scheduling appliances to reduce total load curve. Appliances have been cat‐
egorised based on flexible , non‐flexible deferrable loads. A dynamic algorithm has
been applied to solve two multi‐objective optimisation problems [326]. The first
to flattening power consumption of non‐flexible load and the second to strength
power of flexible loads. Lu et al. [327] developed an optimal scheduling model
for home appliances for smart home consider demand response to reduce power
cost. The problem solved as mixed integer nonlinear programming. The result of
this study showed that power cost reduction with about 34.71 percent considering
incentives as effective variable to shift the load. The types of HVAC scheduling are
shown in the figure 2.16 that follows.
Figure 2.16: HVAC scheduling teypes [322]
AlSkaif et al. [328] created a framework for a household micro‐grid aiming to
increase the self‐consumption of their on‐site RES through a storage system. Their
framework used an optimisation problem by EMS linking with schedule appliances
power consumption and the energy that each home‐owner can get from the stor‐
age unit. The mixed integer linear programming used to solve scheduling prob‐74

2.8. ENERGY ANALYSIS AND SIMULATION TECHNIQUES
lem and simulation result showed that cost saving of 68 percent through sharing
only different classes of home‐owner that exist in the micro‐grid. Setlhaolo et al.
[325] developed scheduling appliances with battery storage system under a time‐
of‐use electricity tariff. A mixed integer nonlinear programming model used with
practical operation constraints to solve the problem. The simulation result showed
that about 22 percent cost saving, and 1.96 kW peak reduction could be achieved
without battery and coordination. A study created energy management model for
scheduling home appliances to reduce electricity bills, peak to average ratio and
increase consumer comfort in a micro‐grid. Heuristic techniques have been used
to optimise scheduling appliances to reduce electricity bills Hussain et al. [329].
Another research suggested a green methodology that will help to increase use of
green energy sources. In addition, a greedy algorithm has been proposed to or‐
der different energy sources based on their estimated price forecast. An artificial
neural network has been used to schedule appliances to reduce total energy cost
[330]. A group of researchers used an optimisation algorithm for the problem of
scheduling appliances in smart homes in order to reduce electricity cost and reduce
peak load. Mixed integer linear programming has been used to solve this problem.
PV systems have been added to a home energy system to reduce electricity cost
[331].
2.8.5 AppliedReal decision‐making systems for EnergyManagement
systems
Fishery ports include all of the operations that are required to catch and prepare
fish and other seafood to create the final product that is delivered to customers
[332]. This activity requires intensive on‐site energy [86] throughout the fish pro‐
duction lifecycle from thefishing stage to the freezing andpackaging process, which
is mainly derived from electricity and liquid fuels [333]. Electricity is typically used
to power processing equipment, lighting, cooling, and freezing [334]. A wide range
of variables impact energy consumption in the fish processing industry, including
the age of the plant, level of automation, and type of production process. Further‐
more, a seafood product production line can involve heating, cooling, and other
types of equipment [335]. According to the Irish seafood development agency,75

2.9. THE CURRENT STATUS OF ENERGY USE AT FISHERY PORTS
Bord Iascaigh Mhara, about 15 percent of global fishery port energy consumption
is related to refrigeration and air conditioning [336] Considering the intensive en‐
ergy use of such cooling systems, any inefficiency can result in sizeable quantities
of emissions from refrigerant gases such as ammonia [337]. P2P energy trading has
recently been presented as a next generation energymanagement system that can
enable prosumers in a smart energy community to share their extra energy with
others. To accomplish this energy trading, the P2P mechanism needs a robust de‐
cision making process and a reliable mathematical model that will ensure shared
interest and optimal motivation between prosumers [338, 339]. various studies
have applied game theory approaches to P2P energy trading due to their feasible
and effectivemeans ofmodelling the energymanagement system. They have done
so using different types of algorithms: the Stackelberg equilibrium game was used
in [340, 341, 342, 343] to optimise the energy cost and social benefit in P2P en‐
ergy trading; a game theory approach was developed in [344, 345, 346, 345, 347]
to optimise energy use and maximise energy incomes for P2P energy prosumers;
Harish et al. [348] proposed a nonlinear optimisation problem to minimise energy
cost and energy losses during transmission; Long et al. [349] developed a linear
programming problem to maximise the local balance between participants; and
Zhong Zhang [350] and Nguyen et al. [351] applied mixed‐integer linear program‐
ming P2P energy trading.
2.9 The current status of Energy use at fishery Ports
The fishing industry is one of themost important traded products in the world, due
to the growing demand and enlarging supply of fishery and aquaculture products.
Based on the Food and Agriculture Organization (FAO), the total world fish produc‐
tion in 2016 is about 171 million tonnes compared to 19.3 million tonnes in 1950
[148]. The sea food trade includes a diverse range of products, from high value
species such as shrimp, salmon, tuna, groundfish, flatfish, sea bass and sea bream
to low value species such as small Pelagic, which has been traded in high quantity
and exported to low income countries [352]. The global investment in fish prod‐
ucts increased significantly during the last 40 years, from € 8 billion to about € 13376

2.9. THE CURRENT STATUS OF ENERGY USE AT FISHERY PORTS
billion in 2017 [353]. In addition, the fish processing industries include operations
to prepare fish and other seafood in such a way to create the final product that
will be delivered to the end user customer [332]. There are two stages for fish
processing: the primary processing stage, which includes cutting, filleting, picking,
peeling, washing, chilling, packing, heading, and gutting; and the secondary pro‐
cessing stage, which includes brining, smoking, cooking, freezing, canning, debon‐
ing, breading, vacuum and controlled packaging, production of ready meals [354].
One of the key environmental impacts of fish processing industries is energy
consumption, which is an essential part of most processes on site [333]. For the
fish processing industry, energy consumption is dependent on the type of activ‐
ity. The main sources of energy are electricity and liquids fuels. These two sources
share in different operations in the processes, from the fishing stage to the frozen
or canned products [355]. Electricity is used in the fish industry for powering pro‐
cessing equipment, lighting, cooling and freezing [334]. Meanwhile, energy con‐
sumption in the fish industries is based onmany different variables, such as the age
of plant, level of automation, and level of processes for production, while the pro‐
duction of seafood products includes heating, cooling and different kind of equip‐
ment [335]. Cooling and freezing in the fish industry are responsible for an inten‐
sive amount of electricity consumption. Based on Ireland’s Seafood Development
Agency (BIM), about 15 percent of energy consumption in fish industries globally
is related to refrigeration and air conditioning systems [336]. With the continuous
energy use for cooling systems in the fish industries, the inefficient use of cooling
systems can result in a huge amount of emissions from refrigerant gases, such as
ammonia[337, 356].
2.9.1 Energy cost
In the last few decades, the cost of fuel and energy has increased, which has had
a direct effect on the food processing industries at a global level [357]. The use of
fuel and energy depends on the type of process. The amount of energy use and fuel
consumption reflects on the amount of fish production. However, the cost of en‐
ergy and fuel are sensitive variables based on the revenue of fish trading from the
processes. For the fishery industries, the energy cost can be high. Fuel equivalent77

2.9. THE CURRENT STATUS OF ENERGY USE AT FISHERY PORTS
Table 2.5: The estimated energy usage and expenses at fish industries ‐ UK
ComponentEstimated energy
(GWh)/yearly
Equivalent cost at
$ 0.15/kWh(Million)
Blast freezers 10.9‐20.7 1.7‐3.2
Blast chillers 12.5‐30 2‐4.5
Cold stores 45 6.8
Refrigerated
transport241 36.2
Catering fridges 200‐238 30‐45.7
Retail displays 288‐635 43.2‐95.2
Total 797‐1210 119.5‐181.5
levels are associated with the direct consumption of fuel and electricity, consid‐
ering the direct fuel and electricity involved in production and the fuel involved
in harvesting raw materials, processing them, and distributing the manufactured
feed to production. Globally, the total energy cost of the fishery industries is about
(€ 9.85 billion) [70]. It has been estimated that the energy consumption of blast
freezers varies from 10.9 to about 20.7 GWh, at the equivalent cost of 1.7 to 3.2
million at USD 0.15/kWh. About 45 GWh is used for cold stores, with a total cost of
6.8 Million at USD 0.15/kWh [358]. The United Nation Environmental Programme
(UNEP) estimate for the global energy consumption and cost of aquaculture pro‐
cessing is given in the following table 2.5 [359].
2.9.2 The challenges of energy use for fish industries
The fish processing industries consume an intensive amount of energy and they
are responsible for a huge amount of carbon emissions. Fish processing has many
different stages, starting from catching the fish to delivered product to the end
users. However, cooling and freezing in the fish industries are responsible for a
huge amount of electricity consumption. Based on Ireland’s Seafood Development
Agency (BIM), about 15 percent of global energy consumption is related to refriger‐
ation and air conditioning [336]. With such an intensive energy use for cooling sys‐
tems in the fish industries, the inefficient use of cooling system can result in a huge78

2.10. GAP IDENTIFICATION
amount of emissions from refrigerant gases, such as ammonia, or different kind of
gases [337]. Cold storage in the fish industries works for 24 hours and consumes
about 80 percent of total energy consumption of energy use in the fish industries.
In addition, processing equipment can consume a considerable amount of energy
in hot seasons, which can increase the amount of energy consumed [360]. So, the
continuous operation of cold storage and other equipment in the fish industries is a
main challenge, followed by the increased cost of energy, whichmight notmeet the
revenue of catch land fish. Therefore, it will reflect on the overall system. Further‐
more, the global motivation toward decarbonisation, especially in the industrial
sector, might need to meet the local obligation policy of minimising carbon emis‐
sion, minimising energy consumption and increasing the use of renewable energy
sources at local sites [361].
2.10 Gap identification
Seaports are the main arteries to transport materials and goods between coun‐
tries, through shipping, and import and export operations. They are important in
commercial dealings and purchases of consumer goods such as food, medicine,
and others. Maritime transport operations are considered to be vital and strategic
pillars on which many of our modern economies are based. However, the world
faces a critical challenge from increased carbon emissions, which has prompted
Western economies to initiate actions to reduce carbon emissions through a num‐
ber of international agreements and alliances.
Maritime activities can play an effective role in contributing to the reduction of
carbon emissions, whichwill be directly reflected in the level of performance, qual‐
ity and competitiveness of seaports, as well as enhancing the level of sustainability
in their local ecosystem. The previous sections have elaborated on the increasing
volume of research aimed at decarbonising seaports, including the development
and design of applied methodologies to quantify carbon emissions produced from
port activities [362],study and analysis of renewable energy sources systems de‐
ployment [245], and also improving the efficiency of maritime transport [363].
One of the major issues that faces the fishing industry is the continuous rise of79

2.10. GAP IDENTIFICATION
energy prices. This poses a major challenge as the pace of work increases and the
demand for fish products increases significantly. This comes at a time of increasing
international pressure and global motivation to address climate change and reduce
carbon emissions in many sectors.
However, very few research studies were found to highlight the optimal use of
power energy in ports and fishery buildings while some studies proposed certain
measures that contribute to some extent to reducing energy consumption and car‐
bon emissions. However, there is an absence of a study discussing the possibility
of developing a holistic energy analysis and management that can be scaled from
a site to a community level to achieve economically and environmentally viable
benefits to the community.
In addition, from the analysis of previous research studies, six themes have
been identified that play a role in decarbonising seaports and fishery industry,
which are: reducing carbon emissions, adopting renewable energy resources, op‐
timising the cost of energy, adopting smart control strategies, developing the reg‐
ulatory landscape for greening seaports, and applying best practice guidelines to
greening seaports and fishery industries.
Moreover, decarbonising seaports can have a profound transformation on port
activities, as elaborated in the following sub‐sections.
2.10.1 The lack of total lifecycle approach to seaports decarbonisa‐
tion
Most of the previous studies focus on developing strategies that contribute to re‐
ducing carbon emissions in seaports by optimising the energy mix [364],improving
the energy efficiency of the equipment andmachinery used in ports [365], andmit‐
igating the environmental impact of ships by reducing their speed and scheduling
their arrival and departure from seaports [104]. These actions have the potential
to contribute significantly to reducing the carbon footprint of modern seaports. In
this context, Lifecycle Assessment (LCA) helps to quantify the environmental pres‐
sures, the trade‐offs, and areas to achieve improvements considering the full life‐
cycle of seaports, from design to recycling. However, current approaches to LCA
do not factor in consistently (both in the foreground and background inventory sys‐80

2.10. GAP IDENTIFICATION
tems) lifecycle variations in: (a) seaport building use, (b) energy supply (including
from renewable sources), and (c) building and environmental regulations, as well
as changes over the building/seaport and the local neighborhood lifetime. These
include: (a) change in the energy mix of a seaports or upgrading and retrofitting
the energy system(s) in place; and (b) time‐increase of energy demand during the
lifetime of a seaport, due to a wide range of reasons such as changes in activity pat‐
terns. Seaports present the highest complexitywithin LCA,which precludes the use
of linear and static approaches but instead requires the use of scalable approaches
that factor in dynamic and non‐linear considerations. Seaport processes involve
longer time scales than in other industries, and therefore they face very differ‐
ent operational and environmental conditions. Consequently, consideration of the
time dimension in port activities modelling is essential to understand the resulting
pollutant emissions and resource consumption. This time dimension is currently
missing in Life Cycle Inventory databases. A further combination of Life Cycle Im‐
pact Assessment (LCIA) models using time‐dependent characterisation factors can,
therefore, lead to more comprehensive and reliable LCA results. Consequently,
real‐time LCA approaches that address temporal and spatial variations in the local
seaport ecosystem are required because they would more effectively promote a
‘cradle‐to‐grave’ environmental sustainability capability” [366].
2.10.2 The lack of semantic‐based modelling, forecasting and opti‐
misation of seaports energy systems
In the complex seaport digital energy landscape, energy software services that ad‐
dress the needs of a wide variety of stakeholders (including prosumers) are re‐
quired. These include forecasting and simulation services, as well as the respon‐
sive day‐ahead and intra‐day management services that are necessary to effec‐
tively integrate distributed energy resources in seaports, including renewables.
This includes the ability to predict behaviours, and adapt to changing weather and
technological environments.It is argued that as the density of local renewables in‐
creases, this importance extends beyond the unit level to intelligence at the system
level, where the impact of uncertainty at each node can be mitigated through the
emergent behaviour of adjacent distributed energy resources.81

2.10. GAP IDENTIFICATION
An optimal management of energy systems should be considered by system‐
atically analysing the decision space of management topologies, schemes, and op‐
erating parameters, which are best conveyed by semantic models, such as ontolo‐
gies. Energy system optimisation is far from novel, but most approaches consider
the system as a static entity and they only consider a single system rather than the
holistic perspective of emerging system of systems landscape. This thesis advo‐
cates the previously described systems approach of energy management, which is
best conveyed through semantic models that provide a holistic conceptualisation
of energy systems and their socio‐technical constituents.
This is essential to address a wide range of scenarios, such as local energy bal‐
ancing, islanding, and blackout prevention, adapted to a changing environment of
high distributed energy resources penetration. A semantic framework has the po‐
tential to meet the requirements of flexibility, scalability, resilience, openness, and
practicality.
Furthermore, it is important to combine the advantages of distributed control
(e.g., scalability, privacy and adaptability) and centralised control (e.g., feasibility,
optimality and responsibility), while mitigating their specific drawbacks. The bene‐
fits of a semantic and AI‐based architecture are particularly evident when the grid
needs to be restored and healed after a disruption in service. The grid should be
able to restore, re‐organise and heal itself via alternative topologies without affect‐
ing the system as a whole, which is informed by the holistic understanding of the
wider energy systems.
There is a need for a new body of research with a view of ensuring the optimi‐
sation and resilience of energy management systems through self‐healing capabil‐
ities: that i) promote autonomy, belonging, connectivity, diversity and emergence,
ii) balance the importance of global and local objectives, iii) dynamically reconfig‐
ure to optimise the overall energy system’s performance across energy carriers and
scales, and iv) enable demand responsive energy management with bidirectional
flow of energy, information and dynamic pricing schemes [367].
Optimisation based grid planning and longer‐term operational control are com‐
mon approaches in power system management. But increasing stochastics on the
supply and demand side, and the coupling of different sectors and markets in‐82

2.10. GAP IDENTIFICATION
creases the complexity of power grid operation and requires multi‐objective, time‐
series based optimisation under increasing uncertainty. Meanwhile, increasing
data availability and computational power gives us anopportunity to optimise short‐
term and close to real‐time operation.
2.10.3 The lack of secure and reliable seaport energy services
Seaports are responsible for shipping circa 90 percent of the global supply chain
of goods. They are, as such, critical infrastructures and are potentially subject to
a wide range of threats [368]. Consequently, there is an urgent need to increase
awareness on cyber threats faced by ports worldwide [369] to ensure secure ship‐
ping and operations [370].
This is now exacerbated by the digitisation of seaport infrastructures, includ‐
ing energy systems, as well as the involvement of a complex value chain. Potential
risks to energy systems include: blackout or service interruption, malicious com‐
mand injection, delayed measurements, Denial‐of‐Service attack, dynamic pricing
information altered, and user accounts alteration. The consequences of such cyber
security threats can be dramatic. Conversely, the reliability and Quality of supply
(QoS) of energy related services in seaports are becoming pressing issues as a re‐
sult of the increasing need for smart integration of distributed energy resources.
A gradual transition is already occurring towards demand responsive energy man‐
agement, which is enabled by smart metering infrastructures with a bidirectional
flow of energy and dynamic pricing schemes.
Therefore, there is a requirement for secure authentication of users, agents,
and transactions at each interface between energy devices. The number of pro‐
cesses is also exacerbated by the increasingly distributed nature of grids and their
underpinning communication requirements. Three interesting avenues for further
research include: (a) research to identify and quantify the risk of a breach of privacy
and security to the systemic reliability and Quality of service (QoS) caused by inse‐
cure authentication occurring in a heterogeneous environment, where legacy stan‐
dards and applications need to remain in operation alongside advanced standards;
(b) research to identify and quantify the loss of data, breach of privacy and vulner‐
ability due to the heterogeneous communication infrastructure (wireless, wired,83

2.10. GAP IDENTIFICATION
PLC), and the impact on grid reliability and QoS; and (c) research to develop guide‐
lines for information securitymanagement, and inform related legislation and stan‐
dardisation in the energy domain in seaports.
2.10.4 The lack of a transition towards prosumer‐driven seaport en‐
ergy communities
Seaports are an important ecosystem, including their local communities. We are
gradually experiencing the emergence of sharing economies, with a correspond‐
ing change in consumption models. These can motivate energy prosumers (local
communities around seaports) to participate in a leasing energymarket where ser‐
vices are used for a shorter period and are more accessible via community sharing.
Blockchain can incentivise the participation in such a sharing economy by provid‐
ing greater choice for both energy consumers and providers, while enabling amuch
greater flexibility in being able to switch between multiple market offerings. This
sharing economy has the potential to decentralise energy production and it can
also balance consumption from consumers by not being restricted to energy ser‐
vices or price constraints from a single energy provider [371].
The energy market is currently transforming towards a large number of sup‐
pliers and buyers, and therefore it is important to enable participants in a sea‐
port ecosystem to exchange an increased amount of traded energy. The interac‐
tion between these actors and the associated processes requires a high degree of
standardisation, which can be facilitated by a Blockchain model. The utilisation
of Blockchain for energy trading can lead to the eradication of brokers, monetisa‐
tion of energy excess and development of energy communities. These brokers and
intermediary parties are usually required for validation or to ensure the trustwor‐
thiness of information across parties, but can be replaced by a more automated
Blockchain process. Third‐party verification can be eliminated because Blockchain
delivers a high level of security and data protection for different applications sup‐
ported by a transparent ledger that records all transactions. In a Blockchain system,
any user can become a trader and offer an energy product or service to a group
of consumers. Blockchain technology has, therefore, the potential to leverage the
benefits of decentralised energy systems and enable an environment where every‐84

2.11. SUMMARY
one can trade, pay, and even deliver energy to others. Blockchain can support the
creation of economically attractive energy communities utilising the power of the
Internet and implement the vision of a perfect energymarket. Blockchain identifies
an online distributed database that aggregates a collection of blocks connected to
each other. It is also a public and decentralised ledger that stores a set of records,
structured as a chain and blocks. From multiple Blockchain solutions, smart con‐
tracts are instruments that can extend Blockchain’s capabilities and have been used
in a variety of industries. Smart contracts have often been used to convert business
rules into codes, based on which a contract code/script is stored in a Blockchain.
Future research will explore the adoption of energy sharing and trading practices
within and around seaports, using blockchain technology [372].
2.11 Summary
Based on the literature survey, it is found that although the existing studies ex‐
plore energy management strategies for ports, they are very limited in terms of
the capability to provide a holistic energy analysis that can be scaled from a site
level to a community level. At a wider scale, the review of the literature has ev‐
idenced that there is a lack of research that delivers a ‘’demand‐response’’ capa‐
bility within a fishery port, while optimising the use of battery storage, and at the
same time promoting the formation of sustainable energy communities. Seaports
are considered to be one of the main drivers of the global economy and are a core
element of the transportation, shipping and tourism and fishing industries. How‐
ever, increased activities in seaports have undoubtedly affected the environment,
including a high level of carbon emissions, noise resulting from activities at the
seaports, high energy consumption and high health impacts among the popula‐
tions of coastal cities near the seaports. This chapter has reviewed the published
and applied research that has contributed significantly to transforming and pro‐
moting the concept of green and smart seaports in various countries. The findings
demonstrate that the key factors contributing to decarbonising seaports are apply‐
ing renewable resources, cost optimisation, deploying intelligent technologies, es‐
tablishing rules and regulations for greening seaports, and/or implementing green85

2.11. SUMMARY
seaport practices guidelines to help seaport authorities move towards applying a
green seaport approach.
An analysis of the research shows that there are three main factors that con‐
tribute directly and indirectly to the environment: the consumption of fossil fu‐
els, the high energy consumption of power systems and the lack of professional
management of resources at seaports. Importantly, the current status of seaports
at the global level shows a lack of experience in smart seaport approaches. It is
argued that the intelligent port approach will increase competitiveness between
seaport authorities, which may ultimately lead to the seaport authority’s inability
to deal with climate challenges. There must be a useful role for business people
and investors in modern technologies that reduce carbon emissions, such as re‐
newable energy systems, smart metering devices and other modern technologies.
While it is not easy to achieve a green and sustainable seaport without investors’
presence, incentives and initiatives must be put in place to convince investors of
the feasibility of investing in modern seaports, both in financial gain, avoidance of
environmental legislation penalties, and sustainability of the port and the global
climate.
As part of the plan tomake seaports sustainable, overall decarbonisation of life
cycle must be provided. This will have a tremendous impact on the overall system,
and will contribute to the comprehensive efficacy of seaports and enhance the
level of greening, sustainability and competitiveness between seaports. LCA can
help quantify the trade‐offs and gains to achieve improvements. However, due to
the complexity of seaports within LCA, scalable approaches that factor in dynamic
and non‐linear considerations should be used. Similarly, the longer time‐scales
of seaport operation make the time dimension another condition to consider in
modeling seaport activity. To achieve environmental sustainability, this chapter
finds that there is a need for the development of real‐time LCA approaches for
seaports which combine LCIA models with time‐dependent characterisation.
It is essential to optimise the operation of energy at seaports. This chapter
finds success in projects that consider many variables that influence the total en‐
ergy management in ports and the importance of using a semantic representation
of the seaport’s environment as a pre‐processing step of smart energy system op‐86

2.11. SUMMARY
eration. It is therefore recommended that seaport energy systems should utilise a
grey‐box approach to energy systems management that factors in both white box
(simulation‐based) and black‐box (data‐driven based) approaches. The grey box
approach will be underpinned by semantics but informed by real‐time feedback.
While longer‐term operational control approaches are commonly used, the com‐
bination of different sectors and markets, and acute fluctuations in supply and de‐
mand increase the complexity of power‐grid operations. Consequently, time‐series
based optimisation with a multi‐objective approach can accommodate for short‐
term or real‐time operation given the appropriate data and computing power.
Although many seaports are pledging land to invest in smart energy systems,
they can make further efforts by reducing their environmental impact and creating
more jobs for the local communities around seaport sites. Consequently, stake‐
holders, policymakers and seaport authorities must develop policies and legisla‐
tion to enhance the role of investment in clean energy at seaports and facilitate all
capabilities to achieve this aim, which includes building expansion at the seaport
sites and also their operation.
It is recommended that future works should use AI applications for energy sys‐
tems in seaports to help predict energy consumption andmeet the required power
demand through local clean energy resources. AI can also help to optimise energy
cost by avoiding selling power in hot seasons and managing power in the seaports
to achieve maximum profit for seaport authorities. This may be achieved through
real‐time changes in power usage to match the grid’s price to maximise income
from selling power or minimise costs in buying power. While energy system op‐
timisation is not a new concept, most implementations have only considered the
system as a singularity. In contrast, we recommend a holistic approach to energy
system optimisation through the use of semantic models.
87

CHAPTER3
Methodology
This chapter describes the methodology used in this thesis, which involves case
studies drawn from the EU INTERREG piSCES project (smart energy cluster for the
fish processing industry).
3.1 Introduction
The concept of researchmethodology involvesmanydifferent interpretations across
disciplines [373]. Based on the Cambridge Dictionary, research is defined as “a de‐
tailed study of subject, especially in order to discover (new) information or reach a
(new) understanding [310]. Meanwhile, the word methodology defined as “a sys‐
tem of ways of doing, teaching, or studying something”. The methodology is the
theory of organisation [374]. Based on the Merriam‐Webster dictionary, organi‐
sation has four meanings, which are: the condition or manner of being organised,
the act or process of organising or of being organised, an administrative and func‐
tional structure (e.g., a business or a political party), and the personnel of such a
structure [375]. Consequently, this methodology considers the organisation of an
activity, which has an integral system with an accurate definition of the character‐
istics, logical structure and accompanying process of realisation [374].
3.1.1 Research methodology approach
The research methodology, also known as strategy, outlines the direction in which
the study should be carried out. It is a set of beliefs and philosophical assumptions
that govern the formulation of research questions and the selection of research
methods[376, 377]. The researchmethodology serves as a roadmap for the thesis,88

3.1. INTRODUCTION
Figure 3.1: The Research Onion [378]
ensuring that the approaches, tools, and philosophy are all in harmony. Research
Onion, proposedby [378], is one of themost prominent approaches for formulating
research technique. It describes the major layers or steps that must be completed
to build an effective research methodology. The primary layers of research Onion
are depicted in Figure 3.1.
It is divided into six levels, which are read from outer to inner, beginning with
thedefinitionof themain philosophy andprogressing to the selectionof approaches,
methods, and strategies. The main research philosophy draws ontology, episte‐
mology, sources of knowledge, and axiology to help build the foundation of re‐
search. The second layer will concentrate on the development of approach theo‐
ries, such as deduction, induction, and abduction. Theories in deductive research
are tested through observation, but inductive research builds a hypothesis by ob‐
servation [379]. Abduction is followed by research, which results in a best guess
or conclusion based on the evidence available. The third layer focuses on method‐
ological selection, which might be quantitative, qualitative, or mixed. Quantitative89

3.1. INTRODUCTION
research relies on data and surveys, whereas qualitative research relies on descrip‐
tion and observation with in‐depth analysis [380, 381, 382].The fourth layer of the
research onion is the data collection and analysis approach, which could be an
experiment, a survey, archival research, a case study, ethnography, or action re‐
search. The fifth layer concerns the research timeline. The final layer discusses the
methods and procedures used to collect and analyse data. This thesis is based on
an industrial research study, which can be defined as action research, but the sim‐
ulationmodel was developed tomake a prediction of the future based on historical
data [383]
This thesis is based on an industrial case study, which can be defined as qual‐
itative research that relies on description and observation with in‐depth analysis.
The data that has been collected from the port site is used to develop simulation
models and analyse the results.
3.1.2 Refined scope of the research
This study aims to reduce the costs and carbon footprint for the fishery buildings
by developing and testing a new ‘smart grid’ electricity network. Based on the lit‐
erature survey, it found that the existing studies, although exploring energy man‐
agement strategies for ports are very limited in terms of the capability to provide
a holistic energy analysis that can be scaled from a site level to a community level.
Such limitations can also be identified for the three criteria used for conducting
analysis which are as follows: applying renewable energy, minimizing carbon emis‐
sion, and the proposed smart grid. Table 3.1 presents a summary of the analysis.
At a wider scale, the review of the literature has evidenced a research gap in that
there is a lack of research that delivers a ‘’demand–response” capability within a
fishery port, while optimizing the use of battery storage, and at the same time pro‐
moting the formation of sustainable energy communities. The research hypothesis
is posited: “The concept of Industry 4.0 has the potential to deliver net zero carbon
fishery ports by leveraging smart and clean energy generation, use, and storage,
while promoting the formation of energy communitieswithin the local ecosystem.”
Consequently, this thesis has threemain research questions that aim to address
this gap, as follows:90

3.2. CASE STUDY DESIGN AND IMPLEMENTATION
1. Can a reliable simulation capability be developed that provides real‐time ac‐
counts of energy demand and use for fishery buildings?
2. Can the concept of a smart grid be adopted and applied to energy systems
in fishery buildings at multi‐levels?
3. Can the energy sharing and trading approachbe simulated to promotedecision‐
making that reflects the efficiency in fishery buildings?
This thesis aims to reduce carbon emissions from energy networks in fishery
buildings by implementing smart energy system technologies.
The first research question is translated to the following objectives:
• Develop an energy model and simulation capability to provide real‐time ac‐
counts of energy flows in seaports.
• Investigate the potential of local power supplies tomeet total power demand
in the fish processing industry using a Co‐simulation platform.
The second research question is translated to the following objective:
• Explore various scenarios for decarbonising seaports by leveraging renew‐
able energy sources, including solar energy and energy storage.
The third research question is translated to the following objective:
• Explore the role of seaports to address the energy demand of their local com‐
munities through energy sharing.
3.2 Case study design and implementation
3.2.1 Problem based industrial case
Fish processing industries use energy‐intensive equipment, such as refrigerators,
air conditioners and ice making machines. This leads to high energy costs and, in‐
directly, to an increase of carbon emissions. Given that most fish industry sites are
old, they need to be made more sustainable and achieve economic competitive‐
ness in the energy market. In 2011, fishery industries consumed about 40 billion
litres of fuel and they produced 179 million tons of carbon emissions. Fisheries91

3.2. CASE STUDY DESIGN AND IMPLEMENTATION
Table 3.1: Related Studies
AuthorApplying Renewable
Resources
Minimize Carbon
EmissionPropose Smart Grid
Buiza et al. [384] ✓
Hua and Wu [61] ✓
Misra et al. [62] ✓
Acciaro et al. [361] ✓
Parise et al. [385] ✓
Lamberti et al. [134] ✓
Prousalidis et al. [283]
Ramos et al. [95] ✓
Alvarez et al. [131] ✓
Misra et al. [107] ✓ ✓ ✓
Manolis et al. [73] ✓
Balbaa et al. [120] ✓
Kotrikla et al. [282] ✓
use many energy‐intensive processes. The traditional design of energy systems at
fishery ports leads to increased energy consumption and carbon emissions. The
percentage of carbon emissions resulting from fishery industries is estimated to
be 4 percent of the global greenhouse gas emission (GHGS). Meanwhile, the to‐
tal human consumption of seafood has increased from 20 million in 1950 to more
than 136 million tons in 2014. This rapid growth in seafood consumption has led
to increased demands being placed on the fishery industries, and therefore has
increased the carbon emissions in the past few years.
The Smart Cluster Energy System (piSCES) project aims to reduce the costs and
carbon footprint of the fish processing industry by developing and testing a new
smart grid electricity network. The smart cluster energy system for the fish pro‐92

3.2. CASE STUDY DESIGN AND IMPLEMENTATION
cessing industry (piSCES) operation will ultimately reduce the costs and carbon
footprint of energy networks in the fish processing industry by implementing smart
grid technologies. This will be done through modelling the use profile of these en‐
ergy networks, which will then be optimised against the wholesale energy market
and any available onsite generation. This addresses the cross‐border innovation
theme of the Ireland‐Wales programme of strengthening research, technological
development and innovation. It will focus on the specific objective, which is: To
increase the intensity of knowledge transfer collaborations involving research or‐
ganisations and SMEs in line with the shared priorities of the smart specialisation
strategies. The aim of this thesis is to reduce the carbon emission of energy net‐
works in the fish processing industry by implementing smart energy system tech‐
nologies. This thesis will focus on applying this project via three sites located in the
United Kingdom and the Republic of Ireland. The next sections will describe these
sites in more detail.
Milford Haven port is one the largest energy ports in the United Kingdom and
it is considered to be the largest handler of oil and gas, with the capability of deliv‐
ering about 30 percent of UK gas demand. One of the core functions of the port is
to take responsibility for the safe movement of vessels on the Milford Haven Wa‐
terway, which is a deep‐water site on the western coast of the UK. Furthermore,
the MHPA has a strategic plan to diversify its functions, including transportation,
energy, renewable, engineering, leisure and tourism fishing, food processing and
aquaculture. In addition, the MHPA continues to improve the process of its opera‐
tions, which will help to create new jobs for people who live in Wales and increase
security of supply.
One of the key strategic plans for the UK is to increase the capacity of the gas
and oil pipelines, and electricity connections to the centre of the UK and increase
the level of trade conducted via the Atlantic. Milford Haven is a leading UK port,
handling over 30 million tons of cargo annually. It is located in the western region
of Wales and it provides expertise in many different marine operations, such as
cargo handling, renewable, freight, passenger ferry services, fisheries, commercial
property management, leisure and retail [386]. Milford Haven’s fish docks are il‐
lustrated in Figure 3.2. It can be seen from this figure that Milford Haven is an ideal93
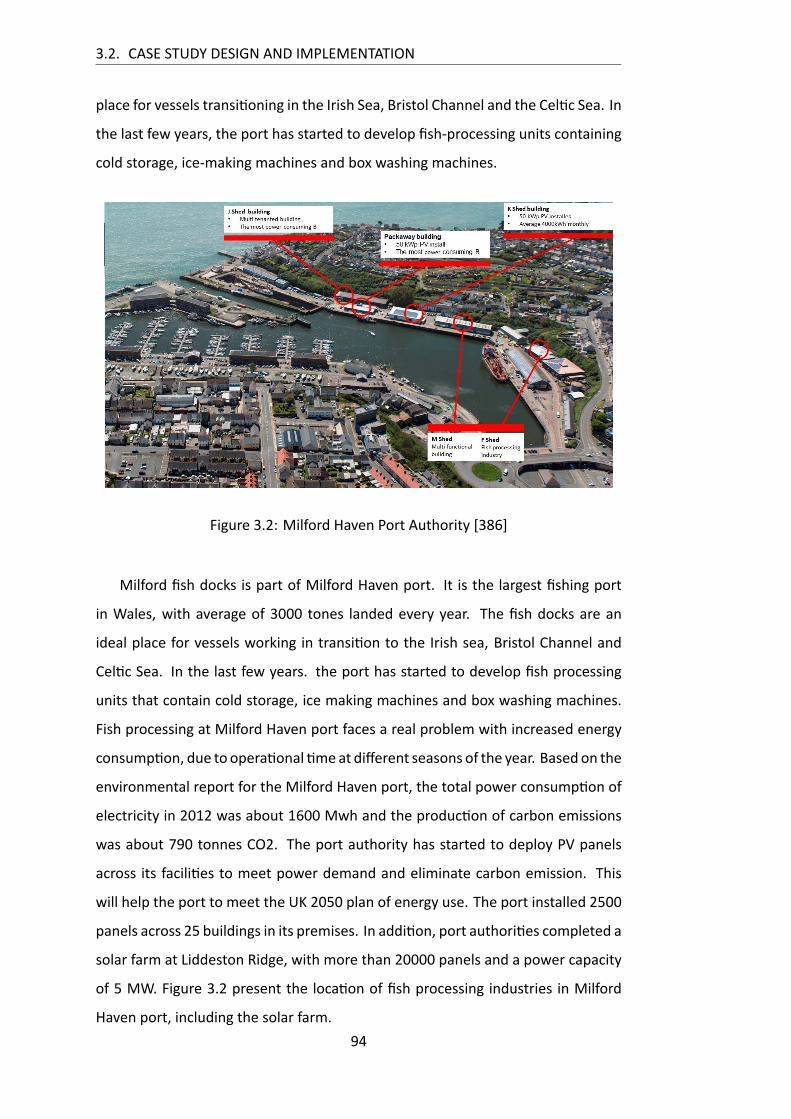
3.2. CASE STUDY DESIGN AND IMPLEMENTATION
place for vessels transitioning in the Irish Sea, Bristol Channel and the Celtic Sea. In
the last few years, the port has started to develop fish‐processing units containing
cold storage, ice‐making machines and box washing machines.
Figure 3.2: Milford Haven Port Authority [386]
Milford fish docks is part of Milford Haven port. It is the largest fishing port
in Wales, with average of 3000 tones landed every year. The fish docks are an
ideal place for vessels working in transition to the Irish sea, Bristol Channel and
Celtic Sea. In the last few years. the port has started to develop fish processing
units that contain cold storage, ice making machines and box washing machines.
Fish processing at Milford Haven port faces a real problem with increased energy
consumption, due to operational timeat different seasons of the year. Based on the
environmental report for the Milford Haven port, the total power consumption of
electricity in 2012 was about 1600 Mwh and the production of carbon emissions
was about 790 tonnes CO2. The port authority has started to deploy PV panels
across its facilities to meet power demand and eliminate carbon emission. This
will help the port to meet the UK 2050 plan of energy use. The port installed 2500
panels across 25 buildings in its premises. In addition, port authorities completed a
solar farm at Liddeston Ridge, with more than 20000 panels and a power capacity
of 5 MW. Figure 3.2 present the location of fish processing industries in Milford
Haven port, including the solar farm.94

3.3. CASE STUDY DESIGN AND IMPLEMENTATION
3.3 Case study design and implementation
3.3.1 Simulation‐based energy analysis at the district level
3.3.1.1 Using DesignBuilder and EnergyPlus simulation tools
One of the main challenges during data collection in this study was the lack of es‐
sential data related to energy consumption in the clusters. Therefore, there it is
necessary to understand the behaviour of energy consumption in the clusters us‐
ing simulation techniques that will help to understand the behaviour of energy
consumption in the buildings and identify opportunities to optimise energy use in
industrial sectors. Two energy simulation software will be used to understand the
behaviour of energy consumption. DesignBuilder is a user‐friendly modelling en‐
vironment where you can work (and play) with virtual building models. It provides
a range of environmental performance data, such as annual energy consumption,
maximum summertime temperatures and HVAC component sizes [76]. The sec‐
ond software is known EnergyPlus which is a new version and combination of two
programs: BLAST and DOE‐2. This new version of the program features sub‐hourly
time steps, user configuration modular HVAC systems that are integrated with a
heat and mass balance‐based zone simulation, and input and output data struc‐
tures that can facilitate third party module and interface development. Figure 3.3
illustrates the process of modeling and simulation of DesignBuilder and Energy‐
Plus. The input data for the simulation are site location, weather data, building
geometry, HVAC system, lighting and electric appliances.
3.3.1.2 Using the Building Control Virtual Test Bed (BCVTB) platform
BCVTB is a software environment that allows users to run several simulation pro‐
grams for co‐simulation. It also couples’ simulation programs with actual hard‐
ware. For example, the BCVTB allows us to simulate a building in EnergyPlus, and
simulate the HVAC and control system inModelica, while exchanging data between
the software as they simulate. The BCVTB is based on the Ptolemy II software en‐
vironment. In addition, BCVTB allows expert users of the simulation to expand the
capabilities of individual programs by linking them to other programs. Themain ob‐95

3.3. CASE STUDY DESIGN AND IMPLEMENTATION
Figure 3.3: The process of modeling and simulation using DesignBuilder and Ener‐
gyPlus
jective of BCVTB is to integrate the cluster of buildings with the solar farm through
simulation to identify the capability of the solar farm to meet the total power de‐
mand of the entire site of buildings with their associated operations. This thesis
also aims to find the optimum management of the energy system in the port by
investigating power supply and demand as a first step in the overall optimisation
process in the port. Co‐simulation software has been used, such as BCVTB software
to connect different types of simulation engines to facilitate the exchange of data
between various simulations. The solar farm has been modelled using SIMULINK
and EnergyPlus linked together with BCVTB.
3.3.2 Simulation‐based energy optimisation at district level
3.3.2.1 Developing a smart grid
A multi‐stage approach adopted with five stages of the proposed methodology,
namely: building simulation stage, energy generation simulation, energy storage96

3.3. CASE STUDY DESIGN AND IMPLEMENTATION
simulation, grid model and integration of agents in MATLAB/SIMULINK.
“MATLAB’’ is a high‐performance language for technical computing. It inte‐
grates computation, visualisation, andprogramming in an easy‐to‐use environment
where problems and solutions are expressed in familiarmathematical notation”[319].
‘’SIMULINK’’ is a block diagram environment for multi‐domain simulation and
Model‐Based Design. It supports system‐level design, simulation, automatic code
generation, and continuous test and verification of embedded systems. It provides
a graphical editor, customisable block libraries, and solvers for modeling and simu‐
lating dynamic systems. It is integrated with MATLAB, enabling you to incorporate
MATLAB algorithms into models and export simulation results to MATLAB for fur‐
ther analysis.
The smart grid model consists of a building simulation model, energy gener‐
ation model, grid model and energy storage system model. The graph that fol‐
lows in 3.4 shows the input‐output variables for a smart grid model using MAT‐
LAB/SIMULINK. It contains a control strategy algorithm of the charge/discharge
controller, and is based upon a set of rules to distribute and manage the power
system between the four agents.
Figure 3.4: Input Output variables for a smart grid model using simulink
3.3.2.2 Developing a smart energy community around a fishery port
After developing the smart grid, a smart energy community has been developed by
including local domestic power demand involving 200 houses around the fishery97

3.3. CASE STUDY DESIGN AND IMPLEMENTATION
port and five processing industrial workflows. However, this experiment was chal‐
lenging because of the complexity of the model’s size. The charge controller will
manage power flow among loads, solar farm, grid, and battery while allowing the
model to run sufficiently without any disruption. The model will keep an activity
interconnectivity with the grid in case there is not enough power from the bat‐
tery system to meet the power demand from the community, especially at night.
The model is run several times to identify the optimum number of battery stor‐
age systems when the model does not supply power from the grid. The model will
present the behavior of the system in separate graph files to see how the entire
industry system is run for 24 hours. The model runs instantaneously (per second)
with different scenarios and input parameters in an attempt to identify the opti‐
mum capacity of the battery storage system to support more optimal use of energy
and reduce capital costs at the site.
3.3.2.3 Developing real‐timedecision strategies towarddecarbonisation seaports
This study has developed and implemented two control strategies. First, a control‐
based price algorithm has been developed for the smart grid fishery industry that
is based on total power production received from the PV panels and the power
storage in electric boats. The price of electricity was also considered, to decide
when to buy or sell power. The system has been built based on constraints of price
during times of selling or buying. In addition, the system considers the state of
charge (SOC) for two different batteries. The condition of battery status is crucial
to the overall system, and the decision will be made based on the SOC of batteries
and the price of power. The control system works instantaneously and will send
signals to the battery charge controller. The flowchart in the figure below illustrates
the several steps used for flow among power supply and power demand in the
fishery industry. Figure 3.5 shows the input‐output variables for the smart grid
model using MATLAB/SIMULINK. It also contains the control strategy algorithm of
the charge/discharge controller, and is based upon a set of rules to distribute and
manage the power system between the four agents.
Second, peer‐to‐peer energy sharing and trading will be used, which is a new
generation energy management strategy in the smart grid that enables prosumers98

3.3. CASE STUDY DESIGN AND IMPLEMENTATION
Figure 3.5: Input output variables for a smart grid model based on control price
in smart energy communities to share their energy surplus with other participants.
There is a motivation towards sharing power with neighbourhoods inside the en‐
ergy community. The aim of power sharing is to increase the local power gener‐
ation from renewable energy resources and encourage local energy providers to
share their positive power with the neighbourhood instead of selling power to the
grid, whichwillminimise the dependency onpower from the grid and alsominimise
the proportion of carbon emissions that are released from burning fuel or gas in
traditional power plants. Figure 3.6 shows the proposed control system scheme for
a smart grid for fishery industries based on peer‐to‐peer power sharing. It contains
a control strategy algorithm of the charge/discharge controller, and is based upon
a set of rules to distribute andmanage the power system between the four agents.
Figure 3.6: Input output variables for a smart grid model based P2P power sharing
99

3.4. RESEARCH STRUCTURE
3.4 Research structure
This section will discuss the overall structure of the research study to answer the
three main questions. The research structure consists of three stages as shown in
figure 3.7 , each stage has different processes. This section will present the overall
idea of each stage and the details will be given in the next section.
3.4.1 Phase one
First, the literature review has found a research gap based on the piSCES project,
as described in Chapter 2. Finding the research gap will help to find the main ob‐
jectives of the research study, and it will help to identify the main challenges and
opportunities to solve the main research problem. Second, data is collected from
Milford Haven port site: one of the key challenges is to ensure that any solution
developed is generalisable, to enable the maximum possible exploitation of the
results of the applied case study . Within the context of the project, this means the
restrictions of the case studies. To ensure this challenge ismet, it is important that a
commonmethodology is adopted at each of the pilot sites to undertake the process
of capturing the technical and business requirements. This methodology is “Data
Requirements Capture ” and consists of four stages, which are: interview with dis‐
trict stakeholders; collecting data from sites through a walk through site visit; an
energy audit and data analysis to extract detailed information on the energy sys‐
tems and pilot site; and the identification of a series of scenarios that are relevant
and applicable to the pilot to which the solution can be targeted. One of the main
challenges during the data collection is the lack of essential data related to energy
consumption in the clusters. Therefore, there is an urgent necessity to understand
the behaviour of energy consumption in the clusters using simulation techniques
that will help to understand the behaviour of energy consumption in the buildings
and identify opportunities of optimise energy use in the industrial sectors. After
the data has been collected from sites, and the questionnaires and interviews have
been analysed, the next step is to develop a simulationmodel for the building using
DesignBuilder, EnergyPlus, and Building control Virtual test bed (BCVTB) software.
The first element of the simulation model is create the building’s geometry using100

3.4. RESEARCH STRUCTURE
DesignBuilder. Once the geometry has been built, Iuse the data collected from
site as input data for each geometry building(e.g., site location, weather data, op‐
eration time, equipment specification etc..). The DesignBuilder interacts with the
simulation engine EnergyPlus to calculate the annual energy consumption of the
building, and calculate the total operation cost and the amount of emission has
been produced during one‐year period.
3.4.2 Phase two
The next step after developing simulation model of each building is to investigate
the capability of the local solar farm to meet the power demand of the five cluster
buildings at the fishery port. To solve this question, the BCVTB integration platform
has been used, which allows users to run a couple of different simulation programs
for co‐simulation and couple simulation programs with actual hardware. The Co‐
simulation platformwas built in BCVTB contains five cluster building and solar farm.
The optimisation process is based on the simulation of the smart energy cluster
system. The optimisation uses simulated energy consumption to determine opti‐
mised schedules of the appliances. These optimised schedules represent the time
intervals based on which appliances can operate in direct relation with the energy
production of the PV system. The optimisation stage is directly integrated with the
simulation framework developed with DesignBuilder, EnergyPlus and BCVTB. The
simulation‐based optimisation will inform of the optimal use of appliances in the
different time intervals based on specific simulation parameters and values. Chap‐
ter Fourwill discuss themodeling and simulation in detail. After develop simulation
model of the building, the next step is to investigate the capability ofmodelling and
simulation of energy use at fishery port to inform sizable energy use and reduce
carbon emission to nearly zero carbon emission. To answer this question, a de‐
veloping of smart grid for fishery industry using MATLAB/SIMULINK platform. The
smart grid consists of load pattern, grid model, energy storage system, renewable
energy generation and control strategy. The result of integrating the components
will identify several parameters, such as number of battery storage, the behavior
of energy consumption and energy generation, and the power used from the na‐
tional grid.Chapter six will conduct an energy analysis andmodelling for the fishery101

3.5. CONCLUSION
industries by exploring energy transition from a building level to an energy com‐
munity level. It will also adapt modelling principles to deliver a simulation analysis
framework that uses energy modelling software tools to increase energy efficiency
for the industrial fish port in Milford Haven, South Wales.
3.4.3 Phase three
The next step after developing the smart grid is to optimise surplus power from
the grid by developing a control‐based price strategy that will consider the cost of
buying and selling power. Chapter Seven will discuss the modeling and simulation
of the smart grid in detail. Another important technique is to integrate power shar‐
ing in the fishery energy community with a peer‐to‐peer energy sharing strategy,
which enable to share energy to local community energy sharing instead of selling
the power to the grid. This will help to build a smart energy community at the fish‐
ery port. This study has been implemented and tested in the MATLAB/SIMULINK
platform. Chapter Seven will also discuss peer‐to‐peer energy sharing strategy in
detail and present the proposed Roadmap for achieving nearly zero carbon fishery
port.
3.5 Conclusion
This chapter has discussed the main methodology that will be used to answer the
research question. First, this chapter began with a brief description of the research
methodology and the research type that been chosen for this research project. It
next refined the research scope and objective. Second, it discussed the piSCES
project and the site location in more detail. It presented the research structure,
which consists of three stages. The first stage is the process of finding a research
gap and capturing data from the site locations. The second stage is to develop a
model and simulation for the cluster at the fishery port site. The third stage is to
develop a methodology to develop a smart grid for industry, considering several
parameters. In this stage, two techniques have been used to optimise the surplus
power from the smart grid. The first technique is control‐based price, which will
help to find the optimum operation of the grid by considering power prices. The102

3.5. CONCLUSION
Figure 3.7: The Main Methodology of Research for the Scope of this Thesis
second techniques is a peer‐to‐peer control strategy, which will help to share the
surplus power to the local neighbourhood instead of selling it the grid. The next
chapter will discuss the use of energy modeling and simulation at fishery ports.
103

CHAPTER4
Energymodeling and simulationof a Fish‐
ery Port
This chapter will discuss energy modeling and simulation at fishery ports. This is
based on the first research question, which aims to develop a simulation capabil‐
ity for fish processing industries and fishery ports. The first part will give a brief
description of the modeling and simulation of energy systems, focusing on energy
modelling for industrial applications. It will then present the follow up methodol‐
ogy that has been used to answer the posited research question. The next part
will describe the simulation software that will be used to simulate fishery port
sites. This chapter will then present the simulation container implementation for
three different pilot sites. It will also describe the process of co‐simulation be‐
tween the fishery cluster and solar farm using BCVTB. The last part will investigate
optimisation‐based simulation through scheduling appliances. Finally, the results
of the simulation model will be discussed.
4.1 Modelling approach
In order to develop a energy simulation model for the selected case study at Mil‐
ford haven; A data requirement captured process is required to develop an energy
simulation model for the selected case study at Milford Haven. The data‐capture
process consists of four stages, which are: interviewwith district stakeholders; col‐
lecting data from sites through a walk‐through site visit; an energy audit and data
analysis to extract detailed information on the energy systems and the selected
pilot study; and identifying a series of scenarios that are relevant and applicable
to the pilot studies. The lack of essential data related to energy consumption in104

4.1. MODELLING APPROACH
the clusters was one of the main challenges during the data collection. Therefore,
there is an urgent need to understand the behaviour of energy consumption in the
clusters using simulation techniques that will help to understand the behaviour of
energy consumption in the buildings and identify opportunities to optimise energy
use in the industrial sectors. After the data has been collected from the sites, and
the questionnaires and interviews have been analysed, the next step is to develop
a simulation model for the building using DesignBuilder, EnergyPlus, and Building
control Virtual test bed (BCVTB) software. Figure 4.1 illustrate the data collection
process from selected pilot site.
Figure 4.1: Modelling and simulation using DesignBuilder and EnergyPlus
The DesignBuilder, EnergyPlus and Building control Virtual test bed (BCVTB)
software has been used to develop a simulation model for each of the buildings.
The first element of the simulation model is create the building’s geometry using
DesignBuilder. Once the geometry has been built, the data collected from the site
has been used as an input for each building’s geometry (e.g., site location, weather
data, operation time, equipment specification etc.). DesignBuilder interacts with
the simulation engine EnergyPlus to calculate the annual energy consumption of
the building, and to calculate the total operation cost and the amount of emissions
produced during one‐year period. The next step after developing the simulation
model for each building is to investigate the capability of a local solar farm to meet
the power demand of five cluster building at a fishery port As shown in figure 4.2.
To solve this question, The BCVBT integration platform allows users to run a
couple of different simulation programs for co‐simulation, and couple simulation105

4.1. MODELLING APPROACH
Figure 4.2: Modelling and simulation using DesignBuilder and EnergyPlus
programs with actual hardware. The Co‐simulation platform was built in BCVTB,
and contains five cluster buildings and solar farm. The result of Co‐simulation be‐
tween power supply and power demand will help to identify optimum scheduling
of appliances through simulation‐based optimisation. The optimisation process is
based on the simulation of the smart energy cluster system.
Optimisation uses simulated energy consumption to determine the optimised
schedules of the appliances. These optimised schedules represent the time in‐
tervals, based on which appliances can operate in direct relation with the energy
production of the PV system. The optimisation stage is directly integrated with
the simulation framework that was developed with DesignBuilder, EnergyPlus and
BCVTB. The simulation‐based optimisation will inform of the optimal use of appli‐
ances in the different time intervals based on specific simulation parameters and
values. Modeling and simulation saves time and money, and provides a high level
of optimisation before applying the system in real life. The term “process” indi‐
cates to everything that can be investigated and analysed in simulation, such as
cars, planes, ships, transportation, buildings and so on.
The simulation tools are based on a mathematical model of the process being106

4.1. MODELLING APPROACH
investigated. Therefore, the simulation tools will allow a detailed analysis of the
object before it is applied in real life. For the mathematical model, different pa‐
rameters can be varied to test multiple aspects of the process. The settings can be
adjusted and the repeated simulation increases the possibility of an accurate sim‐
ulation result. Moreover, the simulation could have an impact on the future result
through predicting and optimising the main parameters that will reflect the overall
system. However, a more precise mathematical model will lead to a more realistic
simulation and a more meaningful the result [387]. These days, when evaluating
the level of sustainability in buildings, building simulation is considered to be the
most important tool to help meet the requirement of nearly zero energy buildings.
Themost important parameters to investigate in building simulation are energy
use, carbon emissions, heating, ventilation and air conditioning systems. The fol‐
lowing sections will discuss the most widely used simulation software, known as
DesignBuilder and EnergyPlus. The following figure 4.3 illustrates the process of
modeling and simulation of DesignBuilder and EnergyPlus. Input data for simula‐
tion is site location, weather data, building geometry, HVAC system, lighting and
electric appliances.
Figure 4.3: Input Output data for simulation container using DesignBuilder and En‐
ergyPlus
The main objective is to integrate the cluster of buildings with the solar farm
through simulation. To achieve this objective, an investigation will be conducted
to identify the capability of the solar farm to meet the total power demand of the
entire site of buildings with their associated operations. This thesis also aims to107

4.1. MODELLING APPROACH
find the optimum management of the energy system in the port by investigating
power supply and demand as a first step in the overall optimisation process in the
port.
Co‐simulation software has been used, such as BCVTB software, to connect dif‐
ferent types of simulation engines and thus facilitates the exchange of data be‐
tween various simulations. The solar farm has been modelled using Simulink and
EnergyPlus linked together with BCVTB. The model shown in Figure 4.4 highlights
the conceptual integration between power demand and supply within the energy
cluster showing the input and output variables.The power generation source iden‐
tified by the solar farm has been modelled using EnergyPlus, which enables simu‐
lation of the power generation during a year determining insights on how the solar
power generation can meet the local power demand. There are several parame‐
ters required for modelling the solar farm, such as PVmodules properties, number
of modules, inverters, the location of the farm, weather data and the total number
of panels based on themodelling and simulation. It is observed that the energy de‐
mand of the port is constant throughout the year, while energy production changes
based on the seasons and weather specificities.
Figure 4.4: Interface between energy models and power generation sources using
BCVTB
108

4.2. ENERGY SIMULATION PROGRAMS
4.2 Energy simulation programs
4.2.1 DesignBuilder
DesignBuilder is a user‐friendly modelling environment where you can work (and
play) with virtual building models. It provides a range of environmental perfor‐
mance data, such as annual energy consumption, maximum summertime temper‐
atures and HVAC component sizes [76]. Some typical uses are: calculating building
energy consumption, evaluating façade options for overheating and visual appear‐
ance, developing a thermal simulation of the building, ventilation), calculate day‐
lighting ‐ models of lighting control systems and calculating savings in electrical
lighting, ability to visualise site layouts, calculating heating and cooling equipment
sizes, communication aid at design meetings, and an educational tool as shown in
figure 4.5.
Figure 4.5: The Process of simulation in DesignBuilder [76]
109

4.2. ENERGY SIMULATION PROGRAMS
4.2.2 EnergyPlus
EnergyPlus is a new version and combination of two programs: BLAST and DOE‐2.
The new version of the program features sub‐hourly time steps, user configuration
modular HVAC systems that are integrated with a heat and mass balance‐based
zone simulation, and input and output data structures that can facilitate third party
module and interface development. The structure of EnergyPlus starts by calculat‐
ing load using a heat balance engine at user‐specified time steps, which is then
passed to the building systems simulation module at the same time step. Figure
4.6 shows the process of EnergyPlus simulation software. Meanwhile, EnergyPlus’s
key capabilities as follow:
Figure 4.6: Energy simulation process of EnergyPlus software [77]
The variable time step module calculates the heating and cooling system of
the plant, and also its electrical system response. This provides feedback from the
building systems simulation module. However, the load does not reflect the next
time step of load calculations in adjusted space temperatures (if necessary).
• Integrated, simultaneous solution.
• Sub‐hourly, user‐definable time steps.
• ASCII text‐based weather, input, and output files.
• Heat balance‐based solution technique.
• Improved ground heat transfer modeling.
• Daylighting controls and atmospheric pollution calculations.110

4.2. ENERGY SIMULATION PROGRAMS
4.2.3 Building Control Virtual Test Bed (BCVTB)
BCVTB is a software environment that allows users to run a couple of different sim‐
ulation programs for co‐simulation. It also couples simulation programswith actual
hardware. For example, the BCVTB allows us to simulate a building in EnergyPlus,
and ican simulate the HVAC and control system inModelica, while exchanging data
between the software as they simulate. The BCVTB is based on the Ptolemy II soft‐
ware environment. In addition, BCVTB allows expert users of the simulation to
expand the capabilities of individual programs by linking them to other programs.
Due to the different programs that may be involved in distributed simulation, fa‐
miliarity with configuring these programs is essential [78]. Figure 4.7 presents an
example of integration multi simulation software in BCVTB. Some programs that
are linked to the BCVTB follow:
• The EnergyPlus whole building energy simulation program.
• The Modelica modeling and simulation environment Dymola.
• Functional Mock‐up Units (FMU) for co‐simulation. model‐exchange for the
Functional Mock‐up Interface (FMI) 1.0 and 2.0.
• The MATLAB and Simulink tools.
• The Radiance ray‐tracing software.
Figure 4.7: The process of integration multi software in BCVTB platform
111

4.3. IMPLEMENTING THE SIMULATION MODEL
4.3 Implementing the simulation model
One of the best solutions that can optimise energy use in energy consuming indus‐
tries is the use of numerical simulation modelling, which has a direct impact on
energy savings, time optimisation and costs. Such simulation analyses can detect
and predict failures, and also provide real time energy optimisation in various use‐
case scenarios. Food and agriculture organisation studies have also reported that
the global human consumption of fish increased dramatically from 1950 to 2012.
The proportion of fish processed world‐wide has increased from 20 million tons
to more than 136 million tons, which adds a level of pressure for fish processing
industries to use energy from different sources to meet the demand of fish and for
fish processing operations [70].
4.3.1 Energy modeling for fish processing industries
Several parameters can influence the energy usage for fish industries, including:
(i) seasons when the amount of fishing can increase the demand of energy; (ii)
weather, which can have a significant effect on the total processed fish during a
year; and (iii) the number of fisheries and boats, which can also effect total en‐
ergy use. Energy use for fish processing industries can have two main operating
modes: (i) direct use, such as lighting systems, heating and box washing machines
or (ii) indirect use through converting the power to another form of energy such
as cooling cycle, freezing and equipment. However, due to an increase in the de‐
mand of energy in industries, an increase of the cost with energy use and the in‐
crease of CO2 emissions, there is a need to move towards more secure, clean and
sustainable energy solutions. The new smart energy systems and techniques that
have recently emerged can meet the requirements of the fish processing indus‐
tries through increased use of renewable energy and smart energy management.
Adopting such modelling principles to deliver a simulation analysis framework util‐
ising energy modelling software tools to increase energy efficiency for a realistic
industrial fish port in Milford Haven, South Wales.112

4.3. IMPLEMENTING THE SIMULATION MODEL
4.3.1.1 Energy simulation container of Milford Haven port
This sectionwill present the simulation andmodelling of energy use in fish process‐
ing industries using DesignBuilder [76], EnergyPlus [77] and BCVTB [78] to model
a smart energy cluster and to propose optimised schedules for the site operation.
The study aim to investigate the integration of local PV solar energy in a local energy
cluster using a multi‐building energy coordination model developed in EnergyPlus.
This section demonstrates the benefits of smart cluster energy systems by leverag‐
ing demand and supply mechanisms with adequate optimisation strategies. Also,
it aims to optimise energy using appliance scheduling techniques for the Packaway
building and assess the impact within the overall energy cluster. The first step of
the simulation phase is to develop an electrical energy consumptionmodel for fish
ports using DesignBuilder, a commercial 3D modeller and energy simulation soft‐
ware platform. The energy model includes geometrical information of the building
enrichedwith occupancy information,material and envelope properties, overall in‐
trinsic attributes (including thermal properties) of the building, and schedules for
heating and cooling devices. The simulation model is generated based on a use‐
case scenario that minimises electrical energy consumption in the fish processing
clusters, while maintaining acceptable CO2 emissions. Initially, the thermal model
is generated using DesignBuilder, which is then exported into EnergyPlus (an open‐
source and cross‐platform energy simulation environment). The next section will
present the simulation model for fish processing industries in MHPA.
4.3.1.1.1 Packaway building
The Packaway building contains a flake icemachine, ice store freezer, boxwash‐
ingmachine, lighting systems, smartmeter and PV solar system. Before fishing, the
fishers collect boxes and ice from this building, they take the amount of ice they
need for fishing and fill each box with about 50 percent ice and 50 percent fish.
Once they are done fishing, the fish is sold directly to fish traders who already have
their boxes. Once the fish has been sold, the tables are taken back to the Packaway
building andwashed in the boxwashingmachine. During the day, the PV panel pro‐
duces power and feeds it directly to the national grid through an inverter, as shown
in Figure 4.8.113

4.3. IMPLEMENTING THE SIMULATION MODEL
Figure 4.8: Packaway building model using DesignBuilder
However, when the fishers need to use electricity for the main appliances in
the building, the system automatically applies the power from the central grid sys‐
tem. The electricity transmission company calculate how much energy Packaway
building produces and how much is consumed during a known period based using
smart meters. A smart meter is used to measure energy consumption or energy
generation from a building, and the data is then stored or transferred to the cen‐
tral control server. The Packaway building has two smart meters, one for the flake
ice machine and one for the ice store. According to electrical staff on‐site, the
smart meter data is logged at 30‐minute intervals. However, the smart meter has
not been calibrated since being installed. The lighting system in Packaway has 23
double tube lighting fixtures, each tube 25 W. Due to the natural light available
in the building, fishers are reported not to use the lighting system very often, and
may rarely use it in the evening for short periods. There are four storage rooms in
the Packaway building, and each storage room has a double tube lighting system.
The box washing machine has a 50‐kW power capacity and is only in use when the
fishers want to clean the boxes (usually towards the end of the day) and is then
only in use for a short period. There is very little historical data for the box wash‐114

4.3. IMPLEMENTING THE SIMULATION MODEL
ing machine, particularly concerning usage time and power consumption. The ice
storage system is in constant operation to meet the fishers demand for ice. Data
from the ice storage machine is recorded every 30 minutes and has done so since
being installed. The simulation of Packaway building has been generated using
design builder software. The model includes building appliances, Milford Haven’s
weather data, PV system, operation time and load capacity of machines. To model
the Packaway building, detailed data was required to obtain accurate results from
the drawing of the building to the hourly power consumption in the building.
4.3.1.1.2 K Shed
The K Shed is an open hall, which is used mainly for storage by MHPA with an
area sectioned off for an external tenant who also uses it for storage, including a
fridge/freezer. Within the property, there is also a cold room that benefits from
solar panels. No heating is used within the premises because the office area is
not in use. This building has a PV solar capacity of 50 kW. After the fish is pro‐
cessed, it is stored in the chiller storage room for up to 12 hours on average. The
chiller storage consists of a lighting system and cooling system, and the cooling
system specification was captured from the system. However, there is a lack of
data about the operation times during the day. The main hall area of the K Shed
is multi‐functional and is used to store boxes, boats and tools. According to staff,
the chiller has been out of order for an extended period. The main area of K Shed
has an estimated 62 double tube lighting system. The building contains only one
smart meter, which records all of the data related to the PV system, and three in‐
verters. Within the K Shed, there is a device to measure temperature and a plot
that contains data that could be used about power consumption The geometry of
the K Shed as shown in figure 4.9 is approximately 30m in length and 15m in width
and 6m in height. It contains chiller units, an extensive repair and storage area and
offices. It is occupied for 8 hours a day.
4.3.1.1.3 M Shed
The M Shed building is currently occupied by multiple tenants, as can be seen
in Figure 4.10. The building includes lighting systems and various appliances. The
project partners in MHPA will liaise with the building’s tenants to acquire the data115

4.3. IMPLEMENTING THE SIMULATION MODEL
Figure 4.9: K Shed model
needed for simulation. Unit A is used as a boat repairworkshop for non‐commercial
boats, While units B and C are used as storage facilities. At the other end of the
building, the Marine Pollution Salvage Centre (MPSC) has an office and workshop
area. The following figure 4.10 shows the simulation result for theMShed building,
generated using design builder software. The model includes building appliances,
Milford Haven weather data, PV system, operation times and appliances load ca‐
pacity. To calibrate the data, further data is required on the M Shed. Although
MHPA’s project partners haver kindly offered to provide utility bills for the build‐
ing, M Shed will need an energy audit if it needs to bemodelled during the project.
Figure 4.10: M Shed model
116

4.3. IMPLEMENTING THE SIMULATION MODEL
4.3.1.1.4 F Shed
F Shed is a new build that has been divided into six units: Unit 1, Unit 2 Ground
Floor, Unit 2 First Floor, Unit 3 Ground Floor, Unit 3 First Floor and Unit 4. The
ground floor units offer facilities for fish processing, and the two first floor units
are for light storage such as fish boxes. The building is currently unoccupied except
for group 4, which is occupied by a tenant. Unit 4 contains multiple appliances for
the fish food processing industry.Unit 4 is currently occupied with a tenant that
specialises in crab processing. The unit contains seven electrical appliances used
as part of the production line. Each appliance has a specific power capacity. How‐
ever, the company only moved into F Shed in March 2018, which means that there
is very limited and accurate data on their total power consumption at this stage.
Nevertheless, Milford Haven has provided data on F Shed, which has made it fea‐
sible to create a model as shown in figure 4.11 to understand the annual power
consumption of the building based on the operation schedule times.
Figure 4.11: F Shed model
4.3.1.1.5 J Shed
J Shed is considered to be the most significant building on the site and is cur‐
rently occupied by different tenants. It looks to be a very complex building and has
many electrical systems. The building itself is split into three occupied units: one of
the units has a retail shop with an area for fish processing and upstairs office space,
the second unit is used for fish processing and storage, the third unit is a fish hawk‐
ers hall that is used by individuals for small processing and storage. The building
has been modelled using DesignBuilder, and the simulation has been developed117

4.3. IMPLEMENTING THE SIMULATION MODEL
for unit 1 only. This unit consists of a retail shop, an area for fish processing and
office space, as shown in the following figure 4.12.
Figure 4.12: J Shed model
4.3.1.1.6 Solar Farm
The first solar farm was built in California in 1980, with limited development
taking place until the beginning of 2004. From 2004, developed countries began
to show more interest in solar farms, which encouraged the development and de‐
ployment of solar farms around the world. Solar farms, also known as solar parks
or a solar field, are large scale systems of solar photovoltaic panels that generate
clean electricity, which usually feeds into the grid. Solar farms typically cover ar‐
eas between 1 to 200 acres and aremost commonly developed in rural, agricultural
areas. According to Burke, the average life expectancy of solar farms range from
20 to 25 years. The power production from solar farms along with its zero CO2
emissions and minimal noise production make solar farms an increasingly popular
choice. The main environmental disadvantage to solar farms is the need for acres
of rural space. Jones has identified that solar farms generating 5‐megawatt peak
(MWp) have the capacity to supply electricity to approximately 1200 houses, sav‐
ing up to 500 grams per kilowatt‐hour (g/kWh) or 2150 tonnes of CO. A 5MW solar
farm requires 15 hectares of land, with roughly one‐third of the total area being
covered by 22,000 solar panels. The output can be utilised on‐site but is usually
fed into the national grid.
A report from the department of energy and climate change states that the
deployment of solar farms has increased from 2011 to 2015, and there are now118

4.3. IMPLEMENTING THE SIMULATION MODEL
23 solar farms in Wales with a capacity of 198.6 MW [388]. According to Govern‐
ment [388] report, the increase in solar farms has been driven by concerns that the
electrical grid has limited capacity for renewable energy. Consequently, there has
been a recent race to guarantee grid connection. MHPA generates a lot of its own
energy, all of the port authority buildings roofs have been installedwith PV systems
with various capacities. The port also has a five‐megawatt PV capacity after more
than 1997 panels were installed on the premises. As shown in Figure 4.13, there
are five cabins on site which are responsible for inverting DC to AC (32000 kV) and
to link it directly to the national grid, as shown in Figure 4.13. Milford Haven’s solar
farm is directly linked with a website that provides instantaneous readings of the
solar farm’s power production.
Figure 4.13: Solar Farm
4.3.2 Co‐Simulation of energy systems at fish processing industries
in MHPA
4.3.2.1 Overview
The previous section highlighted the energy simulation for several fish industries
and a local power generation system, which is a solar farm. The energy simulation
process is individual, which describes the details of energy use during a period of119

4.3. IMPLEMENTING THE SIMULATION MODEL
time for each building. In this case, there are five fish industries and a local power
generation unit. The current status in the port is that power production from the
solar farm feeds directly to the national grid and the power demand of industries
is then met from the national grid. However, some industries have installed PV
systems in the roof. This can meet power demand when the sun is shining but
power is required from the grid at night.
The first step to optimise energy systems in the fishery industries is to find the
optimummanagement of the energy in the port by investigating power supply and
demand as the first stage in the overall optimisation process in the port. To in‐
vestigate utilisation of local power generation from solar farm and meet power
demand of fish activities, it must integrate total power demand with total power
supply via the co‐simulation platform. The role of co‐simulation platform is to in‐
tegrate various simulation tools by exchanging data between the programs at each
time step. The co‐simulation will help to measure the performance of integrated
power supply and demand between the fishery industries and the local solar farm
in one year. It will also help to estimate the surplus power from the solar farm or
power demand from the fishery industries. For this study, The BCVBT integration
platform use to allow users to run a couple of different simulation programs for
co‐simulation, and couple simulation programs with actual hardware. For exam‐
ple, the BCVTB allows us to simulate a building in EnergyPlus, and the HVAC and
control system in Modelica, while exchanging data between the software as they
simulate. The BCVTB is based on the Ptolemy II software environment.
4.3.2.2 Coupling between EnergyPlus and BCVTB
The actor in BCVTB connects to the external interface in the EnergyPlus. The in‐
put/output signals in external interface are exchanged between BCVTB and Ener‐
gyPlus. Then the energy plusmap to EnergyPlus objects. The external interface are
design to take three types of inputs from the BCVTB which is Schedule, Actuator
and Variable [389]. The EnergyManagement System (EMS) is a supervisory control
capability that can read data from different sensors and then use that data to direct
different types of control actions. The EMS:actuator is used to overwrite different
parameters as an input. However, the Output:Variable from any EnergyPlus or EMS120

4.3. IMPLEMENTING THE SIMULATION MODEL
can send to the BCVTB at each time step [390]. The External interface:variable is
a global variable that can be used within the EMS:Program or as EMS:Global Vari‐
able and EMS:Sensor. The External interface:variable must have an initial value is
required to run the systems.
4.3.2.3 The interface between the solar farm and the fishery industries
Themain objectiveof integrating the cluster of buildingswith the solar farm through
simulation is to investigate the capability of the solar farm to meet the total power
demand of the entire site of buildings with their associated operations. It also aims
to find the optimummanagement of the energy system in the port by investigating
power supply and demand as a first step in the overall optimisation process in the
port. Co‐simulation software has been used, such as BCVTB software, to connect
different types of simulation engines to facilitate the exchange of data between
various simulations. The solar farm has been modelled using Simulink and Energy‐
Plus, which are linked togetherwith BCVTB. Figure 4.14 presents the BCVTBmodels
and the main components for the integration. It highlights the conceptual integra‐
tion between power demand and supply within the energy cluster. To analyse the
power supply and demand, two different simulation engines were used which: (i)
the first to evaluate total power demand in the fish industry and (ii) the second to
simulate solar farm energy generation.
Three main items are required to interface with EnergyPlus using an external
interface:
(i) An object to instruct EnergyPlus to activate the external interface.
(ii) Energy plus objects then write data from the external interface to the EMS.
(iii) A configuration file for exchanging data is then produced.
(A) Creating EnergyPlus idf file To write data from the external interface to En‐
ergyPlus, an EMS variable is used via an EnergyPlus object of the following
data:
(B) Using xml syntax to configure the file To map the data between EnergyPlus
and an external interface, it must defined as an XML file called variable.cfg.121

4.3. IMPLEMENTING THE SIMULATION MODEL
Figure 4.14: The conceptual integration between power demand and supply within
the energy cluster
This file needs to be located in the same directory as the EnergyPlus idf file.
The code of the xml syntax for this simulation follows:
The next step is to activate the external interface and declare the variable name
as Input, which can be used in the energy management run‐time language to ac‐
tuate the control between power supply and demand in port, as follows:
4.3.2.4 Configuring the BCVTB platform components
The following figure 4.15 presents the BCVTBmodels and themain components for
the integrations. This model highlights the conceptual integration between power122

4.3. IMPLEMENTING THE SIMULATION MODEL
demand and supply within the energy cluster. To analyze the power supply and
demand, i have used two different simulation engines: (i) the first evaluates total
power demand in the fishery industry and (ii) the second simulates the solar farm’s
energy generation.
Figure 4.15: Integrating power supply and demand in BCVTB
123

4.4. INITIAL INSIGHTS
4.4 Initial insights
This section will present the results of the simulation for Milford Haven port. The
first sectionwill highlight the simulation result of fishery industries inMilfordHaven,
and it will discuss the result and compare it with actual data. The next section with
demonstrate the simulation result of two different operation sites in fish process‐
ing industries and it will discuss the result in detail. The last sectionwill present the
simulation result of integrating fishery industries with a solar farm using BCVTB.
4.4.1 Simulation results
The main objective of this study is to model and analyze energy use in the Milford
Haven port in a smart energy cluster model, and to understand energy demand
and supply with their associated constraints. An inventory of the consumption and
production units is performed, also considering the carbon emission and potential
of making the port a self‐operation energy business.
DesignBuilder softwareproduceddifferent variables of the building energymod‐
elling, such as temperature, fuel consumption, and heat balance system loads ven‐
tilation. In the Packaway building, the focus was on annual power consumption
and annual power generation. DesignBuilder plotted a chart for the energy con‐
sumption for specific appliance, such as the lighting system, cooling, heating and
other appliances. After analysing the simulation result, the next step is to calibrate
the data with actual data from the site. The calibration process compares the daily
power consumption from the port utility bills with the data from the simulation
result. During the calibration process, many challenges were encountered. One
such problem was that not all utility bills from Packaway building were accurate
and were estimated from the power provider. The data that was received from
the MHPA partner has been analysed and compared with the model result.
The power generation source identified by the solar farm has been modelled
using EnergyPlus, which enables simulation of the power generation during a year.
This gives insights into how solar power generation can meet local power demand.
Several parameters are required to model the solar farm, such as PV modules
properties, number of modules, inverters, the location of the farm, weather data124

4.4. INITIAL INSIGHTS
and the total number of panels. Based on the modelling and simulation, figure
4.16 presents the energy consumption of the individual buildings. It is observed
that the energy demand of the port is constant throughout the year.
Figure 4.16: Total power consumption of the buildings in the Milford Haven port
The table 4.1 that follows illustrates the total comparison between actual and
simulated data for the entire energy system in the Packaway building. The dif‐
ference between the real and simulation results are minimal, which is due to the
detailed data provided by the port authority during the first stages of the method‐
ology, including the surveys and questionnaires.
4.4.2 Integrating buildings with the solar farm using BCVTB
Themain objectiveof integrating the cluster of buildingswith the solar farm through
simulation is to investigate the capability of the solar farm to meet the total power
demand of the entire site of buildings, together with their associated operations.
Also, to find the optimummanagement of the energy system in the port by investi‐
gating power supply and demand as a first step in the overall optimisation process
in the port. Co‐simulation software has been used, such as BCVTB software to
connect different types of simulation engines for facilitating the exchange of data
between various simulations. The solar farm has been modelled using Simulink125

4.4. INITIAL INSIGHTS
Table 4.1: The comparison between the actual and simulation result of Packaway
MonthTotal power consumption
(kWh) Actual
Total power consumption
(kWh) Simulation
January 1240.7 1100.132
February 1225.4 1000.12
March 1564.3 2300.276
April 2196.5 2000.24
May 1929.8 2300.276
June 2844.7 3162.8795
July 3132 3019.11225
August 3810 3737.9485
September 2948.7 3150.378
October 1854.7 2200.264
November 1530.9 1100.132
December 1741.4 1050.126
Total 26019.1 26121.88425
and EnergyPlus linked together with BCVTB. The following figure 4.17 presents the
BCVTB models and the main components for the integrations.
The optimisation process is based on the simulation of the smart energy cluster
system. The optimisation is using simulated energy consumption to determine op‐
timised schedules for the appliances. The optimised schedules represent the time
intervals based on which appliances can operate in direct relation with the energy
production of the PV system. The optimisation stage is directly integrated with the
simulation framework developed with DesignBuilder, EnergyPlus and BCVTB. The
simulation‐based optimisation will inform of the optimal use of appliances in the
different time intervals based on specific simulation parameters and values.
4.4.3 Result of optimising schedules in Packaway
The core aim of optimisation in this study is to schedule the appliances to holisti‐
cally approach the energy consumption and production in the port. However, to
understand the impact of energy consumption, first it apply analysis on the Pack‐126

4.4. INITIAL INSIGHTS
Figure 4.17: Simulation based optimisation BCVTB
away building and propose an energy‐based schedulingmethod for smarter energy
management. The results presented below are obtained based on the simulation‐
based optimisation process and they show the optimised time of operation of ap‐
pliances by considering different parameters that impact the total power consump‐
tion and operation time of each appliance. The following figure 4.18 represents the
result of the combination of the electric energy of the five buildings with the en‐
ergy produced from the solar farm. It is clear through the form that the energy
produced from the solar farm is intensive and meets the energy need in the five
buildings, and is even enough for a large number of houses, whichwill be discussed
extensively in Chapter Five.
These optimised schedules can orchestrate energy management at the port
level and they provide a more efficient use of resources within the port.
The following table 4.2 presents the optimised time of operation per appliance
as resulted from the optimisation. It presents the total amount of energy thatmust
be consumed, and the total amount of energy needed, either from the local power
generation or from the grid.127

4.4. INITIAL INSIGHTS
Figure 4.18: Result of integrating buildings with the solar farm in BCVTB
Table 4.2: Impact of energy consumption per applianceAppliance Total power consumption per day (kWh)
Period 24 hr 12 hr 8 hr 4 hr
Cold room 720 360 240 120
Flake ice 720 360 240 120
Box washing 120 60 40 20
Lighting 66.15 33.075 22.05 11.025
The following table 4.3 shows the trends of energy consumption per appliance
at four intervals in the Packaway building, as identified in the simulation.
128

4.4.INITIALINSIGHTS
Table 4.3: The appliance usage list in the Packaway buildingAppliance Total power consumption per day (kWh)
Period Power ratingMinimum running time
(minutes)
Interruption of
appliance
Required usage
frequency
Required
start time
Cold room 30 kW 30 NP* 120 0:00‐23:45
Flake ice 30 kW 60 P* 120 6:00‐16:00
Box washing 50 kW 180 P 20 6:00‐16:00
Lighting 25 W/ per tube 60 P 11.025 0:00‐23:45
* NP: Not Possible, P: Possible
The following table 4.5 presents the input constraints of the appliances that must be considered for the energy optimisation process and
integration with renewable energy sources. It considers power capacity, the minimum running time of each appliance, the ability to interrupt
appliance and the required start time.
129

4.5. DISCUSSION AND CONCLUSION
Table 4.4: Optimized appliances schedules for the Packaway BuildingAppliance Total power consumption Operational interval
Cold room 240 kWh 8 hr/day
Flake ice 120 kWh 4 hr/day
Box washing 5 kWh 1 hr/day
Lighting 5 kWh 2 hr/day
4.5 Discussion and Conclusion
To develop a simulation model for the energy system in ports, it was important to
take an initial step to visit the port and know the nature of the work related to
port activities. This step is called a site visit in the energy auditing methodology.
The purpose of the visit was to collect data about energy systems, as well as to
collect the geographical location, weather data, building drawings, electric appli‐
ances, and operating systems at the port. In addition, the energy managers in the
port, were met and interviewed, and they discussed the nature of the energy sys‐
tems and the challenges that they face. During the visit, a questionnaire for port
workers that assessed the nature of their work has been conducted, their use of
energy systems and the challenges they face during their work in terms of energy
systems. This provided the port’s energy manager with a list of data required to
simulate the port’s energy systems, including important details on the equipment,
working hours, working nature, peak times, and so on.
One of the challenges thatwas faced during the visit and during communication
with the port energy manager was the difficulty of obtaining data on energy sys‐
tems in the five buildings targeted for development because they were rented by
companies for various offshore activities and some of them did not have sufficient
cooperation to obtain the required information. Unfortunately, not enough infor‐
mation was gathered for the J Shed and M Shed building, whose tenants refused
to cooperate with us and provide us with the statement that is needed to do the
modeling work. There was, however, cooperation from some of the tenants of the
buildings, such as K Shed and the Packaway building. These tenants provided us130

4.5. DISCUSSION AND CONCLUSION
with the data that is required to produce the energymodels, which helped to reach
the realistic of the actual consumption that existed. After collecting and analysing
the data, the DesignBuilder programwas used tomake the simulationmodel in the
five buildings. DesignBuilder is one of the most important and popular simulation
software programs for energy systems globally. The introduction of data necessary
for modeling work such as maps, equipment, the nature of the building, the metal
used in the building, the capacity of the devices, the nature of the activity used
and the timing of the riots during the week days was easy. In addition, locating the
building geographically for the sun helped us to calculate the amount of light inside
the building fromall sides.DesignBuilder relies on the EnergyPlus simulation engine
to calculate and analyze the energy use, as well as show the results regarding the
nature of the energy consumption in the building during the year. One of the most
difficult problems that was encountered during the use of DesignBuilder during the
modeling work was the expiry of the program’s subscription period, which needed
a large fee to activate the program continuously and permanently. This delayed
the work for a period of time before the necessary approvals could be obtained
from the university to activate the program.
Another of the challenges that was faced during modelling was the lack of
weather and climate data for the port city. Consequently, the port administra‐
tion was contacted to see if they could provide the city’s weather data. An epw.
weather file was then created through the SQL program, which took more than 8
weeks. Another problem arose during the work of the model because of the lim‐
ited capacity of the device that was used, which was aWindows 7 PC, Intel (R) Core
(TM) i76700K CPU @ 4 GHz with 16 GB RAM. This device took a very long time to
do the modeling. Consequently, long evenings were spent working on the model
and to show the results in a way thatmimics the nature of consumption in the port.
After the simulations of the five buildings weremade, the results of the simula‐
tion of energy systems in some buildings were compared with actual consumption
readings obtained through electricity bills. The result of the convergence between
the results of the simulation and actual readings was very close. The approach in
the building of Packaway building almost reached more than 98 percent because
the main devices operating in the building were reproduced. The following table131

4.5. DISCUSSION AND CONCLUSION
4.5 shows the results of the comparison.
Table 4.5: Comparison between model and actual data for the Packaway buildingAppliance Comparison Power accuracy %
Main Building Actual 43528.1 92.82
Simulation 46894.35
Flake ice Actual 17509 98.36
Simulation 17800
Cold room Actual 26019.1 99.9
Simulation 26109.13
The aim of the energy modelling for the five buildings in this seaport was to
understand the nature of energy consumption, which will contribute significantly
to identifying opportunities to reduce electricity consumption and also save costs.
Simulation models will also contribute significantly to determining the high energy
consumption of buildings and will help to make direct recommendations to the
port administration to deal with this problem by reducing electricity waste and
increasing energy efficiency.Although, simulationmodels of those buildings whose
tenants refused to provide data were developed, it was impossible to match the
simulated results with the actual consumption results due to the lack of data.
After developing the simulationmodels of the energy systems for the five build‐
ings in the port, a simulation model was made for the solar farm to calculate the
amount of electricity generated per hour during the day. The goal is to find the ex‐
tent to which the demand of the five buildings of the solar farm can be met within
one hour because the solar energy generated was sold in full and directly to the
national grid, and nothing was used in the port.The BCVTB platform has been used
to carry out this experiment, which aims to connect simulation models of the five
buildings in the port and the solar farm model to see if the energy demand of the
five buildings can be met per hour from the solar farm. This platform aims to cre‐
ate a link between different programs, and measure the impact of energy use and
generation during one year. It can also be linked to improvement systems that aim
to optimise the efficiency of systems, as well as reduce emissions or any other vari‐
ables. One of the challenges that was found during the process of linking programs132

4.5. DISCUSSION AND CONCLUSION
in the platform was the way in which input orders and also output orders are exe‐
cuted within the platform, which requires commands to be written in the Xml file
and simulation files to be added to either the five buildings or the solar farm. This
process was largely complex, and the platform required high skill and accuracy in
the data entered from the building files for comparison with data from the solar
farm.
Due to increased energy consumption in the fish processing industries, it has
become necessary to find a smarter way to manage energy and to reduce energy
consumption. Renewable energy sources and optimised energy strategies for in‐
dustry play a vital role in the overall energy management landscape. Applying
smart energy management tools can prove to be an efficient and feasible method
froman economic perspective, but such solutions can also have an associatedmod‐
elling complexity.
This chapter focuses on answering the research question of how can a reliable
simulation capability be developed that provides real‐time accounts of energy de‐
mand and use for fishery buildings? And during themodelling and simulation of en‐
ergy systems in fishery buildings; some challenges was faced during this stage such
as the difficulty of obtaining an accurate data for some fishery buildings were dealt
with and took more time to complete the process of developing all the simulaion
models of buildings.However, one of the exceptional results in the Energymodeling
and simulation phase can be said to be the ability to understand the nature of en‐
ergy consumption in fishery buildings, which greatly helps to formulate a strategy
to improve consumption and use available and clean energy at a lower cost.What
distinguishes the results ofmodeling and simulation of somefishey buildings is that
the accuracy of the results was verified by comparing them with real energy con‐
sumption, in which the convergence rate was higher than 90 percent.In addition
to that, Through the simulation stage, the capability of a solar farm owned by the
port authority, which sells the entire energy produced to the national grid with‐
out benefiting from it locally was investigated to meet the energy need of fishery
buildings within a year through interconnected the five buildings with solar farm in
Co‐simulation platform. The process of connecting five building models with the
solar farmmodel is very complex and requires effort and time, and the results have133

4.5. DISCUSSION AND CONCLUSION
been encouraging and have given a deep analysis of how long consumption can be
met through the solar farm within a year.
It can be said that the use of the modeling and simulation process to analyze
and understand the nature of energy consumption as well as the extent of renew‐
able energy capacity available locally to meet the energy demand will contribute
significantly to drawing a future strategy at the level of the target port in this study
to benefit from renewable energy as well as understanding the nature of consump‐
tion comprehensively and accurately within a year or more.The originality of this
study is in the quality of simulation programs used for analysis and investigation,
which is considered one of the first studies that contributed to the understanding
and analysis of energy systems in fishing buildings.
134

CHAPTER5
Developing amicro‐grid for a Fishery Port
at multi‐level
This chapter will highlight the implementation of a micro‐grid for the fish process‐
ing industries. Fish processing industries use of energy‐intensive equipment, such
as refrigerators, air conditioners and ice making machines, which leads to high en‐
ergy costs and, indirectly, to an increase of the carbon emissions. Given that most
fish industries sites are old, there is an urgent requirement to make them more
sustainable and achieve economic competitiveness in the energy market. Micro‐
grids have been utilised as efficient solutions in energy‐intensive industries to bal‐
ance energy consumption and production at different scales. Micro‐grids can also
reduce carbon emissions by using renewable energy resources and applying en‐
ergy management techniques. In this chapter, a micro‐grid system for the fish pro‐
cessing industries has been proposed at multi‐level with a validation use‐case at
Milford Haven Port in South Wales, UK. The system has been modelled using Ener‐
gyPlus and MATLAB with an infinite grid, renewable energy resource, battery and
charge/discharge controllers to optimise energy consumption and production, and
reduce carbon emissions
5.1 Introduction
This chapter will conduct an energy analysis and modelling for a fishery port by ex‐
ploring energy transition from a building level to an energy community level. Mod‐
elling principles to deliver a simulation analysis framework were adopted utilising
energy modelling software tools to increase energy efficiency for the industrial fish
port inMilford Haven, SouthWales. This is achieved by investigating the energy us‐135

5.2. METHODOLOGICAL APPROACH TO MODELLING AND SIMULATING AMICRO‐GRID IN A FISHERY PORT
age for fish processing and maximising the use of renewable energy sources in en‐
ergy clusters. The modelling informs how to minimise carbon emissions and store
the power surplus in energy storage systems. Next, a smart‐energy community
model has been developed using multiple software applications, which allows the
simulation of energy usage at the local site and integration of different consumer
agents. In addition, amathematicalmodel for the integration of five industrieswith
a local domestic community of 200 houses was developed. This scenario investi‐
gates the capability of the local solar farm to meet the power demand of the local
energy community. It aims to find the optimum balance between the battery stor‐
age system and the number of PVs that are required tomeet the community power
demand, followed by a stand‐alone, off‐grid system.At a wider scale, the review of
the literature has found that there is a lack of research that delivers a ‘’demand–
response’’ capability within a fishery port, while optimising the use of battery stor‐
age, and at the same time promoting the formation of sustainable energy commu‐
nities. The novelty of this study is that it delivers a co‐simulation environment that
leverages calibrated energy simulationmodels to deliver an optimisation capability
that (a) manages electrical storage within a district environment, and (b) promotes
the formation of energy communities in a fishery port ecosystem.A methodology
to address these objectives has been developed, which ensures that rigour and sig‐
nificance criteria are met. By rigour, it ensured that the methodology is scalable,
in that the techniques and methods used are independent in the context of the re‐
search as provided by the selected fishery port. Conversely, the significance criteria
are met by ensuring that the proposed methodology generates an impact within
the selected demonstration environment through substantial energy and carbon
reductions, as well as energy autonomy through the concept of energy communi‐
ties that rely on renewables.
5.2 Methodological approach tomodelling and simulat‐
ing a micro‐grid in a fishery port
After develop a simulation model of the building, the next step is to investigate
the capability of modelling and simulation of energy use at a fishery port to inform136

5.2. METHODOLOGICAL APPROACH TO MODELLING AND SIMULATING AMICRO‐GRID IN A FISHERY PORT
the energy use and reduce carbon emission to nearly zero. Consequently, a micro‐
grid for the fishery industry was developed using the MATLAB/SIMULINK platform.
The micro‐grid consists of load pattern, grid model, energy storage system, renew‐
able energy generation and control strategy. The result of the integrated com‐
ponents will identify several parameters, such as amount of battery systems, the
behaviour of energy consumption and energy generation, and the power use from
the national grid. Simulink is a block diagram environment for multidomain simu‐
lation and model‐based design. It supports system‐level design, simulation, auto‐
matic code generation, and continuous test and verification of embedded systems.
Simulink provides a graphical editor, customisable block libraries, and solvers for
modeling and simulating dynamic systems. It is integrated with MATLAB, which
enables MATLAB algorithms to be incorporated into models and export simulation
results to be sent to MATLAB for further analysis. A multi‐stage approach with a
five stage methodology (i.e., building simulation stage, energy generation simula‐
tion, energy storage simulation, grid model and integration of agents) has been
adopted in MATLAB/SIMULINK as shown in Figure 5.1.
Figure 5.1: Grid component for the fishery industry
137

5.3. MODELING AND IMPLEMENTING A MICRO‐GRID IN THE SELECTED CASESTUDY (BUILDING LEVEL)
This study uses amulti‐stage approachwith five stages in the proposedmethod‐
ology, namely: building simulation stage, energy generation simulation, energy
storage simulation, grid model and integration of agents in MATLAB/SIMULINK.
Step 1: The first step of the methodology is to develop amodel of electrical en‐
ergy consumption for fishery ports using a software known as DesignBuilder. The
thermal energy model includes geometrical information of the building enriched
with occupancy information, material and envelope properties, overall intrinsic
(including thermal properties) of the building, scheduled for heating and cooling
devices. The simulation model was generated based on a use‐case scenario that
involves minimising electrical energy consumption in the Packaway building while
maintaining acceptable CO2 emissions.
Step 2: The next step is to simulate the system based on the different combi‐
nations of control variables. Initially, the thermal model will be generated using
DesignBuilder and exported to EnergyPlus (an open‐source and cross‐platform en‐
ergy simulation environment). The Packaway building is the main building and it
contains several appliances consuming energy: a flake ice machine, an ice store
freezer, box washing machine, lighting systems and a smart meter. There are also
four storage rooms in the Packaway building, and each storage room has a dou‐
ble tube lighting system. The box washing machine has a power capacity of 50
kW, and it only works when the fisheries clean boxes during the day. Ice storage
is under operation constantly to meet the demand for fish storage according to
the quantity required. The figure 5.2 below shows the input‐output variables for
smart grid model using MATLAB/SIMULINK. It contains control strategy algorithms
of the charge/discharge controller, and is based upon a set of rules to distribute
and manage the power system between the four agents.
5.3 Modeling and implementing a micro‐grid in the se‐
lected case study (Building level)
Micro‐grid systems provide the opportunity for the fish‐processing industry to be‐
come more sustainable. Introducing smart energy systems to the fish‐processing
industry will help to reduce the operation costs by reducing energy losses and ef‐138

5.3. MODELING AND IMPLEMENTING A MICRO‐GRID IN THE SELECTED CASESTUDY (BUILDING LEVEL)
Figure 5.2: Input Output variables for a smart‐grid model using Simulink
ficiently use locally generated power. Howell et al. [152] suggests that applying
smart‐grid technologies can be beneficial to an industry as a commitment to re‐
duce carbon emissions and can portray this industry in a positive light with the
public and within the industrial sector. For the Milford Haven site, an integration
between load model, PV model, battery and grid was proposed to achieve a bet‐
ter understanding of the overall operation of the system. The signals generated
during simulation are used to assess the load, power generation, grid and the bat‐
tery’s state of charge. presents the main components of the integration model for
the Packaway building battery storage system. The building has a rooftop PV sys‐
tem with a capacity of 50 kW, including a DC‐DC converter and a DC‐AC inverter.
For the proposed smart gridmodel, the power generation relates to themain appli‐
ances in the building and energy excess is configured to charge the battery system.
The systemhas different priority levels, whereby the energy produced is utilised for
operating the appliances. When there is no demand from the building, the battery
system is charged at a second priority level. When there is no demand and the bat‐
tery is charged, the excess will be sent to the national grid. When there is no power
generation from the PV system, the battery system connects with Packaway build‐
ing to meet the power demand. Similarly, if the battery system discharges when
there is power demand from the Packaway building, then the model will allow for
the provision of power from the national grid. The system has been tested with
different battery capacities as a means to identify the required number of battery139

5.3. MODELING AND IMPLEMENTING A MICRO‐GRID IN THE SELECTED CASESTUDY (BUILDING LEVEL)
systems that are required for the local power demand of the Packaway building for
12 months. The following sections will discuss with more details the main compo‐
nents of micro‐grid for the fish processing industries.
5.3.1 Load profile (building Level)
The first main component for the micro‐grid is the Packaway building and to de‐
velop a model of electrical energy consumption for fishery ports using a software
known as DesignBuilder (a commercial 3D modeller and energy simulation soft‐
ware platform). The thermal energy model includes geometrical information of
the building enriched with occupancy information, material and envelope prop‐
erties, overall intrinsic (including thermal properties) of the building, scheduled
for heating and cooling devices. The simulation model was generated based on a
use‐case scenario which involves minimising electrical energy consumption in the
Packaway building while maintaining acceptable CO2 emissions as shown in figure
5.3.
Figure 5.3: 3D‐model of Packaway building in Milford Haven
A description of the scenario is given in Table 5.1. The Packaway building has
installed a PV system on the roof of the building with 50 kW panels that feed the
building at daytime. They have a total power output of 275 W per panel with two
DC‐AC inverters. The building has been modelled using DesignBuilder simulation
software. Themodel usesweather data, appliances, PV system, operationtime and
load of appliances with capacity units. The Packaway building is the most power140

5.3. MODELING AND IMPLEMENTING A MICRO‐GRID IN THE SELECTED CASESTUDY (BUILDING LEVEL)
consuming building of the site, with an annual power consumption of about 60000
kWh. Modelling and simulating the Packaway building will help to understand the
total power consumption and generation, and to determine the periods of the year
that have the highest consumption. In addition, this energy modelling will help to
identify the areas of energy optimisation and will provide a more informed calcu‐
lation of the total amount of carbon emissions.
Table 5.1: List of the main appliances in Packaway buildingAppliances Quantity Power (kW) Use (hr/day)
Cold Storage 1 30 24
Washing machine 1 50 5 minutes
Lighting 24 11W/per lamb 5
Flake Ice 1 0 4
Plug‐in 5 5 1
For the SIMULINK Platform, a three‐phase dynamic load model was created
to receive power from a grid connection and to meet power demand. A three‐
phase dynamic load implemented as a Simulink block that acts as a dynamic load
for active power P and reactive power Q, in the form of a function with positive‐
sequence voltage, was considered [391]. Because the load does not simulate the
negative and zero‐sequence currents, the load currents remains balanced with no
dependency of the voltages. The active and reactive load values can be specified as
a time series, which provides an optimal environment for simulating realistic load
data. In the model, the block has a constant impedance that is triggered when
the applied voltage is lower than a specified value Vmin. The load pattern changes
when the voltage is higher than Vmin, while the active and reactive power of load
varies based on the following equations:
5.3.2 PV power supply
EnergyPlus software was used to generate hourly power production for one year
considering a 50‐kW solar plant and associated inverters. EnergyPlus also uses the
weather data of the fish industry site based on the latitude, longitude of the loca‐
tion. The EnergyPlus engine gives an output of solar energy on an annual basis and141

5.3. MODELING AND IMPLEMENTING A MICRO‐GRID IN THE SELECTED CASESTUDY (BUILDING LEVEL)
shows the hourly power generation and solar radiation. The purpose of the grid
is to supply any power demand to the property/building and take any surplus or
positive power. The solar PV model has a capacity of 50 kW and the power output
from PV is modelled as DC. However, this needs to be converted to AC, which can
be used to run different equipment in the buildings. A DC‐DC converter produces
a regulated output three‐phase voltages at 50Hz and is used to feed generated
power to grid at standard three‐phase voltages.
The schematic figure that follows 5.4 presents the solar PVmodel that has been
developed in SIMULINK. An instantaneous active and reactive power is used for
this model. When the power generation data receives signals from the PV sys‐
tem, then it need to be converted from DC to AC. To convert to AC, control current
sources (CCS) should be used tp convert DC input signal to an equivalent current
source. The output of CCS will be measured to identify current (Amp) and volt‐
age (V). and then calculate the real and reactive power instantaneously based on
equation. When calculating the power, the model may use instantaneous power,
which refers to instantaneous current and voltage. This transformed from three
phase to αβ0 coordinates by using Clarke transformation. The transformation pro‐
duces a stationary reference frame, where coordinates α and β are orthogonal and
the coordinate 0 corresponds to the zero‐sequence component [392].142

5.3. MODELING AND IMPLEMENTING A MICRO‐GRID IN THE SELECTED CASESTUDY (BUILDING LEVEL)
Figure 5.4: PV generation model in SIMULINK platform
5.3.3 Grid connection
The purpose of the grid is to balance the system and take care of spikes in the
system. The grid supplies any excessive power demand to the property/building
and absorbs the surplus of power. An infinite grid is used because of its flexibility
when feeding power demand and generation to the system. For the Packaway
building, the grid is connected with the PV system, load model and battery system
with a frequency of 50 Hz, which is based on the European standard. Because grids
are used for their flexibility of feeding power, the proposed grid was modelled at
a frequency of 50 Hz, based on the European standard using MATLAB/SIMULINK
[393] as shown in figure 5.5.
5.3.4 Energy storage (battery system)
The concept of ”energy storage” depends on how much and how long a quantity
of energy can be stored in relation to chemical, mechanical, thermal or electro‐
magnetic techniques. Energy storage applications have developed with the radical
transitions that have occurred within the energy systems of many nations. There
are several reasons for these changes, such as climate change and mitigation poli‐143

5.3. MODELING AND IMPLEMENTING A MICRO‐GRID IN THE SELECTED CASESTUDY (BUILDING LEVEL)
Figure 5.5: Infinity grid model in SIMULINK platform
cies, which have led to the extensive use of renewables, particularly in Europe. At
the shortest time scales, the most advanced form of electricity storage is when the
quality of power supply is maintained within strict frequency standards.
Electrochemical batteries are the most efficient solutions from the available
options. They store and emit energy via electrochemical reactions, which are ex‐
tremely stable through a variety of operating conditions. These batteries can oper‐
ate on short periods of time and have greater energy storage efficiency. New bat‐
tery chemicals, such as Li‐ion< are far more effective than previous battery chem‐
icals, and are therefore widely used in electric cars. For the Packaway building, a
lithium‐ion battery system has been used to cover the overall system with 12 volts
and 100 A for each battery. The battery model is controlled by an (Input‐P) signal.
From the controller, the signal is generated and sent to themodel in the form of
a command. The signal represents the difference between power generation from
PV and power demand from the Packaway building. The signal indicates the need
to charge or discharge the battery system. A positive signal means that the battery
system is in a charging state and a negative signal that means it is discharging. The
total amount of power is divided based on a battery voltage to find the current
input for controlling current sources. The overall output power signal is determined
by multiplying the voltage and the current. The state of battery charge signal is
generated and sent by a command to themain control block. In this model, a Li‐ion
battery has been used with a nominal voltage of 12 Volt and rated capacity of 1000
Ah, and with an initial state of charge of 50 percent. Li‐Ion batteries are chosen
based on their electrochemical potential to provide energy density for weight as
shown in figure 5.6. Furthermore, Li‐Ion batteries are commonly used in portable144

5.3. MODELING AND IMPLEMENTING A MICRO‐GRID IN THE SELECTED CASESTUDY (BUILDING LEVEL)
electronics and their lifespan depletes with each discharge cycle.
Figure 5.6: Battery model in the SIMULINK platform
5.3.5 Charge/discharge control algorithm
The micro‐grid control strategy involves two scenarios, namely: (a) control algo‐
rithm considering the main storage system, and (b) control algorithm considering
the main storage system and backup storage system.
These scenarios are elaborated in the following subsections.
5.3.5.1 Scenario (a): control algorithm considering the main storage system
The algorithm of the charge/discharge controller is based upon a set of rules to dis‐
tribute and manage the power system between the four agents. The scenario has
two different models: when power consumption (PC) = power generation (PV),
then all of the power generation should feed the power consumption. Is power
generation greater than power consumption? If yes, then check the battery is full
or not. If the battery is full, then send the power generation to the national grid.
Otherwise, charge the battery system. If no, then check the state of charge of the
battery system. Is the SOC greater than 50 percent or not? If yes, then discharge
power demand from the battery system. Otherwise, meet the power demand from
the national grid. Figure 5.7 gives a flow chart that describes the charge and dis‐
charge controller processes considering main storage system.145

5.3. MODELING AND IMPLEMENTING A MICRO‐GRID IN THE SELECTED CASESTUDY (BUILDING LEVEL)
Figure 5.7: Control charge algorithm using main storage system
5.3.5.2 Scenario (b): Control algorithmconsideringmain storage systemandbackup
storage
The algorithm of the charge/discharge controller is based upon a set of rules to
distribute and manage the power system between the four agents. The scenario
has two different models: when power consumption (PC) = power generation (PV),
then all of the power generation should feed the power consumption. Is power
generation greater than power consumption? If no, then charge battery‐1. If yes,
then check if the battery storage‐1 is full or not. If the battery is full, then check
whether backup battery storage. If it is full, then sell the surplus power production
to the national grid. Otherwise, charge the backup battery. If no, then check the
state of charge of the battery system. Is the SOC greater than 50 and less than
20? If no, then check the state of charge of the backup battery system. Is the SOC
greater than 50. If yes, then discharge power demand from the battery system.
Otherwise, meet the power demand from the national grid. Figure 5.8 gives a flow
chart describing the charge and discharge controller processes considering main146

5.3. MODELING AND IMPLEMENTING A MICRO‐GRID IN THE SELECTED CASESTUDY (BUILDING LEVEL)
storage system.
Figure 5.8: Control charge algorithmusingmain storage systemand backup storage
5.3.6 Implementation of a micro‐grid in the selected case study
As presented in this section, there are five steps to develop a micro‐grid for the
fish processing industry. The first step is to produce a simulation model for the
fish industry. Before producing this model, it is necessary to collect data on site.
This step is known as the walk‐through auditing site, and it aims to provide data
of all power consumption appliances and time of operation. The audit can help
to understand the overall system and the design of the industrial site, with a clear
idea of the operation. One of the biggest challenges encountered during the mod‐
eling process was the absence of actual reading of power consumption and gen‐
eration. Moreover, the electricity consumption is usually estimated by the power
provider or utility company, which impacts the accuracy of the overall modelling.
After collecting data from the site, an EnergyPlus simulation model was developed
to provide detailed data and patterns of energy use in the fishery site. This was
followed by modelling the energy generation of the industrial site. Solar energy147

5.4. SCALING UP THE MICRO‐GRID AT A FISHERY PORT
generation has been modelled with Matlab/Simulink based on the specification of
PV panels and the location of site and weather data. The power consumption and
power generation data were used for modelling a micro‐grid to determine the op‐
timum operation of the system for the industry operations. The system consists of
multiple agents such as solar panels with inverter, industry (load pattern), battery
system and the grid. A charge and discharge controller is required to control the
battery system and the different agents. The simulation model has also been con‐
figured to identify the optimum number of batteries required to meet the power
demand of the Packaway building. These batteries have the potential to motivate
stakeholders to install power systems that will aid in reducing carbon emissions in
the fishery industries, while pursuing further research into whether fishery ports
have the capability to produce positive energy and become zero carbon advocates.
The modelling and implementation of a micro‐grid for fish industries represents a
step forward and contributes to the development of energy consumption and pro‐
duction projections to promote more efficient operation within the industry. In
this chapter, I report on the energy use in fish processing industries by proposing
a micro‐grid for increasing the efficiency os the overall processing operation and
energy management. The simulation model of the grid has been modelled based
on four seasons. The model has been simulated based on random intervals in the
seasons to observe the behaviour of the system under different situations. In addi‐
tion, it enables the investigation of the optimum battery storage capacity based on
the state of charge per day. The results of themicro‐grid simulation reflect the flow
of charge and discharge with a curve of differential power generation and power
consumption for the Packaway building for each season.
5.4 Scaling up the micro‐grid at a fishery port
There are five fish processing businesses in Milford Haven port. Each building
houses a fish processing business and has its own energy consumption. Each build‐
ing has been modelled as a separate load using DesignBuilder as shown in figure
5.9 , which calculates energy consumption using the EnergyPlus simulation engine.
The simulation result data will be used in MATLAB/SIMULINK for integration with148

5.4. SCALING UP THE MICRO‐GRID AT A FISHERY PORT
different agents. Three‐phase dynamic load models are connected by default to
ensure integration of each building entitywith the smart‐energy communitymodel
as a part of requirements. The process will be replicated for each building, with the
objective of achieving a community of individual industries, each running different
fish processing businesses.
Figure 5.9: Simulation models of the buildings in the port of Milford Haven
The analyses has focused on the Milford Haven Port, with five buildings and a
solar farm, based on which the entire fish processing workflow is conducted. The
Packaway building is the main building in the port and it contains several appli‐
ances consuming energy: a flake ice machine, ice store freezer, box washing ma‐
chine, lighting systems, and smart meter. Also, there are four storage units in the
Packaway building, and each storage has an installed LED lighting system. A 50‐kW
box‐washingmachine is used by the fisheries when they need to clean fish contain‐
ers. The cold storage room is on for 24 hours per day to store fish or other products
before sending to the market. The Packaway has installed a solar panel system on
the roof of the building, with 50 kW capacity, which is interconnected with a local
inverter to use it directly based on weather factors. The models have been cre‐
ated based on a 2‐D drawing, and the internal appliances have been modelled and
calibrated based on data collected from the port.
The M Shed building is currently occupied by several tenants, and has an inter‐149

5.4. SCALING UP THE MICRO‐GRID AT A FISHERY PORT
nal lighting system and several appliances. Units B and C of the building are used
as storage facilities, while Unit A is used as a boat repair workshop for an incident
response provider. The F shed is a new building that is divided into six units: unit
one, unit two at ground floor, unit two at first floor, unit three is also on the ground
floor. The ground floor units are used for fish processing, while first‐floor units are
used for storage such as fish containers. The building is still unoccupied, except
for unit four, which is occupied with some appliances for fish food processing at
the fishery ports. The J Shed is the largest building at the port site and is currently
occupied by several stakeholders. It is a complex building and has many electri‐
cal systems. The building is split into three occupied units: unit A contains a retail
shop and an office space, fish processing appliances, and storage boxes used by
individuals as fish deposits. The K Shed is a warehouse. It contains a fridge/freezer
used by a stakeholder, with a cold room fed mainly from solar PV panels on the
roof, with a power capacity of 50 kW. There is a chiller storage room used to store
fish, although the chiller is out of service due to technical issues. The main hall has
a 62‐double‐tube lighting system. The chiller storage consists of a lighting system
and cooling system. The solar farm is installed with about a 5‐megawatt PV power
capacity, containing about 20,000 panels. There are four main cabins in the site,
which convert DC to AC (32,000 kV) and then link the solar farm to the national
grid. For the Milford Haven site, a model of an integration between load model,
PV model, battery, and grid has been proposed to achieve a better understanding
of the overall operation of the port. The signals generated during simulation are
used to assess the load, power generation, grid, and the battery’s state of charge.
The building has a rooftop PV system with a capacity of 50 kW, including a DC‐DC
converter and a DC‐AC inverter. For the proposed micro‐grid model, the power
generation is connected with the main appliances in the building and the energy
excess is configured to charge the battery system. The system has different priority,
levels whereby the energy produced is utilised to operate the appliances. When
there is no demand from the building, the battery system is charged at a second
priority level. When there is no demand and the battery is charged, the excess
will be sent to the national grid. When there is no power generation from the PV
system, the battery system is used to meet the power demand. Similarly, if the
150

5.4. SCALING UP THE MICRO‐GRID AT A FISHERY PORT
battery system discharges when there is power demand from a building, then the
model will be interconnected to the national grid to avoid disruption. The system
has been tested with several battery capacities as a means to identify the required
number of battery systems for the local power demand of the main building for 12
months. A multi‐stage approach with five iterations has been adopted to develop
the proposed smart‐energy community for the port, namely building simulation
stage, energy generation model, energy storage model, grid model, and integra‐
tion of agents.The strategy of the charge/discharge controller is based upon a set
of rules to distribute and manage the power among the four agents. Figure 5.10
presents a flow chart describing the charge and discharge controller processes con‐
sidering themain storage system. The scenario has two different operationmodes:
Figure 5.10: Control charge strategy for industries and the local community
when industries demand (ID) = farm production (FP), then all the power genera‐
tion should feed the power consumption. If FP is greater than ID, then check if the
battery is full or not. If the battery is full, then send the power generation to the
national grid. Otherwise, charge the battery system. If FP is less than ID, check the
state of charge of the battery system. Is the SOC greater than 98 percent or less
than 20 percent? If yes, then discharge ID from the battery system. Otherwise, the
power demand is met by the national grid.151

5.5. SCALING UP A MICRO‐GRID TO PROMOTE ENERGY COMMUNITY SHARING
5.5 Scaling up a micro‐grid to promote energy commu‐
nity sharing
A smart‐energy community provides an opportunity for the fishery port to become
more sustainable. Introducing smart‐energy systems to the fishery port will help to
minimise the operation costs by reducing energy losses and it will make the fishery
port more efficient by using locally generated power. Howell et al. [189] suggests
that applying a smart‐energy community model can be beneficial to an industry
as a reliable strategy for reducing carbon emissions, and it can portray this indus‐
try in a positive light with the public and within the industrial sector. In Milford
Haven port, there is a small community of houses around the marina that serve
as living areas for the staff working in the port. Adding domestic buildings is a key
element to the overall modelling because it enables the formation of the smart‐
energy community. In total, 200 houses are used with different loads as a mean to
establish the emerging fish port community. In the simulation, all of the buildings
are simulated under one load to achieve integrationwith other community entities.
As mentioned earlier in the discussion of the chapter modeling and simulation, it
was difficult to obtain energy consumption data of some fish industries in the port
campus, which made us strive and investigate the consumption of different appli‐
ances in industries to help determine the amount of energy consumption for the
entire building. Another challenge has been faced in obtaining the data of energy
consumption for the buildings around the port, which is that one of the most sig‐
nificant challenges when trying to create a larger smart‐networkmodel around the
port to build amore realisticmodel that simulates the reality of energy usage in the
houses surrounding the fishery port. After several attempts were made with the
port authority to communicate with some houses around the fishery port to pro‐
vide important data for the energy simulation models in adjacent homes, the only
other option was to make a simulation model for one real house with four bed‐
rooms and then do a repeated calculation for 200 houses. The simulation work
was conducted on this basis and then linked inside the micro‐grid model with the
solar farm and other systems. The strategy of the charge/discharge controller is
based upon a set of rules to control andmanage the power system among the four152

5.5. SCALING UP A MICRO‐GRID TO PROMOTE ENERGY COMMUNITY SHARING
agents. The scenario has two operation modes: when community demand (CD) =
farm production (FP), then all the power generation should feed the power con‐
sumption. If FP is greater than CD: If no, then charge battery‐1. If yes, then check
if battery storage‐1 is full. If the battery is full, then check backup battery storage.
If it is full, then sell the surplus power production to the national grid. Otherwise,
charge the backup battery. If no, then check the state of charge (SOC) of the bat‐
tery system. Is the SOC is greater than 98 percent and less than 20 percent ? If
no, then check the SOC of the backup battery system. Is the SOC greater than 98
percent? If yes, then discharge CD from the battery system. Otherwise, the power
demand is met by the national grid. Figure 5.11 gives a flow chart describing the
charge and discharge controller processes considering the main storage system.
Figure 5.11: Control charge algorithm using main storage system
153

5.6. RESULTS AND DISCUSSION
5.6 Results and Discussion
5.6.1 Micro‐grid at building level
The modelling and implementation of a micro‐grid for the fishery industries repre‐
sents a step forward, and contributes to the development of energy consumption
and production projections to promote more efficient operation within the indus‐
try. This chapter reports on the energy use in the fish processing industries by
proposing a micro‐grid to increase the efficiency of the overall processing oper‐
ation and energy management. A simulation model of the smart‐grid has been
modelled based on four seasons. The model has been simulated based on random
intervals in the seasons to observe the behaviour of the system under different sit‐
uations. In addition, it enables the investigation of the optimum battery storage
capacity based on the state of charge per day. The results of the micro‐grid sim‐
ulation reflect the flow of charge and discharge with a curve of differential power
generation and power consumption for the Packaway building for each season.
The smart‐gridmodel utilises an algorithm, basedonwhich energy is exchanged
within system components. When the power generation equals the power de‐
mand, then all of the power generation should be used for power consumption.
Consequently, it is important to determine the state of the power supply and de‐
mand, and to identify variability in the consumption intervals. Moreover, a granu‐
lar data modelling process is implemented, which improves the accuracy and de‐
termines the exact response from the battery charge and discharge controller. Fig‐
ure 5.14 demonstrates the charge and discharge controller during the evaluated
period.
The BESS was configured with two lithium‐ion batteries, a main battery and a
backup battery, to provide flexibility in energy use and support the energy demand.
The main battery had a capacity of 7000 Ah and the backup battery had a capacity
of 5000 Ah. Two battery systems are used to utilise the surplus energy generated
by the PV system during daytime to meet the energy demand within 24 hours at
critical times. This BESS provides a certain stability to the site while maintaining an
equilibriumwhen required to feed energy to consuming applications. The resulting
consumption andproduction state of the BESSwhen the excess electricity is utilised154

5.6. RESULTS AND DISCUSSION
to operate the equipment and other power consuming units rather than sold to the
grid at a lower price can be observed in Figure 5.12, which shows the state of power
consumption, generation, and grid exchange over a 24‐hour interval. The results
show the quick response of the BESS during charging and discharging operations
as well as reduced energy consumption from the national grid.
Figure 5.12: Optimising energy use with the micro‐grid model
Based on the smart grid modelling as shown in figure 5.13, the power gener‐
ation is scheduled to operate the appliances in the building, whereas the power
generation excess will go to the battery system (charging mode). Conversely, if the
battery system is full, then it will send the power to the national grid.
155

5.6.RESULTS
ANDDISCUSSION
Figure 5.13: Micro‐grid system
156

5.6. RESULTS AND DISCUSSION
During night‐time, when there is no power generation from the solar system,
the power demand can be met from the local battery system (discharging mode).
If the power in the battery system does not have enough capacity to meet the de‐
mand, then energy from the national grid will be used. Figure 5.14 shows the state
of charge of the battery system for four seasons.: (a) state of charge (SOC) for win‐
ter, (b) SOC for spring (c) SOC for summer and (d) SOC for autumn. The system has
been tested in a random period within the four seasons to identify the behaviour
of the operation system and the optimum number of battery systems. For exam‐
ple, during the winter the solar radiation is lower during the day, which will reflect
on the optimum number of battery systems required to store the energy excess.
Based on this analysis, it has been found that the optimum number of battery stor‐
age is about 2000 A per hour, which is about 20 LI‐IO battery capacity. However,
the size of the battery has been calculated based on a random period in winter.
To get the optimum number of battery modules, it is necessary to run the model
for four months, which requires the utilisation of a high‐performance‐computing
infrastructure. The result of the simulation was produced from a computer using
Windows 7, Intel (R) Core (TM) i7‐6700K CPU @ 4 GHz, with 16 GB RAM. There‐
fore, to get an optimum result, it is necessary to run the model for a longer period
in winter, a modelling process that took between 5 to 6 hours.The values in Figure
5.14 show that the system in spring needsmore battery. However, discussions with
the staff on the site revealed that spring and summer are the main seasons for the
fisheries, whichmeans that the industry should be in operationmode at least from
12 to 18 hours on a daily basis. This indicates the need to increase the number of
battery systems in spring, which led to the determination of an optimum number
of battery charge during the summer of about 7500 A. There are many reasons to
increase the number of battery systems in the summer. The daytime in summer in
Milford Haven averages from 15 to 19 hours per day.This will lead to an increased
number of batteries to augment the charge s to meet the local power demand and
utilise the solar energy system during this season.
157

5.6.RESULTS
ANDDISCUSSION
The results in Figure 5.14, show that the system initially identified a typical stable state with no high‐power consumption, which was followed
suddenly by an increase to a full charge after sunrise. The batterymodel as presented in the overall smart‐grid model facilitates the understanding
of power management in the fishery industries.
Figure 5.14: State of charge for four seasons [ a‐ winter, b‐spring, c‐summer, d‐autumn]
158

5.6. RESULTS AND DISCUSSION
5.6.2 Scale‐up Micro‐grid at Fishery port level
This section will provide the results of the analysis of the community simulation.
In this scenario, the capability to meet the local power demand of a community
using a local solar farm by developing a smart‐grid model will be investigated to
understand how local power generation can satisfy the load demand for a 24‐hour
period.
As explained in Section 5.4, a simulation model of power management of en‐
ergy supply and demand for five fish processing industries and their associated op‐
eration at Milford Haven port has been developed . The simulation results showed
that a stand‐alone smart‐gridmodel canmeet the local power demand for 24 hours
without the need for power from the grid. The power produced from 5 MW solar
from6AM to 4 PM can charge a 600 kW Li‐Io battery storage tomeet the power de‐
mand at night. The simulation result from Figure 5.15 shows that a 50 kAh battery
storage is the optimum capacity to meet the local power demand of five industries
during the night. However, the power load of industries will be met directly from
the solar farm in the daytime period, which will also recharge the battery system
to meet the local power demand at night. In addition, the simulation results show
that the system will dump the surplus power from the solar farm to the grid. The
battery charge state shows that the battery system discharges from 12 AM until 8
AM.
As presented in Figure 5.15, more power supply is needed from 5 AM to 8 AM
because at this time the fish industries run ice making machines required to store
fish before sending it to market. Most of the power demand in the night is used
for lighting, cleaning, and for the cold storage system. Each industry has installed
a cold room to store fish, which is considered to be the most energy consuming
appliances in the industry. The proposed storage integration will help to reduce a
considerable amount of carbon emission and also to reduce energy cost with the
local energy grid. In addition, the installed solar farm can have a significant impact
on the port by increasing income and reducing energy cost because it provides a
cost‐efficient alternative to the main grid. The results prove that a smart‐energy
community for fishery ports can not only reduce carbon emissions but can also
help to reduce energy consumption, thus facilitating a transition towards clean and159

5.6. RESULTS AND DISCUSSION
sustainable energy. In addition, these communitymodels supply greener energy to
the national grid by using renewable resources available at the site. Furthermore,
the solar farm can have a significant impact on the port by increasing the income
by selling power to the grid, as well as minimising the impact on the energy cost
when buying from the national grid.
Figure 5.15: The simulation results when integrating industries in the fishery port
with the solar farm
5.6.3 Scale‐up Micro‐grid to promote energy community sharing
In this experiment, a smart‐energy community around the port using the multi‐
model simulation platform has been developed. The aim of this scenario is to in‐
vestigate the capability of the solar farm tomeet the power demandof the port and
a local community of 200 houses. One of the challenges that arose while collecting
data for the simulationof the energy community around the fishery portwas the in‐
ability to obtain many of the designs of the buildings around the port. This made it
difficult to obtain accurate data on the topography of the buildings around the port
because it could not be obtained directly from the owners of the buildings. Con‐
sequently, a model of a three‐bedroom house with different facilities was made.
The model building was then repeated to equal the required number of buildings160

5.6. RESULTS AND DISCUSSION
around the port. This technique was able to achieve a large percentage of conver‐
gence between the buildings on the ground and the buildings on which the energy
simulationwould bemade. As a result, the available optionwas tomake amodel of
a three‐bedroomhousewith different facilities and the building would be repeated
to equal the required number of buildings around the port, thus achieving a large
percentage of convergence between the buildings on the ground and the build‐
ings on which the energy simulation would be made. The current load is identified
by the five buildings at Milford Haven port. This experiment incorporates a load
consumption of 200 community houses around the port for 24 hours. In addition,
a charge controller strategy containing two battery storage systems is proposed.
The main battery storage system and a backup battery system are adopted due to
variant loads in the community. To conduct the simulation, an Intel® Core i7TM
@ 4.00 GHz with 16 GB RAM is used for the modelling. This computational envi‐
ronment supported the complexity of running an optimisation problem to identify
the required amount of battery storage for the energy community. The proposed
smart‐control strategy contains two battery systems: (i) one battery as a main bat‐
tery for the whole model and, (ii) a backup battery system to meet the variation of
energy demand from the local energy community in the night, as well as to avoid
buying power from the grid. During the experiments, I repeated the simulation
several times with the same input parameters, while changing the battery system
capacity to get the optimum number of batteries (as shown in Table 6.1).
Figure 5.16 presents the simulation result of developing a smart‐energy com‐
munity at the fishery port. The simulation results show that a 1000 battery storage
is the optimum amount of battery storage for a community of five industries and
200 community houses.
The simulation results presented in show that smart‐energy communities can
identify high fluctuations in power demand from both fishery port buildings and
the local surrounding community. The results also demonstrate that battery stor‐
age can avoid or delay the process of purchasing power from the grid because the
state of charge of the main battery reacts adequately to meet the power demand
during the night. When the battery system capability is finished, the back‐up bat‐
tery can be used to satisfy the power demand in the buildings. As a consequence161

5.7. CONCLUSION
Figure 5.16: Simulation results for the expanded energy community around fishery
port
of the complexity of the community simulation, a slight use of power from the grid
between 4 and 6 AMwas identified, which is an expected fault in the model and is
determined by the increased number of energy models included in the simulation.
Table 5.2 shows the simulation trials with an optimum amount of battery stor‐
age. The simulation results show that about 1.2 MW capacity of Li‐Io battery stor‐
age is the optimum capacity for themain battery and about 250 kW is the optimum
capacity of back‐up battery storage.
5.7 Conclusion
This chapter as answering second research question which investigate the capa‐
bility to adopting smart grid concept for fishery port at multi levels. This study
investigates energy use by fishery industries proposing a smart, novel and efficient
energy model to manage consumption and production. The micro‐grid model has
been proposed atmulti level to reduce the dependence on fossil fuel and to reduce
carbon emission by integrating renewable energy resources and adopting smart
energymanagement systems. The smart energy gridmodel has been implemented
for the Milford Haven port in South Wales, UK. The system has been modelled us‐162

5.7. CONCLUSION
Table 5.2: Optimum battery size trials for smart energy community
Trials
Main
Capacity
(Ah)
Second
Capacity
(Ah)
Storage
Capacity
(Ah)
No. of
Main
Battery
No. of
Second
Battery
Grid
Supply
1 20840 5000 250 200 50 Yes
2 25000 300 250
3 30000 360 300
4 35000 420 350
5 40000 480 400
6 45000 10000 540 450 100
7 50000 600 500
8 60000 720 600
9 65000 780 650
10 70000 15000 840 700 150
11 75000 900 750
12 80000 960 800
13 85000 20000 1020 850 200
14 100000 1200 1000 No
ing EnergyPlus and MATLAB/Simulink. The results demonstrate that local power
demand could be met by local power generation using micro‐grids. It has been
demonstrated that for Building level that 50 kW capacity of a PV system can meet
the local power demandwith the integration of LI‐IO battery system of 12 Volt, and
has the capability to manage power flow for different periods. By presenting this
real trial project, It aim to observe what mechanisms from the simulation module
are applicable to the real smart‐grid project, and find newways to optimise energy
consumption and production for industrial sites.the result showed that main bat‐
tery had a capacity of 7000 Ah and the backup battery had a capacity of 5000 Ah.
Two battery systems are used to utilise the surplus energy generated by the PV sys‐
tem during daytime to meet the energy demand within 24 hours at critical times.
For fishery port level, The power produced from 5 MW solar from 6 AM to 4 PM
can charge a 600 kW Li‐Io battery storage to meet the power demand at night. The163

5.7. CONCLUSION
simulation result showed that a 50 kAh battery storage is the optimum capacity to
meet the local power demand of five industries during the night. At community
level, The simulation results showed that about 1.2 MW capacity of Li‐Io battery
storage is the optimum capacity for the main battery and about 250 kW is the op‐
timum capacity of back‐up battery storage. The future work will explore energy
sharing models as a means for optimising energy and resources at the community
level. The formation and use of a community energy sharing market with corre‐
sponding discovery mechanisms will be given focus, whereby energy agents such
as prosumers can satisfy individual demands from consumers [394]. These shar‐
ing models will assess the level of trust that can be placed in an energy provider
with regards to an advertised energy capability. This approach will unlock energy
exchanges within a community [395] and will allow prosumers to monetise their
energy excess in a more secure and flexible local market environment.
164

CHAPTER6
Optimal control strategies for Fishery ports
micro‐grids
This study investigates the energy usage of a case study fishery port and it evalu‐
ates a method to maximise the use of renewable energy sources in these energy
clusters via a smart grid approach, while applying price‐based control and peer‐to‐
peer (P2P) power sharing considering optimised trading of energy. The new smart
control systems aim to reduce gain power from the national grid and they try in‐
stead to utilise local energy sources tomeet power demand. In addition, it will help
the consumers to become local power prosumers who sell, share and trade power
within the local community based on the optimised decision making algorithms.
The results of the simulation prove that optimised decision making algorithms are
able to provide smart, reliable, green and efficient control for a local fishery port
and can help to deliver a nearly zero carbon fishery port.
This chapter investigates the implementationof smartmicro‐grid systems in the
fish processing industry with the applicability of battery storage technology from
a technical and economic perspective for the Port of Milford Haven that employs
price‐based control and peer‐to‐peer (P2P) energy sharing strategies.
6.1 Energy community entities at fishery port
The smart grid concept presents a significant opportunity to upgrade the fish pro‐
cessing industry to use smart, sustainable, and clean dispatchable energy sources,
which can also deliver long‐term economic benefits [134, 396]. The use of smart
grids promotes the integrationof renewable energywith other local energy sources
to increase the reliability and quality of the energy available throughout the grid165

6.1. ENERGY COMMUNITY ENTITIES AT FISHERY PORT
[226]. Consumers play a vital role in smart grid technology because they use en‐
ergy in an informed way to prevent energy waste or loss by optimising their energy
consumption during peak times, leading to reduced operation costs and improved
energy efficiency [228]. However, there are currently several clear shortcomings in
energy management in fishery ports [134, 107, 62, 72, 146, 95, 283, 73, 282, 397,
398, 360, 61, 74, 131, 106]. Consequently, this chapter investigates the imple‐
mentation of smart micro‐grid systems in the fish‐processing industry. To do so,
we consider the applicability of battery storage technology from a technical and
economic perspective for the Port of Milford Haven, which employs price‐based
control and peer‐to‐peer (P2P) energy sharing strategies.
Theproposed smartmicro‐gridwas simulated and testedusingMatlab/Simulink.
Simulink is a block diagram environment for multidomain simulation and model‐
based design that supports system‐level design, simulation, automatic code gen‐
eration, and continuous testing and verification of embedded systems. For the
Milford Haven site, a model was defined and developed to integrate the load, PV
system, battery system, and grid to simulate the overall operation of the system.
Figure 6.1 presents the main components of the grid. The outputs of the simula‐
tion were used to assess the status of load, energy generation by the PV system,
exchange with the grid, and the State Of Charge (SOC) of the battery system. Each
building in the Port of Milford Haven has a rooftop PV system with a capacity of
50 kW that includes a direct current DC–DC converter and a DC–AC inverter. The
proposed smart grid model includes different priority levels whereby the energy
produced the PV system is first utilised to operate the equipment in each building.
When the energy consumption of the building is satisfied, the excess PV‐generated
power is used to charge the battery system.
Once the batteries are fully charged, the excess energy is sold to the national
grid or to peer buildings of the micro‐grid. When the PV system is not generat‐
ing energy, the battery system provides the required energy to the building. The
model also allows for the provision of energy from the national grid if the SOCof the
battery system falls below critical levels. The system was evaluated using different
battery capacities to identify the required number of batteries to meet the energy
consumption of the Packaway building over a 12‐month period. The fishing boats166

6.2. DEVELOPING REAL‐TIME DECISION MAKING TO PROMOTE NEARLY ZEROCARBON FISHERY PORT
Figure 6.1: The grid energy community at fish industry
are another important entity for fishery ports. Traditionally, fishing boats use fos‐
sil fuels to generate power, which has negative impacts on the environment and
leads to carbon emissions, noise, and pollution of seawater [399]. However,the
continued advance of electric road vehicle technology, similar concepts could also
be used to produce efficient electric boats [400], helping to make fishing activities
more environmentally friendly. Minami et al. [401] detailed the main features of
electric boats, including quietness, low vibration, and zero carbon emissions. By
replacing the use of fuel with batteries, not only can the environmental impact of
the boats themselves be reduced but their batteries can also be integrated into the
micro‐grid using bi‐directional chargers that can charge and discharge based on the
employed micro‐grid control strategy [402]. Chapter Six discussed the micro‐grid
community entities in a fishery port in more detail.
6.2 Developing real‐time decision making to promote
nearly zero carbon fishery port
Two different control algorithms were considered to manage the power distribu‐
tion of the proposed fishery port micro‐grid: a price‐based control algorithm and
a P2P energy sharing control algorithm, which will be described in the following
subsections.167

6.2. DEVELOPING REAL‐TIME DECISION MAKING TO PROMOTE NEARLY ZEROCARBON FISHERY PORT
6.2.1 Smart control based pricing
The price‐based smart grid control algorithm for the fishery port was developed
based on the total energy production of the PV panels, the BESS capacity, and/or
the electric boats to consider the price of electricity to decide between buying or
selling energy. As detailed in Algorithm 1, the system checks for constraints to
determine the optimum instantaneous price at the time of selling or buying. These
constraints include the SOC of the main and backup batteries because the battery
status is crucial to the overall system. The control system works instantaneously
and sends signals to the BESS charge controller to store or release energy according
to the results of the control algorithm. In this decision‐making process, the total
power production (T_production) is the sumof the power produced fromPVpanels
(P_PV) and the amount of power available in n batteries of the BESS and/or electric
boats, as follows:
The total power consumption (T_Consumption) is the aggregate consumption
of power from the fish processing facilities in the port (P_demand) and the power
required to charge n batteries of the BESS and electric boats (EB_demand ), as
follows:
6.2.2 Smart control of P2P energy sharing
P2P energy trading represents the latest generation of energy management sys‐
tems. It enables prosumers in the smart energy community to sell their surplus
energy to other participants. The resulting monetary benefits and efficient use
of resources provides an excellent motivation to increase local energy generation
from RESs and encourage domestic energy providers to share their surplus energy
to the closest neighbour instead of selling it to the grid. This helps prosumers to
generate revenue and reduce their dependence on energy from the larger grid.
This change, in turn, is reflected in a decrease in the total proportion of carbon
emissions released by burning fuel or gas in traditional energy plants. Figure 6.2168

6.2. DEVELOPING REAL‐TIME DECISION MAKING TO PROMOTE NEARLY ZEROCARBON FISHERY PORT
Algorithm 1: Price-based control algorithm
Initialisation
1: if ∑ 𝑃𝑛𝑖=0 = ∑ 𝐶𝑛
𝑖=0
2: yes; feed all ∑ 𝑃𝑛𝑖=0 to ∑ 𝑃𝑛
𝑖=0
3: no; go to stage 1
Stage 1
4: if ∑ 𝑃𝑛𝑖=0 > ∑ 𝐶𝑛
𝑖=0
5: then check BESS_1
6: if 20 < SOC1 < 95
7: then charge BESS_1
8: otherwise go to stage 2
Stage 2
9: if SOC1 > 95
10: then check 𝑃£𝑝𝑟𝑖𝑐𝑒
11: if 𝑃𝑟𝑒𝑓𝑒𝑟𝑒𝑛𝑐𝑒 < 𝑃£𝑝𝑟𝑖𝑐𝑒
12: then sell P to the grid
13: else check BESS_2
13: otherwise go to stage 3
Stage 3
14: if SOC2 > 98
15: then sell energy to grid
16: else charge BESS_2
17: otherwise go to stage 4
Stage 4
17: if SOC2 > 20
18: then discharge BESS_2
19: else buy energy from grid
20: end
169

6.3. RESULTS AND DISCUSSION
Figure 6.2: P2P energy sharing architecture and components
shows the proposed control system scheme for the smart grid of the fishery port
at the Port of Milford Haven based on P2P energy sharing.
The flow chart below describes the steps used to regulate energy production
and energy consumption in the fish processing industry. At any instant, the total
power production of the smart grid (T_production) and its total power consump‐
tion (T_Consumption) are determined as per Equations (3) and (4), respectively.
The associated algorithm for determining the P2P energy sharing is shown in Algo‐
rithm 2.
6.3 Results and discussion
This section will discuss the evaluation of the proposed smart grid model using
four scenarios to understand the impact of the price‐based and P2P energy sharing
control strategies. These scenarios and their results are described in the following
subsections.170

6.3. RESULTS AND DISCUSSION
Algorithm 2: P2P energy sharing control algorithm
Initialisation:
1: if ∑ 𝑃𝑛𝑖=0 = ∑ 𝐶𝑛
𝑖=0
2: yes; feed all ∑ 𝑃𝑛𝑖=0 to ∑ 𝐶𝑛
𝑖=0
3: no; go to stage 1
Stage 1
4: if ∑ 𝑃𝑛𝑖=0 > ∑ 𝐶𝑛
𝑖=0
5: then check BESS_1
6: if 20 < SOC1 < 95
7: then charge BESS_1
8: otherwise go to stage 2
Stage 2
9: if SOC1 > 95
10: then check 𝑃𝑐2
11: if 𝑃𝑐2 < SOC1
12: then feed all energy to 𝑃𝑐2
13: otherwise go to stage 3
Stage 3
14: if SOC1 < 95
15: then check 𝑃£𝑝𝑟𝑖𝑐𝑒
16: if 𝑃𝑟𝑒𝑓𝑒𝑟𝑒𝑛𝑐𝑒 < 𝑃£𝑝𝑟𝑖𝑐𝑒
17: then sell P to the grid
18: else check BESS_2
19: otherwise go to stage 3
Stage 4
20: if SOC2 > 98
21: then sell energy to grid
22: else charge BESS_2
23: otherwise go to stage 5
Stage 5
24: if SOC2 > 20
25: then discharge BESS_2
26: else buy energy from grid
27: end
171

6.3. RESULTS AND DISCUSSION
6.3.1 Optimise energy use by applying the price‐based control strat‐
egy
The objective of this scenario was to optimise energy use and associated costs by
minimising the capacity of the BESS and increasing income from trading energy
with the grid. The controller is connected to the local energy market to contin‐
uously retrieve the energy price, based on which a set of rules are triggered to
distribute energy between the local site and the main grid. For this control strat‐
egy, we set a minimum selling price of 4.2 £p/kWh and maximum buying price
of 2.6 £p/kWh to enable a sell/buy decision at the site. The main grid price was
based on the average European electricity market price. In this scenario, the BESS
included a main and backup battery with lower capacities of 6000 Ah and 4000 Ah,
respectively.
Figure 6.3 presents the impact of the price‐based control strategy for the over‐
all energy distribution within the site. As it can see the fist figure demonstrate the
energy generation. The second chart simulate the actual power consumption and
it can seen that it fluctuated during the 24 hr. Grid exchange as shown in the third
figure demonstrate the principle Price based control strategy. It feed the surplus
power to the grid and buy from grid from 5:00 AM until 7:00 AM when the power
price is in the conditioned ranged of buy from gridwhich is less than 2.6 £p/kWh.As
can be observed from the results, if the grid energy price is too low, then the local
system will use energy from the main grid to meet the energy demands of the fish
processing site. However, if the grid energy price is too high and there is an energy
surplus in the local site, then the system will sell surplus energy to the main grid.
The results also reflect the fluctuation of energy price in the European energy mar‐
ket. Finally, it can be observed that the SOC of the main battery system discharges
at night to meet the incoming energy demand of the fish processing equipment,
whereas the SOC of the backup battery is stable at night because once the energy
stored in the main battery is consumed, the energy demand is covered by energy
from the main grid due its low energy price.172

6.3. RESULTS AND DISCUSSION
Figure 6.3: Optimising energy cost using the price‐based control strategy
6.3.2 Optimise energy use by integrating the energy storage capac‐
ity of electric boats
The objective of this scenario was to optimise energy use by utilising the local elec‐
tric fishing boat fleet as an alternative energy storage system to minimise the main
battery storage capacity on site. The use of alternative energy storage solutions,
such as the electric boats, is expected to result in a decrease in the capital cost
for energy storage equipment, and considerably reduces long‐term operation and
maintenance costs.The figure consist of five charts; first chart present the power
consumption of the building in 24 hours and second chart show the activity of PV
power generation. The propose scenario investigate the capability of local electri‐
cal energy storage in boat to take part of overall system through meeting energy
demand when the system need energy instead of getting power from grid. this will
help to calculate the optimum number of energy storage system. It can see that in
yellow line that system doesn’t take any power from grid in 24 hr discharge power
from battery boats between 12:00 AM and 4:00 AM. The algorithm for this sce‐
nario was configured to work with several of the electric boats that were identified173

6.3. RESULTS AND DISCUSSION
Figure 6.4: Optimising energy use when using electric boat battery storage
in the port and use their storage capacities to manage the peaks in energy demand
or store surplus energy once the site batteries are charged to capacity. The algo‐
rithm also ensures that at any point in time, the batteries of the electric boats will
not be discharged below a threshold of 50 percent, to ensure that the boats can
always be used for fishing. In this scenario, the site energy storage capacity was set
to approximately 5000 Ah for the main battery and about 3000 Ah for the backup
battery. Figure6.4 presents the interactions between the different consumption
and production units at the fish processing site and the impact of using electric
boats or alternative energy storage. The results show how the electric boat‐based
storage system discharges and interacts with the local battery system at night and
charges during the day when PV energy production is available. The results also
show that the SOC of the main battery interacts with the storage systems on the
electric boats by charging at night and discharging during the day.
6.3.3 Optimise energy use with P2P energy sharing control strategy
The objective of this scenario was to investigate the energy use when the site iden‐
tifies high energy production from local generation sources by exploring the possi‐174

6.3. RESULTS AND DISCUSSION
bility to share or trade this energy surplus within the community of neighbouring
buildings. This scenario was evaluated to identify new methods for reducing de‐
pendency on the national energy grid and encourage utilisation of clean energy
resources while incentivising energy community members to become prosumers.
This scenario includes themain battery and backup battery systemswith capacities
of 7000 Ah and 3000 Ah, respectively.
Figure 6.5 presents the energy impact when applying the P2P control strategy,
showing trends related to the energy storage system to support a more optimal
energy use at the site by charging and discharging the BESS within a 24‐hour inter‐
val. As presented in the figure, when energy generation is high and the SOC of the
BESS is greater than 95 percent, the control system will check the energy demand
of the neighbourhood buildings, based on which the controller will then feed the
surplus energy to the neighbouring buildings. The results also show a reduction in
the quantity of energy consumed from the national grid.
Figure 6.5: Optimising energy use based on a P2P energy sharing control strategy
175

6.4. CONCLUSIONS
6.4 Conclusions
This chapter answering the third research question which investigating the capa‐
bility of energy sharing and trading approach to be simulated to promote deci‐
sion making that reflects the efficiency in fishery buildings? This research question
aims to develop smart decision making systems to minimise carbon emissions and
provide a more informed energy management strategy in relation to the surplus
energy and available energy storage systems generated from dispatchable energy
sources. and the answer is formed by developing two control scenarios to demon‐
strate how micro‐grid solutions can be implemented in the fishery port. The re‐
search question reflect the third stage of the methodology that developed for the
thesis. The price‐based control scenario was developed in relation to the price
of electricity and a decision model was implemented to determine when to buy
or sell energy to the grid [403].The peer‐to‐peer control strategy was developed
to prioritise the energy demand of neighbouring buildings in the micro‐grid over
selling to the national grid [340]. The results of simulations using these control
strategies demonstrated how peer‐to‐peer energy sharing enables prosumers to
participate in smart energy communities by sharing their surplus energywith other
participants and providesmonetary benefits and efficient use of resources. The re‐
sults indicated improvements in the overall operation between agents in the smart
grid when adopting either the price‐based control or peer‐to‐peer scenarios. In
the price‐based control scenario, the control algorithm reduced energy losses and
maintained energy in the system using an energy storage system [404]. In the peer‐
to‐peer scenario, the control algorithm showed that the surplus energy generated
by prosumers can also be used to feed any neighbourhood energy demand before
selling to the grid. These techniques can also help to incentive the deployment of
local, renewable energy generation within the smart energy community. Further‐
more, the results of this study demonstrated that applying the price‐based control
and peer‐to‐peer methods can have a significant impact on the amount of reduc‐
ing carbon emissions associated with the consumption of energy produced using
traditional fossil fuels which can contribute to decarbonize seaports [405]
176

CHAPTER7
Conclusion and Future works
This thesis focused on the development of a road map for the creation of zero car‐
bon fishery ports and included the application of this to one of the marine ports,
and this chapter aims to present and deduce the most important outputs and dis‐
cuss the obligation that was presented in chapter 3. This chapter will re‐examine
the main research questions of research and review the extent to which they are
achieved, as well as discuss the research contributions in the field of knowledge,
and will also present the most important challenges and obstacles that occurred
during the research phase.The most important future trends in reducing carbon
emissions in seaports will also be presented and its impact on the global level.
7.1 Research findings
During the PhD journey, it was found that there is a good opportunity to develop
seaports and fishing industries through the development of their energy systems.
This can be done by taking advantage of modelling and simulations to understand
the nature of energy consumption. In addition, smart energymanagement through
the establishment of smart grid approach can help us to understand, manage and
optimise energy performance. This will be reflected in the energy performance
and will reduce the cost of energy in the long‐term. The concept of new smart
energy systems in seaportswill enhance the transformationof fisheries at ports and
fishing industries into active members by raising the awareness of the importance
of energy systems and raising efficiency, aswell as adopting energy automation and
utilizing available energy resources.
The direct impact of upgrading and implementing smart energy systems at fish‐
ing ports will be reflected in the following areas: enhances the concept of quality177

7.1. RESEARCH FINDINGS
and liability in workplace and competitiveness among port managers by increasing
the number of fisheries and fishing boats that serve the green port, and will con‐
tribute to raising the efficiency of operation and achieving optimal incomes for the
port authorities. In addition, this development of port energy systems will drive a
clear vision among decisionmakers by supporting, encouraging and promoting the
conversion of seaports and fishing ports to become more efficient and less expen‐
sive ports. It will also contribute to the development of policies that limit the use
of fossil fuels in seaports and their contents. In addition, seaports will attract in‐
vestment by energy companies and investors through participation in investment
deals and tenders to update energy systems, by applying a new generation of en‐
ergy technology, and will therefore achieve long‐term profits. Furthermore, sea‐
ports will be a new direction for researchers and developers because so far there
has been very little research in this area. This will help to bring smart, innovative
minds and researchers to build a new innovative vision for seaports and fishing
industries by adopting a new digital technology for port systems and operations.
This section aims to answer the main research questions which was outlined
in chapter one. each research question will be restated and discussed in specific
sections. and it will followed by final discussion on the research hypothesis.
7.1.1 Developing simulation capability at fishery port
The first research question was:
Can a reliable simulation capability be developed that provides real‐time ac‐
counts of energy demand and use for fishery buildings?
This thesis established that a calibrated simulation model taking into account
port complexity using a combinationof software environments (e.g., DesignBuilder,
EnergyPlus, building control virtual test bed and MATLAB/SIMULINK) may help to
pave the way to the development of a zero‐carbon port using new smart energy
technologies (e.g., smart grids, virtual power plant and distribution generation).
This question constitutes the first phase of the methodology that is used in this
thesis and it focuses on verifying the extent to which a simulation capability model
of energy systems in seaports can be developed over varying periods of time, be‐
tween short‐term and long‐term. This question was answered through a series of178

7.1. RESEARCH FINDINGS
steps that began with a review of the port’s energy systems using an energy audit‐
ingmethodology [406] which will be used to determine and understand the nature
of energy consumption and what complex, most energy‐consuming systems are
used by the operators of fishing systems, which make up a large proportion of the
total consumption in the port (e.g., the flake ice, cold storage units, loading equip‐
ment, storage in the port, etc.). The energy review process aims to collect data
that are necessary and important for the development of the energy system simu‐
lationmodel. Simulationmodels of energy systems for a number of buildings were
developed using DesignBuilder and EnergyPlus programmes at the target port of
study, the port of The City of Milford Haven in Wales [407]. One of the exceptional
results in the Energy modeling and simulation phase is the ability to understand
the nature of energy consumption in fishery buildings, which greatly helps to for‐
mulate a strategy to improve consumption, and use available and clean energy at
a lower cost. What distinguishes the results of modeling and simulation of some
of the fishery buildings is that the accuracy of the results was verified by compar‐
ing them with real energy consumption, in which the convergence rate was higher
than 90 percent. In addition, through the simulation stage, the capability of a solar
farm owned by the port authority, which sells the entire energy produced to the
national grid without benefiting from it locally, was investigated to meet the en‐
ergy requirements of the fishery buildings within a year through interconnecting
the five buildings with a solar farm in a co‐simulation platform [408].The simula‐
tion models that are developed contributed to determining the times consumed
during the year and what devices most consumed the energy. The developed sim‐
ulation models of the buildings at the port will help to determine the opportunity
to reduce consumption, as well as the possibility of meeting existing consumption
in buildings through renewable energy systems and also smart electrical grids.
7.1.2 Deploy and implement micro‐grid at fishery port
The second research question was:
Can the concept of smart grid be adopted and applied to energy systems in
fishery buildings at multi‐levels?
The answer to this question is largely linked to the answer to the first question179

7.1. RESEARCH FINDINGS
because it aims to study andmeasure the extent to whichmarine ports can be con‐
verted into smarter ports by spreading and promoting the concept of smart grids.
The second phase of the methodology in this thesis aimed to develop a microgrid
in seaports, and measuring the potential to meet the need for electricity locally
without the need to buy electricity from the public grid [107]. A micro‐grid model
was developed on a building level, and the simulation model for energy systems
was used in the Packaway building, which was developed in the first phase of the
research for this purpose. The network consists of a range of systems (e.g., solar
system, storage system, smart control power management and real‐time distribu‐
tion system) within 24 hours and it simulates what is going on in real life. The re‐
sults of thismodel were promising because themicro‐gridwas developed using the
programMATLAB/SIMULINK, where all of the systems were connected together in
one platform and controlled through proposed smart power management system.
A series of experiments were conducted during the four seasons to ensure the ef‐
fectiveness of themicrogrid in dealing with different loads within 24 hours simulta‐
neously. This aims to achieve self‐sufficiency without the need to take power from
national grid[283]. The extent to which the micro‐grid is expanded and enlarged
to include all buildings at the fishery port level has also been studied, as well as
the extent to which the micro‐grid is expanded to include a total of 200 houses
from the community adjacent to the port to form a smart energy community. All
of the loads have been attached to the pre‐developed platform in the micro‐grid,
together with a solar farm from the port property, and two power management
systems have been developed: the first at the port level and the second at the
community level.
The proposed model was developed based on a trade‐off criterion related to
the cost of implementation and efficiency with a view to: (a) reduce to a minimum
investment in the implementation of the proposed model, and (b) demonstrate
clear benefits in terms of costs and energy savings [409].
7.1.3 Promote real‐timedecisionmaking towarddecarbonizing sea‐
ports
The third research question was:180

7.1. RESEARCH FINDINGS
Can the energy sharing and trading approach be simulated to promote deci‐
sion making that reflects the efficiency in fishery buildings? This research question
aims to develop smart decision‐making systems to minimise carbon emissions and
provide a more informed energy management strategy in relation to the surplus
energy and available energy storage systems generated from dispatchable energy
sources. The answer is formed by developing two control scenarios to demon‐
strate how micro‐grid solutions can be implemented in the fishery port. This re‐
search question reflects the third stage of the methodology that was developed
for this thesis. The price‐based control scenario was developed in relation to the
price of electricity and a decision model was implemented to determine when to
buy or sell energy to the grid [403]. The peer‐to‐peer control strategy was devel‐
oped to prioritise the energy demand of neighbouring buildings in the micro‐grid
over selling to the national grid [340]. The results of simulations using these con‐
trol strategies demonstrated how peer‐to‐peer energy sharing enables prosumers
to participate in smart energy communities by sharing their surplus energy with
other participants, and provides monetary benefits and efficient use of resources.
The results indicated improvements in the overall operation between agents in the
smart grid when adopting either the price‐based control or peer‐to‐peer scenarios.
In the price‐based control scenario, the control algorithm reduced energy losses
and maintained energy in the system using an energy storage system [404]. In the
peer‐to‐peer scenario, the control algorithm showed that the surplus energy gen‐
erated by prosumers can also be used to feed any neighbourhood energy demand
before selling to the grid. These techniques can also help to incentivise the deploy‐
ment of local, renewable energy generation within the smart energy community.
Furthermore, the results of this study demonstrated that applying the price‐based
control and peer‐to‐peer methods can have a significant impact on the amount of
carbon emissions reduction associated with the consumption of energy produced
using traditional fossil fuels, which can contribute to decarbonise seaports [405].
7.1.4 Revisiting the Hypothesis
Based on the the above answered to research questions, the following Hypothesis
can now be confirmed;181

7.2. CONTRIBUTION TO THE BODY OF KNOWLEDGE
“The concept of Industry 4.0 has the potential to deliver net zero carbon fishery
ports by leveraging smart and clean energy generation, use, and storage, while
promoting the formation of energy communities within the local ecosystem [410].”
7.2 Contribution to the Body of Knowledge
The main contribution of this study is its focus on minimising the cost and emis‐
sions of energy use in the fishery buildings through developing a smart grid model
and proposing real decision‐making scenarios to reduce the cost and increase ef‐
ficiency. The following contributions that have been obtained from this study are
as follows:
1. Propose a reliable simulation capability that provides real‐time accounts of
energy demand and use, as well as short to medium‐term energy projec‐
tions to understand the complex ecosystem around seaports, including en‐
ergy systems in use, fish processing activities, local stakeholders, including
communities by utilising tools such as DesignBuilder [76], EnergyPlus [77]
and Building Control Virtual Test Bed (BCVTB)[78].
2. Develop a simulationmodel of integration of local solar farm energy in a local
energy cluster using a multi‐building energy coordination model developed
in EnergyPlus and simulate in BCVTB.
3. Develop a smart grid model to explore various scenarios for decarbonising
seaports by leveraging renewable energy sources, including solar energy and
energy storage, through a smart monitoring control strategy.
4. Develop a smart energy community model around seaports by integrating
the smart gridwith local community energy storage via developing a simulation‐
based optimisation strategy.
5. Promote real‐time decision‐making strategies that lead seaports and com‐
munities around seaports towards decarbonisation through energy sharing
and trading.182

7.3. LIMITATIONS AND CHALLENGES
7.3 Limitations and challenges
During the PhD research journey, there were a range of challenges that existed and
were scientifically addressed in order to achieve the desired results and objectives
of the research.And it will be displayed in the following points:
1. During the first phase of data collection in theMilford Haven Port, there was
a unwillingness to support the researcher and provide the required data to
make the simulation models, which led to the delay in the development of
energy simulation models in port facilities, and also the lack of some impor‐
tant data such as drawings for buildings and others, which called for research
and frequent visit to the port and take fieldmeasurements of some buildings
as well as know some manufacturers of electric appliances in the port and
communicate with them to get the information to develop the simulation
model and get More accurate and real‐life results.
2. Also, the lack of sensors and actuators to monitor and collect energy con‐
sumption in the buildings increased the complexity of the task to deliver ac‐
curate energy consumption models in the buildings.
3. It is crucial to provide a high specification computer withminimum 64 ram to
develop simulationmodels, which was one of the main challenge during this
research study. For example, at the timewhen design and implement micro‐
grid in SIMULINK platform; it spent one night to run the model for 24 hours
and get result which took about three months to develop microgrid model
with an accurate result.The result of the simulation was produced from a
computer using Windows 7, Intel (R) Core (TM) i7‐6700K CPU@ 4 GHz, with
16 GB RAM.
7.4 Future work
For future work, I argue that decarbonizing seaports can have a profound transfor‐
mation on port activities, as elaborated in the next sub‐sections.183

7.4. FUTURE WORK
7.4.1 Total life‐cycle approach to seaports decarbonisation
Most of the studies focus on developing strategies that contribute to reducing car‐
bon emissions in seaports by optimizing the energy mix [364] and improving the
energy efficiency of the equipment and machinery used in ports [365], as well as
mitigating the environmental impact of ships by reducing their speed and schedul‐
ing their arrival and departure from seaports [104]. These actions have the po‐
tential to contribute significantly to reducing seaports carbon footprint. In this
context,Lifecycle Assessment (LCA) helps to quantify the environmental pressures,
the trade‐offs, and areas for achieving improvements considering the full lifecy‐
cle of seaports from design to recycling. However, current approaches to LCA do
not factor in consistently (both in the foreground and background inventory sys‐
tems)lifecycle variations in (a) seaports buildings usage, (b) energy supply (includ‐
ing from renewable sources), and (c) building and environmental regulations, as
well as other, changes over the building/seaport, and local neighborhood lifetime.
These include: (a) change in the energymix of a seaports or upgrading / retrofitting
the energy system(s) in place; and (b) time‐increase of energy demand during the
lifetime of a seaport due to a wide range of reasons, including changes in activ‐
ity patterns. In fact, seaports present the highest complexity within LCA which
preclude the use of linear and static approaches but instead require the use of
salable approaches that factor in dynamic and non‐linear considerations. Seaport
processes involve longer time scales than in other industries, and therefore face
very different operational and environmental conditions. Therefore, the consid‐
eration of the time dimension in port activities modelling is becoming essential
to understand the resulting pollutant emissions and resource consumption. This
time dimension is currently missing in Life Cycle Inventory databases. A further
combination of Life Cycle Impact Assessment (LCIA) models using time‐dependent
characterization factors can, therefore, lead to more comprehensive and reliable
LCA results. This is therefore a need to develop real‐time LCA approaches for sea‐
port which address temporal and spatial variations in the local seaport ecosystem,
and thus promotes more effectively a ‘cradle‐to‐grave’ environmental sustainabil‐
ity capability”.184

7.4. FUTURE WORK
7.4.2 Semantic‐based modelling, forecasting and optimization of
seaports energy systems
In the complex seaport digital energy landscape, energy software services which
address various stakeholders’ (including prosumers) needs are required. These
include forecasting and simulation services, as well as responsive day‐ahead and
intra‐day management services necessary to effectively integrate distributed en‐
ergy resources, including renewables, in seaports. This includes the ability to pre‐
dict behaviours and adapt to changing weather and technological environments.
We argue that as local renewables density increases, this importance extends be‐
yond the unit level to intelligence at the system level, where the impact of uncer‐
tainty at each node can be mitigated through the emergent behaviour of adjacent
distributed energy resources. As such, an optimal management of energy systems
should be considered by systematically considering the decision space of manage‐
ment topologies, schemes, and operating parameters, best conveyed by semantic
models, such as ontologies. Energy system optimization is far from novel, but most
approaches consider the system as a static entity, and only consider a single sys‐
tem rather than the holistic perspective of emerging system of systems landscape.
We therefore advocate the previously described system of systems approach of en‐
ergy management, best conveyed through semantic models that provide a holistic
conceptualisation of energy systems and their socio‐technical constituents. This is
essential to address a wide range of scenarios, such as local energy balancing, is‐
landing, and blackout prevention, adapted to a changing environment of high dis‐
tributed energy resources penetration. A semantic framework has, therefore, the
potential to meet the requirements of flexibility, scalability, resilience, openness,
and practicality. Furthermore, it is important to combine the advantages of dis‐
tributed control (such as scalability, privacy and adaptability) and centralized con‐
trol (such as feasibility, optimality and responsibility) whilst mitigating their specific
drawbacks. The benefits of a semantic and AI‐based architecture are particularly
evident when the grid needs to be restored and healed after a disruption in ser‐
vice. The grid should be able of restoring, re‐organizing and healing itself via alter‐
native topologies without affecting the system as a whole, informed by the holistic
understanding of the wider energy systems. There is a need for a new body of185

7.4. FUTURE WORK
research with a view of ensuring the optimality and resilience of energy manage‐
ment systems through self‐healing capabilities that i) promote autonomy, belong‐
ing, connectivity, diversity and emergence, ii) balance the importance of global
and local objectives, iii) dynamically reconfigure to optimize the overall energy sys‐
tem’s performance across energy carriers and scales, and iv) enable demand re‐
sponsive energy management with bidirectional flow of energy, information and
dynamic pricing schemes. Optimisation based grid planning and longer‐term op‐
erational control are common approaches in power system management. But in‐
creasing stochastics on supply and demand side and the coupling of different sec‐
tors and markets increases the complexity of power grid operation and requires
multi‐objective, time‐series based optimisation under increasing uncertainty. At
the same time, increasing data availability and computational power give opportu‐
nity for optimisation based short‐term and close to real time operation.
7.4.3 Secure and reliable seaports energy services
Seaports are responsible of shipping circa 90 percent of global supply chain of
goods. They are, as such, critical infrastructures and are potentially subject to a
wide range of threats [368]. There is an urgent need to increase awareness on
cyber threats faced by ports worldwide [369] to ensure secure shipping and oper‐
ations [370]. This is now exacerbated by the digitisation of seaport infrastructures,
including energy systems, as well as the involvement of a complex value chain.
Potential risks to energy systems include: blackout or service interruption, ma‐
licious command injection, delayed measurements, Denial‐of‐Service attack, dy‐
namic pricing information altered, and user accounts alteration. The consequences
of such cyber security threats can be dramatic. Conversely, the reliability and Qual‐
ity of supply (QoS) of energy related services in seaports are becoming pressing
issues as a result of the increasing need for smart integration of distributed energy
resources. In fact, a gradual transition is occurring to demand responsive energy
management enabled by smart metering infrastructures with a bidirectional flow
of energy, and dynamic pricing schemes. There is a requirement for secure authen‐
tication of users, agents, and transactions at each interface between energy de‐
vices. The number of processes is also exacerbated by the increasingly distributed186

7.4. FUTURE WORK
nature of grids, and their underpinning communication requirements. Three inter‐
esting avenues for further research in include (a) research to identify and quantify
the risk of a breach of privacy and security to the systemic reliability and Quality of
service (QoS) caused by insecure authentication occurring in a heterogeneous en‐
vironment, where legacy standards and applications need to remain in operation
alongside advanced standards; (b) research to identify and quantify loss of data,
breach of privacy and vulnerability due to the heterogeneous communication in‐
frastructure (wireless, wired, PLC), and the impact on grid reliability and QoS; and
(c) research to develop guidelines for information securitymanagement and inform
related legislation and standardization in the energy domain in seaports.
7.4.4 Transition towards Prosumer‐driven seaport energy commu‐
nities
Seaports involve an important ecosystem, including their local communities. We
are gradually experiencing the emergence of sharing economies with the change
in consumptionmodels. These canmotivate energy prosumers (local communities
around seaports) to participate in a leasing energy market where services are used
for a shorter period and more accessible via community sharing. Blockchain can
incentivise the participation in such a sharing economy providing greater choice
for both energy consumers and providers while enabling a much greater flexibility
in being able to switch between multiple market offerings. Such sharing economy
has the potential to decentralise energy production but can also balance consump‐
tion from consumers by not being restricted to energy services or price constraints
from a single energy provider. As the energy market today is transforming towards
a large number of suppliers and buyers, it is important to enable participants in a
seaport ecosystem to exchange an increased amount of traded energy. The inter‐
action between these actors and the associated processes require a high degree of
standardisation which can be facilitated by a Blockchain model. The utilisation of
Blockchain for energy trading can lead to the eradication of brokers, monetisation
of energy excess and development of energy communities. Such brokers and inter‐
mediary parties, usually are required for validating or for ensuring trustworthiness
of information across parties, can be replaced by a more automated Blockchain187

7.4. FUTURE WORK
process. As Blockchain delivers a high level of security and data protection for dif‐
ferent applications supported by transparent ledger that records all transactions,
third‐party verification can be eliminated. In a Blockchain system, any user can
become a trader and offer an energy product or service to a group of consumers.
Blockchain technology has, therefore, the potential to leverage the benefits of de‐
centralised energy systems and enable an environment where everyone can trade,
pay, and even deliver energy to others. Blockchain can support the creation of eco‐
nomically attractive energy communities utilising the power of the Internet and im‐
plement the vision of a perfect energy market. Blockchain identifies an online dis‐
tributed database that aggregates a collection of blocks connected to each other.
It is a public and decentralised ledger that stores a set of records, structured as
a chain and blocks. From the multiple Blockchain solutions, smart contracts are
instruments that can extend the Blockchain capabilities and have been used in a
variety of industries. Smart contracts have often been used to convert business
rules into codes based on which a contract code/script is stored in a Blockchain.
Future research will involve exploring the adoption of energy sharing and trading
practices within and around seaports, using blockchain technology.
7.4.5 Propose roadmap for delivering a zero carbon fishery port
with an energy community
The EU played an important role in the development of energy systems policies
for EU countries, which directly reflects on a number of developed and develop‐
ing countries, and even adopted a number of international policies at the United
Nations towards the modernisation of energy systems, which are directly aimed at
reducing dependence on fossil fuels and reducing carbon emissions. Through its
three main objectives, which it aims to achieve by the year 2050, the EU aims to
preserve the environment, create a fair and affordable energy market and finally
ensure the viability, reliability and security of energy supply for all.The industrial
sector is responsible of high percentage of carbon emissions from burning fuels.
Despite the stimulus measures that have been put in place to reduce emissions
from factories, there is still a long way to go to achieve a total reduction of carbon
from the industrial sector. Some EU countries have begun extensive and qualita‐188

7.4. FUTURE WORK
tive processes to convert energy systems to a cleaner, smarter and higher quality
state. Seaports are vital centers that are highly focused on the development of
transition energy systems that are in line with the EU’s vision targets for energy
systems. However, a number of studies in the field of energy systems in seaports
have focused onmore than one factor, including the calculating andmeasuring the
amount of emissions from the port and commercial vessels through different pro‐
posedmethodologies, while a number of studies have focused on studying the fea‐
sibility of converting energy systems in ports to be more environmentally friendly.
A review of the previous studies has previously been presented and discussed in
Chapter Two.
Through the PhD journey with the piSCES project, a roadmap to convert fishing
ports into carbon‐free ports has been developed and implemented using a num‐
ber of techniques and methodologies. Figure 7.1 demonstrates the main stages of
the proposed roadmap. This research began by understanding the nature of con‐
sumption in the port. It then built and developed a model to simulate the energy
systems. A micro‐grid was then developed and implemented. This network was
expanded to include the local community. Finally, a smart decision‐making system
that contributes to reducing energy dependence from the national grid and takes
advantage of the electricity produced locally from solar energy is developed. The
next section will discuss this roadmap in more detail.
189

7.4.FUTURE
WORK
Figure 7.1: Roadmap for Delivering a Zero Carbon Fishery Port with Energy Community
190

7.4. FUTURE WORK
7.4.5.1 Conducting an audit of the fishery port’s energy systems
The first action to start the process of transitioning to a zero carbon fishery port
is to visit the port and understand the nature of its operations. In addition, it is
crucial to meet the energy manager and the staff who are working permanently at
this location. This step is known as a site visit in the procedure of energy auditing
methodology. This action will help to gather information about energy systems
and understand the behaviour of energy consumption in these systems. Next, it is
important to get access to the energy utility bills and analyze them in a 24 months
period to understand the behaviour of energy consumption in different seasons. In
addition, it will help to investigate the hot seasons that have high levels of energy
consumption. Therefore, it is vital to get data for 2 to 3 years of energy consump‐
tion, which will help to build an accurate analysis for the ports premises.
The port authority should provide requirement data sheets for energy appli‐
ances and the operation times on a daily basis, which will help to analyse the en‐
ergy use and compare it with utility bills to determine the high energy consumption
appliances and the hot periods. The final stage in the energy auditing process is to
analyse and recommend opportunities to save energy by replacing inefficient ap‐
pliances, which will help to reduce energy consumption in the building.
It is crucial during an energy audit to investigate the awareness of carbon emis‐
sion at the seaports and understand its impact in the total lifecycle. This will also
help to identify the level of preparation to accept updates in the overall energy
system at this seaport. In addition, will help to introduce key workers and port’s
members to the importance of the transition of energy systems.
7.4.5.2 Development of a simulation model for energy systems at a fishery port
The role of modeling and simulation of energy system is not only to understand
the behaviour of energy in period of time but also to save the time andmoney that
could be spent in real‐life investigation of energy usage. The newenergy simulation
tools help us to identify the areas of high energy consumption at a specific time. In
addition, itwill help you tomodel the exact geometry of real life buildings, including
their components. It will also build a similar environment for the target building.
Energy simulation tools offer a smart platform that will help to propose differ‐191

7.4. FUTURE WORK
ent scenarios of energy saving without effect the overall system. It can also help
to investigate different scenarios by changing the input variables to see the impact
on the overall system. This will help to determine opportunities of promising ar‐
eas to save energy and reduce cost and carbon emission. However, a simulation
is a virtual environment and it cannot change energy consumption in real life. It
can only help to understand the nature of energy consumption in the buildings and
find themain parameters that effect the overall energy system. In addition, energy
simulationwill help to investigate the capability of local energy demand to bemeet
proposed local energy supply, such as solar, wind or tidal.
For this study, a simulation of energy systems at a fishery port was the core
element to develop a smart energy system at a fishery port. The port consists of a
group of buildings with different functions, some of which are used for commercial
purposes and some have been leased to companies operating in the fish industry.
Buildings leased by fish factories are considered to be among the most energy‐
consuming buildings, and the goal was to analyze and understand the amount of
consumption per building. However, one of the challenges that was faced during
data collection is the lack of sufficient data to build the simulation model, such
as drawings of the building, as well as the nature of energy consumption during
different time periods. The data needed have been collected to build a simulation
model of the buildings used by the fish factories. The results were then analysed
and compared with monthly utility bills. Some of the buildings that provided us
with the data to compare with the simulation results have been verified and the
ratio was very high in an approach to actual consumption on the ground. This will
contribute significantly to the design of future scenarios to raise energy efficiency,
as well as to study the possibility of meeting the need for energy locally through
renewable energy systems.
7.4.5.3 Design and implementation of a micro‐grid for a fishery port
After I had developed simulation model using DesignBuilder and EnergyPlus pro‐
grams, the third stage investigated the deployment of a micro‐grid at a fishery
port. This will help to determine the capability of a micro‐grid to meet local en‐
ergy demand. The most robust simulation platform to develop a micro‐grid is192

7.4. FUTURE WORK
MATLAB/SIMULINK. There are many requirements to develop a micro‐grid model
platform, including an energy generation system, energy demand system, energy
storage, energy management control and grid system. Each system has to be built
separately and then tested as standalone system.
After developing a model for each component, the next step is to integrate
all items in one platform as a virtual micro‐grid. Graphs are then added to see the
operation of energy usage. Thiswill help to determine howmuch power the system
receives from the grid and howmuch power is generated in a 24 hour period. It will
also help to identify the capacity of defined energy storage systems. The proposed
control energy strategy will help to enhance the flow of energy, which gives a clear
understanding of energy management in a 24 hour period. The grid model was
considered as a finite grid model to maximise the power flow in the system and
avoid blackout during operations. A finite grid is able to meet unlimited power
demand and accept unlimited surplus power from the system,
Once the proposedmicro‐gridmodel has beendeveloped, it is important to test
the micro‐grid under different scenarios for the system to identify the optimum
amount of energy storage to build a standalone system. In addition, the system
must be testedunder different variables and conditions, such as seasons,maximum
load and minimum power production. This will help to build a robust model that
can be expanded under different conditions.
It is important to run the micro‐grid model in a robust computer with a maxi‐
mum amount of ram memory and smart specification to increase the model’s reli‐
ability. This will lead to a model that is largely identical to the one that will be built
on the ground.
7.4.5.4 Expanding the community’s energy sharing around fishery port
Themicro‐grid in the port has been expanded to include the group of five buildings
thatwork in the fish industry and also a number of residential buildings surrounding
the seaport. Thismove enhances the potential of themicro‐grid tomeet the energy
needs of the port and the surrounding homes by taking advantage of the port‐
owned solar farm, with an estimated capacity of about 5 MWp.
The expansionmodel was built on the prototype that had previously been built193

7.4. FUTURE WORK
for the port’s micro‐grid on the basis of only one expandable building. Electric‐
boats have also been introduced into the grid circle, and utilised as an energy stor‐
age system when needed and as a source of consumption when used.
More than one control model has been developed for the extended network
to determine the extent to which the network can handle the demand and save lo‐
cally generated electricity from solar energy, as well as to determine the required
capacity of storage units, both for the port buildings and for the residential build‐
ings surrounding the port.
The results of the expansion of the network have greatly enhanced the effective
role that the smart grid approach will play in seaports and coastal cities, and even
contribute significantly to enhancing the role of locally generated solar energy to
meet the need for electric power. This will be directly felt by the local community
and the marine activities at the port.
Here, the community surrounding the port can be called net‐zero carbon, which
is an ideal model that many countries seek to reach by reducing dependence on
fossil fuels. The developed model is one of the first to use solar energy in fishing
ports and to have developed a smart energy community around a fishery port.
7.4.6 Develop a smart decision making system to deliver a zero car‐
bon fishery port
After completing the study and analysis of the micro‐grid system, and knowing the
extent of the ability of the network to achieve local energy sufficiency at the port
level, the control systems within the network are developed and optimised. This
will contribute significantly to raising the efficiency of the systems and make the
most efficient utilisation of locally produced solar energy. This study developed a
smart decision‐making system that is based on control‐based pricing and P2P con‐
trol strategies. Both smart decision systems achieve a nearly zero carbon fishery
port.Control‐based pricing is based on the total energy productionof the PVpanels,
the battery capacity, and/or the electric boats to consider the price of electricity
to decide between buying or selling energy. This will contribute to the direct in‐
teraction with energy prices in the energy market, which benefits the port directly
by taking advantage of the cost of selling electricity at a high price or indirectly by194

7.4. FUTURE WORK
supplying to clean, locally produced solar energy to the local community.
The P2P decision support system aims to share the surplus power that has been
produced from Agent A to Agent B tomeet local power demand from clean energy.
P2P energy sharing could be implemented based on price or based on sharing,
which will gain more benefits to the local consumers. It will also help consumers
to become prosumers and trade surplus energy inside the community.
Smart decision making systems within the micro‐grid aims to increase depen‐
dence on locally produced clean energy through an energy department that allows
for the benefit of both the producer and the consumer. This will directly affect the
energymarkets and society by increasing the production of clean energy, activating
the role of the customer, as well as facilitating the customer’s access to the energy
markets.
195

Bibliography
[1] Susan Solomon, Dahe Qin, Martin Manning, Kristen Averyt, Melinda Mar‐
quis, and Melinda MB Tignor. Climate change 2007‐the physical science
basis: Working group I contribution to the fourth assessment report of the
IPCC, volume 4. Cambridge university press, 2007. ISBN 0521705967.
[2] John FB Mitchell, TC Johns, Jonathan M Gregory, and SFB Tett. Climate re‐
sponse to increasing levels of greenhouse gases and sulphate aerosols. Na‐
ture, 376(6540):501, 1995. ISSN 1476‐4687.
[3] NASA. What are climate and climate change?, 2011. URL
https://www.nasa.gov/audience/forstudents/5-8/features/
nasa-knows/what-is-climate-change-58.html.
[4] John P Holdren, Kirk R Smith, Tord Kjellstrom, David Streets, XiaodongWang,
and S Fischer. Energy, the environment and health. New York: United Na‐
tions Development Programme, 2000.
[5] EA Abdelaziz, R Saidur, and S Mekhilef. A review on energy saving strategies
in industrial sector. Renewable and sustainable energy reviews, 15(1):150–
168, 2011. ISSN 1364‐0321.
[6] International Renewable Energy Agency. Future of wind deployment, in‐
vestment, technology, grid integration and socio‐economic aspects. Report,
2019. URL www.irena.org.
[7] Mike Hulme and Martin Mahony. Climate change: What do we know about
the ipcc? Progress in Physical Geography, 34(5):705–718, 2010.
[8] UNFCC. Background on the unfccc: The international response to climate
change, 2017. URL http://www.un.org/en/sections/issues-depth/
climate-change/.196

BIBLIOGRAPHY
[9] Joseph Dutton. Eu energy policy and the third package. Energy Policy
Group/UKERC working paper, 2015.
[10] Eleonora Annunziata, Marco Frey, and Francesco Rizzi. Towards nearly zero‐
energy buildings: The state‐of‐art of national regulations in europe. Energy,
57:125–133, 2013.
[11] Diego Moya, Roberto Torres, and Sascha Stegen. Analysis of the ecuadorian
energy audit practices: a review of energy efficiency promotion. Renewable
and Sustainable Energy Reviews, 62:289–296, 2016.
[12] Leen C Kuiper, Richard Sikkema, and Johan AN Stolp. Establishment needs
for short rotation forestry in the eu to meet the goals of the commission’s
white paper on renewable energy (november 1997). Biomass and Bioenergy,
15(6):451–456, 1998. ISSN 0961‐9534.
[13] Andrew Jordan, Dave Huitema, Harro Van Asselt, Tim Rayner, and Frans
Berkhout. Climate change policy in the European Union: confronting the
dilemmas of mitigation and adaptation? Cambridge University Press, 2010.
[14] European Environmnet Agency. Total greenhouse gas emission trends and
projections, 2018. URL https://www.eea.europa.eu/data-and-maps/
indicators/greenhouse-gas-emission-trends-6/assessment-2.
[15] Europese Commissie. A roadmap for moving to a competitive low carbon
economy in 2050. Europese Commissie, Brussel, 2011.
[16] CatherineMitchell. The england andwales non‐fossil fuel obligation: history
and lessons. Annual review of energy and the environment, 25(1):285–312,
2000. ISSN 1056‐3466.
[17] David M Newberry. Privatization, restructuring, and regulation of network
utilities, volume 2. MIT press, 2002. ISBN 0262640481.
[18] EU Commission et al. Directive 2003/87/ec of the european parliament and
of the council of 13 october 2003 establishing a scheme for greenhouse gas
emission allowance trading within the community and amending council di‐
rective 96/61/ec. Official Journal of the European Union, 46:32–46, 2003.197

BIBLIOGRAPHY
[19] Heidi Heinrichs, Patrick Jochem, andWolf Fichtner. Including road transport
in the eu ets (european emissions trading system): A model‐based analysis
of the german electricity and transport sector. Energy, 69:708–720, 2014.
[20] Andrew J Weaver, Kirsten Zickfeld, Alvaro Montenegro, and Michael Eby.
Long term climate implications of 2050 emission reduction targets. Geo‐
physical Research Letters, 34(19), 2007. ISSN 1944‐8007.
[21] Jan Haase, Fares AlJuheshi, Hiroaki Nishi, Joern Ploennigs, Kim Fung Tsang,
Nasser Aljuhaishi, and Mahmoud Alahmad. Analysis of batteries in the built
environment an overview on types and applications. In IECON 2017‐43rd
Annual Conference of the IEEE Industrial Electronics Society, pages 8113–
8118. IEEE. ISBN 1538611279.
[22] Judith Lipp. Lessons for effective renewable electricity policy from denmark,
germany and the united kingdom. Energy policy, 35(11):5481–5495, 2007.
ISSN 0301‐4215.
[23] EU Directive. Directive 2001/77/ec of the european parliament and of the
council of 27 september 2001 on the promotion of electricity produced from
renewable energy sources in the internal electricity market. Official Journal
of the European Communities L, 283, 2001.
[24] Europäische Union. Directive 2009/28/ec of the european parliament and
of the council of 23 april 2009 on the promotion of the use of energy from
renewable sources and amending and subsequently repealing directives
2001/77/ec and 2003/30/ec. Official Journal of the EuropeanUnion, 5:2009,
2009.
[25] José M Cansino, Rocío Román, and Manuel Ordonez. Main drivers of
changes in co2 emissions in the spanish economy: A structural decompo‐
sition analysis. Energy Policy, 89:150–159, 2016. ISSN 0301‐4215.
[26] Jan Rosenow and Nick Eyre. The green deal and the energy company
obligation–will it work. In 9th BIEE Academic Conference, Oxford.198

BIBLIOGRAPHY
[27] Eduardo F Camacho, Tariq Samad, Mario Garcia‐Sanz, and Ian Hiskens. Con‐
trol for renewable energy and smart grids. The Impact of Control Technol‐
ogy, Control Systems Society, pages 69–88, 2011.
[28] Bob Dudley. Bp statistical review of world energy 2016. London, UK, 2015.
[29] Bob Dudley. Bp statistical review of world energy. BP Statistical Review,
London, UK, accessed Aug, 6:2018, 2018.
[30] IRENA. Renewable Capacity Statistics 2018. International Renewable Energy
Agency (IRENA), Abu Dhabi, 2018. ISBN 978‐92‐9260‐057‐0.
[31] Ehsanul Kabir, Pawan Kumar, Sandeep Kumar, Adedeji A Adelodun, and Ki‐
Hyun Kim. Solar energy: Potential and future prospects. Renewable and
Sustainable Energy Reviews, 82:894–900, 2018. ISSN 1364‐0321.
[32] Angel A Bayod‐Rújula. Future development of the electricity systems with
distributed generation. Energy, 34(3):377–383, 2009. ISSN 0360‐5442.
[33] Guido Pepermans, Johan Driesen, Dries Haeseldonckx, Ronnie Belmans, and
William D’haeseleer. Distributed generation: definition, benefits and issues.
Energy policy, 33(6):787–798, 2005. ISSN 0301‐4215.
[34] Kari Alanne and Arto Saari. Distributed energy generation and sustainable
development. Renewable and sustainable energy reviews, 10(6):539–558,
2006. ISSN 1364‐0321.
[35] Cornelia R Karger andWilfried Hennings. Sustainability evaluation of decen‐
tralized electricity generation. Renewable and Sustainable Energy Reviews,
13(3):583–593, 2009. ISSN 1364‐0321.
[36] Priyanka Paliwal, NP Patidar, and RK Nema. Planning of grid integrated dis‐
tributed generators: A review of technology, objectives and techniques. Re‐
newable and sustainable energy reviews, 40:557–570, 2014. ISSN 1364‐
0321.
[37] Klaus Mayer and Stefan Trück. Electricity markets around the world. Journal
of Commodity Markets, 9:77–100, 2018. ISSN 2405‐8513.199

BIBLIOGRAPHY
[38] Fereidoon P Sioshansi. Evolution of Global Electricity Markets: New
paradigms, new challenges, new approaches. Academic Press, 2013.
[39] Davis W Edwards. Energy trading and investing: trading, risk management
and structuring deals in the energy market. McGraw‐Hill Education, 2009.
[40] Stephen Littlechild. Promoting competition and protecting customers? reg‐
ulation of the gb retail energy market 2008–2016. Journal of Regulatory
Economics, 55(2):107–139, 2019.
[41] Cathy Xin Cui. The uk electricity markets: its evolution, wholesale prices and
challenge of wind energy. 2010.
[42] Michael Pollitt. The future of electricity liberalisation in uk. 2010.
[43] Michael Kattirtzi, Ioanna Ketsopoulou, and JimWatson. Incumbents in tran‐
sition? the role of the ‘big six’energy companies in the uk. Energy Policy,
148:111927.
[44] Tooraj Jamasb andMichael Pollitt. Electricity market reform in the european
union: review of progress toward liberalization & integration. The Energy
Journal, 26(Special Issue), 2005.
[45] UK GOV. Energy act 2013, 2013.
[46] Michael Grubb and David Newbery. Uk electricity market reform and the
energy transition: Emerging lessons. The Energy Journal, 39(6), 2018.
[47] AC Pereira and Fernando Romero. A review of themeanings and the implica‐
tions of the industry 4.0 concept. Procedia Manufacturing, 13:1206–1214,
2017. ISSN 2351‐9789.
[48] Keliang Zhou, Taigang Liu, and Lifeng Zhou. Industry 4.0: Towards future
industrial opportunities and challenges. In 2015 12th International confer‐
ence on fuzzy systems and knowledge discovery (FSKD), pages 2147–2152.
IEEE. ISBN 1467376825.200

BIBLIOGRAPHY
[49] Stephan Weyer, Mathias Schmitt, Moritz Ohmer, and Dominic Gorecky. To‐
wards industry 4.0‐standardization as the crucial challenge for highly mod‐
ular, multi‐vendor production systems. Ifac‐Papersonline, 48(3):579–584,
2015. ISSN 2405‐8963.
[50] Kagermann Henning. Recommendations for implementing the strategic ini‐
tiative industrie 4.0. 2013.
[51] E Hajrizi. Smart solution for smart factory. IFAC‐PapersOnLine, 49(29):1–5,
2016. ISSN 2405‐8963.
[52] Elvis Hozdić. Smart factory for industry 4.0: A review. International Journal
of ModernManufacturing Technologies, 7(1):28–35, 2015. ISSN 2067‐3604.
[53] Fadi Shrouf, Joaquin Ordieres, and Giovanni Miragliotta. Smart factories
in industry 4.0: A review of the concept and of energy management ap‐
proached in production based on the internet of things paradigm. In 2014
IEEE international conference on industrial engineering and engineering
management, pages 697–701. IEEE. ISBN 1479964107.
[54] Sami Kara, Gerrit Bogdanski, andWen Li. Electricitymetering andmonitoring
in manufacturing systems, pages 1–10. Springer, 2011.
[55] Stephan Haller, Stamatis Karnouskos, and Christoph Schroth. The internet of
things in an enterprise context. In Future Internet Symposium, pages 14–28.
Springer.
[56] Elena G Efimova and Alexander A Gapochka. Seaports as drivers of re‐
gional economic development: The case of saint petersburg and leningrad
province. Case Studies on Transport Policy, 8(2):383–393, 2020.
[57] Jean‐Paul Rodrigue. The geography of transport systems. Taylor & Francis,
2016.
[58] Arianna Azzellino, Jens Peter Kofoed, Caterina Lanfredi, Lucia Margheritini,
and Morten Lauge Pedersen. A marine spatial planning framework for the
optimal siting of marine renewable energy installations: two danish case
studies. Journal of Coastal Research, (65):1623–1628, 2013.201

BIBLIOGRAPHY
[59] Yu‐Chung Tsao and Vu Thuy Linh. Seaport‐dry port network design consid‐
ering multimodal transport and carbon emissions. Journal of Cleaner Pro‐
duction, 199:481–492, 2018.
[60] Yalçın DURMUŞOĞLU, Selim AKSOY, and Cengiz DENİZ. A study of renewable
energy in a port facility by using solar organic rankine cycle systems. 2016.
[61] Jian Hua and Yihusan Wu. Implications of energy use for fishing fleet—
taiwan example. Energy Policy, 39(5):2656–2668, 2011.
[62] Atulya Misra, Karthik Panchabikesan, Senthil Kumar Gowrishankar, Elayape‐
rumal Ayyasamy, and Velraj Ramalingam. Ghg emission accounting and
mitigation strategies to reduce the carbon footprint in conventional port
activities–a case of the port of chennai. Carbon Management, 8(1):45–56,
2017. ISSN 1758‐3004.
[63] UNCTAD. Review of maritime transportewea. Carbon Management, 1(1):
1–122, 2015.
[64] Susan Solomon, MartinManning, MelindaMarquis, Dahe Qin, et al. Climate
change 2007‐the physical science basis: Working group I contribution to the
fourth assessment report of the IPCC, volume 4. Cambridge university press,
2007.
[65] Anita Talberg, Simeon Hui, and Kate Loynes. Australian climate change pol‐
icy: a chronology. Parliamentary Library, 2013.
[66] Joseph Dutton. Eu energy policy and the third package. Energy Policy
Group/UKERC working paper, 2015.
[67] Sebastian Oberthür and Lisanne Groen. Explaining goal achievement in in‐
ternational negotiations: the eu and the paris agreement on climate change.
Journal of European Public Policy, 25(5):708–727, 2018.
[68] Jonathan Reynolds, Yacine Rezgui, and Jean‐Laurent Hippolyte. Upscaling
energy control from building to districts: Current limitations and future per‐
spectives. Sustainable cities and society, 35:816–829, 2017. ISSN 2210‐
6707.202

BIBLIOGRAPHY
[69] EU EWEA. Energy policy to 2050–achieving 80–95% emissions reductions. A
report by the European Wind Energy Association, 2011.
[70] JF Muir. Fuel and energy use in the fisheries sector. FAO Fisheries and Aqua‐
culture Circular (FAO) eng no. 1080, 2015. ISSN 9251089345.
[71] AteyahAlzahrani, Ioan Petri, and Yacine Rezgui. Modelling and implementing
smart micro‐grids for fish‐processing industry. In 2019 IEEE International
Conference on Engineering, Technology and Innovation (ICE/ITMC), pages
1–8. IEEE. ISBN 1728134013.
[72] Michele Acciaro, Hilda Ghiara, and Maria Inés Cusano. Energy management
in seaports: A new role for port authorities. Energy Policy, 71:4–12, 2014.
[73] Ntountounakis Manolis, Ishtiaq Ahmad, Kanellos Fotios, Peter Palensky, and
Wolfgang Gawlik. Mas based demand response application in port city using
reefers. In International Conference on Practical Applications of Agents and
Multi‐Agent Systems, pages 361–370. Springer, 2017.
[74] Gracia Buiza, Sara Cepolina, Aleksandar Dobrijevic, M del Mar Cerbán, Oliv‐
eraDjordjevic, andCristinaGonzález. Current situationof themediterranean
container ports regarding the operational, energy and environment areas. In
2015 International Conference on Industrial Engineering and Systems Man‐
agement (IESM), pages 530–536. IEEE, 2015.
[75] Robert W. R. Parker, Julia L. Blanchard, Caleb Gardner, Bridget S. Green,
Klaas Hartmann, Peter H. Tyedmers, and Reg A. Watson. Fuel use and
greenhouse gas emissions of world fisheries. Nature Climate Change, 8(4):
333–337, 2018. ISSN 1758‐6798. doi: 10.1038/s41558‐018‐0117‐x. URL
https://doi.org/10.1038/s41558-018-0117-x.
[76] A Tindale. Designbuilder software. Stroud, Gloucestershire, Design‐Builder
Software Ltd, 2005.
[77] Drury B Crawley, Linda K Lawrie, Curtis O Pedersen, and Frederick C Winkel‐
mann. Energy plus: energy simulation program. ASHRAE journal, 42(4):
49–56, 2000. ISSN 0001‐2491.203

BIBLIOGRAPHY
[78] Michael Wetter, Philip Haves, and Brian Coffey. Building controls virtual test
bed. Report, Lawrence Berkeley National Laboratory, 2008.
[79] Paris Agreement. Paris agreement. In Report of the Conference of the Par‐
ties to the United Nations Framework Convention on Climate Change (21st
Session, 2015: Paris). Retrived December, volume 4, page 2017. HeinOnline,
2015.
[80] Pia Stoll, Larisa Rizvanovic, and Judith EY Rossebo. Active house deployment
architecture for residential electricity customers’ active interaction with the
smart grid. 2013.
[81] WeiWang, Li Huang, Jian Gu, and Liupeng Jiang. Green port project schedul‐
ing with comprehensive efficiency consideration. Maritime Policy & Man‐
agement, 46(8):967–981, 2019. ISSN 0308‐8839.
[82] Karl Gunnar Aarsaether. Energy savings in coastal fisheries: Use of a se‐
rial battery hybrid power system. IEEE Electrification Magazine, 5(3):74–79,
2017.
[83] PENG Yun, LI Xiangda, WANGWenyuan, LIU Ke, and LI Chuan. A simulation‐
based research on carbon emissionmitigation strategies for green container
terminals. Ocean Engineering, 163:288–298, 2018.
[84] WenyuanWang, Yun Peng, Xiangda Li, Qiang Qi, Peng Feng, and Yuan Zhang.
A two‐stage framework for the optimal design of a hybrid renewable energy
system for port application. Ocean Engineering, 191:106555, 2019.
[85] Anahita Molavi, Jian Shi, Yiwei Wu, and Gino J Lim. Enabling smart ports
through the integration of microgrids: A two‐stage stochastic programming
approach. Applied Energy, 258:114022, 2020.
[86] Ateyah Alzahrani, Ioan Petri, Yacine Rezgui, and Ali Ghoroghi. Developing
smart energy communities around fishery ports: Toward zero‐carbon fishery
ports. Energies, 13(11):2779, 2020.
[87] AteyahAlzahrani, Ioan Petri, and Yacine Rezgui. Modelling and implementing
smart micro‐grids for fish‐processing industry. In 2019 IEEE International204

BIBLIOGRAPHY
Conference on Engineering, Technology and Innovation (ICE/ITMC), pages
1–8. IEEE, 2019.
[88] Jasmine Siu Lee Lam, Ming Jun Ko, Jing Rong Sim, and Yang Tee. Feasibility
of implementing energy management system in ports. In 2017 IEEE Interna‐
tional Conference on Industrial Engineering and Engineering Management
(IEEM), pages 1621–1625. IEEE. ISBN 1538609487.
[89] Zhang Heng, Chen Qiushuang, Quan Xiongwen, Jin Xiaochuang, and Xu Ya.
Green shipping oriented coordinated berth allocation for port group. In
2015 34th Chinese Control Conference (CCC), pages 8466–8471. IEEE. ISBN
9881563895.
[90] Li Zhu, Cuihong Qin, and Chuansheng Peng. Analysis on energy saving and
emission reduction of clean energy technology in ports. In IOP Conference
Series: Earth and Environmental Science, volume 121, 2018.
[91] Soukaina Fahdi, Mariam ELKHECHAFI, and Hanaa HACHIMI. Green port in
blue ocean: Optimization of energy in asian ports. In 2019 5th International
Conference on Optimization and Applications (ICOA), pages 1–4. IEEE, 2019.
[92] José E Gutierrez‐Romero, Jerónimo Esteve‐Pérez, and Blas Zamora. Imple‐
menting onshore power supply from renewable energy sources for require‐
ments of ships at berth. Applied Energy, 255:113883, 2019.
[93] Andrés Ortega Piris, Emma Díaz‐Ruiz‐Navamuel, Carlos A Pérez‐Labajos, and
Jesús Oria Chaveli. Reduction of co2 emissions with automatic mooring sys‐
tems. the case of the port of santander. Atmospheric Pollution Research, 9
(1):76–83, 2018. ISSN 1309‐1042.
[94] Beatriz Tovar and Alan Wall. Environmental efficiency for a cross‐section
of spanish port authorities. Transportation Research Part D: Transport and
Environment, 75:170–178, 2019.
[95] V Ramos, R Carballo, M Álvarez, M Sánchez, and G Iglesias. A port towards
energy self‐sufficiency using tidal stream power. Energy, 71:432–444, 2014.205

BIBLIOGRAPHY
[96] LI Haibo, LIWen, and SUNXiaowei. Study on port energy consumption inven‐
tory and monitoring technology. In 2019 5th International Conference on
Transportation Information and Safety (ICTIS), pages 298–302. IEEE, 2019.
[97] Cristian Lazaroiu and Mariacristina Roscia. Sustainable port through sea
wave energy converter. In 2017 IEEE 6th International Conference on Re‐
newable Energy Research and Applications (ICRERA), pages 462–467. IEEE,
2017.
[98] C Erdas, PA Fokaides, and C Charalambous. Ecological footprint analysis
based awareness creation for energy efficiency and climate change mitiga‐
tion measures enhancing the environmental management system of limas‐
sol port. Journal of Cleaner Production, 108:716–724, 2015.
[99] Ying‐Tsai Tsai, Chen‐Jui Liang, Kuo‐Hui Huang, Kuo‐Hsin Hung, Ciao‐Wun
Jheng, and Jeng‐Jong Liang. Self‐management of greenhouse gas and air
pollutant emissions in taichung port, taiwan. Transportation Research Part
D: Transport and Environment, 63:576–587, 2018. ISSN 1361‐9209.
[100] Elen Twrdy and Marina Zanne. Improvement of the sustainability of ports
logistics by the development of innovative green infrastructure solutions.
Transportation Research Procedia, 45:539–546, 2020. ISSN 2352‐1465.
[101] Gara Villalba and Eskinder Demisse Gemechu. Estimating ghg emissions of
marine ports—the case of barcelona. Energy Policy, 39(3):1363–1368, 2011.
[102] Likun Wang, Chen Peng, Wenming Shi, and Mo Zhu. Carbon dioxide emis‐
sions from port container distribution: Spatial characteristics and driving
factors. Transportation Research Part D: Transport and Environment, 82:
102318, 2020. ISSN 1361‐9209.
[103] Felice Arena, Giovanni Malara, Giuseppe Musolino, Corrado Rindone,
Alessandra Romolo, and Antonino Vitetta. From green‐energy to green‐
logistics: A pilot study in an italian port area. Transportation research pro‐
cedia, 30:111–118, 2018.206

BIBLIOGRAPHY
[104] Hannes Johnson and Linda Styhre. Increased energy efficiency in short sea
shipping through decreased time in port. Transportation Research Part A:
Policy and Practice, 71:167–178, 2015.
[105] Yi‐Chih Yang. Operating strategies of co2 reduction for a container terminal
based on carbon footprint perspective. Journal of cleaner production, 141:
472–480, 2017. ISSN 0959‐6526.
[106] Giuseppe Parise, Luigi Parise, Luigi Martirano, Peniamin Ben Chavdarian,
Chun‐Lien Su, and Andrea Ferrante. Wise port and business energy man‐
agement: Port facilities, electrical power distribution. IEEE Transactions on
Industry Applications, 52(1):18–24, 2015.
[107] Atulya Misra, Gayathri Venkataramani, Senthilkumar Gowrishankar,
Elayaperumal Ayyasam, and Velraj Ramalingam. Renewable energy based
smartmicrogrids—a pathway to green port development. Strategic Planning
for Energy and the Environment, 37(2):17–32, 2017. ISSN 1048‐5236.
[108] SaidurMekhilef, Rahman Saidur, and Azadeh Safari. A reviewon solar energy
use in industries. Renewable and sustainable energy reviews, 15(4):1777–
1790, 2011.
[109] John Conti, Paul Holtberg, Jim Diefenderfer, Angelina LaRose, James T Tur‐
nure, and LynnWestfall. International energy outlook 2016 with projections
to 2040. Technical report, USDOE Energy Information Administration (EIA),
Washington, DC (United States …, 2016.
[110] Stefan Hess, Axel Oliva, Michael Hermann, Gerhard Stryi‐Hipp, and Victor
Hanby. Solar process heat–system design for selected lowtemperature ap‐
plications in the industry. In Solar World Congress, 2011.
[111] Emanuele Taibi, Dolf Gielen, and Morgan Bazilian. The potential for renew‐
able energy in industrial applications. Renewable and Sustainable Energy
Reviews, 16(1):735–744, 2012.
[112] Anne Labouret and Michel Villoz. Solar photovoltaic energy, volume 9. IET,
2010.207

BIBLIOGRAPHY
[113] Garabed P Hagopian, Nick Bebel, and Shane P Larson. Renewable energy
with photovoltaic systems. 2007.
[114] Kadra Branker, MJM Pathak, and Joshua M Pearce. A review of solar pho‐
tovoltaic levelized cost of electricity. Renewable and sustainable energy re‐
views, 15(9):4470–4482, 2011.
[115] Tin Tai Chow. A review on photovoltaic/thermal hybrid solar technology.
Applied energy, 87(2):365–379, 2010.
[116] Wu Libo, Zhao Zhengming, and Liu Jianzheng. A single‐stage three‐phase
grid‐connected photovoltaic system with modified mppt method and reac‐
tive power compensation. IEEE Transactions on Energy Conversion, 22(4):
881–886, 2007.
[117] Winfried Hoffmann. Pv solar electricity industry: Market growth and per‐
spective. Solar energymaterials and solar cells, 90(18‐19):3285–3311, 2006.
[118] Morris Brenna, Michela Longo, Dario Zaninelli, Rosario Miceli, and Fabio
Viola. Co 2 reduction exploiting res for ev charging. In 2016 IEEE Inter‐
national Conference on Renewable Energy Research and Applications (ICR‐
ERA), pages 1191–1195. IEEE, 2016.
[119] Jatin Verma, Shi Donghan, Koh Leong Hai, Ong Hueh Chuah, Dong Chaoyu,
Xia Yang, and Xu Yan. Impact study for pv and ess integration in jurong port
distribution grid. In 2018 Asian Conference on Energy, Power and Trans‐
portation Electrification (ACEPT), pages 1–7. IEEE.
[120] Alsnosy Balbaa, RA Swief, and Noha H El‐Amary. Smart integration based on
hybrid particle swarm optimization technique for carbon dioxide emission
reduction in eco‐ports. Sustainability, 11(8):2218, 2019.
[121] 2013. URL https://ses.jrc.ec.europa.eu/e-harbours-electric.
[122] Ibrahim Dincer. Comprehensive energy systems. Elsevier, 2018.
[123] Yogesh Kumar, Jordan Ringenberg, Soma Shekara Depuru, Vijay K Devabhak‐
tuni, Jin Woo Lee, Efstratios Nikolaidis, Brett Andersen, and Abdollah Afjeh.208

BIBLIOGRAPHY
Wind energy: Trends and enabling technologies. Renewable and Sustainable
Energy Reviews, 53:209–224, 2016.
[124] Wei Tong. Wind power generation and wind turbine design. WIT press,
2010. ISBN 1845642058.
[125] Stephen Peake et al. Renewable energy‐power for a sustainable future.
Number Ed. 4. Oxford university press, 2018.
[126] S Cavazzi and AG Dutton. An offshore wind energy geographic information
system (owe‐gis) for assessment of the uk’s offshore wind energy potential.
Renewable Energy, 87:212–228, 2016.
[127] Karim L Anaya andMichael G Pollitt. Integrating distributed generation: Reg‐
ulation and trends in three leading countries. Energy Policy, 85:475–486,
2015. ISSN 0301‐4215.
[128] Fergal O Rourke, Fergal Boyle, and Anthony Reynolds. Marine current energy
devices: Current status and possible future applications in ireland. Renew‐
able and Sustainable Energy Reviews, 14(3):1026–1036, 2010. ISSN 1364‐
0321.
[129] Shahrouz Abolhosseini, Almas Heshmati, and Jorn Altmann. A review of re‐
newable energy supply and energy efficiency technologies. 2014.
[130] Fergal O Rourke, Fergal Boyle, and Anthony Reynolds. Tidal energy update
2009. Applied energy, 87(2):398–409, 2010. ISSN 0306‐2619.
[131] E Alvarez Alvarez, Joaquin Fernández Francos, A Navarro Manso, M Rico
Secades, and AJ Gutiérrez‐Trashorras. Obtaining renewable energy from
tidal currents in the aviles port: New services for citizens. In New Concepts
in Smart Cities: Fostering Public and Private Alliances (SmartMILE), 2013 In‐
ternational Conference on, pages 1–9. IEEE. ISBN 1479929115.
[132] Nikoletta L Trivyza, Athanasios Rentizelas, and Gerasimos Theotokatos. Im‐
pact of carbon pricing on the cruise ship energy systems optimal configura‐
tion. Energy, 175:952–966, 2019. ISSN 0360‐5442.209

BIBLIOGRAPHY
[133] Tianli Song, Yang Li, Xiao‐Ping Zhang, Cong Wu, Jianing Li, Yi Guo, and Haifei
Gu. Integrated port energy system considering integrated demand response
and energy interconnection. International Journal of Electrical Power & En‐
ergy Systems, 117:105654, 2020. ISSN 0142‐0615.
[134] Thomas Lamberti, Alessandro Sorce, Lorenzo Di Fresco, and Stefano Bar‐
beris. Smart port: exploiting renewable energy and storage potential of
moored boats. In OCEANS 2015‐Genova, pages 1–3. IEEE. ISBN 1479987360.
[135] David Sarabia‐Jácome, Ignacio Lacalle, Carlos E Palau, and Manuel Esteve.
Enabling industrial data space architecture for seaport scenario. In 2019
IEEE 5th World Forum on Internet of Things (WF‐IoT), pages 101–106. IEEE.
ISBN 1538649802.
[136] Alessandro Niglia. Securing critical infrastructure with smart grids. In 2017
5th IEEE International Conference onModels and Technologies for Intelligent
Transportation Systems (MT‐ITS), pages 223–225. IEEE. ISBN 1509064842.
[137] Jian Li, Xiao Liu, and Bao Jiang. An exploratory study on low‐carbon ports
development strategy in china. The Asian Journal of Shipping and Logistics,
27(1):91–111, 2011. ISSN 2092‐5212.
[138] Sahar Azarkamand, Guillem Ferré, and Rosa Mari Darbra. Calculating the
carbon footprint in ports by using a standardized tool. Science of The Total
Environment, page 139407, 2020. ISSN 0048‐9697.
[139] Lei Yang, Yiji Cai, YunleiWei, and ShuoHuang. Choice of technology for emis‐
sion control in port areas: A supply chain perspective. Journal of Cleaner
Production, 240:118105, 2019. ISSN 0959‐6526.
[140] Maria Boile, Sotirios Theofanis, Eleftherios Sdoukopoulos, and Nikiforos Ply‐
tas. Developing a port energy management plan: Issues, challenges, and
prospects. Transportation Research Record, 2549(1):19–28, 2016. ISSN
0361‐1981.
[141] Habib Zughbi and Paul Zulli. Energy consumption and co2 emissions bench‐
marking andmodelling in port kembla steelworks. Chemeca 2011: Engineer‐210

BIBLIOGRAPHY
ing a Better World: Sydney Hilton Hotel, NSW, Australia, 18‐21 September
2011, page 1053, 2011.
[142] Gian Paolo Gobbi, Luca Di Liberto, and Francesca Barnaba. Impact of port
emissions on eu‐regulated and non‐regulated air quality indicators: The case
of civitavecchia (italy). Science of The Total Environment, page 134984,
2019. ISSN 0048‐9697.
[143] Maxim A Dulebenets. Green vessel scheduling in liner shipping: Modeling
carbon dioxide emission costs in sea and at ports of call. International Jour‐
nal of Transportation Science and Technology, 7(1):26–44, 2018. ISSN 2046‐
0430.
[144] Jeong‐Il Park and Taeyun Kim. Institutional improvement measures for en‐
vironmental assessment in the pursuit of eco‐friendly ocean renewable en‐
ergy development in south korea. Renewable and Sustainable Energy Re‐
views, 58:526–536, 2016. ISSN 1364‐0321.
[145] Bostjan Pavlic, Franka Cepak, Boris Sucic,Marko Peckaj, andBogomil Kandus.
Sustainable port infrastructure, practical implementation of the green port
concept. Thermal Science, 18(3):935–948, 2014.
[146] Hoda Davarzani, Behnam Fahimnia, Michael Bell, and Joseph Sarkis. Green‐
ing ports and maritime logistics: A review. Transportation Research Part D:
Transport and Environment, 48:473–487, 2016. ISSN 1361‐9209.
[147] Izabela Kotowska. Policies applied by seaport authorities to create sustain‐
able development in port cities. Transportation Research Procedia, 16:236–
243, 2016. ISSN 2352‐1465.
[148] FAO2018. The state of world fisheries and aquaculture 2018‐meeting the
sustainable development goals, 2018.
[149] HOU Jian. Sustainable development of port economics based on system
dynamics [j]. Systems Engineering‐Theory & Practice, 1, 2010.
[150] Chengying Hua, Jihong Chen, Zheng Wan, Lang Xu, Yun Bai, Tianxiao Zheng,
and Yijie Fei. Evaluation and governance of green development practice of211

BIBLIOGRAPHY
port: A sea port case of china. Journal of Cleaner Production, 249:119434,
2020. ISSN 0959‐6526.
[151] Intergovernmental Panel On Climate Change. Ipcc. Climate change, 2017.
[152] Shaun Howell, Yacine Rezgui, Jean‐Laurent Hippolyte, Bejay Jayan, and Hai‐
jiang Li. Towards the next generation of smart grids: Semantic and holonic
multi‐agent management of distributed energy resources. Renewable and
Sustainable Energy Reviews, 77:193–214, 2017. ISSN 1364‐0321.
[153] Climate ChangeMitigation. Ipcc special report on renewable energy sources
and climate change mitigation. Renewable Energy, 20(11), 2011.
[154] Leen C Kuiper, Richard Sikkema, and Johan AN Stolp. Establishment needs
for short rotation forestry in the eu to meet the goals of the commission’s
white paper on renewable energy (november 1997). Biomass and Bioenergy,
15(6):451–456, 1998.
[155] Reinhard Haas, Christian Panzer, Gustav Resch, Mario Ragwitz, Gemma
Reece, and Anne Held. A historical review of promotion strategies for elec‐
tricity from renewable energy sources in eu countries. Renewable and sus‐
tainable energy reviews, 15(2):1003–1034, 2011.
[156] European Union. Directive 2009/28/ec of the european parliament and of
the council of 23 april 2009 on the promotion of the use of energy from
renewable sources and amending and subsequently repealing directives
2001/77/ec and 2003/30/ec. Official Journal of the EuropeanUnion, 5:2009,
2009.
[157] Burak Akgul. Green port/eco port project‐applications and procedures in
turkey. 95(4):042063, 2017.
[158] Mart Puig and Rosa M Darbra. The role of ports in a global economy, issues
of relevance and environmental initiatives. pages 593–611, 2019.
[159] Lea Fobbe, Rodrigo Lozano, and Angela Carpenter. Assessing the coverage of
sustainability reports: An analysis of sustainability in seaports. SPONSORS,
page 609, 2019.212

BIBLIOGRAPHY
[160] Anna Kramers, JosefinWangel, and Mattias Höjer. Governing the smart sus‐
tainable city: the case of stockholm royal seaport. In ICT for Sustainability
2016. Atlantis Press, 2016.
[161] JHR Van Duin, H Geerlings, Jens Froese, and RR Negenborn. Towards a
method for benchmarking energy consumption at terminals: in search of
performance improvement in yard lighting. International Journal of Trans‐
port Development and Integration, 1(2):212–224, 2017.
[162] Noemí Pérez, Jorge Pey, Cristina Reche, Joaquim Cortés, Andrés Alastuey,
and Xavier Querol. Impact of harbour emissions on ambient pm10 and pm2.
5 in barcelona (spain): Evidences of secondary aerosol formation within the
urban area. Science of the Total Environment, 571:237–250, 2016.
[163] Bing Xu, Amar Nayak, David Gray, and Jamal Ouenniche. Assessing energy
business cases implemented in the north sea region and strategy recom‐
mendations. Applied energy, 172:360–371, 2016.
[164] I. Petri, A. Alzahrani, J. Reynolds, and Y. Rezgui. Federating smart cluster
energy grids for peer‐to‐peer energy sharing and trading. IEEE Access, 8:
102419–102435, 2020. doi: 10.1109/ACCESS.2020.2998747.
[165] Wilfried Martens. Europe 2020 and beyond, 2010.
[166] Arbia Hlali and Sami Hammami. Seaport concept and services characteris‐
tics: Theoretical test. The Open Transportation Journal, 11(1), 2017.
[167] Green Cranes. Report on port container terminals energy profile. Version,
14(14):02, 2013.
[168] Adolfo Carballo‐Penela, Ingrid Mateo‐Mantecón, Juan Luis Doménech, and
Pablo Coto‐Millán. From the motorways of the sea to the green corridors’
carbon footprint: the case of a port in spain. Journal of Environmental Plan‐
ning and Management, 55(6):765–782, 2012.
[169] Hidde Ronde, Aulis Ranne, Eric Peirano, Ian Byrne, and Huy Le Duc. Inte‐
grated renewable energy solutions for aquaculture processing; enerfish. In213

BIBLIOGRAPHY
2011 International Conference & Utility Exhibition on Power and Energy Sys‐
tems: Issues and Prospects for Asia (ICUE), pages 1–4. IEEE, 2011.
[170] Eleftherios Sdoukopoulos, Maria Boile, Alkiviadis Tromaras, and Nikolaos
Anastasiadis. Energy efficiency in european ports: State‐of‐practice and in‐
sights on the way forward. Sustainability, 11(18):4952, 2019.
[171] Quanyuan Jiang, Meidong Xue, and Guangchao Geng. Energy management
of microgrid in grid‐connected and stand‐alonemodes. IEEE transactions on
power systems, 28(3):3380–3389, 2013. ISSN 0885‐8950.
[172] Joseph K Siror, Sheng Huanye, and Wang Dong. Rfid based model for an
intelligent port. Computers in industry, 62(8‐9):795–810, 2011. ISSN 0166‐
3615.
[173] Suying Li, Zhenzhou Ma, Peitao Han, Siyang Zhao, Peiying Guo, and Hepeng
Dai. Bring intelligence to ports based on internet of things. In International
Conference on Cloud Computing and Security, pages 128–137. Springer.
[174] Marco Ferretti, Francesco Schiavone,Majed Al‐Mashari, andManlio Del Giu‐
dice. Internet of things and business processes redesign in seaports. the case
of hamburg. Business Process Management Journal, 2016.
[175] M Abaie, H.R.; Rastegary. The emergence of smart ports and their impactful
implications. In Proceedings of 14th Trans Middle East Conference, pages
128–137. Springer.
[176] Gordon Wilmsmeier, Jens Froese, A Zotz, and Andreas Meyer. Energy con‐
sumption and efficiency: emerging challenges from reefer trade in south
american container terminals. 2014.
[177] Michael Oppenheimer and Annie Petsonk. Article 2 of the unfccc: historical
origins, recent interpretations. Climatic change, 73(3):195–226, 2005.
[178] Anahita Molavi, Gino J Lim, and Bruce Race. A framework for building a
smart port and smart port index. International Journal of Sustainable Trans‐
portation, 14(9):686–700, 2020.214

BIBLIOGRAPHY
[179] IMO. Third imo greenhouse gas study 2014, 2014.
[180] Hugh Boyes, Roy Isbell, and Alexandra Luck. Code of practice: cyber security
for ports and port systems. Department for Transport, London, 2016.
[181] Alexander G Mikerov. From the history of electrical engineering: Electricity
and magnetism in old, middle ages and renaissance. Proceedings of the
Russia North West Section, 3, 2012.
[182] Stephen Pumfrey. William gilbert. Cambridge scientific minds, pages 6–20,
2002.
[183] Michael Fowler. Historical beginnings of theories of electricity and mag‐
netism. Physics Department, University of Virginia, 1997.
[184] Ryan D Tweney. 2 inventing the field: Michael faraday and the creative
of electromagnetic field theory. Inventive minds: Creativity in technology,
page 31, 1992. ISSN 0195071700.
[185] Patrick McGuire and Mark Granovetter. Construction of the early electricity
industry in america. Explorations in economic sociology, page 213, 1993.
ISSN 0871548402.
[186] Chris Marnay and Giri Venkataramanan. Microgrids in the evolving electric‐
ity generation and delivery infrastructure. In 2006 IEEE power engineering
society general meeting, pages 5–pp. IEEE, 2006.
[187] Paul A David and Julie Ann Bunn. Gateway technologies and the evolution‐
ary dynamics of network industries: Lessons from electricity supply history.
Evolutionary Technology and Market Structure: Studies in Schumpeterian
Economics. University of Michigan Press, Ann Arbor, pages 121–156, 1990.
[188] MA Ponce‐Jara, E Ruiz, R Gil, E Sancristóbal, C Pérez‐Molina, and M Castro.
Smart grid: Assessment of the past and present in developed and developing
countries. Energy strategy reviews, 18:38–52, 2017. ISSN 2211‐467X.
[189] Shaun Howell, Yacine Rezgui, Jean‐Laurent Hippolyte, Bejay Jayan, and Hai‐
jiang Li. Towards the next generation of smart grids: Semantic and holonic215

BIBLIOGRAPHY
multi‐agent management of distributed energy resources. Renewable and
Sustainable Energy Reviews, 77:193–214, 2017. ISSN 1364‐0321.
[190] AR Abhyankar and SA Khaparde. Introduction to deregulation in power in‐
dustry. Report by Indian Institute of Technology, Mumbai, 2013.
[191] EPA. Centralized generation of electricity and its impacts on the environ‐
ment, 2019.
[192] Ziad Melhem. Electricity transmission, distribution and storage systems. El‐
sevier, 2013. ISBN 0857097377.
[193] Jeremi Martin. Distributed vs. centralized electricity generation: are we wit‐
nessing a change of paradigm. An introduction to distributed generation,
2009.
[194] Thierry Dujardin. Projected costs of generating electricity 2005 update.
2005.
[195] Jim McDonald. Adaptive intelligent power systems: Active distribution net‐
works. Energy Policy, 36(12):4346–4351, 2008. ISSN 0301‐4215.
[196] Thomas Ackermann, Göran Andersson, and Lennart Söder. Distributed gen‐
eration: a definition1. Electric power systems research, 57(3):195–204,
2001. ISSN 0378‐7796.
[197] Frank Jay and JA Goetz. Ieee standard dictionary of electrical and electronics
terms. Institute of Electrical and Electronics Engineers. ISBN 1559370009.
[198] L Mehigan, JP Deane, BP Ó Gallachóir, and V Bertsch. A review of the role of
distributed generation (dg) in future electricity systems. Energy, 2018. ISSN
0360‐5442.
[199] Walid El‐Khattam and Magdy MA Salama. Distributed generation technolo‐
gies, definitions and benefits. Electric power systems research, 71(2):119–
128, 2004.216

BIBLIOGRAPHY
[200] Paulino E Labis, Rey G Visande, Reuel C Pallugna, and Nolan D Caliao. The
contribution of renewable distributed generation in mitigating carbon diox‐
ide emissions. Renewable and Sustainable Energy Reviews, 15(9):4891–
4896, 2011. ISSN 1364‐0321.
[201] Goran Strbac, Charlotte Ramsay, and Danny Pudjianto. Integration of dis‐
tributed generation into the uk power system. DTI Centre for Distributed
Generation and Sustainable Electrical Energy, 2007.
[202] Francesco Gulli. Small distributed generation versus centralised supply: a
social cost–benefit analysis in the residential and service sectors. Energy
Policy, 34(7):804–832, 2006. ISSN 0301‐4215.
[203] Xiaodong Cao, Xilei Dai, and Junjie Liu. Building energy‐consumption status
worldwide and the state‐of‐the‐art technologies for zero‐energy buildings
during the past decade. Energy and buildings, 128:198–213, 2016. ISSN
0378‐7788.
[204] Mohammed Yekini Suberu, Mohd Wazir Mustafa, and Nouruddeen Bashir.
Energy storage systems for renewable energy power sector integration and
mitigation of intermittency. Renewable and Sustainable Energy Reviews, 35:
499–514, 2014.
[205] Ahmed F Zobaa. Energy Storage: Technologies and Applications. BoD–Books
on Demand, 2013. ISBN 9535109510.
[206] Tarik Kousksou, Pascal Bruel, Abdelmajid Jamil, T El Rhafiki, and Youssef
Zeraouli. Energy storage: Applications and challenges. Solar Energy Ma‐
terials and Solar Cells, 120:59–80, 2014. ISSN 0927‐0248.
[207] TMI Mahlia, TJ Saktisahdan, A Jannifar, MH Hasan, and HSC Matseelar. A
review of available methods and development on energy storage; technol‐
ogy update. Renewable and Sustainable Energy Reviews, 33:532–545, 2014.
ISSN 1364‐0321.
[208] Mathew Aneke and Meihong Wang. Energy storage technologies and real217

BIBLIOGRAPHY
life applications–a state of the art review. Applied Energy, 179:350–377,
2016. ISSN 0306‐2619.
[209] Mehmet Esen. Thermal performance of a solar‐aided latent heat store used
for space heating by heat pump. Solar energy, 69(1):15–25, 2000. ISSN
0038‐092X.
[210] Mukrimin Sevket Guney and Yalcin Tepe. Classification and assessment of
energy storage systems. Renewable and Sustainable Energy Reviews, 75:
1187–1197, 2017. ISSN 1364‐0321.
[211] Xingguo Tan, Qingmin Li, and Hui Wang. Advances and trends of energy
storage technology in microgrid. International Journal of Electrical Power &
Energy Systems, 44(1):179–191, 2013. ISSN 0142‐0615.
[212] Yuqing Yang, Stephen Bremner, Chris Menictas, and Merlinde Kay. Battery
energy storage system size determination in renewable energy systems: A
review. Renewable and Sustainable Energy Reviews, 91:109–125, 2018. ISSN
1364‐0321.
[213] Francisco Díaz‐González, Andreas Sumper, Oriol Gomis‐Bellmunt, and
Roberto Villafáfila‐Robles. A review of energy storage technologies for
wind power applications. Renewable and sustainable energy reviews, 16
(4):2154–2171, 2012. ISSN 1364‐0321.
[214] S Koohi‐Fayegh and MA Rosen. A review of energy storage types, applica‐
tions and recent developments. Journal of Energy Storage, 27:101047, 2020.
ISSN 2352‐152X.
[215] Valentin A Boicea. Energy storage technologies: The past and the present.
Proceedings of the IEEE, 102(11):1777–1794, 2014. ISSN 0018‐9219.
[216] Giridhar Kini. Energy management systems. BoD–Books on Demand, 2011.
ISBN 9533075791.
[217] Rahul Chaturvedi, SandeepGuide Kumar, and PraveenGuide Joshi. Efficiency
Improvement By EnergyOptimization Program In Energy Intensive Industries
A Case Study of Satia Industries Limited, Muktsar (Punjab). Thesis, 2016.218

BIBLIOGRAPHY
[218] Giovanni Petrecca. Industrial Energy Management: Principles and Applica‐
tions: Principles and Applications. Springer Science & BusinessMedia, 2012.
ISBN 1461531608.
[219] Mudathir Funsho Akorede, Hashim Hizam, and Edris Pouresmaeil. Dis‐
tributed energy resources and benefits to the environment. Renewable and
sustainable energy reviews, 14(2):724–734, 2010. ISSN 1364‐0321.
[220] Maria Lorena Tuballa and Michael Lochinvar Abundo. A review of the de‐
velopment of smart grid technologies. Renewable and Sustainable Energy
Reviews, 59:710–725, 2016. ISSN 1364‐0321.
[221] Yeliz Yoldaş, Ahmet Önen, SM Muyeen, Athanasios V Vasilakos, and İrfan
Alan. Enhancing smart grid with microgrids: Challenges and opportunities.
Renewable and Sustainable Energy Reviews, 72:205–214, 2017. ISSN 1364‐
0321.
[222] Napaporn Phuangpornpitak and Suvit Tia. Opportunities and challenges of
integrating renewable energy in smart grid system. Energy Procedia, 34:
282–290, 2013. ISSN 1876‐6102.
[223] Dan T Ton and Merrill A Smith. The us department of energy’s microgrid
initiative. The Electricity Journal, 25(8):84–94, 2012. ISSN 1040‐6190.
[224] Nick Jenkins, Chao Long, and Jianzhong Wu. An overview of the smart grid
in great britain. Engineering, 1(4):413–421, 2015. ISSN 2095‐8099.
[225] Luis M Camarinha‐Matos. Collaborative smart grids–a survey on trends. Re‐
newable and Sustainable Energy Reviews, 65:283–294, 2016. ISSN 1364‐
0321.
[226] Ataul Bari, Jin Jiang, Walid Saad, and Arunita Jaekel. Challenges in the smart
grid applications: an overview. International Journal of Distributed Sensor
Networks, 10(2):974682, 2014. ISSN 1550‐1477.
[227] Vehbi C Gungor, Dilan Sahin, Taskin Kocak, Salih Ergut, Concettina Buccella,
Carlo Cecati, and Gerhard P Hancke. Smart grid technologies: Communica‐219

BIBLIOGRAPHY
tion technologies and standards. IEEE transactions on Industrial informatics,
7(4):529–539, 2011. ISSN 1551‐3203.
[228] Yeliz Yoldaş, Ahmet Önen, SM Muyeen, Athanasios V Vasilakos, and İrfan
Alan. Enhancing smart grid with microgrids: Challenges and opportunities.
Renewable and Sustainable Energy Reviews, 72:205–214, 2017. ISSN 1364‐
0321.
[229] Abdeen Mustafa Omer. Energy, environment and sustainable development.
Renewable and sustainable energy reviews, 12(9):2265–2300, 2008. ISSN
1364‐0321.
[230] Di Zhang. Optimal design and planning of energy microgrids. Thesis, 2014.
[231] Di Zhang, Nouri J Samsatli, Adam D Hawkes, Dan JL Brett, Nilay Shah, and
Lazaros G Papageorgiou. Fair electricity transfer price and unit capacity se‐
lection for microgrids. Energy Economics, 36:581–593, 2013. ISSN 0140‐
9883.
[232] Zuo Sun and Xun‐you Zhang. Advances on distributed generation technol‐
ogy. Energy Procedia, 17:32–38, 2012. ISSN 1876‐6102.
[233] Suleiman Abu‐Sharkh, RJ Arnold, J Kohler, R Li, T Markvart, JN Ross, Koen
Steemers, P Wilson, and Runming Yao. Can microgrids make a major con‐
tribution to uk energy supply? Renewable and Sustainable Energy Reviews,
10(2):78–127, 2006.
[234] Md Alamgir Hossain, Hemanshu Roy Pota, Md Jahangir Hossain, and Frede
Blaabjerg. Evolution of microgrids with converter‐interfaced generations:
Challenges and opportunities. International Journal of Electrical Power &
Energy Systems, 109:160–186, 2019. ISSN 0142‐0615.
[235] Quanyuan Jiang, Meidong Xue, and Guangchao Geng. Energy management
of microgrid in grid‐connected and stand‐alonemodes. IEEE transactions on
power systems, 28(3):3380–3389, 2013. ISSN 0885‐8950.
[236] Arangarajan Vinayagam, Ahmad Abu Alqumsan, KSV Swarna, Sui Yang Khoo,
and Alex Stojcevski. Intelligent control strategy in the islanded network of220

BIBLIOGRAPHY
a solar pv microgrid. Electric Power Systems Research, 155:93–103, 2018.
ISSN 0378‐7796.
[237] Hassan Farhangi. Smart Microgrids: Lessons from CampusMicrogrid Design
and Implementation. CRC Press, 2016. ISBN 131535537X.
[238] Omar Ellabban, Haitham Abu‐Rub, and Frede Blaabjerg. Renewable energy
resources: Current status, future prospects and their enabling technology.
Renewable and Sustainable Energy Reviews, 39:748–764, 2014. ISSN 1364‐
0321.
[239] Ran Wang, Ping Wang, and Gaoxi Xiao. A robust optimization approach for
energy generation scheduling in microgrids. Energy Conversion and Man‐
agement, 106:597–607, 2015. ISSN 0196‐8904.
[240] Baseem Khan and Pawan Singh. Selecting a meta‐heuristic technique for
smart micro‐grid optimization problem: A comprehensive analysis. IEEE Ac‐
cess, 5:13951–13977, 2017. ISSN 2169‐3536.
[241] Nikos Hatziargyriou. Microgrids: architectures and control. John Wiley &
Sons, 2014. ISBN 1118720687.
[242] Josep M Guerrero, Zheming Jin, Wenzhao Liu, Muzaidi B Othman, Mehdi
Savaghebi, Amjad Anvari‐Moghaddam, Lexuan Meng, and Juan C Vasquez.
Shipboard microgrids: Maritime islanded power systems technologies. In
PCIMAsia 2016; International Exhibition and Conference for Power Electron‐
ics, Intelligent Motion, Renewable Energy and Energy Management, pages
1–8. VDE, 2016.
[243] Sidun Fang, Yu Wang, Bin Gou, and Yan Xu. Toward future green maritime
transportation: An overview of seaport microgrids and all‐electric ships.
IEEE Transactions on Vehicular Technology, 69(1):207–219, 2019.
[244] Shakir D Ahmed, Fahad SM Al‐Ismail, Md Shafiullah, Fahad A Al‐Sulaiman,
and Ibrahim M El‐Amin. Grid integration challenges of wind energy: A re‐
view. IEEE Access, 8:10857–10878, 2020.221

BIBLIOGRAPHY
[245] Nor Baizura Ahamad, Muzaidi Othman, Juan C Vasquez, Josep M Guerrero,
and Chun‐Lien Su. Optimal sizing and performance evaluation of a renew‐
able energy based microgrid in future seaports. pages 1043–1048, 2018.
[246] Elaheh Mashhour and Seyed Masoud Moghaddas‐Tafreshi. Bidding strat‐
egy of virtual power plant for participating in energy and spinning reserve
markets—part i: Problem formulation. IEEE Transactions on Power Systems,
26(2):949–956, 2010. ISSN 0885‐8950.
[247] Predrag Djapic, Charlotte Ramsay, Danny Pudjianto, Goran Strbac, Joseph
Mutale, Nick Jenkins, and Ron Allan. Taking an active approach. IEEE Power
and Energy Magazine, 5(4):68–77, 2007. ISSN 1540‐7977.
[248] Madina Kenzhina, Ileskhan Kalysh, Ikechi Ukaegbu, and Sivanand K Nunna.
Virtual power plant in industry 4.0: The strategic planning of emerging vir‐
tual power plant in kazakhstan. In 2019 21st International Conference on
Advanced Communication Technology (ICACT), pages 600–605. IEEE. ISBN
9791188428021.
[249] Oliver Nwauka, Arnesh Telukdarie, and Johan Enslin. Virtual power plant
basic requirements for integration of distributed energy resources driven by
industry 4.0. IEOM, pages 511–523, 2018.
[250] Lucian Ioan Dulau, Mihail Abrudean, and Dorin Bica. Applications of virtual
power plants approaches. In 2014 International Conference and Exposition
on Electrical and Power Engineering (EPE), pages 1060–1064. IEEE. ISBN
1479958492.
[251] Lucian Ioan Dulău, Mihail Abrudean, and Dorin Bică. Distributed genera‐
tion and virtual power plants. In 2014 49th International Universities Power
Engineering Conference (UPEC), pages 1–5. IEEE. ISBN 147996557X.
[252] Hedayat Saboori, M Mohammadi, and R Taghe. Virtual power plant (vpp),
definition, concept, components and types. In 2011 Asia‐Pacific Power and
Energy Engineering Conference, pages 1–4. IEEE. ISBN 142446255X.222

BIBLIOGRAPHY
[253] Amanpreet Kaur, Lukas Nonnenmacher, and Carlos FM Coimbra. Net load
forecasting for high renewable energy penetration grids. Energy, 114:1073–
1084, 2016. ISSN 0360‐5442.
[254] AY Abdelaziz, YG Hegazy, Walid El‐Khattam, andMMOthman. Virtual power
plant: The future of power delivery systems. In European Workshop on Re‐
newable Energy Systems, pages 1–2.
[255] Muhammad Waseem Ahmad, Monjur Mourshed, David Mundow, Mario
Sisinni, and Yacine Rezgui. Building energy metering and environmental
monitoring–a state‐of‐the‐art review and directions for future research. En‐
ergy and Buildings, 120:85–102, 2016.
[256] F Bandeiras, M Gomes, P Coelho, and J Fernandes. Towards net zero energy
in industrial and commercial buildings in portugal. Renewable and Sustain‐
able Energy Reviews, 119:109580, 2020. ISSN 1364‐0321.
[257] Kent Peterson, P Torcellini, Roger Grant, C Taylor, S Punjabi, and R Diamond.
A common definition for zero energy buildings. Prepared for the US Depart‐
ment of Energy byThe National Institute of Building Sciences, US Depart‐
ment of Energy, 2015.
[258] EPBD Recast. Directive 2010/31/eu of the european parliament and of the
council of 19 may 2010 on the energy performance of buildings (recast). Of‐
ficial Journal of the European Union, 18(06):2010, 2010.
[259] Shady Attia. Net Zero Energy Buildings (NZEB): Concepts, frameworks and
roadmap for project analysis and implementation. Butterworth‐Heinemann,
2018. ISBN 0128124628.
[260] Serena H Chen, Anthony J Jakeman, and John P Norton. Artificial intelli‐
gence techniques: an introduction to their use for modelling environmental
systems. Mathematics and computers in simulation, 78(2‐3):379–400, 2008.
ISSN 0378‐4754.
[261] I Gupta and G Nagpal. Artificial Intelligence and Expert Systems. Stylus Pub‐
lishing, LLC, 2020. ISBN 1683925068.223

BIBLIOGRAPHY
[262] Ronald R Yager and Lotfi A Zadeh. An introduction to fuzzy logic applications
in intelligent systems, volume165. Springer Science&BusinessMedia, 2012.
ISBN 1461536405.
[263] Andrej Krenker, Janez Bešter, and Andrej Kos. Introduction to the artificial
neural networks. Artificial Neural Networks: Methodological Advances and
Biomedical Applications. InTech, pages 1–18, 2011.
[264] ScottM Thede. An introduction to genetic algorithms. Journal of Computing
Sciences in Colleges, 20(1):115–123, 2004. ISSN 1937‐4771.
[265] Weerakorn Ongsakul and Vo Ngoc Dieu. Artificial intelligence in power sys‐
tem optimization. Crc Press, 2013. ISBN 1578088054.
[266] Aqeel Ahmed Bazmi and Gholamreza Zahedi. Sustainable energy systems:
Role of optimizationmodeling techniques in power generation and supply—
a review. Renewable and sustainable energy reviews, 15(8):3480–3500,
2011. ISSN 1364‐0321.
[267] Ralf T Kreutzer and Marie Sirrenberg. Fields of Application of Artifi‐
cial Intelligence—Customer Service, Marketing and Sales, pages 105–154.
Springer, 2020.
[268] Ralf T Kreutzer and Marie Sirrenberg. Fields of Application of Artificial
Intelligence—Energy Sector, Smart Home, Mobility and Transport, pages
195–210. Springer, 2020.
[269] Muhammad Waseem Ahmad, Jonathan Reynolds, and Yacine Rezgui. Pre‐
dictivemodelling for solar thermal energy systems: A comparison of support
vector regression, random forest, extra trees and regression trees. Journal
of cleaner production, 203:810–821, 2018. ISSN 0959‐6526.
[270] Muhammad Waseem Ahmad, Monjur Mourshed, and Yacine Rezgui. Tree‐
based ensemblemethods for predicting pv power generation and their com‐
parison with support vector regression. Energy, 164:465–474, 2018. ISSN
0360‐5442.224

BIBLIOGRAPHY
[271] MuhammadWaseemAhmad, AnthonyMouraud, Yacine Rezgui, andMonjur
Mourshed. Deep highway networks and tree‐based ensemble for predicting
short‐term building energy consumption. Energies, 11(12):3408, 2018.
[272] Christos D Korkas, Simone Baldi, Iakovos Michailidis, and Elias B Kos‐
matopoulos. Intelligent energy and thermal comfort management in grid‐
connectedmicrogrids with heterogeneous occupancy schedule. Applied En‐
ergy, 149:194–203, 2015. ISSN 0306‐2619.
[273] Anastasios I Dounis. Artificial intelligence for energy conservation in build‐
ings. Advances in Building Energy Research, 4(1):267–299, 2010. ISSN 1751‐
2549.
[274] Zhu Wang, Rui Yang, and Lingfeng Wang. Intelligent multi‐agent control for
integrated building and micro‐grid systems. In ISGT 2011, pages 1–7. IEEE.
ISBN 1612842208.
[275] Linfei Yin, Qi Gao, Lulin Zhao, Bin Zhang, Tao Wang, Shengyuan Li, and
Hui Liu. A review of machine learning for new generation smart dispatch
in power systems. Engineering Applications of Artificial Intelligence, 88:
103372, 2020. ISSN 0952‐1976.
[276] Jonathan Anderson, Tom van Weert, and Charles Duchâteau. Information
and communication technology in education: A curriculum for schools and
programme of teacher development. 2002.
[277] Muhammad Faheem, Syed Bilal Hussain Shah, Rizwan Aslam Butt, Basit
Raza, Muhammad Anwar, MWaqar Ashraf, Md ANgadi, and Vehbi C Gungor.
Smart grid communication and information technologies in the perspective
of industry 4.0: Opportunities and challenges. Computer Science Review,
30:1–30, 2018. ISSN 1574‐0137.
[278] Terézia Kazičková and Barbora Buhnova. Ict architecture for the smart grid:
Concept overview. In 2016 Smart Cities Symposium Prague (SCSP), pages
1–4. IEEE. ISBN 1509011161.225

BIBLIOGRAPHY
[279] Glover T Ferguson. Have your objects call my objects. Harvard business
review, 80(6):138–144, 2002. ISSN 0017‐8012.
[280] Somayya Madakam, Vihar Lake, Vihar Lake, and Vihar Lake. Internet of
things (iot): A literature review. Journal of Computer and Communications,
3(05):164, 2015.
[281] Muhamed Umar Farooq, MuhammadWaseem, SadiaMazhar, Anjum Khairi,
and Talha Kamal. A review on internet of things (iot). International Journal
of Computer Applications, 113(1):1–7, 2015. ISSN 0975‐8887.
[282] Anna Maria Kotrikla, Theodoros Lilas, and Nikitas Nikitakos. Abatement of
air pollution at an aegean island port utilizing shore side electricity and re‐
newable energy. Marine Policy, 75:238–248, 2017. ISSN 0308‐597X.
[283] J Prousalidis, DV Lyridis, S Dallas, C Papaleonidas, P Mitrou, E Vergetis,
E Vaimaki, S Aggelopoulos, T Kourmpelis, and VGeorgiou. The ports as smart
micro‐grids: development perspectives. Proceedings of ΗΑΕΕ, pages 12–16,
2017.
[284] Ben Jemaa Abdelhak, Essounbouli Najib, Hamzaoui Abdelaziz, Faicel Hnaien,
and Farouk Yalaoui. Optimum sizing of hybrid pv/wind/battery using fuzzy‐
adaptive genetic algorithm in real and average battery service life. In 2014
International symposiumon power electronics, electrical drives, automation
and motion, pages 871–876. IEEE. ISBN 1479947490.
[285] David Parra, Stuart A Norman, Gavin S Walker, and Mark Gillott. Optimum
community energy storage for renewable energy and demand loadmanage‐
ment. Applied energy, 200:358–369, 2017. ISSN 0306‐2619.
[286] Jiaming Li. Optimal sizing of grid‐connected photovoltaic battery systems for
residential houses in australia. Renewable energy, 136:1245–1254, 2019.
ISSN 0960‐1481.
[287] Wina Crijns‐Graus, Hui Yue, Shaohui Zhang, Katerina Kermeli, and ErnstWor‐
rell. Energy efficiency improvement opportunities in the global industrial
sector. 2019.226

BIBLIOGRAPHY
[288] Zeineb Abdmouleh, Adel Gastli, Lazhar Ben‐Brahim,Mohamed Haouari, and
Nasser Ahmed Al‐Emadi. Review of optimization techniques applied for the
integration of distributed generation from renewable energy sources. Re‐
newable Energy, 113:266–280, 2017. ISSN 0960‐1481.
[289] Steve Doty and Wayne C Turner. Energy management handbook. Crc Press,
2004. ISBN 0824748123.
[290] Albert Thumann and William J Younger. Handbook of energy audits. The
Fairmont Press, Inc., 2008. ISBN 0881735787.
[291] Aldona Kluczek and Paweł Olszewski. Energy audits in industrial processes.
Journal of cleaner production, 142:3437–3453, 2017. ISSN 0959‐6526.
[292] L Price and H Lu. Industrial energy auditing and assessments: a survey of
programs around the world: Eceee summer study 2011, 2011.
[293] Svetlana Paramonova and Patrik Thollander. Energy‐efficiency networks for
smes: Learning from the swedish experience. Renewable and Sustainable
Energy Reviews, 65:295–307, 2016. ISSN 1364‐0321.
[294] Kenneth Gillingham and Tsvetan Tsvetanov. Nudging energy efficiency au‐
dits: Evidence from a field experiment. Journal of Environmental Economics
and Management, 90:303–316, 2018. ISSN 0095‐0696.
[295] F Kalantzis and D Revoltella. Do energy audits help smes to realize energy‐
efficiency opportunities? Energy Economics, 83:229–239, 2019. ISSN 0140‐
9883.
[296] Costel Mironeasa and Georgiana Gabriela Codină. A new approach of audit
functions and principles. Journal of cleaner production, 43:27–36, 2013.
ISSN 0959‐6526.
[297] Kaixuan Chen, Jin Lin, and Yonghua Song. Trading strategy optimization
for a prosumer in continuous double auction‐based peer‐to‐peer market: A
prediction‐integration model. Applied energy, 242:1121–1133, 2019. ISSN
0306‐2619.227

BIBLIOGRAPHY
[298] Joana Sousa. Energy simulation software for buildings: review and com‐
parison. In International Workshop on Information Technology for Energy
Applicatons‐IT4Energy, Lisabon.
[299] Philip Haves. Energy simulation tools for buildings: An overview. In AIP
Conference Proceedings, volume 1401, pages 313–327. American Institute
of Physics, 2011.
[300] UNDESA UNDP. Wec,(2000): World energy assessment: Energy and the
challenge of sustainability. United Nations Development Programme, New
York, 2000.
[301] Hannes Johnson and Linda Styhre. Increased energy efficiency in short sea
shipping through decreased time in port. Transportation Research Part A:
Policy and Practice, 71:167–178, 2015. ISSN 0965‐8564.
[302] Nebojsa Nakicenovic, A Grubler, H Ishitani, TB Johansson, G Marland,
JR Moreira, and H‐H Rogner. Energy primer. Climate Change 1995, 1996.
[303] Thomas Bruckner, Igor Alexeyevich Bashmakov, Yacob Mulugetta, Helen
Chum, Angel De la Vega Navarro, James Edmonds, A Faaij, B Fungtammasan,
A Garg, E Hertwich, et al. Energy systems. 2014.
[304] Christos A Frangopoulos. Exergy, Energy System Analysis and Optimization‐
Volume III: Artificial Intelligence and Expert Systems in Energy Systems Anal‐
ysis Sustainability Considerations in the Modeling of Energy Systems, vol‐
ume 3. EOLSS Publications, 2009.
[305] L Suganthi and Anand A Samuel. Energy models for demand forecasting—a
review. Renewable and sustainable energy reviews, 16(2):1223–1240, 2012.
[306] RB Hiremath, S Shikha, and NH Ravindranath. Decentralized energy plan‐
ning; modeling and application—a review. Renewable and Sustainable En‐
ergy Reviews, 11(5):729–752, 2007.
[307] Deepak Paramashivan Kaundinya, Palit Balachandra, and Nijavalli H Ravin‐
dranath. Grid‐connected versus stand‐alone energy systems for decentral‐228

BIBLIOGRAPHY
ized power—a review of literature. Renewable and sustainable energy re‐
views, 13(8):2041–2050, 2009.
[308] Raul Banos, Francisco Manzano‐Agugliaro, FGMontoya, Consolacion Gil, Al‐
fredo Alcayde, and Julio Gómez. Optimization methods applied to renew‐
able and sustainable energy: A review. Renewable and sustainable energy
reviews, 15(4):1753–1766, 2011.
[309] Ali M Adil and Yekang Ko. Socio‐technical evolution of decentralized energy
systems: A critical review and implications for urban planning and policy.
Renewable and Sustainable Energy Reviews, 57:1025–1037, 2016.
[310] CambridgeUniversity Press. Cambridge online dictionary, 2019. URL https:
//dictionary.cambridge.org/dictionary/english/methodology.
[311] Th J Schriber. The nature and role of simulation in the design of manufac‐
turing systems. Simulation in CIM and Artificial Intelligence Techniques, 25:
5–18, 1987.
[312] IA Jarvis. Building energy targeting. In Energy Developments: New Forms,
Renewables, Conservation, pages 735–739. Elsevier, 1984.
[313] Ibrahim Dincer. Comprehensive energy systems. Elsevier, 2018. ISBN
0128149256.
[314] Faouzi Bouchhima, Gabriela Nicolescu, M Aboulhamid, andMohamed Abid.
Discrete‐continuous simulationmodel for accurate validation in component‐
based heterogeneous soc design. In 16th IEEE International Workshop on
Rapid System Prototyping (RSP’05), pages 181–187. IEEE. ISBN 0769523617.
[315] Onur Özgün and Yaman Barlas. Discrete vs. continuous simulation: When
does it matter. In Proceedings of the 27th international conference of the
system dynamics society, volume 6, pages 1–22, 2009.
[316] Jerry Banks. Discrete event system simulation. Pearson Education India,
2005. ISBN 8131758966.229

BIBLIOGRAPHY
[317] Anders Skoogh, Björn Johansson, and L Hansson. Data requirements and
representation for simulation of energy consumption in production systems.
In Proceedings of the 44th CIRP Conference on Manufacturing Systems,
pages 1–3.
[318] Michael Oates. A new approach to modelling process and building energy
flows in manufacturing industry. 2013.
[319] Desmond J Higham and Nicholas J Higham. MATLAB guide. SIAM, 2016.
ISBN 1611974658.
[320] MathWorks. Simulink, 2020. URL https://uk.mathworks.com/help/
simulink/.
[321] Cláudio Gomes, Casper Thule, David Broman, Peter Gorm Larsen, and Hans
Vangheluwe. Co‐simulation: a survey. ACM Computing Surveys (CSUR), 51
(3):1–33, 2018. ISSN 0360‐0300.
[322] Nayeemur Rahman,Maria Islam, andMd Ziaur Rahman Khan. Power sharing
between solar home systems by smart control of power flow. In 2018 10th
International Conference on Electrical and Computer Engineering (ICECE),
pages 193–196. IEEE. ISBN 1538674823.
[323] Mohamad Fadzli Haniff, Hazlina Selamat, Rubiyah Yusof, Salinda Buyamin,
and Fatimah Sham Ismail. Review of hvac scheduling techniques for build‐
ings towards energy‐efficient and cost‐effective operations. Renewable and
Sustainable Energy Reviews, 27:94–103, 2013. ISSN 1364‐0321.
[324] Shin Jae Kang, Jungsung Park, Ki‐Yong Oh, Jae Gu Noh, and Hyunggon Park.
Scheduling‐based real time energy flow control strategy for building energy
management system. Energy and Buildings, 75:239–248, 2014.
[325] Ditiro Setlhaolo, Xiaohua Xia, and Jiangfeng Zhang. Optimal scheduling of
household appliances for demand response. Electric Power Systems Re‐
search, 116:24–28, 2014.230

BIBLIOGRAPHY
[326] Hasnae Bilil, Ghassane Aniba, and Hamid Gharavi. Dynamic appliances
scheduling in collaborative microgrids system. IEEE Transactions on Power
Systems, 32(3):2276–2287, 2016.
[327] Xinhui Lu, Kaile Zhou, Felix TS Chan, and Shanlin Yang. Optimal scheduling
of household appliances for smart home energy management considering
demand response. Natural Hazards, 88(3):1639–1653, 2017.
[328] Tarek AlSkaif, Adriana C Luna, Manel Guerrero Zapata, Josep M Guerrero,
and Boris Bellalta. Reputation‐based joint scheduling of households appli‐
ances and storage in amicrogrid with a shared battery. Energy and Buildings,
138:228–239, 2017.
[329] Sardar Mehboob Hussain, Ayesha Zafar, Rabiya Khalid, Samia Abid, Umar
Qasim, Zahoor Ali Khan, and Nadeem Javaid. An efficient scheduling of elec‐
trical appliance in micro grid based on heuristic techniques. In Conference
on Complex, Intelligent, and Software Intensive Systems, pages 164–173.
Springer, 2017.
[330] Raj Mani Shukla, Prasanna Kansakar, and Arslan Munir. A neural network‐
based appliance scheduling methodology for smart homes and buildings
with multiple power sources. In 2016 IEEE International Symposium on
Nanoelectronic and Information Systems (iNIS), pages 166–171. IEEE. ISBN
1509061703.
[331] FA Qayyum, Muhammad Naeem, Ahmed Shaharyar Khwaja, Alagan Anpala‐
gan, Ling Guan, and Bala Venkatesh. Appliance scheduling optimization in
smart home networks. IEEE Access, 3:2176–2190, 2015. ISSN 2169‐3536.
[332] Ministry of Environmnet Stategy and Climate Change. Fish processing facili‐
ties compliance audit report. Report, 2018.
[333] Anca I. Nicolau Daniela Borda and Peter Raspor. Trends in Fish Processing
Technologies. Taylor Francis Group, 2017.
[334] Sunday Olayinka Oyedepo. Energy Use and Energy Saving Potentials in Food231

BIBLIOGRAPHY
Processing and Packaging: Case Study of Nigerian Industries, pages 423–
452. Elsevier, 2019.
[335] COWI Consulting Engineers, Industry Planners AS, Denmark for United
Nations Environment Programme Division of Technology, and Economics.
Cleaner production assessment in fish processing. Report, 2019.
[336] Bord Lascaigh Mahara (BIM). Resource efficiency guide for seafood proces‐
sors. Report, 2016.
[337] Nihar Shah, Max Wei, Virginie Letschert, and Amol Phadke. Benefits of en‐
ergy efficient and low‐global warming potential refrigerant cooling equip‐
ment. 2019.
[338] Wayes Tushar, BoChai, Chau Yuen, ShishengHuang, David B Smith, HVincent
Poor, and Zaiyue Yang. Energy storage sharing in smart grid: A modified
auction‐based approach. IEEE Transactions on Smart Grid, 7(3):1462–1475,
2016. ISSN 1949‐3053.
[339] Wayes Tushar, Chau Yuen, Hamed Mohsenian‐Rad, Tapan Saha, H Vincent
Poor, and Kristin L Wood. Transforming energy networks via peer to peer
energy trading: Potential of game theoretic approaches. arXiv preprint
arXiv:1804.00962, 2018.
[340] Wayes Tushar, Tapan Kumar Saha, Chau Yuen, Thomas Morstyn, Malcolm D
McCulloch, H Vincent Poor, and Kristin L Wood. A motivational game‐
theoretic approach for peer‐to‐peer energy trading in the smart grid. Ap‐
plied energy, 243:10–20, 2019.
[341] Nian Liu, Xinghuo Yu, ChengWang, Chaojie Li, LiMa, and Jinyong Lei. Energy‐
sharing model with price‐based demand response for microgrids of peer‐
to‐peer prosumers. IEEE Transactions on Power Systems, 32(5):3569–3583,
2017. ISSN 0885‐8950.
[342] Nian Liu, Minyang Cheng, Xinghuo Yu, Jiangxia Zhong, and Jinyong Lei.
Energy‐sharing provider for pv prosumer clusters: A hybrid approach using232

BIBLIOGRAPHY
stochastic programming and stackelberg game. IEEE Transactions on Indus‐
trial Electronics, 65(8):6740–6750, 2018. ISSN 0278‐0046.
[343] Augustine Ikpehai Bamidele Adebisi Kelvin Anoh, Sabita Maharjan. Energy
peer‐to‐peer trading in virtual microgrids in smart grids: A game‐theoretic
approach. IEEE Transactions on Smart Grid, pages PP(99):1–1, 2019. doi:
10.1109/TSG.2019.2934830.
[344] Chenghua Zhang, Jianzhong Wu, Yue Zhou, Meng Cheng, and Chao Long.
Peer‐to‐peer energy trading in a microgrid. Applied Energy, 220:1–12, 2018.
ISSN 0306‐2619.
[345] Chou Hon Leong, Chenghong Gu, and Furong Li. Auctionmechanism for p2p
local energy trading considering physical constraints. Energy Procedia, 158:
6613–6618, 2019. ISSN 1876‐6102.
[346] Jema Sharin PankiRaj, Abdulsalam Yassine, and Salimur Choudhury. An auc‐
tion mechanism for profit maximization of peer‐to‐peer energy trading in
smart grids. Procedia Computer Science, 151:361–368, 2019. ISSN 1877‐
0509.
[347] Zhenyuan Zhang, Haoyue Tang, and Qi Huang. Risk implemented simulta‐
neous game‐theoretic approach for energy trading in residential microgrids.
Energy Procedia, 158:6679–6686, 2019. ISSN 1876‐6102.
[348] VSKV Harish, Naqui Anwer, and Amit Kumar. Optimal Energy Sharing Within
a Solar‐Based DC Microgrid, pages 635–644. Springer, 2019.
[349] Chao Long, JianzhongWu, Chenghua Zhang,Meng Cheng, andAli Al‐Wakeel.
Feasibility of peer‐to‐peer energy trading in low voltage electrical distribu‐
tion networks. Energy Procedia, 105:2227–2232, 2017. ISSN 1876‐6102.
[350] Furong Li Zhong Zhang, Ran Li. A novel peer‐to‐peer local electricity market
for joint trading of energy and uncertainty. IEEE Transactions on Smart Grid,
2019. doi: 10.1109/TSG.2019.2933574.
[351] SuNguyen,Wei Peng, Peter Sokolowski, Damminda Alahakoon, and Xinghuo
Yu. Optimizing rooftop photovoltaic distributed generation with battery233

BIBLIOGRAPHY
storage for peer‐to‐peer energy trading. Applied energy, 228:2567–2580,
2018. ISSN 0306‐2619.
[352] Jason Holland. Global seafood trade to increase,
but growth rates will slow, 1 May 2019 2019. URL
https://www.seafoodsource.com/news/supply-trade/
global-seafood-trade-to-increase-but-growth-rates-will-slow.
[353] Food FAO. Agriculture organization, 2014. Livestock Primary. Food and Agri‐
culture Organization of the United Nations, 2016.
[354] Seafish Processing. Survey of the uk seafood processing industry. Seafish
Report, Edinburgh, 2016.
[355] Kati Koponen Miika Rämä. Energy solutions for namibian fishing industry.
Report VTT‐R‐1990‐16, 2016.
[356] SJ James, MJ Swain, and T Brown. Improving the energy efficiency of foods
refrigeration operations. 2008.
[357] Sayyed Mohammad Sanaei, Takaaki Furubayashi, and Toshihiko Nakata. As‐
sessment of energy utilization in iran’s industrial sector using energy and
exergy analysis method. Applied Thermal Engineering, 36:472–481, 2012.
ISSN 1359‐4311.
[358] Swain M.J. Brown T. Evans J.A. Tassou S.A. & Ge Y.T James, S.J. Improving
the energy efficiency of food refrigeration operations. Proceedings of the
Institute of Refrigeration, 2008‐09:5–1–5–8, 2009.
[359] S Naresh Kumar and Bidisha Chakabarti. Energy and Carbon Footprint of
Food Industry, pages 19–44. Springer, 2019.
[360] Jihoon Lee, Taeho Kim, Harald Ellingsen, Erik Skontorp Hognes, and Bokyu
Hwang. Energy consumption and greenhouse gas emission of korean off‐
shore fisheries. Journal of Ocean University of China, 17(3):675–682, 2018.
ISSN 1672‐5182.234

BIBLIOGRAPHY
[361] Michele Acciaro, Hilda Ghiara, and Maria Inés Cusano. Energy management
in seaports: A new role for port authorities. Energy Policy, 71:4–12, 2014.
ISSN 0301‐4215.
[362] Sahar Azarkamand, Chris Wooldridge, and RM Darbra. Review of initiatives
and methodologies to reduce co2 emissions and climate change effects in
ports. International Journal of Environmental Research and Public Health,
17(11):3858, 2020.
[363] Sukhjit Singh and Bhaskar Sengupta. Sustainable maritime transport and
maritime informatics. pages 81–95, 2020.
[364] Yusuf Bicer and Ibrahim Dincer. Clean fuel options with hydrogen for sea
transportation: a life cycle approach. International Journal of Hydrogen En‐
ergy, 43(2):1179–1193, 2018.
[365] Maryam Mohamed Kidere. Analytical assessment of port energy efficiency
and management.: a case study of the kenya ports authority. 2017.
[366] Ralph K Rosenbaum, Michael Z Hauschild, Anne‐Marie Boulay, Peter Fan‐
tke, Alexis Laurent, Montserrat Núñez, and Marisa Vieira. Life cycle impact
assessment. In Life cycle assessment, pages 167–270. Springer, 2018.
[367] Thomas H Beach, Yacine Rezgui, Haijiang Li, and Tala Kasim. A rule‐based
semantic approach for automated regulatory compliance in the construction
sector. Expert Systems with Applications, 42(12):5219–5231, 2015.
[368] Peter Beaumont. Cybersecurity risks and automatedmaritime container ter‐
minals in the age of 4ir. In Handbook of Research on Information and Cy‐
ber Security in the Fourth Industrial Revolution, pages 497–516. IGI Global,
2018.
[369] S Jones. Addressing cyber security risks at ports and terminals. Port Tech‐
nology International Journal, 62, 2015.
[370] Gregory CWilshusen. Maritime critical infrastructure protection: Dhs needs
to enhance efforts to address port cybersecurity. Technical report, 2015.235

BIBLIOGRAPHY
[371] Berk Celik, Robin Roche, David Bouquain, and Abdellatif Miraoui. Decentral‐
ized neighborhood energy management with coordinated smart home en‐
ergy sharing. IEEE Transactions on Smart Grid, 9(6):6387–6397, 2017. ISSN
1949‐3053.
[372] Ateyah Alzahrani, Ioan Petri, Yacine Rezgui, and Ali Ghoroghi. Decarbonisa‐
tion of seaports: A reviewanddirections for future research. Energy Strategy
Reviews, 38:100727, 2021.
[373] B. A. Lehaney. “methodology”: An analysis of its meaning and
use. Work Study, 43(3):5–8, 1994. ISSN 0043‐8022. doi:
10.1108/00438029410058268. URL https://doi.org/10.1108/
00438029410058268.
[374] Alexander M Novikov and Dmitry A Novikov. Research methodology:
From philosophy of science to research design. CRC Press, 2013. ISBN
042921264X.
[375] Merriam‐WebsterDictionary. Merriam‐webster. On‐line at http://www.mw.
com/home. htm, 2002.
[376] Aleksandras Melnikovas. Towards an explicit research methodology: Adapt‐
ing research onion model for futures studies. Journal of Futures Studies, 23
(2):29–44, 2018.
[377] Arunaditya Sahay. Peeling saunder’s research onion. Research Gate, Art,
pages 1–5, 2016.
[378] Mark Saunders, PHILIP Lewis, and ADRIAN Thornhill. Research methods.
Business Students 4th edition Pearson Education Limited, England, 2007.
[379] Alice Goodenough and SueWaite. Real world research: a resource for users
of social research methods in applied settings, 2012.
[380] Alan Bryman. Paradigm peace and the implications for quality. Interna‐
tional journal of social research methodology, 9(2):111–126, 2006. ISSN
1364‐5579.236

BIBLIOGRAPHY
[381] Alan Bryman. Barriers to integrating quantitative and qualitative research.
Journal of mixed methods research, 1(1):8–22, 2007. ISSN 1558‐6898.
[382] Dilanthi Amaratunga, David Baldry, Marjan Sarshar, and Rita Newton. Quan‐
titative and qualitative research in the built environment: application of
“mixed” research approach. Work study, 51(1):17–31, 2002. ISSN 0043‐
8022.
[383] Petter Solding. Increased energy efficiency in manufacturing systems using
discrete event simulation. 2008.
[384] Gracia Buiza, Sara Cepolina, Aleksandar Dobrijevic, M del Mar Cerbán, Oliv‐
eraDjordjevic, andCristinaGonzález. Current situationof themediterranean
container ports regarding the operational, energy and environment areas. In
Industrial Engineering and SystemsManagement (IESM), 2015 International
Conference on, pages 530–536. IEEE. ISBN 2960053265.
[385] Giuseppe Parise, Luigi Parise, Luigi Martirano, Peniamin Ben Chavdarian,
Chun‐Lien Su, and Andrea Ferrante. Wise port and business energy man‐
agement: port facilities, electrical power distribution. IEEE Transactions on
Industry Applications, 52(1):18–24, 2016. ISSN 0093‐9994.
[386] Port ofMilford Haven. Energy, renewables& engineering, 2019. URL https:
//www.mhpa.co.uk/.
[387] Peter G Hamel. In‐Flight Simulators and Fly‐by‐Wire/Light Demonstrators:
A Historical Account of International Aeronautical Research. Springer, 2017.
ISBN 3319539973.
[388] Welsh Government. Energy generation in wales. Report, 2019 2018.
[389] Xiufeng Pang, Prajesh Bhattacharya, Zheng O’Neill, Philip Haves, Michael
Wetter, and Trevor Bailey. Real‐time building energy simulation using ener‐
gyplus and the building controls virtual test bed. In Proceeding of the 12th
IBPSA Conference, pages 2890–2896, 2011.
[390] Application Guide. Guide for using energyplus with external interface (s). US
Department of Energy, 2011.237

BIBLIOGRAPHY
[391] KL Shi, TF Chan, YK Wong, and Siu Lau Ho. Modelling and simulation of
the three‐phase induction motor using simulink. International journal of
electrical engineering education, 36(2):163–172, 1999.
[392] G Bhuvaneswari and R Annamalai. Development of a solar cell model inmat‐
lab for pv based generation system. In 2011 Annual IEEE India Conference,
pages 1–5. IEEE, 2011.
[393] Ali Keyhani. Design of smart power grid renewable energy systems. John
Wiley & Sons, 2016.
[394]
[395] Yacine Rezgui and JohnMiles. Exploring the potential of sme alliances in the
construction sector. Journal of Construction Engineering and Management,
136(5):558–567, 2010.
[396] Jim McDonald. Adaptive intelligent power systems: Active distribution net‐
works. Energy Policy, 36(12):4346–4351, 2008. ISSN 0301‐4215.
[397] ALSNOSYBalbaa andNOHAHEl‐Amary. Green energy seaport suggestion for
sustainable development in damietta port, egypt. WIT Trans. Ecol. Environ,
214:67–77, 2017.
[398] Pablo Fernández, José Miguel Santana, Sebastián Ortega, Agustín Trujillo,
José Pablo Suárez, Conrado Domínguez, Jaisiel Santana, and Alejandro
Sánchez. Smartport: a platform for sensor data monitoring in a seaport
based on fiware. Sensors, 16(3):417, 2016.
[399] M Ferry. Comparative study of hybrid catamaran versus diesel monohull
boat as ferry for short distance routes. The Indonesian Journal of Naval Ar‐
chitecture, 1(1), 2013. ISSN 2301‐847X.
[400] NAS Salleh and WMW Muda. Techno‐economic and sensitivity analysis for
grid‐connected renewable energy electric boat charging station in tereng‐
ganu. In MATECWeb of Conferences, volume 90, page 01016. EDP Sciences.
ISBN 2261‐236X.238

BIBLIOGRAPHY
[401] Shigeyuki Minami, Toshiki Hanada, Nakaba Matsuda, Kyoji Ishizu, Junya
Nishi, and Takuma Fujiwara. Performance of a newly developed plug‐in hy‐
brid boat. Journal of Asian Electric Vehicles, 11(2):1653–1657, 2013. ISSN
1348‐3927.
[402] Vítor Duarte Fernandes Monteiro, João C Ferreira, and João L Afonso. Smart
battery charger for electric mobility in smart grids. In 1st International Con‐
ference on Smart Grids and Green IT Systems, pages 1–6. ISBN 9898565098.
[403] ZiChong Zhang, HongBin Wang, Yu Qin, ChunHui Gu, DaPeng Chen, and
Kuang Yin. A optimization strategy of microgrid energy market based on
scenario method. In 2019 IEEE 3rd Information Technology, Networking,
Electronic and Automation Control Conference (ITNEC), pages 1335–1338.
IEEE, 2019.
[404] Xin Song and Jiayu Qu. An improved real‐time pricing algorithm based on
utilitymaximization for smart grid. In Proceeding of the 11thWorld Congress
on Intelligent Control and Automation, pages 2509–2513. IEEE, 2014.
[405] Hadis Pourasghar Khomami and Mohammad Hossein Javidi. Energy man‐
agement of smart microgrid in presence of renewable energy sources based
on real‐time pricing. In 2014 Smart Grid Conference (SGC), pages 1–6. IEEE,
2014.
[406] Nilesh R Kumbhar and Rahul R Joshi. An industrial energy auditing: basic
approach. International Journal of Modern Engineering Research, 2(1):313–
315, 2012.
[407] Ateyah Alzahrani, Ioan Petri, and Yacine Rezgui. Analysis and simulation of
smart energy clusters and energy value chain for fish processing industries.
Energy Reports, 6:534–540, 2020.
[408] G Allesina, E Mussatti, F Ferrari, and A Muscio. A calibration methodology
for building dynamic models based on data collected through survey and
billings. Energy and Buildings, 158:406–416, 2018.239

BIBLIOGRAPHY
[409] Yuan Hong, Sanjay Goel, Haibing Lu, and Shengbin Wang. Discovering en‐
ergy communities for microgrids on the power grid. In Smart Grid Commu‐
nications (SmartGridComm), 2017 IEEE International Conference on, pages
64–70. IEEE. ISBN 1538609436.
[410] Abiodun E Onile, Ram Machlev, Eduard Petlenkov, Yoash Levron, and Juri
Belikov. Uses of the digital twins concept for energy services, intelligent
recommendation systems, and demand sidemanagement: A review. Energy
Reports, 7:997–1015, 2021.
240

APPENDIXA
Appendix
241

Questions for the staff in Milford haven port related to pack way building in MHP
➢ Questions for fishers and the staff
1. When do fishers start use pack way building every day?
2. What type of equipment’s that fisher use daily in Pack way building?
3. How long that fishers stay in pack way building every day? Why?
4. Does fishers come to the building in two separate shifts?
5. What is the hot season for fishers to work annually?
6. To what extend fishers are aware of power conservation in the building?
7. Do the fishers has the ability to contribute for energy saving approach in MHP?
8. How fishers can be an effective to reduce power consumption in the building?
9. What fisher’s ideas to optimize power consumption in the building?
➢ Questions for the electrician staff
1. What is the most power consumption equipment in the pack way building?
2. What is the department plan maintenance for equipment? Is it regularly?
3. How do you calculate the power efficiency for the equipment?
4. Do you think that power produced from PV panel can meet the demand of power
consumption in pack way building?
5. From your technical experience how could optimise power consumption in the building?
6. To what extend that decarbonisation of the building will protect environment?
7. How could we reduce power consumption for cold storage unit?
8. How could we reduce power consumption for flake ice unit?
9. Do you usually check the calibration of smart meter in the Pack way building?
➢ Questions related to the equipment in Pack way building
• flake Ice
1- How long flake ice machine work on every day?
2- How much the power capacity of flake ice?
3- Is there an accurate reading of the daily quantity of ice that produce?
• Cold Storage
1- Does cold storage operation (on) for 24 hours a day?
2- Which period in day fishers use cold storage continuously? (morning / afternoon/ night)
What was the total power consumption of cold storage in 2016?
3- What is the most power consumption part in cold storage?
4- Is there an accurate reading of the daily quantity of ice that fishers use from cold
storage?
5- Is it possible to make cold storage works as (work based order)?
• Box washing machine
1- How usually fishers use box washing machine? ( daily- weekly- monthly)
2- What is the most power consumption part in box washing machine?
• Lighting system
1- Which period of day that fishers use lighting system?
2- How much the total power consumption of lighting system?
242

Data available from Savenergy online related to packaway building
Type of data available Units
Annual profile of electricity consumption by daylight in two shifts ( daylight/ night)
kWh/ month/year
Annual profile of electricity generation from PV and solar irradiance 𝑤𝑚2⁄
Monthly heating degree days ℃
Monthly cooling degree days ℃
Multi utility summary ( electricity – gas – water ) kWh – kWh - 𝑚3
Annual energy consumption kWh
Annual CO2 emissions Kg CO2
Data available from Savenergy online related to Flake Ice PV generation
Type of data available Units
Annual profile of electricity consumption by daylight in two shifts ( daylight/ night)
kWh/ month/year
Daily power consumption ( every 30 min ) 𝑤𝑚2⁄
Daily power generation ( every 30 min ) 𝑤𝑚2⁄
Monthly data of power consumption and generation kWh/ month
Data available from Savenergy online related to cold room PV generation
Type of data available Units
Annual profile of electricity consumption by daylight in two shifts ( daylight/ night)
kWh/ month/year
Daily power consumption ( every 30 min ) 𝑤𝑚2⁄
Daily power generation ( every 30 min ) 𝑤𝑚2⁄
Monthly data of power consumption and generation kWh/ month
243

The main appliances in Pack way building in Milford haven port
Appliance How it is works Optimization solution 1- Box washing machine The box washing machine has the power capacity
50 Kw. And it works only when the fishers want to clean the boxes after use it which is very short time a day.
- Scheduling is the useful solution in order to optimize the power consumption in pack way.
2- Lighting system Lighting system in this building is about 17 double tubes lighting which is 25 W each. And according to staff that fishers doesn’t use it in day time due to day light accessibility to the building from the ceiling and the might use it in the night which is very short period based on the system
- Change double tube lambs by LED which is more efficient.
- Install sensors in the main hall which will help to save energy.
3- Flake ice Flake ice consumed about 32 Kw of power and it produce the ice for fishing purposes, it produces the ice as small pieces and then move it to the cold storage.
- Based on the scheme of flake ice, we might add a special device known as variable speed drive (VSD) which will help to reduce power consumption for the machine.*
- Scheduling could be effective based on an accurate data of fisher’s period to collect the ice.
4- Cold storage Cold storage is under the operation all the time to meet the demand for fishers with the quantity they need. Also, it consider the most power consumed device in the building that is because of cold temperature need to be -5 degree.
- Based on cold storage cycle, an optimization could be done based on the type of device such as (air flow pattern, variable speed drive, minimizing heat transmission load and create control system). **
- Scheduling could be effective based on an accurate data of fisher’s period to collect the ice
244

Data available from Savenergy online related to packaway building
Type of data available Units
Annual profile of electricity consumption by daylight in two shifts ( daylight/ night)
kWh/ month/year
Annual profile of electricity generation from PV and solar irradiance 𝑤𝑚2⁄
Monthly heating degree days ℃
Monthly cooling degree days ℃
Multi utility summary ( electricity – gas – water ) kWh – kWh - 𝑚3
Annual energy consumption kWh
Annual CO2 emissions Kg CO2
Data available from Savenergy online related to Flake Ice PV generation
Type of data available Units
Annual profile of electricity consumption by daylight in two shifts ( daylight/ night)
kWh/ month/year
Daily power consumption ( every 30 min ) 𝑤𝑚2⁄
Daily power generation ( every 30 min ) 𝑤𝑚2⁄
Monthly data of power consumption and generation kWh/ month
Data available from Savenergy online related to cold room PV generation
Type of data available Units
Annual profile of electricity consumption by daylight in two shifts ( daylight/ night)
kWh/ month/year
Daily power consumption ( every 30 min ) 𝑤𝑚2⁄
Daily power generation ( every 30 min ) 𝑤𝑚2⁄
Monthly data of power consumption and generation kWh/ month
245

1 2 %% Initialize Data %%3 clear4 load("V2G");5 load('PC_1.mat')6 load('PC_7.mat')7 load('PG_1.mat')8 load('Date_Jan_30.mat')9 load('Price_Buying.mat')
10 load('Price_Selling.mat')11 %date = cell2mat(Date_Sec )12 %x= datetime(date,'InputFormat','yyyy-mm-dd HH:MM:SS')13 To_seconds = 3600; 14 solar_generation = PG_1*1000;15 consumption_total = PC_1*1000;16 consumption_total_2 = PC_7*1000;17 solar = timeseries(solar_generation);18 consumption = timeseries(consumption_total);19 consumption_2 = timeseries(consumption_total_2);20 price_buying = timeseries(Price_Buying);21 price_selling= timeseries(Price_Selling);22 load_pattern.time=consumption.Time; % Correcting data time23 load_pattern.signals.values=[consumption_total , 0*consumption_total];24 load_pattern.signals.dimensions=2;25 iSOC = 50;26 sec_per_step = 1;27 steps_per_hr = 3600; 28 price_max_buying =1;% Above this price secondary battery will discharge29 price_min_selling=7; % below this price secondary battery will charge30 hold on;31 plot(PC_1);32 plot(PC_7);
246

247