WORKING GROUP ON PORTS AND SHIPPING - ASIAN ...
211
WORKING GROUP ON PORTS AND SHIPPING FOR THE NATIONAL TRANSPORT DEVELOPMENT POLICY COMMITTEE MINISTRY OF SHIPPING GOVERNMENT OF INDIA AUGUST 2012
-
Upload
khangminh22 -
Category
Documents
-
view
5 -
download
0
Transcript of WORKING GROUP ON PORTS AND SHIPPING - ASIAN ...
WORKING GROUP ON PORTS AND SHIPPING
FOR
THE NATIONAL TRANSPORT DEVELOPMENT
POLICY COMMITTEE
MINISTRY OF SHIPPING GOVERNMENT OF INDIA
AUGUST 2012
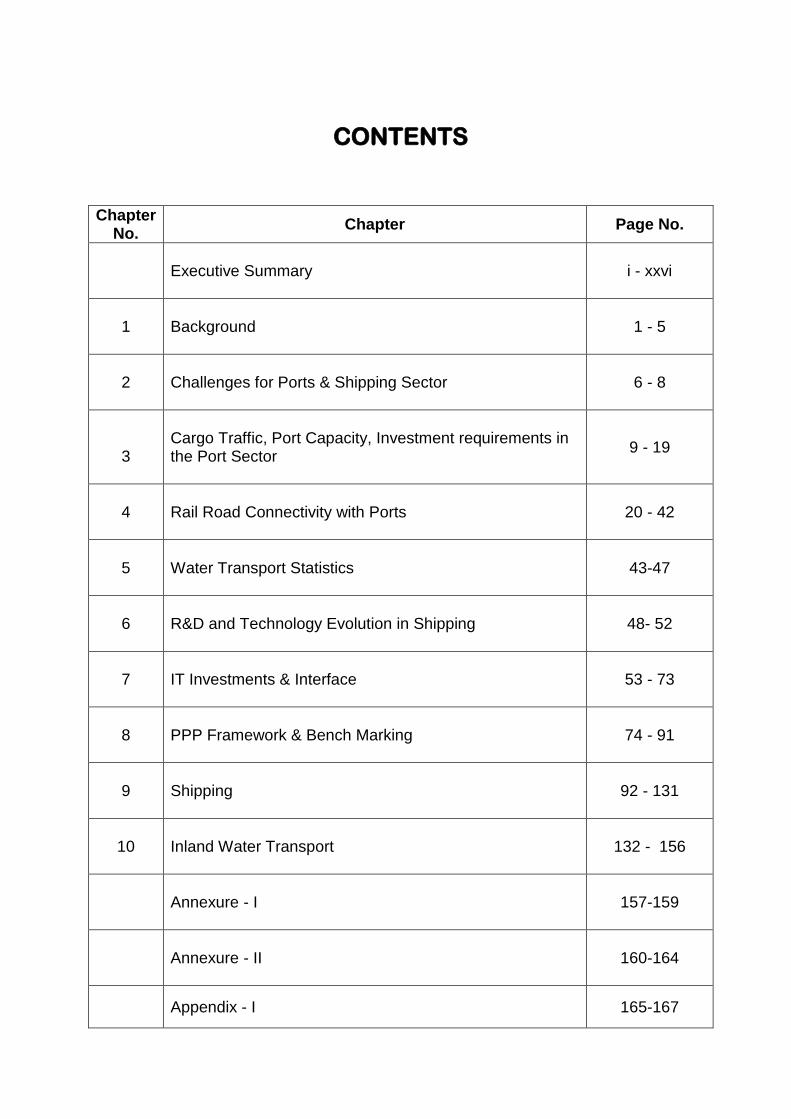
CONTENTS
Chapter No.
Chapter Page No.
Executive Summary
i - xxvi
1
Background
1 - 5
2
Challenges for Ports & Shipping Sector
6 - 8
3
Cargo Traffic, Port Capacity, Investment requirements in the Port Sector
9 - 19
4
Rail Road Connectivity with Ports
20 - 42
5
Water Transport Statistics
43-47
6
R&D and Technology Evolution in Shipping
48- 52
7
IT Investments & Interface
53 - 73
8
PPP Framework & Bench Marking
74 - 91
9
Shipping
92 - 131
10
Inland Water Transport
132 - 156
Annexure - I
157-159
Annexure - II
160-164
Appendix - I 165-167

i
EXECUTIVE SUMMARY
Maritime Transport is the shipment of goods (cargo) and people by sea and other
watreways. Port operations are necessary tool to enable maritime trade between trading partners.
Ports represent a complex structure in a country’s transportation system providing ship harbour
interface services such as pilotage, dredging, provision of berths, maintenance of navigational
channels, etc., ship-port interface in terms of loading and unloading cargoes and port-land
interface in delivering cargo to and from the hinterland. They serve as the interface between
maritime and inland transportation, play a significant role in the economic development of a
country. Maritime transport is the backbone of global trade.
2. It is essential that ports provide efficient, adequate and competitive services. If they fail,
ship-owners who find them too costly or too slow will go elsewhere. Hence if ports do not provide
cost-effective services, imports will cost more for consumers and exports will not be competitive in
world markets.
3. Draft limitation at Indian ports constrains access of large main line vessels. This entails
transportation of goods from India to major export destinations to be transshipped at larger ports
(Dubai, Singapore). Transshipment means additional handling of shipments, which is more
expensive. Consequently shipping costs escalate which erodes cost advantage of Indian exports.
4. Ports should not be viewed in isolation but as being interdependent with the other modes of
transports, road or/and rail for their existence and efficient performance. Lack of integrated or
intermodal transportation constrains quick evacuation of cargo through other modes of transport if
rail-road connectivity from the ports and hinterland is inadequate.
5. We must ensure that there is adequate, safe and seamless access to ports from land and at the
same time ensure modern, navigable waterside access with channels that are deep and wide enough
to handle today’s modern vessels and marine highways to provide transportation options for moving
cargo between ports.
6. These priorities should be included in a long term, national transportation plan that
addresses freight mobility, congestion and productivity. Without such a plan and the necessary
investment to support it, economy will be less competitive.
7. Shipping is necessary for the development of the national economy as well as to keep supply
lines open for transportation of essential commodities during peacetime and emergencies such as
war and famine. The existence of strong and viable national fleet serves as balancing factor in the
freight market. The key issues facing Indian shipping sector are greater cargo support, cargo
assurance through long term charter of vessels, tax regime which enables Indian shipping companies
to compete globally, promotion of coastal shipping and equal treatment for Indian seafarers plying
ii
on vessels in International Waters and Indian territorial waters.
8. Inland Water Transport is the most environment friendly mode with its excellent fuel
efficiency and lower emission levels. Lack of development of IWT infrastructure has constrained full
exploitation inland water transport mode. National Waterways come under the purview of the Central
Government while rest of the waterways come in the domain of State Governments. The National
Waterways carried 4.92 million tonnes of cargo in 2010-11. These have the potential to carry 18
times the present cargo by 2029-30. IWAI has taken up some projects in collaboration with private
sector for movement of cargo on National Waterways. The challenges for inland water transport
sector are integration of waterways with other modes of transportation to form an efficient
multimodal transport network to achieve sustainable development of IWT sector; development of
waterways in North Eastern (NE) region which has large potential/navigable stretches for IWT;
Policy support for creation of floating infrastructure i.e Barges/ Inland Vessels is critical to attract
private capital for development of IWT sector and Creation of adequate education and training
facilities to help sector specific capacity building is necessary.
Cargo Traffic, Port Capacity, Investment requirements in the Port Sector
9. India has a coastline of 7517 km with 12 Major Ports and 199 notified Non-major Ports
along the coastline and Island. Major Ports are the ports which are administered by the Union
Government, while Non-major Ports are administered by the State Governments. Seaports in India
moved more than 80 percent of the country’s overseas cargo, and handled about 912 million tonnes
of cargo in 2011-12. Out of this 61.4% is handled by Major Ports while remaining is handled by
Non-major Ports.
10. During 2011-12 Major and Non-major ports in India accomplished a total cargo throughput
of 911.7 million tonnes reflecting a modest increase of 3.0% over 2011-12 compared to a growth of
4.2 % in 2010-11. The growth in cargo handled at Major and Non-major ports in 2011-12 was 1.7%
and 11.5% respectively compared to 1.6% and 9.1% achieved in 2010-11. The deceleration in
overall growth in India’s seaborne cargo traffic in 2011-12 reflects slowdown in global and
domestic growth during the course of 2011-12.
11. The year 2011-12 was a challenging year for the Major Port Sector as it was buffeted by
three exogenous shocks (a) growth in major industrial countries which are a major market for Indian
merchandise trade decelerated from 3.2% in 2010 to 1.6% in 2011 and is projected to grow at mere
1.4% for 2012. Similarly, growth in world merchandise trade decelerated sharply from 14.3% in
2010 to 6.3% in 2011; (b) India’s GDP growth slowed down from 8.4% in 2010-11 to 6.5% in
2011-12. Slowdown and decline was pronounced in case of India’s GDP pertaining to
manufacturing and mining sectors: while growth in manufacturing slowed from 7.6% in 2010-11 to
2.5% in 2011-12, growth in mining sector made a complete about turn from 5% in 2010-11 to -
0.9% in 2011-12; (c) series of judicial interventions leading to ban/restrictions on iron ore exports
which resulted in more than 30% decline in its export. Iron ore loadings at major ports at 60.69 MT
iii
in 2011-12 were 27 MT lower compared with iron ore loadings 2010-11 leading to overall shortfall
of 30.5 MT between the target and achievement for overall cargo traffic for 2011-12. These
exogenous factors to a large extent reflect in sharp fall in iron ore loadings and deceleration in
container traffic from 12.7% in 2010-11 to 5.4 % in 2011-12.
Major Ports
12. Cargo traffic at 560.1 million tonnes at India’s 12 major ports during 2011-12 accounted for
61.4% of India’s total sea borne cargo. Total cargo of 560.1 million tonnes comprises of cargo
loaded, cargo unloaded and transhipped to the tune of 194.1 million tonnes, 341.6 million tonnes
and 24.4 million tonnes respectively. The overall compound Annual rate of Growth (CAGR) of
traffic at major ports during 1950-51 to 2011-12 has been 5.6 percent, whereas during the post-
liberalisation period i.e. from 1991-92 to 2011-12, the CAGR was 6.6 percent. The CAGR of traffic
growth at major ports for the last 5 years was 3.8 percent.
13. Commodity groupwise analysis of last 5 years of CAGR reveals that the highest CAGR of
10.4% has been observed in container traffic, followed by 7.0% for Fertilizer and Fertilizer
raw material and 5.5% for the coal. As far as the cargo composition is concerned, there has been a
significant change in the share of Iron Ore and container traffic during the past 5 years. The share
of container traffic increased from 15.8% in 2006-07 to 21.5% in 2011-12 while the share of Iron
Ore decreased from 17.4% in 2006-07 to 10.8% in 2011-12. During 2011-12, POL traffic
maintained a dominant share of more than 32%, followed by Container traffic (21.5%), Other cargo
(18.0%), Iron ore (10.8%), Coal (14.1%) and Fertilizer & FRM (3.6%).
Non – Major Ports
14. There are 176 non-major ports situated along the peninsular coast-line and sea-islands. The
traffic is handled by only 61 Ports (including ports of Andaman & Nicobar Islands under the
administrative control of Port Blair Port Trust).
15. Non-major ports in India collectively handled 351.51 million tonnes of traffic during the
year 2011-12 as compared to 95.52 million tonnes of cargo handled in 2001-02. The CAGR growth
in traffic during 2001-02 to 2011-12 achieved by Non-major ports was 13.9% compared with 6.9%
achieved by Major ports in the country. The share of cargo traffic of Non-major ports in the total
cargo traffic handled by all ports in India has increased steadily from 24.9% in 2001-02 to 38.6% in
2011-12. POL & its products (45.8%) was the single largest commodity handled at non major ports
in 2011-12 and its share has ranged between 44% (in 2006-07) to 55 % (in 2001-02). It is observed
that during last five years, the relative shares of commodities handled by the non major ports have
not shown any pronounced shift. In 2011-12, the share of coal in the total traffic was 22.3%
followed by Iron Ore (10.3%) and Building Material (3.2%).
iv
Capacity at Major Ports
16. The total cargo handling capacity at the Major Ports exceeded the actual traffic handled for
the first time in 2000-01 with little excess capacity in subsequent years. The capacity in the Major
ports as on 31.03.2012 was 696.53 million tonnes against the traffic of 560.1 million tonnes with a
capacity utilization of 80.4%. The capacity at Non-major ports as on 31.03.2012 is estimated at
445 million tonnes against a traffic of 351.5 million tonnes reflecting capacity utilization of the
order 79%.
Projection of Cargo Traffic, Capacity and Investment upto 2031-32 in Port Sector
Cargo Traffic
17. Cargo traffic at Indian ports is affected in the short run by global economic and trade
conditions and state of domestic economy. The sharp slowdown in the growth of world trade and in
domestic growth in 2011-12 has impacted Cargo traffic at Indian ports. The growth in cargo
traffic handled by Major ports in the first quarter of 2012-13 was -5.5%. Considering the weak
global growth prospects and weakening of domestic growth dynamics, the cargo traffic at major
ports is expected to grow at 3% in 2012-13 and thereafter at 6% for the remaining 4 years of the
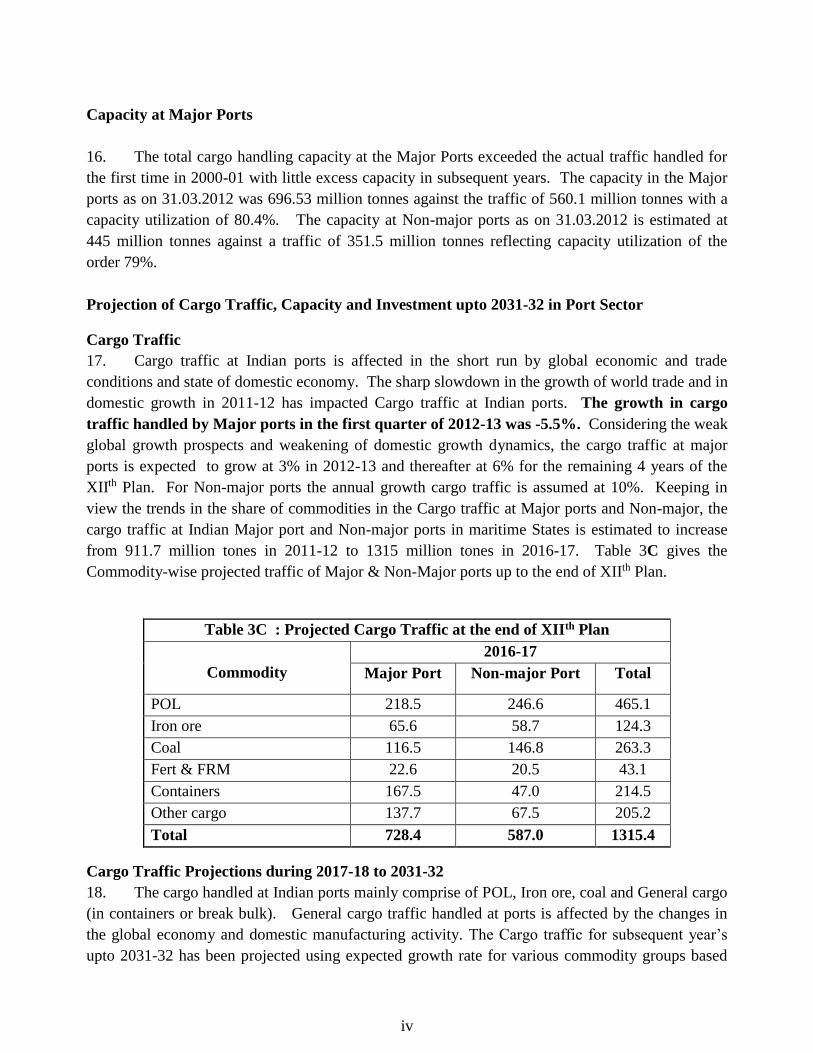
XIIth Plan. For Non-major ports the annual growth cargo traffic is assumed at 10%. Keeping in
view the trends in the share of commodities in the Cargo traffic at Major ports and Non-major, the
cargo traffic at Indian Major port and Non-major ports in maritime States is estimated to increase
from 911.7 million tones in 2011-12 to 1315 million tones in 2016-17. Table 3C gives the
Commodity-wise projected traffic of Major & Non-Major ports up to the end of XIIth Plan.
Table 3C : Projected Cargo Traffic at the end of XIIth Plan
Commodity
2016-17
Major Port Non-major Port Total
POL 218.5 246.6 465.1
Iron ore 65.6 58.7 124.3
Coal 116.5 146.8 263.3
Fert & FRM 22.6 20.5 43.1
Containers 167.5 47.0 214.5
Other cargo 137.7 67.5 205.2
Total 728.4 587.0 1315.4
Cargo Traffic Projections during 2017-18 to 2031-32
18. The cargo handled at Indian ports mainly comprise of POL, Iron ore, coal and General cargo
(in containers or break bulk). General cargo traffic handled at ports is affected by the changes in
the global economy and domestic manufacturing activity. The Cargo traffic for subsequent year’s
upto 2031-32 has been projected using expected growth rate for various commodity groups based
v
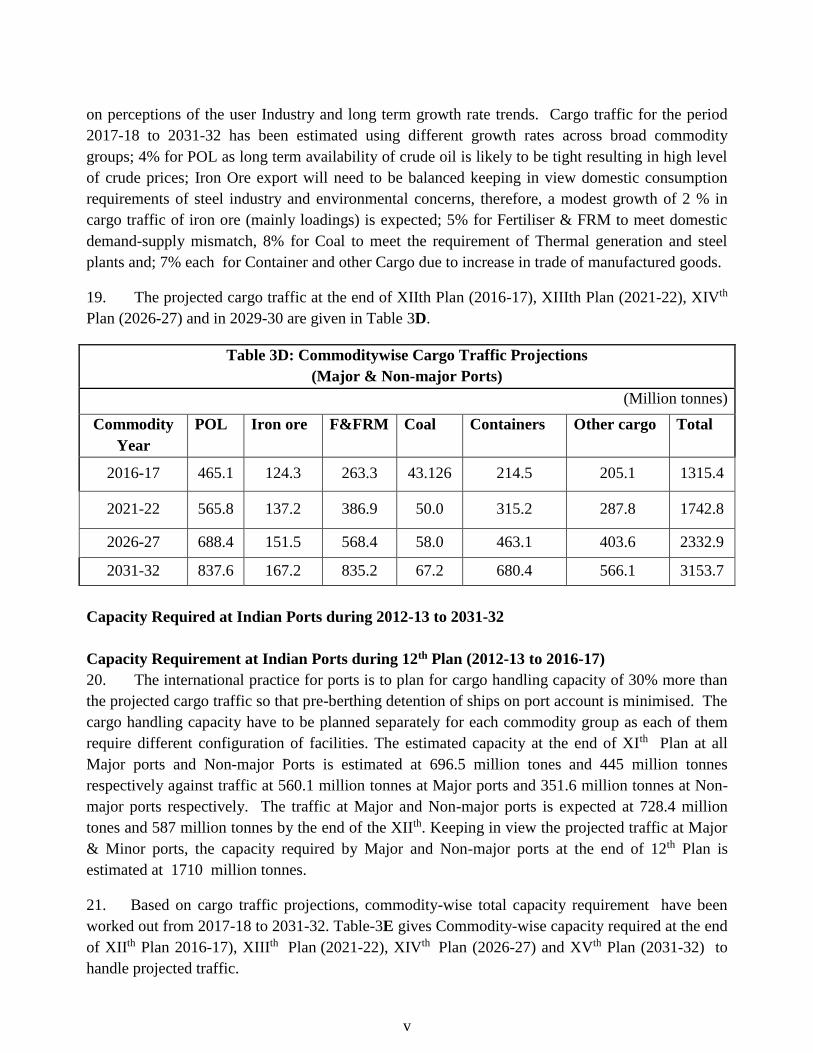
on perceptions of the user Industry and long term growth rate trends. Cargo traffic for the period
2017-18 to 2031-32 has been estimated using different growth rates across broad commodity
groups; 4% for POL as long term availability of crude oil is likely to be tight resulting in high level
of crude prices; Iron Ore export will need to be balanced keeping in view domestic consumption
requirements of steel industry and environmental concerns, therefore, a modest growth of 2 % in
cargo traffic of iron ore (mainly loadings) is expected; 5% for Fertiliser & FRM to meet domestic
demand-supply mismatch, 8% for Coal to meet the requirement of Thermal generation and steel
plants and; 7% each for Container and other Cargo due to increase in trade of manufactured goods.
19. The projected cargo traffic at the end of XIIth Plan (2016-17), XIIIth Plan (2021-22), XIVth
Plan (2026-27) and in 2029-30 are given in Table 3D.
Table 3D: Commoditywise Cargo Traffic Projections
(Major & Non-major Ports)
(Million tonnes)
Commodity
Year
POL Iron ore F&FRM Coal Containers Other cargo Total
2016-17 465.1 124.3 263.3 43.126 214.5 205.1 1315.4
2021-22 565.8 137.2 386.9 50.0 315.2 287.8 1742.8
2026-27 688.4 151.5 568.4 58.0 463.1 403.6 2332.9
2031-32 837.6 167.2 835.2 67.2 680.4 566.1 3153.7
Capacity Required at Indian Ports during 2012-13 to 2031-32
Capacity Requirement at Indian Ports during 12th Plan (2012-13 to 2016-17)
20. The international practice for ports is to plan for cargo handling capacity of 30% more than
the projected cargo traffic so that pre-berthing detention of ships on port account is minimised. The
cargo handling capacity have to be planned separately for each commodity group as each of them
require different configuration of facilities. The estimated capacity at the end of XIth Plan at all
Major ports and Non-major Ports is estimated at 696.5 million tones and 445 million tonnes
respectively against traffic at 560.1 million tonnes at Major ports and 351.6 million tonnes at Non-
major ports respectively. The traffic at Major and Non-major ports is expected at 728.4 million
tones and 587 million tonnes by the end of the XIIth. Keeping in view the projected traffic at Major
& Minor ports, the capacity required by Major and Non-major ports at the end of 12th Plan is
estimated at 1710 million tonnes.
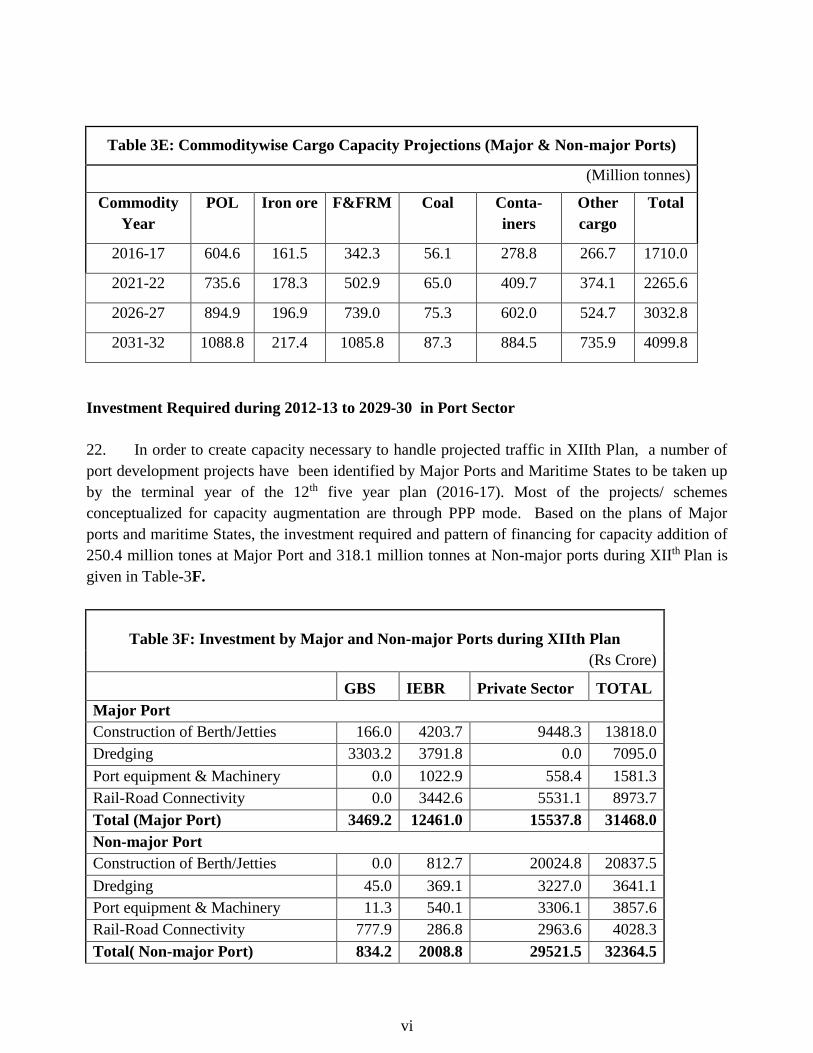
21. Based on cargo traffic projections, commodity-wise total capacity requirement have been
worked out from 2017-18 to 2031-32. Table-3E gives Commodity-wise capacity required at the end
of XIIth Plan 2016-17), XIIIth Plan (2021-22), XIVth Plan (2026-27) and XVth Plan (2031-32) to
handle projected traffic.
vi
Table 3E: Commoditywise Cargo Capacity Projections (Major & Non-major Ports)
(Million tonnes)
Commodity
Year
POL Iron ore F&FRM Coal Conta-
iners
Other
cargo
Total
2016-17 604.6 161.5 342.3 56.1 278.8 266.7 1710.0
2021-22 735.6 178.3 502.9 65.0 409.7 374.1 2265.6
2026-27 894.9 196.9 739.0 75.3 602.0 524.7 3032.8
2031-32 1088.8 217.4 1085.8 87.3 884.5 735.9 4099.8
Investment Required during 2012-13 to 2029-30 in Port Sector
22. In order to create capacity necessary to handle projected traffic in XIIth Plan, a number of
port development projects have been identified by Major Ports and Maritime States to be taken up
by the terminal year of the 12th five year plan (2016-17). Most of the projects/ schemes
conceptualized for capacity augmentation are through PPP mode. Based on the plans of Major
ports and maritime States, the investment required and pattern of financing for capacity addition of
250.4 million tones at Major Port and 318.1 million tonnes at Non-major ports during XIIth Plan is
given in Table-3F.
Table 3F: Investment by Major and Non-major Ports during XIIth Plan
(Rs Crore)
GBS IEBR Private Sector TOTAL
Major Port
Construction of Berth/Jetties 166.0 4203.7 9448.3 13818.0
Dredging 3303.2 3791.8 0.0 7095.0
Port equipment & Machinery 0.0 1022.9 558.4 1581.3
Rail-Road Connectivity 0.0 3442.6 5531.1 8973.7
Total (Major Port) 3469.2 12461.0 15537.8 31468.0
Non-major Port
Construction of Berth/Jetties 0.0 812.7 20024.8 20837.5
Dredging 45.0 369.1 3227.0 3641.1
Port equipment & Machinery 11.3 540.1 3306.1 3857.6
Rail-Road Connectivity 777.9 286.8 2963.6 4028.3
Total( Non-major Port) 834.2 2008.8 29521.5 32364.5
vii
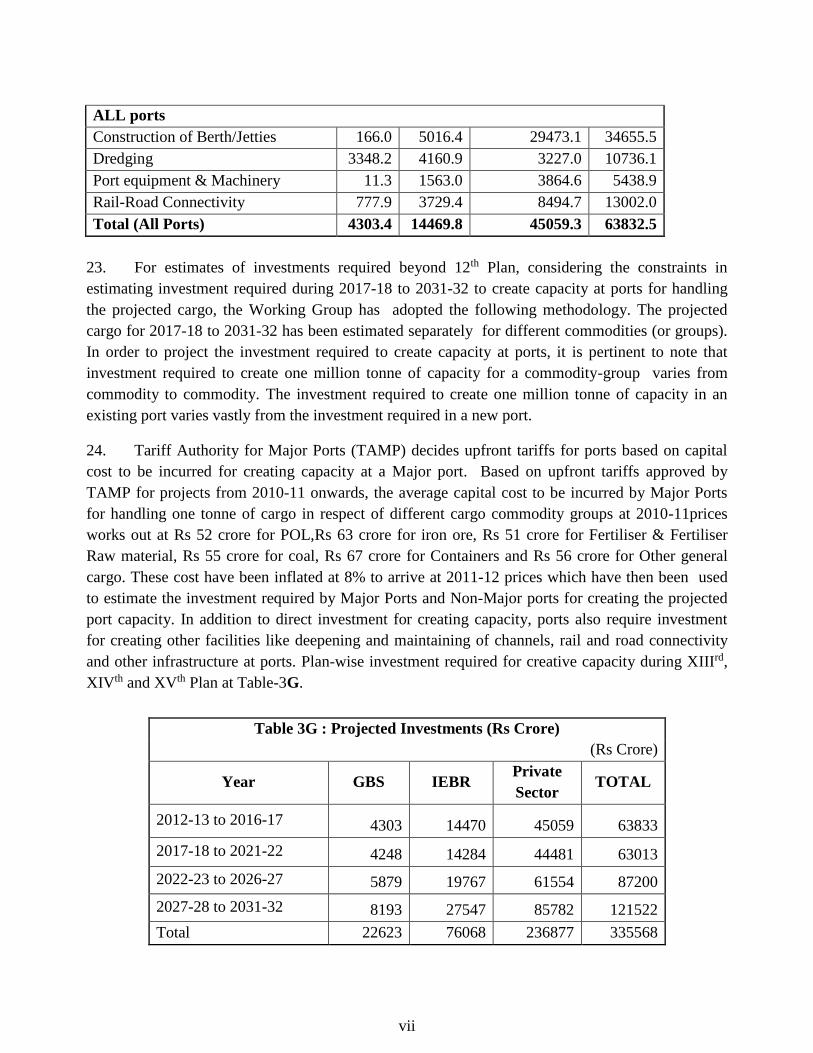
ALL ports
Construction of Berth/Jetties 166.0 5016.4 29473.1 34655.5
Dredging 3348.2 4160.9 3227.0 10736.1
Port equipment & Machinery 11.3 1563.0 3864.6 5438.9
Rail-Road Connectivity 777.9 3729.4 8494.7 13002.0
Total (All Ports) 4303.4 14469.8 45059.3 63832.5
23. For estimates of investments required beyond 12th Plan, considering the constraints in
estimating investment required during 2017-18 to 2031-32 to create capacity at ports for handling
the projected cargo, the Working Group has adopted the following methodology. The projected
cargo for 2017-18 to 2031-32 has been estimated separately for different commodities (or groups).
In order to project the investment required to create capacity at ports, it is pertinent to note that
investment required to create one million tonne of capacity for a commodity-group varies from
commodity to commodity. The investment required to create one million tonne of capacity in an
existing port varies vastly from the investment required in a new port.
24. Tariff Authority for Major Ports (TAMP) decides upfront tariffs for ports based on capital
cost to be incurred for creating capacity at a Major port. Based on upfront tariffs approved by
TAMP for projects from 2010-11 onwards, the average capital cost to be incurred by Major Ports
for handling one tonne of cargo in respect of different cargo commodity groups at 2010-11prices
works out at Rs 52 crore for POL,Rs 63 crore for iron ore, Rs 51 crore for Fertiliser & Fertiliser
Raw material, Rs 55 crore for coal, Rs 67 crore for Containers and Rs 56 crore for Other general
cargo. These cost have been inflated at 8% to arrive at 2011-12 prices which have then been used
to estimate the investment required by Major Ports and Non-Major ports for creating the projected
port capacity. In addition to direct investment for creating capacity, ports also require investment
for creating other facilities like deepening and maintaining of channels, rail and road connectivity
and other infrastructure at ports. Plan-wise investment required for creative capacity during XIIIrd,
XIVth and XVth Plan at Table-3G.
Table 3G : Projected Investments (Rs Crore)
(Rs Crore)
Year GBS IEBR Private
Sector TOTAL
2012-13 to 2016-17 4303 14470 45059 63833
2017-18 to 2021-22 4248 14284 44481 63013
2022-23 to 2026-27 5879 19767 61554 87200
2027-28 to 2031-32 8193 27547 85782 121522
Total 22623 76068 236877 335568
viii
Policy Issues/Policy/regulations for the Port Sector
25. The issues identified are:
(i) The Major ports to continue to work towards implementing ‘landlord port’ concept duly
limiting their role to maintenance of channels and basic infrastructure leaving the development
operation management of terminal and cargo handling facilities to the private sector. Total
realisation of this concept is expected by 2020.
(ii) Public Private Partnerships will be the preferred mode for the development of port terminals
and other commercially viable activities in the Major Ports.
(iii) The need for a Port Regulator for monitoring and regulating the service levels, technical &
performance standards.
(iv) The environmental clearance process be reviewed as one of the major factors for delay in the
fructification of projects is the long environmental clearance mechanism procedure.
(v) Protection of environment is an indispensable factor for sustainable economic growth.
Environmental issues including the handling of hazardous and noxious substances in a port,
prevention of air, water and soil pollution in ports, treatment of ballast water etc., need to be
addressed and tackled. The port industry in general is faced with sustainability issues – compliance
to international and national regulations vis-à-vis demands for bigger port capacity and increased
productivity without compromising environmental quality. Without environmental regulation, it
would be difficult to implement greener practices, as these may put operators at a competitive
disadvantage. Other related issues are availability of incentives to encourage green practices, cost
and availability of clean fuel, the need to do more research on green technologies, use of shoreside
power, training programmes for such industry and designating emission control areas.
(vi) Financial support for dredging is necessary for reducing the port charges.
(viii) There is a need to develop at least 4 hub ports to receive the 13,500+ TEU containerships.
(ix) Maritime projects are specialized in nature and they require a specialized scrutiny and
appraisal for obtaining the finances. There is a need for a specialized Maritime Finance
Corporation with the equity of ports and financial institutions to fund the Port projects.
(x) The Governments, both Central and State should transform the legislative frame-work in
tune with the current requirements. Necessary amendments to the Major Ports Act, 1963, Indian
Ports Act, 1908 and Maritime Board Acts of respective State Governments need to be carried out.
ix
Inter-port and Intra-port Competiton:-
26. The policy approach of the Government has been to mitigate monopoly domination by a
single Operator. The policy states that if there is only one private terminal/berth operator in a port
for a specific cargo, the operator of that berth or his associates shall not be allowed to bid for the
next terminal/berth for handling the same cargo in the same port. Earlier, when the Jawaharlal
Nehru Port Trust (JNPT) was to award third terminal, existing P&O, Australia was debarred from
bidding for the third Terminal. Aggrieved by this decision P&O, Australia went up to the level of
Supreme Court but lost. Similarly, PSA was not allowed to bid for the second Terminal in
Tuticorin and DP World was barred from bidding for the second container terminal in Chennai port.
Private terminal operators have expressed their reservations on this policy. First, given a situation
where demand exceeds the supply as far as container handling capacity is concerned is it desirable
to bar incumbent terminal operators from bidding in the same port. Second, there is an independent
Tariff setting Authority for Ports which fixes tariffs subject to a predetermined cap on return on
investment. Third, competition issues should better be left for the consideration of the Competition
Commission which was set up in India under the provisions of the Competition Act, 2002.
Rail Road Connectivity with Ports
27. Ports are no longer isolated entities and today are nodes for interchange amongst various
modes of transport and a vital element in global logistics chain. As India is opening up its
economy, the share of trade is going up steadily and the expectation of port use will be in terms of
time, cost and quality. Ultimately the commodity from the source of production has to reach the
consumer in the shortest possible time and in the most cost effective way. It is the production
driven need for an integrated global logistics chain that has led to inter-modalism. As such today’s
modern port is a dynamic node in the international production and distribution network. Port
connectivity is essentially dynamic as developments take place continuously in the industrial
activity in the hinterland, market forces and technology improvements. Therefore, there must be a
mechanism of periodical review of the overall performance followed by an exercise of comparing
with the best in the world. The growth of port traffic is expected to be high in coal and containers.
28. To ensure adequate connectivity to the ports following measures are suggested:
i. Every port must have a two-lane road as the minimum connectivity.
ii. Where railable cargo is handled, the requirement is: A two lane road and a single line rail
connection up to a level of 5 million tonnes per annum. It should be improved to 'double
line' rail connectivity and four-lane road connectivity when the traffic handled crosses this
threshold of 5 Million Tonnes per annum.
iii. Connectivity within the port system should also receive more attention than at present.
x
iv. The Railways must finalize their revised policy for attracting private investment as quickly
as possible. PPP investments and state govt. participation are to be facilitated.
v. The present situation in respect of connectivity is grossly inadequate for non-major ports.
Massive investments are needed.
vi. Quantification of connectivity through an "index" should be done and inter-se
prioritization of investments should be guided by it.
vii. Allocation of certain ports for predominantly handling certain commodities should be
done so as to optimize hinterland-port linkages and flows. CFS/ ICD nodes should be
developed as a part of integrated plan. DFCs should be well connected through feeder
routes.
viii. Inland Water Transport potential should be exploited better.
Water Transport Statistics
29. Timely availability of Water Transport statistics comprising of Port Statistics, Port
Statistics, Shipping, Ship Building and Ship Repair Statistics and Inland Water Transport Statistics,
is vital for monitoring of trends in the economy, performance of the water Transport sector and
policy formulation. Water Transport Statistics includes the following:
Port Statistics
30. Over the years the type of cargo being handled has undergone structural change, with the
container traffic gaining in importance. Last one and half decade has seen growing participation of
the private sector in port sector leading to change in the operating environment. In order to
understand the changes, it was felt that new parameters and indicators for monitoring policy effects
need to be identified for data collection. The Ministry of Shipping had set up a Working Group for
Strengthening of Major Port Statistics In May 2009. The Working Group has submitted its
report in March 2011. Main recommendations/suggestions of the working Group are:
(i) The concept of cargo handled and Turn Round Time and its various components have
been rationalised to reflect true picture and to enable inter – port comparisons.
(ii) For uniform collection and presentation of Major Port statistics, certain changes in
procedures/methods have been suggested.
(iii) To measure the dynamics of the port service sector, short term indicators are required.
The three port service indices, namely Index of Service Production (ISP), Consumer
Service Prices Index (CSPI) and Producers Price Index(PPI) have been recommended
to be compiled annually.
xi
(iv) Measures for improving quality of Major ports have been recommended.
31. Non-major Ports are compiling Cargo traffic data. Periodicity of cargo traffic data
available for policy and planning purpose from all Maritime States/UTs is at half yearly interval
i.e. for the period ending 30th September and 31st March. The data is available for important
commodities only. Some of the States take a long time in compilation of detailed cargo traffic and
other non-major port data for the publication ‘Basic Port Statistics’. This inevitably delays
compilation of all India aggregates and subsequent dissemination to Public.
32. In order to comprehensively monitor the trend in cargo handled by Indian ports, it is
imperative that all Maritime States/UTs put in place a mechanism to compile and disseminate
monthly cargo traffic data, particularly for non-major ports handling more than 5 million Tonnes
per annum.
33. The following data gaps in Port’s statistics exist:
(i) Data on countrywise break-up of Origin and destination-wise of cargo is frequently asked by
researchers. Shipping lines/companies generally provide information on the port of country
from where the cargo is loaded or to where the cargo is to be discharged and not the actual
country from where the cargo originated or is destined to.
(ii) Container cargo is fastest growing traffic at Major ports. However, the commoditywise data
handled in containers is not being maintained by major ports.
34. Ports are in the process of implementing Port Community System (PCS) which is intended
to integrate the electronic flow of trade related document/information and function as the
centralized hub for the ports of India and other stakeholders like Shipping Lines/Agents, Surveyors,
Stevedores, Banks, Container Freight Stations, Customs House agents, Importers, Exporters,
Railways/CONCOR, Government regulatory agencies, etc. for exchanging electronic messages in
secure manner. One of the objectives of the PCS is data repository for research and analysis. With
the implementation of PCS, the it may be possible to fulfil the above data gaps.
Shipping Statistics
35. The National Statistical Commission set up by Government of India in its report in 2000 had
identified following important data gaps.
(i) Financial performance indicators of private shipping companies.
(ii) Operational indicators (voyages, cargo, capacity or space utilization).
(iii) Freight rates for selected Indian Import and export commodities for all shipping
companies.
(iv) Safety Statistics.
(v) Environment pollution caused by shipping Industry
xii
36. The National Statistical Commission had recommended that a mechanism should be evolved
by the Ministry of Shipping to collect data from individual shipping companies. TRW in
collaboration with Directorate General of Shipping and Indian National Ship Owners Association
(INSA) may explore ways to obtain and publish data not only on Financial/Operational Indicators,
Safety statistics and environmental pollution caused by shipping industry of at least listed
companies. Freight rates are in the nature of commercial information which varies from day to day
and is acquired by shippers and is subject to negotiation. It may not be easy for a non user/non
shipper like TRW to access accurate information.
Statistics of India’s Ship- Building & Ship Repairing Industry
37. Ship Building Industry is a technology, skill and material intensive assembly operation. It
draws upon a large number of services and utilities. The end product is a high value floating asset.
The Working Group suggests the following to overcome data short comings in ship building and
ship repair activities.
(i) Ship order book data presently published may be further classified into Indigenous and
Export orders.
(ii) Complete coverage of private sector companies engaged ship building and repair
activities may be ensured. This would require a mechanism to regularly update the list of
private ship builders and ship repair companies in India.
Inland Water Transport Statistics
38. Inland Water Transport (IWT) is a cost effective fuel efficient and environment friendly
mode, specially for transportation of bulk Cargo, hazardous goods so vital for industrial
development. Apart from the non-availability of timely data on inland water statistics, particularly
from states, there are data gaps in IWT statistics :
(i) IWAI is providing Cargo statistics for vessels which are registered and are availing the
facilities of IWAI on National Waterways. There are several small unregistered vessels/
boats (country crafts) which carry cargo and do not avail facilities of IWAI infrastructure.
The cargo carried by those vessels/boats is not at all being captured. There is a need to carry
out periodic survey (may be once in five years) to assess the Cargo Carried by such vessels
on National Waterways.
(ii) Many of the State Governments are unable to maintain the data/information on Inland Water
Transport due to lack of scheduled/systematic records on Freight/Passenger operations on
their waterways. Consequently, the data on IWT at all India level lacks full coverage.
(iii)The data also need to be collected on number of people trained by States to operate
mechanised vessels.
xiii
39. The Working Group suggests that states which have inland water transport activity and are
not providing data should put in place an institutional mechanism to regularly collect data on IWT
activities at state level.
Improving Quality of Port, Shipping and Inland Water Transport Statistics
40. The Working Group recommends the following to improve quality of Water Transport
Statistics.
(i) Periodic review of Water Transport statistics is required to assess the system and
identify the possible changes required for meeting the user needs. It is suggested
that such review of various sectors of Water Transport Statistics be undertaken once
in five years
(ii) At present, no system for training and sharing of experiences in respect of Water
Transport statistics exist. Training programme/workshops for officials/staff
involved in compiling Water Transport statistics, particularly Port statistics may be
organized. The workshops should cover statistical concepts, definitions and issues
of compilation, processing and Total Quality Management.
(iii) The annual publication should be brought out in the year following end of the
calendar/financial year. Bi-annual publication should be brought out within the
three months i.e. in June for the period ending 31st March and December for the
period ending September.
(iv) TRW may provide the metadata for water transport statistics in the form of a
manual on the website of Ministry of Shipping.
(v) All the regular publications on Ports, Shipping and Inland Waterways of TRW
should be put on the website of Ministry of Shipping.
(vi) Concurrent audit of statistical activities is necessary for early detection of errors
and mistakes during the progress of work, and their rectification in time is
essentially an internal activity of the primary data compiling agency. It is
suggested that assessment of quality of the data produced by the primary source
agencies may be carried out through statistical audit by officers authorized by the
Ministry of Shipping.
IT Investment & Interface
41. Transport system comprises of a number of distinct modes and services which are an
integral part of supply chain. It is essential to have online information facilities on the various
links in the supply chain. Implementation of IT is of vital importance.Changes in the port
industry are underway because of implementation of Port Community System at Indian Ports.
Similarly, change in the shipping industry is also underway. Leading carriers, consolidators,
freight forwarders, and agents around the globe have introduced electronic commerce to
serve their customers better.
xiv
42. Despite the huge size of the country, the import and export flows are still modest, when
compared with other countries in Eas t As ia . This is reflected especially in India’s container
throughput, where volumes are only a fraction of the Chinese container exports and imports. Also
port development is much smaller and where Chinese ports are now the worlds leading ports (with
the majority of the largest container ports being Chinese), the Indian ports are still relatively small
ports.
43. Logistics costs as a percentage of Gross Domestic Product (GDP) range from around 9
per cent in the United States of America (USA) to 11–12 per cent in France and the United
Kingdom and 10–15 per cent in China, India, Japan, and Singapore. The logistics sector in India
is very fragmented. Only in some sectors, e.g. in the automotive industry, the concept of
outsourcing and chain control is fully
44. Many Companies/Organization in logistics industry have significantly changed the way
they do business by implementing ERP models, Port Community System (PCS). However parts of
the transaction in the Maritime Community are still paper based. Therefore, digitalization process,
which normally should lead to benefits for the users in terms of the time and cost advantages, has
not been completed in logistics industry in India
45. The W.G. noted that only few Non-major ports have shown interest in the
implementation of Port Community System. It is also observed that most of the small users do
not have internal computer applications. Therefore, they are using user interface of PCS to do data
entry for s u b m i s s i o n o f documents instead of uploading messages from internal application
system. The W.G. suggests that Government of India may take initiative to develop such module
and provide to the users at nominal cost.
46. There is urgent need for implementation of suitable IT solution for:
(i) Management of intermodal cargo transfer t o a v o i d cargo traffic bottlenecks,
increased waiting time and lost efficiency;
(ii) M a n a g e m e n t of Multimodal transit network of Ports which may include cargo,
trucks, Trains and coastal ships;
(iii) Automation of trucker movement around Ports with the help of GPS/GIS and RFID
tag technology;
(iv) Automation of Port Gate for free flow traffic;
(v) Exchange of Position of Ship in sea as provided by LRIT shall be implemented
for all the Port and Shipping fraternity;
(vi) Digital signature should be approved and introduced as soon as possible so that a
complete paperless handling of documentation and payment flow is possible and
required improvements in lead time and logistics cost advantages can be realized;
(vii) National Payment Gateway including all banks so that users can make ONLINE
xv
payment from any banks and branch;
(viii) Developing a single window electronic platform for maritime stakeholders to have a
common interface. It is suggested that keeping Port Community System (PCS) as a
base, other components may be integrated using Service Oriented Architecture (SOA).
(ix) Each port should undertake Enterprise Resource Planning (ERP) solutions which
wou ld cover a l l f u n c t i o n a l a r ea s i n c l u d i n g p o r t o p e r a t i on . The functional
areas where ERP solutions are not available off the shelf, the solutions should be
developed and integrated with ERP solutions.
PPP Framework & Benchmarking
47. Constrained by capacity, the challenge facing the country’s ports are:-
(i) Efficiency using Public Private Partnership to add new port capacity: and
(ii) Efficiency using port capacities
48. To speed up port project implementation: six initiatives have been identified for the
government, regulators and nodal agencies to facilitate the implementation of PPP port projects
in India. These emerged through discussions with private players, public sector units, and
government officials across nodal agencies and regulatory bodies. The effective implementation
of PPP port projects can add the much-needed capacity to India’s ports. The six actionable
recommendations enumerated below can resolve the bottlenecks that currently slow down
project implementation.
(i) Establishing a high-power group to monitor and de-bottleneck ports projects
Such a group can add transparency and expedite decisions that enable progress. Its scope
should cover a small number of larger projects. The group can be a part of the Committee on
Infrastructure.. The group should:
a) Monitor project portfolio and port trust performance on at least three key metrics: on-time
award; actual construction progress against planned milestones; and within-budget completion
b) Consolidate performance data on a quarterly basis and make it publicly available,
highlighting areas prone to delays and over-runs
c) Selectively involve providers of large projects to understand bottlenecks and collaborate on
solutions for growing delays and over-runs
d) Escalate inter-ministerial bottlenecks that are impeding important projects (pre- or post-
tendering) to relevant authorities, and push for decisions. For instance, the group can selectively
convene ministers and bureaucrats from concerned areas, creating an empowered group to expedite
the resolution of bottlenecks
xvi
(ii) Amending the MCA to balance the risk sharing:
a) Project cost should be limited to minimum of approved cost, lenders’ cost and actual cost:
b) Due debt should exclude the principal that has fallen due before the termination notice:
c) Sponsors to hold at least 51 per cent stake in the special purpose vehicle for two years after
commercial operation date (COD); lead member to hold 26 per cent stake in SPV at all times; and
each member evaluated for pre-qualification purposes to hold 26 per cent stake for 2 years after
COD.
d) Interest linkage to be changed to 10 year G-Sec from SBI’s prime lending rate:
e) Some other MCA aspects need to be reconsidered in the light of feedback from developers
and financiers. For example, the adequacy of the financial closure window, sufficiency of the
“conditions precedent” clause, fairness of basing the terminal payment on book value,
enforceability of charge on assets given the immobile nature of assets and the effectiveness of port
monopoly norms.
(iii) Modifying the existing economic regulatory framework to achieve uniform regime and use
tariff leverage to promote efficiency in operation: There is a need to introduce a uniform economic
regulatory framework covering the entire port sector. A two-tier regulatory mechanism, as
prevalent in the power sector, may be an ideal choice.
a) The scope of regulation should cover not only tariff setting, as at present, but also
setting, monitoring and regulating service levels and performance standards. The
regulators may also be entrusted with the responsibility of dispute resolution, as
appropriate.
b) A detailed study should be commissioned to assess the extent of competition prevailing
in the market for provision of port services in different regions for different types of
commodities. If such a study reveals the existence of a perfect market condition, tariff
fixation may be left to market forces with the regulatory intervention to be limited to
adjudicating disputes, if any, arising between the service providers and port users.
c) Tariff fixation should be based on the normative approach relying upon the standard
capacity created and efficient cost of operating such facilities. The tariff guidelines of
2008 issued by the government for setting upfront tariff for PPP projects follow such a
model and may, therefore, continue unaltered. However, retaining the upfront tariff
unaltered for the whole project period needs to be re-examined. The guidelines may be
amended to provide for periodic review of tariff, say once in five years, based on
updated performance norms and capital costs.
d) The tariff guidelines of 2005, applicable to the major port trusts and private terminals
that came into existence prior to 2008, require a thorough revision. Tariff fixing in these
cases may also follow a normative approach which will act as an incentive to improve
operational efficiency.
xvii
e) The operators may be allowed to retain the benefit of efficiency gain, provided tariff is
set based on pre-determined standards instead of relying upon their own past
performance and their projections for the future.
f) Regulatory approvals may be granted in a time-bound manner and towards this end, the
regulatory process should be streamlined including adequately strengthening
administrative and statutory aspects of regulatory organisations.
(iv) Ensuring at least 90 per cent of land is acquired before tendering:Pre-conditions for
tendering PPP and EP&C projects can include acquiring 80 to 90 per cent land, including the
tracts indispensable for normal progress of construction work. The land should be considered
“unencumbered land” only when it is free from any dwellings or other physical encumbrance.
Contractual mechanisms (such as a penalty clause) should ensure the relevant port trust’s
continual commitment to land acquisition even after the award. The penalty calculation should
ideally be unambiguous and similar to that of liquidated damages (a fixed quantum of penalty for
each day of delay). Penalties should adequately cover typical extension costs, and could be capped
in a similar way as liquidated damages payable by the provider.
(v) Selecting design and engineering consultants based on quality-cum-cost based
assessment: Paid consultants help to prepare most DPRs and can impact the time and cost of
project execution. It is important to select technical consultants using a quality-cum-cost based
assessment (QCBA) instead of the traditional L1 based (lowest cost) approach. The quality score
should count for at least 50 to 80 per cent of overall assessment (as in Canada and the USA).
Evaluators can rate the consultant through feedback from the respective port trusts about his or her
performance on previous and ongoing projects. The port trusts, in turn can assess performance in a
standard manner across projects using a set of standard guidelines with objective scoring
parameters. For instance, evaluators can look at the magnitude of design changes during project
execution and the reasons for the same.
(vi) Launching a construction-focused vocational training programme: The government
must tackle the manpower shortage by creating additional training capacity to generate another 2
million to 3 million skilled workers per year by 2017. To build such scale, private capital will need
to participate through commercially viable PPP models. The government could contribute partial
equity and real estate for these projects to enhance their viability. The government should also
ensure the commitment of the construction industry to five distinct areas:
Bench marking of Productivity
49. Optimising the vessel handling process end-to-end can reduce the port stay time of a
vessel by up to 40 per cent. This can be achieved by:-
xviii
(i) Improving the port planning process: Better planning, coordination and communication
ahead of the vessel’s arrival in a port can help save 5 to 20 per cent on total port stay time. The two
most critical aspects in the planning process are that: (a) The terminal operator evenly distributes
cranes alongside the vessel so that they all finish around the same time and; (b) The shipping line
allows for a more flexible stowage plan on board preventing unnecessary moves and downtime
(ii) Optimising the steaming and berthing process: Optimising this process for container
ships can save 5 to 15 per cent of total port stay time. The most important levers in this process
are:
a. Orchestrating the arrival of the pilot at the waiting station to limit unnecessary waiting time
b. Levelling the schedule to allow vessels to arrive at non-peak times
c. Optimising the arrival and departure process by executing certain activities in parallel
instead of in sequence
d. The local port authority controls the arrival time of the pilot, but the shipping lines can
control the other two levers.
(iii) Facilitating crane loading/unloading: Efficient crane loading and unloading can cut
port stay times by 10 to 15%. The container terminal operator has complete control over these
levers [(a) to (d)]. But if the operator and the shipping company don’t align their incentives, it
becomes harder to notify and implement these levers. This requires:
a) Creating faster availability of cranes once operations are ready to start
b) Deploying the right type of cranes and drivers at the correct bays of the vessel to ensure
highest productivity levels
c) Making abundant trucks (or other equipment like straddle carriers) available at the quay crane
to transport the containers to the yard, thus minimising crane waiting time
d) Optimising the shift-change process (hot seat change) so that new driver seat is already
installed before shift change takes place
(iv) Streamlining yard operations: Better yard layout and production process (storage and
retrieval of boxes) can save 5 to 10 per cent in existing timelines. This involves:
a) Improving stacking logic of fast moving container flows (large vessel bays) versus
slower moving flows (Exhibit 2)
b) Optimising stacking logic to limit the distance a crane must cover to retrieve a
container
(v) Easing gate operations: This doesn’t directly create any savings potential for shipping
lines or terminal operators, but it reduces the dwell time of the cargo for the shipper and limits the
duration for which shippers need to hire the truck driver. It is estimated that a maximum of 5 per
cent savings if the port focuses on: (a)Avoiding non–value added activities at the gate; (b)
xix
Arranging better arrival/departure pattern of incoming and outgoing trucks and containers to
smooth peak loads
Shipping
50. Shipping is the lifeline of a nation, necessary for the development of the national economy
as well as to keep supply lines open for transportation of essential commodities during peacetime
and emergencies such as war and famine.
51. India has a fleet strength of 1071 vessels as on 31st March 2011 with Gross Tonnage (GT) of
10.45 million. Out of these 1071 vessels 722 vessels (67%) with 1.02 million GT (9.8%) were
engaged in coastal trade and remaining 349 vessels with 9.43 million GT were deployed for
overseas trade. India is ranked 16th in the world in terms of Gross Tonnage under its flag. Indian
compounded annual growth rate (CAGR) in shipping as per national flag registrations from 1980 to
2010 at 1.4% has been much lower compared to growth in tonnage at global level (2.5%) and for
Asia (5.9%). The age profile of Indian vessel is that over 40% of the fleet is above 20 years of age.
52. Around 95% by volume (68% by value) of India’s EXIM trade moves by sea. The average
age of Indian fleet i s a r o u n d 1 8 years, it requires a major fleet replacement programme over
the next 5 years. The overall share of Indian ships in the carriage of the country’s overseas
seaborne trade has been declining over the years. From about 40% in the late 80s, it is currently
around 8% which is a matter of great concern, as it entails heavy outgo of foreign exchange in
terms of freight bill that goes to foreign companies and India stands to lose not only the foreign
exchange on the freight but also the multiplier effect that would accrue to the economy.
53. Besides the economic impact the role of Indian shipping in the national security, its role
energy security is vital. The existence of strong and viable national fleet serves as balancing factor
in the freight market. The key issues facing Indian shipping sector are:
i. Need for greater cargo support policy
ii. Cargo assurance for long term Charters.
iii. Deemed export status for shipping companies providing maritime transport services to
consumers outside India and earning foreign exchange as freight.
iv. Exemption of Services tax on specified services to make the services price competitive.
v. Inequity between the service tax abatement for road/rail transportation and coastal
transportation
vi. Levy of Minimum Alternate Tax (MAT) on profit/loss of sale of vessels.
vii. Need for promotion of coastal shipping.
viii. Unequal treatment for Indian seafarers plying on vessels in International Waters and
Indian territorial waters.
xx
54. The key recommendations of the Working Group to address the above issues are:
i) To retain and consolidate existing tonnage from flagging out to more attractive registers
through greater cargo support, 1/3rd portion of the POL and dry bulk cargoes of EXIM trade of
India, should be reserved for Indian Ships and should be linked as condition for availing benefits
under the export schemes of the Government of India. This will assure cargo availability for Indian
ships and act as a catalyst to boost the growth of Indian fleet.
ii) Indian shipping companies exporting maritime transportation services to consumers out of
India and are earning valuable foreign exchange as freight. The Indian shipping industry is
competing against intense international competition despite the comparatively high taxation
regime in the country and other constraints put on the Indian shipping industry. According
“deemed export status” to Indian shipping services and encourage the maritime transport service
providers in building international competitiveness. Consequently, all inputs in terms of
machinery, stores, spares and other related equipments used for the purposes of effectively
operating an Indian flag vessel providing such an International maritime transportation service
should qualify for a similar deemed export status and consequently be made free of local duties
and taxes. Policy be suitably modified to grant deemed export s tatus to “maritime
transportation services” provided by Indian shipping companies from India.
iii) Make investment in Shipping at least as profitable as any other service industry by offering a
conducive tax regime encompassing both direct and indirect taxes;
(a) Service Tax: Exporters presently get refund of service tax paid by them on input services
used for exports. Government has issued a Notification providing refund of service tax
paid by exporters on four taxable services (services offered to exporters by major ports, minor
ports, road transport services provided by goods transport agency from inland container depot
(ICD) to port of export and transport of export of goods in containers by rail from ICD to port of
export) would now qualify for service tax refund. In many of the maritime countries the shipping
industry is not subject to service tax either domestically or internationally. In the
European Union, United Kingdom, Ireland, Singapore and Australia, the services availed of
by shipping companies are either exempt from service tax or zero rated. The ambit service tax
exemption needs to be expanded to cover all marine services rendered in India and
utilized by exporters. This would need list of such services on a verifiable basis to evaluate
linkage o f s e r v i c e s w i t h g o o d s exported. Such s h i p p i n g /marine services w h i ch
facilitate exports and generate foreign exchange earnings could be exempted or zero rated.
This will make such services price competitive.
(b) Seafarer’s Taxation-Unequal treatment: Indian seafarers employed on foreign vessels
or Indian vessels which ply outside Indian territorial waters for182 days or more in a year are
entitled to non resident status and pay no taxes. This does not apply to officers and seafarers on
coastal ships. Also Indian and foreign seafarers working in Indian territorial waters for 182days
xxi
or more are effectively Indian tax residents and are liable to pay tax on income. It may be noted that
certain countries in Asia (Malaysia, Philippines, Singapore, and Thailand) have exempted income of
their seafarers from personal taxation. In some European countries, ship-owners are given the right
to withhold a certain percentage of personal income tax and social security payment of seafarers as
an incentive to hire European seafarers by offsetting part of the high wage level in their country.
Labour is a factor of production and seafarers by offsetting part of the high wage level in their
country. Labour is a factor of production and seafarers income could be subject to a lower fixed/flat
rate of tax which could be levied on all Indian seafarers irrespective of their residential status (i.e.
place of work within or outside Indian territorial waters) and/or flag of ship they work for: a higher
exemption up to a certain level of income could be given for tax purposes. Such a tax will reduce the
attraction of foreign flag and may also help coastal shipping which find it difficult to engage and
retain Indian seafarers under the existing manning laws.
(c) Rationalising the Fiscal Regime: Indian shipping, as against its foreign counterparts, is
currently subjected to a variety of taxes numbering about 12 , some of them introduced in the year
after relief was given through the tonnage tax, which affect the profitability of Shipping companies
vis-a-vis fleets under foreign flags. Thus there is a strong case for rationalization of the taxation
regime for the Indian shipping industry so as to bring down the effective tax rate to the rate payable
by the industry when tonnage tax was fixed, at a level that will enable shipping companies to
compete globally on a level playing field and also enable them to raise funds for acquisition of
further tonnage. Tonnage tax itself needs to be re-examined as to how it can be made attractive to
new investors, so as to widen the base of the shipping industry in the country. At present, there are
only 46 companies who have subscribed to the tonnage tax regime.
It may be noted that certain countries in Asia (Malaysia, Phillipines, Singapore, and
Thailand) have exempted income of their seafarers from personal taxation. In some European
countries, ship-owners are given the right to withhold a certain percentage of personal income tax
and social security payment of seafarers as an incentive to hire European seafarers by offsetting
part of the high wage level in their country. Labour is a factor of production and seafarers
income could be subject to a lower fixed/ flat rate of tax which could be levied on all Indian
seafarers irrespective of their residential status (i.e. place of work within or outside Indian
territorial waters) and/or flag of ship they work for or; a higher exemption up to a certain level of
income could be given for tax purposes. Such a tax will reduce the attraction of foreign flag and
may also help coastal shipping which find it difficult to engage and retain Indian seafarers under
the existing manning laws.
(d) Minimum Alternate Tax (MAT) on Profit/Loss on Sale of Vessels
In India, profit/loss on sale of vessels is not covered under the tonnage tax regime. Therefore, the
tonnage tax company has to pay minimum alternate tax/capital gains tax on such income.
Minimum Alternate tax (MAT) @ 11.22% is payable on book profits in case the taxable income
(i.e. other than tonnage income) of the company is less than 10% of the book profits. The
xxii
profit/loss on sale of vessel is credited to the profit and loss account and would be included in the
book profits of the qualifyingshipping company on which MAT would be applicable. In United
Kingdom, Singapore, Ireland and Netherlands profit/loss on sale of vessels is covered under the
tonnage tax regime. Thus, in the above jurisdictions the gain on sale of vessels will not be taxed
under the normal corporate taxation rules. Given the need to augment the fleet capacity of the
Indian Shipping it is suggested either to (a) to include surplus resulting from sale of vessels should
be covered within the scope of tonnage tax regime or (b) exempt sale proceeds from tax if used
to purchase a replacement vessel within a certain period of time.
(iv) Cargo Assurance through Long Term Charters: Long term charters by PSUs for critical
energy cargoes of crude oil, petroleum products and gas should be negotiated and concluded
exclusively with Indian ship-owners and the economy at large providing stability in freight costs
and lowering input costs. Long term charters will assist ship-owners to raise finanace to augment
the tonnage under the Indian flag and replace the aging Indian fleet. As is known, uninterrupted
transport and supply of oil, a major source of energy, is very vital to a country’s economy.
Internationally, Japan and Korea have developed strong LNG fleet on the basis of long term
contracts.
Recommendations for Promoting Coastal Shipping:
55. Coastal cargo accounts for only 18% of the total cargo handled at Indian Ports. There is
need for boosting coastal trade in the country. The Working Group has recommended the
following:-
(i) Infrastructure
a) Set up more minor ports along the coast, at least one port at a distance of every100 kms
b) Setting up dedicated berths for coastal ships;
c) Promotion of Ro-Ro jetties;
d) Promoting repairing jetties;
e) LNG supply facilities;
f) Setup dedicated warehouses for coastal cargoes;
g) Setup rail and road connectivity at the ports to the nearest rail heads;
h) Set up adequate ship repair facility and dry-docks along the Indian coast for catering
to the growth of coastal shipping;
i) Deepening of sea channels at minor ports;
(ii) Subsidies: Implement an aggressive shipbuilding subsidy with focus on coastal vessels, tugs,
OSVs etc. In additional following measures may be undertaken: (a) remove the lower limit of 80
metre on ship building: (b) include subsidy for LNG use facility both on retrofitting basis for
existing ships and new ships and (c) subsidy for RO-RO jetties, repair jetties and a higher level of
subsidy for a pair of jetties dedicated to coastal shipping.
(iv) Indirect Tax Taxes/Exemption: (a)Increase in abatement of service tax for coastal
xxiii
transportation from 25% to 75% i.e. at par with transportation of goods by rail/road. (b) Confer
‘Declard Goods’ status to bunkers being consumed by Coastal/Inland vessels.
(iv) Fiscal Incentives: Coastal vessels should be treated as movable infrastructure and therefore
granted such status for the purpose of ensuring competitive funding and fiscal benefits;.
xv.) Introduce fiscal incentives for building & operating small ports (upto 5 metre draft)
dedicated for coastal vessels;
(v) Cabotage Policy Support: a) Absolute cabotage for coastal trade other than
transhipped EXIM containers, including empty containers; b) Right to issue NOC to foreign flag
vessels on coastal run to INSA; c) Increase the Right-of-First-Refusal price band to 25% above
the lowest foreign-bid (up from current 10%);
(iv) Carbon Credit Scheme: Currently user industry gets the carbon credit to the exclusion of
coastal vessels. There is need to put in place a mechanism to provide carbon credits to coastal
shipping providers equivalent to carbon credits availed by the user.
(vii) Financing of Coastal Ship Acquisition: Need to encourage/promote specialized window
infinancial institutional to fund acquisition of coastal vessels.
(viii) Separate legislation for Coastal vessels: Coastal vessels are constructed to specifications of
oceangoing vessels even though they are not subject to the same stress and turbulence. This
needlessly increases their capital costs. There is a need to suitably amend the Merchant Shipping Act
or enact separate legislation for coastal shipping to provide different specifications and lower manning
scales.
Inland Waterways
56. Inland Water Transport is the most environment friendly mode with its excellent fuel
efficiency and lower emission levels. Neglect of development of IWT infrastructure has made this
mode virtually insignificant. Inland Waterways Authority of India (IWAI) is mandated to develop
and regulate inland waterways in the country. National Waterways come under the purview of the
Central Government while rest of the waterways come in the domain of State Governments. The
National Waterways carried 4.92 million tonnes of cargo in 2010-11. These have the potential to
carry 18 times the present cargo by 2029-30. IWAI has taken up some projects in collaboration with
private sector for movement of cargo on National Waterways.
57. Policy issues for Inland Water Transport sector are:
xxiv
(i) Integration of waterways with other modes of transportation to form an efficient multimodal
transport network is the key to achieve sustainable development of IWT sector.
(ii) Public investment in development of waterways shall serve as an important economic lifeline
for development of North Eastern (NE) region which has abundant water resources ideal for IWT.
(iii) Policy support for creation of floating infrastructure i.e Barges/ Inland Vessels is critical to
attract private capital for development of IWT sector.
(iv) Extending mandatory intermodal share for cargo movements (currently mandated to all PSUs
by PMO) to all public limited companies and creation of a suitable tradable instrument to help
monetize the environmental advantages of the IWT sector on the lines of Renewable Energy
Certificate (REC) can serve as a significant policy support.
(v) An institutional framework to appraise mission critical projects identified by IWAI will ensure
timely and effective project development.
(vi) For effective resolution of policy and administrative issues, State Level Coordination
Committees (SLCC) of various State Government agencies and IWAI under the State Chief
Secretaries is critical imperative.
(vii) Creation of adequate education and training facilities to help sector specific capacity building
is necessary.
(viii) For effective development of IWT sector in India all major waterways may be developed
with 3 m depth and Government may take a policy initiative in this regard.
58. The key recommendations of the WG for development of IWT sector in India are:
(i) Navigational Infrastructure :
a) Develop deeper stretches and maintain Least Available Depth (LAD) at 2.5 metres,
preferably 3 metres for round the year navigation.
b) A special central fund may be made available for raising vertical clearance of at least 5
metre above HFL to facilitate passage of bigger IWT vessels.
c) Develop intermodal connectivity at IWT terminals through proper connectivity with
road/rail.
d) Develop night navigation infrastructure in all National Waterways.
(ii) Inland Vessels
a) Revive Inland Vessel Subsidy Scheme.
b) Set up a Special Purpose Vehicle (Inland Vessel Leasing Company) that can procure and
lease out the IWT vessel based on market demand.
c) Private sector participation should be explored for development of Maintenances Repair and
Overhaul (MRO) facilities in North East States and other National Waterway Corridors.
d) Make IWT vessel building eligible for “Infrastructure Status” to avail easier credit
availability
e) Make inland vessel building eligible for priority lending.
xxv
f) Bring inland vessels under Tonnage Tax.
(iii) River Basin Development: Each river basin should be developed with total integration of
multiple users. To this end, a central legislation of “River Basin Authorities” under the control of
Ministry of Water Resources will help total development of river basin.
(iv) River Training Work: Extensive river training works of spurs and dykes or barrages with
navigation locks to be carried out in NW 1 & NW 2 for improving the navigation channel with
depth 2.5 m to 3.0 m and width of about 50 metres for accommodating economic size
vessels/tugs/barges.
(v) Modal Integration: There is need to identify and develop the feeder routes on the water
under jurisdiction of State, to National waterways so that the entire channel can be developed on the
“fish bone structure” This would involve development of feeder routes in the North East such as
Subansiri, Dhansiri, Dibang etc. as well as major tributaries of River Ganga such as Yamuna,
Gandak, Kosi, Ghagra etc. Upon successful operations of these feeder routes will pave the way for
the improvement of these routes by the development of barrages/weirs with navigational locks to
ensure round the year operations of the routes
Similarly, integrate IWT and coastal shipping operations on stretches where feasible to
promote seamless connectivity. One way could be combining inland terminals with automated
RO-RO systems.
(vi) International Protocols: Simplify administrative processes and develop suitable
operational support systems to reduce the average turnaround time of vessels plying on protocol
route.
(vii) Access to tradable renewable energy certificate: Create a suitable instrument to help
monetize the environmental advantages of the IWT sector on the lines of Renewable Energy
Certificate.
(viii) Private Sector Participation in Waterways: Private sector participation into the
development, maintenance and regulation of some stretches of rivers for inland water transport may
be looked into. Power utilities to bear cost of construction and O&M of material handling at power
plant end as in the case with facility for unloading of railway wagon.
(ix) Training and Capacity Building: Need to revive and expand inland vessel crew training
facilities in different States to meet requirement of manpower in IWT.
(x) Long Term Cargo Commitment: Need for a longer term cargo commitment for
economic/revenue sustainability. The shipper should provide guaranteed cargo for a specific period
xxvi
of time; focus on a few bulk commodities such as coal and iron ore besides over-dimensional cargo.
Fix 50% transportation of coal through IWT for new power projects, where origin-destination is on
navigational waterways.
(xi) Policy Parity- Level Playing Field: (a) Provide freight subsidy to IWT sector which is
presently available for transportation of fertilizers by rail and road; (b) Provide transport subsidy
for transportation by IWT mode in the North East; and (c) Abatement of Service Tax to the same
extent as that provided to rail and road.
59. A total of Rs. 64,000 crore is proposed for investment in IWT by way of continuation,
upgradation and launching of new projects during 2012 to 2030.
1
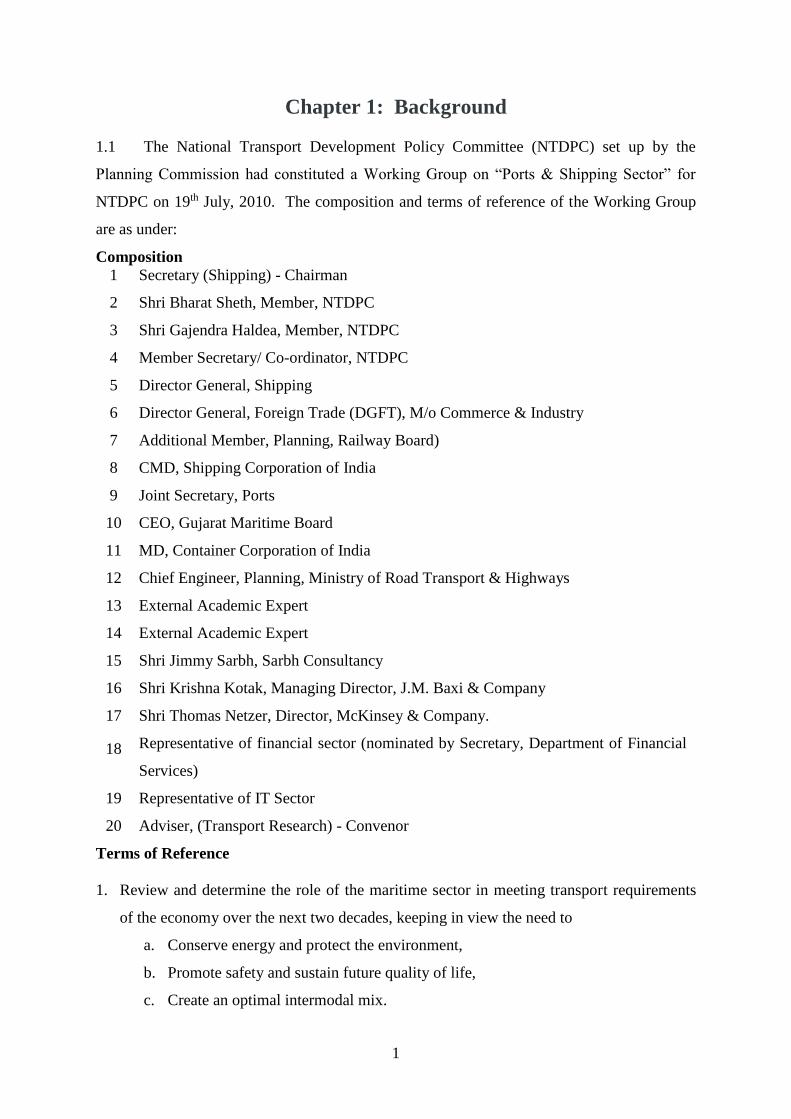
Chapter 1: Background
1.1 The National Transport Development Policy Committee (NTDPC) set up by the
Planning Commission had constituted a Working Group on “Ports & Shipping Sector” for
NTDPC on 19th July, 2010. The composition and terms of reference of the Working Group
are as under:
Composition
1 Secretary (Shipping) - Chairman
2 Shri Bharat Sheth, Member, NTDPC
3 Shri Gajendra Haldea, Member, NTDPC
4 Member Secretary/ Co-ordinator, NTDPC
5 Director General, Shipping
6 Director General, Foreign Trade (DGFT), M/o Commerce & Industry
7 Additional Member, Planning, Railway Board)
8 CMD, Shipping Corporation of India
9 Joint Secretary, Ports
10 CEO, Gujarat Maritime Board
11 MD, Container Corporation of India
12 Chief Engineer, Planning, Ministry of Road Transport & Highways
13 External Academic Expert
14 External Academic Expert
15 Shri Jimmy Sarbh, Sarbh Consultancy
16 Shri Krishna Kotak, Managing Director, J.M. Baxi & Company
17 Shri Thomas Netzer, Director, McKinsey & Company.
18 Representative of financial sector (nominated by Secretary, Department of Financial
Services)
19 Representative of IT Sector
20 Adviser, (Transport Research) - Convenor
Terms of Reference
1. Review and determine the role of the maritime sector in meeting transport requirements
of the economy over the next two decades, keeping in view the need to
a. Conserve energy and protect the environment,
b. Promote safety and sustain future quality of life,
c. Create an optimal intermodal mix.
2
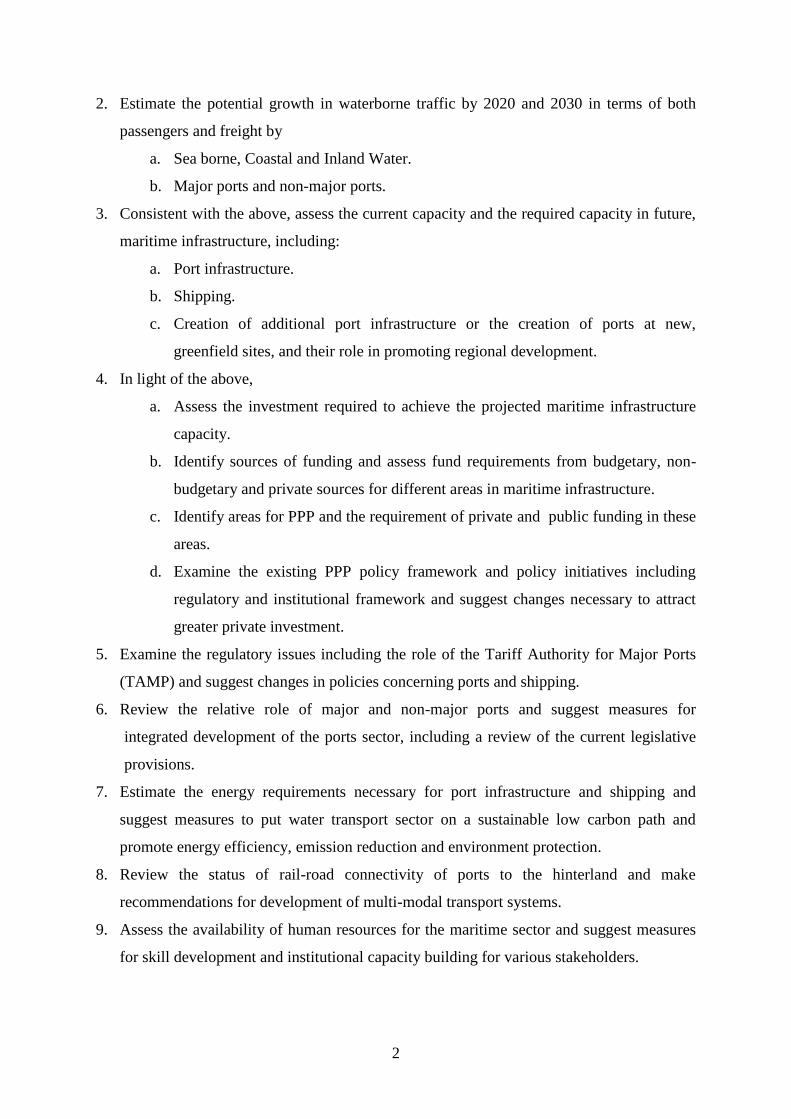
2. Estimate the potential growth in waterborne traffic by 2020 and 2030 in terms of both
passengers and freight by
a. Sea borne, Coastal and Inland Water.
b. Major ports and non-major ports.
3. Consistent with the above, assess the current capacity and the required capacity in future,
maritime infrastructure, including:
a. Port infrastructure.
b. Shipping.
c. Creation of additional port infrastructure or the creation of ports at new,
greenfield sites, and their role in promoting regional development.
4. In light of the above,
a. Assess the investment required to achieve the projected maritime infrastructure
capacity.
b. Identify sources of funding and assess fund requirements from budgetary, non-
budgetary and private sources for different areas in maritime infrastructure.
c. Identify areas for PPP and the requirement of private and public funding in these
areas.
d. Examine the existing PPP policy framework and policy initiatives including
regulatory and institutional framework and suggest changes necessary to attract
greater private investment.
5. Examine the regulatory issues including the role of the Tariff Authority for Major Ports
(TAMP) and suggest changes in policies concerning ports and shipping.
6. Review the relative role of major and non-major ports and suggest measures for
integrated development of the ports sector, including a review of the current legislative
provisions.
7. Estimate the energy requirements necessary for port infrastructure and shipping and
suggest measures to put water transport sector on a sustainable low carbon path and
promote energy efficiency, emission reduction and environment protection.
8. Review the status of rail-road connectivity of ports to the hinterland and make
recommendations for development of multi-modal transport systems.
9. Assess the availability of human resources for the maritime sector and suggest measures
for skill development and institutional capacity building for various stakeholders.
3
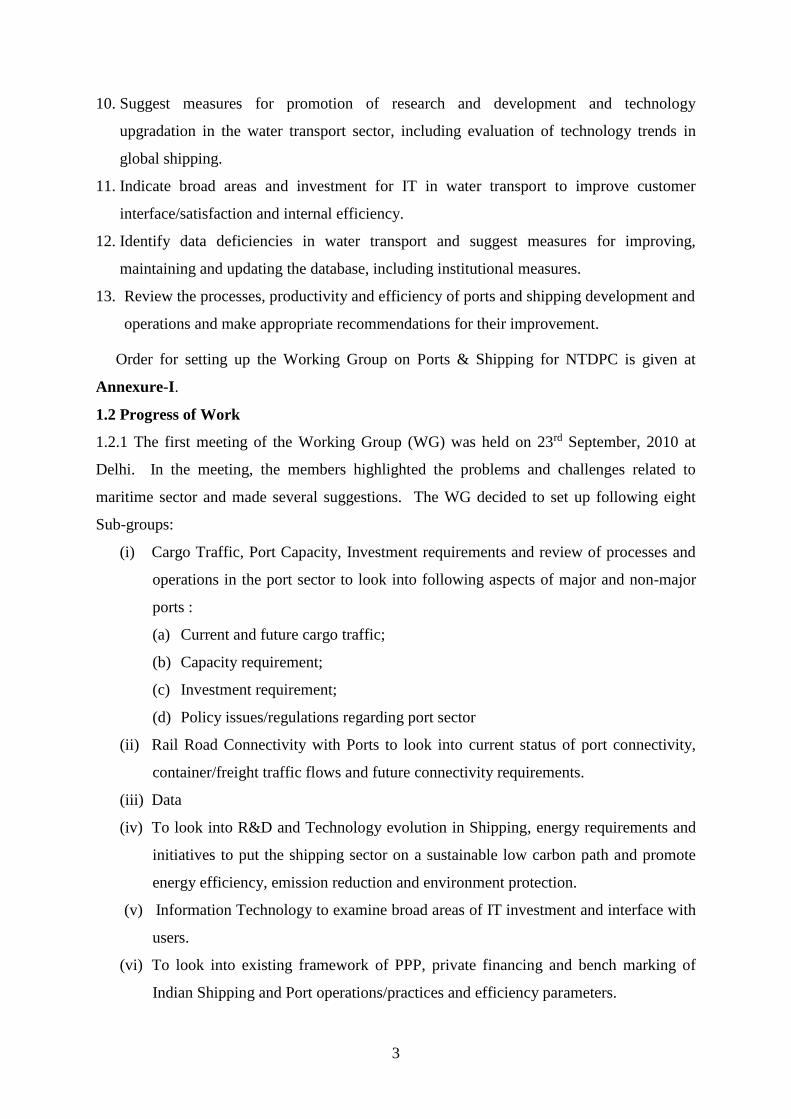
10. Suggest measures for promotion of research and development and technology
upgradation in the water transport sector, including evaluation of technology trends in
global shipping.
11. Indicate broad areas and investment for IT in water transport to improve customer
interface/satisfaction and internal efficiency.
12. Identify data deficiencies in water transport and suggest measures for improving,
maintaining and updating the database, including institutional measures.
13. Review the processes, productivity and efficiency of ports and shipping development and
operations and make appropriate recommendations for their improvement.
Order for setting up the Working Group on Ports & Shipping for NTDPC is given at
Annexure-I.
1.2 Progress of Work
1.2.1 The first meeting of the Working Group (WG) was held on 23rd September, 2010 at
Delhi. In the meeting, the members highlighted the problems and challenges related to
maritime sector and made several suggestions. The WG decided to set up following eight
Sub-groups:
(i) Cargo Traffic, Port Capacity, Investment requirements and review of processes and
operations in the port sector to look into following aspects of major and non-major
ports :
(a) Current and future cargo traffic;
(b) Capacity requirement;
(c) Investment requirement;
(d) Policy issues/regulations regarding port sector
(ii) Rail Road Connectivity with Ports to look into current status of port connectivity,
container/freight traffic flows and future connectivity requirements.
(iii) Data
(iv) To look into R&D and Technology evolution in Shipping, energy requirements and
initiatives to put the shipping sector on a sustainable low carbon path and promote
energy efficiency, emission reduction and environment protection.
(v) Information Technology to examine broad areas of IT investment and interface with
users.
(vi) To look into existing framework of PPP, private financing and bench marking of
Indian Shipping and Port operations/practices and efficiency parameters.
4
(vii) Shipping to look into status of shipping and requirement, review of processes and
operation in shipping, human resource requirement of the maritime sector and
related policy issues and regulations.
(viii) Inland Waterways to look into status, status, growth in cargo traffic and its
composition, future scenario, infrastructure, technical and regulatory issues related
to its operations and potential.
1.2.2 Order for setting up of Sub-groups is at Annexure-II.
1.2.3 All the eight Sub-groups, after wide consultations with the stakeholders had submitted
their reports to the Chairman. The Convener of the Working Group, after examination of the
Working Group report prepared draft report of the Working Group. The sub-group reports
and the draft report of the WG were discussed in the second meeting of the WG held on 9th
December, 2011. The suggestions of the members of the draft report have been incorporated
in the final report. The report was also discussed with the Chairman, NTDPC who desired
that projections should take into account slowdown in world trade (volume of goods) and in
domestic growth in 2011-12. Important policy issues were also discussed with the NTDPC.
The important policy issues and recommendations of the Ministry of shipping are at
Appendix-I.
1.3 Organisation of the Report
1.3.1 The report has been divided into 10 chapters. Chapter 1 is introductory in nature
giving the brief background of the formation of the WG, its composition, the Terms of
Reference, the programme of work followed and organization of the report. Chapter 2
outlines the challenges confronting India’s maritime sector. Commodity groupwise cargo
traffic projections at Indian Ports up to 2031-32, port capacities required to handle the cargo
traffic up to 2031-32 and investments required to create the required cargo handling capacity
are given in Chapter 3. The policy agenda for development of port sector is also covered in
Chapter 3. Current status of port connectivity, container freight traffic flows and future
connectivity requirements are identified in Chapter 4. Issues relating to data gaps in various
sub-sector of water transport sector and suggestions for meeting those data gaps are given in
Chapter 5. Chapter 6 outlines the technology evolution in shipping, energy requirements,
areas of research and development for sustainable low carbon path and promoting energy
efficiency and environment protection. Existing status of information technology (IT)
implementation in India’s maritime sector is reflected in Chapter 7. Use of technology for (i)
improving e-governance, for improving efficiencies of (i) ports, (ii) DG shipping and (iii)
5
IWAI are also detailed in the Chapter. The existing framework of Public-Private Partnership
(PPP), private financing and bench marking of Indian shipping and port operations/practices
and identification of initiatives to speed up project implementation in port sector are dealt in
Chapter 8. Chapter 9 gives status and future shipping requirements of shipping tonnage,
policy and tax issues affecting the shipping sector and key recommendations to improve the
cargo traffic of Indian shipping in world trade. The status of cargo traffic on inland
waterways in India, cargo traffic potential, problems of infrastructure and issues related to
operation of waterways and development are dealt in Chapter 10 of the report.
6
Chapter 2: Challenges for Ports & Shipping Sector
2.1 Introduction
2.1.1 Global economic integration relies upon efficient maritime transport due to its
unparallel physical capacity and ability to carry freight over long distances and at low costs.
Maritime transportation plays a major role in the national and international trade and
economic growth. The seaborne trade represents more than 80% of the international trade in
the world. Seaports in relation to trade are major gateways to the economy of a country.
Nearly everything we import comes to us on a ship, through one of our nation’s seaports. In
turn, nearly everything India sells in the global market place makes its way there via our
seaports.
2.2 Ports
2.2.1 Maritime Transport is the shipment of goods (cargo) and people by sea and other
watreways. Port operations are necessary tool to enable maritime trade between trading
partners. Ports represent a complex structure in a country’s transportation system providing
ship harbour interface services such as pilotage, dredging, provision of berths, maintenance
of navigational channels, etc., ship-port interface in terms of loading and unloading cargoes
and port-land interface in delivering cargo to and from the hinterland. Thus seaports serve
as the interface between maritime and inland transportation, play a significant role in the
economic development of a country. Maritime transport is the backbone of global trade.
2.2.2 Seaports in India are responsible for a varied range of economic activity. They
generated large resources in tax revenue through customs collections, moved more than 80
percent of the country’s overseas cargo, and handled close to 912 million tons of cargo in
2011-12.
2.2.3 Today in any context and in any country, it is essential that ports provide efficient,
adequate and competitive services. If they fail, ship-owners who find them too costly or too
slow will go elsewhere. Hence if ports do not provide cost-effective services, imports will
cost more for consumers and exports will not be competitive on world markets.
2.2.4 Draft limitation at Indian ports constrain access of large main line vessels. This
entails transportation of goods from India to major export destinations to be transshipped at
larger ports (Dubai, Singapore). Transshipment means additional handling of shipments,
which is more expensive. Consequently shipping costs escalate which erodes cost advantage
of Indian exports.
2.2.5 Ports should not be viewed in isolation but as being interdependent with and as the
other modes of transports, road or/and rail for their existence and efficient performance. Lack
of integrated or intermodal transportation constrains quick evacuation of cargo through other
modes of transport if rail-road connectivity from the ports and hinterland is inadequate.
2.2.6 Seaports are centers of commerce and trade, busy and dynamic transportation hubs
that are constantly adapting to meet ever changing global trade demands. Seaports help build
7
and grow international trade, and strengthen local and national economies. The seaports due
to their strategic location foster industrial growth. Industries are located close to seaports in
order to reduce the cost of transportation. Maritime transport spawns growth and
development of a wide range of economic activities. These include ship building and ship
repair yards, construction industry engaged in construction, maintenance and dredging of
seaports and inland waterways; information technology for safe navigation and processing
etc. The increased turnover of those engaged in maritime activity contributes to the gross
domestic product.
2.2.7 Industries tend to cluster in the vicinity of ports to reduce transportation costs
especially outward/export oriented industries. Some of the India’s maritime States have
made a conscious attempt to foster port based industrial development.
2.2.8 In addition maritime transport creates wide range of employment opportunities to
meet its various needs. Ports provide employment opportunities directly and indirectly. These
include jobs in shipbuilding and repairs, seafarers, technical persons to man ships, freight
forwarding, stevedoring, tonnage, pilotage, warehousing, financial services, etc.
2.2.9 It is noteworthy that vessels make money when they are on the move and that the time
spent on discharging and handling cargo carried by vessels cost the shipping lines money on
the crew, port charges, running costs, etc. and so less the delay in turnaround time (i.e. time
to berth, unload cargo, load any new cargo and leave the port), the better for the vessels since
delay entails heavy costs depending on the size of the vessels. Slow cargo discharge and
stacking and clearing operations lead to low throughput, longer turnaround time etc. These
factors impact port competitiveness and make them user unfriendly unattractive.
2.2.10 Electronic data interchange for the transmission of message and documents and other
information technology applications for movement of cargo in transit and clearing goods
should be in place. Vessel Traffic Services (VTS) that involves a traffic monitoring service
for improving safety, efficiency of vessel traffic and protection of the environment should be
effective and efficient. Based on VTS, vessels follow a predetermined movement depending
on their size and type, cargo carried, berth availability, pilotage requirements and can be an
effective tool to reduce/eliminate port delays.
2.2.11 The increase in the level of activities in the ports as reflected in the number of vessels
calling at the ports and the volume of cargoes handled calls for the assessment of the capacity
of the ports to handle present and future cargo throughput. Availability of storage space
influence the efficiency and productivity of any port since, there is an almost inevitable
mismatch between the rate of cargo transshipment and the rate at which it enters and leaves
the port on the landward side.
2.2.12 The operating port system is where the port authority provides the superstructure and
carries out the functions of pilotage, stevedoring activities, warehousing and cargo delivery.
On the other hand in the landlord port, the port authority provides the port facilities while the
8
private operators provide the plants and equipment and carry out the functions of cargo
delivery and discharge. A mixed port is a combination of both port systems.
2.2.13 Deep-draft seaports are dynamic, vibrant centers of trade and commerce, but what’s
most important to understand is that they depend on partnerships, both public and private.
2.2.14 We must ensure that there is adequate, safe and seamless access to ports from land
and at the same time ensure modern, navigable waterside access with channels that are deep
and wide enough to handle today’s modern vessels and marine highways to provide
transportation options for moving cargo between ports.
2.2.15 These priorities should be included in a long term, national transportation plan that
addresses freight mobility, congestion and productivity. Without such a plan and the
necessary investment to support it, economy will be less competitive. Seaports play a critical
role in our economic development; however, connecting infrastructure to ports requires
higher levels of investment. This Chapter provides an outline of policy framework to meet
the challenges confronting India’s maritime sector.
2.2.16 Shipping is necessary for the development of the national economy as well as to keep
supply lines open for transportation of essential commodities during peacetime and
emergencies such as war and famine. The existence of strong and viable national fleet serves
as balancing factor in the freight market. The key issues facing Indian shipping sector are
greater cargo support, cargo assurance through long term charter of vessels, tax regime which
enables Indian shipping companies to compete globally, promotion of coastal shipping and
equal treatment for Indian seafarers plying on vessels in International Waters and Indian
territorial waters.
2.2.17 Inland Water Transport is the most environment friendly mode with its excellent fuel
efficiency and lower emission levels. Lack of development of IWT infrastructure has
constrained full exploitation inland water transport mode. National Waterways come under the
purview of the Central Government while rest of the waterways come in the domain of State
Governments. The National Waterways carried 4.92 million tonnes of cargo in 2010-11. These
have the potential to carry 18 times the present cargo by 2029-30. IWAI has taken up some
projects in collaboration with private sector for movement of cargo on National Waterways.
The challenges for inland water transport sector are integration of waterways with other
modes of transportation to form an efficient multimodal transport network to achieve
sustainable development of IWT sector; development of waterways in North Eastern (NE)
region which has large potential/navigable stretches for IWT; Policy support for creation of
floating infrastructure i.e Barges/ Inland Vessels is critical to attract private capital for
development of IWT sector and Creation of adequate education and training facilities to help
sector specific capacity building is necessary.
9
Chapter 3: Cargo Traffic, Port Capacity, Investment requirements in the
Port Sector
3.1 Introduction
3.1.1 India has a coastline of 7517 km with 12 Major Ports and 199 notified Non-major
Ports along the coastline and Islands. Major Ports are the ports which are administered by the
Union Government, while Non-major Ports are administered by the State Governments.
3.1.2 During 2011-12 Major and Non-major ports in India accomplished a total cargo
throughput of 911.7 million tonnes reflecting a modest increase of 3.0% over 2011-12
compared to a growth of 4.2 % in 2010-11. The growth in cargo handled at Major and Non-
major ports in 2011-12 was 1.7% and 11.5% respectively compared to 1.6% and 9.1%
achieved in 2010-11. The deceleration in overall growth in India’s seaborne cargo traffic in
2011-12 reflects slowdown in global and domestic growth during the course of 2011-12.
3.1.3 The year 2011-12 was a challenging year for the Major Port Sector as it was buffeted
by three exogenous shocks (a) growth in major industrial countries which are a major market
for Indian merchandise trade decelerated from 3.2% in 2010 to 1.6% in 2011 and is projected
to grow at mere 1.4% for 2012. Similarly, growth in world merchandise trade decelerated
sharply from 14.3% in 2010 to 6.3% in 2011; (b) India’s GDP growth slowed down from
8.4% in 2010-11 to 6.5% in 2011-12. Slowdown and decline was pronounced in case of
India’s GDP pertaining to manufacturing and mining sectors: while growth in manufacturing
slowed from 7.6% in 2010-11 to 2.5% in 2011-12, growth in mining sector made a complete
about turn from 5% in 2010-11 to -0.9% in 2011-12; (c) series of judicial interventions
leading to ban/restrictions on iron ore exports which resulted in more than 30% decline in its
export. Iron ore loadings at major ports at 60.69 MT in 2011-12 were 27 MT lower
compared with iron ore loadings 2010-11 leading to overall shortfall of 30.5 MT between the
target and achievement for overall cargo traffic for 2011-12. These exogenous factors to a
large extent reflect in sharp fall in iron ore loadings and deceleration in container traffic from
12.7% in 2010-11 to 5.4 % in 2011-12.
3.2 Cargo traffic at Major Ports in 2011-12
3.2.1 Cargo traffic at 560.1 million tonnes at India’s 12 major ports during 2011-12
accounted for 61.4% of India’s total sea borne cargo. Total cargo of 560.1 million tonnes
10
comprises of cargo loaded, cargo unloaded and transhipped to the tune of 194.1 million
tonnes, 341.6 million tonnes and 24.4 million tonnes respectively. The overall compound
Annual rate of Growth (CAGR) of traffic at major ports during 1950-51 to 2011-12 has been
5.6 percent, whereas during the post- liberalisation period i.e. from 1991-92 to 2011-12, the
CAGR was 6.6 percent. The CAGR of traffic growth at major ports for the last 5 years
was 3.8 percent.
3.2.2 Commodity groupwise analysis of last 5 years of CAGR reveals that the highest
CAGR of 10.4% has been observed in container traffic, followed by 7.0% for Fertilizer
and Fertilizer raw material and 5.5% for the coal. As far as the cargo composition is
concerned, there has been a significant change in the share of Iron Ore and container traffic
during the past 5 years. The share of container traffic increased from 15.8% in 2006-07 to
21.5% in 2011-12 while the share of Iron Ore decreased from 17.4% in 2006-07 to 10.8% in
2011-12. During 2011-12, POL traffic maintained a dominant share of more than 32%,
followed by Container traffic (21.5%), Other cargo (18.0%), Iron ore (10.8%), Coal (14.1%)
and Fertilizer & FRM (3.6%).
3.3 Non – Major Ports
3.3.1 Non-major ports in India collectively handled 351.51 million tonnes of traffic during
the year 2011-12 as compared to 95.52 million tonnes of cargo handled in 2001-02. The
CAGR growth in traffic during 2001-02 to 2011-12 achieved by Non-major ports was 13.9%
compared with 6.9% achieved by Major ports in the country. The share of cargo traffic of
Non-major ports in the total cargo traffic handled by all ports in India has increased steadily
from 24.9% in 2001-02 to 38.6% in 2011-12. POL & its products (45.8%) was the single
largest commodity handled at non major ports in 2011-12 and its share has ranged between
44% (in 2006-07) to 55 % (in 2001-02). It is observed that during last five years, the relative
shares of commodities handled by the non major ports have not shown any pronounced shift.
In 2011-12, the share of coal in the total traffic was 22.3% followed by Iron Ore (10.3%) and
Building Material (3.2%).
3.3.2 The Table 3A gives commodity- wise CAGR of cargo traffic of Major Ports, Non-
major ports and for all ports from 2001-02 to 2011-12 and 2006-07 to 2011-12.
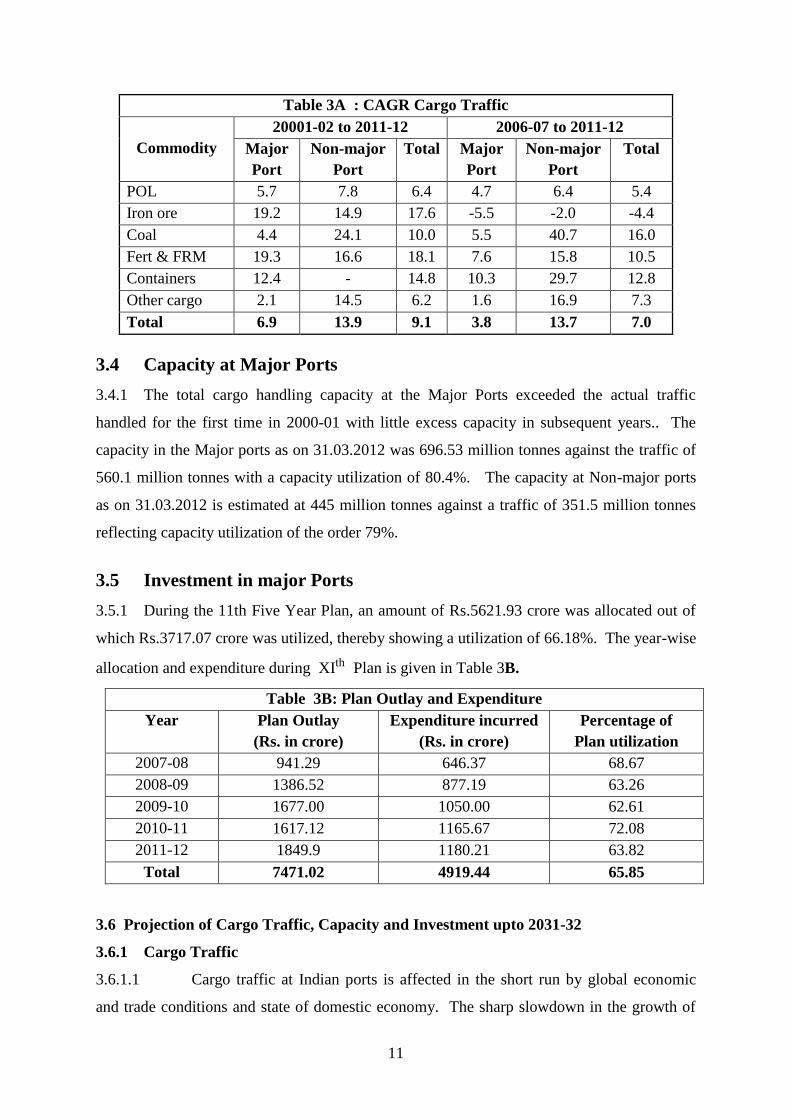
11
Table 3A : CAGR Cargo Traffic
Commodity
20001-02 to 2011-12 2006-07 to 2011-12
Major
Port
Non-major
Port
Total Major
Port
Non-major
Port
Total
POL 5.7 7.8 6.4 4.7 6.4 5.4
Iron ore 19.2 14.9 17.6 -5.5 -2.0 -4.4
Coal 4.4 24.1 10.0 5.5 40.7 16.0
Fert & FRM 19.3 16.6 18.1 7.6 15.8 10.5
Containers 12.4 - 14.8 10.3 29.7 12.8
Other cargo 2.1 14.5 6.2 1.6 16.9 7.3
Total 6.9 13.9 9.1 3.8 13.7 7.0
3.4 Capacity at Major Ports
3.4.1 The total cargo handling capacity at the Major Ports exceeded the actual traffic
handled for the first time in 2000-01 with little excess capacity in subsequent years.. The
capacity in the Major ports as on 31.03.2012 was 696.53 million tonnes against the traffic of
560.1 million tonnes with a capacity utilization of 80.4%. The capacity at Non-major ports
as on 31.03.2012 is estimated at 445 million tonnes against a traffic of 351.5 million tonnes
reflecting capacity utilization of the order 79%.
3.5 Investment in major Ports
3.5.1 During the 11th Five Year Plan, an amount of Rs.5621.93 crore was allocated out of
which Rs.3717.07 crore was utilized, thereby showing a utilization of 66.18%. The year-wise
allocation and expenditure during XIth Plan is given in Table 3B.
Table 3B: Plan Outlay and Expenditure
Year Plan Outlay
(Rs. in crore)
Expenditure incurred
(Rs. in crore)
Percentage of
Plan utilization
2007-08 941.29 646.37 68.67
2008-09 1386.52 877.19 63.26
2009-10 1677.00 1050.00 62.61
2010-11 1617.12 1165.67 72.08
2011-12 1849.9 1180.21 63.82
Total 7471.02 4919.44 65.85
3.6 Projection of Cargo Traffic, Capacity and Investment upto 2031-32
3.6.1 Cargo Traffic
3.6.1.1 Cargo traffic at Indian ports is affected in the short run by global economic
and trade conditions and state of domestic economy. The sharp slowdown in the growth of
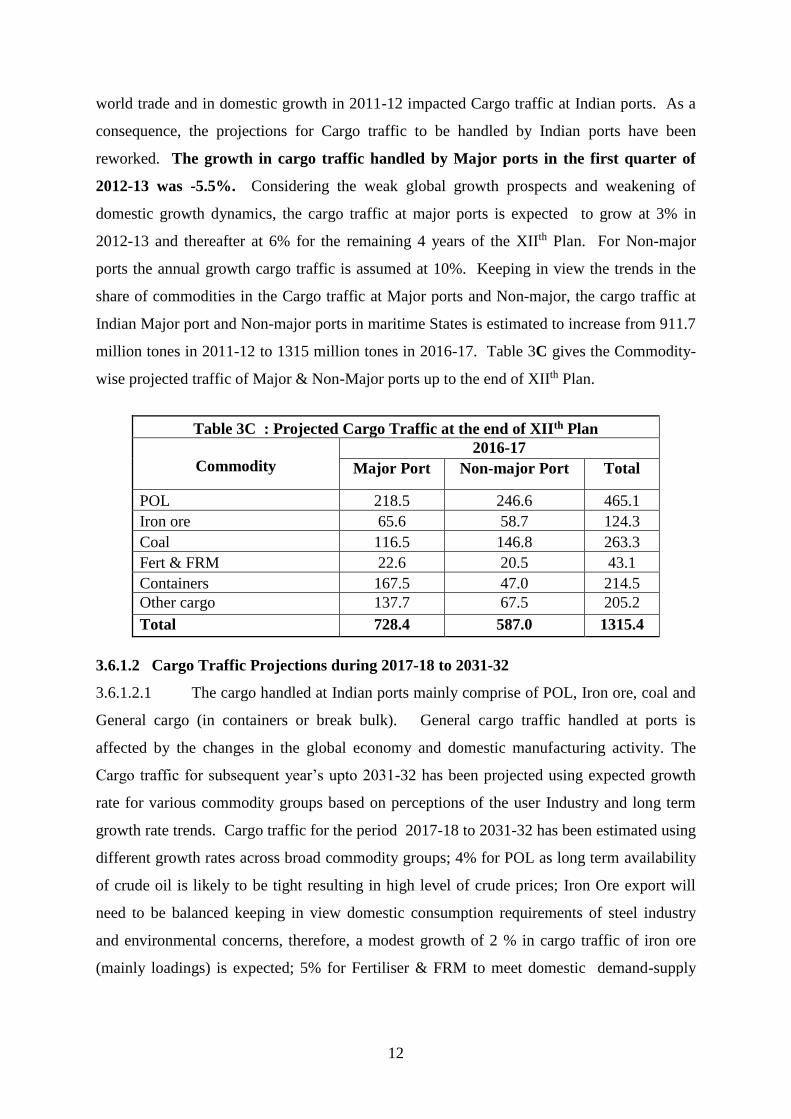
12
world trade and in domestic growth in 2011-12 impacted Cargo traffic at Indian ports. As a
consequence, the projections for Cargo traffic to be handled by Indian ports have been
reworked. The growth in cargo traffic handled by Major ports in the first quarter of
2012-13 was -5.5%. Considering the weak global growth prospects and weakening of
domestic growth dynamics, the cargo traffic at major ports is expected to grow at 3% in
2012-13 and thereafter at 6% for the remaining 4 years of the XIIth Plan. For Non-major
ports the annual growth cargo traffic is assumed at 10%. Keeping in view the trends in the
share of commodities in the Cargo traffic at Major ports and Non-major, the cargo traffic at
Indian Major port and Non-major ports in maritime States is estimated to increase from 911.7
million tones in 2011-12 to 1315 million tones in 2016-17. Table 3C gives the Commodity-
wise projected traffic of Major & Non-Major ports up to the end of XIIth Plan.
Table 3C : Projected Cargo Traffic at the end of XIIth Plan
Commodity
2016-17
Major Port Non-major Port Total
POL 218.5 246.6 465.1
Iron ore 65.6 58.7 124.3
Coal 116.5 146.8 263.3
Fert & FRM 22.6 20.5 43.1
Containers 167.5 47.0 214.5
Other cargo 137.7 67.5 205.2
Total 728.4 587.0 1315.4
3.6.1.2 Cargo Traffic Projections during 2017-18 to 2031-32
3.6.1.2.1 The cargo handled at Indian ports mainly comprise of POL, Iron ore, coal and
General cargo (in containers or break bulk). General cargo traffic handled at ports is
affected by the changes in the global economy and domestic manufacturing activity. The
Cargo traffic for subsequent year’s upto 2031-32 has been projected using expected growth
rate for various commodity groups based on perceptions of the user Industry and long term
growth rate trends. Cargo traffic for the period 2017-18 to 2031-32 has been estimated using
different growth rates across broad commodity groups; 4% for POL as long term availability
of crude oil is likely to be tight resulting in high level of crude prices; Iron Ore export will
need to be balanced keeping in view domestic consumption requirements of steel industry
and environmental concerns, therefore, a modest growth of 2 % in cargo traffic of iron ore
(mainly loadings) is expected; 5% for Fertiliser & FRM to meet domestic demand-supply
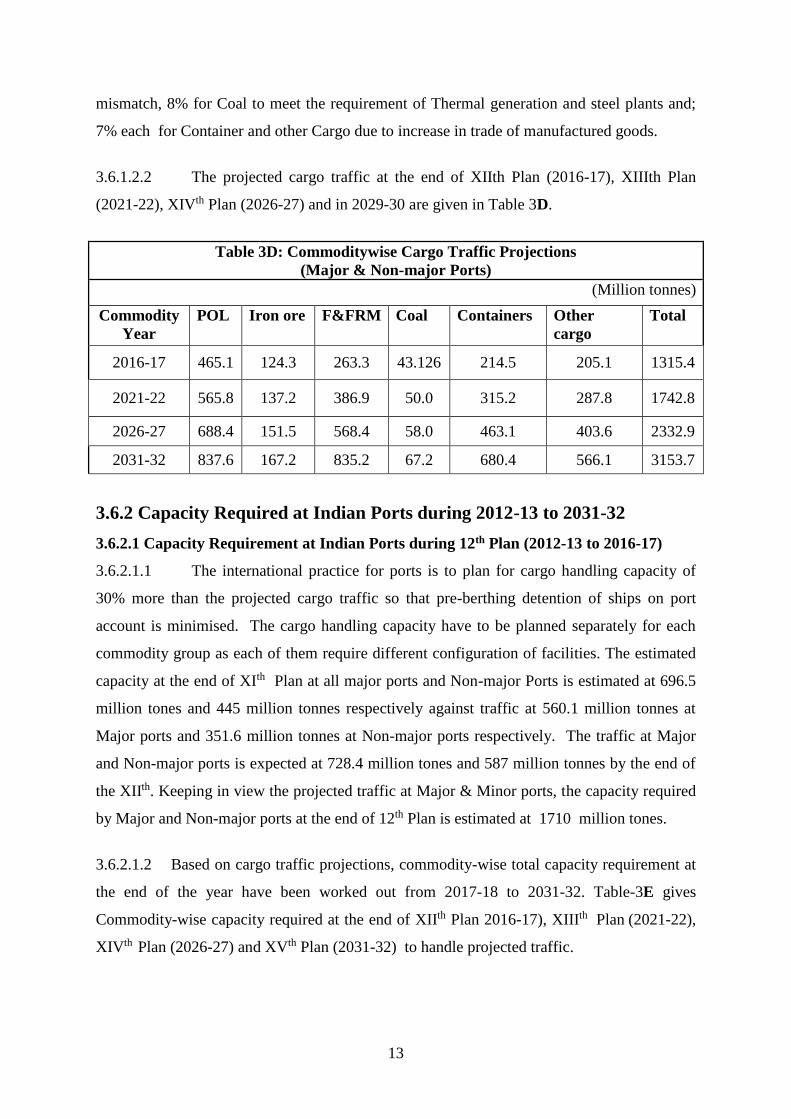
13
mismatch, 8% for Coal to meet the requirement of Thermal generation and steel plants and;
7% each for Container and other Cargo due to increase in trade of manufactured goods.
3.6.1.2.2 The projected cargo traffic at the end of XIIth Plan (2016-17), XIIIth Plan
(2021-22), XIVth Plan (2026-27) and in 2029-30 are given in Table 3D.
Table 3D: Commoditywise Cargo Traffic Projections
(Major & Non-major Ports)
(Million tonnes)
Commodity
Year
POL Iron ore F&FRM Coal Containers Other
cargo
Total
2016-17 465.1 124.3 263.3 43.126 214.5 205.1 1315.4
2021-22 565.8 137.2 386.9 50.0 315.2 287.8 1742.8
2026-27 688.4 151.5 568.4 58.0 463.1 403.6 2332.9
2031-32 837.6 167.2 835.2 67.2 680.4 566.1 3153.7
3.6.2 Capacity Required at Indian Ports during 2012-13 to 2031-32
3.6.2.1 Capacity Requirement at Indian Ports during 12th Plan (2012-13 to 2016-17)
3.6.2.1.1 The international practice for ports is to plan for cargo handling capacity of
30% more than the projected cargo traffic so that pre-berthing detention of ships on port
account is minimised. The cargo handling capacity have to be planned separately for each
commodity group as each of them require different configuration of facilities. The estimated
capacity at the end of XIth Plan at all major ports and Non-major Ports is estimated at 696.5
million tones and 445 million tonnes respectively against traffic at 560.1 million tonnes at
Major ports and 351.6 million tonnes at Non-major ports respectively. The traffic at Major
and Non-major ports is expected at 728.4 million tones and 587 million tonnes by the end of
the XIIth. Keeping in view the projected traffic at Major & Minor ports, the capacity required
by Major and Non-major ports at the end of 12th Plan is estimated at 1710 million tones.
3.6.2.1.2 Based on cargo traffic projections, commodity-wise total capacity requirement at
the end of the year have been worked out from 2017-18 to 2031-32. Table-3E gives
Commodity-wise capacity required at the end of XIIth Plan 2016-17), XIIIth Plan (2021-22),
XIVth Plan (2026-27) and XVth Plan (2031-32) to handle projected traffic.
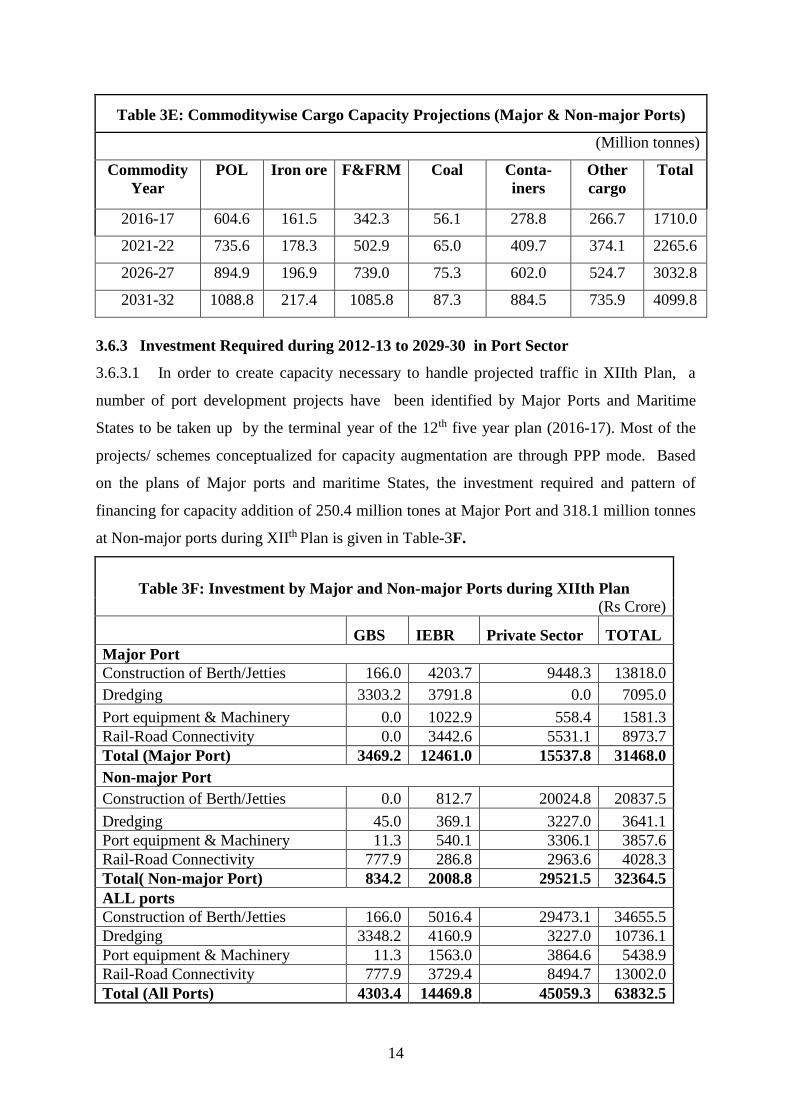
14
Table 3E: Commoditywise Cargo Capacity Projections (Major & Non-major Ports)
(Million tonnes)
Commodity
Year
POL Iron ore F&FRM Coal Conta-
iners
Other
cargo
Total
2016-17 604.6 161.5 342.3 56.1 278.8 266.7 1710.0
2021-22 735.6 178.3 502.9 65.0 409.7 374.1 2265.6
2026-27 894.9 196.9 739.0 75.3 602.0 524.7 3032.8
2031-32 1088.8 217.4 1085.8 87.3 884.5 735.9 4099.8
3.6.3 Investment Required during 2012-13 to 2029-30 in Port Sector
3.6.3.1 In order to create capacity necessary to handle projected traffic in XIIth Plan, a
number of port development projects have been identified by Major Ports and Maritime
States to be taken up by the terminal year of the 12th five year plan (2016-17). Most of the
projects/ schemes conceptualized for capacity augmentation are through PPP mode. Based
on the plans of Major ports and maritime States, the investment required and pattern of
financing for capacity addition of 250.4 million tones at Major Port and 318.1 million tonnes
at Non-major ports during XIIth Plan is given in Table-3F.
Table 3F: Investment by Major and Non-major Ports during XIIth Plan
(Rs Crore)
GBS IEBR Private Sector TOTAL
Major Port
Construction of Berth/Jetties 166.0 4203.7 9448.3 13818.0
Dredging 3303.2 3791.8 0.0 7095.0
Port equipment & Machinery 0.0 1022.9 558.4 1581.3
Rail-Road Connectivity 0.0 3442.6 5531.1 8973.7
Total (Major Port) 3469.2 12461.0 15537.8 31468.0
Non-major Port
Construction of Berth/Jetties 0.0 812.7 20024.8 20837.5
Dredging 45.0 369.1 3227.0 3641.1
Port equipment & Machinery 11.3 540.1 3306.1 3857.6
Rail-Road Connectivity 777.9 286.8 2963.6 4028.3
Total( Non-major Port) 834.2 2008.8 29521.5 32364.5
ALL ports
Construction of Berth/Jetties 166.0 5016.4 29473.1 34655.5
Dredging 3348.2 4160.9 3227.0 10736.1
Port equipment & Machinery 11.3 1563.0 3864.6 5438.9
Rail-Road Connectivity 777.9 3729.4 8494.7 13002.0
Total (All Ports) 4303.4 14469.8 45059.3 63832.5
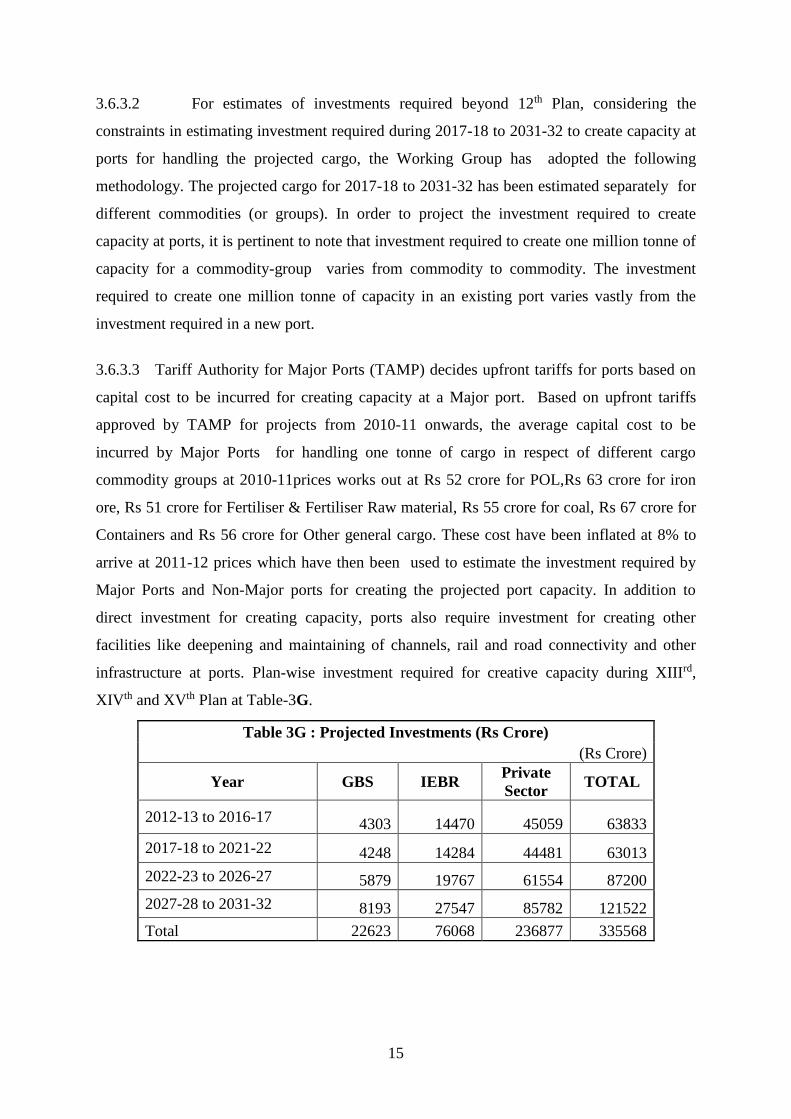
15
3.6.3.2 For estimates of investments required beyond 12th Plan, considering the
constraints in estimating investment required during 2017-18 to 2031-32 to create capacity at
ports for handling the projected cargo, the Working Group has adopted the following
methodology. The projected cargo for 2017-18 to 2031-32 has been estimated separately for
different commodities (or groups). In order to project the investment required to create
capacity at ports, it is pertinent to note that investment required to create one million tonne of
capacity for a commodity-group varies from commodity to commodity. The investment
required to create one million tonne of capacity in an existing port varies vastly from the
investment required in a new port.
3.6.3.3 Tariff Authority for Major Ports (TAMP) decides upfront tariffs for ports based on
capital cost to be incurred for creating capacity at a Major port. Based on upfront tariffs
approved by TAMP for projects from 2010-11 onwards, the average capital cost to be
incurred by Major Ports for handling one tonne of cargo in respect of different cargo
commodity groups at 2010-11prices works out at Rs 52 crore for POL,Rs 63 crore for iron
ore, Rs 51 crore for Fertiliser & Fertiliser Raw material, Rs 55 crore for coal, Rs 67 crore for
Containers and Rs 56 crore for Other general cargo. These cost have been inflated at 8% to
arrive at 2011-12 prices which have then been used to estimate the investment required by
Major Ports and Non-Major ports for creating the projected port capacity. In addition to
direct investment for creating capacity, ports also require investment for creating other
facilities like deepening and maintaining of channels, rail and road connectivity and other
infrastructure at ports. Plan-wise investment required for creative capacity during XIIIrd,
XIVth and XVth Plan at Table-3G.
Table 3G : Projected Investments (Rs Crore)
(Rs Crore)
Year GBS IEBR Private
Sector TOTAL
2012-13 to 2016-17 4303 14470 45059 63833
2017-18 to 2021-22 4248 14284 44481 63013
2022-23 to 2026-27 5879 19767 61554 87200
2027-28 to 2031-32 8193 27547 85782 121522
Total 22623 76068 236877 335568
16
3.7 Policy Issues/regulations
3.7.1 The Ministry of Shipping has in their Maritime Agenda 2010-20 laid out policy
agenda for the future. Salient features of that agenda are:
(i) The Major ports to continue to work towards implementing ‘landlord port’ concept
duly limiting their role to maintenance of channels and basic infrastructure leaving the
development operation management of terminal and cargo handling facilities to the private
sector.
(ii) Public Private Partnerships will be the preferred mode for the development of port
terminals and other commercially viable activities in the Major Ports.
(iii) Policy has been laid down to prevent private sector monopoly in Major Ports.
(iv) There is a need for a Port Regulator for monitoring and regulating the service levels,
technical & performance standards.
(v) The environmental clearance process be reviewed as one of the major factors for
delay in the fructification of projects is the long environmental clearance mechanism
procedure.
(vi) Protection of environment is an indispensable factor for sustainable economic growth.
Environmental issues including the handling of hazardous and noxious substances in a port,
prevention of air, water and soil pollution in ports, treatment of ballast water etc., need to be
addressed and tackled. The port industry in general is faced with sustainability issues –
compliance to international and national regulations vis-à-vis demands for bigger port
capacity and increased productivity without compromising environmental quality. Without
regulation, it would be difficult to implement greener practices, as these may put operators at
a competitive disadvantage. Other related issues are availability of incentives to encourage
green practices, cost and availability of clean fuel, the need to do more research on green
technologies, use of shoreside power, training programmes for such industry and designating
emission control areas.
(vii) Recognising the need to impart structured training to all port personnel including
officers, it is essential to re-train them towards multi-skilling. Every employee should
undergo different tiers of training programme during his service. Focus would be on
revamping of port based training institutions.
(viii) Inadequacy of pilots to navigate vesels in the channels need to be addressed.
(ix) Financial support for dredging is necessary for reducing the port charges.
(x) To ensure seamless flow of cargo, non-major ports need to work with the State
Governments and other authorities to commission 4 - lanes Road connectivity and 2 - lanes
17
Rail Connectivity at their ports so as to facilitate speedy evacuation of cargo. Similarly,
Major Ports may endeavour to expand their connectivity to 8-lane Road Connectivity and 4-
lanes Rail-connectivity by 2020.
(xi) There is a need to develop at least 4 hub ports to receive the 13,500+ TEU
containerships.
(xii) A comprehensive policy need to be evolved for cruise shipping with adequate
arrangements in terms of state of art Passenger Terminals, Baggage screening, Customs
clearance, Immigration, Tourism related ancillaries backed up by effective publicity so that
Indian Ports also become truly world class destinations as in the case of Singapore, Dubai and
several western European and Caribbean countries.
(xiii) Maritime projects are specialized in nature and they require a specialized scrutiny and
appraisal for obtaining the finances. There is a need for a specialized Maritime Finance
Corporation with the equity of ports and financial institutions to fund the Port projects.
(xiv) There is need to strengthen co-operation with international organizations for sharing
the expertise in cargo handling operations and port management, exchange of information,
co-operation in training needs and modules development, establishing joint ventures of
mutual interest, promoting synergy and trade facilitation in the areas of their expertise etc.
(xv) The Governments, both Central and State should transform the legislative frame-
work in tune with the current requirements. Necessary amendments to the Major Ports Act,
1963, Indian Ports Act, 1908 and Maritime Board Acts of respective State Governments need
to be carried out.
(xvi) India with immense expertise in operating ports with highly skilled manpower and
specialised knowledge in port operations, should float a special purpose vehicle for making
investments in ports abroad to become a truly global power in Port Sector world-wide. It
would be appropriate to incorporate a new special purpose vehicle to pursue the objectives.
3.8 Interaction with Stakeholders
3.8.1 The Working Group had called for suggestions from stakeholders viz. non-major
Ports and terminal operators, industries importing/exporting cargo, maritime companies.
Some of the areas of concern of Stakeholders of the port sector are:
(i) The private ports and new upcoming ports are subject to the Navigational Safety in
Ports Committee ( NSPC) inspection and audits on yearly basis and whenever they add a
new facility. This process takes a long time. A timeframe should be laid down within which
18
the audit must necessarily be completed, preferably within 60 days of port declaring readiness
for the audit.
(ii) To address the shortage of pilots, it is suggested that Chief Officers/ 2nd mates and 3rd
mates be permitted to train as Pilots by undergoing longer training schedules.
(iii) To reduce manning cost of Port Crafts, it is suggested that manning for all crafts
which are exclusively used for Port Operations in all the ports of our country without
exception be permitted to be manned as per Inland Vessel Act.
(iv) Dredging cost is a major recurring expenditure for all Indian ports. The ports should
be allowed to build dredgers as per Merchant Shipping (MS) Act and man them as perInland
Vessel (IV) or River Sea rules as they deem fit. This will ensure that ports are able to deepen
and maintain their channel approaches and berth faces with minimal cost.
(v) The state Maritime Boards be allowed to regulate the private ports and emphasis
should be on self regulation rather than through complex rules and regulations
(vi) The legislative frame work needs a relook in tune with the current requirements. The
present Port Acts would need to be suitably amended so that the private ports come under the
same umbrella as available to major ports under the Major Port Act. It is important that the
Indian Port Act of 1908 and the MS Act are thoroughly revised and new laws brought in
place so that the laws are in line with the developments, which have taken place in the
shipping industry in the last 5 Years.
(vii) When the port sector was opened for privatization, Tariff Authority for Major Ports
(TAMP) was created as an independent tariff fixing body for port related services. Since then
many new ports have come up and many new ones continue to be built. The existing and
new ports compete with each other for traffic. Thus scope for monopolistic practices is
constrained. India now has a competition commission which regulates monopolistic anti-
competitive behavior in all sectors. Tariff fixation i.e Scale of rates for cargo handling and
vessel related services is fixed by the TAMP. Owing to TAMP’s regulation, major ports do
not have the flexibility in fixing tariff vis-à-vis the non-major ports with whom those compete
and are not subject to tariff regulations.
3.9 Inter-port and Intra-port Competition
3.9.1 Competition discourages the abuse of market power and monopolistic rent seeking by
port operators and service providers and drives innovation. The port competition can be inter-
port competition, where ports or port service providers compete within the same cargo
hinterland; intra-port competition, where service providers compete at the same port for the
19
same market using different terminals, which they typically control; and intra-terminal
competition, where suppliers provide competing services from the same terminal.
3.9.2 Factors constraining inter and intra port competition are high entry and exit costs and
high fixed cost compared to variable costs. Under the freedom of navigation arrangements,
shipping service providers have no barriers to entry and are able to deploy assets into
shipping routes in an unregulated manner. Consequently, despite the existence of liner
conferences and high replacement cost of ships and relatively low margin in the management
of shipping services, the trading community are able to access a variety of shipping services
at competitive costs.
3.9.3 The policy approach of the Government has been to mitigate monopoly domination
by a single Operator. The policy states that if there is only one private terminal/berth operator
in a port for a specific cargo, the operator of that berth or his associates shall not be allowed
to bid for the next terminal/berth for handling the same cargo in the same port. Earlier, when
the JNPT was to award third terminal, they debarred the then existing P&O Australia from
bidding for the third Terminal. Aggrieved by this decision P&O Australia went up to the
level of Supreme Court but lost. Similarly, PSA was not allowed to bid for the second
Terminal in Tuticorin and DP World was barred from bidding for the second container
terminal in Chennai port. Private terminal operators have expressed their reservations on this
policy. First, given a situation where demand exceeds the supply as far as container handling
capacity is concerned is it desirable to bar incumbent terminal operators from bidding in the
same port. Second, there is an independent Tariff setting Authority for Ports which fixes
tariffs subject to a predetermined cap on return on investment. Third, competition issues
should better be left for the consideration of the Competition Commission which was set up
in India under the provisions of the Competition Act, 2002. The Competition Act lists
several factors that will be considered when dealing with a complaint alleging abuse of a
dominant position. Other than the usual suspects like market share, size and resources of the
enterprise, they also include factors like vertical integration of the enterprise, social
obligations and social costs, relative advantage by way of contribution to the economic
development by the enterprise enjoying a dominant position and dependence of the
consumers on the enterprise.
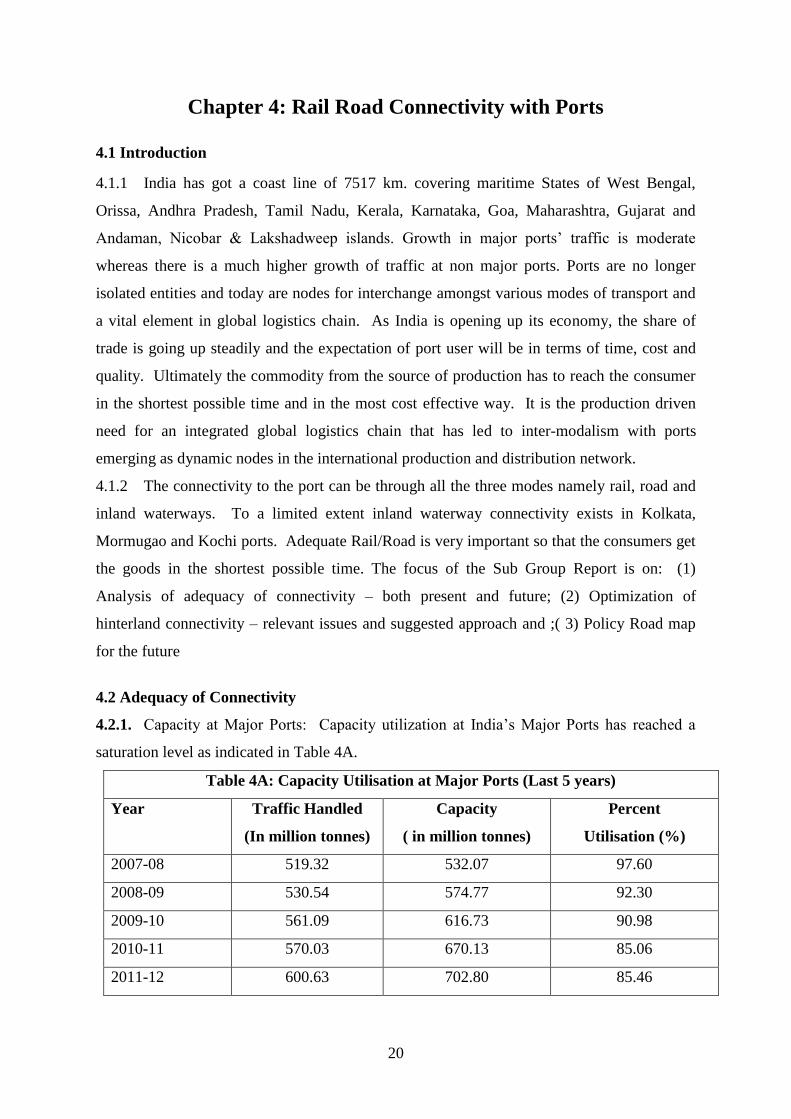
20
Chapter 4: Rail Road Connectivity with Ports
4.1 Introduction
4.1.1 India has got a coast line of 7517 km. covering maritime States of West Bengal,
Orissa, Andhra Pradesh, Tamil Nadu, Kerala, Karnataka, Goa, Maharashtra, Gujarat and
Andaman, Nicobar & Lakshadweep islands. Growth in major ports’ traffic is moderate
whereas there is a much higher growth of traffic at non major ports. Ports are no longer
isolated entities and today are nodes for interchange amongst various modes of transport and
a vital element in global logistics chain. As India is opening up its economy, the share of
trade is going up steadily and the expectation of port user will be in terms of time, cost and
quality. Ultimately the commodity from the source of production has to reach the consumer
in the shortest possible time and in the most cost effective way. It is the production driven
need for an integrated global logistics chain that has led to inter-modalism with ports
emerging as dynamic nodes in the international production and distribution network.
4.1.2 The connectivity to the port can be through all the three modes namely rail, road and
inland waterways. To a limited extent inland waterway connectivity exists in Kolkata,
Mormugao and Kochi ports. Adequate Rail/Road is very important so that the consumers get
the goods in the shortest possible time. The focus of the Sub Group Report is on: (1)
Analysis of adequacy of connectivity – both present and future; (2) Optimization of
hinterland connectivity – relevant issues and suggested approach and ;( 3) Policy Road map
for the future
4.2 Adequacy of Connectivity
4.2.1. Capacity at Major Ports: Capacity utilization at India’s Major Ports has reached a
saturation level as indicated in Table 4A.
Table 4A: Capacity Utilisation at Major Ports (Last 5 years)
Year Traffic Handled
(In million tonnes)
Capacity
( in million tonnes)
Percent
Utilisation (%)
2007-08 519.32 532.07 97.60
2008-09 530.54 574.77 92.30
2009-10 561.09 616.73 90.98
2010-11 570.03 670.13 85.06
2011-12 600.63 702.80 85.46
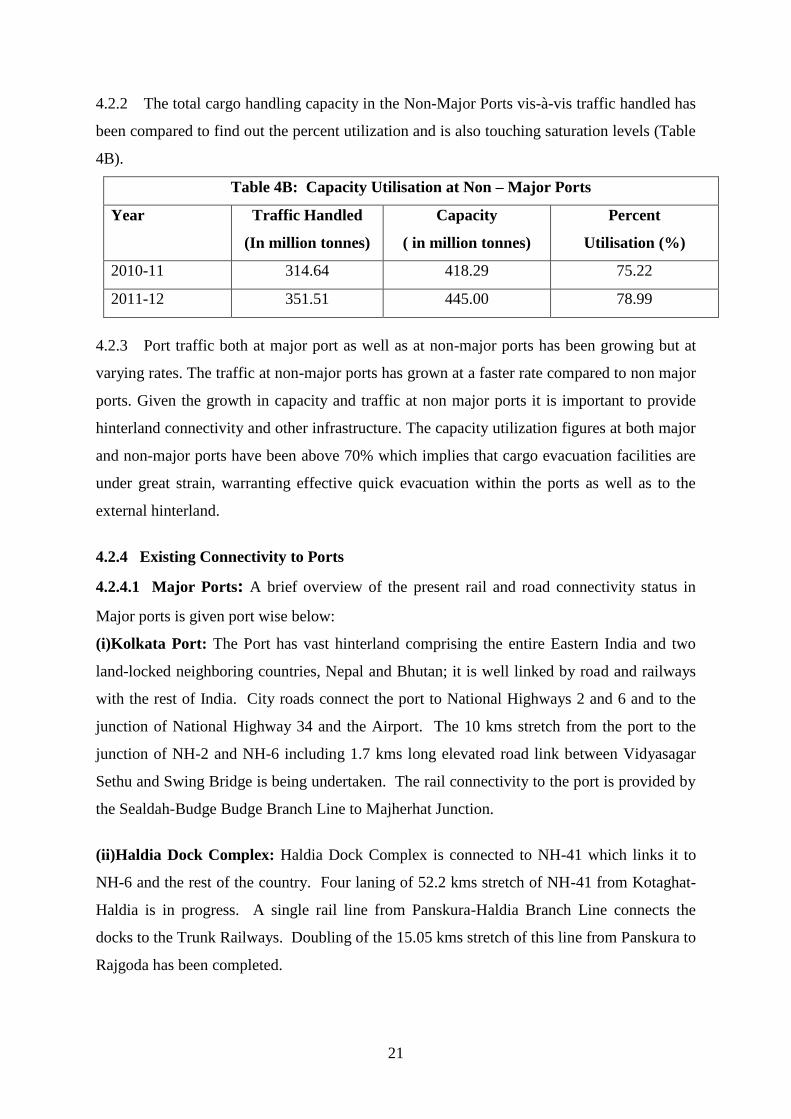
21
4.2.2 The total cargo handling capacity in the Non-Major Ports vis-à-vis traffic handled has
been compared to find out the percent utilization and is also touching saturation levels (Table
4B).
Table 4B: Capacity Utilisation at Non – Major Ports
Year Traffic Handled
(In million tonnes)
Capacity
( in million tonnes)
Percent
Utilisation (%)
2010-11 314.64 418.29 75.22
2011-12 351.51 445.00 78.99
4.2.3 Port traffic both at major port as well as at non-major ports has been growing but at
varying rates. The traffic at non-major ports has grown at a faster rate compared to non major
ports. Given the growth in capacity and traffic at non major ports it is important to provide
hinterland connectivity and other infrastructure. The capacity utilization figures at both major
and non-major ports have been above 70% which implies that cargo evacuation facilities are
under great strain, warranting effective quick evacuation within the ports as well as to the
external hinterland.
4.2.4 Existing Connectivity to Ports
4.2.4.1 Major Ports: A brief overview of the present rail and road connectivity status in
Major ports is given port wise below:
(i)Kolkata Port: The Port has vast hinterland comprising the entire Eastern India and two
land-locked neighboring countries, Nepal and Bhutan; it is well linked by road and railways
with the rest of India. City roads connect the port to National Highways 2 and 6 and to the
junction of National Highway 34 and the Airport. The 10 kms stretch from the port to the
junction of NH-2 and NH-6 including 1.7 kms long elevated road link between Vidyasagar
Sethu and Swing Bridge is being undertaken. The rail connectivity to the port is provided by
the Sealdah-Budge Budge Branch Line to Majherhat Junction.
(ii)Haldia Dock Complex: Haldia Dock Complex is connected to NH-41 which links it to
NH-6 and the rest of the country. Four laning of 52.2 kms stretch of NH-41 from Kotaghat-
Haldia is in progress. A single rail line from Panskura-Haldia Branch Line connects the
docks to the Trunk Railways. Doubling of the 15.05 kms stretch of this line from Panskura to
Rajgoda has been completed.
22
(iii) Paradip Port: The port is connected to NH-5 through a two lane road (78 kms.) up to
Chandikol. Four laning of the road is completed. The two lane State Highway 12 from the
port to Cuttack provides network between the port and the mines. Port is connected by a
Double line section with Cuttack which connects Howrah-Chennai Trunk Line. The 155 kms
Daitari-Banspani rail line is under construction. The 78 kms Haridaspur-Paradip Rail Link to
provide a dedicated corridor from the Port with the iron ore mines and steel plants is also
under construction.
(iv) Visakhapatnam Port:The port has two harbours viz. Inner Harbour and Outer
Harbour. The port has one of the deepest container terminal among major ports (14.9 mtrs).
The port is connected to NH-5. A project for improving the 12.47 kms long stretch of Naval
Dockyard and Industrial by pass State road is available. The port is also connected to the
Chennai –Howrah main railway line of the East Coast Route.
(v) Ennore Port Limited:The first corporate Major port in India, the port is situated at
Ennore, 25 kms north of Chennai on India’s east coast. The port is a functional landlord port.
The port is connected to NH-4, NH-5 and NH-45, Rail connectivity from the port is also
available. Ennore – Manali Road improvement Project (EMRIP) costing around Rs. 600
Crore is to be executed by SPV (comprising NHAI, Chennai Port Trust, Government of
Tamilnadu and Ennore Port Ltd). The objective of the project is to widen and strengthen a
number of roads including Ennore Expressway, Manali Oil Refinery Road etc. covering a
distance of 19 Kms. This road improvement plan is envisaged to improve the connectivity to
Ennore and Chennai Ports. Northern Port Access Road i.e. “Ennore Port – Thatchur Road”
of length 25.5 kms. to NH-5 at a cost of Rs.455 Crore is also being taken up through NHAI.
A new BG line between Puttur-Athipattu (88 kms.) is also to be taken up through the new R3i
policy of Railways.
(vi) Chennai Port:The port is connected by road to NH-5 (Chennai-Kolkata), NH-4
(Chennai – Bangalore / Hyderabad etc.) and NH-45 (Chennai –Dindugal/ Tiruchirappalli.
Apart from national highways the east coast highway connects the city with Puducherry and
rest of South India. NHAI has also taken up Ennore-Manali Road improvement Project
(EMRIP) costing Rs.600 crores, which involves shore protection works, Ennore expressway,
TPP Road, IRR and MOR Road etc. Port is also well connected with the railway network to
the southern parts of Tamil Nadu as also to the rest of India. Chennai Port – Maduravoyal 4
Lane Elevated Corridor project has been taken up through the NHDP Phase-VII to be
23
executed under BOT model at a total estimated cost of Rs,1,655 Crore covering a distance of
19 Kms. The majority of the expressway shall be alongside the river Coovum. The elevated
corridor shall begin from the Exit/Entry Gate of Chennai Port on the southern end to
Maduravoyal connecting NH-4 which leads to the industrial hinterland of Sriperumbudur of
Kanchipuram District and further to Bangalore, Hyderabad etc. Unless the above connectivity
projects at Ennore and Chennai port are implemented, it will be difficult for evacuation of
cargo to be handled at the proposed Chennai Mega container terminal.
(vii) VOC Port (Tuticorin Port): The port has two lane road connectivity through NH-
45B, NH-7 and NH-7A. Four laning of the 47.2 kms stretch of NH-7A between Tuticorin
and Tirunelvelli and NH-45B are in progress. Port/Marshalling yard is connected to
Milavattan junction on the Vanchi maniyachi-Tuticorin section and main line of Southern
Railways.
(viii) Cochin Port:Road connectivity to the port from the mainland is through two bridges
–one on Mattanchery channel and the other on Emakulam Channel. A link road connects
Willingdon Island to NH-47 bypass. Four laning of the 10.40 stretch of NH-47 is under
progress. A single rail line which branches off at Emakulam from the main line from
Shornur—Trivandrum also serves the port. Action is being taken to provide rail connectivity
and National Highway connectivity to the upcoming International Container Transhipment
Terminal, which is targeted to serve the hinterland extending to Major Industrial Hubs of
India. A 17.2 km long four-lane road that will connect the Container Terminal to three
National Highways NH-47 (Setam), NH017 (Mumbai) and (indirectly) to NH-49 (Madurai)
has been newly created. The connectivity to the National railway grid is established to
facilitate container movement to the North Indian Industrial hubs. An 8.86 km long link line
from ICTT to the main rail grid is operational since November 2010. The link will support
the formation of a freight corridor for movement of exports from Tamil Nadu and Karnataka
in future. In addition to the rail/road linking, an Inland water connectivity is also needed to
the terminal in the state of Kerala. The National Waterway (NW3) maintained by the Inland
Waterway Authority of India runs in proximity to the Cochin Port. In the wake of the
commissioning of ICTT, the Waterway Authority is adding two new terminals near the port
to facilitate the movement of Ro-ro barges (Roll on and Roll of) which will enable movement
of container traffic from South Kerala through the Inland Waterways. The terminals will also
24
facilitate movement of containers by coastal vessels and river-sea vessels from west coast
Non-Major Ports.
(ix) New Mangalore Port: It is located in Karnataka State on the west Coast of India, well
connected to the Industrial hubs of Southern India as well as North India via Konkan railway.
Road connectivity to the port is provided through NH-48 (Bangalore-Mangalore), NH-17
(Cochin-Goa-Mangalore) and NH-13 (Sholapur-Mangalore). Four laning of NH-17
(Suratkal-Nantur section), NH-48 (Padil-Bantwal section) and a bypass from Nantur junction
on NH-17 to Padil junction on NH-48 is in progress. A broad guage railway line connects the
port to the southern parts of the country and the Konkan Railway links the port through
Mangalore with Mumbai. Limited rail capacity available for Hassan-Mangalore is only 6
rakes/day (4 down and 2 up) and further rail connectivity through new routes like Hubli-
Ankola have to be established.
(x) Mormugao Port: The port accounted for about 32% of Iron Ore export of the
country (before the ban). Two lane road links from the port to NH-17A through Vasco city is
available. Four laning of 18 kms stretch of NH-17B from Verna Junction on NH-17 to
Mormugao Port is in progress. Rail connectivity to the port is also available.
(xi) Mumbai Port Trust:The port has Indira dock system with 33 berths on the mainland.
The two docks being Prince & Victoria Docks are being used for storage space of off-shore
container berths. The port is well connected to other parts of the country through NH-8
(Ahmedabad), NH-3 (Delhi and Kolkata), NH-4 (Bangalore) and NH-17 (Goa/Mangalore),
Anik-Panjorpole Link Road to provide access between Mumbai Port and Southern parts of
Mumbai, Navi Mumbai on the mainland to the East and Eastern Express Highway is being
undertaken. The port is connected to the Indian Railways at Raoli, Junction, Wadala. At
present trains to Mumbai Port have to move to Kurla and Wadala on busy suburban section.
To address this issue, deposit work by Mumbai Port & Railways for providing third line
between Wadala and Kurla is already sanctioned at a cost of Rs. 131 Crore and is targeted to
be completed by December 2012. Presently R&R works are in progress.
(xii) Jawaharlal Nehru Port: The port is connected through NH-4B to the Mumbai-Pune
Expressway, NH-17 to Mumbai-Goa Highway, SH-54 to the western parts of India. Four
laning of NH-4B and SH-54 and construction of a four lane Amra Marg including six lane
major bridge across Panvel Creek is also in operation. The port is well connected by rail to
25
Panvel. A proposal for construction of grade separators through SPV (NHAI, JNPT and State
Government) is under active consideration. Similarly, construction of second evacuation
road from container gate to CFS / Dronagiri with respect the proposed development of SEZ
in the area is also under consideration.
(xiii) Kandla Port: A gateway to the North West India, it accesses a vast hinterland of 1
million sq. kms stretching up to Jammu & Kashmir by meter gauge and broad gauge railway
system. The port has two lanes and four land approaches to NH-8A. Four laning of various
sections of NH-8A have also been implemented. The port is connected by rail to Mumbai
and Delhi via Ahmedabad. The port has metre-gauge connectivity to Palanpur.
Gandhidham-Kandla Port is single line section and doubling of Gandhidham-Kandla Port is
in progress. Road from NH-8A to Tuna Port will be widened from two lanes to four lanes.
Providing railway connectivity to Tuna Port for 10 kms. will be taken up ;through Western
Railways as a deposit work.
4.2.4.2 Non- Major Ports
4.2.4.2.1 It is equally important to look at the existing connectivity at non-major ports.
Even though there are about 176 Non-major ports across maritime states of which about 60-
65 Ports are active ports handling EXIM cargo and rest are mainly fishing harbours. Even
out of these 60-65 active non major ports only six enjoy rail connectivity upto the port.
Another 8-10 ports have connectivity upto the nearest railway station and will need last mile
connectivity to enable evacuation of cargo by rail. Thus there is an urgent need of improving
rail connectivity. Even the connectivity by road is a serious bottleneck. As an illustrative
case, the details pertaining to rail-road connectivity of non-major ports in Gujarat are
given in Table 4C.
Table 4C: Gujarat: Rail Road Connectivity to Non-major Ports
Ports Road link Nearest Rail link
Bedi Connected to NH from Rajkot Jamnagar Railway Station
(7 Kms. from Bedi)
Bhavnagar Connected with the State Highway Connected by Broad Gauge
(B.G.) Line
26
Ports Road link Nearest Rail link
Dahej Connected to Bharuch (45 Kms.) and
Vadodara (108 Kms.) by road
Bharuch Station
GAPL Connected to NH network via SH no.50
via Anjar and SH no.6 via Gandhidham
57 km. B.G. rail line from
Mundra port to Adipur station
provides rail connectivity to
National Railway grid
GPPL Port Pipavav has built a 11-km long 4
land expressway connecting port to NH
8E
Directly connected to hinterland
by B.G. rail network of railways
Jafrabad - B.G. line available from Rajula
which is 22 Kms. away
Jakhau 120 km from Bhuj. Port connected to
Jakhau village (12 km away) by road
Nearest Railway station is
Malaya
Mandvi 52 kms away from Bhuj town &
connected with coastal highway
-
Magdlla S.H – 2 kms from Port N.H 8 – 15 km
away from Port
15 kms away from Magdalla Port
(Sachin Yard)
Mundra
(Old)
Connected to Gandhidham by road and
then by National Highway
B.G. line available from
Ganchidham to Adani Port
Navlakhi Road from port available connecting
National Highway at Morbi
Connected by BG railway line via
Maliya
Okha Connected by road to
Jamnagar/Porbandar and from there by
National Highway (NH)
Connected by Broad Gauge
(B.G.) Line
Porbander Connected by road to Rajkot and from
there by National Highway (NH)
Connected by Broad Gauge
(B.G.) Line
Simar Connected with coastal highway by a
village road of 8 km
Nearest meter gauge railway line
is at Delvada about 20 km
Vansi-Borsi NH no. 8 is about 35 km from the site BG rail is at a distance of 13 km
at Navsari
Veraval Connected with Ahmedabad & Coastal
highway by road
Narro gauge line in port
27
4.2.4.3 Adequacy of connectivity in respect of Non-major ports has been studied on the basis
of the detailed information contained in Shipping Ministry’s, Maritime Agenda The maritime
agenda: 2010 - 2020 identified the number of projects and capacity creation under different
category including rail-road connectivity in three phases namely (i) upto 2012, (ii) from 2012
to 2017 and (iii) from 2017 to 2020. The Working Group has assessed the status of Rail Road
Connectivity covering Non Major Ports as indicated in the Table 4D.
Table 4D: Maritime States (Non Major Ports):Status of Rail Road Connectivity
States Rail/Road connectivity assessment
Short Term
(upto 2015)
Medium
(upto 2015-2020)
Gujarat Adequate Marginally Inadequate
Maharashtra Inadequate Inadequate
Goa Adequate Marginally Inadequate
Karnataka Inadequate Marginally Inadequate
Andhra Pradesh Adequate Marginally Inadequate
Tamil Nadu Adequate Marginally Inadequate
Kerala Inadequate Inadequate
Orissa Adequate Inadequate
Pondicherry Inadequate Marginally Inadequate
4.2.4.4 In order to assess the hinterland connectivity requirements of various ports up to the
terminal year up to 2031-32, the Working Group felt that it is important to analyze the traffic
composition likely to be handled at major and non-major ports and also the trends in phases
namely (i) upto 2011-12 , (ii) upto 2016-17, (iii) upto 2021-22, (iv) upto 2026-27 and (v)
upto 2031-32 is given in Table 5E.
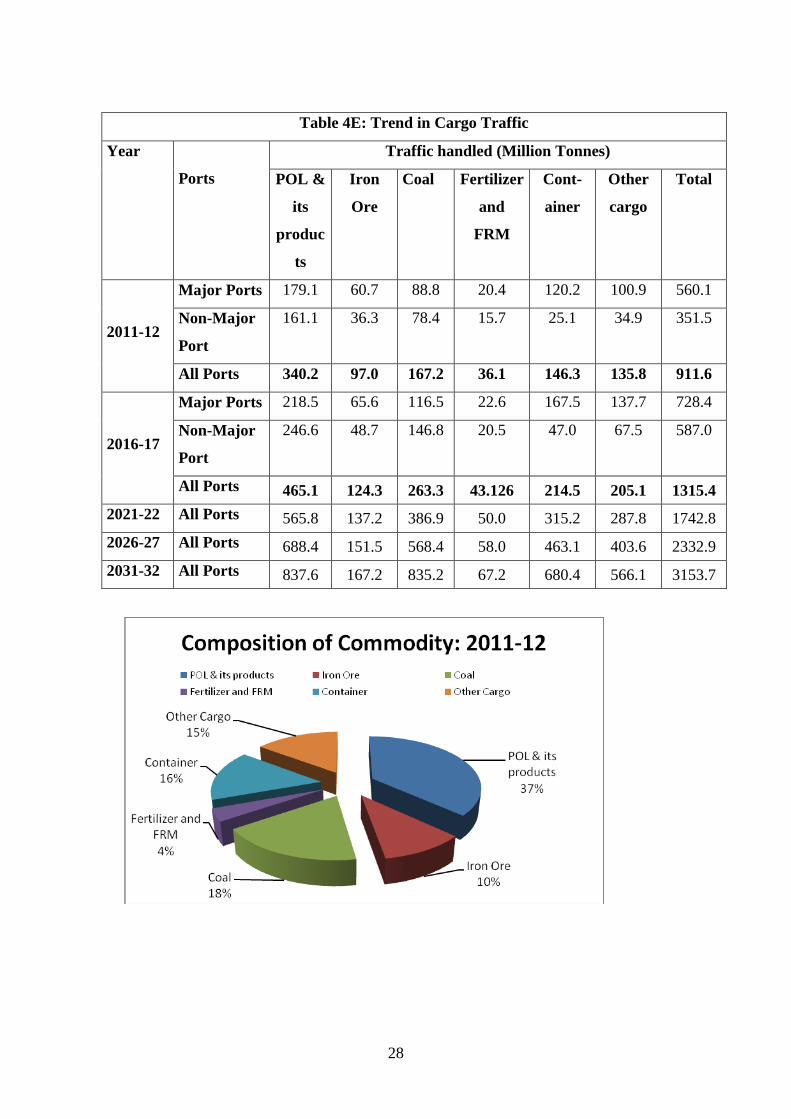
28
Table 4E: Trend in Cargo Traffic
Year
Ports
Traffic handled (Million Tonnes)
POL &
its
produc
ts
Iron
Ore
Coal Fertilizer
and
FRM
Cont-
ainer
Other
cargo
Total
2011-12
Major Ports 179.1 60.7 88.8 20.4 120.2 100.9 560.1
Non-Major
Port
161.1
36.3 78.4 15.7 25.1 34.9 351.5
All Ports 340.2 97.0 167.2 36.1 146.3 135.8 911.6
2016-17
Major Ports 218.5 65.6 116.5 22.6 167.5 137.7 728.4
Non-Major
Port
246.6 48.7 146.8 20.5 47.0 67.5 587.0
All Ports 465.1 124.3 263.3 43.126 214.5 205.1 1315.4
2021-22 All Ports 565.8 137.2 386.9 50.0 315.2 287.8 1742.8
2026-27 All Ports 688.4 151.5 568.4 58.0 463.1 403.6 2332.9
2031-32 All Ports 837.6 167.2 835.2 67.2 680.4 566.1 3153.7
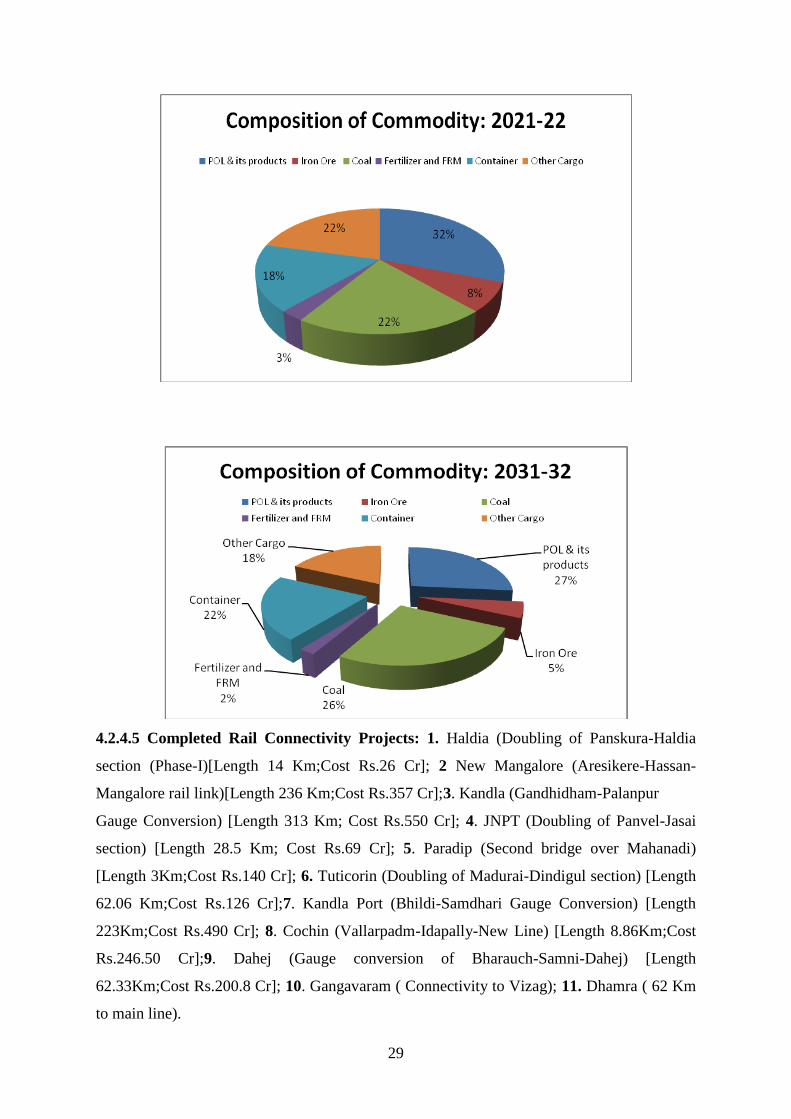
29
4.2.4.5 Completed Rail Connectivity Projects: 1. Haldia (Doubling of Panskura-Haldia
section (Phase-I)[Length 14 Km;Cost Rs.26 Cr]; 2 New Mangalore (Aresikere-Hassan-
Mangalore rail link)[Length 236 Km;Cost Rs.357 Cr];3. Kandla (Gandhidham-Palanpur
Gauge Conversion) [Length 313 Km; Cost Rs.550 Cr]; 4. JNPT (Doubling of Panvel-Jasai
section) [Length 28.5 Km; Cost Rs.69 Cr]; 5. Paradip (Second bridge over Mahanadi)
[Length 3Km;Cost Rs.140 Cr]; 6. Tuticorin (Doubling of Madurai-Dindigul section) [Length
62.06 Km;Cost Rs.126 Cr];7. Kandla Port (Bhildi-Samdhari Gauge Conversion) [Length
223Km;Cost Rs.490 Cr]; 8. Cochin (Vallarpadm-Idapally-New Line) [Length 8.86Km;Cost
Rs.246.50 Cr];9. Dahej (Gauge conversion of Bharauch-Samni-Dahej) [Length
62.33Km;Cost Rs.200.8 Cr]; 10. Gangavaram ( Connectivity to Vizag); 11. Dhamra ( 62 Km
to main line).
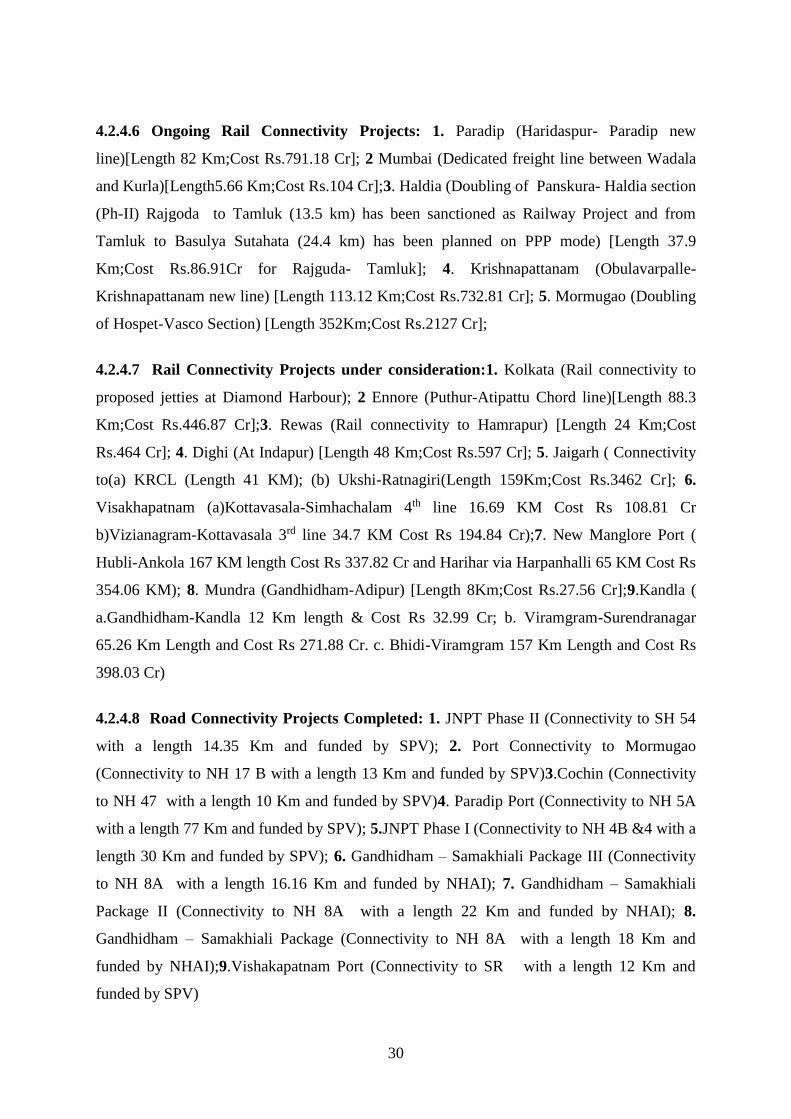
30
4.2.4.6 Ongoing Rail Connectivity Projects: 1. Paradip (Haridaspur- Paradip new
line)[Length 82 Km;Cost Rs.791.18 Cr]; 2 Mumbai (Dedicated freight line between Wadala
and Kurla)[Length5.66 Km;Cost Rs.104 Cr];3. Haldia (Doubling of Panskura- Haldia section
(Ph-II) Rajgoda to Tamluk (13.5 km) has been sanctioned as Railway Project and from
Tamluk to Basulya Sutahata (24.4 km) has been planned on PPP mode) [Length 37.9
Km;Cost Rs.86.91Cr for Rajguda- Tamluk]; 4. Krishnapattanam (Obulavarpalle-
Krishnapattanam new line) [Length 113.12 Km;Cost Rs.732.81 Cr]; 5. Mormugao (Doubling
of Hospet-Vasco Section) [Length 352Km;Cost Rs.2127 Cr];
4.2.4.7 Rail Connectivity Projects under consideration:1. Kolkata (Rail connectivity to
proposed jetties at Diamond Harbour); 2 Ennore (Puthur-Atipattu Chord line)[Length 88.3
Km;Cost Rs.446.87 Cr];3. Rewas (Rail connectivity to Hamrapur) [Length 24 Km;Cost
Rs.464 Cr]; 4. Dighi (At Indapur) [Length 48 Km;Cost Rs.597 Cr]; 5. Jaigarh ( Connectivity
to(a) KRCL (Length 41 KM); (b) Ukshi-Ratnagiri(Length 159Km;Cost Rs.3462 Cr]; 6.
Visakhapatnam (a)Kottavasala-Simhachalam 4th line 16.69 KM Cost Rs 108.81 Cr
b)Vizianagram-Kottavasala 3rd line 34.7 KM Cost Rs 194.84 Cr);7. New Manglore Port (
Hubli-Ankola 167 KM length Cost Rs 337.82 Cr and Harihar via Harpanhalli 65 KM Cost Rs
354.06 KM); 8. Mundra (Gandhidham-Adipur) [Length 8Km;Cost Rs.27.56 Cr];9.Kandla (
a.Gandhidham-Kandla 12 Km length & Cost Rs 32.99 Cr; b. Viramgram-Surendranagar
65.26 Km Length and Cost Rs 271.88 Cr. c. Bhidi-Viramgram 157 Km Length and Cost Rs
398.03 Cr)
4.2.4.8 Road Connectivity Projects Completed: 1. JNPT Phase II (Connectivity to SH 54
with a length 14.35 Km and funded by SPV); 2. Port Connectivity to Mormugao
(Connectivity to NH 17 B with a length 13 Km and funded by SPV)3.Cochin (Connectivity
to NH 47 with a length 10 Km and funded by SPV)4. Paradip Port (Connectivity to NH 5A
with a length 77 Km and funded by SPV); 5.JNPT Phase I (Connectivity to NH 4B &4 with a
length 30 Km and funded by SPV); 6. Gandhidham – Samakhiali Package III (Connectivity
to NH 8A with a length 16.16 Km and funded by NHAI); 7. Gandhidham – Samakhiali
Package II (Connectivity to NH 8A with a length 22 Km and funded by NHAI); 8.
Gandhidham – Samakhiali Package (Connectivity to NH 8A with a length 18 Km and
funded by NHAI);9.Vishakapatnam Port (Connectivity to SR with a length 12 Km and
funded by SPV)
31
4.2.4.9 Ongoing Road Connectivity Projects at Major Ports: 1. Haldia Port Connectivity
[NH 4]) from Kolaghat to Haldia ;( Length 52.50 Kms Est.Cost Rs 552 Cr) 2. Chennai-
Ennore Port Connectivity;(Length 30 Kms Est.CostRs 600 Cr)3. Elevated Road from Gate
No.10Chennai Port to Maduravayal on NH 4 under NHDP Phase VII (BOT)(Length 19 Kms
Est.Cost Rs1345 Cr)4. Tuticorin Port Connectivity [NH 7A];(Length 47.20 Kms Est.Cost Rs
231.20 Cr); 5. New Manglore Port Connectivity [NH 17,13 &48];(Length 37.50 Kms
Est.Cost Rs196.50 Cr)
4.2.4.10 Road Projects being undertaken by NHAI for Minor Ports: 1. Four laning of
Gandhidham Mundra Section of NH-8A (Extn) in Gujarat under NHDP III connecting
Mundra. Estimated Cost Rs 953.80 Cr to be completed in about 30 months; 2. Four laning of
Maharashtra/Gujarat Border –Surat-Hazira Section of NH-6 in the State of Gujarat under
NHDP Ph III to serve Hazira Port Estimated Cost Rs 1509.10 Cr to be completed in about 30
months;4. Vijayawada to Machilipatnam on NH-9 in Andhra Pradesh under NHDP Ph III
connecting Machilipatnam, Andhra Pradesh Estimated Cost Rs 618 Cr to be completed in
about 24 months; 5. 4-lane connectivity to Dighi & Jaygad Ports in the state of Maharashtra
under NHDP Ph under NHDP Ph VII to serve Mundra Port;
4.2.4.11 From the projects of rail and road connectivity as outlined above, it could be seen
that all the major ports except Chennai will be having reasonably adequate rail connectivity
right upto the port. As regards Chennai, although there is a shift of bulk commodities from
Chennai, there is a need for strengthening of rail connectivity for the purpose of loading and
evacuation of containers into and from the port since Chennai has the potential to emerge as
one of the HUB port for containers on the east coast. There also appear to be high prospects
of automobile exports in large volume from Chennai for which efficient rail connectivity is
desirable. At Chennai, internal rail connectivity should be harmonized with the proposed
improved external connectivity.
4.2.4.12 As regards non-major ports, although few project have been taken up and in the
pipeline, they would only serve providing reasonable rail connectivity to the non-major ports
like Dehaj, Gangavaram, Dhamra, Mundra, Krishanapatnam, Rewas, Dighi and Jaigad. For
the remaining, active operational non-major ports, minimum single line broad gauge rail
connectivity upto the port have necessarily to be provided, although some of the ports may
have rail head nearby.
32
4.2.4.13 So far as the road connectivity is concerned, all major ports are having
reasonable road connectivity linking to various highway of the country. Special focus need to
be made on the reorganization /overhauling of road network of approach roads of Mumbai
and Kolkata ports to their linkage NH network. In respect of non-major ports, the existing
projects and which are in pipeline would provide reasonable road connectivity to the ports
like Mundra, Hazira, Machiliatnam, Dighi and Jaygad. Remaining non-major ports, although
may be having skeletal kacha road network to the ports, it is recommended to provide atleast
two lane highway quality roads from the respective ports to the nearest NH Network. NHAI,
in consultation with state government and private port player, may explore different models
for providing the above minimal road connectivity.
4.2.4.14 The above recommendations have been made keeping in view the foreseeable
growth of traffic at the ports. However, if any port crosses a threshold limit of 5 million
tonnes per annum (other than liquid cargo), action has to be initiated by the port for creating
double line BG rail connectivity and also four lane road connectivity. Similarly, if there is
rapid, exponential growth at any port due to any reason, the connectivity both of rail and road
may have to be upgraded in tune with the requirement.
4.3 Optimization of Rail and Road Connectivity
4.3.1 Ideal Flows Vs. Actual Flows – Distance Advantage
4.3.1.1 It is the commonly assumption that cargo move to the nearest Port from the origin
because of distance advantage, but in reality, exporters’ preference to a particular port is
governed by (a)Efficiency; (b)Freight advantage; (c)Connectivity and ;(d)Port Tariff. It is
observed that cargo (like umbrellas) from Kerala are transported to the distant Mumbai
instead of Cochin Port. Similarly, cashew cargo which is processed mainly in the parts of
Kerala moves over a longer distance to Tuticorin rather through Cochin. Textile cargo units
situated in and around Bangalore transport their products in various directions upto Mumbai,
New Mangalore, Tuticorin and Cochin despite the longer distances. Tobacco cargo which is
processed in Andhra Pradesh moves to Chennai rather than to Visakhapatnam. Thus actual
flows do not conform to the ideal flows.
4.3.1.2 As regards container cargo imbalance in the directional movement of export cargo is
observed. Container cargo from northern hinterland destined for China and South East Asian
countries moves through JNPT and other west coast ports rather than using ports on the East
coast resulting in longer sailing distance and higher cost. One of the reasons for this
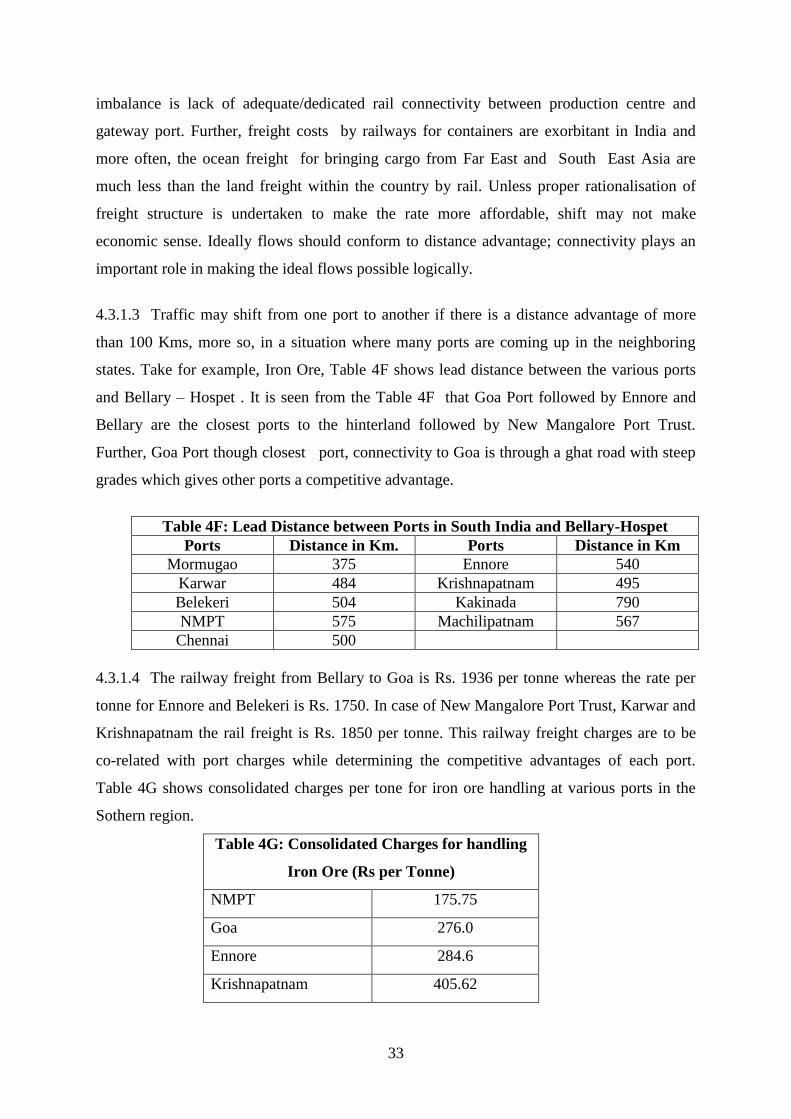
33
imbalance is lack of adequate/dedicated rail connectivity between production centre and
gateway port. Further, freight costs by railways for containers are exorbitant in India and
more often, the ocean freight for bringing cargo from Far East and South East Asia are
much less than the land freight within the country by rail. Unless proper rationalisation of
freight structure is undertaken to make the rate more affordable, shift may not make
economic sense. Ideally flows should conform to distance advantage; connectivity plays an
important role in making the ideal flows possible logically.
4.3.1.3 Traffic may shift from one port to another if there is a distance advantage of more
than 100 Kms, more so, in a situation where many ports are coming up in the neighboring
states. Take for example, Iron Ore, Table 4F shows lead distance between the various ports
and Bellary – Hospet . It is seen from the Table 4F that Goa Port followed by Ennore and
Bellary are the closest ports to the hinterland followed by New Mangalore Port Trust.
Further, Goa Port though closest port, connectivity to Goa is through a ghat road with steep
grades which gives other ports a competitive advantage.
Table 4F: Lead Distance between Ports in South India and Bellary-Hospet
Ports Distance in Km. Ports Distance in Km
Mormugao 375 Ennore 540
Karwar 484 Krishnapatnam 495
Belekeri 504 Kakinada 790
NMPT 575 Machilipatnam 567
Chennai 500
4.3.1.4 The railway freight from Bellary to Goa is Rs. 1936 per tonne whereas the rate per
tonne for Ennore and Belekeri is Rs. 1750. In case of New Mangalore Port Trust, Karwar and
Krishnapatnam the rail freight is Rs. 1850 per tonne. This railway freight charges are to be
co-related with port charges while determining the competitive advantages of each port.
Table 4G shows consolidated charges per tone for iron ore handling at various ports in the
Sothern region.
Table 4G: Consolidated Charges for handling
Iron Ore (Rs per Tonne)
NMPT 175.75
Goa 276.0
Ennore 284.6
Krishnapatnam 405.62
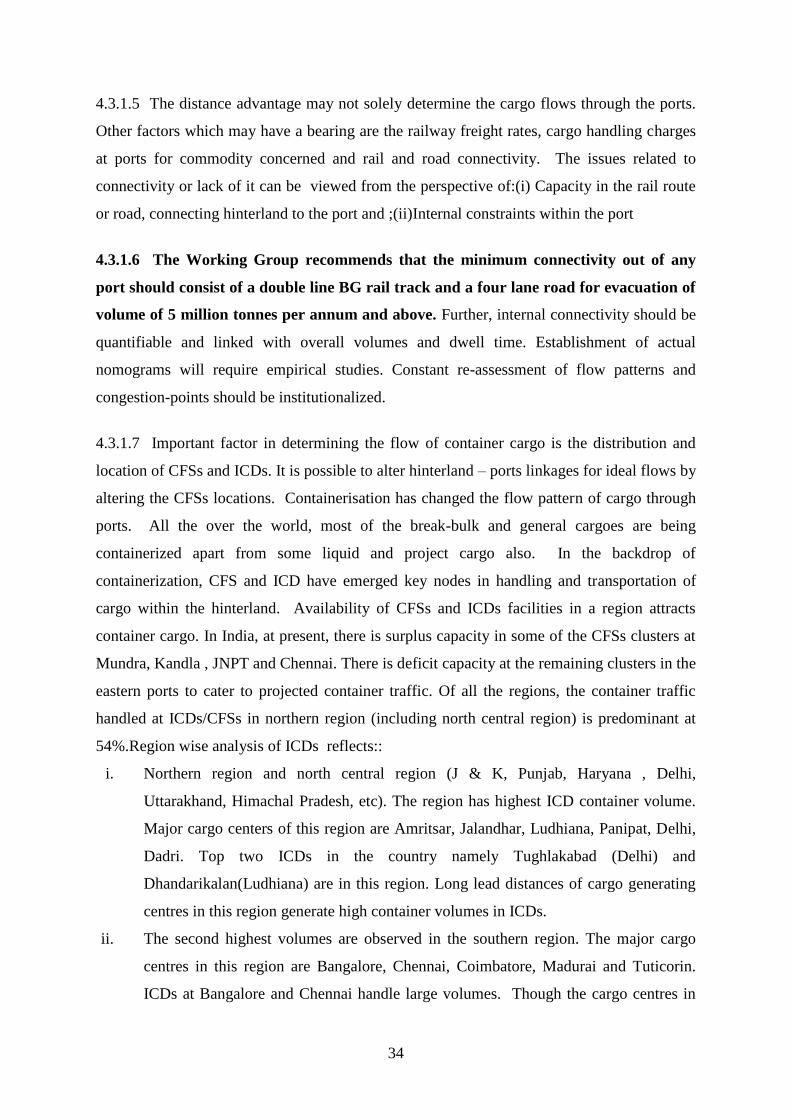
34
4.3.1.5 The distance advantage may not solely determine the cargo flows through the ports.
Other factors which may have a bearing are the railway freight rates, cargo handling charges
at ports for commodity concerned and rail and road connectivity. The issues related to
connectivity or lack of it can be viewed from the perspective of:(i) Capacity in the rail route
or road, connecting hinterland to the port and ;(ii)Internal constraints within the port
4.3.1.6 The Working Group recommends that the minimum connectivity out of any
port should consist of a double line BG rail track and a four lane road for evacuation of
volume of 5 million tonnes per annum and above. Further, internal connectivity should be
quantifiable and linked with overall volumes and dwell time. Establishment of actual
nomograms will require empirical studies. Constant re-assessment of flow patterns and
congestion-points should be institutionalized.
4.3.1.7 Important factor in determining the flow of container cargo is the distribution and
location of CFSs and ICDs. It is possible to alter hinterland – ports linkages for ideal flows by
altering the CFSs locations. Containerisation has changed the flow pattern of cargo through
ports. All the over the world, most of the break-bulk and general cargoes are being
containerized apart from some liquid and project cargo also. In the backdrop of
containerization, CFS and ICD have emerged key nodes in handling and transportation of
cargo within the hinterland. Availability of CFSs and ICDs facilities in a region attracts
container cargo. In India, at present, there is surplus capacity in some of the CFSs clusters at
Mundra, Kandla , JNPT and Chennai. There is deficit capacity at the remaining clusters in the
eastern ports to cater to projected container traffic. Of all the regions, the container traffic
handled at ICDs/CFSs in northern region (including north central region) is predominant at
54%.Region wise analysis of ICDs reflects::
i. Northern region and north central region (J & K, Punjab, Haryana , Delhi,
Uttarakhand, Himachal Pradesh, etc). The region has highest ICD container volume.
Major cargo centers of this region are Amritsar, Jalandhar, Ludhiana, Panipat, Delhi,
Dadri. Top two ICDs in the country namely Tughlakabad (Delhi) and
Dhandarikalan(Ludhiana) are in this region. Long lead distances of cargo generating
centres in this region generate high container volumes in ICDs.
ii. The second highest volumes are observed in the southern region. The major cargo
centres in this region are Bangalore, Chennai, Coimbatore, Madurai and Tuticorin.
ICDs at Bangalore and Chennai handle large volumes. Though the cargo centres in
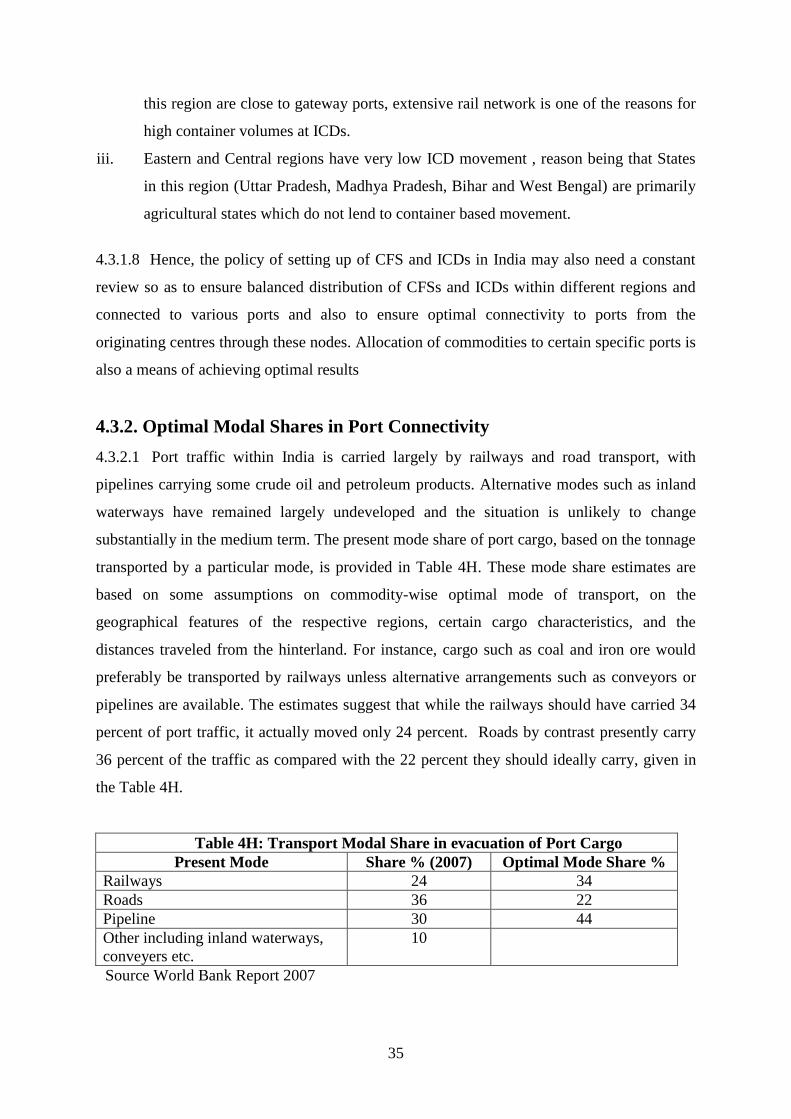
35
this region are close to gateway ports, extensive rail network is one of the reasons for
high container volumes at ICDs.
iii. Eastern and Central regions have very low ICD movement , reason being that States
in this region (Uttar Pradesh, Madhya Pradesh, Bihar and West Bengal) are primarily
agricultural states which do not lend to container based movement.
4.3.1.8 Hence, the policy of setting up of CFS and ICDs in India may also need a constant
review so as to ensure balanced distribution of CFSs and ICDs within different regions and
connected to various ports and also to ensure optimal connectivity to ports from the
originating centres through these nodes. Allocation of commodities to certain specific ports is
also a means of achieving optimal results
4.3.2. Optimal Modal Shares in Port Connectivity
4.3.2.1 Port traffic within India is carried largely by railways and road transport, with
pipelines carrying some crude oil and petroleum products. Alternative modes such as inland
waterways have remained largely undeveloped and the situation is unlikely to change
substantially in the medium term. The present mode share of port cargo, based on the tonnage
transported by a particular mode, is provided in Table 4H. These mode share estimates are
based on some assumptions on commodity-wise optimal mode of transport, on the
geographical features of the respective regions, certain cargo characteristics, and the
distances traveled from the hinterland. For instance, cargo such as coal and iron ore would
preferably be transported by railways unless alternative arrangements such as conveyors or
pipelines are available. The estimates suggest that while the railways should have carried 34
percent of port traffic, it actually moved only 24 percent. Roads by contrast presently carry
36 percent of the traffic as compared with the 22 percent they should ideally carry, given in
the Table 4H.
Table 4H: Transport Modal Share in evacuation of Port Cargo
Present Mode Share % (2007) Optimal Mode Share %
Railways 24 34
Roads 36 22
Pipeline 30 44
Other including inland waterways,
conveyers etc.
10
Source World Bank Report 2007
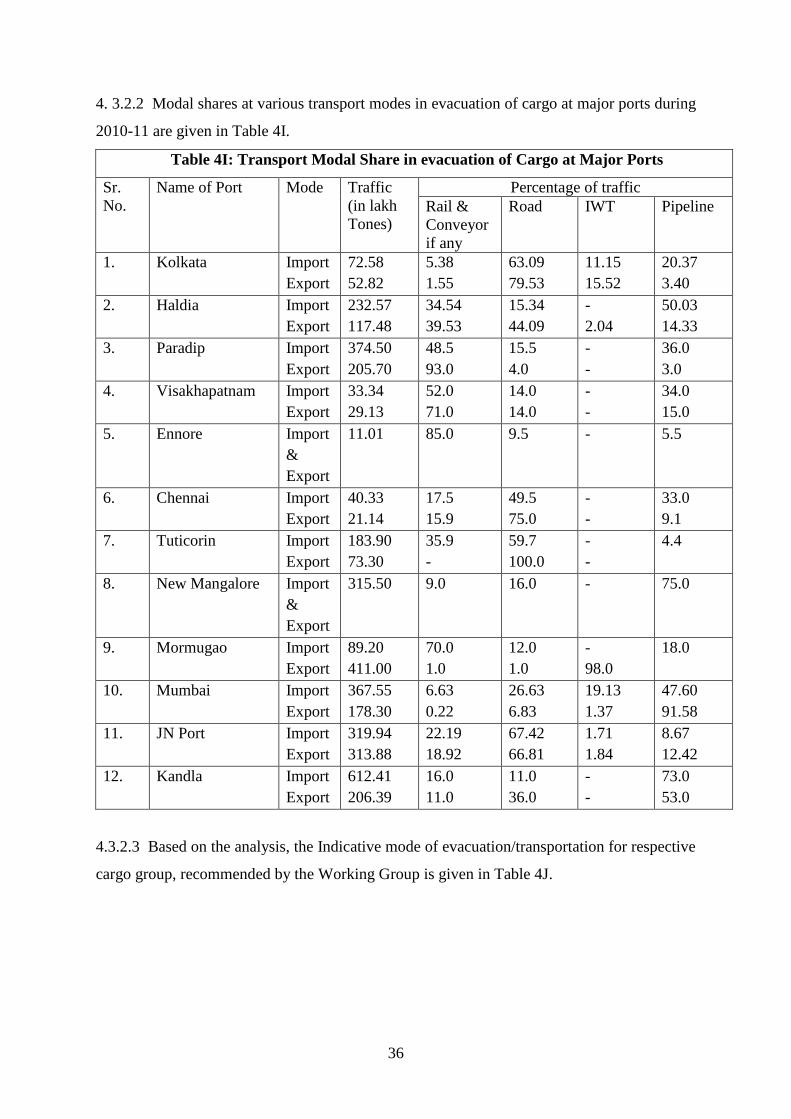
36
4. 3.2.2 Modal shares at various transport modes in evacuation of cargo at major ports during
2010-11 are given in Table 4I.
Table 4I: Transport Modal Share in evacuation of Cargo at Major Ports
Sr.
No.
Name of Port Mode Traffic
(in lakh
Tones)
Percentage of traffic
Rail &
Conveyor
if any
Road IWT Pipeline
1. Kolkata Import
Export
72.58
52.82
5.38
1.55
63.09
79.53
11.15
15.52
20.37
3.40
2. Haldia Import
Export
232.57
117.48
34.54
39.53
15.34
44.09
-
2.04
50.03
14.33
3. Paradip Import
Export
374.50
205.70
48.5
93.0
15.5
4.0
-
-
36.0
3.0
4. Visakhapatnam Import
Export
33.34
29.13
52.0
71.0
14.0
14.0
-
-
34.0
15.0
5. Ennore Import
&
Export
11.01 85.0 9.5 - 5.5
6. Chennai Import
Export
40.33
21.14
17.5
15.9
49.5
75.0
-
-
33.0
9.1
7. Tuticorin Import
Export
183.90
73.30
35.9
-
59.7
100.0
-
-
4.4
8. New Mangalore Import
&
Export
315.50 9.0 16.0 - 75.0
9. Mormugao Import
Export
89.20
411.00
70.0
1.0
12.0
1.0
-
98.0
18.0
10. Mumbai Import
Export
367.55
178.30
6.63
0.22
26.63
6.83
19.13
1.37
47.60
91.58
11. JN Port Import
Export
319.94
313.88
22.19
18.92
67.42
66.81
1.71
1.84
8.67
12.42
12. Kandla Import
Export
612.41
206.39
16.0
11.0
11.0
36.0
-
-
73.0
53.0
4.3.2.3 Based on the analysis, the Indicative mode of evacuation/transportation for respective
cargo group, recommended by the Working Group is given in Table 4J.
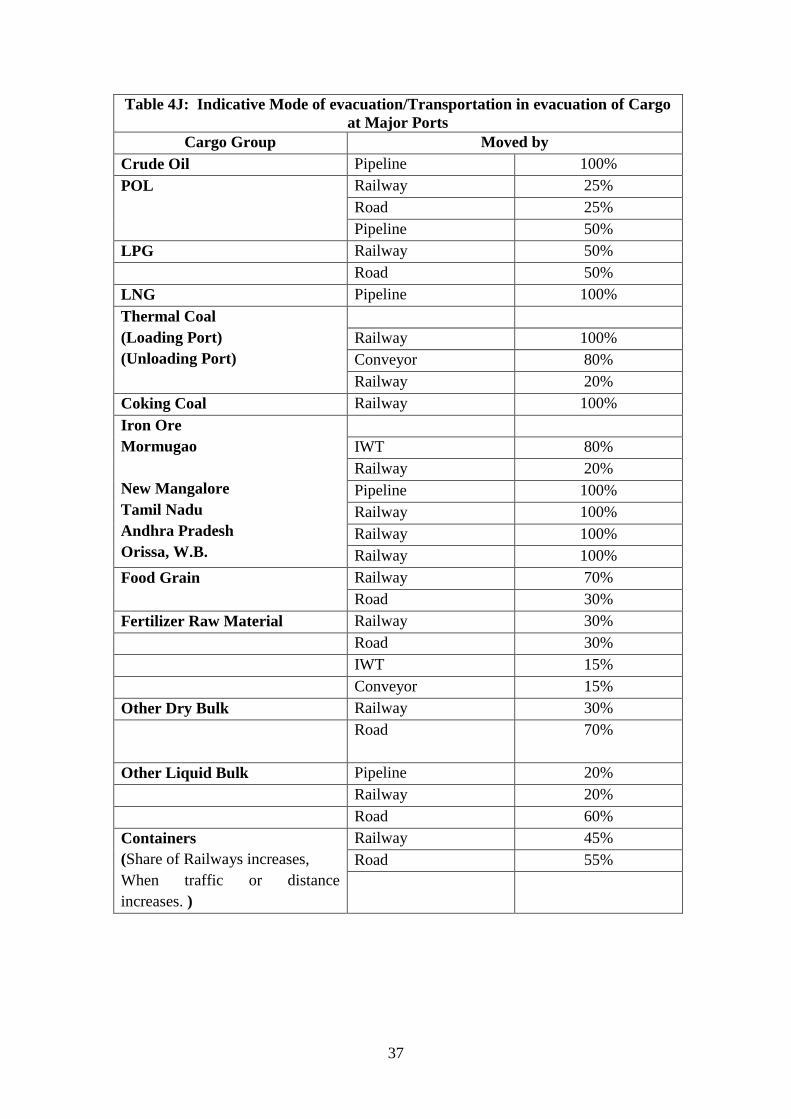
37
Table 4J: Indicative Mode of evacuation/Transportation in evacuation of Cargo
at Major Ports
Cargo Group Moved by
Crude Oil Pipeline 100%
POL Railway 25%
Road 25%
Pipeline 50%
LPG Railway 50%
Road 50%
LNG Pipeline 100%
Thermal Coal
(Loading Port)
(Unloading Port)
Railway 100%
Conveyor 80%
Railway 20%
Coking Coal Railway 100%
Iron Ore
Mormugao
New Mangalore
Tamil Nadu
Andhra Pradesh
Orissa, W.B.
IWT 80%
Railway 20%
Pipeline 100%
Railway 100%
Railway 100%
Railway 100%
Food Grain Railway 70%
Road 30%
Fertilizer Raw Material Railway 30%
Road 30%
IWT 15%
Conveyor 15%
Other Dry Bulk Railway 30%
Road 70%
Other Liquid Bulk Pipeline 20%
Railway 20%
Road 60%
Containers
(Share of Railways increases,
When traffic or distance
increases. )
Railway 45%
Road 55%
38
4.4 Road Map for Future
4.4.1 Dedicated Freight Corridors (DFC)
4.4.1.1 The Ministry of Railways has undertaken a construction of dedicated freight DFC
between Delhi and Mumbai. It will be a high speed rail corridor with multiple linkages with
feeder lines. It stretches over 1483 Kms in length, covering 6 states of India. DFC will help to
alleviate congestion on Delhi-Mumbai Corridor considerably. It is critical to the hinterland
connectivity of the Mumbai and Gujarat Port clusters that serve the large share of India’s
Ports traffic. The focus of the DFC is to ensure high impact developments within 150 Km
distance on either side of alignment of DFC. DFC should be completed at the earliest
preferably by the end of 12th Five Year Plan and should extend upto JNPT. Feeder lines to
DFC from the ports need to be planned/carried out by Railways to complement the capacity
and efficiency of DFC. The second DFC is between Ludhiana and Dankuni. It is expected to
provide connectivity mainly for the traffic stream of coal to the power houses although later
on connectivity to Kolkata port is also a possibility. There are four more DFCs planned
between Kolkata – Mumbai, Chennai – Kolkata, Delhi – Chennai and Goa – Chennai.
4.4.2 Backbone concept for Containers
4.4.2.1 With respect to the rail network, southern ports need to have well developed rail
corridors to aid in the container movement from the northern and eastern Ports of India to get
transshipped through these Ports. For the future needs, especially to further develop northern
hinterland, sufficient capacity is needed. The development of southern ports, as entry gate for
the backbone of India needs a high speed connection on rail with sufficient capacity to bring
the containers within a fixed time to the destination ports as shown in the following picture:-
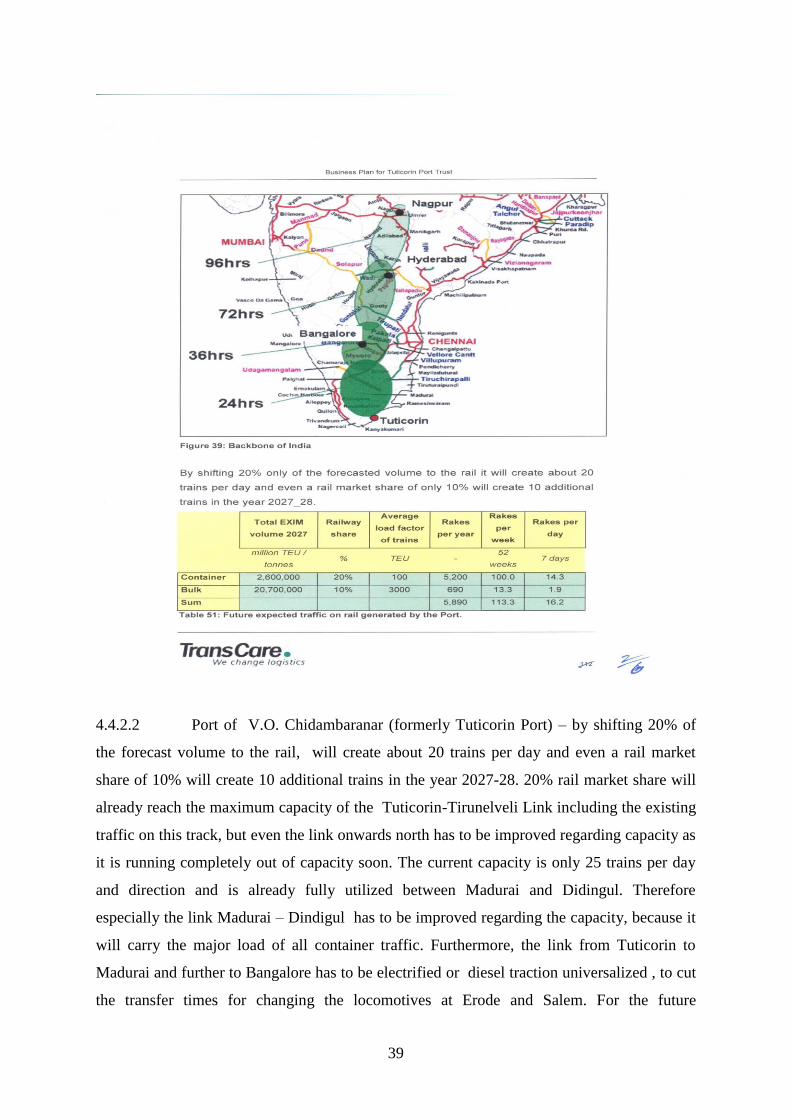
39
4.4.2.2 Port of V.O. Chidambaranar (formerly Tuticorin Port) – by shifting 20% of
the forecast volume to the rail, will create about 20 trains per day and even a rail market
share of 10% will create 10 additional trains in the year 2027-28. 20% rail market share will
already reach the maximum capacity of the Tuticorin-Tirunelveli Link including the existing
traffic on this track, but even the link onwards north has to be improved regarding capacity as
it is running completely out of capacity soon. The current capacity is only 25 trains per day
and direction and is already fully utilized between Madurai and Didingul. Therefore
especially the link Madurai – Dindigul has to be improved regarding the capacity, because it
will carry the major load of all container traffic. Furthermore, the link from Tuticorin to
Madurai and further to Bangalore has to be electrified or diesel traction universalized , to cut
the transfer times for changing the locomotives at Erode and Salem. For the future
40
development of Tuticorin as the entry gate to Central and North India as well, electrification
of rail link to Hyderabad is recommended. Furthermore, there is a big potential for the Ports
in South India, especially Cochin and Tuticorin and upcoming container Ports in Kolachel,
Vizhinjam, Kattupalli and Krailical to consolidate their volumes at a point like Erode, where
all the links from these Ports come together. It is recommended to develop a intermodal
hinterland terminal at Erode together with partners within the liberalised railway market to
realise the above mentioned backbone of India to serve from South to Central India –
Southern Ports to Nagpur. Depending upon the volume, such intermodal hinterland terminals
can be developed at different joints of the backbone.
4.4.2.3 Furthermore, strategic partnership of competitive ports can be done to
consolidate the volumes from South Indian ports .Shuttle services can be created between
Central and Northern India with high frequencies and huge volumes. As time is money, a
shuttle network on a daily basis gives these Southern Ports an opportunity to attract volumes
even in Central and North India.
4.4.3 Inland water transport – Coastal Shipping
4.4.3.1 National waterways provide a cost effective mode of transportation. However, its
potential has not been realized so far due lack of connectivity of this mode with rail, road and
the ports. As of now, there are five National Waterways(NWs)
4.4.3.2 The Ganga-Bhagirathi-Hooghly river system (NW-1) and the Brahmaputra
(NW-2) are linked by Indo-Bangladesh protocol route via Sunderbans and Meghna (total
2258 km) and provide hinterland connectivity to the major ports of Kolkata and Haldia.
Similarly, the East coast canal and Hijili tidal canal alongwith the Brahmani river (NH-5)
provides 588 kms hinterland connectivity to the ports of Kakinada, Krishnapatnam and
Ennore. The West coast canal system, (NW-3)-205 km connects major port of Kochi and
also the ports of Neendakara, Kayamkulam and Munambam. The Mandovi, the Zuari rivers
along with Cumberjua canal (122 m) are connected with the major port of Murmagao and the
port of Panjim. The backwater system of Mumbai-Thane-Ulhas waterway (142 km) provides
hinterland connectivity to major ports of Mumbai and JNPT. Thus, a vast network of
waterway has the potential to provide viable IWT connectivity at many ports of India.
4.4.3.3 Given the near saturation of rail –road connectivity to Ports in particular, it is
imperative to explore and augment the connectivity of ports through inland water mode
41
wherever feasible.IWAI is setting up intermodal terminals at major cargo centres on all
national waterways. Major terminals at Patna and Pandu have been set up and similar
terminals are planned/under construction at Kolkata, Varanasi, Allahabad in NW-1, Dhubri
and Jogighkopa in NW-2, 8 terminals in NW-3, 16 Terminals in NW-4 and 7 terminals in
NW-5. Likewise terminals are set up in Goa and Mumbai waterways by the respective State
Government. There is need to link all IWT terminals with nearest NH by link roads for
which appropriate junctions with NW are to be provided by NHAI. Further, permission for
use of service roads as link loads/use of NH land for construction of link roads needs to be
granted for proper road linkages with NH.
4.5 Quantification of connectivity index for each port
4.5.1 The Working Group recommends that a suitable index should be evolved representing
the connectivity of the port through a single number. The connectivity index can be
conceptualized as:
C = W1 * (Ra / Rc ) + W2 * (La / Lc)
Where W1 = Weight age to Road Traffic
W2 = Weightage to Rail Traffic
Ra = Traffic handled by Road
Rc = Capacity of the Road infrastructure at the Port
La = Traffic handled by Rail
Lc = Capacity of the Rail Infrastructure at the Port
The weightages have to be decided for individual port depending upon the type of commodity
mix and the pattern of lead to the hinterland. General guidelines for fixing the weightages
may be laid down by the Ministry.
4.6 Measures for evaluation of connectivity with reference to best in the World
4.6.1 The Working Group recommends that as the status of port connectivity is essentially
dynamic as developments take place continuously in the industrial activity in the hinterland,
market forces and technology improvements, there must be a mechanism of periodical review
of the overall performance followed by an exercise of comparing with the best in the world.
4.7 Conclusions and Recommendations
1. The growth of port traffic is expected to be high in coal and containers.
2. Every port must have a two-lane road as the minimum connectivity.
42
Where rail able cargo is handled, the requirement is:
A two lane road and a single line rail connection up to a level of 5 million tonnes
per annum. It should be improved to ‘double line’ rail connectivity and four-lane
road connectivity when the traffic handled crosses this threshold of 5 Million
Tonnes per annum.
3. Connectivity within the port system should also receive more attention than at
present.
4. The Railways must finalize their revised policy for attracting private investment as
quickly as possible. PPP investments and state govt. participation are to be
facilitated.
5. The present situation in respect of connectivity is grossly inadequate for non-major
ports. Massive investments are needed.
6. Quantification of connectivity through an “index” should be done and inter-se
prioritization of investments should be guided by it.
7. Allocation of certain ports for predominantly handling certain commodities should be
done so as to optimize hinterland-port linkages and flows. Backbone of CFS/ ICD
nodes should be developed as an integrated plan. DFCs should be well connected
through feeder routes.
8. Inland Water Transport potential should be exploited better.
43
Chapter 5: Water Transport Statistics
5.1 Timely availability of Water Transport statistics is vital for monitoring of trends in the
economy, performance of the water Transport sector and policy formulation. Water Transport
Statistics includes the following:
(i) Port Statistics
(ii) Shipping, Ship Building and Ship Repair Statistics
(iii) Inland Water Transport Statistics
Transport Research Wing, Ministry of Road Transport and Highways is the nodal
agency for collection, compilation, dissemination and analysis of data on water Transport
Statistics.
5.2 Port Statistics
5.2.1 India has a coastline of 7517 km with 12 Major Ports and 176 notified Non-major
Ports along the coastline and Islands. Major Ports are the ports which are administered by the
Union Government, while Non-major Ports are administered by the State Governments.
5.2.2 Major Port’s statistics are being published by Major Ports in their Administrative
Reports. These reports, as per statutory requirement, are placed in the Parliament. Non-Major
Port Statistics in respect of states are collected, compiled and published by respective State
Directorates of Ports.
5.2.3 The data on port statistics is disseminated through the annual publication titled ‘Basic
Port Statistics (BPS)’ and bi-annual update on Indian Port Sector, which provides
data/information on the latest developments in the Indian Port Sector
5.2.4 Over the years the type of cargo being handled has undergone structural change, with
the container traffic gaining in importance. Last one and half decade has seen growing
participation of the private sector in port sector leading to change in the operating
environment. In order to understand the changes, it was felt that new parameters and
indicators for monitoring policy effects need to be identified for data collection. The
Ministry of Shipping had set up a Working Group under the Chairmanship of Adviser
(Transport Research) for Strengthening of Major Port Statistics In May 2009. The
Working Group has submitted its report in March 2011. Main recommendations/suggestions
of the working Group are:
44
(i) The concept of cargo handled and Turn Round Tiime and its various components
have been rationalised to reflect true picture and to enable inter – port
comparisons.
(ii) Dwell Time of cargo/ container for export and import cargo has been defined.
(iii) For uniform collection and presentation of Major Port statistics, certain changes
in procedures/methods have been suggested.
(iv) To measure the dynamics of the port service sector, short term indicators are
required. The three port service indices, namely Index of Service Production
(ISP), Consumer Service Prices Index (CSPI) and Producers Price Index( PPI)
have been recommended to be compiled annually.
(v) Measures for improving quality of Major ports have been recommended.
5.2.5 Non-major Ports are compiling Cargo traffic data. Periodicity of cargo traffic data
available for policy and planning purpose from all Maritime States/UTs is at half yearly
interval i.e. for the period ending 30th September and 31st March. The data is available for
important commodities only. Some of the States take a long time in compilation of detailed
cargo traffic and other non-major port data for the publication ‘Basic Port Statistics’. This
inevitably delays compilation of all India aggregates and subsequent dissemination to Public.
5.2.6 In order to comprehensively monitor the trend in cargo handled by Indian ports, it is
imperative that all Maritime States/UTs put in place a mechanism to compile and
disseminate monthly cargo traffic data, particularly for non-major ports handling more than 5
million Tonnes per annum.
5.2.7 The following data gaps in Port’s statistics exist.
(i) Data on countrywise break-up of Origin and destination-wise of cargo is frequently asked
by researchers. Shipping lines/companies generally provide information on the port of
country from where the cargo is loaded or to where the cargo is to be discharged and not
the actual country from where the cargo originated or is destined to.
(ii) Container cargo is fastest growing traffic at Major ports. However, the commoditywise
data handled in containers is not being maintained by major ports.
5.2.8 Ports are in the process of implementing Port Community System (PCS) which is
intended to integrate the electronic flow of trade related document/information and function
as the centralized hub for the ports of India and other stakeholders like Shipping
45
Lines/Agents, Surveyors, Stevedores, Banks, Container Freight Stations, Customs House
agents, Importers, Exporters, Railways/CONCOR, Government regulatory agencies, etc. for
exchanging electronic messages in secure manner. One of the objectives of the PCS is data
repository for research and analysis. With the implementation of PCS, the it may be possible
to fulfil the above data gaps.
5.3 Shipping Statistics
5.3.1 The country’s maritime sector has witnessed a steady growth in the number of Indian
registered vessels. These have increased from a level of 418 vessels in1990 to 549 in the year
2000 and further to 1050 vessels as on 31.01.2011. These 1050 Indian vessels have 10.38
million Gross Registered Tonnage (GRT). Out of these 1050 vessels, 702 vessels were engaged
in coastal trade and the remaining 348 vessels were deployed for overseas trade. However, in
terms of GRT, the share of Ocean going vessels and coastal vessels was 90.3% and 9.7%
respectively of total GRT.
5.3.2 Data on shipping sector disseminated through its two annual publications viz;
(i) Indian Shipping Statistics
(ii) Statistics of India’s Ship- Building & Ship Repairing Industry
5.3.3 The National Statistical Commission set up by Government of India in its report in
2000 had identified following important data gaps.
(i) Financial performance indicators of private shipping companies.
(ii) Operational indicators (voyages, cargo, capacity or space utilization).
(iii) Freight rates for selected Indian Import and export commodities for all shipping
companies.
(iv) Safety Statistics.
(v) Environment pollution caused by shipping Industry
5.3.4 The National Statistical Commission had recommended that a mechanism should be
evolved by the Ministry of Shipping to collect data from individual shipping companies
which own one on two vessels in most cases. The TRW had asked data on financial
performance from 60 shipping companies. However most of the companies are small and
unlisted and therefore information on financial/operational performance is not readily
accessible. The Working Group is of the view that TRW in collaboration with Directorate
General of Shipping and Indian National Ship Owners Association (INSA) may explore ways
46
to obtain and publish data not only on Financial/Operational Indicators, Safety statistics and
environmental pollution caused by shipping industry of at least listed companies. Freight
rates are in the nature of commercial information which varies from day to day and is
acquired by shippers and is subject to negotiation. It may not be easy for a non user/non
shipper like TRW to access accurate information. Besides, relying on a single source agency
like Shipping Corporation of India may not be a representative rate as it may be sector/route
specific.
Statistics of India’s Ship- Building & Ship Repairing Industry
5.3.5 Ship Building Industry is a technology, skill and material intensive assembly
operation. It draws upon a large number of services and utilities. The end product is a high
value floating asset. The Working Group suggests the following to overcome data short
comings in ship building and ship repair activities.
(i) Ship order book data presently published may be further classified into Indigenous
and Export orders.
(ii) Complete coverage of private sector companies engaged ship building and repair
activities may be ensured. This would require a mechanism to regularly update the
list of private ship builders and ship repair companies in India.
5.4 Inland Water Transport Statistics
5.4.1 Inland Water Transport (IWT) is a cost effective fuel efficient and environment
friendly mode, specially for transportation of bulk Cargo, hazardous goods so vital for
industrial development. Apart from the non-availability of timely data on inland water
statistics, particularly from states, there are data gaps in IWT statistics :
(i) IWAI is providing Cargo statistics for vessels which are registered and are availing
the facilities of IWAI on National Waterways. There are several small unregistered
vessels/ boats (country crafts) which carry cargo and do not avail facilities of IWAI
infrastructure. The cargo carried by those vessels/boats is not at all being captured.
There is a need to carry out periodic survey (may be once in five years) to assess the
Cargo Carried by such vessels on National Waterways.
(ii) Many of the State Governments are unable to maintain the data/information on Inland
Water Transport due to lack of scheduled/systematic records on Freight/Passenger
operations on their waterways. Consequently, the data on IWT at all India level lacks
full coverage.
47
(iii)The data also need to be collected on number of people trained by States to operate
mechanised vessels.
5.4.2 The Working Group suggests that states which have inland water transport activity
and are not providing data should put in place an institutional mechanism to regularly collect
data on IWT activities at state level.
5.5 Improving Quality of Port, Shipping And Inland Water Transport Statistics
5.5.1 The Working Group recommends the following to improve quality of Water
Transport Statistics:
(i) Periodic review of Water Transport statistics is required to assess the system and
identity the possible changes required for meeting the user needs. It is suggested
that such review of various sectors of Water Transport Statistics be undertaken
once in five years.
(ii) At present, no system for training and sharing of experiences in respect of Water
Transport statistics exist. Training programme/workshops for officials/staff
involved in compiling Water Transport statistics, particularly Port statistics may
be organised. The workshops should cover statistical concepts, definitions and
issues of compilation, processing and Total Quality Management .
(iii) The annual publication should be brought out in the year following end of the
calendar/financial year. Bi-annual publication should be brought out within the
three months i.e. in June for the period ending 31st March and December for the
period ending September
(iv) TRW may provide the metadata for water transport statistics in the form of a
manual on the website of Ministry of Shipping.
(v) All the regular publications on Ports, Shipping and Inland Waterways of TRW
should be put on the website of Ministry of Shipping.
(vi) Concurrent audit of statistical activities is necessary for early detection of errors
and mistakes during the progress of work, and their rectification in time is
essentially an internal activity of the primary data compiling agency. It is
suggested that assessment of quality of the data produced by the primary source
agencies may be carried out through statistical audit by officers authorized by the
Ministry of Shipping.
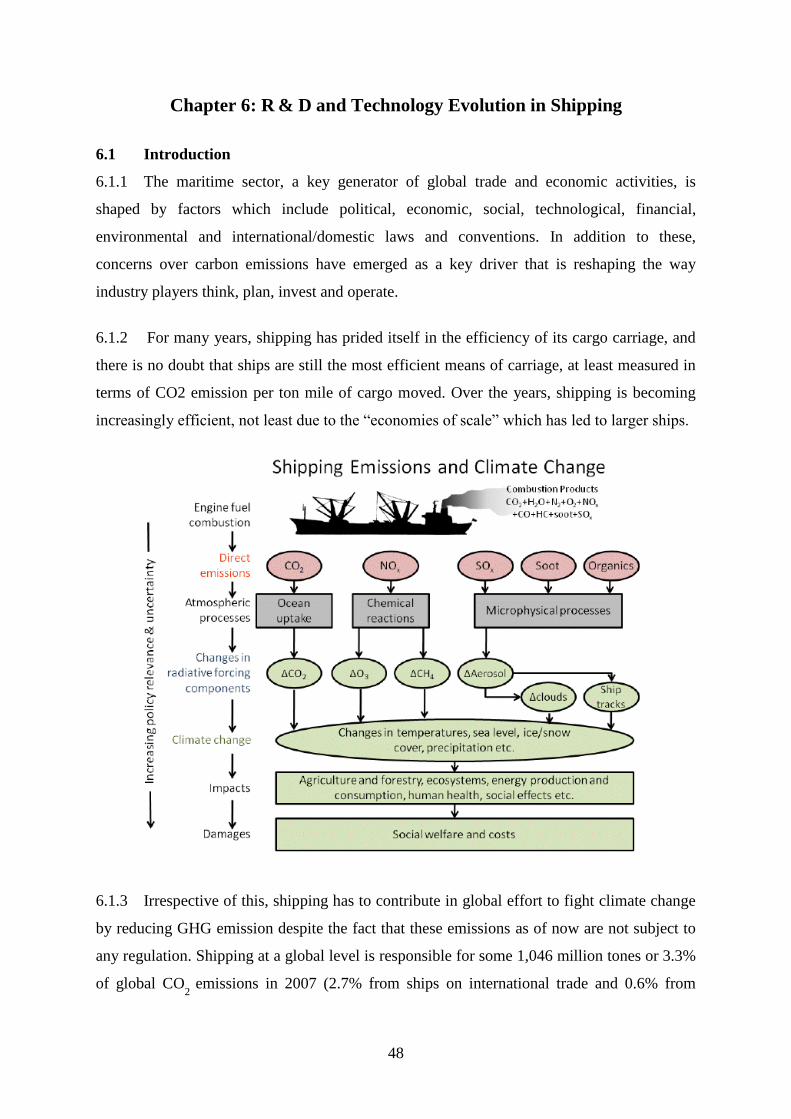
48
Chapter 6: R & D and Technology Evolution in Shipping
6.1 Introduction
6.1.1 The maritime sector, a key generator of global trade and economic activities, is
shaped by factors which include political, economic, social, technological, financial,
environmental and international/domestic laws and conventions. In addition to these,
concerns over carbon emissions have emerged as a key driver that is reshaping the way
industry players think, plan, invest and operate.
6.1.2 For many years, shipping has prided itself in the efficiency of its cargo carriage, and
there is no doubt that ships are still the most efficient means of carriage, at least measured in
terms of CO2 emission per ton mile of cargo moved. Over the years, shipping is becoming
increasingly efficient, not least due to the “economies of scale” which has led to larger ships.
6.1.3 Irrespective of this, shipping has to contribute in global effort to fight climate change
by reducing GHG emission despite the fact that these emissions as of now are not subject to
any regulation. Shipping at a global level is responsible for some 1,046 million tones or 3.3%
of global CO2
emissions in 2007 (2.7% from ships on international trade and 0.6% from
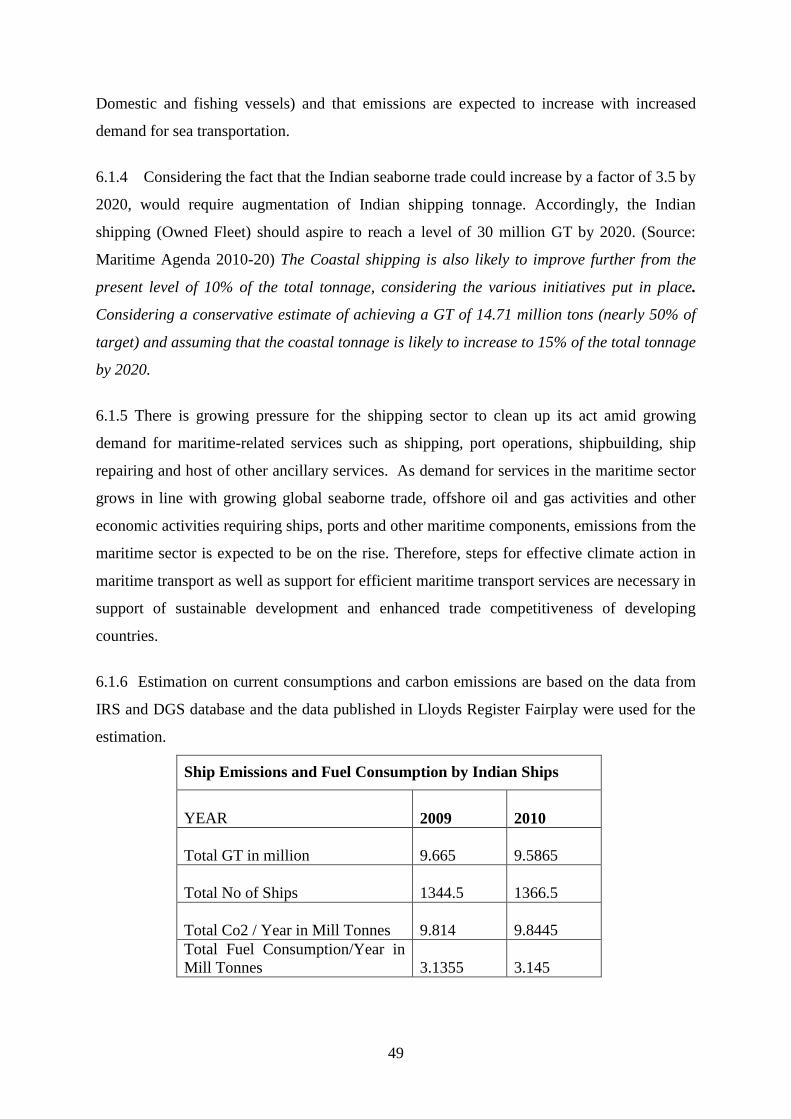
49
Domestic and fishing vessels) and that emissions are expected to increase with increased
demand for sea transportation.
6.1.4 Considering the fact that the Indian seaborne trade could increase by a factor of 3.5 by
2020, would require augmentation of Indian shipping tonnage. Accordingly, the Indian
shipping (Owned Fleet) should aspire to reach a level of 30 million GT by 2020. (Source:
Maritime Agenda 2010-20) The Coastal shipping is also likely to improve further from the
present level of 10% of the total tonnage, considering the various initiatives put in place.
Considering a conservative estimate of achieving a GT of 14.71 million tons (nearly 50% of
target) and assuming that the coastal tonnage is likely to increase to 15% of the total tonnage
by 2020.
6.1.5 There is growing pressure for the shipping sector to clean up its act amid growing
demand for maritime-related services such as shipping, port operations, shipbuilding, ship
repairing and host of other ancillary services. As demand for services in the maritime sector
grows in line with growing global seaborne trade, offshore oil and gas activities and other
economic activities requiring ships, ports and other maritime components, emissions from the
maritime sector is expected to be on the rise. Therefore, steps for effective climate action in
maritime transport as well as support for efficient maritime transport services are necessary in
support of sustainable development and enhanced trade competitiveness of developing
countries.
6.1.6 Estimation on current consumptions and carbon emissions are based on the data from
IRS and DGS database and the data published in Lloyds Register Fairplay were used for the
estimation.
Ship Emissions and Fuel Consumption by Indian Ships
YEAR
2009 2010
Total GT in million
9.665 9.5865
Total No of Ships
1344.5 1366.5
Total Co2 / Year in Mill Tonnes
9.814 9.8445
Total Fuel Consumption/Year in
Mill Tonnes
3.1355 3.145
50
6.2 Identified Areas of R&D and Technologies for Low Carbon Sustainable Shipping
6.2.1 While Shipping has done well to start reducing its emissions levels, immense
challenges remain in rallying industry players to voluntarily clean up their acts and meet the
cost of complying with regulation. New technologies and innovation have to be indigenously
developed and introduced to further reduce GHG from shipping operations, and the resources
for R&D and compliance must be provided.
6.2.2 From India’s perspective, there may be concerns about the cost implications of the
various mitigation measures and, where applicable, the capacity to adopt and implement
technology-based measures. Increased costs are likely to exert additional pressure on the
Indian maritime industry and, by extension, on transport costs, which are already
disproportionately high in India and entail implications for trade competitiveness.
6.2.3 It is therefore imperative that research and development work be undertaken in
developing technologies for shipboard GHG reduction for marketing not only to Indian
shipping fleet but international shipping fleet. Government must put in place a system for
providing easy financial and administrative support to entrepreneurs and R & D
organizations.
6.2.4 With a view to reduce carbon space in atmosphere, market based measures may come
into force in international shipping. In that scenario for Indian shipping fleet to remain
competitive, it is essential that GHG reduction technologies be made indigenously available
at reasonable cost otherwise Indian shipping industry would become uncompetitive by having
to import technologies from developed world at exorbitant cost to make ships fuel efficient or
run energy inefficient ships.
6.2.5 The areas of R & D could be development and use of alternative fuels like bio-
fuel. There is an urgent need to use LNG as fuel of Ships and should be supported by
the Govt. LNG as fuel is cheaper than liquid fossil fuel and given cleaner emission
apart from less GHG emission. However, due to lack of good distribution and bunkering
facilities LNG has remained a very expensive fuel currently. If an infrastructure for
distribution and bunkering facility around the coast is provided as has been done in Baltic, the
cost of operating coastal fleet in India will become cheaper with consequential cleaner
emission. School of Maritime Design and Research in Indian is taking initiative in use of
51
LNG as fuel on ship and the same should be supported. Also adequate steps be taken to have
good distribution and bunkering facilities around the coast. In Scandinavian countries, Japan
etc. currently research is in progress for development and use of fuel cells, Kite sail, air
bubble technologies etc. It is imperative that seminars be held at regular basis in various
forums to encourage innovation and R & D.
6.2.6 Shipyards need to be encouraged to design and build ships in compliance with IMO’s
Energy Efficiency Design Index (EEDI) and Ship owners encouraged to operate ships as per
Ship Energy Efficiency Management Plan (SEEMP).
6.2.7 IMO having approved regulations for Technical and Operational Measures for
reducing GHG emission from ships in July 2011 at MEPC 62 will also in all probability
approve Market Based Measures (MBMs) for further reducing GHG emission from ships in
the next few years. Indian National Ship Owners has carried out an impact assessment on
ship operating cost including cost implications on older vessels. The study has found bunker
levy to be cheapest form of MBM. The regulatory development process needs to be closely
monitored and influenced at IMO to protect our national interest.
6.2.8 India is predominantly dependent on the imported LNG and even the reception
facility for this LNG is very sparse. India being in the tropical zone, extra emphasis needs to
given to research on the cryogenic systems. Though the LNG industry has been operating at
highest standards of safety for several decades. Extra safety precautions / security
arrangements need to be devised to make the LNG Bunkering facilities more fool proof. This
is attributed to the fact, that even a single mishap can potentially pose a threat to the whole
bunkering facility / port.
6.2.9 The Government and Shipping fraternity should encourage on R&D for development
and use of fuel cell, kite sail, air bubble technologies etc. in reducing fuel consumption. It is
suggested that stakeholders should organize seminars/workshops at regular basis to
encourage innovations and R&D.
6.2.10 In order to achieve the objective of sustainable shipping and to achieve our country’s
effort to address the climate change, there is a need to provide government funding to
support energy efficiency initiatives of stake-holders.
52
6.2.11 There would be a huge requirement of ship energy efficiency enhancement
technologies including use of alternative sources of energy. Appropriate funding facilities
may be provided by Ministry of Science & Technology to encourage entrepreneurs
willing to develop new energy efficient designs and technologies through research and
development. Among others, European Union has established such financial instrument for
the environment. European Union funding instrument LIFE+ is intended to finance and co-
finance projects that contribute to EU’s efforts to address the climate change. Accordingly,
financing can be made available for best practice pilot projects in areas such as climate
adaptation techniques, as well as energy efficiency initiatives. With such financing, our
entrepreneurs would be able to sell technologies to international market.The Indian oil
Refineries should be well aware of low sulphur bunker fuel and equipped with producing the
same. Otherwise in future demand of bunker fuel being sourced from India may be in the
decline.
6.2.12 There is also a need to ratify the Ballast water convention, Ship recycling and
Antifouling system convention in order to maintain the uninterrupted overseas trade and
safeguard our coastal waters. There is also an urgent need to complete base line study of
remaining ports in India and to establish at least two ballast water sample testing facilities
one in each coast urgently. Also Government should actively promote research in developing
ballast water treatment technologies so that when the Ballast Water Convention comes in to
force globally, we will have indigenous technology at our disposal instead of totally
dependent on foreign technologies.
6.2.13 The Government may also consider the proposal to carry out the study for designation
of the Lakshadweep Island, Andaman & Nicobar Island & any other area which qualifies for
Particularly Sensitive Sea Area (PSSA). It is also proposed for designation of Emission
Control Area (ECA) for specific portions to Indian coastal waters, for the control of Nitrogen
oxide (NOX), Sulphur oxide (SOX) and particulate matter (P.M.) emissions.
6.2.13 It is crucial to provide training for seafarers on enhancing energy efficiency of Ships.
Most importantly, there has to be a mindset shift among those in the industry to move away
from the mentality of maintaining the status quo to a proactive stance to do their part to
reduce carbon emission.
53
Chapter 7: IT Investments & Interface
7.1 Transport system comprises of a number of distinct modes and services. Transport
system is an integral part of supply chain, implementation of IT is of vital importance. All
these changes require the various links in the supply chain to provide on line information,
facility. Changes in the port industry are underway because of implementation of Port
Community System at Indian Ports. Similarly, change in the shipping industry is also
underway. Leading carriers, consolidators, freight forwarders, and agents around the
globe have introduced electronic commerce to serve their customers better.
7.2 Requirements of Implementation of IT
7.2.1 Transactions in the Ind ian Port Community are still paper based. Though some of
the individual members of the community have computerized their internal operations, it is
difficult for them to transfer the data electronically and the data transfer, getting status
updates from or transacting business with other members of the community take place
manually resulting in re-entry of data into their internal systems manually. These
activities slow down the flow of information and are error- prone, and adversely affect
service levels - all soft costs, very hard to detect and control. As the dominant players
(likes Port/shipping industry and Customs),begin to adopt electronic exchange of data and
e-commerce practices, manual steps are being eliminated one by one and handled by
automated systems and transmitted by EDI messages.
7.3 Information Systems at Ports – a model
7.3.1Ports are vital links in the transport chain between sea and in land routes. Port is,
therefore, required to interface with the Shipping Agents, the representative of ship-
owners and with the Custom House Agents (CHAs) or Forwarding Agents, who manage
the cargo on behalf of importers and exporters. The port has also to work in close
association with the Customs, who have statutory control to permit import and export of
cargo and with banks for funds flow.
7.3.2 Ports deal with a wide range of activities like movement of ships, passengers,
cargo/container through different modes of transport, the loading and unloading of ship and
interaction/clearance from different s t a tu to r y bodies and port users. In addition,
allocation and management of physical resources like berths, anchorage, channels, tugs,
warehouses, storage space, h u m a n resources, etc. are also to be considered. Therefore,
54
management of a port involves efficient deployment and utilization of all resources,
backed-up by timely and accurate information, which can be successfully achieved only
by efficient deployment of state-of-the-art Information Technology.
7.3.3 In view of innovations in Information and Communication Technology, the
maritime industry is undergoing rapid technological changes. High degree of automation
in operations is aimed at the ports world over to meet the increase in demand of
eff iciency of port operations. Hence, application of Informat ion Technology is
one of the key issues in the modernization of Ports.
7.4 Major Business Processes in Ports:
7.4.1 Enterprise Management: It covers (i) Human resources; (ii) Finance; (iii) Accounts;
(iv) Estates; (v) Legal and (v) IT
7.4.2 Operations: (i) Capacity & Demand Planning; (ii) Shipment Booking & Routing; (iii)
Gate Management; (iv) Yard Management; (v) Berth Management; (vi) Vessel Management;
(vii) Service center operation; (viii) Customs, Health inspection & Immigration; (ix)
Warehousing Operation and (x) Equipment Management and Maintenance
7.5 Computerization at Indian Ports
7.5.1 Computerization at Indian Port sector began in 1970s but it was limited to
processing statistical information, preparation of wage bills, etc. It was in mid 1980s,
when some ports initiated action towards computerization of their activities.
However, Indian Ports are now rapidly moving towards application of state-of-art
technology and internet technology to implement integrated Port Operation System
and to move towards paperless regime so as to reduce dwell time and as also cost to
users. The major areas includes, where such automation is aimed at by use of IT: (i)
Vessel Traffic Management System (VTMS); (ii)Information Technology in Scientific
Application, the Cargo/Container handling operations, the non-operation areas; (iii)
Surveillance System and Safety & Security System;(iv) Electronic Commerce
(EC)/Electronic Data Interchange (EDI) .
7.5.2 VTMS regulates the arrival and departure of vessels in the Port channel. VTMS has
already been installed at Mumbai, Jawaharlal Nehru, Kolkata, Cochin, New Mangalore and
Mormugao Ports. The status of installation of VTMS at other Ports is as follows:
55
Kandla : VTMS is installed for the Katchch region.
Chennai : Installation is in progress (Civil work is going on)
Visakhapatnam : Presently Traffic is being managed by GPS Radar & AIS
Tuticorin : It will be procured shortly.
Paradip : Presently Traffic is being managed by GPS Radar & AIS. Tenders are being
issued.
Ennore : Presently Traffic is being managed by GPS Radar & AIS. It will be procured
shortly.
7.5.3 Information Technology: It has scientific, operational and non operational
applications. Scientific applications carried out at major ports in India cover hydraulic
studies of the river regime at Kolkata and hydrographic surveys at the ports of
Visakhapatnam, Mumbai and Kandla. Survey crafts are now equipped with integrated
Computer-GPS system for survey and preparation of Bathymetry Charts.
7.5.4 Operational Application: Major Ports i n I n d i a have been
implementing/implemented heterogeneous system using the latest technology covering
the following modules/applications for efficient functioning of ports: (i) Integrated
Vessel Services and Control Management; (ii) Integrated Cargo Management and
Accounting System for all types of cargo ( which includes import & export module,
Rail/CONCOR Operation and billing); (iii) Integrated Container handling and Tracking
system; ( iv) Resource Planning (Including Equipment, Labor etc). Most of the Private
Container Terminal Operators in Major Ports have also implemented Terminal Operation
Systems like NAVIS, CATOS, etc.
7.5.5 Non-Operational Application: Areas under this category which have been
computerized by the Ports, are Pay Roll preparation and related accounting functions such
as P.F. Accounts, Loan Accounts, Income Tax, Financial Accounting, Stores Inventory,
Personnel Management, Estate Management, Hospital Management, Materials Management
System, etc. All ports have carried out Comprehensive Computerization including Port
Operation System. However, Ports like Cochin, New Mangalore and Mormugao
have implemented Enterprise Resource Planning (ERP) Solution along with Port
Operation System and other modules that are not part of ERP Solution. Jawaharlal Nehru
Port is attempting to implement few modules of ERP Solution. Other Ports are also
attempting to implement ERP solution along with Ports Operation System.
56
7.5.6 Surveillance System and Safety & Security System:
7.5.6.1 As a result of terrorist attacks/threat, a number of new technologies have been
introduced to help the implementation of International Ship & Port Security Code
(ISPS) code in various countries including India. All the Major Ports are ISPS compliant.
In process of implementing ISPS, the need for bio-metric based access management was
felt and many ports are in the process of implementations. Besides, the requirement of
CCTV based control system has also been felt and some ports are also reaping the benefits
of the same.
7.5.6.2 Now, all crafts tend to have GPS system, which install a satellite station on a ship.
Similarly the use of radio frequency identification (RFID) is gaining ground in logistics and
transport planning and optical character recognition (OCR) is being used in terminals to
speed up the processing of containers in and out. It is also proposed to introduce container
scanning system in a phased manner, in addition to the introduction of automatic
surveillance system like CCTVs.
7.5.6.3 The recent 11/26 attacks on Mumbai, the surveillance and security has
become top most priority in Ports. Therefore, the need of very stringent and secured
smart card and biometric verification at access points within ports/terminals for
the seaport personnel, vehicles and container truck traffic management has arisen.
Ports are geared to take up this challenge. The need of electric fencing with breach
alarm is also felt.
7.5.7 Electronic Commerce (EC)/Electronic Data Interchange (EDI): EDI has become
an essential element for maintaining the efficient operation not only of ports but also for
the complete trade and transportation cycle.
7.5.8 Towards Integration- Port Community System: EDI implementation at Ports
was in a piecemeal fashion and hence the real benefits have not realized so far.
Therefore, steps have already been initiated to implement Centralized Web based - Port
Community System (PCS) at all Major Ports to reap the maximum benefits of EC/EDI and
move towards a paperless regime.
7.5.9 Port Community System (PCS)
7.5.9.1 It is intended to integrate the electronic flow of information and function as
57
the centralized hub for Indian Ports and other stakeholders like Shipping
Lines/Agents, Surveyors, Stevedores, Banks, Container Freight Stations,
Government regulatory agencies, Customs House agents, Importers, Exporters,
CONCOR/Railways, etc. through common interface in secure manner using the latest
technologies. It will be accessible through a secure and personalized web browser. This
central and common facility will definitely save time and money and improve the speed of
the services.
7.5.9.2 Main Objectives of PCS are: (a) Develop a centralized web-based application, to
act as a SINGLE WINDOW, for the community members/stakeholders to exchange messages
electronically in secure way and; (b) DATA REPOSITORY for research qand analysis.
Already Vessel, Cargo, Container, Transport finance related messages and e-payment
module with 12 Banks have been made ONLINE. Non-Major Ports namely, Pipavav,
Mundra, Dahej have migrated to PCS. Efforts are being done to migrate other non-Ports to
PCS.
7.5.9.3 Benefits of PCS: (a) User will be able to file documents for any port from anywhere
in India; (b) Convenience 24x7 submission; (c) User will be able to monitor and track the
activities through the web; (d)Provides both web forms as well as message (XML,
UN/EDIFACT, TXT format) exchange options; (e) Standardization of Information
exchanged; (f) Provides gateways for payment, SMS, E-mail, etc. centrally; (g) Timely
Alert during exceptions on e-mail, SMS, etc; (h) Minimize hardware, software procurement
and maintenance cost by avoiding duplication of resources at each Port Community; (i)
Better security, redundancy and providing for Disaster recovery; (j) Building of a repository
of information for endless query options and a variety of needs including statistics and
research; (k) Over a period of time when the repository of information gets built up the past
data can be quite valuable.
7.5.9.4 The ultimate aim is to seamlessly integrate all members of the port community and
also to provide and electronic platform to act as a single window to exchange messages.
This is definitely a positive step towards improving Communication & Productivity
and reduction in transaction cost at Indian Major Ports.
7.5.10 All the above measures will transform the Indian Ports into a truly top-
notch world-class technology d r i v en p o r t s . When India is becoming third
58
largest economy in the world, ports also need to be geared to catch up with the
requirement of world trade and contribute to the economy for which the ports should
be equipped with the State-of-Art Technology.
7.5.11 Information Systems at Shipping – a model
7.5.11.1 SET-IT is a major project initiative taken by The Shipping Corporation of
India to have enterprise wide transformation using Information Technology. The Scope of the
project includes automation of the following business areas.
(i) Liner Shipping business, Bulk Carrier and Tanker Business, Fleet Management and
Technical Services, Procurement of Material and Services, Human Resources (Shore and
Fleet Personal), Financial, Cost and Management Accounting;
(ii) Business Process Integration through PI, MIS/ Business Warehousing & Business
Intelligence, Master Data Management, Employee Self Services / Managerial services
through Portal, Document Management System;
(iii) Interface to EDI Systems.
(iv) Construction of state of the art Data Centre and IT Infrastructure upgrade.
7.5.11.2 Business Benefits include: Customer Support – 24X7 Customer service and
support is possible using technology; Web Access - Single log on through internet for the
Agents. Cargo Container Tracking through internet for customers; Chartering – Automation
of Voyage and Time chartering and its related activities; Ship Management – Improved
process of PMS, Repairs Maintenance, Dry docking, spares, stores supply, bunker supply and
crew management;
7.5.11.3 Work Efficiency - Implementing ERP and COTS will make an employee work
efficiently. Less time spent on reconciliations and more time on quality work; Single
Transaction Entry - Levels of data aggregation and iteration is eliminated by the single
entry of transactions into the ERP-COTS system; Real-time Integration - On-line, real-time,
integrated data from COTS into ERP as well as within each module of ERP reduces service
time, reconciliations and enables data traceability; Process Oriented – The company
becomes process driven. Efficiency in end-to- end processes leads to GROWTH for the
company; Access to Integrated Data – The details required can be accessed from any
location resulting in speed, accuracy and transparency of information; MIS – Very
efficient tools for Management Information and Decision support’; ESS – Employee Self
59
Service through portal.
7.5.11.4 Director General Shipping (DGS):The IT mission of DGS is to be an effective
and efficient regulator for delivering quality services and achieving effective enforcement
of laws Its priority to provide mandated services which may be enhanced and
supplemented by application of Information Technology by providing additional services
to individuals / Industry. DGS envisages a future plan of providing all the services on Line
by making our website fully interactive and integrating it with all the MMDs. Further it
would be DGS endavour to integrate all the stakeholders on one portal.
7.5.11.5 eSamudra Project: This project is one of the vital e-governance initiatives
implemented in the directorate and its allied offices, across the country. The scope of
project includes computerization of various business functions of DGS by developing
different e-Modules resulting in process automation and creation of huge database
containing vital information about various business entities such as ships, licenses,
examination, CDC, INDOS etc. Phase-I of the project is already on the verge of completion
and the directorate would be freezing on activities to be considered in phase-II of the project.
Following e-Modules have been developed and deployed at all concerned allied office of DG
Shipping: (i)Coastal Shipping; (ii) Examination System (completed in part);(iii)Ship
Licensing & Chartering (iv)PRISM – CDC;(v)SMO –other activities;(vi)Meetings &
Resolutions; (vii)Inward/Outward(viii)File Tracking & Documentation;(ix) Manning Agency
(RPA);(x)MTO System;(xi)Ship Registration and;(xii) INDOS Online
7.6 Existing Status of IT Implementation in India’s Maritime Sector
7.6.1 Existing Status at Ports: The type of infrastructure provided at the port largely
depends on type of cargo handled such as General cargo (Break-Bulk / Container),
Dry-Bulk (Ore, Fertilizers, Coal, Food Grains, etc.), Liquid-Bulk (Chemicals and POL,
etc.). Accordingly, Information System/Application System will vary with the nature of
cargo. Major applications, which are required to be implemented for efficient
functioning of the ports, are: (i) Vesse l Information and Control System; (ii) Cargo
Information and Control System; (iii) Container Tracking and Control System; (iv)
Financial Management System; (v) Payroll and Personnel Information System; (vi).
Inventory Management System; (vii) Mate r ia l s Management System; (viii) Estate
Management System and; (ix) Port Management Information System
60
7.6.2 Implementation of Information System at Ports could be either
implementation of Comprehensive Computerization or implementation of Enterprise
Resource Planning (ERP) Solution with Port Operation System (POS)/Cargo Operation
System on the top of it. The details of which is as follows: Three Ports as given below
have implemented Enterprise Resource Planning (ERP) Solution along with Port
Operation System (POS) and other module that are not part of ERP Solution are: Cochin,
New Manglore and Mormugao. Following Ports have carried out Comprehensive
Computerization: (1)Kolkata (Including HDC); (2)Paradip (Tendering stage for ERP
solution); (3) Visakhapatnam (implementing ERP solution); (4)Chennai; (5) Tuticorin; (6)
Mumbai; (7) Jawaharlal Nehru (also attempting to implement few module of ERP solution)
and; (8)Kandla
7.6.3 Existing Status at Shipping Sector: The Shipping Corporation of India has taken a
major IT initiative to standardize and automate the business processes using the state of the
art IT infrastructure. The ERP implementation project has gone live with majority of the
modules along with the end-to-end integrated processes. Some more m od u l es such
as E- Tendering etc are being implemented as Phase II. Also steps are being taken to
setup a disaster recovery site (DR) to handle any eventuality.
7.6.4 Existing Status of National AIS Network (NAIS): The Directorate General of
Lighthouses and Lightships (DGLL) is setting up of a National AIS Network 74 shore
stations on existing lighthouses along our coast and in our island territories will be
established. The NAIS Network would permit tracking of all AIS-equipped vessels
transiting close to our coast.
7.6.5 Existing Status of Coastal Surveillance Network (CSN):To monitor the traffic
along the entire coast of India, a network of shore radar stations and electro-optic
surveillance systems at 46 locations along the coast and in the Lakshadweep and Andaman
& Nicobar Islands, is being set up by the Indian Coast Guard. The radars and electro-
optic sensors will be installed on select lighthouses of the Directorate General of
Lighthouses and Lightships (DGLL) at 38 location on mainland/Lakshadweep Island
and eight lighthouses/convenient structures in the A & N Islands.The NAIS network and
the CSN would together provide real time situational awareness off the Indian coastline
and island territories.
61
7.7 Existing status of e-Governance in the Directorate General of Shipping and its
allied offices: Various a c t i v i t i e s t o b e ca r r i ed o u t t o w a r d s e f f i c i e n t
implementation of e-Governance through E-Governance projects are as follows:
7.7.1 eSamudra Project This project is one of the vital e-governance initiatives
implemented in the directorate & its allied offices, across the country. The scope of
project includes computerization of various business functions (functions of various
branches of DG) of DG Shipping by developing different e- Modules resulting in
process automation and creation of huge database containing vital information about
various business entities such as ships, licenses, examination, CDC, INDOS etc.
7.7.2 ePariksha Project: This project aims at conducting Online Examination for
nautical and engineering wings’ competitive exams. This project would be executed
across all the exam centers all over the country.
7.7.3 Implementation of e-Payment Gateway: The Directorate General of Shipping (DGS)
plans to implement e-Payment gateway for all its financial transactions. It would
undoubtedly facilitate DGS to control and monitor the fiscal transactions.
7.7.4 Information Exchange between DGS and its allied offices:The information
exchange between DGS and its allied offices would be made possible by
migrating/integrating different databases existing in allied offices of DGS. Channeling and
centralizing of shipping/maritime data would enable DGS to generate/compile MIS in
analysis & policy decisions.
7.8 Existing status at Inland Waterways Authority of India (IWAI): IWAI has been
working on Design & Development of Web based Portal for IWAI activities through
NICSI. In this particular project some development had already been c a r r i e d o u t .
This portal w i l l c o v e r d a t a /information r e l a t e d t o P r o j e c t Management, Vessel
management, Terminal Management, Cargo, Hydrographic, Survey, Establishment,
Administration and Finance. The portal is being designed for online processing of proposal
as well as monitoring of activities/projects
7.9 Existing Status at Ports under Gujarat Maritime Board (GMB): GMB has already
implemented online TATAEX software modules for Port dues payment, Payroll, asset
management; online budget preparation using CITRIX server. GMB has initiated
62
implementation of Integrated Port Management System (IPMS) which will cover: (a ) GIS
based lands & assets management system (particularly for Alang); (b) A low cost
communication platform; (c) A fully integrated biometric based access control & T&A
system; (d) Web portal management system; (e) Document management system; (f)
Store/inventory management system; (g) Customer grievance management system; (h)
Integrated Security Management System; (i)Pension Management System; (j) Traffic
Management Module; (k) Control Room and Audio Video Surveillance; (l) Electronic Data
Interchange and; (m) Environmental statutory clearances management system for Alang.
Besides, GMB’s IPMS project will also include ship’s identity, digital fencing (virtual
fencing), security & surveillance equipments, and latest equipments for container
scrutiny by putting latest technology in container handling cranes. GMB i s already having
VTMS services operational in Gulf of Khambat for monitoring the traffic routes of the
vessels which will be integrated with IPMS.
7.10 Implementation of EDI/PCS in the Non-Major Ports:
7.10.1 In the Maritime State Development Council (MSDC) meeting held in August 2010
at Chennai, it was resolved that ‘For facilitating paperless transaction to enhance port
operations, all non-major ports would ensure their integration with the Port
Community System (PCS) for which workshops would be organized by the Indian
Ports Association in the Maritime State”
7.10.2 Migration of Non Major Port to Production Server: The Ports like Mundra, Dahej,
Pipavav and Gangavaram, which contribute a big share in terms of traffic of non-major
portswere to be completely brought at production server by July 2011. However,
Mundra, Dahej & Pipavav Ports have been migrated under the ambit of PCS for LIVE
exchange. Efforts are being done to migrate Gangavaram also under the ambit of PCS.
Efforts are also being made to bring six Non Major Ports namely Kakinada,
Nagapattinam, Magdala, Jamnagar, Sikka, Bedi (as per Custom Roll -Out List ) under the
ambit of PCS. The pre-requisite to integrate with PCS & ICEGate is internal
automation at non-major ports only.
7.11 International Practices
7.11.1 A close look at maritime and port sector globally would reveal that the countries
that are successful in attracting higher volumes of sea borne traffic and trade, have invested
quite substantially on technology and deployed advanced IT systems to improve the
63
efficiency of the port operations. In an attempt to analyze the successful international ports,
Working Group studied I T a p p l i c a t i o n s a n d investments in IT systems in detail
of Ports of Singapore and Amsterdam Following are the major IT infrastructure
investments/deployments initiated by these ports/countries.
7.11.2 Integrated Terminal Operations Systems: Integrated Terminal Operations
System is an Enterprise Resource Planning system for Ports/Terminals. It is a powerful
tool that allows the port to manage its equipment and people seamlessly, flexibly and in
real-time and integrates every asset from prime movers, yard cranes and quay cranes to
containers and drivers. It integrates planning room PCs, PCs on-board cranes and various
database and servers via a real-time fibre optic communication network and wireless data
transmitters. All components work together to cater for every aspect of the terminal's
operations. Terminal Operations Systems include the following applications: (a) Berthing of
the vessels; (b) Ship and Yard Planning and (c) Resource Allocation.
7.11.3 Port Community Systems (PCS): It provides a single window to securely
exchange the documents and information electronically between Ports and other
stakeholders involved in the maritime transport and logistics chain including the
trading partners and government agencies. It also provides global visibility and access to
the central database to all its stakeholders through internet based interfaces. The web based
PCS, connects Ports to shipping lines, freight forwarders, shipping agents, transporters,
banks and other government agencies, helping them to synchronize their complex
operat ional processes enabl ing Electronic Data Interchange (EDI). PCS are
integrated with IT systems used by shipping lines and shippers to slot exchange, manage
transshipment process and monitoring the performance.
7.11.4 Optical Character Recognition (OCR) System at Gates: OCR systems are fully
automated gate-in and gate-out system at terminals that identifies containers as well as
trucks passing through the gates. It would capture, recognize and record the container and
the truck numbers. The system typically comprises of an image capturing system,
Character/image Recognition software and database for storage of images and the data. This
system is integrated to the Terminal Operation systems for verification and update of
container number coming into and out of the port/terminal. This system would increase the
efficiency and throughput at the terminal gates and reduce the waiting time at the gates for
64
trucks. At PSA, its ‘Flow Through Gate’ handles an average traffic flow of 700 trucks per
peak hour.
7.11.5 Vessel Traffic Management Systems (VTMS): It is a real time system that
allows full sharing of information about arrivals, departures and transits among all
the maritime parties, is used by port and harbor authorities to manage the vessels
traffics in port waters and monitor the waterways. The VTMS ensures safe navigational
services to vessels at the port and acts as a Command Centre for Crisis Management
Operations such as SAR, oil spill detection and anti- terrorist activities. In addition to
monitoring the shipping lanes to enforce compliance of safe navigation regulations and
providing protection of vessels carrying hazardous cargoes, VTMS systems assist
Coast Guard and other Authorities to ensure the security in the port waters. VTMS includes
special sensors and systems for oil and gas ports increase the safety of vessel transit and
berthing.
7.11.6 Harbor Craft Transponder System: Maritime authorities of many countries in
collaboration with Coast Guards and Navy have been implementing harbor craft
transponder system systems to automatically track and monitor small powered harbor and
pleasure craft in their port waters. All harbor crafts need to carry a transponder on them
and this system allows real time data from the transponder such as vessel identity, position,
speed, course and other information are transmitted to a main system in the shore through
wireless network. The crafts can also alert the control centre if there is a security threat or
emergency.
7.11.7 Radio Frequency Identification (RFID) and Container Tracking System: Port
of Singapore (PSA) has deployed of RFID transponders into its container yard to
create a multi-dimensional tracking grid in 1993. The PSA tracks many thousands of multi-
ton cargo containers daily, and also manages arrivals and departures of up to 50 ships. A
centralized system manages the placement and location of containers. The Port of
Rotterdam is one of the largest operators of container handling systems. RFID
transponders guide automated guided vehicles (AGVs). Deployment of this system began in
1990. The RFID automated terminals achieve a much higher efficiency than its manned
counterparts. All container transfers are controlled by automated guided vehicles, and
unmanned b r idge c ranes ca r r y out stacking operations – all without human
intervention. The implementation of the RFID would eventually:
65
a) Facilitate the flow of accurate and timely information across supply chain partners
and Government agencies;
b) Optimise container logistics processes;
c) Improve supply chain efficiency and reduce costs;
d) Achieve more efficient and individual container traceability;
e) Deter theft, diversion and counterfeiting;
f) Integrate RFID technology into existing business practices;
g) Reduce face to face intervention and thereby reduce scope for corruption/discretion
7.11.8 Maritime Security and Surveillance Systems: Maritime Surveillance System are
used globally to detect, classify and track threats and disseminate information to the proper
response personnel and monitor and control entry to ports and inland waterways.
Integration of this system with Automatic Identification System (AIS) technology
provides situational awareness with identification of approaching vessels. The
software analyzes the data and identifies situations that are out of the norm and sends
alerts to respective authorities. When an unidentified vessel approaches inland waters,
operators are alerted with warnings. The system also provides support to search and rescue
and emergency response teams in case of emergency.Maritime Surveillance System includes
wireless Surveillance, remote monitoring, night vision systems and video analysis. It
compiles data from a variety of sensors and other sources and processes the data to provide
critical decision-making support to coastal, port and waterway authorities.
7.12 Emerging Trends in IT Applications in Global Airtime Transport
7.12.1 Vessel management in Ports will become fairly uniform across the world and ICT
will have a greater role to play due to security concerns. Real time flow of
information about ships in transit will become a reality through regional joint
initiatives and Ports will have accurate and frequent ETA declarations. Berth planning
and ship scheduling will become far more reliable.
7.12.2 Information flow across the entire logistics chain (Community based systems)
will be shared across all the stakeholders resulting in better planning and
mobilization of resources. In land transportation (truck and rail) will be more amenable
to planning and scheduling resulting in better evacuation of cargo from the ports. The
service time inside the Port will become much shorter due to the availability of the
right documents and compliance achieved through communications from the Regulatory
66
agencies like customs.
7.12.3 In the future, usage of ICT, particularly the mobile technology will be very
high. People and processes will be oriented towards mobile technology to speed up the
information and cargo flow. RFID combined with global positioning systems (GPS)
on all the equipment including ships, land transport vehicles, gantry cranes to facilitate
tracking and documenting movement and storage of cargo/ container. Mobile,
noninvasive inspection systems allow for inspection/ screening with minimum effect on
the flow of commerce. The hitherto grey areas for shipment tracking and tracing while in
port or in transit at sea will diminish. Irrespective of where the cargo is i.e. in truck or
warehouse or container, ICD, Port, ship etc. the consignee and the consignor will be able
to keep track of its movements. Use of a wireless LAN (WLAN) for data transmission
throughout the seaport and use of wireless handheld computers for dock workers will
become increasingly common. New technologies for gate control, perimeter security and
surveillance such as multiple types of access control devices with biometric controls
intelligent fence systems, chemical and biological detectors, underwater cameras, and
infrared perimeter motion detectors will be used.
7.12.4 For water, traffic, and navigation managers, Geographic Information System
(GIS) combined with Global Positioning System (GPS) technology offers a superior
solution for tracking vessels and managing traffic in crowded waterways. Database-
driven nautical charting solutions make it easier for maritime administrations
worldwide to efficiently manage chart products and generate high-quality navigational
products. Therefore, the implementation of GIS will increase.
7.12.5 The number of manual interventions along the process flow will be drastically
reduced resulting in very quick decisions driven by the system – starting from quotes
from the shipping lines for booking till the delivery of the cargo. This is possible only if
documentation flow will be 100% digitalized. In this connection, Digital signature should
be approved and introduced as soon as possible so that a complete paperless handl ing
of documentat ion and payment f low is made possible. End result would be One
Stop Shop (single window) concept and inter-modal transport linking strategically
between ocean, railway, road and inland waterway.
7.12.6 In near future, Indian shipping industry will be having Integrated Logistics
67
Management System linking all entities, which is lacking presently. This system will be
integrated with road transport, FOIS of Railways, container operator system including
CONCOR, Port Community System (PCS) and Shipping System to drive maximum
benefits to entire industry. The entire transaction from the booking by the shipper to the
payment of insurance to the final delivery of goods damage-free, full in quantity can
ultimately be tracked and carried out online. This will lead to standardization of all
commercial documents used in domestic trade and inter-state movement and EXIM trade.
This would also require a comprehensive solution of GPS based vehicle
tracking/communication equipment, up-to-date GIS maps, call centers, portals, and service
providers.
7.12.7 The efficiency of the ports will be based on the infrastructure and the operating
system to drive the planning, operations, control and review. Port/ Terminal Operations
System will be one of the key differentiating factors among competing ports.
7.13 Current gaps in the Indian Po r t / Shipping/ Logistics industry vis a-vis
international s tandards
7.13.1 Port Operations systems implemented in many Indian ports cover only the billing
process – capture of the billable activities through on line or batch mode, applying the
tariff and settlement of bills. No element of operational planning, deployment,
scheduling or execution are covered through the Port Operations software because:
a) The software solutions are built around the existing manual processes and practices
(except for some container terminal operations);
b) The domain inputs come from the operations personnel of the port who are hard
pressed for time cannot ;
c) The features in the systems developed are limited to what is required as per the
existing manual operations.
As a result, most of the processes in the operational chain which do not have a link to
the billing process are left out of the computerization process. Since the Port Operations
are not dependent on or driven by the software, it is not used optimally. In most ports,
the integration of different modules of the Port Operations software solutions with the
back office functions are not yet available. These modules function in isolation.
7.13.2 Operation of the system is not critical to Port Operations (except in the case of
container terminals) since planning and scheduling are not present. Monitoring the
68
operations through alerts and introducing course corrections are not system driven.
The usage of system is focused more towards recording various activities for generating
invoices or statistical information. This is the major gap. There is a pressing need to
provide realistic simulation models to facilitate optimum utilization of available port
resources and better information management to improve customer serviceability (as a
service differentiator). Therefore, GIS solution for following need to be implemented:
7.13.2.1 Port Operations: (i) Real Time Vehicle & Asset Location;(ii) Vessel Routing &
Tracking;(iii) Berth Occupancy & Assignment;(iv) Cargo & Berth Time Calculation; (v)
Dangerous Cargo Display.
7.13.2.2 Public Information: (a) Shipping Channels Location and;(b) Restricted Area
Awareness
7.13.2.3 Data capture is done manually as against automatically in ports of the developed
countries. Data capture is automated with the equipment and devices. E.g. Gate
movement of vehicles, containers, vessel movements, truck movements, rail
movements etc. This result in delays is error prone and does not validate the data thus
captured. Real-time & accurate information for stakeholders is often not available.
Therefore, the need is to implementation of following:
i) Automate Gate for secure and free flow traffic movement : The Process for automatic
Gate shall be as follows: After a manifest is submitted, the fully automated and paperless
process at the gate clears trucks entering the port may use the following steps:
a) The truck arrives at the in-gate. The driver taps his port pass on the Self Service
Terminal (SST) and verifies his identity through a fingerprint biometric reader or
keys in his Personal Identification Number (PIN).
b) The truck is weighed at the weighbridge.
c) The gate picks up the truck's identity from the In-vehicle Unit (IU) at the dashboard.
d) T h e gate's Container Number Recognition System (CNRS) captures the container
number via Closed-Circuit Television (CCTV) cameras
e) The system checks the driver's identity, truck's identity, weight and the container number
against the manifest and clears the truck for entry.
f) The system sends a message to the driver's mobile phone or Mobile Data Terminal
(MDT) on the exact position in the yard where the container will be stacked.
69
ii) Automation of Trucker movement around Ports : To avoid congestion of trucks around
ports, the movement of trucks shall be automated. And t ru ck s shall come around the
ports during the prescribed time limit in the computerized pass.
7.13.3 Sharing of information among the various stakeholders of the Maritime
community is not fully enabled in a structured way. Integration of the various applications
within each entity and then exchange of key information with the other players in the
logistics chain needs to be focused. Currently not able to service the diverse information
management needs of various logistics supply chain stakeholders. Need to further
facilitate paperless trade to reduce transportation costs and speed of information
processing. India has low IT penetration as compared to Japan, Singapore, Australia and
South Korea.
7.14 Recommendations
7.14.1 Despite the huge size of the country, the import and export flows are still modest,
when compared with other countries in Eas t As ia . This is reflected especially in India’s
container throughput, where volumes are only a fraction of the Chinese container exports
and imports. Also port development is much smaller and where Chinese ports are now the
worlds leading ports (with the majority of the largest container ports being Chinese), the
Indian ports are still relatively small ports.
7.14.2 Logistics costs as a percentage of Gross Domestic Product (GDP) range from
around 9 per cent in the United States of America (USA) to 11–12 per cent in France and
the United Kingdom and 10–15 per cent in China, India, Japan, and Singapore. The
logistics sector in India is very fragmented. Only in some sectors, e.g. in the automotive
industry, the concept of outsourcing and chain control is fully
7.14.3 Many Companies/Organization in logistics industry have significantly changed the
way they do business by implementing ERP models, Port Community System (PCS).
However parts of the transaction in the Maritime Community are still paper based. Therefore,
digitalization process, which normally should lead to benefits for the users in terms of the
time and cost advantages, has not been completed in logistics industry in India
7.14.4 It is also noted that only few Non-major ports have shown interest in the
implementation of Port Community System (PCS). It is also observed that most of the
70
small users does not have internal computer application therefore, they are using user
interface of PCS and doing data entering for s u b m i s s i o n o f document i n s t e a d o f
u p l o ad i n g m es s a ge s f r o m i n t e r n a l application system. Therefore, it is felt that
Government of India shall take initiative to develop such module and provide to the users at
nominal cost. There is urgent need for implementation of suitable IT solution for Management
of intermodal cargo transfer t o a v o i d cargo traffic bottlenecks, increased waiting
time and lost efficiency; M a n a g e m e n t of Multimodal transit network of Ports which may
include cargo, trucks, Trains and coastal ships; Automation of trucker movement around
Ports with the help of GPS/GIS and RFID tag technology; Automation of Port Gate for free
flow traffic; Exchange of Position of Ship in sea as provided by LRIT shall be
implemented for all the Port and Shipping fraternity; Digital signature should be approved
and introduced as soon as possible so that a complete paperless handling of
documentation and payment flow is possible. Only by doing so, the so needed
improvements in lead time and logistics cost advantages can be realized; National Payment
Gateway including all banks so that users can make ONLINE payment from any banks
and branch
7.14.5 Need for a single window electronic platform for maritime stakeholders to have a
common interface. Therefore, it is felt that keeping Port Community System (PCS)
as a base, other components can be integrated using Service Oriented Architecture
(SOA).
7.15 Other Recommendations – Sector Wise
7.15.1 Ports Sector
7.15.1.1 Each port should undertake Enterprise Resource Planning (ERP) solutions which
wou ld cover a l l f u nc t i o n a l a r ea s i n c l u d i n g p o r t operation. The functional areas
where ERP solutions are not available off the shelf, the solutions should be developed and
integrated with ERP solutions. Ports like Cochin and Mormugao have already implemented
ERP Solution along with Port Operation System and other modules that are not part of ERP
Solution. New Mangalore is in the process of implementation similar ERP Solution
followed by all the other Ports.
7.15.1.2 Non ERP solution like GIS linking with the Land/Estate Policy, Hospital
Management, Bespoke System like Vigilance, Legal, File Tracking, Employee welfare
etc.
71
7.15.1.3 Ports shall implement Land/Estate Management solution which is completely
scalable for implementation of other Business Process like Financial and
Management Accounting, etc.
7.15.1.4 The provision for Self Service Scheme available in the system would be
introduced as an employee welfare measure.
7.15.1.5 Automated equipment (Cargo/Container handling, Weight Bridges) shall also be
integrated with the centralized system to avoid manual intervention.
7.15.1.6 Campus cabled LAN Network system shall be undertaken covering all the
automation system and as a redundancy wireless LAN network shall also be considered.
7.15.1.7 GIS technology shall be implemented in Port Operation, Security, Intermodal
management, Property and lease Management, Emergency Response &
Management, Environment Management.
7.15.1.8 The IT Policy of the port should be such a way as to integrate all sophisticated
systems in the port in a comprehensive manner such as VTMS, AIS, RFID, CCTV,
Surveillance System and other security systems.
7.15.1.9. A comprehensive data base needs to be developed by the ports themselves which
will lead decision making and provide artificial intelligence and Dash Board.
7.15.1.10 For the paperless scenario, readymade software toll such as Universal Content
Manager shall be implemented for document exchange with approval process by defining
roles and responsibilities among inter ports and regulatory bodies..
7.15.1.11 Sufficient and suitable manpower shall be placed in each port for managing IT
systems and these personnel shall be trained periodically to update their knowledge
& know-how.
7.15..1.12 Each Port shall aim toward the goal to secure the ISO 27001 certification.
7.15.2 Shipping Sector
7.15.2.1 ERP Implementation: Integrated ERP implementa t ion i s imperat ive to
the shipping companies to automate and standardize their business processes. To provide a
72
best logistical solution and requisite information about cargo movements to the
global customers and to get a competitive advantage, the companies needs to constantly
upgrade their IT solutions.
7.15.2.2 On board Systems: Fleet Management, safety on board the vessel for the seafarers
and cargo along with the international standards are the essential aspects of shipping
lines. Hence to achieve this an effective Fleet Management system having an
implementation on board the vessel to record all the events and requirements and
getting it integrated with the shore based ERP system will ensure the above
requirements. Also having the navigational software with the tools to compute the
optimum distance with all the weather conditions would effectively determine the route
to be followed in the case of bulk cargo movements.
7.15.2.3 MIS / Decision Support System: As shipping is a capital intensive business,
proper decision making towards investments and an effective cost control is very important.
A very effective Data warehousing and Business intelligence tools needs to be
implemented to generate Management Information and decision support reports. Now, even
the dash boards are being implemented to control the business online.
7.15.2.4 EDI : Even though the ERP implementations cater to the major requirements of
internal processes of a shipping line or a shipping agent there are many external
stakeholders such as ports, customs, ICDs, Depots, warehouses, shippers,
consignees, Charterers, CHAs, banks, container leasing companies, surveyors etc. who are
playing a very vital role in the complete chain of logistical solution. Currently, we have
standard Interfaces defined by certain international organisations for the shipping trade
related Electronic Data Interchange. Certain countries have extended further and created a
E-Commerce platform for the shippers, consignees, shipping lines, shipping agents to
handle their data through a central repository to avoid duplication work by various
agencies.
7.15.2.5 Integrated E-Commerce framework – Ultimate Objective: A similar framework
with more extensions can be initiated in the Indian shipping sector to have a common
platform to benefit all the entities belonging. As the technology is fully matured to achieve
this objective all concerned need to come together to make this happen. Even a legal
framework can be thought of to enforce this technology initiative which would reap the
73
maximum benefit in terms of commercial and on quality of service.Some of the foreign
shipping lines are bringing the BPO services to India. This gives us an opportunity to have
standard business processes and international best practices to get adopted.
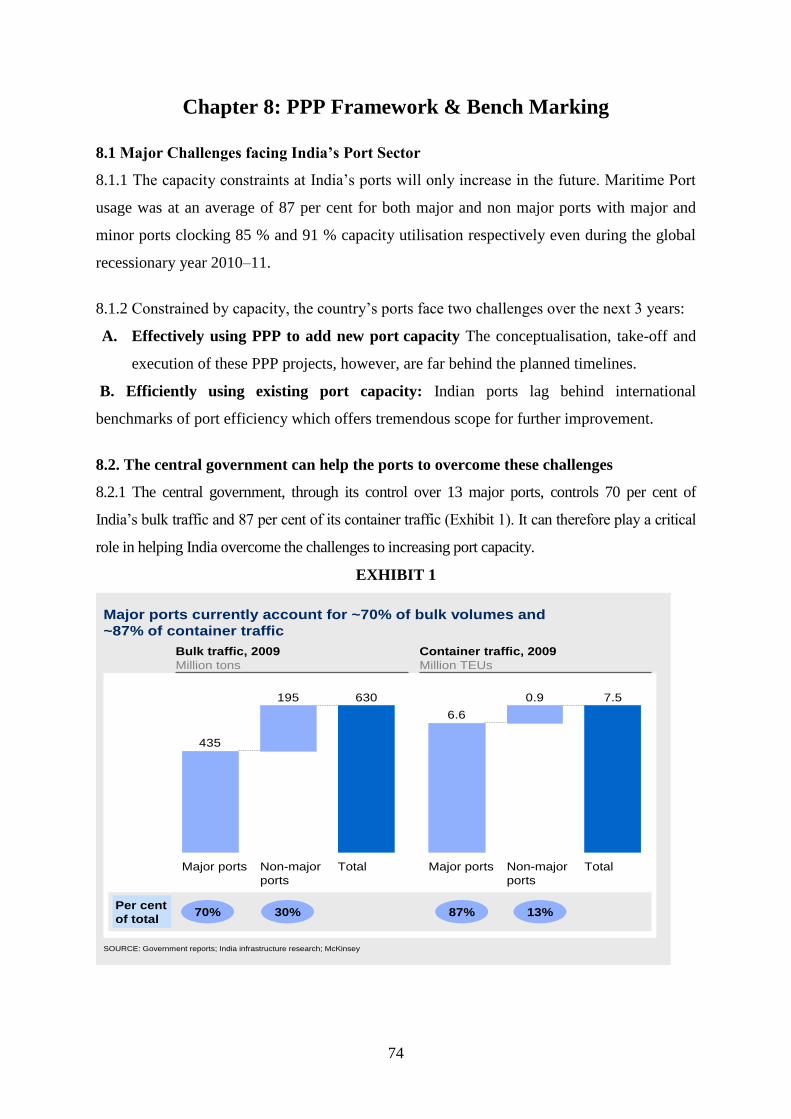
74
Chapter 8: PPP Framework & Bench Marking
8.1 Major Challenges facing India’s Port Sector
8.1.1 The capacity constraints at India’s ports will only increase in the future. Maritime Port
usage was at an average of 87 per cent for both major and non major ports with major and
minor ports clocking 85 % and 91 % capacity utilisation respectively even during the global
recessionary year 2010–11.
8.1.2 Constrained by capacity, the country’s ports face two challenges over the next 3 years:
A. Effectively using PPP to add new port capacity The conceptualisation, take-off and
execution of these PPP projects, however, are far behind the planned timelines.
B. Efficiently using existing port capacity: Indian ports lag behind international
benchmarks of port efficiency which offers tremendous scope for further improvement.
8.2. The central government can help the ports to overcome these challenges
8.2.1 The central government, through its control over 13 major ports, controls 70 per cent of
India’s bulk traffic and 87 per cent of its container traffic (Exhibit 1). It can therefore play a critical
role in helping India overcome the challenges to increasing port capacity.
EXHIBIT 1
70% 30% 87% 13%Per cent
of total
Major ports currently account for ~70% of bulk volumes and
~87% of container traffic
Bulk traffic, 2009
Million tons
Container traffic, 2009
Million TEUs
630195
435
TotalNon-major
ports
Major ports
7.50.9
6.6
TotalNon-major
ports
Major ports
SOURCE: Government reports; India infrastructure research; McKinsey
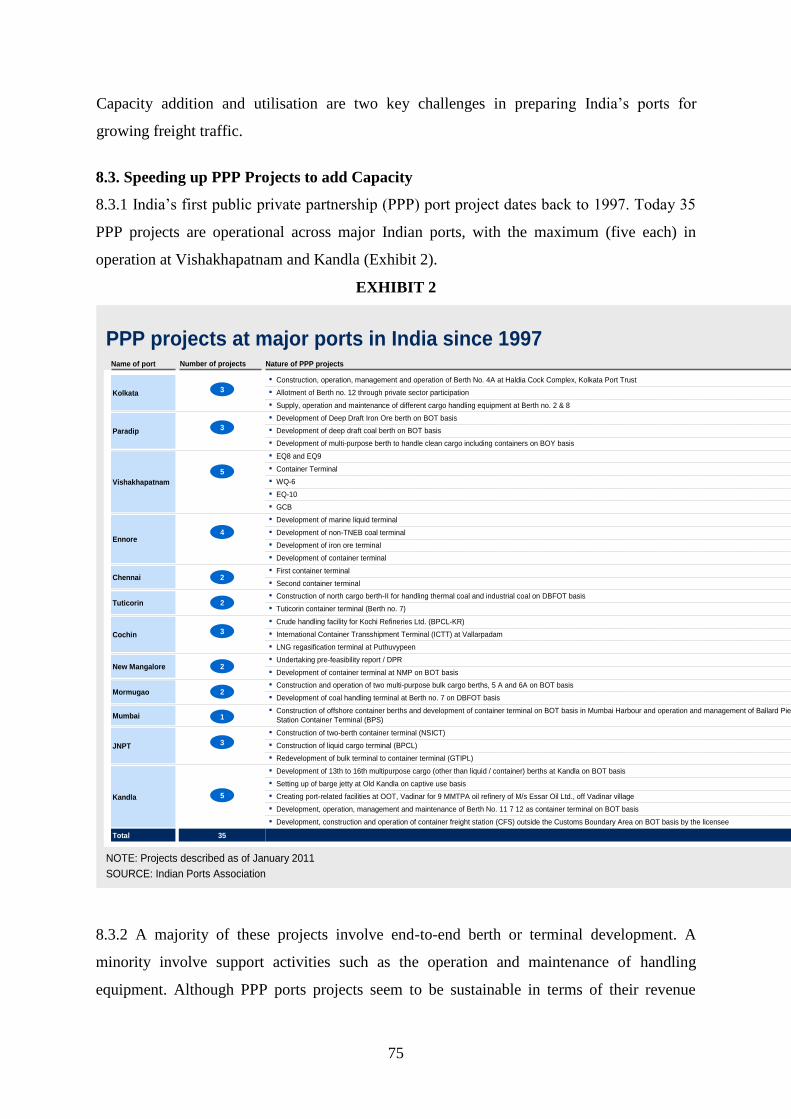
75
Capacity addition and utilisation are two key challenges in preparing India’s ports for
growing freight traffic.
8.3. Speeding up PPP Projects to add Capacity
8.3.1 India’s first public private partnership (PPP) port project dates back to 1997. Today 35
PPP projects are operational across major Indian ports, with the maximum (five each) in
operation at Vishakhapatnam and Kandla (Exhibit 2).
EXHIBIT 2
PPP projects at major ports in India since 1997
35
5
3
1
2
2
3
2
2
4
5
3
▪ Development, construction and operation of container freight station (CFS) outside the Customs Boundary Area on BOT basis by the licensee
▪ Development, operation, management and maintenance of Berth No. 11 7 12 as container terminal on BOT basis
▪ Creating port-related facilities at OOT, Vadinar for 9 MMTPA oil refinery of M/s Essar Oil Ltd., off Vadinar village
▪ Setting up of barge jetty at Old Kandla on captive use basis
▪ Development of 13th to 16th multipurpose cargo (other than liquid / container) berths at Kandla on BOT basis
▪ Redevelopment of bulk terminal to container terminal (GTIPL)
▪ Construction of liquid cargo terminal (BPCL)
▪ Construction of two-berth container terminal (NSICT)
▪ Construction of offshore container berths and development of container terminal on BOT basis in Mumbai Harbour and operation and management of Ballard Pier
Station Container Terminal (BPS)
▪ Development of coal handling terminal at Berth no. 7 on DBFOT basis
▪ Construction and operation of two multi-purpose bulk cargo berths, 5 A and 6A on BOT basis
▪ Development of container terminal at NMP on BOT basis
▪ Undertaking pre-feasibility report / DPR
▪ LNG regasification terminal at Puthuvypeen
▪ International Container Transshipment Terminal (ICTT) at Vallarpadam
▪ Crude handling facility for Kochi Refineries Ltd. (BPCL-KR)
▪ Tuticorin container terminal (Berth no. 7)
▪ Construction of north cargo berth-II for handling thermal coal and industrial coal on DBFOT basis
▪ Second container terminal
▪ First container terminal
▪ Development of container terminal
▪ Development of iron ore terminal
▪ Development of non-TNEB coal terminal
▪ Development of marine liquid terminal
▪ GCB
▪ EQ-10
▪ WQ-6
▪ Container Terminal
▪ EQ8 and EQ9
▪ Development of multi-purpose berth to handle clean cargo including containers on BOY basis
▪ Development of deep draft coal berth on BOT basis
▪ Development of Deep Draft Iron Ore berth on BOT basis
▪ Supply, operation and maintenance of different cargo handling equipment at Berth no. 2 & 8
▪ Allotment of Berth no. 12 through private sector participation
▪ Construction, operation, management and operation of Berth No. 4A at Haldia Cock Complex, Kolkata Port Trust
3
Total
Kandla
JNPT
Mumbai
Mormugao
New Mangalore
Cochin
Tuticorin
Chennai
Ennore
Vishakhapatnam
Paradip
Kolkata
Name of port Number of projects Nature of PPP projects
SOURCE: Indian Ports Association
NOTE: Projects described as of January 2011
8.3.2 A majority of these projects involve end-to-end berth or terminal development. A
minority involve support activities such as the operation and maintenance of handling
equipment. Although PPP ports projects seem to be sustainable in terms of their revenue
76
sharing, bottlenecks at various stages have delayed the conceptualisation, take-off and
execution of these projects far beyond planned timelines.
8.3.3 Factors constraining project implementation
8.3.3.1 Problems emerge at each stage while taking up and implementing ports projects in
India. All stakeholders lose time and money due to three reasons: pre-tendering delays, sub-
optimal interest among developers to take up tenders, and weak implementation of projects..
i. Centralised and slow decision-making delays pre-tendering phase
8.3.3.1.1 There are significant delays in PPPAC regulatory approval, security, environmental
clearances required during the pre-tendering phase. This is due to lack of defined timelines for
clearance and approval during this phase. In addition, the approvals across various departments
and levels happen sequentially rather than in parallel. Delayed approval at one stage can
therefore stall the entire process. Hence PPP projects take time to move from conceptualisation
to the tendering stage.
ii. Sub-optimal interest among developers to take up new tenders
8.3.3.1.2.1 The developer community has only sub-optimal interest in taking up new tenders
for two reasons:
a) Model Concession Agreement (MCA) clauses discourage private investors:
Developers find that these contractual terms constrain investors’ strategic options. The B.K.
Chaturvedi Committee’s recommended changes to the MCA can increase risk for developers
and lenders, diluting their interest in the project. For example, one of the recommendations
proposed excluding the principal falling before the termination date (in a scenario where the
contract gets prematurely terminated) from debt due. Similarly, it has been recommended that
the lead developer maintain at least a 26 per cent stake at all times. This restricts exit options.
Though they are meant in public interest, such recommendations can dissuade potential
investors.
b) Tariff policy hampers the financial attractiveness of projects: The Tariff Authority for
Major Ports (TAMP) issued a new set of guidelines for PPP projects for major ports in February
2008. These guidelines aim at providing comfort to the investors by announcing the tariff in
advance, before they submit their financial bids, thereby reducing regulatory uncertainties. Since
a normative approach is adopted to fix tariff, the tariff does not necessarily account for the actual
cost of an individual operator. The underlying expectation is that the revenue share to be offered
by the bidders will be the leveller between the standards assumed and the actual of an operator.
77
Nonetheless, the efficacy of the upfront tariff system hinges upon the reasonableness of the norms
adopted and reliability of the capital estimates considered. The investors may desire that these
issues are addressed and a fool-proof procedure is evolved for implementation.
8.3.3.1.2 .2A major pitfall in fixing tariff upfront is keeping the same tariff base unaltered for the
whole concession period of 30 years. Indexation of tariff at (WPI – X) alone may not provide
adequate comfort to the investors as it does not capture the additional financial commitments
which investors might have to make in view of the environmental, market and technological
changes that may take place after commencement of the Concession. Most importantly, the
seaward services at major ports are not offered for PPP and the related services and facilities
continue to be provided by major port trusts. Tariff fixation in this case follows the tariff
guidelines of 2005 which adopted the actual port wise cost plus method. Consequently, cost of
inefficiency and redundancy seeps into tariff computation in the name of the actual. Inadequate
maritime infrastructure and high marine cost at the ports may adversely affect the business of
private terminal operators providing land side services. There is, therefore, an immediate need to
review the actual cost plus regime of tariff fixing adopted in these cases. Further, a significant
part of the demurrage costs should be borne by ports
iii. Weak implementation creates project delays after uptake
8.3.3.1.3 Even after uptake most projects suffer from time and cost over-runs due to several
factors:
a) Low quality design and engineering: Creating a detailed project report (DPR) forms a
much smaller percentage of project costs in India compared to global benchmarks. This is
because engineering consultants are chosen for a project primarily based on price, with some
small weight age for quality. Such consultants might cut corners in their work, leading to
inaccurate surveys and low quality DPRs that lack attention to detail. This can often result in
surprises during construction and a change in project scope or plans, adding to delays and costs.
For example, timely completion of port projects depends on prior knowledge of marine floor
conditions. Basing the project plan on inaccurate data can create bottlenecks and cost over-runs
during construction.
b) Shortage of skilled manpower: The pool of skilled and semi-skilled manpower (welders,
fitters, etc.) has not kept pace with the construction needs of infrastructure. A 2008 survey by the
National Sample Survey Organisation reveals that 13 million workers enter the market every
year, but only 3 million of those are trained. India’s vocational training curriculum is outdated. In
78
effect, 70 to 80 % of the existing work force is untrained which affects the quality of project
implementation.
8.3.3.1.4 Absence of specified financial institution, delay in financial closures, involvement
of multiple parties and inadequate hinterland connectivity are some of the other reasons
behind delay in project execution after uptake
8.3.4 Six initiatives can speed up project implementation
8.3.4.1 Six initiatives have been identified for the government, regulators and nodal agencies
to facilitate the implementation of PPP port projects in India. These emerged through
discussions with private players, public sector units, and government officials across nodal
agencies and regulatory bodies. The effective implementation of PPP port projects can add
the much-needed capacity to India’s ports. The six actionable recommendations discussed
here can resolve the bottlenecks that currently slow down project implementation.
8.3.4.1.1 Establishing a high-power group to monitor and de-bottleneck ports projects
a) Such a group can add transparency and force decisions that enable progress. Its scope
should cover a small number of larger projects. The group can be a part of the Committee on
Infrastructure, headed by a minister or a secretary. It can bring in other ministries as
necessary. The group should:
b) Monitor project portfolio and port trust performance on at least three key metrics: on-
time award; actual construction progress against planned milestones; and within-budget
completion
c) Consolidate performance data on a quarterly basis and make it publicly available,
highlighting areas prone to delays and over-runs
d) Selectively involve providers of large projects to understand bottlenecks and
collaborate on `solutions for growing delays and over-runs
e) Escalate inter-ministerial bottlenecks that are impeding important projects (pre- or
post-tendering) to relevant authorities, and push for decisions. For instance, the group can
selectively convene ministers and bureaucrats from concerned areas, creating an empowered
group to expedite the resolution of bottlenecks
8.3.4.1.2 Amending the MCA to balance the risk sharing
8.3.4.1.2.1 The developer community perceives an imbalanced risk-sharing between
developers and the government in the ports MCA. The B.K. Chaturvedi Committee has
79
recommended some amendments to the MCA. There is need to revisit the following
recommendations with the developer and financier community to constructively amend the
MCA for better project uptake:
a) Project cost should be limited to minimum of approved cost, lenders’ cost and
actual cost: Whether and how the nodal agency’s definition of cost and its application affect
the bidders; whether approved cost has been significantly lower than actual cost; the key
sources of deviation; modifications (if any) to the proposed definition of cost and its
application
b) Due debt should exclude the principal that has fallen due before the termination
notice: Whether it increases the project risk for lenders over and above developer's credit
risk; whether lenders can factor this risk into pricing; and possible alternative arrangements
that address the concerns of all stakeholders
c) Sponsors to hold at least 51 per cent stake in the special purpose vehicle for two
years after commercial operation date (COD); lead member to hold 26 per cent stake in
SPV at all times; and each member evaluated for pre-qualification purposes to hold
26 per cent stake for 2 years after COD: Whether this restricts the lead developer's exit
options (do they actually intend to dilute it below 26 per cent?); whether lenders find this
clause to their advantage; whether there is a way to retain the lead developer's responsibility
for operating the port while de-linking ownership from it
d) Interest linkage to be changed to 10 year G-Sec from SBI’s prime lending rate:
The possible negative consequences of this change
e) Some other MCA aspects are not referred to in the B.K. Chaturvedi Committee
recommendations, but need to be reconsidered in the light of feedback from developers
and financiers. For example, the adequacy of the financial closure window, sufficiency of the
“conditions precedent” clause, fairness of basing the terminal payment on book value,
enforceability of charge on assets given the immobile nature of assets and the effectiveness of
port monopoly norms.
8.3.4.1.3 Modifying the existing economic regulatory framework to achieve uniform
regime and use tariff leverage to promote efficiency in operation
There is a need to introduce a uniform economic regulatory framework covering the entire
port sector. A two-tier regulatory mechanism, as prevalent in the power sector, may be an
ideal choice.
80
a) The scope of regulation should cover not only tariff setting, as at present, but also
setting, monitoring and regulating service levels and performance standards. The regulators
may also be entrusted with the responsibility of dispute resolution, as appropriate.
b) A detailed study should be commissioned to assess the extent of competition
prevailing in the market for provision of port services in different regions for different types
of commodities. If such a study reveals the existence of a perfect market condition, tariff
fixation may be left to market forces with the regulatory intervention to be limited to
adjudicating disputes, if any, arising between the service providers and port users.
c) Tariff fixation should be based on the normative approach relying upon the standard
capacity created and efficient cost of operating such facilities. The tariff guidelines of 2008
issued by the government for setting upfront tariff for PPP projects follow such a model and
may, therefore, continue unaltered. However, retaining the upfront tariff unaltered for the
whole project period needs to be re-examined. The guidelines may be amended to provide for
periodic review of tariff, say once in five years, based on updated performance norms and
capital costs.
d) The tariff guidelines of 2005, applicable to the major port trusts and private terminals
that came into existence prior to 2008, require a thorough revision. Tariff fixing in these
cases may also follow a normative approach which will act as an incentive to improve
operational efficiency.
e) The operators may be allowed to retain the benefit of efficiency gain, provided tariff
is set based on pre-determined standards instead of relying upon their own past performance
and their projections for the future.
f) Regulatory approvals may be granted in a time-bound manner and towards this end,
the regulatory process should be streamlined including adequately strengthening
administrative and statutory aspects of regulatory organisations.
8.3.4.1.4 Ensuring at least 90 per cent of land is acquired before tendering
8.3.4.1.4.1 Pre-conditions for tendering PPP and EP&C projects can include acquiring 80 to
90 per cent land, including the tracts indispensable for normal progress of construction work.
The land should be considered “unencumbered land” only when it is free from any dwellings
or other physical encumbrance. Contractual mechanisms (such as a penalty clause) should
ensure the relevant port trust’s continual commitment to land acquisition even after the
award. The penalty calculation should ideally be unambiguous and similar to that of
liquidated damages (a fixed quantum of penalty for each day of delay). Penalties should
81
adequately cover typical extension costs, and could be capped in a similar way as liquidated
damages payable by the provider.
8.3.4.1.5 Selecting design and engineering consultants based on quality-cum-cost based
assessment
8.3.4.1.5.1 Paid consultants help to prepare most DPRs and can impact the time and cost of
project execution. It is important to select technical consultants using a quality-cum-cost
based assessment (QCBA) instead of the traditional L1 based (lowest cost) approach. The
quality score should count for at least 50 to 80 per cent of overall assessment (as in Canada
and the USA). Evaluators can rate the consultant through feedback from the respective port
trusts about his or her performance on previous and ongoing projects. The port trusts, in turn
can assess performance in a standard manner across projects using a set of standard
guidelines with objective scoring parameters. For instance, evaluators can look at the
magnitude of design changes during project execution and the reasons for the same.
8.3.4.1.6 Launching a construction-focused vocational training programme
8.3.3.1.6.1 The government must tackle the manpower shortage by creating additional
training capacity to generate another 2 million to 3 million skilled workers per year by
2017. To build such scale, private capital will need to participate through commercially
viable PPP models. The government could contribute partial equity and real estate for
these projects to enhance their viability. The government should also ensure the
commitment of the construction industry to five distinct areas:
a) Improving faculty training: Industry players and associations have the right
expertise to run courses to train adequate faculty for this programme
b) Setting progressive, modular standards for each skill type: These standards
should have broad-based relevance, and become a reference point for setting the
curriculum
c) Improving certification: Set certification standards and guidelines, emphasising
actual skills displayed over theory-based testing. Further, the industry should participate
in the actual certification process to ensure quality
d) Providing apprenticeship: On-the-job training should be an integral part of the
course curriculum, as in developed countries. Institutes can have formal tie-ups with local
providers for systematically providing apprenticeship
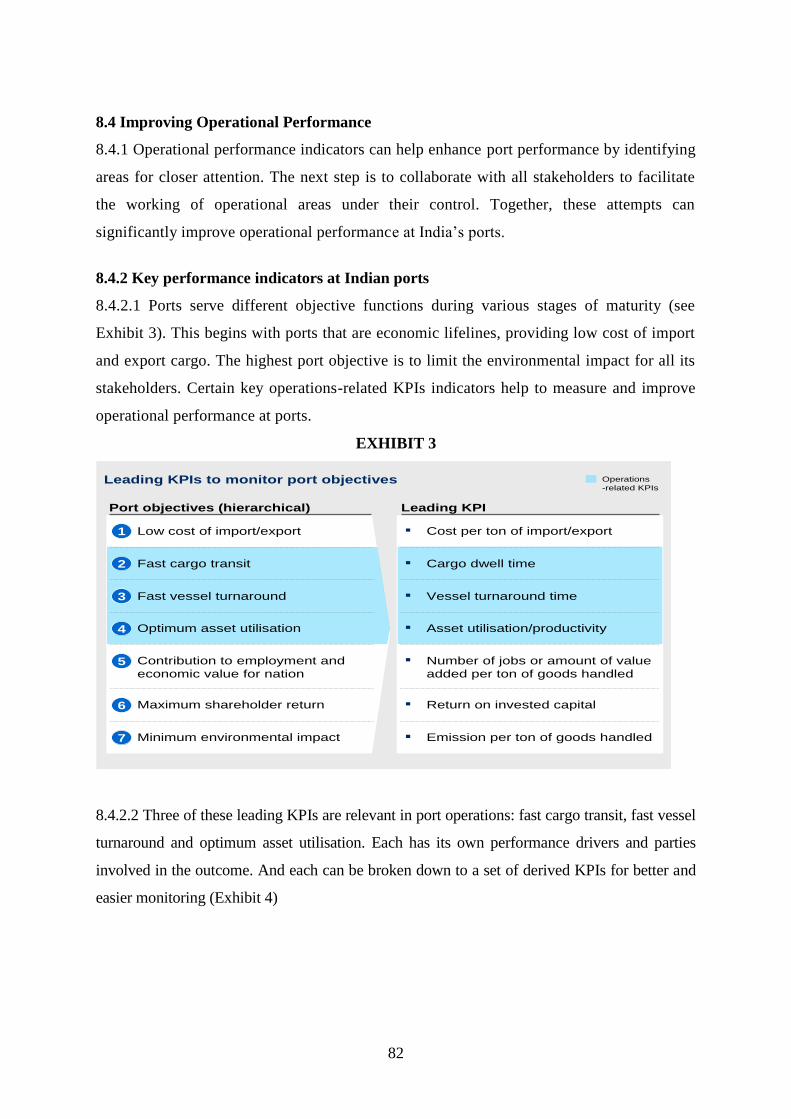
82
8.4 Improving Operational Performance
8.4.1 Operational performance indicators can help enhance port performance by identifying
areas for closer attention. The next step is to collaborate with all stakeholders to facilitate
the working of operational areas under their control. Together, these attempts can
significantly improve operational performance at India’s ports.
8.4.2 Key performance indicators at Indian ports
8.4.2.1 Ports serve different objective functions during various stages of maturity (see
Exhibit 3). This begins with ports that are economic lifelines, providing low cost of import
and export cargo. The highest port objective is to limit the environmental impact for all its
stakeholders. Certain key operations-related KPIs indicators help to measure and improve
operational performance at ports.
EXHIBIT 3
Leading KPIs to monitor port objectives Operations
-related KPIs
▪ Cost per ton of import/exportLow cost of import/export1
▪ Cargo dwell timeFast cargo transit2
▪ Vessel turnaround timeFast vessel turnaround3
▪ Asset utilisation/productivityOptimum asset utilisation4
▪ Number of jobs or amount of value
added per ton of goods handled
Contribution to employment and
economic value for nation5
▪ Return on invested capitalMaximum shareholder return6
▪ Emission per ton of goods handledMinimum environmental impact7
Port objectives (hierarchical) Leading KPI
8.4.2.2 Three of these leading KPIs are relevant in port operations: fast cargo transit, fast vessel
turnaround and optimum asset utilisation. Each has its own performance drivers and parties
involved in the outcome. And each can be broken down to a set of derived KPIs for better and
easier monitoring (Exhibit 4)
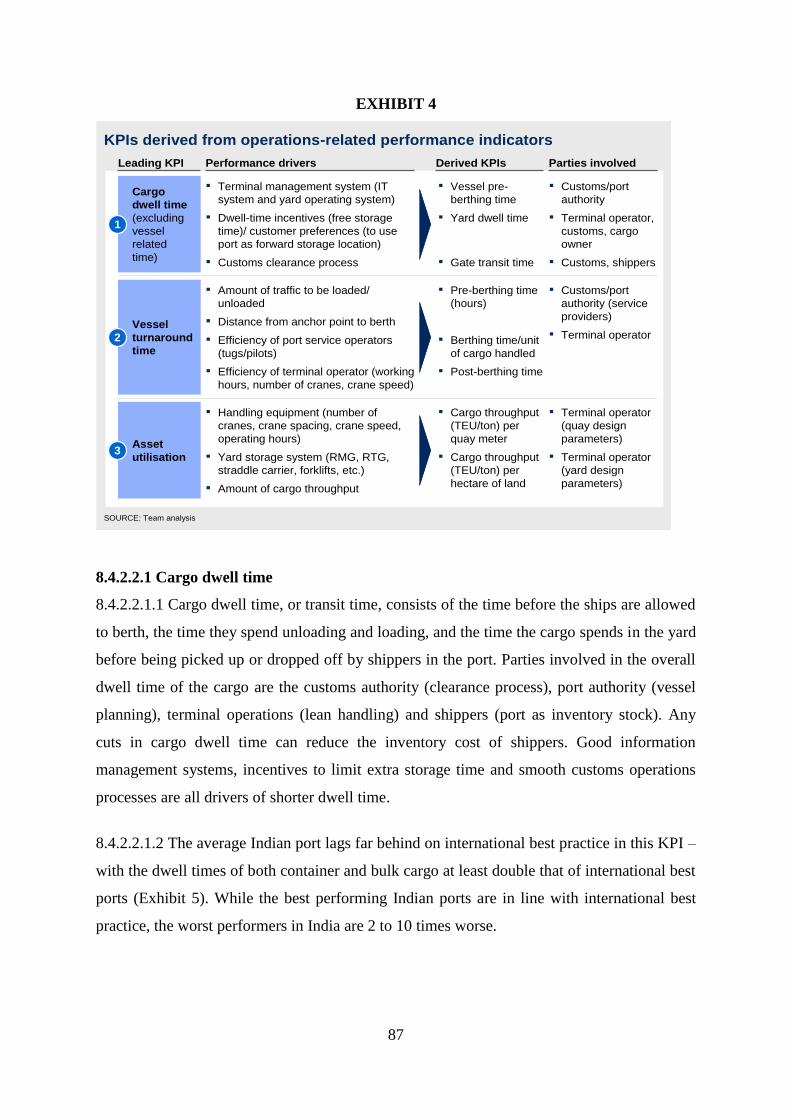
87
EXHIBIT 4
KPIs derived from operations-related performance indicators
SOURCE: Team analysis
Leading KPI Performance drivers Derived KPIs Parties involved
Cargo
dwell time
(excluding
vessel
related
time)
▪ Terminal management system (IT
system and yard operating system)
▪ Dwell-time incentives (free storage
time)/ customer preferences (to use
port as forward storage location)
▪ Customs clearance process
▪ Customs/port
authority
▪ Terminal operator,
customs, cargo
owner
▪ Customs, shippers
▪ Vessel pre-
berthing time
▪ Yard dwell time
▪ Gate transit time
Vessel
turnaround
time
▪ Amount of traffic to be loaded/
unloaded
▪ Distance from anchor point to berth
▪ Efficiency of port service operators
(tugs/pilots)
▪ Efficiency of terminal operator (working
hours, number of cranes, crane speed)
▪ Customs/port
authority (service
providers)
▪ Terminal operator
▪ Pre-berthing time
(hours)
▪ Berthing time/unit
of cargo handled
▪ Post-berthing time
Asset
utilisation
▪ Handling equipment (number of
cranes, crane spacing, crane speed,
operating hours)
▪ Yard storage system (RMG, RTG,
straddle carrier, forklifts, etc.)
▪ Amount of cargo throughput
▪ Cargo throughput
(TEU/ton) per
quay meter
▪ Cargo throughput
(TEU/ton) per
hectare of land
▪ Terminal operator
(quay design
parameters)
▪ Terminal operator
(yard design
parameters)
1
2
3
8.4.2.2.1 Cargo dwell time
8.4.2.2.1.1 Cargo dwell time, or transit time, consists of the time before the ships are allowed
to berth, the time they spend unloading and loading, and the time the cargo spends in the yard
before being picked up or dropped off by shippers in the port. Parties involved in the overall
dwell time of the cargo are the customs authority (clearance process), port authority (vessel
planning), terminal operations (lean handling) and shippers (port as inventory stock). Any
cuts in cargo dwell time can reduce the inventory cost of shippers. Good information
management systems, incentives to limit extra storage time and smooth customs operations
processes are all drivers of shorter dwell time.
8.4.2.2.1.2 The average Indian port lags far behind on international best practice in this KPI –
with the dwell times of both container and bulk cargo at least double that of international best
ports (Exhibit 5). While the best performing Indian ports are in line with international best
practice, the worst performers in India are 2 to 10 times worse.
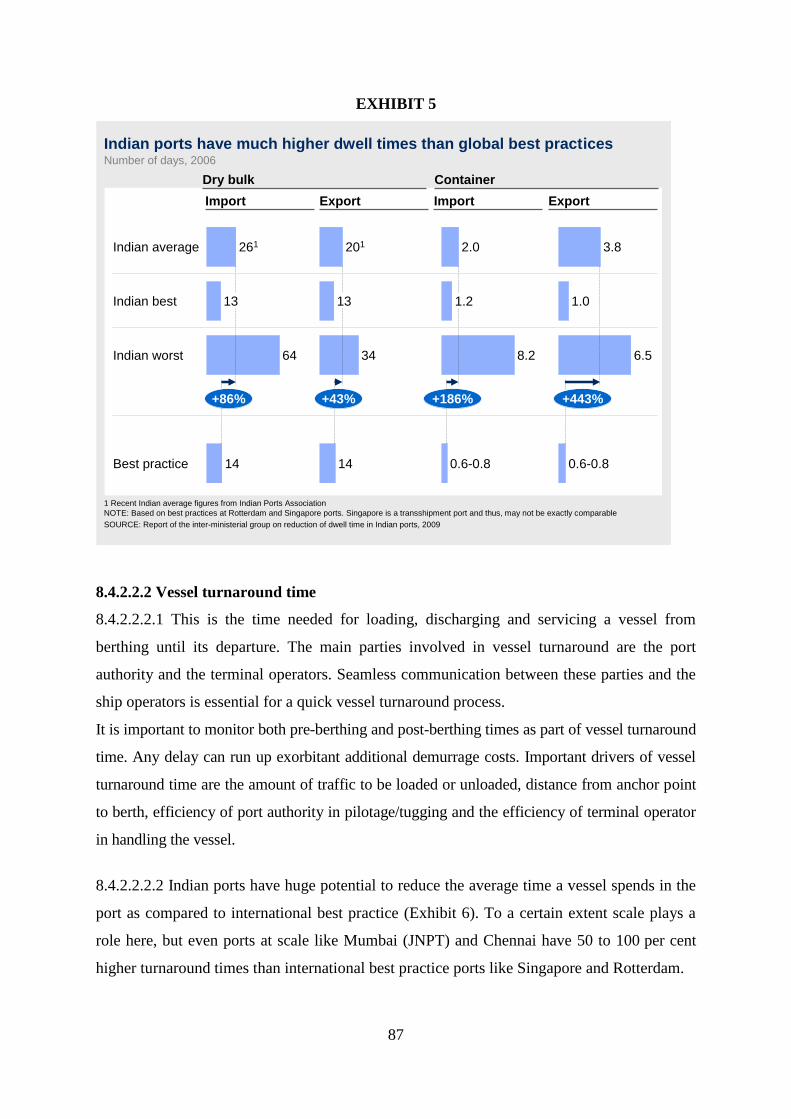
87
EXHIBIT 5
Indian ports have much higher dwell times than global best practices
SOURCE: Report of the inter-ministerial group on reduction of dwell time in Indian ports, 2009
Number of days, 2006
Import Export Import Export
+86%
Best practice 14
Indian worst 64
Indian best 13
Indian average 261
+43%
14
34
13
201
+186%
0.6-0.8
8.2
1.2
2.0
+443%
0.6-0.8
6.5
1.0
3.8
Dry bulk Container
1 Recent Indian average figures from Indian Ports Association
NOTE: Based on best practices at Rotterdam and Singapore ports. Singapore is a transshipment port and thus, may not be exactly comparable
8.4.2.2.2 Vessel turnaround time
8.4.2.2.2.1 This is the time needed for loading, discharging and servicing a vessel from
berthing until its departure. The main parties involved in vessel turnaround are the port
authority and the terminal operators. Seamless communication between these parties and the
ship operators is essential for a quick vessel turnaround process.
It is important to monitor both pre-berthing and post-berthing times as part of vessel turnaround
time. Any delay can run up exorbitant additional demurrage costs. Important drivers of vessel
turnaround time are the amount of traffic to be loaded or unloaded, distance from anchor point
to berth, efficiency of port authority in pilotage/tugging and the efficiency of terminal operator
in handling the vessel.
8.4.2.2.2.2 Indian ports have huge potential to reduce the average time a vessel spends in the
port as compared to international best practice (Exhibit 6). To a certain extent scale plays a
role here, but even ports at scale like Mumbai (JNPT) and Chennai have 50 to 100 per cent
higher turnaround times than international best practice ports like Singapore and Rotterdam.
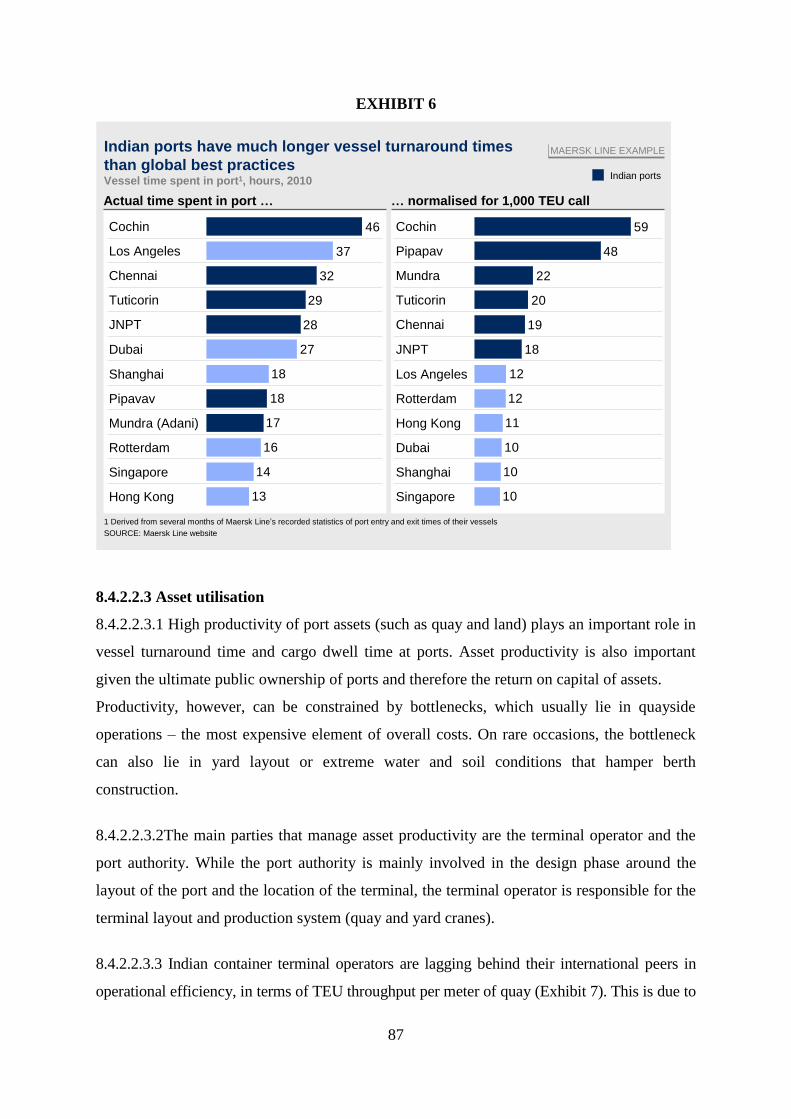
87
EXHIBIT 6
10
10
10
11
12
12
18
19
20
22
48
59
Singapore
Shanghai
Dubai
Hong Kong
Rotterdam
Los Angeles
JNPT
Chennai
Tuticorin
Mundra
Pipapav
Cochin
13
14
16
17
18
18
27
28
29
32
37
46
Los Angeles
Cochin
Hong Kong
Singapore
Rotterdam
Mundra (Adani)
Pipavav
Shanghai
Dubai
JNPT
Tuticorin
Chennai
Indian ports have much longer vessel turnaround times
than global best practices
1 Derived from several months of Maersk Line’s recorded statistics of port entry and exit times of their vessels
SOURCE: Maersk Line website
Vessel time spent in port1, hours, 2010
MAERSK LINE EXAMPLE
Actual time spent in port … … normalised for 1,000 TEU call
Indian ports
8.4.2.2.3 Asset utilisation
8.4.2.2.3.1 High productivity of port assets (such as quay and land) plays an important role in
vessel turnaround time and cargo dwell time at ports. Asset productivity is also important
given the ultimate public ownership of ports and therefore the return on capital of assets.
Productivity, however, can be constrained by bottlenecks, which usually lie in quayside
operations – the most expensive element of overall costs. On rare occasions, the bottleneck
can also lie in yard layout or extreme water and soil conditions that hamper berth
construction.
8.4.2.2.3.2The main parties that manage asset productivity are the terminal operator and the
port authority. While the port authority is mainly involved in the design phase around the
layout of the port and the location of the terminal, the terminal operator is responsible for the
terminal layout and production system (quay and yard cranes).
8.4.2.2.3.3 Indian container terminal operators are lagging behind their international peers in
operational efficiency, in terms of TEU throughput per meter of quay (Exhibit 7). This is due to
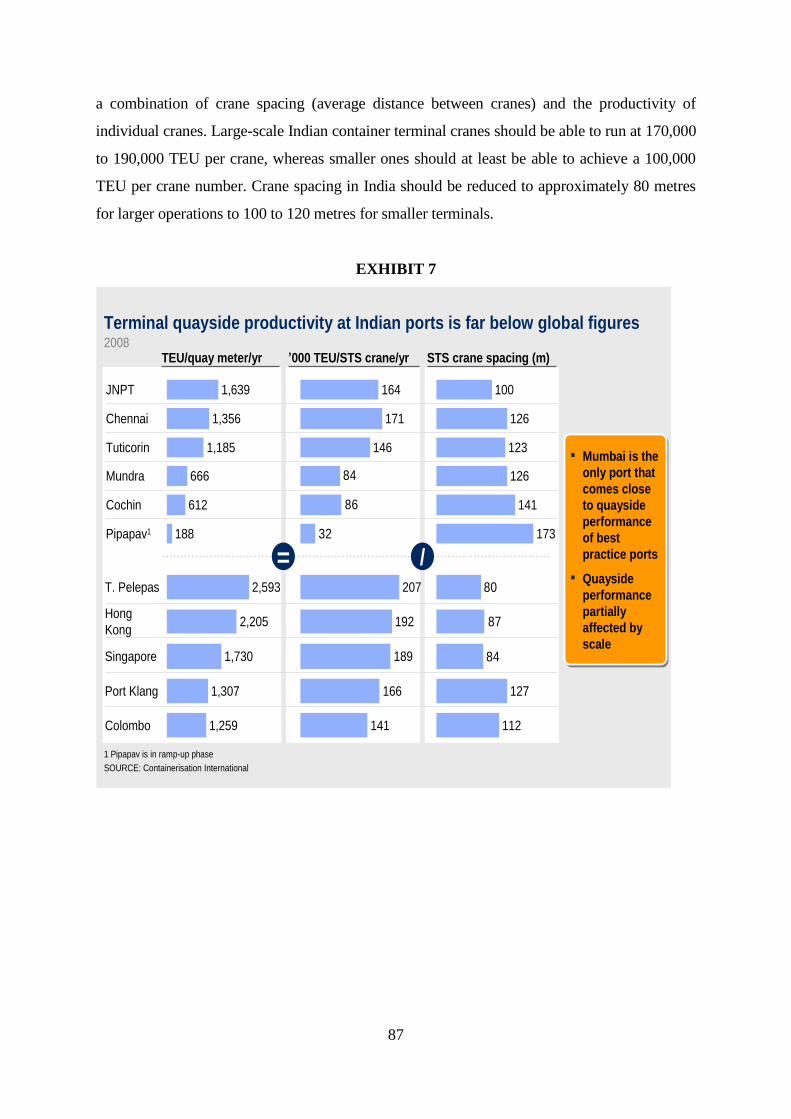
87
a combination of crane spacing (average distance between cranes) and the productivity of
individual cranes. Large-scale Indian container terminal cranes should be able to run at 170,000
to 190,000 TEU per crane, whereas smaller ones should at least be able to achieve a 100,000
TEU per crane number. Crane spacing in India should be reduced to approximately 80 metres
for larger operations to 100 to 120 metres for smaller terminals.
EXHIBIT 7
141
166
189
192
207
Terminal quayside productivity at Indian ports is far below global figures
1 Pipapav is in ramp-up phase
SOURCE: Containerisation International
2008
▪ Mumbai is the
only port that
comes close
to quayside
performance
of best
practice ports
▪ Quayside
performance
partially
affected by
scale
▪ Mumbai is the
only port that
comes close
to quayside
performance
of best
practice ports
▪ Quayside
performance
partially
affected by
scale
Pipapav1 188
Cochin 612
Mundra 666
Tuticorin 1,185
Chennai 1,356
JNPT 1,639
Colombo 1,259
Port Klang 1,307
Singapore 1,730
Hong
Kong2,205
T. Pelepas 2,593
= /32
86
84
146
171
164
173
141
126
123
126
100
84
87
80
112
127
TEU/quay meter/yr ’000 TEU/STS crane/yr STS crane spacing (m)
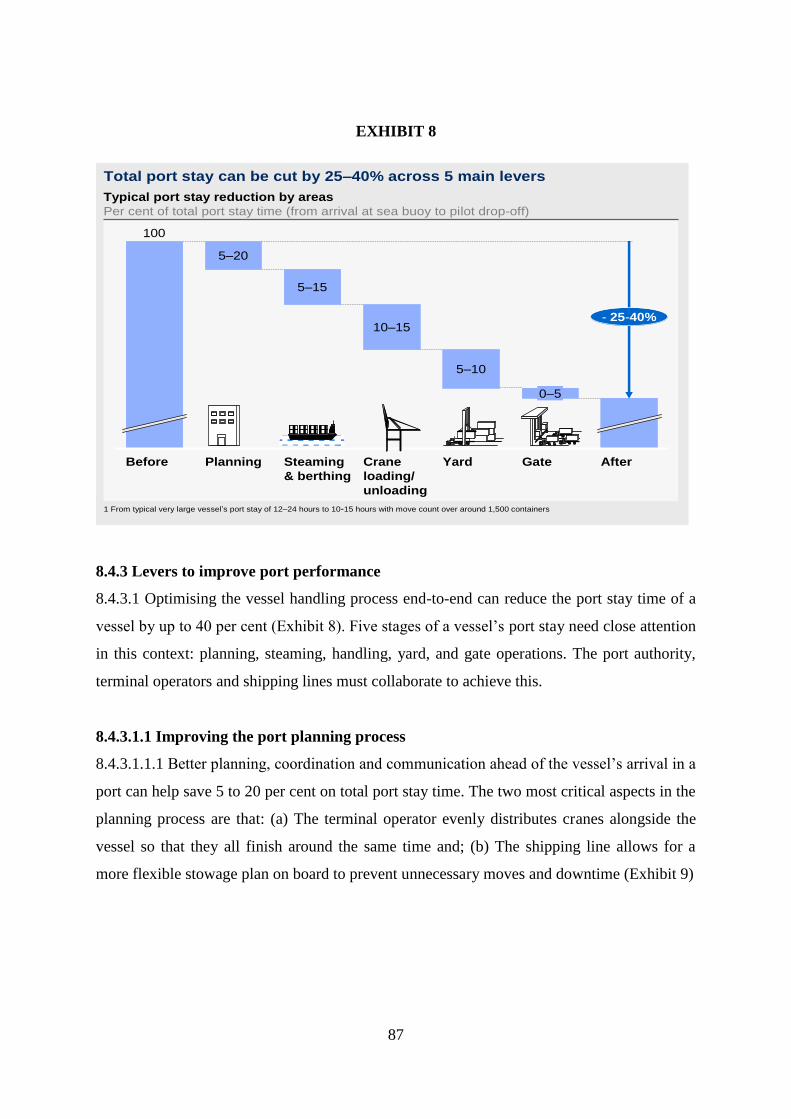
87
EXHIBIT 8
Total port stay can be cut by 25–40% across 5 main levers
1 From typical very large vessel’s port stay of 12–24 hours to 10-15 hours with move count over around 1,500 containers
AfterGate
0–5
- 25-40%
Steaming
& berthing
Yard
5–10
Crane
loading/
unloading
10–15
100
5–15
Planning
5–20
Before
Typical port stay reduction by areas
Per cent of total port stay time (from arrival at sea buoy to pilot drop-off)
8.4.3 Levers to improve port performance
8.4.3.1 Optimising the vessel handling process end-to-end can reduce the port stay time of a
vessel by up to 40 per cent (Exhibit 8). Five stages of a vessel’s port stay need close attention
in this context: planning, steaming, handling, yard, and gate operations. The port authority,
terminal operators and shipping lines must collaborate to achieve this.
8.4.3.1.1 Improving the port planning process
8.4.3.1.1.1 Better planning, coordination and communication ahead of the vessel’s arrival in a
port can help save 5 to 20 per cent on total port stay time. The two most critical aspects in the
planning process are that: (a) The terminal operator evenly distributes cranes alongside the
vessel so that they all finish around the same time and; (b) The shipping line allows for a
more flexible stowage plan on board to prevent unnecessary moves and downtime (Exhibit 9)
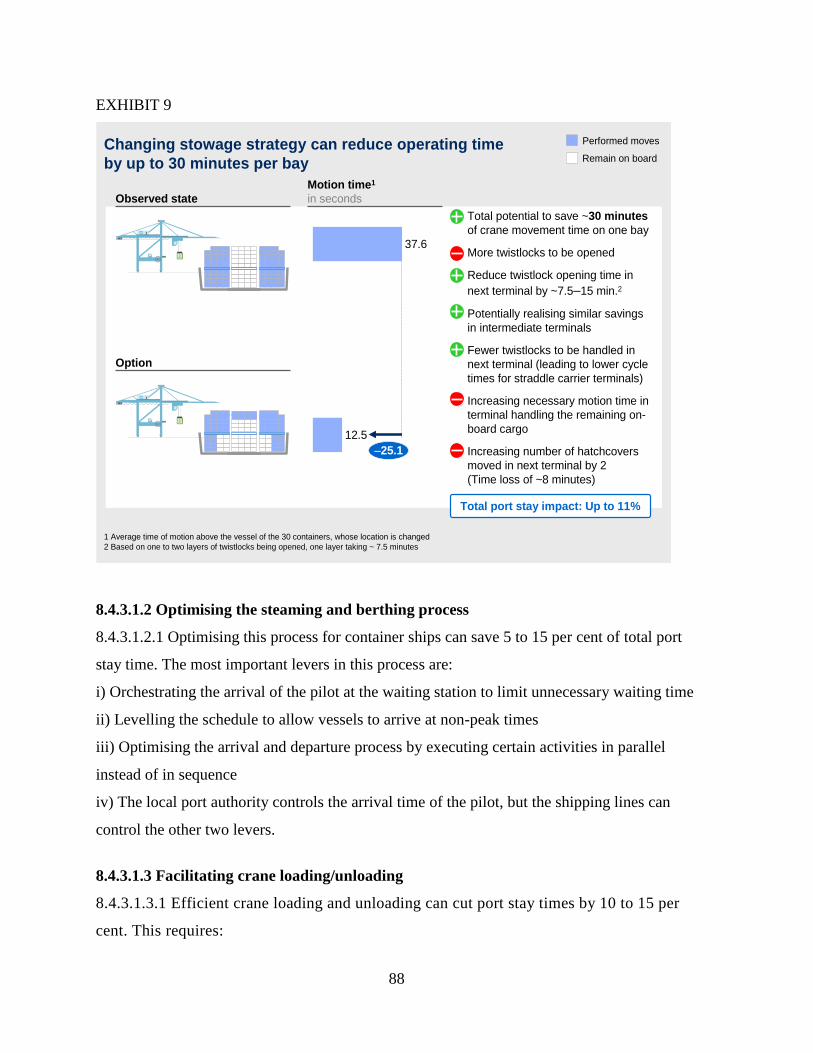
88
EXHIBIT 9
Changing stowage strategy can reduce operating time
by up to 30 minutes per bay
12.5
–25.1
37.6
Motion time1
in secondsObserved state
Option
• Total potential to save ~30 minutes
of crane movement time on one bay
• More twistlocks to be opened
• Reduce twistlock opening time in
next terminal by ~7.5–15 min.2
• Potentially realising similar savings
in intermediate terminals
• Fewer twistlocks to be handled in
next terminal (leading to lower cycle
times for straddle carrier terminals)
• Increasing necessary motion time in
terminal handling the remaining on-
board cargo
• Increasing number of hatchcovers
moved in next terminal by 2
(Time loss of ~8 minutes)
Performed moves
Remain on board
1 Average time of motion above the vessel of the 30 containers, whose location is changed
2 Based on one to two layers of twistlocks being opened, one layer taking ~ 7.5 minutes
Total port stay impact: Up to 11%
8.4.3.1.2 Optimising the steaming and berthing process
8.4.3.1.2.1 Optimising this process for container ships can save 5 to 15 per cent of total port
stay time. The most important levers in this process are:
i) Orchestrating the arrival of the pilot at the waiting station to limit unnecessary waiting time
ii) Levelling the schedule to allow vessels to arrive at non-peak times
iii) Optimising the arrival and departure process by executing certain activities in parallel
instead of in sequence
iv) The local port authority controls the arrival time of the pilot, but the shipping lines can
control the other two levers.
8.4.3.1.3 Facilitating crane loading/unloading
8.4.3.1.3.1 Efficient crane loading and unloading can cut port stay times by 10 to 15 per
cent. This requires:
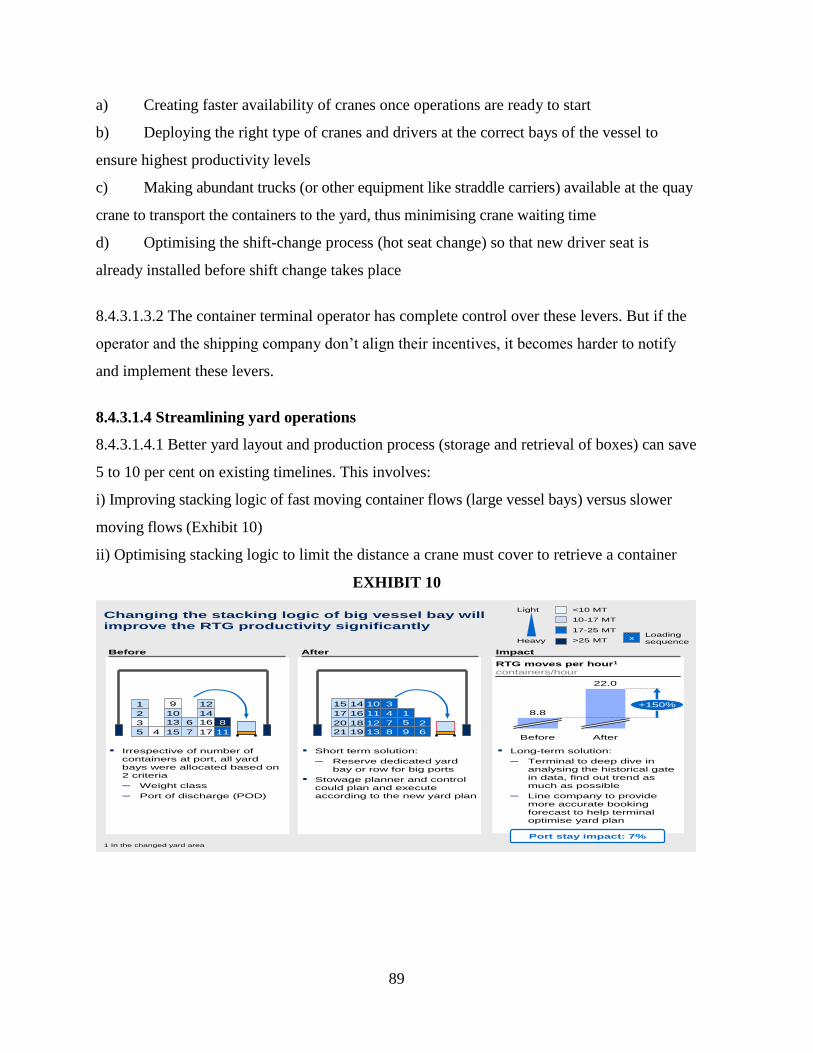
89
a) Creating faster availability of cranes once operations are ready to start
b) Deploying the right type of cranes and drivers at the correct bays of the vessel to
ensure highest productivity levels
c) Making abundant trucks (or other equipment like straddle carriers) available at the quay
crane to transport the containers to the yard, thus minimising crane waiting time
d) Optimising the shift-change process (hot seat change) so that new driver seat is
already installed before shift change takes place
8.4.3.1.3.2 The container terminal operator has complete control over these levers. But if the
operator and the shipping company don’t align their incentives, it becomes harder to notify
and implement these levers.
8.4.3.1.4 Streamlining yard operations
8.4.3.1.4.1 Better yard layout and production process (storage and retrieval of boxes) can save
5 to 10 per cent on existing timelines. This involves:
i) Improving stacking logic of fast moving container flows (large vessel bays) versus slower
moving flows (Exhibit 10)
ii) Optimising stacking logic to limit the distance a crane must cover to retrieve a container
EXHIBIT 10
5
Changing the stacking logic of big vessel bay will
improve the RTG productivity significantly
20
15
16
10
11
12
13
3
4
7
8 9
1
2
6
▪ Irrespective of number of
containers at port, all yard
bays were allocated based on
2 criteria
– Weight class
– Port of discharge (POD)
▪ Short term solution:
– Reserve dedicated yard
bay or row for big ports
▪ Stowage planner and control
could plan and execute
according to the new yard plan
RTG moves per hour1
containers/hour
▪ Long-term solution:
– Terminal to deep dive in
analysing the historical gate
in data, find out trend as
much as possible
– Line company to provide
more accurate booking
forecast to help terminal
optimise yard plan
22.0
+150%
AfterBefore
8.8
17-25 MT
>25 MT
<10 MT
10-17 MT
Light
Heavy xLoading
sequence
1
2
4
6
10
13
15 7
9 12
14
16
17 11
83
5
17
18
21 19
14
1 In the changed yard area
Port stay impact: 7%
Before After Impact
90
8.4.3.1.5 Easing gate operations
8.4.3.1.5.1 This doesn’t directly create any savings potential for shipping lines or terminal
operators, but it reduces the dwell time of the cargo for the shipper and limits the duration for
which shippers need to hire the truck driver. It is estimated that a maximum of 5 per cent
savings if the port focuses on: (a)Avoiding non–value added activities at the gate; (b)
Arranging better arrival/departure pattern of incoming and outgoing trucks and containers to
smooth peak loads
8.4.4.Improving operational performance by involving all stakeholders
8.4.4.1 The right approach is critical in successfully improving operational performance. This
requires involving all stakeholders through a systematic transformation programme in order
to substantially improve the operational performance of Indian ports.The four main
stakeholders in port productivity improvement process are the government (either directly or
through the port authority); the shipping lines; the terminal operators; and the cargo owners or
shippers. Each stakeholder has a specific and critical role in accelerating performance:
i) Government and/or port authorities have to make sufficient pilots/tugs available to bring
vessels to their berths with minimal delay. They must also ensure clearance of cargo in the ports
to limit the dwell time of these goods inside the port.
ii) Shipping lines need to clearly align and communicate with terminal operators around their
port arrival planning and preferred handling process. This enables terminal operators to turn
their vessels around in the fastest possible time.
iii) Terminal operators need to ensure transparent communications, apply leaner operations
in berthing, loading/unloading and yard operations processes, and facilitate faster exit/entry at
the terminal gate.
iv) Shippers need to limit the dwell time of the cargo inside the port. This leads to a higher
turnover rate and improved use of assets.
8.4.4.2 A programme that brings in the right organisational structure, clear processes,
required skills and appropriate tools is critical in improving the operational performance of
Indian ports. Such a programme usually consists of four steps; determine the base line; do a
diagnostic on improvement potential; idea generation; and implementation. It takes several
91
months to complete, and its success requires a strong focus on the following key success
factors: (i) Commitment from management: target setting and responsibility; (ii)Clear
transformation plan driven by the programme management office and; (iii)Incentives and
disincentives based on performance
8.4.4.3 A sustained focus on all three key performance indicators can drive high operational
efficiency at ports. All four major stakeholders must collaborate to ensure optimum utilisation
of existing capacity. This can help our ports effectively manage ever-increasing freight traffic.
92
Chapter 9: Shipping
9.1 Introduction
9.1.1 Shipping plays an important role in the transport sector of India’s economy. Around
95% of India’s merchandise trade by volume (70% in terms of value) is moved by sea.
India has one of the largest merchant shipping fleet among the developing countries and is
ranked 16th in the world in terms of gross tonnage under its flag. Indian maritime sector
facilitates not only transportation of national and international cargoes but also provides a
variety of other services such as cargo handling services, shipbuilding and ship repairing,
freight forwarding, light house facilities, training of marine personnel, etc.
9.2 Status of Indian Shipping
9.2.1 As on end March, 2011 India had a fleet strength of 1071 vessels with gross
tonnage (GT) of 10.45 million (Table 1). Out of these 1071 vessels, 722 vessels (67%)
with 1.02 million GT (9.8%) were engaged in coastal trade and the remaining 349 vessels
with 9.43 million GT were deployed for overseas trade. Thus the tonnage deployed for
overseas trade is 90% of Indian GT in contrast to only 10% of the tonnage deployed for
coastal trade. The Indian Shipping tonnage which was stagnating between 6-7 million
GT till June, 2004 has increased to 10.45 million GT by March 2011. The major share
of Indian tonnage belongs to Shipping Corporation of India, a Public Sector Undertaking
whose share is 33.3 %( 3.15 million GT with 83 vessels).
9.2.2 A detailed analysis of the fleet classified by the type of vessels in 2011 indicates that
the maximum number of vessels (211) were Off-shore supply vessels followed
by tankers(142). In terms of GT, the 55% of the Indian tonnage (5.76 million GT) was in
the category of Oil Tankers, whereas OSVs and Tugs accounted for higher number
of vessels (389) but contributed a mere 2.75 % (0.28 million GT) of the total tonnage.
The share of the tonnage contributed by Dry Cargo Liners has declined from 9% in
1999 to 8% in 2011, whereas the tonnage share of Oil Tankers has increased from 48%
to 55% over the same period. The tonnage share of Bulk Carriers in total tonnage has
also shown a significant decrease in total tonnage share from about 38% to 29% over
the same period.
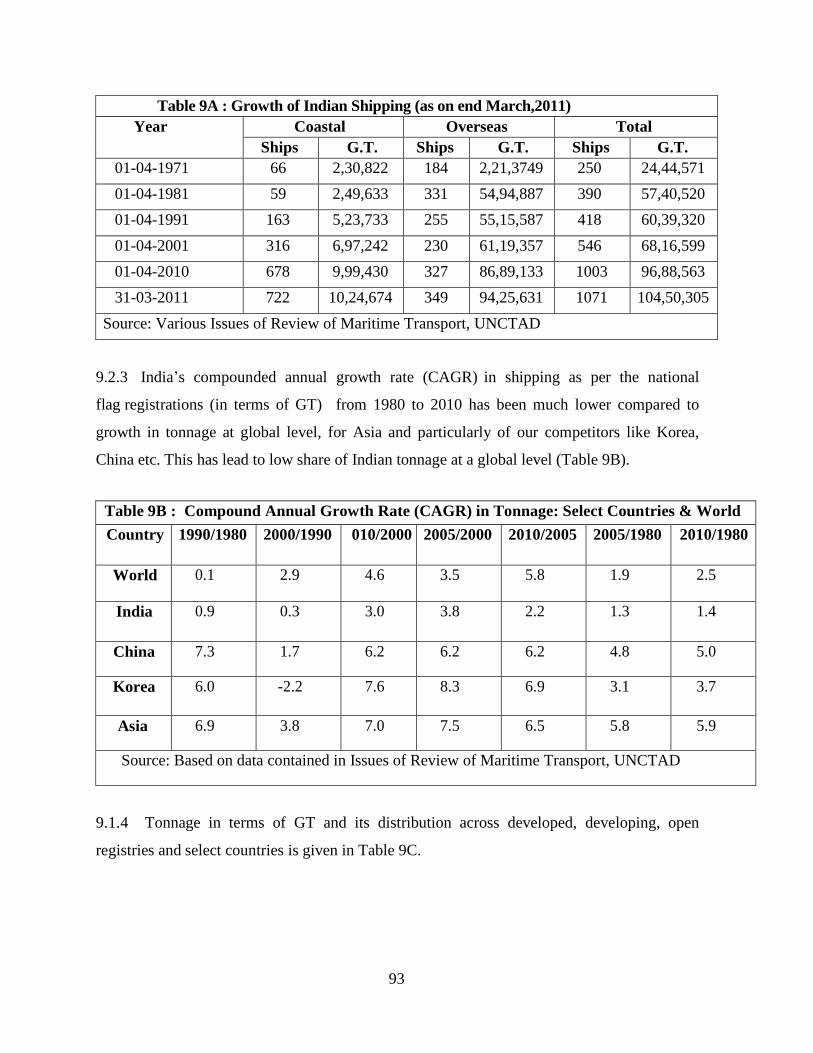
93
Table 9A : Growth of Indian Shipping (as on end March,2011)
Year Coastal Overseas Total
Ships G.T. Ships G.T. Ships G.T.
01-04-1971 66 2,30,822 184 2,21,3749 250 24,44,571
01-04-1981 59 2,49,633 331 54,94,887 390 57,40,520
01-04-1991 163 5,23,733 255 55,15,587 418 60,39,320
01-04-2001 316 6,97,242 230 61,19,357 546 68,16,599
01-04-2010 678 9,99,430 327 86,89,133 1003 96,88,563
31-03-2011 722 10,24,674 349 94,25,631 1071 104,50,305
Source: Various Issues of Review of Maritime Transport, UNCTAD
9.2.3 India’s compounded annual growth rate (CAGR) in shipping as per the national
flag registrations (in terms of GT) from 1980 to 2010 has been much lower compared to
growth in tonnage at global level, for Asia and particularly of our competitors like Korea,
China etc. This has lead to low share of Indian tonnage at a global level (Table 9B).
Table 9B : Compound Annual Growth Rate (CAGR) in Tonnage: Select Countries & World
Country 1990/1980 2000/1990 010/2000 2005/2000 2010/2005 2005/1980 2010/1980
World 0.1 2.9 4.6 3.5 5.8 1.9 2.5
India 0.9 0.3 3.0 3.8 2.2 1.3 1.4
China 7.3 1.7 6.2 6.2 6.2 4.8 5.0
Korea 6.0 -2.2 7.6 8.3 6.9 3.1 3.7
Asia 6.9 3.8 7.0 7.5 6.5 5.8 5.9
Source: Based on data contained in Issues of Review of Maritime Transport, UNCTAD
9.1.4 Tonnage in terms of GT and its distribution across developed, developing, open
registries and select countries is given in Table 9C.
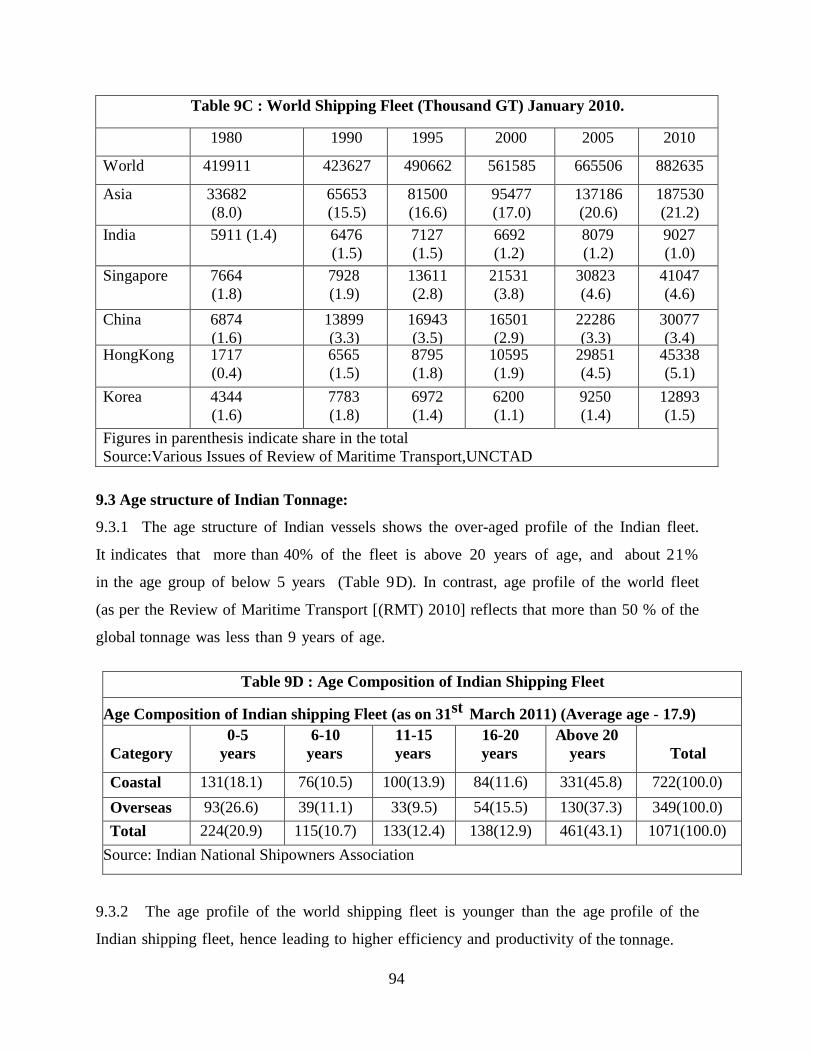
94
Table 9C : World Shipping Fleet (Thousand GT) January 2010.
1980 1990 1995 2000 2005 2010
World 419911 423627 490662 561585 665506 882635
Asia 33682
(8.0)
65653
(15.5)
81500
(16.6)
95477
(17.0)
137186
(20.6)
187530
(21.2)
India 5911 (1.4) 6476
(1.5)
7127
(1.5)
6692
(1.2)
8079
(1.2)
9027
(1.0)
Singapore 7664
(1.8)
7928
(1.9)
13611
(2.8)
21531
(3.8)
30823
(4.6)
41047
(4.6)
China 6874
(1.6)
13899
(3.3)
16943
(3.5)
16501
(2.9)
22286
(3.3)
30077
(3.4) HongKong 1717
(0.4)
6565
(1.5)
8795
(1.8)
10595
(1.9)
29851
(4.5)
45338
(5.1)
Korea 4344
(1.6)
7783
(1.8)
6972
(1.4)
6200
(1.1)
9250
(1.4)
12893
(1.5)
Figures in parenthesis indicate share in the total
Source:Various Issues of Review of Maritime Transport,UNCTAD
9.3 Age structure of Indian Tonnage:
9.3.1 The age structure of Indian vessels shows the over-aged profile of the Indian fleet.
It indicates that more than 40% of the fleet is above 20 years of age, and about 21%
in the age group of below 5 years (Table 9D). In contrast, age profile of the world fleet
(as per the Review of Maritime Transport [(RMT) 2010] reflects that more than 50 % of the
global tonnage was less than 9 years of age.
Table 9D : Age Composition of Indian Shipping Fleet
Age Composition of Indian shipping Fleet (as on 31st March 2011) (Average age - 17.9)
Category
0-5
years
6-10
years
11-15
years
16-20
years
Above 20
years
Total
Coastal 131(18.1) 76(10.5) 100(13.9) 84(11.6) 331(45.8) 722(100.0)
Overseas 93(26.6) 39(11.1) 33(9.5) 54(15.5) 130(37.3) 349(100.0)
Total 224(20.9) 115(10.7) 133(12.4) 138(12.9) 461(43.1) 1071(100.0)
Source: Indian National Shipowners Association
9.3.2 The age profile of the world shipping fleet is younger than the age profile of the
Indian shipping fleet, hence leading to higher efficiency and productivity of the tonnage.
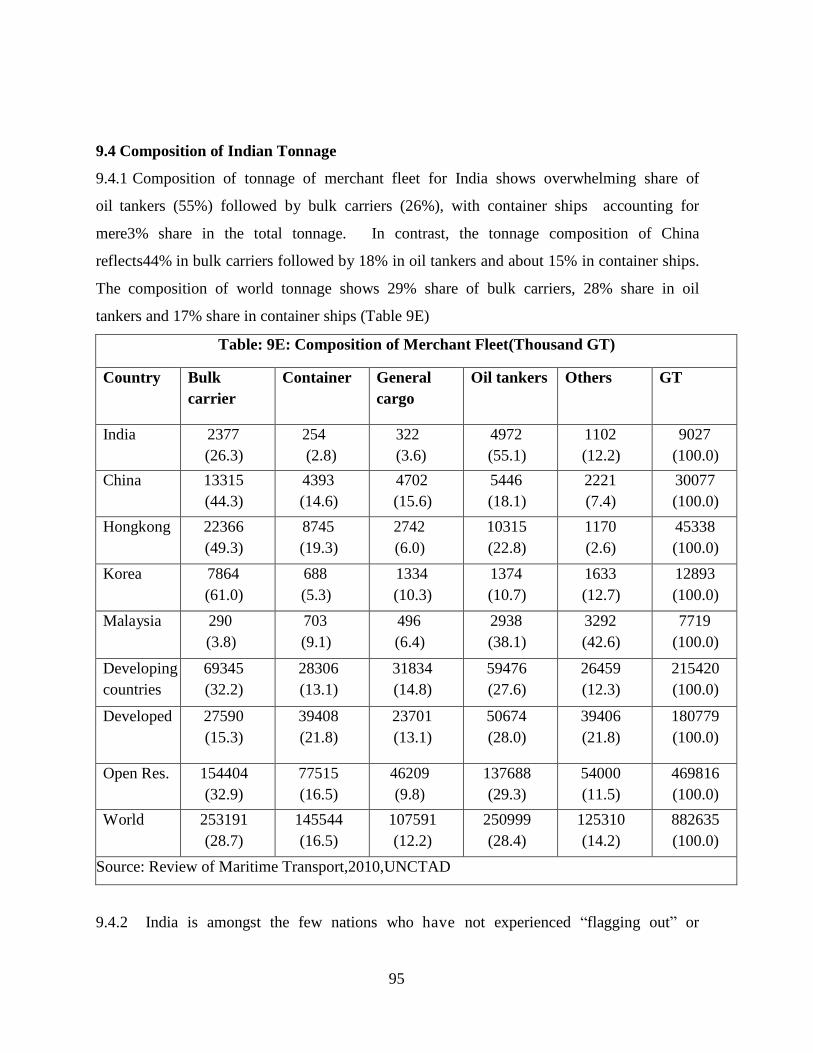
95
9.4 Composition of Indian Tonnage
9.4.1 Composition of tonnage of merchant fleet for India shows overwhelming share of
oil tankers (55%) followed by bulk carriers (26%), with container ships accounting for
mere3% share in the total tonnage. In contrast, the tonnage composition of China
reflects44% in bulk carriers followed by 18% in oil tankers and about 15% in container ships.
The composition of world tonnage shows 29% share of bulk carriers, 28% share in oil
tankers and 17% share in container ships (Table 9E)
Table: 9E: Composition of Merchant Fleet(Thousand GT)
Country Bulk
carrier
Container General
cargo
Oil tankers Others GT
India 2377
(26.3)
254
(2.8)
322
(3.6)
4972
(55.1)
1102
(12.2)
9027
(100.0)
China 13315
(44.3)
4393
(14.6)
4702
(15.6)
5446
(18.1)
2221
(7.4)
30077
(100.0)
Hongkong 22366
(49.3)
8745
(19.3)
2742
(6.0)
10315
(22.8)
1170
(2.6)
45338
(100.0)
Korea 7864
(61.0)
688
(5.3)
1334
(10.3)
1374
(10.7)
1633
(12.7)
12893
(100.0)
Malaysia 290
(3.8)
703
(9.1)
496
(6.4)
2938
(38.1)
3292
(42.6)
7719
(100.0)
Developing
countries
69345
(32.2)
28306
(13.1)
31834
(14.8)
59476
(27.6)
26459
(12.3)
215420
(100.0)
Developed 27590
(15.3)
39408
(21.8)
23701
(13.1)
50674
(28.0)
39406
(21.8)
180779
(100.0)
Open Res. 154404
(32.9)
77515
(16.5)
46209
(9.8)
137688
(29.3)
54000
(11.5)
469816
(100.0)
World 253191
(28.7)
145544
(16.5)
107591
(12.2)
250999
(28.4)
125310
(14.2)
882635
(100.0)
Source: Review of Maritime Transport,2010,UNCTAD
9.4.2 India is amongst the few nations who have not experienced “flagging out” or
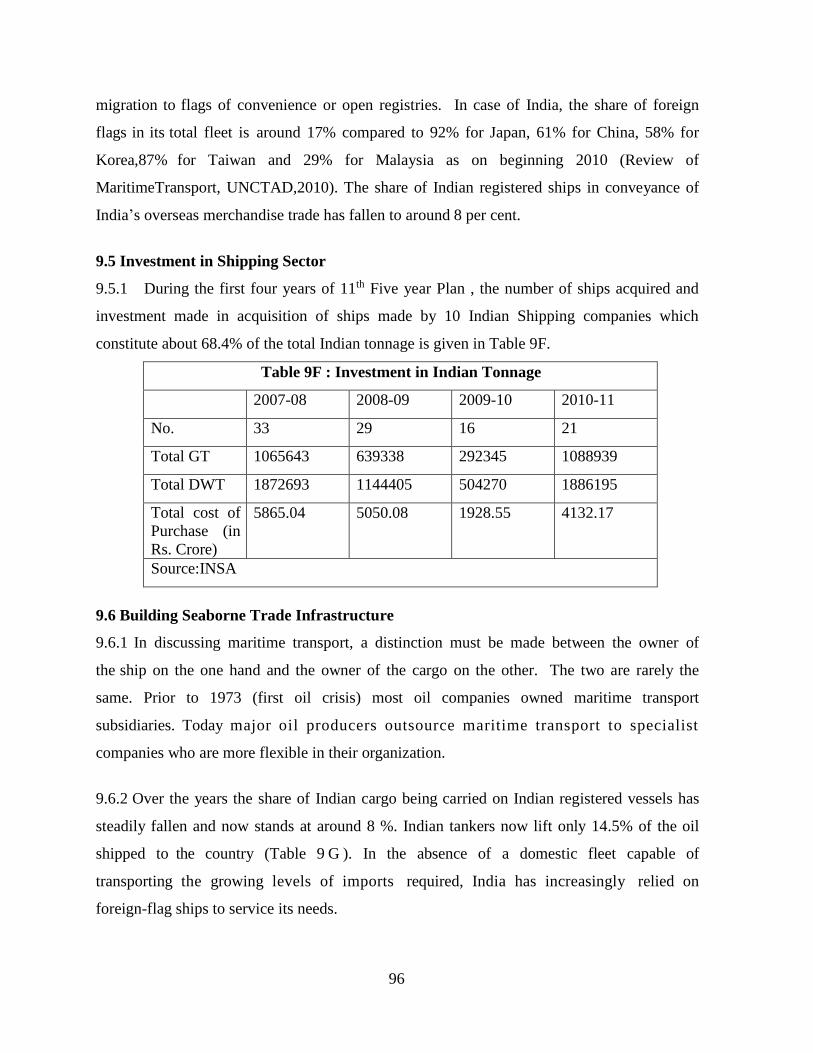
96
migration to flags of convenience or open registries. In case of India, the share of foreign
flags in its total fleet is around 17% compared to 92% for Japan, 61% for China, 58% for
Korea,87% for Taiwan and 29% for Malaysia as on beginning 2010 (Review of
MaritimeTransport, UNCTAD,2010). The share of Indian registered ships in conveyance of
India’s overseas merchandise trade has fallen to around 8 per cent.
9.5 Investment in Shipping Sector
9.5.1 During the first four years of 11th Five year Plan , the number of ships acquired and
investment made in acquisition of ships made by 10 Indian Shipping companies which
constitute about 68.4% of the total Indian tonnage is given in Table 9F.
Table 9F : Investment in Indian Tonnage
2007-08 2008-09 2009-10 2010-11
No. 33 29 16 21
Total GT 1065643 639338 292345 1088939
Total DWT 1872693 1144405 504270 1886195
Total cost of
Purchase (in
Rs. Crore)
5865.04 5050.08 1928.55 4132.17
Source:INSA
9.6 Building Seaborne Trade Infrastructure
9.6.1 In discussing maritime transport, a distinction must be made between the owner of
the ship on the one hand and the owner of the cargo on the other. The two are rarely the
same. Prior to 1973 (first oil crisis) most oil companies owned maritime transport
subsidiaries. Today major oil producers outsource maritime transport to specialist
companies who are more flexible in their organization.
9.6.2 Over the years the share of Indian cargo being carried on Indian registered vessels has
steadily fallen and now stands at around 8 %. Indian tankers now lift only 14.5% of the oil
shipped to the country (Table 9 G ). In the absence of a domestic fleet capable of
transporting the growing levels of imports required, India has increasingly relied on
foreign-flag ships to service its needs.
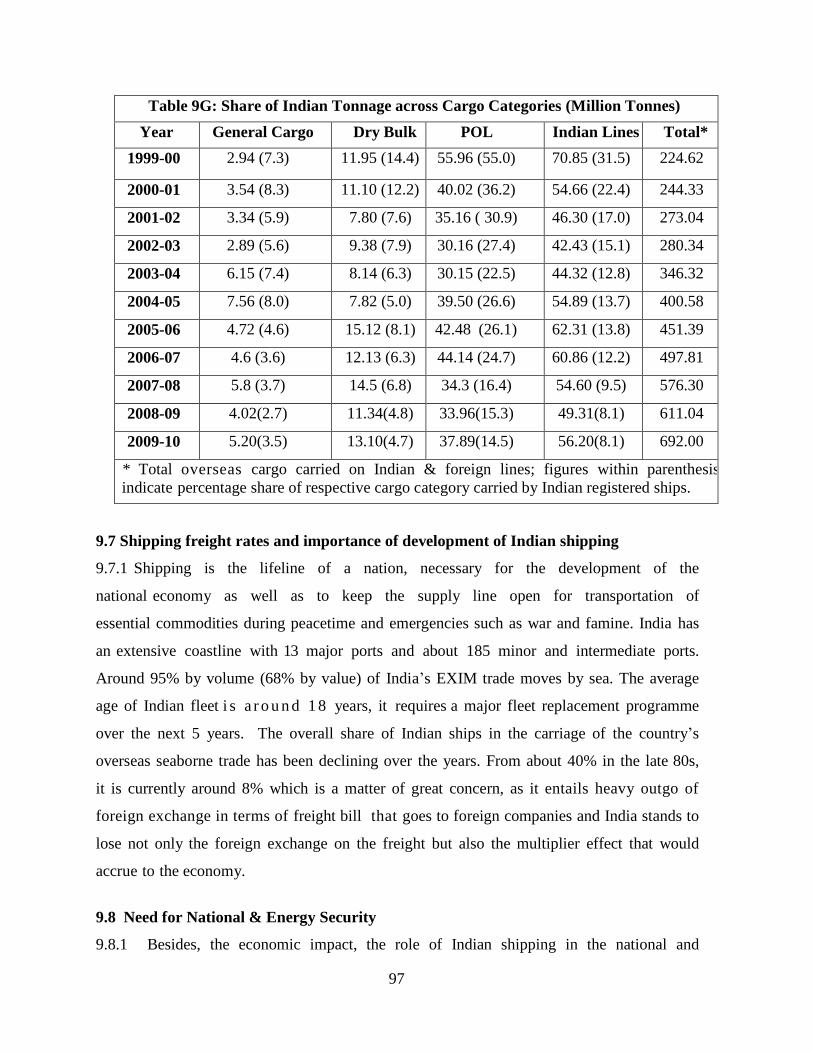
97
Table 9G: Share of Indian Tonnage across Cargo Categories (Million Tonnes)
Year General Cargo Dry Bulk POL Indian Lines Total*
1999-00 2.94 (7.3) 11.95 (14.4) 55.96 (55.0) 70.85 (31.5) 224.62
2000-01 3.54 (8.3) 11.10 (12.2) 40.02 (36.2) 54.66 (22.4) 244.33
2001-02 3.34 (5.9) 7.80 (7.6) 35.16 ( 30.9) 46.30 (17.0) 273.04
2002-03 2.89 (5.6) 9.38 (7.9) 30.16 (27.4) 42.43 (15.1) 280.34
2003-04 6.15 (7.4) 8.14 (6.3) 30.15 (22.5) 44.32 (12.8) 346.32
2004-05 7.56 (8.0) 7.82 (5.0) 39.50 (26.6) 54.89 (13.7) 400.58
2005-06 4.72 (4.6) 15.12 (8.1) 42.48 (26.1) 62.31 (13.8) 451.39
2006-07 4.6 (3.6) 12.13 (6.3) 44.14 (24.7) 60.86 (12.2) 497.81
2007-08 5.8 (3.7) 14.5 (6.8) 34.3 (16.4) 54.60 (9.5) 576.30
2008-09 4.02(2.7) 11.34(4.8) 33.96(15.3) 49.31(8.1) 611.04
2009-10 5.20(3.5) 13.10(4.7) 37.89(14.5) 56.20(8.1) 692.00
* Total overseas cargo carried on Indian & foreign lines; figures within parenthesis
indicate percentage share of respective cargo category carried by Indian registered ships.
9.7 Shipping freight rates and importance of development of Indian shipping
9.7.1 Shipping is the lifeline of a nation, necessary for the development of the
national economy as well as to keep the supply line open for transportation of
essential commodities during peacetime and emergencies such as war and famine. India has
an extensive coastline with 13 major ports and about 185 minor and intermediate ports.
Around 95% by volume (68% by value) of India’s EXIM trade moves by sea. The average
age of Indian fleet i s a r o u n d 1 8 years, it requires a major fleet replacement programme
over the next 5 years. The overall share of Indian ships in the carriage of the country’s
overseas seaborne trade has been declining over the years. From about 40% in the late 80s,
it is currently around 8% which is a matter of great concern, as it entails heavy outgo of
foreign exchange in terms of freight bill that goes to foreign companies and India stands to
lose not only the foreign exchange on the freight but also the multiplier effect that would
accrue to the economy.
9.8 Need for National & Energy Security
9.8.1 Besides, the economic impact, the role of Indian shipping in the national and
98
energy security is vital. The ownership and operation of Indian vessels in Indian trade
offer high security due to the following reasons:
a) An Indian vessel has to be mandatorily “flagged” in India and its inspection,
certification and operation are under the direct control of the Directorate General of
Shipping in India.
b) An Indian vessel has to be manned and operated by Indian nationals. The
identification, certification and security clearances of these officers and seamen are under
the direct control of the Directorate General of Shipping in India.
c) In India, vessels can always be “requisitioned” for Indian trade in the event of
national emergency. This provision of the Merchant Shipping Act ensures that critical
energy cargoes can always be imported/transported during war/national emergency.
d) When Indian shipowners deploy a specialized / technical officer who is not of Indian
origin, on board any of our vessels trading on the Indian coast, they are required to seek
clearance not only from the Naval authorities but also from MoHA (Ministry of Home
Affairs). However, when foreign flag vessels (other than offshore vessels) trade on
the Indian coast, no Naval or MoHA clearance is required. It is, therefore, essential
that the ownership and operation of Indian shipping should be encouraged.
9.9 National tonnage and its effect on freight rates
9.9.1 The existence of a strong and viable national fleet serves as a balancing factor in the
volatile freight market and helps to keep down the freight rates in the shipment of
export and import of goods and maintain competitiveness of exports.
9.9.2 Advantages of Increased National Tonnage : Increase in tonnage for the growing
economy is important for the following reasons:
a) Promotes foreign exchange earnings as it reduces outgo on account of freight
transportation through foreign vessels. India’s total payments on account of sea
transportation covering charter hire charges, freight on iimports and exports is estimated
at US$ 5.4 billion of which around US $ 5.3 billion was paid towards freight charges
(US $ 4.2 Billion on freight imports and US $ 1.1 Billion on freight exports) in
20010-11 a s p e r t h e by the Reserve Bank of India (Table:9I).
b) National tonnage provides leverage over ocean freight rates which have traditionally
99
been subject to collusive/negotiated price setting mechanisms.
c) National tonnage help spawns associated shore based services, such as
stevedoring, ship repairs, logistics, manning, cargo movement etc.. The Shipping sector
constituted 2.5 - 3% of the GDP, according to Rakesh Mohan Committee Report.
d) It provides higher employment opportunities for Indian seafarers. India has about
30,000 officers and 2,30,000 ratings.
e) Having more ships under the Indian flag, will provide bigger opportunities for training
of Indian seafarers.
f) Addresses National Security Concerns: National tonnage maintains the supply line for
essential cargoes, in emergency situations. For example, 100% of the total crude
imports from the Middle East during the Iraq war came on Indian ships.
9.9.3 Strategy for Augmenting Indian tonnage : Apart from direct acquisition of new
tonnage with emphasis on adequate tonnage towards fulfilling energy security needs over a
medium term, domestic tonnage can be augmented in the interim and short run through a
combination of policies aimed to:
i) Retain and consolidate existing tonnage from flagging out to more attractive
registers through greater cargo support and
ii) “Deemed Export Status” for Shipping
iii) Make investment in Shipping at least as profitable as any other service industry by
offering a conducive tax regime encompassing both direct and indirect taxes;
iv) Explore and exploit new/innovative cost effective Charter Hire arrangements.
9.10 Greater Cargo support and development
9.10.1 In order to ensure the development of an Indian fleet in adequate strength for the
transportation of country’s domestic and exim trade, the Indian shipping industry has
reiterated the need for a strong cargo support policy. In many countries preference is given
to the national fleet for carriage of government procured cargoes. Typically the national
fleet will have the first right of refusal and only then will foreign flagged ships be allowed
to participate in the carriage of such cargoes, unless a waiver is granted to foreign flag ships
registered with the maritime administration of the country concerned. Cargo preference or
preferential treatments are powerful instruments because they put vessels from other
100
countries at a disadvantage, by reducing or completely excluding them from participation
in the external trade of the country. Some of the examples of cargo support policies
pursued by other nations in the past and present are: U.S. has reserved government cargoes,
such as all of its aid cargoes, project cargoes financed by Export and Import Bank of the
United States (EXIM) and export of Alaskan oil, for its own ships; In the past Korea has
followed a designated cargo preference system for bulk cargoes and a waiver system for
liner cargoes.
9.10.2 Many countries including India has used the strategy of “Buy FOB and sell CIF” i.e.
encouraging exporters to sell CIF or C&F and for its importers to buy FOB t o lend
support to domestic tonnage and also as an effective bargaining instrument in international
trade wherein, by splitting the CIF costs of imports into components, the buyer can hedge
for separate bargains with sellers of commodities and providers of freight and insurance
companies to extract overall cost advantage. It transfers the right to designate the
carrying vessel to the local seller or buyer. Any economic gains made through the
policy of cargo reservation/support wou ld have to be as ses sed aga ins t t hese
invis ib le cos t s . However, keeping in view that the component of sea freight in the total
cost of Crude and Products are respectively 0.75% and 1.4% , a small increase in sea freight,
if at all, will have only very small or no major impact on the price of the crude being
imported or products being sold.
9.10.3 Cargo Support on EXIM Trade
9.10.3.1 Based on the statistical data available from Ministry of Commerce, the top 4
cargoes in India’s imports are: (i) POL (Petroleum, Oil and Lubricants including Crude)
(~30%), (ii) Solid Bulk Cargoes (Coal, Fertliser, etc.) (~12%); (iii) Engineering Goods and
Machinery (~10%) and; (iv) Electronic goods (~6%). The major items exported are: (i)
Engineering Goods and Machinery (~23%), (ii) Petroleum products (~17%); (iii) Chemicals
& related products(~12%) and (iv) Agricultural products(~7%).
9.10.3.2 The shipping industry has been reiterating that EXIM cargoes moved on account of
the government should be transported on Indian flag vessels whenever Indian flag vessels are
available through the policy of FOB purchase (import) and CIF sale (Export) and the right of
101
first refusal (ROFR) to Indian flag vessels with a view to exercising shipping control over
Indian cargo. Chartering wing of the shipping ministry (Transchart) needs to continue to
make the shipping arrangements for all the government cargoes. Allowing oil companies the
freedom to make their own shipping arrangements since 2005 has resulted in multiplicity of
agencies handling government cargo and needs a review to bring all government cargoes
under a single umbrella. This change of the policy has neither resulted in reducing the cost of
shipping nor in any increase in Indian participation. The shipping industry has also urged the
government to encourage greater involvement of Indian vessels in EXIM trade and a cargo
reservation policy to ensure that all essential cargoes like crude oil, petroleum products, and
gas are carried by Indian flagged vessels. However, for Oil companies which charter vessels
for transport of crude oil to Indian ports, there have been considerable financial savings after
the Government allowed PSU oil companies for direct chartering of ships in 2005, instead of
going through Transchart. Hence the proposal by shipping industry association for the
reversal of this policy to pre-2005 arrangement, i.e., chartering through Transchart, is a step
backward and hence not acceptable to them.
9.10.3.3 After careful consideration of the views of Indian ship owners as well as Indian
charterers, there is a need to reserve some portion of the POL and dry bulk cargoes of
EXIM trade of India for Indian Ships, and should be linked as condition for availing
benefits under the export schemes of the Government of India. This will assure cargo
availability for Indian ships, and act as a catalyst to boost the growth of Indian fleet.
9.11 “Deemed Export Status” for Shipping
9.11.1 As is known, majority of Indian shipping companies are tonnage tax companies and
the essential requirement for tonnage tax benefits is that the place of effective
management has to be in India. Management means the place where the commercial and
strategic decisions are taken.
9.11.2 Given the international nature of its business, the shipping company provides such
service for Indian companies either importing or exporting their cargo. It also
provides its skill sets and its abilities to manage effectively transportations solutions to
companies which are also situated outside India. However, what is important and paramount
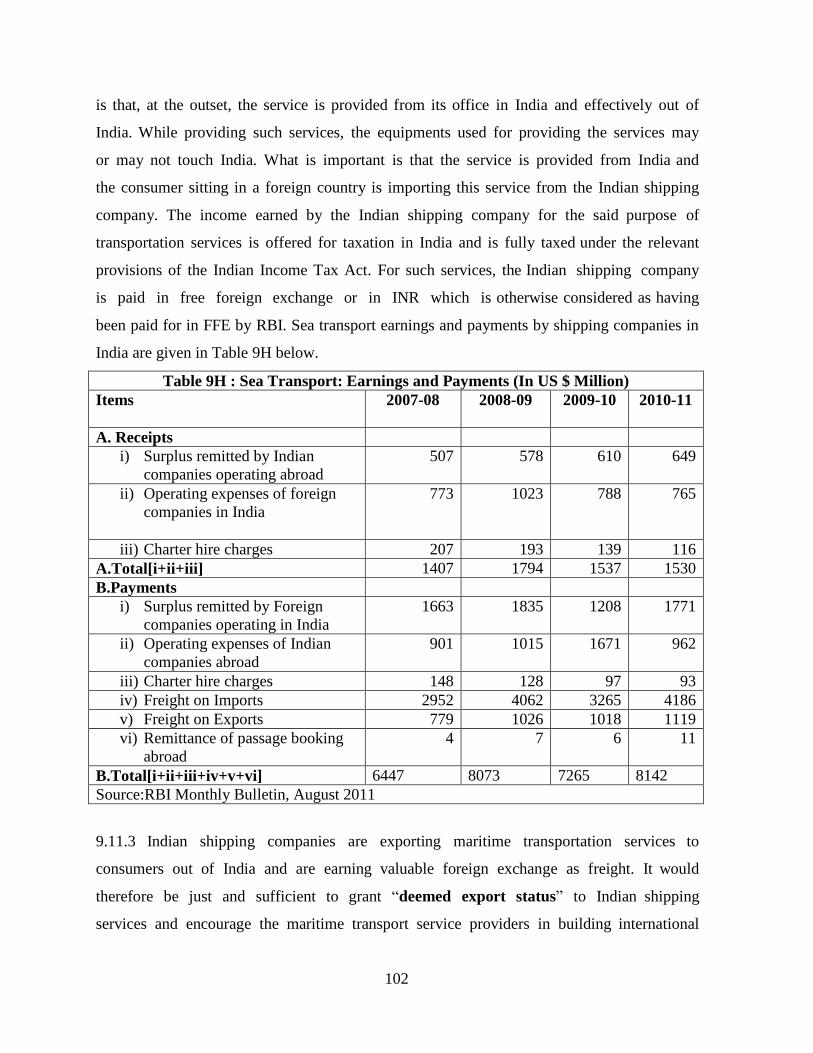
102
is that, at the outset, the service is provided from its office in India and effectively out of
India. While providing such services, the equipments used for providing the services may
or may not touch India. What is important is that the service is provided from India and
the consumer sitting in a foreign country is importing this service from the Indian shipping
company. The income earned by the Indian shipping company for the said purpose of
transportation services is offered for taxation in India and is fully taxed under the relevant
provisions of the Indian Income Tax Act. For such services, the Indian shipping company
is paid in free foreign exchange or in INR which is otherwise considered as having
been paid for in FFE by RBI. Sea transport earnings and payments by shipping companies in
India are given in Table 9H below.
Table 9H : Sea Transport: Earnings and Payments (In US $ Million)
Items 2007-08
2008-09
2009-10
2010-11
A. Receipts
i) Surplus remitted by Indian
companies operating abroad
507 578 610 649
ii) Operating expenses of foreign
companies in India
773 1023 788 765
iii) Charter hire charges 207 193 139 116
A.Total[i+ii+iii] 1407 1794 1537 1530
B.Payments
i) Surplus remitted by Foreign
companies operating in India
1663 1835 1208 1771
ii) Operating expenses of Indian
companies abroad
901 1015 1671 962
iii) Charter hire charges 148 128 97 93
iv) Freight on Imports 2952 4062 3265 4186
v) Freight on Exports 779 1026 1018 1119
vi) Remittance of passage booking
abroad
4 7 6 11
B.Total[i+ii+iii+iv+v+vi] 6447 8073 7265 8142
Source:RBI Monthly Bulletin, August 2011
9.11.3 Indian shipping companies are exporting maritime transportation services to
consumers out of India and are earning valuable foreign exchange as freight. It would
therefore be just and sufficient to grant “deemed export status” to Indian shipping
services and encourage the maritime transport service providers in building international
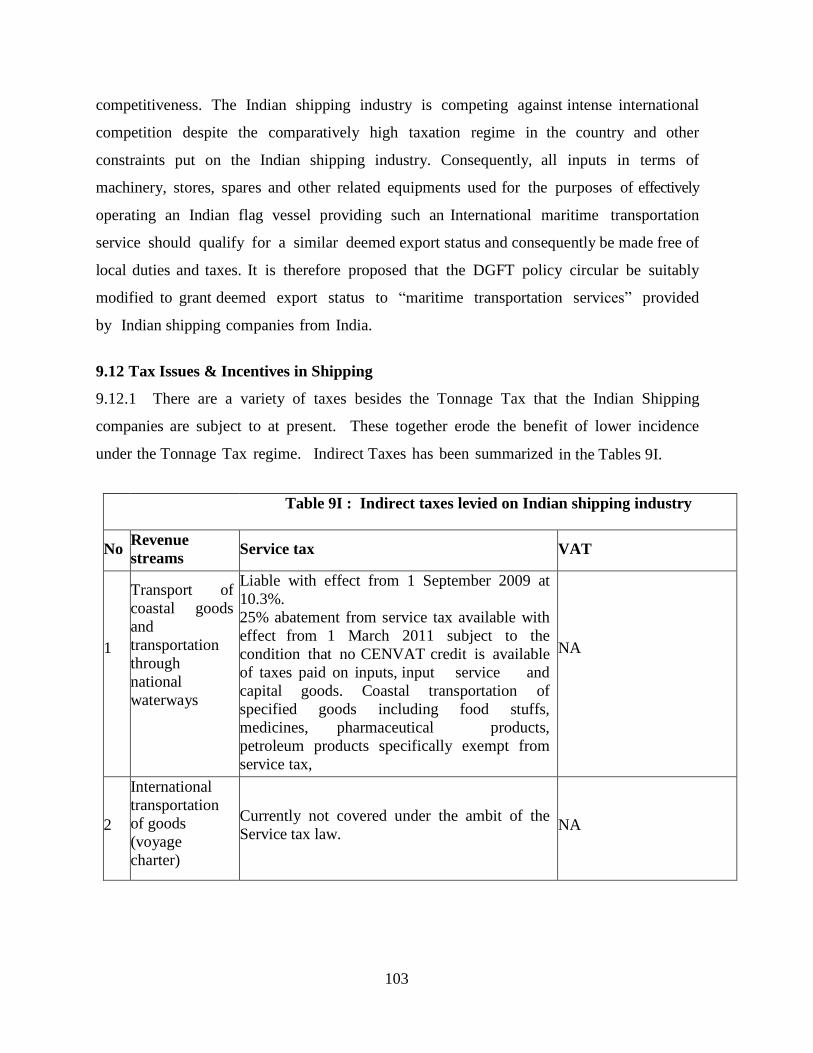
103
competitiveness. The Indian shipping industry is competing against intense international
competition despite the comparatively high taxation regime in the country and other
constraints put on the Indian shipping industry. Consequently, all inputs in terms of
machinery, stores, spares and other related equipments used for the purposes of effectively
operating an Indian flag vessel providing such an International maritime transportation
service should qualify for a similar deemed export status and consequently be made free of
local duties and taxes. It is therefore proposed that the DGFT policy circular be suitably
modified to grant deemed export status to “maritime transportation services” provided
by Indian shipping companies from India.
9.12 Tax Issues & Incentives in Shipping
9.12.1 There are a variety of taxes besides the Tonnage Tax that the Indian Shipping
companies are subject to at present. These together erode the benefit of lower incidence
under the Tonnage Tax regime. Indirect Taxes has been summarized in the Tables 9I.
Table 9I : Indirect taxes levied on Indian shipping industry
No Revenue
streams
Service tax
VAT
1
Transport of
coastal goods
and
transportation
through
national
waterways
Liable with effect from 1 September 2009 at
10.3%.
25% abatement from service tax available with
effect from 1 March 2011 subject to the
condition that no CENVAT credit is available
of taxes paid on inputs, input service and
capital goods. Coastal transportation of
specified goods including food stuffs,
medicines, pharmaceutical products,
petroleum products specifically exempt from
service tax,
NA
2
International
transportation
of goods
(voyage
charter)
Currently not covered under the ambit of the
Service tax law.
NA
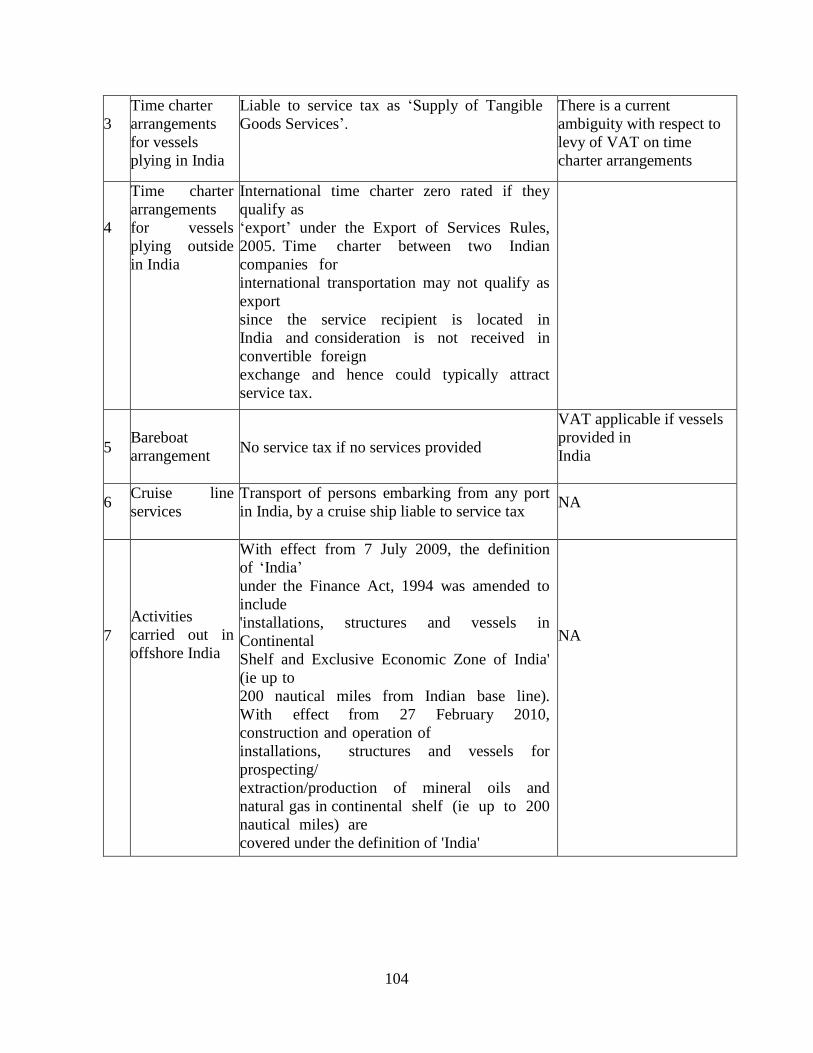
104
3
Time charter
arrangements
for vessels
plying in India
Liable to service tax as ‘Supply of Tangible
Goods Services’.
There is a current
ambiguity with respect to
levy of VAT on time
charter arrangements
4
Time charter
arrangements
for vessels
plying outside
in India
International time charter zero rated if they
qualify as
‘export’ under the Export of Services Rules,
2005. Time charter between two Indian
companies for
international transportation may not qualify as
export
since the service recipient is located in
India and consideration is not received in
convertible foreign
exchange and hence could typically attract
service tax.
5
Bareboat
arrangement
No service tax if no services provided
VAT applicable if vessels
provided in
India
6 Cruise line
services
Transport of persons embarking from any port
in India, by a cruise ship liable to service tax
NA
7
Activities
carried out in
offshore India
With effect from 7 July 2009, the definition
of ‘India’
under the Finance Act, 1994 was amended to
include
'installations, structures and vessels in
Continental
Shelf and Exclusive Economic Zone of India'
(ie up to
200 nautical miles from Indian base line).
With effect from 27 February 2010,
construction and operation of
installations, structures and vessels for
prospecting/
extraction/production of mineral oils and
natural gas in continental shelf (ie up to 200
nautical miles) are
covered under the definition of 'India'
NA
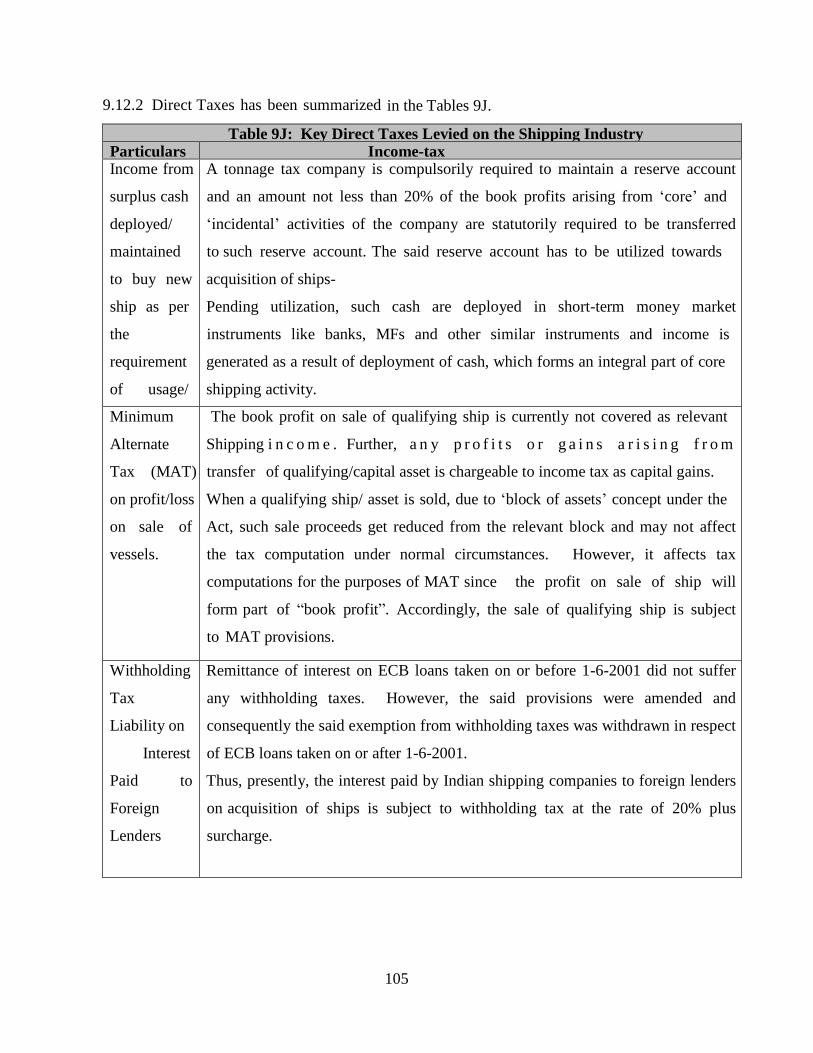
105
9.12.2 Direct Taxes has been summarized in the Tables 9J.
Table 9J: Key Direct Taxes Levied on the Shipping Industry
Particulars Income-tax Income from
surplus cash
deployed/
maintained
to buy new
ship as per
the
requirement
of usage/
utilization of
statutory
reserve
A tonnage tax company is compulsorily required to maintain a reserve account
and an amount not less than 20% of the book profits arising from ‘core’ and
‘incidental’ activities of the company are statutorily required to be transferred
to such reserve account. The said reserve account has to be utilized towards
acquisition of ships-
Pending utilization, such cash are deployed in short-term money market
instruments like banks, MFs and other similar instruments and income is
generated as a result of deployment of cash, which forms an integral part of core
shipping activity.
However, currently the tonnage tax provisions do not include income earned
from utilization of surplus funds as relevant core shipping income and is taxed
under normal taxation.
Minimum
Alternate
Tax (MAT)
on profit/loss
on sale of
vessels.
The book profit on sale of qualifying ship is currently not covered as relevant
Shipping i n c o m e . Further, a n y p r o f i t s o r g a i n s a r i s i n g f r o m
transfer of qualifying/capital asset is chargeable to income tax as capital gains.
When a qualifying ship/ asset is sold, due to ‘block of assets’ concept under the
Act, such sale proceeds get reduced from the relevant block and may not affect
the tax computation under normal circumstances. However, it affects tax
computations for the purposes of MAT since the profit on sale of ship will
form part of “book profit”. Accordingly, the sale of qualifying ship is subject
to MAT provisions.
Withholding
Tax
Liability on
Interest
Paid to
Foreign
Lenders
Remittance of interest on ECB loans taken on or before 1-6-2001 did not suffer
any withholding taxes. However, the said provisions were amended and
consequently the said exemption from withholding taxes was withdrawn in respect
of ECB loans taken on or after 1-6-2001.
Thus, presently, the interest paid by Indian shipping companies to foreign lenders
on acquisition of ships is subject to withholding tax at the rate of 20% plus
surcharge.
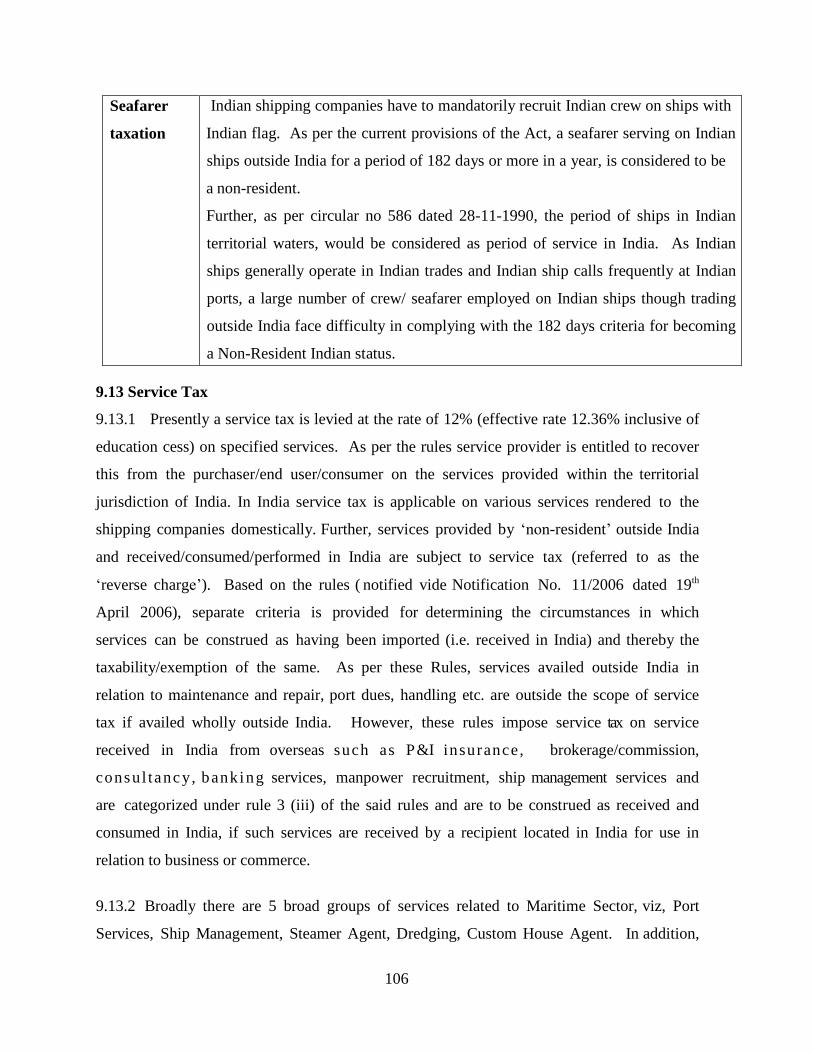
106
Seafarer
taxation
Indian shipping companies have to mandatorily recruit Indian crew on ships with
Indian flag. As per the current provisions of the Act, a seafarer serving on Indian
ships outside India for a period of 182 days or more in a year, is considered to be
a non-resident.
Further, as per circular no 586 dated 28-11-1990, the period of ships in Indian
territorial waters, would be considered as period of service in India. As Indian
ships generally operate in Indian trades and Indian ship calls frequently at Indian
ports, a large number of crew/ seafarer employed on Indian ships though trading
outside India face difficulty in complying with the 182 days criteria for becoming
a Non-Resident Indian status.
However, due to lack of monitoring/ administrative mechanism, Indian crew/
seafarer serving on foreign ships for 182 days or more are treated as non-
resident irrespective of where the ship trades (including Indian waters). Further,
even if the seafarer does not qualify with the requirement to become eligible for
NR status, the foreign shipowners are not subject to TDS regulations in India and
hence Indian seafarer on foreign ships may escape tax net.
9.13 Service Tax
9.13.1 Presently a service tax is levied at the rate of 12% (effective rate 12.36% inclusive of
education cess) on specified services. As per the rules service provider is entitled to recover
this from the purchaser/end user/consumer on the services provided within the territorial
jurisdiction of India. In India service tax is applicable on various services rendered to the
shipping companies domestically. Further, services provided by ‘non-resident’ outside India
and received/consumed/performed in India are subject to service tax (referred to as the
‘reverse charge’). Based on the rules ( notified vide Notification No. 11/2006 dated 19th
April 2006), separate criteria is provided for determining the circumstances in which
services can be construed as having been imported (i.e. received in India) and thereby the
taxability/exemption of the same. As per these Rules, services availed outside India in
relation to maintenance and repair, port dues, handling etc. are outside the scope of service
tax if availed wholly outside India. However, these rules impose service tax on service
received in India from overseas such as P&I insurance, brokerage/commission,
consul tancy, banking services, manpower recruitment, ship management services and
are categorized under rule 3 (iii) of the said rules and are to be construed as received and
consumed in India, if such services are received by a recipient located in India for use in
relation to business or commerce.
9.13.2 Broadly there are 5 broad groups of services related to Maritime Sector, viz, Port
Services, Ship Management, Steamer Agent, Dredging, Custom House Agent. In addition,
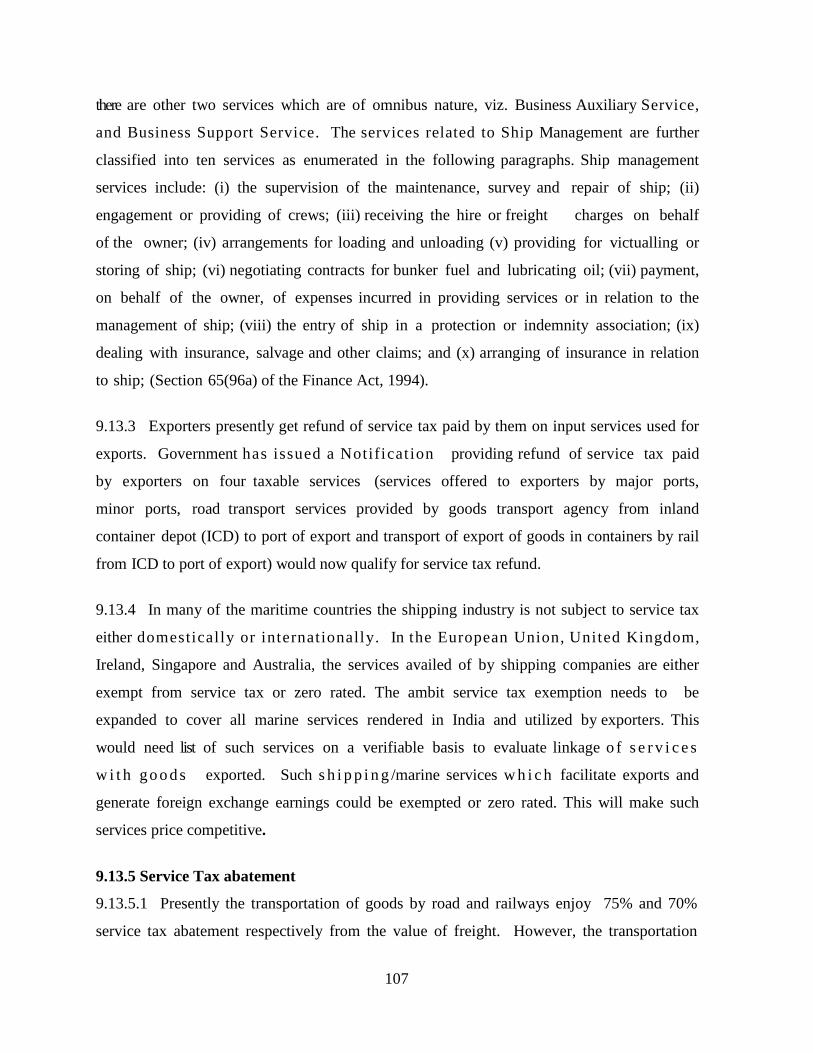
107
there are other two services which are of omnibus nature, viz. Business Auxiliary Service,
and Business Support Service. The services related to Ship Management are further
classified into ten services as enumerated in the following paragraphs. Ship management
services include: (i) the supervision of the maintenance, survey and repair of ship; (ii)
engagement or providing of crews; (iii) receiving the hire or freight charges on behalf
of the owner; (iv) arrangements for loading and unloading (v) providing for victualling or
storing of ship; (vi) negotiating contracts for bunker fuel and lubricating oil; (vii) payment,
on behalf of the owner, of expenses incurred in providing services or in relation to the
management of ship; (viii) the entry of ship in a protection or indemnity association; (ix)
dealing with insurance, salvage and other claims; and (x) arranging of insurance in relation
to ship; (Section 65(96a) of the Finance Act, 1994).
9.13.3 Exporters presently get refund of service tax paid by them on input services used for
exports. Government has issued a Notificat ion providing refund of service tax paid
by exporters on four taxable services (services offered to exporters by major ports,
minor ports, road transport services provided by goods transport agency from inland
container depot (ICD) to port of export and transport of export of goods in containers by rail
from ICD to port of export) would now qualify for service tax refund.
9.13.4 In many of the maritime countries the shipping industry is not subject to service tax
either domestically or internationally. In the European Union, United Kingdom,
Ireland, Singapore and Australia, the services availed of by shipping companies are either
exempt from service tax or zero rated. The ambit service tax exemption needs to be
expanded to cover all marine services rendered in India and utilized by exporters. This
would need list of such services on a verifiable basis to evaluate linkage o f s e r v i c e s
w i t h go o d s exported. Such s h i p p i n g /marine services w h i c h facilitate exports and
generate foreign exchange earnings could be exempted or zero rated. This will make such
services price competitive.
9.13.5 Service Tax abatement
9.13.5.1 Presently the transportation of goods by road and railways enjoy 75% and 70%
service tax abatement respectively from the value of freight. However, the transportation
108
through coastal and inland waterways, which is, environment friendly and cost effective and
infant industry, has been granted only 25% service tax abatement from freight value.
Additionally, this abatement would require that the service providers cannot take any input
credit of taxes. It is noted that this inequity between the service tax abatement for road/rail
transportation and coastal transportation is iniquitous. Hence the percentage of service tax
abatement for coastal and inland waterways transportation be increased from 25% to level on
par with road and railway transportation. Further restriction on availment of input credit is
withdrawn since this condition only adds to the already increasing input cost of such service
providers.
9.14 Seafarer’s Taxation-Unequal treatment
9.14.1 Indian seafarers employed on foreign vessels or Indian vessels which ply outside
Indian territorial waters for 182 days or more in a year are entitled to non resident status
and pay no taxes. This does not apply to officers and seafarers on coastal ships. Also
Indian and foreign seafarers working in Indian territorial waters for 182days or more are
effectively Indian tax residents and are liable to pay tax on income.Crewing costs are
considered the dominant component of operating costs. The crewing costs of a ship are
determined by several factors, such as the ship type, the trade, the level of automation,
employment characteristics, the flag of registration, the nationality of the crew and the relief
crew schedule. Every ship-owner attempts to achieve the optimum crew complement taking
into account statutory requirements, and safety needs. The flag state stipulates the
minimum national manning component of the ship’s crew. The nationality of the crew is
an important factor in determining crew costs. National crew costs in developed countries
reflect the general social and wage conditions of these countries and are much higher than
crew costs in developing countries.
9.14.2 It may be noted that certain countries in Asia (Malaysia, Phillipines, Singapore,
and Thailand) have exempted income of their seafarers from personal taxation. In some
European countries, ship-owners are given the right to withhold a certain percentage of
personal income tax and social security payment of seafarers as an incentive to hire
European seafarers by offsetting part of the high wage level in their country. Labour is a
factor of production and seafarers income could be subject to a lower fixed/ flat rate of tax
109
which could be levied on all Indian seafarers irrespective of their residential status (i.e. place
of work within or outside Indian territorial waters) and/or flag of ship they work for or; a
higher exemption up to a certain level of income could be given for tax purposes. Such a
tax will reduce the attraction of foreign flag and may also help coastal shipping which find
it difficult to engage and retain Indian seafarers under the existing manning laws.
9.15 Minimum Alternate Tax (MAT) on Profit/Loss on Sale of Vessels
9.15.1 In India, profit/loss on sale of vessels is not covered under the tonnage tax regime.
Therefore, the tonnage tax company has to pay minimum alternate tax/capital gains tax on
such income. Minimum Alternate tax (MAT) @ 11.22% is payable on book profits in case
the taxable income (i.e. other than tonnage income) of the company is less than 10% of the
book profits. The profit/loss on sale of vessel is credited to the profit and loss account and
would be included in the book profits of the qualifyingshipping company on which MAT
would be applicable.
9.15.2 In United Kingdom, Singapore, Ireland and Netherlands profit/loss on sale of vessels
is covered under the tonnage tax regime. Thus, in the above jurisdictions the gain on sale of
vessels will not be taxed under the normal corporate taxation rules. Given the need to
augment the fleet capacity of the Indian Shipping it is suggested either to (a) to include
surplus resulting from sale of vessels should be covered within the scope of tonnage tax
regime or (b) exempt sale proceeds from tax if used to purchase a replacement vessel
within a certain period of time.
9.16 Withholding T a x on interest payments to foreign lenders/external commercial
borrowings (ECB)
9.16.1 Under the domestic law of India, any payment to a non-resident which constitutes
taxable income is subject to withholding tax. The burden of such tax has to be
ultimately borne by the borrower who makes payment of grossed up interest. Interest
paid to an overseas lender is subject to withholding tax at the basic rate of20% as per the
Section 195 of the Income Tax Act. The tax liability arising thereto can be borne by either
the borrower or lender abroad depending on the terms of agreement between the two
parties. The aforesaid tax rate would be in a case where the overseas lender is resident of
110
a country with which India has not entered into a double taxation avoidance agreement.
In case of other countries, the beneficial provisions of the Tax Treaty may be availed. The
tax treatment would depend upon whether interest is covered under the specific Article
dealing with ‘shipping profits’ or otherwise. In case it is covered under the said Article,
the interest would be taxed in the similar manner as ‘profits from operations of ships’ are
taxed; i.e. it would be taxed in the place of effective management/country of
residence of the foreign lender. In other cases, in the absence of permanent
establishment, it would be taxed as interest income. The concessional rate of tax for interest
income provided under the Tax Treaty ranges between 10-15%. Subject to the domestic
law of the country of residence of the overseas lender, credit can be claimed for the foreign
taxes. Under the domestic law of Singapore, interest paid to foreign lenders is exempt from
withholding tax. This is subject to the condition that the loan is utilized for purchase of
vessels registered under the Singapore flag. Under the domestic law of United Kingdom,
interest paid to foreign lenders is subject to withholding tax at the rate of 20%. In case
there is a Tax Treaty, the beneficial provisions of the same may be availed of. The
implication of withholding tax is to make ECB expensive and thereby discourage borrowers
from this option. Presently the rationale for this levy appears to be rooted in macro-
economic policy imperatives with a view to discourage capital inflows in the backdrop of
surge in forex reserves and rising rupee.
9.17 Cargo Assurance through Long Term Charters
9.17.1 The Shipping industry has proposed to the government that long term charters by
charterers for essential cargoes should be negotiated and concluded exclusively with Indian
shipowners for Indian flag vessels which will ensure a dedicated fleet of vessels at
competitive rates on a long term basis. The growth of Indian flag tonnage is of strategic
importance to national security, energy security, food security, infrastructure security and
offshore security. Therefore the country needs a strong and reliable merchant fleet which
serves as the ‘fourth arm of defence’. In order to grow, Indian Shipping Industry suggested
following policy initiatives :-
(i) Develop a national fleet in the energy sector, similar in concept to the United States
“Sea-lift Command”. This national fleet should consist of Indian flag vessels to
111
ensure uninterrupted transport of essential cargoes such as crude oil, petroleum
products and gas and in the process ensuring national and energy security.
(ii) EXIM cargoes moved by the charterers must be transported on Indian flag vessels
whenever Indian flag vessels are available. To encourage greater involvement of
Indian vessels in EXIM trade a cargo reservation to be ensured for all energy cargoes.
Transchart would evaluate the existing Indian fleet capacity and stipulate the
percentage of cargo that would be reserved for carriage by Indian flag vessels.
(iii)Long term charters by the charteres for critical energy cargoes of crude oil, petroleum
products and gas should be negotiated and concluded exclusively with Indian ship-
owners for Indian flag vessels which will ensure a national fleet of vessels at
competitive rates on a long term basis and will ultimately result in a win-win situation
for the charterers, shipowners and the economy at large providing stability in freight
costs and lowering input costs. Charterers can only enter into time charter with Indian
flag vessels. In addition to time charters, charterers should also enter into contracts of
Affreightment exclusively with Indian flag vessels.
(iv) The guidelines laid down in this regard should cover:-
(a) Policy is for EXIM cargo, i.e. both exports and imports.
(b) Long term charters of 5-7 years should be given to Indian flag companies.
(c) Commodities: crude and refined products, thermal coal, coking coal, fertilizer iron
ore.
(d) Reservation of 33.33%.
(e) Applicable only to the charterers.
(f) Charterers to supply a monthly return to Director General Shipping (DGS), with a
copy to INSA – showing quantum traded, YTD on Indian and foreign flag.
(g) If Charterers do not support this policy, they should not get any license to in
charter a foreign flag for more than one year.
(h) In order to avoid any mishaps in implementation, the policy may choose to clarify
that for Charters – at any given time Indian flag tonnage on long term should be
33.33%. This should be certified by a suitable competent authority at quarterly
intervals. For non-Indian ships a charter option beyond 3 years cannot be
exercised if Indian flag ships are available then.
112
(i) Non-compliance on the part of charterers will require charterers to buy all its
imports solely on FOB basis in the next year.
(j) Further, non-compliance would entail restricted permission on in chartering of
foreign flag vessels.
(k) The offer will be on the basis of a tender only for Indian companies.
(l) This will be applicable only for Indian flag companies and no other flag.
(m) ROFR on other charters such as spot to continue.
9.17.2 According to Indian PSU Oil companies, though the requirement of vessels for
import of crude oil to India has increased manifold, the participation of Indian vessels in
crude oil import has been dismal and the capacity of Indian fleet is limited to about 5% of the
total tonnage requirement of IOC alone. Out of 296 VLCCs (Very Large Crude Carriers)
fixed by IOC on spot market, only 4 were Indian ships constituting 1.3%. (VLCC import is
essential to optimize the freight cost of IOC where the Indian VLCC tonnage is grossly
inadequate). Even smaller sized Indian vessels are also inadequate to meet the complete
requirement of long term contract. To meet their contract commitments Indian owners are
becoming charterers’ and taking other foreign flag vessels on time charter instead of
increasing their own fleet size.
9.17.3 The oil companies further claim that the rates offered by the Indian vessels are far
from competitive. Indian vessel offer high rates and are reluctant to take part in the
negotiations because of certainty of getting business through ROFR. Reserving the long term
business for Indian ships will make oil companies less competitive and in-turn make Indian
owners as charterers in place of Oil companies. If the proposed reservation is only for the
PSU oil companies and not applicable for the private sector oil companies, it is bound to
make PSU oil companies less competitive in the market.
9.18 Proposed Projects for Shipping Sector
9.18.1 In order to promote growth of Indian shipping framing of appropriate policies,
implementing them with a facilitative regulatory regime and appropriate monitoring at
various stages are essential. To this end, following schemes are proposed.
113
9.18.1.1 Navigational Safety in Ports Committee (NSPC).It is proposed to set up an
NSPC wing, which will carry out the oversight functions related to oil response, safety and
navigational matters in the major and minor ports. The estimated cost for setting up the
NSPC Wing and the recurring cost for the next 5 years would be approximately Rs 10 crore.
9.18.1.2 Ro-Ro Ferry Services: In order to develop coastal shipping, it is suggested to
setup dedicated facilities for the Ro-Ro Ferry service n e t w o r k in Gulf of Kutch, Gulf of
Cambay and western / southern coastal states of India. It is suggested that subsidy may be
provided for construction of Ro-Ro jetties as an infrastructure with additional subsidy
for a project involving construction of a pairs of jetties in order to facilitate movement of
cargo between specified ports and also to cater to specific cargoes. The approximate cost
for setting up jetties would be Rs 100 crore.
9.18.1.3 Pollution Response arrangements on Indian coast: It has been observed that the
Oil Pollution Response arrangements set up in sea ports, oil terminals, and offshore
structures with the coast guard is inadequate to deal with major oil spills There are 13
major ports and 62 operational non-major ports which are dealing with foreign trade. The
estimated cost for the inventory, additional manpower / resources for undertaking the risk
analysis, preparation of Regional mitigation plan, would be approximately Rs 100 crores.
9.18.1.4 Designation of Emission Control Area (ECA): In October 2008, International
Maritime Organisation (IMO) agreed to amend MARPOL Annex VI adopting new tiers for
control of NOx emission and sulphur contents in fuel. The proposal is for designation of an
Emission Control Area (ECA) for specific portions of Indian coastal waters, for the control
of nitrogen oxides (NOx), sulphur oxides (SOx), and particulate matter (PM) emissions.
Adoption of the proposed ECA will result in significant reduction in ambient levels of air
pollution along the coast of India. This will result in achieving substantial benefits to
human health and the environment. The total cost of the project is estimated to be Rs. Rs100
crore.
9.18.1.5 Proposal for designation of Particularly Sensitive Sea Areas(PSSA): It is an
area that needs special protection through action by International Maritime Organization
114
(IMO), because of its significance for recognized ecological or socio-economic or
scientific reasons and which may be vulnerable to damage by international maritime
activities. It is proposed to carry out study for designation of the Lakshadweep Island,
Andaman and Nicobar Island and any other area which qualifies for PSSA. The estimated
cost of the project is around Rs. 50 Crore to be completed in 3 years.
9.18.1.6 Strengthening of Port State Control and Flag State Inspections: At present
inspections cover about 4% foreign ships calling at Indian Ports under PSC and 40% of
Indian ships under FSI. The main constraint in the implementation is the availability of
manpower. It is therefore proposed to recruit more surveyors for this propose so as to
achieve 10% PSC inspections of foreign ships calling at our Indian Ports by 2015 as
mandated by IOMOU. It is also proposed to carry out 100% FSI inspections of Indian
ships by 2020.The expenditure for this project is estimated to be around Rs 100 Crore.
9.18.1.7 Legislative updation: The Merchant Shipping Act was enacted in 1958, and
considerable changes have resulted in the maritime sector during the last 50 years
due to technological advancements and growth in shipping . The provisions of the MS
Act has not been amended for keeping it up-to-date, though minor amendments have been
made from time to time to incorporate adoption of various international conventions
adopted by India. A comprehensive revision of MS Act is necessary to make it in line
with the current requirements of safety, security, seamen’s welfare and pollution prevention.
Further, it is proposed that the period between the adoption of International convention and
National legislation be reduced to 3 years by 2015 and to 1 year by 2020. The following
conventions are proposed to be legislated between 2010 and 2020:Ballast water Convention
Anti Fouling Convention Recycling Convention; OPRC-HNS Convention and Protocol;
London Dumping Convention Wreck Removal Convention Bunker Convention; Maritime
Labour Convention. In addition, the new conventions that are going to be adopted by IMO
will also be taken up during the period. In the absence of regular legal professionals in the
directorate, the legal expertise has to be hired, the expenditure for which upto 2020 is
expected to be Rupees 12 Crore.
9.18.1.8 Voluntary IMO Member State Audit Scheme (VIMSAS): India has offered for
115
Voluntary IMO Member State Audit Scheme (VIMSAS) Once, the Audit Scheme is made
mandatory, the Member States may be required to be audited once in five years. The
Scheme will enhance the maritime administration’s performance and also the port and
Coastal State duties and responsibilities within the IMO instruments, which are of equal
importance to those of flag States in ensuring that global maritime transport is safe, efficient
and environmentally sound.
9.18.1.9 Marine disaster emergency response (Emergency towing vessel): This would
require basic equipment for tow and de-canting of bunker oil from tanks of ships in
distress; and a team of salvagers who will be available at short notice.
9.18 .1 .10 Ballast Water Management: While transporting cargo, ships transfer around
0.66 billion tones of ballast sea water from one port to another and from one part of the
world to another. Ballast water contains various harmful micro organisms it not only
deteriorates the ocean but also affects the territorial waters of other countries. The
problem of bio invasion has therefore to be addressed at the earliest. The Marine
Environment Protection Committee of the IMO has developed guidelines for the Ballast
Water Management System. However, as per the convention, all ships constructed after 2010
onwards have to install ballast water system. The scheme involves two projects with
financial implications: Project 1: Port biological baseline survey and risk assessment in 8
major ports in two phases at a estimated cost of Rs 15 Crore; Project 2 : Setting up of the
facility of Ballast Water treatment Technology: verification and certification at an estimated
cost of Rs 50 Crore.
9.18.1.11 Indian P & I Club: In present day scenario the maritime insurance of the
ships, wreck removal, maritime causality, etc, bo th for the ship and seafarers, are catered
by the P & I Clubs of foreign origin. Establishing the P& I Club in India not only brings
increase in trade but also provides foreign exchange earnings when these clubs are used by
foreign companies. An Indian P&I club can protect the interests of Indian ship owners
especially when there is an international crisis, such as piracy, terrorist activity or a war,
when the foreign clubs can arbitrarily increase the insurance premium.
116
9.19 Making the National Register Attractive to Augment Tonnage
9.19.1 Currently Indian Tonnage stands at 10.741 million GT and ranks 16th in the world
shipping Tonnage. The Indian flagged vessels are carrying presently around 8% of Indian
export – import cargo. Indian Shipping companies should aim to reach a level of 35 million
GT by 2017 which will include owned and chartered tonnage. Out of this, 24 million GT
may be the Indian owned tonnage. For achieving this tonnage an investment (including
private investment) of around Rs.79,000 Crore is estimated. Out of this, SCI has presently
identified projects worth Rs.27,668.40 Crore which will roughly take SCI owned tonnage to 7
million GT by 2020.
9.19.2 Acquisition Plans of the Shipping Corporation of India (SCI): SCI is the country’s
premier Shipping Line, presently owning a fleet of 74 vessels of 29.09 Lakh tonnes GT i.e.
51.13 Lakh tonnes DWT (as on01.10.2010), with a share of about 32% (in DWT) of the
total Indian tonnage. Transportation of Crude oil and Petroleum products has been SCI’s
core business and this segment is expected to grow substantially considering India’s
energy requirements for the future. Taking this into account, by the year 2020, SCI plans
to acquire 25 crude oil tankers of about 2.50 million GT, which would comprise of
VLCC, Suezmax tankers, Aframax tankers and 4 MR size product tankers of about 0.12
million GT. Under the Bulk carrier segment, SCI plans to acquire 30 vessels of about 1.40
million GT by the year 2020, comprising of Capesize, Kamsarmax and Supramax vessels.
SCI also proposes to acquire 4 Kamsarmax bulk carriers of 0.17 million GT through its
Joint Venture company viz. SAIL SCI Pvt. Ltd. Accordingly, SCI plans to acquire 15
container vessels of about 0.72 million GT by the year 2020. SCI would be acquiring a
mix of large and medium sized container vessels so as to effectively utilize them as per the
sector specific requirements. In the offshore Services Sector, SCI has planned to acquire
23 offshore vessels of different capacities comprising of AHTSVs, PSVs, MSV and Rig. In
the LPG and Chemical transportation segment, SCI plans to acquire 2 LPG carriers of
0.06 million GT and 4 Chemical tankers of 0.09 million GT. SCI also proposes to acquire
2 Chemical tankers of 0.04 million GT through its Joint Venture company viz. SCI Forbes
Pvt. Ltd. Considering the opportunities available in the different shipping segments, the
phasing out of SCI’s older vessels and SCI’s quest to become a global maritime player, SCI
117
plans to acquire 110 vessels of about 5.21 million GT in the next ten years. This
acquisition target includes SCI’s 24 vessels on order (as of 01.01.2011) of about 0.74
million GT. Acquisition of the proposed vessels would lead to the SCI fleet touching level
of 9.0 million GT by 2020.
9.19.3 Proposed projects during 2010-2020 by SCI
9.19.3.1 SCI proposes to acquire 110 vessels of different types and sizes based on
the requirement of the trade. Out of the proposed 110 vessels of about 5.21 MGT, 24 vessels
are presently on order (on going projects) amounting to 0.74 MGT which will be delivered to
SCI by 2012. Balance 79 vessel acquisition projects will be processed by SCI and 7 vessel
acquisition projects will be processed by SCI’s Joint Venture companies in the dry bulk
carrier, Chemical tanker and LNG segments. SCI would be reviewing its acquisition
strategy and streamline the same on an ongoing basis to determine the size of the vessels.
9.19.3.2 Financing of projects: Vessel acquisition proposed by SCI would be financed
through a mix of debt and equity, preferably in the ratio 80:20 (80% through commercial
loan and 20% through Internal Resources). No Budgetary support will be required from
Government for SCI’s proposed projects. The total investment required for SCI’s vessel
acquisition Plan during the period 2010~2020 is estimated to be Rs. 27,668.40 crore. The
breakup of investment is as follows: Ongoing Projects: Rs4765 Crore; Phase I Projects
(2010-15):Rs 9632.40 Crore; Phase II Projects (2015-20): Rs13271 Crore.
9.20 Human Resource Development
9.20.1 Manpower in the Indian maritime sector could be vertically divided into two
groups – (i) the seafaring personnel; and (ii) other personnel who are responsible for the
movement of the ships and handling of cargo. Global demand for seafarers is expected to
increase from 1.15 million currently to 1.6 million by 2020, driven by growth in cargo and a
corresponding increase in fleet size. The current demand is 550,000 Officers and about
600,000 Ratings. By 2020, the global demand for each is expected to increase by 20 per
cent: 660,000 Officers and 720,000 Ratings, an additional 110,000 Officers and
125,000 Ratings. In alternative GDP scenarios, growth in the number of seafarers could
vary between 12 per cent and 26 per cent through 2020.
118
9.20.2 India can aspire to strong growth in Officers and Ratings by 2020.The share of
high- quality Officers can increase from 6.3 in 2009 to 9.0 per cent in 2020, whereas share
of Ratings could see a moderate growth from 7.5 per cent in 2009 to 9 per cent in 2020 by
significantly improving their quality. This implies an additional 65,000 Officers and
45,000Ratings taking in to consideration annual attrition, which will require expanding
annual training capacity from 5,600 to 15,000 Officers and from 4,600 Ratings to 9,000
Ratings.
9.20.3 Demand for Indian Ratings was estimated to be 45,000 in 2009, leading to an
oversupply of 10,000 within the country. In addition, Indian Ratings are perceived to be
of lower quality. Therefore, India can set itself an aspiration to grow moderately in the
number of Ratings and attain a market share of 9 per cent from the current 7.5 per cent.
This implies doubling capacity in the next 10 years and significant improvement in
technical skills. India would have to supply an additional 45,000 Ratings, which may vary
depending on the attrition rate. High crude activity is likely to drive manning demand for
Ratings for Offshore Supply Vessels (OSV). In addition, developed economies having
high Near Coastal Voyage (NCV) traffic should be targeted as these countries have a
shortage of domestic seafarers.
9.20.4 Increasing the share of Indian officers in the world Shipping: The number of
merchant navy officers globally is currently estimated to be 5,50,000, which will increase
to 6,60,000 by 2015 assuming major supplying nations continue to train officers at
historical rates. Shortage in officers is expected to become acute by 2013 as a result of higher
growth in fleet size. India is the 5th largest supplier of officers with a global share of
6.3%. India can aspire to substantially increase the number of its officers achieve a
market share of 9%. For this, India would have to supply 65,000 additional officers in
the next 5 years, which would require that the training capacity almost triples in the next 5
years the qu a l i t y does not suffer. The expected cost of the project is Rs.20 Crore.
9.20.5 Dedicated training ships for giving on board training: Currently there are
approximately 4000 training slots available for those coming out of various pre-sea training
119
institutes in India. To achieve a market share of 9% in the next five years, the total training
berths is estimated to be 16000. In order to create the additional training berths it is
proposed to acquire dedicated training ships. Such a vessel, which can carry 400 trainees, is
estimated to cost approximately Rs. 125 Crore. It is proposed to acquire 4 such ships by
2015. The approximate total cost of the project is estimated to be Rs.500 Crore.
9.20.6 Project for Welfare of Seafarers: It is proposed to restructure Seamen Provident
Fund. Considering an average increase of 6000 seamen per year, the estimated financial
outgo for this project would be approximately 400 crores for the period, 2010 to 2020.
The fund requirements for improving, strengthening and starting new initiatives in
maritime transport covering training, welfare of seamen, restructuring of Director General
Shipping, infrastructure for seamen welfare, proposed All India Maritime Service and
development of information technology would entail a total cost of Rs 1425 Crore spread
over three phases Rs252 Crore in 2010-12, Rs978 Crore in 2012-17 and Rs195 Crore in
2018-20, in consonance with international practices are detailed below.
9.21 Coastal Shipping
9.21.1 India has over 7500 km long coastline. Yet coastal shipping in the country is still in
its infancy with the coastal fleet of about 700 ships accounting for just about a million GT
or 10% of the total Indian tonnage whereas 337 ships engaged in overseas trade account for
about 9 million GT. The average age of the coastal fleet is much higher compared to that of
the overseas fleet. In terms of composition too (Table 9 K ), coastal shipping is dominated
by Tugs followed by OSVs, port crafts etc; Coastal cargo accounts for about 133 million
tons or one –fifth of 611 million tones of exim cargo in 2009-2010. Clearly there is a case
for boosting the coastal trade in the country. Hence the need for a Coastal Shipping Policy.
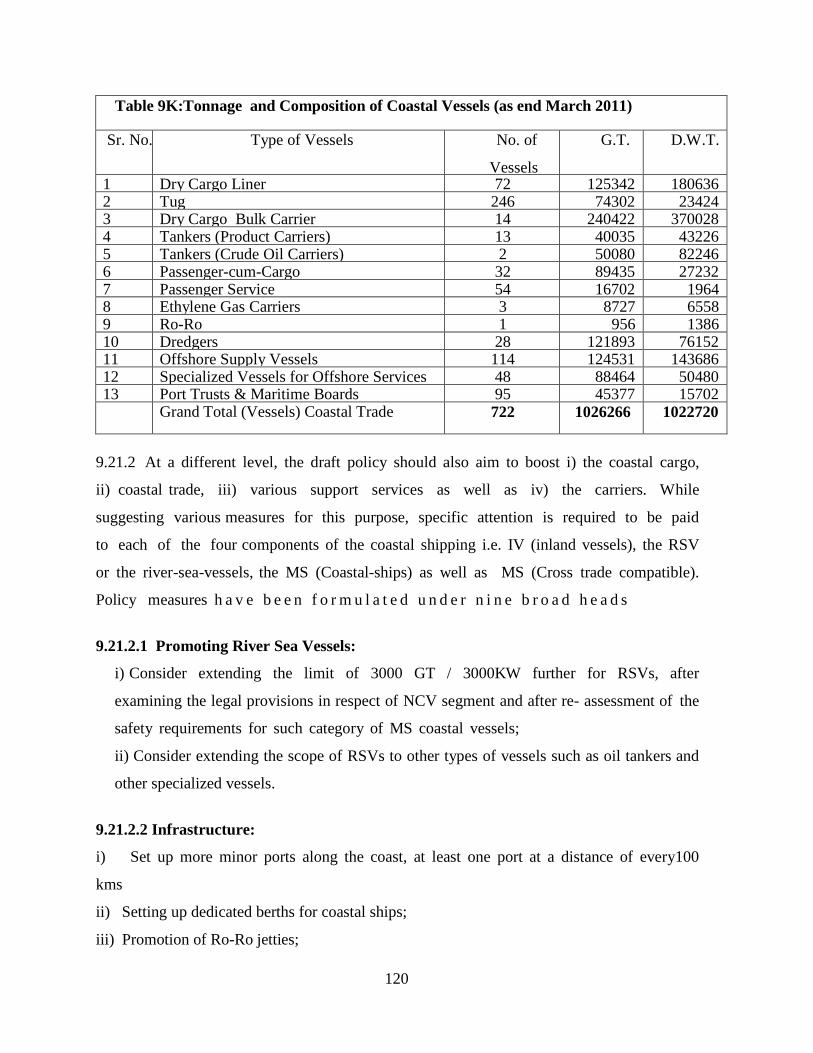
120
Table 9K:Tonnage and Composition of Coastal Vessels (as end March 2011)
Sr. No. Type of Vessels No. of
Vessels
G.T. D.W.T.
1 Dry Cargo Liner 72 125342 180636 2 Tug 246 74302 23424 3 Dry Cargo Bulk Carrier 14 240422 370028 4 Tankers (Product Carriers) 13 40035 43226 5 Tankers (Crude Oil Carriers) 2 50080 82246 6 Passenger-cum-Cargo 32 89435 27232 7 Passenger Service 54 16702 1964 8 Ethylene Gas Carriers 3 8727 6558 9 Ro-Ro 1 956 1386 10 Dredgers 28 121893 76152 11 Offshore Supply Vessels 114 124531 143686 12 Specialized Vessels for Offshore Services 48 88464 50480 13 Port Trusts & Maritime Boards 95 45377 15702
Grand Total (Vessels) Coastal Trade 722 1026266 1022720
9.21.2 At a different level, the draft policy should also aim to boost i) the coastal cargo,
ii) coastal trade, iii) various support services as well as iv) the carriers. While
suggesting various measures for this purpose, specific attention is required to be paid
to each of the four components of the coastal shipping i.e. IV (inland vessels), the RSV
or the river-sea-vessels, the MS (Coastal-ships) as well as MS (Cross trade compatible).
Policy measures h a v e b e e n f o r m u l a t e d u n d e r n i n e b r o a d h e a d s
9.21.2.1 Promoting River Sea Vessels:
i) Consider extending the limit of 3000 GT / 3000KW further for RSVs, after
examining the legal provisions in respect of NCV segment and after re- assessment of the
safety requirements for such category of MS coastal vessels;
ii) Consider extending the scope of RSVs to other types of vessels such as oil tankers and
other specialized vessels.
9.21.2.2 Infrastructure:
i) Set up more minor ports along the coast, at least one port at a distance of every100
kms
ii) Setting up dedicated berths for coastal ships;
iii) Promotion of Ro-Ro jetties;
121
iv) Promoting repairing jetties;
v) LNG supply facilities;
vi) Setup dedicated warehouses for coastal cargoes;
vii) Setup rail and road connectivity at the ports to the nearest rail heads;
viii) Set up adequate ship repair facility and dry-docks along the Indian coast for
catering to the growth of coastal shipping;
ix) Deepening of sea channels at minor ports;
9.21.2.3 Financial incentives including subsidies:
i) Remove the lower limit of 80 M on ship – building subsidy in the new scheme
proposed;
ii) Implement an aggressive ship-building subsidy policy with special focus on coastal
vessels, tugs, OSVs, etc;
iii) Include subsidy for LNG use facility both on retrofitting basis for existing ships and for
new ships;.
iv) SRU status to individual ships;
v) Subsidy for Ro-Ro jetties, repair jetties and a higher level of subsidy for a pair of
jetties dedicated to coastal shipping;
vi) Tariff for coastal ships to be cheaper than those vessels which are on foreign run;
vii) Delink port tariff for coastal vessels from FG vessels and reduce it further by 30%;
viii) Waive service tax on costal/inland sea-freight as well as charter-hire of
coastal/inland vessels;
ix) Establish a Coastal Development Fund for coastal ships. This fund may be used for an
interest subsidy scheme for acquisition of coastal ships;.
x) All Indian ships should be granted the status of SRU thereby reducing the cost of
maintenance for coastal vessels;
xi) Duty free bunkers to coastal vessels;
xii) Exemption of Customs Duty on import of certain categories of vessels (e.g. Tugs,
Pusher Crafts, Dredgers and Floating Docks/Cranes/ Production Platformsetc);
xiii) Reduction/waiver of wharfage for coastal cargo;
xiv) Coastal vessels should be treated as movable infrastructure and therefore granted such
122
status for the purpose of ensuring competitive funding and fiscal benefits;.
xv.) Introduce fiscal incentives for building & operating small ports (upto 5 m draft)
Dedicated for coastal vessels;
xvi) Confer “Declared Goods” status to bunkers being consumed by coastal/inland
vessels;
xvii) Introduce fiscal incentives, duty waivers and low-interest finance schemes for
adopting “green technology – LNG powered vessels, etc;.
xviii) Exemption on tax for ship construction
9.21.2.4 Manpower issues including manning scales:
i) Upgrading of IV crew to RSV crew through bridge courses;
ii) Permitting CoC (FG) holders of MS vessels to jump one level up in manning RSVs;
iii) Permitting foreign CoC holders working on Indian coastal ships for a specified
period before permitting them to appear for Indian CoC examinations’
iv) Establish a RSV cadre for officers-Master (RSV), Mate (RSV), 2nd Mate (RSV),
MEO CI III (RSV-Ch. Engg), MEO CI IV (RSV);
v) The courses & examinations for RSV cadre in order to source candidates from I.V. CoC
holders;
vi)Candidates with certificates from ITI’s should be allowed to work on coastal vessels with
certain bridge courses;
9.21.2.5 Cabotage Policy Support
i) Absolute cabotage for coastal trade other than transhipped EXIM containers,
including empty containers;
ii) Right to issue NOC to foreign flag vessels on coastal run to INSA;
iii) Increase the Right-of-First-Refusal price band to 25% above the lowest foreign-bid
(up from current 10%);
9.21.2.6 Declaration of IV limits for different states
i) Declaration of smooth and partially smooth water limits;
ii) All maritime states to notify model IV rules for construction and survey of IV
vessels for operating in smooth and partially smooth waters;
123
9.21.2.7 Promoting modal shift from road and rail to coastal shipping
i) Improve competitive ability of coastal ships and facilitate shifting of cargo from road and
rail to sea;
ii) A carbon credit scheme to be introduced with support from MoEF;
9.21.2.8 Data base and communication infrastructure
i) Establish & maintain a robust system/database for collection of accurate voyage specific
data on coastal shipping;
ii) Data on the quantum of coastal cargo at various ports;.
9.21.3 Policies to Support Coastal Shipping:
9.21.3.1 Cabotage Law: In India, the Merchant Shipping Act bars foreign bottoms from
carrying cargo between Indian ports; exceptions are made if no suitable Indian vessel is
available. There is a view that in India cabotage restrictions discourage the growth of
coastal shipping insofar as Indian tonnage is not adequate, and Indian industry is not
aggressive enough, to increase the share of coastal shipping. It is also argued that
international competition would bring about greater efficiency. A counter-argument is that
relaxing cabotage laws will tilt the scales against Indian shipping. Ships with foreign
flags are not bound by restrictive manning norms, including minimum remuneration,
and usually operate under favorable foreign taxation rules and subsidies. However, if
the primary objective is to increase coastal shipping and make coastal tonnage competitive it
might be desirable to allow foreign vessels to compete for coastal cargo. Cabotage laws
can any time be reintroduced when there is sustained growth in coastal cargo.There is also
a view that cabotage on carriage of empty and / or transshipment containers should be
partially relaxed with certain conditions. This partial relaxation may facilitate the efficient
movement of containers as well as ease the congestion at ports and port storage. Presently
empty / transshipment containers on the Indian coast are carried by Indian vessels only. If
main line foreign shipping companies are allowed to carry their own empty and laden
containers, these vessels will be able to use their empty slots more effectively and this will
boost the container traffic on the Indian coast.
124
9.21.3.2 Ship Acquisition: One reason why coastal tonnage has been stagnant, , apart from
the low profitability of coastal shipping, is the difficulty in getting finance at low interest
rates. Although coastal ships are entitled to external commercial borrowing, they cannot
effectively do so as they do not earn in foreign exchange. With the winding up of the
Shipping Development Fund Committee and Shipping Credit and Investment Corporation
of India Ltd, companies have to rely on traditional bank funding. These banks are not
equipped to deal with the financing of ships; this also involves high interest rates and short
maturity. There is, therefore, a case for developing specialized wings in development
financial institutions to fund coastal shipping.
9.21.3.3 Import Duties: Coastal ships, unlike oceangoing vessels, have to pay duties on
bunker oil. Bunker fuel oil and high flash high speed diesel for a coastal vessel is
estimated to cost higher compared to an oceangoing vessel. Given the fact that coastal
shipping is both fuel efficient and environmental friendly,there is a case for providing tax
concessions both for fuels and spares.
9.21.3.4 Manning Scales & Cost of Vessels: There is a case for reviewing both manning
scales and qualifications. A study by the Tata Energy Resources Institute (TERI) in 2003
indicated that because of manning scales, taxes, and other benefits, staff cost on Indian
oceangoing vessels was higher than on foreign vessels. Wages still constitute a substantial
portion of the cost of operation of vessels. Qualified officers prefer to work on
oceangoing vessels. Considering that coastal vessels do not have to conform to the different
conservancy and safety requirements in different foreign ports and face the hazards of the
high seas, there is a strong case for revisiting the issue of safety. Coastal vessels are
constructed to specifications of oceangoing vessels even though they are not subject to the
same stress and turbulence. This needlessly increases their capital costs. There is a need to
suitably amend the Merchant Shipping Act or enact separate legislation for coastal shipping
to provide different specifications and lower manning scales.
9.21.3.5 Taxation: Tonnage Tax was introduced in the Budget for 2004-05. Shipping
companies with oceangoing vessels have the option of choosing between corporate tax and
tonnage tax, but not coastal shipping companies. Tonnage tax should also be extended to
125
coastal fleet. Personal Income Tax: Indian seafarers employed on foreign vessels or
Indian vessels which ply outside Indian territorial waters for more than 183 days in a year
are entitled to non resident status and pay no taxes. This does not apply to officers and
seafarers on coastal ships.
9.22 Addressing the issue of Manning
9.22.1 The industry’s complaint about the need for a restricting of the regulatory regime
stemmed mainly from the issue of manning. Indian ships have to mandatorily employ Indian
seafarers, and do not have the dispensation to hire foreign seafarers. In view of the increasing
worldwide shortage of ship’s senior officers, there is inherent disadvantage to the Indian ship
owners as employers. By virtue of extra burden of income tax on Indian seafarers’ income, it
makes the employment on a foreign flag the first choice of any Indian seafarer, and thereby
denies the best talent to the local shipping industry. It will be necessary to take a positive
approach on this issue and grant freedom to the Indian shipping industry by permitting them
to employ foreign seafarers. It must be borne in mind that Indian seafarers on their part enjoy
freedom to seek employment on foreign ships and not be bound by any duty to serve Indian
ships. This position is neither comparable with domestic industry (such as aviation) nor the
competing global industry in the backdrop of tight manpower supplies. Data shows that
while other countries did have similar restrictions place, e.g. Norway, which is largely
dependent on employment foreign seafarers in this sector, they have successfully allowed
relaxation so that only a percentage of the manning complement is mandatorily domestic
now.
9.23 Key Recommendations-Shipping
9.23.1 Cargo support on EXIM trade
9.23.1.1 The shipping industry has been reiterating that EXIM cargoes moved on account of
the government should be transported on Indian flag vessels whenever Indian flag vessels are
available through the policy of FOB purchase (import) and CIF sale (Export) and the right of
first refusal (ROFR) to Indian flag vessels with a view to exercising shipping control over
Indian cargo. Chartering wing of the shipping ministry (Transchart) needs to continue to
make the shipping arrangements for all the government cargoes. Allowing oil companies the
freedom to make their own shipping arrangements since 2005 has resulted in multiplicity of
126
agencies handling government cargo and needs a review to bring all government cargoes
under a single umbrella. This change of the policy has neither resulted in reducing the cost of
shipping nor in any increase in Indian participation. The shipping industry has also urged the
government to encourage greater involvement of Indian vessels in EXIM trade and a cargo
reservation policy to ensure that all essential cargoes like crude oil, petroleum products, and
gas are carried by Indian flagged vessels.
9.23.1.2 According to the Oil companies, which charter vessels for transport of crude oil to
Indian ports, there have been considerable financial savings after the Government allowed
PSU oil companies for direct chartering of ships in 2005, instead of going through Transchart.
Hence the proposal by shipping industry association for the reversal of this policy to pre-2005
arrangement, i.e., chartering through Transchart, is a step backward and hence not acceptable
to them.
9.23.1.3 After careful consideration of the views of Indian ship owners as well as Indian
charterers, it is recommended that 1/3rd portion of the POL and dry bulk cargoes of EXIM
trade of India, should be reserved for Indian Ships, and should be linked as condition
for availing benefits under the export schemes of the Government of India. This will
assure cargo availability for Indian ships, and act as a catalyst to boost the growth of
Indian fleet.
9.23.2 “Deemed Export Status” for Shipping
9.23.2.1 Indian shipping companies are exporting maritime transportation services to
consumers out of India and are earning valuable foreign exchange as freight. It would
therefore be just and sufficient to accord “deemed export status” to Indian shipping
services and encourage the maritime transport service providers in building international
competitiveness. Consequently, all inputs in terms of machinery, stores, spares and other
related equipments used for the purposes of effectively operating an Indian flag vessel
providing such an International maritime transportation service should qualify for a
similar deemed export status and consequently be made free of local duties and taxes. It is
therefore proposed that the DGFT policy circular be suitably modified to grant deemed
export status to “maritime transportation services” provided by Indian shipping companies
127
from India.
9.23.3 Service Tax
9.23.3.1 Exporters presently get refund of service tax paid by them on input services used
for exports. Presently refund of service tax paid by exporters i s g i v e n o n on four
taxable services (services offered to exporters by major ports, minor ports, road transport
services provided by goods transport agency from inland container depot (ICD) to port of
export and transport of export of goods in containers by rail from ICD to port of export)
would now qualify for service tax refund. In many of the maritime countries the shipping
industry is not subject to service tax either domestically or internationally. In the
European Union, United Kingdom, Ireland, Singapore and Australia, the services
availed of by shipping companies are either exempt from service tax or zero rated. The
ambit service tax exemption needs to be expanded to cover all marine services
rendered in India and utilized by exporters. This would need list of such services on
a verifiable basis to evaluate linkage o f s e r v i c e s w i t h g o o d s exported. Such
s h i p p i n g /marine services w h i c h facilitate exports and generate foreign exchange
earnings could be exempted or zero rated. This will make such services price
competitive.
9.23.4 Seafarer’s Taxation-Unequal treatment
9.23.4.1 Indian seafarers employed on foreign vessels or Indian vessels which ply
outside Indian territorial waters for182 days or more in a year are entitled to non resident
status and pay no taxes. This does not apply to officers and seafarers on coastal ships.
Also Indian and foreign seafarers working in Indian territorial waters for 182 days or more
are effectively Indian tax residents and are liable to pay tax on income. It may be noted that
certain countries in Asia (Malaysia, Phillipines, Singapore, and Thailand) have exempted
income of their seafarers from personal taxation. In some European countries, ship-owners
are given the right to withhold a certain percentage of personal income tax and social
security payment of seafarers as an incentive to hire European seafarers by offsetting part
of the high wage level in their country. Labour is a factor of production and seafarers
income could be subject to a lower fixed/ flat rate of tax which could be levied on all Indian
seafarers irrespective of their residential status (i.e. place of work within or outside Indian
128
territorial waters) and/or flag of ship they work for or; a higher exemption up to a certain
level of income could be given for tax purposes. Such a tax will reduce the attraction of
foreign flag and may also help coastal shipping which find it difficult to engage and retain
Indian seafarers under the existing manning laws.
9.23.5 Rationalizing the Fiscal Regime
9.23.5.1 In terms of a strategy reformulation, a rationalization of the fiscal regime towards
more openness and greater efficiencies in operation, is the most important and most urgent.
Indian shipping, as against its foreign counterparts, is currently subjected to a variety of taxes
numbering about 12 , some of them introduced in the year after relief was given through the
tonnage tax, which affect the profitability of Shipping companies vis-a-vis fleets under
foreign flags. Thus there is a strong case for rationalization of the taxation regime for the
Indian shipping industry so as to bring down the effective tax rate to the rate payable by the
industry when tonnage tax was fixed, at a level that will enable shipping companies to
compete globally on a level playing field and also enable them to raise funds for acquisition
of further tonnage.
9.23.5.2 Tonnage tax itself needs to be re-examined as to how it can be made attractive to
new investors, so as to widen the base of the shipping industry in the country. At present,
there are only 46 companies who have subscribed to the tonnage tax regime.. Changes in
tonnage tax, e.g. to permit in-charters to avail of tonnage tax with only minimal limits should
encourage companies to consider diversifying into this sector. In this regard, it may also be
noted that the attempt to add to tonnage via a Bare Boat Charter-cum-Demise (BBCD) policy
has not been very successful. Here again, a less guarded and more open approach to
augmenting the ownership base of the tonnage under the national register is required.
9.24 Recommendations for Promoting Coastal Shipping
9.24.1 Infrastructure : (a) Set up minor ports along the coast, at least one port at a distance
of every 100 kms; (b) set up dedicated berths for coastal ships; (c) promote RO-RO jetties
and repairing jetties; (d) set up LNG supply facilities; (e) set up dedicated warehouses for
coastal cargoes; (f) provide rail and road connectivity at the ports to the nearest rail heads; (g)
set up adequate ship repair facility at dry docks and (h) deepening of sea channels at minor
129
ports.
9.24.2 Subsidies: Implement an aggressive shipbuilding subsidy with focus on coastal
vessels, tugs, OSVs etc. In addition, following measures may be undertaken : (a) remove the
lower limit of 80 metre on ship building; (b) include subsidy for LNG use facility both on
retrofitting basis for existing ships and new ships and (c) subsidy for RO-RO jetties, repair
jetties and a higher level of subsidy for a pair of jetties dedicated to coastal shipping.
9.24.3 Indirect Tax Taxes/Exemption
9.24.3.1 As regards the Service tax issues, it may be stated that in the Union Finance Act,
2011, the Union Finance Minister had proposed an abatement of 25% from Service Tax for
coastal transportation. However, availing this abatement would prevent service providers
from claiming any input credit of taxes. Hence this abatement, from taxable value of freight
should be increased from its present level of 25% to at-least 70% - 75%, which is at par with
transportation of goods by roads and railways along with the waiver of restriction on availing
of input credit. The CBEC has commented that it is a fundamental principle of the GST
regime that a tax base should be wider, exemptions be minimal and tax rates easy to comply
with.
9.24.3.2 One possible solution to reduce the net tax incidence burden on coastal shipping is
to provide "Declared Goods" status for coastal bunkers. Section 2(c) of the Central Sales Tax
[CST} Act defines 'Declared Goods' as those declared under section 14 of the CST Act as
goods of special importance in inter-state trade or commerce. Declared goods are goods of
special importance on which there are certain restrictions placed under the CST Act, 1956, on
an imposition of Sales Tax or VAT by the states. Article 286(3)(a) of the Constitution of
India authorises the Parliament (from the year 1982) to declare some goods as being of
special importance and to impose restrictions & conditions in regard to the power of the states
to levy, rates and other incidence of tax on such goods. Exercising this power, the Parliament,
vide section 14 ibid has declared some goods as of special importance and has placed
restrictions under section 15 supra on the imposition of Sales Tax or VAT on such goods by
the State Govts.
130
9.24.3.3 Some goods like cereals, coal & coke, cotton, crude oil, sugar, textiles, jute, iron
and steel, tobacco products, oil seeds, pulses & LPG etc. have been declared as goods of
special importance. These are termed as 'declared goods'. Simply put, State Governments can
not levy Sales Tax on these goods exceeding 4%. If declared goods are sold inter-state, tax
paid within the state is reimbursed to the seller. Further, the said goods should be sold in
inter-state transactions in the same form. Bunker fuel is used by Indian coastal vessels and
their costs represent a large chunk of the overall operational costs. In view of the need to
encourage the usage of environmentally mode of transport, providing a declared goods status
to bunkers used by Indian flag ships will increase the competitive abilities and strengthen
comparative advantages of coastal shipping.
9.24.3.4 Section 14 of the CST Act, 1956, gives the list of 'goods of special importance'
called 'Declared Goods'. Item ii-d of the said list specifies that 'Aviation turbine fuel' is a
'declared good' under section 14 of the CST Act. Coastal bunkers used by Indian flag vessels
should, similar to 'Aviation Turbine Fuel', be granted 'declared goods' status under section 14
ibid.
9.24.4 Fiscal Incentives: (a) coastal vessels should be treated as movable infrastructure and
therefore, be accorded “infrastructure status” for the purpose of ensuring competitive funding;
(b) introduce fiscal incentives for building and operating small ports (upto 5 metre draft)
dedicated for coastal vessels.
9.22.5 Tariffs: ensure tariffs for coastal vessels are lower than for foreign going vessels.
Further delink port tariff for coastal vessels from foreign going vessels.
9.24.6 Manpower and Manning Scales : (a) upgrade IV crew to RSV crew through bridge
courses ;(b) permit foreign COC holders working on Indian Coastal Ships for a specified
period before permitting them to appear for COC examination; (c) candidates with certificates
from ITI’s be allowed to work on coastal vessels with certain bridge courses.
9.24.7 Cabotage Policy: (a) The shipping industry has been urging the government on the
need for absolute cabotage for coastal cargo as the Indian fleet is more than adequate to meet
the coastal shipping demands in the areas of crude & petroleum products, gas transportation,
131
offshore fleet in terms of PSVs and AHTSs, Construction Support vessels and container
vessels. In such sectors the shipping industry has urged the government that absolute
cabotage be implemented with appropriate amendments to the chartering guidelines in order
to support the growth of the Indian national flag tonnage. Venkiteswaran committee on
chartering guidelines and cabotage should be considered for implementation at the earliest.
(b) right to issue NOC to foreign flag vessels on coastal run to INSA; (c) enhance the Right
of First Refusal Price band to 25% above the lowest foreign bid (up from 10%).
9.24.8 Carbon Credit Scheme: currently user industry gets the carbon credit to the
exclusion of coastal vessels. There is need to put in place a mechanism to provide carbon
credits to coastal shipping providers equivalent to carbon credits availed by the user.
9.24.9 Financing of Coastal Ship Acquisition: need to encourage/promote specialized
window in financial institutional to fund acquisition of coastal vessels.
9.24.10 Separate legislation for Coastal vessels: Coastal vessels are constructed to
specifications of oceangoing vessels even though they are not subject to the same stress and
turbulence. This needlessly increases their capital costs. There is a need to suitably amend
the Merchant Shipping Act or enact separate legislation for coastal shipping to provide
different specifications and lower manning scales.
132
Chapter 10: Inland Water Transport
10.1 Background & Objective
10.1.1 In several developed countries Inland Water Transport (IWT) has long been
recognized as a viable mode of transport with many advantages over other modes namely
road and railways, especially for bulk goods, over dimensional cargo and hazardous goods. It
is considered to be the most environment friendly mode with its excellent fuel efficiency and
lower emission levels. IWT has also the potential to serve as an important economic lifeline
for the integral socio- economic development of the region adjoining the waterway network.
It provides high capacity transport corridors, largely untapped, at least in India. Under
utilization of IWT mode is a great opportunity loss for the country.
10.1.2 Till the first half of 20th century, IWT was an important mode and played significant
role in trade and commerce along several rivers and canals. Growth of roads and railways
coupled with total neglect of development of IWT infrastructure, however, made this mode
virtually insignificant during the later years of 20th century. Since Independence, until 1986
no organization at Central Govt level effectively addressed issues related to this sector despite
several committees recommended proactive actions for development of this mode.
10.2 Current Status of IWT in India
10.2.1 National Waterways: IWAI was formed in October 1986 by an Act of Parliament
with a mandate to develop and regulate inland waterways in the country for shipping and
navigation and matters related to it. Three integral components of IWT infrastructure are (1)
fairway and navigation infrastructure (2) Terminals and network connectivity to main land
transport and (3) Barges/ vessels suitable to the fairway and cargo available. As of now there
are five National Waterways (NW) namely the River Ganga (NW-1), River Brahmaputra
(NW-2), West Coast Canal (NW-3), Kakinada to Puducherry Canal system along with River
Godavari & River Krishna (NW-4); and the Brahmani and Mahanadi delta along with East
Coast Canal (NW-5). River Barak is likely to be declared as the sixth NW. Development and
regulation of NWs is in the purview of the Central Government while rest of the waterways
come in the domain of the respective State Governments.
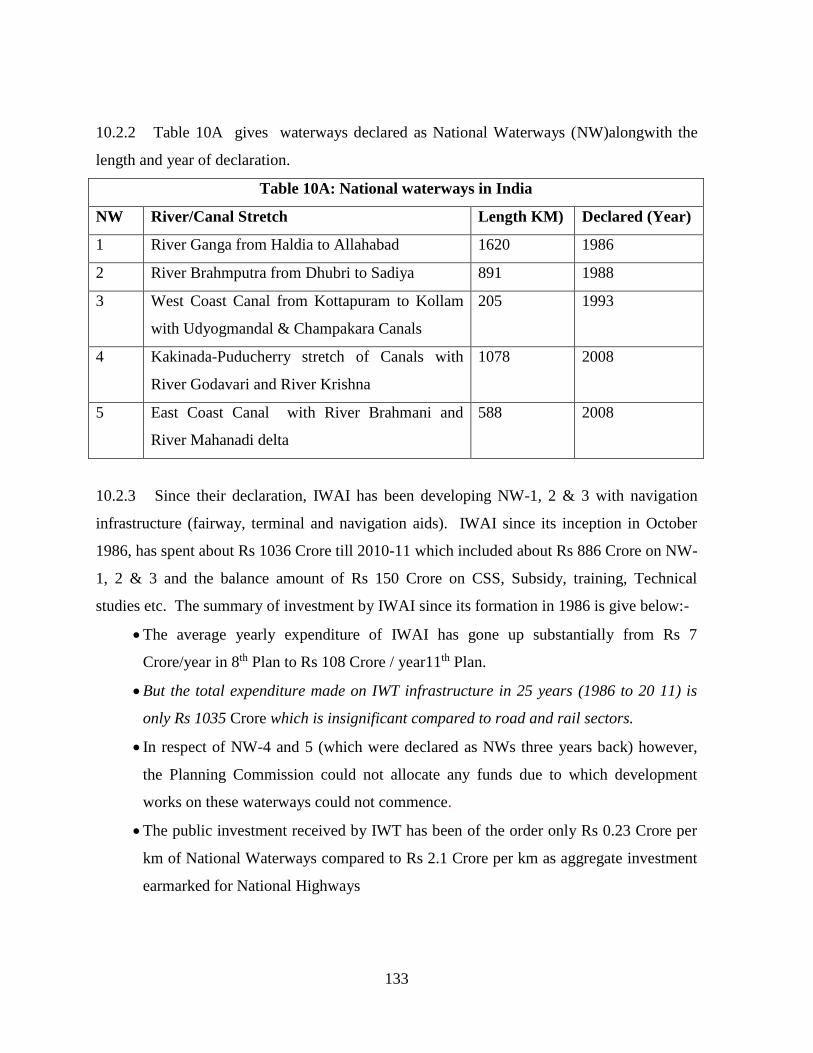
133
10.2.2 Table 10A gives waterways declared as National Waterways (NW)alongwith the
length and year of declaration.
Table 10A: National waterways in India
NW River/Canal Stretch Length KM) Declared (Year)
1 River Ganga from Haldia to Allahabad 1620 1986
2 River Brahmputra from Dhubri to Sadiya 891 1988
3 West Coast Canal from Kottapuram to Kollam
with Udyogmandal & Champakara Canals
205 1993
4 Kakinada-Puducherry stretch of Canals with
River Godavari and River Krishna
1078 2008
5 East Coast Canal with River Brahmani and
River Mahanadi delta
588 2008
10.2.3 Since their declaration, IWAI has been developing NW-1, 2 & 3 with navigation
infrastructure (fairway, terminal and navigation aids). IWAI since its inception in October
1986, has spent about Rs 1036 Crore till 2010-11 which included about Rs 886 Crore on NW-
1, 2 & 3 and the balance amount of Rs 150 Crore on CSS, Subsidy, training, Technical
studies etc. The summary of investment by IWAI since its formation in 1986 is give below:-
The average yearly expenditure of IWAI has gone up substantially from Rs 7
Crore/year in 8th Plan to Rs 108 Crore / year11th Plan.
But the total expenditure made on IWT infrastructure in 25 years (1986 to 20 11) is
only Rs 1035 Crore which is insignificant compared to road and rail sectors.
In respect of NW-4 and 5 (which were declared as NWs three years back) however,
the Planning Commission could not allocate any funds due to which development
works on these waterways could not commence.
The public investment received by IWT has been of the order only Rs 0.23 Crore per
km of National Waterways compared to Rs 2.1 Crore per km as aggregate investment
earmarked for National Highways
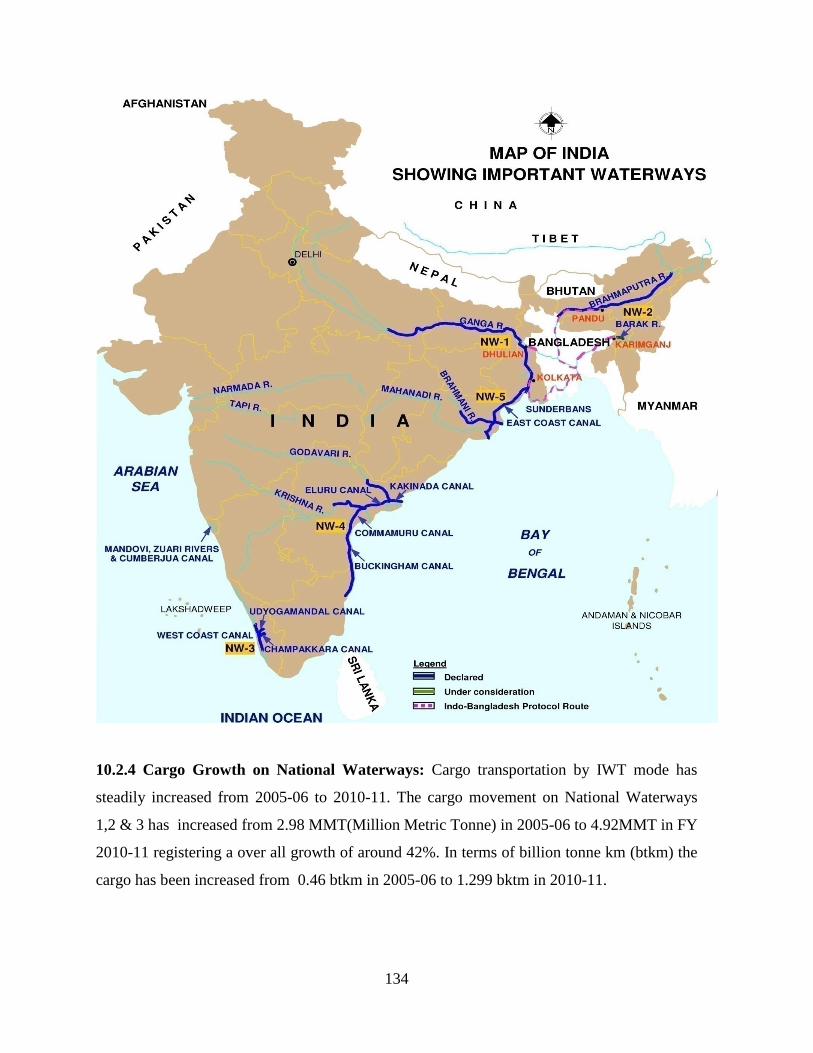
134
10.2.4 Cargo Growth on National Waterways: Cargo transportation by IWT mode has
steadily increased from 2005-06 to 2010-11. The cargo movement on National Waterways
1,2 & 3 has increased from 2.98 MMT(Million Metric Tonne) in 2005-06 to 4.92MMT in FY
2010-11 registering a over all growth of around 42%. In terms of billion tonne km (btkm) the
cargo has been increased from 0.46 btkm in 2005-06 to 1.299 bktm in 2010-11.
135
10.2.5 Other Waterways: Besides National Waterways, several other waterways are
extensively used for IWT; this prominently includes Goa Waterways for transportation of
iron ore for export purpose and Mumbai Waterways for coal, steel etc. Goa Waterways
comprise 50 KM stretch each of river Mandovi and Zuari and 20 Km stretch of Cambarjua
canal. These waterways provide connectivity to Marmugao Port and Panaji Port and carry 50
MMT of iron ore for exports. The cargo movement on goa Waterways increased from 36.27
MMT in 2005-06 to 54.5MMT in FY 2010-11 registering a over all growth of around 50%. In
terms of btkm cargo movement has increased from 1.761 btkm in 2005-06 to 2.725 btkm in
2010-11. Mumbai Waterways carried more than 10 MMT cargo per year mainly comprising
coal and steel is transported on tidal inland waterways of Mumbai (River Amba, River Ulhas,
Dharamtar creek etc). The cargo on Mumbai waterways showed increasing trend from
111.62 MMT in the FY 2005-06 to 1410.75 MMT in FY 2010-11, thus registering a strong
grwoth of over 33% .In terms of btkm cargo movement has increased from 0.603 btkm in
2005-06 to 0.803 btkm in 2010-11.
10.3 Indo-Bangladesh Protocol on IWT
10.3.1 An Inland Water Transit and Trade Protocol exist between India and Bangladesh
under which inland vessels of one country can transit through the specified routes of the other
country. The existing protocol routes are: (i)Kolkata-Silghat -Kolkata ; (ii)Kolkata-
Karimganj-Kolkata; (iii)Rajshahi-Dhulian-Rajshahi and;(iv) Silghat-Karimganj- Silghat. This
protocol also allows trade between the two countries through IWT mode. For inter-country
trade, five ports of call have been designated in each country. More than 1.5 MMT of fly ash
is transported between Kolkata/Haldia and Bangladesh every year under this Protocol.
Recently more than 90 consignments of project materials for Palatana power plant of ONGC,
being constructed near Agartala in Tripura, have been transported from Kolkata/ Haldia
through Protocol route up to Ashuganj in Bangladesh and thereafter by road to Palatana
which is only 40 km from Ashuganj.
10.4 Potential of National Waterways and IWT
10.4.1 Cargo Potential on National Waterway1
10.4.1.1 The waterway is known to be most economical mode of transportation especially
for bulk cargo like coal, iron ore, cement, food grains, fertilizer etc. Commodities wise
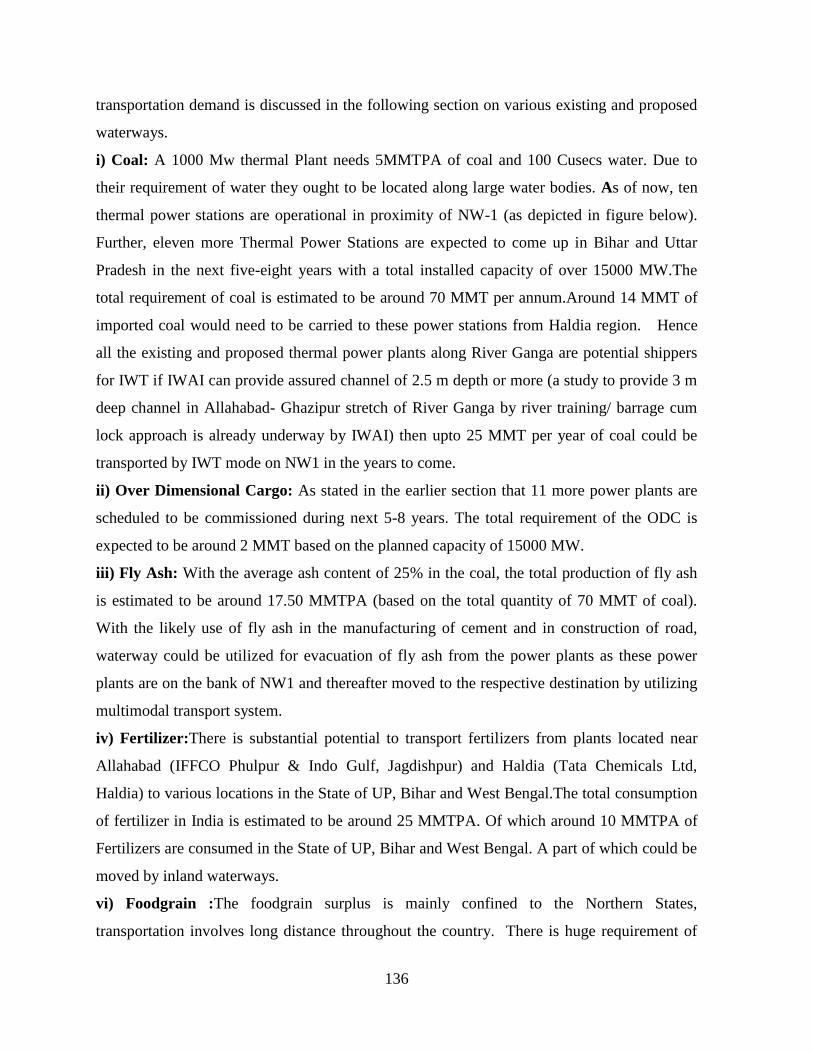
136
transportation demand is discussed in the following section on various existing and proposed
waterways.
i) Coal: A 1000 Mw thermal Plant needs 5MMTPA of coal and 100 Cusecs water. Due to
their requirement of water they ought to be located along large water bodies. As of now, ten
thermal power stations are operational in proximity of NW-1 (as depicted in figure below).
Further, eleven more Thermal Power Stations are expected to come up in Bihar and Uttar
Pradesh in the next five-eight years with a total installed capacity of over 15000 MW.The
total requirement of coal is estimated to be around 70 MMT per annum.Around 14 MMT of
imported coal would need to be carried to these power stations from Haldia region. Hence
all the existing and proposed thermal power plants along River Ganga are potential shippers
for IWT if IWAI can provide assured channel of 2.5 m depth or more (a study to provide 3 m
deep channel in Allahabad- Ghazipur stretch of River Ganga by river training/ barrage cum
lock approach is already underway by IWAI) then upto 25 MMT per year of coal could be
transported by IWT mode on NW1 in the years to come.
ii) Over Dimensional Cargo: As stated in the earlier section that 11 more power plants are
scheduled to be commissioned during next 5-8 years. The total requirement of the ODC is
expected to be around 2 MMT based on the planned capacity of 15000 MW.
iii) Fly Ash: With the average ash content of 25% in the coal, the total production of fly ash
is estimated to be around 17.50 MMTPA (based on the total quantity of 70 MMT of coal).
With the likely use of fly ash in the manufacturing of cement and in construction of road,
waterway could be utilized for evacuation of fly ash from the power plants as these power
plants are on the bank of NW1 and thereafter moved to the respective destination by utilizing
multimodal transport system.
iv) Fertilizer:There is substantial potential to transport fertilizers from plants located near
Allahabad (IFFCO Phulpur & Indo Gulf, Jagdishpur) and Haldia (Tata Chemicals Ltd,
Haldia) to various locations in the State of UP, Bihar and West Bengal.The total consumption
of fertilizer in India is estimated to be around 25 MMTPA. Of which around 10 MMTPA of
Fertilizers are consumed in the State of UP, Bihar and West Bengal. A part of which could be
moved by inland waterways.
vi) Foodgrain :The foodgrain surplus is mainly confined to the Northern States,
transportation involves long distance throughout the country. There is huge requirement of
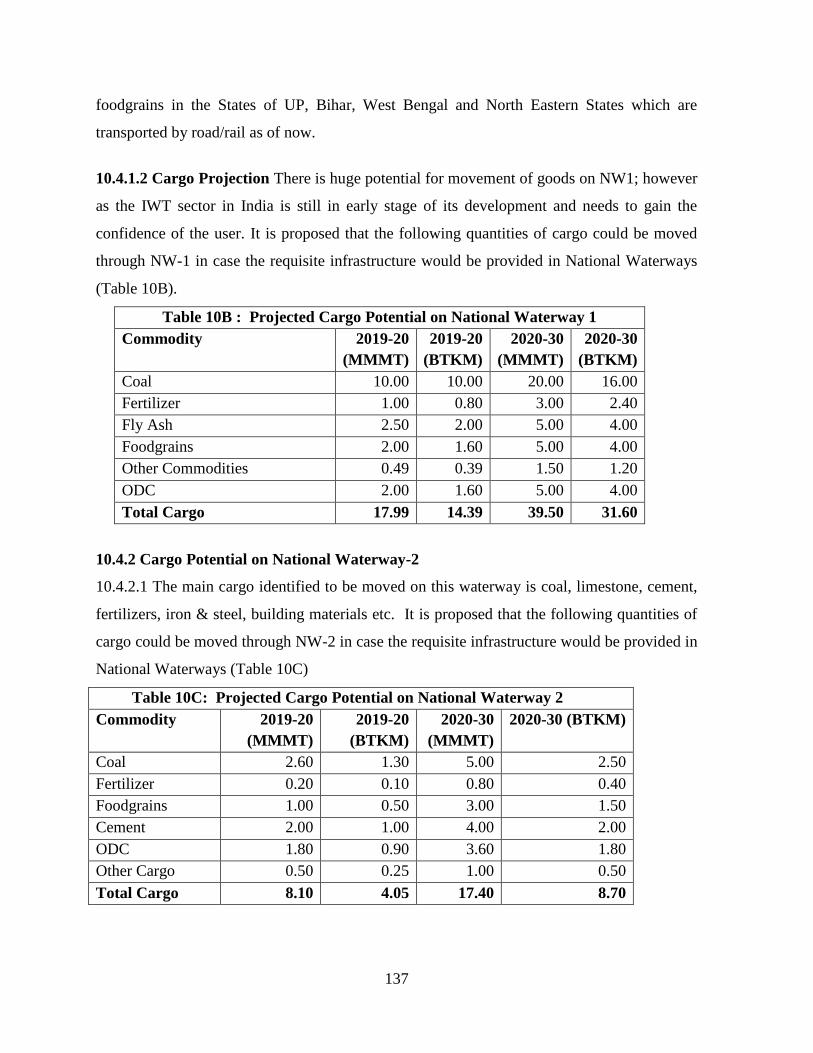
137
foodgrains in the States of UP, Bihar, West Bengal and North Eastern States which are
transported by road/rail as of now.
10.4.1.2 Cargo Projection There is huge potential for movement of goods on NW1; however
as the IWT sector in India is still in early stage of its development and needs to gain the
confidence of the user. It is proposed that the following quantities of cargo could be moved
through NW-1 in case the requisite infrastructure would be provided in National Waterways
(Table 10B).
Table 10B : Projected Cargo Potential on National Waterway 1
Commodity 2019-20
(MMMT)
2019-20
(BTKM)
2020-30
(MMMT)
2020-30
(BTKM)
Coal 10.00 10.00 20.00 16.00
Fertilizer 1.00 0.80 3.00 2.40
Fly Ash 2.50 2.00 5.00 4.00
Foodgrains 2.00 1.60 5.00 4.00
Other Commodities 0.49 0.39 1.50 1.20
ODC 2.00 1.60 5.00 4.00
Total Cargo 17.99 14.39 39.50 31.60
10.4.2 Cargo Potential on National Waterway-2
10.4.2.1 The main cargo identified to be moved on this waterway is coal, limestone, cement,
fertilizers, iron & steel, building materials etc. It is proposed that the following quantities of
cargo could be moved through NW-2 in case the requisite infrastructure would be provided in
National Waterways (Table 10C)
Table 10C: Projected Cargo Potential on National Waterway 2
Commodity 2019-20
(MMMT)
2019-20
(BTKM)
2020-30
(MMMT)
2020-30 (BTKM)
Coal 2.60 1.30 5.00 2.50
Fertilizer 0.20 0.10 0.80 0.40
Foodgrains 1.00 0.50 3.00 1.50
Cement 2.00 1.00 4.00 2.00
ODC 1.80 0.90 3.60 1.80
Other Cargo 0.50 0.25 1.00 0.50
Total Cargo 8.10 4.05 17.40 8.70
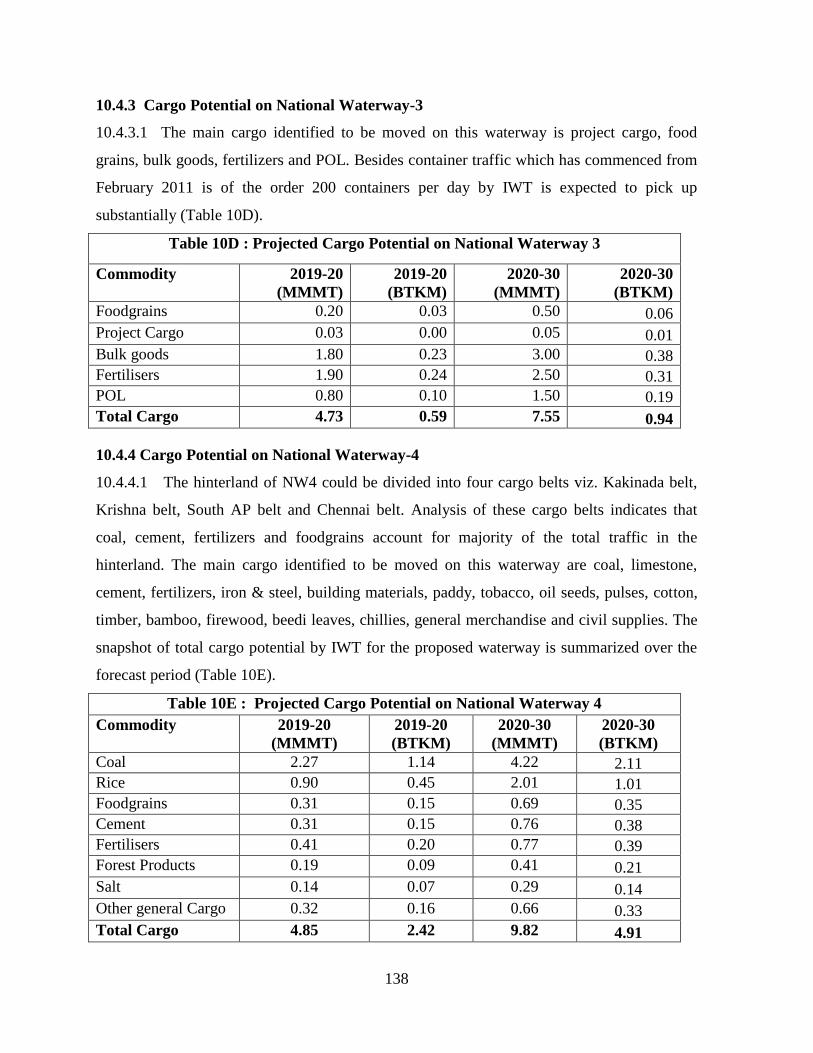
138
10.4.3 Cargo Potential on National Waterway-3
10.4.3.1 The main cargo identified to be moved on this waterway is project cargo, food
grains, bulk goods, fertilizers and POL. Besides container traffic which has commenced from
February 2011 is of the order 200 containers per day by IWT is expected to pick up
substantially (Table 10D).
Table 10D : Projected Cargo Potential on National Waterway 3
Commodity 2019-20
(MMMT)
2019-20
(BTKM)
2020-30
(MMMT)
2020-30
(BTKM)
Foodgrains 0.20 0.03 0.50 0.06
Project Cargo 0.03 0.00 0.05 0.01
Bulk goods 1.80 0.23 3.00 0.38
Fertilisers 1.90 0.24 2.50 0.31
POL 0.80 0.10 1.50 0.19
Total Cargo 4.73 0.59 7.55 0.94
10.4.4 Cargo Potential on National Waterway-4
10.4.4.1 The hinterland of NW4 could be divided into four cargo belts viz. Kakinada belt,
Krishna belt, South AP belt and Chennai belt. Analysis of these cargo belts indicates that
coal, cement, fertilizers and foodgrains account for majority of the total traffic in the
hinterland. The main cargo identified to be moved on this waterway are coal, limestone,
cement, fertilizers, iron & steel, building materials, paddy, tobacco, oil seeds, pulses, cotton,
timber, bamboo, firewood, beedi leaves, chillies, general merchandise and civil supplies. The
snapshot of total cargo potential by IWT for the proposed waterway is summarized over the
forecast period (Table 10E).
Table 10E : Projected Cargo Potential on National Waterway 4
Commodity 2019-20
(MMMT)
2019-20
(BTKM)
2020-30
(MMMT)
2020-30
(BTKM)
Coal 2.27 1.14 4.22 2.11
Rice 0.90 0.45 2.01 1.01
Foodgrains 0.31 0.15 0.69 0.35
Cement 0.31 0.15 0.76 0.38
Fertilisers 0.41 0.20 0.77 0.39
Forest Products 0.19 0.09 0.41 0.21
Salt 0.14 0.07 0.29 0.14
Other general Cargo 0.32 0.16 0.66 0.33
Total Cargo 4.85 2.42 9.82 4.91
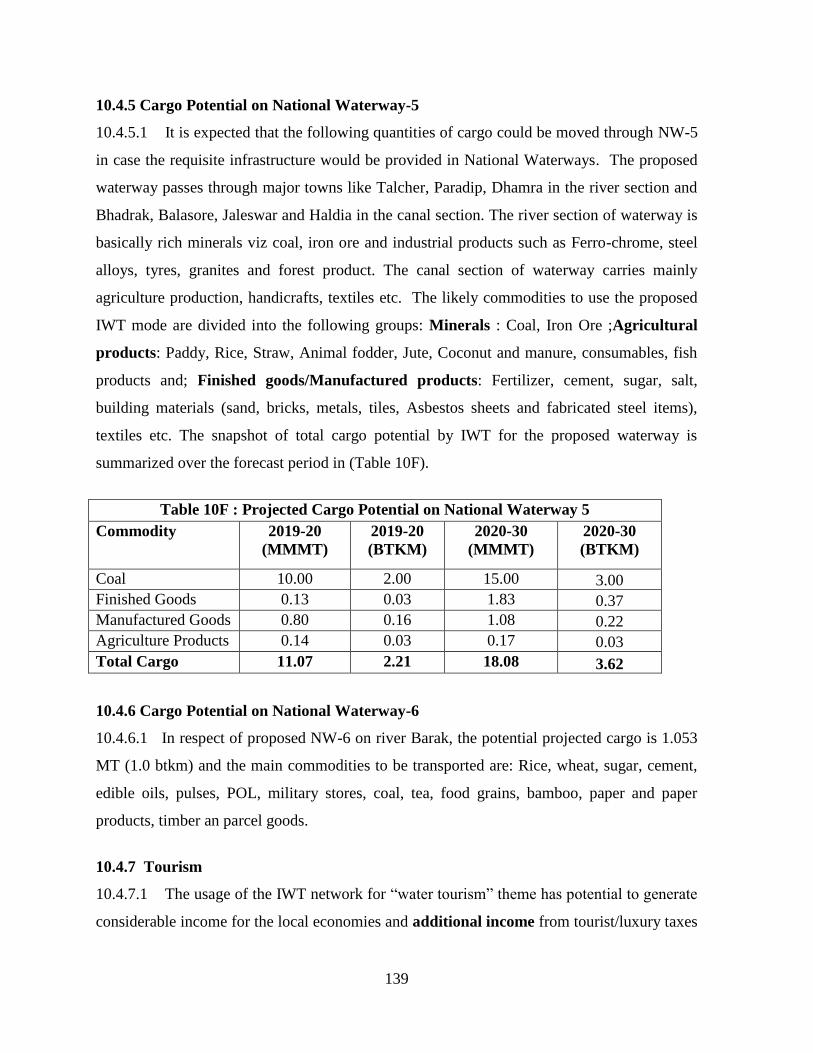
139
10.4.5 Cargo Potential on National Waterway-5
10.4.5.1 It is expected that the following quantities of cargo could be moved through NW-5
in case the requisite infrastructure would be provided in National Waterways. The proposed
waterway passes through major towns like Talcher, Paradip, Dhamra in the river section and
Bhadrak, Balasore, Jaleswar and Haldia in the canal section. The river section of waterway is
basically rich minerals viz coal, iron ore and industrial products such as Ferro-chrome, steel
alloys, tyres, granites and forest product. The canal section of waterway carries mainly
agriculture production, handicrafts, textiles etc. The likely commodities to use the proposed
IWT mode are divided into the following groups: Minerals : Coal, Iron Ore ;Agricultural
products: Paddy, Rice, Straw, Animal fodder, Jute, Coconut and manure, consumables, fish
products and; Finished goods/Manufactured products: Fertilizer, cement, sugar, salt,
building materials (sand, bricks, metals, tiles, Asbestos sheets and fabricated steel items),
textiles etc. The snapshot of total cargo potential by IWT for the proposed waterway is
summarized over the forecast period in (Table 10F).
Table 10F : Projected Cargo Potential on National Waterway 5
Commodity 2019-20
(MMMT)
2019-20
(BTKM)
2020-30
(MMMT)
2020-30
(BTKM)
Coal 10.00 2.00 15.00 3.00
Finished Goods 0.13 0.03 1.83 0.37
Manufactured Goods 0.80 0.16 1.08 0.22
Agriculture Products 0.14 0.03 0.17 0.03
Total Cargo 11.07 2.21 18.08 3.62
10.4.6 Cargo Potential on National Waterway-6
10.4.6.1 In respect of proposed NW-6 on river Barak, the potential projected cargo is 1.053
MT (1.0 btkm) and the main commodities to be transported are: Rice, wheat, sugar, cement,
edible oils, pulses, POL, military stores, coal, tea, food grains, bamboo, paper and paper
products, timber an parcel goods.
10.4.7 Tourism
10.4.7.1 The usage of the IWT network for “water tourism” theme has potential to generate
considerable income for the local economies and additional income from tourist/luxury taxes
140
for regional and federal governments. Expanding the usage of the IWT for tourism can be
efficiently included as one objective of broader plans to improve waterways for economic
development. For example, in the Philippines "Nautical Highway System" was established
to enhance investment opportunities for agro-industrial, commerce, trade and tourism, and
also provide efficient and convenient travel movement of local and international tourists and
investors through shorter travel time and cheaper transportation costs.
10.5 Projects in collaboration with Private Sector
10.5.1 Coal Movement for NTPC Power Plant at Farakka
10.5.1.1 NTPC’s power plants at Farakka and Kahalgaon face acute shortage of coal mainly
on account of limitation in transportation capacity of railways for both domestic and imported
coal. These power plants are located on the bank of Ganga (the National Waterway-1). IWAI
working with NTPC provided a solution for transportation of imported coal from Haldia/
Sagar/ Sandheads to these power plants by inland water transport (IWT) mode. NTPC
provided long term commitment of transportation of 3 million tons per year (MMTPA)
imported coal for their power plant at Farakka for seven years. Part of this coal can be
transported from Farakka to Kahalgaon power plant through MGR railway line of NTPC
between these power plants.
10.5.1.2 IWAI and NTPC along with IL&FS-IDC, developed a project envisaging an
investment of about Rs 650 cr for setting up (a) transshipment facility at Sagar/ Sandheads,
(b) barges for 3 MMTPA coal transportation (c) inland water terminal at Farakka; and (d)
conveyor system from the terminal to the coal stack yard of Farakka power plant. The work
for this project has been awarded to Jindal ITF Ltd whose quoted price for transportation of
coal by IWT mode was about 15% less than what is currently being paid by NTPC. A
Tripartite Agreement (TPA) was executed between NTPC, Jindal ITF and IWAI to carry out
the development and operation of the project in August 2011. As per the agreement, Jindal
ITF have been granted upto 24 months to undertake construction of entire facilities and
thereafter operation and maintenance for seven years. IWAI has guaranteed Least Available
Depth (LAD) of 2.5 m in the entire fairway up to Farakka for a period of 330 days along with
provision of other navigational aids to ensure safe 24x7 river navigation. The coal supply
under this project is expected to commence in 15 months from date of signing of TPA.
141
The Project will immensely help NTPC to overcome the acute shortage of coal due to
inadequate capacity of its existing supply chain network. Since there are several existing
thermal power plants along Ganga and many more are going to come up, success of this
pioneering project may pave way for many more projects for transportation of coal on NW-1
and possibly on other National Waterways. This could also result in emergence of IWT as a
supplementary mode for movement of bulk cargo for various Thermal Power Stations located
on banks of River Ganga / Hooghly in West Bengal, Bihar and UP. Since IWT is an energy
efficient mode of transportation, Power Plants could also earn ‘carbon credits’.
10.5.1.3 This project shows that the private sector is indeed ready to make the requisite
investment in construction and operation of IWT vessels and even to some extent in
unloading infrastructure if adequate contract arrangements are made to mitigate demand and
technology risks. If the consignees like Power Utilities, Food Corporation of India, Fertilizer
Companies, Oil companies etc. are willing to give long term cargo commitment and IWAI is
willing to guarantee safe navigation on the National Waterways with assured LAD, adequate
private investment can be attracted in IWT sector to facilitate movement of several
commodities. Keeping in view the strategic, environmental and economic benefits that can
accrue to the country by developing IWT as a supplementary mode of transport for bulk
cargo, this is an option worth promoting.
10.5.2 The other project being launched is Container Ro-Ro Services on NW 3.
10.5.2.1 IWAI and Cochin Port Trust have entered into an MOU for development of Ro-
Ro/Lo-Lo IWT Terminals at Bolaghaty and Willington Island for providing connectivity to
International Container Transhipment Terminal at Vallarpadam. Container traffic is expected
to rise from 0.7MMTpa to 2.6 MMTPA in initial years of operation.
10.5.3 World over IWT is a preferred mode for transportation of Over Dimensional Cargo
(ODC). With the proposed STPS coming up in UP,Bihar,West Bengal and NE States
movement of ODC through Ganga and Brahmputra offers good opportunity. IWAI is
charging user charge of Rs.1.50 per tonne km. of ODC transportation through NWs. IWAI
has also entered into an MOU with NHPC, Jindal Power etc for usage of waterways for
142
transportation of ODC over waterway. The Over Dimensional cargo moved on National
Waterways for the past three years (2008-09 to 2010-11) has shown a six fold increase.
10.6 Policy Issues
10.6.1 Integration of waterways with other modes of transportation to form an efficient
multimodal transport network is the key to achieve sustainable development of IWT
sector. This requires detailed mapping of waterways and industrial clusters and analysis of
origin and destination of cargo to undertake development of suitable waterways as well as
multimodal transport hubs in IWT corridors.
10.6.2 Public investment in development of waterways shall serve as an important
economic lifeline for development of North Eastern (NE) region which has abundant
water resources ideal for IWT. The NE region does not have adequate road and rail
connectivity but has an excellent river line network which can be developed as an integral
mode of transport.
10.6.3 Policy support for creation of floating infrastructure i.e Barges/ Inland Vessels is
critical to attract private capital for development of IWT sector. Being in its early stages
of development in India, IWT sector bears significant technology and commercial risks. An
institutional arrangement wherein the risk on investment is shared through a PPP mode could
be more effective in making available the requisite infrastructure.
10.6.4 Extending mandatory intermodal share for cargo movements (currently
mandated to all PSUs by PMO) to all public limited companies and creation of a
suitable tradable instrument to help monetize the environmental advantages of the IWT
sector on the lines of Renewable Energy Certificate (REC) can serve as a significant
policy support. IWT sector has specificity in regard to type of cargo and regional
configuration, therefore users’ proximity to the waterways shall be critical in making the
entire logistic chain cost competitive. Considering the significant environment advantages of
IWT sector, its positive externalities need to be captured and monetized to effectively
promote its use. A market based instrument similar to REC which will help monetize the
positive externalities of IWT sector such as reduced carbon foot prints could be an effective
143
policy incentive for the efficient development of this sector. Such a tradable instrument will
help meet the modal share commitment as mandated by the Government while incentivizing
the actual users of IWT for their contribution to the environment and society.
10.6.5 An institutional framework to appraise mission critical projects identified by
IWAI will ensure timely and effective project development. Sub Group has conceptualized
projects for creation of supporting infrastructure for movement of bulk cargo such as coal,
fertilizer and food grains. Effective co-ordination across the respective functional ministries
and PSUs shall ensure timely implementation of these projects. The project conceptualized by
IWAI for movement of coal to NTPC Farakka Plant through NW-1 is a good example.
10.6.6 For effective resolution of policy and administrative issues, State Level
Coordination Committees (SLCC) of various State Government agencies and IWAI
under the State Chief Secretaries is critical imperative. Waterways other than NWs are
being developed by the State Governments.. There is an urgent need for every
reverine/coastal State to set up an IWT organization and to frame a long-term strategy for the
IWT development.
10.6.7 Creation of adequate education and training facilities to help sector specific
capacity building is necessary. IWT training facilities in the country are limited. National
Inland Navigation Institute (NINI) was set up by the IWAI at Patna which started functioning
from February 2004.The Working Group recommends NINI at the apex level and Regional
Crew Training Centers (RCTCs) at State level.
10.6.8 For effective development of IWT sector in India all major waterways may be
developed with 3 m depth and Government may take a policy initiative in this regard.
IWT in all developed countries may vary greatly but they all have one common strategic fact
that they have major IWT routes capable for efficient navigation of large IWT vessels.
10.7 Approach & Methodology for development of IWT sector in India
10.7.1 Analyzing, understanding and suitably adopting international experiences while
formulating solutions are also important for their effectiveness. There are successful
examples of IWT being systematically and sustainably developed internationally viz USA,
144
EU, and China etc. There are lessons to be learnt from their experiences in creation of IWT
infrastructure and vessels and in achieving an equitable modal share. Four countries in EU
have more than7% cargo share by IWT. In Netherlands it is 42% and in China 8.7%. Our
national average share of cargo will increase with formalization of IWT specific regions
like in the Netherlands. It is in this context that fairway development and long term cargo
assurance should get priority in IWT specific regions. In EU there is a Marco Polo
programme which incentivize mode shift from road to environment friendly modes e.g.
waterways/ shipping/ railways. Transport strategies in China, the USA and the EU all have
the stated aim of increasing the role of IWT. IWT has a great potential for
development, this sector should be developed proactively.
10.7.2 Efficiency and equity of resource allocation is critical to compliment the relative
advantages of competing infrastructure sectors and thereby ensuring sustainability.
Germany has 7700 km of waterways and 20% share of cargo by IWT. Their IWT budget
for 2012 is 15 billion Euros, whereas India invested just over Rs 1000 Crore in last 25
years. The Sub Group has identified a number of projects whose financial implications
have been worked out in detail. The aggregate amount of investment and its break up in
terms of Budgetary support and private investment are given in Table 10G.
Table 10G: Investment Needs for IWT
Funding through 2012-20 2021-30 Total (2012-30)
Budgetary Support (BS) 17,430 12,530 29,960
Private Sector Participation (PSP) 15,940 17,860 33,800
Total 33,370
(or say 33,500)
30,390
(or say 30,500)
63,660
(or say 64,000)
10.8 Lessons from International Best Practices
10.8.1 World over bimodal and tri-model inland terminals have become an
intrinsic part of the transport system. The tri-modal inland terminals have developed in
European countries. Tri-modal terminals are so far not developed in our country and there is
145
need to develop such infrastructure to meet the growing demand of efficient economical and
sustainable logistics of the country.
10.8.2 The waterways in most of developed economics are extension and integration of
rivers and canals thereby providing longer and deeper stretches of waterway. Most of the
gateway ports are linked with all the three mode of transportation that provide an alternative
mode of transportation for both inbound and out bound cargo.
10.8.3 China and the EU have both been successful in developing IWT container operations
and China’s container traffic between the coast and inland ports has nearly trebled in the last
five years. This is the case in India where IWT has a greater unrealized value or
potential for development. In line with EU, USA and China standardization of
waterway should be done in India to ensure depth and width which in turn enable in
fixation of barge specification and configuration. Need for state funding of IWT
infrastructure though other models like PPP, Viability gap funding etc. can be
considered on the stretch which are viable from the point of private sector.
10.8.4 Germany has 7700 km of waterways and 20% share of cargo by IWT. Its IWT
budget for 2012 is 15 billion Euros. Four countries in EU have more than7% cargo share by
IWT. In Netherlands it is 42%, and in China 8.7%. The national average will increase when
IWT specific regions have a much larger share like in the Netherlands. It is in this context
that fairway development and long term cargo assurance should get priority in IWT
specific regions e.g. the national waterways in consonance with the directive from the
PMO.
10.8.5 An efficiently run IWT system has environmental and social benefits over other
modes of freight transport. It entails reduced congestion on roads, lower road accident costs,
reduced the average energy consumption of freight transport, and lower the greenhouse gases
(GHG).
146
10.8.6 Efforts should be made to develop tributaries of River Ganga & River
Brahmaputra as feeder routes for inland waterway in line with waterways in European
countries
10.9 Key Issues and Recommendations
10.9.1 The interaction with various stakeholders of IWT sector was of utmost importance to
understand their concerns and to know their suggestions for growth of IWT sector in India.
Dtailed interactive sessions were held with the stakeholders in Guwahati, Kochi and Kolkata
in the months of January, February and March 2011 respectively These sessions were well
attended by various stakeholders’ including Shippers (CIL, NTPC, JCI, POL companies,
Cement Companies) Operators, State Government agencies, Port Trust, Consultants, State
IWT departments, Logistic operators, Ship Builders, FICCI etc. The key issues, challenges
and suggestions emerged therein were carefully analyzed, and international experiences are
suitably adapted while formulating recommendations for key issues. The key issues and
recommendations thereon are outlined below:
10.9.2 Navigational Infrastructure :
a) Develop deeper stretches and maintain Least Available Depth (LAD) at 2.5 metres,
preferably 3 metres for round the year navigation.
b) A special central fund may be made available for raising vertical clearance of at least
5 metre above HFL to facilitate passage of bigger IWT vessels.
c) Develop intermodal connectivity at IWT terminals through proper connectivity with
road/rail.
d) Develop night navigation infrastructure in all National Waterways.
10.9.3 Inland Vessels
a) Revive Inland Vessel Subsidy Scheme.
b) Set up a Special Purpose Vehicle (Inland Vessel Leasing Company) that can procure
and lease out the IWT vessel based on market demand.
c) Private sector participation should be explored for development of Maintenances
Repair and Overhaul (MRO) facilities in North East States and other National
Waterway Corridors.
147
d) Make IWT vessel building eligible for “Infrastructure Status” to avail easier credit
availability
e) Make inland vessel building eligible for priority lending.
f) Bring inland vessels under Tonnage Tax.
10.9.4 River Basin Development
a) Each river basin should be developed with total integration of multiple users. To this
end, a central legislation of “River Basin Authorities” under the control of Ministry of Water
Resources will help total development of river basin.
10.9.5 River Training Work
10.9.5.1 Extensive river training works of spurs and dykes or barrages with navigation
locks to be carried out in NW 1 & NW 2 for improving the navigation channel with depth 2.5
m to 3.0 m and width of about 50 metres for accommodating economic size
vessels/tugs/barges.
10.9.6 Modal Integration
10.9.6.1 There is need to identify and develop the feeder routes on the water under
jurisdiction of State, to National waterways so that the entire channel can be developed on the
“fish bone structure” This would involve development of feeder routes in the North East such
as Subansiri, Dhansiri, Dibang etc. as well as major tributaries of River Ganga such as
Yamuna, Gandak, Kosi, Ghagra etc. Upon successful operations of these feeder routes will
pave the way for the improvement of these routes by the development of barrages/weirs with
navigational locks to ensure round the year operations of the routes
10.9.6.2 Similarly, integrate IWT and coastal shipping operations on stretches where
feasible to promote seamless connectivity. One way could be combining inland terminals
with automated RO-RO systems.
10.9.7 International Protocols
10.9.7.1 Simplify administrative processes and develop suitable operational support
systems to reduce the average turnaround time of vessels plying on protocol route.
148
10.9.8 Access to tradable renewable energy certificate
10.9.8.1 Create a suitable instrument to help monetize the environmental advantages of the
IWT sector on the lines of Renewable Energy Certificate.
10.9.9 Private Sector Participation in Waterways
10.9.9.1 Private sector participation into the development, maintenance and regulation of
some stretches of rivers for inland water transport may be looked into.
10.9.9.2 Power utilities to bear cost of construction and O&M of material handling at power
plant end as in the case with facility for unloading of railway wagon.
10.9.10 Training and Capacity Building
10.9.10.1 Need to revive and expand inland vessel crew training facilities in different
States to meet requirement of manpower in IWT.
10.9.11 Long Term Cargo Commitment
10.9.11.1 Need for a longer term cargo commitment for economic/revenue sustainability.
The shipper should provide guaranteed cargo for a specific period of time; focus on a few
bulk commodities such as coal and iron ore besides over-dimensional cargo.
10.9.11.2 Fix 50% transportation of coal through IWT for new power projects, where origin-
destination is on navigational waterways.
10.9.12 Policy Parity- Level Playing Field
10.9.12.1 Provide freight subsidy to IWT sector which is presently available for
transportation of fertilizers by rail and road.
10.9.12.2 Provide transport subsidy for transportation by IWT mode in the North East.
Abatement of Service Tax to the same extent as that provided to rail and road.
10.9.13 Legal and Administrative Issues
10.9.13.1 Need for uniformity in the realm of various operational/regulation aspects of IWT.
This is necessary as navigable inland waterways run through more than one State.
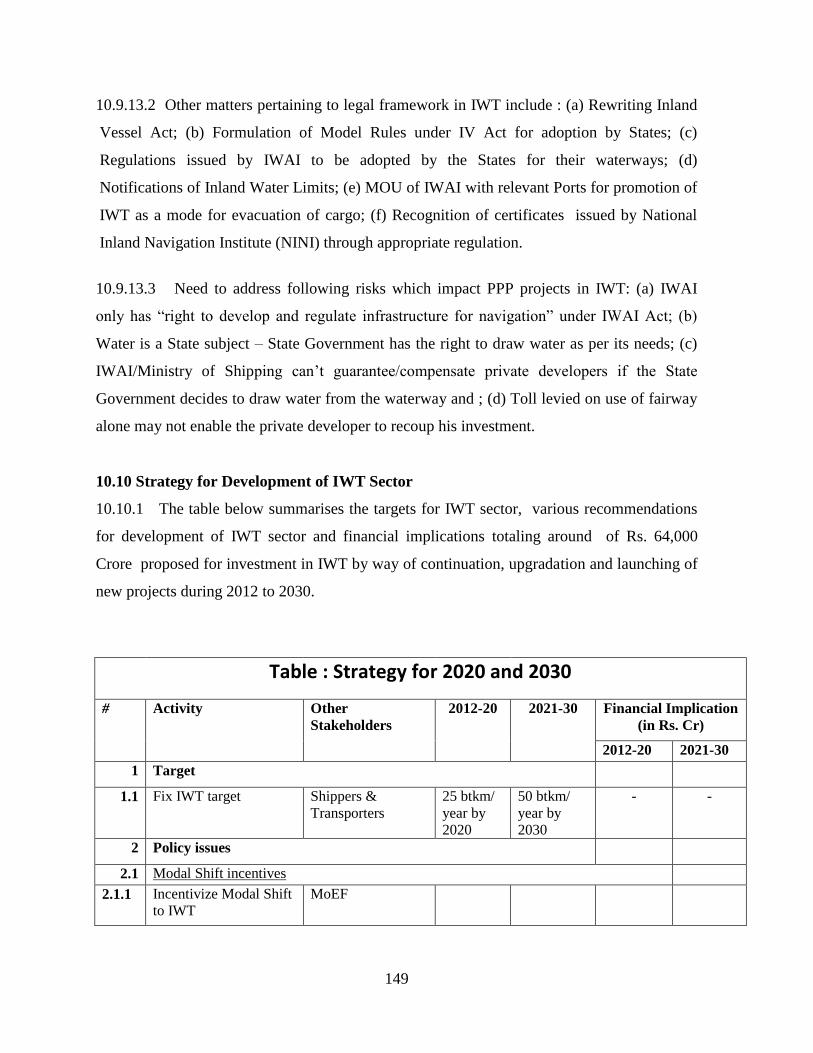
149
10.9.13.2 Other matters pertaining to legal framework in IWT include : (a) Rewriting Inland
Vessel Act; (b) Formulation of Model Rules under IV Act for adoption by States; (c)
Regulations issued by IWAI to be adopted by the States for their waterways; (d)
Notifications of Inland Water Limits; (e) MOU of IWAI with relevant Ports for promotion of
IWT as a mode for evacuation of cargo; (f) Recognition of certificates issued by National
Inland Navigation Institute (NINI) through appropriate regulation.
10.9.13.3 Need to address following risks which impact PPP projects in IWT: (a) IWAI
only has “right to develop and regulate infrastructure for navigation” under IWAI Act; (b)
Water is a State subject – State Government has the right to draw water as per its needs; (c)
IWAI/Ministry of Shipping can’t guarantee/compensate private developers if the State
Government decides to draw water from the waterway and ; (d) Toll levied on use of fairway
alone may not enable the private developer to recoup his investment.
10.10 Strategy for Development of IWT Sector
10.10.1 The table below summarises the targets for IWT sector, various recommendations
for development of IWT sector and financial implications totaling around of Rs. 64,000
Crore proposed for investment in IWT by way of continuation, upgradation and launching of
new projects during 2012 to 2030.
Table : Strategy for 2020 and 2030
# Activity Other
Stakeholders
2012-20 2021-30 Financial Implication
(in Rs. Cr)
2012-20 2021-30
1 Target
1.1 Fix IWT target Shippers &
Transporters
25 btkm/
year by
2020
50 btkm/
year by
2030
- -
2 Policy issues
2.1 Modal Shift incentives
2.1.1 Incentivize Modal Shift
to IWT
MoEF
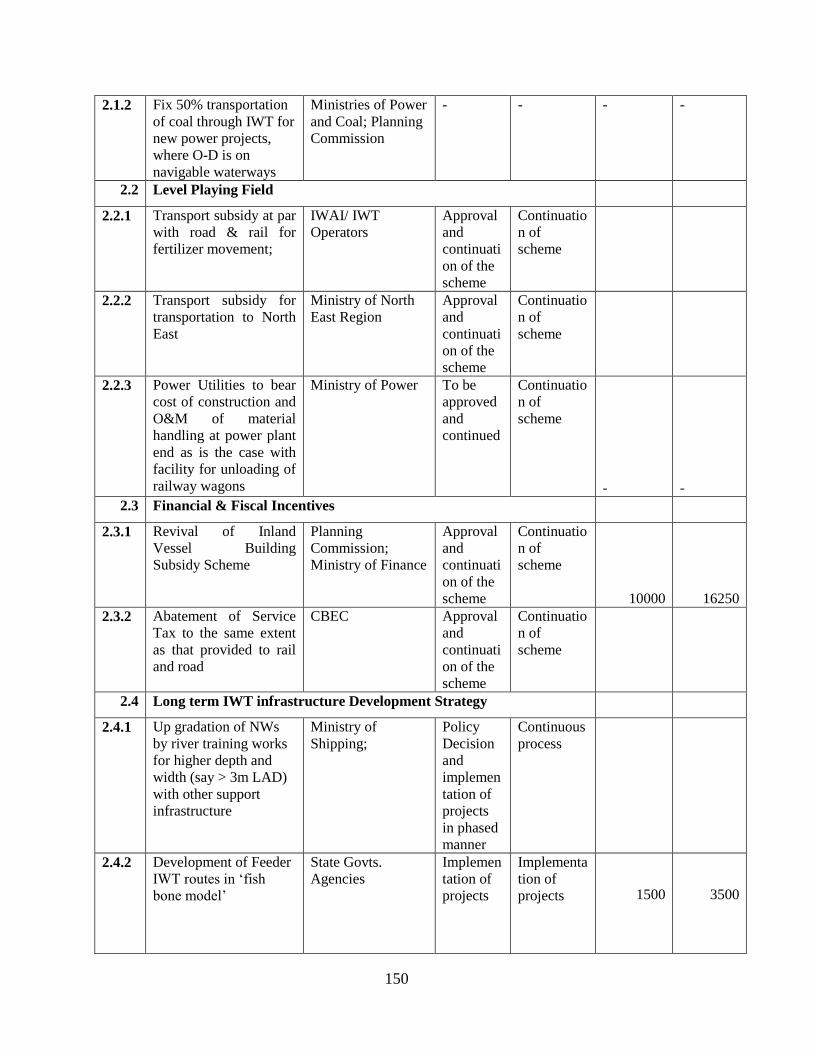
150
2.1.2 Fix 50% transportation
of coal through IWT for
new power projects,
where O-D is on
navigable waterways
Ministries of Power
and Coal; Planning
Commission
- - - -
2.2 Level Playing Field
2.2.1 Transport subsidy at par
with road & rail for
fertilizer movement;
IWAI/ IWT
Operators
Approval
and
continuati
on of the
scheme
Continuatio
n of
scheme
2.2.2 Transport subsidy for
transportation to North
East
Ministry of North
East Region
Approval
and
continuati
on of the
scheme
Continuatio
n of
scheme
2.2.3 Power Utilities to bear
cost of construction and
O&M of material
handling at power plant
end as is the case with
facility for unloading of
railway wagons
Ministry of Power To be
approved
and
continued
Continuatio
n of
scheme
- -
2.3 Financial & Fiscal Incentives
2.3.1 Revival of Inland
Vessel Building
Subsidy Scheme
Planning
Commission;
Ministry of Finance
Approval
and
continuati
on of the
scheme
Continuatio
n of
scheme
10000 16250
2.3.2 Abatement of Service
Tax to the same extent
as that provided to rail
and road
CBEC Approval
and
continuati
on of the
scheme
Continuatio
n of
scheme
2.4 Long term IWT infrastructure Development Strategy
2.4.1 Up gradation of NWs
by river training works
for higher depth and
width (say > 3m LAD)
with other support
infrastructure
Ministry of
Shipping;
Policy
Decision
and
implemen
tation of
projects
in phased
manner
Continuous
process
2.4.2 Development of Feeder
IWT routes in ‘fish
bone model’
State Govts.
Agencies
Implemen
tation of
projects
Implementa
tion of
projects 1500
3500
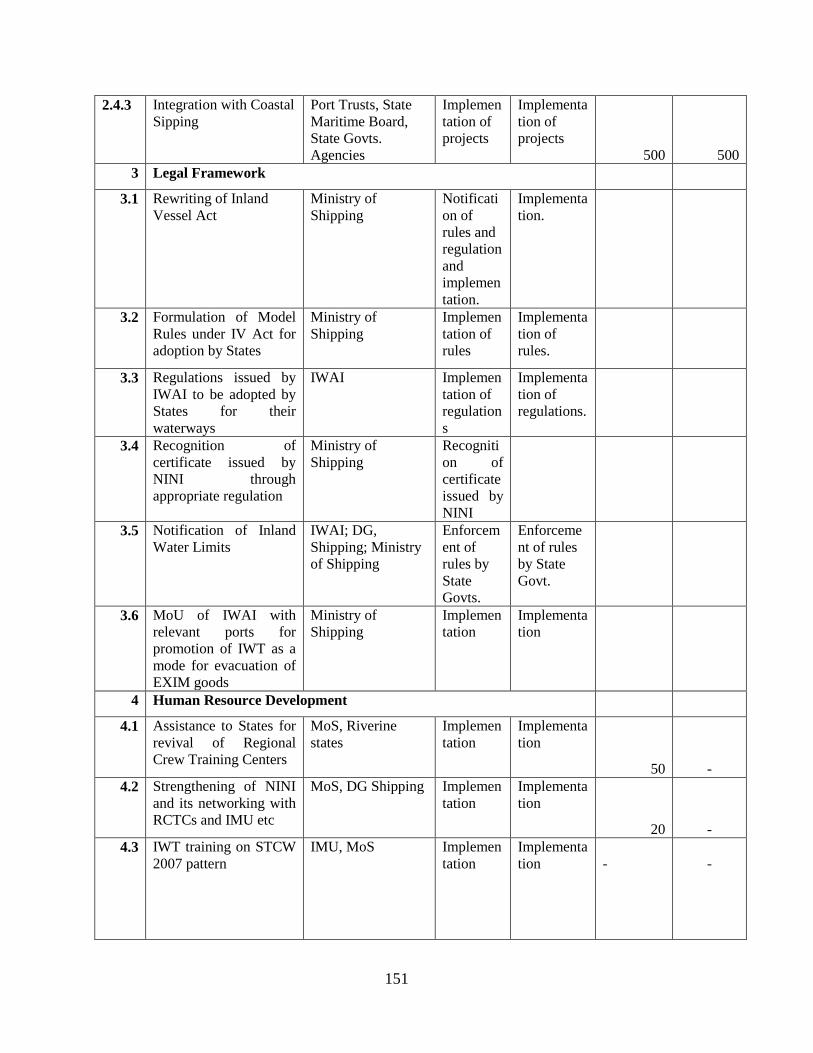
151
2.4.3 Integration with Coastal
Sipping
Port Trusts, State
Maritime Board,
State Govts.
Agencies
Implemen
tation of
projects
Implementa
tion of
projects
500 500
3 Legal Framework
3.1 Rewriting of Inland
Vessel Act
Ministry of
Shipping
Notificati
on of
rules and
regulation
and
implemen
tation.
Implementa
tion.
3.2 Formulation of Model
Rules under IV Act for
adoption by States
Ministry of
Shipping
Implemen
tation of
rules
Implementa
tion of
rules.
3.3 Regulations issued by
IWAI to be adopted by
States for their
waterways
IWAI Implemen
tation of
regulation
s
Implementa
tion of
regulations.
3.4 Recognition of
certificate issued by
NINI through
appropriate regulation
Ministry of
Shipping
Recogniti
on of
certificate
issued by
NINI
3.5 Notification of Inland
Water Limits
IWAI; DG,
Shipping; Ministry
of Shipping
Enforcem
ent of
rules by
State
Govts.
Enforceme
nt of rules
by State
Govt.
3.6 MoU of IWAI with
relevant ports for
promotion of IWT as a
mode for evacuation of
EXIM goods
Ministry of
Shipping
Implemen
tation
Implementa
tion
4 Human Resource Development
4.1 Assistance to States for
revival of Regional
Crew Training Centers
MoS, Riverine
states
Implemen
tation
Implementa
tion
50 -
4.2 Strengthening of NINI
and its networking with
RCTCs and IMU etc
MoS, DG Shipping Implemen
tation
Implementa
tion
20 -
4.3 IWT training on STCW
2007 pattern
IMU, MoS Implemen
tation
Implementa
tion -
-
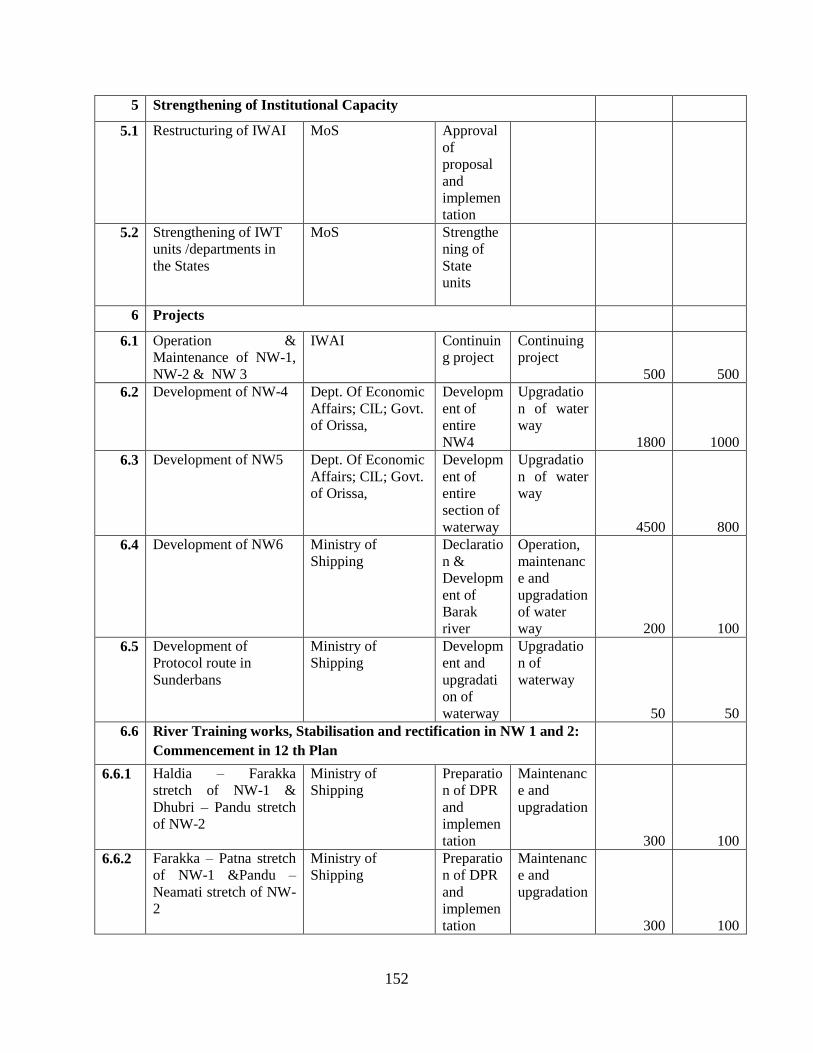
152
5 Strengthening of Institutional Capacity
5.1 Restructuring of IWAI MoS Approval
of
proposal
and
implemen
tation
5.2 Strengthening of IWT
units /departments in
the States
MoS Strengthe
ning of
State
units
6 Projects
6.1 Operation &
Maintenance of NW-1,
NW-2 & NW 3
IWAI Continuin
g project
Continuing
project
500 500
6.2 Development of NW-4 Dept. Of Economic
Affairs; CIL; Govt.
of Orissa,
Developm
ent of
entire
NW4
Upgradatio
n of water
way
1800 1000
6.3 Development of NW5 Dept. Of Economic
Affairs; CIL; Govt.
of Orissa,
Developm
ent of
entire
section of
waterway
Upgradatio
n of water
way
4500 800
6.4 Development of NW6 Ministry of
Shipping
Declaratio
n &
Developm
ent of
Barak
river
Operation,
maintenanc
e and
upgradation
of water
way 200 100
6.5 Development of
Protocol route in
Sunderbans
Ministry of
Shipping
Developm
ent and
upgradati
on of
waterway
Upgradatio
n of
waterway
50 50
6.6 River Training works, Stabilisation and rectification in NW 1 and 2:
Commencement in 12 th Plan
6.6.1 Haldia – Farakka
stretch of NW-1 &
Dhubri – Pandu stretch
of NW-2
Ministry of
Shipping
Preparatio
n of DPR
and
implemen
tation
Maintenanc
e and
upgradation
300 100
6.6.2 Farakka – Patna stretch
of NW-1 &Pandu –
Neamati stretch of NW-
2
Ministry of
Shipping
Preparatio
n of DPR
and
implemen
tation
Maintenanc
e and
upgradation
300 100
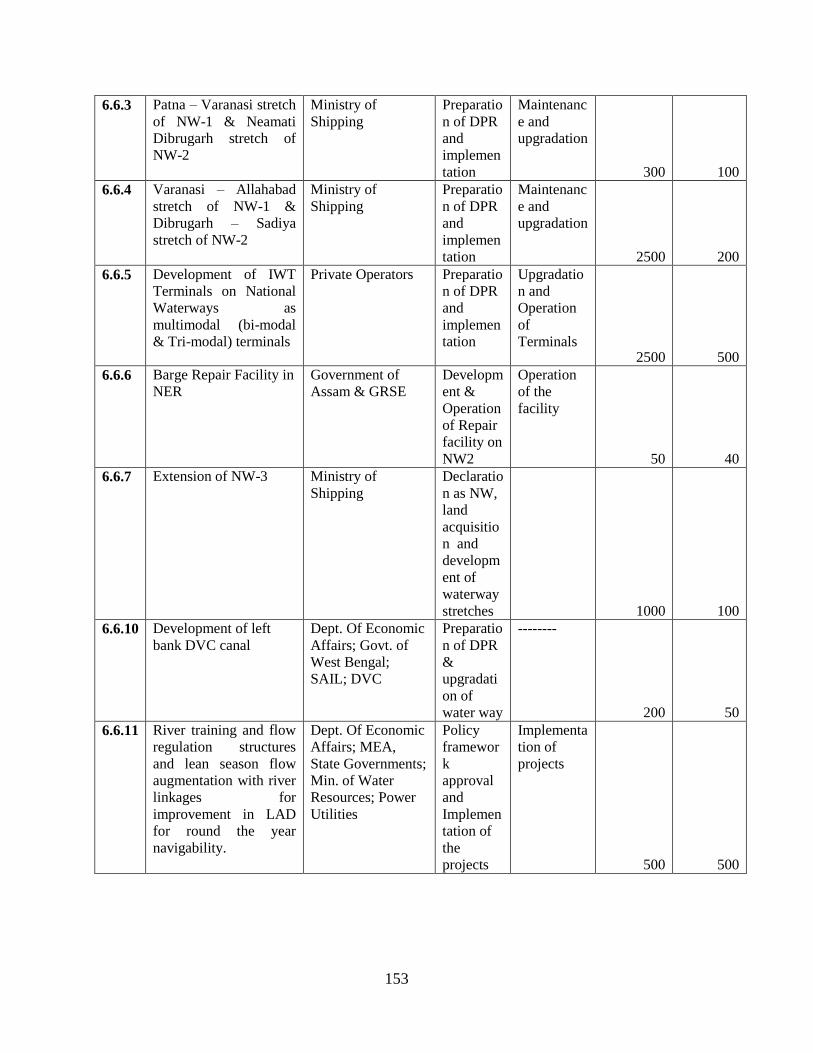
153
6.6.3 Patna – Varanasi stretch
of NW-1 & Neamati
Dibrugarh stretch of
NW-2
Ministry of
Shipping
Preparatio
n of DPR
and
implemen
tation
Maintenanc
e and
upgradation
300 100
6.6.4 Varanasi – Allahabad
stretch of NW-1 &
Dibrugarh – Sadiya
stretch of NW-2
Ministry of
Shipping
Preparatio
n of DPR
and
implemen
tation
Maintenanc
e and
upgradation
2500 200
6.6.5 Development of IWT
Terminals on National
Waterways as
multimodal (bi-modal
& Tri-modal) terminals
Private Operators Preparatio
n of DPR
and
implemen
tation
Upgradatio
n and
Operation
of
Terminals 2500 500
6.6.6 Barge Repair Facility in
NER
Government of
Assam & GRSE
Developm
ent &
Operation
of Repair
facility on
NW2
Operation
of the
facility
50 40
6.6.7 Extension of NW-3 Ministry of
Shipping
Declaratio
n as NW,
land
acquisitio
n and
developm
ent of
waterway
stretches
1000 100
6.6.10 Development of left
bank DVC canal
Dept. Of Economic
Affairs; Govt. of
West Bengal;
SAIL; DVC
Preparatio
n of DPR
&
upgradati
on of
water way
--------
200 50
6.6.11 River training and flow
regulation structures
and lean season flow
augmentation with river
linkages for
improvement in LAD
for round the year
navigability.
Dept. Of Economic
Affairs; MEA,
State Governments;
Min. of Water
Resources; Power
Utilities
Policy
framewor
k
approval
and
Implemen
tation of
the
projects
Implementa
tion of
projects
500 500
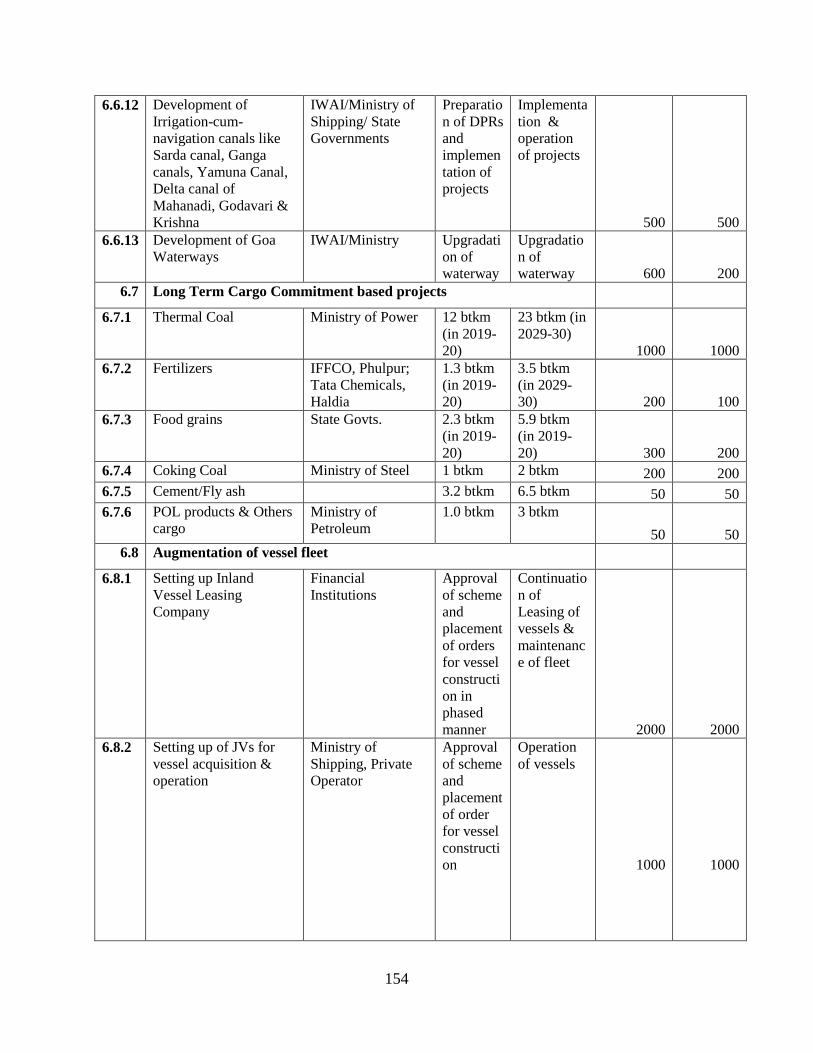
154
6.6.12 Development of
Irrigation-cum-
navigation canals like
Sarda canal, Ganga
canals, Yamuna Canal,
Delta canal of
Mahanadi, Godavari &
Krishna
IWAI/Ministry of
Shipping/ State
Governments
Preparatio
n of DPRs
and
implemen
tation of
projects
Implementa
tion &
operation
of projects
500 500
6.6.13 Development of Goa
Waterways
IWAI/Ministry Upgradati
on of
waterway
Upgradatio
n of
waterway 600 200
6.7 Long Term Cargo Commitment based projects
6.7.1 Thermal Coal Ministry of Power 12 btkm
(in 2019-
20)
23 btkm (in
2029-30)
1000 1000
6.7.2 Fertilizers IFFCO, Phulpur;
Tata Chemicals,
Haldia
1.3 btkm
(in 2019-
20)
3.5 btkm
(in 2029-
30) 200 100
6.7.3 Food grains State Govts. 2.3 btkm
(in 2019-
20)
5.9 btkm
(in 2019-
20) 300 200
6.7.4 Coking Coal Ministry of Steel 1 btkm 2 btkm 200 200
6.7.5 Cement/Fly ash 3.2 btkm 6.5 btkm 50 50
6.7.6 POL products & Others
cargo
Ministry of
Petroleum
1.0 btkm 3 btkm
50 50
6.8 Augmentation of vessel fleet
6.8.1 Setting up Inland
Vessel Leasing
Company
Financial
Institutions
Approval
of scheme
and
placement
of orders
for vessel
constructi
on in
phased
manner
Continuatio
n of
Leasing of
vessels &
maintenanc
e of fleet
2000 2000
6.8.2 Setting up of JVs for
vessel acquisition &
operation
Ministry of
Shipping, Private
Operator
Approval
of scheme
and
placement
of order
for vessel
constructi
on
Operation
of vessels
1000
1000
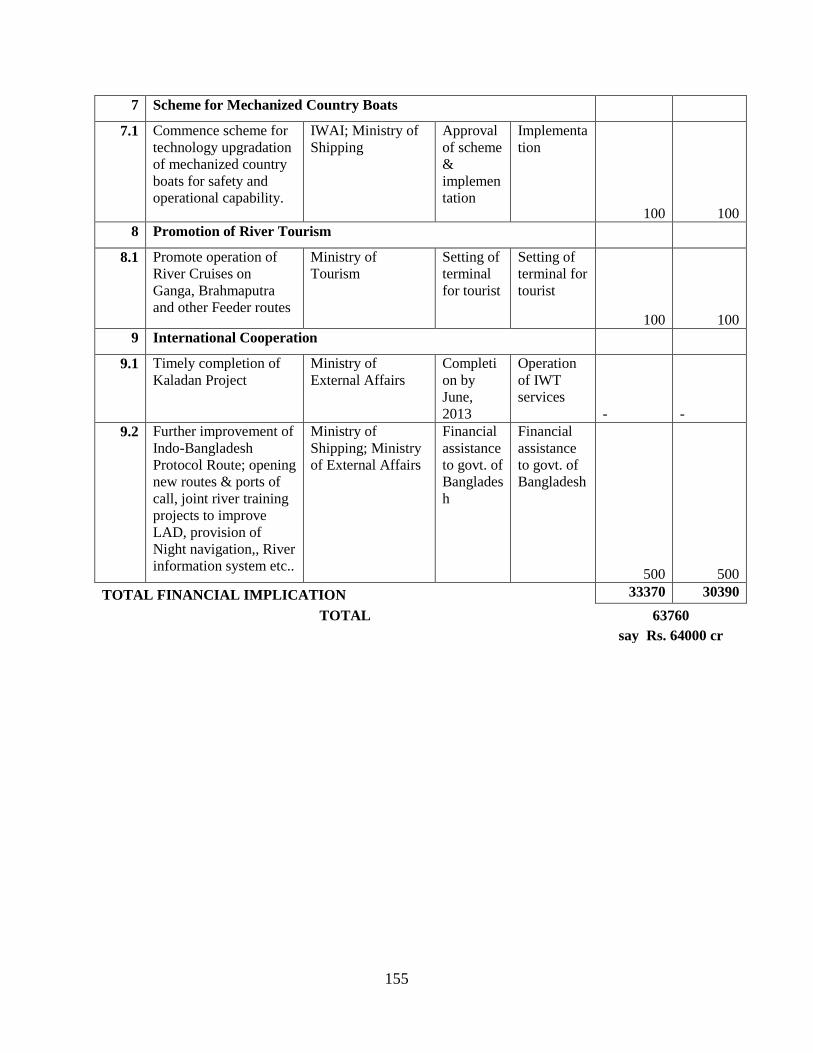
155
7 Scheme for Mechanized Country Boats
7.1 Commence scheme for
technology upgradation
of mechanized country
boats for safety and
operational capability.
IWAI; Ministry of
Shipping
Approval
of scheme
&
implemen
tation
Implementa
tion
100 100
8 Promotion of River Tourism
8.1 Promote operation of
River Cruises on
Ganga, Brahmaputra
and other Feeder routes
Ministry of
Tourism
Setting of
terminal
for tourist
Setting of
terminal for
tourist
100 100
9 International Cooperation
9.1 Timely completion of
Kaladan Project
Ministry of
External Affairs
Completi
on by
June,
2013
Operation
of IWT
services
- -
9.2 Further improvement of
Indo-Bangladesh
Protocol Route; opening
new routes & ports of
call, joint river training
projects to improve
LAD, provision of
Night navigation,, River
information system etc..
Ministry of
Shipping; Ministry
of External Affairs
Financial
assistance
to govt. of
Banglades
h
Financial
assistance
to govt. of
Bangladesh
500 500
TOTAL FINANCIAL IMPLICATION 33370 30390
TOTAL 63760
say Rs. 64000 cr

156
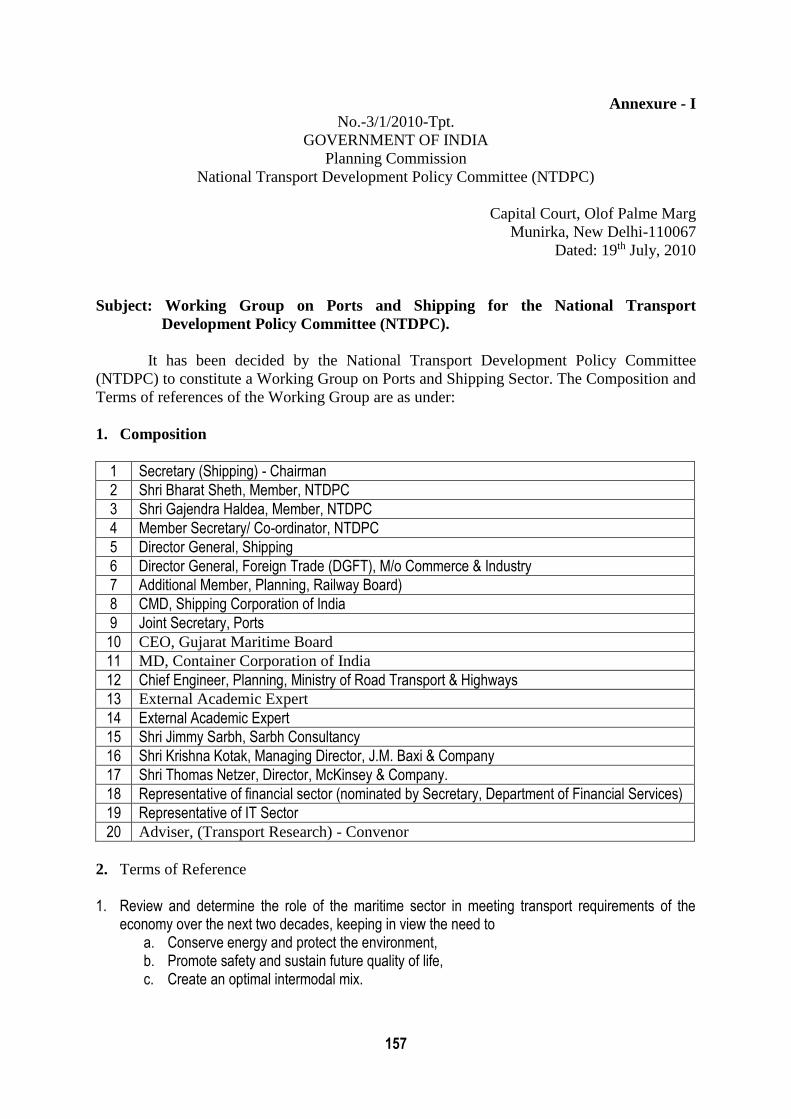
157
Annexure - I
No.-3/1/2010-Tpt.
GOVERNMENT OF INDIA
Planning Commission
National Transport Development Policy Committee (NTDPC)
Capital Court, Olof Palme Marg
Munirka, New Delhi-110067
Dated: 19th July, 2010
Subject: Working Group on Ports and Shipping for the National Transport
Development Policy Committee (NTDPC).
It has been decided by the National Transport Development Policy Committee
(NTDPC) to constitute a Working Group on Ports and Shipping Sector. The Composition and
Terms of references of the Working Group are as under:
1. Composition
1 Secretary (Shipping) - Chairman
2 Shri Bharat Sheth, Member, NTDPC
3 Shri Gajendra Haldea, Member, NTDPC
4 Member Secretary/ Co-ordinator, NTDPC
5 Director General, Shipping
6 Director General, Foreign Trade (DGFT), M/o Commerce & Industry
7 Additional Member, Planning, Railway Board)
8 CMD, Shipping Corporation of India
9 Joint Secretary, Ports
10 CEO, Gujarat Maritime Board
11 MD, Container Corporation of India
12 Chief Engineer, Planning, Ministry of Road Transport & Highways
13 External Academic Expert
14 External Academic Expert
15 Shri Jimmy Sarbh, Sarbh Consultancy
16 Shri Krishna Kotak, Managing Director, J.M. Baxi & Company
17 Shri Thomas Netzer, Director, McKinsey & Company.
18 Representative of financial sector (nominated by Secretary, Department of Financial Services)
19 Representative of IT Sector
20 Adviser, (Transport Research) - Convenor
2. Terms of Reference
1. Review and determine the role of the maritime sector in meeting transport requirements of the
economy over the next two decades, keeping in view the need to a. Conserve energy and protect the environment, b. Promote safety and sustain future quality of life, c. Create an optimal intermodal mix.
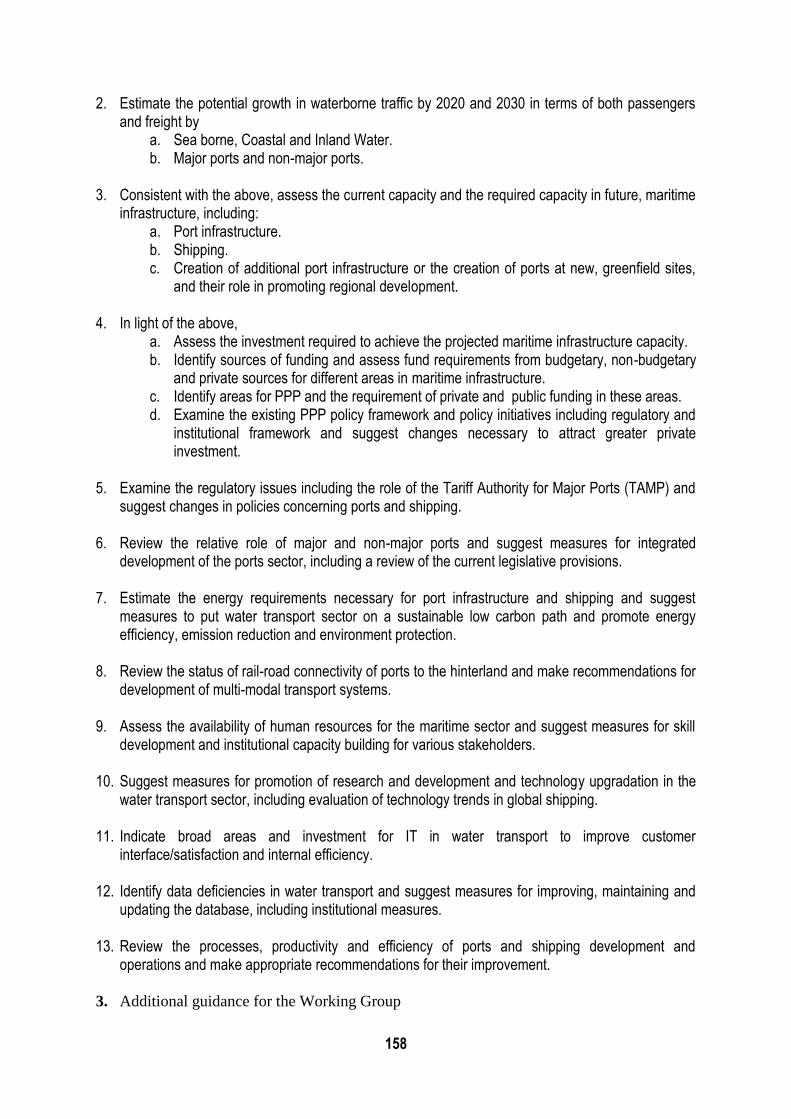
158
2. Estimate the potential growth in waterborne traffic by 2020 and 2030 in terms of both passengers and freight by
a. Sea borne, Coastal and Inland Water. b. Major ports and non-major ports.
3. Consistent with the above, assess the current capacity and the required capacity in future, maritime
infrastructure, including: a. Port infrastructure. b. Shipping. c. Creation of additional port infrastructure or the creation of ports at new, greenfield sites,
and their role in promoting regional development.
4. In light of the above, a. Assess the investment required to achieve the projected maritime infrastructure capacity. b. Identify sources of funding and assess fund requirements from budgetary, non-budgetary
and private sources for different areas in maritime infrastructure. c. Identify areas for PPP and the requirement of private and public funding in these areas. d. Examine the existing PPP policy framework and policy initiatives including regulatory and
institutional framework and suggest changes necessary to attract greater private investment.
5. Examine the regulatory issues including the role of the Tariff Authority for Major Ports (TAMP) and suggest changes in policies concerning ports and shipping.
6. Review the relative role of major and non-major ports and suggest measures for integrated development of the ports sector, including a review of the current legislative provisions.
7. Estimate the energy requirements necessary for port infrastructure and shipping and suggest measures to put water transport sector on a sustainable low carbon path and promote energy efficiency, emission reduction and environment protection.
8. Review the status of rail-road connectivity of ports to the hinterland and make recommendations for development of multi-modal transport systems.
9. Assess the availability of human resources for the maritime sector and suggest measures for skill development and institutional capacity building for various stakeholders.
10. Suggest measures for promotion of research and development and technology upgradation in the water transport sector, including evaluation of technology trends in global shipping.
11. Indicate broad areas and investment for IT in water transport to improve customer interface/satisfaction and internal efficiency.
12. Identify data deficiencies in water transport and suggest measures for improving, maintaining and updating the database, including institutional measures.
13. Review the processes, productivity and efficiency of ports and shipping development and operations and make appropriate recommendations for their improvement.
3. Additional guidance for the Working Group
159
1. The Group may get special studies carried out by experts.
2. The Group may visit such places and consult such stakeholders, key users and experts as may
be considered necessary for its work.
3. The Group may examine the laws, rules and regulations pertaining to maritime sector in connection with the TOR above and suggest legal, organizational, institutional and procedural reforms as necessary.
4. The Chairman may co-opt up to two additional members.
5. The expenditure on studies commissioned by the Working Group would be borne by the
Ministry of Shipping.
6. The Working Group shall submit its report within nine months.
7. The non-official members of the Working Group will be paid TA/DA in accordance with
the guidelines of NTDPC. The official Members will be paid TA/DA as per their
entitlement by concerned Ministry/Departments where they are working.
(B.N. Puri)
Member Secretary (NTDPC)
Copy to
1. Chairman, NTDPC
2. All the Members of the Working Group
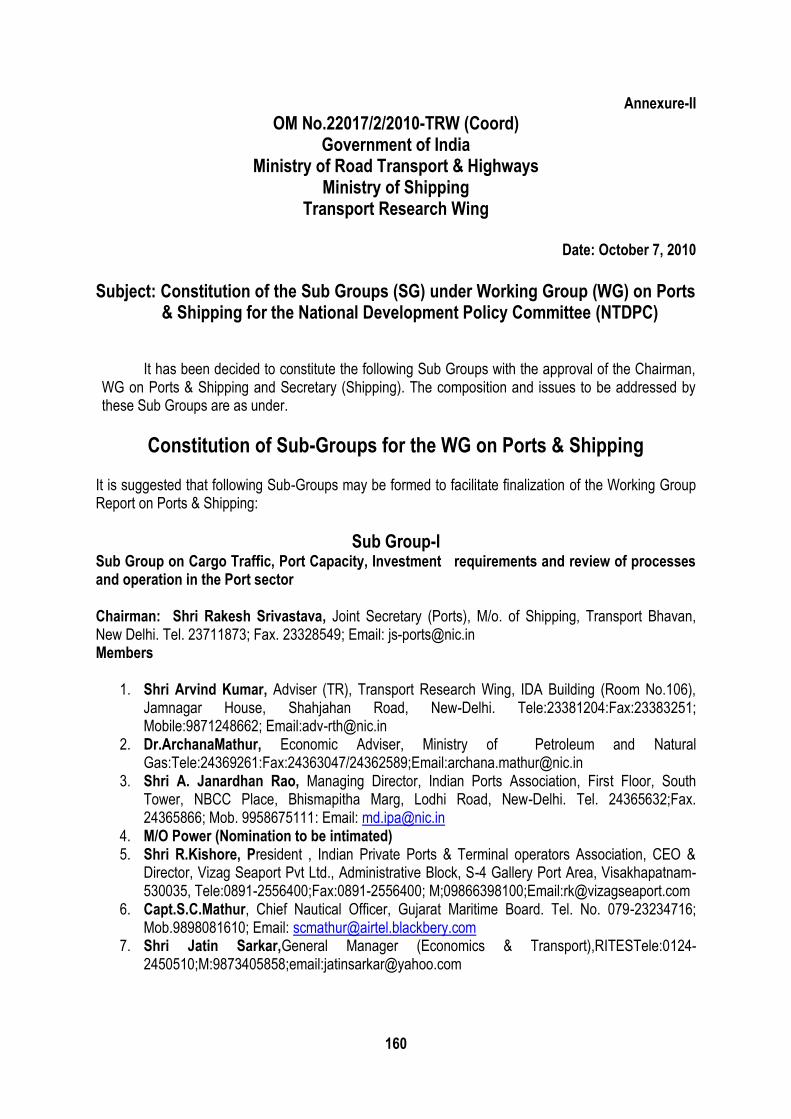
160
Annexure-II
OM No.22017/2/2010-TRW (Coord) Government of India
Ministry of Road Transport & Highways Ministry of Shipping
Transport Research Wing
Date: October 7, 2010
Subject: Constitution of the Sub Groups (SG) under Working Group (WG) on Ports
& Shipping for the National Development Policy Committee (NTDPC)
It has been decided to constitute the following Sub Groups with the approval of the Chairman, WG on Ports & Shipping and Secretary (Shipping). The composition and issues to be addressed by these Sub Groups are as under.
Constitution of Sub-Groups for the WG on Ports & Shipping It is suggested that following Sub-Groups may be formed to facilitate finalization of the Working Group Report on Ports & Shipping:
Sub Group-I Sub Group on Cargo Traffic, Port Capacity, Investment requirements and review of processes and operation in the Port sector Chairman: Shri Rakesh Srivastava, Joint Secretary (Ports), M/o. of Shipping, Transport Bhavan, New Delhi. Tel. 23711873; Fax. 23328549; Email: [email protected] Members
1. Shri Arvind Kumar, Adviser (TR), Transport Research Wing, IDA Building (Room No.106), Jamnagar House, Shahjahan Road, New-Delhi. Tele:23381204:Fax:23383251; Mobile:9871248662; Email:[email protected]
2. Dr.ArchanaMathur, Economic Adviser, Ministry of Petroleum and Natural Gas:Tele:24369261:Fax:24363047/24362589;Email:[email protected]
3. Shri A. Janardhan Rao, Managing Director, Indian Ports Association, First Floor, South Tower, NBCC Place, Bhismapitha Marg, Lodhi Road, New-Delhi. Tel. 24365632;Fax. 24365866; Mob. 9958675111: Email: [email protected]
4. M/O Power (Nomination to be intimated) 5. Shri R.Kishore, President , Indian Private Ports & Terminal operators Association, CEO &
Director, Vizag Seaport Pvt Ltd., Administrative Block, S-4 Gallery Port Area, Visakhapatnam-530035, Tele:0891-2556400;Fax:0891-2556400; M;09866398100;Email:[email protected]
6. Capt.S.C.Mathur, Chief Nautical Officer, Gujarat Maritime Board. Tel. No. 079-23234716; Mob.9898081610; Email: [email protected]
7. Shri Jatin Sarkar,General Manager (Economics & Transport),RITESTele:0124-2450510;M:9873405858;email:[email protected]
161
8. Shri M.M.Hasija, Adviser (Statistics)-Convenor, M/o. Road Transport & Highways, Transport Research Wing, IDA Building, Jamnagar House, Shahjahan Road, New Delhi. Tel. 23389017; Mob. 9810932789; Email: [email protected]
The Sub group would look into following aspects of major and non-major ports:1. Current and future Cargo traffic; 2. Capacity requirement; 3. Investment requirement; 4. Policy issues/regulations regarding the port sector
Sub Group-II Sub Group on Rail Road Connectivity with Ports to look into current status of Port Connectivity, container/freight traffic flows and future connectivity requirements Chairman: Additional Member (Planning), Rail Bhawan (Room No.202), New-Delhi.Tele:23382623; Fax:23303988 Members:
1. Shri S.K. Puri, Additional Director General (Roads), M/o. Road Transport & Highways, Transport Bhavan, New Delhi. Tel. 23739026; Mob. 9818222800; Email: [email protected]
2. Shri Anil K. Gupta, Managing Director, Container Corporation of India, CONCOR Bhavan, C-3, Mathura Road, Opposite Apollo Hospital, New Delhi-110076. Tel. 41673013; Fax. 41673019;Email: [email protected]
3. Shri A. Janardhan Rao, Managing Director, Indian Ports Association, First Floor, South Tower, NBCC Place, Bhismapitha Marg, Lodhi Road, New-Delhi. Tel. 24365632;Fax. 24365866; Mob. 9958675111; Email: [email protected]
4. Shri B.Poiyaamozhi DA (Ports) –Convenor, M/o. Shipping, Transport Bhavan, New Delhi. Tel. 23710456. Email: [email protected]
Sub Group-III Sub Group on Data under Shri Arvind Kumar-, Adviser (TR), Transport Research Wing, IDA Building (Room No.106), Jamnagar House, Shahjahan Road, New-Delhi. Tele:23381204:Fax:23383251; Mobile:9871248662; Email:[email protected] Members:
1. Shri A. Janardhan Rao, Managing Director, Indian Ports Association, First Floor, South Tower, NBCC Place, Bhismapitha Marg, Lodhi Road, New-Delhi. Tel. 24365632;Fax. 24365866; Mob. 9958675111; Email: [email protected]
2. Shri Suresh Kumar Kantholy, General Manager (ODC), Crimson Logic India Pvt.Ltd, 124 ,6th Floor, Surya Chambers, Murugeshpalya Airport Main Road, Begaluru-560017; Tele:080 4128 9999;Fax:080 2522 2889/4;M:9845999898; Email:[email protected]
3. Shri M.M.Hasija, Adviser (Statistics)-Convenor, M/o. Road Transport & Highways, Transport Research Wing, IDA Building, Jamnagar House, Shahjahan Road, New Delhi. Tel. 23389017; Mob. 9810932789; Email: [email protected]
4. Shri J.Murgadas, GM(ERP), Shipping Corporation of India Ltd., Shipping House 245, Madame Came Road, Mumbai – 440021. Mob. 9869023980; Tel. 24937484/6179; Email: [email protected]
162
Sub Group-IV Sub Group to look into R&D and Technology evolution in Shipping, energy requirements and initiatives to put the shipping sector on a sustainable low carbon path and promote energy efficiency, emission reduction and environment protection; Chairman Prof.S.C.Mishra, Director, National Ship Design & Research Centre (NSDRC), Visakhapatnam Campus, Gandhigram,Visakhapatnam 530005; Tel:0891-2577744;Fax:0891-2577754;Mobile:09490417748 Email:[email protected];[email protected] Members:
1. Shri Suresh Kumar, Chief Ship Surveyor, DG, Shipping, Mumbai, Tel. 22656295/22613651/534; Email: [email protected]
2. Shri G.V.S. Rao, Executive Director, Shipping Corporation of India (SCI) Shipping House 245, Madame Came Road, Mumbai – 440021. Tel. 24950289; Email: [email protected]
3. Shri D.J.Basu, Deputy Director, Development Adviser Ports Wing-Convenor, M/o. Shipping, Transport Bhavan, New Delhi. Tel. 23357558;Email:[email protected]
Sub Group-V Sub Group on IT to examine broad areas of IT investment and interface with users Chairman: Shri Janardhan Rao, MD,IPA Members:
1. Shri J.Murgadas, GM(ERP), Shipping Corporation of India Ltd., Shipping House 245, Madame Came Road, Mumbai – 440021. Mob. 9869023980; Tel. 24937484/6179; Email: [email protected]
2. Shri Suresh Kumar Kantholy, General Manager (ODC), Crimson Logic India Pvt.Ltd, 124 ,6th Floor, Surya Chambers, Murugeshpalya Airport Main Road, Begaluru-560017; Tele:080 4128 9999;Fax:080 2522 2889/4;M:9845999898; Email:[email protected]
3. Shri Rajiev Puri, Deputy Director, IPA –Convenor, First Floor, South Tower, NBCC Place, Bhismapitha Marg, Lodhi Road, New-Delhi. Tel. 24365041;M:9818555789;Email:[email protected]
Sub Group-VI
Sub Group to look into existing framework of PPP, Private financing and bench marking of Indian Shipping and Port operations/practices and efficiency parameters Chairman; Shri Thomas Netzer, Director, Mckinsey & Company Inc., Express Towers, 21st Floor, Nariman Point, Mumbai – 400021. Tel. 022-66302108;M:09833898856:Email:[email protected] Members:
1) Shri Pradeep Roy, Flat NO. 42, Bldg. 2-C, Kalpatru Estate, JVL Road, Andheri East, Mumbai – 400093. Tel. 022-66786554;Mob. 09967065946/ 09821124710. Email: [email protected]
2) Prof G. Raghuram, Indian Institute of Management, Ahmedabad, Tel. 079-66324948;Fax. 079-66326896; Mob. 9825304948; Email: [email protected]
3) Shri A. Janardhan Rao, Managing Director, Indian Ports Association, First Floor, South Tower, NBCC Place, Bhismapitha Marg, Lodhi Road, New-Delhi. Tel. 24365632;Fax. 24365866; Mob. 9958675111; Email: [email protected]
4) Smt. Geetu Joshi, Director, M/o Shipping;Telefax:23321672;Email:[email protected]
163
5) Shri C.S. Venkatraman, Secretary, TAMP-Convenor, Tariff Authority For Major Ports, 4th
Floor, Bhandar Bhavan, M.P. Road, Mumbai – 400010. Tel. 022-23792003; Mob. Email: [email protected]
Sub Group-VII
Sub Group on Shipping to look into status of shipping and requirement, review of processes and operation in shipping, human resource requirement of the maritime sector and related policy issues and regulations Chairman: Dr. S.B. Agnihotri, DG(Shipping), Directorate General of Shipping, Jahaz Bhavan, Walchand Hirachand Marg, Ballard Estate, Mumbai – 400001. Tel. 022-22673827 Fax. 022-22613655/22626756; Mob. 9403933383; Email: [email protected] Members:
1. Shri S. Hajara, Chairman & Managing Director, The Shipping Corporation of India Ltd. Shipping House 245, Madame Came Road, Mumbai – 400021. Tel. 022-22023463; Fax. 022-22022933; Mob. 9820000965; Email: [email protected]
2. Director General Foreign Trade, Ministry of Commerce, Udyog bhawan,Tele:23062777;23063436; Fax:23061613;Email:[email protected]
3. Shri Arvind Kumar, Adviser (TR), Transport Research Wing, IDA Building (Room No.106), Jamnagar House, Shahjahan Road, New-Delhi. Tele:23381204:Fax:23383251; Mobile:9871248662; Email:[email protected]
4. Shri Jimmy Sarbh, Sarbh Consultancy, Kamu Villa, 9 J.Mehta Road, Malabar Hill, Mumbai 400006; Tele:022 23611266;Fax:022 2361 1267; M:91 9867 333888; Email: [email protected]
5. Mr. Krishna Kotak, G.M. Bakshi & Co. Sapt Building, 18, J.N. Heredia Marg, Ballard Estate, Mumbai – 400001. Tel. 022-22620148; Fax. 022-22621878; Mob. 9820095352; Email: [email protected]
6. Shri Mark S. Fernandes, Chairman, Shipping & Aviation Committee, Indian Merchant Chamber, Indian Merchants Chamber Marg, Church gate, Mumbai – 400020. Tel. 022-22046633;022-22661634;022-22661673; Fax. 022-22048508; Email:
7. Shri Bharat Seth, Chairman, Great Eastern Shipping Company,15 Rajdoot Marg, Chanakyapuri;Tele:26876908;26111030;Fax:26114910;26111934;Emai:[email protected].
8. Shri V.K.Sharma, Chief Controller Chartering, M/o Shipping Tele:23719008;9810669203;Email:[email protected]
9. Shri C. Rathina Das, Deputy Director General, DG Shipping, Directorate General of shipping, Jahaz Bhavan, Walchand Hirachand Marg, Ballard Estate, Mumbai –Convenor, Tel. 22612385; Email: [email protected]
Sub Group-VIII Sub Group on Inland Waterways to look into status, growth in cargo traffic and its composition, future scenario; infrastructure; technical and regulatory issues related to its operation and potential. Chairperson: Smt Bhupendra Prasad, Chairperson, Inland Water Authority of India (IWAI), A-13, Sector -1,NOIDA, Uttar Pradesh, Tele:0120-2543972/2543973: Email: [email protected]
164
Members: 1. Shri Sunil Kumar, Vice Chairman,IWAI-Convenor, Inland Waterways Authority of India, A-
13, Sector-1, Noida (UP);Tele:0120-2544009;Email:[email protected] 2. Shri Jimmy Sarbh, Sarbh Consultancy, Kamu Villa, 9 J.Mehta Road, Malabar Hill,
Mumbai 400006; Tele:022 23611266;Fax:022 2361 1267; M:91 9867 333888; Email: [email protected]
3. Mr. Krishna Kotak, G.M. Bakshi & Co. Sapt Building, 18, J.N. Heredia Marg, Ballard Estate, Mumbai – 400001. Tel. 022-22620148; Fax. 022-22621878; Mob. 9820095352; Email: [email protected]
4. Shri Suresh Kumar, Chief Ship Surveyor, DG, Shipping, Mumbai, Tel. 22656295/22613651/534; Email: [email protected]
5. Shri G.S.Bhalla,Sr Vice President, The Shipping Corporation of India Ltd. Shipping House 245, Madame Came Road, Mumbai – 400021. Tel: 22027346/22772411; Email: [email protected]
165
Appendix-I
Some Important Policy Issues & Recommendations
Mega Ports: Mega Ports find mention in the Interim Report. However, the time frame for
planning/execution required to be curtailed from 20 years to a 12 years69999999999 time
horizon, given the Exim requirements of the Indian economy in the coming years. In
choosing location for mega ports, it is imperative to ensure rail-road connectivity and
requirements of end users.
Dredging: Draft limitation at Indian Ports restricts the access of large vessels leading to
transshipment of cargo from/to India at some foreign port or transshipment/trans-loading on
high seas leading to extra cost/time. To overcome the draft limitations at India’s Major Ports
there is a need to provide draft up to at least 17 metres during the 12th Plan and the 13th Plan
period. This would help Major Ports in attracting large size vessels which were increasingly
being deployed by main line shipping companies. Funding requirements in this regard are
not as huge as one would imagine. Besides, there is need for part Government funding of
dredging in the ship entrance channels.
On the issue of structure of port governance, it is imperative to establish governance
structures which provide both functional and financial autonomy. While landlord port model
has emerged as the most desirable form for managing ports worldwide, the moot point
remains, whetherthe existing ports needs to be incorporated under Companies Act or
constituted as an Independent Authority.
On the issue of unified law for the Port Sector, there is need to use/modify the existing port
legislations to suit present day requirements. While the focus of Major Ports Act, 1963 is
primarily on the governance structure for Major Ports that of Indian Ports Act, 1908 is on
host of other technical issues – conservancy, safety, navigation, technical, health, etc. In a
federal set up to put in place a unified law may be a daunting task and this should later not
inhibit the process of bringing about changes from time to time. Therefore a feasible option
is to modernize the above general sections of Indian Ports Act, 1908 where it would be easier
to achieve consensus and support from Maritime States. At the same time concerted efforts
could be made to modernize the Major Ports Act 1963. This being a Central Act would be
easier to amend and help bring convergence between these two Acts.
166
Efficiency Parameters: To tackle the high turn round time and pre-berthing detention one
needed to take a holistic view of port operations: ship to shore and shore to hinterland. This
needs identification of weak links in the chain. Presently only 33 berths at Major Ports are
under Private/ (PPP) mode and the rest continue to be under the management of respective
Major Ports. Therefore, a concerted effort is required to mechanize and modernize berth side
operations, so as to concentrate on improvement of the efficiency parameters at ports.
Shipping: Domestic Shipping Lines have expressed strong need for cargo support for Indian
Flagged Vessels to arrest the decline in share of Indian cargo being carried on Indian Flagged
Vessels. While it may be not be easy to pursue “cargo support” for Indian Flagged Vessels
there is need to focus on other fiscal incentives etc. for protecting the interests of the
Domestic Shipping Industry. A desirable option to promote Indian Shipping is to put in
place an incentive framework which : (a) promoted long term charter arrangements between
India Flagged Vessels and domestic users (bulk commodities in particular) and; (b)
promoting Indian owned but foreign flagged vessels in the first instance over the foreign
owned foreign flagged vessels.
Coastal Shipping: In order to make coastal shipping a competitive and attractive alternative
to road/rail, following initiatives could be pursued: (a) accord import duty exemption to
bunker fuel; (b) 100% service tax abatement. Presently, transportation by coastal mode is
subject to full service tax which makes it uncompetitive viz-a-viz other competing modes,
such as Road (75% abatement) and Rail (70% abatement).
Tariff setting for Major Ports: Presently scale of rates for vessels/cargo handling for Major
Ports (excluding corporatized Port of Ennore) is done by TAMP. Non Major/Minor Ports
governed by States are outside the ambit of TAMP. This has led to a situation where Non
Major Ports enjoy complete freedom/flexibility in tariff setting whereas Major Ports do not.
Keeping these factors into account there is need to look into a dispensation where tariff is
not set by TAMP but determined by competitive forces with TAMP overseeing from the
point of view of maintaining competition and preventing monopoly/oligopoly situations.
Specialized Financing Agency for Maritime Sector: Keeping in view the massive funding
requirement for the maritime sector there is a case for a specialized financing agency for
167
maritime sector on the grounds: (i) Port projects involve huge sunk costs with long gestation
period. Dwindling GBS for Major Ports and their weak balance sheets makes it difficult to
access capital markets; (b) to get focused sectoral attention in accordance with the sectoral
priorities; (c) maritime sector encompassed many other activities/businesses as well, such as,
shipbuilding, ship repair, specialized equipment for loading/unloading etc. In case
specialized financing institution for the maritime sector is not possible as it may face the risk
on account of concentrated lending and exposure to a single sector, a specialized window
within the existing financial institutions may be set up.
Model Concession Agreement (MCA): It has been observed that that MCA while reducing
scope for constructive innovation in tendering process provided no flexibility and little scope
for customization to suit the specific requirements of a port. The Land Lord Port Authority
model may cut down time for investment approvals.
Coastal Vessels: Need for separate codes for coastal vessels which provide less rigorous
construction specifications and manning scales viz-a-viz ocean going vessels. This would
ultimately result in lower cost of operations for coastal fleet.
With the growing emphasis on modal shift towards eco friendly and efficient mode of
transport there is a need to take a cue from Marco Polo Scheme in vogue in European Union
to promote modal shift in favor of IWT/Coastal Shipping. Marco Polo Scheme offers
subsidy to innovative schemes which promote coastal/IWT mode.
1
ADDENDUM
Projection of Cargo Traffic, Port Capacity, Investment
requirements in the Port Sector
During 2011-12 Major and Non-major ports in India accomplished a total
cargo throughput of 912 million tonnes reflecting a modest increase of 3.0% over
2011-12 compared to a growth of 4.2 % in 2010-11. The growth in cargo handled
at Major and Non-major ports in 2011-12 was 1.7% and 11.5% respectively
compared to 1.6% and 9.1% achieved in 2010-11. The deceleration in overall
growth in India’s seaborne cargo traffic in 2011-12 reflects slowdown in global and
domestic growth during the course of 2011-12.
2. The year 2011-12 was a challenging year for the Major Port Sector as it
was buffeted by three exogenous shocks (a) growth in major industrial countries
which are a major market for Indian merchandise trade decelerated from 3.2% in
2010 to 1.6% in 2011 and is projected to grow at mere 1.4% for 2012. Similarly,
growth in world merchandise trade decelerated sharply from 14.3% in 2010 to
6.3% in 2011; (b) India’s GDP growth slowed down from 8.4% in 2010-11 to 6.5%
in 2011-12. Slowdown and decline was pronounced in case of India’s GDP
pertaining to manufacturing and mining sectors: while growth in manufacturing
slowed from 7.6% in 2010-11 to 2.5% in 2011-12, growth in mining sector made a
complete about turn from 5% in 2010-11 to -0.9% in 2011-12; (c) series of judicial
interventions leading to ban/restrictions on iron ore exports which resulted in more
than 30% decline in its export. Iron ore loadings at major ports at 60.69 MT in
2011-12 were 27 MT lower compared with iron ore loadings 2010-11 leading to
overall shortfall of 30.5 MT between the target and achievement for overall cargo
traffic for 2011-12. These exogenous factors to a large extent reflect in sharp fall
in iron ore loadings and deceleration in container traffic from 12.7% in 2010-11 to
5.4 % in 2011-12.
Cargo traffic at Major Ports in 2011-12
2
3. Cargo traffic at 560.1 million tonnes at India’s 12 major ports during 2011-
12 accounted for 61.4% of India’s total sea borne cargo. Total cargo of 560.1
million tonnes comprises of cargo loaded, cargo unloaded and transhipped to the
tune of 194.1 million tonnes, 341.6 million tonnes and 24.4 million tonnes
respectively. The overall compound Annual rate of Growth (CAGR) of traffic at
major ports during 1950-51 to 2011-12 has been 5.7 percent, whereas during the
post- liberalisation period i.e. from 1991-92 to 2011-12, the CAGR was 6.7 percent.
The CAGR of traffic growth at major ports for the last 5 years was 3.8 percent.
4. Commodity groupwise analysis of last 5 years of CAGR reveals that the
highest CAGR of 10.3% has been observed in container traffic, followed by
7.0% for Fertilizer and Fertilizer raw material and 5.5% for the coal. As far as
the cargo composition is concerned, there has been a significant change in the
share of Iron Ore and container traffic during the past 5 years. The share of
container traffic increased from 15.8% in 2006-07 to 21.5% in 2011-12 while the
share of Iron Ore decreased from 17.4% in 2006-07 to 10.8% in 2011-12. During
2011-12, POL traffic maintained a dominant share of more than 32%, followed by
Container traffic (21.5%), Other cargo (18.0%), Iron ore (10.8%), Coal (14.1%)
and Fertilizer & FRM (3.6%).
Non – Major Ports – An Overview
5. Non-major ports in India collectively handled 351.51 million tonnes of traffic
during the year 2011-12 as compared to 95.52 million tonnes of cargo handled in
2001-02. The CAGR growth in traffic during 2001-02 to 2011-12 achieved by
Non-major ports was 13.9% compared with 6.9% achieved by Major ports in the
country. The share of cargo traffic of Non-major ports in the total cargo traffic
handled by all ports in India has increased steadily from 24.9% in 2001-02 to
38.6% in 2011-12. POL & its products (45.8%) was the single largest commodity
handled at non major ports in 2011-12 and its share has ranged between 44% (in
2006-07) to 55 % (in 2001-02). It is observed that during last five years, the
relative shares of commodities handled by the non major ports have not shown
any pronounced shift. In 2011-12, the share of coal in the total traffic was 22.3%
followed by Iron Ore (10.3%) and Building Material (3.2%).
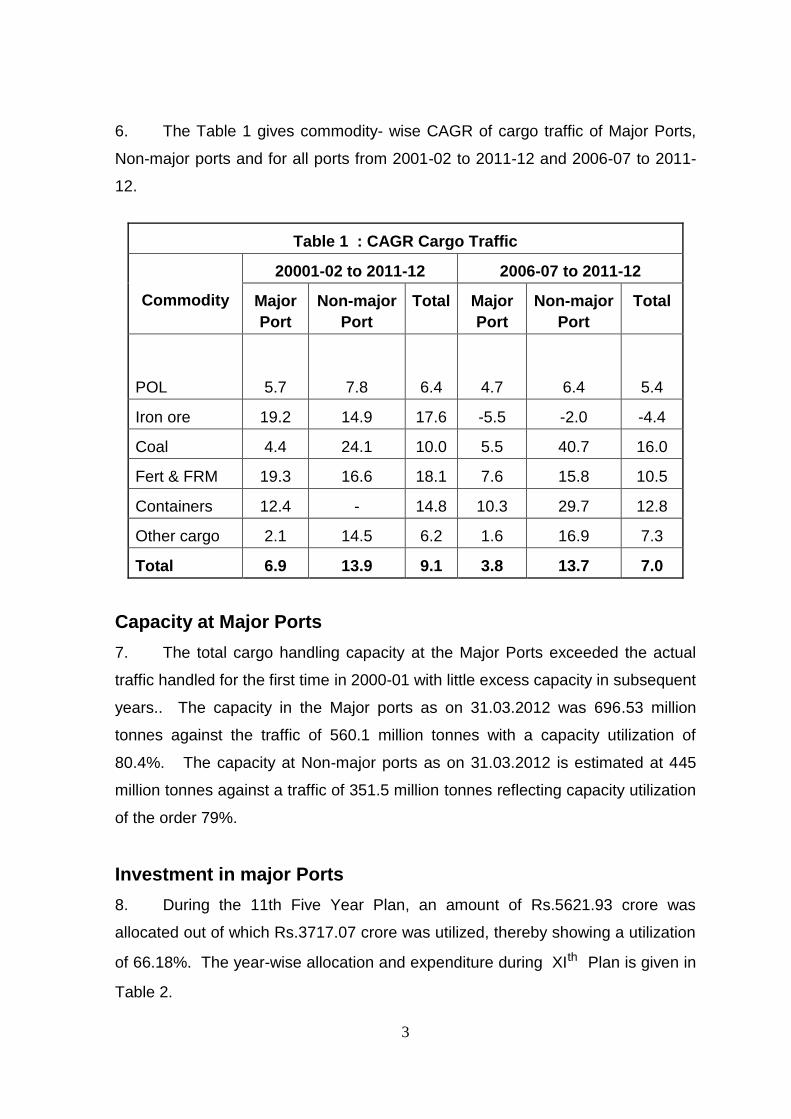
3
6. The Table 1 gives commodity- wise CAGR of cargo traffic of Major Ports,
Non-major ports and for all ports from 2001-02 to 2011-12 and 2006-07 to 2011-
12.
Table 1 : CAGR Cargo Traffic
Commodity
20001-02 to 2011-12 2006-07 to 2011-12
Major
Port
Non-major
Port
Total Major
Port
Non-major
Port
Total
POL 5.7 7.8 6.4 4.7 6.4 5.4
Iron ore 19.2 14.9 17.6 -5.5 -2.0 -4.4
Coal 4.4 24.1 10.0 5.5 40.7 16.0
Fert & FRM 19.3 16.6 18.1 7.6 15.8 10.5
Containers 12.4 - 14.8 10.3 29.7 12.8
Other cargo 2.1 14.5 6.2 1.6 16.9 7.3
Total 6.9 13.9 9.1 3.8 13.7 7.0
Capacity at Major Ports
7. The total cargo handling capacity at the Major Ports exceeded the actual
traffic handled for the first time in 2000-01 with little excess capacity in subsequent
years.. The capacity in the Major ports as on 31.03.2012 was 696.53 million
tonnes against the traffic of 560.1 million tonnes with a capacity utilization of
80.4%. The capacity at Non-major ports as on 31.03.2012 is estimated at 445
million tonnes against a traffic of 351.5 million tonnes reflecting capacity utilization
of the order 79%.
Investment in major Ports
8. During the 11th Five Year Plan, an amount of Rs.5621.93 crore was
allocated out of which Rs.3717.07 crore was utilized, thereby showing a utilization
of 66.18%. The year-wise allocation and expenditure during XIth Plan is given in
Table 2.
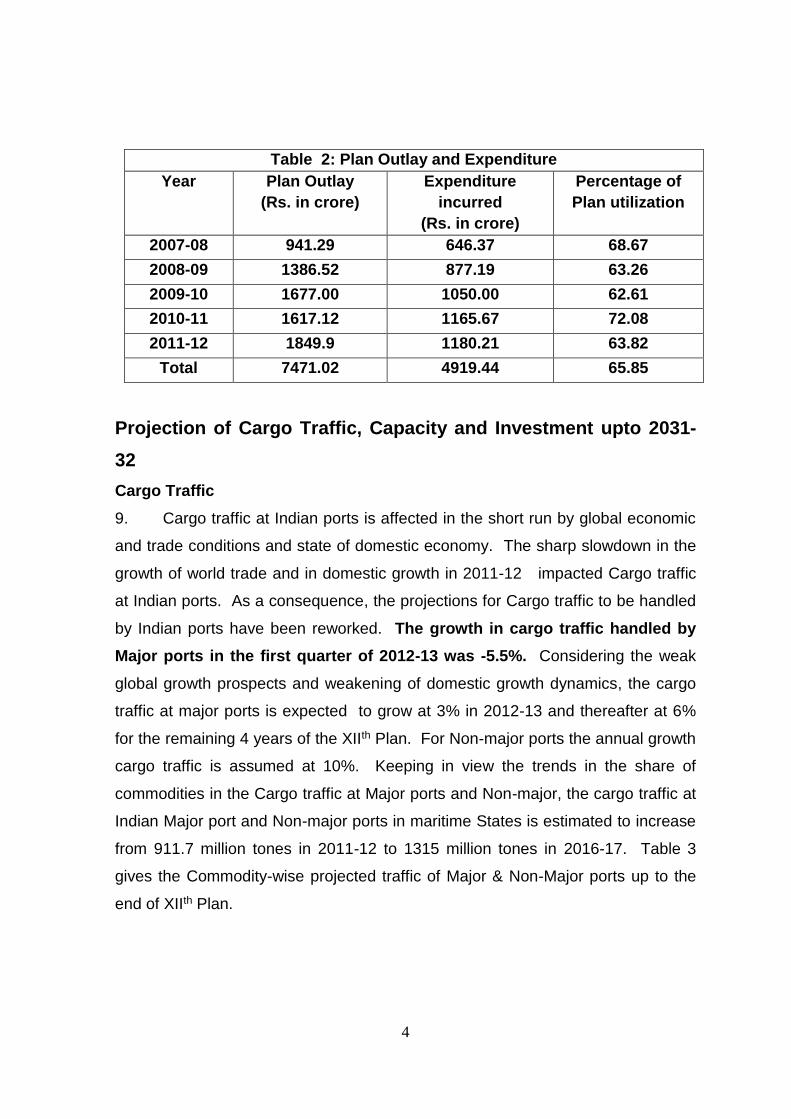
4
Table 2: Plan Outlay and Expenditure
Year Plan Outlay
(Rs. in crore)
Expenditure
incurred
(Rs. in crore)
Percentage of
Plan utilization
2007-08 941.29 646.37 68.67
2008-09 1386.52 877.19 63.26
2009-10 1677.00 1050.00 62.61
2010-11 1617.12 1165.67 72.08
2011-12 1849.9 1180.21 63.82
Total 7471.02 4919.44 65.85
Projection of Cargo Traffic, Capacity and Investment upto 2031-
32
Cargo Traffic
9. Cargo traffic at Indian ports is affected in the short run by global economic
and trade conditions and state of domestic economy. The sharp slowdown in the
growth of world trade and in domestic growth in 2011-12 impacted Cargo traffic
at Indian ports. As a consequence, the projections for Cargo traffic to be handled
by Indian ports have been reworked. The growth in cargo traffic handled by
Major ports in the first quarter of 2012-13 was -5.5%. Considering the weak
global growth prospects and weakening of domestic growth dynamics, the cargo
traffic at major ports is expected to grow at 3% in 2012-13 and thereafter at 6%
for the remaining 4 years of the XIIth Plan. For Non-major ports the annual growth
cargo traffic is assumed at 10%. Keeping in view the trends in the share of
commodities in the Cargo traffic at Major ports and Non-major, the cargo traffic at
Indian Major port and Non-major ports in maritime States is estimated to increase
from 911.7 million tones in 2011-12 to 1315 million tones in 2016-17. Table 3
gives the Commodity-wise projected traffic of Major & Non-Major ports up to the
end of XIIth Plan.
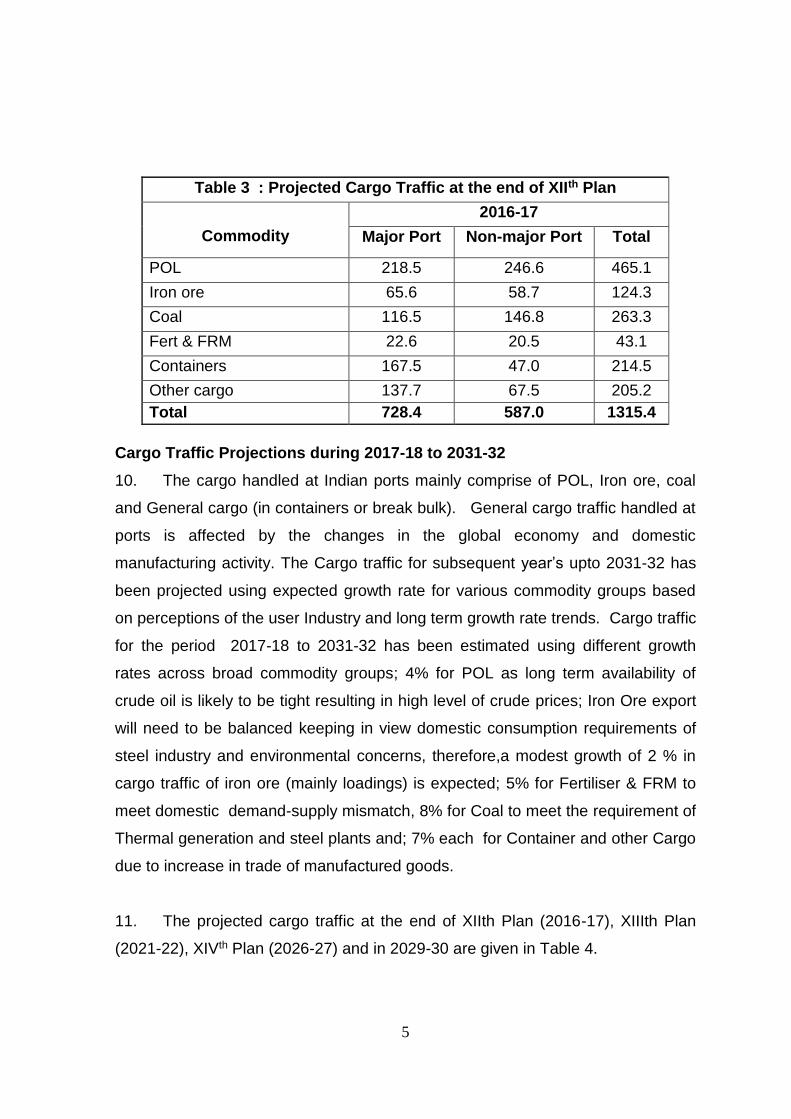
5
Table 3 : Projected Cargo Traffic at the end of XIIth Plan
Commodity
2016-17
Major Port Non-major Port Total
POL 218.5 246.6 465.1
Iron ore 65.6 58.7 124.3
Coal 116.5 146.8 263.3
Fert & FRM 22.6 20.5 43.1
Containers 167.5 47.0 214.5
Other cargo 137.7 67.5 205.2
Total 728.4 587.0 1315.4
Cargo Traffic Projections during 2017-18 to 2031-32
10. The cargo handled at Indian ports mainly comprise of POL, Iron ore, coal
and General cargo (in containers or break bulk). General cargo traffic handled at
ports is affected by the changes in the global economy and domestic
manufacturing activity. The Cargo traffic for subsequent year’s upto 2031-32 has
been projected using expected growth rate for various commodity groups based
on perceptions of the user Industry and long term growth rate trends. Cargo traffic
for the period 2017-18 to 2031-32 has been estimated using different growth
rates across broad commodity groups; 4% for POL as long term availability of
crude oil is likely to be tight resulting in high level of crude prices; Iron Ore export
will need to be balanced keeping in view domestic consumption requirements of
steel industry and environmental concerns, therefore,a modest growth of 2 % in
cargo traffic of iron ore (mainly loadings) is expected; 5% for Fertiliser & FRM to
meet domestic demand-supply mismatch, 8% for Coal to meet the requirement of
Thermal generation and steel plants and; 7% each for Container and other Cargo
due to increase in trade of manufactured goods.
11. The projected cargo traffic at the end of XIIth Plan (2016-17), XIIIth Plan
(2021-22), XIVth Plan (2026-27) and in 2029-30 are given in Table 4.
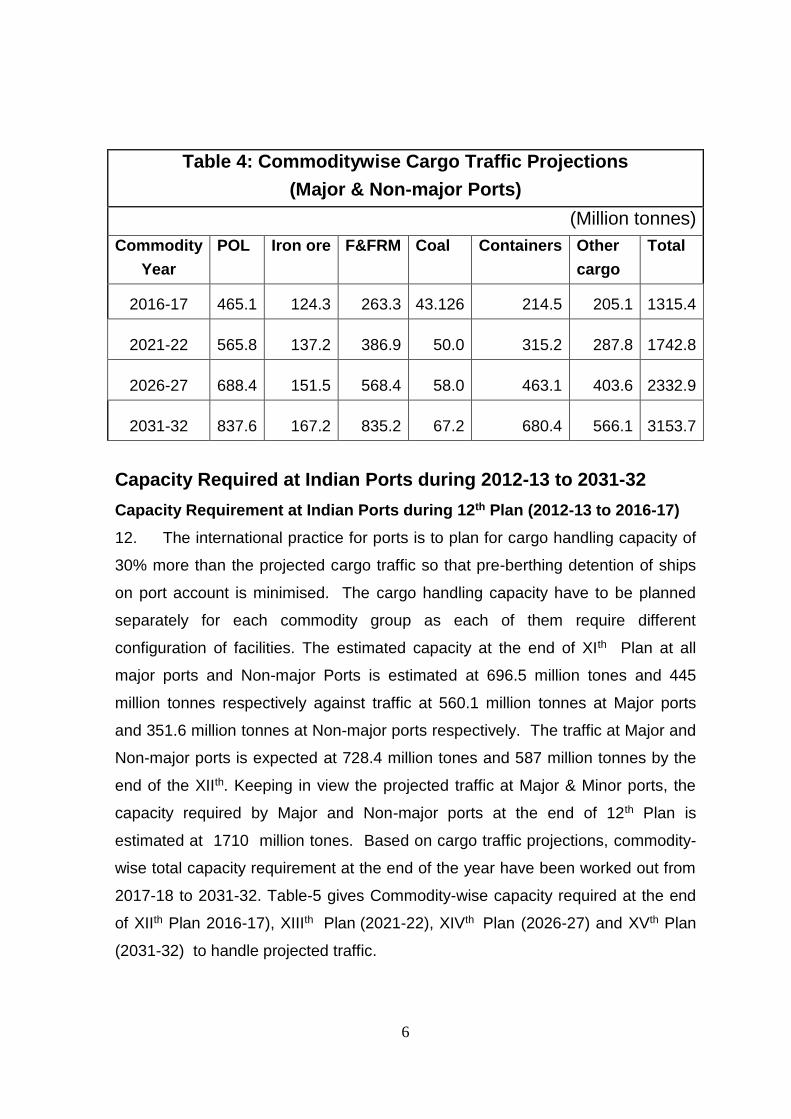
6
Table 4: Commoditywise Cargo Traffic Projections
(Major & Non-major Ports)
(Million tonnes)
Commodity
Year
POL Iron ore F&FRM Coal Containers Other
cargo
Total
2016-17 465.1 124.3 263.3 43.126 214.5 205.1 1315.4
2021-22 565.8 137.2 386.9 50.0 315.2 287.8 1742.8
2026-27 688.4 151.5 568.4 58.0 463.1 403.6 2332.9
2031-32 837.6 167.2 835.2 67.2 680.4 566.1 3153.7
Capacity Required at Indian Ports during 2012-13 to 2031-32
Capacity Requirement at Indian Ports during 12th Plan (2012-13 to 2016-17)
12. The international practice for ports is to plan for cargo handling capacity of
30% more than the projected cargo traffic so that pre-berthing detention of ships
on port account is minimised. The cargo handling capacity have to be planned
separately for each commodity group as each of them require different
configuration of facilities. The estimated capacity at the end of XIth Plan at all
major ports and Non-major Ports is estimated at 696.5 million tones and 445
million tonnes respectively against traffic at 560.1 million tonnes at Major ports
and 351.6 million tonnes at Non-major ports respectively. The traffic at Major and
Non-major ports is expected at 728.4 million tones and 587 million tonnes by the
end of the XIIth. Keeping in view the projected traffic at Major & Minor ports, the
capacity required by Major and Non-major ports at the end of 12th Plan is
estimated at 1710 million tones. Based on cargo traffic projections, commodity-
wise total capacity requirement at the end of the year have been worked out from
2017-18 to 2031-32. Table-5 gives Commodity-wise capacity required at the end
of XIIth Plan 2016-17), XIIIth Plan (2021-22), XIVth Plan (2026-27) and XVth Plan
(2031-32) to handle projected traffic.
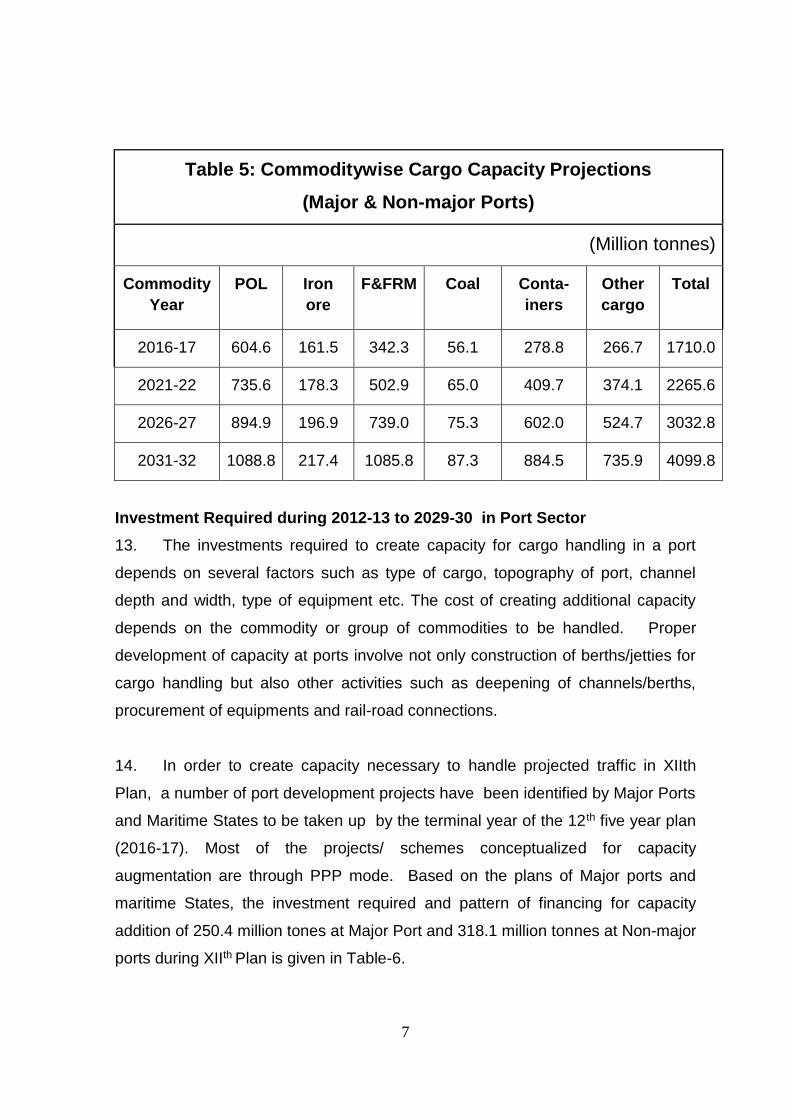
7
Table 5: Commoditywise Cargo Capacity Projections
(Major & Non-major Ports)
(Million tonnes)
Commodity
Year
POL Iron
ore
F&FRM Coal Conta-
iners
Other
cargo
Total
2016-17 604.6 161.5 342.3 56.1 278.8 266.7 1710.0
2021-22 735.6 178.3 502.9 65.0 409.7 374.1 2265.6
2026-27 894.9 196.9 739.0 75.3 602.0 524.7 3032.8
2031-32 1088.8 217.4 1085.8 87.3 884.5 735.9 4099.8
Investment Required during 2012-13 to 2029-30 in Port Sector
13. The investments required to create capacity for cargo handling in a port
depends on several factors such as type of cargo, topography of port, channel
depth and width, type of equipment etc. The cost of creating additional capacity
depends on the commodity or group of commodities to be handled. Proper
development of capacity at ports involve not only construction of berths/jetties for
cargo handling but also other activities such as deepening of channels/berths,
procurement of equipments and rail-road connections.
14. In order to create capacity necessary to handle projected traffic in XIIth
Plan, a number of port development projects have been identified by Major Ports
and Maritime States to be taken up by the terminal year of the 12th five year plan
(2016-17). Most of the projects/ schemes conceptualized for capacity
augmentation are through PPP mode. Based on the plans of Major ports and
maritime States, the investment required and pattern of financing for capacity
addition of 250.4 million tones at Major Port and 318.1 million tonnes at Non-major
ports during XIIth Plan is given in Table-6.
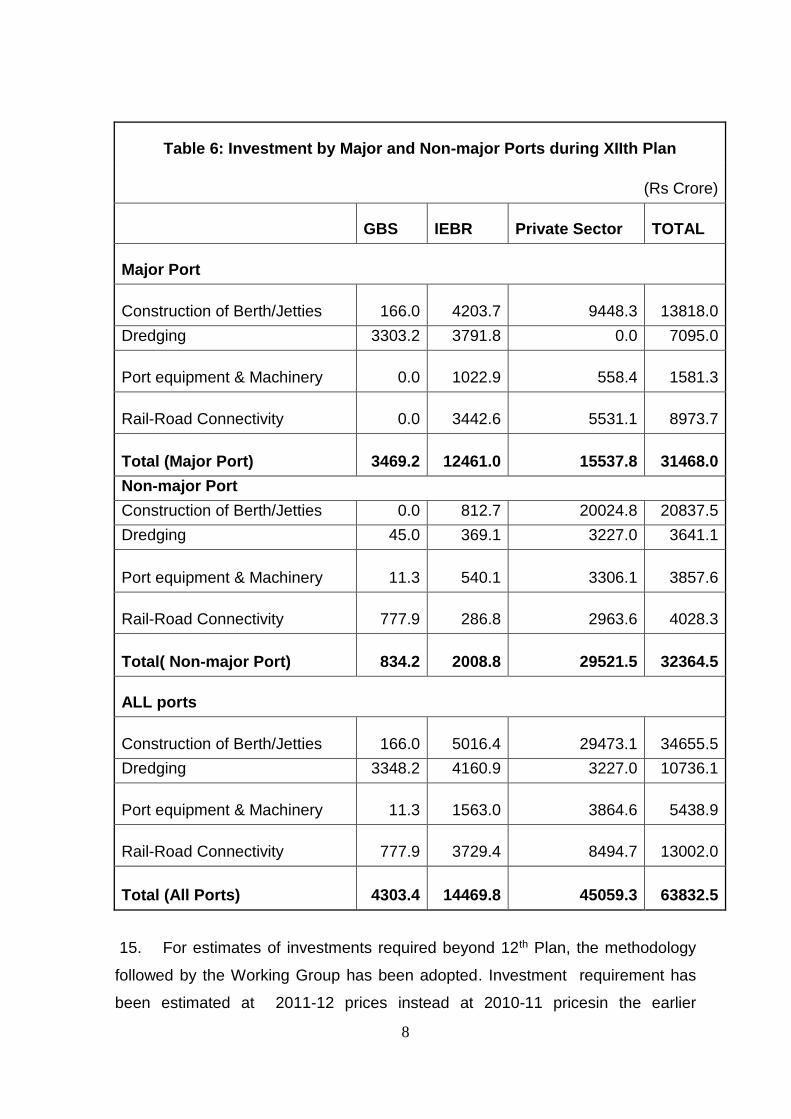
8
Table 6: Investment by Major and Non-major Ports during XIIth Plan
(Rs Crore)
GBS IEBR Private Sector TOTAL
Major Port
Construction of Berth/Jetties 166.0 4203.7 9448.3 13818.0
Dredging 3303.2 3791.8 0.0 7095.0
Port equipment & Machinery 0.0 1022.9 558.4 1581.3
Rail-Road Connectivity 0.0 3442.6 5531.1 8973.7
Total (Major Port) 3469.2 12461.0 15537.8 31468.0
Non-major Port
Construction of Berth/Jetties 0.0 812.7 20024.8 20837.5
Dredging 45.0 369.1 3227.0 3641.1
Port equipment & Machinery 11.3 540.1 3306.1 3857.6
Rail-Road Connectivity 777.9 286.8 2963.6 4028.3
Total( Non-major Port) 834.2 2008.8 29521.5 32364.5
ALL ports
Construction of Berth/Jetties 166.0 5016.4 29473.1 34655.5
Dredging 3348.2 4160.9 3227.0 10736.1
Port equipment & Machinery 11.3 1563.0 3864.6 5438.9
Rail-Road Connectivity 777.9 3729.4 8494.7 13002.0
Total (All Ports) 4303.4 14469.8 45059.3 63832.5
15. For estimates of investments required beyond 12th Plan, the methodology
followed by the Working Group has been adopted. Investment requirement has
been estimated at 2011-12 prices instead at 2010-11 pricesin the earlier
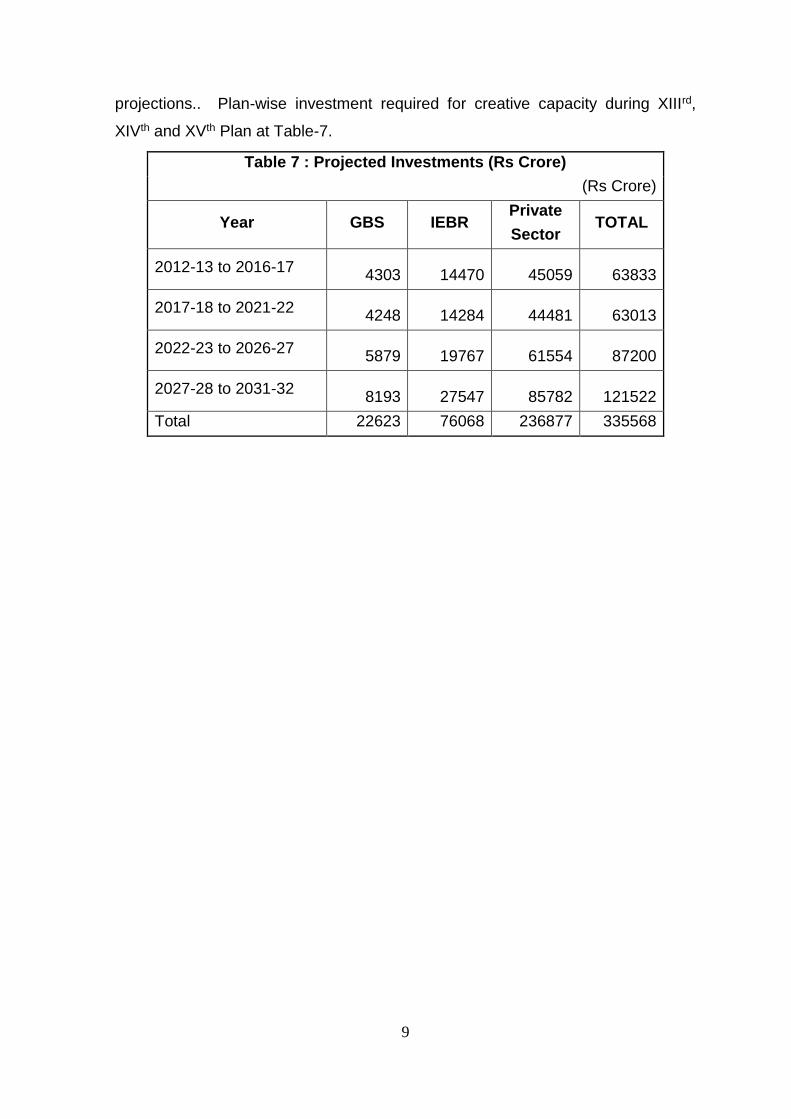
9
projections.. Plan-wise investment required for creative capacity during XIIIrd,
XIVth and XVth Plan at Table-7.
Table 7 : Projected Investments (Rs Crore)
(Rs Crore)
Year GBS IEBR Private
Sector TOTAL
2012-13 to 2016-17 4303 14470 45059 63833
2017-18 to 2021-22 4248 14284 44481 63013
2022-23 to 2026-27 5879 19767 61554 87200
2027-28 to 2031-32 8193 27547 85782 121522
Total 22623 76068 236877 335568
10
Some Important Policy Issues & Recommendations
Mega Ports: Mega Ports find mention in the Interim Report. However, the time frame for
planning/execution required to be curtailed from 20 years to a 12 years time horizon, given
the Exim requirements of the Indian economy in the coming years. In choosing location
for mega ports, it is imperative to ensure rail-road connectivity and requirements of end
users.
Dredging: Draft limitation at Indian Ports restricts the access of large vessels leading to
transshipment of cargo from/to India at some foreign port or transshipment/trans-loading
on high seas leading to extra cost/time. To overcome the draft limitations at India’s Major
Ports there is a need to provide draft up to at least 17 metres during the 12th Plan and the
13th Plan period. This would help Major Ports in attracting large size vessels which were
increasingly being deployed by main line shipping companies. Funding requirements in
this regard are not as huge as one would imagine. Besides, there is need for part
Government funding of dredging in the ship entrance channels.
On the issue of structure of port governance, it is imperative to establish governance
structures which provide both functional and financial autonomy. While landlord port
model has emerged as the most desirable form for managing ports worldwide, the moot
point remains, whetherthe existing ports needs to be incorporated under Companies Act
or constituted as an Independent Authority.
On the issue of unified law for the Port Sector, there is need to use/modify the existing
port legislations to suit present day requirements. While the focus of Major Ports Act,
1963 is primarily on the governance structure for Major Ports that of Indian Ports Act,
1908 is on host of other technical issues – conservancy, safety, navigation, technical,
health, etc. In a federal set up to put in place a unified law may be a daunting task and this
should later not inhibit the process of bringing about changes from time to time.
Therefore a feasible option is to modernize the above general sections of Indian Ports Act,
1908 where it would be easier to achieve consensus and support from Maritime States. At
11
the same time concerted efforts could be made to modernize the Major Ports Act 1963.
This being a Central Act would be easier to amend and help bring convergence between
these two Acts.
Efficiency Parameters: To tackle the high turn round time and pre-berthing detention
one needed to take a holistic view of port operations: ship to shore and shore to hinterland.
This needs identification of weak links in the chain. Presently only 33 berths at Major
Ports are under Private/ (PPP) mode and the rest continue to be under the management of
respective Major Ports. Therefore, a concerted effort is required to mechanize and
modernize berth side operations, so as to concentrate on improvement of the efficiency
parameters at ports.
Shipping: Domestic Shipping Lines have expressed strong need for cargo support for
Indian Flagged Vessels to arrest the decline in share of Indian cargo being carried on
Indian Flagged Vessels. While it may be not be easy to pursue “cargo support” for Indian
Flagged Vessels there is need to focus on other fiscal incentives etc. for protecting the
interests of the Domestic Shipping Industry. A desirable option to promote Indian
Shipping is to put in place an incentive framework which : (a) promoted long term charter
arrangements between India Flagged Vessels and domestic users (bulk commodities in
particular) and; (b) promoting Indian owned but foreign flagged vessels in the first
instance over the foreign owned foreign flagged vessels.
Coastal Shipping: In order to make coastal shipping a competitive and attractive
alternative to road/rail, following initiatives could be pursued: (a) accord import duty
exemption to bunker fuel; (b) 100% service tax abatement. Presently, transportation by
coastal mode is subject to full service tax which makes it uncompetitive viz-a-viz other
competing modes, such as Road (75% abatement) and Rail (70% abatement).
Tariff setting for Major Ports: Presently scale of rates for vessels/cargo handling for
Major Ports (excluding corporatized Port of Ennore) is done by TAMP. Non Major/Minor
Ports governed by States are outside the ambit of TAMP. This has led to a situation where
Non Major Ports enjoy complete freedom/flexibility in tariff setting whereas Major Ports
do not. Keeping these factors into account there is need to look into a dispensation where
tariff is not set by TAMP but determined by competitive forces with TAMP overseeing
from the point of view of maintaining competition and preventing monopoly/oligopoly
situations.
12
Specialized Financing Agency for Maritime Sector: Keeping in view the massive
funding requirement for the maritime sector there is a case for a specialized financing
agency for maritime sector on the grounds: (i) Port projects involve huge sunk costs with
long gestation period. Dwindling GBS for Major Ports and their weak balance sheets
makes it difficult to access capital markets; (b) to get focused sectoral attention in
accordance with the sectoral priorities; (c) maritime sector encompassed many other
activities/businesses as well, such as, shipbuilding, ship repair, specialized equipment for
loading/unloading etc. In case specialized financing institution for the maritime sector is
not possible as it may face the risk on account of concentrated lending and exposure to a
single sector, a specialized window within the existing financial institutions may be set up.
Model Concession Agreement (MCA): It has been observed that that MCA while
reducing scope for constructive innovation in tendering process provided no flexibility and
little scope for customization to suit the specific requirements of a port. The Land Lord
Port Authority model may cut down time for investment approvals.
Coastal Vessels: Need for separate codes for coastal vessels which provide less rigorous
construction specifications and manning scales viz-a-viz ocean going vessels. This would
ultimately result in lower cost of operations for coastal fleet.
With the growing emphasis on modal shift towards eco friendly and efficient mode of
transport there is a need to take a cue from Marco Polo Scheme in vogue in European
Union to promote modal shift in favor of IWT/Coastal Shipping. Marco Polo Scheme
offers subsidy to innovative schemes which promote coastal/IWT mode.
13
Policy Recommendations to promote Coastal Shipping
1. Promoting River Sea Vessels:
a. Facilitate smooth switch between IV (inland vessels) and RSV
(river sea vessels) category on one hand and RSV and MS
(larger merchant shipping vessels) category on the other, as per
the need of the trade.
b. Create facility for e-notification of change of command,
category of vessel and crew.
c. Consider extending the limit of 3000 GT / 3000 KW further for
RSVs
d. Extend the scope of RSVs to other types of vessels such as oil
tankers and other specialized vessels.
2. Infrastructure:
a. Set up dedicated berths for coastal ships (or exclusive coastal
jetty)
b. Promote of Ro-Ro jetties
c. Set up adequate ship repair facility and dry-docks along the
Indian coast to cater to coastal shipping
d. LNG supply facilities
e. Setup dedicated warehouses for coastal cargoes
f. Setup rail and road connectivity at the ports to the nearest rail
heads
g. Deepening of sea channels at minor ports
3. Financial incentives including subsidies:
a. Accord ship repair unit status to individual ships
b. Delinking port tariff for coastal vessels from foreign going
vessels and reduce it further by 30%
c. Waive service tax on costal/inland sea-freight as well as charter-
hire of coastal/inland vessels
d. Duty free bunkers to coastal vessels
14
e. Confer “Declared Goods” status to bunkers being consumed by
coastal/inland vessels
f. Establish a Coastal (Shipping) Development Fund for coastal
ships. This fund may be used for an interest subsidy scheme for
acquisition of coastal ship
g. Coastal vessels should be treated as movable infrastructure and
therefore granted such status for the purpose of ensuring
competitive funding and fiscal benefits
h. Exemption of Customs Duty on import of certain categories of
vessels (e.g. Tugs, Pusher Crafts, Dredgers and Floating
Docks/Cranes/ Production Platforms etc)
4. Manpower issues including manning scales:
a. Upgrading of IV crew to RSV crew through bridge courses
b. Permitting CoC (FG) holders of MS vessels to jump one level up
in manning RSVs
c. Permitting foreign CoC holders working on Indian coastal ships
for a specified period before permitting them to appear for
Indian CoC examinations
d. Establish a RSV cadre for officers-Master (RSV), Mate (RSV),
2nd Mate (RSV), MEO CI III (RSV-Ch. Engg), MEO CI IV
(RSV)
e. Allowing Candidates with certificates from ITI’s should be
allowed to work on coastal vessels with certain bridge courses
5. Cabotage Policy Support
a. Promote acquisition of vessels through the BBCD route
6. Declaration of IV (inland vessel) limits for different states
a. Integration of the IV waters with coastal shipping will require
the declaration of smooth and partially smooth water limits and
15
notification by all maritime states of model IV rules for
construction and survey of IV vessels for operating in smooth
and partially smooth waters
7. Promoting modal shift from road and rail to coastal shipping
a. Improve competitive ability of coastal ships and facilitate
shifting of cargo from road and rail to sea
b. Carbon credit scheme: Not withstanding all its merits, the modal shift
from road / rail to coastal shipping is not happening at the desired pace.
It is necessary to incentivise this shift by bringing it under a carbon
credit scheme;
8. Data base and communication infrastructure
a. Establish & maintain a robust system/database for collection of
accurate voyage specific data on coastal shipping
b. INSA to publish annual report on coastal tonnage and coastal
cargo and work towards a coastal index
c. Develop a freight exchange for India-centric international
container trade which may later be extended to coastal
operations
d. Streamlining the multi-modal transport operations