Philippine Domestic Shipping Industry
84
PASCN Philippine APEC Study Center Network PASCN Discussion Paper No. 2002-04 Philippine Domestic Shipping Industry: State of Competition and Market Structure Myrna S. Austria The PASCN Discussion Paper Series constitutes studies that are preliminary and subject to further revisions and review. They are being circulated in a limited number of copies only for purposes of soliciting comments and suggestions for further refinements. The views and opinions expressed are those of the author(s) and do not neces- sarily reflect those of the Network. Not for quotation without permission from the author(s).
-
Upload
khangminh22 -
Category
Documents
-
view
0 -
download
0
Transcript of Philippine Domestic Shipping Industry
PASCNPhilippineAPECStudy CenterNetwork
PASCN Discussion Paper No. 2002-04
Philippine Domestic Shipping Industry:State of Competition and Market Structure
Myrna S. Austria
The PASCN Discussion Paper Series constitutes studies that are preliminary andsubject to further revisions and review. They are being circulated in a limitednumber of copies only for purposes of soliciting comments and suggestions forfurther refinements.
The views and opinions expressed are those of the author(s) and do not neces-sarily reflect those of the Network.
Not for quotation without permission from the author(s).
PASCNP H I L I P P I N E
A P E C S T U D Y C E N T E R
N E T W O R K
PASCN Discussion Paper No. 2002-04
Philippine Domestic Shipping Industry: State of Competition and Market Structure
Myrna S. Austria
Philippine Institute for Development Studies
June 2002
The PASCN Discussion Paper Series constitutes studies that are preliminary and subject to further revisions and review. They are being circulated in a limited number of copies only for purposes of soliciting comments and suggestions for further refinements. The views and opinions expressed are those of the author(s) and do not necessarily reflect those of the Network. Not for quotation without permission from the author(s).
For comments, suggestions or further inquiries, please contact:
The PASCN Secretariat Philippine Institute for Development Studies NEDA sa Makati Building, 106 Amorsolo Street Legaspi Village, Makati City, Philippines Tel. Nos. 893-9588 and 892-5817

i
Table of Contents
Page No. Abstract Executive Summary Table of Contents i. List of Tables ii. List of Figures iii. List of Appendices iv.
1. Introduction 1
2.Domestic Shipping Transport Industry: Brief Profile 2
3.Contestability of Markets in the Shipping Industry 5
4.Regulatory Framework and Policies: Pre-reform Period 8
5.Liberalization, Deregulation and Other Government Policies 14
6.Market Structure and Competition 22
7.The Role of MARINA in a Deregulated Environment 39
8.Areas for Competition Policy and Further Reforms 41
9.Summary and Conclusions 43
10.References 44
11.Appendices 46

ii
List of Tables
Table Title Page No. 1 Gross value added in water transport (million pesos at constant
1985 prices) 3
2 Domestic passenger and cargo traffic, 1990-2000 3 3 Government regulations on domestic shipping rates 16 4 Classification of routes 23 5 Indicators of market structure, passenger service, 1998 23 6 State of competition, passenger service, 1998 24 7 Indicators of market structure, cargo service, 1998 25 8 State of competition, cargo service, 1998 25 9 Distribution of top 5 players as effective competitors, by type of
routes, passenger and cargo services, 1998 26
10 State of competition, routes originating from Manila and Cebu, passenger service, 1998
28
11 State of competition, routes originating from Manila and Cebu, cargo services, 1998
29
12 Range of market shares of dominant players in routes with only 1 effective competitor and routes with mild competition (%)
30
13 Annual increase in cargo rates, Sulpicio Lines (%, 1995 prices) 33 14 Annual increase in cargo rates, WG&A (%, 1995 prices) 34 15 Annual increase in passenger rates, WG&A (%, 1995 prices) 35 16 Annual increase in passenger rates, Sulpicio Lines (%, 1995
prices) 2000- 2001 36
17 Entry- exit of firms, domestic shipping industry, 1990-1999 38 18 Surviving firms, growing and declining based on Net Registered
Tonnage (NRT) change 39
iii
List of Figures Figure Title Page No.
1 Total GRT of domestic merchant fleet, by type of service, 1990-1999 4 2 Annual growth rate, passenger GRT and traffic (1990-1999) (%) 4 3 Annual growth rate, cargo GRT and traffic (1990-1999) (%) 5 4 Average age of domestic merchant fleet, by type of service, 1990-1999 5 5 Loans released by sector, DSMP I, as of June 2001 21 6 Loans released by sector, DSMP II, as of June 2001 21
iv
List of Appendices
Table Title 1 Dominant/ effective players per route, per type of market, passenger traffic,
primary routes, 1998
2 Dominant/ effective players per route, per type of market, passenger traffic, secondary routes, 1998
3 Dominant/ effective players per route, per type of market, passenger traffic, tertiary routes, 1998
4 Dominant/ effective players per route, per type of market, cargo revenue, primary routes, 1998
5 Dominant/ effective players per route, per type of market, cargo revenue, secondary routes, 1998
6 Dominant/ effective players per route, per type of market, cargo revenue, tertiary routes, 1998
1
Philippine Domestic Shipping Transport Industry: State of Competition and Market Structure*
Myrna S. Austria**
1. Introduction The shipping transport industry plays a very important role in the country’s development. Considering the archipelagic setting of the country, shipping provides the primary means of interisland transport. That is, the bulk of domestic trade is transported by shipping; interisland travel, especially in the southern part of the country, is also largely dependent on shipping. Considering this role, an efficient shipping industry that facilitates the movement of commodities, products and people is vital to the growth of the country. This is one where passengers and cargoes get to their destinations on time and in good and safe condition at the least possible cost. For cargoes, especially agricultural commodities, the transport should be in a manner where their physical condition at their place of destination allows them to be marketed at the most competitive price. The country’s domestic shipping industry, however, has been regarded to be inefficient. This is rather unfortunate as the industry has a large number of shipping companies where competition could be expected to be a powerful force for eliminating inefficiency. Past studies suggest the underlying explanation has much to do with the regulations in the industry and policies of the government affecting the industry. The industry has been highly regulated until reforms, through deregulation and liberalization, were instituted in the 1990s in response to the continuing inefficiency. This study examines the inefficiency of the industry in terms of the complex interaction between regulation and competition; and the effects of the reforms on competition and market structure. The scope of the paper is limited to the interisland liner shipping industry because this is the sector of the industry where regulation is highly concentrated and whose viability is highly sensitive to government policy. The paper is organized as follows. Section 2 provides a brief profile of the industry. Section 3 discusses the contestability of markets in the shipping industry, including the arguments for and against regulating the industry. Section 4 examines the regulatory framework and policies during the pre-reform period. This is followed by a discussion of liberalization, deregulation and other government policies affecting the industry in Section 5. Section 6 is an analysis of the market structure and state of competition arising from the reforms, including the impact of competition. Section 7 is a discussion of the role of the MARINA in a deregulated environment. Areas for
* This paper was made possible through the financial assistance from the Philippine APEC Study Center Network. ** Senior Research Fellow, Philippine Institute for Development Studies (PIDS) and Project Director, Philippine APEC Study Center Network (PASCN) Secretariat. The author would like to acknowledge the able research assistance provided by Ms. Dorothea Lazaro.
2
competition policy and further reforms are then identified in Section 8. The summary and conclusions are presented in Section 9.
2. Domestic Shipping Transport Industry: Brief Profile Marine transport services consist of three types of activities namely, maritime transport services, maritime auxiliary services and port services (Fink, Mattoo and Neagu, 2000). Marine transport refers to the actual transportation service performed once the commodity or passenger is on board a ship until the ship reaches its port of destination. Marine auxiliary services refer to activities related to cargo manipulation in ports and on ships. Under the General Agreement on Trade in Services (GATS) classification, these include cargo handling, storage and warehousing, custom clearance, container station and depot, maritime agency and freight forwarding. On the other hand, port services refer to those activities related solely to ship management in ports. Under GATS classification, these include pilotage, towing and tug assistance, provisioning, fuelling and watering, garbage collecting and disposal, port captain’s services, navigation aids, shore-based operational services and emergency repair facilities. This paper will concentrate on marine transport, as the other two types of activities have separate issues of their own.
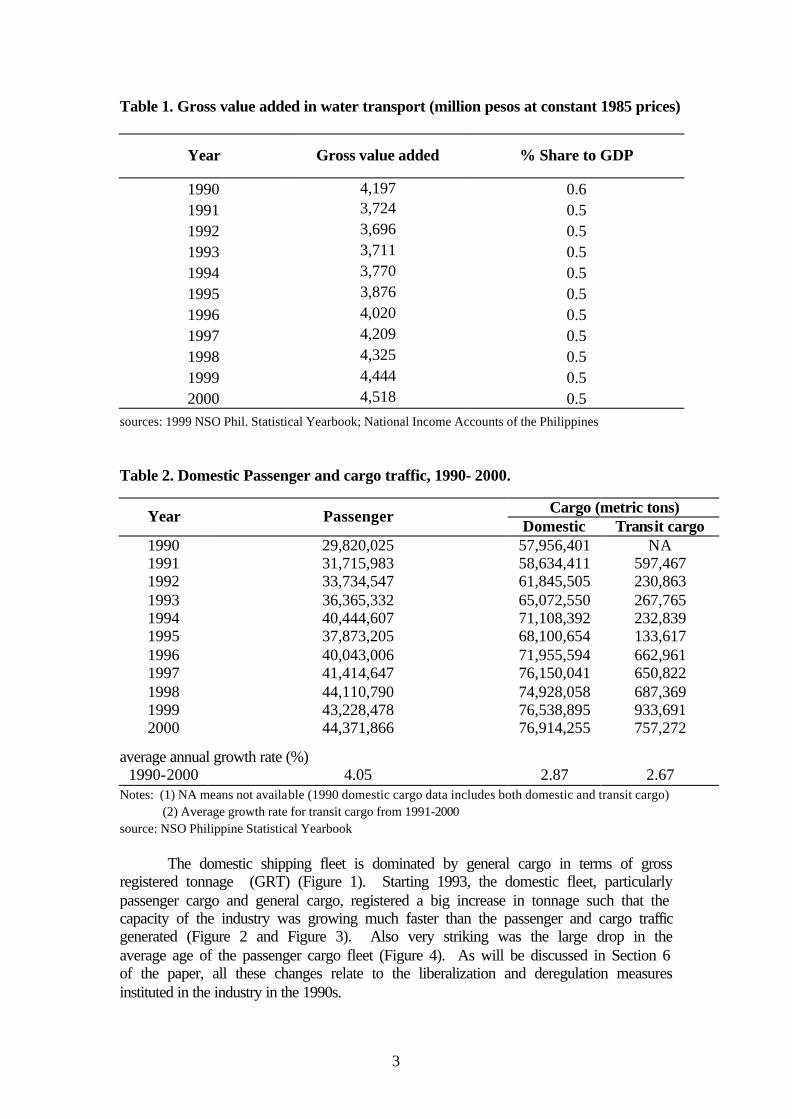
The country’s domestic shipping transport is composed of three sectors: liner, tramp and industrial carriage. Liner shipping refers to the operation of domestic water transportation that offers their services to the public without discrimination to any user, have regular ports of call and have fixed sailing schedules and frequency. Tramp shipping, on the other hand, refers to the operation of freight vessels that are not plying a regular route but are hired on a contractual basis by shippers under mutually agreed terms and usually carry cargoes of bulky commodities. Industrial carriage refers to the shipping operations of companies arising from the necessity to cater to the needs of their own enterprises. Of the three sectors, only liner shipping is regulated by the government. The water transport industry contributes about half a percent to the country’s gross domestic product and this share has remained unchanged throughout the 1990s (Table 1). Passenger traffic carried by liner shipping increased from almost 30 million in 1990 to 44.4 million in 2000 registering a 4.05 percent average annual growth rate during the period (Table 2). The volume of domestic cargo carried also went up from 58 million metric tons in 1990 to 76.9 million metric tons in 2000 or a growth rate of almost 2.87 percent per year.
The domestic shipping industry also plays an important role in the country’s international trade by carrying, between ports in the country, cargoes intended for exports and cargoes arriving as imports, or what are referred to as transit cargoes. Between 1991 and 1998, transit cargoes carried by domestic vessels grew from 597.5 thousand metric tons to 757.3 thousand metric tons or by 2.67 percent per annum (Table 2).
3
Table 1. Gross value added in water transport (million pesos at constant 1985 prices)
Year Gross value added % Share to GDP
1990 4,197 0.6 1991 3,724 0.5 1992 3,696 0.5 1993 3,711 0.5 1994 3,770 0.5 1995 3,876 0.5 1996 4,020 0.5 1997 4,209 0.5 1998 4,325 0.5 1999 4,444 0.5 2000 4,518 0.5
sources: 1999 NSO Phil. Statistical Yearbook; National Income Accounts of the Philippines Table 2. Domestic Passenger and cargo traffic, 1990- 2000.
Cargo (metric tons) Year Passenger Domestic Transit cargo
1990 29,820,025 57,956,401 NA 1991 31,715,983 58,634,411 597,467 1992 33,734,547 61,845,505 230,863 1993 36,365,332 65,072,550 267,765 1994 40,444,607 71,108,392 232,839 1995 37,873,205 68,100,654 133,617 1996 40,043,006 71,955,594 662,961 1997 41,414,647 76,150,041 650,822 1998 44,110,790 74,928,058 687,369 1999 43,228,478 76,538,895 933,691 2000 44,371,866 76,914,255 757,272
average annual growth rate (%) 1990-2000 4.05 2.87 2.67
Notes: (1) NA means not available (1990 domestic cargo data includes both domestic and transit cargo) (2) Average growth rate for transit cargo from 1991-2000
source: NSO Philippine Statistical Yearbook
The domestic shipping fleet is dominated by general cargo in terms of gross registered tonnage (GRT) (Figure 1). Starting 1993, the domestic fleet, particularly passenger cargo and general cargo, registered a big increase in tonnage such that the capacity of the industry was growing much faster than the passenger and cargo traffic generated (Figure 2 and Figure 3). Also very striking was the large drop in the average age of the passenger cargo fleet (Figure 4). As will be discussed in Section 6 of the paper, all these changes relate to the liberalization and deregulation measures instituted in the industry in the 1990s.

4
Figure 1. Total GRT of domestic merchant fleet, by type of service, 1990-1999
0200,000400,000600,000
800,0001,000,0001,200,0001,400,000
1,600,0001,800,000
1990 1991 1992 1993 1994 1995 1997 1998 1999Year
GR
T (
me
tric
to
ns
)
Passenger Ferry
Passenger Cargo
General Cargo
Container
Others
Total
Notes: (1) The 1996 inventory does not include vessels with sizes 3 GT and below such that the resulting figures turned out to be smaller than the 1995 figures, thereby rendering the statistics non-comparable for purposes of trend determination. (2) "others" include liquid cargo/ lighterage, barging, tanker, towing, salvaging, pleasure, pilotage, and others with no information. Source: MARINA Domestic Fleet Inventory
Figure 2. Annual growth rate, passenger GRT and traffic (1990-1999)
-10.0
0.0
10.0
20.0
30.0
40.0
50.0
60.0
70.0
90-91 91-92 92-93 93-94 94-95 95-97 97-98 98-99
gro
wth
rat
e (%
)
GRT (based on passenger cargo)GRT (based on passenger cargo and ferry)passenger traffic
sources: MARINA (for GRT) and NSO Phil. Statistical Yearbook (for total passenger traffic)
Liner shipping routes are classified as primary, secondary, tertiary and developmental routes. The classification is based on ports being served, population and economic development in the area, and the cargo/passenger throughput attendant to the linkages fostered. Primary routes include those that handle domestic volume of national significance and usually cover the major ports of the country. Secondary routes include those that handle domestic volume of regional significance and are linked to ports of lesser throughputs than major ports. Tertiary routes are feeder routes that handle cargoes consolidated and destined for primary and secondary ports. Finally, developmental routes do not have existing shipping operators but shipping operations are economically desirable because of their potentials in agriculture, tourism or mining. Operation along these routes, during the initial stages, is not financially viable.

5
Figure 3. Annual growth rate, cargo GRT and traffic, 1990-1999 (%)
-20.0
0.0
20.0
40.0
60.0
80.0
100.0
120.0
140.0
160.0
90-91 91-92 92-93 93-94 94-95 95-97 97-98 98-99
gro
wth
rat
e (%
)
GRT (based on general cargo and container)GRT (based on passenger cargo, general cargo and container)cargo traffic including transit
sources: MARINA (for GRT) and NSO Phil. Statistical Yearbook (for total cargo traffic)
Figure 4. Average age of domestic merchant fleet, by type of service, 1990-1999
0.00
5.00
10.00
15.00
20.00
25.00
30.00
1990 1991 1992 1994 1995 1997 1998 1999
Passenger ferry
Passenger Cargo
General Cargo
Container
Ave Merchant fleet
Notes: (1) The 1996 inventory does not include vessels with sizes 3 GT and below such that the resulting figures turned out to be smaller than the 1995 figures, thereby rendering the statistics non-comparable for purposes of trend determination. (2) No data available for 1993.
Source: MARINA Domestic Fleet Inventory 3. Contestability of Markets in the Shipping Industry The literature on contestability of markets points to the importance of the threat of competition, as distinct from actual competition, in enforcing good behavior and conduct among firms in the industry (Hanlon, 1996). This kind of market is characterized by the following: (i) there are no barriers to entry, i.e. no extra cost borne by new entrants that are not borne by the incumbents; (ii) there are no sunk costs, i.e. costs that cannot be recouped when a firm withdraws from the industry; (iii) the time for the incumbents to change their price in response to the entry is longer than the time for the new entrant to make profits. According to this theory, firms in
6
oligopolistic industries will still price at the same level as they would in a perfectly competitive market so long as the threat of competition exists. In other words, under this market, the incumbents can protect themselves from new competition only by behaving well. A contestable market offers to consumers and the society similar benefits from a perfectly competitive market (Baumol and Lee, 1991). Because of the threat of competition, firms cannot charge higher-than-competitive prices or earn excessive profits; any attempt to do so would invite new entrants to undercut the incumbents’ prices to a level that could still be give them attractive return. Waste and inefficiency beyond that which is allowed by the current of state of technology and level of knowledge are also avoided as these would be reflected in higher costs and prices, the presence of which would invite the entry of efficient firms. Likewise, predatory pricing and cross-subsidy pricing are prevented. Predation becomes unattractive since it can only be done if there is a prospect for making future profits large enough to recoup losses made when prices or profits were kept low to drive competitors or new entrants away; but then excessive profits would invite entry. Cross-subsidy occurs when a firm charges a price below cost to particular group of customers and the loss is made up for by charging excessive prices to other customers. This is not feasible under a contestable market as the excessive price would invite new entrants who can sell at a lower price level. In effect, the new entrants are capturing from the incumbents the earnings that were previously used for cross-subsidy. Arguments for and against regulating the shipping industry
The shipping industry is a highly contestable market in the absence of government regulations that prevent market forces take their course on the functioning of the industry. The common argument for the need to regulate liner shipping is based on the supposed danger of chronic instability due to inherent tendencies to ruinous competition and monopoly (Renardet Sauti Consulting Engineers, 1986). That is, the industry is highly vulnerable to price and capacity fluctuations that lead to ruinous competition and eventually to monopoly, after the weak firms are driven out. Price instability. The vulnerability to price and capacity fluctuations, if there are no limits to competition, is argued to be associated with the cost structure of the industry. Once a vessel is at berth, the only cost associated with carrying an extra ton of cargo is the cost of loading and discharging it; and such marginal cost is very low, an average of about 25-30 percent of the freight rate. At such rate, an operator cannot survive. Hence, an operator will find it profitable to take an extra cargo at a rate higher than the handling cost. However, if there is free competition, the rate would be forced to go down to the level of the handling cost whenever there is any surplus in capacity. The industry will then become unprofitable for all operators. However, it is also argued that the above argument is not plausible as shipping operators do not in practice cut their rates to the level of marginal costs once the ship is at berth. Instead, what influences the behavior of operators is not the marginal cost of an extra ton of cargo, but the cost of an extra voyage or set of voyages and their relation to revenues at pre-determined rate levels.
7
Nevertheless, price-cutting is practiced but only in so far as there is overcapacity or overtonnaging in the industry. And this can lead to rate instability. Monopoly. Another argument for government regulation is the danger of monopoly. A natural monopoly occurs when there are economies of scale that allows a large company to charge lower prices because its unit costs are lower than a small company. This will eventually drive small firms from the market. In shipping, the lower unit costs may arise from larger ships or from a larger number of ships. It is also argued, however, that there are no significant economies of scale in the shipping industry (Renardet Sauti Consulting Engineers, 1986) or that economies of scale is not a significant barrier to entry in the industry (Dick, 1987). While a larger vessel will generally give lower costs per ton than a small ship, the cost advantage of larger vessels is offset by two factors. One, cargo handling rates increase less than proportionately with ship size, so that the larger ship tends to spend a larger proportion of its time in port. Two, smaller ships are able to provide more frequent service because of their faster turnaround. Hence, small ships can operate alongside with larger ships.
On the number of ships, a large fleet will not necessarily have lower costs per
ton than a small fleet. More than 80 percent of a shipping company’s operating costs are ship operating costs, the rest being terminal and administrative costs. Thus, if a company increases its fleet by 20 percent, its operating cost is expected to increase by the same amount (Renardet Sauti Consulting Engineers, 1986).
Furthermore, economies of size appear to be insignificant beyond about 3
ships, while diseconomies seem to occur beyond about 10 ships (Dick, 1987). This is attributed to managerial diseconomies of scale. Shipping companies are said to be difficult to manage because the locations of the head office, branch office and terminals are so dispersed. Profitability is highly dependent on capacity utilization, which in turn depends on port turnaround. This would then require some kind of loyalty to the shipping company of officers and crews to cooperate in speeding up turnaround. As a general rule, however, officers and crews would prefer a longer to a shorter stay in port. Hence, to increase turnaround and productivity, some kind of incentive and a good wage structure is required. In family shipping business, the practice is to appoint family members to man the day-to-day operations of the business across various ports. However, as the number of ships, routes and ports increases, the problem of control and management seem to increase disproportionately.
Competition in shipping Rate discounting, particularly on freight rates, is a common practice in the industry. Even when there are government regulations on rate setting, the official rates become just a benchmark or a base from which to discount. Actual freight rates are usually the product of bargaining between shippers and shipping operators (Dick, 1987). Discount comes in various forms like under-recording the weight or volume of the cargo or declaring the cargo as a low-value item. Since such practices do not involve a reduction in freight rate as reflected in the bill of lading, shipping companies can make it appear that they are following the official rates.
8
Discounting drives up price competition in the industry. To lessen the pressure for rate discounts, shipping companies with established financial position offer longer term for payment. But on the other hand, forwarders, traders and large companies that distribute their own products can make bargains for large discounts by offering a contract for their cargoes for a fixed period. Guaranteed by the security of a contract and a large volume of cargoes, a shipping company can thus settle for a low margin for its shipping rates.
The disadvantage of competing through rate discounting, however, is that any
discount can readily be matched by competitors. Thus, in the face of intense rate competition, the best strategy for a shipping company is to try and become the market leader in terms of quality of service. In practice, freight rates are not the primary but the balancing item in the services negotiated with shippers, as shippers and traders are more concerned with the safety of their cargoes. That is, the cost of a late or damaged cargo could be much more than the savings from a small discount in freight rate.
Thus, competition in shipping is primarily in terms of quality of service. A
good reputation for reliable service can insulate shipping companies from intense competition in freight rates and allows them to charge a premium rate and earn a more than normal profit. But such cannot last long as the premium invites other companies to improve on the quality of their service. However, in times of excess capacity when rate-cutting is prevalent, companies with good reputation are able to keep their share of the market while companies offering not so reliable service destroy each other in a fight for the crumbs. In practice, rate-cutting is prevalent only among firms at the lower end of the market offering the poorest service and struggling to survive. 4. Regulatory Framework and Policies: Pre-reform Period Regulation of the domestic liner shipping industry was first introduced in the country during the American colonial rule. In fact, the pattern of the early regulations closely resembled those that applied to American railroads and motor trucking industry. The then Board of Transportation (BOT) was in charge of regulating the industry until the Maritime Industry Authority (MARINA) took over the function in 1985. Regulation covers route entry and rate/tariff determination. Liner rate regulations
Regulations for liner rates began in 1928. The objective was to protect the public from indiscriminate charging by shipping companies and, at the same time, protect the investment of liner operators by preventing ruinous competition. Rates, or what are commonly called as tariffs, were fixed by the government. To simplify the task of setting rates for a large number of commodities or passengers, rates were structured by commodity or passenger class. Commodities were initially classified as Class A for processed goods or high value manufactured goods, Class B for semi-processed goods or low value manufactured goods, Class C for unprocessed commodities and Basic for rice, palay, corn, corngrits, fruits, vegetables and livestocks. As will be discussed later, some of the Basic commodities were reclassified when policy reforms were introduced into the industry. Passenger
9
services, on the other hand, were classified as First Class, Second Class and Third Class depending on the kind of services and accommodation offered. Starting in 1983, the tariff structure for both passenger and cargo provided different rates with respect to three distance ranges namely, 0-100 miles, 101-300 miles and over 300 miles.
The tariff structure prescribes a set of formulae for user charges that vary in
accordance with the commodity classification or service class of passengers and the direct distance between the ports of origin and destination. The formula for cargo rates has a fixed and distance-related component while the passage rate only has a distance-related component. The fixed component reflects the cost of the vessel while loading or discharging in port and it is computed in pesos revenue per ton. On the other hand, the variable or distance-related component reflects the cost of the vessel’s time while at sea and is computed in pesos per revenue ton mile or pesos per passenger mile. A revenue ton is either a measurement ton of one cubic meter, or a weight ton of 1000 kilograms, whichever gives the higher revenue to the shipping operator.
The first rate formulae instituted in 1928 were originally cost-based, with a
uniform tariff per nautical mile for most cargoes. Cost-based tariff is one which passes on the costs of providing the service to shippers without discriminating between cargoes. By the 1980s, however, the rates were both cost- and value-based in that while the fixed and variable components were retained, high-value goods had higher rates than low-value goods. Such practice allows the cross-subsidization of the shipment of low-value goods.
For cargo rates, there was an alternative to the class rates. The liner operators
had the option to charge an ad valorem rate on any goods valued at over P1,000 per ton. The original objective was to limit the ad valorem rates only on very high value goods but with the passage of time and as inflation increases the prices of all commodities, the ad valorem option became applicable to more and more commodities. The rate was 0.5 percent in 1928 and at that time, it excluded almost all goods in the interisland trade. By the 1980s, however, the threshold included most commodities.
Throughout the period 1928-1985, the basic structure of tariffs has remained
largely unchanged (Renardet Sauti Consulting Engineers, 1986). Only the level of rates had changed by periodic across-the-board increases, basically to reflect changes in inflation rate. For the ad valorem rate, the rate is increased by the square of the inflation rate. It increased first automatically as the price of the cargo increases and then a second time with the official increase in the ad valorem percentage rate. From 0.5 percent in 1928, the rate rose to 7.3 percent by 1989. In the 1980s, the ad valorem rate became so high that it represented serious deviations from appropriate charges based on shipping costs (PTF, 1989).
For the class rates (passage and freights rates), upward adjustments were made
using the revenue deficiency method. Under this method, rate adjustments are made based on the revenues that need to be generated by liner operators to provide a rate of return (ROI) consistent with Commonwealth Act No.146 or the Public Service Act of

10
1936. The Act declared the provision of shipping services, along with other services1, a public service. The maximum allowable ROI for public utilities was 12 percent and it has remained at this level until today. Under the revenue deficiency method, the required revenue is compared to the actual revenue (based on audited financial statements provided by the ship operators), and the difference indicated the deficiency in rates.
The method is too dependent on the financial reports of shipping operators.
Before the reforms were instituted, MARINA combines the financial statements of all members of the Domestic Shipping Association (DSA) to get the average for the industry from which to base the increase and then apply an across-the-board rate increase. The method does not consider average load factors and degree of efficiency of operations such that even if load factors are low and vessel operation is inefficient, rate increases were approved so long as revenue was insufficient to obtain the prescribed ROI. Thus, even inefficient firms, which would normally be driven out of the industry if market forces are allowed to operate, were made to earn profits. Since the method guarantees operators of earning profits regardless of their performance, there is no pressure on the part of shipowners to search for more efficient means of meeting the country’s demand for shipping services (Balisacan, 1989). But worse, the method has made the level of shipping rates too high over the years. It resulted in rates that did not consider the actual cost of providing cargo or passenger services.
While the government fixed the rates, enforcement was weak or minimal.
Because the rates were too high (both ad valorem and class rates) and the enforcement was weak, discounting became the rule. A discount of 15-25 percent discount was common in the 1980s (Nathan Associates, 1991).
At the same time, however, the freight rates for Basic commodities and the
passage rates, particularly for the Third Class, were not permitted to increase as rapidly as the general inflation rate, for social reasons. Route Licensing
Originally, the shipping industry was exempted from the government regulation under the Public Service Act of requiring operators of all public service to obtain a certificate of public convenience (CPC) (Chapter II, Section (13a) of the Act). A CPC is an authorization for the operation of a public service; and in this case, the authorization to a vessel for domestic water transportation services for commercial use. Route licensing, however, was introduced in 1972. The commonly accepted reason for its introduction was that the major routes were overtonnaged while many of the other routes were inadequately served or had no service (Nathan Associates 1991). The objective therefore of regulating entry was to bring capacity and demand into balance. For a CPC to be granted, the following requisites must be complied with:
1 Also included as public service are any common carrier, railroad, street railway, sub-way or motor vehicle engaged in the transportation of passengers or freight or both, shipyard, marine railways, wharf or dock, ice plant, ice-refrigeration plant, canal, irrigation system, gas, electric light, water supply and power, petroleum, sewerage system, wire or wireless communication system, broadcasting stations and other similar public service.

11
• The applicant must be a citizen of the Philippines, or a corporation or a co-partnership, association or joint-stock company constituted and organized under the laws of the Philippines, 60 percent at least of the stock or paid-up capital of which belongs entirely to the citizens of the Philippines;
• The applicant must be financially capable of undertaking the proposed
shipping service and meeting the responsibilities incident to its operation; and,
• The applicant must prove that the operations of the public service
proposed and authorized to do business will promote the public interests in the proper and suitable manner.
CPCs are given on a vessel-to-vessel basis, specifying the exact route and
schedule. There was a deliberate policy, throughout the pre-reform period, of limiting competition by restricting market entry. The general principles for issuing a CPC were prior-operator, prior-applicant and protection of investment or what are commonly referred to as “grandfather rules”. The “prior applicant rule” means that priority is given to the first applicant, among the various applicants, for a CPC. “Prior operator rule” means the priority is given to an existing authorized2 operator in a route, and in each segment of the route, by virtue of a CPC or provisional authority (PA) issued. On the other hand, “protection of investment rule” means the protection and conservation of investment that have already been made by operators.
There are two types of application for a license: (i) an application for a route for which the applicant/operator has no franchise,
i.e. new entrant in a route; If the route being applied for is already serviced by a franchised3 operator, the
BOT/MARINA conducts a market evaluation upon receipt of an application for the route to see if the entry of additional operators in the route is justifiable. If the demand warrants additional fleet, the application is not immediately approved. The existing operator is first given the priority to put in additional vessel/s to meet the demand; only if he cannot meet the demand within six months will the application of a new operator is approved.
However, if the route is already served by non-franchised operators, the “prior
applicant rule” applies. For a development route, entry is allowed and the new entrant is protected in
his investment by not allowing another operator to ply the same route until such time that he has recovered his investment. Since there was no limit in the number of years by which the operator is protected to recoup his investment, there was no incentive for him to make his operation efficient. On the other hand, if market conditions warrant additional tonnage, entry was open to additional operator/s, but subject to the “prior
2An authorized operator is one who is issued either a certificate of public convenience (CPC) or provisional authority (PA). 3 A franchised operator is one that has been issued a certificate of public convenience (CPC).
12
operator rule”. That is, priority was given to the original operator to put in the additional tonnage.
(ii) an application to expand capacity in a route for which the operator already
has a franchise. If the demand calls for additional capacity, a franchised operator was allowed
to increase 50 percent to his capacity, at minimum interval of three years. If there are several existing franchised operators in the same route, the “prior-applicant rule” applied.
However, in all the above rules, the past service records of the operator/s or
the new applicant/s were not taken into consideration.
During the early years of franchising, compliance was low. Some liners did not register and those that did were issued CPCs that did not specify their routes (1986 study). In 1977, a freezing program was introduced in the industry, through Memorandum Circular No. 11, with the aim to control overtonnaging in the industry. Under the program, all operators were supposed to secure provisional authority to operate. But there was confusion in the administration of franchising. Prior to assuming the full responsibility of handling franchising, MARINA served as the technical arm of the BOT. But since MARINA and BOT issued approvals independently of each other, the program did not improve the capability of the government to control and monitor capacity. In 1978, MC No. 16 was issued declaring a policy to protect established shipping companies already providing adequate service from undue competition. Under the policy, no new operator was allowed to enter primary and secondary routes and only one operator for the tertiary route. Where there was more than one existing operator in a tertiary route, merger or joint services was promoted or encouraged. MC No. 26, issued in 1982, introduced the rationalization of the interisland shipping operations. Among other things, the circular required all operators (i) to observe their authorized routes, sailing frequency and schedules, and that any deviation from such without appropriate authority shall be penalized; (ii) abandonment, withdrawal or suspension of service was not allowed without authority from the BOT; (iii) vessel rerouting is discouraged and becomes illegal if pursued without an amendment of the CPC; and (iv) acquisition of new vessels was regulated, limiting it only to the modernization of tonnage in the route and giving priority to existing operators4. Impacts and problems arising from government regulations The past regulations of the domestic shipping industry had adverse impacts on the economy. These are well documented in the findings of several studies and these are summarized in this section. These include the Inter-island Shipping Regulation Study prepared by the Renardet Sauti Consulting Engineers in 1986; findings of the Presidential Task Force (PTF) on Inter-island Shipping Industry in 1989; the 4 Acquisition of new vessels is allowed if it can be proven that there is general deterioration of services in terms of quality and reliability. All existing operators are given equal opportunity and advance notice on the need to modernize; and if no application is received within six months, application from new entrants are entertained and on first come first served basis.
13
Philippine Transport Sector Review in 1990; and the studies prepared by Nathan Associates, Inc. on the Inter-island Liner Shipping Rate Rationalization Study in 1991 and the Liner Shipping Route Study in 1994. Overtonnaging. As discussed earlier, regulating the routes was meant to reduce overtonnaging of the industry. Over the years, however, onvertonnaging had persisted. This was manifested in low load factors in most cases. In short, route franchising did not succeed in bringing capacity and demand on balance although it moderately succeeded in limiting overtonnaging in individual routes.
Several factors contributed to the persistent overtonnaging. Route franchising can only deal with the distribution of capacity between routes but not on the absolute level of capacity of the industry. That is, if a vessel was refused entry in one route, it could find its way in another route; or if it was withdrawn from a particular route, it was only re-routed in another route. Hence, the overall capacity of the industry was maintained or even increased if the vessel involved was new. The origin of overtonnaging is at the vessel import approval stage. In the past, refusal of import approvals rarely happened. The 12 percent cap on the return on investment is also said to have contributed to the overtonnaging of the industry. One practice in the industry to circumvent the cap is for shipping operators to horizontally expand by acquiring more vessels thereby increasing their assets, which in turn, form part in the computation of the required revenue to obtain the ROI. Such practice does not promote efficiency where the use of vessels is maximized at the least cost. Additional vessels and tonnage should be dictated by an increase in demand and not by the desire to meet the prescribed ROI. The high rates arising from the revenue deficiency method also caused the overcapacity in the industry. The high rates were sufficient to guarantee profits even at low load factors.
Flaws in the tariff structure. The tariff structure established in 1928 suffered from major flaws. First, the rate differentials between class did not reflect differences in the cost of providing services for each commodity group but instead it was an attempt by the government to incorporate consideration of “what the market will bear” into the regulation process. The product value is generally supposed to indicate what the market will bear as a proxy for price elasticity of demand for the product. As discussed below, this resulted to the discrimination of some commodities and particular routes in the provision of shipping services.
Second, the commodity classification was also problematic as rates for some
commodities were set too low thus, failing to ensure the availability of sufficient services at all times. This was true, in particular, for the Basic commodities. At the same time, rates for other commodities have been set too high to permit them to bear the charges.
Third, the application of a uniform rate formula for all routes was
inappropriate as it did not consider both cargo inflow imbalances and cargo mixes. The unit cost per ton of cargo increases as capacity utilization falls. High capacity utilization rate cannot be achieved if there are large imbalances in the in-bound and
14
out-bound traffic. Hence, rates for routes with a good balance of traffic in the two directions will not be appropriate for routes with large imbalances. Also, the mixture of class of commodities determines the earning potentials of the routes. Hence, routes with a high proportion of Class A or Class B commodities in the total cargo traffic will have higher earning potentials than routes with a higher proportion of Class C (Basic) commodities.
Effects on the economy. The flaws in the tariff structure and rate setting
created adverse effects on the economy. In general, the adverse effects have fallen disproportionately on the producers and traders of agricultural commodities. The very low rates for Basic commodities had limited the availability of appropriate services for agricultural products. In particular, grain shippers from Mindanao had difficulty in obtaining sufficient cargo space because the rates were too low5 to make the commodities attractive to operators. In turn, the unavailability of sufficient liner services, inhibited the growth of inter-island trade and agricultural diversification; and resulted to high storage costs, commodity value losses resulting from deterioration and high charges for the alternative and limited services of trampers and air transport.
On the other hand, since the passage rates were not permitted to increase with
the general inflation rate, they have failed to keep pace with the increasing cost of providing passenger services. The practice in general is for cargo services to subsidize passenger services. This made profitability in passenger service difficult to achieve and resulted to both the tendency to overload and provide very low service standards resulting to some of the major maritime disasters in the country’s history. It also hindered the introduction liner services on new routes as it raises the minimum level of traffic required to make the service profitable.
Overall, the past regulatory system protected inefficient industry operation.
5. Liberalization, Deregulation and Other Government Policies The problems arising from the regulations of the industry and the major maritime disasters and accidents that claimed thousands of lives towards the end of the 1980s prompted the government to finally introduce policy reforms in the industry (PTF, 1989). The reforms came through the deregulation of the passage and freight rates and the liberalization of routes. As discussed below, the process of reform was implemented gradually starting 1989 and is still continuing at present. The change in policy was meant to introduce and/or enhance the level of competition in terms of the rates charged and the quality of service rendered while at the same time to attract new shipping investments by leveling the playing field for existing and new operators. Deregulation of liner rates
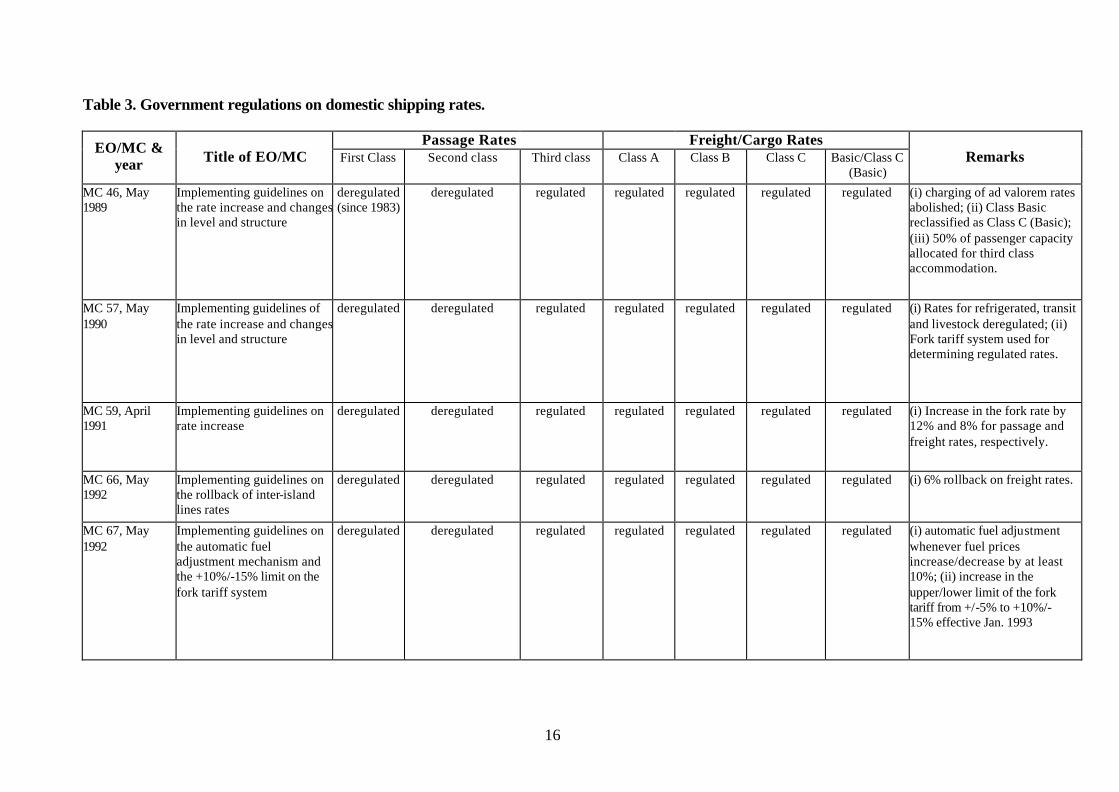
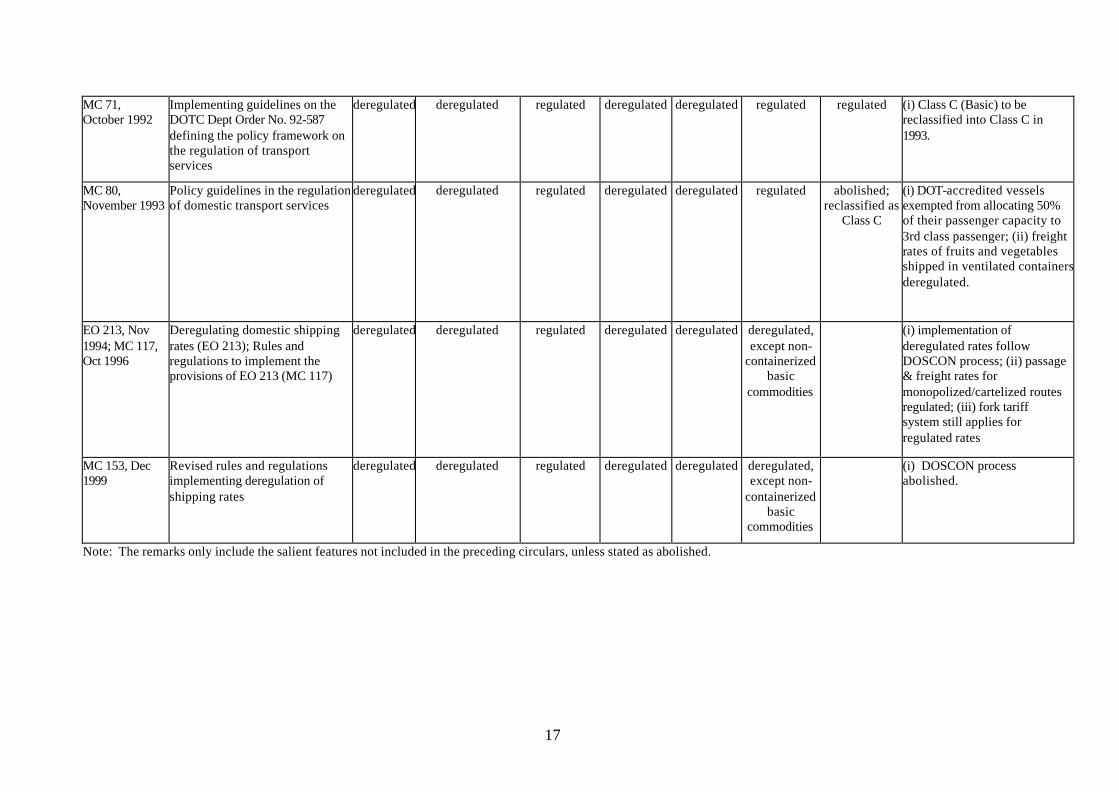
A summary of the reforms for liner rates is shown in Table 3. Changes in
policies and regulations were first initiated in 1989 under Memorandum Circular
5 The rates are lower than those imposed by tramp operators for hauling grains.
15
(MC) No. 46 as a result of the recommendations of the Presidential Task Force on the Inter-island Shipping Industry. Early reforms included the (i) abolition of the charging of ad valorem rates, although a 3/10 percent surcharge of the declared valued of the commodity was imposed, except for Basic commodities; (ii) reclassification of Basic commodities to Class C (Basic); and (iii) deregulation of the first and second class passage rates6. For the later, a minimum of 50 percent of vessel capacity should be allocated to Third Class accommodation. The deregulation allowed operators to determine the rates they will charge for their services. Further reforms were made in 1990 under MC No. 57. The 3/10 percent surcharge was abolished; hence, all commodities were charged the corresponding class rates. Freight rates for refrigerated cargoes, transit cargoes, and livestock were also deregulated. A most welcome reform was the introduction of the fork tariff system for the determination of freight and passage rates7. Under the system, rates are allowed to fluctuate between upper and lower limits from a given reference or indicative rate, thereby providing some flexibility in the determination of rates. For cargoes, the system provides a mechanism for the shippers and shipping operators to negotiate for the rates within the band set by the government. The first fork tariff system had a lower and upper limit of –5 percent and +5 percent of the reference rate, respectively. This means that a domestic shipping operator may increase its freight rate of a given commodity or shipment up to a maximum of 5 percent and may deduct a maximum of 5 percent on the base rate.
In 1991 (MC No. 59), the reference rate for the fork tariff system was increased by 12 percent for the passage rate and by 8 percent for the freight rate. In 1992 (MC No. 66), a 6 percent rollback on freight rates was adopted. Also, the lower and upper limit of the fork tariff system was increased from +/-5 percent to +10/-15 percent. A mechanism for automatic fuel adjustment whenever prices of fuel will increase or decrease by at least 10 percent was also instituted. Under the mechanism, however, shipping operators cannot unilaterally adjust their rates. Instead, MARINA will automatically adjust the rates with the issuance of the appropriate Order increasing or decreasing the rates within five working days after the increase/decrease of fuel price. The early reforms, however, were unable to correct the problems identified earlier. For one, the flexibility provided by the fork tariff system was very limited as the rates cannot vary to the extent that operating costs vary with respect to routes, ship technology especially with the introduction of container service and roll on-roll off (RORO) service, quality of packaging, and changes in cargo handling methods. Second, the compulsory requirement to allocate 50 percent of passenger capacity to accommodate third class passengers made pure passenger vessel operation less viable. Third, the reclassification of Basic commodities to Class C (Basic) failed to correct the insufficiency of appropriate liner service for these commodities. Finally, the deregulation of the second and first class passenger service did not caused movement of passengers from third to second class (Nathan and Associates 1991). 6 First Class passenger rate was first deregulated in 1983. 7 Only members of the Conference of Inter-island Shipowners and Operators and any other operators who have filed applications for rate increase by paying the corresponding fee and issued the corresponding Order are authorized to use the fork tariff system.
16
Table 3. Government regulations on domestic shipping rates.
Passage Rates Freight/Cargo Rates EO/MC & year Title of EO/MC First Class Second class Third class Class A Class B Class C Basic/Class C
(Basic) Remarks
MC 46, May 1989
Implementing guidelines on the rate increase and changes in level and structure
deregulated (since 1983)
deregulated regulated regulated regulated regulated regulated (i) charging of ad valorem rates abolished; (ii) Class Basic reclassified as Class C (Basic); (iii) 50% of passenger capacity allocated for third class accommodation.
MC 57, May 1990
Implementing guidelines of the rate increase and changes in level and structure
deregulated deregulated regulated regulated regulated regulated regulated (i) Rates for refrigerated, transit and livestock deregulated; (ii) Fork tariff system used for determining regulated rates.
MC 59, April 1991
Implementing guidelines on rate increase
deregulated deregulated regulated regulated regulated regulated regulated (i) Increase in the fork rate by 12% and 8% for passage and freight rates, respectively.
MC 66, May 1992
Implementing guidelines on the rollback of inter-island lines rates
deregulated deregulated regulated regulated regulated regulated regulated (i) 6% rollback on freight rates.
MC 67, May 1992
Implementing guidelines on the automatic fuel adjustment mechanism and the +10%/-15% limit on the fork tariff system
deregulated deregulated regulated regulated regulated regulated regulated (i) automatic fuel adjustment whenever fuel prices increase/decrease by at least 10%; (ii) increase in the upper/lower limit of the fork tariff from +/-5% to +10%/-15% effective Jan. 1993
17
MC 71, October 1992
Implementing guidelines on the DOTC Dept Order No. 92-587 defining the policy framework on the regulation of transport services
deregulated deregulated regulated deregulated deregulated regulated regulated (i) Class C (Basic) to be reclassified into Class C in 1993.
MC 80, November 1993
Policy guidelines in the regulation of domestic transport services
deregulated deregulated regulated deregulated deregulated regulated abolished; reclassified as
Class C
(i) DOT-accredited vessels exempted from allocating 50% of their passenger capacity to 3rd class passenger; (ii) freight rates of fruits and vegetables shipped in ventilated containers deregulated.
EO 213, Nov 1994; MC 117, Oct 1996
Deregulating domestic shipping rates (EO 213); Rules and regulations to implement the provisions of EO 213 (MC 117)
deregulated deregulated regulated deregulated deregulated deregulated, except non-
containerized basic
commodities
(i) implementation of deregulated rates follow DOSCON process; (ii) passage & freight rates for monopolized/cartelized routes regulated; (iii) fork tariff system still applies for regulated rates
MC 153, Dec 1999
Revised rules and regulations implementing deregulation of shipping rates
deregulated deregulated regulated deregulated deregulated deregulated, except non-
containerized basic
commodities
(i) DOSCON process abolished.
Note: The remarks only include the salient features not included in the preceding circulars, unless stated as abolished.
18
Hence, further deregulation was made towards the end of 1992 (MC No. 67), this time involving the freight rates for Class A and Class B cargoes. The operators were however required to file their rates for Class A and Class B and any changes thereafter with the MARINA. In 1993 (MC No. 80), Class C (Basic) was abolished and the commodities classified therein were reclassified as Class C. Fruits and vegetables in ventilated containers were also deregulated. For passage rates, vessels accredited by the Department of Tourism as serving tourist areas were exempted from the requirement of allocating 50 percent of their total passenger capacity to Third Class passengers; and accordingly, their rates were deregulated. However, if the vessel only has First Class and Second Class passenger accommodation or where the Third Class passenger accommodation is less than 50 percent of the passenger capacity, the Second Class passage rate was regulated. Further deregulation of freight rates was made in 1994 through Executive Order No. 213, with implementing guidelines under MC No. 117 issued in 1996. All freight rates were deregulated, except for non-containerized basic commodities. However, for monopolized and cartelized routes, passage and freight rates continue to be regulated. The fork tariff system is still applied to all regulated rates, the upward adjustment of which continues to follow the revenue deficiency method; but this time, the rate increase is computed on a per company basis.
The implementation of deregulated freight rates, however, is another matter as operators were not allowed to determine on their own the rates they will charge for their services. Instead, the Domestic Shipping Consultative Councils (DOSCONs), composed of shippers/consumers, operators and representatives from the government, was instituted to provide a forum for the process of consultation and negotiations for the implementation of the deregulated rates or any upward adjustments of the rates. Hence, the deregulation as provided for in EO 214 only modified the process of fixing cargo rates that was previously exercised by the government through a quasi-judicial procedures.
The DOSCON process, however, was abolished in late 1999 when the implementing guidelines of EO 213 were revised under MC No. 153. Under the revised guidelines, all an operator needs to do is to file a notice of adoption of deregulated rates with the MARINA, and when qualified, MARINA will issue an Order within 30 days upon receipt of the notice. The deregulated freight and passage rates should remain in force for at least 3 months before any upward adjustment is allowed.
Upward adjustments of deregulated rates can take effect 15 days after the publication of the notice for increase filed with the MARINA in one daily newspaper of national circulation and in one daily newspaper of regional circulation in the port/s affected by the rate adjustment. For regulated rates, upward adjustment is still based on the revenue deficiency method. Under the new policy environment, the method may no longer be appropriate as the financial statements of shipping companies include their deregulated operations.

19
In general, the deregulation of the liner shipping rates has been a slow process. It took the government more than 10 years to gradually deregulate the liner rates. Yet, it was only in the year 2000 that government intervention in rate setting was lessened. With deregulation, the shipping companies can now consider the traffic imbalances and cargo mixes in setting the rates for the routes they serve. While there are still areas that remain regulated, these can be overcome and can be strategic areas for modernizing the industry. For example, shipping companies can upgrade their vessels and facilities and be accredited to DOT to qualify them in the exemption from allocating 50 percent of their passenger capacity to third class and enjoy the deregulated rates. Also, the exception of non-containerized basic commodities from deregulation should encourage the use of other shipping technology in transporting these commodities, like roll-on roll-off vessels.
Much is still desired, however. The rate for Third Class passenger is yet to be deregulated.
Route liberalization Liberalization of the routes was first introduced in 1992. Two general principles are observed for the issuance of a CPC. First, the interest of the public is paramount. That is, the interest of the public shall prevail over the “grandfather rules” of the pre-reform namely, “prior applicant”, “prior operator” and “protection of investment”. Second, the presumption of public need for a service is deemed in favor of the applicant for a CPC while the burden of proving that there is no need for a proposed service shall be with oppositors who is/are the current authorized operator/s.
Given these principles, routes were opened to entry to at least two operators (MC No. 71 and MC NO. 80 in 1992). Monopolized routes were opened for entry to additional operators. Operators in developmental routes, on the other hand, were accorded protection for their investment for a maximum period of five years, after which, the route is open to entry to at least one additional operator. This was a big contrast to the pre-reform period regulation where an operator in a developmental route is accorded protection of his investment for an indefinite period, i.e. until he has recovered his investment. This change in rule would definitely encourage the operator to increase his efficiency for him to be able to recover his investments before competition from additional operators set in. Entry of newly-acquired vessels in routes already served by existing franchised operators, including developmental routes, is also deregulated provided that the entry will introduce innovative, technologically and cost-effective shipping services, among others. Operators are allowed to withdraw or suspend their operations after notifying MARINA 15 days prior to such and after informing the public. An operator, however, forfeits his CPC if he abandons, withdraws, or suspends his operation for four months without notifying MARINA. Increase in capacity is also allowed through replacement with a bigger vessel, introduction of additional vessels and/or increase in frequency of existing vessels. An operator can also change his routing pattern through the omission of ports, addition of one or more ports, or the introduction of an entirely new route provided however that the change does not pose any conflict with the schedule and frequency of existing operators and that no route is left unserved by the rerouting.

20
The initial liberalization efforts were further strengthened with the issuance of Executive Order 185 in 1994 and its corresponding implementing rules and regulations under MC 106 in 1995. In particular, any operator who pioneers in the provision of a certain technological level of shipping service in a developmental route is allowed to charge market-accepted freight and passage rates different from the fork rates. The adoption of such rates after five years, however, is dependent on the evaluation of MARINA. Also, when capacity is increased through the replacement of a vessel, the CPC of the vessel to be replaced is revoked. The revocation of CPC will ensure that the vessel replaced will not be used anywhere else and hence, will not result in increase in tonnage in the routes. Similarly, when capacity is increased through the introduction of additional vessel that is chartered from a franchised operator, the original franchise of the vessel is revoked. This policy was again a big contrast to the pre-reform regulation where the CPCs of vessels replaced were not revoked. The implementing guidelines of EO 185 were revised under MC No. 161 in 2000 providing further dimensions to the liberalization efforts. Specifically, all routes that have been serviced by any operator for an aggregate period of at least five years shall be open for entry to additional operators provided that the entry will not result to ruinous competition as characterized by any of the following conditions:
• When an existing operator/s in a given route carry less than average annual break-even load factor as determined by the MARINA;
• When the audited financial statements of any of the operators in a given
route show losses directly related to their operations for the last two years; and,
• Such other analogous circumstances as may be determined by MARINA. In addition, operators of pioneering8 routes will be protected in their
investments by according protection from entry for a period to be determined by MARINA following some guidelines that considers cost recovery, the number of years of which shall not be more than five years. Other government policies
Cabotage Law. Foreign shipping lines are not allowed to ply the country’s interisland routes.
Domestic Shipping Modernization Program. To complement the
liberalization and deregulation efforts, the government implemented the Domestic Shipping Modernization Program (DSMP) funded by a loan package from the Overseas Economic Cooperation Fund (OECF) of Japan and administered by the Development Bank of the Philippines (DBP). The program has two phases: Phase I (1995-2000) with a loan package of 14.8 billion yen or roughly P3.91 billion for the
8 Pioneering route refers to either (i) a route that does not have existing shipping services or an abandoned route or link; or (ii) a route considered developmental with respect to the introduction of new or technologically advanced type of service.
21
modernization of inter-island vessels; and Phase II (1999-2005) with a loan package of 19.5 billion yen or P6.7 billion for the development of port facilities in rural areas.
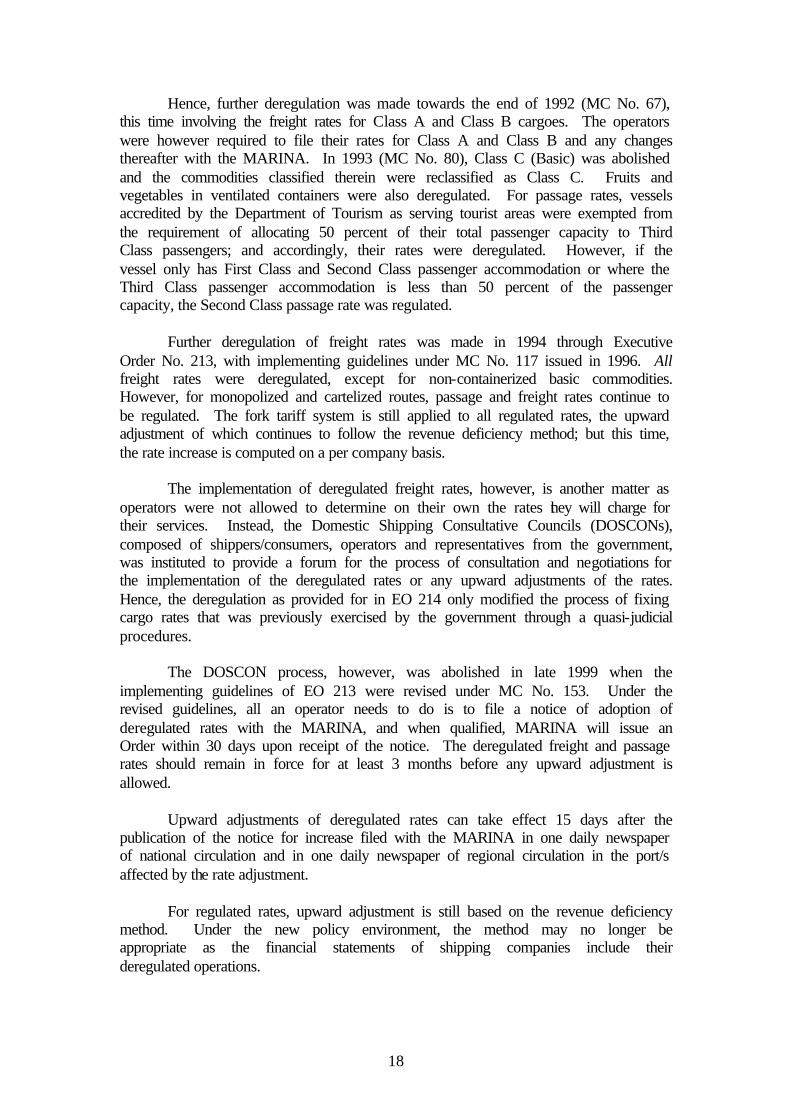
Phase I was used to finance the replacement of vessels (new buildings and/or second hand), rehabilitation and/or upgrading (bringing to class) and modernization of inter-island fleet; acquisition, rehabilitation, and modernization of shipyards and port cargo handling equipment; and working capital. As of June 2001, almost 84 percent of the package has been loaned out, most of which went to passenger-cargo vessels and tankers (Figure 5). This explains the increase in the capacity (GRT) of passenger vessels and the decline in their average age as discussed earlier in Section 2 of the paper.
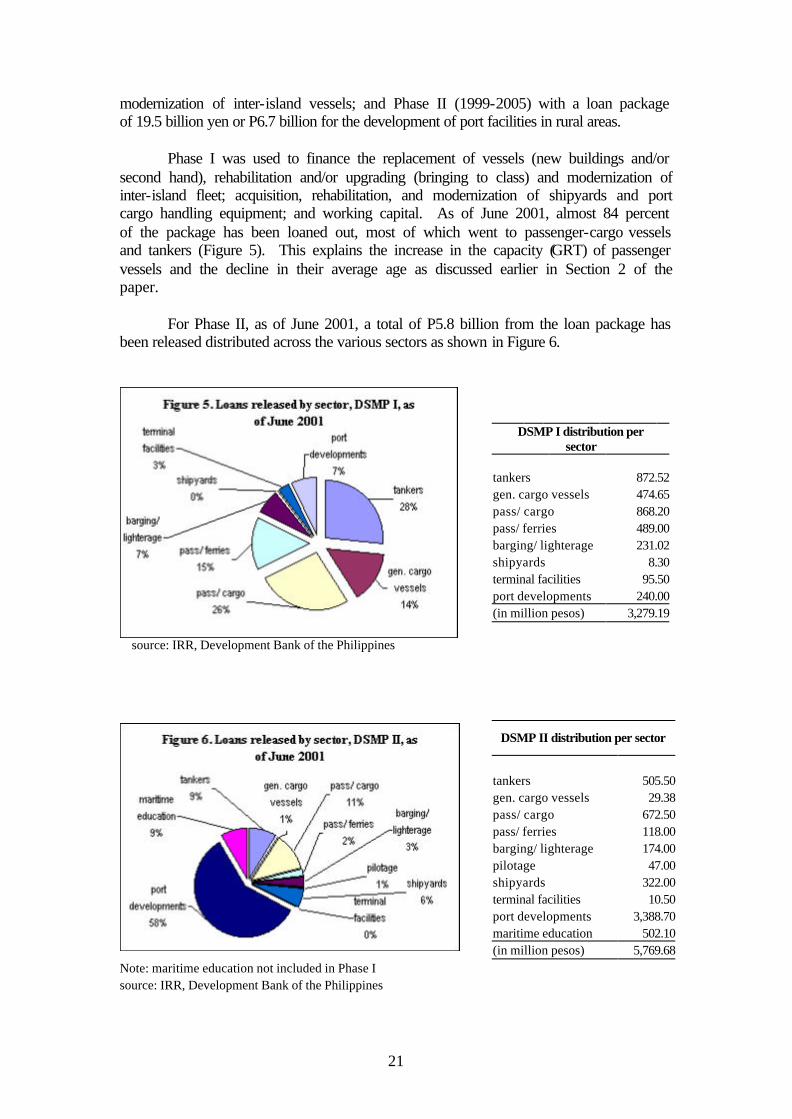
For Phase II, as of June 2001, a total of P5.8 billion from the loan package has
been released distributed across the various sectors as shown in Figure 6.
DSMP I distribution per
sector
tankers 872.52
gen. cargo vessels 474.65 pass/ cargo 868.20 pass/ ferries 489.00 barging/ lighterage 231.02 shipyards 8.30 terminal facilities 95.50 port developments 240.00 (in million pesos) 3,279.19
source: IRR, Development Bank of the Philippines
DSMP II distribution per sector
tankers 505.50 gen. cargo vessels 29.38 pass/ cargo 672.50 pass/ ferries 118.00 barging/ lighterage 174.00 pilotage 47.00 shipyards 322.00 terminal facilities 10.50 port developments 3,388.70 maritime education 502.10 (in million pesos) 5,769.68 Note: maritime education not included in Phase I source: IRR, Development Bank of the Philippines

22
6. Market Structure and Competition The study used secondary data and interviews of shipping operators to analyze market structure and competition in the shipping industry. Secondary data on passenger and cargo traffic by route and shipping company were gathered using the 1998 annual traffic reports of shipping companies submitted to the MARINA. This is the latest data that is available and complete. Much as we would like to include early years to represent the pre-reform period so that we can analyze the change in the market structure arising from the reforms, the annual reports of shipping companies were not complete9. Hence, to get a sense of the impact of the reforms in the absence of data, interviews were made with four shipping lines based in Metro Manila, six shipping lines based in Cebu, three shipping associations, and the Distributors Management Association of the Philippines (DMAP). Market structure
The Herfindahl-Hirschman Index (HHI) is used as an indicator of market structure. The index is measured as the sum of the squares of the market shares. It is compared with the ratio 1/n where n is the number of operators in the industry. The higher the index relative to 1/n, the less competitive the industry is. The inverse of the index gives the number of equal sized competitors that would provide a degree of competition equivalent to that actually observed in the market share data. Hence, it is used as a measure of the number of effective competitors.
The aggregate indicator of market structure for the industry is based on the
primary and secondary routes only, i.e. tertiary routes were excluded in the computation. Since the tertiary routes involve short distance travel and hence more frequencies of trips, passengers and cargo plying these routes would be larger in number compared to the primary and secondary routes. And since HHI is based on market shares, including them in the computation would distort the picture.
However, the aggregate indicator of market structure may give very little
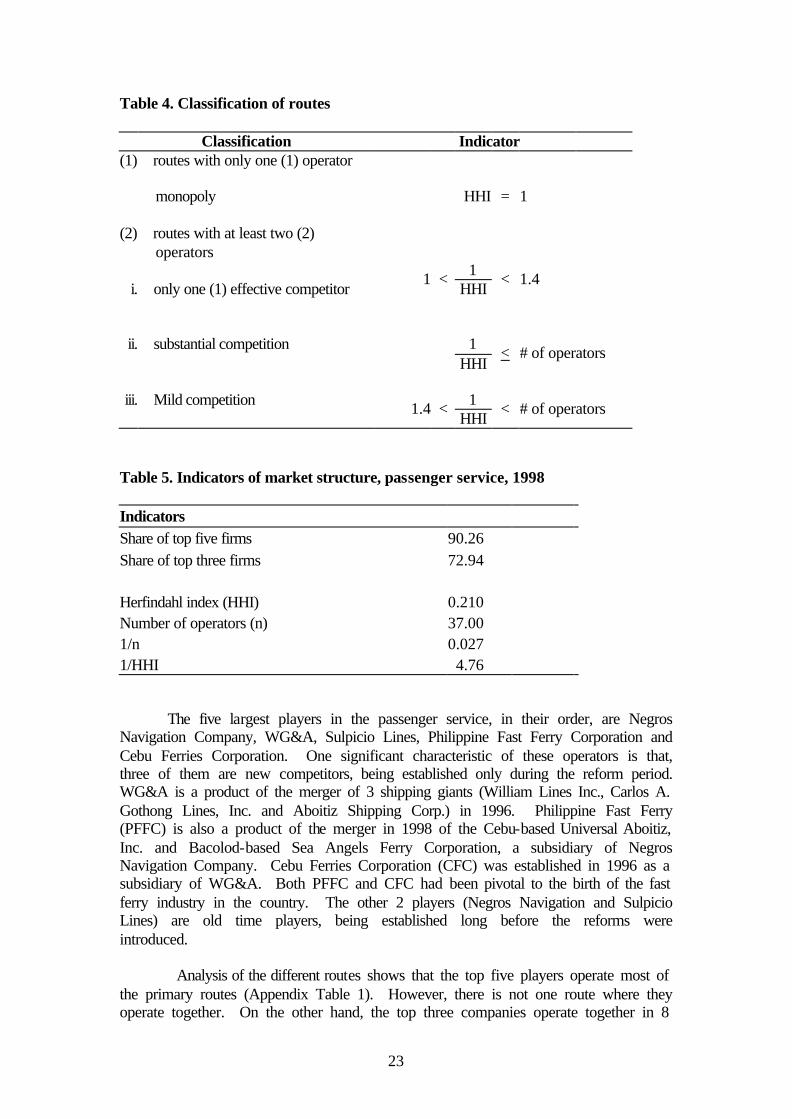
insight on the extent of market power in the different routes because the interisland fleet is distributed across so many different routes. It is possible that a small operator may capture a large market share in a particular route by concentrating its fleet in that route while a large operator may not capture a significant market share if it spreads its fleet across several routes. Thus, it is important to also examine the market structure by routes. The routes are classified based on the value of 1/HHI as shown in Table 4.
Passenger Service. The HHI shows that the domestic shipping industry is
highly concentrated (Table 5). The five (5) largest operators accounted for as much as 90 percent of the total passengers. The inverse of HHI shows that out of the 37 operators plying the primary and secondary routes, less than 5 are effectively competing.
9 The 1993 data was initially processed but the annual reports of some of the shipping companies are missing. MARINA has data on annual total passenger and cargo traffic but not by route and shipping company which is what is needed in analyzing market structure and competition.
23
Table 4. Classification of routes
Classification Indicator (1) routes with only one (1) operator monopoly HHI = 1 (2) routes with at least two (2)
operators 1
i. only one (1) effective competitor 1 <
HHI < 1.4
ii. substantial competition 1 HHI
< # of operators
iii. Mild competition 1
1.4 <
HHI < # of operators
Table 5. Indicators of market structure, passenger service, 1998 Indicators Share of top five firms 90.26 Share of top three firms 72.94 Herfindahl index (HHI) 0.210 Number of operators (n) 37.00 1/n 0.027 1/HHI 4.76 The five largest players in the passenger service, in their order, are Negros Navigation Company, WG&A, Sulpicio Lines, Philippine Fast Ferry Corporation and Cebu Ferries Corporation. One significant characteristic of these operators is that, three of them are new competitors, being established only during the reform period. WG&A is a product of the merger of 3 shipping giants (William Lines Inc., Carlos A. Gothong Lines, Inc. and Aboitiz Shipping Corp.) in 1996. Philippine Fast Ferry (PFFC) is also a product of the merger in 1998 of the Cebu-based Universal Aboitiz, Inc. and Bacolod-based Sea Angels Ferry Corporation, a subsidiary of Negros Navigation Company. Cebu Ferries Corporation (CFC) was established in 1996 as a subsidiary of WG&A. Both PFFC and CFC had been pivotal to the birth of the fast ferry industry in the country. The other 2 players (Negros Navigation and Sulpicio Lines) are old time players, being established long before the reforms were introduced. Analysis of the different routes shows that the top five players operate most of the primary routes (Appendix Table 1). However, there is not one route where they operate together. On the other hand, the top three companies operate together in 8
24
routes, all originating from Manila (Manila-Cagayan de Oro, Manila-Cebu, Manila-Davao, Manila-Dumaguete, Manila-General Santos, Manila-Iligan, Manila-Iloilo and Manila-Tagbilaran).
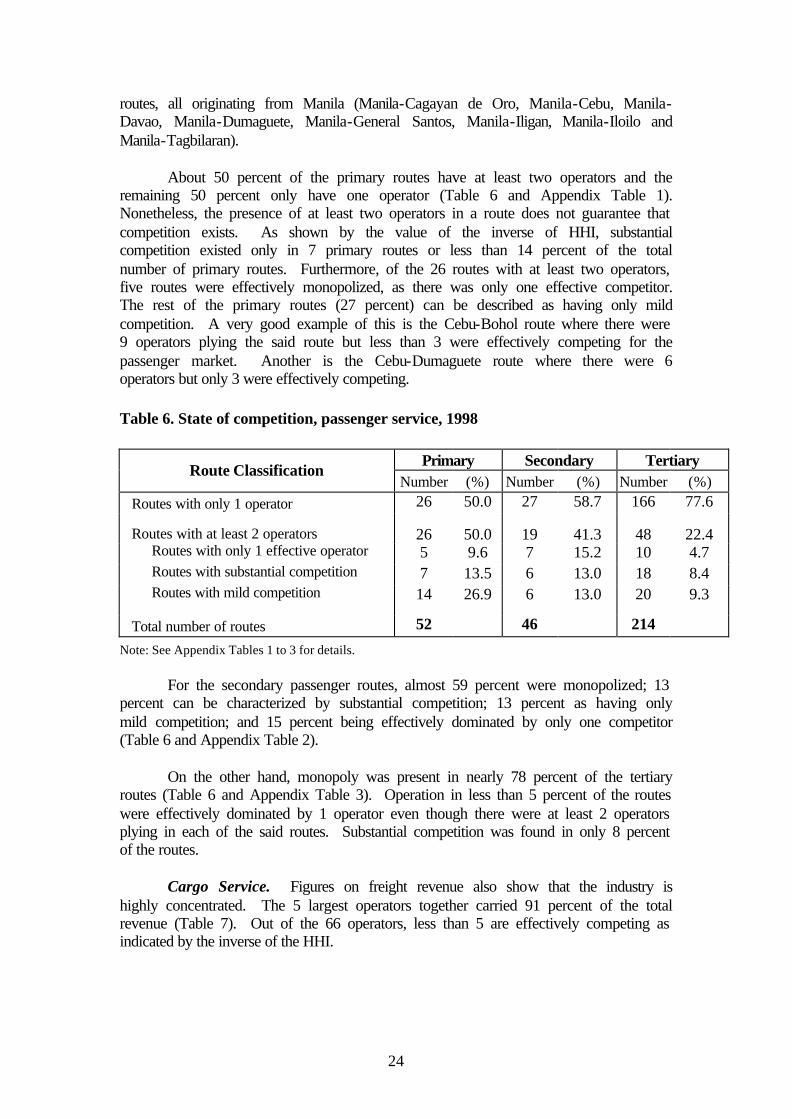
About 50 percent of the primary routes have at least two operators and the remaining 50 percent only have one operator (Table 6 and Appendix Table 1). Nonetheless, the presence of at least two operators in a route does not guarantee that competition exists. As shown by the value of the inverse of HHI, substantial competition existed only in 7 primary routes or less than 14 percent of the total number of primary routes. Furthermore, of the 26 routes with at least two operators, five routes were effectively monopolized, as there was only one effective competitor. The rest of the primary routes (27 percent) can be described as having only mild competition. A very good example of this is the Cebu-Bohol route where there were 9 operators plying the said route but less than 3 were effectively competing for the passenger market. Another is the Cebu-Dumaguete route where there were 6 operators but only 3 were effectively competing.
Table 6. State of competition, passenger service, 1998
Primary Secondary Tertiary Route Classification
Number (%) Number (%) Number (%) Routes with only 1 operator 26 50.0 27 58.7 166 77.6
Routes with at least 2 operators 26 50.0 19 41.3 48 22.4 Routes with only 1 effective operator 5 9.6 7 15.2 10 4.7
Routes with substantial competition 7 13.5 6 13.0 18 8.4 Routes with mild competition 14 26.9 6 13.0 20 9.3
Total number of routes 52 46 214
Note: See Appendix Tables 1 to 3 for details.
For the secondary passenger routes, almost 59 percent were monopolized; 13 percent can be characterized by substantial competition; 13 percent as having only mild competition; and 15 percent being effectively dominated by only one competitor (Table 6 and Appendix Table 2).
On the other hand, monopoly was present in nearly 78 percent of the tertiary
routes (Table 6 and Appendix Table 3). Operation in less than 5 percent of the routes were effectively dominated by 1 operator even though there were at least 2 operators plying in each of the said routes. Substantial competition was found in only 8 percent of the routes. Cargo Service. Figures on freight revenue also show that the industry is highly concentrated. The 5 largest operators together carried 91 percent of the total revenue (Table 7). Out of the 66 operators, less than 5 are effectively competing as indicated by the inverse of the HHI.

25
Table 7. Indicators of market structure, cargo service, 1998 Indicators Share of top five firms 91.12 Share of top three firms 70.92 Herfindahl index (HHI) 0.217 Number of operators (n) 66.00 1/n 0.015 1/HHI 4.61
The five major players in the cargo service, in their order, include WG&A, Sulpicio Lines, Lorenzo Shipping Corporation, Solid Shipping Corporation and Negros Navigation. Lorenzo Shipping and Solid Shipping are purely cargo services. Analysis of the routes shows that there are only three routes (Manila-Cagayan, Manila-Dumaguete and Manila-General Santos) where the top five companies operate together. Furthermore, close to two thirds of the primary and secondary cargo routes had at least 2 operators but less than 15 percent experienced substantial competition (Table 8 and Appendix Tables 4 and 5). On the other hand, a greater majority (76 percent) of the tertiary routes were still monopolized (Table 8 and Appendix Table 6). Table 8. State of competition cargo service, 1998
Primary Secondary Tertiary Route Classification
Number (%) Number (%) Number (%) Routes with only 1 operator 25 36.2 16 34.8 444 76.7
Routes with at least 2 operators 44 63.8 30 65.2 135 23.3 Routes with only 1 effective operator 7 10.1 9 19.6 39 6.7 Routes with substantial competition 10 14.5 6 13.0 38 6.5 Routes with mild competition 27 39.1 15 32.6 58 10.0
Total number of routes 69 46 579 Note: See Appendix Tables 4 to 6 for details.
Findings common to passenger and cargo. The dominance of the top five companies, in both passenger and cargo services, was prevalent in the primary and secondary routes, regardless of the routes’ state of competition (Table 9). In other words, they effectively control the market in these routes. Regular monitoring of the routes then becomes necessary to ensure that the top five players do not abuse their market power, more so given the fact that the percentage of routes with substantial competition is relatively small.

26
Table 9. Distribution of top 5 players as effective competitors, by type of routes, passenger and cargo services, 1998.
Route Classification
PASSENGER PRIMARY Total number of routes 26 7 5 14
Negros Navigation 12 Negros Navigation 2 Negros Navigation 2 Negros Navigation 6Sulpicio Lines 9 Sulpicio Lines 6 WG&A 2 Sulpicio Lines 4WG&A 1 WG&A 3 Cebu Ferries 1 WG&A 8Cebu Ferries 1 Cebu Ferries 2 Cebu Ferries 1Others 3 Others 1 Phil Fast Ferry 2
Others 3
SECONDARYTotal number of routes 27 6 7 6
Negros Navigation 5 Negros Navigation 1 Negros Navigation 1 Negros Navigation 2Sulpicio Lines 10 Sulpicio Lines 3 Sulpicio Lines 1 WG&A 2WG&A 1 WG&A 2 WG&A 1 Cebu Ferries 1Cebu Ferries 2 Cebu Ferries 2 Cebu Ferries 1 Phil Fast Ferry 1Others 9 Others 2 Others 3 Others 3
TERTIARY Total number of routes 166 18 10 21
Negros Navigation 14 Sulpicio Lines 1 Phil. Fast Ferry 1 Others 21 Sulpicio Lines 14 Cebu Ferries 1 Cebu Ferries 2 WG&A 1 Others 17 Others 7 Phil. Fast Ferry 1 Others 136
CARGO SERVICE PRIMARY
Total number of routes 25 10 7 27 Negros Navigation 1 Negros Navigation 2 Negros Navigation 1 Negros Navigation 11 Sulpicio Lines 6 Sulpicio Lines 5 Sulpicio Lines 2 Sulpicio Lines 11 WG&A 3 WG&A 2 WG&A 1 WG&A 17 Others 15 Others 7 Others 3 Solid Shipping Lines 3
Lorenzo Shipping 4Others 11
SECONDARYTotal number of routes 16 6 9 15
Sulpicio Lines 7 Negros Navigation 1 Negros Navigation 1 Negros Navigation 3Others 9 Sulpicio Lines 4 Sulpicio Lines 1 Sulpicio Lines 7
WG&A 4 Others 7 WG&A 7Lorenzo Shipping 1 Others 10 Others 2
TERTIARY Total number of routes 444 38 39 58
Negros Navigation 3 Negros Navigation 1 Negros Navigation 1 Negros Navigation 2Sulpicio Lines 22 Sulpicio Lines 2 Sulpicio Lines 3 Sulpicio Lines 5WG&A 6 WG&A 1 WG&A 3 WG&A 6Others 413 Lorenzo Shipping 3 Lorenzo Shipping 1 Lorenzo Shipping 2
Others 38 Others 31 Others 52
Source: Appendix Tables 1 to 6.
Note: The number corresponding to each player represents the number of routes where it operates (out of the total number of routes).
Routes with only 1 operator Routes with substantial competition
Routes with only 1 effective competitor Routes with mild competition

27
Substantial competition is expected in routes common to the top five or top three players. It is surprising, however, that this is not the case. In fact, there was only mild competition in those routes. Only in the Manila-Dumaguete passenger route, where the top three companies operated together, was there substantial competition.
Substantial competition is also expected in the major ports because the
supposed large passenger market and volume of cargoes will draw more players into the routes. However, the analysis of the routes originating from Manila or Cebu, two of the countries major ports, shows otherwise. Most of the routes either have only one operator or are characterized by only mild competition (Table 10 and Table 11).
A further analysis of the individual routes shows that operators have their own niche markets. And this is true even for the five largest operators. A good example of this is Solid Shipping Lines that operates in only three cargo routes (Manila-Cagayan, Manila-Dumaguete and Manila-General Santos). Also, the five largest players are not always the dominant player in the routes where they operate. An example of this is the Dumaguete-Zamboanga cargo route that includes WG&A and Sulpicio Lines as operators but which are not the dominant players.
Analysis of the routes with only one effective competitor or mild competition shows that the dominant player or players get the bulk of the market while the rest have very small share. The market shares of the dominant player or players range from 83 percent to almost 100 percent for the routes with only one effective competitor and from 59 percent to almost 100 percent for those with mild competition (Table 12). An example is the Cebu-Ormoc passenger route where there were 6 operators but 84 percent of the passenger traffic went to only 2 players. Another is the Cebu-Bohol passenger route with 9 operators but only 3 operators captured 83 percent of the market. It is possible that the dominant players offer lower rates or they have more vessels and larger capacities enabling them to capture a large segment of the market and leaving the crumbs to the rest who probably have only small capacities. Pursuing this issue however is beyond the scope of this paper since it requires an analysis of the cost structures of the individual operators.
The high concentration in the tertiary routes for both passenger and cargo
services may not really pose a problem since these are usually considered “thin routes” where traffic is insufficient to attract more than one operator. That is, only one operator is required to make the operation profitable and efficient. As discussed in Section 2 of the paper, there is less economic activity and population in the tertiary routes, implying smaller passenger and cargo traffic compared to the primary and secondary routes. What is critical, however, is the close monitoring by MARINA of the services of operators plying the said routes to make sure that these operators do not abuse their market power to the detriment of the welfare of passengers and shippers.
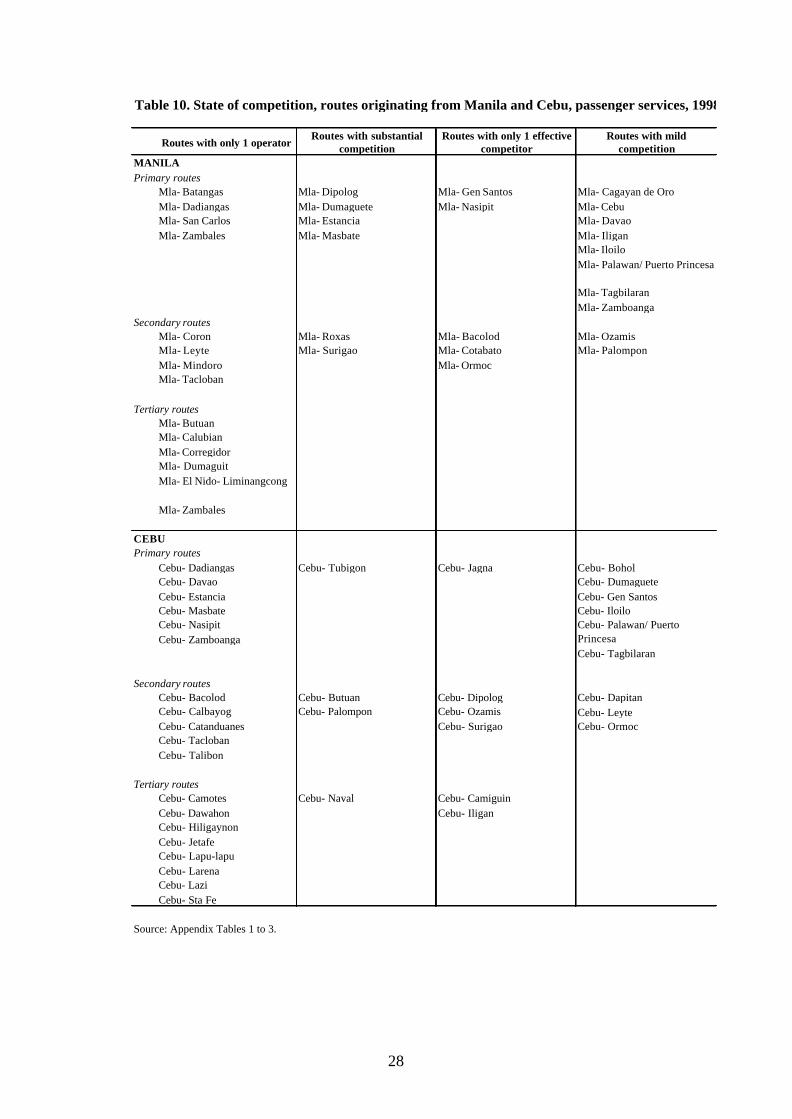
28
Table 10. State of competition, routes originating from Manila and Cebu, passenger services, 1998
Routes with only 1 operatorRoutes with substantial
competition Routes with only 1 effective
competitor Routes with mild
competitionMANILA Primary routes
Mla- Batangas Mla- Dipolog Mla- Gen Santos Mla- Cagayan de OroMla- Dadiangas Mla- Dumaguete Mla- Nasipit Mla- CebuMla- San Carlos Mla- Estancia Mla- DavaoMla- Zambales Mla- Masbate Mla- Iligan
Mla- IloiloMla- Palawan/ Puerto Princesa
Mla- Tagbilaran Mla- Zamboanga
Secondary routes Mla- Coron Mla- Roxas Mla- Bacolod Mla- OzamisMla- Leyte Mla- Surigao Mla- Cotabato Mla- PalomponMla- Mindoro Mla- OrmocMla- Tacloban
Tertiary routesMla- Butuan Mla- Calubian Mla- CorregidorMla- Dumaguit Mla- El Nido- Liminangcong
Mla- Zambales
CEBUPrimary routes
Cebu- Dadiangas Cebu- Tubigon Cebu- Jagna Cebu- BoholCebu- Davao Cebu- DumagueteCebu- Estancia Cebu- Gen SantosCebu- Masbate Cebu- IloiloCebu- NasipitCebu- Zamboanga
Cebu- Tagbilaran
Secondary routesCebu- Bacolod Cebu- Butuan Cebu- Dipolog Cebu- DapitanCebu- Calbayog Cebu- Palompon Cebu- Ozamis Cebu- LeyteCebu- Catanduanes Cebu- Surigao Cebu- OrmocCebu- TaclobanCebu- Talibon
Tertiary routesCebu- Camotes Cebu- Naval Cebu- CamiguinCebu- Dawahon Cebu- IliganCebu- HiligaynonCebu- JetafeCebu- Lapu-lapuCebu- LarenaCebu- LaziCebu- Sta Fe
Source: Appendix Tables 1 to 3.
Cebu- Palawan/ Puerto Princesa
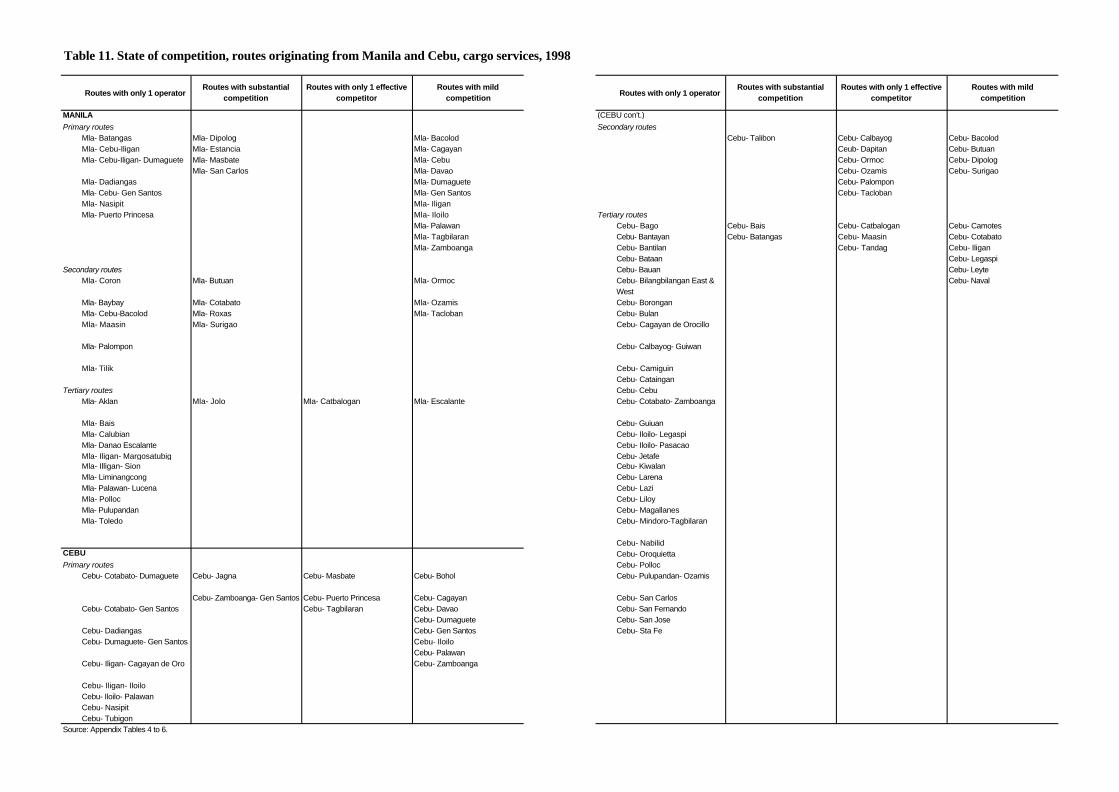
Table 11. State of competition, routes originating from Manila and Cebu, cargo services, 1998
Routes with only 1 operatorRoutes with substantial
competition Routes with only 1 effective
competitor Routes with mild
competitionRoutes with only 1 operator
Routes with substantial competition
Routes with only 1 effective competitor
Routes with mild competition
MANILA (CEBU con't.)Primary routes Secondary routes
Mla- Batangas Mla- Dipolog Mla- Bacolod Cebu- Talibon Cebu- Calbayog Cebu- Bacolod Mla- Cebu-Iligan Mla- Estancia Mla- Cagayan Ceub- Dapitan Cebu- Butuan
Mla- Masbate Mla- Cebu Cebu- Ormoc Cebu- DipologMla- San Carlos Mla- Davao Cebu- Ozamis Cebu- Surigao
Mla- Dadiangas Mla- Dumaguete Cebu- PalomponMla- Cebu- Gen Santos Mla- Gen Santos Cebu- TaclobanMla- Nasipit Mla- IliganMla- Puerto Princesa Mla- Iloilo Tertiary routes
Mla- Palawan Cebu- Bago Cebu- Bais Cebu- Catbalogan Cebu- CamotesMla- Tagbilaran Cebu- Bantayan Cebu- Batangas Cebu- Maasin Cebu- CotabatoMla- Zamboanga Cebu- Bantilan Cebu- Tandag Cebu- Iligan
Cebu- Bataan Cebu- LegaspiSecondary routes Cebu- Bauan Cebu- Leyte
Mla- Coron Mla- Butuan Mla- Ormoc Cebu- Bilangbilangan East & West
Cebu- Naval
Mla- Baybay Mla- Cotabato Mla- Ozamis Cebu- Borongan Mla- Cebu-Bacolod Mla- Roxas Mla- Tacloban Cebu- BulanMla- Maasin Mla- Surigao Cebu- Cagayan de Orocillo
Mla- Palompon Cebu- Calbayog- Guiwan
Mla- Tilik Cebu- CamiguinCebu- Cataingan
Tertiary routes Cebu- CebuMla- Aklan Mla- Jolo Mla- Catbalogan Mla- Escalante Cebu- Cotabato- Zamboanga
Mla- Bais Cebu- GuiuanMla- Calubian Cebu- Iloilo- LegaspiMla- Danao Escalante Cebu- Iloilo- PasacaoMla- Iligan- Margosatubig Cebu- JetafeMla- Illigan- Sion Cebu- KiwalanMla- Liminangcong Cebu- LarenaMla- Palawan- Lucena Cebu- LaziMla- Polloc Cebu- LiloyMla- Pulupandan Cebu- MagallanesMla- Toledo Cebu- Mindoro-Tagbilaran
Cebu- NabilidCEBU Cebu- OroquiettaPrimary routes Cebu- Polloc
Cebu- Jagna Cebu- Masbate Cebu- Bohol Cebu- Pulupandan- Ozamis
Cebu- Puerto Princesa Cebu- Cagayan Cebu- San CarlosCebu- Tagbilaran Cebu- Davao Cebu- San Fernando
Cebu- Dumaguete Cebu- San JoseCebu- Dadiangas Cebu- Gen Santos Cebu- Sta Fe
Cebu- IloiloCebu- PalawanCebu- Zamboanga
Cebu- Iligan- IloiloCebu- Iloilo- PalawanCebu- NasipitCebu- Tubigon
Source: Appendix Tables 4 to 6.
Cebu- Zamboanga- Gen Santos
Mla- Cebu-Iligan- Dumaguete
Cebu- Dumaguete- Gen Santos
Cebu- Iligan- Cagayan de Oro
Cebu- Cotabato- Gen Santos
Cebu- Cotabato- Dumaguete
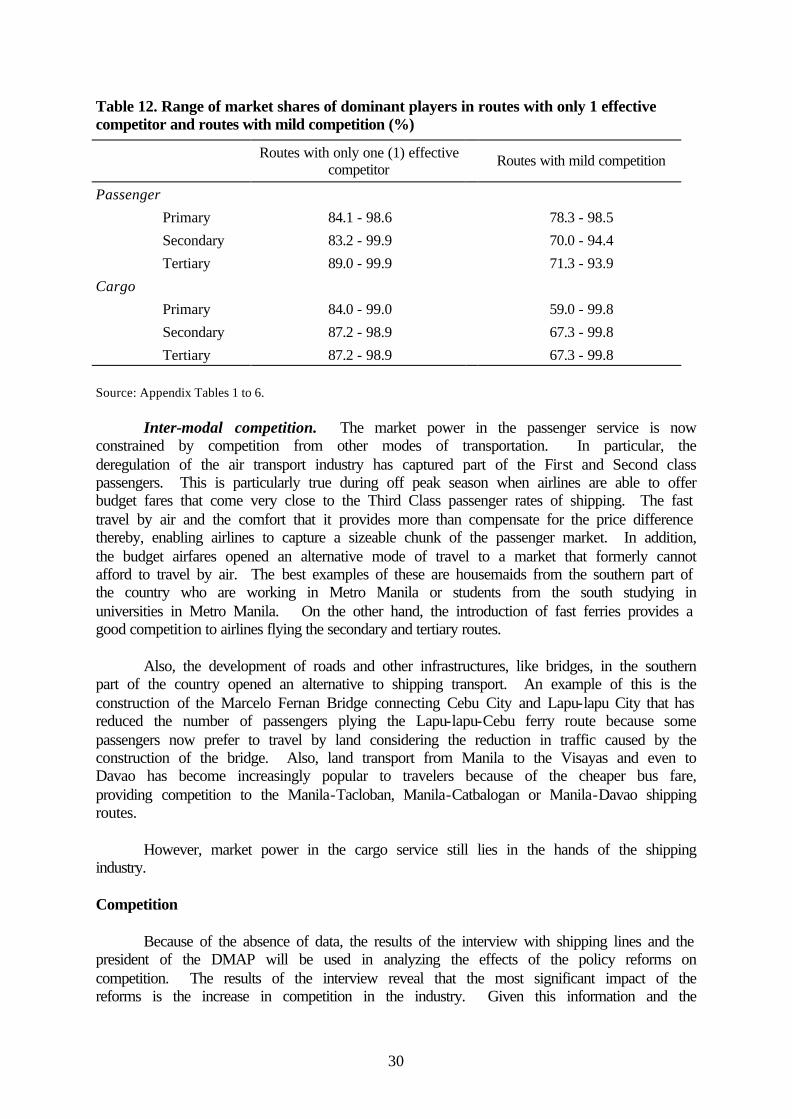
30
Table 12. Range of market shares of dominant players in routes with only 1 effective competitor and routes with mild competition (%)
Routes with only one (1) effective competitor
Routes with mild competition
Passenger
Primary 84.1 - 98.6 78.3 - 98.5
Secondary 83.2 - 99.9 70.0 - 94.4
Tertiary 89.0 - 99.9 71.3 - 93.9
Cargo
Primary 84.0 - 99.0 59.0 - 99.8
Secondary 87.2 - 98.9 67.3 - 99.8
Tertiary 87.2 - 98.9 67.3 - 99.8
Source: Appendix Tables 1 to 6. Inter-modal competition. The market power in the passenger service is now constrained by competition from other modes of transportation. In particular, the deregulation of the air transport industry has captured part of the First and Second class passengers. This is particularly true during off peak season when airlines are able to offer budget fares that come very close to the Third Class passenger rates of shipping. The fast travel by air and the comfort that it provides more than compensate for the price difference thereby, enabling airlines to capture a sizeable chunk of the passenger market. In addition, the budget airfares opened an alternative mode of travel to a market that formerly cannot afford to travel by air. The best examples of these are housemaids from the southern part of the country who are working in Metro Manila or students from the south studying in universities in Metro Manila. On the other hand, the introduction of fast ferries provides a good competition to airlines flying the secondary and tertiary routes.
Also, the development of roads and other infrastructures, like bridges, in the southern part of the country opened an alternative to shipping transport. An example of this is the construction of the Marcelo Fernan Bridge connecting Cebu City and Lapu-lapu City that has reduced the number of passengers plying the Lapu-lapu-Cebu ferry route because some passengers now prefer to travel by land considering the reduction in traffic caused by the construction of the bridge. Also, land transport from Manila to the Visayas and even to Davao has become increasingly popular to travelers because of the cheaper bus fare, providing competition to the Manila-Tacloban, Manila-Catbalogan or Manila-Davao shipping routes.
However, market power in the cargo service still lies in the hands of the shipping industry. Competition Because of the absence of data, the results of the interview with shipping lines and the president of the DMAP will be used in analyzing the effects of the policy reforms on competition. The results of the interview reveal that the most significant impact of the reforms is the increase in competition in the industry. Given this information and the
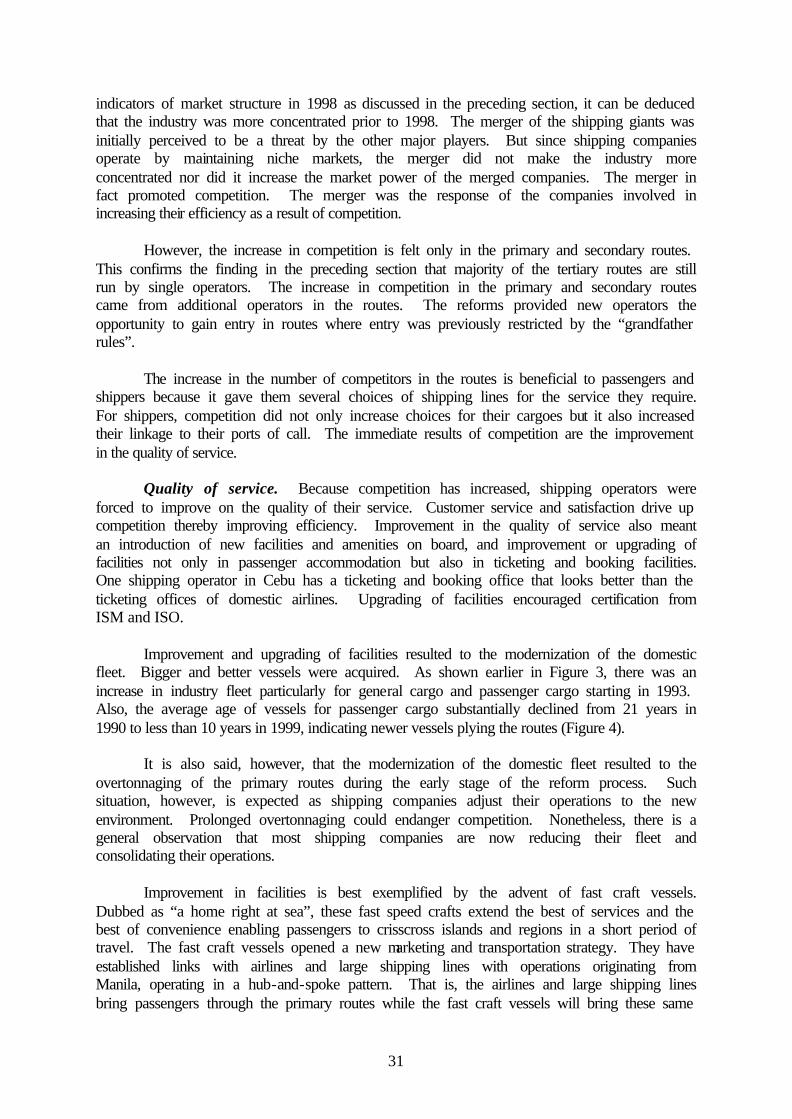
31
indicators of market structure in 1998 as discussed in the preceding section, it can be deduced that the industry was more concentrated prior to 1998. The merger of the shipping giants was initially perceived to be a threat by the other major players. But since shipping companies operate by maintaining niche markets, the merger did not make the industry more concentrated nor did it increase the market power of the merged companies. The merger in fact promoted competition. The merger was the response of the companies involved in increasing their efficiency as a result of competition.
However, the increase in competition is felt only in the primary and secondary routes. This confirms the finding in the preceding section that majority of the tertiary routes are still run by single operators. The increase in competition in the primary and secondary routes came from additional operators in the routes. The reforms provided new operators the opportunity to gain entry in routes where entry was previously restricted by the “grandfather rules”.
The increase in the number of competitors in the routes is beneficial to passengers and
shippers because it gave them several choices of shipping lines for the service they require. For shippers, competition did not only increase choices for their cargoes but it also increased their linkage to their ports of call. The immediate results of competition are the improvement in the quality of service.
Quality of service. Because competition has increased, shipping operators were
forced to improve on the quality of their service. Customer service and satisfaction drive up competition thereby improving efficiency. Improvement in the quality of service also meant an introduction of new facilities and amenities on board, and improvement or upgrading of facilities not only in passenger accommodation but also in ticketing and booking facilities. One shipping operator in Cebu has a ticketing and booking office that looks better than the ticketing offices of domestic airlines. Upgrading of facilities encouraged certification from ISM and ISO.
Improvement and upgrading of facilities resulted to the modernization of the domestic
fleet. Bigger and better vessels were acquired. As shown earlier in Figure 3, there was an increase in industry fleet particularly for general cargo and passenger cargo starting in 1993. Also, the average age of vessels for passenger cargo substantially declined from 21 years in 1990 to less than 10 years in 1999, indicating newer vessels plying the routes (Figure 4).
It is also said, however, that the modernization of the domestic fleet resulted to the
overtonnaging of the primary routes during the early stage of the reform process. Such situation, however, is expected as shipping companies adjust their operations to the new environment. Prolonged overtonnaging could endanger competition. Nonetheless, there is a general observation that most shipping companies are now reducing their fleet and consolidating their operations.
Improvement in facilities is best exemplified by the advent of fast craft vessels.
Dubbed as “a home right at sea”, these fast speed crafts extend the best of services and the best of convenience enabling passengers to crisscross islands and regions in a short period of travel. The fast craft vessels opened a new marketing and transportation strategy. They have established links with airlines and large shipping lines with operations originating from Manila, operating in a hub-and-spoke pattern. That is, the airlines and large shipping lines bring passengers through the primary routes while the fast craft vessels will bring these same

32
passengers to their destinations in the secondary routes. Visayas is the hub of the country’s fast crafts operation. The strategy has propelled commerce and trade and accelerated tourism and tourism-related activities in the southern part of the country.
However, the profitability of the fast craft industry is observed to be difficult to
sustain. It is said that fast crafts are not appropriate yet for the country considering the country’s level of development. Fast-craft vessels generally cater to the A-B crowd or those belonging to high-income group of the society. However, domestic sea passengers in the country are mostly C-D crowd or low-income group of the society. Likewise, fast crafts are good only for short distance travel but then again most passengers in these routes are C-D crowd and a few businessmen who travel to places not within the reach of air transport. It is observed that some of the fast craft vessels have been pulled out from some of the routes.
For cargo services, improvement in quality means the availability of sufficient and
appropriate services. The latter was achieved through improvement in technology in cargo services, like the use of roll-on roll-off (RORO) vessels and containerization, the shipment of goods by containers against shipping these by bags. However, the use of RORO vessels is more appropriate for the country considering its archipelagic setting. Large benefits can be derived from RORO operations by avoiding handling at two ports, and the time losses and value losses deriving from the time spent at ports. On the other hand, containerization is more appropriate for long voyages, like in international shipping. This could help explain the drop in the fleet of containers after 1995 (Figure 3).
Services in the tertiary routes, on the other hand, remained unimproved because of the lack, if not absence, of competition. Old vessels and motorized bancas are still utilized, endangering the lives of passengers. Passage and freight rates. Available data on the actual rates charged by two of the major players in the industry show that rates for both passage and cargo have increased in real terms (Tables 13 to 16). What is striking however is the large increase in rates after 1999 compared to the years before it. This is true regardless of the class of commodity or passenger, except for the first class passenger of WG&A.
As discussed earlier in the paper, the DOSCON process was abolished in late 1999 allowing companies full freedom to determine their deregulated rates. However, the three automatic fuel rate adjustments in 2000 totaling 19.15 percent contributed to the large increase for the period 1999-2000. On the other hand, the general rate increase of 20 percent adopted by the shipping association in November 2000 contributed to the increase in 2000-2001. The uniform increase for all shipping operators is alarming as it has a semblance of a cartel-like arrangement.
Nonetheless, the deregulation has corrected what otherwise are very low rates arising
from the past regulatory system. This could be seen from the large increase (53.3%) in cargo rate of the Manila-Tacloban route in 1999-2000 (Table 13). Based on the interview, the route is a classic example of the large imbalance between in-bound and out-bound cargo traffic. That is, the ship is full from Manila to Tacloban but not vice-versa. Hence, before deregulation, the regulated rate for the route did not reflect the cost of providing the shipping services. Given the abolition of the DOSCON process, the market could have corrected the rate and have contributed to the large increase that occurred in 2000. This argument is strengthened by the fact that the rate increase in 2000-2001 was already small (9.1%).
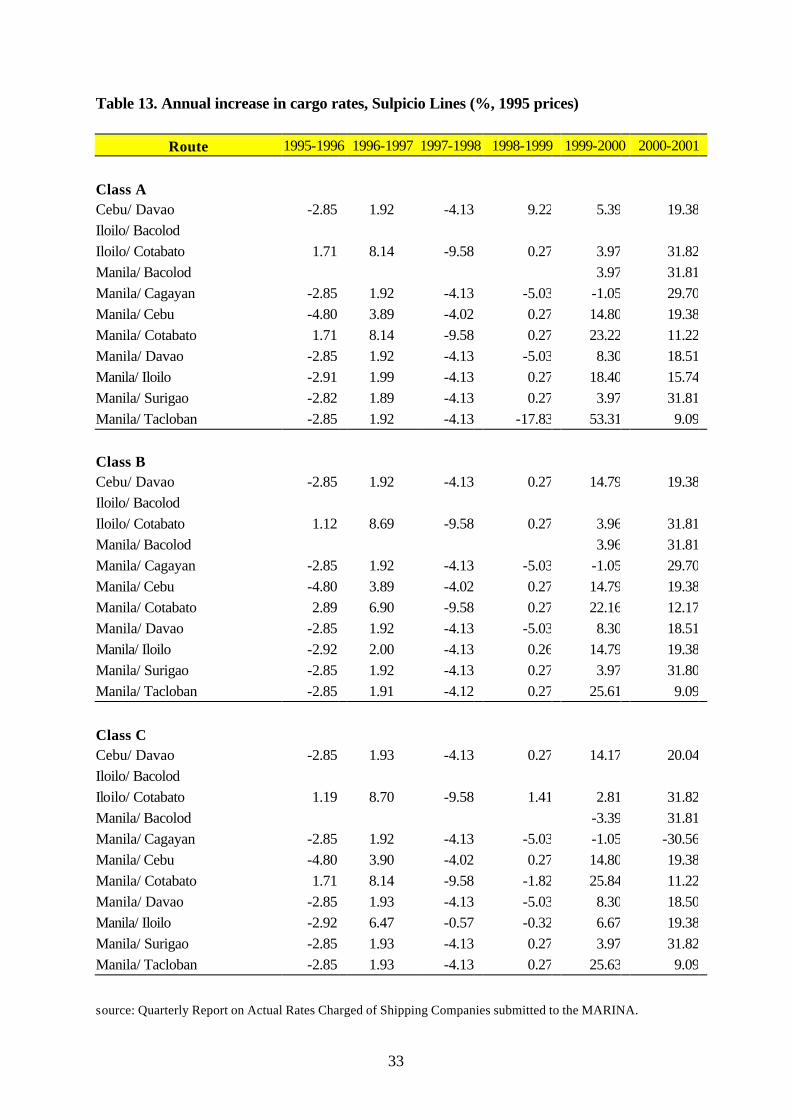
33
Table 13. Annual increase in cargo rates, Sulpicio Lines (%, 1995 prices)
Route 1995-1996 1996-1997 1997-1998 1998-1999 1999-2000 2000-2001
Class A Cebu/ Davao -2.85 1.92 -4.13 9.22 5.39 19.38 Iloilo/ Bacolod Iloilo/ Cotabato 1.71 8.14 -9.58 0.27 3.97 31.82 Manila/ Bacolod 3.97 31.81 Manila/ Cagayan -2.85 1.92 -4.13 -5.03 -1.05 29.70 Manila/ Cebu -4.80 3.89 -4.02 0.27 14.80 19.38 Manila/ Cotabato 1.71 8.14 -9.58 0.27 23.22 11.22 Manila/ Davao -2.85 1.92 -4.13 -5.03 8.30 18.51 Manila/ Iloilo -2.91 1.99 -4.13 0.27 18.40 15.74 Manila/ Surigao -2.82 1.89 -4.13 0.27 3.97 31.81 Manila/ Tacloban -2.85 1.92 -4.13 -17.83 53.31 9.09 Class B Cebu/ Davao -2.85 1.92 -4.13 0.27 14.79 19.38 Iloilo/ Bacolod Iloilo/ Cotabato 1.12 8.69 -9.58 0.27 3.96 31.81 Manila/ Bacolod 3.96 31.81 Manila/ Cagayan -2.85 1.92 -4.13 -5.03 -1.05 29.70 Manila/ Cebu -4.80 3.89 -4.02 0.27 14.79 19.38 Manila/ Cotabato 2.89 6.90 -9.58 0.27 22.16 12.17 Manila/ Davao -2.85 1.92 -4.13 -5.03 8.30 18.51 Manila/ Iloilo -2.92 2.00 -4.13 0.26 14.79 19.38 Manila/ Surigao -2.85 1.92 -4.13 0.27 3.97 31.80 Manila/ Tacloban -2.85 1.91 -4.12 0.27 25.61 9.09 Class C Cebu/ Davao -2.85 1.93 -4.13 0.27 14.17 20.04 Iloilo/ Bacolod Iloilo/ Cotabato 1.19 8.70 -9.58 1.41 2.81 31.82 Manila/ Bacolod -3.39 31.81 Manila/ Cagayan -2.85 1.92 -4.13 -5.03 -1.05 -30.56 Manila/ Cebu -4.80 3.90 -4.02 0.27 14.80 19.38 Manila/ Cotabato 1.71 8.14 -9.58 -1.82 25.84 11.22 Manila/ Davao -2.85 1.93 -4.13 -5.03 8.30 18.50 Manila/ Iloilo -2.92 6.47 -0.57 -0.32 6.67 19.38 Manila/ Surigao -2.85 1.93 -4.13 0.27 3.97 31.82 Manila/ Tacloban -2.85 1.93 -4.13 0.27 25.63 9.09 source: Quarterly Report on Actual Rates Charged of Shipping Companies submitted to the MARINA.
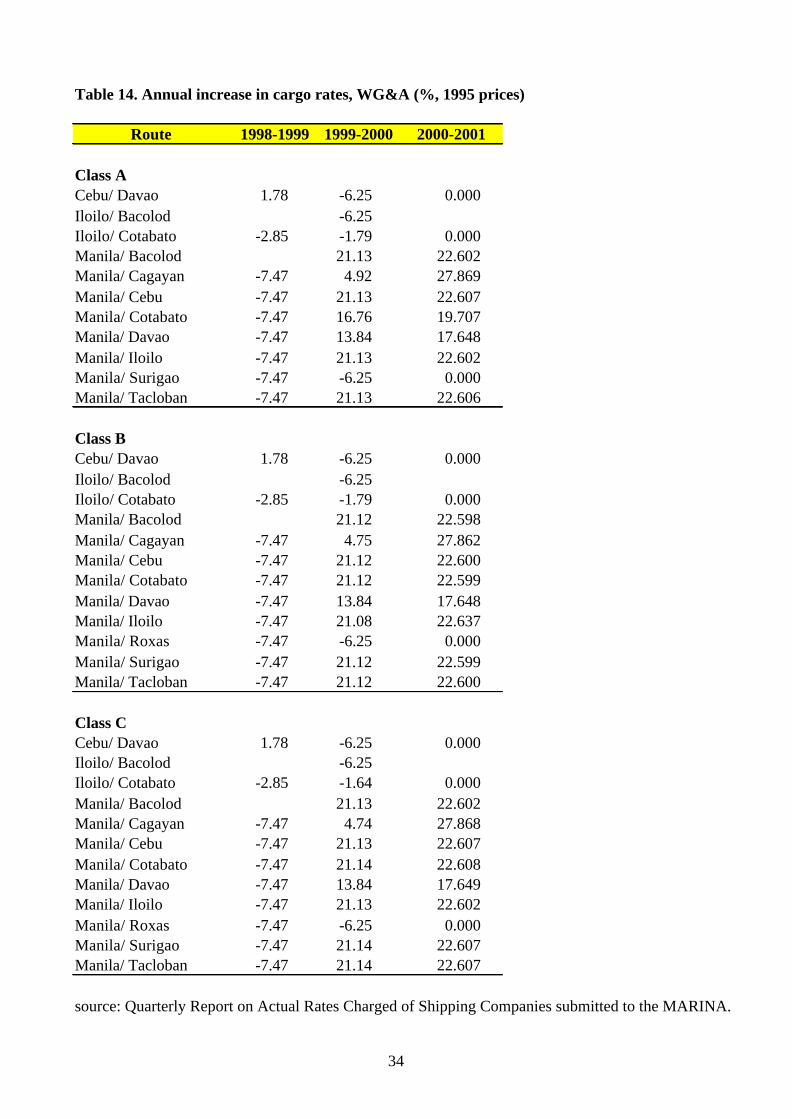
34
Table 14. Annual increase in cargo rates, WG&A (%, 1995 prices)
Route
Class A Cebu/ Davao 1.78 -6.25 0.000Iloilo/ Bacolod -6.25Iloilo/ Cotabato -2.85 -1.79 0.000Manila/ Bacolod 21.13 22.602Manila/ Cagayan -7.47 4.92 27.869Manila/ Cebu -7.47 21.13 22.607Manila/ Cotabato -7.47 16.76 19.707Manila/ Davao -7.47 13.84 17.648Manila/ Iloilo -7.47 21.13 22.602Manila/ Surigao -7.47 -6.25 0.000Manila/ Tacloban -7.47 21.13 22.606
Class BCebu/ Davao 1.78 -6.25 0.000Iloilo/ Bacolod -6.25Iloilo/ Cotabato -2.85 -1.79 0.000Manila/ Bacolod 21.12 22.598Manila/ Cagayan -7.47 4.75 27.862Manila/ Cebu -7.47 21.12 22.600Manila/ Cotabato -7.47 21.12 22.599Manila/ Davao -7.47 13.84 17.648Manila/ Iloilo -7.47 21.08 22.637Manila/ Roxas -7.47 -6.25 0.000Manila/ Surigao -7.47 21.12 22.599Manila/ Tacloban -7.47 21.12 22.600
Class CCebu/ Davao 1.78 -6.25 0.000Iloilo/ Bacolod -6.25Iloilo/ Cotabato -2.85 -1.64 0.000Manila/ Bacolod 21.13 22.602Manila/ Cagayan -7.47 4.74 27.868Manila/ Cebu -7.47 21.13 22.607Manila/ Cotabato -7.47 21.14 22.608Manila/ Davao -7.47 13.84 17.649Manila/ Iloilo -7.47 21.13 22.602Manila/ Roxas -7.47 -6.25 0.000Manila/ Surigao -7.47 21.14 22.607Manila/ Tacloban -7.47 21.14 22.607
source: Quarterly Report on Actual Rates Charged of Shipping Companies submitted to the MARINA.
1998-1999 1999-2000 2000-2001
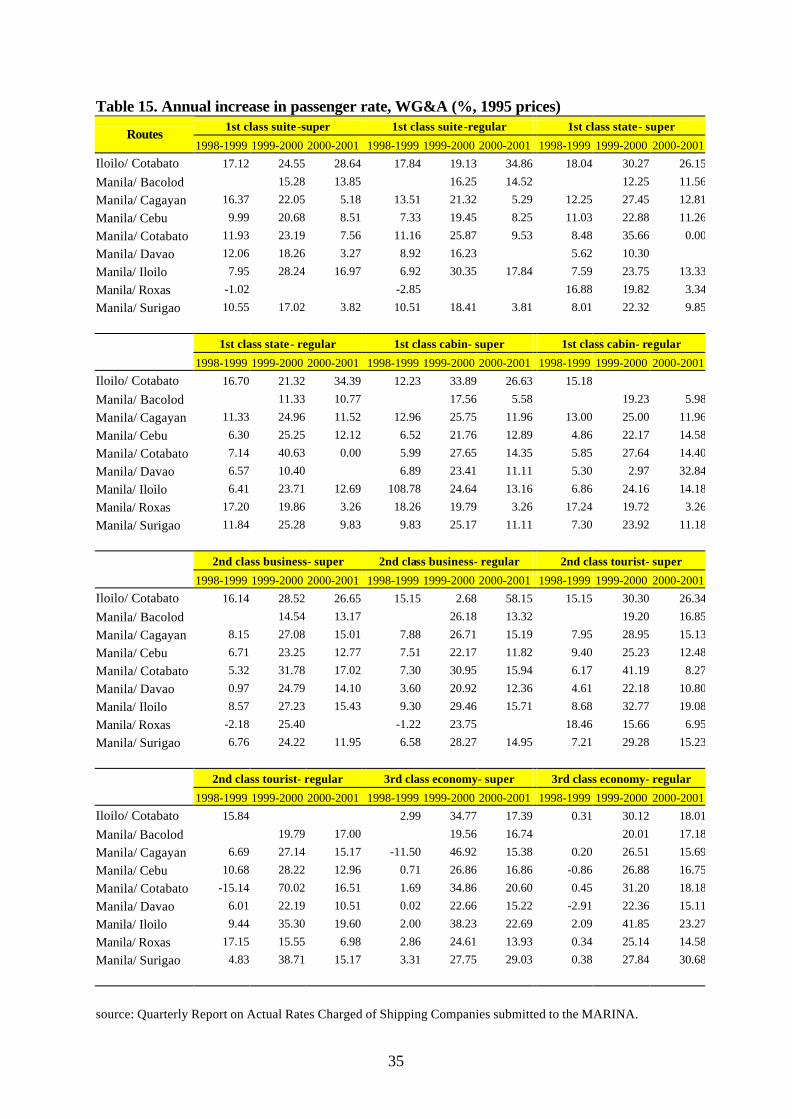
35
Table 15. Annual increase in passenger rate, WG&A (%, 1995 prices)
1st class suite-super 1st class suite-regular 1st class state- super Routes
1998-1999 1999-2000 2000-2001 1998-1999 1999-2000 2000-2001 1998-1999 1999-2000 2000-2001
Iloilo/ Cotabato 17.12 24.55 28.64 17.84 19.13 34.86 18.04 30.27 26.15
Manila/ Bacolod 15.28 13.85 16.25 14.52 12.25 11.56
Manila/ Cagayan 16.37 22.05 5.18 13.51 21.32 5.29 12.25 27.45 12.81
Manila/ Cebu 9.99 20.68 8.51 7.33 19.45 8.25 11.03 22.88 11.26
Manila/ Cotabato 11.93 23.19 7.56 11.16 25.87 9.53 8.48 35.66 0.00
Manila/ Davao 12.06 18.26 3.27 8.92 16.23 5.62 10.30
Manila/ Iloilo 7.95 28.24 16.97 6.92 30.35 17.84 7.59 23.75 13.33
Manila/ Roxas -1.02 -2.85 16.88 19.82 3.34
Manila/ Surigao 10.55 17.02 3.82 10.51 18.41 3.81 8.01 22.32 9.85
1st class state- regular 1st class cabin- super 1st class cabin- regular
1998-1999 1999-2000 2000-2001 1998-1999 1999-2000 2000-2001 1998-1999 1999-2000 2000-2001
Iloilo/ Cotabato 16.70 21.32 34.39 12.23 33.89 26.63 15.18
Manila/ Bacolod 11.33 10.77 17.56 5.58 19.23 5.98
Manila/ Cagayan 11.33 24.96 11.52 12.96 25.75 11.96 13.00 25.00 11.96
Manila/ Cebu 6.30 25.25 12.12 6.52 21.76 12.89 4.86 22.17 14.58
Manila/ Cotabato 7.14 40.63 0.00 5.99 27.65 14.35 5.85 27.64 14.40
Manila/ Davao 6.57 10.40 6.89 23.41 11.11 5.30 2.97 32.84
Manila/ Iloilo 6.41 23.71 12.69 108.78 24.64 13.16 6.86 24.16 14.18
Manila/ Roxas 17.20 19.86 3.26 18.26 19.79 3.26 17.24 19.72 3.26
Manila/ Surigao 11.84 25.28 9.83 9.83 25.17 11.11 7.30 23.92 11.18
2nd class business- super 2nd class business- regular 2nd class tourist- super
1998-1999 1999-2000 2000-2001 1998-1999 1999-2000 2000-2001 1998-1999 1999-2000 2000-2001
Iloilo/ Cotabato 16.14 28.52 26.65 15.15 2.68 58.15 15.15 30.30 26.34
Manila/ Bacolod 14.54 13.17 26.18 13.32 19.20 16.85
Manila/ Cagayan 8.15 27.08 15.01 7.88 26.71 15.19 7.95 28.95 15.13
Manila/ Cebu 6.71 23.25 12.77 7.51 22.17 11.82 9.40 25.23 12.48
Manila/ Cotabato 5.32 31.78 17.02 7.30 30.95 15.94 6.17 41.19 8.27
Manila/ Davao 0.97 24.79 14.10 3.60 20.92 12.36 4.61 22.18 10.80
Manila/ Iloilo 8.57 27.23 15.43 9.30 29.46 15.71 8.68 32.77 19.08
Manila/ Roxas -2.18 25.40 -1.22 23.75 18.46 15.66 6.95
Manila/ Surigao 6.76 24.22 11.95 6.58 28.27 14.95 7.21 29.28 15.23
2nd class tourist- regular 3rd class economy- super 3rd class economy- regular
1998-1999 1999-2000 2000-2001 1998-1999 1999-2000 2000-2001 1998-1999 1999-2000 2000-2001
Iloilo/ Cotabato 15.84 2.99 34.77 17.39 0.31 30.12 18.01
Manila/ Bacolod 19.79 17.00 19.56 16.74 20.01 17.18
Manila/ Cagayan 6.69 27.14 15.17 -11.50 46.92 15.38 0.20 26.51 15.69
Manila/ Cebu 10.68 28.22 12.96 0.71 26.86 16.86 -0.86 26.88 16.75
Manila/ Cotabato -15.14 70.02 16.51 1.69 34.86 20.60 0.45 31.20 18.18
Manila/ Davao 6.01 22.19 10.51 0.02 22.66 15.22 -2.91 22.36 15.11
Manila/ Iloilo 9.44 35.30 19.60 2.00 38.23 22.69 2.09 41.85 23.27
Manila/ Roxas 17.15 15.55 6.98 2.86 24.61 13.93 0.34 25.14 14.58
Manila/ Surigao 4.83 38.71 15.17 3.31 27.75 29.03 0.38 27.84 30.68
source: Quarterly Report on Actual Rates Charged of Shipping Companies submitted to the MARINA.

36
Table 16. Annual increase in passenger rate, Sulpicio Lines (%, 1995 prices), 2000-2001
Route 1st class suite 1st class royal
suite 1st class cabin
for 2 1st class cabin for 4
2000-2001 2000-2001 2000-2001 2000-2001 Cebu/ Davao 11.11 6.51 11.11 55.51 Iloilo/ Cotabato 10.94 11.07 Manila/ Cagayan 22.36 - 11.11 Manila/ Cebu 42.34 3.00 11.02 10.99 Manila/ Cotabato 11.06 11.01 Manila/ Davao 5.61 - 11.11 7.91 Manila/ Iloilo 11.11 11.06 Manila/ Surigao 11.05 - 10.99 11.11
2nd class tourist (basic)
2nd class tourist (deluxe)
3rd class economy (deluxe)
2000-2001 2000-2001 2000-2001 Cebu/ Davao 11.03 11.01 11.11 Iloilo/ Cotabato 10.94 11.11 Manila/ Cagayan 11.11 11.04 10.99 Manila/ Cebu 10.97 11.11 11.01 Manila/ Cotabato 11.07 11.11 Manila/ Davao 11.08 11.11 11.07 Manila/ Iloilo 11.11 11.11 Manila/ Surigao 10.98 11.07 11.02 3rd class economy (basic) 1995-1996 1996-1997 1997-1998 2000-2001 Cebu/ Davao -1.45 3.42 -4.05 10.99 Iloilo/ Cotabato 4.69 10.66 -9.58 3.11 Manila/ Cagayan 18.40 8.90 -4.03 37.53 Manila/ Cebu 6.39 15.48 0.28 10.14 Manila/ Cotabato 3.99 11.45 -9.58 3.09 Manila/ Davao -1.35 3.54 -4.02 11.00 Manila/ Iloilo 3.88 20.99 -15.85 3.17 Manila/ Surigao 7.56 3.83 3.15 11.11 Manila/ Tacloban 97.36 -48.25 3.09 Note: No data available for 1999. source: Quarterly Report on Actual Rates Charged of Shipping Companies submitted to the MARINA.
37
It would have been nice to examine the rates for basic commodities as the deregulation of these commodities when containerized is expected to increase their rates since the regulated rates for non-containerized basic commodities were so low that they were unattractive to shipping operators. However, data for rates for basic commodities are not available. Based on the interview of shipping companies, during off peak season when there is excess capacity, cut-throat competition leads to “fare diving”. Some companies go to the extent of cutting their rates to the level that is just enough to get a break-even income or recover the cost of oil. This is true even for the regulated rates because enforcement is weak. But the worst scenario is when a shipping operator practices fare diving and yet still earns profits by overloading. Discounting of this form adversely affects competition because it punishes operators who follow regulations. Likewise, overloading puts the safety of passengers at risk. Impact of competition Competition creates pressure on the shipping companies to produce the quality of service desired by passengers and shippers at the least cost. In other words, competition drives them to become efficient. Companies whose quality of service is poor, whose costs are high or whose profit margins are excessive will lose their customers to their rivals and eventually be driven out the market. Thus, only the efficient ones remain.
This section of the paper examines how competition promotes efficiency in the industry. Ideally, efficiency would be measured in terms of the costs and profit margins of companies. However, financial data are difficult to obtain; and if ever they could be obtained, they may not reflect the true financial operations as it is accepted that businessmen maintain different books of accounts depending on what purpose these will be used. Thus, the analysis here deals, not on efficiency per se, but on the process by which competition promotes the level of efficiency. This is called the transfer mechanism, defined as the process whereby output is reallocated from less to more efficient operators (Dick, 1987).
The indicator used is the turnover of firms that takes into account the entry and exit of companies arising from competition. Again, only those plying the primary and secondary routes were considered. The shipping companies are classified into two: (i) those established before the reform or the old order companies; and (ii) those established after the reform or the new order companies. The cut off year is 1992 since the liberalization of routes occurred towards the end of that year. Also, exit is defined as when an operator does not operate in any of the routes (primary and secondary) for two or three consecutive years. Mergers are considered new entrants in the industry. There were about 103 shipping companies that operated in the industry during the period 1990-1998, 76 of which were established before the reforms were instituted and 27 were established during the reform period (Table 17). By the end of 1998, only 37 or 49 percent of the old order companies still existed. That is, 51 percent are no longer operating, probably due to the stiff competition brought about by the reforms or they have acquired new names due to merger or acquisition.
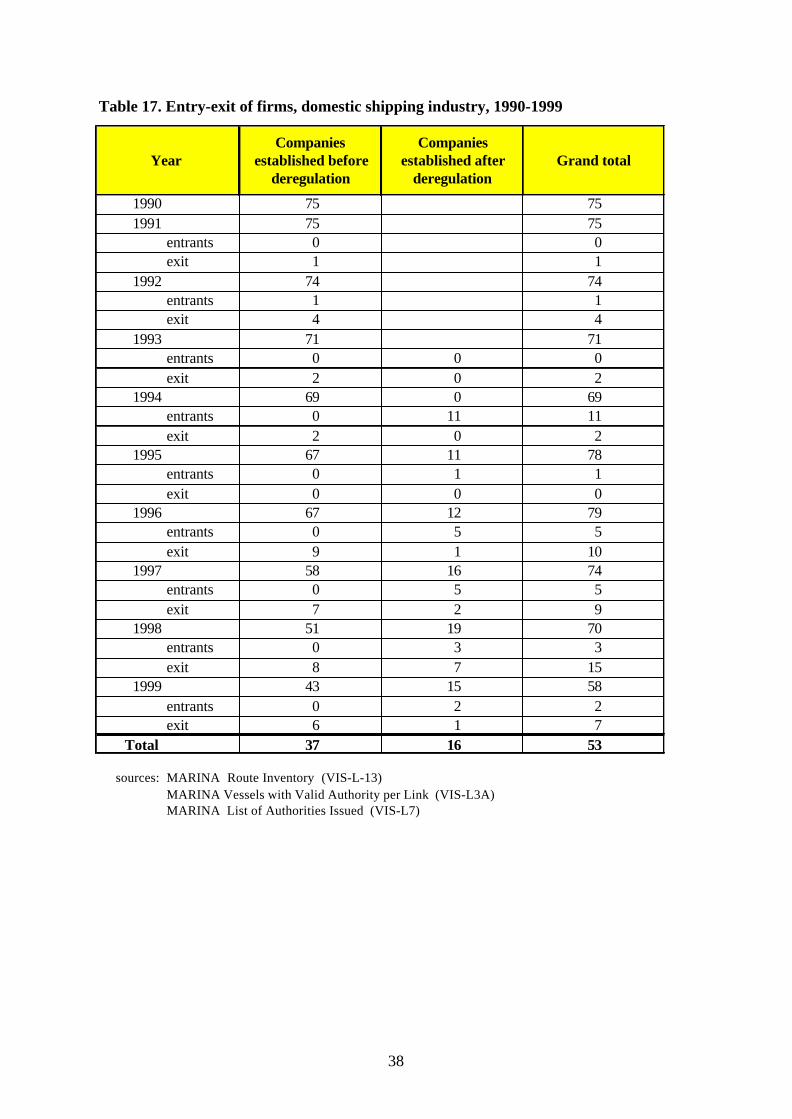
38
Table 17. Entry-exit of firms, domestic shipping industry, 1990-1999
1990 75 751991 75 75
entrants 0 0exit 1 1
1992 74 74entrants 1 1exit 4 4
1993 71 71entrants 0 0 0exit 2 0 2
1994 69 0 69entrants 0 11 11exit 2 0 2
1995 67 11 78entrants 0 1 1exit 0 0 0
1996 67 12 79entrants 0 5 5exit 9 1 10
1997 58 16 74entrants 0 5 5exit 7 2 9
1998 51 19 70entrants 0 3 3exit 8 7 15
1999 43 15 58entrants 0 2 2exit 6 1 7
Total 37 16 53
sources: MARINA Route Inventory (VIS-L-13)MARINA Vessels with Valid Authority per Link (VIS-L3A)MARINA List of Authorities Issued (VIS-L7)
Year Companies
established before deregulation
Companies established after
deregulation Grand total
39
The liberalization of route entry, on the other hand, enabled 27 new shipping companies to enter the industry during the period 1993-1998. Nonetheless, only 16 or 59 percent survived by the end of 1998. In other words, 11 exited the industry, i.e. they could have succumbed to competition.
However, despite the high survival rate of the new order companies, (59 percent as against 49 percent for the old order companies), the surviving companies are still dominated by the old order companies. That is, 70 percent of the surviving firms were established before the reforms. Likewise, these operators control about 64 percent of the industry’s cargo capacity and 63 percent of passenger capacity.
It is important to note that exit from the industry was highest in 1998 (15 operators)
when there was financial crisis. On the other hand, entry was highest in 1994 (11 operators). A further analysis of the surviving companies show that 43 percent of them are
growing in their capacity; 34 percent experienced a decline in their capacity while the remaining 23 percent did not register any change in their capacity since they were established (Table 18). There was also a redistribution of capacity from among the surviving companies. The share of the growing companies increased from 51 percent in 1990 (or when they were established) to 86 percent by 1998. Their absolute tonnage in 1998 was 43 percent higher. On the other hand, the share of the declining companies went down from 48 percent to 12 percent.
If competition is effective, the redistribution of capacity from declining to growing companies should be accompanied by the redistribution of output from the less efficient to more efficient companies. Unfortunately, whether this in fact occurred with the surviving companies in 1998 cannot be analyzed from the data available. For it is possible that some of the growing companies were able to increase their capacities for reasons other than commercial efficiency. On the other hand, it is also possible that companies experience a decline in capacity not because of commercial pressure but because of marine loss. This could be an interesting area of further research to ascertain whether the competition arising from the reforms in fact increases the level of efficiency of the industry. 7. The Role of MARINA in a Deregulated Environment
As presented earlier, MARINA takes charge of regulating the shipping industry. Created under Presidential Decree No. 474 in 1974, the agency was mandated, among other things, to provide for the effective supervision, regulation and rationalization of the organizational management, ownership and operations of all water transport utilities and other maritime enterprises. Before the reforms were instituted, the agency’s regulatory functions include the regulation of interisland rates, regulation of entry by granting of route certificate of public convenience or provisionary authority, and regulation of safety and service standards.
With only few areas remaining regulated, MARINA should focus its regulatory power on service standards and safety regulations to avoid maritime accidents. MARINA should ensure the seaworthiness of the vessels (condition of the hull, requirements for navigational/firefighting/life-saving equipment, manning requirements, etc.) and that shipping operators strictly observe the minimum service standards.
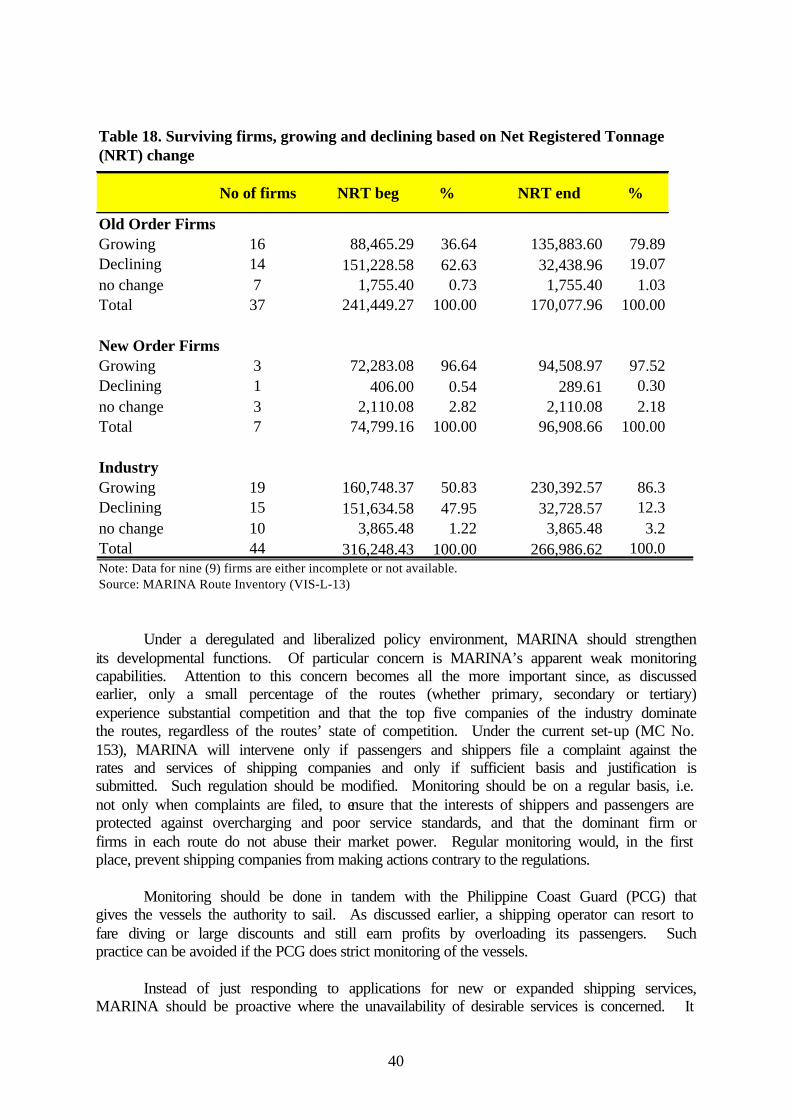
40
Under a deregulated and liberalized policy environment, MARINA should strengthen
its developmental functions. Of particular concern is MARINA’s apparent weak monitoring capabilities. Attention to this concern becomes all the more important since, as discussed earlier, only a small percentage of the routes (whether primary, secondary or tertiary) experience substantial competition and that the top five companies of the industry dominate the routes, regardless of the routes’ state of competition. Under the current set-up (MC No. 153), MARINA will intervene only if passengers and shippers file a complaint against the rates and services of shipping companies and only if sufficient basis and justification is submitted. Such regulation should be modified. Monitoring should be on a regular basis, i.e. not only when complaints are filed, to ensure that the interests of shippers and passengers are protected against overcharging and poor service standards, and that the dominant firm or firms in each route do not abuse their market power. Regular monitoring would, in the first place, prevent shipping companies from making actions contrary to the regulations.
Monitoring should be done in tandem with the Philippine Coast Guard (PCG) that
gives the vessels the authority to sail. As discussed earlier, a shipping operator can resort to fare diving or large discounts and still earn profits by overloading its passengers. Such practice can be avoided if the PCG does strict monitoring of the vessels.
Instead of just responding to applications for new or expanded shipping services,
MARINA should be proactive where the unavailability of desirable services is concerned. It
No of firms NRT beg % NRT end %
Old Order Firms Growing 16 88,465.29 36.64 135,883.60 79.89Declining 14 151,228.58 62.63 32,438.96 19.07no change 7 1,755.40 0.73 1,755.40 1.03Total 37 241,449.27 100.00 170,077.96 100.00
New Order Firms Growing 3 72,283.08 96.64 94,508.97 97.52Declining 1 406.00 0.54 289.61 0.30no change 3 2,110.08 2.82 2,110.08 2.18Total 7 74,799.16 100.00 96,908.66 100.00
Industry Growing 19 160,748.37 50.83 230,392.57 86.3Declining 15 151,634.58 47.95 32,728.57 12.3no change 10 3,865.48 1.22 3,865.48 3.2Total 44 316,248.43 100.00 266,986.62 100.0Note: Data for nine (9) firms are either incomplete or not available. Source: MARINA Route Inventory (VIS-L-13)
Table 18. Surviving firms, growing and declining based on Net Registered Tonnage (NRT) change
41
should identify underdeveloped routes or routes where there is shortage of vessels or routes that are not served and then publicly invite investors for these routes. MARINA should focus into allowing new entrants in the tertiary routes where practically there is no safe, reliable and adequate service and more often than not, rampant overloading of passengers during peak seasons.
However, for MARINA to be able to exercise its monitoring functions effectively and
for it to be able to identify routes requiring adequate shipping services, there must be established a database that is easily accessible to the public, researchers, shipping operators, investors and policymakers. The database should include, at the very least, passenger/cargo traffic and freight/passage rates by shipping company and by route; number of operators per route and vessel capacity per route. Current regulations require shipping companies to submit to the MARINA quarterly reports of passenger/cargo traffic and the actual rates charged by their vessels, whether regulated or deregulated. Nonetheless, such reports remain as reports and are not being processed into a database10.
One particular issue confronting the MARINA these days is the basis for the approval
of upward adjustment of regulated rates. The approach currently used is still the revenue deficiency method. However, the approach is no longer appropriate as the financial statements of shipping companies include their deregulated operations.
8. Areas for Competition Policy and Further Reforms Competition policy Liberalization and deregulation should not be undertaken in isolation. The policy reforms should be complemented by competition policy to ensure that the competition and other benefits arising from liberalization and deregulation are not eroded by possible development of market power among shipping lines. As discussed earlier, substantial competition exists in only a small percentage of the routes and that cartel-like arrangements have been observed to exist in the industry. One area for competition policy is on merger and acquisition or consolidation. Fierce competition can push companies into bankruptcy, merger or consolidation. The latter can have both positive and negative effects. On the positive side, efficiency could be enhanced as it allows shipping companies to consolidate their functions like marketing, ticketing, repair and maintenance, etc. On the negative side, there is the fear that the end result will be a large company becoming so dominant that it can exert considerable market power. The country’s shipping industry had seen merger and consolidation happening in response to the reforms. The merger did not result to an increase in market power of the merged companies, at least for now, since the current concern of the companies is more on consolidating their functions and not much on increasing their market share. The picture could change, however, once the consolidation had been complete.
10 This is based on the experience of the author in making this study. No data on freight/passage rates or passenger/cargo traffic by routes and by company are readily available.
42
Hence, a policy on merger and consolidation should be defined in such a way that mergers and consolidation would not result to reduced service and less competition. The efficiency effects should be weighed against the market power effects. In short, merger should be in the interests of the traveling public. Another important area to consider is the development of the tertiary routes. The shipping industry has become an important source of competition for the air transport industry in providing transport services in the country’s islands in the south (Austria 2000). The system of providing government incentives to shipping operators developing the tertiary routes should therefore be designed in such a way that the efficiency arising from the intermodal competition will not be distorted. Further reforms
The government should continue its deregulation efforts. Of particular interest is the
regulated rate for non-DOT accredited vessels that either only offers first and second class accommodation or whose third class accommodation is less than 50 percent of the total passenger capacity. This regulation has no rationale as the first class and second class passenger services have already been deregulated.
One important issue remaining for deregulation is the third class passenger service.
About 70 percent of passengers take the third class service, majority of whom also come from the C-D crowd. The regulated rate for this service is regarded by shipping companies as very low and cannot cover cost. The operation is therefore cross-subsidized, and often by cargo revenue. Since most of the cargo rates are already deregulated, passenger-cargo vessels are placed at a disadvantage against pure cargo vessels because cross-subsidization is no longer feasible under a deregulated environment. This is also aggravated by the fact that current regulation requires passenger vessels to allocate 50 percent of their passenger capacity to third class passengers, except for DOT-accredited vessels. Given the sensitivity of the issue because of its social implications, any attempt to deregulate the third class passenger service should be carefully looked into. A balance should be struck between social objectives and economic efficiency.
Two other significant areas for reform are the ceiling on the return on investment and
the application of the revenue deficiency method for upward adjustment of regulated rates. Both are anti-competitive. The ceiling on ROI serves as a disincentive for efficient shipping companies because the return may not be commensurate to the level of service rendered. Based on the results of the interview, many of the shipping companies have regarded shipping as less profitable than other competing investments. The ceiling on ROI makes the industry less attractive to investors.
On the other hand, the revenue deficiency method awards inefficient companies
because it guarantees return, regardless of the level of efficiency. As presented earlier, the method can no longer be applied under the new environment because the financial statements of companies also include their deregulated operations.
43
9. Summary and Conclusions Regulation has a long history in the country’s shipping industry. This paper examined the conflicting forces of past government regulations and competition and their impact on the industry. The restrictive regulations have weakened, if not prevented, competition thereby rendering them ineffective in achieving the avowed aim of regulatory policy, which is to promote efficiency.
The inefficiency and the consequent adverse impacts on the economy prompted the government to institute reforms through liberalization and deregulation in the 1990s. Competition has improved, undermining industry practices leading to an improvement in the quality of service. Nonetheless, substantial competition exists in only a small percentage of the routes. A greater majority of the routes are still effectively monopolized or experienced only mild competition. The top three or top five companies in the industry effectively dominate the different routes, regardless of the routes’ state of competition. What is more striking is the large increase in cargo and passenger rates after the reforms. The cartel-like arrangement that is observed to exist in the industry may have contributed to this.
The policy reform has been a slow process and much is still desired. There is a need
for competition policy to ensure that the benefits derived from liberalization and deregulation will not be eroded by the possible abuse of market power among the shipping lines. Likewise, the commercial success or failure of shipping companies in a liberalized and deregulated environment hinge much on their responsiveness to market requirements; in short, their competitiveness. However, competitiveness depends on a host of factors that include shipping costs and physical and administrative infrastructures. It has always been argued that domestic shipping costs (fuel, interest rate, insurance, and income and freight taxes) and handling costs in the country are higher than other countries in the region (Lorenzo, 1997; PISA, 2001). On the other hand, port facilities in the country are far below world-class standards, with some ports still undeveloped.
Finally, the high domestic shipping cost in the country is causing the pressure for the
lifting of the cabotage law to enable domestic shippers avail of lower shipping costs from foreign vessels. The lifting of the cabotage law will expose interisland shipping to the pressures of international competition. This would be advantageous for the country in the long run as it will increase the pressure for efficiency among all players in the industry. However, the government needs to identify what measures and actions need to be undertaken, including their sequencing, during the transition to full liberalization in order to prepare domestic shipping lines to foreign competition. At the very least, the domestic shipping environment should be improved by addressing the domestic issues affecting the industry’s competitiveness.
44
References Austria, Myrna, 2000. The State of Competition and Market Structure of the
Philippine Air Transport Industry, PASCN Discussion Paper No. 2000-12., Philippine APEC Study Center Network, Makati City.
Balbon, Paciencio Jr., 1989."The Philippine Interisland Liner Shipping Industry: An
Insight into the Provision of Shipping Services by the Private Sector," Private Sector Papers, Regional Seminar on Transport Policy, vol. 2, ADB and Economic Development Institute, Manila.
Balisacan, Arsenio, 1989. An Analysis of Philippine Inter-island Shipping Industry,
UPSE Discussion Paper No. 89-09, School of Economics, University of the Philippines, Quezon City.
Basilio, Enrico, 1997. Study on the Contributions of the Inter-island Shipping
Industry to the Philippine Economy, SBE Consulting, Pasig City. Dick, Howard 1987. The Indonesian Interisland Shipping Industry: An Analysis of
Competition and Regulation, Institute of Southeast Asian Studies, Singapore. Economic Development Institute, 1989. "Philippines Country Paper," Regional
Seminar on Transport Policy, vol. 2, ADB and Economic Development Institute, Manila.
Fink, Carsten, Aaditya Mattoo and Ileana Cristina Neagu, 2000. “Trade in
International Maritime Services: How Much Does Policy Matter”, Paper presented at the APEC Regional Seminar on WTO Issues: Investment and Competition Policies, 29-30 November 2000, Makaty City, Philippines.
Free Trade Asia Consulting Inc., 1998. Industry Structure and Competitivenes: Inter-
island Freight Shipping Industry, TAPS PP 1998-21, Trade and Investment Policy Analysis and Advocacy Support Project, Philexport, Manila.
Hanlon, Pat, 1996. Global Airlines, Competition in a Transnational Industry,
Butterworth-Heinemann, Great Britain. Lorenzo, Emerson, 1997. The Domestic Shipping Industry of the Philippines: A
Situation Report, Maritime Industry Authority, Manila. Nathan Associates Inc., 1994. Liner Shipping Route Study, Final Report vol. 1 and
14, US AID, Manila. National Economic Development Authority, 19__. PhilippineTransport Strategy
Study, Chapter 14-15, NEDA, Pasig City. Philippine Exporters Confederation Inc., 1999. Proceedings of Forum: Impact of the
1998 US Ocean Shipping Reform Act on Philippine Exports, Manila.
45
Philippine Exporters Confederation Inc., Unbundling Freight Rates Imposed by
Foreign and Domestic Shipping Lines on Inter-island Transport of Export and Import Cargoes, Trade and Investment Policy Analysis and Advocacy Support Project, Philexport, Manila.
Philippine Exporters Confederation Inc., Unbundling Freight Rates Imposed by
Foreign and Domestic Shipping Lines on Inter-island Transport of Export and Import Cargoes, Trade and Investment Policy Analysis and Advocacy Support Project, Philexport, Manila.
Philippine Interisland Shipping Association and Filipino Shipowners Association,
2001. Philippine Shipping Industry Position Paper, Manila. Presidential Task Force, 1989. Final Report on Inter-island Shipping Industry,
NEDA, Pasig City. Renardet Sauti Consulting Engineers, 1986. Interisland Shipping Regulation Study,
National Transportation Planning Project, Ministry of Transportation and Communications, Philippines.
Saragih, Barens Th., 2000. "Globalization and Its Effects in Shipping Indonesian
Perspectives", National Shipping Congress 2000 Book of Proceedings, PISA and FSA, Manila.
Serafica, Ramonette, 1998. Beyond 2000: An Assessment of Infrastructure Policies,
PIDS Discussion Paper Series No. 98-07, Philippine Institute for Development Studies, Makati City.
Stewart-Smith, Martin C., 1999. Industry Structure and Regulation, World Bank. United Nations Conference on Trade and Development, 1992. Industry and Policy
Developments in World Shipping and their Impact on Developing Countries, TD/B/CN.4/5, Report by the UNCTAD Secretariat.
United Nations Conference on Trade and Development, 1994. Progressive
Liberalization and the Development of Shipping Services in Developing Countries, TD/B/CN.4/34, Report by the UNCTAD Secretariat.
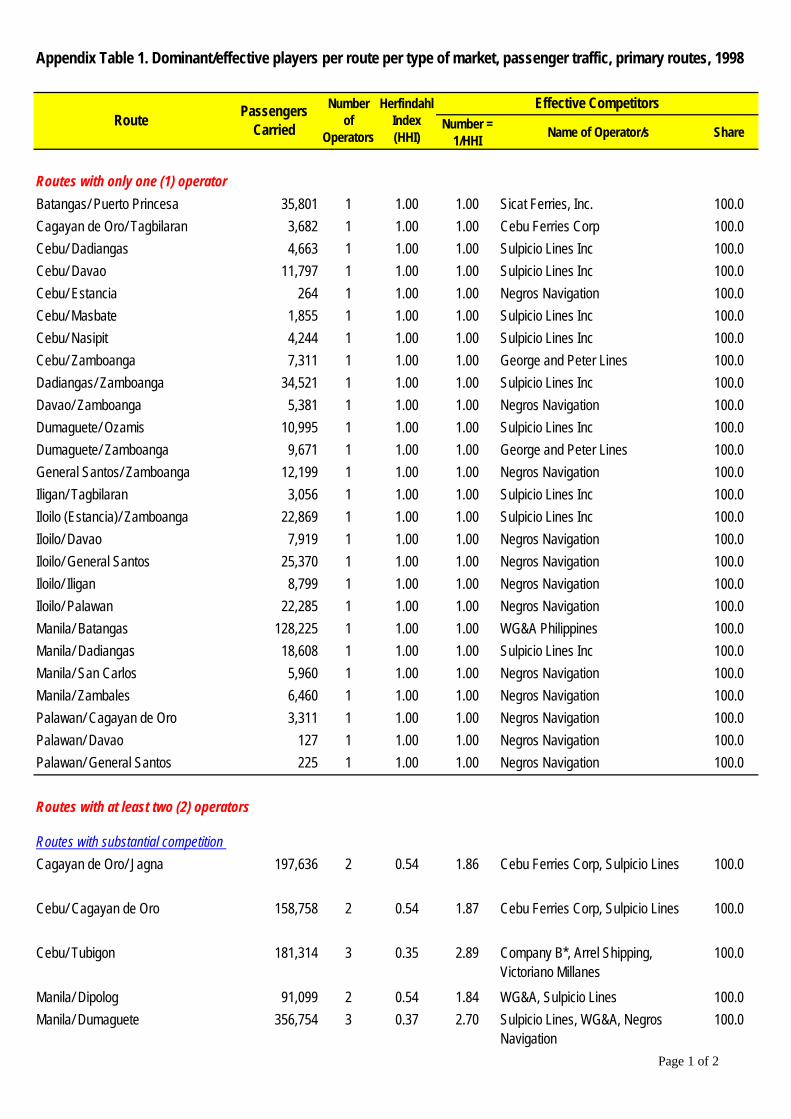
Number = 1/HHI
Name of Operator/s Share
Routes with only one (1) operator
Batangas/ Puerto Princesa 35,801 1 1.00 1.00 Sicat Ferries, Inc. 100.0Cagayan de Oro/ Tagbilaran 3,682 1 1.00 1.00 Cebu Ferries Corp 100.0Cebu/ Dadiangas 4,663 1 1.00 1.00 Sulpicio Lines Inc 100.0Cebu/ Davao 11,797 1 1.00 1.00 Sulpicio Lines Inc 100.0Cebu/ Estancia 264 1 1.00 1.00 Negros Navigation 100.0Cebu/ Masbate 1,855 1 1.00 1.00 Sulpicio Lines Inc 100.0Cebu/ Nasipit 4,244 1 1.00 1.00 Sulpicio Lines Inc 100.0Cebu/ Zamboanga 7,311 1 1.00 1.00 George and Peter Lines 100.0Dadiangas/ Zamboanga 34,521 1 1.00 1.00 Sulpicio Lines Inc 100.0Davao/ Zamboanga 5,381 1 1.00 1.00 Negros Navigation 100.0Dumaguete/ Ozamis 10,995 1 1.00 1.00 Sulpicio Lines Inc 100.0Dumaguete/ Zamboanga 9,671 1 1.00 1.00 George and Peter Lines 100.0General Santos/ Zamboanga 12,199 1 1.00 1.00 Negros Navigation 100.0Iligan/ Tagbilaran 3,056 1 1.00 1.00 Sulpicio Lines Inc 100.0Iloilo (Estancia)/ Zamboanga 22,869 1 1.00 1.00 Sulpicio Lines Inc 100.0Iloilo/ Davao 7,919 1 1.00 1.00 Negros Navigation 100.0Iloilo/ General Santos 25,370 1 1.00 1.00 Negros Navigation 100.0Iloilo/ Iligan 8,799 1 1.00 1.00 Negros Navigation 100.0Iloilo/ Palawan 22,285 1 1.00 1.00 Negros Navigation 100.0Manila/ Batangas 128,225 1 1.00 1.00 WG&A Philippines 100.0Manila/ Dadiangas 18,608 1 1.00 1.00 Sulpicio Lines Inc 100.0Manila/ San Carlos 5,960 1 1.00 1.00 Negros Navigation 100.0Manila/ Zambales 6,460 1 1.00 1.00 Negros Navigation 100.0Palawan/ Cagayan de Oro 3,311 1 1.00 1.00 Negros Navigation 100.0Palawan/ Davao 127 1 1.00 1.00 Negros Navigation 100.0Palawan/ General Santos 225 1 1.00 1.00 Negros Navigation 100.0
Routes with at least two (2) operators
Routes with substantial competition
Cagayan de Oro/ Jagna 197,636 2 0.54 1.86 Cebu Ferries Corp, Sulpicio Lines 100.0
Cebu/ Cagayan de Oro 158,758 2 0.54 1.87 Cebu Ferries Corp, Sulpicio Lines 100.0
Cebu/ Tubigon 181,314 3 0.35 2.89 Company B*, Arrel Shipping, Victoriano Millanes
100.0
Manila/ Dipolog 91,099 2 0.54 1.84 WG&A, Sulpicio Lines 100.0Manila/ Dumaguete 356,754 3 0.37 2.70 Sulpicio Lines, WG&A, Negros
Navigation 100.0
Appendix Table 1. Dominant/effective players per route per type of market, passenger traffic, primary routes, 1998
Effective CompetitorsRoute
Passengers Carried
Number of
Operators
Herfindahl Index (HHI)
Page 1 of 2

Number = 1/HHI
Name of Operator/s Share
Effective CompetitorsRoute
Passengers Carried
Number of
Operators
Herfindahl Index (HHI)
Manila/ Estancia 56,761 2 0.61 1.64 Sulpicio Lines, Negros Navigation 100.0
Manila/ Masbate 139,328 2 0.51 1.96 WG&A, Sulpicio Lines 100.0
Routes with only one (1) effective competitor
Cebu/ Jagna 2,916 2 0.88 1.13 Cebu Ferries Corp 93.8Davao/ General Santos 2,359 2 0.97 1.03 Negros Navigation 98.6Dumaguete/ Tagbilaran 51,695 2 0.86 1.17 Negros Navigation 92.2Manila/ Gen. Santos 100,322 3 0.73 1.37 WG&A Philippines 84.1Manila/ Nasipit 103,980 3 0.97 1.03 WG&A Philippines 98.5
Routes with mild competition
Cebu/ Bohol 239,093 9 0.37 2.69 Romulo Wagwag, Ormoc Enterprises, MY Lines
83.2
Cebu/ Dumaguete 277,557 6 0.33 3.07 Phil Fast Ferry, Negros Navigation, George and Peter Lines
84.3
Cebu/ General Santos 1,746 2 0.71 1.40 Sulpicio Lines 82.8Cebu/ Iloilo 12,524 3 0.51 1.97 Cokaliong Shipping, Negros
Navigation 98.5
Cebu/ Palawan/ Puerto Princesa 11,257 3 0.68 1.47 Cebu Ferries Corp 80.4
Cebu/ Tagbilaran 472,250 3 0.54 1.87 Phil Fast Ferry, Negros Navigation 96.5
Manila/ Cagayan de Oro 406,331 3 0.40 2.49 Sulpicio Lines, WG&A 87.6Manila/ Cebu 663,471 3 0.52 1.92 WG&A, Sulpicio Lines 97.7Manila/ Davao 175,719 3 0.60 1.66 WG&A, Sulpicio Lines 90.8Manila/ Iligan 128,207 3 0.64 1.56 WG&A 78.3Manila/ Iloilo 645,024 3 0.60 1.66 Negros Navigation, WG&A 98.7Manila/ Palawan/ Puerto Princesa 186,402 3 0.54 1.86 WG&A, Negros Navigation 96.3
Manila/ Tagbilaran 192,526 3 0.46 2.17 WG&A, Negros Navigation 93.1Manila/ Zamboanga 176,144 2 0.67 1.50 WG&A 79.0source: 1998 Annual Traffic Reports of Shipping Companies submitted to the MARINA.
Page 2 of 2
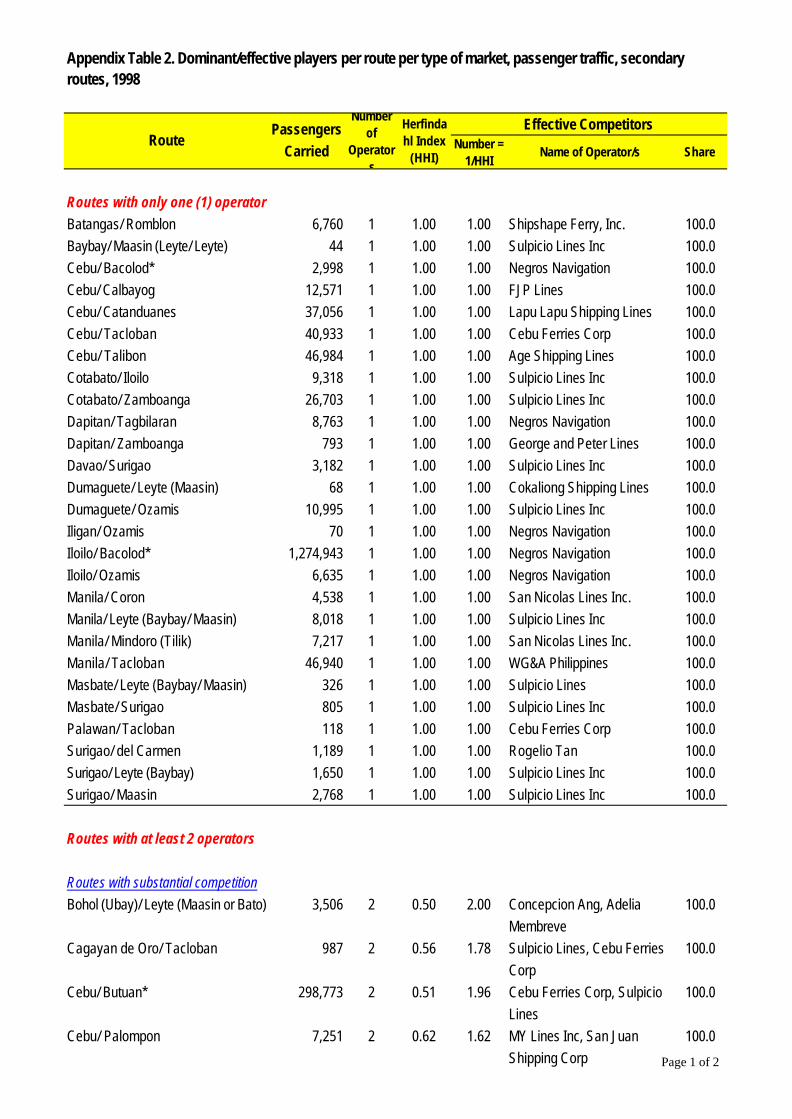
Number = 1/HHI
Name of Operator/s Share
Routes with only one (1) operatorBatangas/ Romblon 6,760 1 1.00 1.00 Shipshape Ferry, Inc. 100.0Baybay/ Maasin (Leyte/ Leyte) 44 1 1.00 1.00 Sulpicio Lines Inc 100.0Cebu/ Bacolod* 2,998 1 1.00 1.00 Negros Navigation 100.0Cebu/ Calbayog 12,571 1 1.00 1.00 FJP Lines 100.0Cebu/ Catanduanes 37,056 1 1.00 1.00 Lapu Lapu Shipping Lines 100.0Cebu/ Tacloban 40,933 1 1.00 1.00 Cebu Ferries Corp 100.0Cebu/ Talibon 46,984 1 1.00 1.00 Age Shipping Lines 100.0Cotabato/ Iloilo 9,318 1 1.00 1.00 Sulpicio Lines Inc 100.0Cotabato/ Zamboanga 26,703 1 1.00 1.00 Sulpicio Lines Inc 100.0Dapitan/ Tagbilaran 8,763 1 1.00 1.00 Negros Navigation 100.0Dapitan/ Zamboanga 793 1 1.00 1.00 George and Peter Lines 100.0Davao/ Surigao 3,182 1 1.00 1.00 Sulpicio Lines Inc 100.0Dumaguete/ Leyte (Maasin) 68 1 1.00 1.00 Cokaliong Shipping Lines 100.0Dumaguete/ Ozamis 10,995 1 1.00 1.00 Sulpicio Lines Inc 100.0Iligan/ Ozamis 70 1 1.00 1.00 Negros Navigation 100.0Iloilo/ Bacolod* 1,274,943 1 1.00 1.00 Negros Navigation 100.0Iloilo/ Ozamis 6,635 1 1.00 1.00 Negros Navigation 100.0Manila/ Coron 4,538 1 1.00 1.00 San Nicolas Lines Inc. 100.0Manila/ Leyte (Baybay/ Maasin) 8,018 1 1.00 1.00 Sulpicio Lines Inc 100.0Manila/ Mindoro (Tilik) 7,217 1 1.00 1.00 San Nicolas Lines Inc. 100.0Manila/ Tacloban 46,940 1 1.00 1.00 WG&A Philippines 100.0Masbate/ Leyte (Baybay/ Maasin) 326 1 1.00 1.00 Sulpicio Lines 100.0Masbate/ Surigao 805 1 1.00 1.00 Sulpicio Lines Inc 100.0Palawan/ Tacloban 118 1 1.00 1.00 Cebu Ferries Corp 100.0Surigao/ del Carmen 1,189 1 1.00 1.00 Rogelio Tan 100.0Surigao/ Leyte (Baybay) 1,650 1 1.00 1.00 Sulpicio Lines Inc 100.0Surigao/ Maasin 2,768 1 1.00 1.00 Sulpicio Lines Inc 100.0
Routes with at least 2 operators
Routes with substantial competitionBohol (Ubay)/ Leyte (Maasin or Bato) 3,506 2 0.50 2.00 Concepcion Ang, Adelia
Membreve100.0
Cagayan de Oro/ Tacloban 987 2 0.56 1.78 Sulpicio Lines, Cebu Ferries Corp
100.0
Cebu/ Butuan* 298,773 2 0.51 1.96 Cebu Ferries Corp, Sulpicio Lines
100.0
Cebu/ Palompon 7,251 2 0.62 1.62 MY Lines Inc, San Juan Shipping Corp
100.0
Effective Competitors
Appendix Table 2. Dominant/effective players per route per type of market, passenger traffic, secondary routes, 1998
RoutePassengers
Carried
Number of
Operators
Herfindahl Index
(HHI)
Page 1 of 2
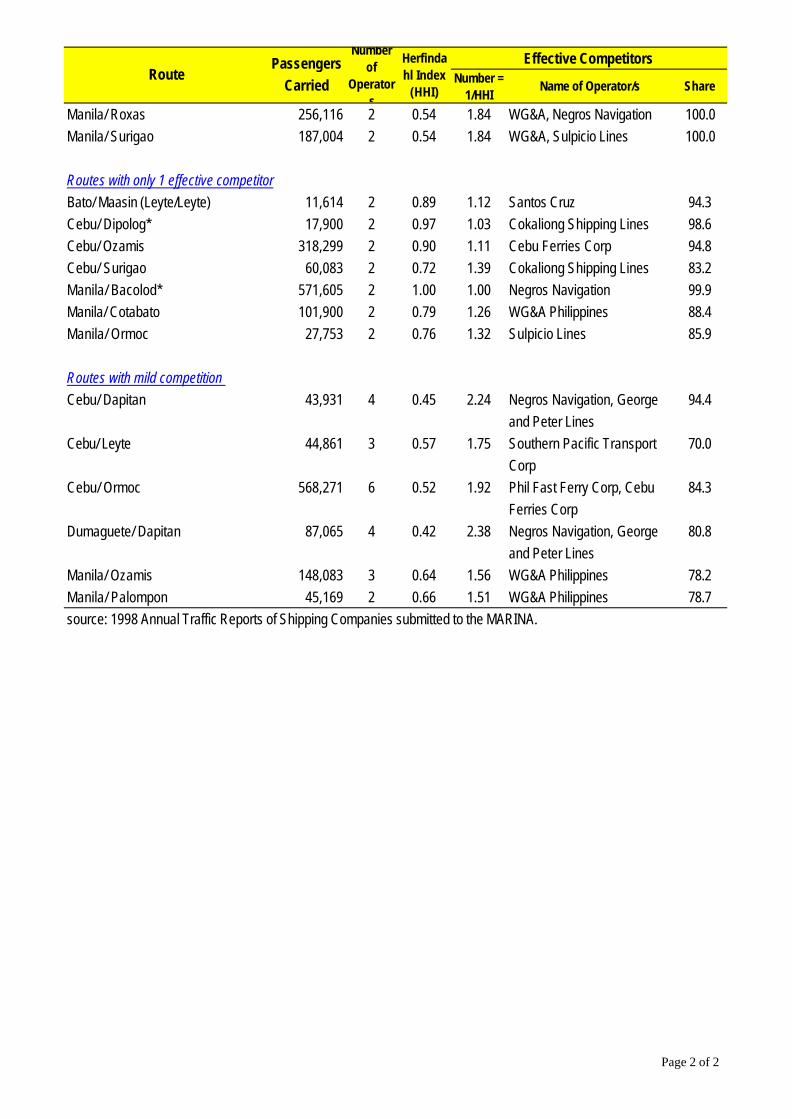
Number = 1/HHI
Name of Operator/s Share
Effective CompetitorsRoute
Passengers
Carried
Number of
Operators
Herfindahl Index
(HHI)
Manila/ Roxas 256,116 2 0.54 1.84 WG&A, Negros Navigation 100.0Manila/ Surigao 187,004 2 0.54 1.84 WG&A, Sulpicio Lines 100.0
Routes with only 1 effective competitorBato/ Maasin (Leyte/Leyte) 11,614 2 0.89 1.12 Santos Cruz 94.3Cebu/ Dipolog* 17,900 2 0.97 1.03 Cokaliong Shipping Lines 98.6Cebu/ Ozamis 318,299 2 0.90 1.11 Cebu Ferries Corp 94.8Cebu/ Surigao 60,083 2 0.72 1.39 Cokaliong Shipping Lines 83.2Manila/ Bacolod* 571,605 2 1.00 1.00 Negros Navigation 99.9Manila/ Cotabato 101,900 2 0.79 1.26 WG&A Philippines 88.4Manila/ Ormoc 27,753 2 0.76 1.32 Sulpicio Lines 85.9
Routes with mild competition Cebu/ Dapitan 43,931 4 0.45 2.24 Negros Navigation, George
and Peter Lines94.4
Cebu/ Leyte 44,861 3 0.57 1.75 Southern Pacific Transport Corp
70.0
Cebu/ Ormoc 568,271 6 0.52 1.92 Phil Fast Ferry Corp, Cebu Ferries Corp
84.3
Dumaguete/ Dapitan 87,065 4 0.42 2.38 Negros Navigation, George and Peter Lines
80.8
Manila/ Ozamis 148,083 3 0.64 1.56 WG&A Philippines 78.2Manila/ Palompon 45,169 2 0.66 1.51 WG&A Philippines 78.7source: 1998 Annual Traffic Reports of Shipping Companies submitted to the MARINA.
Page 2 of 2
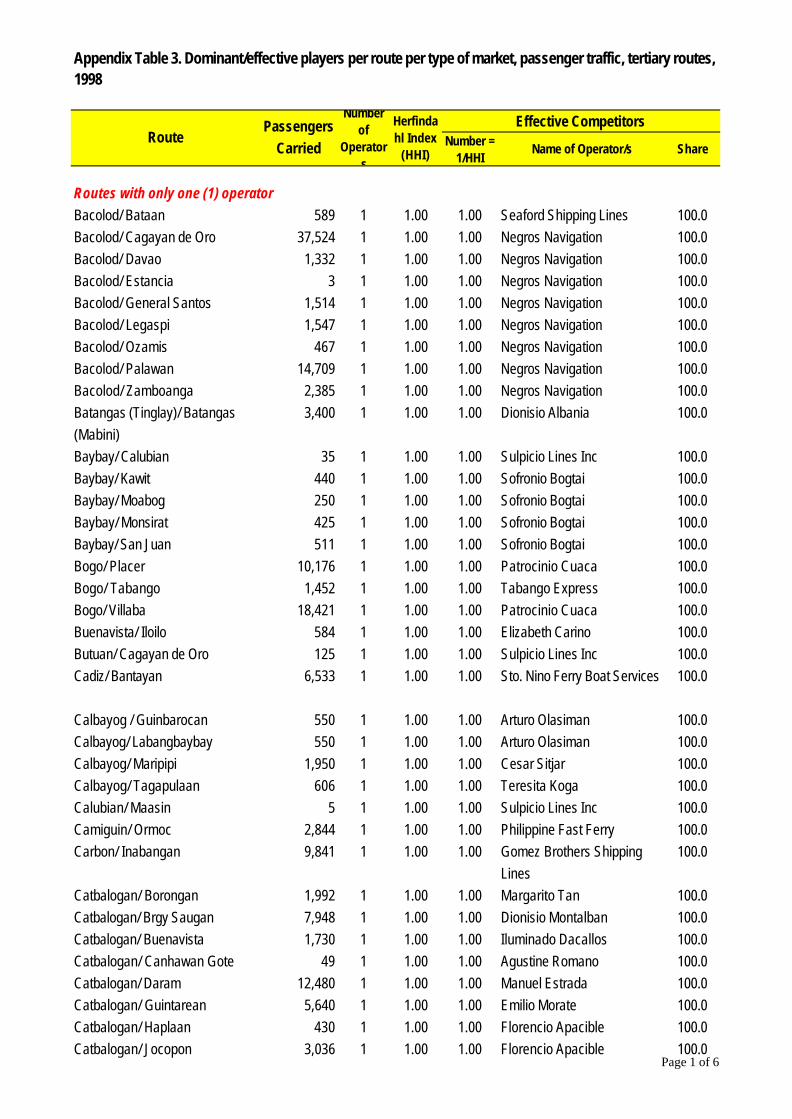
Number = 1/HHI
Name of Operator/s Share
Routes with only one (1) operatorBacolod/ Bataan 589 1 1.00 1.00 Seaford Shipping Lines 100.0Bacolod/ Cagayan de Oro 37,524 1 1.00 1.00 Negros Navigation 100.0Bacolod/ Davao 1,332 1 1.00 1.00 Negros Navigation 100.0Bacolod/ Estancia 3 1 1.00 1.00 Negros Navigation 100.0Bacolod/ General Santos 1,514 1 1.00 1.00 Negros Navigation 100.0Bacolod/ Legaspi 1,547 1 1.00 1.00 Negros Navigation 100.0Bacolod/ Ozamis 467 1 1.00 1.00 Negros Navigation 100.0Bacolod/ Palawan 14,709 1 1.00 1.00 Negros Navigation 100.0Bacolod/ Zamboanga 2,385 1 1.00 1.00 Negros Navigation 100.0Batangas (Tinglay)/ Batangas (Mabini)
3,400 1 1.00 1.00 Dionisio Albania 100.0
Baybay/ Calubian 35 1 1.00 1.00 Sulpicio Lines Inc 100.0Baybay/ Kawit 440 1 1.00 1.00 Sofronio Bogtai 100.0Baybay/ Moabog 250 1 1.00 1.00 Sofronio Bogtai 100.0Baybay/ Monsirat 425 1 1.00 1.00 Sofronio Bogtai 100.0Baybay/ San Juan 511 1 1.00 1.00 Sofronio Bogtai 100.0Bogo/ Placer 10,176 1 1.00 1.00 Patrocinio Cuaca 100.0Bogo/ Tabango 1,452 1 1.00 1.00 Tabango Express 100.0Bogo/ Villaba 18,421 1 1.00 1.00 Patrocinio Cuaca 100.0Buenavista/ Iloilo 584 1 1.00 1.00 Elizabeth Carino 100.0Butuan/ Cagayan de Oro 125 1 1.00 1.00 Sulpicio Lines Inc 100.0Cadiz/ Bantayan 6,533 1 1.00 1.00 Sto. Nino Ferry Boat Services 100.0
Calbayog / Guinbarocan 550 1 1.00 1.00 Arturo Olasiman 100.0Calbayog/ Labangbaybay 550 1 1.00 1.00 Arturo Olasiman 100.0Calbayog/ Maripipi 1,950 1 1.00 1.00 Cesar Sitjar 100.0Calbayog/ Tagapulaan 606 1 1.00 1.00 Teresita Koga 100.0Calubian/ Maasin 5 1 1.00 1.00 Sulpicio Lines Inc 100.0Camiguin/ Ormoc 2,844 1 1.00 1.00 Philippine Fast Ferry 100.0Carbon/ Inabangan 9,841 1 1.00 1.00 Gomez Brothers Shipping
Lines100.0
Catbalogan/ Borongan 1,992 1 1.00 1.00 Margarito Tan 100.0Catbalogan/ Brgy Saugan 7,948 1 1.00 1.00 Dionisio Montalban 100.0Catbalogan/ Buenavista 1,730 1 1.00 1.00 Iluminado Dacallos 100.0Catbalogan/ Canhawan Gote 49 1 1.00 1.00 Agustine Romano 100.0Catbalogan/ Daram 12,480 1 1.00 1.00 Manuel Estrada 100.0Catbalogan/ Guintarean 5,640 1 1.00 1.00 Emilio Morate 100.0Catbalogan/ Haplaan 430 1 1.00 1.00 Florencio Apacible 100.0Catbalogan/ Jocopon 3,036 1 1.00 1.00 Florencio Apacible 100.0
Effective Competitors
Appendix Table 3. Dominant/effective players per route per type of market, passenger traffic, tertiary routes, 1998
RoutePassengers
Carried
Number of
Operators
Herfindahl Index
(HHI)
Page 1 of 6

Number = 1/HHI
Name of Operator/s Share
Effective CompetitorsRoute
Passengers
Carried
Number of
Operators
Herfindahl Index
(HHI)
Catbalogan/ San Rogue 4,899 1 1.00 1.00 Reynaldo Cajefe Jr 100.0Catbalogan/ Sitio Bitoon 50 1 1.00 1.00 Agustine Romano 100.0Catbalogan/ Tarangnan 294 1 1.00 1.00 Antonio Vencio 100.0Catbalogan/ Villareal 3,668 1 1.00 1.00 Avelino Arraz 100.0Cebu/ Camotes 5,302 1 1.00 1.00 Palacio Shipping 100.0Cebu/ Dawahon 2,604 1 1.00 1.00 Concepcion Ang 100.0Cebu/ Hiligaynon 31,696 1 1.00 1.00 Roble Shipping 100.0Cebu/ Jetafe 23,901 1 1.00 1.00 Carmelo Simolde 100.0Cebu/ Lapu-lapu 2,933,142 1 1.00 1.00 Metro Ferry Cebu 100.0Cebu/ Larena 3,855 1 1.00 1.00 Palacio Shipping Inc 100.0Cebu/ Lazi 167 1 1.00 1.00 George and Peter Lines 100.0Cebu/ Sta Fe 12,949 1 1.00 1.00 FJP Lines 100.0Cogon/ Sta Ana 22,501 1 1.00 1.00 Roger Bandao 100.0Cuyo/ El Nido 20 1 1.00 1.00 Virgilio Arbolado 100.0Cuyo/ San Vicente 55 1 1.00 1.00 Virgilio Arbolado 100.0Dadiangas/ Iloilo 9,211 1 1.00 1.00 Sulpicio Lines Inc 100.0Danao/ Camotes 18,680 1 1.00 1.00 Carlito Latonio 100.0Danao/ Kawit 455 1 1.00 1.00 Sofronio Bogtai 100.0Danao/ Moabog 569 1 1.00 1.00 Sofronio Bogtai 100.0Danao/ Naval 94 1 1.00 1.00 Cesar Sitjar 100.0Dapitan/ Lazi 543 1 1.00 1.00 George and Peter Lines 100.0Davao/ Dadiangas 34 1 1.00 1.00 Sulpicio Lines Inc 100.0Dipolog/ Iligan 534 1 1.00 1.00 Sulpicio Lines Inc 100.0Dipolog/ Tagbilaran 12,065 1 1.00 1.00 Sulpicio Lines Inc 100.0Doong / Hagnaya 231 1 1.00 1.00 Gaudencio Baruc 100.0Doong/ Vito 130 1 1.00 1.00 Gaudencio Baruc 100.0Dumaguete/ Estancia 3 1 1.00 1.00 Negros Navigation 100.0Gravahan/ Pag-asa 238,416 1 1.00 1.00 German Gutierrez 100.0Guimaras/ Pulupandan 600 1 1.00 1.00 Teresita Gananan 100.0Guimaras/ Roxas City 204 1 1.00 1.00 Nomn Novyar 100.0Hilutungan/ Boyong 3 1 1.00 1.00 Tripple "S" Divers Services 100.0Hilutungan/ Shangrila 103 1 1.00 1.00 Tripple "S" Divers Services 100.0Iligan/ Bacolod 725 1 1.00 1.00 Negros Navigation 100.0Iligan/ Lazi 2,919 1 1.00 1.00 George and Peter Lines 100.0Iligan/ Ormoc 189 1 1.00 1.00 Sulpicio Lines Inc 100.0Iloilo/ Cagayan de Oro 52,247 1 1.00 1.00 Negros Navigation 100.0Iloilo/ Zambales 6,635 1 1.00 1.00 Negros Navigation 100.0Jagna/ Nasipit 1,042 1 1.00 1.00 Sulpicio Lines Inc 100.0Kalusuan/ Boyong 15 1 1.00 1.00 Tripple "S" Divers Services 100.0Kalusuan/ Shang rila 155 1 1.00 1.00 Tripple "S" Divers Services 100.0Lapinig,Garcia/ Bohol (Ubay) 5,268 1 1.00 1.00 M/ V Intan 100.0Limasawa/ P. Burgos 10,968 1 1.00 1.00 Zenaida Petracorta 100.0Mactan/ Dumilon 572 1 1.00 1.00 Tristar Sea Ventures Inc 100.0Madredejos/ Kawit 4,731 1 1.00 1.00 Saturnino Atienza 100.0Page 2 of 6

Number = 1/HHI
Name of Operator/s Share
Effective CompetitorsRoute
Passengers
Carried
Number of
Operators
Herfindahl Index
(HHI)
Magalona/ Iloilo 3,055 1 1.00 1.00 Antonio Mogasa 100.0Mandaue/ Bohol 5,174 1 1.00 1.00 Casiano Obligado, Jr 100.0Manila/ Butuan 22,026 1 1.00 1.00 Sulpicio Lines Inc 100.0Manila/ Calubian 11,813 1 1.00 1.00 Sulpicio Lines Inc 100.0Manila/ Corregidor 25,235 1 1.00 1.00 Sun Cruises 100.0Manila/ Dumaguit 43,567 1 1.00 1.00 WG&A Philippines 100.0Manila/ El Nido- Liminangcong 1,557 1 1.00 1.00 San Nicolas Lines Inc. 100.0Manila/ Zambales 6,460 1 1.00 1.00 Negros Navigation 100.0Margos/ Malangas 4,041 1 1.00 1.00 Ever Lines 100.0Margos/ Subanipa 3,328 1 1.00 1.00 Ever Lines 100.0Margos/ Talusan 1,495 1 1.00 1.00 Ever Lines 100.0Masbate/ Calubian 833 1 1.00 1.00 Sulpicio Lines Inc 100.0Masbate/ Maya 6,415 1 1.00 1.00 Arturo Susas 100.0Masbate/ Ormoc 3,123 1 1.00 1.00 Sulpicio Lines Inc 100.0Maya/ Logon 6,023 1 1.00 1.00 Edison Dalag 100.0Mindoro/ Burunga 2,630 1 1.00 1.00 San Nicolas Lines Inc. 100.0Mindoro/ Libertad 7,173 1 1.00 1.00 San Nicolas Lines Inc. 100.0Mindoro/ Semerara 8,136 1 1.00 1.00 San Nicolas Lines Inc. 100.0Naval/ Bato 2,260 1 1.00 1.00 Cesar Sitjar 100.0Naval/ Binalayan 107 1 1.00 1.00 Teodulo Lapure 100.0Naval/ Burabod 101 1 1.00 1.00 Teodulo Lapure 100.0Naval/ Calbani 84 1 1.00 1.00 Teodulo Lapure 100.0Naval/ Canduhao 2,110 1 1.00 1.00 Cesar Sitjar 100.0Naval/ Casibang 76 1 1.00 1.00 Teodulo Lapure 100.0Naval/ Hagonoy 165 1 1.00 1.00 Teodulo Lapure 100.0Naval/ Maripipi 168 1 1.00 1.00 Teodulo Lapure 100.0Naval/ Trabugan 91 1 1.00 1.00 Teodulo Lapure 100.0Naval/ Ulog 73 1 1.00 1.00 Teodulo Lapure 100.0Naval/ Viga 63 1 1.00 1.00 Teodulo Lapure 100.0Odiongan/ Oangay 3,666 1 1.00 1.00 Manuel Perez 100.0Ormoc/ Camotes (Pilar) 19,240 1 1.00 1.00 Antonieto Pedericos 100.0Ormoc/ Dapdap 1,228 1 1.00 1.00 Sofronio Bogtai 100.0Ormoc/ Kawit 1,050 1 1.00 1.00 Sofronio Bogtai 100.0Ormoc/ Lanao 1,035 1 1.00 1.00 Sofronio Bogtai 100.0Ormoc/ Moabog 990 1 1.00 1.00 Sofronio Bogtai 100.0Ormoc/ Monsirat 733 1 1.00 1.00 Sofronio Bogtai 100.0Ozamis/ Kolambugan 36,279 1 1.00 1.00 M/V Lilly/ Dona Antonina/
Dona Anita100.0
Ozamis/ Mukas 491,114 1 1.00 1.00 Daima Shipping Corp 100.0Ozamis/ Tubod 35,741 1 1.00 1.00 M/V Lilly/ Dona Antonina/
Dona Anita100.0
Paradise/ Insular 30,800 1 1.00 1.00 Armando Salva 100.0Perez/ Antimonan 5,180 1 1.00 1.00 Eutiquio Caringal 100.0Romblon/ Lucena 42 1 1.00 1.00 Rolando Liwanag 100.0Page 3 of 6
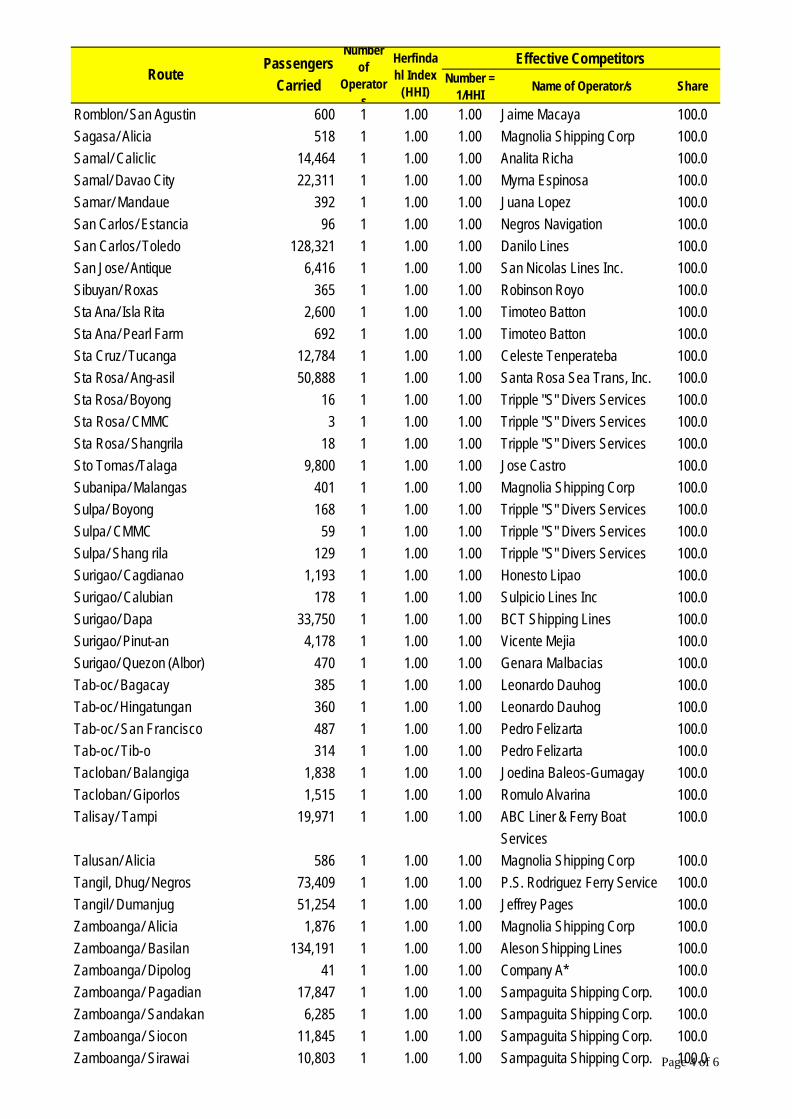
Number = 1/HHI
Name of Operator/s Share
Effective CompetitorsRoute
Passengers
Carried
Number of
Operators
Herfindahl Index
(HHI)
Romblon/ San Agustin 600 1 1.00 1.00 Jaime Macaya 100.0Sagasa/ Alicia 518 1 1.00 1.00 Magnolia Shipping Corp 100.0Samal/ Caliclic 14,464 1 1.00 1.00 Analita Richa 100.0Samal/ Davao City 22,311 1 1.00 1.00 Myrna Espinosa 100.0Samar/ Mandaue 392 1 1.00 1.00 Juana Lopez 100.0San Carlos/ Estancia 96 1 1.00 1.00 Negros Navigation 100.0San Carlos/ Toledo 128,321 1 1.00 1.00 Danilo Lines 100.0San Jose/ Antique 6,416 1 1.00 1.00 San Nicolas Lines Inc. 100.0Sibuyan/ Roxas 365 1 1.00 1.00 Robinson Royo 100.0Sta Ana/ Isla Rita 2,600 1 1.00 1.00 Timoteo Batton 100.0Sta Ana/ Pearl Farm 692 1 1.00 1.00 Timoteo Batton 100.0Sta Cruz/ Tucanga 12,784 1 1.00 1.00 Celeste Tenperateba 100.0Sta Rosa/ Ang-asil 50,888 1 1.00 1.00 Santa Rosa Sea Trans, Inc. 100.0Sta Rosa/ Boyong 16 1 1.00 1.00 Tripple "S" Divers Services 100.0Sta Rosa/ CMMC 3 1 1.00 1.00 Tripple "S" Divers Services 100.0Sta Rosa/ Shangrila 18 1 1.00 1.00 Tripple "S" Divers Services 100.0Sto Tomas/Talaga 9,800 1 1.00 1.00 Jose Castro 100.0Subanipa/ Malangas 401 1 1.00 1.00 Magnolia Shipping Corp 100.0Sulpa/ Boyong 168 1 1.00 1.00 Tripple "S" Divers Services 100.0Sulpa/ CMMC 59 1 1.00 1.00 Tripple "S" Divers Services 100.0Sulpa/ Shang rila 129 1 1.00 1.00 Tripple "S" Divers Services 100.0Surigao/ Cagdianao 1,193 1 1.00 1.00 Honesto Lipao 100.0Surigao/ Calubian 178 1 1.00 1.00 Sulpicio Lines Inc 100.0Surigao/ Dapa 33,750 1 1.00 1.00 BCT Shipping Lines 100.0Surigao/ Pinut-an 4,178 1 1.00 1.00 Vicente Mejia 100.0Surigao/ Quezon (Albor) 470 1 1.00 1.00 Genara Malbacias 100.0Tab-oc/ Bagacay 385 1 1.00 1.00 Leonardo Dauhog 100.0Tab-oc/ Hingatungan 360 1 1.00 1.00 Leonardo Dauhog 100.0Tab-oc/ San Francisco 487 1 1.00 1.00 Pedro Felizarta 100.0Tab-oc/ Tib-o 314 1 1.00 1.00 Pedro Felizarta 100.0Tacloban/ Balangiga 1,838 1 1.00 1.00 Joedina Baleos-Gumagay 100.0Tacloban/ Giporlos 1,515 1 1.00 1.00 Romulo Alvarina 100.0Talisay/ Tampi 19,971 1 1.00 1.00 ABC Liner & Ferry Boat
Services 100.0
Talusan/ Alicia 586 1 1.00 1.00 Magnolia Shipping Corp 100.0Tangil, Dhug/ Negros 73,409 1 1.00 1.00 P.S. Rodriguez Ferry Service 100.0Tangil/ Dumanjug 51,254 1 1.00 1.00 Jeffrey Pages 100.0Zamboanga/ Alicia 1,876 1 1.00 1.00 Magnolia Shipping Corp 100.0Zamboanga/ Basilan 134,191 1 1.00 1.00 Aleson Shipping Lines 100.0Zamboanga/ Dipolog 41 1 1.00 1.00 Company A* 100.0Zamboanga/ Pagadian 17,847 1 1.00 1.00 Sampaguita Shipping Corp. 100.0Zamboanga/ Sandakan 6,285 1 1.00 1.00 Sampaguita Shipping Corp. 100.0Zamboanga/ Siocon 11,845 1 1.00 1.00 Sampaguita Shipping Corp. 100.0Zamboanga/ Sirawai 10,803 1 1.00 1.00 Sampaguita Shipping Corp. 100.0Page 4 of 6
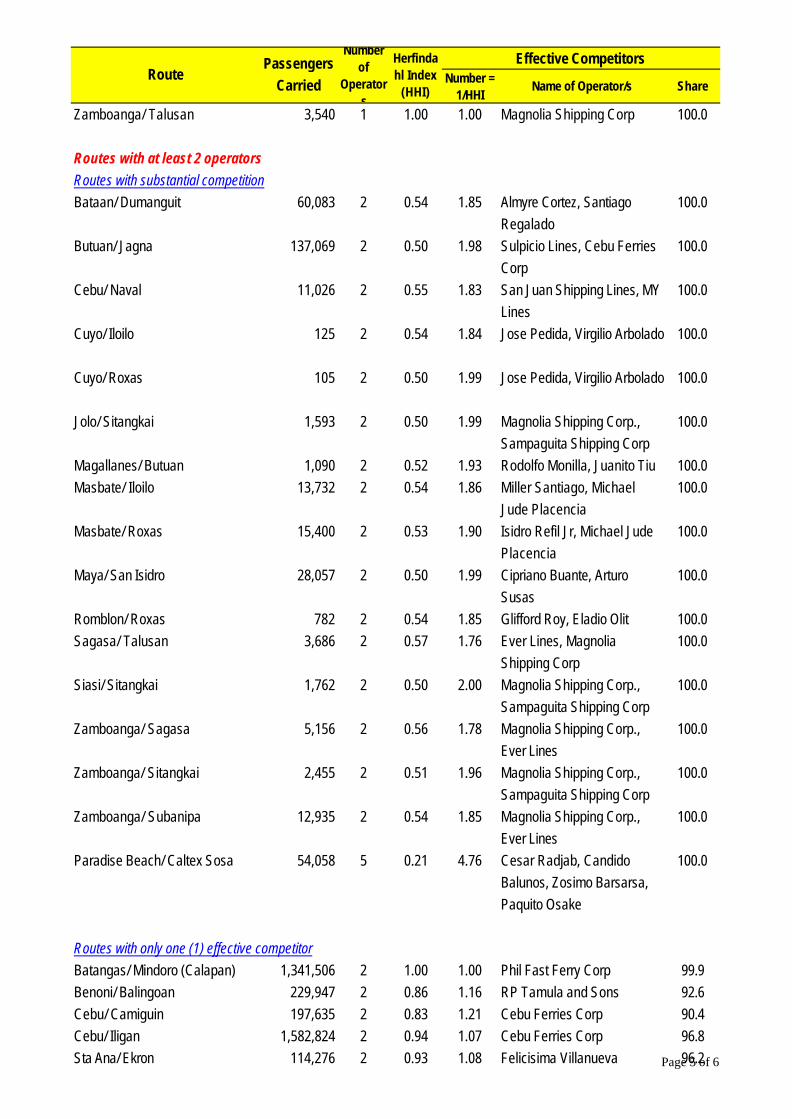
Number = 1/HHI
Name of Operator/s Share
Effective CompetitorsRoute
Passengers
Carried
Number of
Operators
Herfindahl Index
(HHI)
Zamboanga/ Talusan 3,540 1 1.00 1.00 Magnolia Shipping Corp 100.0
Routes with at least 2 operatorsRoutes with substantial competitionBataan/ Dumanguit 60,083 2 0.54 1.85 Almyre Cortez, Santiago
Regalado100.0
Butuan/ Jagna 137,069 2 0.50 1.98 Sulpicio Lines, Cebu Ferries Corp
100.0
Cebu/ Naval 11,026 2 0.55 1.83 San Juan Shipping Lines, MY Lines
100.0
Cuyo/ Iloilo 125 2 0.54 1.84 Jose Pedida, Virgilio Arbolado 100.0
Cuyo/ Roxas 105 2 0.50 1.99 Jose Pedida, Virgilio Arbolado 100.0
Jolo/ Sitangkai 1,593 2 0.50 1.99 Magnolia Shipping Corp., Sampaguita Shipping Corp
100.0
Magallanes/ Butuan 1,090 2 0.52 1.93 Rodolfo Monilla, Juanito Tiu 100.0Masbate/ Iloilo 13,732 2 0.54 1.86 Miller Santiago, Michael
Jude Placencia100.0
Masbate/ Roxas 15,400 2 0.53 1.90 Isidro Refil Jr, Michael Jude Placencia
100.0
Maya/ San Isidro 28,057 2 0.50 1.99 Cipriano Buante, Arturo Susas
100.0
Romblon/ Roxas 782 2 0.54 1.85 Glifford Roy, Eladio Olit 100.0Sagasa/ Talusan 3,686 2 0.57 1.76 Ever Lines, Magnolia
Shipping Corp100.0
Siasi/ Sitangkai 1,762 2 0.50 2.00 Magnolia Shipping Corp., Sampaguita Shipping Corp
100.0
Zamboanga/ Sagasa 5,156 2 0.56 1.78 Magnolia Shipping Corp., Ever Lines
100.0
Zamboanga/ Sitangkai 2,455 2 0.51 1.96 Magnolia Shipping Corp., Sampaguita Shipping Corp
100.0
Zamboanga/ Subanipa 12,935 2 0.54 1.85 Magnolia Shipping Corp., Ever Lines
100.0
Paradise Beach/ Caltex Sosa 54,058 5 0.21 4.76 Cesar Radjab, Candido Balunos, Zosimo Barsarsa, Paquito Osake
100.0
Routes with only one (1) effective competitorBatangas/ Mindoro (Calapan) 1,341,506 2 1.00 1.00 Phil Fast Ferry Corp 99.9Benoni/ Balingoan 229,947 2 0.86 1.16 RP Tamula and Sons 92.6Cebu/ Camiguin 197,635 2 0.83 1.21 Cebu Ferries Corp 90.4Cebu/ Iligan 1,582,824 2 0.94 1.07 Cebu Ferries Corp 96.8Sta Ana/ Ekron 114,276 2 0.93 1.08 Felicisima Villanueva 96.2Page 5 of 6
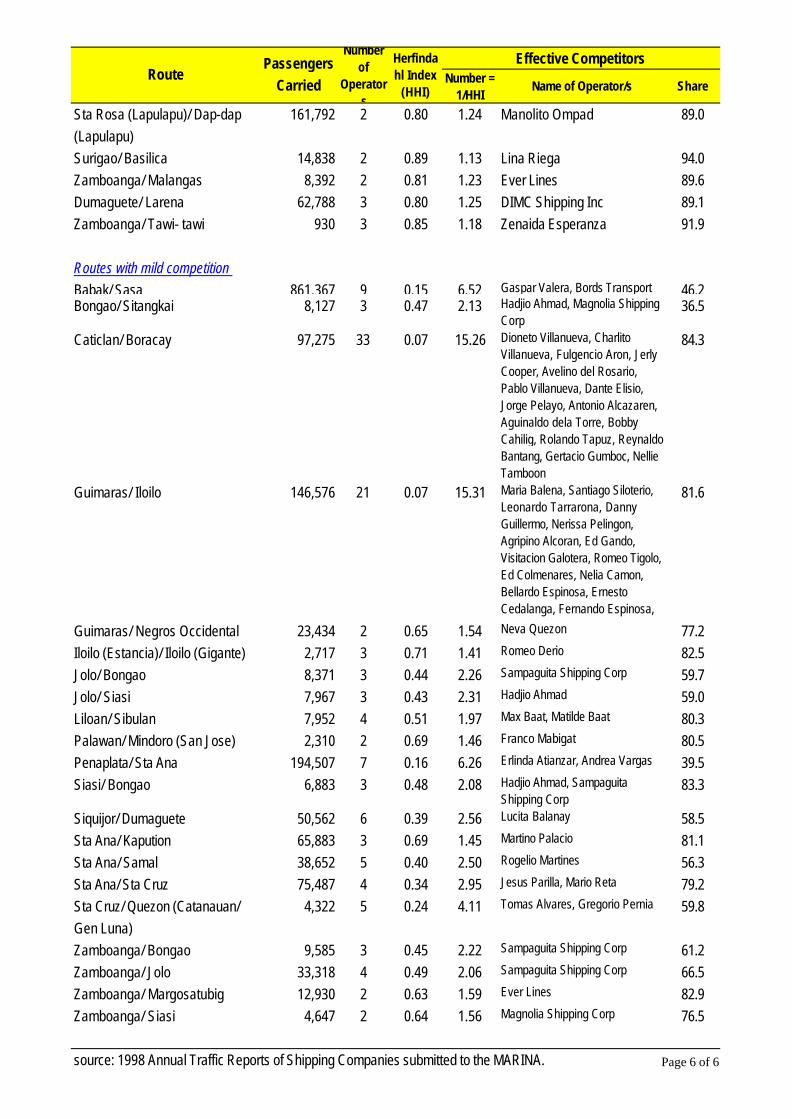
Number = 1/HHI
Name of Operator/s Share
Effective CompetitorsRoute
Passengers
Carried
Number of
Operators
Herfindahl Index
(HHI)
Sta Rosa (Lapulapu)/ Dap-dap (Lapulapu)
161,792 2 0.80 1.24 Manolito Ompad 89.0
Surigao/ Basilica 14,838 2 0.89 1.13 Lina Riega 94.0Zamboanga/ Malangas 8,392 2 0.81 1.23 Ever Lines 89.6Dumaguete/ Larena 62,788 3 0.80 1.25 DIMC Shipping Inc 89.1Zamboanga/ Tawi- tawi 930 3 0.85 1.18 Zenaida Esperanza 91.9
Routes with mild competition Babak/ Sasa 861,367 9 0.15 6.52 Gaspar Valera, Bords Transport 46.2Bongao/ Sitangkai 8,127 3 0.47 2.13 Hadjio Ahmad, Magnolia Shipping
Corp36.5
Caticlan/ Boracay 97,275 33 0.07 15.26 Dioneto Villanueva, Charlito Villanueva, Fulgencio Aron, Jerly Cooper, Avelino del Rosario, Pablo Villanueva, Dante Elisio, Jorge Pelayo, Antonio Alcazaren, Aguinaldo dela Torre, Bobby Cahilig, Rolando Tapuz, Reynaldo Bantang, Gertacio Gumboc, Nellie Tamboon
84.3
Guimaras/ Iloilo 146,576 21 0.07 15.31 Maria Balena, Santiago Siloterio, Leonardo Tarrarona, Danny Guillermo, Nerissa Pelingon, Agripino Alcoran, Ed Gando, Visitacion Galotera, Romeo Tigolo, Ed Colmenares, Nelia Camon, Bellardo Espinosa, Ernesto Cedalanga, Fernando Espinosa, Ely Canja
81.6
Guimaras/ Negros Occidental 23,434 2 0.65 1.54 Neva Quezon 77.2Iloilo (Estancia)/ Iloilo (Gigante) 2,717 3 0.71 1.41 Romeo Derio 82.5Jolo/ Bongao 8,371 3 0.44 2.26 Sampaguita Shipping Corp 59.7Jolo/ Siasi 7,967 3 0.43 2.31 Hadjio Ahmad 59.0Liloan/ Sibulan 7,952 4 0.51 1.97 Max Baat, Matilde Baat 80.3Palawan/ Mindoro (San Jose) 2,310 2 0.69 1.46 Franco Mabigat 80.5Penaplata/ Sta Ana 194,507 7 0.16 6.26 Erlinda Atianzar, Andrea Vargas 39.5Siasi/ Bongao 6,883 3 0.48 2.08 Hadjio Ahmad, Sampaguita
Shipping Corp 83.3
Siquijor/ Dumaguete 50,562 6 0.39 2.56 Lucita Balanay 58.5Sta Ana/ Kapution 65,883 3 0.69 1.45 Martino Palacio 81.1Sta Ana/ Samal 38,652 5 0.40 2.50 Rogelio Martines 56.3Sta Ana/ Sta Cruz 75,487 4 0.34 2.95 Jesus Parilla, Mario Reta 79.2Sta Cruz/ Quezon (Catanauan/ Gen Luna)
4,322 5 0.24 4.11 Tomas Alvares, Gregorio Pernia 59.8
Zamboanga/ Bongao 9,585 3 0.45 2.22 Sampaguita Shipping Corp 61.2Zamboanga/ Jolo 33,318 4 0.49 2.06 Sampaguita Shipping Corp 66.5Zamboanga/ Margosatubig 12,930 2 0.63 1.59 Ever Lines 82.9Zamboanga/ Siasi 4,647 2 0.64 1.56 Magnolia Shipping Corp 76.5
source: 1998 Annual Traffic Reports of Shipping Companies submitted to the MARINA. Page 6 of 6

Number = 1/HHI
Name of Operator/s Share
Routes with only one (1) operator
Cagayan de Oro/Iligan/Tagbilaran 72,436.80 1 1.00 1.00 Sampaguita Shipping Corp. 100.0Cebu/ Cotabato/ Dumaguete 18,496.00 1 1.00 1.00 Sun Lines 100.0Cebu/ Cotobato/Gen. Santos 14,114.50 1 1.00 1.00 Magnolia Shipping Corporation 100.0
Cebu/ Dadiangas 25,933,846.19 1 1.00 1.00 Sulpicio Lines Inc. 100.0Cebu/ Dumaguete/ Gen Santos 53,297.10 1 1.00 1.00 Sun Lines 100.0Cebu/ Estancia 22,325.00 1 1.00 1.00 Negros Navigation Company 100.0Cebu/ Iligan/Cagayan de Oro 67,992.30 1 1.00 1.00 Sampaguita Shipping Corp. 100.0Cebu/ Iligan/Iloilo 103,600.00 1 1.00 1.00 Ocean Express Shipping Corp 100.0
Cebu/ Iloilo/ Palawan (Brookes) 132,700.00 1 1.00 1.00 Ocean Express Shipping Corp 100.0
Cebu/ Nasipit 641,884.59 1 1.00 1.00 Sulpicio Lines Inc. 100.0Cebu/ Tubigon 134,851.50 1 1.00 1.00 Arrel Shipping 100.0Dadiangas/ Zamboanga 21,520,435.14 1 1.00 1.00 Sulpicio Lines Inc. 100.0General Santos/ Cebu/ Dumaguete 98,711.50 1 1.00 1.00 Magnolia Shipping Corporation 100.0
Iligan/ Cagayan 1,453.38 1 1.00 1.00 Cebu Ferries Corporation 100.0Iloilo (Estancia)/ Zamboanga 7,229,858.05 1 1.00 1.00 Sulpicio Lines Inc. 100.0Iloilo/ Puerto Princesa/ Palawan 24,448.44 1 1.00 1.00 William, Gothong & Aboitiz, Inc. 100.0
Manila/ Batangas 4,641,173.87 1 1.00 1.00 William Michael Shipping Corp. 100.0
Manila/ Cebu/ Iligan 110,372.85 1 1.00 1.00 William Michael Shipping Corp. 100.0
Manila/ Cebu/ Iligan/ Dumaguete 288,072.64 1 1.00 1.00 William Michael Shipping Corp. 100.0
Manila/ Dadiangas 54,455,246.17 1 1.00 1.00 Sulpicio Lines Inc. 100.0Manila/ General Santos/Cebu 114,543.60 1 1.00 1.00 Magnolia Shipping Corporation 100.0
Manila/ Nasipit 3,986,782.48 1 1.00 1.00 Sulpicio Lines Inc. 100.0Manila/ Puerto Princesa 49,564,716.59 1 1.00 1.00 William, Gothong & Aboitiz, Inc. 100.0
Palawan/ Davao 776,404.12 1 1.00 1.00 William, Gothong & Aboitiz, Inc. 100.0
Tagbilaran/Iligan/Cebu 147,424.40 1 1.00 1.00 Sampaguita Shipping Corp. 100.0
Routes with at least 2 operators
Effective Competitors
Appendix Table 4. Dominant/effective players per route per type of market, cargo revenue, primary routes, 1998
Route Cargo Revenue
Number of
Operators
Herfindahl Index
(HHI)
Page 1 of 3
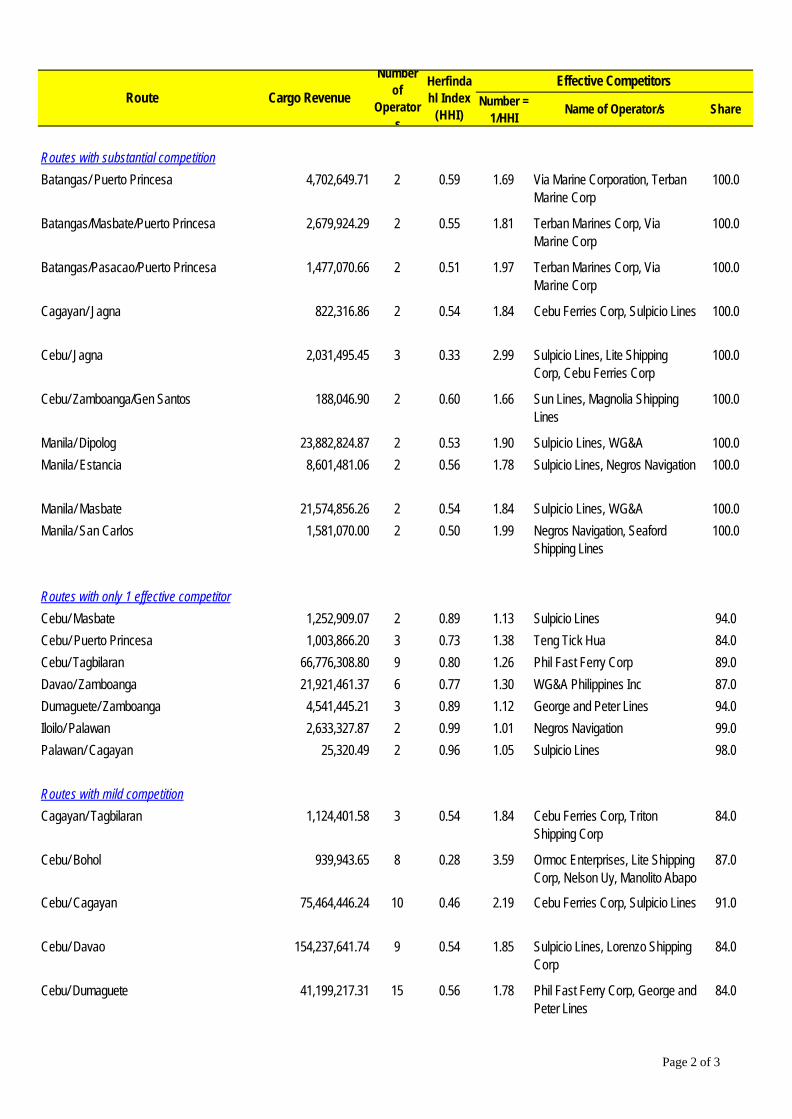
Number = 1/HHI
Name of Operator/s Share
Effective CompetitorsRoute Cargo Revenue
Number of
Operators
Herfindahl Index
(HHI)
Routes with substantial competition
Batangas/ Puerto Princesa 4,702,649.71 2 0.59 1.69 Via Marine Corporation, Terban Marine Corp
100.0
Batangas/Masbate/Puerto Princesa 2,679,924.29 2 0.55 1.81 Terban Marines Corp, Via Marine Corp
100.0
Batangas/Pasacao/Puerto Princesa 1,477,070.66 2 0.51 1.97 Terban Marines Corp, Via Marine Corp
100.0
Cagayan/ Jagna 822,316.86 2 0.54 1.84 Cebu Ferries Corp, Sulpicio Lines 100.0
Cebu/ Jagna 2,031,495.45 3 0.33 2.99 Sulpicio Lines, Lite Shipping Corp, Cebu Ferries Corp
100.0
Cebu/ Zamboanga/Gen Santos 188,046.90 2 0.60 1.66 Sun Lines, Magnolia Shipping Lines
100.0
Manila/ Dipolog 23,882,824.87 2 0.53 1.90 Sulpicio Lines, WG&A 100.0Manila/ Estancia 8,601,481.06 2 0.56 1.78 Sulpicio Lines, Negros Navigation 100.0
Manila/ Masbate 21,574,856.26 2 0.54 1.84 Sulpicio Lines, WG&A 100.0Manila/ San Carlos 1,581,070.00 2 0.50 1.99 Negros Navigation, Seaford
Shipping Lines100.0
Routes with only 1 effective competitor
Cebu/ Masbate 1,252,909.07 2 0.89 1.13 Sulpicio Lines 94.0Cebu/ Puerto Princesa 1,003,866.20 3 0.73 1.38 Teng Tick Hua 84.0Cebu/ Tagbilaran 66,776,308.80 9 0.80 1.26 Phil Fast Ferry Corp 89.0Davao/ Zamboanga 21,921,461.37 6 0.77 1.30 WG&A Philippines Inc 87.0Dumaguete/ Zamboanga 4,541,445.21 3 0.89 1.12 George and Peter Lines 94.0Iloilo/ Palawan 2,633,327.87 2 0.99 1.01 Negros Navigation 99.0Palawan/ Cagayan 25,320.49 2 0.96 1.05 Sulpicio Lines 98.0
Routes with mild competition
Cagayan/ Tagbilaran 1,124,401.58 3 0.54 1.84 Cebu Ferries Corp, Triton Shipping Corp
84.0
Cebu/ Bohol 939,943.65 8 0.28 3.59 Ormoc Enterprises, Lite Shipping Corp, Nelson Uy, Manolito Abapo
87.0
Cebu/ Cagayan 75,464,446.24 10 0.46 2.19 Cebu Ferries Corp, Sulpicio Lines 91.0
Cebu/ Davao 154,237,641.74 9 0.54 1.85 Sulpicio Lines, Lorenzo Shipping Corp
84.0
Cebu/ Dumaguete 41,199,217.31 15 0.56 1.78 Phil Fast Ferry Corp, George and Peter Lines
84.0
Page 2 of 3

Number = 1/HHI
Name of Operator/s Share
Effective CompetitorsRoute Cargo Revenue
Number of
Operators
Herfindahl Index
(HHI)
Cebu/ General Santos 28,219,026.84 9 0.37 2.67 Cebu Ferries Corp, Sulpicio Lines, WG&A
82.0
Cebu/ Iloilo 11,164,007.84 15 0.27 3.68 Negros Navigation, Cokaliong Shipping, WG&A,Lorenzo Shipping
81.0
Cebu/ Palawan 3,773,296.70 5 0.31 3.19 Victan Transport Services, Negros Navigation, Cebu Ferries Corp
94.0
Cebu/ Zamboanga 36,241,689.67 12 0.39 2.56 George and Peter Lines, Sulpicio Lines, Lite Shipping Corp
2.2
Davao/ General Santos 1,060,800.89 4 0.67 1.49 WG&A Philippines Inc 80.0Dumaguete/ Tagbilaran 1,464,389.78 4 0.39 2.57 Negros Navigation, Phil Fast
Ferry Corp, Philip Go94.2
General Santos/ Zamboanga 3,201,282.49 7 0.34 2.94 Negros Navigation, WG&A, Galactic Shipping
85.7
Iligan/ Tagbilaran 3,067,418.09 4 0.58 1.71 Sulpicio Lines, WG&A 95.6Iloilo/ Davao 10,225,379.99 3 0.48 2.08 WG&A, Negros Navigation 98.0Iloilo/ General Santos 8,357,274.35 4 0.46 2.16 Negros Navigation, WG&A 95.1Iloilo/ Iligan 3,387,507.92 9 0.43 2.33 Negros Navigation, Hosanna
Shipping 76.4
Manila/ Bacolod 347,282,893.07 5 0.50 2.02 Negros Navigation, WG&A 90.6Manila/ Cagayan 711,473,013.28 6 0.26 3.82 WG&A, Sulpicio Lines, Solid
Shipping Lines, Lorenzo Shipping Corp
94.8
Manila/ Cebu 1,004,747,524.76 4 0.38 2.61 WG&A, Sulpicio Lines 86.0Manila/ Davao 678,986,652.52 4 0.32 3.17 WG&A, Sulpicio Lines 69.5Manila/ Dumaguete 428,166,781.64 5 0.69 1.45 Solid Shipping Corp 83.0Manila/ General Santos 518,799,626.22 6 0.37 2.73 WG&A, Solid Shipping Lines,
Lorenzo Shipping Corp95.7
Manila/ Iligan 87,277,223.44 4 0.54 1.86 WG&A, Sulpicio Lines 88.6Manila/ Iloilo 40,950.00 7 0.28 3.62 WG&A, Negros Navigation,
Lorenzo Shipping Corp, Sulpicio Lines
99.8
Manila/ Palawan 127,482,600.03 5 0.65 1.55 Negros Navigation, WG&A 59.0
Manila/ Tagbilaran 63,169,311.82 3 0.46 2.17 WG&A, Negros Navigation 85.3Manila/ Zamboanga 411,264,594.59 4 0.34 2.93 Sulpicio Lines, WG&A, Lorenzo
Shipping Corp 98.7
source: 1998 Annual Traffic Reports of Shipping Companies submitted to the MARINA.
Page 3 of 3
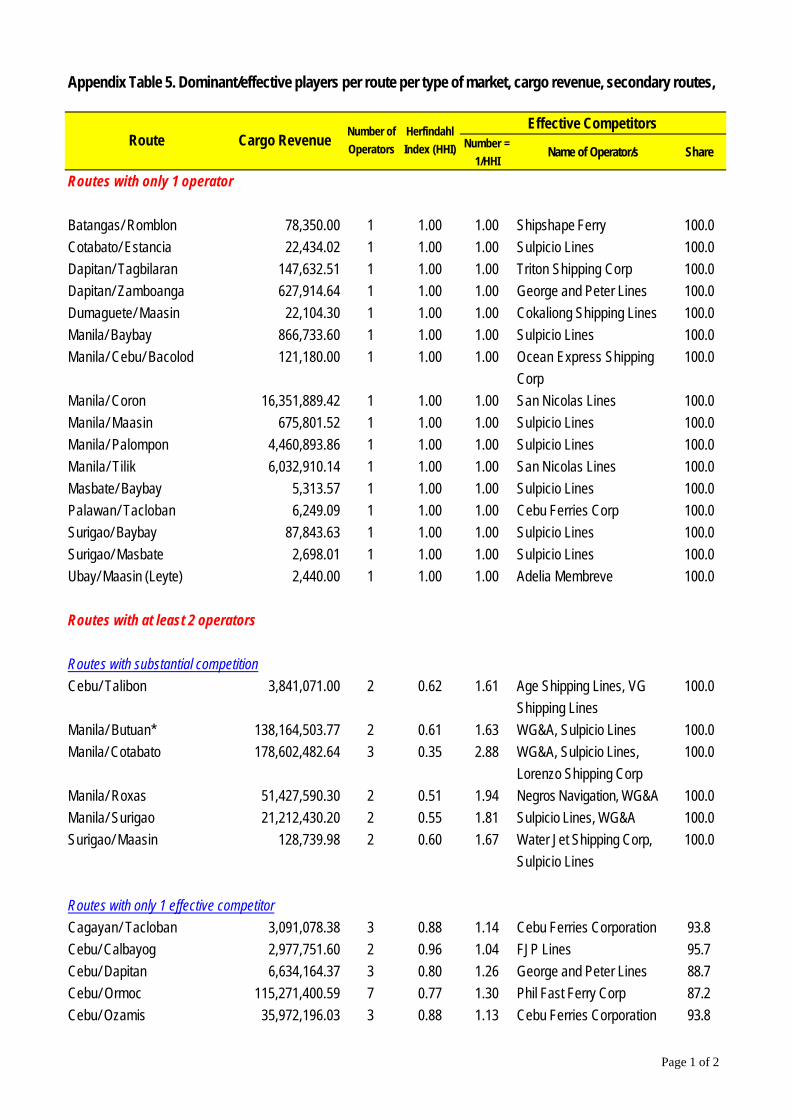
Number =
1/HHIName of Operator/s Share
Routes with only 1 operator
Batangas/ Romblon 78,350.00 1 1.00 1.00 Shipshape Ferry 100.0Cotabato/ Estancia 22,434.02 1 1.00 1.00 Sulpicio Lines 100.0Dapitan/ Tagbilaran 147,632.51 1 1.00 1.00 Triton Shipping Corp 100.0Dapitan/ Zamboanga 627,914.64 1 1.00 1.00 George and Peter Lines 100.0Dumaguete/ Maasin 22,104.30 1 1.00 1.00 Cokaliong Shipping Lines 100.0Manila/ Baybay 866,733.60 1 1.00 1.00 Sulpicio Lines 100.0Manila/ Cebu/ Bacolod 121,180.00 1 1.00 1.00 Ocean Express Shipping
Corp100.0
Manila/ Coron 16,351,889.42 1 1.00 1.00 San Nicolas Lines 100.0Manila/ Maasin 675,801.52 1 1.00 1.00 Sulpicio Lines 100.0Manila/ Palompon 4,460,893.86 1 1.00 1.00 Sulpicio Lines 100.0Manila/ Tilik 6,032,910.14 1 1.00 1.00 San Nicolas Lines 100.0Masbate/ Baybay 5,313.57 1 1.00 1.00 Sulpicio Lines 100.0Palawan/ Tacloban 6,249.09 1 1.00 1.00 Cebu Ferries Corp 100.0Surigao/ Baybay 87,843.63 1 1.00 1.00 Sulpicio Lines 100.0Surigao/ Masbate 2,698.01 1 1.00 1.00 Sulpicio Lines 100.0Ubay/ Maasin (Leyte) 2,440.00 1 1.00 1.00 Adelia Membreve 100.0
Routes with at least 2 operators
Routes with substantial competitionCebu/ Talibon 3,841,071.00 2 0.62 1.61 Age Shipping Lines, VG
Shipping Lines100.0
Manila/ Butuan* 138,164,503.77 2 0.61 1.63 WG&A, Sulpicio Lines 100.0Manila/ Cotabato 178,602,482.64 3 0.35 2.88 WG&A, Sulpicio Lines,
Lorenzo Shipping Corp100.0
Manila/ Roxas 51,427,590.30 2 0.51 1.94 Negros Navigation, WG&A 100.0Manila/ Surigao 21,212,430.20 2 0.55 1.81 Sulpicio Lines, WG&A 100.0Surigao/ Maasin 128,739.98 2 0.60 1.67 Water Jet Shipping Corp,
Sulpicio Lines100.0
Routes with only 1 effective competitorCagayan/ Tacloban 3,091,078.38 3 0.88 1.14 Cebu Ferries Corporation 93.8Cebu/ Calbayog 2,977,751.60 2 0.96 1.04 FJP Lines 95.7Cebu/ Dapitan 6,634,164.37 3 0.80 1.26 George and Peter Lines 88.7Cebu/ Ormoc 115,271,400.59 7 0.77 1.30 Phil Fast Ferry Corp 87.2Cebu/ Ozamis 35,972,196.03 3 0.88 1.13 Cebu Ferries Corporation 93.8
Effective Competitors
Appendix Table 5. Dominant/effective players per route per type of market, cargo revenue, secondary routes, 1998
Route Cargo RevenueNumber of
Operators
Herfindahl
Index (HHI)
Page 1 of 2
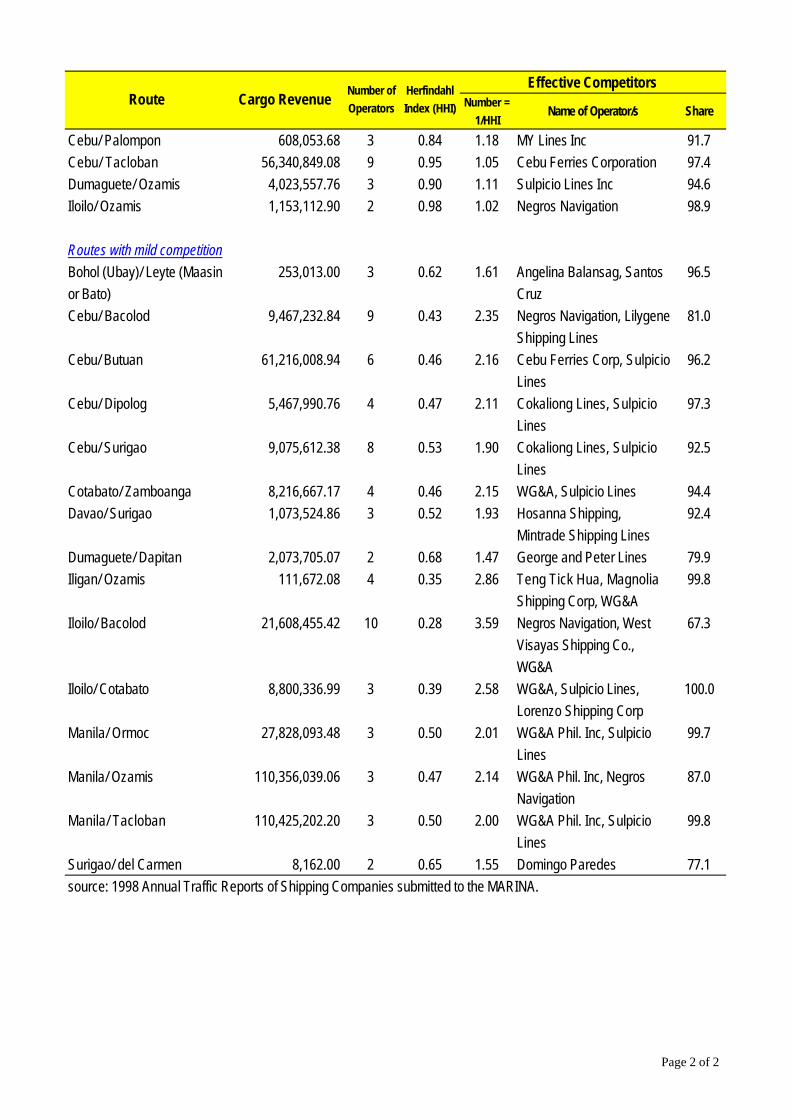
Number =
1/HHIName of Operator/s Share
Effective CompetitorsRoute Cargo Revenue
Number of
Operators
Herfindahl
Index (HHI)
Cebu/ Palompon 608,053.68 3 0.84 1.18 MY Lines Inc 91.7Cebu/ Tacloban 56,340,849.08 9 0.95 1.05 Cebu Ferries Corporation 97.4Dumaguete/ Ozamis 4,023,557.76 3 0.90 1.11 Sulpicio Lines Inc 94.6Iloilo/ Ozamis 1,153,112.90 2 0.98 1.02 Negros Navigation 98.9
Routes with mild competitionBohol (Ubay)/ Leyte (Maasin or Bato)
253,013.00 3 0.62 1.61 Angelina Balansag, Santos Cruz
96.5
Cebu/ Bacolod 9,467,232.84 9 0.43 2.35 Negros Navigation, Lilygene Shipping Lines
81.0
Cebu/ Butuan 61,216,008.94 6 0.46 2.16 Cebu Ferries Corp, Sulpicio Lines
96.2
Cebu/ Dipolog 5,467,990.76 4 0.47 2.11 Cokaliong Lines, Sulpicio Lines
97.3
Cebu/ Surigao 9,075,612.38 8 0.53 1.90 Cokaliong Lines, Sulpicio Lines
92.5
Cotabato/ Zamboanga 8,216,667.17 4 0.46 2.15 WG&A, Sulpicio Lines 94.4Davao/ Surigao 1,073,524.86 3 0.52 1.93 Hosanna Shipping,
Mintrade Shipping Lines92.4
Dumaguete/ Dapitan 2,073,705.07 2 0.68 1.47 George and Peter Lines 79.9Iligan/ Ozamis 111,672.08 4 0.35 2.86 Teng Tick Hua, Magnolia
Shipping Corp, WG&A99.8
Iloilo/ Bacolod 21,608,455.42 10 0.28 3.59 Negros Navigation, West Visayas Shipping Co., WG&A
67.3
Iloilo/ Cotabato 8,800,336.99 3 0.39 2.58 WG&A, Sulpicio Lines, Lorenzo Shipping Corp
100.0
Manila/ Ormoc 27,828,093.48 3 0.50 2.01 WG&A Phil. Inc, Sulpicio Lines
99.7
Manila/ Ozamis 110,356,039.06 3 0.47 2.14 WG&A Phil. Inc, Negros Navigation
87.0
Manila/ Tacloban 110,425,202.20 3 0.50 2.00 WG&A Phil. Inc, Sulpicio Lines
99.8
Surigao/ del Carmen 8,162.00 2 0.65 1.55 Domingo Paredes 77.1source: 1998 Annual Traffic Reports of Shipping Companies submitted to the MARINA.
Page 2 of 2
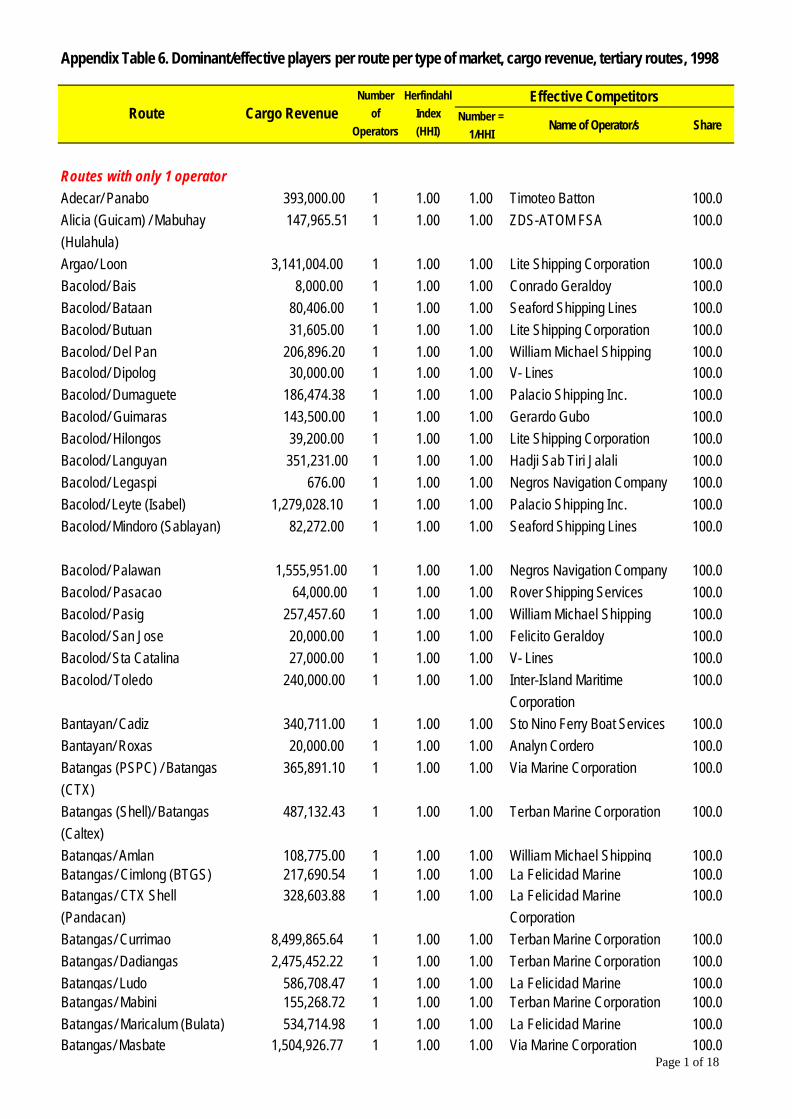
Number =
1/HHIName of Operator/s Share
Routes with only 1 operatorAdecar/ Panabo 393,000.00 1 1.00 1.00 Timoteo Batton 100.0Alicia (Guicam) / Mabuhay (Hulahula)
147,965.51 1 1.00 1.00 ZDS-ATOM FSA 100.0
Argao/ Loon 3,141,004.00 1 1.00 1.00 Lite Shipping Corporation 100.0Bacolod/ Bais 8,000.00 1 1.00 1.00 Conrado Geraldoy 100.0Bacolod/ Bataan 80,406.00 1 1.00 1.00 Seaford Shipping Lines 100.0Bacolod/ Butuan 31,605.00 1 1.00 1.00 Lite Shipping Corporation 100.0Bacolod/ Del Pan 206,896.20 1 1.00 1.00 William Michael Shipping 100.0Bacolod/ Dipolog 30,000.00 1 1.00 1.00 V- Lines 100.0Bacolod/ Dumaguete 186,474.38 1 1.00 1.00 Palacio Shipping Inc. 100.0Bacolod/ Guimaras 143,500.00 1 1.00 1.00 Gerardo Gubo 100.0Bacolod/ Hilongos 39,200.00 1 1.00 1.00 Lite Shipping Corporation 100.0Bacolod/ Languyan 351,231.00 1 1.00 1.00 Hadji Sab Tiri Jalali 100.0Bacolod/ Legaspi 676.00 1 1.00 1.00 Negros Navigation Company 100.0Bacolod/ Leyte (Isabel) 1,279,028.10 1 1.00 1.00 Palacio Shipping Inc. 100.0Bacolod/ Mindoro (Sablayan) 82,272.00 1 1.00 1.00 Seaford Shipping Lines 100.0
Bacolod/ Palawan 1,555,951.00 1 1.00 1.00 Negros Navigation Company 100.0Bacolod/ Pasacao 64,000.00 1 1.00 1.00 Rover Shipping Services 100.0Bacolod/ Pasig 257,457.60 1 1.00 1.00 William Michael Shipping 100.0Bacolod/ San Jose 20,000.00 1 1.00 1.00 Felicito Geraldoy 100.0Bacolod/ Sta Catalina 27,000.00 1 1.00 1.00 V- Lines 100.0Bacolod/ Toledo 240,000.00 1 1.00 1.00 Inter-Island Maritime
Corporation100.0
Bantayan/ Cadiz 340,711.00 1 1.00 1.00 Sto Nino Ferry Boat Services 100.0Bantayan/ Roxas 20,000.00 1 1.00 1.00 Analyn Cordero 100.0Batangas (PSPC) / Batangas (CTX)
365,891.10 1 1.00 1.00 Via Marine Corporation 100.0
Batangas (Shell)/ Batangas (Caltex)
487,132.43 1 1.00 1.00 Terban Marine Corporation 100.0
Batangas/ Amlan 108,775.00 1 1.00 1.00 William Michael Shipping 100.0Batangas/ Cimlong (BTGS) 217,690.54 1 1.00 1.00 La Felicidad Marine 100.0Batangas/ CTX Shell (Pandacan)
328,603.88 1 1.00 1.00 La Felicidad Marine Corporation
100.0
Batangas/ Currimao 8,499,865.64 1 1.00 1.00 Terban Marine Corporation 100.0Batangas/ Dadiangas 2,475,452.22 1 1.00 1.00 Terban Marine Corporation 100.0Batangas/ Ludo 586,708.47 1 1.00 1.00 La Felicidad Marine 100.0Batangas/ Mabini 155,268.72 1 1.00 1.00 Terban Marine Corporation 100.0Batangas/ Maricalum (Bulata) 534,714.98 1 1.00 1.00 La Felicidad Marine 100.0Batangas/ Masbate 1,504,926.77 1 1.00 1.00 Via Marine Corporation 100.0
Effective Competitors
Appendix Table 6. Dominant/effective players per route per type of market, cargo revenue, tertiary routes, 1998
Route Cargo RevenueNumber
of
Operators
Herfindahl
Index
(HHI)
Page 1 of 18
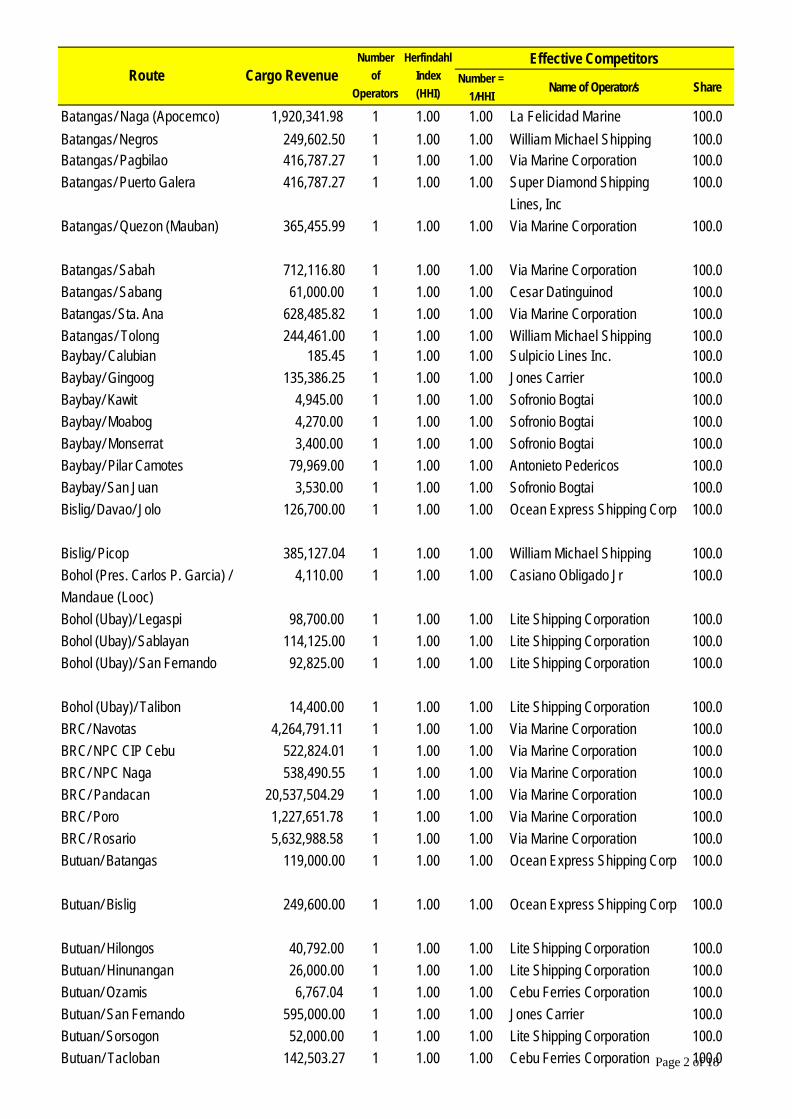
Number =
1/HHIName of Operator/s Share
Effective CompetitorsRoute Cargo Revenue
Number
of
Operators
Herfindahl
Index
(HHI)
Batangas/ Naga (Apocemco) 1,920,341.98 1 1.00 1.00 La Felicidad Marine 100.0Batangas/ Negros 249,602.50 1 1.00 1.00 William Michael Shipping 100.0Batangas/ Pagbilao 416,787.27 1 1.00 1.00 Via Marine Corporation 100.0Batangas/ Puerto Galera 416,787.27 1 1.00 1.00 Super Diamond Shipping
Lines, Inc100.0
Batangas/ Quezon (Mauban) 365,455.99 1 1.00 1.00 Via Marine Corporation 100.0
Batangas/ Sabah 712,116.80 1 1.00 1.00 Via Marine Corporation 100.0Batangas/ Sabang 61,000.00 1 1.00 1.00 Cesar Datinguinod 100.0Batangas/ Sta. Ana 628,485.82 1 1.00 1.00 Via Marine Corporation 100.0Batangas/ Tolong 244,461.00 1 1.00 1.00 William Michael Shipping 100.0Baybay/ Calubian 185.45 1 1.00 1.00 Sulpicio Lines Inc. 100.0Baybay/ Gingoog 135,386.25 1 1.00 1.00 Jones Carrier 100.0Baybay/ Kawit 4,945.00 1 1.00 1.00 Sofronio Bogtai 100.0Baybay/ Moabog 4,270.00 1 1.00 1.00 Sofronio Bogtai 100.0Baybay/ Monserrat 3,400.00 1 1.00 1.00 Sofronio Bogtai 100.0Baybay/ Pilar Camotes 79,969.00 1 1.00 1.00 Antonieto Pedericos 100.0Baybay/ San Juan 3,530.00 1 1.00 1.00 Sofronio Bogtai 100.0Bislig/ Davao/ Jolo 126,700.00 1 1.00 1.00 Ocean Express Shipping Corp 100.0
Bislig/ Picop 385,127.04 1 1.00 1.00 William Michael Shipping 100.0Bohol (Pres. Carlos P. Garcia) / Mandaue (Looc)
4,110.00 1 1.00 1.00 Casiano Obligado Jr 100.0
Bohol (Ubay)/ Legaspi 98,700.00 1 1.00 1.00 Lite Shipping Corporation 100.0Bohol (Ubay)/ Sablayan 114,125.00 1 1.00 1.00 Lite Shipping Corporation 100.0Bohol (Ubay)/ San Fernando 92,825.00 1 1.00 1.00 Lite Shipping Corporation 100.0
Bohol (Ubay)/ Talibon 14,400.00 1 1.00 1.00 Lite Shipping Corporation 100.0BRC/ Navotas 4,264,791.11 1 1.00 1.00 Via Marine Corporation 100.0BRC/ NPC CIP Cebu 522,824.01 1 1.00 1.00 Via Marine Corporation 100.0BRC/ NPC Naga 538,490.55 1 1.00 1.00 Via Marine Corporation 100.0BRC/ Pandacan 20,537,504.29 1 1.00 1.00 Via Marine Corporation 100.0BRC/ Poro 1,227,651.78 1 1.00 1.00 Via Marine Corporation 100.0BRC/ Rosario 5,632,988.58 1 1.00 1.00 Via Marine Corporation 100.0Butuan/ Batangas 119,000.00 1 1.00 1.00 Ocean Express Shipping Corp 100.0
Butuan/ Bislig 249,600.00 1 1.00 1.00 Ocean Express Shipping Corp 100.0
Butuan/ Hilongos 40,792.00 1 1.00 1.00 Lite Shipping Corporation 100.0Butuan/ Hinunangan 26,000.00 1 1.00 1.00 Lite Shipping Corporation 100.0Butuan/ Ozamis 6,767.04 1 1.00 1.00 Cebu Ferries Corporation 100.0Butuan/ San Fernando 595,000.00 1 1.00 1.00 Jones Carrier 100.0Butuan/ Sorsogon 52,000.00 1 1.00 1.00 Lite Shipping Corporation 100.0Butuan/ Tacloban 142,503.27 1 1.00 1.00 Cebu Ferries Corporation 100.0Page 2 of 18
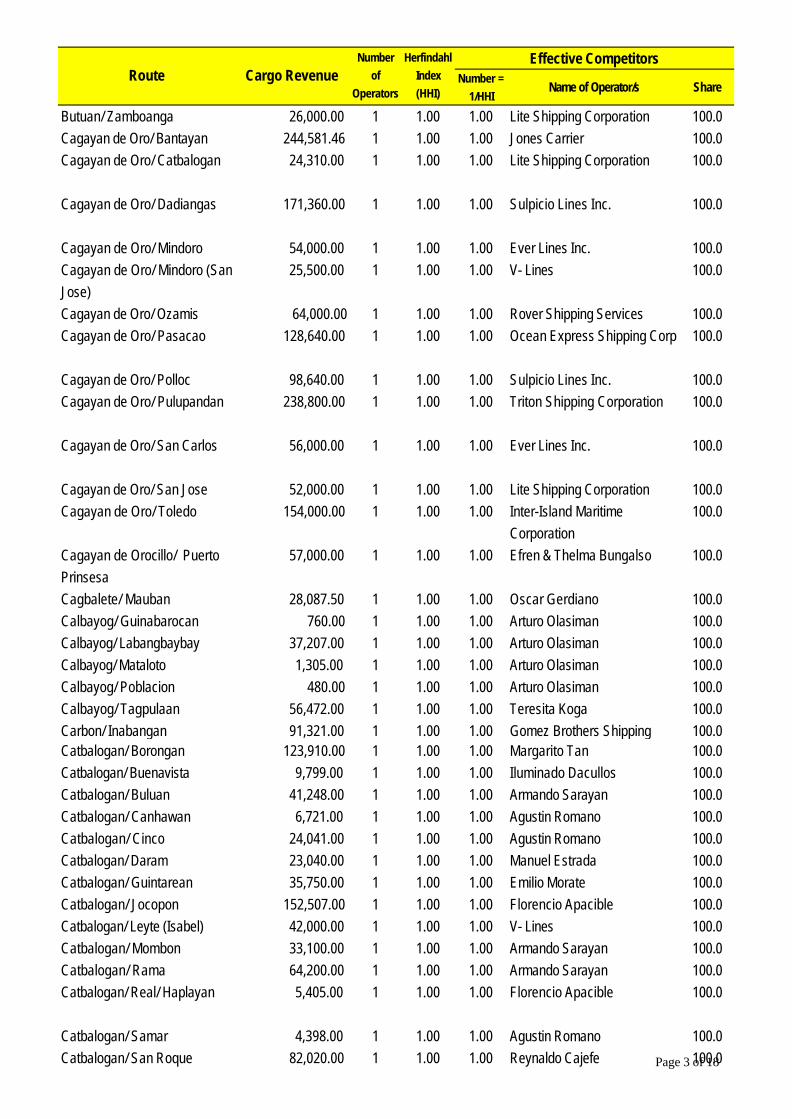
Number =
1/HHIName of Operator/s Share
Effective CompetitorsRoute Cargo Revenue
Number
of
Operators
Herfindahl
Index
(HHI)
Butuan/ Zamboanga 26,000.00 1 1.00 1.00 Lite Shipping Corporation 100.0Cagayan de Oro/ Bantayan 244,581.46 1 1.00 1.00 Jones Carrier 100.0Cagayan de Oro/ Catbalogan 24,310.00 1 1.00 1.00 Lite Shipping Corporation 100.0
Cagayan de Oro/ Dadiangas 171,360.00 1 1.00 1.00 Sulpicio Lines Inc. 100.0
Cagayan de Oro/ Mindoro 54,000.00 1 1.00 1.00 Ever Lines Inc. 100.0Cagayan de Oro/ Mindoro (San Jose)
25,500.00 1 1.00 1.00 V- Lines 100.0
Cagayan de Oro/ Ozamis 64,000.00 1 1.00 1.00 Rover Shipping Services 100.0Cagayan de Oro/ Pasacao 128,640.00 1 1.00 1.00 Ocean Express Shipping Corp 100.0
Cagayan de Oro/ Polloc 98,640.00 1 1.00 1.00 Sulpicio Lines Inc. 100.0Cagayan de Oro/ Pulupandan 238,800.00 1 1.00 1.00 Triton Shipping Corporation 100.0
Cagayan de Oro/ San Carlos 56,000.00 1 1.00 1.00 Ever Lines Inc. 100.0
Cagayan de Oro/ San Jose 52,000.00 1 1.00 1.00 Lite Shipping Corporation 100.0Cagayan de Oro/ Toledo 154,000.00 1 1.00 1.00 Inter-Island Maritime
Corporation100.0
Cagayan de Orocillo/ Puerto Prinsesa
57,000.00 1 1.00 1.00 Efren & Thelma Bungalso 100.0
Cagbalete/ Mauban 28,087.50 1 1.00 1.00 Oscar Gerdiano 100.0Calbayog/ Guinabarocan 760.00 1 1.00 1.00 Arturo Olasiman 100.0Calbayog/ Labangbaybay 37,207.00 1 1.00 1.00 Arturo Olasiman 100.0Calbayog/ Mataloto 1,305.00 1 1.00 1.00 Arturo Olasiman 100.0Calbayog/ Poblacion 480.00 1 1.00 1.00 Arturo Olasiman 100.0Calbayog/ Tagpulaan 56,472.00 1 1.00 1.00 Teresita Koga 100.0Carbon/ Inabangan 91,321.00 1 1.00 1.00 Gomez Brothers Shipping 100.0Catbalogan/ Borongan 123,910.00 1 1.00 1.00 Margarito Tan 100.0Catbalogan/ Buenavista 9,799.00 1 1.00 1.00 Iluminado Dacullos 100.0Catbalogan/ Buluan 41,248.00 1 1.00 1.00 Armando Sarayan 100.0Catbalogan/ Canhawan 6,721.00 1 1.00 1.00 Agustin Romano 100.0Catbalogan/ Cinco 24,041.00 1 1.00 1.00 Agustin Romano 100.0Catbalogan/ Daram 23,040.00 1 1.00 1.00 Manuel Estrada 100.0Catbalogan/ Guintarean 35,750.00 1 1.00 1.00 Emilio Morate 100.0Catbalogan/ Jocopon 152,507.00 1 1.00 1.00 Florencio Apacible 100.0Catbalogan/ Leyte (Isabel) 42,000.00 1 1.00 1.00 V- Lines 100.0Catbalogan/ Mombon 33,100.00 1 1.00 1.00 Armando Sarayan 100.0Catbalogan/ Rama 64,200.00 1 1.00 1.00 Armando Sarayan 100.0Catbalogan/ Real/ Haplayan 5,405.00 1 1.00 1.00 Florencio Apacible 100.0
Catbalogan/ Samar 4,398.00 1 1.00 1.00 Agustin Romano 100.0Catbalogan/ San Roque 82,020.00 1 1.00 1.00 Reynaldo Cajefe 100.0Page 3 of 18

Number =
1/HHIName of Operator/s Share
Effective CompetitorsRoute Cargo Revenue
Number
of
Operators
Herfindahl
Index
(HHI)
Catbalogan/ Saugan 69,616.00 1 1.00 1.00 Dionisio Montalban 100.0Catbalogan/ Sitio Bitoon 25,584.00 1 1.00 1.00 Agustin Romano 100.0Catbalogan/ Sogod 26,000.00 1 1.00 1.00 Lite Shipping Corporation 100.0Catbalogan/ Tarangnan 3,320.00 1 1.00 1.00 Antonio Vencio 100.0Cebu/ Bago 11,786.00 1 1.00 1.00 William Michael Shipping 100.0Cebu/ Bantayan 50,000.00 1 1.00 1.00 Eastern Pacific Lines 100.0Cebu/ Bantilan 1,733,688.67 1 1.00 1.00 Lapu-Lapu Shipping Lines 100.0Cebu/ Bataan 185,000.00 1 1.00 1.00 Ocean Express Shipping Corp 100.0
Cebu/ Bauan 482,812.50 1 1.00 1.00 Aquilina Guro 100.0Cebu/ Bilangbilangan East & West
427,018.35 1 1.00 1.00 Wilson C. Rabanos 100.0
Cebu/ Borongan 95,000.00 1 1.00 1.00 Lilygene Shipping Lines 100.0Cebu/ Bulan 80,000.00 1 1.00 1.00 Torcuato Bahian 100.0Cebu/ Cagayan de Orocillo 23,000.00 1 1.00 1.00 Efren & Thelma Bungalso 100.0Cebu/ Calbayog/ Guiwan 350,000.00 1 1.00 1.00 Sultan Shipping 100.0Cebu/ Camiguin 40,000.00 1 1.00 1.00 Torcuato Bahian 100.0Cebu/ Cataingan 60,000.00 1 1.00 1.00 Torcuato Bahian 100.0Cebu/ Cebu 365,123.60 1 1.00 1.00 Cebu Ferries Corporation 100.0Cebu/ Cotabato/ Zamboanga 55,007.90 1 1.00 1.00 Sun Lines 100.0
Cebu/ Guiuan 60,000.00 1 1.00 1.00 Torcuato Bahian 100.0Cebu/ Iloilo/ Legaspi 100,000.00 1 1.00 1.00 Sultan Shipping 100.0Cebu/ Iloilo/ Pasacao 124,000.00 1 1.00 1.00 Sultan Shipping 100.0Cebu/ Jetafe 80,129.00 1 1.00 1.00 Carmelo T. Simolde 100.0Cebu/ Kiwalan 26,307.55 1 1.00 1.00 George and Peter Lines 100.0Cebu/ Larena 1,536,462.12 1 1.00 1.00 Palacio Shipping Inc. 100.0Cebu/ Lazi 638,884.67 1 1.00 1.00 George and Peter Lines 100.0Cebu/ Liloy 65,000.00 1 1.00 1.00 Torcuato Bahian 100.0Cebu/ Magallanes 178,960.50 1 1.00 1.00 Eduardo Jarque 100.0Cebu/ Mindoro/Tagbilaran 80,000.00 1 1.00 1.00 Sultan Shipping 100.0Cebu/ Nabilid 49,454.70 1 1.00 1.00 Eduardo Jarque 100.0Cebu/ Oroquietta 258,631.10 1 1.00 1.00 George and Peter Lines 100.0Cebu/ Polloc 425,729.40 1 1.00 1.00 Sulpicio Lines Inc. 100.0Cebu/ Pulupandan/ Ozamis 111,142.00 1 1.00 1.00 Teng Tick Hua 100.0Cebu/ San Carlos 48,000.00 1 1.00 1.00 Ever Lines Inc. 100.0Cebu/ San Fernando 84,000.00 1 1.00 1.00 Eduardo Jarque 100.0Cebu/ San Jose 227,122.00 1 1.00 1.00 Lite Shipping Corporation 100.0Cebu/ Sta Fe 2,538,314.98 1 1.00 1.00 FJP Lines 100.0Cotabato/ Dadiangas 1,994.15 1 1.00 1.00 Sulpicio Lines Inc. 100.0Cotabato/ Davao 67,192.74 1 1.00 1.00 Cebu Ferries Corporation 100.0Cotabato/ Roxas City 40,000.00 1 1.00 1.00 Felicito Geraldoy 100.0Cuyo/ El Nido 2,249.40 1 1.00 1.00 Virgilio Arbolado 100.0Cuyo/ San Vicente 10,150.45 1 1.00 1.00 Virgilio Arbolado 100.0Page 4 of 18
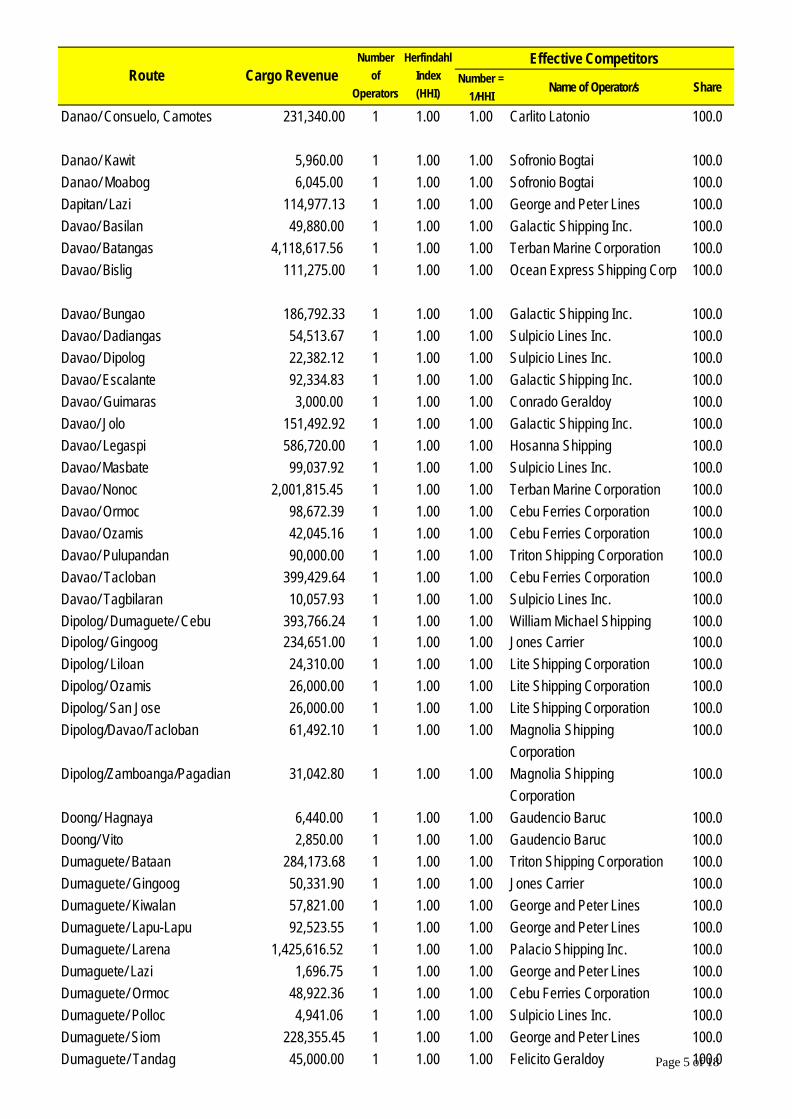
Number =
1/HHIName of Operator/s Share
Effective CompetitorsRoute Cargo Revenue
Number
of
Operators
Herfindahl
Index
(HHI)
Danao/ Consuelo, Camotes 231,340.00 1 1.00 1.00 Carlito Latonio 100.0
Danao/ Kawit 5,960.00 1 1.00 1.00 Sofronio Bogtai 100.0Danao/ Moabog 6,045.00 1 1.00 1.00 Sofronio Bogtai 100.0Dapitan/ Lazi 114,977.13 1 1.00 1.00 George and Peter Lines 100.0Davao/ Basilan 49,880.00 1 1.00 1.00 Galactic Shipping Inc. 100.0Davao/ Batangas 4,118,617.56 1 1.00 1.00 Terban Marine Corporation 100.0Davao/ Bislig 111,275.00 1 1.00 1.00 Ocean Express Shipping Corp 100.0
Davao/ Bungao 186,792.33 1 1.00 1.00 Galactic Shipping Inc. 100.0Davao/ Dadiangas 54,513.67 1 1.00 1.00 Sulpicio Lines Inc. 100.0Davao/ Dipolog 22,382.12 1 1.00 1.00 Sulpicio Lines Inc. 100.0Davao/ Escalante 92,334.83 1 1.00 1.00 Galactic Shipping Inc. 100.0Davao/ Guimaras 3,000.00 1 1.00 1.00 Conrado Geraldoy 100.0Davao/ Jolo 151,492.92 1 1.00 1.00 Galactic Shipping Inc. 100.0Davao/ Legaspi 586,720.00 1 1.00 1.00 Hosanna Shipping 100.0Davao/ Masbate 99,037.92 1 1.00 1.00 Sulpicio Lines Inc. 100.0Davao/ Nonoc 2,001,815.45 1 1.00 1.00 Terban Marine Corporation 100.0Davao/ Ormoc 98,672.39 1 1.00 1.00 Cebu Ferries Corporation 100.0Davao/ Ozamis 42,045.16 1 1.00 1.00 Cebu Ferries Corporation 100.0Davao/ Pulupandan 90,000.00 1 1.00 1.00 Triton Shipping Corporation 100.0Davao/ Tacloban 399,429.64 1 1.00 1.00 Cebu Ferries Corporation 100.0Davao/ Tagbilaran 10,057.93 1 1.00 1.00 Sulpicio Lines Inc. 100.0Dipolog/ Dumaguete/ Cebu 393,766.24 1 1.00 1.00 William Michael Shipping 100.0Dipolog/ Gingoog 234,651.00 1 1.00 1.00 Jones Carrier 100.0Dipolog/ Liloan 24,310.00 1 1.00 1.00 Lite Shipping Corporation 100.0Dipolog/ Ozamis 26,000.00 1 1.00 1.00 Lite Shipping Corporation 100.0Dipolog/ San Jose 26,000.00 1 1.00 1.00 Lite Shipping Corporation 100.0Dipolog/Davao/Tacloban 61,492.10 1 1.00 1.00 Magnolia Shipping
Corporation100.0
Dipolog/Zamboanga/Pagadian 31,042.80 1 1.00 1.00 Magnolia Shipping Corporation
100.0
Doong/ Hagnaya 6,440.00 1 1.00 1.00 Gaudencio Baruc 100.0Doong/ Vito 2,850.00 1 1.00 1.00 Gaudencio Baruc 100.0Dumaguete/ Bataan 284,173.68 1 1.00 1.00 Triton Shipping Corporation 100.0Dumaguete/ Gingoog 50,331.90 1 1.00 1.00 Jones Carrier 100.0Dumaguete/ Kiwalan 57,821.00 1 1.00 1.00 George and Peter Lines 100.0Dumaguete/ Lapu-Lapu 92,523.55 1 1.00 1.00 George and Peter Lines 100.0Dumaguete/ Larena 1,425,616.52 1 1.00 1.00 Palacio Shipping Inc. 100.0Dumaguete/ Lazi 1,696.75 1 1.00 1.00 George and Peter Lines 100.0Dumaguete/ Ormoc 48,922.36 1 1.00 1.00 Cebu Ferries Corporation 100.0Dumaguete/ Polloc 4,941.06 1 1.00 1.00 Sulpicio Lines Inc. 100.0Dumaguete/ Siom 228,355.45 1 1.00 1.00 George and Peter Lines 100.0Dumaguete/ Tandag 45,000.00 1 1.00 1.00 Felicito Geraldoy 100.0Page 5 of 18
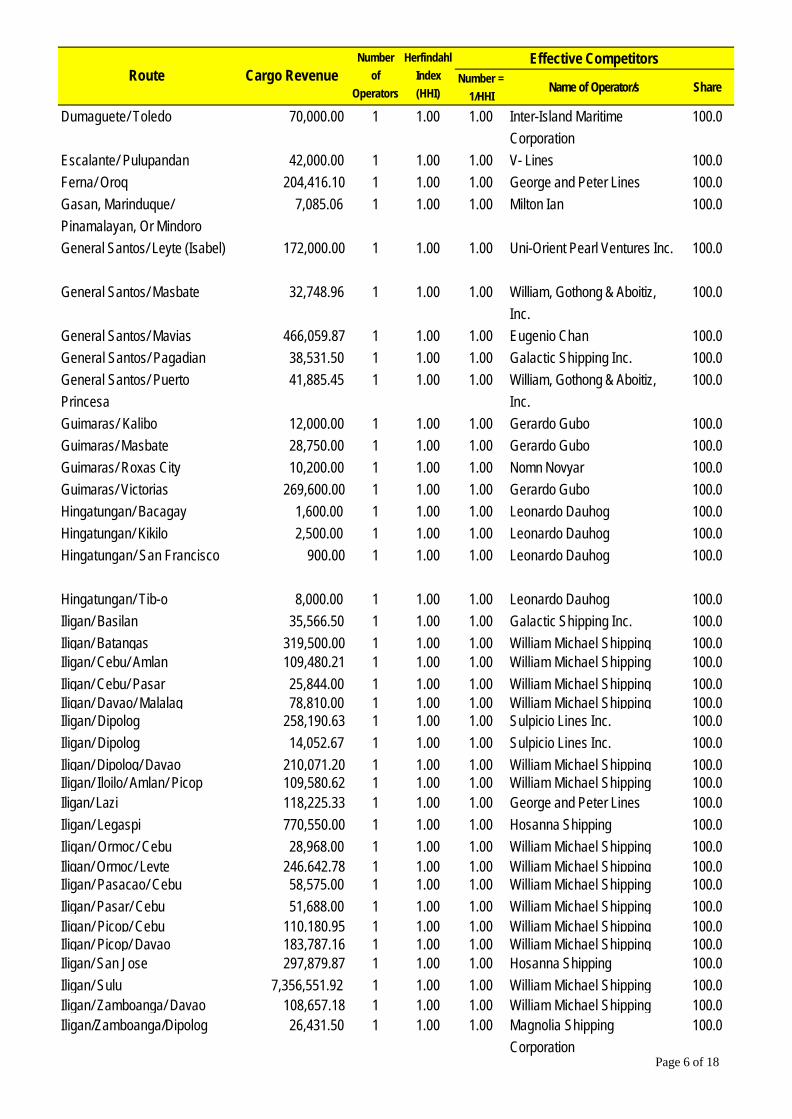
Number =
1/HHIName of Operator/s Share
Effective CompetitorsRoute Cargo Revenue
Number
of
Operators
Herfindahl
Index
(HHI)
Dumaguete/ Toledo 70,000.00 1 1.00 1.00 Inter-Island Maritime Corporation
100.0
Escalante/ Pulupandan 42,000.00 1 1.00 1.00 V- Lines 100.0Ferna/ Oroq 204,416.10 1 1.00 1.00 George and Peter Lines 100.0Gasan, Marinduque/ Pinamalayan, Or Mindoro
7,085.06 1 1.00 1.00 Milton Ian 100.0
General Santos/ Leyte (Isabel) 172,000.00 1 1.00 1.00 Uni-Orient Pearl Ventures Inc. 100.0
General Santos/ Masbate 32,748.96 1 1.00 1.00 William, Gothong & Aboitiz, Inc.
100.0
General Santos/ Mavias 466,059.87 1 1.00 1.00 Eugenio Chan 100.0General Santos/ Pagadian 38,531.50 1 1.00 1.00 Galactic Shipping Inc. 100.0General Santos/ Puerto Princesa
41,885.45 1 1.00 1.00 William, Gothong & Aboitiz, Inc.
100.0
Guimaras/ Kalibo 12,000.00 1 1.00 1.00 Gerardo Gubo 100.0Guimaras/ Masbate 28,750.00 1 1.00 1.00 Gerardo Gubo 100.0Guimaras/ Roxas City 10,200.00 1 1.00 1.00 Nomn Novyar 100.0Guimaras/ Victorias 269,600.00 1 1.00 1.00 Gerardo Gubo 100.0Hingatungan/ Bacagay 1,600.00 1 1.00 1.00 Leonardo Dauhog 100.0Hingatungan/ Kikilo 2,500.00 1 1.00 1.00 Leonardo Dauhog 100.0Hingatungan/ San Francisco 900.00 1 1.00 1.00 Leonardo Dauhog 100.0
Hingatungan/ Tib-o 8,000.00 1 1.00 1.00 Leonardo Dauhog 100.0Iligan/ Basilan 35,566.50 1 1.00 1.00 Galactic Shipping Inc. 100.0Iligan/ Batangas 319,500.00 1 1.00 1.00 William Michael Shipping 100.0Iligan/ Cebu/ Amlan 109,480.21 1 1.00 1.00 William Michael Shipping 100.0Iligan/ Cebu/ Pasar 25,844.00 1 1.00 1.00 William Michael Shipping 100.0Iligan/ Davao/ Malalag 78,810.00 1 1.00 1.00 William Michael Shipping 100.0Iligan/ Dipolog 258,190.63 1 1.00 1.00 Sulpicio Lines Inc. 100.0Iligan/ Dipolog 14,052.67 1 1.00 1.00 Sulpicio Lines Inc. 100.0Iligan/ Dipolog/ Davao 210,071.20 1 1.00 1.00 William Michael Shipping 100.0Iligan/ Iloilo/ Amlan/ Picop 109,580.62 1 1.00 1.00 William Michael Shipping 100.0Iligan/ Lazi 118,225.33 1 1.00 1.00 George and Peter Lines 100.0Iligan/ Legaspi 770,550.00 1 1.00 1.00 Hosanna Shipping 100.0Iligan/ Ormoc/ Cebu 28,968.00 1 1.00 1.00 William Michael Shipping 100.0Iligan/ Ormoc/ Leyte 246,642.78 1 1.00 1.00 William Michael Shipping 100.0Iligan/ Pasacao/ Cebu 58,575.00 1 1.00 1.00 William Michael Shipping 100.0Iligan/ Pasar/ Cebu 51,688.00 1 1.00 1.00 William Michael Shipping 100.0Iligan/ Picop/ Cebu 110,180.95 1 1.00 1.00 William Michael Shipping 100.0Iligan/ Picop/ Davao 183,787.16 1 1.00 1.00 William Michael Shipping 100.0Iligan/ San Jose 297,879.87 1 1.00 1.00 Hosanna Shipping 100.0Iligan/ Sulu 7,356,551.92 1 1.00 1.00 William Michael Shipping 100.0Iligan/ Zamboanga/ Davao 108,657.18 1 1.00 1.00 William Michael Shipping 100.0Iligan/Zamboanga/Dipolog 26,431.50 1 1.00 1.00 Magnolia Shipping
Corporation100.0
Page 6 of 18
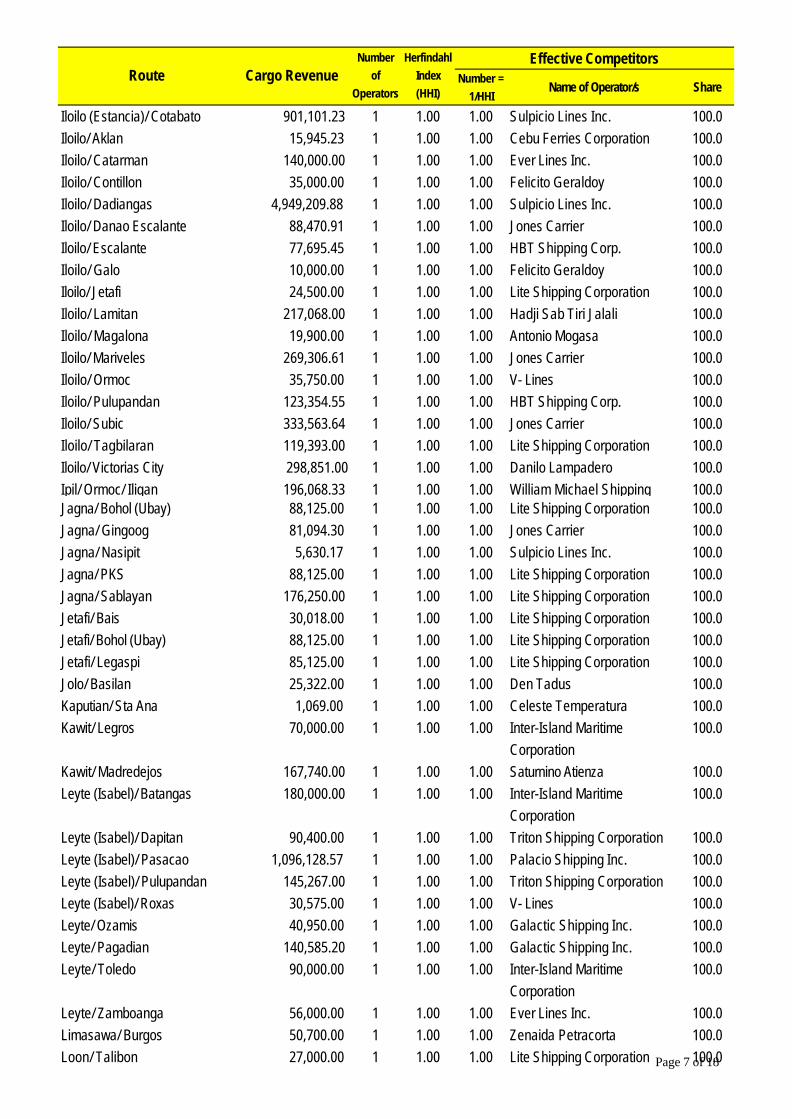
Number =
1/HHIName of Operator/s Share
Effective CompetitorsRoute Cargo Revenue
Number
of
Operators
Herfindahl
Index
(HHI)
Iloilo (Estancia)/ Cotabato 901,101.23 1 1.00 1.00 Sulpicio Lines Inc. 100.0Iloilo/ Aklan 15,945.23 1 1.00 1.00 Cebu Ferries Corporation 100.0Iloilo/ Catarman 140,000.00 1 1.00 1.00 Ever Lines Inc. 100.0Iloilo/ Contillon 35,000.00 1 1.00 1.00 Felicito Geraldoy 100.0Iloilo/ Dadiangas 4,949,209.88 1 1.00 1.00 Sulpicio Lines Inc. 100.0Iloilo/ Danao Escalante 88,470.91 1 1.00 1.00 Jones Carrier 100.0Iloilo/ Escalante 77,695.45 1 1.00 1.00 HBT Shipping Corp. 100.0Iloilo/ Galo 10,000.00 1 1.00 1.00 Felicito Geraldoy 100.0Iloilo/ Jetafi 24,500.00 1 1.00 1.00 Lite Shipping Corporation 100.0Iloilo/ Lamitan 217,068.00 1 1.00 1.00 Hadji Sab Tiri Jalali 100.0Iloilo/ Magalona 19,900.00 1 1.00 1.00 Antonio Mogasa 100.0Iloilo/ Mariveles 269,306.61 1 1.00 1.00 Jones Carrier 100.0Iloilo/ Ormoc 35,750.00 1 1.00 1.00 V- Lines 100.0Iloilo/ Pulupandan 123,354.55 1 1.00 1.00 HBT Shipping Corp. 100.0Iloilo/ Subic 333,563.64 1 1.00 1.00 Jones Carrier 100.0Iloilo/ Tagbilaran 119,393.00 1 1.00 1.00 Lite Shipping Corporation 100.0Iloilo/ Victorias City 298,851.00 1 1.00 1.00 Danilo Lampadero 100.0Ipil/ Ormoc/ Iligan 196,068.33 1 1.00 1.00 William Michael Shipping 100.0Jagna/ Bohol (Ubay) 88,125.00 1 1.00 1.00 Lite Shipping Corporation 100.0Jagna/ Gingoog 81,094.30 1 1.00 1.00 Jones Carrier 100.0Jagna/ Nasipit 5,630.17 1 1.00 1.00 Sulpicio Lines Inc. 100.0Jagna/ PKS 88,125.00 1 1.00 1.00 Lite Shipping Corporation 100.0Jagna/ Sablayan 176,250.00 1 1.00 1.00 Lite Shipping Corporation 100.0Jetafi/ Bais 30,018.00 1 1.00 1.00 Lite Shipping Corporation 100.0Jetafi/ Bohol (Ubay) 88,125.00 1 1.00 1.00 Lite Shipping Corporation 100.0Jetafi/ Legaspi 85,125.00 1 1.00 1.00 Lite Shipping Corporation 100.0Jolo/ Basilan 25,322.00 1 1.00 1.00 Den Tadus 100.0Kaputian/ Sta Ana 1,069.00 1 1.00 1.00 Celeste Temperatura 100.0Kawit/ Legros 70,000.00 1 1.00 1.00 Inter-Island Maritime
Corporation100.0
Kawit/ Madredejos 167,740.00 1 1.00 1.00 Saturnino Atienza 100.0Leyte (Isabel)/ Batangas 180,000.00 1 1.00 1.00 Inter-Island Maritime
Corporation100.0
Leyte (Isabel)/ Dapitan 90,400.00 1 1.00 1.00 Triton Shipping Corporation 100.0Leyte (Isabel)/ Pasacao 1,096,128.57 1 1.00 1.00 Palacio Shipping Inc. 100.0Leyte (Isabel)/ Pulupandan 145,267.00 1 1.00 1.00 Triton Shipping Corporation 100.0Leyte (Isabel)/ Roxas 30,575.00 1 1.00 1.00 V- Lines 100.0Leyte/ Ozamis 40,950.00 1 1.00 1.00 Galactic Shipping Inc. 100.0Leyte/ Pagadian 140,585.20 1 1.00 1.00 Galactic Shipping Inc. 100.0Leyte/ Toledo 90,000.00 1 1.00 1.00 Inter-Island Maritime
Corporation100.0
Leyte/ Zamboanga 56,000.00 1 1.00 1.00 Ever Lines Inc. 100.0Limasawa/ Burgos 50,700.00 1 1.00 1.00 Zenaida Petracorta 100.0Loon/ Talibon 27,000.00 1 1.00 1.00 Lite Shipping Corporation 100.0Page 7 of 18
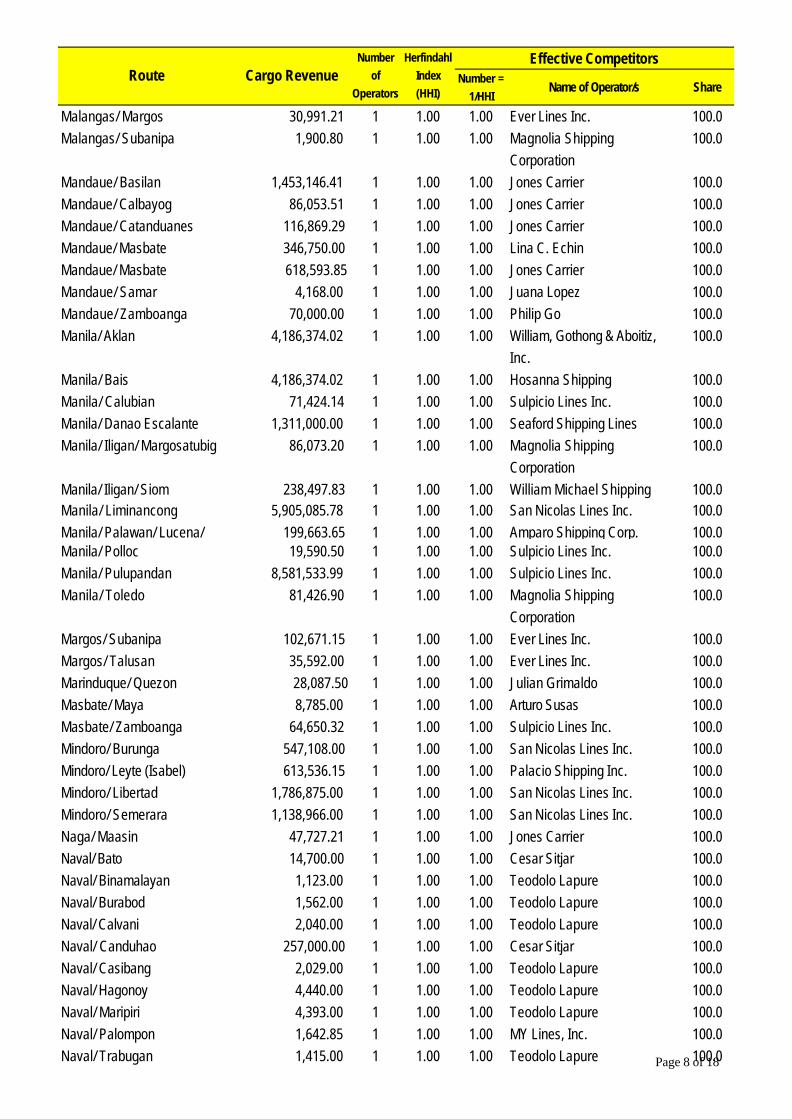
Number =
1/HHIName of Operator/s Share
Effective CompetitorsRoute Cargo Revenue
Number
of
Operators
Herfindahl
Index
(HHI)
Malangas/ Margos 30,991.21 1 1.00 1.00 Ever Lines Inc. 100.0Malangas/ Subanipa 1,900.80 1 1.00 1.00 Magnolia Shipping
Corporation100.0
Mandaue/ Basilan 1,453,146.41 1 1.00 1.00 Jones Carrier 100.0Mandaue/ Calbayog 86,053.51 1 1.00 1.00 Jones Carrier 100.0Mandaue/ Catanduanes 116,869.29 1 1.00 1.00 Jones Carrier 100.0Mandaue/ Masbate 346,750.00 1 1.00 1.00 Lina C. Echin 100.0Mandaue/ Masbate 618,593.85 1 1.00 1.00 Jones Carrier 100.0Mandaue/ Samar 4,168.00 1 1.00 1.00 Juana Lopez 100.0Mandaue/ Zamboanga 70,000.00 1 1.00 1.00 Philip Go 100.0Manila/ Aklan 4,186,374.02 1 1.00 1.00 William, Gothong & Aboitiz,
Inc.100.0
Manila/ Bais 4,186,374.02 1 1.00 1.00 Hosanna Shipping 100.0Manila/ Calubian 71,424.14 1 1.00 1.00 Sulpicio Lines Inc. 100.0Manila/ Danao Escalante 1,311,000.00 1 1.00 1.00 Seaford Shipping Lines 100.0Manila/ Iligan/ Margosatubig 86,073.20 1 1.00 1.00 Magnolia Shipping
Corporation100.0
Manila/ Iligan/ Siom 238,497.83 1 1.00 1.00 William Michael Shipping 100.0Manila/ Liminancong 5,905,085.78 1 1.00 1.00 San Nicolas Lines Inc. 100.0Manila/ Palawan/ Lucena/ 199,663.65 1 1.00 1.00 Amparo Shipping Corp. 100.0Manila/ Polloc 19,590.50 1 1.00 1.00 Sulpicio Lines Inc. 100.0Manila/ Pulupandan 8,581,533.99 1 1.00 1.00 Sulpicio Lines Inc. 100.0Manila/ Toledo 81,426.90 1 1.00 1.00 Magnolia Shipping
Corporation100.0
Margos/ Subanipa 102,671.15 1 1.00 1.00 Ever Lines Inc. 100.0Margos/ Talusan 35,592.00 1 1.00 1.00 Ever Lines Inc. 100.0Marinduque/ Quezon 28,087.50 1 1.00 1.00 Julian Grimaldo 100.0Masbate/ Maya 8,785.00 1 1.00 1.00 Arturo Susas 100.0Masbate/ Zamboanga 64,650.32 1 1.00 1.00 Sulpicio Lines Inc. 100.0Mindoro/ Burunga 547,108.00 1 1.00 1.00 San Nicolas Lines Inc. 100.0Mindoro/ Leyte (Isabel) 613,536.15 1 1.00 1.00 Palacio Shipping Inc. 100.0Mindoro/ Libertad 1,786,875.00 1 1.00 1.00 San Nicolas Lines Inc. 100.0Mindoro/ Semerara 1,138,966.00 1 1.00 1.00 San Nicolas Lines Inc. 100.0Naga/ Maasin 47,727.21 1 1.00 1.00 Jones Carrier 100.0Naval/ Bato 14,700.00 1 1.00 1.00 Cesar Sitjar 100.0Naval/ Binamalayan 1,123.00 1 1.00 1.00 Teodolo Lapure 100.0Naval/ Burabod 1,562.00 1 1.00 1.00 Teodolo Lapure 100.0Naval/ Calvani 2,040.00 1 1.00 1.00 Teodolo Lapure 100.0Naval/ Canduhao 257,000.00 1 1.00 1.00 Cesar Sitjar 100.0Naval/ Casibang 2,029.00 1 1.00 1.00 Teodolo Lapure 100.0Naval/ Hagonoy 4,440.00 1 1.00 1.00 Teodolo Lapure 100.0Naval/ Maripiri 4,393.00 1 1.00 1.00 Teodolo Lapure 100.0Naval/ Palompon 1,642.85 1 1.00 1.00 MY Lines, Inc. 100.0Naval/ Trabugan 1,415.00 1 1.00 1.00 Teodolo Lapure 100.0Page 8 of 18
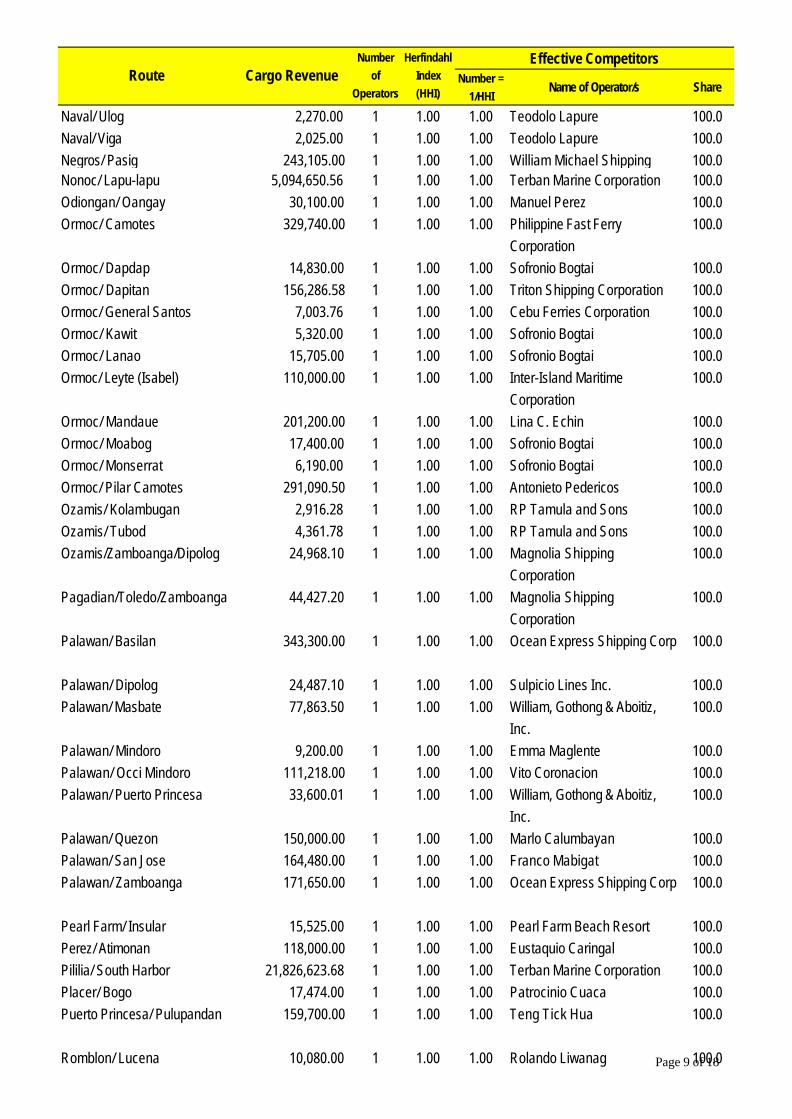
Number =
1/HHIName of Operator/s Share
Effective CompetitorsRoute Cargo Revenue
Number
of
Operators
Herfindahl
Index
(HHI)
Naval/ Ulog 2,270.00 1 1.00 1.00 Teodolo Lapure 100.0Naval/ Viga 2,025.00 1 1.00 1.00 Teodolo Lapure 100.0Negros/ Pasig 243,105.00 1 1.00 1.00 William Michael Shipping 100.0Nonoc/ Lapu-lapu 5,094,650.56 1 1.00 1.00 Terban Marine Corporation 100.0Odiongan/ Oangay 30,100.00 1 1.00 1.00 Manuel Perez 100.0Ormoc/ Camotes 329,740.00 1 1.00 1.00 Philippine Fast Ferry
Corporation100.0
Ormoc/ Dapdap 14,830.00 1 1.00 1.00 Sofronio Bogtai 100.0Ormoc/ Dapitan 156,286.58 1 1.00 1.00 Triton Shipping Corporation 100.0Ormoc/ General Santos 7,003.76 1 1.00 1.00 Cebu Ferries Corporation 100.0Ormoc/ Kawit 5,320.00 1 1.00 1.00 Sofronio Bogtai 100.0Ormoc/ Lanao 15,705.00 1 1.00 1.00 Sofronio Bogtai 100.0Ormoc/ Leyte (Isabel) 110,000.00 1 1.00 1.00 Inter-Island Maritime
Corporation100.0
Ormoc/ Mandaue 201,200.00 1 1.00 1.00 Lina C. Echin 100.0Ormoc/ Moabog 17,400.00 1 1.00 1.00 Sofronio Bogtai 100.0Ormoc/ Monserrat 6,190.00 1 1.00 1.00 Sofronio Bogtai 100.0Ormoc/ Pilar Camotes 291,090.50 1 1.00 1.00 Antonieto Pedericos 100.0Ozamis/ Kolambugan 2,916.28 1 1.00 1.00 RP Tamula and Sons 100.0Ozamis/ Tubod 4,361.78 1 1.00 1.00 RP Tamula and Sons 100.0Ozamis/Zamboanga/Dipolog 24,968.10 1 1.00 1.00 Magnolia Shipping
Corporation100.0
Pagadian/Toledo/Zamboanga 44,427.20 1 1.00 1.00 Magnolia Shipping Corporation
100.0
Palawan/ Basilan 343,300.00 1 1.00 1.00 Ocean Express Shipping Corp 100.0
Palawan/ Dipolog 24,487.10 1 1.00 1.00 Sulpicio Lines Inc. 100.0Palawan/ Masbate 77,863.50 1 1.00 1.00 William, Gothong & Aboitiz,
Inc.100.0
Palawan/ Mindoro 9,200.00 1 1.00 1.00 Emma Maglente 100.0Palawan/ Occi Mindoro 111,218.00 1 1.00 1.00 Vito Coronacion 100.0Palawan/ Puerto Princesa 33,600.01 1 1.00 1.00 William, Gothong & Aboitiz,
Inc.100.0
Palawan/ Quezon 150,000.00 1 1.00 1.00 Marlo Calumbayan 100.0Palawan/ San Jose 164,480.00 1 1.00 1.00 Franco Mabigat 100.0Palawan/ Zamboanga 171,650.00 1 1.00 1.00 Ocean Express Shipping Corp 100.0
Pearl Farm/ Insular 15,525.00 1 1.00 1.00 Pearl Farm Beach Resort 100.0Perez/ Atimonan 118,000.00 1 1.00 1.00 Eustaquio Caringal 100.0Pililia/ South Harbor 21,826,623.68 1 1.00 1.00 Terban Marine Corporation 100.0Placer/ Bogo 17,474.00 1 1.00 1.00 Patrocinio Cuaca 100.0Puerto Princesa/ Pulupandan 159,700.00 1 1.00 1.00 Teng Tick Hua 100.0
Romblon/ Lucena 10,080.00 1 1.00 1.00 Rolando Liwanag 100.0Page 9 of 18
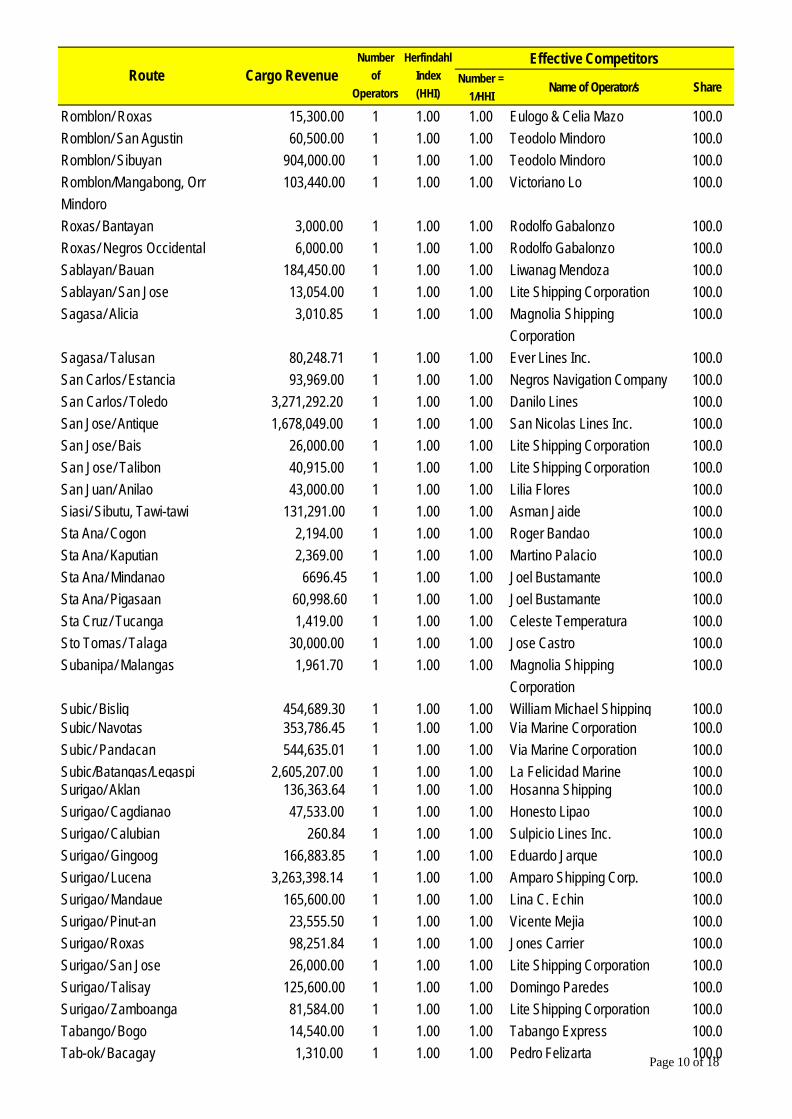
Number =
1/HHIName of Operator/s Share
Effective CompetitorsRoute Cargo Revenue
Number
of
Operators
Herfindahl
Index
(HHI)
Romblon/ Roxas 15,300.00 1 1.00 1.00 Eulogo & Celia Mazo 100.0Romblon/ San Agustin 60,500.00 1 1.00 1.00 Teodolo Mindoro 100.0Romblon/ Sibuyan 904,000.00 1 1.00 1.00 Teodolo Mindoro 100.0Romblon/Mangabong, Orr Mindoro
103,440.00 1 1.00 1.00 Victoriano Lo 100.0
Roxas/ Bantayan 3,000.00 1 1.00 1.00 Rodolfo Gabalonzo 100.0Roxas/ Negros Occidental 6,000.00 1 1.00 1.00 Rodolfo Gabalonzo 100.0Sablayan/ Bauan 184,450.00 1 1.00 1.00 Liwanag Mendoza 100.0Sablayan/ San Jose 13,054.00 1 1.00 1.00 Lite Shipping Corporation 100.0Sagasa/ Alicia 3,010.85 1 1.00 1.00 Magnolia Shipping
Corporation100.0
Sagasa/ Talusan 80,248.71 1 1.00 1.00 Ever Lines Inc. 100.0San Carlos/ Estancia 93,969.00 1 1.00 1.00 Negros Navigation Company 100.0San Carlos/ Toledo 3,271,292.20 1 1.00 1.00 Danilo Lines 100.0San Jose/ Antique 1,678,049.00 1 1.00 1.00 San Nicolas Lines Inc. 100.0San Jose/ Bais 26,000.00 1 1.00 1.00 Lite Shipping Corporation 100.0San Jose/ Talibon 40,915.00 1 1.00 1.00 Lite Shipping Corporation 100.0San Juan/ Anilao 43,000.00 1 1.00 1.00 Lilia Flores 100.0Siasi/ Sibutu, Tawi-tawi 131,291.00 1 1.00 1.00 Asman Jaide 100.0Sta Ana/ Cogon 2,194.00 1 1.00 1.00 Roger Bandao 100.0Sta Ana/ Kaputian 2,369.00 1 1.00 1.00 Martino Palacio 100.0Sta Ana/ Mindanao 6696.45 1 1.00 1.00 Joel Bustamante 100.0Sta Ana/ Pigasaan 60,998.60 1 1.00 1.00 Joel Bustamante 100.0Sta Cruz/ Tucanga 1,419.00 1 1.00 1.00 Celeste Temperatura 100.0Sto Tomas/ Talaga 30,000.00 1 1.00 1.00 Jose Castro 100.0Subanipa/ Malangas 1,961.70 1 1.00 1.00 Magnolia Shipping
Corporation100.0
Subic/ Bislig 454,689.30 1 1.00 1.00 William Michael Shipping 100.0Subic/ Navotas 353,786.45 1 1.00 1.00 Via Marine Corporation 100.0Subic/ Pandacan 544,635.01 1 1.00 1.00 Via Marine Corporation 100.0Subic/Batangas/Legaspi 2,605,207.00 1 1.00 1.00 La Felicidad Marine 100.0Surigao/ Aklan 136,363.64 1 1.00 1.00 Hosanna Shipping 100.0Surigao/ Cagdianao 47,533.00 1 1.00 1.00 Honesto Lipao 100.0Surigao/ Calubian 260.84 1 1.00 1.00 Sulpicio Lines Inc. 100.0Surigao/ Gingoog 166,883.85 1 1.00 1.00 Eduardo Jarque 100.0Surigao/ Lucena 3,263,398.14 1 1.00 1.00 Amparo Shipping Corp. 100.0Surigao/ Mandaue 165,600.00 1 1.00 1.00 Lina C. Echin 100.0Surigao/ Pinut-an 23,555.50 1 1.00 1.00 Vicente Mejia 100.0Surigao/ Roxas 98,251.84 1 1.00 1.00 Jones Carrier 100.0Surigao/ San Jose 26,000.00 1 1.00 1.00 Lite Shipping Corporation 100.0Surigao/ Talisay 125,600.00 1 1.00 1.00 Domingo Paredes 100.0Surigao/ Zamboanga 81,584.00 1 1.00 1.00 Lite Shipping Corporation 100.0Tabango/ Bogo 14,540.00 1 1.00 1.00 Tabango Express 100.0Tab-ok/ Bacagay 1,310.00 1 1.00 1.00 Pedro Felizarta 100.0
Page 10 of 18

Number =
1/HHIName of Operator/s Share
Effective CompetitorsRoute Cargo Revenue
Number
of
Operators
Herfindahl
Index
(HHI)
Tab-ok/ San Roque 1,060.00 1 1.00 1.00 Pedro Felizarta 100.0Tab-ok/ Sta Lucia 490.00 1 1.00 1.00 Pedro Felizarta 100.0Tacloban/ Balangina 108,747.00 1 1.00 1.00 Joedina Gumagay 100.0Tacloban/ Bolusao 22,176.00 1 1.00 1.00 Rogelio Germones 100.0Tacloban/ Catbalogan 32,708.00 1 1.00 1.00 Lite Shipping Corporation 100.0Tacloban/ Giporlos 5,000.00 1 1.00 1.00 Romulo Alvarino 100.0Tacloban/ Lawaan 3,000.00 1 1.00 1.00 Felix Delantar 100.0Tacloban/ Leyte (Isabel) 321,032.80 1 1.00 1.00 Palacio Shipping Inc. 100.0Tacloban/ Lucena 198,000.00 1 1.00 1.00 Seaford Shipping Lines 100.0Tacloban/ Mandaue 486,300.00 1 1.00 1.00 Lina C. Echin 100.0Tacloban/ Masbate 52,000.00 1 1.00 1.00 Lite Shipping Corporation 100.0Tacloban/ Nabilid 118,209.00 1 1.00 1.00 Eduardo Jarque 100.0Tacloban/ Ozamis 24,310.00 1 1.00 1.00 Lite Shipping Corporation 100.0Tacloban/ Roxas 467,885.00 1 1.00 1.00 Jones Carrier 100.0Tacloban/ Sablayan 26,000.00 1 1.00 1.00 Lite Shipping Corporation 100.0Tacloban/ Sogod 64,833.00 1 1.00 1.00 Lite Shipping Corporation 100.0Tagbilaran/ Batangas 3,452,731.56 1 1.00 1.00 Terban Marine Corporation 100.0Tagbilaran/ Bohol (Ubay) 89,840.00 1 1.00 1.00 Lite Shipping Corporation 100.0Tagbilaran/ Dipolog 141,001.24 1 1.00 1.00 Sulpicio Lines Inc. 100.0Tagbilaran/ General Santos 6,873.87 1 1.00 1.00 Cebu Ferries Corporation 100.0
Tagbilaran/ Hinunangan 26,000.00 1 1.00 1.00 Lite Shipping Corporation 100.0Tagbilaran/ Lapu-Lapu 34,500.00 1 1.00 1.00 Lite Shipping Corporation 100.0Tagbilaran/ Leyte (Isabel) 32,500.00 1 1.00 1.00 V- Lines 100.0Tagbilaran/ Liloan 21,810.00 1 1.00 1.00 Lite Shipping Corporation 100.0Tagbilaran/ Loon 38,400.00 1 1.00 1.00 Lite Shipping Corporation 100.0Tagbilaran/ Ozamis 3,056.05 1 1.00 1.00 William, Gothong & Aboitiz,
Inc.100.0
Tagbilaran/ San Carlos 48,185.00 1 1.00 1.00 Lite Shipping Corporation 100.0Tagbilaran/ San Fernando 60,000.00 1 1.00 1.00 Jones Carrier 100.0Tagbilaran/ Talibon 113,100.00 1 1.00 1.00 Lite Shipping Corporation 100.0Tagbilaran/ Tandag 30,000.00 1 1.00 1.00 Felicito Geraldoy 100.0Tagbilaran/ Zamboanga 41,775.00 1 1.00 1.00 Lite Shipping Corporation 100.0Talibon/ Colorado 10,292.00 1 1.00 1.00 Lite Shipping Corporation 100.0Talisay/ Tampi 19,358.00 1 1.00 1.00 ABC Liner 100.0Talusan/ Alicia 3,255.10 1 1.00 1.00 Magnolia Shipping
Corporation100.0
Talusan/ Sagasa 8,636.50 1 1.00 1.00 Magnolia Shipping Corporation
100.0
Talusan/ Zamboanga 44,572.60 1 1.00 1.00 Magnolia Shipping Corporation
100.0
Tampi, San Jose/ Ayungon, Negros Oriental
4,687.95 1 1.00 1.00 Maayo Shipping, Inc. 100.0
Page 11 of 18

Number =
1/HHIName of Operator/s Share
Effective CompetitorsRoute Cargo Revenue
Number
of
Operators
Herfindahl
Index
(HHI)
Tampi, San Jose/ Bato, Samboan, Cebu
3,741,252.35 1 1.00 1.00 Maayo Shipping, Inc. 100.0
Tampi, San Jose/ Lazi, Siquijor 7,492.80 1 1.00 1.00 Maayo Shipping, Inc. 100.0
Tampi, San Jose/ Tan-awan, Oslob, Cebu
235,019.35 1 1.00 1.00 Maayo Shipping, Inc. 100.0
Tangil/ Dumanjug 102,324.00 1 1.00 1.00 Jefren D. Pages 100.0Tinglay (Batangas)/ Mabini 89,650.00 1 1.00 1.00 Reynaldo Baleno 100.0Tinglay (Batangas)/ Pisa 50,000.00 1 1.00 1.00 Rodolfo Manalo 100.0Toledo/ Bohol 160,000.00 1 1.00 1.00 Inter-Island Maritime
Corporation100.0
Toledo/ Naval (Tacloban) 96,000.00 1 1.00 1.00 Inter-Island Maritime Corporation
100.0
Toledo/ Pasacao 70,000.00 1 1.00 1.00 Inter-Island Maritime Corporation
100.0
Toledo/ Talibon 170,000.00 1 1.00 1.00 Inter-Island Maritime Corporation
100.0
Zamboanga City/ Zamboanga del Sur/Norte
64,999.00 1 1.00 1.00 Den Tadus 100.0
Zamboanga del Sur/Norte/ Basilan
15,000.00 1 1.00 1.00 Den Tadus 100.0
Zamboanga/ Alicia 22,870.75 1 1.00 1.00 Magnolia Shipping Corporation
100.0
Zamboanga/ Bais 18,702.00 1 1.00 1.00 Lite Shipping Corporation 100.0Zamboanga/ Bislig 240,000.00 1 1.00 1.00 William Michael Shipping
Corp. 100.0
Zamboanga/ Bohol (Ubay) 31,283.00 1 1.00 1.00 Lite Shipping Corporation 100.0Zamboanga/ Limaong 38,000.00 1 1.00 1.00 Hadji Jalleh Jayyari 100.0Zamboanga/ Malabang 1,090,980.00 1 1.00 1.00 Sing Hock Chua Amik 100.0Zamboanga/ San Jose 52,360.00 1 1.00 1.00 Lite Shipping Corporation 100.0Zamboanga/ Sandakan 1,763,851.60 1 1.00 1.00 Sampaguita Shipping Corp. 100.0Zamboanga/ Siocon 767,373.55 1 1.00 1.00 Sampaguita Shipping Corp. 100.0Zamboanga/ Siom 203,018.17 1 1.00 1.00 William Michael Shipping 100.0Zamboanga/ Sirawai 550,111.40 1 1.00 1.00 Sampaguita Shipping Corp. 100.0Zamboanga/ Sogod 39,200.00 1 1.00 1.00 Lite Shipping Corporation 100.0Zamboanga/ Tungawan 10,000.00 1 1.00 1.00 Hadji Jalleh Jayyari 100.0
Routes with at least 2 operatorsRoutes with substantial competitionBacolod/ Batangas 1,806,755.16 2 0.56 1.78 Terban Marine Corp, La
Felicidad Marine Corp100.0
Bacolod/ General Santos 1,770,738.41 3 0.39 2.60 WG&A, Palacio Shipping Lines, Negros Navigation
100.0
Bacolod/ Tagbilaran 169,190.50 2 0.50 1.98 Philip Go, Lite Shipping Corp 100.0Page 12 of 18
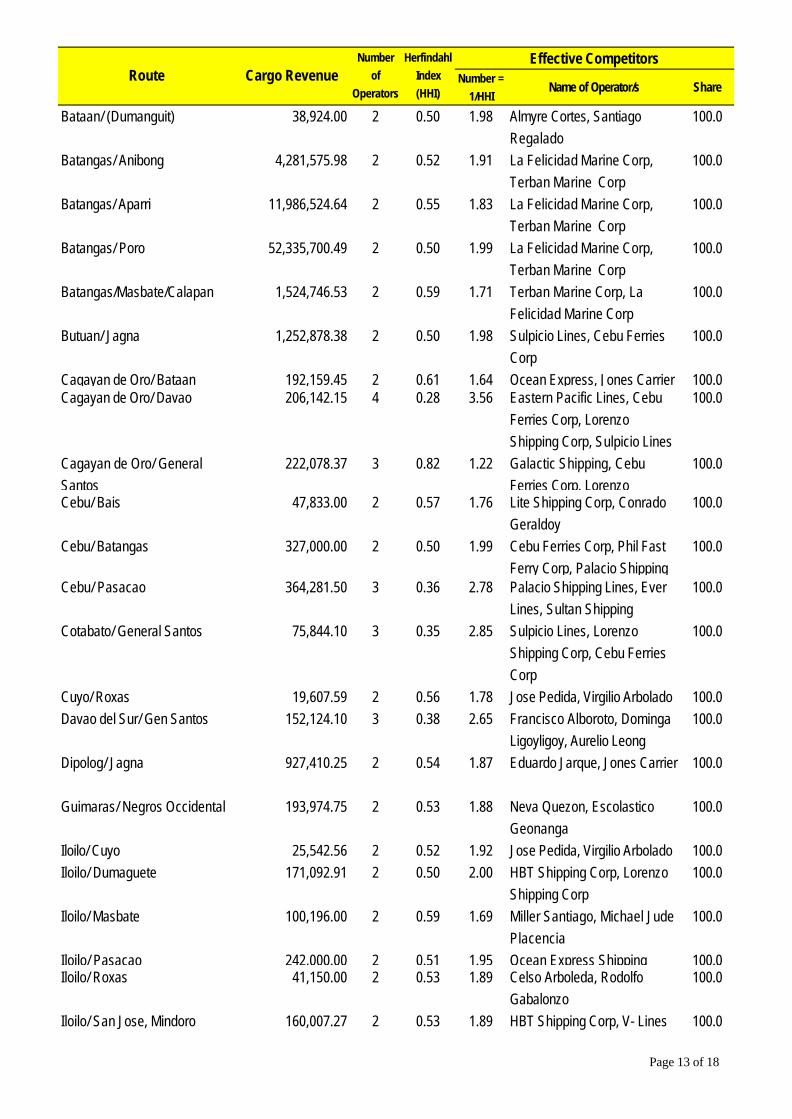
Number =
1/HHIName of Operator/s Share
Effective CompetitorsRoute Cargo Revenue
Number
of
Operators
Herfindahl
Index
(HHI)
Bataan/ (Dumanguit) 38,924.00 2 0.50 1.98 Almyre Cortes, Santiago Regalado
100.0
Batangas/ Anibong 4,281,575.98 2 0.52 1.91 La Felicidad Marine Corp, Terban Marine Corp
100.0
Batangas/ Aparri 11,986,524.64 2 0.55 1.83 La Felicidad Marine Corp, Terban Marine Corp
100.0
Batangas/ Poro 52,335,700.49 2 0.50 1.99 La Felicidad Marine Corp, Terban Marine Corp
100.0
Batangas/Masbate/Calapan 1,524,746.53 2 0.59 1.71 Terban Marine Corp, La Felicidad Marine Corp
100.0
Butuan/ Jagna 1,252,878.38 2 0.50 1.98 Sulpicio Lines, Cebu Ferries Corp
100.0
Cagayan de Oro/ Bataan 192,159.45 2 0.61 1.64 Ocean Express, Jones Carrier 100.0Cagayan de Oro/ Davao 206,142.15 4 0.28 3.56 Eastern Pacific Lines, Cebu
Ferries Corp, Lorenzo Shipping Corp, Sulpicio Lines
100.0
Cagayan de Oro/ General Santos
222,078.37 3 0.82 1.22 Galactic Shipping, Cebu Ferries Corp, Lorenzo
100.0
Cebu/ Bais 47,833.00 2 0.57 1.76 Lite Shipping Corp, Conrado Geraldoy
100.0
Cebu/ Batangas 327,000.00 2 0.50 1.99 Cebu Ferries Corp, Phil Fast Ferry Corp, Palacio Shipping
100.0
Cebu/ Pasacao 364,281.50 3 0.36 2.78 Palacio Shipping Lines, Ever Lines, Sultan Shipping
100.0
Cotabato/ General Santos 75,844.10 3 0.35 2.85 Sulpicio Lines, Lorenzo Shipping Corp, Cebu Ferries Corp
100.0
Cuyo/ Roxas 19,607.59 2 0.56 1.78 Jose Pedida, Virgilio Arbolado 100.0Davao del Sur/ Gen Santos 152,124.10 3 0.38 2.65 Francisco Alboroto, Dominga
Ligoyligoy, Aurelio Leong100.0
Dipolog/ Jagna 927,410.25 2 0.54 1.87 Eduardo Jarque, Jones Carrier 100.0
Guimaras/ Negros Occidental 193,974.75 2 0.53 1.88 Neva Quezon, Escolastico Geonanga
100.0
Iloilo/ Cuyo 25,542.56 2 0.52 1.92 Jose Pedida, Virgilio Arbolado 100.0Iloilo/ Dumaguete 171,092.91 2 0.50 2.00 HBT Shipping Corp, Lorenzo
Shipping Corp100.0
Iloilo/ Masbate 100,196.00 2 0.59 1.69 Miller Santiago, Michael Jude Placencia
100.0
Iloilo/ Pasacao 242,000.00 2 0.51 1.95 Ocean Express Shipping 100.0Iloilo/ Roxas 41,150.00 2 0.53 1.89 Celso Arboleda, Rodolfo
Gabalonzo100.0
Iloilo/ San Jose, Mindoro 160,007.27 2 0.53 1.89 HBT Shipping Corp, V- Lines 100.0
Page 13 of 18

Number =
1/HHIName of Operator/s Share
Effective CompetitorsRoute Cargo Revenue
Number
of
Operators
Herfindahl
Index
(HHI)
Manila/ Jolo 402,000.00 2 0.53 1.90 Ocean Express Shipping Corp, Ever Lines Inc
100.0
Masbate/ Bauan 167,910.00 2 0.56 1.79 Aquilina Guro, V- Lines 100.0Surigao/ Basilica 150,715.00 2 0.59 1.69 Lina Riega, Cesar Borja 100.0Surigao/ Dipolog 1,770,229.22 2 0.52 1.91 Eduardo Jarque, Jones Carrier 100.0
Tab-ok/ San Francisco 16,241.30 2 0.62 1.62 Leonardo Dauhog, Pedro Felizarta
100.0
Tacloban/ Mindoro (San Jose) 78,500.00 2 0.56 1.80 V- Lines, Lite Shipping Corp 100.0
Tagbilaran/ Toledo 137,500.00 2 0.50 2.00 Inter-island Maritime Corp, Lite Shipping Corp
100.0
Zamboanga/ Dipolog 77,834.90 2 0.53 1.87 Galactic Shipping, Magnolia Shipping Lines
100.0
Zamboanga/ Lamitan 246,540.19 2 0.56 1.77 Joyalcyd Corp, Sing Hock Chua Amik
100.0
Zamboanga/ Sitangkai 781,615.70 2 0.50 2.00 Sampaguita Shipping Corp, Magnolia Shipping Corp
100.0
Zamboanga/ Subanipa 354,474.61 2 0.58 1.73 Magnolia Shipping Lines, Ever Lines
100.0
Zamboanga/ Talusan 62,399.61 2 0.55 1.82 Magnolia Shipping Lines, Ever Lines
100.0
Routes with only 1 effective competitor Bacolod/ Cagayan de Oro 19,220,657.32 6 0.83 1.20 Negros Navigation 91.2Bacolod/ Zamboanga 1,607,320.06 3 0.74 1.35 WG&A Philippines 85.2Batangas/ Calapan 187,665,518.13 4 0.98 1.02 Phil Fast Ferry Corp 99.0Batangas/ Pasacao 4,435,253.24 2 0.93 1.08 Terban Marine Corp 96.3Batangas/Calapan/Pasacao 2,060,381.83 2 0.80 1.24 Terban Marine Corp 89.0
Baybay/ Dipolog 1,113,681.86 2 0.83 1.20 Eduardo Jargue 90.7Benoni/ Balingoan 1,419,177.25 2 0.96 1.04 RP Tamula and Sons 98.0Cagayan de Oro/ Butuan 26,369.56 2 0.97 1.03 Lite Shipping Corp 98.6Cagayan de Oro/ Cotabato 2,384,611.52 2 0.78 1.29 Cebu Ferries Corp 87.2Cagayan de Oro/ Ormoc 1,272,943.29 2 0.92 1.08 Cebu Ferries Corp 96.0Cagayan de Oro/ Zamboanga 483,206.18 3 0.51 1.27 Lorenzo Shipping Corp 71.1
Catbalogan/ Villareal 322,025.00 2 0.97 1.03 Avelino Arraz 98.4Cebu/ Catbalogan 1,768,496.58 3 0.89 1.12 Lapu-lapu Shipping Lines 94.3Cebu/ Maasin 2,337,195.98 3 0.77 1.31 Cokaliong Shipping Lines 86.9Cebu/ Tandag 1,354,200.00 2 0.84 1.19 BCT Shipping Lines 91.1Dumaguete/ Cagayan de Oro 5,698,152.18 4 0.76 1.31 WG&A Philippines 87.1
Dumaguete/ Cotabato 1,236,068.40 3 0.87 1.15 Cebu Ferries Corp 93.3Page 14 of 18

Number =
1/HHIName of Operator/s Share
Effective CompetitorsRoute Cargo Revenue
Number
of
Operators
Herfindahl
Index
(HHI)
Dumaguete/ Dadiangas 7,195,808.35 2 0.97 1.03 Sulpicio Lines 98.6Dumaguete/ General Santos 11,467,787.41 6 0.74 1.36 Cebu Ferries Corp 84.8
Guimaras/ Pulupandan 81,190.00 2 0.77 1.29 Rolando Gamilong 87.0Hingatungan/ Tab-ok 13,830.00 2 0.75 1.33 Leonardo Dauhog 85.3Iligan/ Ormoc 225,963.45 2 0.97 1.03 Cebu Ferries Corp 98.4Iloilo (Gigante Norte)/ Iloilo(Estancia)
138,309.50 2 0.77 1.30 Roger Marcelo 86.9
Iloilo/ Bantayan 125,250.00 2 0.74 1.36 Gerardo Gubo 84.4Jolo/ Bongao 217,105.60 2 0.87 1.16 Sampaguita Shipping Corp 92.8Liloan/ Sibulan 10,280.00 3 0.74 1.35 Max Baat 85.3Mandaue/ Bantayan 1,571,062.17 2 0.82 1.23 Douglas del Rosario 89.7Manila/ Catbalogan 3,576,428.10 2 0.98 1.02 Sulpicio Lines 99.1Masbate/ Roxas 189,850.00 2 0.72 1.39 Isidro Refil 83.2Maya/ San Isidro 158,180.00 2 0.75 1.33 Arturo Susas 85.4Ormoc/ Masbate 645,907.79 2 0.99 1.01 Sulpicio Lines 99.5Pagadian/ Zamboanga 405,090.55 2 0.89 1.12 Sampaguita Shipping Corp 94.4Sta Rosa/ Dapdap 22,008.00 2 0.98 1.02 Rufino Augusto 99.2Surigao/ Dapa 8,345.00 2 0.79 1.27 Domingo Paredes 88.0Tab-ok/ Kikilo 9,710.00 2 0.86 1.16 Leonardo Dauhog 92.7Tab-ok/ Tibo 22,515.80 2 0.77 1.30 Pedro Felizarta 86.7Tacloban/ Batangas 2,870,870.42 2 0.98 1.02 La Felicidad Marine Corp 98.8Tacloban/ General Santos 485,020.42 3 0.75 1.33 WG&A Philippines 86.1Zamboanga/ Pagadian 2,524,315.25 2 0.74 1.35 Abdusakar Tan 84.8
Routes with mild competitionAntimonan/ Alabat 120,603.60 3 0.44 2.28 Jose Leal, Agustin
Nepomuceno89.8
Babak/ Sasa 7,937.20 6 0.68 1.47 Dolorosa Ibo 82.0Bacolod/ Bauan 142,646.25 2 0.67 1.49 Aquilina Guro 79.3Bacolod/ Davao 2,107,167.25 4 0.59 1.69 WG&A Philippines, Negros
Navigation 94.9
Bacolod/ Iligan 845,039.66 5 0.28 3.59 WG&A Philippines, Rover Shipping Services, William Michael Shipping Corp
89.0
Bacolod/ Romblon 46,500.00 3 0.51 1.96 Jaime Geraldoy, Eva Norono 94.6
Bacolod/ Tacloban 257,328.47 5 0.47 2.12 Palacio Shipping, WG&A, Lite Shipping Corp
41.3
Batangas/ Legaspi 7,631,981.52 2 0.63 1.58 La Felicidad Marine Corp 75.9
Batangas/ Mindoro 102,349.90 2 0.63 1.59 Dionisio Albania 75.6
Page 15 of 18
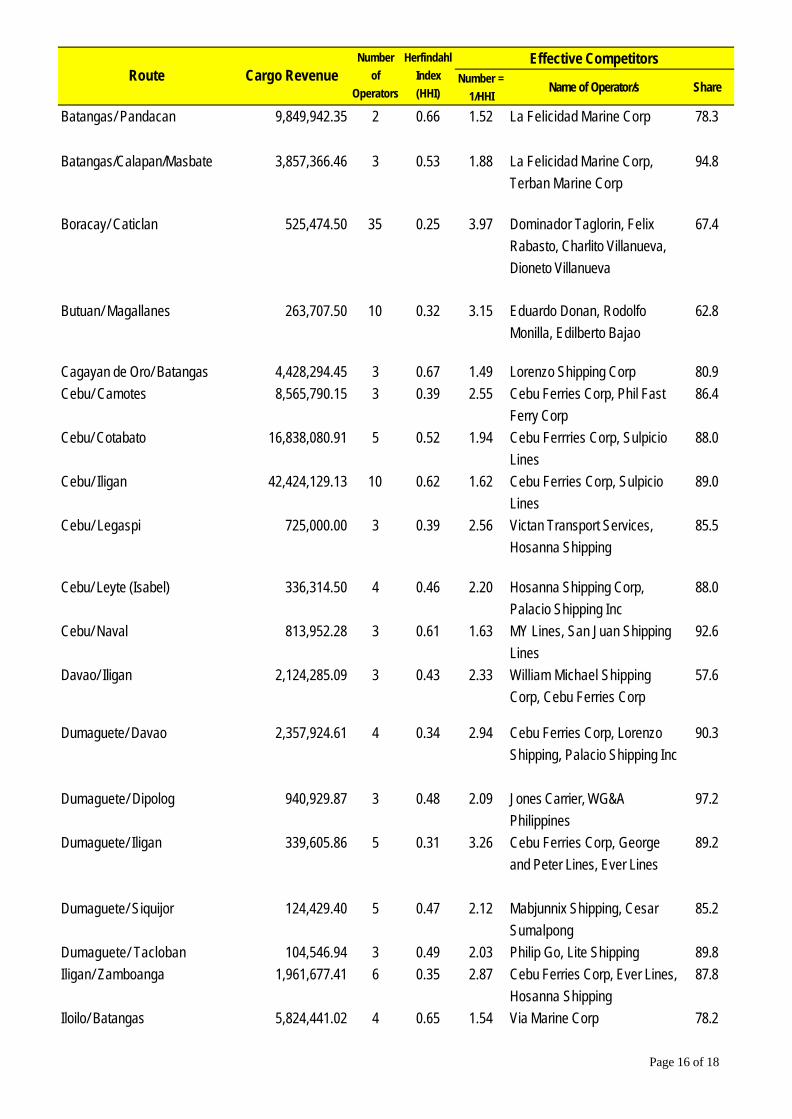
Number =
1/HHIName of Operator/s Share
Effective CompetitorsRoute Cargo Revenue
Number
of
Operators
Herfindahl
Index
(HHI)
Batangas/ Pandacan 9,849,942.35 2 0.66 1.52 La Felicidad Marine Corp 78.3
Batangas/Calapan/Masbate 3,857,366.46 3 0.53 1.88 La Felicidad Marine Corp, Terban Marine Corp
94.8
Boracay/ Caticlan 525,474.50 35 0.25 3.97 Dominador Taglorin, Felix Rabasto, Charlito Villanueva, Dioneto Villanueva
67.4
Butuan/ Magallanes 263,707.50 10 0.32 3.15 Eduardo Donan, Rodolfo Monilla, Edilberto Bajao
62.8
Cagayan de Oro/ Batangas 4,428,294.45 3 0.67 1.49 Lorenzo Shipping Corp 80.9Cebu/ Camotes 8,565,790.15 3 0.39 2.55 Cebu Ferries Corp, Phil Fast
Ferry Corp86.4
Cebu/ Cotabato 16,838,080.91 5 0.52 1.94 Cebu Ferrries Corp, Sulpicio Lines
88.0
Cebu/ Iligan 42,424,129.13 10 0.62 1.62 Cebu Ferries Corp, Sulpicio Lines
89.0
Cebu/ Legaspi 725,000.00 3 0.39 2.56 Victan Transport Services, Hosanna Shipping
85.5
Cebu/ Leyte (Isabel) 336,314.50 4 0.46 2.20 Hosanna Shipping Corp, Palacio Shipping Inc
88.0
Cebu/ Naval 813,952.28 3 0.61 1.63 MY Lines, San Juan Shipping Lines
92.6
Davao/ Iligan 2,124,285.09 3 0.43 2.33 William Michael Shipping Corp, Cebu Ferries Corp
57.6
Dumaguete/ Davao 2,357,924.61 4 0.34 2.94 Cebu Ferries Corp, Lorenzo Shipping, Palacio Shipping Inc
90.3
Dumaguete/ Dipolog 940,929.87 3 0.48 2.09 Jones Carrier, WG&A Philippines
97.2
Dumaguete/ Iligan 339,605.86 5 0.31 3.26 Cebu Ferries Corp, George and Peter Lines, Ever Lines
89.2
Dumaguete/ Siquijor 124,429.40 5 0.47 2.12 Mabjunnix Shipping, Cesar Sumalpong
85.2
Dumaguete/ Tacloban 104,546.94 3 0.49 2.03 Philip Go, Lite Shipping 89.8Iligan/ Zamboanga 1,961,677.41 6 0.35 2.87 Cebu Ferries Corp, Ever Lines,
Hosanna Shipping 87.8
Iloilo/ Batangas 5,824,441.02 4 0.65 1.54 Via Marine Corp 78.2
Page 16 of 18

Number =
1/HHIName of Operator/s Share
Effective CompetitorsRoute Cargo Revenue
Number
of
Operators
Herfindahl
Index
(HHI)
Iloilo/ Butuan 176,425.62 3 0.43 2.30 Inter-island Maritime Corp, Sulpicio Lines
88.1
Iloilo/ Cagayan de Oro 17,632,866.97 9 0.49 2.05 Negros Navigation, WG&A 86.7
Iloilo/ Guimaras (Jordan) 1,967,178.25 24 0.10 10.30 SKMMOOA, Maria Balena, Santiago Siloterio, Anacleto Galabo, Anita Galve, Ruthelo Geonanga, Eduardo Gando, Nelia Canon, Fernando Espinosa, Nerissa Pelingon
69.9
Iloilo/ Negros Occidental 32,100.00 2 0.70 1.44 Romeo Geraldoy 81.3Iloilo/ Tacloban 442,697.73 4 0.52 1.91 WG&A Philippines, Sulpicio
Lines80.1
Iloilo/ Zamboanga 10,892,946.35 5 0.50 2.01 WG&A Philippines, Sulpicio Lines
84.4
Jolo/ Siasi 269,735.15 4 0.36 2.78 Hadji Ahmad, Asman Jaide, Sampaguita Shipping Corp
94.7
Jolo/ Sitangkai 45,876.80 2 0.68 1.47 Sampaguita Shipping Corp 79.9Jolo/ Tawi-tawi 78,889.00 2 0.66 1.51 Den Tadus 78.6Jolo/ Zamboanga 7,258,975.93 10 0.17 5.97 Erwin Tan, Sampaguita
Shipping Lines, Hadji Tan, Radzma Burahan, Anton Burahan, Hadji Daud
85.9
Mamburao/ Bauan 149,455.56 2 0.63 1.58 Liwanag Mendoza 75.7Manila/ Escalante 172,000.00 2 0.64 1.56 Ocean Express Shipping
Lines76.7
Siasi/ Bongao 336,099.65 3 0.53 1.90 Hadji Hahmad, Sampaguita Shipping Corp
94.8
Sitangkai/ Bongao 198,573.75 3 0.70 1.43 Hadji Hahmad 82.5Sitangkai/ Siasi 55,298.85 2 0.71 1.40 Sampaguita Shipping Corp 82.6Sta Ana/ Penaplata 5,085.00 7 0.17 5.97 Erlinda Atianzar, Andrea
Vargas, Caesar Playda, Alejandro Requina, Jesus Basarten, Flaviano Cuenca
91.0
Sta Ana/ Sta Cruz 6,612.00 3 0.47 2.12 Jesus Plarilla, Diana Barail 87.1
Sta Cruz/ Gen Luna 175,980.00 2 0.70 1.42 Marites Pielaga 81.9Tacloban/ Dipolog 6,558,856.11 3 0.50 1.99 Jones Carrier, Eduardo Jarque 97.7
Tacloban/ Gingoog 2,922,366.00 2 0.65 1.55 Jones Carrier 77.1Tacloban/ Iligan 1,477,130.15 3 0.54 1.85 Cebu Ferries Corp, Hosanna
Shipping 97.4
Page 17 of 18

Number =
1/HHIName of Operator/s Share
Effective CompetitorsRoute Cargo Revenue
Number
of
Operators
Herfindahl
Index
(HHI)
Tacloban/ Zamboanga 144,690.38 4 0.60 1.67 Sulpicio Lines, William Chiong 89.8
Zamboanga/ Basilan 1,033,976.45 4 0.31 3.26 Alibasa Alih, Jovito Chiong, George Tan
92.1
Zamboanga/ Bongao 1,665,807.60 3 0.65 1.54 Sampaguita Shipping Corp 58.0Zamboanga/ Leyte (Isabela) 100,750.00 2 0.68 1.47 Sing Hock Chua Amik 80.1
Zamboanga/ Malangas 223,787.19 2 0.67 1.50 Ever Lines 78.8Zamboanga/ Margosatubig 302,255.13 2 0.72 1.40 Ever Lines 82.9Zamboanga/ Sagasa 109,345.01 2 0.65 1.53 Magnolia Shipping Corp 77.5Zamboanga/ Siasi 1,327,871.60 4 0.41 2.42 Hadji Mubin Daud, Magnolia
Shipping Corp 88.7
Zamboanga/ Tawi tawi 968,649.00 4 0.36 2.74 Jasper Askalani, Lino Lao, Jainal Tiking
99.0
source: 1998 Annual Traffic Reports of Shipping Companies submitted to the MARINA.
Page 18 of 18