PORTS OF FERROL AND SAN CIBRAO
412
PORTS OF FERROL AND SAN CIBRAO Annual report 2020
-
Upload
khangminh22 -
Category
Documents
-
view
3 -
download
0
Transcript of PORTS OF FERROL AND SAN CIBRAO

PORTSOF FERROL
AND SAN CIBRAOAnnual report 2020

INDEXPORTS OF FERROL AND SAN CIBRAO ANNUAL REPORT 2020
1. Presentation of the President and the Director
2. The Port in figures
3. Milestones of the year 2020
4. Government of the Port Authority
Management Board of the Port Authority
Port Authority Stakeholders
5. Our strategyMission: The PAFSC Roadmap
Projects and alliances to generate long-term value
6. Our strengthsThe value offer to our stakeholders:
- Facilities
- Services
- Port authority´s Price Quotation
- Management Systems implemented in the port
- Intermodality
Economic and social development of the environment:
- Economic sectors served
- We connect the economy of our region with the rest of the world
- Staff
- Our relationship with society
7. Our managementValue offered to our Stakeholders:
Satisfaction of stakeholders
Internal and external analysis
Strategy deployment through processes
Evaluation, review and innovation
Strategy tracking
Process tracking
Risk evaluation
02
04
08
14
18
24
46
Page

1
APPENDIX
Active transparency in information.Data in detail
1. Financial statements
2. Technical characteristics of the port
3. Works or activities authorized to private companies
4. Traffic statistics
5. Use of the port
6. Works
7 Regular shipping lines
8. Spanish port system sustainability indicators
9. Parameters and GRI content index
Access to information (QR):

32
Presentation of the President and the Director Annual Report 2020 · Ferrol-San Cibrao Port Authority
PRESENTATION BY THE PRESIDENT AND DIRECTOR OF THE PORT AUTHORITY
The year 2020 will mark a before and after in the history of the Ferrol-San Cibrao Port Authority, so trying to cover in a few paragraphs everything that happened in that period seems difficult.
We ended the year with the replacement in the Pre-sidency of the highest governing body of the entity, so it is essential to recognize and thank José Manuel Vilariño Anca for his excellent management in the last 7 years, which positions us in good conditions to face this turning point in which we find ourselves at this time.
As in any stage of transition, when threats and oppor-tunities in the environment converge simultaneous-ly with a very significant impact, a firm response is necessary to promote the required transformations that allow us to emerge stronger and improve our offer of value to our stakeholders.
We have the necessary strengths to face this new cycle with solvency, since we have competitive in-frastructures and top port terminals for the traffic of solid bulks, liquid bulks, general merchandise and containers, all of them managed by expert multina-tional companies, which work with high standards of quality, environment and safety.
The Port, as a logistical node between maritime and land transport, is the key to the economic and so-cial development of the region and it is affected by a myriad of externalities that directly concern it, but also affect its clients and allies.
In 2020 the impact of the decarbonization of the economy on the results of the PAFSC was speci-fied in figures, with an average loss of 3.8 million tons of imported coal for Endesa in As Pontes. With respect to the Alcoa factory, the effect was on the production of aluminium, with very high-power consumption requirements. Through the Port of San Cibrao that serves the factory, the total volume of cargo loading and unloading exceeded 6 million tons, reaching its historical maximum. In both ca-ses, we are working together with these clients and other administrations and public organisations in the maximum use of these port terminals, genera-ting alternatives.
Although in the medium term we will continue to face the changes that occur at the global, national and re-gional levels in the energy model, which will impact
our liquid bulk terminals for LNG, petroleum products and biofuels, we can highlight that in the last year we reached a record figure for this set traffic with a move-ment of 2.6 million tons. The forecast is for an increase in the next 4 years. The holders of these concessions have been involved in innovative projects for years to diversify their activity towards renewable energies.
New plans are also on the horizon, such as offshore wind, for which we are very well positioned. On the one hand, as we were able to verify with the first offs-hore assembly operation of offshore wind turbines, our Outer Port facilities, due to their shelter, draft and surface characteristics, will allow savings in costs and assembly time from the loader to the floating base. This synergy between PAFSC, Navantia and Win-dar-Renovables will improve the competitiveness of its offer. On the other hand, in terms of energy pro-duction through this renewable source, one of the po-tential areas for the placement of offshore wind farms in Galicia is in Mariña Lucense, in front of the service area of the Port of San Cibrao.
Our container terminal in the Outer Port managed by Yilport, a company that ranked 17th in the world ranking of terminal operators in 2019, continues its firm journey with a third regular line, which enables us to offer 4 weekly stopovers of container ships. Containerized freight traffic achieved an increase of 35.46% last year in contrast to the evolution of the port system with a decrease of 0.73%. Our forecast for the future is one of continuous increase in the coming years.
We have formulated our strategy and determined the necessary investments in the next 5 years, to en-hance the possibilities that are presented to us and give support to the present and future initiatives of our allies and the regional economy. The three prio-rity axes will be:
-Competitiveness of our facilities and services.With an investment of more than 40 million euros in port infrastructures and facilities, and initiatives to obtain new authorizations for border inspec-tion services, updating of service delivery speci-fications, improvement in operational processes and excellence in management.
-Connection of our facilities with the national andinternational internal market. With a total invest-ment of close to 107 million euros in improving
our rail connections and in the internal network of the port. Framed in the objective of providing the PAFSC with a competitive intermodality between the railway and the port.
-Economic and social impact of our activity. With an approximate investment of 15 million euros. At the end of this year, we will have an updated sus-tainability strategy aligned with the sustainability objectives of the United Nations. In addition, we will resume passenger traffic, once cruise stops are authorized again, and we will work to improve our facilities for these ships.
We already have a plan of actions aimed at com-pleting our offer of areas for the enjoyment of the population in the area of the Dársena (dock) de Cu-ruxeiras and the Ensenada de La Malata. With the mobility limitations derived from the measures to control the Covid-19 pandemic, it became evident the need for walking spaces in cities, where the po-pulation density is higher. From the PAFSC we made ourselves available to citizens by closing the circu-lation of vehicles on the lower road of the Port at the moments with the smallest allowed perimeter (1 kilometre). And we put out to tender technical assis-
tance to design our offer of leisure and promenade surfaces in this area. In this way we will complete the actions already executed and delivered to the city, such as the Paseo de la Malata from the port access to La Cabana, with others already contracted such as the pedestrian walkway that will run parallel to the railway connection, and that will enable comple-te the circuit around the cove, expanding and provi-ding street furniture to the sidewalks that connect the entrance to the Port with the Dársena de Curu-xeiras (dock).
We have a team of professionals who have once again demonstrated their response capacity and commit-ment to their port in 2020, in the face of the challen-
Indalecio Joaquín Seijo Jordán President of the PAFSC
Alejandro Rey Seoane Director of the PAFSC
ges that arose to deal with the pandemic that affec-ted health and the economy throughout the planet.Among all of us: staff from the Port Authority, our contractors, service operators and terminals, we ma-naged to keep these critical infrastructures open and fully operational.
Before them and our stakeholders, this Presidency and Management of the Port Authority acquired the commitment to support alliances and promote the necessary actions to together build a sustainable fu-ture for our Port.

02The Port in FIGURES

The Port in Figures
76
Port Authority of Ferrol-San Cibrao, Annual Report 2020
TOTAL EMPLOYEES
112
EVENTUALEMPLOYEES
(over total)
No. OF ACCIDENTS &INCIDENTS IN SAFETY
& PROTECTION
19.82%
EMPLOYEES INVOLVEDIN TRAINING PROGRAMS
28%
ANNUALABSCENCE INDEX
(days lost due to work leave)
9.18%
1,865,017 Kw*h
OWN ELECTRICITYCONSUMPTION
60.41 t
DIRECT EMISSIONS OF CO2E
PORT AUTHORITY
15.794 m3
OWN WATERCONSUMPTION
1,707.17 m3
MARPOL I LIQUID WASTECOLLECTION TO SHIPS
MARPOL V SOLID WASTECOLLECTION TO SHIPS
1,918.97 m3 2
No OF ENVIRONMENTALINCIDENTS
FREIGHT TRAFFIC
10.034.625 t
COMMERCIAL DOCKFREIGHT TRAFFIC
1.641,13 t/m
SHIPS TRAFFIC (nº)
1.002
12,84Million Euros
7,44Million Euros
TRAFFIC QUOTA IN THE PORTSECTOR OF THE NORTHERN SPAIN
11.50%
TRAFFIC QUOTA IN THE REGIONALPORT SECTOR (GALICIA)�
35.29%
15,212Thousands of Euros
6,153Thousands of Euros
1,148Thousands of Euros
8.18%DEBT RATIO
0.51%RETURN ON ASSETS
NET AMOUNT TURNOVEROF PAFSC CASH FLOW
RESULT OFTHE EXERCISE
AMOUNT OF PORT AUTHORITYINVESTMENTS
PRIVATE INVESTMENTIN PORT INFRASTRUCTURE
MAXIMUM COMPETITIVENESS
OUR STAFF
ENVIRONMENTAL PERFORMANCE
ECONOMIC AND SOCIAL DEVELOPMENT

03MILESTONES OF THE YEAR 2020

1110
Milestones of the year Port Authority of Ferrol-San Cibrao, Annual Report 2020
COMPETITIVENESS21
3
NEW WEEKLY LINE OF CONTAINERS
In 2020 Containerships-CMA CGM SAU launched a new regular container line, which allowed us to have three weekly calls for this type of ships, connecting the Outer Port terminal with France, the United Kingdom, Ire-land, Holland, Belgium and Portugal. This shipping company, which at the beginning of 2021 has launched a third regular line, bringing the number of calls to 4 weeks, and it has boosted the container traffic of the Port Authority, which has achieved in the year 2020 an increase of 35.46% in contrast to the evolution of the port system with a decrease of 0.73%.
The coming into operation of the Outer Port container terminal, and especially the consolidation of regular weekly lines, have allowed us to serve other economic sectors, which are especially reflected in the Agro-Li-vestock and Food group, as well as in the group of Other merchandise. The demand in logistics operations for goods moved in containers, as well as the nature of these products, potentially have an impact on the gross added value and employment generated by the Port Authority.
EVOLUTION OF THE COMPOSITION OF TRAFFIC ACCORDING TO ITS NATURE
Year 2010 2011 2012 2013 2014 2015 2016 2017 2018 2019 2020
0.00%
5.00%
10.00%
15.00%
20.00%
25.00%
30.00%
35.00%
40.00%
45.00%
50.00%
55.00%
60.00%
Energetic
Fertilisers Non-metallic minerals Vehicles and transport elements
Steel and metal Chemicals Other merchandise Food Agro-Livestock
Construction materials
1600.00%
1400.00%
1200.00%
1000.00%
800.00%
600.00%
400.00%
200.00%
0.00%
RATE OF VARIATION OF GOODSIN CONTAINERS BASED ON 2012
1st regular line
2nd regular line129,237 tonnes
AÑO 2013 2014 2015 2016 2017 2018 2019 2020
-200.00%
PORT AUTHORITY PORT SYSTEM
Unloading containers from the liner ship
FM LogisticBorder Inspection Post in the Outer Port FM LogisticTerminal
Land access Intasa in San SadurniñoRío do Pozo Industrial Estate
RESPONSE TO THE IMPACT OF CLIMATE CHANGE ON THE FSC TRAFFIC:
IMPROVING THE LOGISTICS SUPPLY
Ground mounting of the wind turbineon the floating platform
Floating wind turbine trailer
SYNERGIES TO SUPPORT THE COMPETITIVENESS OF THE MARINE WIND SECTOR: Navan tia-Windar renowables-PAFSC
In order that the floating wind turbine could be transported to its final location without the need to use specialized vessels, with the corresponding cost savings and improved operability, in 2020 it was carried out and because of the characteristics of shelter, draft and surfaces of our Outer Port, the final assembly part of the wind blade to the floating base was carried out from land.
The improvement of our merchandise inspection faci-lities, the arrival of leading companies in the maritime port logistics sector, and the future commissioning of the rail connection of our most competitive facilities are allowing us to face our future economically, socia-lly and environmentally sustainable.
As we have been reflecting in different editions of our annual report, in the section of Appen-dix 8 destined to the "Economic Impact of Climate Change", the normative regulation, that su-pports the gradual use of ener-gy sources with less impact on climate change and a less use of non-renewable natural resour-ces, has clearly had an impact on the composition of our tra-ffic, with 2019 being the turning point in the future of the Port Authority.

1312
Milestones of the year Port Authority of Ferrol-San Cibrao, Annual Report 2020
Control system by facial recognition and temperature reader at the entrance of buildings
Cleaning of the fish market
Maintenance staff
The House of the Sea Cleaning staff
IT staff Port police
ECONOMIC AND SOCIAL DEVELOPMENTTHE PAFSC'S RESPONSE TO THE IMPACT OF COVID-19 ON SOCIETY
PAFSC Staff Response
Uninterrupted activity maintenance
The response of the port community (port operators, terminals and administrations)
The response of the management team
Supply of EPIS
Cleaning of facilities
Agility in the reorganization of activities, processes and internal and external guidelines
Leadership of the port community by PAFSC
Fast establishment of communication channels
Clarity and dissemination of the changes introduced
Implementation of security protocols according to the alarm situation
Supply of other material and training for COVID products (hydrogel, screens, etc.)
Supply of the necessary material and training according to the new activities, processes, protocols and internal and external guidelines (teleworking, etc.)
Economic-financial support to face the impact of the measures taken by both the Port Authority and the different administra-tions (termination of activity, mobility limitations)
AVERAGE RATING GIVEN BY THE IG ON THE PAFSC RESPONSE TO COVID 19
In 2020, all of us: citizens, social agents, national and international institutions and organisations, will face the double challenge of safeguarding health and continuing our lives in the best possible way.
In the Port Authority of Ferrol-San Cibrao we focus on the following actions:
1.-Safety of the people: from the declaration of the state of alarm by the Government of Spain, the assistance of the staff was organized so that all the office staff teleworked from home and shifts were established for a minimum assistance of the staff of maintenance, port police and personnel of the service of navigational aids. A risk assessment was carried out and the new protocols were distributed, also establishing a short-term action plan. Recommendations on teleworking were sent by the health and safety service. Cleaning protocols were increased both inside the buildings, as well as outside the Fish market and the Border Inspection Post. Protection screens, hydrogel dispensers were placed, and a facial recognition system and a temperature reader were installed at the entrances to the main building as well as the service coordination center. A total of 8,933 masks were distributed to Port Authority personnel, and 26,655 masks to companies in the port community: freight terminals, service operators, etc.
2.-Maintenance of port operations, as it is a strategic facility as a logistics node for the transport of goods, constant communication was maintained with the entire port community and work guidelines were reorga-nized.
3.-Mitigate the economic impact of the slowdown in economic activity in companies located in its public domain area, many of them key. With respect to clients, payment terms were suspended for more than a month, and a mechanism was regulated that allowed the debt to be deferred without accrual of interest for 6 months. In the case of concessionary companies, and once the impact of COVID on their activity was justified, discounts were applied to occupancy and activity rates, as well as a reduction in penalties for minimum tra-ffic. Regarding the payment to suppliers, the processing procedures were streamlined to make the transfers in the shortest possible time.
4.-Give support to other administrations and institutions to help the population. They collaborated with the Ferrol Council and the Navy to provide shelter for homeless people in the Casa del Mar. During the first phase of the deconfinement, the circulation of vehicles at the entrance of the port was reorganized to make availa-ble to pedestrians down the road from the port on weekends. These actions have been positively valued by our stakeholders, with an average score of 6.89 points out of a maximum of 10.
INTERMODALITYRAILWAY CONNECTION OF THE OUTER PORT DOCK
Progress of the works contracted by the Port Autho-rity:
The construction project to be executed develops the infrastructure works, platform, superstructure and rai-lway and non-railway facilities, of a section of 6,374.5 m in length, in a single track, exclusively for freight tra-ffic and a suitable platform for circulation in Iberian and metric width. The two main elements of the access are a 5,575 m long tunnel and a 299 m viaduct over the RíaAs of December 31, 2020, 4,176 meters of tunnel exca-vation had been carried out in advance from the west mouth of the Outer Port. Also noteworthy in the year was the start of the work on the eastern opening of the tunnel, which enabled the excavation of the tunnel from its eastern mouth to begin at the beginning of 2021.
Throughout the year we have scrupulously continued to monitor and control compliance with the actions appro-ved in the project's environmental impact statement, in the areas: Atmosphere, noise and vibrations, geology
and soils, hydrology, vegetation, fauna, landscape, cul-tural heritage and population. Further information on the measures and their corresponding monitoring can be consulted in the "Our relationship with society" sec-tion of this report.
Improvement in the connection by rail of the Port of Fe-rrol with the ADIF station in Ferrol:
In June 2020, the Railway Infrastructure Administrator (ADIF in its Spanish acronym) awarded the drafting work of the project for the renewal of the access road to the Inland Port of Ferrol, for an amount of € 505,184.3.
This action will give continuity to the set of works ca-rried out by the Port Authority both for the improve-ment of the rail connection of its docks, and for the im-provement of the internal service in both facilities. The amount of these actions in the Investment Plan for the Ferrol-San Cibrao Port Authority 2021-2025 amounts to 107 million euros.
Noise control at the tunnel workTunnel mouth in Outer Port Tunnel mouth in A Graña

04Governmentof the PORTAUTHORITY
Winning photograph of the Photography
Contest "Port and city"
Photographer: Omar Lanazca Chamorro

1716
Government of the Port Authority Port Authority of Ferrol-San Cibrao, Annual Report 2020
President of the Port Authority of Ferrol-San CibraoIndalecio Joaquín Seijo Jordán
Maritime Captain of FerrolJorge Cao Ruíz
Director of the Port Authority of Ferrol-San CibraoAlejandro Rey Seoane
SecretaryAntonio López Coira (Head of the Legal Services and Labour Relations Area of the PAFSC)
Representative of the General State Antonio Duelo Menor (Admiral Chief of Ferrol Arsenal)
Representative of the General State AdministrationAdela Álvarez Caramés (State advocacy)
Representative of the General State AdministrationGonzalo Gómez Barquín (Head of the State Ports In-frastructure Projects Area)
Representative of the Xunta de GaliciaPablo Ramón Fernández Asensio (Territorial Head of the Department do Mar Province of Lugo)
Representative of the Xunta de GaliciaFabiola García Martínez (Social Policy Department)
Representative of the Xunta de GaliciaJavier Arias Fouz (Territorial Delegate of Xunta de Galicia in Lugo)
Representative of the Xunta de GaliciaMartina Aneiros Barros (Councilor of the City Council of Ferrol)
Representative of the City Council of FerrolÁngel Manuel Mato Esca-lona (Mayor of Ferrol)
Representative of the City Council of Xove Demetrio Salgueiro Rapa (Mayor of Xove)
Fishery Sector RepresentativeJavier Sánchez Fernández (Senior Patron of the Fisher-men's Association of San Cibrao)
Representative of business organisationsPatricio Erhardt Barrenechea (General Director of Mariti-me Terminals of Galicia)
Representative of trade union organisationsFrancisco José Pena Varela (President of the PAFSC organisation Committee)
MANAGEMENT BOARDOF THE PAFSC PORT AUTHORITY STAKEHOLDERS
All PAFSC’s stakeholders are represented on their governing body.
CLIENTPORT SECTOR
SOCIETY SUPPLIERSADMINISTRATIONAND PUBLIC BODIES
PARTNERS EMPLOYEESSERVICE OPERATORSAND FREIGHT TERMINALS
The complete information about PAFSC Government can be con-
sulted in the following (QR):

05OurSTRATEGY

Our Strategy
2120
Port Authority of Ferrol-San Cibrao, Annual Report 2020
THE DIVERSITY OF TRAFFIC
THROUGH OUR FACILITIES IMPACTS
THE ECONOMIC AND SOCIAL
DEVELOPMENT OF OUR REGION
To achieve the economic and social development of our region, it is essential to facilitate the mobility of both people and goods
CITY
LOGISTICS
“Transportation is essential for our economy and our society. Mobility is vital for the internal market and forthe quality of life that gives citizens the freedom to travel. Transport allows the growth of the economy and thecreation of jobs: it must be sustainable in the light of the new challenges we face.”
White Paper on Transport. European Commission.
WORLD TRADEIS DONE BY SEA
Tourism
Quality PORT Security Environment
Marine Transport
80%
Price Speed
Fishing Sport Activities
Mobility of people Goods Mobility
Commerce Industry HomeHostelry
TRANSPORT IS VITAL FOR PROSPERITY
21

Our Strategy Port Authority of Ferrol-San Cibrao, Annual Report 2020
MISSION: THE PAFSC ROADMAP
MAXIMUMCOMPETITIVENESS
Attracting key traffic customers andgreater hinterland
- Promoting commercial action - Boosting foreign investment
Expansion of infrastructures and services of the goods borderinspection center
PAFSC-Ministry of Health-Ministry of Agriculture, Fishe-ries and Foodministry of Finance OWN: 1,829,000
Joint actions with other administrations and business organizations to boost port traffic
PAFSC:
OWN: 27,317AeutransmerASIMEGOE-ASIMECOFER
Cluster of the Logistics Func-tion of Galicia FITP
Northwest Business InitiativeCLIACRUISE EUROPE
Building key customer loyalty
- Boosting external investment
Analysis of future scenarios for the Port of San CibraoALCOA-PAFSC (Domestic cost)
OUTSIDE: 52,001,000Improvement of the capacity and operations of the San Cibrao multipurpose terminal
Container Terminal in the Outer Port APFSC- YILPORT-FERROL CONTAINER TERMINAL (FCT) OWN: 1,821,000 OUTSIDE: 11,944,000
Strategic alliance to turn the Port of Ferrol into a benchmark in theprovisioning of LNG ships REGANOSA-PAFSC (Domestic cost)
OUTSIDE: 200,387,000
Joint analysis with Endesa about the business continuity strategyENDESA-PAFSC (Domestic cost)
OUTSIDE: 3,455,000 Terminal de graneles sólidos de Endesa en el Puerto Exterior
Endesa's solid bulk terminal in the Outer Port SOUTHERN ATLANTIC FOREST-PAFSC OUTSIDE: 19,000
Masol Liquid Bulk Terminal in the Outer Port MASOL-PAFSC OUTSIDE: 887,000
Having competitive prices Valuation update of PAFSC lands PAFSC OWN: 46,005
Improving the quality of the corporate image in the provision of services and procedures
Training and informative sessions on quality of services and processes PAFSC OWN: 4,590Monitoring and improvement of the quality of services provided to ships and merchandise PAFSC- Freight Terminals -Service Operators OWN:12,000
Improving the quality of port services including those provided by third parties
Improvements in facilities and machinery services provided by third parties Port Services Operators-PAFSC OWN: 2,364,000OUTSIDE: 4,565,000
Updating of the specifications for the provision of services PAFSC - Spanish State Ports (Own resources)
Reaching excellency in the management, maintenance and development of infrastructures and facilities
Updating and computerization of the inventory and inspection and mainte-nance guidelines for facilities and equipment, including those reversed PAFSC OWN:14,400
Sheltering areas, docks and surfaces PAFSC OWN: 35,066,000
CONNECTION WITH HINTERLAND Improving intermodality and logistics offerActively promoting the development of accesses and services to the port
Development of actions to provide the Port of Ferrol with competitive rail intermodality PAFSC OWN: 106,962,000
ECONOMIC AND SOCIALDEVELOPMENT OFTHE ENVIRONMENT
Obtaining the support of the environment and avoiding conflicts with other group
Improving the institutional image of the port
Alignment of the PAFSC strategy and management with the United NationsSustainable Development Goals and sustainability principles PAFSC OWN: 39,120
Energy efficiency PAFSC OWN:1,592,000
Accessibility Plan PAFSC OWN: 229,000 Construction of adequate facilities to provide service to certain traffic:passengers PAFSC OWN: 3,087,000
Reorganization of the lower road of the port and surrounding areas toincrease the walking and leisure areas of the population PAFSC OWN: 8,910,000
Formulation of the Special Management Plan for the Port of Ferrol PAFSC [Domestic cost]
Excellence in management to optimize a sustainable value offer Transition to the EFQM 2020 Model PAFSC OWN: 58,080
Managing the environment in a sustainable way
R.O.M. Quality of coastal waters. Purpose Proposed by PPEE (Ports of Spain) PAFSC [Domestic cost]Meteorological and oceanographic support system of the Port Authority (SAMOA 2) Spanish State Ports - PAFSC OWN: 141,075
LIFE DRAINRAIN project. Purification of runoff water on pavement PROYFE-PAFSC-CYE-CETIM-VIAS OUTSIDE: 1,431,147
Improving safety and protection in operations
Thermal cameras for temperature detection in the entrances to buildingsand dependencies of the Port Authority PAFSC OWN: 11,012
Improvements in access control systems-presence control-facialrecognition system with mask PAFSC OWN:13,359
Container Scanner in the Outer Port PAFSC OWN: 3,000,000
Agreement with Sasemar Spanish State Ports-SASEMAR-APFSC OWN: 494,000
Adapting the organization and staff to the strategic objectives and promoting cultural change
Implementation of remote working: remote access to the virtual desktopand videoconferences PAFSC OWN:17,490
Optimal and safe ICTSAdaptation to the national security scheme NSE PAFSC OWN: 80,000
Apps integration PAFSC [Domestic cost]
Mission: To contribute to a context of maximum port competitiveness to the economic and social develo-pment of its surroundings in a sustainable way, maximizing both port infrastructures and connection with its hinterland. Allowing further expansion of it and increasing the provision of value-added services to a growing variety of traffic.
INVESTMENTALLIANCEMISSION STRATEGY PROYECT
22 23

06OurSTRENGTHS

2726
Our strengths Port Authority of Ferrol-San Cibrao, Annual Report 2020
We have a dock outside the estuary, with 2,148 me-ters of berthing, 1,509 of them with 20 meters of draft, and a storage area of 660,297 m3 .
Inside the estuary, we have a large area of shelte-red water corresponding to docks and anchorages. This allows us to have a liquefied natural gas termi-nal, connected to the national network of natural gas, and shipyards, among the largest in Europe, which also allow the repair of large ships.
Our port also has a terminal for the traffic and sto-rage of fuels.
In San Cibrao, we have a multipurpose terminal, dedi-cated entirely to traffic for the production of alumina and aluminum.
PORT OF FERROL
PORT OF SAN CIBRAO
OUR OFFER OF SHELTERED WATER, DOCKS AND SURFACES STANDS OUT COMPARED TO THE
AVERAGE OF THE COMPETING PORTS
Puesto de control fronterizo del Puerto Exterior.
> MAXIMUM COMPETITIVENESS
FACILITIES
LAND SURFACE (m)
Total 3,425,626 1,954,698 3,482,369
Storage 873,630 951,934 1,345,936
QUAYS (m)
Total 14,418 11,640 13,752
Depth > 12 m 4,180 3,150 3,901
PAFSC AVERAGE IN SPAIN’S NORTHERN SEABOARD*
AVERAGE IN THE PORT SYSTEM*
Total 4,621 6,719 7,142
WATER SURFACE (ha)
Sheltered water surface 2,164 768 633
THE VALUE OFFER TO OUR STAKEHOLDERS
FACILITIESFreight terminals of the
port authorityPrivate freight terminals
SERVICESServices provided by
Port authorityServices provided byPrivate enterprises
PRIVATE INVESTMENT
PUBLIC INVESTMENT
REGULATION PORT AUTHORITY
CUSTOMER SATISFACTION INDEX (2020)
%78.22
OUR PORT WORKS TO IMPROVE ITS OFFER OF FACILITIES AND SERVICES,
TO FACILITATE GREATER MOBILITY OF PEOPLE AND GOODS, WITH THE HIGHEST STANDARDS OF QUALITY, SAFETY AND
ENVIRONMENT WITH COMPETITIVE
SPEED
SECURITY
QUALITY
PRICE
ENVIRONMENT
* Port system data: year 2019

2928
Our strengths Port Authority of Ferrol-San Cibrao, Annual Report 2020
20 m Depth
6-14 m Depth
14 m Depth
ARESMUGARDOS
FERROL
FENE
NARÓN
Endesa Generación, S.A. dry bulk terminal
Regasificadora del Noroeste, S.A. Liquefied natural gas (LNG) terminal
Fishing dock
Connection with conventional railway network (work in progress)
Masol Ibérica Biofuel, S.L. liquid bulk terminalNavantia S.A. shipyard High capacity motorway connection
Ferrol Container Terminal, S.A. container terminal
Forestal del Atlántico, S.A. liquid bulk terminal
Nautical sports
Public areas outside the port area
Public areas outside the port areaRoad connection with high capacity motorway
Other terminalsOther terminals
Connection with conventional railway network
Road connection with high capacity motorway
MAP OF THE PORT OF FERROL. Port facilities and terminals.
INNER HARBOUR 11,632 m QUAY 1,917,209 m SURFACE
> MAXIMUM COMPETITIVENESS
OUTER HARBOUR 2,148 m QUAY 1,112,303 m SURFACE
The complete information on the facilities of the
Port, can be consulted in the following (QR):
(Work in progress)

31
Our strengths Port Authority of Ferrol-San Cibrao, Annual Report 2020
MAP OF THE PORT OF SAN CIBRAO. Port facilities and terminals.
> MAXIMUM COMPETITIVENESS
14-17 m Depth
Alcoa multipurpose terminal
XOVE
CERVO
HARBOUR 738 m QUAY 396,114 m SURFACE SERVICES
Our Port Authority provides a wide variety of services, with many means and resources. In the case of services provided by private com-panies, the conditions of provision are regula-ted by the Port Authority.
CONDITIONS REGULATED BY THE PORT AUTHORITY
• SERVICES
• TRAINING
• FEES
• HUMAN RESOURCES
• QUALITY
• SECURITY
• ENVIRONMENT
• FACILITIES AND EQUIPMENT
SERVICES PROVIDED
GENERALSERVICES
MARITIMESIGNALING
SERVICES OF THE COAST
PORT SERVICESLICENSED BY
THE PORT AUTHORITY
COMMERCIALSERVICES UNDERAUTHORIZATION
OF THE PORTAUTHORITY
Provided by the Port AuthorityProvided by private companiesRegulated by the Port Authority
Consignment
Ship provisioningfrom floating mediaor trucks
Ship provisionists
Shipyards and naval repair facilities
Reception services for ship-generated waste. Port Marpol I-IV-V
Passenger services
Technical nautical services
Pilotage Mooring Towing
Goods services
Stowage
Control, coordination andorder of port traffic
Control and coordination of other services
Inland maritime signalingand access of the ship to the port
Policing of common areas
Lighting of common areas
Cleaning of common areas
Emergency prevention and control
The contractual conditions established, as well as the applicable rates, can be consulted on our website and
at the port system services observatory. (QR)
Bauxite unloading in San Cibrao
Gisweb app enables users to know the current, historical and forecast status of ships, through any mobile device.
30

3332
Our strengths Port Authority of Ferrol-San Cibrao, Annual Report 2020
Gassing-ipand Cooling-downGoods fee 40%Ship fee 0% - 20%
GNL for BunkeringGoods fee 40%
PORT AUTHORITY´S PRICE QUOTATION
MANAGEMENT SYSTEMS IMPLEMENTED IN THE PORT
Management systems and external recognition help us improving our offer, incorporating it into our strategy and giving it continuity in the long term.
Our billing per service unit, in relation to port fees, is very competitive in the main
services.
Port Authority 1.10 1.00 0.80
GENERAL OFFERCorrection coefficient to apply to the base rate (year 2020)
Average in Spain’s Northern Seaboard
1.17 1.13 1.00
Average in the Port System 1.14 1.13 1.02
OUR POSITION
We prepare our annual rate offer based on our results as well as our planning for the next 5 years. Our economic solvency allows us to make a competitive price offer
OFFER FOR CERTAIN TRAFFICS (% BONUS)The details of our rates and fees can be consulted on our website.
Ship fee 40% Passenger’s fee 40%
Goods fee0 - 20%
STEELPRODUCTS
Goods fee20 - 35%
Goods fee0 - 10%
WOOD FUEL-GAS OILFOR BUNKER
Goods fee0 - 30%
• Quality management system ISO 9001
• Environment management system ISO 14001-emas
• Safety management system OSHAS 18001
• Certification in specific quality references approved by the Port Authority
• Environmental agreements signed with the Port Authority
• Self-protection plans
• Inner marine plan
• Management sustainability
• Verified GRI memory
OUR POSITIONINGQUALITY ENVIRONMENT SECURITY EXCELLENCE SPECIFIC
REFERENCESAPPROVED
CERTIFIED TERMINALS IN REFERENTIALS
SUSTAINABILITY RECORD
Port Authority ISO 9001 ISO 14001Not
certified
EFQM 500+
Specific references
for bulk goods and general merchandise
2 TERMINALS
Verified sustainability reports GRI exhausting
option
Ports in the northern spainseaboard 10 port authorities,including PAFSC*
9 10 8 3 7 35 1
Port system28 port authorities,including PAFSC*
25 28 17 5 17 86 1
Goods feeShip fee Passengers’ fee
> MAXIMUM COMPETITIVENESS > MAXIMUM COMPETITIVENESS
Goods fee0 - 10%
CONTAINERSCRUISE SHIPS COAL BIODIESEL
Ship fee 40% Passenger’s fee 40%Occupancy rate 30%
WIND PRODUCTS
Goods fee15 - 32%
0.196
OUR POSITIONING
BILLING PER SERVICEUNIT (Year 2020)
Port Authority(Year 2020)
Ship fee( /GT)
(Year 2019)Average in the portsystem 0.102
0.374
Goods fee ( /t)
0.464
0.485
Passengers’ fee/passenger)
2.151
2.292
Rate of occupancy ( /m2)
7.02
(
*Data from Sustainability Report port system: 2018. GRI models published in GRI’s Sustainability Disclosure Database” Verified memories (year 2019)
Port Authority
• Quality management system ISO 9001
• Environmental management system ISO 14001
• Security management system
• Self-protection plans
• Inner Maritime Plan
• Specific quality referential approved for goods terminals
• European seal of excellence of 500+EFQM
• Sustainability in the organisational management Stakeholder of GRI
• Integral scorecard
• Verified GRI memory
NATURAL GAS
Goods fee
0 - 10%
• Management system ISO 9001
• Environment management system ISO 14001-EMAS
• Safety management system OSHAS 18001
Private suppliers of
services
Safety management
system
For more information, see the following code (QR):

3534
Our strengths Port Authority of Ferrol-San Cibrao, Annual Report 2020
CONNECTION WITH HINTERLANDINTERMODALITY
ROAD AND RAIL CONNECTIONS MAP
PORT OFFERROL
PORT OFSAN CIBRAO
Palma de Mallorca
PO
RT
UG
AL
F R A N C I A
M A R R U E C O S
High speed lineConventional lineNarrow gauge line
RAILWAYS
HIGHWAY AND MOTORWAYS
SCALE Kilometers0 56 130
OviedoSan SebastiánSantander Bilbao
Vitoria
Logroño
SoriaZaragoza
Lleida
Tarragona
Castellón
Valencia
Alicante
Murcia
AlmeríaMálaga
Cádiz
Ceuta
Melilla
Granada
Jaén
Córdoba
Badajoz
CaceresToledo
Ciudad RealAlbacete
Cuenca
GuadalajaraMadrid-Ch.
Madrid-Atocha
Sevilla
Huelva
Barcelona
Girona
FigueresHuesca
Teruel
Burgos
Palencia
Valladolid
León
Zamora
SalamancaÁvila
PamplonaLugo
Sanabria
A Coruña
Pontevedra Ourense
Segovia
Main road traffic network
E803
E5
E15
E5
E15
E15
E15
E-70
E1
E5
A-6
E-70
A-6
A-6
E5
E5
AG-64
Fonts: http://www.adif.es y https://www.mitma.gob.es
All our terminals are connected to high capacity roads. In 2020 we moved a total of 2,563,174 t by road.
Our internal dock has a direct connection to the conventional national rail network, which is 4 km away from an intermodal facility that has a 4,000 m2 railroad track and a vial of 1,500 m2 of surface.
ROAD TYPE BILBAO MADRID LISBOA BARCELONA ALGECIRAS PARÍS
FERROLHighway
Motorway
521 km 506 km 629.5 km 1,098.8 km 1,112.6 km 1,433 km
SAN CIBRAO 436 km 570 km 706 km 1,042 km 1,081 km 1,349 km
FERROL
RAILWAY
CONVENTIONAL ROAD
ROAD TYPE

3736
Our strengths Port Authority of Ferrol-San Cibrao, Annual Report 2020
ECONOMIC AND SOCIAL DEVELOPMENT OF THE AREAECONOMIC SECTORS SERVEDThe growth in the passage of goods and passengers through our facilities is continuous over time. This has allowed us to increase our share in the Spanish and regional port sector.
2015 2016 2017 2018 2019 2020 2021 2022 2023 2024 2025
16,000
12,000
8,000
4,000
0
151413
11109
765
321
FORECAST
Total Solid bulk Liquid bulk General goods
GOODS EVOLUTION AND FORECASTThe figures for 2021 onwards correspond to forecasts subject to change
TRAFFIC FEES
2.21% 31.63%
YEAR 2006
1.95%
YEAR 2020
AP fee%Port System
AP% fee Spain’sNorthern Seaboard
AP% feeGalician Ports
9.40% 11.50% 35.29%
ENERGY IRON AND STEEL OTHER GOODS CHEMICALPRODUCTS
CONSTRUCTIONMATERIALS
22.65%2,269,768 t
AGRIBUSINESSAND FOOD
FERTILIZERS
3.54%354,281 t
NON-METALMATERIALS
0.08%8,077 t
0.23%22,963 t
50%5,048,630 t
3.93%393,463 t
16.52%1,654,927 t
2.41%241,249 t
TOTAL TRAFFIC 10,020,719 t
(Data from 2020)
ECONOMIC SECTORS
Ships in operation in the inner harbour
2016 2017 2018 2019 2020
40
30
20
10
0
100
90
80
70
60
50
%
96.61
12.38
2 2.8 3.21 1.65 0.52
11.57 10.64 9.3 8.18
87.63 84.44
100.26 114.26
Operating expenses/Operating income
Debt ratio Return on assets
2016 2017 2018 2019 2020
20
15
10
5
0Thousands
of euros
Net amountturnover of PAFSC
Cash Flow Result of the exercise
OUR ECONOMIC AND FINANCIAL SOLVENCY ALLOWS US TO MAINTAIN THE VALUE OFFER TO OUR STAKEHOLDERS
The traffic details are available in
the QR:

39
Our strengths Port Authority of Ferrol-San Cibrao, Annual Report 2020
COUNTRY
PORT OFDE FERROL
PORT OFSAN CIBRAO
ALCOA|Xove - Cervo|
VESTAS
MEGASA |Narón|
|Mugardos|
REGASIFICADORADEL NOROESTE
NAVANTIAMADERASDEL NOROESTE|Ferrol| |Ferrol-Fene|
|Viveiro|
RENEWABLEENERGIES
CARGAS
USERSSHIP REPAIR
MASOL IBERIA|Puerto Exterior|
FORESTALDEL ATLÁNTICO|Mugardos|
CONSTRUCTIONFUELS
We facilitate the import and export of goods, and the sale of services to the main companies of our area: Alcoa, Regasificadora del Noroeste , Masol Iberia, Forestal del Atlántico, Megasa, Vestas, Navantia, etc.
4,538,833
INDONESIA 195,725
NETHERLAND 542,970
PORTUGAL 265,265
NORUEGA 542,282
UK 297,705
RUSSIA 770,120
NIGERIA 128,069
FRANCE 277,288
BELGIUM 245,350
SWEDEN 213,531
SINGAPUR 32,628
ROMANIA 39,134
GHANA 86,921
Tons per country
MOROCCO 45,506
IRELAND 66,468
UKRAINE 66,844
EQUATORIAL GUINEA 95,497
OTHER COUNTRIES 288,506
TOTAL 10,020,719
GUINEA-CONAKRI
487,323USA
351,393TRINIDAD AND TOBAGO
SPAIN 300,830
FINLAND 74,219
LATVIA 34,863
Maritime transport of goods
INDONESIA
SINGAPUR
RUSSIA
FRANCE
SPAIN
NIGERIA
IRELAND
FINLANDSWEDEN
MOROCCO
GUINEA CONAKRITRINIDAD AND TOBAGO
USA
GHANA
ECUATORIAL GUINEA
LATVIA
NETHERLAND
PORTUGAL
UK
BELGIUM
NORWAY
WORLD MAP. A connected economy between our region and the world
WE CONNECT THE ECONOMY OF OUR REGION WITH THE REST OF THE WORLD
38 39
ECONOMIC AND SOCIALDEVELOPMENT OF THE AREA
For more information on the countries of origin and destination of our goods you can
use the code (QR):

4140
Our strengths Port Authority of Ferrol-San Cibrao, Annual Report 2020
PERCENTAGE OF EVENTUAL OVER TOTAL EMPLOYEES
9.82% 16.20%
PERCENTAGE OF WOMEN OVER TOTAL EMPLOYEES
24.11% 27.53%
PORCENTAGE OF PERMANENT EMPLOYEES OVER AGE 50 YEARS
33.93% 49%
AVERAGE OF THEPORT
SYSTEM (2018)
PAFSC
OUR POSITIONING IN THE HUMAN RESOURCES MANAGEMENT:
EVOLUTION OF MAIN INDICATORS:
ECONOMIC AND SOCIALDEVELOPMENT OF THE AREASTAFFOur staff is the key to our success in developing the strategy of our Port. We improve our offer of services with trained and well-prepared personnel, seeking their personal motivation and satisfac-tion.
2016 2017 2018 2019 2020
40
30
20
10
0%
2016 2017 2018 2019 2020
28.67
16.63 14.57 14.25
72.46
2016 2017 2018 2019 2020
Annualaccidentseverityindex(SG)
Numberof days lostper thousandhours worked
0.28
2.742.060.87 0.67
Percentage of permanent workers over age 50 years
Annual accident frequency index (FI)
Number of accidents with leave for every million hours worked
21.97
15.69
6.8511.85
9.05
Our customers, freight terminals, service opera-tors and partners place our staff at the head of the highest scoring questions in the annual satisfac-tion survey. In the 2020 we once again checked the professional and human quality of our team, which taught us a lesson in professionalism and involvement with its response to the pandemic.
OUR BEST VALUE: OUR STAFF
OUR RELATIONSHIP WITH SOCIETY
%68.47 STAFF SATISFACTION INDEX YEAR 2020
Pedestrian walkway from La Cabana to the entrance of the port
Pedestrian walkway attached to the railway access viaduct, of about 620 m, will allow citizens a path that goes around the Ensenada de A Malata | 1,250 thousands of Euros.
WE INVEST IN GENERATING SPACES FOR THE USE PF CITIZENSIn order to create spaces of great value in the surroundings of the maritime-land line, which allow citizens to develop sports and leisure activities, we have continued with the actions framed in the strategic line of integration with the environment as well as we have planned the following actions for the coming years (in-vestment plan 2021-2025):
In a stage of restriction of the mobility of citizens for health reasons, we are aware of the need to increase the availability of greater pedestrianized areas in confined urban centers. Therefore in 2020 there were cuts in the circulation of vehicles in the vicinity of the access to the Malata promenade and the Curuxeiras Dock. In addition, the required projects were carried out to improve the pedestrianization of the area as well as to provide elements to brings benefits to citizens.
WE CREATE LINKS WITH OUR YOUNG PEOPLE TO EXCHANGE KNOWLEDGE ABOUT THE IMPACT OF THE PORT'S ACTIVITY ON THEIR LIVES
After the impasse of the activities that we organised to bring new generations closer to our reality, promo-ting socio-cultural activities, with the help of the Neighbours Association for Ferrol we have organized in the spring of 2021 the I Photography Contest "Puerto y Ciudad”.
We are very grateful to all the participants for their contribution to this activity, giving us a different vision of who we are and what we do.
Refurbishment of the customs building
The old customs building recoveryas | 600 thousands of Euros
Refurbishment of the PAFSC office building
Comprehensive refurbishment of the Port of Ferrol Marina Command building and refur-bishment of the A.P. building. Both buildings will house the offices of the Port Authority | 2,979 thousands of Euros
TOTAL INVESTMENT:12,729
thousands of Euros
The PAFSC intends to undertake a remodeling of the port's con-tact area with the city of Ferrol, aimed at its integration and hu-manization.
Phase 1 - Reorganization of the lower road of the port and main street. Project that seeks to reor-
der the uses of the lower road of the Port and the main street of the Inner Port (road, rail, par-king areas, storage, etc.), as well as completely renew its servi-ces and pavement |7,900 thou-sands of Euros
Previous study for the Humanization of the contact area between the port and the city of Ferrol

4342
Our strengths Port Authority of Ferrol-San Cibrao, Annual Report 2020
Executed bythe Miño-SilHydrographicConfederation
Ongoing Projectby the P.A.F.S.C.
Executedby the P.A.F.S.C., disaffected andtransferredto Costas
Executed by theP.A.F.S.C. andin process ofdeclassification
Executed by theP.A.F.S.C.
Executed bythe P.A.F.S.C.
Executed bythe P.A.F.S.C.and later assignedto the Ferrol Concello
Project bythe P.A.F.S.C.
Project bythe P.A.F.S.C.
OUR RELATIONSHIP WITH SOCIETY
WE PROVIDE SPACES FOR CITIZEN USE

4544
Our strengths Port Authority of Ferrol-San Cibrao, Annual Report 2020
OUR RELATIONSHIP WITH SOCIETYTHE RAIL CONNECTION TO THE OUTER PORT
The focus of the Port Authority actions is to maximize our contribution to society, as we are key to enhancing the wealth and prospe-rity of our region.
A large part of our efforts in recent years and near future is focused on providing our port facilities with the best land connectivity, thus promoting a more efficient mobility of goods in economic, safety and environmen-tal terms.
This action aims at generating the following long-term positive effects:
Safety and health benefit
(accident reduction)
0.54 million €/year
Increase in the net added value
237 million euros
BENEFIT ENVIRONMENTAL(noise, direct emissions and climate change)
3.7 million €/year
Increase in goods traffic in the long run
9.77 million of tons
Employment growth
4,521 people
RAIL ACCESS TO THE OUTER PORT
On the other hand, analytical controls have been carried out at the discharge point of the existing wastewater treatment plant in the works area of the West Emboquille of the Brión Tunnel, as well as in the receiving environment.
We have also been maintained the monitoring work by seis-mographs of the incidence of vibrations introduced into the ground by the blasting associated with the excavation of the tunnel. In addition, se han realizado noise and vibration me-asurements have been carried out in the nearest houses. In November 2020, an acoustic study was carried out in one of the houses in the town of Cariño closest to the Brión Tunnel in order to find out what the insulating behavior of the natural ground between the house and the tunnel is, and thus be able to evaluate, the possible conditions that could occur in the same during the infrastructure operating phase.
Efforts continue in the monitoring of flows and levels in springs and wells throughout the Brión massif, as well as the level readings in those wells that are accessible from the geo-technical campaigns carried out.
The works related to the Railway Access to the External Port are subject to an archaeological control plan, authorized by the Archaeological Heritage Directorate General, due to the need to carry out geotechnical research probes in the Brión mountains in areas close to six burial mounds. The work, ca-rried out in 2020, has been completed without any impact on the protected elements.
Finally, one of the major effects on third parties that the exe-cution of the Brión tunnel can cause is damage to the struc-tures and houses located in the vicinity of the tunnel, which are the Cariño and A Graña important components. In Cariño, a monitoring was carried out of the wall that supports the embankment that served to generate the esplanade where the Outer Port Access control is located. In the nucleus of A Graña, the following auscultation has been carried out with placement of prisms to control movements in XYZ in facades of houses and retaining wall of the park. The main idea of this is to control by an automated station, as well as placement of leveling milestones on the Vello Road from A Graña and Rúa Alta, on the ground and on the facades of some houses.
In the Access tunnel to the A Graña Naval Base, in addition to reinforcing its structure, a continuous monitoring system has been installed that allows early detection and monitoring of any condition to this structure during the excavation of the Brión Tunnel.
ENVIR. VARIABLES
IMPLEMENTING MEASURES IN CONSTRUCTION PROJECTS
CONDITIONING ENVIRONMENTAL FACTORS COORD./ADMIN. BODY
ATMOSPHERE
Periodic watering to minimize dust
Tuning and speed limitation of vehicles
Transport of covered materials
NOISE ANDVIBRATION
Acoustic screens
Study of noise andvibration detail
Dpt. Quality and Environmental and Natural Environment Assessment (Ministry of Agriculture, Food &Env)
Blankets under ballast
Restrictions on work schedules. No night jobs
GEOLOGY/ SOIL
Reuse of leftover materials in the work
Nature conservation departmentof environment, territory and
infrastructure (Xunta de Galicia)
Quarries in operation / abandonedStudy of loans and
landfillsDeep viaduct foundation
Location of zia in port esplanade
HYDROLOGY
Viaduct design (5 batteries max)Hydrogeological study
Galician Water Department andEnv. & Territory & Infrastructure
(Xunta de Galicia)
Tunnel design (waterproofing
Setteling raft (zias & tunnel)wáter treatment Maritime land / hydraulic
public domainWater analysis in sedimentation traps
(during viaduct works)
VEGETATION
Plant restoration project / treatment of pitheads
Nature Conservation Departmentof Environment, Territory and
Infrastructure (Xunta de Galicia)Vegetation protection plan Study of habitats
Fire prevention and extinction plan
FAUNA
Control by larval cultivation control plot taught to A malata (before, during and after
the viaduct works)Works calendar (blasting,clearing, noisy operations)
Nature Conservation Department of Environment, Territory and Infrastructure;
Fishermen’s associations and A Graña biological station
(Xunta de Galicia)
Construction process of the viaduct(by means of pontoons and tabbed enc.)
Anti-pollution barriers
LANDSCAPE
Environmental and landscape integration project
Pithead treatment of tunnels, dumps, channels
Conditioning of the seafront/promenade
Boardwalk Conditioning
CULTURALHERITAGE
Design of ventilation ducts and emergency exits Study of cultural heritage
Archaelogical survey
Cultural Heritage Department ofCulture, Education and University
Planning (Xunta de Galicia)Archaeological control of the works
POPULATIONReplacement of affected services
Territorial permeability (308-2), (413-1), (413-2)
(308-2), (413-1), (413-2), (304-2)
Derived from the execution of the works, and as part of the environmental impact statement formulated by the Secretary of State for the Environment (the main actions of which are detailed on page 45) the Port Authority will allocate approximately 867 thousand euros to control these actions and for the coordination of safety and health.
The work started in 2018 for the regenera-tion of the school of shellfish of A Graña and A Malata continues in operation, which will contribute to improving the current si-tuation in these areas. Throughout this year, we have been maintained the preoperatio-nal characterization works carried out in the waters of Ensenada de A Malata and Ense-nada de Cariño, in collaboration with the Mariña de A Graña Biology Station.
Expand information (QR):

DIRECTOR
Alejandro Rey Seoane
Engineer of roads, canals and portsMaster in Port Engineering and Management
HEAD OF INFRASTRUCTURE DEPARTMENT
Jesús Busto Míguez
Engineer of roads, canals and ports
HEAD OF ECONOMIC-FINANCIAL AREA
Manuel Vázquez Faraldo
Degree in Economics and Business Administration
HEAD OF LEGAL SERVICES AND LABOR RELATIONS AREA
Antonio López CoiraDegree in LawMaster in Human Resources Management
HEAD OF OPERATION DEPARTMENT
Javier Calviño Gómez
Engineer of roads, canals and portsMaster's Degree in Executive Business Management Master in Maritime Administration and Port Management
HEAD OF MAINTENANCE AND NAVIGATION AIDS DEPARTMENT:
Gervasio Dopico Martínez
Technical engineer in public works
HEAD OF SUSTAINABILITY AND MANAGEMENT SYSTEMS DEPARTMENT:
Débora Acea Escrich
Degree in Economics and Business SciencesMaster in Business Auditing
HEAD OF COMMERCIAL AND DEVELOPMENT DEPARTMENT:
Julio Hernández Sanmamed
Engineer of roads, canals and portsMaster in Maritime and Port Management
EXECUTIVE TEAM
OurMANAGEMENT

4948
Our management Port Authority of Ferrol-San Cibrao, Annual Report 2020
STAKEHOLDERS OF PORT AUTHORITY
VALUE OFFERED TO OUR STAKEHOLDERS
Competitive port offer:time, cost, quality, security
Obtaining Synergies
Business Opportunities
(Autonomic, State, International)
Coordination of actionsand obtaining synergies
Labour Stability
Equal Opportunities
Career Development
Economic Development
Respect for the environment
Support to social initiatives
Transparency in hiring
Short-term payments
Coordination & Collaboration in actions
CLIENTS SERVICEOPERATORS & PARTNERS
GOODS TERMINALS
PORT SECTOR
EMPLOYEES
SOCIETY
SUPPLIERS
ADMIN. ANDPUBLIC BODIES
SATISFACTION OF STAKEHOLDERSCLIENTS, SERVICE OPERATORS AND FREIGHTS TERMINALS, PARTNERSHIPS
• Communication
• Image
• Commercial policy
• Price
• Logistic & telematic services
• General services
SATISFACTION INDEX (%)
ASSESSED ASPECTS OF THE VALUE OFFER
• Admin processes
• Security
• Environment
• Staff characteristics
Quality ofmanagement
• Quality of infrastructures
• Conservation & cleaning
• Land communications
Quality ofinfraestructure
• Quality of services
• Price of services
Services provided by port operators (consignment, stowage, towing,etc.)
Client’s satisfaction index
Satisfaction index with General Aspects
Satisfaction index with quality factors
Satisfaction index with factors of Quality in Price and Service
Satisfaction index with Quality of infrastructures
Satisfaction index with services provided by third-party entities
GOAL2016 2017 2018 2019 2020
82
78
74
70
66
151413
11109
765
321
General aspects
Price quality &
service

5150
Our management Port Authority of Ferrol-San Cibrao, Annual Report 2020
EMPLOYEES
• Functions
• Objectives
• Ethics
• Promotion of values
• Promotion of teamwork
• Teamwork
• Promotion of creativy and initiative
• Participation in processes, objetives, etc..
• Working environment
• Personal relations
• Performance assessment
• Recognition
• Professional careers
• Competence profiles
• Training plans
• Quality of training
• Information to disseminate
• Communication channels
• Rumours
• Communication among departments
• Flexible schedule
• Conciliation
• Working equipment
• Safety
• Equality
Training
Communication
Working conditions
Leadership
Participation
Motivation
Staff’s satisfaction level
Satisfaction level of Agreement Staff
Satisfaction level of out-of-agreement staff
META
2016 2017 2018 2019 2020
Satisfaction Level with Leadership
Satisfaction Level with Training
Satisfaction Level with Participation
Satisfaction Level with Communication
Satisfaction Level with Motivation
Satisfaction Level with Working Conditions
GOAL
80
70
60
50
90
70
50
30
40
60
80
2016 2017 2018 2019 2020
SATISFACTION INDEX BYPERSONAL TYPE (%)
SATISFACTION INDEX BYEVALUATED ASPECT (%)
SATISFACTION INDEXES OF DIFFERENT ASPECTS OF SUPPLIERS (%)
SUPPLIERS
• Most used publishing medium
• Rating
• Offers reception
• Award terms
• Contract signing deadlines
• Rectification procedures
• Legislation
• Scope of works
• Technical requirements
• Procedures
• People to turn to
Clarity in hiringconditions
• Certificate issuance term
• Invoice processing
• Payment terms
• Work completion certificates
Execution ofworks and billing
Hiringprocedures
Publicity ofoffer request
Suppliers’ satisfaction index
Satisfaction of suppliers with advertising of offers
Suppliers’ satisfaction. Clarity in hiring conditions
Suppliers’ satisfaction. Contracting procedures
Suppliers’ satisfaction. Execution and collection
GOAL
2017 2018 2019 2020
100
80
60
50
40
60
80
ASSESSED ASPECTS OF THE VALUE OFFER ASSESSED ASPECTS OF THE VALUE OFFER

5352
Our management Port Authority of Ferrol-San Cibrao, Annual Report 2020
SOCIETY (Expectations of all stakeholders)
In the year 2021 we have taken into consideration the 2021 Business Plan that seeks to improve the determination of the key interest groups of the PAFSC, as well as in the increase of their participation in the definition of those topics that they consider essential. They are added later into the Port Authority's strategy and processes, so that we can guarantee the best performance in our value offer to each stakeholder. In addition, with the collaboration of Ernst & Young, work is being carried out on the “Alignment of strategy and management with the United Nations Sustainable Deve-lopment Goals (SDGS) and sustainability principles."
The work includes materiality surveys of all PAFSC stakeholders, as well as personal interviews with key stakeholders.
Define and implement theStrategy that guaranteesLong-term efficacy
Define and implement strategy
To efficiently assignThe required resources
Evaluate, review & innovate
We allocate our resources
Develop processes
On pursuing our strategy
Meet strategic objectives
STAGES IN THE CONSTRUCTION OF A COMPETITIVEVALUE OFFER
COMPLAINTS, INITIATIVES AND SUGGESTIONS
In 2020, no complaint, initiative or suggestion was received through the manage-ment system.
INTERNAL AND EXTERNAL ANALYSIS STRATEGY OF THE PORT AUTHORITY OF FERROL-SAN CIBRAO
SECTOR ANALYSIS
MONITORING OF MANAGEMENT SYSTEM
INTERNATIONAL TRENDS OF COMMERCE AND TRANSPORT
GOAL TRACKING
• Surveys of all stakeholders, of opinion on sustainability performance
• Surveys on service quality
• Personnel surveys
• Surveys to suppliers
• Complaints, suggestions and claims
• Meetings with President and Director of PAFSC
• Visits of the Commercial and Development Department
• Events in which the different stakeholders participate
• International Maritime Organization
• PIANC ”The World Association for Waterborne Transport Infrastructure”
• European Commission
• European Sea Port Organization
• Eurostat
• Spain’s State Ports
• Indicator tracking
• Follow-up of improvement actions: Action Plan
• Review of the management system
• Risks evaluation - Inspections of all processes
• Internal audits
• External audits
• Annual report
• World Trade Organization
• United Nations Conference on Trade and Development
• Organization for Economic Cooperation and Development
• World Economic Forum
• World Bank
• Quarterly monitoring of objectives
• Annual audit
• White Paper of the European Union: Roadmap to a single European transport area: for a competitive and sustainable transport policy
• Ports and Merchant Marine Law
• Law on transparency of access to public information
• Sustainable Economy Law
• Public Sector Contract Law
• Prevention law of occupational hazards
• Environmental legislation
• Criteria evaluated:
• Leadership
• Strategy
• People
• Alliances and resources
• Processes, products and services
• Results in clients
• Results in people
• Results in society
• Key results
OPINION OF INTEREST GROUPS
PARTICIPATION OF INTEREST GROUPS IN THE STRATEGIC FORMULATION AND IN EVERY PROCESS
EXTERNAL ANALYSIS
INTERNAL ANALYSIS
INTERNATIONAL, EUROPEAN, NATIONAL, REGIONAL & LOCAL STANDARDS
SELF-ASSESSMENT AND EXTERNAL EVALUATION IN EFQM MODEL FOR EXCELLENT MANAGEMENT
• Planning process
• Process of satisfaction of interest groups
• Human resources organization and management process
• Evaluation, review and innovation process
• Process of concessions and authorizations
• Process of management, coordination and control of traffic and services
• Process of services provided by private companies
• Investment and conservation process
• Information and communication technology process
• Environmental management process

54
Our management Port Authority of Ferrol-San Cibrao, Annual Report 2020
STRATEGY DEPLOYMENT THROUGH PROCESSESSSTRATEGIC MAP OF PORT AUTHORITY OF FERROL-SAN CIBRAO
GROWTH & OUTER PORTECONOMIC
SELF-SUFFIENCYOPERATIONAL EXCELLENCE AP MISSION
INFRASTRUCTURE OPTIMIZATION
INTEGRATION WITH ENVIRONMENT
E1Increasingbusinessvolume
E3Maintaining
Port’sprofitability
E5Maintaining
the profitabilityof investmentsE2
Generating revenuefrom concessions
E4Generating cashflow toreduce indebtednessF
INA
NC
IAL
BUSINESS CLIENTS ENVIRONMENT
C1Attracting customers from key traffic and greater hinterland
C2Retaining key custo-
mersC6
Getting the support
of the environment
and avoiding conflicts
with other groups
VALUE PROPOSAL
C3Improving image in quality services and
procedures
C4Offer compe-titive prices
C5Improving in inter-moda-
lity & logistics offer
CL
IEN
TS
P1Promoting commercial
actionlP2
Improving the quality of
port services including
those provided by third
P3Imp.
Structure of costs
P5Actively
promoting the developmentof land access
and port services
P7Being excellent in the manage-
ment,maintenance and develop-
ment ofinfrastructure
and facilities
P8Improvingsafety and
protection inoperations
P9Improving theinstitutional
imageof the Port
P4Boosting foreign
investment
P6Efficiently
manage port commissioning
exterior
P10
Managing in anenvironmentallysustainable way
PR
OC
ES
SE
S
R1Adapting the organization and staff to the strategic objectives and promoting
R2Developping
and training staff
R3Improving information
systems and management
R4Boosting the concept
of port community
RE
SO
UR
CE
SS
TA
KE
HO
LD
ER
S
Planning Stakeholders satisfactionOrganisation and manage-ment of human resources
Evaluation, review and innovation
Concessions and authorizations
Maritime navigation aidsManagement, coordination and control of traffic and services
Services provided byprivate companies
Infrastructure and facilities management
Information andcommunication technologies
Environmental managementSecurity and protection
management
PROCESS MAP OF THE PORT AUTHORITY OF FERROL-SAN CIBRAO
OPERATIONAL processes
support PROCESSES
STRATEGIC processes
PUBLIC DOMAIN & SERVICES MANAGEMENT
PUBLIC DOMAIN SERVICES
Key processes With own management system, neither integrated nor certified nor developed in accordance with ISO
EVALUATION, REVIEW AND INNOVATIONKEY INDICATORS OF PROCESS AND STRATEGY MONITORING
55
STRATEGIC GOAL/ PROCESS TITLE INDICATORS UNITS
2019 2020
TOTAL YEAR TOTAL YEAR GOAL
E1 / PE1 Net amount of PAFSC turnover (thousands of euros) Thousands of Euros 17,528.00 15,212.00 14,286.00 E2 / PO1 Income from occupancy and activity rates with respect to the net amount of turnover (%) % 39.06 43.9 46.31
E3 / PE1Result for the year Thousands of Euros 3,220 1,148.00 -130
Return on assets % 1.65 0.51 -0.21
E4 / PE1Cash Flow (Thousands of euros) Thousands of Euros 8,676.00 6,153.00 4,802.00 Debt ratio (%) % 9.3 8.18 8.1
C1 / PE1
Freight traffic Tons 11,183,384.00 10,034,625 9,230,000.00
Ship traffic No. of ships 1,086.00 1,002 826.00
Number of containers (TEUS) TEUS 8,277.00 12,472.75 25,330.00
C2 / PE1
Coal traffic tn 2,162,592.00 7,699.09 80,000.00 Natural gas traffic tn 902,826.00 1,454,336.81 1,178,000.00 Bauxite traffic tn 3,966,686.00 4,595,796 3,966,686.00 Fuel oil traffic tn 498,473.00 521,932.81 400,000.00 Alumina traffic tn 1,167,630.00 1,172,788 1,078,969.02
C3 / PE2 Customer Satisfaction Index % 76.9 78.22 70C3 / PO1 No. of concessionary or authorized port terminals certified in the references
of PAFSC quality of service nº 2 2 5
C4 / PE1 Income from occupancy rate per m² of concession area €/m2 2.19 2.29 2.21C5 / PE1 % goods moved by rail % 0.06 0 0C6 / PE2 No. of complaints from other interest groups (Includes claims for social impact) nº 1 0 0C6 / PE2 Investments dedicated to the improvement of the port-city interface Thousands of Euros 23.42 0 80
P2 / PE2 No. of complaints (related to the provision of the service) nº 0 0 0P3 / PE1 Operating expenses / Operating income (%) % 100.26 114.26 124.87P4 / PO1 Foreign investment Thousands of Euros 8.19 7.44 10P5 / PS1 Investments in road and rail access Thousands of Euros 10,633.00 11,836.06 17,206.00
P7/PS1Maintenance Plan Compliance (only the activities carried out by PAFSC staff) % 97.89 93.64 98Compliance with the Investment Plan (%) % 64.86 63.53 70Port Authority Investment Amount (public investment) Thousands of Euros 11.86 12.84 19.94
P8/PO2 Number of accidents and incidents in safety and security nº 1 1 0
P8/PS4
Number of exercises and drills in security and protection nº 4 4 8Current SSMM Availability % 98.77 99.05 99.28
Annual accident severity index (GI) no. days lost per thou-sand hours worked 0.28 2.74 0.4
P9/PE2 Stakeholder Satisfaction Index. Sustainability % 77.6 70
P10/PS3
Marpol I Collection of liquid waste to ships m3 2,438.72 1,707.17 1,500.00 Own water consumption (Type D List of Environmental Aspects) m3 14,295.00 15,794.00 25,000.00
Own electricity consumption (Type D List of Environmental Aspects) KW*h 2,007,341.00 1,865,017.00 2,000,000.00
No. environmental incidents nº 4 2 0Total investment in environment Thousands of Euros 164 110.02 45
P10/PE2 Environmental complaints nº 0 0 0
P10/PS1 Direct emissions of greenhouse gases tons of CO2 equivalent 72.07 60.41 80
R1/PE2 Personnel’s satisfaction level % 69.62 68.47 70
R1/PE3
Total number of PA workers nº 115 112 112% of temporary workers over the total % 17.39 9.82 10.71% of women over total workers % 25.22 24.11 29.89
Annual absenteeism index % days lost per losses 9.12 9.18 6
R1/PE1 Compliance with the Objective Plan % 41.96 31.45 70R2/PE3 % of workers who follow training programs % 80 25 80R3/PE4 Compliance with the Action Plan of the Integrated Management System % 68.33 12.5 70

5756
Our management Port Authority of Ferrol-San Cibrao, Annual Report 2020
STRATEGY TRACKINGPROCESS TRACKING
PROCESS IMPROVEMENT ACTION YEAR 2020 YEAR 2021 COMPLIANCE2020
PE1 / PLANNING
Linking the investment plan to the SWOT analysis, and to the strategic objectives, in line with the codes of Puertos del Estado (Spain’s National Ports)
Yes Yes 25%
Analysis of the deviations cause in the process (deadlines from planning) No Yes
PE3 / HR ORGANIZATION AND MANAGEMENT Assessment of HR needs to improve the effective-ness and efficiency of processes No Yes
PO1 / CONCESSIONS AND AUTHORIZATIONS
Incorporate visual inspections to the PA infrastruc-tures and facilities located in concession areas No Yes
Annual analysis with the concessionaire (business plan) of business viability (traffic and investments) and joint action plan with the main concessionaires
No Yes
PO3 / ORDINATION, COORDINATION AND CONTROL OF TRAFFIC AND SERVICES
Measure indicators related to the level of service in operational processes Yes Yes 0%
Standardise, focus on the user and measure the access control process in order to reduce the pro-bability of risk
No Yes
Automate the entry of service information to the maximum and keep a single record for each type of integral service
No Yes
PO2/ / NAVIGATION AIDSEvaluation of causes of the incidents detected in the beaconing of the entrance channel to the estuary (Ría)
No Yes
PS1 / INVESTMENTS AND CONSERVATION
To propose an improvement to the person in charge of the process: Plan of inspections, maintenance and control of incidents with traceability to inventory. Monitoring of plans and incidents
No Yes
PS3 / ENVIRONMENTAL MANAGEMENT
Soil quality measurement and environmental indi-cator. PAFSC’s soil No Yes
Analysis of consumption, improvements detection, establishment of a plan and promotion of resource savings, or use of more efficient energy
No Yes
PS2 / INFORMATION AND COMMUNICATION TECHNOLOGIES
ICT plan drawn up to processes and annual review according to degree of progress of needs with pen-ding status to be covered by processes and GI
No Yes
ACTION PLAN COMPLIANCE 12.50%
STRATEGIC GOAL OPERATIVE GOAL YEAR 2020
YEAR 2021
COMPLIANCE 2020
E2 - GENERATING REVENUE FROM CONCESSIONS DEUP Ferrol Yes Yes 0%
E3 - MAINTAINING THE PROFITABILITY OF THE PORTPlan for the removal of materials and facilities deposited in the Port Yes Yes 35%
Analysis of future scenarios for the port of San Cibrao No Yes
C1 - ATTRACTING CUSTOMERS OF KEY TRAFFICS AND GREATER HINTERLAND Enabling a Border Inspection Point (BIP) in the Port of Ferrol Yes Yes 58.75%
C2 - RETAINING KEY CUSTOMERS
Strategic alliance to turn the Port of Ferrol into a reference in the provisioning of ships with LNG Yes Yes 0%
Joint analysis with Endesa of the business continuity strategy Yes Yes 0%
Deployment of the functions of the Port Authority in the province of Lugo Yes Yes 0%
C3 - IMPROVE THE IMAGE OF QUALITY IN THE PROVISION OF SERVICES AND PROCEDURES Transition to EFQM 2020 mode Yes Yes 100%
C4 -OFFER COMPETITIVE PRICES New land valuations in Ferrol and San Cibrao Yes Yes 33.33%
C5 - IMPROVING INTERMODALITY AND LOGISTICS OFFERDevelopment of actions to provide the Port of Ferrol with a compe-titive rail intermodality. Completion and commissioning of the Rail Access to the Outer Port
Yes Yes 72.5%
C6 - GETTING THE SUPPORT OF THE ENVIRONMENT AND AVOIDING CONFLICTS WITH OTHER GROUPS
Formulation of the Special Management Plan for the Port of Ferrol Yes Yes 0%
Construction of adequate facilities to serve certain traffic: passengers Yes Yes 100%
Alignment of strategy and management with the United Nations Sustainable Development Goals (SDGS) and sustainability principles No Yes
Accessibility Plan Yes Yes 10%
P 2 - IMPROVING QUALITY OF PORT SERVICESINCLUDING THOSE PROVIDED BY THIRDPARTIES
Remission of the specifications of particular requirements for port services: goods handling, Marpol and mooring in the Port of Ferrol Yes Yes 36%
Remission of the list of particular requirements for passenger, towing and pilotage port services in the Port of Ferrol, and granting of new licenses.
Yes Yes 0%
Approval of the specifications of particular requirements for port services of pilotage, towing, mooring, handling of goods and Marpol in the Port of San Cibrao
Yes Yes 36%
P 7 - BEING EXCELLENT IN MANAGEMENT, MAINTENANCE AND DEVELOPMENT OF INFRASTRUCTURES AND FACILITIES
Update and computerization of inventory and inspectionand maintenance guidelines for facilities and equipment,including reverts
Yes Yes 86.67%
P10 - SUSTAINABLY MANAGING THE ENVIRONMENT
Update of the reception and handling plan of waste in port (RD 1381/2002) Yes Yes 90%
Control plan for annoying activities in the Inner and Outer Port Yes Yes 0%
R.O.M. Coastal Water Quality Yes Yes 0%
R1 - ADAPTING THE ORGANIZATION ANDSTAFF TO THE STRATEGIC OBJECTIVES ANDPROMOTING CULTURAL CHANGE
Evaluation of the Performance of Out of Agreement Personnel Yes Yes 0%
Review of the Strategic Plan 2007-2015. Development of a new Strategic Plan 2018-2025 Yes Yes 50%
R2 - DEVELOPING AND TRAINING A HUMAN TEAM Training plan from the perspective of retirement Yes Yes 0%
R3 - IMPROVING INFORMATION AND MANAGEMENT SYSTEMS Application integration Yes Yes 15%
COMPLIANCE WITH THE OBJECTIVE PLAN YEAR 2020 29.92%

5958
Our management Port Authority of Ferrol-San Cibrao, Annual Report 2020
RISK EVALUATION In 2020 the Sustainability Department together with the PAFSC Management and Areas / Departments have overseen carrying out the risk assessment whose scope is limited to compliance with what is establi-shed for this purpose in the ISO 9001 and ISO 14001.
The most relevant points of the evaluation report were:
ScopeThe scope of these works is limited to complying with the requirement of ISO 9001 for the identification of
quality risks, and ISO 14001 for the identification of environmental risks, through process management.
Evaluation:Once the IMPACT and PROBABILITY values have been assigned, the following formula is applied to calcula-
te the RISK LEVEL:
LEVEL OF RISK = IMPACT * PROBABILITY
Based on this evaluation, the following risk levels are identified:
IMPACT PROBABILITY RISK LEVEL RISK SECTION RISK LEVEL
I P I x P
100 5% 5 5-49 INTANGIBLE RISK
200 25% 50 50-149 LOW RISK
300 50% 150 150-299 MEDIUM RISK
400 75% 300 300-474 HIGH RISK
500 95% 475 475+ MAX. RISK
Results of the evaluation: After the review, a total of 34 risks have been identified, distributed in the processes as follows:
PROCESS YEAR 2017:52 YEAR 2018: 50 YEAR 2019: 35 YEAR 2020: 34
STRATEGIC 10 10 10 10
Planning 2 2 2 2
Satisfaction of stakeholders 3 3 3 3
Organisation and management of HR 3 3 3 3
Evaluation, review and innovation 2 2 2 2
OPERATIONAL 17 17 14 12
Concessions and authorisations 2 2 2 2
Management, coordination and control of tra-ffic and services
8 8 5 4
Navigation aids 3 3 3 2
Services provided by private companies 4 4 4 4
SUPPORT 25 23 11 12
Investments and Conservation 2 2 2 2
Environmental management 17 15 7 8
Information and communication technologies 6 6 2 2
Level of risks by processIn relation to 2019, there are 2 fewer risks in the operational processes, specifically in Aids to Navigation and Management, coordination and control of traffic, however, one more risk has been added in the Support process related to Environmental Management
The overall percentages for the distri-bution of risk levels have also varied, decreasing the proportion of intangi-ble and medium risks, but increasing the proportion of low risks compared to the total. The following graph shows the number and percentage of risks at each level:
Evolution of the level of risksThe evolution of the level of risks in the last three years is shown below:
TreatmentOnce the risk levels have been identified, the treatment options are established in order to make decisions about how to face the risks that affect the achievement of the company’s objectives. To facilitate uniformity of criteria among all those responsible, some general treatment guidelines have been defined, which are identified in the following table.
MEDIUM RISKS: 15
44.12LOW RISKS: 13
32.65
INTANGIBLE RISKS: 3
8.82HIGH RISKS: 3
44.12
MAXIMUM RISKS: 0
60
Low risks Medium risks Maximum risksIntangible risks High risks alto
YEAR 2017
EVOLUTION OF THE NUMBER OF RISKS BY LEVEL
YEAR 2018 YEAR 2019 YEAR 2020
50
40
30
20
10
RISK LEVEL TREATMENT
Intangible risk It is not necessary to reduce the risk.
Low risk It is not necessary to reduce the risk.
Medium riskAlthough it is recommended to reduce the risk, through the strengthening of con-trols, it is not essential, unless the Risk Manager considers so.
High risk Actions must be established to minimize the impact or occurrence of risks.
Maximum riskThey should be eliminated, transferred, shared or reduced. It is only accepted if it is inherent to the activity of the Organization.
All treatment plans proposed for high and top risk levels will be included as improvement actions and ma-naged through the PAFSC Action Plan in force.
These treatment options do not limit the proposal for improvements associated with any of the risks with low, medium or immaterial risk levels. This decision ultimately corresponds to the person responsible for the risk or manager of the process where this risk is identified. Additionally, a list of improvements related to each of the risks has been created to facilitate their monitoring.

The paper used in this publication is ecological from forests managed in a sustainable way, guaranteeing their conservation and the efficient use of natural resources. Port Authority of Ferrol - San Cibrao
Muelle Curuxeiras, s/n 15401 Ferrol (España)Tel: +34 981 33 80 [email protected]
Design and Layout: Atelier Gráfica Visual
Cover photo: Luis Cobas
Inside pictures: Luis Cobas and the Port Authority of Ferrol-San Cibrao Ferrol (A Coruña), july 2021
Publisher: Department of Sustainability and Management Systems. Port Authority of Ferrol-San Cibrao


Apéndice 1. Appendix 1
ESTADOS FINANCIEROSFINANCIAL STATEMENTSTransparencia activa de la información. Los datos en detalle.
Active transparency in the information. Data in detail


1. FINANCIAL STATEMENTSBALANCE SHEET at 31st december 2020 (102‐7)
ASSETS 2020 2019 EQUITY AND LIABILITIES 2020 2019
A) NON CURRENT ASSETS 230.212.641,46 218.358.895,72 A) EQUITY 193.571.069,21 208.841.358,74I. Intangible fixed assets 270.254,41 323.553,62 A‐1) Equity 146.229.908,54 144.397.999,23 1. Industrial property and other intangible assets ‐ ‐ 2. IT applications 199.408,67 285.416,77 I. Net worth 46.819.763,54 46.819.763,54 3. Advances for intangible assets 70.845,74 38.136,85
II. Accumulated profit and loss 98.262.390,05 94.358.663,37 II. Tangible fixed assets 162.919.699,04 157.963.258,80 1. Land and natural assets 30.615.306,20 30.590.951,69 III. Profit for the year 1.147.754,95 3.219.572,32 2. Buildings 95.805.388,32 102.397.378,80 3. Equipment and technical facilities 472.728,20 650.638,20 A‐2) Adjustments for changes in value ‐ ‐ 4. Advance and current fixed assets 35.511.119,25 23.681.268,95 5. Other fixed assets 515.157,07 643.021,16 I. Financial assets available for sale ‐ ‐
III. Real estate investments 59.527.496,23 59.881.179,37 II. Coverage operations ‐ ‐ 1. Land 52.689.504,24 52.689.504,24 2. Buildings 6.837.991,99 7.191.675,13 III. Others ‐ ‐
IV. Long term investments in group and associated companies 216.000,00 108.000,00 A‐3) Subsidies, donations and legacies received 47.341.160,67 64.443.359,51 1. Equity investments ‐ ‐ 2. Loans to companies 216.000,00 108.000,00 B) NON‐CURRENT LIABILITIES 72.886.088,79 44.683.005,50
V. Long term financial investments 6.512.343,67 8.555,26 I. Long term provisions ‐ ‐ 1. Equity investments ‐ ‐ 1. Provision for staff benefit obligations ‐ ‐ 2. Loans to third parties 12.343,67 8.555,26 2. Provision for legal liabilities ‐ ‐ 3. Public administrations, deferred official subsidies ‐ ‐ 3. Other provisions ‐ ‐ 4. Other financial assets 6.500.000,00 ‐
II. Long term debt 23.018.814,83 26.683.005,50 VI. Deferred tax assets 766.041,65 63.090,81 1. Long term bank debt 20.481.770,94 22.432.415,78
2. Long term suppliers of fixed assets ‐ ‐ VII. Non‐current trade debtors 806,46 11.257,86 3. Others 2.537.043,89 4.250.589,72
B) CURRENT ASSETS 43.964.236,69 43.835.112,38 III. Long term debt with group and associated companies 36.000.000,00 18.000.000,00 I. Non‐current assets held for sale ‐ ‐ IV. Deffered tax liabilities 13.867.273,96 ‐ II. Stock 138.544,32 135.255,25 V. Long term accruals and deferrals ‐ ‐ III. Trade debtors and other receivables 3.016.475,46 1.960.029,43 C) CURRENT LIABILITIES 7.719.720,15 8.669.643,861. Customers for sales and services provided 1.871.157,97 1.142.831,83 2. Customers and debtors, group and associated companies ‐ 7.090,25 3. Miscellaneus 533.767,39 546.757,03 II. Short term provisions 9.889,61 13.936,994. Public administrations, official subsidies receivable ‐ 3.742,95 5. Other credits with public administration 611.550,10 259.607,37 III. Short term debt 5.725.363,82 7.000.459,41
1. Bank debt 1.950.644,84 1.950.644,84IV. Short term investments in group and associated companies ‐ ‐ 2. Short term suppliers of fixed assets 1.339.773,31 2.166.263,32
3. Other financial liabilities 2.434.945,67 2.883.551,25V. Short term financial investments 29.515.451,91 35.620.838,76 1. Equity investments ‐ ‐ IV. Short term debt with group and associated companies 201.667,97 100.389,712. Loans to companies ‐ ‐ 3. Other financial assets 29.515.451,91 35.620.838,76 V. Trade creditors and other receivables 1.782.547,19 1.554.278,84
1. Creditors and other receivables 1.087.011,27 1.211.583,36VI. Accrual accounts 41.418,52 36.685,27 2. Advance payments of public subsidies 365.865,24 37.826,38
3. Other debts with public administrations 329.670,68 304.869,10VII. Cash and other equivalent liquid assets 11.252.346,48 6.082.303,67 1. Treasury 11.252.346,48 4.582.270,79 VI. Accruals 251,56 578,91 2. Other cash equivalents ‐ 1.500.032,88
TOTAL ASSETS (A+B) 274.176.878,15 262.194.008,10 TOTAL EQUITY AND LIABILITIES (A+B+C) 274.176.878,15 262.194.008,10
(in euros)
Apéndice: Transparencia Activa en la Información. Los datos en detalle.Appendix: Active Transparency in the Information. Data in detail. 1

PROFIT AND LOSS ACCOUNTfor the ending year 12‐31‐2020
(Debit) Credit
2020 20191. Net turnover 15.211.831,92 17.528.040,06
A. Port fees 13.477.230,78 16.017.317,95 a) Occupation fee 3.638.041,02 3.872.752,54 b) Fees for special use of port facilities 6.629.503,48 8.988.657,44 1. Vessel fees (T1) 2.789.953,06 4.561.846,07 2. Fees for pleasure craft (T5) 24.203,12 24.357,42 3. Passenger fees (T2) 3.790,61 17.995,89 4. Good fees (T3) 3.754.956,65 4.315.403,70 5. Fresh fish fee (T4) 9.021,67 5.037,62 6. Fee for special use of transit area (T6) 47.578,37 64.016,74
c) Activity fee 3.039.531,95 2.974.047,14 d) Navigation aid fee 170.154,33 181.860,83
B. Other business income 1.734.601,14 1.510.722,11 a) Additional income to fees ‐ 398,02 b) Fees and others 1.734.601,14 1.510.324,09
3. Work carried out by the company for its fixed assets ‐ ‐
5. Other operating income 1.513.032,67 1.522.472,14 a) Accesory income and other management income 185.747,37 214.420,15 b) Operating subsidies included in results 8.052,64 3.563,94 c) Income from return of concessions 649.232,66 647.488,05 d) Interport Fund compensation received 670.000,00 657.000,00
6. Staff cost (5.021.788,47) (4.793.709,93) a) Salaries and wages (3.660.451,80) (3.520.638,06) b) Indemnities (11.151,44) (1.255,74) c) Social charges (1.350.185,23) (1.271.816,13) d) Provisions ‐ ‐
7. Other operating expenses (4.809.936,79) (5.033.639,40) a) External services (2.552.676,48) (2.729.510,10)
1. Repairs and upkeep (1.057.568,89) (1.178.799,06) 2. Independent professional services (175.891,62) (285.745,60) 3. Supplies and consumables (668.182,73) (618.568,42) 4. Other external services (651.033,24) (646.397,02)
b) Taxes (716.337,31) (674.782,57) c) Losses, deterioration and variation in provisions by commercial activities (81.555,06) 39.369,07 d) Other current management expenses (244.675,22) (153.991,73) e) Contribution to PPEE art. 19.1. b) RDL 2/2011 (640.692,72) (755.724,07) f) Interport Compensation Fund contribution (574.000,00) (759.000,00)
8. Amortization of fixed assets (8.204.514,09) (8.464.992,87) 9. Allocation of subsidies for non‐financial assets and others
10. Excess provisions ‐ ‐ 11. Deterioration and results for fixed assets disposals (2.842,77) (17.986,06) a) Deterioration and depreciation ‐ ‐ b) Results for fixed assets disposals and others (2.842,77) (17.986,06)
Other results ‐ ‐ a) Exceptional incomes ‐ ‐ b) Exceptional expenses ‐ ‐
A.1. OPERATING RESULTS (1+3+5+6+7+8+9+10+11) 1.102.471,04 3.187.866,71 12. Financial income 274.918,12 400.704,10 a) Stakes in equity instruments ‐ ‐ b) Income from other marketable instruments 230.192,62 320.458,10 c) Incorporation of financial expenses to assets 44.725,50 80.246,00
13. Financial expenses (248.430,69) (368.998,49) a) For third party debts (248.430,69) (368.030,09) b) For updating of provisions ‐ (968,40)
14. Changes to the reasonable value of financial instruments ‐ ‐ 16. Deterioration and results for financial instruments disposals ‐ ‐ a) Deterioration and depreciation ‐ ‐ b) Trading portfolio and others ‐ ‐
A.2. FINANCIAL RESULT (12+13+14+16) 26.487,43 31.705,61
A.3. PRE‐TAX RESULT (A.1+A.2) 1.128.958,47 3.219.572,32 17. Company tax 18.796,48 ‐
A.4. BALANCE OF THE FINANCIAL YEAR (A.3+17) 1.147.754,95 3.219.572,32
(in euros)
Apéndice: Transparencia Activa en la Información. Los datos en detalle.Appendix: Active Transparency in the Information. Data in detail. 2

CASH FLOWfor the year ending 12‐31‐2020
CONCEPT 2020 2019
A) CASH FLOW FROM OPERATING ACTIVITIES (+/‐1+/‐2+/‐3+/‐4) 5.187.462,93 10.338.479,88 1. Profit before taxes 1.128.958,47 3.219.572,32 2. Adjustments to profit 5.127.309,31 5.415.882,25 a) Depreciation of fixed assets (+) 8.204.514,09 8.464.992,87 b) Valuation adjustments for impairment (+/‐) ‐ ‐ c) Variation of provisions (+/‐) 9.889,61 12.968,59 d) Entering subsidies (‐) (2.416.688,57) (2.447.682,77) e) Results of fixed assets removed or disposed (+/‐) 2.842,77 17.986,06 f) Results for cancellation and disposal of financial instruments (+/‐) ‐ ‐ g) Financial income (‐) (274.918,12) (400.704,10) h) Financial expenditure (+) 248.430,69 368.998,49 i) Variation in the reasonable value of financial instruments (+/‐) ‐ ‐ j) Income transferred to results for reverted concessions (‐) (649.232,66) (647.488,05) k) Inclusion of advances received for sales or provision of services (‐) ‐ ‐ l) Other income and expenses (+/‐) 2.471,50 46.811,16
3. Changes in working capital (640.951,25) 1.716.275,71 a) Stocks (+/‐) (3.289,07) 5.570,26 b) Trade debtors and other receivable (+/‐) (648.249,75) 1.008.541,89 c) Other current assets (+/‐) (5.143,53) (26.759,07) d) Creditors and other receivables (+/‐) (35.305,15) 473.221,76 e) Other current assets (+/‐) 63.130,90 269.273,83 f) Other non‐current assets and liabilities (+/‐) (12.094,65) (13.572,96)
4. Other cash flow from operating activities (427.853,60) (13.250,40) a) Interest payments (‐) (46.898,30) (79.000,00) b) Dividends received (+) ‐ ‐ c) Interest received (+) 34.480,68 31.295,25 d) Interest on late payments due to tariff disputes (‐) ‐ ‐ e) Interest on late subsidy payments due to tariff disputes (+) ‐ ‐ f) Amounts received (paid) on profit tax (+/‐) (415.403,08) 34.421,47 g) Other amounts paid (‐/+) (32,90) 32,88
B) CASH FLOW FROM INVESTING ACTIVITIES (7‐6) (13.986.815,98) (18.015.408,39) 6. Payments for Investments (‐) (20.086.815,98) (18.015.408,39) a) Group companies & associated (108.000,00) (108.000,00) b) Intangible assets (67.290,73) (106.300,84) c) Tangible fixed assets (13.122.573,21) (11.595.506,75) d) Real state investments (288.952,04) (5.600,80) e) Other financial assets (6.500.000,00) (6.200.000,00) f) Non‐current assets maintained for sale ‐ ‐ g) Other assets ‐ ‐
7. Disinvestment received (+) 6.100.000,00 ‐ a) Group and associated companies ‐ ‐ b) Intangible assets ‐ ‐ c) Tangible fixed assets ‐ ‐ d) Real state investments ‐ ‐ e) Other financial assets 6.100.000,00 ‐ f) Non‐current assets held for sale ‐ ‐ g) Other assets ‐ ‐
C) CASH FLOW FROM FINANCING ACTIVITIES (+/‐9+/‐10) 13.969.395,86 13.647.410,27 9. Equity instrument received and paid 359.436,00 37.450,46 a) Subsidies, donations and legacies received (+) 359.436,00 37.450,46 b) Issuance of equity instruments (+/‐) ‐ ‐
10. Financial liability instruments payables and receivables 13.609.959,86 13.609.959,81 a) Issue 18.000.000,00 18.000.000,00
1. Bank debt (+) ‐ ‐ 2. Group and associated company debt (+) 18.000.000,00 18.000.000,00 3. Other debts (+) ‐ ‐
b) Repayment and amortization of (4.390.040,14) (4.390.040,19) 1. Bank debt (‐) (1.950.644,84) (1.950.644,84) 2. Debt with group and associated companies (‐) ‐ ‐ 3. Other payables (+) (2.439.395,30) (2.439.395,35)
E) NET INCREASE/DECREASE IN CASH OR EQUIVALENTS (+/‐A+/‐B+/‐C) 5.170.042,81 5.970.481,76 Cash or cash equivalents at beginning of the year 6.082.303,67 111.821,91 Cash or cash equivalents at the end of the year 11.252.346,48 6.082.303,67
(in euros)
Apéndice: Transparencia Activa en la Información. Los datos en detalle.Appendix: Active Transparency in the Information. Data in detail. 3

2020 2019
A) Profit and loss statement 1.147.754,95 3.219.572,32
B) Income and expenses recognised directly in equity (I+II+III+V) (14.440.601,10) 163.371,62
I. Valuation of financial instruments ‐ ‐ 1. Financial assets available for sale ‐ ‐ 2. Other income / expenditure ‐ ‐
II. Cash flow coverage ‐ ‐
III. Subsidies, donations and legacies 30.845,00 163.371,62
V. Tax effect (14.471.446,10) ‐
C) Transfers to profit and loss statements(VI+VII+VIII+IX) (2.661.597,74) (3.382.954,91)
VI. Valuation of assets and liabilities ‐ ‐ 1. Financial assets available for sale ‐ ‐ 2. Other income / expenditure ‐ ‐
VII. Cash flow coverage ‐ ‐
VIII. Subsidies, donations and legacies (3.265.769,88) (3.382.954,91)
IX. Tax effect 604.172,14 ‐
Total declared income and expenses (A+B+C) (15.954.443,89) (10,97)
Capital Retained earningProfit (loss) for the
yearValuation
adjustmentsGrants, donations
and legacies receivedTotal
A. BALANCE AT THE END OF 2018 46.819.763,54 87.959.509,68 6.399.153,69 ‐ 67.662.942,80 208.841.369,71
I. Adjustments for changes in standards for 2018 and previous.
‐ ‐ ‐ ‐ ‐ ‐
II. Adjustments for errors in 2018 and previous years ‐ ‐ ‐ ‐ ‐ ‐
B. ADJUSTED BEGINNING BALANCE 2019 46.819.763,54 87.959.509,68 6.399.153,69 ‐ 67.662.942,80 208.841.369,71
I. Total recognised income and expenses ‐ ‐ 3.219.572,32 ‐ (3.219.583,29) (10,97) II. Transactions with shareholders or owners (*) ‐ ‐ ‐ ‐ ‐ ‐ III. Other changes in equity ‐ 6.399.153,69 (6.399.153,69) ‐ ‐ ‐
C. BALANCE AT END 2019 46.819.763,54 94.358.663,37 3.219.572,32 ‐ 64.443.359,51 208.841.358,74
I. Adjustments for changes to criteria 2019 ‐ ‐ ‐ ‐ ‐ ‐ II. Adjustments for errors in 2019 ‐ ‐ ‐ ‐ ‐ ‐
D. ADJUSTED BALANCE AT START 2020 46.819.763,54 94.358.663,37 3.219.572,32 ‐ 64.443.359,51 208.841.358,74
I. Total declared income and expenditure ‐ ‐ 1.147.754,95 ‐ (17.102.198,84) (15.954.443,89) II. Operations with partners or owners (*) ‐ ‐ ‐ ‐ ‐ ‐ III. Other changes in equity ‐ 3.903.726,68 (3.219.572,32) ‐ ‐ 684.154,36
E. BALANCE AT END OF 2020 46.819.763,54 98.262.390,05 1.147.754,95 0,00 47.341.160,67 193.571.069,21 (*) Adscriptions and desadscriptions of property
B) Statement of changes in equity for the year ending 12‐31‐2020
(in euros)
A) Recognised income and expenses for the year ending 12‐31‐2020
STATEMENT OF CHANGES IN EQUITYfor the year ending 12‐31‐2020
(in euros)
Apéndice: Transparencia Activa en la Información. Los datos en detalle.Appendix: Active Transparency in the Information. Data in detail 4

Apéndice 2. Appendix 2
CARACTERÍSTICAS TÉCNICAS DEL PUERTOTECHNICAL CHARACTERISTICS OF THE PORT
Transparencia activa de la información. Los datos en detalle.
Active transparency in the information. Data in detail


2. CARACTERÍSTICAS TÉCNICAS DEL PUERTO / TECHNICAL CHARACTERISTICS OF THE PORT
2.1. CONDICIONES GENERALES ‐ PUERTO FERROL / GENERAL DATA ‐ PORT OF FERROL
Puerto interior Inner harbour
Puerto exterior Outer harbour
Longitud Longitude 8º 14' 54'' W 8º 19' 32'' W
Latitud Latitude 43º 28' 34'' N 43º 27' 46'' N
2.1.2. REGIMEN DE VIENTOS / WIND CONDITIONS
Reinante Prevailing
Dominante Strongest
2.1.3. RÉGIMEN DE TEMPORALES / STORM CONDITIONS
Altura significante maxima de oleaje (Hs max) / Maximun significant wave height
Periodo de pico (Tp) asociado a Hs max / Peak period asociated to Hs max
Dirección media de procedencia asociada a Hs max / Average direction of waves
2.1.4. NIVEL DEL MAR Y MAREAS / SEA LEVEL
Máxima carrera de marea registrada en el añoMaximum tide in the year
Bajamar mínima registrada en el año respecto al cero del puerto / Minimum low tide registered in the year with respect to the zero of the port
Pleamar máxima registrada en el año respecto al cero del puerto Maximum high tide registered in the year with respect zero of the port
ENE
ENE
2.1.1. SITUACIÓN / LOCATION
Datos actualizados a 31/12/2020
Datos obtenidos de Mareografo Ferrol 1, periodo 2020‐2021
Puerto de Ferrol Port of Ferrol
Datos actualizados a 31/12/2020
Datos obtenidos del Punto de la red SIMAR 211055023. Año: 2020.
Puerto de Ferrol Port of Ferrol
5,88
16,1
275
Puerto de Ferrol Port of Ferrol
4,36
0,13
4,49
Apéndice: Transparencia Activa en la Información. Los datos en detalle.Appendix: Active Transparency in the Information. Data in detail.
1

2.1.5 ENTRADA ‐ FERROL / ENTRANCE ‐ FERROL
2.1.5.1. CANAL DE ENTRADA / ENTRANCE CHANNEL
Puerto interiorInner harbour
Orientación / Position SW
Ancho / Width 160m
Longitud / Length 2994m
Calado en B.M.V.E. / Water depth in LLW 11,30m
Naturaleza del fondo / Sea botton characteristics cascajo y roca
2.1.5.2. BOCA DE ENTRADA / ENTRANCE MOUTH
Puerto interiorInner harbour
Puerto exteriorOuter harbour
Orientación / Position SW SW
Ancho / Width 546m 546m
Calado en B.M.V.E. / Water depth in LLW 20m 20m
Máxima corriente controlada / Maximum recorded stream
‐ ‐
ESLORA / LENGTH Nº REMOLCADORES / Nº TUGBOATS
<100 m 0 (1)
100‐130 m 0‐1
130‐165 m 1‐2
165‐250 m 2‐3
>250 m (2) 2‐4
(1) Salvo mercancias peligrosas. Except dangerous goods
(2) Y buques gaseros de cualquier eslora. And GNL ships of any lengh.Datos actualizados a 31/12/2020
Datos actualizados a 31/12/2020
Datos actualizados a 31/12/2020
Para buques de última generación, en casos puntuales, la Capitanía Marítima puede autorizar la utilización de menos
remolcadores.
For vessels of last generation, in punctual cases, the Maritime Captaincy can authorize the utilization of fewer tugboats.
2.1.5.3. UTILIZACIÓN DE REMOLCADORES DE ENTRADA Y SALIDA / USE OF TUGS IN SHIP APPROACHING
Apéndice: Transparencia Activa en la Información. Los datos en detalle.Appendix: Active Transparency in the Information. Data in detail.
2

2.1.1. SITUATION / LOCATION
Longitud / Longitude 7º27' 42''W
Latitud /Latitude 43º42' 29''N
2.1.2. RÉGIMEN DE VIENTOS / WIND CONDITIONS
Reinante / Prevailing WSW
Dominante / Strongest W‐WSW
2.1.3. RÉGIMEN DE TEMPORALES / STORM CONDITIONS
Altura significante maxima de oleaje (Hs max) Maximun significant wave height 5,5
‐
Periodo de pico (Tp) asociado a Hs max / Peak period asociated to Hs max 17,74Dirección media procedencia oleaje (DIR) asociado a Hs max Average direction of waves 336
2.1.4. NIVEL DEL MAR Y MAREAS / SEA LEVEL
Puerto de San CibraoSan Cibrao port
Máxima carrera de marea registrada en el añoMaximum tide in the year
4,51
Bajamar mínima registrada en el año respecto al cero del puertoMinimum low tide registered in the year with respect to the zero of the port
0,19
Pleamar máxima registrada en el año respecto al cero del puerto Maximum high tide registered in the year with respect zero of the port
4,7
2.1. CONDICIONES GENERALES ‐ PUERTO DE SAN CIBRAO / GENERAL CONDITIONES ‐ SAN CIBRAO PORT
Datos actualizados a 31/12/2020
Datos obtenidos del Punto de red SIMAR 3050041, periodo 2020‐2021
Datos obtenidos del Punto de la red SIMAR 3050041. Año: 2020.
Datos actualizados a 31/12/2020
Apéndice: Transparencia Activa en la Información. Los datos en detalle.Appendix: Active Transparency in the Information. Data in detail.
3

2.1.5. ENTRADA PUERTO DE SAN CIBRAO / ENTRANCE SAN CIBRAO PORT2.1.5.1. CANAL DE ENTRADA / ENTRANCE CHANNEL
Orientación / Position NE
Ancho / Width 546m
Longitud / Length 2.160m
Calado en B.M.V.E. / Water depth in LLW 16,7m
Naturaleza del fondo / Sea botton characteristics arena
Orientación / Position E
Ancho / Width 191m
Longitud / Length 2.160m
Calado en B.M.V.E. / Water depth in LLW 17,9m
Naturaleza del fondo / Sea botton characteristics arena
2.1.5.2. BOCA DE ENTRADA / ENTRANCE MOUTH
Orientación / Position E
Ancho / Width 305m
Calado en B.M.V.E. / Water depth in LLW 20m
Máxima corriente controlada / Maximum recorded current ‐
ESLORA / VESSEL LENGTHNº REMOLCADORES Nº
TUGBOATS
<100 m 0 (*)
100‐165 m 2
>165 m 3
(*) Salvo mercancias peligrosas. Except dangerous goods
Datos actualizados a 31/12/2020
2.1.5.3. UTILIZACIÓN DE REMOLCADORES DE ENTRADA Y SALIDA / USE OF TUGS IN SHIP APPROACHING
Datos actualizados a 31/12/2020
Datos actualizados a 31/12/2020
Canal Nordeste
Canal Este
Apéndice: Transparencia Activa en la Información. Los datos en detalle.Appendix: Active Transparency in the Information. Data in detail.
4

Zona 1 Zona 2 Zona 1 Zona 2
Nombre NameCHRISTOPHE DE
MARGERIE
BW PAVILION
LEEARAMONTESPERANZA MAYARO
Nacionalidad Nacionality CHIPRE SINGAPUR PORTUGAL JAPÓN
G.T. 128.806 105.945 81.187 21.129
T.P.M.
Eslora Length 299 288 274,23 175
Calado Draught 13 12,5 17,02 16
Tipo TypeGranelero Líquido
(tanque)
Granelero Líquido
(tanque)
Granelero Líquido
(tanque)
Granelero Líquido
(tanque)
Calado a la entrada o salida Draught at entrance or departure
12,00 8,30 9,00 6,30
Datos actualizados a 31/12/2020
Zona 1 Zona 2 Zona 1 Zona 2
Nombre Name BEKS YILMAZ ‐ KATJA OLDENDORF ‐
Nacionalidad Nacionality ISLAS MARSHAL ‐ LIBERIA ‐
G.T. 44.422 ‐ 44.109 ‐
T.P.M. ‐ ‐
Eslora Length 230 ‐ 229 ‐
Calado Draught 14,5 ‐ 20 ‐
Tipo Type Granelero Sólido ‐Granelero Líquido
(tanque)‐
Calado a la entrada o salida Draught at entrance or departure
12,00 ‐ 12,00 ‐
Datos actualizados a 31/12/2020
Características / CharacteristicsMayor eslora / By length Mayor calado / By draugth
2.1.5.4. MAYOR BUQUE ENTRADO EN EL ÚLTIMO AÑO ‐ PUERTO DE FERROL / BIGGEST SHIP IN LAST YEAR ‐ PORT OF FERROL
Características / CharacteristicsMayor eslora / By length Mayor calado / By draugth
2.1.5.4. MAYOR BUQUE ENTRADO EN EL ÚLTIMO AÑO ‐ PUERTO SAN CIBRAO / BIGGEST SHIP IN LAST YEAR ‐ PORT SAN CIBRAO
Apéndice: Transparencia Activa en la Información. Los datos en detalle.Appendix: Active Transparency in the Information. Data in detail.
5

2.1.6.1. ZONA I / ZONE I
Comerciales (Ha) Commercial
Pesqueras (Ha) / Fishing
Resto (Ha) / Rest
Puerto de Ferrol ‐ 126,72 ‐ 1.856,45 1.983,17
Puerto de San Cibrao ‐ 181,33 ‐ ‐ 181,33
TOTAL ZONA I ‐ 308,05 ‐ 1.856,45 2.164,50
Datos actualizados a 31/12/2020
2.1.6.2. ZONA II / ZONE II
Situación / LocationAccesos (Ha) /
EntrancesFondeadero (Ha) /
AnchourageResto (Ha)
/ RestTotal (Ha)
Puerto de Ferrol 290,54 1.699,29 466,79 2.456,62
Puerto de San Cibrao ‐ ‐ ‐ ‐
TOTAL ZONA II 290,54 1.699,29 466,79 2.456,62
Datos actualizados a 31/12/2020
Situación / LocationAntepuerto (Ha) Outer harbour
Dársenas / Basins
Total (Ha)
2.1.6. SUPERFICIE DE FLOTACIÓN / WATER AREAS
Apéndice: Transparencia Activa en la Información. Los datos en detalle.Appendix: Active Transparency in the Information. Data in detail.
6

2.2. INSTALACIONES AL SERVICIO DEL COMERCIO MARÍTIMO / FACILITIES FOR MARITIME TRAFFIC
2.2.1. MUELLES Y ATRAQUES / QUAYS AND BERTHS
2.2.1.1. CLASIFICACIÓN POR DÁRSENAS / QUAYS CLASSIFICATION
Nombre / Name Longitud (m) / Length Calado (m) / Depth Ancho (m)/ Width Empleos / Uses
Del servicio / Public
Darsenas comerciales Commercial quays
Muelle Concepción Arenal 414,00 20,00 27 ‐ 60 Graneles sólidos
Muelle Concepción Arenal 922,00 20,00 60 Polivalente
Muelle Concepción Arenal 173,00 20,00 60 Contenedores
Muelle José Canalejas 148,00 10 ‐ 17,50 60 Polivalente
Martillo del Dique Virgen de Chamorro 107,00 15,00 11,15 Servicios portuarios
Total del servicio / Total public 1.764,00
De particulares / Private
Darsenas comerciales Commercial quays
Atraque de graneles líquidos 384,00 16,00 27 Graneles Líquidos
Total de particulares / Private 384,00
TOTAL PUERTO EXTERIOR TOTAL OUTER HARBOUR
2.148,00
Del servicio / Public
Darsenas comerciales Commercial quays
Espigón Interior 106,00 6,50 4 Polivalente
Cabeza de Espigón 47,00 6,50 12,5 Servicios Portuarios
Espigón Exterior 244,00 9,00 77,65 Polivalente
Fernández Ladreda 454,00 12,50 40 Polivalente
Fernández Ladreda 357,00 6 ‐ 8 20 ‐ 40 Polivalente
Cerramiento Norte F. Ladreda 253,00 10,00 40 Polivalente
Nuevo Muelle 271,00 14,00 23,5 Polivalente
Nuevo Muelle Auxiliar 68,00 14,00 10 Polivalente
Rampa Ro‐Ro Espigón Exterior 229,00 9,00 15 Tráfico Ro‐Ro
Rampa Ro‐Ro Cerramiento Norte 216,00 10,00 20,4 Tráfico Ro‐Ro
Total del servicio / Public 2.245,00
FERROL ‐ PUERTO EXTERIOR / OUTER HARBOUR
FERROL ‐ PUERTO INTERIOR / INNER HARBOUR
Apéndice: Transparencia Activa en la Información. Los datos en detalle.Appendix: Active Transparency in the Information. Data in detail.
7

Nombre / Name Longitud (m) / Length Calado (m) / Depth Ancho (m)/ Width Empleos / Uses
Dársenas deportivas /Leisure quays
Muelle Dársena de Curuxeiras 347,00 0,00 2 Recreativas ‐ Deportivas
Muelle A Graña 70,00 ‐ 2 Recreativas ‐ Deportivas
Muelle San Felipe 45,00 ‐ 3 Recreativas ‐ Deportivas
Pantalanes Flotantes Curuxeiras 813,00 2 ‐ 4,50 6 ‐ 12 Recreativas ‐ Deportivas
Pantalanes Flotantes A Graña 831,00 2,5 ‐ 3,50 6 ‐ 12 Recreativas ‐ Deportivas
Pantalanes Flotantes Caranza 418,00 0 ‐ 3,50 6 ‐ 8 Recreativas ‐ Deportivas
Total dársenas deportivas /Total leisure quays
2.524,00
Dársenas pesqueras /Fishing quays
Muelle Dársena de Curuxeiras 186,00 1 ‐ 6,00 2 Pesca
Pantalanes Flotantes Curuxeiras 536,00 1 ‐ 6,00 6 Pesca
Pantalanes Flotantes A Gándara 84,00 ‐ 2 Pesca
Total dársenas pesqueras/Fishing quays
806,00
Otras dársenas /Other quays
Muelle Dársena de Curuxeiras 38,00 5,50 2,00 Servicios Portuarios
Pantalanes Flotantes Curuxeiras 62,00 5,5 ‐ 7,5 6 ‐12 Servicios Portuarios
Muelle Dársena de Curuxeiras 296,00 2,50 2,00 Otros usos
Muelle Dársena de Curuxeiras 80,00 6,50 2,00 Otros usos
Total otras dársenas Total other quays
476,00
Total del servicio / Public 6.051,00
De particulares / Private
Darsenas comerciales Commercial quays
Muelle Forestal del Atlántico 542,00 14,00 50 Graneles Líquidos
Muelle Reganosa 433,00 14,00 50 Graneles Líquidos
Navantia ‐ Fene 2.522,00 3,00 ‐ 11,20 ‐ Reparaciones y armamento
Navantia ‐ Ferrol 1.984,00 6,00 ‐ 12,00 ‐ Reparaciones y armamento
Total de particulares / Private 5.481,00
Total Puerto Interior / Inner harbour 11.532,00
TOTAL FERROL (PI +PE) 13.680,00
Apéndice: Transparencia Activa en la Información. Los datos en detalle.Appendix: Active Transparency in the Information. Data in detail.
8

Nombre / Name Longitud (m) / Length Calado (m) / Depth Ancho (m)/ Width Empleos / Uses
De particulares Private
Darsenas comerciales Commercial quays
Muelle Principal 338,00 14,00 ‐ 17,00 35,00 Polivalente
Muelle Auxiliar 206,00 7,00 30,00 Polivalente
Puerto Morás 194,00 ‐ 30,00 Polivalente
TOTAL SAN CIBRAO 738,00
TOTAL AUTORIDAD PORTUARIA TOTAL PORT AUTHORITY
14.418,00
Datos actualizados a 31/12/2020
PUERTO DE SAN CIBRAO SAN CIBRAO PORT
Apéndice: Transparencia Activa en la Información. Los datos en detalle.Appendix: Active Transparency in the Information. Data in detail.
9

2.2.1.2. CLASIFICACIÓN POR EMPLEOS Y CALADOS / CLASIFICATION BY USES AND DEPTHS
C>=12 12>C>=10 10>C>=8 8>C>=6 6>C>=4
Del servicio / Public 1.690,00 74,00 ‐ ‐ ‐ 1.764,00 ‐
Darsenas comerciales Commercial quays
1.690,00 74,00 ‐ ‐ ‐ 1.764,00 ‐
Polivalentes 996,00 74,00 ‐ ‐ ‐ 1.070,00 ‐
Servicios portuarios 107,00 ‐ ‐ ‐ ‐ 107,00
Graneles sólidos 414,00 ‐ ‐ ‐ ‐ 414,00
Contenedores 173,00 ‐ ‐ ‐ ‐ 173,00 ‐
De particulares / Private 384,00 ‐ ‐ ‐ ‐ 384,00 ‐
Darsenas comerciales Commercial quays
384,00 ‐ ‐ ‐ ‐ 384,00 ‐
Graneles líquidos 384,00 ‐ ‐ ‐ ‐ 384,00 ‐
TOTAL PUERTO EXTERIOR / OUTER HARBOUR
2.074,00 74,00 ‐ ‐ ‐ 2.148,00 ‐
Del servicio / Public 793,00 469,00 742,00 1.105,00 1.198,00 4.307,00 1.744,00
Darsenas comerciales Commercial quays
793,00 469,00 742,00 241,00 ‐ 2.245,00 ‐
Polivalentes 793,00 253,00 513,00 194,00 ‐ 1.753,00 ‐
Tráfico Ro‐Ro ‐ 216,00 229,00 ‐ ‐ 445,00 ‐
Servicios portuarios ‐ ‐ ‐ 47,00 ‐ 47,00 ‐
Otras dársenas Other quays
‐ ‐ ‐ 864,00 1.198,00 2.062,00 1.744,00
Recreativas‐Deportivas ‐ ‐ ‐ ‐ 1.160,00 1.160,00 1.364,00
Pesca ‐ ‐ ‐ 722,00 ‐ 722,00 84,00
Otros usos ‐ ‐ ‐ 80,00 ‐ 80,00 296,00
Servicios portuarios ‐ ‐ ‐ 62,00 38,00 100,00 ‐
De particulares / Private 975,00 811,00 1.317,00 1.760,00 468,00 5.331,00 150,00
Darsenas comerciales Commercial quays
975,00 ‐ ‐ ‐ ‐ 975,00 ‐
Graneles líquidos 975,00 ‐ ‐ ‐ ‐ 975,00 ‐
Otras dársenas Other quays
‐ 811,00 1.317,00 1.760,00 468,00 4.356,00 150,00
Reparaciones y armamento ‐ 811,00 1.317,00 1.760,00 468,00 4.356,00 150,00
TOTAL PUERTO INTERIOR / INNER HARBOUR
1.768,00 1.280,00 2.059,00 2.865,00 1.666,00 9.638,00 1.894,00
De particulares Private 338,00 ‐ ‐ 206,00 ‐ 544,00 194,00
Polivalentes 338,00 ‐ ‐ 206,00 ‐ 544,00 194,00
TOTAL SAN CIBRAO 338,00 ‐ ‐ 206,00 ‐ 544,00 194,00
TOTAL AUTORIDAD PORTUARIA PORT AUTHORITY
4.180,00 1.354,00 2.059,00 3.071,00 1.666,00 12.330,00 2.088,00
Datos actualizados a 31/12/2020
FERROL ‐ PUERTO EXTERIOR / OUTER HARBOUR
FERROL ‐ PUERTO INTERIOR / INNER HARBOUR
PUERTO SAN CIBRAO / SAN CIBRAO PORT
Empleo / UsedMetros lineales con calado "C" (m) / Linear meters with draft "C" (m)
Totales C<4
Apéndice: Transparencia Activa en la Información. Los datos en detalle.Appendix: Active Transparency in the Information. Data in detail.
10

2.2.2. SUPERFICIES TERRESTRES Y ÁREAS DE DEPÓSITO (m2) / LAND SURFACE AND DEPOSIT AREAS
DESCUBIERTOS UNCOVERED
CUBIERTO‐ABIERTO
COVER‐OPEN
CERRADOS CLOSED
Interior recinto portuario 446.888 9.217 85.692 335.835 877.632
Exterior recinto portuario 18.623 18.623
446.888 9.217 85.692 354.458 896.255
208.725 2.603 211.328
4.684 36 4.720
Subtotal particulares / private 213.409 2.639 216.048
660.297 9.217 85.692 357.097 1.112.303
Interior recinto portuario 166.616 4.374 57.763 53.439 282.192
Exterior recinto portuario 123.378 123.378
166.616 4.374 57.763 176.817 405.570
Interior recinto portuario 33.126 314 2.651 36.091
Exterior recinto portuario 1.659 1.659
Subtotal particulares / private 33.126 314 4.310 37.750
166.616 37.500 58.077 181.127 443.320
80.875 80.875
26.722 26.722
210.101 210.101
42.311 42.311
29.555 29.555
47.485 47.485
86.122 86.122
9.646 9.646
532.817
12.693 12.693
255 255
303 303
696.550 696.550
140.385 140.385
90.739 90.739
128 128
19 19
Subtotal particulares/private 941.072
1.473.889 1.473.889
826.913 46.717 143.769 2.012.113 3.029.512
A Graña e Infraestructura Túnel
A Malata
A Cabana
A Malata
Caranza
Perlío‐Fene
Xubia‐Naron
Cariño
As Pias
Subtotal servicio / public
Particulares / Private
A Cabana
Caranza
Perlío‐Fene
Mugardos
Narón
Cariño
Prior
TOTAL RIA FERROL
TOTAL FERROL
Del servicio Public
RIA DE FERROL / FERROL ESTUARY
Particulares / Private
Muelle
Dique
Del servicio / Public
PUERTO INTERIOR / INNER PORT
TOTAL PUERTO EXTERIOR / OUTER HARBOUR
Subtotal servicio / public
TOTAL PUERTO INTERIOR / INNER HARBOUR
Particulares / Private
TOTAL
Subtotal servicio / public
MUELLE‐ZONA / QUAY‐ZONE
ALMACENES / WAREHOUSES
VIALES / VIALS RESTO / REST
Del servicio / Public
PUERTO FERROL / FERROL PORT
PUERTO EXTERIOR / OUTER HARBOUR
Apéndice: Transparencia Activa en la Información. Los datos en detalle.Appendix: Active Transparency in the Information. Data in detail.
11

DESCUBIERTOS UNCOVERED
CUBIERTO‐ABIERTO
COVER‐OPEN
CERRADOS CLOSED
TOTALMUELLE‐ZONA / QUAY‐ZONE
ALMACENES / WAREHOUSES
VIALES / VIALS RESTO / REST
508 508
27.470 4.664 43.933 319.039 395.106
500 500
27.470 4.664 43.933 319.539 395.606
27.470 4.664 43.933 320.047 396.114
854.383 ‐ 51.381 187.702 2.332.160 3.425.626
Datos actualizados a 31/12/2020
PUERTO DE SAN CIBRAO / SAN CIBRAO PORT
San Cibrao
Isla Pancha
Del servicio / Public
TOTAL SAN CIBRAO
TOTAL AUTORIDAD PORTUARIA
Particulares / Private
Subtotal particulares /private
Apéndice: Transparencia Activa en la Información. Los datos en detalle.Appendix: Active Transparency in the Information. Data in detail.
12

(sin datos / without data )
2.2.4. ESTACIONES MARÍTIMAS /PASSENGER TERMINALS
(sin datos / without data )
CLASE DE INSTALACIÓN / TYPE OF INSTALATION SITUATION / LOCATION SUPERFICIE (m2) / AREA
Lonja / Fish warehouse Muelle espigón 835,59
Usos múltiples / Multiple uses Muelle espigón 320,61
Casetas para industrias de pesca / Stands for fishing industry Muelle espigón 281,39
Total 1.437,59
Datos actualizados a 31/12/2020
2.2.5. INSTALACIONES PESQUERAS /FISHING INSTALATIONS
2.2.3. ALMACENES FRIGORÍFICOS Y FABRICAS DE HIELO COLD STORE AND ICE FACTORY
Apéndice: Transparencia Activa en la Información. Los datos en detalle.Appendix: Active Transparency in the Information. Data in detail.
13

2.2.6. EDIFICACIONES E INSTALACIONES DE USO PÚBLICO /BUILDINGS FOR PUBLIC FACILITIES
SITUACIÓN LOCATION
PROPIETARIO OWNER
USOUSE
CARACTERÍSTICAS CHARACTERISTICS
Acceso APFSC Caseta de control de accesos 1 planta 179,90 m2
Cabo Prioriño APFSC Centro Interpretativo y edificio multiusos 2 ptas, 571,47 m2
Dique de Abrigo APFSC Centro de Coordinación de Servicios 4 ptas, 920,85 m2
Explanada APFSC Centro de Inspección de Mercancías 1 planta. 466,51 m²
Cabo Prioriño APFSC Batería Cabo Prioriño 1 planta. 1.109,41 m²
Cabo Prioriño APFSC Batería Punta Viñas 1 planta 2.393,86 m²
Cabo Prioriño APFSC Centro de Transformación CT10 1 planta. 10,80 m²
Dique de Abrigo APFSC Centro de Transformación CT3 1 planta. 7,57 m²
Dique de Abrigo APFSC Centro de distribución CD3 1 planta. 7,57 m²
Explanada APFSC Centro de distribución CDPCF1 1 planta. 23,62 m²
Explanada APFSC Centro de transformación CT1 1 planta, 11,40 m2
Explanada APFSC Centro de transformacion CT2 1 planta, 9,36 m2
Explanada APFSC Centro de Transformación CT4 1 planta. 9,36 m²
Explanada APFSC Centro de Transformación CT5 1 planta. 10,80 m²
Explanada APFSC Centro de Transformación CT6 1 planta. 12,00 m²
Explanada APFSC Centro de Transformación CT7 1 planta. 12,00 m²
Explanada APFSC Centro de Transformación CT8 1 planta. 12,60 m²
Explanada APFSC Centro de distribución CD1 1 planta. 7,92 m²
Explanada APFSC Centro de distribución CD2 1 planta. 8,88 m²
Explanada APFSCEstructura de Edificio (Antigua concesión a la
Cámara de Comercio)3 plantas. 3975,21 m²
Calle nº 1 Dirección Gral. Marina Mercante Capitanía Marítima 2 plantas, 1.173 m2
Calle nº 1 APFSC Sala Exposiciones 1 planta. 392,00 m2
Calle nº 3 APFSC Oficinas y talleres 1 planta, 247,01 m2
Calle nº 3 APFSC Local social personal APFSC 1 planta. 141,53 m2
Calle nº 4 APFSC Varios y Guardia Civil 3 plantas.953,61m2
Calle Principal APFSC Policía de Fronteras/Oficinas/Aulas de formación 3 ptas. 556,48 m2
Dársena Curuxeiras APFSC Oficinas principales 4 plantas. 839,16 m2
Dársena Curuxeiras APFSC Ampliación de oficinas (en ejecución) 3 plantas. 625 m2
Avda. la Marina APFSC Antiguo edificio de Aduanas 3 plantas. 701 m2
FERROL PUERTO EXTERIOR / OUTER HARBOUR
FERROL PUERTO INTERIOR / INNER HARBOUR
Edificios
Instalaciones
Otros
Patrimonio histórico
Edificios
Apéndice: Transparencia Activa en la Información. Los datos en detalle.Appendix: Active Transparency in the Information. Data in detail.
14

SITUACIÓN LOCATION
PROPIETARIO OWNER
USOUSE
CARACTERÍSTICAS CHARACTERISTICS
Entrada Puerto APFSC Casetas control de acceso (2 Ud) 1 planta. 2x16 m2
Muelle Espigón APFSC Centro de Cordinación de Servicios 3 ptas. 763,37 m2
Calle nº 3 APFSC Talleres 1 planta. 814,11 m2
Calle nº 3 APFSC Garaje 1 planta. 195,13 m2
Calle Principal APFSC Almacén auxiliar del taller 1 planta. 77,93 m2
Muelle Fdez Ladreda APFSC Centro de Transformación nº 1 1 planta. 62,94 m2
Muelle Fdez Ladreda APFSC Centro de Transformación nº 2 1 planta. 26,21 m2
Nuevo Muelle APFSC Centro de Transformación nº 3 1 planta. 22,90 m2
Nuevo Muelle APFSC Centro de Transformación nº 4 1 planta. 37,70 m²
Calle nº 3 APFSC Aparcamiento 585,66 m2
Puerto Ministerio de Hacienda Aduana 40 m2
Datos actualizados a 31/12/2020
2.2.7. DIQUES DE ABRIGO / BREAKWATERS
DENOMINACIÓN/NAME LONGITUD (m)/ LENGTH
Puerto de Ferrol
Dique Virgen de Chamorro
1.067
Puerto de San Cibrao
Dique Norte 935
Dique Sur 1.130
Datos actualizados a 31/12/2020
Dique con manto de protección de dolos y bloques
Dique con manto de protección de dolos y bloques
PUERTO DE SAN CIBRAO / SAN CIBRAO PORT
CARACTERÍSTICAS / CHARACTERISTICS
Dique en talud con manto de protección de bloques
Instalaciones
Otros
Apéndice: Transparencia Activa en la Información. Los datos en detalle.Appendix: Active Transparency in the Information. Data in detail.
15

SEÑALES MARÍTIMAS DE LA RED LITORAL DE LA APFSC / MARITIME SIGNS OF THE COASTAL OF APFSC
Datos actualizados a 31/12/2020
2.2.8. PLANO ESQUEMATICO DE FAROS Y BALIZAS / LIGHTHOUSES AND BEACON PLAN
Apéndice: Transparencia Activa en la Información. Los datos en detalle.Appendix: Active Transparency in the Information. Data in detail.
16

BALIZAMIENTO DEL PUERTO Y RIA DE FERROL / BEACON MAP
Datos actualizados a 31/12/2020
Apéndice: Transparencia Activa en la Información. Los datos en detalle.Appendix: Active Transparency in the Information. Data in detail.
17

2.2.9. RELACIÓN DE FAROS Y BALIZAS / LIGHTHOUSES AND BEACON LIST
NÚMERO NUMBER
NOMBRE Y SITUACIÓN NAME AND LOCATION
TIPO TYPE
COMPETENCIACOMPETENCE
DESCRIPCIÓN DESCRiPTION
COLOR COLOUR
CARACTERÍST CHARACT
ALCANCE SCOPE
2740 Isla Pancha. Faro APFSC Torre cilíndrica blanca, bandas negras Blanca GpD(3+1)B 20s 21
2742 2ª enfilación 205º ant. Enfilación costa APFSC Torre blanca. Rombo rojo Roja RpR 0,6s 3
2742.1 2ª enfilación 205º post Enfilación costa APFSC Soporte rectangular blanco Roja OcR 2s 3
2741 Punta Castrelius Baliza costa APFSC Torre cilíndrica verdeVerde y Blanca
GpD(4)BV 15s 5
2743 Puente de los Santos Pilar de Br. Baliza costa APFSC Pilar del puente. La Br Roja GpD(4)R 11s 4
2743.1 Puente de los Santos Pilar de Er. Baliza costa APFSC Pilar del puente. La Er Verde GpD(2)V 7s 4
2745 Dársena de Porcillan a Er. Portos de Galicia Poste verde sobre columna blanca y verde Verde DV 5s 3
2747 Dársena de Porcillan A Br. Portos de Galicia Poste rojo sobre columna cilíndrica B/R Roja DR 5s 1
2750 Dársena de Mirasol A Er. Portos de Galicia Poste verde sobre columna B/V Verde GpD(2) V 7s 1
2752 Dársena de Mirasol A Br. Portos de Galicia Poste rojo sobre columna cilíndrica B/R Roja GpD(2)R 7s 1
2760 Muelle de Mirasol Extr. N. Portos de Galicia Poste verde sobre columna B/V Verde GpD(3)V 9s 1
2775 Dique extremo Portos de Galicia Torre cilíndrica verde Verde DV 5s 3
2810 Espigon contención de arena. Extr. Portos de Galicia Poste Verde Ct V 1s 3
2812 Dársena Portochico Espigón. Extr. Portos de Galicia Torreta cilíndrica blanca Verde GpD(2) V 7s 1
2814 Dársena Portochico Dique. Extr. Portos de Galicia Poste blanco Roja GpD(2) R 7s 1
2820 Dársena pesquera Dique. Extr. Portos de Galicia Poste blanco Roja GpD(3) R 9s 1
2830 Piedra Burela Baliza costa APFSC Torre negra banda amarilla.Card. E Blanca GpCt (3) B 10 s 10
2840 Dique de abrigo. Extr. Portos de Galicia Columna verde Roja y verde GpD(2) RV 7s 5
2850 Martillo. Extr. Portos de Galicia Torre verde Verde GpD(3)V 9s 3
2850.1 1 Boya a babor Portos de Galicia De espeque. Lateral de babor Roja GpD(3) R 9s 3
2852 Muelle Comercial. Espigón. Extr. Portos de Galicia Torre verde con banda central roja Verde GpD(2+1)V 15s 1
2852.1 2 Boya a babor Portos de Galicia De espeque. Lateral de babor Roja GpD(4) R 11s 1
2855 Contradique. Extr. SE Portos de Galicia Poste rojo blanco Rojo GpD(3)R 9s 1
2857 Martillo. Ang. Interior Portos de Galicia Poste rojo blanco Rojo GpD(4)R 11s 1
2859 Dique. Muelle. Tacón Portos de Galicia Poste verde blanco Verde DV 5s 1
2865 Emisario submarino. boya Acuidoro De castillete. Marca especial Amarilla DA 2s 3
2870 Punta Atalaya Faro APFSC Torreta cilíndrica blanca franja negra Blanca GpD(5)B 20s 20
2880 Luz de dirección Portos de Galicia Torreta blanca. Rombo rojoRoja y blanca
DirCtRB 1s 5
2890 Islote Anxuela. Dique extremo Portos de Galicia Columna blanca con banda verde Verde DV 3s 3
2900 Muelle Angulo Portos de Galicia Columna roja Roja GpD(2)R 7s 3
SAN CIBRAO‐PUERTO PESQUERO
RIA DE RIBADEO
PUERTO DE RIBADEO
PUERTO DE RINLO
RIA DE FOZ‐PUERTO PESQUERO
PUERTO DE BURELA
Apéndice: Transparencia Activa en la Información. Los datos en detalle.Appendix: Active Transparency in the Information. Data in detail.
18

NÚMERO NUMBER
NOMBRE Y SITUACIÓN NAME AND LOCATION
TIPO TYPE
COMPETENCIACOMPETENCE
DESCRIPCIÓN DESCRiPTION
COLOR COLOUR
CARACTERÍST CHARACT
ALCANCE SCOPE
2910 Enfilación canal N203º55’ anterior ALCOA Torre cilíndrica blanca bandas rojas Blanca GpD(2)B 6s 7
2911 Enf.canal N203º55’.P.A 475 ant ALCOA Torre cilindrica blanca bandas rojas Blanca OcB 6s 7
2920 Boya bajo la Baixa ALCOA Card. S Blanca GpCt (6)B+DL 15s 3
2925 Boya al NW ALCOA Card. W. Blanca GpCt(9)B15s 3
2930 Enfilacion canal E273º14’.Anterior ALCOA Torre cilíndrica blanca bandas rojas Blanca GpD(2)B 6s 7
2931Enfil..canal E273º 14’ Post.A275m. de
ant. ALCOA Torre cilindrica blanca bandas rojas Blanca OcB 6s 7
2940 Dique norte extremo ALCOACastillete piramidal sobre prisma
octogonalVerde y blanca
GpD(2)VB 8s 3
2942 Boya Bocana Er. ALCOA Conica lateral exteriorVerde y blanca
DV 4s 5
2945 Dique sur extremo ALCOA Castillete metálico sobre columna gris Roja GpD(3)R 8s 3
2947 Boya Bocana Br. ALCOA Cilíndrica lateral babor Roja DR 4s 5
2955 Boya L‐1 ALCOA De espeque Mc Esp. Amarilla DA 1
2965 Boya L‐5 ALCOA De espeque mc Esp. Amarilla DA 1
2970 Boya Granja Marina ALCOA De espeque mc. Esp. Amarilla Ct A 1
2975 Boya emisario submarino ALCOA De castillete Mc Esp. Amarilla DA 10s 2
2990 Punta Roncadoira Faro APFSC Torre cilíndrica blanca Blanca D8 7,5s 21
3010 Punta de Faro Baliza costa APFSC Torreta roja Roja DR 5s 7
3020 Punta Socastro Baliza costa APFSC Torreta verde Verde DV 5s 7
3030 Punta del Puntal. Dique de abrigo. Extr. Portos de Galicia Columna roja lateral babor Roja GpD(2)R 7s 5
3032 Martillo. Extr. Portos de Galicia Columna roja lateral babor Roja GpD(3)R 9s 1
3034 Muelle Sur. Extr. Portos de Galicia Cilindrica la Er. Ppal Br. Verde GpD(2+1)V 15s 1
3036 Encauzamiento Rio Landrove Portos de Galicia Columna verde lateral estribor Verde GpD(2)V 7s 1
3038 Dique abrigo Extr. Portos de Galicia Columna verde. La Er. Verde GpD(2+1)V 15s 1
03038.5 Bocana. A babor Portos de Galicia Poste rojo Rojo GpD(4)R 11s 1
3040 Boya ODAS 7003 EPPE Lenticular amarilla con superestructura Amarilla Gp Ct (5) A 20s 3
3060 Isla Coelleira Baliza costa APFSC Torre conica de silleria gris Blanca GpD(4)B 16s 7
3065 Puerto de Bares. Extr. Dique Portos de Galicia Punta verde Verde GpD(2)V 7s 3
3070 Punta del Castro Baliza costa APFSC Torre troncoconica blanca Blanca GpD(2)B 7s 5
3080 Punta de la Barra Baliza costa APFSC Torre trococonica blanca B/R/V DBRV 3s 5
3085 Dique Norte Extr. Portos de Galicia Poste rojo sobre torreta B/R Roja GpD(4)R11 s 5
3087 Dique Sur Extr. Portos de Galicia Poste verde sobre tcolumna B/V Verde GpD(4)V 11 s 3
03087.5 Extr. Dique flotante Portos de Galicia Poste metálico rojo Rojo DR 5 s 1
PUERTO DE ALUMINIA ESPAÑOLA
RIA DE VIVERO
PUERTO DE CELEIRO
PUERTO DE VIVEIRO
RIA DEL BARQUERO
PUERTO DE O VICEDO
Apéndice: Transparencia Activa en la Información. Los datos en detalle.Appendix: Active Transparency in the Information. Data in detail.
19

NÚMERO NUMBER
NOMBRE Y SITUACIÓN NAME AND LOCATION
TIPO TYPE
COMPETENCIACOMPETENCE
DESCRIPCIÓN DESCRiPTION
COLOR COLOUR
CARACTERÍST CHARACT
ALCANCE SCOPE
3088 Extr. Dique de abrigo Portos de Galicia Poste metálico rojo Rojo GpD(3)R 9s 5
3089 Contradique. E Portos de Galicia Poste metálico verde Verde GpD(3)V 9s 3
3090 Contradique. W Portos de Galicia Poste metálico verde Verde GpD(4)V 11s 1
3100 Punta Estaca de Bares Faro APFSC Torre octogonal y casa Blanca GpD(2)B 7,5 s 25
3125 Boya Piedras Lixeiras Boya costa APFSC De castillete Card. W Blanca GpCt(9)B 15 s 5
3130 Dique de abrigo. Extr. Portos de Galicia Torreta roja Roja DR 5 s 3
3135 Contradique. Extr. Portos de Galicia Torreta verde Verde DV 5 s 1
3136 Boya Portos de Galicia De espeque. Card. N Blanca Ct 1s 3
3138 Muelle pesquero. Extremo S Portos de Galicia Torreta roja Roja CtR 1s 1
3140 Contradique Extremo Portos de Galicia Torre cilindrica Roja Roja GpD(4)R 11s 3
3142 Dique Abrigo Extremo Portos de Galicia Torre cilindrica verde Verde GpD(4)V 11s 5
3150 Rompeolas. Extr. Portos de Galicia Torre cilíndrica verde y blanca Verde GpD(3)V 9 s 5
3151 Extr. SW Dique Portos de Galicia Poste metálico verde Verde GpD(3)V 9s 3
3153 Ang. N. Muelle Adosado al dique Portos de Galicia Poste metálico verde Verde GpD(4)V 11s 1
3160 Cabo Ortegal Faro APFSC Torre cilíndrica blanca y roja Blanca GpD(2+1)B 15s 18
3170 Punta Candelaria Faro APFSC Torre octogonal y edificio Blanca GpD(3+1)B 24s 21
3190 Punta Promontorio Baliza costa APFSC Torre hexagonal blanca Blanca GpOc(4)B 10s 10
3192 Punta Sarridal Baliza costa APFSC Torre cilíndrica rojaBlanca y
rojaOcBR 6s 10
3195 Piedra de Media Mar Baliza costa APFSC Torre troncónica blanca Blanca GpD(2)B 7s 4
3200 Dique abrigo Extr. Portos de Galicia Torre cilíndrica roja Roja GpD(2)R 7s 5
3201 Muelle adosado dique Portos de Galicia Poste Rojo GpD(3)R 9s 1
3210 Punta de la Frouxeira Faro APFSC Torre prismática de hormigón Blanca GpD(5)B 15s 20
3220 Cabo Prior Faro APFSC Torre hexagonal de sillería y casa Blanca GpD(1+2)B 15s 22
3225 Boya ODAS EPPE Boya Amarilla Amarilla GpCt(5)A 20 s ‐‐
3235 Punta del Castro Baliza costa APFSC Torre hexagonal blanca Blanca GpD(2)B 7s 8
3240 Cabo Prioriño Chico Faro APFSC Torre octogonal blanca y casa Blanca DB 5s 23
03241.5 Boya ODAS EPPE Boya Amarilla Amarilla GpD(5)A 20s 3
3242 Boya de Punta Coitelada Boya costa APFSC De castillete Cardinal WNegro y Amarillo
GpCt(9)B 15s 5
3245 Extr. Dique de Abrigo Baliza interior APFSC Torre roja con caseta Roja DR 5s 7
03245.1 Extr. Martillo Dique Baliaza interior APFSC Torre Roja con caseta Roja GpD(2)R 7s 3
PUERTO DE SANTA MARIA DE ORTIGUEIRA
PUERTO DEL BARQUERO
PUERTO DE ESPASANTE
PUERTO DE CARIÑO
RIA DE CEDEIRA
PUERTO DE CEDEIRA
PUERTO EXTERIOR FERROL
Apéndice: Transparencia Activa en la Información. Los datos en detalle.Appendix: Active Transparency in the Information. Data in detail.
20

NÚMERO NUMBER
NOMBRE Y SITUACIÓN NAME AND LOCATION
TIPO TYPE
COMPETENCIACOMPETENCE
DESCRIPCIÓN DESCRiPTION
COLOR COLOUR
CARACTERÍST CHARACT
ALCANCE SCOPE
3250 Batería San Cristóbal Baliza costa APFSC Torre cuadrangular/ Verde, BlancaBlanca y
rojaFVBR 5
3260Enfil. 085º 25’ Anterior en Punta
S.MartínEnfilación costa APFSC Torre blanca Blanca DB 1,5 s 3
3261Enfil. 085º 25’ Posterior a 701 de la
anteriorEnfilación costa APFSC Torre blanca Blanca OcB 4 s 3
3270 Boya Muela del Segaño Boya costa APFSC De castillete La. Er. Verde DV 2 s 5
3272 Boya de San Carlos Boya costa APFSC De castillete La. Br. Roja GpD(3)R 9s 3
3273 Boya Punta Louridal Boya costa APFSC De castillete La. Br. Roja GpD(4)R 12s 3
3274 Boya de San Martín Boya costa APFSC De castillete La. Er. Verde GpD(2)V 7s 3
3280 Boya de San Felipe Boya costa APFSC De castillete La. Br. Roja DR 5s 3
3290 Boya de la Palma Boya costa APFSC De castillete La. Er. Verde GpD(3)V 9s 3
3300 Castillo de La Palma Baliza costa APFSC Torre de sillería y casa Blanca GpOc(1+2)B 7s 5
3303 Boya de Cetárea Boya costa APFSC De castillete La Br. Roja GpD(3)R9s 3
3305 Boya de Punta Redonda Boya costa APFSC De castillete La. Er. Verde GpD(4)V 12s 3
3310 Boya del Pereiro Boya costa APFSC De castillete La. Br. Roja GpD(2)R 7s 3
3320 Boya del Vispón Boya costa APFSC De castillete La. Br. Roja GpD(4)R 12s 3
3330 Boya rompeolas Punta Piteira Boya costa APFSC De espeque La. Er. Verde DV 5s 3
3335 Dique Muelle Abrigo Extr. E Portos de Galicia Torreta verde y blanca Verde CtV 1s 3
03335.5 Dique flotante. Extremo Portos de Galicia Poste rojo y blanco Roja CtR 1s 1
3337 Muelle de Levante Extr. Portos de Galicia Torreta roja y blanca Rojo CtR 1s 1
3338 Dique flotante. Extremo E Portos de Galicia Poste verde y blanco Verde CtV 1s 1
3340 Muelle del Petróleo amarre NE Defensa Poste metálico Roja GpD(2)R 7s 1
3345 Muelle del Petróleo amarre SW Defensa Poste metálico Roja DR 5s 1
3355 Extr. Espigón Sur Defensa Columna roja Roja GpD(4)R 12s 1
3359 Nuevo Muelle, ángulo SW Baliza interior APFSC Cilíndrica La. Br. Ppal. Er. Roja GpD(2+1)R 12s 3
3360 Nuevo Muelle, ángulo SE Baliza interior APFSC Columna roja Roja DR 5s 1
3363 Muelle F. Ladreda. Extr. Baliza interior APFSC Columna verde Verde DV 5s 3
3364 Boya Punta Leiras Boya costa APFSC De castillete La. Er. Verde CtV 1s 3
3365 Duque de Alba Defensa Pirámide negra y roja Blanca GpD(2)B 7s 1
3375 Muelle Estación Desgasif. Extrem. W Reganosa Poste verde Verde GpD(2)V 7s 1
3385 Pant. Estación Desgasif. Extrem. EForestal del
AtlanticoPoste verde Verde GpD(3)V 7s 1
3395 Muelle Concepción Arenal Baliza interior APFSC Columna roja Roja GpD(2)R 7s 3
3397 Darsena de Curuxeiras. Bocana Er Baliza interior APFSC Columna verde/blanca Verde CtV 1s 1
3398 Darsena de Curuxeiras. Bocana Br Baliza interior APFSC Columna roja/blanca Roja CtR 1s 1
3400 Arsenal en el Asta del Parque Defensa Cilíndrica La. Br. Ppal. Er. Roja GpD(2+1)R 12s 3
3410 Arsenal en la Punta del Martillo Defensa Columna roja Roja DR 5s 1
3420 Dársena nº1 Extremo del Espigón Defensa Columna verde Verde GpD(2)V 7s 1
3425 Muelle exterior. Extremo NW Defensa Columna metálica Verde DV 1s 1
RIA DE FERROL‐CANAL DE ENTRADA
PUERTO DE MUGARDOS
BASE NAVAL DE LA GRAÑA
PUERTO INTERIOR‐ARSENAL MILITAR‐NAVANTIA FERROL‐FORESTAL‐REGANOSA
Apéndice: Transparencia Activa en la Información. Los datos en detalle.Appendix: Active Transparency in the Information. Data in detail.
21
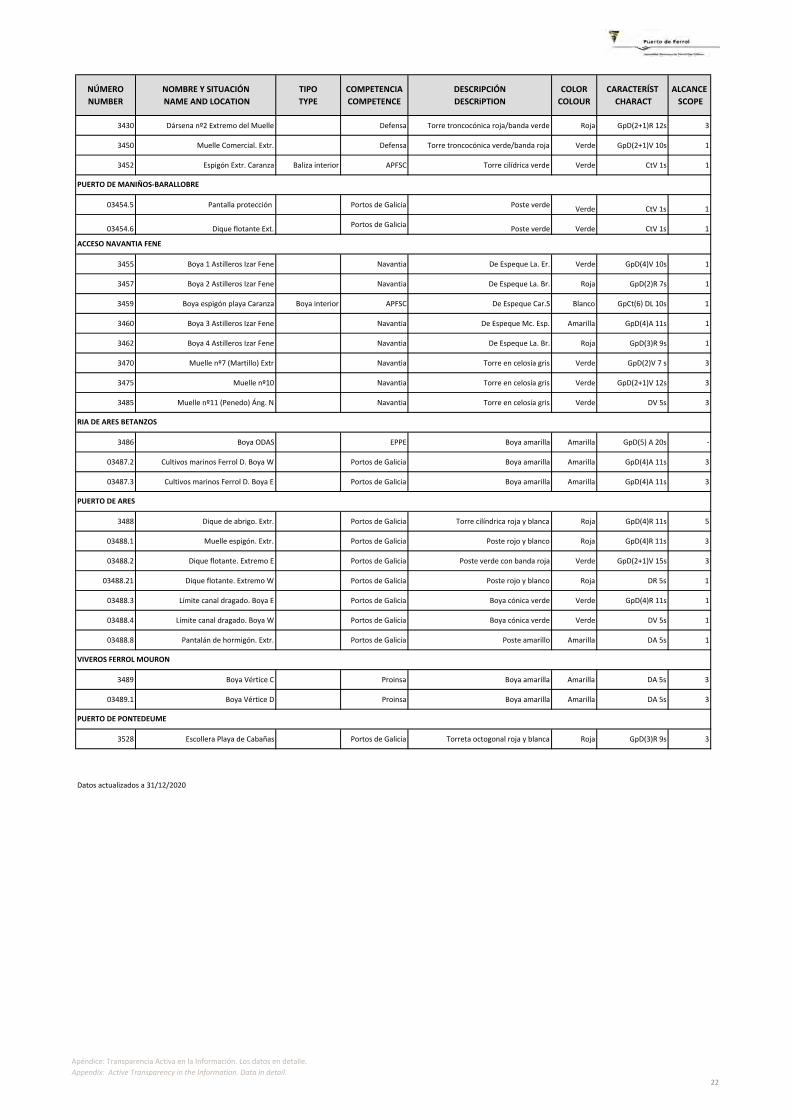
NÚMERO NUMBER
NOMBRE Y SITUACIÓN NAME AND LOCATION
TIPO TYPE
COMPETENCIACOMPETENCE
DESCRIPCIÓN DESCRiPTION
COLOR COLOUR
CARACTERÍST CHARACT
ALCANCE SCOPE
3430 Dársena nº2 Extremo del Muelle Defensa Torre troncocónica roja/banda verde Roja GpD(2+1)R 12s 3
3450 Muelle Comercial. Extr. Defensa Torre troncocónica verde/banda roja Verde GpD(2+1)V 10s 1
3452 Espigón Extr. Caranza Baliza interior APFSC Torre cilídrica verde Verde CtV 1s 1
03454.5 Pantalla protección Portos de Galicia Poste verde Verde CtV 1s 1
03454.6 Dique flotante Ext. Portos de Galicia Poste verde Verde CtV 1s 1
3455 Boya 1 Astilleros Izar Fene Navantia De Espeque La. Er. Verde GpD(4)V 10s 1
3457 Boya 2 Astilleros Izar Fene Navantia De Espeque La. Br. Roja GpD(2)R 7s 1
3459 Boya espigón playa Caranza Boya interior APFSC De Espeque Car.S Blanco GpCt(6) DL 10s 1
3460 Boya 3 Astilleros Izar Fene Navantia De Espeque Mc. Esp. Amarilla GpD(4)A 11s 1
3462 Boya 4 Astilleros Izar Fene Navantia De Espeque La. Br. Roja GpD(3)R 9s 1
3470 Muelle nº7 (Martillo) Extr Navantia Torre en celosía gris Verde GpD(2)V 7 s 3
3475 Muelle nº10 Navantia Torre en celosía gris Verde GpD(2+1)V 12s 3
3485 Muelle nº11 (Penedo) Áng. N Navantia Torre en celosía gris Verde DV 5s 3
3486 Boya ODAS EPPE Boya amarilla Amarilla GpD(5) A 20s ‐
03487.2 Cultivos marinos Ferrol D. Boya W Portos de Galicia Boya amarilla Amarilla GpD(4)A 11s 3
03487.3 Cultivos marinos Ferrol D. Boya E Portos de Galicia Boya amarilla Amarilla GpD(4)A 11s 3
3488 Dique de abrigo. Extr. Portos de Galicia Torre cilíndrica roja y blanca Roja GpD(4)R 11s 5
03488.1 Muelle espigón. Extr. Portos de Galicia Poste rojo y blanco Roja GpD(4)R 11s 3
03488.2 Dique flotante. Extremo E Portos de Galicia Poste verde con banda roja Verde GpD(2+1)V 15s 3
03488.21 Dique flotante. Extremo W Portos de Galicia Poste rojo y blanco Roja DR 5s 1
03488.3 Límite canal dragado. Boya E Portos de Galicia Boya cónica verde Verde GpD(4)R 11s 1
03488.4 Límite canal dragado. Boya W Portos de Galicia Boya cónica verde Verde DV 5s 1
03488.8 Pantalán de hormigón. Extr. Portos de Galicia Poste amarillo Amarilla DA 5s 1
3489 Boya Vértice C Proinsa Boya amarilla Amarilla DA 5s 3
03489.1 Boya Vértice D Proinsa Boya amarilla Amarilla DA 5s 3
3528 Escollera Playa de Cabañas Portos de Galicia Torreta octogonal roja y blanca Roja GpD(3)R 9s 3
ACCESO NAVANTIA FENE
PUERTO DE MANIÑOS‐BARALLOBRE
RIA DE ARES BETANZOS
PUERTO DE ARES
VIVEROS FERROL MOURON
PUERTO DE PONTEDEUME
Datos actualizados a 31/12/2020
Apéndice: Transparencia Activa en la Información. Los datos en detalle.Appendix: Active Transparency in the Information. Data in detail.
22

2.3. SERVICIOS PORTUARIOS (TÉCNICO‐NÁUTICOS) /PORT SERVICES (TECHNICAL‐NAUTICAL)
2.3.1. REMOLQUE DE BUQQUES SHIP TOWING
2.3.2. AMARRE Y DESAMARRE DE BUQUES /MOORING AND UNMOORING OF SHIPS
2.3.3. PRACTICAJE DE BUQUES /PILOTAGE OF SHIPS
(sin contenido / no content)
Apéndice: Transparencia Activa en la Información. Los datos en detalle.Appendix: Active Transparency in the Information. Data in detail.
23

2.4. INSTALACIONES PARA BUQUES / SHIPPING FACILITIES
2.4.1. DIQUES / DOCKS
2.4.1.1. DIQUES SECOS / DRY DOCKS
SITUACIÓN LOCATION
PROPIETARIO OWNER
ESLORA (m)
LENGTH
MANGA (m) BREADTH
CALADO (m)DEPTH
CAPACIDAD DWT
CAPACITYFerrol Navantia, S.A,‐ Ferrol 205,00 27,00 10,99 36.000
Ferrol Navantia, S.A,‐ Ferrol 330,00 51,00 13,87 230.000
Perlío‐Fene Navantia, S.A. ‐ Fene 160,00 26,00 7,50 20.000
Perlío‐Fene Navantia, S.A. ‐ Fene 274,00 36,00 10,50 80.000
Datos actualizados a 31/12/2020
2.4.1.2. DIQUES FLOTANTES / FLOATING DOCKS
( sin movimiento without movement)
2.4.2. VARADEROS / SLIP WAYS
SITUACIÓN LOCATION
PROPIETARIOOWNER
Nº RAMPASNº RAMPS
LONGITUD RAMPA
RAMP LENGTH
ANCHURA (m)WIDTH
PENDIENTE (%)SLOPE
CALADO (m)DEPTH
MAX. TM BUQUEMAX
ADMISIBLEPuerto de FerrolPort of FerrolLa Graña APFSC 1,00 85,00 11,50
Datos actualizados a 31/12/2020
SITUACIÓN LOCATION
PROPIETARIOOWNER
Nº GRADASNº SLIPS
LONGITUD GRADAS
SLIPS LENGTH
ANCHURAWIDTH
Ferrol Navantia, S.A,‐ Ferrol 1 200 34Ferrol Navantia, S.A,‐ Ferrol 1 228 43Ferrol Navantia, S.A,‐ Ferrol 1 287 53Perlío‐Fene Navantia, S.A. ‐ Fene 1 338 58Perlío‐Fene Navantia, S.A. ‐ Fene 1 338 50
Datos actualizados a 31/12/2020
2.4.3. ASTILLEROS (GRADAS) / SHIPYARDS (SLIPWAYS)
Apéndice: Transparencia Activa en la Información. Los datos en detalle.Appendix: Active Transparency in the Information. Data in detail.
24

2.4.4. SERVICIO DE SUMINISTRO A BUQUES / SUPPLY VESSELS SERVICE
CLASE DE SUMINISTRO
TYPE OF SUPPLY
SITUACIÓNLOCATION
Nº DE TOMASPOINTS
CAPACIDAD HORARIA DE CADA TOMA
HOURLY CAP OF POINT
CAPACIDAD HORARIA DEL
MUELLEHOURLY CAP OF
QUAY
SUMINISTRADORSUPPLIER
PUERTO DE FERROL / FERROL PORT
De servicio / Public
Agua Puerto Exterior 37 20t ‐ 30t 80t APFSC
Energía Elec. Puerto Exterior 16 70kw/400v 3.200kw a 400v APFSC
Particulares / Private
Agua Atraque graneles líquidos 1 23t 23t Masol Iberia Biofuel, S.L.
Puerto Interior / Inner harbour
De servicio / Public
Agua Fernandez Ladreda 29 20 t – 30 t 70 t APFSC
Agua Nuevo muelle 7 20 t – 30 t 70 t APFSC
AguaCerramiento Norte F.
Ladreda8 20 t – 30 t 70 t APFSC
Agua Espigón Exterior 9 15 t – 20 t 60 t APFSC
Agua Morro del Espigón 1 15 t – 20 t 60 t APFSC
Agua Muelle Dársena Curuxeiras 18 15 t – 20 t 60 t APFSC
Energía Elect. Espigón Exterior 5 160 kw/400v 3.200 kw a 380 v APFSC
Energía Elect. Fernandez Ladreda 1 160kw/400v 3.200 kw a 380 v APFSC
Energía Elect. Fernandez Ladreda 26 240kw/400v 3.200 kw a 400 v APFSC
Energía Elect. Cerramiento Norte F. Lad 6 240kw/400v 3.200 kw a 380 v APFSC
Particulares / Private
Agua M. Forestal del Atlántico 2 15 t 15 t Forestal del Atlántico S.A.
Fueloil M. Forestal del Atlántico 2 1.000 t 1.000 t Forestal del Atlántico S.A.
GO "B" Muelle Dársena Curuxeiras 1 30.000l 660 l/minRepsol Comercial de Productos
Petrolíferos S.A.GO "A" Muelle Dársena Curuxeiras 1 4.800l 70 l/min
Repsol Comercial de Productos Petrolíferos S.A.
Gna "95" Muelle Dársena Curuxeiras 2 3.300l 45 l/minRepsol Comercial de Productos
Petrolíferos S.A.Agua Muelle Reganosa 1 10t 10t Regasificadora del Noroeste S.A.
Nitrógeno Muelle Reganosa 1 18t 18t Regasificadora del Noroeste S.A.
PUERTO DE SAN CIBRAO / SAN CIBRAO PORT
Agua Muelles 5 30t 100t Alumina Española, S. A.
Datos actualizados a 31/12/2020 a excepción de Alumina y Forestal
Puerto Exterior / Outer harbour
Apéndice: Transparencia Activa en la Información. Los datos en detalle.Appendix: Active Transparency in the Information. Data in detail.
25

2.5. MEDIOS MECÁNICOS DE TIERRA / DOCKSIDE CARGO EQUIPMENT
2.5.1. GRÚAS / CRANES
2.5.1.1. GRÚAS DE MUELLE / DOCKSIDE CRANES
SITUACIÓN LOCATION
PROPIETARIOOWNER
NºTIPOTYPE
MARCAMARK
ENERGÍAENERGY
FUERZA ™
SWL
ALCANCE (m)
REACH
RENDIMIENTO (Tm/H)
CAPACITY
AÑOYEAR
Puerto exterior Endesa 2 Pórtico DFPI+
KonecranesEléctrica 54 45 1500 2008
Puerto exterior Ferrol Container Terminal, S.A. 2 Pórtico Konecranes Eléctrica 60‐70 51 2003
Puerto interior Pérez Torres Marítima, S.L. 2 Portico Macosa 12 25 1996
Puerto interior Pérez Torres Marítima, S.L. 1 Portico Macosa 16 16 1996
Puerto interior Pérez Torres Marítima, S.L. 1 Portico Macosa 16/30 35 1996
8
Datos obtenidos el 01/03/2021 de SIGEIN ‐ Observatorio de servicios portuarios
SITUACIÓN LOCATION
PROPIETARIOOWNER
NºTIPOTYPE
MARCAMARK
ENERGÍAENERGY
FUERZA ™
SWL
ALCANCE (m)
REACH
RENDIMIENTO (Tm/H)
CAPACITY
AÑOYEAR
Puerto Exterior Ferrol Container Terminal, S.A. 4Transtainer RTT/2RxP
Paceco Gasóleo 70t 2003
Puerto Exterior Galigrain, S.A. 1 Mantsinen 90
Puerto Exterior Galigrain, S.A. 1 High lift V55
Puerto Exterior Galigrain, S.A. 1 Volvo V3
Puerto Exterior Greenalia Logistics, S.L.U. 1Senneborgen
870200 20 2015
Puerto Interior Perez Torres Marítima, S.L. 1 LHM500 Liebherr 140 51 2008
Puerto Interior Perez Torres Marítima, S.L. 1 LHM500 Liebherr 144 54 2013
Puerto Interior Perez Torres Marítima, S.L. 1 LHM500 Liebherr 144 54 2015
Puerto InteriorTerminales Marítimas de Galicia
S.L.1 HMK 260 Gotwald
Electrica/gasoleo
100 100 400
Puerto InteriorTerminales Marítimas de Galicia
S.L.1 HMK 4406 Gotwald
Electrica/gasoleo
100 100 400
San Cibrao Perez Torres Marítima, S.L. 1 Gottwald 125 50 2017
14
Datos obtenidos el 01/03/2021 de SIGEIN ‐ Observatorio de servicios portuarios, excepto la situación.
2.5.1.3. NÚMERO DE GRÚAS / NUMBER OF CRANES
TIPO / TYPE SERVICIO / SERVICE PARTICULARES/ PRIVATE TOTAL
Portacontenedor 0 2 2
De pórtico
Hasta 6 Tm 0 0 0
Entre 7 y 12 Tm 0 2 2
Entre 13 y 16 Tm 0 1 1
Mayor de 16 Tm 0 3 3
Total de pórtico 0 6 6
Automóviles 0 14 14Otras grúas 0 0 0TOTAL 0 22 22
Datos obtenidos el 01/03/2021 de SIGEIN ‐ Observatorio de servicios portuarios
2.5.1.2. GRÚAS AUTOMOVILES / MOVIL CRANES
Total
Total Puerto Ferrol + San Cibrao
Apéndice: Transparencia Activa en la Información. Los datos en detalle.Appendix: Active Transparency in the Information. Data in detail.
26

SITUACIÓN / LOCATION PROPIETARIO / OWNER AÑO / YEARCARACTERÍSTICAS / CHARACTERIST
FERROL PUERTO EXTERIOR / OUTER HARBOUR
Concepción Arenal Endesa Generación, S.A. 2009 Cintas transportadoras
Dique Virgen de Chamorro Masol Iberica Biofuel, S.L. 2017 Rack aéreo
Concepción Arenal Masol Iberica Biofuel, S.L. Rack enterrado
Concepción Arenal Procesoil, S.L. 2016 Rack enterrado
FERROL PUERTO INTERIOR / INNER HARBOUR
Fernandez Ladreda Cementos Tudela Veguín S.A. 1965 Descargador cemento
Fernandez Ladreda Cementos Tudela Veguín S.A. 1966 Descargador cemento
Pantalán Forestal del Atlantico S.A. 1977‐2002 Tubería
Pantalán Regasificadora del Noroeste S.A. 2007 Tubería
PUERTO SAN CIBRAO / SAN CIBRAO PORT
Atraque principal Alumina Española, S. A.Descargador sólidos a granel
(bauxita y coque)
Atraque principal Alumina Española, S. A. Manifold descargador de fuel
Atraque principal Alumina Española, S. A.Manifold descargar sosa
caustica
Atraque auxiliar Alumina Española, S. A. Manifold descargador de sosa
Atraque principal Alumina Española, S. A. Cargador alúmina
Atraque auxiliar Alumina Española, S. A. Cargador alúmina
Actualizados datos a 31/12/2020 excepto Alumina y Forestal.
2.5.2. INSTALACIONES ESPECIALES DE CARGA Y DESCARGA /SPECIAL LOADING AND UNLOADING EQUIPMENT
Apéndice: Transparencia Activa en la Información. Los datos en detalle.Appendix: Active Transparency in the Information. Data in detail.
27

CLASE MATERIAL / TYPE PROPIETARIO / OWNER NºENERGIA POWER
CARACTERÍSTICAS CHARACT
CARRETILLA ELEVADORA Autoridad Portuaria Ferrol‐San Cibrao 1 Gasóleo Nissan 2t
BÁSCULA Autoridad Portuaria Ferrol‐San Cibrao 2
DUMPER Autoridad Portuaria Ferrol‐San Cibrao 1 Gasóleo Ausa 200 RM
BÁSCULAS Endesa Generación, S.A. 1 Eléctrica 60tn
CINTA TRANSPORTADORA Endesa Generación, S.A 1 Eléctrica 5400t/h
APILADOR Endesa Generación, S.A 1 Eléctrica 5400t/h
PLATAFORMA ELEVADORA Ferrol Container Terminal, S.A. 2 Gasóleo AD107149
PLATAFORMA ELEVADORA Ferrol Container Terminal, S.A. 2 Gasóleo Carretilla Forklift
REACH‐STACKER Ferrol Container Terminal, S.A. 1
REMOLQUES Ferrol Container Terminal, S.A. 6
ELEVADOR FRONTAL CON PINZAS Galigrain, S.A. 21 Mecánica
MANIPULADOR Greenalia Logistics, S.L.U. 1 Sennenbogen 305
BÁSCULA Pérez Torres Marítima, S.L. 2
REACH‐STACKER Pérez Torres Marítima, S.L. 4
CINTA TRANSPORTADORA Pérez Torres Marítima, S.L. 1
CARRETILLA ELEVADORA Pérez Torres Marítima, S.L. 24
CUCHARAS Pérez Torres Marítima, S.L. 13 Eléctrica
PALA CARGADORA Pérez Torres Marítima, S.L. 21 Mecánica
PANTOGRAFO Pérez Torres Marítima, S.L. 2 Aurano
PANTOGRAFO Pérez Torres Marítima, S.L. 2 Cascade
PULPOS Pérez Torres Marítima, S.L. 8
MANIPULADOR DE PALETS Pérez Torres Marítima, S.L. 1
TOLVA Pérez Torres Marítima, S.L. 2
ELEVADOR FRONTAL CON HORQUILLAS Terminales Marítimas de Galicia S.L. 2 1,6tn y 4tn / H50
CARRETILLA ELEVADORA Terminales Marítimas de Galicia S.L. 4 Gasóleo 0/Hyster 4XL/Hyster H50
CUCHARA ELECTROHIDRAÚLICA Terminales Marítimas de Galicia S.L. 1 Eléctrica Demag 20 m3
PULPO ELECTROHIDRÁULICO Terminales Marítimas de Galicia S.L. 1 Eléctrica Verstegen 13m3
PULPO MECÁNICO Terminales Marítimas de Galicia S.L. 1 Mecánica Verstegen 11m3
BALANCÍN ELEVADOR Terminales Marítimas de Galicia S.L. 1 Teccontainer 110tn
Datos obtenidos el 01/03/2021 de SIGEIN ‐ Observatorio de servicios portuarios
2.5.5. OTRO MATERIAL AUXILIAR / OTHER AUXILIARY EQUIPMENT
CLASE / TYPE PROPIETARIO / OWNER NºENERGIA POWER
CARACTERIST CHARACT
BARREDORA/ASPIRADORA Autoridad Portuaria Ferrol‐San Cibrao 1 Gasóleo Applied 636HS
ASPIRADORAS Galigrain, S.A. 2
BARREDORAS Pérez Torres Marítima, S.L. 2
CAÑON AGUA BTG Pérez Torres Marítima, S.L. 2
CAJON BARREDOR Pérez Torres Marítima, S.L. 1
BARREDORAS Pérez Torres Marítima, S.L. 2
PLATAFORMAS Pérez Torres Marítima, S.L. 7
Datos obtenidos el 01/03/2021 de SIGEIN ‐ Observatorio de servicios portuariosDatos de la APFSC actualizados 31/12/2020
2.5.4. MATERIAL AUXILIAR DE CARGA, DESCARGA Y TRANSPORTE AUXILIAR CARGO HANDLING AND TRANSPORT EQUIPMENT
Apéndice: Transparencia Activa en la Información. Los datos en detalle.Appendix: Active Transparency in the Information. Data in detail.
28

2.6.1. DRAGAS / DREDGERS (sin movimiento / witout movement)
NOMBRE / NAME PROPIETARIO / OWNERENERGÍA POWER
POTENCIA (HP) FORCE
ESLORA (m) LENGHT
MANGA (m) BEAM
PUNTAL (m) DRAUGTH
AÑO YEAR
Ramon Casas Refesa Diesel 5.072,0 27,55 15,25 3,3 2005
Hocho Refesa Diesel 3.300,0 25 4,7 4,7 2000
BizkorRemolcadores del Noroeste, S.A.
Diesel 1.492,7 24 7,91 3,95 1981
Punta Redonda UnoRemolcadores del Noroeste, S.A.
Diesel 3.528,0 23,98 10 4,8 2015
F. SullaRemolques y Navegación,S.A.
Diesel 3.400,0 28,85 8,7 4,8 1993
Ibaizabal 5 Flotanor Diesel 5.200,0 28,8 11 4 2003
Ibaizabal 4 1977Sertosa 19 1979Sertosa 23 1982Sertosa 26 1993
Datos obtenidos el 02/03/2021 de SIGEIN ‐ Observatorio de servicios portuarios
2.6.3. GANGILES, GABARRAS Y BARCAZAS / HOPPERS, LIGTERS AND BARGES(sin información / without information)
2.6.4 GRÚAS FLOTANTES / FLOATING CRANES
(sin información / without information)
2.6.5. OTROS MEDIOS FLOTANTES AUXILIARES DE SERVICIO / OTHER AUXILIARY EQUIPMENT
NOMBRE NAME
PROPIETARIO OWNER
TIPO TYPE
CARACTERÍSTICAS CHARACT
AÑO YEAR
Asunción NievesAutoridad Portuaria Ferrol‐
San CibraoEmbarcació
n motor
Eslora: 8,060 mManga: 2,800 mPuntal: 1,490Arqueo: 7,03 TRB
2004
Datos de la APFSC actualizados a 31/12/2020
2.6. MATERIAL FLOTANTE / FLOATING EQUIPMENT
2.6.2. REMOLCADORES / TUGBOATS
PUERTO FERROL / FERROL PORT
Sertosa Norte, S.L.
PUERTO SAN CIBRAO / SAN CIBRAO PORT
Apéndice: Transparencia Activa en la Información. Los datos en detalle.Appendix: Active Transparency in the Information. Data in detail.
29

2.7. COMUNICACIONES Y PLANOS DEL PUERTO / COMMUNICATIONS AND PLANS OF THE PORT
2.7.1. ACCESOS TERRESTRES Y COMUNICACIONES INTERIORES / LAND ACCESSES AND INTERIOR COMMUNICATIONS
PUERTO DE FERROLAccesos terrestres por carretera y circulación interior
El control de accesos del Puerto Interior de Ferrol se encuentra situado al final del ramal a Ferrol de la AP‐9 (Autopista delAtlántico), autopista que conecta con la A‐6 (Autovía del Noroeste), desde la que a su vez se accede al resto de la red de AltaCapacidad del Estado español y europeo.
El Puerto Exterior de Ferrol se conecta con la red general de Carreteras a través de la N‐655. Tanto a través de la AP‐9 como de la N‐655 existe conexión directa con la AG‐64, y desde esta con la A‐8, que conecta a ambos puertos con el norte de la provincia y de laPenínsula, y permite también su salida hacia Europa.
Desde el punto de vista de la red viaria interior del Puerto, y en el caso del Puerto Interior, el acceso se realiza desde la rotonda enla que finaliza la Autopista AP‐9. Desde el control de accesos el tráfico se organiza desde la rotonda de entrada que la cualdistribuye el tráfico hacia el Nuevo Muelle y la Calle Principal. La Calle Principal discurre paralela al Muelle Fernández Ladreda hastallegar al Muelle del Espigón. De ella parten seis calles en perpendicular que dan acceso a la zona de depósitos, almacenes y muelleFernández Ladreda; el final de la misma da acceso al Muelle del Espigón.
En el caso del Puerto Exterior, el tráfico se distribuye hacia cada una de las distintas fases en las que se organiza éste, 1ª y 2ª fase,desde la rotonda situada al final del viaducto de acceso, la cual se encuentra ubicada en el centro de la instalación portuaria.
Acceso terrestres por ferrocarril y ordenación interior
El acceso ferroviario al Puerto de Ferrol se realiza a través de una línea ferroviaria existentes de ancho ibérico (1.668 mm), aunquetambién se encuentran próximas al puerto infraestructuras en ancho métrico (1.000 mm) como la línea Ferrol‐Oviedo.
En particular, el Puerto Interior de Ferrol dispone de conexión ferroviaria directa en ancho ibérico sin electrificar con la estación deferrocarril de la ciudad. De esta estación parte el ramal Ferrol‐Betanzos, línea de ancho ibérico a través de la cual se conecta elpuerto con el resto de España por vía férrea (línea Madrid‐Coruña por León), y la línea de ancho métrico hasta Asturias.
La red interna de ferrocarril está constituida por dos alineaciones principales; una paralela al cantil del Muelle Fernández Ladreda ya los depósitos y almacenes de la Calle Principal que forman un anillo que da servicio a la rampa ro‐ro instalada en el nudo de uniónentre el Espigón Exterior, a la explanada de servicio del Muelle Fernández Ladreda, a la rampa ro‐ro entrada al extremo norte delMuelle Fernández Ladreda y a las naves de la Calle principal; la segunda de las alineaciones conduce a una terminal ferroviariaubicada en la explanada del Muelle del Cerramiento Norte, destinada a dar servicio a los tráficos de este muelle y del Nuevo Muelle.
PUERTO DE SAN CIBRAOAccesos terrestres por carretera
El acceso por carretera al Puerto de San Cibrao se realiza desde la N‐642 que conecta con la A‐8 desde la que, y hacia el Norte, seaccede al norte de la Península, y hacia al sur conecta con la A‐6 y el centro de la península.
Apéndice: Transparencia Activa en la Información. Los datos en detalle.Appendix: Active Transparency in the Information. Data in detail.
30

PORT OF FERROLLand accesses by road and internal circulationThe access control of the Inland Port of Ferrol is located at the end of the Ferrol branch of the AP‐9 (Atlantic Highway), a highway that connects with the A‐6 (Northwest Highway), from which in turn Access to the rest of the High Capacity network of the Spanish and European State.The Outer Port of Ferrol is connected to the general road network through the N‐655. Both through the AP‐9 and the N‐655 there is a direct connection with the AG‐64, and from this with the A‐8, which connects both ports with the north of the province and the Peninsula, and allows also his departure to Europe.From the point of view of the interior road network of the Port, and in the case of the Interior Port, access is from the roundabout where the AP‐9 Highway ends. From the access control the traffic is organized from the entrance roundabout which distributes the traffic towards the New Pier and the Main Street. The Main Street runs parallel to the Fernández Ladreda Pier until it reaches the Espigón Pier. Six streets depart from it perpendicularly that give access to the Fernández Ladreda warehouse, warehouses and dock area; the end of it gives access to the Pier of the Espigón.In the case of the Outer Port, the traffic is distributed towards each of the different phases in which it is organized, 1st and 2nd phase, from the roundabout located at the end of the access viaduct, which is located in the center of the port facility.
Land access by rail and inland planningRail access to the Port of Ferrol is through an existing Iberian gauge railway line (1,668 mm), although infrastructures in metric gauge (1,000 mm) are also close to the port, such as the Ferrol‐Oviedo line.In particular, the Inland Port of Ferrol has a direct non‐electrified Iberian gauge railway connection with the city's railway station. The Ferrol‐Betanzos branch line, an Iberian gauge line through which the port is connected with the rest of Spain by rail (Madrid‐Coruña line through León), and the metric gauge line to Asturias.The internal railway network is made up of two main alignments; a parallel to the edge of the Fernández Ladreda Pier and the warehouses and warehouses of the Main Street that form a ring that serves the ro‐ro ramp installed at the junction between the Exterior Breakwater, to the service esplanade of the Fernández Ladreda Pier , to the ro‐ro ramp entrance to the north end of the Fernández Ladreda Pier and to the main street warehouses; the second of the alignments leads to a railway terminal located on the esplanade of the North Enclosure Pier, destined to serve the traffic of this pier and the New Pier.
PORT OF SAN CIBRAOLand accesses by roadAccess by road to the Port of San Cibrao is made from the N‐642 that connects with the A‐8 from which, and to the north, you access the north of the Peninsula, and to the south it connects with the A‐6 and the center of the peninsula
Datos actualizados a 31/12/2020
Apéndice: Transparencia Activa en la Información. Los datos en detalle.Appendix: Active Transparency in the Information. Data in detail.
31

2.7.2. PLANO DE COMUNICACIONES INTERNAS / INNER COMUNICATIONS MAP
PUERTO EXTERIOR / OUTER HARBOUR
Datos actualizados a 31/12/2020.
Apéndice: Transparencia Activa en la Información. Los datos en detalle.Appendix: Active Transparency in the Information. Data in detail.
32

PUERTO INTERIOR / INNER HARBOUR
Datos actualizados a 31/12/2020
Apéndice: Transparencia Activa en la Información. Los datos en detalle.Appendix: Active Transparency in the Information. Data in detail.
33

2.7.3. PLANO DE ACCESOS TERRESTRES / LAND ACCES MAP
Fuentes: http://www.adif.es y http://www.mitma.gob.es
Apéndice: Transparencia Activa en la Información. Los datos en detalle.Appendix: Active Transparency in the Information. Data in detail.
34

2.8. BREVE DESCRIPCIÓN DE INSTALACIONES PARA TRÁFICOS ESPECÍFICOS
PUERTO DE FERROL
ENDESA
Endesa cuenta con una Terminal Portuaria de 100.000 m2 apta para la carga/descarga y almacenamiento de graneles sólidos ymercancía general.Las instalaciones cuentan con un sistema automatizado de descarga de graneles sólidos formado por 2 pórticos reversibles decarga/descarga, sistema de cintas y apilador. Además cuenta con una campa de almacenamiento de 60.000 m2, vigilada los 365días del año.Las grúas están diseñadas para buques con capacidad de carga/descarga entre 5.000 y 200.000 T.P.M.Se dispone además de 3 básculas de camiones completamente automatizadas y reversibles para camiones.La campa de almacenamiento dispone de una superficie de 60.000 m2 y es apta para acoger tanto graneles, como diferentestipos de mercancías, incluidas piezas de gran tamaño y bultos.La terminal se haya certificada bajos las normas, UNE‐EN‐ISO 9001, 14001, 45001, reglamento EMAS, Huella de Carbono yResiduo Cero.
MASOL IBERICA BIOFUEL, S.L.
Las instalaciones que Masol posee en su plataforma de atraque concesionada constan de los siguientes equipos principales:‐ Dos brazos de carga/descarga de 10’’ para conexión a buques
‐ Facilidades de envío y recepción de “pig” para las dos líneas de conexión con la plata de producción de biodiesel‐ Un depósito compartimentado para recogida de drenajes y purgas de líneas‐ Instalaciones de botellas B50 de nitrógeno, para purga y barrido de brazos de carga/descarga‐ Instalaciones para protección contra incendios (PCI) con torre de cañón y conexión a manguera Barreras antiderrame, protegidas bajo cubierta plástica.En la interconexión entre la plataforma de atraque y la planta de producción de biodiesel se dispondrán los siguientescomponentes principales:
‐ Dos líneas de 12’’ para descarga de materias primas (aceites), carga de biodiesel, descarga de metanol y carga de glicerina‐ Un tubo conduit de DN200 para cables de instrumentación y control.
FERROL CONTAINER TERMINAL, S.A.Maquinaria específica para la carga y descarga de contenedores a buque, así como su acarreo y ordenación entre cantil de muelley patio de la terminal concesionada:
‐ 2 grúas de muelle STS Post‐Panamax (51 m de alcance), de alimentación eléctrica y capacidad de elevación máxima de 70 T; seprevé que, con el desarrollo total de la terminal, el número de grúas STS aumente, por lo menos, a 5‐ 4 grúas RTG de neumáticos, para el patio de terminal concesionada; se prevé que, con el desarrollo total de la terminal, elnúmero de grúas RTG aumente, por lo menos, a 20‐ otra maquinaria para tránsitos entre muelle y patio, y transportes interiores: 6 conjuntos tractor+remolque (se prevé que, con eldesarrollo total de la terminal, el número de conjuntos tractor+remolque aumente, por lo menos, a 53); y 2 carretillas tipo reach‐stacker.
Apéndice: Transparencia Activa en la Información. Los datos en detalle.Appendix: Active Transparency in the Information. Data in detail.
35

FORESTAL DEL ATLÁNTICOI, S.A.
La carga/descarga de productos químicos e hidrocarburos se realiza en el pantalán de graneles líquidos, siendo la conexión entreel buque y la tubería en tierra, mangueras flexibles de diferentes diámetros, colocadas en una grúa torre de tres toneladas situadaen la plataforma central de dicha pantalán.
La instalación posee las siguientes tuberías para carga / descarga de productos: Colas 6”, Metanol 8”, Gasoil 8”‐10”, Gasolinas 8”,Fuel Oil 24”, Slops 8”, Bunker Gasoil 6”, Bunker Fuel‐Oil 10”, Aire 3”, Agua Potable 2” y Agua P.C.I.4”.
REGASIFICADORA DEL NOROESTE, S.A.
3 brazos para descarga de GNL, con capacidad de 4.000m3/h cada uno; los 3 confluyen en un colector general hacia los 2 tanquesde almacenamiento; cada tanque tiene una capacidad de 150.000 m3.Uno de los 3 brazos de descarga puede actuar también para carga de buque, con una capacidad (limitada por la terminal) de2.000 m3/h.Hay un 4º brazo, para el vapor de boil‐off del buque.
PUERTO DE SAN CIBRAO
ALUMINA ESPAÑOLA, S.A.
Descarga de bauxita y cok de petróleo"Se efectúa en el atraque principal a través de una descargadora móvil con capacidad de descarga de 1.350 t/hora, ycinta transportadora a la nave de bauxita o a los silos de cok. La capacidad de elevación es de 36 t, y el ciclo detrabajo 55 segundos.Se efectúa con grúa móvil la descarga de bauxita de apoyo al pórtico descargador, con capacidad de descarga de 600t/hora." Descarga de líquidosLa descarga de Sosa Caustica en el atraque Principal por medio de un manifold y manguera con conexión de 8”,tubería de 8. También se dispone de otro manifold en el muelle Auxiliar, con línea de 8. Ambas líneas conectan conotra de 16” que van a los tanques de almacenamiento. Carga de alúminaSe realiza en los dos atraques. En el atraque Principal a través de una cargadora móvil con capacidad de carga de1.200 t/hora y en el atraque auxiliar con una cargadora fija de capacidad igual a 600 t/hora para buques especiales.El sistema de transporte se realiza con cintas transportadoras desde los silos de almacenamiento. Carga de hidrato de alúminaSe realiza con camiones a través de una cinta transportadora móvil, siendo el ritmo de carga de 300 t/horaaproximadamente. Carga de aluminioSe realiza en el atraque auxiliar a través de grúa móvil con capacidad máxima de elevación de 10 tm y carretillaselevadoras de diversa capacidades.
Datos actualizados a 31/12/2020 excepto Alumina y Forestal.
Apéndice: Transparencia Activa en la Información. Los datos en detalle.Appendix: Active Transparency in the Information. Data in detail.
36


CODE OWNER DESTINATION DATE SURFICE M2 OCCUPATION RATE ACTIVITY RATE
C‐434Alúmina Española S.A. y Aluminio Español S.A.
Occupation of public domain land in the San Cibrao inlet, ttmm de Cervo and Xove (Lugo) for the operation of a commercial port for loading and unloading of its industry
11/10/1978 382.430 369.336 1.099.149
C‐435Alúmina Española S.A. y Aluminio Español S.A.
Service port of the commercial port granted by Ministerial Order of October 11, 1978
23/01/1987 12.528 34.358 3.998
C‐436‐U Navantia S.A.
Construction and repair of vessels and other floating artifacts, loading and unloading of merchandise at any of its docks, strengthening of repairs and new shipbreaking activity and manufacturing of equipment goods, semi‐heavy machinery and industrial equipment in general.
27/04/2016 694.179 267.060 110.262
C‐442Cementos Tudela Veguín S.A.
Silos for unloading and storage of cement in bulk transported by vessels
30/04/1961 1.024 7.179 1.436
C‐443Cementos Tudela Veguín S.A.
Cement storage and loading station 06/03/1965 1.042 7.306 1.461
C‐444Cementos Tudela Veguín S.A.
Installation of an underground pipelines for the transport of cement in bulk
31/10/1967 171 34
C‐461 Megasa Siderúrgica S.L.
Expansion of MEGASA's steel facility in the _Aytºde Narón_ Ria de Ferrol area for the transport, storage, handling and production of raw materials, steel products and their derivatives
30/12/1994 90.739 36.554 7.311
C‐462‐3Pérez Torres Marítima S.L.
Handling and storage of goods and vehicles for their transit through the Port of Ferrol
29/05/2007 11.398 74.468 42.111
C‐464Pérez Torres Marítima S.L.
Construction of 3 warehouses for storage of goods shipped or unloaded by sea
30/09/1996 6.967 48.697 17.501
C‐468Boteros Amarradores del Noroeste S.L.
Mechanical workshop 15/11/1968 300 1.589 633
C‐493‐1
Regasificadora del Noroeste S.A.
Construction and Operation of a Liquefied Natural Gas Storage and Regasification Plant
14/05/1997 69.626 59.700 742.427
C‐493‐2Forestal del Atlántico S.A.
Reception, storage, handling and dispatch of bulk and general merchandise for the Forestal del Atlántico S.A. activities.
14/05/1997 70.759 85.283 207.218
C‐501 Unif
Pérez Torres Marítima S.L.
Construction of a module for the company's general offices 27/05/2015 252 5.223 4.236
3. WORKS OR ACTIVITIES AUTHORISED TO PRIIVATE COMPANIES
3.1. CONCESIONS
3.1.1. CONCESIONS AWARED PRIOR TO START THE YEAR AND STILL IN EFFECT
Apéndice: Transparencia Activa en la Información. Los datos en detalle.Appendix: Active Transparency in the Information. Data in detail. 1

CODE OWNER DESTINATION DATE SURFICE M2 OCCUPATION RATE ACTIVITY RATE
C‐514 Galicia Textil S.A. Outlets, pump houses and pipelines in Cariño 04/10/2011 128 1.190 840
C‐515Confederación Hidrográfica del Norte
Occupation of areas necessary for the execution of the A Malata Crossing and Impulsion works
07/05/2003 12.531 0 0
C‐521Endesa Generación S.A.
Loading, unloading and storage of coal, as well as other solid bulks used in the combustion processes of thermal power plants (coke, limestone, etc.), and use of auxiliary means for this
18/11/2003 100.472 720.711 144.142
C‐524Unión Fenosa Distribución S.A.
Construction and operation of a medium voltage line in A Graña
27/02/2004 536 107
C‐544R Cable y Telecomunicaciones de Galicia S.A.
Installation and operation of telecommunications networks 14/09/2005 288 127
C‐553 Nedgia Galicia S.A.Buried surfaces affected by the works called "Project for the expansion of gas distribution networks in the municipality of Ferrol: Gas channeling in the Paseo de la Marina
21/12/2005 680 136
C‐555Pérez Torres Marítima S.L.
Construction of an industrial warehouse of 6,060 m2 approx. And a canopy of about 15x50 m (750 m2) along one side for storage and handling of goods and vehicles
21/12/2005 6.766 51.340 31.653
C‐556 Concello de CervoConstruction and Operation of a building for an environmental exhibition area and marine fauna observatory on a parcel located in Punta Atalaya (Cervo)
15/07/2005 148 104 21
C‐563Unión Fenosa Distribución S.A.
Construction and operation of a 132/15 kv electrical substation
28/03/2007 1.018 8.528 3.819
C‐564Unión Fenosa Distribución S.A.
Underground installation of a medium voltage line (Cabana and A Malata)
27/06/2007 953 517
C‐581Telefónica de España S.A.U.
Provision of phone services 26/02/2014 44 1.437 287
C‐584Masol Iberia Biofuel, S.L.
Construction and operation of a biodiesel plant of 300,000 tons per year in the Outer Port of Ferrol
14/11/2007 41.352 358.618 304.896
C‐589Masol Iberia Biofuel, S.L.
Construction and Operation of a berth for loading and unloading liquid bulk for the INFINITA RENOVABLES S.A. biodiesel plant. in the Outer Port of Ferrol and of a pipe rack from the berth to the Plant
04/04/2008 4.684 28.904 5.781
C‐606Vodafone España S.A.U.
Provision of mobile telecommunications services 25/11/2009 49 920 5.569
C‐610Confederación Hidrográfica Miño‐Sil
Electricity supply to the Cabo Prioriño Edar from the Unión Fenosa substation in the outer port of Ferrol
25/11/2009 0 0
Apéndice: Transparencia Activa en la Información. Los datos en detalle.Appendix: Active Transparency in the Information. Data in detail. 2

CODE OWNER DESTINATION DATE SURFICE M2 OCCUPATION RATE ACTIVITY RATE
C‐631 Nedgia Galicia S.A. Natural gas pipeline 13/05/2010 564 113
C‐643Endesa Generación S.A.
Telecommunications tower for service to the Endesa Generación S.A. coal terminal in the outer port of Ferrol
01/12/2010 2 10 20
C‐649Amarradores del Puerto y Ría de Ferrol S.L.
Mooring and unmooring service, wind farm work, mechanical workshop and activities associated with Marpol services; more complementary hygiene and rest activities
01/12/2010 1.366 7.959 10.683
C‐650Ferrol Container Terminal S.L.U.
Container Terminal in the Outer Port of Ferrol 27/07/2011 61.783 255.718 8.970
C‐658 Concello de Ares
Wastewater pumping station for the work "Sanitation actions in the northern area of the Ares estuary and in the southern area of the Ferrol, Fene and Mugardos estuary (A Coruña)"
17/01/2012 2.371 0 0
C‐709Pérez Torres Marítima S.L.
Port operations machinery maintenance 13/06/2013 2.112 18.124 4.349
C‐711Unión Fenosa Distribución S.A.
Electric power supply 27/06/2013 8 87 17
C‐729Sociedad Estatal Aguas de las cuencas de España S.A.
General interceptors for the purification and sanitation system on the right bank of the Ferrol estuary
27/06/2013 333 0 0
C‐738Pérez Torres Marítima S.L.
Solid bulk and general merchandise storage 18/12/2013 4.895 81.760 8.010
C‐756 Procesoil, S.L.Execution of tanks and oily waste treatments, plus auxiliary facilities
26/11/2014 3.000 25.887 30.000
C‐770 Eirobra A Mariña, S.L. Hotel and Cafeteria in Faro Isla Pancha 30/06/2015 500 12.521 2.060
C‐775Repsol Comercial de Productos Petrolíferos S.A.
Fuel supply to professional vessels and recreational boats 29/10/2014 73 992 385
C‐784Aguas de las Cuencas de España, S.A.
Submarine pipeline, corresponding to the works derived from the action "General Interceptors on the right bank of the Ria de Ferrol"
23/07/2014 0 0
C‐801Aguas de las Cuencas de España, S.A.
Execution and operation of a network of general collectors between O Cadaval and the mouth of the Xubia River, which complements the general interceptors for the purification and sanitation system on the right bank of the Ría de Ferrol.
22/07/2015 0 0
C‐814 Navantia S.A.Repair, maintenance and transformation of civil and military vessels
28/09/2016 48.150 106.522
Apéndice: Transparencia Activa en la Información. Los datos en detalle.Appendix: Active Transparency in the Information. Data in detail. 3

CODE OWNER DESTINATION DATE SURFICE M2 OCCUPATION RATE ACTIVITY RATE
C‐815SGS Española de Control, S.A.
Equipment control for sample taking of conveyor belts from the Endesa terminal
30/11/2016 6 53 1.378
C‐819Pérez Torres Marítima S.L.
Company headquarters 30/11/2016 190 1.306 2.541
C‐825Cofradia de Pescadores y Mariscadores
Management and operation of the Ferrol fish and shellfish market
19/07/2017 757 12.826 3.050
C‐836Prácticos del Puerto y Ría de Ferrol
Pilotage service facilities 19/07/2017 134 6.999 738
C‐840
Instituto tecnoloxico para o control do medio mariño de Galicia
Device for measuring currents and waves on the north coast of Galicia
29/05/2018 19 0 0
C‐861 Concello Malata sanitation services 05/04/2018 771 0 0
C‐865 Alvaro Gonzalez Café Bar El Yate 07/03/2018 436 5.923 5.501
C‐874Terminales Maritimos de Galicia, S.L.
Offices and changing rooms ‐ warehouse and maintenance of machinery and its repair
27/02/2019 386 3.115 1.280
1.587.578,22 2.653.128,03 2.921.290,37
Data updated as of 12/31/2020
TOTAL
Apéndice: Transparencia Activa en la Información. Los datos en detalle.Appendix: Active Transparency in the Information. Data in detail. 4

CODE OWNER DESTINATION DATE SURFICE M2 OCCUPATION RATE ACTIVITY RATE
C‐895 Pérez Torres Marítima S.L.Inner port vehicles and merchandise platform weighing scales
29/01/2020 228 5.843 1.478
C‐908 FM Logistic Ibérica, S.L.Carrying out logistics and transport activities and other related activities
26/02/2020 1.534 5.329 0
C‐909 Pérez Torres Marítima S.L.Warehouses, workshops, offices, and
fuel supply depots26/02/2020 714 8.267 16.950
C‐931 Anton Martin Shipping, S.L.Temporary storage of spare parts and materials for vessels calling at the Port of Ferrol.
28/10/2020 210 1.171 734
C‐932 Berge Marítima, S.L.Temporary storage of spare parts and materials for vessels calling at the Port of Ferrol.
25/11/2020 210 727 413
2.896,54 21.337,10 19.575,67
Data updated as of 12/31/2020
3.1.2. CONCESSIONS GRANTED IN 2020
TOTAL
Apéndice: Transparencia Activa en la Información. Los datos en detalle.Appendix: Active Transparency in the Information. Data in detail. 5

CODE OWNER DESTINATION DATE SURFICE M2 OCCUPATION RATEACTIVITY RATE
A‐830 La Gruta Sofdan, S.L.Hostelry services on terrace for ancillary activity to the main establishment
24/01/2017 6,00 47,69 180,62
A‐832 Hosal Vending S.L. Food and beverage trade through vending machines 02/01/2017 6,00 53,39 577,97
A‐881 Begoña López Rodríguez Terrace for hostelry services 08/08/2018 25,00 198,66 361,23
A‐885Cofradía de Pescadores y Mariscadores de Ferrol
Installation and use of the dry dock 20/12/2018 247,00 328,16 142,74
A‐887Pérez Torres Marítima, S.L.
Huts with changing rooms, showers and meetings areas.
28/12/2018 52,00 457,00 1.957,10
A‐889R Cable y Telecomunicaciones Galicia, S.A.U.
Installation and operation of telecommunications networks
31/05/2019235,66
3.680,88
A‐890 Greenalia Logistics, S.L. Storage, handling and processing of forest products 11/01/2019 2.890,00 33.729,68 12.087,20
A‐894 Consellería do Mar Bivalve mollusk troughs 01/03/2019 Exenta Exenta
A‐897Estigal centro de empleo portuario ETT, S.L.
Changing rooms, showers and meetings booths 25/03/2019 28,00 219,16 5.991,46
A‐899Pérez Torres Marítima, S.L.
Merchandise platform weighing scales 23/04/2019 106,00 1.182,68 918,40
A‐911Pérez Torres Marítima, S.L.
Solid bulk storage 31/12/2019 6.132,00 144.206,30 12.216,12
A‐912 Conselleria do MarOffices and warehouse for protection and control works of fishery resources
30/10/2019 130,00 Exenta Exenta
A‐917 Greenalia Logistics, S.L.Installation of a removable scale and two booths for scale service
19/11/2019 164,00 2.172,96 720,00
A‐921Guardia Civil (Comandancia de A Coruña)
Offices and car parks in the Port of Ferrol 26/12/2019 Exenta Exenta
430.609,64 115.570,08
Data updated as of 12/31/2020
3.2. AUTHORIZATIONS
3.2.1. PUBLIC DOMAIN AUTHORIZATIONS
3.2.1.1. PUBLIC DOMAIN AUTHORIZATIONS GRANTED BEFORE START THE YEAR AND STILL IN FORCE
TOTAL
Apéndice: Transparencia Activa en la Información. Los datos en detalle.Appendix: Active Transparency in the Information. Data in detail. 6

CODE OWNER DESTINATION DATE SURFICE M2OCCUPATION
RATEACTIVITY RATE
A‐915‐1 Marco Antonio Fernández BouzaWarehouse of supplies and equipment for fishing and shellfish
01/02/1900 13,55 32,04 13,55
A‐915‐2 Julian Gonzalez LorenzoWarehouse of supplies and equipment for fishing and shellfish
03/04/2020 13,16 28,90 13,55
A‐915‐3 Manuel Rodriguez FreireWarehouse of supplies and equipment for fishing and shellfish
03/04/2020 13,16 28,90 13,55
A‐915‐5 Jesus Varela VazquezWarehouse of supplies and equipment for fishing and shellfish
03/04/2020 13,16 28,90 13,55
A‐915‐6 Jorge Juan Cendan VazquezWarehouse of supplies and equipment for fishing and shellfish
03/04/2020 13,16 28,90 13,55
A‐915‐7Gustavo Adolfo Charcartegui Pérez Castrillón
Warehouse of supplies and equipment for fishing and shellfish
03/04/2020 13,16 28,90 13,55
A‐915‐8 Maria Pilar González LagoWarehouse of supplies and equipment for fishing and shellfish
03/04/2020 13,16 28,90 13,55
A‐915‐9 Ramiro Souto GonzálezWarehouse of supplies and equipment for fishing and shellfish
03/04/2020 14,59 32,04 13,55
A‐915‐10 Virxe do Nordés, S.C.Warehouse of supplies and equipment for fishing and shellfish
03/04/2020 14,51 31,85 13,55
A‐915‐11 José Luís Vázquez PichínWarehouse of supplies and equipment for fishing and shellfish
03/04/2020 14,59 32,04 13,55
A‐915‐12 Rubén Fernández PérezWarehouse of supplies and equipment for fishing and shellfish
03/04/2020 13,16 28,90 13,55
A‐915‐13 Alberto Acevedo PardoWarehouse of supplies and equipment for fishing and shellfish
03/04/2020 13,16 28,90 13,55
A‐915‐14 Jennifer Martínez DíazWarehouse of supplies and equipment for fishing and shellfish
03/04/2020 13,16 28,90 13,55
A‐915‐15 Antonio Aneiros CasteleiroWarehouse of supplies and equipment for fishing and shellfish
03/04/2020 13,16 28,90 13,55
A‐915‐16 José Manuel Díaz PérezWarehouse of supplies and equipment for fishing and shellfish
03/04/2020 13,16 28,90 13,55
A‐915‐17 Miguel Angel Costoya LopezWarehouse of supplies and equipment for fishing and shellfish
03/04/2020 13,16 28,90 13,55
A‐915‐19 Fernando García HermidaWarehouse of supplies and equipment for fishing and shellfish
03/04/2020 14,51 31,85 13,55
A‐922Refesa, Renosa, Sertosa Norte, Remarsa, U.T.E.
Deposit with material for the provision of the Port Service towage.
18/01/2020 112,00 724,40 900,95
A‐923Transportes Adaptados Regionales, S.L.U., Mai tours, S.L.U., Interurbana de autocares, S.A.U. Y
Bus stop in the Port of Ferrol 19/02/2020 115,00 1.127,66 887,37
A‐924 Bosques do Atlántico, S.L.Storage, handling and processing of forest products
19/02/2020 7.010,00 39.549,23 19.520,72
A‐925 Agropesca Fene, S.L. Fishing Items vending machine 18/03/2020 1.5 11,38 280,00
A‐926 Galia Vending 97, S.L. Food and beverage vending machines 23/03/2020 7,00 53,01 648,40
A‐928Boteros Amarradores del Noroeste, S.L.
Office for the port service of mooring and unmooring of vessels
30/04/2020 84,00 2.737,72 1.740,44
A‐929 Bergé Marítima, S.L.Provisional Office for vessels consignment service
29/04/2020 34.85 493,53 534,60
A‐933 Pérez y Cía S.L.Office for the activity exercise of consignment of goods and vessels
21/10/2020 53,00 752,76 751,43
3.2.1.2. PUBLIC DOMAIN AUTHORIZATIONS GRANTED IN 2020 AND STILL IN FORCE
Apéndice: Transparencia Activa en la Información. Los datos en detalle.Appendix: Active Transparency in the Information. Data in detail. 7

CODE OWNER DESTINATION DATE SURFICE M2OCCUPATION
RATEACTIVITY RATE
A‐935 Galigrain, S.A.U.Booths for offices, changing rooms, and fuel tanks in order for port operations and services
02/10/2020 37,00 234,10 341,69
A‐939 Concello de Ferrol Sports area for public use in A Malata 12/07/2020 129.313,00 160.986,33 32.197,27
A‐940 Concello de FerrolSport use area, complementing other existing actions in A Malata
12/07/2020 45.875,00 57.111,87 11.422,37
A‐943 Club do Mar FerrolManagement and Operation of the A Graña and Curuxeiras marinas
17/08/2020 444,00 31.751,36 1.172,37
A‐946 Pérez Torres Marítima, S.L. Auxiliary offices and services 09/10/2020 432,00 2.775,54 3.159,49
A‐951 Club Naútico Barrio de CaranzaManagement and operation of the Caranza marina
05/11/2020 4.195,46 108,16
A‐952 Anton Martin Shipping S.L.Parcel attached to the new dock warehouse for the storage of spare parts and materials for vessels calling to Ferrol
29/12/2020 90,00 123,17 132,20
A‐954 Telefonica Móviles, S.A.Telecommunications sending and receiving center
26/11/2020 10,00 37,80 1.812,95
A‐955 Pérez Torres Marítima, S.L. Wind parts storage 26/11/2020 490,00 608,22 153,35
A‐956 Eulen, S.A. Booths for cleaning tools 17/12/2020 9,00 13,61 94,43
A‐959 Maritima Consiflet, S.A.Office for the activity of consignment of vessels and merchandise
17/12/2020 110,00 372,36 372,68
A‐965 Pérez Torres Marítima, S.L. Wind tube storage 17/12/2020 1.800,00 1.083,41 224,05
215,16 474,77 216,80
Data updated as of 12/31/2020
TOTAL
Apéndice: Transparencia Activa en la Información. Los datos en detalle.Appendix: Active Transparency in the Information. Data in detail. 8

CODE OPERATOR DESTINATION AWARED DATA
A‐702‐SH Sthil Holland S.L. Commercial Service Provision "Ship supplier (chandler)" 02/03/2012
A‐702‐PB Suministros Puerto y Bahía S.L. Commercial Service Provision "Ship supplier (chandler)" 14/05/2014
A‐702‐AL Allforsail, S.L. Commercial Service Provision "Ship supplier (chandler)" 27/04/2012
A‐702‐EM EMS Ship Supply (Spain), S.A. Commercial Service Provision "Ship supplier (chandler)" 27/04/2012
A‐702‐MP Manuel Pena Anllo Commercial Service Provision "Ship supplier (chandler)" 27/04/2012
A‐702‐EC Emilio Castro Luaces Commercial Service Provision "Ship supplier (chandler)" 29/06/2012
A‐702‐SN Suministros Marítimos del Norte, S.L. Commercial Service Provision "Ship supplier (chandler)" 29/06/2012
A‐702‐US United Stores S.L. Commercial Service Provision "Ship supplier (chandler)" 29/06/2012
A‐702‐DT Dino Theo Atlantis MC, S.L. Commercial Service Provision "Ship supplier (chandler)" 13/06/2013
A‐702‐PR Provisur S.L. Commercial Service Provision "Ship supplier (chandler)" 15/11/2012
A‐702‐CP Casa Pepe Vigo S.L. Commercial Service Provision "Ship supplier (chandler)" 13/06/2013
A‐702‐SS Same Suppliers S.L. Commercial Service Provision "Ship supplier (chandler)" 31/07/2013
A‐702‐JLG J. L. Gándara y Cía, S.A. Commercial Service Provision "Ship supplier (chandler)" 31/07/2013
A‐702‐SV Suministros Vigil Marítimos, S.L. Commercial Service Provision "Ship supplier (chandler)" 02/10/2013
A‐702‐SC Ship Chandler Viveiro, S.L. Commercial Service Provision "Ship supplier (chandler)" 05/06/2019
A‐702‐SS Ship&Seaman, S.L Commercial Service Provision "Ship supplier (chandler)" 29/07/2019
A‐720‐AM Antón Martín Shipping S.L. Commercial Service Provision "Shipping agency” 07/05/1993
A‐720‐BM Bergé Marítima S.A. Commercial Service Provision "Shipping agency” 06/11/1995
A‐720‐MC Marítima Consiflet S.A. Commercial Service Provision "Shipping agency” 13/03/2008
A‐720‐F Finisterre Agencia Marítima S.A. Commercial Service Provision "Shipping agency” 11/09/1996
A‐720‐PT Pérez Torres Marítima S.L. Commercial Service Provision "Shipping agency” 07/05/1993
A‐720‐RH Rubine e Hijos S.L. Commercial Service Provision "Shipping agency” 09/11/2005
3.2.2 COMMERCIAL SERVICES AUTHORIZATIONS
3.2.2.1 COMMERCIAL SERVICES AUTHORIZATIONS GRANTED BEFORE START THE YEAR AND STILL IN FORCE
Apéndice: Transparencia Activa en la Información. Los datos en detalle.Appendix: Active Transparency in the Information. Data in detail. 9

CODE OPERATOR DESTINATION AWARED DATA
A‐720‐KL Kaleido Logística S.L. Commercial Service Provision "Shipping agency” 07/05/1993
A‐720‐GR Greenalia Logistics, S.L. Commercial Service Provision "Shipping agency” 24/06/2015
A‐720‐PC Pérez y Cía S.L. Commercial Service Provision "Shipping agency” 14/05/2014
A‐720‐CN Ceferino Nogueira S.A. Commercial Service Provision "Shipping agency” 01/06/2012
A‐720‐MC MacAndrews, S.A.U. Commercial Service Provision "Shipping agency” 29/03/2017
A‐720‐IG Incargo Galicia, S.L. Commercial Service Provision "Shipping agency” 31/05/2017
A‐720‐GT Gabriel Torrente Rodriguez Commercial Service Provision "Shipping agency” 05/04/2018
A‐735‐OC OilchAart UK LTDSupply of Commercial Service Provision, from floating and marine equipment to ships, of petroleum products in the service area of the Port of Ferrol
24/09/2014
A‐736‐O Ozagás Galicia S.LCommercial supply service, from land to ships, of petroleum products
26/11/2014
A‐736‐F Forestal del Atlántico S.A.Commercial supply service, from land to ships, of petroleum products
13/06/2013
A‐736‐CEP Compañía Española de Petróleos S.A.Commercial supply service, from land to ships, of petroleum products
13/06/2013
A‐736‐RCRepsol Comercial de Productos Petrolíferos S.A.
Commercial supply service, from land to ships, of petroleum products
13/06/2013
A‐736‐CL Cepsa Comercial Petróleo S.A.U.Commercial supply service, from land to ships, of petroleum products
13/06/2013
A‐736‐RLRepsol Lubricantes y Especialidades S.A.
Commercial supply service, from land to ships, of petroleum products
27/06/2013
A‐736‐JLC José Luis Comesaña RamiloCommercial supply service, from land to ships, of petroleum products
13/06/2013
A‐736‐VB Viguesa de Bombeos, S.L.Commercial supply service, from land to ships, of petroleum products
13/06/2013
A‐736‐DGDistribuidora Gallega de productos petrolíferos S.L
Commercial supply service, from land to ships, of petroleum products
28/09/2016
A‐736‐GL Galp Energía España S.A.UCommercial supply service, from land to ships, of petroleum products
28/09/2016
A‐736‐ME Marítima del Estrecho Servilog S.LCommercial supply service, from land to ships, of petroleum products
20/12/2018
A‐736‐ED Esergui Disteser S.LCommercial supply service, from land to ships, of petroleum products
29/07/2019
A‐760‐P Pérez Torres Marítima S.L.Commercial intermediation service in the relationship with ship suppliers
30/10/2013
A‐760‐B Bergé Marítima S.A.Commercial intermediation service in the relationship with ship suppliers
30/10/2013
A‐760‐C Marítima Consiflet S.A.Commercial intermediation service in the relationship with ship suppliers
26/02/2014
A‐760‐A Antón Martín Shipping S.L.Commercial intermediation service in the relationship with ship suppliers
18/12/2013
A‐745‐R Rilo Dopico S.LSolid waste collection commercial service on land in outer harbour
27/02/2014
Apéndice: Transparencia Activa en la Información. Los datos en detalle.Appendix: Active Transparency in the Information. Data in detail. 10

CODE OPERATOR DESTINATION AWARED DATA
A‐896 Ferrol Container Terminal S.A.Auxiliary services at the border facilities for the sanitary control of goods in the Port of Ferrol
28/03/2019
Data updated as of 12/31/2020
Apéndice: Transparencia Activa en la Información. Los datos en detalle.Appendix: Active Transparency in the Information. Data in detail. 11

CODE OPERATOR DESTINATION AWARED DATA
A‐702‐SA Horno San Amaro ‐ Paulas, S.L. Ship supplier (chandler) Commercial Service 30/09/2020
Data updated as of 12/31/2020
3.2.2.2. COMMERCIAL SERVICE AUTHORIZATIONS GRANTED IN 2019 AND STILL IN FORCE
Apéndice: Transparencia Activa en la Información. Los datos en detalle.Appendix: Active Transparency in the Information. Data in detail. 12

PORT SERVICE OPERATOR DESTINATION AWARED DATE PORT
Sertosa Norte, S.L. Vessels Mooring and Unmooring Service 27/04/2016 San Cibrao
Amarradores del Puerto y Ría de Ferrol S.L. Vessels Mooring and Unmooring Service 31/05/2017 Ferrol y su Ría
Boteros Amarradores del Noroeste S.L. Vessels Mooring and Unmooring Service 31/05/2017 Ferrol y su Ría
Cyrgasa, S.A. Vessels Mooring and Unmooring Service 27/03/2019 San Cibrao
Marpol Ferrol S.L.Provision of the port reception service for vessels‐generated wastes (liquids: Marpol annexes I; solids: Marpol annex V)
24/09/2014 Ferrol y su Ría
Forestal del Atlántico, S.A.Provision of the port reception service for vessels‐generated wastes (liquids: Marpol annexes I)
08/03/2018 Ferrol y su Ría
Navantia, S.A.Provision of the port reception service for vessels‐generated wastes (liquids: Marpol annexes I & IV]; solids: Marpol annex V & VI)
30/10/2019 Ferrol y su Ría
Galigrain S.A.U. Stowing and unstowing of vessels service 25/11/2020 Ferrol y su Ría
Pérez Torres Marítima S.L. Stowing and unstowing of vessels service 25/11/2020 Ferrol y su Ría
Terminales Marítimos de Galicia S.L. Stowing and unstowing of vessels service 25/11/2020 Ferrol y su Ría
Greenalia Logistics S.L. Stowing and unstowing of vessels service 25/11/2020 Ferrol y su Ría
Endesa Generación, S.A. Stowing and unstowing of vessels service 27/01/2021 Ferrol y su Ría
Ferrol Container terminal S.A Stowing and unstowing of vessels service 29/07/2020 Ferrol y su Ría
Practicos del Puerto y Ría de Ferrol, S.L.P. Pilotage Service Provision 07/12/2010 Ferrol y su Ría
Alumina Española S.A. Pilotage Service Provision 23/12/2015 San Cibrao
U.T.E. “Remolcadores Ferrolanos S.A. (Refesa), Remolcadores del Noroeste S.A. (Renosa), Sertosa Norte S.L. (Sertosa Norte), Remolcadores Marracoi S.A. (Remarsa), Unión Temporal de Empresas Ley18/1982)"
Towing Service 12/01/2009 Ferrol y su Ría
Sertosa Norte, S.L. Towing Service 11/03/2011 San Cibrao
Data obtained on 03/02/2021 from SIGEIN ‐ Observatory of Port Services
To get updated information about service providers, including their contact information, you can do so through the following link to the Permanent Observatory of the Port Services Market, http://observatorio.puertos.es/SitePages/BuscadorLicenses.aspx
Mooring
Waste handling
Merchandise handling
Pilotage
Towing
3.3. LICENSES
3.3.1. LICENSES GRANTED IN FORCE
Apéndice: Transparencia Activa en la Información. Los datos en detalle.Appendix: Active Transparency in the Information. Data in detail. 13

Apéndice 4. Appendix 4
ESTADÍSTICAS DE TRÁFICOTRAFFIC STATISTICS
Transparencia activa de la información. Los datos en detalle.
Active transparency in the information. Data in detail


EJERCICIO 2020
CABOTAJE /
DOMESTIC
EXTERIOR /
FOREIGNINTERIOR TOTAL
Embarcados / Embarked 4.772 4.772
Desembarcados / Disembarked 0
En tránsito / In Transit 0
Total 4.772 4.772
En tránsito / In Transit 3.027
Inicio de línea / Starting a cruise 1
Fin de línea / Ending a cruise 12
Total 3.040
0
Total 0
Total 4.772 7.812
OTROS PASAJEROS
4.1 TRÁFICO DE PASAJE / PASSENGER TRAFFIC
4.1.1 PASAJEROS / PASSENGERS
4.1.1.1 PASAJEROS, NÚMERO / PASSENGERS, NUMBER
EN RÉGIMEN DE TRANSPORTE / SHIPPING LINES
DE CRUCERO / CRUISE
AUTORIDAD PORTUARIA DE FERROL-SAN CIBRAO
Apéndice: Transparencia activa de la información. Los datos en detalle.
Apendix: Active transparency in information. Data in detail.
Datos actualizados a 31/12/2020
1

FERROL EJERCICIO 2020
CABOTAJE /
DOMESTIC
EXTERIOR /
FOREIGNINTERIOR TOTAL
Embarcados / Embarked 4.772 4.772
Desembarcados /
Disembarked0
En tránsito / In Transit 0
Total 4.772 4.772
En tránsito / In Transit 3.027
Inicio de línea / Starting a
cruise1
Fin de línea / Ending a cruise 12
Total 3.040
0
Total 0
Total 4.772 7.812
OTROS PASAJEROS
4.1 TRÁFICO DE PASAJE / PASSENGER TRAFFIC
4.1.1 PASAJEROS / PASSENGERS
4.1.1.1 PASAJEROS, NÚMERO / PASSENGERS, NUMBER
EN RÉGIMEN DE TRANSPORTE / SHIPPING LINES
DE CRUCERO / CRUISE
Apéndice: Transparencia activa de la información. Los datos en detalle.
Apendix: Active transparency in information. Data in detail.Datos actualizados a 31/12/2020
2
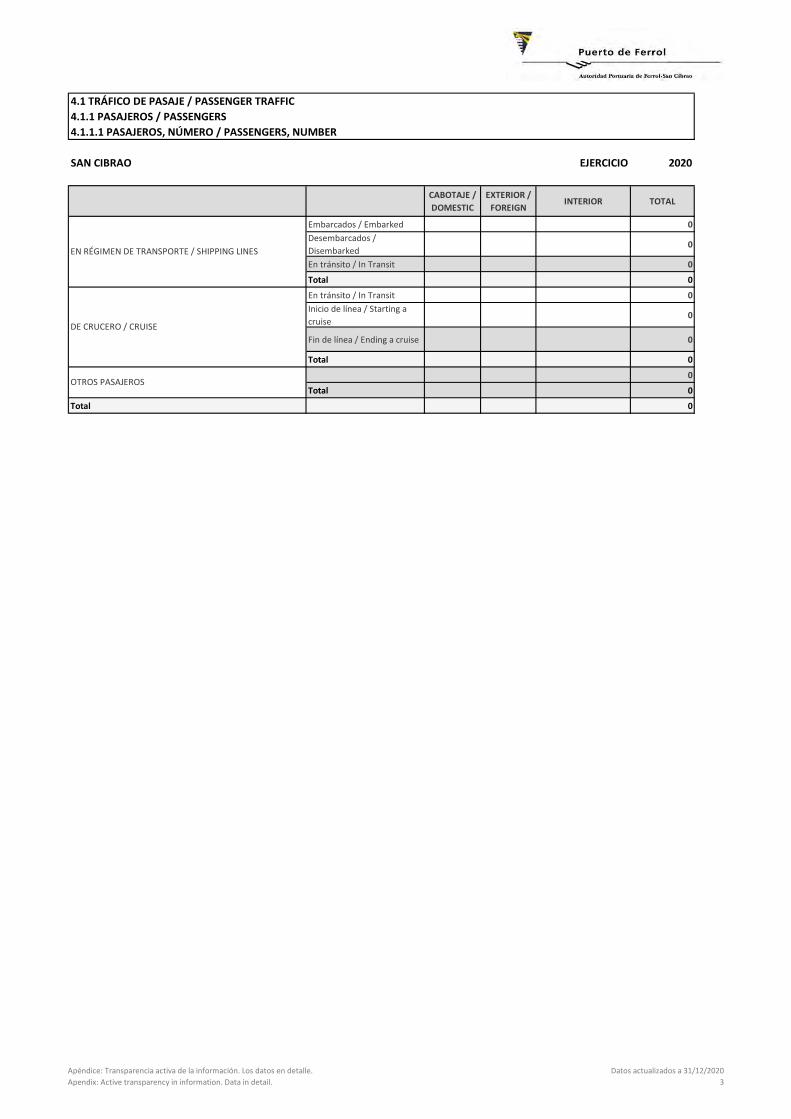
SAN CIBRAO EJERCICIO 2020
CABOTAJE /
DOMESTIC
EXTERIOR /
FOREIGNINTERIOR TOTAL
Embarcados / Embarked 0
Desembarcados /
Disembarked0
En tránsito / In Transit 0
Total 0
En tránsito / In Transit 0
Inicio de línea / Starting a
cruise0
Fin de línea / Ending a cruise 0
Total 0
0
Total 0
Total 0
OTROS PASAJEROS
4.1 TRÁFICO DE PASAJE / PASSENGER TRAFFIC
4.1.1 PASAJEROS / PASSENGERS
4.1.1.1 PASAJEROS, NÚMERO / PASSENGERS, NUMBER
EN RÉGIMEN DE TRANSPORTE / SHIPPING LINES
DE CRUCERO / CRUISE
Apéndice: Transparencia activa de la información. Los datos en detalle.
Apendix: Active transparency in information. Data in detail.
Datos actualizados a 31/12/2020
3

2020
TOTAL
PUERTO DE EMBARQUE Y
DESEMBARQUE / PORT OF ORIGIN
AND DESTINATION
EMBARCADOS / EMBARKED
DESEMBARCA
DOS /
DISEMBARKED
EMBARCADOS /
EMBARKED
DESEMBARCA
DOS /
DISEMBARKED
0 0 0 0 0
Total 0 0 0 0 0
4.1.1.2 PASAJEROS DE LÍNEA REGULAR, NÚMERO, PUERTOS DE ORIGEN Y DESTINO /
PASSENGERS OF REGULAR SHIPPING LINES, NUMBER, PORTS OF ORIGIN AND DESTINATION
CABOTAJE / DOMESTIC EXTERIOR / FOREIGN
AUTORIDAD PORTUARIA DE FERROL-SAN CIBRAO EJERCICIO
Apéndice: Transparencia activa de la información. Los datos en detalle.
Apendix: Active transparency in information. Data in detail.
Datos actualizados a 31/12/2020
4

FERROL EJERCICIO 2020
TOTAL
PUERTO DE EMBARQUE Y DESEMBARQUE / PORT OF ORIGIN AND
DESTINATION
EMBARCADOS /
EMBARKED
DESEMBARCAD
OS /
DISEMBARKED
EMBARCADOS /
EMBARKED
DESEMBARCA
DOS /
DISEMBARKED
0 0 0 0 0
Total 0 0 0 0 0
4.1.1.2 PASAJEROS DE LÍNEA REGULAR, NÚMERO, PUERTOS DE ORIGEN Y DESTINO /
PASSENGERS OF REGULAR SHIPPING LINES, NUMBER, PORTS OF ORIGIN AND DESTINATION
CABOTAJE / DOMESTIC EXTERIOR / FOREIGN
Apéndice: Transparencia activa de la información. Los datos en detalle.
Apendix: Active transparency in information. Data in detail.
Datos actualizados a 31/12/2020
5

SAN CIBRAO EJERCICIO 2020
TOTAL
PUERTO DE EMBARQUE Y DESEMBARQUE / PORT OF ORIGIN
AND DESTINATION
EMBARCADOS /
EMBARKED
DESEMBARCA
DOS /
DISEMBARKED
EMBARCADOS /
EMBARKED
DESEMBARCA
DOS /
DISEMBARKED
0 0 0 0 0
Total 0 0 0 0 0
4.1.1.2 PASAJEROS DE LÍNEA REGULAR, NÚMERO, PUERTOS DE ORIGEN Y DESTINO /
PASSENGERS OF REGULAR SHIPPING LINES, NUMBER, PORTS OF ORIGIN AND DESTINATION
CABOTAJE / DOMESTIC EXTERIOR / FOREIGN
Apéndice: Transparencia activa de la información. Los datos en detalle.
Apendix: Active transparency in information. Data in detail.
Datos actualizados a 31/12/2020
6

EJERCICIO 2020
TIPO DE VEHÍCULO / TYPE OF VEHICLE EMBARCADOS /
EMBARKED
DESEMBARCA
DOS /
DISEMBARKED
TOTAL
MOTOCICLETAS / MOTORCYCLES (0004) 0 0 0
COCHES / CARS (0005 y 0005L) 0 0 0
FURGONETAS / VANS (0006) 0 0 0
AUTOBUSES / BUSES (0007 y 0008) 0 0 0
Total 0 0 0
MOTOCICLETAS / MOTORCYCLES (0004) 0 0 0
COCHES / CARS (0005 y 0005L) 0 0 0
FURGONETAS / VANS (0006) 0 0 0
AUTOBUSES / BUSES (0007 y 0008) 0 0 0
Total 0 0 0
Total 0 0 0
4.1.2 AUTOMÓVILES EN RÉGIMEN PASAJE. NÚMERO DE UNIDADES /
AUTOMOBILES WITH PASSENGERS, NUMBER OF VEHICLES
CABOTAJE / DOMESTIC
EXTERIOR / FOREIGN
AUTORIDAD PORTUARIA DE FERROL-SAN CIBRAO
Apéndice: Transparencia activa de la información. Los datos en detalle.
Apendix: Active transparency in information. Data in detail.
Datos actualizados a 31/12/2020
7

FERROL EJERCICIO 2020
TIPO DE VEHÍCULO / TYPE OF VEHICLE EMBARCADOS /
EMBARKED
DESEMBARCA
DOS /
DISEMBARKED
TOTAL
MOTOCICLETAS / MOTORCYCLES (0004) 0 0 0
COCHES / CARS (0005 y 0005L) 0 0 0
FURGONETAS / VANS (0006) 0 0 0
AUTOBUSES / BUSES (0007 y 0008) 0 0 0
Total 0 0 0
MOTOCICLETAS / MOTORCYCLES (0004) 0 0 0
COCHES / CARS (0005 y 0005L) 0 0 0
FURGONETAS / VANS (0006) 0 0 0
AUTOBUSES / BUSES (0007 y 0008) 0 0 0
Total 0 0 0
Total 0 0 0
4.1.2 AUTOMÓVILES EN RÉGIMEN PASAJE. NÚMERO DE UNIDADES /
AUTOMOBILES WITH PASSENGERS, NUMBER OF VEHICLES
CABOTAJE /
DOMESTIC
EXTERIOR /
FOREIGN
Apéndice: Transparencia activa de la información. Los datos en detalle.
Apendix: Active transparency in information. Data in detail.
Datos actualizados a 31/12/2020
8

SAN CIBRAO EJERCICIO 2020
TIPO DE VEHÍCULO / TYPE OF VEHICLE EMBARCADOS /
EMBARKED
DESEMBARCA
DOS /
DISEMBARKED
TOTAL
MOTOCICLETAS / MOTORCYCLES (0004) 0 0 0
COCHES / CARS (0005 y 0005L) 0 0 0
FURGONETAS / VANS (0006) 0 0 0
AUTOBUSES / BUSES (0007 y 0008) 0 0 0
Total 0 0 0
MOTOCICLETAS / MOTORCYCLES (0004) 0 0 0
COCHES / CARS (0005 y 0005L) 0 0 0
FURGONETAS / VANS (0006) 0 0 0
AUTOBUSES / BUSES (0007 y 0008) 0 0 0
Total 0 0 0
Total 0 0 0
4.1.2 AUTOMÓVILES EN RÉGIMEN PASAJE. NÚMERO DE UNIDADES /
AUTOMOBILES WITH PASSENGERS, NUMBER OF VEHICLES
CABOTAJE /
DOMESTIC
EXTERIOR /
FOREIGN
Apéndice: Transparencia activa de la información. Los datos en detalle.
Apendix: Active transparency in information. Data in detail.
Datos actualizados a 31/12/2020
9

AUTORIDAD PORTUARIA DE FERROL-SAN CIBRAO EJERCICIO 2020
Hasta 3.000
G.T. / Up to
3.000 G.T.
De 3.001 a
5.000 G.T. /
From 3.001 to
5.000 G.T.
De 5.001 a
10.000 G.T. /
From 5.001 to
10.000 G.T.
De 10.001 a
25.000 G.T. /
From 10.001 to
25.000 G.T.
De 25.001 a
50.000 G.T. /
From 25.001 to
50.000 G.T.
Más de 50.000
G.T. / More
than 50.000
G.T.
TOTAL
Número /
Number21 11 1 1 0 2 36
G.T. / G.T. 26.448 43.935 8.973 21.682 0 185.657 286.695
Número /
Number290 132 223 165 118 38 966
G.T. / G.T. 706.280 487.096 1.734.292 2.408.810 4.532.041 4.098.580 13.967.099
Número /
Number 311 143 224 166 118 40 1.002
G.T. / G.T. 732.729 531.031 1.743.265 2.430.492 4.532.041 4.284.237 14.253.795
Número /
Number31,04 % 14,27 % 22,36 % 16,57 % 11,78 % 3,99 % 100,00 %
G.T. / G.T. 5,14 % 3,73 % 12,23 % 17,05 % 31,80 % 30,06 % 100,00 %
% sobre el total
ESPAÑOLES / SPANISH
EXTRANJEROS / FOREIGN
Total
4.2 BUQUES / VESSELS
4.2.1 BUQUES MERCANTES / MERCHANT SHIPS
4.2.1.1 DISTRIBUCIÓN POR TONELAJE / DISTRIBUTION BY TONNAGE
Apéndice: Transparencia activa de la información. Los datos en detalle.
Apendix: Active transparency in information. Data in detail.
Datos actualizados a 31/12/2020
10

FERROL EJERCICIO 2020
Hasta 3.000
G.T. / Up to
3.000 G.T.
De 3.001 a
5.000 G.T. /
From 3.001 to
5.000 G.T.
De 5.001 a
10.000 G.T. /
From 5.001 to
10.000 G.T.
De 10.001 a
25.000 G.T. /
From 10.001 to
25.000 G.T.
De 25.001 a
50.000 G.T. /
From 25.001 to
50.000 G.T.
Más de 50.000
G.T. / More
than 50.000
G.T.
TOTAL
Número /
Number19 11 1 1 0 2 34
G.T. / G.T. 23.581 43.935 8.973 21.682 0 185.657 283.828
Número /
Number143 114 174 141 40 38 650
G.T. / G.T. 343.205 424.435 1.357.052 2.061.920 1.309.104 4.098.580 9.594.296
Número /
Number 162 125 175 142 40 40 684
G.T. / G.T. 366.787 468.370 1.366.025 2.083.602 1.309.104 4.284.237 9.878.125
Número /
Number23,68 % 18,27 % 25,58 % 20,76 % 5,85 % 5,85 % 100,00 %
G.T. / G.T. 3,71 % 4,74 % 13,83 % 21,09 % 13,25 % 43,37 % 100,00 %
% sobre el total
ESPAÑOLES / SPANISH
EXTRANJEROS / FOREIGN
Total
4.2 BUQUES / VESSELS
4.2.1.1 DISTRIBUCIÓN POR TONELAJE / DISTRIBUTION BY TONNAGE
4.2.1 BUQUES MERCANTES / MERCHANT SHIPS
Apéndice: Transparencia activa de la información. Los datos en detalle.
Apendix: Active transparency in information. Data in detail.
Datos actualizados a 31/12/2020
11

SAN CIBRAO EJERCICIO 2020
Hasta 3.000
G.T. / Up to
3.000 G.T.
De 3.001 a
5.000 G.T. /
From 3.001 to
5.000 G.T.
De 5.001 a
10.000 G.T. /
From 5.001 to
10.000 G.T.
De 10.001 a
25.000 G.T. /
From 10.001 to
25.000 G.T.
De 25.001 a
50.000 G.T. /
From 25.001 to
50.000 G.T.
Más de 50.000
G.T. / More
than 50.000
G.T.
TOTAL
Número /
Number2 0 0 0 0 0 2
G.T. / G.T. 2.867 0 0 0 0 0 2.867
Número /
Number147 18 49 24 78 0 316
G.T. / G.T. 363.075 62.661 377.240 346.890 3.222.937 0 4.372.803
Número /
Number 149 18 49 24 78 0 318
G.T. / G.T. 365.942 62.661 377.240 346.890 3.222.937 0 4.375.670
Número /
Number46,86 % 5,66 % 15,41 % 7,55 % 24,53 % 0,00 % 100,00 %
G.T. / G.T. 8,36 % 1,43 % 8,62 % 7,93 % 73,66 % 0,00 % 100,00 %
% sobre el total
ESPAÑOLES / SPANISH
EXTRANJEROS / FOREIGN
Total
4.2 BUQUES / VESSELS
4.2.1 BUQUES MERCANTES / MERCHANT SHIPS
4.2.1.1 DISTRIBUCIÓN POR TONELAJE / DISTRIBUTION BY TONNAGE
Apéndice: Transparencia activa de la información. Los datos en detalle.
Apendix: Active transparency in information. Data in detail.
Datos actualizados a 31/12/2020
12

EJERCICIO 2020
BANDERAS / FLAGS Número / Number G.T. / G.T.
ALEMANIA 17 115.456
ANTIGUA Y BARBUDA 158 1.083.074
BARBADOS 39 106.786
BELGICA 4 297.268
BERMUDAS 3 328.314
CHINA 2 66.335
CHIPRE 127 1.399.303
CROACIA 1 30.638
DINAMARCA 7 84.120
ESPAÑA 36 286.695
FILIPINAS 3 131.904
FINLANDIA 3 15.731
FRANCIA 3 558
GIBRALTAR 19 64.442
GRAN BAHAMAS 28 737.942
GRECIA 13 790.407
HOLANDA 144 981.290
HONG KONG 14 644.747
INDONESIA 1 25.507
IRAN 3 29.997
IRLANDA 21 138.359
IS. MARSHALL 39 1.196.035
ISLA DE MAN 4 133.516
ISLAS COOK 1 7.000
ITALIA 3 79.160
JAPON 4 185.312
LETONIA 3 6.492
LIBANO 1 22.863
LIBERIA 43 1.036.607
LITUANIA 3 11.478
LUXEMBURGO 1 3.500
MALTA 107 937.937
NORUEGA 13 382.494
PANAMA 37 1.232.358
PORTUGAL 20 166.486
REINO UNIDO 28 220.025
RUSIA 3 56.876
S.VICENTE Y GRANADINA 1 1.307
SINGAPUR 26 1.076.844
SRI LANKA 1 9.772
SUECIA 10 100.142
TURQUIA 8 28.718
Total 1.002 14.253.795
AUTORIDAD PORTUARIA DE FERROL-SAN CIBRAO
4.2.1.2 DISTRIBUCIÓN POR BANDERA / DISTRIBUTION BY FLAG
Apéndice: Transparencia activa de la información. Los datos en detalle.
Apendix: Active transparency in information. Data in detail.
Datos actualizados a 31/12/2020
13

FERROL EJERCICIO 2020
BANDERAS / FLAGS Número / Number G.T. / G.T.
ALEMANIA 16 112.460
ANTIGUA Y BARBUDA 135 1.010.533
BARBADOS 7 18.345
BELGICA 4 297.268
BERMUDAS 3 328.314
CHINA 1 25.443
CHIPRE 111 1.316.920
CROACIA 1 30.638
DINAMARCA 7 84.120
ESPAÑA 34 283.828
FINLANDIA 3 15.731
FRANCIA 3 558
GIBRALTAR 17 59.473
GRAN BAHAMAS 10 700.210
GRECIA 10 660.290
HOLANDA 82 514.957
HONG KONG 8 387.739
INDONESIA 1 25.507
IRLANDA 7 20.819
IS. MARSHALL 26 666.335
ISLA DE MAN 2 46.425
ISLAS COOK 1 7.000
ITALIA 3 79.160
JAPON 4 185.312
LIBANO 1 22.863
LIBERIA 20 264.293
LITUANIA 3 11.478
LUXEMBURGO 1 3.500
MALTA 57 524.945
NORUEGA 13 382.494
PANAMA 14 440.462
PORTUGAL 19 164.049
REINO UNIDO 24 207.062
RUSIA 3 56.876
S.VICENTE Y GRANADINA 1 1.307
SINGAPUR 15 788.739
SRI LANKA 1 9.772
SUECIA 10 100.142
TURQUIA 6 22.758
Total 684 9.878.125
4.2.1.2 DISTRIBUCIÓN POR BANDERA / DISTRIBUTION BY FLAG
Apéndice: Transparencia activa de la información. Los datos en detalle.
Apendix: Active transparency in information. Data in detail.
Datos actualizados a 31/12/2020
14

SAN CIBRAO EJERCICIO 2020
BANDERAS / FLAGS Número / Number G.T. / G.T.
ALEMANIA 1 2.996
ANTIGUA Y BARBUDA 23 72.541
BARBADOS 32 88.441
CHINA 1 40.892
CHIPRE 16 82.383
ESPAÑA 2 2.867
FILIPINAS 3 131.904
GIBRALTAR 2 4.969
GRAN BAHAMAS 18 37.732
GRECIA 3 130.117
HOLANDA 62 466.333
HONG KONG 6 257.008
IRAN 3 29.997
IRLANDA 14 117.540
IS. MARSHALL 13 529.700
ISLA DE MAN 2 87.091
LETONIA 3 6.492
LIBERIA 23 772.314
MALTA 50 412.992
PANAMA 23 791.896
PORTUGAL 1 2.437
REINO UNIDO 4 12.963
SINGAPUR 11 288.105
TURQUIA 2 5.960
Total 318 4.375.670
4.2.1.2 DISTRIBUCIÓN POR BANDERA / DISTRIBUTION BY FLAG
Apéndice: Transparencia activa de la información. Los datos en detalle.
Apendix: Active transparency in information. Data in detail.
Datos actualizados a 31/12/2020
15

AUTORIDAD PORTUARIA DE FERROL-SAN CIBRAO EJERCICIO 2020
TIPO DE BUQUES / TYPE OF VESSELS Número /
NumberG.T. / G.T.
Número /
NumberG.T. / G.T.
Número /
Number G.T. / G.T.
Graneleros
líquidos -
Tankes
5 211.739 187 6.047.015 192 6.258.754
Total 5 211.739 187 6.047.015 192 6.258.754
Graneleros
solidos7 28.207 131 3.123.316 138 3.151.523
Total 7 28.207 131 3.123.316 138 3.151.523
Carga General 8 27.184 472 2.931.948 480 2.959.132
Transportes
Especializados0 0 1 2.875 1 2.875
Total 8 27.184 473 2.934.823 481 2.962.007
RO-RO
Mercancías0 0 26 260.535 26 260.535
RO-RO Mixtos 1 8.973 1 18.189 2 27.162
RO-RO Pasaje 0 0 0 0 0 0
Total 1 8.973 27 278.724 28 287.697
Pasaje Crucero 0 0 2 129.423 2 129.423
Pasaje Rápido 0 0 0 0 0 0
Pasaje Otros
Buques0 0 0 0 0 0
Total 0 0 2 129.423 2 129.423
Portacontenedo
res0 0 129 1.300.080 129 1.300.080
Total 0 0 129 1.300.080 129 1.300.080
Pesqueros de
altura
congeladores
0 0 4 908 4 908
Otros Buques 15 10.592 13 152.811 28 163.403
DESCONOCIDO 0 0 0 0 0 0
Total 15 10.592 17 153.718 32 164.311
Total 36 286.695 966 13.967.099 1.002 14.253.795
OTROS BUQUES MERCANTES / OTHER
MERCHANT SHIPS
4.2.1.3 DISTRIBUCIÓN POR TIPOS DE BUQUES
CARGA GENERAL / GENERAL CARGO
RO-RO / RO RO
PASAJE / PASSENGERS
PORTACONTENEDORES / CONTAINERS
GRANELEROS SÓLIDOS / BULK-CARRIERS
ESPAÑOLES / SPANISH EXTRANJEROS / FOREIGN Total
GRANELEROS LÍQUIDOS / TANKERS
Apéndice: Transparencia activa de la información. Los datos en detalle.
Apendix: Active transparency in information. Data in detail.
Datos actualizados a 31/12/2020
16

FERROL EJERCICIO 2020
TIPO DE BUQUES / TYPE OF VESSELS Número /
NumberG.T. / G.T.
Número /
NumberG.T. / G.T.
Número /
Number G.T. / G.T.
Graneleros
líquidos -
Tankes
5 211.739 158 5.661.939 163 5.873.678
Total 5 211.739 158 5.661.939 163 5.873.678
Graneleros
solidos7 28.207 34 338.221 41 366.428
Total 7 28.207 34 338.221 41 366.428
Carga General 7 24.336 284 1.741.208 291 1.765.544
Transportes
Especializados0 0 1 2.875 1 2.875
Total 7 24.336 285 1.744.083 292 1.768.419
RO-RO
Mercancías0 0 26 260.535 26 260.535
RO-RO Mixtos 1 8.973 1 18.189 2 27.162
RO-RO Pasaje 0 0 0 0 0 0
Total 1 8.973 27 278.724 28 287.697
Pasaje Crucero 0 0 2 129.423 2 129.423
Pasaje Rápido 0 0 0 0 0 0
Pasaje Otros
Buques0 0 0 0 0 0
Total 0 0 2 129.423 2 129.423
Portacontenedo
res0 0 127 1.288.188 127 1.288.188
Total 0 0 127 1.288.188 127 1.288.188
Pesqueros de
altura
congeladores
0 0 4 908 4 908
Otros Buques 14 10.573 13 152.811 27 163.384
DESCONOCIDO 0 0 0 0 0 0
Total 14 10.573 17 153.718 31 164.292
Total 34 283.828 650 9.594.296 684 9.878.125
4.2.1.3 DISTRIBUCIÓN POR TIPOS DE BUQUES
GRANELEROS SÓLIDOS / BULK-CARRIERS
ESPAÑOLES / SPANISHEXTRANJEROS /
FOREIGNTotal
GRANELEROS LÍQUIDOS / TANKERS
CARGA GENERAL / GENERAL CARGO
RO-RO / RO RO
PASAJE / PASSENGERS
PORTACONTENEDORES / CONTAINERS
OTROS BUQUES MERCANTES / OTHER
MERCHANT SHIPS
Apéndice: Transparencia activa de la información. Los datos en detalle.
Apendix: Active transparency in information. Data in detail.
Datos actualizados a 31/12/2020
17

SAN CIBRAO EJERCICIO 2020
TIPO DE BUQUES / TYPE OF VESSELS Número /
NumberG.T. / G.T.
Número /
NumberG.T. / G.T.
Número /
Number G.T. / G.T.
Graneleros
líquidos -
Tankes
0 0 29 385.076 29 385.076
Total 0 0 29 385.076 29 385.076
Graneleros
solidos0 0 97 2.785.095 97 2.785.095
Total 0 0 97 2.785.095 97 2.785.095
Carga General 1 2.848 188 1.190.740 189 1.193.588
Transportes
Especializados0 0 0 0 0 0
Total 1 2.848 188 1.190.740 189 1.193.588
RO-RO
Mercancías0 0 0 0 0 0
RO-RO Mixtos 0 0 0 0 0 0
RO-RO Pasaje 0 0 0 0 0 0
Total 0 0 0 0 0 0
Pasaje Crucero 0 0 0 0 0 0
Pasaje Rápido 0 0 0 0 0 0
Pasaje Otros
Buques0 0 0 0 0 0
Total 0 0 0 0 0 0
Portacontenedo
res0 0 2 11.892 2 11.892
Total 0 0 2 11.892 2 11.892
Pesqueros de
altura
congeladores
0 0 0 0 0 0
Otros Buques 1 19 0 0 1 19
DESCONOCIDO 0 0 0 0 0 0
Total 1 19 0 0 1 19
Total 2 2.867 316 4.372.803 318 4.375.670
OTROS BUQUES MERCANTES / OTHER
MERCHANT SHIPS
4.2.1.3 DISTRIBUCIÓN POR TIPOS DE BUQUES
CARGA GENERAL / GENERAL CARGO
RO-RO / RO RO
PASAJE / PASSENGERS
PORTACONTENEDORES / CONTAINERS
GRANELEROS SÓLIDOS / BULK-CARRIERS
ESPAÑOLES / SPANISHEXTRANJEROS /
FOREIGNTotal
GRANELEROS LÍQUIDOS / TANKERS
Apéndice: Transparencia activa de la información. Los datos en detalle.
Apendix: Active transparency in information. Data in detail.
Datos actualizados a 31/12/2020
18

EJERCICIO 2020
ESPAÑOLES / SPANISH EXTRANJEROS / FOREIGN Total
Número / Number 0 3 3
G.T. / G.T. 0 22.618 22.618
AUTORIDAD PORTUARIA DE FERROL- SAN CIBRAO
4.2.2 BUQUES DE GUERRA / WARSHIPS
Apéndice: Transparencia activa de la información. Los datos en detalle.
Apendix: Active transparency in information. Data in detail.
Datos actualizados a 31/12/2020
19

FERROL EJERCICIO 2020
ESPAÑOLES /
SPANISHEXTRANJEROS / FOREIGN Total
Número / Number 0 3 3
G.T. / G.T. 0 22.618 22.618
4.2.2 BUQUES DE GUERRA / WARSHIPS
Apéndice: Transparencia activa de la información. Los datos en detalle.
Apendix: Active transparency in information. Data in detail.
Datos actualizados a 31/12/2020
20

SAN CIBRAO EJERCICIO 2020
ESPAÑOLES /
SPANISHEXTRANJEROS / FOREIGN Total
Número / Number 0 0 0
G.T. / G.T. 0 0 0
4.2.2 BUQUES DE GUERRA / WARSHIPS
Apéndice: Transparencia activa de la información. Los datos en detalle.
Apendix: Active transparency in information. Data in detail.
Datos actualizados a 31/12/2020
21

AUTORIDAD PORTUARIA DE FERROL-SAN CIBRAO
Número / Number 0
G.T. / G.T. 0
4.2.3 EMBARCACIONES DE PESCA FRESCA / FISHING FRESH SHIPS
EJERCICIO 2020
Apéndice: Transparencia activa de la información. Los datos en detalle.
Apendix: Active transparency in information. Data in detail.
Datos actualizados a 31/12/2020
22

FERROL EJERCICIO 2020
Número / Number 0
G.T. / G.T. 0
4.2.3 EMBARCACIONES DE PESCA FRESCA / FISHING FRESH SHIPS
Apéndice: Transparencia activa de la información. Los datos en detalle.
Apendix: Active transparency in information. Data in detail.
Datos actualizados a 31/12/2020
23

SAN CIBRAO EJERCICIO 2020
Número / Number 0
G.T. / G.T. 0
4.2.3 EMBARCACIONES DE PESCA FRESCA / FISHING FRESH SHIPS
Apéndice: Transparencia activa de la información. Los datos en detalle.
Apendix: Active transparency in information. Data in detail.
Datos actualizados a 31/12/2020
24

AUTORIDAD PORTUARIA DE FERROL-SAN CIBRAO EJERCICIO 2020
Número / Number 55
Eslora media / Average length 11
Manga media / Average beam 4
Embarcaciones deportivas con base en puertos autonómicos
4.2.4 EMBARCACIONES DE RECREO / PLEASURE BOATS
Apéndice: Transparencia activa de la información. Los datos en detalle.
Apendix: Active transparency in information. Data in detail.
Datos actualizados a 31/12/2020
25

FERROL EJERCICIO 2020
Número / Number 55
Eslora media / Average length 11
Manga media / Average beam 4
Embarcaciones deportivas con base en puertos autonómicos
4.2.4 EMBARCACIONES DE RECREO / PLEASURE BOATS
Apéndice: Transparencia activa de la información. Los datos en detalle.
Apendix: Active transparency in information. Data in detail.
Datos actualizados a 31/12/2020
26

SAN CIBRAO EJERCICIO 2020
Número / Number 0
Eslora media / Average length 0
Manga media / Average beam 0
Embarcaciones deportivas con base en puertos autonómicos
4.2.4 EMBARCACIONES DE RECREO / PLEASURE BOATS
Apéndice: Transparencia activa de la información. Los datos en detalle.
Apendix: Active transparency in information. Data in detail.
Datos actualizados a 31/12/2020
27

AUTORIDAD PORTUARIA DE FERROL-SAN CIBRAO EJERCICIO 2020
Hasta 3.000
G.T. / Up to
3.000 G.T.
De 3.001 a
5.000 G.T. /
From 3.001
De 5.001 a 10.000
G.T. / From 5.001
to 10.000 G.T.
De 10.001 a 25.000
G.T. / From 10.001
to 25.000 G.T.
De 25.001 a
50.000 G.T. /
From 25.001 to
Más de
50.000 G.T. /
More than
Total
Número /
Number0 0 0 0 0 0 0
G.T. / G.T. 0 0 0 0 0 0 0
Número /
Number0 0 0 0 0 0 0
G.T. / G.T. 0 0 0 0 0 0 0
Número /
Number 0 0 0 0 0 0 0
G.T. / G.T. 0 0 0 0 0 0 0
ESPAÑOLES / SPANISH
EXTRANJEROS / FOREIGN
Total
4.2.5 BUQUES ENTRADOS PARA DESGUACE / SHIPS ENTERED FOR BREAKING UP
Apéndice: Transparencia activa de la información. Los datos en detalle.
Apendix: Active transparency in information. Data in detail.
Datos actualizados a 31/12/2020
28

FERROL EJERCICIO 2020
Hasta 3.000 G.T.
/ Up to 3.000
G.T.
De 3.001 a
5.000 G.T. /
From 3.001 to
De 5.001 a
10.000 G.T. /
From 5.001 to
De 10.001 a
25.000 G.T. /
From 10.001 to
De 25.001 a
50.000 G.T. /
From 25.001 to
Más de 50.000 G.T. /
More than 50.000 G.T.Total
Número /
Number0 0 0 0 0 0 0
G.T. / G.T. 0 0 0 0 0 0 0
Número /
Number0 0 0 0 0 0 0
G.T. / G.T. 0 0 0 0 0 0 0
Número /
Number 0 0 0 0 0 0 0
G.T. / G.T. 0 0 0 0 0 0 0
ESPAÑOLES /
SPANISH
EXTRANJEROS /
FOREIGN
Total
4.2.5 BUQUES ENTRADOS PARA DESGUACE / SHIPS ENTERED FOR BREAKING UP
Apéndice: Transparencia activa de la información. Los datos en detalle.
Apendix: Active transparency in information. Data in detail.
Datos actualizados a 31/12/2020
29

SAN CIBRAO EJERCICIO 2020
Hasta 3.000
G.T. / Up to
3.000 G.T.
De 3.001 a 5.000
G.T. / From
3.001 to 5.000
De 5.001 a
10.000 G.T. /
From 5.001 to
De 10.001 a
25.000 G.T. /
From 10.001 to
De 25.001 a 50.000 G.T. /
From 25.001 to 50.000
G.T.
Más de 50.000 G.T. /
More than 50.000
G.T.
Total
Número /
Number0 0 0 0 0 0 0
G.T. / G.T. 0 0 0 0 0 0 0
Número /
Number0 0 0 0 0 0 0
G.T. / G.T. 0 0 0 0 0 0 0
Número /
Number 0 0 0 0 0 0 0
G.T. / G.T. 0 0 0 0 0 0 0
ESPAÑOLES /
SPANISH
EXTRANJEROS /
FOREIGN
Total
4.2.5 BUQUES ENTRADOS PARA DESGUACE / SHIPS ENTERED FOR BREAKING UP
Apéndice: Transparencia activa de la información. Los datos en detalle.
Apendix: Active transparency in information. Data in detail.
Datos actualizados a 31/12/2020
30

AUTORIDAD PORTUARIA DE FERROL-SAN CIBRAO EJERCICIO 2020
TIPO / TYPE NÚMERO / NUMBER G.T. / G.T.
PESQUEROS LITORAL 35 5.552
REMOLCADOR 10 17.260
TOTAL 45 22.812
4.2.6 OTRAS EMBARCACIONES / OTHER SHIPS
Apéndice: Transparencia activa de la información. Los datos en detalle.
Apendix: Active transparency in information. Data in detail.
Datos actualizados a 31/12/2020
31

FERROL EJERCICIO 2020
TIPO / TYPE NÚMERO / NUMBER G.T. / G.T.
PESQUEROS LITORAL 35 5.552
REMOLCADOR 10 17.260
TOTAL 45 22.812
4.2.6 OTRAS EMBARCACIONES / OTHER SHIPS
Apéndice: Transparencia activa de la información. Los datos en detalle.
Apendix: Active transparency in information. Data in detail.
Datos actualizados a 31/12/2020
32

SAN CIBRAO EJERCICIO 2020
TIPO / TYPE
4.2.6 OTRAS EMBARCACIONES / OTHER SHIPS
Apéndice: Transparencia activa de la información. Los datos en detalle.
Apendix: Active transparency in information. Data in detail.
Datos actualizados a 31/12/2020
33

AUTORIDAD PORTUARIA DE FERROL SAN CIBRAO EJERCICIO 2020
MERCANCÍAS /
GOODS
EMBARCADAS
/ LOADED
DESEMBARCA
DAS / TOTAL
EMBARCADAS
/ LOADED
DESEMBARCADA
S / UNLOADEDTOTAL
EMBARCADAS
/ LOADED
DESEMBARCADA
S / UNLOADEDTOTAL
ACEITES 2.038 2.038 2.038 2.038
GAS-OIL 29.811 29.811 24.882 24.882 54.693 54.693
2.038 29.811 31.848 24.882 24.882 2.038 54.693 56.730
CEMENTO Y
CLINKER2.822 2.822 2.822 2.822
CARBON 7.699 7.699 7.699 7.699
10.521 10.521 10.521 10.521
ASTILLA Y
DESPERDICIOS
DE MADERA
13.751 13.751 13.751 13.751
MAGNESITA 15.710 15.710 15.710 15.710
ABONOS 10.730 10.730 10.730 10.730
CUARZO Y
GRANITO72.495 72.495 72.495 72.495
BAUXITA 56.963 56.963 56.963 56.963
OTRAS
MERCANCIAS4.199 4.199 3.006 131.792 134.797 7.205 131.792 138.996
CHATARRA 7.270 7.270 241.666 241.666 248.936 248.936
4.199 7.270 11.469 104.962 441.151 546.113 109.161 448.421 557.582
CONTENEDORE
S418 383 801 12.493 12.412 24.905 12.912 12.794 25.706
CONSTRUCCIO
NES
PREFABRICADA
S
5 5 5 5
ASTILLA Y
DESPERDICIOS
DE MADERA
215 318 533 215 318 533
MAGNESITA 411 411 411 411
MADERA 9.810 9.810 247.241 14.492 261.732 257.051 14.492 271.542
MATERIALES
DE
CONSTRUCCIO
N
1.426 874 2.300 23.445 168 23.612 24.871 1.042 25.912
CUARZO Y
GRANITO21 21 49 21 71 71 21 92
ACERO 155.467 375 155.842 155.467 375 155.842
ACEITES 17 17 17 17
AEROGENERAD
ORES700 700 41.579 7.810 49.390 41.579 8.510 50.089
OTRAS
MERCANCIAS963 639 1.601 38.432 18.993 57.426 39.395 19.632 59.027
TABLERO 138 138 23.388 1.533 24.921 23.526 1.533 25.058
APARATOS,
HERRAMIENTA
S Y REPUESTOS
32 21 53 20.121 201 20.322 20.153 222 20.375
ELECTRODOS 2.774 2.774 2.774 2.774
PAPEL 25 25 1.160 43.679 44.839 1.185 43.679 44.864
CARBON 70 70 70 70
12.834 2.616 15.449 566.797 100.072 666.869 579.631 102.688 682.319
Total 19.070 50.217 69.288 671.759 566.105 1.237.865 690.830 616.322 1.307.152
No se incluyen los transbordos
c) Graneles sólidos
sin instalac. especial
/ Dry bulks without
special installation
d) Mercancía
general / General
cargo
CABOTAJE / DOMESTIC EXTERIOR / FOREIGN
4.3 MERCANCÍAS, TONELADAS / GOODS, TONS
4.3.1 MOVIDAS POR MUELLES Y ATRAQUES DEL SERVICIO / HANDLED AT PORT AUTHORITY QUAYS AND BERTHS
TOTAL / TOTAL
a) Graneles líquidos
/ Liquid bulks
b) Graneles sólidos
por instalac.
especial / Dry bulks
by special
installation
Apéndice: Transparencia activa de la información. Los datos en detalle.
Apendix: Active transparency in information. Data in detail.
Datos actualizados a 31/12/2020
34

FERROL EJERCICIO 2020
MERCANCÍAS /
GOODS
EMBARCADAS
/ LOADED
DESEMBARCA
DAS / TOTAL
EMBARCADAS
/ LOADED
DESEMBARCADA
S / UNLOADEDTOTAL
EMBARCADAS
/ LOADED
DESEMBARCADA
S / UNLOADEDTOTAL
ACEITES 2.038 2.038 2.038 2.038
GAS-OIL 29.811 29.811 24.882 24.882 54.693 54.693
2.038 29.811 31.848 24.882 24.882 2.038 54.693 56.730
CEMENTO Y
CLINKER2.822 2.822 2.822 2.822
CARBON 7.699 7.699 7.699 7.699
10.521 10.521 10.521 10.521
ASTILLA Y
DESPERDICIOS
DE MADERA
13.751 13.751 13.751 13.751
MAGNESITA 15.710 15.710 15.710 15.710
ABONOS 10.730 10.730 10.730 10.730
CUARZO Y
GRANITO72.495 72.495 72.495 72.495
BAUXITA 56.963 56.963 56.963 56.963
OTRAS
MERCANCIAS4.199 4.199 3.006 131.792 134.797 7.205 131.792 138.996
CHATARRA 7.270 7.270 241.666 241.666 248.936 248.936
4.199 7.270 11.469 104.962 441.151 546.113 109.161 448.421 557.582
CONTENEDOR
ES418 383 801 12.493 12.412 24.905 12.912 12.794 25.706
CONSTRUCCIO
NES
PREFABRICADA
S
5 5 5 5
ASTILLA Y
DESPERDICIOS
DE MADERA
215 318 533 215 318 533
MAGNESITA 411 411 411 411
MADERA 9.810 9.810 247.241 14.492 261.732 257.051 14.492 271.542
MATERIALES
DE
CONSTRUCCIO
N
1.426 874 2.300 23.445 168 23.612 24.871 1.042 25.912
CUARZO Y
GRANITO21 21 49 21 71 71 21 92
ACERO 155.467 375 155.842 155.467 375 155.842
ACEITES 17 17 17 17
AEROGENERAD
ORES700 700 41.579 7.810 49.390 41.579 8.510 50.089
OTRAS
MERCANCIAS963 639 1.601 38.432 18.993 57.426 39.395 19.632 59.027
TABLERO 138 138 23.388 1.533 24.921 23.526 1.533 25.058
APARATOS,
HERRAMIENTA
S Y REPUESTOS
32 21 53 20.121 201 20.322 20.153 222 20.375
ELECTRODOS 2.774 2.774 2.774 2.774
PAPEL 25 25 1.160 43.679 44.839 1.185 43.679 44.864
CARBON 70 70 70 70
12.834 2.616 15.449 566.797 100.072 666.869 579.631 102.688 682.319
Total 19.070 50.217 69.288 671.759 566.105 1.237.865 690.830 616.322 1.307.152
No se incluyen los transbordos
c) Graneles sólidos
sin instalac. especial
/ Dry bulks without
special installation
d) Mercancía
general / General
cargo
CABOTAJE / DOMESTIC EXTERIOR / FOREIGN
4.3 MERCANCÍAS, TONELADAS / GOODS, TONS
4.3.1 MOVIDAS POR MUELLES Y ATRAQUES DEL SERVICIO / HANDLED AT PORT AUTHORITY QUAYS AND BERTHS
TOTAL / TOTAL
a) Graneles líquidos
/ Liquid bulks
b) Graneles sólidos
por instalac.
especial / Dry bulks
by special
installation
Apéndice: Transparencia activa de la información. Los datos en detalle.
Apendix: Active transparency in information. Data in detail.
Datos actualizados a 31/12/2020
35

SAN CIBRAO EJERCICIO 2020
MERCANCÍAS / GOODS
No se incluyen los transbordos
4.3 MERCANCÍAS, TONELADAS / GOODS, TONS
4.3.1 MOVIDAS POR MUELLES Y ATRAQUES DEL SERVICIO / HANDLED AT PORT AUTHORITY QUAYS AND BERTHS
Apéndice: Transparencia activa de la información. Los datos en detalle.
Apendix: Active transparency in information. Data in detail.
Datos actualizados a 31/12/2020
36

AUTORIDAD PORTUARIA DE FERROL-SAN CIBRAO EJERCICIO 2020
MERCANCÍAS / GOODS EMBARCADAS
/ LOADED
DESEMBARCA
DAS / TOTAL
EMBARCADAS
/ LOADED
DESEMBARCADA
S / UNLOADEDTOTAL
EMBARCADAS
/ LOADED
DESEMBARCADA
S / UNLOADEDTOTAL
GLICEROL 25.561 25.561 25.561 25.561
SOSA
CAUSTICA29.090 29.090 283.351 283.351 312.441 312.441
FUEL OIL 59.261 25.815 85.077 237.117 199.740 436.856 296.378 225.555 521.933
METANOL 4.344 4.344 32.726 32.726 4.344 32.726 37.071
ACEITES 5.795 5.795 293.764 293.764 299.560 299.560
GAS NATURAL 5.358 1.448.978 1.454.337 5.358 1.448.978 1.454.337
GAS-OIL 16.470 16.470 16.470 16.470
BIODIESEL 54.930 5.049 59.979 152.077 152.077 207.007 5.049 212.056
118.535 65.750 184.285 420.114 2.275.030 2.695.144 538.649 2.340.780 2.879.429
COQUE 22.805 22.805 57.947 57.947 80.752 80.752
ALUMINA 13.448 13.448 1.159.340 1.159.340 1.172.788 1.172.788
BAUXITA 4.538.833 4.538.833 4.538.833 4.538.833
13.448 22.805 36.253 1.159.340 4.596.780 5.756.120 1.172.788 4.619.585 5.792.373
UREA 11.004 11.004 11.004 11.004
11.004 11.004 11.004 11.004
MADERA 16 16 16 16
ALUMINIO 30.745 30.745 30.745 30.745
30.761 30.761 30.761 30.761
Total 131.983 99.559 231.542 1.610.215 6.871.810 8.482.025 1.742.198 6.971.369 8.713.567
No se incluyen los transbordos
d) Mercancía
general /
General cargo
CABOTAJE / DOMESTIC EXTERIOR / FOREIGN
4.3.2 MOVIDAS POR MUELLES Y ATRAQUES DE PARTICULARES / HANDLED AT PRIVATE QUAYS AND BERTHS
TOTAL / TOTAL
a) Graneles
líquidos / Liquid
bulks
b) Graneles
sólidos por
instalac.
especial / Dry
bulks by special
installation
c) Graneles
sólidos sin
instalac.
especial / Dry
bulks without
special
installation
Apéndice: Transparencia activa de la información. Los datos en detalle.
Apendix: Active transparency in information. Data in detail.
Datos actualizados a 31/12/2020
37

FERROL EJERCICIO 2020
MERCANCÍAS / GOODS EMBARCADAS
/ LOADED
DESEMBARCA
DAS / TOTAL
EMBARCADAS /
LOADED
DESEMBARCAD
AS / TOTAL
EMBARCADAS /
LOADED
DESEMBARCAD
AS / TOTAL
GLICEROL 25.561 25.561 25.561 25.561
SOSA
CAUSTICA29.090 29.090 4.702 4.702 33.793 33.793
FUEL OIL 59.261 25.815 85.077 237.117 199.740 436.856 296.378 225.555 521.933
METANOL 4.344 4.344 32.726 32.726 4.344 32.726 37.071
ACEITES 5.795 5.795 293.764 293.764 299.560 299.560
GAS NATURAL 5.358 1.448.978 1.454.337 5.358 1.448.978 1.454.337
GAS-OIL 16.470 16.470 16.470 16.470
BIODIESEL 54.930 5.049 59.979 152.077 152.077 207.007 5.049 212.056
118.535 65.750 184.285 420.114 1.996.382 2.416.495 538.649 2.062.131 2.600.780
UREA 11.004 11.004 11.004 11.004
11.004 11.004 11.004 11.004
Total 118.535 76.754 195.289 420.114 1.996.382 2.416.495 538.649 2.073.135 2.611.784
No se incluyen los transbordos
4.3.2 MOVIDAS POR MUELLES Y ATRAQUES DE PARTICULARES / HANDLED AT PRIVATE QUAYS AND BERTHS
TOTAL / TOTAL
a) Graneles líquidos
/ Liquid bulks
c) Graneles sólidos
sin instalac. especial
/ Dry bulks without
special installation
CABOTAJE / DOMESTIC EXTERIOR / FOREIGN
Apéndice: Transparencia activa de la información. Los datos en detalle.
Apendix: Active transparency in information. Data in detail.
Datos actualizados a 31/12/2020
38

SAN CIBRAO EJERCICIO 2020
MERCANCÍAS / GOODS EMBARCADAS
/ LOADED
DESEMBARCA
DAS / TOTAL
EMBARCADAS
/ LOADED
DESEMBARCADA
S / UNLOADEDTOTAL
EMBARCADAS
/ LOADED
DESEMBARCADA
S / UNLOADEDTOTAL
SOSA
CAUSTICA278.649 278.649 278.649 278.649
278.649 278.649 278.649 278.649
COQUE 22.805 22.805 57.947 57.947 80.752 80.752
ALUMINA 13.448 13.448 1.159.340 1.159.340 1.172.788 1.172.788
BAUXITA 4.538.833 4.538.833 4.538.833 4.538.833
13.448 22.805 36.253 1.159.340 4.596.780 5.756.120 1.172.788 4.619.585 5.792.373
MADERA 16 16 16 16
ALUMINIO 30.745 30.745 30.745 30.745
30.761 30.761 30.761 30.761
Total 13.448 22.805 36.253 1.190.101 4.875.428 6.065.529 1.203.549 4.898.234 6.101.782
No se incluyen los transbordos
4.3.2 MOVIDAS POR MUELLES Y ATRAQUES DE PARTICULARES / HANDLED AT PRIVATE QUAYS AND BERTHS
TOTAL / TOTAL
a) Graneles
líquidos / Liquid
bulks
b) Graneles
sólidos por
instalac.
especial / Dry
bulks by special
installation
d) Mercancía
general /
General cargo
CABOTAJE / DOMESTIC EXTERIOR / FOREIGN
Apéndice: Transparencia activa de la información. Los datos en detalle.
Apendix: Active transparency in information. Data in detail.
Datos actualizados a 31/12/2020
39

AUTORIDAD PORTUARIA DE FERROL-SAN CIBRAO EJERCICIO 2020
MERCANCÍAS /
GOODS
EMBARCADAS
/ LOADED
DESEMBARCAD
AS /
UNLOADED
TOTAL EMBARCADAS
/ LOADED
DESEMBARCAD
AS / UNLOADEDTOTAL
EMBARCADAS
/ LOADED
DESEMBARCAD
AS /
UNLOADED
TOTAL
GLICEROL 25.561 25.561 25.561 25.561
FUEL OIL 59.261 25.815 85.077 237.117 199.740 436.856 296.378 225.555 521.933
METANOL 4.344 4.344 32.726 32.726 4.344 32.726 37.071
ACEITES 2.038 5.795 7.833 293.764 293.764 2.038 299.560 301.598
GAS NATURAL 5.358 1.448.978 1.454.337 5.358 1.448.978 1.454.337
GAS-OIL 29.811 29.811 41.352 41.352 71.163 71.163
BIODIESEL 54.930 5.049 59.979 152.077 152.077 207.007 5.049 212.056
120.573 95.560 216.133 420.114 2.299.912 2.720.026 540.687 2.395.473 2.936.159
COQUE 22.805 22.805 57.947 57.947 80.752 80.752
CEMENTO Y
CLINKER2.822 2.822 2.822 2.822
ALUMINA 13.448 13.448 1.159.340 1.159.340 1.172.788 1.172.788
BAUXITA 4.538.833 4.538.833 4.538.833 4.538.833
CARBON 7.699 7.699 7.699 7.699
13.448 33.326 46.774 1.159.340 4.596.780 5.756.120 1.172.788 4.630.106 5.802.894
ASTILLA Y
DESPERDICIOS DE
MADERA
13.751 13.751 13.751 13.751
MAGNESITA 15.710 15.710 15.710 15.710
ABONOS 10.730 10.730 10.730 10.730
CUARZO Y GRANITO 72.495 72.495 72.495 72.495
BAUXITA 56.963 56.963 56.963 56.963
OTRAS
MERCANCIAS4.199 4.199 3.006 131.792 134.797 7.205 131.792 138.996
CHATARRA 7.270 7.270 241.666 241.666 248.936 248.936
UREA 11.004 11.004 11.004 11.004
4.199 18.274 22.473 104.962 441.151 546.113 109.161 459.425 568.586
CONTENEDORES 418 383 801 12.493 12.412 24.905 12.912 12.794 25.706
CONSTRUCCIONES
PREFABRICADAS5 5 5 5
ASTILLA Y
DESPERDICIOS DE
MADERA
215 318 533 215 318 533
MAGNESITA 411 411 411 411
MADERA 9.810 9.810 247.256 14.492 261.748 257.066 14.492 271.558
MATERIALES DE
CONSTRUCCION1.426 874 2.300 23.445 168 23.612 24.871 1.042 25.912
CUARZO Y GRANITO 21 21 49 21 71 71 21 92
ALUMINIO 30.745 30.745 30.745 30.745
ACERO 155.467 375 155.842 155.467 375 155.842
ACEITES 17 17 17 17
AEROGENERADORE
S700 700 41.579 7.810 49.390 41.579 8.510 50.089
OTRAS
MERCANCIAS963 639 1.601 38.432 18.993 57.426 39.395 19.632 59.027
TABLERO 138 138 23.388 1.533 24.921 23.526 1.533 25.058
APARATOS,
HERRAMIENTAS Y
REPUESTOS
32 21 53 20.121 201 20.322 20.153 222 20.375
ELECTRODOS 2.774 2.774 2.774 2.774
PAPEL 25 25 1.160 43.679 44.839 1.185 43.679 44.864
CARBON 70 70 70 70
12.834 2.616 15.449 597.558 100.072 697.630 610.392 102.688 713.079
Total 151.053 149.776 300.830 2.281.974 7.437.915 9.719.889 2.433.028 7.587.691 10.020.719
No se incluyen los transbordos
CABOTAJE / DOMESTIC EXTERIOR / FOREIGN
4.3.3 EMBARCADAS Y DESEMBARCADAS EN EL AÑO / LOADED AND UNLOADED DURING THE YEAR
TOTAL / TOTAL
a) Graneles
líquidos / Liquid
bulks
b) Graneles
sólidos por
instalac. especial
/ Dry bulks by
special
installation
c) Graneles
sólidos sin
instalac. especial
/ Dry bulks
without special
installation
d) Mercancía
general / General
cargo
d) Mercancía
general / General
cargo
Apéndice: Transparencia activa de la información. Los datos en detalle.
Apendix: Active transparency in information. Data in detail.
Datos actualizados a 31/12/2020
40

FERROL EJERCICIO 2020
MERCANCÍAS /
GOODS
EMBARCADAS
/ LOADED
DESEMBARCADA
S / UNLOADEDTOTAL
EMBARCADAS
/ LOADED
DESEMBARCADA
S / UNLOADEDTOTAL
EMBARCADAS
/ LOADED
DESEMBARCADA
S / UNLOADEDTOTAL
GLICEROL 25.561 25.561 25.561 25.561
SOSA CAUSTICA 29.090 29.090 4.702 4.702 33.793 33.793
FUEL OIL 59.261 25.815 85.077 237.117 199.740 436.856 296.378 225.555 521.933
METANOL 4.344 4.344 32.726 32.726 4.344 32.726 37.071
ACEITES 2.038 5.795 7.833 293.764 293.764 2.038 299.560 301.598
GAS NATURAL 5.358 1.448.978 1.454.337 5.358 1.448.978######
####GAS-OIL 29.811 29.811 41.352 41.352 71.163 71.163
BIODIESEL 54.930 5.049 59.979 152.077 152.077 207.007 5.049 212.056
120.573 95.560 216.133 420.114 2.021.264 2.441.377 540.687 2.116.824######
####
CEMENTO Y
CLINKER2.822 2.822 2.822 2.822
CARBON 7.699 7.699 7.699 7.699
10.521 10.521 10.521 10.521
ASTILLA Y
DESPERDICIOS
DE MADERA
13.751 13.751 13.751 13.751
MAGNESITA 15.710 15.710 15.710 15.710
ABONOS 10.730 10.730 10.730 10.730
CUARZO Y
GRANITO72.495 72.495 72.495 72.495
BAUXITA 56.963 56.963 56.963 56.963
OTRAS
MERCANCIAS4.199 4.199 3.006 131.792 134.797 7.205 131.792 138.996
CHATARRA 7.270 7.270 241.666 241.666 248.936 248.936
UREA 11.004 11.004 11.004 11.004
4.199 18.274 22.473 104.962 441.151 546.113 109.161 459.425 568.586
CONTENEDORE
S418 383 801 12.493 12.412 24.905 12.912 12.794 25.706
CONSTRUCCION
ES
PREFABRICADAS
5 5 5 5
ASTILLA Y
DESPERDICIOS
DE MADERA
215 318 533 215 318 533
MAGNESITA 411 411 411 411
MADERA 9.810 9.810 247.241 14.492 261.732 257.051 14.492 271.542
MATERIALES DE
CONSTRUCCION1.426 874 2.300 23.445 168 23.612 24.871 1.042 25.912
CUARZO Y
GRANITO21 21 49 21 71 71 21 92
ACERO 155.467 375 155.842 155.467 375 155.842
ACEITES 17 17 17 17
AEROGENERAD
ORES700 700 41.579 7.810 49.390 41.579 8.510 50.089
OTRAS
MERCANCIAS963 639 1.601 38.432 18.993 57.426 39.395 19.632 59.027
TABLERO 138 138 23.388 1.533 24.921 23.526 1.533 25.058
APARATOS,
HERRAMIENTAS
Y REPUESTOS
32 21 53 20.121 201 20.322 20.153 222 20.375
ELECTRODOS 2.774 2.774 2.774 2.774
PAPEL 25 25 1.160 43.679 44.839 1.185 43.679 44.864
CARBON 70 70 70 70
12.834 2.616 15.449 566.797 100.072 666.869 579.631 102.688 682.319
Total 137.606 126.971 264.577 1.091.873 2.562.487 3.654.360 1.229.479 2.689.458######
####
No se incluyen los transbordos
d) Mercancía
general / General
cargo
CABOTAJE / DOMESTIC EXTERIOR / FOREIGN
4.3.3 EMBARCADAS Y DESEMBARCADAS EN EL AÑO / LOADED AND UNLOADED DURING THE YEAR
TOTAL / TOTAL
a) Graneles líquidos
/ Liquid bulks
b) Graneles sólidos
por instalac.
especial / Dry bulks
by special
installation
c) Graneles sólidos
sin instalac. especial
/ Dry bulks without
special installation
Apéndice: Transparencia activa de la información. Los datos en detalle.
Apendix: Active transparency in information. Data in detail.
Datos actualizados a 31/12/2020
41

SAN CIBRAO EJERCICIO 2020
MERCANCÍAS / GOODS EMBARCADA
S / LOADED
DESEMBARC
ADAS /
UNLOADED
TOTAL EMBARCADAS
/ LOADED
DESEMBARCAD
AS / UNLOADEDTOTAL
EMBARCADAS
/ LOADED
DESEMBARCAD
AS /
UNLOADED
TOTAL
SOSA CAUSTICA 278.649 278.649 278.649 278.649
278.649 278.649 278.649 278.649
COQUE 22.805 22.805 57.947 57.947 80.752 80.752
ALUMINA 13.448 13.448 1.159.340 1.159.340 1.172.788 1.172.788
BAUXITA 4.538.833 4.538.833 4.538.833 4.538.833
13.448 22.805 36.253 1.159.340 4.596.780 5.756.120 1.172.788 4.619.585 5.792.373
MADERA 16 16 16 16
ALUMINIO 30.745 30.745 30.745 30.745
30.761 30.761 30.761 30.761
Total 13.448 22.805 36.253 1.190.101 4.875.428 6.065.529 1.203.549 4.898.234 6.101.782
No se incluyen los transbordos
4.3.3 EMBARCADAS Y DESEMBARCADAS EN EL AÑO / LOADED AND UNLOADED DURING THE YEAR
TOTAL / TOTAL
a) Graneles líquidos
/ Liquid bulks
b) Graneles sólidos
por instalac. especial
/ Dry bulks by
special installation
d) Mercancía
general / General
cargo
CABOTAJE / DOMESTIC EXTERIOR / FOREIGN
Apéndice: Transparencia activa de la información. Los datos en detalle.
Apendix: Active transparency in information. Data in detail.
Datos actualizados a 31/12/2020
42

AUTORIDAD PORTUARIA DE FERROL-SAN CIBRAO EJERCICIO 2020
PAÍS / COUNTRY EMBARCADAS / LOADED DESEMBARCADAS / UNLOADED Total
ALEMANIA 4.450 1.718 6.168
ARGELIA 11.880 0 11.880
AUSTRALIA 92 0 92
BELGICA 108.043 137.307 245.350
BRASIL 0 30.732 30.732
CAMERUN 1.051 0 1.051
CHINA 158 1.079 1.236
DINAMARCA 5.532 3.868 9.401
E.E.U.U. 93.643 393.680 487.323
EGIPTO 3.524 4.500 8.024
ESPAÑA 151.053 149.776 300.830
ESTONIA 3.640 977 4.617
FINLANDIA 22.817 51.403 74.219
FRANCIA 166.842 110.446 277.288
GHANA 0 86.921 86.921
GIBRALTAR 30.521 4 30.525
GRECIA 31.975 0 31.975
GUINEA ECUA. 0 95.497 95.497
GUINEA-CONAK 0 4.538.833 4.538.833
HOLANDA 484.085 58.885 542.970
INDONESIA 0 195.725 195.725
IRLANDA 27.546 38.922 66.468
ISLANDIA 15.341 0 15.341
ISLAS VIRGENES (ESTADO UNIDOS) 11.799 0 11.799
ITALIA 30.481 0 30.481
LETONIA 33.396 1.467 34.863
LITUANIA 11.893 21 11.914
MALTA 29.936 0 29.936
MARRUECOS 44.897 609 45.506
MAURITANIA 1.562 386 1.948
MEXICO 47 0 47
MONTENEGRO 26.748 0 26.748
NIGERIA 0 128.069 128.069
NORUEGA 501.828 40.454 542.282
POLONIA 33.079 372 33.451
PORTUGAL 263.861 1.403 265.265
REINO UNIDO 142.565 155.140 297.705
REPUBLICA DE KOREA 0 5.539 5.539
RUMANIA 0 39.134 39.134
RUSIA 4.117 766.003 770.120
SINGAPUR 31.080 1.548 32.628
SUECIA 84.491 129.039 213.531
TAIWAN 1.402 0 1.402
TRINIDAD-TOB 0 351.393 351.393
TUNEZ 17.650 0 17.650
UCRANIA 0 66.844 66.844
Total 2.433.028 7.587.691 10.020.719
4.3.4 TOTAL MERCANCÍAS POR PAÍSES DE ORIGEN Y DESTINO /
TOTAL GOODS BY NATIONALITY OF PORTS OF ORIGIN AND DESTINATION
Apéndice: Transparencia activa de la información. Los datos en detalle.
Apendix: Active transparency in information. Data in detail.
Datos actualizados a 31/12/2020
43

FERROL EJERCICIO 2020
PAÍS / COUNTRY EMBARCADAS / LOADED DESEMBARCADAS / UNLOADED Total
ALEMANIA 4.450 1.718 6.168
ARGELIA 11.880 0 11.880
AUSTRALIA 92 0 92
BELGICA 106.608 97.057 203.664
BRASIL 0 30.732 30.732
CAMERUN 1.051 0 1.051
CHINA 158 1.079 1.236
DINAMARCA 5.532 3.868 9.401
E.E.U.U. 93.643 196.428 290.071
ESPAÑA 137.606 126.971 264.577
ESTONIA 3.640 977 4.617
FINLANDIA 13.008 51.403 64.411
FRANCIA 94.956 110.446 205.403
GHANA 0 86.921 86.921
GIBRALTAR 30.521 4 30.525
GRECIA 31.975 0 31.975
GUINEA ECUA. 0 95.497 95.497
HOLANDA 144.266 30.480 174.746
INDONESIA 0 195.725 195.725
IRLANDA 27.546 38.922 66.468
ISLANDIA 4.892 0 4.892
ISLAS VIRGENES (ESTADO UNIDOS) 11.799 0 11.799
ITALIA 5.299 0 5.299
LETONIA 301 1.467 1.768
LITUANIA 3.436 21 3.457
MALTA 29.936 0 29.936
MARRUECOS 42.896 609 43.504
MAURITANIA 1.562 386 1.948
MEXICO 47 0 47
NIGERIA 0 128.069 128.069
NORUEGA 1.371 7.334 8.705
POLONIA 20.289 372 20.661
PORTUGAL 263.861 1.403 265.265
REINO UNIDO 93.890 126.989 220.880
REPUBLICA DE KOREA 0 5.539 5.539
RUMANIA 0 34.215 34.215
RUSIA 558 766.003 766.561
SINGAPUR 31.080 1.548 32.628
SUECIA 9.926 129.039 138.966
TAIWAN 1.402 0 1.402
TRINIDAD-TOB 0 351.393 351.393
UCRANIA 0 66.844 66.844
Total FERROL 1.229.479 2.689.458 3.918.937
4.3.4 TOTAL MERCANCÍAS POR PAÍSES DE ORIGEN Y DESTINO /
TOTAL GOODS BY NATIONALITY OF PORTS OF ORIGIN AND DESTINATION
Apéndice: Transparencia activa de la información. Los datos en detalle.
Apendix: Active transparency in information. Data in detail.
Datos actualizados a 31/12/2020
44

SAN CIBRAO EJERCICIO 2020
PAÍS / COUNTRY EMBARCADAS / LOADED DESEMBARCADAS / UNLOADED Total
BELGICA 1.436 40.250 41.686
E.E.U.U. 0 197.252 197.252
EGIPTO 3.524 4.500 8.024
ESPAÑA 13.448 22.805 36.253
FINLANDIA 9.809 0 9.809
FRANCIA 71.885 0 71.885
GUINEA-CONAK 0 4.538.833 4.538.833
HOLANDA 339.819 28.404 368.224
ISLANDIA 10.450 0 10.450
ITALIA 25.182 0 25.182
LETONIA 33.095 0 33.095
LITUANIA 8.456 0 8.456
MARRUECOS 2.001 0 2.001
MONTENEGRO 26.748 0 26.748
NORUEGA 500.457 33.120 533.577
POLONIA 12.790 0 12.790
REINO UNIDO 48.675 28.150 76.825
RUMANIA 0 4.919 4.919
RUSIA 3.559 0 3.559
SUECIA 74.565 0 74.565
TUNEZ 17.650 0 17.650
Total SAN CIBRAO 1.203.549 4.898.234 6.101.782
4.3.4 TOTAL MERCANCÍAS POR PAÍSES DE ORIGEN Y DESTINO /
TOTAL GOODS BY NATIONALITY OF PORTS OF ORIGIN AND DESTINATION
Apéndice: Transparencia activa de la información. Los datos en detalle.
Apendix: Active transparency in information. Data in detail.
Datos actualizados a 31/12/2020
45

AUTORIDAD PORTUARIA DE FERROL-SAN CIBRAO EJERCICIO 2020
MERCANCÍAS / GOODS
EMBARCAD
AS /
LOADED
DESEMBARC
ADAS /
UNLOADED
TOTAL
EMBARCAD
AS /
LOADED
DESEMBAR
CADAS /
UNLOADED
TOTAL
EMBARC
ADAS /
LOADED
DESEMB
ARCADA
S /
UNLOAD
TOTAL
GLICEROL 0 0 0 0 0 0 0 0 0
SOSA CAUSTICA 0 0 0 0 0 0 0 0 0
FUEL OIL 0 0 0 0 0 0 0 0 0
METANOL 0 0 0 0 0 0 0 0 0
ACEITES 0 0 0 0 0 0 0 0 0
GAS NATURAL 0 0 0 0 0 0 0 0 0
GAS-OIL 0 0 0 0 0 0 0 0 0
BIODIESEL 0 0 0 0 0 0 0 0 0
0 0 0 0 0 0 0 0 0
GLICEROL 0 0 0 0 0 0 0 0 0
SOSA CAUSTICA 0 0 0 0 0 0 0 0 0
FUEL OIL 0 0 0 0 0 0 0 0 0
METANOL 0 0 0 0 0 0 0 0 0
ACEITES 0 0 0 0 0 0 0 0 0
GAS NATURAL 0 0 0 0 0 0 0 0 0
GAS-OIL 0 0 0 0 0 0 0 0 0
BIODIESEL 0 0 0 0 0 0 0 0 0
0 0 0 0 0 0 0 0 0
0 0 0 0 0 0 0 0 0
0 0 0 0 0 0 0 0 0
COQUE 0 0 0 0 0 0 0 0 0
ASTILLA Y DESPERDICIOS
DE MADERA0 0 0 0 0 0 0 0 0
MAGNESITA 0 0 0 0 0 0 0 0 0
ABONOS 0 0 0 0 0 0 0 0 0
CEMENTO Y CLINKER 0 0 0 0 0 0 0 0 0
CUARZO Y GRANITO 0 0 0 0 0 0 0 0 0
ALUMINA 0 0 0 0 0 0 0 0 0
BAUXITA 0 0 0 0 0 0 0 0 0
OTRAS MERCANCIAS 0 0 0 0 0 0 0 0 0
CHATARRA 0 0 0 0 0 0 0 0 0
CARBON 0 0 0 0 0 0 0 0 0
UREA 0 0 0 0 0 0 0 0 0
0 0 0 0 0 0 0 0 0
CONTENEDORES 0 0 0 0 0 0 0 0 0
CONSTRUCCIONES
PREFABRICADAS0 0 0 0 0 0 0 0 0
COLA DE UREA 0 0 0 0 0 0 0 0 0
ASTILLA Y DESPERDICIOS
DE MADERA0 0 0 0 0 0 0 0 0
MAGNESITA 0 0 0 0 0 0 0 0 0
MADERA 0 0 0 0 0 0 0 0 0
MATERIALES DE
CONSTRUCCION0 0 0 0 0 0 0 0 0
CUARZO Y GRANITO 0 0 0 0 0 0 0 0 0
ALUMINIO 0 0 0 0 0 0 0 0 0
ACERO 0 0 0 0 0 0 0 0 0
ACEITES 0 0 0 0 0 0 0 0 0
c) Graneles sólidos sin
instalac. especial / Dry bulks
without special installation
MERCANCÍA
GENERAL
CONVENCIONAL
d) Mercancía general /
General cargo
4.3.5 MERCANCÍAS TRANSBORDADAS / TRANSHIPPED GOODS
EXTERIOR / FOREIGN TOTAL / TOTAL
b) Graneles sólidos por
instalac. especial / Dry bulks
by special installation
a) Graneles líquidos / Liquid
bulks
Otros líquidos
Productos
petrolíferos
CABOTAJE / DOMESTIC
Apéndice: Transparencia activa de la información. Los datos en detalle.
Apendix: Active transparency in information. Data in detail.
Datos actualizados a 31/12/2020
46

AUTORIDAD PORTUARIA DE FERROL-SAN CIBRAO EJERCICIO 2020
MERCANCÍAS / GOODS
EMBARCAD
AS /
LOADED
DESEMBARC
ADAS /
UNLOADED
TOTAL
EMBARCAD
AS /
LOADED
DESEMBAR
CADAS /
UNLOADED
TOTAL
EMBARC
ADAS /
LOADED
DESEMB
ARCADA
S /
UNLOAD
TOTAL
4.3.5 MERCANCÍAS TRANSBORDADAS / TRANSHIPPED GOODS
EXTERIOR / FOREIGN TOTAL / TOTALCABOTAJE / DOMESTIC
AEROGENERADORES 0 0 0 0 0 0 0 0 0
OTRAS MERCANCIAS 0 0 0 0 0 0 0 0 0
TABLERO 0 0 0 0 0 0 0 0 0
APARATOS,
HERRAMIENTAS Y
REPUESTOS
0 0 0 0 0 0 0 0 0
ELECTRODOS 0 0 0 0 0 0 0 0 0
PAPEL 0 0 0 0 0 0 0 0 0
CARBON 0 0 0 0 0 0 0 0 0
ARENAS 0 0 0 0 0 0 0 0 0
0 0 0 0 0 0 0 0 0
CONTENEDORES 0 0 0 0 0 0 0 0 0
CONSTRUCCIONES
PREFABRICADAS0 0 0 0 0 0 0 0 0
COLA DE UREA 0 0 0 0 0 0 0 0 0
ASTILLA Y DESPERDICIOS
DE MADERA0 0 0 0 0 0 0 0 0
MAGNESITA 0 0 0 0 0 0 0 0 0
MADERA 0 0 0 0 0 0 0 0 0
MATERIALES DE
CONSTRUCCION0 0 0 0 0 0 0 0 0
CUARZO Y GRANITO 0 0 0 0 0 0 0 0 0
ALUMINIO 0 0 0 0 0 0 0 0 0
ACERO 0 0 0 0 0 0 0 0 0
ACEITES 0 0 0 0 0 0 0 0 0
AEROGENERADORES 0 0 0 0 0 0 0 0 0
OTRAS MERCANCIAS 0 0 0 0 0 0 0 0 0
TABLERO 0 0 0 0 0 0 0 0 0
APARATOS,
HERRAMIENTAS Y
REPUESTOS
0 0 0 0 0 0 0 0 0
ELECTRODOS 0 0 0 0 0 0 0 0 0
PAPEL 0 0 0 0 0 0 0 0 0
CARBON 0 0 0 0 0 0 0 0 0
ARENAS 0 0 0 0 0 0 0 0 0
0 0 0 0 0 0 0 0 0
Total 0 0 0 0 0 0 0 0 0
MERCANCÍA
GENERAL EN
CONTENEDORES
d) Mercancía general /
General cargo
MERCANCÍA
GENERAL
CONVENCIONAL
Apéndice: Transparencia activa de la información. Los datos en detalle.
Apendix: Active transparency in information. Data in detail.
Datos actualizados a 31/12/2020
47

FERROL EJERCICIO 2020
MERCANCÍAS / GOODS EMBARCAD
AS /
DESEMBARC
ADAS / TOTAL
EMBARCAD
AS /
DESEMBAR
CADAS / TOTAL
EMBARC
ADAS /
DESEMB
ARCADATOTAL
GLICEROL 0 0 0 0 0 0 0 0 0
SOSA CAUSTICA 0 0 0 0 0 0 0 0 0
FUEL OIL 0 0 0 0 0 0 0 0 0
METANOL 0 0 0 0 0 0 0 0 0
ACEITES 0 0 0 0 0 0 0 0 0
GAS NATURAL 0 0 0 0 0 0 0 0 0
GAS-OIL 0 0 0 0 0 0 0 0 0
BIODIESEL 0 0 0 0 0 0 0 0 0
0 0 0 0 0 0 0 0 0
GLICEROL 0 0 0 0 0 0 0 0 0
SOSA CAUSTICA 0 0 0 0 0 0 0 0 0
FUEL OIL 0 0 0 0 0 0 0 0 0
METANOL 0 0 0 0 0 0 0 0 0
ACEITES 0 0 0 0 0 0 0 0 0
GAS NATURAL 0 0 0 0 0 0 0 0 0
GAS-OIL 0 0 0 0 0 0 0 0 0
BIODIESEL 0 0 0 0 0 0 0 0 0
0 0 0 0 0 0 0 0 0
0 0 0 0 0 0 0 0 0
0 0 0 0 0 0 0 0 0
COQUE 0 0 0 0 0 0 0 0 0
ASTILLA Y DESPERDICIOS
DE MADERA0 0 0 0 0 0 0 0 0
MAGNESITA 0 0 0 0 0 0 0 0 0
ABONOS 0 0 0 0 0 0 0 0 0
CEMENTO Y CLINKER 0 0 0 0 0 0 0 0 0
CUARZO Y GRANITO 0 0 0 0 0 0 0 0 0
ALUMINA 0 0 0 0 0 0 0 0 0
BAUXITA 0 0 0 0 0 0 0 0 0
OTRAS MERCANCIAS 0 0 0 0 0 0 0 0 0
CHATARRA 0 0 0 0 0 0 0 0 0
CARBON 0 0 0 0 0 0 0 0 0
UREA 0 0 0 0 0 0 0 0 0
0 0 0 0 0 0 0 0 0
CONTENEDORES 0 0 0 0 0 0 0 0 0
CONSTRUCCIONES
PREFABRICADAS0 0 0 0 0 0 0 0 0
COLA DE UREA 0 0 0 0 0 0 0 0 0
ASTILLA Y DESPERDICIOS
DE MADERA0 0 0 0 0 0 0 0 0
MAGNESITA 0 0 0 0 0 0 0 0 0
MADERA 0 0 0 0 0 0 0 0 0
MATERIALES DE
CONSTRUCCION0 0 0 0 0 0 0 0 0
CUARZO Y GRANITO 0 0 0 0 0 0 0 0 0
ALUMINIO 0 0 0 0 0 0 0 0 0
ACERO 0 0 0 0 0 0 0 0 0
ACEITES 0 0 0 0 0 0 0 0 0
AEROGENERADORES 0 0 0 0 0 0 0 0 0
OTRAS MERCANCIAS 0 0 0 0 0 0 0 0 0
c) Graneles sólidos sin
instalac. especial / Dry bulks
without special installation
a) Graneles líquidos / Liquid
bulks
Otros líquidos
Productos
petrolíferos
4.3.5 MERCANCÍAS TRANSBORDADAS / TRANSHIPPED GOODS
EXTERIOR / FOREIGN TOTAL / TOTAL
b) Graneles sólidos por
instalac. especial / Dry bulks
by special installation
CABOTAJE / DOMESTIC
d) Mercancía general /
General cargo
MERCANCÍA
GENERAL
CONVENCIONAL
Apéndice: Transparencia activa de la información. Los datos en detalle.
Apendix: Active transparency in information. Data in detail.
Datos actualizados a 31/12/2020
48

FERROL EJERCICIO 2020
MERCANCÍAS / GOODS EMBARCAD
AS /
DESEMBARC
ADAS / TOTAL
EMBARCAD
AS /
DESEMBAR
CADAS / TOTAL
EMBARC
ADAS /
DESEMB
ARCADATOTAL
4.3.5 MERCANCÍAS TRANSBORDADAS / TRANSHIPPED GOODS
EXTERIOR / FOREIGN TOTAL / TOTALCABOTAJE / DOMESTIC
TABLERO 0 0 0 0 0 0 0 0 0
APARATOS,
HERRAMIENTAS Y
REPUESTOS
0 0 0 0 0 0 0 0 0
ELECTRODOS 0 0 0 0 0 0 0 0 0
PAPEL 0 0 0 0 0 0 0 0 0
CARBON 0 0 0 0 0 0 0 0 0
ARENAS 0 0 0 0 0 0 0 0 0
0 0 0 0 0 0 0 0 0
CONTENEDORES 0 0 0 0 0 0 0 0 0
CONSTRUCCIONES
PREFABRICADAS0 0 0 0 0 0 0 0 0
COLA DE UREA 0 0 0 0 0 0 0 0 0
ASTILLA Y DESPERDICIOS
DE MADERA0 0 0 0 0 0 0 0 0
MAGNESITA 0 0 0 0 0 0 0 0 0
MADERA 0 0 0 0 0 0 0 0 0
MATERIALES DE
CONSTRUCCION0 0 0 0 0 0 0 0 0
CUARZO Y GRANITO 0 0 0 0 0 0 0 0 0
ALUMINIO 0 0 0 0 0 0 0 0 0
ACERO 0 0 0 0 0 0 0 0 0
ACEITES 0 0 0 0 0 0 0 0 0
AEROGENERADORES 0 0 0 0 0 0 0 0 0
OTRAS MERCANCIAS 0 0 0 0 0 0 0 0 0
TABLERO 0 0 0 0 0 0 0 0 0
APARATOS,
HERRAMIENTAS Y
REPUESTOS
0 0 0 0 0 0 0 0 0
ELECTRODOS 0 0 0 0 0 0 0 0 0
PAPEL 0 0 0 0 0 0 0 0 0
CARBON 0 0 0 0 0 0 0 0 0
ARENAS 0 0 0 0 0 0 0 0 0
0 0 0 0 0 0 0 0 0
Total 0 0 0 0 0 0 0 0 0
MERCANCÍA
GENERAL
CONVENCIONAL
d) Mercancía general /
General cargo
MERCANCÍA
GENERAL EN
CONTENEDORES
Apéndice: Transparencia activa de la información. Los datos en detalle.
Apendix: Active transparency in information. Data in detail.
Datos actualizados a 31/12/2020
49

SAN CIBRAO EJERCICIO 2020
MERCANCÍAS / GOODS EMBARCAD
AS /
DESEMBARC
ADAS / TOTAL
EMBARCAD
AS /
DESEMBAR
CADAS / TOTAL
EMBARC
ADAS /
DESEMB
ARCADATOTAL
GLICEROL 0 0 0 0 0 0 0 0 0
SOSA CAUSTICA 0 0 0 0 0 0 0 0 0
FUEL OIL 0 0 0 0 0 0 0 0 0
METANOL 0 0 0 0 0 0 0 0 0
ACEITES 0 0 0 0 0 0 0 0 0
GAS NATURAL 0 0 0 0 0 0 0 0 0
GAS-OIL 0 0 0 0 0 0 0 0 0
BIODIESEL 0 0 0 0 0 0 0 0 0
0 0 0 0 0 0 0 0 0
GLICEROL 0 0 0 0 0 0 0 0 0
SOSA CAUSTICA 0 0 0 0 0 0 0 0 0
FUEL OIL 0 0 0 0 0 0 0 0 0
METANOL 0 0 0 0 0 0 0 0 0
ACEITES 0 0 0 0 0 0 0 0 0
GAS NATURAL 0 0 0 0 0 0 0 0 0
GAS-OIL 0 0 0 0 0 0 0 0 0
BIODIESEL 0 0 0 0 0 0 0 0 0
0 0 0 0 0 0 0 0 0
0 0 0 0 0 0 0 0 0
0 0 0 0 0 0 0 0 0
COQUE 0 0 0 0 0 0 0 0 0
ASTILLA Y DESPERDICIOS
DE MADERA0 0 0 0 0 0 0 0 0
MAGNESITA 0 0 0 0 0 0 0 0 0
ABONOS 0 0 0 0 0 0 0 0 0
CEMENTO Y CLINKER 0 0 0 0 0 0 0 0 0
CUARZO Y GRANITO 0 0 0 0 0 0 0 0 0
ALUMINA 0 0 0 0 0 0 0 0 0
BAUXITA 0 0 0 0 0 0 0 0 0
OTRAS MERCANCIAS 0 0 0 0 0 0 0 0 0
CHATARRA 0 0 0 0 0 0 0 0 0
CARBON 0 0 0 0 0 0 0 0 0
UREA 0 0 0 0 0 0 0 0 0
0 0 0 0 0 0 0 0 0
CONTENEDORES 0 0 0 0 0 0 0 0 0
CONSTRUCCIONES
PREFABRICADAS0 0 0 0 0 0 0 0 0
COLA DE UREA 0 0 0 0 0 0 0 0 0
ASTILLA Y DESPERDICIOS
DE MADERA0 0 0 0 0 0 0 0 0
MAGNESITA 0 0 0 0 0 0 0 0 0
MADERA 0 0 0 0 0 0 0 0 0
MATERIALES DE
CONSTRUCCION0 0 0 0 0 0 0 0 0
CUARZO Y GRANITO 0 0 0 0 0 0 0 0 0
ALUMINIO 0 0 0 0 0 0 0 0 0
ACERO 0 0 0 0 0 0 0 0 0
ACEITES 0 0 0 0 0 0 0 0 0
AEROGENERADORES 0 0 0 0 0 0 0 0 0
OTRAS MERCANCIAS 0 0 0 0 0 0 0 0 0
c) Graneles sólidos sin
instalac. especial / Dry
bulks without special
installation
a) Graneles líquidos /
Liquid bulks
Otros líquidos
Productos
petrolíferos
4.3.5 MERCANCÍAS TRANSBORDADAS / TRANSHIPPED GOODS
EXTERIOR / FOREIGN TOTAL / TOTAL
b) Graneles sólidos por
instalac. especial / Dry
bulks by special
installation
CABOTAJE / DOMESTIC
d) Mercancía general /
General cargo
MERCANCÍA
GENERAL
CONVENCIONAL
Apéndice: Transparencia activa de la información. Los datos en detalle.
Apendix: Active transparency in information. Data in detail.
Datos actualizados a 31/12/2020
50

SAN CIBRAO EJERCICIO 2020
MERCANCÍAS / GOODS EMBARCAD
AS /
DESEMBARC
ADAS / TOTAL
EMBARCAD
AS /
DESEMBAR
CADAS / TOTAL
EMBARC
ADAS /
DESEMB
ARCADATOTAL
4.3.5 MERCANCÍAS TRANSBORDADAS / TRANSHIPPED GOODS
EXTERIOR / FOREIGN TOTAL / TOTALCABOTAJE / DOMESTIC
TABLERO 0 0 0 0 0 0 0 0 0
APARATOS,
HERRAMIENTAS Y
REPUESTOS
0 0 0 0 0 0 0 0 0
ELECTRODOS 0 0 0 0 0 0 0 0 0
PAPEL 0 0 0 0 0 0 0 0 0
CARBON 0 0 0 0 0 0 0 0 0
ARENAS 0 0 0 0 0 0 0 0 0
0 0 0 0 0 0 0 0 0
CONTENEDORES 0 0 0 0 0 0 0 0 0
CONSTRUCCIONES
PREFABRICADAS0 0 0 0 0 0 0 0 0
COLA DE UREA 0 0 0 0 0 0 0 0 0
ASTILLA Y DESPERDICIOS
DE MADERA0 0 0 0 0 0 0 0 0
MAGNESITA 0 0 0 0 0 0 0 0 0
MADERA 0 0 0 0 0 0 0 0 0
MATERIALES DE
CONSTRUCCION0 0 0 0 0 0 0 0 0
CUARZO Y GRANITO 0 0 0 0 0 0 0 0 0
ALUMINIO 0 0 0 0 0 0 0 0 0
ACERO 0 0 0 0 0 0 0 0 0
ACEITES 0 0 0 0 0 0 0 0 0
AEROGENERADORES 0 0 0 0 0 0 0 0 0
OTRAS MERCANCIAS 0 0 0 0 0 0 0 0 0
TABLERO 0 0 0 0 0 0 0 0 0
APARATOS,
HERRAMIENTAS Y
REPUESTOS
0 0 0 0 0 0 0 0 0
ELECTRODOS 0 0 0 0 0 0 0 0 0
PAPEL 0 0 0 0 0 0 0 0 0
CARBON 0 0 0 0 0 0 0 0 0
ARENAS 0 0 0 0 0 0 0 0 0
0 0 0 0 0 0 0 0 0
Total 0 0 0 0 0 0 0 0 0
d) Mercancía general /
General cargo
MERCANCÍA
GENERAL
CONVENCIONAL
MERCANCÍA
GENERAL EN
CONTENEDORES
Apéndice: Transparencia activa de la información. Los datos en detalle.
Apendix: Active transparency in information. Data in detail.
Datos actualizados a 31/12/2020
51

AUTORIDAD PORTUARIA DE FERROL-SAN CIBRAO EJERCICIO 2020
CABOTAJE /
DOMESTIC
EXTERIOR /
FOREIGNTotal
En contenedores / By containers 0 63 63
En otros medios / By other means 0 6.468 6.468
Total 0 6.531 6.531
En contenedores / By containers 0 79 79
En otros medios / By other means 0 40.298 40.298
Total 0 40.377 40.377
En contenedores / By containers 0 142 142
En otros medios / By other means 0 46.766 46.766
Total 0 46.909 46.909
EMBARCADAS MÁS DESEMBARCADAS / LOADED AND UNLOADED
4.3.6 TRÁFICO ROLL-ON/ROLL-OFF / ROLL-ON/ROLL-OFF TRAFFIC
4.3.6.1 RESUMEN DEL TRÁFICO ROLL-ON/ROLL-OFF /
SUMMARY OF THE TRAFFIC ROOL-ON/ROLL-OFF
EMBARCADAS / LOADED
DESEMBARCADAS / UNLOADED
Apéndice: Transparencia activa de la información. Los datos en detalle.
Apendix: Active transparency in information. Data in detail.
Datos actualizados a 31/12/2020
52

FERROL EJERCICIO 2020
CABOTAJE /
DOMESTIC
EXTERIOR /
FOREIGNTotal
En contenedores / By containers 0 63 63
En otros medios / By other means 0 6.468 6.468
Total 0 6.531 6.531
En contenedores / By containers 0 79 79
En otros medios / By other means 0 40.298 40.298
Total 0 40.377 40.377
En contenedores / By containers 0 142 142
En otros medios / By other means 0 46.766 46.766
Total 0 46.909 46.909
EMBARCADAS MÁS DESEMBARCADAS / LOADED AND UNLOADED
4.3.6 TRÁFICO ROLL-ON/ROLL-OFF / ROLL-ON/ROLL-OFF TRAFFIC
4.3.6.1 RESUMEN DEL TRÁFICO ROLL-ON/ROLL-OFF /
SUMMARY OF THE TRAFFIC ROOL-ON/ROLL-OFF
EMBARCADAS / LOADED
DESEMBARCADAS / UNLOADED
Apéndice: Transparencia activa de la información. Los datos en detalle.
Apendix: Active transparency in information. Data in detail.
Datos actualizados a 31/12/2020
53

SAN CIBRAO EJERCICIO 2020
CABOTAJE /
DOMESTIC
EXTERIOR /
FOREIGNTotal
En contenedores / By containers 0 0 0
En otros medios / By other means 0 0 0
Total 0 0 0
En contenedores / By containers 0 0 0
En otros medios / By other means 0 0 0
Total 0 0 0
En contenedores / By containers 0 0 0
En otros medios / By other means 0 0 0
Total 0 0 0
EMBARCADAS MÁS DESEMBARCADAS / LOADED AND UNLOADED
4.3.6 TRÁFICO ROLL-ON/ROLL-OFF / ROLL-ON/ROLL-OFF TRAFFIC
4.3.6.1 RESUMEN DEL TRÁFICO ROLL-ON/ROLL-OFF /
SUMMARY OF THE TRAFFIC ROOL-ON/ROLL-OFF
EMBARCADAS / LOADED
DESEMBARCADAS / UNLOADED
Apéndice: Transparencia activa de la información. Los datos en detalle.
Apendix: Active transparency in information. Data in detail.
Datos actualizados a 31/12/2020
54

AUTORIDAD PORTUARIA DE FERROL-SAN CIBRAO EJERCICIO 2020
TIPO / TYPE
EMBARCAD
AS /
LOADED
DESEMBAR
CADAS /
UNLOADED
TOTAL
EMBARCAD
AS /
LOADED
DESEMBAR
CADAS /
UNLOADE
D
TOTAL
EMBARCAD
AS /
LOADED
DESEMBARC
ADAS /
UNLOADED
TOTAL
Camión articulado 0 0 0 0 0 0 0 0 0
Camión rígido 0 0 0 0 0 0 0 0 0
Tren de carretera 0 0 0 0 0 0 0 0 0
TOTAL 0 0 0 0 0 0 0 0 0
Remolques, semirremolques y
plataformas0 0 0 0 0 0 0 0 0
TOTAL 0 0 0 0 0 0 0 0 0
Cabeza Tractora 0 0 0 0 0 0 0 0 0
Furgón 0 0 0 0 0 0 0 0 0
Roll tráiler y otros equipos 0 0 0 137 142 279 137 142 279
TOTAL 0 0 0 137 142 279 137 142 279
TOTAL 0 0 0 137 142 279 137 142 279
4.3.6.2 UNIDADES DE TRANSPORTE INTERMODAL (UTI) ROLL-ON/ROLL-OFF /
TOTAL
ACOMPAÑADO
NO ACOMPAÑADO
RESTO
CABOTAJE / DOMESTIC EXTERIOR / FOREIGN
UNITS OF INTERMODAL TRANSPORT ROLL-ON/ROLL-OFF
Apéndice: Transparencia activa de la información. Los datos en detalle.
Apendix: Active transparency in information. Data in detail.
Datos actualizados a 31/12/2020
55

FERROL EJERCICIO 2020
TIPO / TYPE
EMBARCAD
AS /
LOADED
DESEMBAR
CADAS /
UNLOADED
TOTAL
EMBARCAD
AS /
LOADED
DESEMBAR
CADAS /
UNLOADE
D
TOTAL
EMBARCAD
AS /
LOADED
DESEMBARC
ADAS /
UNLOADED
TOTAL
Camión articulado 0 0 0 0 0 0 0 0 0
Camión rígido 0 0 0 0 0 0 0 0 0
Tren de carretera 0 0 0 0 0 0 0 0 0
TOTAL 0 0 0 0 0 0 0 0 0
Remolques, semirremolques y
plataformas0 0 0 0 0 0 0 0 0
TOTAL 0 0 0 0 0 0 0 0 0
Cabeza Tractora 0 0 0 0 0 0 0 0 0
Furgón 0 0 0 0 0 0 0 0 0
Roll tráiler y otros equipos 0 0 0 137 142 279 137 142 279
TOTAL 0 0 0 137 142 279 137 142 279
TOTAL 0 0 0 137 142 279 137 142 279
4.3.6.2 UNIDADES DE TRANSPORTE INTERMODAL (UTI) ROLL-ON/ROLL-OFF /
TOTAL
ACOMPAÑADO
NO ACOMPAÑADO
RESTO
CABOTAJE / DOMESTIC EXTERIOR / FOREIGN
UNITS OF INTERMODAL TRANSPORT ROLL-ON/ROLL-OFF
Apéndice: Transparencia activa de la información. Los datos en detalle.
Apendix: Active transparency in information. Data in detail.
Datos actualizados a 31/12/2020
56

SAN CIBRAO EJERCICIO 2020
TIPO / TYPE
EMBARCAD
AS /
LOADED
DESEMBAR
CADAS /
UNLOADED
TOTAL
EMBARCAD
AS /
LOADED
DESEMBAR
CADAS /
UNLOADE
D
TOTAL
EMBARCAD
AS /
LOADED
DESEMBARC
ADAS /
UNLOADED
TOTAL
Camión articulado 0 0 0 0 0 0 0 0 0
Camión rígido 0 0 0 0 0 0 0 0 0
Tren de carretera 0 0 0 0 0 0 0 0 0
TOTAL 0 0 0 0 0 0 0 0 0Remolques, semirremolques y
plataformas0 0 0 0 0 0 0 0 0
TOTAL 0 0 0 0 0 0 0 0 0
Cabeza Tractora 0 0 0 0 0 0 0 0 0
Furgón 0 0 0 0 0 0 0 0 0
Roll tráiler y otros equipos 0 0 0 0 0 0 0 0 0
TOTAL 0 0 0 0 0 0 0 0 0
TOTAL 0 0 0 0 0 0 0 0 0
4.3.6.2 UNIDADES DE TRANSPORTE INTERMODAL (UTI) ROLL-ON/ROLL-OFF /
TOTAL
ACOMPAÑADO
NO ACOMPAÑADO
RESTO
CABOTAJE / DOMESTIC EXTERIOR / FOREIGN
UNITS OF INTERMODAL TRANSPORT ROLL-ON/ROLL-OFF
Apéndice: Transparencia activa de la información. Los datos en detalle.
Apendix: Active transparency in information. Data in detail.
Datos actualizados a 31/12/2020
57

AUTORIDAD PORTUARIA DE FERROL-SAN CIBRAO EJERCICIO 2020
TIPO / TYPE EMBARCADAS /
LOADED
DESEMBARCADA
S / UNLOADEDTOTAL
EMBARCADAS /
LOADED
DESEMBARCADA
S / UNLOADEDTOTAL
EMBARCADAS /
LOADED
DESEMBARCADA
S / UNLOADEDTOTAL
Autobuses 0 0 0 0 0 0 0 0 0
Turismos (matriculados y sin
matricular)0 0 0 0 0 0 0 0 0
Camiones 0 0 0 10 1 11 10 1 11
Vehículos especiales 0 0 0 0 0 0 0 0 0
Motocicletas (incl. los
ciclomotores)0 0 0 15 0 15 15 0 15
Total 0 0 0 25 1 26 25 1 26
CABOTAJE / DOMESTIC EXTERIOR / FOREIGN TOTAL
4.3.6.3 UNIDADES DE AUTOMÓVILES EN RÉGIMEN DE MERCANCÍA /
UNITS OF AUTOMOBILES CONSIDERED LIKE GOOD
Apéndice: Transparencia activa de la información. Los datos en detalle.
Apendix: Active transparency in information. Data in detail.
Datos actualizados a 31/12/2020
58

FERROL EJERCICIO 2020
TIPO / TYPE EMBARCADAS /
LOADED
DESEMBARCADA
S / UNLOADEDTOTAL
EMBARCADAS /
LOADED
DESEMBARCADA
S / UNLOADEDTOTAL
EMBARCADAS /
LOADED
DESEMBARCADA
S / UNLOADEDTOTAL
Autobuses 0 0 0 0 0 0 0 0 0
Turismos (matriculados y sin
matricular)0 0 0 0 0 0 0 0 0
Camiones 0 0 0 10 1 11 10 1 11
Vehículos especiales 0 0 0 0 0 0 0 0 0
Motocicletas (incl. los
ciclomotores)0 0 0 15 0 15 15 0 15
Total 0 0 0 25 1 26 25 1 26
CABOTAJE / DOMESTIC EXTERIOR / FOREIGN TOTAL
4.3.6.3 UNIDADES DE AUTOMÓVILES EN RÉGIMEN DE MERCANCÍA /
UNITS OF AUTOMOBILES CONSIDERED LIKE GOOD
Apéndice: Transparencia activa de la información. Los datos en detalle.
Apendix: Active transparency in information. Data in detail.
Datos actualizados a 31/12/2020
59

SAN CIBRAO EJERCICIO 2020
TIPO / TYPE EMBARCADAS /
LOADED
DESEMBARCADA
S / UNLOADEDTOTAL
EMBARCADAS /
LOADED
DESEMBARCADA
S / UNLOADEDTOTAL
EMBARCADAS /
LOADED
DESEMBARCADA
S / UNLOADEDTOTAL
Autobuses 0 0 0 0 0 0 0 0 0
Turismos (matriculados y sin
matricular)0 0 0 0 0 0 0 0 0
Camiones 0 0 0 0 0 0 0 0 0
Vehículos especiales 0 0 0 0 0 0 0 0 0
Motocicletas (incl. los
ciclomotores)0 0 0 0 0 0 0 0 0
Total 0 0 0 0 0 0 0 0 0
CABOTAJE / DOMESTIC EXTERIOR / FOREIGN TOTAL
4.3.6.3 UNIDADES DE AUTOMÓVILES EN RÉGIMEN DE MERCANCÍA /
UNITS OF AUTOMOBILES CONSIDERED LIKE GOOD
Apéndice: Transparencia activa de la información. Los datos en detalle.
Apendix: Active transparency in information. Data in detail.
Datos actualizados a 31/12/2020
60

AUTORIDAD PORTUARIA DE FERROL - SAN CIBRAO EJERCICIO 2020
MERCANCÍAS /
GOODS
EMBARCADA
S / LOADED
DESEMBARC
ADAS /
UNLOADED
TOTAL EMBARCADA
S / LOADED
DESEMBARCADAS
/ UNLOADEDTOTAL
EMBARCADA
S / LOADED
DESEMBARC
ADAS /
UNLOADED
TOTAL
1Petróleo crudo /
Crude oil0 0 0 0 0 0 0 0 0
2 Fuel-oil / Fuel oil 59.261 25.815 85.077 237.117 199.740 436.856 296.378 225.555 521.933
3 Gas-oil / Gas oil 0 29.811 29.811 0 41.352 41.352 0 71.163 71.163
4 Gasolina / Petrol 0 0 0 0 0 0 0 0 0
6
Otros productos
petrolíferos / Other
petroleum products
2.038 0 2.038 0 0 0 2.038 0 2.038
7
Gases energéticos
del petróleo /
Energetic petroleum
gases
0 0 0 0 0 0 0 0 0
12
Carbones y coque de
petróleo / Steam
coal and petroleum
coke
0 7.699 7.699 405 116 521 405 7.815 8.220
35
Gas natural y otros
gases / Natural gas
and other gases
0 0 0 5.358 1.448.978 1.454.337 5.358 1.448.978 1.454.337
51Biocombustibles /
Biofuel54.930 5.049 59.979 152.077 22 152.099 207.007 5.071 212.078
Total 116.229 68.374 184.603 394.958 1.690.208 2.085.166 511.186 1.758.582 2.269.768
8Mineral de hierro /
Iron ore0 0 0 0 0 0 0 0 0
10
Otros minerales y
residuos metálicos /
Other mineral ores
0 0 0 16.121 4.596.061 4.612.182 16.121 4.596.061 4.612.182
11Chatarras de hierro /
Scrap iron0 7.270 7.270 0 241.666 241.666 0 248.936 248.936
13
Productos
siderúrgicos / Iron
products
122 0 122 155.768 646 156.414 155.891 646 156.536
36
Otros productos
metalúrgicos / Other
metallurgic products
0 0 0 30.777 199 30.975 30.777 199 30.975
Total 122 7.270 7.392 202.666 4.838.571 5.041.237 202.789 4.845.841 5.048.630
25 Sal común / Salt 0 0 0 0 23 23 0 23 23
52
Otros minerales no
metálicos / Other
non-metallic
minerals
4.199 0 4.199 3.831 25 3.856 8.030 25 8.055
Total 4.199 0 4.199 3.831 48 3.879 8.030 48 8.077
14Fosfatos /
Phosphates0 0 0 0 0 0 0 0 0
15 Potasas / Potash 0 0 0 0 69 69 0 69 69
16
Abonos naturales y
artificiales / Natural
and artificial
fertilizers
0 11.004 11.004 24 11.865 11.889 24 22.869 22.894
Total 0 11.004 11.004 24 11.934 11.959 24 22.939 22.963
TOTALCABOTAJE / DOMESTIC EXTERIOR / FOREIGN
4.3.7 CLASIFICACIÓN DE MERCANCÍAS / CLASSIFICATION OF GOODS
4.3.7.1 CLASIFICACIÓN SEGÚN NATURALEZA / CLASSIFICATION BY NATURE
Energético /
Power
Products
Siderometalú
rgico /
Siderurgical
and
Metallurgic
Products
Minerales no
metálicos /
Non-metallic
minerals
Abonos /
Fertilizers
Apéndice: Transparencia activa de la información. Los datos en detalle.
Apendix: Active transparency in information. Data in detail.
Datos actualizados a 31/12/2020
61

AUTORIDAD PORTUARIA DE FERROL - SAN CIBRAO EJERCICIO 2020
MERCANCÍAS /
GOODS
EMBARCADA
S / LOADED
DESEMBARC
ADAS /
UNLOADED
TOTAL EMBARCADA
S / LOADED
DESEMBARCADAS
/ UNLOADEDTOTAL
EMBARCADA
S / LOADED
DESEMBARC
ADAS /
UNLOADED
TOTAL
TOTALCABOTAJE / DOMESTIC EXTERIOR / FOREIGN
4.3.7 CLASIFICACIÓN DE MERCANCÍAS / CLASSIFICATION OF GOODS
4.3.7.1 CLASIFICACIÓN SEGÚN NATURALEZA / CLASSIFICATION BY NATURE
17Productos químicos
/ Chemical products17.797 29.090 46.887 1.185.810 422.230 1.608.040 1.203.607 451.321 1.654.927
Total 17.797 29.090 46.887 1.185.810 422.230 1.608.040 1.203.607 451.321 1.654.927
5 Asfalto / Asphalt 0 22.805 22.805 0 57.947 57.947 0 80.752 80.752
18Cemento y clinker /
Cement and clinker0 2.822 2.822 102 0 102 102 2.822 2.924
20
Materiales de
construcción
elaborados/
Manufactured
building materials
1.497 1.574 3.071 147.493 7.009 154.502 148.990 8.583 157.572
Total 1.497 27.201 28.698 147.595 64.956 212.551 149.092 92.156 241.249
21
Cereales y sus
harinas / Cereals and
their flours
0 0 0 0 131.864 131.864 0 131.864 131.864
22Habas de soja /
Soybean0 0 0 0 0 0 0 0 0
23
Frutas, hortalizas y
legumbres / Fruits
and vegetables
0 0 0 0 50 50 0 50 50
24
Vinos,bebidas,
alcoholes y
derivados /
Wines,drinks and
spirits
11 0 11 684 701 1.386 696 701 1.397
27Conservas / Tinned
food72 0 72 8.308 102 8.410 8.380 102 8.482
28
Tabaco,cacao,café y
especias /
Tobacco,cocoa,coffe
e and spices
0 0 0 0 0 0 0 0 0
29Aceites y grasas /
Oils and greases0 5.795 5.795 317 195.725 196.042 317 201.520 201.837
30
Otros productos
alimenticios / Other
foods
318 0 318 4.130 4.540 8.670 4.448 4.540 8.988
33
Pescados congelados
y refrigerados /
Chilled or frozen fish
56 639 695 316 420 735 372 1.058 1.430
37
Pienso y forrajes /
Animal feed and
fodder
0 0 0 90 143 232 90 143 232
Total 457 6.434 6.891 13.845 333.545 347.390 14.302 339.979 354.281
Agro-
Ganadero y
Alimentario /
StockBreedin
g and Feeding
Products
Químicos /
Chemical
Products
Materiales de
construcción
Apéndice: Transparencia activa de la información. Los datos en detalle.
Apendix: Active transparency in information. Data in detail.
Datos actualizados a 31/12/2020
62

AUTORIDAD PORTUARIA DE FERROL - SAN CIBRAO EJERCICIO 2020
MERCANCÍAS /
GOODS
EMBARCADA
S / LOADED
DESEMBARC
ADAS /
UNLOADED
TOTAL EMBARCADA
S / LOADED
DESEMBARCADAS
/ UNLOADEDTOTAL
EMBARCADA
S / LOADED
DESEMBARC
ADAS /
UNLOADED
TOTAL
TOTALCABOTAJE / DOMESTIC EXTERIOR / FOREIGN
4.3.7 CLASIFICACIÓN DE MERCANCÍAS / CLASSIFICATION OF GOODS
4.3.7.1 CLASIFICACIÓN SEGÚN NATURALEZA / CLASSIFICATION BY NATURE
19Maderas y corcho /
Wood and cork9.948 0 9.948 284.610 16.323 300.934 294.558 16.323 310.882
26Papel y pasta / Paper
and pulp25 0 25 1.160 43.937 45.097 1.185 43.937 45.123
31
Maquinaria,
herramientas y
repuestos /
Machinery, tools and
spares
76 21 97 28.824 1.546 30.370 28.901 1.567 30.467
34Resto mercancías /
Other goods284 0 284 5.438 1.268 6.707 5.722 1.268 6.991
Total 10.334 21 10.355 320.033 63.075 383.108 330.367 63.096 393.463
32
Vehículos y sus
piezas / Vehicles and
their parts
0 0 0 154 233 387 154 233 387
38
Tara Equipamiento
(Ro-Ro) / Ro-Ro
traffic tare weights
0 0 0 566 703 1.269 566 703 1.269
39Tara contenedores /
Containers tare418 383 801 12.493 12.412 24.905 12.912 12.794 25.706
Total 418 383 801 13.213 13.348 26.560 13.631 13.730 27.361
Total 151.053 149.776 300.830 2.281.974 7.437.915 9.719.889 2.433.028 7.587.691 10.020.719
En este cuadro NO se incluyen los avituallamientos, pesca fresca, tráfico interior, transbordo, tránsito terrestre y control aduanero
Otras
mercancías /
Other goods
Vehículos y
elementos de
transporte /
Vehicles and
tranport
elements
Apéndice: Transparencia activa de la información. Los datos en detalle.
Apendix: Active transparency in information. Data in detail.
Datos actualizados a 31/12/2020
63

FERROL EJERCICIO 2020
MERCANCÍAS /
GOODS
EMBARCADA
S / LOADED
DESEMBARC
ADAS /
UNLOADED
TOTAL EMBARCADA
S / LOADED
DESEMBARCADAS
/ UNLOADEDTOTAL
EMBARCADA
S / LOADED
DESEMBARC
ADAS /
UNLOADED
TOTAL
1Petróleo crudo /
Crude oil0 0 0 0 0 0 0 0 0
2 Fuel-oil / Fuel oil 59.261 25.815 85.077 237.117 199.740 436.856 296.378 225.555 521.933
3 Gas-oil / Gas oil 0 29.811 29.811 0 41.352 41.352 0 71.163 71.163
4 Gasolina / Petrol 0 0 0 0 0 0 0 0 0
6
Otros productos
petrolíferos / Other
petroleum products
2.038 0 2.038 0 0 0 2.038 0 2.038
7
Gases energéticos
del petróleo /
Energetic petroleum
gases
0 0 0 0 0 0 0 0 0
12
Carbones y coque de
petróleo / Steam
coal and petroleum
coke
0 7.699 7.699 405 116 521 405 7.815 8.220
35
Gas natural y otros
gases / Natural gas
and other gases
0 0 0 5.358 1.448.978 1.454.337 5.358 1.448.978 1.454.337
51Biocombustibles /
Biofuel54.930 5.049 59.979 152.077 22 152.099 207.007 5.071 212.078
Total 116.229 68.374 184.603 394.958 1.690.208 2.085.166 511.186 1.758.582 2.269.768
8Mineral de hierro /
Iron ore0 0 0 0 0 0 0 0 0
10
Otros minerales y
residuos metálicos /
Other mineral ores
0 0 0 16.121 57.228 73.349 16.121 57.228 73.349
11Chatarras de hierro /
Scrap iron0 7.270 7.270 0 241.666 241.666 0 248.936 248.936
13
Productos
siderúrgicos / Iron
products
122 0 122 155.768 646 156.414 155.891 646 156.536
36
Otros productos
metalúrgicos / Other
metallurgic products
0 0 0 32 199 230 32 199 230
Total 122 7.270 7.392 171.921 299.738 471.659 172.044 307.008 479.052
25 Sal común / Salt 0 0 0 0 23 23 0 23 23
52
Otros minerales no
metálicos / Other
non-metallic
minerals
4.199 0 4.199 3.831 25 3.856 8.030 25 8.055
Total 4.199 0 4.199 3.831 48 3.879 8.030 48 8.077
14Fosfatos /
Phosphates0 0 0 0 0 0 0 0 0
15 Potasas / Potash 0 0 0 0 69 69 0 69 69
16
Abonos naturales y
artificiales / Natural
and artificial
fertilizers
0 11.004 11.004 24 11.865 11.889 24 22.869 22.894
Total 0 11.004 11.004 24 11.934 11.959 24 22.939 22.963
TOTALCABOTAJE / DOMESTIC EXTERIOR / FOREIGN
4.3.7 CLASIFICACIÓN DE MERCANCÍAS / CLASSIFICATION OF GOODS
4.3.7.1 CLASIFICACIÓN SEGÚN NATURALEZA / CLASSIFICATION BY NATURE
Energético /
Power
Products
Siderometalú
rgico /
Siderurgical
and
Metallurgic
Products
Minerales no
metálicos /
Non-metallic
minerals
Abonos /
Fertilizers
Apéndice: Transparencia activa de la información. Los datos en detalle.
Apendix: Active transparency in information. Data in detail.
Datos actualizados a 31/12/2020
64

FERROL EJERCICIO 2020
MERCANCÍAS /
GOODS
EMBARCADA
S / LOADED
DESEMBARC
ADAS /
UNLOADED
TOTAL EMBARCADA
S / LOADED
DESEMBARCADAS
/ UNLOADEDTOTAL
EMBARCADA
S / LOADED
DESEMBARC
ADAS /
UNLOADED
TOTAL
TOTALCABOTAJE / DOMESTIC EXTERIOR / FOREIGN
4.3.7 CLASIFICACIÓN DE MERCANCÍAS / CLASSIFICATION OF GOODS
4.3.7.1 CLASIFICACIÓN SEGÚN NATURALEZA / CLASSIFICATION BY NATURE
17Productos químicos
/ Chemical products4.349 29.090 33.439 26.469 143.582 170.051 30.819 172.672 203.490
Total 4.349 29.090 33.439 26.469 143.582 170.051 30.819 172.672 203.490
5 Asfalto / Asphalt 0 0 0 0 0 0 0 0 0
18Cemento y clinker /
Cement and clinker0 2.822 2.822 102 0 102 102 2.822 2.924
20
Materiales de
construcción
elaborados/
Manufactured
building materials
1.497 1.574 3.071 147.493 7.009 154.502 148.990 8.583 157.572
Total 1.497 4.395 5.893 147.595 7.009 154.604 149.092 11.405 160.497
21
Cereales y sus
harinas / Cereals and
their flours
0 0 0 0 131.864 131.864 0 131.864 131.864
22Habas de soja /
Soybean0 0 0 0 0 0 0 0 0
23
Frutas, hortalizas y
legumbres / Fruits
and vegetables
0 0 0 0 50 50 0 50 50
24
Vinos,bebidas,
alcoholes y
derivados /
Wines,drinks and
spirits
11 0 11 684 701 1.386 696 701 1.397
27Conservas / Tinned
food72 0 72 8.308 102 8.410 8.380 102 8.482
28
Tabaco,cacao,café y
especias /
Tobacco,cocoa,coffe
e and spices
0 0 0 0 0 0 0 0 0
29Aceites y grasas /
Oils and greases0 5.795 5.795 317 195.725 196.042 317 201.520 201.837
30
Otros productos
alimenticios / Other
foods
318 0 318 4.130 4.540 8.670 4.448 4.540 8.988
33
Pescados congelados
y refrigerados /
Chilled or frozen fish
56 639 695 316 420 735 372 1.058 1.430
37
Pienso y forrajes /
Animal feed and
fodder
0 0 0 90 143 232 90 143 232
Total 457 6.434 6.891 13.845 333.545 347.390 14.302 339.979 354.281
19Maderas y corcho /
Wood and cork9.948 0 9.948 284.595 16.323 300.918 294.543 16.323 310.866
26Papel y pasta / Paper
and pulp25 0 25 1.160 43.937 45.097 1.185 43.937 45.123
31
Maquinaria,
herramientas y
repuestos /
Machinery, tools and
spares
76 21 97 28.824 1.546 30.370 28.901 1.567 30.467
34Resto mercancías /
Other goods284 0 284 5.438 1.268 6.707 5.722 1.268 6.991
Total 10.334 21 10.355 320.017 63.075 383.092 330.351 63.096 393.447
Agro-
Ganadero y
Alimentario /
StockBreedin
g and Feeding
Products
Otras
mercancías /
Other goods
Químicos /
Chemical
Products
Materiales de
construcción
Apéndice: Transparencia activa de la información. Los datos en detalle.
Apendix: Active transparency in information. Data in detail.
Datos actualizados a 31/12/2020
65

FERROL EJERCICIO 2020
MERCANCÍAS /
GOODS
EMBARCADA
S / LOADED
DESEMBARC
ADAS /
UNLOADED
TOTAL EMBARCADA
S / LOADED
DESEMBARCADAS
/ UNLOADEDTOTAL
EMBARCADA
S / LOADED
DESEMBARC
ADAS /
UNLOADED
TOTAL
TOTALCABOTAJE / DOMESTIC EXTERIOR / FOREIGN
4.3.7 CLASIFICACIÓN DE MERCANCÍAS / CLASSIFICATION OF GOODS
4.3.7.1 CLASIFICACIÓN SEGÚN NATURALEZA / CLASSIFICATION BY NATURE
32
Vehículos y sus
piezas / Vehicles and
their parts
0 0 0 154 233 387 154 233 387
38
Tara Equipamiento
(Ro-Ro) / Ro-Ro
traffic tare weights
0 0 0 566 703 1.269 566 703 1.269
39Tara contenedores /
Containers tare418 383 801 12.493 12.412 24.905 12.912 12.794 25.706
Total 418 383 801 13.213 13.348 26.560 13.631 13.730 27.361
Total 137.606 126.971 264.577 1.091.873 2.562.487 3.654.360 1.229.479 2.689.458 3.918.937
En este cuadro NO se incluyen los avituallamientos, pesca fresca, tráfico interior, transbordo, tránsito terrestre y control aduanero
Vehículos y
elementos de
transporte /
Vehicles and
tranport
elements
Apéndice: Transparencia activa de la información. Los datos en detalle.
Apendix: Active transparency in information. Data in detail.
Datos actualizados a 31/12/2020
66

SAN CIBRAO EJERCICIO 2020
MERCANCÍAS /
GOODS
EMBARCADAS
/ LOADED
DESEMBARC
ADAS /
UNLOADED
TOTAL EMBARCADA
S / LOADED
DESEMBARCADAS
/ UNLOADEDTOTAL
EMBARCADA
S / LOADED
DESEMBARC
ADAS /
UNLOADED
TOTAL
1Petróleo crudo /
Crude oil0 0 0 0 0 0 0 0 0
2 Fuel-oil / Fuel oil 0 0 0 0 0 0 0 0 0
3 Gas-oil / Gas oil 0 0 0 0 0 0 0 0 0
4 Gasolina / Petrol 0 0 0 0 0 0 0 0 0
6
Otros productos
petrolíferos / Other
petroleum products
0 0 0 0 0 0 0 0 0
7
Gases energéticos
del petróleo /
Energetic petroleum
gases
0 0 0 0 0 0 0 0 0
12
Carbones y coque de
petróleo / Steam
coal and petroleum
coke
0 0 0 0 0 0 0 0 0
35
Gas natural y otros
gases / Natural gas
and other gases
0 0 0 0 0 0 0 0 0
51Biocombustibles /
Biofuel0 0 0 0 0 0 0 0 0
Total 0 0 0 0 0 0 0 0 0
8Mineral de hierro /
Iron ore0 0 0 0 0 0 0 0 0
10
Otros minerales y
residuos metálicos /
Other mineral ores
0 0 0 0 4.538.833 4.538.833 0 4.538.833 4.538.833
11Chatarras de hierro /
Scrap iron0 0 0 0 0 0 0 0 0
13
Productos
siderúrgicos / Iron
products
0 0 0 0 0 0 0 0 0
36
Otros productos
metalúrgicos / Other
metallurgic products
0 0 0 30.745 0 30.745 30.745 0 30.745
Total 0 0 0 30.745 4.538.833 4.569.578 30.745 4.538.833 4.569.578
25 Sal común / Salt 0 0 0 0 0 0 0 0 0
52
Otros minerales no
metálicos / Other
non-metallic
minerals
0 0 0 0 0 0 0 0 0
Total 0 0 0 0 0 0 0 0 0
14Fosfatos /
Phosphates0 0 0 0 0 0 0 0 0
15 Potasas / Potash 0 0 0 0 0 0 0 0 0
16
Abonos naturales y
artificiales / Natural
and artificial
fertilizers
0 0 0 0 0 0 0 0 0
Total 0 0 0 0 0 0 0 0 0
TOTALCABOTAJE / DOMESTIC EXTERIOR / FOREIGN
4.3.7 CLASIFICACIÓN DE MERCANCÍAS / CLASSIFICATION OF GOODS
4.3.7.1 CLASIFICACIÓN SEGÚN NATURALEZA / CLASSIFICATION BY NATURE
Energético /
Power
Products
Siderometalú
rgico /
Siderurgical
and
Metallurgic
Products
Minerales no
metálicos /
Non-metallic
minerals
Abonos /
Fertilizers
Apéndice: Transparencia activa de la información. Los datos en detalle.
Apendix: Active transparency in information. Data in detail.
Datos actualizados a 31/12/2020
67

SAN CIBRAO EJERCICIO 2020
MERCANCÍAS /
GOODS
EMBARCADAS
/ LOADED
DESEMBARC
ADAS /
UNLOADED
TOTAL EMBARCADA
S / LOADED
DESEMBARCADAS
/ UNLOADEDTOTAL
EMBARCADA
S / LOADED
DESEMBARC
ADAS /
UNLOADED
TOTAL
TOTALCABOTAJE / DOMESTIC EXTERIOR / FOREIGN
4.3.7 CLASIFICACIÓN DE MERCANCÍAS / CLASSIFICATION OF GOODS
4.3.7.1 CLASIFICACIÓN SEGÚN NATURALEZA / CLASSIFICATION BY NATURE
17Productos químicos
/ Chemical products13.448 0 13.448 1.159.340 278.649 1.437.989 1.172.788 278.649 1.451.437
Total 13.448 0 13.448 1.159.340 278.649 1.437.989 1.172.788 278.649 1.451.437
5 Asfalto / Asphalt 0 22.805 22.805 0 57.947 57.947 0 80.752 80.752
18Cemento y clinker /
Cement and clinker0 0 0 0 0 0 0 0 0
20
Materiales de
construcción
elaborados/
Manufactured
building materials
0 0 0 0 0 0 0 0 0
Total 0 22.805 22.805 0 57.947 57.947 0 80.752 80.752
21
Cereales y sus
harinas / Cereals and
their flours
0 0 0 0 0 0 0 0 0
22Habas de soja /
Soybean0 0 0 0 0 0 0 0 0
23
Frutas, hortalizas y
legumbres / Fruits
and vegetables
0 0 0 0 0 0 0 0 0
24
Vinos,bebidas,
alcoholes y
derivados /
Wines,drinks and
spirits
0 0 0 0 0 0 0 0 0
27Conservas / Tinned
food0 0 0 0 0 0 0 0 0
28
Tabaco,cacao,café y
especias /
Tobacco,cocoa,coffe
e and spices
0 0 0 0 0 0 0 0 0
29Aceites y grasas /
Oils and greases0 0 0 0 0 0 0 0 0
30
Otros productos
alimenticios / Other
foods
0 0 0 0 0 0 0 0 0
33
Pescados congelados
y refrigerados /
Chilled or frozen fish
0 0 0 0 0 0 0 0 0
37
Pienso y forrajes /
Animal feed and
fodder
0 0 0 0 0 0 0 0 0
Total 0 0 0 0 0 0 0 0 0
19Maderas y corcho /
Wood and cork0 0 0 16 0 16 16 0 16
26Papel y pasta / Paper
and pulp0 0 0 0 0 0 0 0 0
31
Maquinaria,
herramientas y
repuestos /
Machinery, tools and
spares
0 0 0 0 0 0 0 0 0
34Resto mercancías /
Other goods0 0 0 0 0 0 0 0 0
Total 0 0 0 16 0 16 16 0 16
Agro-
Ganadero y
Alimentario /
StockBreedin
g and Feeding
Products
Otras
mercancías /
Other goods
Químicos /
Chemical
Products
Materiales de
construcción
Apéndice: Transparencia activa de la información. Los datos en detalle.
Apendix: Active transparency in information. Data in detail.
Datos actualizados a 31/12/2020
68

SAN CIBRAO EJERCICIO 2020
MERCANCÍAS /
GOODS
EMBARCADAS
/ LOADED
DESEMBARC
ADAS /
UNLOADED
TOTAL EMBARCADA
S / LOADED
DESEMBARCADAS
/ UNLOADEDTOTAL
EMBARCADA
S / LOADED
DESEMBARC
ADAS /
UNLOADED
TOTAL
TOTALCABOTAJE / DOMESTIC EXTERIOR / FOREIGN
4.3.7 CLASIFICACIÓN DE MERCANCÍAS / CLASSIFICATION OF GOODS
4.3.7.1 CLASIFICACIÓN SEGÚN NATURALEZA / CLASSIFICATION BY NATURE
32
Vehículos y sus
piezas / Vehicles and
their parts
0 0 0 0 0 0 0 0 0
38
Tara Equipamiento
(Ro-Ro) / Ro-Ro
traffic tare weights
0 0 0 0 0 0 0 0 0
39Tara contenedores /
Containers tare0 0 0 0 0 0 0 0 0
Total 0 0 0 0 0 0 0 0 0
Total 13.448 22.805 36.253 1.190.101 4.875.428 6.065.529 1.203.549 4.898.234 6.101.782
En este cuadro NO se incluyen los avituallamientos, pesca fresca, tráfico interior, transbordo, tránsito terrestre y control aduanero
Vehículos y
elementos de
transporte /
Vehicles and
tranport
elements
Apéndice: Transparencia activa de la información. Los datos en detalle.
Apendix: Active transparency in information. Data in detail.
Datos actualizados a 31/12/2020
69

EJERCICIO 2020
MERCANCÍAS /
GOODS
EMBARCADA
S / LOADED
DESEMBARCAD
AS /
UNLOADED
TOTAL EMBARCADAS
/ LOADED
DESEMBARCAD
AS /
UNLOADED
TOTAL
EMBARCAD
AS /
LOADED
DESEMBAR
CADAS /
UNLOADED
TOTAL
1Petróleo crudo /
Crude oil0 0 0 0 0 0 0 0 0
2 Fuel-oil / Fuel oil 296.378 225.555 521.933 0 0 0 0 0 0
3 Gas-oil / Gas oil 0 71.163 71.163 0 0 0 0 0 0
4 Gasolina / Petrol 0 0 0 0 0 0 0 0 0
6
Otros productos
petrolíferos / Other
petroleum products
2.038 0 2.038 0 0 0 0 0 0
7
Gases energéticos
del petróleo /
Energetic petroleum
gases
0 0 0 0 0 0 0 0 0
12
Carbones y coque de
petróleo / Steam
coal and petroleum
coke
0 0 0 0 7.699 7.699 405 116 521
35
Gas natural y otros
gases / Natural gas
and other gases
5.358 1.448.978 1.454.337 0 0 0 0 0 0
51Biocombustibles /
Biofuel207.007 5.049 212.056 0 0 0 0 22 22
Total 510.781 1.750.745 2.261.526 0 7.699 7.699 405 138 543
8Mineral de hierro /
Iron ore0 0 0 0 0 0 0 0 0
10
Otros minerales y
residuos metálicos /
Other mineral ores
0 0 0 15.710 4.595.796 4.611.506 411 265 676
11Chatarras de hierro /
Scrap iron0 0 0 0 248.936 248.936 0 0 0
13
Productos
siderúrgicos / Iron
products
0 0 0 0 0 0 520 480 999
36
Otros productos
metalúrgicos / Other
metallurgic products
0 0 0 0 0 0 32 199 230
Total 0 0 0 15.710 4.844.732 4.860.442 963 943 1.906
25 Sal común / Salt 0 0 0 0 0 0 0 23 23
52
Otros minerales no
metálicos / Other
non-metallic
minerals
0 0 0 7.205 0 7.205 825 25 850
Total 0 0 0 7.205 0 7.205 825 48 873
14Fosfatos /
Phosphates0 0 0 0 0 0 0 0 0
15 Potasas / Potash 0 0 0 0 0 0 0 69 69
16
Abonos naturales y
artificiales / Natural
and artificial
fertilizers
0 0 0 0 21.734 21.734 24 1.135 1.159
Total 0 0 0 0 21.734 21.734 24 1.204 1.229
Energético /
Power
Products
Siderometalúr
gico /
Siderurgical
and
Metallurgic
Products
Minerales no
metálicos /
Non-metallic
minerals
Abonos /
Fertilizers
MERCANCÍA GENERAL
GRANELES LÍQUIDOS GRANELES SÓLIDOSMERCANCÍA GENERAL EN
CONTENEDORES
AUTORIDAD PORTUARIA DE
FERROL -SAN CIBRAO
4.3.7.2 CLASIFICACIÓN SEGÚN
NATURALEZA Y PRESENTACIÓN / CLASSIFICATION BY NATURE AND
PACKAGING
Apéndice: Transparencia activa de la información. Los datos en detalle.
Apendix: Active transparency in information. Data in detail.
Datos actualizados a 31/12/2020
70

EJERCICIO 2020
MERCANCÍAS /
GOODS
EMBARCADA
S / LOADED
DESEMBARCAD
AS /
UNLOADED
TOTAL EMBARCADAS
/ LOADED
DESEMBARCAD
AS /
UNLOADED
TOTAL
EMBARCAD
AS /
LOADED
DESEMBAR
CADAS /
UNLOADED
TOTAL
MERCANCÍA GENERAL
GRANELES LÍQUIDOS GRANELES SÓLIDOSMERCANCÍA GENERAL EN
CONTENEDORES
AUTORIDAD PORTUARIA DE
FERROL -SAN CIBRAO
4.3.7.2 CLASIFICACIÓN SEGÚN
NATURALEZA Y PRESENTACIÓN / CLASSIFICATION BY NATURE AND
PACKAGING
17Productos químicos
/ Chemical products29.906 443.207 473.113 1.172.788 0 1.172.788 913 8.113 9.026
Total 29.906 443.207 473.113 1.172.788 0 1.172.788 913 8.113 9.026
5 Asfalto / Asphalt 0 0 0 0 80.752 80.752 0 0 0
18Cemento y clinker /
Cement and clinker0 0 0 0 2.822 2.822 102 0 102
20
Materiales de
construcción
elaborados/
Manufactured
building materials
0 0 0 72.495 0 72.495 16.193 514 16.707
Total 0 0 0 72.495 83.574 156.069 16.295 514 16.809
21
Cereales y sus
harinas / Cereals and
their flours
0 0 0 0 131.792 131.792 0 72 72
22Habas de soja /
Soybean0 0 0 0 0 0 0 0 0
23
Frutas, hortalizas y
legumbres / Fruits
and vegetables
0 0 0 0 0 0 0 50 50
24
Vinos,bebidas,
alcoholes y
derivados /
Wines,drinks and
spirits
0 0 0 0 0 0 696 701 1.397
27Conservas / Tinned
food0 0 0 0 0 0 8.380 102 8.482
28
Tabaco,cacao,café y
especias /
Tobacco,cocoa,coffe
e and spices
0 0 0 0 0 0 0 0 0
29Aceites y grasas /
Oils and greases0 201.520 201.520 0 0 0 317 0 317
30
Otros productos
alimenticios / Other
foods
0 0 0 0 0 0 4.448 4.540 8.988
33
Pescados congelados
y refrigerados /
Chilled or frozen fish
0 0 0 0 0 0 372 1.058 1.430
37
Pienso y forrajes /
Animal feed and
fodder
0 0 0 0 0 0 90 143 232
Total 0 201.520 201.520 0 131.792 131.792 14.302 6.667 20.969
19Maderas y corcho /
Wood and cork0 0 0 13.751 0 13.751 29.330 5.141 34.471
26Papel y pasta / Paper
and pulp0 0 0 0 0 0 1.182 5.941 7.123
31
Maquinaria,
herramientas y
repuestos /
Machinery, tools and
spares
0 0 0 0 0 0 3.234 221 3.456
34Resto mercancías /
Other goods0 0 0 0 0 0 5.722 1.164 6.886
Total 0 0 0 13.751 0 13.751 39.468 12.468 51.936
Agro-
Ganadero y
Alimentario /
StockBreedin
g and Feeding
Products
Otras
mercancías /
Other goods
Químicos /
Chemical
Products
Materiales de
construcción
Apéndice: Transparencia activa de la información. Los datos en detalle.
Apendix: Active transparency in information. Data in detail.
Datos actualizados a 31/12/2020
71

EJERCICIO 2020
MERCANCÍAS /
GOODS
EMBARCADA
S / LOADED
DESEMBARCAD
AS /
UNLOADED
TOTAL EMBARCADAS
/ LOADED
DESEMBARCAD
AS /
UNLOADED
TOTAL
EMBARCAD
AS /
LOADED
DESEMBAR
CADAS /
UNLOADED
TOTAL
MERCANCÍA GENERAL
GRANELES LÍQUIDOS GRANELES SÓLIDOSMERCANCÍA GENERAL EN
CONTENEDORES
AUTORIDAD PORTUARIA DE
FERROL -SAN CIBRAO
4.3.7.2 CLASIFICACIÓN SEGÚN
NATURALEZA Y PRESENTACIÓN / CLASSIFICATION BY NATURE AND
PACKAGING
32
Vehículos y sus
piezas / Vehicles and
their parts
0 0 0 0 0 0 27 213 241
38
Tara Equipamiento
(Ro-Ro) / Ro-Ro
traffic tare weights
0 0 0 0 0 0 0 0 0
39Tara contenedores /
Containers tare0 0 0 0 0 0 12.912 12.794 25.706
Total 0 0 0 0 0 0 12.939 13.008 25.947
Total 540.687 2.395.473 2.936.159 1.281.949 5.089.531 6.371.480 86.134 43.103 129.237
Vehículos y
elementos de
transporte /
Vehicles and
tranport
elements
Apéndice: Transparencia activa de la información. Los datos en detalle.
Apendix: Active transparency in information. Data in detail.
Datos actualizados a 31/12/2020
72

MERCANCÍAS /
GOODS
1Petróleo crudo /
Crude oil
2 Fuel-oil / Fuel oil
3 Gas-oil / Gas oil
4 Gasolina / Petrol
6
Otros productos
petrolíferos / Other
petroleum products
7
Gases energéticos
del petróleo /
Energetic petroleum
gases
12
Carbones y coque de
petróleo / Steam
coal and petroleum
coke
35
Gas natural y otros
gases / Natural gas
and other gases
51Biocombustibles /
Biofuel
Total
8Mineral de hierro /
Iron ore
10
Otros minerales y
residuos metálicos /
Other mineral ores
11Chatarras de hierro /
Scrap iron
13
Productos
siderúrgicos / Iron
products
36
Otros productos
metalúrgicos / Other
metallurgic products
Total
25 Sal común / Salt
52
Otros minerales no
metálicos / Other
non-metallic
minerals
Total
14Fosfatos /
Phosphates
15 Potasas / Potash
16
Abonos naturales y
artificiales / Natural
and artificial
fertilizers
Total
Energético /
Power
Products
Siderometalúr
gico /
Siderurgical
and
Metallurgic
Products
Minerales no
metálicos /
Non-metallic
minerals
Abonos /
Fertilizers
AUTORIDAD PORTUARIA DE
FERROL -SAN CIBRAO
4.3.7.2 CLASIFICACIÓN SEGÚN
NATURALEZA Y PRESENTACIÓN / CLASSIFICATION BY NATURE AND
PACKAGING
EJERCICIO 2020
EMBARCAD
AS /
LOADED
DESEMBAR
CADAS /
UNLOADED
TOTAL EMBARCADA
S / LOADED
DESEMBARC
ADAS /
UNLOADED
TOTAL EMBARCADAS /
LOADED
DESEMBARCAD
AS /
UNLOADED
TOTAL
0 0 0 0 0 0 0 0 0
0 0 0 0 0 0 296.378 225.555 521.933
0 0 0 0 0 0 0 71.163 71.163
0 0 0 0 0 0 0 0 0
0 0 0 0 0 0 2.038 0 2.038
0 0 0 0 0 0 0 0 0
0 0 0 405 116 521 405 7.815 8.220
0 0 0 0 0 0 5.358 1.448.978 1.454.337
0 0 0 0 22 22 207.007 5.071 212.078
0 0 0 405 138 543 511.186 1.758.582 2.269.768
0 0 0 0 0 0 0 0 0
0 0 0 411 265 676 16.121 4.596.061 4.612.182
0 0 0 0 0 0 0 248.936 248.936
155.371 166 155.537 155.891 646 156.536 155.891 646 156.536
30.745 0 30.745 30.777 199 30.975 30.777 199 30.975
186.116 166 186.282 187.079 1.109 188.188 202.789 4.845.841 5.048.630
0 0 0 0 23 23 0 23 23
0 0 0 825 25 850 8.030 25 8.055
0 0 0 825 48 873 8.030 48 8.077
0 0 0 0 0 0 0 0 0
0 0 0 0 69 69 0 69 69
0 0 0 24 1.135 1.159 24 22.869 22.894
0 0 0 24 1.204 1.229 24 22.939 22.963
TOTAL
MERCANCÍA GENERAL CONVENCIONAL TOTAL MERCANCÍA GENERAL TOTAL MERCANCÍA
MERCANCÍA GENERAL
Apéndice: Transparencia activa de la información. Los datos en detalle.
Apendix: Active transparency in information. Data in detail.
Datos actualizados a 31/12/2020
73

MERCANCÍAS /
GOODS
AUTORIDAD PORTUARIA DE
FERROL -SAN CIBRAO
4.3.7.2 CLASIFICACIÓN SEGÚN
NATURALEZA Y PRESENTACIÓN / CLASSIFICATION BY NATURE AND
PACKAGING
17Productos químicos
/ Chemical products
Total
5 Asfalto / Asphalt
18Cemento y clinker /
Cement and clinker
20
Materiales de
construcción
elaborados/
Manufactured
building materials
Total
21
Cereales y sus
harinas / Cereals and
their flours
22Habas de soja /
Soybean
23
Frutas, hortalizas y
legumbres / Fruits
and vegetables
24
Vinos,bebidas,
alcoholes y
derivados /
Wines,drinks and
spirits
27Conservas / Tinned
food
28
Tabaco,cacao,café y
especias /
Tobacco,cocoa,coffe
e and spices
29Aceites y grasas /
Oils and greases
30
Otros productos
alimenticios / Other
foods
33
Pescados congelados
y refrigerados /
Chilled or frozen fish
37
Pienso y forrajes /
Animal feed and
fodder
Total
19Maderas y corcho /
Wood and cork
26Papel y pasta / Paper
and pulp
31
Maquinaria,
herramientas y
repuestos /
Machinery, tools and
spares
34Resto mercancías /
Other goods
Total
Agro-
Ganadero y
Alimentario /
StockBreedin
g and Feeding
Products
Otras
mercancías /
Other goods
Químicos /
Chemical
Products
Materiales de
construcción
EJERCICIO 2020
EMBARCAD
AS /
LOADED
DESEMBAR
CADAS /
UNLOADED
TOTAL EMBARCADA
S / LOADED
DESEMBARC
ADAS /
UNLOADED
TOTAL EMBARCADAS /
LOADED
DESEMBARCAD
AS /
UNLOADED
TOTAL
TOTAL
MERCANCÍA GENERAL CONVENCIONAL TOTAL MERCANCÍA GENERAL TOTAL MERCANCÍA
MERCANCÍA GENERAL
0 0 0 913 8.113 9.026 1.203.607 451.321 1.654.927
0 0 0 913 8.113 9.026 1.203.607 451.321 1.654.927
0 0 0 0 0 0 0 80.752 80.752
0 0 0 102 0 102 102 2.822 2.924
60.302 8.069 68.370 76.495 8.583 85.077 148.990 8.583 157.572
60.302 8.069 68.370 76.597 8.583 85.180 149.092 92.156 241.249
0 0 0 0 72 72 0 131.864 131.864
0 0 0 0 0 0 0 0 0
0 0 0 0 50 50 0 50 50
0 0 0 696 701 1.397 696 701 1.397
0 0 0 8.380 102 8.482 8.380 102 8.482
0 0 0 0 0 0 0 0 0
0 0 0 317 0 317 317 201.520 201.837
0 0 0 4.448 4.540 8.988 4.448 4.540 8.988
0 0 0 372 1.058 1.430 372 1.058 1.430
0 0 0 90 143 232 90 143 232
0 0 0 14.302 6.667 20.969 14.302 339.979 354.281
251.477 11.182 262.659 280.807 16.323 297.130 294.558 16.323 310.882
4 37.996 38.000 1.185 43.937 45.123 1.185 43.937 45.123
25.666 1.345 27.012 28.901 1.567 30.467 28.901 1.567 30.467
0 104 105 5.722 1.268 6.991 5.722 1.268 6.991
277.148 50.628 327.776 316.615 63.096 379.711 330.367 63.096 393.463
Apéndice: Transparencia activa de la información. Los datos en detalle.
Apendix: Active transparency in information. Data in detail.
Datos actualizados a 31/12/2020
74

MERCANCÍAS /
GOODS
AUTORIDAD PORTUARIA DE
FERROL -SAN CIBRAO
4.3.7.2 CLASIFICACIÓN SEGÚN
NATURALEZA Y PRESENTACIÓN / CLASSIFICATION BY NATURE AND
PACKAGING
32
Vehículos y sus
piezas / Vehicles and
their parts
38
Tara Equipamiento
(Ro-Ro) / Ro-Ro
traffic tare weights
39Tara contenedores /
Containers tare
Total
Total
Vehículos y
elementos de
transporte /
Vehicles and
tranport
elements
EJERCICIO 2020
EMBARCAD
AS /
LOADED
DESEMBAR
CADAS /
UNLOADED
TOTAL EMBARCADA
S / LOADED
DESEMBARC
ADAS /
UNLOADED
TOTAL EMBARCADAS /
LOADED
DESEMBARCAD
AS /
UNLOADED
TOTAL
TOTAL
MERCANCÍA GENERAL CONVENCIONAL TOTAL MERCANCÍA GENERAL TOTAL MERCANCÍA
MERCANCÍA GENERAL
126 19 146 154 233 387 154 233 387
566 703 1.269 566 703 1.269 566 703 1.269
0 0 0 12.912 12.794 25.706 12.912 12.794 25.706
692 722 1.414 13.631 13.730 27.361 13.631 13.730 27.361
524.257 59.585 583.842 610.392 102.688 713.079 2.433.028 7.587.691 10.020.719
En este cuadro NO se incluyen los avituallamientos, pesca fresca, tráfico interior, transbordo, tránsito terrestre y control aduanero
Apéndice: Transparencia activa de la información. Los datos en detalle.
Apendix: Active transparency in information. Data in detail.
Datos actualizados a 31/12/2020
75

FERROL
EJERCICIO 2020
MERCANCÍAS /
GOODS
EMBARCADA
S / LOADED
DESEMBARCAD
AS /
UNLOADED
TOTAL EMBARCADAS
/ LOADED
DESEMBARCAD
AS /
UNLOADED
TOTAL
EMBARCAD
AS /
LOADED
DESEMBAR
CADAS /
UNLOADED
TOTAL
1Petróleo crudo /
Crude oil0 0 0 0 0 0 0 0 0
2 Fuel-oil / Fuel oil 296.378 225.555 521.933 0 0 0 0 0 0
3 Gas-oil / Gas oil 0 71.163 71.163 0 0 0 0 0 0
4 Gasolina / Petrol 0 0 0 0 0 0 0 0 0
6
Otros productos
petrolíferos / Other
petroleum products
2.038 0 2.038 0 0 0 0 0 0
7
Gases energéticos
del petróleo /
Energetic petroleum
gases
0 0 0 0 0 0 0 0 0
12
Carbones y coque de
petróleo / Steam
coal and petroleum
coke
0 0 0 0 7.699 7.699 405 116 521
35
Gas natural y otros
gases / Natural gas
and other gases
5.358 1.448.978 1.454.337 0 0 0 0 0 0
51Biocombustibles /
Biofuel207.007 5.049 212.056 0 0 0 0 22 22
Total 510.781 1.750.745 2.261.526 0 7.699 7.699 405 138 543
8Mineral de hierro /
Iron ore0 0 0 0 0 0 0 0 0
10
Otros minerales y
residuos metálicos /
Other mineral ores
0 0 0 15.710 56.963 72.673 411 265 676
11Chatarras de hierro /
Scrap iron0 0 0 0 248.936 248.936 0 0 0
13
Productos
siderúrgicos / Iron
products
0 0 0 0 0 0 520 480 999
36
Otros productos
metalúrgicos / Other
metallurgic products
0 0 0 0 0 0 32 199 230
Total 0 0 0 15.710 305.899 321.609 963 943 1.906
25 Sal común / Salt 0 0 0 0 0 0 0 23 23
52
Otros minerales no
metálicos / Other
non-metallic
minerals
0 0 0 7.205 0 7.205 825 25 850
Total 0 0 0 7.205 0 7.205 825 48 873
14Fosfatos /
Phosphates0 0 0 0 0 0 0 0 0
15 Potasas / Potash 0 0 0 0 0 0 0 69 69
16
Abonos naturales y
artificiales / Natural
and artificial
fertilizers
0 0 0 0 21.734 21.734 24 1.135 1.159
Total 0 0 0 0 21.734 21.734 24 1.204 1.229
MERCANCÍA GENERAL
GRANELES LÍQUIDOS GRANELES SÓLIDOSMERCANCÍA GENERAL EN
CONTENEDORES
4.3.7.2 CLASIFICACIÓN SEGÚN
NATURALEZA Y PRESENTACIÓN / CLASSIFICATION BY NATURE AND
PACKAGING
Energético /
Power
Products
Siderometalúr
gico /
Siderurgical
and
Metallurgic
Products
Minerales no
metálicos /
Non-metallic
minerals
Abonos /
Fertilizers
Apéndice: Transparencia activa de la información. Los datos en detalle.
Apendix: Active transparency in information. Data in detail.
Datos actualizados a 31/12/2020
76

FERROL
EJERCICIO 2020
MERCANCÍAS /
GOODS
EMBARCADA
S / LOADED
DESEMBARCAD
AS /
UNLOADED
TOTAL EMBARCADAS
/ LOADED
DESEMBARCAD
AS /
UNLOADED
TOTAL
EMBARCAD
AS /
LOADED
DESEMBAR
CADAS /
UNLOADED
TOTAL
MERCANCÍA GENERAL
GRANELES LÍQUIDOS GRANELES SÓLIDOSMERCANCÍA GENERAL EN
CONTENEDORES
4.3.7.2 CLASIFICACIÓN SEGÚN
NATURALEZA Y PRESENTACIÓN / CLASSIFICATION BY NATURE AND
PACKAGING
17Productos químicos
/ Chemical products29.906 164.559 194.464 0 0 0 913 8.113 9.026
Total 29.906 164.559 194.464 0 0 0 913 8.113 9.026
5 Asfalto / Asphalt 0 0 0 0 0 0 0 0 0
18Cemento y clinker /
Cement and clinker0 0 0 0 2.822 2.822 102 0 102
20
Materiales de
construcción
elaborados/
Manufactured
building materials
0 0 0 72.495 0 72.495 16.193 514 16.707
Total 0 0 0 72.495 2.822 75.317 16.295 514 16.809
21
Cereales y sus
harinas / Cereals and
their flours
0 0 0 0 131.792 131.792 0 72 72
22Habas de soja /
Soybean0 0 0 0 0 0 0 0 0
23
Frutas, hortalizas y
legumbres / Fruits
and vegetables
0 0 0 0 0 0 0 50 50
24
Vinos,bebidas,
alcoholes y
derivados /
Wines,drinks and
spirits
0 0 0 0 0 0 696 701 1.397
27Conservas / Tinned
food0 0 0 0 0 0 8.380 102 8.482
28
Tabaco,cacao,café y
especias /
Tobacco,cocoa,coffe
e and spices
0 0 0 0 0 0 0 0 0
29Aceites y grasas /
Oils and greases0 201.520 201.520 0 0 0 317 0 317
30
Otros productos
alimenticios / Other
foods
0 0 0 0 0 0 4.448 4.540 8.988
33
Pescados congelados
y refrigerados /
Chilled or frozen fish
0 0 0 0 0 0 372 1.058 1.430
37
Pienso y forrajes /
Animal feed and
fodder
0 0 0 0 0 0 90 143 232
Total 0 201.520 201.520 0 131.792 131.792 14.302 6.667 20.969
19Maderas y corcho /
Wood and cork0 0 0 13.751 0 13.751 29.330 5.141 34.471
26Papel y pasta / Paper
and pulp0 0 0 0 0 0 1.182 5.941 7.123
31
Maquinaria,
herramientas y
repuestos /
Machinery, tools and
spares
0 0 0 0 0 0 3.234 221 3.456
34Resto mercancías /
Other goods0 0 0 0 0 0 5.722 1.164 6.886
Total 0 0 0 13.751 0 13.751 39.468 12.468 51.936
Agro-
Ganadero y
Alimentario /
StockBreeding
and Feeding
Products
Otras
mercancías /
Other goods
Materiales de
construcción
Químicos /
Chemical
Products
Apéndice: Transparencia activa de la información. Los datos en detalle.
Apendix: Active transparency in information. Data in detail.
Datos actualizados a 31/12/2020
77

FERROL
EJERCICIO 2020
MERCANCÍAS /
GOODS
EMBARCADA
S / LOADED
DESEMBARCAD
AS /
UNLOADED
TOTAL EMBARCADAS
/ LOADED
DESEMBARCAD
AS /
UNLOADED
TOTAL
EMBARCAD
AS /
LOADED
DESEMBAR
CADAS /
UNLOADED
TOTAL
MERCANCÍA GENERAL
GRANELES LÍQUIDOS GRANELES SÓLIDOSMERCANCÍA GENERAL EN
CONTENEDORES
4.3.7.2 CLASIFICACIÓN SEGÚN
NATURALEZA Y PRESENTACIÓN / CLASSIFICATION BY NATURE AND
PACKAGING
32
Vehículos y sus
piezas / Vehicles and
their parts
0 0 0 0 0 0 27 213 241
38
Tara Equipamiento
(Ro-Ro) / Ro-Ro
traffic tare weights
0 0 0 0 0 0 0 0 0
39Tara contenedores /
Containers tare0 0 0 0 0 0 12.912 12.794 25.706
Total 0 0 0 0 0 0 12.939 13.008 25.947
Total 540.687 2.116.824 2.657.511 109.161 469.946 579.107 86.134 43.103 129.237
Vehículos y
elementos de
transporte /
Vehicles and
tranport
elements
Apéndice: Transparencia activa de la información. Los datos en detalle.
Apendix: Active transparency in information. Data in detail.
Datos actualizados a 31/12/2020
78

FERROL
MERCANCÍAS /
GOODS
1Petróleo crudo /
Crude oil
2 Fuel-oil / Fuel oil
3 Gas-oil / Gas oil
4 Gasolina / Petrol
6
Otros productos
petrolíferos / Other
petroleum products
7
Gases energéticos
del petróleo /
Energetic petroleum
gases
12
Carbones y coque de
petróleo / Steam
coal and petroleum
coke
35
Gas natural y otros
gases / Natural gas
and other gases
51Biocombustibles /
Biofuel
Total
8Mineral de hierro /
Iron ore
10
Otros minerales y
residuos metálicos /
Other mineral ores
11Chatarras de hierro /
Scrap iron
13
Productos
siderúrgicos / Iron
products
36
Otros productos
metalúrgicos / Other
metallurgic products
Total
25 Sal común / Salt
52
Otros minerales no
metálicos / Other
non-metallic
minerals
Total
14Fosfatos /
Phosphates
15 Potasas / Potash
16
Abonos naturales y
artificiales / Natural
and artificial
fertilizers
Total
4.3.7.2 CLASIFICACIÓN SEGÚN
NATURALEZA Y PRESENTACIÓN / CLASSIFICATION BY NATURE AND
PACKAGING
Energético /
Power
Products
Siderometalúr
gico /
Siderurgical
and
Metallurgic
Products
Minerales no
metálicos /
Non-metallic
minerals
Abonos /
Fertilizers
EJERCICIO 2020
EMBARCADAS
/ LOADED
DESEMBARCA
DAS /
UNLOADED
TOTAL EMBARCADAS
/ LOADED
DESEMBARCA
DAS /
UNLOADED
TOTAL EMBARCADAS
/ LOADED
DESEMBARCA
DAS /
UNLOADED
TOTAL
0 0 0 0 0 0 0 0 0
0 0 0 0 0 0 296.378 225.555 521.933
0 0 0 0 0 0 0 71.163 71.163
0 0 0 0 0 0 0 0 0
0 0 0 0 0 0 2.038 0 2.038
0 0 0 0 0 0 0 0 0
0 0 0 405 116 521 405 7.815 8.220
0 0 0 0 0 0 5.358 1.448.978 1.454.337
0 0 0 0 22 22 207.007 5.071 212.078
0 0 0 405 138 543 511.186 1.758.582 2.269.768
0 0 0 0 0 0 0 0 0
0 0 0 411 265 676 16.121 57.228 73.349
0 0 0 0 0 0 0 248.936 248.936
155.371 166 155.537 155.891 646 156.536 155.891 646 156.536
0 0 0 32 199 230 32 199 230
155.371 166 155.537 156.334 1.109 157.443 172.044 307.008 479.052
0 0 0 0 23 23 0 23 23
0 0 0 825 25 850 8.030 25 8.055
0 0 0 825 48 873 8.030 48 8.077
0 0 0 0 0 0 0 0 0
0 0 0 0 69 69 0 69 69
0 0 0 24 1.135 1.159 24 22.869 22.894
0 0 0 24 1.204 1.229 24 22.939 22.963
MERCANCÍA GENERAL TOTAL
MERCANCÍA GENERAL CONVENCIONAL TOTAL MERCANCÍA GENERAL TOTAL MERCANCÍA
Apéndice: Transparencia activa de la información. Los datos en detalle.
Apendix: Active transparency in information. Data in detail.
Datos actualizados a 31/12/2020
79

FERROL
MERCANCÍAS /
GOODS
4.3.7.2 CLASIFICACIÓN SEGÚN
NATURALEZA Y PRESENTACIÓN / CLASSIFICATION BY NATURE AND
PACKAGING
17Productos químicos
/ Chemical products
Total
5 Asfalto / Asphalt
18Cemento y clinker /
Cement and clinker
20
Materiales de
construcción
elaborados/
Manufactured
building materials
Total
21
Cereales y sus
harinas / Cereals and
their flours
22Habas de soja /
Soybean
23
Frutas, hortalizas y
legumbres / Fruits
and vegetables
24
Vinos,bebidas,
alcoholes y
derivados /
Wines,drinks and
spirits
27Conservas / Tinned
food
28
Tabaco,cacao,café y
especias /
Tobacco,cocoa,coffe
e and spices
29Aceites y grasas /
Oils and greases
30
Otros productos
alimenticios / Other
foods
33
Pescados congelados
y refrigerados /
Chilled or frozen fish
37
Pienso y forrajes /
Animal feed and
fodder
Total
19Maderas y corcho /
Wood and cork
26Papel y pasta / Paper
and pulp
31
Maquinaria,
herramientas y
repuestos /
Machinery, tools and
spares
34Resto mercancías /
Other goods
Total
Agro-
Ganadero y
Alimentario /
StockBreeding
and Feeding
Products
Otras
mercancías /
Other goods
Materiales de
construcción
Químicos /
Chemical
Products
EJERCICIO 2020
EMBARCADAS
/ LOADED
DESEMBARCA
DAS /
UNLOADED
TOTAL EMBARCADAS
/ LOADED
DESEMBARCA
DAS /
UNLOADED
TOTAL EMBARCADAS
/ LOADED
DESEMBARCA
DAS /
UNLOADED
TOTAL
MERCANCÍA GENERAL TOTAL
MERCANCÍA GENERAL CONVENCIONAL TOTAL MERCANCÍA GENERAL TOTAL MERCANCÍA
0 0 0 913 8.113 9.026 30.819 172.672 203.490
0 0 0 913 8.113 9.026 30.819 172.672 203.490
0 0 0 0 0 0 0 0 0
0 0 0 102 0 102 102 2.822 2.924
60.302 8.069 68.370 76.495 8.583 85.077 148.990 8.583 157.572
60.302 8.069 68.370 76.597 8.583 85.180 149.092 11.405 160.497
0 0 0 0 72 72 0 131.864 131.864
0 0 0 0 0 0 0 0 0
0 0 0 0 50 50 0 50 50
0 0 0 696 701 1.397 696 701 1.397
0 0 0 8.380 102 8.482 8.380 102 8.482
0 0 0 0 0 0 0 0 0
0 0 0 317 0 317 317 201.520 201.837
0 0 0 4.448 4.540 8.988 4.448 4.540 8.988
0 0 0 372 1.058 1.430 372 1.058 1.430
0 0 0 90 143 232 90 143 232
0 0 0 14.302 6.667 20.969 14.302 339.979 354.281
251.461 11.182 262.644 280.791 16.323 297.115 294.543 16.323 310.866
4 37.996 38.000 1.185 43.937 45.123 1.185 43.937 45.123
25.666 1.345 27.012 28.901 1.567 30.467 28.901 1.567 30.467
0 104 105 5.722 1.268 6.991 5.722 1.268 6.991
277.132 50.628 327.760 316.600 63.096 379.696 330.351 63.096 393.447
Apéndice: Transparencia activa de la información. Los datos en detalle.
Apendix: Active transparency in information. Data in detail.
Datos actualizados a 31/12/2020
80

FERROL
MERCANCÍAS /
GOODS
4.3.7.2 CLASIFICACIÓN SEGÚN
NATURALEZA Y PRESENTACIÓN / CLASSIFICATION BY NATURE AND
PACKAGING
32
Vehículos y sus
piezas / Vehicles and
their parts
38
Tara Equipamiento
(Ro-Ro) / Ro-Ro
traffic tare weights
39Tara contenedores /
Containers tare
Total
Total
Vehículos y
elementos de
transporte /
Vehicles and
tranport
elements
EJERCICIO 2020
EMBARCADAS
/ LOADED
DESEMBARCA
DAS /
UNLOADED
TOTAL EMBARCADAS
/ LOADED
DESEMBARCA
DAS /
UNLOADED
TOTAL EMBARCADAS
/ LOADED
DESEMBARCA
DAS /
UNLOADED
TOTAL
MERCANCÍA GENERAL TOTAL
MERCANCÍA GENERAL CONVENCIONAL TOTAL MERCANCÍA GENERAL TOTAL MERCANCÍA
126 19 146 154 233 387 154 233 387
566 703 1.269 566 703 1.269 566 703 1.269
0 0 0 12.912 12.794 25.706 12.912 12.794 25.706
692 722 1.414 13.631 13.730 27.361 13.631 13.730 27.361
493.497 59.585 553.081 579.631 102.688 682.319 1.229.479 2.689.458 3.918.937
En este cuadro NO se incluyen los avituallamientos, pesca fresca, tráfico interior, transbordo, tránsito terrestre y control aduanero
Apéndice: Transparencia activa de la información. Los datos en detalle.
Apendix: Active transparency in information. Data in detail.
Datos actualizados a 31/12/2020
81

SAN CIBRAO EJERCICIO 2020
MERCANCÍAS /
GOODS
EMBARCADA
S / LOADED
DESEMBARCAD
AS /
UNLOADED
TOTAL EMBARCADAS
/ LOADED
DESEMBARCAD
AS /
UNLOADED
TOTAL
EMBARCAD
AS /
LOADED
DESEMBAR
CADAS /
UNLOADED
TOTAL
1Petróleo crudo /
Crude oil0 0 0 0 0 0 0 0 0
2 Fuel-oil / Fuel oil 0 0 0 0 0 0 0 0 0
3 Gas-oil / Gas oil 0 0 0 0 0 0 0 0 0
4 Gasolina / Petrol 0 0 0 0 0 0 0 0 0
6
Otros productos
petrolíferos / Other
petroleum products
0 0 0 0 0 0 0 0 0
7
Gases energéticos
del petróleo /
Energetic petroleum
gases
0 0 0 0 0 0 0 0 0
12
Carbones y coque de
petróleo / Steam
coal and petroleum
coke
0 0 0 0 0 0 0 0 0
35
Gas natural y otros
gases / Natural gas
and other gases
0 0 0 0 0 0 0 0 0
51Biocombustibles /
Biofuel0 0 0 0 0 0 0 0 0
Total 0 0 0 0 0 0 0 0 0
8Mineral de hierro /
Iron ore0 0 0 0 0 0 0 0 0
10
Otros minerales y
residuos metálicos /
Other mineral ores
0 0 0 0 4.538.833 4.538.833 0 0 0
11Chatarras de hierro /
Scrap iron0 0 0 0 0 0 0 0 0
13
Productos
siderúrgicos / Iron
products
0 0 0 0 0 0 0 0 0
36
Otros productos
metalúrgicos / Other
metallurgic products
0 0 0 0 0 0 0 0 0
Total 0 0 0 0 4.538.833 4.538.833 0 0 0
25 Sal común / Salt 0 0 0 0 0 0 0 0 0
52
Otros minerales no
metálicos / Other
non-metallic
minerals
0 0 0 0 0 0 0 0 0
Total 0 0 0 0 0 0 0 0 0
14Fosfatos /
Phosphates0 0 0 0 0 0 0 0 0
15 Potasas / Potash 0 0 0 0 0 0 0 0 0
16
Abonos naturales y
artificiales / Natural
and artificial
fertilizers
0 0 0 0 0 0 0 0 0
Total 0 0 0 0 0 0 0 0 0
GRANELES LÍQUIDOS GRANELES SÓLIDOSMERCANCÍA GENERAL EN
CONTENEDORES
4.3.7.2 CLASIFICACIÓN SEGÚN
NATURALEZA Y PRESENTACIÓN / CLASSIFICATION BY NATURE AND
PACKAGING
MERCANCÍA GENERAL
Energético /
Power
Products
Siderometalúr
gico /
Siderurgical
and
Metallurgic
Products
Minerales no
metálicos /
Non-metallic
minerals
Abonos /
Fertilizers
Apéndice: Transparencia activa de la información. Los datos en detalle.
Apendix: Active transparency in information. Data in detail.
Datos actualizados a 31/12/2020
82

SAN CIBRAO EJERCICIO 2020
MERCANCÍAS /
GOODS
EMBARCADA
S / LOADED
DESEMBARCAD
AS /
UNLOADED
TOTAL EMBARCADAS
/ LOADED
DESEMBARCAD
AS /
UNLOADED
TOTAL
EMBARCAD
AS /
LOADED
DESEMBAR
CADAS /
UNLOADED
TOTAL
GRANELES LÍQUIDOS GRANELES SÓLIDOSMERCANCÍA GENERAL EN
CONTENEDORES
4.3.7.2 CLASIFICACIÓN SEGÚN
NATURALEZA Y PRESENTACIÓN / CLASSIFICATION BY NATURE AND
PACKAGING
MERCANCÍA GENERAL
17Productos químicos
/ Chemical products0 278.649 278.649 1.172.788 0 1.172.788 0 0 0
Total 0 278.649 278.649 1.172.788 0 1.172.788 0 0 0
5 Asfalto / Asphalt 0 0 0 0 80.752 80.752 0 0 0
18Cemento y clinker /
Cement and clinker0 0 0 0 0 0 0 0 0
20
Materiales de
construcción
elaborados/
Manufactured
building materials
0 0 0 0 0 0 0 0 0
Total 0 0 0 0 80.752 80.752 0 0 0
21
Cereales y sus
harinas / Cereals and
their flours
0 0 0 0 0 0 0 0 0
22Habas de soja /
Soybean0 0 0 0 0 0 0 0 0
23
Frutas, hortalizas y
legumbres / Fruits
and vegetables
0 0 0 0 0 0 0 0 0
24
Vinos,bebidas,
alcoholes y
derivados /
Wines,drinks and
spirits
0 0 0 0 0 0 0 0 0
27Conservas / Tinned
food0 0 0 0 0 0 0 0 0
28
Tabaco,cacao,café y
especias /
Tobacco,cocoa,coffe
e and spices
0 0 0 0 0 0 0 0 0
29Aceites y grasas /
Oils and greases0 0 0 0 0 0 0 0 0
30
Otros productos
alimenticios / Other
foods
0 0 0 0 0 0 0 0 0
33
Pescados congelados
y refrigerados /
Chilled or frozen fish
0 0 0 0 0 0 0 0 0
37
Pienso y forrajes /
Animal feed and
fodder
0 0 0 0 0 0 0 0 0
Total 0 0 0 0 0 0 0 0 0
Agro-
Ganadero y
Alimentario /
StockBreeding
and Feeding
Products
Materiales de
construcción
Químicos /
Chemical
Products
Apéndice: Transparencia activa de la información. Los datos en detalle.
Apendix: Active transparency in information. Data in detail.
Datos actualizados a 31/12/2020
83

SAN CIBRAO EJERCICIO 2020
MERCANCÍAS /
GOODS
EMBARCADA
S / LOADED
DESEMBARCAD
AS /
UNLOADED
TOTAL EMBARCADAS
/ LOADED
DESEMBARCAD
AS /
UNLOADED
TOTAL
EMBARCAD
AS /
LOADED
DESEMBAR
CADAS /
UNLOADED
TOTAL
GRANELES LÍQUIDOS GRANELES SÓLIDOSMERCANCÍA GENERAL EN
CONTENEDORES
4.3.7.2 CLASIFICACIÓN SEGÚN
NATURALEZA Y PRESENTACIÓN / CLASSIFICATION BY NATURE AND
PACKAGING
MERCANCÍA GENERAL
19Maderas y corcho /
Wood and cork0 0 0 0 0 0 0 0 0
26Papel y pasta / Paper
and pulp0 0 0 0 0 0 0 0 0
31
Maquinaria,
herramientas y
repuestos /
Machinery, tools and
spares
0 0 0 0 0 0 0 0 0
34Resto mercancías /
Other goods0 0 0 0 0 0 0 0 0
Total 0 0 0 0 0 0 0 0 0
32
Vehículos y sus
piezas / Vehicles and
their parts
0 0 0 0 0 0 0 0 0
38
Tara Equipamiento
(Ro-Ro) / Ro-Ro
traffic tare weights
0 0 0 0 0 0 0 0 0
39Tara contenedores /
Containers tare0 0 0 0 0 0 0 0 0
Total 0 0 0 0 0 0 0 0 0
Total 0 278.649 278.649 1.172.788 4.619.585 5.792.373 0 0 0
Otras
mercancías /
Other goods
Vehículos y
elementos de
transporte /
Vehicles and
tranport
elements
Apéndice: Transparencia activa de la información. Los datos en detalle.
Apendix: Active transparency in information. Data in detail.
Datos actualizados a 31/12/2020
84

SAN CIBRAO
MERCANCÍAS /
GOODS
1Petróleo crudo /
Crude oil
2 Fuel-oil / Fuel oil
3 Gas-oil / Gas oil
4 Gasolina / Petrol
6
Otros productos
petrolíferos / Other
petroleum products
7
Gases energéticos
del petróleo /
Energetic petroleum
gases
12
Carbones y coque de
petróleo / Steam
coal and petroleum
coke
35
Gas natural y otros
gases / Natural gas
and other gases
51Biocombustibles /
Biofuel
Total
8Mineral de hierro /
Iron ore
10
Otros minerales y
residuos metálicos /
Other mineral ores
11Chatarras de hierro /
Scrap iron
13
Productos
siderúrgicos / Iron
products
36
Otros productos
metalúrgicos / Other
metallurgic products
Total
25 Sal común / Salt
52
Otros minerales no
metálicos / Other
non-metallic
minerals
Total
14Fosfatos /
Phosphates
15 Potasas / Potash
16
Abonos naturales y
artificiales / Natural
and artificial
fertilizers
Total
4.3.7.2 CLASIFICACIÓN SEGÚN
NATURALEZA Y PRESENTACIÓN / CLASSIFICATION BY NATURE AND
PACKAGING
Energético /
Power
Products
Siderometalúr
gico /
Siderurgical
and
Metallurgic
Products
Minerales no
metálicos /
Non-metallic
minerals
Abonos /
Fertilizers
EJERCICIO 2020
EMBARCADAS
/ LOADED
DESEMBARCA
DAS /
UNLOADED
TOTAL EMBARCADAS
/ LOADED
DESEMBARCA
DAS /
UNLOADED
TOTAL EMBARCADAS
/ LOADED
DESEMBARCA
DAS /
UNLOADED
TOTAL
0 0 0 0 0 0 0 0 0
0 0 0 0 0 0 0 0 0
0 0 0 0 0 0 0 0 0
0 0 0 0 0 0 0 0 0
0 0 0 0 0 0 0 0 0
0 0 0 0 0 0 0 0 0
0 0 0 0 0 0 0 0 0
0 0 0 0 0 0 0 0 0
0 0 0 0 0 0 0 0 0
0 0 0 0 0 0 0 0 0
0 0 0 0 0 0 0 0 0
0 0 0 0 0 0 0 4.538.833 4.538.833
0 0 0 0 0 0 0 0 0
0 0 0 0 0 0 0 0 0
30.745 0 30.745 30.745 0 30.745 30.745 0 30.745
30.745 0 30.745 30.745 0 30.745 30.745 4.538.833 4.569.578
0 0 0 0 0 0 0 0 0
0 0 0 0 0 0 0 0 0
0 0 0 0 0 0 0 0 0
0 0 0 0 0 0 0 0 0
0 0 0 0 0 0 0 0 0
0 0 0 0 0 0 0 0 0
0 0 0 0 0 0 0 0 0
TOTAL
MERCANCÍA GENERAL CONVENCIONAL TOTAL MERCANCÍA GENERAL TOTAL MERCANCÍA
MERCANCÍA GENERAL
Apéndice: Transparencia activa de la información. Los datos en detalle.
Apendix: Active transparency in information. Data in detail.
Datos actualizados a 31/12/2020
85

SAN CIBRAO
MERCANCÍAS /
GOODS
4.3.7.2 CLASIFICACIÓN SEGÚN
NATURALEZA Y PRESENTACIÓN / CLASSIFICATION BY NATURE AND
PACKAGING
17Productos químicos
/ Chemical products
Total
5 Asfalto / Asphalt
18Cemento y clinker /
Cement and clinker
20
Materiales de
construcción
elaborados/
Manufactured
building materials
Total
21
Cereales y sus
harinas / Cereals and
their flours
22Habas de soja /
Soybean
23
Frutas, hortalizas y
legumbres / Fruits
and vegetables
24
Vinos,bebidas,
alcoholes y
derivados /
Wines,drinks and
spirits
27Conservas / Tinned
food
28
Tabaco,cacao,café y
especias /
Tobacco,cocoa,coffe
e and spices
29Aceites y grasas /
Oils and greases
30
Otros productos
alimenticios / Other
foods
33
Pescados congelados
y refrigerados /
Chilled or frozen fish
37
Pienso y forrajes /
Animal feed and
fodder
Total
Agro-
Ganadero y
Alimentario /
StockBreeding
and Feeding
Products
Materiales de
construcción
Químicos /
Chemical
Products
EJERCICIO 2020
EMBARCADAS
/ LOADED
DESEMBARCA
DAS /
UNLOADED
TOTAL EMBARCADAS
/ LOADED
DESEMBARCA
DAS /
UNLOADED
TOTAL EMBARCADAS
/ LOADED
DESEMBARCA
DAS /
UNLOADED
TOTAL
TOTAL
MERCANCÍA GENERAL CONVENCIONAL TOTAL MERCANCÍA GENERAL TOTAL MERCANCÍA
MERCANCÍA GENERAL
0 0 0 0 0 0 1.172.788 278.649 1.451.437
0 0 0 0 0 0 1.172.788 278.649 1.451.437
0 0 0 0 0 0 0 80.752 80.752
0 0 0 0 0 0 0 0 0
0 0 0 0 0 0 0 0 0
0 0 0 0 0 0 0 80.752 80.752
0 0 0 0 0 0 0 0 0
0 0 0 0 0 0 0 0 0
0 0 0 0 0 0 0 0 0
0 0 0 0 0 0 0 0 0
0 0 0 0 0 0 0 0 0
0 0 0 0 0 0 0 0 0
0 0 0 0 0 0 0 0 0
0 0 0 0 0 0 0 0 0
0 0 0 0 0 0 0 0 0
0 0 0 0 0 0 0 0 0
0 0 0 0 0 0 0 0 0
Apéndice: Transparencia activa de la información. Los datos en detalle.
Apendix: Active transparency in information. Data in detail.
Datos actualizados a 31/12/2020
86

SAN CIBRAO
MERCANCÍAS /
GOODS
4.3.7.2 CLASIFICACIÓN SEGÚN
NATURALEZA Y PRESENTACIÓN / CLASSIFICATION BY NATURE AND
PACKAGING
19Maderas y corcho /
Wood and cork
26Papel y pasta / Paper
and pulp
31
Maquinaria,
herramientas y
repuestos /
Machinery, tools and
spares
34Resto mercancías /
Other goods
Total
32
Vehículos y sus
piezas / Vehicles and
their parts
38
Tara Equipamiento
(Ro-Ro) / Ro-Ro
traffic tare weights
39Tara contenedores /
Containers tare
Total
Total
Otras
mercancías /
Other goods
Vehículos y
elementos de
transporte /
Vehicles and
tranport
elements
EJERCICIO 2020
EMBARCADAS
/ LOADED
DESEMBARCA
DAS /
UNLOADED
TOTAL EMBARCADAS
/ LOADED
DESEMBARCA
DAS /
UNLOADED
TOTAL EMBARCADAS
/ LOADED
DESEMBARCA
DAS /
UNLOADED
TOTAL
TOTAL
MERCANCÍA GENERAL CONVENCIONAL TOTAL MERCANCÍA GENERAL TOTAL MERCANCÍA
MERCANCÍA GENERAL
16 0 16 16 0 16 16 0 16
0 0 0 0 0 0 0 0 0
0 0 0 0 0 0 0 0 0
0 0 0 0 0 0 0 0 0
16 0 16 16 0 16 16 0 16
0 0 0 0 0 0 0 0 0
0 0 0 0 0 0 0 0 0
0 0 0 0 0 0 0 0 0
0 0 0 0 0 0 0 0 0
30.761 0 30.761 30.761 0 30.761 1.203.549 4.898.234 6.101.782
En este cuadro NO se incluyen los avituallamientos, pesca fresca, tráfico interior, transbordo, tránsito terrestre y control aduanero
Apéndice: Transparencia activa de la información. Los datos en detalle.
Apendix: Active transparency in information. Data in detail.
Datos actualizados a 31/12/2020
87

AUTORIDAD PORTUARIA DE FERROL-SAN CIBRAO EJERCICIO 2020
MERCANCÍAS /
GOODS
EMBARCADAS
/ LOADED
DESEMBARCA
DAS /
UNLOADED
TOTAL EMBARCADAS
/ LOADED
DESEMBARCA
DAS /
UNLOADED
TOTAL EMBARCADAS
/ LOADED
DESEMBARCA
DAS /
UNLOADED
TOTAL
1Petróleo crudo /
Crude oil0 0 0 0 0 0 0 0 0
2 Fuel-oil / Fuel oil 0 0 0 0 0 0 0 0 0
3 Gas-oil / Gas oil 0 0 0 0 0 0 0 0 0
4 Gasolina / Petrol 0 0 0 0 0 0 0 0 0
6
Otros productos
petrolíferos / Other
petroleum products
0 0 0 0 0 0 0 0 0
7
Gases energéticos
del petróleo /
Energetic
petroleum gases
0 0 0 0 0 0 0 0 0
12
Carbones y coque
de petróleo /
Steam coal and
petroleum coke
0 0 0 0 0 0 0 0 0
35
Gas natural y otros
gases / Natural gas
and other gases
0 0 0 0 0 0 0 0 0
51Biocombustibles /
Biofuel0 0 0 0 0 0 0 0 0
Total 0 0 0 0 0 0 0 0 0
8Mineral de hierro /
Iron ore0 0 0 0 0 0 0 0 0
10
Otros minerales y
residuos metálicos
/ Other mineral
ores
0 0 0 0 0 0 0 0 0
11Chatarras de hierro
/ Scrap iron0 0 0 0 0 0 0 0 0
13
Productos
siderúrgicos / Iron
products
0 0 0 0 0 0 0 0 0
36
Otros productos
metalúrgicos /
Other metallurgic
products
0 0 0 0 0 0 0 0 0
Total 0 0 0 0 0 0 0 0 0
25 Sal común / Salt 0 0 0 0 0 0 0 0 0
52
Otros minerales no
metálicos / Other
non-metallic
minerals
0 0 0 0 0 0 0 0 0
Total 0 0 0 0 0 0 0 0 0
TOTAL TRÁNSITO / TOTAL TRANSITCABOTAJE / DOMESTIC EXTERIOR / FOREIGN
4.3.7.3 CLASIFICACIÓN DE MERCANCÍAS EN TRÁNSITO SEGÚN NATURALEZA /
CLASSIFICATION OF GOODS IN TRANSIT BY NATURE
Energético /
Power Products
Siderometalúrgico
/ Siderurgical and
Metallurgic
Products
Minerales no
metálicos / Non-
metallic minerals
Apéndice: Transparencia activa de la información. Los datos en detalle.
Apendix: Active transparency in information. Data in detail.
Datos actualizados a 31/12/2020
88

AUTORIDAD PORTUARIA DE FERROL-SAN CIBRAO EJERCICIO 2020
MERCANCÍAS /
GOODS
EMBARCADAS
/ LOADED
DESEMBARCA
DAS /
UNLOADED
TOTAL EMBARCADAS
/ LOADED
DESEMBARCA
DAS /
UNLOADED
TOTAL EMBARCADAS
/ LOADED
DESEMBARCA
DAS /
UNLOADED
TOTAL
TOTAL TRÁNSITO / TOTAL TRANSITCABOTAJE / DOMESTIC EXTERIOR / FOREIGN
4.3.7.3 CLASIFICACIÓN DE MERCANCÍAS EN TRÁNSITO SEGÚN NATURALEZA /
CLASSIFICATION OF GOODS IN TRANSIT BY NATURE
14Fosfatos /
Phosphates0 0 0 0 0 0 0 0 0
15 Potasas / Potash 0 0 0 0 0 0 0 0 0
16
Abonos naturales y
artificiales / Natural
and artificial
fertilizers
0 0 0 0 0 0 0 0 0
Total 0 0 0 0 0 0 0 0 0
17Productos químicos
/ Chemical products0 0 0 0 0 0 0 0 0
Total 0 0 0 0 0 0 0 0 0
5 Asfalto / Asphalt 0 0 0 0 0 0 0 0 0
18Cemento y clinker /
Cement and clinker0 0 0 0 0 0 0 0 0
20
Materiales de
construcción
elaborados/
Manufactured
building materials
0 0 0 0 0 0 0 0 0
Total 0 0 0 0 0 0 0 0 0
21
Cereales y sus
harinas / Cereals
and their flours
0 0 0 0 0 0 0 0 0
22Habas de soja /
Soybean0 0 0 0 0 0 0 0 0
23
Frutas, hortalizas y
legumbres / Fruits
and vegetables
0 0 0 0 0 0 0 0 0
24
Vinos,bebidas,
alcoholes y
derivados /
Wines,drinks and
spirits
0 0 0 0 0 0 0 0 0
27Conservas / Tinned
food0 0 0 0 0 0 0 0 0
28
Tabaco,cacao,café y
especias /
Tobacco,cocoa,coff
ee and spices
0 0 0 0 0 0 0 0 0
29Aceites y grasas /
Oils and greases0 0 0 0 0 0 0 0 0
30
Otros productos
alimenticios / Other
foods
0 0 0 0 0 0 0 0 0
33
Pescados
congelados y
refrigerados /
Chilled or frozen
fish
0 0 0 0 0 0 0 0 0
Abonos /
Fertilizers
Químicos /
Chemical Products
Materiales de
construcción
Agro-Ganadero y
Alimentario /
StockBreeding
and Feeding
Products
Apéndice: Transparencia activa de la información. Los datos en detalle.
Apendix: Active transparency in information. Data in detail.
Datos actualizados a 31/12/2020
89

AUTORIDAD PORTUARIA DE FERROL-SAN CIBRAO EJERCICIO 2020
MERCANCÍAS /
GOODS
EMBARCADAS
/ LOADED
DESEMBARCA
DAS /
UNLOADED
TOTAL EMBARCADAS
/ LOADED
DESEMBARCA
DAS /
UNLOADED
TOTAL EMBARCADAS
/ LOADED
DESEMBARCA
DAS /
UNLOADED
TOTAL
TOTAL TRÁNSITO / TOTAL TRANSITCABOTAJE / DOMESTIC EXTERIOR / FOREIGN
4.3.7.3 CLASIFICACIÓN DE MERCANCÍAS EN TRÁNSITO SEGÚN NATURALEZA /
CLASSIFICATION OF GOODS IN TRANSIT BY NATURE
Agro-Ganadero y
Alimentario /
StockBreeding
and Feeding
Products
37
Pienso y forrajes /
Animal feed and
fodder
0 0 0 0 0 0 0 0 0
Total 0 0 0 0 0 0 0 0 0
19Maderas y corcho /
Wood and cork0 0 0 0 0 0 0 0 0
26Papel y pasta /
Paper and pulp0 0 0 0 0 0 0 0 0
31
Maquinaria,
herramientas y
repuestos /
Machinery, tools
and spares
0 0 0 0 0 0 0 0 0
34Resto mercancías /
Other goods0 0 0 0 0 0 0 0 0
Total 0 0 0 0 0 0 0 0 0
32
Vehículos y sus
piezas / Vehicles
and their parts
0 0 0 0 0 0 0 0 0
38
Tara Equipamiento
(Ro-Ro) / Ro-Ro
traffic tare weights
0 0 0 0 0 0 0 0 0
39Tara contenedores
/ Containers tare0 0 0 0 0 0 0 0 0
Total 0 0 0 0 0 0 0 0 0
Total 0 0 0 0 0 0 0 0 0
La mercancía en tránsito de este cuadro se encuentra incluida como embarcadas y desembarcadas en los siguientes cuadros anteriores (4.3.1/2/3/4, 4.3.7.1 y 4.3.7.2.A/B)
Otras mercancías
/ Other goods
Vehículos y
elementos de
transporte /
Vehicles and
tranport elements
Apéndice: Transparencia activa de la información. Los datos en detalle.
Apendix: Active transparency in information. Data in detail.
Datos actualizados a 31/12/2020
90

FERROL EJERCICIO 2020
MERCANCÍAS / GOODS EMBARCADAS
/ LOADED
DESEMBARCA
DAS /
UNLOADED
TOTAL EMBARCADAS
/ LOADED
DESEMBARCA
DAS /
UNLOADED
TOTAL EMBARCADAS
/ LOADED
DESEMBARCA
DAS /
UNLOADED
TOTAL
1Petróleo crudo / Crude
oil0 0 0 0 0 0 0 0 0
2 Fuel-oil / Fuel oil 0 0 0 0 0 0 0 0 0
3 Gas-oil / Gas oil 0 0 0 0 0 0 0 0 0
4 Gasolina / Petrol 0 0 0 0 0 0 0 0 0
6
Otros productos
petrolíferos / Other
petroleum products
0 0 0 0 0 0 0 0 0
7
Gases energéticos del
petróleo / Energetic
petroleum gases
0 0 0 0 0 0 0 0 0
12
Carbones y coque de
petróleo / Steam coal
and petroleum coke
0 0 0 0 0 0 0 0 0
35
Gas natural y otros
gases / Natural gas and
other gases
0 0 0 0 0 0 0 0 0
51Biocombustibles /
Biofuel0 0 0 0 0 0 0 0 0
Total 0 0 0 0 0 0 0 0 0
8Mineral de hierro / Iron
ore0 0 0 0 0 0 0 0 0
10
Otros minerales y
residuos metálicos /
Other mineral ores
0 0 0 0 0 0 0 0 0
11Chatarras de hierro /
Scrap iron0 0 0 0 0 0 0 0 0
13Productos siderúrgicos
/ Iron products0 0 0 0 0 0 0 0 0
36
Otros productos
metalúrgicos / Other
metallurgic products
0 0 0 0 0 0 0 0 0
Total 0 0 0 0 0 0 0 0 0
25 Sal común / Salt 0 0 0 0 0 0 0 0 0
52
Otros minerales no
metálicos / Other non-
metallic minerals
0 0 0 0 0 0 0 0 0
Total 0 0 0 0 0 0 0 0 0
14 Fosfatos / Phosphates 0 0 0 0 0 0 0 0 0
15 Potasas / Potash 0 0 0 0 0 0 0 0 0
16
Abonos naturales y
artificiales / Natural and
artificial fertilizers
0 0 0 0 0 0 0 0 0
Total 0 0 0 0 0 0 0 0 0
17Productos químicos /
Chemical products0 0 0 0 0 0 0 0 0
Total 0 0 0 0 0 0 0 0 0
TOTAL TRÁNSITO / TOTAL TRANSITCABOTAJE / DOMESTIC EXTERIOR / FOREIGN
4.3.7.3 CLASIFICACIÓN DE MERCANCÍAS EN TRÁNSITO SEGÚN NATURALEZA /
CLASSIFICATION OF GOODS IN TRANSIT BY NATURE
Energético /
Power Products
Siderometalúrgico
/ Siderurgical and
Metallurgic
Products
Minerales no
metálicos / Non-
metallic minerals
Abonos /
Fertilizers
Químicos /
Chemical Products
Apéndice: Transparencia activa de la información. Los datos en detalle.
Apendix: Active transparency in information. Data in detail.
Datos actualizados a 31/12/2020
91

FERROL EJERCICIO 2020
MERCANCÍAS / GOODS EMBARCADAS
/ LOADED
DESEMBARCA
DAS /
UNLOADED
TOTAL EMBARCADAS
/ LOADED
DESEMBARCA
DAS /
UNLOADED
TOTAL EMBARCADAS
/ LOADED
DESEMBARCA
DAS /
UNLOADED
TOTAL
TOTAL TRÁNSITO / TOTAL TRANSITCABOTAJE / DOMESTIC EXTERIOR / FOREIGN
4.3.7.3 CLASIFICACIÓN DE MERCANCÍAS EN TRÁNSITO SEGÚN NATURALEZA /
CLASSIFICATION OF GOODS IN TRANSIT BY NATURE
5 Asfalto / Asphalt 0 0 0 0 0 0 0 0 0
18Cemento y clinker /
Cement and clinker0 0 0 0 0 0 0 0 0
20
Materiales de
construcción
elaborados/
Manufactured building
materials
0 0 0 0 0 0 0 0 0
Total 0 0 0 0 0 0 0 0 0
21Cereales y sus harinas /
Cereals and their flours0 0 0 0 0 0 0 0 0
22Habas de soja /
Soybean0 0 0 0 0 0 0 0 0
23
Frutas, hortalizas y
legumbres / Fruits and
vegetables
0 0 0 0 0 0 0 0 0
24
Vinos,bebidas,
alcoholes y derivados /
Wines,drinks and spirits
0 0 0 0 0 0 0 0 0
27Conservas / Tinned
food0 0 0 0 0 0 0 0 0
28
Tabaco,cacao,café y
especias /
Tobacco,cocoa,coffee
and spices
0 0 0 0 0 0 0 0 0
29Aceites y grasas / Oils
and greases0 0 0 0 0 0 0 0 0
30
Otros productos
alimenticios / Other
foods
0 0 0 0 0 0 0 0 0
33
Pescados congelados y
refrigerados / Chilled or
frozen fish
0 0 0 0 0 0 0 0 0
37Pienso y forrajes /
Animal feed and fodder0 0 0 0 0 0 0 0 0
Total 0 0 0 0 0 0 0 0 0
19Maderas y corcho /
Wood and cork0 0 0 0 0 0 0 0 0
26Papel y pasta / Paper
and pulp0 0 0 0 0 0 0 0 0
31
Maquinaria,
herramientas y
repuestos / Machinery,
tools and spares
0 0 0 0 0 0 0 0 0
34Resto mercancías /
Other goods0 0 0 0 0 0 0 0 0
Total 0 0 0 0 0 0 0 0 0
Agro-Ganadero y
Alimentario /
StockBreeding and
Feeding Products
Otras mercancías /
Other goods
Materiales de
construcción
Apéndice: Transparencia activa de la información. Los datos en detalle.
Apendix: Active transparency in information. Data in detail.
Datos actualizados a 31/12/2020
92

FERROL EJERCICIO 2020
MERCANCÍAS / GOODS EMBARCADAS
/ LOADED
DESEMBARCA
DAS /
UNLOADED
TOTAL EMBARCADAS
/ LOADED
DESEMBARCA
DAS /
UNLOADED
TOTAL EMBARCADAS
/ LOADED
DESEMBARCA
DAS /
UNLOADED
TOTAL
TOTAL TRÁNSITO / TOTAL TRANSITCABOTAJE / DOMESTIC EXTERIOR / FOREIGN
4.3.7.3 CLASIFICACIÓN DE MERCANCÍAS EN TRÁNSITO SEGÚN NATURALEZA /
CLASSIFICATION OF GOODS IN TRANSIT BY NATURE
32Vehículos y sus piezas /
Vehicles and their parts0 0 0 0 0 0 0 0 0
38
Tara Equipamiento (Ro-
Ro) / Ro-Ro traffic tare
weights
0 0 0 0 0 0 0 0 0
39Tara contenedores /
Containers tare0 0 0 0 0 0 0 0 0
Total 0 0 0 0 0 0 0 0 0
Total 0 0 0 0 0 0 0 0 0
La mercancía en tránsito de este cuadro se encuentra incluida como embarcadas y desembarcadas en los siguientes cuadros anteriores (4.3.1/2/3/4, 4.3.7.1 y 4.3.7.2.A/B)
Vehículos y
elementos de
transporte /
Vehicles and
tranport elements
Apéndice: Transparencia activa de la información. Los datos en detalle.
Apendix: Active transparency in information. Data in detail.
Datos actualizados a 31/12/2020
93

SAN CIBRAO EJERCICIO 2020
MERCANCÍAS / GOODS EMBARCADAS
/ LOADED
DESEMBARCA
DAS /
UNLOADED
TOTAL EMBARCADAS
/ LOADED
DESEMBARCA
DAS /
UNLOADED
TOTAL EMBARCADAS
/ LOADED
DESEMBARCA
DAS /
UNLOADED
TOTAL
1Petróleo crudo / Crude
oil0 0 0 0 0 0 0 0 0
2 Fuel-oil / Fuel oil 0 0 0 0 0 0 0 0 0
3 Gas-oil / Gas oil 0 0 0 0 0 0 0 0 0
4 Gasolina / Petrol 0 0 0 0 0 0 0 0 0
6
Otros productos
petrolíferos / Other
petroleum products
0 0 0 0 0 0 0 0 0
7
Gases energéticos del
petróleo / Energetic
petroleum gases
0 0 0 0 0 0 0 0 0
12
Carbones y coque de
petróleo / Steam coal
and petroleum coke
0 0 0 0 0 0 0 0 0
35
Gas natural y otros
gases / Natural gas and
other gases
0 0 0 0 0 0 0 0 0
51Biocombustibles /
Biofuel0 0 0 0 0 0 0 0 0
Total 0 0 0 0 0 0 0 0 0
8Mineral de hierro / Iron
ore0 0 0 0 0 0 0 0 0
10
Otros minerales y
residuos metálicos /
Other mineral ores
0 0 0 0 0 0 0 0 0
11Chatarras de hierro /
Scrap iron0 0 0 0 0 0 0 0 0
13Productos siderúrgicos /
Iron products0 0 0 0 0 0 0 0 0
36
Otros productos
metalúrgicos / Other
metallurgic products
0 0 0 0 0 0 0 0 0
Total 0 0 0 0 0 0 0 0 0
25 Sal común / Salt 0 0 0 0 0 0 0 0 0
52
Otros minerales no
metálicos / Other non-
metallic minerals
0 0 0 0 0 0 0 0 0
Total 0 0 0 0 0 0 0 0 0
14 Fosfatos / Phosphates 0 0 0 0 0 0 0 0 0
15 Potasas / Potash 0 0 0 0 0 0 0 0 0
16
Abonos naturales y
artificiales / Natural and
artificial fertilizers
0 0 0 0 0 0 0 0 0
Total 0 0 0 0 0 0 0 0 0
17Productos químicos /
Chemical products0 0 0 0 0 0 0 0 0
Total 0 0 0 0 0 0 0 0 0
TOTAL TRÁNSITO / TOTAL TRANSITCABOTAJE / DOMESTIC EXTERIOR / FOREIGN
4.3.7.3 CLASIFICACIÓN DE MERCANCÍAS EN TRÁNSITO SEGÚN NATURALEZA /
CLASSIFICATION OF GOODS IN TRANSIT BY NATURE
Energético /
Power Products
Siderometalúrgico
/ Siderurgical and
Metallurgic
Products
Minerales no
metálicos / Non-
metallic minerals
Abonos /
Fertilizers
Químicos /
Chemical Products
Apéndice: Transparencia activa de la información. Los datos en detalle.
Apendix: Active transparency in information. Data in detail.
Datos actualizados a 31/12/2020
94

SAN CIBRAO EJERCICIO 2020
MERCANCÍAS / GOODS EMBARCADAS
/ LOADED
DESEMBARCA
DAS /
UNLOADED
TOTAL EMBARCADAS
/ LOADED
DESEMBARCA
DAS /
UNLOADED
TOTAL EMBARCADAS
/ LOADED
DESEMBARCA
DAS /
UNLOADED
TOTAL
TOTAL TRÁNSITO / TOTAL TRANSITCABOTAJE / DOMESTIC EXTERIOR / FOREIGN
4.3.7.3 CLASIFICACIÓN DE MERCANCÍAS EN TRÁNSITO SEGÚN NATURALEZA /
CLASSIFICATION OF GOODS IN TRANSIT BY NATURE
5 Asfalto / Asphalt 0 0 0 0 0 0 0 0 0
18Cemento y clinker /
Cement and clinker0 0 0 0 0 0 0 0 0
20
Materiales de
construcción
elaborados/
Manufactured building
materials
0 0 0 0 0 0 0 0 0
Total 0 0 0 0 0 0 0 0 0
21Cereales y sus harinas /
Cereals and their flours0 0 0 0 0 0 0 0 0
22 Habas de soja / Soybean 0 0 0 0 0 0 0 0 0
23
Frutas, hortalizas y
legumbres / Fruits and
vegetables
0 0 0 0 0 0 0 0 0
24
Vinos,bebidas, alcoholes
y derivados /
Wines,drinks and spirits
0 0 0 0 0 0 0 0 0
27 Conservas / Tinned food 0 0 0 0 0 0 0 0 0
28
Tabaco,cacao,café y
especias /
Tobacco,cocoa,coffee
and spices
0 0 0 0 0 0 0 0 0
29Aceites y grasas / Oils
and greases0 0 0 0 0 0 0 0 0
30
Otros productos
alimenticios / Other
foods
0 0 0 0 0 0 0 0 0
33
Pescados congelados y
refrigerados / Chilled or
frozen fish
0 0 0 0 0 0 0 0 0
37Pienso y forrajes /
Animal feed and fodder0 0 0 0 0 0 0 0 0
Total 0 0 0 0 0 0 0 0 0
19Maderas y corcho /
Wood and cork0 0 0 0 0 0 0 0 0
26Papel y pasta / Paper
and pulp0 0 0 0 0 0 0 0 0
31
Maquinaria,
herramientas y
repuestos / Machinery,
tools and spares
0 0 0 0 0 0 0 0 0
34Resto mercancías /
Other goods0 0 0 0 0 0 0 0 0
Total 0 0 0 0 0 0 0 0 0
Agro-Ganadero y
Alimentario /
StockBreeding
and Feeding
Products
Otras mercancías
/ Other goods
Materiales de
construcción
Apéndice: Transparencia activa de la información. Los datos en detalle.
Apendix: Active transparency in information. Data in detail.
Datos actualizados a 31/12/2020
95

SAN CIBRAO EJERCICIO 2020
MERCANCÍAS / GOODS EMBARCADAS
/ LOADED
DESEMBARCA
DAS /
UNLOADED
TOTAL EMBARCADAS
/ LOADED
DESEMBARCA
DAS /
UNLOADED
TOTAL EMBARCADAS
/ LOADED
DESEMBARCA
DAS /
UNLOADED
TOTAL
TOTAL TRÁNSITO / TOTAL TRANSITCABOTAJE / DOMESTIC EXTERIOR / FOREIGN
4.3.7.3 CLASIFICACIÓN DE MERCANCÍAS EN TRÁNSITO SEGÚN NATURALEZA /
CLASSIFICATION OF GOODS IN TRANSIT BY NATURE
32Vehículos y sus piezas /
Vehicles and their parts0 0 0 0 0 0 0 0 0
38
Tara Equipamiento (Ro-
Ro) / Ro-Ro traffic tare
weights
0 0 0 0 0 0 0 0 0
39Tara contenedores /
Containers tare0 0 0 0 0 0 0 0 0
Total 0 0 0 0 0 0 0 0 0
Total 0 0 0 0 0 0 0 0 0
La mercancía en tránsito de este cuadro se encuentra incluida como embarcadas y desembarcadas en los siguientes cuadros anteriores (4.3.1/2/3/4, 4.3.7.1 y 4.3.7.2.A/B)
Vehículos y
elementos de
transporte /
Vehicles and
tranport elements
Apéndice: Transparencia activa de la información. Los datos en detalle.
Apendix: Active transparency in information. Data in detail.
Datos actualizados a 31/12/2020
96

EJERCICIO 2020
MERCANCÍAS / GOODS EMBARCADA
S / LOADED
DESEMBARCAD
AS /
UNLOADED
TOTAL EMBARCADAS
/ LOADED
DESEMBARCAD
AS /
UNLOADED
TOTAL
EMBARCAD
AS /
LOADED
DESEMBAR
CADAS /
UNLOADED
TOTAL
1 Petróleo crudo / Crude oil 0 0 0 0 0 0 0 0 0
2 Fuel-oil / Fuel oil 0 0 0 0 0 0 0 0 0
3 Gas-oil / Gas oil 0 0 0 0 0 0 0 0 0
4 Gasolina / Petrol 0 0 0 0 0 0 0 0 0
6Otros productos petrolíferos
/ Other petroleum products0 0 0 0 0 0 0 0 0
7
Gases energéticos del
petróleo / Energetic
petroleum gases
0 0 0 0 0 0 0 0 0
12
Carbones y coque de
petróleo / Steam coal and
petroleum coke
0 0 0 0 0 0 0 0 0
35Gas natural y otros gases /
Natural gas and other gases0 0 0 0 0 0 0 0 0
51 Biocombustibles / Biofuel 0 0 0 0 0 0 0 0 0
Total 0 0 0 0 0 0 0 0 0
8 Mineral de hierro / Iron ore 0 0 0 0 0 0 0 0 0
10
Otros minerales y residuos
metálicos / Other mineral
ores
0 0 0 0 0 0 0 0 0
11Chatarras de hierro / Scrap
iron0 0 0 0 0 0 0 0 0
13Productos siderúrgicos /
Iron products0 0 0 0 0 0 0 0 0
36
Otros productos
metalúrgicos / Other
metallurgic products
0 0 0 0 0 0 0 0 0
Total 0 0 0 0 0 0 0 0 0
25 Sal común / Salt 0 0 0 0 0 0 0 0 0
52
Otros minerales no
metálicos / Other non-
metallic minerals
0 0 0 0 0 0 0 0 0
Total 0 0 0 0 0 0 0 0 0
14 Fosfatos / Phosphates 0 0 0 0 0 0 0 0 0
15 Potasas / Potash 0 0 0 0 0 0 0 0 0
16
Abonos naturales y
artificiales / Natural and
artificial fertilizers
0 0 0 0 0 0 0 0 0
Total 0 0 0 0 0 0 0 0 0
17Productos químicos /
Chemical products0 0 0 0 0 0 0 0 0
Total 0 0 0 0 0 0 0 0 0
Energético /
Power
Products
Siderometalúr
gico /
Siderurgical
and
Metallurgic
Products
Minerales no
metálicos /
Non-metallic
minerals
Abonos /
Fertilizers
Químicos /
Chemical
Products
GRANELES LÍQUIDOS GRANELES SÓLIDOSMERCANCÍA GENERAL EN
CONTENEDORES
4.3.7.4 CLASIFICACIÓN DE MERCANCÍAS
EN TRÁNSITO SEGÚN SU NATURALEZA Y
PRESENTACIÓNCLASSIFICATION OF GOODS IN TRANSIT
BY NATURE AND PACKAGING
AUTORIDAD PORTUARIA DE FERROL -
SAN CIBRAO
MERCANCÍA GENERAL
Apéndice: Transparencia activa de la información. Los datos en detalle.
Apendix: Active transparency in information. Data in detail.
Datos actualizados a 31/12/2020
97

EJERCICIO 2020
MERCANCÍAS / GOODS EMBARCADA
S / LOADED
DESEMBARCAD
AS /
UNLOADED
TOTAL EMBARCADAS
/ LOADED
DESEMBARCAD
AS /
UNLOADED
TOTAL
EMBARCAD
AS /
LOADED
DESEMBAR
CADAS /
UNLOADED
TOTAL
GRANELES LÍQUIDOS GRANELES SÓLIDOSMERCANCÍA GENERAL EN
CONTENEDORES
4.3.7.4 CLASIFICACIÓN DE MERCANCÍAS
EN TRÁNSITO SEGÚN SU NATURALEZA Y
PRESENTACIÓNCLASSIFICATION OF GOODS IN TRANSIT
BY NATURE AND PACKAGING
AUTORIDAD PORTUARIA DE FERROL -
SAN CIBRAO
MERCANCÍA GENERAL
5 Asfalto / Asphalt 0 0 0 0 0 0 0 0 0
18Cemento y clinker / Cement
and clinker0 0 0 0 0 0 0 0 0
20
Materiales de construcción
elaborados / Manufactured
building materials
0 0 0 0 0 0 0 0 0
Total 0 0 0 0 0 0 0 0 0
21Cereales y sus harinas /
Cereals and their flours0 0 0 0 0 0 0 0 0
22 Habas de soja / Soybean 0 0 0 0 0 0 0 0 0
23
Frutas, hortalizas y
legumbres / Fruits and
vegetables
0 0 0 0 0 0 0 0 0
24
Vinos,bebidas, alcoholes y
derivados / Wines,drinks
and spirits
0 0 0 0 0 0 0 0 0
27 Conservas / Tinned food 0 0 0 0 0 0 0 0 0
28
Tabaco,cacao,café y
especias /
Tobacco,cocoa,coffee and
spices
0 0 0 0 0 0 0 0 0
29Aceites y grasas / Oils and
greases0 0 0 0 0 0 0 0 0
30Otros productos
alimenticios / Other foods0 0 0 0 0 0 0 0 0
33
Pescados congelados y
refrigerados / Chilled or
frozen fish
0 0 0 0 0 0 0 0 0
37Pienso y forrajes / Animal
feed and fodder0 0 0 0 0 0 0 0 0
Total 0 0 0 0 0 0 0 0 0
19Maderas y corcho / Wood
and cork0 0 0 0 0 0 0 0 0
26Papel y pasta / Paper and
pulp0 0 0 0 0 0 0 0 0
31
Maquinaria, herramientas y
repuestos / Machinery,
tools and spares
0 0 0 0 0 0 0 0 0
34Resto mercancías / Other
goods0 0 0 0 0 0 0 0 0
Total 0 0 0 0 0 0 0 0 0
32Vehículos y sus piezas /
Vehicles and their parts0 0 0 0 0 0 0 0 0
38Tara Equipamiento (Ro-Ro) /
Ro-Ro traffic tare weights0 0 0 0 0 0 0 0 0
39Tara contenedores /
Containers tare0 0 0 0 0 0 0 0 0
Total 0 0 0 0 0 0 0 0 0
Total 0 0 0 0 0 0 0 0 0
Vehículos y
elementos de
transporte /
Vehicles and
tranport
elements
Materiales de
construcción
Agro-
Ganadero y
Alimentario /
StockBreeding
and Feeding
Products
Otras
mercancías /
Other goods
Apéndice: Transparencia activa de la información. Los datos en detalle.
Apendix: Active transparency in information. Data in detail.
Datos actualizados a 31/12/2020
98

MERCANCÍAS / GOODS
1 Petróleo crudo / Crude oil
2 Fuel-oil / Fuel oil
3 Gas-oil / Gas oil
4 Gasolina / Petrol
6Otros productos petrolíferos
/ Other petroleum products
7
Gases energéticos del
petróleo / Energetic
petroleum gases
12
Carbones y coque de
petróleo / Steam coal and
petroleum coke
35Gas natural y otros gases /
Natural gas and other gases
51 Biocombustibles / Biofuel
Total
8 Mineral de hierro / Iron ore
10
Otros minerales y residuos
metálicos / Other mineral
ores
11Chatarras de hierro / Scrap
iron
13Productos siderúrgicos /
Iron products
36
Otros productos
metalúrgicos / Other
metallurgic products
Total
25 Sal común / Salt
52
Otros minerales no
metálicos / Other non-
metallic minerals
Total
14 Fosfatos / Phosphates
15 Potasas / Potash
16
Abonos naturales y
artificiales / Natural and
artificial fertilizers
Total
17Productos químicos /
Chemical products
Total
Energético /
Power
Products
Siderometalúr
gico /
Siderurgical
and
Metallurgic
Products
Minerales no
metálicos /
Non-metallic
minerals
Abonos /
Fertilizers
Químicos /
Chemical
Products
4.3.7.4 CLASIFICACIÓN DE MERCANCÍAS
EN TRÁNSITO SEGÚN SU NATURALEZA Y
PRESENTACIÓNCLASSIFICATION OF GOODS IN TRANSIT
BY NATURE AND PACKAGING
AUTORIDAD PORTUARIA DE FERROL -
SAN CIBRAOEJERCICIO 2020
EMBARCADAS
/ LOADED
DESEMBARCA
DAS /
UNLOADED
TOTAL EMBARCADAS
/ LOADED
DESEMBARCA
DAS /
UNLOADED
TOTAL EMBARCADAS
/ LOADED
DESEMBARCA
DAS /
UNLOADED
TOTAL
0 0 0 0 0 0 0 0 0
0 0 0 0 0 0 0 0 0
0 0 0 0 0 0 0 0 0
0 0 0 0 0 0 0 0 0
0 0 0 0 0 0 0 0 0
0 0 0 0 0 0 0 0 0
0 0 0 0 0 0 0 0 0
0 0 0 0 0 0 0 0 0
0 0 0 0 0 0 0 0 0
0 0 0 0 0 0 0 0 0
0 0 0 0 0 0 0 0 0
0 0 0 0 0 0 0 0 0
0 0 0 0 0 0 0 0 0
0 0 0 0 0 0 0 0 0
0 0 0 0 0 0 0 0 0
0 0 0 0 0 0 0 0 0
0 0 0 0 0 0 0 0 0
0 0 0 0 0 0 0 0 0
0 0 0 0 0 0 0 0 0
0 0 0 0 0 0 0 0 0
0 0 0 0 0 0 0 0 0
0 0 0 0 0 0 0 0 0
0 0 0 0 0 0 0 0 0
0 0 0 0 0 0 0 0 0
0 0 0 0 0 0 0 0 0
TOTAL TRÁNSITO / TOTAL TRANSIT
MERCANCÍA GENERAL CONVENCIONAL TOTAL MERCANCÍA GENERAL TOTAL MERCANCÍA
MERCANCÍA GENERAL
Apéndice: Transparencia activa de la información. Los datos en detalle.
Apendix: Active transparency in information. Data in detail.
Datos actualizados a 31/12/2020
99

MERCANCÍAS / GOODS
4.3.7.4 CLASIFICACIÓN DE MERCANCÍAS
EN TRÁNSITO SEGÚN SU NATURALEZA Y
PRESENTACIÓNCLASSIFICATION OF GOODS IN TRANSIT
BY NATURE AND PACKAGING
AUTORIDAD PORTUARIA DE FERROL -
SAN CIBRAO
5 Asfalto / Asphalt
18Cemento y clinker / Cement
and clinker
20
Materiales de construcción
elaborados / Manufactured
building materials
Total
21Cereales y sus harinas /
Cereals and their flours
22 Habas de soja / Soybean
23
Frutas, hortalizas y
legumbres / Fruits and
vegetables
24
Vinos,bebidas, alcoholes y
derivados / Wines,drinks
and spirits
27 Conservas / Tinned food
28
Tabaco,cacao,café y
especias /
Tobacco,cocoa,coffee and
spices
29Aceites y grasas / Oils and
greases
30Otros productos
alimenticios / Other foods
33
Pescados congelados y
refrigerados / Chilled or
frozen fish
37Pienso y forrajes / Animal
feed and fodder
Total
19Maderas y corcho / Wood
and cork
26Papel y pasta / Paper and
pulp
31
Maquinaria, herramientas y
repuestos / Machinery,
tools and spares
34Resto mercancías / Other
goods
Total
32Vehículos y sus piezas /
Vehicles and their parts
38Tara Equipamiento (Ro-Ro) /
Ro-Ro traffic tare weights
39Tara contenedores /
Containers tare
Total
Total
Vehículos y
elementos de
transporte /
Vehicles and
tranport
elements
Materiales de
construcción
Agro-
Ganadero y
Alimentario /
StockBreeding
and Feeding
Products
Otras
mercancías /
Other goods
EJERCICIO 2020
EMBARCADAS
/ LOADED
DESEMBARCA
DAS /
UNLOADED
TOTAL EMBARCADAS
/ LOADED
DESEMBARCA
DAS /
UNLOADED
TOTAL EMBARCADAS
/ LOADED
DESEMBARCA
DAS /
UNLOADED
TOTAL
TOTAL TRÁNSITO / TOTAL TRANSIT
MERCANCÍA GENERAL CONVENCIONAL TOTAL MERCANCÍA GENERAL TOTAL MERCANCÍA
MERCANCÍA GENERAL
0 0 0 0 0 0 0 0 0
0 0 0 0 0 0 0 0 0
0 0 0 0 0 0 0 0 0
0 0 0 0 0 0 0 0 0
0 0 0 0 0 0 0 0 0
0 0 0 0 0 0 0 0 0
0 0 0 0 0 0 0 0 0
0 0 0 0 0 0 0 0 0
0 0 0 0 0 0 0 0 0
0 0 0 0 0 0 0 0 0
0 0 0 0 0 0 0 0 0
0 0 0 0 0 0 0 0 0
0 0 0 0 0 0 0 0 0
0 0 0 0 0 0 0 0 0
0 0 0 0 0 0 0 0 0
0 0 0 0 0 0 0 0 0
0 0 0 0 0 0 0 0 0
0 0 0 0 0 0 0 0 0
0 0 0 0 0 0 0 0 0
0 0 0 0 0 0 0 0 0
0 0 0 0 0 0 0 0 0
0 0 0 0 0 0 0 0 0
0 0 0 0 0 0 0 0 0
0 0 0 0 0 0 0 0 0
0 0 0 0 0 0 0 0 0
Apéndice: Transparencia activa de la información. Los datos en detalle.
Apendix: Active transparency in information. Data in detail.
Datos actualizados a 31/12/2020
100

FERROL EJERCICIO 2020
MERCANCÍAS / GOODS EMBARCADA
S / LOADED
DESEMBARCAD
AS /
UNLOADED
TOTAL EMBARCADAS
/ LOADED
DESEMBARCAD
AS /
UNLOADED
TOTAL
EMBARCAD
AS /
LOADED
DESEMBAR
CADAS /
UNLOADED
TOTAL
1 Petróleo crudo / Crude oil 0 0 0 0 0 0 0 0 0
2 Fuel-oil / Fuel oil 0 0 0 0 0 0 0 0 0
3 Gas-oil / Gas oil 0 0 0 0 0 0 0 0 0
4 Gasolina / Petrol 0 0 0 0 0 0 0 0 0
6Otros productos petrolíferos
/ Other petroleum products0 0 0 0 0 0 0 0 0
7
Gases energéticos del
petróleo / Energetic
petroleum gases
0 0 0 0 0 0 0 0 0
12
Carbones y coque de
petróleo / Steam coal and
petroleum coke
0 0 0 0 0 0 0 0 0
35Gas natural y otros gases /
Natural gas and other gases0 0 0 0 0 0 0 0 0
51 Biocombustibles / Biofuel 0 0 0 0 0 0 0 0 0
Total 0 0 0 0 0 0 0 0 0
8 Mineral de hierro / Iron ore 0 0 0 0 0 0 0 0 0
10
Otros minerales y residuos
metálicos / Other mineral
ores
0 0 0 0 0 0 0 0 0
11Chatarras de hierro / Scrap
iron0 0 0 0 0 0 0 0 0
13Productos siderúrgicos /
Iron products0 0 0 0 0 0 0 0 0
36
Otros productos
metalúrgicos / Other
metallurgic products
0 0 0 0 0 0 0 0 0
Total 0 0 0 0 0 0 0 0 0
25 Sal común / Salt 0 0 0 0 0 0 0 0 0
52
Otros minerales no
metálicos / Other non-
metallic minerals
0 0 0 0 0 0 0 0 0
Total 0 0 0 0 0 0 0 0 0
14 Fosfatos / Phosphates 0 0 0 0 0 0 0 0 0
15 Potasas / Potash 0 0 0 0 0 0 0 0 0
16
Abonos naturales y
artificiales / Natural and
artificial fertilizers
0 0 0 0 0 0 0 0 0
Total 0 0 0 0 0 0 0 0 0
17Productos químicos /
Chemical products0 0 0 0 0 0 0 0 0
Total 0 0 0 0 0 0 0 0 0
4.3.7.4 CLASIFICACIÓN DE MERCANCÍAS
EN TRÁNSITO SEGÚN SU NATURALEZA Y
PRESENTACIÓNCLASSIFICATION OF GOODS IN TRANSIT
BY NATURE AND PACKAGING
MERCANCÍA GENERAL
GRANELES SÓLIDOSMERCANCÍA GENERAL EN
CONTENEDORESGRANELES LÍQUIDOS
Energético /
Power
Products
Siderometalúr
gico /
Siderurgical
and
Metallurgic
Products
Minerales no
metálicos /
Non-metallic
minerals
Abonos /
Fertilizers
Químicos /
Chemical
Products
Apéndice: Transparencia activa de la información. Los datos en detalle.
Apendix: Active transparency in information. Data in detail.
Datos actualizados a 31/12/2020
101

FERROL EJERCICIO 2020
MERCANCÍAS / GOODS EMBARCADA
S / LOADED
DESEMBARCAD
AS /
UNLOADED
TOTAL EMBARCADAS
/ LOADED
DESEMBARCAD
AS /
UNLOADED
TOTAL
EMBARCAD
AS /
LOADED
DESEMBAR
CADAS /
UNLOADED
TOTAL
4.3.7.4 CLASIFICACIÓN DE MERCANCÍAS
EN TRÁNSITO SEGÚN SU NATURALEZA Y
PRESENTACIÓNCLASSIFICATION OF GOODS IN TRANSIT
BY NATURE AND PACKAGING
MERCANCÍA GENERAL
GRANELES SÓLIDOSMERCANCÍA GENERAL EN
CONTENEDORESGRANELES LÍQUIDOS
5 Asfalto / Asphalt 0 0 0 0 0 0 0 0 0
18Cemento y clinker / Cement
and clinker0 0 0 0 0 0 0 0 0
20
Materiales de construcción
elaborados / Manufactured
building materials
0 0 0 0 0 0 0 0 0
Total 0 0 0 0 0 0 0 0 0
21Cereales y sus harinas /
Cereals and their flours0 0 0 0 0 0 0 0 0
22 Habas de soja / Soybean 0 0 0 0 0 0 0 0 0
23
Frutas, hortalizas y
legumbres / Fruits and
vegetables
0 0 0 0 0 0 0 0 0
24
Vinos,bebidas, alcoholes y
derivados / Wines,drinks
and spirits
0 0 0 0 0 0 0 0 0
27 Conservas / Tinned food 0 0 0 0 0 0 0 0 0
28
Tabaco,cacao,café y
especias /
Tobacco,cocoa,coffee and
spices
0 0 0 0 0 0 0 0 0
29Aceites y grasas / Oils and
greases0 0 0 0 0 0 0 0 0
30Otros productos
alimenticios / Other foods0 0 0 0 0 0 0 0 0
33
Pescados congelados y
refrigerados / Chilled or
frozen fish
0 0 0 0 0 0 0 0 0
37Pienso y forrajes / Animal
feed and fodder0 0 0 0 0 0 0 0 0
Total 0 0 0 0 0 0 0 0 0
19Maderas y corcho / Wood
and cork0 0 0 0 0 0 0 0 0
26Papel y pasta / Paper and
pulp0 0 0 0 0 0 0 0 0
31
Maquinaria, herramientas y
repuestos / Machinery,
tools and spares
0 0 0 0 0 0 0 0 0
34Resto mercancías / Other
goods0 0 0 0 0 0 0 0 0
Total 0 0 0 0 0 0 0 0 0
32Vehículos y sus piezas /
Vehicles and their parts0 0 0 0 0 0 0 0 0
38Tara Equipamiento (Ro-Ro) /
Ro-Ro traffic tare weights0 0 0 0 0 0 0 0 0
39Tara contenedores /
Containers tare0 0 0 0 0 0 0 0 0
Total 0 0 0 0 0 0 0 0 0
Total 0 0 0 0 0 0 0 0 0
Agro-
Ganadero y
Alimentario /
StockBreeding
and Feeding
Products
Otras
mercancías /
Other goods
Vehículos y
elementos de
transporte /
Vehicles and
tranport
elements
Materiales de
construcción
Apéndice: Transparencia activa de la información. Los datos en detalle.
Apendix: Active transparency in information. Data in detail.
Datos actualizados a 31/12/2020
102

FERROL
MERCANCÍAS / GOODS
1 Petróleo crudo / Crude oil
2 Fuel-oil / Fuel oil
3 Gas-oil / Gas oil
4 Gasolina / Petrol
6Otros productos petrolíferos
/ Other petroleum products
7
Gases energéticos del
petróleo / Energetic
petroleum gases
12
Carbones y coque de
petróleo / Steam coal and
petroleum coke
35Gas natural y otros gases /
Natural gas and other gases
51 Biocombustibles / Biofuel
Total
8 Mineral de hierro / Iron ore
10
Otros minerales y residuos
metálicos / Other mineral
ores
11Chatarras de hierro / Scrap
iron
13Productos siderúrgicos /
Iron products
36
Otros productos
metalúrgicos / Other
metallurgic products
Total
25 Sal común / Salt
52
Otros minerales no
metálicos / Other non-
metallic minerals
Total
14 Fosfatos / Phosphates
15 Potasas / Potash
16
Abonos naturales y
artificiales / Natural and
artificial fertilizers
Total
17Productos químicos /
Chemical products
Total
4.3.7.4 CLASIFICACIÓN DE MERCANCÍAS
EN TRÁNSITO SEGÚN SU NATURALEZA Y
PRESENTACIÓNCLASSIFICATION OF GOODS IN TRANSIT
BY NATURE AND PACKAGING
Energético /
Power
Products
Siderometalúr
gico /
Siderurgical
and
Metallurgic
Products
Minerales no
metálicos /
Non-metallic
minerals
Abonos /
Fertilizers
Químicos /
Chemical
Products
EJERCICIO 2020
EMBARCADAS
/ LOADED
DESEMBARCA
DAS /
UNLOADED
TOTAL EMBARCADAS
/ LOADED
DESEMBARCA
DAS /
UNLOADED
TOTAL EMBARCADAS
/ LOADED
DESEMBARCA
DAS /
UNLOADED
TOTAL
0 0 0 0 0 0 0 0 0
0 0 0 0 0 0 0 0 0
0 0 0 0 0 0 0 0 0
0 0 0 0 0 0 0 0 0
0 0 0 0 0 0 0 0 0
0 0 0 0 0 0 0 0 0
0 0 0 0 0 0 0 0 0
0 0 0 0 0 0 0 0 0
0 0 0 0 0 0 0 0 0
0 0 0 0 0 0 0 0 0
0 0 0 0 0 0 0 0 0
0 0 0 0 0 0 0 0 0
0 0 0 0 0 0 0 0 0
0 0 0 0 0 0 0 0 0
0 0 0 0 0 0 0 0 0
0 0 0 0 0 0 0 0 0
0 0 0 0 0 0 0 0 0
0 0 0 0 0 0 0 0 0
0 0 0 0 0 0 0 0 0
0 0 0 0 0 0 0 0 0
0 0 0 0 0 0 0 0 0
0 0 0 0 0 0 0 0 0
0 0 0 0 0 0 0 0 0
0 0 0 0 0 0 0 0 0
0 0 0 0 0 0 0 0 0
MERCANCÍA GENERAL
MERCANCÍA GENERAL CONVENCIONAL TOTAL MERCANCÍA GENERAL TOTAL MERCANCÍA
TOTAL TRÁNSITO / TOTAL TRANSIT
Apéndice: Transparencia activa de la información. Los datos en detalle.
Apendix: Active transparency in information. Data in detail.
Datos actualizados a 31/12/2020
103

FERROL
MERCANCÍAS / GOODS
4.3.7.4 CLASIFICACIÓN DE MERCANCÍAS
EN TRÁNSITO SEGÚN SU NATURALEZA Y
PRESENTACIÓNCLASSIFICATION OF GOODS IN TRANSIT
BY NATURE AND PACKAGING
5 Asfalto / Asphalt
18Cemento y clinker / Cement
and clinker
20
Materiales de construcción
elaborados / Manufactured
building materials
Total
21Cereales y sus harinas /
Cereals and their flours
22 Habas de soja / Soybean
23
Frutas, hortalizas y
legumbres / Fruits and
vegetables
24
Vinos,bebidas, alcoholes y
derivados / Wines,drinks
and spirits
27 Conservas / Tinned food
28
Tabaco,cacao,café y
especias /
Tobacco,cocoa,coffee and
spices
29Aceites y grasas / Oils and
greases
30Otros productos
alimenticios / Other foods
33
Pescados congelados y
refrigerados / Chilled or
frozen fish
37Pienso y forrajes / Animal
feed and fodder
Total
19Maderas y corcho / Wood
and cork
26Papel y pasta / Paper and
pulp
31
Maquinaria, herramientas y
repuestos / Machinery,
tools and spares
34Resto mercancías / Other
goods
Total
32Vehículos y sus piezas /
Vehicles and their parts
38Tara Equipamiento (Ro-Ro) /
Ro-Ro traffic tare weights
39Tara contenedores /
Containers tare
Total
Total
Agro-
Ganadero y
Alimentario /
StockBreeding
and Feeding
Products
Otras
mercancías /
Other goods
Vehículos y
elementos de
transporte /
Vehicles and
tranport
elements
Materiales de
construcción
EJERCICIO 2020
EMBARCADAS
/ LOADED
DESEMBARCA
DAS /
UNLOADED
TOTAL EMBARCADAS
/ LOADED
DESEMBARCA
DAS /
UNLOADED
TOTAL EMBARCADAS
/ LOADED
DESEMBARCA
DAS /
UNLOADED
TOTAL
MERCANCÍA GENERAL
MERCANCÍA GENERAL CONVENCIONAL TOTAL MERCANCÍA GENERAL TOTAL MERCANCÍA
TOTAL TRÁNSITO / TOTAL TRANSIT
0 0 0 0 0 0 0 0 0
0 0 0 0 0 0 0 0 0
0 0 0 0 0 0 0 0 0
0 0 0 0 0 0 0 0 0
0 0 0 0 0 0 0 0 0
0 0 0 0 0 0 0 0 0
0 0 0 0 0 0 0 0 0
0 0 0 0 0 0 0 0 0
0 0 0 0 0 0 0 0 0
0 0 0 0 0 0 0 0 0
0 0 0 0 0 0 0 0 0
0 0 0 0 0 0 0 0 0
0 0 0 0 0 0 0 0 0
0 0 0 0 0 0 0 0 0
0 0 0 0 0 0 0 0 0
0 0 0 0 0 0 0 0 0
0 0 0 0 0 0 0 0 0
0 0 0 0 0 0 0 0 0
0 0 0 0 0 0 0 0 0
0 0 0 0 0 0 0 0 0
0 0 0 0 0 0 0 0 0
0 0 0 0 0 0 0 0 0
0 0 0 0 0 0 0 0 0
0 0 0 0 0 0 0 0 0
0 0 0 0 0 0 0 0 0
Apéndice: Transparencia activa de la información. Los datos en detalle.
Apendix: Active transparency in information. Data in detail.
Datos actualizados a 31/12/2020
104

SAN CIBRAO EJERCICIO 2020
MERCANCÍAS / GOODS EMBARCADAS
/ LOADED
DESEMBARCA
DAS /
UNLOADED
TOTAL EMBARCADAS
/ LOADED
DESEMBARCAD
AS /
UNLOADED
TOTAL
EMBARCAD
AS /
LOADED
DESEMBAR
CADAS /
UNLOADED
TOTAL
1Petróleo crudo / Crude
oil0 0 0 0 0 0 0 0 0
2 Fuel-oil / Fuel oil 0 0 0 0 0 0 0 0 0
3 Gas-oil / Gas oil 0 0 0 0 0 0 0 0 0
4 Gasolina / Petrol 0 0 0 0 0 0 0 0 0
6
Otros productos
petrolíferos / Other
petroleum products
0 0 0 0 0 0 0 0 0
7
Gases energéticos del
petróleo / Energetic
petroleum gases
0 0 0 0 0 0 0 0 0
12
Carbones y coque de
petróleo / Steam coal
and petroleum coke
0 0 0 0 0 0 0 0 0
35
Gas natural y otros gases
/ Natural gas and other
gases
0 0 0 0 0 0 0 0 0
51 Biocombustibles / Biofuel 0 0 0 0 0 0 0 0 0
Total 0 0 0 0 0 0 0 0 0
8Mineral de hierro / Iron
ore0 0 0 0 0 0 0 0 0
10
Otros minerales y
residuos metálicos /
Other mineral ores
0 0 0 0 0 0 0 0 0
11Chatarras de hierro /
Scrap iron0 0 0 0 0 0 0 0 0
13Productos siderúrgicos /
Iron products0 0 0 0 0 0 0 0 0
36
Otros productos
metalúrgicos / Other
metallurgic products
0 0 0 0 0 0 0 0 0
Total 0 0 0 0 0 0 0 0 0
25 Sal común / Salt 0 0 0 0 0 0 0 0 0
52
Otros minerales no
metálicos / Other non-
metallic minerals
0 0 0 0 0 0 0 0 0
Total 0 0 0 0 0 0 0 0 0
14 Fosfatos / Phosphates 0 0 0 0 0 0 0 0 0
15 Potasas / Potash 0 0 0 0 0 0 0 0 0
16
Abonos naturales y
artificiales / Natural and
artificial fertilizers
0 0 0 0 0 0 0 0 0
Total 0 0 0 0 0 0 0 0 0
17Productos químicos /
Chemical products0 0 0 0 0 0 0 0 0
Total 0 0 0 0 0 0 0 0 0
4.3.7.4 CLASIFICACIÓN DE
MERCANCÍAS EN TRÁNSITO SEGÚN SU
NATURALEZA Y PRESENTACIÓNCLASSIFICATION OF GOODS IN
TRANSIT BY NATURE AND PACKAGING
MERCANCÍA GENERAL
GRANELES SÓLIDOSMERCANCÍA GENERAL EN
CONTENEDORESGRANELES LÍQUIDOS
Energético /
Power
Products
Siderometalúr
gico /
Siderurgical
and
Metallurgic
Products
Minerales no
metálicos /
Non-metallic
minerals
Abonos /
Fertilizers
Químicos /
Chemical
Products
Apéndice: Transparencia activa de la información. Los datos en detalle.
Apendix: Active transparency in information. Data in detail.
Datos actualizados a 31/12/2020
105

SAN CIBRAO EJERCICIO 2020
MERCANCÍAS / GOODS EMBARCADAS
/ LOADED
DESEMBARCA
DAS /
UNLOADED
TOTAL EMBARCADAS
/ LOADED
DESEMBARCAD
AS /
UNLOADED
TOTAL
EMBARCAD
AS /
LOADED
DESEMBAR
CADAS /
UNLOADED
TOTAL
4.3.7.4 CLASIFICACIÓN DE
MERCANCÍAS EN TRÁNSITO SEGÚN SU
NATURALEZA Y PRESENTACIÓNCLASSIFICATION OF GOODS IN
TRANSIT BY NATURE AND PACKAGING
MERCANCÍA GENERAL
GRANELES SÓLIDOSMERCANCÍA GENERAL EN
CONTENEDORESGRANELES LÍQUIDOS
5 Asfalto / Asphalt 0 0 0 0 0 0 0 0 0
18Cemento y clinker /
Cement and clinker0 0 0 0 0 0 0 0 0
20
Materiales de
construcción elaborados
/ Manufactured building
materials
0 0 0 0 0 0 0 0 0
Total 0 0 0 0 0 0 0 0 0
21Cereales y sus harinas /
Cereals and their flours0 0 0 0 0 0 0 0 0
22 Habas de soja / Soybean 0 0 0 0 0 0 0 0 0
23
Frutas, hortalizas y
legumbres / Fruits and
vegetables
0 0 0 0 0 0 0 0 0
24
Vinos,bebidas, alcoholes
y derivados /
Wines,drinks and spirits
0 0 0 0 0 0 0 0 0
27 Conservas / Tinned food 0 0 0 0 0 0 0 0 0
28
Tabaco,cacao,café y
especias /
Tobacco,cocoa,coffee
and spices
0 0 0 0 0 0 0 0 0
29Aceites y grasas / Oils
and greases0 0 0 0 0 0 0 0 0
30
Otros productos
alimenticios / Other
foods
0 0 0 0 0 0 0 0 0
33
Pescados congelados y
refrigerados / Chilled or
frozen fish
0 0 0 0 0 0 0 0 0
37Pienso y forrajes / Animal
feed and fodder0 0 0 0 0 0 0 0 0
Total 0 0 0 0 0 0 0 0 0
19Maderas y corcho /
Wood and cork0 0 0 0 0 0 0 0 0
26Papel y pasta / Paper and
pulp0 0 0 0 0 0 0 0 0
31
Maquinaria,
herramientas y repuestos
/ Machinery, tools and
spares
0 0 0 0 0 0 0 0 0
34Resto mercancías / Other
goods0 0 0 0 0 0 0 0 0
Total 0 0 0 0 0 0 0 0 0
32Vehículos y sus piezas /
Vehicles and their parts0 0 0 0 0 0 0 0 0
38
Tara Equipamiento (Ro-
Ro) / Ro-Ro traffic tare
weights
0 0 0 0 0 0 0 0 0
39Tara contenedores /
Containers tare0 0 0 0 0 0 0 0 0
Total 0 0 0 0 0 0 0 0 0
Total 0 0 0 0 0 0 0 0 0
Agro-
Ganadero y
Alimentario /
StockBreeding
and Feeding
Products
Otras
mercancías /
Other goods
Vehículos y
elementos de
transporte /
Vehicles and
tranport
elements
Materiales de
construcción
Apéndice: Transparencia activa de la información. Los datos en detalle.
Apendix: Active transparency in information. Data in detail.
Datos actualizados a 31/12/2020
106

SAN CIBRAO
MERCANCÍAS / GOODS
1Petróleo crudo / Crude
oil
2 Fuel-oil / Fuel oil
3 Gas-oil / Gas oil
4 Gasolina / Petrol
6
Otros productos
petrolíferos / Other
petroleum products
7
Gases energéticos del
petróleo / Energetic
petroleum gases
12
Carbones y coque de
petróleo / Steam coal
and petroleum coke
35
Gas natural y otros gases
/ Natural gas and other
gases
51 Biocombustibles / Biofuel
Total
8Mineral de hierro / Iron
ore
10
Otros minerales y
residuos metálicos /
Other mineral ores
11Chatarras de hierro /
Scrap iron
13Productos siderúrgicos /
Iron products
36
Otros productos
metalúrgicos / Other
metallurgic products
Total
25 Sal común / Salt
52
Otros minerales no
metálicos / Other non-
metallic minerals
Total
14 Fosfatos / Phosphates
15 Potasas / Potash
16
Abonos naturales y
artificiales / Natural and
artificial fertilizers
Total
17Productos químicos /
Chemical products
Total
4.3.7.4 CLASIFICACIÓN DE
MERCANCÍAS EN TRÁNSITO SEGÚN SU
NATURALEZA Y PRESENTACIÓNCLASSIFICATION OF GOODS IN
TRANSIT BY NATURE AND PACKAGING
Energético /
Power
Products
Siderometalúr
gico /
Siderurgical
and
Metallurgic
Products
Minerales no
metálicos /
Non-metallic
minerals
Abonos /
Fertilizers
Químicos /
Chemical
Products
EJERCICIO 2020
EMBARCADAS
/ LOADED
DESEMBARCA
DAS /
UNLOADED
TOTAL EMBARCADAS
/ LOADED
DESEMBARCA
DAS /
UNLOADED
TOTAL EMBARCADAS
/ LOADED
DESEMBARCA
DAS /
UNLOADED
TOTAL
0 0 0 0 0 0 0 0 0
0 0 0 0 0 0 0 0 0
0 0 0 0 0 0 0 0 0
0 0 0 0 0 0 0 0 0
0 0 0 0 0 0 0 0 0
0 0 0 0 0 0 0 0 0
0 0 0 0 0 0 0 0 0
0 0 0 0 0 0 0 0 0
0 0 0 0 0 0 0 0 0
0 0 0 0 0 0 0 0 0
0 0 0 0 0 0 0 0 0
0 0 0 0 0 0 0 0 0
0 0 0 0 0 0 0 0 0
0 0 0 0 0 0 0 0 0
0 0 0 0 0 0 0 0 0
0 0 0 0 0 0 0 0 0
0 0 0 0 0 0 0 0 0
0 0 0 0 0 0 0 0 0
0 0 0 0 0 0 0 0 0
0 0 0 0 0 0 0 0 0
0 0 0 0 0 0 0 0 0
0 0 0 0 0 0 0 0 0
0 0 0 0 0 0 0 0 0
0 0 0 0 0 0 0 0 0
0 0 0 0 0 0 0 0 0
MERCANCÍA GENERAL
MERCANCÍA GENERAL CONVENCIONAL TOTAL MERCANCÍA GENERAL TOTAL MERCANCÍA
TOTAL TRÁNSITO / TOTAL TRANSIT
Apéndice: Transparencia activa de la información. Los datos en detalle.
Apendix: Active transparency in information. Data in detail.
Datos actualizados a 31/12/2020
107

SAN CIBRAO
MERCANCÍAS / GOODS
4.3.7.4 CLASIFICACIÓN DE
MERCANCÍAS EN TRÁNSITO SEGÚN SU
NATURALEZA Y PRESENTACIÓNCLASSIFICATION OF GOODS IN
TRANSIT BY NATURE AND PACKAGING
5 Asfalto / Asphalt
18Cemento y clinker /
Cement and clinker
20
Materiales de
construcción elaborados
/ Manufactured building
materials
Total
21Cereales y sus harinas /
Cereals and their flours
22 Habas de soja / Soybean
23
Frutas, hortalizas y
legumbres / Fruits and
vegetables
24
Vinos,bebidas, alcoholes
y derivados /
Wines,drinks and spirits
27 Conservas / Tinned food
28
Tabaco,cacao,café y
especias /
Tobacco,cocoa,coffee
and spices
29Aceites y grasas / Oils
and greases
30
Otros productos
alimenticios / Other
foods
33
Pescados congelados y
refrigerados / Chilled or
frozen fish
37Pienso y forrajes / Animal
feed and fodder
Total
19Maderas y corcho /
Wood and cork
26Papel y pasta / Paper and
pulp
31
Maquinaria,
herramientas y repuestos
/ Machinery, tools and
spares
34Resto mercancías / Other
goods
Total
32Vehículos y sus piezas /
Vehicles and their parts
38
Tara Equipamiento (Ro-
Ro) / Ro-Ro traffic tare
weights
39Tara contenedores /
Containers tare
Total
Total
Agro-
Ganadero y
Alimentario /
StockBreeding
and Feeding
Products
Otras
mercancías /
Other goods
Vehículos y
elementos de
transporte /
Vehicles and
tranport
elements
Materiales de
construcción
EJERCICIO 2020
EMBARCADAS
/ LOADED
DESEMBARCA
DAS /
UNLOADED
TOTAL EMBARCADAS
/ LOADED
DESEMBARCA
DAS /
UNLOADED
TOTAL EMBARCADAS
/ LOADED
DESEMBARCA
DAS /
UNLOADED
TOTAL
MERCANCÍA GENERAL
MERCANCÍA GENERAL CONVENCIONAL TOTAL MERCANCÍA GENERAL TOTAL MERCANCÍA
TOTAL TRÁNSITO / TOTAL TRANSIT
0 0 0 0 0 0 0 0 0
0 0 0 0 0 0 0 0 0
0 0 0 0 0 0 0 0 0
0 0 0 0 0 0 0 0 0
0 0 0 0 0 0 0 0 0
0 0 0 0 0 0 0 0 0
0 0 0 0 0 0 0 0 0
0 0 0 0 0 0 0 0 0
0 0 0 0 0 0 0 0 0
0 0 0 0 0 0 0 0 0
0 0 0 0 0 0 0 0 0
0 0 0 0 0 0 0 0 0
0 0 0 0 0 0 0 0 0
0 0 0 0 0 0 0 0 0
0 0 0 0 0 0 0 0 0
0 0 0 0 0 0 0 0 0
0 0 0 0 0 0 0 0 0
0 0 0 0 0 0 0 0 0
0 0 0 0 0 0 0 0 0
0 0 0 0 0 0 0 0 0
0 0 0 0 0 0 0 0 0
0 0 0 0 0 0 0 0 0
0 0 0 0 0 0 0 0 0
0 0 0 0 0 0 0 0 0
0 0 0 0 0 0 0 0 0
Apéndice: Transparencia activa de la información. Los datos en detalle.
Apendix: Active transparency in information. Data in detail.
Datos actualizados a 31/12/2020
108

AUTORIDAD PORTUARIA DE FERROL - SAN CIBRAO EJERCICIO 2020
MERCANCÍAS / GOODS EMBARCADAS
/ LOADED
DESEMBARCA
DAS /
UNLOADED
TOTAL
GLICEROL 0 0 0
SOSA CAUSTICA 0 0 0
FUEL OIL 0 0 0
METANOL 0 0 0
ACEITES 0 0 0
GAS NATURAL 0 0 0
GAS-OIL 0 0 0
BIODIESEL 0 0 0
0 0 0
COQUE 0 0 0
ASTILLA Y DESPERDICIOS DE MADERA 0 0 0
MAGNESITA 0 0 0
ABONOS 0 0 0
CEMENTO Y CLINKER 0 0 0
CUARZO Y GRANITO 0 0 0
ALUMINA 0 0 0
BAUXITA 0 0 0
OTRAS MERCANCIAS 0 0 0
CHATARRA 0 0 0
CARBON 0 0 0
UREA 0 0 0
0 0 0
CONTENEDORES 0 0 0
CONSTRUCCIONES PREFABRICADAS 0 0 0
COLA DE UREA 0 0 0
ASTILLA Y DESPERDICIOS DE MADERA 0 0 0
MAGNESITA 0 0 0
MADERA 0 0 0
MATERIALES DE CONSTRUCCION 0 0 0
CUARZO Y GRANITO 0 0 0
ALUMINIO 0 0 0
ACERO 0 0 0
ACEITES 0 0 0
AEROGENERADORES 0 0 0
OTRAS MERCANCIAS 0 0 0
TABLERO 0 0 0
APARATOS, HERRAMIENTAS Y
REPUESTOS0 0 0
ELECTRODOS 0 0 0
PAPEL 0 0 0
CARBON 0 0 0
ARENAS 0 0 0
0 0 0
Total 0 0 0
Graneles líquidos / Liquid bulks
Graneles sólidos sin instalac. especial / Dry bulks
without special installation
Mercancía general / General cargo
4.4 TRÁFICO INTERIOR, TONELADAS
LOCAL TRAFFIC, TONS
Apéndice: Transparencia activa de la información. Los datos en detalle.
Apendix: Active transparency in information. Data in detail.
Datos actualizados a 31/12/2020
109

FERROL EJERCICIO 2020
MERCANCÍAS / GOODS EMBARCADAS
/ LOADED
DESEMBARCAD
AS /
UNLOADED
TOTAL
GLICEROL 0 0 0
SOSA CAUSTICA 0 0 0
FUEL OIL 0 0 0
METANOL 0 0 0
ACEITES 0 0 0
GAS NATURAL 0 0 0
GAS-OIL 0 0 0
BIODIESEL 0 0 0
0 0 0
COQUE 0 0 0
ASTILLA Y DESPERDICIOS DE MADERA 0 0 0
MAGNESITA 0 0 0
ABONOS 0 0 0
CEMENTO Y CLINKER 0 0 0
CUARZO Y GRANITO 0 0 0
ALUMINA 0 0 0
BAUXITA 0 0 0
OTRAS MERCANCIAS 0 0 0
CHATARRA 0 0 0
CARBON 0 0 0
UREA 0 0 0
0 0 0
CONTENEDORES 0 0 0
CONSTRUCCIONES PREFABRICADAS 0 0 0
COLA DE UREA 0 0 0
ASTILLA Y DESPERDICIOS DE MADERA 0 0 0
MAGNESITA 0 0 0
MADERA 0 0 0
MATERIALES DE CONSTRUCCION 0 0 0
CUARZO Y GRANITO 0 0 0
ALUMINIO 0 0 0
ACERO 0 0 0
ACEITES 0 0 0
AEROGENERADORES 0 0 0
OTRAS MERCANCIAS 0 0 0
TABLERO 0 0 0
APARATOS, HERRAMIENTAS Y
REPUESTOS0 0 0
ELECTRODOS 0 0 0
PAPEL 0 0 0
CARBON 0 0 0
ARENAS 0 0 0
0 0 0
Total 0 0 0
Graneles líquidos / Liquid bulks
Graneles sólidos sin instalac. especial / Dry bulks
without special installation
Mercancía general / General cargo
4.4 TRÁFICO INTERIOR, TONELADAS
LOCAL TRAFFIC, TONS
Apéndice: Transparencia activa de la información. Los datos en detalle.
Apendix: Active transparency in information. Data in detail.
Datos actualizados a 31/12/2020
110

SAN CIBRAO EJERCICIO 2020
MERCANCÍAS / GOODS EMBARCADAS
/ LOADED
DESEMBARCAD
AS /
UNLOADED
TOTAL
GLICEROL 0 0 0
SOSA CAUSTICA 0 0 0
FUEL OIL 0 0 0
METANOL 0 0 0
ACEITES 0 0 0
GAS NATURAL 0 0 0
GAS-OIL 0 0 0
BIODIESEL 0 0 0
0 0 0
COQUE 0 0 0
ASTILLA Y DESPERDICIOS DE MADERA 0 0 0
MAGNESITA 0 0 0
ABONOS 0 0 0
CEMENTO Y CLINKER 0 0 0
CUARZO Y GRANITO 0 0 0
ALUMINA 0 0 0
BAUXITA 0 0 0
OTRAS MERCANCIAS 0 0 0
CHATARRA 0 0 0
CARBON 0 0 0
UREA 0 0 0
0 0 0
CONTENEDORES 0 0 0
CONSTRUCCIONES PREFABRICADAS 0 0 0
COLA DE UREA 0 0 0
ASTILLA Y DESPERDICIOS DE MADERA 0 0 0
MAGNESITA 0 0 0
MADERA 0 0 0
MATERIALES DE CONSTRUCCION 0 0 0
CUARZO Y GRANITO 0 0 0
ALUMINIO 0 0 0
ACERO 0 0 0
ACEITES 0 0 0
AEROGENERADORES 0 0 0
OTRAS MERCANCIAS 0 0 0
TABLERO 0 0 0
APARATOS, HERRAMIENTAS Y
REPUESTOS0 0 0
ELECTRODOS 0 0 0
PAPEL 0 0 0
CARBON 0 0 0
ARENAS 0 0 0
0 0 0
Total 0 0 0
Graneles líquidos / Liquid bulks
Graneles sólidos sin instalac. especial / Dry bulks
without special installation
4.4 TRÁFICO INTERIOR, TONELADAS
LOCAL TRAFFIC, TONS
Mercancía general / General cargo
Apéndice: Transparencia activa de la información. Los datos en detalle.
Apendix: Active transparency in information. Data in detail.
Datos actualizados a 31/12/2020
111

AUTORIDAD PORTUARIA DE FERROL- SAN CIBRAO EJERCICIO 2020
AVITUALLAMIENTO / SUPPLIES TONELADAS / TONS
Combustibles líquidos / Liquid fuels 6.295
Agua / Water 7.433
Hielo / Ice 0
Provisiones / Provisions 0
Varios / Others 0
Total 13.728
4.5 AVITUALLAMIENTOS / SUPPLIES
Apéndice: Transparencia activa de la información. Los datos en detalle.
Apendix: Active transparency in information. Data in detail.
Datos actualizados a 31/12/2020
112

FERROL EJERCICIO 2020
AVITUALLAMIENTO / SUPPLIES TONELADAS / TONS
Combustibles líquidos / Liquid fuels 5.797
Agua / Water 7.433
Hielo / Ice 0
Provisiones / Provisions 0
Varios / Others 0
Total 13.230
4.5 AVITUALLAMIENTOS / SUPPLIES
Apéndice: Transparencia activa de la información. Los datos en detalle.
Apendix: Active transparency in information. Data in detail.
Datos actualizados a 31/12/2020
113

SAN CIBRAO EJERCICIO 2020
AVITUALLAMIENTO / SUPPLIES TONELADAS / TONS
Combustibles líquidos / Liquid fuels 498
Agua / Water 0
Hielo / Ice 0
Provisiones / Provisions 0
Varios / Others 0
Total 498
4.5 AVITUALLAMIENTOS / SUPPLIES
Apéndice: Transparencia activa de la información. Los datos en detalle.
Apendix: Active transparency in information. Data in detail.
Datos actualizados a 31/12/2020
114

AUTORIDAD PORTUARIA DE FERROL- SAN CIBRAO EJERCICIO 2020
TIPOS / TYPES PESO (kg) / WEIGHT
(kg)
VALOR EN 1ª VENTA
(euros) / VALUE IN FIRST
SALE (euros)
84.986,96 813.462,21
Total 84.986,96 813.462,21
27.210,46 308.286,84
Total 27.210,46 308.286,84
24.448,24 183.246,08
Total 24.448,24 183.246,08
40.834,60 36.751,14
Total 40.834,60 36.751,14
TOTAL PESCA CAPTURADA / TOTAL FISH CAPTURES 177.480,26 1.341.746,27
MOLUSCOS / MOLLUSKS
CRUSTÁCEOS / CRUSTACEANS
PECES / FISH
OTROS PRODUCTOS / OTHER PRODUCTS
4.6 PESCA CAPTURADA / FISH CAPTURES
Apéndice: Transparencia activa de la información. Los datos en detalle.
Apendix: Active transparency in information. Data in detail.
Datos actualizados a 31/12/2020
115

FERROL EJERCICIO 2020
TIPOS / TYPES PESO (kg) / WEIGHT
(kg)
VALOR EN 1ª VENTA
(euros) / VALUE IN FIRST
SALE (euros)
84.986,96 813.462,21
Total 84.986,96 813.462,21
27.210,46 308.286,84
Total 27.210,46 308.286,84
24.448,24 183.246,08
Total 24.448,24 183.246,08
40.834,60 36.751,14
Total 40.834,60 36.751,14
TOTAL PESCA CAPTURADA / TOTAL FISH CAPTURES 177.480,26 1.341.746,27
MOLUSCOS / MOLLUSKS
CRUSTÁCEOS / CRUSTACEANS
PECES / FISH
OTROS PRODUCTOS / OTHER PRODUCTS
4.6 PESCA CAPTURADA / FISH CAPTURES
Apéndice: Transparencia activa de la información. Los datos en detalle.
Apendix: Active transparency in information. Data in detail.
Datos actualizados a 31/12/2020
116

SAN CIBRAO EJERCICIO 2020
TIPOS / TYPES
4.6 PESCA CAPTURADA / FISH CAPTURES
Apéndice: Transparencia activa de la información. Los datos en detalle.
Apendix: Active transparency in information. Data in detail.
Datos actualizados a 31/12/2020
117

AUTORIDAD PORTUARIA DE FERROL-SAN CIBRAO EJERCICIO 2020
NÚMERO /
NUMBERTONELADAS / TONS
NÚMERO /
NUMBER
TONELADAS /
TONSNÚMERO / NUMBER
TONELADAS /
TONS
Con carga /
Full12 190 504 11.960 516 12.150
Vacíos /
Empty0 0 55 120 55 120
Total 12 190 559 12.079 571 12.270
Con carga /
Full2 25 461 9.040 463 9.065
Vacíos /
Empty1 2 155 337 156 340
Total 3 27 616 9.377 619 9.404
Total 15 217 1.175 21.456 1.190 21.674
4.7 TRÁFICO DE CONTENEDORES / CONTAINER TRAFFIC
TOTAL
EMBARCADAS / LOADED
DESEMBARCADAS / UNLOADED
CABOTAJE / DOMESTIC EXTERIOR / FOREIGN
4.7.1 CONTENEDORES DE 20 PIES / 20FEET CONTAINERS
Apéndice: Transparencia activa de la información. Los datos en detalle.
Apendix: Active transparency in information. Data in detail.
Datos actualizados a 31/12/2020
118

FERROL EJERCICIO 2020
NÚMERO /
NUMBERTONELADAS / TONS
NÚMERO /
NUMBER
TONELADAS /
TONSNÚMERO / NUMBER
TONELADAS /
TONS
Con carga /
Full12 190 504 11.960 516 12.150
Vacíos /
Empty0 0 55 120 55 120
Total 12 190 559 12.079 571 12.270
Con carga /
Full2 25 461 9.040 463 9.065
Vacíos /
Empty1 2 155 337 156 340
Total 3 27 616 9.377 619 9.404
Total 15 217 1.175 21.456 1.190 21.674
4.7 TRÁFICO DE CONTENEDORES / CONTAINER TRAFFIC
4.7.1 CONTENEDORES DE 20 PIES / 20FEET CONTAINERS
TOTAL
EMBARCADAS / LOADED
DESEMBARCADAS / UNLOADED
CABOTAJE / DOMESTIC EXTERIOR / FOREIGN
Apéndice: Transparencia activa de la información. Los datos en detalle.
Apendix: Active transparency in information. Data in detail.
Datos actualizados a 31/12/2020
119

SAN CIBRAO EJERCICIO 2020
NÚMERO /
NUMBER
TONELADAS /
TONS
NÚMERO /
NUMBER
TONELADAS /
TONSNÚMERO / NUMBER
TONELADAS /
TONS
Con carga /
Full0 0 0 0 0 0
Vacíos /
Empty0 0 0 0 0 0
Total 0 0 0 0 0 0
Con carga /
Full0 0 0 0 0 0
Vacíos /
Empty0 0 0 0 0 0
Total 0 0 0 0 0 0
Total 0 0 0 0 0 0
4.7.1 CONTENEDORES DE 20 PIES / 20FEET CONTAINERS
4.7 TRÁFICO DE CONTENEDORES / CONTAINER TRAFFIC
TOTAL
EMBARCADAS /
LOADED
DESEMBARCADAS
/ UNLOADED
CABOTAJE / DOMESTIC EXTERIOR / FOREIGN
Apéndice: Transparencia activa de la información. Los datos en detalle.
Apendix: Active transparency in information. Data in detail.
Datos actualizados a 31/12/2020
120

AUTORIDAD PORTUARIA DE FERROL- SAN CIBRAO EJERCICIO 2020
NÚMERO /
NUMBER
TONELADAS /
TONS
NÚMERO /
NUMBER
TONELADAS /
TONS
NÚMERO /
NUMBER
TONELADAS /
TONS
Con carga /
Full55 1.298 2.571 72.024 2.626 73.322
Vacíos /
Empty31 141 95 402 126 543
Total 86 1.439 2.666 72.425 2.752 73.865
Con carga /
Full24 750 1.054 26.339 1.078 27.089
Vacíos /
Empty64 265 1.500 6.345 1.564 6.610
Total 88 1.015 2.554 32.684 2.642 33.699
Total 174 2.454 5.220 105.109 5.394 107.564
4.7.2 CONTENEDORES MAYORES DE 20 PIES / CONTAINERS OVER 20 FEET
DESEMBARCADAS / UNLOADED
CABOTAJE / DOMESTIC EXTERIOR / FOREIGN TOTAL
EMBARCADAS / LOADED
Apéndice: Transparencia activa de la información. Los datos en detalle.
Apendix: Active transparency in information. Data in detail.
Datos actualizados a 31/12/2020
121

FERROL EJERCICIO 2020
NÚMERO /
NUMBER
TONELADAS /
TONS
NÚMERO /
NUMBER
TONELADAS /
TONSNÚMERO / NUMBER
TONELADAS /
TONS
Con carga /
Full55 1.298 2.571 72.024 2.626 73.322
Vacíos /
Empty31 141 95 402 126 543
Total 86 1.439 2.666 72.425 2.752 73.865
Con carga /
Full24 750 1.054 26.339 1.078 27.089
Vacíos /
Empty64 265 1.500 6.345 1.564 6.610
Total 88 1.015 2.554 32.684 2.642 33.699
Total 174 2.454 5.220 105.109 5.394 107.564
4.7.2 CONTENEDORES MAYORES DE 20 PIES / CONTAINERS OVER 20 FEET
DESEMBARCADAS /
UNLOADED
CABOTAJE / DOMESTIC EXTERIOR / FOREIGN TOTAL
EMBARCADAS /
LOADED
Apéndice: Transparencia activa de la información. Los datos en detalle.
Apendix: Active transparency in information. Data in detail.
Datos actualizados a 31/12/2020
122

SAN CIBRAO EJERCICIO 2020
NÚMERO /
NUMBER
TONELADAS /
TONS
NÚMERO /
NUMBER
TONELADAS /
TONSNÚMERO / NUMBER TONELADAS / TONS
Con carga /
Full0 0 0 0 0 0
Vacíos /
Empty0 0 0 0 0 0
Total 0 0 0 0 0 0
Con carga /
Full0 0 0 0 0 0
Vacíos /
Empty0 0 0 0 0 0
Total 0 0 0 0 0 0
Total 0 0 0 0 0 0
4.7.2 CONTENEDORES MAYORES DE 20 PIES / CONTAINERS OVER 20 FEET
DESEMBARCADAS /
UNLOADED
CABOTAJE / DOMESTIC EXTERIOR / FOREIGN TOTAL
EMBARCADAS / LOADED
Apéndice: Transparencia activa de la información. Los datos en detalle.
Apendix: Active transparency in information. Data in detail.
Datos actualizados a 31/12/2020
123

AUTORIDAD PORTUARIA DE FERROL-SAN CIBRAO EJERCICIO 2020
NÚMERO /
NUMBER
TONELADAS /
TONS
NÚMERO /
NUMBER
TONELADAS /
TONSNÚMERO / NUMBER
TONELADAS /
TONS
Con carga /
Full67 1.488 3.075 83.983 3.142 85.472
Vacíos /
Empty31 141 150 521 181 662
Total 98 1.630 3.225 84.505 3.323 86.134
Con carga /
Full26 775 1.515 35.379 1.541 36.154
Vacíos /
Empty65 267 1.655 6.682 1.720 6.949
Total 91 1.042 3.170 42.061 3.261 43.103
Total 189 2.672 6.395 126.566 6.584 129.237
4.7.3 TOTAL CONTENEDORES DE 20 PIES O MAYORES /
TOTAL CONTAINERS EQUAL AND OVER 20FEET
TOTAL
EMBARCADAS / LOADED
DESEMBARCADAS / UNLOADED
CABOTAJE / DOMESTIC EXTERIOR / FOREIGN
Apéndice: Transparencia activa de la información. Los datos en detalle.
Apendix: Active transparency in information. Data in detail.
Datos actualizados a 31/12/2020
124

FERROL EJERCICIO 2020
NÚMERO /
NUMBER
TONELADAS /
TONS
NÚMERO /
NUMBER
TONELADAS /
TONSNÚMERO / NUMBER
TONELADAS /
TONS
Con carga /
Full67 1.488 3.075 83.983 3.142 85.472
Vacíos /
Empty31 141 150 521 181 662
Total 98 1.630 3.225 84.505 3.323 86.134
Con carga /
Full26 775 1.515 35.379 1.541 36.154
Vacíos /
Empty65 267 1.655 6.682 1.720 6.949
Total 91 1.042 3.170 42.061 3.261 43.103
Total 189 2.672 6.395 126.566 6.584 129.237
4.7.3 TOTAL CONTENEDORES DE 20 PIES O MAYORES /
TOTAL CONTAINERS EQUAL AND OVER 20FEET
TOTAL
EMBARCADAS / LOADED
DESEMBARCADAS /
UNLOADED
CABOTAJE / DOMESTIC EXTERIOR / FOREIGN
Apéndice: Transparencia activa de la información. Los datos en detalle.
Apendix: Active transparency in information. Data in detail.
Datos actualizados a 31/12/2020
125

SAN CIBRAO EJERCICIO 2020
NÚMERO /
NUMBER
TONELADAS /
TONS
NÚMERO /
NUMBER
TONELADAS /
TONSNÚMERO / NUMBER
TONELADAS /
TONS
Con carga /
Full0 0 0 0 0 0
Vacíos /
Empty0 0 0 0 0 0
Total 0 0 0 0 0 0
Con carga /
Full0 0 0 0 0 0
Vacíos /
Empty0 0 0 0 0 0
Total 0 0 0 0 0 0
Total 0 0 0 0 0 0
4.7.3 TOTAL CONTENEDORES DE 20 PIES O MAYORES /
TOTAL CONTAINERS EQUAL AND OVER 20FEET
TOTAL
EMBARCADAS / LOADED
DESEMBARCADAS /
UNLOADED
CABOTAJE / DOMESTIC EXTERIOR / FOREIGN
Apéndice: Transparencia activa de la información. Los datos en detalle.
Apendix: Active transparency in information. Data in detail.
Datos actualizados a 31/12/2020
126

AUTORIDAD PORTUARIA DE FERROL-SAN CIBRAO EJERCICIO 2020
NÚMERO /
NUMBER
TONELADAS /
TONS
NÚMERO /
NUMBER
TONELADAS /
TONSNÚMERO / NUMBER
TONELADAS /
TONS
Con carga /
Full0 0 0 0 0 0
Vacíos /
Empty0 0 0 0 0 0
Total 0 0 0 0 0 0
Con carga /
Full0 0 0 0 0 0
Vacíos /
Empty0 0 0 0 0 0
Total 0 0 0 0 0 0
Total 0 0 0 0 0 0
4.7.4 CONTENEDORES DE 20 PIES O MAYORES EN TRÁNSITO /
CONTAINERS EQUAL AND OVER 20 FEET IN TRANSIT
TOTAL
EMBARCADAS / LOADED
DESEMBARCADAS / UNLOADED
CABOTAJE / DOMESTIC EXTERIOR / FOREIGN
Apéndice: Transparencia activa de la información. Los datos en detalle.
Apendix: Active transparency in information. Data in detail.
Datos actualizados a 31/12/2020
127

FERROL EJERCICIO 2020
NÚMERO /
NUMBER
TONELADAS /
TONS
NÚMERO /
NUMBER
TONELADAS /
TONSNÚMERO / NUMBER
TONELADAS /
TONS
Con carga /
Full0 0 0 0 0 0
Vacíos /
Empty0 0 0 0 0 0
Total 0 0 0 0 0 0
Con carga /
Full0 0 0 0 0 0
Vacíos /
Empty0 0 0 0 0 0
Total 0 0 0 0 0 0
Total 0 0 0 0 0 0
4.7.4 CONTENEDORES DE 20 PIES O MAYORES EN TRÁNSITO /
CONTAINERS EQUAL AND OVER 20 FEET IN TRANSIT
TOTAL
EMBARCADAS / LOADED
DESEMBARCADAS / UNLOADED
CABOTAJE / DOMESTIC EXTERIOR / FOREIGN
Apéndice: Transparencia activa de la información. Los datos en detalle.
Apendix: Active transparency in information. Data in detail.
Datos actualizados a 31/12/2020
128

SAN CIBRAO EJERCICIO 2020
NÚMERO /
NUMBER
TONELADAS /
TONS
NÚMERO /
NUMBER
TONELADAS /
TONSNÚMERO / NUMBER
TONELADAS /
TONS
Con carga /
Full0 0 0 0 0 0
Vacíos /
Empty0 0 0 0 0 0
Total 0 0 0 0 0 0
Con carga /
Full0 0 0 0 0 0
Vacíos /
Empty0 0 0 0 0 0
Total 0 0 0 0 0 0
Total 0 0 0 0 0 0
4.7.4 CONTENEDORES DE 20 PIES O MAYORES EN TRÁNSITO /
CONTAINERS EQUAL AND OVER 20 FEET IN TRANSIT
TOTAL
EMBARCADAS / LOADED
DESEMBARCADAS / UNLOADED
CABOTAJE / DOMESTIC EXTERIOR / FOREIGN
Apéndice: Transparencia activa de la información. Los datos en detalle.
Apendix: Active transparency in information. Data in detail.
Datos actualizados a 31/12/2020
129

AUTORIDAD PORTUARIA DE FERROL - SAN CIBRAO EJERCICIO 2020
NÚMERO /
NUMBER
TONELADAS /
TONS
NÚMERO /
NUMBER
TONELADAS /
TONSNÚMERO / NUMBER
TONELADAS /
TONS
Con carga /
Full126 1.488 5.879 83.983 6.006 85.472
Vacíos /
Empty70 141 252 521 321 662
Total 196 1.630 6.131 84.505 6.327 86.134
Con carga /
Full50 775 2.696 35.379 2.746 36.154
Vacíos /
Empty136 267 3.264 6.682 3.400 6.949
Total 186 1.042 5.960 42.061 6.146 43.103
Total 382 2.672 12.091 126.566 12.473 129.237
4.7.5 TOTAL CONTENEDORES EQUIVALENTES A 20 PIES (TEUS) /
TOTAL EQUIVALENT 20FEET CONTAINERS (TEUS)
TOTAL
EMBARCADAS / LOADED
DESEMBARCADAS / UNLOADED
CABOTAJE / DOMESTIC EXTERIOR / FOREIGN
Apéndice: Transparencia activa de la información. Los datos en detalle.
Apendix: Active transparency in information. Data in detail.
Datos actualizados a 31/12/2020
130

FERROL EJERCICIO 2020
NÚMERO /
NUMBER
TONELADAS /
TONS
NÚMERO /
NUMBER
TONELADAS /
TONSNÚMERO / NUMBER
TONELADAS /
TONS
Con carga /
Full126 1.488 5.879 83.983 6.006 85.472
Vacíos /
Empty70 141 252 521 321 662
Total 196 1.630 6.131 84.505 6.327 86.134
Con carga /
Full50 775 2.696 35.379 2.746 36.154
Vacíos /
Empty136 267 3.264 6.682 3.400 6.949
Total 186 1.042 5.960 42.061 6.146 43.103
Total 382 2.672 12.091 126.566 12.473 129.237
4.7.5 TOTAL CONTENEDORES EQUIVALENTES A 20 PIES (TEUS) /
TOTAL EQUIVALENT 20FEET CONTAINERS (TEUS)
TOTAL
EMBARCADAS / LOADED
DESEMBARCADAS / UNLOADED
CABOTAJE / DOMESTIC EXTERIOR / FOREIGN
Apéndice: Transparencia activa de la información. Los datos en detalle.
Apendix: Active transparency in information. Data in detail.
Datos actualizados a 31/12/2020
131

SAN CIBRAO EJERCICIO 2020
NÚMERO /
NUMBER
TONELADAS /
TONS
NÚMERO /
NUMBER
TONELADAS /
TONSNÚMERO / NUMBER
TONELADAS /
TONS
Con carga /
Full0 0 0 0 0 0
Vacíos /
Empty0 0 0 0 0 0
Total 0 0 0 0 0 0
Con carga /
Full0 0 0 0 0 0
Vacíos /
Empty0 0 0 0 0 0
Total 0 0 0 0 0 0
Total 0 0 0 0 0 0
4.7.5 TOTAL CONTENEDORES EQUIVALENTES A 20 PIES (TEUS) /
TOTAL EQUIVALENT 20FEET CONTAINERS (TEUS)
TOTAL
EMBARCADAS / LOADED
DESEMBARCADAS / UNLOADED
CABOTAJE / DOMESTIC EXTERIOR / FOREIGN
Apéndice: Transparencia activa de la información. Los datos en detalle.
Apendix: Active transparency in information. Data in detail.
Datos actualizados a 31/12/2020
132

AUTORIDAD PORTUARIA DE FERROL-SAN CIBRAO EJERCICIO 2020
NÚMERO /
NUMBER
TONELADAS /
TONS
NÚMERO /
NUMBER
TONELADAS /
TONSNÚMERO / NUMBER
TONELADAS /
TONS
Con carga /
Full0 0 0 0 0 0
Vacíos /
Empty0 0 0 0 0 0
Total 0 0 0 0 0 0
Con carga /
Full0 0 0 0 0 0
Vacíos /
Empty0 0 0 0 0 0
Total 0 0 0 0 0 0
Total 0 0 0 0 0 0
4.7.6 CONTENEDORES EQUIVALENTES A 20 PIES (TEUS) EN TRÁNSITO /
EQUIVALENT 20 FEET CONTAINERS (TEUS) IN TRANSIT
TOTAL
EMBARCADAS / LOADED
DESEMBARCADAS / UNLOADED
CABOTAJE / DOMESTIC EXTERIOR / FOREIGN
Apéndice: Transparencia activa de la información. Los datos en detalle.
Apendix: Active transparency in information. Data in detail.
Datos actualizados a 31/12/2020
133

FERROL EJERCICIO 2020
NÚMERO /
NUMBER
TONELADAS /
TONS
NÚMERO /
NUMBER
TONELADAS /
TONSNÚMERO / NUMBER
TONELADAS /
TONS
Con carga /
Full0 0 0 0 0 0
Vacíos /
Empty0 0 0 0 0 0
Total 0 0 0 0 0 0
Con carga /
Full0 0 0 0 0 0
Vacíos /
Empty0 0 0 0 0 0
Total 0 0 0 0 0 0
Total 0 0 0 0 0 0
4.7.6 CONTENEDORES EQUIVALENTES A 20 PIES (TEUS) EN TRÁNSITO /
EQUIVALENT 20 FEET CONTAINERS (TEUS) IN TRANSIT
TOTAL
EMBARCADAS / LOADED
DESEMBARCADAS / UNLOADED
CABOTAJE / DOMESTIC EXTERIOR / FOREIGN
Apéndice: Transparencia activa de la información. Los datos en detalle.
Apendix: Active transparency in information. Data in detail.
Datos actualizados a 31/12/2020
134

SAN CIBRAO EJERCICIO 2020
NÚMERO /
NUMBER
TONELADAS /
TONS
NÚMERO /
NUMBER
TONELADAS /
TONSNÚMERO / NUMBER
TONELADAS /
TONS
Con carga /
Full0 0 0 0 0 0
Vacíos /
Empty0 0 0 0 0 0
Total 0 0 0 0 0 0
Con carga /
Full0 0 0 0 0 0
Vacíos /
Empty0 0 0 0 0 0
Total 0 0 0 0 0 0
Total 0 0 0 0 0 0
4.7.6 CONTENEDORES EQUIVALENTES A 20 PIES (TEUS) EN TRÁNSITO /
EQUIVALENT 20 FEET CONTAINERS (TEUS) IN TRANSIT
TOTAL
EMBARCADAS / LOADED
DESEMBARCADAS / UNLOADED
CABOTAJE / DOMESTIC EXTERIOR / FOREIGN
Apéndice: Transparencia activa de la información. Los datos en detalle.
Apendix: Active transparency in information. Data in detail.
Datos actualizados a 31/12/2020
135

AUTORIDAD PORTUARIA DE FERROL-SAN CIBRAO EJERCICIO 2020
MERCANCÍAS / GOODS EMBARCADAS /
LOADED
DESEMBAR
CADAS /
UNLOADED
TOTAL EMBARCADAS /
LOADED
DESEMBAR
CADAS /
UNLOADED
TOTAL EMBARCADA
S / LOADED
DESEMBARCA
DAS /
UNLOADED
TOTAL
1Petróleo crudo /
Crude oil0 0 0 0 0 0 0 0 0
2 Fuel-oil / Fuel oil 0 0 0 0 0 0 0 0 0
3 Gas-oil / Gas oil 0 0 0 0 0 0 0 0 0
4 Gasolina / Petrol 0 0 0 0 0 0 0 0 0
6
Otros productos
petrolíferos /
Other petroleum
products
0 0 0 0 0 0 0 0 0
7
Gases energéticos
del petróleo /
Energetic
petroleum gases
0 0 0 0 0 0 0 0 0
12
Carbones y coque
de petróleo /
Steam coal and
petroleum coke
0 0 0 405 116 521 405 116 521
35
Gas natural y
otros gases /
Natural gas and
other gases
0 0 0 0 0 0 0 0 0
51Biocombustibles /
Biofuel0 0 0 0 22 22 0 22 22
Total 0 0 0 405 138 543 405 138 543
8Mineral de hierro
/ Iron ore0 0 0 0 0 0 0 0 0
10
Otros minerales y
residuos
metálicos / Other
mineral ores
0 0 0 411 265 676 411 265 676
11
Chatarras de
hierro / Scrap
iron
0 0 0 0 0 0 0 0 0
13
Productos
siderúrgicos / Iron
products
122 0 122 397 480 877 520 480 999
36
Otros productos
metalúrgicos /
Other metallurgic
products
0 0 0 32 199 230 32 199 230
Total 122 0 122 841 943 1.783 963 943 1.906
25 Sal común / Salt 0 0 0 0 23 23 0 23 23
52
Otros minerales
no metálicos /
Other non-
metallic minerals
0 0 0 825 25 850 825 25 850
Total 0 0 0 825 48 873 825 48 873
TOTALCABOTAJE / DOMESTIC EXTERIOR / FOREIGN
4.7.7 MERCANCÍAS TRANSPORTADAS EN CONTENEDORES CLASIFICADAS SEGÚN NATURALEZA, TONELADAS /
CONTAINERISED GOODS CLASSIFIED BY NATURE, TONS
Energético /
Power
Products
Siderometalúr
gico /
Siderurgical
and
Metallurgic
Products
Minerales no
metálicos /
Non-metallic
minerals
Apéndice: Transparencia activa de la información. Los datos en detalle.
Apendix: Active transparency in information. Data in detail.
Datos actualizados a 31/12/2020
136

AUTORIDAD PORTUARIA DE FERROL-SAN CIBRAO EJERCICIO 2020
MERCANCÍAS / GOODS EMBARCADAS /
LOADED
DESEMBAR
CADAS /
UNLOADED
TOTAL EMBARCADAS /
LOADED
DESEMBAR
CADAS /
UNLOADED
TOTAL EMBARCADA
S / LOADED
DESEMBARCA
DAS /
UNLOADED
TOTAL
TOTALCABOTAJE / DOMESTIC EXTERIOR / FOREIGN
4.7.7 MERCANCÍAS TRANSPORTADAS EN CONTENEDORES CLASIFICADAS SEGÚN NATURALEZA, TONELADAS /
CONTAINERISED GOODS CLASSIFIED BY NATURE, TONS
14Fosfatos /
Phosphates0 0 0 0 0 0 0 0 0
15 Potasas / Potash 0 0 0 0 69 69 0 69 69
16
Abonos naturales
y artificiales /
Natural and
artificial fertilizers
0 0 0 24 1.135 1.159 24 1.135 1.159
Total 0 0 0 24 1.204 1.229 24 1.204 1.229
17
Productos
químicos /
Chemical
products
5 0 5 908 8.113 9.021 913 8.113 9.026
Total 5 0 5 908 8.113 9.021 913 8.113 9.026
5 Asfalto / Asphalt 0 0 0 0 0 0 0 0 0
18
Cemento y clinker
/ Cement and
clinker
0 0 0 102 0 102 102 0 102
20
Materiales de
construcción
elaborados/
Manufactured
building materials
81 0 81 16.112 514 16.626 16.193 514 16.707
Total 81 0 81 16.214 514 16.728 16.295 514 16.809
21
Cereales y sus
harinas / Cereals
and their flours
0 0 0 0 72 72 0 72 72
22Habas de soja /
Soybean0 0 0 0 0 0 0 0 0
23
Frutas, hortalizas
y legumbres /
Fruits and
vegetables
0 0 0 0 50 50 0 50 50
24
Vinos,bebidas,
alcoholes y
derivados /
Wines,drinks and
spirits
11 0 11 684 701 1.386 696 701 1.397
27Conservas /
Tinned food72 0 72 8.308 102 8.410 8.380 102 8.482
28
Tabaco,cacao,café
y especias /
Tobacco,cocoa,co
ffee and spices
0 0 0 0 0 0 0 0 0
29Aceites y grasas /
Oils and greases0 0 0 317 0 317 317 0 317
30
Otros productos
alimenticios /
Other foods
318 0 318 4.130 4.540 8.670 4.448 4.540 8.988
33
Pescados
congelados y
refrigerados /
Chilled or frozen
fish
56 639 695 316 420 735 372 1.058 1.430
Abonos /
Fertilizers
Químicos /
Chemical
Products
Materiales de
construcción
Agro-
Ganadero y
Alimentario /
StockBreeding
and Feeding
Products
Apéndice: Transparencia activa de la información. Los datos en detalle.
Apendix: Active transparency in information. Data in detail.
Datos actualizados a 31/12/2020
137

AUTORIDAD PORTUARIA DE FERROL-SAN CIBRAO EJERCICIO 2020
MERCANCÍAS / GOODS EMBARCADAS /
LOADED
DESEMBAR
CADAS /
UNLOADED
TOTAL EMBARCADAS /
LOADED
DESEMBAR
CADAS /
UNLOADED
TOTAL EMBARCADA
S / LOADED
DESEMBARCA
DAS /
UNLOADED
TOTAL
TOTALCABOTAJE / DOMESTIC EXTERIOR / FOREIGN
4.7.7 MERCANCÍAS TRANSPORTADAS EN CONTENEDORES CLASIFICADAS SEGÚN NATURALEZA, TONELADAS /
CONTAINERISED GOODS CLASSIFIED BY NATURE, TONS
37
Pienso y forrajes /
Animal feed and
fodder
0 0 0 90 143 232 90 143 232
Total 457 639 1.096 13.845 6.029 19.873 14.302 6.667 20.969
19Maderas y corcho
/ Wood and cork160 0 160 29.170 5.141 34.311 29.330 5.141 34.471
26Papel y pasta /
Paper and pulp25 0 25 1.156 5.941 7.098 1.182 5.941 7.123
31
Maquinaria,
herramientas y
repuestos /
Machinery, tools
and spares
76 21 97 3.158 200 3.358 3.234 221 3.456
34Resto mercancías
/ Other goods284 0 284 5.438 1.164 6.602 5.722 1.164 6.886
Total 545 21 566 38.922 12.447 51.369 39.468 12.468 51.936
32
Vehículos y sus
piezas / Vehicles
and their parts
0 0 0 27 213 241 27 213 241
38
Tara
Equipamiento (Ro-
Ro) / Ro-Ro traffic
tare weights
0 0 0 0 0 0 0 0 0
39
Tara
contenedores /
Containers tare
418 383 801 12.493 12.412 24.905 12.912 12.794 25.706
Total 418 383 801 12.521 12.625 25.146 12.939 13.008 25.947
Total 1.630 1.042 2.672 84.505 42.061 126.566 86.134 43.103 129.237
Otras
mercancías /
Other goods
Vehículos y
elementos de
transporte /
Vehicles and
tranport
elements
Agro-
Ganadero y
Alimentario /
StockBreeding
and Feeding
Products
Apéndice: Transparencia activa de la información. Los datos en detalle.
Apendix: Active transparency in information. Data in detail.
Datos actualizados a 31/12/2020
138

FERROL EJERCICIO 2020
MERCANCÍAS / GOODS EMBARCADAS /
LOADED
DESEMBARC
ADAS /
UNLOADED
TOTAL EMBARCADAS /
LOADED
DESEMBAR
CADAS /
UNLOADED
TOTAL EMBARCADA
S / LOADED
DESEMBARCA
DAS /
UNLOADED
TOTAL
1Petróleo crudo /
Crude oil0 0 0 0 0 0 0 0 0
2 Fuel-oil / Fuel oil 0 0 0 0 0 0 0 0 0
3 Gas-oil / Gas oil 0 0 0 0 0 0 0 0 0
4 Gasolina / Petrol 0 0 0 0 0 0 0 0 0
6
Otros productos
petrolíferos /
Other petroleum
products
0 0 0 0 0 0 0 0 0
7
Gases energéticos
del petróleo /
Energetic
petroleum gases
0 0 0 0 0 0 0 0 0
12
Carbones y coque
de petróleo /
Steam coal and
petroleum coke
0 0 0 405 116 521 405 116 521
35
Gas natural y
otros gases /
Natural gas and
other gases
0 0 0 0 0 0 0 0 0
51Biocombustibles /
Biofuel0 0 0 0 22 22 0 22 22
Total 0 0 0 405 138 543 405 138 543
8Mineral de hierro
/ Iron ore0 0 0 0 0 0 0 0 0
10
Otros minerales y
residuos
metálicos / Other
mineral ores
0 0 0 411 265 676 411 265 676
11
Chatarras de
hierro / Scrap
iron
0 0 0 0 0 0 0 0 0
13
Productos
siderúrgicos / Iron
products
122 0 122 397 480 877 520 480 999
36
Otros productos
metalúrgicos /
Other metallurgic
products
0 0 0 32 199 230 32 199 230
Total 122 0 122 841 943 1.783 963 943 1.906
25 Sal común / Salt 0 0 0 0 23 23 0 23 23
52
Otros minerales
no metálicos /
Other non-
metallic minerals
0 0 0 825 25 850 825 25 850
Total 0 0 0 825 48 873 825 48 873
TOTALCABOTAJE / DOMESTIC EXTERIOR / FOREIGN
4.7.7 MERCANCÍAS TRANSPORTADAS EN CONTENEDORES CLASIFICADAS SEGÚN NATURALEZA, TONELADAS /
CONTAINERISED GOODS CLASSIFIED BY NATURE, TONS
Energético /
Power
Products
Siderometalúr
gico /
Siderurgical
and
Metallurgic
Products
Minerales no
metálicos /
Non-metallic
minerals
Apéndice: Transparencia activa de la información. Los datos en detalle.
Apendix: Active transparency in information. Data in detail.
Datos actualizados a 31/12/2020
139

FERROL EJERCICIO 2020
MERCANCÍAS / GOODS EMBARCADAS /
LOADED
DESEMBARC
ADAS /
UNLOADED
TOTAL EMBARCADAS /
LOADED
DESEMBAR
CADAS /
UNLOADED
TOTAL EMBARCADA
S / LOADED
DESEMBARCA
DAS /
UNLOADED
TOTAL
TOTALCABOTAJE / DOMESTIC EXTERIOR / FOREIGN
4.7.7 MERCANCÍAS TRANSPORTADAS EN CONTENEDORES CLASIFICADAS SEGÚN NATURALEZA, TONELADAS /
CONTAINERISED GOODS CLASSIFIED BY NATURE, TONS
14Fosfatos /
Phosphates0 0 0 0 0 0 0 0 0
15 Potasas / Potash 0 0 0 0 69 69 0 69 69
16
Abonos naturales
y artificiales /
Natural and
artificial fertilizers
0 0 0 24 1.135 1.159 24 1.135 1.159
Total 0 0 0 24 1.204 1.229 24 1.204 1.229
17
Productos
químicos /
Chemical
products
5 0 5 908 8.113 9.021 913 8.113 9.026
Total 5 0 5 908 8.113 9.021 913 8.113 9.026
5 Asfalto / Asphalt 0 0 0 0 0 0 0 0 0
18
Cemento y clinker
/ Cement and
clinker
0 0 0 102 0 102 102 0 102
20
Materiales de
construcción
elaborados/
Manufactured
building materials
81 0 81 16.112 514 16.626 16.193 514 16.707
Total 81 0 81 16.214 514 16.728 16.295 514 16.809
21
Cereales y sus
harinas / Cereals
and their flours
0 0 0 0 72 72 0 72 72
22Habas de soja /
Soybean0 0 0 0 0 0 0 0 0
23
Frutas, hortalizas
y legumbres /
Fruits and
vegetables
0 0 0 0 50 50 0 50 50
24
Vinos,bebidas,
alcoholes y
derivados /
Wines,drinks and
spirits
11 0 11 684 701 1.386 696 701 1.397
27Conservas /
Tinned food72 0 72 8.308 102 8.410 8.380 102 8.482
28
Tabaco,cacao,café
y especias /
Tobacco,cocoa,co
ffee and spices
0 0 0 0 0 0 0 0 0
29Aceites y grasas /
Oils and greases0 0 0 317 0 317 317 0 317
30
Otros productos
alimenticios /
Other foods
318 0 318 4.130 4.540 8.670 4.448 4.540 8.988
33
Pescados
congelados y
refrigerados /
Chilled or frozen
fish
56 639 695 316 420 735 372 1.058 1.430
Abonos /
Fertilizers
Químicos /
Chemical
Products
Materiales de
construcción
Agro-
Ganadero y
Alimentario /
StockBreeding
and Feeding
Products
Apéndice: Transparencia activa de la información. Los datos en detalle.
Apendix: Active transparency in information. Data in detail.
Datos actualizados a 31/12/2020
140

FERROL EJERCICIO 2020
MERCANCÍAS / GOODS EMBARCADAS /
LOADED
DESEMBARC
ADAS /
UNLOADED
TOTAL EMBARCADAS /
LOADED
DESEMBAR
CADAS /
UNLOADED
TOTAL EMBARCADA
S / LOADED
DESEMBARCA
DAS /
UNLOADED
TOTAL
TOTALCABOTAJE / DOMESTIC EXTERIOR / FOREIGN
4.7.7 MERCANCÍAS TRANSPORTADAS EN CONTENEDORES CLASIFICADAS SEGÚN NATURALEZA, TONELADAS /
CONTAINERISED GOODS CLASSIFIED BY NATURE, TONS
Agro-
Ganadero y
Alimentario /
StockBreeding
and Feeding
Products
37
Pienso y forrajes /
Animal feed and
fodder
0 0 0 90 143 232 90 143 232
Total 457 639 1.096 13.845 6.029 19.873 14.302 6.667 20.969
19Maderas y corcho
/ Wood and cork160 0 160 29.170 5.141 34.311 29.330 5.141 34.471
26Papel y pasta /
Paper and pulp25 0 25 1.156 5.941 7.098 1.182 5.941 7.123
31
Maquinaria,
herramientas y
repuestos /
Machinery, tools
and spares
76 21 97 3.158 200 3.358 3.234 221 3.456
34Resto mercancías
/ Other goods284 0 284 5.438 1.164 6.602 5.722 1.164 6.886
Total 545 21 566 38.922 12.447 51.369 39.468 12.468 51.936
32
Vehículos y sus
piezas / Vehicles
and their parts
0 0 0 27 213 241 27 213 241
38
Tara
Equipamiento (Ro-
Ro) / Ro-Ro traffic
tare weights
0 0 0 0 0 0 0 0 0
39
Tara
contenedores /
Containers tare
418 383 801 12.493 12.412 24.905 12.912 12.794 25.706
Total 418 383 801 12.521 12.625 25.146 12.939 13.008 25.947
Total 1.630 1.042 2.672 84.505 42.061 126.566 86.134 43.103 129.237
Otras
mercancías /
Other goods
Vehículos y
elementos de
transporte /
Vehicles and
tranport
elements
Apéndice: Transparencia activa de la información. Los datos en detalle.
Apendix: Active transparency in information. Data in detail.
Datos actualizados a 31/12/2020
141

SAN CIBRAO EJERCICIO 2020
MERCANCÍAS / GOODS EMBARCADAS /
LOADED
DESEMBA
RCADAS /
UNLOADE
D
TOTAL EMBARCADAS /
LOADED
DESEMBAR
CADAS /
UNLOADED
TOTAL EMBARCADA
S / LOADED
DESEMBARCA
DAS /
UNLOADED
TOTAL
1Petróleo crudo /
Crude oil0 0 0 0 0 0 0 0 0
2 Fuel-oil / Fuel oil 0 0 0 0 0 0 0 0 0
3 Gas-oil / Gas oil 0 0 0 0 0 0 0 0 0
4 Gasolina / Petrol 0 0 0 0 0 0 0 0 0
6
Otros productos
petrolíferos /
Other petroleum
products
0 0 0 0 0 0 0 0 0
7
Gases energéticos
del petróleo /
Energetic
petroleum gases
0 0 0 0 0 0 0 0 0
12
Carbones y coque
de petróleo /
Steam coal and
petroleum coke
0 0 0 0 0 0 0 0 0
35
Gas natural y
otros gases /
Natural gas and
other gases
0 0 0 0 0 0 0 0 0
51Biocombustibles /
Biofuel0 0 0 0 0 0 0 0 0
Total 0 0 0 0 0 0 0 0 0
8Mineral de hierro
/ Iron ore0 0 0 0 0 0 0 0 0
10
Otros minerales y
residuos
metálicos / Other
mineral ores
0 0 0 0 0 0 0 0 0
11Chatarras de
hierro / Scrap iron0 0 0 0 0 0 0 0 0
13
Productos
siderúrgicos / Iron
products
0 0 0 0 0 0 0 0 0
36
Otros productos
metalúrgicos /
Other metallurgic
products
0 0 0 0 0 0 0 0 0
Total 0 0 0 0 0 0 0 0 0
25 Sal común / Salt 0 0 0 0 0 0 0 0 0
52
Otros minerales
no metálicos /
Other non-
metallic minerals
0 0 0 0 0 0 0 0 0
Total 0 0 0 0 0 0 0 0 0
TOTALCABOTAJE / DOMESTIC EXTERIOR / FOREIGN
4.7.7 MERCANCÍAS TRANSPORTADAS EN CONTENEDORES CLASIFICADAS SEGÚN NATURALEZA, TONELADAS /
CONTAINERISED GOODS CLASSIFIED BY NATURE, TONS
Energético /
Power
Products
Siderometalúr
gico /
Siderurgical
and
Metallurgic
Products
Minerales no
metálicos /
Non-metallic
minerals
Apéndice: Transparencia activa de la información. Los datos en detalle.
Apendix: Active transparency in information. Data in detail.
Datos actualizados a 31/12/2020
142

SAN CIBRAO EJERCICIO 2020
MERCANCÍAS / GOODS EMBARCADAS /
LOADED
DESEMBA
RCADAS /
UNLOADE
D
TOTAL EMBARCADAS /
LOADED
DESEMBAR
CADAS /
UNLOADED
TOTAL EMBARCADA
S / LOADED
DESEMBARCA
DAS /
UNLOADED
TOTAL
TOTALCABOTAJE / DOMESTIC EXTERIOR / FOREIGN
4.7.7 MERCANCÍAS TRANSPORTADAS EN CONTENEDORES CLASIFICADAS SEGÚN NATURALEZA, TONELADAS /
CONTAINERISED GOODS CLASSIFIED BY NATURE, TONS
14Fosfatos /
Phosphates0 0 0 0 0 0 0 0 0
15 Potasas / Potash 0 0 0 0 0 0 0 0 0
16
Abonos naturales
y artificiales /
Natural and
artificial fertilizers
0 0 0 0 0 0 0 0 0
Total 0 0 0 0 0 0 0 0 0
17
Productos
químicos /
Chemical
products
0 0 0 0 0 0 0 0 0
Total 0 0 0 0 0 0 0 0 0
5 Asfalto / Asphalt 0 0 0 0 0 0 0 0 0
18
Cemento y clinker
/ Cement and
clinker
0 0 0 0 0 0 0 0 0
20
Materiales de
construcción
elaborados/
Manufactured
building materials
0 0 0 0 0 0 0 0 0
Total 0 0 0 0 0 0 0 0 0
21
Cereales y sus
harinas / Cereals
and their flours
0 0 0 0 0 0 0 0 0
22Habas de soja /
Soybean0 0 0 0 0 0 0 0 0
23
Frutas, hortalizas
y legumbres /
Fruits and
vegetables
0 0 0 0 0 0 0 0 0
24
Vinos,bebidas,
alcoholes y
derivados /
Wines,drinks and
spirits
0 0 0 0 0 0 0 0 0
27Conservas /
Tinned food0 0 0 0 0 0 0 0 0
28
Tabaco,cacao,café
y especias /
Tobacco,cocoa,cof
fee and spices
0 0 0 0 0 0 0 0 0
29Aceites y grasas /
Oils and greases0 0 0 0 0 0 0 0 0
30
Otros productos
alimenticios /
Other foods
0 0 0 0 0 0 0 0 0
33
Pescados
congelados y
refrigerados /
Chilled or frozen
fish
0 0 0 0 0 0 0 0 0
37
Pienso y forrajes /
Animal feed and
fodder
0 0 0 0 0 0 0 0 0
Total 0 0 0 0 0 0 0 0 0
Agro-
Ganadero y
Alimentario /
StockBreeding
and Feeding
Products
Abonos /
Fertilizers
Químicos /
Chemical
Products
Materiales de
construcción
Apéndice: Transparencia activa de la información. Los datos en detalle.
Apendix: Active transparency in information. Data in detail.
Datos actualizados a 31/12/2020
143

SAN CIBRAO EJERCICIO 2020
MERCANCÍAS / GOODS EMBARCADAS /
LOADED
DESEMBA
RCADAS /
UNLOADE
D
TOTAL EMBARCADAS /
LOADED
DESEMBAR
CADAS /
UNLOADED
TOTAL EMBARCADA
S / LOADED
DESEMBARCA
DAS /
UNLOADED
TOTAL
TOTALCABOTAJE / DOMESTIC EXTERIOR / FOREIGN
4.7.7 MERCANCÍAS TRANSPORTADAS EN CONTENEDORES CLASIFICADAS SEGÚN NATURALEZA, TONELADAS /
CONTAINERISED GOODS CLASSIFIED BY NATURE, TONS
19Maderas y corcho
/ Wood and cork0 0 0 0 0 0 0 0 0
26Papel y pasta /
Paper and pulp0 0 0 0 0 0 0 0 0
31
Maquinaria,
herramientas y
repuestos /
Machinery, tools
and spares
0 0 0 0 0 0 0 0 0
34Resto mercancías
/ Other goods0 0 0 0 0 0 0 0 0
Total 0 0 0 0 0 0 0 0 0
32
Vehículos y sus
piezas / Vehicles
and their parts
0 0 0 0 0 0 0 0 0
38
Tara
Equipamiento (Ro-
Ro) / Ro-Ro traffic
tare weights
0 0 0 0 0 0 0 0 0
39
Tara
contenedores /
Containers tare
0 0 0 0 0 0 0 0 0
Total 0 0 0 0 0 0 0 0 0
Total 0 0 0 0 0 0 0 0 0
Otras
mercancías /
Other goods
Vehículos y
elementos de
transporte /
Vehicles and
tranport
elements
Apéndice: Transparencia activa de la información. Los datos en detalle.
Apendix: Active transparency in information. Data in detail.
Datos actualizados a 31/12/2020
144

AUTORIDAD PORTUARIA DE FERROL- SAN CIBRAO EJERCICIO 2020
CONCEPTOS / ITEM
TONELADAS / TONS
PARCIALES /
PARTIALS
TONELADAS / TONS
TOTALES / TOTAL
Productos petrolíferos / Oil
products595.134
Gas natural / Natural gas 1.454.337
Otros líquidos / Other liquid 886.689
Total 2.936.159
6.371.480
Total 6.371.480
713.079
Total 713.079
0
Total 0
Productos petrolíferos / Oil
products6.295
Resto / Rest 7.433
Total 13.728
177
Total 177
Total 10.034.625 10.034.625
PESCA FRESCA / FRESH FISH
GRANELES LÍQUIDOS / LIQUID BULKS
GRANELES SÓLIDOS / DRY BULKS
MERCANCÍA GENERAL / GENERAL CARGO
4.8 RESUMEN GENERAL DEL TRÁFICO MARÍTIMO /
GENERAL SUMMARY OF MARITIME TRAFFIC
4.8.1 CUADRO GENERAL NÚMERO 1 / GENERAL CHART NUMBER 1
TRÁFICO INTERIOR / LOCAL TRAFFIC
AVITUALLAMIENTO / SUPPLIES
Apéndice: Transparencia activa de la información. Los datos en detalle.
Apendix: Active transparency in information. Data in detail.
Datos actualizados a 31/12/2020
145

FERROL EJERCICIO 2020
CONCEPTOS / ITEM
TONELADAS / TONS
PARCIALES /
PARTIALS
TONELADAS / TONS
TOTALES / TOTAL
Productos petrolíferos / Oil
products595.134
Gas natural / Natural gas 1.454.337
Otros líquidos / Other liquid 608.040
Total 2.657.511
579.107
Total 579.107
682.319
Total 682.319
0
Total 0
Productos petrolíferos / Oil
products5.797
Resto / Rest 7.433
Total 13.230
177
Total 177
Total 3.932.344 3.932.344
PESCA FRESCA / FRESH FISH
GRANELES LÍQUIDOS / LIQUID BULKS
GRANELES SÓLIDOS / DRY BULKS
MERCANCÍA GENERAL / GENERAL CARGO
4.8 RESUMEN GENERAL DEL TRÁFICO MARÍTIMO /
GENERAL SUMMARY OF MARITIME TRAFFIC
4.8.1 CUADRO GENERAL NÚMERO 1 / GENERAL CHART NUMBER 1
TRÁFICO INTERIOR / LOCAL TRAFFIC
AVITUALLAMIENTO / SUPPLIES
Apéndice: Transparencia activa de la información. Los datos en detalle.
Apendix: Active transparency in information. Data in detail.
Datos actualizados a 31/12/2020
146

SAN CIBRAO EJERCICIO 2020
CONCEPTOS / ITEM
TONELADAS / TONS
PARCIALES /
PARTIALS
TONELADAS / TONS
TOTALES / TOTAL
Productos petrolíferos / Oil
products0
Gas natural / Natural gas 0
Otros líquidos / Other liquid 278.649
Total 278.649
5.792.373
Total 5.792.373
30.761
Total 30.761
0
Total 0
Productos petrolíferos / Oil
products498
Resto / Rest 0
Total 498
0
Total 0
Total 6.102.280 6.102.280
GENERAL SUMMARY OF MARITIME TRAFFIC
4.8 RESUMEN GENERAL DEL TRÁFICO MARÍTIMO /
TRÁFICO INTERIOR / LOCAL TRAFFIC
AVITUALLAMIENTO / SUPPLIES
PESCA FRESCA / FRESH FISH
GRANELES LÍQUIDOS / LIQUID BULKS
GRANELES SÓLIDOS / DRY BULKS
MERCANCÍA GENERAL / GENERAL CARGO
4.8.1 CUADRO GENERAL NÚMERO 1 / GENERAL CHART NUMBER 1
Apéndice: Transparencia activa de la información. Los datos en detalle.
Apendix: Active transparency in information. Data in detail.
Datos actualizados a 31/12/2020
147

AUTORIDAD PORTUARIA DE FERROL-SAN CIBRAO EJERCICIO 2020
CONCEPTOS / ITEM TONELADAS / TONS
Mercancías embarcadas / Goods loaded 2.446.756
Mercancías desembarcadas / Goods unloaded 7.587.869
Mercancías transbordadas / Goods transhipped 0
Total 10.034.625
Avituallamientos: Se incluyen en mercancías embarcadas.
Pesca fresca: Se incluyen en mercancías desembarcadas.
Tráfico interior: Se incluyen en mercancías embarcadas o desembarcadas. Según su operación.
4.8.2 CUADRO GENERAL NÚMERO 2 (Incluido tráfico interior, avituallamiento y pesca fresca)
GENERAL CHART NUMBER 2 (Local traffic, supplies and fresh fish included)
Apéndice: Transparencia activa de la información. Los datos en detalle.
Apendix: Active transparency in information. Data in detail.
Datos actualizados a 31/12/2020
148

FERROL EJERCICIO 2020
CONCEPTOS / ITEM TONELADAS / TONS
Mercancías embarcadas / Goods loaded 1.242.709
Mercancías desembarcadas / Goods unloaded 2.689.635
Mercancías transbordadas / Goods transhipped 0
Total 3.932.344
Avituallamientos: Se incluyen en mercancías embarcadas.
Pesca fresca: Se incluyen en mercancías desembarcadas.
Tráfico interior: Se incluyen en mercancías embarcadas o desembarcadas. Según su operación.
4.8.2 CUADRO GENERAL NÚMERO 2 (Incluido tráfico interior, avituallamiento y pesca fresca)
GENERAL CHART NUMBER 2 (Local traffic, supplies and fresh fish included)
Apéndice: Transparencia activa de la información. Los datos en detalle.
Apendix: Active transparency in information. Data in detail.
Datos actualizados a 31/12/2020
149

SAN CIBRAO EJERCICIO 2020
CONCEPTOS / ITEM TONELADAS / TONS
Mercancías embarcadas / Goods loaded 1.204.047
Mercancías desembarcadas / Goods unloaded 4.898.234
Mercancías transbordadas / Goods transhipped 0
Total 6.102.280
Avituallamientos: Se incluyen en mercancías embarcadas.
Pesca fresca: Se incluyen en mercancías desembarcadas.
Tráfico interior: Se incluyen en mercancías embarcadas o desembarcadas. Según su operación.
4.8.2 CUADRO GENERAL NÚMERO 2 (Incluido tráfico interior, avituallamiento y pesca fresca)
GENERAL CHART NUMBER 2 (Local traffic, supplies and fresh fish included)
Apéndice: Transparencia activa de la información. Los datos en detalle.
Apendix: Active transparency in information. Data in detail.
Datos actualizados a 31/12/2020
150

EJERCICIO 2020
CONCEPTOS / ITEM
TONELADAS /
TONS
PARCIALES /
PARTIALS
TONELADAS /
TONS
TOTALES / TOTAL
Graneles
líquidos /
Liquid Bulks
2.299.912
Graneles
sólidos / Solid
bulks
5.037.930
Mercancía
general /
General Cargo
86.957
Total 7.424.800
Graneles
líquidos /
Liquid Bulks
420.114
Graneles
sólidos / Solid
bulks
1.264.303
Mercancía
general /
General Cargo
584.499
Total 2.268.915
Total 9.693.715
300.029
Total 300.029
0
Total 0
0
Total 0
26.975
Total 26.975
13.906
Total 13.906
Total 10.034.625
MERCANCÍAS EN TRANSITO / GOODS IN TRANSIT
MERCANCÍAS TRANSBORDADAS / GOODS TRANSHIPMENT
TARAS DE EQUIPAMIENTOS / EQUIPMENTS TARES
PESCA FRESCA, AVITUALLAMIENTO Y TRÁFICO INTERIOR / FRESH FISH,
SUPPLIES AND LOCAL TRAFFIC
COMERCIO EXTERIOR / FOREIGN TRADE
Importadas / Import
Exportadas / Export
COMERCIO NACIONAL / DOMESTIC TRADE
AUTORIDAD PORTUARIA DE FERROL- SAN CIBRAO
4.8.3 CUADRO GENERAL NÚMERO 3
GENERAL CHART NUMBER 3
Apéndice: Transparencia activa de la información. Los datos en detalle.
Apendix: Active transparency in information. Data in detail.
Datos actualizados a 31/12/2020
151

FERROL EJERCICIO 2020
CONCEPTOS / ITEM
TONELADAS /
TONS
PARCIALES /
PARTIALS
TONELADAS /
TONS
TOTALES / TOTAL
Graneles
líquidos /
Liquid Bulks
2.021.264
Graneles
sólidos / Solid
bulks
441.151
Mercancía
general /
General Cargo
86.957
Total 2.549.372
Graneles
líquidos /
Liquid Bulks
420.114
Graneles
sólidos / Solid
bulks
104.962
Mercancía
general /
General Cargo
553.738
Total 1.078.814
Total 3.628.186
263.776
Total 263.776
0
Total 0
0
Total 0
26.975
Total 26.975
13.408
Total 13.408
Total 3.932.344
MERCANCÍAS EN TRANSITO / GOODS IN TRANSIT
MERCANCÍAS TRANSBORDADAS / GOODS TRANSHIPMENT
TARAS DE EQUIPAMIENTOS / EQUIPMENTS TARES
PESCA FRESCA, AVITUALLAMIENTO Y TRÁFICO INTERIOR / FRESH FISH,
SUPPLIES AND LOCAL TRAFFIC
COMERCIO EXTERIOR / FOREIGN TRADE
Importadas / Import
Exportadas / Export
COMERCIO NACIONAL / DOMESTIC TRADE
4.8.3 CUADRO GENERAL NÚMERO 3
GENERAL CHART NUMBER 3
Apéndice: Transparencia activa de la información. Los datos en detalle.
Apendix: Active transparency in information. Data in detail.
Datos actualizados a 31/12/2020
152

SAN CIBRAO EJERCICIO 2020
CONCEPTOS / ITEM
TONELADAS /
TONS
PARCIALES /
PARTIALS
TONELADAS /
TONS
TOTALES / TOTAL
Graneles
líquidos /
Liquid Bulks
278.649
Graneles
sólidos / Solid
bulks
4.596.780
Mercancía
general /
General Cargo
0
Total 4.875.428
Graneles
líquidos /
Liquid Bulks
0
Graneles
sólidos / Solid
bulks
1.159.340
Mercancía
general /
General Cargo
30.761
Total 1.190.101
Total 6.065.529
36.253
Total 36.253
0
Total 0
0
Total 0
0
Total 0
498
Total 498
Total 6.102.280
MERCANCÍAS EN TRANSITO / GOODS IN TRANSIT
MERCANCÍAS TRANSBORDADAS / GOODS TRANSHIPMENT
TARAS DE EQUIPAMIENTOS / EQUIPMENTS TARES
PESCA FRESCA, AVITUALLAMIENTO Y TRÁFICO INTERIOR / FRESH FISH,
SUPPLIES AND LOCAL TRAFFIC
COMERCIO EXTERIOR / FOREIGN TRADE
Importadas / Import
Exportadas / Export
COMERCIO NACIONAL / DOMESTIC TRADE
GENERAL CHART NUMBER 3
4.8.3 CUADRO GENERAL NÚMERO 3
Apéndice: Transparencia activa de la información. Los datos en detalle.
Apendix: Active transparency in information. Data in detail.
Datos actualizados a 31/12/2020
153

4.9 TRÁFICO TERRESTRE /
HINTERLAND TRAFFIC
EJERCICIO 2020
MEDIO DE TRANSPORTE UTILIZADO PARA LA ENTRADA O SALIDA DE LA ZONA DE
SERVICIO DEL PUERTO / TRANSPORT SYSTEM USED FOR HINTERLAND
CONNECTIONS FROM OR TO PORT AREA
CARGADAS EN
BARCO / LOADED
ON VESSEL
DESCARGADAS DE
BARCO / UNLOADED
FROM VESSEL
TOTAL
Ferrocarril / Railway 0 0 0
Carretera / Road 1.196.532 1.366.642 2.563.174
Tubería / Pipe 48.298 1.387.716 1.436.014
Otros medios / Other 1.188.198 4.833.334 6.021.531
Sin Transporte Terrestre ST 0 0 0
Total de Mercancia según Transporte 2.433.028 7.587.691 10.020.719
Pesca, Avituallamientos y Tráfico Interior o Local / Fresh Fish, Supplies & Local
Traffic13.728 177 13.906
Total 2.446.756 7.587.869 10.034.625
AUTORIDAD PORTUARIA DE FERROL-SAN CIBRAO
Apéndice: Transparencia activa de la información. Los datos en detalle.
Apendix: Active transparency in information. Data in detail.
Datos actualizados a 31/12/2020
154

FERROL EJERCICIO 2020
MEDIO DE TRANSPORTE UTILIZADO PARA LA ENTRADA O SALIDA DE LA ZONA DE
SERVICIO DEL PUERTO / TRANSPORT SYSTEM USED FOR HINTERLAND
CONNECTIONS FROM OR TO PORT AREA
CARGADAS EN
BARCO / LOADED
ON VESSEL
DESCARGADAS DE
BARCO / UNLOADED
FROM VESSEL
TOTAL
Ferrocarril / Railway 0 0 0
Carretera / Road 1.181.181 1.301.742 2.482.923
Tubería / Pipe 48.298 1.387.716 1.436.014
Otros medios / Other 0 0 0
Sin Transporte Terrestre ST 0 0 0
Total de Mercancia según Transporte 1.229.479 2.689.458 3.918.937
Pesca, Avituallamientos y Tráfico Interior o Local / Fresh Fish, Supplies & Local
Traffic13.230 177 13.408
Total 1.242.709 2.689.635 3.932.344
4.9 TRÁFICO TERRESTRE /
HINTERLAND TRAFFIC
Apéndice: Transparencia activa de la información. Los datos en detalle.
Apendix: Active transparency in information. Data in detail.
Datos actualizados a 31/12/2020
155

HINTERLAND TRAFFIC
SAN CIBRAO EJERCICIO 2020
MEDIO DE TRANSPORTE UTILIZADO PARA LA ENTRADA O SALIDA DE LA ZONA DE
SERVICIO DEL PUERTO / TRANSPORT SYSTEM USED FOR HINTERLAND
CONNECTIONS FROM OR TO PORT AREA
CARGADAS EN
BARCO / LOADED
ON VESSEL
DESCARGADAS DE
BARCO / UNLOADED
FROM VESSEL
TOTAL
Ferrocarril / Railway 0 0 0
Carretera / Road 15.351 64.900 80.251
Tubería / Pipe 0 0 0
Otros medios / Other 1.188.198 4.833.334 6.021.531
Sin Transporte Terrestre ST 0 0 0
Total de Mercancia según Transporte 1.203.549 4.898.234 6.101.782
Pesca, Avituallamientos y Tráfico Interior o Local / Fresh Fish, Supplies & Local
Traffic498 0 498
Total 1.204.047 4.898.234 6.102.280
4.9 TRÁFICO TERRESTRE /
Apéndice: Transparencia activa de la información. Los datos en detalle.
Apendix: Active transparency in information. Data in detail.
Datos actualizados a 31/12/2020
156

Apéndice 5. Appendix 5
UTILIZACIÓN DEL PUERTOPORT USE
Transparencia activa de la información. Los datos en detalle.
Active transparency in the information. Data in detail


AUTORIDAD PORTUARIA
MUELLE O ALINEACIÓN / QUAY OR BERTH EMBARQUE
/ LOADING
DESEMBARQUE
/ UNLOADINGTOTAL
Mercancía
general108.423 9.816 118.239
Granel sólido 26.042 186.861 212.903
Mercancía
general79.041 7.294 86.335
Granel sólido 10.625 108.842 119.466
Mercancía
general44.448 556 45.004
Granel sólido 1.000 1.000
Mercancía
general23.380 193 23.573
Granel sólido 72.495 154.540 227.035
F-0010-RAMPA RO-RO C.N.Mercancía
general6.531 40.377 46.909
F-0012-Estación Naval de La Graña Granel líquido 54.693 54.693
F-0020-PUERTO EXTERIOR GENERALMercancía
general61.570 53 61.623
F-0021-PUERTO EXTERIOR AUXILIARMercancía
general162.863 162.863
F-0023-P.E. GRANELES LIQUIDOS Granel líquido 227.521 218.724 446.244
Granel sólido 7.699 7.699
Granel líquido 2.038 2.038
F-0025-Terminal de Contenedores Pto. ExteriorMercancía
general86.045 42.603 128.647
F-0037-NAVANTIA FENE MUELLE 10Mercancía
general7.330 1.282 8.612
F-0038-NAVANTIA FENE MUELLE 11Mercancía
general292 292
F-0055-NAVANTIA FERROL MUELLE 14Mercancía
general222 222
F-0070-REGANOSA Granel líquido 5.358 1.448.978 1.454.337
Granel sólido 7.001 7.001
Granel líquido 247.787 193.725 441.513
Granel sólido 4.003 4.003
Granel líquido 57.983 200.704 258.687
Mercancía
general16 16
Granel sólido 698.333 4.610.933 5.309.266
Granel líquido 163.639 163.639
Mercancía
general30.745 30.745
Granel sólido 474.455 8.652 483.107
Granel líquido 115.010 115.010
Total 2.433.028 7.587.691 10.020.719
F-0071-FORESTAL DEL ATLANTICO
F-0072-FORESTAL DUQUES DE ALBA
S-0080-SAN CIPRIAN MUELLE PRINCIPAL
S-0081-SAN CIPRIAN MUELLE AUXILIAR
5.1 UTILIZACIÓN DE MUELLES - TONS / QUAY UTILIZATION - TONS
F-0004-FERNANDEZ LADREDA (1 - 18)
F-0005-FERNANDEZ LADREDA (19 - 31)
F-0006-CERRAMIENTO NORTE
F-0007-NUEVO MUELLE
F-0024-PUERTO EXTERIOR CARBONERO
Apéndice: Transparencia activa de la información. Los datos en detalle.
Apendix: Active transparency in information. Data in detail.
Datos actualizados a 31/12/2020
1

SAN CIBRAO
MUELLE O ALINEACIÓN / QUAY OR BERTH EMBARQUE /
LOADING
DESEMBARQUE
/ UNLOADINGTOTAL
Mercancía
general16 16
Granel
sólido698.333 4.610.933 5.309.266
Granel
líquido163.639 163.639
Mercancía
general30.745 30.745
Granel
sólido474.455 8.652 483.107
Granel
líquido115.010 115.010
Total 1.203.549 4.898.234 6.101.782
5.1 UTILIZACIÓN DE MUELLES - TONS / QUAY UTILIZATION - TONS
S-0080-SAN CIPRIAN MUELLE PRINCIPAL
S-0081-SAN CIPRIAN MUELLE AUXILIAR
Apéndice: Transparencia activa de la información. Los datos en detalle.
Apendix: Active transparency in information. Data in detail.
Datos actualizados a 31/12/2020
2

FERROL
MUELLE O ALINEACIÓN / QUAY OR BERTH EMBARQUE
/ LOADING
DESEMBARQUE
/ UNLOADINGTOTAL
Mercancía
general108.423 9.816 118.239
Granel
sólido26.042 186.861 212.903
Mercancía
general79.041 7.294 86.335
Granel
sólido10.625 108.842 119.466
Mercancía
general44.448 556 45.004
Granel
sólido1.000 1.000
Mercancía
general23.380 193 23.573
Granel
sólido72.495 154.540 227.035
F-0010-RAMPA RO-RO C.N.Mercancía
general6.531 40.377 46.909
F-0012-Estación Naval de La GrañaGranel
líquido54.693 54.693
F-0020-PUERTO EXTERIOR GENERALMercancía
general61.570 53 61.623
F-0021-PUERTO EXTERIOR AUXILIARMercancía
general162.863 162.863
F-0023-P.E. GRANELES LIQUIDOSGranel
líquido227.521 218.724 446.244
Granel
sólido7.699 7.699
Granel
líquido2.038 2.038
F-0025-Terminal de Contenedores Pto. ExteriorMercancía
general86.045 42.603 128.647
F-0037-NAVANTIA FENE MUELLE 10Mercancía
general7.330 1.282 8.612
F-0038-NAVANTIA FENE MUELLE 11Mercancía
general292 292
F-0055-NAVANTIA FERROL MUELLE 14Mercancía
general222 222
F-0070-REGANOSAGranel
líquido5.358 1.448.978 1.454.337
Granel
sólido7.001 7.001
Granel
líquido247.787 193.725 441.513
Granel
sólido4.003 4.003
Granel
líquido57.983 200.704 258.687
Total 1.229.479 2.689.458 3.918.937
F-0071-FORESTAL DEL ATLANTICO
F-0072-FORESTAL DUQUES DE ALBA
5.1 UTILIZACIÓN DE MUELLES - TONS / QUAY UTILIZATION - TONS
F-0004-FERNANDEZ LADREDA (1 - 18)
F-0005-FERNANDEZ LADREDA (19 - 31)
F-0006-CERRAMIENTO NORTE
F-0007-NUEVO MUELLE
F-0024-PUERTO EXTERIOR CARBONERO
Apéndice: Transparencia activa de la información. Los datos en detalle.
Apendix: Active transparency in information. Data in detail.
Datos actualizados a 31/12/2020
3

AUTORIDAD PORTUARIA
Nº de barcos fondeados 158
G.T. de barcos fondeados 1.431.482
G.T. por días de fondeo 1.908.741
FERROL
Nº de barcos fondeados 149
G.T. de barcos fondeados 1.401.219
G.T. por días de fondeo 1.863.931
SAN CIBRAO
Nº de barcos fondeados 9
G.T. de barcos fondeados 30.263
G.T. por días de fondeo 44.810
AUTORIDAD PORTUARIA
Nº de barcos amarrados 0
G.T de barcos amarrados 0
G.T por días de amarre 0
FERROL
Nº de barcos amarrados 0
G.T de barcos amarrados 0
G.T por días de amarre 0
SAN CIBRAO
Nº de barcos amarrados 0
G.T de barcos amarrados 0
G.T por días de amarre 0
5.2 DÁRSENAS
5.3 ATRAQUES DE PUNTA
Apéndice: Transparencia activa de la información. Los datos en detalle.
Apendix: Active transparency in information. Data in detail.
Datos actualizados a 31/12/2020
4

AUTORIDAD PORTUARIA
Nº de barcos atracados 1.190
Metros lineales de atraque (suma de
esloras)147.799
Metros lineales por días de atraque 778.186
FERROL
Nº de barcos atracados 858
Metros lineales de atraque (suma de
esloras)102.923
Metros lineales por días de atraque 677.067
SAN CIBRAO
Nº de barcos atracados 332
Metros lineales de atraque (suma de
esloras)44.877
Metros lineales por días de atraque 101.119
AUTORIDAD PORTUARIA
Nº de pesadas 0
Toneladas 0
FERROL
Nº de pesadas 0
Toneladas 0
SAN CIBRAO
Nº de pesadas 0
Toneladas 0
5.4 ATRAQUES
5.13 BÁSCULAS
Apéndice: Transparencia activa de la información. Los datos en detalle.
Apendix: Active transparency in information. Data in detail.
Datos actualizados a 31/12/2020
5


6.1. WORKS IN PROGRESS OR COMPLETED IN THE YEAR
Code Description Total budgetCertified
31/12/2019Budget 2020
Certified 2020
Certified in origin
Location Subsid Objective
90.598 21.768 17.213 11.732 33.500
FS2E2002Rail Access to the Outer port
72.498 19.124 14.412 9.810 28.934En ejecución /
In actionFFAT 2
FS2E2008Modified Rail Access
7.250 0 804 370 370En ejecución /
In actionFFAT 2
FS2E2005Prices' check
4.976 178 974 537 715En ejecución /
In actionFFAT 2
FS2B2003 Other AA.TT. associated with the RailwayAccess Works to the Outer Port
818 98 100 26 124En ejecución /
In actionFFAT 2
FS2B2004 AT Management and coordination, andtechnical and execution control.
2.218 899 365 583 1.482En ejecución /
In actionFFAT 2
FS2B2005AT Coordination of safety and health.
525 222 101 99 321En ejecución /
In actionFFAT 2
FS2B2006AT Control of materials and tests
669 335 87 87 422En ejecución /
In actionFFAT 2
FS2B2007AT Management and environmental advice
586 192 112 98 290En ejecución /
In actionFFAT 2
FS2G6001Acquisition of land
657 532 125 31 563
FS2E2007Minor works associated with the Railway Access
401 188 133 91 279En ejecución /
In actionFFAT 2
849 267 217 232 499
FS2C1001 Investments to improve the operation of theOuter Port
849 267 217 232 499Finalizada /
Finished3
1.122 672 125 65 737
FS1G3002 Actions on security/safety 838 638 50 24 662En ejecución /
In action3
FS1G3003Actions on security/security
284 34 75 41 75
867 443 40 60 503
FS1B3001Energy efficiency actions
717 443 15 54 497En ejecución /
In action5
FS1H2001 Actions on environmental sustainability 150 0 25 6 6En ejecución /
In action5
28.138 22.123 915 569 22.692
FS1G2001 Asistencias técnicas /Technical assistance 4.016 3.090 150 123 3.213En ejecución /
In action0
FS1H9001Settlements and reviews
8.893 7.418 75 25 7.443En ejecución /
In action0
FS1G3001Small budget works
7.155 5.405 400 342 5.747En ejecución /
In action0
6. WORKS
GENERIC AND MINOR WORKS
OTHER ACTIONS
ACTIONS ON RAILWAY ACCESSIBILITY CHARGED TO THE FFTAP: OUTER PORT
ACTIONS ON SECURITY
ACTIONS IN THE AREA OF ENVIRONMENTAL SUSTAINABILITY
Apéndice: Transparencia Activa en la Información. Los datos en detalle.Appendix: Active Transparency in the Information. Data in detail. Datos actualizados a 31/12/2018

Code Description Total budgetCertified
31/12/2019Budget 2020
Certified 2020
Certified in origin
Location Subsid Objective
FS1G1001Maritime signals
4.920 4.070 100 22 4.092En ejecución /
In action6
FS1G5001Computer equipment
914 564 100 28 592En ejecución /
In action0
FS1H30011,5% cultural
2.240 1.576 90 29 1.605 0
1.168 784 117 58 842
FS1I1001Computer applications and programs
1.046 726 70 27 753En ejecución /
In action0
FS1I1002Intangible assets I + D + i
122 58 47 31 89En ejecución /
In action0
2.429 2.141 138 120 2.261
FS1J1001L.P. credits AP
422 242 30 11 253 0
FS1J3001Debtors to l/p, accrued subsidies pendingcollection
17 17 0 1 18
FS2J9003 Contributions to the Financial Fund for PortTerrestrial Accessibility
1.990 1.882 108 108 1.990 1
125.171 48.198 18.765 12.836 61.034
(Amounts in thousands of euros)
FFAT Fondo Financiero de Accesibilidad Terrestre Portuaria
FCI Fondo Compensación Interportuario
(2) Investments objectives
0 6
1 7 Fishing
2 8 Sports
3 9 Passengers
4 Port-City
5
Infraestructure and port capacity
Logistic and intermodal activities
INTANGIBLE ASSETS
FINNANCIAL ASSETS
Equipment and facilities
Enviromental actions
Maritime sinaling and security
TOTAL
(1) Subsidies
Others
Apéndice: Transparencia Activa en la Información. Los datos en detalle.Appendix: Active Transparency in the Information. Data in detail. Datos actualizados a 31/12/2018

Apéndice: Transparencia Activa en la Información. Los datos en detalle. Datos actualizados a 31/12/2020 Appendix: Active transparency in the information. Data in detail. 3
6.2. DESCRIPTION OF THE MOST IMPORTANT WORKS
ACTIONS IN THE FIELD OF RAIL ACCESSIBILITY – OUTER HARBOUR “Rail Access to the Outer Harbour and other associated investments”. The availability of adequate railway
accesses to the Port of Ferrol, and particularly to its Outer Harbour, is not only a key factor for the proper
operation of the infrastructure itself, but also a fundamental element for the economic and social development
of its environment in a sustainable manner. It is also an essential infrastructure for the implementation of certain
operators in the port, particularly those whose objective is container throughput within the import-export
regime. The Ferrol-San Cibrao Port Authority has been working on the definition of these accesses since 1998.
After almost two decades of studies, the works were contracted in February 2017 for an amount of €
72,498,200 (VAT not included), starting on June 16, 2017. The construction project to be carried out develops
the infrastructure works, platform, superstructure and railway and non-railway facilities, located on a section of
6,374.5-m in length, in a single track, exclusively for freight traffic and suitable platform for circulation in Iberian
and metric width. The two main elements of the access are: a 5,575-meter tunnel and a 299-m viaduct over
the estuary.
As of December 31, 2020, 4,176-m of tunnel excavation were carried out in advance from the west entrance
of the Outer Harbour. In the year it is also noteworthy the start of the work on the eastern tunnel opening,
which has enabled the commencement of the tunnel excavation from its eastern entrance at the beginning of
2021.
OTHER ACTIONS “New deck on the Outer Harbour ship”. The works to supplement the existing cover were completed, adapting
the warehouse for the storage of all kinds of merchandise.
NON-SINGULARIZED ACTIONS “Small budget works”. Within this section, the most outstanding works have been carried out such as: the
acquisition of the Ferrol’s Port Custom old building, the “Improvement of the optical fibre backbone connections
in the Inner Harbour of the Ferrol-San Cibrao Port Authority”, actions related to the “Reinforcement of the dock
foundations at Outer Harbour” and “Drainage network in the manoeuvring area and public use in the second
phase of the Outer Harbour (among 36 and 40 bollards)”.
MARITIME SIGNALS “Maritime signals”. Among these actions, improvement works have been carried out on maritime signals in the
province of A Coruña and Lugo, the most notable being the “Renovation and updating of the lighting equipment
at the Punta Roncadoira Lighthouse”.

Apéndice: Transparencia Activa en la Información. Los datos en detalle. Datos actualizados a 31/12/2020 Appendix: Active transparency in the information. Data in detail. 4
COMPUTER APPLICATIONS “Computer applications”. The most outstanding developed action in the year has been the “Integration of the
internal and external active directory and preparation for integration with future applications”, and the “Supply
and implementation of an application for comprehensive human resources management”.

Apéndice 7. Appendix 7
LÍNEAS MARÍTIMAS REGULARESREGULAR SHIPPING LINES
Transparencia activa de la información. Los datos en detalle.
Active transparency in the information. Data in detail


7. LÍNEAS MARÍTIMAS REGULARES / MARITIME REGULAR LINES
LÍNEA MARÍTIMA /
MARITIME LINE
NAVIERA / SHIPPING
CO.
FRECUENCIA /
FRECUENCY
PUERTOS/
PORTS
MERCANCÍAS /
GOODS
NWUK‐CONTAINERSHIPS
CONTAINERSHIPS‐CMA CGM SAU
semanalFERROL‐DUBLIN‐LIVERPOOL‐GIJÓN
CONTENEDORES
CISS‐PG CONTAINERSHIPS
CONTAINERSHIPS‐CMA CGM SAU
dos escalas a la
semana
FERROL‐TILBURY‐ROTTERDAM‐CADIZ‐DUNKERKE‐AMBERES‐LEIXOES‐SETUBAL
CONTENEDORES
UPM‐KYMMENE SEAWAYS OY, LTD.
UPM‐KYMMENE SEAWAYS OY, LTD.
quincenalFERROL‐SANTANDER‐AMSTERDAM‐KOTKA‐RAUMA
MERCANCÍA GENERAL
GREENALIA LOGISTICS S.L.
GREENALIA LOGISTICS, SL
semanal FERROL‐FIGUEIRA DA FOZ MERCANCÍA GENERAL
Datos actualizados a 31/12/2020
* En el año 2021 comienza a operar una tercera línea regular de contenedores.
Apéndice: Transparencia Activa en la Información. Los datos en detalleAppendix: Active Transparency in the Information. Data in detail. 1


Apéndice: Transparencia Activa en la Información. Los datos en detalle. Data updated at 31/12/2020 Appendix: Active transparency in the information. Data in detail.
1
INSTITUTIONAL DIMENSION
A PRESENTATION AND STRATEGY FOR THE SUSTAINABILITY OF THE PORT AUTHORITY
Presentation of the President and the Director (102-14)
The year 2020 will mark a turning point in the history of the Port Authority Ferrol-San Cibrao, so attempting to offer
some paragraphs about everything that happened over that period of time seems difficult.
We ended the year with a replacement in the presidency of the highest governing body of the entity, for which it is
necessary to recognise and thank Mr José Manuel Vilariño Anca for his excellent management over the last seven years,
which put us in good conditions to face this inflection point at which we find ourselves in these moments.
As in any phase of transition, when the threats and opportunities of the environment come together simultaneously
with a very significant impact, it is necessary to have a firm response that drives the transformations necessary to allow
ourselves to become stronger and improve our offer of value to our stakeholders.
We have the necessary strengths to face this new cycle with solvency, since we have at our disposal competitive
infrastructures and cutting-edge port terminals for transporting bulk solids, bulk liquids, general goods and containers,
managed by expert multi-national corporations that work with high quality, environmental, and safety standards.
The Port, as a logistic hub between maritime and ground transport, key to the economic and social development of the
region, is affected by innumerable eternal factors that directly concern it, yet they also impact its clients and partners.
In 2020, the repercussion of decarbonisation throughout the economy was reported in numbers in the results of the
PAFSC (Port Authority of Ferrol-San Cibrao), with a loss on average of 3.8 million tons of carbon from importation for
Endesa in As Pontes. As for the factory in Alcoa, the effects were on the production of aluminium, with some very lofty
consumption requirements. For the Port of San Cibrao, which services the factory, the total goods loading and unloading
volume exceeded 6 million tons, breaking its historical record. In both cases, we are working together with those clients
and other administrations and public agencies on the maximum use of these port terminals generating alternatives.
Although over the medium term we will continue facing the changes occurring at the global, national and regional levels
in the energy model, which will impact our bulk liquids terminals for LNG, petroleum products and biofuels, last year
we achieved a record number for this sector of transport, with movement of 2.6 million tons. The expectation is that
this will increase over the next 4 years. These concession holders bring years of experience in innovative products to
diversify their activity toward renewable energy.
Also on the horizon are new plans such as offshore wind energy, for which we are very well positioned. On the one
hand, as we were able to verify with the first operation of offshore marine turbines, our installations in the Outer Port,
due to its characteristics of shelter, moisture and surfaces, allow for cost and time savings in assembling the blade on
the floating base. This synergy between PAFSC, Navantia and Windar-Renovables, will improve the competitiveness of
their offer. On the other hand, as far as the energy production through this renewable source, one of the potential zones
for placing the offshore wind farms in Galicia is in Mariña Lucense, in front of the service area of the Port of San Cibrao.
Our containers terminal in the Outer Port, administered by Yilport, a company placed 17th in the global ranking of
terminal operators in 2019, continues its strong course with a regular third line, which allows us to offer 4 weekly stops
by container ships. Containerised freight traffic achieved an increase last year of 35.46% in contrast with the evolution
of the port system, with a drop of 0.73%. Our expectation for the future is a continuous increase in the coming years.
We have formulated our new strategy and determined the necessary investments over the next 5 years, to potentiate
the possibilities that are presented to us and to support the present and future initiatives of our partners and the
regional economy. The three axes of priority will be:

Apéndice: Transparencia Activa en la Información. Los datos en detalle. Data updated at 31/12/2020 Appendix: Active transparency in the information. Data in detail.
2
-Competitiveness of our facilities and services. With an investment exceeding €40 million in port infrastructures and
facilities, and initiatives for obtaining new service qualifications for border inspection, updating service provision
documents, improvement in operational processes, and excellence in management.
-Connection of our facilities with internal, domestic and international markets. With a total investment of around €107
million to improve our rail line and internal port network connections. Framed by the objective of furnishing the PAFSC
with a competitive intermodality between the railway and the port.
-Economic and social impact of our activity. With an approximate investment of €15 million. At the end of this year, we
will have a new strategy for sustainability, updated and aligned with the sustainability goals of the United Nations, we
will resume passenger transport, once the cruise stops are re-authorised and we will work to improve our facilities
intended for these ships.
We already have a plan of action aimed at completing our zone offer for the enjoyment of the population in the areas
of Dársena de Curuxeiras and Ensenada de La Malata. With the mobility limitations deriving from measures to control
the Covid-19 pandemic, the need became evident to have walkways in the city, where the population density is greater.
At the PAFSC, we made ourselves available to citizens by closing the circulation of vehicles along the lower road of the
Port at the points of least permitted perimeter (1 kilometre). And we requested technical assistance to design our offer
for walkway and leisure surfaces in that area. That is how we will complete the activities we have already carried out
and delivered to the city, like the walkway in La Malata from the Port’s access to La Cabana, with others already
contracted, such as the pedestrian footbridge that will run parallel to the rail line connection, and which will allow for
completion of the circuit around Ensenada, expanding and furnishing the sidewalks that connect the Port’s entrance to
Dársena de Curuxeiras.
We have a team of professionals that once again demonstrated their capacity for response and commitment to their
port in 2020, given the challenges that they faced with the pandemic that affected the health and economy of the entire
planet. Among others, the staff from the Port Authority, our contractors, the service and terminal operators, we were
able to keep these critical infrastructures open and fully operational.
With them and our stakeholders, this presidency and administration for the Port Authority took on the commitment to
solidify partnerships and drive the necessary actions for all of us to build a sustainable future for our Port.

Apéndice: Transparencia Activa en la Información. Los datos en detalle. Data updated at 31/12/2020 Appendix: Active transparency in the information. Data in detail.
3
Strategy
MISSION, VISION AND VALUES OF THE PORT.
Mission: To contribute in a context of maximum port competitiveness to the economic and social development of its environment in a sustainable way, potentiating both port infrastructures and connections with its hinterland to the fullest. Allowing for greater expansion of the port and extending the provision of value-added services to a growing variety of traffic. Vision: The Port Authority has to face the challenge of leading the port community in the industrial and economic development of the zones where its ports are located, not just strengthening current traffic but also generating new traffic, offering top-level infrastructures and adapting the services that it provides to the demands of port competitiveness, in order to become a distinguished port along the Atlantic European facade. Values:
• Availability of adequate surface area and modern infrastructures.
• Provision of quality, competitive services within the port system.
• Excellent relationship with the environment, and referential for regional economic development.
• Gaining the loyalty of principal clients who contribute critical mass to the Port, and capacity for uptake of new traffic and clients.
• Respect and integration in an environment of great value and contribution to its sustainable.
• Culture and Implementation of Quality / Safety / Environmental Policies. • Efficient, trained and motivated team on staff.

Apéndice: Transparencia Activa en la Información. Los datos en detalle. Data updated at 31/12/2020 Appendix: Active transparency in the information. Data in detail.
4
PROJECTS AND PARTNERS FOR GENERATING LONG-TERM VALUE (203-2)
(102-15) Table 1

Apéndice: Transparencia Activa en la Información. Los datos en detalle. Datos actualizados a 31/12/2020 Appendix: Active transparency in the information. Data in detail.
5
LEGAL FORM AND FUNCTIONS. (102-2), (102-5) I_01. General description of the legal structure of the Port Authority, giving information on aspects such as ownership, the competency framework,
the plan for management in the public domain, and financing mechanisms (according to the Consolidated Text of the Law on State Ports).
The Port Authority of Ferrol-San Cibrao is a public agency, of those set forth in Article 2, section 1, of the General Budget Act, with its own legal personality and assets, as well as full operational capacity. We report to the Ministry of Development, through the State Ports Department, and we belong to the Spanish port system. The Port Authority is responsible for managing the Ferrol Port and the San Cibrao Port under an autonomous regime, and the State Ports Department is responsible for the coordination and control of the port system’s efficiency. The PAFSC is governed by Royal Decree 2/2011, of 5 September, which approves the Consolidated Text of the Law on State Ports and the Merchant Marine (TRLPEMM, for its initials in Spanish). Within the applicable regulatory framework, the provisions of the General Budget Act and the General Taxation Act that may apply shall govern; in addition to Law 6/1997, of 14 April, on the Organisation and Operation of the General State Administration. As an Entity in the Public State Sector, Law 19/2013, of 9 December, on transparency, access to public information and good governance, does apply to us. We act in adherence with the private legal code, even in asset acquisitions and contracting, except in the exercise of our public power functions that the code attributes to us. We submit during contracting to the principles of publicity, concurrence, safeguarding the interest of the agency, and standardising the contracting system in the Spanish public sector. During contracting, we always submit to the principles of publicity, concurrence, safeguarding the interest of the agency, and standardising the contracting system in the public sector, as well as conserving our full management autonomy, as established in Law 9/2017, of 8 November, on Contracts in the Public Sector, by which the Directives of the European Parliament and of the Council 2014/23/EU and 2014/24/EU, of 26 February 2014, are transposed to the Spanish legal code. As far as the asset regime, we are governed by the Law of State Ports (TRLPEMM) and, where not set forth therein, by legislation on the assets of Public Administrations. Our management is governed by corporate efficacy criteria and by the principle of self-finance, and we have our own revenue at our disposal that we are authorised to obtain: port charges and fees, products and income from our assets, contributions to the Interport Compensation Fund, etc.
Competences of the Port Authority
a) The provision of general services, as well as the management and control of port services to achieve their development in optimum conditions of efficacy, economy, productivity, and security, without prejudice to the jurisdiction of other agencies. b) The organisation of the port service zone and port uses, in coordination with the competent Administrations on territorial ordination and urbanisation. c) The planning, design, construction, conservation, and exploitation of the port’s works and services, and that of the maritime signals with which it has been entrusted, subject to the provisions of this law. d) The management of the public port domain and maritime signals as it may be assigned. e) The optimisation of economic management and profiting from the assets and resources it has allocated. f) The fostering of industrial and commercial activities related to maritime or port traffic. g) The coordination of operations for different modes of transport in the port space. h) The organisation and coordination of port traffic, both maritime and ground

Apéndice: Transparencia Activa en la Información. Los datos en detalle. Datos actualizados a 31/12/2020 Appendix: Active transparency in the information. Data in detail.
6
THE IMPACT OF THE PORT’S ACTIVITY IN PEOPLE’S LIVES (102-15) Figure 1
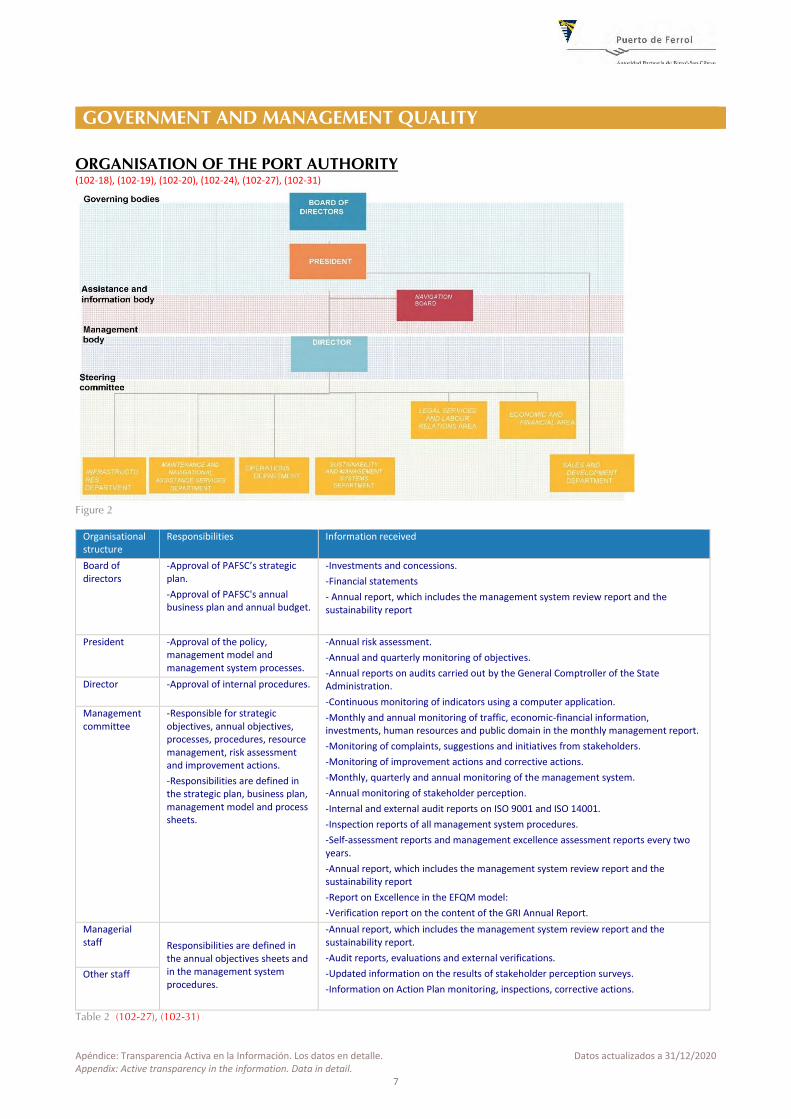
Apéndice: Transparencia Activa en la Información. Los datos en detalle. Datos actualizados a 31/12/2020 Appendix: Active transparency in the information. Data in detail.
7
GOVERNMENT AND MANAGEMENT QUALITY ORGANISATION OF THE PORT AUTHORITY (102-18), (102-19), (102-20), (102-24), (102-27), (102-31)
Figure 2
Organisational structure
Responsibilities Information received
Board of directors
-Approval of PAFSC’s strategic plan.
-Approval of PAFSC's annual business plan and annual budget.
-Investments and concessions.
-Financial statements
- Annual report, which includes the management system review report and the sustainability report
President -Approval of the policy, management model and management system processes.
-Annual risk assessment.
-Annual and quarterly monitoring of objectives.
-Annual reports on audits carried out by the General Comptroller of the State Administration.
-Continuous monitoring of indicators using a computer application.
-Monthly and annual monitoring of traffic, economic-financial information, investments, human resources and public domain in the monthly management report.
-Monitoring of complaints, suggestions and initiatives from stakeholders.
-Monitoring of improvement actions and corrective actions.
-Monthly, quarterly and annual monitoring of the management system.
-Annual monitoring of stakeholder perception.
-Internal and external audit reports on ISO 9001 and ISO 14001.
-Inspection reports of all management system procedures.
-Self-assessment reports and management excellence assessment reports every two years.
-Annual report, which includes the management system review report and the sustainability report
-Report on Excellence in the EFQM model:
-Verification report on the content of the GRI Annual Report.
Director -Approval of internal procedures.
Management committee
-Responsible for strategic objectives, annual objectives, processes, procedures, resource management, risk assessment and improvement actions.
-Responsibilities are defined in the strategic plan, business plan, management model and process sheets.
Managerial staff
Responsibilities are defined in the annual objectives sheets and in the management system procedures.
-Annual report, which includes the management system review report and the sustainability report.
-Audit reports, evaluations and external verifications.
-Updated information on the results of stakeholder perception surveys.
-Information on Action Plan monitoring, inspections, corrective actions.
Other staff
Table 2 (102-27), (102-31)

Apéndice: Transparencia Activa en la Información. Los datos en detalle. Data updated at 31/12/2020 Appendix: Active transparency in the information. Data in detail.
8
(102-18), (102-24) I_02 Functions and manner in which the governing bodies of the Port Authority are elected, such as the President, Management and Board of
Directors.
Governing bodies
The board of directors
This is the highest governing body of the PAFSC. The composition of the board of directors, as well as its functions and incompatibilities are regulated in art. 30 of RLD 2/2011 of 5 September, which approves the Consolidated Text of the State Ports and Merchant Marine Law. (102-25) The members are appointed, i.e. designated and dismissed, by the Galician Regional Government at the proposal of the public administration, entity or body to which the aforementioned law grants representation on the board of directors. (102-18), (102-26)
Functions of the board of directors:
To govern and manage the port, notwithstanding the powers corresponding to the President.
To define the functions and responsibilities of its bodies and to confer and revoke general or special powers of attorney to specific persons, both natural and legal, for those matters for which it is necessary to grant said powers.
To approve, at the request of the President, the organisation of the entity and any modifications to it.
To establish its management rules and its internal operating rules, its economic regime and the functions of the Secretary.
To approve the draft operating and capital budgets of the Port Authority and its multiannual action programme, as well as their submission to Ports of Spain for processing.
To approve the agreements, pacts, conventions and contracts that the Board itself determines to be within its jurisdiction, due to their importance or subject matter.
To authorise the entity's investments and financial operations, including the incorporation of commercial entities and shareholdings in such entities, subject to compliance with the necessary legal requirements.
To approve projects involving the occupation of property and acquisition of rights referred to in Article 61 of RLD 2/2011, notwithstanding their technical approval by a competent technician.
To exercise the law enforcement powers attributed to it by this law, and that are necessary for the fulfilment of its purposes.
To set the annual management objectives, within the framework of the global objectives established by Ports of Spain for the system as a whole.
To propose the financial operations of assets or liabilities for which approval corresponds to Ports of Spain, within the framework of the investment, financing and debt management plans that the Government and the Spanish Parliament approve for this Public Body.
To authorise loans for the financing of working capital.
To agree on the exercise of actions and appeals corresponding to the Port Authorities in defence of their interests before the Public Administrations and Courts of Justice of any level or jurisdiction. In urgent cases, this power may be exercised by the President, who shall immediately report to the Board of Directors at its first meeting.
To grant concessions and authorisations, in accordance with the criteria and General Terms and Conditions approved by the Ministry of Development, to collect fees for private use or special use of the public port area and for the provision of the maritime signalling service.
To approve the financial statements, which shall include the balance sheet, the profit and loss statement, the statement of changes in equity, the cash flow statement, the notes to the financial statements and the proposal, if applicable, for the distribution of earnings. It shall agree on the percentage of them to be allocated to reserves, to the extent necessary to make investments and for its proper functioning.
To set the tariffs for the commercial services provided by the Port Authority.
To promote free competition and ensure that no monopoly situations arise in the provision of the different port services.
To carry out as many acts of management, disposal and administration of its own assets as are deemed necessary.
To approve the Port Ordinances, subject to the provisions of article 295 of this law.
To exercise the other functions of the Port Authority established in article 26 of RLD 2/2011 not conferred to other governing or management bodies and not listed in the previous sections.
Table 3 (102-24)
The board of directors is subject to the provisions of Law 19/2013 of 9 December, on transparency, access to public information and good governance. 18.75% of its members are women. Its members include representatives of all PAFSC stakeholders.

Apéndice: Transparencia Activa en la Información. Los datos en detalle. Data updated at 31/12/2020 Appendix: Active transparency in the information. Data in detail.
9
The President (102-23), (102-24) In accordance with the provisions of art. 31 of Royal Legislative Decree 2/2011 of 5 September, approving the Consolidated Text of the State Ports and Merchant Marine Law, the president of the PAFSC is appointed or designated by the head of the Regional Ministry responsible for ports of the Galician Regional Government, from among persons with recognised professional expertise and who are suitable for the role. His or her appointment is published in the Official Gazette of Galicia, after notification to the Ministry of Public Works and Transport, which will do the same in the Official State Gazette. The President of the Port Authority is subject to the provisions of Law 3/2015, of 30 March, regulating the exercise of senior positions in the General State Administration. (102-25) (102-18), (102-23), (102-24), (102-26), (102-28), (102-29), (102-30), (102-32)
The President's functions:
To permanently represent the Port Authority and
its Board of Directors in any acts and contracts and
in dealings with any natural or legal person,
whether public or private, in or out of court,
notwithstanding the powers of attorney of the
Board of Directors.
To call, set the agenda, chair and adjourn the
meetings of the Board of Directors, directing
its proceedings. Meetings may be convened ex
officio or at the proposal of one fifth of the
members of the Board of Directors.
To establish general guidelines for the
management of the entity's services.
To ensure compliance with the regulations
applicable to the Port Authority and the
agreements adopted by the Board of Directors.
To present the Business Plan to the Board of
Directors, with the entity’s management
objectives and action guidelines, as well as the
draft budgets, action, investment and
financing programmes and financial
statements.
To arrange expenses and order, jointly
with the Director, payments or
movements of funds.
To exercise the special powers delegated to them
by the Board of Directors.
The other powers attributed to this
position by RLD 2/2011 of 5 September.
Table 4 (102-24)
(102-35), (102-36), (102-37)
The president's remuneration is approved by the Secretary of State for Budget and Expenditure of the Ministry of Finance and Public Administrations and by the public body Ports of Spain, and is published on its website. The president's variable remuneration is linked to the achievement of the PAFSC's objectives. The strategic formulation of the PAFSC, which is explained in detail in the “Our Strategy” chapter of this report, and in the “Our Management” section in this chapter, includes the entity’s sustainability objectives. The strategic formulation includes comprehensive tools (internal and external analysis, SWOT analysis, determination of Key Success Factors, etc.) that are used for risk assessment. The SWOT analysis is reviewed annually, and an analysis report is drawn up to accompany the annual business plan, which, in accordance with the President's functions and as described in table 4, is submitted to the Board of Directors for approval. The annual Business Plan is accompanied by the Sustainability Report, as established in article 55 of Royal Legislative Decree 2/2011.
In his or her capacity as President of the PAFSC, and as a senior member of the state administration, the President is subject to the provisions of Law 19/2013 of 9 December, on transparency, access to public information and good governance. (102-23), (102-24), (102-33), (102-34) Given the participation of the PAFSC's priority stakeholders as members of the board of directors and the Navigation Board, the President of the Board of Directors and the Director of the Navigation Board report regularly on the management of the PAFSC, including sustainability objectives. At the meetings held by these bodies, the various directors can also ask questions. In order to delegate responsibilities for the achievement and monitoring of the functions described in tables 4 and 5, which include the establishment of management objectives for the entity and the PAFSC's economic, environmental and social objectives, the President and Director use different management tools, which we discuss in the “Our Management” chapter in the Annual Report. Beyond what has been described in the two previous paragraphs, it is worth noting that as a public body in the state sector, the different representatives of citizens present in the Spanish Parliament ask questions on all kinds of issues related to our activity and management, which we receive and are processed through the public body Ports of Spain. (102-18), (102-33), (102-34)

Apéndice: Transparencia Activa en la Información. Los datos en detalle. Data updated at 31/12/2020 Appendix: Active transparency in the information. Data in detail.
10
On a more local level, through our management system, the president of the PAFSC is regularly informed about the status of all complaints, suggestions and initiatives submitted by any organisation, company or citizen. We did not receive any complaints in 2020.
Management body
The Director
This is the management body of the PAFSC. The director is appointed and removed by an absolute majority of the board of directors, at the proposal of the president, from among people with higher education qualifications, recognised professional standing and at least five years' experience in port techniques and management. This is as provided for in art. 33 of RLD 2/2011 of 5 September, which approves the Consolidated Text of the State Ports and Merchant Marine Law.
The director’s functions:
The ordinary direction and management of the entity and its services, in accordance with the general guidelines received from the governing bodies of the Port Authority, as well as the submission to the President of the proposal for the entity’s organisational structure.
The initiation and processing of administrative proceedings, when not expressly attributed to another body, as well as the mandatory issuing of reports on authorisations and concessions, drawing up technical studies and reports on the projects and proposals for activities that serve as a basis for them.
The preparation and submission to the president for his or her consideration and approval of the entity's management objectives and action guidelines, the preliminary draft budgets, action programme, investment, financing and financial statements, as well as the entity's staffing needs.
Table 5. The director’s functions.
In his or her capacity as Director of the PAFSC, and as a senior member of the state administration, the Director is subject to the provisions of Law 19/2013 of 9 December, on transparency, access to public information and good governance and Law 3/2015 of 30 March, regulating the exercise of senior positions in the General State Administration. (102-25) (102-35), (102-36), (102-37)
The general criteria for the remuneration of the director and managerial staff of the PAFSC, in accordance with the provisions of art. 48 of RLD 2/2011, are set by Ports of Spain. This body is ultimately responsible for approving the PAFSC's total salary costs, taking into account, for the variable concepts of performance and productivity, the development of the management ratios, as well as the adoption of management and administration systems for the entity that lead to the achievement of the objectives set. These salaries are published in the human resources section of the
Ports of Spain website. (102-18), (102-22), (102-24), (102-25) I_03 Structure of the Port Authority's Board of Directors, reporting on groups and associations represented on it.
1. The Board of Directors is made up of the following members: a) The President of the entity, who will be the Chairman of the Board. b) An ex officio member, who will be the Harbour Master. c) A number of members between 10 and 13, except for the Canary Islands and the Balearic Islands, in which case it may reach 16 members, to be established by the Autonomous Communities or by the Autonomous Cities of Ceuta and Melilla, and appointed by them. 2. The appointment by the Autonomous Communities or the Autonomous Cities of Ceuta and Melilla of the members referred to in letter c) of the previous section shall respect the following criteria: a) The General State Administration shall be represented, in addition to the Harbour Master, by three of these members, one of whom shall be a Government Lawyer and another from the Ports of Spain Public Body. b) The Autonomous Community shall be represented, in addition to the President, by four members. c) In the case of the Canary Islands, each council (Cabildo) shall have one representative and in the case of the Balearic Islands, each council (Consell) shall have one representative. d) The municipalities in whose area the service area of the port is located will have a representation of 33 per cent of the remaining members of the Board. When several municipalities are affected, representation will firstly correspond to the municipality or municipalities that bear the name of the port or ports governed by the (102-22)
Port Authority, and then to the others in proportion to the surface area of the municipality affected by the service area. e) 66 per cent of the remaining members of the Board shall be appointed to represent the Chambers of Commerce, Industry and Navigation, business and trade union organisations and relevant economic sectors in the port area.

Apéndice: Transparencia Activa en la Información. Los datos en detalle. Data updated at 31/12/2020 Appendix: Active transparency in the information. Data in detail.
11
The Board of Directors of the Ferrol – San Cibrao Port Authority is made up of representatives of the administrations and economic sectors related to the port's activity, in accordance with the provisions of the consolidated text of the State Ports and Merchant Marine Law, approved by Royal Legislative Decree 2/2011, of 5 September. The appointments of the members of the Board of Directors referred to in letter c) of the first section of art. 30, will have a duration of four years, and are renewable.
President Mr Indalecio Joaquín Seijo Jordán (Length of service on the board of directors: 6 months)
Ex officio member Mr Jorge Cao Ruiz. Harbour Master of Ferrol (Length of service on the board of directors: 22 years and 11 months)
Representative of the General State Administration Ms Adela Álvarez Caramés. Government Lawyer (Length of service on the board of directors: 2 years and 6 months)
Mr Antonio Duelo Menor. Chief Admiral of the Arsenal of Ferrol (Length of service on the board of directors: 3 years and 9 months)
Mr Gonzalo Gómez Barquín. Ports of Spain (Length of service on the board of directors: 7 months)
Representative of the Galician Regional Government. Mr Pablo Ramón Fernández Asensio. Head of coordination of the sea area of Lugo. (Length of service on the board of directors: 1 year) Ms Martina Aneiros Barros. (Length of service on the board of directors: 2 years and 6 months)
Mr Javier Arias Fouz. (Length of service on the board of directors: 4 months) Ms Fabiola García Martínez. (Length of service on the board of directors: 4 months)
Representative of those municipalities in whose municipal district the service area of the Port of Ferrol and San Cibrao is located. Mr Ángel Manuel Mato Escalona. Mayor of Ferrol City Council (Length of service on the board of directors: 1 years and 8 months) Mr José Demetrio Salgueiro Rapa. Mayor of Xove City Council. (Length of service on the board of directors: 1 year)
Representative of chambers of commerce, business and trade union organisations and relevant sectors in the port sector Mr Patricio Erhardt Barrenechea. Representative of the Provincial Confederation of Employers (Length of service on the board of directors: 5 months) Mr Javier Sánchez Fernández. Representative of the Fisheries Sector (Length of service on the board of directors: 5 months) Mr Francisco José Pena Varela. Representative of the Trade Union Confederation of Workers’ Commissions (Length of service on the board of directors: 3 years)
Member with a voice but no vote Mr Alejandro Rey Seoane. Director of the Port Authority (Length of service on the board of directors: 7 years and 5 months)
Secretary of the Board of Directors Mr Antonio López Coira. Head of the Legal Services and Labour Relations Area of the Port Authority (Length of service on the board of directors: 20 years and 11 months)
(102-22), (102-24) Table 6 (Seniority calculated at 31/5/2021)
Under 30 years of age Between 30 and 50 years
of age Over 50 years of age
Men 0 7 6
Women 0 3 0

Apéndice: Transparencia Activa en la Información. Los datos en detalle. Data updated at 31/12/2020 Appendix: Active transparency in the information. Data in detail.
12
(405-1) THE PAFSC SUPPLY CHAIN
Figure 3.a. The PAFSC supply chain (102-9)
Supplier assessment and monitoring:
(103-1) on procurement practices, on social assessment of suppliers, (103-3) on procurement practices, on social assessment of suppliers, (308-1), (414-1)
In our relationship with suppliers, we abide by the requirements of Law 9/2017, of 8 November, on Public Sector Contracts, which transposes into Spanish law the Directives of the European Parliament and of the Council 2017/23/EU and 2017/24/EU, of 26 February 2014. No assessment criteria or classification of suppliers can be established outside the processing of procurement procedures, which must always follow the provisions established in the aforementioned law. The legislation applies to 100% of our suppliers. Regarding the minimum content of the contract, art.35 of the aforementioned Law 9/2017 establishes: “Article 35. Minimum content of the contract.
1. The documents formalising the contracts entered into by public sector entities, unless they are already included in the specifications, must include the following information: a) The identification of the parties. b) Accreditation of the capacity of the signatories that are to sign the contract. c) Definition of the purpose and type of contract, taking into account social, environmental and innovation aspects in defining the purpose. d) Reference to the legislation applicable to the contract. e) A list of the documents that make up the contract. If so stated in the contract, this list may be hierarchical, arranged according to the order of priority agreed by the parties. In this case, unless there is a manifest error, the agreed order shall be used to determine the respective priority if there are contradictions between different documents. f) The fixed price, or how it is determined. g) The duration of the contract or the estimated dates for the beginning of its execution and for its completion, as well as that of any extension(s), if foreseen.
h) The conditions of receipt, delivery or acceptance of the services. i) The terms of payment. j) The cases in which modification is required, if applicable. k) the cases in which termination is required. l) the budgetary provision or the programme or accounting heading against which the price is to be paid, if applicable. m) the objective and time limit of the duty of confidentiality, if any, imposed on the contractor. n) The obligation of the contractor to comply throughout the contract performance period with the rules and conditions laid down in the applicable collective bargaining agreement. 2. The contract document may not include clauses that establish rights and obligations for the parties other than those set out in the specifications, defined, if applicable, in the manner corresponding to the successful bidder's proposal, or those specified in the contract award documentation in accordance with the procedure, if these do not exist”.
OFFER OF FACILITIES
AND SERVICES OF THE
PAFSC
Offer of facilities
Provision of General
Services and Coastal
Maritime Signalling
Services
Carried out by PAFSC
staff
Investment in new infrastructures and facilities
Providers of works
Water and electricity supply
Supply providers
Outsourced
Outsourced Maintenance of infrastructure and
facilities Service providers
Carried out by Port
Authority staff
Outsourced
Service providers
Outsourced

Apéndice: Transparencia Activa en la Información. Los datos en detalle. Data updated at 31/12/2020 Appendix: Active transparency in the information. Data in detail.
13
(103-1) on procurement practices, on social assessment of suppliers, (103-3) on procurement practices, on social assessment of suppliers, (308-1), (414-1)
(204-1) No criteria restricting competition or scoring linked to the supplier's location may be established in our procurement. Taking into account this aspect, we consider local suppliers to be those based in Spain. In this regard, 97.8% of our suppliers were local in 2020. With regard to the environmental or social conditions to be met by suppliers, prior to the assessment of bids, art. 201 Environmental, social or labour obligations establishes: “Contracting authorities shall take appropriate measures to ensure that in the
performance of contracts contractors comply with the applicable environmental, social or labour law obligations laid down in European Union law, national law, collective agreements or by the provisions of international environmental, social and labour law binding on the State and in particular
those set out in Annex V...” and Article 202. Special conditions for the performance of the contract of a social, ethical, environmental or other nature, states: “1. Contracting authorities may lay down special conditions relating to the performance of the
contract, provided that they are linked to the contract's purpose within the meaning of Article 145, are not directly or indirectly discriminatory, are compatible with EU law and are specified in the call for tenders and in the specifications…..”
The advertising of procurement procedures is regulated in TITLE III Management of contract advertising by electronic, computer and telematic means, Article 347. Public Sector Procurement Platform. All PAFSC procurement procedures are published on the Public Sector Procurement Platform, so that any interested party may view them and contact both the PAFSC and the different assistance bodies and advisory bodies regulated in BOOK FOUR, Administrative Organisation for Procurement Management, TITLE I Competent Bodies in Procurement, Chapter II Assistance Bodies and Chapter III Advisory Bodies, to put forward their questions, appeals or complaints. The PAFSC's financial statements, audited by the General Intervention Board of the State Administration (IGAE), which are published annually in the Official State Gazette (BOE), include a list of open litigation proceedings under the following headings: 1. Contentious-Administrative Appeals and Appeals for Reversal, 2. Social Claims, 3. Disputes relating to property. In each procurement procedure, the person responsible for the contract shall carry out the supervisory functions regulated in art. 62 of the law and inform the procurement body if any penalties are necessary for partial or defective non-fulfilment of the work covered by the contract, for incorrect allocation of resources, for non-compliance with the special conditions regulated in the aforementioned article 202, or for delay. Failure to comply with the PAFSC's suppliers procurement conditions may result in the application of the provisions of art. 71 of Prohibitions on procurement, which states: “..2. In addition to those provided for in the previous section, the following
circumstances shall prevent contractors from engaging in procurement with the entities included in Article 3 of this Law, under the conditions established in Article 73. a) Having improperly withdrawn their proposal or application in an award procedure, or having made the award of the contract to them impossible by not complying with the provisions of Article 150.2 within the period established due to misconduct, fault or negligence. b) Failure to formalise the contract, which has been awarded to them within the time limits established in Article 153 for reasons attributable to the successful bidder. c) Failure to comply with the clauses that are essential to the contract, including the special conditions of execution established in accordance with the provisions of Article 202, when this non-compliance has been defined in the specifications or in the contract as a serious infringement, with wilful misconduct, fault or negligence by the contractor, and provided that it has given rise to the enforcement of penalties or compensation for damages. d) Having caused, due to grounds for which they have been found liable, the final termination of any contract entered into with an entity included in Article 3 of this Law. The prohibition shall apply to companies whose contract has been terminated due to the contractor's culpable breach of the obligations that the specifications have classified as essential in accordance with the provisions of Article 211.1.f)...”.
The General Intervention Board of the State Administration carries out annual monitoring of all PAFSC procurement procedures. The mandatory reports are sent to the Court of Auditors with the same frequency. Through the Environmental Control of Operations procedure, the Port Authority ensures that, among other activities, it establishes and controls 100% compliance with environmental conditions in all procurement procedures. The following graph shows the general supplier evaluation and monitoring scheme applied in the PAFSC:

Apéndice: Transparencia Activa en la Información. Los datos en detalle. Datos actualizados a 31/12/2020 Appendix: Active transparency in the information. Data in detail.
14
Figure 3.b. PAFSC's general supplier assessment and monitoring scheme of (103-1) Procurement practices, on social assessment of suppliers, (103-3) on procurement practices, on social assessment of suppliers, (308-1), (414-1)
REQUIREMENTS FOR THE SUPPLIER TO COMPLY WITH PRIOR TO THEIR OFFER
IT MAY BE TAKEN INTO ACCOUNT.
REQUIREMENTS FOR THE SUPPLIER TO COMPLY WITH FOR THE OFFER PRESENTED
GENERAL SCHEME OF EVALUATION AND TRACKING OF SUPPLIERS IN EACH PROCUREMENT. CONTRACTS LAW IN THE PUBLIC SECTOR
ACCREDITATION OF THE
CAPACITY TO CONTRACT
/ PROHIBITION OF
CONTRACT
TECHNICAL SOLVENCY:
Linked to the object of the contract
ECONOMIC
SOLVENCY:
Linked to the object of
the contract
DESCRIPTION OF THE
WORKS TO BE
CARRIED OUT
Article 124. List of particular technical specifications. Article 126. Rules for the establishment of technical specifications. Article 231. Construction
project.
DESCRIPTION OF
THE STAFF AND
MEANS ADSCRIBED
TO THE CONTRACT
Article 125. Definition of certain technical specifications.
ENVIRONMEN
TAL, SOCIAL,
LABOUR
OBLIGATIONS
SP. CONDITIONS FOR EX. OF THE
CONTRACT: SOCIAL, ETHICAL, ENVIRONMENTAL,
ETC.
DEADLINE
Article 29. Duration of the contracts and execution of provision
PRICE / SUBJECT /
ESTIMATED
VALUE
Article 101.
Estimated value. (In the PAFSC, it is
also included in the List of
Technical Specification
s).
CRITERIA FOR
ASSESSING OFF
Article 74. Demand for solvency.
Article 76. Specification of the solvency conditions.
(In the PAFSC, it is also included in the List of Technical Specifications).
Article 201. Obligations in environmental, social, or labour matters.
Article 202. Special conditions for execution of the contract of a social, ethical, environmental, or of another nature.
(In the PAFSC, it is also included in the List of Technical Specifications).
Article 309.
Determination
of the price.
Article 145. Requirements and classes of contract awarding criteri
Article 326. Trading desks
Article 140. Presentation of the documentation accrediting compliance with the previous requirements.
Article 150. Classification of the offers and awarding of the contract.
Article 62. Contract manager.
(In the PAFSC, duties are attributed depending
on media and attached personnel)
Article 198. Payment
of the price
Works Article 240. Certifications and
payment on account.
Supplies Article
301. Payment of the
price.
Article 146. Application of the awarding criteria.
Article 86. Means of accrediting solvency.
Article 88. Technical
solvency in construction
contracts
Article 89. Technical
solvency in supply contracts.
Article 91. Technical
or professional solvency in
the remaining contracts.
Article 90. Technical or professional solvency in services contracts.
Article 87. Accreditation of economic and financial solvency.
Article
102. Price.
Article 71. Prohibitions from procurement.
Article
100. Bid
base
budget.
AS
SIS
TA
NC
E
TR
AD
ING
DE
SK
:
TE
CH
NIC
AL
CR
ITE
RIA
PE
NA
LT
IES
DU
E T
O
NO
N-C
OM
PL
IAN
CE
: C
ON
TR
AC
TIN
G B
OD
Y
AT
TH
E P
RO
PO
SA
L O
F
TH
E C
ON
TR
AC
T
MA
NA
GE
R
RE
CE
IPT
OF
TH
E
WO
RK
S:
CO
NT
RA
CT
M
AN
AG
ER
AS
SE
SS
ME
NT
OF
OF
FE
RS
: T
RA
DIN
G
DE
SK
LIS
T O
F P
AR
TIC
UL
AR
TE
CH
NIC
AL
SP
EC
IFIC
AT
ION
S. P
AF
SC
MO
NIT
OR
ING
OF
TH
E
CO
NT
RA
CT
:
MA
NA
GE
R O
F T
HE
C
ON
TR
AC
T
LIS
T O
F P
AF
SC
AD
MIN
IST
RA
TIV
E
CL
AU
SE
S
Article 193. Delay in execution Article 195. Resolution due to delay and expansion of the contract execution deadline.
Article 192. Partial compliance or defective compliance
Article 194. Damages and imposing of penalties
Article 242. Modification of the construction contract.
Article 311. Execution, contractor responsibility and fulfilment of the service contracts.
Article 238. Execution of construction and contractor responsibility.
Construction: Article 243. Receipt and warranty period. Supply: Article 300.
Delivery and receipt
Services: article 311. Execution,…
Article 122. Lists of particular administrative clauses
Article 122. List of particular administrative clauses

Apéndice: Transparencia Activa en la Información. Los datos en detalle. Datos actualizados a 31/12/2020 Appendix: Active transparency in the information. Data in detail.
15
(416-1)
I_04 Description of the management and decision support systems used by the Port Authority, such as quality management systems, balanced scorecards, market characterisation campaigns, etc.
MANAGEMENT SYSTEMS IMPLEMENTED IN THE PORT
Figure 4
SCOPE OF THE PORT AUTHORITY FERROL SAN CIBRAO MANAGEMENT SYSTEM
• Management of the use of the port area: -Concessions, authorisations and licences. -Infrastructure and port investment.
• Management of port services: -Maritime signalling. -Stopovers of vessels and recreational boats. -Freight and passenger traffic. -Electricity and drinking water supply. -Storage service.
In the public port area of the Port Authority Ferrol San Cibrao.
Table 7
In the scope of the management system, given the regulatory framework governing the provision of services in ports of general interest, points 8.3 and 8.5.1 of ISO 9001 do not apply. For the internal dissemination of the continuous and detailed monitoring of the Management System, defined in the Evaluation, Review and Innovation Process (link to the process sheet), approved by the President of the Port Authority, including the results of audits and corrective actions, as well as the corresponding meetings held with the Management Committee, and PAFSC staff, we have the Internal Portal of the Port Authority Ferrol San Cibrao Management System. In said system, the content is updated at the frequency defined in the process, as and when follow-ups are carried out, sending a notification reporting the update by email. This platform is accessible to all PAFSC staff, including the President and the Director of the PAFSC.

Apéndice: Transparencia Activa en la Información. Los datos en detalle. Data updated at 31/12/2020 Appendix: Active transparency in the information. Data in detail.
16
Figure 5

Apéndice: Transparencia Activa en la Información. Los datos en detalle. Datos actualizados a 31/12/2020 Appendix: Active transparency in the information. Data in detail.
17
With regard to the final closure information of the management system review, and in order to improve the traceability, integrity, quality and transparency of the information reported by the PAFSC, we include the results of the monitoring and measurement, as well as the performance results of the processes in the different sections of our annual report.
Table 8
YEAR: 2020
ISO 9001 INPUTS ISO 14001 INPUTS ANNUAL REPORT. Section, content and page ISO 9001 OUTPUTS ISO 14001 OUTPUTS ANNUAL REPORT. Section, content and page
a) State of the actions of previous management
reviewsa) State of the actions of previous management reviews
Our management, process tracking, page 57
Appendix 8, institutional d., pages 18-20a) Improvement opportunities
Decision regarding opportunities for continuous
improvementOur management, Strategy tracking, page 56.
b) Changes in: 1) external and internal issues regarding
environmental management system
Our management, internal and external analysis, page 53
Appendix. 8, institutional d., management systems, access to the progress
card E.R. e I., pag 15
b) Any necessary changes in the quality management
system
Conclusions regarding the continuous convenience,
adaptation and efficacy of the environmental
management system
Process tracking, page 57
b) Changes in: 2) Neccessities and expectations of the
stakeholders, including legal and other requirements Appendix 8, institutional d., pages 5 to 14
Necessary actions when the environmental goals have
not been achievedAppendix 8, institutional d., page 18-20
b) Changes in: 3) its significant environmental aspects Appendix 8, environmental d., environmental aspects, pages 85-90Improvement opportunities to improve the integration
of the environmental management system in other
business procedures, if necessaryc) Information about the performance and efficacy of
the quality management system, including trends
regarding:
Any implication for the strategic direction of the
organisation
1) Client satisfaction and stakeholders' feedbackf) Relevant stakehodlers' communications, including complains
Our management, value offered to our interest groups, page 48, and
satisfaction of the interest groups, pages 49 to 52
Appendix 8, institutional d., governance and management quality, page
10. Satisfaction of our interest groups, pages 36-39, PA interest groups 44-
49
c) Resource neccessities
Decisions regarding any necessary changes in the
environmental management system, including
resources
Appendix 8, institutional d., roadmap, page 4
2) Degree to which the quality goals have been
achieved
c) Degree to which the environmental goals have been
achieved
Our management, strategy and processes tracking, pages 56-57.
Appendix 8, institutional d., pages 18-20
3) Performance of processes and compliance of
products and services
Planning and strategy, appendix 8, pages 18-20. Our management, pages
54-57
HR organisation and management, apprendix 8, social d., pages 72-82
Satisfaction of the groups of interest, appendix 8, pages 36-39, 44-49, our
management, pages 49-52
Evaluation, revision and innovation, apprendix 8, institutional d., pages
18-20, our management, page 55
Concessions and authorisations, appendix 8, economic d, pages 59-60,
appendix 3 navigation assistance, appendix 2
Appendix 8, institutional d., pages 29-36. Our strenghts pages 24-36. Our
management, page 55
Facilities and insfrastructures management, appendix 6, appendix 2. Our
strenghts, pages 42-44
Gestión ambiental, Ap. 8, D. ambiental
d) Information about the environemntal performance of the
organisation, including the trends of: 3) compliance with legal
and other requirements
Appendix 8, environmental d., environmental management, pages 83-116
4) Non conformities and corrective actions
d) Information about the environemntal performance of the
organisation, including the trends of: 1) non conformities and
corrective actions
Appendix 8, institutional d., management systems, pages 18-20
5) Tracking results and measuring
d) Information about the environemntal performance of the
organisation, including the trends of: 2) tracking and measuring
results
Our management, evaluation, revision and innovation, page 55
The port in figures, pages 6 to 7. Value offer of our groups of interest,
page 26. Human team, page 40.
Appendix 8, enconomic d., pages 59-71. Social D. , pages 72-82.
6) Audits resultsd) Information about the environemntal performance of the
organisation, including the trends of: 4) audit resultsAppendix 8, institutional d., management systems, pages 18-20
7) Performance of external suppliers Appendix 8, institutional d., Supply chain, pages 12-14. Economic D. 59-71
d) Resources adecquacy e) Resources adecquacy
Appendix 1, pages 1 to 8.
Appendix 8, economic d., pages 59-71. Social d., pages 72-82.
Environmental d., pages 83-116
e) Efficacy of the actions taken to deal with risks and
opportunities (see 6.1) b) Changes of: 4) risks and opportunities Our management, Risk evaluation, pages 58 and 59
f) Improvement opportunities g) Continuous improvement opportunities Appendix 8, institutional d., page 18
MANAGEMENT REVIEW
b) Changes of external and internal issues regarding
quality management system

Apéndice: Transparencia Activa en la Información. Los datos en detalle. Datos actualizados a 31/12/2020 Appendix: Active transparency in the information. Data in detail.
18
In terms of the highlights of the review: -The areas of improvement detected in the management system during 2020 were as follows:
PROCESS AREA FOR IMPROVEMENT
Aids to maritime navigation Evaluation of the causes of the incidents detected in the beaconing of the entrance channel to the estuary
Concessions and authorisations Increase monitoring of private investment
Improve monitoring/surveillance of concessions
Evaluation, review and innovation Update of process and indicator tool
Transition to the new 2020 EFQM model
Environmental management
Consumption, detection of improvements, establishment of a plan and promotion of resource saving, or use of more efficient energies.
Land, environmental controls on concessions
Monitoring of discharge permits
Management of infrastructures and facilities
Updating of the inventory, implementation of a specific application for the management of preventive and corrective maintenance
Analysis of the cause of deviations in the process (deadlines from planning)
Organisation, coordination and control of traffic and services
As much as possible, automate the input of service information and keep a single record for each type of service in Integra 2
Standardise, user focus and measure the access control process
Customs bonded warehouse approval
Measure indicators related to port services
Organisation and management of human resources
Design of training plan taking into account retirement planning
Improve resource allocation
Improve performance appraisal and recognition of achievements
Planning Improve the Port Authority's rail-port connection and operations
Review of the 2017-2015 strategic plan
Stakeholder satisfaction
Improve the detection of stakeholder needs and expectations, reviewing the value proposition to stakeholders and aligning strategy and management to the SDGs.
Improve the measurement of stakeholder perceptions through interviews and review of surveys associated with the review of the value proposition to the stakeholders and alignment of the strategy and management to the SDGs.
Services provided by private companies
Referral of the specific specifications for voyage, towage and pilotage port services in the port of Ferrol, and the granting of new licences.
Measure indicators
Referral of the specific specifications for voyage, towage and pilotage port services in the port of Ferrol, and the granting of new licences.
Referral of the specific specifications for voyage, towage and pilotage port services in the port of Ferrol, and the granting of new licences.
Information and communication technologies
Inspection, maintenance and incident control plan with inventory traceability. Monitoring of plans and incidents.
ICT plan drawn up for processes and annual review according to the degree of progress of needs to be covered by processes and stakeholders.
Table 9 (102-30)
-The monitoring of the objectives and actions for 2020, as well as those developed for 2021, were as follows:

Apéndice: Transparencia Activa en la Información. Los datos en detalle. Data updated at 31/12/2020 Appendix: Active transparency in the information. Data in detail.
19
Table 10 (102-30)

Apéndice: Transparencia Activa en la Información. Los datos en detalle. Data updated at 31/12/2020 Appendix: Active transparency in the information. Data in detail.
20
Table 11 (102-30)
- In the external audit carried out in January 2021, a total of 4 non-conformities were detected, leading to the opening of 4 corrective actions. - Status of corrective actions:
PART NO.
STANDARD AFFECTED
ISSUE DATE AUDIT STANDARD/PROCESS ITEM DATE OF
APPROVAL STATUS OF
ACTION
24 14001 11/12/2019 INTERNAL 6.1.3. Legal and other requirements 22/01/2020 PENDING
25 14001 11/12/2019 INTERNAL 6.1.3. Legal and other requirements 22/01/2020 PENDING
26 14001 11/12/2019 INTERNAL 6.1.3. Legal and other requirements 17/12/2019 PENDING
27 9001 05/01/2021 EXTERNAL 7.2. Competition 08/02/2021 PENDING
28 14001 05/01/2021 EXTERNAL 8.1. Operational planning and control 29/01/2021 PENDING
29 9001 05/01/2021 EXTERNAL 9.2. Internal audits 29/01/2021 CLOSED
30 9001/14001 05/01/2021 EXTERNAL 7.1.3. Infrastructure 02/02/2021 CLOSED
Table 12

Apéndice: Transparencia Activa en la Información. Los datos en detalle. Data updated at 31/12/2020 Appendix: Active transparency in the information. Data in detail.
21
Figure 6 (102-29)
Figure 7 (102-29)

Apéndice: Transparencia Activa en la Información. Los datos en detalle. Data updated at 31/12/2020 Appendix: Active transparency in the information. Data in detail.
22
Strategic objectives and supporting processes
Figure 8 (102-29)

Apéndice: Transparencia Activa en la Información. Los datos en detalle. Data updated at 31/12/2020 Appendix: Active transparency in the information. Data in detail.
23
(102-18)
I_05 Existence of management committee and its structure.
Figure 9

Apéndice: Transparencia Activa en la Información. Los datos en detalle. Data updated at 31/12/2020 Appendix: Active transparency in the information. Data in detail.
24
(102-18)
I_06 Description of sectoral technical committees supporting the Board of Directors, in addition to the Navigation and Port Board, the Port Services Committee, the Safety Advisory Committee.
Assistance and information body
The Navigation Board
This is the President's assistance and information body. How its members are appointed and dismissed, and the rules
governing its meetings are approved by the Board of Directors. In accordance with the provisions of art. 34 of RLD
2/2011, those natural or legal persons who request it and who have a direct and relevant interest in the smooth
functioning of the port, maritime trade or who can effectively contribute to it, may form part of the navigation board.
Functions of the Navigation Board:
Information to the PAFSC on those aspects related to port or maritime activity and operations that, in general, may be of interest to the Board and information from the Harbour Master's Office on those matters within its jurisdiction that it deems appropriate.
Information from all sectors, public or private, represented on the Board, on those aspects that may be of interest for the improved functioning of the Port and maritime trade.
Study of specific matters included in the agenda and debate on them. Given the nature of the Board, as an assistance and information body, the conclusions that may be adopted.
Table 13
The members of the Navigation Board do not receive any remuneration for attending the meetings held.
INFRASTRUCTURES AND CAPACITY (203-1) I_07 Description of the role of the Port Authority as infrastructure provider and a reference to the land lord model. List of the general technical
characteristics of the port, such as land area, sheltered water area, concession area, docks and their functions and land access.
THE VALUE PROPOSITION OF THE PORT AUTHORITY
Figure 10

Apéndice: Transparencia Activa en la Información. Los datos en detalle. Data updated at 31/12/2020 Appendix: Active transparency in the information. Data in detail.
25
FACILITIES (102-4)
Figure 11

Apéndice: Transparencia Activa en la Información. Los datos en detalle. Datos actualizados a 31/12/2020 Appendix: Active transparency in the information. Data in detail.
26
(102-4)
Figure 12

Apéndice: Transparencia Activa en la Información. Los datos en detalle. Datos actualizados a 31/12/2020 Appendix: Active transparency in the information. Data in detail.
27
(102-4)
Figure 13

Apéndice: Transparencia Activa en la Información. Los datos en detalle. Datos actualizados a 31/12/2020 Appendix: Active transparency in the information. Data in detail.
28
I_08 Infrastructures in progress or project and purposes served.
Investments in progress or completed in 2020 (203-1)
Code Description Total budget
Certified 31/12/2019
Budget 2020
Certified 2020
Certified in origin
Location Subsid Objective
ACTIONS ON RAILWAY ACCESSIBILITY CHARGED TO THE FFTAP: OUTER PORT 90.598 21.768 17.213 11.732 33.500
FS2E2002 Rail Access to the Outer port
72.498 19.124 14.412 9.810 28.934 In action FFAT 2
FS2E2008 Modified Rail Access
7.250 0 804 370 370 In action FFAT 2
FS2E2005 Prices' check
4.976 178 974 537 715 In action FFAT 2
FS2B2003 Other AA.TT. associated with the Railway Access Works to the Outer Port
818 98 100 26 124 In action FFAT 2
FS2B2004 AT Management and coordination, and technical and execution control.
2.218 899 365 583 1.482 In action FFAT 2
FS2B2005 AT Coordination of safety and health.
525 222 101 99 321 In action FFAT 2
FS2B2006 AT Control of materials and tests
669 335 87 87 422 In action FFAT 2
FS2B2007 AT Management and environmental advice
586 192 112 98 290 In action FFAT 2
FS2G6001 Acquisition of land
657 532 125 31 563
FS2E2007 Minor works associated with the Railway Access
401 188 133 91 279 In action FFAT 2
OTHER ACTIONS 849 267 217 232 499
FS2C1001 Investments to improve the operation of the Outer Port
849 267 217 232 499 Finished 3
ACTIONS ON SECURITY
1.122 672 125 65 737
FS1G3002 Actions on security/safety 838 638 50 24 662 In action 3
FS1G3003 Actions on security/security
284 34 75 41 75
ACTIONS IN THE AREA OF ENVIRONMENTAL SUSTAINABILITY
867 443 40 60 503
FS1B3001 Energy efficiency actions
717 443 15 54 497 In action 5
FS1H2001 Actions on environmental sustainability 150 0 25 6 6 In action 5
GENERIC AND MINOR WORKS
28.138 22.123 915 569 22.692
FS1G2001 Tecnhical assistance 4.016 3.090 150 123 3.213 In action 0
FS1H9001 Settlements and reviews
8.893 7.418 75 25 7.443 In action 0
FS1G3001 Small budget works
7.155 5.405 400 342 5.747 In action 0
FS1G1001 Maritime signals 4.920 4.070 100 22 4.092 In action 6
FS1G5001 Computer equipment
914 564 100 28 592 In action 0
FS1H3001 1,5% cultural
2.240 1.576 90 29 1.605 0
INTANGIBLE ASSETS
1.168 784 117 58 842
FS1I1001 Computer applications and programs
1.046 726 70 27 753 In action 0
FS1I1002 Intangible assets I + D + i
122 58 47 31 89 In action 0
FINNANCIAL ASSETS
2.429 2.141 138 120 2.261
FS1J1001 L.P. credits AP
422 242 30 11 253 0
FS1J3001 Debtors to l/p, accrued subsidies pending collection 17 17 0 1 18
FS2J9003 Contributions to the Financial Fund for Port Terrestrial Accessibility
1.990 1.882 108 108 1.990 1
TOTAL (Amounts in thousands of euros) 125.171 48.198 18.765 12.836 61.034
(1) Subsidies (2) Investments objectives
FFAT Port’s Road Access Financial Fund 0 Others Maritime sinaling and security
FCI Inter-Port Compensation Fund 1 Infraestructure and port capacity Fishing
2 Logistic and intermodal activities 8
Sports
3 Equipment and facilities Passengers
4 Port-City
5 Enviromental actions
Table 14

Apéndice: Transparencia Activa en la Información. Los datos en detalle. Data updated at 31/12/2020 Appendix: Active transparency in the information. Data in detail.
29
(203-1) Description of the most important works
Rail accessibility initiatives - Outer Port
“Rail Access to the Outer Port and other associated investments”. The availability of suitable rail access to the Port of Ferrol, and specifically to its Outer Port, is not only a key factor for the proper operation of this infrastructure, but also a fundamental element for the sustainable economic and social development of its surroundings. It is also an essential infrastructure for the implementation of certain operators in the port, in particular those whose focus is container traffic relating to imports and exports. The Port Authority of Ferrol-San Cibrao has been working on the development of these accesses since 1998. After almost two decades of studies, the works were awarded in February 2017 for an amount of €72,498,200 (excluding VAT), starting on 16 June 2017. The construction project to be carried out includes the infrastructure, platform, superstructure and railway and non-railway installations for a 6,374.5-metre-long, single-track section, exclusively for freight traffic and a platform suitable for Iberian and metric gauge traffic. The two main elements of the access are a 5,575 m long tunnel and a 299 m viaduct over the estuary.
As of 31 December 2020, 4,176 metres of tunnel excavation had been completed ahead of the western mouth of the Outer Port. Also noteworthy during the year was the start of work on the tunnel's east mouth, which has allowed the tunnel excavation to begin from its east mouth at the beginning of 2021.
Other initiatives
“New roof on the Outer Port building”. Work was completed to extend the existing roof, adapting the building for the storage of all types of goods.
Non-targeted initiatives
“Small scale works”. The most significant projects carried out in this chapter include the acquisition of the building of the former customs office =of the Port of Ferrol, the "Improvement of the fibre-optic connections in the inner harbour of the Port Authority Ferrol San Cibrao", the "Reinforcement of the foundations of the Outer Port seawall" and the “Drainage system in the manoeuvring and public use area in the second phase of the Outer Port (between bollards 36 and 40)”.
Maritime signals
“Maritime signals”. Among these initiatives, work has been carried out to improve maritime signals in the province of A Coruña and Lugo, with the most noteworthy of these being the “Renovation and updating of the lighting equipment at the Punta Roncadoira lighthouse”.
Computer applications
“Computer applications”. The most significant initiatives carried out during the year were the “Integration of the internal and external active directory and preparation for integration with future applications”, and the “Supply and implementation of a comprehensive human resources management application”.
I_09 Industrial or logistics promotion initiatives, such as participation in a Logistics Activities Zone (ZAL), dry port, etc. and the purposes it serves.
Contacts are ongoing to promote the establishment of companies and logistics facilities to support the needs of industry in the area for maritime transport.

Apéndice: Transparencia Activa en la Información. Los datos en detalle. Data updated at 31/12/2020 Appendix: Active transparency in the information. Data in detail.
30
MARKETS SERVED (102-6) I_10 Evolution, over a minimum of the past three years, of the traffic represented as the total tons moved, total tons by generic groups of
merchandise, and as each of the aforementioned groups as a percentage the total.
2017 2018 2019 2020
Solid bulk 10,455,812 10,754,000 8,095,000 6,371,480
Liquid bulk 2,294,337 2,149,000 2,312,000 2,936,159
General merchandise 779,017 761,000 764,000 713,079
Total 13,529,166 13,664,000 11,171,000 10,020,718
Table 15
Figure 14
I_11 Hinterland and foreland: main origins and destinations of merchandise, understood as those which constitute 70% of port traffic. (102-6)
COUNTRY Total COUNTRY Total
Guinea 4,538,833 France 277,288
Russia 770,120 Portugal 265,265
Holland 542,970 Belgium 245,350
Norway 542,282 Sweden 213,531
USA 487,323 Indonesia 195,725
Trinidad and Tobago 351,393 Nigeria 128,069
Spain 300,830 Remaining countries 864,037
United Kingdom 297,705 Total 10,020,719
Table 16
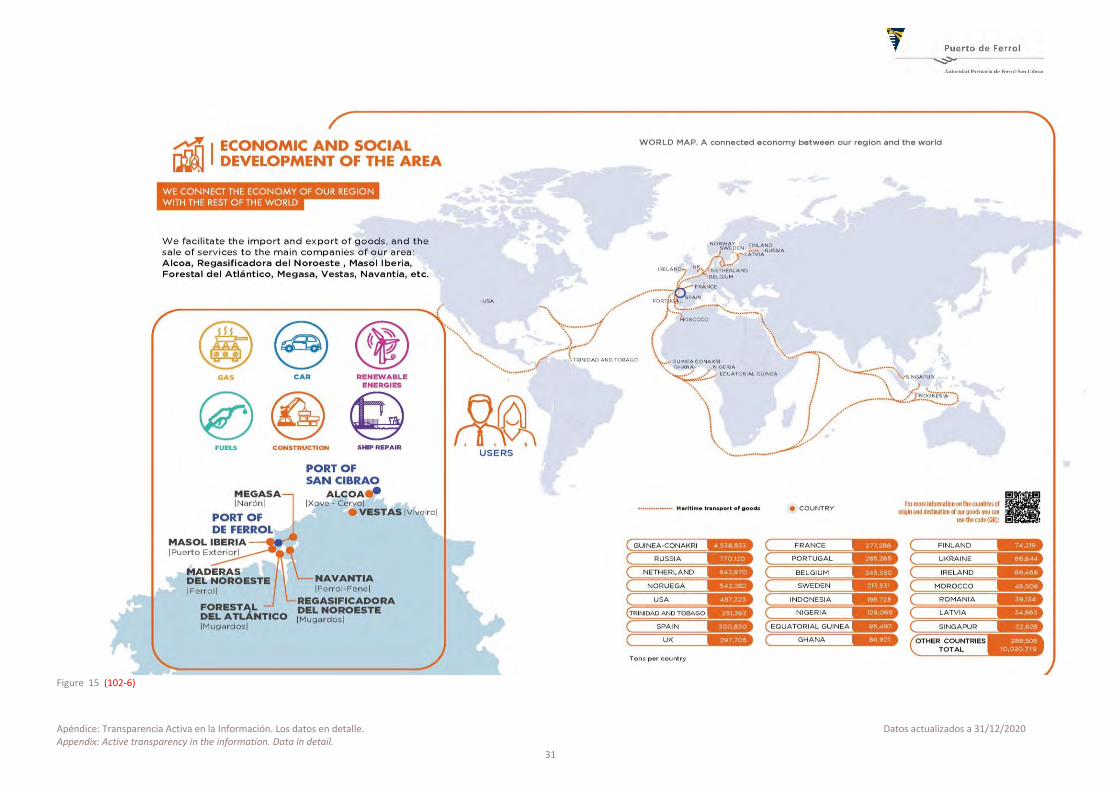
Apéndice: Transparencia Activa en la Información. Los datos en detalle. Datos actualizados a 31/12/2020 Appendix: Active transparency in the information. Data in detail.
31
Figure 15 (102-6)

Apéndice: Transparencia Activa en la Información. Los datos en detalle. Datos actualizados a 31/12/2020 Appendix: Active transparency in the information. Data in detail.
32
I_12 Revenue billed to the five main customers, expressed as a percentage of the total billed.
Total billed during 2020 15,714,969.99 €
Revenue billed to the 5 main customers 9,838,929.69 €
% 5 main customers / total billed 62.61%
Table 17
I_13 Description of the main sectors or relevant activities in local economic development that are supported by the port in their development. (102-6)
Economic Sector Tons in 2020 % of total
Iron and steel 5,048,630 50.38%
Energy 2,269,768 22.65%
Chemicals 1,654,927 16.52%
Other merchandise 393,463 3.93%
Agriculture, livestock farming, and food 354,281 3.54%
Construction materials 241,249 2.41%
Vehicles and transportation elements 27,361 0.27%
Fertilizer 22,963 0.23%
TOTAL 10,020,719
Table 18
SERVICES (102-2) (417-1) I_14 Description of the role of private initiative in the provision of port services and the port’s operation. Types of services, describing, for each of
them, the role of the Port Authority and of private initiative. Description of the role of the Port Authority in regulating and overseeing activities, referring to the devices that it possesses to do so.
Figure 16

Apéndice: Transparencia Activa en la Información. Los datos en detalle. Data updated at 31/12/2020 Appendix: Active transparency in the information. Data in detail.
33
I_15 Number of businesses that operate at the port under a concession or authorization, or under a license.
Number of businesses operating at the port under a concession or authorization: 81
Port service providers operating at the port in 2020
Type of services Number of companies
Loading 6
MARPOL 3
Pilotage 2
Towing 2
Mooring 4
Table 19 I_16 Percentage of real surface area allocated for commercial use that is under concession
Percentage of surface area under concession
Total ground-level surface area (m2) 3,425,626 m2
Total ground-level surface area under concession (m2) 1,590,474.76 m2
Ratio (%) 46.43 %
Table 20 I_17 Percentage of total tons moved at the port through maritime merchandise terminals operating under a concession or authorization as a
function of total merchandise traffic.
Port Line Service/Entity Tons
Ferrol
Fernández Ladreda (1 - 18) PAFSC 331,142
Fernández Ladreda (19 - 31) PAFSC 205,801
North Wall PAFSC 46,004
New Dock PAFSC 250,608
Ro-Ro C.N. Ramp PAFSC 46,909
La Graña Navy Station Navy 54,693
General Outer Port PAFSC 61,623
Auxiliary Outer Port PAFSC 162,863
Liquid Bulk Outer Port Masol Ibérica Biofuel, S.L. 446,244
Coal Outer Port Endesa Generación, S.A. 9,737
Outer Port-Container Terminal Ferrol Container Terminal, S.A. 128,647
Navantia Fene Dock 10 Navantia, S.A. 8,612
Navantia Fene Dock 11 Navantia, S.A. 292
Navantia Ferrol Dock 14 Navantia, S.A. 222
Reganosa Regasificadora del Noroeste, S.A. 1,454,337
Forestal Del Atlántico Forestal del Atlántico, S.A. 448,514
Forestal Duques De Alba Forestal del Atlántico, S.A. 262,690
San Cibrao San Cibrao Main Dock Alúmina Española, S.A. 5,472,921
San Cibrao Auxiliary Dock Alúmina Española, S.A. 331,142
Total PAFSC merchandise traffic 10,020,721
Tons moved through terminals under concession 8,861,078
% of total merchandise 88.43%
Table 21

Apéndice: Transparencia Activa en la Información. Los datos en detalle. Data updated at 31/12/2020 Appendix: Active transparency in the information. Data in detail.
34
SERVICE QUALITY
(417-1) I_18 Information devices provided by the Port Authority allowing to guarantee that any operator that wishes to private provide services at the port
or to obtain a concession is able to be transparently informed of the conditions applicable to operating at the port and the administrative devices regulating this process, such as the online availability of terms of service, informative industry-specific conferences, etc.
• Indicate whether the following measures have been implemented at the Port Authority in order to guarantee the unrestricted access and competition of private initiative of the port.
YES ▪ The terms of service for different port services are available online.
NO ▪ The general conditions applicable to granting licenses are available online.
YES ▪ Information is available online regarding the procedures necessary to carry out in order to apply for a license or concession.
NO ▪ Informative conferences intended for potential target sectors are held to inform of the conditions of access for operating at the port.
NO ▪ Information is available on the Internet regarding the surface areas available and their designated uses.
YES ▪ The Port Authority provides potential operators with documentation that clearly details the procedures and steps to follow in order to operate at the port, whether for service providers or concessionaires.
YES ▪ The conditions of the provision of general services (such as border checkpoints, water supply replenishment, etc.) have been regulated.
It is necessary to include any other information on initiatives which in the opinion of the Port Authority guarantee that private initiative will be involved in the port operation process in an environment of transparency and open competition.
- Lists and contact data of port service providers published on the Port Authority’s website. - Forms for applying for authorization to provide commercial services, published on the Port Authority’s
website. - Lists and contact data of commercial service providers published on the Port Authority’s website.
I_19 Initiatives forwarded by the Port Authority directed at improving the efficiency, quality of service, and performance of services provided for
merchandise.
• Whether the Port Authority has set up or hosts forums with different operators in the port community allowing to agree upon and establish joint commitments to end-user customer service. If yes, please indicate the following:
▪ The scope of the aforementioned commitments: price, integrity, time, etc. ▪ The formalization method: certification markings, guaranteed services, non-guaranteed agreements, etc.
(Left blank)
• Whether the Port Authority has published the adjustment rates and indices that apply on its website.
PORT AUTHORITY PRICES
Our up-to-date rates and the adjustment coefficients in force are available on the Port Authority Ferrol San Cibrao’s website. The general regime of fees and rates applicable to PAFSC users is governed by CHAPTER II-Economic regime applicable to the use of the public domain and the provision of port services of Spanish Real Decree 2/2011 of September 5 approving the Revised Text of the Law on Ports and Merchant Navy Status. In addition, in 2020, in accordance with the provisions of Spanish Law 6/2018 of July 3 on General State Budgets for the Year 2018, we apply the following coefficients and discounts: Adjustment coefficients
Rate for boats Rate for merchandise Rate for passage
1.10 1.00 0.80
Table 22

Apéndice: Transparencia Activa en la Información. Los datos en detalle. Data updated at 31/12/2020 Appendix: Active transparency in the information. Data in detail.
35
Discount for certain traffic (% discount): Traffic Rate for boats Rate for merchandise Rate for passage Occupancy rate
Cruise ships 40% 40%
Wind turbine products 15-32%
Containers 40% 40% 30%
Coal 0-10%
Biodiesel 0-20%
Wood 0-30%
Iron and steel products 20-35%
Fuel/gas oil 0-10%
Gassing-up and cooling-down 0-20% 40%
LNG for bunkering 40%
Table 23
Figure 17 (417-1)
In the year 2020, the revenue obtained per service unit on the main rates was: Revenue by service unit Rate for boats
(€/GT) Rate for merchandise (€/T)
Rate for passage (€/passenger)
Occupancy rate (€/m2)
PAFSC (2020) 0.196 0.374 0.485 2.29
Port system average (2019) 0.102 0.464 2.151 7.02
Table 24 • If the Port Authority encourages and coordinates quality committees or groups alongside the port community. (Left blank)
• If any initiatives directed at streamlining merchandise inspection processes have been implemented, such as signing protocols with other governments, better infrastructure related to customs inspection, etc. (Left blank)
• If the Port Authority has created Reference Frameworks for Specific Services and submitted them for approval.

Apéndice: Transparencia Activa en la Información. Los datos en detalle. Data updated at 31/12/2020 Appendix: Active transparency in the information. Data in detail.
36
QUALITY OF SERVICE AT SERVICE SUPPLIERS AND MERCHANDISE TERMINALS UNDER CONCESSION The PAFSC’s specific reference frameworks can be consulted on the external portal of the Port Authority website’s management system.
Specific reference framework applicable to quality of service for bulk traffic at the PAFSC: link to the document
Specific reference framework applicable to quality of service for general conventional merchandise traffic at the PAFSC: link to the document
Initial version: 10/02/2013. Version 1 03/08/2017.
Initial version: 02/26/2014. Version 1 03/08/2017.
Companies certified in the year 2020: Regasificadora del Noroeste, S.A.
Forestal del Atlántico, S.A. Table 25
• Types of conditions applicable to the quality of the provision of services and performance included in service requirements and conditions of issuance. In particular, indicate the following:
▪ Whether services requirements and conditions of issuance include minimum performance levels in terms of loading/unloading operations and the handover/receipt of merchandise. (Left blank)
▪ Whether services requirements and conditions of issuance include the requirement of possessing ISO 9001 certification.
Service Quality conditions in the terms and conditions Concessionaire companies
% of companies that comply with the quality conditions in the terms and conditions
Loading ISO 9001 certification. 2 0 (*)
Marpol NONE 2 -
Pilotage ISO 9001 certification. 4 25% (*)
Towing ISO 9001 quality system integrated with a certified ISO 14001 environmental system.
6 16,6% (*)
Mooring The service provider must possess, within one year, certification to provide services in accordance with the generic reference framework established for the port system, issued by an entity that has been duly accredited in accordance with standard UNE-EN-45011.
3 -
(*) According to data obtained on 03/30/2021 from the SIGEIN-Port Services Observatory
Table 26
▪ Whether conditions directed at obtaining terminal specialization have been included. (Left blank)
I_20 Number of concessionaires or authorized companies providing port services subscribed for the bonus to incentivize improvements in quality of service. Volume of traffic represented by these companies.
Specific reference framework applicable to quality of service for bulk traffic at the PAFSC
Number of certified companies: 2 Volume of traffic in 2020: 2,165,541
Table 27 I_21 Description of the Port Authority’s initiatives to receive and manage complaints or suggestions from final customers of the port, as well as to
assess customers’ degree of satisfaction with the services provided by the port.
SATISFYING OUR INTEREST GROUPS (102-15), (102-21), (102-34)
The process map of the Port Authority’s management system includes the interest group satisfaction process, approved by the President and Director of the Port Authority.

Apéndice: Transparencia Activa en la Información. Los datos en detalle. Datos actualizados a 31/12/2020 Appendix: Active transparency in the information. Data in detail.
37
(102-15), (102-21), (102-34), (102-42), (102-43
.
Figura 18.a

Apéndice: Transparencia Activa en la Información. Los datos en detalle. Datos actualizados a 31/12/2020 Appendix: Active transparency in the information. Data in detail.
38
(102-15), (102-21), (102-34), (102-42), (102-43)
Figure 18.b

Appendix: Active Transparency in the Information. Data in detail. Data updated on 31/12/2020 Appendix: Active transparency in the information. Data in detail.
39
(102-15), (102-34) The Port Authority’s website provides access to the Management System Portal, which offers both the form and system for submitting complaints or suggestions, such as interest group satisfaction surveys.
Figure 19
No complaints were received in 2020.
The following were the results of the satisfaction surveys sent out in 2021:
Satisfaction of customers, operators, merchandise terminals, and partners
Staff satisfaction Supplier satisfaction
78.22% 68.47% 72.76%
Table 28 In 2021, and in relation to the Business Plan 2021—which seeks to improve the definition of the PAFSC’s key interest groups and to increase their participation in defining the subjects that they consider relevant, for these to be subsequently incorporated into the Port Authority’s strategy and processes in such a way that we can guarantee improved performance in terms of the value proposal we offer to each interest group—and with the collaboration of Ernst&Young, we are conducting
INITIATIVE OR SUGGESTION COMPLAINTS SUBMISSION FORM SYSTEMATICS FOR THE SUBMISSION OF COMPLAINTS For the improvement of the management of the Port Authority of Ferrol-San Cibrao, as a citizen, user of services, supplier or as any other group interested in our activity, you can submit any complaint, initiative or suggestion that you deem appropriate with this form "Presentation of Complaints, Initiatives or Suggestions", made available to users on the website, public service units of this AP and on the electronic site, through the following means: -Telematically
• Through this online form, by clicking the Next button at the bottom of the page. (In the event of not being obliged to interact electronically with the administration, in accordance with article 14 of Law 39/2015).
• Through the electronic headquarters of the Port Authority http://sede.apfsc.gob.es/, a system that requires the use of DNI-e or electronic signature accredited through certification recognized by the State. Download the form in word and once completed submit it through the electronic office.
• By email to [email protected]. (In the event of not being obliged to interact electronically with the administration, in accordance with article 14 of Law 39/2015)
-Postal mail (In the event of not being obliged to interact electronically with the administration, in accordance with article 14 of Law 39/2015) Addressed to the Official Registry of the Port Authority of Ferrol-San Cibrao, Muelle de Curuxeiras, s / n 15401 Ferrol. -In person (In the event of not being obliged to interact electronically with the administration, in accordance with article 14 of Law 39/2015) Delivering the form in the Official Registry of the Port Authority. EFFECTS OF THE PRESENTATION: Royal Decree 951/2005, of July 29, which establishes the general framework for quality improvement in the General State Administration. Article 19. Effects: "Complaints formulated in accordance with the provisions of this royal decree will not, in any case, be classified as an administrative appeal nor will their presentation interrupt the deadlines established in current regulations. These complaints do not condition, in any way, the exercise of the remaining actions or rights that, in accordance with the regulations governing each procedure, may be exercised by those who consider themselves interested in the procedure. "

Appendix: Active Transparency in the Information. Data in detail. Data updated on 31/12/2020 Appendix: Active transparency in the information. Data in detail.
40
(102-34)
work related to “Aligning the strategy and management with United Nations Sustainable Development Goals (SDGs) and Sustainability Principles.” This work includes materiality surveys of all PAFSC interest groups, as well as one-on-one interviews with key interest groups.
INTEGRATION OF THE TRANSPORTATION SYSTEM AND SUSTAINABLE MOBILITY
I_22 Current road and rail accesses and the actions planned to improve them, as well as a description of the strategies adopted by the Port
Authority to promote port-rail inter-modality in terms of infrastructure, functional coordination, and business management.
The breakdown of the road and rail accesses to the Port of Ferrol and San Cibrao is presented in figure 20 of this chapter. The accesses enable the interconnection of our port facilities with the rest of Iberian Peninsula, as presented in the following figure:
Figure 20
Investment Plan 2021-2025 (in thousands of euros)

Appendix: Active Transparency in the Information. Data in detail. Data updated on 31/12/2020 Appendix: Active transparency in the information. Data in detail.
41
In the years 2021 and 2022, the following actions will be underway:
*Investment code
SEINVER code
PROJECT Sub
sidy
Operativ
e goal
Start year
End year
Total investme
nt
Real amount accumulated
as of 12/31/2019
Real 2020
2021 2022
ACTIONS IN TERMS OF ROAD ACCESS NOT FINANCED BY THE FFATP: OUTER PORT 2022 2025 1,821 0 0 0 321
1207 FS2E9003
Broadening of access control capacity and FCT access coordination. 3 2022 2025 1,821 321
ACTIONS IN ACCORDANCE WITH THE UNIVERSAL ACCESSIBILITY PLAN 2021 2021 229 0 0 229 0
1220 FS1H1003 Accessibility improvements in the Interior Port of Ferrol (buildings and public areas) 4 2021 2021 229 229
CITY-PORT JOINT ACTIONS 2021 2026 3,500 0 0 100 400
1221 FS1B2011
Reorganization of the Lower road of the port 4 2021 2026 3,500 100 400
Table 29
In terms of encouraging intermodal transportation via rail, the following actions are underway:
Goal of the company’s plan to encourage intermodal transportation via rail:
C5-000005 Development activities to provide the Port of Ferrol with a competitive rail intermodality. Financing and launch of rail access to the Outer Port.
Actions with regards to rail accessibility financed by the FFTAP: Outer Port This category includes multiple line items that can be grouped together as follows:
• Work: the main line item is that of “Rail Access to the Outer Port,” with a 2020 budget of €15,216,000, €10,180,000 of which have been spent, representing a degree of compliance of 66.90%. The degree of compliance was less than that planned due to delays in the commencement of work for excavating the tunnel from the A Graña entrance. The suspension of work caused by COVID-19 also had an effect, although to a lesser extent.
• With regards to price revision, the forecast of €974,000 was not realized, and ended up as €537,000 both due to the smaller volume of investment executed as well as because updated indices (which were forecasted as increasing) were not published. The accrued amount constituted 55.13% of the forecasted amount.
• Associated AA.TT. (Regional Associations): The budgeted amount for 2020 was €765,000, but €893,000 were spent, representing a degree of compliance of 116.73%, mainly due to the procedure to modify the Execution Control A.T. faced with the need to make a modification to the work associated with the planned viaduct.
• Purchase of land: The budgeted amount for 2020 was €125,000, €77,000 of which were spent, representing a degree of compliance of 61.80%.
• Associated minor work: The budgeted amount for 2020 was €133,000, €91,000 of which was spent, representing a degree of compliance of 68.42%. The degree of compliance was less than that planned because only one project was carried out, namely the improvement of the lighting in the A Graña military tunnel, with the amount awarded for the execution of this work ending up less than that planned in the tender, and therefore less than the amount budgeted. No other minor work was carried out.
Overall, the category’s degree of budget compliance was 68.43%. It is once again worth noting the effect that the work for “Rail Access to the Outer Port” has had on the Investment Plan and will have over the upcoming years. In 2020, this item represented 86.30% of the Investment Plan budget, and over the upcoming years, will make up a similar or even larger percentage. The progress of this work will have a significant effect on the degree of compliance over the upcoming years. Investment Plan 2021-2025 (in thousands of euros)

Appendix: Active Transparency in the Information. Data in detail. Data updated on 31/12/2020 Appendix: Active transparency in the information. Data in detail.
42
For the years 2021 and 2022, the following actions will be underway:
*Investment code
SEINVER code
PROJECT Subsid
y
Goal
Start year
End year
Total investmen
t
Real amount
accumulated as of
12/31/2019
Real 2020
2021 2022
ACTIONS RELATED TO RAIL ACCESS FINANCED BY THE FFTAP: OUTER PORT
2016 2024 95,189 21,768 11,778 16,283 22,448
7212 FS2E2002 Rail Access to the Outer Port
FFAT 2 2017 2023 72,498 19,124 9,810 13,600 17,964
7212 FS2E2008 Modified Rail Access
FFAT 2 2019 2023 7,250 0 370 1,260 3,100
7212 FS2E2005 Price Revision FFAT 2 2019 2024 1,977 178 537 297 421
7212 FS2E2003 Other AA.TT. Work for Rail Access to the Outer Port
FFAT 2 2016 2023 818 98 26 300 270
7212 FS2E2004
AT Management and coordination, technical oversight and oversight of execution
FFAT 2 2017 2023 2,436 899 583 365 365
7212 FS2E2005 AT Health and safety coordination
FFAT 2 2017 2023 578 222 99 101 101
7212 FS2E2006 AT Oversight of materials and testing
FFAT 2 2017 2023 669 335 87 87 87
7212 FS2E2007 AT Management and environmental consulting
FFAT 2 2017 2023 592 192 98 120 100
7212 FS2G6001 Purchase of land FFAT 2 2017 2021 659 532 77 50
7212 FS2E2009 Liquidation of work FFAT 2 2023 2024 7,250
7212 FS2E2010 Minor work related to rail access
FFAT 2 2018 2023 462 188 91 103 40
ACTIONS RELATED TO RAIL ACCESS NOT FINANCED BY THE FFTAP: OUTER PORT
2021 2022 7,704 0 0 3,371 4,333
1218 FS2E2001 Internal Railroad Network in Cabo Prioriño. Phase 1.
CEF 2 2021 2021 4,141 3,313 828
1218 FS2E2011 Internal Railroad Network in Cabo Prioriño. Phase 2.
CEF 2 2021 2022 1,221 0 1,221
1218 FS2E2012 Internal Railroad Network in Cabo Prioriño. Phase 3.
CEF 2 2021 2022 1,532 0 1,532
1218 FS2E2013 AATT to the project management
CEF 2 2021 2022 121 58 63
1218 FS2E2014 Liquidation of work CEF 2 2022 2022 689 689
Table 30
I_23 Description of the strategies adopted by the Port Authority to increase the amount of traffic served using roll-on roll-off (RO-RO) loading and unloading operations.
With regards to RO-RO traffic, the following actions are underway: Investment Plan 2021-2025 (thousands of Euros)

Appendix: Active Transparency in the Information. Data in detail. Data updated on 31/12/2020 Appendix: Active transparency in the information. Data in detail.
43
*Investment code
SEINVER code
PROJECT Subsidy
Goal
Start year
End
year
Total
investment
Real amount
accumulated as of
12/31/2019
Real 2020
2021 2022
2026 and
following years
1200
FS1D200
2
Third RO-RO ramp
2
2026 2026 3,435 3,435
Table 31 I_24 Changes over the past three years in the percentage of merchandise entering and exiting the port by rail, compared to traffic by highway and
rail combined; as well as changes over the past three years in the percentage of maritime merchandise entering and exiting the port by means of roll-on roll-off loading and unloading operations, compared to total general merchandise for import-export.
2018 2019 2020
Total Port Authority traffic 13,664,189 11,183,384 10,034,625
Rail traffic in tons 0 6,852 0
% Rail traffic 0% 0.06% 0%
RO-RO traffic in tons 63,579.34 50,936 46,909
% RO-RO 0.46% 0.46% 0.47% Table 32

Appendix: Active Transparency in the Information. Data in detail. Data updated on 31/12/2020 Appendix: Active transparency in the information. Data in detail.
44
INSTITUTIONAL COMMUNICATION (102-15), (102-44), (102-40)
I_25 List of interest groups identified by the Port Authority.
The interest groups identified by the Port Authority are the following:
Figure 21
I_26 Diagram representing communication with interest groups and their participation model.
The diagram representing communication with interest groups and their participation model is portrayed in figure 21 of this chapter.

Appendix: Active Transparency in the Information. Data in detail. Data updated on 31/12/2020 Appendix: Active transparency in the information. Data in detail.
45
I_27 Main concerns or preoccupations of interest groups. (102-40), (102-44)
EXPECTATIONS AND ASSESSMENTS OF OUR INTEREST GROUPS
SUPPLIERS The elements considered most important by those surveyed when it comes to contracting with the PAFSC are: (102-15), (102-40), (102-44)
Figure 22
Factors that have a positive impact on changes in the rate of satisfaction: Clarity in contractual conditions, publishing of tenders. Factors that have a negative impact: Execution of the work and collections, contracting procedures.
Figure 23
0,00
1,00
2,00
3,00
4,00
5,00
6,00
7,00
8,00
Ad
ecq
uat
e a
dve
rtis
ing
of
the
req
ues
tfo
r p
rop
osa
ls
Cla
rity
of
the
sco
pe
of
the
wo
rks
to b
eca
rrie
d o
ut
Cla
rity
of
the
tech
nic
al r
equ
irem
ents
to f
ulf
il in
ord
er t
o is
sue
pro
po
sals
Cla
rity
of
the
lega
l re
qu
irem
ents
to
fulf
il in
ord
er t
o is
sue
an o
ffer
Cla
rity
of
the
adm
inis
trat
ive
pro
ced
ure
s d
uri
ng
the
enti
re p
roce
ss,
form
th
e is
suin
g o
f th
e o
ffer
un
til t
he
rece
pit
of
the
pay
men
t
Cla
ity
of
the
peo
ple
to
co
nta
ct in
ord
er
to f
ulf
il th
e ad
min
istr
ativ
ep
roce
du
res
in e
ach
mo
men
t
Pe
rso
n d
esig
nat
ed b
y th
e P
A a
sre
spo
nsi
ble
fo
r th
e co
ntr
act
Pay
men
t d
ead
line
and
so
lven
cy o
f th
eP
A
Syst
em t
o is
sue
a co
mp
lain
t ab
ou
t th
ep
roce
du
re
WEIGHTING OF ELEMENTS
60,00%
70,00%
80,00%
90,00%
100,00%
YEAR 2017 YEAR 2018 YEAR 2019 YEAR 2020
SUPPLIER SATISFACTION OVER TIME
GLOBAL RATE Publicity of the request for proposals
Clarity of the contractual conditions Contractual procedures
Work implementation and receipt of the payment

Appendix: Active Transparency in the Information. Data in detail. Data updated on 31/12/2020 Appendix: Active transparency in the information. Data in detail.
46
STRENGTHS Year 2020 % satisfied
+ very satisfied % dissatisfied
+ very dissatisfied CLARITY OF INFORMATION: The information regarding the people to contact to carry out the procedures described was clear.
98.46% 100.00% 0.00%
CLARITY OF INFORMATION: If you required them, were you provided with clarifications or necessary information on the scope, technical requirements, legal requirements, procedures, and people to contact?
96.92% 100.00% 0.00%
CLARITY OF INFORMATION: The procedures that you must complete (from preparing and submitting your proposal to the assessment and awarding of the work; the contract formalization process, the execution of the work, service, or supply; the sending of invoices; and collections) were clear.
93.85% 92.31% 0.00%
CLARITY OF INFORMATION: The applicable legislation is clear before submitting a proposal.
89.23% 84.62% 0.00%
CLARITY OF INFORMATION: The scope of the work is clear from the beginning.
87.69% 84.62% 0.00%
CLARITY OF INFORMATION: Technical requirements are clear and in line with sector standards.
87.69% 84.62% 7.69%
AREAS FOR IMPROVEMENT Year 2020 % satisfied
+ very satisfied % dissatisfied
+ very dissatisfied
EXECUTION PHASE: Certificate of compliance at the time of the completion of the work.
60.00% 8.33% 16.67%
CONTRACTING PHASE: Deadline for awarding the work. 66.67% 25.00% 16.67%
Table 33 (102-15), (102-40), (102-44) HUMAN RESOURCES
Factors that have a positive effect on changes in the rate of satisfaction: Working conditions and leadership. Factors that have a negative effect: Training, communication, and participation.
Figure 24

Appendix: Active Transparency in the Information. Data in detail. Data updated on 31/12/2020 Appendix: Active transparency in the information. Data in detail.
47
STRENGTHS Year 2020 % satisfied
+ very satisfied % dissatisfied
+ very dissatisfied
Do you have good personal relationships with your coworkers? 85.00% 82% 0%
Have you had any problems in terms of equality or diversity in your position?
91.85% 81.48% 0%
Table 34
AREAS FOR IMPROVEMENT Year 2020 % satisfied
+ very satisfied % dissatisfied
+ very dissatisfied
Do you believe that the training that the Port Authority offers you furthers your career? 44.83% 13.79% 65.52%
Do you believe that your annual training is well-planned? 47.86% 10.71% 57.14%
Do you participate alongside your immediate superior in terms of the proposal that he or she makes for training courses for the upcoming year?
55.71% 28.57% 46.43%
Does the Port Authority offer you a range of training options from which you can choose the most suitable one? 41.43% 14.29% 71.43%
Do you believe that the number of training hours that you receive annually are enough? 44.83% 10.34% 58.62%
Does the Port Authority encourage the contribution of ideas and creativity among its staff members? 48.33% 8.33% 50.00%
Is staff performance formally evaluated and are staff members informed of the results of this evaluation? 44.62% 11.54% 61.54%
Table 35
(102-15), (102-40), (102-44)
CUSTOMERS, SERVICE OPERATORS, TERMINALS, AND PARTNERS
WEIGHTING OF ELEMENTS
Figure 25

Appendix: Active Transparency in the Information. Data in detail. Data updated on 31/12/2020 Appendix: Active transparency in the information. Data in detail.
48
(102-15)
Factors that have a positive effect on changes in the rate of satisfaction: High-quality management, quality of infrastructure Factors that have a negative effect: Quality in terms of price and service, and services provided by third parties
Figure 26
STRENGTHS RATE % SATISFIED
+ VERY SATISFIED
QUALITY OF SERVICE: Marpol 90.00% 100.00%
PAFSC STAFF: Knowledge, efficiency, skills 89.09% 100.00%
PAFSC STAFF: Demonstrated attention 89.09% 100.00%
LAND CONNECTIONS: Highways 88.00% 100.00%
QUALITY OF SERVICE: Victualling of vessels 88.00% 100.00%
QUALITY OF SERVICE: Pilotage 87.50% 100.00%
QUALITY OF SERVICE: Mooring 87.50% 100.00%
PAFSC STAFF: Sympathy, kindness 87.27% 90.90%
QUALITY OF SERVICE: Consignment 86.67% 100.00%
QUALITY OF SERVICE: Port Master 86.67% 100.00%
THE ENVIRONMENT: Respect for the environment 86.00% 90.00%
Table 36
AREAS FOR IMPROVEMENT RATE % DISSATISFIED
+ VERY DISSATISFIED
RATES: Pilotage 52.50% 50.00%
RATES: Marpol 60.00% 42.90%
RATES: Towing 61.85% 25.00%
LAND COMMUNICATIONS: Rail 64.00% 40.00%
INFRASTRUCTURE: Fiber optics network 65.00% 25.00%
RATES: Moorage 65.71% 28.60%
RATES: Victualling of vessels 66.67% 22.20%
RATES: Loading and unloading 66.67% 16.70%
Table 37
60,00%62,00%64,00%66,00%68,00%70,00%72,00%74,00%76,00%78,00%80,00%82,00%84,00%
CUSTOMER SATISFACTION RATE OVER TIME
SATISFACTION RATE General aspects
Managemenet quality factors Price and Service Quality factors
Quality of Facilities Services provided by third parties

Appendix: Active Transparency in the Information. Data in detail. Data updated on 31/12/2020 Appendix: Active transparency in the information. Data in detail.
49
(102-15), (102-40), (102-44) SOCIETY
In 2021, and in relation to the Business Plan 2021—which seeks to improve the definition of the PAFSC’s key interest groups and to increase their participation in defining the subjects that they consider relevant, for these to be subsequently incorporated into the Port Authority’s strategy and processes in such a way that we can guarantee improved performance in terms of the value proposal we offer to each interest group—and with the collaboration of Ernst&Young, we are conducting work related to “Aligning the strategy and management with United Nations Sustainable Development Goals (SDGs) and Sustainability Principles.” This work includes materiality surveys of all PAFSC interest groups, as well as one-on-one interviews with key interest groups.
All areas for improvement indicated in the interest group satisfaction analysis are addressed via the PAFSC’s Evaluation, Review, and Innovation process. Improvement actions and approved goals, as well as their monitoring, are presented in the management systems section of this appendix. (102-12), (413-1) I_28 Projects to coordinate and collaborate with other government organizations. PROJECTS TO COORDINATE AND COLLABORATE WITH OTHER GOVERNMENT ORGANIZATIONS
AGREEMENT BODIES VALID FROM/TO
AGREEMENT BETWEEN THE PAFSC AND THE "FUNDACIÓN PARA EL FOMENTO DEL CONOCIMIENTO DE LA
CONSTRUCCIÓN NAVAL Y DE LAS ACTIVIDADES MARÍTIMAS, EXPONAV" TO EXHIBIT THE HISTORICAL COLLECTION OF
NAVIGATION ASSISTANCE SYSTEMS OF THE SPANISH PUBLIC PORTS DEPARTMENT [PORTS OF SPAIN] AND THE
PAFSC IN THE MARITIME CONSTRUCTION MUSEUM
Ports of Spain and the PAFSC
AGREEMENT From 12/14/2018
To 12/14/2020 EXTENSION AGREEMENT
From 11/19/2020 Duration: 2 years
(According to REICO dates)
LEGAL ASSISTANCE AGREEMENT BETWEEN THE STATE GENERAL AUTHORITY [ADMINISTRACIÓN GENERAL DEL ESTADO] (MINISTRY OF JUSTICE, THE GOVERNMENT ATTORNEY’S OFFICE [ABOGACÍA GENERAL DEL ESTADO] - GENERAL STATE DEPARTMENT [DIRECCIÓN GENERAL DEL ESTADO]) AND THE PAFSC
Administración General del Estado and the PAFSC
AGREEMENT From 05/22/2018
To 05/22/2020 EXTENSION AGREEMENT
From 05/20/2020 Duration: 1 year
(According to the REICO date)
AGREEMENT BETWEEN THE SPANISH PUBLIC PORTS DEPARTMENT [PORTS OF SPAIN] AND THE PAFSC FOR THE EXECUTION OF WORK RELATED TO THE SAMOA 2 PROJECT
Ports of Spain and the PAFSC
From 06/06/2018 To 06/06/2022
(According to the REICO
date)
AGREEMENT BETWEEN THE MUNICIPALITY OF FERROL AND THE PAFSC IN VIEW OF FIRE PREVENTION AND EXTINGUISHMENT 2018-2019
The Municipality of Ferrol and the PAFSC
From 09/27/2018 To 09/27/2020
(According to the REICO date)
COLLABORATION FRAMEWORK AGREEMENT BETWEEN THE PORTS OF SPAIN AND SASEMAR FOR PORT TRAFFIC CONTROL
Ports of Spain SASEMAR From 03/19/2014
Table 38 (102-13),(413-1)

Appendix: Active Transparency in the Information. Data in detail. Data updated on 31/12/2020 Appendix: Active transparency in the information. Data in detail.
50
I_29 Technical or business associations to which the Port Authority belongs or in which it actively participates
In 2020, the Port Authority has collaborated with the following technical or business associations:
Cruise Lines International Association CLIA Spain is a member of the Cruise Lines International Association (CLIA). It is the largest association in the cruise ship industry, with representation South America, North America, Europe, Asia, Australia, and New Zealand.
Iniciativa empresarial del Noroeste (IEN por Europa)
Iniciativa Empresarial del Noroeste – This is a multisectoral business association that was founded in 1993 and has the goal of defending entrepreneurs as a whole within the geographic area of Spain, as well as of facilitating access to European Union (EU) policies, promoting any measures that are relevant for optimizing the interests of its members.
Employer’s Confederation of Ferrolterra, Eume y Ortegal
Among others, this confederation has the following purposes: • To promote and defend the system of private initiative and free-market economics, considering private companies to be the basic core of wealth creation and the provision of services to society, and therefore, worthy of the esteem and respect that the social significance of their purpose deserves. • To promote the country’s economic development as a way of obtaining an increasingly fairer social reality. • To represent and defend the general and joint interests of companies.
Global Reporting Initiative (GRI) The GRI is an independent international organization that has been a pioneer in creating sustainability reports since 1997. Mission: To encourage decisions that generate social, environmental, and economic benefits for everybody.
Cruise Europe This is a European port association that is seeking to increase its respective cruise ship traffic. It is committed to promoting northern and western Europe as a world-class cruise ship destination.
AEUTRANSMER The Asociación de Cargadores y Usuarios del Transporte de Mercancías is a business association the goal of which is to represent and defend the interests of loading companies and the users of different merchandise transportation methods. The industrial fabric that makes up this association is characterized by its particular dedication to exports, using maritime routes as one of its preferred options.
Fundación Instituto Tecnológico del Pienso (FITP)
A foundation that is a part of the AGAFAC, the Galician fodder producers’ association, which offers a product of significant commercial interest due to its very high volume of port traffic.
Cluster da Función Loxística The Clúster da Función Loxística was born of the desire to drive the Galician logistics sector from within, with the idea that the efforts would not only benefit sector companies but also would constitute a competitive advantage for the economy of the entire region.
Table 39

Appendix: Active Transparency in the Information. Data in detail. Data updated on 31/12/2020 Appendix: Active transparency in the information. Data in detail.
51
COMMERCIAL PROMOTION I_30 Description of initiatives forwarded by the Port Authority in view of the commercial promotion of the port. Reference to target sectors and
potential market prospecting fieldwork carried out.
Multiple and diverse activities have been carried out in this respect, mainly in the context of the scopes indicated in the “Commercial Management” Internal Procedure, such as presenting the Port of Ferrol at a logistics conference organized by UNO and CEL or at the conference organized by the Spanish association ShortSea and the Cluster de la Logística de Galicia, where Ferrol played a leading role as a part of CONTAINERSHIPS’ presentation on its shipping lines at Ferrol.
I_31 Total expenses earmarked for the commercial promotion of the port, expressed as a function of total expenses and as a percentage of
operating expenses. (Left blank)
Figure 27
INSTITUTIONAL COMMITMENT I_32 Description of projects related to communications and the provision of services over the Internet or via other digital means, intended to
optimize port management, provide information to interest groups, or enable the administrative management of customers or suppliers.
• Management of services and access to information based on information and communication technologies. (left blank) o Describe the catalogue of electronic services that the Port Authority provides to port users and citizens in general, by means of its
electronic headquarters or website. (left blank) o State whether the Port Authority provides citizens with a catalogue of open data, and what type of data is accessible (in the context
of the Spanish Plan to Reuse Public Sector Information, as per Spanish Royal Decree 1495/2011). (left blank)
• Security with regards to the provision of services based on information and communication technologies. (left blank) o State whether the Port Authority has a business continuity plan with regards to information and communication technologies. o State whether the Port Authority has a contingency plan with regards to information and communication technologies. o Describe the initiatives carried out with respect to cybersecurity.
• Quality of the provision of services based on information and communication technologies. (left blank) o State whether the Port Authority has implemented any specific methodology intended at guaranteeing the quality of the provision
of information and communication technology services. o State whether the Port Authority has implemented quality assessment indicators in the provision of information and communication
technology services.
• Smart port (left blank)

Appendix: Active Transparency in the Information. Data in detail. Data updated on 31/12/2020 Appendix: Active transparency in the information. Data in detail.
52
R+D+i PROJECTS I_33 The R+D+i projects pursued by the Port Authority or in which it is actively participating, their goals and targets, and the institutions with which
it is collaborating on the aforementioned projects. Total financial resources allocated to this category: expenses and investments, expressed as totals in euros and as percentages of the Port Authority’s total expenses and investments.
Agreement between the Ports of Spain and the Port Authority for work related to the “Samoa 1 and 2” project
• Budget executed in 2020 (investment) €31,028.90 (excluding VAT). 0.24% of the investment executed in 2020.
• Total budget originally executed (investment): €101,867.30 (excluding VAT). The Spanish Public Ports Department has set the goal of developing personalized meteorological and oceanographic support systems (SAMOA) for each port authority. The SAMOA project is a system based on a proprietary graphic interface (the Environmental Dashboard (CMA)), which comes with a series of modules that are implemented at each port authority in accordance with their needs and features. Those implemented at the Port Authority of Ferrol-San Cibrao for the Ports of Ferrol (Interior and Exterior) and San Cibrao are those indicated in the following table:
Module Port of Ferrol Port of San Cibrao
Module 1: Display software and CMA alert Already implemented during Samoa1. Will be updated during Samoa2.
To be implemented during Samoa2
Module 2: High-resolution atmospheric winds (1 km) To be implemented during Samoa2
To be implemented during Samoa2
Module 3: Forecasting of agitation inside the port Already implemented during Samoa1. Will be updated during Samoa2.
To be implemented during Samoa2
Module 4: Forecasting of currents inside the port Already implemented during Samoa1. Will be updated during Samoa2.
To be implemented during Samoa2
Module 5: Meteorological station (wind and pressure) on the tide gauge
Already implemented during Samoa1. Will be updated during Samoa2.
To be implemented during Samoa2
Module 6: GNSS station on the tide gauge Already implemented during Samoa1. Will be updated during Samoa2.
Module 7: Real-time alerts To be implemented during Samoa2
Module 9:: Overflow prediction system To be implemented during Samoa2
Module 10: Long wave prediction system To be implemented during Samoa2
Module 12: Zone-based measurement campaign To be developed during Samoa2
Table 40
LIFE funds project (beneficiary: PROYFE): LIFE DrainRain purification for pavement runoff waters Participation of the PAFSC as a part of the consortium:
• Budget executed in 2020 (investment): €0.00 (excluding VAT). In 2020, the project was in its first year of
testing and operation.
• Total original budget executed (investment): €36,070.95 (excluding VAT).
The runoff water from pavement transited by vehicle traffic is a significant source of water pollution (nonpoint source pollution). In accordance with the water policy framework directive (Directive 2000/ 60/EC), the establishment of measures to prevent and control this type of pollution is fundamental. Runoff water transports a significant load of contaminants, mainly composed of:
• Heavy metals such as copper, zinc, lead iron.
• Polycyclic aromatic hydrocarbons.
• Suspended solids.

Appendix: Active Transparency in the Information. Data in detail. Data updated on 31/12/2020 Appendix: Active transparency in the information. Data in detail.
53
The LIFE DrainRain project’s main goal is to demonstrate the effectiveness of an innovative, modular, and economically viable system for the treatment of runoff water from paved areas (transited surfaces, storage clearings, patios, etc.) by combining porous concrete pavement that has been photocatalytically activated with on-site modular water treatment based on developed and demonstrated technologies, to guarantee a reduction in nonpoint source pollution in order to prevent a direct source of the pollution of natural areas, and allowing to reuse this water for other uses. The project will consist of implementing two pilots to demonstrate the effectiveness and replicability of the solution in different locations and with respect to different environmental priorities:
1. Creation of a pilot in a coastal area with a high volume of industrial activities, in the Atlantic climate zone (abundance of water) and in an environment with a high environmental and socioeconomic value (fishing, shellfishing, tourism).
2. Creation of the second pilot in the Levante region (Murcia) in the Mediterranean region (water stress and occurrence of one-time large floods).
To carry out this initiative, the Port Authority of Ferrol-San Cibrao joined a consortium consisting of the companies PROYFE SL, COPASA, the CETIM, and CYE Control y Estudios SL, each of which will contribute to consulting, research, and final execution work. The DrainRain project is financed by the European Commission as a part of the European LIFE environmental program. The LIFE program selects the best projects in the European Union each year in order to fund those seeking environmental innovation and which have a high potential for impact at the global level. Investment Plan 2021-2025 (in thousands of Euros): % over investment plan 0.24%
*Investment code
SEINVER code
PROJECT
Subs
idy
Goal
Start year
End year
Total investment
Real amount accumulated
as of 12/31/2019
Real 2020
2021 2022 2023 2024 2025
2026 and
following
years
DIGITALIZATION AND INNOVATION 0 0 274 124 0 25 25 25 25 25 25
1214
FS1I1002
Tangible investments in digitalization and innovation 0
Continuous
Continuous 274 124 25 25 25 25 25 25
1216 FS1I1002
R+D+i intangible assets
0 Contin
uous Contin
uous 144 58 31 30 5 5 5 5 5
Table 41

Appendix: Active Transparency in the Information. Data in detail. Data updated on 31/12/2020 Appendix: Active transparency in the information. Data in detail.
54
SOCIAL PROGRAMMES I_34 Charities, cultural initiatives, courses, seminars, educational programmes, or other social programmes promoted or supported by the Port
Authority and total financial resources allocated to them: expenses and investments, expressed as a total amount in euros and as percentages of the Port Authority’s respective total expenses and investments.
(left blank)
PORT-CITY JOINT PROJECTS (413-1) I_35 Description of programmes or projects intended at improving the port-city interface, and total financial resources dedicated to this line of
them: expenses and investments, expressed as a total amount in euros and as percentages of the Port Authority’s respective total expenses and investments
Reorganization of the Lower road of the port Plans have been established to remodel the area connecting the port to the city of Ferrol with the goal of integrating and humanizing it, by reorganizing the sidewalk of the lower highway between A Malata and Curuxeiras by constructing a pedestrian walkway and bicycle route adjacent to the commercial port gate. Improvements in the accessibility of the Interior Port of Ferrol (buildings and public areas) In the goal of guaranteeing accessibility to physical means under conditions enabling the quality of all people, Ferrol region functional diversity association has provided the Port Authority of Ferrol-San Cibrao with a report/study highlighting deficiencies in the accessibility conditions applicable to public spaces in a geographic area which is primarily its responsibility. Using the deficiencies detected in this report as a starting point, in February 2018, a draft project was written the goal of which was to advance with respect to the scope and to constructively define the solutions adopted to eliminate architectural barriers in the targeted area. Based on this draft project, in May 2018, the applicable offprints were made in order to inform and request authorization from the bodies responsible for managing the occupied the space not dependent on the PAFSC. The plan is to begin the work in 2021 and to complete it in 2022. With this action, the PAFSC will improve the sections between the two ends of the esplanade extending from the promenade of Marina to the intersection between the upper port highway and the port-A Graña highway, guaranteeing longitudinal pedestrian access that builds on with the multifaceted improvement work that the PAFSC will carry out in the areas for which it is responsible. Pedestrian walkway next to the viaduct to access the Outer Port of Ferrol As a part of work related to rail access to the Outer Port of Ferrol, a pedestrian connection open to the public will be constructed, enabling a route encircling A Malata Bay, also establishing a direct connection between the centres of A Graña and A Cabana and the city center. Once this action is complete, the A Malata esplanade will be 5 km long in its new configuration. The planned action will take place by means of the construction of a new esplanade section which will be added to the existing esplanade, traveling a length of 1.1 km, the most complex element of which is a pedestrian walkway adjacent to the rail access viaduct with an approximate length of 620 m. The beginning of the pedestrian connection will start beside the location of the A Cabana tidal dam, and will end at the A Malata esplanade under the suspended pedestrian walkway located over the entry to the Interior Port. In the A Cabana and A Graña regions, the pedestrian walkway will initially run parallel to the coast, at ground level, taking advantage of the natural slopes in the ground, up to an initial structured enabling access to the railway platform level. From this point on, the walkway will run parallel to the latter, first suspended over the inlet for a 300-m section, and later running along the edge of the port breakwater until connecting with the A Malata esplanade following an additional 500-m section. The width of the pedestrian traffic pathway will be 3 m. It will have guardrails, vandalism prevention walls, and lighting systems.

Appendix: Active Transparency in the Information. Data in detail. Data updated on 31/12/2020 Appendix: Active transparency in the information. Data in detail.
55
The entire route will contain the appropriate lighting, guardrails, and urban furniture elements. The design of the route as a part of a pedestrian itinerary complies with the criteria established in regulations regarding accessibility for people with reduced mobility, in particular with respect to slopes, ramp lengths, and rest areas. The planned cost of the project to complete this action is more than €1 million. Investment Plan 2021-2025 (in thousands of euros): % over investment plan: 0.74% (without counting the budget for the pedestrian walkway project)
*Investment code
SEINVER code
PROJECT
Subsi
dy
Goal
Start year
End year
Total investme
nt
Real amount accumulated
as of 12/31/2019
Real 2020
2021 2022 2023 2024 2025 2026 and following
years
ACTIONS IN ACCORDANCE WITH THE UNIVERSAL ACCESSIBILITY PLAN 2021 2021 229 0 0 229 0 0 0 0 0
1220 FS1H1003
Improvements to the accessibility of the Interior Port of Ferrol (buildings and public areas) 4 2021 2021 229 229
PORT-CITY JOINT ACTIONS 2021 2026 3,500 0 0 100 400 0 0 0 3,000
1221
FS1B2011
Reorganization of the Lower road of the port 4 2021 2026 3,500 100 400 3,000
Table 42 (413-1)

Appendix: Active Transparency in the Information. Data in detail. Data updated on 31/12/2020 Appendix: Active transparency in the information. Data in detail.
56
PROTECTION AND SECURITY
I_36 Total economic resources: expenses and investments, employees in protection and security, expressed as totals in euros and as respective
percentages of the total expenses and investments of the Port Authority. Describing the items or initiatives that they include.
2021-2025 Investment Plan (Thousands of Euros): % on Investment Plan 2.30%
*Investment code
SEINVER Code
PROJECT Sub. Objective Starting
year End year
Total investment
Actual accumulated
as of 31/12/2019
Actual 2020
2021 2022 2023 2024 2025 2026 and
up
1026 FS2D9001
Mooring system to improve dock operability.
3 2016 2021 2,364 1,164 600 600
7212 FS2E2005
AT Health and safety coordination.
FFAT 2 2017 2023 578 222 99 101 101 55
ACTIONS IN SECURITY MATTERS
2026 2026 4,682 734 65 383 180 80 80 80 3,080
Safety
1215 FS1G3002
Actions in matters of security/safety
6 Continuing Continuing 813 639 24 25 25 25 25 25 25
1215
FS1G8001
Sasemar Framework Agreement Investments
FCI 6
Continuing Continuing 494 61 283 30 30 30 30 30
Security
1215 FS1G3003
Actions in matters of security
6 Continuing Continuing 375 34 41 75 125 25 25 25 25
1215 FS2D9001
Scanner for containers in the Outer Port
6 2026 2026 3,000 3,000
Table 43
Mooring system to improve dock operability. The functionality of any port is fundamentally determined by its accessibility and the frenzy inside of it. The conditions of stay and of loading and unloading ships, efforts on boats and moorings, as well as the loads to which the external defence structures, piers, protections, etc. are subjected, are conditioned by the action of oscillations and the associated currents outside and inside the port. Between 2011 and 2012, the Port Authority studied the different possibilities in the market (assistance systems to regulate the tension of moorings and dynamic movement compensation systems), to reduce the movements of docked ships, being considered systems based on active control of the tension of the mooring lines to be the more appropriate solution for their installations, both from a technical and economic point of view. The investment covers the purchase of two pairs of Shore Tension equipment, including all auxiliary elements, the first in 2021 and the second in 2022. AT Coordination of health and safety “Access to the Outer Port Railway”. On 1 April 2016, the Board of Directors agreed to initiate the dossier and tender for the works of “Rail access to the Outer Port of Ferrol”. The next execution of this project involves, among other things, work related to occupational health and safety. The purpose of this dossier is to contract the provision of Technical Assistance services to the Port Authority in all aspects related to occupational health and safety due to the execution of the Railway Access project to the Outer Port of Ferrol, exercising the functions of coordination in matters of safety and health in the execution phase of the works in accordance with the provisions of Royal Decree 1627/97 of 24 October, which establishes minimum health and safety provisions in construction works and all their related legislation. Actions in matters of safety-security These are two lines of the Investment Plan that cover non-exceptional investments related to security. Sasemar Framework Agreement Investments On 19 March 2014, the State Ports Public Agency and the Public Business Entity Sociedad de Salvamento y Seguridad Marítima (hereinafter “SASEMAR”) signed a Framework Agreement of collaboration in which the conditions are

Appendix: Active Transparency in the Information. Data in detail. Data updated on 31/12/2020 Appendix: Active transparency in the information. Data in detail.
57
regulated for the aforementioned Public Entity to provide the general service of planning, coordination, and control of maritime port traffic on behalf of the different Port Authorities. On 22 February 2016, the PAFSC and SASEMAR signed a Services contract that develops the framework agreement and which details the particularities of the Service to be provided by SASEMAR in the Service Zones and anchorages under the responsibility of the PAFSC. For SASEMAR's provision of the general service of planning, coordination, and control of maritime port traffic, it is necessary to have a communications infrastructure that allows the Maritime Rescue Coordination Centres (hereinafter “CCS”) to capture information on the exact location of the vessels which are located in or are navigating waters under the responsibility of the Port Authority, at all times. The service to be provided requires a real traffic image (INS, TOS, NAS) in these waters; it is essential to have a RADAR signal. For the provision of the Service in the port of San Cibrao, and given that SASEMAR does not have equipment in the area, different locations are studied and it is concluded that the ideal location, in terms of Radar coverage, for traffic control inside and in the anchorages of San Román and Los Farallones, is the Roncadoira Lighthouse.
ENVIRONMENT I_37 Total economic resources: expenses and investments, used in environmental matters, expressed as totals in euros and as respective
percentages of the total costs and investments of the Port Authority. Describing the items or initiatives that they include.
2021-2025 Investment Plan (Thousands of Euros): % on Investment Plan 1.59%
*Investment code
SEINVER Code
PROJECT Sub. Objective Starting
year End year
Total investment
Actual accumulate
d as of 31/12/2019
Actual
2020 2021 2022 2023 2024 2025
2026 and up
FS2E2007
AT Environmen
tal manageme
nt and consultancy
FFAT 2
2017 2023 592 192 98 120 100 82
ACTIONS IN MATTERS
OF ENVIRONM
ENTAL SUSTAINABI
LITY
0 0 1,803 443 60 105 430 630 45 45 45
6912 FS1H2002 Air quality 5
Continuing
Continuing 30 5 5 5 5 5 5
6912 FS1B3001
Actions in energy
efficiency 5 Continui
ng Continui
ng 1,592 443 54 50 400 600 15 15 15
6912
FS1H2001
Actions in matters of
environment
sustainability - Others
5
Continuing
Continuing 181 6 50 25 25 25 25 25
Table 44

Appendix: Active Transparency in the Information. Data in detail. Data updated on 31/12/2020 Appendix: Active transparency in the information. Data in detail.
58
ECONOMIC DIMENSION
DESCRIPTION OF THE ECONOMIC POLICY OF THE PA
(103-1) on Economic development, Indirect economic impacts, (103-2) on Economic development, indirect economic impacts
The economic and social development of the region in which we are located depends on our behaviour as a public body, in the role that we have to play in the logistics chains of transportation of people and goods. The Mission of the PAFSC puts our organization directly into our strategy, and the need to work as a generator of prosperity in our region into our activities, going beyond the role of a mere investor or provider of infrastructures and services. It is this vision that makes us responsible for collaborating and forming alliances, so that all sectors affected by our activity have the same development opportunity, regardless of the contribution to our business margin. To maximize the economic and social impact of our business lines, minimizing the environmental impact of port activity, and generate long-term value for our stakeholders, we must start by having the economic and financial solvency necessary to be able to meet our objectives, projects, and investments. The Planning process allows us to link the annual update of our five-year plan of objectives with the investment plan, human resources, traffic and income forecast, and finally the financial economic budget, parameters the evolution of which we follow monthly through the monthly management report. This monitoring also includes a report on collections and payments, which allows us to control solvency in the short term, while keeping our supplier payment period under supervision, since we are aware of the impact of this policy in extending our solvency to the rest of the supply chain, and positively impacting the regional economy. Law 15/2010 has established that as of 1 January 2013, the period in which administrations are required to pay the obligations derived from commercial operations will be within 30 days after the acceptance of the supporting documents of the execution of the contract. The Port Authority of Ferrol-San Cibrao has complied with this legal precept since then. In the 2020 financial year, the average payment period from customers was 36 days and the average payment period from suppliers was 39.71 days. Since Royal Decree 463/2020, of 14 March, was enacted, which declares the state of alarm for the management of the health crisis situation, to minimize its possible negative effects, the Port Authority adopted various measures within its competence, which include among other things, in terms of economic management, those related to the deferral of payment to customers and the prioritization of payment to suppliers.

Appendix: Active Transparency in the Information. Data in detail. Data updated on 31/12/2020 Appendix: Active transparency in the information. Data in detail.
59
(103-2) on Economic performance, Indirect Economic Impacts
Figure 28
Our management system, certified under the ISO 9001:2015 and ISO 14001:2015 standards, and with the 5-star recognition of excellence, provided by the European Foundation of
Quality Management (EFQM), provides the necessary tools to implement the objectives strategies and monitor them through the corresponding indicators. The improvement actions
and approved objectives, as well as their monitoring, are presented in the management systems section of this appendix. (103-2) on Economic performance, Indirect economic impacts (103-3) on Economic performance, (103-2) on Economic performance, Indirect economic impacts
Figure 29

Apéndice: Transparencia Activa en la Información. Los datos en detalle. Updated data as o 12/31/2020 Appendix: Active transparency in the information. Data in detail.
60
ECONOMIC AND FINANCIAL SITUATION ANNUAL ACCOUNTS OF THE PORT AUTHORITY FERROL SAN CIBRAO The complete information on the financial-economic situation of the Port Authority can be consulted in the annual accounts and in the audit report of the General Intervention Board of the State Administration that accompanies them, which are published in the APFSC webpage through the following QR
EVOLUTION OF THE FINANCIAL-ECONOMIC INDICATORS. Comparison with that budgeted (Goal), and with the average from the Spanish port system (Average). (201-1)
Net turnover amount PAFSC (thousands of euros)
a Figure 30
a Code Title Ind. Units Formula 2013 2014 2015 2016 2017 2018 2019 2020
I0088
Net turnover amount PAFSC (thousands of euros)
Thousands of euros
Net turnover amount PAFSC
19,882.00 18,959.00 16,633.00 17,243.81 18,983.00 20,312.00 17,528.00 15,212
Table 45
Results of the financial year (thousands of euros)
Figure 31
Code Title Ind. Units Formula 2013 2014 2015 2016 2017 2018 2019 2020
I0091 Results of the financial year
Thousands of euros
Results of the financial year
6,465 5,724 2,800 4,291.44 5,911 6,399 3,220 1,148
Table 46

Apéndice: Transparencia Activa en la Información. Los datos en detalle. Updated data as o 12/31/2020 Appendix: Active transparency in the information. Data in detail.
61
(201-1)
Profitability over assets (%) E_01 Yearly profitability, stated as a percentage of the results of the financial year against average non-current assets, according to the definition given in final provision twenty-two of Law 2/2012 of 29 June on General State Budgets
RATIO (Results of the Financial Year / Average net non-current asset) *100
In accordance with final provision twenty-two of Law 2/2012, the annual profitability is calculated as a result of dividing: a) The profit for the year after tax, excluding impairment and profit due to disposals of fixed assets and other results that are extraordinary, as well as financial income corresponding to the incorporation of financial expenses as assets and the balance of the Fund of Interport Compensation contributed or received b) Average net non-current assets for the financial year, excluding fixed assets in progress, fixed assets corresponding to land and natural assets on which no type of activity has been carried out during the year, deferred tax assets and commercial non-current debtors. The incorporation of a new basic port infrastructure (breakwater, sluice, and maritime access) will be prorated for seven years from the date of receipt.
Figure 32
Code Title Ind. Units Formula Description 2013 2014 2015 2016 2017 2018 2019 2020
I0095 Profitability over assets
%
According to that established in art. 157 RDL 2/2011
Results of the financial year/Average net non-current assets
3.13 2.75 1.37 2.00 2.80 3.21 1.69 0.51
Table 47
EBITDA/Tonnes (thousands of euros) E_02 Evolution of EBIDTA during at least the last three years expressed in euros, of total tonnes moved, of the EBIDTA ratio versus tonnes moved and the percentage of variation of EBIDTA expressed as a percentage compared to the previous year (closed 31 from December).
RATIO (EBIDTA/tonne)
The EBITDA for the Port System would be calculated based on the Operating Result that is corrected with the following items:
• Amortizations = A.
• Balance of impairment and result from disposal of fixed assets and others = S.D.
• Exceptional results = R.E. EBITDA = Operating Income - A. ± S.D. ± R.E. Where the amounts enter with the sign of the profit and loss account. Whereby ± it is understood that when the amounts appear in the profit and loss account with a + sign they will be subtracted, and when they appear with a - sign they will be added.
Figure 33
Code Title Ind. Units Formula 2013 2014 2015 2016 2017 2018 2019 2020
I0096 EBITDA (euros)/ Tonnes moved
Thousands of euros
EBIDTA / tonnes moved
0.89 0.85 0.71 0.82 0.89 0.92 0.83 0.69
Table 48

Apéndice: Transparencia Activa en la Información. Los datos en detalle. Updated data as o 12/31/2020 Appendix: Active transparency in the information. Data in detail.
62
Cash Flow (thousands of euros)
Figure 34
Code Title Ind. Units Formula 2013 2014 2015 2016 2017 2018 2019 2020
I0092 Cash Flow (thousands of euros)
Thousands of Euros
Cash Flow (thousands of euros)
11,877 10,900 8,632 9,805 11,355 11,905 8,6765 6,153
Table 49
Debt ratio (%)
Figure 35
Code Title Ind. Units Formula 2013 2014 2015 2016 2017 2018 2019 2020
I0093 Debt ratio (%) % Bank indebtedness (LT + ST) / Total liabilities
14.38 13.62 13.04 12.38 11.57 10.64 9.3 8.18
Table 50
Debt service (%) E_03 Debt service, expressed as 100 x (Amortization of the debt1 + Interest2) / Cash Flow3
RATIO (%): 100*(Amortization of the debt+interest)/ Cash Flow
1 It would include the annuity corresponding to long-term loans with credit institutions that are returned to the financial institution in the financial year (NOT to be confused with the short-term transfer of debts with long-term credit institutions) + early cancellation, not scheduled in the repayment schedule, of the main long-term debts with credit institutions + negative variation in the balance of short-term loans with credit institutions (that is to say, short-term loans with credit institutions that mature in the financial year and, therefore, do not renew or lower the limit). 2 Financial expenses for interest on debts with credit institutions. 3 Cash Flow before interest
Figure 36

Apéndice: Transparencia Activa en la Información. Los datos en detalle. Updated data as o 12/31/2020 Appendix: Active transparency in the information. Data in detail.
63
Code Title Ind. Units Formula 2013 2014 2015 2016 2017 2018 2019 2020
I0098 Debt service % 100*((payments+interest)/(cash flow+interest))
0.27 0.19 0.23 0.20 0.17 0.16 0.22 0.32
Table 51
Land and natural assets without activity in 5 years (%) E_04 Non-operating assets, defined as land and natural assets without activity during the financial year which can be put in economic, social, or environmental value, expressed as a percentage of the net carrying value over the average net non-current assets for the financial year.
RATIO = (Land and natural assets without activity in the financial year3 / Average net non-current assets of the financial
year4) *100
3 Value according to the balance of the land and natural assets that have not been active during the financial year). 4 The average net non-current assets for the financial year according to Law 2/2012 of 29 June on the General State Budget
Code Title Ind. Units Formula Description 2013 2014 2015 2016 2017 2018 2019 2020
I0115
Land and natural assets without activity in the last 5 years / Total assets
%
Land and natural assets without activity during the last five years (3) / Total assets (4)
(3) Value according to the balance sheet of the lands and natural assets that during the last five years have not had activity (this is understood to be without activity within any of the five years) (4) Average net non-current assets in operation as defined in article 157 of Royal Legislative Decree 2/2011 that approves the Consolidated Text of the Law on State Ports and the Merchant Navy, also excluding financial assets.
0.00 0.00 0.00 0.00 0.00 0.00 0.00 0.00
Table 52
Operating expenses / operating income (%) E_05 Evolution, during at least the last three years, of operating expenses with respect to operating income.
RATIO (%): (Operating expenses5 / Operating income6)*100
5 Personnel expenses + Other operating expenses (excluding the items of Losses, impairment and variation of provisions due to commercial operations and the Interport Compensation Fund contributed) + amortizations. 6 Understanding the net turnover amount as operating income
Figure 37
Code Title Ind. Units Formula 2013 2014 2015 2016 2017 2018 2019 2020
I0090 Operating expenses / Operating income (%)
% Operating expenses / Operating income (%)
79.62 88.54 105.10 96.61 87.63 84.44 100.26 114.26
Table 53

Apéndice: Transparencia Activa en la Información. Los datos en detalle. Updated data as o 12/31/2020 Appendix: Active transparency in the information. Data in detail.
64
LEVEL AND STRUCTURE OF INVESTMENTS (203-1), (203-2)
Amount of Port Authority investments (public investment) (millions of euros)
Figure 38
Code Indicator title Units Formula Description 2013 2014 2015 2016 2017 2018 2019 2020
I0134
Amount of Port Authority Investments (public investment)
Millions of Euros
Value of annual investments
Total amount of Port Authority Investments
4.06 2.86 9.50 4.85 8.24 9.17 11.86 12.84
Table 54
Foreign investment (millions of euros)
Figure 39
Code Indicator title Units Formula Description 2013 2014 2015 2016 2017 2018 2019 2020
I0140 Foreign investment
Millions of Euros
Value in Euros
Investment by concessionaires, stevedores, terminals, etc. in infrastructure and port facilities Amounts consigned in the Investment Plan and Annual Business Plan.
12.69 4.25 14.78 2.61 10.18 8.88 8.19 7.44
Table 55
Public investment by PAFSC with regard to the Cash Flow (%) E_06 Evolution,during at least the last three years, of the public investment carried out by the Port Authority with regard to the Cash Flow.
RATIO = Total Public Investment carried out by the Port Authority7 / Cash Flow
7 Investment in fixed financial assets is excluded.
Figure 40

Apéndice: Transparencia Activa en la Información. Los datos en detalle. Updated data as o 12/31/2020 Appendix: Active transparency in the information. Data in detail.
65
(203-2)
Code Indicator title Units Formula 2013 2014 2015 2016 2017 2018 2019 2020
I0099 Public investment carried out by PAFSC with regard to the cash flow
% Public Investment / Cash Flow
34 26 110 31 72 77 135 207
Table 56
Foreign investment/Public investment carried out by PAFSC (%) E_07 Evolution, during at least the last three years, of foreign investment compared with public investment carried out by the Port Authority.
RATIO = Foreign investment / Public investment carried out by the Port Authority8
8 Excludes investment in fixed financial assets (it is the same investment data used in indicator E_06).
Figure 41
Code Indicator title Units Formula 2013 2014 2015 2016 2017 2018 2019 2020
I0100 Foreign investment / Public investment carried out by PAFSC
% Foreign investment / Public investment carried out by PAFSC
3.15 1.51 1.56 0.85 1.24 0.97 0.70 0.62
Table 57
Public investment / Average net assets (%) E_08 Renewal of assets, expressed as the relationship of the annual volume of investment with regards to the average net non-current assets or the fiscal year (according to Law 2/2012 from 29 June, State's General Budget)
RATIO = Total public investment carried out by the Port Authority9 / Average net assets10
9 Excludes investment in financial assets (it is the same investment data used for indicator E_06). 10 The average net non-current assets from the fiscal year according to Law 2/2012 of 29 June, from the State's General Budget.
Figure 42
Code Indicator title Units Formula Description 2013 2014 2015 2016 2017 2018 2019 2020
I0101
Public investment / Average net assets (%)
%
Public investment (8) / Average net assets (9)
( 8) Excludes investment in fixed financial assets (it is the same investment data used in indicator E_06). (9) Average net non-current operating assets as defined in article 157 of Royal Legislative Decree 2/2011 sanctioning the revised text of the Law On State Ports And Merchant Marine,
1.84 1.30 4.44 1.44 3.94 4.50 5.93 6.66
Table 58

Apéndice: Transparencia Activa en la Información. Los datos en detalle. Updated data as o 12/31/2020 Appendix: Active transparency in the information. Data in detail.
66
(201-1)
BUSINESS AND SERVICES
Income from occupancy and activity rates with respect to the net amount of turnover (%) E_09 Evolution, during at least the last three years, of the income from occupancy and activity rates, as well as the percentage from each with respect to the net amount of turnover
Figure 43
Code Indicator title Units Formula 2013 2014 2015 2016 2017 2018 2019 2020
I0104
Income from occupancy and activity rates with respect to the net amount of turnover
% Income from occupancy and activity rates/net amount of turnover
38.32 35.68 35.90 37.15 33.37 32.81 39.06 43.90
Table 59
E_10 Evolution, during at least the last three years, of tons moved by meter square of land service area characterized as commercial use (surface for concessions).
(No content)
Tons moved by lineal meter of commercial dock (t/m) E_11 Evolution, during at least the last three years, of the tons moved per linear meter of active dock. Active dock is understood as that which has registered activity within the last three years.
Figure 44
Code Indicator title Units Formula Description 2016 2017 2018 2019 2020
I0153
Tons moved per linear meter of commercial dock
t/m
Total tons loaded and unloaded in the year/Total meters dock and dockings in commercial docks
Total tons of the table from Annual Report 4.3.3 divided by the total linear meters of commercial docks in table 2.2.1.1. from the Annual Report.
2,047.24 2,215.72 2,237.80 1,829.28 1,641.127
Table 60

Apéndice: Transparencia Activa en la Información. Los datos en detalle. Updated data as o 12/31/2020 Appendix: Active transparency in the information. Data in detail.
67
(201-1)
GENERATED VALUE AND PRODUCTIVITY Net amount of turnover PAFSC/employee (thousands of euros)
E_12 Evolution, during at least the last three years, of the net amount of turnover per employee (annual average workforce).
RATIO: Net amount of turnover / No. of employees (thousand of € per employee)
Figure 45
Code Indicator title Units Formula Description 2013 2014 2015 2016 2017 2018 2019 2020
I0089 Net amount of turnover PAFSC / employee
Thousands of Euros
Net amount of turnover A.P. / employee
Taking into account the average workforce
177.52 169.28 152.60 161.16 180.79 191.62 159.35 140.85
Table 61
EBITDA per employee (thousands of euros)
E_12 Evolution, during at least the last three years, of the EBITDA per employee (annual average workforce) RATIO (Thousands of euros): EBITDA11 / Average annual payroll
11 It is the EBITDA for the Port System calculated as reflected for indicator E_02.
Figure 46
Code Indicator title Units Formula Description 2013 2014 2015 2016 2017 2018 2019 2020
I0097
EBITDA11 per employee (average annual payroll)
Thousands of Euros
EBITDA / No. of employees
Taking into account the average workforce
99.51 99.59 83.51 96.21 114.52 118.32 83.85 63.82
Table 62

Apéndice: Transparencia Activa en la Información. Los datos en detalle. Updated data as o 12/31/2020 Appendix: Active transparency in the information. Data in detail.
68
FINANCIAL IMPACT AND PRODUCTIVITY E_14 Estimate of the number of direct, indirect and induced employment by the port community, referencing the study and methodology followed to obtain said estimate.
(No content) E_15 Estimate of the gross added value of the port community, referencing the study and methodology followed to obtain said estimate.
(No content)
Financial implications and other risks and opportunities derived from climate change. (201-2)
The necessary international, European and Spanish regulation for controlling the emission of greenhouse gases is a variable to be taken into consideration in our economic management.
Table 63
Variables with possible repercussions to port traffic and to PAFSC’s income
With incidence in the traffic of carbon, natural gas and fuels The variation of the energy mix that is affecting our main clients in order to
meet the objectives defined by the European Union with regards to climate change and that are contained in *The European Parliament resolution of March 2019 regarding the long-
term strategic vision for a prosperous, modern, competitive and climate-neutral economy in line with the Paris Agreement. *In the European Council conclusions on climate change from December
2019. *In the European Parliament resolution of 15 January 2020, regarding “The European Union Green Deal”.
*In the European Commission document from 6 March 2020, regarding the long-term strategy on the emission of greenhouse gases of the European Union and its member states.
In 2021, Spain sanctioned the following legislation: *Law 7/2021 of May 20, on climate change and energy transition. In 2020, the impact of the transition policies of the energy model being
promoted adopted to date in the traffic of carbon (which represented an average 30% of the Port Authority’s traffic), has been from the disappearance of said traffic. This directly affects the Port Authority's profit
and loss account, and the economic and social fabric of its area of influence. In 2020, PAFSC formalized, in its annual Business Plan, the objective that allows it to address the change scenario analysed in its annual SWOT, in its
most significant impact in the entity's economic-financial sphere. And has also included 5-year budgetary and financing provisions, contemplating the current scenario.
Objective C2-00003. Joint analysis with Endesa of the business continuity strategy. With an impact on energy consumption and emissions produced at the port and the transportation chains with origin/destination at ports. In the following years, the Port Authority must put together different
mechanisms to promote the use of renewable and clean energies in the transportation chain as well as in the concessionary and licensee companies. As well as to measure consumption and emissions.
*Law 7/2021 of May 20, on climate change and energy transition. PREAMBLE Likewise, the law includes the need to adopt measure for reducing
emissions generated by the consumption of fossil fuels in maritime transportation and at ports, so that ports under the jurisdiction of the State be free of direct emissions by 2050.
Article 16. Maritime transport and docks. 4. a) It will apply financial incentive measures aimed at stimulating the power supply or use of alternative fuels in docked ships, railway transport
with origin and destination to ports and energy efficiency measures at concessions. 4. d) It will establish objectives to reduce energy consumption at docks
relative to their level of activity.
With incidence in the provisioning of vessels. *In Law 7/2021 of May 20, on climate change and energy transition.
Article 16. Maritime transport and docks. a) It will apply financial incentive measures aimed at stimulating the power supply or use of alternative fuels in docked ships, railway
transport with origin and destination at ports and energy efficiency measures at concessions. LIQUEFIED NATURAL GAS
Article of Directive 2012/0012 states: “Member States must guarantee the installation of LNG refuelling stations for maritime and river transport of public access at all maritime ports of the main Trans-
European Transport Network, no longer than by 31 December 2020.” Both, the Authority of Ferrol-San Cibrao as well as Reganosa are partners in the CORE LNGas hive project.
“CORE LNGas hive is an initiative co-financed by the European Commission through the Connecting Europe Facility (CEF) mechanism of the Transport Calls for Proposals 2014. The project objective is to
develop an integrated, safe and efficient logistical chain for supplying liquefied natural gas (LNG) as fuel in the transportation section, specially maritime transport, in the Iberian Peninsula. This will
promote the use of this alternative fuel not just in ships but also in port areas. The project, led by Ports of the State and coordinated by Enagás, has 42 partners in Spain and Portugal.”
The Reganosa terminal is already operational for this type of supply, which it has been conducting since 2019. In 2020, the PAFSC formalized, in its annual Business Plan, the
objective that allows it to address the opportunity presented by having the regasification plant in its service area. Objective C2-00002. Strategic alliance to transform the Ferrol Port
into a referent in the provisioning of ships with LNG. GREEN HYDROGEN Both, the Forestal del Atlántico fuel terminal as well as the LNG
terminal, have announced that they are working with green hydrogen projects that position us favourably for the supply of this type of fuel in the future.
“Forestal del Atlántico plans to create a plant in Mugardos to produce zero emission fuels by mixing the gas generated with renewable energies and CO2.”
Reganosa: “The Xunta confirms that Reganosa will promote a green hydrogen plant in As Pontes.” In the SWOT analysis conducted for 2021, for the 2022 Business Plan,
the following opportunity has been included: “Development of the ship service business, given the proximity to the Finisterre Corridor: supply of fuel (derived from oil as well as from LNG
and other new fuels), small and large repairs, crew change, provisioning, etc. Availability of facilities (anchorages, tankage, gas plant, shipyards) and specialized auxiliary industry and optimal
geographic location in the Atlantic corridor.”

Apéndice: Transparencia Activa en la Información. Los datos en detalle. Updated data as o 12/31/2020 Appendix: Active transparency in the information. Data in detail.
69
Table 64
In 2021, within the framework of our review of our sustainability strategy and its alignment with the UN's sustainable development
objectives, we will establish diverse strategies that will allows us to better understand and address the impacts to both, the port
infrastructure and operations, as well as the need to use renewable and clean energy sources, by the PAFSC, our suppliers and the
rest of the port community.
Variables with possible impact in the costs of PAFSC.
With incidence in the connection with land transport via railway PAFSC 2020: 2.6 million tons moved by road The European Union's White Paper: A roadmap towards a single
European transport area: for a competitive and sustainable transportation policy, it reads: “2. A vision for a competitive and sustainable transport system. It is highly unlikely that more
sustainable vehicles and less polluting fuels will achieve the necessary reductions in emissions and nor will they resolve the issue of congestion either. This has to be accompanied by the
consolidation of large volumes for travelling long distances. That implies a greater use of buses and coaches, train and aeroplanes for transporting passengers and for transporting goods, to
multimodal solutions based on river navigation and railway for long-haul...” “...Optimising performance of multimodal logistic chains, even
increasing the use of more efficient modes from an energy perspective. Attempting to transfer 30% of the transport of goods by road to other means, such as railway or river navigation, by
2030, and by 2050, over 50%, relying on efficient and ecological goods transit corridors. In order to achieve this objective, it will also be necessary to develop the adequate infrastructure...”
*In Law 7/2021 of May 20, on climate change and energy transition.
Article 16. Maritime transport and docks 4.a) It will apply financial incentive measures aimed at stimulating
the power supply or use of alternative fuels in docked ships, railway transport with origin and destination at ports and energy efficiency measures at concessions.
b) It will promote and execute projects for improving road and railway access points, and actions to improve the railway network to increase competitiveness of railway transport with origin and
destination at ports and logistic platforms, promoting, as much as possible, their location in inland provinces. Likewise, it will promote the improvement of the ports’ electricity grids.
The summary of the Port Authority Ferrol San Cibrao's Investment Plan for the improvement of the intermodality between railway
and the port amounts to 107 million euros. As to the execution of the main item included in this section: the railway connection to the outer dock, as of 31 December 2020,
4,176 meters of tunnel excavation had been carried out from the western tunnel entrance of the outer port. Also noteworthy this year is the start of the execution of works on the eastern tunnel
entrance, allowing the start of the excavation of the tunnel from its eastern entrance in early 2021.
With incidence in PAFSC’s energy consumption *In Law 7/2021 of May 20, on climate change and energy transition. PREAMBLE Likewise, the law includes the need to adopt measure for reducing
emissions generated by the consumption of fossil fuels in maritime transportation and at ports, so that ports under the jurisdiction of the State be free of direct emissions by 2050.
Article 16. Maritime transport and docks 1. At the ports under the jurisdiction of the State, the Government will adopt measures to gradually reduce the emissions generated by the
consumption of fossil fuels by ships, boats, naval crafts and physical platforms when moored or berthed at ports, in order to achieve the objective of zero direct emissions from the aforementioned by 2050.
b) It will promote and execute projects for improving road and railway access points, and actions to improve the railway network to increase competitiveness of railway transport with origin and destination at ports
and logistic platforms, promoting, as much as possible, their location in inland provinces. Likewise, it will promote the improvement of the ports’ electricity grids.
CO2e direct emissions
CO2e indirect emissions
The summary of the Port Authority Ferrol San Cibrao's Investment Plan for the improvement of the port’s energy efficiency amounts to 1.6 million
euros. In the SWOT analysis conducted for 2021, for the 2022 Business Plan, the following threat has been included: “Impacts of Climate Change and
consequent regulations on the infrastructure and operations of the Port Authority, and economic sectors linked with port activities”, and formulated the objective:
C6-000012: Implementation of the sustainability action plan and 2030 agenda. With the initiative for 2020: contracting the implementation of ISO 1404 and ISO 5001 standards.

Apéndice: Transparencia Activa en la Información. Los datos en detalle. Updated data as o 12/31/2020 Appendix: Active transparency in the information. Data in detail.
70
LABOUR FORCE OF THE PORT AUTHORITY
DESCRIPTION OF THE HUMAN RESOURCES POLICY
Regarding human resources management, our strategic plan includes the following goals:
SOCIAL DIMENSION

Apéndice: Transparencia Activa en la Información. Los datos en detalle. Updated data as o 12/31/2020 Appendix: Active transparency in the information. Data in detail.
71
(103-1) Related to Employment, Worker-company relations, Training and education, Diversity and equal opportunities, Non-discrimination, (103-2) Employment, Worker-company relations, Training and education, Diversity and equal opportunities, Non-discrimination
Resources STRATEGIC MAP OF THE PORT AUTHORITY OF FERROL-SAN CIBRAO Growth and Outer Port Economic self-
sufficiency Operational excellence
PA Mission Infrastructure optimisation Integration with the environment
R1 Adapting the organization and staff to the
strategic objectives and promoting
cultural change
R2 Develop and train the human team
Figure 47
Our management system, certified in the ISO 9001: 2015 and ISO 14001: 2015 standards, and with the 5-star recognition of excellence, provided by the European Foundation of Quality Management
(EFQM), provides the necessary tools to implement the goals strategies and monitor them through the corresponding indicators. The improvement actions and approved objectives, as well as their
monitoring, are presented in the management systems section of this appendix. (103-2) on Employment, Worker-company relations, Training and education, Diversity and equal opportunities, Non-
discrimination, (103-3) Employment, Worker-company relations, Training and education, Diversity and equal opportunities, Non-discrimination.
Strategic line Growth and Outer Port
Economic self-sufficiency
Operational excellence
Infrastructure optimisation
Integration with the
environment
PROCESS THAT SUPPORTS THE
STRATEGY
PROCEDURES Management system key indicator
Strategic perspective Strategic goals
RESOURCES R1 Adapting the organization and staff to the strategic objectives and promoting
cultural change
Organisation and management of
human resources
Training management and management by competencies. Hiring of staff subject to collective agreement
• 10026 Staff satisfaction level
• 10037 Total number of PA workers
• 10038 % of temporal workers over total
• 10040 % of women over total workers
• 10046 % of workers who follow training programs
• 10052 Annual absenteeism index
• 10054 Number of accidents and incidents in safety and security
• 10127 Annual accident severity index (GI)
R2 Develop and train the human team
Figure 48

Apéndice: Transparencia Activa en la Información. Los datos en detalle. Updated data as of 12/31/2019 Appendix: Active transparency in the information. Data in detail.
72
EMPLOYMENT IN THE PORT AUTHORITY (401-1)
Total number of Port Authority workers S_01 Total number of Port Authority workers. (102-7)
Description 2018 2019 2020
Staff at 31 December 118 115 112
Average anual staff 106 110 109
Table 65
Discharges 2020 No. personas Casualties 2020 No. personas
Temporal 5 Temporary contract expiry 25
Interim 17 Resignation 1
Permanent 9 Retirement 3
Others 5
TOTAL 31 TOTAL 34
Tabla 66
Discharges 2020
Men Women Total
<30 30-50 >50 Total <30 30-50 >50 Total
Office without collective agreement
0 0 1 1 0 0 0 0 1
Office with collective agreement
0 3 1 4 0 2 0 2 6
Police 1 13 8 22 0 1 0 1 23
Maintenance 0 1 0 1 0 0 0 0 1
Total 1 17 10 28 0 3 0 3 31
Table 67
Casualties 2020
Men Women Total
<30 30-50 >50 Total <30 30-50 >50 Total
Office without collective agreement
0 0 1 1 0 0 0 0 1
Office with collective agreement
0 0 2 2 0 3 2 5 7
Police 2 10 11 23 0 0 0 0 23
Maintenance 0 2 1 3 0 0 0 0 3
Total 2 12 15 29 0 3 2 5 34
Table 68
Percentage of temporary workers (%) S_02 Percentage of temporary workers over the total of permanent workers. For the calculation of this indicator, the contracts conditioned to
production circumstances will be excluded from the calculation of temporary workers (102-8)
Description 2018 2019 2020
Percentage of temporary workers (based on staff as of December 31) 17.80% 17.39% 9.82%
Table 69
Distribution of staff by areas of activity (%) (102-8)
S_03 Distribution of staff by areas of activity. Thess areas are considered understood as personnel assigned to the police service, maintenance personnel, office personnel in agreement and office personnel excluded from agreement.
Distribution of the staff by areas of activity during 2020
Activity Percentage of staff as of December 31
Office without collective agreement 17.85%
Office with with collective agreement 27.68%
Maintenance 10.71%
Port Police 43.75%
Table 70

Apéndice: Transparencia Activa en la Información. Los datos en detalle Updated data as of 31/12/2020 Appendix: Active transparency in the information. Data in detail.
73
(102-8)
Activity Total Men Women
< 30 30 - 50 > 50 total < 30 30 - 50 > 50 total
High position 2 0 1 1 2 0 0 0 0
Maintenance 12 0 5 4 9 0 0 3 3
Office with collective agreement 31 0 13 5 18 0 7 6 13
Office without collective agreement 18 0 4 5 9 0 4 5 9
Port police 49 1 35 11 47 0 2 0 2
Total 112 1 58 26 85 0 13 14 27
Table 71 (102-41)
Percentage of employees covered by collective contract. (%) S_04 Percentage of employees covered by collective contract. Staff as of December 31
Figure 49
(102-41)
Description 2020
Percentage of employees covered by collective agreement (based on staff as of 12/31/2020) 82.14%
Table 72
Description Men Women Total
Employees with labour agreement 74 18 92
Employees without labor agreement 11 9 20
Total 85 27 112
Table 73
82.14
17.86
Staff covered by collective contracts %
with labour agreement no labour agreement

Apéndice: Transparencia Activa en la Información. Los datos en detalle Updated data as of 31/12/2020 Appendix: Active transparency in the information. Data in detail.
74
INTERNAL COMMUNICATION AND ENGAGEMENT
THE WORKERS REPRESENTATION S_05 Mechanisms for the workers representation and their communication with the management.
The regulation on equality and discrimination of the Spanish Port System can be consulted in Chapter VIII of the • III Collective Agreement of PPEE and AAPP, (BOE Resolution of June 13, 2019, of the General Directorate of Labour), also published in the State Ports website. Company Committee, Equality Commission, Union Sections, Health and Safety Committee, Local Agreement Negotiating Commission, Pension Plan Control Commission S_06 Mechanisms for technical participation of workers in the improvement of the Port Authority's production processes (suggestion systems,
regular activity coordination meetings, quality groups, etc.).
Company Committee Meetings
PARTICIPATION IN THE DEFINITION OF THE MANAGEMENT SYSTEM
The Sustainability and Management Systems Department must facilitate the participation of all stakeholders in the definition of the management system and the different processes / procedures / instructions. For this, the following actions are carried out:
ACTION RESPONSIBLE AGENT
Meetings to identify the necessary changes. 1. The person responsible for the process / procedure / instruction. 2. All the staff of the different Areas / Departments that intervene in the process. 3. The staff and managers involved from other companies, if necessary. 4. The Department of Sustainability and Management Systems
Meetings to redefine the process / procedure / instruction
1. The person responsible for the process / procedure / instruction. 2. Port Authority Director 3. The Department of Sustainability and Management Systems. 4. The staff of the different Areas / Departments that intervene in the process, and who are affected by the changes
Dissemination of changes via email. 1. Department of Sustainability and Management Systems. 2. All the staff involved in the Port Authority.
Permanent dissemination of the current versions of the Management System, processes, procedures, instructions through the Management System Portal.
1. Department of Sustainability and Management Systems. 2. All the staff involved in the Port Authority. 3. All stakeholders.
Table 74

Apéndice: Transparencia Activa en la Información. Los datos en detalle Updated data as of 31/12/2020 Appendix: Active transparency in the information. Data in detail.
75
Changes in processes / procedures in 2020
Document type Current title Edition Effective D.
Procedure Stakeholder satisfaction 12 02/21/2020
Procedure Control and management of waste 6 01/13/2020
Process sheet Infrastructure and facilities management 11 10/13/2020
3 changes which represents 8.8% of the system Table 75
Management System Portal Since 2011, the Ferrol-San Cibrao Port Authority has been using a computer tool to manage procedures: "Preparation of system documentation" and "Indicator Management". It also uses the intranet portal to disseminate everything related to the Management System, in terms of policies, plans, follow-ups, results of evaluations and audits, satisfaction reports, etc .; as well as to keep the updated versions of the manual, processes, procedures and instructions accessible, and to automatically notify any changes made. In addition, it allows working with an internal portal system for only Port Authority employees, and an external portal, which anyone can access through the website.

Apéndice: Transparencia Activa en la Información. Los datos en detalle Updated data as of 31/12/2020 Appendix: Active transparency in the information. Data in detail.
76
TRAINING
% of workers who follow training programs S_07 Percentage of workers who follow training programs, differentiating among workers who are within and outside the agreement.
Description 2020
Percentage of workers who follow training programs without collective agreement (based on staff as of 12/31) 0%
Percentage of workers who follow training programs with collective agreement (based on staff as of 12/31) 30,43%
Table 76 Average hours of training per worker (hours / worker) (404-1) S_08 Evolution of the average hours of training per worker, differentiating among workers who are within and outside the agreement.
Description Total hours No. Of employees Average
With collective agreement 1,327 92 14.42
Without collective agreement 0 20 0
Total 1,327 112 11.85
Table 77
No. of training hours 2020 Percentage of training hours 2020
Employment status Men Women Total Employment status Men Women Total
Office without collective agreement
0 0 0 Office without collective agreement
0% 0.00% 0%
Office with collective agreement
373 213 586 Office with collective agreement
3.33% 1.90% 5.23%
Police 638 95 733 Police 5.70% 0.85% 6.54%
Maintenance 8 0 8 Maintenance 0.07% 0.00% 0.07%
Total 1.019 308 1.327 Total 9.10% 2.75% 11.85%
Table 78 Number of management training programs by competencies (no.) ( 404-2) S_09 Number of training programs in progress in relation to the competency management system (in accordance with the collective agreement
currently in force).
Description Planned programs 2020 Programs made 2020
Number of training programs in the General Training Plan 6 2
Number of training programs in the Specific Training Plan 10 10
Total training programs 16 12
Table 79
Level of satisfaction with the training (%) Description 2018 2019 2020
Level of satisfaction with the training 52.09% 56.40% 53.68
Table 80
Performance evaluation: (404-3)
For the staff of the agreement, the III Collective Agreement of Spanish State Ports and Port Authorities https://www.boe.es/boe/dias/2019/06/15/pdfs/BOE-A-2019-9021.pdf regulates: II. Professional qualification, quality or quantity of work plusses: Productivity. These productivity supplements will reward the special performance, extraordinary activity and dedication, interest or initiative with which the occupation is carried out. It is paid based on the category or professional level that the worker holds, whether it is variable or fixed, and the result improvement of the work. The productivity assessment will be carried out based on circumstances directly related to the performance of the occupation and the achievement of the results or goals assigned to it. The right to accrual will not be accumulable on a personal capacity and is linked to the permanence of the circumstances that would have determined its recognition of such circumstances that would have determined its initial recognition, the recipient declining in such right at the time the disappearance of such circumstances. Any bonus that is thus qualified or is generated in the Company Agreements, must be specifically indicated whether or not it corresponds to this category. They are considered bonuses those ones related to professional qualification, quality or quantity of work (productivity), among others, bonuses
regulated in the Company Agreements of these characteristics, as well as bonuses or complements of position or productivity (Plus of special
performance at work, Responsibility Gr. II-BII, Quality, Availability, etc.), and all those linked to a personal qualification or to the category or
professional level that the worker has. In any case, a plus on performance evaluation will be regulated.
For non collective contract staff, there is an objective in the Annual Business Plan, to establish an objective system.

Apéndice: Transparencia Activa en la Información. Los datos en detalle Updated data as of 31/12/2020 Appendix: Active transparency in the information. Data in detail.
77
STRUCTURE OF THE STAFF AND EQUITY
The salary regulation of the personnel of the Spanish port system does not contemplate differences between men and women. The ratio of average salary of women / average salary of men is 1,089 (405-2) (103-3) of Presence in the market
Information about the remuneration scheme and the updating of the values to be applied, can be consulted in the Human Resources-regulations section of the Puertos del Estado website, which can be accessed through the following QR: As a representative data of our family and work conciliation policies, during 2020, there were two paternity leaves (men), both returned to work after terminating parental leave and were still employed 12 months after their return, so the return rates were 100% with no retention. (401-3)
(202-1)
Annual national interprofessional minimum wage 2020 13,300.00€
Annual PAFSC Lowest Salary 2020 19,868.67€
% PAFSC minimum salary / minimum interprofessional salary 149.39% Table 74 (406-1)
The prevention of incidents of discrimination or sexual harassment can be consulted in the III Collective Agreement between State Ports and Port Authorities (BOE, resolution of June 13, 2019, of the General Directorate of Labor). In the PAFSC, the Equality Commission was established on November 14, 2014. During the year 2020, no complaints were received for sexual harassment, or for harassment on grounds of sex in the Equality Commission.
% of women over total workers (%) (102-8), (405-1) S_10 Percentage of women over total workers
Description 2020
Percentage of women over total workers (based on staff as of 12/31/2020) 24.11%
Table 81
% women not attached to the collective agreement over the total number of workers (102-8), (405-1) S_11 Percentage of women not attached to a collective agreement over the total number of workers and over the total number of workers
without the collective agreement.
Description 2020
% women not covered by collective agreement over total workers not covered by coolective agreement (based on staff at 12/31/2020)
45%
% women not covered by collective agreement over total workers (based on staff at 12/31/2020) 8.04%
Table 82
% permanent workers over 50 years (405-1)
S_12 Percentage of permanent workers over 50 years
Description 2020
Percentage of permanent workers over 50 years (based on staff at 12/31/2020) 33.93%
Table 83
% permanent workers under 30 years old (405-1)
S_13 Percentage of permanent workers under 30 years old.
Description 2020
Percentage of permanente workers under 30 years (based on staff at 12/31/2020) 0%
Table 84

Apéndice: Transparencia Activa en la Información. Los datos en detalle Updated data as of 31/12/2020 Appendix: Active transparency in the information. Data in detail.
78
(405-1)
% Ages Under 30 years Between 30 and 50 years Over 50 years
Activity area Man Woman Man Woman Man Woman
High position 0% 0% 0.89% 0% 0.89% 0%
Office without collective agreement 0% 0% 3.57% 3.57% 4.46% 4.46%
Office with collective agreement 0% 0% 11.61% 6.25% 4.46% 5.36%
Police 0.89% 0% 31.25% 1.79% 9.82% 0%
Mantenance 0% 0% 4.46% 0% 3.57% 2.68%
Total 0.89% 0% 51.79% 11.61% 23.21% 12.50% Table 85
(405-1)
% Permanent/temporary Permanent Temporary Total
Activity area Man Woman Man Woman Man Woman
High position 1.79% 0% 0% 0% 1.79% 0%
Office without collective agreement 8.04% 8.04% 0% 0% 8.04% 8%
Office with collective agreement 15.18% 10.71% 0.89% 0.89% 16.07% 12%
Police 34.82% 0.89% 7.14% 0.89% 42% 2%
Manintenance 8.04% 2.68% 0% 0% 8.04% 3%
Total 67.86% 22.32% 8.03% 1.79% 75.89% 24.11% Table 86

Apéndice: Transparencia Activa en la Información. Los datos en detalle Updated data as of 31/12/2020 Appendix: Active transparency in the information. Data in detail.
79
SECURITY AND HEALTH AT WORK
THE PREVENTION OF LABOUR RISKS (403-1), (403-4)
The regulations on occupational risk prevention mechanisms in the Spanish port system, including the composition of the corresponding committees / commissions, are included in CHAPTER VII LABOUR RISK PREVENTION of the III COLLECTIVE AGREEMENT OF STATE PORTS AND PORT AUTHORITIES, published in the BOE and on the website of Puertos del Estado (Spanish State Ports). Index for anual accident frecuency (IF) (403-2)
S_14 Evolution of the annual accident frequency index (IF), expressed as the ratio of the number of accidents with sick leave registered in a year, with respect to the total number of hours worked in this year, calculated as: IF = (total number of accidents with sick leave / number of hours worked) x 106
Description 2018 2019 2020
volution of the annual accident frequency index (IF), expressed as the ratio of the number of accidents with sick leave registered in a year, with respect to the total number of hours worked in this year, calculated as: IF = (total number of accidents with sick leave / number of hours worked) x 106
14.57 14.25 72.46
Table 87
Annual accident severity index (GI)) (403-2)
S_15 Evolution of the annual accident severity index (GI), expressed as the ratio of the number of days lost (number of business days lost) by accident in a year, with respect to the total number of hours worked in this year, calculated as: GI = (number of days lost due to accident / number of hours worked) x 103
Description 2018 2019 2020
Evolution of the annual accident severity index (GI), expressed as the ratio of the number of days lost (number of business days lost) by accident in a year, with respect to the total number of hours worked in this year, calculated as: GI = (number of days lost due to accident / number of hours worked) x 103
0.87 0.28 2.74
Table 88
Annual absenteeism index (403-2)
S_16 Evolution of the annual absenteeism index, expressed as the ratio of the number of calendar days lost due to leave, with respect to the number of workers, calculated as: IA = (number of calendar days lost due to leave x 100) / (number of workers x 365)
Description 2018 2019 2020
Evolution of the annual absenteeism index, expressed as the ratio of the number of calendar days lost due to leave, with respect to the number of workers, calculated as: IA = (number of calendar days lost due to leave x 100) / (number of workers x 365)
6.08 9.12 9.18
Table 89
During 2020 there has been 1 accident without sick leave, in an average workforce of 109 people. (403-2)
Training in labour risk prevention
S_17 Effort in training in labour risk prevention, expressed as the total number of training hours divided by the number of workers.
Effort in training in labour risk prevention during 2020
Total number of training hours Total number of workers
(average staff) Average number of hours per worker
0 109 0
Table 90
S_18 Number of security drills and number of protection drills. (403-4)
number of protection drills 4
Number of security drills 0
Table 91

Apéndice: Transparencia Activa en la Información. Los datos en detalle Updated data as of 31/12/2020 Appendix: Active transparency in the information. Data in detail.
80
EMPLOYMENT AND SAFETY AT WORK IN THE PORT COMMUNITY S_19 Total estimated number of direct jobs generated by maritime freight terminals and passenger stations as well as companies that provide
port services. - (no content) S_20 Synthetic description of the type of conditions or requirements established, on aspects such as security and training, in the specifications
of port services particular requirements, in the granting conditions and in the concession or authorization titles.
The conditions required in the port services specific specifications relating to Safety and ORP, are the following: ORP - Occupational Risk Prevention Plan. This document may be replaced by a duly accredited Health and Safety Management System. -Declaration of compliance with regard to Occupational Risk Prevention and Occupational Health and Safety. -Plan for the Coordination of Business Activities -Emergency Measures, art. 20 of Law 31/95. -Declaration of having received the information on own risks and emergency measures from the Port of Ferrol. -List of machinery, according to format F-SEG-02-03 -SAFETY -Port Facility Security Plan -Emergency Plan according to applicable regulations. (See RD 145/89, RD 840/2015, RD 393/2007) -List of staff and vehicles, according to format F-SEG-02-02 or access control database. S_21 Description of the mechanisms for coordinating existing business activities in the port community in terms of occupational risk prevention
within the port.
The Port Authority has a CAE procedure that is available to all users at the following link: https://www.apfsc.com/autoridad-portuaria/seguridad-y-p-r-l/procedimientos-y-solicitudes/ Likewise, there is a designated person to carry out the tasks of coordinating preventive activities. S_22 Total number and percentage of maritime freight terminals and passenger stations under concession or authorization, as well as
companies with license or authorization to provide port or commercial services that have the OHSAS system.
• Inform if the Port Authority periodically checks the degree of implementation of OHSAS systems in port service providers and cargo handling terminals. In case of carrying them out, indicate how it is applied (surveys, visits, documentation requirements, etc.). In case you do not carry out this type of checks, inform if you plan to apply them.
At the time that the Public Domain issues a Grant Title for a concession, authorization or license, it is asked for specific documentation of PRL (where the PRL system appears), it is requested again on an annual basis. Therefore, the answer would be through the request for documentation plus renewal of the same.
• If you have available information on the degree of implementation of OHSAS systems in service providers and merchandise handling terminals, report on

Apéndice: Transparencia Activa en la Información. Los datos en detalle Updated data as of 31/12/2020 Appendix: Active transparency in the information. Data in detail.
81
DOCUMENTATION OF OCCUPATIONAL RISK PREVENTION.
DOCUMENT MUST DELIVER DELIVERY TIME DELIVERY FREQUENCY
Occupational Risk Prevention Plan. This document may be replaced by a duly accredited Health and Safety Management System.
YES NO Before starting activity Whenever a modification is made.
Statement of compliance with regard to Occupational Risk Prevention and Occupational Health and Safety.
YES NO Before starting activity Annually
Business Activities Coordination Plan 1 YES NO Before starting activity Whenever a modification is made.
Emergency Measures, art. 20 of Law 31/95. YES NO Before starting activity Whenever a modification is made.
Declaration of having received the information about own risks and emergency measures of the Port of Ferrol.
YES NO Before starting activity When the port updates of such information.
List of machinery, according to format F-SEG-02-03 YES NO Before starting activity Whenever a modification is made.
Appointment of official interlocutor with the Port Authority in matters of Occupational Risk Prevention. Coordinator of Business Activities.
YES NO Before starting activity Whenever a modification is made.
Table 92
MINIMUM CONTENT OF THE CAE PLAN: 1. Appointment of the coordinator of business activities. 2. List of general risks of the activity carried out. 3. Develop how the company will carry out the CAE with concurrent companies, assuming as set out in the Port Authority Coordination Annex.
Total number and percentage of maritime terminals and service companies that have implemented an OHSAS system for the prevention of occupational risks:
Terminal / service type Total number with OHSAS
% with OHSAS
Freight terminal 4 of 6 66.6%
Passenger terminal 0 0
Stowage service 4 of 5 66.6%
MARPOL service 2 of 3 66.6%
Technical-nautical service 6 of 8 75% Tabla 93
S_23 Number of training actions of a technical nature, in relation to security and protection, coordinated by the Port Authority, aimed at the
port community.
Training actions aimed at the port community have not been carried out, but various meetings have been held for the
Coordination of preventing activities service.

Apéndice: Transparencia Activa en la Información. Los datos en detalle Updated data as of 31/12/2020 Appendix: Active transparency in the information. Data in detail.
82
ENVIRONMENTAL DIMENSION
DESCRIPTION OF THE ENVIRONMENTAL STRATEGY (103-1) Related to Energy, Water, Biodiversity, Emissions, Effluents and waste, Environmental Compliance, Environmental Assessment of suppliers
One of the critical success factors of the Ferrol-San Cibrao Port Authority, defined in the 2007-2015 strategic plan, is
"Carrying out the development and activity of the port in an environmentally sustainable way", being included among
the processes of our Strategic Map the strategic objective of "Manage in an environmentally sustainable way", belonging
to the "Strategic Line of Integration with the Environment".
During 2020, the Ferrol – San Cibrao Port Authority has continued to monitor environmental aspects related to our
entity through the Integrated Quality and Environmental Management System implemented and adapted to the UNE
EN ISO 14001: 2015 Standard.
Through the Management Model, we transfer our strategy to our daily activity, thus seeking a
positive evolution of our results, and incorporating the best practices in the sector into our
management.
To achieve the sustainable economic and social development contemplated in our Mission, it is
essential the development of environmental actions based on achieving the minimization of the
environmental impact of port activity on its surroundings.
Annually, the Ferrol – San Cibrao Port Authority defines operational goals aimed at achieving the
strategic goals belonging to the “Strategic Line of Integration with the Environment”, among them
the strategic goal “Manage in an environmentally sustainable way”.

Apéndice: Transparencia Activa en la Información. Los datos en detalle. Updated data as of 12/31/2019 Appendix: Active transparency in the information. Data in detail.
83
(103-1) Energy, Water, Biodiversity, Emissions, Effluents and waste, Environmental Compliance, Environmental Assessment of suppliers, (103-2) Energy, Water, Biodiversity, Emissions, Effluents and waste, Environmental
Compliance, Environmental Assessment of suppliers
Processes STRATEGIC MAP OF THE PORT AUTHORITY OF FERROL-SAN CIBRAO Growth and Outer Port Economic self-sufficiency Operational excellence PA Mission Infrastructure optimisation Integration with the
environment
Manage in an
environmentally
sustainable way
P10
Figure 50
Our management system, certified in the ISO 9001: 2015 and ISO 14001: 2015 standards, and with the 5-star recognition of excellence, provided by the European
Foundation of Quality Management (EFQM), provides the necessary tools to implement the strategic goals and monitor them through the corresponding indicators. (103-2) related to Energy, Water, Emissions, Effluents and waste, Environmental Compliance, Environmental Assessment of suppliers (103-3), related to Energy, Water, Emissions, Effluents and waste, Environmental
Compliance, Environmental Assessment of suppliers
Strategic line Integration with the environment PROCESS THAT SUPPORTS
THE STRATEGY PROCEDURES Management system key indicator
STRATEGIC
PERSPECTIVE
PROCESSES MANAGE IN A SUSTAINABLE
WAY
ENVIRONMENTAL
MANAGEMENT
Identification and evaluation of environmental aspects I0072 Marpol I collection of liquid waste from ships
Environmental control of operations I0074 Own water consumption
Consumption management I0075 Own electricity consumption
Waste management I0078 No. environmental incidents
Wastewater monitoring I0079 Investment in the environment
Control atmospheric emissions I0080 Environmental complaints
Noise control
I0141 Direct emissions of greenhouse gases Preparedness and response to environmental
emergencies
Table 94AS

Apéndice: Transparencia Activa en la Información. Los datos en detalle Updated data as of 31/12/2020 Appendix: Active transparency in the information. Data in detail.
84
SIGNIFICANT ENVIRONMENTAL ASPECTS
Current environmental aspects:
(103-2) related to Energy, Water, Emissions, Effluents and waste, Environmental Compliance, Environmental Assessment of suppliers ,(103-3) related to Energy, Water, Emissions, Effluents and waste, Environmental Compliance, Environmental Assessment of suppliers
They are those that are generated in normal operating conditions of the organization. In turn, we classify them into direct environmental aspects, which are those derived from activities over which the PAFSC has control of its management, and indirect environmental aspects, which are those over which it does not have full control.
LIST OF CURRENT ENVIRONMENTAL ASPECTS 2020, update date: 04/22/2021
ENVIRONMENTAL ASPECTS RATE HAZARD MAGNITUDE F+P+
M SIGNIFICANT
Categ Activity/ Service
Aspect Description
Type(D/I)
CONDITION
Frequency F
(3,2,1) CHARACTERISTI
CS P
(3,2,1) INDICATOR
CURRENT VALUE
VALUE REFERENCE
M (3,2,1)
CO
NSU
MP
TIO
NS
Inner Port. Own consumption
Water consumption
D CN
It is generated more than 8 hours a day for more than 90 days / year.
3 Municipal network
2 m3/year 21,513 19,547 3 8 yes
Outer Port. Own consumption
Water consumption
D CN
It is generated more than 8 hours a day for more than 90 days / year.
3 Municipal network
2 m3/year 5,408 21,111 1 6 no
Inner Port, Third parties
Water consumption
I CN
It is generated more than 8 hours a day for more than 90 days / year.
3 Port network 2 m3/year 12,892 12,554 2 7 no
Outer Port. Third parties
Water consumption
I CN
It is generated more than 8 hours a day for more than 90 days / year.
3 Port network 2 m3/year 193,649 177,910 2 7 no
Lighthouses Own consumption
Water consumption
D CN
It is generated less than 8 hours a day for more than 90 days a year
2 Own collection 3 m3/year 252 514 1 6 no
Inner Port. Own consumption
Electric power consumption
D CN
It is generated more than 8 hours a day for more than 90 days / year.
3 Electricity grid 2 kwh 1,013,8
88 1,090,036 1 6 no
Outer Port. Own consumption
Electric power consumption
D CN
It is generated more than 8 hours a day for more than 90 days / year.
3 Electricity grid 2 kwh 851,129 888,476 1 6 no
Lighthouses Own consumption
Electric power consumption
D CN
It is generated more than 8 hours a day for more than 90 days / year.
3 Electricity grid 2 kwh 58,593 65,947 1 6 no
Inner Port, Third parties
Electric power consumption
I CN
It is generated more than 8 hours a day for more than 90 days / year.
3 Electricity grid 2 kwh 645,865 577,854 3 8 yes
Outer Port. Third parties
Electric power consumption
I CN
It is generated more than 8 hours a day for more than 90 days / year.
3 Electricity grid 2 kwh 2,692,3
99 1,378,364 3 8 yes
PA buildings Heating and DHW
Consumo gasoil D CN
It is generated more than 8 hours a day for more than 90 days / year.
3 Diesel oil 2 litres 7,879 9,042 1 6 no
Transport (vehicles and ship)
Diesel oil consumption
D CN
It is generated more than 8 hours a day for more than 90 days / year.
3 Diesel oil and petrol
2 litres 13,377 19,548 1 6 no
W
AST
E
Maintenance and works
Contaminated empty containers
D CN Occasional 1 hazardous waste
3 Kg/year 120 200 1 5 no
Maintenance and works
Spent absorbents D CN Occasional 1 hazardous waste
3 Kg/year 0 100 1 5 no
Maintenance and works
Aerosols D CN Occasional 1 hazardous waste
3 Kg/year 0 100 1 5 no
Maintenance Batteries D CN Occasional 1 hazardous waste
3 Kg/year 0 50 1 5 no
Maintenance Fluorescents D CA Occasional 1 hazardous waste
3 Kg/year 0 200 1 5 no
Maintenance Lighthouses
Reject batteries D CA Occasional 1 hazardous waste
3 Kg/year 228 140 3 7 no
Maintenance Abandoned waste I CA Occasional 1 hazardous waste
3 Kg/year 0 38 1 5 no
Maintenance Electronic appliances
D CA Occasional 1 hazardous waste
3 Kg/year 325 181 3 7 no

Apéndice: Transparencia Activa en la Información. Los datos en detalle Updated data as of 31/12/2020 Appendix: Active transparency in the information. Data in detail.
85
ENVIRONMENTAL ASPECTS RATE HAZARD MAGNITUDE F+P+
M SIGNIFICANT
Categ Activity/ Service
Aspect Description
Type(D/I)
CONDITION
Frequency F
(3,2,1) CHARACTERISTI
CS P
(3,2,1) INDICATOR
CURRENT VALUE
VALUE REFERENCE
M (3,2,1)
Ship Signal flares D CA Occasional 1 hazardous
waste 3 Unit/year 0 7 1 5 no
Maintenance Transformers & capacitors that contains PCB
D CA Occasional 1 hazardous waste
3 Kg/year 0 2 1 5 no
Maintenance Septic tank and sludge
D CA Occasional 1 hazardous waste
2 kg/year 1960 2,220 1 4 no
W
AST
E
Offices Toner D CN Occasional 1 Commercial waste
1 kg/year 0 46 1 3 no
Offices Office paper D CN Working hours more than 90 days / year
3 Commercial waste
1 Kg/year 147 332 1 5 no
Port Activties Plastics I CN Working hours less than 90 days / year
2 Industrial waste 2 Kg/year 380 1,320 1 5 no
Port Activties Wood I CN Working hours less than 90 days / year
2 Industrial waste 2 Kg/year 4,280 5,263 1 5 no
Port Activties Road cleaning I CN Working hours less than 90 days / year
2 Industrial waste 2 Kg/year 14,700 14,220 2 6 no
Maintenance and works
Scrap metal D CN Occasional 1 Industrial waste 2 Kg/year 4,040 2,307 3 6 no
Outer Port. Third parties - W
RSU I CN Occasional 2 Commercial waste
2 m3/year 60 60 1 5 no
Outer Port. Third parties - E
RSU I CN Occasional 2 Commercial waste
2 m3/year 18 18 1 5 no
Workers RCD´s I CN Working hours less than 8h / day
2 Industrial waste 2 T/year 62 1,000 1 5 no
Workers Polluted land I CA Occasional 1 hazardous waste
3 Kg/year 460 64,527 1 5 no
MARPOL Service Marpol I I CN
Service provided on demand (less than 8 hours). It can be generated for more than 90 days
2 hazardous waste
3 m3/year 1,707 2,119 1 6 no
MARPOL Service Marpol V I CN
Service provided on demand. It can be generated for more than 90 days
2 Non-segregated assimilable urban waste
2 m3/year 1,919 2,139 1 5 no
MARPOL Service Third parties (Navantia, Forestal and Alcoa)
Marpol I I CN
Service provided on demand (less than 8 hours). It can be generated for more than 90 days
2 hazardous waste
3 m3/year 3,775 4,663 1 6 no
MARPOL Service Third parties (Navantia, Forestal and Alcoa)
Marpol IV I CN
Service provided on demand (less than 8 hours). It can be generated for more than 90 days
2 hazardous waste
3 m3/year 33 108 1 6 no
MARPOL Service Third parties (Navantia, Forestal and Alcoa)
Marpol V I CN
Service provided on demand (less than 8 hours). It can be generated for more than 90 days
2 RP/RnP 3 m3/year 854 1,082 1 6 no
ATM
OSP
HER
IC E
MIS
SIO
NS
Heating and DHW
Combustion gases D CN Less than 8 hours a day in winter
2 Diesel oil comb gasses and petrol
2 T CO2 eq 28,6 25,933 3 7 no
Rolling stock Combustion gases D CN Less than 8h / day, more than 90 days a year
2 Diesel oil comb gasses and petrol
2 T CO2 eq 31,8 48,144 1 5 no
Port Community P.I.
PM10 emissions I CN More than 8h / day to more than 90 days
3 Harmful solid particles with harmful risk
3 µg/m3 13,1 40 1 7 no
Port Community P.E.
PM10 emissions I CN More than 8h / day to more than 90 days
3 Harmful solid particles with harmful risk
3 µg/m3 26,1 40 1 7 no
GEI Emission Total CO2 emission
D/I CN More than 8h / day to more than 90 days
3 CO2 3 T CO2 eq 321,5 612 1 7 no
WA
STE
WA
TER
Outer Port Receiving environment
D/I CN Permanent 3
Industrial cleaning / Non-contaminated rainwater
3
Most unfavorable parameter
monthly average suspended solids
2,2 7,5 1 7 no
Inner Port receiving environment
D/I CN Permanent 3
Industrial cleaning / Non-contaminated rainwater
3 90th percentile of
Chlorophyll a 4,9 <12 1 7 no
Inner Port
Discharge to municipal network: collectors 1 and 2
D/I CN Permanent 3 Unpolluted sanitary and rainwater
2 Most unfavorable parameter COD
289,0 1000 1 6 no
Prioriño Cape Dump pit FE1 D CN Permanent 3 Sanitary 2 Most unfavorable parameter COD
204 <300 1 6 No
Outer Port, accesses control
Dump pit FE5 D CN Permanent 3 Sanitary 2 Most unfavorable parameter COD
209 <300 1 6 No

Apéndice: Transparencia Activa en la Información. Los datos en detalle Updated data as of 31/12/2020 Appendix: Active transparency in the information. Data in detail.
86
ENVIRONMENTAL ASPECTS RATE HAZARD MAGNITUDE F+P+
M SIGNIFICANT
Categ Activity/ Service
Aspect Description
Type(D/I)
CONDITION
Frequency F
(3,2,1) CHARACTERISTI
CS P
(3,2,1) INDICATOR
CURRENT VALUE
VALUE REFERENCE
M (3,2,1)
NO
ISE
Inner Port, Services Management
Noise in offices D CN Working hours, more than 90 days a year
2 Non-noisy activity
1 No complaints, it is
not perceived at more than 20m
no no 1 4 No
Inner Port Workshop
Noise in workshops
D CN Occasional 1 Activity inside building
2 No complaints, it is
not perceived at more than 20m
no no 1 4 No
Rolling stock Vehicle noise D CN Less than 8 h / day, more than 90 days a year
2 Traffic 2 Better techniques si si 1 5 No
General port area. P.Int.
General noise Inner Port
D/I CN
Noisy activities, more than 8 hours a day, less than 90 days / year
2 Loading / unloading, machinery
3 No complaints, it is
perceived up to 100 m
no no 1 6 No
General port area: P.Ext.
General noise Inner Port
D/I CN
Noisy activities, more than 8 hours a day, less than 90 days / year
2 Loading / unloading, machinery
3 No complaints, it is
perceived up to 100 m
no no 1 6 no
Soil
Common areas Inner Port
Affection to the ground
D/I CA Less than 5 incidents per year
1 Asphalt or paved ground
2
Preventive measures are
applied, but other could be
implemented
yes yes 2 5 no
Common areas Outer Port
Affection to the ground
D/I CA Less than 5 incidents per year
1 Asphalt or paved ground
2
Preventive measures are
applied, but other could be
implemented
yes yes 2 5 no
Non-concessioned service area
Affection to the ground
D/I CA Less than 5 incidents per year
1 Natural terrain / Unpaved ground
3
Preventive measures are
applied, but other could be
implemented
yes yes 2 6 no
BIO
DIV
ERSI
TY
Outer Port Invasive species cover (Cortaderia sp.)
D CN More than 90 days per year, more than 8h
3
Dispersion to undeveloped areas. Proximity to ZEC Costa ártabra.
3
Degree of coverage greater
than 50% of undeveloped area
yes yes 3 9 yes
Inner Port Invasive species cover (Cortaderia sp.)
D CN More than 90 days per year, more than 8h
3 Impact on unprotected land
2
Degree of coverage less than
20% of undeveloped area
yes yes 1 6 no
Table 95 -(103-2) Related to biodiversity, Emissions, Effluents and waste, Environmental Compliance, Environmental Assessment
of suppliers, (103-3), Related to biodiversity, Emissions, Effluents and waste, Environmental Compliance, Environmental
Assessment of suppliers. (304-2)

Apéndice: Transparencia Activa en la Información. Los datos en detalle Updated data as of 31/12/2020 Appendix: Active transparency in the information. Data in detail.
87
POTENTIAL ENVIRONMENTAL ASPECTS:
(103-2) Related to emissions, Effluents and waste, Environmental Compliance, (103-3) about Emissions, Environmental Compliance
They are those that are generated as a result of accidents and emergency situations in the organisation.
LIST OF POTENTIAL ENVIRONMENTAL ASPECTS 2020. Update date: 04/22/2021
EMERGENCY SITUATION
ENVIRONMENTAL ASPECTS
PROBABILITY SEVERITY
P*G SIGNIFI CANT FRECUENCY
P (3,2,1
) DAMAGE TO THE ENVIRONMENT G (3,2,1)
FIRE in transformer
Hazardous waste generated as a result of the extinction of the fire.
Less than once every 5 years
1 It does not affect the outside environment related to the perimeter of the land port enclosure or outside the port docks.
1 1 no
Inert waste generated as a result of the extinction of the fire.
Less than once every 5 years
1 It does not affect the outside environment related to the perimeter of the land port enclosure or outside the port docks.
1 1 no
Emissions with a high load of solid particles.
Less than once every 5 years
1
Mild effect on the outside environment related to the perimeter of the land port enclosure or in inner zone I of port waters. A mild condition is when the medium is restored within a period of less than one month.
2 2 no
Spills with a high load of solid particles as a result of cleaning operations.
Less than once every 5 years
1
Mild effect on the outside environment related to the perimeter of the land port enclosure or in inner zone I of port waters. A mild condition is when the medium is restored within a period of less than one month.
2 2 no
FIRE in offices and premises
Hazardous waste generated as a result of the extinction the fire
Less than once every 5 years
1 It does not affect the outside environment related to the perimeter of the land port enclosure or outside the port docks.
1 1 no
Hazardous waste generated as a result of the extinction the fire
Less than once every 5 years
1 It does not affect the outside environment related to the perimeter of the land port enclosure or outside the port docks.
1 1 no
Emissions with high load of solid particles Less than once every 5 years
1
Mild effect on the outside environment related to the perimeter of the land port enclosure or in inner zone I of port waters. A mild condition is when the medium is restored within a period of less than one month.
2 2 no
Effects on cultural heritage offices Less than once every 5 years
1 It does not affect the outside environment related to the perimeter of the land port enclosure or outside the port docks.
1 1 no
Spills with a high load of solid particles as a result of cleaning operations.
Less than once every 5 years
1
Mild effect on the outside environment related to the perimeter of the land port enclosure or in inner zone I of port waters. A mild condition is when the medium is restored within a period of less than one month.
2 2 no
FIRE in workshops
Hazardous waste generated as a result of the extinction of the fire.
Less than once every 5 years
1 It does not affect the outside environment related to the perimeter of the land port enclosure or outside the port docks.
1 1 no
Inert waste generated as a result of the extinction of the fire.
Less than once every 5 years
1 It does not affect the outside environment related to the perimeter of the land port enclosure or outside the port docks.
1 1 no
Emissions with a high load of solid particles.
Less than once every 5 years
1
Mild effect on the outside environment related to the perimeter of the land port enclosure or in inner zone I of port waters. A mild condition is when the medium is restored within a period of less than one month.
2 2 no
Spills with a high load of solid particles as a result of cleaning operations.
Less than once every 5 years
1
Mild effect on the outside environment related to the perimeter of the land port enclosure or in inner zone I of port waters. A mild condition is when the medium is restored within a period of less than one month.
2 2 no
FIRE in storage
Hazardous waste generated as a result of the extinction of the fire.
Less than once a year but more than once every 5 years
2 It does not affect the outside environment related to the perimeter of the land port enclosure or outside the port docks.
1 2 no
Inert waste generated as a result of the extinction of the fire.
Less than once a year but more than once every 5 years
2 It does not affect the outside environment related to the perimeter of the land port enclosure or outside the port docks.
1 2 no
Emissions with high load of solid particles Less than once a year but more than once every 5 years
2
Mild effect on the outside environment related to the perimeter of the land port enclosure or in inner zone I of port waters. A mild condition is when the medium is restored within a period of less than one month.
2 4 yes
Discharges with a high load of solid particles as a result of cleaning operations
Less than once every 5 years
1
Mild effect on the outside environment related to the perimeter of the land port enclosure or in inner zone I of port waters. A mild condition is when the medium is restored within a period of less than one month.
2 2 no
FIRE of combustible gases for cutting and welding
Hazardous waste generated as a result of the extinction of the fire.
Less than once every 5 years
1 It does not affect the outside environment related to the perimeter of the land port enclosure or outside the port docks.
1 1 no
Inert waste generated as a result of the extinction of the fire.
Less than once every 5 years
1 It does not affect the outside environment related to the perimeter of the land port enclosure or outside the port docks.
1 1 no
Emissions with high load of solid particles Less than once every 5 years
1
Mild effect on the outside environment related to the perimeter of the land port enclosure or in inner zone I of port waters. A mild condition is when the medium is restored within a period of less than one month.
2 2 no
Spills with a high load of solid particles as a result of cleaning operations.
Less than once every 5 years
1
Mild effect on the outside environment related to the perimeter of the land port enclosure or in inner zone I of port waters. A mild condition is when the medium is restored within a period of less than one month.
2 2 no
FIRE at the point of fuel supply to ships
Hazardous waste generated as a result of the extinction of the fire.
Less than once every 5 years
1 It does not affect the outside environment related to the perimeter of the land port enclosure or outside the port docks.
1 1 no
Inert waste generated as a result of the extinction of the fire.
Less than once every 5 years
1 It does not affect the outside environment related to the perimeter of the land port enclosure or outside the port docks.
1 1 no

Apéndice: Transparencia Activa en la Información. Los datos en detalle Updated data as of 31/12/2020 Appendix: Active transparency in the information. Data in detail.
88
EMERGENCY SITUATION
ENVIRONMENTAL ASPECTS
PROBABILITY SEVERITY
P*G SIGNIFI CANT FRECUENCY
P (3,2,1
) DAMAGE TO THE ENVIRONMENT G (3,2,1)
FIRE at the fuel supply point to ships
Emissions with high load of solid particles Less than once every 5 years
1
Mild effect on the outside environment related to the perimeter of the land port enclosure or in inner zone I of port waters. A mild condition is when the medium is restored within a period of less than one month.
2 2 no
Spills with a high load of solid particles as a result of cleaning operations.
Less than once every 5 years
1
Mild effect on the outside environment related to the perimeter of the land port enclosure or in inner zone I of port waters. A mild condition is when the medium is restored within a period of less than one month.
2 2 no
FIRE in ship
Hazardous waste generated as a result of the extinction of the fire.
Less than once a year but more than once every 5 years
2 It does not affect the outside environment related to the perimeter of the land port enclosure or outside the port docks.
1 2 No
Inert waste generated as a result of the extinction of the fire.
Less than once a year but more than once every 5 years
2 It does not affect the outside environment related to the perimeter of the land port enclosure or outside the port docks.
1 2 No
Emissions with high load of solid particles Less than once a year but more than once every 5 years
2
Mild effect on the outside environment related to the perimeter of the land port enclosure or in inner zone I of port waters. A mild condition is when the medium is restored within a period of less than one month.
2 4 yes
Spills with a high load of solid particles as a result of cleaning operations.
Less than once a year but more than once every 5 years
2
Mild effect on the outside environment related to the perimeter of the land port enclosure or in inner zone I of port waters. A mild condition is when the medium is restored within a period of less than one month.
2 4 yes
FIRE after spill from cistern
Hazardous waste generated as a result of the extinction of the fire.
Less than once every 5 years
1 It does not affect the outside environment related to the perimeter of the land port enclosure or outside the port docks.
1 1 No
Inert waste generated as a result of the extinction of the fire.
Less than once every 5 years
1 It does not affect the outside environment related to the perimeter of the land port enclosure or outside the port docks.
1 1 No
Emissions with high load of solid particles Less than once every 5 years
1
Mild effect on the outside environment related to the perimeter of the land port enclosure or in inner zone I of port waters. A mild condition is when the medium is restored within a period of less than one month.
2 2 No
Spills with a high load of solid particles as a result of cleaning operations.
Less than once every 5 years
1
Mild effect on the outside environment related to the perimeter of the land port enclosure or in inner zone I of port waters. A mild condition is when the medium is restored within a period of less than one month.
2 2 No
FIRE in railway accident
Hazardous waste generated as a result of the extinction of the fire.
Less than once every 5 years
1 It does not affect the outside environment related to the perimeter of the land port enclosure or outside the port docks.
1 1 No
Inert waste generated as a result of the extinction of the fire.
Less than once every 5 years
1 It does not affect the outside environment related to the perimeter of the land port enclosure or outside the port docks.
1 1 No
Emissions with high load of solid particles Less than once every 5 years
1
Mild effect on the outside environment related to the perimeter of the land port enclosure or in inner zone I of port waters. A mild condition is when the medium is restored within a period of less than one month.
2 2 No
Spills with a high load of solid particles as a result of cleaning operations.
Less than once every 5 years
1
Mild effect on the outside environment related to the perimeter of the land port enclosure or in inner zone I of port waters. A mild condition is when the medium is restored within a period of less than one month.
2 2 No
EXPLOSION of combustible gases
for cutting and welding
Gas emission Less than once every 5 years
1
Mild effect on the outside environment related to the perimeter of the land port enclosure or in inner zone I of port waters. A mild condition is when the medium is restored within a period of less than one month.
2 2 No
Non-hazardous solid waste derived from affected materials
Less than once every 5 years
1 It does not affect the outside environment related to the perimeter of the land port enclosure or outside the port docks.
1 1 no
Hazardous solid waste derived from affected materials
Less than once every 5 years
1 It does not affect the outside environment related to the perimeter of the land port enclosure or outside the port docks.
1 1 no
Spills with a high load of solid particles as a result of cleaning operations.
Less than once every 5 years
1
Mild effect on the outside environment related to the perimeter of the land port enclosure or in inner zone I of port waters. A mild condition is when the medium is restored within a period of less than one month.
2 2 no
EXPLOSION in storage
Gas emission Less than once every 5 years
1
Mild effect on the outside environment related to the perimeter of the land port enclosure or in inner zone I of port waters. A mild condition is when the medium is restored within a period of less than one month.
2 2 no
Non-hazardous solid waste derived from affected materials
Less than once every 5 years
1 It does not affect the outside environment related to the perimeter of the land port enclosure or outside the port docks.
1 1 no
Hazardous solid waste derived from affected materials
Less than once every 5 years
1 It does not affect the outside environment related to the perimeter of the land port enclosure or outside the port docks.
1 1 no
Spills with a high load of solid particles as a result of cleaning operations.
Less than once every 5 years
1
Mild effect on the outside environment related to the perimeter of the land port enclosure or in inner zone I of port waters. A mild condition is when the medium is restored within a period of less than one month.
2 2 no

Apéndice: Transparencia Activa en la Información. Los datos en detalle Updated data as of 31/12/2020 Appendix: Active transparency in the information. Data in detail.
89
EMERGENCY SITUATION
ENVIRONMENTAL ASPECTS
PROBABILITY SEVERITY
P*G SIGNIFI CANT FRECUENCY
P (3,2,1
)
DAMAGE TO THE ENVIRONMENT G (3,2,1)
EXPLOSION in a railway accident
Gas emission Less than once every 5 years
1
Mild effect on the outside environment related to the perimeter of the land port enclosure or in inner zone I of port waters. A mild condition is when the medium is restored within a period of less than one month.
2 2 no
Non-hazardous solid waste derived from affected materials
Less than once every 5 years
1 It does not affect the outside environment related to the perimeter of the land port enclosure or outside the port docks.
1 1 no
Hazardous solid waste derived from affected materials
Less than once every 5 years
1 It does not affect the outside environment related to the perimeter of the land port enclosure or outside the port docks.
1 1 no
Spills with a high load of solid particles as a result of cleaning operations.
Less than once every 5 years
1
Mild effect on the outside environment related to the perimeter of the land port enclosure or in inner zone I of port waters. A mild condition is when the medium is restored within a period of less than one month.
2 2 no
LEAK OF Combustible Gases
for Cutting and Welding
Emissions of harmful or toxic gases affecting the port facilities
Less than once every 5 years
1
Mild effect on the outside environment related to the perimeter of the land port enclosure or in inner zone I of port waters. A mild condition is when the medium is restored within a period of less than one month.
2 2 no
Emissions of harmful or toxic gases affecting the population
Less than once every 5 years
1
Mild effect on the outside environment related to the perimeter of the land port enclosure or in inner zone I of port waters. A mild condition is when the medium is restored within a period of less than one month.
2 2 no
LEAK in railroad accident
Emissions of harmful or toxic gases affecting the port facilities
Less than once every 5 years
1
Mild effect on the outside environment related to the perimeter of the land port enclosure or in inner zone I of port waters. A mild condition is when the medium is restored within a period of less than one month.
2 2 no
Emissions of harmful or toxic gases affecting the population
Less than once every 5 years
1
Mild effect on the outside environment related to the perimeter of the land port enclosure or in inner zone I of port waters. A mild condition is when the medium is restored within a period of less than one month.
2 2 no
LEAK of refrigerant gases from
equipment (SF6)
Emissions of greenhouse gases Less than once every 5 years
1
Mild effect on the outside environment related to the perimeter of the land port enclosure or in inner zone I of port waters. A mild condition is when the medium is restored within a period of less than one month.
2 2 no
SPILLS during fuel supply from tanker
to ship (1)
Dumping of toxic materials, solid or liquid Less than once a year but more than once every 5 years
2
Mild effect on the outside environment related to the perimeter of the land port enclosure or in inner zone I of port waters. A mild condition is when the medium is restored within a period of less than one month.
2 4 yes
Hazardous waste in the water sheet mirror
Less than once a year but more than once every 5 years
2
Mild effect on the outside environment related to the perimeter of the land port enclosure or in inner zone I of port waters. A mild condition is when the medium is restored within a period of less than one month.
2 4 yes
SPILLS during fuel supply from barge
to ship (1)
Dumping of toxic materials, solid or liquid Less than once every 5 years
1
Mild effect on the outside environment related to the perimeter of the land port enclosure or in inner zone I of port waters. A mild condition is when the medium is restored within a period of less than one month.
3 3 yes
Hazardous waste in the water sheet mirror
Less than once every 5 years
1
Mild effect on the outside environment related to the perimeter of the land port enclosure or in inner zone I of port waters. A mild condition is when the medium is restored within a period of less than one month.
2 2 no
SPILLS during fuel supply from pump
(1)
Dumping of toxic materials, solid or liquid Less than once every 5 years
1 It does not affect the outside environment related to the perimeter of the land port enclosure or outside the port docks.
1 1 no
Dumping of toxic materials, solid or liquid Less than once every 5 years
1 It does not affect the outside environment related to the perimeter of the land port enclosure or outside the port docks.
1 1 no
SPILLS during Marpol waste collection operations (1)
Dumping of Marpol waste into the sea during waste collection by land or sea
Less than once every 5 years
1
Mild effect on the outside environment related to the perimeter of the land port enclosure or in inner zone I of port waters. A mild condition is when the medium is restored within a period of less than one month.
2 2 no
DUMPS from ship because of maritime
accident (1)
Cargo spill: hydrocarbons or harmful and potentially dangerous substances
Less than once every 5 years
1 It does not affect the outside environment related to the perimeter of the land port enclosure or outside the port docks.
2 2 no
Hazardous waste (MARPOL) or fuel More than once a year
3 It does not affect the outside environment related to the perimeter of the land port enclosure or outside the port docks.
2 6 yes

Apéndice: Transparencia Activa en la Información. Los datos en detalle Updated data as of 31/12/2020 Appendix: Active transparency in the information. Data in detail.
90
EMERGENCY SITUATION
ENVIRONMENTAL ASPECTS
PROBABILITY SEVERITY
P*G SIGNIFI CANT FRECUENCY
P (3,2,1
)
DAMAGE TO THE ENVIRONMENT G (3,2,1)
DUMPing from ship due to operational
failure (1)
Cargo spill: hydrocarbons or harmful and potentially dangerous substances
Less than once every 5 years
1 Mild effect on the outside environment related to the perimeter of the land port enclosure or in inner zone I of port waters.
2 2 no
Hazardous waste (MARPOL) or fuel Less than once a year but more than once every 5 years
2 Mild effect on the outside environment related to the perimeter of the land port enclosure or in inner zone I of port waters.
2 4 yes
DUMPING from bleachers or dry
docks (1)
Dumping of harmful substances or residues in accidents during lifting / launching; shot blasting; operational failure or breakage.
Less than once every 5 years
1 Mild effect on the outside environment related to the perimeter of the land port enclosure or in inner zone I of port waters.
2 2 no
DUMPING from deposits / storage in
concessions (1)
Dumpinge of harmful substances, solid or liquid
Less than once a year but more than once every 5 years
2 Mild effect on the outside environment related to the perimeter of the land port enclosure or in inner zone I of port waters.
2 4 yes
Dangerous residues Less than once a year but more than once every 5 years
2 Mild effect on the outside environment related to the perimeter of the land port enclosure or in inner zone I of port waters.
2 4 yes
SPILL from cistern Dumping of toxic materials, solid or liquid
Less than once every 5 years
1 Mild effect on the outside environment related to the perimeter of the land port enclosure or in inner zone I of port waters.
2 2 no
Dangerous residues Less than once every 5 years
1 It does not affect the outside environment related to the perimeter of the land port enclosure or outside the port docks.
1 1 no
SPILL from machinery in port
operation
Hydrocarbon spill (oil, fuel, etc.) More than once a year
3 It does not affect the outside environment related to the perimeter of the land port enclosure or outside the port docks.
1 3 yes
SPILL in rail accident
Dumpinge of harmful substances, solid or liquid
Less than once every 5 years
1 Mild effect on the outside environment related to the perimeter of the land port enclosure or in inner zone I of port waters.
2 2 no
Dangerous residues Less than once every 5 years
1 It does not affect the outside environment related to the perimeter of the land port enclosure or outside the port docks.
1 1 no
SPILL because of broken fuel tanks in
workshop
Fuel spill Less than once every 5 years
1 It does not affect the outside environment related to the perimeter of the land port enclosure or outside the port docks.
1 1 no
Dangerous residues Less than once every 5 years
1 It does not affect the outside environment related to the perimeter of the land port enclosure or outside the port docks.
1 1 no
SPILL from deposits / storages in concessions
Dumpinge of harmful substances, solid or liquid
More than once a year
3 It does not affect the outside environment related to the perimeter of the land port enclosure or outside the port docks.
1 3 yes
Dangerous residues More than once a year
3 It does not affect the outside environment related to the perimeter of the land port enclosure or outside the port docks.
1 3 yes
FAILURE in the wastewater system
Untreated sewage discharge Less than once a year but more than once every 5 years
2 It does not affect the outside environment related to the perimeter of the land port enclosure or outside the port docks.
1 2 no
Non-hazardous waste Less than 1 time a year and more than 1 time in 5 years
2 It does not affect the outside environment related to the perimeter of the land port enclosure or outside the port docks.
1 2 no
Outbreak of legionella
Release to the environment of biological pollutants
Less than once every 5 years
1
Mild effect on the outside environment related to the perimeter of the land port enclosure or in inner zone I of port waters. A mild condition is when the medium is restored within a period of less than one month.
2 2 no
Table 96 (103-2) Related to emissions, Effluents and waste, Environmental Compliance, (103-3), of Emissions, Effluents and waste,
Environmental Compliance

Apéndice: Transparencia Activa en la Información. Los datos en detalle Updated data as of 31/12/2020 Appendix: Active transparency in the information. Data in detail.
91
ENVIRONMENTAL MANAGEMENT
A_01Total economic resources: expenditure and eventual investments associated to the implementation, certification and maintenance of an environment management system for the Port Authority in compliance to EMAS regulations, to the ISO14001:2004 regulation or to the PERS certification, expressed in Euros and in the respective percentages of total expenditures and investments made by the Port Authority.
• Inform if the P.A with an Environmental Management System (EMAS, ISO 14001: 2004 or PERS)
X Yes, fully certified
No, but this project phase No, but it No, but it is in the implementation phase
No and it is not projected
• In case of having a certified SGA or in the implementation phase, inform about the reference standard followed
EMAS X ISO 14001:2015
PERS
• If you have a certified SGA or in the implementation phase, describe the scope
The management of the use of the port public domain: - Concessions, authorizations and licenses. - Infrastructure and port investment. Direct management of port services: - Maritime signaling. - Scale of ships and sports boats. - Freight and passenger traffic. - Security and vigilance. - Supply of electricity and drinking water. - Storage services. In the public port domain of the Ferrol San Cibrao Port Authority.
• Financial information during the 2020 financial year on expenses and investments in the implementation or maintenance
of the SGMA
Investments related to the implementation or maintenance of the SGA 12,079.42 € (Investments in SGA / Total tangible and intangible investments) * 100 0.097 % Expenses related to the implementation or maintenance of the SGA 29,386.48 € (SGA expenses / Other operating expenses) * 100 0.61 %
Table 97
• Concepts covered:
• In expenses: The expenses required to implement and maintain the certification or consigned as objectives of improvement of the environmental management system. Examples of these concepts are expenses related to auded
tasks or environmental characterization studies. Expenses of own personnel, linked to environmental management
tasks, will not be included.
• In investments: The investments required to implement and maintain the certification or consigned as objectives of improvement of the environmental management system. Examples of this concept are improvements in sanitation, monitoring systems, acoustic screens, irrigation systems, etc.
• Expenses and investments linked to master plans, works projects and the actions resulting from the DIA of the latter are excluded from these sections.
• Comments
Investments: - Datalogger supply to control water network consumption. - Supply and installation of pulse emitters for reading water meters. - Modification of the septic tank discharge control access to the Outer Port. - Repairs and actions in Maritime Signals wind generators. - Punta Promontorio lighthouse solar panels and Isla Pancha lighthouse wind turbine support modification. - Supply and installation of two groups of solar panels in Isla Pancha. - Updating of the control and management system of the meteorological stations of the Casa del Mar and the CCS of the Inner Port. - Total tangible and intangible investments in 2020 amounted to € 12,451,012.84. Expenses: - Discharge water characterization. - Verification of piezometers - Characterization of wastewater.

Apéndice: Transparencia Activa en la Información. Los datos en detalle Updated data as of 31/12/2020 Appendix: Active transparency in the information. Data in detail.
92
- Audit and ISO certification. - TA support Environmental Management. - Energy audit and project drafting. - Drinking water quality control. - Characterization and Turbidity Analysis of drinking water.
A_02 Total economic resources: expenses and investments, in environmental monitoring and characterization, expressed as totals in euros and as respective percentages of the total expenses and investments of the Port Authority. This concept includes expenses and investments associated with measurement systems, measurement campaigns and inventory projects and characterization of environmental aspects related to traffic and port activity.
• Inform if any work or measurement program has been carried out, or environmental characterization during financial year 2020. (Measurement campaigns, data acquisition with measurement networks, characterization of environmental problems, etc)
x Yes
No
• Inform on the aspects that have been measured or characterized during the 2020 period
x Water or sediment quality
Soil quality x Air quality
Sounds
Protected areas or species x Other habitats or species.
• Provide financial information during the 2019 financial year on financial resources for the characterization and monitoring of the port environment
Investments in environmental characterization 1,153.17 € (Investments in characterization / Total tangible and intangible investments) * 100 0.0092 % Expenses in environmental characterization 29,699,48 € Characterization expenses / Other operating expenses) * 100 0.61 %
Table 98
• Comments
Investments in environmental characterization: • Datalogger supply to control water network consumption.
• Updating of the control and management system of the meteorological stations of the Casa del Mar and the CCS of the Inner Port.
Expenses in environmental characterization: • Maintenance of meteorological stations and air quality.
• Characterization of drinking water in Cabo Prior lighthouse and Punta Candieira lighthouse for application for a drinking water concession.
• Characterization of wastewater to municipal collector in the inner port.
• Verification of piezometers and groundwater quality analysis.
• Control of the quality of drinking water in the facilities of the Ferrolport.
• Characterization of wastewater for Prioriño lighthouse and CCA outer port.
• Turbidity analysis of drinking water in Prior lighthouse and Punta Candieira lighthouse. Other actions: Characterization of shellfish species: expenses not made directly by PA. PEX tunnel work DIA follow-up.
• Covered concepts: Part of the total expenses and investments destined to the environment directed specifically to the environmental characterization.
• Investments: They will be within this concept:
• Acquisition of environmental parameter monitoring systems, such as particle collectors, buoys for the observation of environmental parameters, sound level meters, etc.
• Environmental data processing software.
• Expenses in maintenance of environmental monitoring systems or in the exploitation of data from environmental parameter monitoring systems.
• Campaigns to measure environmental parameters.
• Characterization studies of the natural environment.
• Characterization studies of the effect of port activity on the environment.

Apéndice: Transparencia Activa en la Información. Los datos en detalle Updated data as of 31/12/2020 Appendix: Active transparency in the information. Data in detail.
93
A_03 Cleaning expenses corresponding to the cleaning of common areas of land and water, expressed as thousands of euros per square meter of service area.
• Report about the attributions of the Port Authority in matters of cleaning the land surface and the water surface, and responsibilities of other administrations and operators.
Land cleaning of docks and roads by the PA Maintenance Department, and sheet of water in marine pollution events by third parties.
• Provide financial information during financial year 2020 about the cleaning costs for common areas Expenses in ground cleaning 4,800.69 € Service land surface area 532,729 m2 Land cleaning expenses / Land service area area 0,009 €/m2 Water sheet cleaning expenses 3,720.00 € Surface area zone I 19.831.700 m2 Expenses in cleaning the sheet of water / Surface area I 1,87x10⁻⁴ €/m2
Table 99
• Comments
Land area of service: roads and rest P.Int. and P.Ext of "interior port enclosure" (table 2.2.2 appendix surfaces 2020 Annual Report). Ground cleaning: there is no contract for cleaning. The costs of waste management (non-hazardous containers) are considered: collection, transport and delivery of waste to an authorized manager. Area 1 surface area: table 2.1.6 appendix 2020 environmental memory surfaces (Port of Ferrol). Sheet of water: Management of cleaning of sheet of water (spills).
Concepts covered:
• Ground cleaning: Cleaning costs for roads and docks for common use. It will be calculated from the invoices of the cleaning company hired by the Port Authority. Expenses associated with cleaning offices, workshops, or spaces used by Port Authority personnel will not be included.
• Cleaning the sheet of water: It will be included in the set of expenses related to the sheet of water, both those linked to the
collection of floats and those linked to possible accidental spills attended by the Port Authority. When these activities are carried out by third parties, their invoices will be used, when they are carried out by the Port Authority they will be calculated from the amortization of the means used and an estimate of the maintenance and provisioning costs of said means during the year. in progress.
A_04 Environmental training, expressed as a percentage of staff on the Port Authority staff, who have received environmental training,
accredited by the Port Authority, in accordance with the functions that they perform in the port.
• Report on the following aspects related to the dedication of human resources to environmental management. Number of people dedicated to environmental management and supervision 2 Number of workers who are accredited of having received environmental training based on their competences in tasks of surveillance or management of the port environment:
1
Percentage of workers with environmental training compared to the average annual workforce for 2020 0.91% Table 100
• Comments
In addition to the two people indicated for management, in 2020 there is a port police who carries out the environmental inspection of facilities.

Apéndice: Transparencia Activa en la Información. Los datos en detalle Updated data as of 31/12/2020 Appendix: Active transparency in the information. Data in detail.
94
AIR QUALITY (305-7)
A_05 Synthetic description of the main emission sources (specific and diffuse) of the port, which represent significant emissions. Such as: construction, demolition and maintenance of port infrastructures, emissions from machinery linked to port operations, engine emissions from road traffic in facilities ports, docked ships, handling or storage of solid bulk, or others linked to port activity.
Report on what is considered to be the main cause of deterioration in the port's air quality
x Dust and particulate emissions
Combustion gases CO, NOx, SOx, etc
Others. Indicate:
• Inform if the Port Authority has carried out an inventory and assessment of the sources of emission to the atmosphere
existing in the port. Yes
In implementation x In project
It is not foreseen
• If so, describe what it consists of.
• Report on which of the following emission sources are present in the port or ports and are relevant, stating the number
of sources for the activities indicated according to the proposed criteria.
Type of activity Order of
relevance Number of bulbs
• Storage of solid bulks outdoors (Calculated as number of concessions that store solid bulks outdoors)
5 1 (Endesa)
• Handling of solid bulks by conventional means (Calculated as the number of companies with a stowage license that move bulks by means of a bucket / hopper-conventional / truck or bucket / stockpiling-dock / shovel / truck or truck / mobile-conventional-belt)
1 3 (Endesa, TMGA and PT)
• Bulk handling using special systems not covered. (Calculated as the number of companies that have uncovered or partially covered continuous merchandise haulage systems.)
4 3 (Endesa, PT, TMGA,)
• Industrial activities in concessions (Calculated as the number of concessions where industrial activities involving emissions channeled into the atmosphere are carried out)
2
6 (Alcoa, Masol, Megasa, Forestal, Procesoil and Reganosa
• Boat hull cleaning and painting (Calculated as the number of concessions that carry out cleaning and painting of hulls outdoors)
6 3(Navantia, club del mar
(club of the sea), lonja)
• Works 3
• Emissions from untold truck bodies 9
• Emissions from vehicle engines 8
• Emissions from docked ships and cruise ships 7
• Other activities (specify which ones)
Table 101 –according to the criteria of the Safety, Environment and Prevention Division
• Assessment according to the criteria of the Safety, Environment and Prevention Division
• Comments: In yellow information without evidence

Apéndice: Transparencia Activa en la Información. Los datos en detalle Updated data as of 31/12/2020 Appendix: Active transparency in the information. Data in detail.
95
(307-1)
A_06 Evolution during, at least, the last three years of the number of complaints or denunciations registered by the Port Authority, coming from interest groups of the port (port community, urban centers, administrations, etc.), regarding dust emissions or quality air in general. Availability of a systematized complaints management system.
• Inform if the Port Authority has a specific procedure for the reception and management of environmental complaints.
x Yes
No
• If so, describe the mode of access and the mechanics of the process followed in the management of environmental complaints.
The procedure Management of complaints, initiatives or suggestions can be accessed through the following QR.
• Report about the number of complaints received during 2020 related to air quality and attributable to port activity,
reporting on the focus and group of origin of the complaints.
Activity causing the complaint Number of complaints Origin of the complaint 0
Table 102
Where the complaint comes from, identify the group from which they come, such as:
• Port community • Neighbors • Autonomous community
• Town hall • Others
Report the evolution of the number of complaints:
2018 2019 2020 Number of complaints 0 0 0
Table 103
Comments:
During 2020, no complaints have been received for non-compliance with laws or regulations on environmental matters.
A_07 Synthetic description of the measures implemented by the Port Authority to control emissions linked to the activity of the port as a whole, whether it is administrative, operational or technical measures, such as the development of environmental standards,

Apéndice: Transparencia Activa en la Información. Los datos en detalle Updated data as of 31/12/2020 Appendix: Active transparency in the information. Data in detail.
96
control of environmental operations by the port surveillance service, measurement of environmental parameters, limitations on the handling of powdery goods, or other initiatives.
• Report on which of the following measures have been implemented by the Port Authority to control air pollutant emissions.
x • Follow-up to port operators of authorizations and regulatory notifications regarding emissions to the atmosphere. • Mandatory regulations and disciplinary proceedings.
x • Specific direction instructions for certain operations. • Good practice guides and voluntary environmental codes.
x • Direct supervision at the dock by technicians from the Port Authority.
x • There are systems for measuring air quality parameters or periodic campaigns. • Reorganization of the activity in the port plant to move away emission sources from sensitive areas. • Improvement of interior roads or accesses aimed at reducing truck traffic through urban centers. • Environmental criteria in the management and allocation of berths. • Incentive to the use of trucks with low emission levels. • Conditions on atmospheric emissions in service regulatory specifications. • Requirements on emissions to the atmosphere under conditions of granting concessions.
x • Signing of good practice agreements. • Specific technical measures related to the control of dust emissions such as: • Windbreak screens
x • Irrigation systems for bulk and road stockpiles
x • Wheel washing systems • Warning and information systems linked to wind speed
x • Operational stop due to adverse wind speed
• Incentive to trucks with automatic awning or installation of awning points
Inform if the Port Authority verifies if concessions and port service operators meet the administrative and control requirements established by law 33/2007 and RD 100/2011 on air quality.
x Yes
In implementation
In project
It is not foreseen
• If so, describe what it consists of and how often it is done.
Documentary monitoring: At the beginning of the activity, the concessionary, authorized and licensee companies are requested an Environmental Management Plan with all the information at the environmental legislative level; and annually, the evidence of compliance with emissions with the submission of an Annual Report
Dock operations monitoring
2 air quality control stations (Inner port and outer port)
Current good practice agreements (Reganosa and Forestal del Atlántico)
A_08 Synthetic description of the initiatives undertaken by the Port Authority to assess the effect of port operations on air quality, and the total number of studies or campaigns carried out. Schematic description of the operational air quality monitoring equipment that the Port Authority has, indicating the total number of them, the parameters measured, whether they measure continuously or delayed, and the area where they are located.

Apéndice: Transparencia Activa en la Información. Los datos en detalle Updated data as of 31/12/2020 Appendix: Active transparency in the information. Data in detail.
97
• Inform if the Port Authority has fixed air quality measurement stations, operational during 2020.
x Yes
No
• If so, indicate how many, if they are to control air quality in general or for some particular activity, and the type of pollutant they measure (particles, PM10, SOx, NOx, O3, etc):
Team Place Object Type of
pollutants Automatic Beta Radiation Attenuation PM10 Monitor (BAM-1020)
Inner port (08°14'50"W; 43°28'59"N)
Air quality in inner port
Particles PM10
Automatic Beta Radiation Attenuation PM10 Monitor (BAM-1020)
Outer port (08°19'15"W; 43°28'05"N)
Air quality in the outer port
Particles PM10
Table 104
• Inform if during the 2020 period, the Port Authority has carried out measurement campaigns or any study on air quality due to the activity of the port.
x Yes
No
• En caso afirmativo describirlo sucintamente, indicando en que ha consistido y la motivación (planes de vigilancia ligados a DIA, quejas, exigencias planteadas por administraciones, vigilancia rutinaria del SGA):
Dos captadores en continuo de PM10 situados en ambos puertos para el control de la calidad del aire. Vigilancia del SGA
• Informar si se dispone de algún acuerdo con el ayuntamiento o con la comunidad autónoma en materia de vigilancia de la calidad del aire.
Si x No
A_09 Value of air quality parameters in the port, such as annual mean values or number of times the daily limit value is exceeded, for
pollutants that are significant in relation to port activity: PM particles, sedimentable particles, oxides of nitrogen and sulfur oxides.
Code Title Ind. Units Formula Description 2018 2019 2020
I0152 Average value of PM10 emissions µg/m3 Annual average
µg / m3 Annual average of the measurements of the Inner Port and Outer Port stations 22,30 21,80 19,7
Table 105
• If you have stable measurement networks, provide annual mean values and number of days in which daily limit values are exceeded.
INNER PORT
Pollutant Annual average value Number of exceedances of the daily limit value. Suspended particles
PM10 Particles 13,1 μg/m3 2 SOx
NOx
Table 106.a
OUTER PORT
Pollutant Annual average value Number of exceedances of the daily limit value. Suspended particles
PM10 Particles 26,3 μg/m3 8
SPILL
A_10 Description of the main sources of spill (specific and diffuse) located in the port, which have a significant impact on the quality of
the water and sediments of the port docks, such as boulevards, ditches, urban discharge points, operational with solid bulks or others. Differentiating between discharges generated and not generated by companies or activities of the port.
• Indicate which of the following sources of dock water contamination are present in the port or ports and are relevant.

Apéndice: Transparencia Activa en la Información. Los datos en detalle Updated data as of 31/12/2020 Appendix: Active transparency in the information. Data in detail.
98
Origin of the spill Order of relevance • Untreated urban wastewater
• Urban treated wastewater (EDAR's)
• Rivers, streams, boulevards or ditches
• Rain or irrigation runoff, not channeled or channeled untreated 3
• Industrial discharges from port concessions
• Works (CLEAN WATER, OUTER PORT TUNNEL DRILLING) 5
• Dredged
• Cleaning and dripping of boat hulls
• Bad practices in cleaning and maintenance of docks and equipment 4
• Non-regulatory discharges from ships (bilges, etc.)
• Solid bulk loading / unloading spills 6
• Refueling and provisioning of the ship at the dock (operational failure) 1
• BUNKERING of anchored vessels
• Accidental spills when loading / unloading liquid bulk
• Other discharges (indicate which ones): DISCHARGES FROM STORAGE (GRG) 2 Table 107 – Assessment according to the criteria of the Safety, Environment and Prevention Division, taking into account
the existence of the focus plus its relevance in the impact on the environment.
• Order of relevance: Enter the order of relevance of each outbreak with numbers from 1 onwards, until all significant outbreaks present in the port or ports are covered.
• Report on what is considered to be the main cause of deterioration in the quality of the port's waters.
Spill upstream in rivers, streams, etc.
Spill from concessions
Urban discharges to the port x Accidental spills Others. Indicate:
• Inform if the Port Authority has carried out an inventory and characterization of the different sources of spill and contamination
of the port's waters. Yes
In implementation x In project
It is not foreseen
• If so, describe what it consists of and the methodology used (ROM, etc.)
In yellow information without evidence
A_11 The synthetic description of the measures implemented by the Port Authority to control discharges linked to the activity of the port as a whole, whether it is administrative, operational or technical measures (cleaning points and controlled maintenance, improvements to the sanitation network, operational surveillance, etc.). In particular, those measures that are expressly reflected in the hydrological plan of the basin in which the port is located will be dealt with.
• Indicate which of the following measures have been implemented by the Port Authority to improve or control the quality of the port's waters.
• ROM 5.1 program implementation • Inventory and characterization of dock pollution sources
x • Follow-up to concessions of regulatory discharge permissions
x • Periodic campaigns to characterize the quality of water and sediments

Apéndice: Transparencia Activa en la Información. Los datos en detalle Updated data as of 31/12/2020 Appendix: Active transparency in the information. Data in detail.
99
• Mandatory regulations and application of the sanctioning regime • Guides of good practice and voluntary codes of conduct • Specific technical instructions for loading / unloading of solid bulks.
x • Direct supervision at the dock by technicians from the Port Authority. • Improvements in the sanitation network. • Installation of areas enabled for cleaning and maintenance of equipment. • Runoff management improvements (collection, channeling, bulk wells, storm tanks, etc.)
• Specific environmental requirements on wastewater and runoff management under conditions of granting
concessions.
• Environmental requirements on maintenance and cleaning of equipment in service specifications and granting
conditions. x • Good practice agreements
• Approval of Internal Maritime Plans (IMP) for response to emergencies due to marine pollution.
• Improvement in the provision of own resources for the fight against accidental marine pollution
x
• Other measures. Specify which ones
•
•
• Indicate whether some of the measures adopted by the Port Authority to control and improve the quality of port waters are included in the watershed hydrological plan, indicating the most relevant ones.
• Inform if the Port Authority verifies if the concessions have the applicable permits in the matter of discharges.
x Yes
In implementation
In project
It is not foreseen
• If so, indicate how this check is carried out and how often.
Monitoring of concessions of regulatory discharge permits with the review of the Environmental Management Plan of the concession, through the annual environmental report.
A_12 Number and synthetic description of port water quality characterization campaigns, which are not the result of obligations arising from environmental impact statements
• Inform if during 2020 the Port Authority carried out a campaign to measure the quality of port waters that was not required by Environmental Impact Declarations.
Yes X No • If so, indicate whether the measurement campaigns are due to continuous control programs (ROM 5.1, DMA, etc.), or
on the contrary, are the consequence of specific problems and the reasons for them:
• Indicate the type of parameters that have been measured:
Indicators
Physico-chemical
Turbidity / Suspended solids
Nutrients
Chlorophylls
Heavy metals
Pesticides
Other organic micropollutants
Biological indicators
Table 108

Apéndice: Transparencia Activa en la Información. Los datos en detalle Updated data as of 31/12/2020 Appendix: Active transparency in the information. Data in detail.
100
• Report on the existence of agreements with the competent environmental administration in matters of characterization of port water quality, such as collaboration in the development of periodic measurement campaigns or collaboration in taking samples in case.
A_13 Percentage of the surface of the service area that has wastewater collection and treatment. It will be understood that wastewater
is treated when it is discharged into a municipal collector, or when it is discharged into the basin and has the corresponding discharge authorization.
Type of treatment % of surface
• Percentage of the surface of the land service area that has a sanitation network (regardless of where it discharges and the treatment received)
100%
• Percentage of the surface of the land service area that has a sanitation network connected to the municipal collector or to a EDAR
94%
• Percentage of the land surface that discharges to septic tanks 0.14% Table 109
• To estimate the percentage of surface occupied by each of the types of treatment, determine the total space occupied by concessions and facilities of the Port Authority that have each of the types of sanitation installation indicated, and relate it to the total surface area dedicated to port uses.
•
Port Authority
• Report, where appropriate, succinctly on the main actions to improve the sanitation network carried out by the Port
Authority, such as extension of network coverage, connection to the municipal network, improvements in treatment, installation of points of control, etc.
Connection of the sanitation network of the inner port to the municipal collector: Two discharge control points.
Comments:
Total of area taken as a reference to percentages: Inner Port = 281,866 (total sup interior enclosure, table 2.2.2 appendix 2 of the report) Outter Port = 879,166 (total sup. inside enclosure, table 2.2.2 appendix 2 of the report) Pits: Control. (Pext.), Moorings (P.Int.), Perez Torres (P.Int.), TMGA (P.Int.), Total 1,571.42 m2. In process, obtaining authorization for dumping of the ditch from the Port Authority in Control of Access to the Outer Port.
In yellow information without evidence
A_14 Percentage of the surface of the service area that has rainwater collection and treatment. It will be understood that wastewater is treated when it is discharged into a municipal collector, or when it is discharged into the basin and has the corresponding discharge authorization.
• Report on the degree of coverage and the type of rainwater collection network.
Network type % of
surface • Percentage of the land surface that has a rainwater collection network (Enter the percentage of surface with
rainwater collection regardless of whether the water is treated or not)
100 % • Percentage of the surface of the service area that has rainwater collection and treatment. (Enter the
percentage of surface area with rainwater collection that discharges into the city hall collector, or that receives some treatment before being discharged into the sea. The existence of thick wells or storm wells can be considered treatment).
27 %
Table 110
• To calculate these percentages take into account the entire service area.

Apéndice: Transparencia Activa en la Información. Los datos en detalle Updated data as of 31/12/2020 Appendix: Active transparency in the information. Data in detail.
101
• By runoff, rainwater, irrigation, flushing, cleaning, dripping, etc. will be understood. The previous decantation of the water before its discharge will be considered treatment.
• Report, where appropriate, succinctly on the main actions to improve the rainwater network carried out by the Port Authority, such as extension of network coverage, bulk wells, storm wells, etc.
Storm tanks in the inland port network sanitation work and connection to the municipal collector. Percentages attending the inner and outer ports.
A_15 Schematic description of the technical means used to clean the sheet of water, and weight of floats collected during the year.
• Report on the following data on the cleaning service of the floating water surface of the port during the year 2020.
Number of boats
Cleaning frequency
Weight of waste collected in Tm
Table 111
• Comments:
•
There is no contract for cleaning the sheet of water, so in case of minor incidents it is cleaned through the relevant order with subsequent payment to the mooring companies. Floats are usually removed with the PA's own vessel, or, where appropriate, by SSPP vessels.
In yellow information without evidence
A_16 Activation of the Internal Maritime Plans (IMP) for response to emergencies due to pollution. (306-1) (306-3).
Code Ind. Title Units Formula Description 2014 2015 2016 2017 2018 2019 2020
I0078 No environmental incidents
No Sum (environmental incidents)
Events with an environmental incident, which give rise to the activation of the PEI, the PICCMA or the opening of the sanctioning file by the competent administration.
1 2 6 7 3 4 2
Table 112
01/16/2020: PIM activation due to discharge from dock storage tanks. Curuxeiras dock. 05/20/2020: PIM activation due to spillage from dock of fuel transfer concessions. Pier 12 Navantia.
of marine pollution incidents that have not required PIM activation. 0 Number of marine pollution emergencies that have required the activation of the PIM. Of any concession without the need
to activate the Port's PIM (“situation 0”) 0

Apéndice: Transparencia Activa en la Información. Los datos en detalle Updated data as of 31/12/2020 Appendix: Active transparency in the information. Data in detail.
102
Number of marine pollution emergencies that have required the activation of the Port's PIM (“situation 0”) 2 Number of marine pollution emergencies that have required the activation of the National Maritime Plan (“situation 1 or
higher”) 0
Table 113
Synthetic description of the emergency response scheme. (own resources, spill cleaning service
contracts, signed agreements, etc.): Emergencies due to marine pollution are dealt with in accordance
with the provisions of the PIM of the Port of Ferrol or PIM of the Port of San Cibrao. The Port Authority
has annually updated the means of prevention and fight against pollution of the companies involved that
operate in the port area. Since February 2017, the contract with Sasemar for the provision of nautical
coordination services and the fight against marine pollution has been in force.
A_17 Volume of wastewater discharges generated by the Port Authority, or discharged by collectors owned by the Port Authority, broken down by type.
(306-1) (306-5)
• Briefly describe which activities of the A.P. generate wastewater discharges (offices, workshops, sheds, etc.) and if these are urban (ARU), industrial (ARI) or mixed
Offices and workshop (urban waters) • , whenever possible, an estimate of the volumes generated during 2020
Total volume 691 m3 ARU volume m3 ARI volume m3 Mixed volume m3
Table 114 Inform about the destination of said wastewater:
Municipal collector x Septic tank x Own treatment
Table 115 Comments Discharges are equated to own consumption since the waters are not modified in any process. The Port authority has its discharge points connected through the municipal network to the municipal sewage treatment plant, so it is an indirect discharge to bodies of sea water without special protection.
Code Ind. Title Unit Formula 2018 2019 2020 I0063 Water quality in Faro Prioriño (FE1) Mg/l DQO value 563 102 204 I0064 Water quality in the Access Control of the
Outer Port Mg/l DQO value 75,50 76,50 209
I0167 Concentration of suspended solids in the outer port receiving medium. MASOL dealer measurements
Mg/l Most unfavorable parameters of the monthly average of suspended solids
5,57 7,75 2,4
Table 116
NOISES
A_18 Synthetic description of the main emission sources (specific and diffuse) of the port, which represent significant acoustic emissions.
Indicate which of the following noise sources are present in the port or ports and are relevant.
Type of activity Order of relevance • Truck traffic
• Rail traffic
• Port machinery
• Scrap handling 2
• Container handling
• RO-RO terminal movement
• Industrial activity in concessions.
• Ships docked
• Works
• Places of leisure

Apéndice: Transparencia Activa en la Información. Los datos en detalle Updated data as of 31/12/2020 Appendix: Active transparency in the information. Data in detail.
103
• Other activities (indicate which ones): LOADING-UNLOADING OF STONE 1 Table 117
Order of relevance: Enter the order of relevance of each outbreak with numbers from 1 onwards, until all significant outbreaks present in the port or ports are covered.
(307-1)
A_19 Number of complaints or reports registered by the Port Authority in the year, made by port interest groups (port community, urban centers, administrations, etc.), regarding noise emissions from port activity. Availability of a systematized complaints management system.
• Inform if the Port Authority of a specific procedure for the reception and management of environmental complaints
x Yes
No
• If yes, describe the mode of access and the mechanics of the process followed in the management of environmental complaints
The procedure Management of complaints, initiatives or suggestions can be accessed through the following QR. Complaints received through this procedure are counted in this section. No breaches of environmental laws or regulations have been identified in 2020.
• Number of complaints received during 2020 related to noise pollution and attributable to port activity, reporting on the focus and group of origin of the complaints.
Activity causing the complaint Number of complaints Origin of the complaint 0
Table 118 • Where the complaint comes from, identify the group from which they come, such as:
• Port community • Neighbours • Autonomous community
• Town hall • Others
• Report on the actions carried out during 2020 due to complaints about noise pollution attributable to the activity of the port.
Activity causing the complaint Performance Table 119
• • Evolution of the number of complaints: 2018 2019 2020
Number of complaints 0 0 0 Table 120
A_20 Description of the port situation in relation to the elaboration of the noise map and acoustic action plan.
• Indicate if the Port Authority has prepared a noise map of the port or ports.
Yes
No, but it is in development
No, but it is in the project x No, and it is not planned If you have drawn up a noise map, indicate the reason
Project impact evaluation
Plan evaluation Required by municipality action plan
Internal Environmental Management
If noise maps have been drawn up in several ports, indicate which ones Indicate if any port is included in the noise map drawn up by a municipality
x No
Yes Port: Municipality:
If so, indicate if the port is included in the acoustic action plan drawn up by the town hall.
Yes
No • Report on possible campaigns to measure the sound levels generated by the port community. Indicate your motivation
and objective

Apéndice: Transparencia Activa en la Información. Los datos en detalle Updated data as of 31/12/2020 Appendix: Active transparency in the information. Data in detail.
104
In 2021 it is planned to carry out an initial campaign to measure sound levels that allows knowing the impact of port activities on the environment: unloading of scrap metal and wood in the inner and outer ports, port traffic and machinery associated with loading-unloading operations, within the Nuisance Activities Control Plan.
A_21 Number of actions, and characteristics of said actions, undertaken during the current year on sources of noise identified as a result
of complaints and non-conformities registered by the Port Authority.
• Indicate which of the following measures have been implemented by the Port Authority to control noise emissions linked to the activity of the port.
• Stable acoustic measurement networks. • Acoustic quality measurement campaigns.
x • Surveillance / inspection by A.P. personnel.
x • Standards or good practices in loading / unloading of scrap metal or containers. • Machinery maintenance conditions in service specifications and concession conditions.
• Installation of acoustic screens.
x • Speed limits on port roads. • Improvements to the road surface to reduce acoustic emissions.
x • Activity limitations during the night. • Installation of acoustic screens. • Improved access or reorganization of internal circulation to reduce truck traffic through urban centers.
• Reorganization of port activity to remove sources of noise from urban areas.
• Other measures. Specify which ones • Regarding the limitation of night activities, indicate that they must be expressly authorized.
In yellow information without evidence
WASTE MANAGEMENT (306-2)
Code Ind. Title Units Formula 2015 2016 2017 2018 2019 2020
I0070 Non-hazardous waste Kg/year Sum (NON-hazardous waste) 8,834,890 43,726 39,573 41,415 25,840 37,000
I0071 Dangerous residues Kg/year Sum (Hazardous waste) 5,491 2,497 193,922 1158 539 673
I0072 Marpol I Collection of liquid waste from ships m³ Sum m³ (Marpol I
Waste) 1,492.69 1,572.90 1,899.12 2,403 2,438.7 1,707.17
I0073 Marpol V Collection of solid waste from ships m³ Sum m³ (Marpol V
Waste) 1,836.50 2,380.76 2,188.98 2,249 2,576.7 1,918.97
Table 121 : Construction waste is not included, so waste from the “Railway access to the Outer Port” work is not counted.
To ensure that the Ferrol-San Cibrao Port Authority correctly manages the waste generated as a result of its activities and direct services, the Waste Management and Control Procedure is followed.
A_22 Percentage of waste generated by the Port Authority, which is segregated and valued, broken down by type of waste. (typical ton of waste recovered / ton of total waste collected) x 100).
• Inform if the Port Authority carries out an accounting of the volume of waste generated in its facilities by type of waste. Otherwise, inform the status
x Yes
In implementation
In project
Unforeseen

Apéndice: Transparencia Activa en la Información. Los datos en detalle Updated data as of 31/12/2020 Appendix: Active transparency in the information. Data in detail.
105
• Inform if the Port Authority carries out an accounting of the volume of waste generated that goes through a recovery process. Otherwise, inform the status
x Yes
In implementation
In project
Unforeseen
• Inform if the Port Authority has a plan to minimize and recover the waste generated in its own facilities and services
under its responsibility (including cleaning). Otherwise, inform the status Yes
In implementation
In project x Unforeseen
• Report the percentage of waste produced by the Port Authority that has undergone a separate collection and that has
been subsequently recovered during 2020.
Waste type Separate Collection
(Tm separated waste / Tm total waste generated) * 100
Valorization (Tm recovered waste / Tm total waste generated) * 100
R.S.U 51.78 % 29.73 % Dangerous residues
100 % 82.17 %
Oils 0 % 0 % Table 122
• Inform if the Port Authority carries out an accounting of the volume and type of waste generated by the cleaning service, and the destination of said waste. If not, report the status of the initiative.
x Yes
In implementation
In project
Unforeseen
• If so, inform about the nature of those collected by the port cleaning service, for the purpose of depositing them in a landfill, during the year 2020.
Waste type Total amount collected during the year in Tm Percentage of the total collected.
Inert 26 70.27% Not dangerous 5,3 14.32% Dangerous 1,2 17.83%
Table 123
A_23 Synthetic description of the main activities or sources of waste generation within the port, such as fishing activities (fishing gear, packaging), movement of solid bulk (remains of merchandise after operation), recreational areas, machinery maintenance tasks, or septic tank sludge, among others.
• Inform if the Port Authority has carried out an inventory or characterization of the volume and type of waste generated by concessions and service providers. If not, report the status of the initiative.
Yes
In implementation
In project x Unforeseen In the event that an accounting of concessions is not carried out, inform if any accounting is made of the waste generated in the port community, and which groups of waste are accounted for (fishing area, cleaning, clean points, etc.).
Companies operating in the port: annually the PA requests an environmental report with the declaration of legal compliance in the matter of waste as well as the declaration of the quantities generated by waste, LER code and manager.
Indicate which of the following sources of waste are present in the port and are relevant. Record the order of importance of each waste source with numbers from 1 onwards, until all sources are covered.
Type of source or activity Order of importance MARPOL waste delivery 1 Cargo and stowage waste (discarded cargo, packaging, etc.) (1) 2 Fishing (packaging, nets, fish remains, etc) 3 Remains of solid bulk movement sweeps (2).
Cleaning of docks, roads and common areas 4 Water sheet cleaning (floating solids)
Accidental spill cleanup 5

Apéndice: Transparencia Activa en la Información. Los datos en detalle Updated data as of 31/12/2020 Appendix: Active transparency in the information. Data in detail.
106
Activity of bars, leisure and commerce in the service area
Works
Concession activities generated by concessions
Septic tank cleaning
Machinery maintenance
Other activities
Table 124
• Comments
1. The 2nd place assigned to cargo residues is due to the fact that Ferrol is a port with large shipyards and as
a consequence it has a large tank washing and shedding station, which collects considerable volumes.
2. Managed by operators.
A_24 Initiatives promoted by the Port Authority to improve waste management in the port community. Existence of clean points, waste
collection programs, recovery programs, etc.
• Indicate which of the following measures have been implemented by the Port Authority to improve waste management in the port.
• Inventory of the port's waste-generating activities.
x • Regular monitoring of concessions and port service providers to verify the monitoring of the administrative requirements established by the waste law.
• Mandatory standards. • Sanctions in case of waste abandonment in non-authorized places. • Good practice guides or Environmental codes of conduct. • Transfer centers promoted by the Port Authority. • Clean points with separate collection. • Composting areas and inert waste drying areas.
x • Good practice agreements. • Awareness campaigns. • Fishing waste recovery projects promoted by the Port Authority.
• Other measures or initiatives • Surveillance and inspection by PA personnel.
• Inform if the Port Authority verifies if the concession operators and service providers comply with the administrative requirements imposed by the waste law for their activities. If not, indicate the status of the initiative
x Yes
In implementation
In project
Unforeseen
If so, indicate how this check is carried out and how often.
Verification of registration as a producer / waste manager. Information provided by the concession in the environmental report, licenses, or good practice agreements, or work. At the beginning of the activity, failing that, annual.
If there are transfer centers in the port, or clean points, inform who is in charge of them (cleaning company, authorized manager, municipal company, etc.)
Reception point for waste generated by vessels (fishing and sports) through an authorized manager according to port legislation (Marpol).
License to a provider of commercial waste collection service in the Outer Port.
Municipal waste collection company in the public area of the Inner Port.
A_25 Type of management applied to dredged material, expressed as volumes of dredged material of each of the categories in which said
material can be classified according to the CIEM Dredging Guidelines
• Report on the development of possible dredging and their motivations, explaining the importance of this process to guarantee the competitiveness, operability and safety of the port.
During 2020 no dredging has been carried out

Apéndice: Transparencia Activa en la Información. Los datos en detalle Updated data as of 31/12/2020 Appendix: Active transparency in the information. Data in detail.
107
• Report the reason for the dredging First establishment
Draft improvement
Foundation preparation
Maintenance
Environmental
Report the volume of dredged material of each of the classes contemplated in the guidelines
Inform about the destination given to the dredged material classified as category C, as well as the treatment applied to the dredged material classified as waste.
Report on the measures adopted to reduce the impact of dredging both in the extraction area and in the dumping or confinement area.
In yellow information without evidence
BIODIVERSITY
A_26 Description of areas or species with some kind of protection, adjacent to the port or within the port public domain: LIC, ZEPA, BIC,
Ramsar. (304-1) (304-4)
• Provide a schematic list of the protected areas that may be affected by port activity or its extensions:
Name Type of space2 Distance to port2 Mariñas Coruñesas e Terras do Mandeo-Transition Zone
Biosphere Reserve
6 km south of zone I
Costa Ártabra ES1110002 ZEC Red Natura Waters in zone I, entrance channel to the port, included. Land zone, adjacent to zone I in the Outer Port, 0 km.
Xubia Castro ZEC Red Natura 4,5 km Marine Area of the coast of Ferrolterra Valdoviño
ZEPA Adjacent to the outer port.
Ferrolterra Valdoviño coast IBA Partial outer port included Cape Prior-Doniños area GAL 03/01
Mollusk production area
Including zone I and II waters
A Frouxeira Lagoon RAMSAR More than 15 km Beach, dune and lagoons of A Frouxeira
Biotopos Corine (CE)
More than 15 km
Table 125
• Inform if these spaces have a management plan in place in which the Port Authority participates, or, failing that, if it is planned or under preparation:
Name of the place Management plan2
Table 126

Apéndice: Transparencia Activa en la Información. Los datos en detalle Updated data as of 31/12/2020 Appendix: Active transparency in the information. Data in detail.
108
Provide a schematic list of some of the most significant protected species that may be affected by port activity or by works undertaken by the port:
Seabirds: Hydrobates pelagicus, Phalacrocorax aristotelis, Phalacrocorax carbo. Cliff birds: Falco peregrinus, chough (Pyrrhocorax pyrrhocorax). Dune plants: Antirrhinum mahus, Corema alba, orchids and peat bog plants (Sphagnum). Vegetation: heaths, alluvial forests of Alnus glutinosa and Fraxinus excelsior, and cover peat bogs.
A_27 Characterization and inventory work of the natural environment in the port and adjacent areas. In particular, the availability of underwater bionomic mapping of the harbor waters. (304-2)
• Report on possible studies or work carried out by the Port Authority aimed at characterizing or inventorying the natural environment of the port. For each of the works carried out, it is proposed to report on the following aspects.
Name "Analytical monitoring, sedimentation and shellfish resources in the works of the railway access to
the Outer Port of Ferrol (execution phase of the works prior to the start of the A Malata viaduct)” Place Ensenada de A Malata. State Preoperational characterization Year 2020 Reason Evaluate the potential environmental impact generated by the development of the railway access
works to the outer port of Ferrol, in compliance with the DIA. Description Study of the shellfish banks of bivalves in the area of execution of pillars on the estuary, in order to
comply with the EIS of the project, and to be able to determine the possible effect that the works may have on the bank and assess the consequences for the brotherhoods .
Table 127
Insert new "tabs" if necessary • Inform if the Port Authority has carried out an underwater bionomy mapping.
Yes
Developing
In project x It is not foreseen
A_28 Schematic description of projects for the regeneration of the natural environment undertaken by the Port Authority, and valuation
in euros of the cost of said actions. (304-3)
Inform about possible regeneration projects, or enhancement, of the natural environment affected by the port, undertaken by the Port Authority. For each of the projects it is proposed to report on the following aspects.
Name They have not existed during 2020 Place Space in which the performance took place Stade State of development during the year 2020: in development, developed Year Year of completion if completed before 2020 or during 2020

Apéndice: Transparencia Activa en la Información. Los datos en detalle Updated data as of 31/12/2020 Appendix: Active transparency in the information. Data in detail.
109
Reason Reason for the project, such as: environmental impact statements, Port-City agreements, etc.
Description Brief description of the performance
Investment and expenditure in €
Valuation of investments and expenses in € of the action:
Table 128
ECO-EFFICIENCY
A_29 Efficiency in land use, expressed as a percentage of the land service area that is occupied by active facilities, whether they are their
own or under a concession or authorization regime.
Report on the percentage of the port's land service area that is occupied by active facilities, whether they are their own or under a concession or authorization regime.
39,4 %
• Those lands in the service area defined as not active in indicator E_04 will be considered to be not active. Comments:
Of a total of 3,029,512 m2 of land service area of the Port of Ferrol, 1,194,807 m2 correspond to surface occupied by individuals, which represents 39.4%. By zones, 19.4% of the Outer Port area, 8.5% of the Iner Port, and 63.8% of the rest of the Ferrol port land service area are occupied by facilities. The surface data are detailed in appendix 2.- Technical characteristics of the port, table 2.2.2. Land surface and storage areas (m2), from the 2020 Sustainability Report.
A_30 Evolution, at least in the last three years, of the Port Authority's total annual water consumption, expressed as total cubic meters
and as cubic meters per square meter of surface of the service area, indicating whether the network management falls on the Port Authority or is outsourced.
(303-1),(303-2), (303-3)
Code I Title Units Formula Description 2015 2016 2017 2018 2019 2020
I0074 Own water consumption (Type D List of Environmental Aspects)
m³ Sum (m3 water consumed)
Water consumption of the Port Authority
62,476 21,323 34,337 37,203 34,657 15,794
Table 129 The water consumed in the Port Authority is supplied by the Concello de Ferrol, and comes from the As Forcadas reservoir. Information on the management of the capture and treatment of this source can be consulted on the

Apéndice: Transparencia Activa en la Información. Los datos en detalle Updated data as of 31/12/2020 Appendix: Active transparency in the information. Data in detail.
110
EMAFESA website. Being the reservoir capacity of 10.7 Hm³, the consumption made by the Port Authority does not significantly affect it. Currently, the Port Authority does not reuse the consumed water, pouring it as indicated in the Discharges section of this chapter.
x The Port Authority
Outsourced to
• Inform who carries out the sale of water in the port. x The Port Authority
Outsourced to
Report on the degree to which the Port Authority controls or registers the different sources of consumption of the total water it consumes directly.
x Greater than 75%
Between 75% and 50%
E Between 50% and 25%
Less than 25%
Annual water consumption of the Port Authority in the last three years, total and relative to the service area. (The water consumption of the Port Authority refers only to consumption in its own facilities and common services, the water supplied to third parties will not be counted)
2016 2017 2018 2019 2020
Consumption in m3 26,560 34,337 37,203 34,657 15,794 Service area area in m2 1,555,483 1,555,623 1,555,623 1,555,623 1,555,623 Ratio m3 / m2 0,017 0,022 0,024 0,022 0,01
Table 130
• Water consumption of the Port Authority by uses during 2020:
Source of consumption % of the total Domestic / offices 100 % Irrigation green areas 0 % Irrigation dust prevention systems (only if they are from the PA)
Other uses (indicate which ones)
Table 131 (estimates)
• Inform if the data provided is Are measured data x They are data and estimates
They are estimates
• Report on water saving measures implemented by the Port Authority, such as:
• Installation of meters to have a better knowledge of consumption by application and detect losses
• Improvements in the irrigation of garden areas by optimizing irrigation systems or using plants with lower requirements
• Water saving systems for human consumption
The water is not recycled or reused.
A_31 Evolution, at least in the last three years, of the efficiency of the water distribution network, expressed as a percentage, for those
Port Authorities that carry out direct management of said distribution network.
• Report on the evolution of the efficiency of the network consigned as a percentage of the consumptions that are controlled and recorded, with respect to the total water distributed.
2016 2017 2018 2019 2020 Network efficiency in % 56.9% 61% 85.1% 85.5% 93%
Table 132
Network efficiency = 100 * (Registered water) / (Distributed water)
• Distributed water: Total water purchased by the Port Authority and in charge of its management
Registered water: Total of the water that is registered or controlled at the points of distribution to third parties or for own final consumption.
Uncontrolled water: Distributed water - Registered water. (Includes unregistered supplies and network losses)
Report on the measures adopted to improve consumption control, as well as to reduce possible losses.

Apéndice: Transparencia Activa en la Información. Los datos en detalle Updated data as of 31/12/2020 Appendix: Active transparency in the information. Data in detail.
111
A_32 Evolution, at least in the last three years, of the total annual electricity consumption in Port Authority facilities and lighting of common service areas, expressed as total kwh and as total kwh per square meter of service area.
(302-1), (302-2), (302-3), (302-4)
Code Iitle Units Formula Description 2017 2018 2019 2020
I0075
Own electricity consumption (Type D List of Environmental Aspects)
KW*h Sum (KW * h consumed)
Own electricity consumption of the Port Authority 1,941,196 1,963,244 2,031,097 1,865,017
I0146 Energy intensity. Power consumption
Kwh/M²
Kwh consumed / M² of total surface (PI and PE)
Intensity determines an organization's energy consumption in the context of a specific organization measure. Puertos del Estado Established the m² of surface. The square meters of surface are those of table 2.2.2 of the Annual Report. Total Exterior Port + Total Interior Port.
1,25 1,26 1,306 1,20
I0147 External electricity consumption Kwh Kwh
Third party electricity consumption. Both the electrical energy supplied to third parties, as well as the electrical energy consumed by the main port terminals (Endesa, Forestal, Reganosa, San Cibrao) are included.
1,228,297 2,194,676 2,445,683 3,388,264
I0148 Electric consumption Lighting
Kwh Kwh
Electricity consumption of lighting in the Outer Port and Inner Port The lighting of common areas is one of the general services of the PAFSC
725,752 787,597 765,124 697,409
Table 133 Inform about who carries out the management of the port electrical network
x The Port Authority
Outsourced to

Apéndice: Transparencia Activa en la Información. Los datos en detalle Updated data as of 31/12/2020 Appendix: Active transparency in the information. Data in detail.
112
• In the Outer Port there are concessionaires that carry out the management directly with the supplying company.
Inform about who carries out the sale of electricity to port operators
x The Port Authority
Outsourced to
Annual consumption of electricity in Port Authority facilities in the last three years, total and relative to the service area. (Energy supplied to third parties will not be considered energy consumed in Port Authority facilities.)
Greater than 75%
Between 75% and 50%
Between 50% and 25%
Less than 25% Annual consumption of electricity in Port Authority facilities in the last three years, total and relative to the service area. (Energy supplied to third parties will not be considered energy consumed in Port Authority facilities.)
2016 2017 2018 2019 2020
Consumption in kWh 2,028,245 1,941,196 1,963,244 2,031,097 1,865,017 Service area area in m2 1,555,483 1,555,623 1,555,623 1,555,623 1,555,623 Kwh / m2 ratio 1,30 1,25 1,26 1,306 1,20
Table 134
• Electricity consumption of the Port Authority by uses during 2019:
Source of consumption % of the total Road lighting
Offices (lighting, air conditioning, etc.)
Other uses (indicate which ones)
Table 135 • Inform if the data provided is
Are measured data x They are data and estimates
They are estimates
• Report about measures or initiatives to control, save, or produce electrical energy, such as:
• Installation of meters to have a better knowledge of consumption by application.
• Lighting optimization, indicating what has consisted of.
• Photovoltaic systems.
• Optimization of air conditioning systems, indicating what has consisted of.
(302-4), (302-5), (305-5) .
Flow reducers. Programming of schedules in the lighting control, which in combination with the flux reducer allows to reduce the light intensity and consequently save energy in the hours of less activity. (The lighting of common areas is one of the general services of the PAFSC). The calculation of the reduction of greenhouse gas (GHG) emissions of scope 2 (lighting) is as follows:
Consumption (kWh) Emission factor (kg CO2 / kWh) / Emissions (Kg CO2) Consumption 2019 765,124 0,25 191,281 Consumption 2020 697,409 0,25 174,352 Difference 67.21
16,929
In percentage 8.85%
8.85%
Table 136
A_33 Evolution, at least in the last three years, of the total annual consumption of fuels (diesel, gasoline, natural gas, etc.), used by the Port Authority (cars, heating, etc.), expressed as Kwh and as Kwh per meter square of service area.
(302-1), (302-2), (305-3 Code I Title Units Formula 2017 2018 2019 2020
0076 Diesel consumption Heating and DHW L/year Sum (liters consumed) 7,935 10,211 8,981 7,879
I0077 Diesel + gasoline consumption Transport L/year Sum (liters consumed) 19,247 19,970 19,426 13,377.28
Table 137
• Report the annual fuel consumption of the Port Authority in the last three years. 2017 2018 2019 2020
Total fuel consumption in kWh 292,792.69 331,051.12 298,213.061 245,151.80 Service area area in m2 1,555,623 1,555,623 1,555,623 1,555,623 Ratio m3 / m2 0,018*10-3 0,020*10-3 0,018*10-3 8,59*10-6
Table 138

Apéndice: Transparencia Activa en la Información. Los datos en detalle Updated data as of 31/12/2020 Appendix: Active transparency in the information. Data in detail.
113
• Report consumption by type of fuel during 2020
Fuel type % of the total Natural gas
Butane or propane gas, or liquefied petroleum gases
Gas 1.20% Diesel oil 98.80% Biodiesel
Table 139 • Report fuel consumption by uses during 2020:
Consumption sources % of the total Heating / Sanitary Hot Water 32.94% Vehicles 55.18% Boats 0.74% Generators 9.39% Other uses 34.69%
Table 140
• Report on fuel saving measures introduced by the Port Authority, such as, for example:
o Update of the fleet of cars or boats.
o Optimization of lighting, indicating what has consisted.
o Own generation of electrical energy, indicating the method used.
o Optimization of air conditioning systems, indicating what it has consisted of.
• Conversion factors to kWh
CONVERSION FACTORS TO kWh FUEL KWh / liter KWh/Kg
Natural Gas 0,0117 15,75 Gasnam Liquefied Natural Gas (LNG) 6,79 15,75 Gasnam Liquefied petroleum gas (LPG)
12,75 IDAE
Butane
12,44 IDAE Propane
12,83 IDAE
Gas 9,23 12,39 Gasnam Gas oil 10,26 12,14 Gasnam Biodiesel 8,80 10,25 IDAE
Table 141
EMISSIONS OF GREENHOUSE GASES (305-1), (305-2), (305-4), (305-5)
Code I Title Units Formula Description 2017 2018 2019 2020
I0141 Direct greenhouse gas emissions
tons of CO2 equivalent
Sum of tons of CO2 emitted by each source.
Gross direct emissions of Greenhouse Gases in metric tons of CO2, from the identified emission sources. There must be traceability by source of emission, between energy consumption, the calculation made, and the equivalent tons of CO2. According to the Corporate Accounting and Reporting standard related to the GHG Protocol of the WRI and the WBCSD.
71,17 78,99 72,07 60,41
I0149
Indirect greenhouse gas emissions (own electricity consumption)
Tn CO2 equivalent
Sum of tons of CO2 equivalent
Gross indirect emissions of Greenhouse Gases in metric tons of CO2, from the identified emission sources. They are calculated from the own consumption of electrical energy, since they are related to the GHGs that are generated when producing electricity. There must be traceability by source of emission, between energy consumption, the calculation made, and the tons of CO2 equivalent. According to the Corporate Accounting and Reporting standard
679,4 490,81 426,53 261,10

Apéndice: Transparencia Activa en la Información. Los datos en detalle Updated data as of 31/12/2020 Appendix: Active transparency in the information. Data in detail.
114
related to the GHG Protocol of the WRI and the WBCSD.
I0151
Intensity of direct and indirect GHG emissions
Tn CO2 equivalent / m²
Tn of CO2 equivalent / m² of total surface (Interior + Exterior P.)
Intensity determines the GHG emissions of an organization in the context of a specific measure. For the numerator, the emissions corresponding to scope 1 of the GRI Guide G-4 (consumption of heating and transportation fuel) and scope 2 of GRI (own energy consumption) are used. The total area of the Ext. Port is used. del Puerto Int., which is calculated in table 2.2.2 of the annual report.
4,82 3,66 3,20 2,06
Table 142
PORT COMMUNITY
A_34 Synthetic description of the type of conditions, or established requirements, on environmental aspects in the specifications of
particular requirements of port services, in granting conditions and in concession or authorization titles.
• Indicate which of the following conditions are generally required in service prescriptions and concession titles
• Have an EMS on the whole of the activity. • Have documented operational control of the processes likely to generate emissions, discharges, spills or waste. • Specific conditions on air quality levels or discharges. • Reference to specific operating practices for the control of environmental aspects. • Requirement of specific technical measures that prevent or mitigate emissions, discharges or spills (irrigation
systems, requirements in workshops, etc.). • Requirement on the level of order and cleanliness of work facilities. • to the development of maintenance in areas adequately enabled for it. • Need to have maintenance plans for those equipment or systems whose malfunction or condition may cause
emissions, spills or discharges.
x • Requirement on waste management. • In the movement of goods, reference to the management of cargo residues and the stowage of goods.
x • Reference to contingency plans and necessary means. • Obligation to obtain environmental liability insurance in accordance with the provisions of law 27/2007. • In dock operations, the obligation to have an operations manager who responds at all times of the operation. • Extinction of the service license when the operator is finely sanctioned for a serious environmental offense.
x • Provision of sanitation and rainwater network in concessions. • Control of soil contamination and decontamination in concessions.
Table 143

Apéndice: Transparencia Activa en la Información. Los datos en detalle Updated data as of 31/12/2020 Appendix: Active transparency in the information. Data in detail.
115
• Inform of other required conditions
The port establishes the information requirements for workers on PRL and emergency measures, and the obtaining and maintenance of permits, licenses, plans and certifications established by current legislation.
• Comments:
In the case of providers of Port Services, it is an essential requirement to obtain the Environmental Management certificate according to the ISO 14001 standard. The Port Authority awards the best environmental practices with bonuses to the managers of freight terminals. New Agreements on good environmental practices, in force since 2018, with Reganosa and Forestal del Atlántico, which regulate the conditions to be met in order to obtain bonuses.
A_35 Level of implementation of environmental management systems in port facilities, expressed as the total number and percentage of maritime freight terminals and maritime passenger stations under concession or authorization, and of companies with a license or authorization to provide port or commercial services, that have EMAS accreditation or that are certified according to the ISO 14001: 2015 standard with a scope that covers “all environmental aspects linked to the development of their activity”.
• Inform if the Port Authority has any system to know the degree of implementation of environmental management systems of service providers and cargo handling terminals. If not, indicate the status of said initiative.
x Yes
In implementation
In project
It is not foreseen
Report about the degree of implementation of SGMA in service providers and cargo handling terminals
Total number and percentage of maritime terminals and service companies that have a SGA in place that covers their entire activity:
Terminal / service type Number of terminals
% with SGA Freight terminal 6
83.3%
Passenger terminal 0
0 Stowage service 5
80%
MARPOL service 3
66.7% Nautical technical service 8
87.5%
Table 144
• Report on the initiatives adopted by the Port Authority to promote the adoption of SGA by providers of port services and
concessions. For example:
• Approval of a generic good practice agreement for the regulation of activity rate bonuses.
• Inclusion of the requirement to have SGA in service specifications and grant conditions

Apéndice: Transparencia Activa en la Información. Los datos en detalle Updated data as of 31/12/2020 Appendix: Active transparency in the information. Data in detail.
116
In the case of providers of Port Services, it is a requirement to obtain the Environmental Management certificate according to the ISO 14001 standard. The Port Authority awards the best environmental practices with bonuses to the managers of freight terminals. New Good Environmental Practices Agreements, in force since 2018, with Reganosa and Forestal del Atlántico, which regulate the conditions to be met in order to obtain bonuses

Apéndice 9. Appendix 9
PARÁMETROS E ÍNDICEDE CONTENIDOS GRI
PARAMETERS & TABLEOF CONTENTS GRI
Transparencia activa de la información. Los datos en detalle.
Active transparency in the information. Data in detail


Appendix: Active Transparency in the Information. Data in detail. Data updated on 31/12/2020 Appendix: Active transparency in the information. Data in detail.
1
ENTITIES INCLUDED IN THE FINANCIAL STATEMENTS
The complete information on the economic-financial situation of the Port Authority can be checked in the annual accounts and in the audit report of the General Intervention Board of the State Administration that accompanies them, published in the Official State Gazette, which can be accessed through the following QR code:
(102-45)
DEFINITION OF THE CONTENTS OF THE REPORTS AND COVERAGE ON THE TOPIC
(102-46)
CONTENT OF THE ANNUAL
REPORT OF THE PORT
AUTHORITY OF FERROL-SAN
CIBRAO
Information on strategy and
strengths of the PAFSC
(Chapters on Our Strategy, Our Strengths:
a competitive and sustainable port, Our
Management)
Management System Review
Report.
(Chapter on Our Management and
Appendix 8)
Contents of the Annual Report Model of the
Public Administrations of
the State Port System.
(Appendices 1 to 7)
Information on monitoring and analysis of key
indicators
(Chapter on Our Management)
Information for monitoring and
analysis of the rest of the GRI standards:
comprehensive option.
(Appendix 9)
Information on Monitoring and
Analysis of sustainability
indicators of the Port System
(Appendix 8)

Appendix: Active Transparency in the Information. Data in detail. Data updated on 31/12/2020 Appendix: Active transparency in the information. Data in detail.
2
LIST OF MATERIAL TOPICS (102-47)
For the determination of material topics, and taking into account the provisions of Royal Legislative Decree
2/2011 (hereinafter RDL 2/2011), of 5 September, which approves the Consolidated Text of the Ports Law of
the State and the Merchant Navy, the following steps have been followed:
Following this methodology, the analysis of material aspects at a strategic level, their deployment through
processes, and the analysis and monitoring of both the strategic and operational objectives of the strategic
line “Integration with the environment”, as well as the processes approved to give support for such a strategy,
is guaranteed.
In this way, the following material aspects of the PAFSC in terms of sustainability are created:
MANAGEMENT APPROACH AND ASSESSMENT OF THE MANAGEMENT APPROACH
MANAGEMENT SYSTEM OF THE PORT AUTHORITY OF FERROL-SAN CIBRAO
MANAGEMENT MODEL-PROCESSES-PROCEDURES-ACTION PLANASSESSMENT, REVIEW, AND INNOVATION PROCESS: MONITORING OF OBJECTIVES,
ACTIONS AND INDICATORS. RISK ASSESSMENTS, AUDITS, INSPECTIONS, SELF-ASSESSMENTS, AND EXTERNAL ASSESSMENTS. ANNUAL REPORTS.
MATERIAL ASPECTS OF THE PORT AUTHORITY OF FERROL-SAN CIBRAO
PORT AUTHORITY OF FERROL-SAN CIBRAO:CREATION OF THE STRATEGY
STRATEGIC MAP: STRATEGIC LINES AND STRATEGIC OBJECTIVESPLANNING PROCESS: INTERNAL AND EXTERNAL ANALYSIS, SWOT ANALYSIS
ANNUAL OBJECTIVES
SECTORAL FRAMEWORK OF MATERIAL ASPECTS FOR THE SPANISH PORT SYSTEM
SPANISH PORT SYSTEM: RDL 2/2011Title III. Chapter I PLANNING
STRATEGIC FRAMEWORK OF THE SYSTEM OF GENERAL INTEREST
(RDL 2/2001.Art.52)
ANNUAL COMPANY PLANS
Which include a sustainability report that will be carried out in accordance with the methodology that will be approved by State Ports,
after a hearing with the Port Authorities

(102‐47)
YEAR 2020
% COMPLIA
NCE(103‐3)
YEAR 2020
% COMPLIAN
CE(103‐3) SU
STAINAB
ILITY
INDICA
TOR CO
DE OF TH
E PO
RT SYSTEM (R
oyal
DESCRIPTION
GRI Cod
e
Description
Internal PAF
SC
code Title Ind. Units Year 2.019 2020
RISKS >=150(Range from 0 to 500)Evaluation year 2020
(103‐1)
IMPROVEMENT ACTION YEAR 2020(103‐2)
INDICATORS(103‐3)
IMPACT MATERIAL SUBJECTSTRATEGIC OBJECTIVE
(103‐1)
OPERATIONAL OBJECTIVE YEAR 2020(103‐2)
STRAGEGY SUPPORT PROCESSES
(103‐2)
If there is no process, a tracking tool is detailed
Quart.3/Total Year 17.528,00 15.212,00
Goal 16.569,00 14.286,00
Quart.3/Total Year
1.829,28 1.641,13
Goal 2.020,00 1.509,56
Quart.3/Total Year
159,35 140,85
Goal 159,32 142,86
Quart.3/Total Year 39,06 43,90
Goal 39,69 46,31
Quart.3/Total Year 3.220,00 1.148,00
Goal 1.520,00 ‐130,00
Quart.3/Total Year 1,65 0,51
Goal 0,78 ‐0,21
Quart.3/Total Year
0,83 0,69
Goal 0,69 0,63
Quart.3/Total Year
0,00 0,00
Goal 0,00 0,00
201‐1 Quart.3/Total Year
5,93 6,66
Goal 9,13 10,36
201‐1 Quart.3/Total Year 83,85 63,82
Goal 73,38 57,17
Quart.3/Total Year 8.676,00 6.153,00
Goal 7.056,00 4.802,00
Quart.3/Total Year 9,30 8,18
Goal 9,40 8,10
Quart.3/Total Year 0,22 0,32
Goal 0,28 0,41
Quart.3/Total Year 135,00 207,00
Goal 257,00 412,00
201‐4Financial assistance received from government
Quart.3/Total Year
0,00 0,00
Goal 0,00 0,00
Quart.3/Total Year 100,26 114,26
Goal 110,22 124,87
Comment
Quart.3/Total Year
Goal
Tonnes moved per linear metre of dock
201‐1
201‐1
E_08
E2‐GENERATE INCOME FROM CONCESSIONS
PLANNING: investment plan and HR plan
P3‐IMPROVE THE COST STRUCTURE
201‐1 Direct economic value generated I0089
%
201‐1Direct economic value generated and distributed
I0104Income from occupancy and activity rates compared to the net amount of turnover
%
Thousands of Euros
Direct economic value generated and distributed
Thousands of euros
201‐1 Tonnes moved per linear metre of commercial dock
I0088Net PAFSC turnover (thousands of euros)
E_12 Net PAFSC turnover / employee
Tn/ml
201‐1
Direct economic value generated and distributed
I0153E_11
Public investment / Average net assets (%)
%
I0097EBITDA per employee (average annual workforce)
Thousands of euros
Thousands of euros
%
I0101
Net amount of turnover/no. of employees
I0115E_04Land and natural assets without activity 201‐1
EBITDA (euros)/ Tonnes moved
Thousands of Euros
Direct economic value generated and distributed
I0096
Direct economic value generated and distributed
I0095
I0091 Result of the financial year
Profitability about assets %
Land and natural assets without activity in the last 5 years / Total assets
I0115
Descriptive indicator included in Appendix 9 of the Annual Report
Debt ratio (%)
Direct economic value generated and distributed
Direct economic value generated and distributed
201‐1Direct economic value generated and distributed
E_04Land and natural assets without activity 201‐1
Direct economic value generated and distributed
E_03 Debt service 201‐1
201‐1
201‐1
Land and natural assets without activity in the last 5 years / Total assets
Operating expenses/operating income (%)
%
Structure costs/total %
Cash Flow (thousands of euros) Thousands of Euros
Direct economic value generated and distributed
I0093
%Direct economic value generated and distributed
%I0099Public investment by the PASFC in relation to cash flow
%
I0098 Debt service
Plan for the removal of materials and facilities deposited in the Port
35%
E4‐GENERATE CASHFLOW TO REDUCE DEBT
PLANNING
PLANNING
E3‐MAINTAIN THE PROFITABILITY OF THE PORT
E5‐MAINTAIN THE PROFITABILITY OF INVESTMENTS
ECONOMIC PERFORMANCEECONOMIC
DEUP Ferrol. 0%CONCESSIONS AND AUTHORIZATIONS
E1‐INCREASE THE TURNOVER PLANNING
Direct economic value generated and distributed
E_05Operating expenses/operating income
E_06 Public investment/Cash‐Flow
EBITDA/Employee
Public investment / Average net assets
E_01
201‐1Direct economic value generated and distributed
Annual profitability 201‐1
E_02 EBITDA/ Tonnes
I0090
I0092
Direct economic value generated and distributed
E_13
Direct economic value generated and distributed
Appendix: Active Transparency in the Information. Data in detail. 3
Data updated on 31/12/2020

(102‐47)
YEAR 2020
% COMPLIA
NCE(103‐3)
YEAR 2020
% COMPLIAN
CE(103‐3) SU
STAINAB
ILITY
INDICA
TOR CO
DE OF TH
E PO
RT SYSTEM (R
oyal
DESCRIPTION
GRI Cod
e
Description
Internal PAF
SC
code Title Ind. Units Year 2.019 2020
RISKS >=150(Range from 0 to 500)Evaluation year 2020
(103‐1)
IMPROVEMENT ACTION YEAR 2020(103‐2)
INDICATORS(103‐3)
IMPACT MATERIAL SUBJECTSTRATEGIC OBJECTIVE
(103‐1)
OPERATIONAL OBJECTIVE YEAR 2020(103‐2)
STRAGEGY SUPPORT PROCESSES
(103‐2)
If there is no process, a tracking tool is detailed
Quart.3/Total Year 11.183.384,00 10.034.625,00
Goal 11.041.000,00 9.230.000,00
Quart.3/Total Year 1.086,00 1.002,00
Goal 1.009,00 826,00
Quart.3/Total Year 8.277,00 12.472,75
Goal 10.000,00 25.330,00
Quart.3/Total Year 2.162.592,00 7.699,09
Goal 2.155.000,00 80.000,00
Quart.3/Total Year 902.826,00 1.454.336,81
Goal 720.000,00 1.178.000,00
Quart.3/Total Year 3.966.686,00 4.595.796,00
Goal 4.240.000,00 3.966.686,00
Quart.3/Total Year 498.473,00 521.932,81
Goal 500.000,00 400.000,00
Quart.3/Total Year 1.167.630,00 1.172.788,05
Goal 1.451.000,00 1.078.969,02
Joint analysis with Endesa of the business continuity strategy
0%
Deployment of the functions of the Port Authority in the province of Lugo
0%
PLANNING
Risks for the intermodality of the port, loss of connectivity(325 points)
Quart.3/Total Year 0,06 0,00
SERVICES RENDERED BY PRIVATE COMPANIES
Goal 0,00 0,00
R1‐ADAPT THE ORGANIZATION AND WORKFORCE TO THE STRATEGIC OBJECTIVES AND PROMOTE CULTURAL CHANGE
ORGANIZATION AND MANAGEMENT OF HUMAN RESOURCES
201‐3Obligations of the established benefits plan and other retirement plans
202‐1Ratio of standard entry‐level salary by sex against local minimum wage
PAFSC minimum salary / Interprofessional salary
% 156,54 149,39
202‐2Proportion of senior executives hired from the local community
Quart.3/Total Year 8,19 7,44
Goal 17,94 10,00
Quart.3/Total Year
70,00 62,00
Goal 99,00 38,00
Quart.3/Total Year 64,86 63,53
Goal 70,00 70,00
Quart.3/Total Year 11,86 12,84
Goal 18,75 19,94
Quart.3/Total Year
5,93 6,66
Goal 9,13 10,36
Tn
I0158 Aluminium traffic
I0154 Coal traffic
C2‐GAIN KEY CUSTOMERS’ LOYALTY
‐SATISFACTION OF STAKEHOLDERS:
SALES PROCEDURE
‐PLANNING
201‐2Financial implications and other risks and opportunities due to climate change
The optimal state (maintenance) of all facilities and infrastructures cannot be guaranteed.(285 points)
Reduction of private investment of the main concessionaires with great impact on the accounts of the PA(250 points)
Delay/loss of business opportunities in the Port due to lack of infrastructure in time limits(250 points) Millions of
Euros
Fuel‐oil traffic
Millions of Euros
I0100
201‐2
Tn
Strategic alliance to turn the Port of Ferrol into a benchmark in supplying LNG ships.
0%
%
203‐1
Financial implications and other risks of climate change
I0155
Infrastructure investments and services supported
Significant indirect economic impacts203_02
203_02
203‐1Infrastructure investments and services supported
Significant indirect economic impacts
Tn
I0157
CONCESSIONS AND AUTHORIZATIONS
SERVICES RENDERED BY PRIVATE COMPANIES
INVESTMENTS AND CONSERVATION
PLANNING
COORDINATION, PLANNING, AND CONTROL OF TRAFFIC AND SERVICES
ORGANIZATION AND MANAGEMENT OF HUMAN RESOURCES
%goods moved by rail
Descriptive indicator included in Appendix 9 of the Annual Report
I0117Compliance with the Investment Plan (%)
%
I0134Investment Amount of the Port Authority (public investment)
I0101Public investment / Average net assets (%)
%
Number of containers (TEUS)
%
Foreign investment
I_24 % goods moved by rail 201‐2
Tn
I0156 Bauxite traffic Tn
Foreign investment / Public investment by the PAFSC
I0140
Descriptive indicator included in Appendix 9 of the Annual Report
I0159
Ship traffic no. of ships
I0142 Freight traffic Tonnes
Natural gas traffic
TEUS
I0143
I0145Financial implications and other risks of climate change
INDIRECT ECONOMIC IMPACTS
P4‐BOOST FOREIGN INVESTMENT
Development of actions to provide the Port of Ferrol with a competitive rail intermodality. Commissioning of the Railway Access to the Outer Port.
72,50%
Enabling of a Border Inspection Point (BIP) in the port of Ferrol.
59%
PRESENCE ON THE MARKET
R1‐ADAPT THE ORGANIZATION AND WORKFORCE TO THE STRATEGIC OBJECTIVES AND PROMOTE CULTURAL CHANGE
C5‐IMPROVE INTERMODALITY AND LOGISTICS OFFER
P7‐BE EXCELLENT IN THE MANAGEMENT, MAINTENANCE, AND DEVELOPMENT OF INFRASTRUCTURES AND FACILITIES
C1‐ATTRACT KEY AND MAJOR HINTERLAND TRAFFIC CUSTOMERS
E_07Foreign investment/public investment
E_08
Limitations in addressing certain traffic subject to BIP border inspection. (225 points)
Economic impact for the PA that entails the deterioration of infrastructures and facilities on concessioned public lands (due to improper use of the same, precarious maintenance, etc.) which is shown after the concession ends. (150 points)
Public investment / Average net assets
ECONOMIC PERFORMANCE
ECONOMIC
Appendix: Active Transparency in the Information. Data in detail. 4
Data updated on 31/12/2020

(102‐47)
YEAR 2020
% COMPLIA
NCE(103‐3)
YEAR 2020
% COMPLIAN
CE(103‐3) SU
STAINAB
ILITY
INDICA
TOR CO
DE OF TH
E PO
RT SYSTEM (R
oyal
DESCRIPTION
GRI Cod
e
Description
Internal PAF
SC
code Title Ind. Units Year 2.019 2020
RISKS >=150(Range from 0 to 500)Evaluation year 2020
(103‐1)
IMPROVEMENT ACTION YEAR 2020(103‐2)
INDICATORS(103‐3)
IMPACT MATERIAL SUBJECTSTRATEGIC OBJECTIVE
(103‐1)
OPERATIONAL OBJECTIVE YEAR 2020(103‐2)
STRAGEGY SUPPORT PROCESSES
(103‐2)
If there is no process, a tracking tool is detailed
ACQUISITION PRACTICES
Regulatory regulations on hiring of public administrations
Contract specifications 204‐1 Proportion of spending on local suppliers
205‐1Operations assessed for risks related to corruption
205‐2Communication and training about anti‐corruption policies and procedures
205‐3Confirmed incidents of corruption and actions taken
UNFAIR COMPETITION
Royal Legislative Decree 2/2011, of 5 September, approving the Consolidated Text of the Law on State Ports and the Merchant Navy
FIRST BOOK: STATE‐OWNED PORT SYSTEM
206‐1Legal actions for anti‐competitive behavior, anti‐trust, and monopoly practices
Descriptive indicator included in Appendix 9 of the Annual Report
Descriptive indicator included in Appendix 8 of the Annual Report
Descriptive indicator included in Appendix 9 of the Annual Report
Descriptive indicator included in Appendix 9 of the Annual Report
Descriptive indicator included in Appendix 9 of the Annual Report
Points 5 and 6 of the code of conduct: 5.‐ ACCEPTANCE, COMPLIANCE, DUTY OF COMMUNICATION, AND INTERPRETATION OF THE CODE.6.‐VALIDITY AND UPDATING OF THE CODE OF ETHICS.
ANNUAL MONITORING BY THE CODE OF CONDUCT COMMITTEEANTI‐CORRUPTIONCode of Conduct and Responsible Practices
ECONOMIC
Appendix: Active Transparency in the Information. Data in detail. 5
Data updated on 31/12/2020

(102‐47)
YEAR 2020
% COMPLIA
NCE(103‐3)
YEAR 2020
% COMPLIAN
CE(103‐3) SU
STAINAB
ILITY
INDICA
TOR CO
DE OF TH
E PO
RT SYSTEM (R
oyal
DESCRIPTION
GRI Cod
e
Description
Internal PAF
SC
code Title Ind. Units Year 2.019 2020
RISKS >=150(Range from 0 to 500)Evaluation year 2020
(103‐1)
IMPROVEMENT ACTION YEAR 2020(103‐2)
INDICATORS(103‐3)
IMPACT MATERIAL SUBJECTSTRATEGIC OBJECTIVE
(103‐1)
OPERATIONAL OBJECTIVE YEAR 2020(103‐2)
STRAGEGY SUPPORT PROCESSES
(103‐2)
If there is no process, a tracking tool is detailed
Quart.3/Total Year 2.007.341,00 1.865.017,00
302‐4 Reduction of energy consumption
Quart.3/Total Year
1,30 1,20
Goal 1,16 1,40Quart.3/Total Year
765.124,00 697.409,00
Goal 800.000,00 700.000,00Quart.3/Total Year
2.445.683,00 3.388.264,00
Goal 2.200.000,00 2.200.000,00Quart.3/Total Year
8.981,00 7.879,00
Goal 10.000,00 10.000,00Quart.3/Total Year
19.426,19 13.377,28
Goal 20.000,00 20.000,00
Quart.3/Total Year 14.295,00 15.794,00
Goal 25.000,00 25.000,00
303‐2Management of water discharge‐related impacts
303‐3 Water withdrawal
304‐1
Operational sites owned, leased, managed in, or adjacent to, protected areas and areas of high biodiversity value outside protected areas
304‐4IUCN Red List species and national conservation list species with habitats in areas affected by operations
A_27Profiling and inventory of the natural environment in the port and adjacent areas
304‐2Significant impacts of activities, products, and services on biodiversity
A_28
Schematic description of natural environment regeneration projects undertaken by the Port Authority, and valuation in euros of the cost of said actions
304‐3 Habitats protected or restores
305‐1 Direct (Scope 1) GHG emissions Quart.3/Total Year 72,07 60,41
305‐5 Reduction of GHG emissions Goal 80,00 80,00
Quart.3/Total Year
426,53 261,10
Goal 450,00 462,00Quart.3/Total Year
3,20 2,06
Goal 3,40 3,46
A_05Synthetic description of the main emission sources (point and diffuse) of the port.
A_07
Synthetic description of the measures implemented by the Port Authority to control emissions linked to the activity of the port as a whole
I0152 Average value of PM10 emissions µg/m3Quart.3/Total
Year21,80 19,70
Goal 40,00 40,00
302‐1
302‐4
ECO‐EFFICIENCY:Uncontrolled consumption of natural resources (excessive own/third party consumption and consumption of 2 springs)(285 points)
Goal
Reduction of energy consumption
302‐3
302‐1
Nitrogen oxides (NOX), sulfur oxides (SOX), and other significant air emissions
I0146
302‐5
Energy consumption within the organization
Reductions in energy requirements of products and services
Energy indirect (Scope 2) GHG emissions
Own consumption of electricity
305‐7
Equivalent tonnes of CO2
I0149Indirect greenhouse gas emissions (own electricity consumption)
I0151
I0141Direct greenhouse gas emissions
Energy intensity
Descriptive indicator included in Appendix 8 of the Annual ReportENVIRONMENTAL
P10‐MANAGE THE ENVIRONMENT SUSTAINABLY
P10‐MANAGE THE ENVIRONMENT SUSTAINABLY
ENVIRONMENTAL MANAGEMENT:CONSUMPTION CONTROL AND MANAGEMENT
P10‐MANAGE THE ENVIRONMENT SUSTAINABLY
ENVIRONMENTAL MANAGEMENT:CONSUMPTION CONTROL AND MANAGEMENT
ENERGY
ENVIRONMENTAL MANAGEMENT: BIODIVERSITY
EMISSIONS
WATER
BIODIVERSITY
P10‐MANAGE THE ENVIRONMENT SUSTAINABLY
ENVIRONMENTAL MANAGEMENT: AIR EMISSIONS CONTROL
A_09
A_30
External electrical consumptionI0147 Kwh
I0076 Diesel consumption Heating and DHW L/year
I0077Diesel + gasoline consumption Transport
L/year
m³
Descriptive indicator included in Appendix 8 of the Annual Report. Eco‐efficiency section
Descriptive indicator included in Appendix 8 of the Annual Report. Eco‐efficiency section
I0074Own water consumption (Type D List of Environmental Aspects)
Descriptive indicator included in Appendix 8 of the Annual Report
Intensity of direct and indirect GHG emissions
Descriptive indicator included in Appendix 8 of the Annual Report. Air Quality Section. It is reported to State Ports, not material for the purposes of the GRI.
Descriptive indicator included in Appendix 8 of the Annual Report
Equivalent Tn CO2
Equivalent Tn CO2/m²
1.800.000,00 2.000.000,00
Own electricity consumption (Type D List of Environmental Aspects)
KW*h
Energy intensity. Electric consumption Kwh/M²
I0075
KwhI0148 Electrical consumption Lighting
A_08
GHG emissions intensity
Energy consumption outside of the organization
Energy consumption within the organization
Value of air quality parameters in the port
Synthetic description of the initiatives undertaken by the Port Authority to assess the effect of port operations on air quality.
303‐1 Interactions with water as a shared resource
LIC, ZEPA, BIC, Ramsar zones, within or adjacent to the port public domain area
305‐4
305‐2
302‐2
Own water consumption
A_32
A_33 Own fuel consumption
A_26
Appendix: Active Transparency in the Information. Data in detail. 6
Data updated on 31/12/2020

(102‐47)
YEAR 2020
% COMPLIA
NCE(103‐3)
YEAR 2020
% COMPLIAN
CE(103‐3) SU
STAINAB
ILITY
INDICA
TOR CO
DE OF TH
E PO
RT SYSTEM (R
oyal
DESCRIPTION
GRI Cod
e
Description
Internal PAF
SC
code Title Ind. Units Year 2.019 2020
RISKS >=150(Range from 0 to 500)Evaluation year 2020
(103‐1)
IMPROVEMENT ACTION YEAR 2020(103‐2)
INDICATORS(103‐3)
IMPACT MATERIAL SUBJECTSTRATEGIC OBJECTIVE
(103‐1)
OPERATIONAL OBJECTIVE YEAR 2020(103‐2)
STRAGEGY SUPPORT PROCESSES
(103‐2)
If there is no process, a tracking tool is detailed
A_15Description of means for cleaning standing water
A_10 Description of discharge sources Quart.3/Total Year 7,75 2,40
A_11 Measures to control discharges Goal 7,50 7,50
A_12 Water quality profiling campaignsQuart.3/Total Year
289,00
A_13Port area with waste water collection and treatment
Goal 1.000,00
Quart.3/Total Year
102,00 204,00
Goal 300,00 300,00Quart.3/Total Year
76,50 209,00
Goal 300,00 300,00Quart.3/Total Year
2.438,72 1.707,17
Goal 1.500,00 1.500,00Quart.3/Total Year
2.576,77 1.918,97
Goal 1.000,00 1.000,00Quart.3/Total Year
25.840,00 37.000,00
Goal 60.000,00 60.000,00Quart.3/Total Year
539,00 673,00
Goal 4.000,00 2.650,00
CONCESSIONS AND AUTHORIZATIONS
SERVICES RENDERED BY PRIVATE COMPANIES
INVESTMENTS AND CONSERVATION
308‐1New suppliers that were screened using environmental criteria
306‐2
m³
I0070 Non‐hazardous waste
Management of significant waste‐related impacts
I0071
I0072
4,00
Goal 0,00
2,00
0,00
no.
Significant environmental impacts in the supply chain and measures taken
Descriptive indicator included in Appendix 8 of the Annual Report. Port Community section and in appendix 9 GRI content index and parameters
Water Quality in Faro Prioriño (FE1)
I0064
Kg/year
Waste generation and significant waste‐related impacts
Waste directed to disposal
A_14
A_17
306‐3
mg/LPercentage of port area with rainwater collection and treatment
I0063
Descriptive indicator included in Appendix 8 of the Annual Report, Discharges Section
I0078 No. environmental incidents
ENVIRONMENTAL
Update of the waste reception and handling plan (RD 1381/2002)
90%
Annoying activities control plan in the Inner and Outer Port
0%
ENVIRONMENTAL MANAGEMENT: WASTE WATER CONTROL
ENVIRONMENTAL MANAGEMENT:WASTE CONTROL AND MANAGEMENT
ENVIRONMENTAL ASSESSMENT OF SUPPLIERS
ENVIRONMENTAL MANAGEMENT:ENVIRONMENTAL CONTROL OF OPERATIONS
P10‐MANAGE THE ENVIRONMENT SUSTAINABLY
P10‐MANAGE THE ENVIRONMENT SUSTAINABLY
ENVIRONMENTAL COMPLIANCE
EFFLUENTS AND WASTE
SATISFACTION OF STAKEHOLDERS
A_06
A_25
A_16
DISCHARGES:
Impact on water quality due to:Discharges of polluting water through sewage pipes to the receiving environment.(150 points)
no.
Water quality in the Outer Port Access Control (FE5)
0,00
Goal 0,00
m³
I0177Water quality Collectors 1 and 2 Inland port
units
Concentration of suspended solids in receiving medium
I0167
Marpol I Collection of liquid waste from ships
I0073
Descriptive indicator included in Appendix 8 of the Annual Report. Government and Management Quality Section
mg/L
Quart.3/Total Year
0,00
mg/l
Marpol V Collection of solid waste from ships
0,00
Quart.3/Total Year
Hazardous waste Kg/year
I0080 Environmental complaints
Significant spills
Evolution of complaints or reports due to the emission of dust or air quality
307‐1Non‐compliance with environmental laws and regulations
308‐2
306‐1
306‐5
Percentage of waste that is separated and recovered
Volume of waste water discharges and destination.
Sources of waste generation
DISCHARGES:Impact on the water quality of the receiving environment (from ship, land‐sea, operational) due to discharges or spilling of pollutants into the water.(225 points)
SOIL:Impact on soil quality due to accidental spillage of dangerous substances(225 points)
A_23
A_22
A_19
A_34Environmental conditions in specifications for concessions, authorizations, and service licences
Private freight terminals and service licensees with environmental certification
Evolution of noise complaints or claims
Dredging material management
IMP activation
A_35
Appendix: Active Transparency in the Information. Data in detail. 7
Data updated on 31/12/2020

(102‐47)
YEAR 2020
% COMPLIA
NCE(103‐3)
YEAR 2020
% COMPLIAN
CE(103‐3) SU
STAINAB
ILITY
INDICA
TOR CO
DE OF TH
E PO
RT SYSTEM (R
oyal
DESCRIPTION
GRI Cod
e
Description
Internal PAF
SC
code Title Ind. Units Year 2.019 2020
RISKS >=150(Range from 0 to 500)Evaluation year 2020
(103‐1)
IMPROVEMENT ACTION YEAR 2020(103‐2)
INDICATORS(103‐3)
IMPACT MATERIAL SUBJECTSTRATEGIC OBJECTIVE
(103‐1)
OPERATIONAL OBJECTIVE YEAR 2020(103‐2)
STRAGEGY SUPPORT PROCESSES
(103‐2)
If there is no process, a tracking tool is detailed
Quart.3/Total Year 115,00 112,00
Goal 108,00 112,00
Quart.3/Total Year 17,39 9,82
Goal 7,00 10,71
401‐2Benefits provided to full‐time employees that are not provided to temporary or part‐time employees
401‐3 Parental leaveno. of men who enjoyed parental leave (28 days) in the year
no. 4,00 2,00
401‐3 Parental leaveno. of women who enjoyed maternity leave (16 weeks)
no. 1,00 0,00
WORKER‐COMPANY RELATIONS
R1‐ADAPT THE ORGANIZATION AND WORKFORCE TO THE STRATEGIC OBJECTIVES AND PROMOTE CULTURAL CHANGE
HR ORGANIZATION AND MANAGEMENT
402‐1Minimum notice periods regarding operational changes
403‐1Occupational health and safety management system
Quart.3/Total Year
14,25 72,46
Goal 10,00 10,00
Quart.3/Total Year 0,28 2,74
Goal 0,60 0,40
Quart.3/Total Year
9,12 9,18
Goal 6,00 6,00
403‐3 Occupation health services
S_17Training in occupational risk prevention
403‐4Worker participation, consultation, and communication on occupational health and safety
Hours of safety training/average annual workforce
hours/worker
0,53 0,00
S_18Number of exercises or drills in terms of safety and protection
403‐4Worker participation, consultation, and communication on occupational health and safety
Number of safety exercises or drills no. 4,00 4,00
Quart.3/Total Year 80,00 25,00
Goal 70,00 80,00Quart.3/Total Year
80,00 0,00
Goal 50,00 80,00Quart.3/Total Year
80,00 30,43
Goal 75,00 80,00
Quart.3/Total Year 9,05 11,85
Goal 14,07 16,07Quart.3/Total Year
10,45 14,42
Goal 15,00 16,00Quart.3/Total Year
2,40 0,00
Goal 10,00 16,00Quart.3/Total Year
10,00 10,00
Goal 18,00 16,00
Quart.3/Total Year 41,96 31,45
Goal 70,00 70,00
PERSONS: Performance Evaluation of Staff Outside of the Agreement
0,00%HR ORGANIZATION AND MANAGEMENT
Staff satisfaction level, ask: Is your job performance formally assessed and is the assessment passed on to you?
% 54,55 44,60
Quart.3/Total Year
25,22 24,11
Goal 25,93 29,89
DIVERSITY AND EQUAL OPPORTUNITIES
S_16
Hazard identification, risk assessment, and incident investigation
%
Descriptive indicator included in Appendix 9 of the Annual Report. There are no regulatory differences (labour legislation, collective agreement, internal instruction) regarding social benefits due to the type of contract.
S_10
Number of management training programs by skills
S_09
S_08 Average hours of training per worker
S_07
S_07
Annual accident frequency index 403‐2
Annual accident severity index (SI) 403‐2
Percentage of women over total workers
TRAINING AND TEACHING
HR ORGANIZATION AND MANAGEMENT
STRATEGY: Review of the Strategic Plan 2007‐2015. Preparation of a new Strategic Plan 2018‐2025
R1‐ADAPT THE ORGANIZATION AND WORKFORCE TO THE STRATEGIC OBJECTIVES AND PROMOTE CULTURAL CHANGE
EMPLOYMENT
HEALTH AND SAFETY IN THE WORKPLACE
P8‐IMPROVE SAFETY AND PROTECTION IN OPERATIONS
MANAGEMENT OF SAFETY AND PROECTION. SYSTEM NOT INTEGRATED WITH ISO 9001 AND ISO 14001. MANAGER: DEPARTMENT OF OPERATION
RISK ASSESSMENT SYSTEM OWNED BY THE SECURITY MANAGEMENT SYSTEM NOT INTEGRATED IN ISO 9001 AND ISO 14001. ASSESSMENT MANAGER: DEPARTMENT OF OPERATION
HR ORGANIZATION AND MANAGEMENT
Loss in effectiveness and efficiency in the execution of the Port processes due to difficulties in allocating the necessary resources. (225 points)
50% PLANNING
Annual absenteeism index (AI)
Lack of updated knowledge suited to jobsLoss of knowledge of the organization(225 points)
S_15
R2‐DEVELOP AND TRAIN HUMAN TEAM
R1‐ADAPT THE ORGANIZATION AND WORKFORCE TO THE STRATEGIC OBJECTIVES AND PROMOTE CULTURAL CHANGE
Training plan from the perspective of retirements
I0040
404‐1Average hours of training per year per employee
Compliance with the Plan of Objectives
%
% of women over total workers %
404‐3Percentage of employees receiving regular performance and career development reviews
%
I0131
I0052
Descriptive indicator included in Appendix 8 of the Annual Report, Safety and Health in the workplace section.
Descriptive indicator included in Appendix 9 of the Annual Report. The monitoring is included in the annual reports of the third‐party prevention service.
Descriptive indicator included in Appendix 9 of the Annual Report. Labour legislation and the collective agreement regulate functional mobility and geographical mobility.In the case of a substantial change of working conditions, art. 41 of the Workers' Statute establishes a minimum period of 15 days.
Number of management training programs by skills
no.
Percentage of workers who follow training programs. Agreement
Annual accident severity index (SI)
# days lost per thousand hours worked
Percentage of workers who follow training programs outside the agreement
Hours/worker
no. of hours per employee
Average hours of training per worker. Staff Outside of the Agreement
Average hours of training per worker. Agreement
hours per employee
Average hours of training per worker
%
I0046
I0047
404‐1Average hours of training per year per employee
Average hours of training per year per employee
404‐1
404‐1
I0118
I0132
I0130
405‐1Diversity of governance bodies and employees
Annual absenteeism index% days lost due to leave
Total number of PA workers I0037 no.
%
I0038% of temporary workers out of the total
no. accidents with leave per million hours worked
I0129
I0127
% of workers who follow training programs
I0128
I0053 Annual accident frequency index (FI)
404‐1
Percentage of workers who follow training programs
Hazard identification, risk assessment, and incident investigation
401‐1
403‐2
Programs for upgrading employee skills and transition assistance programs
404‐2
Hazard identification, risk assessment, and incident investigation
New employee hires and employee turnover
Percentage of workers who follow training programs
Average hours of training per year per employee
Average hours of training per year per employee
404‐1
Average hours of training per year per employee
S_01Total number of workers of the Port Authority
Percentage of temporary workers
S_14
S_08 Average hours of training per worker
Percentage of workers who follow training programs
S_08 Average hours of training per worker
S_02
S_07
SOCIAL
R1‐ADAPT THE ORGANIZATION AND WORKFORCE TO THE STRATEGIC OBJECTIVES AND PROMOTE CULTURAL CHANGE
0%
Unmotivated staff(190 puntos)
Appendix: Active Transparency in the Information. Data in detail. 8
Data updated on 31/12/2020

(102‐47)
YEAR 2020
% COMPLIA
NCE(103‐3)
YEAR 2020
% COMPLIAN
CE(103‐3) SU
STAINAB
ILITY
INDICA
TOR CO
DE OF TH
E PO
RT SYSTEM (R
oyal
DESCRIPTION
GRI Cod
e
Description
Internal PAF
SC
code Title Ind. Units Year 2.019 2020
RISKS >=150(Range from 0 to 500)Evaluation year 2020
(103‐1)
IMPROVEMENT ACTION YEAR 2020(103‐2)
INDICATORS(103‐3)
IMPACT MATERIAL SUBJECTSTRATEGIC OBJECTIVE
(103‐1)
OPERATIONAL OBJECTIVE YEAR 2020(103‐2)
STRAGEGY SUPPORT PROCESSES
(103‐2)
If there is no process, a tracking tool is detailed
Quart.3/Total Year
7,83 8,04
Goal 8,33 8,04
Quart.3/Total Year
45,00 45,00
Goal 45,00 45,00
405‐1Diversity of governance bodies and employees
% women on the board of directors % 18,75 18,75
405‐2Ratio of basic salary and remuneration of women to men
NON‐DISCRIMINATION
R1‐ADAPT THE ORGANIZATION AND WORKFORCE TO THE STRATEGIC OBJECTIVES AND PROMOTE CULTURAL CHANGE
HR ORGANIZATION AND MANAGEMENT
406‐1Incidents of discrimination and corrective actions taken
Quart.3/Total Year 23,42 0,00
Goal 250,00 80,00
Quart.3/Total Year 77,60 (1)
Goal 70,00 70,00
Quart.3/Total Year
76,65 (1)
Goal 70,00 70
Quart.3/Total Year
76,88 (1)
Goal 70,00 70
Quart.3/Total Year
79,48 (1)
Goal 70,00 70
Quart.3/Total Year
77,40 (1)
Goal 70,00 70
I_26Communication scheme with stakeholders and their participation model
413‐1Operations with local community engagement, impact assessments, and development programs
I_27Main concerns or worries of stakeholders 413‐1
Operations with local community engagement, impact assessments, and development programs
I_28Coordination and collaboration projects with other administrations
413‐1Operations with local community engagement, impact assessments, and development programs
I_34
Foundations, cultural initiatives, courses, seminars, educational programs, or other social programs promoted by the Port Authority, and total financial resources dedicated.
413‐1Operations with local community engagement, impact assessments, and development programs
Quart.3/Total Year
13,00 6
Goal 10,00 10
Quart.3/Total Year
12,00 3
Goal 10,00 10
Quart.3/Total Year 23,42 0,00
Goal 250,00 80,00
Stakeholder Satisfaction Index with “Environmental Involvement”
Investments dedicated to improving the port‐city interface
413‐1
413‐1
413‐1
413‐1
Stakeholder Satisfaction Index with the "General Image"
%
Operations with local community engagement, impact assessments, and development programs
Operations with local community engagement, impact assessments, and development programs
413‐1
Operations with local community engagement, impact assessments, and development programs
I0126Operations with local community engagement, impact assessments, and development programs
I0166
Descriptive indicator included in Appendix 9 of the Annual Report.
I0124Stakeholder Satisfaction Index with "Involvement in the Community"
%
Descriptive indicator included in Appendix 8 of the Annual Report
Stakeholder Satisfaction Index (global score)
%
% of women not attached to agreement over the total number of workers
%
Thousands of Euros
Opinion of stakeholders on the Impact on the economy and employment
I0125
%
% of women not attached to agreement over the total number of workers outside the agreement
%
Descriptive indicator included in Appendix 8 of the Annual Report
413‐1
413‐1Operations with local community engagement, impact assessments, and development programs
I0122
I0041
I0042
I0086Operations with local community engagement, impact assessments, and development programs
413‐1Operations with local community engagement, impact assessments, and development programs
413‐1Operations with local community engagement, impact assessments, and development programs
405‐1
I0086
Descriptive indicator included in Appendix 8 of the Annual Report.
Descriptive indicator included in Appendix 8 of the Annual Report.
Descriptive indicator included in Appendix 8 of the Annual Report.
Descriptive indicator included in Appendix 8 of the Annual Report.
I0082
no.
No. of cultural activities promoted by the PAFSC
no.
I0083
Thousands of Euros
No. of activities promoted by the PAFSC to contribute to knowledge
Investments dedicated to improving the port‐city interface
%
Operations with local community engagement, impact assessments, and development programs
Diversity of governance bodies and employees
405‐1Diversity of governance bodies and employees
S_11
SOCIAL
LOCAL COMMUNITIES
R1‐ADAPT THE ORGANIZATION AND WORKFORCE TO THE STRATEGIC OBJECTIVES AND PROMOTE CULTURAL CHANGE
(1) In the year 2020, the work to review the materiality and perception of stakeholders was contracted, which is carried out with our own questionnaires. At the end of the work in December 2021, the surveys associated with these indicators will be updated.
I_35
Description of programs or projects aimed at improving the port‐city interface, and total economic resources dedicated to this concept: expenses and investments, expressed as totals in euros and as respective percentages of the total expenses and investments of the Port Authority.
Construction of adequate facilities to serve certain traffic: passengers
INVESTMENTS AND CONSERVATION
100%
I_34
Foundations, cultural initiatives, courses, seminars, educational programs, or other social programs promoted by the Port Authority, and total financial resources dedicated.
DIVERSITY AND EQUAL OPPORTUNITY
C7‐IMPROVE THE PORT'S INSTITUTIONAL IMAGE(This objective is closely related to offering value to stakeholders)
Percentage of women not attached to agreement / total workers
Percentage of women not attached to agreement/total workers outside the
SATISFACTION OF STAKEHOLDERS
Appendix: Active Transparency in the Information. Data in detail. 9
Data updated on 31/12/2020

(102‐47)
YEAR 2020
% COMPLIA
NCE(103‐3)
YEAR 2020
% COMPLIAN
CE(103‐3) SU
STAINAB
ILITY
INDICA
TOR CO
DE OF TH
E PO
RT SYSTEM (R
oyal
DESCRIPTION
GRI Cod
e
Description
Internal PAF
SC
code Title Ind. Units Year 2.019 2020
RISKS >=150(Range from 0 to 500)Evaluation year 2020
(103‐1)
IMPROVEMENT ACTION YEAR 2020(103‐2)
INDICATORS(103‐3)
IMPACT MATERIAL SUBJECTSTRATEGIC OBJECTIVE
(103‐1)
OPERATIONAL OBJECTIVE YEAR 2020(103‐2)
STRAGEGY SUPPORT PROCESSES
(103‐2)
If there is no process, a tracking tool is detailed
Quart.3/Total Year
1,00 0
Goal 0,00 0
INVESTMENTS AND CONSERVATION
413‐2Operations with significant actual and potential negative impacts on local communities
414‐1 New suppliers that were screened using social criteria
414‐2Negative social impacts in the supply chain and actions taken
Quart.3/Total Year
98,77 99,05
Goal 99,28 99,28
Quart.3/Total Year 1,00 1,00
Goal 0,00 0,00
Quart.3/Total Year 4,00 4,00
Goal 8,00 8,00
416‐2Incidents of non‐compliance concerning the health and safety impacts of products and services
SATISFACTION OF STAKEHOLDERS
416‐1 No. of accidents and incidents in safety and protection
no.
I0060No. of exercises and drills on safety and protection
Descriptive indicator included in Appendix 8 of the Annual Report.
No. of complaints from other stakeholders (includes claims for social impact)
Assessment of the health and safety impacts of product and service categories
Descriptive indicator included in Appendix 9 of the Annual Report.
I0105 Current availability of SSMM %
I0054
413‐1Operations with local community engagement, impact assessments, and development programs
I0081
Descriptive indicator included in Appendix 9 of the Annual Report.
no.
no.
Descriptive indicator included in Appendix 8 of the Annual Report.
SOCIAL
HEALTH AND SAFETY IN CUSTOMERS
SOCIAL EVALUATION OF SUPPLIERS
Regulatory regulations on hiring of public administrations
Article 35. Minimum content of the contract.Article 71. Prohibitions from hiring.Article 122. Lists of particular administrative clauses
LOCAL COMMUNITIES
P8‐IMPROVE SAFETY AND PROTECTION IN OPERATIONS
AID TO MARITIME NAVIGATION
Failures in the operation of critical maritime signals (access to the port). (300 points)
SECURITY AND PROTECTION MANAGEMENT OWN MANAGEMENT SYSTEM
OWN RISK ASSESSMENT SYSTEM
C7‐IMPROVE THE PORT'S INSTITUTIONAL IMAGE(This objective is closely related to offering value to stakeholders)
I_21
Description of the initiatives promoted by the Port Authority to receive and manage complaints or suggestions from end customers of the port, as well as to evaluate their degree of satisfaction with the services provided by the port.
Appendix: Active Transparency in the Information. Data in detail. 10
Data updated on 31/12/2020

(102‐47)
YEAR 2020
% COMPLIA
NCE(103‐3)
YEAR 2020
% COMPLIAN
CE(103‐3) SU
STAINAB
ILITY
INDICA
TOR CO
DE OF TH
E PO
RT SYSTEM (R
oyal
DESCRIPTION
GRI Cod
e
Description
Internal PAF
SC
code Title Ind. Units Year 2.019 2020
RISKS >=150(Range from 0 to 500)Evaluation year 2020
(103‐1)
IMPROVEMENT ACTION YEAR 2020(103‐2)
INDICATORS(103‐3)
IMPACT MATERIAL SUBJECTSTRATEGIC OBJECTIVE
(103‐1)
OPERATIONAL OBJECTIVE YEAR 2020(103‐2)
STRAGEGY SUPPORT PROCESSES
(103‐2)
If there is no process, a tracking tool is detailed
R4‐PROMOTE THE CONCEPT OF THE PORT COMMUNITY
I_14
Description of the role of private initiative in the provision of services and operation of the port. Types of services, describing for each one of them the role of the Port Authority and the private initiative. Description of the role of the Port Authority in the regulation and control of the activity, making reference to the mechanisms available to do so.
417‐1 Requirements for product and service information and labeling
Remission of the particular specifications for port services: handling of goods, Marpol, and mooring in the port of Ferrol.
36% I_18
Information mechanisms provided by the Port Authority that allow it to guarantee that any operator who wishes to provide services in the port or to opt for a concession can find out in a transparent way the conditions to operate in the portand the administrative mechanisms that regulate said process, such as, for example, internet availability of regulatory specifications for services, sectoral information sessions, etc.
Approval of the particular specifications for the basic port services of pilotage, towing, mooring, handling of goods, and Marpol in the port of San Cibrao.
36%
Remission of the particular specifications for passenger, towing, and pilotage port services in the port of Ferrol, and granting of new licences
0%
PLANNING, COORDINATION, AND CONTROL OF TRAFFIC AND SERVICES
Quart.3/Total Year 0,00 0,00
Goal 0,00 0,00
417‐2
Incidents of non‐compliance concerning product and service information and labeling
417‐3
Incidents of non‐compliance concerning marketing communications
CUSTOMER PRIVACYOrganic Law 3/2018, of 5 December, on Personal Data Protection and the guarantee of digital rights.
OWN ACTION PLAN DERIVED FROM AUDITS IN COMPLIANCE WITH THE ORGANIC LAW ON DATA PROTECTION
418‐1 Substantiated complaints concerning breaches of customer privacy and losses of customer data
SOCIO‐ECONOMIC COMPLIANCE
Different regulation on economic/social matters
LEGAL SERVICE OF THE PAFSC 419‐1 Non‐compliance with laws and regulations
in the social and economic area
MARKETING AND LABELING
P2‐IMPROVE QUALITY OF PORT SERVICES INCLUDING THIRD PARTIES
Limitation in the exercise of regulation of port activities, which leads to situations of defencelessness of the PA in ensuring compliance with service requirements (impact on service quality)(380 points)
Descriptive indicator included in Appendix 8 of the Annual Report.
I0009 no.
Initiatives promoted by the Port Authority aimed at improving efficiency, quality of service, and performance of the services provided to the merchandise.
SERVICES RENDERED BY PRIVATE COMPANIES
No. of complaints (related to the provision of the service)
417‐1 Requirements for product and service information and labeling
Descriptive indicator included in Appendix 8 of the Annual Report.
Descriptive indicator included in Appendix 9 of the Annual Report.
Descriptive indicator included in Appendix 9 of the Annual Report.
FIRST BOOK: STATE‐OWNED PORT SYSTEMTitle VI. Service RenderingTitle VII Economic Regime
Descriptive indicator included in Appendix 9 of the Annual Report.
SATISFACTION OF STAKEHOLDERS
SOCIAL
Royal Legislative Decree 2/2011, of 5 September, approving the Consolidated Text of the Law on State Ports and the Merchant Navy
P1‐PROMOTE COMMERCIAL ACTION I_21
Description of the initiatives promoted by the Port Authority to receive and manage complaints or suggestions from end customers of the port, as well as to evaluate their degree of satisfaction with the services provided by the port.
I_19
Appendix: Active Transparency in the Information. Data in detail. 11
Data updated on 31/12/2020

Appendix: Active Transparency in the Information. Data in detail. Data updated on 31/12/2020 Appendix: Active transparency in the information. Data in detail.
12
RESTATEMENT OF INFORMATION AND CHANGES IN THE PREPARATION OF REPORTS
(102-48), (102-49)
The Annual Report of the Port Authority of Ferrol-San Cibrao for the year 2020 does not include significant
changes in the measurement of the indicators, nor in the material aspects included in the report, nor in the
annual nature of the information, with respect to the Annual Report of the Port Authority of Ferrol-San Cibrao
of the year 2019.
PERIOD SUBJECT TO THE REPORT (102-50)
The information included in the Annual Report of the Port Authority of Ferrol-San Cibrao for the year 2020
corresponds to the year 2020.
DATE OF THE LAST REPORT (102-51)
The information included in the Annual Report of the Port Authority of Ferrol-San Cibrao for the year 2020
corresponds to the year 2020. The last report published previously was the Annual Report of the Port Authority
of Ferrol-San Cibrao for the year 2019.
REPORTING CYCLE (102-52)
The reporting cycle for the Annual Report of the Port Authority of Ferrol-San Cibrao is annual.
CONTACT POINT FOR QUESTIONS ABOUT THE REPORT (102-53)
Department of Sustainability and Management Systems of the Port Authority of Ferrol-San Cibrao

Appendix: Active Transparency in the Information. Data in detail. Data updated on 31/12/2020 Appendix: Active transparency in the information. Data in detail.
13
GRI CONTENT INDEX IN ACCORDANCE WITH GRI STANDARDS: EXHAUSTIVE OPTION
“This report has been prepared in accordance with GRI standards: Comprehensive option” (102-54)
GRI TABLE OF CONTENTS (102-55)
GRI Standard
Content Page numbers or URL Omission
External verification
(Yes/No) GRI 101: 2016 Foundations GENERAL DISCLOSURES GRI 102: General Disclosures 2016
102-1 Name of the organization.
PORT AUTHORITY OF FERROL-SAN CIBRAO
102-2 Activities, brands, products and services.
Appendix 8 Reporting of Sustainability Indicators for Ports of
Spain. Page 5, 32
102-3 Location of headquarters.
Muelle de Curuxeiras s/n. 15401 Ferrol-Spain
102-4 Location of operations.
Appendix 8 Reporting of Sustainability Indicators for Ports of
Spain. Page 25, 26, 27
102-5 Ownership and legal form.
Appendix 8 Reporting of Sustainability Indicators for Ports of Spain. Page 5
102-6 Markets served. Appendix 8 Reporting of Sustainability Indicators for Ports of Spain. Page 29, 30, 31, 32
102-7 Scale of the Organization.
Appendix 8 Reporting of Sustainability Indicators for Ports of Spain. Page 71 Appendix 1 Financial Statements. Page 1, 3
Appendix 4 Traffic Statistics. Page 151
102-8 Information on employees and other workers.
Appendix 8 Reporting of Sustainability Indicators for Ports of Spain. Page 72, 73, 77.
102-9 Supply chain. Appendix 8 Reporting of Sustainability Indicators for Ports of Spain. Page 12
102-10 Significant changes to the organization and its supply chain.
No significant changes to the organization or the supply chain occurred in the year 2020.
102-11 Precautionary principle or approach.
Our Management. Page 58, 59
102-12 External initiatives.
Appendix 8 Reporting of Sustainability Indicators for Ports of Spain. Page 49
102-13 Membership of associations.
Appendix 8 Reporting of Sustainability Indicators for Ports of Spain. Page 50
102-14 Statement from senior decision-making.
Appendix 8 Reporting of Sustainability Indicators for Ports of Spain. Page 1
102-15 Key impacts, risks, and opportunities.
Appendix 8 Reporting of Sustainability Indicators for Ports of Spain. Page 4, 6, 36, 37, 38, 39, 44, 45, 46, 47, 48, 49.

Appendix: Active Transparency in the Information. Data in detail. Data updated on 31/12/2020 Appendix: Active transparency in the information. Data in detail.
14
(102-55) GRI Standard
Content Page numbers or URL Omission
External verification
(Yes/No) GRI 102: General Disclosures 2016
102-16 Values, principles, standards, and norms of behaviour.
Electronic headquarters of the Port Authority of Ferrol-San Cibrao: Code of conduct and responsible practices of the Port Authority of Ferrol-San Cibrao
http://sede.apfsc.gob.es/transparency/0a9d2ed3-c9b4-4679-b164-0966cb13e5b8/
102-17 Mechanisms for advice and concerns about ethics.
Electronic headquarters of the Port Authority of Ferrol-San Cibrao: Code of conduct and responsible practices of the Port Authority of Ferrol-San Cibrao
http://sede.apfsc.gob.es/transparency/0a9d2ed3-c9b4-4679-b164-0966cb13e5b8/
102-18 Governance structure.
Appendix 8 Reporting of Sustainability Indicators for Ports
of Spain. Page 7, 8, 9, 10, 23, 24
102-19 Delegating authority.
Appendix 8 Reporting of Sustainability Indicators for Ports
of Spain. Page 7
102-20 Executive-level responsibility for economic, environmental, and social topics.
Appendix 8 Reporting of Sustainability Indicators for Ports of Spain. Page 7
102-21 Consulting stakeholders on economic, environmental, and social topics.
Appendix 8 Reporting of Sustainability Indicators for Ports of Spain. Page 36, 37, 38
102-22 Composition of the highest governance body and its committees.
Appendix 8 Reporting of Sustainability Indicators for Ports of Spain. Page 10, 11, 12
102-23 Chair of the highest governance body.
Appendix 8 Reporting of Sustainability Indicators for Ports
of Spain. Page 9
102-24 Nominating and selecting the highest governance body.
Appendix 8 Reporting of Sustainability Indicators for Ports of Spain. Page 7, 8, 9, 10, 11
102-25 Conflicts of interest.
Appendix 8 Reporting of Sustainability Indicators for Ports
of Spain. Page 8, 9, 10
102-26 Role of highest governance body in setting purpose, values, and strategy.
Appendix 8 Reporting of Sustainability Indicators for Ports of Spain. Page 8, 9
102-27 Collective knowledge of highest governance body.
Appendix 8 Reporting of Sustainability Indicators for Ports
of Spain. Page 7
102-28 Evaluating the highest governance body’s performance.
Appendix 8 Reporting of Sustainability Indicators for Ports
of Spain. Page 9
102-29 Identifying and managing economic, environmental, and social impacts.
Appendix 8 Reporting of Sustainability Indicators for Ports of Spain. Page 9, 21, 22
102-30 Effectiveness of risk management processes
Appendix 8 Reporting of Sustainability Indicators for Ports of Spain. Page 9, 18, 19, 20
102-31 Review of economic, environmental, and social topics.
Appendix 8 Reporting of Sustainability Indicators for Ports
of Spain. Page 7
102-32 Highest governance body’s role in sustainability reporting
Appendix 8 Reporting of Sustainability Indicators for Ports
of Spain. Page 9
102-33 Communicating critical concerns
Appendix 8 Reporting of Sustainability Indicators for Ports of Spain. Page 9, 10

Appendix: Active Transparency in the Information. Data in detail. Data updated on 31/12/2020 Appendix: Active transparency in the information. Data in detail.
15
(102-55) GRI Standard
Content Page numbers or URL Omission
External verification
(Yes/No) GRI 102: General Disclosures 2016
102-34 Nature and total number of critical concerns
Appendix 8 Reporting of Sustainability Indicators for Ports of Spain. Page 9, 10, 36, 37, 38, 39, 40
102-35 Remuneration policies
Appendix 8 Reporting of Sustainability Indicators for Ports of Spain. Page 9, 10 Website of State Ports: Regulations | puertos.es : -President remuneration table. -Remuneration outside the agreement
102-36 Process for determining remuneration
Appendix 8 Reporting of Sustainability Indicators for Ports of Spain. Page 9, 10 Website of State Ports: Regulations http://www.puertos.es/es-es/rrhh/Paginas/Normativa.aspx
102-37 Stakeholders’ involvement in remuneration
Appendix 8 Reporting of Sustainability Indicators for Ports of Spain. Page 9, 10
102-38 Annual total compensation ratio
higher salary 2020/(median(total 2020-higher salary 2020)=3.39
102-39 Percentage increase in total annual compensation ratio
((higher salary 2020-higher salary 2019)/higher salary 2019))/((median 2020-median 2019)/median 2019))= -0.02999484 Median= median (total-higher salary)
102-40 List of stakeholder groups
Appendix 8 Reporting of Sustainability Indicators for Ports of Spain. Page 44
102-41 Collective bargaining agreements
Appendix 8 Reporting of Sustainability Indicators for Ports of Spain. Page 73
102-42 Identifying and selecting stakeholders
Appendix 8 Reporting of Sustainability Indicators for Ports of Spain. Page 37, 38
102-43 Approach to stakeholder engagement
Appendix 8 Reporting of Sustainability Indicators for Ports of Spain. Page 37, 38, 44
102-44 Key topics and concerns raised
Appendix 8 Reporting of Sustainability Indicators for Ports of Spain. Page 45, 46, 47, 48, 49
102-45 Entities included in the consolidated financial statements
Appendix 9 GRI content index and parameters. Page 1
102-46 Defining report content and topic Boundaries
Appendix 9 GRI content index and parameters. Page 1
102-47 List of material topics
Appendix 9 GRI content index and parameters. Page 2, 3, 4, 5, 6, 7, 8, 9, 10, 11
102-48 Restatement of information
Appendix 9 GRI content index and parameters. Page 12
102-49 Changes in reporting
Appendix 9 GRI content index and parameters. Page 12
102-50 Reporting period Appendix 9 GRI content index and parameters. Page 12 102-51 Date of most recent report
Appendix 9 GRI content index and parameters. Page 12
102-52 Reporting cycle Appendix 9 GRI content index and parameters. Page 12 102-53 Contact point for questions regarding the report
Appendix 9 GRI content index and parameters. Page 12

Appendix: Active Transparency in the Information. Data in detail. Data updated on 31/12/2020 Appendix: Active transparency in the information. Data in detail.
16
(102-55) GRI Standard
Content Page numbers or URL Omission
External verification
(Yes/No) GRI 102: General Disclosures 2016
102-54 Claims of reporting in accordance with the GRI Standards
Appendix 9 GRI content index and parameters. Page 13
102-55 GRI content index
Appendix 9 GRI content index and parameters. Page 13, 14, 15, 16, 17, 18, 19, 20, 21, 22, 23
102-56 External assurance
Appendix 9 GRI content index and parameters. Page 25
MATERIAL TOPICS GRI 200 Economic Economic Performance GRI 103 Management Approach 2016
103-1 Explanation of the material topic and its boundary.
Appendix 9 GRI content index and parameters. Page 3, 4 Appendix 8 Reporting of Sustainability Indicators for Ports of Spain. Page 58
103-2 The management approach and its components
Appendix 9 GRI content index and parameters. Page 3, 4 Appendix 8 Reporting of Sustainability Indicators for Ports of Spain. Page 58.59
103-3 Evaluation of the management approach
Appendix 9 GRI content index and parameters. Page 3, 4 Appendix 8 Reporting of Sustainability Indicators for Ports of Spain. Page 59
GRI 201 Economic Performance 2016
201-1 Direct economic value generated and distributed
Appendix 9 GRI content index and parameters. Page 24. Annual accounts Port Authority of Ferrol San Cibrao: Electronic web site APFSC. https://sede.apfsc.gob.es/transparency/93c95d58-5cbd-470a-b14f-d12ea5176397/ Pág: 2 y 3 Appendix 8 Reporting of Sustainability Indicators for Ports of Spain. Page 60, 61, 66, 67
201-2 Financial implications and other risks and opportunities due to climate change
Appendix 8 Reporting of Sustainability Indicators for Ports of Spain. Page 68, 69
201-3 Defined benefit plan obligations and other retirement plans
Annual accounts Port Authority of Ferrol San Cibrao: Electronic website APFSC https://sede.apfsc.gob.es/transparency/93c95d58-5cbd-470a-b14f-d12ea5176397/ Memoria económica: pág 15
201-4 Financial assistance received from government
Annual accounts Port Authority of Ferrol San Cibrao: Electronic web site APFSC https://sede.apfsc.gob.es/transparency/93c95d58-5cbd-470a-b14f-d12ea5176397/ Memoria económica: pág: 47
Presence in the market GRI 103 Management Approach 2016
103-1 Explanation of the material topic and its boundary.
Appendix 9 GRI content index and parameters. Page 4
103-2 The management approach and its components
Appendix 9 GRI content index and parameters. Page 4
103-3 Evaluation of the management approach
Appendix 8 Reporting of Sustainability Indicators for Ports of Spain. Page 77
GRI 202 Market Presence 2016
202-1 Ratio of standard entry-level wage by gender compared to local minimum wage
Appendix 8 Reporting of Sustainability Indicators for Ports of Spain. Page 77
202-2 Proportion of senior management hired from the local community
Senior management: 100%, considering the local community, just like in the case of suppliers, Spain.
Indirect economic impacts GRI 103 Management Approach 2016
103-1 Explanation of the material topic and its boundary.
Appendix 9 GRI content index and parameters. Page 4 Appendix 8 Reporting of Sustainability Indicators for Ports of Spain. Page 58
103-2 The management approach and its components
Appendix 9 GRI content index and parameters. Page 4 Appendix 8 Reporting of Sustainability Indicators for Ports of Spain. Page 58, 59
103-3 Evaluation of the management approach
Appendix 9 GRI content index and parameters. Page 4

Appendix: Active Transparency in the Information. Data in detail. Data updated on 31/12/2020 Appendix: Active transparency in the information. Data in detail.
17
(102-55) GRI Standard Content Page numbers or URL Omission External
verification (Yes/No)
GRI 203 Indirect economic impacts 2016
203-1 Infrastructure investments and services supported
Appendix 8 Reporting of Sustainability Indicators for Ports of Spain. Page 24, 28, 29, 64, 65
203-2 Significant indirect economic impacts
Appendix 8 Reporting of Sustainability Indicators for Ports of Spain. Page 4, 64, 65
Acquisition practices GRI 103 Management Approach 2016
103-1 Explanation of the material topic and its boundary.
Appendix 9 GRI content index and parameters. Page 5 Appendix 8 Reporting of Sustainability Indicators for Ports of Spain. Page 13
103-2 The management approach and its components
Appendix 9 GRI content index and parameters. Page 5
103-3 Evaluation of the management approach
Appendix 8 Reporting of Sustainability Indicators for Ports of Spain. Page 13
GRI 204 Procurement practices 2016
204-1 Proportion of spending on local suppliers
Appendix 8 Reporting of Sustainability Indicators for Ports of Spain. Page 13
Anti-corruption GRI 103 Management Approach 2016
103-1 Explanation of the material topic and its boundary.
Appendix 9 GRI content index and parameters. Page 5 Electronic headquarters of the Port Authority of Ferrol-San Cibrao: Code of conduct and responsible practices of the Port Authority of Ferrol-San Cibrao http://sede.apfsc.gob.es/transparency/0a9d2ed3-c9b4-4679-b164-0966cb13e5b8/
103-2 The management approach and its components
Appendix 9 GRI content index and parameters. Page 5 Electronic headquarters of the Port Authority of Ferrol-San Cibrao: Code of conduct and responsible practices of the Port Authority of Ferrol-San Cibrao http://sede.apfsc.gob.es/transparency/0a9d2ed3-c9b4-4679-b164-0966cb13e5b8/
103-3 Evaluation of the management approach
Appendix 9 GRI content index and parameters. Page 5
GRI 205 Anti-corruption 2016
205-1 Operations assessed for risks related to corruption
Electronic headquarters of the Port Authority of Ferrol-San Cibrao: Code of conduct and responsible practices of the Port Authority of Ferrol-San Cibrao http://sede.apfsc.gob.es/transparency/0a9d2ed3-c9b4-4679-b164-0966cb13e5b8/ Section 1.-Object, Section 2.-Scope
205-2 Communication and training about anti-corruption policies and procedures
Electronic headquarters of the Port Authority of Ferrol-San Cibrao: Code of conduct and responsible practices of the Port Authority of Ferrol-San Cibrao http://sede.apfsc.gob.es/transparency/0a9d2ed3-c9b4-4679-b164-0966cb13e5b8/ . Section 5.-Acceptance, compliance, duty of communication, and interpretation of the code.
205-3 Confirmed incidents of corruption and actions taken
Transparency portal of the Port Authority of Ferrol-San Cibrao https://sede.apfsc.gob.es/transparency
Unfair competition GRI 103 Management Approach 2016
103-1 Explanation of the material topic and its boundary.
Appendix 9 GRI content index and parameters. Page 5 The activity of the Port Authority is regulated by Royal Legislative Decree 2/2011, of 5 September, which approves the Consolidated Text of the Law on State Ports and the Merchant Navy, so there is no room for practices of unfair competition with other public administrations.
103-2 The management approach and its components
Appendix 9 GRI content index and parameters. Page 5 Royal Legislative Decree 2/2011, of 5 September, approving the Consolidated Text of the Law on State Ports and the Merchant Navy: https://www.boe.es/buscar/act.php?id=BOE-A-2011-16467
103-3 Evaluation of the management approach
Transparency portal of the Port Authority of Ferrol-San Cibrao https://sede.apfsc.gob.es/transparency Annual accounts Port Authority of Ferrol-San Cibrao. Electronic website APFSC. https://sede.apfsc.gob.es/transparency/93c95d58-5cbd-470a-b14f-d12ea5176397/ Pág 3 y 4
GRI 206- Anti-competitive Behaviour 2016
206-1 Legal actions for anti-competitive behaviour, anti-trust, and monopoly practices
Transparency portal of the Port Authority of Ferrol-San Cibrao https://sede.apfsc.gob.es/transparency Annual accounts Port Authority of Ferrol-San Cibrao. Electronic website APFSC https://sede.apfsc.gob.es/transparency/93c95d58-5cbd-470a-b14f-d12ea5176397/. Memoria económica, índice pág 41

Appendix: Active Transparency in the Information. Data in detail. Data updated on 31/12/2020 Appendix: Active transparency in the information. Data in detail.
18
(102-55) GRI Standard
Content Page numbers or URL Omission External verification
(Yes/No) GRI 300 Environmental Energy GRI 103 Management Approach 2016
103-1 Explanation of the material topic and its boundary.
Appendix 9 GRI content index and parameters. Page 6 Appendix 8 Reporting of Sustainability Indicators for Ports of Spain. Page 82, 83
103-2 The management approach and its components
Appendix 9 GRI content index and parameters. Page 6 Appendix 8 Reporting of Sustainability Indicators for Ports of Spain. Page 83, 84, 85, 86, 87, 88, 89, 90
103-3 Evaluation of the management approach
Appendix 9 GRI content index and parameters. Page 6 Appendix 8 Reporting of Sustainability Indicators for Ports of Spain. Page 83, 84, 85, 86, 87, 88, 89, 90
GRI 302 Energy 2016
302-1 Energy consumption within the organization
Appendix 8 Reporting of Sustainability Indicators for Ports of Spain. Page 112, 113
302-2 Energy consumption outside of the organization
Appendix 8 Reporting of Sustainability Indicators for Ports of Spain. Page 112, 113
302-3 Energy intensity Appendix 8 Reporting of Sustainability Indicators for Ports of Spain. Page 112
302-4 Reduction of energy consumption
Appendix 8 Reporting of Sustainability Indicators for Ports of Spain. Page 112, 113
302-5 Reduction in energy requirements of products and services
Appendix 8 Reporting of Sustainability Indicators for Ports of Spain. Page 113
Water GRI 103 Management Approach 2016
103-1 Explanation of the material topic and its boundary.
Appendix 9 GRI content index and parameters. Page 6 Appendix 8 Reporting of Sustainability Indicators for Ports of Spain. Page 82, 83
103-2 The management approach and its components
Appendix 9 GRI content index and parameters. Page 6 Appendix 8 Reporting of Sustainability Indicators for Ports of Spain. Page 83, 84, 85, 86, 87, 88, 89, 90
103-3 Evaluation of the management approach
Appendix 9 GRI content index and parameters. Page 6 Appendix 8 Reporting of Sustainability Indicators for Ports of Spain. Page 83, 84, 85, 86, 87, 88, 89, 90
GRI 303- Water and effluents 2016
303-1 Interactions with water as a shared resource
Appendix 8 Reporting of Sustainability Indicators for Ports of Spain. Page 110
303-2 Management of water discharge-related impacts
Appendix 8 Reporting of Sustainability Indicators for Ports of Spain. Page 110
303-3 Water withdrawal Appendix 8 Reporting of Sustainability Indicators for Ports of Spain. Page 110
Biodiversity GRI 103 Management Approach 2016
103-1 Explanation of the material topic and its boundary.
Appendix 9 GRI content index and parameters. Page 6 Appendix 8 Reporting of Sustainability Indicators for Ports of Spain. Page 82, 83
103-2 The management approach and its components
Appendix 9 GRI content index and parameters. Page 6 Appendix 8 Reporting of Sustainability Indicators for Ports of Spain. Page 83, 84, 85, 86, 87, 88, 89, 90
103-3 Evaluation of the management approach
Appendix 9 GRI content index and parameters. Page 6 Appendix 8 Reporting of Sustainability Indicators for Ports of Spain Page 83, 84, 85, 86, 87, 88, 89, 90
GRI 304- Biodiversity 2016
304-1 Operational sites owned, leased, managed in, or adjacent to, protected areas and areas of high biodiversity value outside protected areas
Appendix 8 Reporting of Sustainability Indicators for Ports of Spain. Page 108
304-2 Significant impacts of activities, products and services on biodiversity
Appendix 8 Reporting of Sustainability Indicators for Ports of Spain. Page 108
304-3 Habitats protected or restored
Appendix 8 Reporting of Sustainability Indicators for Ports of Spain. Page 109
304-4 IUCN Red List species and national conservation list species with habitats in areas affected by operations
Appendix 8 Reporting of Sustainability Indicators for Ports of Spain. Page 108

Appendix: Active Transparency in the Information. Data in detail. Data updated on 31/12/2020 Appendix: Active transparency in the information. Data in detail.
19
(102-55) GRI Standard
Content Page numbers or URL Omission External verificati
on (Yes/No)
Emissions GRI 103 Management Approach 2016
103-1 Explanation of the material topic and its boundary.
Appendix 9 GRI content index and parameters. Page 6 Appendix 8 Reporting of Sustainability Indicators for Ports of Spain. Page 82, 83
103-2 The management approach and its components
Appendix 9 GRI content index and parameters. Page 6 Appendix 8 Reporting of Sustainability Indicators for Ports of Spain. Page 83, 84, 85, 86, 87, 88, 89, 90
103-3 Evaluation of the management approach
Appendix 9 GRI content index and parameters. Page 6 Appendix 8 Reporting of Sustainability Indicators for Ports of Spain. Page 83, 84, 85, 86, 87, 88, 89, 90
GRI 305 Emissions 2016
305-1 Direct (Scope 1) GHG emissions
Appendix 8 Reporting of Sustainability Indicators for Ports of Spain. Page 114
305-2 Energy indirect (Scope 2) GHG emissions
Appendix 8 Reporting of Sustainability Indicators for Ports of Spain. Page 114
305-3 Other indirect (Scope 3) GHG emissions
Appendix 8 Reporting of Sustainability Indicators for Ports of Spain. Page 113
It is impossible to discriminate from the complete electricity consumption of the industries settled in the port area, that relating exclusively to port services. Adding total consumption, in activities as divergent as aluminium production, regasification, or biofuel production, would not provide useful information for decision-making.
305-4 GHG emissions intensity Appendix 8 Reporting of Sustainability Indicators for Ports of Spain. Page 114
305-5 Reduction of GHG emissions
Appendix 8 Reporting of Sustainability Indicators for Ports of Spain. Page 113
305-6 Emissions of ozone-depleting substances (ODS)
Not applicable. The activity of the Port Authority is administrative, so it does not produce, import, or export ozone-depleting substances (ODS).
305-7 Nitrogen oxides (NOx), sulphur oxides (SOx), and other significant air emissions
Appendix 8 Reporting of Sustainability Indicators for Ports of Spain. Page 94
Effluents and waste GRI 103 Management Approach 2016
103-1 Explanation of the material topic and its boundary.
Appendix 9 GRI content index and parameters. Page 7 Appendix 8 Reporting of Sustainability Indicators for Ports of Spain. Page 82, 83
103-2 The management approach and its components
Appendix 9 GRI content index and parameters. Page 7 Appendix 8 Reporting of Sustainability Indicators for Ports of Spain. Page 83, 84, 85, 86, 87, 88, 89, 90
103-3 Evaluation of the management approach
Appendix 9 GRI content index and parameters. Page 7 Appendix 8 Reporting of Sustainability Indicators for Ports of Spain. Page 83, 84, 85, 86, 87, 88, 89, 90
GRI 306 Waste 2016
306-1 Waste generation and significant waste-related impacts
Appendix 8 Reporting of Sustainability Indicators for Ports of Spain. Page 102
306-2 Management of significant waste-related impacts
Appendix 8 Reporting of Sustainability Indicators for Ports of Spain. Page 105
306-3 Waste generated Appendix 8 Reporting of Sustainability Indicators for Ports of Spain. Page 102
306-4 Waste diverted from disposal
Not applicable:
The Port Authority does not
transport, import, or export
hazardous waste.
306-5 Waste directed to disposal
Appendix 8 Reporting of Sustainability Indicators for Ports of Spain. Page 102

Appendix: Active Transparency in the Information. Data in detail. Data updated on 31/12/2020 Appendix: Active transparency in the information. Data in detail.
20
(102-55) GRI Standard Content Page numbers or URL Omissi
on External
verification (Yes/No)
Environmental compliance GRI 103 Management Approach 2016
103-1 Explanation of the material topic and its boundary.
Appendix 9 GRI content index and parameters. Page 7 Appendix 8 Reporting of Sustainability Indicators for Ports of Spain. Page 82, 83
103-2 The management approach and its components
Appendix 9 GRI content index and parameters. Page 7 Appendix 8 Reporting of Sustainability Indicators for Ports of Spain. Page 83, 84, 85, 86, 87, 88, 89, 90
103-3 Evaluation of the management approach
Appendix 9 GRI content index and parameters. Page 7 Appendix 8 Reporting of Sustainability Indicators for Ports of Spain. Page 83, 84, 85, 86, 87, 88, 89, 90
GRI 307 Environmental compliance 2016
307-1 Non-compliance with environmental laws and regulations
During the year 2020, there have been no sanctions for non-compliance with environmental legislation and regulations. Annual accounts Port Authority of Ferrol San Cibrao: electronic website APFSC https://sede.apfsc.gob.es/transparency/93c95d58-5cbd-470a-b14f-d12ea5176397/ Memoria económica, Índice pág 41
Environmental assessment of suppliers GRI 103 Management Approach 2016
103-1 Explanation of the material topic and its boundary.
Appendix 9 GRI content index and parameters. Page 7 Appendix 8 Reporting of Sustainability Indicators for Ports of Spain. Page 82, 83
103-2 The management approach and its components
Appendix 9 GRI content index and parameters. Page 7 Appendix 8 Reporting of Sustainability Indicators for Ports of Spain. Page 83, 84, 85, 86, 87, 88, 89, 90
103-3 Evaluation of the management approach
Appendix 9 GRI content index and parameters. Page 7 Appendix 8 Reporting of Sustainability Indicators for Ports of Spain. Page 83, 84, 85, 86, 87, 88, 89, 90
GRI 308 Supplier Environmental Assessment 2016
308-1 New suppliers that were screened using environmental criteria
Appendix 8 Reporting of Sustainability Indicators for Ports of Spain. Page 12, 13
308-2 Negative environmental impacts in the supply chain and actions taken
Environmental control of works. During the year 2020, the documentary control of environmental management has been carried out on the companies awarded works with a base bid budget of more than €150,000 (VAT not included), following the procedure of the ISO 14001 management system for Environmental Control of operations. -Our relationship to society. The railway connection to the Outer Port. page 41, 42, 43, 44, 45.
GRI 400 Social
Employment GRI 103 Management Approach 2016
103-1 Explanation of the material topic and its boundary.
Appendix 9 GRI content index and parameters. Page 8 Appendix 8 Reporting of Sustainability Indicators for Ports of Spain. Page 71l
103-2 The management approach and its components
Appendix 9 GRI content index and parameters. Page 8 Appendix 8 Reporting of Sustainability Indicators for Ports of Spain. Page 71
103-3 Evaluation of the management approach
Appendix 8 Reporting of Sustainability Indicators for Ports of Spain. Page 71, 77
GRI 401 Employment 2016
401-1 New employee hires and employee turnover
Appendix 8 Reporting of Sustainability Indicators for Ports of Spain. Page 72
401-2 Benefits provided to full-time employees that are not provided to temporary or part-time employees
The only difference in terms of company benefits due to the type of contract is medical insurance, which is contracted only for permanent staff.
401-3 Parental leave Appendix 8 Reporting of Sustainability Indicators for Ports of Spain. Page 77

Appendix: Active Transparency in the Information. Data in detail. Data updated on 31/12/2020 Appendix: Active transparency in the information. Data in detail.
21
(102-55) GRI Standard Content Page numbers or URL Omissi
on External verificati
on (Yes/No)
Labour/Management Relations GRI 103 Management Approach 2016
103-1 Explanation of the material topic and its boundary.
Appendix 9 GRI content index and parameters. Page 8 Appendix 8 Reporting of Sustainability Indicators for Ports of Spain. Page 71
103-2 The management approach and its components
Appendix 9 GRI content index and parameters. Page 8 Appendix 8 Reporting of Sustainability Indicators for Ports of Spain. Page 71
103-3 Evaluation of the management approach
Appendix 8 Reporting of Sustainability Indicators for Ports of Spain. Page 71
GRI 402 Labour/Management Relations 2016
402-1 Minimum notice periods regarding operational changes
The provisions of Royal Legislative Decree 2/2015, of 23 October, which approves the consolidated text of the Workers' Statute Law, articles 39, 40, and 41: https://www.boe.es/buscar/act.php?id=BOE-A-2015-11430 The provisions of the 3rd COLLECTIVE AGREEMENT OF STATE PORTS AND PORT AUTHORITIES, Chapter II, article 9 apply: http://www.puertos.es/es-es/rrhh/Documents/BOE-A-2019-9021%20III%20Convenio.pdf
Occupational Health and Safety GRI 103 Management Approach 2016
103-1 Explanation of the material topic and its boundary.
Appendix 9 GRI content index and parameters. Page 8
103-2 The management approach and its components
Appendix 9 GRI content index and parameters. Page 8
103-3 Evaluation of the management approach
Appendix 9 GRI content index and parameters. Page 8
GRI 403 Occupational Health and Safety 2016
403-1 Occupational health and safety management system
Appendix 8 Reporting of Sustainability Indicators for Ports of Spain. Page 79
403-2 Hazard identification, risk assessment, and incident investigation
Appendix 8 Reporting of Sustainability Indicators for Ports of Spain. Page 79
403-3 Occupational health services There are no workers with a high incidence or high risk of diseases related to their activity.
403-4 Worker participation, consultation, and communication on occupational health and safety
Appendix 8 Reporting of Sustainability Indicators for Ports of Spain. Page 79
Training and education GRI 103 Management Approach 2016
103-1 Explanation of the material topic and its boundary.
Appendix 9 GRI content index and parameters. Page 8 Appendix 8 Reporting of Sustainability Indicators for Ports of Spain. Page 71
103-2 The management approach and its components
Appendix 9 GRI content index and parameters. Page 8 Appendix 8 Reporting of Sustainability Indicators for Ports of Spain. Page 71
103-3 Evaluation of the management approach
Appendix 9 GRI content index and parameters. Page 8
GRI 404 Training and education 2016
404-1 Average hours of training per year per employee
Appendix 8 Reporting of Sustainability Indicators for Ports of Spain. Page 76
404-2 Programs for upgrading employee skills and transition assistance programs
Appendix 8 Reporting of Sustainability Indicators for Ports of Spain. Page 76
404-3 Percentage of employees receiving regular performance and career development reviews
Appendix 8 Reporting of Sustainability Indicators for Ports of Spain. Page 76

Appendix: Active Transparency in the Information. Data in detail. Data updated on 31/12/2020 Appendix: Active transparency in the information. Data in detail.
22
(102-55) GRI Standard
Content Page numbers or URL Omission
External
verification
(Yes/No)
Diversity and equal opportunity GRI 103 Management Approach 2016
103-1 Explanation of the material topic and its boundary.
Appendix 9 GRI content index and parameters. Page 9 Appendix 8 Reporting of Sustainability Indicators for Ports of Spain. Page 71
103-2 The management approach and its components
Appendix 9 GRI content index and parameters. Page 9 Appendix 8 Reporting of Sustainability Indicators for Ports of Spain. Page 71
103-3 Evaluation of the management approach
Appendix 9 GRI content index and parameters. Page 9 Appendix 8 Reporting of Sustainability Indicators for Ports of Spain. Page 71
GRI 405: Diversity and equal opportunity 2016
405-1 Diversity of governance bodies and employees
Appendix 8 Reporting of Sustainability Indicators for Ports of Spain. Page 11, 12, 77, 78 Annual accounts in electronic website APFSC: https://sede.apfsc.gob.es/transparency/93c95d58-5cbd-470a-b14f-d12ea5176397/ Memoria económica, Índice pág 56
405-2 Ratio of basic salary and remuneration of women to men
Appendix 8 Reporting of Sustainability Indicators for Ports of Spain. Page 77
Non-discrimination GRI 103 Management Approach 2016
103-1 Explanation of the material topic and its boundary.
Appendix 9 GRI content index and parameters. Page 9 Appendix 8 Reporting of Sustainability Indicators for Ports of Spain. Page 71
103-2 The management approach and its components
Appendix 9 GRI content index and parameters. Page 9 Appendix 8 Reporting of Sustainability Indicators for Ports of Spain. Page 71
103-3 Evaluation of the management approach
Appendix 9 GRI content index and parameters. Page 9 Appendix 8 Reporting of Sustainability Indicators for Ports of Spain. Page 71
GRI 406: Non-discrimination 2016
Content 406-1 Incidents of discrimination and corrective actions taken
Appendix 8 Reporting of Sustainability Indicators for Ports of Spain. Page 77
Local communities GRI 103 Management Approach 2016
103-1 Explanation of the material topic and its boundary.
Appendix 9 GRI content index and parameters. Page 9
103-2 The management approach and its components
Appendix 9 GRI content index and parameters. Page 9
103-3 Evaluation of the management approach
Appendix 9 GRI content index and parameters. Page 9
GRI 413: Local communities 2016
413-1 Operations with local community engagement, impact assessments, and development programs
-Our relationship to society. The railway connection to the Outer Port. page 41, 42, 43, 44, 45. -Appendix 8 Reporting of Sustainability Indicators for Ports of Spain. Page 49, 50, 54, 55
413-2 Operations with significant actual and potential negative impacts on local communities
-Our relationship to society. The railway connection to the Outer Port. page 41, 42, 43, 44, 45.
Supplier Social Assessment GRI 103 Management Approach 2016
103-1 Explanation of the material topic and its boundary.
Appendix 9 GRI content index and parameters. Page 10 Appendix 8 Reporting of Sustainability Indicators for Ports of Spain. Page 12, 13, 14
103-2 The management approach and its components
Appendix 9 GRI content index and parameters. Page 10
103-3 Evaluation of the management approach
Appendix 9 GRI content index and parameters. Page 10 Appendix 8 Reporting of Sustainability Indicators for Ports of Spain. Page 12, 13, 14
GRI 414: Supplier Social Assessment 2016
414-1 New suppliers that were screened using social criteria
Appendix 8 Reporting of Sustainability Indicators for Ports of Spain. Page 12, 13, 14
414-2 Negative social impacts in the supply chain and actions taken
Annual accounts Port Authority of Ferrol San Cibrao: electronic Website APFSC https://sede.apfsc.gob.es/transparency/93c95d58-5cbd-470a-b14f-d12ea5176397/ Memoria económica, Índice pág 4

Appendix: Active Transparency in the Information. Data in detail. Data updated on 31/12/2020 Appendix: Active transparency in the information. Data in detail.
23
(102-55) GRI Standard
Content Page numbers or URL Omission
External verification
(Yes/No) Customer health and safety GRI 103 Management Approach 2016
103-1 Explanation of the material topic and its boundary.
Appendix 9 GRI content index and parameters. Page 10
103-2 The management approach and its components
Appendix 9 GRI content index and parameters. Page 10
103-3 Evaluation of the management approach
Appendix 9 GRI content index and parameters. Page 10
GRI 416: Customer health and safety 2016
416-1 Assessment of the health and safety impacts of product and service categories
Appendix 8 Reporting of Sustainability Indicators for Ports of Spain. Page 15
416-2 Incidents of non-compliance concerning the health and safety impacts of products and services
Annual accounts Port Authority of Ferrol San Cibrao: electronic website APFSC https://sede.apfsc.gob.es/transparency/93c95d58-5cbd-470a-b14f-d12ea5176397/ Memoria económica, Índice pág 41
Marketing and Labeling GRI 103 Management Approach 2016
103-1 Explanation of the material topic and its boundary.
Appendix 9 GRI content index and parameters. Page 11
103-2 The management approach and its components
Appendix 9 GRI content index and parameters. Page 11
103-3 Evaluation of the management approach
Appendix 9 GRI content index and parameters. Page 11
GRI 417: Marketing and Labeling 2016
417-1 Requirements for product and service information and labeling
Appendix 8 Reporting of Sustainability Indicators for Ports of Spain. Page 32, 34, 35
417-2 Incidents of non-compliance concerning product and service information and labeling
Annual accounts Port Authority of Ferrol San Cibrao: electronic website APFSC https://sede.apfsc.gob.es/transparency/93c95d58-5cbd-470a-b14f-d12ea5176397/ Memoria económica, Índice pág 41
417-3 Incidents of non-compliance concerning marketing communications
Annual accounts Port Authority of Ferrol San Cibrao: electronic website APFSC https://sede.apfsc.gob.es/transparency/93c95d58-5cbd-470a-b14f-d12ea5176397/ Memoria económica, Índice pág 41
Customer privacy GRI 103 Management Approach 2016
103-1 Explanation of the material topic and its boundary.
Appendix 9 GRI content index and parameters. Page 11
103-2 The management approach and its components
Appendix 9 GRI content index and parameters. Page 11
103-3 Evaluation of the management approach
Appendix 9 GRI content index and parameters. Page 11
GRI 418: Customer privacy
418-1 Substantiated complaints concerning breaches of customer privacy and losses of customer data
Annual accounts Port Authority of Ferrol San Cibrao: electronic website APFSC https://sede.apfsc.gob.es/transparency/93c95d58-5cbd-470a-b14f-d12ea5176397/ Memoria económica, Índice pág 41
Socio-economic compliance GRI 103 Management Approach 2016
103-1 Explanation of the material topic and its coverage.
Appendix 9 GRI content index and parameters. Page 11
103-2 The management approach and its components
Appendix 9 GRI content index and parameters. Page 11
103-3 Evaluation of the management approach
Appendix 9 GRI content index and parameters. Page 11
GRI 419: Socioeconomic compliance
419-1 Non-compliance with laws and regulations in the social and economic area
Annual accounts Port Authority of Ferrol San Cibrao: electronic website APFSC https://sede.apfsc.gob.es/transparency/93c95d58-5cbd-470a-b14f-d12ea5176397/ Memoria económica, Índice pág 41

Appendix: Active Transparency in the Information. Data in detail. Data updated on 31/12/2020 Appendix: Active transparency in the information. Data in detail.
24
Direct economic value generated and distributed (201-1)
YEAR 2020 YEAR 2019
ECONOMIC VALUE GENERATED 16,305,824.55 18,723,482.25
NET AMOUNT OF TURNOVER 15,211,831.92 17,528,040.06
OTHER OPERATING INCOME 863,800.01 874,984.09
FINANCIAL INCOME 230,192.62 320,458.10
ECONOMIC VALUE DISTRIBUTED (9,998,600.89) (10,235,716.89)
OPERATIONAL COSTS (3,849,766.44) (4,334,800.30)
EMPLOYEE SALARIES AND BENEFITS (5,021,788.47) (4,793,709.93)
PAYMENTS TO CAPITAL SUPPLIERS (248,430.69) (368,998.49)
PAYMENTS TO THE GOVERNMENT (716,337.31) (674,782.57)
INVESTMENTS IN THE COMMUNITY (162,277.98) (63,425.60)
ECONOMIC VALUE RETAINED 6,307,223.66 8,487,765.36

Appendix: Active Transparency in the Information. Data in detail. Data updated on 31/12/2020 Appendix: Active transparency in the information. Data in detail.
25
EXTERNAL VERIFICATION (102-56)
The annual reports of the Port Authority of Ferrol-San Cibrao, corresponding to the years 2015, 2016, 2017, and 2018 were submitted to external verification by Bureau Veritas Certificación. The 2019 annual report
was submitted to external verification by the ICDQ Certification Institute. The content of these documents, as well as the corresponding verification reports, can be consulted on the website of the Port Authority,
which can be accessed through the following QR code: