Ports in short sea shipping - accedaCRIS
201
Ports in Short Sea Shipping A CRITICAL ASSESSMENT OF THE EUROPEAN MARITIME TRANSPORT POLICY PhD Dissertation Author: Ancor Suárez Alemán Supervisors: Dr. Javier Campos Méndez Dr. Lourdes Trujillo Castellano
-
Upload
khangminh22 -
Category
Documents
-
view
3 -
download
0
Transcript of Ports in short sea shipping - accedaCRIS

Ports in Short Sea Shipping
A CRITICAL ASSESSMENT OF THE EUROPEAN MARITIME TRANSPORT POLICY
PhD Dissertation
Author:
Ancor Suárez Alemán
Supervisors:
Dr. Javier Campos Méndez Dr. Lourdes Trujillo Castellano

v
CONTENTS
PART I. DISSERTATION
Introduction ................................................................................................................. 1
Chapter 1. A critical review of recent European maritime transport policies ................ 11
1.1. A single European Transport Area ........................................................................... 11
1.2. The European Maritime Transport Policy (EMTP) in context .................................. 16
1.2.1. The environmental concerns ............................................................................ 18
1.2.2. The role of intermodal competition .................................................................. 22
1.2.3. Main objectives and instruments of the EMTP ................................................. 24
1.2.4. Conclusions ....................................................................................................... 35
Chapter 2. Theoretical tools for analysing the role of ports within the EMTP ............... 39
2.1. A theoretical model for freight transport market ................................................... 40
2.2. European Transport Policies. Fostering the SSS-‐intermodality ............................... 53
2.3. Conclusions .............................................................................................................. 61
Chapter 3. Port efficiency in the EMTP. Is time adequate to measure a port’s Performance? .............................................................................................................. 63
3.1. Considering time in Data Envelopment and Stochastic Frontier analysis ............... 65
3.1.1. Port efficiency analysis ...................................................................................... 65
3.1.2. Time, an input in the production function ........................................................ 69
3.1.3. Time in port activities ....................................................................................... 71
3.2. Characteristics of “SSS ports” .................................................................................. 73
3.3. Decomposing the time in port activities .................................................................. 75
3.4. Mathematical specification ..................................................................................... 78
3.5. An empirical example .............................................................................................. 80
3.6. Conclusions .............................................................................................................. 84
Chapter 4. Are there other incentives to promote port efficiency? ............................... 87
4.1. The role of financing port infrastructure ................................................................. 89
4.2. Modelling subsidies in maritime transport policies ................................................. 90
4.3. The model ................................................................................................................ 92
4.4. Government and port infrastructure: a moral hazard problem .............................. 94

vi
4.5. How to incentivize gains in port efficiency? ............................................................ 99
4.6. Conclusions ............................................................................................................ 104
Chapter 5. The determinants of SSS potential success. A case study ........................... 107
5.1. The demand perspective: price, time and external cost ....................................... 109
5.2. Case study: the competitiveness of the Spanish SSS corridors ............................. 112
5.2.1. The role of prices ............................................................................................ 115
5.2.2. The role of time and external costs ................................................................ 120
5.3. Deconstructing the savings from SSS ..................................................................... 125
5.4. Conclusions ............................................................................................................ 128
Appendix ............................................................................................................. 131
PART II. SPANISH SUMMARY
I. Introducción ........................................................................................................ 137
II. Objetivos ............................................................................................................. 143
III. Planteamiento ..................................................................................................... 149
III.a. Política de transporte marítimo en la UE: competencia y medioambiente .......... 152
III.b. Principales políticas de promoción del transporte marítimo en Europa. ............. 156
III.c. Análisis crítico de las políticas de promoción del transporte marítimo ................ 162
IV. Metodología ........................................................................................................ 165
IV.a. Modelo teórico de competencia intermodal ........................................................ 165
IV.b. Análisis envolvente de datos. Modelo teórico e implementación ....................... 169
IV.c. Modelo teórico de riesgo moral ........................................................................... 172
IV.d. Modelo econométrico del componente monetario del coste generalizado ........ 174
V. Aportaciones originales ....................................................................................... 177
VI. Conclusiones obtenidas ....................................................................................... 179
References ............................................................................................................. 187

vii
TABLES
Table 1.1. TEN-‐T investments from 1996 to 2013 26
Table 1.2. European port projects funding by TEN-‐T in 2011 28
Table 2.5. Madrid – Lyon corridor 52
Table 3.1. Applications of SFA to port or terminal efficiency estimation 66
Table 3.2. Applications of DEA to port or terminal efficiency estimation 67
Table 3.3. DEA versus SFA – A comparison 68
Table 3.4. Descriptive statistics of the sample 81
Table 3.5. Technical efficiencies in African ports 82
Table 5.1. Descriptive statistics by subsidized routes 118
Table 5.2. Estimation results 119
Table 5.4. Deconstructing SSS savings. The case of Madrid 126
Table 5.5. Deconstructing SSS savings. The case of Barcelona 127
Table A.1. Routes from Madrid 131
Table A.1. Routes from Madrid (cont.) 132
Table A.2. Routes from Barcelona 133

viii
FIGURES
Figure 0.1. Navigation chart 10
Figure 1.1. Investment in transport infrastructure as % GDP (by mode, 1995-‐2008) 13
Figure 1.2. EU investments in transport. 1992-‐2009 14
Figure 1.3. EMTP concept map 17
Figure 1.4. CO2 emissions from transport EU-‐27 countries by modes in 2009 (shares %) 20
Figure 1.5. Freight transport modal shares (EU-‐27) 23
Figure 2.1. Theoretical freight transport market; a single corridor 43
Figure 2.3. Port inefficiency disaggregation 48
Figure 2.4. Generalized cost functions 51
Figure 2.6. An increase in road transport taxes 55
Figure 2.7. A decrease in carriage cost 56
Figure 2.8. An improvement in port efficiency 58
Figure 3.1. System processes within a Ro-‐Ro terminal 75
Figure 3.2. DEA-‐CCR and DEA-‐BCC representation 78
Figure 5.1. Two competing transport modes: SSS vs. Road Transport 111
Figure 5.2. Major Spanish ports considered in this study case 113
Figure 5.3. Routes from Madrid 115

1
INTRODUCTION
In the course of human history, many civilizations have used the sea to expand their
economic horizons. The adventurous and uncertain journeys of ancient times, made in
boats hardly more than floating nutshells, were progressively replaced by regular routes,
with safer and more reliable vessels, and this increased confidence in seafaring helped
shippers and traders to build commercial ties that contributed to the economic growth
and overall prosperity of their societies. The invention of the steam engine launched a
golden age for long-‐distance maritime transport during the nineteenth century, although
the development of railroads and the improvement and generalization of road transport
have in contrast reduced the relative importance of short-‐distance maritime routes since
the first half of the twentieth century.
In balance, about 80% of world trade is still carried via maritime transport. This
means that around 80% of cargo needs a ship to be moved from the place where it is
produced to where it is finally sold. This also means that ports, as origins and destinations
of ships, have to handle the roughly 80% of the goods that we all consume worldwide
(COM, 2009a).
In the case of European countries, shipping has been widely identified as “one of
the key stepping-‐stones that might explain their historical relevance, their cultural
influence or their economic potential” (COM, 2009a). The growth (and, sometimes, the
decline) of the Greeks, the Phoenicians, the Romans, the Hanseatic League, the Spanish,
the Dutch, the English and many other peoples and empires has largely been the result of
their commercial, mainly maritime, trades. In today’s European Union (EU), almost 90% of

2
the external freight trade is seaborne, whereas above the 40% of intra-‐EU exchanges are
completed through coastal and short-‐distance shipping.
In the future estimates of this traffic are relatively optimistic: maritime transport is
predicted to grow from 3.8 billion tonnes in 2006 to some 5.3 billion tonnes in 2018,
according to COM (2009a). Consequently, the related infrastructure, namely the ports
and their hinterland links, will have to manage “a traffic growth of between 30% and 50%
for the 2030-‐50 period” (COM, 2012a). Translated into aggregate figures, COM (2012b)
calculates that European ports will continue to provide millions of direct, indirect,
induced and related jobs.1 In broader terms, approximately one third of global shipping
witnesses an EU port as its origin or destination (COM, 2011a)
All these facts and figures summarize the relevance of maritime transport for the
European society and contribute to identifying the ports as crucial infrastructures that
make this economic activity develop in a smooth way – expanding its horizons again.
These can, however also, hinder its development through obstacles and inefficiencies. A
port is much more than a place on a waterway with facilities for loading and unloading
ships; it is a focus of economic activity cantered around intermodal transport. Thus, each
improvement in a port, or in the land corridors that link two or more ports, could be then
directly interpreted as being a potential benefit for the European economy as a whole.
However, as elsewhere in the world, the stubborn reality is that for most intra-‐EU cargo
movements, roads are still the preferred modal choice for users, with a market share of
46,6% (COM, 2012c). This is so even after acknowledging that – apart from its
1 In fact, several analyses of employment trends in sea-‐related sectors show the generation of approximately five million jobs in 2004/2005, being Spain the holder of the highest share (37%), followed by United Kingdom (12%) and France (9.7%) (COM, 2006a).

3
unquestionable advantages in terms of flexibility and scope – road transport also causes
damage to the society in terms of larger external costs that are not fully internalized.
Problems such as congestion, pollution and other environmentally negative effects have
been widely associated with roads, and have encouraged the development of a more
conscientious and greener European transport policy (COM 2012c).
It is within this context that we intend to study some specific European policies
aimed at reducing the environmentally negative effects of road transport and to re-‐
balance the uneven modal split in the last decades. In particular, as it will be detailed in
the following chapters, the EU has identified maritime transport as one of the keys to
developing a more sustainable transport system. Taking a leap backwards, and building
on centuries of historical experience in the Old Continent, Short Sea Shipping (SSS) is
currently viewed as an alternative to road transport in most of the European corridors,
either as part of a wider intermodal transport chain or as a fully substitutive mode. To
question whether this is possible or not is precisely the main objective of this dissertation.
We will particularly focus on the ports within the European Maritime Transport policies,
with a special mention of the role that these infrastructures play (or should play) in the
proper encouragement of SSS.
To begin with, there is not an unequivocal definition of short sea shipping. Musso
and Marchese (2002) defined four classification criteria to discuss when defining this
concept:
(a) geographical, based on route length;
(b) supply approach, based on type-‐size containers;

4
(c) commercial criteria or demand distinguishing between ‘feeder traffic’, intraregional traffic and nature of load; and
(d) legal approach, according to member ports of the same state.
With respect to the first criteria, there is no agreement as to how short the SSS is.
A report from the Spanish Ministry of Public Works (2011) suggests that it is convenient
to select corridors of around 800 kilometres, which places the SSS in direct competition
with road transport. The supply approach refers to how SSS is effectively conducted. That
is, the type of vessels, containers or cargo handling techniques.
As Paixão and Marlow (2002) pointed out, “(…) SSS can embrace different ships,
from conventional to innovative ones such as fast ships, with a variety of cargo handling
techniques (horizontal, vertical or a mixture of both), ports, networks and information
systems, which when studied from engineering, economics, logistics, business/marketing
or regulatory viewpoints.”
In fact, there is not even a unique demand criterion about the type of traffic. Most of
European SSS studies and definitions are based on intraregional traffic, that is, according
to member ports of the EU. However, according to the geographical principle, the traffic
to close non-‐European countries – such as the North Africans – could be included in the
SSS concept.
In this thesis we adopt the description suggested by the EU, which defines the SSS
as “the movement of cargo and passengers by sea between ports situated in geographical
Europe or between those ports situated in non-‐European countries having a coastline on
the enclosed seas bordering Europe.” The different criteria suggest that the previous

5
definition is only valid for Europe. This is highly conditioned by the European geography.2
Moreover, in the following chapters, SSS is considered as a competitor to road transport,
so we refer to those corridors that actually have an alternative by land.
Once this conceptual point has been established, the European Commission (EC)
has largely discussed the advantages and disadvantages within the continental transport
system, and has reached the conclusion that SSS offers a set of positive features that no
other mode can currently provide, especially in relation to the environment, as supported
by previous studies (Medda and Trujillo, 2009). Taking into consideration the
characteristics of SSS and its potential role in intermodal freight transport, a number of
different policies have been developed in recent years with the aim of re-‐balancing
intermodal competition and their analysis defines the structure of this dissertation.
Thus, the more general EU programmes, such as the Pilot Action for Combined
Transport (PACT), Marco Polo I and II and Trans-‐European Transport Network (TEN-‐T) will
be reviewed in Chapter 1. They have been designed (with slight differences among them,
in terms of period of time and specific objectives), to promote different (and socially
preferable) modes of transport and their intermodal connections. In particularly, PACT
and the Marco Polo I and II programmes have encouraged SSS by providing support to
companies with a project to transfer freight from road to rail or short sea shipping routes
or inland waterways.3 Specifically, it has been estimated that approximately 40-‐60% of
SSS overall transit costs are due to port charges (Pettersen, 2004).
2 For instance, considering the United States of America case, the Maritime Administration does not define SSS per se, although it seeks to develop a robust SSS system to aid in the reduction of growing freight congestion of national rail and highway system (Brooks and Frost, 2004). 3 See more in http://ec.europa.eu/transport/infrastructure/index_en.htm.

6
“The EU port industry has a significant economic impact in terms of employment and activity in the port industry itself (direct impacts), down the supply chain (indirect impacts) and in the wider EU economy (induced impacts). There is a wide range of industrial activities – petro-‐chemical, steel, automotive, energy production and distribution that are located in ports. Ports are also at the heart of economic activity for wider maritime clusters, including shipyards, marine equipment, crane and terminal equipment producers, salvage companies, offshore companies, marine construction firms, dredging firms, naval bases, etc.” (COM, 2013a).
Nevertheless, the role of ports in fostering SSS promotion has been under-‐
reported. EU policy has focused mainly on prompting companies to transfer cargo from
road to sea. The Marco Polo programmes reflect this policy; that is, to give grants to
companies in order to cover “a share of costs associated with the launch and operation of
a new modal-‐shift project.”4 However, none of these programmes have addressed the
improvement of port efficiency as a way to facilitate the modal shift from road to sea
transport.
After studying the main causes, objectives and instruments of the European
Maritime Transport Policies, Chapter 2 analyses the role played by them in European
multimodal transport chains from a theoretical viewpoint. Despite the EU efforts in
promoting policies that encourage SSS based on its advantages in terms of intermodal
improvements and environmentally friendly results, this mode has not yet reached a
significant market share compared to road transport. Chapter 2 establishes the
hypothesis that funding programmes, such as Marco Polo I and II have possibly not
offered the adequate incentives to effectively promote SSS, and aspects such as the key
role of port infrastructure and its characteristics have been neglected or, at least, not
taken into enough consideration. To support this idea, and in departing from traditional 4 See more in http://ec.europa.eu/transport/marcopolo/about/index_en.html.

7
transport cost models, we develop a simple theoretical intermodal competition model to
compare alternative modes – such as road transport vs. SSS. The main conclusion is that
the EU could need to re-‐focus on the role of ports and their efficiency within the overall
transport system in order to re-‐balance the freight transport market.
“Today's many bottlenecks in the EU are often due to low efficiency and
sometimes to restrictive labour and other non-‐competitive regimes operating inside the
port” (COM, 2012a). Port efficiency is a major issue in SSS competitiveness. After
identifying this idea, Chapter 3 develops a methodology to estimate port efficiency
considering SSS specific requirements. Traditionally, port efficiency studies have focused
on factors such as size or value of the labour force or the number or value of capital items
as inputs into the port production process, with quantities (typically contabilized in terms
of TEUs5, containers or tons) as the product of the production process. Frequently, in
order to analyse the degree of efficiency of a whole port or a specific terminal, data
envelopment analysis (DEA) or stochastic frontier analysis (SFA) has been carried out
(González and Trujillo, 2009; Cullinane et al, 2006). These methodologies consist of
establishing relationships between inputs that may have an effect, either directly or as a
proxy for some other determinant, on the level of efficiency achieved and the generated
outputs. In the absence of viable alternatives, these previous efficiency measures have
proved extremely useful and are ubiquitously applied to studies of port performance,
since they provide valuable information on whether a port or terminal is utilising its
inputs appropriately.
5 The twenty-‐foot equivalent unit is a unit of cargo capacity of containers, based on the volume of a 20-‐foot-‐long intermodal container.

8
The motivation for the research presented in Chapter 3 is that the relationships
established between the aforementioned inputs and outputs utilised in most previous
studies may not be directly relevant to port users. Through the development of a
conceptual and theoretical model – together with an empirical implementation – this
chapter proposes the direct utilization of time in the measurement of port efficiency
analysis and an alternative methodology is described for evaluating the efficiency of ports
on this basis.
Even though promoting port efficiency might be a more proper tool to increase
the modal split of SSS than subsidizing companies that transfer cargo from road to sea,
defining port efficiency is a complex task in itself. Therefore, granting money directly to
port authorities or terminal operators could also generate perverse moral hazard effects,
particularly when the improvements are difficult to monitor and the investments are non-‐
refundable. Chapter 4 analyses this issue.
The European Court of Auditors (ECA, 2012) points out that millions of EU public
port finance was wasted on empty terminal and other unused infrastructure. COM
(2012b) highlights the need for a transparent framework of financing and efficient use of
public funding, in order to use funding at an optimal level. As this report stated, “(…) the
Commission intends to create a level-‐playing field across Europe and is assessing if there
is a need to provide clear and transparent rules on port charges and port services. The
services need to be efficient and the charges to be cost-‐based, proportional to the service
provision and non-‐discriminatory. This transparency should avoid access-‐barriers to ports
and allow the ports to be developed to their full potential.” Once the importance of
promoting port efficiency to encourage SSS – and maritime transport overall – is

9
established, the objective of this chapter is to design a second-‐best mechanism. That is, a
subsidy to promote SSS by encouraging port improvements through a proper system of
incentives. As an alternative policy, Chapter 4 proposes the development of a subsidy per
inefficiency-‐reduction unit. Only if port operators perceive the benefits of decreasing
loading-‐unloading, administrative or port access time, among others, this policy will meet
its real objectives.
Finally, in order to provide a case study of the functioning of existing or potential
SSS routes in Europe, we empirically analyse the competitiveness of several Spanish SSS
corridors in Chapter 5. We compare the generalized costs – including prices, external
costs and time – of different alternatives for cargo movement from Spain’s two largest
cities to other European destinations either by road or by using a SSS intermodal corridor.
The main ports located in the Iberian Peninsula have been included in this analysis by
defining 34 services connecting 43 European ports in the Atlantic shore and 35 services
linking 64 European ports in the Mediterranean coast. This chapter shows that, apart
from the internalization of the external costs and the existence of bottlenecks in transit
time, the freight rates should be also considered as a critical factor in explaining why a
particular SSS corridor is more/less competitive than its road alternative. For that reason,
an econometric analysis is carried out to determine the main drivers of maritime prices in
several SSS routes and quantify to what extent the instruments promoted by EU maritime
policy – higher frequencies, fiercer competition or direct subsidies – favour real price
reductions in them. A conceptual chart, or more properly within this context of maritime
policy, a navigation chart, is presented in Figure 0.1 to summarize the structure of this
dissertation.

10
Figure 0.1. Navigation chart
Source: own elaboration.
The EU promotes maritime transport ���
-------���SSS
How ? How not ?
Giving aids to companies that shift cargo from road to sea and
funding infrastructure
Encouraging port efficiency
How to estimate it according to
SSS requirements?
Time in the port performance
How to minimize it?
Incentives to promote port
efficiency
A case study
Why?
Environmental concerns
Competition concerns
Other reasons
CHAPTER 1
CHAPTER 2
CHAPTER 3
CHAPTER 4
CHAPTER 5

11
CHAPTER 1
A CRITICAL REVIEW OF RECENT EUROPEAN MARITIME TRANSPORT POLICIES
Since ancient times, transport activities have been essential to the European economy
and even to the concept of Europe. They currently account for about 5% of European
GDP, providing around ten million direct jobs and uncountable indirect ones in related
sectors. As the European Commission has widely recognized, an efficient transport
system fosters economic growth and social cohesion, since it has a global nature that
connects peoples, cities and regions. Therefore, any effective transport policy needs to go
well beyond local or national borders, and requires strong international cooperation
(COM, 2011b).
In the context of maritime transport, this chapter reviews the effectiveness of
several EU policies by focusing on its promotion programmes. As we will show, whereas in
the last decade SSS has received more financial support than ever, this has hardly
increased its market share. Thus, we are interested in studying what measures have been
taken and why, in order to determine the drivers of this apparent failure.
1.1. A single European Transport Area
In 1957, the European Union (then called the European Economic Community) set up a
Common Transport Policy (CTP) to facilitate the mobility of people and goods across the
member states, and later also with third countries. The CTP was initially devoted to co-‐
ordinating efforts and practices in road, train, maritime and inland waterways,
progressively seeking an integrated and uniformly defined market. In the 1970s, air

12
transport was added and the CTP experienced a subsequent take-‐off in terms of common
policies and regulation.
Since the beginning, road transport has received particular attention from the
authorities. The high demand for this mode and its official encouragement resulted in
much congestion on the roads. 10% of the transport network suffers from congestion
regularly. More than 16,600 kilometres of the train network are also overcrowded,
resulting in bottlenecks. According to the EU estimations, the damage from congestion
accounts for more than 1% of EU GDP (COM, 2011b).
The growth in freight transport demand has also contributed in the last two
decades to congested transport infrastructures. Issues such as the reallocation of some
industries and the economic development of certain areas (especially in Eastern Europe)
have had a large impact on transport demand. As the COM (2001c) stated, the European
economy has moved from a storage model to a flow one, which means more trucks and
wagons going across Europe.
Road transport still plays the leading role in the EU freight movements. With
regard to the modal split, it has absorbed about half of the market share in the last few
decades (COM, 2012c). Second place is occupied by maritime transport. Its market share
has been around a 35-‐40% over the last two decades (COM, 2012c). As Figure 1.1 shows,
road transport has been receiving around the 60% of the European total transport
investment. The same figure shows how seaports received barely 5%. Indeed, Figure 1.2
shows how road infrastructure investments have increased between 2003 and 2008 (from
52% to 58%), while the share of investment in all other modes has dropped (EEA, 2011).

13
Figure 1.1. Investment in transport infrastructure as % GDP (by mode, 1995-‐2008)
Source: EEA (2011).
This data does not seem to match with the fact that ports deal with 90% of the
commerce between the EU and third countries and 30% of the intra-‐EU commerce (COM,
2012a). The progressive increase in rail and sea infrastructure investments could be seen
as a positive shift towards more environmentally friendly modes of transport.
Nevertheless, “in the case of sea infrastructure it could equally be argued that the
investment has enabled an overall increase in freight movement, rather than shifting
freight away from less environmentally friendly modes” (EEA, 2011).
0,00
0,20
0,40
0,60
0,80
1,00
1,20
1,40
1995 1996 1997 1998 1999 2000 2001 2002 2003 2004 2005 2006 2007 2008
Road Rail Inland waterways Sea Air Total

14
Figure 1.2. EU investments in transport. 1992-‐2009
Source: EEA (2011).
As the White Paper of 2011 points out, the main objective in current European
transport policy is to reach a more competitive and sustainable transport system and to
achieve this goal, it seems that the modes with the lowest negative impacts on
environment should be promoted. In fact, this document specifies that “30% of road
freight over 300 kilometres should shift to other modes such as rail or waterborne
transport by 2030, and more than 50% by 2050, facilitated by efficient and green freight
corridors. To meet this goal will also require appropriate infrastructure to be developed”
(COM, 2011b).
Under this framework of developing a competitive and efficient transport system,
the European government has specified other goals. According to the development of a
new fuels and propulsion systems, it is considered necessary to “halve the use of
‘conventionally-‐fuelled’ cars in urban transport by 2030; phase them out in cities by 2050
and achieve essentially CO2-‐free city logistics in major urban centres by 2030. Moreover,
0
10
20
30
40
50
60
70
80
90
100
1992 1994 1996 1998 2000 2002 2004 2006 2008
Airports
Seaports
Inland waterways
Rails
Roads

15
low-‐carbon sustainable fuels in aviation to reach 40% by 2050; also by 2050 reduce EU
CO2 emissions from maritime bunker fuels by 40% (if feasible 50%)” (COM, 2011a).
Considering the optimization of the performance of multimodal logistic chains, as
well as the aforementioned shift from road to other modes, the EU has planned “to
complete a European high-‐speed rail network by 2050. Tripling the length of the existing
high-‐speed rail network by 2030 and maintaining a dense railway network in all member
states. By 2050 the majority of medium-‐distance passenger transport should go by rail.
Moreover, a fully functional and EU-‐wide multimodal TEN-‐T ‘core network’ will exist by
2030, along with a high quality and capacity network by 2050 and a corresponding set of
information services. By 2050, all core network airports will also be connected to the rail
network, preferably high-‐speed, as well as all core seaports will be sufficiently connected
to the rail freight and, where possible, the inland waterway system” (COM, 2011b).
Increasing the efficiency of transport and the use of its infrastructure through
information systems and market-‐based incentives have been also regarded as one of the
mail goals:
“(…) the deployment of the modernised air traffic management infrastructure (SESAR) in Europe by 2020 and completion of the European Common Aviation Area, the deployment of equivalent land and waterborne transport management systems and the deployment of the European Global Navigation Satellite System (Galileo). By 2020, establish the framework for a European multimodal transport information, management and payment system. By 2050, move close to zero fatalities in road transport. In line with this goal, the EU aims at halving road casualties by 2020. It will make sure that the EU is a World leader in safety and security of transport in all modes of transport. Last, it will be moving towards full application of ‘user pays’ and ‘polluter pays’ principles and private sector engagement to eliminate distortions, including harmful subsidies, generating revenues and ensuring financing for future transport investments.”

16
To sum up, the EU pursues the objective of attaining a sustainable and efficient
transport system, environmentally friendly and socially accepted, with larger modal
integration. “Better modal choices will result from greater integration of the modal
networks: airports, ports, railway, metro and bus stations should increasingly be linked
and transformed into multimodal connection platforms” (COM, 2011b). The EU defines
intermodality “as a characteristic of a transport system whereby at least two different
modes are used in an integrated manner in order to complete a door-‐to-‐door transport
sequence. As they have also stated, intermodality is not intended to impose a particular
mode option, but to enable better use to be made of the railways, inland waterways and
transport by sea, which individually cannot provide a door-‐to-‐door service” (COM, 1997).
1.2. The European maritime transport policies (EMTP) in context
To avoid the massive use of environmentally harmful modes of transport such as road,
the EU has developed a number of different financing instruments with the aim of
reaching actual intermodal competition in the last two decades.
The EU transport programmes have been designed – with slight differences among
them, in terms of period of time and specific objectives – to promote different (and
socially profitable) modes of transport and their combination. As mentioned, the EU goal
is to shift a 30% of cargo from road to other modes such as rail or SSS by 2030, and this
figure will rise up to 50% by 2050.
Two main topics arise when we discuss about maritime transport advantages:
environmental and competition issues. Regarding the former, the EU points out the
damage that road transport generates to society in terms of external costs. Externalities

17
such as congestion, pollution and other environmental aspects have encouraged the
development of a more conscientious transport policy (Medda and Trujillo, 2009). With
respect to the second, competition issues have risen regarding the unbalanced modal
split in freight transport market. Thus, the EU goals may be summarized as 1) offering
environmentally sustainable solutions and 2) promoting the aperture of the transport
markets to achieve free and undistorted competition (COM, 2011b).
A considerable number of policies have been decided on in order to promote a
socially preferable combination of modes, in which where maritime transport should play
a significant role. As mentioned, the goal of this section is to provide a critical review of
the instruments and their objectives that affect (or should affect, by definition) ports and
maritime corridors. Figure 1.3 shows a concept map of this section. The main
specifications related to environmental and competition issues are considered below.
Figure 1.3. EMTP concept map
Source: own elaboration.
Environmental,concerns,
Compe11on,concerns,
Other,reasons,(geographical,,poli1cal),
European,Mari1me,Transport,Policies,(EMTP),
Infrastructure,(TEN?T), Opera1ons,(PACT,,Marco,Polo,I,and,II),
SSS,?,MoS,

18
1.2.1. The environmental concerns
Short Sea Shipping reduces air pollution and is thus considered to be the most
environmentally friendly mode of transport (Paixão and Marlow, 2002; Camarero Orive
and González Cancelas, 2004; Medda and Trujillo, 2010). COM (2010) recognized this
reality reflecting how the specific external costs of road transport in euros per tonne-‐
kilometre are higher than the SSS ones. By definition, the external cost comprises the
damage caused to societies that is not borne by private companies. In COM (2013c), air
pollution, climate change, noise, accidents and congestion are pointed out as road and
rail external cost components. For SSS, these categories are reduced to air pollution and
climate change.
However, the 2012 Marco Polo proposal incorporated a more detailed calculator
of these externalities. This new estimates include differences in maritime external costs
attending to the type of vessel and fuel used. With this, the Commission tries to reflect
how with some fuels (those with higher levels of sulphur) and vessels (a Ro-‐Ro/Ro-‐Pax
vessel at more than 23 knots) combinations, the SSS may incur in higher external costs
than road (COM, 2013c).
Therefore, the use of more appropriate environmental technologies is also
required. A more proper combination for the same service could reduce the external
costs to a quarter. Indeed, as COM (2013d) states, the EU funding programmes “will
positively evaluated the proposals presented with the objective of using services which
implement innovative technologies which significantly reduce polluting and/or carbon
dioxide (CO2) emissions of maritime transport; namely the use of low sulphur fuels (…) or
the use of the emissions abatement measures such as: the LNG powered vessels, vessels

19
operating scrubber technologies for the cleaning of exhaust emissions or vessels using
shore side electricity.”
According to the Eurostat (2011) data, 33% of energy consumption is accounted
for by transport and 80% of this is by road. COM (2011b) reflects that transport is the
largest consumer of energy and producer of greenhouse gases with the fastest growth in
the EU. The impact of CO2 and nitrogen oxide (NOX) emissions is crucial to the future of
European transport policies.
However, the internalization of external costs produced by transport has not yet
been achieved at a European level. Therefore, transport prices do not reflect the costs
that this activity produces for the society. As Janic (2001) states, if the full costs (both
internal and external costs) are to be used as the main basis for pricing, the break-‐even
distance will increase for intermodal transport and thus push it to compete in longer
distance markets. Nevertheless, as Brooks and Frost (2006) argue with respect to
environmental degradation, it is unrealistic for governments to expect shippers to move
to a more environmentally friendly, modally integrated transport choice if, in doing so, it
results in additional costs.

20
Figure 1.4. CO2 emissions from transport EU-‐27 countries by modes in 2009 (shares %)
Source: COM (2012c).
A comparison between road and sea transport in terms of CO2 emissions shows a
large difference over the last two decades. As Figure 1.4 shows, road transport is the
main producer of CO2 with a share of 71.7% of total emissions – and a market share of
46.6% in the freight transport market for 2009. Although maritime transport has been
recognised as a more environmentally friendly mode of transport, we have to be
conscious that transport is always a producer of emissions, and maritime transport also
causes damages to the environment. Thus, marine pollution also needs to be considered.
COM (2005) stated in the Clean Air for Europe impact Assessment that “air
pollutant emissions from maritime transport can be transported over long distances and
thus increasingly contribute to air quality problems in the EU. (…) Sulphur emissions from
shipping were forecast to exceed those from all land-‐based sources in the EU by 2020.”
71,7
14,6
12,3
0,8 0,6
Road Sea Air Rail Other

21
“Emissions from ships are a large and growing source of the greenhouse gases (mainly CO2) that are causing climate change. Emissions from shipping are currently some 1000 million tonnes annually, and in the absence of action they are expected to more than double by 2050. However, to limit global warming to 2°C, global emissions need to be reduced by at least 50% below 1990 levels by 2050.” 6
Therefore even considering SSS as a more environmentally friendly mode, the EU
is forced to control its impact on environment. The Commission “is considering possible
actions in 2013 to introduce monitoring, reporting and verification of greenhouse gas
emissions from maritime transport as a first step towards measures to reduce these
emissions.”7 In addition, the European Maritime Safety Agency (EMSA) was launched in
2002, with the objective of reducing marine pollution from ships, among others. To
facilitate this, the EMSA provides technical assistance regarding implementation,
monitoring, development and evolution of relevant EU and international legislation.
Nowadays, around twenty EU directives or regulations that deal with maritime safety are
also designated to protect the environment.8 In the worldwide context, the International
Maritime Organization (IMO) has been in charge of the control of pollution from shipping
since 1993.
The environmental impact of ports also needs to be taken into account. As COM
(2011c) states, “port infrastructure projects can have a wide range of impacts. The
potential impacts of ports on biodiversity cover a wide range – from degradation,
fragmentation or loss of ecosystems and their services due to the land intake of port
infrastructure, over contamination till the intrusion of invasive species, for which ports
6 http://ec.europa.eu/clima/policies/transport/shipping/index_en.html. 7 http://ec.europa.eu/clima/policies/transport/shipping/index_en.html. 8 http://emsa.europa.eu/implementation-‐tasks/environment.html.

22
are one of the main entry points.” Here they make a distinction between two different
types of impacts: direct and indirect ones. “Direct spatial impacts include loss of habitats
due to, for example, infrastructure developments and dredging activities. Indirect impacts
comprise disturbances due to maritime transport operations. To avoid potential impacts,
it is essential that both strategic and detailed project planning fully integrate Natura
20009 considerations to avoid conflicts, costs and delays.”10
1.2.2. The role of intermodal competition
COM (2011b) points out the need of establishing a level playing field between modes that
are in direct competition. The Commission has stated that “SSS can help rebalance the
modal split, bypass land bottlenecks, and it is safe and sustainable” (COM, 2003). In line
with the positive reasons mentioned above, the Programme for the promotion of Short
Sea Shipping (COM, 2003) has established some legislative, operational and technical
actions (composed of 14 measures), to advance SSS in the EU.
As Figure 1.5 shows, road transport absorbs around half of the total market across
Europe. Despite the policies implemented over the last decades (that will be discussed
later), obstacles to smooth functioning of and effective competition in the internal market
remain (COM, 2011b). Road transport in 1995 represented 42.1% of the total freight 9 Adopted in 1992 by the EU, the main goal of this programme is to protect the most seriously threatened habitats and species across Europe, which are listed by each Member State. Currently, these areas cover above 20% of the European territory.
10 With regard to the legislative measures, the first steps were done in the mid-‐70’s. Psaraftis (2005) pointed out the main environmental policies related to the environment protection in ports, such us the Dangerous Substances Directive (1976), the Urban Waste Water Treatment Directive (1991), the Environmental Impact Assessment Directive (1997), the Water Framework Directive (2000), the Strategic Environmental Assessment Directive (2001) and the Environmental Liability Directive (2004), among others.

23
transport in EU-‐27, and sea transport comprised 37.5%. In 2009, these figures changed to
46.6 and 36.8%, respectively; so, while road transport has increased its market share, sea
transport has suffered a decrease, resulting in an increase in the difference between the
competitors (from 4.6% to 9.8%).11
Figure 1.5. Freight transport modal shares (EU-‐27)
Source: COM (2012c).
COM (1997) established some recommendations in terms of competition between
operators. The commission points out that a key element would be “the scrutiny and
regulation of any abuse of dominant positions by carriers and operators. Examples of
illegal practices by dominant players, which carry heavy fines under EC law, include the
cross-‐subsidization of revenues from operations in one mode in order to eliminate
competition in another, structural foreclosures of markets, predatory pricing and the
exploitation of sub-‐contractors.”
11 It has to be noticed that these figures also comprise European maritime corridors that do not have an alternative by land, so SSS as intermodal competitor certainly have an even lower market share in the freight transport market.
0
20
40
60
80
100
120
1995
1996
1997
1998
1999
2000
2001
2002
2003
2004
2005
2006
2007
2008
2009
2010
Air
Sea
Pipelines
Inland waterways
Rail
Road

24
Finally, geography is a natural reason for maritime transport advantages (and,
specially, SSS activities) in Europe. Around 70% of European industrial production is
located within 150-‐200 kilometres from the sea (Paixão and Marlow, 2002). At the same
time, the production is not the only variable. Demand is also very important. According to
the Eurostat Regional Yearbook (Eurostat, 2011), around 205 million people live in the EU
coastal regions, i.e. 41% of the EU population or 44% of the coastal Member States’
population. Over 1,200 commercial seaports operate along some 70,000 kilometres of the
Union’s coasts. Europe is one of the densest port regions worldwide (COM, 2013a). The
capacity and potential of sea transport in Europe makes SSS a proper alternative in freight
market. However, this is true as long as the ports are able to hold them. Thus, ports have
become the main cog in the wheel of maritime transport attractiveness.
1.2.3. Main objectives and instruments of the EMTP
The fundamental European tools can be classified in two groups: those dedicated to fund
the transport infrastructure (Trans-‐European Transport Network projects) and those
dedicated to support operations and activities (Pilot Action for Combined Transport and
Marco Polo I and II). Here there is a more-‐detailed description of these programmes.
• Trans-‐European Transport Network (TEN-‐T)
The TEN-‐T programme is part of the Trans-‐European Networks (TENS), developed by
the EU in 1996 together with telecommunications and energy sectors (COM, 1996).12
These programmes were designed to encourage European cohesion through the
12 Decision No 1692/96/EC of the European Parliament and of the Council of 23 July 1996 on Community guidelines for the development of the Trans-‐European Transport Network. Official Journal L 228, 09/09/1996 P. 0001 – 0104.

25
improvement of long-‐distance communications and to provide a basic infrastructure
for the movement of people, goods, services and information across EU member
states (Giannopoulos, 2002). TENS programmes are thus basically designed to fund
these infrastructures.
The European Commission has pointed out that “TEN-‐T constitutes a key element
in the Lisbon Strategy13 for competitiveness and employment in Europe and will play
an equally central role in the attainment of the objectives of the Europe 2020
Strategy.14 The main goal is to remove the bottlenecks in the transport infrastructure,
as well as to ensure the future sustainability of the transport networks by taking into
account the energy efficiency needs and the climate change challenges” (COM,
2009b). Therefore, both environmental and competition concerns are considered by
this policy.
Table 1.1 shows the TEN-‐T investments since the coming into force of this
programme. The EU has estimated the cost of the EU infrastructure development to
match the growing demand for transport at over €1.5 trillion for 2010-‐2030,15 so the
collaboration of national governments will be extremely indispensable. Moreover, in
order to afford this huge investment, the Cohesion Fund, the European Regional
13 This action consisted of an agenda for EU economy in the last decade, whose objectives were to make it more competitive by enhancing a more sustainable economic growth with more and better jobs and greater social cohesion.
14 In 2010, the Commission listed the European social and economic objectives to be achieved by 2020. The EU headline targets for current decade were that 75 % of the population aged 20-‐64 should be employed; 3% of the EU's GDP should be invested in R&D; the 20/20/20 climate/energy targets should be met (including an increase to 30% of emissions reduction if the conditions are right); the share of early school leavers should be under 10% and at least 40% of the younger generation should have a tertiary degree; 20 million less people should be at risk of poverty (COM, 2010).
15 http://ec.europa.eu/transport/themes/infrastructure/index_en.html.

26
Development Fund (ERDF) and loans and credit guarantees from the European
Investment Bank (EIB) supports the EU.
Table 1.1. TEN-‐T investments from 1996 to 2013
Transeuropean Transport Network 1996-‐1999 EU-‐27
2000-‐2006 EU-‐27
2007-‐2013 EU-‐27
Cost (€ billion) -‐ TEN-‐T Basic Network
106
275
390
Community contribution (€ billion) -‐ Programme TEN-‐T -‐ Cohesion Fund + ERDF (regions convergence) -‐ EIB Loans and guarantees
2.23 15.74 26.50
4.43 25.1 41.4
8.013 44.2 53.00
Other resources (national) 63.4 231.1 285
Source: http://ec.europa.eu/transport/themes/infrastructure/.
The TENT-‐T also promotes the intermodality of transport. In particular, they
attempt to stimulate investment on an integrated transport network covering all of
the Community through the different modes of transport. To manage this
programme, the EU has set up the Trans-‐European Transport Network Executive
Agency (TEN-‐T EA) in 2006. The main objectives of the agency are:
(a) the “management of the preparatory, funding and monitoring phases of the
financial assistance granted to projects of common interest under the budget for
the TEN-‐T, as well as the supervision required for this purpose, by taking relevant
decisions where the Commission has delegated responsibility for it to do so”;
(b) the “coordination with other Community instruments by ensuring better
coordination of assistance, over the entire route, for priority projects which also
receive funding under the Structural Funds, the Cohesion Fund and from the
European Investment Bank”;

27
(c) the “technical assistance to project promoters regarding the financial
engineering for projects and the development of common evaluation methods”;
(d) the “adoption of the budget implementation instruments for income and
expenditure and implementation, where the Commission has delegated
responsibility to it, for all operations required for the management of Community
actions in the field of the TEN-‐T, as provided for in Council Regulation (EC) No
2236/95, in particular those relating to the award of contracts and grants”;
(e) the “collection, analysis and transmission to the Commission of all information
required for the implementation of the TEN-‐T”;
(f) “any technical and administrative support requested by the Commission.”
The TEN-‐T grants cover feasibility, technical or environmental studies as well as
works. Regarding seaports, the EU established that these “shall permit the
development of sea transport and shall constitute shipping links for islands and the
points of interconnection between sea transport and other modes of transport. They
shall provide equipment and services to transport operators. Their infrastructure shall
provide a range of services for passenger and goods transport, including ferry services
and short-‐ and long-‐distance shipping services, including coastal shipping, within the
Community and between the latter and third countries” (COM, 1996). As COM
(2006b) has reflected, “the aim is to increase and modernise port capacity, and
improve their ability to handle intermodal transport activity.” Table 1.2 comprises the
TEN-‐T maritime projects related to ports in 2011, where it can be observed how the
EU covered a part of the total cost of projects, together with national funding.

28
Table 1.2. European port projects funding by TEN-‐T in 2011
Project Concept Region / Country EU funding National funding
Total Project Cost
2011-‐EU-‐21010-‐M
Green Bridge on Nordic Corridor
Germany and Sweden €19,829,297 (works and studies)
€11,592,700 €84,640,830
2011-‐EU-‐21009-‐M
IBUK-‐Intermodal corridor
Spain and UK €7,299,307 (works and studies)
€24,689,693 €31,989,000
2011-‐EU-‐21007-‐S
COSTA
Mediterranean, Atlantic Ocean and Black Sea areas
€1,521,291 (studies)
€1,521,291 €3,042,582
2011-‐EU-‐21005-‐S
LNG in Baltic Sea Ports
Baltic Sea €2,392,520 (studies)
€2,392,520 €4,785,040
2011-‐EU-‐21002-‐P
On Shore Power Supply -‐ an integrated North Sea network
North Sea €1,007,950 (works)
€4,031,800 €5,039,750
2011-‐EU-‐21001-‐M
Adriatic Motorways of the Sea (ADRIAMOS)
Adriatic Sea €12,210,000 (works and studies)
€44,490,000 €56,700,000
Source: http://tentea.ec.europa.eu/en/ten-‐t_projects/.
The TEN-‐T programme has pointed out 30 priority projects (PP) since it began. As
the TEN-‐T guidelines mention (COM, 1996), those projects were chosen because of
their European added-‐value and their contribution to the sustainable development of
transport. Most of projects are related to railway (60%), while maritime issues are
specifically related to two of them: Galileo and Motorways of the Sea.
The Galileo (PP15) programme was launched in 2011 by the European Space
Agency (ESA) and is co-‐funded by ESA and the EU. With regard to maritime transport
promotion, its objective is to contribute to a safer and more efficient navigation owing
to the better accuracy and availability provided through improved satellite navigation
system.16
16 More information can be obtained at http://ec.europa.eu/enterprise/policies/satnav/galileo/.

29
Motorways of the Sea (MoS, PP21) is one of the most ambitious axes of the TEN-‐T.
The EU description of this project reads, “MoS builds on the EU’s goal of achieving a
clean, safe and efficient transport system by transforming shipping into a genuine
alternative to overcrowded land transport. The concept aims at introducing new
intermodal maritime-‐based logistics chains to bring about a structural change to
transport organisation: door-‐to-‐door integrated transport chains. It will also help
implement the policy initiatives on the European maritime space without barriers, the
maritime transport strategy for 2018 and will positively contribute to CO2 reductions,
which is of paramount importance in the context of climate change. (…) They are
designed to shift cargo traffic from heavily congested land networks to where there is
more available spare capacity – the environmentally friendly waterways. This will be
achieved through the establishment of more efficient and frequent, high-‐quality
maritime-‐based logistics services between Member States.”
Briefly, the objectives of this project are to establish freight flow concentration on
sea-‐based logistical routes, increase cohesion and reduce road congestion through
modal shifts (COM, 2004a). This document also collects the four corridors designated
by the EU, which are:
o Motorway of the Baltic Sea (linking the Baltic Sea Member States with
Member States in Central and Western Europe, including the route
through the North Sea/Baltic Sea canal);
o Motorway of the Sea of Western Europe (leading from Portugal and
Spain via the Atlantic Arc to the North Sea and the Irish Sea);

30
o Motorway of the Sea of South-‐East Europe (connecting the Adriatic
Sea to the Ionian Sea and the Eastern Mediterranean, including
Cyprus);
o Motorway of the Sea of South-‐West Europe (western Mediterranean,
connecting Spain, France, Italy and including Malta and linking with
the Motorway of the Sea of South-‐East Europe and including links to
the Black Sea).
As COM (2006b) states, basically, “the EU’s aim is to develop high-‐quality,
integrated SSS connections that provide door-‐to-‐door services which can match or
better those offered by road-‐only routes. Concentrating traffic on such busy routes is
more likely to generate the critical mass required to produce economically viable and
efficient services.”
• Pilot Action for Combined Transport (PACT). 1992-‐2001
The PACT was the first programme to encourage intermodality in the territory of the
Community. Launched in 1992, the main objective was to intensify the use of
intermodal transport in cases where it is economically feasible in the long term, as an
alternative to unimodal road transport (COM, 2001a). The central measure was
intended “to grant for pilot combined transport schemes which run on existing routes
or routes still to be established and which try out measures to improve the
organization and operation of combined transport services on these routes and to
integrate operators into the entire logistic chain, in a way which involves all operators,

31
and evaluates whether measures of this kind make it possible ultimately to achieve
effective combined transport services which can compete with road haulage and are
economically viable (93/45/EEC).”
This programme, established in order to support the activities related to the
development of the TEN-‐T, was implemented in two periods: from 1992 to 1996, and
then from 1997 to 2001. In the whole period, 167 projects were funded with a budget
of €53 million. Although there are some remarkable case studies related to maritime
transport,17 the Commission (COM, 2001a) recognized that about 20% of the money
foreseen for rail and SSS projects could not be spent because the actions had to be
terminated without success or had to be scaled down.
The Commission has described launching and maintaining innovative intermodal
actions in the market as being difficult, and the commercial success of new services is
not always guaranteed even with initial public financing. The PACT evaluation report
also named ports as an irreplaceable interconnection that still focuses their services
on the requirements of deep sea shipping, resulting in this sub-‐optimal for SSS.
However, regarding the environment, the Commission reflected that most of the
operational measures supported by the PACT programme were cost-‐effective and
avoided CO2 emissions (COM, 2001a).
17 As COM (2001a) states, considering the case of Spain and its commerce with Germany, an intermodal rail-‐maritime service between two countries has taken over 6.500 truck journeys per year congested road corridors. However, no comparison between the cost of this measure and its achievement has been carried out.

32
• Marco Polo I and II. 2003-‐2013
The first version of this programme was definitely launched in 2003, after being
proposed in the 2001 White Paper on Transport – where the concept of intermodality
was highlighted. The objective was to extend the view of the PACT. Therefore, the aim
was also to transfer the total growth of international road freight transport to
alternative modes such as rail or sea transport, rather than just combined options.
This present-‐day programme gives grants to companies to shift cargo from road to
more environmentally friendly modes of transport, so herein lies the role played by
SSS. It was estimated that every euro spent in grants to Marco Polo would generate at
least six euros in social and environmental benefits (EFTA, 2007).
As PACT, Marco Polo was implemented in two different periods: until 2006 (Marco
Polo I) and from 2007 to 2013 (Marco Polo II) with similar conditions. The main
difference between this latter programme and the former is its extension to other
countries such as Russia, Belarus, Ukraine, the Balkans and the Mediterranean region,
and the inclusion of the aforementioned MoS and traffic avoidance measures.
According to the Commission, the Marco Polo programme would make a
substantial contribution to converting intermodality into a reality in Europe (COM,
2003). Thus, from 2003-‐2007, with a budget of €102 million, 125 projects involving
more than 500 companies received funding from this programme. Lastly, Marco Polo
II has replaced Marco Polo I, with a budget of €740 million for the period 2007-‐2013.18
18 See more details in http://ec.europa.eu/transport/marcopolo/index_en.html.

33
The Marco Polo programmes co-‐fund direct modal shifts or traffic avoidance
projects, as well as projects providing supporting services. The main goal is to shift 12
billion tonne-‐kilometres a year from road to non-‐road modes (Psaraftis, 2005). There
are five categories to potentially fund:
o Modal shifts from road to rail and waterborne systems (“It is not
necessary to shift all the traffic off the road to obtain a grant”).
o Catalyst actions which promote modal shifts (“providing supporting
services for modal shift like management systems, integrated cargo control
via GPS, or common IT platforms for inter-‐operability between modes”).
o Motorways of the sea between major ports (“They must be innovative
and intermodal, and operate between the larger European ports fully
equipped to handle this traffic”).
o Traffic avoidance (“Projects which introduce new ways of avoiding or
reducing road traffic, such as avoiding empty runs or improving supply
chain logistics”).
o Common learning actions (“Projects related to enhanced knowledge and
cooperation in inter-‐modal transport and logistics are a regular feature
among funded projects”).
As reflected in the official description of Marco Polo programme, “funding is in the
form of an outright grant. It is not a loan to be repaid later (…). Grants cover a share of
costs associated with the launch and operation of a new modal-‐shift project, but must
be supported by results. A grant gives financial support in the crucial start-‐up phase of
a project before it pays its way to viability. Grants last from two to five years. Projects

34
should be commercially viable by the time the funding stops. (…) The project has to
involve a cross-‐border route. It has to make economic as well as ecological sense.” 19
The proposal for the establishment of European Intermodal Loading Units (EILU)
needs also to be taken into account as part of the intermodality promotion in the EU.
According to the Commission, “this unit combines the benefits of European land
containers (swapbodies) with maritime containers (ISO series 1), which are
optimisation of loading space and stackability. This will provide European industry and
transporters with efficiency gains, estimated as a reduction of up to 2% in logistics
costs” (COM, 2004b).
In addition, some national and regional initiatives have been implemented in
order to promote SSS routes within EU. The Italian Ecobonus is the most representative of
them. This programme was established in the 2007 with a three-‐years budget of €240
million. The aim of the Italian Government was to encourage the modal shift from road to
SSS, by giving a rebate on the freight.
Some other regions, such as the Basque Country or the scheme between Nice and
Genoa, have been benefited from regional aids to promote SSS. With regard to the first, it
was established in 2008. The Basque Country Ecobono refunded between 15-‐30% of
freight rate, being limited to companies registered in the region that use MoS between
Spain and Belgium (Becquelin, 2012).
Finally, in 2012, the French Government proposed the Ecotasa system. This
programme has been conceived to internalize the road external costs and to stimulate
19 http://ec.europa.eu/transport/marcopolo/about/index_en.html.

35
modal shift to SSS or rail. The rates (agreed last May 2013) will be imposed to those road
haulers heavier than 3.5 tonnes that use some of the 15,000 kilometres of French roads
under this scheme. The expected date for its implementation is October 2013, and the
official rates are predicted to increase by 10% next in 2014.20
1.2.4. Conclusions
With a total budget of approximately €895 million focused on maritime-‐SSS promotion
(considering PACT, Marco Polo I and II), the EU measures have not yet reached their
proposed goals. It seems that the EU policy has not stimulated major observable
differences with regard to the modal split. As shown, road transport represents around
the half of the freight market, while maritime comprises a bit more than a third.
As COM (2013b) states, “the ambitious objectives of modal shift set by the
legislator have not been fully achieved (…) Furthermore, the programmes are considered
as rather complex, and in some cases not easy to be used by the European companies.”
One might even argue that road has improved its position in the freight market. In fact, it
is the only mode of transport that has augmented its market share in the last decade.
What it is more significant (and worrying) is that, during the subperiod 2000-‐2009, road
transport has increased by 11.4%, whereas sea transport has increased by only 1.7%.
These results show virtually insignificant impacts of the Marco Polo I and II programmes
over a 10-‐year period.
Therefore, maritime transport has not been properly promoted. The current
trends suggest that we are not on the right path to meet the EU objective of shifting a 20 Flash Transport. www.legifrance.gouv.fr.

36
30% of road freight over 300 kilometres to other modes such as rail or waterborne
transport by 2030, and more than 50% by 2050, facilitated by efficient and green freight
corridors (COM, 2011b). Considering the Marco Polo programmes, the commission also
states that the “provision of public funding directly to the market raised also some
competition concerns during the lifecycle of the programme” (COM, 2013b).
Moreover, an overgenerous and contradictious sentence from the Commission
states, “Marco Polo represents a good example of efficient use of the EU funds even if the
programme's objectives have not been fully met and the allocated budget has not been
entirely spent” (COM, 2013b).
In addition, the White Paper establishes that in order to meet the proposed goal it
is required for appropriate infrastructure to be developed. However, ports have not
received the same attention as other modes infrastructures. As mentioned, ports have
benefited from a 5% of total European transport investments, while road transport has
received 60% (Figures 1.1 and 1.2). Moreover, since the current economic crisis started,
road transport has increased its share of transport investments. Additionally, as Chapter 4
describes, it is not only a question of money, but also of efficiency in the investment.
In order to determine why these programmes and measures have not reached
their objectives, it is necessary to analyse how they have been implemented. As Marco
Polo’s official information about the programme stipulates, the funding is in the form of
outright grants to cover a part of launches and operations, which do not have to be
reimbursed later. Thus, while support and funding have been given to companies that
shift cargo from road to rail or SSS, there are no incentives to promote efficiency in SSS
activities and to make this more attractive to companies.

37
The role of ports (as nodes) and their characteristics in an intermodal chain are
instrumental in the shift to SSS and EU needs to promote efficiency in the entire system
instead of giving grants directly to companies. In other words, rather than to tackle the
issue in a piecemeal way, as the EU has been doing thus far (i.e., companies), the EU
should instead promote a high level of efficiency throughout the system.

38

39
CHAPTER 2
THEORETICAL TOOLS FOR ANALYSING THE ROLE OF PORTS WITHIN THE EMTP
As seen before, around 70% of European industrial production is located within 150-‐200
kilometres from the sea. This data indicates how straightforward it may be to integrate
sea transport into an intermodal freight transport chain in accordance with European
geography. Paixão and Marlow (2002) argue that the capacity of sea transport as a
corridor by itself is unlimited, and there is no congestion; that is, a new shipper who uses
a specific corridor does not generate delays to other shippers.
Previous literature has thoroughly analysed the main advantages, disadvantages
and goals of SSS. Baird et al (2002) highlight some natural advantages of sea transport, in
particular that “sea transport capacity may be increased, substantially and speedily,
through the addition of more ships, or larger ships, or faster ships, whereas to expand
roadway or railway capacity requires very expensive adjustments to infrastructure, new
legislation, etc.” Although most studies discuss SSS as an advantageous mode in the
transport chain, some authors defend its different disadvantages. Douet and Cappuccilli
(2011) show how lack of information on SSS markets has led to an overestimation of the
possibility for a modal shift from road to sea transport; they argue that the routes
benefiting from EU programmes are captive markets where there is no road option,
hence no modal shift. However, this aspect represents a criticism of EU SSS promotion
policy, not of the actual nature of SSS as an alternative mode of transport. Nevertheless,
the objective of the present chapter is not to address advantages and disadvantages of

40
SSS,21 but to analyse the variables and policies that may hamper the progress of SSS in the
intermodal transport chain.
As detailed in Chapter 1, the Commission has carried out several studies
highlighting the role of SSS in transport competition. However, despite the fact that SSS is
more profitable to the whole society (and, with the correct signals, to companies), and is
recommended by the EU, SSS has not yet reached a significant market share compared to
road transport. In this chapter we argue that funding programmes such as Marco Polo I
and II, have not offered the correct incentives to stimulate SSS, and that the key role
played by port infrastructure and its characteristics has largely been ignored. We assert
that the EU needs to advocate the development of a competitive intermodal freight
transport chain in order to reduce road transport market share and, consequently, its
disadvantages.
2.1. A theoretical model for freight transport market
“Transport modelling can make to improve decision-‐making and planning in the transport
field” (Ortúzar and Willumsen, 2011). This area has been widely explored in the
economic literature. Florian et al (1988) identified different levels of analysis for decision-‐
making contexts: activity location, demand, transport system performance, supply
actions, infrastructure, cost minimization and production.
The classic transport model is a sequence of four sub-‐models: trip generation,
distribution, modal split and assignment. This model provides a point of reference to
21 Medda and Trujillo (2010) analyse the situation of SSS in Europe: its advantages, disadvantages, goals and future perspectives.

41
contrast alternative methods (Ortúzar and Willumsen, 2011). Besides them, evaluation
could be included as a fifth stage, where cost-‐benefit analysis stands out.
We could mainly distinguish between supply and demand models. The supply
models are those that mostly study the production functions (as Chapter 3 does) and the
cost structures of different modes of transport. With regard to demand modelling, it has
been deeply explored, particularly those that analyse the competition among modes in
terms of discrete choice and modal split models.
Intermodal competition modelling has been developed and discussed from
different points of view. Considering the level of aggregation selected for the
measurement of data, some differences between aggregated and disaggregated
transport models have been established. Particularly, Quand and Baumol (1966) and
Levin (1978) analysed the intermodal competition from a modal split perspective, while
Oum and Gillien (1979) modelled it behind the user’s behaviour perspective, as most
representative first steps on aggregated modelling. Regarding disaggregated ones;
McFadden (1973) is the seminar paper. In his work, the author built a discrete choice
model in which the transport user chooses the mode that gives (her) him the greater
utility.
In this chapter, the theoretical model for freight transport market is developed in
terms of intermodal competition. As stated in De Rus et al (2003), the key issue here is to
know what factors drive to the distribution among different modes, that is, the modal
split.
According to Eurostat data,22 in 2009 the whole SSS – that is, not just intraregional
transport – represented 62% of the total European sea transport (with differences among
22 Short Sea Shipping of Goods in 2009. See more data at http://epp.eurostat.ec.europa.eu/.

42
countries). When we consider the regions of partner ports, the Mediterranean and North
Sea comprise 29.7 and 26.4%, respectively, followed by Baltic Sea, with 19.6%. In relation
to type of cargo for all sea European regions, liquid bulk represents the most frequent in
total SSS operations, with a share ranging between 40 and 69% of total cargo among
different sea regions. Last, the top 20 listed ports accounted for 36% of total EU-‐27 SSS of
goods, being Rotterdam at the top (7.5% share of total EU-‐27 SSS operations).
We depart from traditional transport cost models to develop a theoretical model
for intermodal competition between two alternative modes – road transport vs. SSS – in a
single corridor. The representation shows the interaction of two alternatives modes in the
freight transport market. Figure 2.1 represents this freight transport market in a specific
corridor. There are two alternatives: first to move from factory (A) to final market (B) by
using shipper 1. We consider this option as road freight transport market. Option two
starts at factory (A) to Port C by shipper 2, continues to port D and, finally, to final market
(B) using shipper 3 (known as door-‐to-‐door system). We consider this option as the
Intermodal-‐SSS freight transport market.

43
Figure 2.1. Theoretical freight transport market; a single corridor
Source: own elaboration.
A suitable example of this theoretical corridor in the EU could be the following: let
us consider a company that has to transfer cargo from Madrid (Spain, A) to Lyon (France,
B). The first option is to move cargo by road, across the Pyrenees, but this is not the only
option. The company could use an intermodal transport chain, by using the ports in
Barcelona (Spain, C) and Fos (France, D), as shown in Figure 2.2.
By#road#
Origin# Des/na/on#Factory( Final(Market(
By#SSS#
Port#C#
1
2# 3#
Port#D#

44
Figure 2.2. Madrid-‐Lyon corridor. An example
Source: own elaboration using Google Maps.
This example corresponds with the UE SSS promotional policy requirements (it
must also satisfy some cargo and cost conditions)23: that is, a corridor that links two
different European countries where there is the option to shift cargo from road to sea, as
specified by Marco Polo II.
Therefore, in order to develop a theoretical representation of a corridor like the
previous one, we can set out different agents involved in each market. In the road
transport option, there is only one agent: shipper 1. The intermodal-‐SSS option involves
sea-‐shipper, shippers 2 and 3, and port services. In this model we do not take producers
23 See specific conditions in http://ec.europa.eu/transport/marcopolo/index_en.html.

45
and consumers, because they are the same among alternatives, and we suppose that
their producer and consumer decisions are not affected by the freight transport market. It
is noteworthy that the model examines a specific market size, thus the modal split in it.
We will determine the generalized cost of each alternative, that is, the whole cost
that includes monetary as well as time cost, in order to obtain a better performance of
cost functions and to consider the traditional transport cost models. This analysis comes
from Dixit and Nalebuff (1993). In their model, authors show the interaction between
two different modes – road and train – and the impact on congested roads. According to
their model, road time increases when the number of commuters does. The interaction of
both modes drives to equilibrium where each commuter chooses the transport mode that
minimizes its time.
The model here presented departs from the previous one. Now time is not the
only variable, but also prices and taxes. In order to homogenize these variables, it is
required to add a value that turns time into money: the time value. This model extension
is now solved in terms of this new variable, by following a similar strategy to that of Dixit
and Nalebuff (1993). Then, the generalized cost functions of one unit of product (e.g. a
twenty-‐foot equivalent unit, TEU) of each alternative are:
GCroad = p+ z( ) ⋅dAB +vi troadAB +troad
a"#
$% (1)
GCsss = p+ z( ) ⋅ dBD +dAC( )+ κQ
"
#$
%
&'⋅dCD +vi troad
BD +troadAC +2troad
a +tsssCD +η(
)*+ (2)
where

46
tmodeOD =
dOD
Smode
(3)
and
p : price per kilometre z : taxes per kilometre dOD: distance between origin O and destination D vi : value of time of shipper i κ : carriage all in (includes loading, unloading, drive to the storage) Q : quantity (p.eg., a TEU) Smode :
average speed on each mode
troada : road access time (explain)
η : port inefficiency
In the road transport generalized cost function, we take into account the
monetary cost (price and taxes) of carrying a TEU from A to B (Madrid to Lyon, according
to the example), plus the whole time cost of the same distance – not only the travel time
but also the road access time, that is, the time required to access to the infrastructure. In
the SSS-‐intermodality option, we examine the monetary cost of shipper 2 and 3 (from
Madrid to Barcelona and from Fos to Lyon, respectively) and carriage all in per unit of
product, and also the time cost of the whole distance (for each mode in the intermodal
chain). Parameter z is included to show all types of taxes that may be relevant in each
transport activity; z could also comprise the internalization tax of externalities caused by
each mode, which is the only way for a firm to account for the damage that it generates
to society.24
24 This type of internalization measure, known as Pigouvian tax (after Pigou, 1932), is designed to correct a market distortion when there are negative externalities that, without it, would not be considered by private companies.

47
Regarding intermodality cost function, the price of carriage per unit, k (divided by
the total quantity), in maritime distance is introduced. Furthermore, road transport from
origin to port C and from port D to destination are included, considering also road access
time in both cases, in order to consider the whole cost of intermodality option (both
maritime and road sections).
Let us now focus on parameter 𝜂. This parameter comprises port access time, ship
waiting time in port – due to, for example, the existence of congestion in port–, custom
and documentary and administrative procedures, etc.; as well as hourly container load
and unload rates i.e., all the characteristics that affect port efficiency. For instance, if port
access is not well designed (in terms of infrastructure and logistics), companies could
suffer from congestion and, therefore, longer total time. As they relate to time
considerations, it is thus part of time cost and consequently is affected by the value of
time v of the shipper i under consideration. From above, a definition of port inefficiency is
developed, considering its impact on time. Figure 2.3 comprises port inefficiency
components. Next chapter provides a more detailed analysis of these components.

48
Figure 2.3. Port inefficiency disaggregation
Source: own elaboration.
With respect to hourly load and unload rates, their impact on the level of port
inefficiency is negative, due to how these variables are expressed: an increase in either of
these rates will decrease the level of inefficiency of the port considered. Obviously, the
relationship between port inefficiency and the rest of the variables considered is positive.
In other words, certain companies more than others could be more unwilling to
suffer delays on their shipping activities, depending on different characteristics, especially
if their products were perishable or value added, among others. Here is the main reason
why port inefficiency is included in the time part of the generalized cost (and is
consequently affected by the time value). It is noteworthy that this model reflects private
decisions of companies, so external costs (not internalized) are not considered in the cost
functions. As mentioned earlier, external costs could be introduced in this model through
Port Inef*iciency
Port access time
Hourly load rate
Ship waiting time
Custom procedures
Other administrative procedures
Hourly unload rate

49
taxes (z), and therefore we would be using a social cost perspective. Each company i will
choose the mode that minimizes its cost:
mGCmode =min GC1 ,...,GCM{ } (4)
As noted, different companies have different values of time that are contingent
upon product characteristics as perishability, mainly. This feature may lead to companies
with very high time values, because they transport highly perishable or value added
products, and some other companies with very low time values, that are willing to accept
long waiting time in exchange for lower monetary cost. This may be the reason why some
companies consider one mode to be more advantageous for its purposes than the other
options.
Let us now suppose that there is heterogeneity in the value of time (v); the
willingness to pay for time differs at individual level. It is distributed as an uniform
function between [0,1]. Then, firms will have a time value situated in this interval.25
vi = f (product+and+company+characteristics)∈ (0,1) (5)
In this assumption we know the proportion of companies that will choose each
mode, by calculating a value (i.e., a company) where there is no difference between
choosing one or another mode.
GCroad =GCsss (6)
25 For a detailed analysis of the value of time, see CEDEX (2010).

50
p+ z( ) ⋅dAB +vi troad
AB +troada"
#$%= p+ z( ) ⋅ dBD +dAC( )+
κQ
&
'(
)
*+⋅dCD +vi troad
BD +troadAC +2troad
a +tsssCD +η"
#$%
(7)
In this, we seek the shipper that is indifferent to choose one mode or another.
Therefore, considering companies are located between 0 and 1 in time value space, this
company will determine the modal split.
vi* =
p+ z( ) ⋅ dAB −dAC −dBD( )− κQ
#
$%
&
'(⋅dCD
troadBD +troad
AC +troada +tsss
CD +η−troadAB)
*+,
(8)
If the monetary cost of road transport (i.e., the intercept of road transport cost
function) is bigger than the monetary cost of SSS (i.e., the intercept of SSS cost function),
that is:
p+ z( ) ⋅dAB > p+ z( ) ⋅ dBD +dAC( )+ κQ
"
#$
%
&'⋅dCD (9)
Therefore:
vi* = $Proportion$of$companies$on$SSS.
1−vi* =Proportion$of$companies$on$road.
(10)
and the reverse if the monetary cost of road transport smaller than the SSS one. Figure
2.4 represents the modal split built from previous functions.26
26 Present analysis is valid inasmuch we consider a bimodal choice. It could be considered the case of SSS and general land transport. The inclusion of a third mode in this analysis does not add any remarkable contribution to this theoretical model.

51
Figure 2.4. Generalized cost functions
Source: own elaboration.
The model above for a given market size has allowed us to calculate the
proportion of companies that choose each mode as a function of their characteristics,
parameterized through a value of time. Up to this point, we have assumed that
companies in a market are the same size, but it would be disingenuous to regard different
firms as equals. The market share of each mode is relevant in our analysis, and to
determine this, it is necessary to calculate the distribution of firm sizes of a specific
corridor or market. Therefore, to calculate market shares, it will be necessary to approach
the actual distribution of firm size. Moreover, an empirical work would analyse the
correct distribution of them by considering market share rather than the proportion of
companies choosing each mode. Through our theoretical analysis, we build a foundation
for empirical studies to test how different European policies may affect companies and
their decisions about modal choice.
0 v* 1
Road
SSS
“Road companies”“SSS companies”
GC

52
According to our example, Table 2.5 shows the road option and two
intermodality-‐SSS corridors to transfer cargo from Madrid to Lyon. As the theoretical
model reflected, the monetary cost in road transport option is usually bigger than
intermodality-‐SSS corridors. Nevertheless, according to the time parameter, road option
is more competitive.
Table 2.5. Madrid – Lyon corridor
Option Origin Destination Cost (€) Time (hours) Distance (km) External costs(€) CO2 emission (Kg)
Road Madrid Lyon 1361 42,5 1238 412 2740
Intermodal 1 Madrid Barcelona Port 680 11 618 206 1368
Barcelona Port Fos Port 300 30 343 33 86
Fos Port Lyon 353 5,7 321 107 711
Total 1333 46,7 1282 346 2165
Intermodal 2 Madrid Castellón Port 466 7,3 424 141 938
Castellón Port Fos Port 500 54 587 57 147
Fos Port Lyon 353 5,7 321 107 711
Total 1319 67 1332 305 1796
p=1,1 €/km.
Average speed = 65km/h.
Source: Short Sea Shipping Promotion Centre-‐Spain. www.shortsea.es. 27
Table 2.5 shows the interaction between monetary cost and time cost of each
option. Even a second intermodal-‐SSS option, by using Castellón Port instead Barcelona,
would have a lower monetary cost (but a higher time cost). Value of time will be
determinant at the point of a company chooses one option or another. It has to be
mentioned that this data does not disaggregate time. Nevertheless, as it is asserted here,
port inefficiency increases waiting time. A slight reduction in time would turn SSS-‐
27 Short Sea Promotion Centre-‐Spain is part of the European Short Sea Network (ESN), since it was constituted in Paris in 2002. The objective of this association consists of promoting SSS in Europe and it is one of the operational measures that EU has carried out to encourage this mode of transport. For more information see: www.shortsea.es.

53
intermodality option into the better alternative in previous case-‐study. For example, CO2
emissions (and therefore its associated cost) could dropped about 21% by choosing
intermodal option 1 (that is, through Barcelona port), with an increase of 9% in total time.
2.2. European Transport Policies. Fostering the SSS-‐intermodality
Data and literature review show how the EU has advocated SSS for many years via Marco
Polo I and II programmes, whose objective is to increase the market share of SSS as part
of an intermodal transport chain. Key aims of the programmes consist of increasing the
level of competition in this market, and also to reduce problems such as congestion and
other external costs that road transport generates through grants to companies that
transfer cargo from road to SSS routes.
Using the previous model, we test how different policies may affect the
theoretical modal split so that we may find the best tool to reach EU goals. Three
different policies are analysed: first, taxation is the traditional tool to urge companies to
internalize its external costs. Second, the current EU policy of giving grants to companies
to shift cargo from road transport to SSS. The third policy is an increase in port efficiency
is considered. Let us calculate the different impacts of each policy, as shown the following
expressions:

54
a) Increasing road transport taxes
Increasing road transport taxes is one way to make road transport to internalize the
external costs it produces. This measure is considered as one of the easiest tools for
increasing the level of competition between road transport and SSS.
δvi
*
δz=
dAB −dAC −dBD
troadBD +troad
AC +troada +tsss
CD +η−troadAB"
#$%
(11)
In practice, an increase in road transport taxes decreases the market share of this
mode, and consequently increases the market share of its competitor. However, as the
above expression shows, this reduction is conditioned by the relationship between time
and port inefficiency. It is straightforward to prove how the impact of this policy is less
effective when port inefficiency is high.

55
Figure 2.6. An increase in road transport taxes
Source: own elaboration.
Figure 2.6 shows graphically the shift in modal split. An increase in road transport
taxes raises road monetary cost (Road’), as well as SSS monetary cost (SSS’). However, the
impact on road option is bigger the smaller the road section in the intermodal option.
Thus, SSS modal split is augmented in v*’-‐v* %.
b) Funding “carriage all in” cost
Some EU policies and programmes have consisted of giving grants (which do not have to
be reimbursed later) to firms if they shift cargo from road to sea. Marco Polo I and II
programmes are proof of that. Firms, in essence, could regard this measure as a reduction
0 v* v*’ 1
Road
SSS
“Road companies”“SSS companies”
GC
New “SSS” companies
Road’
SSS’

56
of shipping costs. Therefore, this type of measure is analysed in our model as a reduction
of “carriage all in” cost.
δvi
*
δ κ / Q( )=
dCD
troadBD +troad
AC +troada +tsss
CD +η−troadAB"
#$%
(12)
We expected that previous expression is negative, so a decrease in carriage price
increases SSS market share. As previous policy, time structure affects this expression so
does port inefficiency. The impact on market shares of carriage price changes is
conditioned by the level of efficiency of ports C and D (in our example, Barcelona and Fos
ports). Once again, it is possible to prove how the impact of this policy is less effective
when port inefficiency is high.
Figure 2.7. A decrease in carriage cost
Source: Own elaboration.
0 v* v*’ v*’ 1
Road
SSS
“Road companies”
“SSS companies”
GC
New “SSS” companies
SSS’ (h) New “SSS” companies
“Road comp.”SSS’ (l)

57
As Figure 2.7 shows, a decrease in carriage cost would increase the SSS market
share. However, this result is highly conditioned by the port inefficiency. When the
inefficiency is high (SSS’(h)), the increase is equal to v*’-‐v* %. But if port inefficiency is low
(SSS’(l)), the increase is equal to v*’-‐v* %, which is v*’-‐v*’ % bigger than the former. Thus,
the same policy on carriage cost has different impacts on modal shift depending on the
degree of inefficiency.
c) Improving port efficiency
Lastly, let us consider the impact of an improvement in port efficiency. As defined, in the
model 𝜂 comprises waiting time, documentary and administrative procedures, etc. In this
line here we calculate the impact on results of an improvement of these procedures, so
port efficiency is increased.
δvi
*
δη=
− p+ z( ) ⋅ dAB −dAC −dBD( )− κQ
#
$%
&
'(⋅dCD
)
*++
,
-..
troadBD +troad
AC +troada +tsss
CD +η−troadAB)
*,-2
(13)
In practice, an improvement in port efficiency may increase SSS-‐intermodality
market share, so the expression above is likely negative. This policy will be affected by the
total transport cost structure, as time, price, taxes or carriage, as expected. A more
detailed result could be reach through an empirical estimation of this model in a specific
corridor. If we take into account the aforementioned hypothesis that monetary cost of
road transport is usually bigger than monetary cost of SSS, previous expression will be
always negative; that is, a decrease of port inefficiency will increase SSS market share.
More specifically, that would be done by decreasing port access time, custom and other

58
administrative procedures or ship waiting time; or by increasing hourly load and unload
container rate, according to Figure 2.3.
Figure 2.8. An improvement in port efficiency
Source: Own elaboration.
The improvement in port efficiency is shown in Figure 2.8. The result on SSS
generalized cost function is that now the slope is lower; so the interaction with road
transport function provokes an increase in the SSS market share equal to v*’-‐v* %.
Along the same line, some authors have focused on port efficiency and its
relevance on shipping costs and trade. Limao and Venables (2001) point out that a poor
infrastructure account for more than 40% of predicted transport costs. As Wilmsmeier et
0 v* v*’ 1
Road
SSS“Road
companies”“SSS companies”
GC
New “SSS” companies
SSS’

59
al (2006) estimates, double port efficiency in a pair of ports has the same impact on
international transport costs as halving the distance between them would have.
Moreover, in a more detailed analysis of different countries, Clark et al (2002), show how
improving port efficiency from the 25th to 75th percentile reduces shipping costs by 12%.
However, the lack of information about each port provokes that its analysis does not
distinguish different infrastructures within each country.
Sánchez et al (2003) also try to shed some light on the measurement of port
efficiency, through the use of a principal component analysis methodology. They examine
port efficiency of each port considered, by using questionnaires of 55 port terminals in
Latin America. In their study, authors also analyse some factors that drive to port
efficiency, as the container loading rate, the annual average of containers loaded per
vessel or waiting time. They also find that the estimated elasticity for port efficiency is
similar to that of distance.
Clark et al (2002) also try to explain port inefficiency. In this case, authors point
out as determinants some variables such as custom clearance, container handling charges
in ports, cargo handling restrictions (special requirements imposed on foreign suppliers),
mandatory port services (for incoming ships) or even a crime index, arguing that it
constitutes a real threat to port operations and merchandise in transit. They find out that
some level of regulations increases port efficiency, however, an excess of it could
generate a negative impact. According to crime variable, an increase in organized crime
from 25th to 75th percentiles reduces port efficiency from 50th to 25th percentiles.
Empirically, Baird (2007) highlights port efficiency as an essential service attribute
together with prices, reliability, schedule, transit time and on-‐board facilities through a

60
survey of shippers carried out during the European Marine Motorways project (EMMA).
They consider as essential not only the speed of loading/unloading or low port charges,
but also other aspects such as cargo security, absence of bureaucracy, 24-‐hour working
and fast access to the road network; that is, they all related to the degree of efficiency of
ports.
Paixão Casaca (2008) comprises the requirements considered by port authorities
to properly develop SSS. According to operational criterion, these authorities demand a
high coordination between port and transport operations and reduced ships’ time in port
to a minimum. With regard to information handling, the author also suggests a speedy
transfer of documents between intra-‐ports and inter-‐ports actors, and also software to
simplify customs operations, among others.
Nevertheless, even if there are some empirical studies about its determinants,
there is no consensus about what comprises port inefficiency. In previous model, we
defined it as a mixture of port access time, waiting time, documentary and administrative
procedures, etc.; i.e., they all relate to time considerations. Furthermore, this idea
matches with Blue Belt UE project, which was launched in November 2010 by the UE, and
carried out by European Maritime Safety Agency (EMSA) since May 2011. The project
consists of a set of facilitations to reduce administrative procedures between two EU
ports in leaving and entering ports activities, “in order to promote and to facilitate SSS in
the EU by reducing the administrative burden for intra Community trade.”28 Future data
will show if this project reaches its main goal, confirming the thesis of this chapter at the
same time.
28 http://www.emsa.europa.eu/news-‐a-‐press-‐centre/external-‐news/item/684-‐emsa-‐5-‐year-‐strategy.html.

61
From the previous analysis, it has been shown how every single policy is
conditioned by the whole system. The results of implementing a unique policy in the aim
to promote a SSS-‐intermodal transport chain depend not only on variables such as
distance and speed (where introducing major changes is not possible), but also on port
efficiency. Therefore, the results here presented indicate that policies which aim to
internalize road transport cost and strive to shift cargo from road to sea transport must
be accompanied by directives to improve port procedures and infrastructure. In so doing,
effective competition may be actually enhanced in the freight transport market.
2.3. Conclusions
In this theoretical chapter, we have analysed the intermodal competition between road
and sea transport in the European freight transport market. The EU has attempted to
promote SSS instead of road transport since the early 90’s. EU programmes such as the
PACT, Marco Polo I and II have been developed in order to obtain a real competition
between road and SSS by giving grants to firms that shift cargo from road to sea
transport. In last decades, it has been designated around €895 million (considering
previous three programmes budgets) to reach this goal.
Despite these policies, however, maritime transport has experienced a decrease in
terms of market share while road transport has augmented; the distance between both
competitors has therefore increased from 4.6% in 1995 to 9.8% in 2009, even with EU
promotional policies and efforts.

62
Therefore, if goals have not been reached, it is logical to seek measures that may
be more appropriate to deal with the issue. In this theoretical analysis we have proved
how transport system is interconnected. The impact of a specific policy is conditioned by
different variables that have to be considered in order to achieve the greatest efficiency
possible. Furthermore, EU policies have not taken into account that firms have different
valuations of time, thus in terms of modal shift an examination of values of time is
necessary because firms differ, and thus have responded differently to EU incentives.
System efficiency has been largely ignored by the EU, especially in the case of
ports, the nodes of SSS activities, despite their key role in SSS competitiveness. Port
efficiency is essential in the aim to increase the competitiveness of SSS, through
improving waiting time, documentary and administrative procedures, and, in the end,
acting as efficient corridors. This chapter inquires into the role of port efficiency in SSS
promotion policies. EU needs to consider this reality, and to promote port efficiency if the
final goal is to encourage SSS as an effective competitor against road transport.
This theoretical model has shown how the implementation of current policies is
highly conditioned by port efficiency; so giving grants to companies to shift cargo from
road to sea transport, but not promoting port efficiency could be considered a virtual
waste of money. The EU should not be financing firms to reach the desired modal shift,
but making SSS more attractive, through the promotion of system efficiency and
implementing a combined road internalization cost measure. This would offer the correct
incentives to firms, which would recognize by themselves how SSS is more profitable in
cases where it actually is. In conclusion, the EU should address the “issue” globally, by
considering the whole system when designing the proper measures.
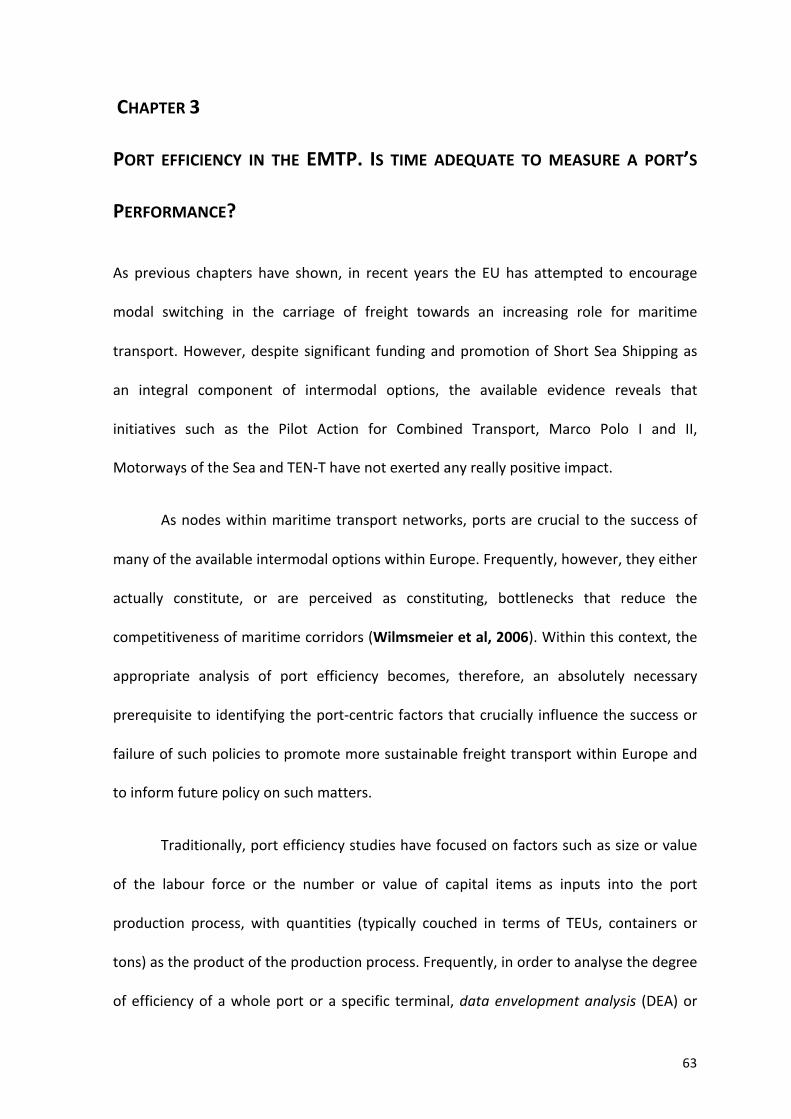
63
CHAPTER 3
PORT EFFICIENCY IN THE EMTP. IS TIME ADEQUATE TO MEASURE A PORT’S
PERFORMANCE?
As previous chapters have shown, in recent years the EU has attempted to encourage
modal switching in the carriage of freight towards an increasing role for maritime
transport. However, despite significant funding and promotion of Short Sea Shipping as
an integral component of intermodal options, the available evidence reveals that
initiatives such as the Pilot Action for Combined Transport, Marco Polo I and II,
Motorways of the Sea and TEN-‐T have not exerted any really positive impact.
As nodes within maritime transport networks, ports are crucial to the success of
many of the available intermodal options within Europe. Frequently, however, they either
actually constitute, or are perceived as constituting, bottlenecks that reduce the
competitiveness of maritime corridors (Wilmsmeier et al, 2006). Within this context, the
appropriate analysis of port efficiency becomes, therefore, an absolutely necessary
prerequisite to identifying the port-‐centric factors that crucially influence the success or
failure of such policies to promote more sustainable freight transport within Europe and
to inform future policy on such matters.
Traditionally, port efficiency studies have focused on factors such as size or value
of the labour force or the number or value of capital items as inputs into the port
production process, with quantities (typically couched in terms of TEUs, containers or
tons) as the product of the production process. Frequently, in order to analyse the degree
of efficiency of a whole port or a specific terminal, data envelopment analysis (DEA) or

64
stochastic frontier analysis (SFA) has been carried out (González and Trujillo, 2009;
Cullinane et al, 2006). These methodologies consist of establishing relationships between
inputs that may have an effect, either directly or as a proxy for some other determinant,
on the level of efficiency achieved and the generated outputs. In the absence of viable
alternatives, these efficiency measures have proved extremely useful and ubiquitously
applied measures of port performance – that is, the economic performance of a port–, in
that they provide valuable information on whether a port or terminal is employing its
inputs appropriately.
From the perspective of SSS as intermodal competitor in freight market, the time
spent within the whole transport corridor becomes a major issue, in contrast to deep sea
shipping where differences in time may not be as relevant as the type of carriage or
geographical situation, among others. Through the development of a conceptual and
theoretical model, this chapter proposes the direct utilization of the time in ports as a
suitable measure for port efficiency analysis and a methodology is described for
evaluating the efficiency of SSS ports or terminals on this basis.
By adopting an approach where the outputs in port efficiency analyses are
reoriented more directly to the needs and interests of port users (i.e. related to the time
spent in port), the potential benefits are that: 1) There is greater transparency for port
users in comparing and selecting alternative intermodal solutions, in that they will be
better able to evaluate the price/quality (efficiency) choices that they face; 2) Port
decision makers are provided with more market-‐oriented (rather than merely technical)
benchmarks, which allow the identification of potential performance improvement
measures and against which they may then continuously assess their own performance

65
and; 3) Policy makers within the EU are provided with explicit information on relative port
performance from the perspective of users. This might then be used to better inform
policy formulation to reduce bottlenecks within ports and also to better define and
promote European maritime transport programmes that are aimed at enhancing the use
of intermodal transport with a maritime component.
The structure of this chapter is as follows. First, it is provided a review of port
efficiency studies and methodologies. Then, we analyse the role of time in the production
function and in port activities. After that, it is considered a specification of the main
characteristics of SSS in this field and a structural decomposition of the time ships spend
in port. Then, the DEA mathematical specification and an empirical example are
presented to finally conclude.
3.1. Considering time in Data Envelopment and Stochastic Frontier analysis
The relevant literature here can be decomposed into three parts: (1) an analysis of port
efficiency studies; (2) the role of time in the production function and, finally; 3) an
analysis of the role of time in port activities.
3.1.1. Port efficiency analysis
Port efficiency has been widely covered in the academic literature, particularly from an
empirical point of view and most often in relation to container ports or terminals.
Although some studies have attempted to evaluate the level of port efficiency using
traditional OLS estimations and similar econometric specifications (Blonigen and Wilson,

66
2006; Sánchez et al, 2003) or even using Bayesian techniques (Notteboom et al, 2000),
most of these empirical analyses can broadly be dichotomously categorised as utilising
either parametric or non-‐parametric approaches (or models) for port efficiency
estimation. The main difference between these two categories is that while the former
assumes a statistical function underpins the data, the latter revolves around
programming approaches that make no such assumption. Both categories of approach,
however, basically attempt to determine a relationship between inputs to the port
production process and the outputs from it.
Within the category of approach characterised by the assumption of a parametric
specification, SFA is the most commonly applied methodology. The principal advantages
of SFA are that the resulting estimated function allows statistical hypothesis testing, that
it caters for an error term and also that assumptions on the distribution of the inefficiency
term can be evaluated. As illustrated in Table 3.1, within the literature there are
numerous studies that have applied SFA to deduce the level of port or terminal efficiency.
Table 3.1. Applications of SFA to port or terminal efficiency estimation
Article Scope of Analysis Time Series of Data Analysis
Liu (1995) U.K. ports 1983-‐1990 Baños-‐Pino et al (1999) Spanish container ports 1985-‐1997 Notteboom et al (2000) European container terminals 1994 Coto-‐Millán et al (2000) Spanish ports 1985-‐1989 Estache et al (2002) Mexican ports 1996–1999 Cullinane, Song and Gray (2002) Major container ports in Asia 1989-‐1998 Cullinane and Song (2003) Korean & UK container terminals 1979-‐1996 Tongzon and Heng (2005) World container terminals 2000 Barros (2005) Portuguese ports 1990-‐2000 Cullinane and Song (2006) European container ports 2003 González and Trujillo (2008) Spanish container ports 1990-‐2000 Yan et al (2009) World’s major container ports 1997-‐2004
Source: Cullinane (2010).

67
In contrast, DEA is the most frequently applied non-‐parametric methodology for
estimating efficiency levels in the port industry. The initial exposition of DEA was
contained in a seminal paper due to Charnes et al (1978), but Roll and Hayuth (1993)
were the first to explicitly advocate the use of DEA for the estimation of efficiency in the
port sector. By presenting a hypothetical application of DEA to a fictional set of container
terminal data, they revealed what potential the approach might hold. Since that time,
there have been numerous applications of DEA for the estimation of port or terminal
efficiency (see Table 3.2), including a number which have applied some variations on the
fundamental DEA specification, such as Lee et al (2005), Park and De (2004) (who apply a
four-‐stage DEA) and Cullinane et al (2004) (who conducted a DEA windows analysis).
Table 3.2. Applications of DEA to port or terminal efficiency estimation
Article Scope of Analysis Time Series of Data Analysis
Martínez-‐Budría et al (1999) Spanish Port Authorities 1993-‐97 Tongzon (2001) Australian and other international container ports 1996 Valentine and Gray (2001) 31 of the top 100 container ports 1998 Itoh (2002) Japan’s international container ports 1990-‐1999 Barros (2003, 2004) Portuguese port industry 1999-‐2000 Barros and Athanassiou (2004) Portuguese and Greek seaports 1998-‐2000 Bonilla et al (2004) Spanish port system 1995-‐1998 Park and De (2004) Korean ports 1999 Turner et al (2004) North American ports 1984-‐1997 Estache et al (2004) Mexico’s main ports 1996-‐1999 Cullinane et al (2005) World’s top 30 container ports 2001 Barros (2006) Italian ports 2002-‐2003 Rios and Gastaud Maçada (2006) Container terminals in the Mercosur region 2002-‐2004 Cullinane and Wang (2006) European container terminals 2003 Wang and Cullinane (2006) European container terminals 2003 Liu (2008) 10 Asia-‐Pacific ports 1998-‐2001 Cullinane and Wang (2010) 25 of the World’s top container ports in 2001 1992-‐1999 Hung, Lu and Wang (2010) Asian container ports 2007
Source: Cullinane (2010).

68
Cullinane (2010) provides a comprehensive review of these studies, while
González and Trujillo (2009) undertake a detailed analysis of the main characteristics of
DEA, as compared and contrasted to SFA (see Table 3.3).
Table 3.3. DEA versus SFA – A comparison
DEA SFA § Non-‐parametric approach § Parametric approach § Deterministic approach § Stochastic approach § Does not consider random noise § Consider random noise § Does not allow statistical hypothesis tests § Allows statistical hypothesis tests • No assumptions on the distribution of the
inefficiency term § Requires assumptions on the distribution
of the inefficiency term § Does not include an error term § Includes a compound error term: one
one-‐sided and the other symmetrical § Does not require the specification of a
functional form § Requires specifying a functional form
§ Sensitive to the number of variables, measurement error and outliers
§ Can confuse inefficiency with a bad specification of the model
§ Estimation method: mathematical programming
§ Estimation method: econometric
Source: González and Trujillo (2009).
As previously mentioned, both the DEA and SFA methodologies consist of
determining a relationship between the inputs to a production process and the outputs
that emerge as a result. In the port industry, the inputs which are most usually selected
for these analyses are physical facilities, such as the number or size of berths, gantry
cranes and equipment or terminal yardage, among others, and also the labour force
(Cullinane et al, 2005). As Chang (1978) pointed out, the real monetary value of net
assets in ports should also be considered but, due to its potential sensitivity, the
availability of this type of data may prove to be problematic. Regarding the outputs, it is
most usually quantities or traffic levels that are chosen. As Cullinane et al (2005)
reflected, for container terminals, the number of container movements across the
quayside or the revenue derived from these movements should be considered as the

69
main outputs. However, a consensus exists concerning the multi-‐output nature of more
general port activity (González and Trujillo, 2009). Coto-‐Millán et al (2000), for example,
incorporated cargo moved, boarded and unboarded passengers and vehicles with
passengers as outputs.
There is no consensus on the measurement of outputs in terms of either the
physical quantity of merchandise or the revenue derived from it (González and Trujillo,
2009). In recent years, some papers have considered TEU throughput as the output from
container ports (Cullinane, 2006; Cullinane et al, 2006; Turner et al, 2004), while others
which have addressed more general ports, such as Barros (2003), have considered a
larger number of outputs, such as the number of ship calls, the movement of freight,
market share, different types of cargo, roll-‐on/roll-‐off traffic, containers and net profit,
among others.
3.1.2. Time, an input in the production function
For a standard single-‐output activity, the production function f(·∙) is a simplified
representation of all the possible combinations of productive factors that generate each
specific level of production. It is considered that this function summarizes all the levels of
technically efficient output that can be obtained from different combinations of inputs.
In the analysis of transport activities factors such as capital (K), vehicles or mobile
equipment (E), labour force (L), energy or fuel (F) and natural resources (N), (for example,
the usage of land, air and water) are the main inputs included into the production

70
function, while the outputs are usually physical quantities (Q, in tons) or, in the specific
case of ports, the movement of cargo.
Users’ time is also a particular input in many transport activities production
functions. However, as De Rus et al (2003) states, time cannot be considered as an input
which is totally exogenous to the production function, since it usually depends on how
the other factors are combined. In the case of infrastructure, a larger or smaller capacity
determines the presence or lack of congestion and, therefore, additional delays in the
estimated movement time. For instance, a proper or an improper access to a port, or a
high-‐tech crane compares to a low-‐tech one may have different impacts on time.
The production of cargo services associated to a transport infrastructure such as a
port has been traditionally quantified through the total endowment of factors.
Nevertheless, the (time) intensity of the use of these factors is also important. This is
particularly relevant for efficiency analyses. For example, the total number of cranes
existing in a port is less relevant than the effective usage of this capital input (that is, its
time intensity) in order to evaluate its contribution to total output. The same applies to
other inputs and therefore the production function may be written as
Q= f [K(t ); )L(t ); )E(t ); )F(t ); )N(t )] (14)
For the sake of simplicity we can consider that time intensity is defined by a linear
relationship. For example, K(t) = k·∙t means that the effective usage of capital (e.g. cranes)
depends on its endowment (k) and the number of working hours (t). In general:
Q= f [t ⋅k ; 't ⋅ l ; 't ⋅e; 't ⋅ f ; 't ⋅n] (15)

71
where the output is now related with the effective usage of all inputs. Again, under the
simplifying assumption of degree 1 homogeneity for the production function, we may
rewrite:
Q= t ⋅ f [k ; 'l ; 'e; 'f ; 'n] (16)
and then
q(t )= Qt= f [k ; *l ; *e; *f ; *n] (17)
Thus the output is explicitly affected by time and we can properly use the
(physical) endowment of inputs in efficiency analyses. As a result, an efficiency approach
where the output is reoriented to the worries of port users (“how long is going to take my
stay at port?”, is the most natural question that they ask themselves) introduces greater
transparency for them in terms of intermodal competition. As mentioned above, they will
now be in a better position to assess the price/quality (efficiency) choices that they face.
3.1.3. Time in port activities
An efficient port has the scope to charge higher prices if it provides faster and more
reliable services or if it allows the shipper to save elsewhere (Wilmsmeier et al, 2006).
The time a ship spends in a port is a significant determinant of that port’s
competitiveness and, therefore, of maritime transport itself, particularly in the case of
intermodal freight movements. Indeed, Hummels (2001) goes so far as to suggest that
time constitutes a trade barrier.

72
All this implies that a detailed analysis of ship time in ports is necessary, not only
as the basis for deriving port efficiency estimates, but also as a potential basis for
determining how to properly promote maritime transport. Despite this, none of the
aforementioned analyses of port efficiency have explicitly related the time in port to the
output of the port production process. There are, however, some works that have
considered the role of time in ports when applying different methodologies. Sánchez et al
(2003), for example, is one of the few papers that provide a detailed analysis of the
structure of time spent in ports. By developing a principal component analysis based on
survey data collected from 55 ports in Latin America, the authors analysed the factors
that drive port efficiency in terms of time; such as the container loading rate, the annual
average of containers loaded per vessel or waiting time. They also found that the
estimated elasticity for port efficiency was similar to that of distance.
Along the same lines, Wilmsmeier et al (2006) related port characteristics to
international maritime transport costs. In their results, they proved how the delay of
cargo during customs procedures has an impact on freight: a 1% reduction of the time it
takes to clear customs implies a reduction in maritime freight of 0.051%.
In similar fashion, Nordas (2006) also recognised that minimizing waiting time and
providing a seamless logistics chain is a challenge for logistics services providers. As a very
extreme case of how waiting time can reduce the competitiveness of a corridor, Devlin
and Yee (2005) pointed to the case of the Egyptian port of Alexandria, where customs
clearance time, including waiting, takes at best two weeks. In addition, Hummels (2001)
revealed that increasing the shipping time to the United States by one day reduced the
probability of exporting a manufacture to this country by 1.5%.

73
Djankov et al (2005) found that a 10% increase in overall transport time reduces
bilateral trade commerce by between 5% and 8%. Also, by considering the control of
corruption as a proxy variable for time, Nordas (2006) states that a 10% improvement in
transport time will lead to an increase in the value of trade by between 8% and 40%
(depending on the sector and the country of destination). This author also concluded that
customs and related procedures are the weakest link in the logistics chain and that they
have a significant impact on dampening trade flows.
3.2. Characteristics of “SSS ports”
The efficiency of a port or terminal exerts a significant influence over intermodal
competition. That is, when considering SSS as an alternative to road transport, we should
consider a company that wants to shift cargo from origin A to destination B. In effect, this
company will compare the generalized costs (that is, not only monetary, but also time
costs) of carrying freight by road or by multimodal chain (i.e. to and from a port by road
and then also making use of a maritime corridor). Therefore, it is important to think in
terms of specific terminals that deal with cargo that could alternatively be transported
from origin to destination by road.
As Marlow and Paixão Casaca (2004) point out:
“SSS ferries constitute an extension of road transport and even rail if they are prepared to take on board rail wagons, although this last option requires the commitment of high capital investment and can only be employed on routes whose terminals are prepared to receive such technology. These ships are capable of carrying both passengers and/or a whole range of cargoes that embraces palletised cargo, accompanied and unaccompanied trailers, semi-‐trailers, pallets, swapbodies, railway wagons, cassettes, project cargo and machinery.”

74
In order to analyse the efficiency of a SSS terminal, it is important to understand
the specifications of SSS traffic and associated terminal requirements. In terms of SSS as a
competitor to road transport, Ro-‐Ro cargo is considered as the main intermodal
alternative. Indeed, Quaresma Dias et al (2010) state that it makes sense to associate SSS
with Ro-‐Ro maritime. Thus, within this study, the Ro-‐Ro terminal is considered to provide
the most appropriate operational framework for the analysis of SSS-‐terminal efficiency.
Maksimavičius (2004) emphasised the number of terminal gateways, customs and
border points and also the size of storage facilities as extremely important influences on,
and indications of, the level of Ro-‐Ro terminal efficiency. Quaresma Dias et al (2010) also
considered that an efficient Ro-‐Ro port or terminal has to be located as near as possible
to market dealers and to factories. Based on the work of Maksimavičius (2004), Figure
3.1 provides an analysis of the systematic processes at play within a Ro-‐Ro terminal and
which will provide the basis for identifying the range of input or output variables which
might be catered for within an ensuing efficiency analysis. This process comprises the
whole path of a Ro-‐Ro cargo from origin to destination port, considering each required
procedure.

75
Figure 3.1. System processes within a Ro-‐Ro terminal
Source: own elaboration, adapted from Maksimavičius (2004).
3.3. Decomposing the time in port activities
This subsection identifies the several sub-‐times considered in Figure 2.3. Traditional
efficiency analysis has been developed on the premise that entities are efficient when
they use their inputs properly. That is, these entities produce a particular quantity of
goods or services with the minimum amount of required factor inputs. Alternatively, that
the quantity of goods or services is maximized for a given amount of factor inputs. Within
the context of shipping and the port production process, this idea implicitly conveys that
the most efficient ports or terminals will attempt to minimize the time in port of ships,
since it is only in this way that output can be maximized.
Ticket booking and collection
Check in
Entering the terminal gateway
Border control formalities
Custom clearance
Waiting at loading site
Boarding the ship
Freight transportation
Disembarkation
Queuing at storage site
Border control
Custom clearance
Exiting terminal

76
For several possible reasons, however, this could not be the case. For example,
where there is any sort of rupture between the time a ship spends in port and the
quantity of output that a port or terminal might produce; one such situation might be
when waiting time for berths are high because the port is congested (e.g. in very high
demand) and port output is maximized. Another example might be when a port serves an
essentially captive market, when relative performance and the competitiveness of a port
or terminal is not really a major consideration in determining the output level achieved.
These sorts of circumstances, where the productive output just in quantity terms of a port
or terminal may not really reflect the relative time that ships spend in these facilities, are
all reinforced by the fact that on the input side, port or terminal costs do not tend to vary
with the total amount of time ships spend in port.
The corollary is that any efficiency analysis of ports or terminals which is based
solely on a quantity output from the port production process may not adequately reflect
the time spent on cargo handling operations in ports. Thus, the estimated levels of
efficiency which are derived from such an analysis may not correlate very well with the
levels of efficiency as observed or perceived by port users in terms of the time their ships
spend in ports. Traditional efficiency analysis utilizing just quantities as an output may
not, therefore, provide the most appropriate basis for evaluating the competitiveness of
ports or terminals with respect to other ports and terminals or, even more importantly
from a policy perspective, the competitiveness of maritime intermodal alternatives vis à
vis road-‐based freight transport. In contrast, by developing relative efficiency estimates
that add some measure of the time a ship spends in port, it is the intention that better
assessments might be made of the competitiveness of individual ports or terminals with
respect to others and of intermodal options versus solely road-‐based alternatives. This

77
has the potential to inform European port policy in terms of the establishment and
assessment of measures to influence modal choice.
In order to determine what individual time factors could be optimized, there is a
need to focus on the structure of time ships spend in port. Based on previous empirical
work (e.g. Wilmsmeier et al, 2006; Sánchez et al, 2003; Clark et al, 2002), for the purpose
of this analysis, port time is defined as the sum of port access time, loading and unloading
time of cargo, ship waiting time and time for customs and other administrative
procedures (as previously shown in Figure 2.3). On the basis of elementary logic, all these
different time elements are positively related to estimated levels of port inefficiency
(named as 𝜂). That is, an increase in port access time will obviously decrease the level of
efficiency of that port.
When attempting to include port or terminal time into a theoretical modelling
framework, it is important to recognize that in an ideal world the data that would permit
such an analysis would be readily available and it would be possible, therefore, to
incorporate each single time element into the model. In order to appropriately identify
the precise factors that will yield greater port or terminal efficiency, it will ultimately be
necessary to decompose the time structure in ports. The use of Automatic Identification
System (AIS) data is being investigated as the basis for this and for future, more highly
detailed, analyses.

78
3.4. Mathematical specification
As previously mentioned, the DEA methodology has proved to be a really useful tool in
providing valuable information on whether a port or terminal is employing its inputs
appropriately. This is achieved by establishing the relationship between the inputs and
the outputs. By so doing, it is possible to obtain a proxy for the level of efficiency
achieved. This deterministic non-‐parametric method, which uses mathematical
programming techniques to envelop the data as compactly as possible, was first
developed in the seminal work of Charnes, Cooper and Rhodes (1978). In their paper, the
authors assumed constant return to scale, that is, all observed combinations can be
scaled up or down proportionally (Cullinane et al, 2005). The literature named it DEA-‐CCR
model. After that, Banker, Charnes and Cooper (1984) allowed for variable returns to
scale, baptizing it as DEA-‐BCC model.
Figure 3.2. DEA-‐CCR and DEA-‐BCC representation
Source: own elaboration.
x!
y! DEA&CCR!
DEA&BCC!

79
As Cullinane et al (2006) state, “an output-‐oriented efficiency measurement
problem can be written as a series of K linear programming envelopment problems, with
the constraints differentiating between the DEA-‐CCR and DEA-‐BCC models.”
Thus, the objective is to maximize the proportional increase in output while
remaining within the production possibility set (U):
Max U U,z
Subject to Uyk’ − Y’z ≤ 0 (18)
X’z – xk’≤ 0
z ≥ 0 (DEA-‐CCR)
ez’ = 1 (DEA-‐BCC)
where inputs xk = (x1k, x2k, …, xMk)∈RM+ are used to produce outputs yk = (y1k, y2k, … , yNk)
∈RN+. The row vectors xk and yk form the kth rows of the data matrices X and Y,
respectively. z = (z1, z2,…, zK)∈RK+ a non-‐negative vector, which forms the linear
combinations of the K ports or terminals. Finally, e = (1, 1,…,1) is a dimensioned vector of
unity values.29
Then, by solving the previous programme for each case (CCR or BCC) form the DEA
models. Thus, the technical efficiency of the kth unit can be calculated as
TEk =1Uk
(19)
The best practice frontier is derived by solving the above programme, with the
distance of each port or terminal from the frontier providing a measure of relative
29 Cullinane et al (2006) provides a more detailed explanation of this traditional problem.

80
efficiency for each sample port or terminal considered. From this procedure we could
estimate levels of efficiency related with time and facilitate a comparison of performance
as derived from both outputs. By focusing on the differences that are revealed through
such an analysis, inferences may be drawn as to how closely DEA applications with solely
quantities as output reflect the efficiency levels observed by port users, as deduced from
the time their ships spend in port. This may provide a much firmer basis for the
assessment of port user preferences and their port or terminal choice decisions, thus
greatly facilitating the evaluation of port competitiveness. In addition, in specific contexts,
it may also have important implications for the specific assessment of port
competitiveness. For instance, where a particular port exhibits a high level of efficiency
based on the large quantity of cargo it handles when, in fact, this could be masking a
dubious level of performance (as measured in terms of outputs related to time) because
it enjoys a captive market.
3.5. An empirical example
In order to implement an empirical example of the previous DEA specification, data has
been collected for different African ports from the statistical information published
annually by the Containerization International Yearbook (2012). Movements per hour
have been taken from the Africa Infrastructure Country Diagnostic (AICD)30 database as a
proxy of time spend in ports. Ideally, this empirical example should be based on the
European experience, by considering the time ship spends in a sample of ports involved in
SSS routes. However, there appears to be no data available with respect to this. Thus,
30 http://www.infrastructureafrica.org/aicd/.

81
African ports provide a relatively straightforward and suitable study case to determine if
empirically there are differences in results when we take different outputs specifications
in efficiency analysis.
As expected, the data related to the decomposition of time in port has proved
extremely difficult to obtain. For this reason, the original sample has been reduced to 16
African ports in 2007. However, a non-‐parametric specification is proposed. Hence,
although the analysis could obviously be more exhaustive if a greater number of
observations could be found, the following results are not conditioned by any goodness-‐
of-‐fit measure. Ideally, the analysis would involve disaggregating the data to the level of
the terminals, but this has also proved impossible to do, so the data on output is
aggregated at the port level. Thus, we analyse the terminal efficiency aggregated in each
port, which at the very least allow us to fulfil the purpose of illustrating the conceptual
approach proposed herein.
Table 3.4. Descriptive statistics of the sample
Movements (Output 1= Q)
Mov. per hour (Output 2= Q’/t)
T. Berths length (m) (input 1)
Terminal (m²) (input 2)
Cranes (input 3)
Mean 557,422 16 1,233 547,773 8 Standard deviation
550,949 8 879 602,447 8
Maximum 1,955,803 40 2,854 1,940,000 31
Minimum 54,088 7 300 22,000 1
N 16 16 16 16 16
Table 3.4 provides the descriptive statistics for two outputs and three inputs.
Length of berths (in meters), terminal area (in squared-‐meters) and the number of cranes
(as a proxy of labour) are the inputs selected in the two specifications considered. The
outputs vary between both DEAs. In the first model, movements in the ports constitute

82
the output – that is, the traditional specification where quantity is used as the main
output – while the second introduces time factor.
Table 3.5. Technical efficiencies in African ports
Port Ranking Technical Efficiency
(Output 1) Technical Efficiency
(Output 2) Technical Efficiency overestimation
Ranking Changes
Port Said 1 1.000 1.000 0.000 1 (=)
Port Sudan 2 1.000 1.000 0.000 2 (=)
Cape Town Port 3 1.000 1.000 0.000 3 (=)
Ghana Ports 4 1.000 0.375 0.625 12 (-‐8)
Port of Maputo 5 1.000 1.000 0.000 5 (+1)
Alexandria Port 6 0.986 0.444 0.542 10 (-‐4)
Kenya Port 7 0.939 0.238 0.701 16 (-‐11)
Namibian Ports 8 0.610 1.000 -‐0.390 5 (+3)
Damietta Port 9 0.560 0.292 0.268 15 (-‐6)
Port of Lobito 10 0.508 0.772 -‐0.264 7 (+3)
Port Autonome d´Abidjan 11 0.469 1.000 -‐0.531 6 (+5)
Port Elizabeth 12 0.412 0.701 -‐0.289 8 (+4)
Durban Port 13 0.399 0.477 -‐0.078 9 (+4)
Sokhna Port 14 0.262 0.350 -‐0.088 13 (+1)
Port of Douala 15 0.254 0.341 -‐0.087 14 (+1)
Port of Djibouti 16 0.094 0.400 -‐0.306 11 (+5)
Average Efficiency 0.656 0.649 0.007
The third and fourth columns of Table 3.5 show the technical efficiencies varying
between considering time or not in a simple DEA-‐CCR. We are not interested in these
efficiencies per se. The main objective of this example application is to prove how
rankings significantly change depending on the inclusion of time or not. Considering the
three aforementioned inputs, in both rankings the ports of Port Said (Egypt), Port Sudan
and Cape Town (South Africa) occupy the first positions. From there, the ranking changes
and the average efficiency decreases when time is included.

83
These results suggest some level of robustness underpinning this analysis; it would
not have made sense to observe huge differences in every single port. The aim is simply
to prove how the inclusion of time introduces some differences (sometimes only subtle)
in efficiency measures, and Table 3.5 confirms this.
There are some cases which need to be highlighted. For instance, Kenya Port
appears to be pretty efficient when solely quantities are considered. However, when a
time-‐based criterion is applied, its efficiency falls by more than 70 points. Similar
outcomes occur for the cases of Ghana Ports and Damietta (Egypt), while the opposite
occurs in the ports of Abidjan (Cote D’Ivoire) and Djibouti, where they are found to be
more efficient when time is included, rising five positions in the rankings in both cases.
The explanation may lie in the fact that ports with a much higher score, considering just
quantity rather than the inclusion of time, may not be facing any competition – neither
intermodal nor inter-‐port – so time is not a relevant factor for them.
The previous example proves how the inclusion of time in efficiency analysis can
modify the results derived from a more traditional approach based just on quantities.
Recognising this possibility may mean that when time is taken into account as a
potentially influential factor, then policy implications resulting from traditional efficiency
analysis are altered. That is, in cases where time is crucial – for example, when ports face
intermodal competition – it should be incorporated into analyses of port efficiency and,
therefore, in policy actions where the results of which are influenced by differential levels
of port efficiency. Further steps in developing this research would ideally include data on
the time spend in European SSS terminals that would facilitate the corroboration of this
hypothesis.

84
3.6. Conclusions
In the past few decades, the EU has encouraged the role of SSS in the European freight
market. The perceived advantages of SSS in terms of the environment and competition
have provided a fundamental underpinning principle of maritime transport policy in
Europe. In order to optimize the performance of SSS activity, an efficient value chain is
required. However, in many instances, ports have been identified as the cause of
bottlenecks that reduce the competitiveness of maritime intermodal transport. Supply
chain participants frequently perceive ports as the “black box” of the value chain.31 Thus,
EU maritime transport policy needs to focus on port efficiency when attempting to
promote SSS.
Improving user perceptions of ports requires greater transparency in relation to
port activities and the reduction of the time needed to deal with cargo. When attempting
to promote SSS, appropriate attention needs to be given to what determines the length
of time ships spend in individual ports or terminals and to offer users an efficient value
chain through the minimization of this variable. As a consequence of this requirement, an
appropriate quantification of these times is essential in order to determine the most
suitable measures to promote maritime transport for intra-‐European and other short sea
movements.
As previously mentioned, most port efficiency studies have applied methodologies
such as DEA or SFA which use factors such as the size or value of the labour force or the
number or value of capital items as inputs into the port production process, with some
31 The study of the user’s port perception and its impact in SSS constitutes an interesting subject for future research.

85
form of product quantities as the output of the production process. Here the time ships
spend in port has been decomposed for the purpose of establishing a theoretical
modelling framework. Port access time, hourly load/unload rate, ship waiting time,
customs and other administrative procedures have been identified as different time
elements that are positively related to estimated levels of port inefficiency.
The appropriate and accurate identification of these decomposed time elements
may be crucial to determining the baseline causes of infrastructure inefficiency. Despite
this, there exists little or no data that is publicly available at a suitable level of
disaggregation. However, this chapter proposes the inclusion of time ships spend in port
as an appropriate measure for assessing the efficiency of ports or terminals and goes on
to develop an empirical example involving a comparison of results of two DEA
specifications. When the technical efficiencies derived using time in one case and just
quantities in the other are compared and contrasted, some remarkable differences can
be identified. Some ports show a huge decrease in their efficiencies when time is
included. Indeed, the overall average efficiency level for the sample decreases quite
markedly when time is involved in the DEA specification. Thus, on the basis of the
evidence derived herein, if time is regarded as a relevant factor in maritime corridors and
port competitiveness, failing to account for it in the analysis of efficiency will likely lead to
an overestimation of the true efficiency of the infrastructure. However, both broader and
deeper empirical analysis is required in order to evaluate the robustness of such an
inference.
Finally, as it has been emphasized on many occasions, in order to identify the
factors that will yield greater port or terminal efficiency, it will ultimately be necessary to

86
collect systematic disaggregate data on the decomposed time which ships spend in port.
This has an immediate policy implication. Namely, the need to establish a data collection
process in SSS terminals, with the aim and intention of identifying and removing
bottlenecks. By so doing, EU policy makers then have the prospect of promoting maritime
transport based on appropriate knowledge with respect to relative port performance
from the perspective of users.

87
CHAPTER 4
ARE THERE OTHER INCENTIVES TO PROMOTE PORT EFFICIENCY?
As seen in Chapter 1, since the early 90s the EU has developed different projects to
promote maritime corridors as an alternative to road traffic, highlighting their potential in
the freight market (COM, 2007). However, road market share has improved while sea
transport has decreased; the difference between both has increased from 4.6% to 9.8%.
As COM(2009a) sentenced, “transport is a market that is far from having arrived at a
stage of even fair competition, especially between modes.”
In addition, as shown in Chapter 2, costs associated to port infrastructure
represent a large proportion of the cost structure of maritime transport (Limao and
Venables, 2001; Clark et al, 2002; Sánchez et al, 2003; Wilmsmeier et al, 2006).
However, the role of ports, as nodes, has been under-‐estimated.
Previous chapter also revealed how promoting port efficiency – by increasing the
speed of cargo loading/unloading, the fast access to ports, the administrative procedures,
and customs, among others – may be more effective to increase the modal split of SSS
than just giving grants to companies.32 For instance, let us consider that a company that
chooses a maritime route instead of a road route receives some public funds to operate
in a specific corridor. If administrative procedures at port take longer than expected, and
operating time increase highly, companies could be unwilling to suffer long waiting time,
thus they would still prefer road transport. The EU policy would have no effect.
32 To transfer cargo from road to sea is the main requirement that Marco Polo I and II programmes establish at the time to give grants which not have to be reimbursed later.

88
Therefore, port efficiency in terms of time would turn into a vital issue in a mode that
usually suffers from longer total time.
The port industry comprises a relevant number of agents: port authorities,
consignees, terminal operators, shippers, and local authorities, among many others. They
all compose the well-‐known logistic chain, whose total time is the sum of each individual
time. As expected, each agent may generate delays, bottlenecks, and other failures on
port activity – for example, congestion in port access, a slow procedure from authorities,
queuing at storage site or a low hourly cargo load/unload rate. This makes difficult to
reach an agreement in the definition of the port efficiency.
To give grants to port authorities to reduce their inefficiency could generate some
perverse effects: some ports could receive aids that they would not have to reimbursed
later nor showing the achieved positive results, thus we would face a moral hazard
problem. The EU cannot easily observe the real effort that ports exert to reduce
inefficiency; a non-‐positive result could be explained by the lack of effort or other
exogenous circumstances. Even when the UE observes a bad performance, its monitoring
process becomes extremely bureaucratic and dawdling. Therefore, procedures to deal
with those issues stumble down a blind alley.
Indeed, the European Court of Auditors (ECA, 2012) states that millions of EU
public port finance was squandered on ineffective transport projects.33 That means empty
33 In three cases audited, the European Court of Auditors (ECA) found that the allocation of over €30m of EU cohesion and structural funds has led to three empty ports, two in Spain (Campamento and Arinaga) and one in Italy (Augusta). In these cases, the EU has not asked for the refunding of the grants, but to redefine the use of them. By now, the ECA recommendation has been to remind Member States of their obligation to use EU funding in a way compatible with the tenets of sound financial management. To do so, the Commission should provide appropriate guidance and disseminate best practices found in Member States (ECA, 2012).

89
ports and unused infrastructure. The report finds 16 out of 27 audited transport projects
– which covered 85.5% of allocated the EU cohesion and structural funds between 2000
and 2006 – ended up unsuccessfully.
In this chapter contracts to incentivize ports to reduce inefficiency through the EU
transport programme are designed. The latter objective is to encourage reductions in
total time throughout the logistic chain by removing the above-‐mentioned bottlenecks.
The structure is as follows: after discussing the role of financing port infrastructure,
Section 4.2 models the subsidies in maritime transport policies. Then, the relation
between the government and port infrastructure is examined under the framework of a
moral hazard problem. From this, Section 4.5 reflects how to incentivize a port
inefficiency reduction. Lastly, conclusions and policy recommendations are presented.
4.1. The role of financing port infrastructure
“Increased investment within ports and towards the hinterland is necessary in order to
improve and extend services so that ports become poles for growth instead of potential
transhipment bottlenecks” (COM, 2006c). Therefore, a successful ports policy will need to
clarify rules for public contributions to investment.
Baird (2007) states that traditionally the EU has expected the private sector to
finance maritime transport investments, while the public sector has not had any doubt in
investing as much as rail or road need – or even more. In other words, road and rail
infrastructures receive more public funds than maritime ones yet (Gese-‐Aperte and
Baird, 2013).

90
Previous studies highlight the importance of ports in maritime transport
competitiveness. Adequate cost-‐effective and efficient ports are essential to reach a
modal shift in freight transport (Paixão Casaca, 2008). Gese-‐Aperte and Baird (2013) also
identify ports as key factors for the development of MoS, reflecting that some port
services must improve their adequacy for SSS. A proper development of SSS requires high
port efficiency (COM, 2004). The Commission points out the bottlenecks arising from
administration, documentation and custom procedures as the main source of inefficiency.
Maritime transport has been traditionally under-‐considered – especially in terms
of financing. Moreover, within European maritime policy, ports have been even less
promoted: as shown in Chapter 1, in the last years the public investment in ports
represented around 5% of total Community investments in the transport infrastructure
(EEA, 2011). Nevertheless, COM (2009a) currently states that the challenge is to provide
the right mix of measures to ensure that ports can cope efficiently with their gateway
function. This chapter develops a theoretical model to meet this Commission’s purpose.
4.2. Modelling subsidies in maritime transport policies
The existing economic literature points out maritime transport as a more competitive
mode when external costs are considered. Thus, the EU has developed policies to attain a
most sustainable freight transport. Programmes such as Marco Polo I and II have given
grants to companies that shift cargo from road to sea transport, mainly. These grants
have not to be reimbursed. Therefore, they have the same effect on modal shift as
reducing costs; the impact on market shares of carriage price changes are conditioned by
time spent on shipping activity (Chapter 2).

91
Moreover, shipping time do not only comprise journey time, but also access and
waiting time, loading and unloading time and each administrative procedure which may
delay the movement of freight. These time components are highly correlated with the
efficiency degree of the infrastructure.
For instance, we could consider the need of adapting terminals to SSS
requirements by accomplishing multimodality (through getting road or rail links closer to
the terminals) or by improving hinterland-‐ports connections. As seen in Chapter 3,
Maksimavičius (2004) points out as SSS requirements the increase of terminal gateways,
custom and border points or the size of storage facilities. All previous measures could
diminish total time of cargo in ports. Therefore, we name port inefficiency (η) as a bad
performance of this infrastructure, expressed in terms of time. Obviously, an efficient
performance would be identified through the comparison among ports or terminals,
there is no an objective value of a good or bad implementation in terms of time.34 Thus,
in here the port or terminal inefficiency has to be regarded as relative to others.
It is noticed that part of this inefficiency could not be directly handled through
physical infrastructure improvements. Here we refer to those caused from bureaucratic
procedures. It could also be considered the managerial or operational systems as port
infrastructure (for example, the Information Technological Services, ITS), and they could
be addressed to reduce administrative time as well.35
34 The existing literature has traditionally dealt with port inefficiency in terms of quantities or movements in ports. As seen in previous chapter, there are numerous studies that analyse and compare it among ports or terminals by using techniques such as DEA or SFA. 35 COM (2009c) reflected these types of measures, with the objectives to simplify customs formalities for vessels only sailing between EU ports; to establish guidelines for speeding up documentary checks or to rationalize the documents requested under different bodies of legislations. The establishment of an E-‐maritime Policy or E-‐Freight look for the goal to improve systems across European ports is also mentioned.

92
This chapter departs from the suggestion that port infrastructure should be
promoted to increase maritime transport modal shift, by reducing port inefficiency.
However, as García-‐Alonso and Martín-‐Bofarrul (2007) state, the volume of investment
to increase efficiency is no guarantee of success. In this chapter it is asserted that a
proper contract has to be designed to reach the objective proposed, and that is
essentially the basis of the following sections.
4.3. The model
There are several agents in our model setting. The government (representing the overall
society), road infrastructure (R) and port infrastructure (P).36 From a social perspective,
each agent must be taken into account. So we have to minimize the aggregate social cost
defined as the sum of the generalized cost of each transport mode plus the subsidy that
the government gives to port infrastructure operator.
The generalized cost per mode is the sum of the monetary component (m) – the
access fees to the infrastructure, the consumption of fuel and other required components
to travel from origin to destination – and the non-‐monetary component. That is, the
invested time and its value plus the externality cost of each mode. To avoid an
unnecessary notation in this case, this chapter represents the monetary component m as
the sum of the parameters p and z considered in Chapter 2. Likewise, the invested time is
decomposed into a minimum invested time – comprising the disaggregated terms of time
in Chapter 2 – and the port infrastructure inefficiency (η). Technological characteristics
36 It has to be noted that this analysis could be done by considering terminal operators instead of port authorities. Therefore, the model here presented could be implemented in different port structures.

93
limit the minimum invested time while infrastructure inefficiency (η) depends on the
exerted effort by the infrastructure operator. For instance, there is a minimum time
required at the time to access to a terminal (i.e., transit time, basic procedures). There is
also a second source of time spent when getting into a port if we consider the congestion
at the access – due to long time in customs, an insufficient number of access, etc. – that
could diminish through the proper investments. Our analysis considers that there is only
inefficiency in the maritime transport associated to the port infrastructure.37 Thus,
considering the previous simplifications, the generalized cost functions are:
GCP =mp +v tp +η e( )( )+ε p (20)
GCR =mR +vtR +εR (21)
First, we consider that the monetary component of both modes, are
equal to focus mainly on the role of the infrastructure inefficiency (η).38 Second, as seen
in Chapter 2, the willingness to pay for time differs at individual level. It is distributed as
an uniform between [0,1]. This potential heterogeneity is useful to determine the
proportion of consumers that are more prone to move using port or roads.
By comparing both generalized cost, R and P, there is an indifferent shipper
between both modes. That is GCiP =GCi
R characterizes the critical value of the invested time
vi* . This threshold determines the market share of each mode. It is pretty straightforward
to reach the following solution where
37 Our analysis is robust if we consider any degree of inefficiency associated to the road infrastructure. In that case, η can be reinterpreted as the relative inefficiency of the port infrastructure with respect to the road one. 38 Chapter 5 analyses the impact on generalized cost when monetary costs are not equal between modes.
P Rm m=

94
v* = −εP +εR
tP −tR +η e( ) (22)
The critical value v* determines the demand per mode. Given that individuals
distribute as a uniform between [0,1], those with a time valuation in the range [0,v*]
choose maritime and those with a time valuation higher v* choose road transport. In
other words, port infrastructure operator has a demand equal to v*, while road has a
demand equal to (1-‐v*). Both depend on the infrastructure inefficiency (η) and indirectly
on the exerted effort. Thus, the profit function of the port infrastructure is
π = m−c( ) −εP +εR
tP −tR +η e( )"
#
$$
%
&
''−k−c e( )+ S η e( )( ) (23)
where c represents the cost per unit, k the infrastructure capital cost, c(e) is the cost of
the effort exerted by the operator and S(η(e)) is the subsidy that depends on the
inefficiency and indirectly on the effort exerted. To simplify the previous effort cost
function, we assume that c(e)=e and e ∈ {0,1}. This implies the existence of different
degrees of effort from the lowest to the highest. Thus, we face the following
normalization c(0)=0 and c(1)=1.
4.4. Government and port infrastructure: a moral hazard problem
Given previous expressions, the government cannot observe the effort exerted by the
infrastructure operator; it faces a moral hazard problem.39 There exists the risk that port
infrastructure receives a subsidy for not exerting any (or a low) degree of effort. 39 For further analysis of moral hazard, see Laffont and Martimort (2002).

95
Therefore, the objective is to obtain a second-‐best solution, that is, a proper subsidy to
promote maritime transport.
This implies that the information is not symmetric. As Compes and Poole (1998)
state, regulator and private logistics firms face to a principal-‐agent relationship.
Noticeably, the operator who has an informational advantage will try to use it to his
benefit.
Here the assumption is that operator’s behaviour is not observable by the
government or, in case of being, it is not verifiable. That is, the effort cannot be included
in contract terms. Even though the operator’s behaviour is not verifiable, we assume we
will know it at the end of the period. Consequently, the obtained result will be included in
the contract that stipulates the operator’s pay-‐off.
As Barros (2003) states for the Portuguese case, the government is under-‐
informed in relation to the return of its policies, so ports are free to establish their own
private goals, bypassing the public objectives that they are assumed to pursue.
Considering the United States ports, Luberoff and Walder (2000) suggest that subsidized
balance-‐sheet financing means that port authorities tend to underestimate the risks
involved with investments, so they could not choose the optimal investment in each case.
It could be sentenced that port authorities could have some political incentives far from
just a social economic perspective.
Concretely, the problem is as follows; the government proposes a menu of
contracts depending on the effort exerted by the port infrastructure. The higher the
effort, the more likely is to get a higher inefficiency reduction. But, the government has to

96
minimize the social cost (S.C.), satisfying two conditions; the participation constraint (P.
C.) and the restriction of incentives compatibility (R.I.C.).
The P.C., in our setting, implies that profits of the port infrastructure must be
above zero, that is, to have positive profits. The participation constraint implies that the
objective function of the port operator is to maximize his private profits. This assumption
has consequences on the management model but not directly on the ownership.
Maximizing private profits as a management goal can be attained by public or private
operators. It has to be noted that this function includes the subsidy, so this constraint is
not determining if ports are profitable or not without public funds. The R.I.C. indicates
that a port infrastructure exerting a low effort cannot receive a subsidy that corresponds
to a higher type. In other words, exerting a higher effort leads to a higher subsidy.
Taking into consideration a probabilistic approach and assuming that effort is a
continuous variable, the problem is as follows.
Min SC
p(e)[(m−c) εR −εP
tP −tR +η(e)
"
#$
%
&'
i=1
N
∑ −k−e+ S η(e)"#
%&≥ 0
∂
∂ep(e)[(m−c) εR −εP
tP −tR +η(e)
"
#$
%
&'
i=1
N
∑ −k−e+ S η(e)"#
%&
"
#$$
%
&''≥ 0
. (24)
The social cost – that is, the sum of the aggregate generalized cost of each
transport mode plus the subsidy – has to be minimized satisfying the above conditions.
This problem is solved as usual for inequalities, that is, with a Kuhn-‐Tucker approach. To
solve it, we compute the Lagrangian function

97
L e ,η ,λ ,µ( )= SC +λ p(e)[(m−c) εR −εP
tP −tR +η(e)
"
#$
%
&'
i=1
N
∑ −k−e+ S η(e)"#
%&
"
#$$
%
&''
+µ∂
∂ep(e)[(m−c) εR −εP
tP −tR +η(e)
"
#$
%
&'
i=1
N
∑ −k−e+ S η(e)"#
%&
"
#$$
%
&''≥ 0
"
#$$
%
&''
. (25)
Taking into account SC = 2m+tR +2εR + S η e( )!"
#$ , the first order condition with
respect to η for a given level of effort is
∂L e ,λ ,µ( )∂
= p e( )S'(η )+λp e( )S'(η )+
+µ p'(e)S'(η )+p e( ) η'(e)S''(η )−c−m( ) εP −εR( )η''(e)(tP −tR +η(e))2
#
$
%%
&
'
((+ S'(η )η''(e)
#
$
%%%
&
'
(((,
(26)
rearranging terms, and solving that problem for e, we have the equilibrium condition.
1=−λ −µ p'(e)p(e)
+η''(e)+η'(e) S''(η )S'(η )
−c−m( ) εP −εR( )η''(e)S'(η )(tP −tR +η(e))2
"
#
$$
%
&
''. (27)
Corollary 1. The ratio p'(e)p(e)
is positive with respect to e what means that the higher is the
effort exerted; the more likely is to reduce the inefficiency.
This ratio introduces rationality in the analysis;40 without this traditional result,
there would not be any initial incentive to exert any degree of effort. Previous expression
may be simplified if we assume a linear relation of the subsidy with respect to the
inefficiency, then S”(η)=0. This assumption seems reasonable if we consider that the
40 Innes (1990) characterizes optimal contracts in a model with a risk-‐neutral principal and a risk-‐neutral agent, both with limited liability constraints, using the first order approach described below for concave utility functions (see also Park 1995). Milgrom (1981) proposes an extensive discussion of the Monotone Likelihood-‐Ratio Property (MLRP) assumption.

98
government subsidises ports for each “unit of inefficiency” reduction (for instance,
waiting hours in ports). Thus, the expression is
1=−λ −µ p'(e)p(e)
+η''(e) 1+m−c( ) εP −εR( )
S'(η )(tP −tR +η(e))2
"
#
$$
%
&
''
"
#
$$$
%
&
'''
. (28)
With η”(e)<0 we assume a concave function of the inefficiency with respect to the
effort. That is, the marginal contribution of the effort is lower and lower in terms of the
inefficiency reduction.
Therefore, there is a trade-‐off between the effort exerted by the port and the
reduction of its inefficiency. There is a cost associated to exert the effort c(e) – equal to e
in our assumption. Each port (or terminal) would choose its own combination of (η*, e*).
The concave function is reasonable when considering that most inefficiency
reductions could be handled with investments on technological improvements or
optimization systems of bureaucratic procedures.41
Rearranging previous expression in terms of the likelihood ratio and renaming
Δε = εP −εR( ) , Δb= m−c( ) and Δt = tP −tR( ) ; the expression is
p'(e)p(e)
=−1−λµ
+η''(e) 1+Δb Δε
S'(η )(Δt+η(e))2#
$%%
&
'(( . (29)
41 We assume that reduction inefficiency can be attained by continuous technological improvements or optimization systems. But, port operators usually face discontinuity and improvements are associated to step functions. Qualitatively, our model would not change; we should only substitute derivates by discrete changes.

99
Knowing that the left-‐hand side of the equation is positive, we get some
reasonable findings on our parameters. Regarding external costs, maritime transport has
been pointed out as a more environmentally friendly mode than road (Medda and
Trujillo, 2010; Paixão and Marlow, 2002). Thus, Δε < 0 . Lastly, we also assume that ports
cover its operational costs.
Corollary 2. Under the previous assumptionsη''(e)< 0 , Δε < 0 and m>c, a necessary
condition is S'(η )(Δt+η(e))2 <−Δb Δε .
Both terms are positive; the right hand side of the previous condition is fixed
considering that prices and externalities are not affected by the subsidy. The left hand
side depends crucially on two unknown functions S’(η) and η(e). Here we can discuss
among different types of contracts – depending on different subsidies schemes – to
determine how they incentive port inefficiency reductions. Next section analyses previous
conditions by bearing in mind three different specifications.
4.5. How to incentivize gains in port efficiency?
The final inefficiency reduction crucially depends on the specific contract policy that the
government chooses. Concretely, in here we assess three different possibilities.
First, the government could consider a fixed payment subsidy that the operator
would receive regardless of the exerted effort. Second, a payment proportional to the
inefficiency reduction is also considered and third, the government could choose a two-‐

100
part contract with a fixed payment plus a payment proportional to the inefficiency
reduction. In order to get tractable expressions, we assume that the relation between
effort and inefficiency is characterized by η(e)=−e2 , that is, a concave function.
Fixed payment
It represents the most frequent mechanism exerted by the governments for funding
ports. This scheme comprises each policy based on giving a fixed amount of money to
port authorities or terminal operators.
In this setting, the infrastructure operator’s behaviour chooses the smallest
possible effort. Then, the government will anticipate this reaction, so if he proposes a
contract based on a fixed payment, he chooses the wage that exactly compensates the
operator for his effort.
Proposition 1. Under a fixed payment, the effort exerted by the operator is equal to 0,
e=0. Therefore, the optimal contract is a fixed payment equal to 0, S η( )= 0 .
Fixed payments – as grants – are popular in the EU. Indeed, the TEN-‐T programme
comprises the concession of a fixed subsidy to port improvements, where the EU covers a
percentage of total project costs. The TEN-‐T programme finances around 268 ongoing
and 59 closed projects with a budget of more than €7 billion.42 Its aim is to encourage the
cohesion and interconnection of European countries, by investing in each transport
42 March 2012. http://tentea.ec.europa.eu/en/ten-‐t_projects/.

101
mode. Approximately 1% of the total amount is designated to port improvements.43 Their
actions (as other programmes such as Marco Polo I and II) subsidize projects with a
specific amount of money no properly related to any result. Thus, ports have no
incentives to make a proper use of the funding; they could not be exerting the required
effort.
Proportional payment
The operator receives a payment proportional to the inefficiency reduction. Let us
assume that the proposed contract takes the form S η( )=αη .
The operator maximizes his profits considering this contract and the government
takes the operator’s decision as given to choose the minimum 𝛼.
Proposition 2. The minimum 𝛼, the one that determines the government’s choice, is given
by αMIN =Δb Δε
e2 −Δt( )2−12e
.
The marginal payment per inefficiency reduction depends negatively on the
exerted effort. Thus, the level of effort has a double role under this scheme. On one hand,
the higher the effort is, the higher the inefficiency reduction is; on the other hand, the
higher the exerted effort is, the lower the marginal payment per inefficiency reduction is.
43 http://tentea.ec.europa.eu/en/ten-‐t_projects/statistics/projects_managed.html.

102
Here it is necessary to analyse the role of alpha in previous expression. It is
straightforward to observe how this parameter establishes a direct relationship between
the degree of inefficiency and the subsidy. In other words, 𝛼 represents the value of the
inefficiency.
Port inefficiency, as seen in previous chapters, is mainly a question of time: access
and waiting time, loading and unloading time and each administrative procedure –
customs and sanitation, among others – may delay the movement of freight from origin
to destination.
Turning this model into an effective policy, a proportional payment would require
the establishment of a subsidy per inefficiency-‐reduction unit. Linking the subsidy with an
inefficiency-‐reduction – by giving funds for removing unnecessary administrative
procedures, improving the access to the terminal or implementing ITS systems, among
others – would be the key to make effective the current EU maritime transport policy.
This would have to meet the alpha-‐minimum condition determined above. Thereby, port
authorities or terminal operators would internalize the indirect benefits of each exerted
effort. The final subsidy would not depend on the effort but on the achievements in port
efficiency. From this, the entities would be encouraged to do their bests.
Two-‐part contract
Let us consider the establishment of a two-‐part contract. That is, a fixed payment and a
proportional one. In our case, it means S η( )=δ +αη .

103
This mixed contract is always theoretically preferred to the other alternatives. In
fact, both previous results can be obtained with this contract scheme; a more flexible
contract allows us to attain a lower social cost.
Proposition 3. Fixed part of the two-‐part tariff does not give incentives to the operator to
exert any level of effort. Thus, the optimal two-‐part tariff becomes a proportional one with
δ = 0 , and αMIN =Δb Δε
e2 −Δt( )2−12e
.
In our setting, the fixed parameter does not induce any effort: a two-‐part contract
would turn into a proportional payment, since fixed fee would not offer any incentive to
reduce the inefficiency in port or terminal activities. Particularly, propositions 2 and 3
provide the same result and the 𝛼 is the minimum one, where the marginal payment per
inefficiency reduction depends negatively on the exerted effort.
Hence, by comparing the three proposed contracts, the proportional payment
becomes the best alternative when considering the inefficiency reduction as the main
goal. Lastly, we should characterize the final equilibrium. That is uneasy if we do not
consider more restricted assumption or if we solve the problem for a particular case.
However, we have just concluded that a proportional payment equivalent to the
inefficiency reduction is the best alternative. This result validates our thesis that subsidies
similar to those proposed by European Commission are not an efficient mechanism for
forcing port or terminal operators to exert an effort in the inefficiency reduction.

104
It is also important to remark that we assume that government minimizes social
costs without considering the role of the management of the infrastructure or the
potential competition between port infrastructures. These are two relevant extensions
for future research. On one hand, the private participation in the public capital of the
infrastructure may affect the objective function of the regulator biasing the efficient
result achieved previously. On the other hand, competition between port infrastructures
may affect final results; in case port infrastructure is managed by a central government,
these may not compete between them through inefficiency reduction because strategic
behaviour of the central government.
4.6. Conclusions
It is broadly agreed that port efficiency is a major issue in maritime competitiveness. As in
every firm or institution, the proper performance of its activities is crucial to determine its
success. The EU recognizes the advantages of maritime transport for the European
society. Maritime corridors are accepted as the most environmentally friendly transport
mode, and also as an adequate competitor to road.
Traditionally the EU has expected the private sector to afford investments in
maritime transport, not being the case of other modes such as road or rail (Baird, 2007).
Thereby, promoting maritime corridors has become a strong requirement to reach the
maritime advantages, especially in terms of environment and competition.
The need of improving port efficiency is also pointed out by the Commission
through its different reports during the last decades. Mainly, it is regarded as a way to

105
promote maritime transport and, at the same time, to support these improvements.
However, this does not mean that the EU should support these projects without any
condition. This chapter asserts that the European programmes should link the funding
with the effort exerted by port operators. Current subsidies are a virtual waste of money
when they deal with port efficiency, not considering that sometimes ports could not have
the same incentives than governments.
We suggest that the government – mainly the EU, but also the national or regional
authorities – cannot observe the effort exerted by the infrastructure operator; it faces a
moral hazard problem. That means there is a risk when port infrastructure receives a
subsidy even if they do not exert any (or a low) degree of effort. In other words, the
information of the government and infrastructure operators to a contract is not
symmetric. Thus, in here we design a proper contract that gives incentives to port
authorities to exert the highest effort.
As mentioned, port inefficiency is mainly a matter of time: the more the
movement of cargo in port/terminal takes, the more inefficient the port/terminal is.
When a shipper faces the choice of a mode or another, total time is crucial in its decision.
Thus, longer time in ports reduce drastically the maritime transport competitiveness. In
other words, the reductions of time in ports should be regarded as efficiency gains.
In this chapter we prove how a proportional payment that connects the port
efficiency achievements with the subsidy is the best mechanism to incentivize ports to do
their bests. As a policy recommendation, here we propose the development of a subsidy
per inefficiency-‐reduction unit. If port operators perceive the benefits of decreasing total
time – by reducing administrative procedures or improving access to the infrastructure,

106
among others – then the policy will meet its real objective. Thereby, the efficiency gain
process would be internalized.
Lastly, it has to be remarked the necessity of developing a proper database of time
in ports. National port authorities should be worried about this matter if their objective is
to take the most of their funds. Without a right knowledge of time in port processes and
procedures, there is no chance of detecting the weakness and, therefore, of enhancing
the advantages of maritime transport.

107
CHAPTER 5
THE DETERMINANTS OF SSS POTENTIAL SUCCESS. A CASE STUDY
“Road users were not facing the ‘full cost’ associated to the mode, that is, a generalized
cost that included both its internal and external effects” (COM, 2001). In fact, the
discussion about the external costs of transport – pollution, congestion, noise, accidents
and climate change – has increasingly gained relevance in the European transport policy
during the recent decades. The 2011 White Paper (COM, 2011b) explicitly assumes that
the transport system (as currently defined) is not sustainable and radical changes have to
be implemented in the near future with the aim of favouring new transport patterns
according to which larger volumes of freight are carried to their destination by the most
efficient (combination of) modes.
As seen in Chapter 1, the promotion of maritime transport, globally considered as
more environmentally-‐friendly and safer than roads, has been one of the main solutions
implemented by the Commission to address this issue. After several years of explicit
political and financial support by the EU and Member States, SSS has not gained yet a
significant market share, and roads remain comfortably placed at the top of the European
freight transport market.
There are several factors that could explain this apparent failure and the still
unbalanced modal split. In previous chapters we have deeply studied port inefficiency as
one of the main reasons of this failure.
Another important factor to regard, as extensively analysed in the existing
literature, lies in the fact that the internalization of external costs has not been fully

108
achieved at European level.44 As suggested by Janic (2001), external costs are a crucial
component in the generalized cost associated to freight transport. This concept also
includes the rate(s) paid by the shipper for that service and the value of the time spent by
goods between their origin and their final destination (travel time, loading/unloading,
storage, etc.). These internal components of the generalized cost must be completed with
a corresponding economic valuation of the external costs imposed by that cargo
movement to the society as a whole (in terms of its particular contribution to pollution,
congestion, climate change, noise and accidents). If not, the users will not face the full
price of the transport service, and the resulting market shares will be distorted.
Both these reasons seem to suggest that European transport policies have not
offered so far the right incentives to effectively promote SSS as an alternative for the
users. Several programmes, for example, have been focusing on subsidizing to shippers
that choose a maritime alternative. By doing this, the EU has been generating a double
inefficiency: road transport has not been forced to assume its external costs and the
maritime market have been distorted by artificial means.
This chapter proposes a back-‐to-‐basics methodology. We want to study the
competitiveness of SSS – defined as being as good as or better than other modes in
certain routes – using several Spanish corridors as an example. The database includes
information from some of the most important ports located in Southern Europe
(connecting Spain with the rest of the continent via the Mediterranean and the Atlantic
Ocean). With them, we will first carry out a descriptive analysis and comparison of
selected SSS routes in terms of time, freight rates and external costs. We will then rely on
44 At national level, France will implement the Ecotasa in its roads at the end of 2013 (Chapter 1).

109
the generalized cost methodology to calculate the costs of carrying cargo from Madrid
and Barcelona (the country’s main economic areas) to several European destinations
(London, Paris, Berlin, Rome and Moscow) via different ports in a short sea shipping
intermodal chain, and contrast these values with an alternative city-‐to-‐city direct road
route. This will allow us to identify the role of external costs, time and prices in SSS
competitiveness and finally quantify how EU policies have affected the rates.
The main objective is to discuss whether (and why) some corridors (some of them
benefitting from European public funds) are actually a better alternative than road
transport or not. After this introduction, the structure of this chapter is as follows: next
section briefly discusses the demand perspective, which allows us to analyse the
competitiveness of the Spanish short sea shipping corridors competitiveness from the
three different categories of the transport cost function: prices, time and external costs.
After that, we calculate the savings that SSS provides in those categories. Finally, we
summarize the conclusions from this study case.
5.1. The demand perspective: price, time and external cost
Here the approach to the competitiveness of short sea shipping is based on the
generalized cost, a well-‐established principle to summarize the shipper’s decision in the
transport economics literature (Button, 2010).
From a user’s viewpoint, the demand for any particular service is inversely related
to the full price (P) that must be paid for it. In the particular case of freight transport, any
carrier commonly provides its services in exchange for a monetary price in the form of a

110
freight rate (including carriage, taxes, insurance, etc.) per kilometre, which is then
multiplied by the distance. In addition the shipper has to bear the (opportunity) cost of
the immobilized cargo during the transport service, which is proportional to total transit
time (defined by the ratio between distance and speed) and the value of time for the
average user. A third component, from the society point of view, is given by the external
costs per kilometre.
Following the theoretical Chapter 2 framework, now consider the situation
expressed in Figure 5.1. The shipper may choose between two alternative transport
modes. On one hand, the cargo can be transported directly by road between the origin
(e.g., Madrid, Barcelona) and the destination (e.g., London, Paris, Rome, Berlin, or
Moscow). Alternatively, the shipper may choose a SSS multimodal transport chain that
combines road (between origin and port C, and between port D and destination) with sea
transport (between C and D).

111
Figure 5.1. Two competing transport modes: SSS vs. Road transport
Source: own elaboration.
We can set out different agents involved in each market. In the road transport
option, there is only one agent: shipper 1. The SSS-‐intermodal option involves sea-‐
shipper, shippers 2 and 3 (to and from ports), and port services. We will determine the
generalized cost of each alternative, that is, the whole cost to include monetary cost
(price) as well as time and external costs, in order to obtain a better performance of cost
functions and to consider the traditional transport cost models.
In an internalized cost’ scenario, each company that wishes to carry cargo from a
specific origin to a specific destination should compare both generalized costs, and should
choose the one which has the lower full cost, that is, considering these three cost
components.
By#road#
Origin# Des/na/on#MADRID&
BARCELONA&
LONDON&PARIS&ROME&BERLIN&
MOSCOW&
By#SSS#
Port#C#
1
2# 3#
Port#D#

112
5.2. Case study: the competitiveness of the Spanish SSS corridors
As a case study, in this section we try to estimate the competitiveness of several Spanish
SSS corridors, through an analysis of different existing or potential routes that make use
of Spanish and other European ports in intermodal option. According to SPC-‐Spain (2011)
data, there are 34 services which link 43 European ports in the Cantabrian shore and 35
services linking 64 European ports in the Mediterranean, considering SSS as alternative to
road transport. We have selected the main ports located in the Iberian Peninsula:
Santander, Bilbao, Gijón, Ferrol and Vigo, in the Atlantic Ocean; Barcelona, Tarragona,
Castellón, Valencia and Cartagena, on the Mediterranean Sea (Figure 5.2). We have also
selected different routes, considering a standardized cargo that has to be carried from
two main Spanish economic centres (Madrid and Barcelona) to some of the main
European cities (London, Paris, Rome, Berlin and Moscow), as shown in Figure 5.3.

113
Figure 5.2. Major Spanish ports considered in this study case
Source: own elaboration.
At the same time, the choice of Madrid and Barcelona tries to consider the
differences in SSS competitiveness between coastal and non-‐coastal origin cities (and the
same for destination cities). The choice of destinations attempts to reflect different
European geographical areas, by considering main economic centres. Data has been
obtained from SPC-‐Spain and the Spanish Port Authority.
The capital city of Madrid is located in the centre of Spain, more than 300
kilometres away from the nearest port. With more than 6 million of inhabitants in its
surrounding economic area, and many redistribution chains to the rest of the country,

114
about 72% of the 2000 biggest Spanish companies are located here.45 We analyse the
freight of 18 cargo net tons,46 assuming an average road speed of 65 kilometres/hour,
and a price per kilometre of 1.1 euros,47 from Madrid to London, Paris, Rome, Berlin and
Moscow. Previous assumptions are also considered by Short Sea Promotion Agency
established by the Commission.48
Barcelona is located in the Mediterranean coast, with more than 1.6 million of
inhabitants (the second largest Spanish city after Madrid), and 5.5 million of inhabitants in
the Province. With a GDP per capita of 126.4% over the average EU-‐27,49 Barcelona is
definitely different from Madrid in terms of geographical situation.
45 http://www.investinspain.org. 46 This assumption is based on the weight allowed for an intermodal container in a twenty-‐foot equivalent unit (TEU). The maximum weight for cargo is estimated in 21.6 net tons. Thus, we assume the freight of 18 cargo net tons. 47 In Spain, price per kilometre by road is estimated between 1.1-‐2.4 euros, depending on type of cargo and lorry, mainly. This price includes not only fuel but also maintenance and depreciation costs, among other components (Spanish Ministry of Public Works, 2013). A higher value than here assumed would increase the competitiveness of SSS. Therefore, here we are placed in the most conservative scenario. 48 http://www.shortsea.es. 49 Catalonia Regional Government statistics in 2011. http://www.idescat.cat/economia/.

115
Figure 5.3. Routes from Madrid
Source: Google maps, SPC-‐Spain.
For all previous ten combinations, we have calculated time, prices and external
costs of carrying cargo from each origin-‐destination pair by road and also by an
intermodal chain, through using ports as nodes in maritime corridors. For instance, for
the combination Madrid – Rome, we calculate road option generalized costs and different
maritime combinations such as Barcelona, Valencia or Castellón origin ports, and
Citavecchia, Livorno (Italy) or Fos (France) destination ports.
5.2.1. The role of prices
One of the main objectives here is to encourage a real competition in freight transport by
reflecting both external and monetary costs. However, some exogenous factors affect the
latter, which finally is one of the main strategic variables in any market: price established
by transport operators.

116
When one firm needs to move a good from one city to another, it compares prices
between alternatives; in our case, we are comparing road transport versus the mixed
system of road-‐SSS-‐road, that is, the multimodal alternative. Using the same previous
structure of data, we try to establish whether there are some relationships among final
prices, characteristics of the route, competitors in the route, price of substitutive
alternative and others.
To answer these questions we created a database that includes the following
variables, all of which are used in the estimations described further on:
a. Total Cost per Kilometrei (mi): this is the endogenous variable, and it
represents the cost of the mixed option between two cities, per kilometre. It is
in current euros per kilometre. Source: own elaboration based on Short Sea
Promotion Centre Spain, shipping lines and Spanish Freight Road Transport
Costs Observatory50 data.
b. Subsidized routei: binary variable that takes value 1 if route considered
includes a SSS route that it is directly subsidized by European public funds for
creating a SSS route. Source: different EU funding programmes.51
c. Maritime frequency (MFi): this covariate measures the total number of weekly
trips between two ports considered. Source: Short Sea Promotion Centre Spain
and shipping lines.
d. Competitors in the route (NCi): the number of different competitors that
operate in the maritime route i at the moment we obtain data. We try to
50 www.fomento.es. 51 This variable is introduced to analyse the success of the subsidies at European level. Thus, some regional initiatives such us the Italian Ecobonus or the Basque Country Ecobono are not considered.

117
control a competition effect on prices on maritime traffic on each route.
Source: Short Sea Promotion Centre Spain.
e. Distancei: total number of kilometres between ports of origin and destination.
This variable has been included to control for route characteristics and
economies of scale in the operations of maritime transport. We also included
the percentage share of maritime corridor in the whole distance. Source:
Google maps.
f. Road transport cost (RCi): this is the total cost, in current euros, of the road
alternative to reach the two cities joined. We expect that a higher cost of
alternative, a higher level of demand and higher prices in the SSS route.
Source: Short Sea Promotion Centre Spain based on Spanish Freight Road
Transport Costs Observatory data.
g. GDP origin and destination: Gross Domestic Product of region in which both
ports are located. In current euros, 2012. Source: Eurostat.
Table 5.1 includes the descriptive statistics of variables considered. We split the
sample between subsidized and non-‐subsidized routes. The database includes 185
observations in 2012.

118
Table 5.1. Descriptive statistics by subsidized routes
Variable Mean Std. Dev. Minimum Maximum
S Non-‐S S Non-‐S S Non-‐S S Non-‐S
Total cost per km
2.90 2.99 1.63 1.94 0.76 0.68 6.72 14.5
Maritime frequency
1.05 1.51 0.48 1.41 0.5 0.25 2 6
Competitors in the route
1 1.06 0 0.25 1 1 1 2
Distance 1327.67 1778.1 775.94 1201.2 796 343 2969 3758
Road transport cost (alternative)
0.82 0.73 0.22 0.30 0.37 0.21 1.22 1.43
% distance by sea
43.5 44.1 18.2 17.8 17.5 7.9 78.6 82.7
GDP region of origin
22600 23561.3 3419.5 3557.5 19100 19100 29700 29700
GDP region of destination
26766.6 27358.2 3671.3 5938.8 22600 13824 31400 40100
Note: S: Subsidized route; Non-‐S: non-‐subsidized route.
The average total cost per kilometre of a route is 2.90 and 2.99 euros in subsidized
and non-‐subsidized one respectively. This two average data are quite similar and, in fact,
no statistical differences are in means, by t-‐test. Non-‐subsidized routes show more
maritime frequencies, competitors, distance and average GDP´s than subsidized ones.
However, no significance differences exist among them.
Our main objective is to test what factors affect the total cost using a SSS
mechanism. For this reason, we have established a gravitational relationship among
variables described in the following equation.
mi = β0 +β1Subsidizedi +β2MFi +β3NCi +β4Distancei +
+β5RCi +β6GDPo+β7GDPd + Port9effecti +i=8
18
∑ εi (30)

119
The estimations results are included in Table 5.2. Our empirical strategy has been
to include gradually the variables, using subsidized route, frequency and distance as the
explanatory variables in the base. All estimations have been made using OLS estimations,
considering cluster option in Stata, by route, to minimize errors within groups in order to
control the possible existence of heterogeneity among the observations of different
routes.
Table 5.2. Estimation results
Explanatory variables (A) (B) (C) (D) (E)
Subsidized route -‐0.59 (0.27)* -‐0.60 (0.28)* -‐0.57 (0.26)* -‐0.17 (0.13) -‐0.19 (0.08)*
Maritime frequency -‐0.07 (0.06) -‐0.07 (0.06) -‐0.07 (0.06) -‐0.08 (0.03)** -‐0.19 (0.06)**
Competitors in the route 0.35 (0.31) -‐0.11 (0.14) -‐0.75 (0.12)***
Distance -‐0.001 (0.0003)**
-‐0.001 (0.0002)**
-‐0.001 (0.0002)**
2e-‐4 (6e-‐5)** 0.0001 (6e-‐5)
Road transport cost (alternative)
-‐0.02 (1.68) -‐0.018 (1.70) 0.94 (0.27)** 1.04 (0.34)**
% distance by sea -‐9.67 (1.59)***
-‐9.36 (1.23)***
GDP region of origin 6e-‐5 (4e-‐4)
GDP region of destination -‐6e-‐8 (6e-‐6)
Fixed effects by Port of origin No No No No Yes
Constant 4.98 (0.93)*** 5.00 (1.42)** 4.59 (1.68)** 6.46 (0.64)*** 6.21 (0.74)***
Observations 185 185 185 185 185
R2 0.38 0.38 0.38 0.75 0.79
F-‐statistic 14.16** (*) (*) (*) (*)
Note 1: *** 1%, ** 5%, *10% significance test. Standard errors are shown in brackets.
Note 2: (*) Due to use of cluster option, Stata does not report the F statistic for conjoint significance.
All variables show jointly significance and the explanatory capacity of the
estimated models is quite satisfactory. The following conclusions can be drawn from
these findings. Firstly, it appears to exist some scale economies in these routes, due to

120
the negative sign of coefficient of distance. However, when we introduce more
explanatory variables distance becomes a non-‐significant covariate, which rejects this
hypothesis.
Secondly, subsidized binary variable shows a negative effect on prices, which
means that prices in these routes are lower than in others. Another interesting result is
the effect of competition on prices: both maritime frequency and number of competitors
are significant and show a negative effect on prices. These results induce to foster
maritime competition to make this transport mode more attractive to users.
The effect of alternative cost is positive. This means that higher cost of road
transport from pair cities considered, higher prices in the mixed corridor. This outcome
maybe is caused by a demand effect on SSS corridor, due to a substitution effect between
both alternatives. Finally, the higher percentage of distance moved by sea, the lower the
price.
5.2.2. The role of time and external costs
This section examines the up and down of maritime transport. On the one side, external
costs are pointed out as the main reason for the promotion of this mode, conventionally
regarded as environmentally friendly. On the other side, time has not been traditionally
considered a competitive variable in maritime: it has been even named as a trade barrier
(Hummels, 2001). To completely assess the competitiveness of a SSS route, it is needed
to address these full-‐cost terms.

121
In previous subsection, we have tried to shed some light on the determinants of
SSS monetary price through an econometric specification. With regard to time and
external costs, these estimations are not required. Travelling time depends on distances
and speeds; that is, fixed and known factors. There is also other time that is not taken
into consideration in this analysis: port time. This time – previously defined as the sum of
port access time, loading and unloading time of cargo, ship waiting time and time for
customs and other administrative procedures – are positively related to estimated levels
of port inefficiency. A more detailed analysis should include these variables that influence
on SSS competitiveness through the role of ports.
Considering the externalities, here we included the cost in terms of CO2 emissions.
Other external costs such as congestion or accidents are not considered. In any case, its
introduction will not change the results and discussions, as we will show later. It has to be
mentioned that we include maritime options which can be preferred by operators taking
into account different preferences: that is, an operator may prefer to spend more time
instead of paying a huge amount of money, or reverse. We do not include some maritime
options which are dominated by others: that is, if a maritime corridor takes more time, is
more expensive and generate more external costs than other; it is eliminated.
Tables in the Appendix summarize the movement of cargo from Madrid and
Barcelona to the main European cities, reflecting external cost and time of different
maritime options according to diverse origin-‐destination ports combinations. Below we
report a summary of the different corridors.

122
-‐To Paris
From Madrid, road option monetary cost, not considering external costs, is always lower
than any maritime option. However, if EU would internalize external costs, the difference
between road and intermodal option, by using Gijón (Spain) and Saint Nazaire (France)
ports, decreases substantially. Thus, intermodal option would suppose a minimal price
increase, but reducing time in more than a 15% (7 hours, approx.). Other maritime
options generate higher prices and external costs, and also time. Therefore, Gijón – Saint
Nazaire route could be a more competitive option easily by internalizing external costs.
An increase of 1.75% in monetary cost would reduce time cost in a 15%, so the
companies’ choices will finally depend on each time value.
In the route from Barcelona, the competitiveness of SSS corridors is not quite
clear. Not internalizing the external costs, there is no discussion in considering road
transport as the most competitive option (lower monetary and time costs). However, if
companies assume external costs, SSS converts the most competitive in terms of money,
but definitely not in terms of time, where almost double to road transport ones.
-‐To Rome
Let us consider now Madrid – Rome route. In this case, as shown in Table A.1, there are
eleven intermodal options cheaper than road corridor. There is no discussion about the
competitiveness of SSS with Madrid as origin and Rome as destination. The situation of
Civitavecchia (Rome) and the Mediterranean Spanish ports such as Barcelona, Valencia,
Tarragona or Castellón turns into the real explanation of maritime corridors advantage.

123
Moreover, taking into consideration the time, most of intermodal routes (especially
Barcelona-‐Civitavecchia), take less time in carrying cargo from Madrid to Rome.
With regard to the Barcelona-‐Rome route (Table A.2), the analysis is
straightforward. Being two coastal cities, with two important ports respectively, there is
again no discussion in the competitiveness and potential of SSS for this route. Even not
internalizing the external costs, the maritime option is much more competitive than road
in every single part of the generalized cost function. All of these previous routes are not
(and should still not being) subsidized by European funding programmes in terms of
monetary cost, due to the fact that they are actually more competitive. In terms of time
cost, the most competitive route takes almost the half of road option (from Barcelona to
Civitavecchia port, with a reduction from 65.5 to 33.2 hours).
-‐To London
Now we consider the routes to London. From Madrid, without internalizing external
costs, six intermodal corridors are more competitive than road option only considering
monetary cost. Concretely, the ones which make use of Bilbao and Santander (Cantabrian
Sea) and British ports such us Portsmouth, Plymouth or Poole, or even through Zeebrugge
(Belgium) and then, from there to London through English Channel. Moreover, four of
them spend less time than road corridor, so shippers should prefer them. Three of the
last are subsidized when their generalized costs are always lower than road option
generalized cost. What it is more important; if external costs are internalized, three
others corridors from Bilbao, Gijón and Ferrol to Saint Nazaire (France) and Antwerp or

124
Zeebrugge (Belgium) ports are more competitive than road transport, although only
Gijón-‐St. Nazaire seems to be competitive according to time cost.
Nevertheless, considering the route from Barcelona, when external costs are not
internalized, the preferred option by companies does not match with the social one. As
Table A.2 highlights, road transport monetary cost is lower than maritime, but in terms of
time, the combination Bilbao-‐Portsmouth ports is more competitive. As internalized
prices show, by forcing companies to assume external costs, this last option becomes the
one with a lower generalized cost. This combination (also with Genoa as destination port)
proves the competitiveness of SSS through the internalization of external costs in terms
of CO2 emissions.
-‐To Berlin
From Madrid, it is straightforward to observe how, considering only monetary cost (the
one that actually the shippers perceived) four routes show a lower cost. However,
according to time, they all are less competitive, so the shipper choice would finally
depend on time value. But if we internalize external costs, the maritime route from
Valencia to Genoa becomes the most competitive option, with a lower generalized cost.
This route shows the real competitiveness of SSS through the internalization of damages
to the society from road transport in terms of CO2 emissions.
With regard to Barcelona-‐Berlin route, as Table A.2 shows, Barcelona to Genoa
SSS corridor turns into the most competitive option, even when road transport does not

125
internalize its external costs. It is also the best option in terms of time, usually the less
competitive variable of maritime transport.
-‐To Moscow
Finally, we have included a destination where road transport (as unique mode and as part
of an intermodal chain) takes more time. As Table A.1 shows, there are five intermodal
options that are more competitive than road in terms of monetary costs. Moreover, two
of them (Santander and Ferrol, Spain – Kotka, Finland) present lower time than road, in a
20.6 and 18.6% respectively. In a similar analysis than previous cases, we observe how
some other corridors become a competitive option by internalizing external costs; they all
generate a lower generalized cost (monetary, time as well as external costs) than road.
Finally, in Table A.2 we also analyse the route from Barcelona. Departing from
Barcelona port and arriving to Livorno port, the maritime corridor provides a lower
monetary cost and also a reduction in terms of external costs, but it is less competitive
than road in terms of time. However, the combination of Barcelona and Genoa ports
would report a lower cost in terms of money if external costs were internalized, and
would reduce time in more than 30 hours.
5.3. Deconstructing the savings from SSS
From previous analysis, it has been proved how, according to different destinations and
distances, some SSS routes would turn into the most competitive option to carry cargo by

126
internalizing external costs.52 However, in some cases the best option is not quite clear.
Monetary price, time and external costs provide evidences to choose different
alternatives. Thus, the final choice will depend on user’s time value.
Table 5.4. Deconstructing SSS savings. The case of Madrid
Route from Madrid
Best Origin–Destination ports combination
Monetary Cost
Time Cost External Cost Generalized prices
to Paris Gijón -‐ St. Nazaire -‐6.8% 15.08% 16.54% Undetermined
to Rome Barcelona-‐ Civitavecchia 26.9% 49.3% 52.3% gROAD > gSSS
to London Bilbao -‐ Portsmouth 35% 40.27% 50.45% gROAD > gSSS
to Berlin Bilbao -‐ Zeebrugge 7.44% -‐4.70% 44.9% Undetermined
to Moscow Santander -‐ Kotka 6.41% 20.6% 40.59% gROAD > gSSS
In Table 5.4, SSS savings are considered by selecting the most competitive origin-‐
destination ports pair for each route from Madrid. As expected, SSS would reduce the
external costs in all the cases analysed, reaching in some of them a reduction to the half.
Road generalized prices are higher than maritime ones in routes to Rome, London and
Moscow: SSS is more competitive not only in monetary or external costs but also in
time.53
In these cases, no matter what the time values of companies are, we already know
the sign of these expressions. However, considering routes to Paris and Berlin,
generalized cost expressions, and therefore, the choice of the most competitive mode will
finally depend on time values. In Madrid-‐Paris route, maritime-‐multimodal option would
report lower external and time costs, but would lose competitiveness in terms of
52 As detailed in Chapter 1, SSS also needs to regard some conditions on fuels and vessels to really reach the most of its competitiveness in terms of external costs. 53 EU road safety issues have also an impact on road transit time. The current legislation forces professional drivers not to exceed 9 hours a day or 56 hours a week. Moreover, they are required to stop after 4,5 hours for a break of at least 45 minutes, among other restrictions. Therefore, SSS could also provide an advantage in these terms, considering the possibility to rest in the ship during the journey. See more in http://ec.europa.eu/transport/road_safety/users/professional-‐drivers/index_en.html.

127
monetary costs. But, with an increase of a 6.8% of the latter, a reduction of 15.08% and
16.54% in time and external costs, respectively, would be achieved. Finally, taking into
consideration the route from Madrid to Berlin, we found the common case of maritime
transport. By using the ports of Bilbao and Zeebrugge, a reduction of monetary and
external costs would be reached, but time would be higher.
The lack of data does not allow us to consider the impact of port-‐related time on
those generalized cost functions. Therefore, time cost savings should be faced waiting,
load and unload, custom and other administrative procedures time. Our analysis in terms
of costs savings could be considered as a maximum gap in order to keep SSS
competitiveness.
Previous analysis is conditioned by the choice of Madrid as origin. Therefore, the
results depend on its location: in the middle of the Iberian mainland, far from the coast.
In order to see if, as expected, SSS competitiveness increases when origin markets are
really close to the shore, we carried out the same analysis but considering the city of
Barcelona as origin.
Table 5.5. Deconstructing SSS savings. The case of Barcelona
Route from Barcelona
Best Origin–Destination ports combination
Monetary Cost Time Cost External Cost Generalized
prices
to Paris Barcelona-‐Fos -‐6.76% -‐88.3% 30.56% Undetermined
to Rome Barcelona-‐ Civitavecchia 40.32% 50.11% 76.7% gROAD > gSSS
to London Bilbao -‐ Portsmouth -‐5.15% 9.34% 30.50% Undetermined
to Berlin Barcelona -‐ Genoa 71.28% 13.56% 27.01% gROAD > gSSS
to Moscow Barcelona -‐ Genoa -‐0.91% 30.63% 15.88% Undetermined
Barcelona, being a coastal city, provides some advantages in the commerce with
other coastal cities such as Rome, as shown in Table 5.5. It is probably the most

128
competitive Spanish SSS corridor, due to the European geography, as cost data reflects.
Barcelona-‐Genoa seems to be a highly potential SSS corridor to carry cargo from
Mediterranean Spanish coast to Central and East Europe, in terms of generalized costs. As
obvious, Barcelona port does not seem to be a proper way to get to London, but maritime
option could have also a chance through Bilbao port in the Cantabrian Sea, and
Portsmouth in the British coast. Finally, maritime transport from Barcelona to Paris is not
really competitive, with an increase in time costs of 88.3% and in monetary cost in 6.76%.
Only by internalizing external costs, SSS suits a more competitive option in terms of
money, but it also seems that the increase in time is too large to be compensated in the
generalized cost function.
5.4. Conclusions
In this chapter we have carried out an analysis of Spanish SSS corridors, in order to
attempt their potential and competitiveness. Frequently, it is assumed that maritime
transport generates longer transit time, and it is seen as the slowest mode of transport.
However, the European geography provides a very proper scenario to encourage SSS
corridors. In the present analysis, the Mediterranean and Cantabrian coasts have proved
to be suitable locations to establish some profitable corridors to central and east Europe.
From non-‐coastal cities, as Madrid, it has been shown how some SSS corridors
reduce transit time in most of cases, especially to Rome (49.3%) or London (40.27%),
through Barcelona and Bilbao ports. Considering a coastal city as Barcelona, these time
savings are remarkably important in the routes to Rome (50.11%) and Moscow (30.63%).

129
Generally speaking, the Port of Barcelona seems to be very competitive in the
establishment of SSS corridors across the Mediterranean Shore.
At the same time, it is crucial to take into consideration the need of avoiding the
external costs provoked by road transport. As expected, SSS corridors generate a
substantial reduction in every single analysed route comparing to road transport, and
varying from 15.88 to 76.7%. This is mainly the reason why EU has been promoting
maritime corridors. However, as mentioned, these savings must be faced to increases in
time and monetary cost in order to finally determine the most competitive mode of
transport for each route. Only a generalized cost perspective indicates the real
competitiveness of a corridor. Furthermore, as Chapter 1 mentioned, the use of
appropriate environmental technologies in fuels and vessels is also required.
Moreover, there are also other variables that have to be considered. Time in
ports, as load or unload waiting, customs and other administrative procedures time must
be taken into account. In this chapter these time costs are not included because of the
lack of data. Nevertheless, the importance of these components is crucial and has been
deeply analysed in previous chapters. As the sum of them is the unique variable that we
do not control here, our analysis could be useful as a reference to consider the gap that
ports have before reducing the competitiveness of SSS corridors to the point of making
road the most attractive mode to users. In other words, if the generalized price of SSS in a
specific corridor is lower than road in terms of monetary, external and time costs, and the
SSS time savings are x hours, then ports should not incur in higher time than x. Here we
provide a methodology to determine x in different cases, in an attempt to be useful to
port authorities and EU policies.

130
Using an own elaborated database, we have estimated a price equation to test
what factors affect pricing decisions in a SSS route. The results yield to three main
conclusions: firstly, subsidized routes show lower prices than non-‐subsidized ones. It
means that there is a positive incidence on prices from EU public expenditure on SSS.
Second, that higher cost of alternative road transport, higher prices in the mixed corridor.
And finally, the importance of competition: prices are lower in routes with higher
maritime frequency and higher number of competitors. For these reasons, public policies
must to encourage not only the use of SSS by attracting them to firms, but also to
improving the levels of competition in this mode.
Finally, we should remark that SSS corridors have to be promoted only in cases
where it is the most competitive mode of transport, and to know that we have to
consider all the variables that compose their different generalized prices and compare
among them and also other modes as, mainly, road transport. EU should be worried
about reducing the inefficiency in the freight market, by making modes to assume the
real cost that they produce and promoting those SSS-‐intermodal corridors that are
actually the best alternative to the society.

131
APPENDIX
Table A.1. Routes from Madrid
Port A Port B Maritime price (€)
(1)
Maritime time
(hours) (2)
Maritime external costs (€)
(3)
Monetary cost (€)
(4= 1+road costs)
Total time (hours) (5= 2+
road time)
Total external costs (€)
(6= 3+ road ext. costs)
Subsidized
Int. Price (€) (4+6)
To Paris
Road Option 1398 43.1 423 1821
Gijón St. Nazaire 450 21 49 1500 36.6 353 No 1853
Bilbao Zeebrugge 950 44 127 1759 56.4 362 No 2121
Bilbao Portsmouth 900 30 100 1785 43.4 356 No 2141
Vigo St. Nazaire 650 30 83 1826 48.1 425 Yes 2251
Santander Portsmouth 900 30 96 1848 44.3 372 Yes 2220
To Rome
Barcelona Civitavecchia 21 800 79 1577 33.2 312 No 1889
Valencia Livorno 30 850 96 1724 43.1 348 No 2072
Barcelona Livorno 78 600 68 1761 95.9 407 No 2168
Valencia Cagliari 30 850 82 1843 44.6 367 No 2210
Tarragona Genoa 54 638 72 1867 72.0 428 No 2295
Valencia Genoa 31 852 92 1870 46.0 384 No 2254
Barcelona Genoa 24 590 63 1895 43.8 442 No 2337
Barcelona Livorno 21 750 68 1911 38.9 407 No 2318
Valencia Salerno 52 960 128 1978 67.0 420 No 2398
Castellón Fos 54 500 57 2086 88.2 509 No 2595
Barcelona Fos 30 300 33 2100 67.9 550 No 2650
Road Option 2160 65.5 654 -‐ 2814
To London
Bilbao Portsmouth 900 30 100 1482 38.7 272 No 1754
Santander Portsmouth 900 30 96 1545 39.6 288 Yes 1833
Santander Poole 900 33 90 1611 43.5 300 Yes 1911
Bilbao Zeebrugge 950 44 127 1738 55.4 356 No 2094
Santander Zeebrugge 1000 40.1 123 1851 52.4 372 No 2223
Santander Plymouth 900 30 77 1859 44.4 356 Yes 2215
Road Option 1901 50.8 575 -‐ 2476
Bilbao Antwerp 1050 78 140 1932 91.3 395 Yes 2327
Gijón St. Nazaire 450 21 49 1948 53.3 477 No 2425
Ferrol Zeebrugge 1000 102 127 2020 117.4 427 No 2447

132
Table A.1. Routes from Madrid (cont.)
Port A Port B Maritime price (€)
(1)
Maritime time
(hours) (2)
Maritime external
costs (€) (3)
Monetary cost (€)
(4= 1+road costs)
Total time (hours) (5= 2+ road time)
Total external costs (€)
(6= 3+ road ext. costs)
Subsidized
Int. Price (€) (4+6)
To Berlin
Cartagena Bremen 1335 198 331 2319 212.8 617 No 2936
Bilbao Antwerp 1050 78 140 2367 107.9 516 Yes 2883
Bilbao Zeebrugge 950 44 127 2378 75.3 534 No 2912
Santander Zeebrugge 1000 40.1 123 2491 72.3 550 No 3041
Road Option 2555 71.7 774 3329
Valencia Genoa 852 31 92 2655 68.5 602 No 3257
Barcelona Genoa 590 24 63 2680 66.3 660 No 3340
To Moscow
Bilbao S. Petersb. 2700 174 362 4172 205.9 781 No 4953
Santander Kotka 2600 101.2 343 4286 136.7 824 No 5110
Cartagena Bremen 1335 198 331 4430 275.1 1203 No 5633
Ferrol Kotka 2600 102.4 347 4455 141 879 No 5334
Bilbao Helsinki 2700 150 337 4466 186.4 837 No 5303
Road Option 4580 172.3 1387 -‐ 5967
Bilbao Antwerp 1050 78 140 4589 171.7 1133 Yes 5722
Bilbao Zeebrugge 950 44 127 4605 139.9 1152 No 5757
Valencia Livorno 850 30 96 4705 128.3 1176 No 5881
Santand. Zeebrugge 1000 40.1 123 4718 136.9 1168 No 5886
Source: own elaboration. External costs have been calculated from www.shortsea.es.
Note: Int. Price refers to Intermodal Price.

133
Table A.2. Routes from Barcelona
Port A Port B Maritime price (€)
(1)
Maritime time
(hours) (2)
Maritime external
costs (€) (3)
Monetary cost (€)
(4= 1+road costs)
Total time (hours) (5= 2+ road time)
Total external costs (€)
(6= 3+ road ext. costs)
Subsidized
Int. Price (€) (4+6)
To Paris
Road Option 1139 28.4 494 -‐ 2125
Barcelona Fos 30 300 33 1216 53.5 343 No 2058
Barcelona Genoa 24 590 63 1685 50.5 444 No 2225
To Rome
Barcelona Civitav. 21 800 79 897 22.2 106 No 1003
Barcelona Livorno 78 600 68 1081 84.9 201 No 1282
Barcelona Genoa 24 590 63 1215 32.8 236 No 1451
Tarragona Genoa 54 638 72 1389 64.6 283 No 1672
Barcelona Fos 30 300 33 1420 56.9 344 No 1764
Road Option 1503 44.5 455 -‐ 1958
Castellón Livorno 102 700 91 1505 114.2 322 No 1827
Valencia Livorno 30 850 96 1733 43.3 351 No 2084
To London
Road Option 1631 47.1 494 -‐ 2125
Bilbao Portsm. 30 900 100 1715 42.7 343 No 2058
Barcelona Fos 30 300 33 1781 62.2 444 No 2225
Santander Portsm. 30 900 96 1817 54.4 370 Yes 2187
Santander Poole 33 900 90 1883 58.3 382 Yes 2265
Bilbao Zeebrugge 44 950 127 1971 59.4 427 No 2398
To Berlin
Barcelona Genoa 24 590 63 590 55.3 454 No 1044
Road Option 2055 64 622 -‐ 2677
Barcelona Fos 30 300 33 2164 78.1 550 No 2714
Tarragona Genoa 54 638 72 2174 87.1 501 No 2675
To Moscow
Barcelona Livorno 78 600 68 4062 170.1 1029 No 5091
Road Option 4076 153.5 1234 -‐ 5310
Barcelona Genoa 24 590 63 4104 117.5 1038 No 5142
Tarragona Genoa 54 638 72 4278 149.3 1085 No 5363
Bilbao S.Petersb. 174 2700 362 4405 209.9 852 No 5257
Source: own elaboration. External costs have been calculated from www.shortsea.es.
Note: Int. Price refers to Intermodal Price.

134
In order to meet the requirements established by the University of Las Palmas de
Gran Canaria to obtain the doctoral degree, Part II of this document comprises a
summary in Spanish of the above contents.

135
Los puertos en el transporte
marítimo de corta distancia UN ANÁLISIS CRÍTICO DE LA POLÍTICA DE TRANSPORTE MARÍTIMO EUROPEA54
Resumen de la Tesis Doctoral
Autor:
Ancor Suárez Alemán
Directores:
Dr. Javier Campos Méndez Dra. Lourdes Trujillo Castellano
54 El presente documento ha sido realizado a partir de la financiación del Programa de Formación del Personal Investigador, de la Agencia Canaria de Investigación, Innovación y Sociedad de la Información del Gobierno de Canarias y la cofinanciación y tasa de cofinanciación del Fondo Social Europeo.

136

137
I. INTRODUCCIÓN
Desde el inicio de los tiempos, varias han sido las civilizaciones que han hecho uso del mar
para expandir sus horizontes económicos. Mucho ha pasado ya desde aquellos botes que
desafiaban el oleaje por los siete mares con una tecnología similar a la de un cascarón de
nuez. Progresivamente, la flota marítima mundial mejoró de un modo tal que permitió al
comercio ser clave para el crecimiento económico y el bienestar social de las regiones. Es
a partir del siglo diecinueve cuando inventos tales como la máquina de vapor marcan una
edad de oro para el transporte marítimo de larga distancia, mientras que la mejora de
infraestructuras terrestres como la carretera o el ferrocarril generan duros competidores
para el transporte marítimo de corta distancia (TMCD). Aun con todo, en la actualidad
alrededor del 80% del comercio mundial se lleva a cabo por mar (COM, 2009a). Esto
significa que alrededor de un 80% de la mercancía precisa de un barco para ser
transportada desde el origen, donde es producida, hasta el destino final donde será
consumida. Este dato supone igualmente que alrededor del 80% de los bienes que vemos
si apartamos la vista de esta lectura han pasado por algún puerto.
En cuanto a Europa, la navegación marítima ha sido comúnmente identificada
como un factor clave para la relevancia histórica de la región, su influencia cultural y su
potencial económico (COM, 2009a). Tanto el esplendor como la caída de civilizaciones
como la griega, la fenicia, los romanos, la liga hanseática, los españoles, los holandeses,
ingleses y muchos otros imperios han estado explicadas por el resultado de sus
actividades comerciales mediante el transporte marítimo. Hoy en día, alrededor del 90%
del comercio exterior de la Unión Europea (UE) se lleva a cabo por mar, cifra que se sitúa
en el 40% para el comercio intrarregional mediante las actuales rutas de TMCD.

138
La UE prevé que el comercio marítimo aumente desde los 3,8 billones de
toneladas contabilizados en 2006 hasta los 5,3 billones estimados para 2018 (COM,
2009a). La principal consecuencia de esto resulta en la necesidad de desarrollar una
infraestructura – en este caso, el puerto y su hinterland55 – capaz de hacerse cargo de un
incremento del tráfico de entre un 30% y un 50% para el periodo 2030-‐2050 (COM,
2012a). Esto supondrá igualmente un gran impacto sobre el empleo de un sector que
genera millones de puestos de trabajo de manera directa, indirecta e inducida.
Especialmente en el caso de España, país que posee el mayor ratio de trabajadores
relacionados con dichas infraestructuras de Europa (COM, 2006a).
Todo lo anterior resume la importancia del transporte marítimo – y en especial de
los puertos – para la sociedad europea. De este modo, cualquier medida encaminada a la
mejora de estas infraestructuras y de los corredores que se forman a partir de ellas debe
ser considerada como un beneficio para la sociedad en su conjunto. Sin embargo, como
mostrarán más adelante los datos, la carretera continúa siendo el modo preferido por los
transportistas europeos, a pesar de tratarse de un modo de transporte que genera
mayores costes externos que sus competidores directos – el tren y el TMCD,
principalmente. La congestión, polución, el cambio climático, ruido y accidentes han
forzado el desarrollo de una política de transportes socialmente responsable. Del mismo
modo, la UE ha reconocido las ventajas que el TMCD ofrece en relación a la competencia
intermodal en la región. La posibilidad de equilibrar un reparto modal que en la
actualidad favorece a la carretera –modo de transporte que absorbe aproximadamente la
55 Este término hace referencia al área de influencia del puerto, que dependerá no sólo de su localización sino de sus conexiones y de la competencia de los puertos cercanos.

139
mitad de la cuota de mercado total en la UE – resulta también uno de los principales
motivos de promoción del TMCD en la UE (COM, 2012c).
En resumen, durante las últimas décadas la UE ha centrado sus esfuerzos en
reducir los efectos medioambientales generados por el transporte, además de equilibrar
el reparto modal en el transporte de mercancías. Y la promoción del TMCD responde
perfectamente a estas voluntades.
No existe una única definición del TMCD. Musso and Marchese (2002) proponen
una clasificación del concepto atendiendo a cuatro criterios: (a) geográficos, basados en la
longitud de la ruta; (b) una visión orientada a la oferta, basada en el tipo y tamaño de
containers; (c) comercial o de demanda, distinguiendo entre tráfico feeder, intrarregional
y naturaleza de la carga y, por último; (d) visión legal, de acuerdo a los puertos miembros
de un mismo estado. Como declaran Paixão and Marlow (2002), el TMCD puede hacer
uso de diferentes tecnologías en barcos, desde los más convencionales a los más
innovadores, con una gran variedad en las técnicas de manejo de la mercancía
(horizontal, vertical o una combinación de ambas), o con diferentes características en los
sistemas de información, redes y puertos – los cuales, a su vez, pueden ser estudiados
desde una perspectiva económica, ingenieril, logística, regulatoria o de gestión. De este
modo, se observa la inexistencia de acuerdo incluso en cuán corta debe ser la distancia
para hablar de TMCD. Para determinar la misma podemos basarnos en el informe
publicado por el Ministerio de Fomento (2011), donde se sugiere escoger corredores de
alrededor de 800 kilómetros que se encuentren en competencia directa con la carretera.
Esta tesis adoptará la descripción oficial de la UE, según la cual se define el TMCD
como el movimiento de mercancías y pasajeros por mar entre puertos situados en la

140
geografía europea o entre aquellos puertos situados en países no europeos cuyas costas
se encuentren cercanas a las europeas.
Igualmente, la Comisión Europea (CE) ha afirmado que el TMCD ofrece mayores ventajas
en términos medioambientales que ningún otro modo, hecho que ha sido igualmente
refrendado por gran parte de la literatura existente (Medda and Trujillo, 2009). Debido a
ello, y a su potencial en el transporte intermodal de mercancías europeo, la UE ha
desarrollado en los últimos años una serie de políticas con el objetivo de alcanzar una
verdadera competencia intermodal en el sector. Programas (analizados más adelante)
tales como la Acción Piloto para el Transporte Combinado (APTC), Marco Polo I y II y la
Red Trans-‐Europea de Transportes (RTE-‐T) han sido diseñados – considerando ciertas
diferencias entre ellos en cuanto a objetivos específicos, tiempos y aspectos formales –
para promocionar modos de transporte socialmente preferidos, además de la
intermodalidad de los mismos. En concreto, APTC, Marco Polo I y II se han centrado en la
promoción del TMCD a través de la concesión de ayudas a aquellas compañías que
transfiriesen mercancía desde la carretera.
Por otra parte, se ha estimado que alrededor del 40-‐60% de los costes totales del
TMCD se corresponden con tasas portuarias (Pettersen, 2004). Aun así, el papel que los
puertos juegan en la promoción del TMCD no ha sido abordado: las políticas de la UE se
han centrado básicamente en incentivar a los transportistas para que desplacen sus
mercancías a través de rutas TMCD en lugar de hacer uso de la carretera. En concreto, los
programas Marco Polo se han basado en la concesión de ayudas a determinadas
compañías con el objeto de que cubran parte de los costes asociados al lanzamiento y
operación de proyectos de intercambio modal. Sin embargo, ninguno de estos programas

141
ha considerado la mejora de la eficiencia portuaria como un modo de equilibrar este
reparto modal.

142
Figura 0.1. Carta de navegación
Fuente: elaboración propia.
La UE promociona el transporte marítimo ���
-------���SSS
¿Cómo? ¿Cómo no?
Mediante ayudas a las compañías que transfieran carga de la carretera al mar y
financiando infraestructura
Promoviendo la eficiencia portuaria
¿Cómo estimarla atendiendo a las particularidades
del SSS?
El tiempo en la actividad portuaria
¿Cómo minimizarlo?
Incentivos para la promoción de
la eficiencia portuaria
Caso de estudio
¿Por qué?
Mediambiente
Competencia
Otros motivos
CAPÍTULO 1
CAPÍTULO 2
CAPÍTULO 3
CAPÍTULO 4
CAPÍTULO 5

143
II. OBJETIVOS
Como se desprende de los diferentes informes emitidos por la Comisión en los últimos
años, el TMCD debería constituir una alternativa real al transporte de mercancías en los
corredores europeos, ya sea como parte de una cadena intermodal de transporte o como
un modo completamente sustitutivo. Este hecho encaja perfectamente con el principal
objetivo de esta tesis, que pasa por analizar el papel que las infraestructuras portuarias –
y en concreto, la determinación y el resultado de su eficiencia – juegan en la promoción
del transporte marítimo en Europa, especialmente en las políticas de fomento del TMCD.
El primer capítulo de esta tesis se encarga de determinar las causas, objetivos e
instrumentos considerados por la UE en materia de transporte marítimo, a partir del
marco general de las políticas de transporte. El objetivo de este primer paso es analizar el
papel que éstas juegan en las cadenas de transporte multimodal desde un punto de vista
teórico.
Como se analizará más adelante, a pesar de los esfuerzos de la UE en promover el
TMCD basándose principalmente en sus ventajas en términos de competencia y
medioambiente, este modo no ha alcanzado todavía una cuota de mercado
verdaderamente significativa en comparación con el transporte por carretera. A partir de
los modelos tradicionales de costes de transporte, esta tesis desarrolla en un primer paso
un modelo teórico de competencia intermodal que permite realizar comparaciones entre
dos modos alternativos como son la carretera y el TMCD. Esta modelización permite
analizar diferentes políticas europeas – como Marco Polo I y II – apoyando la tesis según
la cual estos programas no han ofrecido los incentivos correctos a la hora de promocionar
el TMCD, ya que aspectos tales como el papel que juega la infraestructura portuaria y sus

144
características básicas han sido olvidados. El modelo nos permite concluir que la mejora
de la eficiencia portuaria es una política más efectiva que la concesión de ayudas a los
transportistas privados a la hora de promover un intercambio modal.
En la actualidad, gran parte de los cuellos de botella en el transporte europeo
tienen su origen en la baja eficiencia, las prácticas no competitivas y restricciones
laborales en los puertos (COM, 2012a). Esta idea comparte la visión de cuán importante
resulta la eficiencia portuaria en la competitividad del TMCD.
Por todo ello, el segundo capítulo de esta tesis propone una metodología para
estimar la eficiencia portuaria atendiendo a las características particulares del TMCD
como competidor intermodal. Tradicionalmente, los estudios de eficiencia se han
centrado en metodologías tales como el análisis envolvente de datos o de fronteras
estocásticas (González y Trujillo, 2009; Cullinane et al, 2006). En ellas, se consideran
como inputs factores tales como el tamaño de las terminales portuarias, la fuerza laboral
o el número o valor de los bienes de capital y, como outputs, las cantidades producidas –
principalmente en términos de TEUs56, containers o toneladas. A partir de estos datos, el
establecimiento de relaciones entre los mencionados inputs y outputs permite conocer la
el grado de eficiencia para una infraestructura en concreto. Ante la ausencia de
alternativas – marcada principalmente por la escasez de datos suficientes – estas
herramientas metodológicas han demostrado ser realmente útiles para valorar los
procedimientos portuarios, aportando información sobre cuán eficiente son empleados
los inputs en los puertos.
56 Twenty-‐foot equivalent unit. Este término hace referencia a la medida de capacidad de los containers comúnmente más empleada.

145
La motivación para este segundo capítulo pasa por considerar que, en un contexto
de competencia intermodal, la relación establecida anteriormente entre inputs y outputs
puede no ser tan relevante para los usuarios como otras alternativas. A partir del
desarrollo de un modelo teórico-‐conceptual – además de su implementación empírica –
se propone la utilización del tiempo como una medida adecuada a la hora de relativizar el
output en un contexto de análisis intermodal.
Por otro lado, aunque la promoción de la eficiencia en puertos pueda ser una
medida más adecuada a la hora de incrementar la cuota modal del TMCD que otorgar
subsidios a compañías privadas para que transfieran carga de la carretera al mar (como
parte de las actuales políticas europeas hacen), definir dicha eficiencia y su valoración no
resulta sencillo. De este modo, una incorrecta definición y la inexistencia de una
monitorización adecuada podría provocar que, al otorgar subsidios a las autoridades
portuarias o a los operadores de terminales, estuviésemos generando ciertos efectos
perversos. El hecho de que dichas ayudas no tengan que ser reintegradas, ni respondan a
ningún tipo de incentivos para fomentar un uso apropiado de las mismas, nos introduce
en un problema de riesgo moral.
La Corte Europea de Auditores (ECA, 2012) señala que millones de fondos
europeos destinados a la financiación y mejora de la red de puertos han dado como
resultado terminales vacías e infraestructuras inutilizadas. COM (2012b) destaca la
necesidad de crear un marco de financiación transparente y un uso eficiente de los
fondos públicos. Este informe recoge cómo la Comisión tiene la intención de crear un
escenario de financiación en igualdad de condiciones en toda la Unión, determinando la
necesidad de establecer reglas transparentes sobre las tasas y servicios portuarios. Del

146
mismo modo, recoge cómo dichos servicios deben resultar eficientes y cómo las tasas
deben ser determinadas a partir de los costes, proporcionales a la provisión del servicio y
no discriminatorios. Esta transparencia debería ser de utilidad para evitar barreras de
entradas a los puertos y permitir a estos últimos su máximo desarrollo potencial.
Una vez establecida la importancia de promover la eficiencia portuaria como
medida de fomento del TMCD, el siguiente objetivo pasará por diseñar un mecanismo de
second best que proponga un subsidio que incentive a los puertos a realizar mejoras en
sus infraestructuras, procedimientos y gestión.
Como una política alternativa, se propondrá el desarrollo de un subsidio por
unidad de reducción de la ineficiencia, que resultará operativo a través de la
contabilización de tiempos de espera en puerto. Únicamente si los puertos perciben los
beneficios de mejorar sus ratios de carga y descarga, reducir los tiempos en tareas
administrativas y de acceso a puertos, entre otros, dichas políticas podrán cumplir su
verdadero objetivo.
Por último, con el objeto de proveer un caso de estudio que analice el
funcionamiento de rutas existentes y potenciales de TMCD en Europa, se abordará el
estudio empírico de la competitividad de determinados corredores TMCD en las costas
españolas. Para ello, se realiza una comparación en términos de costes generalizados –
esto es, incluyendo precios, tiempos y costes externos – de diferentes alternativas para el
traslado de mercancías desde las dos principales ciudades españoles hacia los principales
destinos europeos, tanto por carretera como haciendo uso de los corredores
intermodales del TMCD. Han sido incluidos en el análisis los principales puertos españoles
localizados en la península ibérica, a través de los 34 servicios que conectan 43 puertos
europeos en la costa cantábrica y los 35 servicios entre 64 puertos europeos en la costa

147
mediterránea. De este modo, se mostrará como, además de los efectos de la
internalización de los costes externos y de la existencia de cuellos de botella en los
tiempos de traslado, las tasas deberían ser consideradas igualmente como un factor
crítico a la hora de explicar porqué un corredor de TMCD determinado es más o menos
competitivo que su recorrido alternativo por carretera. Por esta razón, se desarrolla un
análisis econométrico para establecer los principales determinantes de dichos precios en
diferentes rutas de TMCD, y para cuantificar hasta qué punto los instrumentos
promovidos por la UE tienen verdaderamente un impacto sobre los precios.

148

149
III. PLANTEAMIENTO
Desde la antigüedad, el transporte ha resultado esencial para la economía europea y, más
allá, para el concepto de Europa per se. En la actualidad, se estima que esta actividad
supone alrededor del 5% del Producto Interior Bruto (PIB) europeo, y cerca de los diez
millones de empleos. Como la Comisión ha reconocido, un sistema de transportes
eficiente promueve el crecimiento económico y la cohesión social, debido a su carácter
globalizador que permite conectar ciudades, regiones y personas. De este modo, las
políticas de transporte no conocen de fronteras, y por tanto requieren de una fuerte
cooperación internacional (COM, 2011b).
En este planteamiento se analiza en primer lugar la efectividad de las
determinadas políticas europeas implementadas a través de diversos programas en las
últimas décadas. Mientras que en estos últimos años el TMCD ha recibido mayor apoyo
financiero que nunca, este modo apenas ha visto incrementada su cuota de mercado. Por
ello, resulta de interés conocer qué medidas han sido tomadas y el motivo por el cual
fueron las seleccionadas, con el objeto de conocer las causas de este aparente fracaso.
En 1957, la UE (Comunidad Económica Europea por entonces) estableció una
política de transportes común con la intención de facilitar la movilidad de personas y
bienes entre los estados miembros, y más tarde con terceros países. Dicha política fue
originariamente establecida para coordinar los esfuerzos y prácticas en carretera,
ferrocarril, transporte marítimo y fluvial. En los setenta, el transporte aéreo se incorporó
experimentando un rápido despegue en términos de políticas y regulación.

150
Desde sus comienzos, el transporte por carretera ha recibido una atención
particular por parte de las autoridades. La elevada demanda de este modo y su
promoción derivó en carreteras congestionadas. Actualmente, el 10% de la red de
carreteras sufre este coste externo. Del mismo modo, más de 16.600 kilómetros de la red
de tren están igualmente masificados, con la consecuente aparición de cuellos de botella
en la red de transportes. De acuerdo con las estimaciones de la EU, los daños derivados
de la congestión suponen más del 1% del PIB europeo.
El crecimiento en la demanda del transporte de mercancías ha contribuido
igualmente a la congestión de sus infraestructuras en las dos últimas décadas. Temas
tales como la relocalización de determinadas industrias y el desarrollo económico de
regiones áreas como Europa del Este han provocado un gran impacto sobre la demanda
de transporte. Como declara el Ministerio de Fomento (2011), la economía europea ha
pasado de un modelo de almacenamiento a uno de flujos, lo que significa más camiones y
vagones atravesando Europa.
Atendiendo al análisis modal, el transporte por carretera continúa jugando un
papel principal en el transporte de mercancías en la UE. Con respecto al reparto modal,
este modo de transporte ha ostentado alrededor de la mitad de la cuota total de mercado
durante las últimas décadas. La segunda posición es ocupada por el transporte marítimo:
su cuota de mercado se ha situado entre el 35 y el 40% a la largo de los últimos años
(COM, 2012c).
Por otra parte, el transporte por carretera recibe alrededor del 60% del
presupuesto total para inversiones en transporte, mientras que los puertos apenas
superan un 5% del total. Estas cifras no parecen responder al hecho de que los puertos

151
manejen el 90% del comercio entre la EU y terceros países, y el 30% del comercio
intrarregional (COM, 2012a).
El principal objetivo de la política de transportes actual de la UE es alcanzar un
sistema más sostenible y competitivo, por lo cual los modos con un impacto
medioambiental menor deben ser promocionados. De hecho, el Libro Blanco de 2011
recoge específicamente que “el 30% del transporte de mercancías por carretera por
encima de 300 kilómetros debería ser trasladado a otros modos como el ferrocarril o el
marítimo antes de 2030, y más del 50% antes del 2050. Para alcanzar este objetivo se
requiere igualmente una infraestructura apropiada” (COM, 2011b).
Bajo este marco de desarrollo de un sistema de transportes eficiente y
competitivo, la EU ha establecido otros objetivos. Entre ellos, el desarrollo de nuevos
combustibles y sistemas de propulsión son considerados necesarios, estableciendo como
meta reducir a la mitad el uso de los combustibles tradicionales en el transporte urbano
para 2030, y eliminándolos definitivamente de las ciudades para 2050. Igualmente, se
pretende hacer uso de combustibles sostenibles en aviación en un 40% de los casos para
2050, así como reducir las emisiones de CO2 por parte del transporte marítimo a un 40%
(o incluso 50% cuando sea posible) (COM, 2011a).
Considerando la optimización en los procesos de la cadena logística, aparte del ya
mencionado intercambio modal, la UE ha declarado el deseo de completar una red de
alta velocidad europea para 2050, triplicando la red actual para 2030. De este modo, se
espera que para 2050 la mayoría de los pasajeros de media y larga distancia realicen sus
recorridos a través de este modo. Para esta fecha, se prevé igualmente conectar la red de
aeropuertos a la red ferroviaria de alta velocidad, además de establecer un perfecto

152
acoplamiento entre la red de transporte de mercancías por ferrocarril y los puertos con el
objeto de conseguir una verdadera intermodalidad. La UE define este concepto como
“una característica de los sistemas de transportes por la cual al menos dos modos
diferentes son utilizados de una forma integrada con el objeto de completar una
secuencia de transportes puerta-‐a-‐puerta. El concepto de intermodalidad no supone la
imposición de un modo sobre el resto, sino el uso adecuado de cada modo en cada
tramo” (COM, 1997).
A modo de resumen, podría decirse que la UE posee como objetivo ulterior la
consecución de un sistema de transportes eficiente y sostenible, medioambientalmente
respetuoso y socialmente aceptado, además de con un alto grado de integración modal.
“Las mejores elecciones modales serán las resultantes de un mayor grado de integración
de las redes de transportes: aeropuertos, puertos, trenes, estaciones de autobuses y
metros deberían ser progresivamente enlazados y transformados en plataformas de
conexión multimodal” (COM, 2011b).
III.a. Política de transporte marítimo en la UE: competencia y medioambiente
Con la intención de evitar un uso masivo de un medio de transporte tan
medioambientalmente perjudicial como es la carretera, la UE ha desarrollado en las
últimas décadas una serie de instrumentos de financiación para alcanzar una
competencia intermodal real en el transporte de mercancías.
Los programas de la UE han sido diseñados – con determinadas diferencias entre
ellos, especialmente en cuanto a períodos de tiempo y objetivos específicos – para

153
promocionar diferentes (y socialmente preferibles) modos de transporte, además de su
combinación.
Los argumentos para apoyar el transporte marítimo pueden ser resumidos
principalmente en dos ideas: mejoras medioambientales y fomento de la competencia. En
cuanto al primero, la UE ha cuantificado el daño que el transporte por carretera supone
para la sociedad en términos de costes externos. Así pues, externalidades tales como la
congestión, polución y otros aspectos medioambientales motivaron – como quedó
señalado en el apartado anterior – el desarrollo de una política de transporte socialmente
responsable (Medda y Trujillo, 2009).
Por otra parte, el segundo argumento gira en torno a la necesidad de fomentar la
competencia en el mercado del transporte de mercancías, tradicionalmente
desequilibrado por modos. Por tanto, los principales objetivos de la política de transporte
marítimo europeo pueden ser resumidos en 1) la necesidad de facilitar la apertura de los
mercados de transportes a la competencia libre y no distorsionada y 2) ofrecer soluciones
de transporte medioambientalmente sostenibles (COM, 2011b).
El TMCD es considerado el modo de transporte menos dañino en términos
medioambientales (Paixão y Marlow, 2002; Medda y Trujillo, 2010). COM (2010)
reconoce este hecho estimando el coste externo– por definición, todo daño causado a la
sociedad que no resulta internalizado por las empresas privadas tales como congestión,
polución, accidentes, ruido y cambio climático – en carretera por encima del relativo al
TMCD. Haciendo uso de tecnologías sostenibles relativas al tipo de combustible – con
bajo contenido de azufre – y al tipo de barco – con velocidades no superiores a los 23
nudos (aproximadamente 42,5 kilómetros por hora) –, el TMCD puede llegar a reducir a

154
una cuarta parte los costes externos ocasionados por la carretera. Debe ser igualmente
mencionado que, bajo determinadas condiciones, el uso de barcos altamente
contaminantes puede ocasionar que el TMCD no ofrezca ventajas en términos de costes
externos o que incluso genere una contaminación superior a la provocada por la carretera
(COM, 2013c).
De acuerdo con el Eurostat (2011), el 33% del consumo energético pertenece al
transporte, y de éste el 80% a la carretera. COM (2011b) refleja igualmente que el
transporte es el consumidor de energía y productor de gases invernadero con mayores
tasas de crecimiento en la UE.
Sin embargo, la internalización de los costes externos producidos por el transporte
no ha sido todavía implementada a nivel comunitario.57 De este modo, los precios del
transporte no reflejan de un modo apropiado los costes que esta actividad supone para la
sociedad. Como Janic (2001) establece, si los costes totales (esto es, internos y externos)
fueran usados como la base para la fijación de los precios, el transporte intermodal podría
competir en mercados de larga distancia. Sin embargo, Brooks y Frost (2006) señalan, con
respecto a la degradación medioambiental, cómo los gobiernos no deberían esperar de
los transportistas que acudiesen a modos de transporte medioambientalmente
conscientes e integrados modalmente si, en ello, fuesen a incurrir en costes adicionales.
Por otra parte, el fomento de la competencia supone el segundo gran motivo para
la promoción del TMCD en Europa. COM (2011b) señala la necesidad de establecer un
escenario en igualdad de condiciones para los modos que se encuentran en competencia
57 A nivel nacional, Francia ha desarrollado recientemente la Ecotasa, una medida que provocará desde finales de 2013 la internalización de los costes externos en la carretera. www.legifrance.gouv.fr.

155
directa. La Comisión ha señalado que “el TMCD puede ayudar a equilibrar el reparto
modal y superar los cuellos de botella, además de ser seguro y sostenible” (COM, 2003). A
partir de los motivos mencionados, la UE ha establecido el Programa para la promoción
del Transporte Marítimo de Corta Distancia (COM, 2003), desarrollando medidas
legislativas, operativas y técnicas para el desarrollo del TMCD en Europa.
En términos de competencia intermodal, el transporte por carretera absorbe
alrededor de la mitad del mercado de transporte de mercancías. A pesar de los esfuerzos
y las políticas analizadas más adelante, los obstáculos a una competencia efectiva en el
mercado continúan existiendo (COM, 2011b). En 1995, el transporte por carretera
suponía el 42.1% del total del mercado en la UE-‐27, y el transporte marítimo un 37.5%. En
2009, estas cifras habían cambiado a 46.6 y 36.8%, respectivamente. Esto es, la diferencia
entre ambos modos se ha visto incrementada de un 4.6 al 9.8%.
COM (1997) establece ciertas recomendaciones en términos de competencia
entre operadores. La Comisión señala como elemento clave el “escrutinio y regulación de
cualquier abuso de posición dominante por parte de los transportistas y operadores. Los
ejemplos de prácticas ilegales incluyen los subsidios cruzados de ingresos para eliminar la
competencia, prácticas predatorias o la explotación de subcontratas, entre otros.”
Por último, la geografía resulta un elemento natural en el conjunto de ventajas del
transporte marítimo (y especialmente de las actividades del TMCD) en Europa: alrededor
del 70% de la producción industrial europea se encuentra a 150-‐200 kilómetros de la
costa (Paixão y Marlow, 2002). Al mismo tiempo, la producción no es la única variable
relevante. La demanda deber ser igualmente considerada. De acuerdo a las estadísticas
del Eurostat (2011), más de 205 millones de personas viven en regiones costeras en

156
Europa, esto es, el 41% de la población de la UE. Más de 1.200 puertos comerciales
operan a lo largo de los 70.000 kilómetros de costas europeas (COM, 2013a).
La capacidad y potencial del transporte marítimo en Europa hacen del TMCD una
alternativa real en el transporte de mercancías. Sin embargo, esto será cierto siempre y
cuando los puertos sean capaces de manejarlo. Por tanto, dichas infraestructuras resultan
vitales en la competitividad del transporte marítimo.
III.b. Principales políticas de promoción del transporte marítimo en Europa.
Las principales políticas de promoción del transporte marítimo en Europa pueden ser
clasificadas en dos grupos: aquellas destinadas a la promoción de las infraestructuras de
transporte (Proyectos de la Red Trans-‐Europea de Transportes) y aquellas otras
destinadas a la promoción de las operaciones y actividades (Acción Piloto para el
Transporte Combinado, Marco Polo I y Marco Polo II).
• Red Trans-‐Europea de Transportes (RTE-‐T)
Este programa es parte de las Redes Trans-‐Europeas (RTE) desarrolladas por la UE
en 1996 junto a la del sector de telecomunicaciones y el energético. Dichos
programas fueron diseñados con el objeto de promover la cohesión europea a
través de las mejoras en las comunicaciones de larga distancia y de la provisión de
la infraestructura básica para el movimiento de personas, mercancías, servicios e
información entre los estados miembros (Giannopoulos, 2002).

157
La Comisión estableció estas redes como elemento clave para la
competitividad y el empleo en Europa. “El principal objetivo consiste en eliminar
los cuellos de botella en las infraestructuras del transporte, así como asegurar la
futura sostenibilidad de las redes de transporte considerando las necesidades de
eficiencia energética y los retos del cambio climático” (COM, 2009a). Como se
desprende de la descripción de este programa, considera las principales
preocupaciones en términos de competencia y medioambiente anteriormente
mencionados.
La UE ha estimado que el coste del desarrollo de las infraestructuras del
transporte para satisfacer la demanda creciente alcanzará el 1.5 trillones de euros
para el período 2010-‐2013,58 por lo que la colaboración de los gobiernos
nacionales en materia de financiación será indispensable. Además, con el objeto
de afrontar esta titánica inversión, la UE recibe el apoyo financiero de los Fondos
de Cohesión, el Fondo Europeo de Desarrollo Regional y el Banco Europeo de
Inversiones.
Del mismo modo, el RTE-‐T promociona también la intermodalidad en
transportes. Particularmente, se centra en estimular inversiones en una red de
transportes integrada que recorra toda la comunidad a través de los diferentes
modos.
Las ayudas del RTE-‐T cubren tanto los estudios de viabilidad técnicos o
medioambientales así como parte de las obras. En cuanto a los puertos, la UE ha
declarado que éstos “deben permitir el desarrollo del transporte y constituir las
58 http://ec.europa.eu/transport/themes/infrastructure/index_en.html.

158
interconexiones entre el transporte marítimo y otros modos. De la misma forma,
deben proveer de los servicios e infraestructuras necesarias a los operadores. Sus
infraestructuras deben ser capaces de proveer servicios tanto para pasajeros
como mercancías, incluyendo ferrys al igual que servicios de corta y larga distancia
y envolviendo al TMCD, dentro de la Comunidad y entre ésta y terceros países”
(COM, 1996). Como señala la Comisión, “el objetivo pasa por incrementar y
modernizar la capacidad portuaria, además de mejorar su habilidad a la hora de
manejar la actividad del transporte intermodal” (COM, 2006b).
Desde sus comienzos, el RTE-‐T estableció 30 proyectos prioritarios, en
función del potencial valor añadido y contribución al desarrollo sostenible del
transporte europeo. La mayoría de estos proyectos se encuentran relacionados
con el ferrocarril (60%), mientras que el marítimo se halla especialmente presente
en dos de ellos: Galileo y las Autopistas del Mar.
Por una parte, el programa Galileo (PP15) – establecido en 2011 – posee
como objetivo principal contribuir a una más segura y eficiente navegación a
través de las mejoras en los sistemas satélites de navegación.
Por otro lado, las Autopistas del Mar (AdM, PP21) constituyen uno de los
ejes más ambiciosos de la RTE-‐T. Siguiendo la descripción del proyecto por parte
de la UE, “las AdM parten del objetivo comunitario de conseguir un sistema de
transportes limpio, seguro y eficiente a través del establecimiento del transporte
marítimo como una alternativa real al masificado transporte terrestre. Este
concepto pretende introducir las cadenas logísticas intermodales con la intención

159
de provocar un cambio estructural en la organización del transporte: las cadenas
de transporte integradas puerta-‐a-‐puerta.”
Del mismo modo, este programa se encuentra diseñado para trasladar
mercancía desde las congestionadas redes terrestres hacia modos con mayor
capacidad y medioambientalmente no tan dañinos.
De forma breve, los objetivos de este macro proyecto pasan por concentrar
parte de la mercancía en rutas logísticas con base marítima, incrementar la
cohesión y reducir la congestión en las carreteras a partir del intercambio modal
(COM, 2004a). Este documento recoge igualmente los cuatro corredores
designados por la UE, a saber:
o Autopista del Mar Báltico (conectando los estados miembros del Mar
Báltico con Europa Central y Occidental);
o Autopista del Mar de Europa Occidental (encabezada por Portugal y
España, a través del Arco Atlántico, el Mar de Irlanda y el del Norte);
o Autopista del Mar de Europa del Sureste (conectando el Mar
Adriático con el Jónico y el Mediterráneo, incluyendo Chipre);
o Autopista del Mar de Europa del Suroeste (Mediterráneo occidental,
conectando España, Francia, Italia e incluyendo Malta, relacionándolo
igualmente con la AdM del sureste y el Mar Negro).
Esencialmente, como COM(2006b) establece, “el propósito de la UE en
esta materia consiste en desarrollar conexiones de TMCD de alta calidad que
provean servicios de puerta-‐a-‐puerta. A través de la concentración de ciertas rutas

160
resultará más probable generar la masa requerida para producir servicios más
eficientes y económicamente viables.”
• Acción Piloto para el Transporte Combinado (APTC). 1992-‐2001
La APTC fue el primer programa comunitario en promover la intermodalidad.
Lanzado en 1992, el principal objetivo pasaba por intensificar el uso del
transporte intermodal en aquellos casos donde resultase económicamente viable
en el largo plazo, como alternativa al transporte por carretera unimodal (COM,
2001a). Este programa, establecido para apoyar determinadas actividades
relacionadas con el desarrollo del RTE-‐T, fue implementado en dos fases: desde
1992 hasta 1996 y desde 1997 hasta 2001. Durante la totalidad del período, 167
proyectos recibieron financiación con un presupuesto total de 53 millones de
euros.
La Comisión señaló la dificultad existente a la hora de desarrollar y mantener
acciones intermodales novedosas en el mercado, y que el éxito comercial de
nuevos servicios no se encontraba siempre garantizado siquiera con la
financiación pública inicial. La evaluación de este programa reveló que los puertos
europeos centraban sus esfuerzos en los requisitos para el transporte marítimo
de larga distancia, resultando ineficientes a la hora de tratar los corredores de
TMCD.
Sin embargo, en cuanto a las consideraciones medioambientales, la Comisión
reflejó igualmente que gran parte de las medidas operativas apoyadas por este

161
programa resultaron efectivas a la hora de reducir las emisiones de dióxido de
carbono (COM, 2001a).
• Marco Polo I y II. 2003-‐2013
Propuesto en el Libro Blanco del Transporte de 2001, donde el concepto de
intermodalidad cobró una especial relevancia, la primera fase de este programa
fue definitivamente lanzada en 2003. El objetivo inicial era extender la APTC. De
este modo, el propósito de su lanzamiento también partió de la necesidad de
transferir el crecimiento del trasporte de mercancías por carretera hacia modos
alternativos como el ferrocarril y el marítimo, además de opciones intermodales.
Este programa consiste básicamente en la concesión de ayudas a aquellas
compañías que transfieran mercancía desde la carretera a otros modos
medioambientalmente menos perjudiciales, como es el caso del TMCD. Se estimó
que cada euro gastado en ayudas Marco Polo generarían al menos seis euros en
beneficios sociales y medioambientales (EFTA, 2007).
Como la APTC, Marco Polo fue implementado en dos períodos diferentes:
hasta 2006 (Marco Polo I) y desde 2007 hasta la actualidad (Marco Polo II), con
condiciones similares. La principal diferencia entre los dos subperíodos consistió
en la extensión del programa a terceros países o regiones como Rusia, Bielorrusia,
Ucrania, los Balcanes y la región del Mediterráneo, además de la inclusión de las
ya mencionadas AdM.

162
De acuerdo a la Comisión, el programa Marco Polo contribuiría de manera
sustancial a la hora de convertir la intermodalidad en una realidad europea
(COM, 2003). Entre 2003 y 2007, con un presupuesto de 102 millones de euros,
125 proyectos que incumbían a 500 compañías recibieron financiación de este
programa. Más tarde, Marco Polo II reemplazaría a la primera edición del
programa, con un presupuesto de 740 millones de euros para el período
comprendido entre 2007 y 2013.
Como se detalla en (COM, 2001a), “la financiación tiene forma de ayuda. No
se trata de un préstamo que deba ser reintegrado. Las ayudas cubren parte de los
costes asociados al desarrollo y operación de proyectos de intercambio modal,
pero deben estar apoyadas por ciertos resultados (…) Los proyectos, con una
duración de entre dos y cinco años, deben ser comercialmente viables cuando la
financiación termine (…) El proyecto debe constar de rutas internacionales, y
deberá tener sentido económico y ecológico.”
III.c. Análisis crítico de las políticas de promoción del transporte marítimo
Pese a todo, con un presupuesto total aproximado de 895 millones de euros centrados en
la promoción del transporte marítimo y en especial del TMCD (considerando la APTC,
Marco Polo I y II), las medidas establecidas por la UE no han alcanzado los objetivos
propuestos. Parece que las políticas comunitarias no han provocado los estímulos
necesarios con respecto al intercambio modal. Como se ha visto, el transporte por
carretera continua representando alrededor de la mitad del total del transporte por
mercancías, mientras que el marítimo difícilmente supera una tercera parte.

163
Como sentencia la Comisión, “los objetivos ambiciosos en cuanto al cambio modal
no han sido completamente logrados (…) Además, los programas son considerados como
complejos; en algunos casos no resultan fácilmente entendibles por parte de las
compañías que podrían hacer uso de ellos” (COM, 2013b). Se podría incluso decir que el
transporte por carretera ha mejorado su posición en el mercado del transporte de
mercancías. De hecho, es el único modo que ha visto incrementada su cuota de mercado
en la última década.
Lo que resulta más significante (y preocupante) es que, durante el subperíodo
comprendido entre el año 2000 y el 2009, el transporte por carretera incrementó su
cuota en un 11.4% mientras que el marítimo lo hizo en un 1.7%. Estos resultados
muestran el impacto insignificante que determinados programas tales como los Marco
Polo han tenido a lo largo de una década.
De esta forma, podría afirmarse que el TMCD no ha sido correctamente
promocionado. Las tendencias actuales sugieren que no estamos en el camino correcto
para cumplir los objetivos de la UE de trasladar un 30% de la mercancía de corredores por
carretera superiores a los 300 kilómetros a otros modos para el 2030, y mucho menos un
50% en 2050 (COM, 2011b).
Considerando los programas Marco Polo, la Comisión ha declarado que “la
provisión de fondos públicos directamente hacia los mercados ha generado igualmente
algunas preocupaciones en términos de competencia durante la duración del ciclo de vida
de dicho programa” (COM, 2013b).
Asimismo, una más que generosa y contradictoria declaración por parte de la
Comisión señala como “Marco Polo representa un buen ejemplo en el uso eficiente de los

164
fondos europeos incluso si los objetivos de dichos programas no han sido completamente
logrados y el presupuesto designado para ello no ha sido empleado en su totalidad”
(COM, 2013b).
Por otra parte, el Libro Blanco de la UE establece que, para conseguir los objetivos
propuestos resulta necesario el desarrollo de una infraestructura adecuada. Sin embargo,
los puertos europeos no han recibido la misma atención que otras infraestructuras
homólogas. Como se observó anteriormente, mientras los puertos reciben alrededor de
un 5% de la inversión total en infraestructuras, las carreteras se quedan con algo más del
60% del total de fondos. Este modo ha recibido incluso mayor apoyo financiero relativo
desde el inicio de la actual crisis económica. Aun así, no sólo se trata de una cuestión de
dinero, sino de eficiencia en el uso del mismo.
Para poder determinar porqué estos programas y medidas no han logrado los
objetivos propuestos, resulta necesario analizar cómo han sido implementados. Mientras
ayudas como la PACT, Marco Polo I y II han sido otorgadas a compañías con el propósito
de que trasladasen mercancía desde las carreteras hacia otros modos como el TMCD, no
ha habido ninguna política de incentivos que promueva la eficiencia en las actividades del
TMCD ni que incremente el atractivo de este modo ante sus potenciales usuarios.
La principal conclusión en este caso es que los puertos (como nodos) y sus
características en las cadenas intermodales son básicos para la correcta promoción del
TMCD. Como se justifica en el Capítulo 2, la UE necesita promocionar la eficiencia en el
sistema en lugar de dar ayudas directas a las compañías. En otras palabras, la UE debería
considerar el problema en su conjunto en lugar de centrarse en determinados agentes del
sistema.

165
IV. METODOLOGÍA
En este trabajo se ha hecho uso de diversas metodologías con la intención de abordar el
problema planteado desde diversas perspectivas. De este modo, el Capítulo 2 desarrolla
un modelo teórico de competencia intermodal con el objeto de analizar el papel de los
puertos en las actuales políticas de promoción del TMCD. El Capítulo 3 desarrolla la
propuesta que supone el uso de los tiempos en puerto para medir la eficiencia portuaria.
Para ello, se emplea la metodología proveniente del análisis envolvente de datos para
desarrollar un modelo teórico-‐conceptual que es testado a partir de un breve ejercicio
empírico. Por su parte, el Capítulo 4 plantea un modelo teórico de riesgo moral que
analiza la relación entre las infraestructuras portuarias y los niveles de gobierno
encargados de la concesión de ayudas. Por último, el Capítulo 5 analiza la competitividad
de los corredores españoles de TMCD atendiendo a la metodología del coste
generalizado, y en concreto profundizando en el desarrollo de un modelo econométrico
para determinar los factores que influyen en el componente monetario de dicho coste.
En esta sección se analizan de un modo resumido las metodologías utilizadas en
cada uno de los capítulos mencionados.
IV.a. Modelo teórico de competencia intermodal
A partir del planteamiento anterior, puede verse cómo la Comisión Europea ha llevado a
cabo diversos estudios poniendo de relieve el papel que el TMCD puede jugar en la
competencia existente en el transporte de mercancías europeo. Sin embargo, a pesar de
los hechos que demuestran cómo este modo resulta una alternativa socialmente más

166
beneficiosa para la sociedad, y de la promoción que la UE ha hecho del mismo a través de
diversos mecanismos, el TMCD no ha conseguido equilibrar el mercado del transporte de
mercancías. Mediante el modelo teórico de competencia intermodal aquí desarrollado, se
pretende demostrar cómo los actuales mecanismos de promoción no han sido diseñados
para ofrecer los incentivos correctos, y que el rol que juegan los puertos, además de sus
características, ha sido minusvalorado en dicha promoción. El principal objetivo de esta
modelización pasa por analizar las variables y principales políticas que pueden impulsar
una correcta promoción del TMCD en las cadenas de transporte intermodales en Europa.
La modelización del transporte es un campo ampliamente estudiado por parte de
la literatura económica. En concreto, Florian et al (1988) identificó los diferentes niveles
existentes en el análisis de la toma de decisiones en los mercados de transporte, a saber:
la localización de la actividad, demanda, procedimientos del sistema, acciones de oferta,
infraestructuras, minimización de costes y producción. En cuanto al modelo teórico
tradicional de transportes, se compone de una secuencia de cuatro sub-‐modelos:
generación de viajes, distribución, reparto modal y asignación. Este modelo supone una
referencia a la hora de contrastar representaciones alternativas (Ortúzar y Willumsen,
2011). Junto a ellos, podría incluirse en una quinta etapa la evaluación ex–post, donde el
análisis coste-‐beneficio cobra una relevancia especial.
Principalmente, podríamos distinguir entre modelos de oferta y de demanda. En
cuanto a los primeros, son aquellos centrados fundamentalmente en el análisis de
funciones de producción y de estructuras de costes en diferentes modos de transporte.
Con respecto a la modelización de la demanda, son numerosos los trabajos que analizan
la competencia existente entre modos en términos de elección discreta y elección modal.

167
En concreto, y en cuanto a la competencia intermodal que aquí nos ocupa, su
modelización ha sido llevada a cabo desde diferentes perspectivas. Considerando un nivel
agregado, destacan los trabajos de Quand y Baumol (1966) y Levin (1978) desde una
perspectiva de reparto modal, y Oum y Gillien (1979) con modelos de comportamiento
del usuario. A nivel desagregado, McFadden (1973) es considerado el principal trabajo.
Como se recoge en De Rus et al (2003), en términos de competencia entre modos de
transporte, la clave pasa por conocer qué factores determinan la distribución modal, y es
esto precisamente lo que se pretende con el modelo desarrollado en el Capítulo 2.
En este modelo teórico partimos de las representaciones tradicionales de costes
para desarrollar un modelo de competencia intermodal entre dos modos de transporte
alternativos que rivalizan en un mismo corredor. De este modo, queda recogida la
interacción existente entre el transporte marítimo y la carretera en el mercado de
transporte de mercancías. Existen entonces dos posibilidades: la primera, trasladar la
mercancía desde la fábrica hasta el mercado final por carretera. En la segunda, se hace
uso del transporte marítimo a través del corredor intermodal, esto es, el traslado hacia y
desde los puertos se realiza por carretera mientras que la distancia por mar se recorre
mediante el TMCD.
El modelo queda resuelto en el Capítulo 2, a partir de la determinación de las
funciones de coste generalizado de cada alternativa, esto es, el coste total que incluye
una parte monetaria así como la no monetaria, donde los tiempos son valorados
mediante un parámetro específico. Este análisis tiene su origen el modelo básico de Dixit
y Nalebuff (1993), donde se recoge el impacto sobre carreteras congestionadas de la
competencia existente entre la carretera y el ferrocarril.

168
En cuanto a los tiempos empleados, el modelo contempla no sólo los relativos al
recorrido para cada modo. También se representan los tiempos de acceso a cada
infraestructura, y se introduce el parámetro 𝜂. Este término agrega diferentes tiempos en
puerto.
El parámetro 𝜂 supone la suma de los tiempos de acceso al puerto, de espera de la
mercancía en las terminales – debido, por ejemplo, a la existencia de congestión en
dichas infraestructuras – además de los tiempos empleados en los diferentes
procedimientos administrativos y de aduanas, así como los ratios de carga y descarga por
hora en las terminales portuarias. Es decir, 𝜂 recoge todos aquellos tiempos que afectan a
la eficiencia portuaria.
Veámoslo con un ejemplo. Imaginemos que la entrada a un puerto no está
apropiadamente diseñada en términos de infraestructura y/o logística. Como
consecuencia lógica, los transportistas podrían estar expuestos a una mayor congestión y,
por tanto, a mayores tiempos de espera. Como todos estos valores pueden ser
expresados en términos de tiempo, se encuentran afectados por el valor del tiempo de
cada transportista. Determinadas compañías podrían estar más dispuestas que otras a
sufrir un retraso en sus actividades a cambio de un coste monetario menor. De este
modo, se justifica el porqué de la inclusión de la ineficiencia portuaria como parte del
componente temporal en la función de coste generalizado.
En el modelo de competencia intermodal desarrollado en esta tesis partimos del
concepto de valor del tiempo para su resolución. De este modo, suponemos la existencia
de heterogeneidad en el valor del tiempo: la disposición a pagar por el mismo difiere
entre individuos. Asumimos que se encuentra distribuido como una variable uniforme

169
entre 0 y 1. Por tanto, las compañías quedarán situadas en la recta en función de su valor
del tiempo. De esta forma, podemos calcular la cuota modal de cada modo de transporte
mediante la determinación del transportista indiferente, esto es, aquel para el que los
costes generalizados son iguales para cada modo.
La determinación del valor crítico que reparte el mercado permite desarrollar en el
Capítulo 2 un análisis de estática comparativa en el que se representan las determinadas
políticas europeas implementadas hasta la fecha y se establece una posible explicación
para su fracaso.
IV.b. Análisis envolvente de datos. Modelo teórico e implementación
Los puertos, nodos de las redes de transporte marítimo, resultan cruciales para el éxito de
la intermodalidad en Europa. A menudo, sin embargo, éstos son percibidos como “cajas
negras” donde las mercancías se eternizan, se crean cuellos de botella en la cadena
logística y se desconocen exactamente los trámites que en ellos tienen lugar (Wilmsmeier
et al, 2006). Dentro de este contexto, un análisis apropiado de la eficiencia portuaria se
convierte en un requisito indispensable para identificar los factores cruciales para la
correcta promoción de una política de transportes de mercancías más sostenible.
Tradicionalmente, los estudios de eficiencia portuaria han estado centrados en
factores tales como el tamaño o el valor de la fuerza laboral o el número de elementos de
capital como inputs de los procesos de producción, y por otro lado las cantidades
(normalmente medidas en términos de TEUs, containers o toneladas) como el producto o
output de dichos procesos.

170
Con la intención de analizar el grado de eficiencia de todo un puerto o de una
terminal en concreto, el análisis económico se ha centrado en el uso de técnicas como la
envolvente de datos o las fronteras estocásticas (González y Trujillo, 2009; Cullinane et
al, 2006). Estas metodologías parten básicamente de establecer relaciones entre los
inputs y outputs mencionados. En la ausencia de alternativas viables, estas medidas de
eficiencia han demostrado ser extremadamente útiles a la hora de valorar la correcta
actuación de los puertos, ya que proporcionan información valiosa relativa a si los puertos
están haciendo uso de sus inputs de una manera adecuada.
Sin embargo, en un contexto de competencia intermodal como el aquí analizado,
el establecimiento de dichas relaciones pueden no ser tan relevantes para los usuarios del
puerto como otras alternativas, especialmente cuando nos centramos en el análisis del
TMCD. Desde esta perspectiva, el tiempo de espera en puertos debe cobrar una atención
especial.
En el Capítulo 3, a partir del establecimiento de un modelo de análisis envolvente
de datos, se propone la utilización del tiempo en puertos como un modo de relativizar el
output, con la intención de adecuar los estudios de eficiencia portuaria al contexto del
TMCD como competidor intermodal.
En cuanto a la metodología del análisis envolvente de datos, decir que resulta el
modelo no paramétrico más implementado en las estimaciones de los niveles de
eficiencia de la industria portuaria. Desde el primer trabajo de Charnes et al (1978), y la
primera implementación en puertos (Roll y Hayuth, 1993), han proliferado los estudios
relativos a la aplicación de esta metodología en la eficiencia de los puertos y sus
terminales, además de numerosas extensiones de modelo (Lee et al, 2005; Park y De,

171
2004; Cullinane et al, 2004; entre otros). Cabe destacar especialmente los trabajos de
Cullinane (2010), quien recoge una revisión exhaustiva de estos estudios, y González y
Trujillo (2009), quienes realizan una comparación de las principales características de esta
metodología frente a las fronteras estocásticas.
En el caso presente en el Capítulo 3, el análisis envolvente de datos incorpora los
tiempos en puertos como un modo de relativizar el output en la determinación del grado
de eficiencia de estas infraestructuras o sus terminales con características de TMCD. Para
ello, a partir de la especificación matemática del problema, se pretende maximizar el
incremento proporcional del output dentro del conjunto de posibilidades de producción
existente. De este modo, en el Capítulo 3 se resuelve el programa calculando la distancia
a la que cada puerto o terminal se sitúa hasta la frontera, desarrollando por tanto una
medida de eficiencia relativa basada en tiempos.
Con el objeto de implementar el modelo teórico desarrollado, y ante la
imposibilidad de disponer de datos de tiempo en puertos europeos, se ha hecho uso de
los diferentes puertos africanos que reportan datos relativos a tiempos. Estos datos han
sido publicados en el Africa Infrastructure Country Diagnostic59 (AICD) y el
Containerization International Yearbook (2012). Mediante la comparación de diferentes
análisis de eficiencia que consideran por una parte las cantidades como output tradicional
y la relativización mediante los tiempos como propuesta, se observa cómo los resultados
varían significativamente. De este modo, estaríamos viendo cómo en casos donde el
tiempo es una variable crucial – como ocurre en el contexto de competencia intermodal
59 http://www.infrastructureafrica.org/aicd/.

172
donde se sitúa el TMCD –, los estudios de eficiencia no reflejan su relevancia, y por tanto
deberían ser incorporados a dichos análisis.
IV.c. Modelo teórico de riesgo moral
El modelo de competencia intermodal desarrollado en el Capítulo 2 muestra la relevancia
de la eficiencia portuaria en el correcto desarrollo del TMCD en Europa. Podríamos
considerar entonces conceder directamente ayudas a los puertos para que incrementen
su eficiencia a través de inversiones en mejora de infraestructura u operativas – como ha
hecho durante las últimas décadas la UE a través de los diversos programas mencionados
en el planteamiento. Sin embargo, otorgar ayudas directas a las autoridades portuarias
podría generar efectos perversos: algunos puertos podrían estar recibiendo estas ayudas
sin tener que realizar ningún tipo de contraprestación futura ni mostrar resultados
positivos de sus actuaciones. De este modo, estaríamos enfrentándonos a un caso típico
de riesgo moral: el gobierno no puede observar fácilmente el esfuerzo real que ejercen
los puertos a la hora de reducir su ineficiencia. De esta forma, un resultado negativo
podría deberse tanto a una falta de esfuerzo como a determinadas circunstancias
exógenas. Como señalan García-‐Alonso y Martín-‐Bofarrul (2007), un elevado volumen de
inversión para el incremento de la eficiencia no es suficiente garantía de éxito.
El Capítulo 4 refleja esta situación a través de un modelo teórico de riesgo moral.
En él, el gobierno, como representante de la sociedad en su conjunto, posee el objetivo
de minimizar el coste total agregado – definido como la suma de los costes agregados
generalizados de cada modo de transporte y el subsidio que el gobierno concede al
operador de la infraestructura.

173
Tras calcular el valor crítico que determina la demanda a la que debe enfrentarse
el operador de la infraestructura, se presenta la función de beneficios de la misma. Dicha
función queda caracterizada como la diferencia entre ingresos y costes de operación,
además del coste de capital, el subsidio que le concede el gobierno como ingreso y, por
último, el coste que supone hacer el esfuerzo necesario para reducir la ineficiencia. De
este modo, el subsidio dependería de la ineficiencia de manera inversa y ésta, a su vez,
del esfuerzo de igual modo.
La resolución del modelo desarrollado en el Capítulo 4 a partir de la relación
tradicional de principal-‐agente supone que la información no es simétrica. Como señala
Barros (2003), el gobierno se encuentra escasamente informado sobre el resultado de sus
políticas y, por tanto, los puertos son libres a la hora de perseguir sus objetivos privados
que pueden alejarse de los socialmente deseables. En definitiva, las autoridades
portuarias pueden tener determinados incentivos – especialmente políticos – muy
alejados de los planteados bajo una perspectiva estrictamente socioeconómica.
El modelo se resuelve del siguiente modo: el gobierno propone un menú de
contratos en función del esfuerzo ejercido por la infraestructura. Cuanto mayor sea el
esfuerzo, más probable es reducir la ineficiencia. El gobierno tendrá que minimizar el
coste social satisfaciendo dos condiciones: la restricción de participación – esto es, que
sea rentable para la autoridad operar – y la de compatibilidad de incentivos – es decir,
que resulte más rentable ejercer un esfuerzo alto que uno bajo. De esta forma, y bajo una
serie de supuestos detallados en el Capítulo 4, se determina una condición necesaria que
nos permite evaluar el impacto de las políticas de concesión de ayudas actuales y
proponer posibles mejoras a las mismas.

174
IV.d. Modelo econométrico del componente monetario del coste generalizado
El Capítulo 5 propone una revisión de los componentes básicos del coste generalizado del
TMCD y la carretera: precios, tiempos y costes externos. El objetivo principal pasa por
estudiar la competitividad del TMCD haciendo uso de determinados corredores desde las
ciudades españoles más importantes en términos económicos hasta las principales
ciudades del resto de Europa. De este modo, construimos una base de datos que
considera los principales puertos españoles localizados en la Península Ibérica y que
conectan con el resto de Europa a través de los mares Mediterráneo y Cantábrico.
A partir de ellos, partiendo de las funciones de coste generalizado planteadas en el
Capítulo 2, se realiza en primer lugar un análisis comparativo y descriptivo en términos de
tiempo, precios y costes externos. Atendiendo a los datos del Centro para la promoción
en España del TMCD60, existen en este país 34 servicios que conectan 43 puertos
europeos en la costa cantábrica, y 35 servicios que relacionan 64 puertos europeos en la
mediterránea. En este caso, hemos hecho uso de los principales puertos localizados en la
Península Ibérica: Santander, Bilbao, Gijón, Ferrol y Vigo en el Océano Atlántico, y
Barcelona, Tarragona, Castellón, Valencia y Cartagena en el mar Mediterráneo. Del mismo
modo hemos seleccionado diferentes rutas desde Madrid y Barcelona hacia Londres,
París, Roma, Berlín y Moscú. De la misma manera, la elección de las ciudades de Madrid y
Barcelona intenta igualmente considerar las diferencias en cuanto a la competitividad del
TMCD entre ciudades con origen costero y no costero. La elección de los destinos
pretende recoger diferentes centros económicos distribuidos por la geografía europea.
60 www.shortsea.es.

175
El análisis comprende en dos partes bien diferenciadas. En primer lugar, se realiza
una estimación econométrica para determinar los factores exógenos que afectan a los
precios del transporte marítimo. Para ello, incorporamos a la estimación datos relativos al
coste total por kilómetro, si la ruta se encuentra subvencionada, la frecuencia marítima,
los competidores en la ruta marítima, la distancia, los costes del transporte por carretera
así como el PIB de la región de origen y destino. La relación establecida en el modelo es
de corte gravitacional, y la estrategia empírica perseguida consiste en la incorporación
gradual de las variables mediante estimaciones de mínimos cuadrados ordinarios
realizando clusters por grupos, con la intención de minimizar los errores dentro de los
grupos.
En segundo lugar, se examinan las diferencias por rutas entre los tiempos de
recorrido y los costes externos para cada modo. En este caso, no se requieren
estimaciones econométricas toda vez que estas variables únicamente dependen de
valores como distancias y velocidades, además de factores de emisión de CO2 para cada
modo, todas ellas variables que no precisan de estimación para su determinación.
El objetivo final de este análisis es determinar aquellas rutas donde el TMCD
resulta más competitivo que la carretera atendiendo a todos los factores considerados y
mostrar los ahorros en tiempo, dinero y costes externos frente a la carretera. Sin
embargo, la falta de datos no permite incorporar los tiempos de espera en puertos que,
como han señalado los capítulos anteriores, afectan sobremanera a la competitividad del
TMCD. Sin embargo, el análisis presente en el Capítulo 5 permite conocer el margen en
tiempos del que disponen los puertos para no llevar al TMCD a ser la opción menos
competitiva en un escenario determinado.

176

177
V. APORTACIONES ORIGINALES
Este trabajo pretende llevar a cabo un análisis del papel que los puertos juegan en la
promoción del transporte marítimo de corta distancia. Para ello se establece en primer
lugar un modelo de competencia intermodal que permite analizar las políticas de
promoción del transporte marítimo realizada durante las últimas dos décadas por parte
de la UE.
La aportación de este modelo original desarrollado a partir del trabajo de Dixit y
Nalebuff (1993) se centra en la demostración de la incidencia que la actividad de los
puertos tiene sobre la competitividad de la cadena logística intermodal. De esta forma, el
modelo permite aproximar de manera teórica el impacto que programas europeos como
la APTC, Marco Polo y II han tenido sobre las cuotas de mercado en el transporte de
mercancías e igualmente posibilita determinar las ya mencionadas razones de su fracaso.
En segundo lugar, el Capítulo 3 establece el uso del tiempo como medida de
relativización del output en los análisis de eficiencia de puertos cuando la competencia
intermodal es relevante, como es el caso del TMCD. La aportación original que se
propone en este trabajo permite adoptar una perspectiva por la cual dichos análisis están
más orientados a los verdaderos intereses de los usuarios de estas infraestructuras. De
este modo, muchos son los potenciales beneficios. Por un lado, un mayor grado de
transparencia para los usuarios a la hora de comparar y seleccionar entre soluciones
intermodales alternativas, ya que estos serán más capaces de evaluar la relación calidad-‐
precio en las elecciones a las que se enfrentan. Por otro, las autoridades portuarias y
operadores de infraestructuras son provistos de comparativas con una orientación de
mercado más allá de los tradicionales estudios de eficiencia que se han centrado en una

178
perspectiva más técnica, lo que les permitiría identificar potenciales medidas de mejora.
Por último, puede proveer a los órganos políticos de la UE y diferentes niveles de
gobierno de información relevante acerca de la actividad portuaria desde el punto de
vista de sus usuarios. Esta información podría ser utilizada a la hora de formular políticas
que permitiesen reducir los cuellos de botella en puertos y promover de una manera más
adecuada el transporte marítimo y la intermodalidad en Europa.
El Capítulo 4 supone, hasta donde conocemos, la primera modelización teórica en
términos de riesgo moral de la relación existente entre el gobierno y el operador de la
infraestructura. De este modo, se establece la hipótesis inicial de que las autoridades
gubernamentales no pueden observar el buen uso que los autoridades portuarias y/u
operadores de las infraestructuras hacen de los fondos públicos de los que disponen.
Como se refleja en dicho capítulo, los operadores pueden tener objetivos privados que se
alejan de la perspectiva socioeconómica que debe imperar en los gestores públicos. Por
ello, se propone el establecimiento de una relación directa entre la subvención o ayuda
concedida y los logros o resultados positivos de las mismas. El Capítulo 4 desarrolla de
forma original un subsidio por reducción de ineficiencia basada en tiempos.
Por último, la aportación original del Capítulo 5 se centra en el análisis empírico de
los corredores TMCD españoles como caso de estudio a partir del concepto del coste
generalizado. En concreto, en este capítulo se pone especial atención al análisis
econométrico del componente monetario, a partir del cual se determina la relevancia de
la competencia en los corredores marítimos como medida de fomento de la promoción
del transporte marítimo intermodal, un hecho que no ha sido contemplado por la UE en
ninguno de sus programas ni medidas de actuación.

179
VI. CONCLUSIONES OBTENIDAS
La UE ha reflejado en sus políticas el intento de promover el TMCD en lugar de la
carretera desde principios de los noventa. Programas tales como la APTC, Marco Polo I y II
han sido desarrollados para lograr una competencia real entre ambos modos, con un
presupuesto total aproximado de 895 millones de euros.
Sin embargo, a pesar de las políticas mencionadas, el transporte por carretera ha
visto incrementada su cuota de mercado durante estos últimos años, acrecentando
igualmente las diferencias con el TMCD. De este modo, si los objetivos no se han logrado
resulta lógico buscar la explicación de este hecho además de proponer medidas
alternativas. A través de un modelo teórico de competencia intermodal, el Capítulo 2
establece la interconexión existente entre el sistema de transportes en su conjunto, y
cómo cada política llevada a cabo está condicionada por otras variables.
La eficiencia del sistema ha sido ignorada por parte de la UE. En concreto, el papel
que los puertos juegan como nodos del TMCD no ha sido considerado por parte de las
políticas mencionadas. La eficiencia portuaria resulta esencial a la hora de incrementar la
competitividad del TMCD. En concreto, reducciones en los tiempos de espera, en los
procesos administrativos o mejoras en los ratios de carga y descarga podrían constituir
mejores herramientas de promoción del transporte marítimo que la concesión de ayudas
actuales.
El modelo teórico muestra cómo la implementación de las políticas actuales sin
tener en cuenta las mejoras en términos de eficiencia portuaria puede ser considerada
como una pérdida de dinero. La UE no debería financiar a las compañías privadas para

180
lograr el deseado intercambio modal, sino hacer más atractivo al TMCD a través de la
promoción de la eficiencia de la cadena logística combinándolo con medidas de
internalización de costes externos en el transporte por carretera. Esto ofrecería a los
transportistas los incentivos necesarios para que fuesen capaces de reconocer al TMCD
como la opción más beneficiosa en los casos en los que realmente lo es. En definitiva, los
resultados suponen una llamada de atención a la UE, que debe considerar el sistema de la
cadena logística en su conjunto a la hora de diseñar las medidas de promoción
adecuadas.
Por otra parte, el Capítulo 3 mostraba cómo los puertos eran frecuentemente
considerados las “cajas negras” del transporte marítimo, constituyendo en la mayoría de
las ocasiones los verdaderos cuellos de botella de la cadena logística.
Mejorar la percepción que los usuarios de los puertos tienen de los mismos
requiere una mayor transparencia en relación a las actividades portuarias y la reducción
de los tiempos requeridos para el manejo de la mercancía. A la hora de promocionar el
TMCD, debe prestarse especial atención a todo aquello que influye en la duración del
tiempo que emplean los transportistas en el puerto para ofrecer a estos una cadena de
valor eficiente. Como consecuencia de este requisito, una cuantificación adecuada de
esos tiempos resulta esencial a la hora de determinar las medidas más apropiadas para la
promoción del transporte marítimo dentro de Europa a través de corredores de corta
distancia.
Como se mencionó en el apartado metodológico, la mayoría de los estudios de
eficiencia en puertos realizados han hecho uso de metodologías como las fronteras
estocásticas o el análisis envolvente de datos con factores tales como la fuerza laboral o

181
las unidades físicas de capital como inputs y las cantidades del proceso productivo como
output. Sin embargo, no existen estudios que hayan considerado el tiempo como un
modo de relativizar el output en la actividad portuaria. En el Capítulo 3 se desagrega la
estructura de tiempos que componen el tiempo total en puerto a través de un marco
teórico. Los tiempos relativos al acceso a la infraestructura, ratios de carga o descarga por
hora, tiempos de espera del barco, aduanas u otros trámites administrativos han sido
identificados como diferentes elementos temporales que están directamente
relacionados con los niveles de ineficiencia en puertos.
La identificación precisa de esos elementos resulta crucial a la hora de determinar
la causa de determinadas ineficiencias. A pesar de conocer esto, no existen datos
disponibles a un nivel tan desagregado en el contexto que nos ocupa. Sin embargo, se
propone el tiempo de espera en puerto como una proxy apropiada a la hora de valorar la
eficiencia portuaria y se presenta un modelo teórico y una implementación empírica
donde se observan las diferencias entre resultados haciendo uso de dos especificaciones
distintas del análisis envolvente de datos.
Cuando comparamos las eficiencias técnicas con diferentes outputs –esto es, con
cantidades absolutas en una parte y relativizadas por tiempo de espera en otra – se
observan ciertas diferencias notables. Algunos puertos muestran un gran descenso en sus
ratios de eficiencia cuando introducimos el componente temporal. De hecho, la eficiencia
global de los puertos de la muestra desciende cuando incorporamos el tiempo como
medida de eficiencia en la producción. Por tanto, podríamos decir que cuando el tiempo
es una variable relevante en un corredor marítimo y en la competitividad del puerto –

182
como ocurre en el TMCD – no considerarlo en el análisis podría llevarnos a una
sobreestimación en la determinación de la eficiencia efectiva de dicha infraestructura.
Finalmente, resulta una implicación política inmediata la necesidad de disponer de
una fuente de datos de estancia en puertos desagregada por tiempos para poder
identificar las debilidades y fallos en las cadenas de transporte. Con ello, la UE podría
disponer de la información necesaria con respecto a la eficiencia de sus infraestructuras
desde el punto de vista de sus usuarios.
Del mismo modo, la necesidad de promover la eficiencia portuaria no significa que
la UE deba financiar proyectos encaminados a ese objetivo sin ningún tipo de condición.
Como concluye el Capítulo 4, los programas de promoción del transporte marítimo
europeo deberían establecer una relación directa entre los fondos otorgados y el nivel de
esfuerzo ejercido por parte de los operadores o autoridades portuarias. El sistema de
ayudas actuales mediante programas tales como la RTE-‐T supone una pérdida de dinero
en cuanto a la mejora de la eficiencia portuaria, ya que no consideran que en ciertas
ocasiones los puertos pueden tener objetivos diferentes a los de los gobiernos que los
financian.
El Capítulo 4 aborda el hecho de que los gobiernos – principalmente la UE, aunque
el análisis puede ser trasladado a niveles nacionales o regionales – no pueden observar el
esfuerzo ejercido por parte del operador de la infraestructura y, por tanto, se enfrentan a
un problema de riesgo moral. Esto significa que existe el riesgo de que la infraestructura
portuaria pueda recibir un subsidio incluso cuando no ejerza ningún (o un muy bajo)
esfuerzo. En otras palabras, la información que los gobiernos y operadores de las

183
infraestructuras poseen no es simétrica. Por ello, en dicho capítulo se realiza un diseño de
contratos que garantice que las autoridades portuarias ejerzan el mayor esfuerzo posible.
Como se mencionó anteriormente, la ineficiencia portuaria es esencialmente un
problema de tiempos: cuanto más tiempo lleva el movimiento de mercancías en un
puerto o terminal, más ineficiente resulta esa infraestructura. Cuando un transportista se
enfrenta a la decisión de seleccionar entre un modo u otro, los tiempos totales resultan
cruciales en la elección. Por tanto, los tiempos totales en puerto reducen drásticamente la
competitividad del transporte marítimo. Por ello, las reducciones en los tiempos en
puerto deberían ser consideradas como ganancias de eficiencia.
El Capítulo 4 muestra cómo – a través del desarrollo de un modelo teórico de
riesgo moral – un pago proporcional que establece una relación entre las ganancias en
términos de eficiencia portuaria y la ayuda para la misma es el mejor mecanismo para
incentivar a los puertos en la búsqueda de dichas mejoras de eficiencia. Como
recomendación de política, se propone el desarrollo de un subsidio por unidad de
reducción de la ineficiencia en términos de tiempo. En la práctica, esto consistiría en la
contabilización de los tiempos totales de espera en puerto, y en la concesión de ayudas
cuando estos tiempos se redujesen de forma real mediante la inversión en determinadas
infraestructuras, las políticas de fomento de la productividad laboral o la supresión de
procedimientos administrativos innecesarios mediante, por ejemplo, el uso de
tecnologías de la información.
De este modo, si los operadores de las infraestructuras percibiesen por sí mismos
los beneficios de reducir los tiempos totales, entonces dicha política podría lograr el

184
objetivo establecido y, de la misma forma, el proceso de ganancias de eficiencia quedaría
internalizado.
Por último, el Capítulo 5 lleva a cabo un análisis de los principales corredores del
TMCD con la intención de valorar su potencial y su competitividad. Frecuentemente, se
asume que el transporte marítimo incurre en mayores tiempos de recorrido, y resulta
tradicionalmente considerado como el modo de transporte más lento. Sin embargo, la
geografía europea provee un marco muy apropiado para la promoción de dichos
corredores. En este análisis, las costas mediterránea y cantábrica son ejemplos de
localizaciones apropiadas para establecer y/o mantener algunos corredores rentables
para Europa Central y del Este.
Desde una ciudad interior como Madrid se ha demostrado como algunos
corredores de TMCD reducen los tiempos totales de recorrido en comparación con la
carretera, especialmente en los casos del comercio con Roma (49.3%) o Londres (40.27%),
a través de los puertos de Barcelona y Bilbao. Considerando por otra parte una ciudad
costera como es Barcelona, estos ahorros de tiempos son especialmente importantes en
las rutas con Roma (50.11%) y Moscú (30.63%). De forma general, el Puerto de Barcelona
resulta ser realmente competitivo en el establecimiento de corredores de TMCD a lo largo
de la costa mediterránea.
Al mismo tiempo, resulta crucial considerar la necesidad de evitar los costes
externos que provoca la carretera. Como cabe esperar, los corredores TMCD generan una
reducción sustancial en cada ruta analizada comparándolo con el transporte por carretera
y variando entre un 15.88 y un 76.7%. Ésta es principalmente la razón por la cual la UE ha
estado promoviendo los corredores marítimos en las últimas décadas, aun con pobres

185
resultados. Sin embargo, estos ahorros deben hacer frente en algunos casos a los
incrementos en términos de tiempo y coste monetario para determinar finalmente la
competitividad de este modo de transporte para cada ruta. Únicamente la perspectiva del
coste generalizado indica la verdadera competitividad de un corredor.
Del mismo modo, existen otras variables que deben ser consideradas, como los
mencionados tiempos de espera en puertos, cruciales para el TMCD como se estableció
anteriormente. Sin embargo, estos tiempos no pueden ser incorporados en este análisis
empírico debido a la indisponibilidad de los datos. De esta forma, el análisis presente en
el Capítulo 5 debe ser empleado a la hora de considerar el gap del que disponen los
puertos antes de volver al TMCD en un modo no competitivo en el corredor en concreto
analizado.
Igualmente, haciendo uso de la base de datos elaborada, se ha estimado la
ecuación de precios para conocer qué factores afectan a los mismos en las rutas del
TMCD. Los resultados conducen a tres conclusiones principales: en primer lugar, las rutas
subvencionadas muestran menores precios que las no subvencionadas. Esto significa que
existe una incidencia positiva sobre los precios del gasto público en el TMCD. En segundo
lugar, cuanto mayores son los costes de la alternativa por carretera, mayores son los
precios en las rutas intermodales. Finalmente, se destaca la importancia de la
competencia: los precios son más bajos en aquellas rutas donde existe una mayor
frecuencia y un mayor número de competidores. Este último resultado supone un motivo
claro para la promoción de la competencia en los corredores marítimos a la hora de
fomentar el atractivo del TMCD.

186
Por último, decir que los corredores TMCD deben ser promocionados únicamente
en aquellos casos donde resulta el modo de transporte más competitivo, considerando
todas las variables que componen los precios generalizados y comparándolo con otros
modos, especialmente con el transporte por carretera. Es decir, la promoción del
transporte marítimo no debe responder a más principios que los que establece la
racionalidad económica. La UE debería centrar su preocupación en reducir la ineficiencia
existente en el mercado del transporte de mercancías, haciendo que el transporte asuma
el coste real que provoca, incentivando las ganancias de eficiencia en las infraestructuras
y promoviendo aquellos corredores intermodales que son realmente la mejor alternativa
para la sociedad.

187
REFERENCES
Baird, A. (2007): The economics of Motorways of the Sea. Maritime Policy & Management, Vol. 34(4), pp. 287-‐310.
Baird, A., Hoffmann J. and Wilmsmeier, G. (2002): The Chilean Maritime Highway. IAME Panama Conference Proceedings. 13-‐15 November 2002, Panamá.
Banker, R.D., Charnes, A. and Cooper, W.W. (1984): Some Models for Estimating Technical and Scale Inefficiencies in Data Envelopment Analysis. Management Science, Vol. 30, pp. 1078-‐1092.
Baños-‐Pino, J., Coto-‐Millán, P. and Rodríguez-‐Álvarez, A. (1999): Allocative efficiency and over-‐capitalization: an application. International Journal of Transport Economics. Vol. 26(2), pp. 181–199.
Barros, C.P. (2006): A Benchmark Analysis of Italian Seaports Using Data Envelopment Analysis. Maritime Economics & Logistics. Vol. 8, pp. 347-‐365.
Barros, C.P. (2005): Decomposing Growth in Portuguese Seaports: A Frontier Cost Approach. Maritime Economics & Logistics, Vol. 7, pp. 297-‐315.
Barros, C.P. (2004): The measurement of efficiency of Portuguese sea port authorities with DEA. International Journal of Transport Economics, Vol. 30(3), pp. 335-‐354.
Barros, C. (2003): Incentive Regulation and Efficiency of Portuguese Port Authorities. Maritime Economics & Logistics, Vol. 5(1), pp. 55-‐69.
Barros, C.P. and Athanassiou, M. (2004): Efficiency in European seaports with DEA: Evidence from Greece and Portugal. Maritime Economics and Logistics, Vol. 6(2), pp. 122-‐140.
Becquelin, F. (2012): Ecobonus, from regional to European. European Maritime Day Göteborg 22/05/2012.
Blonigen, B.A. and Wilson, W.W. (2006): New measures of Port Efficiency using international trade data. Nber working paper series, Working Paper 12502. National Bureau of Economic Research. Cambridge.
Bonilla, M., Casasus, T., Medal, A., and Sala, R. (2004): An efficiency analysis of the Spanish port system. International Journal of Transport Economics, Vol. 31(3), pp. 379-‐400.
Brooks, M.R., and Frost, J.D. (2006): Short Sea Shipping on the East Coast of North America: Analysis of opportunities and issues. Transportation Planning/Modal Integration Initiative, Canada–Dalhousie University. Project ACG-‐TPMI-‐AH08.
Brooks, M.R., and Frost, J.D. (2004): Short Sea Shipping: a Canadian perspective. Maritime Policy & Management, Vol. 31(4), pp. 393-‐407.

188
Button, K. (2010): Transport Economics, Elsevier.
Camarero Orive, A. and González Cancelas, N. (2004): Short Sea Shipping: a transport alternative for the future or an immediate reality? Revista de Obras Públicas. Vol. 3448, pp.19-‐32.
CEDEX (2010): Economic Evaluation of Transport Projects Guidelines, Spanish Ministry of Transport. Granted by Centro de Estudios y Experimentación de Obras Públicas (CEDEX). PT-‐2007-‐001-‐02IAPP.
Chang, S. (1978): In Defence of Port Economic Impact Studies. Transportation Journal, Vol. 17(3), pp. 79–85.
Charnes, A., Cooper, W.W. and Rhodes, E.L. (1978): Measuring the efficiency of decision making units. European Journal of Operational Research, pp. 429–444.
Clark, X., Dollar, D. and Micco, A. (2000): Maritime transport costs and port efficiency, Mimeo, World Bank.
COM (2013a): Europe’s Seaports 2030: Challenges Ahead. European Commission, Memo/13/448.
COM (2013b): The Marco Polo programme – Results and outlook. European Commission, 278 final.
COM (2013c): External cost calculator for Marco Polo freight transport project proposals. Call 2013 version. Report 25929.
COM (2013d): Marco Polo II. Call for proposals 2013. Executive Agency for Competitiveness and Innovation. European Commission.
COM (2012a): Vice-‐President and Commissioner for Transport speech. Steering a course fot the future: Europe’s ports in the 21st century. Speech/12/352. 11 May 2012.
COM (2012b): Importance of ports for economic recovery and jobs. European Commission, MEMO /12/317. 12 May 2012, Brussels.
COM (2012c): EU Transport in figures – Statistical pocketbook 2012. European Commission.
COM (2011a): Developments in the EU maritime transport policy. Directorate C-‐ Maritime Transport, European Commission, Brussels, 13 April 2011.
COM (2011b): White Paper. Roadmap to a Single European Transport Area –Towards a competitive and resource efficient transport system. European Commission, 144 final.
COM (2011c): Integrating biodiversity and nature protection into port development. European Commission, 319 final. Brussels, 8 March 2011.

189
COM (2010): Europe 2020. A strategy for smart, sustainable and inclusive growth. Communication from the Commission, 2020 final.
COM (2009a): Strategic goals and recommendations for the EU’s maritime transport policy until 2018. Communication from the Commission to the European Parliament, the Council, the European Economic and Social Committee and the Committee of the Regions, 8 final.
COM (2009b): Final Green Paper TEN-‐T: A policy review. Towards a better integrated Transeuropean Transport Network at the service of the common transport policy. European Commission.
COM (2009c): Communication and action plan with a view to establishing a European maritime transport space without barries. European Commission, 11.
COM (2007): The EU's freight transport agenda: Boosting the efficiency, integration and sustainability of freight transport in Europe. Communication from the Commission.
COM (2006a): An exhaustive analysis of employment trends in all sectors related to sea or using sea resources. Final report for the European Commission, DG Fisheries and Maritime Affairs. C3135/ 2006. ECOTEC Reseatch & Consulting.
COM (2006b): Maritime transport policy. Improving the competitiveness, safety and security of European shipping. Directorate –General for Energy and Transport.
COM (2006c): Sustainable mobility for our continent -‐ Mid-‐term review of the European Commission’s 2001 Transport White Paper. Communication from the Commission to the Council and to the European Parliament Keep Europe moving.
COM (2005): Annex to: The communication on Thematic Strategy on Air Pollution and The Directive on Ambient Air Quality and Cleaner Air for Europe. Impact Assessment. Brussels, 21, 9. SEC 1133.
COM (2004a): Decision No 884/2004/EC of the European Parliament and of the Council of 29 April 2004 on amending Decision No 1692/96/EC on Community guidelines for the development of the trans-‐European transport network. Official Journal of the European Union L 167.
COM (2004b): Amended proposal for a directive of the European Parliament and of the Council on intermodal loading units. 361 final. Brussels.
COM (2003): The programme for the promotion Short Sea Shipping. Communication from the European Commission. COD 2003/0155. (http://europa.eu.int).
COM (2001a): The Marco Polo Programme. A New Promotion Concept for Alternatives to Road Transport. Consultation Paper. European Commission Directorate General for Energy and Transport Directorate for Inland Transport.
COM (2001b): Reinforcing Quality Services in Sea Ports: a Key for European Transport. Communication from the Commission to the Council, the European Parliament, the

190
Economic and Social Committee and the Committee of the regions of 13 February of 2011 -‐Not published in the Official Journal.
COM (2001c): White Paper-‐European transport policy for 2010: time to decide. Communication from the Commission to the Council, the European Parliament, the Economic and Social Committee and the Committee of the regions, 370 final. Brussels.
COM (1997): Intermodality and intermodal freight transport: A systems approach to freight transport. Strategies and actions to enhance efficiency, services and sustainability. Communication from the Commission to the Council, the European Parliament, the Economic and Social Committee and the Committee of the regions, 243 final, Brussels.
COM (1996): Community guidelines for the development of the trans-‐European transport network (TEN-‐T). Communication from the Commission to the Council, the European Parliament, the Economic and Social Committee and the Committee of the regions, 228 final, Brussels, 23 July.
Compes Lopez, R. and Poole, N. (1998): Quality assurance in the maritime port logistics chain: the case of Valencia, Spain. Supply chain management: An international Journal, Vol. 3 (1), pp.33-‐44.
Containerization International Yearbook (2012): Informa Trade and Energy Publishing. ISBN 9781843119906.
Coto-‐Millán, P., J. Baños -‐Pino, and Rodríguez-‐Álvarez, A. (2000): Economic Efficiency in Spanish Ports: some Empirical Evidence. Maritime Policy and Management, Vol 27(2), pp. 169–74.
Cullinane, K.P.B. (2010): Revisiting the Productivity and Efficiency of Ports and Terminals: Methods and Applications, in Handbook of Maritime Economics and Business. Ed. C. Grammenos, Informa Publications. London.
Cullinane, K.P.B. (2006): Devolution, Port Governance and Port Performance. Research in Transportation Economics, Vol. 17.
Cullinane, K.P.B. and Song, D-‐W. (2006): Estimating the Relative Efficiency of European Container Ports: A Stochastic Frontier Analysis. Research in Transportation Economics, Vol. 16, Elsevier, Amsterdam, pp. 85-‐115.
Cullinane, K.P.B. and Song, D-‐W. (2003): A Stochastic Frontier Model of the Productive Efficiency of Korean Container Terminals. Applied Economics, Vol. 35(3), pp. 251-‐267.
Cullinane, K.P.B. and Wang, T. (2010): The Efficiency Analysis of Container Port Production Using DEA Panel Data Approaches. OR Spectrum, Vol. 32(3), pp. 717-‐738.

191
Cullinane, K.P.B. and Wang, T. (2007): Data Envelopment Analysis (DEA) and Improving Container Port Efficiency. Research in Transportation Economics, Vol. 17, pp. 517-‐566, Amsterdam.
Cullinane, K. P. B. and Wang, T. (2006): The efficiency of European container ports: A cross-‐sectional data envelopment analysis. International Journal of Logistics: Research and Applications, Vol. 9(1), pp. 19-‐31.
Cullinane, K.P.B., Wang, T., Song, D-‐W. and Ji, P. (2006): The technical efficiency of container ports: Comparing data envelopment analysis and stochastic frontier analysis. Transportation Research Part A: Policy and Practice, Vol. 40(4), pp. 354-‐374.
Cullinane, K.P.B., Ji, P. and Wang, T. (2005): The relationship between privatization and DEA estimates of efficiency in the container port industry. Journal of Economics and Business, Vol. 57(5), pp. 433-‐462.
Cullinane, K.P.B., Song, D-‐W. and Wang, T. (2005): The Application of Mathematical Programming Approaches to Estimating Container Port Production Efficiency. Journal of Productivity Analysis, Vol. 24, pp. 73–92.
Cullinane, K.P.B; Song, D-‐W; Ji, P. and Wang, T. (2004): An Application of DEA Windows Analysis to Container Port Production Efficiency. Review of Network Economics, Vol. 3(2), pp. 186-‐208.
Cullinane, K.P.B., Song, D-‐W. and Gray, R. (2002): A Stochastic Frontier Model of the Efficiency of Major Container Terminals in Asia: Assessing the Influence of Administrative and Ownership Structures. Transportation Research A, Vol. 36(8), pp. 743-‐762.
De Rus, G., Campos, J. and Nombela, G. (2003): Economía del Transporte. Ed. Antoni Bosch. Barcelona, Spain. ISBN:84-‐95348-‐08-‐X.
Devlin, J. and Yee, P. (2005): Trade Logistics in Developing Countries: The Case of the Middle East and North Africa. World Economy, Vol. 28, pp. 435-‐456.
Dixit, A. and Nalebuff, B. (1993): Thinking strategically. The Competitive Edge in Business, Politics, and Everyday Life. W.W. Norton and Company Ltd. Castle House, 75/76 Wells Street, London.
Djankov, S., Freund, C. And Pham, C.S. (2005): Trading on time. Mimeo, World Bank.
Douet, M. and Cappuccilli, J.F. (2011): A review of Short Sea Shipping policy in the European Union. Journal of Transport Geography, Vol. 19, pp. 968–976.
ECA (2012): Special Report, Nº4. Using structural and cohesion funds to co-‐finance transport infrastructures in seaports: an effective investment?, Pursuant to Article 287(4), second subparagraph, TFEU.

192
EEA (2011): Transport infrastructure investments. European Environment Agency. Assessment published in January.
EFTA (2007): EFTA Guide to EU Programmes (2007-‐13). European Free Trade Association Bulletin 2.
Estache, A., González, M. and Trujillo, L. (2002): Efficiency gains from port reform and the potencial for Yardstick competition: lessons from Mexico. World Development, Vol. 30(4), pp. 545–560.
Estache, A., Tovar, B. and Trujillo, L. (2004): Sources of efficiency gains in port reform: a DEA decomposition of a Malmquist TFP index for Mexico. Utilities Policy, Vol. 12, pp 21–230.
European Parliament (2010): Decision No 661/2010/EU of the European Parliament and of the Council of 7 July 2010. Union guidelines for the development of the trans-‐European transport network. Official Journal of the European Union L 204.
Eurostat (2011): Eurostat Regional Yearbook 2011. Coastal Regions, 13.
Florian, M., Gaudry, M. and Lardinois, C. (1988): A two-‐dimensional framework for the understanding of transportation planning models. Transportation Research Part B: Methodological, Vol. 22(6), pp. 411-‐419.
García-‐Alonso, L. and Martín-‐Bofarrul, M. (2007): Impact of Port investment on efficiency and capacity. Maritime Economics & Logistics, Vol. 9, pp. 254-‐267.
García-‐Menéndez, L., I. Martínez-‐Zarzoso and D. Piñero de Miguel (2004): Determinants of Mode Choice between Road and Shipping for Freight Transport. Journal of Transport Economics and Policy, Vol. 38(3), pp. 447–466.
Gese Aperte, X. and Baird, A. (2013): Motorways of the sea policy in Europe. Journal of Maritime Policy & Management, Vol. 40 (1), pp.10-‐26.
Giannopoulos, GA. (2002) Integrating freight transportation with intelligent transportation systems: some European issues and priorities. Journal of the Transportation Research Board, Vol. 1790, pp. 29-‐35.
González, M. and Trujillo, L. (2008): Reforms and infrastructure efficiency in Spain’s container ports. Transportation Research A, Vol. 42(1), pp. 243–257.
González, M. and Trujillo, L. (2009): Efficiency Measurement in the Port Industry: A Survey of the Empirical Evidence. Journal of Transport Economic and Policy, Vol. 43(2), pp. 157-‐192.
Grosso, M. Lynce, A.R., Silla, A. and Vaggelas, G.K. (2010): Short Sea Shipping, intermodality and parameters influencing pricing policies: the Mediterranean Case. Netnomics, Vol. 11, pp. 47-‐67.
Hummels, D. (2001): Time as a Trade Barrier. Mimeo, Purdue University.

193
Hung, S-‐H., Lu, W-‐M. and Wang, T.P. (2010): Benchmarking the operating efficiency of Asia container ports. European Journal of Operational Research, Vol. 203(3), pp. 706-‐713.
Innes, R. (1990): Limited Liabilities and Incentive Contracting with ex ante Action Choices. Journal of Economic Theory, Vol. 52, pp. 45–67.
Itoh, H. (2002): Efficiency changes at major container ports in Japan: A window application of data envelopment analysis. Review of Urban and regional Development Studies, Vol. 14(2), pp. 133-‐152.
Janic, M. (2002): Integrated transport systems in the European Union: An overview of some recent developments. Transport Reviews: A transnational transdisciplinary journal, Vol. 21(4), pp. 469-‐497.
Laffont, J. and Martimort, D. (2002): The theory of incentives, the principal-‐agent model. Princeton University Press.
Lee, H., Chou, M. and Kuo, S. (2005): Evaluating port efficiency in Asia Pacific region with recursive Data Envelopment Analysis. Journal of the Eastern Asia Society for Transportation Studies, Vol. 6, pp. 544 – 559.
Levin, R. C. (1978): Allocation in surface freight transportation: Does rate regulation matter?. Bell Journal of Economics, Vol. 9(1), pp. 18-‐45.
Limao, A. and Venables, J. (2001): Infrastructure, geographical disadvantage and transport costs. World Bank Economic Review, Vol. 15. Washington.
Liu, C-‐C. (2008): Evaluating the operational efficiency of major ports in the Asia-‐Pacific region using data envelopment analysis. Applied Economics, Vol. 40(13), pp. 1737-‐1743.
Liu, Z. (1995): The Comparative Performance of Public and Private Enterprises: The Case of British Ports. Journal of Transport Economics and Policy, Vol. 29(3), pp. 263-‐274.
Luberoff, D., & Walder, J. (2000): U.S. Ports and the Funding of Intermodal Facilities: An Overview of Key Issues. Kennedy School of Government. Harvard University. Unpublished manuscript.
Maksimavičius, R. (2004): Some elements of the Ro‐Ro terminals. Transport, Vol. 19(2), pp. 75-‐81.
Martínez, F.X. and Olivella, J. (2005): Short Sea Shipping opportunities for the Pyrenean Cargo Flows. Journal of Maritime Research, Vol. 2(2), pp. 65-‐80.
Martínez-‐Budría, E., Díaz-‐Armas, R., Navarro-‐Ibañez, M. and Ravelo-‐Mesa, T. (1999): A study of the Efficiency of Spanish port authorities using Data Envelopment Analysis. International Journal of Transport Economics, Vol. 26 (2), June

194
Marlow, P.B. and Paixão Casaca, A.C. (2004): Short Sea Shipping and its role in logistics supply chains: A European perspective. Journal of International Logistics and trade, Vol. 2, pp. 57-‐68.
McFadden, D. (1973): Conditional logit analysis of qualitative choice behavior. Frontiers, in Econometrics. Ed. P. Zaremka. Academic Press, New York and London.
Medda, F. and Trujillo, L. (2010): Short Sea Shipping: an analysis of its determinants. Maritime Policy & Management, Vol. 37(3), pp. 285-‐303.
Medda, F. and Trujillo, L. (2009): A Boost for Short Sea Shipping: The Environmental and Economic Determinants. The Environmentalist, Vol. 80, pp.14-‐20.
Milgrom, P. (1981): Good News and Bad News: Representation Theorems and Application. Bell Journal of Economics, Vol. 12, pp. 380–391.
Musso, E. And Marchese, U. (2002) Economics of shortsea Shipping. The handbook of Maritime economics and business. Grammenos Costas, T.H. Ed. LLP ; Informa Professional.
Ng, A.K.Y. (2009): Competitiveness of short sea shipping and the role of port: the case of North Europe. Maritime Policy & Management, Vol. 36(4), pp. 337-‐352.
Nordas, H.K. (2006): Time as a trade barrier: implications for low-‐income countries. OECD Economic Studies, Vol. 42.
Notteboom., T; Coeck, C. and van den Broeck, J. (2000): Measuring and Explaining the Relative Efficiency of Container Terminals by means of Bayesian Stochastic Frontier Models. International Journal of Maritime Economics, Vol. 2(2), pp. 83-‐106.
Ortúzar, J. and Willumsen, L.G. (2011): Modelling transport. A John Wiley and Sons, Ltd. Publication. Fourth Edition. ISBN: 9780470760390.
Oum, T. H. and Gillen, D. (1979): The structure of intercity travel demands in Canada: theory, tests and empirical results. Working Paper No. 79-‐18, Queen’s University, Canada.
Paixão Casaca, A.C. (2008): Motorways of the sea port requirements: the viewpoint of port authorities. International Journal of Logistics Research and Applications: A Leading Journal of Supply Chain Management, Vol. 11(4), pp. 279-‐294.
Paixão Casaca, A.C. and P.B. Marlow (2007): The Impact of the Trans-‐European Transport Networks on the Development of Short Sea Shipping. Maritime Economics & Logistics, Vol. 9, pp. 302-‐323.
Paixão, A.C. and Marlow, P.B. (2002): Strengths and weaknesses of Short Sea Shipping. Marine Policy. Vol. 26 (3), pp. 167–178.
Park, E. S. (1995): Incentive contracting under Limited Liability. Journal of Economics and Management Strategy, Vol. 4, pp. 477–490.

195
Park, R-‐K and De, P. (2004): An alternative approach to efficiency measurement of seaports. Maritime Economics & Logistics, Vol. 6, pp. 53-‐69.
Pettersen, S. (2004): Port pricing structures and ship efficiency. Review of Network Economics, Vol. 3(2).
Pigou, A.C. (1932): Divergences Between Marginal Social Net Product and Marginal Private Net Product, in The Economics of Welfare. London, Macmillan and Co.
Psaraftis, H.N. (2005): EU ports policy: where do we go from here?. Maritime Economics and Logistics, Vol. 7 (1), pp. 73-‐82.
Quandt, R. and Baumol, W. (1966): The demand for abstract transport modes: Theory and measurement. Journal of Regional Science, Vol. 6(2), pp. 13-‐26.
Quaresma Dias, J.C., Calado, J.M.F. and Mendonça, M.C. (2010): The role of European «ro-‐ro» port terminals in the automotive supply chain management. Journal of Transport Geography, Vol. 18, pp. 116–124.
Rios, L.R. and Gastaud Maçada, A.C. (2006): Analysing the Relative Efficiency of Container Terminals of Mercosur using DEA. Maritime Economics & Logistics, Vol. 8, pp. 331-‐346.
Roll, Y. and Hayuth, Y. (1993): Port performance comparison applying data envelopment analysis (DEA). Maritime Policy and Management, Vol. 20 (2), pp. 153-‐161.
Saldhana, J. and Gray, R. (2002): The potential for British coastal shipping in a multimodal chain. Maritime Policy and Management, Vol. 29 (1), pp. 77-‐92.
Sánchez, R., Hoffmann, J., Micco, A., Pizzolitto, G., Sgut, M, and Wilmsmeier, G. (2003): Port efficiency and international trade: Port efficiency as a determinant of maritime transport costs. Maritime economics and logistics, Vol. 5, pp. 199-‐218.
SPC-‐Spain (2012): Spanish Statistical observatory of SSS 2009-‐2011. European Short Sea Network. http://www.shortsea.es.
SPC-‐Spain (2011): Spanish statistical observatory of Short Sea Shipping 2009-‐2011. European Short Sea Network. http://www.shortsea.es.
Spanish Ministry of Public Works (2013): Road freight transport costs observatory. Executive summary. Spanish Government.
Spanish Ministry of Public Works (2011): Intermodal transport observatory. Executive summary. Spanish Government.
Strandenes, S.P. (2004): Port pricing structures and ship efficiency. Review of Network Economics, Vol. 3(2), pp. 135-‐144.
Tongzon, J. (2001): Efficiency Measurement of Selected Australian and other International Ports using Data Envelopment Analysis. Transportation Research, Vol. 35A(2), pp. 107-‐122.

196
Tongzon, J. and Heng, W. (2005): Port privatization, efficiency and competitiveness: Some empirical evidence from container ports (terminals). Transportation Research A, Vol. 39(5), pp. 405-‐424.
Trujillo, L. and Tovar, B. (2007): The European Port Industry: An Analysis of its Economic Efficiency. Journal of Maritime Economics & Logistics, Vol. 9(2), pp.148-‐171.
Turner, H., Windle, R. and Dresner, M. (2004): North American container port productivity: 1984-‐1997. Transportation Research E, Vol. 40, pp. 339-‐356.
Valentine, V.F. and Gray, R. (2001): The measurement of port efficiency using data envelopment analysis. 9th World Conference on Transport Research Proceedings. 22–27 July, Seoul, South Korea.
Wang, T. and Cullinane, K.P.B. (2006): The Efficiency of European Container Terminals and Implications for Supply Chain Management. Maritime Economics & Logistics, Vol. 8(1), pp. 82-‐99.
Wilmsmeier, G., Hoffmann, J. and Sánchez, R. (2006): The Impact of Port Characteristics on International Maritime Transport Costs. Research in Transportation Economics, Vol. 16(1), pp. 117-‐140.
Yan, J., Sun, X. and Liu, J.J. (2009): Assessing container operator efficiency with heterogeneous and time-‐varying production frontiers. Transportation Research B, Vol. 43(1), pp. 172–185.