ocean and shipping engineering
74
-
Upload
independent -
Category
Documents
-
view
3 -
download
0
Transcript of ocean and shipping engineering


Journal of Shipping and
Ocean Engineering
Volume 3, Number 1-2, February 2013 (Serial Number 10)
David
David Publishing Company
www.davidpublishing.com
PublishingDavid

Publication Information: Journal of Shipping and Ocean Engineering is published monthly in hard copy (ISSN 2159-5879) and online (ISSN 2159-5887) by David Publishing Company located at 9460 Telstar Ave Suite 5, EL Monte, CA 91731, USA. Aims and Scope: Journal of Shipping and Ocean Engineering, a monthly professional academic journal, covers all sorts of researches on ship research and marine engineering, shipbuilding technology, maritime technology, water transportation enterprise management, ocean energy development and utilization, coast protection engineering, harbor engineering, offshore engineering as well as other issues. Editorial Board Members: Prof. Hwung-Hweng Hwung (China Taiwan), Dr. Jun Zang (UK), Prof. Maciej Pawłowski (Poland), Prof. Ehsan Mesbahi (UK), Prof. Charles W. Finkl (USA), Dr. Zaili Yang (UK), Prof. Bob You (Australia), Prof. Levent Bat (Turkey), Prof. Corrado Schenone (Italy), Prof. Decheng Wan (China), Dr. Vladimir Krasilnikov (Norway), Prof. Alexander B. Ezersky (France), Prof. Carmine Biancardi (USA). Manuscripts and correspondence are invited for publication. You can submit your papers via Web Submission, or E-mail to [email protected], [email protected] or [email protected]. Submission guidelines and Web Submission system are available at http://www.davidpublishing.com and http://www.davidpublishing.org. Editorial Office: 9460 Telstar Ave Suite 5, EL Monte, CA 91731, USA Tel: 1-323-984-7526, 323-410-1082 Fax: 1-323-984-7374, 323-908-0457 E-mail: [email protected]; [email protected]; [email protected] Copyright©2013 by David Publishing Company and individual contributors. All rights reserved. David Publishing Company holds the exclusive copyright of all the contents of this journal. In accordance with the international convention, no part of this journal may be reproduced or transmitted by any media or publishing organs (including various websites) without the written permission of the copyright holder. Otherwise, any conduct would be considered as the violation of the copyright. The contents of this journal are available for any citation. However, all the citations should be clearly indicated with the title of this journal, serial number and the name of the author. Abstracted / Indexed in: Database of EBSCO, Massachusetts, USA Database of Cambridge Science Abstracts (CSA), USA Chinese Database of CEPS, American Federal Computer Library Center (OCLC), USA Ulrich’s Periodicals Directory Summon Serials Solutions ProQuest Subscription Information: Price: Print $420 (per year) Online $300 (per year) Print and Online $560 (per year) David Publishing Company 9460 Telstar Ave Suite 5, EL Monte, CA 91731, USA Tel: 1-323-984-7526, 323-410-1082 Fax: 1-323-984-7374, 323-908-0457 E-mail: [email protected]; [email protected]
David Publishing Company
www.davidpublishing.com
DAVID PUBLISHING
D

Journal of Shipping and Ocean Engineering
Volume 3, Number 1-2, February 2013 (Serial Number 10)
Contents
1 The Energy Efficiency Gap in Maritime Transport
Michele Acciaro, Peter Nyegaard Hoffmann and Magnus Strandmyr Eide
11 Sea Trials of a Wave Energy Converter in Strangford Lough, Northern Ireland
Vladimir Krivtsov, Ian Bryden, Brian Linfoot and Robin Wallace
21 Marine Accident Analysis with GIS
Ozkan Ugurlu, Umut Yıldırım and Ercan Yuksekyıldız
30 Investigation of Shoreline and Topographic Change on the West Side of the Imagire-Guchi Inlet,
Japan
Andi Subhan Mustari, Shigeru Kato, Takumi Okabe and Mieko Kataoka
40 Views from Maritime Education and Training on the Full Implementation of 2010 STCW
Amendments
Ruan Wei
47 Role of Naval Architects in Ship Recycling
Sivaprasad K. and Nandakumar C. G.
55 Some Peculiarities of the Preprocessing of Spectral Data and Images
Valentin Atanassov, Georgi Jelev and Lubomira Kraleva
61 Investigating the Effect of Winds and Storms on Shoreline Erosion along the Coast of Tanzania
Shigalla Mahongo and Yohanna Shaghude


Journal of Shipping and Ocean Engineering 3 (2013) 1-10
The Energy Efficiency Gap in Maritime Transport
Michele Acciaro1, 2, Peter Nyegaard Hoffmann3 and Magnus Strandmyr Eide1
1. DNV Research and Innovation, Det Norske Veritas (DNV), Høvik, Norway
2. Department of Logistics, The Kühne Logistics University (KLU), Hamburg, Germany
3. DNV Technical Advisory Ship and Offshore, Ship Operations, Det Norske Veritas (DNV), Høvik, Norway
Abstract: There is evidence that the shipping industry could achieve energy efficiency gains through the implementation of new technologies, with considerable reductions of fuel costs and emissions to air in the sector. Although the cost reducing effects of some new technologies are well established, companies appear reluctant to innovate despite the financial and societal benefits, as a result of what is referred to as the energy efficiency gap. The global emission impacts of the shipping industry, most notably of greenhouse gases, sulphur and nitrogen oxides are increasingly attracting the attention of regulators, non-governmental organisations and the media, and shipping companies are under pressure to find new ways to reduce their emission footprint. Understanding the determinants of the energy efficiency gap in shipping is then critical in improving the environmental profile of the industry. This paper presents the results of a survey among Norwegian shipping companies aimed at gaining a better understanding of the barriers to implementation of new cost saving technologies. The paper assesses the technical barriers that have traditionally been indicated as the main cause of the energy efficiency gap in shipping. The paper results indicate that next to technical factors, important barriers are constituted also by managerial practices and legal constraints. Key Words: Energy efficiency gap, emission reduction technologies, barriers, maritime transport.
1. Introduction
CO2 abatement measures have beneficial effects on
the company bottom line by reducing the fuel bill [1]. It
would therefore be expected that these measures are
adopted independently of their CO2 reduction potential.
In practice though, we observe that the degree of
implementation of economically viable technologies is
slower than expected if appropriate incentives are not
provided.
This reluctance to adopt economically beneficial
technologies is often referred to as barriers to energy
efficiency [2] or the energy efficiency gap [3]. The
literature on barriers in shipping is limited [3, 4]
although in the last few years a few studies have been
published. Gordon [5] carried out a survey among ship
owners and shipbuilders in the UK. From the 69 valid
responses the Author concluded that barriers in
shipping are mostly related to costs and risks, low
Corresponding author: Michele Acciaro, the Kühne
Logistics University (KLU). E-mail: [email protected].
awareness of the potential of different energy options
and split incentives between ship-owners and
charterers. The survey focused only on five
technologies and four main barriers. Of those
measures the most promising appeared slow steaming
although in this case charter requirements turned out to
be the large obstacle to implementation. The analysis is
limited to only a handful of measures and for the
current study it was believed that a larger set of
technologies and a more detailed analysis of barriers
should be performed.
In addition to Gordon [5] few other studies have
conducted surveys or company analysis in shipping.
Some studies are based on case studies or in depth
interviews. Girard [6] makes use of multi criteria
decision analysis to assess the level of barriers
connected to 25 technologies in a case study involving
the Grieg Shipping Group. Similarly Hoffmann et al. [7]
performed an analysis on 21 measures on another
Waste heat recovery, Hull/propeller optimisation, Propeller features, Anti-fouling measures, Slow Steaming.
DAVID PUBLISHING
D

The Energy Efficiency Gap in Maritime Transport
2
shipping company. Those studies identify in shipping
the existence of institutional or market barriers, such as
contractual arrangements, and technical barriers related
to costs and complexity of installation.
Johnson et al. [8] provide an analysis of barriers in a
short sea shipping company. In their study they
highlighted the importance of management practice
and organisational culture in achieving energy
efficiency. Among the factors discussed they highlight
the role of project management capabilities, ship-shore
communication, division of responsibilities, access to
performance measurements, and competence in energy
efficiency.
These results are a further elaboration of some ideas
presented in Johnson and Andersson [3, 9]. In those
two studies the Authors aimed at identifying the causes
of the energy efficiency gap in shipping through a set
of targeted interviews. The studies highlight that in
addition to the cost, uncertainty and information
asymmetries in many shipping organisations the
energy efficiency gap is the result of internal
organisational issues, such as fragmentation of
responsibility in taking action concerning energy use
and organisational structures that prevent learning and
innovation and can be formalised as principal-agent
problems.
This paper presents the results of a survey carried out
among members of the Norwegian Shipowners’
Association. Respondents constitute approximately ten
per cent of Norwegian ship-owners with tonnage and
assessed a set of 12 CO2 emission abatement
technologies. The analysis builds on a method to rank
barriers presented in Acciaro et al. [4]. Parts of the
methodology have been tested using the CO2
Abatement Screening Tool (CAST) on a shipping
company with positive feedback that has highlighted
that there is great value in adding a dimension of
barrier scoring to the decision process related to
abatement measures [7]. The results of the present
paper are consistent with those of the case studies
developed in Hoffmann et al. [7] and Girard [6].
The paper is structured in the following way. The
next section dwells on the energy efficiency gap in
shipping with reference also to other industries and
provides a brief taxonomy of barriers. Section three
presents the methodology and structure of the survey
and the results of a preliminary study. Section four
presents the main finding of the survey and section five
concludes and provides indications for further
research.
2. Barriers to Energy Efficiency in Shipping
On the basis of Sorrell et al. [2], Sudhakar and
Painuly [10], Girard [6] and Acciaro et al. [4] this study
groups barriers to energy efficiency in shipping in the
following categories:
(1) Safety and reliability. This relates to the risk
associated with the implementation of new
technologies that can potentially compromise the
safety of the crew, or the vessel or of operations.
Reliability refers to the risk that the installed measures
could affect the ability of the ship to sail.
(2) Technical uncertainty. Encompasses all issues
related to the interaction between different ship
components when new or unproven technologies are
brought onboard of the ship. The maturity of the
technology is another influencing factor.
(3) Behavioural barriers. This set of barriers is
related to the interaction within the shipping firm and
the availability of information across the organisation.
The lack of, quality of and/or awareness of information
regarding different aspects of a new measure could
often be a barrier.
(4) Market constraints. A common example of
market constraints is related to split incentives deriving
from the structure of charter parties and how costs are
shared between cargo owners and shipping companies.
In general they refer to regulatory issues and market
inter-firm practices, e.g., demurrage charges.
(5) Financial and economic constraints. Most
measures require an upfront investment cost and their
economic viability is linked to market conditions, fuel

The Energy Efficiency Gap in Maritime Transport
3
prices etc. All cost elements will be included among
this set of barriers, including capital costs, operation
costs and hidden costs, e.g., maintenance, spare parts
etc. A further barrier in this category might be linked to
the ability of the ship-owner to access capital.
A. Complexity. Often new technologies are complex
to install and operate. The more complex the
implementation and operation of a new measure is, the
more this hampers the rate of implementation. Many
shipping organisations are set up to handle normal day
to day operations and any added complexity will be
seen as an unwanted burden. In shipping this can
increase the burden on the crew.
3. Survey Methodology
3.1 Preliminary Study and Focus Interviews
In preparation of the survey a preliminary barrier
analysis was performed in 2010 based on a set of
structured interviews in a Norwegian ship-owning
company [7]. The interviews involved eight respondents.
The results of the preliminary study showed that there
was a need for a better understanding of the energy
efficiency gap in shipping.
3.2 Questionnaire Methodology
The analysis performed in the preliminary study was
aimed at testing the barrier framework and preparing
for a more elaborate study. During the spring of 2011 a
new questionnaire was developed and its composition
verified with DNV internal experts and representatives
of the Norwegian Ship-owners’ Association. The
questionnaire consisted of 20 questions and its overall
structure is shown below1.
Part 1 (question 1-11): Technology focus;
Part 2 (question 12-13): Barrier focus;
Part 3 (question 14-20): Respondent/company
characteristics.
1A copy of the questionnaire is available from the authors upon request.
The first question aimed at establishing the
familiarity of each respondent with a set of 12 emission
reduction technologies (listed in Table 1).
The remaining ten questions in part 1 were
technology focused and asked the respondents to rank
different attributes on a Likert scale on 1 to 5, where 1
indicated the absence of the barrier and 5 a very high
incidence of the barrier. The attributes of the
technology were: expensive, effective in reducing
emissions, easy to install, easy to operate, technically
mature, safe for the crew and the ship, reliable,
compatible with existing regulation, compatible with
charter party specification, and finally suitable to the
company. Question 12 required the respondents to
express their agreement with 11 statements aiming at
verifying their views on barriers and obtain
understanding of the company strategy.
Question 13 required the respondents to rate barriers
on a 1-5 Likert scale, where 1 means least important
and 5 means most important. The barriers are
consistent with the framework described in the section
above.
The remaining questions aimed at investigating the
respondent profile and collecting some characteristics
of the company of the respondent.
3.3 Population and Sampling
During the summer of 2011 a list of contacts was
obtained through the Norwegian Ship-owners’
Association and a web-based questionnaire was
developed. The questionnaire was administered
through Questback © in September/October 2011. The
Norwegian Ship-owners’ Association groups 160
members (105 with tonnage and 55 without tonnage)
for a total of 1385 vessels and 47 mobile offshore units
for a total of over 27 million in tonnage as of 1st of
January 2011 [11]. The questionnaire was distributed
to 25 individuals that had given their availability to
participate in the study, representing 19 companies,
selected in order to ensure a representative sample of
the association membership. We received 10 responses
(response rate of 40%) from 10 different companies.

The Energy Efficiency Gap in Maritime Transport
4
Table 1 Summary of barrier and measure scores (where “O” indicates a positive score and “X” a negative score).
Barrier Average score
Average std. dev.Measure Familiar Costs Effective
Easy to install
Easy to operate
Mature Safe Reliable Regulation Charter party
1. Drag reduction technologies O O O O 2,1 0,91
2. Cold ironing O O X 2,7 1,22
3. Propeller efficiency devices X O O 2,3 0,94
4. Waste heat recovery 2,6 0,79
5. Main engine improvement O O O O O 2,0 0,86
6. Wind power X X X X X X X X X X 3,6 0,98
7. Reduced need for auxiliary O O O O 2,0 1,00
8. Fuel cell X X X X X X X X X X 3,8 0,90
9. LNG X O X X X X 3,5 0,85
10. Solar power X X X X X 3,0 1,07
11. Speed reduction O O O O O O O O O 1,8 0,73
12. Voyage performance O O O O O O O O 1,9 0,80
This represents 6.3% of the association members
(slightly below 10% of members with tonnage) and
although the sample size is limited, it is consistent with
those used in other exploratory studies of this kind.
The lack of multiple responses from the same
company prevented us from analysing barriers that are
internal to the company, and this remains among the
objectives of future work. The sample size also does
not allow strong inferences on the population and the
results are limited to Norwegian Ship-owners, so that
barriers may be ranked differently among ship-owners
in other countries. Of 59 shipping segments we see that
17 are represented and that almost every company has
indicated a different primary segment (with the
exception of bulker between 60000 and 100000 DWT,
which was selected by two companies).
The segment is representative of the Norwegian fleet,
characterised of energy, bulk and passenger segments.
Most notably the large container segment is not
represented in the survey 2 . Respondents had the
possibility of indicating one main segment and up to
four secondary segments. Only one respondent
indicated three secondary segments and none indicated
2At a later stage the questionnaire was distributed to a large Nordic container carrier to verify consistency of answers. The results are similar to those obtained in our survey. These answers are not reported in this study.
a fourth, which seems to point to the fact that the
survey managed to capture the multi-segment nature of
some companies. Although the responding companies
are rather diverse in terms of line of operation, the
composition of the sample also tends to show a bias
towards smaller player.
The profile of the respondents in terms of position
within the company and in terms of the predominant
type of contractual agreement that regulates vessel
employment indicates that the majority of respondents
had a technical or operations background, while less
than 20% was at executive level. As far as the
contractual agreements that regulate company
transactions are concerned, we observe a rather
uniform distribution among long term contracts, short
term contracts, and liner operations.
3.3 Background on Company Strategy
In order to obtain a better understanding of the
population at the end of the questionnaire a few
questions on company strategy with respect to CO2
abatement were asked. This was done in order to assess
the relevance of environmental concerns for the
respondents. We asked them to indicate how
strategically important was CO2 emission abatement.
All respondents indicated, as it was to be expected that
they consider CO2 emission abatement as an important

The Energy Efficiency Gap in Maritime Transport
5
part of their company strategy. Only 20% rated it as
very high and the same amount of respondents as
neither low nor high. If we compare with the answer we
obtained when we asked the same company to rank the
importance of fuel costs we see that the respondents are
much more consistent with their judgment. Eight
respondents out of ten stated that fuel costs are very
important. There is one respondent, associated with an
offshore drilling company who rated fuel costs as not
important at all. These results are consistent with the
answer to the question on how often are fuel costs
borne directly by the company instead of being
transferred to others.
4. Survey Results
4.1 Safety and Reliability
Safety and reliability are of paramount importance
for shipping companies. The respondents perceive
operational measures, such as speed reduction and
voyage performance, as the safest measures available.
Well-established technologies that require limited
modification to the ship are also considered safe.
Although on average all measures rank quite highly in
terms of safety (average score is 2, median 1.5 and
standard deviation 0.63) wind power, fuel cell, LNG
and solar power are perceived somewhat less safe. On
average the results of this part of the survey have the
lowest variability among all questions.
New technologies often carry an inherent degree of
unreliability. The questionnaire results show that with
the exception of wind power and fuel cells, the other
measures are perceived as rather reliable (average 2.4,
median 2 and standard deviation 0.88). The most
reliable measures are perceived as main engine
improvement, reduced need for auxiliary power, speed
reduction and voyage performance.
4.2 Technical Uncertainty
One of key aspects of the implementation of new
technologies relates to the existence of technical
barriers. In order to fully account for technical barriers
the questionnaire asked respondents three questions,
one related to easiness of installation, one related to
easiness of operation of the measure and one related to
the technical maturity.
In general we observe that the perception of
respondents across the various measures is consistent.
The average score for across measures is a between
2.60 and 3.08 and the average variance across the
measures is around 0.8, where a low score indicates the
absence of the barrier. Installation complexity emerges
as the single most important technical barrier.
If we look at the specific technologies, we observe
that wind power, fuel cells and LNG appear to be those
measures for which the level of barriers is the highest.
LNG installation is perceived as a burden, while for
fuel cell the technical maturity of the measure seems to
be the issue in addition to installation complexity. For
wind power operation seems to score highest (although
marginally). Variability among respondents with
respect LNG and fuel cell installation is very limited
with 65% of respondents assigned the highest score and
the remaining indicate that the barrier is very high.
Operational measures such as speed reduction and
voyage performance appear to have low barriers,
similarly to main engine improvement and reduced
need for auxiliary power. The standard deviation for
these measures is also limited. Drag reduction
technologies and propeller efficiency have low
operational barriers but high installation barriers. The
variability of the answers is low, though higher for drag
reduction, indicating that the sample has less coherent
response on the level of barriers for this measure. Cold
ironing is situated in the middle with an average score
of just below 3. The variability for this measure though
is very high, indicating that the respondents have very
different views on the technical barriers connected to
this technology. Solar power has mixed scores. One the
one side respondents seem to believe that installation
costs are an issue and that the technology is not yet
fully mature for implementation on board of the ship.
On the other side, operational barriers are perceived
The Energy Efficiency Gap in Maritime Transport
6
low, although there is a high degree of variability on
this attribute.
An important part of the questionnaire was
identifying the perceived effectiveness of the measures
in reducing CO2 emissions. The average score among
all measures is 2.9 (median 3) and average standard
deviation of 1.24. From this question it appears that
respondents all have very different opinions on the
effectiveness of the measures, although they tend to
think that they have some degree of success in reducing
emissions. Only solar power has a median of 4,
although on average it scores similarly to wind power
and fuel cells. This question had the highest variability
among all questions (1.24) indicating that respondents
do not agree on the level of effectiveness of the
measures in terms of emission reduction.
4.3 Market Constraints
Respondents were asked to rank the barriers on the
basis of their perception of whether the technology
would require substantial changes in regulation for
being implemented or modifications in charter parties.
We see that charter party is perceived as a more
stringent barrier to the implementation of new
technologies in general (mean 2.7, median 2.75) while
regulation does not appear to have major impact on the
applicability of the measures (mean 1.9, median 1).
There is more agreement on regulation impact than on
the charter party (standard deviation of 0.81 and 1.19).
If we look at the measures individually there seem to
be a similar pattern where those measure that score
highly with respect to regulation score high also with
respect to the charter party. The main exceptions are
drag reduction technologies, speed reduction and
voyage performance, the implementation of which
does not require amendments to the current regulation,
but finds difficulties with respect to the charter party.
4.4 Financial and Economic Constraints
The cost component was an important part of the
analysis. The questionnaire asked the respondents to
rank the measures according to how expensive they
perceived the measure to be in term of installation costs
and procurement costs. The results are rather diverse
with average score for all measures of 3.2 (median 3)
and standard deviation of 0.97. We can identify three
groups of measures, cheap, moderately expensive and
very expensive. In the first group respondents placed
reduce need for auxiliary power, speed reduction and
voyage performance. Among the moderately expensive
measures, respondents selected main engine
improvements, propeller efficiency enhancement, cold
ironing and drag reduction technologies. Among the
very expensive they listed wind power, fuel cell, LNG
and solar power.
4.5 Behavioural Barriers and Complexity
In order to assess the importance of barriers in the
operational and investment decisions that users make
with respect to implementing emission reduction
technologies the respondents were asked to indicate
their opinion on 11 statements. One of the interesting
results of the study is the perception that there is too
much uncertainty with respect to the effectiveness and
the costs of the measures (statements 5 and 6). Most of
the respondents argue that their organisation is ready to
handle new technologies (statement 7). Safety and
regulation do not appear to constitute substantial
obstacles (statements 8 and 11), neither are the
difficulties in operating and installing the measures
(statements 3 and 4) although the variability of answers
in such response is higher. With respect to regulation
and the charter party responses are consistent with the
previous part of the survey where charter parties appear
more critical than regulation in general.
Respondents seem to indicate that the costs of
operation and installation of new technologies pose
some limitation on the viability of the barriers both
from a technical perspective and from a cost
perspective (statements 1 and 2), but the variability of
answers is quite high especially as far as the costs of
installation of the measures is concerned (statement 1).

The Energy Efficiency Gap in Maritime Transport
7
Reliability of information appears also to be an issue
(statement 9).
4.6 Summary of Results
The respondents were asked directly to rank on a
Likert scale each barrier individually. The results
confirm the findings of the other parts of the survey.
In particular reliability, safety, and cost of the new
seem to be the most relevant in determining the choice
of implementing a new technology. In summary if we
combine the information on the barriers and the
technical measure we can select those abatement
technologies that appear the most promising.
Operational measures, such as speed reduction, voyage
performance, main engine improvements and to a lesser
extent drag reduction technologies are those that appear
the easiest to be implemented. Fuel cell, wind power,
LNG and solar power appear among the measures with
the highest barriers. It should be stressed that the degree
of variability of the answers is a also an important
parameter in the analysis. While for example for fuel
cell there seem to be agreement on the scores, for LNG
respondents appear to have diverging opinions.
The results for the other measures appear more
mixed. Barriers are present but they are limited to
isolated issues such as installation costs or reliability.
The presence of a single barrier can in practical terms
set an obstacle high enough for the company that the
technology might not be implemented. Fig. 1 shows the
relative importance of each barrier, so we can argue
that those technologies that score badly in terms of
reliability, safety and costs, will be those that will be
least easy to implement. On the other side we see that
for example cold ironing scores badly in terms of
regulation but this may not be determinant in the
uptake of the technology because the weight of the
barrier appears low.
Table 1 provides a summary of the survey results
where the measure with the lowest and the highest
scores are listed with O and X respectively. We observe
that cold ironing, solar power and drag reduction
technologies have a higher variability (approximately
60%) measured by average standard deviation among
the various questions. Speed reduction, voyage
performance and waste heat recovery on the other side
have a lower variability (40%), indicating consensus
among the rating of the measures. In order to correctly
assess the barriers related to a specific measure it
would be important to investigate the specific
characteristics of that measure in the company context.
Clearly what is also relevant is not only the perception
of barriers in general, but the specific conditions in
which the company is operating.
Fig. 2 illustrates the average barrier for technology
level in comparison with the suitability of the measure
for the company and the degree of knowledge that the
degree of familiarity that the respondents have on the
measure. As it is to be expected there is correlation
between the three variables in general, with those
measures with witch the respondents feel more familiar
being also those that show lower barrier and higher
potential for implementation in the respondents’
companies. The figure also shows though that for LNG
and fuel cells, even if the respondents appear to be
familiar with the measure, they do not believe they are
suitable for the company and perceive that barrier
levels are high. Cold ironing shows a medium barrier
level although knowledge of the measure appears high
(it should be noted that cold ironing shows a high
degree of variability among respondents).
We observe that the results of the survey are
consistent with the results of the selected interviews as
far as the measures with high barriers are concerned.
Barrier levels on the survey study appear to be lower
for those measures with low barriers. Some
discrepancies could be motivated by the aggregation
(e.g., drag reduction technologies or reduced need for
auxiliary power).

8
Fig. 1 Meanrespondents).
Fig. 2 Barrirespondents).
n ranking (wh.
ier level (green.
The E
hite mark), me
n bar), techno
Energy Efficie
edian (diamon
ology familiari
ency Gap in M
nd) and standa
ity (column) a
Maritime Tran
ard deviation
and degree of
nsport
of the perceiv
suitability to t
ved barrier im
the company (
mportance (10
(blue bar) (all
0
l

The Energy Efficiency Gap in Maritime Transport
9
5. Conclusions
The paper has developed and tested a categorisation
of barriers to the implementation of CO2 abatement
measures in shipping, and has presented the results of a
survey among Norwegian ship-owners aiming at
capturing their perception of barriers.
The analysis of the results indicates that hardware
measures appear to have higher barriers than
operational measures. Less mature technologies appear
also more difficult to implement. While on some
technologies there seem to be agreement on the barrier
ranking among respondents, such as voyage
performance that is consistently ranked with low
barriers or fuel cell that is consistently ranked with high
barriers, for other technologies there seem to be a
multiplicity of views, such as for onshore power supply
or LNG.
In addition to cost issues many barriers are related to
the reliability of the information available as well as
industry practice and internal company organisational
issues.
The paper proposed on the basis of the literature and
interviews with DNV experts and shipping companies
a set of barriers to energy efficiency relevant in the
context of shipping. These barriers are:
A. Safety and reliability
B. Technical uncertainty
C. Behavioural
D. Market constraints
E. Financial and economic constraints
F. Complexity
After consultation with internal DNV energy
efficiency experts a questionnaire has been developed
and distributed among selected members of the
Norwegian Ship-owners’ Association. The respondents
to the questionnaire are representative of 10% of the
companies with tonnage that member of the
Association. The questionnaire provided useful insight
on what barriers are the most relevant for the
implementation of energy efficiency in shipping. In
particular we observe that operational measures appear
to have lower barriers than hardware measures.
Immature technologies also show higher barrier levels.
Cost considerations appear also important together
with the perception that some new technologies may
come into conflict with existing regulation and industry
practices. In this respect an active role of the policy
maker through financial incentives and through the
revision of existing regulation may be effective in
overcoming these barriers.
Acknowledgments
This paper has been prepared as part of the Research
Council of Norway funded project Low Carbon
Shipping and is based on Acciaro, Hoffmann and Eide
[4]. We acknowledge the help of the Norwegian
Ship-owners’ Association in providing contacts of
some of their members for the survey. A preliminary
version of this paper has been presented at the 5th
International Congress on Maritime Transport,
Technological Innovation and Research, held in
Barcelona, 27-28-29 June, 2012.
References
[1] M. S. Eide, T. Longva, P. N. Hoffmann, Ø. Endresen and S. Dalsøren, Future cost scenarios for reduction of ship CO2 emissions, Maritime Policy & Management 38 (1) (2011) 11–37.
[2] S. Sorrell, E. O’Malley, J. Schleich and S. Scott, The Economics of Energy Efficiency: Barriers to Cost-Effective Investment, Cheltenham, UK: Edward Elgar, 2004.
[3] H. Johnson and K. Andersson, The energy efficiency gap in shipping: Barriers to improvement, International Association of Maritime Economists Annual Conference, Santiago de Chile, 25th-28th of October 2011.
[4] M. Acciaro, P. N. Hoffmann and M. S. Eide, Identifying and overcoming barriers to the implementation of emissions reduction measures in shipping, DNV Report No. 2010-1800, 2012.
[5] Gordon S., Steering towards Change: Overcoming barriers to Energy Efficiency in Merchant Ships, MSc Thesis, MSc in Environmental Change & management, Environmental Change Institute, University of Oxford, 2009.

The Energy Efficiency Gap in Maritime Transport
10
[6] C. Girard, Exploring a decision framework for evaluating cost-effectiveness and utility of CO2 abatement measures in shipping, NTNU MSc thesis, 2010.
[7] P. Hoffmann, T. Longva and M. S. Eide, CAST system documentation and user manual, DNV report no. 2010-0863, 2010.
[8] H. Johnson and K. Andersson, Barriers to Energy Efficiency: Why Shipping Firms fail to Improve, mimeo. 2012.
[9] H. Johnson, M. Johansson and K. Andersson, Barriers to energy efficiency in short sea shipping: A case study, Short Sea Shipping 2012 Conference, 2nd-3rd of April 2012, Lisbon, 2012.
[10] R. Sudhakar and J. P. Painuly, Diffusion of renewable energy technologies — barriers and stakeholders’ perspectives, Renewable Energy 29 (2004) 1431-1447.
[11] P. N. Hoffmann, M. S. Eide and T. Longva, Result from the CAST pilot, Case ship: Aframax tanker, DNV report no. 2010-1800, 2010.
[12] Norwegian Shipowners’ Association, Annual report 2010, January 2011.
[13] J. P. Painuly, Barriers to renewable energy penetration, a framework for analysis, Article published in Elsevier, Renewable Energyvol 24 (2001) 73-89.

Journal of Shipping and Ocean Engineering 3 (2013) 11-20
Sea Trials of a Wave Energy Converter in Strangford
Lough, Northern Ireland
Vladimir Krivtsov1, 3, Ian Bryden1, Brian Linfoot2 and Robin Wallace1
1. The University of Edinburgh, Kings Buildings, Edinburgh EH9 3JN, Scotland, UK
2. SBE, Heriot-Watt University, Edinburgh EH14 4AS, UK
3. Department of Ecology, Kharkov State University, 4 Svobody Square, Kharkov 310077, USSR, Ukraine
Abstract: This paper describes a campaign of WEC (wave energy converter) testing and presents a selection of the results related to the measured motions and mooring tensions. A 1:20 physical model has been successfully deployed using a three point mooring installed at sea (Strangford Lough, NI) in 10 m depth. In calm weather the overall dynamics of mooring tensions is dominated by the tidal cycle due to the progressive lifting of the heavy chain with the increase in water depth on the flood and gradual lowering on the ebb. In fresh winds the dynamics is very complex, but can be studied with the aid of mathematical modelling. A simulation model was used to assess the dynamics of the mooring lines, and the results of open water tests have been compared with the model’s performance. The results indicate that, in general, the model shows a reasonable agreement with the observations. The WEC’s motions and the measured loads on the leading mooring line appear to relate to the concurrent environmental conditions. The data obtained can therefore be used for the model’s calibration and further improvements, which is valuable for improving the WEC’s design and operational characteristics. This may be important not only in relation to the issues of reliability and power take off, but also in terms of minimising the adverse effects of mooring lines on bottom sediments, as well as indirect effects of the eroded particles on a wide range of aquatic processes.
Key words: Bottom sediments, mooring loads, meteorological data, model simulations, optimisation, Orcaflex, CRESS, wind waves.
1. Introduction
Robust moorings are indispensable for harvesting
the energy of waves. Tests in wave basins and at sea
help to further our understanding of the dynamics of
mooring loads in relation to the sea state. Here we
present a selection of the results obtained in a
campaign of sea trials of a WEC (wave energy
converter) in Strangford Lough, Northern Ireland.
These tests followed the previous lab research, where
physical models of wave energy converters were first
tested in a wave basin and the results of their
behaviour were then compared to the simulations
performed using mathematical modelling [1, 2].
2. Materials and Methods
A 1:20 model has been successfully deployed using
Corresponding author: Vladimir Krivtsov, email
a three point mooring installed at sea in 10 m depth
and tested in the open water conditions. A picture of
the WEC and a schematic diagram of the mooing used
are presented in Fig. 1 and Fig. 2 respectively.
Measurements of 6Df (degrees of freedom) motions
were obtained using a MICRO-ISU BP3010 IMU
(inertial motion unit) manufactured by “BEC
Navigation Ltd”, which was installed close to the
COG (centre of gravity). The digital signal was logged
to the GigalogF dasta logger via RS232 port, and after
downloading processed using a suite of custom made
Matlab scripts to calculate estimates of heave, pitch,
roll, sway, surge and yaw. It should be noted that due
to the restrictions on data storage, only 10 minutes
worth of data were recorded every hour during the
normal operation of the equipment.
Unfortunately, no reliable wind data were available
for Strangford Lough locality per se. However, the
DAVID PUBLISHING
D

Sea Trials of a Wave Energy Converter in Strangford Lough, Northern Ireland
12
Fig. 1 WEC in strong winds at Strangford Lough.
Fig. 2 Schematic diagram of the mooring, note that only one load cell was installed at this stage of the research.
winds measured at the Orlock Head weather station
are of a good quality, and deemed to be broadly
representative for the region. These data were
downloaded (with permission) from the website of the
BADC (British Atmospheric Data Centre).
An OrcaFlex modelling scenario was designed to
simulate the WEC and the environmental conditions
concurrent with the second set of results presented
here. Estimates of the Hs (significant wave height)
and Ts (average period for waves with H ≧ Hs)
were obtained using CRESS (Coastal and River
Engineering Support System) using a variable depth
fetch of 4.76 km. The typical measured value of wind
strength for this period was 17 m/s. However, given
that the wind measurements from Orlock are at 10 m
height, that was converted using a conversion factor of
0.78 to wind at 2 m height (as used by Shaw [3], p.
251), making u = 13.265. This is still likely to be an

Sea Trials of a Wave Energy Converter in Strangford Lough, Northern Ireland
13
overestimate, hence 13 m/s was used in the CRESS
calculations, giving Hs = 0.6 m and Ts = 2.86, the
latter value was converted to Tp using a conversion
factor of 0.95 [4], giving Tp = 3.01 s. These values of
Tp and Hs were used within Orcaflex to generate an
ISSC (International Ship and Offshore Structure
Congress) type wave spectrum.
3. Results
The first deployment of the WEC was carried out in
August 2011 using RV “Cuan Cat”. The operations
were carefully planned, and subsequently carried out
during a suitable weather window. The weather was
freshening during the deployment, and the wind was
quite fresh towards the end. However, any
considerable increase in wave height was apparent
only after the deployment operations had finished.
The wind subsequently subsided and mainly
remained light (2-8 m/s) till 11 am on Aug. 23, when
it showed a considerable increase peaking at 11 m/s
by midday (Fig. 3). The sea trials subsequently
continued until late autumn, but were hampered many
times buy harsh weather, logistics and issues of
equipment failure. In particular, both the mooring and
the measuring equipment were severely damaged
during hurricane Katya in September. Nevertheless,
the experiment yielded some interesting results,
selections of which are presented below.
3.1 August Results
Mooring loads for most of this period are presented
in Fig. 4, whilst a short fraction of the mooring loads
dynamics is illustrated in Fig. 5. It is evident that the
signal is fairly clean, and that it represents a complex
interplay between motions of different frequencies.
The overall dynamics of mooring tensions is
dominated by the tidal cycle due to the progressive
lifting of the (relatively) heavy chain with the increase
in water depth on the flood and gradual lowering on
the ebb. There is also an interesting pattern of sudden
jerks (up to 300 kN full scale) during the flood’s
midtide. The peak mooring loads on the ebb are,
generally, less prominent.
Fig. 3 Wind measurments at the Orlock Head weather station for August results.

Sea Trials of a Wave Energy Converter in Strangford Lough, Northern Ireland
14
Fig. 4 Mooring loads for August results.
Fig. 5 An example short-term dynamics of mooring loads.
An example of the 6Df motions obtained using an
IMU is shown in Fig. 6. It is obvious that in these
light winds most of the observed motions of the WEC
are rather limited. An exception to the above, however,
is yaw, which is characterised by a low frequency
wave of > 200 s period and the range of
approximately -30 to 30 degrees. This motion is likely
to be chiefly attributed to the interplay between the
mooring’s natural frequency characteristics and the
resulting combination of wind and stidal forces, and
should be investigated by further research.
Fig. 7 presents a relationship between mooring
loads and heave, whilst Fig. 8 gives a joint density
distribution for minima and maxima of the heave’s
rainflow cycles, all values there are recalculated for
full scale.
3.2 October Deployment
After the damage caused by hurricane Katya, the
equipment had to be repaired, and the mooring was
subsequently redeployed in mid October. The dataset
collected in October contains a period of very valuable

Sea Trials of a Wave Energy Converter in Strangford Lough, Northern Ireland
15
Fig. 6 An example of 6DF motions obtained using an IMU.
Fig. 7 Relationship between mooring loads and heave for the first set of results.

Sea Trials of a Wave Energy Converter in Strangford Lough, Northern Ireland
16
Fig. 8 Joint density distribution for minima and maxima.
data collected in fresh winds of a steady SW direction
(Fig. 9). It can be seen that on Oct. 20 the wind started
to increase in the late afternoon from 13 to 17 m/s, and
then remained fairly steady for 6 hours (with a peak of
18 m/s at 22:00), eventually decreasing after midnight.
Summary of the mooring tensions on the leading
mooring line collected during this period of fresh
winds is shown in Fig. 10. During this time the mean
value of the dynamic range of mooring tensions
ranged between 42 and 107 N, whilst the maximum
values between 112 and 292 N. A histogram for the
peak mooring loads is given in Fig. 11. It is evident
that only a few cases exceed 240 N.
4. Discussion
It has previously been shown that the bulk of
mooring tensions may be described by either normal
or logistic distribution, whilst extreme value
distribution shows a reasonable fit to the tail [1]. From
a preliminary inspection of our histograms it appears
to be the case for the results presented here as well.
4.1 Modelling
Histogram of modelled mooring tensions for the
August scenario is presented in Fig. 12 whilst a
selection of modelled motions is given in Figure 13. It
is evident that these figures are all of the credible
order of magnitude, which gives some confidence in
the model. The discrepancies between the simulated
and observed ranges may be attributable to the
model’s simplifications, the lack of current and wind
influences in the model, the limitations imposed by
the sampling rate, and the differences between the
observed and the simulated wave regimes.
It should be noted, however, that whilst in relatively
smaller and moderate waves investigated for the
purpose of this paper (e.g., Hs up to 0.6 m, which is
12 m full scale) the model’s behaviour seems
reasonable, in high waves (data not shown) it is

Sea Trials of a Wave Energy Converter in Strangford Lough, Northern Ireland
17
currently rather erratic (data not shown). The WEC
jerks violently in high seas and the mooring tensions
appear too large. Further experimental and modelling
work is therefore needed to investigate these effects
Fig. 9 Wind measurements at the Orlock Head weather station for October results.
Fig. 10 Summary of mooring tensions results during the fresh winds in October.

Sea Trials of a Wave Energy Converter in Strangford Lough, Northern Ireland
18
Fig. 11 Histogram of peak loads for October results.
Fig. 12 Histogram of modelled peak loads in conditions simulating October results.
and improve the model, as well as to optimise the
design of the mooring.
4.2 Limitations of the Study and Further work
The results of this study have been restricted by its
scope, time and financial constraints, weather
conditions, reliability of the equipment used, and a
whole range of logistical issues. Nevertheless, the
research presented here provides some important
information on the behaviour of the experimental
system tested. The data collected are useful for
modelling, and, together with the model’s results
should be helpful for planning the further research and
practical applications.
Considering the issues of reliability of the
equipment and logistical constraints encountered
during the research presented here, we suggest that the
“wave tank” stage should follow by a “fresh water”
stage, preferably carried out in a local sheltered
reservoir located close to the laboratory to minimise
logistical efforts.

Sea Trials of a Wave Energy Converter in Strangford Lough, Northern Ireland
19
Fig. 13 Time series (0 to 5400 s) for the modelled WEC’s motions in conditions simulating October results, the beginning of simulation followed a 200 s period of pre-simulation.
The extreme mooring loads in arrays of WECs may
show a considerable increase compared to a single
WEC installation [1]. Further research should
therefore aim at measuring mooring forces in a farm
of devises. It should be noted, however, that such a
study will be very costly and would have to overcome
some considerable increase in logistical constraints.
5. Conclusions
The WEC’s motions and the measured loads on the
leading mooring line appear to relate to the concurrent
environmental conditions. In calm weather the overall
dynamics of mooring tensions is dominated by the
tidal cycle due to the progressive lifting of the
(relatively) heavy chain with the increase in water
depth on the flood and gradual lowering on the ebb. In
fresh winds the dynamics is very complex, but can be
studied with the aid of mathematical modelling. The
results show that, in general, the model captures the
most important aspects of the WEC’s dynamics.
The data obtained can therefore be used for the
model’s calibration and further improvements, which
is valuable for improving the WEC’s design and
operational characteristics. This may be important not
only in relation to the issues of reliability and power
take off, but also in terms of minimising the adverse
effects of mooring lines on bottom sediments, as well
as indirect effects of the eroded particles on a wide
range of aquatic processes [5-7].
Acknowledgments
Wind data were kindly supplied by the BADC
(British Atmospheric Data Centre). The Rogers family
(Desmond, Simon and Jeremy) and Dr. Henk van
Rein are kindly thanked for the boat work support. We
are also grateful to Jeremy Rogers for his invaluable
help with a whole range of logistical issues. Orcina

Sea Trials of a Wave Energy Converter in Strangford Lough, Northern Ireland
20
staff, and in particular Colin Blundell and Sarah
Ellwood, and Professor Dimitry Val (Heriot Watt) are
kindly thanked for their help and support as regards
OrcaFlex modelling.
References
[1] V. Krivtsov and B. T. Linfoot, Physical model investigation of mooring loads in arrays of wave energy converters, in: Proceedings of IAHR, Heriot-Watt University, Edinburgh, 2010.
[2] V. Krivtsov, B. T. Linfoot and R. E. Harris, Investigation of the effects of mooring line surface buoys on the extreme mooring loads of wave energy converters, Journal of Chongqing University 11 (1) (2012) 1-4., available online at: http://qks.cqu.edu.cn/cqdxywen/ch /reader/view_abstract.aspx?file_no=201201002&flag=1.
[3] E. M. Shaw, Hydrology in Practice (3rd ed.), Chapman & Hall, London, 1994.
[4] L. H. Holthuijsen, Waves in Oceanic and Coastal Waters, Cambridge University Press, 2007, p. 387.
[5] V. Krivtsov, M. J. Howarth and S. E. Jones, Characterizing observed patterns of suspended particulate matter and relationships with oceanographic and meteorological variables: Studies in Liverpool Bay, Environmental Modelling & Software 24 (6) (2009) 677-685.
[6] V. Krivtsov et al., Monitoring and modelling of the Irish Sea and Liverpool Bay: An overview and an SPM case study, Ecological Modelling 212 (2008) 37-52.
[7] V. Krivtsov and B. T. Linfoot, Modelling of disruption to benthic habitats and overall ecosystem functioning by marine renewable energy installations, Ecological Modelling 245 (2012) 121–124.
Journal of Shipping and Ocean Engineering 3 (2013) 21-29
Marine Accident Analysis with GIS
Ozkan Ugurlu1, Umut Yıldırım2 and Ercan Yuksekyıldız3
1. Karadeniz Technical University, Maritime Transportation and Management Engineering Department, Sürmene, Trabzon, Turkey
2. Karadeniz Technical University, Maritime Transportation and Management Engineering Department, Sürmene, Trabzon, Turkey
3. Karadeniz Technical University, Maritime Transportation and Management Engineering Department, Sürmene, Trabzon, Turkey
Abstract: In this study, marine casualties which are recorded Global Integrated Shipping Information System (GISIS) in 2007-2011, result in death, injury, economic loss and environmental pollution are discussed. The studied types of ships are container, bulk dry, general cargo, roro, ropax, passenger and tankers. The information contained in GISIS system is textual format and it is difficult to systematically analyze this information. For this reason, by creating a new data base, which is Microsoft Excel-based, ship accidents are classified according to name, flag state and type of ship, type, size and coordinates of the accidents that are evaluated by entering the Geographical Information System(GIS). In the study, all marine areas having been separated into ranges in ArcGIS 10 program, the marine areas with intensive marine accidents have been determined and marine accident chart has been created. As a result of the study, high risk marine areas are Strait of Dover and Hamburg in the North Europe, Belfast Shores in Ireland, the seas surrounding Great Belt, Kattegat and Copenhagen in Baltic Sea, In far east, Kanmon Strait, Urage Channel and Bungo Strait in Japan, Shanghai, Ningbo and Hong Kong in China. Key words: Marine accidents, maritime transportation, GIS.
1. Introduction
An accident an undesired event that causes damage
or injury [1]. Shipping accident is a term generally used
for any accident results in financial loss, either in life or
property or both [2]. The reasons for shipping accidents
are many and complex [3]. However the main groups
of accidental causes are human causes, mechanical
causes, fire and explosion, structural causes, weather
related causes and miscellaneous [4]. The cases of
death and pollution at sea are mostly caused by human
errors [5]. Studies consistently estimate that around
80% of causes in marine accidents are attributable to
human factor [6].
Over the last decade, international maritime
authorities have made significant efforts to promote
safety at sea in the shipping transportation industry [7].
But there are still an enormous number of shipping
accidents [8]. The lessons taken from marine accidents
Corresponding author: Özkan Uğurlu, Ph.D., assistant professor, research fields: marine accidents, accident analysis, GIS, risk analysis, fatigue. E-mail: [email protected].
experienced in the history form a basis for the
conventions and contracts produced for the prevention
of marine accidents [9].
Therefore, accident research code has been accepted
as an obligation in the 84th meeting of Maritime Safety
Committee (MSC), which was held by International
Maritime Organisation (IMO) in London on dates
between 07th and 16th May 2008. Such code includes a
safety research, recommended practices and
international standards for marine accidents or marine
incidents. Parties to the Convention shall undertake a
marine safety research for each serious marine accident
in accordance with that code and provide its findings in
researches to be transferred to IMO. Within the internet
site of IMO, a database is available, which is called as
GISIS. This database includes a module by the name of
marine incident and accident. This module contains
marine accident reports which have been reported to
IMO [10, 11].
In this study, marine accident data recorded in GISIS
have been analysed, and they have been assessed by
means of GIS in terms of marine accidents, accident
DAVID PUBLISHING
D

Marine Accident Analysis with GIS
22
type and accident density, and such marine accident
areas with high risk have been determined.
2. Method
In this study, data pertaining to 585 marine accidents
occurred during the years between 2007 and 2011,
which have been recorded into GISIS, have been
examined. The vessels include bulk dry, general cargo,
container, ro/ro, passenger, passenger ro/ro, oil tanker,
gas tanker and chemical tankers. A database has been
created in GISIS system, having grouped the data
recorded according to accident type, vessel name, flag,
accident size and accident coordinates.
In the study, it has been intended to create marine
accident chart for marine accidents, and for such
purpose Microsoft Excel 2010 and ArcGIS 10
programs have been used. By means of Microsoft
Excel 2010, the geographical coordinates in degrees,
minutes have been converted into numerical values
suitable with ArcGIS 10 program. To prevent any
mistake, the accident data entered into the system have
been analysed singly after the conversion. Marine
accident chart has been created with the data processed
once have been transferred into ArcGIS 10 program,
and the created marine accident chart has been
separated into ranges and risky areas have been
determined.
3. Marine Accident Data
The study includes data regarding the marine
accidents occurred in 2007-2011, which are recorded
into GISIS marine accident and incident database and
classified as very serious, serious, less serious. Very
serious accidents are the accidents including vessel loss,
loss of life and solid pollution. In the 37th meeting of
Marine Environment Protection Committee (MESC),
solid pollution has been defined as the pollution
affecting the coast state or flag state, which generates
serious destructive impacts on environment and
requires preventive measures. Serious accidents are the
incidents such as fire, explosion, collision, grounding,
contact, heavy weather damage, ice damage, cracks
within the body of vessel, hull flaw which do not have
very serious accident nature. Blockage of main engine,
underwater damage, accommodation deck damage,
solid structural damages, pollution in small quantities,
damages requiring shore assistance or tugboat use are
included in this group. Less serious accidents are the
accidents which are not as notable as very serious
accidents and serious accidents and it aims at recording
useful information [11]. All of the accidents analysed
have been suffered by commercial vessels. Fig. 1
contains distribution of vessel accidents in percentages
in terms of vessel type.
A hundred ninety six of such accidents have caused
to loss of life, loss of vessel or serious environmental
pollution (very serious accident). Three hundred
twenty four of such have resulted in injury, small
scaled environmental pollution or vessel’s becoming
unsuitable for navigation (serious accident) and the
remaining 65 accidents are less serious accidents other
than abovementioned accidents.
Flag state is responsible for that the vessel, which
has its flag, be fitted out in accordance with
international life, property safety, national and
international rules. Therefore, flag state practices are
an important factor for marine accidents [10]. Table 1
indicates the distribution of vessel accidents recorded
in GISIS according to flag state. Among accident data
which have been transferred to the database, 188
accidents have been caused by the vessels with Panama
flag, 83 of them with United Kingdom flag, 30 with
Denmark flag, 24 with Malta flag and 23 with Liberia
flag (Fig. 2).
Marine accidents have been analysed in seven
categories, including collision, grounding,
fire/explosion, flooding/sinking, damages to ship or
equipment, occupational accident and other accidents.
As a result of examination of marine accident data, it
has been found that the most frequent 3 accident types
are collision, grounding and damages to ship or
equipment (Table 1).

Marine Accident Analysis with GIS
23
Fig. 1 Distribution of vessel accidents according to vessel type.
Table 1 Distribution of vessel accidents according to accident type [11].
TYPE of SHIP TYPE of MARINE ACCIDENTS
Collision Grounding Damages to ship or equipment
Occupational accident
Fire/ explosion
Flooding/sinking
Other
Bulk Dry/ General Cargo 97 66 52 20 23 10 20
Container 41 12 13 19 4 2 5
Oil Tanker 14 10 4 9 6 2 4
Chemical Tanker 15 6 9 7 4 2 1
Gas Tanker 2 1 1 4 3 - -
Passanger Ship 4 7 3 4 3 3 6
Passanger Ro/Ro Cargo 15 2 5 2 4 1 2
Ro/Ro Cargo 7 8 5 6 7 2 1
Total 195 112 92 71 54 22 39
Fig. 2 Distribution of vessel accidents according to flag state.

Marine Accident Analysis with GIS
24
4. GIS
GIS is an information system which performs
integratedly the functions of collection, storage,
processing and presentation to customer of the
information, either graphical or non-graphical, which
have been obtained through data or observations based
on location [12]. GIS has 5 important components.
These are hardware, software, data, human and method.
Effective use of GIS depends on organized use of all
components. The most important component is the data
which requires the maximum time and cost among
others [13].
Achievement of GIS project depends on availability
of data with appropriate structure. In GIS, the
geographical data consists of 2 main groups: verbal and
graphical. In verbal data, the information, which
indicates attributions of geographical data, is stored.
On the other hand, in graphical data, the information,
which indicates the form and location of objects in the
world, is stored. Since the GIS is based on relational
data model, table data and graphical data may be
connected to each other. In order to transfer
geographical data into computer, to process and display
it in computer, said raw data must primarily be
converted into a form cognizable by computer. Such a
conversion is possible through conversion of data into
numerical form [12, 14].
GIS technology has been a popular tool for
visualization of accident data and analysis. Accident
analysis studies aim at the identification of high rate
accident locations and safety deficient areas [15]. The
use of GIS is the most effective way of examining and
evaluating the results of analyses which use a multitude
of data and different criteria [16]. GIS is used to locate
accidents on a digital chart and realize their
distribution [17].
4.1 Implementation of GIS in The Study
Marine accidents have been analyzed in 5 stages in
ArcGIS 10 program. In the first stage, marine accident
chart has been created by entering marine accident data
into ArcGIS 10 program. Fig. 3 indicates the distribution
of marine accidents according to vessel type. In the 2nd
stage, the world chart has been divided into 10 degree
latitude and longitude intervals and accident density has
been identified for marine accidents.
Accident density chart has been created for general
marine accidents in Fig. 4, and for collision and
grounding accidents in Fig. 5. In the study, marine
accident areas have been classified as very high risk,
high risk, risk, moderate risk and low risk marine area.
Definitions are associated with quantity of accidents,
depending on the size of accident area. Accordingly,
ranges with density of more than 30 accidents are very
high risk marine areas; ranges with density of between
20 and 30 accidents are high risk marine areas; ranges
with density of between 10 and 20 accidents are risky
marine areas; ranges with density of between 5 and 10
accidents are moderate risk marine areas; and ranges
with density of less than 5 accidents are low risk
marine areas.
In the 3rd stage, marine areas where marine
accidents are intensive have been analysed. In this
stage, the North Europe and Far East have been
determined as the marine areas with the most intensive
marine accidents. In the 4th stage, such marine areas
have been focused on. Therefore, such marine areas
have been divided into grids with 2 degree latitude and
longitude intervals. So it has been made possible to
display and interpret the marine accidents in the North
Europe and Far East comprehensively (Figs. 6, 7, 8 and
9). It has been found that such process is required for
determination of marine accident locations. Such
created charts enable assessment of marine accidents in
terms of location.
In the last stage, marine accident charts have been
assessed and interpreted. In order to provide
comprehensibleness of the assessment, ranges with high
accident density have been numerated from 1 to 16 (Figs.
6 and 8). Table 2 indicates quantitative distribution of
marine accidents according to range number.

Marine Accident Analysis with GIS
25
Fig. 3 Marine accidents chart for merchant ships.
Fig. 4 Density chart for all of marine accidents.

Marine Accident Analysis with GIS
26
Fig. 5 Density chart for collision & grounding accidents.
Fig. 6 Density chart for North Europa Countries.

Marine Accident Analysis with GIS
27
Fig. 7 General distribution of types of marine accidents in the North Europe.
Fig. 8 Density chart for Far East Countries.

Marine Accident Analysis with GIS
28
Fig. 9 General distribution of types of marine accidents in the Far East.
Table 2 Quantitative distribution of marine accidents according to range number.
Polygon Number
Total Accident Numbers
Collision&Grounding Accident Numbers
For Fig. 6
1 7 4
2 7 6
3 12 6
4 9 5
5 12 11
6 8 8
7 8 5
For Fig. 8
8 11 7
9 8 4
10 11 6
11 12 11
12 8 8
13 7 4
14 7 6
15 8 6
16 7 4
5. Results
Marine areas with the highest risk, in terms of
marine accidents, are North Europe and Far East.
The marine areas with very high risk and high risk in
the North Europe are Strait of Dover between England
and France, Belfast shores in Ireland, Hamburg in
Germany, east coasts of Denmark and in the south
coasts of Norway the seas surrounding Kattegat, Great
Belt and Copenhagen.
Marine accidents in the Far East are intensive
especially in the coasts of Japan and China.
In the Far East, marine areas with intensive marine
accidents are Kanmon Strait, Urage Channel and
Bungo Strait in Japan, Shanghai, Ningbo and Hong
Kong in China.
As a consequence of a general assessment of all
accidents, it has been found that especially collision
and grounding accidents have high intensity in these
areas.

Marine Accident Analysis with GIS
29
6. Conclusion
GIS is a basic guide which provides interpretation of
results on a chart. It enables visual interpretation of
accidents. In this study, marine accident areas with
high intensity have been visually interpreted. It is
important for determining measures required to detect
marine accident areas with high intensity and prevent
marine accidents in such areas. Coastal areas and straits
are the marine areas where collision and grounding
accidents have the highest density.
GIS is a significant instrument for the follow-up and
mapping of marine accidents. In this context, the usage
of GIS in the field of maritime must be extended. It
shall be important to determine the common reasons of
marine accidents in the marine areas, with high density
of accident, for preventing similar accidents.
References
[1] L. H. Ringdahl, Safety Analysis, New York: Taylor&Francis, 2001.
[2] N. Akten, Shipping accidents: A serious threat for marineenvironment, J. Black Sea/Mediterranean Environment 12 (2006) 269-304.
[3] S. E. Chapman and N. Akten, Marine casualties in the Turkish Straits — A way ahead, Seaways (1998) 6-8.
[4] S. Kristiansen, Maritime Transportation Safety Management and Risk Analysis, Elsevier Butterworth-Heinemann, 2005.
[5] IMO, STCW including 2010 manila amendments STCW conventions and STCW code, 2011.
[6] N. R. Council, Human error in merchant marine safety, Washington: National Academy Press, 1976.
[7] W. A. O’Neil, The human element in shipping, Journal of Maritime Affairs 2 (2) (2003) 95-97.
[8] M. Celik, S. M. Lavasani and J. Wang, A risk-based modelling approach to enhance shipping accident investigation, Safety Science 48 (1) (2010) 18-27.
[9] O. Ugurlu, Risk Analysis of Oil Tanker Accidents, PhD, Karadeniz Technical University, TRABZON, 2011.
[10] IMO, Casualty-Related Matters Reports on Marine Casualties and Incidents, London, 2005.
[11] IMO, available online at: http://www.gisis.imo.org/, 2010.
[12] T. Yomralioglu, Basic Concepts and Applications of Geographic Information System, İstanbul: Seçil Ofset, 2000.
[13] S. R. Somer, Geographic information system in local government: A commentary, Photogrammetric Engineering and Remote Sensing 53 (10) (1987) 1379-1382.
[14] R. Nisanci, The production of pixel based urban land value maps with nominal valuation method using GIS, Karadeniz Technical University, Trabzon, 2005.
[15] S. Erdogan, I. Yimaz, T. Baybura and M. Gullu, Geographical information systems aided traffic accident analysis system case study: City of Afyonkarahisar, Accident Analysis and Prevention 40 (1) (2008) 174-181.
[16] I. B. Gundogdu, A new approach for GIS-supported mapping of traffic accidents, in: Proceedings of the Institution of Civil Engineers-Transport 164 (2) (2011) 87-96.
[17] K. S. Ng, W. T. Hung and W. G. Wong, An algorithm for assessing the risk of traffic accident, Journal of Safety Research 33 (3) (2002) 387-410.
Journal of Shipping and Ocean Engineering 3 (2013) 30-39
Investigation of Shoreline and Topographic Change on
the West Side of the Imagire-Guchi Inlet, Japan
Andi Subhan Mustari1, 2, Shigeru Kato1, Takumi Okabe1 and Mieko Kataoka1
1. Department of Architecture and Civil Engineering, Toyohashi University of Technology, Toyohashi 4418580, Japan
2. Department of Civil Engineering, Hasanuddin University, Makassar 90245, Indonesia
Abstract: Near the Imagire-guchi inlet, which is the target area in this study, the shoreline on the west side of a jetty retreats because of a decrease in sediment supply from the east side upstream. This study attempts to analyze the shoreline and topographic changes around the inlet through analysis of GPS (global position system) measurements and digitized shoreline from aerial photographs. In addition, the DoC (depth of closure) is determined by examining datasets of cross-shore profiles and by calculations using the Hallermeier equation (1981) based on the offshore wave height and period. The results obtained by GPS indicate coastal erosion caused by waves generated by typhoons. The gradual recovery of the shoreline position after the typhoons struck was also captured by the GPS survey. However, analysis of the aerial photographs reveals that the shoreline on the west side of the jetty fluctuated widely. The cross-shore profile datasets reveal that closure depth far from the inlet was deeper than that near the inlet.
Key words: Shoreline, topographic, GPS, aerial photograph, cross-shore profile.
1. Introduction
In coastal management and engineering design,
shoreline changes due to complicated processes such
as coastal erosion, sediment transport, and coastal
development are important concerns for coastal
scientists. The impacts of these coastal changes
include loss of life and property, changes in coastal
socioeconomic environments, and decrease in coastal
land resources. In the recent decade, greater demands
for recreation and tourism have led to a significant
increase in the occupation of coastal areas. Therefore,
the monitoring and analysis of shoreline and
topographic changes that utilize information
pertaining to natural factors such as shoreline deposits,
shoreline material, and slope of coastal zone have
become mandatory for coastal management.
Jetties generally affect inlets and adjacent
shorelines by decreasing the amount of sediment
entering the inlet and by moving the sediment
Corresponding author: Andi Subhan Mustari, doctoral
student, research field: coastal engineering. E-mail: [email protected].
offshore. These structures can also affect neighboring
shorelines by creating sediment deficits that result in
downdrift erosion to account for the missing volume
of sand. Jetties are usually constructed in navigational
channels to prevent sand deposition and to provide
wave protection around inlets. In case of the
Imagire-guchi inlet, which is the target area in this
study, the jetty has an enormous influence on
shoreline conditions. The shoreline changes around
the inlet affect transportation routes, communities, and
ecosystems. The impact of shoreline change on coastal
communities and structures can be severe and costly.
Therefore, it is important for coastal residents,
including those living near the Imagire-guchi inlet, to
understand the conditions of their local shorelines and
to determine whether it is advancing, retreating, or
stable.
Several authors have presented the definition of
shoreline position. For example, an idealized definition
of a shoreline is that it coincides with the physical
interface of land and water [1, 4, 6]. The shoreline is
the intersection of water, land, and air [8]. The
appropriate definition of the shoreline status depends
DAVID PUBLISHING
D

Investigation of Shoreline and Topographic Change on the West Side of the Imagire-Guchi Inlet, Japan
31
on the methods used in this study. The rate-of-change
value precision is dependent on the following factors:
(1) accuracy of the shoreline measurement, (2)
temporal variability of the shoreline, (3) number of
measured shoreline positions to create data points used
in rate calculation, (4) proximity of each observation to
the time of the actual change in the trend of shoreline
movement, (5) period between shoreline measurements,
(6) total time span of shoreline data, and (7) method
used for rate calculation [3].
Sediment transport around the Imagire-guchi inlet
can create morphological changes through erosion or
deposition. Strong offshore-bound currents strongly
influence sediment transport around this inlet [12].
The shoreline may be accreted or eroded because of the
movement of sediment. The sediment mechanism
around the Imagire-guchi inlet has not yet been fully
understood. Currents and waves are major factors of
sediment transport in these waters. In rivers, the flow
from upstream plays an important role in the transport
process. However, in coastal areas and estuaries, the
combination of currents, waves, and tides is dominant.
During the erosion process, sediment transportation, in
which the material is displaced from its original
location, occurs. Sedimentation occurs when the
inflow of the sediment supplied to a particular
location is greater than that carried by the outflow
from the location and can be caused by deposition or
erosion along the coast. These processes, particularly
sedimentation, may have significant implications for
engineers working in this environment. Therefore, the
shoreline must be considered in a temporal sense, and
the selected time scale depends on the context of the
investigation [1]. In addition, the shoreline position and
its rate of change constitute the basic information
required for conducting many coastal engineering
studies [8]. This paper investigates the shoreline and
topographic changes in the area near the
Imagire-guchi inlet. Aerial photographs and
cross-shore profile datasets for various years and field
surveys that employ RTK-GPS (real-time
kinematic-global positioning system) have been used
to characterize the shoreline position trend and to
investigate the closure depth around the Imagire-guchi
inlet.
2. Study Area
The Imagire-guchi inlet is located in the middle
region of the Enshu-Nada Coast, Japan, and faces the
Pacific Ocean. The Enshu-Nada Coast is located in
central Honshu. The Imagire-guchi inlet was
dramatically altered in 1498AD by a tsunami
generated by an 8.6 magnitude earthquake, which also
shifted the estuary mouth of the Hamana Lake by
approximately 3.5 km. As a result, the freshwater lake
was changed into a brackish system [2]. The general
description of the study area is shown in Fig. 1. The
main source of sediment supply to the Imagire-guchi
inlet is the Tenryu River, and the alongshore sediment
is transported mainly westward on the west side of the
river mouth. The Imagire-guchi inlet, which connects
Hamana Lake to the Enshu Nada Coast, is 200 m wide.
Hamana Lake has a surface area of approximately 74
km2, its body stretches approximately 103 km, and its
maximum and averaged depths are 12 m and 4.8 m,
respectively [7]. The lake preserves about 340 million
m3 of brackish water and is acknowledged as one of the
biggest brackish water regions in Japan. Numerous
freshwater inflows from rivers at the northern part of
the lake provide ideal habitats for aquatic creatures
including clams, eels, crabs, oysters, and shrimp.
At the Imagire-guchi inlet, two jetties were
constructed between 1954 and the early 1970s to
stabilize the navigation channel [9]. These structures
impede sediment transport, and as a result, a large
amount of sediment has accumulated on the east side of
the east jetty. On the contrary, the shoreline retreats on
the west side of the west jetty because of a decrease in
the sediment supplied from the east. These jetties have
a significant impact on the surrounding coastal area.
During the last 10,000 years, the Imagire-guchi inlet,
the sole inlet of seawater into Lake Hamana, has been

Investigation of Shoreline and Topographic Change on the West Side of the Imagire-Guchi Inlet, Japan
32
Kyushu Island
JAPAN
Tokyo
Pacific Ocean
0km
Honshu Island
Japan Sea
200Miles
200km
Hokkaido Island
Kumano Nada Coast
0 20
Ise Bay
40 km
Hamana Lake
Enshu Nada Coast
Tenryu River
Izu Peninsula
Fig. 1 Study area of the Imagire-guchi inlet located in Hamamatsu city, Shizuoka prefecture, Japan.
repeatedly opened and closed because of natural events
such as fluctuations in sea level, earthquakes, and
tsunamis [7]. Multiphase inlet construction projects
have been applied in this region to maintain the inlet
stability in terms of depth and width, and to protect the
coastline and navigation channel in the area. Previous
field observations at the Imagire-guchi inlet revealed
that a strong offshore-bound current through the inlet
strongly influenced sediment transport in the area [14].
This inlet has undergone multiphase construction
modifications, which led to topographical changes and
a higher water exchange rate [15].
3. Typhoon and Weather Factors at the Site
Precipitation and wind velocity data obtained by
field measurements with the AMeDAS (Automated
Meteorological Data Acquisition System) in the area
surrounding the Imagire-guchi inlet are shown in Fig.
2. These values increased concurrently with typhoons
occurring in July and September, which caused
significant changes in the shoreline position.
Between June 2011 and March 2012, typhoon
events occurred on three occasions near the research
site. The first, typhoon No. 6 (Typhoon Ma-on),
approached Japan (Fig. 3a) on July 19, 2011, with a
rainfall amount of 95.5 mm and wind velocity of 9.1
m/s (Fig. 2). This typhoon caused a retreat of the
shoreline, as determined from previous conditions
measured earlier in the month (Fig. 4b).
The second, Typhoon No. 12 (Typhoon Talas),
approached Shikoku Island (Fig. 3b) on September 2,
2011, with a rainfall amount of 10.5 mm and wind
velocity 10.5 m/s (Fig. 2).
On September 21, 2011, Typhoon No. 15 (Typhoon
Roke) landed in Hamamatsu near the Imagire-guchi
inlet (Fig. 3c). The sea level rose about 1.4 m in
Mikawa port, rainfall reached 154 mm, and wind
velocity was 20.3 m/s (Fig. 2). Although all three
typhoons greatly affected shoreline positions near the
measurement area, Typhoon Roke caused the most
significant changes in the shoreline position (Fig. 3c).
4. Potential Data Source
4.1 Field Measurement
GPS measurement was used to determine shoreline
position near the Imagire-guchi inlet. The effects of
seasonal variation and influence of individual storms
were considered in the measurements. The shoreline
changes were measured near the Imagire-guchi inlet
along the 2.5 km stretch on the west side of the jetty
(Fig. 1). The measurements were conducted every 50 m
with the level of T.P. +88 cm using GPS with RTK
(real time kinematics) (Topcon GB-500 GPS). The
GPS measurement represents three dimensions of XYZ
positions. A base station was set on BM (benchmark)
No. 7500. The measurements of shoreline alteration
were started from the BM. Two GPS rovers (mobile
GPS receivers) were used for time efficiency purposes;
the 0.9 km stretch from the BM on the east side was
measured by the first, and the 1.6 km stretch from that
2.5 km
Imagire-guchi inlet
BM No. 7500

Investigation of Shoreline and Topographic Change on the West Side of the Imagire-Guchi Inlet, Japan
33
Fig. 2 Precipitation and wind velocity recorded at the study area (Japan Meteorological Agency).
Fig. 3 Path of typhoons occurring near the study area: (a) No. 6 (Ma-on) in July; (b) No. 12 (Talas) in September; (c) No. 15 (Roke) in September (Japan Meteorological Agency).
on the west side was measured by the second.
The measurements were conducted every month at
low tide conditions during spring tides beginning in
June 2011. The measurement results, reveal historical
shoreline changes that occurred during a 10-month
period (Fig. 4a). Measurements of shoreline changes
near the Imagire-guchi inlet were conducted in its
western area to study the behavior of shoreline change.
Water level is an important factor because it can
indicate shoreline changes. Nine shoreline positions
were examined at this site from June 2011 to March
2012.
4.2 Image Data
Aerial photographs of the Imagire-guchi inlet were
obtained in 1900, 2002–2005, and 2007–2010 by the
Hamamatsu Doboku local government office in
Shizuoka prefecture, Japan. To investigate the
shoreline changes on the west side of the Imagire-guchi
inlet, shoreline positions were digitized in aerial
photographs obtained in various years to summarize
the historical shoreline movement and shoreline
position around the inlet. Long-term shoreline changes
were observed on the basis of these maps. Historical
shoreline behavior is generally obtained by field
measurements. However, in the present study, this
method is supplemented by the use of aerial
photographs to provide greater spatial coverage,
resulting in a better indication of rates of change along
the shoreline [11].
4.3 Cross-Shore Profile, Hallermeier Equation and
Depth of Closure
To investigate topographic changes by the
estimated DoC (depth of closure) around the
Imagire-guchi inlet, comparative analysis was
performed among cross-shore profile datasets in 1990,
1991, 2004, and 2006–2010. In addition, estimations
were conducted using the Hallermeier equation (1981)
on the basis of offshore wave height and period data
obtained by using data from an 11-year period of
1999-2009, excluding 2008.
DoC is a concept widely used in the field of coastal
engineering to describe the seaward limit of
appreciable depth change. DoC is often used to
determine seaward limits of significant cross-shore
(a) (b) (c)
30
25
20
15
10
5
0
Win
d V
eloc
ity (m
/s)
6/1/2011
6/1/2011
7/1/2011
7/1/2011
8/1/2011
8/1/2011
9/1/2011
9/1/2011
10/1/2011
10/1/2011
11/1/2011
11/1/2011
12/1/2011
12/1/2011
1/1/2012
1/1/2012
2/1/2012
2/1/2012
3/1/2012
3/1/2012
4/1/2012
4/1/2012
Date of Measurement
180
150
120
90
60
30
0
Precipitation (mm
)
Wind Velocity (m/s) Precipitation (mm)
Typhoon No. 15 (Roke)
Typhoon No. 12 (Talas)
Typhoon No. 6 (Ma-on)
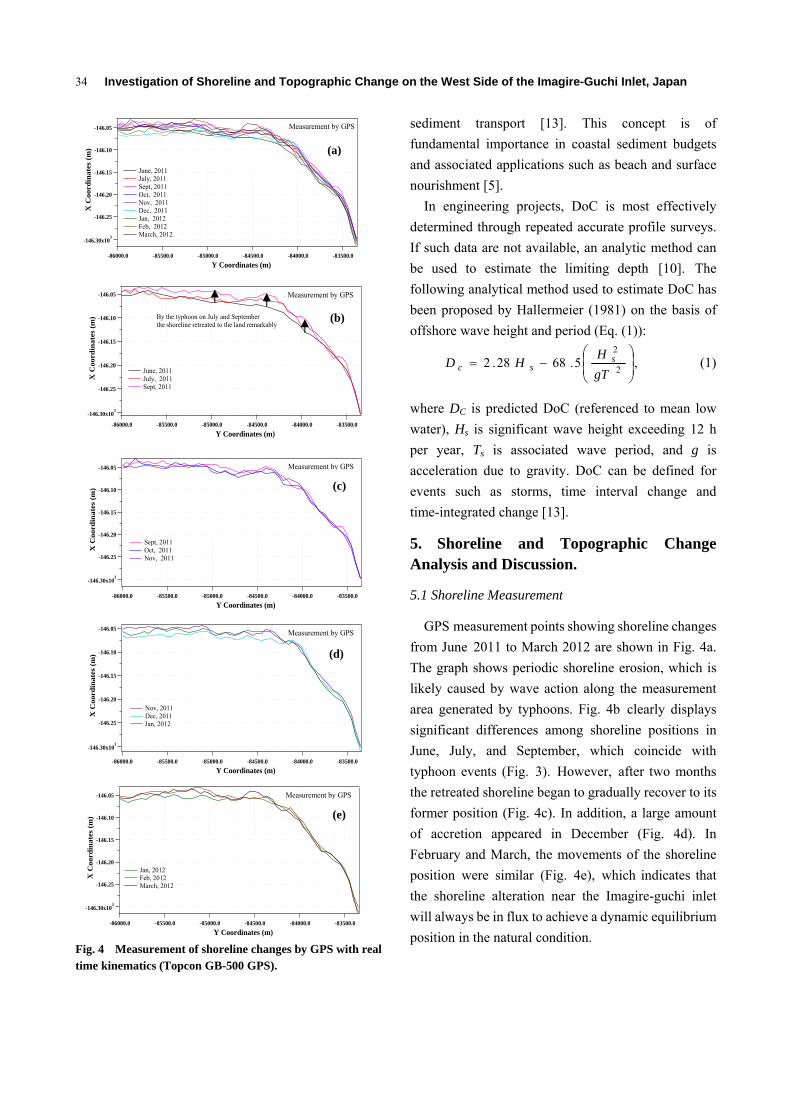
Investigation of Shoreline and Topographic Change on the West Side of the Imagire-Guchi Inlet, Japan
34
Fig. 4 Measurement of shoreline changes by GPS with real time kinematics (Topcon GB-500 GPS).
sediment transport [13]. This concept is of
fundamental importance in coastal sediment budgets
and associated applications such as beach and surface
nourishment [5].
In engineering projects, DoC is most effectively
determined through repeated accurate profile surveys.
If such data are not available, an analytic method can
be used to estimate the limiting depth [10]. The
following analytical method used to estimate DoC has
been proposed by Hallermeier (1981) on the basis of
offshore wave height and period (Eq. (1)):
,5.6828.22
2
gT
HHD s
sc (1)
where DC is predicted DoC (referenced to mean low
water), Hs is significant wave height exceeding 12 h
per year, Ts is associated wave period, and g is
acceleration due to gravity. DoC can be defined for
events such as storms, time interval change and
time-integrated change [13].
5. Shoreline and Topographic Change Analysis and Discussion.
5.1 Shoreline Measurement
GPS measurement points showing shoreline changes
from June 2011 to March 2012 are shown in Fig. 4a.
The graph shows periodic shoreline erosion, which is
likely caused by wave action along the measurement
area generated by typhoons. Fig. 4b clearly displays
significant differences among shoreline positions in
June, July, and September, which coincide with
typhoon events (Fig. 3). However, after two months
the retreated shoreline began to gradually recover to its
former position (Fig. 4c). In addition, a large amount
of accretion appeared in December (Fig. 4d). In
February and March, the movements of the shoreline
position were similar (Fig. 4e), which indicates that
the shoreline alteration near the Imagire-guchi inlet
will always be in flux to achieve a dynamic equilibrium
position in the natural condition.
-146.30x10³
-146.25
-146.20
-146.15
-146.10
-146.05
X C
oord
inat
es (
m)
-86000.0 -85500.0 -85000.0 -84500.0 -84000.0 -83500.0
Y Coordinates (m)
Jan, 2012 Feb, 2012 March, 2012
Measurement by GPS
(e)
-146.30x10³
-146.25
-146.20
-146.15
-146.10
-146.05
X C
oord
inat
es (
m)
-86000.0 -85500.0 -85000.0 -84500.0 -84000.0 -83500.0
Y Coordinates (m)
June, 2011 July, 2011 Sept, 2011
Measurement by GPS
By the typhoon on July and September the shoreline retreated to the land remarkably
(b)
-146.30x10³
-146.25
-146.20
-146.15
-146.10
-146.05
X C
oord
inat
es (
m)
-86000.0 -85500.0 -85000.0 -84500.0 -84000.0 -83500.0
Y Coordinates (m)
Sept, 2011 Oct, 2011 Nov, 2011
Measurement by GPS
(c)
-146.30x10³
-146.25
-146.20
-146.15
-146.10
-146.05
X C
oord
inat
es (
m)
-86000.0 -85500.0 -85000.0 -84500.0 -84000.0 -83500.0
Y Coordinates (m)
Nov, 2011 Dec, 2011 Jan, 2012
Measurement by GPS
(d)
-146.30x10³
-146.25
-146.20
-146.15
-146.10
-146.05
X C
oord
inat
es (
m)
-86000.0 -85500.0 -85000.0 -84500.0 -84000.0 -83500.0
Y Coordinates (m)
Measurement by GPS
June, 2011 July, 2011 Sept, 2011 Oct, 2011 Nov, 2011 Dec, 2011 Jan, 2012 Feb, 2012 March, 2012
(a)

Investigation of Shoreline and Topographic Change on the West Side of the Imagire-Guchi Inlet, Japan
35
5.2 Analysis of Aerial Photographs
For aerial photography, the actual shoreline position
at any given time is dependent on the prevailing
oceanographic conditions during the flight [3]. On the
basis of aerial photographs obtained for this study,
shoreline changes between 1990 and 2010 were
investigated.
Fig. 5a shows an aerial photograph captured in 1990,
depicting a wide natural sandy beach extended along
the shoreline. Fig. 5b shows an aerial photograph
captured in 2002 that clearly indicates beach erosion on
the west side of the Imagire-guchi inlet caused by the
reduction of sediment supply from the Tenryu River. A
comparison of the two photographs reveals that the
width of the sandy beach decreased considerably due to
erosion in 2002 that was caused by a different process
than that in 1990 (circle in Fig. 5b).
Figs. 5c and 5d show aerial photographs captured in
2007 and 2010, respectively. It is apparent that the
shoreline changes began to recover gradually toward
the initial position (Fig. 5e), which indicates that a
significant amount of sediment was deposited in the
area between 2002 and 2010.
This study utilizes the image data of 1990,
2002–2005, and 2007–2010 for long-term analysis
(Fig. 6). To analyze shoreline changes in the spatial term, the mean shoreline position ( y ) (Eq. (2)) and
standard deviations (σ) (Eq. (3)) were calculated for
every section:
n
t
txyn
xy1
),(1
)( , (2)
1
))(),((
)( 1
2
n
xytxy
x
n
t . (3)
Fig. 7a shows the mean shoreline position around the
Imagire-guchi inlet with maximum and minimum
conditions of shoreline changes. The shoreline adjacent
to and behind the breakwater was more advanced in
2010 than that in 1990 (Fig. 7b), which indicates that
during the 20 year period (1990-2010), the western
area of the Imagire-guchi inlet accumulated a
significant amount of sediment.
The trends of the maximum and minimum shoreline
positions show slight differences from the mean
shoreline position. Some parts of the maximum and
minimum positions do not follow the mean shoreline
position. The range of shoreline position between the
maximum and minimum were approximately 60 m on
the left side and 23 m on the right side (Fig. 7a). These
conditions indicate that the force on the left side was
Fig. 5 (a)-(d) Aerial photographs captured in 1990 to 2010; (e) Detected shorelines.
(a) 1990
(b) 2002
(c) 2007
(d) 2010
1100
1050
1000
950
900
850
800
Dis
tanc
e (m
)
500045004000350030002500200015001000
Distance (m)
Digitizing Aerial Photograph
1990 2002 2007 2010
(e)

Investigation of Shoreline and Topographic Change on the West Side of the Imagire-Guchi Inlet, Japan
36
Fig. 6 Digitized aerial photographs obtained by the Hamamatsu Doboku office, Shizuoka prefecture, Japan.
Fig. 7 (a) Max–mean–min shoreline position; (b) Shoreline change in 1990 and 2010; (c) Standard deviation.
larger than that on the right side. The standard
deviation of the shoreline alteration around the inlet
was approximately 20 m at the farthest point from the
breakwaters (left side in Fig. 7c) and 8 m behind the
breakwater indicating that the movement was more
significant in the area farther from the breakwaters
than that behind them. The shoreline changes near the
breakwater were more stable than those in any other
location. However, some parts of the standard
deviation of the shoreline alteration also show a
movement greater than 20 m. The magnitude of
standard deviation varied from 8 m to 30 m.
1100
1050
1000
950
900
850
800
750
Dis
tanc
e (m
)
4500
4500
4000
4000
3500
3500
3000
3000
2500
2500
2000
2000
1500
1500
1000
1000
Distance (m)
Digitizing Aerial Photograph
1990 2002 2003 2004 2005 2007 2008 2009 2010
0 500 1000 1500 2000 3000 35002500
50
100
150
200
250
300
350
0 500 1000 1500 2000 2500 3000 3500
0
Breakwater
35
30
25
20
15
10
5
350032503000275025002250200017501500125010007505002500Distance (m)
(m
)
(c)
1100
1050
1000
950
900
850
800
350032503000275025002250200017501500125010007505002500
1990 2010
y (m
)
(b)
y (m
)
1100
1050
1000
950
900
850
800
3500
3500
3250
3250
3000
3000
2750
2750
2500
2500
2250
2250
2000
2000
1750
1750
1500
1500
1250
1250
1000
1000
750
750
500
500
250
250
0
0
Mean Shoreline Position Max Shoreline Position Min Shoreline Postion
Breakwater
(a)
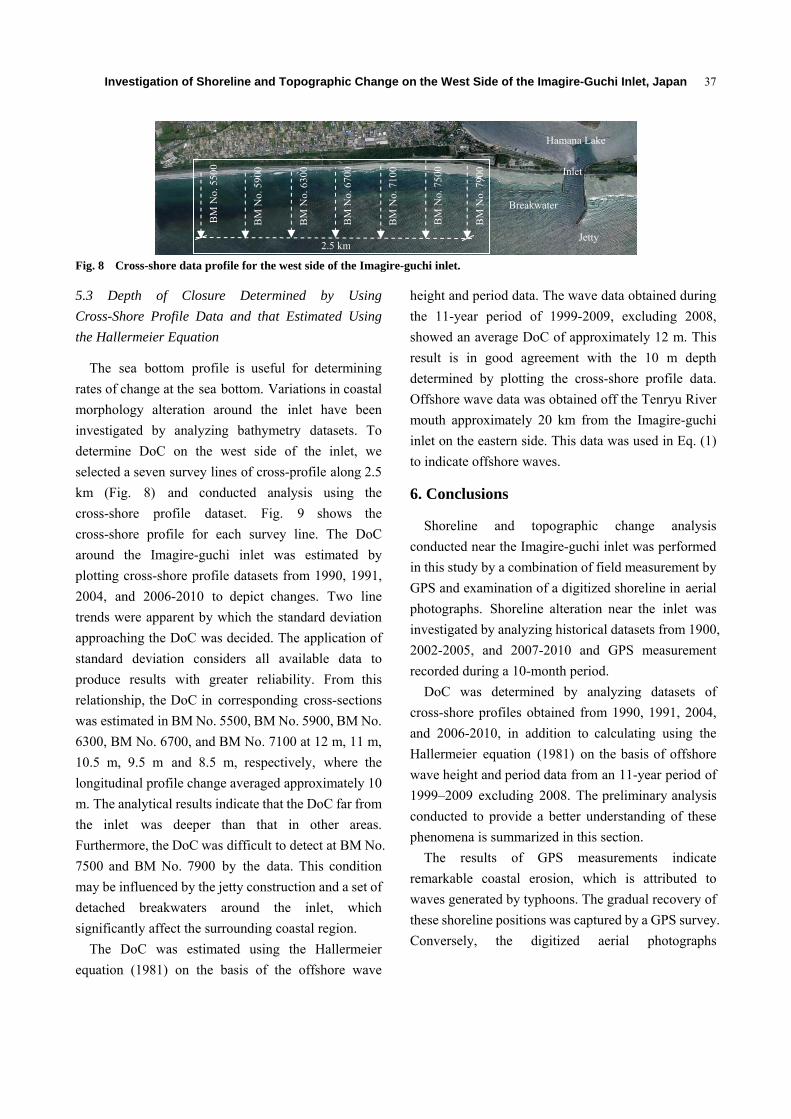
Investigation of Shoreline and Topographic Change on the West Side of the Imagire-Guchi Inlet, Japan
37
Fig. 8 Cross-shore data profile for the west side of the Imagire-guchi inlet.
5.3 Depth of Closure Determined by Using
Cross-Shore Profile Data and that Estimated Using
the Hallermeier Equation
The sea bottom profile is useful for determining
rates of change at the sea bottom. Variations in coastal
morphology alteration around the inlet have been
investigated by analyzing bathymetry datasets. To
determine DoC on the west side of the inlet, we
selected a seven survey lines of cross-profile along 2.5
km (Fig. 8) and conducted analysis using the
cross-shore profile dataset. Fig. 9 shows the
cross-shore profile for each survey line. The DoC
around the Imagire-guchi inlet was estimated by
plotting cross-shore profile datasets from 1990, 1991,
2004, and 2006-2010 to depict changes. Two line
trends were apparent by which the standard deviation
approaching the DoC was decided. The application of
standard deviation considers all available data to
produce results with greater reliability. From this
relationship, the DoC in corresponding cross-sections
was estimated in BM No. 5500, BM No. 5900, BM No.
6300, BM No. 6700, and BM No. 7100 at 12 m, 11 m,
10.5 m, 9.5 m and 8.5 m, respectively, where the
longitudinal profile change averaged approximately 10
m. The analytical results indicate that the DoC far from
the inlet was deeper than that in other areas.
Furthermore, the DoC was difficult to detect at BM No.
7500 and BM No. 7900 by the data. This condition
may be influenced by the jetty construction and a set of
detached breakwaters around the inlet, which
significantly affect the surrounding coastal region.
The DoC was estimated using the Hallermeier
equation (1981) on the basis of the offshore wave
height and period data. The wave data obtained during
the 11-year period of 1999-2009, excluding 2008,
showed an average DoC of approximately 12 m. This
result is in good agreement with the 10 m depth
determined by plotting the cross-shore profile data.
Offshore wave data was obtained off the Tenryu River
mouth approximately 20 km from the Imagire-guchi
inlet on the eastern side. This data was used in Eq. (1)
to indicate offshore waves.
6. Conclusions
Shoreline and topographic change analysis
conducted near the Imagire-guchi inlet was performed
in this study by a combination of field measurement by
GPS and examination of a digitized shoreline in aerial
photographs. Shoreline alteration near the inlet was
investigated by analyzing historical datasets from 1900,
2002-2005, and 2007-2010 and GPS measurement
recorded during a 10-month period.
DoC was determined by analyzing datasets of
cross-shore profiles obtained from 1990, 1991, 2004,
and 2006-2010, in addition to calculating using the
Hallermeier equation (1981) on the basis of offshore
wave height and period data from an 11-year period of
1999–2009 excluding 2008. The preliminary analysis
conducted to provide a better understanding of these
phenomena is summarized in this section.
The results of GPS measurements indicate
remarkable coastal erosion, which is attributed to
waves generated by typhoons. The gradual recovery of
these shoreline positions was captured by a GPS survey.
Conversely, the digitized aerial photographs
Breakwater
Jetty
Hamana Lake
Inlet
2.5 km
BM
No.
550
0
BM
No.
670
0
BM
No.
630
0
BM
No.
590
0
BM
No.
750
0
BM
No.
710
0
BM
No.
790
0

Investigation of Shoreline and Topographic Change on the West Side of the Imagire-Guchi Inlet, Japan
38
Fig. 9 Cross-profile data showing depth of closure.
clearly reveal shoreline behavior near the inlet such
that the shoreline alteration on the west side of the jetty
fluctuates widely. The magnitude of shoreline change
on this side is apparently due to a set of detached
breakwaters constructed in the 1970s to protect the
landward part of the inlet. The breakwaters were built
alongshore on the west side of the inlet, and the
shoreline position was fixed along these structures.
Furthermore, the large amount of sediment on the west
side of the jetty decreased because the transport of
sediment supply from the east side was hindered by the
jetty in the inlet. Therefore, this structure significantly
affected the surrounding coastal region.
Analysis of the cross-shore profile datasets revealed
that DoC away from the inlet was deeper than that in
other areas. The average DoC near the inlet was
estimated to be approximately 10 m. The DoC was
difficult to determine around the inlet, which can be
attributed to the construction of the jetty and the
detached breakwaters. On the contrary, the average
DoC near the inlet was estimated using the
Hallermeier equation (1981) to be approximately 12 m.
This result is in good agreement with the 10 m depth
-20
-18
-16
-14
-12
-10
-8
-6
-4
-2
0
Dep
th (
m)
-148.0x10³ -147.8 -147.5 -147.2 -147.0 -146.8 -146.5 -146.2
Cross-shore distance (m)
1.2
1.0
0.8
0.6
0.4
0.2
0.0
Stan
dard
deviation
(m)
BM No. 7500 1990 1991 2004 2006 2007 2008 2009 2010 Standard deviation
(f)
-20
-18
-16
-14
-12
-10
-8
-6
-4
-2
0
Dep
th (
m)
-148.00x10³ -147.75 -147.50 -147.25 -147.00 -146.75 -146.50 -146.25
Cross-shore distance (m)
1.2
1.0
0.8
0.6
0.4
0.2
Stan
dard
deviation
(m)
BM No. 7900
1990 1991 2004 2006 2007 2008 2009 2010 Standard deviation (m)
(g)
-20
-18
-16
-14
-12
-10
-8
-6
-4
-2
0
Dep
th (
m)
-148.0x10³ -147.8 -147.5 -147.2 -147.0 -146.8 -146.5 -146.2 -146.0
Cross-shore distance (m)
1.2
1.0
0.8
0.6
0.4
0.2
0.0
Sta
nd
ard
dev
iatio
n (m
)
BM No. 5500
1990 1991 2004 2006 2007 2008 2009 2010 Standard deviation (m)
(a)
DoC
-20
-18
-16
-14
-12
-10
-8
-6
-4
-2
0
Dep
th (
m)
-148.0x10³ -147.8 -147.6 -147.4 -147.2 -147.0 -146.8 -146.6 -146.4 -146.2 -146.0
Cross-shore distance (m)
1.0
0.8
0.6
0.4
0.2
0.0
Sta
nd
ard
dev
iatio
n (m
)
BM No. 6300
1990 1991 2004 2006 2007 2008 2009 2010 Standard Deviation (m)
(c)
DoC
-20
-18
-16
-14
-12
-10
-8
-6
-4
-2
0
Dep
th (
m)
-148.0x10³ -147.8 -147.5 -147.2 -147.0 -146.8 -146.5 -146.2 -146.0
Cross-shore distance (m)
0.8
0.6
0.4
0.2
0.0
Stan
dard
dev
iation
(m)
BM No. 6700 1990 1991 2004 2006 2007 2008 2009 2010 Standard deviation (m)
(d)
DoC
-20
-18
-16
-14
-12
-10
-8
-6
-4
-2
0
Dep
th (
m)
-148.2x10³ -148.0 -147.8 -147.5 -147.2 -147.0 -146.8 -146.5 -146.2 -146.0
Cross-shore distance (m)
0.8
0.6
0.4
0.2
0.0
Stan
dard
devia
tion
(m)
BM No. 7100
1990 1991 2004 2006 2007 2008 2009 2010 Standard deviation (m) (e)
DoC
-20
-18
-16
-14
-12
-10
-8
-6
-4
-2
0
Dep
th (
m)
-148.0x10³ -147.8 -147.5 -147.2 -147.0 -146.8 -146.5 -146.2 -146.0
Cross-shore distance (m)
1.0
0.8
0.6
0.4
0.2
0.0S
tan
dard
dev
iatio
n (m
)
BM No. 5900
1990 1991 2004 2006 2007 2008 2009 2010 Standard deviation (m)
(b)
DoC

Investigation of Shoreline and Topographic Change on the West Side of the Imagire-Guchi Inlet, Japan
39
determined by plotting the cross-shore profile data.
Offshore wave data was obtained off the Tenryu River
mouth, which is approximately 20 km from inlet on
the eastern side.
Acknowledgments
The authors wish to express grateful thanks to the
Hamamatsu Doboku office, Shizuoka prefecture,
Japan, for providing topographical maps and
topographic survey data for the region near
Imagire-guchi inlet. This study was financially
supported by the Ministry of National Education and
the Republic of Indonesia and is a part of doctoral
study of the first author. The authors are particularly
grateful to Coastal Engineering Laboratory members
of Toyohashi University of Technology who assisted
with the field survey. The authors would like to thank
Enago (www.enago.jp) for the English language
review.
References
[1] E. H. Boak and I. L. Turner, Shoreline definition and
detection: A review, Journal of Coastal Research 21 (4)
(2005) 688-703.
[2] H. Chanson, S. Aoki, The Enshu Coast of Japan, Shore
and Beach 72 (1) (2004) 19-20.
[3] R. Dolan, M. S. Fenster and S. T. Holme, Temporal
analysis of shoreline recession and accretion, Journal of
Coastal Research 7 (3) (1991) 723-744.
[4] R. Dolan, B. P. Hayden and S. May, The reliability of
shoreline change measurement from aerial photographs,
Shore and Beach 48 (1980) 22-29.
[5] C. Hinton and R. J. Nicholls, Spatial and temporal
behavior of depth of closure along the Holland coast, in:
Proceedings of 26th International Conference on Coastal
Engineering, ASCE, Copenhagen, 1998, pp. 2913-2925.
[6] K. Horikawa, Nearshore Dynamics and Coastal
Processes—Theory, Measurement and Predictive Models,
University of Tokyo Press, Tokyo, 1988.
[7] N. Itoh, Y. Tani, T. Nagatani and M. Soma, Phototrophic
activity and redox condition in Lake Hamana, Japan,
indicated by sedimentary photosynthetic pigments and
molybdenum over the last 250 years, Journal of
Paleolimnology 29 (2003) 403-422.
[8] N. C. Kraus and J. N. Rosati, Interpretation of
Shoreline-Position Data for Coastal Engineering Analysis,
Coastal Engineering Technical Note II-39, U.S. Army
Engineer Waterways Experiment Station, Vicksburg, MS,
1997, pp. 1-14.
[9] Y. Kuriyama, Y. Uchiyama, S. Nakamura and T. Nagae,
Medium-term bathymetric change around jetties at
Imagireguchi inlet, Journal of Coastal Research 33 (2003)
223-236.
[10] Z. Liu, Sediment Transport, Aalborg University, 2001, p.
53.
[11] Z. Mcwilliams, Shoreline Change along the Awatoto,
Clive and Haumoana Foreshores, Hawke’s Bay,
Geography 420 Honours Dissertation, Department of
Geography, 2010.
[12] A. S. Mustari, S. Kato, T. Okabe and S. Aoki,
Characteristics of bottom turbidity around the inlet of
Hamana Lake, in: Proceedings of International Sessions at
Conference on Coastal Engineering, JSCE 1 (2010)
31-35.
[13] R. J. Nicholls, W. A. Birkemeier and R. J. Hallermeier,
Application of the depth of closure concept, in:
Proceedings of 25th International Conference on Coastal
Engineering, ASCE, Orlando, 1996, pp. 3874-3887.
[14] Syamsidik, S. Aoki, S. Kato, Effects of tidal currents and
waves on bottom suspended sediment fluxes off two river
mouths, in: Proceedings of ISOPE-2008 Vancouver, 2008,
pp. 491-497.
[15] J. H. Yuk and S. Aoki, Impact of Jetty Construction on the Current and Ecological System in an Estuary with a Narrow Inlet, Journal of Coastal Research 50 (2007) 784-788.

Journal of Shipping and Ocean Engineering 3 (2013) 40-46
Views from Maritime Education and Training on the Full
Implementation of 2010 STCW Amendments
Ruan Wei
Shanghai Maritime University, China
Abstract: The full review of The International Convention on Standards of Training, Certification and Watch keeping for Seafarers (the STCW Convention) has been accomplished by International Maritime Organization (IMO) and the new amendment, which is also named as Manila amendment, has been effective since 2012, with a transitional period of 2012-2017.
Based on the system engineering context consisting of “Human, Machine and Environment”, human factors at sea, i.e., those factors relevant to the seafarers, are consistently underlined. STCW convention is the unique but systematic international maritime legislation looking after the “professional competency standards” of seafarers. The amendment thereto is of great significance for the Maritime Education and Training (MET) systems, which should be fully understood so as to respond to it effectively.
The paper analyzes major impacts brought by the amendment, with purposes to raise recommendations for MET systems to implement the amendment effectively.
Keywords: Maritime education and training, 2010 STCW amendments, seafarers training, maritime strategy.
1. Overview of the New STCW Amendment
STCW 78/95 was amended for the reasons of fast
development of world shipping industry, more
applications of new maritime technologies onboard,
higher standards and stricter management regime in
maritime safety and pollution prevention, more
importance of human factors in maritime technical
operations, and the latent flaws in the current version
of the code.
A number of important changes have been made to
each chapter of the Annex and Codes of the
convention. The most influential advancements for
MET institutions are:
Improved measures to prevent fraudulent
practices associated with Certificates of Competency
and strengthen the evaluation process;
Revised requirements on hours of work and rest
and new requirements for the prevention of drug and
Corresponding author: Ruan Wei, Ph.D., assoicate
professor, research fields: maritime safety and pollution prevention conventions, maritime education and training, maritime safety management, maritime policies and management. E-mail: [email protected].
alcohol abuse, as well as updated standards relating to
medical fitness standards for seafarers;
New certification requirements for able seafarers
deck and engine;
New requirements relating to training in modern
technology such as Electronic Charts Displaying and
Information Systems (ECDIS);
New requirements for marine environment
awareness training and leadership and teamwork
training;
Updated competence requirements for personnel
serving on board all types of tankers, including new
requirements for personnel serving on liquefied gas
tankers;
New requirements for security training, as well as
provisions to ensure that seafarers are properly trained
to cope if their ship comes under attack by pirates;
Introduction of modern training methodology
including distance learning and e-learning;
Complete revision of Chapter V;
Simplification of celestial navigation standards;
DAVID PUBLISHING
D
Views from Maritime Education and Training on the Full Implementation of 2010 STCW Amendments
41
Addition of new requirements of Vessel Traffic
System (VTS) training for masters, chief officers and
Officer Of Watch-keeping for maritime safety;
Introduction of standards of electrical-electronic
officer training;
Improved and more systematic maritime security
training;
Incorporating compulsory Bridge Resource
Management (BRM) and Engine-room Resource
Management (ERM) training requirements by
transferring relevant requirements from section
B-VIII/2 to A-VIII/2;
Updated IMO model courses such as those on
Automatic Identification Systems, Familiarization
Training for Liquefied Natural Gas (LNG) tanker
operations, basic training in marine environment
awareness, Integrated Bridge System (IBS), Liquefied
Petroleum Gas (LPG) Tanker Cargo and Ballast
Handling Simulator, Liquefied Petroleum Gas (LPG)
Tanker Cargo and Ballast Handling Simulator.
The amendments reflect general future development
of STCW convention and codes, i.e., more focuses on
the development of technology-application onboard,
the occupational and professional skills of seafarers
(management, teamwork, leadership, security,
environment protection awareness, etc, as required by
the Chapter VI), the special training (as proved by the
complete revision of chapter V). In addition, more
“transparency” of management in terms of certificate
of competency and informatization for MET activities
are proposed throughout the process of reviews and
debates.
2. Major Impacts upon MET Systems
2.1 Academic Activities of MET
The amendment impacts directly upon the MET
activities with the above-mentioned changes. All the
relevant academic processes and activities are affected
including:
adjustment and updating of curriculum, training
syllabi, textbooks, etc., including the designing of
curricula for new STCW courses.
updating of maritime training facilities;
refreshment of qualifications of maritime
instructors, in particular the sea-going experience
thereof;
re-designing of the academic management
system for maritime students;
updating of the examination and assessment
system for seafarers (theoretical and practical skills);
The amendment brings also indirect impacts upon
the MET systems through the ways of, for instance,
accordingly-changed national regulations for
seafarer’s certification, examination and assessment,
regulations for the quality system of Maritime Safety
Administrations, and the competitiveness of the MET
graduates in the international seafarer manpower
market.
2.2 Certification Arrangement
To duly certify the students or trainees is the key
aim of MET activities. Therefore changes in
certification arrangements for seafarers need to be
diligently observed and handled. The certification
arrangement in maritime nations has to be modified as
per the STCW. For MET institutions, the deletion and
addition of certain certificates, the transferring and
equivalent arrangement of certificates of seafarers, the
order of issuing various certificates, the requirements
and ways of combing theoretical education, practical
skill training with sea-going experience, etc,. are most
influential.
For instance, certificates of seafarers are clearly
categorized into three levels by the new amendment,
i.e., Certificate of Competency (CoC), Certificate of
Proficiency (CoP) and Documentary Evidence (DE),
and the relationship between CoC and CoP has been
established for the certification of relevant officers
and engineers, which signifies the order of training
that CoP courses must go before those for CoC.

Views from Maritime Education and Training on the Full Implementation of 2010 STCW Amendments
42
Also, there are higher standards than those in
STCW in some existing national certification systems
- Ratings forming part of a navigational watch may be
certified with CoC while the convention requires a
CoP only and BRM and ECDIS training can be
certificated with an independent CoP while the
convention incorporates relevant requirements in the
table of “Knowledge, Understandings and
Proficiency” (KUP). This hints that training courses
need to be updated, created and phased out.
Lastly, attention should be paid to the transitional
period arrangements for seafarers’ certification
required by the national maritime administration in
accordance with the new STCW amendment. In most
of maritime nations, such transitional period
arrangements are mainly done through new and
individual courses.
The curriculum, training syllabi, textbooks, etc., of
maritime education and training courses are therefore
affected, and possibly the mode the MET.
2.3 “Flexibilities”
The amendment, as required by the principles of
full review set up by the IMO at the very beginning of
amending STCW, created more flexibilities for the
convenience of shipping companies and seafarers. The
first type of “flexibility” can be seen in balancing
“approved training” and “sea-going experience”. For
instance, Regulation III/1 provides that Engineer
officers can be certified “when they have completed
combined workshop skill training and an approved
seagoing service of not less than 12 months as part of
an approved training programme which includes
onboard training which meets the requirements of
section A-III/1 of the STCW Code, or otherwise have
approved seagoing service of not less than 36 months”.
The second type can be witnessed by “equivalent
transferring”. Able seafarers can be acquired from
ratings with sufficient sea-going experience, and the
Electro-Technical Officers can be transferred from “a
suitably qualified person”, or an Engineer officer
certified as per the new amendment since the new
amendment has incorporated electric and electronic
KUPs into that of the engineer officers, except the
exclusive training for ETOs according to Section
A-III/6 “Mandatory minimum requirements for
certification of electro-technical officer” of the code.
What should be the responses of MET systems then?
The above-mentioned flexibilities will of course lead
to the diversity of MET training courses, the existence
and development of MET programs, co-operations
between MET institutions and shipping companies,
competitiveness of students and trainees in different
MET programs. The MET institutions should
therefore keep close watch for such.
2.4 Special Training
The complete revision of Chapter V such as the
new regulation V/1-1 and V/1-2, and “competence
requirements for personnel operating Dynamic
Positioning (DP) systems”; “Training requirements for
ships operating in ice-covered waters”; “Training
requirements for personnel in charge of — or involved
in — anchor-handling operations”, and “Training
requirements for personnel serving on board offshore
supply vessels” signifies the close attention of the
organization and industry and great potential of
special training.
The contemporary commercial shipping business is
indicating by and large that the special transportation
is the effective strategy of enhancing the
competitiveness of a shipping enterprise. Meanwhile,
special training can be understood as a strong aid for
the achievement of “high-level, professional and
specialized” MET. More and more shipping
companies start such business and MET institutions
are thus involved. In such a circumstance, the
complete revision of the Chapter V exerts great
impacts on those MET institutions running or to be
running special courses, in the respect of qualified
maritime instructors, special training facilities, and an
approved bank of maritime expertise.
Views from Maritime Education and Training on the Full Implementation of 2010 STCW Amendments
43
2.5 Quality Management Activities
The new amendment reinforces the requirements of
quality management practices in MET. The new
Regulation I/8-2 reads “This evaluation shall include
all changes to national regulations and procedures in
compliance with the amendments to the Convention
and STCW Code, with dates of entry into force later
than the date information was communicated to the
Secretary-General”. It will increase the frequency of a
member state to communicate the IMO for such a
matter. Furthermore, a relevant requirement is added
to the B-I/6.12 of the new amendment as a guideline,
which requires that “Each Party should ensure that a
register or registers of approved training providers,
courses and programmes are maintained and made
available to Companies and other Parties on request”.
It can be concluded that the training and
certification of seafarers will be more and more
“informatized”, “traceable” and “transparent”, for
which a continuous and effective quality management
system can be helpful through its documentation and
record mechanism. The current quality management
system in MET systems should be updated and
enhanced to enforce the above.
2.6 Medical Standards
Medical standards (I/9 and A-I/9) are relevant to
MET institutions traditionally. Substantial changes
have been made to them and raise the “level of
entrance” generally for the prospective seafarers,
affecting the enrollment of the students, as well as the
possibility of completing all training subjects and their
seafaring profession. Additional attention should be
paid to the “potential and future” requirements on the
“physical standards”.
The MET institutions should attentive for the
possible reduced number the student enrollment while
adjusting or inventing physical and medical standards
for the students to be registered. Institutions should
increase the time of physical training and exercises by
modifying the curriculum or other activities effective
for the maintenance and promotion of the fitness of
maritime students and trainees.
2.7 Distance Learning and E-Learning
Use of distance learning and e-learning in MET is
once again encouraged by the new amendment
(B-I/6-11). The amendment provides two complete
paragraphs “the Guidance for training by distance
learning and e-learning” and “Guidance for assessing
a trainee’s progress and achievements by training by
distance learning and e-learning”.
MET practices accomplished through distance
learning and e-learning are not popularized and not
applicable for mandatory certification of seafarers
currently due to the lack of approved training facilities,
monitoring systems and facilities, control of MET
quality, control of the examination and assessment,
etc,.. In such a circumstance, the above provisions in
the amendment constitute important technical support,
and more and more distance learning and e-learning
activities may come up then.
3. Summary and Strategies
The new amendments would be applicable
generally in next 8-10 years by estimate. It will play
important roles in keeping maritime safety and
preventing pollutions at sea by guaranteeing the
quality of the special group of people — seafarers
onboard modern ships.
The amendment sets up new standards of training
and competency, bringing in not only opportunities
for development, but also challenges to the global
MET system. individual MET institutions need to be
ready in all respects, from the top-level designing, to
strategic development, to the details such as training
facilities and equipment, teaching staff, quality
management and maritime expertise, etc,.
As a general principle to respond to the new
amendment, MET institutions should rely on the
understandings above, and also bear in mind those on
the “quality shipping” and shortage of quality seafarer

Views from Maritime Education and Training on the Full Implementation of 2010 STCW Amendments
44
manpower worldwide, which is kept being indicated
by the industry.
3.1 Full Review MET Activities
The MET institutions shall analyze fully the new
amendments and national laws and regulations, the
implications of “quality shipping” and balance
between the international seafarer manpower demand
and supply. Then, take measures to respond them all.
For such a purpose, the new amendment creates a
necessity to fully review the context where MET
institutions are being operated. The ranges of such a
review are as follows:
General capability of the institution in
implementing the STCW convention and codes, in
terms of quality, quantity and type of training;
Mode of training;
Curricula and training plans for relevant maritime
courses, especially new training training programmes
such as ECDIS, able seafarer deck and engine,
electro-technical officer and maritime security;
Training facilities, in particular for professional
and special training, various facilities and installations
such as LNG and LPG training facilities should be
considered;
Qualification of maritime instructors and
teaching staff related;
Existing maritime expertise;
Quality management system being operated
internally, including its substantial and procedural
requirements and arrangements.
Based on such a review, demand analysis, necessity
analysis and gap analysis can be carried out so as to
set up new goals, objectives and strategic directions of
the organization, to identify the key shortcomings and
operations of MET. Individualized approaches will
follow up then for each identification.
3.2 Full Compliance with the STCW
Full compliance can be achieved in two alternatives:
fully meet with the requirements of national
regulations which are transferred and developed from
the STCW new amendment, or implementing directly
the STCW. However for MET institutions in both
cases, the benchmark or scale of standards for such a
“full compliance” is exclusively derived from their
“ultimate MET practices” — The MET institutions
affect the competency of seafarers as a “decisive
practitioner” through the execution of the objectives
of training, the proper uses of curriculum, textbooks,
examination and assessment questions.
This signifies MET institutions should be diligent
and professional in the said key points for full
compliance. However, it should be noted furthermore
during the development of the above, the KUP
standards affecting the competency of seafarers in
STCW amendment may be interpreted in different
ways, owing to the fact that, for instance, the STCW
amendment does not provide the exact requirements
of hours for a certain competency. Documentation ad
evidences should be made in place anyway.
The IMO model courses, which are continuously
accentuated not only by the IMO but the whole
industry, aim to provide guidelines for the unanimous
and authentic interpretation of the KUPs. They are to
be referred to in day-to-day MET academic activities.
MET institutions may be also benefited from such
practices since model courses are made to assist in the
implementation of the convention and codes, and
approved by the IMO.
3.3 Higher Than STCW Standards
IMO has been devoting to a systematic safety
framework for maritime safety, maritime pollution
prevention and security through the SOLAS,
MARPOL and other conventions and rules. Today,
there are more and more new issues popping up on
technical applications for maritime safety and
pollution prevention, exceeding the requirements of
STCW new amendment. The new developments in
IMO currently are:

Views from Maritime Education and Training on the Full Implementation of 2010 STCW Amendments
45
- Long Range Identification Tracking system
(LRIT);
- E-Navigation;
- Green-House Gas Emissions from Ships ;
- Goal-Based Standards (GBS );
- Ship-recycling;
- Energy efficiency management;
- Ballast Water Management;
- Noise from commercial shipping and its adverse
impacts on marine life;
- Formal Safety Assessment and risk management;
- Human element;
- Harmful anti-fouling systems for ships;
- Port of refuge
- …
Understandably the development above requires
MET institutions to dedicate themselves to a
comprehensive or “systematic” MET — developing
multi-discipline knowledge, or the capability of
co-ordinating various maritime expertise and
resources. “Systematic MET” means in more details a
cross-reference or utilization of multidiscipline
knowledge. Maritime students can thus be offered
with a much more systematic and qualified maritime
competency, such as a combined knowledge system
with navigation, logistics, economy and maritime laws.
It will contribute to not only the implementation of
STCW, but also the higher quality of MET, the
creation of new maritime knowledge branches and
applications and the capability of innovation.
3.4 Co-operating and Networking
The revised standards of STCW, the fast
development and application of modern maritime
technologies, the specialized and professional sea
transportation, and the requirements of “quality
shipping” are presenting a high level and
comprehensive needs of “quality MET” as a whole.
But the number of maritime institutions providing
“systematic MET” is small after all. For the vast
majority of MET institutions, embarrassment will be
encountered during the implementation of the new
amendment in respect of installation of training
simulators and equipment, development of maritime
human resources and maritime expertise.
Co-operations and networking between MET
institutions become thus recommendable in such a
case.
4. Conclusions
STCW convention is the unique legal document for
the competency of seafarers. It is bringing great
impacts upon the maritime industry, including the
MET systems. Conversely, the practices of MET
institutions affect the effectiveness of implementation
of the convention, the quality of seafarers, the global
distributions of seafarer labor services, and general
level of safety and pollution prevention, because MET
institutions are the “ultimate and decisive” entities for
the achievements of such competency.
The new STCW amendment is being practiced
worldwide, with aim to serve the industry better by
more qualified seafarer. It is important to understand
and assess first of all the impacts of the new
amendment, to identify the keys on “full
implementation”, and then to take correct actions.
Based on the STCW amendment and for the
purpose of higher level implementation, ideally, an
assessment for the comprehensive impacts exerted by
the adoption of ILO MLC 2006, the comprehensive
development of SOLAS, MARPOL and other
international conventions and rules, shortage of
qualified seafarers, the stricter PSC and FSC
inspections, as well as the changing needs of the
industry needs to be done, for the purpose of seeing
more clearly the picture that MET systems are facing
with and making proper strategies therefor.
References
[1] The 1978 International Convention on Standards of Training, Certification and Watchkeeping for Seafarers (STCW) , as amended in 2010, IMO, London, 2010.

Views from Maritime Education and Training on the Full Implementation of 2010 STCW Amendments
46
[2] Enhong Li et al., Interpretation of the Manila Amendments to STCW convention, World Shipping 187 (2011) 20-24.
[3] Jicai Shi, Strategies for seafarer trainings under the new amendment of STCW, Water Transportation of China 9 (2012) 40-41.
[4] Wei Ruan, Comprehensive researches on the STCW convention, STCW Sub-committee of Chinese Maritime Research Committee (Maritime Safety Administration, China), Research Project, 2009.
[5] Daoke Li, Study on the Affection to Domestic Seaman Education and Training when STCW78/10 Amendment Implementation, Proceedings of 2011 Symposium for Institute of Nautical of Jiang Su, Fu Jian, Zhe Jiang and Shanghai, 2011, pp. 129-131.
[6] Junzhong Bao and Manhua Yao, Requirements of the STCW convention on the maritime education and training activities, Maritime Education Research 1 (2013) 18-21.
[7] Guidelines for the interpretation of the Manila Amendments to STCW Convention, Maritime Safety Administration, Dalian Maritime University Publication, China, 2010
[8] Yongxing Jin and Wei Ruan, Understandings the Impacts of the International Maritime Conventions and Rules upon Maritime Education and Training and the Strategies thereof, Proceedings on 17th International Maritime Lecturers Association (IMLA), Ghana, 2009.
[9] Xiangwu Wu, The impacts of the draft of STCW new amendment upon the maritime education and training, Publication of the STCW Sub-committee of Chinese Maritime Research Committee (Maritime Safety Administration, China), 2009, p. 105.

Journal of Shipping and Ocean Engineering 3 (2013) 47-54
Role of Naval Architects in Ship Recycling
Sivaprasad K. and Nandakumar C. G.
Department of Ship Technology, Cochin University of Science and Technology, Kochi-682022, Kerala, India
Abstract: The paper identifies twelve elements of ship recycling and highlights their respective roles and duties in a proposed ship recycling system. The source and items of knowledgebase for ship recycling have been brought out. A new philosophy focusing clean and safe ship recycling namely design for ship recycling has been introduced based on principles such as ecofriendliness, engineering efficiency, energy conservation and ergonomics. The role of naval architects in ship recycling industry has been described based on the above factors. The paper brings out the role of naval architects in ship recycling the way it has been practiced worldwide and proposed by regulatory bodies. The authors have brought out the new concept of design for ship recycling and various aspects of it. The role of naval architects in the practice of this new design philosophy which is ready to be embraced by the maritime industry has been reiterated. Key Words: Ship recycling, naval architect knowledgebase, design for ship recycling.
1. Introduction
The last life cycle stage of a ship is its dismantling at
any of the ship recycling yard. Ship dismantling has
been treated as a hull steel recovering operation, which
involves no major engineering activity other than gas
cutting of the steel components. Ships carry a wide
range of material onboard which sometimes include
hazardous materials like TBT, PCB etc.,. In some cases
the cargo residues may be high pollutants to the marine
environment. The case of obsolete French Aircraft
Carrier, Clemenceau which carried quite a lot of
asbestos as insulating material and arrived for
dismantling at the Indian coast is a typical example.
Basel Convention organised by United Nations
Environment Program (UNEP) considers obsolete ship
as a hazardous waste [2]. It has been the presence of
such banned and polluting component in the ships
ready for dismantling that brings the concerned
industry to notice of environmentalists and the legal
system. Once the media and the social activists get
involved in this, various issues including the
engineering aspects and the risks of dismantling
operators came into limelight. Institutions like
Corresponding author: Sivaprasad K., associate professor.
E-mail: [email protected].
International Maritime Organisation (IMO), regulatory
bodies like the ship classification societies, the
academics and the intelligentsia deliberated on this and
efforts are made to give the dismantling of obsolete
ships, the status of a decent engineering industry. The
efforts of IMO and other stake holders of the maritime
sector have brought out a significant change in the
industry by introducing the concepts of recycling
during the end of life activities of obsolete ships and
designating the name ship recycling to end of life
disassembly activities carried out as per IMO
Guidelines on Ship Recycling [5] in a ship dismantling
yard. Ship recycling is a wider concept compared to
ship dismantling as it envisages the ways and means to
identify and classify various products and processes
involved in dismantling of obsolete vessels and to
formulate best practices for carrying out various
processes leading to clean and safe end of life
operations. In this context it may specially be noted that
IMO has defined ship recycling as the best option for
all time expired vessels.
Ship as an industrially designed and constructed
product is essentially an output of the efforts of naval
architects. The role of naval architects in various life
cycle stages except in ship recycling has been well
established and their duties are performed in a
DAVID PUBLISHING
D

Role of Naval Architects in Ship Recycling
48
systematic manner. Very few research attempts have
been made in the field connected with the role of naval
architects in ship recycling: Alkaner et al. [1] have
compared the similarities of ship production and ship
recycling highlighting the role design fors such as
design for environment and design for dismantling in
ship design. This paper has envisaged the need of
extending the life cycle stage of ships to the end of life
dismantling, going beyond the conventional life cycle
concepts. However no specific remarks has been
pointed out showing explicit role of naval architects in
ship recycling processes Dilok et al. [3] have discussed
the characteristics of the product structure in
shipbuilding and the concept of design for dismantling
of ships. Though no direct reference have been made
on the role of naval architects in end of life ship
recycling activities, some of the suggestions included
in the deliberations have proved the essentiality of
having principles of naval architecture and
shipbuilding incorporated in ship recycling. Shahid [7]
has stressed the need of having some of the important
naval architectural calculations as a part of
preparations for ready for recycling certification. IMO
in its historic resolution on ship recycling [5]
incorporated design for recycling as one of the
important ship recycling guidelines. The topics
covered under the guidelines underline the role to be
played by naval architects in the matters connected
with sustainable ship recycling. Sivaprasad et al. [9]
have presented the importance of allotting a sustainable
index for all ships based on product features of ships
such as environmental friendliness, safety aspects and
naval architectural & ship design attributes.
2. Elements of Ship Recycling System
Ship recycling has to be conceived as the reverse
engineering process of modern shipbuilding and some
efforts have been made here to connect the missing
links between ship recycling and modern shipbuilding.
The combination of the roles played by the following
major elements identified in the ship recycling domain
and their mutual interactions can be formulated as an
ideal system of ship recycling.
Ship owner is either an individual or a firm who has
got the legal ownership of the vessel just before she is
dismantled. As on today the ship owner has no role and
responsibility in the issues related to ship recycling.
Once he sells the vessel to the ship dismantling broker,
he simply vanishes from the turbulent scene to be
followed. Role of obsolete ship owners ends with
selling of the ship and the owner is not a party to any of
subsequent ship recycling activities, for the time being
in the ship recycling industry.
Ship Recycling Brokers are international agents
who participate in the auction bid and take over the
charge of the ship before it is delivered to the recycling
site. Ship recycling broker is yet another intermediate
owner of the obsolete ship and his role is limited to
negotiation of bids in the early stages of ship recycling
activity. They are, just agents seen in these business
ventures, and are not concerned about any issues
related to ship recycling other than the monitory
benefits.
Ship Classification Societies are very active and
authoritative in other life cycle activities of seagoing
vessels since their inception. However, at present their
role in ship recycling is limited to preparing proposals,
attending meetings and conducting research studies.
Ship Recyclers are supposed to provide all
infrastructural facilities which regard to safe and
eco-friendly dismantling of vessels and they constitute
a strong link in the ship recycling chain. They work
closely with other promotional and statutory bodies to
deliver safe and smooth ship recycling. Currently, most
of the ship recyclers are just providers of plot and basic
infrastructure to the next element in the recycling
chain.
Ship Recycling Subcontractors provide manpower
and machines for the actual dismantling. They are
responsible for employing trained personnel for
dismantling operations involving risk and hazard. The
work force employed by the subcontractors, the biggest

Role of Naval Architects in Ship Recycling
49
contingent of the ship recycling, and they are called as
ship recycling workers.
Statutory Maritime Bodies, which have otherwise
lot of statutory powers, are not actively involved in the
ship recycling issues. The obsolete ship loses the status
of a sea worthy vessel and comes out from the purview
of maritime regulatory bodies. At present statutory
maritime bodies seldom appear in the ship recycling
scene unless and otherwise requested by the concerned
legislative bodies and courts of law.
Promotional Bodies provide land, expertise,
infrastructural facilities, man power training, transport,
logistics support to the ship recyclers and the
subcontractors. They are the custodians of important
statistics regarding ship recycling activities including
the accident rates, pollution effect, health hazards etc.,.
Pollution Control Boards/Safety Councils work as
advisory bodies at present. Their roles and
responsibilities are limited as far as safe and clean ship
recycling is concerned These agencies now work in
tandem with the promotional bodies to create a clean,
safe and productive ship recycling system and at
present they attain active partner status along with
statutory maritime department type institutions.
Steel Re-Rollers enjoy maximum benefit out ship
recycling in all the major ship recycling countries and
they usually set the national agenda for ship recycling.
This is the case with almost all major recycling nations.
They do not seem to contribute back to the
development of ship recycling infrastructure... Re-
rollers are one of the powerful links in the chain and
with the current information their role is yet to be
defined clearly.
Supply Chain Brokers include the agents who
purchase various equipment and other onboard items
which are kept for auction by the
recycler/subcontractor after dismantling. These
auctioned items are sold out as pre-owned or pre-used
items. Most of these item and equipment re enter the
domestic and industrial market through shop/shelf.
Non Governmental Green Organizations are the
international organizations involved in green issues
and are active in ship recycling. There is a constant
pressure from these NGOs on ship recyclers. They are
now targeting ship owners than the ship recyclers for
the lack of eco-friendliness in the issues in ship
recycling. The presence of these Green NGOs has
significantly influenced the functioning of the ship
recycling promotional bodies and the ship recyclers.
Worker Forums are the trade unions and similar
associations involved in this industry. They are actively
participating in all the issues related to improving the
status of present day ship recycling from the point of
view of worker welfare and green issues. However
their voice is not powerful. If these worker forums
couple their activities with stronger international
NGOs working in ship recycling and gain stronger
position in bargaining.
3. Duties of Elements of Ship Recycling
Duties of the above mentioned elements of ship
recycling can be generally classified based on the
technical and nontechnical content in their field of
activity. Activities of the technical elements are further
divided into categories such as ship recycling processes
undertaken during pre-dismantling, dismantling,
statutory & regulatory operations as well as technical
procedures and dealings involved supply chain of
recycled products. Agenda of various programmes of
the voluntary organizations associated with ship
recycling sector are of activist nature and the
corresponding elements of the system can be treated as
nontechnical.
The important duties of owners of obsolete vessels
and vessel brokers who are involved at pre dismantling
stage can be identified as arranging documents and
drawings necessary for making their vessels ready for
recycling. The process includes preparing
comprehensive list of all mandatory certificates and
documents as prescribed by Green Passport
requirements and relevant data regarding conditions of
various systems of the obsolete vessels. All important

Role of Naval Architects in Ship Recycling
50
drawings such as General Arrangement, Access Plan,
Tank Plan, Painting Scheme etc.,. are to be refurbished
and kept ready for before the ship is decommissioned.
The owners shall recognize that the information
generation has to be accomplished with an active
support from naval architects with good experience in
ship design and life cycle management. A systematic
and thorough inspection procedure has to be
undertaken by a team of marine experts lead by a naval
architect to assess and arrange the “as is” condition
information of the ship ready for recycling. They
should also ensure that this exhaustive obsolete ship
status data have to be passed on to the broker so that the
same will reach the ultimate ship recycling destination.
Ship recyclers and ship recycling subcontractors are
the major elements of ship recycling system who are
actively involved in the actual dismantling process.
Since these two elements have to take the blame of any
untoward incidents that may occur during ship
recycling, they have to be fully aware of steps involved
in the ship recycling process. The ship recyclers attain
key role in the ship recycling system with a major
thrust on responsibilities leading to clean and safe ship
recycling. Ship recycler is responsible for
implementation of statutory and classification rules on
ship recycling and thereby it becomes essential that the
ship recyclers fully understand the importance of best
practices to be followed during the dismantling.
Presence of naval architects is seen as an essential
requirement, as statutory and classification rules are
better appreciated and interpreted by them. Apart from
imparting proper training on clean and safe ship
dismantling they can guide the recyclers and
subcontracting work force regarding the recyclability
aspects of the dismantled products. This will ensure
effective ship dismantling as far as the subsequent
supply chain activities is concerned. The ship recyclers
should be mindful that proper process planning of ship
dismantling can be achieved only with the active
participation of naval architects with ample shipyard
experience.
Statutory & regulatory bodies which are connected
with ship recycling sector play an important role in
inflicting major developments in promoting the present
inferior industrial status of ship recycling industry. The
statutory & regulatory bodies which participate in the
ship recycling system are statutory maritime bodies
such as state maritime departments, pollution control
boards, industrial fire and safety inspectorates,
maritime development agencies and ship classification
societies representing the national and regional
governments. These statutory bodies which are to be
associated with the ship recycling industry have to
recognize that they should work in a similar fashion
like their sister departments operating in various other
important ship life cycle stages such as design,
construction, operation, repair and survey. The
statutory & regulatory bodies linked with ship
recycling can achieve a lively role only by involving
naval architects and marine technology experts well
experienced in various maritime industrial operations.
Ship classification societies which are employing naval
architects and marine engineers with sound marine
technology background are not yet ready to deploy
their human resources in day to day functioning ship
recycling yards. These agencies should take initiative
to distribute important functions related to ship
recycling to naval architects who can contribute
positively to improve the status of the industry with
proactive steps to implement both short spanned ship
recycling process planning & control and long term
sustainable development oriented policy decisions [11]
in this sector.
Steel re-rollers and dealers of other dismantled
products are included in the supply chain category.
They have a secondary role in the ship recycling
system as they operate partially outside the actual ship
recycling base. Still they should recognize their role in
the process and participate actively in the ship
recycling activities. Guidance from consulting naval
architects and marine engineers can be better utilized
by the supply chain operators for deciding the

Role of Naval Architects in Ship Recycling
51
recyclability options [10] of dismantled products such
as steel items, main engine, onboard equipment and
systems.
Organizations such as NGOs and ship recycling
workers forums should develop strategic action plan
that will ensure fruitful participation of interested and
experienced naval architects to find solutions to their
problems and to formulate new proposals for
sustainable ship recycling aiming at improved
industrial status.
Present day issues related to the performance of ship
recycling yards can be partially attributed to
nonparticipation of naval architects and marine
technology experts in the core topics in ship recycling.
The general approach of ship classification societies
possessing substantial resources in marine technology
is reported to be not promising and this situation has
really created a vacuum in the ship recycling industry
as far as involvement of naval architects are concerned.
4. Information, Knowledge and Expertise of the Ship Recycling System
Ship recycling is an engineering industry where
various branches of knowledge such as science &
technology, engineering, management, law, economics,
commerce and political science have been involved.
Information base of these branches of knowledge as
applicable to the development of a comprehensive
knowledgebase of ship recycling and the expertise
required for developing it have been identified and
presented in Table 1. The role of naval architects as a
knowledge engineer in ship recycling activities has
been clearly brought out in this table. The duties of the
element of the ship recycling can be effectively put into
performance only with the personnel with
knowledgebase as indicated above.
The knowledgebase of the ship recycling .system
can be effectively utilized by the industry, if an expert
system is made out of it. Computer based expert system
helps to provide recommendations for improving the
situation in the ship recycling industry domain by
collecting and analyzing data from the ship recycling
system domain.
An expert system can be developed for the ship
recycling practices which generally has major elements,
like, data base regarding ship (Ship Data), codes,
regulations and guidelines (Rules) and disassembly
processes in ship recycling (Practices). The
information model for such an expert system which has
been developed for ship recycling activities is given in
Fig. 1 and the role of naval architects as source of
knowledgebase has been rightly brought out in this.
The details of the development of the expert system are
available elsewhere [8, 13]. Recommendations for best
practices in ship recycling have been envisaged as the
output from the expert system.
Table 1 Information base identified for development of knowledgebase of ship recycling.
Information Base Knowledge Expert
Innovation R&D Naval Architects, Production & Structural E i
Environment Pollution and Hazards Ecologists
Safety Human /System factors Safety & Production Engineers
Production Technology Technology of Dismantling Naval Architects
Information Knowledge Base Engineering Naval Architects and IT Specialists
Recycling Energy Production Engineers
Management Recycling, Planning and Plant Layout Naval Architects
Marketing Demand Forecasting Market Research Analysts
Finance Cost and Accounts Economists, Accountants
Regulation Rules, Acts and Laws Lawyers
Green Topics Socio-environmental Impact Green Activists

Role of Naval Architects in Ship Recycling
52
Fig. 1 Information Model of the Expert System.
5. Design for Ship Recycling Philosophy
In recent IMO conventions emphasis has been
attributed to producing ships which are safe and
environment friendly during their regular operation
conditions [4]. Marine Safety Committee (MSC) a
subsidiary of IMO in its 80th session calls for safety and
environmental friendliness of the vessels in specific
damage conditions too [6]. This requirement envisages
a proper design for recycling which caters to the
specific demands of IMO, i.e., minimizing marine
pollution and reducing accidents causing loss of life
and damage of property. The IMO guidelines on design
for recycling of ships should be integrated with the ship
life cycle system and can be called as design for ship
recycling [12]
This design for ship recycling philosophy can be
broadly based on the hull structural design, equipment
manuals, knowledgebase on recycling, environmental
factors, onboard materials, equipment & systems and
general arrangement of ship.
5.1 Scope of Design for Ship Recycling
The scope of design for ship recycling in this context
has been defined as various aspects that should come
under the purview of design for ship recycling
philosophy which will improve the efficiency of
recycling of ships.
5.1.1 Design Philosophy
Happenings at the end of life of the vessels are not
taken into serious consideration during initial stages of
design and in the follow up activities in the life cycle by
the designers. Designers are still working around
design for production and its contemporary design fors.
Marine pollution related issues have created awareness
among designers towards design for environment.
Similar awareness has to be developed in recycling
oriented design attributes as well. Design for ship
recycling is the best way to address the environment
and safety problems related to ship recycling.
Implementation of design for ship recycling
philosophy is essential for achieving sustainable
development of international maritime sector.
5.1.2 Product Design and Development
Design for ship recycling envisages product design
and development with easy parts and components
assembly procedures. It gives more focus on integrated
assembly of various identical parts. Simple product
structure will always enable easy disassembly activities
which in turn makes end of life dismantling of onboard
equipment and parts less cumbersome. Dilok et al. [3]
has discussed the characteristics of the product
structure and concept of design for dismantling of ships.
The scope of this concept has to be extended by
incorporating five objectives of design for ship
recycling, viz, environmental orientation and safety
during operations, energy consciousness, use of state of
art technology and ergonomics in all onboard
operations including final and partial dismantling.
Active and mandatory involvement of naval architects
is essential for effective implementation of these
attributes in ship life cycle operations.
5.1.3 Common Industrial Standards

Role of Naval Architects in Ship Recycling
53
Quality requirements of various industrial products
for marine application are more stringent. Onboard
systems are complex owing to the high standard of
safety requirements and accessibility problems due to
onboard space constraints. These characteristics of
marine quality parts make recycling of equipment and
components different from the common recycling
processes adopted in civil construction. Design for ship
recycling emphasizes common industrial product
standards. Naval architects will have to seriously
consider this concept while attempting different ship
design spiral operations Recycling activities and
reusability of dismantled products with common
standards can be easily compared. This will make
recycling of ships less complex and more acceptable.
5.1.4 Product Standardisation
Product standardisation ensures improved quality
and productivity in design and manufacturing in
shipbuilding and this concept has been developed to
support simplifying ship design procedures,
minimizing different types of inventories in ship
production, compatibility of component replacements
in ship repair and ensuring implementation of essential
international rules and recommendations by agencies
such as IMO and IACS... This can be better achieved
by introducing the fundamentals of naval architecture
and shipbuilding in end of life ship recycling activities.
5.1.5 Process Standardisation of Ship Recycling and
Proposing Best Practices
Standardisation of ship recycling process is as
important as the product standardisation. For ship
recycling to be more effective, both product and
process standardisations should go in tandem. Process
standardisation focuses on development of best
practices for ship recycling operations. Ship recycling
yard organisation, infrastructure support and lay out
management of recycling yards constitute one part of
the process standardisation. This part has been included
in International Standardisation Organisation (ISO)
standards [ISO/DIS 30000:2008]. This process
standard covers all yard oriented issues in ship
recycling. Best practices for ship recycling activities,
right from towing of the obsolete vessels to dismantling
of the last component, constitute the second phase of
the process standards. Process standards for the later
part have been developed by Sivaprasad [8]. Ship
General Arrangement (GA) design attributes such as
accessibility, water/weather/fire tightness, availability
of light, ventilation and features of materials and
components act as fundamental frame work for the
development of the best practices.
5.1.6 Environmentally Contraband Materials
Presence of environmentally contraband materials in
hull structure, outfit items and machineries are
considered as the most serious issue by the agencies
involved in uplifting the status of ship recycling
industry. Dets Norske Veritas has developed an
onboard material inventory recording database, Green
Passport addressing this special ship recycling issue.
Participation of naval architects in the process of
design for ship recycling can widen the scope of this
inventory recording mechanism by proposing an
extended green passport. Various characteristics of
common onboard materials and cargo residues with
respect to ship recycling activities can be prepared and
can be used as a an effective knowledgebase for safe
and green shipbuilding.
6. Conclusion
The necessity for changing the ship recycling
industry into sustainable industry based on 4E
principles, i.e., ecofriendliness, engineering efficiency,
energy conservation and ergonomics has been
emphasized with due support from new concept of
design of ship recycling. The role of naval architects as
contributory elements to sustainable ship recycling and
as the knowledgebase for ship recycling system has
been identified and presented. The authors have
brought out the new concept of design for ship
recycling and various aspects of it. The role of naval
architects in the practice of this new design philosophy

Role of Naval Architects in Ship Recycling
54
which is ready to be embraced by the maritime industry
has been reiterated.
References
[1] Das S. Alkaner, P. K. Smith, D. L. and P. Dilok, Comparative analysis of ship production and ship dismantling, in: Proceedings of the First International Conference on Dismantling of Obsolete Vessels, Glasgow September, 2006, pp. 3-17
[2] Basel, Convention, Reports, Control of Transboundary Movements of Hazardous Wastes and Their Disposal, October, 2005.
[3] P. Dilok, S. Alkaner and P. K. Das, Design for dismantling –Guidelines to facilitate reuse and recycling, in: Proceedings of the Second International Conference on Dismantling of Obsolete Vessels, Glasgow September, session-6, 2008, pp. 1-15.
[4] S. Dimakopoulose, The IMO’s work on ship recycling, International Conference on Recycling of Ships and Other Marine Structures, London, May, 2005, pp. 7-15.
[5] IMO Guidelines-2003 Resolution A962 (23) IMO Guidelines on Ship Recycling, 2003
[6] MSC 80/24 [2005] Report of Maritime Safety Committee on its eightieth session, May 2005.
[7] M. Shahid, Ship recycling in Pakistan, International Conference on Recycling of Ships and Other Marine Structures, London, May 2005, pp. 39-48.
[8] K. Sivaprasad, Development of best practices for ship recycling processes, PhD Thesis Submitted to Cochin University of Science and Technology, Kochi,India, 2010.
[9] K. Sivaprasad, K. Dileep Krishnan and C. G. Nandakumar, Sustainable development index for ship recycling, Proceedings of Second International Conference On Dismantling of Obsolete Vessels, ASRAnet, Combined Universities of Glasgow and Strathclyde, Glasgow, September, 2008.
[10] K. Sivaprasad and C. G. Nandakumar, Recyclability analysis of obsolete ships and products, Proceedings of Third International Conference on Dismantling of Obsolete Vessels, ASRAnet, Combined Universities of Glasgow and Strathclyde, Glasgow, September, 2010.
[11] K. Sivaprasad and C. G. Nandakumar, Sustainable recycling of ships, in: International Conference on Recent Advances in Chemical Engineering,RACET_2011, Indian Institute of Chemical Engineers, Kochi Regional Centre and CUSAT, March, 2011.
[12] K. Sivaprasad and C. G. Nandakumar, Design for Ship Recycling, Journal of Ship and Offshore Structures, available online at: http://www.tandfonline.com/doi/abs/10.1080/17445302.2012.669264, March, 2012.
[13] K. Sivaprasad and C. G. Nandakumar, Expert system for ship recycling, International Journal of Maritime Technology, Royal Institution of Naval Architects, London (in press).

Journal of Shipping and Ocean Engineering 3 (2013) 55-60
Some Peculiarities of the Preprocessing of Spectral Data
and Images
Valentin Atanassov, Georgi Jelev and Lubomira Kraleva
Space Research and Technology Institute, Bulgarian Academy of Sciences
Abstract: Remotely sensed spectral data and images are acquired under significant additional effects accompanying their major formation process, which greatly determine measurement accuracy. In order to be used in subsequent quantitative analysis and assessment, this data should be subject to preliminary processing aiming to improve its accuracy and credibility. The paper considers some major problems related with preliminary processing of remotely sensed spectral data and images. The major factors are analyzed, which affect the occurrence of data noise or uncertainties and the methods for reduction or removal thereof. Assessment is made of the extent to which available equipment and technologies may help reduce measurement errors.
Key words: spectrometry, spectral data and images, preliminary processing.
1. Introduction
Remote sensing of the Earth from Space occupies an
exclusively important place in the development of
modern science and technologies. The application
scope of remotely sensed spectral data and images is
expanding continuously to involve new areas, such as
ecological monitoring of endangered areas, monitoring
of the global changes of natural resources and the
environment, climate changes, coastal area monitoring
etc. The conclusion may be drawn that spectral images
make it possible to map with unprecedented accuracy
biophysical and biochemical changes in the Earth’s
surface and atmosphere status.
Imaging spectrometers are a relatively new remote
sensing instrument which, during the recent decades,
ranked among the top instruments used in these studies.
This high ranking is due to the numerous advantages
they offer to remote sensing, the most important of
which are: complexity of obtained spectral data, i. е.
ability to form spectral data in a great number of
continuous spectral channels, fast spectral data
acquisition rate, high spectral and spatial resolution etc.
Corresponding author: Valentin Atanassov, associate
professor, research fields: remote sensing, spectrometry, spectral data and images. E-mail: [email protected].
But, alongside with these convincing advantages, the
data obtained thereby are subject to numerous
non-uniformity effects and noises caused by the
instruments’ operation and data formation principles, the
parameters of data-containing storage, the atmospheric
conditions under which the data were acquired, the
detector’s operation mode (usually, a CCD matrix) and
the control electronics, the data conversion and storage
systems etc. [1-5]. Each case in which non-uniformity has
appeared in acquired data requires the adoption and
application of an appropriate strategy for preliminary
processing of the acquired spectral data. Therefore, the
vast information potential of spectral images may be used
in subsequent scientific and practical applications only
following an appropriate preliminary processing of the
initially acquired spectral data.
2. Methods for Preprocessing of Data and Correlations with Imaging Spectrometer Measurements
In Imaging spectrometers using the principle of light
flow dispersion and pushbroom type of scanning,
spectral data for each image line with width of one pixel
are obtained simultaneously; thus, the whole image is
built line by line to make the entire image (Fig. 1). The
DAVID PUBLISHING
D

Some Peculiarities of the Preprocessing of Spectral Data and Images
56
radiation passing through the input slit and
corresponding to one line (with width of one pixel)
from the surface of the examined object then falls onto
a dispersing element, which decomposes it spectrally.
The points along the length of the input slit
corresponding to one line of the examined object’s
image are displayed as spectral lines in the imaging
spectrometer’s spectral plane (Fig. 2). They may be
recorded by a matrix detector (usually, a CCD matrix).
The whole process is repeated after the platform on
which the imaging spectrometer is located moves
forward along the carrier’s track to a distance equal to
one spatial resolution element.
While conventional images have two coordinate
axes, x and y, spectral images also have a third
coordinate axis, . Thus, the so-called “spectral cube”
is formed, in which each plane perpendicular to the
spectral axis constitutes a spectral image for a
definite electromagnetic spectrum wavelength band
(Fig. 3). Therefore, the spectral image is not built at
once, but in series, through a scanning process, as a
result of which it is subject to a greater extent to the
additional destructive influences of the conditions
under which the image is built and which form the
image’s non-uniformity.
Generally, these non-uniformity effects may be
expressed in: missed individual pixels and/or lines in
the acquired data resulting from the available bad
pixels in the used detector, reading errors, electronics
failures, spatial and spectral direction irregularities
caused by the generation of the so-called keystone and
smile effects induced by the optics etc.
Spectrometric data require correction in the three
major aspects – spatial, spectral, and radiometric.
2.1 Spatial Non-uniformity
It should be noted that the effects of spatial
non-uniformity are manifested to a greater extent by
airborne imaging spectrometers, whose platforms are
more unstable, so, these instruments are designed to
feature greater spatial resolution.
The real imaging spectrometers of the pushbroom
type are affected by various effects of spatial
non-homogeneity, such as loss of individual pixels,
lines or columns, generation of the so-called keystone
and smile effects induced by the optics, point spread
function non-uniformity etc.
During the correction of spatial non-uniformity, the
image within a given pixel must be restored, which is
made by choosing an appropriate restoration strategy.
Fig. 1 Observation geometry.
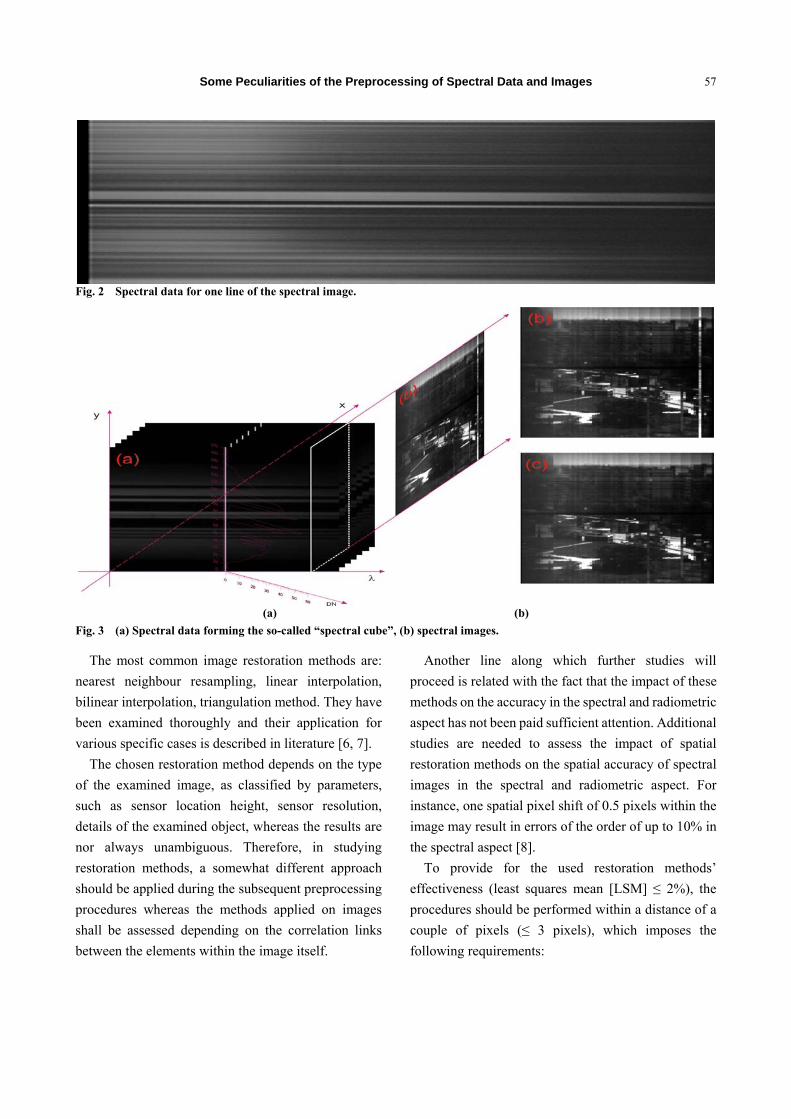
Some Peculiarities of the Preprocessing of Spectral Data and Images
57
Fig. 2 Spectral data for one line of the spectral image.
(a) (b)
Fig. 3 (а) Spectral data forming the so-called “spectral cube”, (b) spectral images.
The most common image restoration methods are:
nearest neighbour resampling, linear interpolation,
bilinear interpolation, triangulation method. They have
been examined thoroughly and their application for
various specific cases is described in literature [6, 7].
The chosen restoration method depends on the type
of the examined image, as classified by parameters,
such as sensor location height, sensor resolution,
details of the examined object, whereas the results are
nor always unambiguous. Therefore, in studying
restoration methods, a somewhat different approach
should be applied during the subsequent preprocessing
procedures whereas the methods applied on images
shall be assessed depending on the correlation links
between the elements within the image itself.
Another line along which further studies will
proceed is related with the fact that the impact of these
methods on the accuracy in the spectral and radiometric
aspect has not been paid sufficient attention. Additional
studies are needed to assess the impact of spatial
restoration methods on the spatial accuracy of spectral
images in the spectral and radiometric aspect. For
instance, one spatial pixel shift of 0.5 pixels within the
image may result in errors of the order of up to 10% in
the spectral aspect [8].
To provide for the used restoration methods’
effectiveness (least squares mean [LSM] ≤ 2%), the
procedures should be performed within a distance of a
couple of pixels (≤ 3 pixels), which imposes the
following requirements:

Some Peculiarities of the Preprocessing of Spectral Data and Images
58
to the platforms’ stability – deviation between
0.1° and 0.5°;
to the carrier’s velocity – overlapping between 0.1
and 0.3 pixels;
to the detector’s quality – reduction of the number
of bad pixels and the size of bad areas, improvement of
the uniformity of pixels’ response;
to the control electronics.
2.2. Spectral Non-uniformity
The spectral non-uniformity of the instrument’s
response is determined by the instrument’s uniform
response over the entire spectral range; usually, it is
described by the width (normally, FWHM) (Fig. 3) and
position (central wavelength λn) (Fig. 4) of the spectral
channels. Therefore, the introduced spectral
non-uniformity in the data (axis λ in the spectral cube)
is the result of errors in the width and position of the
individual channels. It may be caused by the
instrument’s operation conditions, temperature,
pressure, as well as by the stability of the
characteristics of the instrument itself.
The instrument’s spectral response function is
determined in laboratory conditions during the
calibration process. The spectral response function is
used to describe the instrument’s response to input
impact — monochrome light [9]. In most cases, the
spectral function may be approximated by a Gaussian
model or polynomial approximation (Fig. 4).
Requirements for reduction of spectral data
non-uniformity:
strict requirements for the instrument’s design;
laboratory calibration;
envisaging of appropriate procedures for on-board
calibration;
choosing appropriate algorithms for correction of
SRF non-uniformities.
It should be noted that the correlation links between
the elements along the spectral axis are manifested
better.
Digital Numbers [DN]
540.00 544.00 548.00 552.00 556.00 560.00
0.00
2.00
4.00
6.00
8.00
10.00
[]
Fig. 3 Spectral response function for the 550 nm channel
(polynomial approximation) of a video spectrometer (in
1.65 nm).
Digital Numbers [DN]
400.00 450.00 500.00 550.00 600.00 650.00
0.00
10.00
20.00
30.00
40.00
50.00
[] Fig. 4 Determination of the spectral range. Instrument’s
response to input impacts with central wavelengths 0 of 500
nm, 550 nm and 600 nm.
2.3 Radiometric Accuracy
Radiometric non-uniformities in these systems are
generated by the same above-described factors, which
determine spatial and spectral non-uniformity:
the conditions under which the image was
acquired: changes in the scene’s illumination,
atmospheric conditions, observation geometry etc.
stability of the instrument’s response characteristics.
Radiometric corrections:
accounting for the seasonal position of the Sun
with respect to the Earth;
accounting for the distance between the Sun and
the Earth.
accounting for the spectral distribution of solar
radiation energy.

Some Peculiarities of the Preprocessing of Spectral Data and Images
59
Thus, the acquired data are normalized depending on
the Sun’s illumination conditions.
Another radiometric correction involves
transforming the acquired values measured in digital
numbers (DN) to represent them in absolute units
W/(m2.sr.nm). This correction is required to make data
comparable when reflected radiation has been
measured at different times by different instruments.
Requirements:
detectors: constructed and calibrated in laboratory
conductions and featuring linear dependence of the
response function on incident spectral radiation;
stability of the characteristics, so that this linear
dependence may be preserved during the experiment’s
performance;
envisaged on-board calibration procedures with
appropriate hardware;
The achievement of high spectral and spatial
resolution with this type of instruments is also related
with the sensors’ operation under the conditions of low
energy levels of the radiation collected at the sensor’s
input. The sensors’ operation in such modes results in
generation of radiometric non-uniformities. Several
approaches are available to reduce such radiometric
non-uniformities:
the first of them, naturally, consists in
technological improvement of the sensors themselves,
improvement of quantum efficiency, reduction of the
number of bad pixels, improvement of the pixels’
response uniformity;
another, quite often used approach consists in
improvement of sensor integration time, for instance,
from х10 μs to х10 ms, whereas the restriction imposed
here originates from the instrument’s spatial resolution
and the carrier’s movement velocity, so that the
overlaid image be not greater than 0.1 to 0,3 pixels of
the examined scene;
apart from the above restriction, this method also
imposes a restriction originating from the dark current
levels, which increase with increase of integration time,
and the saturation effects in some individual image
pixels [10] resulting in the so-called fuzzy image areas
whose size should not exceed several pixels;
the use of TDI instruments, in which sensitivity is
increased by summing up several image lines, however,
at the expense of resolution.
3. Conclusions
(1) The available non-uniformities in acquired
spectral data require the application of appropriate
preliminary processing of such data. Preliminary
processing is a mandatory procedure, if such data will
be used for further processing and analysis.
The application of preliminary processing reduces
greatly and in certain cases eliminates completely
non-uniformity effects on spectral data, which results
in increasing the efficiency/cost factor of spectrometric
data use.
(2) It should be noted that preliminary processing
cannot compensate the omissions or inaccuracies made
during the instrument’s construction. Therefore, based
on the performed analysis during preliminary
processing, requirements for the specific parameters of
spectrometric systems under construction are
formulated which should be satisfied.
Acknowledgments
This work was supported by a grant under Contract
I-01/8/2012 with the Scientific Research Fund at the
Bulgarian Ministry of Education.
References
[1] V. Atanassov, L. Kraleva and G. Jelev, Noise and uncertainties in remote sensing spectrometric measurements, Conf. Proceedings of Third Scientific Conference with International Participation, Space, Ecology, Nanotechnology, Safety – SENS’2007, Varna, Bulgaria, 27-29 June 2007, pp. 170-174. (in Bulg)
[2] J. NIeke et al., Uniformity of Imaging spectrometry data products, IEEE Transactions on Geoscience and Remote Sensing 46 (10) (2008) 1.
[3] V. Atanassov, G. Jelev and L. Kraleva, Measurement equation in spectrometric systems, Conf. Proceedings of Third Scientific Conference with International Participation, Space, Ecology, Nanotechnology, Safety –

Some Peculiarities of the Preprocessing of Spectral Data and Images
60
SENS’2007, Varna, Bulgaria, 27-29 June 2007, pp. 174-179. (in Bulg)
[4] V. Atanassov, B. Peev, N. Vassilev and V. Vassilev, Functional mode features of CCD sensor operating in imaging spectrometer, Proceedings of The Eighth National Scientific and Applied Science Conference “Electronics’99”, September, 1999, book 4, pp. 7-12.
[5] D. Schläpfer et al., Effects of geo-atmospheric preprocessing on imaging spectroscopy data: Quality and methods, Remote Sensing Laboratories (RSL), Department of Geography, University of Zurich, CH-8057 Zurich, Switzerland, 2002.
[6] D. Schläpfer, J. Nieke and K. Itten, Spatial PSF non-uniformity effects in airborne pushbroom imaging spectrometry data, IEEE Transactions on Geoscience and Remote Sensing 45 (2) (2007) 458-468.
[7] V. Atanassov, L. Kraleva and G. Jelev, Spatial resolution
of spectrometric systems, Conference Proceedings of Seventh Scientific Conference with International Participation “Space, Ecology, Safety” “SES 2011”, 29 November – 1 December 2011, Sofia, Bulgaria, pp. 251-255.
[8] D. Schläpfer, M. Schaepman and P. Strobl, Impact of spatial resampling methods on the radiometric accuracy of airborne imaging spectrometer data, 5th Int. Airb. Rem. Sens. Conference and Exhibition, VERIDIAN, San Francisco, 2001.
[9] V. Atanassov et al., Hyperspectral imaging spectrometer as a power tool for ecological monitoring, Journal of Balkan Ecology 4 (2) (2001) 168-170.
[10] V. Atanassov and G. Jelev, Algorithm for dark current characterization of imaging spectrometer, Aerospace Research in Bulgaria 19 (2006) 77-83.

Journal of Shipping and Ocean Engineering 3 (2013) 61-69
Investigating the Effect of Winds and Storms on
Shoreline Erosion along the Coast of Tanzania
Shigalla Mahongo1 and Yohanna Shaghude2
1. Tanzania Fisheries Research Institute, P.O. Box 9750, Dar es Salaam, Tanzania
2. Institute of Marine Sciences, University of Dar es Salaam, P.O. Box 668, Zanzibar, Tanzania
Abstract: Wind data spanning 28 years (1977-2004) from four meteorological stations (Tanga, Zanzibar, Dar es Salaam and Mtwara) were analyzed to elucidate the effect of winds on coastal erosion along the coast of Tanzania. The investigation entailed wavelet analysis of the time series of winds which were related with past erosion events at each site. The study also analyzed qualitatively the incidences of tropical storms in relation to coastal erosion events along the coast. The results revealed that most of the critical erosion incidents in the past few decades were associated with periods of occurrence of extreme wind speeds and tropical storms. Furthermore, the results indicated that the wind speeds and the frequency and intensity of tropical storms had generally been increasing during the past three decades. The findings were consistent to those recently reported for the coast of Dar es Salaam. The increasing trends of winds and storms are considered to have direct impact on the wave climate with increased risk of shoreline wave-induced erosion that is already affecting relatively many parts of Tanzania. Key words: coastal erosion, shoreline change, winds, tropical cyclones, Tanzania.
1. Introduction
Shorelines which mark the boundary between the
coastal lands and oceans/seas are among the most
dynamic features of the coastal environment, whose
changes are influenced by a complex interaction of
natural processes and human induced activities. The
natural processes influencing shoreline changes
include: the combined action of waves, long-shore
currents, winds, sea level variations and changes, local
tectonics and episodic atmospheric changes such as
storm surges, tsunamis and water waves caused by
submarine landslides [1-5].The coastal vulnerability to
change due to the influence of natural agents of
erosion such as waves and tidal currents is also
dependent on the coastal geology and the nearshore
bathymetry proximal to the coastal section [6, 7].
Anthropogenic activities influencing shoreline
changes include: the disruption of hydrological cycles
such as mining along river beds, draining to the coastal
Corresponding author: Shigalla Mahongo, oceanographer, research fields: coastal oceanography and coastal meteorology. Email: [email protected].
beaches, beach sand mining, beach rock blasting,
clearing of coastal vegetation, building of coastal
structures along the shoreline and destruction of
offshore barriers such as blasting of coral reefs [2, 8].
Shoreline change, particularly coastal erosion has been
affecting many sites along the Tanzanian coast [2, 9],
and among the most seriously affected sites include the
coastal sections of Msasani-Kunduchi (Dar es Salaam),
Mwambani, Kigombe and Pangani (Tanga), Mikindani
Bay (Mtwara), Lindi Bay, Kilwa Masoko and Kilwa
Kisiwani (Lindi) and various parts of Zanzibar such as
Jambiani, Paje, Maruhubi and Nungwi [2, 6, 10].
Documented literature on coastal erosion along the
Tanzanian coast indicates that the present state of
shoreline erosion in Tanzania had been active even
before 1940s [11].The problem of coastal erosion in
Tanzania, particularly the causative factors of coastal
erosion had remained one of the least understood
subjects [7]. Reference [12] carried out an
investigation into the causes and effects of beach
erosion in Dar es Salaam, and concluded that sand
DAVID PUBLISHING
D

Investigating the Effect of Winds and Storms on Shoreline Erosion along the Coast of Tanzania
62
extraction from seasonal streams was not the main
cause of erosion.
Dynamite fishing was also rebutted by Reference
[12] and Reference [8] as the main cause because at
spring high tides and during storm surges when most
erosion occurred, the fringing reefs were submerged
and could not therefore expect to interfere with the
fetch and consequently the force of incoming waves.
Reference [1] drew attention to the disappearance of
Maziwi Island in Tanga during 1978, attributing the
disappearance to the rise in sea level. The most
significant loss of beaches was first observed during
1960’s as evidenced by uprooting of casuarina trees
and that by 1970’s the life of turtles in the island was
already under threat. However, Reference [7] rebutted
these findings and associated the disappearance to
anthropogenic clearing of the island vegetation.
Reference [13] also used results of sea level
reconstruction from tide gauge and satellite altimetry
[14] to show that sea level change was not the main
factor for the disappearance of the island. Reference
[15] undertook a study to explore the factors that
influenced coastal erosion along Kunduchi beach in
Dar es Salaam and noted that the rates of erosion at
this site had a direct linear relationship with changes
in the monsoon winds.
Other recent studies at the Kunduchi site, Dar es
Salaam showed evidence of increasing wind speeds in
Dar es Salaam during the last 25 years, suggesting that
the observed erosion at Kunduchi could possibly be
associated with a change in wind regime with a
corresponding change in wave dynamics [16, 17].
However, these studies were not scaled up to include
other coastal sections of Tanzania.
Severe coastal erosion problems generally occur
during the Southeast (SE) monsoons [1, 2, 18]. In
general, the SE winds which prevail from April to
October, are stronger than the Northeast (NE) winds
that blow from November to March [19-21].
Occasionally, the SE monsoons are associated with
epidemic events such as storms and cyclones, which
have devastating erosional effects on the coast.
Although cyclones are fairly common and frequently
strike nearby Mozambique and the Mascarene Islands,
they rarely make landfall on the coast of Tanzania.
The changes in wind regime often have a direct
influence on the currents and wave dynamics, thereby
serving as an important agent for coastal erosion. The
effect of erosion may be stronger when extreme wind
speeds coincide with spring high tides. Along the
coast of Tanzania, the mean spring tidal range is
around 3 m, while the maximum spring tide slightly
exceeds 4 m [22, 23]. Nevertheless, the seasonal
difference in sea level is rather small with an average
range of only about 6 cm [24], which may therefore
not be important in influencing erosion.
The recent changes in the global climate are also
advocated to have both direct and indirect effects on
coastal erosion. The direct effect is related to the rise
in the thermal expansion of the oceans and increased
melting of the ice sheets and glaciers, thus leading to
changes in mean sea level [25]. The change in global
climate is also a complex and spatially
inhomogeneous process which also manifests itself
through changes in the wind climate [26] and through
the increase in the frequency and magnitude of
extreme events such as tropical storms [27]. During
the past few decades, significant changes in the wind
regime have been recorded in various regions of the
earth including the western Indian Ocean islands of
Zanzibar [21] and the Maldives [28].
The purpose of the present study was to investigate
the wind climate regime in selected sites along the
coast of Tanzania and its possible linkages to coastal
erosion incidents. The study utilized a method of
wavelet analysis which was applied on the time series
of monthly wind speeds. The study is shading further
light complementing to other recent research findings
on shoreline changes in Tanzania. The study assumes
that although storm-induced erosion such as that due
to extreme wind speeds is generally sporadic, its
impacts on coastal erosion may be quite significant.
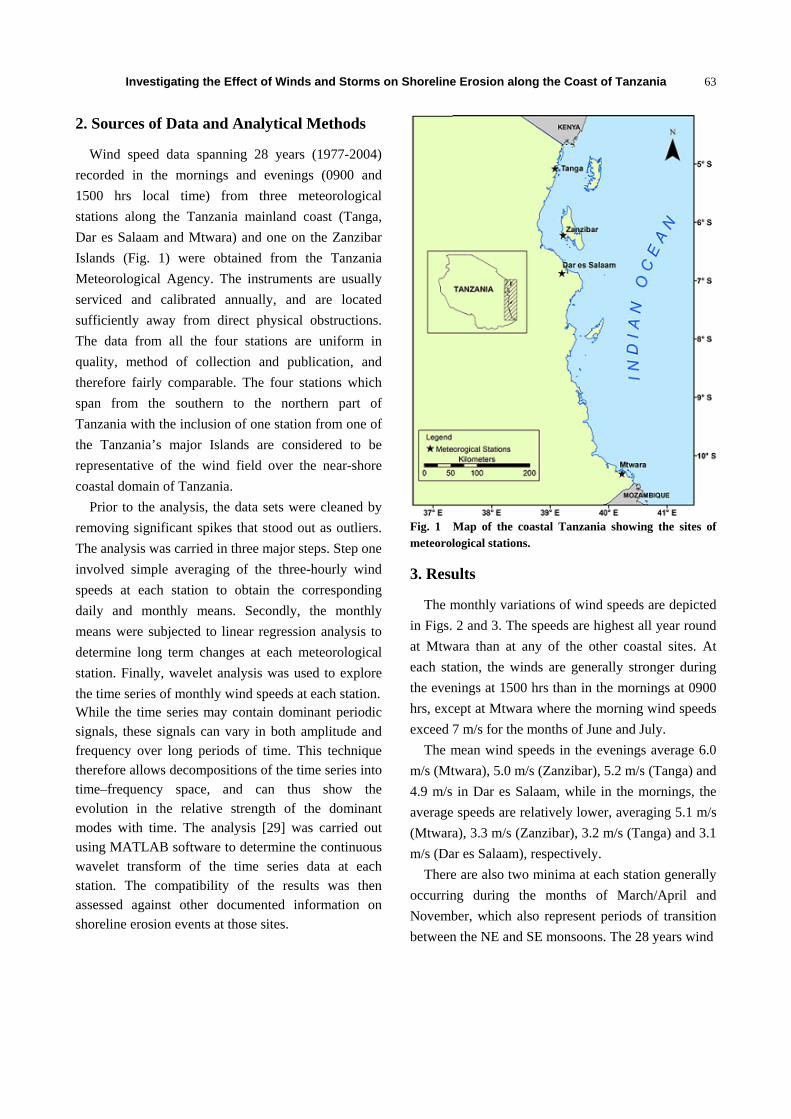
Investigating the Effect of Winds and Storms on Shoreline Erosion along the Coast of Tanzania
63
2. Sources of Data and Analytical Methods
Wind speed data spanning 28 years (1977-2004)
recorded in the mornings and evenings (0900 and
1500 hrs local time) from three meteorological
stations along the Tanzania mainland coast (Tanga,
Dar es Salaam and Mtwara) and one on the Zanzibar
Islands (Fig. 1) were obtained from the Tanzania
Meteorological Agency. The instruments are usually
serviced and calibrated annually, and are located
sufficiently away from direct physical obstructions.
The data from all the four stations are uniform in
quality, method of collection and publication, and
therefore fairly comparable. The four stations which
span from the southern to the northern part of
Tanzania with the inclusion of one station from one of
the Tanzania’s major Islands are considered to be
representative of the wind field over the near-shore
coastal domain of Tanzania.
Prior to the analysis, the data sets were cleaned by
removing significant spikes that stood out as outliers.
The analysis was carried in three major steps. Step one
involved simple averaging of the three-hourly wind
speeds at each station to obtain the corresponding
daily and monthly means. Secondly, the monthly
means were subjected to linear regression analysis to
determine long term changes at each meteorological
station. Finally, wavelet analysis was used to explore
the time series of monthly wind speeds at each station. While the time series may contain dominant periodic signals, these signals can vary in both amplitude and frequency over long periods of time. This technique therefore allows decompositions of the time series into time–frequency space, and can thus show the evolution in the relative strength of the dominant modes with time. The analysis [29] was carried out using MATLAB software to determine the continuous wavelet transform of the time series data at each station. The compatibility of the results was then assessed against other documented information on shoreline erosion events at those sites.
Fig. 1 Map of the coastal Tanzania showing the sites of meteorological stations.
3. Results
The monthly variations of wind speeds are depicted
in Figs. 2 and 3. The speeds are highest all year round
at Mtwara than at any of the other coastal sites. At
each station, the winds are generally stronger during
the evenings at 1500 hrs than in the mornings at 0900
hrs, except at Mtwara where the morning wind speeds
exceed 7 m/s for the months of June and July.
The mean wind speeds in the evenings average 6.0
m/s (Mtwara), 5.0 m/s (Zanzibar), 5.2 m/s (Tanga) and
4.9 m/s in Dar es Salaam, while in the mornings, the
average speeds are relatively lower, averaging 5.1 m/s
(Mtwara), 3.3 m/s (Zanzibar), 3.2 m/s (Tanga) and 3.1
m/s (Dar es Salaam), respectively.
There are also two minima at each station generally
occurring during the months of March/April and
November, which also represent periods of transition
between the NE and SE monsoons. The 28 years wind
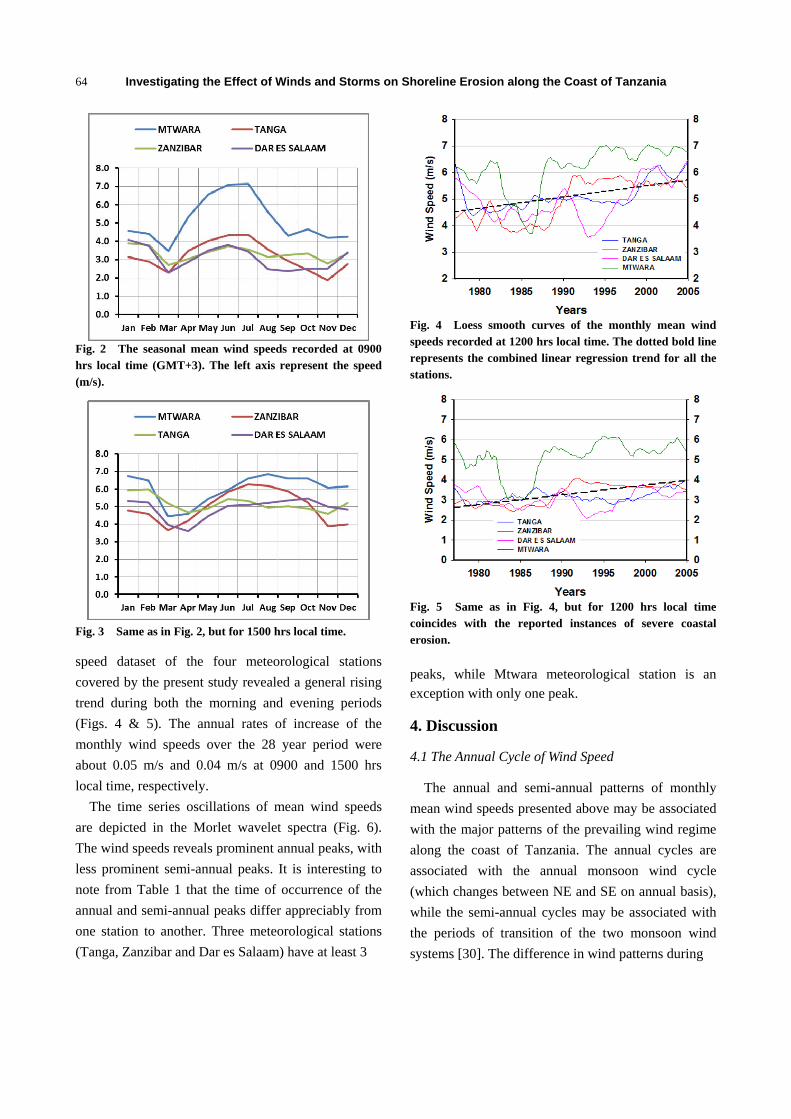
Investigating the Effect of Winds and Storms on Shoreline Erosion along the Coast of Tanzania
64
Fig. 2 The seasonal mean wind speeds recorded at 0900 hrs local time (GMT+3). The left axis represent the speed (m/s).
Fig. 3 Same as in Fig. 2, but for 1500 hrs local time.
speed dataset of the four meteorological stations
covered by the present study revealed a general rising
trend during both the morning and evening periods
(Figs. 4 & 5). The annual rates of increase of the
monthly wind speeds over the 28 year period were
about 0.05 m/s and 0.04 m/s at 0900 and 1500 hrs
local time, respectively.
The time series oscillations of mean wind speeds
are depicted in the Morlet wavelet spectra (Fig. 6).
The wind speeds reveals prominent annual peaks, with
less prominent semi-annual peaks. It is interesting to
note from Table 1 that the time of occurrence of the
annual and semi-annual peaks differ appreciably from
one station to another. Three meteorological stations
(Tanga, Zanzibar and Dar es Salaam) have at least 3
Fig. 4 Loess smooth curves of the monthly mean wind speeds recorded at 1200 hrs local time. The dotted bold line represents the combined linear regression trend for all the stations.
Fig. 5 Same as in Fig. 4, but for 1200 hrs local time coincides with the reported instances of severe coastal erosion.
peaks, while Mtwara meteorological station is an exception with only one peak.
4. Discussion
4.1 The Annual Cycle of Wind Speed
The annual and semi-annual patterns of monthly
mean wind speeds presented above may be associated
with the major patterns of the prevailing wind regime
along the coast of Tanzania. The annual cycles are
associated with the annual monsoon wind cycle
(which changes between NE and SE on annual basis),
while the semi-annual cycles may be associated with
the periods of transition of the two monsoon wind
systems [30]. The difference in wind patterns during

Investigating the Effect of Winds and Storms on Shoreline Erosion along the Coast of Tanzania
65P
erio
d (
Yea
rs)
TANGA
1980 1985 1990 1995 2000 2005
0.5
1
1.5
0.5
1
1.5
2
2.5
Per
iod
(Y
ears
)
ZANZIBAR
1980 1985 1990 1995 2000 2005
0.5
1
1.5
0.5
1
1.5
2
2.5
Per
iod
(Y
ears
)
DAR ES SALAAM
1980 1985 1990 1995 2000 2005
0.5
1
1.5
0.5
1
1.5
2
Per
iod
(Y
ear
s)
MTWARA
1980 1985 1990 1995 2000 2005
0.5
1
1.5
1
2
3
4
Fig. 6 The Morlet wavelet spectra representing mean wind speeds (0600 and 1200 hrs) in the annual timescale. The legends on the right indicate wind speeds in m/s and the bottom axis shows the data span (1977-2004).
Table 1 Peak wind speeds cycles (indicated by cross symbol) at the four meteorological stations along the coast of Tanzania during 1977-2004.
Year Tanga Zanzibar Dar es Salaam Mtwara
1977-1982 x1 x2
1978-1983 x
1980-1982 x3
1988-1991 x x4
1991-1993 x
1994-1996 x4 x4
1996-1997 x
2001-2002 x5
2003-2004 x6 1, 2, 3Severe erosions at Maziwi Island, RasNungwi& beach hotels in Dar es Salaam; 4Tropical storms in 1989 and 1994, Source: Reference [10]; 5,6Tropical cyclones in 2002 and 2004.
the mornings at 0900 hrs and evenings at 1500 hrs
reflect the effects of local land and sea breezes on the
general circulation during those periods, respectively
[31]. Along the Msasani – Kunduchi coastal section,
the longshore beach sand drift caused by the monsoon
currents have been reported to be disrupted by the
tidal current forces from the Manyema tidal Creek
[32]. Over the last three decades, the tidal channel and
the associated sand spits had assumed various courses
and forms respectively. The delta platform of the
Manyema tidal Creek is dominated by migratory and
elongate sandbanks [32] and the mode of migration of
the migratory sandbanks to the northern shore and
their subsequent welding to the beach has resulted into
major changes in the distribution of sand along the
beaches, giving rise to years of sand ‘starvation’
followed by years of sand ‘abundance’. The above
cycles are probably linked to the wind pattern
variability discussed in the present study.
4.2 Peak Wind Speeds, Tropical Cyclones and Known
Cases of Shoreline Erosion
The presented timings of the peak wind speeds in
Tanga meteorological station (Table 1) may be
associated with the reported incidence of
disappearance of the Maziwi Island, off the Pangani
river delta, in the northern coast of Tanzania [1, 7].
Reference [1] had attributed the disappearance of the
Island to sea level rise, but a later study [7] attributed
the disappearance of the Island to wave erosion after
intentional vegetation clearance on the Island. The
period of disappearance of Maziwi Island in Tanga
coincide with the peak wind speeds that occurred in
1977-82 at Tanga meteorological station (Table 1).
This view is consistent with the conclusions earlier
put forward by Reference [7] and Reference [13] that
the Island may have disappeared due to factors other
than the purported rise in sea level which were
opposed to the earlier assumption by Reference [1]
who had ruled out the possibility of extraordinary
heavy storm events after interviewing four fishermen.

Investigating the Effect of Winds and Storms on Shoreline Erosion along the Coast of Tanzania
66
Here it is contended that, apart from the peak wind
speeds, the Lily and Honorine cyclones which are
reported to hit the northern coast of Tanzania during
1966 and 1974 respectively (Table 2), might have
contributed to the increased rates of erosion on the
Island as well.
Similar linkages between peak wind speeds and
incidences of erosion are also found in Zanzibar and
Dar es Salaam. In the case of Zanzibar, critical
incidences of shoreline changes during 1977-1989 had
been reported at Nungwi, the northern tip of the Island
[2], the period which coincides with the occurrence of
peak wind speeds at Zanzibar, reported by the present
study (Table 1). In Dar es Salaam, the disappearance
of Africana Hotel during 1980s and 1990s had been
attributed to serious coastal erosion that started in the
early 1980s [33]. The erosion at the beach in front of
Silver Sands Hotel was reported to have started at
around 1988 with a net erosion of up to 5 m per year
by 2000 [4]. These periods are also closely linked to
the occurrence of peak wind speeds in Dar es Salaam
during 1980-82, 1988-91 and 1995-96 (Table 1).Other
coastal establishments that started witnessing serious
erosion during the peak wind speeds in 1988 were
Rungwe Oceanic, Bahari Beach and Kunduchi Beach
hotels [33]. In Mtwara however, there seems to be no
documented information on the periods of occurrences
of beach erosion which can possibly be related with
peak wind speeds events.
In the southwest Indian Ocean, the region between
l0oS and 30oS is prone to tropical cyclones [27]. About
15-20 cyclones are formed annually from October
through April due to temperature gradients of surface
seawater and differences in atmospheric pressure.
Historically, Tanzania is not prone to cyclones since
only three cases have been reported to make direct
landfall since 1872 (Table 2). Most of the cyclones that
head towards Tanzania lose their energy before
arriving at the coast. Some of the cyclones are either
intercepted by Madagascar, or curve southwards into
the Mozambique Channel. Table 3 lists the cyclones
that approached the coast of Tanzania since July 1944,
most of them being in the southern coast (near Mtwara
station).
The cyclones that approach or strike the coast are
accompanied by severe damaging winds, torrential
rains and flooding. However, the winds from tropical
cyclones do not present the most serious erosion
hazard. Instead, it is the waves and storm surge
associated with the cyclones that cause the major
damage to the coast through release of enormously
large energy. It is worth noting that the storm damage
by tropical storms or cyclones along the coast of
Tanzania (Table 2 & 3) coincides with the reported
instances of severe coastal erosion.
Although modelling guidance rarely exists on
possible changes in tropical cyclones affecting the
southeast coast of Africa [34], a closer look at the
cyclone tracks that form and prevail in the region
clearly shows an apparent increase in the frequency
and intensity of these systems since 1944/45 (Tables 2
& 3). It is here contended that this trend is continuing,
leading to increased threat of coastal erosion hazard
along the coast of Tanzania.
Mtwara in the southern coast of Tanzania
experiences the strongest wind speeds than any of the
other coastal stations. Apparently, the effect of
tropical cyclones that strike or make an approach to
the coastline of Tanzania is also much greater in the
southern coast. Accordingly, since peak wind speeds
and storm surges associated with cyclones have
enormous impact on erosion, it is therefore expected
that the rates of erosion along the southern coast
should be larger than those in the north.
Our findings are consistent with the findings of Ref.
[11] and Ref. [35], who observed that although
erosion along the north-eastern coast of Tanzania was
discontinuous, there was a southward increase in
intensity. The authors attributed the geographical
disparity in erosion to non-uniform rate of coastal
uplift, which was believed to be relatively higher in
the north than in the south. However, Ref. [11] and

Investigating the Effect of Winds and Storms on Shoreline Erosion along the Coast of Tanzania
67
Table 2 Recorded cyclones that made landfall on the Tanzanian coast.
S/N Cyclone Name Date of strike Affected areas No. of Deaths
1 Zanzibar1 15 Apr 1872 Zanzibar, Mafia, Bagamoyo, Kilwa >200
2 Lindi2 15Apr 1952 Kilwa, Lindi, Mtwara 34
3 Atang3 13 Nov 2002 Mtwara 0
Sources: 1The New York Times, 6 June 1872; 1, 2Reference [10]; 3www.australiansevereweather.com
Table 3 Recorded tropical cyclones that approached the Tanzanian coast.
S/N Cyclone Number/Name Cyclone Date Year Nearest coastal Position
1 196003 01 - 10 Dec 1959 11.3S 40.5E
2 Lily 22 Apr - 01 May 1966 07.0S, 41.6E
3 Bernadette 16 - 28 Oct 1973 12.1S, 42.6E
4 Honorine 14 - 23 Apr 1974 07.1S, 40.7E
5 197621 10 - 12 Mar 1976 10.8S, 41.5E
6 Bettina 22 Nov - 01 Dec 1980 11.8S, 40.8E
7 198802 20 - 26 Nov 1987 10.2S, 42.0E
8 Nadia 17 Mar - 2 Apr 1994 14.5S, 40.6E
9 Josta 04 - 12 Mar 1995 12.5S, 41.5E
10 200502 24 - 29 Oct 2004 08.2S, 41.0E
11 Anita 29 - 30 Nov 2006 11.0S, 41.6E
12 Bondo 16 - 26 Dec 2006 10.0S, 42.0E
13 Jokwe 02 - 12 Mar 2008 14.5S, 42.8E
Data source: http://www.australiasevereweather.com
Fig. 7 Frequencies of monthly averages for the morning/evening surface wind speeds exceeding 10 knots (̴ 5.14 m/s) at Zanzibar. Source: Reference [36].
Ref. [35] lacked quantitative evidence on land
movements along the coast of Tanzania.
4.3 Long Term Changes
The results of the present study at Zanzibar
Meteorological station are similar to those reported by
Ref. [36] and Ref. [24] who affirm a general
increasing trend of wind speeds from 1988- 2007 (Fig.
7) and 1985-2004, respectively. As for the Dar es
Salaam meteorological station, the results of the
present study are also consistent with those reported
by unpublished [17] who observed that the total
number of days with wind speeds exceeding 10 knots
(5.14 m/s) were significantly higher during the decade
spanning from 1995 to 2004 than those in the previous
decade. The rates for the annual increase of mean
wind speeds observed in the present study are similar
to those reported in the Mozambican Channel over the
period 1950-1987, which did not exceed 0.1 m/s [37].
According to Reference [38] however, a longer record
of at least 50 years is needed to ascertain the
relationship between ocean environmental trends and
changes in the global climate system.
5. Conclusions
This study highlights the importance of sporadic
events on shoreline changes, and it is here contended
that most of the observed coastal erosion along the
coast of Tanzania during the last three decades is

Investigating the Effect of Winds and Storms on Shoreline Erosion along the Coast of Tanzania
68
mainly associated with peak wind speeds
corresponding with storm events. Accordingly, the
observed trends of increasing wind speeds may have
ramifications for augmented risk of shoreline erosion.
Moreover, the observed increase in the frequency and
intensity of tropical storms, which will presumably
continue due to on-going changes in the world climate,
may likely amplify further the risk of erosion hazard
along the coast of Tanzania.
Acknowledgments
We are grateful to Tanzania Meteorological Agency
(TMA) for provision of meteorological data.
Preliminary results of this work were presented in
Maputo, Mozambique (21-23 November 2011) at the
workshop on ‘Dynamic shorelines in a changing
climate: WIO perspectives and updates’ which was
facilitated by the Western Indian Ocean Marine
Science Association (WIOMSA), to whom we are
grateful.
References
[1] M. Fay, Maziwi Island off Pangani (Tanzania): History of its destruction and possible causes, UNEP 139 (1992) 1-43.
[2] Y. W. Shaghude, M. K. D. Mutakyahwa and S. K. Mohamed, National report on the status of coastal erosion, sea-level changes and their impacts, Tanzanian case, IOC Workshop Report No. 96 – Supplement 1 (1994) 85-106.
[3] J. Francis J., N. Nyandwi and F. E. Msuya, Interdisciplinary survey on the status and socio-economic impacts of coastal erosion along the Tanzanian coastline and islands, UNESCO-Kenya National Seminar on Sustainable Coastal Development through integrated planning and management focused on mitigating the impacts of coastline instability, 23-25 June 1997, Whitesands Hotel, Mombasa (1997) 41-52.
[4] K. Kairu and N. Nyandwi, Guidelines for the study of shoreline changes in the western Indian Ocean Region, UNESCO 2000, France (2000) 1-55.
[5] N. Nyandwi and A. M. Dubi, Episodic atmospheric changes and their impact on the hydrography of the coastal waters of Tanzania, Clim. Res. 18 (2001) 157-162.
[6] N. Nyandwi, Reassessment of the nature of beach erosion north of Dar es Salaam, Tanzania, in Marine science development in Tanzania and Eastern Africa, Proceedings
of the 20th Anniversary Conference in Marine Science in Tanzania, M. D. Richmond and J. Francis (Eds.), IMS/WIOMSA (2001) 107-120.
[7] Y. W. Shaghude, Shore morphology and sediment characteristics, south of PanganiRiver, coastal Tanzania, Western Indian Ocean J. Mar. Sci. 3 (2004) 93-104.
[8] N. Nyandwi, Survey of the extent of human-induced beach erosion problems in, Marine sciences development in Tanzania and eastern Africa, Proceedings of the 20th Anniversary Conference in Marine Science in Tanzania, M.D. Richmond and J. Francis (Eds.), IMS, Zanzibar 2002, pp. 121-130.
[9] B. Almström and L. Larsson, Shoreline Change Analysis for the Kunduchi Beach Area, Tanzania. Minor Field Study, Lund University, 2008, pp. 1-86.
[10] J. Francis et al., Eastern Africa Atlas of Coastal Resources: Tanzania, UNEP, Nairobi, 2001, pp. 1-111.
[11] C. S. Alexander, A method of descriptive shore classification and mapping as applied to the north east coast of Tanganyika, Annals Assoc. American Geographers 56 (1966) 122-140.
[12] GUTE, A geographical investigation into the causes and effects of beach erosion north of Dar es Salaam. Glasgow University Tanzania Expedition (GUTE), Royal Geographic Society, London/Department of Geography, University of Dar es Salaam, 1991, pp. 1-64.
[13] S. B. Mahongo, The changing global climate and its implication on sea level trends in Tanzania and the Western Indian Ocean region, Western Indian Ocean J. Mar. Sci. 8 (2009) 147-159.
[14] J. A. Church, N. J. White and J. R. Hunter, Sea-level rise at tropical Pacific and Indian Ocean islands, Glob. Plan. Change 53 (2006) 155-168.
[15] H. M. Mushala, Coastal processes along Kunduchi Beach, J. Geogr. Assoc. Tanz. 17 (1978) 41-73.
[16] N. N. Nyandwi, The major cause of observed erosion surge on the beaches north of Dar es Salaam City, Tanzania J. Sci. 36 (2010) 73-83.
[17] Y. W. Shaghude, J. W. Mburu, J. Uku, J. Ochiewo, N. Nyandwi, H. Onganda, C. Magori, I. Sanga and R. S. Arthurton, Beach sand supply and transport at Kunduchi, Tanzania and Bamburi, Kenya, Western Indian Ocean J. Mar. Sci., in review (2012).
[18] E. J. Schiller and I. Bryceson, Beach erosion in the Dar es Salaam area, Univ. Sci. J. (University of Dar es Salaam) 4 (1978) 101-120.
[19] B. S. Newell, A preliminary survey of the hydrography of the British East African Coastal Waters, Fishery Publications, Colonial Office 9 (1957) 1-21.
[20] S. A. Iversen, S. Myklevoll, K. Lwiza and J. Yonazi, Tanzanian Marine fish Resources as investigated by Dr.

Investigating the Effect of Winds and Storms on Shoreline Erosion along the Coast of Tanzania
69
Fridtj of Nansen Research Vessel, Proceedings of the NORAD-Tanzania Seminar, Tanzania, 1984, pp. 1-65.
[21] S. B. Mahongo, J. Francis and S. E. Osima, Wind Patterns of Coastal Tanzania: Their Variability and Trends, Western Indian Ocean J. Mar. Sci., 10 (2012) 107-120.
[22] A. Ngusaru, Climate and oceanography, in A fieldguide to the seashores of Eastern Africa and the Western Indian Ocean Islands, M. D. Richmond (Ed.), Sida/SAREC – UDSM (2002) 12-16.
[23] S. B. Mahongo, Tanzania Report on Tidal Analysis and Prediction, WIOMSA/IOC/UNESCO (2008) 1-23.
[24] S. B. Mahongo, J. Francis, Monthly variations of sea level at the Island of Zanzibar. Western Indian Ocean J. Mar. Sci. 9 (2010) 1-14.
[25] K. E. Trenberth et al., Observations: Surface and Atmospheric Climate Change, in Climate Change 2007: The Physical Science Basis. Contribution of Working Group I to the Fourth Assessment Report of the IPCC, S. Solomon et al. (Eds.), Cambridge and New York: Cambridge University Press (2007) 235–336.
[26] U. Suursaal and T. Kullas, Influence of wind climate changes on the mean sea level and current regime in the coastal waters of west Estonia, Baltic Sea, Oceanologia, 48 (2006) 361-383.
[27] UNESCO, IOC-SAREC-KMFRI Regional Workshop on Causes and Consequences of sea Level Changes in the Western Indian Ocean and Islands, Mombasa, Kenya, 24-28 Nov. 1991, IOC Workshop Report No. 77 (1991) 1-11.
[28] N. Mörner, M. Tooley and G. Possnert, New perspectives for the future of the Maldives, Glob. Plan Change 40 (2004) 177-182.
[29] C. Torrence and G. P. Compo, A practical guide to wavelet analysis, Bull. Amer. Meteor. Soc. 79 (1998) 61-78.
[30] J. H. Steele, S. A. Thorpe and K. K. Turekian, Ocean Currents: A Derivative of Encyclopaedia of Ocean Sciences (2nd ed.), Elsevier, 2009, pp. 1-627.
[31] S. Nieuwolt, Breezes along the Tanzanian East Coast, Arch. Met. Geoph. Biokl., Ser. B 21 (1973) 189-206.
[32] N. Nyandwi, Y. W. Shaghude, J. W. Mburu, A. M. Dubi, I. Sanga and R. S. Arthurton, Morphodynamics of the Manyema tidal delta at Kunduchi, Tanzania, Western Indian Ocean J. Mar. Sci., in review, 2012.
[33] E. Pattantyus, Beach erosion in the northern Dar es Salaam area: A review. Research Report No. 75 New Series, Institute of Resource Assessment, University of Dar es Salaam, 1988, pp. 1-26.
[34] J. H. Christensen et al., Regional Climate Projections, in Climate Change 2007: The Physical Science Basis. Contribution of Working Group I to the Fourth Assessment Report of the IPCC, S. Solomon et al. (Eds.), Cambridge and New York: Cambridge University Press (2007) 847-940.
[35] C. S. Alexander, Beach ridges in north-eastern Tanzania, Geogr. Rev. 59 (1969) 104-122.
[36] Y. W. Shaghude and A. M. Dubi, Survey of beach erosion problems at Lagemma Dell Est Beach Hotel, Nungwi, Zanzibar, Report submitted to Lagemma Dell Est Beach Hotel (2008) 1-26.
[37] G. R. Bigg, Validation of trends in the surface wind field over the Mozambique Channel, Int. J. Climatol. 12 (1992) 829-838.
[38] B. C. Douglas, Global sea level acceleration, J. Geophy. Res. 97 (1992) 12699-12706.