Environmental correlates of plant and invertebrate species ...
27
This is a repository copy of Environmental correlates of plant and invertebrate species richness in ponds. White Rose Research Online URL for this paper: http://eprints.whiterose.ac.uk/74905/ Article: Hassall, C, Hollinshead, J and Hull, A (2011) Environmental correlates of plant and invertebrate species richness in ponds. Biodiversity and Conservation, 20 (13). 3189 - 3222 . ISSN 0960-3115 https://doi.org/10.1007/s10531-011-0142-9 [email protected] https://eprints.whiterose.ac.uk/ Reuse See Attached Takedown If you consider content in White Rose Research Online to be in breach of UK law, please notify us by emailing [email protected] including the URL of the record and the reason for the withdrawal request.
-
Upload
khangminh22 -
Category
Documents
-
view
4 -
download
0
Transcript of Environmental correlates of plant and invertebrate species ...

This is a repository copy of Environmental correlates of plant and invertebrate species richness in ponds.
White Rose Research Online URL for this paper:http://eprints.whiterose.ac.uk/74905/
Article:
Hassall, C, Hollinshead, J and Hull, A (2011) Environmental correlates of plant and invertebrate species richness in ponds. Biodiversity and Conservation, 20 (13). 3189 - 3222 . ISSN 0960-3115
https://doi.org/10.1007/s10531-011-0142-9
[email protected]://eprints.whiterose.ac.uk/
Reuse
See Attached
Takedown
If you consider content in White Rose Research Online to be in breach of UK law, please notify us by emailing [email protected] including the URL of the record and the reason for the withdrawal request.

1
Environmental correlates of plant and invertebrate species
richness in ponds, Hassall et al (2011) - SELF-ARCHIVED COPY
This document is the final, reviewed, and revised version of the manuscript
さEnvironmental correlates of plant and invertebrate species richness in pondsざが as submitted to the journal Biodiversity and Conservation. It does not include
final modifications made during typesetting or copy-editing by the Biodiversity
and Conservation publishing team. This document was archived in line with the
self-archiving policies of the journal Biodiversity and Conservation, which can be
found here:
http://www.springer.com/open+access/authors+rights?SGWID=0-176704-12-
683201-0
The version of record can be found at the following address:
http://link.springer.com/article/10.1007%2Fs10531-011-0142-9
The paper should be cited as:
HASSALL, C., HOLLINSHEAD, J. & HULL, A. 2011. Environmental correlates of plant
and invertebrate species richness in ponds. Biodiversity and Conservation, 20,
3189-3222.

2
Running head: Correlates of pond species richness
Title: Environmental correlates of plant and invertebrate species richness in ponds
Authors: Christopher Hassall1, Jim Hollinshead
2, Andrew Hull
2
Affiliations: 1Carleton University,
2Liverpool John Moores University
Addresses: 1Department of Biology, Carleton University, Ottawa, ON, K1S 5B6, Canada,
2School of
Humanities and Social Science, 68 Hope St, Liverpool, L1 9HW, UK.
Corresponding author: Christopher Hassall
Telephone: 00 1 (613) 520 2600 (ext. 3866)
Fax: 00 1 (613) 520 3539
Email: [email protected]

3
ABSTRACT
Ponds (lentic water bodies <2ha) constitute a considerable biodiversity resource. Understanding the
environmental factors that underlie this diversity is important in protecting and managing the habitat.
We surveyed 425 ponds for biological and physical characteristics with 78 of those also surveyed for
chemical characteristics. A total of 277 invertebrate species and 265 plant species were found. Species
richness varied between 2 and 99 (mean 27.2 ± 0.6 SE) for invertebrates and 1 and 58 (mean 20.8 ± 0.4
SE) for plants. Generalised linear models were used to investigate variables that correlate with the
species richness of plants and invertebrates, with additional models to investigate insect, Coleoptera,
Odonata, Hemiptera, Trichoptera and Mollusca species richness. Models performed well for
invertebrates in general (R2=39.8%) but varied between lower-order invertebrate taxa (8.2-34.9%).
Ponds with lower levels of shading and no history of drying contained higher numbers of species of
plants and all invertebrate groups. Aquatic plant coverage positively correlated with species richness in
all invertebrate groups apart from Trichoptera and the presence of fish was associated with high
invertebrate species richness in all groups apart from Coleoptera. The addition of chemistry variables
only increased the explanatory power of the model explaining plant species richness, for which
phosphate was a highly significant factor. We demonstrate that the composition of biological
communities varies along with their species richness and that less diverse ponds are more variable
compared to more diverse ponds. Promoting a high landscape-level pond biodiversity will involve the
management of a high diversity of pond types within that landscape.
KEYWORDS: species richness, invertebrates, plants, pond, shade, water permanence.

4
INTRODUCTION
The determinants of species richness at continental scales are still unclear. However, the correlates of
species richness appear to centre around the twin concepts of water and energy (Field et al. 2009). At a
local level, the problem becomes only slightly more tractable. Concepts such as niche overlap (Leibold
and McPeek 2006), habitat heterogeneity (both temporal and spatial) (Tews et al. 2004) and area
(Lomolino 2000) can be quantified and manipulated experimentally to investigate within and between
habitat richness. One benefit of understanding the predictors of species richness is the potential for
habitat management targeting those variables which enhance species richness of one or more taxa.
Such informed management can ameliorate damage done either through passive damage and neglect or
even through benign mismanagement based on unsound principles.
Ponds (defined as lentic water bodies under 2ha in area (De Meester et al. 2005)) represent a habitat
that has traditionally been neglected in ecological studies (Céréghino et al. 2008). It is only recently that
the value of ponds as a biodiversity resource (Williams et al. 2004), carbon sink (Downing et al. 2008),
floodwater management tool and pollution filter (Fiener et al. 2005) has been recognised. Even when
managed for mankind's use, ponds can still contribute to biodiversity, as has been shown for motorway
stormwater retention ponds in France (Scher et al. 2004) and angling ponds in England (Wood et al.
2001). This combination of biodiversity and tangible ecosystem services make pond ecosystems
excellent candidates for conservation. Previous studies have highlighted the biodiversity value of ponds
in comparison to other aquatic habitats. Ponds in a lowland region of the UK were shown to contribute
more species on a regional level than rivers, streams or ditches, although there was considerable
variation in richness between individual ponds (Williams et al. 2004). The significant contribution made
by ponds to the regional species pool に gamma diversity に has also been demonstrated across Europe
(Davies et al. 2008). A number of studies have been published on pond species richness and its
correlates, although no consensus has emerged on which variables best predict species richness. We
briefly review a representative sample of these predictors below.
Physical correlates of pond species richness
The geographical location of ponds has been shown to influence communities and species richness,
including the altitude of the pond (Hinden et al. 2005) and the location of the pond relative to other
ponds (Briers and Biggs 2005). However, evidence for an effect of connectivity at smaller spatial scales
is equivocal (Cottenie and De Meester 2003). In an analysis of climatic correlates of ponds varying in
altitude, Rosset et al. (2010) found that environmental temperature explained a large proportion of the
variance in species richness. Rosset et al. argue that there could be a 83% increase in species richness in
lowland areas and a 150% increase in species richness in upland areas under projected climate warming.
Studies involving pond area have yielded conflicting results, with some demonstrating strong influences
on plants and invertebrates (Biggs et al. 2005) and others demonstrating weak (if any) effects on
macroinvertebrate richness (Oertli et al. 2002; Søndergaard et al. 2005). This break from conventional
species-area relationships may be due to second-order effects in the form of ecological interactions
which vary between ponds of differing connectivity and dimensions (Scheffer et al. 2006). The relatively
small size of ponds also renders them vulnerable to drying out, and drying has been shown to have an
effect on alpha diversity of ponds (Biggs et al. 2005), with variations between the biological communities
5
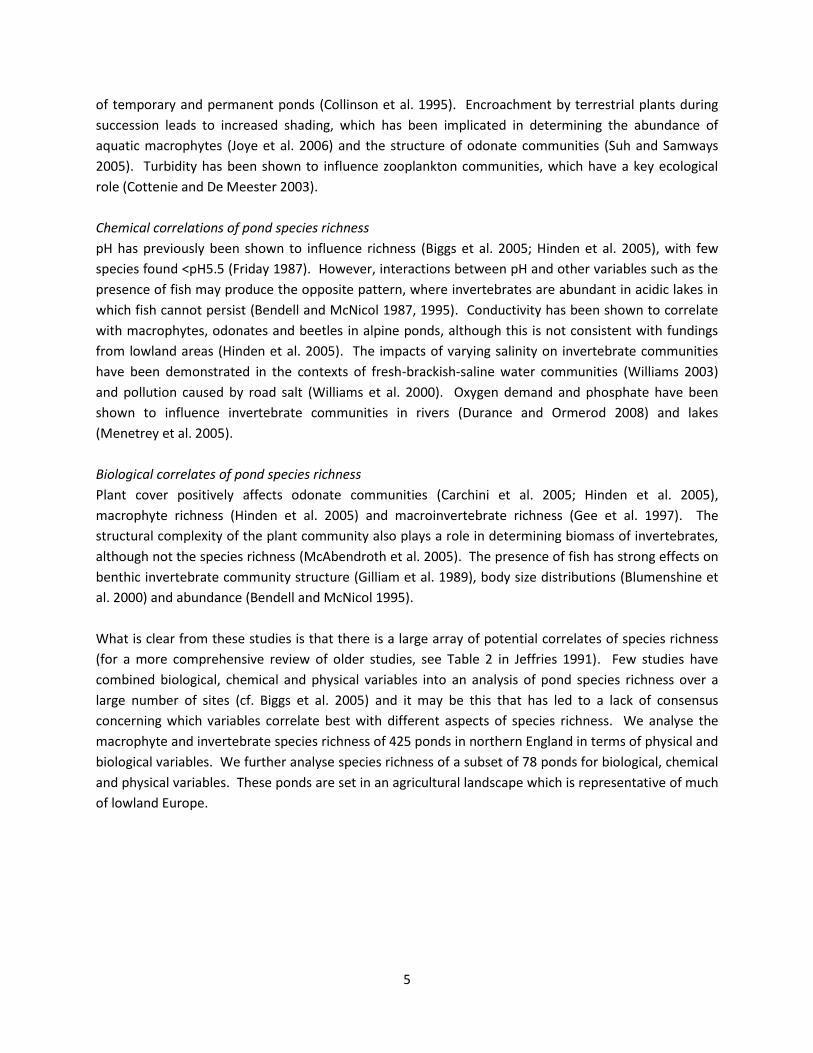
of temporary and permanent ponds (Collinson et al. 1995). Encroachment by terrestrial plants during
succession leads to increased shading, which has been implicated in determining the abundance of
aquatic macrophytes (Joye et al. 2006) and the structure of odonate communities (Suh and Samways
2005). Turbidity has been shown to influence zooplankton communities, which have a key ecological
role (Cottenie and De Meester 2003).
Chemical correlations of pond species richness
pH has previously been shown to influence richness (Biggs et al. 2005; Hinden et al. 2005), with few
species found <pH5.5 (Friday 1987). However, interactions between pH and other variables such as the
presence of fish may produce the opposite pattern, where invertebrates are abundant in acidic lakes in
which fish cannot persist (Bendell and McNicol 1987, 1995). Conductivity has been shown to correlate
with macrophytes, odonates and beetles in alpine ponds, although this is not consistent with fundings
from lowland areas (Hinden et al. 2005). The impacts of varying salinity on invertebrate communities
have been demonstrated in the contexts of fresh-brackish-saline water communities (Williams 2003)
and pollution caused by road salt (Williams et al. 2000). Oxygen demand and phosphate have been
shown to influence invertebrate communities in rivers (Durance and Ormerod 2008) and lakes
(Menetrey et al. 2005).
Biological correlates of pond species richness
Plant cover positively affects odonate communities (Carchini et al. 2005; Hinden et al. 2005),
macrophyte richness (Hinden et al. 2005) and macroinvertebrate richness (Gee et al. 1997). The
structural complexity of the plant community also plays a role in determining biomass of invertebrates,
although not the species richness (McAbendroth et al. 2005). The presence of fish has strong effects on
benthic invertebrate community structure (Gilliam et al. 1989), body size distributions (Blumenshine et
al. 2000) and abundance (Bendell and McNicol 1995).
What is clear from these studies is that there is a large array of potential correlates of species richness
(for a more comprehensive review of older studies, see Table 2 in Jeffries 1991). Few studies have
combined biological, chemical and physical variables into an analysis of pond species richness over a
large number of sites (cf. Biggs et al. 2005) and it may be this that has led to a lack of consensus
concerning which variables correlate best with different aspects of species richness. We analyse the
macrophyte and invertebrate species richness of 425 ponds in northern England in terms of physical and
biological variables. We further analyse species richness of a subset of 78 ponds for biological, chemical
and physical variables. These ponds are set in an agricultural landscape which is representative of much
of lowland Europe.

6
METHODS
Pond survey methods
425 ponds in Cheshire, UK (Figure 1), were visited during the summer over a period of four years:
between 25 May に 9 September 1995, 4 May に 25 August 1996, 27 April に 27 July 1997, and 1 July に 16
August 1998. Each pond was surveyed for physical and biological characteristics (Table 1) and one
water chemistry sample was taken for each of a subset of 78 ponds from 1995 at the time of sampling.
These water samples were sent to the National Rivers Association laboratory in Nottingham, UK, for
analysis. Pond width and length were measured using measuring tape. Depth was ranked as either
<0.5m, 0.5-1m, 1-1.5m, 1.5-2m or >2m. The proportion of the pond that was shaded ("% shade") was
defined as the proportion of the water surface overhung by vegetation. The proportion of the pond
covered by aquatic vegetation ("% plant cover") was estimated by eye. Landowners were asked
whether the pond had ever been known to dry up to ascertain the permanence of water ("water
permanence", 0=not known to dry up, 1=known to dry up). The presence of fish ("fish present") was
evaluated both at the time of sampling using nets and by asking landowners. Turbidity of water
("turbidity") was defined as a binary variable, indicating whether the water appeared cloudy on the day
of sampling. The drawdown of the pond ("drawdown") was defined as the vertical height between the
normal winter mean water level and the height of the water at time of sampling. Summary statistics for
these variables and chemical variables included in the analysis can be found in Table 2.
The presence or absence of invertebrate species was recorded using standardised sampling methods.
Pond nets with 1mm mesh were used to collect invertebrates in the following microhabitats: (i) open
water, (ii) over both sediment and bare substrate, and (iii) within the leaf litter. In addition, animals
were collected through the scraping of rocks and logs that were either submerged or were found within
the perimeter set by the maximum winter water level. Damp poolside areas were surveyed by creating
a depression and netting the resulting puddles. The rationale behind the sampling was to continue
surveying until no further species were found (Eyre et al. 1986). All plants present in the pond up to the
winter high water level were recorded to species. Six species of amphibians were recorded during the
surveys: Triturus cristatus, T. vulgaris, T. helveticus, Bufo bufo, B. calamita and Rana temporaria.
Amphibian presence was confirmed at 297 of the 425 ponds. However, surveys were carried out across
the amphibian breeding season and so it was not possible to verify whether a particular species was
truly absent or simply not observed due to it not using the pond at the time of sampling. As such
amphibian data are not included in this analysis.
Data analysis
Species richness of invertebrates, insects, Coleoptera, Hemiptera, Odonata, Trichoptera, Mollusca and
plants were calculated from the aquatic sampling data. A Pearson correlation was used to assess the
relationship between plant and invertebrate species richness. Cross-taxon congruence in species
community similarity was investigated using non-parametric Mantel tests (Heino et al. 2009). Since
water chemistry was only recorded for a subset of 78 ponds, two analyses were conducted. The first
investigated plant and invertebrate richness in terms of the physical characteristics of the pond (n=425)
and the second included both the physical characteristics and the chemical variables (n=78). Variables
were assessed for normality and homoscedasticity using Shapiro-Wilk tests and by examining

7
histograms, and transformations were applied where appropriate (Table 1). To reduce the number of
variables, principal components analysis was used to summarise pond length, width and depth. The
first component ("pond volume") explained 78.3% of the variance in these three measurements and is
taken as a measure of pond volume. In the chemistry data, biochemical oxygen demand (BOD) and
chemical oxygen demand (COD) were summarised using PCA into a principal component ("O2 demand")
which explained 90.1% of the variance in the two variables.
Patterns of species richness
Due to uncertainties over the shape of non-linear relationships in the data, generalised additive models
were used to model patterns fo richness in terms of environmental predictors. In the first analysis
(n=425 ponds), generalised additive mixed-effects models (GAMMs) were constructed using the nlme
{Pinheiro, 2011 #1413} and mgcv {Wood, 2006 #1446} packages in R (R Development Core Team 2010).
Pond volume (PC1 as described above), % plant cover, % shade, and ordinal date were included as
smoothing functions, with water permanence and fish presence as parametric terms. The year of
sampling was included as a random effect. The "gam" function in the mgcv library optimises smoothing
during the fitting of the model, such that a prior estimation of polynomials is not required. Cubic
regression spline smooth functions were used with shrinkage. This approach penalises poorly-fitting
splines such that the smooth is reduced to zero when explanatory power is low, effectively removing
that term from the model. The second analysis included only those ponds with chemistry data (n=78).
All these ponds were all sampled in 1995 so there was no need for the inclusion of year as a random
effect. Instead of GAMMs, generalised additive models (GAMs) were used for these analyses. For both
analyses, models were used to explain species richness in each of the following groups: (i) invertebrates,
(ii) insects, (iii) Coleoptera, (iv) Hemiptera, (v) Odonata, (vi) Trichoptera, (vii) Mollusca and (viii) plants.
Community variation
Conservation recommendations cannot be made solely on the basis of differences in species richness.
For example, temporary ponds contain species which are largely restricted to intermittent hydroperiods
and cannot persist in permanent ponds. These temporary waters also contain fewer species on average
than permanent water bodies. Using only species richness as a measure of conservation value would
involve removing temporary ponds and losing those species which are restricted to them. Therefore we
analysed variations in community structure using models that were selected to describe species
richness. Canonical correspondence analysis (CCA) was used in the vegan package in R to analyse each
of the models and the significance of each term was calculated using the anova.cca function in vegan.

8
RESULTS
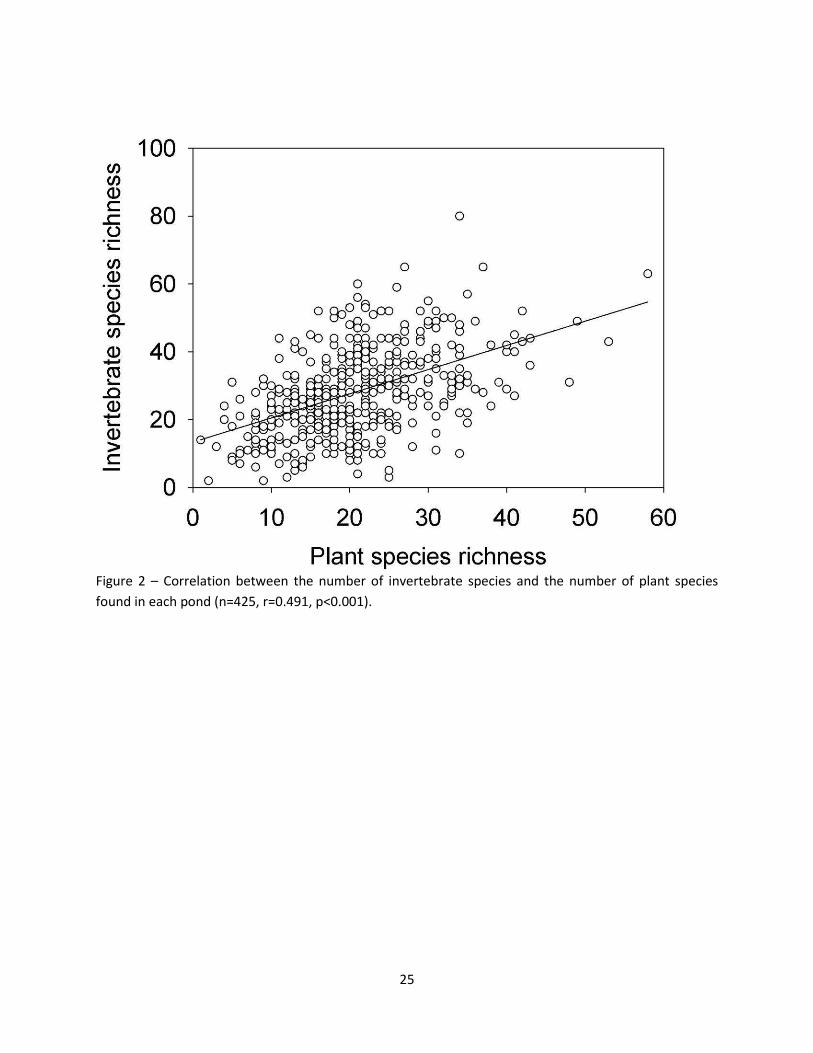
A total of 265 species of plants and 277 species of invertebrates were recorded during the surveys (see
Appendix A and Appendix B, respectively, for species lists). Mean invertebrate species richness in each
pond was 28.2 (± 0.6 SE) and mean plant species richness was 20.8 (± 0.4). There was a significant,
though weak, correlation between plant and invertebrate species richness (r=0.491, p<0.001, R2=0.239,
Figure 2). When similarity matrices of the different groups were analysed, cross-taxon congruence was
typically low between taxa that were independent of one another (Table 3).
Pond characteristics only (n=425)
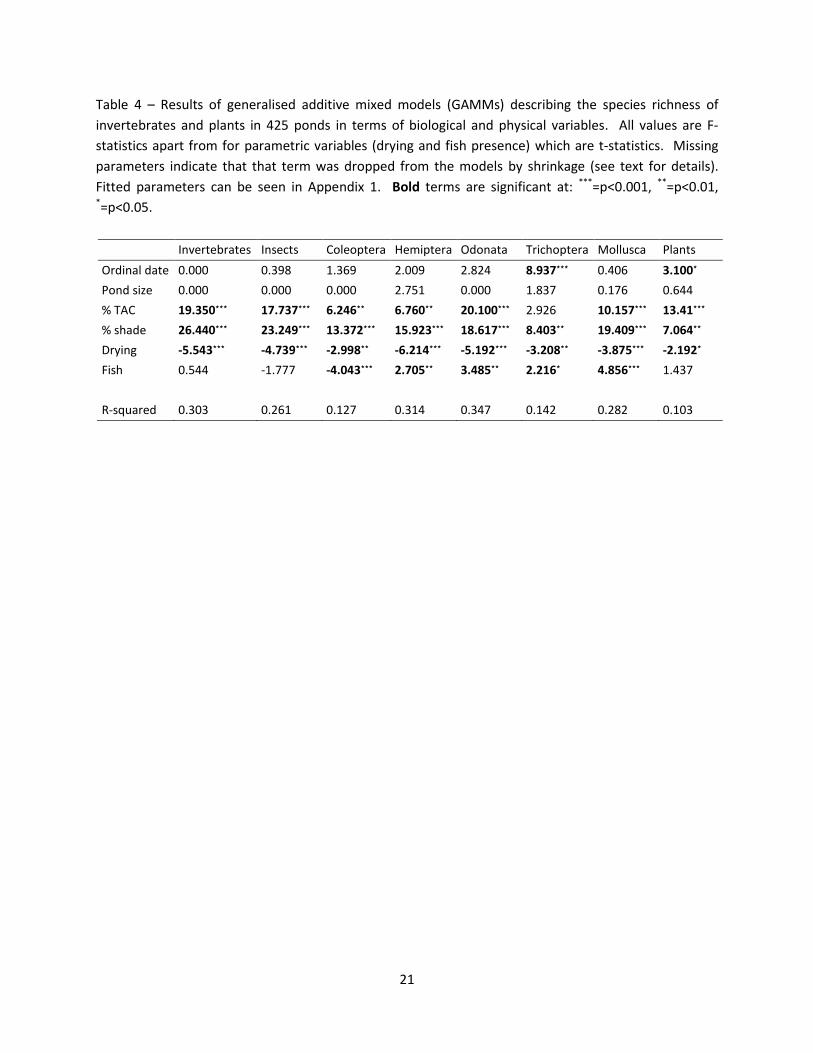
Fitted relationships for parameters in this analysis can be seen in Appendix A and the related statistics
are in Table 4. Pond volume has no relationship with species richness in any taxa and sampling date is
related only to Trichoptera and plant richness (Table 4). The proportion of the pond that was shaded
and a history of drying were both consistently significant across all taxa. In three taxa (Odonata, plants,
Trichoptera), the relationship between shading and richness was approximately linear, corresponding to
a progressive decline in species richness with increasing shading. However, in the remaining taxa
(molluscs, Coleoptera, Hemiptera, insects generally and invertebrates generally) there was a non-linear
response indicating that low levels of shading had no impact on richness but that higher levels of
shading had strong negative effects on richness. Ponds that were known to have dried out contained
significantly fewer species of all taxa. Plant cover was consistently positive and significant in all taxa
apart from Trichoptera (although this approached significance, p=0.089). As with shading, relationships
between plant cover and taxonomic richness. This was particularly evident with insect and invertebrate
richness where increasing levels of plant cover had a positive effect where plant cover was sparse, but
beyond a certain point (around 30% cover), there was no additional increase in species richness.
Relationships between species richness and fish presence varied strongly between taxa, with significant
positive relationships in the Odonata, Trichoptera and Mollusca but a significant negative relationship in
the Coleoptera.
The explanatory power of models varied strongly between taxonomic groups between 10.3% (plants)
and 31.4% (Hemiptera). The strongest term in the model explaining plant species richness was the
percentage cover of aquatic plants. As this could be circular reasoning (more plants lead to more
plants), we ran the same model excluding the plant coverage term. This reduced the adjusted-R2 from
10.3% to 6.3%.
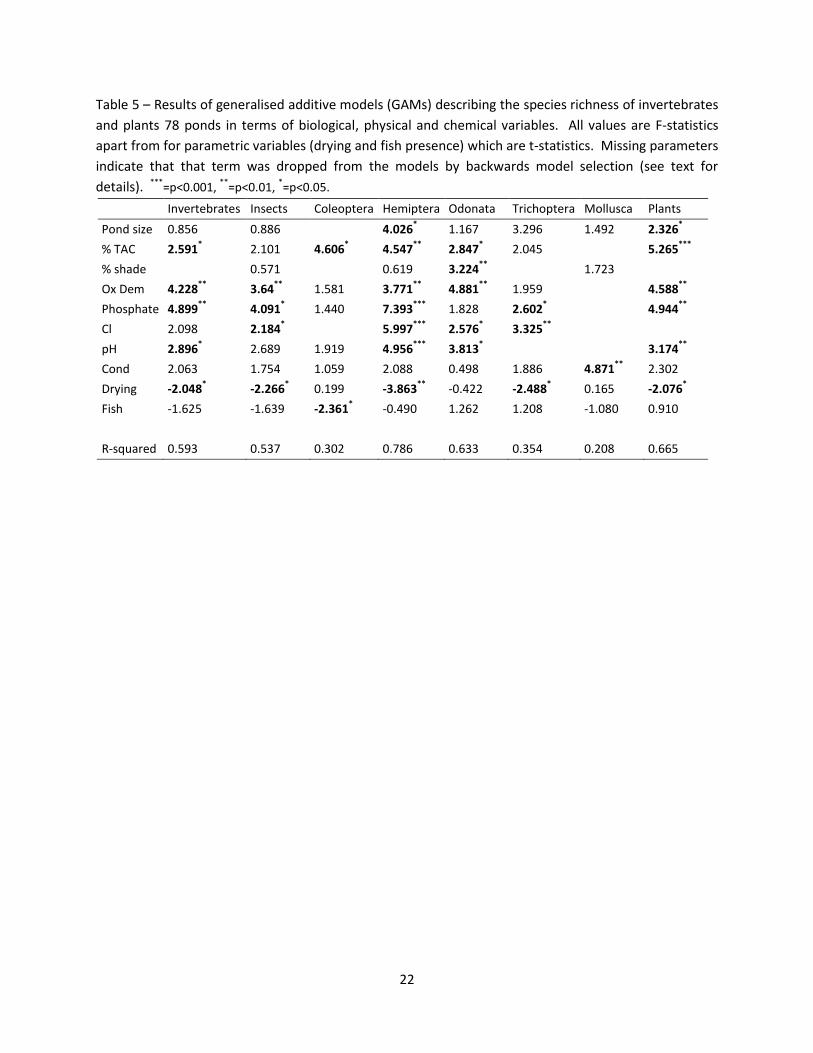
Pond characteristics and water chemistry (n=78)
Fitted relationships for parameters in this analysis can be seen in Appendix B and the related statistics
are in Table 5. When chemistry data were included to analyse the subset of ponds the model fit (as
measured by adjusted-R2) was increased in models for all taxa apart from molluscs. However, the
nature of the relationships between richness and predictors became extremely difficult to interpret with
evidence of over-fitting of the splines to the data. This was particularly true for those taxa with
relatively few species recorded (maximum species recorded in a single pond: Trichoptera=6, Mollusca=7,
Hemiptera=7, Odonata=5, Coleoptera=32, insects=46, invertebrates=57, plants=43). For this reason, we
limit our interpretation to the four richest groups: Coleoptera, insects, invertebrates and plants.

9
As with the first analysis, plant cover was positively related to richness in all four groups although this
was not significant in the insects (p=0.093). Non-linearity in the relationship between invertebrate and
insect richness and plant cover suggests that there is little variation in richness across intermediate
levels of plant cover but a decline at low levels (<5%) and an increase in richness at higher levels (>30%).
Also replicated in this analysis was the negative relationship between drying and species richness,
although this was not a factor for the Coleoptera which was the only taxon negatively affected by fish
presence. Pond volume was weakly (p=0.037) positively associated with plant richness. Higher species
richness of plants, invertebrates and insects were associated with intermediate phosphate
concentrations, while this was not a factor for Coleoptera. There is evidence for the opposite
relationship with oxygen demand, where insect, invertebrate and plant richness is lowest at
intermediate levels of oxgen demand.
Community variation
CCA demonstrated that there were a number of factors that influenced not only species richness but
also community structure (Table 6). This means that speciose ponds tend to be associated with one
extreme of a variable's range. This pattern can be seen for invertebrates (Figure 3A), where speciose
ponds are clustered slightly above and to the left of the origin of the CCA plot, and plants (Figure 3B),
where speciose ponds are clustered above and to the right of the origin. In both cases the less species
rich ponds contain different and more-variable communities compared to the more species rich ponds.

10
DISCUSSION
General observations
We demonstrate that a reasonable proportion (26-30%) of the variance in the species richness of broad
taxonomic groups such as invertebrates, insects and molluscs can be predicted with relatively few
environmental variables. However, the predictive ability of models of species richness in lower-order
taxonomic groups is more variable. While Hemiptera (31.4%) and Odonata (34.7%) were relatively well
predicted, models explaining Coleoptera (12.7%) and Trichoptera (14.2%) species richness performed
worse. Taxa responded uniformly with higher species richness in ponds that did not have a history of
drying up and pond with lower amounts of shading. Pond volume never influenced species richness.
Responses to turbidity and fish presence varied between groups. However, less species-rich ponds tend
to contain different communities to more diverse ponds. The addition of water chemistry variables only
seems to increase the predictive ability of models describing plant species richness, with phosphate
concentration being a significant variable.
Physical correlates
Shading and drying exerted strong negative effects on the species richness of all taxa in the first analysis
of only biological and physical pond characteristics. Shading has previously been suggested as having
little effect on species richness (Biggs et al. 2005) but it is clearly a major factor affecting ponds in
northern England and Switzerland (Joye et al. 2006). As mentioned earlier, permanent and temporary
water bodies have different communities (Williams 1997), and while species richness is often lower in
temporary water bodies these habitats may support more rare species (Collinson et al. 1995). Certainly
fluctuating water levels and varying patterns of hydroperiodic fluctuation provide different habitats for
species than permanent water bodies (Williams 1997) and occasional drying may benefit regional
species richness when species vary in their ability to recolonise (Dorn 2008; Van De Meutter et al. 2006).
The only other study of this scale is described by Biggs et al. (2005), who list those environmental
variables with which species richness was correlated. They find that only pond area and pH were
significantly correlated with species richness in both macroinvertebrates and plants. Drying
("seasonality" in Biggs et al. 2005) negatively correlated with macroinvertebrate species richness and %
cover vegetation positively correlated with plant species richness, as in our study. While vegetation
abundance (% plant cover in this analysis) exhibited a significant relationship with species richness in our
analysis, we can state categorically that there is no relationship between pond volume and species
richness in our study system (in line with other studies Oertli et al. 2002; Søndergaard et al. 2005).
Furthermore, Biggs et al. discount a range of variables as having an effect on species richness, including
shade which was highly significant in this study. Thus, while there is agreement between the two
studies that ponds constitute a considerable biodiversity resource, there is relatively little agreement on
which environmental variables are influencing that species richness. However, it is worth noting that
Biggs et al. do not include multiple regressions in their analysis, so it is not possible to draw direct
parallels between their results and ours.
Chemical correlates

11
Water chemistry appeared not to significantly improve models with the exception that the addition of
phosphate to the plant model leading to a 57% increase in explanatory power. Higher nutrient loading
leads to a shift from vascular plants to an ecosystem dominated by algae (Genkai-Kato and Carpenter
2005), although this does not seem to have negatively influenced the faunal communities. Conductivity
also featured in a number of models, although the effect was not so great. Conductivity has received
attention in colder areas of the world where road salt has been implicated in increasing the lability of
heavy metals in aquatic environments (Bauske and Goetz 1993). While chloride concentrations
themselves have been shown to have little effect on macroinvertebrates (Benbow and Merritt 2004),
amphibians are susceptible to levels of chloride produced by run-off from de-icing (Sanzo and Hecnar
2006).
Biological correlates
Fish have been shown to alter the composition of aquatic macroinvertebrate communities (Bendell and
McNicol 1987), but it is clear that the effect is not uniform across invertebrate taxa. Our results agree
with those of Hinden et al. (2005) who demonstrate positive relationships between fish presence and
odonate species richness but negative relationships between fish presence and coleopteran species
richness. We add to this pattern positive relationships with Hemiptera, Trichoptera and Mollusca.
Schilling et al. (2009) have demonstrated that Coleoptera are less prevalent and occur at lower
abundance in lakes containing fish than in lakes lacking fish (particularly Dystiscidae which were
completely absent in fish-containing lakes). While they demonstrate similar patterns for Odonata and
Hemiptera, Schilling et al. also find that (i) some Hemipteran groups are more prevalent and abundant in
lakes containing fish and (ii) the percent occurrence of coenagrionid damselflies, one of the most
common odonate groups in our sample, does not vary significantly between fish-containing and fishless
lakes. Some coenagrionid damselflies are known to have adaptations which allow persistence with fish
(McPeek 1990). Thus the variation between taxa in response to fish may stem from variation in
susceptibility to fish predation, although Coleoptera have also been shown to avoid colonising sites
containing fish (Resetarits 2001). Cloudy water is characteristic of algae-dominated systems with low
macrophyte species richness, as we observed. The negative relationship between Coleoptera and
Mollusca species richness and water turbidity may be an indirect effect of this relationship between
turbidity and plant species richness. It is unclear as to why Hemiptera are more species rich in turbid
ponds.
We have analysed a vast dataset of ponds over a relatively limited geographical scale, using consistent
sampling methodology and measuring a wide array of biological, physical and chemical variables. With
two exceptions (water permanence and shade), we have failed to find consistent predictors of species
richness across aquatic taxa. Given such a result, possible explanations include that key predictor
variables have been omitted from the analysis or that the relationship between predictors and response
variables followed a non-linear pattern that was not characterised accurately by GLMs. However, an
alternative explanation might involve the small island effect (SIE, Lomolino 2000; Lomolino and Weiser
2001) where species-area relationships break down at small island sizes. The SIE is thought to result
from idiosyncratic processes that swamp the mechanisms that generate the species-area relationship in
larger islands. Rather than only affecting the species-area relationship, such idiosyncratic processes may
12
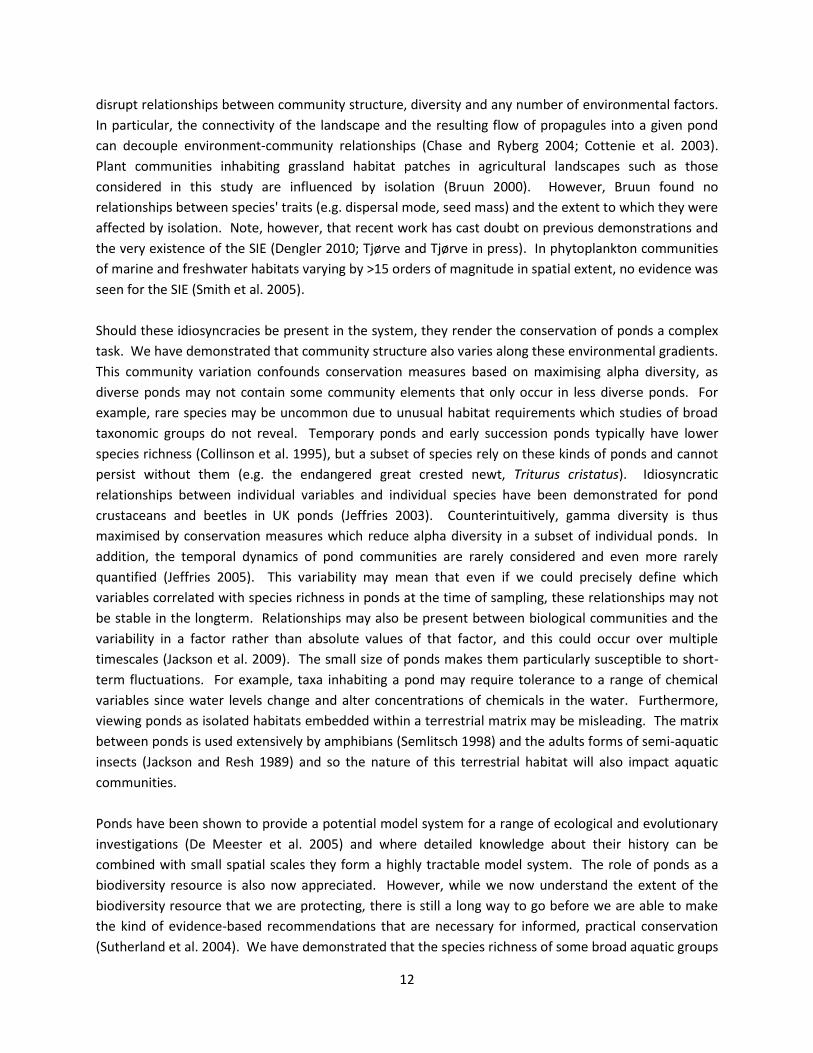
disrupt relationships between community structure, diversity and any number of environmental factors.
In particular, the connectivity of the landscape and the resulting flow of propagules into a given pond
can decouple environment-community relationships (Chase and Ryberg 2004; Cottenie et al. 2003).
Plant communities inhabiting grassland habitat patches in agricultural landscapes such as those
considered in this study are influenced by isolation (Bruun 2000). However, Bruun found no
relationships between species' traits (e.g. dispersal mode, seed mass) and the extent to which they were
affected by isolation. Note, however, that recent work has cast doubt on previous demonstrations and
the very existence of the SIE (Dengler 2010; Tjørve and Tjørve in press). In phytoplankton communities
of marine and freshwater habitats varying by >15 orders of magnitude in spatial extent, no evidence was
seen for the SIE (Smith et al. 2005).
Should these idiosyncracies be present in the system, they render the conservation of ponds a complex
task. We have demonstrated that community structure also varies along these environmental gradients.
This community variation confounds conservation measures based on maximising alpha diversity, as
diverse ponds may not contain some community elements that only occur in less diverse ponds. For
example, rare species may be uncommon due to unusual habitat requirements which studies of broad
taxonomic groups do not reveal. Temporary ponds and early succession ponds typically have lower
species richness (Collinson et al. 1995), but a subset of species rely on these kinds of ponds and cannot
persist without them (e.g. the endangered great crested newt, Triturus cristatus). Idiosyncratic
relationships between individual variables and individual species have been demonstrated for pond
crustaceans and beetles in UK ponds (Jeffries 2003). Counterintuitively, gamma diversity is thus
maximised by conservation measures which reduce alpha diversity in a subset of individual ponds. In
addition, the temporal dynamics of pond communities are rarely considered and even more rarely
quantified (Jeffries 2005). This variability may mean that even if we could precisely define which
variables correlated with species richness in ponds at the time of sampling, these relationships may not
be stable in the longterm. Relationships may also be present between biological communities and the
variability in a factor rather than absolute values of that factor, and this could occur over multiple
timescales (Jackson et al. 2009). The small size of ponds makes them particularly susceptible to short-
term fluctuations. For example, taxa inhabiting a pond may require tolerance to a range of chemical
variables since water levels change and alter concentrations of chemicals in the water. Furthermore,
viewing ponds as isolated habitats embedded within a terrestrial matrix may be misleading. The matrix
between ponds is used extensively by amphibians (Semlitsch 1998) and the adults forms of semi-aquatic
insects (Jackson and Resh 1989) and so the nature of this terrestrial habitat will also impact aquatic
communities.
Ponds have been shown to provide a potential model system for a range of ecological and evolutionary
investigations (De Meester et al. 2005) and where detailed knowledge about their history can be
combined with small spatial scales they form a highly tractable model system. The role of ponds as a
biodiversity resource is also now appreciated. However, while we now understand the extent of the
biodiversity resource that we are protecting, there is still a long way to go before we are able to make
the kind of evidence-based recommendations that are necessary for informed, practical conservation
(Sutherland et al. 2004). We have demonstrated that the species richness of some broad aquatic groups

13
(invertebrates, plants) can be predicted using environmental variables, although predictive power is
reduced for narrower groups. However, we caution against the uncritical use of such relationships as
justification for conservation measures, since promoting alpha diversity in individual ponds may not
necessarily promote landscape level biodiversity.
ACKNOWLEDGEMENTS
The Pond Life Project is funded by the Life Programme of the European Union and a consortium of
partners, including Cheshire County Council, with Warrington and Vale Royal Borough Councils. We are
indebted to Jonathan Guest and David Bentley for their efforts in carrying out the pond surveys. CH was
supported by a Government of Canada Postdoctoral Research Fellowship.

14
REFERENCES
Bates D, Maechler M and Bolker B (2011) lme4: Linear mixed-effects models using S4 classes, R package
version 0.999375-39, http://CRAN.R-project.org/package=lme4.
Bauske B and Goetz D (1993) Effects of deicing salts on heavy metal mobility. Acta Hydrochimica et
Hydrobiologica 21: 38-42.
Benbow M and Merritt R (2004) Road-salt toxicity of select Michigan wetland macroinvertebrates under
different testing conditions. Wetlands 24: 68-76.
Bendell BE and McNicol DK (1987) Fish predation, lake acidity and the composition of aquatic insect
assemblages. Hydrobiologia 150: 193-202.
Bendell BE and McNicol DK (1995) Lake acidity, fish predation and the distribution and abundance of
some littoral insects. Hydrobiologia 302: 133-145.
Biggs J, Williams P, Whitfield M, Nicolet P and Weatherby A (2005) 15 years of pond assessment in
Britain: results and lessons learned from the work of Pond Conservation. Aquatic Conservation: Marine
and Freshwater Ecosystems 15: 693-714.
Blumenshine SC, Lodge DM and Hodgson JR (2000) Gradient of fish predation alters body size
distributions of lake benthos. Ecology 81: 374-386.
Briers RA and Biggs J (2005) Spatial patterns in pond invertebrate communities: separating
environmental and distance effects. Aquatic Conservation: Marine and Freshwater Ecosystems 15: 549-
557.
Bruun HH (2000) Patterns of species richness in dry grassland patches in an agricultural landscape.
Ecography 23: 641-650.
Burnham KP and Anderson DR (2002) Model Selection and Multimodel Inference: A Practical
Information-Theoretic Approach. Springer-Verlag, New York.
Carchini G, Solimini AG and Ruggiero A (2005) Habitat characteristics and odonate diversity in mountain
ponds of central Italy. Aquatic Conservation: Marine and Freshwater Ecosystems 15: 573-581.
Céréghino R, Biggs J, Oertli B and Declerck S (2008) The ecology of European ponds: defining the
characteristics of a neglected freshwater habitat. Hydrobiologia 597: 1-6.
Chase JM and Ryberg WA (2004) Connectivity, scale-dependence, and the productivityにdiversity
relationship. Ecology Letters 7: 676-683.
Collinson NH, Biggs J, Corfield A, Hodson MJ, Walker D, Whitfield M and Williams PJ (1995) Temporary
and permanent ponds: an assessment of the effects of drying out on the conservation value of aquatic
macroinvertebrate communities. Biological Conservation 74: 125-133.
Cottenie K and De Meester L (2003) Connectivity and cladoceran species richness in a metacommunity
of shallow lakes. Freshwater Biology 48: 823-832.
Cottenie K, Michels E, Nuytten N and De Meester L (2003) Zooplankton metacommunity structure:
regional vs local processes in highly interconnected ponds. Ecology 84: 991-1000.
Davies B, Biggs J, Williams P, Whitfield M, Nicolet P, Sear D, Bray S and Maund S (2008) Comparative
biodiversity of aquatic habitats in the European agricultural landscape. Agriculture, Ecosystems &
Environment 125: 1-8.
De Meester L, Declerck S, Stoks R, Louette G, Van De Meutter F, De Bie T, Michels E and Brendonck L
(2005) Ponds and pools as model systems in conservation biology, ecology and evolutionary biology.
Aquatic Conservation: Marine and Freshwater Ecosystems 15: 715-725.

15
Dengler J (2010) Robust methods for detecting a small island effect. Diversity and Distributions 16: 256-
266.
Dorn NJ (2008) Colonisation and reproduction of large macroinvertebrates are enhanced by drought-
related fish reductions. Hydrobiologia 605: 209-218.
Downing JA, Cole JJ, Middelburg JJ, Striegel RG, Duarte CM, Kortelainen P, Prairie YT and Laube KA
(2008) Sediment organic carbon burial in agriculturally eutrophic impoundments over the last century.
Global Biogeochemical Cycles 22: GB1018.
Durance I and Ormerod SJ (2008) Trends in water quality and discharge confound long-term warming
effects on river macroinvertebrates. Freshwater Biology 54: 388-405.
Eyre MD, Ball SG and Foster GN (1986) An initial classification of the habitats of aquatic Coleoptera in
north-east England. Journal of Applied Ecology 23: 841-852.
Field R, Hawkins BA, Cornell HV, Currie DJ, Diniz-Filho JAF, Guégan JF, Kaufman DM, Kerr JT, Mittelbach
GGが OHWヴSラヴaa Tが OげBヴキWミ EM ;ミS T┌ヴミWヴ JRG ふヲヰヰΓぶ Sヮ;デキ;ノ ゲヮWIキWゲ-richness gradients across scales: a
meta-analysis. Journal of Biogeography 36: 132-147.
Fiener P, Auerswald K and Weigand S (2005) Managing erosion and water quality in agricultural
watersheds by small detention ponds. Agriculture, Ecosystems & Environment 110: 132-142.
Friday LE (1987) The diversity of macroinvertebrate and macrophyte communities in ponds. Freshwater
Biology 18: 87-104.
Gee JHR, Smith BD, Lee KM and Griffiths SW (1997) The ecological basis of freshwater pond
management for biodiversity. Aquatic Conservation: Marine and Freshwater Ecosystems 7: 91-104.
Genkai-Kato M and Carpenter SR (2005) Eutrophication due to phosphorus recycling in relation to lake
morphometry, temperature, and macrophytes. Ecology 86: 210-219.
Gilliam JF, Fraser DF and Sabat AM (1989) Strong effects of foraging minnows on a stream benthic
invertebrate community. Ecology 70: 445-452.
Heino J, Tolonen K, Kotanen J and Paasivirta L (2009) Indicator groups and congruence of assemblage
similarity, species richness, and environmental relationships in littoral macroinvertebrates. Biodiversity
and Conservation 18: 3085-3098.
Hinden H, Oertli B, Menetrey N, Sager L and Lachavanne JB (2005) Alpine pond biodiversity: what are
the related environmental variables? Aquatic Conservation: Marine and Freshwater Ecosystems 15: 613-
624.
Jackson JK and Resh VH (1989) Distribution and abundance of adult aquatic insects in the forest adjacent
to a northern California stream. Environmental Entomology 18: 278-283.
Jackson ST, Betancourt JL, Booth RK and Gray ST (2009) Ecology and the ratchet of events: climate
variability, niche dimensions, and species distributions. Proceedings of the National Academy of Sciences
106: 19685-19692.
Jeffries MJ (1991) The ecology and conservation value of forestry ponds in Scotland, United Kingdom.
Biological Conservation 58: 191-211.
Jeffries MJ (2003) Idiosyncratic relationships between pond invertebrates and environmental, temporal
and patch-specific predictors of incidence. Ecography 26: 311-324.
Jeffries MJ (2005) Small ponds and big landscapes: the challenge of invertebrate spatial and temporal
dynamics for European pond conservation. Aquatic Conservation: Marine and Freshwater Ecosystems
15: 541-547.

16
Joye DA, Oertli B, Lehmann A, Juge R and Lachavanne J-B (2006) The prediction of macrophyte species
occurrence in Swiss ponds. Hydrobiologia 570: 175-182.
Leibold MA and McPeek MA (2006) Coexistence of the niche and neutral perspectives in community
ecology. Ecology 87: 1399-1410.
Lomolino MV (2000) Ecology's most general, yet protean pattern: the species-area relationship. Journal
of Biogeography 27: 17-26.
Lomolino MV and Weiser MD (2001) Towards a more general speciesにarea relationship: diversity on all
islands, great and small. Journal of Biogeography 28: 431-445.
McAbendroth L, Ramsay PM, Foggo A, Rundle SD and Bilton DT (2005) Does macrophyte fractal
complexity drive invertebrate diversity, biomass and body size distributions? Oikos 111: 279-290.
McPeek MA (1990) Behavioral differences between Enallagma species (Odonata) influencing differential
vulnerability to predators. Ecology 71: 1714-1726.
Menetrey N, Sager L, Lachavanne JB and Oertli B (2005) Looking for metrics to assess the trophic state of
ponds. Macroinvertebrates and amphibians. Aquatic Conservation: Marine and Freshwater Ecosystems
15: 653-664.
Oertli B, Joye DA, Castella E, Juge R, Cambin D and Lachavanne J-B (2002) Does size matter? The
relationship between pond area and biodiversity. Biological Conservation 104: 59-70.
R Development Core Team (2010) R: A language and environment for statistical computing, R
Foundation for Statistical Computing, Vienna, Austria.
Resetarits W (2001) Colonization under threat of predation: avoidance of fish by an aquatic beetle,
Tropisternus lateralis (Coleoptera: Hydrophilidae). Oecologia 129: 155-160.
Rosset V, Lehmann A and Oertli B (2010) Warmer and richer? Predicting the impact of climate warming
on species richness in small temperate waterbodies. Global Change Biology 16: 2376-2387.
Sanzo D and Hecnar SJ (2006) Effects of road de-icing salt (NaCl) on larval wood frogs (Rana sylvatica).
Environmental Pollution 140: 247-256.
Scheffer M, Van Geest GJ, Zimmer K, Jeppesen E, Søndergaard M, Butler MG, Hanson MA, Declerck S
and De Meester L (2006) Small habitat size and isolation can promote species richness: second-order
effects on biodiversity in shallow lakes and ponds. Oikos 112: 227-231.
Scher O, Chavaren P, Despreaux M and Thiéry A (2004) Highway stormwater detention ponds as
biodiversity islands? Archives des Sciences 57: 121-130.
Schilling EG, Loftin CS and Huryn AD (2009) Macroinvertebrates as indicators of fish absence in naturally
fishless lakes. Freshwater Biology 54: 181-202.
Semlitsch RD (1998) Biological delineation of terrestrial buffer zones for pond-breeding salamanders.
Conservation Biology 12: 1113-1119.
Smith VH, Foster BL, Grover JP, Holt RD, Leibold MA and deNoyelles F (2005) Phytoplankton species
richness scales consistently from laboratory microcosms to the world's oceans. Proceedings of the
National Academy of Sciences of the United States of America 102: 4393-4396.
Søndergaard M, Jeppesen E and Jensen JP (2005) Pond or lake: does it make any difference? Archiv für
Hydrobiologie 162: 143-165.
Suh AN and Samways MJ (2005) Significance of temporal changes when designing a reservoir for
conservation of dragonfly diversity. Biodiversity and Conservation 14: 165-178.
17
Sutherland WJ, Pullin AS, Dolman PM and Knight TM (2004) The need for evidence-based conservation.
Trends in Ecology & Evolution 19: 305-308.
Tews J, Brose U, Grimm V, Tielbörger K, Wichmann MC, Schwager M and Jeltsch F (2004) Animal species
diversity driven by habitat heterogeneity/diversity: the importance of keystone structures. Journal of
Biogeography 31: 79-92.
Tjørve E and Tjørve KMC (in press) Subjecting the theory of the small-キゲノ;ミS WaaWIデ デラ OIニエ;マげゲ ヴ;┣ラヴく Journal of Biogeography.
Van De Meutter F, Stoks R and De Meester L (2006) Rapid response of macroinvertebrates to drainage
management of shallow connected lakes. Journal of Applied Ecology 43: 51-60.
Williams DD (1997) Temporary ponds and their invertebrate communities. Aquatic Conservation: Marine
and Freshwater Ecosystems 7: 105-117.
Williams DD (2003) The brackishwater hyporheic zone: invertebrate community structure across a novel
ecotone. Hydrobiologia 510: 153-173.
Williams DD, Williams NE and Cao Y (2000) Road salt contamination of groundwater in a major
metropolitan area and development of a biological index to monitor its impact. Water Research 34: 127-
138.
Williams P, Whitfield M, Biggs J, Bray S, Fox G, Nicolet P and Sear DA (2004) Comparative biodiversity of
rivers, streams, ditches and ponds in an agricultural landscape in Southern England. Biological
Conservation 115: 329-341.
Wood PJ, Greenwood MT, Barker SA and Gunn J (2001) The effects of amenity management for angling
on the conservation value of aquatic invertebrate communities in old industrial ponds. Biological
Conservation 102: 17-29.
18
TABLES
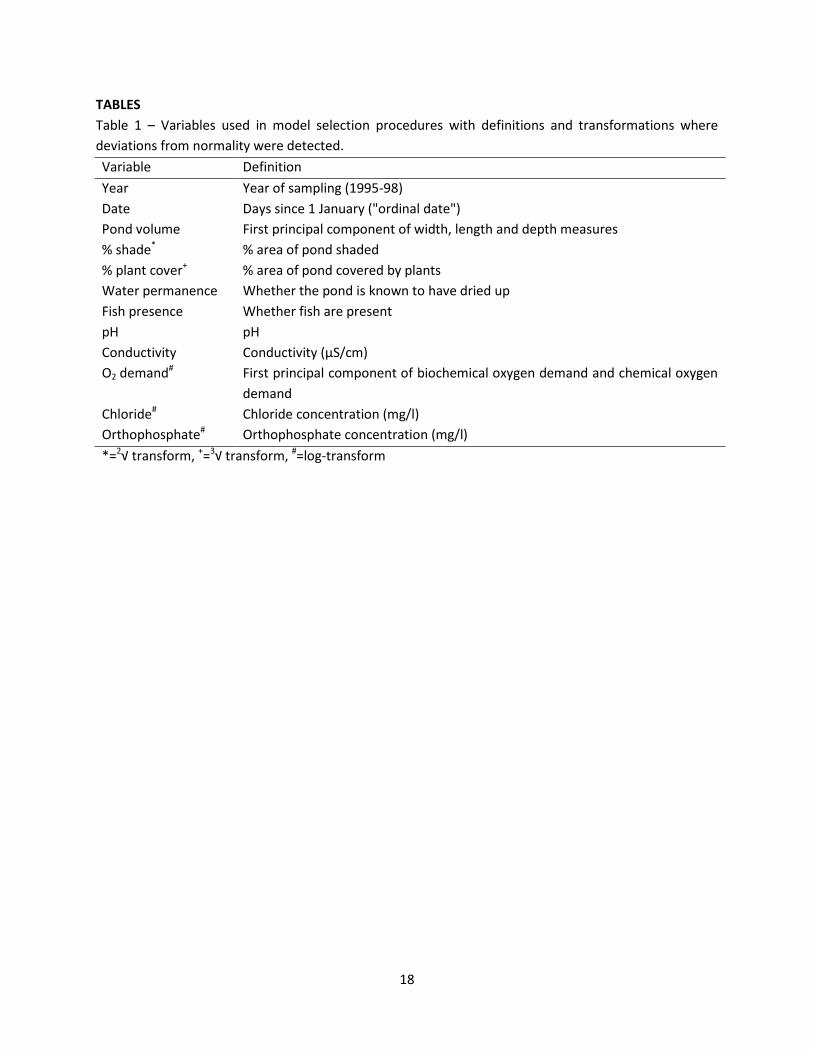
Table 1 に Variables used in model selection procedures with definitions and transformations where
deviations from normality were detected.
Variable Definition
Year Year of sampling (1995-98)
Date Days since 1 January ("ordinal date")
Pond volume First principal component of width, length and depth measures
% shade*
% area of pond shaded
% plant cover+
% area of pond covered by plants
Water permanence Whether the pond is known to have dried up
Fish presence Whether fish are present
pH pH
Conductivity CラミS┌Iデキ┗キデ┞ ふ´SっIマぶ O2 demand
# First principal component of biochemical oxygen demand and chemical oxygen
demand
Chloride# Chloride concentration (mg/l)
Orthophosphate# Orthophosphate concentration (mg/l)
*=2к デヴ;ミゲaラヴマが +=3к デヴ;ミゲaラヴマが #=log-transform

19
Table 2 に Summary statistics for pond variables
Variable Mean S.E. Median Min Max N
Ordinal date 179 1.19 176.00 117 237 425
Width (m) 23.4 0.76 20 2 110 425
Length (m) 28.2 1.13 22 1.5 231 425
% total aquatic plant cover 12.9 1.08 1 0 95 425
% shading 22.9 1.37 10 0 100 425
Drawdown (cm) 7.16 0.62 5 0 150 425
Depth <0.5m: n=109; 0.5-1m: n=99; 1-1.5m: n=76; 1.5-2m:
n=122; >2m: n=17
425
Water permanence 96 (22.6%) ponds were known to dry up 425
Fish presence 149 (35.1%) ponds contain fish 425
Turbidity 115 (27.1%) ponds had cloudy water 425
pH 7.59 0.08 7.50 5.90 10.5 78
CラミS┌Iデキ┗キデ┞ ふ´SっIマぶ 537 29.9 470 111 1490 78
BOD (mg/l) 14.81 3.03 6.25 1.40 168 78
COD (mg/l) 261 111 97.0 25.0 8710 78
Cl (mg/l) 36.5 3.12 29.0 10.0 157 78
Orthophosphate (mg/l) 1.05 0.17 0.345 0.05 5.87 78

20
Table 3 に Results of Mantel tests on community similarity matrices to test cross-taxon congruence.
Values are Spearman's rank correlations and are all significant at p<0.01. Values in italics indicate
correlations between non-independent matrices.
Invertebrates Insects Coleoptera Hemiptera Odonata Mollusca
Invertebrates
Insects 0.918
Coleoptera 0.759 0.847
Hemiptera 0.467 0.497 0.191
Odonata 0.370 0.367 0.100 0.081
Mollusca 0.396 0.135 0.070 0.089 0.132
Plants 0.215 0.173 0.118 0.102 0.097 0.145
21
Table 4 に Results of generalised additive mixed models (GAMMs) describing the species richness of
invertebrates and plants in 425 ponds in terms of biological and physical variables. All values are F-
statistics apart from for parametric variables (drying and fish presence) which are t-statistics. Missing
parameters indicate that that term was dropped from the models by shrinkage (see text for details).
Fitted parameters can be seen in Appendix 1. Bold terms are significant at: ***
=p<0.001, **
=p<0.01, *=p<0.05.
Invertebrates Insects Coleoptera Hemiptera Odonata Trichoptera Mollusca Plants
Ordinal date 0.000*** 0.398*** 1.369*** 2.009*** 2.824*** 8.937*** 0.406*** 3.100***
Pond size 0.000*** 0.000*** 0.000*** 2.751*** 0.000*** 1.837*** 0.176*** 0.644***
% TAC 19.350*** 17.737*** 6.246*** 6.760*** 20.100*** 2.926*** 10.157*** 13.41***
% shade 26.440*** 23.249*** 13.372*** 15.923*** 18.617*** 8.403*** 19.409*** 7.064***
Drying -5.543*** -4.739*** -2.998*** -6.214*** -5.192*** -3.208*** -3.875*** -2.192***
Fish 0.544*** -1.777*** -4.043*** 2.705*** 3.485*** 2.216*** 4.856*** 1.437***
R-squared 0.303*** 0.261*** 0.127*** 0.314*** 0.347*** 0.142*** 0.282*** 0.103***
22
Table 5 に Results of generalised additive models (GAMs) describing the species richness of invertebrates
and plants 78 ponds in terms of biological, physical and chemical variables. All values are F-statistics
apart from for parametric variables (drying and fish presence) which are t-statistics. Missing parameters
indicate that that term was dropped from the models by backwards model selection (see text for
details). ***
=p<0.001, **
=p<0.01, *=p<0.05.
Invertebrates Insects Coleoptera Hemiptera Odonata Trichoptera Mollusca Plants
Pond size 0.856***
0.886***
4.026***
1.167***
3.296***
1.492***
2.326***
% TAC 2.591***
2.101***
4.606***
4.547***
2.847***
2.045***
5.265***
% shade
0.571***
0.619***
3.224***
***
1.723***
Ox Dem 4.228***
3.64***
1.581***
3.771***
4.881***
1.959***
4.588***
Phosphate 4.899***
4.091***
1.440***
7.393***
1.828***
2.602***
4.944***
Cl 2.098***
2.184***
5.997***
2.576***
3.325***
pH 2.896***
2.689***
1.919***
4.956***
3.813***
3.174***
Cond 2.063***
1.754***
1.059***
2.088***
0.498***
1.886***
4.871***
2.302***
Drying -2.048***
-2.266***
0.199***
-3.863**
-0.422***
-2.488***
0.165***
-2.076***
Fish -1.625***
-1.639***
-2.361***
-0.490***
1.262***
1.208***
-1.080***
0.910***
R-squared 0.593***
0.537***
0.302***
0.786***
0.633***
0.354***
0.208***
0.665***

23
Table 6 に Results of canonical correspondence analysis (CCA) describing the variation in community
structure of invertebrates and plants in 425 ponds based on models in Table 4. Missing parameters
indicate that that term was dropped from the models by backwards model selection (see text for
details). Values are F-statistics calculated using ANOVA with 999 permutations.
Invertebrates Insects Coleoptera Hemiptera Odonata Trichoptera Mollusca Plants
% plant cover 2.406***
2.387***
2.034***
2.525**
2.541**
2.120**
1.937***
% shading 4.228***
4.209***
4.003***
5.691***
4.408**
2.423**
2.642***
3.098***
Water permanence 2.895***
2.709***
2.329***
3.466***
3.368***
0.960 3.670***
1.211*
Fish presence
1.887***
5.906***
1.893* 1.032 2.977
*** 1.487
***
Turbidity
1.976***
3.577***
0.944 1.270**

24
FIGURES
Figure 1 に Location of 425 ponds surveyed.
25
Figure 2 に Correlation between the number of invertebrate species and the number of plant species
found in each pond (n=425, r=0.491, p<0.001).

26
Figure 3 に Results of a canonical correspondance analysis describing community structure of (A)
invertebrates and (B) plants in 425 ponds. See Table 6 for statistics. Symbols represent individual ponds
and lighter symbols indicate more diverse ponds.